DESIGN INTERACTION DIAGRAMS FOR REINFORCED ...
8
01.2021 26 MATERIALS & CONSTRUCTION DESIGN INTERACTION DIAGRAMS FOR REINFORCED CONCRETE CIRCULAR COLUMNS FOLLOWING ACI 319-19 Minh Thien Vo Minh Thien Vo Minh Thien Vo Minh Thien Vo 1 , , , , Thanh Tung Vo Thanh Tung Vo Thanh Tung Vo Thanh Tung Vo 2 1 Lecturer, Department of Civil Engineering, Ho Chi Minh City University of Technology (HUTECH) 2 Student, Department of Civil Engineering, Ho Chi Minh City University of Technology (HUTECH) Received 09/11/2020, Revised 13/12/2020, Accepted 08/01/2021 Abstract Abstract Abstract Abstract The procedure for creating interaction diagrams for reinforced-concrete circular crosssections, based on ACI 318-19, is described in the paper. The algorithm is generated based on mathematical tools Mathcad Prime. The author would like to introduce algorithms to the company designs, engineers build an evaluation method column bearing capacity of the circular cross-section. The obtained results are compared with a conventional method (ie, the computer software SP‐Column). The obtained results are promising, as the values obtained by the Interaction Charts and the conventional method appear to be in good agreement. Keywords Keywords Keywords Keywords: reinforced concrete, circular cross-section, interaction diagrams. 1. 1. 1. 1. Introduction Introduction Introduction Introduction This paper presents a novel analytical method to generate interaction diagrams useful for the design of reinforced concrete (RC) biaxial columns. Analysis and design of a structural concrete member for biaxial moments is difficult because a trial and adjustment procedure is necessary to find the inclination and depth of the neutral axis satisfying the equilibrium equations. In the process of calculating the bearing capacity of the column in two main directions of the column cross-section, the reinforcement is usually arranged evenly according to the cross section's circumference. The exact calculation of stress in the rebars is complicated by the uneven distribution of stress. Stress depends on the distance from the rebars to the neutral axis. A novel analytical method is derived for the ultimate capacity interaction diagram (i.e., axial compression, P ‐ bending moment resistance, Mx, My) of reinforced concrete (RC) columns with circular cross-section has been proposed by the American Concrete Institute [1] since 1997. For the case of a rectangular cross-section column (Figure 1a), the P-M interaction diagram resulting from using the strong axis is different from that resulting from using the weak axis. Since there is no strong or weak axis being defined for a circular reinforced concrete section, it has been assumed that a circular reinforced concrete section will only result in one P-M diagram, it does not matter which bending axis in the section is used. (Figure 1b). The arrangement of reinforcement at a circular cross-section will create a relationship diagram P-M. However, this issue also depends on many factors: load combination, the magnitude of bending moment Mx, My, and the number of rebars arranged in the section. Hence, the complete interactive diagram setup is essential. It is very useful for structural design companies, construction engineers. This solution is assessed bearing capacity comprehensive column. The growing use of digital computers as a design tool has resulted in very rapid advances in the dynamic analyze s of Figure 1. Figure 1. Figure 1. Figure 1.Typical types of reinforced concrete cross-section. structures. The biaxial interaction diagrams of RC rectangular columns have been investigated extensively by numerous researchers. The development of bearing capacity structure models is a field of extensive research and many different models have been proposed. The initial background research methodology of interactive diagrams, D.C. Kent và R. Park (1971) using these derived stress-strain curves the moment-curvature relationships for reinforced concrete members under cyclic loading are studied theoretically and compared with the re suit s of a series of tests on reinforced concrete beams under cyclic loading. They have provided good and practical guidance on methods of basic research on interactive diagrams. Evaluate the bearing capacity of the column by method increasing the longitudinal steel bars cross-section area or the number of steel bars. With that idea, researchers have proposed improved methods for interactive diagrams, which have been applied to ACI318. In 2010, Angus Law & Martin Gillie [2] constructed the axial force-moment interaction diagram of an RC section using existing numerical methods, high computation demand, and knowledge of heat transfer and stress analysis are required. In 2012, Ž. Smolčić and D. Grandić [3] have developed an interactive diagramming process for reinforced concrete circular cross- sections, based on HRN EN 1992-1-1. In 2014, Yingjie Jia, Peng Chang, and Jing Sun [4] developed a specified domain in Nu-Mu interaction diagram for logical judgment in numerical analysis on Vertical axis Horizontal axis Main axis
-
Upload
khangminh22 -
Category
Documents
-
view
0 -
download
0
Transcript of DESIGN INTERACTION DIAGRAMS FOR REINFORCED ...
01.202126
MATERIALS & CONSTRUCTION
DESIGN INTERACTION DIAGRAMS FOR REINFORCED CONCRETE CIRCULAR COLUMNS FOLLOWING ACI 319-19
Minh Thien VoMinh Thien VoMinh Thien VoMinh Thien Vo1111, , , , Thanh Tung VoThanh Tung VoThanh Tung VoThanh Tung Vo2222 1Lecturer, Department of Civil Engineering, Ho Chi Minh City University of Technology (HUTECH) 2Student, Department of Civil Engineering, Ho Chi Minh City University of Technology (HUTECH)
Received 09/11/2020, Revised 13/12/2020, Accepted 08/01/2021
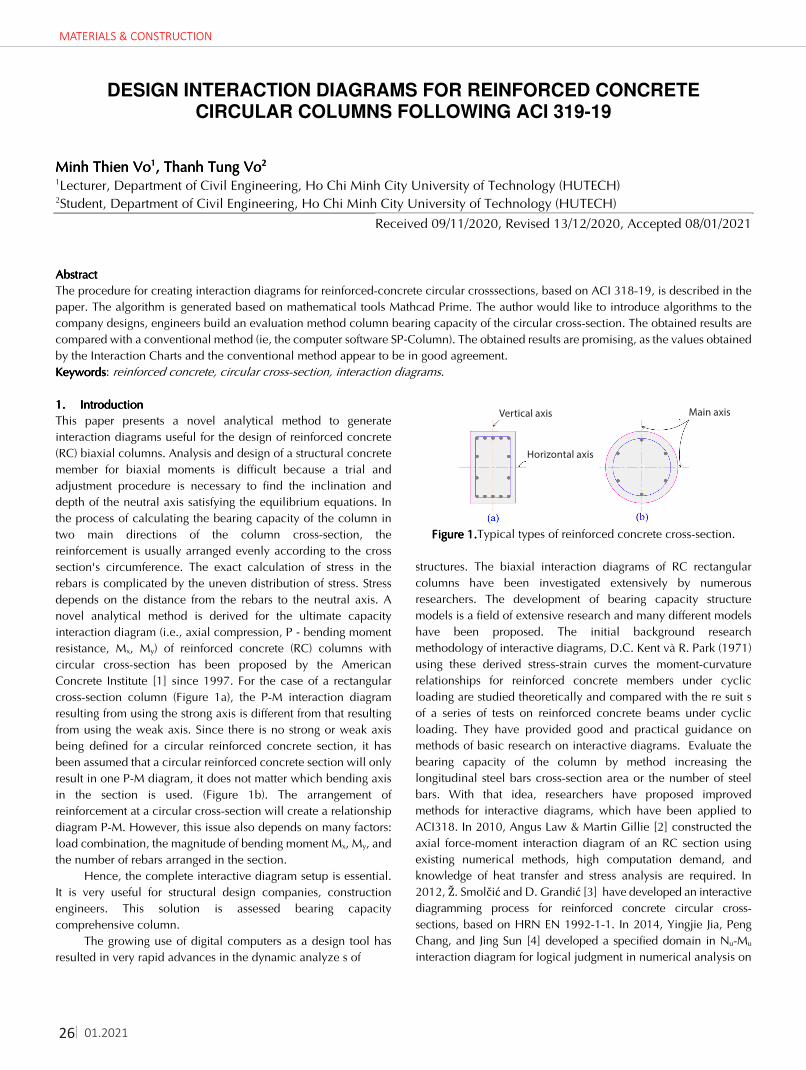
AbstractAbstractAbstractAbstract The procedure for creating interaction diagrams for reinforced-concrete circular crosssections, based on ACI 318-19, is described in the paper. The algorithm is generated based on mathematical tools Mathcad Prime. The author would like to introduce algorithms to the company designs, engineers build an evaluation method column bearing capacity of the circular cross-section. The obtained results are compared with a conventional method (ie, the computer software SP‐Column). The obtained results are promising, as the values obtained by the Interaction Charts and the conventional method appear to be in good agreement. KeywordsKeywordsKeywordsKeywords: reinforced concrete, circular cross-section, interaction diagrams. 1.1.1.1. IntroductionIntroductionIntroductionIntroduction This paper presents a novel analytical method to generate interaction diagrams useful for the design of reinforced concrete (RC) biaxial columns. Analysis and design of a structural concrete member for biaxial moments is difficult because a trial and adjustment procedure is necessary to find the inclination and depth of the neutral axis satisfying the equilibrium equations. In the process of calculating the bearing capacity of the column in two main directions of the column cross-section, the reinforcement is usually arranged evenly according to the cross section's circumference. The exact calculation of stress in the rebars is complicated by the uneven distribution of stress. Stress depends on the distance from the rebars to the neutral axis. A novel analytical method is derived for the ultimate capacity interaction diagram (i.e., axial compression, P ‐ bending moment resistance, Mx, My) of reinforced concrete (RC) columns with circular cross-section has been proposed by the American Concrete Institute [1] since 1997. For the case of a rectangular cross-section column (Figure 1a), the P-M interaction diagram resulting from using the strong axis is different from that resulting from using the weak axis. Since there is no strong or weak axis being defined for a circular reinforced concrete section, it has been assumed that a circular reinforced concrete section will only result in one P-M diagram, it does not matter which bending axis in the section is used. (Figure 1b). The arrangement of reinforcement at a circular cross-section will create a relationship diagram P-M. However, this issue also depends on many factors: load combination, the magnitude of bending moment Mx, My, and the number of rebars arranged in the section.
Hence, the complete interactive diagram setup is essential. It is very useful for structural design companies, construction engineers. This solution is assessed bearing capacity comprehensive column.
The growing use of digital computers as a design tool has resulted in very rapid advances in the dynamic analyze s of
Figure 1.Figure 1.Figure 1.Figure 1.Typical types of reinforced concrete cross-section.
structures. The biaxial interaction diagrams of RC rectangular columns have been investigated extensively by numerous researchers. The development of bearing capacity structure models is a field of extensive research and many different models have been proposed. The initial background research methodology of interactive diagrams, D.C. Kent và R. Park (1971) using these derived stress-strain curves the moment-curvature relationships for reinforced concrete members under cyclic loading are studied theoretically and compared with the re suit s of a series of tests on reinforced concrete beams under cyclic loading. They have provided good and practical guidance on methods of basic research on interactive diagrams. Evaluate the bearing capacity of the column by method increasing the longitudinal steel bars cross-section area or the number of steel bars. With that idea, researchers have proposed improved methods for interactive diagrams, which have been applied to ACI318. In 2010, Angus Law & Martin Gillie [2] constructed the axial force-moment interaction diagram of an RC section using existing numerical methods, high computation demand, and knowledge of heat transfer and stress analysis are required. In 2012, Ž. Smolčić and D. Grandić [3] have developed an interactive diagramming process for reinforced concrete circular cross-sections, based on HRN EN 1992-1-1. In 2014, Yingjie Jia, Peng Chang, and Jing Sun [4] developed a specified domain in Nu-Mu interaction diagram for logical judgment in numerical analysis on
Vertical axis
Horizontal axis
Main axis
compression reinforced concrete members. In Vietnam, Nguyen Viet Hung[5] researched the establishment of interactive diagrams of reinforced concrete structures with a rectangular cross-section in the inclined plane according to US standard ACI 318-14. This study is based on mathematical software Mathcad and includes the numerical example of columns using the proposed mathematical model approach for both compression and tension failure cases. Calculation process based on ACI 318-19 [6]. Besides, this algorithm also supports the structural design engineer to import data from Excel, CSI Etabs [7]. and adjust some parameters to improve the accuracy of results[8]. 2.2.2.2. MethodologyMethodologyMethodologyMethodology 2.12.12.12.1 AssumptionsAssumptionsAssumptionsAssumptions In recent years several methods for designing biaxially loaded columns have been published. Most methods have in common some form of an interaction surface as shown in Figure 2. Interactive diagrams that show the relation between the axial load and bending moment at failure. To understandable, internal force combination (Nz, Mx, My) is shown on the graph with the points L:
Figure Figure Figure Figure 2222. Interaction diagrams for circular cross-sections. Point C is the stretching point of the segment OL, C is a point
at the limit of the bearing capacity of the section. Thus, the cross-section of the column is considered to ensure the bearing capacity when the point showing the internal destructive force is inside the chart:
1OL
OC≤ (1)
The design charts are prepared to get the pairs of values of Pu and Mu in non-dimensional form from the equations of equilibrium for different locations of the neutral axis. For each position of the neutral axis, the following assumptions were used to determine the stress of reinforced concrete by ACI318-19:
a) The assumption that plane sections remain plane also gives guidance as to when a structural element should be regarded as one, two, or three dimensional.
b) The hypothesis of the deformation of a solid body in which the displacements of the material particles are assumed to be much smaller (indeed, infinitesimally smaller) than any relevant dimension of the body.
c) The stress-strain relationship for materials is given by the material’s stress-strain curve. Under different loads, the stress and corresponding strain values are plotted (Figure 3);
Figure Figure Figure Figure 3333. Deformation chart (ACI318-19.21.2.2.2). d) This analysis assumes the stress is evenly distributed over
the entire compression zone ranges c. (Figure 4).
1a cβ= ⋅ ACI318-19.22.2.2.4.1 (2)
Figure Figure Figure Figure 4444. stress and strain distribution diagram of circular cross-section.
e) Values of β1 for equivalent column concrete stress distribution. It depends on the compressive strength of concrete.
Table Table Table Table 1111. Table of experimental coefficients 1β (ACI318-
19.22.2.2.4.3).
cf ′ (MPa) h s 1β
17 28c
f ′≤ ≤ 0.85
28 55c
f ′< < ( )0.05 280.85
7
cf ′⋅ −
−
55c
f ′≤ 0.65
f) The tensile strength of concrete is ignored; g) The stress in the tensile steel is less than a limiting value
by the standard ACI318-19.21.2.2.1;
These factors are related to the loads exerted on the structure and considerably affect the bearing capacity. We need to consider the impact of φ all these issues (Figure 4):
Figure Figure Figure Figure 5555. Variation of ϕ with net tensile strain in extreme tension reinforcement εt.
s s s y
s
y s
E f ff
f f f
ε⋅ ← ≤=
← > (3)

2701.2021
MATERIALS & CONSTRUCTION
DESIGN INTERACTION DIAGRAMS FOR REINFORCED CONCRETE CIRCULAR COLUMNS FOLLOWING ACI 319-19
Minh Thien VoMinh Thien VoMinh Thien VoMinh Thien Vo1111, , , , Thanh Tung VoThanh Tung VoThanh Tung VoThanh Tung Vo2222 1Lecturer, Department of Civil Engineering, Ho Chi Minh City University of Technology (HUTECH) 2Student, Department of Civil Engineering, Ho Chi Minh City University of Technology (HUTECH)
Received 09/11/2020, Revised 13/12/2020, Accepted 08/01/2021
AbstractAbstractAbstractAbstract The procedure for creating interaction diagrams for reinforced-concrete circular crosssections, based on ACI 318-19, is described in the paper. The algorithm is generated based on mathematical tools Mathcad Prime. The author would like to introduce algorithms to the company designs, engineers build an evaluation method column bearing capacity of the circular cross-section. The obtained results are compared with a conventional method (ie, the computer software SP‐Column). The obtained results are promising, as the values obtained by the Interaction Charts and the conventional method appear to be in good agreement. KeywordsKeywordsKeywordsKeywords: reinforced concrete, circular cross-section, interaction diagrams. 1.1.1.1. IntroductionIntroductionIntroductionIntroduction This paper presents a novel analytical method to generate interaction diagrams useful for the design of reinforced concrete (RC) biaxial columns. Analysis and design of a structural concrete member for biaxial moments is difficult because a trial and adjustment procedure is necessary to find the inclination and depth of the neutral axis satisfying the equilibrium equations. In the process of calculating the bearing capacity of the column in two main directions of the column cross-section, the reinforcement is usually arranged evenly according to the cross section's circumference. The exact calculation of stress in the rebars is complicated by the uneven distribution of stress. Stress depends on the distance from the rebars to the neutral axis. A novel analytical method is derived for the ultimate capacity interaction diagram (i.e., axial compression, P ‐ bending moment resistance, Mx, My) of reinforced concrete (RC) columns with circular cross-section has been proposed by the American Concrete Institute [1] since 1997. For the case of a rectangular cross-section column (Figure 1a), the P-M interaction diagram resulting from using the strong axis is different from that resulting from using the weak axis. Since there is no strong or weak axis being defined for a circular reinforced concrete section, it has been assumed that a circular reinforced concrete section will only result in one P-M diagram, it does not matter which bending axis in the section is used. (Figure 1b). The arrangement of reinforcement at a circular cross-section will create a relationship diagram P-M. However, this issue also depends on many factors: load combination, the magnitude of bending moment Mx, My, and the number of rebars arranged in the section.
Hence, the complete interactive diagram setup is essential. It is very useful for structural design companies, construction engineers. This solution is assessed bearing capacity comprehensive column.
The growing use of digital computers as a design tool has resulted in very rapid advances in the dynamic analyze s of
Figure 1.Figure 1.Figure 1.Figure 1.Typical types of reinforced concrete cross-section.
structures. The biaxial interaction diagrams of RC rectangular columns have been investigated extensively by numerous researchers. The development of bearing capacity structure models is a field of extensive research and many different models have been proposed. The initial background research methodology of interactive diagrams, D.C. Kent và R. Park (1971) using these derived stress-strain curves the moment-curvature relationships for reinforced concrete members under cyclic loading are studied theoretically and compared with the re suit s of a series of tests on reinforced concrete beams under cyclic loading. They have provided good and practical guidance on methods of basic research on interactive diagrams. Evaluate the bearing capacity of the column by method increasing the longitudinal steel bars cross-section area or the number of steel bars. With that idea, researchers have proposed improved methods for interactive diagrams, which have been applied to ACI318. In 2010, Angus Law & Martin Gillie [2] constructed the axial force-moment interaction diagram of an RC section using existing numerical methods, high computation demand, and knowledge of heat transfer and stress analysis are required. In 2012, Ž. Smolčić and D. Grandić [3] have developed an interactive diagramming process for reinforced concrete circular cross-sections, based on HRN EN 1992-1-1. In 2014, Yingjie Jia, Peng Chang, and Jing Sun [4] developed a specified domain in Nu-Mu interaction diagram for logical judgment in numerical analysis on
compression reinforced concrete members. In Vietnam, Nguyen Viet Hung[5] researched the establishment of interactive diagrams of reinforced concrete structures with a rectangular cross-section in the inclined plane according to US standard ACI 318-14. This study is based on mathematical software Mathcad and includes the numerical example of columns using the proposed mathematical model approach for both compression and tension failure cases. Calculation process based on ACI 318-19 [6]. Besides, this algorithm also supports the structural design engineer to import data from Excel, CSI Etabs [7]. and adjust some parameters to improve the accuracy of results[8]. 2.2.2.2. MethodologyMethodologyMethodologyMethodology 2.12.12.12.1 AssumptionsAssumptionsAssumptionsAssumptions In recent years several methods for designing biaxially loaded columns have been published. Most methods have in common some form of an interaction surface as shown in Figure 2. Interactive diagrams that show the relation between the axial load and bending moment at failure. To understandable, internal force combination (Nz, Mx, My) is shown on the graph with the points L:
Figure Figure Figure Figure 2222. Interaction diagrams for circular cross-sections. Point C is the stretching point of the segment OL, C is a point
at the limit of the bearing capacity of the section. Thus, the cross-section of the column is considered to ensure the bearing capacity when the point showing the internal destructive force is inside the chart:
1OL
OC≤ (1)
The design charts are prepared to get the pairs of values of Pu and Mu in non-dimensional form from the equations of equilibrium for different locations of the neutral axis. For each position of the neutral axis, the following assumptions were used to determine the stress of reinforced concrete by ACI318-19:
a) The assumption that plane sections remain plane also gives guidance as to when a structural element should be regarded as one, two, or three dimensional.
b) The hypothesis of the deformation of a solid body in which the displacements of the material particles are assumed to be much smaller (indeed, infinitesimally smaller) than any relevant dimension of the body.
c) The stress-strain relationship for materials is given by the material’s stress-strain curve. Under different loads, the stress and corresponding strain values are plotted (Figure 3);
Figure Figure Figure Figure 3333. Deformation chart (ACI318-19.21.2.2.2). d) This analysis assumes the stress is evenly distributed over
the entire compression zone ranges c. (Figure 4).
1a cβ= ⋅ ACI318-19.22.2.2.4.1 (2)
Figure Figure Figure Figure 4444. stress and strain distribution diagram of circular cross-section.
e) Values of β1 for equivalent column concrete stress distribution. It depends on the compressive strength of concrete.
Table Table Table Table 1111. Table of experimental coefficients 1β (ACI318-
19.22.2.2.4.3).
cf ′ (MPa) h s 1β
17 28c
f ′≤ ≤ 0.85
28 55c
f ′< < ( )0.05 280.85
7
cf ′⋅ −
−
55c
f ′≤ 0.65
f) The tensile strength of concrete is ignored; g) The stress in the tensile steel is less than a limiting value
by the standard ACI318-19.21.2.2.1;
These factors are related to the loads exerted on the structure and considerably affect the bearing capacity. We need to consider the impact of φ all these issues (Figure 4):
Figure Figure Figure Figure 5555. Variation of ϕ with net tensile strain in extreme tension reinforcement εt.
s s s y
s
y s
E f ff
f f f
ε⋅ ← ≤=
← > (3)

01.202128
MATERIALS & CONSTRUCTION
Variation of ξ depends on the type of shear reinforcement
ACI318-19.22.4.2.1. Table Table Table Table 2222. Determine the coefficient ξ.
Member Transverse
reinforcement ξ
Nonprestressed Stirrup 0.80 Spirals 0.85
2.22.22.22.2.... Method establish interaction diagramMethod establish interaction diagramMethod establish interaction diagramMethod establish interaction diagram The basic steps establish the interaction diagram
Figure Figure Figure Figure 6666. The procedure of setting up interaction diagrams.
In comparison to bending about one axis of a reinforced concrete column, biaxial bending presents an entirely different and more complex situation. As a second bending moment is introduced, the neutral axes are no longer parallel to the centroidal axes of the section but lie at some angle θ from them.
No Yes
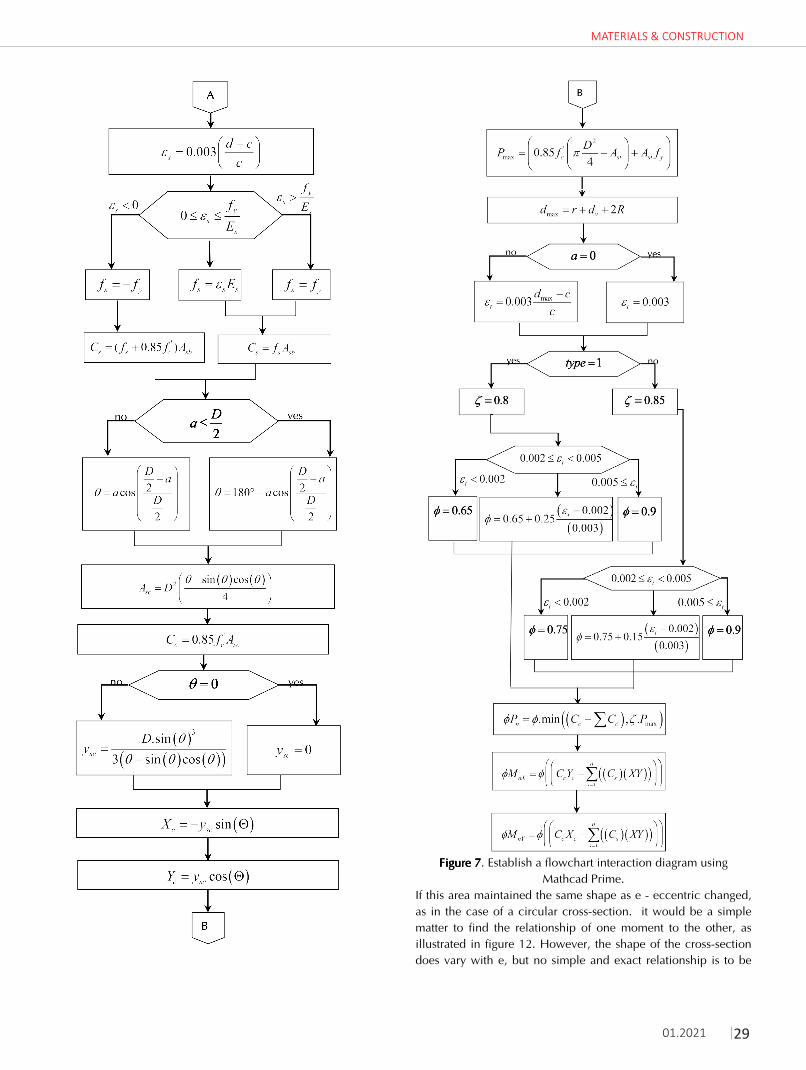
Figure 7Figure 7Figure 7Figure 7. Establish a flowchart interaction diagram using
Mathcad Prime. If this area maintained the same shape as e - eccentric changed, as in the case of a circular cross-section. it would be a simple matter to find the relationship of one moment to the other, as illustrated in figure 12. However, the shape of the cross-section does vary with e, but no simple and exact relationship is to be
2901.2021
MATERIALS & CONSTRUCTION
Variation of ξ depends on the type of shear reinforcement
ACI318-19.22.4.2.1. Table Table Table Table 2222. Determine the coefficient ξ.
Member Transverse
reinforcement ξ
Nonprestressed Stirrup 0.80 Spirals 0.85
2.22.22.22.2.... Method establish interaction diagramMethod establish interaction diagramMethod establish interaction diagramMethod establish interaction diagram The basic steps establish the interaction diagram
Figure Figure Figure Figure 6666. The procedure of setting up interaction diagrams.
In comparison to bending about one axis of a reinforced concrete column, biaxial bending presents an entirely different and more complex situation. As a second bending moment is introduced, the neutral axes are no longer parallel to the centroidal axes of the section but lie at some angle θ from them.
Figure 7Figure 7Figure 7Figure 7. Establish a flowchart interaction diagram using
Mathcad Prime. If this area maintained the same shape as e - eccentric changed, as in the case of a circular cross-section. it would be a simple matter to find the relationship of one moment to the other, as illustrated in figure 12. However, the shape of the cross-section does vary with e, but no simple and exact relationship is to be

01.202130
MATERIALS & CONSTRUCTION
found between e and the load capacity of the column. An outline of the series of operations: required to design a column is given in figure 6. The flow chart follows the column design procedure from the initial assumptions to the final sizing in Figure 7. This procedure represents the fundamental approach to column design.
The neutral axis position should be assumed in advance (the boundary between the tensile and compression of the section). Next, it is necessary to determine tensile stress/compression in the longitudinal reinforcement. Determine the column bearing capacity from the axial force balance equation. A uniaxial interaction diagram defines the load-moment strength along a single plane of a section under an axial load P and a uniaxial moment M. The biaxial bending resistance of an axially loaded column can be represented schematically as a surface formed by a series of uniaxial interaction curves drawn radially from the P axis. Data for these intermediate curves are obtained by varying the angle of the neutral axis (for assumed strain configurations) concerning the major axes. The procedure is shown by the flowchart in figure 6 3.3.3.3. Numerical examplesNumerical examplesNumerical examplesNumerical examples As an example, consider the problem where it is desired to design a column to carry the following design loads obtained from a structural analysis (table 3). As a trial size: column diameter D = 50cm , cover thickness for column rebars r = 30 mm, the longitudinal bars 8 20ϕ are arranged in a circle surrounded by a closely spaced continuous spiral, shown in Figure 8. Concrete materials have a compressive strength '
cf = 21MPa ; yield strength of longitudinal reinforcement yf = 420MPa and elastic modulus
of reinforced concrete SE = 200GPa . Create interactive diagrams according to US standards ACI 318-19 to check the bearing capacity of the column according to the following 5 internal force combinations:
Table Table Table Table 3333.... internal forces in column. Combination 1 2 3 4 5
Nz (kN)
200 400 600 800 1000
Mx (kN.m)
-50 70 -90 110 -130
My (kN.m)
80 -100 120 -140 160
Step Step Step Step 1: 1: 1: 1: Material properties and geometric parameters of the section.
Material parameters - Compressive strength of concrete fc’ = 21MPa - Yield strength of the longitudinal
reinforcement fy = 420MPa
- Elastic modulus of reinforced concrete Es = 200GPa Geometry parameters
- The cross-sectional diameter of a circular column
D = 50cm
- The thickness of Concrete Cover r = 30mm Parameters for the rebars and stirrups
- The diameter of a longitudinal bar db = 22mm - Number of the longitudinal bar n = 8 - Stirrups diameter dv = 8mm - The type of shear reinforcement (type = 1 — stirrup; type = 2 — spirals)
type = 1
Geometric parameter of the interactive diagram - Parameter changes the angle of the neutral
axis t = 10
- Parameter changes the height of the neutral axis
nz = 10
- The total area of longitudinal reinforcement arranged on the section:
- The longitudinal steel bar coordinates on a Cartesian
coordinate system (Figure 8)
Figure Figure Figure Figure 8888. The coordinates of the longitudinal rebars.
Step Step Step Step 2: 2: 2: 2: Set parameters for height, rotation neutral axis:
Set the angle Θ represents the changing angle of the neutral axis on the section with t turns. The distance represents the change in axis height from the edge of the section with nz turns:
Step Step Step Step 3: 3: 3: 3: Determine the tensile, compression of the cross-section:
Determine the distance from the position of each steel bar to the edge of the section when neutral axis rotation changes (Figure 4):
Determine θk when the neutral axis changes height and
determine the compression zone of the column cross-section:
Step Step Step Step 4: 4: 4: 4: Calculate the stress and strain in the bar: Strain in concrete is the same as in reinforcing bars at the
same level, provided that the bond between the steel and concrete is sufficient to keep them acting together under the different load stages i.e., no-slip can occur between the two materials. For a specified position and direction of the neutral axis, the strain diagram can be set with the maximum tensile strain in the concrete of εcu = 0.005 and the maximum compressive strain in concrete 0.003 (Figure 9).
Figure Figure Figure Figure 9999. Strain diagrams showing the change between the
depth and rotation with the neutral axis.
Determination of stresses in steel bars. However, the stress should not exceed the yield strength of the reinforcement (Figure 10):
Figure Figure Figure Figure 10101010. Stress distribution diagram in longitudinal steel
bars.
Step Step Step Step 5555: : : : Determine the bearing capacity of each longitudinal rebar when the neutral axis changes:
The tensile strength of concrete may be neglected. Ignore the concrete area due to the steel bars were arranged.

3101.2021
MATERIALS & CONSTRUCTION
found between e and the load capacity of the column. An outline of the series of operations: required to design a column is given in figure 6. The flow chart follows the column design procedure from the initial assumptions to the final sizing in Figure 7. This procedure represents the fundamental approach to column design.
The neutral axis position should be assumed in advance (the boundary between the tensile and compression of the section). Next, it is necessary to determine tensile stress/compression in the longitudinal reinforcement. Determine the column bearing capacity from the axial force balance equation. A uniaxial interaction diagram defines the load-moment strength along a single plane of a section under an axial load P and a uniaxial moment M. The biaxial bending resistance of an axially loaded column can be represented schematically as a surface formed by a series of uniaxial interaction curves drawn radially from the P axis. Data for these intermediate curves are obtained by varying the angle of the neutral axis (for assumed strain configurations) concerning the major axes. The procedure is shown by the flowchart in figure 6 3.3.3.3. Numerical examplesNumerical examplesNumerical examplesNumerical examples As an example, consider the problem where it is desired to design a column to carry the following design loads obtained from a structural analysis (table 3). As a trial size: column diameter D = 50cm , cover thickness for column rebars r = 30 mm, the longitudinal bars 8 20ϕ are arranged in a circle surrounded by a closely spaced continuous spiral, shown in Figure 8. Concrete materials have a compressive strength '
cf = 21MPa ; yield strength of longitudinal reinforcement yf = 420MPa and elastic modulus
of reinforced concrete SE = 200GPa . Create interactive diagrams according to US standards ACI 318-19 to check the bearing capacity of the column according to the following 5 internal force combinations:
Table Table Table Table 3333.... internal forces in column. Combination 1 2 3 4 5
Nz (kN)
200 400 600 800 1000
Mx (kN.m)
-50 70 -90 110 -130
My (kN.m)
80 -100 120 -140 160
Step Step Step Step 1: 1: 1: 1: Material properties and geometric parameters of the section.
Material parameters - Compressive strength of concrete fc’ = 21MPa - Yield strength of the longitudinal
reinforcement fy = 420MPa
- Elastic modulus of reinforced concrete Es = 200GPa Geometry parameters
- The cross-sectional diameter of a circular column
D = 50cm
- The thickness of Concrete Cover r = 30mm Parameters for the rebars and stirrups
- The diameter of a longitudinal bar db = 22mm - Number of the longitudinal bar n = 8 - Stirrups diameter dv = 8mm - The type of shear reinforcement (type = 1 — stirrup; type = 2 — spirals)
type = 1
Geometric parameter of the interactive diagram - Parameter changes the angle of the neutral
axis t = 10
- Parameter changes the height of the neutral axis
nz = 10
- The total area of longitudinal reinforcement arranged on the section:
- The longitudinal steel bar coordinates on a Cartesian
coordinate system (Figure 8)
Figure Figure Figure Figure 8888. The coordinates of the longitudinal rebars.
Step Step Step Step 2: 2: 2: 2: Set parameters for height, rotation neutral axis:
Set the angle Θ represents the changing angle of the neutral axis on the section with t turns. The distance represents the change in axis height from the edge of the section with nz turns:
Step Step Step Step 3: 3: 3: 3: Determine the tensile, compression of the cross-section:
Determine the distance from the position of each steel bar to the edge of the section when neutral axis rotation changes (Figure 4):
Determine θk when the neutral axis changes height and
determine the compression zone of the column cross-section:
Step Step Step Step 4: 4: 4: 4: Calculate the stress and strain in the bar: Strain in concrete is the same as in reinforcing bars at the
same level, provided that the bond between the steel and concrete is sufficient to keep them acting together under the different load stages i.e., no-slip can occur between the two materials. For a specified position and direction of the neutral axis, the strain diagram can be set with the maximum tensile strain in the concrete of εcu = 0.005 and the maximum compressive strain in concrete 0.003 (Figure 9).
Figure Figure Figure Figure 9999. Strain diagrams showing the change between the
depth and rotation with the neutral axis.
Determination of stresses in steel bars. However, the stress should not exceed the yield strength of the reinforcement (Figure 10):
Figure Figure Figure Figure 10101010. Stress distribution diagram in longitudinal steel
bars.
Step Step Step Step 5555: : : : Determine the bearing capacity of each longitudinal rebar when the neutral axis changes:
The tensile strength of concrete may be neglected. Ignore the concrete area due to the steel bars were arranged.

01.202132
MATERIALS & CONSTRUCTION
Step Step Step Step 6: 6: 6: 6: Determine the bearing capacity of the concrete in the compression zone when the neutral axis changes:
Figure Figure Figure Figure 11111111. Determine the bearing capacity of the
concrete in the compression zone according to θk when the neutral axis changes.
Figure Figure Figure Figure 12121212. Determine the compressed area on the cross-
section.
Step Step Step Step 7: 7: 7: 7: Determine the nominal strength of an axially loaded column by an axial balance equation:
Step Step Step Step 8:8:8:8: Resistance of reinforced concrete columns subjected to axial force and bending:
Step Step Step Step 9: 9: 9: 9: Construction of interaction diagrams
Figure Figure Figure Figure 13131313. Interaction surface from the computer program
P-M. Besides, the authors have set the parameters (t-parameter
changes the angle of the neutral axis và nz-parameter changes the height of the neutral axis), which helps design engineers can easily adjust the level of accuracy in building an interactive surface;
t =10; nz = 10 t =20; nz = 20
t =30; nz = 10 t =40; nz = 40
Figure Figure Figure Figure 14141414. Change parameter t - nz to create interactive diagrams.
The results obtained are also compared with the Finite Element software SP column:
Figure Figure Figure Figure 15151515. Material parameters in SpColumn.
Figure Figure Figure Figure 16161616. Geometry parameters in SpColumn.
Figure Figure Figure Figure 17171717. Steel reinforcement parameters in SpColumn.
Figure Figure Figure Figure 11118888. Internal force parameters in SpColumn.
Figure Figure Figure Figure 11119999. Interactive diagrams in SpColumn.
4.4.4.4. ConclusionConclusionConclusionConclusion The computer program gives an exact curve of the interaction surface and interaction lines when the method from ACI 318-19. Based on the calculated results achieved. We noticed, Mathcad Prime and SpColumn had results are similar.
Through the article, the authors have provided the construction engineers with an algorithm to set up an interactive diagram for the circular cross-section column according to ACI 318-19.
The structural engineers were able to easily change the parameters of the program to achieve the desired reliability.
The structural engineer will easily adjust, improved, updated following ACI or other standards of the same platform. ReferencesReferencesReferencesReferences [1] American Concrete Institute, Handbook in Accordance with the Strength
Design Method. American Concrete Institute, 1997. [2] M. Law, Angus; Gillie, “Interaction diagrams for ambient and heated
concrete sections,” Eng. Struct., vol. Vol. 32, N, pp. 1641–1649. [3] Ž. Smolčić and D. Grandić, “Interaction diagrams for reinforced concrete
circular cross-section,” Gradjevinar, vol. 64, no. 1, pp. 23–31, 2012, doi: 10.14256/jce.627.2011.
[4] Y. Jia, P. Chang, and J. Sun, “Specified domain in Nu-Mu interaction diagram for logical judgment in numerical analysis on compression reinforced concrete members,” Open Constr. Build. Technol. J., vol. 8, no. 1, pp. 400–405, 2015, doi: 10.2174/1874836801408010400.
[5] Nguyen Viet Hung, “Interaction diagram of the rectangular section reinforced concrete members in the inclined plane according to the ACI 318 code of the United States,” Vietnam J. Constr., vol. 7, 2019.
[6] American Concrete Institute, J. P. Moehle, and G. M. Zeisler, “Building code requirements for structural concrete (ACI 318-19) an ACI standard (SI unit), and Commentary (ACI 318R-19) Reported by ACI committee 318,” 2019, doi: 10.14359/51716937.
[7] Computers & Structures Inc CSI, CSI Analysis Reference Manual For
SAP2000 , ETABS , SAFE and CSiBridge., Rev.14. Berkeley, California, USA, 2017.
[8] Craig T. Christy, Structural Engineering Templates Using Excel Engineering, Engineerin. American Society of Civil Engineers, 2006.

3301.2021
MATERIALS & CONSTRUCTION
Step Step Step Step 6: 6: 6: 6: Determine the bearing capacity of the concrete in the compression zone when the neutral axis changes:
Figure Figure Figure Figure 11111111. Determine the bearing capacity of the
concrete in the compression zone according to θk when the neutral axis changes.
Figure Figure Figure Figure 12121212. Determine the compressed area on the cross-
section.
Step Step Step Step 7: 7: 7: 7: Determine the nominal strength of an axially loaded column by an axial balance equation:
Step Step Step Step 8:8:8:8: Resistance of reinforced concrete columns subjected to axial force and bending:
Step Step Step Step 9: 9: 9: 9: Construction of interaction diagrams
Figure Figure Figure Figure 13131313. Interaction surface from the computer program
P-M. Besides, the authors have set the parameters (t-parameter
changes the angle of the neutral axis và nz-parameter changes the height of the neutral axis), which helps design engineers can easily adjust the level of accuracy in building an interactive surface;
t =10; nz = 10 t =20; nz = 20
t =30; nz = 10 t =40; nz = 40
Figure Figure Figure Figure 14141414. Change parameter t - nz to create interactive diagrams.
The results obtained are also compared with the Finite Element software SP column:
Figure Figure Figure Figure 15151515. Material parameters in SpColumn.
Figure Figure Figure Figure 16161616. Geometry parameters in SpColumn.
Figure Figure Figure Figure 17171717. Steel reinforcement parameters in SpColumn.
Figure Figure Figure Figure 11118888. Internal force parameters in SpColumn.
Figure Figure Figure Figure 11119999. Interactive diagrams in SpColumn.
4.4.4.4. ConclusionConclusionConclusionConclusion The computer program gives an exact curve of the interaction surface and interaction lines when the method from ACI 318-19. Based on the calculated results achieved. We noticed, Mathcad Prime and SpColumn had results are similar.
Through the article, the authors have provided the construction engineers with an algorithm to set up an interactive diagram for the circular cross-section column according to ACI 318-19.
The structural engineers were able to easily change the parameters of the program to achieve the desired reliability.
The structural engineer will easily adjust, improved, updated following ACI or other standards of the same platform. ReferencesReferencesReferencesReferences [1] American Concrete Institute, Handbook in Accordance with the Strength
Design Method. American Concrete Institute, 1997. [2] M. Law, Angus; Gillie, “Interaction diagrams for ambient and heated
concrete sections,” Eng. Struct., vol. Vol. 32, N, pp. 1641–1649. [3] Ž. Smolčić and D. Grandić, “Interaction diagrams for reinforced concrete
circular cross-section,” Gradjevinar, vol. 64, no. 1, pp. 23–31, 2012, doi: 10.14256/jce.627.2011.
[4] Y. Jia, P. Chang, and J. Sun, “Specified domain in Nu-Mu interaction diagram for logical judgment in numerical analysis on compression reinforced concrete members,” Open Constr. Build. Technol. J., vol. 8, no. 1, pp. 400–405, 2015, doi: 10.2174/1874836801408010400.
[5] Nguyen Viet Hung, “Interaction diagram of the rectangular section reinforced concrete members in the inclined plane according to the ACI 318 code of the United States,” Vietnam J. Constr., vol. 7, 2019.
[6] American Concrete Institute, J. P. Moehle, and G. M. Zeisler, “Building code requirements for structural concrete (ACI 318-19) an ACI standard (SI unit), and Commentary (ACI 318R-19) Reported by ACI committee 318,” 2019, doi: 10.14359/51716937.
[7] Computers & Structures Inc CSI, CSI Analysis Reference Manual For
SAP2000 , ETABS , SAFE and CSiBridge., Rev.14. Berkeley, California, USA, 2017.
[8] Craig T. Christy, Structural Engineering Templates Using Excel Engineering, Engineerin. American Society of Civil Engineers, 2006.