EU deregulation and dealer-supplier relations in automotive distribution

Deregulation of PAX2 expression in renal cell tumours:
mechanisms and potential use in differential diagnosis
Patr�ıcia Patr�ıcio a, b, Jo~ao Ramalho-Carvalho a, b, Pedro Costa-Pinheiro a, b, Mafalda Almeida a, b,Jo~ao Diogo Barros-Silva b, c, Joana Vieira b, c, Paula Cristina Dias d, Francisco Lobo e,
Jorge Oliveira e, Manuel R. Teixeira b, c, f, Rui Henrique a, d, f, #, Carmen Jeronimo a, b, f, #, *
a Cancer Epigenetics Group, Research Center of the Portuguese Oncology Institute - Porto, Porto, Portugalb Department of Genetics, Portuguese Oncology Institute – Porto, Porto, Portugal
c Cancer Genetics Group, Research Center of the Portuguese Oncology Institute - Porto, Porto, Portugald Department of Pathology, Portuguese Oncology Institute – Porto, Porto, Portugale Department of Urology, Portuguese Oncology Institute – Porto, Porto, Portugal
f Department of Pathology and Molecular Immunology, Institute of Biomedical Sciences Abel Salazar,University of Porto, Porto, Portugal
Received: February 11, 2013; Accepted: May 13, 2013
Abstract
Expression of PAX2 (Paired-box 2) is suppressed through promoter methylation at the later stages of embryonic development, but eventuallyreactivated during carcinogenesis. Pax-2 is commonly expressed in the most prevalent renal cell tumour (RCT) subtypes—clear cell RCC (ccRCC),papillary RCC (pRCC) and oncocytoma—but not in chromophobe RCC (chrRCC), which frequently displays chromosome 10 loss (to which PAX2is mapped). Herein, we assessed the epigenetic and/or genetic alterations affecting PAX2 expression in RCTs and evaluated its potential as bio-marker. We tested 120 RCTs (30 of each main subtype) and four normal kidney tissues. Pax-2 expression was assessed by immunohistochemis-try and PAX2 mRNA expression levels were determined by quantitative RT-PCR. PAX2 promoter methylation status was assessed by methylation-specific PCR and bisulfite sequencing. Chromosome 10 and PAX2 copy number alterations were determined by FISH. Pax-2 immunoexpressionwas significantly lower in chrRCC compared to other RCT subtypes. Using a 10% immunoexpression cut-off, Pax-2 immunoreactivity discrimi-nated chrRCC from oncocytoma with 67% sensitivity and 90% specificity. PAX2 mRNA expression was significantly lower in chrRCC, comparedto ccRCC, pRCC and oncocytoma, and transcript levels correlated with immunoexpression. Whereas no promoter methylation was found in RCTsor normal kidney, 69% of chrRCC displayed chromosome 10 monosomy, correlating with Pax-2 immunoexpression. We concluded that Pax-2expression might be used as an ancillary tool to discriminate chrRCC from oncocytomas with overlapping morphological features. The biologicalrationale lies on the causal relation between Pax-2 expression and chromosome 10 monosomy, but not PAX2 promoter methylation, in chrRCC.
Keywords: Renal cell tumours� PAX2� differential diagnosis� chromosome 10 monosomy� promoter methylation
Introduction
Renal cell tumours (RCTs) are the most common kidney neoplasms inadults, accounting for 2–3% of all non-cutaneous malignant
neoplasms, ranking 14th in incidence for both genders and presentinga mortality rate of 1.6/100,000 worldwide [1]. Globally, in 2008,~167,947 new cases of kidney cancer were diagnosed and 72,030patients died because of this malignancy [1]. Renal cell tumours are aheterogeneous group of neoplasms which arise from the epithelium ofrenal tubules [2] and represent more than 90% of all renal tumoursoccurring in adults in both genders [3]. The most prevalent benignRCT is oncocytoma, whereas among the malignant RCTs, clear cellrenal cell carcinoma (ccRCC, 70–75% of cases), papillary renalcell carcinoma (pRCC, 10–15% of cases) and chromophobe renal cellcarcinoma (chrRCC, 5–10% of cases) are the most common subtypes[3, 4]. Most RCTs display characteristic histological features, enabling
#Joint senior authors.
*Correspondence to: Carmen JER�ONIMO, Ph.D.,
Research Center/ Department of Genetics,Portuguese Oncology Institute-Porto,
Rua Dr. Ant�onio Bernardino Almeida,
Porto 4200-072, Portugal.
Tel.: +351 225084000 (ext. 7264)Fax: + 351 225084016
E-mails: [email protected]/[email protected]
ª 2013 The Authors.
Journal of Cellular and Molecular Medicine Published by Foundation for Cellular and Molecular Medicine/Blackwell Publishing Ltd
This is an open access article under the terms of the Creative Commons Attribution License, which permits use,
distribution and reproduction in any medium, provided the original work is properly cited.
doi: 10.1111/jcmm.12090
J. Cell. Mol. Med. Vol 17, No 8, 2013 pp. 1048-1058

their distinction in haematoxylin and eosin stained slides, but in a pro-portion of cases there are overlapping characteristics, which impair aclear diagnostic discrimination. For instance, the eosinophilic variant ofchrRCC may be difficult to discriminate from oncocytoma, yet this dis-tinction is critical because the former is a malignant tumour and thelatter is a benign one, thus entailing different clinical approaches [5].
The PAX2 (Paired-box 2) gene encodes a transcription factor fromthe evolutionarily conserved paired-box family, characterized by thepresence of a paired-box DNA-binding domain [6]. This gene is locatedat 10q24.3-q25.1 and contains 12 exons [7], several of which are alter-natively spliced, originating five well characterized alternative splicevariants, sharing a common promoter region [8]. The PAX2 gene prod-uct is required during development of the central nervous system andgenitourinary tract [9], being expressed in the developing kidney, aswell as in the optic stalk, midbrain–hindbrain junction, and spinal cord[10]. During kidney development, Pax-2 expression is primarily pres-ent during early stages of embryogenesis, where it is thought to sup-press apoptosis and promote epithelial aggregation, then it is switchedoff in most part of the kidney structures in the later phases of differen-tiation [11]. Indeed, in adult kidney, PAX2 mRNA expression isrestricted to cells of the collecting ducts (where it seems to protectmedullary cells against the stress induced by high levels of NaCl andurea) and, to a lesser extent, to cells of the distal tubules [12].Although the precise mechanism of Pax-2 expression downregulationis not fully understood, epigenetic silencing mediated by PAX2 pro-moter methylation has been reported in the normal adult kidney cellsof rats [13]. Conversely, PAX2 promoter methylation has been foundin normal endometrium lacking Pax-2 expression and its loss has beenassociated with Pax-2 re-expression in endometrial carcinoma [14].
This temporal and spatial expression of PAX genes seems to beessential for Pax proteins function as nuclear transcription factors,critically involved in cell proliferation, differentiation and migration,and constitute, therefore, putative targets of disruption during tumo-urigenesis [15]. Although there is evidence for re-expression of thePAX2 gene in RCTs, the mechanism of oncogenic activation has notbeen reported [16]. Indeed, significant Pax-2 protein expression hasbeen found in three of the most prevalent RCT subtypes—clear cellRCC, papillary RCC and oncocytoma—but not in chromophobe RCC[17]. Interestingly, chromophobe RCC frequently display chromo-some 10 loss [18, 19], which might justify that finding.
To clarify the mechanism(s) underlying PAX2 deregulation inRCTs, we assessed PAX2 mRNA and protein expression, as wellgenomic copy number changes and gene promoter methylation sta-tus in a large series of RCTs, representing the four major subtypes.Furthermore, the potential usefulness of Pax-2 immunoexpression fordiscriminating among RCTs subtypes was determined.
Materials and methods
Patients and sample collection
One hundred and twenty RCT samples, comprising 30 cases of each of
the four major subtypes (ccRCC, pRCC, chrRCC, and Oncocytoma) were
consecutively selected from a larger series of patients diagnosed andtreated at the Portuguese Oncology Institute,Porto, Portugal, whom
underwent partial or radical nephrectomy, after informed consent. In
each case, a tumour fragment was immediately snap-frozen, stored at
�80°C, and subsequently cut in a cryostat for nucleic acid (DNA andRNA) extraction. The bulk material was routinely fixed in buffered for-
malin and paraffin-embedded. The corresponding hematoxylin-eosin
stained sections were examined by a pathologist to determine thetumour type [3], grade classification [20] and pathological stage
according to the TNM staging system [21]. A representative paraffin
block of each tumour was further selected for immunohistochemical
and FISH analyses. Relevant clinical and pathological data were col-lected and are provided in Table 1.
These studies were approved by the ethics committee of Portuguese
Oncology Institute – Porto (Comiss~ao de �Etica do IPO Porto).
Nucleic acids extraction and cDNA synthesis
Genomic DNA was extracted from tumour and normal tissues by the phe-nol–chlorophorm method at pH 8, as previously described [22]. Samples
were first submitted to overnight digestion, in a bath at 55°C, using buffer
solution SE (75 mM NaCl; 25 mM EDTA), SDS 10% and proteinase K,
20 mg/ml (Sigma-Aldrich�, Schnelldorf, Germany). After digestion,extraction was performed with phenol/chloroform (Sigma-Aldrich�,
Schnelldorf, Germany, Merck, Darmstadt, Germany) followed by precipita-
tion with 100% ethanol.
Total RNA from RCT samples was extracted by the PureLinkTM RNA MiniKit (Invitrogen, Carlsbad, CA, USA) and reverse transcription was accom-
Table 1 Clinical and pathological features of patient population
Clinicopathological features RCT
Patients, n 120
Gender, n (%)
Male 70 (58)
Female 50 (42)
Median age, years (range) 59 (29–83)
Pathological stage*, n (%)
I 50 (56)
II 22 (24)
III 16 (18)
IV 2 (2)
Furhman grade*, n (%)
1 2 (2)
2 29 (32)
3 39 (44)
4 20 (22)
*Includes RCC cases only.
ª 2013 The Authors.
Journal of Cellular and Molecular Medicine Published by Foundation for Cellular and Molecular Medicine/Blackwell Publishing Ltd
1049
J. Cell. Mol. Med. Vol 17, No 8, 2013

plished by using the RevertAidTM H Minus First Strand cDNA synthesis Kit(Fermentas, Ontario, Canada), following the manufacturer’s instructions.
DNA and RNA quality and concentration were analysed in a Nano-
Drop ND-1000 (NanoDrop Technologies, DE, USA) spectrophotometer.
PAX2 mRNA quantification
Quantification of PAX2 mRNA was performed by real-time RT-PCR usingTaqman probes on an Applied Biosystems 7500 Real-time PCR (Applied
Biosystems, Foster City, CA, USA). Primers and probes for PAX2
(Hs01057413_m1) and HPRT1 (Hs 99999909_m1) (endogenous control)
were purchased as pre-designed optimized real-time PCR assay reagentsfrom Applied Biosystems. In each reaction, 9 ll of cDNA, 1 ll of Taq-man� Gene Expression Assay and 11 ll of Taqman� Gene Expression
Assay Master Mix (Applied Biosystems) were used. All samples were run
in triplicate. Two negative controls, consisting on the replacement ofcDNA with DEPC-treated water (MP Biomedicals, Solon, OH, USA), were
included in each plate. PCR parameters were as follows: 50°C for 2 min.,
95°C for 10 min. and 45 amplification cycles at 95°C for 15 sec. and60°C for 1 min. For quantitation, a standard curve was built with a series
of cDNA dilutions prepared from commercial Stratagene� QPCR Human
Reference total RNA (Agilent Technologies, Stratagene, La Jolla, CA,
USA) or from a PAX2 expressing RCT (oncocytoma), for HPRT1 andPAX2 analysis, respectively. PAX2 expression levels were calculated by
dividing the values of PAX2 mean quantity by those of hypoxanthine
phosphoribosyltransferase 1 (HPRT1), as endogenous control. This ratio
was then multiplied by 1000 for easier tabulation.
Immunohistochemistry
Immunohistochemistry was performed according to the avidin-biotin
method using the VECTASTAIN� Universal Elite ABC Kit (©Vector Labo-ratories, Burlingame, CA, USA). Four micron-thick sections from the
representative paraffin block of each RCT and of five normal endome-
trium samples (collected from women submitted to hysterectomy for
uterine leiomyomas, and intended as controls) were deparaffinized withxylene and rehydrated with consecutive ethanol solutions (100%, 90%
and 70%). Subsequently slides were steamed in a 19 sodium citrate
buffer solution (©Vector Laboratories) for 20 min. in a 700 W micro-wave oven for antigen retrieval. Endogenous peroxidase was blocked by
incubating the slides in a 0.6% H2O2 solution for 20 min. After washing
the slides in distilled water and PBS/tween 20 solution, they were incu-
bated with Normal Horse Serum 1:100 in PBS-BSA for 30 min., in ahumid chamber, at room temperature. Then, slides were incubated with
primary antibody [rabbit monoclonal antibody, Pax-2 (clone ab79389;
Abcam, Cambridge, UK)] at a dilution of 1:3000 for 18 hrs, at 4°C, in a
humid chamber. The slides were next incubated with a biotynilated sec-ondary antibody 1:100 in PBS/BSA for 30 min. in a humid chamber, at
room temperature and localization was performed by incubating the
sections with the ABC complex 1:100 in PBS/BSA for 45 min., in a
humid chamber, at room temperature. The slides were then immersedin a 3,3′-diaminobenzidine solution for 7 min. Slides were counter-
stained with hematoxylin for 10 sec., washed in tap water, dehydrated,
and mounted with Entellan� (Merck, Germany). An unrelated ccRCCsection showing intense immunoreactivity for Pax-2 protein was used
as positive control. The negative control consisted on the omission of
the primary antibody.
The results for Pax-2 expression in each tumour were expressed in asemi-quantitative approach according to the estimated percentage of
positive tumour cells. Immunostaining of more than 10% of the tumour
cell nuclei was required for scoring a case as positive. The positive
cases were further divided into two categories according to the propor-tion of positive cells: >10–50% of the nuclei stained and >50% of the
nuclei stained [17, 19, 23].
Bisulfite modification and methylation-specificPCR
DNA samples from RCTs, normal renal tissue (NK, four cases obtained
from patients without renal tumour, used as negative control for meth-
ylation status) and normal endometrium (two cases, serving as putative
positive control for PAX2 promoter methylation [14]), were subjected tosodium bisulfite modification, using the EZ DNA Methylation-GoldTM Kit
(Zymo Research, Orange, CA, USA) according to manufacturer’s
instructions.Methylation analysis of PAX2 promoter was performed by methyla-
tion-specific PCR (MSP). Bisulfite-modified genomic DNA was tested
using two sets of primers, each recognizing either the methylated or
the unmethylated sequences located at the promoter region of PAX2gene. Two adjacent regions were screened to assess the promoter
methylation status [13, 14]. Primer sequences are summarized in
Table 2, along with amplicon lengths and positions, and also optimized
annealing temperatures.PCR reactions were performed in an Applied Biosystems Veriti�
Thermal Cycler (Applied Biosystems). Each PCR tube contained 14.36 llof sterile distilled water (B. Braun, Melsungen, Germany), 2 ll of 109DyNAzymeTM Hot Start Reaction Buffer (Finnzymes, Espoo, Finland),
0.2 mM of dNTPs (Fermentas, Ontario, Canada), 250 nM of primer for-
ward and 250 nM of reverse primer, 0.24 ll of DyNAzymeTM II Hot Start
DNA polymerase 2 U/ll (Finnzymes, Finland), and 2 ll of sample DNA,to a final volume of 20 ll. PCR amplifications were performed as fol-
lows: 10 min. at 94°C, followed by 38 cycles of 30 sec. at 94°C, 30 sec.
at annealing temperature (see Table 2) and 30 sec. at 72°C. A 10 min.
elongation step at 72°C completed the PCR amplification and PCRproducts were then submitted to electrophoresis on a 2% agarose gel.
Primers’ specificity was assessed using CpGenomeTM Universal
Methylated DNA (Millipore, Darmstadt, Germany) and CpGenomeTM
Universal Unmethylated DNA (Millipore) as positive and negative
controls, respectively.
Bisulfite sequencing
The promoter region of the PAX2 gene was subjected to bisulfite
sequencing in the aforementioned normal kidney and endometrial tis-
sue samples. Primer sequences, amplicons, and annealing tempera-tures are listed in Table S1. PCR reactions included a 94°Cdenaturation 10 min. step followed by 40 cycles at 94°C for 30 sec.,
annealing temperature for 30 sec., and 72°C for 30 sec. PCR productswere loaded in a 2% agarose gel, stained with ethidium bromide and
visualized under an ultraviolet transilluminator. Excess primer and nu-
cleotides were removed by Illustra GFX PCR DNA and Gel Band Purifi-
cation kit (GE Healthcare, USB Corporation, Cleveland, OH, USA)following manufacturer’s protocol. The purified products were
sequenced using the dGTP BigDye Terminator Cycle Sequencing Ready
1050 ª 2013 The Authors.
Journal of Cellular and Molecular Medicine Published by Foundation for Cellular and Molecular Medicine/Blackwell Publishing Ltd

Reaction kit (Applied Biosystems) in an ABI PRISMTM 310 GeneticAnalyzer (Applied Biosystems). The approximate amount of methylcyto-
sine of each CpG site was calculated by comparing the peak height of
the cytosine signal with the sum of the cytosine and thymine peak
height signals [24]. CpG sites with ratios 0–0.20, 0.21–0.80, and 0.81–1.0 were considered unmethylated, partially methylated, and fully
methylated, respectively.
Fluorescence in situ hybridization analysis
Bacterial Artificial Chromosome (BAC) clones targeting the PAX2 gene
(RP11_1061B5) were selected using the UCSC Human Genome Browserplatform and obtained from the BACPAC Resources Center (Oakland,
USA). The Escherichia coli bacteria were first grown in LB agarose med-
ium supplemented with cloramphenicol 12.5 mg/ml, at 37°C overnight.
Then, an individual colony was inoculated in 10 ml of liquid LB mediumand incubated at 37°C for 16 hrs with continuous agitation. The culture
was centrifuged and pellet used for plasmid DNA extraction using the
NucleoSpin� Plasmid kit (Macherey-Nagel, D€uren, Germany), accordingto manufacturer’s instructions. DNA concentration was determined in a
NanoDrop ND-1000 spectrophotometer.
After adjusting the plasmid DNA concentration to 10 ng/ll, amplifica-
tion was carried out using the Illustra GenomiPhi V2 DNA AmplificationKit (GE Healthcare), according to manufacturer’s instructions. Probes
were labelled using a nick translation DNA labelling system (Enzo Life
Sciences, Exeter, UK). DNA was eluted in 10 ll of Vysis LSI/WCP
Hybridization Buffer (Abbott Molecular, Des Plaines, IL, USA).FISH analysis for PAX2 was performed in 4 lm thick tissue sections
obtained from representative paraffin blocks of each sample and placed
in SuperFrost Plus Adhesion slides (Menzel-Glaser, Braunschweig, Ger-many). Sample processing, hybridization, and analysis were performed
as previously described [25]. The PAX2 probe, labelled with Spectrum-
Green, was combined with the Vysis centromeric probe for chromo-
some 10 (CEP10), labelled with SpectrumOrange (Abbott Molecular)and applied to each sample. For scoring purposes, only intact, non-
overlapping nuclei were considered. An abnormal population was
considered representative when at least 10% of neoplastic cell nuclei
presented a copy number change.
Statistical analysis
The chi-square test or Fisher’s exact test were used to uncover differ-
ences in the frequency of immunoreactivity for Pax-2 protein according
to immunohistochemical scoring, among the four RCT types. To assessthe value of Pax-2 protein immunohistochemical expression for discrim-
ination between chromophobe RCC and oncocytomas, sensitivity, speci-
ficity, positive and negative predictive values (PPV and NPV) weredetermined using the 10% or the 50% cut-off values. Differences
among groups were assessed by the Kruskal–Wallis non-parametric
test, followed by pairwise comparisons using the Mann–Whitney U test,
when appropriate. Association between PAX2 mRNA expression levelsand protein expression (immunohistochemistry score) was carried out
using the Mann–Whitney U test. Relation between FISH and immunoex-
pression results was assessed by chi-square or Fisher’s exact test, and
the directional measure Somers’d was also computed. Moreover, theassociation between FISH findings and PAX2 mRNA levels for chrRCC
was estimated using the Kruskal–Wallis test. Significance value was set
at P < 0.05 and Bonferroni’s correction was used when appropriate. Alltests were two-sided. Statistical analysis was performed using SPSS for
Windows, version 15.0 (SPSS, Chicago, IL, USA).
Results
PAX2 expression by quantitative RT-PCR
Significant differences were found for PAX2 mRNA gene expressionamong the four RCT subtypes (Kruskal–Wallis test, P < 0.001,Fig. 1). Although PAX2 mRNA expression levels did not differbetween ccRCC and pRCC, both were significantly higher when com-pared to chrRCC and oncocytoma (P < 0.001, except for papillaryversus oncocytoma: P = 0.011). Moreover, mRNA expression levelsin oncocytomas also differed significantly from those of chrRCC(P < 0.001). PAX2 mRNA expression levels differed significantlyamong Fuhrman grade categories (P < 0.001). Grade 4 tumours dis-played the lowest relative median levels and these statistically differed
Table 2 Sequences of the primers used in the methylation-specific PCR assays
Primer Primer sequence (5′–3′) AS (bp) AL AnT (ºC) Reference
PAX2_M (F1) GGGTTTTTTTCGTCGAAGTTC 170 �676 to �846 60 [14]
PAX2_M (R1) ACTAAAACCTCGACTCCCGAT
PAX2_U (F1) GGTTTTTTTTGTTGAAGTTTGG 172 �673 to �845 62 [14]
PAX2_U (R1) AAAACTAAAACCTCAACTCCCAAT
PAX2_M (F2) AGTTGTTAGCGTCGTTCGGTTT 139 �489 to �628 62 [13]
PAX2_M (R2) ACAATCCCGAAAATATCCGAAATAA
PAX2_U (F2) AGAGTTGTTAGTGTTGTTTGGT 141 �489 to �630 59 –
PAX2_U (R2) ACAATCCCAAAAATATCCAAAAT
AS: amplicons size; AL: Amplicons location in relation to the transcriptional start site; Ant: Optimized annealing temperatures; M: Methylated; U:Unmethylated; F: Forward; R: Reverse; bp: base pairs.
ª 2013 The Authors.
Journal of Cellular and Molecular Medicine Published by Foundation for Cellular and Molecular Medicine/Blackwell Publishing Ltd
1051
J. Cell. Mol. Med. Vol 17, No 8, 2013
from those of grade 2 and grade 3 tumours (P < 0.01, for both).However, no correlation was found between PAX2 mRNA expressionlevels and patients’ age (r = �0.112, P = 0.295) or pathologicaltumour stage (P = 0.542).
Pax2 protein expression byimmunohistochemistry
As expected, immunoreactivity for Pax-2 was only found in cell nuclei.In normal renal tissue, Pax-2 immunoexpression was restricted todistal tubules and collecting duct cells, which showed intense andhomogeneous staining (Fig. 2A). Among RCTs, intense staining wasshown by ccRCC (Fig. 2B), oncocytomas (Fig. 2C), and pRCC(Fig. 2D), whereas most chrRCC were negative (Fig. 2E). The resultsof immunostaining scoring for Pax-2 in all RCT subtypes are summa-rized in Table 3.
In normal endometrium samples, intense immunostaining forPax-2 was apparent in all nuclei of endometrial glands (Fig. 2F) in allcases tested (n = 5).
Statistically significant differences were observed for quantitativePax-2 expression among the four subtypes of RCTs (chi-square test,P < 0.001). Pairwise comparisons disclosed significant differences inall cases (P < 0.01) except for pRCC versus chrRCC (P = 0.119) andfor oncocytoma versus ccRCC (P = 0.612). Concerning the clinico-pathological data, we found significant differences between the immu-noexpression frequencies according to Furhman grade (P = 0.04)and pathological stage (P = 0.03). These results are shown inTable 4. Both grade and stage were grouped in two categories for sta-tistical purposes (Fig. 3).
Pax-2 negative cases, categorized according to the 10% cut-offvalue, showed significantly lower median mRNA levels compared toPax-2 positive cases (P = 0.011), as illustrated in Figure 4.
Because the morphological differential diagnosis between chrRCCand oncocytoma might be troublesome, we tested whether Pax-2immunostaining might be used as an ancillary tool for histopathologi-cal assessment. Indeed, the best Pax-2 immunostaining cut-off valuefor discriminating between chrRCC and oncocytoma was 10%, with asensitivity and specificity of 67% and 90%, respectively. For compari-son purposes, we also calculated the performance of Pax-2 immuno-expression for discriminating chrRCC from oncocytoma in previouspublications, and the results are summarized in Table 5.
PAX2 promoter methylation
Using the previously published set of primers by Wu et al. no methyl-ation was found for the PAX2 promoter in any of the tumour or nor-mal renal tissue samples. As these primers showed PAX2 promoteras methylated in normal endometrium [14], we tested the same pri-mer’s set in two normal endometrium tissue samples and both wereunmethylated at the PAX2 promoter (Fig. 5).
Because no methylation was found, either in RCTs or in normaltissues using the two primer sets and PAX2 methylation might occurat regions that were not assessed by MSP, we performed bisulfitesequencing of the entire PAX2 promoter region CpG island. Strikingly,the full characterization of the methylation status of PAX2 promoterallowed us to confirm absence of methylation in most of CpG dinucle-otides within the CpG island (Fig. 6).
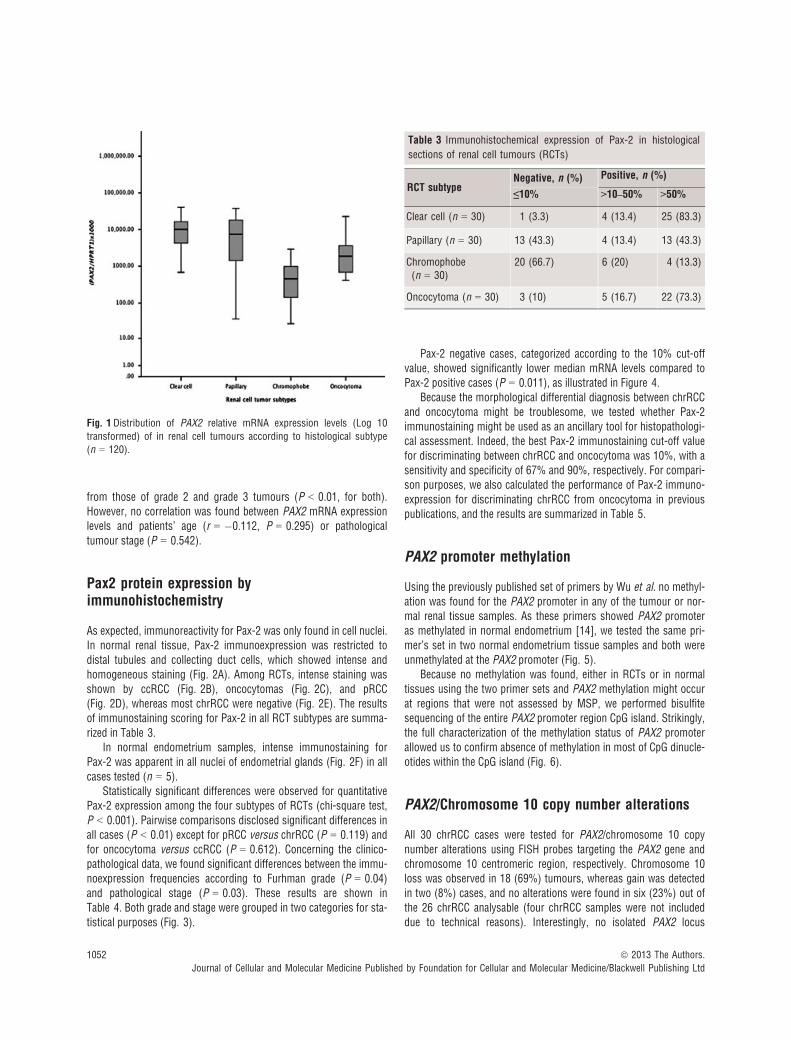
PAX2/Chromosome 10 copy number alterations
All 30 chrRCC cases were tested for PAX2/chromosome 10 copynumber alterations using FISH probes targeting the PAX2 gene andchromosome 10 centromeric region, respectively. Chromosome 10loss was observed in 18 (69%) tumours, whereas gain was detectedin two (8%) cases, and no alterations were found in six (23%) out ofthe 26 chrRCC analysable (four chrRCC samples were not includeddue to technical reasons). Interestingly, no isolated PAX2 locus
Fig. 1 Distribution of PAX2 relative mRNA expression levels (Log 10
transformed) of in renal cell tumours according to histological subtype(n = 120).
Table 3 Immunohistochemical expression of Pax-2 in histological
sections of renal cell tumours (RCTs)
RCT subtypeNegative, n (%) Positive, n (%)
≤10% >10–50% >50%
Clear cell (n = 30) 1 (3.3) 4 (13.4) 25 (83.3)
Papillary (n = 30) 13 (43.3) 4 (13.4) 13 (43.3)
Chromophobe(n = 30)
20 (66.7) 6 (20) 4 (13.3)
Oncocytoma (n = 30) 3 (10) 5 (16.7) 22 (73.3)
1052 ª 2013 The Authors.
Journal of Cellular and Molecular Medicine Published by Foundation for Cellular and Molecular Medicine/Blackwell Publishing Ltd

deletion was found in any of the examined samples. Figure 6 showsrepresentative FISH images of chrRCC tested.
Significant differences in Pax-2 immunoexpression were observedamong the three categories of PAX2/CEP 10 copy number changes,when the 10% (P < 0.001) or the 50% (P = 0.018) cut-off values wereused (Table 6). Moreover, Somers’d directional measure revealed a
A B
C D
E F
Fig. 2 Pax-2 protein expression by immu-
nohistochemical analysis in normal kidney
(A), and endometrial glands (F) and renalcell tumours (C–E). Both normal distal
tubules and the collecting duct cells with
intense homogeneous nuclear immunore-activity (A). Higher intensity staining was
depicted in ccRCC (B) and oncocytomas
(C), as well as in pRCC (D), whereas most
of chrRCC were negative (E).
Table 4 Correlation between PAX2 immunoexpression and Furhman
nuclear grade and pathological tumour stage, n (%)
Immunoexpression scoringP
≤10% >10%
Furhman grade
1–2 7 (23%) 24 (77%) 0.04
3–4 27 (46%) 32 (54%)
Stages
I–II 23 (32%) 49 (68%) 0.03
III–IV 11 (61%) 7 (39%)
Fig. 3 Distribution of PAX2 mRNA expression levels (Log 10 trans-
formed) according to Pax-2 immunoexpression scoring using the 10%cut-off value (n = 120).
ª 2013 The Authors.
Journal of Cellular and Molecular Medicine Published by Foundation for Cellular and Molecular Medicine/Blackwell Publishing Ltd
1053
J. Cell. Mol. Med. Vol 17, No 8, 2013

strong positive association between the immunoexpression frequencyand PAX2/CEP 10 copy number changes, both using the 10% (d = 0.8,P < 0.001) or 50% (d = 0.498, P = 0.041) immunoexpression cut-offvalues. No statistically significant association was found betweenPAX2/CEP 10 copy number and PAX2mRNA expression (P = 0.919).
Discussion
PAX2 is an important transcription factor intensely expressed dur-ing kidney development [10], but which is downregulated in the
latter phases of differentiation in most of the kidney structures[11]. In the mature kidney, Pax-2 expression is restricted to thecollecting ducts and distal tubules, where it promotes osmotic tol-erance and protects cells from apoptosis due to high sodiumchloride and urea exposure [12]. The mechanisms leading toPAX2 silencing at the end of kidney development, however, arestill controversial and hypotheses include PAX2 promoter methyla-tion [13] and WT1 mediated repression [26]. Moreover, PAX2 has
Fig. 4 Representative methylation-specific PCR results from the analysis of PAX2 promoter region (�676 to �846; primer set 1) in renal cell
tumours, normal kidney and endometrium tissues using primers published by Wu et al. A visible PCR product in lanes U indicates the presence of
unmethylated alleles whereas a PCR product in lanes M indicates the presence of methylated alleles. C+: fully methylated DNA, positive control for
methylated samples; C�: fully unmethylated DNA, positive control for unmethylated samples; H2O: negative control. U: lane for unmethylated MSP;M: lane for methylated MSP.
Table 5 Performance of Pax-2 immunoscoring for the discrim-
ination between chromophobe RCC and oncocytoma
Sensitivity(%)
Specificity(%)
PPV(%)
NPV(%)
Present study
10% cut-off 67 90 87 73
50% cut-off 87 73 76 85
Gupta et al. (2009)
10% cut-off 94 100 100 85
50% cut-off 94 65 89 79
Mazal et al. (2005)
10% cut-off 91 10 50 54
50% cut-off 100 3.5 51 100
Memeo et al. (2007)
10% cut-off 91 87 77 95
PPV: Positive predictive value; NPV: negative predictive value.
Fig. 5 Characterization of the methylation status of individual CpG dinu-
cleotides by bisulfite sequencing of the PAX2. The upper part of each
panel provides a schematic representation of the CpG island in thetranscription start (+1) region. Vertical bars indicate the location of
individual CpG sites and the two arrows indicate a location of methyla-
tion-specific PCR primers. For the middle part of the panel, unfilled
circles represent unmethylated CpGs, black-filled circles representmethylated CpGs and grey-filled circles represent partially methylated
sites. The lower panel is a section of the bisulfite reverse sequence
electropherogram, were cytosines in CpG sites are in underlined red as
adenines due to bisulfite conversion.
1054 ª 2013 The Authors.
Journal of Cellular and Molecular Medicine Published by Foundation for Cellular and Molecular Medicine/Blackwell Publishing Ltd

been reported to function as an oncogene, conferring proliferativeand apoptosis inhibitory characteristics to cells in several tumourmodels [16], including RCTs [27]. Finally, diffuse protein expres-sion of Pax-2 has been reported to be frequent in three of themost prevalent RCT subtypes - ccRCC, pRCC and oncocytoma -but not in chrRCC, suggesting its use for differential diagnosis inproblematic cases [17, 19, 23, 28].
In this study, immunohistochemical analysis of Pax-2 expres-sion disclosed significant differences among the four major sub-
types of RCT. Whereas ccRCC and oncocytoma showed thehighest frequency of positive cases (immunoexpression >10% oftumour cells), chrRCC showed the opposite trend, in line previousreports [17, 19, 23], although some differences were apparentmainly in the frequency of positive cases among chrRCC. As thesame cut-off value was used, it is likely that methodological differ-ences underlie these discrepant results. Indeed, we used a mono-clonal antibody (which tends to be more specific), in a 1/3000dilution, whereas all the aforementioned studies used polyclonal
A B
C D
Fig. 6 PAX2/CEP 10 copy number changes
in chrRCC (chromosome 10 probe in red;
PAX2 probe in green). (A) Normal. (B)Monosomy. (C) Trisomy. (D) Polysomy.
Table 6 FISH results for PAX2/CEP10 copy number and distribution of the immunoexpression frequencies and mRNA expression levels, in
chrRCC cases
FISH analysis
Immunoexpression, n (%)
mRNA expressionMedian (interquartile range)
10% cut-off 50% cut-off
� + � +
Monosomy 17 (94) 1 (6) 18 (100) 0 (0) 213.2 (104.9–1000.4)
No ch10 loss 1 (17) 5 (83) 4 (67) 2 (33) 524.7 (114.1–1508.3)
Polysomy 0 (0) 2 (100) 1 (50) 1 (50) 384.7 and 527.7*
*Descriptive values.
ª 2013 The Authors.
Journal of Cellular and Molecular Medicine Published by Foundation for Cellular and Molecular Medicine/Blackwell Publishing Ltd
1055
J. Cell. Mol. Med. Vol 17, No 8, 2013

antibodies in 1/50 and 1/100 dilutions [17, 19, 23]. Thus, thehigher frequency of Pax-2 immunoreactivity in chrRCC found inour study is not due to lack of antibody specificity or to excessiveconcentration.
Some degree of morphological overlap exists between some RCCsubtypes, which prompted the use of panels of immunohistochemicalmarkers to assist the diagnosis in difficult cases [29]. Although sev-eral panels have been proposed, none has reached widespread accep-tance. Thus, we also aimed to confirm the potential of Pax-2 as abiomarker for discrimination between RCT subtypes, specificallybetween chrRCC (a malignant tumour) and oncocytoma (a benigntumour), which might be difficult to discriminate morphologically,despite being distinct entities with different prognosis and clinicalbehaviour. For that purpose, we determined the validity estimatesusing the 10% or the 50% cutoffs and compared with previously pub-lished data [17, 19, 23]. Our results followed the same trend of thosestudies, confirming that the 10% cut-off value offers the highestspecificity, whereas, as expected, the 50% cut-off value displayed thehighest sensitivity. The more discrepant values are those of Mazalet al. as they only reported Pax-2 positivity in 14% of oncocytomas,against 87–100% of positivity in our study and those of Memeo et al.and Gupta et al. [17, 19, 23].
In line with the observations of Pax-2 protein expression, PAX2mRNA expression also unveiled significant differences among thefour RCT subtypes. However, the highest levels were observed inpRCC and ccRCC, whereas oncocytomas showed intermediate lev-els, and chrRCCs displayed the lowest levels of PAX2 mRNA. Impor-tantly, associations between PAX2 mRNA levels and proteinimmunoexpression were also apparent, using both immunohisto-chemical cut-off values above referred, implying that PAX2 transcrip-tion and translation are correlated. The differences in Pax-2expression between pRCC and ccRCC on one hand, and chrRCC andoncocytoma, on the other, may be related with the site of origin ofeach tumour type and may, thus, reflect distinct carcinogenic path-ways. Indeed, whereas the former derive from proximal tubule cells,the latter originate from cortical collecting duct cells [30]. This is asomewhat unexpected finding because in normal renal tissue, Pax-2expression is restricted to the distal portion of the nephron. Takentogether, these findings suggest that Pax-2 is overexpressed inpRCC and ccRCC, whereas in chrRCC it is underexpressed, whencompared to their normal cell counterparts. Hypothetically, oncocy-tomas retain the normal Pax-2 expression patterns. This model is inaccordance with the putative proto-oncogenic function of the PAX2gene [16], as pRCC and ccRCC are malignant neoplasms and onco-cytoma is a benign tumour. Therefore, the loss of Pax-2 expressionin chrRCC might be interpreted as a bystander alteration and it istempting to speculate whether this might contribute to the lessaggressive clinical behaviour of chrRCC compared to pRCC andccRCC [31].
Correlation analyses revealed similar trends in PAX2 expression atthe protein or transcript levels and tumour grade, disclosing signifi-cant inverse correlations. Although these findings were somewhat un-predicted owing to the role ascribed to PAX2 as a transcription factor,our results are in agreement with those of Mazal et al., who alsoreported a decrease or lack of Pax-2 immunoexpression with increas-
ing Fuhrman grade [23], and of Luu et al., although a different grad-ing system was used and only ccRCC were analysed [32]. Concerningpathological tumour stage, however, only PAX2 immunoexpressionshowed a significant inverse correlation, whereas the same trend wasnot apparent at the mRNA level. The reason for this discrepancy isnot immediately apparent and may derive from the higher heterogene-ity of the staging system compared to the more homogeneousnuclear grading system.
Another main objective of the present study was to ascertain themechanism underlying the differential expression of Pax-2 amongRCT subtypes. Two possibilities for PAX2 downregulation have beensuggested: PAX2 promoter hypermethylation and/or gene deletion.The former possibility was founded upon existence of a CpG island inthe promoter region and the putative role of promoter methylation inPAX2 gene silencing at the final stages of kidney development [13].The latter hypothesis stemmed from the observation that loss ofchromosome 10 (to which PAX2 is mapped) is a frequent event inchrRCC [17, 19, 23].
To test the PAX2 promoter methylation hypothesis, methylation-specific PCR was performed not only in chrRCC but also in theremainder RCT subtypes and normal kidney tissue samples, usingtwo different sets of primers that anneal to two adjacent regions inthe promoter [13, 14]. These regions have been previously reportedto be involved in PAX2 gene transcription regulation. Remarkably, nomethylation was detected in those regions either in any of the analy-sed RCT samples, including chrRCC nor in normal kidney tissues.Furthermore, no methylation was found in normal endometrium (fiverandom samples), which was previously reported to harbour PAX2promoter methylation using one of the primer sets [13, 14]. In addi-tion, we tested for methylation using the other set of primers and theresult was again negative. Importantly, we demonstrated Pax-2 pro-tein expression in endometrial glands [which were negative accordingto previous studies [13, 14], which is consistent with absence ofmethylation by MSP analysis. Moreover, our results are in accordancewith those of Luu et al., which also did not find PAX2 promoter meth-ylation in ccRCC or in normal kidney tissues [32]. As bisulfitesequencing allows for a more detailed characterization of the methyla-tion status for individual CpGs, we used this approach to further con-firm the absence of methylated residues in the promoter region ofPAX2. Bisulfite sequencing in normal kidney and endometrium sam-ples validated MSP results, showing that no methylation was presentin PAX2 promoter region. Taken together our results indicate thatmethylation does not explain PAX2 different expression levels bothwhen comparing groups of tumours and stages of kidney develop-ment.
To explore the chromosome 10 loss hypothesis, FISH analysisusing specific probes for chromosome 10 and for the PAX2 genewas performed in all cases of chrRCC. As expected, the vastmajority of chrRCC cases exhibited chromosome 10 monosomy,which is in accordance with a previous report [18], and no case ofisolated PAX2 locus deletion was observed. This might explain boththe lower PAX2 mRNA levels and protein expression globallyobserved in this tumour subtype. Remarkably, a significant associ-ation with the immunoexpression findings was observed, indicatingthat chromosome 10 loss is the most likely mechanism underlying
1056 ª 2013 The Authors.
Journal of Cellular and Molecular Medicine Published by Foundation for Cellular and Molecular Medicine/Blackwell Publishing Ltd

PAX2 loss of expression. This is further supported by the higherfrequency of Pax-2 immunoexpression in cases with no copy num-ber change or with polysomy, a trend confirmed by the Somers’dtest. Interestingly, the highest correlation value was found for the10% immunoexpression cut-off, suggesting that this cut-off mightbe more biologically meaningful. Our results indicate that PAX2promoter methylation is not implicated in gene silencing in chrRCCor in normal kidney. Instead, the frequent chromosome 10 lossobserved in chrRCC samples, and the significant correlation withPax-2 immunoexpression categories, indicate that this genetic alter-ation is the major cause for PAX2 underexpression in this tumoursubtype. Importantly, this feature might be used for discriminatingchrRCC from oncocytoma in challenging cases. Nonetheless, addi-tional studies are required to further determine the genetic and/orepigenetic regulation mechanisms underlying PAX2 differentialexpression in other RCTs.
Acknowledgements
The authors are grateful to Vera L. Costa, and Manuela Pinheiro for their
skilful technical support. JR-C and JDB-S are supported by a grant from LigaPortuguesa Contra o Cancro – N�ucleo Regional do Norte and from FCT -
Fundac�~ao para a Ciencia e a Tecnologia (SFRH/BD/46574/2008), respectively.
This study was funded by a research grant from the Research Center of Por-tuguese Oncology Institute – Porto (CI-IPOP 4-2008) and the Calouste Gul-
benkian Foundation (Project # 96474). The funding agencies had no role in
study design, data collection and analysis, decision to publish, or preparation
of the manuscript. No additional external funding has been received for thisstudy.
Conflicts of interest
The authors declare that they have no competing interests.
References
1. Ferlay J, Shin HR, Bray F, et al. GLOBOCAN2008: cancer incidence and mortality world-wide. Lyon: IARCPress; 2010. http://globo-
can.iarc.fr/map.asp?selection=9200&title=
Kidney&sex=0&type=0&statistic=2&map=5&window=1&size=1&colour=1&scale=0
&submit=%A0Execute%A0.
2. Baldewijns MM, van Vlodrop IJ, SchoutenLJ, et al. Genetics and epigenetics of renalcell cancer. Biochim Biophys Acta. 2008;
1785: 133–55.3. Eble JN, Sauter G, Epstein JI, et al. Pathol-
ogy and genetics of tumours of the urinarysystem and male genital organs. Lyon:
IARCPress; 2004.
4. Kovacs G, Akhtar M, Beckwith BJ, et al. TheHeidelberg classification of renal cell
tumours. J Pathol. 1997; 183: 131–3.5. Thoenes W, Storkel S, Rumpelt HJ, et al.
Chromophobe cell renal carcinoma and itsvariants–a report on 32 cases. J Pathol.
1988; 155: 277–87.6. Wang Q, Fang WH, Krupinski J, et al. Pax
genes in embryogenesis and oncogenesis. JCell Mol Med. 2008; 12: 2281–94.
7. Sanyanusin P, Norrish JH, Ward TA, et al.Genomic structure of the human PAX2 gene.
Genomics. 1996; 35: 258–61.8. Ward TA, Nebel A, Reeve AE, et al.
Alternative messenger RNA forms and
open reading frames within an additionalconserved region of the human PAX-2
gene. Cell Growth Differ. 1994; 5: 1015–21.
9. Torban E, Eccles MR, Favor J, et al.PAX2 suppresses apoptosis in renal col-
lecting duct cells. Am J Pathol. 2000; 157:
833–42.
10. Chi N, Epstein JA. Getting your Pax straight:
Pax proteins in development and disease.Trends Genet. 2002; 18: 41–7.
11. Dressler GR, Woolf AS. Pax2 in develop-
ment and renal disease. Int J Dev Biol. 1999;43: 463–8.
12. Cai Q, Dmitrieva NI, Ferraris JD, et al. Pax2expression occurs in renal medullary epithe-
lial cells in vivo and in cell culture, is osmo-regulated, and promotes osmotic tolerance.
Proc Natl Acad Sci USA. 2005; 102: 503–8.13. Metsuyanim S, Pode-Shakked N, Schmidt-
Ott KM, et al. Accumulation of malignantrenal stem cells is associated with epigenetic
changes in normal renal progenitor genes.
Stem Cells. 2008; 26: 1808–17.14. Wu H, Chen Y, Liang J, et al. Hypomethyla-
tion-linked activation of PAX2 mediates
tamoxifen-stimulated endometrial carcino-
genesis. Nature. 2005; 438: 981–7.15. Schafer BW. Emerging roles for PAX tran-
scription factors in cancer biology. Gen
Physiol Biophys. 1998; 17: 211–24.16. Robson EJ, He SJ, Eccles MR. A PANorama
of PAX genes in cancer and development.
Nat Rev Cancer. 2006; 6: 52–62.17. Gupta R, Balzer B, Picken M, et al. Diag-
nostic implications of transcription factorPax 2 protein and transmembrane enzyme
complex carbonic anhydrase IX immunore-
activity in adult renal epithelial neoplasms.Am J Surg Pathol. 2009; 33: 241–7.
18. Brunelli M, Eble JN, Zhang S, et al. Eosino-philic and classic chromophobe renal cell
carcinomas have similar frequent losses ofmultiple chromosomes from among chro-
mosomes 1, 2, 6, 10, and 17, and this
pattern of genetic abnormality is not present
in renal oncocytoma. Mod Pathol. 2005; 18:
161–9.19. Memeo L, Jhang J, Assaad AM, et al.
Immunohistochemical analysis for cytokera-
tin 7, KIT, and PAX2: value in the differentialdiagnosis of chromophobe cell carcinoma.
Am J Clin Pathol. 2007; 127: 225–9.20. Fuhrman SA, Lasky LC, Limas C. Prognostic
significance of morphologic parameters inrenal cell carcinoma. Am J Surg Pathol.
1982; 6: 655–63.21. Edge SB, Byrd DR, Compton CC, et al. Chap-
ter 43 - Kidney. In: Edge SB, Byrd DR, Comp-ton CC, Fritz AG, Greene FL, Trotti A, editors.
AJCC cancer staging manual. 7th ed. New
York: Springer-Verlag; 2010: p. 479–89.22. Pearson H, Stirling D. DNA extraction
from tissue. Methods Mol Biol. 2003; 226:
33–4.23. Mazal PR, Stichenwirth M, Koller A, et al.
Expression of aquaporins and PAX-2 com-
pared to CD10 and cytokeratin 7 in renal
neoplasms: a tissue microarray study. Mod
Pathol. 2005; 18: 535–40.24. Costa VL, Henrique R, Danielsen SA, et al.
Three epigenetic biomarkers, GDF15,
TMEFF2, and VIM, accurately predict bladder
cancer from DNA-based analyses of urinesamples. Clin Cancer Res. 2010; 16: 5842–51.
25. Barros-Silva JD, Ribeiro FR, Rodrigues A,et al. Relative 8q gain predicts disease-spe-
cific survival irrespective of the TMPRSS2-
ERG fusion status in diagnostic biopsies of
prostate cancer. Genes Chromosom Cancer.2011; 50: 662–71.
26. Ryan G, Steele-Perkins V, Morris JF, et al.Repression of Pax-2 by WT1 during normal
ª 2013 The Authors.
Journal of Cellular and Molecular Medicine Published by Foundation for Cellular and Molecular Medicine/Blackwell Publishing Ltd
1057
J. Cell. Mol. Med. Vol 17, No 8, 2013

kidney development. Development. 1995;121: 867–75.
27. Gnarra JR, Dressler GR. Expression of Pax-
2 in human renal cell carcinoma and growth
inhibition by antisense oligonucleotides.Cancer Res. 1995; 55: 4092–8.
28. Shen SS, Truong LD, Scarpelli M, et al.Role of immunohistochemistry in diagnos-ing renal neoplasms: when is it really
useful? Arch Pathol Lab Med. 2012; 136:410–7.
29. Truong LD, Shen SS. Immunohistochemical
diagnosis of renal neoplasms. Arch Pathol
Lab Med. 2011; 135: 92–109.30. Bodmer D, van den Hurk W, van Groningen
JJ, et al. Understanding familial and non-
familial renal cell cancer. Hum Mol Genet.2002; 11: 2489–98.
31. Lopez-Beltran A, Carrasco JC, Cheng L,et al. 2009 update on the classification of
renal epithelial tumors in adults. Int J Urol.
2009; 16: 432–43.32. Luu VD, Boysen G, Struckmann K, et al.
Loss of VHL and hypoxia provokes PAX2
up-regulation in clear cell renal cell carci-
noma. Clin Cancer Res. 2009; 15: 3297–304.
1058 ª 2013 The Authors.
Journal of Cellular and Molecular Medicine Published by Foundation for Cellular and Molecular Medicine/Blackwell Publishing Ltd
Copyright © 2022 FDOKUMEN