DELIVERABLE No D3.1 Report on the comparison of model ...
307
Project No 282846 LIMITS Low climate IMpact scenarios and the Implications of required Tight emission control Strategies FP7-Cooperation-ENV Collaborative project Small or medium-scale focused research project DELIVERABLE No D3.1 Report on the comparison of model runs, based on the global and national IAMs Due date of deliverable: 30/09/2013 Submission date: 11/11/2013 Second submission date (updated deliverable): 09/09/2014 Start date of project: 01/10/2011 Duration: 36 months Organisation name of lead contractor for this deliverable: Utrecht University Revision: 1 Project co-funded by the European Commission within the Seventh Framework Programme Dissemination level PU Public X PP Restricted to other programme participants (including the Commission Services) RE Restricted to a group specified by the consortium (including the Commission Services) CO Confidential, only for members of the consortium (including the Commission Services)
-
Upload
khangminh22 -
Category
Documents
-
view
0 -
download
0
Transcript of DELIVERABLE No D3.1 Report on the comparison of model ...

Project No 282846 LIMITS
Low climate IMpact scenarios and the Implications of required Tight emission control Strategies
FP7-Cooperation-ENV Collaborative project Small or medium-scale focused research project
DELIVERABLE No D3.1 Report on the comparison of
model runs, based on the global and national IAMs
Due date of deliverable: 30/09/2013 Submission date: 11/11/2013
Second submission date (updated deliverable): 09/09/2014 Start date of project: 01/10/2011
Duration: 36 months
Organisation name of lead contractor for this deliverable: Utrecht University
Revision: 1
Project co-funded by the European Commission within the Seventh Framework Programme Dissemination level
PU Public X PP Restricted to other programme participants (including the Commission Services) RE Restricted to a group specified by the consortium (including the Commission Services) CO Confidential, only for members of the consortium (including the Commission Services)
LIMITS – LOW CLIMATE IMPACT SCENARIOS AND THE IMPLICATION OF
REQUIRED TIGHT EMISSION CONTROL STRATEGIES PROJECT NO 282846
DELIVERABLE NO.D3.1
2
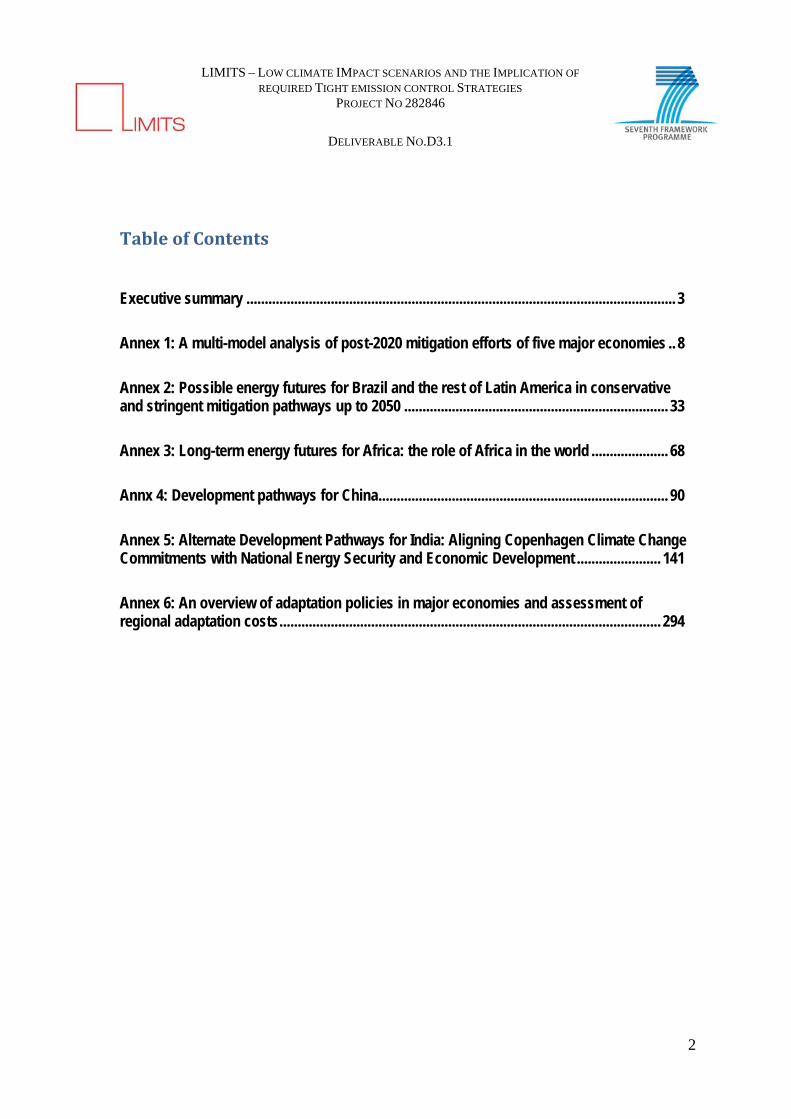
TableofContents Executive summary ..................................................................................................................... 3
Annex 1: A multi-model analysis of post-2020 mitigation efforts of five major economies .. 8
Annex 2: Possible energy futures for Brazil and the rest of Latin America in conservative and stringent mitigation pathways up to 2050 ........................................................................ 33
Annex 3: Long-term energy futures for Africa: the role of Africa in the world ..................... 68
Annx 4: Development pathways for China ............................................................................... 90
Annex 5: Alternate Development Pathways for India: Aligning Copenhagen Climate Change Commitments with National Energy Security and Economic Development ....................... 141
Annex 6: An overview of adaptation policies in major economies and assessment of regional adaptation costs ........................................................................................................ 294

LIMITS – LOW CLIMATE IMPACT SCENARIOS AND THE IMPLICATION OF
REQUIRED TIGHT EMISSION CONTROL STRATEGIES PROJECT NO 282846
DELIVERABLE NO.D3.1
3
Executive summary
Authors: Sara Herrerasa and Detlef P. van Vuurena, b
a Copernicus Institute of Sustainable Development, Utrecht University, Heidelberglaan 2, NL-3584 CS Utrecht, The Netherlands b PBL Netherlands Environment Assessment Agency, PO Box 303, 3720 BA Bilthoven, The Netherlands
This document is the outcome of the LIMITS project under task 3.1 “Regional assessment and modelling of climate policy scenarios (2°C scenarios)”. The goal of this task is to assess the implication for different world regions of the implementing climate policies to achieve the 2oC target using the outcomes of global Integrated Assessment Models (IAM) and regional insights.
The deliverable consists of 6 separate annexes (products) in addition to this executive summary. The first Annex describes a model comparison study looking at the long-term implications on five major economies (China, EU, India, Japan and USA) based on the outcomes of seven global models. The next four annexes describe 4 additional studies that link the outcomes of the global models to national policies in the different regions and the results of national modelling activities, in order to have a better understanding on the different regions. These studies comprise analysis on four regions; Latin America, China, India and Africa. The Latin America study uses two global models and one regional model for the analysis. The Africa study looks at regional trends using the results of six global models. Annex 4 and 5 are written by local partners in China and India who use the outcomes of their respective national models to compare these with the global scenario results. A final annex provides a short summary on the main adaptation policies implemented in four major economies (India, China, USA and Japan) and assesses the adaptation and residual costs under a 2 degree Celsius policy in different world regions. The included Annexes are as follows:
Annex 1: A study on the five major economies (China, EU, India, Japan and USA)
Annex 2: A study on Latin America with a special focus on Brazil
Annex 3: A study on Africa
Annex 4: A study on China
Annex 5: A study on India
Annex 6: An overview of adaptation policies in major economies and assessment of regional adaptation costs

LIMITS – LOW CLIMATE IMPACT SCENARIOS AND THE IMPLICATION OF
REQUIRED TIGHT EMISSION CONTROL STRATEGIES PROJECT NO 282846
DELIVERABLE NO.D3.1
4
Annex 1-5 use a set of scenarios that describe three main (potential) developments: (i) development in the absence of climate policy; (ii) development under current policies; and (iii) development consistent with the 2°C target.
The main findings of the six studies are:
Annex 1: A tripling or quadrupling of current mitigation ambitions is required in all five major economies by 2050 to comply with the 2°C target. For least cost scenarios leading to 2oC, all five major economies are projected to achieve negative emissions during the second half of the century. Across the set of the seven models used, in the long-term decarbonization of the energy supply sector (and in particular power generation) contributes more to mitigation than reducing energy demand. Some regional differences can be noted. In India and the USA the emphasis is on prolonging fossil fuel use by coupling conventional technologies with carbon capture and storage (CCS), whereas the other main strategy depicts a shift to carbon-neutral technologies with mostly renewables (China, EU) or nuclear power (Japan). Regions with access to large amounts of biomass, such as the USA, China and the EU often use bio-energy as a major component of their mitigation strategy. After supply side changes, the most important abatement strategy focuses on end-use efficiency improvements, leading to considerable emission reductions in both the industry and transport sectors across all five studied regions. Abatement strategies for non-CO2 emissions and land-use emissions are found to have a smaller potential.
Annex 2: The study on Latin America shows that there is general agreement between the global and the regional models regarding the projected emissions trends for the three main scenarios for the region. Under current policies, energy-related CO2 emissions are projected to increase 1.5-3.0% per year in the whole Latin American region according to the three models used. In order to achieve the 2°C target, deep CO2 emission reductions are needed in the energy system of the region where the power sector offers the greatest mitigation opportunities. CO2 emission reductions ranging between 55%-87% in Brazil and 40%-74% in the rest of Latin America are needed from the current policies scenario by 2050. The implementation of CCS, in combination with fossil fuels and bioenergy, and hydro, biomass and wind energy are identified as the most promising low-carbon options for the region. The realistic implementation of these options will depend, however, on their capability to overcome the present technical, economic, environmental and social challenges. Besides, an appropriate policy framework to stimulate the transformation of the energy system is also important. Brazil is the first country in Latin America to adopt a national voluntary mitigation goal by law. However, the assessment of the effectiveness of this goal up to now becomes difficult due to the vague targets established.
Annex 3: Although Africa’s share in the global energy system and CO2 emissions is only small today, its ongoing population growth and economic development suggests that this can change
LIMITS – LOW CLIMATE IMPACT SCENARIOS AND THE IMPLICATION OF
REQUIRED TIGHT EMISSION CONTROL STRATEGIES PROJECT NO 282846
DELIVERABLE NO.D3.1
5
significantly. The results of the African study show that emissions trends in this region are highly uncertain. As a result, current policies may imply that Africa’s share in global CO2 emissions remains rather small, but at the same time other models show that emissions could become up to one quarter of global emissions. Overall, the African continent – according to the model projections, slowly converges towards a similar energy mix as current developed countries. Interestingly, the situation with respect to energy trade is projected to change significantly. Where the continent is now a net exporter of oil and gas, towards 2050 it probably needs most of its resources to meet its rapidly growing domestic demand. The study also finds that in the residential sector, traditional bio-energy is likely to remain an important energy source for decades to come. Therefore, if policy-makers want to achieve a complete phase- out of traditional bio-energy use, specific policies addressing energy poverty are required. As part of global climate policy that aims reaching the 2°C target, Africa needs to start mitigating its emissions around 2030. The rapid expansion of the industrial and the power sector presents large mitigation potential and thereby the possibility to capture the investment peak with climate policy.
Annex 4: The study on the Chinese region discussed a possible Chinese scenarios consistent with the global 2 degree target, The results show that given the volume of Chinese emissions, stringent emission reductions will be required. In the scenario presented, China’s CO2 emission will peak before 2025 and start decreasing thereafter. By 2050, a 70% reduction compared to 2025 levels is required. The local projections suggest that this is feasible but it would require the successful deployment of all available low-carbon energy technologies and massive international cooperation. These policies, however, would go significantly beyond those that are currently in place. Renewable energy development policies are crucial for China to reach the 2 degree target. With the current technology progress, much more renewable energy could be utilized in China. Nuclear is still an important option for China, even though recent accident in Japan slowed down the development of nuclear. China’s energy system has to be diverse and nuclear is still a relatively clean and safe energy supply. China is now implementing caps on energy demand in its 12th Five Year Plan, together with targets for non-fossil fuel energy by 2020. China can use this experience to set up a cap on CO2 emissions after 2015. Carbon pricing could also be introduced in coming years in the country. Even though it is hard to implement this across the whole region in the short term, it will have significant influence on economy optimization and technology progress. Setting a cap for CO2 emissions in China has been an effective way to limit CO2 emission increase in recent years. Currently, China is making significant progress in the implementation of domestic emission trading schemes in pilot cities and provinces.
Annex 5: This study looks specifically in to short and long-term emission trends in India. As part of the Copenhagen commitment, India aims a 20-25% reduction in GHG intensity during 2005-2020. In doing so, it has comprehensively planned policies and measures across numerous sectors –
LIMITS – LOW CLIMATE IMPACT SCENARIOS AND THE IMPLICATION OF
REQUIRED TIGHT EMISSION CONTROL STRATEGIES PROJECT NO 282846
DELIVERABLE NO.D3.1
6
both at the national and sub-national levels. The results of global and regional models were used to assess the future implications of these policies. Both the global and regional models showed that coal will remain the mainstay of the Indian energy system under the BaU scenario even by the end of the century. Coal is the most important domestic resource and is available at rather low costs. Future coal use, however, is expected to be much cleaner than now. Results from all modelling teams indicate that Indian CO2 emissions will not peak until 2100 under the BaU scenario. To achieve peaking of Indian emissions by 2030, a minimum carbon tax of US$150 per tonne would need to be imposed. Under the most stringent scenario, CO2 emissions would peak by 2020 followed by absolute emission reductions afterwards. However, in order to achieve this, a minimum carbon tax of $200 per ton CO2e is needed to be imposed now onwards, (according to the models), along with expedited phasing-out of at least a third of coal-based energy infrastructure in the next ten years. The high level of investments in India, also implies that the potential to make a relatively fast transition towards a low-carbon energy system requires a careful planning. Ensuring the right infrastructure plays a key role here. For transport, this requires an integrated mobility plan with low-carbon transport at its core.
Annex 6: Developing countries are particularly vulnerable to the adverse effects of climate change. Four major economies, including developed and emerging economies, were analysed in the report (India, China and USA and Japan). The first three countries have already started establishing adaptation plans and programs in different sectors. Japan, on the contrary has not approved yet concrete policies focusing on adaptation and its climate policy framework includes mostly mitigation activities.
Studies on burden sharing have focused on equal allocation of mitigation costs without considering the full cost of climate change, which also includes adaptation costs and residual damages. Since the distribution of adaptation costs and residual damages does not necessarily mirror the distribution of mitigation costs, accounting for adaptation costs and residual damage can change the picture of burden sharing. The study shows that 1) there are still considerable adaptation and residual impacts under a 2 degree Celsius policy and that 2) to “compensate” those as part of an equal effort scheme – this would lead to a different allocation than focusing on a mitigation based perspective. Allocating emissions based on total climate change costs would increase the allocation especially for India and Africa, whereas notably North America would allocate fewer rights compared to mitigation-based allocation alone.
There are number of robust messages coming from the regional studies (Annex 1-5). First of all reducing emissions to a level that could keep a global temperature rise by 2100 under 2°C has not only be found technologically feasible at the global level, but also at the level of specific regions and countries. However, the studies also demonstrate there is a large gap between current ambition and scientific reality. Countries need to increase their mitigation ambitious much more
LIMITS – LOW CLIMATE IMPACT SCENARIOS AND THE IMPLICATION OF
REQUIRED TIGHT EMISSION CONTROL STRATEGIES PROJECT NO 282846
DELIVERABLE NO.D3.1
7
than their current climate pledges made at Copenhague and Cancun if to achieve the 2°C objective. Although there are important differences between national and global models, the study shows that, in the main, the outcomes of the projections made by local and global models are relatively close. Under BaU conditions, emissions in the different regions are projected to peak by some models earlier than in others but most models generally show either a peak or stabilization pathway in the second half of the century. To reverse the current emissions growth trend in a low-carbon scenario, emission reduction efforts need to take place in the short-term (2020-2030). Our studies showed that accelerated uptake of all available renewable technologies and energy efficiency improvements can deliver a large reduction of emissions. In most of the studied cases of this report, the power sector generally presents the largest mitigation opportunities for energy-related emissions. Countries with large reliance on biomass, such as many countries in Latin America, Africa and Asia, can also reach significant emission reductions in the land-use sector.
This report provides key information about the possible options to meet the global 2°C challenge in different regions. One key challenge for mitigation in developing countries is finance and technical support. However, a number of major emerging economies such as China, India and Brazil have recently shown to be capable to develop robust and ambitious climate legislation and mitigation programs evidencing to be capable to achieve their objectives without international assistance.

LIMITS – LOW CLIMATE IMPACT SCENARIOS AND THE IMPLICATION OF
REQUIRED TIGHT EMISSION CONTROL STRATEGIES PROJECT NO 282846
DELIVERABLE NO.D3.1
8
Annex 1: A multi-model analysis of post-2020 mitigation efforts of five major economies
Mariësse A.E. van Sluisveld a, David E.H.J. Gernaat a, Shuichi Ashinab, Katherine V. Calvin c, Amit Gargd , Morna Isaaca, Paul L. Lucase, Ioanna Mouratiadou f, Sander A.C. Ottoa, Shilpa Rao g, Priyadarshi R. Shuklad, Jasper van Vliet e, Detlef P. van Vuurena,e
a Copernicus Institute of Sustainable Development, Utrecht University, Heidelberglaan 2, NL-3584 CS Utrecht, The Netherlands b NIES National Institute for Environmental Studies, 16-2 Onogawa, Tsukuba-City, Ibaraki, 305-8506 Japan. c Joint Global Change Research Institute, Pacific Northwest National Laboratory and University of Maryland, USA d IIMAHD Indian Institute of Management Ahmedabad, Vastrapur, Ahmedabad, India e PBL Netherlands Environment Assessment Agency, PO Box 303, 3720 BA Bilthoven, The Netherlands f Potsdam Institute for Climate Impact Research (PIK), PO Box 60 12 03, 14412 Potsdam, Germany g International Institute for Applied Systems Analysis (IIASA), Schlossplatz 1, A-2361 Laxenburg, Austria This deliverable has also been accepted for publication in the LIMITS Special Isssue in Climate Change Economics with the title “A multi-model analysis of post-2020 mitigation efforts of five major economies“.
LIMITS – LOW CLIMATE IMPACT SCENARIOS AND THE IMPLICATION OF
REQUIRED TIGHT EMISSION CONTROL STRATEGIES PROJECT NO 282846
DELIVERABLE NO.D3.1
9
Contents Executive summary ................................................................................................................... 10
1. Introduction ...................................................................................................................... 11
2. Methodology ..................................................................................................................... 12
2.1 Scenarios and data .......................................................................................... 12 2.2 Model framework ............................................................................................. 13
3. Results .............................................................................................................................. 15
3.1 Trends in major drivers of emissions .................................................................. 15 3.2 Trends in CO2 emissions ................................................................................... 16 3.3 Emission decomposition ................................................................................... 18 3.4 Sectoral emission changes ............................................................................... 19 3.5 Changes in electricity production ....................................................................... 22
4. Discussion ........................................................................................................................ 23
5. Conclusions ...................................................................................................................... 27
6. Acknowledgements .......................................................................................................... 28
7. References ........................................................................................................................ 29
LIMITS – LOW CLIMATE IMPACT SCENARIOS AND THE IMPLICATION OF
REQUIRED TIGHT EMISSION CONTROL STRATEGIES PROJECT NO 282846
DELIVERABLE NO.D3.1
10
Executive summary This report looks into the regional mitigation strategies of five major economies (China, EU, India, Japan and USA) in the context of the 2°C target, using a multi-model comparison. In order to stay in line with the 2°C target:
a) a tripling or quadrupling of mitigation ambitions is required in all regions by 2050, employing vigorous decarbonization of the energy supply system and achieving negative emissions during the second half of the century.
b) In all regions looked at, decarbonization of energy supply (and in particular power generation) is more important than reducing energy demand.
c) In India and the USA the emphasis is on prolonging fossil fuel use by coupling
conventional technologies with carbon storage, whereas the other main strategy depicts a shift to carbon-neutral technologies with mostly renewables (China, EU) or nuclear power (Japan).
d) Regions with access to large amounts of biomass, such as the USA, China and the
EU, can make a trade-off between energy related emissions and land related emissions, as the use of bioenergy can lead to a net increase in land use emissions.
e) After supply-side changes, the most important abatement strategy focuses on end-
use efficiency improvements, leading to considerable emission reductions in both the industry and transport sectors across all regions.
f) Abatement strategies for non-CO2 emissions and land use emissions are found to
have a smaller potential.
g) Inherent model, as well as collective, biases have been observed affecting the regional response strategy or the available reduction potential in specific (end-use) sectors.
LIMITS – LOW CLIMATE IMPACT SCENARIOS AND THE IMPLICATION OF
REQUIRED TIGHT EMISSION CONTROL STRATEGIES PROJECT NO 282846
DELIVERABLE NO.D3.1
11
1. Introduction In the last few years, the international community has broadly agreed to aim at limiting the increase of global mean temperature to a maximum of 2°C compared to pre-industrial levels (UNFCCC, 2009), although opinions differ on the acceptable level of risks, preferred mitigation strategies and the distribution of costs. Scenario studies indicate that, globally, emission reductions in the order of 35-80% by 2050 are needed in order to be consistent with this target (e.g. Rogelj et al. (2011) and Van Vuuren and Riahi, (2010)). Such reductions cannot be achieved without significant contributions from all major greenhouse gas emitting countries, which raises questions concerning the different emission reduction strategies in major economies (Clarke et al. 2009). So far, most of the literature on scenarios has focused on globally coordinated responses, in particular on the consequences of climate policy at the global level or for large aggregated regions (van Vuuren et al., 2012). However, the Copenhagen Conference and subsequent UNFCCC dialogues have not led to a comprehensive and long-term multilateral agreement on emission limitation and reduction commitments. Given the present fragmentation in global climate action, the exploration of the role of national strategies across different economies and the implications of delayed global action have become more important (Bertram et al., submitted; Bosetti et al., 2008; Luderer et al., submitted) The LIMITS project looks into the question on how scenarios consistent with the 2oC targets look like under different assumptions with respect to the international policy context – and analyses the scenarios further in terms of consequences for issues like technology development, investments, energy security and air pollution. A key element of the project is the use of multiple models to provide an indication of the range of possible outcomes. This report presents a comparative analysis done within the LIMITS project focusing on long-term mitigation efforts across five major economies, including the United States of America (USA), the European Union (EU), Japan, China and India, based on a multi-model scenario analysis oriented towards the 2°C target. The use of multiple models allows us to estimate the robustness of these responses. The analysis discusses two key mitigation scenarios, both starting from a fragmented policy approach, namely the implementation of the national pledges according to the Copenhagen Accords until 2020. The first scenario extends the 2020 pledges by a similar level of ambition in the subsequent decades. The second scenario increases the mitigation ambition after 2020 by assuming a global carbon market aimed at the 2°C climate stabilization target.

LIMITS – LOW CLIMATE IMPACT SCENARIOS AND THE IMPLICATION OF
REQUIRED TIGHT EMISSION CONTROL STRATEGIES PROJECT NO 282846
DELIVERABLE NO.D3.1
12
2. Methodology
2.1 Scenarios and data The scenarios that are used in this report are based on different policy assumptions for long-term international climate policy (see Table 1) and have been developed as part of the LIMITS project. The baseline (Base) scenario addresses the future energy system and emission developments in the absence of climate policy. The fragmented policy scenario (RefPol) is based on formulated 2020 national energy and climate targets reflecting the unconditional Copenhagen pledges. The scenario is extended after 2020 by assuming a similar national effort in the subsequent decades (see Table 2). Finally, the delayed global cooperation scenario (RefPol-450) mimics the RefPol scenario until 2020, and thereafter all regions adopt the long‐term 2.8 W/m2 radiative forcing target, consistent with a high likelihood (>70%) of staying within 2oC temperature increase, as a binding commitment for joint mitigation action. Implementation of the target is achieved via a global (harmonized) carbon tax. This scenario can be used to obtain information on attractive strategies at the regional level.
Table 1 - Scenario definitions *1 Scenario name Abbreviation Explanation
Baseline Base No climate policy baseline
Fragmented policy baseline
RefPol Regional policy reflecting the Copenhagen pledges of individual countries for 2020,and a fixed regional greenhouse gas intensity reduction percentage afterwards based on the current pledges.
Delayed global cooperative action
RefPol‐450 Radiative forcing target of 2.8 W/m2 *2 in 2100, with RefPol (fragmented) policy reflecting the Copenhagen pledges of individual countries prior to global cooperation in 2020.
*1 See Kriegler et al. (this issue) for a more detailed description of the scenarios. *2 The policy target assumed for the depicted scenarios refers to the aggregate radiative forcing from the following substances: Kyoto gases (CO2, CH4, N2O, HFCs, PFCs, SF6), Non‐Kyoto gases (substances controlled under the Montreal protocol, i.e. chlorides, halons, bromine; tropospheric and stratospheric ozone; stratospheric water vapor), and aerosols (sulfate, black and organic carbon from fossil fuel and biomass burning, indirect aerosol forcing).
Table 2 - Regional climate policy targets for RefPol and RefPol-450*1 Target in 2020 Unit China EU India Japan USA
Across the board GHG emission reduction pledges % (2005) ‐15
‐1 ‐5
GHG intensity reductions % 40 20
Modern renewable energy share in electricity production
% 25 20 13
Installed (renewable) energy capacity GW wind 200 20 5
GW solar 50 10 28
GW nuclear
41 20
Average GHG emission intensity improvements after 2020
% /yr 3.3 3 3.3 2.2 2.5
*1 See Kriegler et al. (this issue) or the Supplementary Online Material (SOM) for a more detailed description of the policy scenarios.
LIMITS – LOW CLIMATE IMPACT SCENARIOS AND THE IMPLICATION OF
REQUIRED TIGHT EMISSION CONTROL STRATEGIES PROJECT NO 282846
DELIVERABLE NO.D3.1
13
The 2020 targets in the RefPol and RefPol-450 scenarios include capacity and renewable energy share targets as well as greenhouse gas (GHG) emission reduction and intensity targets (see table 2). Given the uncertainty in the actual interpretation of the pledges, the targets reflect the lower end of the Copenhagen pledges for plausibility considerations (Kriegler et al., this issue). As such, the European GHG emission reduction target is based on the unconditional pledge of 20% in 2020 relative to 1990 levels, recalculated to reflect 2005 as a base year. Similarly for China and India, who pledged to reduce their emission intensity by respectively a range of 40-45% and 20-25% by 2020 (Townshend et al., 2011), the lower end of their pledge has been included in this study. In the case of Japan the ambition level for GHG emission reductions has been set at the unconditional Kyoto Protocol target (-6%) rather than the conditional Copenhagen target (of -25% relative to 1990 levels) (UNFCCC, 2011) – and has been amended downward to -1% to account for policy changes after the Fukushima incident in 20111. The USA target reflects the general Kyoto Protocol target for industrialized countries. The level of stringency in these 2020 ambitions is extrapolated thereafter until the end of the model time horizon in the form of an annual greenhouse gas intensity reduction rate calculated for Kyoto GHG equivalent emissions including land-use, land-use change and forestry (LULUCF).
2.2 Model framework
To get an indication of the robustness of the regional responses we use a multi-model approach, involving seven (global) models (AIM-Enduse: Kainuma et al. (2003) GCAM; Clarke et al. (2007); REMIND: Luderer et al. (2012); MESSAGE: Messner & Strubegger (1995); IMAGE: Bouwman et al. (2006); WITCH: Bosetti et al. (2006); TIAM-ECN: (Keppo and Zwaan, 2011)) which differ in model characteristics, coverage of sectors, disaggregation and definitions (economy wide or energy system) and baseline assumptions (see Table 3). As the sources of key parameters tend to vary (e.g. population and GDP growth projections) this will impact the relative mitigation potential per model (Clapp et al., 2009), but will also allow for the exploration of associated ranges of structural uncertainty and the robustness across a diversity of methodologies (Keppo and Zwaan, 2011). To incorporate outcomes of all models we limit the analysis to 2005‐2050 but for models that have a time horizon up to 2100 we extend the timescale for trend analysis of key drivers. When model outcomes overlap we assume modeling consensus, in which case the relative position of individual models is considered less relevant. Clearly deviating model behaviour is seen in ‘outlier’ values. Results for the world region are included as a weighted average.
1 The policy tendencies after the Fukushima incident are based on calculations from the Japanese National Institute of
Environmental Science (NIES) and the Research Institute of Innovative Technology for the Earth (RITE)

LIMITS – LOW CLIMATE IMPACT SCENARIOS AND THE IMPLICATION OF
REQUIRED TIGHT EMISSION CONTROL STRATEGIES PROJECT NO 282846
DELIVERABLE NO.D3.1
14
Table 3 - key model characteristics Name Time horizon Model category Intertemporal Solution Methodology
AIM‐ENDUSE 2050 Partial equilibrium Recursive dynamic
GCAM 2100 Partial equilibrium Recursive dynamic
IMAGE 2100 Partial equilibrium Recursive dynamic
MESSAGE 2100 General equilibrium Intertemporal optimization
REMIND 2100 General equilibrium Intertemporal optimization
TIAM‐ECN 2100 Partial equilibrium Intertemporal optimization
WITCH 2100 General equilibrium Intertemporal optimization

LIMITS – LOW CLIMATE IMPACT SCENARIOS AND THE IMPLICATION OF
REQUIRED TIGHT EMISSION CONTROL STRATEGIES PROJECT NO 282846
DELIVERABLE NO.D3.1
15
3. Results
3.1 Trends in major drivers of emissions Population and income are major drivers of CO2 emission growth in the absence of climate policy. Models differ with respect to population and GDP assumptions as a result of varying statistical data sources, base year and methods for accounting (Chaturvedi et al., 2012), creating a band that can be seen in figure 1a-b. For population, India and the USA show a rapid increase in population size in the 2010-2050 period. After 2050, growth rates in both regions are considerably reduced, resulting in a declining population in all models for India and in diverging trends for the USA. In China and the EU population growth stagnates by 2050, followed by a decline. For Japan, the population is projected to decline in all models throughout the whole century. In China, EU and Japan, the projected 2100 population is below the 2005 level. For income, there is a clear distinction between the developing countries and industrialized regions. The average growth rate for India and China is rapid in the short term (respectively 7-8% and 8-9% per year). In contrast, in the EU, Japan and the USA the growth rate is only 1-2% per year (Figure 1b). It should be noted that socioeconomic trends are exogenous inputs derived from sources independent of the integrated assessment models, hence trends are equal in every scenario and show no relation to the implemented climate policy. MESSAGE is found to adopt both higher relative and absolute values for population in China, EU and India compared to other models, which may have a noticeable effect on the available abatement potential under 2°C constraints. For GDP growth we find IMAGE to be relatively optimistic in both relative and absolute terms for China, EU and India. The implications of this are not clear, since the literature is inconclusive concerning the possible implications of rapid economic development for meeting the radiative forcing target (van Vuuren et al., 2012).
a b

LIMITS – LOW CLIMATE IMPACT SCENARIOS AND THE IMPLICATION OF
REQUIRED TIGHT EMISSION CONTROL STRATEGIES PROJECT NO 282846
DELIVERABLE NO.D3.1
16
Figure 1 - (a-b) Indexed growth figures of population and GDP (MER) per capita of all the considered regions.
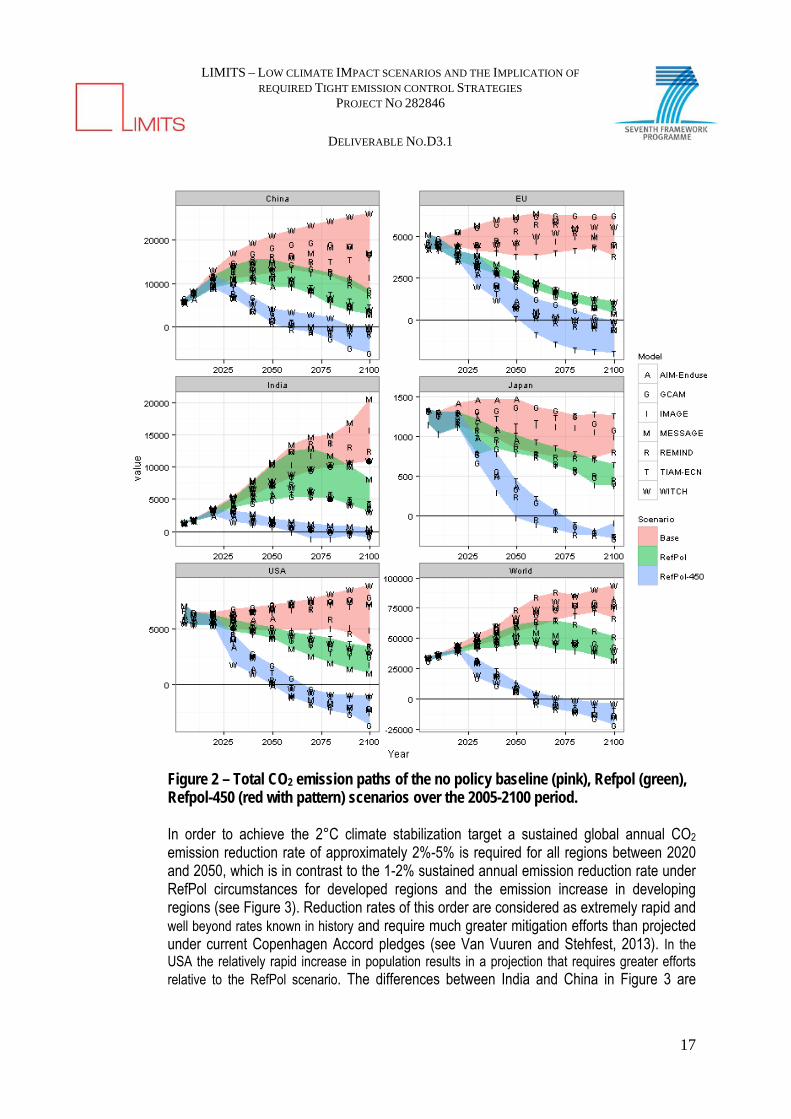
3.2 Trends in CO2 emissions Figure 2 shows the regional emission projections for all three scenarios. Baseline CO2 emissions are generally projected to gradually increase for all regions and most models show either a peak or stabilization in the second half of the century. Only the WITCH and TIAM-ECN models depict constant growth throughout the century in nearly all regions. The short term targets included in the RefPol scenario (reflecting the Copenhagen pledges) lead to emission reductions compared to the baseline scenario in all regions. The level of emission reduction differs strongly across regions. While in India and China the 2020 commitments lead to noteworthy reductions compared to baseline, emissions are still projected to increase and reach a peak near 2050 in China, and later in India. This is in contrast to the EU, Japan and the USA, for which the Copenhagen commitments are projected to lead to immediate decreasing emission pathways. In fact, the difference between the EU ambition level in the RefPol scenario and in the RefPol-450 scenario is small, implying that the assumed policies for the EU in the RefPol scenario aim for emission reductions that seem to be in line with the 2°C target (Clapp et al., 2009). It should be noted that for China and India the RefPol-450 emission trajectory peaks immediately after 2020. For the high income regions the RefPol-450 emissions need to be more than halved by 2050 compared to 2005 levels. All economies and models show that negative emissions are needed near the end of the century to reach the 2°C stabilization target. As described earlier, the assumptions concerning socioeconomic development are considered to be important drivers of total emissions. However, the results show that clearly deviating assumptions (e.g. population in relative and absolute terms in China for MESSAGE and the USA for GCAM) do not necessarily define the borders of the outcome space but lead to outcomes that remain more or less within the range of future (baseline) emissions. In the reference scenario most regions show a significantly larger range of possible outcomes than in the mitigation scenarios. This is due to the interplay of various fundamental processes and different base-year values for key metrics (Chaturvedi et al., 2012; Edenhofer et al., 2010) in the reference scenario and due to the unanimous shift to (vigorous) mitigation options that lower energy demand across all regions (van Vuuren et al., 2012) in the mitigation scenarios.
LIMITS – LOW CLIMATE IMPACT SCENARIOS AND THE IMPLICATION OF
REQUIRED TIGHT EMISSION CONTROL STRATEGIES PROJECT NO 282846
DELIVERABLE NO.D3.1
17
Figure 2 – Total CO2 emission paths of the no policy baseline (pink), Refpol (green), Refpol-450 (red with pattern) scenarios over the 2005-2100 period.
In order to achieve the 2°C climate stabilization target a sustained global annual CO2 emission reduction rate of approximately 2%-5% is required for all regions between 2020 and 2050, which is in contrast to the 1-2% sustained annual emission reduction rate under RefPol circumstances for developed regions and the emission increase in developing regions (see Figure 3). Reduction rates of this order are considered as extremely rapid and well beyond rates known in history and require much greater mitigation efforts than projected under current Copenhagen Accord pledges (see Van Vuuren and Stehfest, 2013). In the USA the relatively rapid increase in population results in a projection that requires greater efforts relative to the RefPol scenario. The differences between India and China in Figure 3 are

LIMITS – LOW CLIMATE IMPACT SCENARIOS AND THE IMPLICATION OF
REQUIRED TIGHT EMISSION CONTROL STRATEGIES PROJECT NO 282846
DELIVERABLE NO.D3.1
18
related to future projections of rapid economic change and the rate of capital stock turnover in the energy production sector (Lucas et al., submitted).
3.3 Emission decomposition We apply the Kaya-identity (Kaya, 1990) to examine the regional contribution to CO2 emissions reductions of changes in efficiency and consumption patterns (energy intensity) and of changes in the choice of energy carriers (carbon factor). For further elaboration on the calculation the reader is referred to Steckel et al. (2011) and Zhang et al. (2009). It appears that in all regions decarbonization is the leading strategy and the level of climate policy determines to which extent this occurs. However, it should be noted that the emission reductions shown in Figure 4 are relative to the no policy baseline scenario, which implicitly entails some bias as the reference scenario encompasses a degree of autonomous efficiency improvements whereas the carbon factor remains unchanged. In India and China the reduction of emissions through energy efficiency is projected to play a larger role. This can be explained by looking at the absolute values for carbon intensity and energy intensity. The data show that in 2050 the carbon intensity is at a similar level for all regions (near 60 kg/GJ), whereas the energy intensity can still be reduced by a factor of 4-6 in the developing regions. Another type of bias can be observed in the model types present in this study, as earlier studies (Johansson et al., in prep; van Vuuren et al., 2009) argue that CGE/econometric models (top-down) show more demand side changes than energy-system models (bottom-up) and therefore favour energy savings. In this study this tendency is apparent as well since the WITCH model (a hybrid energy system and economic growth model) shows a greater preference for energy efficiency solutions (particularly in China, as shown in figure 3), whereas more strongly technology based (bottom-up) models (such as AIM-Enduse, GCAM and TIAM-ECN) generally show more carbon intensity reductions.

LIMITS – LOW CLIMATE IMPACT SCENARIOS AND THE IMPLICATION OF
REQUIRED TIGHT EMISSION CONTROL STRATEGIES PROJECT NO 282846
DELIVERABLE NO.D3.1
19
Figure 3 – Decomposition of regional emission reductions relative to Base emissions, axes depict the share of a strategy in total emission reductions between 2005-2050 for the RefPol and RefPol-450 approach.
3.4 Sectoral emission changes By zooming in to the sectoral level (Figure 5), it can be observed that the energy production sector (combining power and heat supply, extraction, transformation and distribution) is projected to contribute the most to emission reductions in all regions and models in a 2°C regime, which can be explained by the large amount of greenhouse gas emissions for this sector, the relatively large potential for emission reduction (including technologies such as CCS, nuclear power and renewables) and the possibility for ‘negative emissions‘ (through combining biofuels with CCS) (Hallding et al., 2011; Van Vuuren et al., 2009). For the EU, models agree that the additional emission reductions in the energy production sector are limited as projections of Copenhagen or 2°C ambitions show similar emission reductions in this sector in the short term. In contrast, the emission reduction in emerging regions such as China and India is larger as 2°C ambitions diverge from the reference scenario to a greater extent. A considerable spread in outcomes can be seen across the models, yet models that project higher baseline emissions (Figure 2) consistently report higher emission reductions as well (e.g. WITCH and REMIND). Changes in the end-use sectors (including industry, transport, residential and commercial and other sectors) typically contribute 10-20% of total emission reductions in the RefPol-450 scenario. No systematic differences in reduction percentages across the different regions can be observed (despite the expectation of higher reduction rates in India and China as a result of reportedly lower levels of end-use efficiency). In the results, some differences between the models can be noted, with relatively high reduction rates in MESSAGE and AIM-Enduse, possibly caused by greater detail in end-use sector systematic in these models. In GCAM and REMIND relatively lower rates are observed, which is partly due to higher decarbonization rates in the energy production (both REMIND and GCAM) and land use (GCAM) sectors, reducing the relative contribution of the end-use sector in the mitigation strategy. Not all models report emission reductions from land use, land-use change and forestry (LULUCF) measures (GCAM alone reports consistently LULUCF emission reductions for each region). The results suggest a limited abatement potential, i.e. up to 10% emission reduction relative to cumulative baseline emissions for both climate policy scenarios. In fact, the contribution of this category is lower in the RefPol-450 scenario than in the RefPol scenario, showing that emission savings from LULUCF measures might be offset by the increasing need for bioenergy and CCS under strict climate policies (see. Calvin et al., this issue, Wise et al., 2009). GCAM’s greater projected LULUCF abatement potential in the EU and USA is directly linked to the explicit implemented policies that incentivize afforestation. For Japan, the potential for emission reductions from land-use change and forestry is argued to be too low to justify developing explicit abatement policies (OECD, 2010).

LIMITS – LOW CLIMATE IMPACT SCENARIOS AND THE IMPLICATION OF
REQUIRED TIGHT EMISSION CONTROL STRATEGIES PROJECT NO 282846
DELIVERABLE NO.D3.1
20
Non-CO2 sources, although considered a relatively important short to medium term mitigation option (Rao and Riahi, 2006; Lucas et al. 2007; Elzen et al. 2008), appear to have limited abatement potential for all regions by 2050, ranging around 5-10% of total cumulative emission reductions relative to the baseline. China, India and the USA show the largest greenhouse gas abatement potential through non-CO2 emission reductions, whereas the non-CO2 abatement potential is considered negligible for Japan. Looking at emission reductions in subsectors of the end-use sector, we observe that the industry sector (including feedstocks, agriculture and fishery) is the main source for abatement in China and India, whereas the USA and the EU achieve significant emission reductions through measures in the transport sector (see Figure 6). Japan forms an exception among developed regions, which could be explained by the high level of energy efficiency already implemented in the Japanese transport sector (Lipscy and Schipper, 2013). Transportation abatement is smaller in GCAM than in other models due to the abundance of other low cost mitigation measures (e.g. LULUCF, bioenergy with CCS). In all regions, as the contribution of industry to total end-use sector emission reduction increases, emission reductions from other end-use sectors become less important. The residential and commercial sector shows a marginal contribution to the regional abatement potential for all regions, except for a single result by TIAM-ECN for China.

LIMITS – LOW CLIMATE IMPACT SCENARIOS AND THE IMPLICATION OF
REQUIRED TIGHT EMISSION CONTROL STRATEGIES PROJECT NO 282846
DELIVERABLE NO.D3.1
21
Figure 4 (a-f) – Reduction percentage of cumulative emissions between 2005 and 2050 for the RefPol and RefPol-450 scenarios, compared to the baseline scenario in different sectors. Energy supply covers CO2 emissions from power and heat generation, other energy conversion (e.g. refineries, synfuel production), resource extraction and energy transmission and distribution (e.g. gas pipelines). Energy end-use sectors encompass the industry, residential and commercial, transportation and other sectors. Land-use encompasses net carbon dioxide emissions from all categories of land use and land-use change (e.g. pasture conversion, deforestation, afforestation, reforestation, soil management, etc.). Non-CO2 emissions encompass residual Kyoto gas emissions (CH4, N2O and F-gases) of all the former described sectors.

LIMITS – LOW CLIMATE IMPACT SCENARIOS AND THE IMPLICATION OF
REQUIRED TIGHT EMISSION CONTROL STRATEGIES PROJECT NO 282846
DELIVERABLE NO.D3.1
22
Figure 5 – Emission reductions shares per end-use-sector, reductions are relative to total end-use abatement potential compared to baseline emission reductions (indicating relative importance of the abatement potential of a sector within the aggregated energy end use category)
3.5 Changes in electricity production In the previous section, in all regions the energy supply sector is shown to have the largest potential for emission reductions. Here, we examine the changes in electricity production in detail. Figure 7 shows the percentage of electricity production from different electricity generation technologies in 2050 in specific regions for the two mitigation scenarios. Several regional patterns can be identified in the figure:
In terms of coal-based electricity production, the Chinese and Indian regions show the largest fraction of coal energy use in RefPol, due to the large available reserves (Garg and Shukla, 2009; Hallding et al., 2011; Shukla and Chaturvedi, 2012). Coal also makes a substantial contribution to electricity production in Japan and USA in the RefPol scenario but with considerable spread across the models. The EU generally has a lower fraction of coal and a higher fraction of natural gas and nuclear electricity (but with little consensus among the various models). The
LIMITS – LOW CLIMATE IMPACT SCENARIOS AND THE IMPLICATION OF
REQUIRED TIGHT EMISSION CONTROL STRATEGIES PROJECT NO 282846
DELIVERABLE NO.D3.1
23
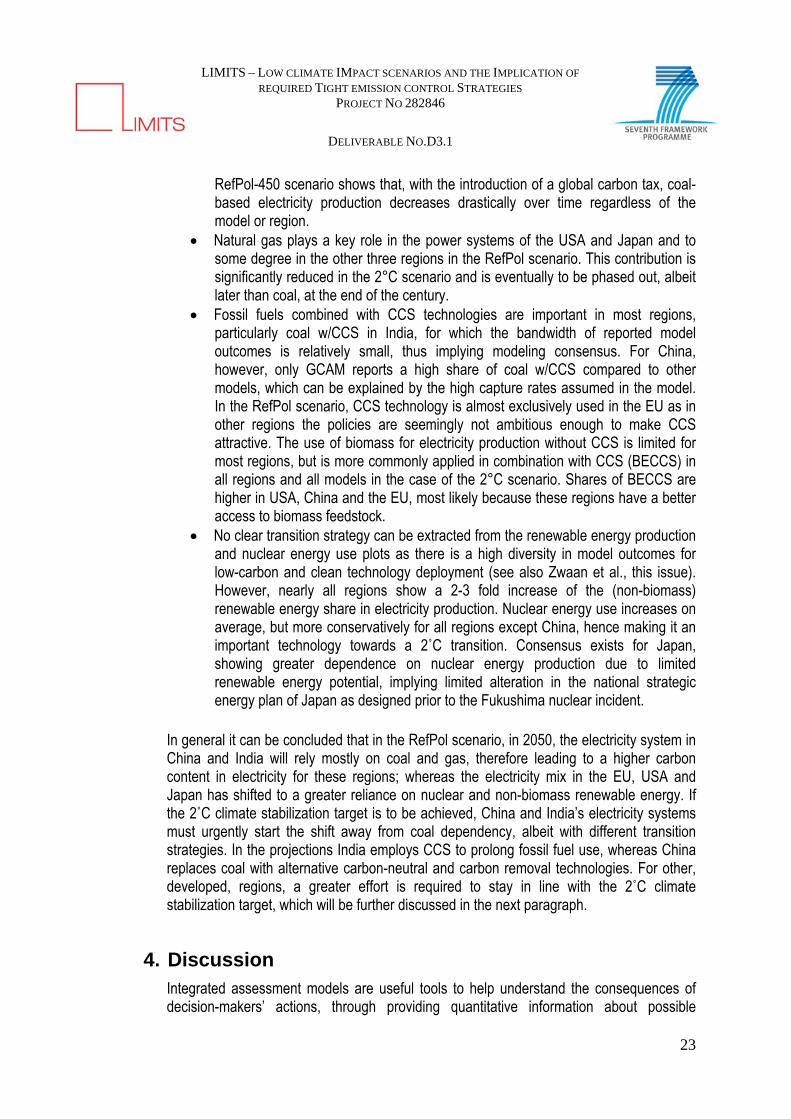
RefPol-450 scenario shows that, with the introduction of a global carbon tax, coal-based electricity production decreases drastically over time regardless of the model or region.
Natural gas plays a key role in the power systems of the USA and Japan and to some degree in the other three regions in the RefPol scenario. This contribution is significantly reduced in the 2°C scenario and is eventually to be phased out, albeit later than coal, at the end of the century.
Fossil fuels combined with CCS technologies are important in most regions, particularly coal w/CCS in India, for which the bandwidth of reported model outcomes is relatively small, thus implying modeling consensus. For China, however, only GCAM reports a high share of coal w/CCS compared to other models, which can be explained by the high capture rates assumed in the model. In the RefPol scenario, CCS technology is almost exclusively used in the EU as in other regions the policies are seemingly not ambitious enough to make CCS attractive. The use of biomass for electricity production without CCS is limited for most regions, but is more commonly applied in combination with CCS (BECCS) in all regions and all models in the case of the 2°C scenario. Shares of BECCS are higher in USA, China and the EU, most likely because these regions have a better access to biomass feedstock.
No clear transition strategy can be extracted from the renewable energy production and nuclear energy use plots as there is a high diversity in model outcomes for low-carbon and clean technology deployment (see also Zwaan et al., this issue). However, nearly all regions show a 2-3 fold increase of the (non-biomass) renewable energy share in electricity production. Nuclear energy use increases on average, but more conservatively for all regions except China, hence making it an important technology towards a 2˚C transition. Consensus exists for Japan, showing greater dependence on nuclear energy production due to limited renewable energy potential, implying limited alteration in the national strategic energy plan of Japan as designed prior to the Fukushima nuclear incident.
In general it can be concluded that in the RefPol scenario, in 2050, the electricity system in China and India will rely mostly on coal and gas, therefore leading to a higher carbon content in electricity for these regions; whereas the electricity mix in the EU, USA and Japan has shifted to a greater reliance on nuclear and non-biomass renewable energy. If the 2˚C climate stabilization target is to be achieved, China and India’s electricity systems must urgently start the shift away from coal dependency, albeit with different transition strategies. In the projections India employs CCS to prolong fossil fuel use, whereas China replaces coal with alternative carbon-neutral and carbon removal technologies. For other, developed, regions, a greater effort is required to stay in line with the 2˚C climate stabilization target, which will be further discussed in the next paragraph.
4. Discussion Integrated assessment models are useful tools to help understand the consequences of decision-makers’ actions, through providing quantitative information about possible
LIMITS – LOW CLIMATE IMPACT SCENARIOS AND THE IMPLICATION OF
REQUIRED TIGHT EMISSION CONTROL STRATEGIES PROJECT NO 282846
DELIVERABLE NO.D3.1
24
pathways for economic, social and environmental developments under different circumstances. In this study, the designed scenarios have been based on formulated 2020 national energy and climate targets, reflecting unconditional Copenhagen pledges or amended Copenhagen pledges to account for restraining occurrences in specific regions. In order to look further into the consequences of current 2020 commitments, we consider a limited set of policy relevant indicators to discuss the projected and required regional mitigation efforts (see Table 4): For Europe, the reference scenario includes the targets of 20% emission reductions,
20% share of renewable energy and 20% more energy efficiency by 2020 (relative to 1990 levels, as part of the Europe 2020 strategy) (see also IEA, 2012). This strategy implies an annual emission reduction rate of 1-2% till 2020. However this commitment, or the continuation of such rate of change after 2020, shows to be insufficient as a 2-11% emission reduction per annum is more likely to stay in line with 2°C ambitions. Moreover, energy efficiency needs to improve at a faster rate while doubling the 2020 renewable energy deployment rate by 2050.
In the US, several sectoral and state level policies have currently been implemented (such as regional cap-and-trade programs, renewable portfolio standards and, to a smaller degree, feed-in tariffs at a state level) yet a long-term (federal) commitment is missing (Schuman and Lin, 2012). In the reference scenario this translates to an emission reduction of around 1% per annum till 2020. In a 2°C scenario this requires a much higher annual emission reduction rate (of 4-12% per year depending on the model) in subsequent years till 2050. Some models even suggest lower per capita emissions for the USA than in other OECD regions in 2050, resulting from the available potential for CCS, renewable energy and bio-energy (especially CCS use is much higher than in other regions).
As Japan has formally committed itself to a conditional pledge of 25% of emission reductions relative to 2005 (conditional to the participation of all major economies)(UNFCCC, 2011), an consistent annual emission reduction rate of 2% would be minimally required to comply to this 2020 target. Although this rate is much higher than currently assumed in the reference scenario (accounting for possible revised nuclear policies in Japan), it still shows to be misaligned with 2°C ambitions. After 2020, a more rapid annual decrease in emissions is required regardless of the considered commitment. Furthermore, the results also suggest that nuclear power will play a significant role in reducing emissions in Japan. However, since the Fukushima accident, several initiatives to reduce the reliance on nuclear energy have been proposed (e.g. achieved through more renewable energy, greater energy efficiency improvements, reforms in energy systems and a (restrained) increase in fossil-fuel generated energy) which may lead to the sacrifice of nationally pledged climate change goals (National Policy Unit, 2013). The combination of both an inadequate emission reduction commitment and a diverging mitigation strategy may thus lead to a bigger post-2020 challenge for Japan than currently anticipated.
In the 2°C scenario, Chinese emissions would more-or-less peak in 2020 followed by a decline. In order to follow this pathway, China needs to maintain a similar annual emission intensity reduction rate of 4% as committed to in the Copenhagen pledges and extend this rate till 2050. This requires a major energy transition, surpassing the

LIMITS – LOW CLIMATE IMPACT SCENARIOS AND THE IMPLICATION OF
REQUIRED TIGHT EMISSION CONTROL STRATEGIES PROJECT NO 282846
DELIVERABLE NO.D3.1
25
non-hydro renewables generation of regions like the USA and EU by 2025-2030 to fulfill its future energy demand.
A similar pattern is observed for India, as emissions are projected to peak and decline in the first half of the century while returning to 2005 emission levels no sooner than 2050 in the 2°C scenario. However, unlike China, current efforts are found to be inconsistent with 2°C ambitions, as the emission intensity improvement committed to in the Copenhagen Accord is slightly below the value that is needed (currently describing a constant annual emission intensity reduction of 2.9% till 2020, whereas at least 3.4% is needed till 2050). As less ‘easy’ reduction options will be available and increasing economic growth is expected, this will represent a clear challenge for India. Moreover, per capita emissions in India are projected to remain significantly below the OECD average (which could be very important in the context of proposals on emission allocation and financing).
Table 4 thus emphasizes that significant emission reductions are needed in all regions, yet more rapid changes than currently described in the Copenhagen commitments are required per region. For the three high-income regions this implies that emissions need to be reduced more rapidly than accounted for in the 2020 commitments, whereas a turnaround in emission trajectories and faster decarbonization rates are required for China and India. Lastly, it should be noted that some evidence in earlier studies suggest that global assessment models are more optimistic about emission reductions and technological developments than national models (either due to better representation of national policies or assumed higher economic growth), possibly implying even greater regional challenges than described in this report (Chen et al., submitted; Johansson et al., in prep; Yang et al., 2011). Policy consequences of current model projections Another policy implication relates to the wide variation in the future portfolio choice among nuclear, CCS and non-biomass renewables across the models. For example, models that assume a greater scope for bioenergy, or the combination of bioenergy and CCS, allow regions with high application rates (such as the USA and EU) to rely heavily on the assumed technologies. As negative emission technologies will specifically play a key role in the second half of the century (considering how net negative emissions will be achieved in the 2060-2080 period in developed regions and no sooner than 2080-2100 in developing regions), it implies that global and local decisions made today will partly be based on our expectations of long-term technology developments over multiple decades. Other factors that are not explicitly modeled may also influence the choices for available future energy portfolios, such as technological constraints, geopolitical limitations and suboptimal policies. For example, the depicted rapid growth in renewable energy production in the scenarios (45-55% by 2050 relative to 2005 across every region except Japan) will be very challenging in all regions given the intermittency of these resources, but even more so in developing regions due to the poor current infrastructure, the slower market signals and lack of conducive renewable energy push policies (Hong et al., 2013; Shukla and Chaturvedi, 2011; Shukla et al., 2007). Interesting in this context are also the expectations on economic growth. Economic stagnation may dampen the available
LIMITS – LOW CLIMATE IMPACT SCENARIOS AND THE IMPLICATION OF
REQUIRED TIGHT EMISSION CONTROL STRATEGIES PROJECT NO 282846
DELIVERABLE NO.D3.1
26
resources and thus endanger the continuity of policies, creating suboptimal policies in the long run. The European Union, for instance, suffers from the impact of the economic crisis on the emission trading scheme, and has also abandoned subsidy programs and postponed planned investments in long-term infrastructure (Townshend et al., 2011). The effect of inconsistencies in climate mitigation policies has also been particularly critical for the renewable technology investment climate in the USA, causing boom and bust cycles over time (IEA, 2012).
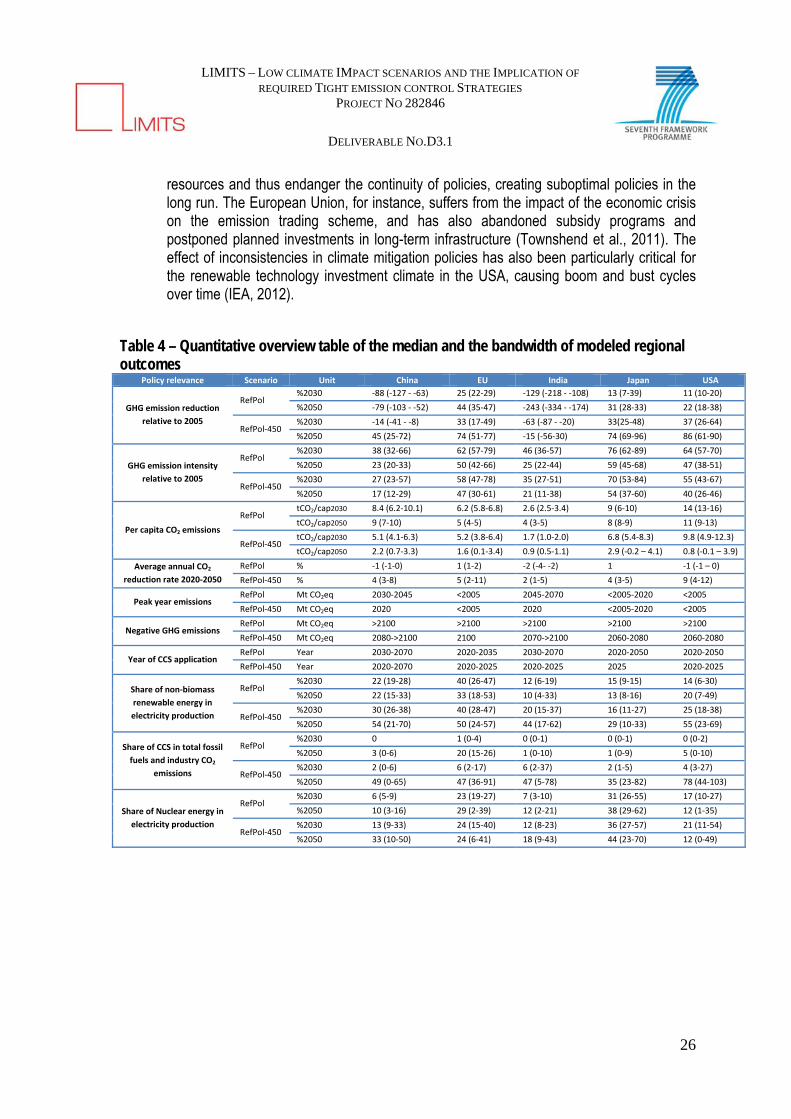
Table 4 – Quantitative overview table of the median and the bandwidth of modeled regional outcomes
Policy relevance Scenario Unit China EU India Japan USA
GHG emission reduction
relative to 2005
RefPol %2030 ‐88 (‐127 ‐ ‐63) 25 (22‐29) ‐129 (‐218 ‐ ‐108) 13 (7‐39) 11 (10‐20)
%2050 ‐79 (‐103 ‐ ‐52) 44 (35‐47) ‐243 (‐334 ‐ ‐174) 31 (28‐33) 22 (18‐38)
RefPol‐450 %2030 ‐14 (‐41 ‐ ‐8) 33 (17‐49) ‐63 (‐87 ‐ ‐20) 33(25‐48) 37 (26‐64)
%2050 45 (25‐72) 74 (51‐77) ‐15 (‐56‐30) 74 (69‐96) 86 (61‐90)
GHG emission intensity
relative to 2005
RefPol %2030 38 (32‐66) 62 (57‐79) 46 (36‐57) 76 (62‐89) 64 (57‐70)
%2050 23 (20‐33) 50 (42‐66) 25 (22‐44) 59 (45‐68) 47 (38‐51)
RefPol‐450 %2030 27 (23‐57) 58 (47‐78) 35 (27‐51) 70 (53‐84) 55 (43‐67)
%2050 17 (12‐29) 47 (30‐61) 21 (11‐38) 54 (37‐60) 40 (26‐46)
Per capita CO2 emissions
RefPol tCO2/cap2030 8.4 (6.2‐10.1) 6.2 (5.8‐6.8) 2.6 (2.5‐3.4) 9 (6‐10) 14 (13‐16)
tCO2/cap2050 9 (7‐10) 5 (4‐5) 4 (3‐5) 8 (8‐9) 11 (9‐13)
RefPol‐450 tCO2/cap2030 5.1 (4.1‐6.3) 5.2 (3.8‐6.4) 1.7 (1.0‐2.0) 6.8 (5.4‐8.3) 9.8 (4.9‐12.3)
tCO2/cap2050 2.2 (0.7‐3.3) 1.6 (0.1‐3.4) 0.9 (0.5‐1.1) 2.9 (‐0.2 – 4.1) 0.8 (‐0.1 – 3.9)
Average annual CO2
reduction rate 2020‐2050
RefPol % ‐1 (‐1‐0) 1 (1‐2) ‐2 (‐4‐ ‐2) 1 ‐1 (‐1 – 0)
RefPol‐450 % 4 (3‐8) 5 (2‐11) 2 (1‐5) 4 (3‐5) 9 (4‐12)
Peak year emissions RefPol Mt CO2eq 2030‐2045 <2005 2045‐2070 <2005‐2020 <2005
RefPol‐450 Mt CO2eq 2020 <2005 2020 <2005‐2020 <2005
Negative GHG emissions RefPol Mt CO2eq >2100 >2100 >2100 >2100 >2100
RefPol‐450 Mt CO2eq 2080‐>2100 2100 2070‐>2100 2060‐2080 2060‐2080
Year of CCS application RefPol Year 2030‐2070 2020‐2035 2030‐2070 2020‐2050 2020‐2050
RefPol‐450 Year 2020‐2070 2020‐2025 2020‐2025 2025 2020‐2025
Share of non‐biomass
renewable energy in
electricity production
RefPol %2030 22 (19‐28) 40 (26‐47) 12 (6‐19) 15 (9‐15) 14 (6‐30)
%2050 22 (15‐33) 33 (18‐53) 10 (4‐33) 13 (8‐16) 20 (7‐49)
RefPol‐450 %2030 30 (26‐38) 40 (28‐47) 20 (15‐37) 16 (11‐27) 25 (18‐38)
%2050 54 (21‐70) 50 (24‐57) 44 (17‐62) 29 (10‐33) 55 (23‐69)
Share of CCS in total fossil
fuels and industry CO2
emissions
RefPol %2030 0 1 (0‐4) 0 (0‐1) 0 (0‐1) 0 (0‐2)
%2050 3 (0‐6) 20 (15‐26) 1 (0‐10) 1 (0‐9) 5 (0‐10)
RefPol‐450 %2030 2 (0‐6) 6 (2‐17) 6 (2‐37) 2 (1‐5) 4 (3‐27)
%2050 49 (0‐65) 47 (36‐91) 47 (5‐78) 35 (23‐82) 78 (44‐103)
Share of Nuclear energy in
electricity production
RefPol %2030 6 (5‐9) 23 (19‐27) 7 (3‐10) 31 (26‐55) 17 (10‐27)
%2050 10 (3‐16) 29 (2‐39) 12 (2‐21) 38 (29‐62) 12 (1‐35)
RefPol‐450 %2030 13 (9‐33) 24 (15‐40) 12 (8‐23) 36 (27‐57) 21 (11‐54)
%2050 33 (10‐50) 24 (6‐41) 18 (9‐43) 44 (23‐70) 12 (0‐49)

LIMITS – LOW CLIMATE IMPACT SCENARIOS AND THE IMPLICATION OF
REQUIRED TIGHT EMISSION CONTROL STRATEGIES PROJECT NO 282846
DELIVERABLE NO.D3.1
27
5. Conclusions In this report we have identified trends in region specific responses to climate policy by looking at the results of a multi-model scenario study. The analysis is based on (1) a reference scenario assuming policy implementation of Copenhagen Accord pledges followed by similar mitigation action after 2020 and (2) a scenario that assumes strengthening of regional action after 2020 in order to reach the 2°C target (assuming an international carbon market). The main conclusions of this analysis are: Optimal reduction pathways leading to the achievement of the 2°C target require greater energy system transformations compared to current policies in all regions after 2020. The results indicate that without more stringent climate policy emissions in the assessed regions will not stay in line with the 2°C climate stabilization target. Emissions in India and China are projected to rise under unilateral climate ambitions, with an energy-related CO2-
eq emissions peak arriving no sooner than 2030. Due to the accelerating growth in socioeconomic indicators, developing regions face increasingly greater challenges over time. While the reference scenario in the EU, based on the pledged targets, leads to considerable emission reductions close in line with 2°C ambitions, further reaching reduction commitments are needed. In order to stay in line with the 2°C regime, the EU will be required to at least double its 2020 commitments in terms of renewable energy capacity by 2050. In the USA, as well as Japan, the rate of emission reduction in the reference scenario is lower than 1% per annum till 2020. For both regions this means that more rapid reductions are required in a 2°C regime after 2020 to compare to at least similar per capita levels as in Europe under increasing socioeconomic trends (USA) or to correct for possible changes to be made in the mitigation strategy (Japan). Both similarities and differences in mitigation strategies are observed for all regions. Putting in place a 2°C global climate stabilization target leads to an immediate inflection point in emission trajectories. Such a target requires a tripling or quadrupling of currently pledged mitigation efforts across each region. The results show that most emission reductions come from decarbonization of the energy supply sector in all regions and from the deployment of technologies with negative emissions in the second half of the century. The most important response strategy observed in this study is the shift away from fossil-fuelled power plants without CCS towards renewable energy and carbon-neutral sources. This shift in energy production leads to a diversification of the energy supply sector in all regions, with some differences in terms of mitigation strategy per region. Two specific directions become apparent, namely prolonging fossil fuel consumption by coupling conventional methods with carbon storage technologies (India, USA) and rigorously shifting to carbon-neutral technologies and mostly renewables (China, EU) or nuclear power (Japan). Regions with access to large amounts of biomass, such as the USA, China and the EU, can make a trade-off between energy related emissions and land related emissions, as the use of bioenergy can lead to a net increase in land use emissions. Japan shows a distinct preference for the expansion of nuclear power generation as its main
LIMITS – LOW CLIMATE IMPACT SCENARIOS AND THE IMPLICATION OF
REQUIRED TIGHT EMISSION CONTROL STRATEGIES PROJECT NO 282846
DELIVERABLE NO.D3.1
28
mitigation strategy, despite the current reduced social acceptance of nuclear power accounted for in this study. This result is mainly due to supply constraints of other sources in the country. All regions are found to require power generation from all available renewable sources to fulfill future energy demand while substituting for conventional fossil fuelled power generation. In China, the expansion of renewable energy is very rapid and the countries’ deployment rate is projected to surpass those of the USA and EU by 2025-2030. More stringent ambitions appear to extend the response capacity of the regions, rather than lead to deviating mitigation strategies. The next most important abatement strategy is energy efficiency in end-use sectors, leading to considerable and more or less homogeneous emission reductions across all regions. Other mitigation strategies focusing on non-CO2 emissions and land use emission can be considered as complementary response strategies as they contribute only marginally to the total emissions reductions for each region. Models may show a tendency to favour a specific transition strategy in all regions. In this study we used multiple models to examine regional response strategies. The results highlight the importance of the underlying assumptions and structure of each model. It can be seen that models have a tendency to favour specific response strategies in all regions, due to (1) their baseline assumptions (higher baseline emissions tend to result in more emission reductions being needed), (2) the model structure (which influences the level of decarbonization or efficiency improvement that can be achieved) or (3) the assumptions on technology developments (as models assuming a greater scope for specific technologies also project a greater reliance on the assumed technologies). Model comparison studies can expose these biases, but it should be noted that there can also be collective biases, for instance, in the abundance of lower cost mitigation measures in the energy supply sector, underestimating the available abatement potential in specific (end-use) sectors such as industry or transport. Further in-depth research is recommended into the implications of inherent model differences, uncertainties and underlying assumptions influencing the outcome space in baseline as well as mitigation scenarios. For regional assessments, it is also recommended to include more detailed ‘real world’ challenges in the scenarios that take into account factors such as limited availability of resources, limited participation of regions, suboptimal design of policy instruments and other barriers to implementation.
6. Acknowledgements The research leading to these results has received funding from the European Union Seventh Framework Programme FP7/2007-2013 under grant agreement n° 282846 (LIMITS).

LIMITS – LOW CLIMATE IMPACT SCENARIOS AND THE IMPLICATION OF
REQUIRED TIGHT EMISSION CONTROL STRATEGIES PROJECT NO 282846
DELIVERABLE NO.D3.1
29
7. References
Bertram, C., Johnson, N., Luderer, G., Riahi, K., Isaac, M., Eom, J., n.d. Carbon Lock-in and Path Dependency associated with weak near-term climate polices. Technological Forecasting and Social Change Submitted.
Bosetti, V., Carraro, C., Galeotti, M., Massetti, E., Tavoni, M., 2006. WITCH: A World Induced Technical Change Hybrid Model. The Energy Journal, Special Issue: Hybrid Modeling of Energy-Environment Policies: Reconciling Bottom-up and Top-down.
Bosetti, V., Carraro, C., Sgobbi, A., Tavoni, M., 2008. Delayed Participation of Developing Countries to Climate Agreements: Should Action in the EU and US be Postponed?
Bouwman, A.F., Kram, T., Klein Goldewijk, K., 2006. Integrated modelling of global environmental change. An overview of IMAGE 2.4. Netherlands Environmental Assessment Agency. available at: www.mnp.nl\en, Bilthoven, The Netherlands.
Calvin, K., Wise, M., Klein, D., Mccollum, D., Tavoni, M., Van Der Zwaan, B., Van Vuuren, D.P., 2013. A multi-model analysis of the regional and sectoral roles of bioenergy in near-term and long-term carbon mitigation 1–9.
Chaturvedi, V., Waldhoff, S., Clarke, L., Fujimori, S., 2012. What are the starting points? Evaluating base-year assumptions in the Asian Modeling Exercise. Energy Economics 34, S261–S271.
Chen, W.., Yin, X., Zhang, H., n.d. Towards low carbon development: Findings from the China TIMES model. Climatic Change.
Clapp, C., Karousakis, K., Buchner, B., Chateau, J., 2009. National and sectoral GHG mitigation potential: a comparison across models.
Clarke, L., Edmonds, J., Krey, V., Richels, R., Rose, S., Tavoni, M., 2009. International climate policy architectures: Overview of the EMF 22 International Scenarios. Energy Economics 31, S64–S81.
Clarke, L., Kim, S.H., Edmonds, J.A., Dooley, J., 2007. Model Documentation for the MiniCAM Climate Change Science Program Stabilization Scenarios: CCSP Product 2.1a.
Edenhofer, O., Pichs-Madruga, R., Sokona, Y., Barros, V., Field, C.B., Zwickel, T., Schlömer, S., Ebi, K., Mastrandrea, M., Mach, K., Von Stechow, C., 2010. IPCC Workshop on Socio-Economic Scenarios.
Elzen, M.G.J., Lucas, P.L., Vuuren, D.P. Van, 2008. Regional abatement action and costs under allocation schemes for emission allowances for achieving low CO2-equivalent concentrations. Climatic Change 90, 243–268.
LIMITS – LOW CLIMATE IMPACT SCENARIOS AND THE IMPLICATION OF
REQUIRED TIGHT EMISSION CONTROL STRATEGIES PROJECT NO 282846
DELIVERABLE NO.D3.1
30
Garg, A., Shukla, P.R., 2009. Coal and energy security for India: Role of carbon dioxide (CO2) capture and storage (CCS). Energy 34, 1032–1041.
Hallding, K., Olsson, M., Atteridge, A., Vihma, A., Carson, M., Román, M., 2011. Together Alone - BASIC countries and the climate change conundrum.
Hong, L., Zhou, N., Fridley, D., Raczkowski, C., 2013. Assessment of China’s renewable energy contribution during the 12th Five Year Plan. Energy Policy null.
IEA, 2012. World Energy Outlook 2012.
Johansson, D.J.A., Lucas, P.L., Weitzel, M., Ahlgren, E.O., Bazaz, A.B., n.d. Multi-model analyses of the economic and energy implications for China and India in a post-Kyoto climate regime 46, 1–57.
Kainuma, M., Matsuoka, Y., Morita, T., 2003. Climate policy assessment, Asia-Pacific Integrated Modeling.
Kaya, Y., 1990. Impact of carbon dioxide emission control on GNP growth: interpretation of proposed scenarios, Paper presented at the IPCC Energy and Industry Subgroup.
Keppo, I., Zwaan, B., 2011. The Impact of Uncertainty in Climate Targets and CO2 Storage Availability on Long-Term Emissions Abatement. Environmental Modeling & Assessment 17, 177–191.
Kriegler, E., Tavoni, M., Aboumahboub, T., Luderer, G., Demaere, G., Krey, V., Riahi, K., Rosler, H., 2013. Can we still meet 2 ° C with global climate action ? The LIMITS study on implications of Durban Action Platform scenarios 1. Climate Change Economics 282846.
Lipscy, P.Y., Schipper, L., 2013. Energy efficiency in the Japanese transport sector. Energy Policy In press.
Lucas, P.L., Shukla, P.R., Chen, W., Dhar, S., Van Ruijven, B., Den Elzen, M.G.J., Van Vuuren, D.P., n.d. Implications of the international reduction pledges on long-term energy system changes and costs in China and India. Energy Policy.
Lucas, P.L., van Vuuren, D.P., Olivier, J.G.J., den Elzen, M.G.J., 2007. Long-term reduction potential of non-CO2 greenhouse gases. Environmental Science & Policy 10, 85–103.
Luderer, G., Bertram, C., Calvin, K., De Cian, E., Kriegler, E., n.d. Implications of weak near-term climate policies on long-term climate mitigation pathways. Climatic Change.
Luderer, G., Pietzcker, R.C., Kriegler, E., Haller, M., Bauer, N., 2012. Asia’s role in mitigating climate change: A technology and sector specific analysis with ReMIND-R. Energy Economics 34, pp. S378–S390.

LIMITS – LOW CLIMATE IMPACT SCENARIOS AND THE IMPLICATION OF
REQUIRED TIGHT EMISSION CONTROL STRATEGIES PROJECT NO 282846
DELIVERABLE NO.D3.1
31
Messner, S., Strubegger, M., 1995. User’s guide for MESSAGE III. Working Paper WP-95-069. International Institute for Applied Systems Analysis (IIASA).
National Policy Unit, 2013. Options for Energy and the Environment The Energy and Environment Council Decision on June 29, 2012 [Outline] [WWW Document]. 2012. URL https://s3-ap-northeast-1.amazonaws.com/sentakushi01/public/pdf/Outline_English.pdf
OECD, 2010. Climate Change. In: OECD Environmental Performance Reviews: Japan 2010.
Rao, S., Riahi, K., 2006. The Role of Non-CO2 Greenhouse Gases in Climate Change Mitigation: Long-term Scenarios for the 21st Century. Energy Journal 27, 177–200.
Rogelj, J., Hare, W., Chen, C., 2011. Discrepancies in historical emissions point to a wider 2020 gap between 2 ◦ C benchmarks and aggregated national 024002.
Schuman, S., Lin, A., 2012. China’s Renewable Energy Law and its impact on renewable power in China: Progress, challenges and recommendations for improving implementation. Energy Policy 51, 89–109.
Shukla, P.R., Chaturvedi, V., 2011. Sustainable energy transformations in India under climate policy. Sustainable Development.
Shukla, P.R., Chaturvedi, V., 2012. Low carbon and clean energy scenarios for India: Analysis of targets approach. Energy Economics.
Shukla, P.R., Garg, A., Dhar, S., Halsnaes, K., 2007. Balancing Energy, Development and Climate Priorities in India. UNEP Risoe Centre on Energy, Climate and Sustainable Development, Roskilde, Denmark.
Steckel, J., Jakob, M., Marschinski, R., Luderer, G., 2011. From carbonization to decarbonization?—Past trends and future scenarios for China’s CO2 emissions. Energy Policy 39, 3443–3455.
Townshend, T., Frankhauser, S., Matthews, A., Feger, C., Liu, J., Narciso, T., 2011. GLOBE Climate Legislation Study.
UNFCCC, 2009. Report of the Conference of the Parties on its fifteenth session, held in Copenhagen from 7 to 19 December 2009 [WWW Document]. URL http://unfccc.int/resource/docs/2009/cop15/eng/11a01.pdf#page=4
UNFCCC, 2011. Framework Convention on Climate Change Compilation of economy-wide emission reduction targets to Convention 1–8.
Van Vuuren, D.P., Hoogwijk, M., Barker, T., Riahi, K., Boeters, S., Chateau, J., Scrieciu, S., van Vliet, J., Masui, T., Blok, K., Blomen, E., Kram, T., 2009. Comparison of top-down and
LIMITS – LOW CLIMATE IMPACT SCENARIOS AND THE IMPLICATION OF
REQUIRED TIGHT EMISSION CONTROL STRATEGIES PROJECT NO 282846
DELIVERABLE NO.D3.1
32
bottom-up estimates of sectoral and regional greenhouse gas emission reduction potentials. Energy Policy 37, 5125–5139.
Van Vuuren, D.P., Kok, M.T.J., Girod, B., Lucas, P.L., de Vries, B., 2012. Scenarios in Global Environmental Assessments: Key characteristics and lessons for future use. Global Environmental Change 22, 884–895.
Van Vuuren, D.P., Lowe, J., Stehfest, E., Gohar, L., Hof, A.F., Hope, C., Warren, R., Meinshausen, M., Plattner, G.-K., 2009. How well do integrated assessment models simulate climate change? Climatic Change 104, 255–285.
Van Vuuren, D.P., Riahi, K., 2010. The relationship between short-term emissions and long-term concentration targets. Climatic Change 104, 793–801.
Van Vuuren, D.P., Stehfest, E., 2013. If climate action becomes urgent: the importance of response times for various climate strategies. Climatic Change.
Wise, M., Calvin, K., Thomson, A., Clarke, L., Bond-Lamberty, B., Sands, R., Smith, S.J., Janetos, A., Edmonds, J., 2009. Implications of limiting CO2 concentrations for land use and energy. Science (New York, N.Y.) 324, 1183–6.
Yang, L., Mingqi, P., Deetman, S., Hof, A., 2011. Country report on mitigation and adaptation policies in China.
Zhang, M., Mu, H., Ning, Y., 2009. Accounting for energy-related CO2 emission in China, 1991–2006. Energy Policy 37, 767–773.
Zwaan, B.C.C. Van Der, Rösler, H., Kober, T., Aboumahboub, T., Calvin, K. V, 2013. A Cross-model Comparison of Global Long-term Technology Diffusion under a 2 ˚ C Climate Change Control Target. Climate Change Economics 1–17.

LIMITS – LOW CLIMATE IMPACT SCENARIOS AND THE IMPLICATION OF
REQUIRED TIGHT EMISSION CONTROL STRATEGIES PROJECT NO 282846
DELIVERABLE NO.D3.1
33
Annex 2: Possible energy futures for Brazil and the rest of Latin America in conservative and stringent mitigation
pathways up to 2050
Sara Herreras Martíneza, Alexandre Koberleb,d, Pedro Rochedob, Roberto Schaefferb, Andre Lucenab, Alexandre Szklob, Suishi Ashinac, Detlef P. van Vuurena,d
a Copernicus Institute of Sustainable Development, Utrecht University, Heidelberglaan 2, NL-3584 CS Utrecht, The Netherlands
b COPPE, Universidade Federal do Rio de Janeiro, Centro de Tecnologia, Bloco C, Sala 211,Cidade Universitária, Ilha do Fundão, 21941-972 Rio de Janeiro, RJ, Brazil
c National Institute for Environmental Studies, Onogawa 16-2, Tsukuba, Ibaraki 305-8506, Japan
d PBL Netherlands Environment Assessment Agency, PO Box 303, 3720 BA Bilthoven, The Netherlands

LIMITS – LOW CLIMATE IMPACT SCENARIOS AND THE IMPLICATION OF
REQUIRED TIGHT EMISSION CONTROL STRATEGIES PROJECT NO 282846
DELIVERABLE NO.D3.1
34
Contents Executive summary ................................................................................................................... 35
1 Introduction ...................................................................................................................... 36
2 Methodology ..................................................................................................................... 37
2.1 Models description ........................................................................................ 37 2.2 Model scenarios and assumptions ................................................................. 38
2.2.1 Population and income assumptions ....................................................................................... 40
3 Results .............................................................................................................................. 42
3.1 Emissions ...................................................................................................... 42 3.1.1 CO2 emissions .......................................................................................................................... 42 3.1.2 Non-CO2 emissions .................................................................................................................. 45 3.1.3 Comparison of emissions scenarios with similar studies ......................................................... 47
3.2 Underlying trends in energy use and production .......................................... 49 3.2.1 Energy use and production trends in Brazil ............................................................................ 49 3.2.2 Energy use and production trends in RLAM ............................................................................ 51
3.3 Power sector .................................................................................................. 54 3.3.1 Power-related emissions and electricity generation ................................................................ 54 3.3.2 Power sector capacity ............................................................................................................. 55
4 Discussion ........................................................................................................................ 57
4.1 Limitation of modelling studies .................................................................... 57 4.2 Putting the main outcomes into perspective: Challenges and policy implications ............................................................................................................ 58
4.2.1 Climate policies in Brazil in relation to the models’ outcomes ............................................... 59
5 Conclusions ...................................................................................................................... 61
6 References ........................................................................................................................ 63
LIMITS – LOW CLIMATE IMPACT SCENARIOS AND THE IMPLICATION OF
REQUIRED TIGHT EMISSION CONTROL STRATEGIES PROJECT NO 282846
DELIVERABLE NO.D3.1
35
Executive summary
Latin America has a unique position to address climate change impacts due to its many mitigation opportunities and its growing economy. This study applied two global and one regional integrated assessment models to assess the energy and emissions trends in Brazil and the rest of the Latin American region up to 2050 based on a set of scenarios consistent with current trends and with the 2°C global mitigation target. The models show that to achieve this target, deep CO2 emission reductions are needed. The power sector offers the greatest mitigation opportunities. The implementation of CCS, in combination with fossil fuels and bioenergy, and hydro, biomass and wind energy are identified in this study as the most promising low-carbon options for the region. The realistic implementation of these options will depend, however, on their capability to overcome the present technical, economic, environmental and social challenges. Besides, an appropriate policy framework to stimulate the transformation of the energy system is also important. Brazil is the first country in Latin America to adopt a national voluntary mitigation goal by law. However, the assessment of the effectiveness of this goal up to now becomes difficult due to the vague targets established.
LIMITS – LOW CLIMATE IMPACT SCENARIOS AND THE IMPLICATION OF
REQUIRED TIGHT EMISSION CONTROL STRATEGIES PROJECT NO 282846
DELIVERABLE NO.D3.1
36
1 Introduction
The global energy system faces several key challenges, related to securing sufficient supply to support economic development, limiting energy security issues and mitigating the environmental impacts. Climate change represents a crucial challenge in this context: in order to limit global warming to less than 2°C compared to pre-industrial levels (consistent with the Cancun Agreements), greenhouse gas emissions associated with energy use need to be reduced all around the world. To understand global response strategies better, it is important to look at regional trends. While several studies have looked at trends in Asian regions (Ahlgren et al., 2013; Calvin et al., 2012; Lucas et al., 2013; van Ruijven et al., 2012), much less studies have looked at trends in the Latin American (LAM) region. LAM is on the one hand vulnerable to climate change, given the key role of natural systems (IPCC, 2014a; Schaeffer et al., 2013) but it also has a unique position in addressing the issue. Many countries in the region may profit in their response strategies from the abundance of natural resources and their position as growing economies. With this in mind, several countries have elaborated low-carbon plans: e.g. Brazil, Colombia, Mexico, Bolivia, Chile, Costa Rica, and Peru. Brazil, in particular, has an important position in mitigation initiatives worldwide, launching comprehensive programs such as the National Plan on Climate Change (Ministry of Environment Brazil, 2007).
In 2010 the LAM region accounted for about 11% of global greenhouse gases (GHG) emissions (Vergara, Rios et al., 2013). Interestingly, the 2010 emissions were about 11% below 2000 emissions, largely caused by a decline in land-use (LU) related emissions. The latest IPCC report showed the LAM region among those with the highest abatement potential across different scenarios (IPCC, 2014b). The great mitigation potential of the region is attracting interest among the international community to explore low-carbon development opportunities further (de la Torre et al., 2009; IADB, 2013; IEA, 2013; Vergara et al., 2013). However, only a limited amount of studies have assessed and quantified the implications of high and low mitigation commitments in the long-term in the LAM region, in general, or in Brazil in particular, often using very different assumptions (Borba et al., 2012; IEA, 2013; IPCC, 2007a; La Rovere et al., 2013; Nogueira et al., 2014; Vergara et al., 2013).
This study aims to address the current lack of scenario analysis by looking into a set of long-term pathways developed by three different integrated assessment models (IAM) for Brazil and the rest of LAM region (henceforth referred as RLAM). The use of multiple models allows a better assessment of the uncertainties involved. The scenarios explore the potential development of the energy sector and its emissions with and without stringent climate policy. Using these scenarios, this study addresses the following questions:
(1) How does the future for the energy system and CO2 emissions look like in Brazil and the RLAM in these scenarios?
(2) What are the key challenges to implement the required mitigation strategies in LAM, according to the models?
(3) How do the identified mitigation pathways, according to the models, compare to current policies in Brazil?

LIMITS – LOW CLIMATE IMPACT SCENARIOS AND THE IMPLICATION OF
REQUIRED TIGHT EMISSION CONTROL STRATEGIES PROJECT NO 282846
DELIVERABLE NO.D3.1
37
This article is structured as follows. Section 2 describes the methodology and the input data used. Section 3 presents the results for a variety of variables from the models utilized in the analysis. Section 4 discusses the outcomes and how the main findings relate to the challenges faced by the region as well as to the climate policy context in Brazil. Finally, Section 5 presents the conclusions.
2 Methodology
2.1 Models description This study describes the results of two global IAM (IMAGE and AIM-Enduse) and one regional IAM (MESSAGE-Brazil) to assess possible emissions pathways up to 2050 in Brazil and the RLAM (including the Caribbean and Mexico). Comparing the global projections with national insight provides a better understanding of the implications of climate change and energy responses at more refined scales, improving the quality of projections. The scenarios describe developments consistent with current policies and the 2°C target.
The Integrated Model to Assess the Global Environment framework (IMAGE 2.4) (Bouwman et al., 2006), developed by the Netherlands Environmental Assessment Agency, consists of a set of linked and integrated models that describe fundamental elements in the long-term dynamics of global environmental change, such as air pollution, land-use change and climate change. The main components are the global energy model TIMER 2.0 (Bouwman et al., 2006), the land use and the land cover submodel and the climate policy model FAIR-SiMCaP (Den Elzen & Lucas, 2005). The energy model TIMER describes the demand and supply of 12 different energy carriers for 26 world regions. The IMAGE land-cover submodels simulate the change in land use and land cover driven by demands for food, timber and biofuels and changes in climate. The FAIR module distributes the global emissions reduction across the different regions, gases and sources in a cost-optimal manner by using information on marginal abatement costs. The SiMCaP pathfinder module uses an iterative procedure to find multi-gas emissions paths that correspond to a pre-defined climate target (Van Vuuren et al., 2007).
The AIM-Enduse model (Asia-Pacific Integrated Model) is an inter-temporal dynamic optimization, techno-economic model for mid-to long-term climate policy assessment. The world is divided into 32 regions over a time horizon up to 2050 and covers both the energy and non-energy sectors (e.g. agriculture, waste, and fluorinated gases) (Kainuma et al., 2003; Kainuma et al., 2013). It simulates flows of energy and materials in an economy, from supply of primary energy and materials, through conversion and supply of secondary energy and materials, to satisfaction of end-use services. AIM-Enduse models these flows of energy and materials through detailed representation of technologies. Consequent emissions are modelled elaborately. Selection of technologies takes place in a linear optimization framework where system cost is minimized based on the exogenously given energy price under several constraints like satisfaction of service demands, availability of energy and material supplies, and limiting GHG emissions to a specific level.
MESSAGE is a perfect-foresight, mixed integer linear optimization model developed by the International Institute for Applied Systems Analysis (IIASA) and the International Atomic Energy Agency (IAEA) to evaluate alternative energy supply options under economic, environmental or technical constraints, among others. MESSAGE-Brazil (MSG-BR) is a regional variation of the global MESSAGE model developed by the Centre for Energy and Environmental Economics
LIMITS – LOW CLIMATE IMPACT SCENARIOS AND THE IMPLICATION OF
REQUIRED TIGHT EMISSION CONTROL STRATEGIES PROJECT NO 282846
DELIVERABLE NO.D3.1
38
(CENERGIA) of COPPE/UFRJ in Brazil. The Brazilian regional model has been adapted to the Brazilian case with global input variables (e.g. population, GDP, land use, trade) set exogenously; and the country divided into three regions. The current version of MSG-BR was initially developed as part of a study of the IAEA (IAEA, 2006). Since then, it has been constantly improved to model the Brazilian energy system’s adaptation to possible long-term climate change scenarios (de Lucena et al., 2010) and the integration of wind or solar options (Malagueta et al., 2013) into the country’s electric power grid. The most recent version includes: fossil fuel power plants with carbon capture and storage (coal and natural gas); improvements to Brazil´s petroleum refinery infrastructure that allow partial flexibility in the runs to naphtha or distillates; an expansion of the advanced liquid biofuels module. The new version also improves the petroleum supply to account for the development of the so-called pre-salt resources in Brazil (Saraiva et al., 2014). For a more complete description of MSG-BR see (Nogueira et al., 2014).
Table 5 presents an overview of the main features of the three models used in the study.
Table 5: Main characteristics of the three models used
Model Scale Type Time horizon
IMAGE Global Energy system and land-use partial equilibrium model
Up to 2100
AIM-Enduse Global Techno-economic model Up to 2050
MESSAGE-Brazil Regional Hybrid energy system – economic growth model
Up to 2050
AIM and IMAGE describe both the energy and land-use system while MSG-BR only describes the energy system. In this study, we focus mostly on the energy system to include as much as possible all models during the comparison and because LU scenarios are still less robust and need to be further developed before they can be compared with a similar rigour at the regional scale.
2.2 Model scenarios and assumptions The scenarios used in this study were developed in the LIMITS project (Low Climate Impact Scenarios and the Implications of Required Tight Emission Control Strategies)2,3. They describe three possible developments: 1) baseline assumptions, 2) an extension of current policies, and 3) consistent with the 2oC target (Table 6).
2 LIMITS is a model intercomparison study part of the European Union Seventh Framework Programme FP7/2007-2013. 3 Some updates were made to the scenarios for the IMAGE and AIM model results. In IMAGE, an update was implemented to better reflect the current hydropower capacity in Brazil. The changes in hydropower capacity indirectly influenced other parts of the energy system results. In AIM, corrections were introduced to the capacity factor of solar power technologies.
LIMITS – LOW CLIMATE IMPACT SCENARIOS AND THE IMPLICATION OF
REQUIRED TIGHT EMISSION CONTROL STRATEGIES PROJECT NO 282846
DELIVERABLE NO.D3.1
39
The baseline scenario addresses the energy and emissions developments in the absence of climate policies. The baseline scenario is a counterfeit scenario, unlikely to happen, but it is used here to analyse the consequences of inaction and the net effect of climate policies. This scenario has been used by the IMAGE and AIM models. MSG-BR did not develop a no-policy baseline scenario. The second scenario is a reference-policy scenario (RefPol) reflecting a business-as-usual (BaU) trajectory. In the case of AIM and IMAGE the scenario includes current Copenhagen policies and regulations implemented in those regions where they exist, and in MSG-BR, National Appropriate Mitigation Actions (NAMAs) are covered. This scenario is a more representative scenario of the current situation than the baseline scenario. Finally, the last scenario studied (450) is a deep mitigation scenario that sets out an energy pathway consistent with limiting the increase in global GHG concentration to 450 ppm CO2-eq. This scenario is consistent with a 70% chance of meeting the goal of limiting global warming to 2°C (IPCC, 2014b). The three possible developments have been evaluated in this study for the period 2010 to 2050.
Table 6: Brief description of the three scenarios used in this study
Scenario name
Description
Baseline Scenario with no climate policies (only AIM/IMAGE).
RefPol (or BaU)
The scenario reflects developments assuming a continuation of current climate policies. In AIM and IMAGE, this scenario includes the Copenhagen pledges and other expressed policies of individual countries for 2020, which are extended assuming similar efforts after 2020 to 2050. In MSG-BR, this scenario includes all the NAMAs for the energy sector defined in the 2019 Decennial Energy plan of the country (Ministry of Mines and Energy Brazil, 2010).
450
This scenario reflects development consistent with a 450 ppm CO2-eq target. IMAGE and AIM implement this scenario by assuming a global carbon price. In MSG-BR, instead, a cumulative emissions cap was applied for Brazil in the 2010-2050 period based on the resulted emissions of the IMAGE global 450 scenario.
The policies that are included in IMAGE and AIM in the RefPol scenario for Brazil and LAM are regional 2020 targets on emissions reductions, renewable portfolio standards and capacity targets (Table 7). Up to 2020 the scenario reflects moderate policy context, and because of this a conservative estimate of the Copenhagen targets has been considered. For example, in the Copenhagen Accord, Brazil promised to reduce 2020 emissions by 36.1–38.9% compared to BaU levels. For the country, it was assumed that it would actually implement about 50% of the pledge (18%). The same approach was used for Mexico. Due to the lack of data for quantitative mitigation targets in the other Latin American countries, the climate targets for Mexico and Brazil were taken as a proxy for the RLAM and a 15% emission reduction was assumed for this region. The targets included in the RefPol scenario of MSG-BR were based on the NAMAs stated in the 2019 Decennial Energy Plan of Brazil wherever possible. In the Plan, emissions reductions ranges are
LIMITS – LOW CLIMATE IMPACT SCENARIOS AND THE IMPLICATION OF
REQUIRED TIGHT EMISSION CONTROL STRATEGIES PROJECT NO 282846
DELIVERABLE NO.D3.1
40
not defined for each sector, but the specific measures to achieve those targets are forced into the model regardless of a baseline. Therefore, energy reduction targets were implemented by reproducing the electricity generation mix, biofuel production/consumption and energy efficiency measures of the 2019 Decennial Energy Plan.
For the 450 ppm scenario, both the AIM and IMAGE models applied a global carbon tax in order to reach the final concentration target. As a result, low costs emission reduction measures in both models were implemented. The MSG-BR model used the regional emissions cap of the IMAGE 450 model for Brazil as a constraint.
Table 7: Copenhagen Accord pledges considered in the RefPol scenario in IMAGE and AIM
Region GHG emission reduction targets in 2020 (relative to baseline and including LULUCF)
Share of renewables in electricity production
Average GHG emissions intensity improvements after 2020 (%/year)a
Data source
Brazil 36.1% N/A 3.7% (Centre for Climate and Energy Solutions, 2011; GLOBE International, 2013)
Mexico 30.0% 35% by 2020 3.3%
(Centre for Climate and Energy Solutions, 2011; GLOBE International, 2013; Jotzo, 2011; UNEP, 2010)
a Measured as GHG emissions per GDP at 2005-market exchange rate
2.2.1 PopulationandincomeassumptionsBoth, IMAGE and AIM used population assumptions based on the United Nations population prospects (UN, 2009), in which the global population attains 9.2 billion by 2050. GDP assumptions were taken in both models from the reference scenario of the OECD Environmental Outlook (OECD, 2012). MSG-BR used population data from the Brazilian Institute of Geography and Statistics (IBGE, 2010) and GDP data from the World Energy Outlook (IEA, 2013). The population and GDP assumptions used by the three models are very similar (Figure 6). The differences are larger for the GDP in Brazil where the MSG-BR model shows more conservative growth rates (Table 8).

LIMITS – LOW CLIMATE IMPACT SCENARIOS AND THE IMPLICATION OF
REQUIRED TIGHT EMISSION CONTROL STRATEGIES PROJECT NO 282846
DELIVERABLE NO.D3.1
41
Figure 6: Total population (left panel) and GDP expressed in year-2005 dollars at market exchange rate (right panel)
Compared to historical annual growth rates, according to AIM and IMAGE projections, Brazil GDP growth is expected to increase in the medium-term, but to decrease the growth rate in the longer term (Table 8). For the RLAM, GDP growth slows down in the entire period of study. Annual population growth rate is anticipated to decline in the medium and long-term for both regions. Annual growth rates on GDP and population for RLAM, especially in the medium-term, are generally slightly higher than those projected for Brazil. The lower population growth in Brazil than in RLAM is a result of historical demographic trends in both regions. Though Brazil in the recent past had a more stable economy with robust monetary and fiscal policies, and relatively low inflation rates compared to the other countries of LAM, this situation is deteriorating as of 2014. On the other hand, Latin American countries such as Peru, Bolivia, Colombia and Chile are experiencing in the last years a much larger economic growth in their economies than Brazil, which explains the higher GDP growth projected in RLAM than in Brazil (World Bank, 2012).
Table 8: Assumptions on GDP and population growth (%) in the short and medium-term for the two studied regions. Historical growth rates are calculated based on population and GDP 2000 data taken from UN (UN, 2008) and Fresard (Fresard & Milena, 2001), respectively
GDP growth Population growth
Brazil RLAM Brazil RLAM
2000-2010
2010-2025
2025-2050
2000-2010
2010-2025
2025-2050
2000-2010
2010-2025
2025-2050
2000-2010
2010-2025
2025-2050
AIM 3.9 4.4 3.7 6.5 4.7 3.5 1.4 0.7 0.1 1.3 1.1 0.5
IMAGE 3.9 4.3 3.9 6.0 4.4 4.0 1.4 0.6 0.1 1.2 1.0 0.5
MSG-BR 3.9 3.4 3.1
1.4 0.6 0.1
LIMITS – LOW CLIMATE IMPACT SCENARIOS AND THE IMPLICATION OF
REQUIRED TIGHT EMISSION CONTROL STRATEGIES PROJECT NO 282846
DELIVERABLE NO.D3.1
42
3 Results
3.1 Emissions
3.1.1 CO2emissionsCurrently, most of the region’s emissions are concentrated in six countries: i.e. Brazil, Mexico, Argentina, Colombia, Peru, Bolivia and Venezuela (de la Torre et al., 2009). Figure 7 shows the projected total carbon dioxide (CO2) emissions from the energy/industry sectors. CO2 emissions are expected to increase over time under the baseline and the RefPol scenario, especially in AIM projections where emission levels in 2050 reach the highest values, 1.7 GtCO2 in Brazil and 3.4 GtCO2 in the RLAM (Figure 7). The models project as slightly higher growth rate for Brazil than for the RLAM.
When stringent policies are implemented, IMAGE and MSG-BR project a clear reduction over time compared to 2010 (approximately 1% to 2% annual reduction). In contrast, AIM shows an initial decline followed by a small increase after 2040. This increase comes from the allocation of mitigation efforts around the world regions based on marginal costs. In the AIM model most mitigation actions in LAM will be taken before 2040, where emission reductions are more economically feasible than in other regions. However, from this year onwards, no further mitigation is needed in the region to meet the global 450 ppm target, causing a growth in local emissions. The emission increase projected in AIM after 2040 is also caused by a rapid decline in LU emissions in the region that reduces the need for the energy sector to decrease its emissions (total emissions from energy and land use continues to drop in AIM). Overall, CO2 emissions in Brazil in 2050 in the low-carbon scenario are reduced by 55% (AIM), 71% (IMAGE) and 87% (MSG-BR) compared to the values of the RefPol scenario. The lower CO2 emission reduction for the energy sector in AIM than in the other models is also observed in the RLAM, with a reduction of 74% (IMAGE) and 39% (AIM) in 2050 compared to the RefPol emissions. These differences between IMAGE and MSG-BR compared to AIM are a consequence of a more prominent role of bioenergy combined with Carbon Capture and Storage (BECCS) and, in the case of the IMAGE model, additional energy intensity improvements. Although models show different levels of emissions reduction for the LAM region, they all agree that the emission reductions needed to stay below the 2°C target are much larger than those in the commitments made under the Copenhagen agreement.

LIMITS – LOW CLIMATE IMPACT SCENARIOS AND THE IMPLICATION OF
REQUIRED TIGHT EMISSION CONTROL STRATEGIES PROJECT NO 282846
DELIVERABLE NO.D3.1
43
Figure 7: Total CO2 emissions excluding land-use emissions for Brazil (left panel) and the rest of Latin America (right panel) for the three scenarios
Table 9 summarizes some of the key characteristics of the emission trends for the RefPol and the 450 scenario. In the stringent policy scenario, emissions per capita decrease considerably compared to the current policies scenario dropping to an average of 2 tCO2/cap in LAM. In both regions under the RefPol pathway CO2 emissions peak around 2050, while under the stringent mitigation scenarios such a peak is already reached as early in 2020 (IMAGE/MSG-BR). Annual emission reduction rates in the two regions are around 2% in the 450 scenario.
Table 9: Overview table of the bandwidth of the models’ outcomes for the RefPol and 450 scenario for Brazil and the rest of Latin America. CO2 emissions do not include land-use related emissions
Variable Scenario Unit Brazil RLAM
Band width Band width
Total CO2 emissions in 2050 450 Mtonne CO2 (212-733) (527-1572)
RefPol Mtonne CO2 (960-1633) (2047-2563)
Per capita CO2 emissions in 2050 450 tCO2/cap (1.0-3.3) (1.0-3.0)
RefPol tCO2/cap (4.4-7.4) (4.0-4.9)
CO2 annual reduction rate 2010-2050
450 % (-1.9-1.3) (-1.9-0.7)
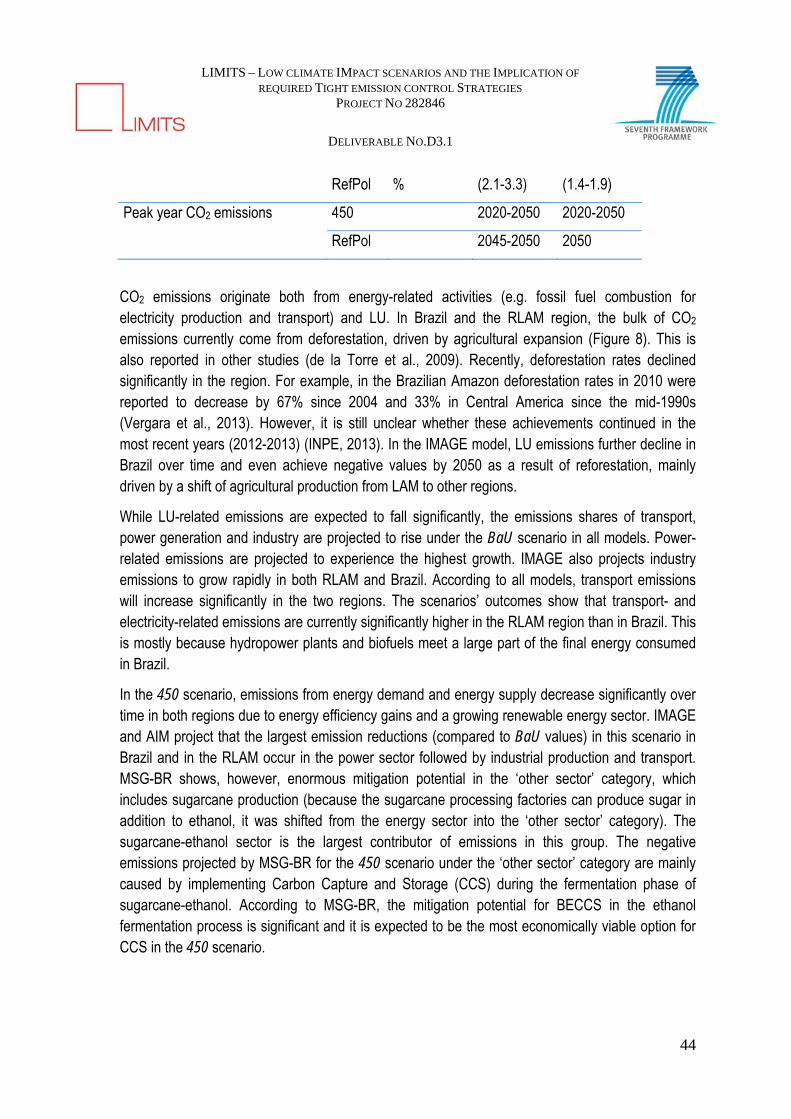
LIMITS – LOW CLIMATE IMPACT SCENARIOS AND THE IMPLICATION OF
REQUIRED TIGHT EMISSION CONTROL STRATEGIES PROJECT NO 282846
DELIVERABLE NO.D3.1
44
RefPol % (2.1-3.3) (1.4-1.9)
Peak year CO2 emissions 450 2020-2050 2020-2050
RefPol 2045-2050 2050
CO2 emissions originate both from energy-related activities (e.g. fossil fuel combustion for electricity production and transport) and LU. In Brazil and the RLAM region, the bulk of CO2 emissions currently come from deforestation, driven by agricultural expansion (Figure 8). This is also reported in other studies (de la Torre et al., 2009). Recently, deforestation rates declined significantly in the region. For example, in the Brazilian Amazon deforestation rates in 2010 were reported to decrease by 67% since 2004 and 33% in Central America since the mid-1990s (Vergara et al., 2013). However, it is still unclear whether these achievements continued in the most recent years (2012-2013) (INPE, 2013). In the IMAGE model, LU emissions further decline in Brazil over time and even achieve negative values by 2050 as a result of reforestation, mainly driven by a shift of agricultural production from LAM to other regions.
While LU-related emissions are expected to fall significantly, the emissions shares of transport, power generation and industry are projected to rise under the BaU scenario in all models. Power-related emissions are projected to experience the highest growth. IMAGE also projects industry emissions to grow rapidly in both RLAM and Brazil. According to all models, transport emissions will increase significantly in the two regions. The scenarios’ outcomes show that transport- and electricity-related emissions are currently significantly higher in the RLAM region than in Brazil. This is mostly because hydropower plants and biofuels meet a large part of the final energy consumed in Brazil.
In the 450 scenario, emissions from energy demand and energy supply decrease significantly over time in both regions due to energy efficiency gains and a growing renewable energy sector. IMAGE and AIM project that the largest emission reductions (compared to BaU values) in this scenario in Brazil and in the RLAM occur in the power sector followed by industrial production and transport. MSG-BR shows, however, enormous mitigation potential in the ‘other sector’ category, which includes sugarcane production (because the sugarcane processing factories can produce sugar in addition to ethanol, it was shifted from the energy sector into the ‘other sector’ category). The sugarcane-ethanol sector is the largest contributor of emissions in this group. The negative emissions projected by MSG-BR for the 450 scenario under the ‘other sector’ category are mainly caused by implementing Carbon Capture and Storage (CCS) during the fermentation phase of sugarcane-ethanol. According to MSG-BR, the mitigation potential for BECCS in the ethanol fermentation process is significant and it is expected to be the most economically viable option for CCS in the 450 scenario.
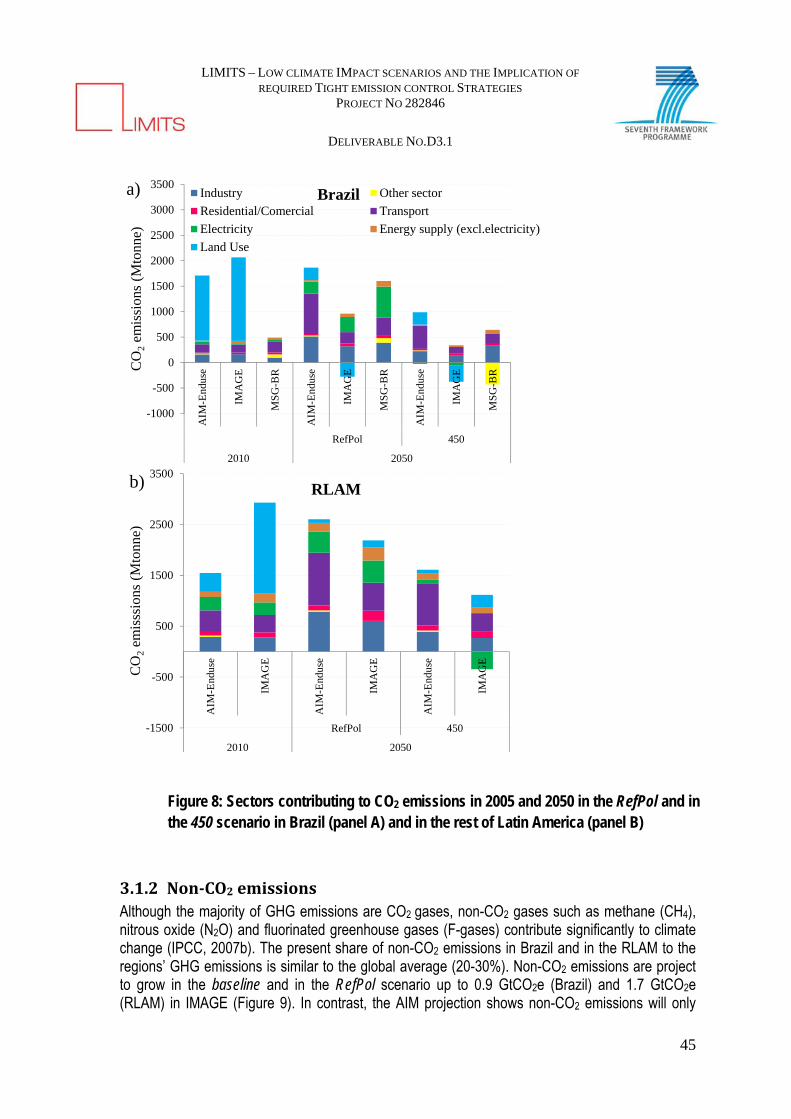
LIMITS – LOW CLIMATE IMPACT SCENARIOS AND THE IMPLICATION OF
REQUIRED TIGHT EMISSION CONTROL STRATEGIES PROJECT NO 282846
DELIVERABLE NO.D3.1
45
-1000
-500
0
500
1000
1500
2000
2500
3000
3500
AIM
-End
use
IMA
GE
MS
G-B
R
AIM
-End
use
IMA
GE
MS
G-B
R
AIM
-End
use
IMA
GE
MS
G-B
R
RefPol 450
2010 2050
CO
2em
issi
ons
(Mto
nne)
BrazilIndustry Other sector
Residential/Comercial Transport
Electricity Energy supply (excl.electricity)
Land Use
-1500
-500
500
1500
2500
3500
AIM
-End
use
IMA
GE
AIM
-End
use
IMA
GE
AIM
-End
use
IMA
GE
RefPol 450
2010 2050
CO
2em
isss
ions
(M
tonn
e)
RLAM
a)
b)
Figure 8: Sectors contributing to CO2 emissions in 2005 and 2050 in the RefPol and in the 450 scenario in Brazil (panel A) and in the rest of Latin America (panel B)
3.1.2 Non‐CO2emissionsAlthough the majority of GHG emissions are CO2 gases, non-CO2 gases such as methane (CH4), nitrous oxide (N2O) and fluorinated greenhouse gases (F-gases) contribute significantly to climate change (IPCC, 2007b). The present share of non-CO2 emissions in Brazil and in the RLAM to the regions’ GHG emissions is similar to the global average (20-30%). Non-CO2 emissions are project to grow in the baseline and in the RefPol scenario up to 0.9 GtCO2e (Brazil) and 1.7 GtCO2e (RLAM) in IMAGE (Figure 9). In contrast, the AIM projection shows non-CO2 emissions will only
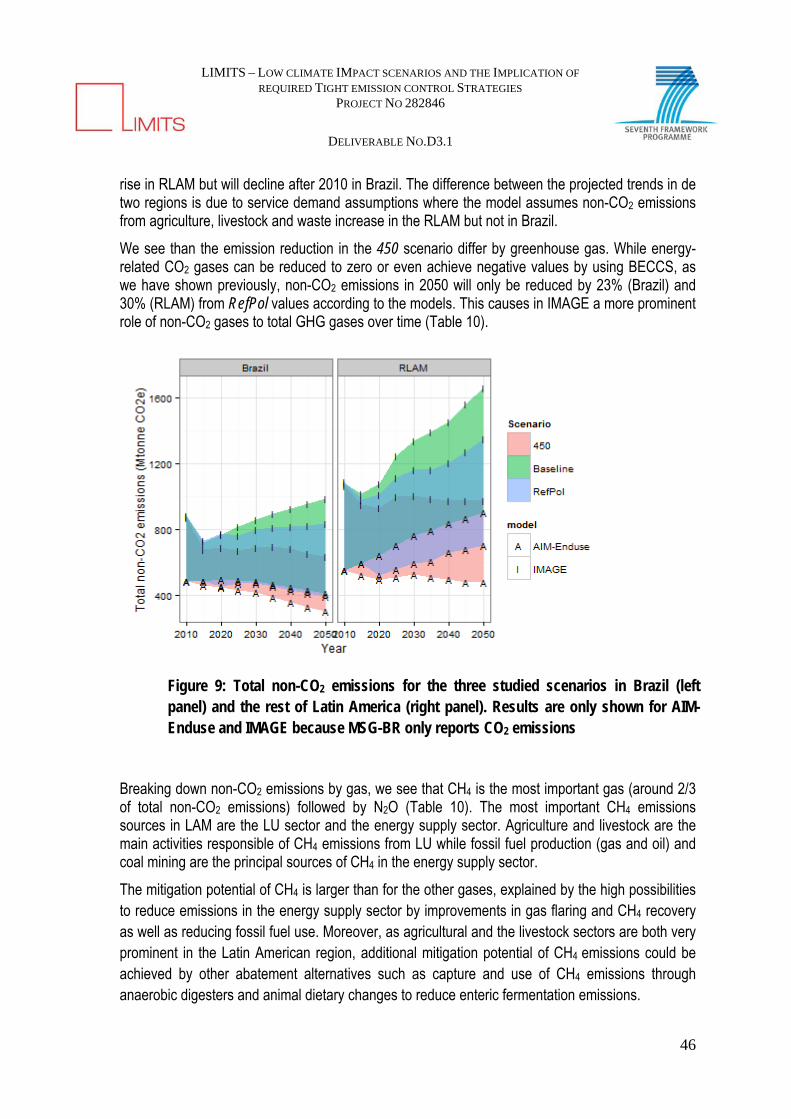
LIMITS – LOW CLIMATE IMPACT SCENARIOS AND THE IMPLICATION OF
REQUIRED TIGHT EMISSION CONTROL STRATEGIES PROJECT NO 282846
DELIVERABLE NO.D3.1
46
rise in RLAM but will decline after 2010 in Brazil. The difference between the projected trends in de two regions is due to service demand assumptions where the model assumes non-CO2 emissions from agriculture, livestock and waste increase in the RLAM but not in Brazil.
We see than the emission reduction in the 450 scenario differ by greenhouse gas. While energy-related CO2 gases can be reduced to zero or even achieve negative values by using BECCS, as we have shown previously, non-CO2 emissions in 2050 will only be reduced by 23% (Brazil) and 30% (RLAM) from RefPol values according to the models. This causes in IMAGE a more prominent role of non-CO2 gases to total GHG gases over time (Table 10).
Figure 9: Total non-CO2 emissions for the three studied scenarios in Brazil (left panel) and the rest of Latin America (right panel). Results are only shown for AIM-Enduse and IMAGE because MSG-BR only reports CO2 emissions
Breaking down non-CO2 emissions by gas, we see that CH4 is the most important gas (around 2/3 of total non-CO2 emissions) followed by N2O (Table 10). The most important CH4 emissions sources in LAM are the LU sector and the energy supply sector. Agriculture and livestock are the main activities responsible of CH4 emissions from LU while fossil fuel production (gas and oil) and coal mining are the principal sources of CH4 in the energy supply sector.
The mitigation potential of CH4 is larger than for the other gases, explained by the high possibilities to reduce emissions in the energy supply sector by improvements in gas flaring and CH4 recovery as well as reducing fossil fuel use. Moreover, as agricultural and the livestock sectors are both very prominent in the Latin American region, additional mitigation potential of CH4 emissions could be achieved by other abatement alternatives such as capture and use of CH4 emissions through anaerobic digesters and animal dietary changes to reduce enteric fermentation emissions.
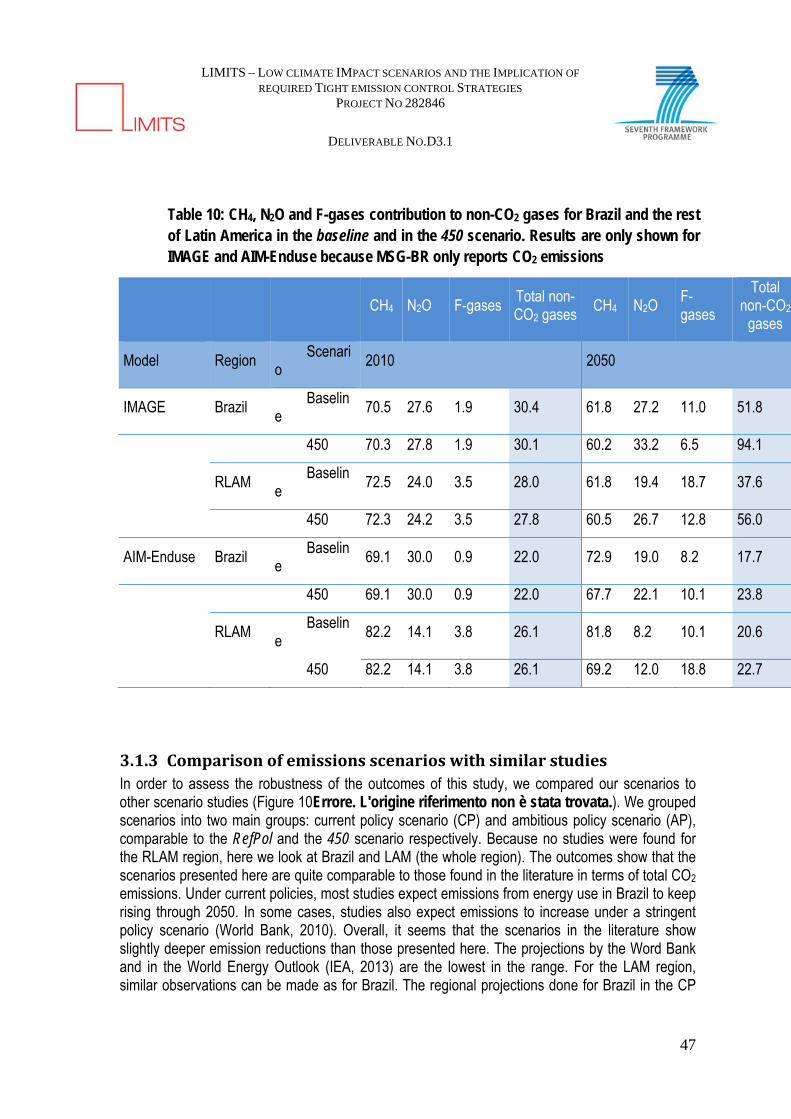
LIMITS – LOW CLIMATE IMPACT SCENARIOS AND THE IMPLICATION OF
REQUIRED TIGHT EMISSION CONTROL STRATEGIES PROJECT NO 282846
DELIVERABLE NO.D3.1
47
Table 10: CH4, N2O and F-gases contribution to non-CO2 gases for Brazil and the rest of Latin America in the baseline and in the 450 scenario. Results are only shown for IMAGE and AIM-Enduse because MSG-BR only reports CO2 emissions
CH4 N2O F-gases
Total non-CO2 gases
CH4 N2O F-gases
Total non-CO2
gases
Model Region Scenario
2010 2050
IMAGE Brazil Baseline
70.5 27.6 1.9 30.4 61.8 27.2 11.0 51.8
450 70.3 27.8 1.9 30.1 60.2 33.2 6.5 94.1
RLAM
Baseline
72.5 24.0 3.5 28.0 61.8 19.4 18.7 37.6
450 72.3 24.2 3.5 27.8 60.5 26.7 12.8 56.0
AIM-Enduse Brazil Baseline
69.1 30.0 0.9 22.0 72.9 19.0 8.2 17.7
450 69.1 30.0 0.9 22.0 67.7 22.1 10.1 23.8
RLAM
Baseline
82.2 14.1 3.8 26.1 81.8 8.2 10.1 20.6
450 82.2 14.1 3.8 26.1 69.2 12.0 18.8 22.7
3.1.3 ComparisonofemissionsscenarioswithsimilarstudiesIn order to assess the robustness of the outcomes of this study, we compared our scenarios to other scenario studies (Figure 10Errore. L'origine riferimento non è stata trovata.). We grouped scenarios into two main groups: current policy scenario (CP) and ambitious policy scenario (AP), comparable to the RefPol and the 450 scenario respectively. Because no studies were found for the RLAM region, here we look at Brazil and LAM (the whole region). The outcomes show that the scenarios presented here are quite comparable to those found in the literature in terms of total CO2
emissions. Under current policies, most studies expect emissions from energy use in Brazil to keep rising through 2050. In some cases, studies also expect emissions to increase under a stringent policy scenario (World Bank, 2010). Overall, it seems that the scenarios in the literature show slightly deeper emission reductions than those presented here. The projections by the Word Bank and in the World Energy Outlook (IEA, 2013) are the lowest in the range. For the LAM region, similar observations can be made as for Brazil. The regional projections done for Brazil in the CP

LIMITS – LOW CLIMATE IMPACT SCENARIOS AND THE IMPLICATION OF
REQUIRED TIGHT EMISSION CONTROL STRATEGIES PROJECT NO 282846
DELIVERABLE NO.D3.1
48
scenario by the World Bank include mainly the government´s own energy expansion plans (Ministry of Mines and Energy Brazil, 2012).
a)
b)
Figure 10: Comparison of projections of CO2 emissions from energy use in Brazil (panel A) and Latin America (panel B) between our models and other studies in the current policy scenario (CP) and the ambitious policy scenario (AP)

LIMITS – LOW CLIMATE IMPACT SCENARIOS AND THE IMPLICATION OF
REQUIRED TIGHT EMISSION CONTROL STRATEGIES PROJECT NO 282846
DELIVERABLE NO.D3.1
49
3.2 Underlying trends in energy use and production
3.2.1 EnergyuseandproductiontrendsinBrazilThe emission trends discussed in the previous section are directly related to underlying trends in energy production and consumption. Figure 11 (top figure, left half) shows that, in the RefPol scenario, the projections of primary energy consumption in Brazil are fairly consistent across models in the beginning of the studied period (2010 and 2030). Energy consumption increases from around 10 EJ/year in 2010 to 22-28 EJ/year in 2050. Both IMAGE and MSG-BR project oil use will fall over time with its share dropping from around 40% in 2010 to 23% (IMAGE) and to 27% (MSG-BR). Natural gas and coal are projected by both models to become important. AIM also projects natural gas to have a more prominent position but the share of coal and oil are kept rather constant over time. The models disagree on the contribution of biomass to the energy system in Brazil under the BaU development. AIM shows the contribution of biomass to considerably go down over time whereas in the other two models the share of bioenergy is sustained.
Looking at the 450 scenario, in contrast, we see that IMAGE and AIM project the levels of primary energy of Brazil to be reduced to the RefPol trajectory, especially after 2030 (Figure 11, below). Under this scenario, Brazil can save up to 3 EJ (AIM) and 6 EJ (IMAGE) by 2050 of primary energy, a drop between 10% to 28% of BaU levels. MSG-BR, however, shows a rapid increase in biomass energy, which rises total primary energy demand by 43% compared to BaU levels. This result is explained by a shift from coal- and gas- to woody biomass-power plants, which are less efficient (50%, 33% and 20% are the conversion efficiencies assumed for gas, coal and biomass power plants, respectively), leading to an increase in primary energy. In the mitigation scenario of MSG-BR, biomass competes with national and imported coal. Originally, biomass plants using advanced heat and power generation from bagasse, mostly replace domestic coal (that is of low grade and is therefore used inefficiently). Later in the scenario period, bioenergy replaces imported coal, which is more expensive but has larger efficiencies (closer to 40%).
Model differences play also a role on the different projected level of primary energy use in the 450 scenario. In IMAGE, energy efficiency gains are expected to be key on the reduction of energy consumption (Figure 11, below) while in AIM and MSG BR, energy efficiency is exogenously implemented and does not respond to any price induced effect. Besides differences, the three models show similar developments in the 450 scenario, in particular in the large reduction in fossil fuels use with respect to the RefPol scenario (Figure 11, below). The energy system begins to rely more on renewable sources as well as on options that include CCS. IMAGE and MSG-BR, for example, show by 2050, 58% and 71% share of renewable energy sources (hydro, wind, solar and biomass with and without CCS), respectively. AIM projects a lower share (46%). IMAGE and AIM project fossil fuel alternatives combined with CCS to contribute with approximately 7 to 9% to the total primary energy mix by 2050.The implementation period of CCS technology varies per model and per energy source. MSG-BR expects implementation of BECCS (for sugarcane-ethanol) to start around 2020 while IMAGE and AIM project BECCS’ take-off a bit later (2030-2050). All models show that fossil-fuel power plants CCS will be introduced from 2025 onwards.
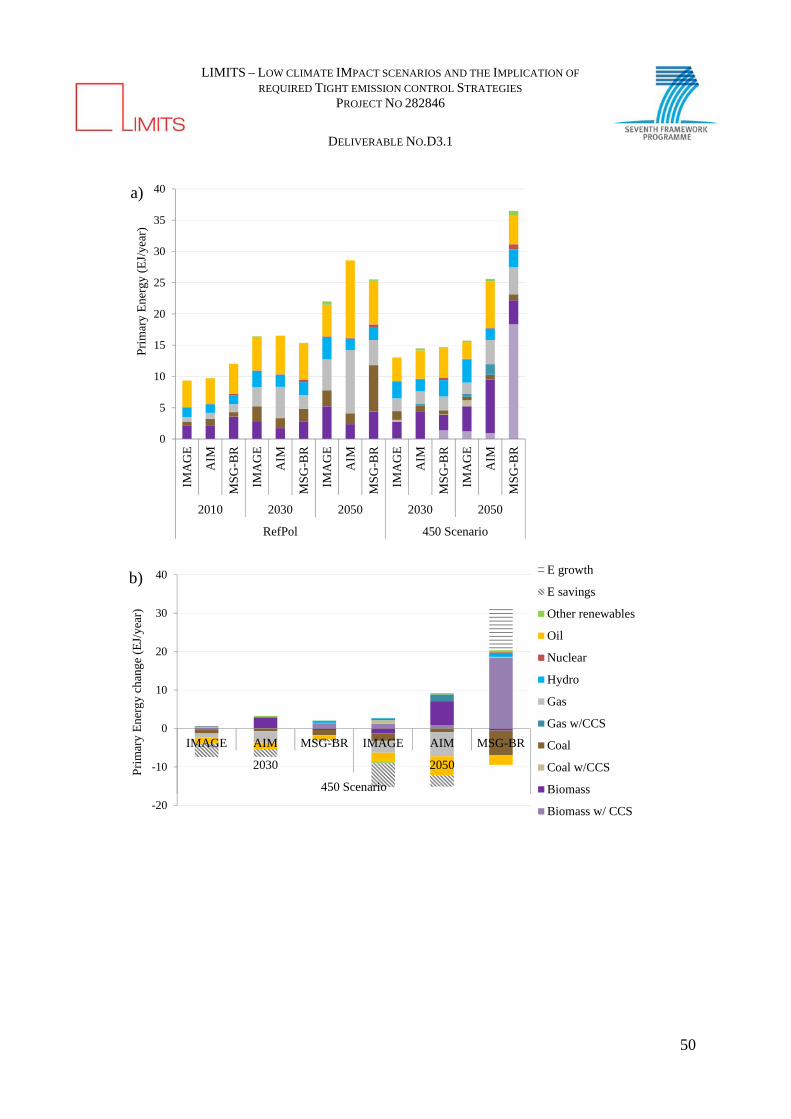
LIMITS – LOW CLIMATE IMPACT SCENARIOS AND THE IMPLICATION OF
REQUIRED TIGHT EMISSION CONTROL STRATEGIES PROJECT NO 282846
DELIVERABLE NO.D3.1
50
0
5
10
15
20
25
30
35
40IM
AG
E
AIM
MS
G-B
R
IMA
GE
AIM
MS
G-B
R
IMA
GE
AIM
MS
G-B
R
IMA
GE
AIM
MS
G-B
R
IMA
GE
AIM
MS
G-B
R2010 2030 2050 2030 2050
RefPol 450 Scenario
Pri
mar
y E
nerg
y (E
J/ye
ar)
-20
-10
0
10
20
30
40
IMAGE AIM MSG-BR IMAGE AIM MSG-BR
2030 2050
450 Scenario
Pri
mar
y E
nerg
y ch
ange
(E
J/ye
ar)
E growth
E savings
Other renewables
Oil
Nuclear
Hydro
Gas
Gas w/CCS
Coal
Coal w/CCS
Biomass
Biomass w/ CCS
a)
b)

LIMITS – LOW CLIMATE IMPACT SCENARIOS AND THE IMPLICATION OF
REQUIRED TIGHT EMISSION CONTROL STRATEGIES PROJECT NO 282846
DELIVERABLE NO.D3.1
51
Figure 11: Primary energy use in 2010, 2030 and 2050 in RefPol and 450 scenario (panel A) and primary energy change in 450 scenario from RefPol levels in 2030 and 2050 (panel B) in Brazil. Other renewables include solar, wind and geothermal energy. Energy savings are the net difference in the total energy demand
3.2.2 EnergyuseandproductiontrendsinRLAMIn Figure 12, we can see similar trends for the RLAM as for Brazil. Under the RefPol trajectory, AIM and IMAGE show similar developments, especially up to 2030. The demand of primary energy is expected to double in this region by 2050 from current levels. According to IMAGE, similar developments for energy demand will occur in the RLAM than in Brazil in the RefPol and in the 450 scenario (approximately 130% and 70% growth compared to current energy levels, respectively). AIM, however, reveals lower growth in energy use in RLAM (30% lower) than in Brazil in both scenarios because of the different GDP growths in the two regions.
Oil, gas and biomass will dominate the energy system of the RLAM in the RefPol scenario. As observed for Brazil, oil will also lose some importance in the RLAM region. At the end of the period, a growth of the share of biomass can be noted. IMAGE projects the share of renewables (excluding biomass) to increase faster in the RLAM than in Brazil in both studied scenarios, mainly due to the expected growth in wind energy.
In the 450 scenario, an increase in renewable energy, CCS and energy efficiency is expected to reduce emissions. The contribution of renewable energy (including biomass) by 2050 constitutes 30% to 40% of the total primary energy demand in the region. Options including CCS in combination with gas, biomass and coal will start being implemented in 2035 and will contribute with 29% (IMAGE) and 12% (AIM) of the primary energy consumption by 2050 (Figure 12). The potential for energy efficiency is assed to be larger in relative terms in RLAM than in Brazil. This is due to the lower energy-efficient system nowadays in most Latin American countries compared to Brazil, where continues efforts to implement energy-efficiency programs have been made in the last years (Carpio C., 2010; IEA, 2013).

LIMITS – LOW CLIMATE IMPACT SCENARIOS AND THE IMPLICATION OF
REQUIRED TIGHT EMISSION CONTROL STRATEGIES PROJECT NO 282846
DELIVERABLE NO.D3.1
52
0
10
20
30
40
50
60IM
AG
E
AIM
IMA
GE
AIM
IMA
GE
AIM
IMA
GE
AIM
IMA
GE
AIM
2010 2030 2050 2030 2050
RefPol 450 Scenario
Pri
mar
y E
nerg
y (E
J/ye
ar)
-40
-30
-20
-10
0
10
20
IMAGE AIM IMAGE AIM
2030 2050
450 Scenario
Prim
ary
Ene
rgy
chan
ge (
EJ/
year
)
E savings
Other renewables
Oil
Nuclear
Hydro
Gas
Gas w/CCS
Coal
Coal w/CCS
Biomass
Biomass w/ CCS
a)
b)
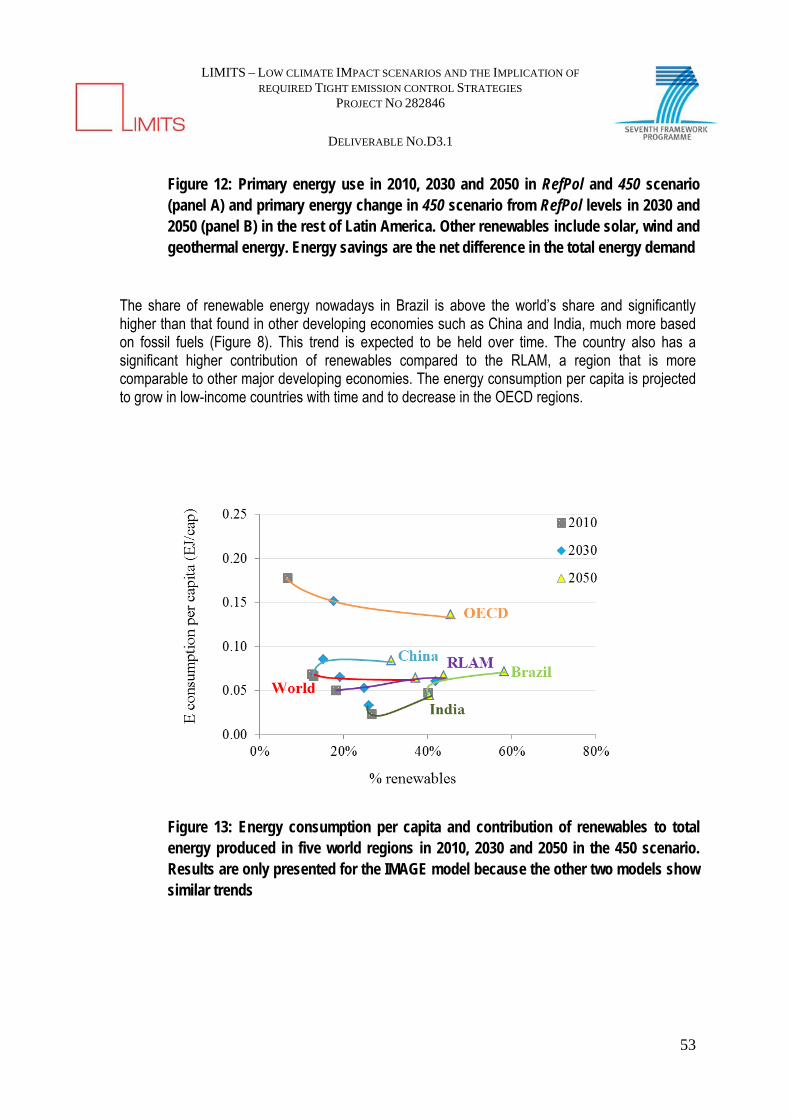
LIMITS – LOW CLIMATE IMPACT SCENARIOS AND THE IMPLICATION OF
REQUIRED TIGHT EMISSION CONTROL STRATEGIES PROJECT NO 282846
DELIVERABLE NO.D3.1
53
Figure 12: Primary energy use in 2010, 2030 and 2050 in RefPol and 450 scenario (panel A) and primary energy change in 450 scenario from RefPol levels in 2030 and 2050 (panel B) in the rest of Latin America. Other renewables include solar, wind and geothermal energy. Energy savings are the net difference in the total energy demand
The share of renewable energy nowadays in Brazil is above the world’s share and significantly higher than that found in other developing economies such as China and India, much more based on fossil fuels (Figure 8). This trend is expected to be held over time. The country also has a significant higher contribution of renewables compared to the RLAM, a region that is more comparable to other major developing economies. The energy consumption per capita is projected to grow in low-income countries with time and to decrease in the OECD regions.
Figure 13: Energy consumption per capita and contribution of renewables to total energy produced in five world regions in 2010, 2030 and 2050 in the 450 scenario. Results are only presented for the IMAGE model because the other two models show similar trends

LIMITS – LOW CLIMATE IMPACT SCENARIOS AND THE IMPLICATION OF
REQUIRED TIGHT EMISSION CONTROL STRATEGIES PROJECT NO 282846
DELIVERABLE NO.D3.1
54
3.3 Power sector
3.3.1 Power‐relatedemissionsandelectricitygenerationThe power sector is important for deep mitigation pathways because of the large share of this sector in total emissions, and the potential to achieve large emission reductions at lower costs than in other sectors. Figure 14 shows (a) the evolution of power CO2 emissions and (b) the mix of electricity production in the RefPol and the 450 scenario in both Brazil (left half of the figure) and RLAM (right half of the figure).
Under the RefPol trajectory, the emissions in the power sector in Brazil projected by IMAGE and MSG-BR in 2050 will continuously grow (according to MSG-BR up to 600 MtCO2, a 20 times growth over current levels). AIM, however, projects a much smaller growth. In the RLAM the growth of emissions over time in the the RefPol scenario reach beyond 400 MtCO2.
Under the 450 scenario, the emissions in the power sector decrease to zero and in the case of IMAGE, to negative values after 2035 in both regions. This represents a reduction of 80-100% in Brazil and 80-180% in the RLAM from BaU levels in 2050. The sharp decline is because the models direct most of the biomass use towards the power sector (instead of other sectors such as transport and industry), which generates negative emissions when combining it with CCS technology. Although the largest reduction under the 450 scenario comes from decarbonisation, some of the reduction comes from efficiency improvement too.
-400
-300
-200
-100
0
100
200
300
400
500
2010 2015 2020 2025 2030 2035 2040 2045 2050
Em
issi
ons
(Mt
CO
2/yr
)
-100
0
100
200
300
400
500
600
700
2010 2015 2020 2025 2030 2035 2040 2045 2050
Em
issi
ons
(Mt C
O2/
yr)
450 AIM450 IMAGE450 MSG-BRRefPol AIMRefPol IMAGERefPol MSG-BR
0
1
2
3
4
5
6
7
AIM
IMA
GE
MSG
-BR
AIM
IMA
GE
MSG
-BR
AIM
IMA
GE
MSG
-BR
AIM
IMA
GE
MSG
-BR
AIM
IMA
GE
MSG
-BR
RefPol 450 RefPol 450
2010 2030 2050
Ele
ctri
city
gen
erat
ion
(EJ/
yr)
0
2
4
6
8
10
12
14
AIM
IMA
GE
AIM
IMA
GE
AIM
IMA
GE
AIM
IMA
GE
AIM
IMA
GE
RefPol 450 RefPol 450
2010 2030 2050
Other renewables
Oil and Gas
Oil and Gas CCS
Nuclear
Hydro
Coal
Coal CCS
Biomass
Biomass CCS
Figure 14: (a) CO2 emissions from the power sector and (b) electricity generation in the RefPol and 450 scenarios in Brazil (left panels) and the rest of Latin America (right panels). Other renewables includes solar, wind and geothermal energy

LIMITS – LOW CLIMATE IMPACT SCENARIOS AND THE IMPLICATION OF
REQUIRED TIGHT EMISSION CONTROL STRATEGIES PROJECT NO 282846
DELIVERABLE NO.D3.1
55
3.3.2 PowersectorcapacityConsistent with the trends discussed in the previous section, the power sector capacity needs to grow rapidly in these scenarios (Figure 15). The largest capacity additions of the three models are projected by IMAGE (3% annual growth) whereas MSG-BR expectations are much more conservative (1% annual growth). Differences in base year play a key factor here. A peak in capacity is observed around 2030 in AIM results because the model assumes capacity levels, mainly of renewable sources, to increase until 2030 and to slow down afterwards.
Under the low-carbon pathway, the total electrical capacity in 2050 will decline due to energy savings according to IMAGE from the levels of the BaU scenario to 250 GW in Brazil and 700 GW in RLAM (Figure 15 and Figure 16). The capacity reductions are expected to take place mostly in gas and coal-power plants. A reduction in total capacity, however, is not observed in the power projections made by AIM and MSG-BR because both models consider less energy efficiency improvements. In fact, in MSG-BR total power capacity in the 450 scenario in 2050 is much higher than in the RefPol trajectory due to: (i) a lower capacity factor assumed in the model from renewables (50% for hydro and 30%-40% for other renewables) in compared to coal (85%) and (ii) the constrains for high levels of intermittent electricity generation that adds flexible power option such as hydro.
The current power sector in Brazil is already low-carbon. Hydro power plants in Brazil remain in the future the main contributor of power capacity in both scenarios. In the mitigation scenario IMAGE, MSG-BR and AIM project an additional capacity of hydro plants of 100, 83 and 27 GW, respectively. Only AIM expects hydropower to lose its prominent position due a large growth of natural gas-fired power. In the 450 scenario, the Brazilian power sector is expected to be more diversified as renewables, in particular wind energy and biomass, will provide also a significant amount of the electricity consumed by 2050.

LIMITS – LOW CLIMATE IMPACT SCENARIOS AND THE IMPLICATION OF
REQUIRED TIGHT EMISSION CONTROL STRATEGIES PROJECT NO 282846
DELIVERABLE NO.D3.1
56
0
50
100
150
200
250
300
350
400
450
2010 2015 2020 2025 2030 2035 2040 2045 2050
Ele
ctri
c po
wer
cap
acit
y (G
W) Brazil RefPol ‐MSG‐BR Wind
Biomass
Solar andgeothermalOil
Nuclear
Hydro
0
50
100
150
200
250
300
350
400
450
2010 2015 2020 2025 2030 2035 2040 2045 2050
Ele
ctri
c po
wer
cap
acit
y (G
W) Brazil RefPol ‐AIM Wind
Biomass
Solar and geothermal
Oil
Nuclear
Hydro
Gas
Coal
0
50
100
150
200
250
300
350
400
450
2010 2015 2020 2025 2030 2035 2040 2045 2050
Ele
ctri
c po
wer
cap
acit
y (G
W) Brazil RefPol ‐ IMAGE Wind
Biomass
Solar and geothermal
Oil
Nuclear
Hydro
Gas
Coal
0
50
100
150
200
250
300
350
400
450
2010 2015 2020 2025 2030 2035 2040 2045 2050
Ele
ctri
c po
wer
cap
acit
y (G
W) Brazil 450 ‐AIM Wind
Biomass
Solar and geothermal
Oil
Nuclear
Hydro
Gas
Coal
0
50
100
150
200
250
300
350
400
450
2010 2015 2020 2025 2030 2035 2040 2045 2050
Ele
ctri
c po
wer
cap
acit
y (G
W) Brazil 450 ‐ IMAGE Wind
Biomass
Solar and geothermal
Oil
Nuclear
Hydro
Gas
Coal
0
50
100
150
200
250
300
350
400
450
2010 2015 2020 2025 2030 2035 2040 2045 2050
Ele
ctri
c po
wer
cap
acit
y (G
W) Brazil 450 ‐MSG‐BR Wind
Biomass
Solar and geothermal
Oil
Nuclear
Hydro
Gas
Coal
Figure 15: Evolution of electric power capacity in Brazil in the RefPol and 450 scenario
By zooming in the RLAM region, it can be seen that the projected additional power supply needed in 2050 under the BaU scenario is 350 GW (AIM) and 840 GW (IMAGE), as shown in Figure 16. While hydropower is also important in the RLAM region, it is not as prominent as in Brazil (Sheinbaum et al., 2011). Nevertheless, other renewable sources (in particular wind) are expected to grow more in the RLAM than in Brazil in both scenarios (IMAGE) and in the 450 scenario (AIM). A rapid growth of gas-fired plans expand under the RefPol scenario is projected but in the 450 scenario, this growth is reduced because of more wind (AIM) and energy-efficiency gains (IMAGE).

LIMITS – LOW CLIMATE IMPACT SCENARIOS AND THE IMPLICATION OF
REQUIRED TIGHT EMISSION CONTROL STRATEGIES PROJECT NO 282846
DELIVERABLE NO.D3.1
57
0
100
200
300
400
500
600
700
800
900
1000
Ele
ctri
c po
wer
cap
acit
y (G
W) RLAM RefPol ‐AIM Wind
Biomass
Solar andgeothermalOil
Nuclear
Hydro
0
100
200
300
400
500
600
700
800
900
1000
Ele
ctri
c po
wer
cap
acit
y (G
W) RLAM RefPol ‐ IMAGE Wind
Biomass
Solar andgeothermalOil
Nuclear
Hydro
0
100
200
300
400
500
600
700
800
900
1000
Ele
ctri
c po
wer
cap
acit
y (G
W) RLAM 450 ‐AIM Wind
Biomass
Solar and geothermal
Oil
Nuclear
Hydro
Gas
Coal
0
100
200
300
400
500
600
700
800
900
1000
Ele
ctri
c po
wer
cap
acit
y (G
W) RLAM 450 ‐ IMAGE Wind
Biomass
Solar and geothermal
Oil
Nuclear
Hydro
Gas
Coal
Figure 16: Evolution of electric power capacity in the rest of Latin America in the RefPol and 450 scenario
4 Discussion
4.1 Limitation of modelling studies We deliberately have included both regional and global models in this study. It is expected that regional models have better access to regional data and can better simulate local features than global models do. On the other hand, models at regional scales overlook global effects such as international energy trade and global mitigation actions, which are better covered by global models. Still, the projections of IAMs have clear limitations caused not only by the complex dynamic processes simulated such as demographic and economic development, technological change and climate policies, but also by their underlying assumptions (Schneider, 1997). Some key limitations in the context of this study are:
Model differences influence the outcomes of the models. While in IMAGE, energy-efficiency gains play a key role on emissions mitigation, energy-efficiency in the current version of MSG-BR is set exogenously for the building and the transport sectors. Also in AIM, energy-efficiency plays only a limited role. This may lead to an underestimation of the mitigation capacity of energy-efficiency gains in AIM and MSG-BR projections. In the same way, hydropower, solar and wind are exogenously implemented in IMAGE and AIM but not in MSG-BR. Biomass
LIMITS – LOW CLIMATE IMPACT SCENARIOS AND THE IMPLICATION OF
REQUIRED TIGHT EMISSION CONTROL STRATEGIES PROJECT NO 282846
DELIVERABLE NO.D3.1
58
assumptions in MSG-BR are also different than in the other two models which leads to a substantially higher share of this energy source under deep mitigation conditions.
Since the projected capacity of hydropower is exogenously implemented in IMAGE and AIM. For countries, like Brazil, where hydropower plants account for the largest part of domestic electricity generation, this approach is clearly not adequate.
In the 450 scenario in MSG-BR, the primary BECCS source is the carbon released from the fermentation process duringsugarcane-ethanol production, which is the least marginal cost option to output negative carbon emissions in Brazil. As a result, the projected ethanol production exceeds the light duty vehicle fuel demand. In MSG-BR, this is now overcome by allowing the use of ethanol in power generation and in urban buses and cargo transport. In further model improvement, it is important to consider land-use limitations better for sugarcane production too.
4.2 Putting the main outcomes into perspective: Challenges and policy implications
If a 2°C global target is to be achieved, the LAM region would also need to put efforts to mitigate emissions, given the expected emissions growth. This will require a rapid transition towards clean energy sources. The implementation of CCS in coal, gas and biomass plants, and the growth of hydro, wind and biomass energy represent promising low-carbon options for the energy system in LAM according to the models’ calculation. We briefly discuss how realistic large-scale application of these technologies in Brazil or the RLAM is.
The models identified CCS as a fundamental technology to decarbonize both the industry and the power sectors, partly because it can be attractively combined with bioenergy and fossil fuels. However, to date, there is no commercial CCS application in the power sector or in energy-intensive industries and only a handful of large-scale demonstration projects are in operation or under construction worldwide, only one of them in LAM (Santos Basin, Brazil). The implementation of large-scale demonstration projects remains even more complex under the economic and legal context of developing and emerging economies (such as LAM) because of its high capital and technology costs and the complexity on its implementation. Given also limitations with storage capacity, water restrictions and societal acceptance, it might be challenging to scale up CCS in LAM as soon as shown in the model outcomes.
Hydropower is already the main source of renewable energy in LAM, supplying over 40% of total electricity production in most countries and up to 90% in some countries such as Brazil, Paraguay and almost all Central American countries. The models’ results indicate that hydropower is expected to maintain a high share in LAM, especially in Brazil, which is in agreement with Brazil’s government expansion plans (Ministry of Mines and Energy Brazil, 2013). The additional capacity projected by some models (100 GW) might be, however, difficult to implement, given the current difficulties to receive environmental licensing or public approval. Any plans to significantly increase hydropower capacity in Brazil will face problems with delays and budget overruns (Tolmasquim, 2012; Viola & Franchini, 2011). There are also indications that climate change may largely affect
LIMITS – LOW CLIMATE IMPACT SCENARIOS AND THE IMPLICATION OF
REQUIRED TIGHT EMISSION CONTROL STRATEGIES PROJECT NO 282846
DELIVERABLE NO.D3.1
59
rainfall patterns in the region increasing concerns over the energy security of hydroenergy (de Lucena et al., 2009).
The present share of wind power in LAM is very low (0.8% and 2 GW total installed capacity). Besides Costa Rica, there is no other country with more than 30 MW of wind power installed. However, the Latin American wind power market begins to show more maturity. In 2012, LAM experienced the highest growth rate of wind power investment globally. Cumulative installed capacity in LAM reached 3.5 GW in 2012, an increase of 53% compared to the 2.3 GW installed in 2011 (Vergara, Alatorre et al., 2013). The majority of these additions came from large wind farms in Brazil and Mexico. Yet, there are several key issues for the prospects of wind energy in LAM and other regions in the world, such as the transmission of energy from the places of greatest potential to consumption centres and the great costs. The fast growth expected from the models in wind power, growing from 1GW in 2010 to 230 GW (AIM) and 340 GW (IMAGE) would need to solve these difficulties.
The models agree on the key role of bioenergy in the Latin American region. Biomass resources, mostly from sugarcane or wood, are currently making a significant contribution to the energy supply of some countries (e.g. Brazil, El Salvador, Guatemala, Haiti, Honduras and Nicaragua). In many of these countries, however, a large portion of the biomass used - for either domestic small scale or large-scale industrial purposes- has a an unquestionable impact on the national forest resources. The sustainability of biomass supply is therefore a clear issue. In IMAGE and AIM, sustainability criteria is applied to bioenergy supply (e.g. key role for residues, no deforestation allowed), but still in the real word implementing these criteria will be more complicated, as revealed by past trends.
4.2.1 ClimatepoliciesinBrazilinrelationtothemodels’outcomesSeveral countries in the LAM region have recently begun to set the regulatory and fiscal incentives to support low-carbon growth. In general, four main sectors have been chosen by most of the implemented climate policies in the region due to their low costs, their large co-benefits and emission reductions. These are: energy generation, transport, LU and energy efficiency. The main policies supporting low-carbon development in these four sectors are discussed for Brazil.
Since early 2000 Brazil has introduced climate policies at a national, state and municipality level. As one of the earliest non-Annex I signatories to the Copenhagen Accord, it has established important climate policies where the most comprehensive is the National Policy on Climate Change (NPCC or PNMC in Portuguese). The NPCC (in force since 2010) established the country’s voluntary emission reduction target of 36.1 to 38.9% by 2020 compared to 2005 levels. With this, Brazil has become the first country in LAM to adopt a national voluntary mitigation goal by law. Because our models projections focus on CO2 energy-related emissions, it is not possible to compare the Brazilian target (that includes all GHG) with the outcomes of the study. Other studies have criticised the target to be unambitious and to hardly differ from the baseline (Schaeffer R. et al., 2010). One issue is that the baseline was revised upwards in the NPCC causing the pledges to be already largely accomplished at the time they were announced (den Elzen et al., 2013). A difficulty in assessing the effectiveness of the Brazilian NPCC is the rather vague targets set, which are not always accompanied by the mitigation actions that will accomplish the target.

LIMITS – LOW CLIMATE IMPACT SCENARIOS AND THE IMPLICATION OF
REQUIRED TIGHT EMISSION CONTROL STRATEGIES PROJECT NO 282846
DELIVERABLE NO.D3.1
60
Even in the presence of these uncertainties, the NPCC is an important framework to mitigate climate change in the country as it incorporates all previous government climate-related instruments (Table 11). Under the NPCC four main objectives were set: (i) reduce GHG emissions from all its sources and to strength GHG sinks; (ii) preserve and recuperate national biomes; (iii) Reduce climate change vulnerability and increase adaptive capacity work towards adaptation; (iv) develop a national cap-and-trade system. In order to reach the mitigation goals, the NPCC covers areas such as deforestation, energy supply, energy efficiency and transport.
Regarding deforestation, a number of laws and regulations have been adopted. Yet, effective implementation and operation of REDD projects (Reducing Emissions of Deforestation and Forest Degradation) has been challenging due to large competing sectorial incentives and land-tenure issues, among other reasons. Nevertheless, Brazil is currently one of the countries in LAM possessing key capabilities for effective REDD implementation such as technical and human monitoring capacity and good forest management.
Renewable energy is one of the key sectors targeted under the NPCC where the country aims to increase to 80% the share of renewable energy by 2030 though the expansion of hydropower, bioenergy, wind and solar PV power. Though, since only few concrete measures are included (34 GW of hydropower in 2016, reduction of power losses by 25% between 2010 and 2020 and 11.4% increase of bagasse-sugarcane electricity by 2030), it remains unclear how the target will be met by implementing the individual measures. Comparing this target with the models projections, we can see that the projected share of renewable power for 2030 in the RefPol and 450 scenario is lower ranging between 57% (AIM) and 75% (IMAGE and MSG-BR). In order to achieve this goal, the models expect additional hydro capacity in 2020 to be higher than the targets stated in the NPCC (40 GW and 56 GW in IMAGE and MSG-BR, respectively).
As part of the NPCC, Brazil also seeks to decrease electricity consumption by 10% relative to the baseline in 2030 by energy efficiency actions. This study’s projections indicate, conversely, total consumption of electricity will not be reduced over time in any of the scenarios because of population growth, not even in the long-term. An important barrier to stimulate efficient energy consumption in Brazil are the fossil fuel subsidies, introduced during the 1970s and 1980s when around 80% of its domestic oil consumption was imported. The subsidy regime reduced incentives for energy conservation and limited the beneficiaries to ethanol producers and the large industrial energy consumers. Although Brazil has now discovered large oil reserves in 2007, the subsidies have not been reformed and they still encourage wasteful consumption. In fact, Petrobras has to buy petroleum distillates and even gasoline in the global market and sell them in Brazil at a loss in order to meet demand (de Oliveira & Laan, 2010). However, removing fossil fuel subsidies is politically complex.
Biomass in combination with CCS offers very interesting prospects to decarbonize the Brazilian energy sector. Although the country does not have yet a legal framework supporting CCS technology, there are a number of research and development programs ongoing. A good example is the Brazilian CCS Network, managed by Petrobras, which established 20 CCS research projects in the country. In addition, the Centre of Excellence in Research and Innovation in Petroleum, Mineral Resources and Carbon Storage (CEPAC), a collaboration between Petrobras and the University of Rio Grande do Sul, is dedicating significant resources to CCS investigation (Beck et al., 2011).

LIMITS – LOW CLIMATE IMPACT SCENARIOS AND THE IMPLICATION OF
REQUIRED TIGHT EMISSION CONTROL STRATEGIES PROJECT NO 282846
DELIVERABLE NO.D3.1
61
Regarding transport, the NPCC plans an increase of rail and water transport and to improve mass transit, cycling and river cargo. The plan brings forward the 5% biodiesel blending requirement introduced in 2005 from 2013 to 2010 and seeks the implementation of an international biofuel market.
Table 11: Overview of the main climate policies including in the National Policy on Climate Change of Brazil and their characteristics (adapted from (Nachmany et al., 2014))
Policy (entry year) Sectors covered Main characteristics and goalsForest Code (2012) REDD and LULUCF
National Plan on Climate Change (2008)
Mandatory Biodiesel Requirement (2005) Transport
Energy supply
Energy Efficiency
Programme for Incentives for Alternative Electricity Sources -PROINFA (2012)
It sets 2 targets in two time periods: (1) To have 3,300 MW power production frrenewable sources (wind, biomass and small hydro) by 2007. This is reached bysystem of subsidies and incentives. (2) To increase the electricity generated by 3 power sources to 10% of annual consumption within 20 years. During this periRenewable Energy Certificates should be issued.
National Conservation and Rational Energy Use Policy (2001)
Establishing maximum levels of energy consumption and minimum levels of enerefficiency for appliances and machines produced and traded in Brazil.
It sets regulation to manage forest, protected areas and water sources sustainabUnder the Forest Code, which dates back to 1965, landowners must conserve a percentage of their terrain forested, ranging from 20% in some regions to 80% inAmazon.
Energy supply, Energy Efficiency, Transport, REDD and LULUCF
The Plan, defines actions and measures for climate change mitigation and adaptIt aims to increase energy efficiency, the use of renewable power sources, redudeforestation , strenght adaptation capacity and support climate change researchEstablishes the mandatory blending of biodiesel to 5% 3 years ahead of the origischedule (from 2013 to 2010).
To ensure an effective enforcement of climate policies, the allocation of climate funds is indispensable. Brazil has the largest budgetary allocation for climate issues in LAM. Within the country’s climate change law, specific resources are allocated for the implementation of climate-change policies in the national budget and it has specific climate funds such as the National Climate Change Fund and the Amazon Fund. Besides these funds, a large credit line to support mitigation and adaptation projects was announced in 2012 by BNDES with an estimated budget of US$ 570 million until 2014, which will be obtained from royalties from the oil industry.
5 Conclusions
This study explores the mitigation potential of Brazil and the RLAM up to 2050 under current climate policies and in a scenario limiting global mean temperature increase to 2°C. The analysis has been based on the results of two global and one regional IAM. The following conclusions can be drawn from the analysis:
There is general agreement between the global and the regional models used on the projected emissions trends. Given the current climate policy framework, energy-related CO2 emissions will increase 1.5-3.0% per year in the whole Latin American region. The models show that in the stringent mitigation scenario, deep CO2 emission reductions are needed from

LIMITS – LOW CLIMATE IMPACT SCENARIOS AND THE IMPLICATION OF
REQUIRED TIGHT EMISSION CONTROL STRATEGIES PROJECT NO 282846
DELIVERABLE NO.D3.1
62
the emissions projected under the commitments in the Copenhagen agreement, ranging between 55%-87% in Brazil and 40%-74% in the RLAM. These reductions reveal the urgent need to significantly increase global mitigation efforts if countries really want to achieve this target.
The power sector is important for deep mitigation pathways because of the large share of the sector in total CO2 emissions and the potential to achieve large emission reductions at lower costs than in other sectors. The power sector offers the largest mitigation opportunities in the pathway consistent with the 2°C target, followed by industrial production and transport. MSG-BR also identifies great mitigation potential in Brazil by implementing CCS during the ethanol fermentation process. According to IMAGE, capacity levels in 2050 are reduced from the BaU trajectory to 250 GW (Brazil) and 700 GW (RLAM) due to energy-efficiency gains.
Large share of clean technologies to the energy demanded in the region is expected under the low-carbon scenario. The implementation of CCS in coal, gas and biomass plants, and the growth of hydro, biomass and wind energy dominate our present view of future low-carbon options in the energy system of LAM. Under the current policy scenario, natural gas (Brazil and RLAM) and coal (Brazil) are dominant sources of primary energy supply in the future but this situation can change if stringent mitigation policies materialize. Our exploration of low-carbon options suggest that renewables and CCS technologies can provide up to 70% (Brazil) and 40% (RLAM) of the energy demanded in 2050. Biomass resources, mostly from sugarcane and wood, remain a key energy source in the region. CCS is a fundamental technology to decarbonize both the power sector and the industry, especially because it can be combined with bioenergy and fossil fuels. In addition, there is large untapped potential for hydro energy (Brazil and RLAM) and wind energy (RLAM) for power generation.
Model assumptions play a key role in the models’ outcomes for the low-carbon scenario. In IMAGE energy-efficiency gains are expected to be key on the reduction of energy consumption while in the other two models energy-efficiency is exogenously implemented and only minor efficiency improvements are considered. In the same way, projections on hydropower, solar, wind and biomass energy also differ among the models due to the diverse assumptions and implementation approach of these energy sources in each model.
In order to implement the mitigation options identified, LAM will need to overcome large technical and non-technical challenges. The projected potential for clean technologies in this study can be difficult to realize as it depends on technical uncertainties, but also on more elusive issues such as social acceptance and political decisions. All main mitigation options like renewables, CCS and bio-energy face considerable implementation barriers.
In order to stimulate the transformation of the energy system and increase capacity levels for green energy, the appropriate supportive clean energy policies need to be implemented. Brazil is experiencing since 2000 a new wave of regulatory changes to stimulate climate change mitigation and renewable energy investment. The country is the first country in LAM to adopt a national emission mitigation target by law under their NPCC

LIMITS – LOW CLIMATE IMPACT SCENARIOS AND THE IMPLICATION OF
REQUIRED TIGHT EMISSION CONTROL STRATEGIES PROJECT NO 282846
DELIVERABLE NO.D3.1
63
framework. However, some studies report the target, on the contrary, to be unambitious. A difficulty in assessing the effectiveness of the Brazilian NPCC is the vague targets established, which are not always accompanied by the mitigation actions that will accomplished the target.
Acknowledgments
The research leading to these results has received funding from the European Union Seventh Framework Programme FP7/2007-2013 under grant agreement n° 282846 (LIMITS).
6 References
Ahlgren E. O., D.J.A. Johanssona, P. Lucas et al. (2013). Policy Options to engage EMering Asia Economies in a post-Kyoto regime (POEM) project
Beck, B., P. Cunha, M. Ketzer et al. (2011), The current status of CCS development in Brazil. Energy Procedia 4(0), pp.6148-6151.
Borba, B.S.M.C., A.F.P. Lucena, R. Rathmann et al. (2012), Energy-related climate change mitigation in Brazil: Potential, abatement costs and associated policies. Energy Policy 49(0), pp.430-441.
Bouwman L., T. Kram & K. Klein-Goldewijk. (2006). IMAGE 2.4: An overviewNetherlands Environmental Assessment Agency, Bilthoven.
Calvin, K., L. Clarke, V. Krey et al. (2012), The role of Asia in mitigating climate change: Results from the Asia modeling exercise. Energy Economics 34(SUPPL. 3), pp.S251-S260.
Carpio C. (2010). Energy efficiency in Latin America and the Caribbean: situation and outlook. ECLAC, Economic Commision for Latin America and the Caribbean
Centre for Climate and Energy Solutions. (2011). Common metric: Comparing countries climate pledges. Available at: http://www.c2es.org/publications/common-metrics-comparing-countries-climate-pledges [online].
de la Torre, A., Fajnzylber, P. & Nash, J. (2009). Low-Carbon, High Growth - Latin American Responses to Climate Change. An overview. Washington: The World Bank.
de Lucena, A.F.P., R. Schaeffer & A.S. Szklo. (2010), Least-cost adaptation options for global climate change impacts on the Brazilian electric power system. Global Environmental Change 20(2), pp.342-350.

LIMITS – LOW CLIMATE IMPACT SCENARIOS AND THE IMPLICATION OF
REQUIRED TIGHT EMISSION CONTROL STRATEGIES PROJECT NO 282846
DELIVERABLE NO.D3.1
64
de Lucena, A.F.P., A.S. Szklo, R. Schaeffer et al. (2009), The vulnerability of renewable energy to climate change in Brazil. Energy Policy 37(3), pp.879-889.
de Oliveira A. & T. Laan. (2010). Lessons learned from Brazil's experience with fossil-fuel subsidies and their reform - The International Institute for Sustainable Development (IISD)
Den Elzen, M.G.J. & P.L. Lucas. (2005), The FAIR model: A tool to analyse environmental and costs implications of regimes of future commitments. Environmental Modeling and Assessment 10(2), pp.115-134.
den Elzen, M.G.J., A.F. Hof & M. Roelfsema. (2013), Analysing the greenhouse gas emission reductions of the mitigation action plans by non-Annex I countries by 2020. Energy Policy 56(0), pp.633-643.
Fresard C. & O.A. Milena. (2001). Indicadores macroeconómicos de América Latina 1990-2000. Lecturas de Economía. No 54. Medellín:
GLOBE International. (2013). Climate Legislation Study: A Review of Climate Change Legislation in 33 countries. Third edition. Available at: http://www.globeinternational.org/images/climate-study/3rd_GLOBE_Report.pdf
IADB. (2013). Climate Scope 2013 - New Frontiers for Low-Carbon Energy Investment in Latin America and the Caribbean. Inter-American Development Bank and Bloomeberg New Energy Finance
IAEA. (2006). Brazil: A country profile on Sustainable Energy Development. International Atomic Energy Agency, Austria
IBGE. (2010). Projeção da População do Brasil por sexo e idade: 2000-2060 [online]. Retrieved 04/18, 2014. Available on the world wide web: <http://www.ibge.gov.br/home/estatistica/populacao/projecao_da_populacao/2013/default.shtm>.
IEA. (2013). World Energy Outlook
INPE. (2013). Projeto Prodes - Monitoramento da Floresta Amazonica Brasileira por Satelite<br /> [online].Available on the world wide web: <http://www.obt.inpe.br/prodes/index.php>.
IPCC. (2007a). Intergovernmental Panel on Climate Change. Synthesis report
IPCC. (2007b). The Physical Science Basis. In Contribution of Working Group I to the Fourth Assessment Report of the Intergovernmental Panel on Climate Change
IPCC. (2014a). Final Draft Working Group II. Volume II Regional Aspects. 5th Assessment Report - Impacts, Adaptation and Vulnerability.

LIMITS – LOW CLIMATE IMPACT SCENARIOS AND THE IMPLICATION OF
REQUIRED TIGHT EMISSION CONTROL STRATEGIES PROJECT NO 282846
DELIVERABLE NO.D3.1
65
IPCC. (2014b). Final draft Working Group III. 5th Assessment Report "Climate Change 2014: Mitigation of Climate Change"
Jotzo F. (2011). Comparing the Copenhagen Emissions Targets. Crawford School Centre for Climate Economics & Policy Paper No. 1.10. Available at: http://ssrn.com/abstract=1878905
Kainuma, M., Matsuoka, Y. & Morita, T. (2003). In Springer (Ed.), Climate policy assessment: Asia-Pacific integrated modeling
Kainuma, M., K. Miwa, T. Ehara et al. (2013), A low-carbon society: Global visions, pathways, and challenges. Climate Policy 13(SUPPL.1), pp.5-21.
La Rovere, E.L., C. Burle Dubeux, A.O. Pereira Jr. et al. (2013), Brazil beyond 2020: From deforestation to the energy challenge. Climate Policy 13(SUPPL.1), pp.70-86.
Lucas, P.L., P.R. Shukla, W. Chen et al. (2013), Implications of the international reduction pledges on long-term energy system changes and costs in China and India. Energy Policy 63, pp.1032-1041.
Malagueta, D., A. Szklo, B.S.M.C. Borba et al. (2013), Assessing incentive policies for integrating centralized solar power generation in the Brazilian electric power system. Energy Policy 59(0), pp.198-212.
Ministry of Environment Brazil. (2007). National Plan of Climate Change. Available at: http://www.mma.gov.br/publicacoes/clima/category/70-mudancas-do-clima
Ministry of Mines and Energy Brazil. (2010). Decennial Plan of Energy Expansion 2019. Available at: http://www.epe.gov.br/pdee/forms/epeestudo.aspx
Ministry of Mines and Energy Brazil. (2012). Decennial Plan of Energy Expansion 2021. Available at: http://www.epe.gov.br/pdee/forms/epeestudo.aspx
Ministry of Mines and Energy Brazil. (2013). Decennial Plan of Energy 2021. Available at: http://mme.gov.br/mme/arquivos/pde_2019/PDE_2021/PDE_2021
Nachmany M., S. Fankhauser, T. Townshend et al. (2014). The GLOBE Climate Legislation Study: A Review of Climate Change Legislation in 66<br />Countries. Fourth Edition.” London: GLOBE International and the Grantham<br />Research Institute, London School of Economics.
Nogueira, L.P.P., A. Frossard Pereira de Lucena, R. Rathmann et al. (2014), Will thermal power plants with CCS play a role in Brazil's future electric power generation? International Journal of Greenhouse Gas Control 24(0), pp.115-123.
OECD. (2012), OECD Environmental Outlook to 2050: the consequences of inaction. Organisation for Economic Cooperation and Development, OECD Publishing<br /><br />.
LIMITS – LOW CLIMATE IMPACT SCENARIOS AND THE IMPLICATION OF
REQUIRED TIGHT EMISSION CONTROL STRATEGIES PROJECT NO 282846
DELIVERABLE NO.D3.1
66
Saraiva, T.A., A. Szklo, A.F.P. Lucena et al. (2014), Forecasting Brazil’s crude oil production using a multi-Hubbert model variant. Fuel 115(0), pp.24-31.
Schaeffer R., A. Szklo & C. Gouvello. (2010). Low Carbon Emissions Scenarios in Brazil . The World Bank Group. Sysnthesis Report
Schaeffer, R., A. Szklo, Frossard Pereira de Lucena, A. et al. (2013), The Vulnerable Amazon: The Impact of Climate Change on the Untapped Potential of Hydropower Systems. IEEE Power & Energy Magazine 11(3), pp.22-31.
Schneider, S.H. (1997), Integrated assessment of global climate chamge: Transparent rational tool for policy making or opaque screen hiding value-laden assumptions? Environmental Modelling and Assessment 2, pp.229-249.
Sheinbaum, C., B.J. Ruíz & L. Ozawa. (2011), Energy consumption and related CO2 emissions in five Latin American countries: Changes from 1990 to 2006 and perspectives. Energy 36(6), pp.3629-3638.
Tolmasquim, M.T. (2012), Perspectivas e planejamento do setor energético no Brasil. Estudos Avançados 26(74), pp.247-260.
UN. (2008). World Population Prospects, The 2008 Revision
UN. (2009). World Population Prospects: The 2008 Revision. Population Division of the Department of Economic and Social Affairs of the United Nations Secretariat
UNEP. (2010). The Emissions Gap Report - Are the Copenhaguen Pledges sufficient to limit global warming to 2 or 1.5 degrees celsius?. A prelimnary assessment. Available at: http://www.unep.org/publications/ebooks/emissionsgapreport/pdfs/GAP_REPORT_SUNDAY_SINGLES_LOWRES.pdf;
van Ruijven, B.J., D.P. van Vuuren, J. van Vliet et al. (2012), Implications of greenhouse gas emission mitigation scenarios for the main Asian regions. Energy Economics 34(SUPPL. 3), pp.S459-S469.
Van Vuuren, D.P., M.G.J. Den Elzen, P.L. Lucas et al. (2007), Stabilizing greenhouse gas concentrations at low levels: An assessment of reduction strategies and costs. Climatic Change 81(2), pp.119-159.
Vergara W., C. Alatorre & L. Alves. (2013). Rethinking our energy future - A white paper on renewable energy for the 3GFLAC Regional Forum. Inter-American Development Bank
Vergara W., R.R. Rios, L.M. Galindo et al. (2013). The Climate and Development Challenge for Latin America and the Caribbean: Options for climate-resilent, low-carbon development No. 978-1-59782-165-0)IADB.

LIMITS – LOW CLIMATE IMPACT SCENARIOS AND THE IMPLICATION OF
REQUIRED TIGHT EMISSION CONTROL STRATEGIES PROJECT NO 282846
DELIVERABLE NO.D3.1
67
Viola E. & M. Franchini. (2011). A mudanca climática em 2011: Governanca estagnada e o novo perfil do Brasil. Textos CINDES n 25. CINDES - Centro de Estudos de Integracao e Desenvolvimento.
World Bank. (2010). Brasil: País de Baixo Carbono. Estudo de caso. ESMAP - Energy Sector Management Assistance Program. Available here: http://www.esmap.org/sites/esmap.org/files/2011000172BRAbra001_LowRes.pdf
World Bank. (2012). GDP Growth Data [online]. Retrieved 04/16, 2013. Available on the world wide web: <http://data.worldbank.org/indicator>.

LIMITS – LOW CLIMATE IMPACT SCENARIOS AND THE IMPLICATION OF
REQUIRED TIGHT EMISSION CONTROL STRATEGIES PROJECT NO 282846
DELIVERABLE NO.D3.1
68
Annex 3: Long-term energy futures for Africa: the role of Africa in the world
Paul L. Lucas a, Jens Nielsen a and Detlef P. van Vuuren a,b
a PBL Netherlands Environment Assessment Agency, PO Box 303, 3720 BA Bilthoven, The Netherlands.
b Copernicus Institute of Sustainable Development, Utrecht University, Heidelberglaan 2, NL-3584 CS Utrecht, The Netherlands.
LIMITS – LOW CLIMATE IMPACT SCENARIOS AND THE IMPLICATION OF
REQUIRED TIGHT EMISSION CONTROL STRATEGIES PROJECT NO 282846
DELIVERABLE NO.D3.1
69
Contents Executive summary ................................................................................................................... 70
1 Introduction ...................................................................................................................... 71
2 Methodology ..................................................................................................................... 72
3 Results .............................................................................................................................. 73
3.1 Baseline developments .................................................................................. 73 3.1.1 Drivers ..................................................................................................................................... 73 3.1.2 Energy use and related CO2 emissions .................................................................................... 75
3.2 Changes in the energy system under climate policy ..................................... 78 3.2.1 Changes in energy use and CO2 emissions .............................................................................. 78 3.2.2 Decomposition in emission reductions .................................................................................... 79 3.2.3 Changes in the energy system .................................................................................................. 80
3.3 Trade in primary energy sources ................................................................... 81 3.4 Energy poverty .............................................................................................. 83
4 Discussion ........................................................................................................................ 84
4.1 Climate policy ............................................................................................... 85 4.2 Robustness of results..................................................................................... 85
5 Conclusions ...................................................................................................................... 86
Acknowledgements ................................................................................................................... 87
6 References ........................................................................................................................ 87
LIMITS – LOW CLIMATE IMPACT SCENARIOS AND THE IMPLICATION OF
REQUIRED TIGHT EMISSION CONTROL STRATEGIES PROJECT NO 282846
DELIVERABLE NO.D3.1
70
Executive summary
Although Africa’s share in the Global energy system, including energy production and trade, and CO2 emissions, is only small today, its ongoing population growth and economic development suggests that this can change significantly. In this paper, we discuss Africa’s long-term energy developments, using the results of a multi-model scenario study. The results show that, without additional policies, Africa’s share in global CO2 emissions could remain small, but could also grow up to one quarter. Overall, the African continent can converge to an average energy consuming country, with a similar energy mix as currently developed countries. Where the continent is now a large net exporter of oil and gas, towards 2050 it most likely needs most of its resources to meet its rapidly growing domestic demand. However, the results also show that in the residential sector, traditional bio-energy is likely to remain an important energy source for decades to come. Therefore, to completely phase out traditional bio-energy use, specific policies addressing energy poverty are required. As part of global climate policy that aims for reaching the 2 oC target, Africa needs to start mitigating its emissions around 2030. The rapid expansion of the industrial and the power sector creates large mitigation potential and thereby the possibility to capture the investment peak with climate policy.
LIMITS – LOW CLIMATE IMPACT SCENARIOS AND THE IMPLICATION OF
REQUIRED TIGHT EMISSION CONTROL STRATEGIES PROJECT NO 282846
DELIVERABLE NO.D3.1
71
7 Introduction
Africa’s share in global energy use and greenhouse gas emissions is currently relatively small, only around 5% (UNCTAD, 2012). This small shares can partly be explained by the lack of access to modern sources of energy. The share of the population without access to electricity and liquid or gaseous fuels for cooking and heating in Africa is the largest in the world (Pachauri et al., 2013). At the same time, several African countries are endowed with large fossil fuel resources, being net exporters of primarily oil and natural gas (UNECA, 2011). Ongoing population growth, urbanisation and economic development could change this picture significantly. There is, however, considerable uncertainty on how Africa’s energy system could evolve in the future, and about its role in the global energy system with respect to energy resources and greenhouse gas emissions. While increasing access to modern sources of energy provides great opportunities to reduce poverty and accelerate economic growth, depending on fuel choice, it could also have major local, regional and global environmental impacts. Therefore, increasing access to modern energy services should be combined with a strategy to leap-frog the unsustainable development pathways most developed countries, but also emerging economies like China, have taken sofar. There are ample studies that have assessed developments in the energy system at the global scale, many focussing on climate change (Kriegler et al., 2014a; Kriegler et al., 2014b; Riahi et al., 2014). Recent studies have also focussed on specific regions, including Europe (Weyant et al., 2013), Asia (Calvin et al., 2012; Johansson et al., 2014) and several large economies (Van Sluisveld et al., 2013). Furthermore, the results of a Latin American modelling project are underway (Calvin, 2013; Herreras Martínez et al., Submitted). At the same time, few studies have focussed on projections for the African continent. A study of Calvin et al. (2013) is an important exception, describing the results of a multi-model comparison, addressing how possible population and economic growth pathways for Africa will transform their energy system and emissions. The study also looked into the question to what extent future economic growth could improve access to modern forms of energy and whether climate policy can hasten or hinder this. Bazilian et al. (2012) discusses scenarios for the sub-Saharan African power sector to 2030, concluding that most existing projection show roughly a threefold increase in installed generation capacity occurring by 2030. Neither studies, however, discuss Africa’s long-term role in the global energy system. Africa’s long-term role in the global energy system is the central theme in this paper. The paper discusses long-term developments in Africa’s energy system using the results of a recent multi-model scenario analysis (LIMITS, Kriegler et al., 2014a). This analysis involves a larger set of models than used by Calvin et al. (2013). The use of multiple models, that differ in model structure, data sources and basic assumptions, allows to assess the robustness of the projected developments. In this paper we discusses two scenario. A scenario based on business as usual assumptions and a scenario that assumes globally coordinated action oriented towards limiting the increase of global mean temperature to a maximum of 2 OC compared to pre-industrial levels (UNFCCC, 2009). The analysis focusses on the following questions:
How does Africa’s energy system develop under a business as usual scenarios? What do the energy scenarios imply for development? What is Africa’s role in global mitigation scenarios? What is Africa’s role in global trade in primary energy sources?
The paper is structured as follows. Section 2 describes the methodology, including the scenarios and models used. Section 3 discusses developments in Africa’s energy with and without climate

LIMITS – LOW CLIMATE IMPACT SCENARIOS AND THE IMPLICATION OF
REQUIRED TIGHT EMISSION CONTROL STRATEGIES PROJECT NO 282846
DELIVERABLE NO.D3.1
72
policy, including energy supply, energy-related CO2 emissions, energy poverty and trade in primary energy sources, and compares these with global developments. Section 4 then discusses opportunities for making the transition as well as some major uncertainties with respect to the model projections. Finally, Section 6 draws the main conclusions. 8 Methodology
For the analysis, we use the results of the recent LIMITS model comparison study (Kriegler et al., 2014a) that includes results for six different Integrated Assessment Models: GCAM (Calvin, 2011), IMAGE (MNP, 2006; van Vuuren, 2007), MESSAGE (Riahi et al., 2007), REMIND (Luderer. et al., 2011), TIAM-ECN (Loulou, 2008; Loulou and Labriet, 2008) and WITCH (Bosetti et al., 2006; Bosetti et al., 2009). The diversity in model structure and assumptions allows to assess the associated range of uncertainties. For an overview of model details see Kriegler et al. (2014a) and its supplementary material. See Table 1 for some key model characteristics. The models have a different sub-division for the African continent. For our comparison, they therefore are divided in two groups: a group of models that specially address Sub-Saharan Africa (excluding North Africa) and models that address the whole African continent in an single region (see Table 1 for an overview). Only the IMAGE model is represented in both groups as it divides Africa in five regions, thereby creating the possibility of including both aggregates. Formally, Sub-Saharan Africa includes all countries South of the Sahara. The United Nations uses sub-Saharan Africa to indicate all of Africa except northern Africa, with the Sudan included in sub-Saharan Africa (UN, 2013). Only MESSAGE follows this formal definition. REMIND and WITCH include Sudan and exclude the Republic of South Africa in their regional definition of Sub-Saharan Africa. We also apply this grouping for IMAGE. Thus, when we discuss results for Sub-Saharan Africa in this paper we generally refer to Africa without Northern Africa and the Republic of South Africa. Table 1: Regional grouping for Africa and key model characteristics Regional grouping Key model characteristics Model Sub-Saharan
Africa African continent
Model category Solution methodology
IMAGE X X Partial equilibrium Recursive dynamic REMIND X General equilibrium Intertemporal optimization MESSAGE X b General equilibrium Intertemporal optimization WITCH X General equilibrium Intertemporal optimization GCAM X Partial equilibrium Recursive dynamic TIAM-ECN X Partial equilibrium Intertemporal optimization a Sub-Saharan Africa excludes the Republic of South Africa and the North African countries b Includes the Republic of South Africa and excludes North and South Sudan The LIMITS study explored different scenarios to look into the question what would be required to meet the 2oC target (FEEM, 2011). In our analysis, we look into two scenarios from this project:
1. The baseline scenario, that assumes that no new climate policies are implemented. Assumptions on the development of trends in socio-economic parameters, energy and land-use and derived emissions were left to the individual models teams.
2. The Refpol-450 scenario, that aims at limiting the increase of global mean temperature to a maximum of 2 OC compared to pre-industrial levels, starting from the Copenhagen Accord pledges.
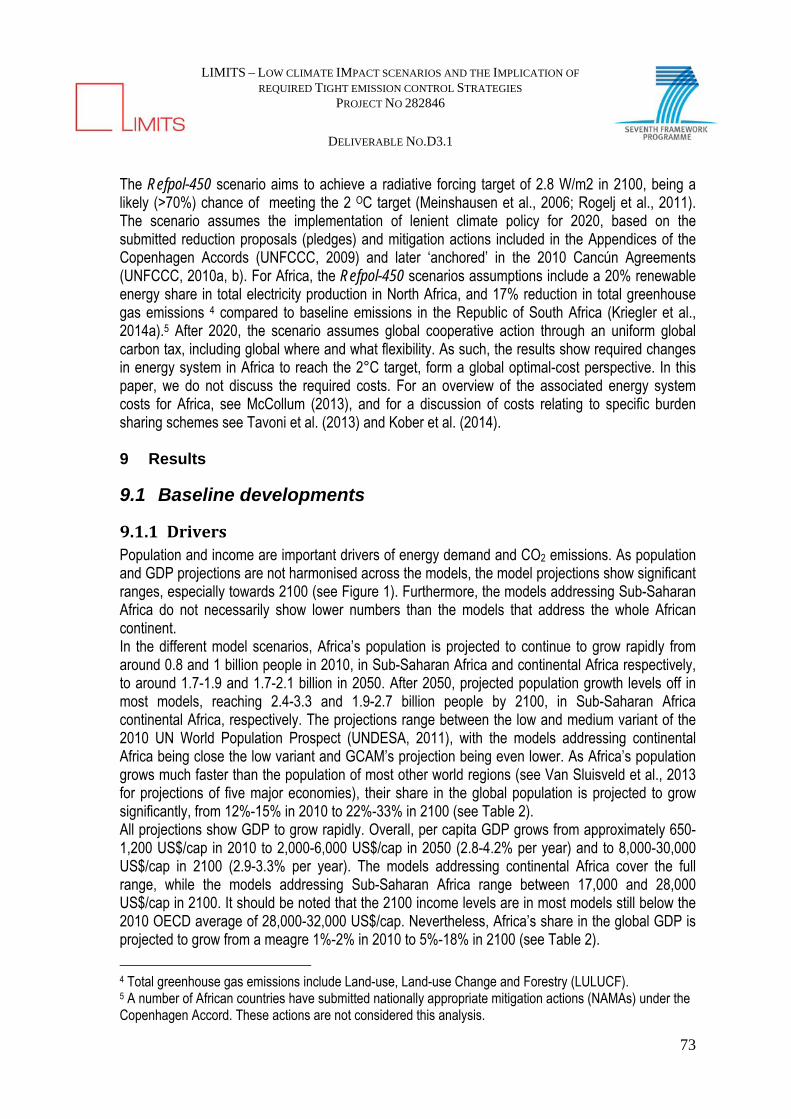
LIMITS – LOW CLIMATE IMPACT SCENARIOS AND THE IMPLICATION OF
REQUIRED TIGHT EMISSION CONTROL STRATEGIES PROJECT NO 282846
DELIVERABLE NO.D3.1
73
The Refpol-450 scenario aims to achieve a radiative forcing target of 2.8 W/m2 in 2100, being a likely (>70%) chance of meeting the 2 OC target (Meinshausen et al., 2006; Rogelj et al., 2011). The scenario assumes the implementation of lenient climate policy for 2020, based on the submitted reduction proposals (pledges) and mitigation actions included in the Appendices of the Copenhagen Accords (UNFCCC, 2009) and later ‘anchored’ in the 2010 Cancún Agreements (UNFCCC, 2010a, b). For Africa, the Refpol-450 scenarios assumptions include a 20% renewable energy share in total electricity production in North Africa, and 17% reduction in total greenhouse gas emissions 4 compared to baseline emissions in the Republic of South Africa (Kriegler et al., 2014a).5 After 2020, the scenario assumes global cooperative action through an uniform global carbon tax, including global where and what flexibility. As such, the results show required changes in energy system in Africa to reach the 2°C target, form a global optimal-cost perspective. In this paper, we do not discuss the required costs. For an overview of the associated energy system costs for Africa, see McCollum (2013), and for a discussion of costs relating to specific burden sharing schemes see Tavoni et al. (2013) and Kober et al. (2014). 9 Results
9.1 Baseline developments
9.1.1 DriversPopulation and income are important drivers of energy demand and CO2 emissions. As population and GDP projections are not harmonised across the models, the model projections show significant ranges, especially towards 2100 (see Figure 1). Furthermore, the models addressing Sub-Saharan Africa do not necessarily show lower numbers than the models that address the whole African continent. In the different model scenarios, Africa’s population is projected to continue to grow rapidly from around 0.8 and 1 billion people in 2010, in Sub-Saharan Africa and continental Africa respectively, to around 1.7-1.9 and 1.7-2.1 billion in 2050. After 2050, projected population growth levels off in most models, reaching 2.4-3.3 and 1.9-2.7 billion people by 2100, in Sub-Saharan Africa continental Africa, respectively. The projections range between the low and medium variant of the 2010 UN World Population Prospect (UNDESA, 2011), with the models addressing continental Africa being close the low variant and GCAM’s projection being even lower. As Africa’s population grows much faster than the population of most other world regions (see Van Sluisveld et al., 2013 for projections of five major economies), their share in the global population is projected to grow significantly, from 12%-15% in 2010 to 22%-33% in 2100 (see Table 2). All projections show GDP to grow rapidly. Overall, per capita GDP grows from approximately 650-1,200 US$/cap in 2010 to 2,000-6,000 US$/cap in 2050 (2.8-4.2% per year) and to 8,000-30,000 US$/cap in 2100 (2.9-3.3% per year). The models addressing continental Africa cover the full range, while the models addressing Sub-Saharan Africa range between 17,000 and 28,000 US$/cap in 2100. It should be noted that the 2100 income levels are in most models still below the 2010 OECD average of 28,000-32,000 US$/cap. Nevertheless, Africa’s share in the global GDP is projected to grow from a meagre 1%-2% in 2010 to 5%-18% in 2100 (see Table 2).
4 Total greenhouse gas emissions include Land-use, Land-use Change and Forestry (LULUCF). 5 A number of African countries have submitted nationally appropriate mitigation actions (NAMAs) under the Copenhagen Accord. These actions are not considered this analysis.

LIMITS – LOW CLIMATE IMPACT SCENARIOS AND THE IMPLICATION OF
REQUIRED TIGHT EMISSION CONTROL STRATEGIES PROJECT NO 282846
DELIVERABLE NO.D3.1
74
Figure 1: Projected population, GDP, primary energy demand and CO2 emissions, in the different models.
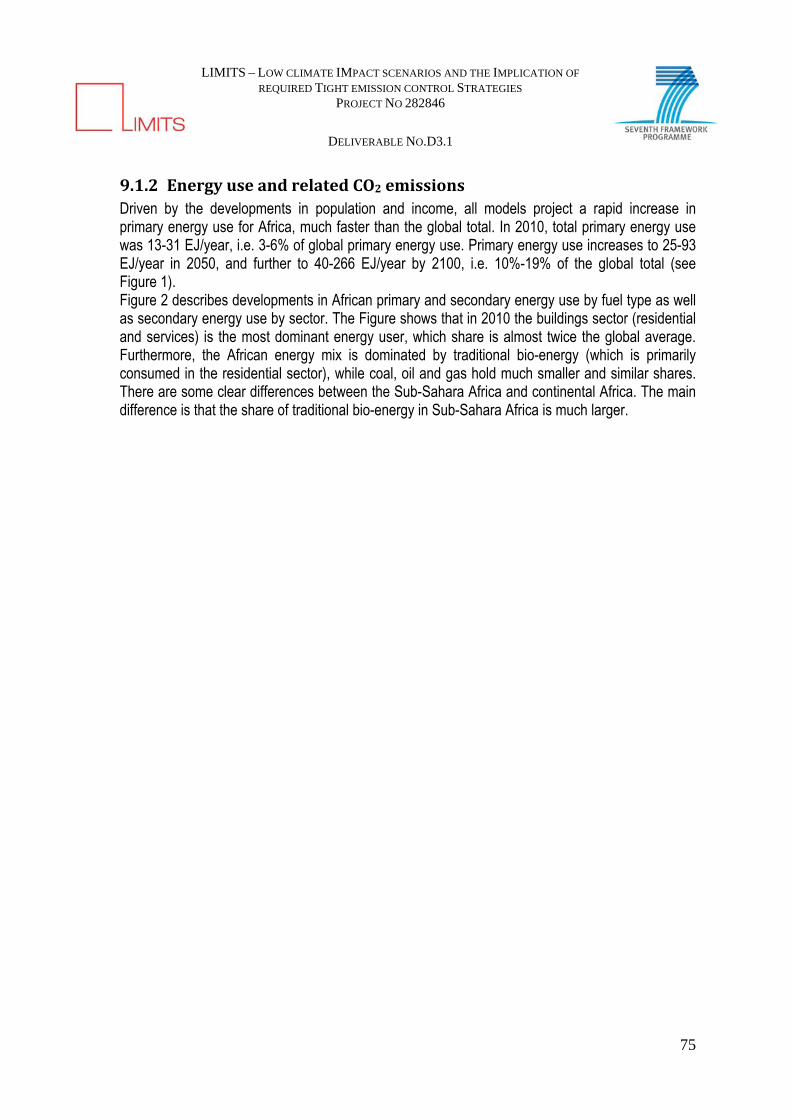
LIMITS – LOW CLIMATE IMPACT SCENARIOS AND THE IMPLICATION OF
REQUIRED TIGHT EMISSION CONTROL STRATEGIES PROJECT NO 282846
DELIVERABLE NO.D3.1
75
9.1.2 EnergyuseandrelatedCO2emissionsDriven by the developments in population and income, all models project a rapid increase in primary energy use for Africa, much faster than the global total. In 2010, total primary energy use was 13-31 EJ/year, i.e. 3-6% of global primary energy use. Primary energy use increases to 25-93 EJ/year in 2050, and further to 40-266 EJ/year by 2100, i.e. 10%-19% of the global total (see Figure 1). Figure 2 describes developments in African primary and secondary energy use by fuel type as well as secondary energy use by sector. The Figure shows that in 2010 the buildings sector (residential and services) is the most dominant energy user, which share is almost twice the global average. Furthermore, the African energy mix is dominated by traditional bio-energy (which is primarily consumed in the residential sector), while coal, oil and gas hold much smaller and similar shares. There are some clear differences between the Sub-Sahara Africa and continental Africa. The main difference is that the share of traditional bio-energy in Sub-Sahara Africa is much larger.
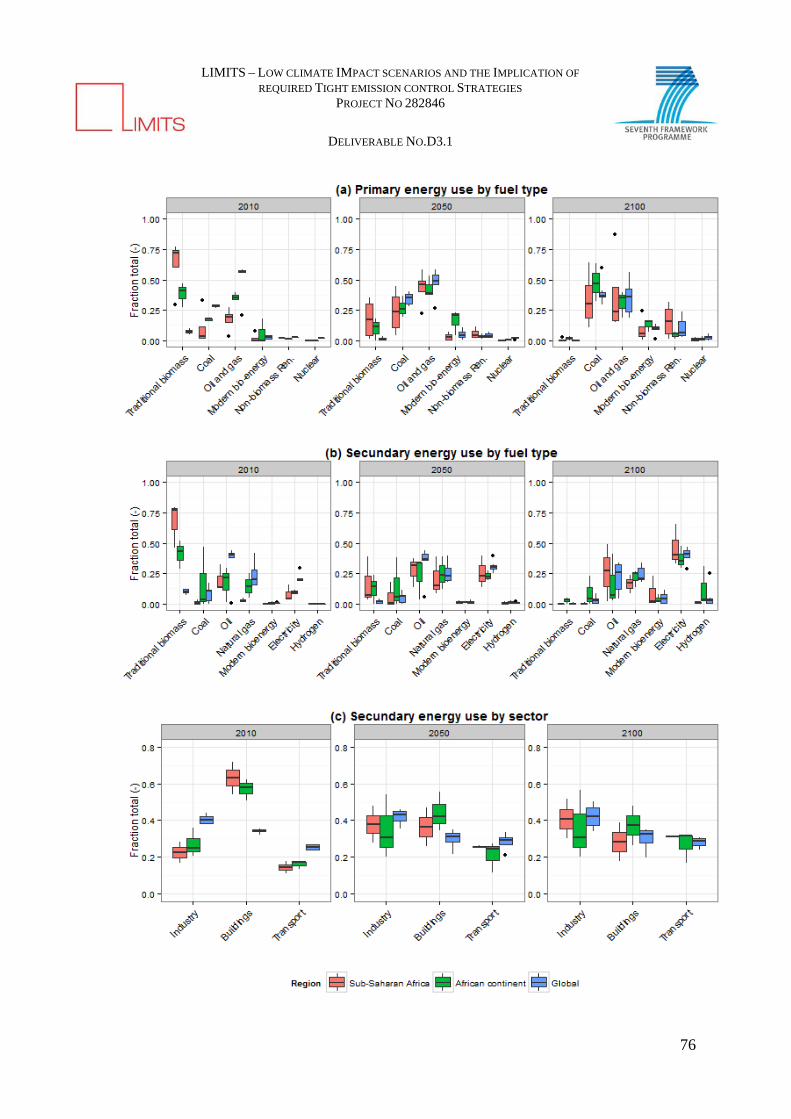
LIMITS – LOW CLIMATE IMPACT SCENARIOS AND THE IMPLICATION OF
REQUIRED TIGHT EMISSION CONTROL STRATEGIES PROJECT NO 282846
DELIVERABLE NO.D3.1
76

LIMITS – LOW CLIMATE IMPACT SCENARIOS AND THE IMPLICATION OF
REQUIRED TIGHT EMISSION CONTROL STRATEGIES PROJECT NO 282846
DELIVERABLE NO.D3.1
77
Figure 2: Primary energy use by fuel type (panel a) and secondary energy by fuel type (panel b) and sector (panel c). The bottom and top of the box represent the first and third quartiles, the band inside the box is the median and the whiskers represent 1.5 IQR deviation from the box. Data outside 1.5 IQR from the box are represented as individual dots. Towards 2050 the share of the industry and transportation gain importance at expense of the buildings sector. In fact by 2100 the sectoral share has converged to global levels in all model projections. The share of traditional bio-energy also decreases rapidly to around 5-35% in 2050 and further to close to 0% in 2100. In absolute terms, however, traditional bio-energy consumption in 2100 is according to most models still about half the 2010 consumption level (see Figure 3). The large increase in primary energy demand is almost fully accommodated by fossil fuels. Major drivers of the increasing demand are the increase in transport energy demand and a rapid increase in electricity consumption. For continental African, the shares of coal, oil and gas grow towards the world average in 2100. In Sub-Saharan Africa , however, these fossil shares remain slightly lower than the world average, explained by a higher share of traditional energy and non-biomass renewables (REMIND and MESSAGE). The rapid increase in energy demand results also in a large increase in energy-related CO2 emissions. For most models, the increase of CO2 emissions ranges from a factor 3-6 in the 2010-2050 period and another factor 2-6 in the 2050-2100 period. As a result Africa’s share in global CO2 emissions increases from 1%-4% in 2010 to 10%-23% in 2100. In absolute terms, most of the growth in CO2 emissions occur after 2050. In fact, in 2050 Africa’s share is projected to be still only around 7%-9%. It should be noted that the models do not calculate CO2 emissions for traditional bio-energy use (that dominates the energy mix in 2010). This is, however, only true for sustainably harvested biomass. Globally, only around 60% of traditional bio-energy is estimated to be produced sustainably, i.e. 80% for fuelwood and only 20% for charcoal 6 (Bailis et al., 2005; Reddy and Balachandra, 2006).
2050
2100
2010
0.1
1
10
100
0.1 1 10 100
Log Per capita emissions (M
tCO2/cap)
log Per capita GDP ($/cap)
Africa trend ChinaUSA EUIndia JapanAfrica 2010 Africa 2050Africa 2100
1
10
100
1000
0.1 1 10 100
Log Per capita energy use (MtCO2/cap
)
Log Per capita GDP ($/cap)
6 Fuelwood consumption is typically a non-commercial, local activity so that consumers can tailor their behavior to local production rates. Charcoal, on the other hand, is a commercial activity; it is typically transported long distances so that consumers are far-removed from production zones and pricing mechanisms are not in place to adequately reflect supply scarcity. In addition, charcoal is frequently associated with clearance for crop cultivation.

LIMITS – LOW CLIMATE IMPACT SCENARIOS AND THE IMPLICATION OF
REQUIRED TIGHT EMISSION CONTROL STRATEGIES PROJECT NO 282846
DELIVERABLE NO.D3.1
78
Figure 3: Emissions per capita versus per capita income (left) and primary energy use versus per capita income (right). For Africa, the individual model values are given as while as their median (red line). For the USA, EU, Japan, China and India, values are the median over the models. Figure 3 presents future developments in per capita energy use and CO2 emissions compared to developments in per capita GDP. Africa’s starting point is almost similar to that of India, with low per capita GDP and related low per capita energy use and CO2 emissions. In their future trajectory, per capita energy use and CO2 emissions grow towards similar levels as currently observed in the EU and Japan. The trajectory is however lower than current levels in China and when the projected trends prevail beyond 2100, both per capita energy use and CO2 emissions stays well below current levels in the USA. Table 2: African shares in global population, GDP, primary energy use and CO2 emissions 2010 2050 2100
African continent Population 15% [15%-15%] 21% [19%-23%] 26% [22%-28%]
GDP 2% [2%-2%] 4% [3%-6%] 8% [5%-14%]
Primary energy use 6% [5%-6%] 8% [8%-8%] 14% [10%-18%]
CO2 emissions 4% [3%-4%] 7% [7%-8%] 14% [10%-19%]
Sub-Saharan Africa Population 12% [12%-12%] 20% [18%-21%] 30% [25%-33%]
GDP 1% [1%-2%] 5% [4%-6%] 15% [13%-18%]
Primary energy use 3% [3%-3%] 7% [3%-10%] 13% [3%-19%]
CO2 emissions 1% [1%-3%] 7% [2%-9%] 12% [3%-23%]
9.2 Changes in the energy system under climate policy
9.2.1 ChangesinenergyuseandCO2emissionsFigure 4 shows the energy demand and emission projections for both the baseline and the RefPol-450 scenario. Results for continental Africa and Sub-Saharan Africa are grouped together and only the differences between both scenarios are shown. Under baseline developments energy demand and related CO2 emissions steadily increase, as was already concluded in Section 3.1. Table 3 summarizes relevant climate policy indicators for Africa, and compares the results to the global average results. In the RefPol-450 scenario, emissions peak in 2020 in most models, with levels ranging between 1,400 and 1,900 Mt CO2. Notable exceptions are REMIND where emissions peak in 2030, and IMAGE Sub-Saharan Africa, where emissions steadily increase towards 2060, followed by a rapid decline. Between 2020 and 2050, emissions decrease with on average by 1% of the 2020 emissions per year (but with a very wide model range from -1% to 5% per year). The models project CO2 emissions in Africa going negative under the RefPol-450 scenario between 2040 and 2090, as a result of the application of bio-energy energy with carbon capture and storage (see Figure 5). Only in IMAGE Sub-Saharan Africa the CO2 emissions stay slightly above zero by 2100.
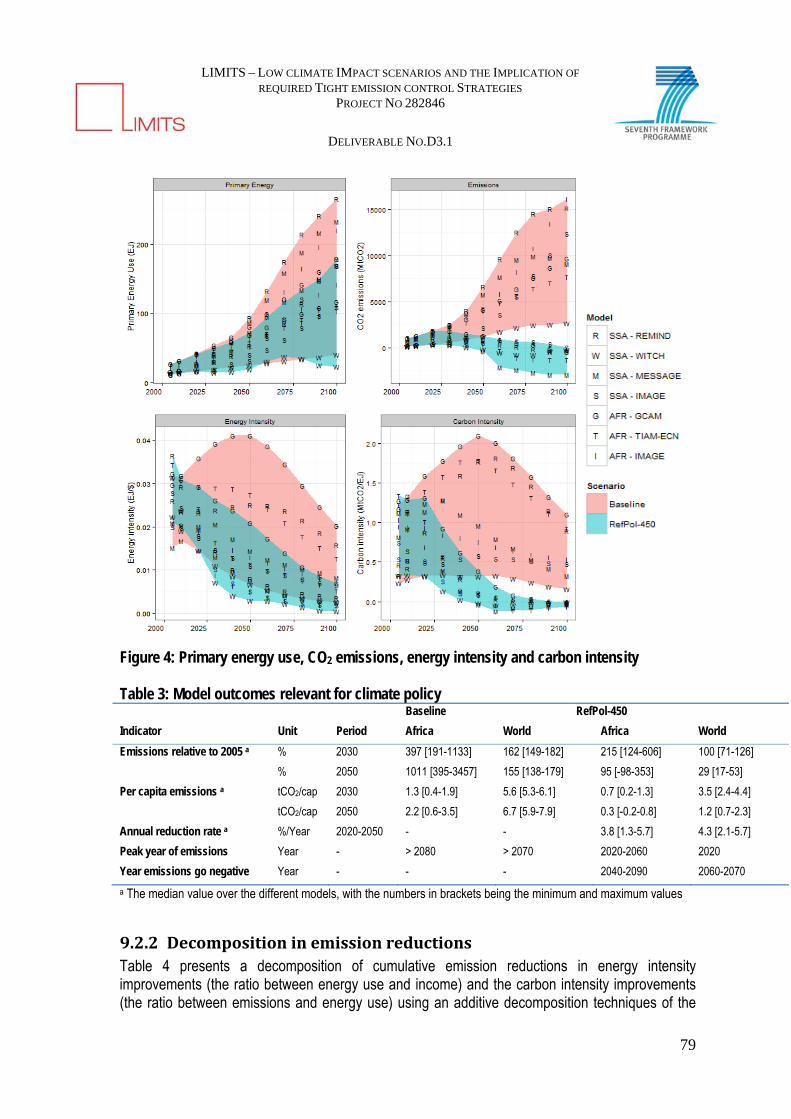
LIMITS – LOW CLIMATE IMPACT SCENARIOS AND THE IMPLICATION OF
REQUIRED TIGHT EMISSION CONTROL STRATEGIES PROJECT NO 282846
DELIVERABLE NO.D3.1
79
Figure 4: Primary energy use, CO2 emissions, energy intensity and carbon intensity Table 3: Model outcomes relevant for climate policy Baseline RefPol-450
Indicator Unit Period Africa World Africa World
Emissions relative to 2005 a % 2030 397 [191-1133] 162 [149-182] 215 [124-606] 100 [71-126]
% 2050 1011 [395-3457] 155 [138-179] 95 [-98-353] 29 [17-53]
Per capita emissions a tCO2/cap 2030 1.3 [0.4-1.9] 5.6 [5.3-6.1] 0.7 [0.2-1.3] 3.5 [2.4-4.4]
tCO2/cap 2050 2.2 [0.6-3.5] 6.7 [5.9-7.9] 0.3 [-0.2-0.8] 1.2 [0.7-2.3]
Annual reduction rate a %/Year 2020-2050 - - 3.8 [1.3-5.7] 4.3 [2.1-5.7]
Peak year of emissions Year - > 2080 > 2070 2020-2060 2020
Year emissions go negative Year - - - 2040-2090 2060-2070
a The median value over the different models, with the numbers in brackets being the minimum and maximum values
9.2.2 DecompositioninemissionreductionsTable 4 presents a decomposition of cumulative emission reductions in energy intensity improvements (the ratio between energy use and income) and the carbon intensity improvements (the ratio between emissions and energy use) using an additive decomposition techniques of the
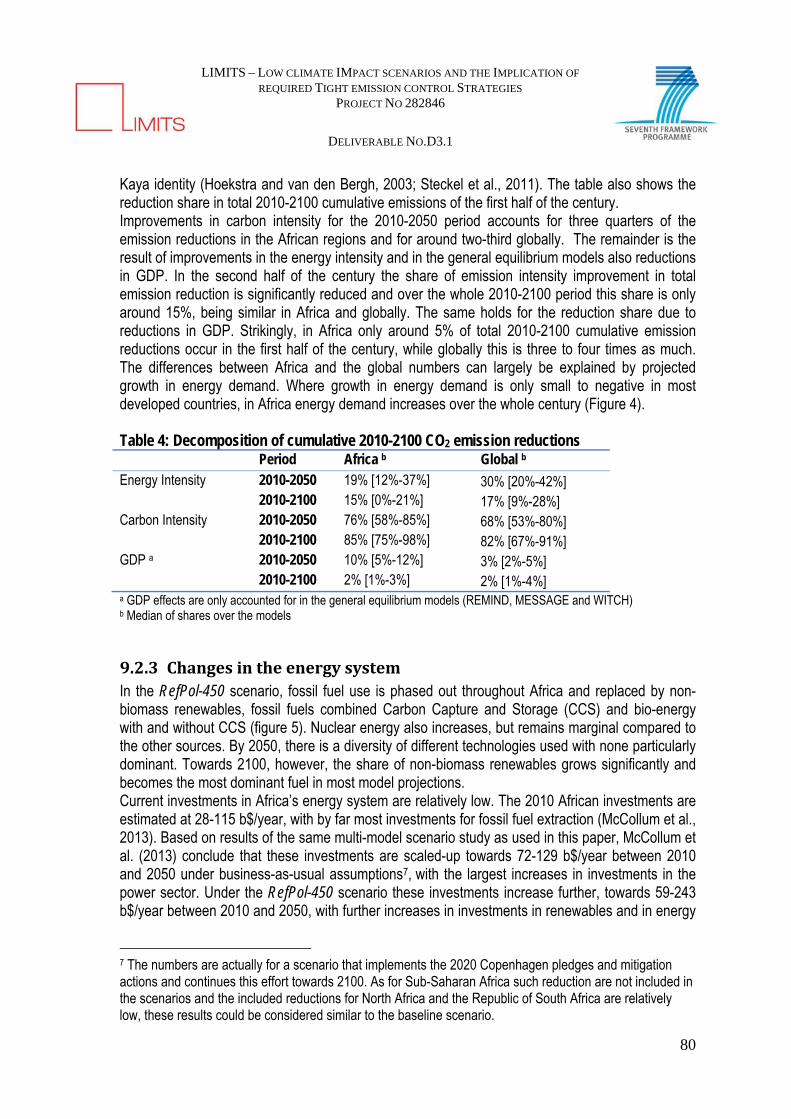
LIMITS – LOW CLIMATE IMPACT SCENARIOS AND THE IMPLICATION OF
REQUIRED TIGHT EMISSION CONTROL STRATEGIES PROJECT NO 282846
DELIVERABLE NO.D3.1
80
Kaya identity (Hoekstra and van den Bergh, 2003; Steckel et al., 2011). The table also shows the reduction share in total 2010-2100 cumulative emissions of the first half of the century. Improvements in carbon intensity for the 2010-2050 period accounts for three quarters of the emission reductions in the African regions and for around two-third globally. The remainder is the result of improvements in the energy intensity and in the general equilibrium models also reductions in GDP. In the second half of the century the share of emission intensity improvement in total emission reduction is significantly reduced and over the whole 2010-2100 period this share is only around 15%, being similar in Africa and globally. The same holds for the reduction share due to reductions in GDP. Strikingly, in Africa only around 5% of total 2010-2100 cumulative emission reductions occur in the first half of the century, while globally this is three to four times as much. The differences between Africa and the global numbers can largely be explained by projected growth in energy demand. Where growth in energy demand is only small to negative in most developed countries, in Africa energy demand increases over the whole century (Figure 4). Table 4: Decomposition of cumulative 2010-2100 CO2 emission reductions Period Africa b Global b Energy Intensity 2010-2050 19% [12%-37%] 30% [20%-42%] 2010-2100 15% [0%-21%] 17% [9%-28%] Carbon Intensity 2010-2050 76% [58%-85%] 68% [53%-80%] 2010-2100 85% [75%-98%] 82% [67%-91%] GDP a 2010-2050 10% [5%-12%] 3% [2%-5%] 2010-2100 2% [1%-3%] 2% [1%-4%] a GDP effects are only accounted for in the general equilibrium models (REMIND, MESSAGE and WITCH) b Median of shares over the models
9.2.3 ChangesintheenergysystemIn the RefPol-450 scenario, fossil fuel use is phased out throughout Africa and replaced by non-biomass renewables, fossil fuels combined Carbon Capture and Storage (CCS) and bio-energy with and without CCS (figure 5). Nuclear energy also increases, but remains marginal compared to the other sources. By 2050, there is a diversity of different technologies used with none particularly dominant. Towards 2100, however, the share of non-biomass renewables grows significantly and becomes the most dominant fuel in most model projections. Current investments in Africa’s energy system are relatively low. The 2010 African investments are estimated at 28-115 b$/year, with by far most investments for fossil fuel extraction (McCollum et al., 2013). Based on results of the same multi-model scenario study as used in this paper, McCollum et al. (2013) conclude that these investments are scaled-up towards 72-129 b$/year between 2010 and 2050 under business-as-usual assumptions7, with the largest increases in investments in the power sector. Under the RefPol-450 scenario these investments increase further, towards 59-243 b$/year between 2010 and 2050, with further increases in investments in renewables and in energy
7 The numbers are actually for a scenario that implements the 2020 Copenhagen pledges and mitigation actions and continues this effort towards 2100. As for Sub-Saharan Africa such reduction are not included in the scenarios and the included reductions for North Africa and the Republic of South Africa are relatively low, these results could be considered similar to the baseline scenario.

LIMITS – LOW CLIMATE IMPACT SCENARIOS AND THE IMPLICATION OF
REQUIRED TIGHT EMISSION CONTROL STRATEGIES PROJECT NO 282846
DELIVERABLE NO.D3.1
81
efficiency. It should be noted that in both scenarios, yearly investments are in the order of around 5% of total investments in the global energy system. Compared to their share in global GDP and energy use, this is relatively small.
Figure 5: African and global shares of total primary energy use per technology in 2050 and 2100. The bottom and top of the box represent the first and third quartiles, the band inside the box is the median and the whiskers represent 1.5 IQR deviation from the box. Data outside 1.5 IQR from the box are represented as individual dots.
9.3 Trade in primary energy sources Figure 6 shows projections in net trade in primary energy sources as percentage of primary energy use. In 2010, the volumes traded were very substantial compared to domestic use. Africa was a net exporters of oil and gas. On average, over 70% of the oil produced and 55% of the natural gas produced was exported outside the continent (IEA, 2011). In comparison, export of coal is only marginal. Clearly, Africa’s fossil fuel resources are not evenly distributed across the continent (BGR, 2013). Around 95% of the continent’s coal reserves are situated in the Republic of South Africa and more than 80% of the coal resources are situated in Botswana, Mozambique and Zimbabwe. For natural gas, around 74% of the combined reserves and resources are situated in only five countries, i.e. Algeria, Egypt, Libya, Nigeria and South Africa. Finally, 66% of the combined oil reserves and resources are situated in only four countries, mostly in Libya and Nigeria. Therefore, although the continent as a whole is a net energy exporter, many individual countries are not. Demand for coal and net trade increases steadily, although the model range are large. Furthermore, the models do not agree whether Africa is a net exporter or a net importer of coal,
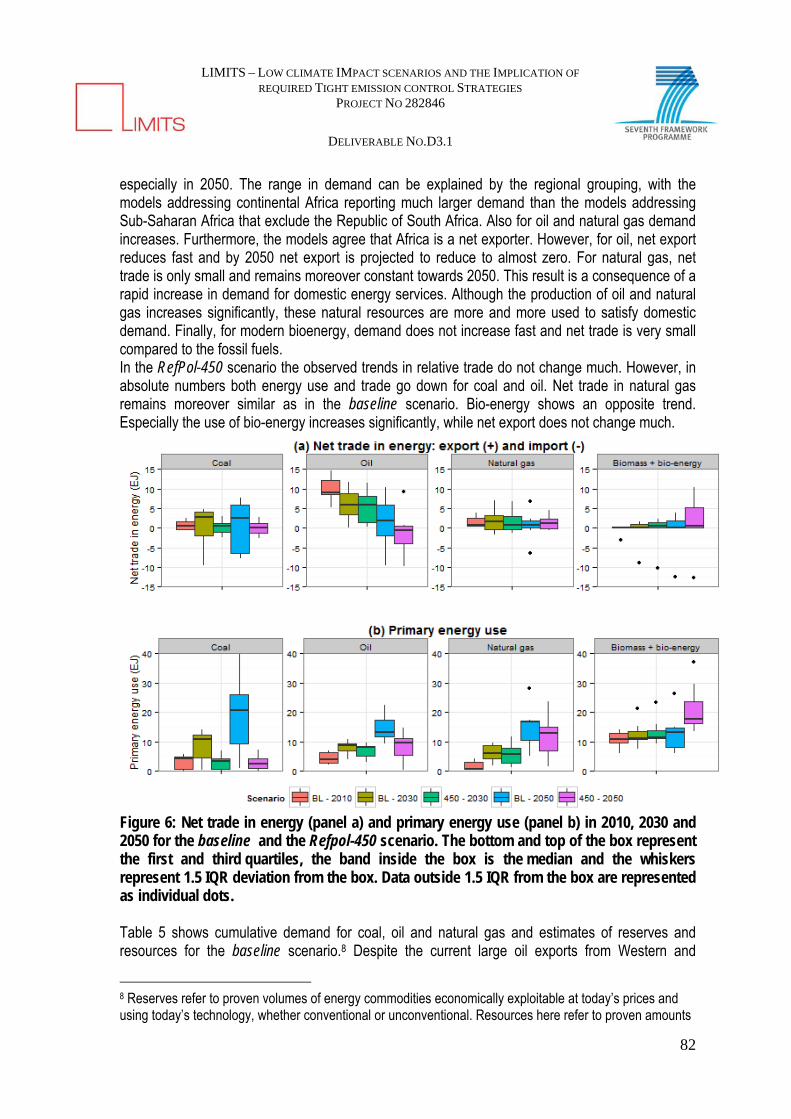
LIMITS – LOW CLIMATE IMPACT SCENARIOS AND THE IMPLICATION OF
REQUIRED TIGHT EMISSION CONTROL STRATEGIES PROJECT NO 282846
DELIVERABLE NO.D3.1
82
especially in 2050. The range in demand can be explained by the regional grouping, with the models addressing continental Africa reporting much larger demand than the models addressing Sub-Saharan Africa that exclude the Republic of South Africa. Also for oil and natural gas demand increases. Furthermore, the models agree that Africa is a net exporter. However, for oil, net export reduces fast and by 2050 net export is projected to reduce to almost zero. For natural gas, net trade is only small and remains moreover constant towards 2050. This result is a consequence of a rapid increase in demand for domestic energy services. Although the production of oil and natural gas increases significantly, these natural resources are more and more used to satisfy domestic demand. Finally, for modern bioenergy, demand does not increase fast and net trade is very small compared to the fossil fuels. In the RefPol-450 scenario the observed trends in relative trade do not change much. However, in absolute numbers both energy use and trade go down for coal and oil. Net trade in natural gas remains moreover similar as in the baseline scenario. Bio-energy shows an opposite trend. Especially the use of bio-energy increases significantly, while net export does not change much.
Figure 6: Net trade in energy (panel a) and primary energy use (panel b) in 2010, 2030 and 2050 for the baseline and the Refpol-450 scenario. The bottom and top of the box represent the first and third quartiles, the band inside the box is the median and the whiskers represent 1.5 IQR deviation from the box. Data outside 1.5 IQR from the box are represented as individual dots. Table 5 shows cumulative demand for coal, oil and natural gas and estimates of reserves and resources for the baseline scenario.8 Despite the current large oil exports from Western and
8 Reserves refer to proven volumes of energy commodities economically exploitable at today’s prices and using today’s technology, whether conventional or unconventional. Resources here refer to proven amounts
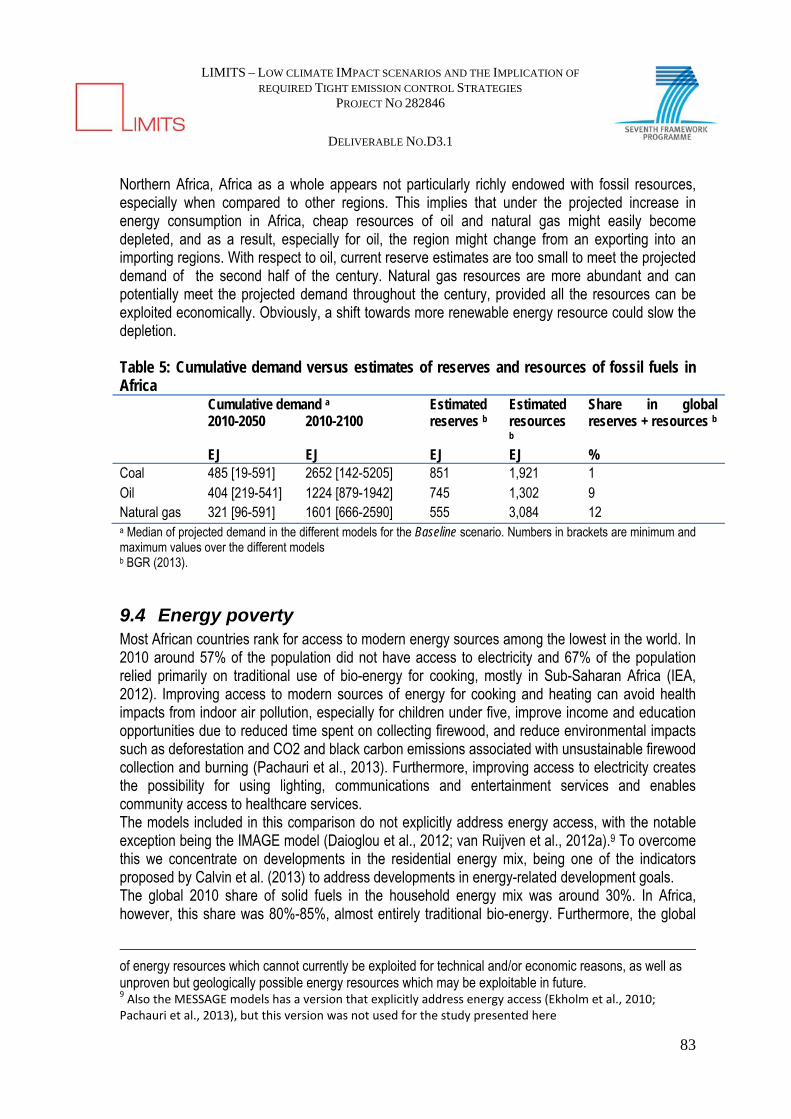
LIMITS – LOW CLIMATE IMPACT SCENARIOS AND THE IMPLICATION OF
REQUIRED TIGHT EMISSION CONTROL STRATEGIES PROJECT NO 282846
DELIVERABLE NO.D3.1
83
Northern Africa, Africa as a whole appears not particularly richly endowed with fossil resources, especially when compared to other regions. This implies that under the projected increase in energy consumption in Africa, cheap resources of oil and natural gas might easily become depleted, and as a result, especially for oil, the region might change from an exporting into an importing regions. With respect to oil, current reserve estimates are too small to meet the projected demand of the second half of the century. Natural gas resources are more abundant and can potentially meet the projected demand throughout the century, provided all the resources can be exploited economically. Obviously, a shift towards more renewable energy resource could slow the depletion. Table 5: Cumulative demand versus estimates of reserves and resources of fossil fuels in Africa Cumulative demand a Estimated
reserves b Estimated resources b
Share in global reserves + resources b 2010-2050 2010-2100
EJ EJ EJ EJ % Coal 485 [19-591] 2652 [142-5205] 851 1,921 1 Oil 404 [219-541] 1224 [879-1942] 745 1,302 9 Natural gas 321 [96-591] 1601 [666-2590] 555 3,084 12 a Median of projected demand in the different models for the Baseline scenario. Numbers in brackets are minimum and maximum values over the different models b BGR (2013).
9.4 Energy poverty Most African countries rank for access to modern energy sources among the lowest in the world. In 2010 around 57% of the population did not have access to electricity and 67% of the population relied primarily on traditional use of bio-energy for cooking, mostly in Sub-Saharan Africa (IEA, 2012). Improving access to modern sources of energy for cooking and heating can avoid health impacts from indoor air pollution, especially for children under five, improve income and education opportunities due to reduced time spent on collecting firewood, and reduce environmental impacts such as deforestation and CO2 and black carbon emissions associated with unsustainable firewood collection and burning (Pachauri et al., 2013). Furthermore, improving access to electricity creates the possibility for using lighting, communications and entertainment services and enables community access to healthcare services. The models included in this comparison do not explicitly address energy access, with the notable exception being the IMAGE model (Daioglou et al., 2012; van Ruijven et al., 2012a).9 To overcome this we concentrate on developments in the residential energy mix, being one of the indicators proposed by Calvin et al. (2013) to address developments in energy-related development goals. The global 2010 share of solid fuels in the household energy mix was around 30%. In Africa, however, this share was 80%-85%, almost entirely traditional bio-energy. Furthermore, the global
of energy resources which cannot currently be exploited for technical and/or economic reasons, as well as unproven but geologically possible energy resources which may be exploitable in future. 9 Also the MESSAGE models has a version that explicitly address energy access (Ekholm et al., 2010; Pachauri et al., 2013), but this version was not used for the study presented here

LIMITS – LOW CLIMATE IMPACT SCENARIOS AND THE IMPLICATION OF
REQUIRED TIGHT EMISSION CONTROL STRATEGIES PROJECT NO 282846
DELIVERABLE NO.D3.1
84
2010 share of electricity was 25%-28%, while in Africa the share was only around 7%-9%. According to the model projections, the share of solid fuels converges to the global average by 2100. However, in 2050 the projected share is still around 50%. In fact, in absolute terms the projected decrease in traditional bio-energy is much smaller and some models even project a small increase towards 2050, followed by a decrease to around 50% of the 2010 use in 2100 (see Figure 7). This trend is in line with earlier IMAGE and MESSAGE model projections that have explicitly looked at the number of people dependent on traditional fuels (mostly bio-energy) for cooking and heating (Pachauri et al., 2013; Van Vuuren et al., submitted). These studies conclude without explicitly policies to address energy poverty it is not likely that there will be a significant absolute change in the number of people using traditional fuels towards 2030 and only a small decrease towards 2050. Both studies also show that it is possible to increase access to modern energy services by explicit policies. Interestingly, the studies This increases from 8% in 2010 to approximately 30% by 2050 and 60% by 2100. The results also show that the share of solid fuels used (primarily traditional bio-energy) decrease further in Sub-Saharan Africa in an climate policy scenario, already by 2050, while the share of electricity use increases. This is consistent with the findings on the global level in most studies: electricity increases the flexibility of the system to respond to climate policy and coal use is reduced due to its high carbon content. Earlier studies looking specifically into the impact of climate policy on traditional bio-energy use concluded that climate policy could make the transition away from traditional bio-energy more difficult for the poorest households (Daioglou et al., 2012; Calvin et al., 2013; Lucas et al., 2013).
Figure 7: Residential energy use in the baseline and the RefPol-450 scenario. The bottom and top of the box represent the first and third quartiles, the band inside the box is the median and the whiskers represent 1.5 IQR deviation from the box. Data outside 1.5 IQR from the box are represented as individual dots. 10 Discussion
The current energy system in Africa (especially in Sub-Saharan Africa) is still in its infancy, with low levels of electrification and many people using solid fuels for cooking and heating. However, the baseline scenarios project an enormous increase in demand for energy services, a reflection of

LIMITS – LOW CLIMATE IMPACT SCENARIOS AND THE IMPLICATION OF
REQUIRED TIGHT EMISSION CONTROL STRATEGIES PROJECT NO 282846
DELIVERABLE NO.D3.1
85
general development. Without climate policy this increase in demand will most likely be supplied by fossil energy sources, with Africa’s share in global CO2 emissions increasing from 1%-4% in 2010 to 10%-23% in 2100. These numbers are in line with the findings of Calvin et al. (2013), who show a global share of 5%-20% in 2100.
10.1 Climate policy An important aspect of mitigation strategies is the timing of emission reductions. Earlier studies showed for China and India that periods of rapid expansion of the power sector and heavy industry represent an important moment to avoid lock-in into carbon intensive energy systems (Van Ruijven et al., 2012b; Lucas et al., 2013). Technologies are mostly replaced after their technical lifetime, which is 30-60 years for most fossil-powered plants (Riahi et al., 2012). However, increasing demand for energy services also increases demand for infrastructure expansion and thereby the possibility to choose between a fossil-intensive or a renewable energy future . Where expansion in Chinese energy infrastructure takes mainly place between now and 2030, the rapid growth phase in India was projected between 2020 and 2050 (Lucas et al., 2013). The models used here project rapid expansion in power generation in Africa accelerating in absolute terms towards 2060-2080 and subsequently decelerates, remaining positive throughout the century.10 This implies that in order to avoid a significant lock-in, the most critical period for climate mitigation is the 2030-2070 period where most of the energy system is built. Actually, ensuring the transition during this period, the investment peak might be even more crucial for climate policy than to peak emissions in 2020, as emissions by 2020 are projected to be still very low. It is unlikely for Africa to continue exporting fossil fuels in the long term, at least without substantial change in policy. The existing reserves, are likely to be insufficient to meet projected domestic demand, and although there are substantial additional resources, these resources are generally expensive and may have to compete with other regions which have large, inexpensive reserves available. Still, Africa can choose to invest heavily in the extraction of fossil fuel resources, import fossil fuels, or become independent of fossil fuels by making the transition towards more renewable energy resources in their energy mix.
10.2 Robustness of results The results presented here often have very large ranges across the various models, pointing at significant uncertainties. The models mostly agree with respects to broad trends and developments in shares of different sectors and energy carriers in the energy mix, while especially projections of total energy use and CO2 emissions differ largely. Furthermore, with respect to trade in coal and bioenergy the models not only show large difference in magnitude, but also with respect to the sign (Africa being a net exporter or importer). Finally, no significant differences between the results for continental Africa and Sub-Saharan Africa was found. There are several factors that contribute to this uncertainty, including: i) differences in regional definitions (see Table 1); ii) differences in base year data and data sources (see also Chaturvedi et al., 2012); iii) differences in projections for key drivers, including population, technology and GDP; and iv) differences in model dynamics. Growth rates of the key drivers – population and GDP –differ greatly over the models. Population differs by a factor 2 and GDP by a factor 6 in 2100, between the highest and the lowest baseline projection, undoubtedly the root of much of the ranges
10 Only MESSAGE and WITCH show a constant increase in primary energy demand.

LIMITS – LOW CLIMATE IMPACT SCENARIOS AND THE IMPLICATION OF
REQUIRED TIGHT EMISSION CONTROL STRATEGIES PROJECT NO 282846
DELIVERABLE NO.D3.1
86
we observe in this study. The growth rates are not endogenous to the different models, but taken from sources like the UN World Population projections (UNDESA, 2009, 2011) for population and OECD (2012) for GDP. The models represent the global energy system with various levels of sectoral and regional detail. Furthermore, they differ with respect to their methodological approaches (top-down CGE/econometric models and bottom-up energy system models), energy demand and supply sectors, and assumptions about techno-economic parameters. Differences in climate mitigation over the different models can partly be explained by their methodological approach. In general, under a carbon tax, top-down models tend to induce more demand side changes, while bottom-up models induce more carbon intensity reductions (van Vuuren et al., 2009; Johansson et al., 2014). (Steckel et al., 2013) 11 Conclusions
In this paper we have discussed Africa’s role in global energy developments towards 2100, using a multi-model scenario analysis. Important developments in the energy system include increasing energy demand for energy resources and the related energy mix, changes in the energy system as the result of global climate policy and trade in energy resources. The projected CO2 emissions for Africa show a very wide range, increasing from 1%-4% of the global total in 2010 to 10%-23% by 2100. As a result of the large growth in population and economic development in Africa, as projected in the different models, energy demand is set to grow significantly, with on average 2.5%/year. With the current energy system largely dominated by the use of traditional bio-energy, towards 2100 Africa’s energy system might converge to an energy mix similar to the global average, with high shares of fossil fuels and electricity use. This means that emissions are likely to increase much faster than the global average. Still given the low starting point, emissions only start to become really important from a global perspective after 2050. Traditional bio-energy is likely to remain an important energy sources in Africa for decades to come. The current energy mix in Africa is dominated by traditional fuel use for cooking and heating. Other sources of primary energy gain importance towards 2050. Nevertheless, in absolute terms traditional bio-energy remains a relevant source for the poorest part of the population. In other words, to completely phase out solid fuel use for cooking and heating and increase access to electricity to global levels, specific policies addressing energy poverty are required. Although Africa is currently a large net exporter of oil and gas, towards 2050 the continent most likely needs most of its resources to meet its rapidly growing domestic demand. Where it is a common perception that Africa can become a major player in global energy provision –both fossil (oil and gas) and renewable (bio-energy) – all models project a decrease of oil exports to around zero in 2050 and a stagnation of natural gas exports at current low levels. Furthermore, no significant export in bio-energy is projected by the models. The major reason is fast developments in African energy system and the related rapid increase in domestic energy consumption. As part of global climate policy that aims for reaching the 2oC target, Africa needs to start mitigating its emissions around 2030. Under global cost-effective assumption most models project a peak in Africa’s CO2 emissions already around 2020. However, until 2030 the expansion of energy demand in Africa is relative small. Only after 2030 large scale development takes off, which lasts until approximately 2070. The rapid expansion of the industrial and the power sector creates large mitigation potential, as energy system investments can be curbed towards more efficient and low-carbon technologies. This makes the 2030-2070 period is a critical period for climate mitigation, while mature and reasonably priced renewable energy sources are required to
LIMITS – LOW CLIMATE IMPACT SCENARIOS AND THE IMPLICATION OF
REQUIRED TIGHT EMISSION CONTROL STRATEGIES PROJECT NO 282846
DELIVERABLE NO.D3.1
87
make the transition. Furthermore, it may be more important to make sure to capture the investment peak with climate policy than to peak emissions in 2020.
Acknowledgements The research presented in this paper was funded by the Dutch ministry of Foreign Affairs, Directorate General of Trade and International Cooperation. Furthermore, the analysis builds on the massive volume of the work carried out in the LIMITS project, funded from the European Union Seventh Framework Programme FP7/2007–2013 under grant agreement no. 282846. 12 References
Bailis, R., Ezzati, M., Kammen, D.M., 2005. Mortality and Greenhouse Gas Impacts of Biomass and Petroleum Energy Futures in Africa. Science 308 (5718): 98-103.
Bazilian, M., Nussbaumer, P., Rogner, H.-H., Brew-Hammond, A., Foster, V., Pachauri, S., Williams, E., Howells, M., Niyongabo, P., Musaba, L., Gallachóir, B.Ó., Radka, M., Kammen, D.M., 2012. Energy access scenarios to 2030 for the power sector in sub-Saharan Africa. Utilities Policy 20 (1): 1-16.
BGR, 2013. Energy study 2013. Reserves, resources and availability of energy resources. Federal Institute for Geosciences and Natural Resources (BGR), Hannover, Germany.
Bosetti, V., Carraro, C., Galeotti, M., Massetti, E., Tavoni, M., 2006. A world induced technical change hybrid model. The Energy Journal 27: 13-38.
Bosetti, V., Tavoni, M., De Cian, E., Sgobbi, A., 2009. The 2008 WITCH model: new model features and baseline. Nota di lavoro//Fondazione Eni Enrico Mattei: Sustainable development.
Calvin, K., Clarke, L., Krey, V., Blanford, G.J., Jiang, K., Kainuma, M., Kriegler, E., Luderer, G., Shukla, P.R., 2012. The Role of Asia in Mitigating Climate Change: Results from the Asia Modeling Exercise. Energy Economics 34 (Supplement 3): S251-S260.
Calvin, K., 2013. The Latin American Modeling Project (LAMP). Presented at the CESM SDWG Meeting, 19 February 2013. http://www.cesm.ucar.edu/working_groups/Societal/Presentations/13/calvin.pdf.
Calvin, K.V., Pachauri, S., De Cian, E., Mouratiadou, I., 2013. The effect of African growth on future global energy, emissions, and regional development. Climatic Change: 1-17.
Calvin, K.V.e.a., 2011. GCAM wiki Documentation, Wikipedia. Chaturvedi, V., Waldhoff, S., Clarke, L., Fujimori, S., 2012. What are the starting points? Evaluating base-
year assumptions in the Asian Modeling Exercise. Energy Economics 34, Supplement 3 (0): S261-S271.
Daioglou, V., van Ruijven, B.J., van Vuuren, D.P., 2012. Model projections for household energy use in developing countries. Energy 37 (1): 601-615.
Ekholm, T., Krey, V., Pachauri, S., Riahi, K., 2010. Determinants of household energy consumption in India. Energy Policy 38 (10): 5696-5707.
FEEM, 2011. Low Climate Impacy Scenarios and the Implications of required Tight Emission Control Strategies.
Herreras Martínez, S., Koberle, A., Rochedob, P., Schaeffer, R., Lucena, A., Szklo, A., Ashina, S., van Vuuren, D.P., Submitted. Possible energy futures for Brazil and the rest of Latin America in conservative and stringent mitigation pathways up to 2050. Technological Forecasting and Social Change.
Hoekstra, R., van den Bergh, J.C.J.M., 2003. Comparing structural decomposition analysis and index. Energy Economics 25 (1): 39-64.
IEA, 2011. World Energy Outlook 2011. International Energy Agency, Paris. IEA, 2012. World Energy Outlook 2012. International Energy Agency, Paris. Johansson, D.J.A., Lucas, P.L., Weitzel, M., Ahlgren, E.O., Bazaz, A.B., Chen, W., den Elzen, M.G.J.,
Ghosh, J., Grahn, M., Liang, Q.-M., Peterson, S., Pradhan, B.K., van Ruijven, B.J., Shukla, P.R.,

LIMITS – LOW CLIMATE IMPACT SCENARIOS AND THE IMPLICATION OF
REQUIRED TIGHT EMISSION CONTROL STRATEGIES PROJECT NO 282846
DELIVERABLE NO.D3.1
88
van Vuuren, D.P., Wei, Y.M., 2014. Multi-model comparison of the economic and energy implications for China and India in an international climate regime. Mitigation and Adaptation Strategies for Global Change: 1-25.
Kober, T., van der Zwaan, B., Rösler, H., 2014. Emission Certficate Trade and Costs under Regional Burden-Sharing Regimes for a 2oC Climate Change Control Target. Climate Change Economics 5 (1): 1440001.
Kriegler, E., Tavoni, M., Aboumahboub, T., Luderer, G., Calvin, K., DeMaere, G., Krey, V., Riahi, K., Rösler, H., Schaeffer, M., van Vuuren, D.P., 2014a. What does the 2°C target imply for a global climate agreement in 2020? The LIMITS study on Durban Platform scenarios. Climate Change Economics.
Kriegler, E., Weyant, J., Blanford, G., Krey, V., Clarke, L., Edmonds, J., Fawcett, A., Luderer, G., Riahi, K., Richels, R., Rose, S., Tavoni, M., Vuuren, D., 2014b. The role of technology for achieving climate policy objectives: overview of the EMF 27 study on global technology and climate policy strategies. Climatic Change: 1-15.
Loulou, R., 2008. ETSAP-TIAM: the TIMES integrated assessment model. part II: mathematical formulation. Computational Management Science 5 (1-2): 41-66.
Loulou, R., Labriet, M., 2008. ETSAP-TIAM: the TIMES integrated assessment model Part I: Model structure. Computational Management Science 5 (1-2): 7-40.
Lucas, P.L., Shukla, P.R., Chen, W., van Ruijven, B.J., Dhar, S., den Elzen, M.G.J., van Vuuren, D.P., 2013. Implications of the international reduction pledges on long-term energy system changes and costs in China and India. Energy Policy 63: 1032-1041.
Luderer., G., Leimbach, M., Bauer, N., Kriegler, E., 2011. Description of the ReMIND-R model. McCollum, D., Nagai, Y., Riahi, K., Marangoni, G., Calvin, K., Pietzcker, R., van Vliet, J., van der Zwaan, B.,
2013. Energy Investments under climate policy: a comparison of global models. Climate Change Economics 4 (4): 1340010.
Meinshausen, M., Hare, B., Wigley, T.M.L., Van Vuuren, D., Den Elzen, M.G.J., Swart, R., 2006. Multi-gas emissions pathways to meet climate targets. Climatic Change 75 (1-2): 151-194.
MNP, 2006. Integrated modelling of global environmental change. An overview of IMAGE 2.4, in: Bouwman, A.F., Kram, T., Klein Goldewijk, K. (Eds.). Netherlands Environmental Assessment Agency (MNP), Bilthoven, the Netherlands.
OECD, 2012. OECD Environmental outlook to 2050: the consequences of inaction. Organisation for Economic Co-operation and Development, OECD Publishing.
Pachauri, S., van Ruijven, B.J., Nagai, Y., Riahi, K., van Vuuren, D.P., Brew-Hammond, A., Nakicenovic, N., 2013. Pathways to achieve universal household access to modern energy by 2030. Environmental Research Letters 8 (2): 024015.
Reddy, B.S., Balachandra, P., 2006. Climate change mitigation and business opportunities – the case of the household sector in India. Energy for Sustainable Development 10 (4): 59-73.
Riahi, K., Grübler, A., Nakicenovic, N., 2007. Scenarios of long-term socio-economic and environmental development under climate stabilization. Technological Forecasting and Social Change 74 (7): 887-935.
Riahi, K., Dentener, F., Gielen, D., Grubler, A., Jewell, J., Klimont, Z., Krey, V., McCollum, D., Pachauri, S., Rao, S., van Ruijven, B., van Vuuren, D.P., Wilson, C., 2012. Chapter 17 - Energy Pathways for Sustainable Development, Global Energy Assessment - Toward a Sustainable Future, Cambridge University Press, Cambridge, UK and New York, NY, USA and the International Institute for Applied Systems Analysis, Laxenburg, Austria, pp. 1203-1306.
Riahi, K., Kriegler, E., Johnson, N., Bertram, C., den Elzen, M., Eom, J., Schaeffer, M., Edmonds, J., Isaac, M., Krey, V., Longden, T., Luderer, G., Méjean, A., McCollum, D.L., Mima, S., Turton, H., van Vuuren, D.P., Wada, K., Bosetti, V., Capros, P., Criqui, P., Hamdi-Cherif, M., Kainuma, M., Edenhofer, O., 2014. Locked into Copenhagen pledges — Implications of short-term emission targets for the cost and feasibility of long-term climate goals. Technological Forecasting and Social Change (0).
LIMITS – LOW CLIMATE IMPACT SCENARIOS AND THE IMPLICATION OF
REQUIRED TIGHT EMISSION CONTROL STRATEGIES PROJECT NO 282846
DELIVERABLE NO.D3.1
89
Rogelj, J., Hare, W., Lowe, J., van Vuuren, D.P., Riahi, K., Matthews, B., Hanaoka, T., Jiang, K., Meinshausen, M., 2011. Emission pathways consistent with a 2 °C global temperature limit. Nature climate change 1: 413–418.
Steckel, J.C., Jakob, M., Marschinski, R., Luderer, G., 2011. From carbonization to decarbonization?—Past trends and future scenarios for China's CO2 emissions. Energy Policy 39 (6): 3443-3455.
Steckel, J.C., Brecha, R.J., Jakob, M., Strefler, J., Luderer, G., 2013. Development without energy? Assessing future scenarios of energy consumption in developing countries. Ecological Economics 90: 53-67.
Tavoni, M., Kriegler, E., Aboumahboub, T., Calvin, K., De Maere, G., Jewell, J., Kober, T., Lucas, P.L., Luderer, G., McCollum, D., Marangoni, G., Riahi, K., van Vuuren, D.P., 2013. The distribution of the major economies’ effort in the Durban platform scenarios. Climate Change Economics 4 (4): 1340009.
UN, 2013. Composition of macro geographical (continental) regions, geographical sub-regions, and selected economic and other groupings. Accessed June 13, 2014. United Nations Statistics Division.
UNCTAD, 2012. Economic development in Africa Report 2012: Structural transformation and sustainable development in Africa. United Nations Conference on Trade And Development, New York and Geneva.
UNDESA, 2009. World Population Prospects: The 2008 Revision. Population Division of the Department of Economic and Social Affairs of the United Nations Secretariat, New York.
UNDESA, 2011. World Population Prospects: The 2010 Revision. Population Division of the Department of Economic and Social Affairs of the United Nations Secretariat.
UNECA, 2011. Fossil fuels in Africa in the context of a carbon constrained world. United Nations Economic Commission for Africa (UNECA), African Climate Policy Centre (ACPC).
UNFCCC, 2009. Copenhagen Accord, Draft decision COP15. Retrieved 15 March 2010, from http://unfccc.int/resource/docs/2009/cop15/eng/l07.pdf.
UNFCCC, 2010a. Information provided by Parties relating to Appendix I of the Copenhagen Accord, Retrieved March 15, 2010. http://unfccc.int/home/items/5264.php.
UNFCCC, 2010b. Information provided by Parties relating to Appendix II of the Copenhagen Accord, Retrieved March 15, 2010. http://unfccc.int/home/items/5264.php.
van Ruijven, B.J., Schers, J., van Vuuren, D.P., 2012a. Model-based scenarios for rural electrification in developing countries. Energy 38 (1): 386-397.
Van Ruijven, B.J., van Vuuren, D.P., van Vliet, J., Mendoza Beltran, A., Deetman, S., den Elzen, M.G.J., 2012b. Implications of greenhouse gas emission mitigation scenarios for the main Asian regions. Energy Economics 34 (Supplement 3): S459-S469.
Van Sluisveld, M.A.E., Gernaat, D.E.H.J., Ashina, S., Calvin, K.V., Garg, A., Isaac, M., Lucas, P.L., Mouratiadou, I., Otto, S.A.C., Rao, S., Shukla, P.R., van Vliet, J., van Vuuren, D.P., 2013. A multi-model analysis of post-2020 mitigation efforts of five major economies. Climate Change Economics 4 (4): 1340012.
van Vuuren, D.P., 2007. Energy systems and climate policy - Long-term scenarios for an uncertain future, Science, Technology and Society. Utrecht University, Utrecht.
van Vuuren, D.P., den Elzen, M.G.J., van Vliet, J., Kram, T., Lucas, P., Isaac, M., 2009. Comparison of different climate regimes: the impact of broadening participation. Energy Policy 37 (12): 5351-5362.
Van Vuuren, D.P., Kok, M.T.J., Lucas, P.L., Prins, A.G., Alkemade, R., van den Berg, M., Bouwman, A.F., van der Esch, S., Jeuken, M., Kram, T., Stehfest, E., submitted. Pathways to achieve a set of ambitious global sustainability objectives by 2050. Explorations using the IMAGE integrated assessment model. Technological Forecasting and Social Change.
Weyant, J., Knopf, B., De Cian, E., Keppo, I., van Vuuren, D.P., 2013. Introduction to the EMF28 study on scenarios for transforming the European energy system. Climate Change Economics 4 (supp01): 1302001.
LIMITS – LOW CLIMATE IMPACT SCENARIOS AND THE IMPLICATION OF
REQUIRED TIGHT EMISSION CONTROL STRATEGIES PROJECT NO 282846
DELIVERABLE NO.D3.1
90
Annx 4: Development pathways for China Jiang Kejuna, He Chenmina, Zhuang Xinga, Liu Jiaa, Gao Jib
a Energy Research Institute, Energy System Analysis Research Centre, B1505, Jia.11, Muxidibeili, Xicheng District, Beijing , 100038 , China b Chinese Academy of Agriculture Science, No.12, Zhongguancunnandajie, Haidian Dist., Beijing 100081, China

LIMITS – LOW CLIMATE IMPACT SCENARIOS AND THE IMPLICATION OF
REQUIRED TIGHT EMISSION CONTROL STRATEGIES PROJECT NO 282846
DELIVERABLE NO.D3.1
91
Contents1 Introduction ...................................................................................................................... 92
2 Methodology ..................................................................................................................... 92
2.1 Modelling framework ................................................................................... 92 2.2 Scenarios ....................................................................................................... 94
3 Policies .............................................................................................................................. 95
3.1 Policies implemented in China’s Five Year Plan ......................................... 96 3.1.1 Energy efficiency under the 11th 5-year plan .......................................................................... 96 3.1.2 Renewable energy development and nuclear energy development plan. ................................. 99
3.2 National program on Climate Change ........................................................ 101 3.2.1 Other policies and administrative measures...........................................................................102 3.2.2 Energy and Climate Targets ...................................................................................................103
4 Model results .................................................................................................................. 107
4.1 Economic development ............................................................................... 107 4.2 Population development.............................................................................. 109 4.3 Business as Usual scenario ......................................................................... 110
4.3.1 Energy supply and demand .....................................................................................................110 4.3.2 Emissions development ...........................................................................................................113
4.4 The 2 degree scenario ................................................................................. 114 4.4.1 Energy supply and demand .....................................................................................................114 4.4.2 Emissions development ...........................................................................................................117
4.5 CO2 emissions in all scenarios .................................................................... 119 5 Comparison of results with global models .................................................................. 120
6 Discussion ...................................................................................................................... 127
6.1 Key factors for the 2 degree scenario ......................................................... 127 6.2 Policy analysis for a low-carbon scenario .................................................. 135
7 Conclusions .................................................................................................................... 137
8 References ...................................................................................................................... 139

LIMITS – LOW CLIMATE IMPACT SCENARIOS AND THE IMPLICATION OF
REQUIRED TIGHT EMISSION CONTROL STRATEGIES PROJECT NO 282846
DELIVERABLE NO.D3.1
92
13 Introduction
In December, 2009, The Copenhagen Accord declared that deep cuts in global emissions are required to hold the increase in global temperature below 2 degrees Celsius. At the climate conference in Cancun one year later, parties decided to hold the increase in global average temperature below 2°C above preindustrial levels and left open the option for strengthening the long-term global goal on the basis of best available scientific knowledge including in relation to a global average temperature rise of 1.5°C. The Copenhagen Accord called for an assessment that would consider strengthening the long-term goal including temperature rises of 1.5 degrees. Consequently the IPCC AR5 called research communities to work on an assessment by modelling teams on the emission pathway and feasibilities to reach the global target. Recently several global emission scenario studies present energy and emission scenarios focusing on the 2°C target, which requires global emission must peak at latest before 2020, such as RoSE, EMPARA, and the LIMITS projects. However the commitments in Copenhagen Accord are not matching with the global 2°C target scenarios (UNEP, 2010, 2011, 2012, 2013). Therefore, further efforts from countries are needed. It is essential to make additional analysis at country level to see whether it is possible to mitigate CO2 emission to follow the 2°C target pathway. This report presents the modelling results based on IPAC modelling team in the Energy Research Institute (ERI) on China’s energy and emission scenario analysis in the background of global 2 degree scenario. Emission from energy in China over passed United States around 2006 and it accounts for around 24% of global emission in 2010, 29% by 2012 (Jos G.J et al, 2013). Due to rapid economy development, it is expected that CO2 emissions would increase significantly in the coming decades (Kejun, et, al, 2008; Kejun et al, 2009). This brings China to a very big challenge of reducing largely CO2 emissions after 2030. Additional efforts should be done in the rest of the world. What happens in China will serve as a model for other countries. If China could make emission reduced to support the global 2°C pathway, most of the other countries may also have the potential to carry out similar actions. 14 Methodology
14.1 Modelling framework
In this study, we use the linked Integrated Policy Assessment Model of China (IPAC) to make a quantitative analysis, covering both the global scenario analysis and China’s national emission scenario analysis. IPAC is an integrated model developed by the Energy Research Institute (ERI) in Beijing to analyse global, national and regional energy and environment policies. ERI has been doing long-term research in developing and utilizing energy model since 1992 (Jiang et al, 1998; Jiang et al, 2006a; Kejun et al, 2009).

LIMITS – LOW CLIMATE IMPACT SCENARIOS AND THE IMPLICATION OF
REQUIRED TIGHT EMISSION CONTROL STRATEGIES PROJECT NO 282846
DELIVERABLE NO.D3.1
93
In order to analyse a global emission scenario and China’s emission scenario, here we use three models (a global model and two national models). These are: the IPAC-Emission global model, IPAC-CGE model and IPAC-AIM/technology model. The links among the three models are shown in Figure 1. These modules in IPAC are currently soft-linked, which means the output of one module is used as the input of another module.
Figure 1. Links among the three modules of the Chinese model used for the research IPAC-Emission model is a global model inside IPAC family, which currently covers 9 regions and it is being extended to 22 regions. Because IPAC-emission model focuses on energy and land use activities, in order to simulate other gases emissions, the model was revised to cover the analysis for HFC, PHC, SF6, CH4 and N2O. The results of the study for EMF-21 were used here (Jiang, et al., 2006b). Data for the abatement curve for HFC, PFC and SF6 emission from industry process and other sources were used in IPAC model. The current version of IPAC-AIM/technology model includes 42 sectors and their products, and nearly 600 technologies, including existing and potential technologies. IPAC-AIM/technology is the main component of the IPAC model (Jiang et al, 1998). IPAC-AIM/technology model is based on a cost-minimization principle, i.e. technologies with the least costs would be selected to provide the energy service. IPAC-SGM is a general equilibrium model (CGE model) for China. It is mainly responsible for analysing the economic impacts of different energy and environmental policies, and can analyse the mid- and long-term energy and environment scenarios.
Methodology framework
Global ModelIPAC-Emission
Energy technology modelIPAC-AIM/technology
Energy economic modelIPAC-CGE
Global energy demandand supplyGlobal GHG EmissionGlobal TargetBurden sharingEnergy import/exportEnergy PriceReduction cost
Future economic sector detailEnergy intensive industryReduction cost
China energy and emissionscenarios
Energy demand by sectorsEnergy supply Reduction cost

LIMITS – LOW CLIMATE IMPACT SCENARIOS AND THE IMPLICATION OF
REQUIRED TIGHT EMISSION CONTROL STRATEGIES PROJECT NO 282846
DELIVERABLE NO.D3.1
94
IPAC-SGM divides the whole economic system into household, government, agriculture, energy and other production sectors. Now there are 42 sectors inside IPAC-SGM model. Scenario setting for China comes from relative studies such as GDP, population, sector outputs etc. However, the IPAC modelling team also perform its own studies on these parameters by using IPAC-SGM (a CGE type of model), and its own population model. Economy activities are becoming one of the key research topics in IPAC modelling studies due to the potential big change in economy development. Trends in sector development are crucial for energy and emission scenarios in the modelling studies. Energy intensive sectors, such as ferrous metal manufacture, non-ferrous metal manufacture, building material manufacture and chemical industry account for 50% of total final energy use in China. Future changes in these sectors are very important for scenario analysis. By using IPAC modelling framework, we made scenario for these economic activities. Compared with global model data, the national analysis on economy development could well reflect national experts’ view points, which normally has quite big difference with the global projection on China’s GDP growth. The regional analysis presents much more sight insight into the effects of structural economic change (e.g. energy demand and emissions from economic structure change), when in many case global model have difficulties to deal with. This is very important for scenario analysis in China because China is undergoing rapid economy development and changing its economic framework. The quick change in the pattern of economy development means much high social energy conservation rate, which could be different with historical trends in China. This also brings large uncertainty for China’s future energy demand and CO2 emissions scenario. Many global models use AEEI as key factor for energy demand factor, and therefore need to pay more attention into that.
14.2 Scenarios The first scenario used in this study is the business-as-usual scenario (BaU) which is a scenario with no climate policies under a high GDP growth rate assumption. A key driver to this scenario is economic development. According with the results of previous scenario analyses, this scenario reflects the economic development path in the future 50 years. The population will grow according to the national population plan, i.e. reaching the population peak of 1.47 billion between 2040 and 2050. The second scenario studied is the Low Carbon Scenario (LC) under the high GDP growth rate assumption. This scenario considers factors of national energy security, domestic environment, and low carbon development strategy. This is the low-carbon emission scenario which can be realized by domestic policies. This scenario mainly takes into account the domestic social and economic development requirements as well as the environment development demand. Factors such as enhanced technology improvement, change in economic development mode, shift in consumption behaviour, and realizing
LIMITS – LOW CLIMATE IMPACT SCENARIOS AND THE IMPLICATION OF
REQUIRED TIGHT EMISSION CONTROL STRATEGIES PROJECT NO 282846
DELIVERABLE NO.D3.1
95
low-energy and low GHG emissions have been considered. This is an energy and emission scenario that can be realized by domestic unilateral efforts. The third scenario is the Enhanced Low Carbon Scenario (ELC) under the high growth rate assumption, taking into account that in the shared vision of global concurrent efforts to mitigation climate change, China can make further GHG emission reduction contributions. In this global efforts scenario, the technology is to be enhanced to a greater level; the cost for key technologies will have a sharper decrease; the policies in the developed countries will expand to developing countries. Additionally, under this scenario, China increases the investment in low-carbon economy, and better uses the low-carbon opportunities to enhance the economic development after 2030 when China becomes the biggest economies in the world. Meanwhile, China will become a global leader in developing some of the technologies, such as clean coal and CCS. The fourth scenario is the 2 degree scenario. This scenario is based on the global emission pathway to reach the 2 degree target. The IPAC-Global model’s scenario for 2 degree global scenario was used here, then a per capita CO2 emission convergence method was used to see the China’s CO2 emission pathway under the global emission scenario. The national technology model was also used to analyse the feasibility for China of reaching the emission pathway. By using this modelling analysis, we can see much more detail into economic activities, energy activities, technology progress and lifestyle change. The 2 degree scenario was developed based on the Enhanced low carbon scenario by pushing further actions. Table 1. Descriptions of the four scenarios
Scenarios Abbreviation Descriptions
BaU under high growth rate
BaU
Annual average growth rate between 2005 and 2050 is set to be 7.5%, representing the high economic growing prospect in previous researches. Characterized by high consumption mode, global investment, caring for environment but treatment after pollution, huge investment for technologies and having a rapid technology improvement.
Low Carbon Scenario
LC
Considering the sustainable development, energy security, and economic competitiveness factors. Fully considering energy saving, renewable energy and nuclear power generation developments, and the CCS technology. Having certain amount of investment in low carbon economy development under the condition of full development of Chinese economy.
Enhanced Low Carbon Scenario
ELC
Concurrent global mitigation, realizing a low GHG stabilization target. Main mitigation technologies will be further developed, and have a faster decrease in cost. China will have more investment in low carbon economy. CCS will be used to a much larger scale.
2 degree scenario 2 degree More energy conservation, natural gas renewable energy, nuclear, CCS etc.
15 Policies
China is very vulnerable to the adverse impact of climate change. Starting in 2011, the country has been hit by a string of extreme weather and climate events, including the low-temperature freezing rain and snow in south China, spring and summer droughts in the

LIMITS – LOW CLIMATE IMPACT SCENARIOS AND THE IMPLICATION OF
REQUIRED TIGHT EMISSION CONTROL STRATEGIES PROJECT NO 282846
DELIVERABLE NO.D3.1
96
middle and lower reaches of the Yangtze River, rainstorms and floods in the south, typhoons in coastal areas, autumn rains in western China and serious waterlogging in Beijing. These weather and climate disasters have impacted China's economic and social development as well as people's lives and property in a large degree. In 2011 alone, natural disasters affected 430 million people and caused direct economic losses of 309.6 billion yuan. The Chinese government gives great importance to the issue of climate change. In 2011, the Fourth Session of the Eleventh National People's Congress approved the Outline of the 12th Five-Year Plan for National Economic and Social Development, which defines the objectives, tasks and general framework for China's economic and social development during the 12th Five-Year Plan period. The Outline underlines the importance of climate change and integrates measures for addressing it into the country's mid-term and long-term plans for economic and social development. It sets binding targets to reduce energy consumption per unit of GDP by 16 percent, cut CO2 emissions per unit of GDP by 17 percent, and raise the proportion of non-fossil fuels in the overall primary energy mix to 11.4 percent. It defines the objectives, tasks and policy orientation of China's response to climate change over the next five years and identifies key tasks, including controlling greenhouse gas emissions, adapting to climate change, and strengthening international cooperation. In the Plan there is also a full paragraph detailing China’s commitment to international cooperation and the UN-led climate negotiation process, including concerns of climate finance and technology transfer. The Plan also discusses the need to implement more climate adaptation-related policies, such as greater preparedness for extreme weather events. To fulfil the country's objectives and tasks in addressing climate change during the 12th Five-Year Plan period and promote green and low-carbon development, the State Council has issued a number of important policy documents, including the Work Plan for Controlling Greenhouse Gas Emissions During the 12th Five-Year Plan Period and the Comprehensive Work Plan for Energy Conservation and Emission Reduction During the 12th Five-Year Plan Period, to strengthen planning and guidance in addressing climate change. Relevant departments and local governments have actively addressed climate change and made remarkable progress in this regard. China continues to play a positive and constructive role in international climate change negotiations and pushed for positive outcomes at the Durban Climate Change Conference, thereby making a significant contribution to addressing global climate change.
15.1 Policies implemented in China’s Five Year Plan
15.1.1 Energyefficiencyunderthe11th5‐yearplan The 16th CPC National Congress advanced that China will achieve the objective of building a society that is well-off in every aspect by 2020. Along with the increase of population and the acceleration of industrialization and urbanization, the rapid

LIMITS – LOW CLIMATE IMPACT SCENARIOS AND THE IMPLICATION OF
REQUIRED TIGHT EMISSION CONTROL STRATEGIES PROJECT NO 282846
DELIVERABLE NO.D3.1
97
development of heavy industry and transportation will lead to a significant increase in the demand for energy. The imbalance between energy constraints and economic development, and the environmental pollution caused by energy utilization will become even more evident. In November 2004, the China Medium and Long-Term Energy Conservation Plan was announced. This plan aims to push the whole society towards energy conservation and energy intensity reduction, to remove energy bottlenecks, to build an energy saving society, and to promote a sustainable social and economic development, thus realizing the grand objective of building a society that is well-off in every aspect. The Plan covers the Eleventh Five-Years Plan, and the period from 2010 to 2020. The development and energy conservation objectives to be reached by 2010 are essentially planned, whereas the objectives stated for 2020 are proposed. The four main objectives are:
1. Macro energy conservation indicators: by 2010, energy consumption per 10,000 Yuan GDP (constant price in 1990, the same below) is expected to drop from 2.68tce (ton of coal equivalent) in 2002 to 2.25tce, with an annual average energy conservation rate of 2.2% from 2003 to 2010. The energy conservation capacity is expected to reach 400 million tce. Energy consumption per 10,000 Yuan GDP will drop to 1.54tce in 2020, with an annual average energy conservation rate of 3% from 2003 to 2020. The energy conservation capacity is expected to reach 1.4 billion tce, it is 11% more than the total planned newly-increased energy production of 1.26 billion tce during the same period, and correspondingly reduction of 21 million tons sulphur dioxide.
2. Energy consumption indicators per unit of major products (amount of output): by 2010, China’s products as a whole was expected to reach or approach the advanced international level of the early 1990s in terms of the indicators, where large and medium sized enterprises are expected to reach the advanced international level at the beginning of the 21st century; and by 2020 China is expected to reach or approach the international advanced level.
3. Energy efficiency indicators of major energy consuming equipment: by 2010, the energy efficiency of newly added major energy consuming equipment is expected to reach or approach international advanced level, and some automobiles, motors and household electric appliances are expected to reach the international leading level .
4. Objectives of Macro-regulation: starting from 2010 it will establish laws, regulations and a standard-system to govern energy conservation; in addition, it will develop policy support, supervision and regulation, and a technical service system. All together are suitable for a socialist market economy.
In the plan, key fields for energy conservation were listed, and they constitute the framework for the state and local governments to implement the Five Year Plan.

LIMITS – LOW CLIMATE IMPACT SCENARIOS AND THE IMPLICATION OF
REQUIRED TIGHT EMISSION CONTROL STRATEGIES PROJECT NO 282846
DELIVERABLE NO.D3.1
98
In order to reach the target, the following ten key projects were required to be implemented during the 11th Five-Year Plan:
Coal-fired industrial boiler (kiln) retrofit Projects. District Cogeneration Projects. Residual Heat and Pressure Utilization Projects. Petroleum Saving and Substituting Projects. Motor System Energy Saving Projects. Energy System Optimization Projects. Building Energy Conservation Projects. Green Lighting Projects. Government Agency Energy Conservation Projects. Energy Saving Monitoring and Testing, and Technology Service System Building
Projects.
There is significant progress for energy efficiency in China during 11th Five Year Plan, and it is continued to implement these policies in the 12th Five Year Plan, with stronger standard and policies.
Speeding up the elimination of backward production capacity is one of the unique policies in China. Continuing to implement the Opinions on Curbing Overcapacity and Redundant Construction in Some Industries and Guiding the Sound Development of Industries, as well as the Notice of Further Strengthening Elimination of Obsolete Production Capacity, China has been making efforts to improve the exit mechanism for obsolete production capacity. In 2011, relevant departments, including the Ministry of Industry and Information Technology and the National Development and Reform Commission, jointly issued the Notice of Issuing the Implementation Plan to Assess the Work of Eliminating Obsolete Production Capacity, the Opinions on Resettling Workers Laid off due to Elimination of Obsolete Production Capacity and Corporate Merger and Restructuring, and the Catalogue (2nd Batch) of Obsolete Mechanical and Electrical Equipment (Products) Eliminated due to High Energy Consumption. Following the guidelines set out in these documents, the government has improved its examination and evaluation of efforts to eliminate obsolete production capacity, and issued directions to local governments on the redeployment of displaced employees. In 2011, China shut down small thermal power generating units with a total generating capacity of 8 million kw and eliminated obsolete production capacity in the following industries: iron smelting, 31.92 million tons; steel production, 28.46 million tons; cement (clinker and mill), 155 million tons; coke, 20.06 million tons; plate glass, 30.41 million cases; paper, 8.3 million tons; electrolytic aluminium, 639,000 tons; copper smelting, 425,000 tons; lead smelting, 661,000 tons, and coal production, 48.7 million tons.

LIMITS – LOW CLIMATE IMPACT SCENARIOS AND THE IMPLICATION OF
REQUIRED TIGHT EMISSION CONTROL STRATEGIES PROJECT NO 282846
DELIVERABLE NO.D3.1
99
15.1.2 Renewable energy development and nuclear energydevelopmentplan.
In 2005, China announced the Renewable Energy Law, which set the target of increasing the share of renewable energy to 15% by 2020. The renewable energy development plan was later further developed, and the major renewable energy development targets to be reached by 2020 are now the following (Table 2).
Table 2. Renewable target in the Renewable Energy Law
Wind: 30GW Solar Power PV: 1.8GW Solar heater: 300million m2 Biomass Power: 30GW Biomass Diesel: 2Mt Biomass: 10Mt Biomass solid fuel: 50million ton Small Hydro: 80GW
However, the development of renewable energy in China always goes beyond the target setting. In China’s 12th Five Year Plan, the renewable energy target was set as wind power 100GW by 2015, 21GW for solar, 12GW for biomass power generation, 260GW for hydro power (State Council, 2011). This was announced in beginning of 2013. However the target was revised just several months later to be 35GW for solar, and now seems it could be more than 43GW by 2015 if the target in 2014 could be achieved, and it could be the same in 2015. In the meantime, installed capacity for wind reached 80.55GW by first quarter of 2014, and it is nearly sure to be more than 100GW by 2015.
The government changed wind power feed-in tariffs in 2009. The 2005 Renewable Energy Law authorized feed-in tariffs for wind power based on ‘government guided’ prices, which evolved year-by-year as competitive bidding for wind power capacity resulted in standardized or ‘approved’ prices, generally on a province-by-province basis. In August 2009, a new feed-in tariff regime was established for wind power. Four specific tariffs were established nationwide to be applied on a regional basis based on geographic wind resources.
The lowest tariff is RMB0.51/kWh (7.5 US cents/kWh), for the best resource regions of Inner Mongolia and parts of Xinjiang. The second and third levels are RMB0.54/kWh (7.9 US cents/kWh) and RMB0.58/kWh (8.5 US cents/kWh) for more average regions throughout large sections of the country such as parts of western, central and north-eastern China. Finally, the fourth level is RMB0.61/kWh (9.0 US cents/kWh) for the least-favourable resource regions. The tariffs were established to be consistent with prices from previously approved projects in these provinces/regions over the past three years. However, the tariffs apply to onshore wind projects only as the tariffs for offshore wind projects have not yet been established.
LIMITS – LOW CLIMATE IMPACT SCENARIOS AND THE IMPLICATION OF
REQUIRED TIGHT EMISSION CONTROL STRATEGIES PROJECT NO 282846
DELIVERABLE NO.D3.1
100
The biomass feed-in tariff has also been amended. The previous feed-in tariff for biomass, established under the 2005 law, was a RMB0.25/kWh (3.7 US cents/kWh) premium added to a province-specific coal power generation price. The new premium was increased to RMB0.35/kWh (5.2 US cents/kWh).
Another significant change has been the elimination of the wind turbine domestic content requirement. China previously required wind turbines installed in China to have at least 70% ‘domestic content’ in terms of the value of incorporated materials and components. This requirement was dropped in 2010 as no longer necessary, as virtually all turbine installations were Chinese-produced products.
Another recent change exempts renewable energy projects from local (provincial) income taxation. This may have the effect, perhaps unintended, of reducing the incentives for provincial governments to support renewable energy projects, unless local manufacturing enterprises also benefit.
For the solar sector, new solar PV subsidies have been introduced. The so-called ‘Golden Sun’ programme was initiated in 2009, providing capital subsidies for solar PV installations through 2011 on a project-by-project basis. Off-grid (stand-alone) installations receive 70% capital subsidies while grid-connected installations receive 50% subsidies. Qualifying grid-connected installations must have a peak capacity of 300 kW or larger. There are also programme caps, which limit the overall quantity of systems installed – under the terms of the programme installations in any given province are limited to 20 MW total.
Almost 300 projects have been proposed under the Golden Sun programme totalling 640 MW and entailing about RMB20 billion ($2.9 billion) of investment. As a separate part of the programme, the Ministries of Finance and Construction are providing subsidies of RMB15/watt ($2.20/watt) for grid-connected solar PV and RMB20/watt ($2.90/watt) for building-integrated PV. Eligible installations must be 50 kW or larger, and must utilize solar PV modules of minimum efficiency levels (16% for mono-crystalline, 14% for poly-crystalline, and 6% for amorphous). In 2010, the subsidy levels were reduced to RMB13/watt ($1.90/watt) for grid-connected and RMB17/watt ($2.50/watt) for building-integrated.
There is also a new solar PV bidding programme. Similar to the early development of the wind power industry, the government initiated a competitive bidding programme for solar PV projects. This programme is creating new benchmark tariffs for solar PV (so-called ‘approved price levels’) on the basis of competitive bidding. One example was a bidding process in Dunhuang, in Gansu Province in 2009 for two 10 MW projects. Bid prices ranged as low as RMB0.69/kWh (10.1 US cents/kWh), and resulted in an approved price of RMB1.09/kWh. Another approved price was RMB1.15/kWh (16.9 US cents/kWh) in April 2010 for four projects in Ningxia totalling 40 MW.
Finally, there are new provincial-level solar PV preferential tariffs. The provinces of Zhejiang and Jiangsu have established province-wide preferential tariffs for solar PV. In
LIMITS – LOW CLIMATE IMPACT SCENARIOS AND THE IMPLICATION OF
REQUIRED TIGHT EMISSION CONTROL STRATEGIES PROJECT NO 282846
DELIVERABLE NO.D3.1
101
Zhejiang, the tariff was set as a premium of RMB0.70/kWh (10.3 US cents/kWh) added to the province-average coal power generation price which was RMB0.46/kWh in 2009 (6.8 US cents/kWh), thus producing a total tariff of RMB1.16/kWh (17 US cents/kWh). Jiangsu set preferential tariffs significantly higher than Zhejiang, and also established a range of tariffs depending on technology type: RMB2.1/kWh (31 US cents/kWh) for ground-based systems, RMB3.7/kWh (54 US cents/kWh) for roof-top, and RMB4.3/kWh (63 US cents/kWh) for building-integrated (all 2009 levels). Jiangsu also slated tariffs to decrease progressively, to 1.7/3.0/3.5 in 2010 and to 1.4/2.4/2.9 in 2011, respectively. However, the Zhejiang and Jiangsu preferential tariffs were not considered ‘approved’ prices at the national level in principle, which means the money to cover the tariffs comes from provincial budgets rather than national funds.
The policies regarding to solar power in 2013 are significant. State grid announced distributed energy with capacity up to 6 MW could be connected to grid with free of charge. In August 2013, NDRC announced feed-in-tariff was set as 0.9yuan/kWh, 0.95 and 1yuan/kWh based on solar condition. Subsidy for distributed energy power generation is 0.42yuan/kWh. And most importantly, after the national pricing policy, many of provinces and cities announced their own pricing policy for solar power generation. For example, Shanghai will provide additional 0.4yuan/kWh subsidy on top of national subsidy, which make solar power generation much more attractive.
Because of the above policies, it is believed that wind and solar power will make large amount progress in the near future.
15.2 National program on Climate Change
On June 4th 2007, the National Program on Climate Change (NPCC) was released. It is the first one ever elaborated in the developing world and therefore plays a milestone role. This document specified China’s objectives, basic principles, key activities and projects, as well as policies and measures to be undertaken by the country for 2010 in response to climate change. According to the National Programme, China has to commit to seriously complete all the tasks outlined, strive to construct a resource-conservative and environment-friendly society, build up national capacity to mitigate and adapt to climate change, and make further contribution to the protection and understanding of the global climate system. By a preliminary review of the progress, the targets set up in the national program were reached in 2010.
In the document, the following contents are covered:
• Status quo of climate change in China and efforts to deal with climate change • Impacts and challenges of climate change on China • Guidelines, principles and objectives of China to respond to climate change • China’s policies and measures to address climate change • China’s position on key climate change issues and need for international
LIMITS – LOW CLIMATE IMPACT SCENARIOS AND THE IMPLICATION OF
REQUIRED TIGHT EMISSION CONTROL STRATEGIES PROJECT NO 282846
DELIVERABLE NO.D3.1
102
cooperation
15.2.1 Otherpoliciesandadministrativemeasures Sustainable development is recognised as an important issue. Agenda 21 for China11, whose adoption was announced by the Chinese government in 1994, explicitly states that ‘Taking the path of sustainable development is a choice China must make in order to ensure its future development in the century. Because China is a developing country, the goal of increasing social productivity, enhancing overall national strength and improving people’s quality of life cannot be realised without giving priority on economy development. At the same time, it will be necessary to conserve natural resources and to improve the environment, so that the country will see long-term, stable development’. Since 1994, Agenda 21’s objectives have been translated into other policy plans, including the successive Five-Year plans. Other objectives include reducing the large differences in wealth in different areas (especially the rural ones and the regions in the West of the country), and hence to more generally reduce poverty and to control population growth. Tree-planting and afforestation, together with enhancing ecology restoration and protection, constitute long-term policies in China since the 1970s. According to the Sixth National Forest Assessment, in 2005 the acreage of conserved artificial forests in China was 54 million hectares, ranking top one in the world, and the amount of growing stock was 1505 million cubic meters. The total area covered by forests was 174.91 million hectares, and the percentage of forest coverage increased from 13.92% to 18.21% during the period from early 1990s to 2005. In addition to tree-planning and afforestation, China initiated many other policies for ecology restoration and protection, including natural forest protection, converting cultivated land to forest or grassland, pasture restoration and protection, further enhancing the capacity of forest as the sinks of greenhouse gas. Meanwhile, urban greening also grew rapidly in China. By the end of 2005, total green area in the built-up urban area in the whole country reached 1.06 million hectares with 33% green coverage and 8.1 square meters of public green area per capita. The green area helps absorbing CO2 in the atmosphere (carbon sink). In 1998, China established the National Coordination Committee on Climate Change (NCCC), which currently comprises ministers belonging to 17 ministries and agencies. The NCCC has taken the lead in the formulation and coordination of China’s important climate change-related policies and measures, providing guidance for central and local governments’ response to climate change.
11 During the 1992 Environment and Development Summit, the UN launched the Agenda 21 programme to guide sustainable development. As regards China, the government published a specific Agenda 21 for the country in order to implement the broader UN mme.

LIMITS – LOW CLIMATE IMPACT SCENARIOS AND THE IMPLICATION OF
REQUIRED TIGHT EMISSION CONTROL STRATEGIES PROJECT NO 282846
DELIVERABLE NO.D3.1
103
15.2.2 EnergyandClimateTargetsAs expected, there are separate targets for energy intensity (16 percent reduction by 2015) and CO2 emissions per unit GDP (17 percent reduction by 2015). These are within the expected range and congruent with the 40 to 45 percent reduction in carbon intensity from 2005 levels that was first announced in the Copenhagen talks and reaffirmed in Cancun. Clearly defined and distinct energy and CO2 emissions targets will help ensure provinces implement energy policies with carbon goals clearly in mind. There was no mention of a total energy consumption target, which was recently announced by China’s former Minister in charge of the National Energy Administration, Zhang Guobao. The Plan and Work Reports also include noteworthy policies in:
A. Forests: China has been steadily increasing forest cover since the founding of the People’s Republic in 1949. This next five year plan goes a significant distance toward meeting China’s Copenhagen commitment on forests. In the Plan itself the Chinese government set a goal to increase the area of forest cover by 12.5 million hectares by 2015, while in Premier Wen’s Work Report, he announced a forest stock volume goal of 600 million m3. While the forest cover area goal seems more or less in line with the already stated 2020 goal to increase forest cover by 40 million hectares over 2005 levels, the volume stock target seems more ambitious because it seeks to achieve almost half of the 15-year target of 1.3 billion cubic meters by year 2020.
B. Tracking Implementation: To achieve these climate and energy targets, the level of detail and specificity, covering a full range of resource and environmental issues, provided in the Plan and the Work Reports are impressive. Premier Wen stated that China would put in place “well-equipped statistical and monitoring systems for greenhouse gas emissions, energy conservation and emissions reductions” to ensure these policies are tracked and properly implemented.
C. Efficiency: China has had a particularly successful track record on industrial energy efficiency in the previous five years. In the new Plan, there are both new policies to promote greater industrial efficiency, and a major push to include all other sectors of the economy, including both new and existing buildings. For example, the Plan introduces a 10,000 Enterprises Program. While we don’t have details as to what this program will be, it appears to be a ramp up of the successful Top 1,000 enterprises program. We’ll certainly be following this development closely in the coming months. Following the endorsement of new types of mechanisms in the October Party Plenum Document, the Plan specifically endorses market approaches like energy service companies (ESCOs) that help to finance energy efficiency.
D. Transport: While China certainly has plans for additional air and road transport, what is striking is the commitment to rail, both long distance and in urban mass transit. The Plan includes proposals for the construction of 35,000 km of high-speed rail and a goal to connect every city with a population greater than 500,000. There are also plans to improve subway and light rail in cities that already have urban transit systems, building new systems in at least nine other cities, and
LIMITS – LOW CLIMATE IMPACT SCENARIOS AND THE IMPLICATION OF
REQUIRED TIGHT EMISSION CONTROL STRATEGIES PROJECT NO 282846
DELIVERABLE NO.D3.1
104
making plans for six or more cities. We expect to see more detail and perhaps more cities as the sector-specific plan becomes available.
E. Non-fossil energy: The Plan incorporates the goal of 11.4 percent non-fossil fuels in primary energy consumption by 2015 announced by Zhang Guobao last month. China continues to exceed earlier targets in non-fossil development. For example, the five-year target for wind is 70 gigawatts of additional installation, which exceeds the 2020 target of just a few years ago. For nuclear, the plan is to install 40 additional gigawatts of capacity by 2015. China currently has around 10 GW of installed nuclear capacity now, which means that if this five-year target is achieved, China is likely to exceed even the expectation of 70 GW by 2020 discussed a year ago. If China achieves these numbers, it will have the world’s highest installed capacity of nuclear energy by 2020.
F. Environment: The Plan itself does not make clear the specific targets for major environmental pollutants. However, they were all announced at an official NPC-connected press conference. On March 6, Zhang Ping, Director of the National Development and Reform Commission, stated that the reduction targets for Chemical Oxygen Demand (COD) and Sulfur Dioxide (SO2) are 8 percent, while ammonia nitrogen and nitrogen oxides are 10 percent. Director Zhang also said that these targets would be made binding for the first time in the 12th Five-Year Plan, as well as an “index evaluation system” implemented to allocate targets to provinces and ensure they are on track to meet reductions. We are not clear on exactly how these targets will be made binding, whether there will be additional documents at this NPC, or whether they will be binding in a later sector-specific plan.
While the Plan itself is general on targets, it is much more specific on policies. It assigns specific targets for cities required to reach new motor vehicle emission standards and sets goals for a wide variety of environmental infrastructure, including wastewater and solid waste treatment. There is also a strong emphasis on reuse and recycling, or what the Chinese call “circular economy.”
China is a middle-income, developing country and the next five years is when it needs to put in place the infrastructure that will enable it to develop successfully into a high-income developing country and beyond. There’s a clear recognition in these plans of the importance of environmental sustainability in being able to reach not just higher levels of income and but also increased welfare of the Chinese people. The Plan itself is highly specific in some areas but also in others somewhat unclear (for instance, target pollutants). Much of the clarity in implementation comes through sectoral plans and later regulations and guidance. We will continue to track policy implementation as it unfolds.
In a move that exceeded expectations, the 12th Five Year Plan China would cap total energy use at 4 billion tons coal equivalent (TCE) by 2015. The significance of this target is the fact that it is an absolute energy target, rather than what the specific number is. The actual number is closely aligned to China’s announced 40-45% 2020 carbon intensity goal as well as its likely 16-17% energy intensity goal
LIMITS – LOW CLIMATE IMPACT SCENARIOS AND THE IMPLICATION OF
REQUIRED TIGHT EMISSION CONTROL STRATEGIES PROJECT NO 282846
DELIVERABLE NO.D3.1
105
for 2015. In the past the Chinese have argued that absolute targets are difficult to project and meet, given the volatile growth of a developing country. The new target suggests more confidence that they can estimate both growth rates and energy use trends, and use these to set absolute goals. It is also significant that this new target is set as part of China’s domestic policy-making process. It is not timed in relation to any international meeting, nor is it the result of international urging. China’s domestic imperatives to use resources effectively and control the negative impacts of fuel use, including climate change and other environmental impacts, seem to have driven this decision.
i. Air pollution control policies
The Chinese government has released its toughest plan so far to combat air pollution, in an effort to ease mounting public concern over air quality.
The plan promises that in five years, concentration of hazardous particles, including PM 2.5, a key air quality indicator, will drop by ten percent in all cities compared with 2012.
By this action plan, China will make the overall improvement of air quality and dramatic drop of seriously polluted days. The air quality of the Beijing-Tianjin-Hebei, Yangtze Delta and Pearl River Delta areas will improve significantly. China will strive to gradually eliminate the seriously polluted weather and notably better the national air quality in another five years or longer. Specific targets are as follows: PM10 in cities at prefecture level or above declines by over 10% in 2017 compared with that in 2012 and premium air quality days increase year by year. The PM2.5 of the Beijing-Tianjin-Hebei, Yangtze Delta and Pearl River Delta areas drops by about 25%, 20% and 15% respectively and the annual PM2.5 in Beijing is controlled to within 60 micrograms per cubic meter.
In order to realize the above objectives, the action plan makes 10 specific measures: firstly, enhance the integrated control and decrease the release of multiple contaminants. Comprehensively regulate the small coal-fired boiler, and advance projects of key industries aiming at desulfurization, denitrification and dust removing. Comprehensively handle the city dust and cooking fume pollution. Remove yellow label cars and old cars from streets, promote public transportation, popularize new energy vehicles and speed up the improvement of the fuel quality. Secondly, adjust and optimize the industrial structure and promote the transformation and upgrading of economy. Strictly control the newly added output capacity of high energy consumption and high emission industries, accelerate the elimination of the backward output capacity and suspend illegal projects of over-capacity industries. Thirdly, speed up the enterprise technical reformation and improve the capacity of technical innovation. Promote the rapid development of circular economy, establish and expand energy-saving and environmentally-friendly industries, and promote the innovative development and industrial application of major environmentally-friendly equipment and products. Fourthly,

LIMITS – LOW CLIMATE IMPACT SCENARIOS AND THE IMPLICATION OF
REQUIRED TIGHT EMISSION CONTROL STRATEGIES PROJECT NO 282846
DELIVERABLE NO.D3.1
106
accelerate the adjustment of energy structure and increase the supply of clean energy so that by 2017 coal consumption accounts for less than 65% of the total energy consumption. Beijing-Tianjin-Hebei, Yangtze Delta and Pearl River Delta and other areas should strive to realize the negative growth of the total coal consumption. Fifthly, strictly control the access to investment projects in energy conservation and environment protection and raise the access standard. Optimize the industrial spatial distribution and tightly restrict the introduction of projects with “high consumption of energy and heavy pollution” in environmentally fragile or sensitive districts. Sixthly, exert the functions of the market and better the environmental and economic policies. The central fiscal authorities should establish special funds and implement the subsidy for prize policy, adjust and improve price and tax policies, and encourage civil and social capital to enter the air pollution prevention field. Seventhly, improve the law and regulation system, and supervision and administration should strictly abide by the law. The government shall regularly release the air quality ranking of major cities and set up environmental information mandatory disclosure system of heavily polluting enterprises. Improve environmental supervising and administrative ability and enhance the environmental law enforcement. Eighthly, foster regional cooperation mechanism and coordinate regional environmental treatment. Establish air pollution prevention and control cooperation mechanism between Beijing-Tianjin-Hebei and Yangtze River Delta areas. The State Council and provincial governments shall sign the objective and responsibility agreement, and all provinces will be assessed annually and the violator of the agreement shall be held responsible. Ninthly, build the monitoring, early warning and emergency response system, and formulate, improve, and timely start the emergency preplan to properly deal with seriously polluted weather. Finally, make clear the responsibility of all parties, and encourage the public to improve the air quality.
The action plan requires a total investment of 1,750 billion yuan raised through five channels. According to the introduction, the five channels are: enterprises that are hold responsible for the pollution shall assume the duty; actively encourage civil and social capital to enter the air pollution prevention field; employ price leverage to divert part of the pollution treatment costs; the local government shall enhance support of policies concerning people's livelihood such as “replacing coal by gas” and elimination of yellow label cars and old cars; the central financial authorities shall set up special funds and strengthen the support for air pollution prevention and control in major areas by prizes as subsidies.
The action plan will promote economic and social development and environmental improvement. In terms of the economy, it will bring a GDP increase of 2.39 trillion yuan of which environmentally-friendly industries related to the air pollution control account over 1 trillion. Meanwhile, it will promote the industrial structure adjustment, productivity distribution optimization and corporate transformation and upgrading, and alter the economic development mode.

LIMITS – LOW CLIMATE IMPACT SCENARIOS AND THE IMPLICATION OF
REQUIRED TIGHT EMISSION CONTROL STRATEGIES PROJECT NO 282846
DELIVERABLE NO.D3.1
107
16 Model results
16.1 Economic development The development pathways of China’s economic and population in future are very close to the national development target. After years of researches and evaluations, this development mode is a widely accepted economic development pathway. However, in this study we have also considered some of the recent optimistic economic projections. In this research, the three-step target in the national development plan as the mid- and long-term development targets has been taken. This means reaching the current developed countries’ level till 2050. In this mode, due to the change of domestic and international market environment, China’s industrial structure needs to be adjusted and reformed. Especially after China enters the World Trade Organization, the Chinese industries will become more international. In the coming decades, China will be the centre for international manufacturing; export will be the important factor to drive economic growth. Considering the rapid development of Chinese economy, after 2030, the main factor to drive economic growth will turn to the domestic demand; competition of the international manufacturing sector will decrease due to the quick increase in labour cost. China will take a series of effective measures to improve the economic structure, upgrade the industrial structure, and enhance the international competition of advanced industry. These measures will make China have a normal development speed during continuous adjustment. It is estimated that during 2000-2050, China will have an annual average growth rate of 6.4%. The economic growth for each period is shown in tables 3-5. Table 3. Projections on scenario setting of GDP (108 Yuan, Price in 2005)
2005 2010 2020 2030 2040 2050
GDP 183132 290505 649852 1291047 2099744 2991810
Added value of primary industry
22718 29206 44179 55819 65786 73824
Added value of secondary industry
87446 142889 316258 587736 853207 1087893
Added value of tertiary industry
72968 118409 289415 647491 1180751 1830094
Table 4. Projections on GDP growth rate, %
2005-2010 2010-2020 2020-2030 2030-2040 2040-2050 2005-2050
GDP 9.73% 8.55% 6.44% 4.56% 3.38% 6.15%
Primary industry 5.15% 4.28% 2.65% 1.91% 1.34% 2.83%
Secondary industry
10.32% 7.99% 5.56% 3.19% 2.16% 5.31%
Tertiary industry 10.33% 9.99% 7.68% 5.77% 4.20% 7.26%
Table 5. Projections on structure of GDP, %

LIMITS – LOW CLIMATE IMPACT SCENARIOS AND THE IMPLICATION OF
REQUIRED TIGHT EMISSION CONTROL STRATEGIES PROJECT NO 282846
DELIVERABLE NO.D3.1
108
2005 2010 2020 2030 2040 2050
Primary industry 12.4% 10.0% 6.7% 4.7% 3.6% 3.0%
Secondary industry 47.8% 49.0% 46.6% 42.9% 37.6% 33.4%
Tertiary industry 39.8% 40.9% 46.7% 52.5% 58.8% 63.7%
The economic data in domestic research and planning are mostly general data, i.e. most of them only give out the GDP growth rate in 2030 or 2050, and the ratio among three major industries. They are all lack of the analysis of each detailed sector’s contribution to the economic growth. Here we use IPAC-SGM model to analyse each sector’s contribution to the structural change of economy. This is a new task for IPAC modelling team. We kept contact with other economic models and referred to related research literatures. The main objective is to carry out an in-depth study and provide some results for broader discussion. The results are shown in table 6. Table 6. Projections on added value of detailed sectors (108 Yuan, BaU Scenario)
2005 2010 2020 2030 2040 2050
Agriculture 22718 29206 44398 57680 69689 79583
Mining and Washing of Coal
4752 7131 12671 17746 21310 19787
Extraction of Petroleum 3678 5659 8131 9448 9901 10046
Extraction of Natural Gas
1136 1708 3754 7248 10193 12147
Mining and Processing of Ferrous Metal Ores
1299 2116 3896 5680 6370 6153
Mining and Processing of Non-Ferrous Metal
Ores 498 823 1664 2570 3079 3318
Mining and Processing of Nonmetal Ores,
Mining of Other Ores, Processing of Timber
and Bamboo
528 848 1630 2442 3009 3350
Manufacture of Foods and Beverages
5079 8386 20416 38913 57586 72989
Manufacture of Tobacco 2163 3531 6803 8955 10034 10745
Manufacture of Textile 3860 6251 13414 23203 32352 39545
Manufacture of Texile Wearing Apprarel,
Leather, and other fibre products
2435 3991 8699 15183 21286 26106
Processing of Timber, Manufacture of Wood, Bamboo, Rattan, Palm
and Straw Products
896 1435 3023 5504 7919 9866
Manufacture of Paper and Paper Products
1460 2313 4617 8229 10717 12081
Printing, Reproduction of Recording Media,
Manufacture of Articles for Culture, Education
1090 1815 3951 6858 9582 11884

LIMITS – LOW CLIMATE IMPACT SCENARIOS AND THE IMPLICATION OF
REQUIRED TIGHT EMISSION CONTROL STRATEGIES PROJECT NO 282846
DELIVERABLE NO.D3.1
109
and Sport Activity
Processing of Petroleum 1567 2419 4836 7913 10153 11509
Processing of Coking 0 0 0 0 0 0
Manufacture of Raw Chemical Materials and
Chemical Products 4392 7893 17432 30365 32326 32123
Manufacture of Medicines
1530 2632 6495 13256 21959 31348
Manufacture of Chemical Fibers
490 778 1582 2725 3400 3717
Manufacture of Rubber, Plastics
1867 2889 5647 9336 11451 12432
Manufacture of Non-metallic Mineral
Products 3890 5873 10703 16557 19759 21215
Smelting and Pressing of Ferrous Metals
5777 9024 16840 21852 22436 22312
Smeting and Pressing of Non-ferrous Metals
1930 3196 6757 9599 9948 9874
Manufacture of Metal Products
1930 3297 8096 15415 21380 25882
Manufacture of General and Special Purpose
Machinery 4649 7875 19237 36564 47508 54059
Manufacture of Transport Equipment
4022 6963 17495 34905 56889 83442
Manufacture of Electrical Machinery and Equipment, Manufacture
of Communication Equipment, Computers and Other Electronic
Equipment
9296 15992 39377 74682 117395 165862
Manufacture of Measuring Instruments
and Machinery for Cultural Activity and
Office Work
807 1458 3705 7557 12512 18489
Other industries 688 1239 3027 5588 8616 12045
Electric Power Production and Supply
4141 6611 13896 24221 35851 47252
Steam and Water Production and Supply
1034 1611 3213 5490 8011 10453
Production and Distribution of Gas
545 822 1556 2552 3619 4627
Construction 0 0 0 0 0 0
Transport 10018 16311 35507 58822 77889 92268
Other services industries 13805 23602 63579 136210 237120 354525
16.2 Population development Population forecast in this study is mainly based on several recent plans and research results. The government will keep controlling the population growth in China. The birth

LIMITS – LOW CLIMATE IMPACT SCENARIOS AND THE IMPLICATION OF
REQUIRED TIGHT EMISSION CONTROL STRATEGIES PROJECT NO 282846
DELIVERABLE NO.D3.1
110
conditions in rural areas will be improved on; unplanned birth will be decreased. Population in China will move forward according to the current structure. In the latter years, along with the gradual development of China’s economy and the change in people’s notion of birth, and meanwhile the negative growth of population after the population peak, the government will lose the control of population growth. Here we take the population growth scenario from national family planning commission, and use IPAC-population model for the analysis. In this scenario, China’s population will reach the peak between 2030 and 2040. The peak value will be around 1.47 billion. In 2050, the population will decrease to 1.46 billion. Population in different periods is shown in table 9. The values of urbanization rate are given out by considering the trend of china’s urbanization and the effect of floating labour force from rural area. In the long term scenario, china’s economic; especially the situation of employment and living in rural area will reach the level of developed countries. The mechanical production level of agriculture is modern enough so that the gross labor demand of agriculture is closed to the level of developed countries. All factors above will accelerate the urbanization progress in china. Compared with other researches, we adopted a higher value of urbanization (see table 7). Table 7. Projections on population and urbanization development
2005 2010 2020 2030 2040 2050
Population, million 1308 1360 1440 1470 1470 1460
Urbanization rate,% 43% 49% 63% 70% 74% 79% Urban
population,million 562 666 907 1029 1088 1138
Household population, people
2.96 2.88 2.80 2.75 2.70 2.65
Number of families,million
190 222 288 337 365 380
Rural population,million
745 694 533 441 382 302
Household population, people
4.08 3.80 3.50 3.40 3.20 3.00
Number of families, million
183 190 181 160 152 144
16.3 Business as Usual scenario
16.3.1 EnergysupplyanddemandTable 8 to Table 11 present the projections made by the model on primary energy demand, final
energy demand and power generation for the BaU scenario.
The energy demand of China will keep the trend of increase in the future. In the BaU
scenario the primary energy demand of China will increase steadily before 2050, and will

LIMITS – LOW CLIMATE IMPACT SCENARIOS AND THE IMPLICATION OF
REQUIRED TIGHT EMISSION CONTROL STRATEGIES PROJECT NO 282846
DELIVERABLE NO.D3.1
111
be 7.1 billion tce by 2050, in which coal accounts for 44%, petroleum accounts for
27.6%, natural gas accounts for 10%, nuclear power accounts for 9%, hydro power
accounts for 6%, and renewable energy such as wind and biomass power accounts for
3.4%.
Table 8. Projections on primary energy demand in China in the BaU scenario, Mtce
Coal Oil N.Gas Hydro Nuclear Wind Solar Biomass Power Ethanol
Bio-Diesel
2005 1536.5 432.9 59.1 139.5 21.1 0.9 0.0 1.9 1.8 0.6 2010 2476.9 627.7 109.3 218.7 30.6 13.9 0.0 16.1 9.7 0.6 2020 3006.2 1096.4 270.5 302.7 64.7 27.1 0.0 31.3 21.5 3.1 2030 3185.6 1586.9 460.3 349.8 129.9 42.5 0.0 45.7 33.4 7.9 2040 3262.1 1710.2 532.4 402.1 402.1 71.8 0.0 71.3 36.1 8.5 2050 3497.8 1835.5 668.0 384.2 576.2 70.4 0.0 80.8 38.9 9.2
Table 9. Projections on final energy demand in China in the BaU scenario, Mtce
Coal Coke Towngas Oil N.Gas Heat Electricity Total 2005 600 189 38 388 44 74 284 1618 2010 846 321 50 597 78 125 446 2463 2020 1032 209 33 1043 169 227 669 3382 2030 1064 164 23 1509 279 343 847 4229 2040 1003 141 19 1620 277 371 991 4422 2050 972 123 15 1731 313 406 1177 4737
Table 10. Projections on final energy by sectors in the BaU scenario, Mtce Agriculture
Coal Coke Towngas Oil N.Gas Heat Electricity Total 2005 13.4 1.9 0.0 20.8 0.0 0.0 10.4 46.6 2010 17.4 2.5 0.0 25.3 0.0 0.0 12.7 57.9 2020 29.9 4.3 0.0 30.9 0.0 0.1 17.4 82.5 2030 40.5 6.0 0.0 35.8 0.0 0.1 21.9 104.2 2040 40.5 6.0 0.0 38.3 0.0 0.1 24.0 108.9 2050 39.7 5.8 0.0 41.0 0.0 0.1 25.7 112.3
Industry Coal Coke Towngas Oil N.Gas Heat Electricity Total
2005 492.6 187.3 31.3 139.0 27.6 52.6 201.3 1131.6 2010 686.9 318.5 42.9 226.3 46.7 82.3 321.9 1725.5 2020 798.4 204.1 25.2 331.7 86.9 154.5 432.5 2033.3
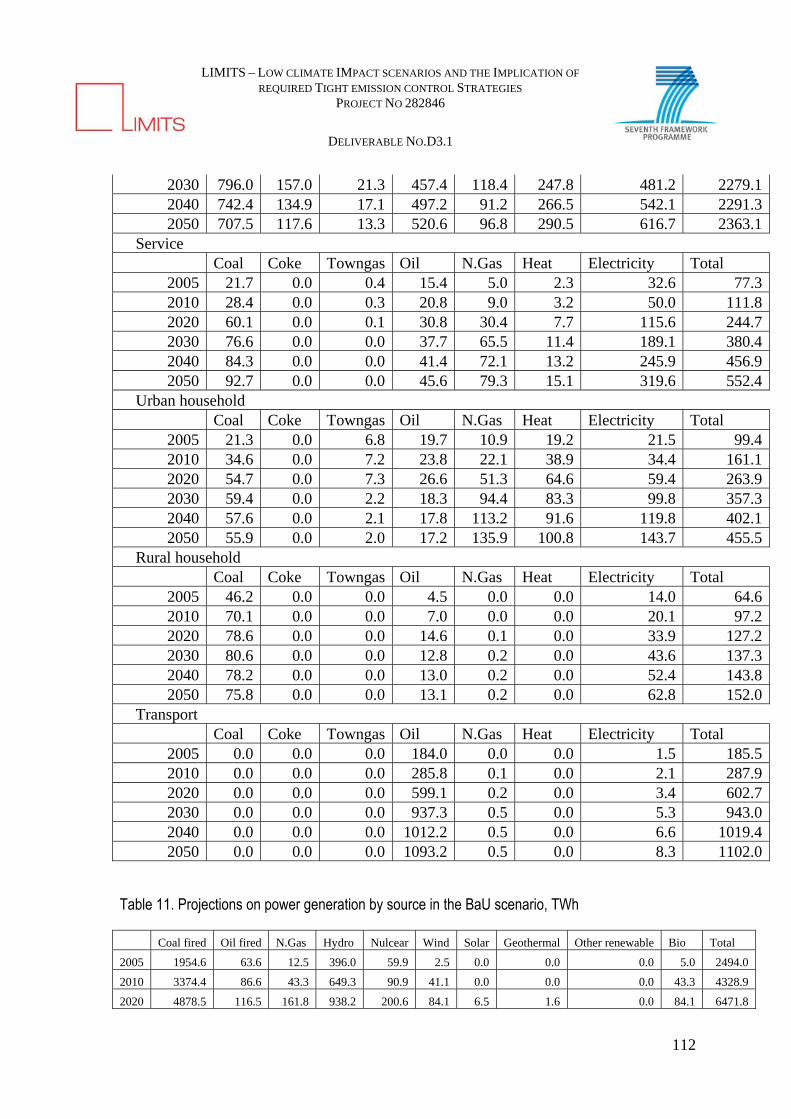
LIMITS – LOW CLIMATE IMPACT SCENARIOS AND THE IMPLICATION OF
REQUIRED TIGHT EMISSION CONTROL STRATEGIES PROJECT NO 282846
DELIVERABLE NO.D3.1
112
2030 796.0 157.0 21.3 457.4 118.4 247.8 481.2 2279.1 2040 742.4 134.9 17.1 497.2 91.2 266.5 542.1 2291.3 2050 707.5 117.6 13.3 520.6 96.8 290.5 616.7 2363.1
Service Coal Coke Towngas Oil N.Gas Heat Electricity Total
2005 21.7 0.0 0.4 15.4 5.0 2.3 32.6 77.3 2010 28.4 0.0 0.3 20.8 9.0 3.2 50.0 111.8 2020 60.1 0.0 0.1 30.8 30.4 7.7 115.6 244.7 2030 76.6 0.0 0.0 37.7 65.5 11.4 189.1 380.4 2040 84.3 0.0 0.0 41.4 72.1 13.2 245.9 456.9 2050 92.7 0.0 0.0 45.6 79.3 15.1 319.6 552.4
Urban household Coal Coke Towngas Oil N.Gas Heat Electricity Total
2005 21.3 0.0 6.8 19.7 10.9 19.2 21.5 99.4 2010 34.6 0.0 7.2 23.8 22.1 38.9 34.4 161.1 2020 54.7 0.0 7.3 26.6 51.3 64.6 59.4 263.9 2030 59.4 0.0 2.2 18.3 94.4 83.3 99.8 357.3 2040 57.6 0.0 2.1 17.8 113.2 91.6 119.8 402.1 2050 55.9 0.0 2.0 17.2 135.9 100.8 143.7 455.5
Rural household Coal Coke Towngas Oil N.Gas Heat Electricity Total
2005 46.2 0.0 0.0 4.5 0.0 0.0 14.0 64.6 2010 70.1 0.0 0.0 7.0 0.0 0.0 20.1 97.2 2020 78.6 0.0 0.0 14.6 0.1 0.0 33.9 127.2 2030 80.6 0.0 0.0 12.8 0.2 0.0 43.6 137.3 2040 78.2 0.0 0.0 13.0 0.2 0.0 52.4 143.8 2050 75.8 0.0 0.0 13.1 0.2 0.0 62.8 152.0
Transport Coal Coke Towngas Oil N.Gas Heat Electricity Total
2005 0.0 0.0 0.0 184.0 0.0 0.0 1.5 185.5 2010 0.0 0.0 0.0 285.8 0.1 0.0 2.1 287.9 2020 0.0 0.0 0.0 599.1 0.2 0.0 3.4 602.7 2030 0.0 0.0 0.0 937.3 0.5 0.0 5.3 943.0 2040 0.0 0.0 0.0 1012.2 0.5 0.0 6.6 1019.4 2050 0.0 0.0 0.0 1093.2 0.5 0.0 8.3 1102.0
Table 11. Projections on power generation by source in the BaU scenario, TWh
Coal fired Oil fired N.Gas Hydro Nulcear Wind Solar Geothermal Other renewable Bio Total
2005 1954.6 63.6 12.5 396.0 59.9 2.5 0.0 0.0 0.0 5.0 2494.0
2010 3374.4 86.6 43.3 649.3 90.9 41.1 0.0 0.0 0.0 43.3 4328.9
2020 4878.5 116.5 161.8 938.2 200.6 84.1 6.5 1.6 0.0 84.1 6471.8
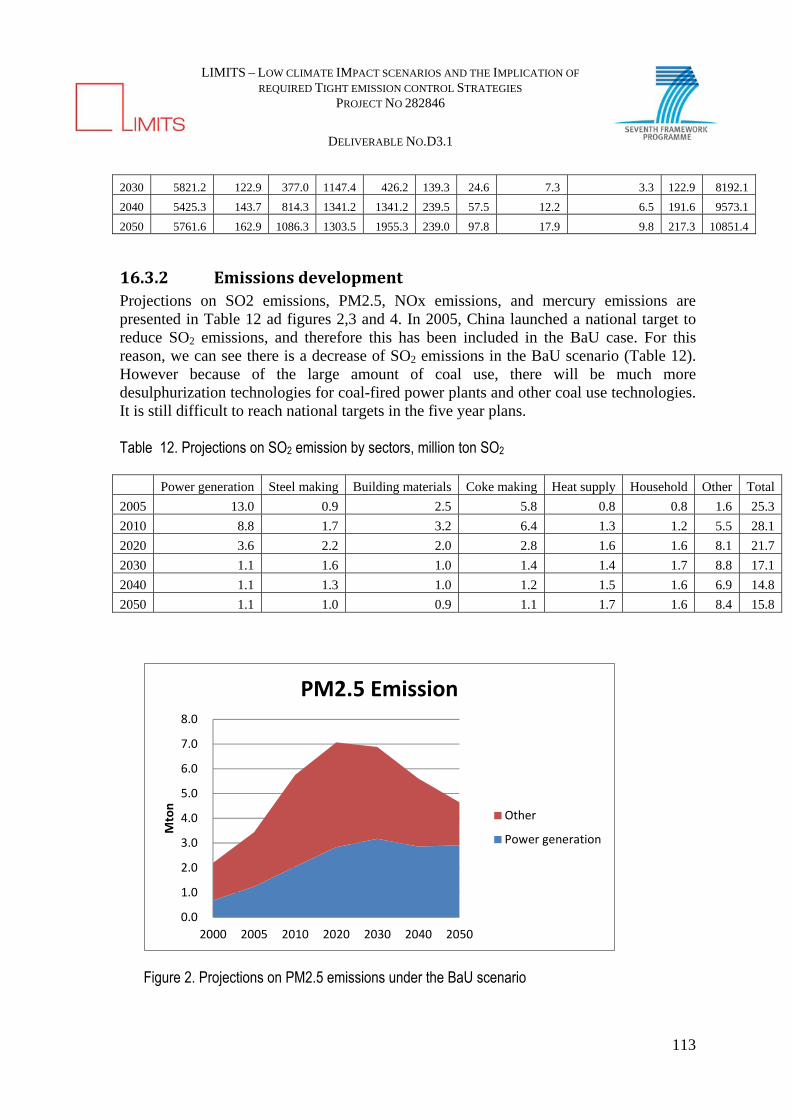
LIMITS – LOW CLIMATE IMPACT SCENARIOS AND THE IMPLICATION OF
REQUIRED TIGHT EMISSION CONTROL STRATEGIES PROJECT NO 282846
DELIVERABLE NO.D3.1
113
2030 5821.2 122.9 377.0 1147.4 426.2 139.3 24.6 7.3 3.3 122.9 8192.1
2040 5425.3 143.7 814.3 1341.2 1341.2 239.5 57.5 12.2 6.5 191.6 9573.1
2050 5761.6 162.9 1086.3 1303.5 1955.3 239.0 97.8 17.9 9.8 217.3 10851.4
16.3.2 EmissionsdevelopmentProjections on SO2 emissions, PM2.5, NOx emissions, and mercury emissions are presented in Table 12 ad figures 2,3 and 4. In 2005, China launched a national target to reduce SO2 emissions, and therefore this has been included in the BaU case. For this reason, we can see there is a decrease of SO2 emissions in the BaU scenario (Table 12). However because of the large amount of coal use, there will be much more desulphurization technologies for coal-fired power plants and other coal use technologies. It is still difficult to reach national targets in the five year plans. Table 12. Projections on SO2 emission by sectors, million ton SO2
Power generation Steel making Building materials Coke making Heat supply Household Other Total
2005 13.0 0.9 2.5 5.8 0.8 0.8 1.6 25.3
2010 8.8 1.7 3.2 6.4 1.3 1.2 5.5 28.1
2020 3.6 2.2 2.0 2.8 1.6 1.6 8.1 21.7
2030 1.1 1.6 1.0 1.4 1.4 1.7 8.8 17.1
2040 1.1 1.3 1.0 1.2 1.5 1.6 6.9 14.8
2050 1.1 1.0 0.9 1.1 1.7 1.6 8.4 15.8
0.0
1.0
2.0
3.0
4.0
5.0
6.0
7.0
8.0
2000 2005 2010 2020 2030 2040 2050
Mton
PM2.5 Emission
Other
Power generation
Figure 2. Projections on PM2.5 emissions under the BaU scenario

LIMITS – LOW CLIMATE IMPACT SCENARIOS AND THE IMPLICATION OF
REQUIRED TIGHT EMISSION CONTROL STRATEGIES PROJECT NO 282846
DELIVERABLE NO.D3.1
114
0.0
5.0
10.0
15.0
20.0
25.0
2000 2005 2010 2020 2030 2040 2050
Mt
NOx Emission in China, ELC scenario
Other
Power generation
Figure 3. Projections on NOx emissions under the BaU scenario
0.0
100.0
200.0
300.0
400.0
500.0
600.0
700.0
800.0
2000 2005 2010 2020 2030 2040 2050
ton
Mercury Emission
Other
Power generation
Figure 4. Projections on mercury emissions in China under the BaU scenario
16.4 The 2 degree scenario
16.4.1 Energysupplyanddemand

LIMITS – LOW CLIMATE IMPACT SCENARIOS AND THE IMPLICATION OF
REQUIRED TIGHT EMISSION CONTROL STRATEGIES PROJECT NO 282846
DELIVERABLE NO.D3.1
115
Table 13 to Table 16 present the projections made by the model on primary energy
demand, final energy demand and power generation for the 2 degree scenario. Under this
scenario, the primary energy demand increases from 2.189 billion tce in 2005 to 5.233
billion tce in 2050. Coal accounts for 20.3%, petroleum for 18%, natural gas for 15.9%,
nuclear power for 17.4%, hydropower for 8.8%, and other renewable energy such as
wind, solar and biomass power accounts for 19.7%.
Compared to the BaU scenario, energy demand decreases 27%, due to energy
conservation.
Table 13. Projections on primary energy demand in China under the 2 degree scenario, Mtce
Coal Oil N.Gas Hydro Nuclear Wind Solar Biomass Power Ethanol Bio-Diesel Total
2005 1536.5 435.2 60.4 131.5 19.9 0.8 0.0 1.9 1.8 0.6 2188.6
2010 2241.6 534.8 109.9 196.5 48.1 22.6 0.4 7.1 2.0 1.0 3164.0
2020 2418.9 907.7 406.8 412.9 240.9 160.6 41.3 41.3 17.8 5.8 4653.9
2030 2001.9 1012.1 628.9 426.6 426.6 276.0 97.9 47.7 44.6 12.0 4974.3
2040 1422.0 1002.2 728.9 483.3 744.8 454.8 230.3 54.0 48.2 13.0 5181.5
2050 1062.1 943.6 829.6 462.1 908.7 585.3 317.3 58.5 52.1 14.0 5233.4
Table 14. Projections on final energy demand under the 2 degree scenario, Mtce
Coal Coke Towngas Oil N.Gas Heat Electricity Total 2005 606 192 27 407 45 90 280 1648 2010 696 269 38 499 67 111 478 2157 2020 787 185 27 846 223 174 784 3027 2030 670 127 19 937 284 208 954 3199 2040 569 109 16 916 307 226 1097 3240 2050 470 89 13 845 310 236 1216 3179
Table 15. Projections on final energy demand by sector under the 2 degree scenario, Mtce
Agriculture
Coal Coke Towngas Oil N.Gas Heat Electricity Total 2005 13.4 1.9 0.0 20.8 0.0 0.0 10.4 46.6 2010 16.2 2.2 0.0 23.9 0.0 0.0 13.1 55.5 2020 26.5 3.6 0.0 27.2 0.0 0.1 18.5 75.9 2025 30.5 3.8 0.0 28.1 0.0 0.1 20.1 82.7 2030 31.6 3.6 0.0 29.0 0.0 0.1 21.7 86.0 2040 31.6 3.6 0.0 31.0 0.0 0.1 23.2 89.5 2050 30.9 3.5 0.0 32.3 0.0 0.1 24.8 91.7
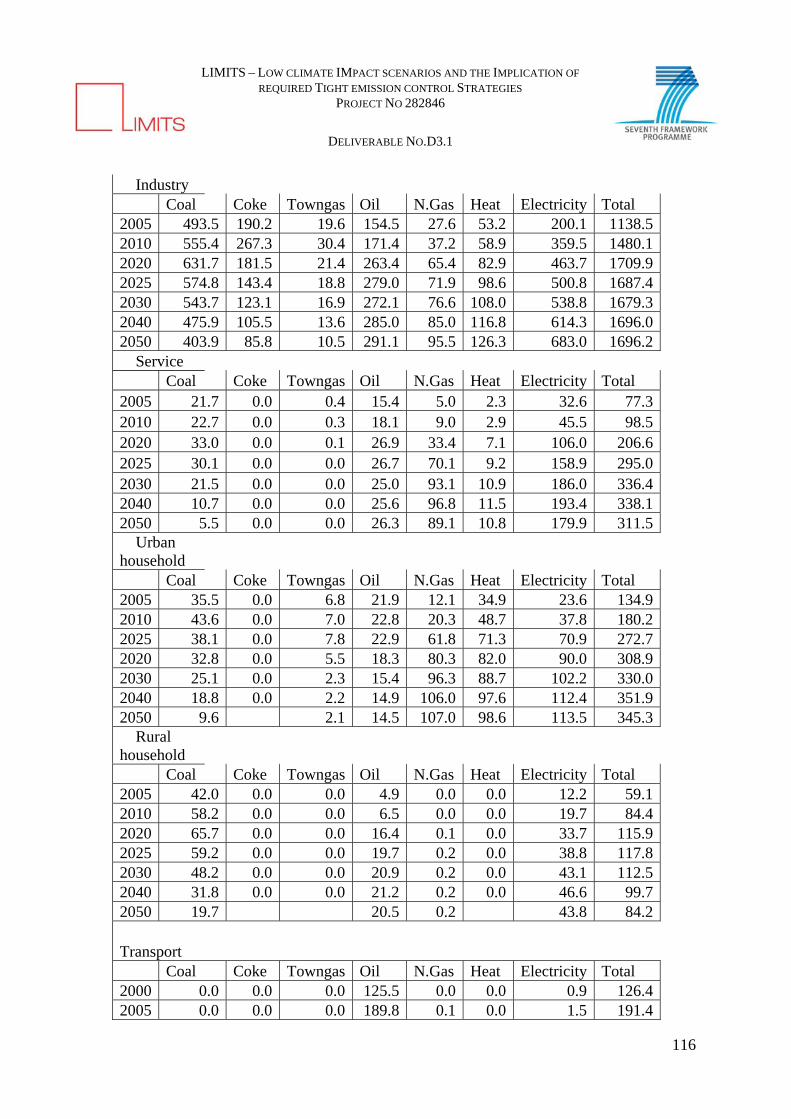
LIMITS – LOW CLIMATE IMPACT SCENARIOS AND THE IMPLICATION OF
REQUIRED TIGHT EMISSION CONTROL STRATEGIES PROJECT NO 282846
DELIVERABLE NO.D3.1
116
Industry Coal Coke Towngas Oil N.Gas Heat Electricity Total
2005 493.5 190.2 19.6 154.5 27.6 53.2 200.1 1138.5 2010 555.4 267.3 30.4 171.4 37.2 58.9 359.5 1480.1 2020 631.7 181.5 21.4 263.4 65.4 82.9 463.7 1709.9 2025 574.8 143.4 18.8 279.0 71.9 98.6 500.8 1687.4 2030 543.7 123.1 16.9 272.1 76.6 108.0 538.8 1679.3 2040 475.9 105.5 13.6 285.0 85.0 116.8 614.3 1696.0 2050 403.9 85.8 10.5 291.1 95.5 126.3 683.0 1696.2 Service
Coal Coke Towngas Oil N.Gas Heat Electricity Total 2005 21.7 0.0 0.4 15.4 5.0 2.3 32.6 77.3 2010 22.7 0.0 0.3 18.1 9.0 2.9 45.5 98.5 2020 33.0 0.0 0.1 26.9 33.4 7.1 106.0 206.6 2025 30.1 0.0 0.0 26.7 70.1 9.2 158.9 295.0 2030 21.5 0.0 0.0 25.0 93.1 10.9 186.0 336.4 2040 10.7 0.0 0.0 25.6 96.8 11.5 193.4 338.1 2050 5.5 0.0 0.0 26.3 89.1 10.8 179.9 311.5 Urban household
Coal Coke Towngas Oil N.Gas Heat Electricity Total 2005 35.5 0.0 6.8 21.9 12.1 34.9 23.6 134.9 2010 43.6 0.0 7.0 22.8 20.3 48.7 37.8 180.2 2025 38.1 0.0 7.8 22.9 61.8 71.3 70.9 272.7 2020 32.8 0.0 5.5 18.3 80.3 82.0 90.0 308.9 2030 25.1 0.0 2.3 15.4 96.3 88.7 102.2 330.0 2040 18.8 0.0 2.2 14.9 106.0 97.6 112.4 351.9 2050 9.6 2.1 14.5 107.0 98.6 113.5 345.3 Rural household
Coal Coke Towngas Oil N.Gas Heat Electricity Total 2005 42.0 0.0 0.0 4.9 0.0 0.0 12.2 59.1 2010 58.2 0.0 0.0 6.5 0.0 0.0 19.7 84.4 2020 65.7 0.0 0.0 16.4 0.1 0.0 33.7 115.9 2025 59.2 0.0 0.0 19.7 0.2 0.0 38.8 117.8 2030 48.2 0.0 0.0 20.9 0.2 0.0 43.1 112.5 2040 31.8 0.0 0.0 21.2 0.2 0.0 46.6 99.7 2050 19.7 20.5 0.2 43.8 84.2 Transport
Coal Coke Towngas Oil N.Gas Heat Electricity Total 2000 0.0 0.0 0.0 125.5 0.0 0.0 0.9 126.4 2005 0.0 0.0 0.0 189.8 0.1 0.0 1.5 191.4

LIMITS – LOW CLIMATE IMPACT SCENARIOS AND THE IMPLICATION OF
REQUIRED TIGHT EMISSION CONTROL STRATEGIES PROJECT NO 282846
DELIVERABLE NO.D3.1
117
2010 0.0 0.0 0.0 255.9 0.4 0.0 2.1 258.5 2020 0.0 0.0 0.0 494.5 7.6 0.0 19.5 521.6 2025 0.0 0.0 0.0 565.7 12.1 0.0 25.3 603.2 2030 0.0 0.0 0.0 574.1 17.7 0.0 62.6 654.5 2040 0.0 0.0 0.0 538.4 19.2 0.0 106.9 664.4 2050 0.0 0.0 0.0 460.6 18.4 0.0 171.0 650.0
Table 16. Projections on power generation by source under the 2 degree scenario, TWh
Coal fired Oil fired N.Gas Hydro Nulcear Wind Solar Bio Total
2005 1938 62 25 396 60 2 0 10 2494 2010 3193 58 83 575 141 66 1 21 4138 2020 3869 72 471 1304 761 507 130 130 7246 2030 3498 62 775 1498 1498 969 344 167 8812 2040 2045 51 1023 1721 2653 1620 820 192 10125 2050 1336 45 1347 1684 3312 2133 1156 213 11226
16.4.2 Emissionsdevelopment Other gases except CO2 in the 2 degree scenario are presented in table 17, and figure 5 to 7. The most interesting observation here is the large reduction on other pollutants when CO2 emissions drop. Table 17. Projections on SO2 emissions by sectors under the 2 degree scenario, million ton SO2
Power generation
Steel making
Building materials
Coke making
Heat supply Household Other Total
2005 13.1 0.9 2.5 5.8 0.8 0.9 1.4 25.4 2010 8.7 1.2 2.6 5.6 1.1 1.2 4.4 24.9 2020 3.7 1.7 1.7 2.8 0.8 1.2 3.9 15.8 2030 1.0 1.1 0.9 1.4 0.5 0.9 2.8 8.7 2040 0.6 0.9 0.7 1.2 0.4 0.6 1.8 6.2 2050 0.4 0.6 0.6 1.0 0.3 0.3 1.6 4.8
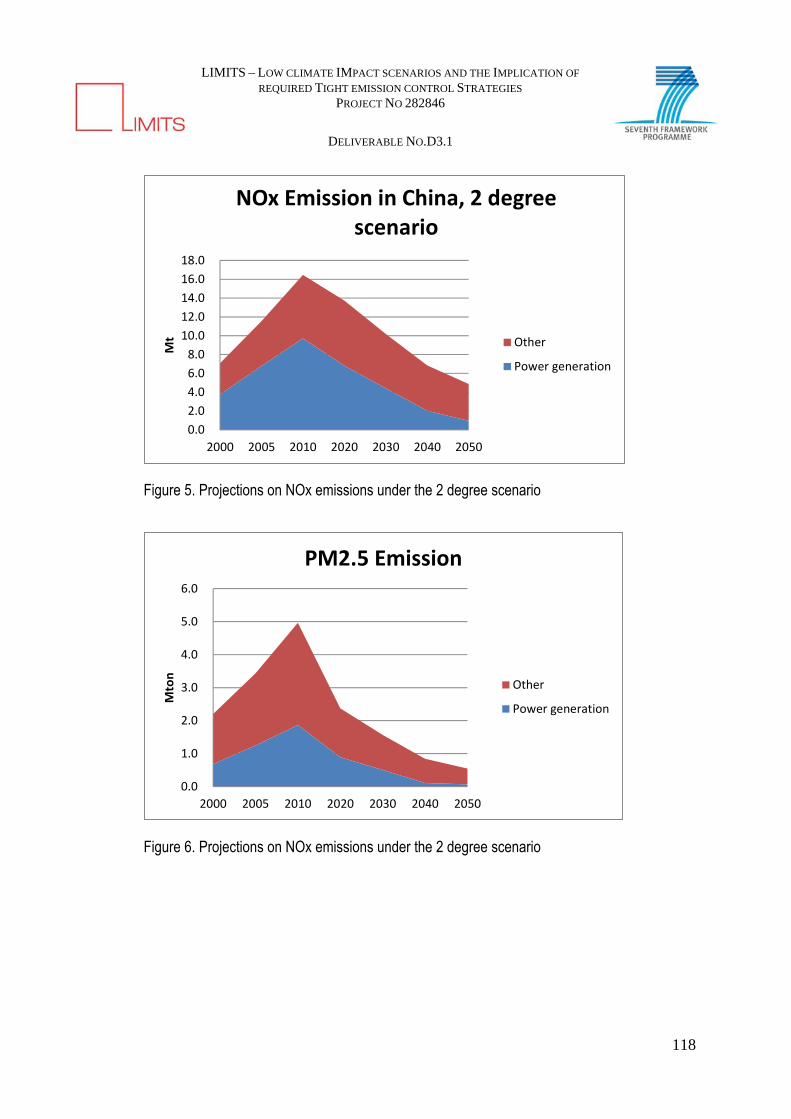
LIMITS – LOW CLIMATE IMPACT SCENARIOS AND THE IMPLICATION OF
REQUIRED TIGHT EMISSION CONTROL STRATEGIES PROJECT NO 282846
DELIVERABLE NO.D3.1
118
0.0
2.0
4.0
6.0
8.0
10.0
12.0
14.0
16.0
18.0
2000 2005 2010 2020 2030 2040 2050
Mt
NOx Emission in China, 2 degree scenario
Other
Power generation
Figure 5. Projections on NOx emissions under the 2 degree scenario
0.0
1.0
2.0
3.0
4.0
5.0
6.0
2000 2005 2010 2020 2030 2040 2050
Mton
PM2.5 Emission
Other
Power generation
Figure 6. Projections on NOx emissions under the 2 degree scenario
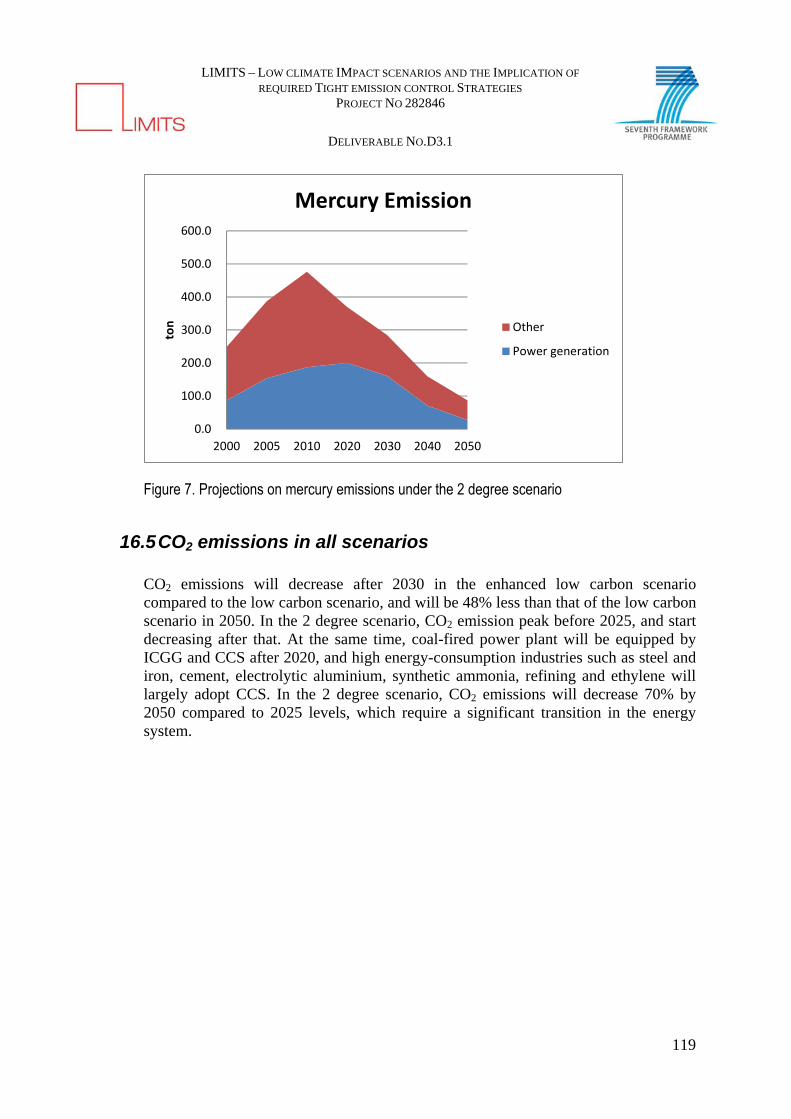
LIMITS – LOW CLIMATE IMPACT SCENARIOS AND THE IMPLICATION OF
REQUIRED TIGHT EMISSION CONTROL STRATEGIES PROJECT NO 282846
DELIVERABLE NO.D3.1
119
0.0
100.0
200.0
300.0
400.0
500.0
600.0
2000 2005 2010 2020 2030 2040 2050
ton
Mercury Emission
Other
Power generation
Figure 7. Projections on mercury emissions under the 2 degree scenario
16.5 CO2 emissions in all scenarios
CO2 emissions will decrease after 2030 in the enhanced low carbon scenario compared to the low carbon scenario, and will be 48% less than that of the low carbon scenario in 2050. In the 2 degree scenario, CO2 emission peak before 2025, and start decreasing after that. At the same time, coal-fired power plant will be equipped by ICGG and CCS after 2020, and high energy-consumption industries such as steel and iron, cement, electrolytic aluminium, synthetic ammonia, refining and ethylene will largely adopt CCS. In the 2 degree scenario, CO2 emissions will decrease 70% by 2050 compared to 2025 levels, which require a significant transition in the energy system.
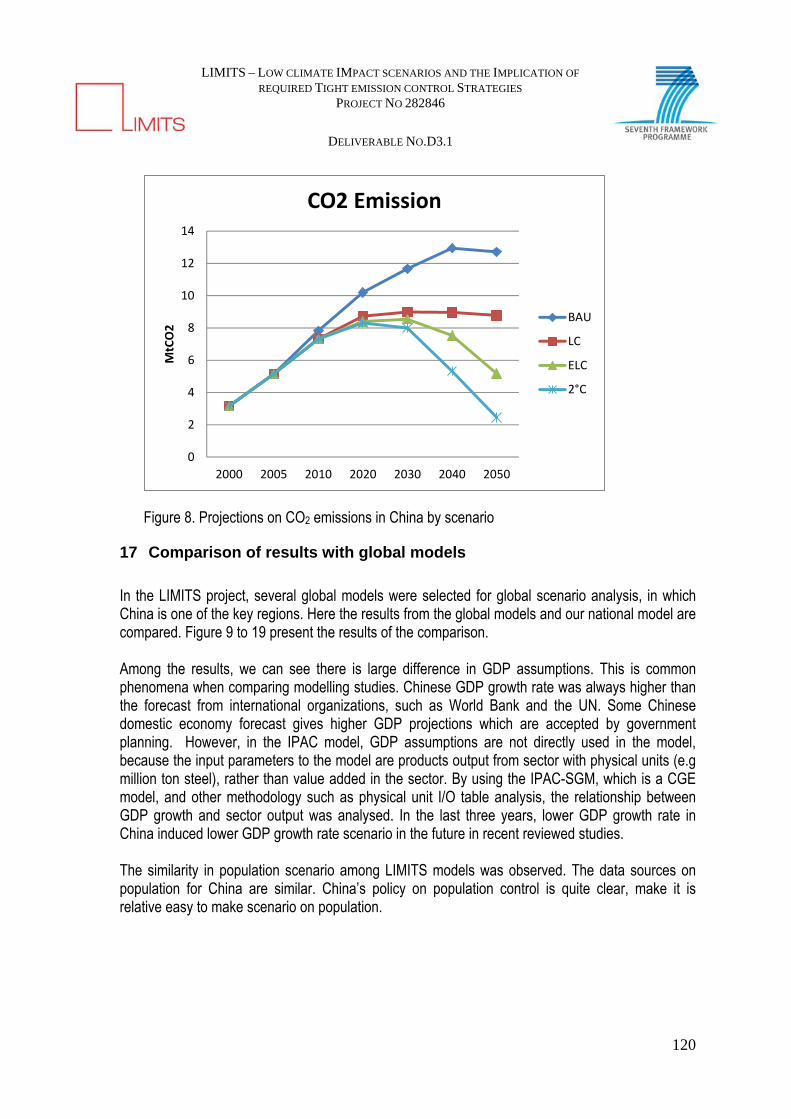
LIMITS – LOW CLIMATE IMPACT SCENARIOS AND THE IMPLICATION OF
REQUIRED TIGHT EMISSION CONTROL STRATEGIES PROJECT NO 282846
DELIVERABLE NO.D3.1
120
0
2
4
6
8
10
12
14
2000 2005 2010 2020 2030 2040 2050
MtCO2
CO2 Emission
BAU
LC
ELC
2°C
Figure 8. Projections on CO2 emissions in China by scenario
17 Comparison of results with global models
In the LIMITS project, several global models were selected for global scenario analysis, in which China is one of the key regions. Here the results from the global models and our national model are compared. Figure 9 to 19 present the results of the comparison.
Among the results, we can see there is large difference in GDP assumptions. This is common phenomena when comparing modelling studies. Chinese GDP growth rate was always higher than the forecast from international organizations, such as World Bank and the UN. Some Chinese domestic economy forecast gives higher GDP projections which are accepted by government planning. However, in the IPAC model, GDP assumptions are not directly used in the model, because the input parameters to the model are products output from sector with physical units (e.g million ton steel), rather than value added in the sector. By using the IPAC-SGM, which is a CGE model, and other methodology such as physical unit I/O table analysis, the relationship between GDP growth and sector output was analysed. In the last three years, lower GDP growth rate in China induced lower GDP growth rate scenario in the future in recent reviewed studies. The similarity in population scenario among LIMITS models was observed. The data sources on population for China are similar. China’s policy on population control is quite clear, make it is relative easy to make scenario on population.

LIMITS – LOW CLIMATE IMPACT SCENARIOS AND THE IMPLICATION OF
REQUIRED TIGHT EMISSION CONTROL STRATEGIES PROJECT NO 282846
DELIVERABLE NO.D3.1
121
0
200
400
600
800
1,000
1,200
1,400
1,600
1,800
2005 2010 2020 2030 2040 2050 2060 2070 2080 2090 2100
Population , Million AIM‐Enduse LIMITS‐
450AIM‐Enduse LIMITS‐
BaseGCAM LIMITS‐450
GCAM LIMITS‐Base
IMAGE LIMITS‐450
IMAGE LIMITS‐Base
MESSAGE LIMITS‐450
MESSAGE LIMITS‐Base
REMIND LIMITS‐450
REMIND LIMITS‐Base
TIAM‐ECN LIMITS‐450
TIAM‐ECN LIMITS‐Base
WITCH LIMITS‐450
WITCH LIMITS‐Base
IPAC BaU
IPAC 2 degree
Figure 9. Global and regional population projection for China
0
10,000
20,000
30,000
40,000
50,000
60,000
70,000
80,000
90,000
100,000
2005 2010 2020 2030 2040 2050 2060 2070 2080 2090 2100
GDP , Billion US$ AIM‐Enduse LIMITS‐450AIM‐Enduse LIMITS‐BaseGCAM LIMITS‐450
GCAM LIMITS‐Base
IMAGE LIMITS‐450
IMAGE LIMITS‐Base
MESSAGE LIMITS‐450
MESSAGE LIMITS‐Base
REMIND LIMITS‐450
REMIND LIMITS‐Base
TIAM‐ECN LIMITS‐450
TIAM‐ECN LIMITS‐Base
WITCH LIMITS‐450
WITCH LIMITS‐Base
IPAC BaU
IPAC 2 degree
Figure 10. Global and regional GDP projection for China
Even though there are differences in GDP growth among the global and the regional models, similar results in primary energy intensity and carbon intensity in the long term are observed.
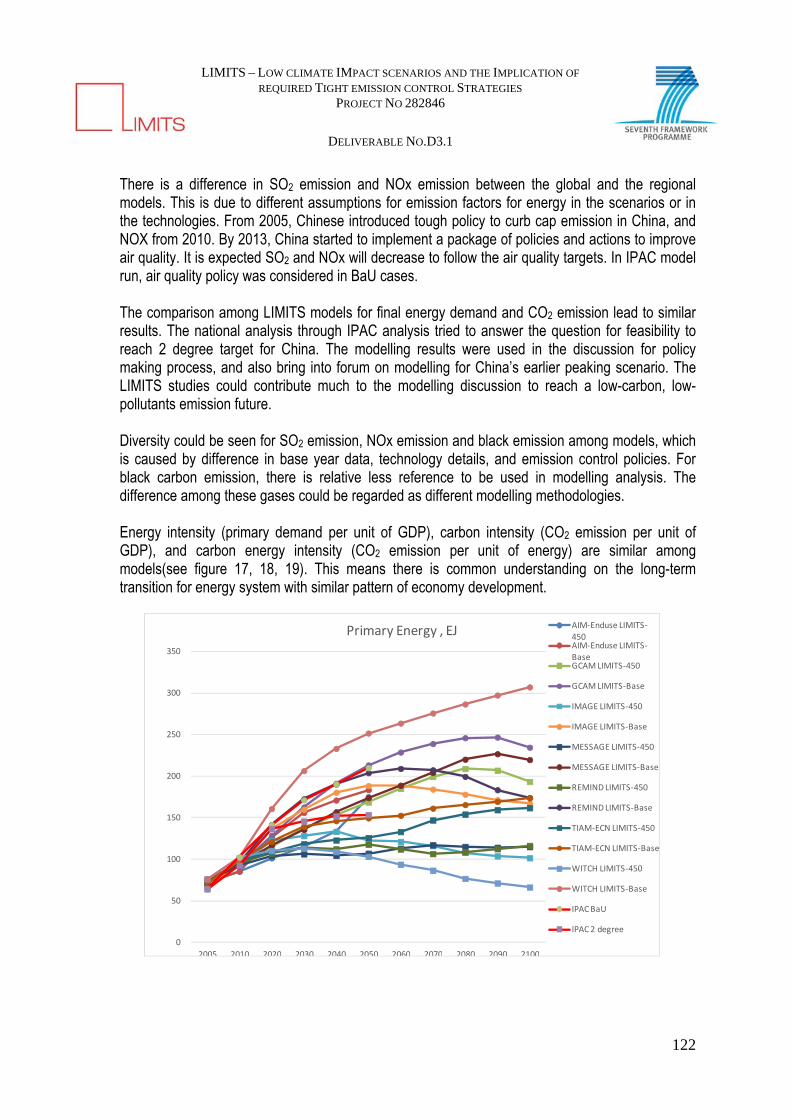
LIMITS – LOW CLIMATE IMPACT SCENARIOS AND THE IMPLICATION OF
REQUIRED TIGHT EMISSION CONTROL STRATEGIES PROJECT NO 282846
DELIVERABLE NO.D3.1
122
There is a difference in SO2 emission and NOx emission between the global and the regional models. This is due to different assumptions for emission factors for energy in the scenarios or in the technologies. From 2005, Chinese introduced tough policy to curb cap emission in China, and NOX from 2010. By 2013, China started to implement a package of policies and actions to improve air quality. It is expected SO2 and NOx will decrease to follow the air quality targets. In IPAC model run, air quality policy was considered in BaU cases. The comparison among LIMITS models for final energy demand and CO2 emission lead to similar results. The national analysis through IPAC analysis tried to answer the question for feasibility to reach 2 degree target for China. The modelling results were used in the discussion for policy making process, and also bring into forum on modelling for China’s earlier peaking scenario. The LIMITS studies could contribute much to the modelling discussion to reach a low-carbon, low-pollutants emission future. Diversity could be seen for SO2 emission, NOx emission and black emission among models, which is caused by difference in base year data, technology details, and emission control policies. For black carbon emission, there is relative less reference to be used in modelling analysis. The difference among these gases could be regarded as different modelling methodologies. Energy intensity (primary demand per unit of GDP), carbon intensity (CO2 emission per unit of GDP), and carbon energy intensity (CO2 emission per unit of energy) are similar among models(see figure 17, 18, 19). This means there is common understanding on the long-term transition for energy system with similar pattern of economy development.
0
50
100
150
200
250
300
350
2005 2010 2020 2030 2040 2050 2060 2070 2080 2090 2100
Primary Energy , EJ AIM‐Enduse LIMITS‐
450AIM‐Enduse LIMITS‐
BaseGCAM LIMITS‐450
GCAM LIMITS‐Base
IMAGE LIMITS‐450
IMAGE LIMITS‐Base
MESSAGE LIMITS‐450
MESSAGE LIMITS‐Base
REMIND LIMITS‐450
REMIND LIMITS‐Base
TIAM‐ECN LIMITS‐450
TIAM‐ECN LIMITS‐Base
WITCH LIMITS‐450
WITCH LIMITS‐Base
IPAC BaU
IPAC 2 degree
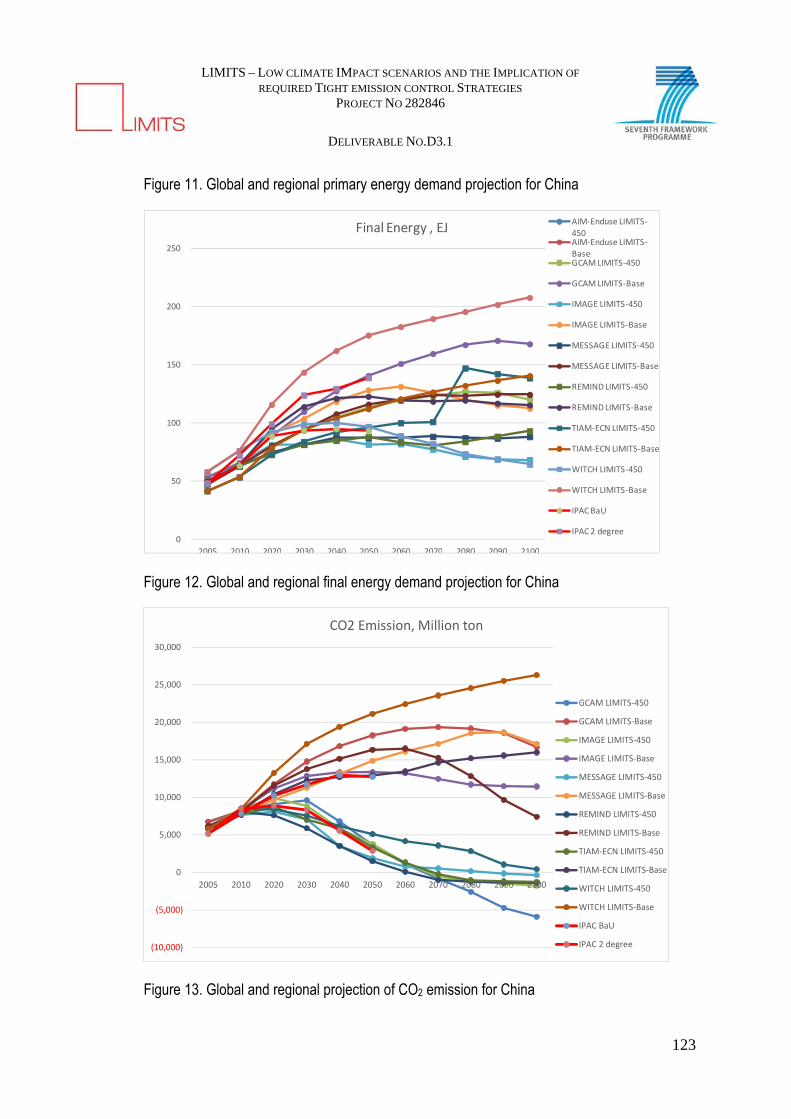
LIMITS – LOW CLIMATE IMPACT SCENARIOS AND THE IMPLICATION OF
REQUIRED TIGHT EMISSION CONTROL STRATEGIES PROJECT NO 282846
DELIVERABLE NO.D3.1
123
Figure 11. Global and regional primary energy demand projection for China
0
50
100
150
200
250
2005 2010 2020 2030 2040 2050 2060 2070 2080 2090 2100
Final Energy , EJAIM‐Enduse LIMITS‐
450AIM‐Enduse LIMITS‐BaseGCAM LIMITS‐450
GCAM LIMITS‐Base
IMAGE LIMITS‐450
IMAGE LIMITS‐Base
MESSAGE LIMITS‐450
MESSAGE LIMITS‐Base
REMIND LIMITS‐450
REMIND LIMITS‐Base
TIAM‐ECN LIMITS‐450
TIAM‐ECN LIMITS‐Base
WITCH LIMITS‐450
WITCH LIMITS‐Base
IPAC BaU
IPAC 2 degree
Figure 12. Global and regional final energy demand projection for China
(10,000)
(5,000)
0
5,000
10,000
15,000
20,000
25,000
30,000
2005 2010 2020 2030 2040 2050 2060 2070 2080 2090 2100
CO2 Emission, Million ton
GCAM LIMITS‐450
GCAM LIMITS‐Base
IMAGE LIMITS‐450
IMAGE LIMITS‐Base
MESSAGE LIMITS‐450
MESSAGE LIMITS‐Base
REMIND LIMITS‐450
REMIND LIMITS‐Base
TIAM‐ECN LIMITS‐450
TIAM‐ECN LIMITS‐Base
WITCH LIMITS‐450
WITCH LIMITS‐Base
IPAC BaU
IPAC 2 degree
Figure 13. Global and regional projection of CO2 emission for China
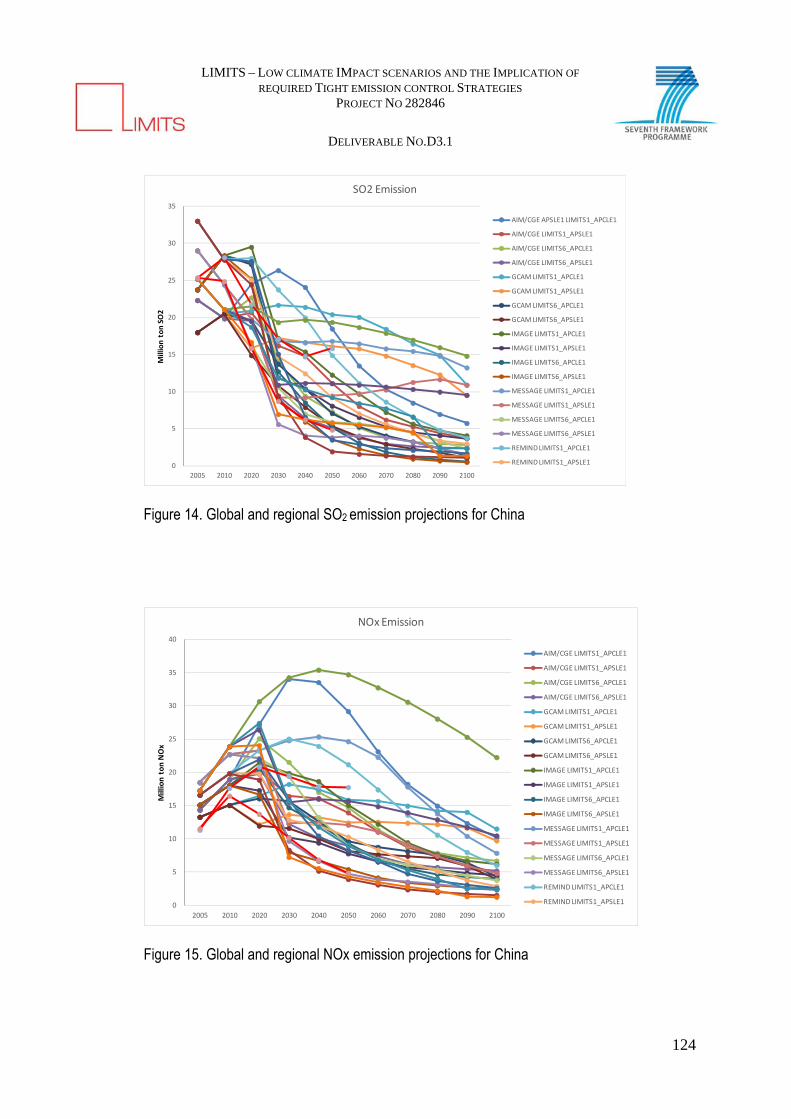
LIMITS – LOW CLIMATE IMPACT SCENARIOS AND THE IMPLICATION OF
REQUIRED TIGHT EMISSION CONTROL STRATEGIES PROJECT NO 282846
DELIVERABLE NO.D3.1
124
0
5
10
15
20
25
30
35
2005 2010 2020 2030 2040 2050 2060 2070 2080 2090 2100
Million ton SO2
SO2 Emission
AIM/CGE APSLE1 LIMITS1_APCLE1
AIM/CGE LIMITS1_APSLE1
AIM/CGE LIMITS6_APCLE1
AIM/CGE LIMITS6_APSLE1
GCAM LIMITS1_APCLE1
GCAM LIMITS1_APSLE1
GCAM LIMITS6_APCLE1
GCAM LIMITS6_APSLE1
IMAGE LIMITS1_APCLE1
IMAGE LIMITS1_APSLE1
IMAGE LIMITS6_APCLE1
IMAGE LIMITS6_APSLE1
MESSAGE LIMITS1_APCLE1
MESSAGE LIMITS1_APSLE1
MESSAGE LIMITS6_APCLE1
MESSAGE LIMITS6_APSLE1
REMIND LIMITS1_APCLE1
REMIND LIMITS1_APSLE1
Figure 14. Global and regional SO2 emission projections for China
0
5
10
15
20
25
30
35
40
2005 2010 2020 2030 2040 2050 2060 2070 2080 2090 2100
Million ton NOx
NOx Emission
AIM/CGE LIMITS1_APCLE1
AIM/CGE LIMITS1_APSLE1
AIM/CGE LIMITS6_APCLE1
AIM/CGE LIMITS6_APSLE1
GCAM LIMITS1_APCLE1
GCAM LIMITS1_APSLE1
GCAM LIMITS6_APCLE1
GCAM LIMITS6_APSLE1
IMAGE LIMITS1_APCLE1
IMAGE LIMITS1_APSLE1
IMAGE LIMITS6_APCLE1
IMAGE LIMITS6_APSLE1
MESSAGE LIMITS1_APCLE1
MESSAGE LIMITS1_APSLE1
MESSAGE LIMITS6_APCLE1
MESSAGE LIMITS6_APSLE1
REMIND LIMITS1_APCLE1
REMIND LIMITS1_APSLE1
Figure 15. Global and regional NOx emission projections for China
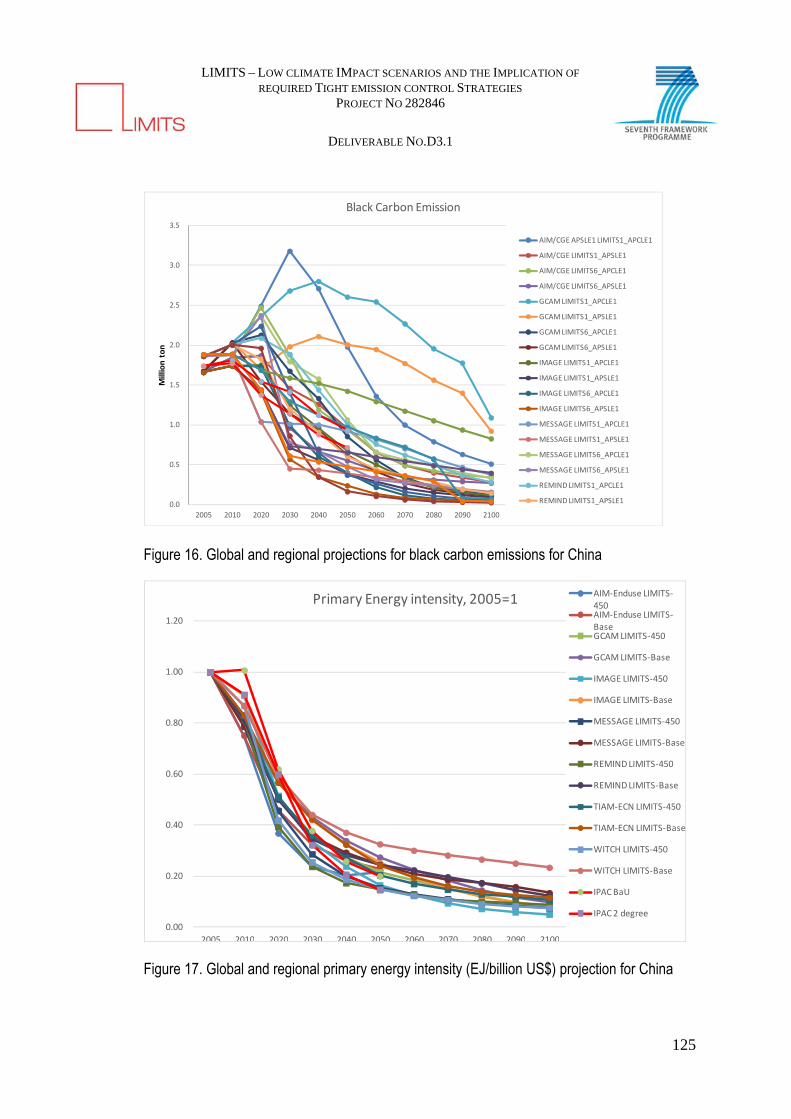
LIMITS – LOW CLIMATE IMPACT SCENARIOS AND THE IMPLICATION OF
REQUIRED TIGHT EMISSION CONTROL STRATEGIES PROJECT NO 282846
DELIVERABLE NO.D3.1
125
0.0
0.5
1.0
1.5
2.0
2.5
3.0
3.5
2005 2010 2020 2030 2040 2050 2060 2070 2080 2090 2100
Million ton
Black Carbon Emission
AIM/CGE APSLE1 LIMITS1_APCLE1
AIM/CGE LIMITS1_APSLE1
AIM/CGE LIMITS6_APCLE1
AIM/CGE LIMITS6_APSLE1
GCAM LIMITS1_APCLE1
GCAM LIMITS1_APSLE1
GCAM LIMITS6_APCLE1
GCAM LIMITS6_APSLE1
IMAGE LIMITS1_APCLE1
IMAGE LIMITS1_APSLE1
IMAGE LIMITS6_APCLE1
IMAGE LIMITS6_APSLE1
MESSAGE LIMITS1_APCLE1
MESSAGE LIMITS1_APSLE1
MESSAGE LIMITS6_APCLE1
MESSAGE LIMITS6_APSLE1
REMIND LIMITS1_APCLE1
REMIND LIMITS1_APSLE1
Figure 16. Global and regional projections for black carbon emissions for China
0.00
0.20
0.40
0.60
0.80
1.00
1.20
2005 2010 2020 2030 2040 2050 2060 2070 2080 2090 2100
Primary Energy intensity, 2005=1 AIM‐Enduse LIMITS‐450AIM‐Enduse LIMITS‐BaseGCAM LIMITS‐450
GCAM LIMITS‐Base
IMAGE LIMITS‐450
IMAGE LIMITS‐Base
MESSAGE LIMITS‐450
MESSAGE LIMITS‐Base
REMIND LIMITS‐450
REMIND LIMITS‐Base
TIAM‐ECN LIMITS‐450
TIAM‐ECN LIMITS‐Base
WITCH LIMITS‐450
WITCH LIMITS‐Base
IPAC BaU
IPAC 2 degree
Figure 17. Global and regional primary energy intensity (EJ/billion US$) projection for China

LIMITS – LOW CLIMATE IMPACT SCENARIOS AND THE IMPLICATION OF
REQUIRED TIGHT EMISSION CONTROL STRATEGIES PROJECT NO 282846
DELIVERABLE NO.D3.1
126
(0.20)
0.00
0.20
0.40
0.60
0.80
1.00
1.20
2005 2010 2020 2030 2040 2050 2060 2070 2080 2090 2100
Carbon intensity, 2005=1 AIM‐Enduse LIMITS‐
450AIM‐Enduse LIMITS‐
BaseGCAM LIMITS‐450
GCAM LIMITS‐Base
IMAGE LIMITS‐450
IMAGE LIMITS‐Base
MESSAGE LIMITS‐450
MESSAGE LIMITS‐Base
REMIND LIMITS‐450
REMIND LIMITS‐Base
TIAM‐ECN LIMITS‐450
TIAM‐ECN LIMITS‐Base
WITCH LIMITS‐450
WITCH LIMITS‐Base
IPAC BaU
IPAC 2 degree
Figure 18. Global and regional carbon intensity (million ton CO2/billion US$) projection for China
(2.00)
(1.00)
0.00
1.00
2.00
3.00
4.00
5.00
2005 2010 2020 2030 2040 2050 2060 2070 2080 2090 2100
Carbon energy intensity, 2005=1 AIM‐Enduse LIMITS‐
450AIM‐Enduse LIMITS‐BaseGCAM LIMITS‐450
GCAM LIMITS‐Base
IMAGE LIMITS‐450
IMAGE LIMITS‐Base
MESSAGE LIMITS‐450
MESSAGE LIMITS‐Base
REMIND LIMITS‐450
REMIND LIMITS‐Base
TIAM‐ECN LIMITS‐450
TIAM‐ECN LIMITS‐Base
WITCH LIMITS‐450
WITCH LIMITS‐Base
IPAC BaU
IPAC 2 degree

LIMITS – LOW CLIMATE IMPACT SCENARIOS AND THE IMPLICATION OF
REQUIRED TIGHT EMISSION CONTROL STRATEGIES PROJECT NO 282846
DELIVERABLE NO.D3.1
127
Figure 19. Global and regional carbon energy intensity (million ton CO2/ EJ) projection for China
18 Discussion
18.1 Key factors for the 2 degree scenario
In the modeling analysis, the key area for CO2 emissions are economic development optimization, energy efficiency improvement, renewable energy, nuclear development, carbon capture and storage, change of life style and of consumption patterns. In the IPAC modeling study under the enhanced low-carbon scenario, in order to decrease CO2 emissions, several key issues have to be realized: Change on economic structure: There are a lot of discussions during the scenario building process by inviting experts on economics and reviewing relative studies. The GDP growth used here is a most common result which comes from economic research teams, especially before 2030. Information on economic structure change in the main industrial sectors is also diverse. However, there is not much detail research on the quantitative structural change in secondary industry. Here by reviewing literature, we used our own model, IPAC-SGM model to simulate the structure change in secondary industry (see figure 20).
0%
10%
20%
30%
40%
50%
60%
70%
80%
90%
100%
2005 2010 2020 2030
%
Year
Share of Value added by industry sectorsPower generation
Manufacture of Artwork and Other Manufacturing
Manufacture of Measuring Instruments and Machinery for Cultural Activity and Off ice Work
Manufacture of Electrical Machinery and Equipment, Communication Equipment, Computers and Other Electronic Equipment
Manufacture of Transport Equipment
Manufacture of General Purpose Machinery
Manufacture of Metal Products
Smelting and Pressing of Non-ferrous Metals
Smelting and Pressing of Ferrous Metals
Manufacture of Non-metallic Mineral Products
Manufacture of Rubber,Plastics
Manufacture of Chemical Fibers
Manufacture of Medicines
Manufacture of Raw Chemical Materials and Chemical Products
Processing of Petroleum, Coking, Processing of Nuclear Fuel
Figure 20. Structure change in secondary industry

LIMITS – LOW CLIMATE IMPACT SCENARIOS AND THE IMPLICATION OF
REQUIRED TIGHT EMISSION CONTROL STRATEGIES PROJECT NO 282846
DELIVERABLE NO.D3.1
128
Energy intensive products: The share of GDP from energy intensive industry (middle part in the figure 20) would be reduced due to change on demand. China’s GDP will surpass US’s GDP between 2020 and 2030. Such a huge amount of GDP could not rely on the existing economic pattern which is mainly driven by heavy industry development and raw material production. We found that many energy intensive products12 will peak between 2020 and 2025, assuming that in the future export of energy intensive products will not increase much, but currently it is already major part of global output. This was obtained by looking at the infrastructure development including building construction, road, railway, airport etc., and final consumption needs, where more than 95% of cement and more than 55% of steel are consumed (Jiang, 2011).These analysis showed that the output of most of energy intensive products will peak before 2020. By 2009, energy use in energy intensive production sectors accounted for 60% of total energy use by industry, or around 40% of total national final energy consumption. The developments in energy intensive product manufacturing will, therefore, heavily impact on energy use in China. The output of major energy intensive products is a key area for low-carbon emission scenario analysis. We have studied the likely future demand for major energy intensive products and considered implications of limiting the output of these energy intensive products in order to ensure a low energy and low-carbon future. For the scenario analysis we have used the IPAC-CGE model to analyse the structure of economic development and considered future industry development including mix of industrial sub-sectors. The analysis showed that in 2030, industry will still play a major role in GDP being the main energy consumer. It is, therefore, necessary to carry out a detailed industry analysis for the mid- and long-term scenarios. In this study we focus on energy-intensive industrial sectors, describing sectoral scenarios for 30 to 50 years in the future. Detailed analysis of industrial sectors has been historically lacking in energy scenario analysis. In the past, the assessment of the future development of energy-intensive sectors (focusing mainly on the production of energy-intensive products) was carried out based on discussions with sectoral experts. As there are very few in-depth studies, large differences among scenarios usually exist. This is the main reason for significant uncertainty and low veracity in the energy demand forecasts. In order to further understand the future development of industrial sectors and better predict the future of energy-intensive sectors and other sectors, we employed several analytical methods in order to generate better data for analysis. This supplies input parameters for our own model as well as provides basis for discussion on methodology and data with other studies. In this study we mainly use three methods to make projections on energy intensive products:
The first method is using the IPAC-CGE model to predict future economic development of different sectors. Using this method, sectoral growth and
12 Energy intensive products include steel, cement, glass, brick, non-ferrous products, chemical products , paper etc.

LIMITS – LOW CLIMATE IMPACT SCENARIOS AND THE IMPLICATION OF
REQUIRED TIGHT EMISSION CONTROL STRATEGIES PROJECT NO 282846
DELIVERABLE NO.D3.1
129
production are forecasted taking the overall economic development perspective. This is a new research methodology. No similar research has been done domestically; however there are some uncertainties related to the use of this method. It is, however, evident that this approach will become an important methodology in the future, and will need more research groups’ work.
The second method is to use means to forecast future development of the sector in detail. This is similar to the input-output analysis method, which can also be viewed as an extention of the first method. For example, forecasting future iron and steel demand is based on analysing development of downstream sectors.
The third method is to employ sectoral analysis and sectoral experts, which is a commonly used method.
In the analysis of future industry development, the value added of each industrial sector was presented by using the IPAC-CGE model. Among these sectors, only the iron and steel sector can use the added value data to calculate its production. There are fewer types of production in building materials sector, and some of the products are dominating the market. Therefore, we can also correlate added value and production to deduce sectoral production data. Table 12 presents data on production of the main energy-intensive products under two scenarios considered. Table 12. Production of main energy-intensive products, LC and ELC scenarios
Unit 2005 2020 2030 2040 2050
Iron and steel 108 tons 3.55 6.7 5.7 4.4 3.6
Cement 108 tons 10.6 17 16 12 9
Glass 108 weight cases 3.99 6.5 6.9 6.7 5.8
Copper 104 tons 260 700 700 650 460
Aluminium 104 tons 851 1600 1600 1500 1200
Lead and zinc 104 tons 510 720 700 650 550
Sodium
carbonate 104 tons 1467 2300 2450 2350 2200
Caustic Soda 104 tons 1264 2400 2500 2500 2400
Paper and
paperboard 104 tons 6205 11000 11500 12000 12000
Chemical
fertilizer 104 tons 5220 6100 6100 6100 6100
Ethylene 104 tons 756 3400 3600 3600 3300

LIMITS – LOW CLIMATE IMPACT SCENARIOS AND THE IMPLICATION OF
REQUIRED TIGHT EMISSION CONTROL STRATEGIES PROJECT NO 282846
DELIVERABLE NO.D3.1
130
Ammonia 104 tons 4630 5000 5000 5000 4500
Calcium
carbide 104 tons 850 1000 800 700 400
Energy intensive products is consuming nearly 50% of energy in China, so if there is not significant increase in energy intensive products production, with a much lower growth rate than GDP, the energy use increase in these energy intensive products would also be limited. This will be a big contribution to decrease energy intensity per GDP, and then contribution to reduce emissions intensity. Energy efficiency improvement: Energy efficiency improvement is one of key policies for mitigation in China. In the model scenario, enery demand in the 2 degree scenario is 30% lower than the BaU scenario, which comes from energy efficiency improvement. From the point of view of policy making, there is much room for China to make further efforts on energy efficiency gains. This could be a long-term policy. During the 11th Five Year plan (2006 to 2010), energy efficiency has been improved significantly (State Council, 2011; Mark L. et al, 2010; Keyun, 2009). Comparing to energy conservation efforts in last several decades, and efforts in other countries, China now is making an unprecedented action on energy conservation, which could be seen from following: Made energy conservation policy as one of national top policies. Made energy intensity target as one of key indicator for local government official. Frequency of policy making is extremely high. There is nearly one policy per week from 2007
to 2008 on energy conservation from central government, which not include local government energy conservation policies.
The first is the Top-1000 Energy-Consuming Enterprise Program, which focused on improving energy efficiency in China’s largest 1000 companies, responsible for one third of China’s total energy use.
Closure of small size power generation and other industry is a very brave action which may cause social problem with unemployment and loss of profit for stock holders.
From the technical point of view, energy efficiency has made big achievements. China has released a total of 115 state key energy-efficient technology promotion catalogues in three batches, and specially promoted seven energy-efficient technologies in the iron and steel, building material and chemical industries. Unit energy use per ton of steel products, copper, cement decreased 12.1%, 35.9% and 28.6 by 2010 respectively. By 2010, almost all advanced technologies on energy saving in Industry were adopted in China. In steel making industry, penetration rate of Coke Dry Quenching increase from 30% to more than 80%. Top Gas Recovery Turbine (TRT) increased from 49 set to 597 set. The share of furnace with capacity above 1000m3, increased from 21% to 52%; . The share of new
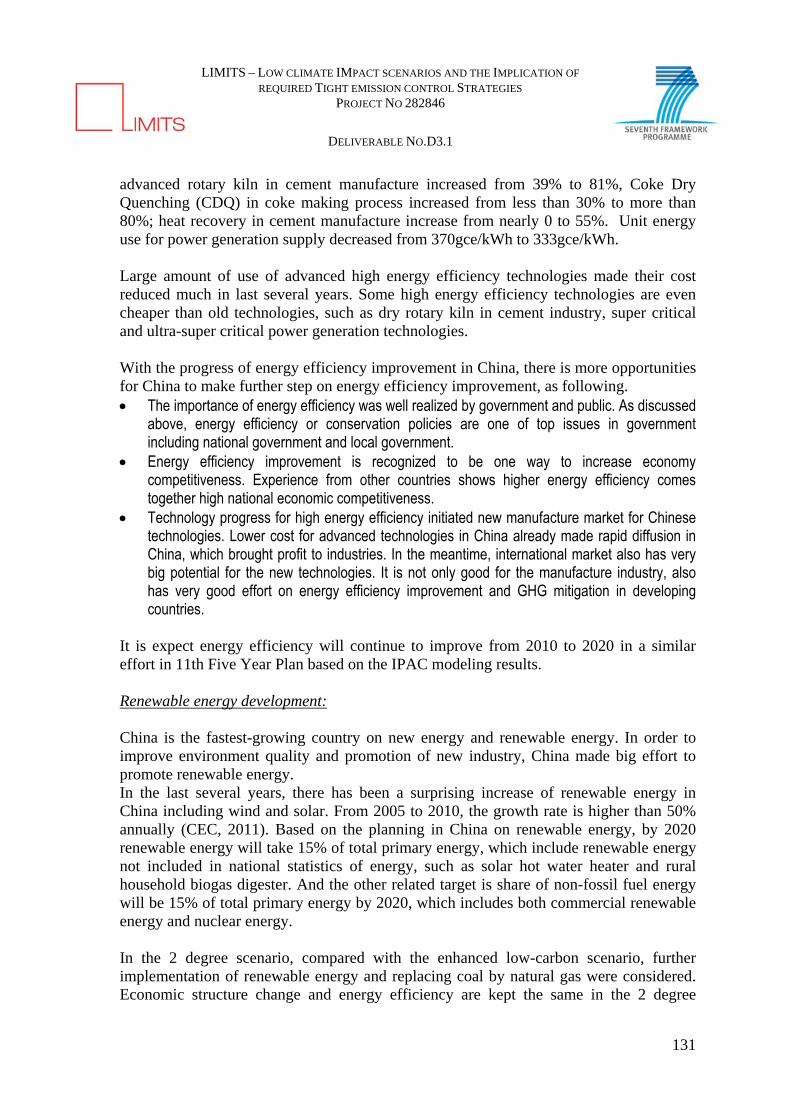
LIMITS – LOW CLIMATE IMPACT SCENARIOS AND THE IMPLICATION OF
REQUIRED TIGHT EMISSION CONTROL STRATEGIES PROJECT NO 282846
DELIVERABLE NO.D3.1
131
advanced rotary kiln in cement manufacture increased from 39% to 81%, Coke Dry Quenching (CDQ) in coke making process increased from less than 30% to more than 80%; heat recovery in cement manufacture increase from nearly 0 to 55%. Unit energy use for power generation supply decreased from 370gce/kWh to 333gce/kWh. Large amount of use of advanced high energy efficiency technologies made their cost reduced much in last several years. Some high energy efficiency technologies are even cheaper than old technologies, such as dry rotary kiln in cement industry, super critical and ultra-super critical power generation technologies. With the progress of energy efficiency improvement in China, there is more opportunities for China to make further step on energy efficiency improvement, as following. The importance of energy efficiency was well realized by government and public. As discussed
above, energy efficiency or conservation policies are one of top issues in government including national government and local government.
Energy efficiency improvement is recognized to be one way to increase economy competitiveness. Experience from other countries shows higher energy efficiency comes together high national economic competitiveness.
Technology progress for high energy efficiency initiated new manufacture market for Chinese technologies. Lower cost for advanced technologies in China already made rapid diffusion in China, which brought profit to industries. In the meantime, international market also has very big potential for the new technologies. It is not only good for the manufacture industry, also has very good effort on energy efficiency improvement and GHG mitigation in developing countries.
It is expect energy efficiency will continue to improve from 2010 to 2020 in a similar effort in 11th Five Year Plan based on the IPAC modeling results. Renewable energy development: China is the fastest-growing country on new energy and renewable energy. In order to improve environment quality and promotion of new industry, China made big effort to promote renewable energy. In the last several years, there has been a surprising increase of renewable energy in China including wind and solar. From 2005 to 2010, the growth rate is higher than 50% annually (CEC, 2011). Based on the planning in China on renewable energy, by 2020 renewable energy will take 15% of total primary energy, which include renewable energy not included in national statistics of energy, such as solar hot water heater and rural household biogas digester. And the other related target is share of non-fossil fuel energy will be 15% of total primary energy by 2020, which includes both commercial renewable energy and nuclear energy. In the 2 degree scenario, compared with the enhanced low-carbon scenario, further implementation of renewable energy and replacing coal by natural gas were considered. Economic structure change and energy efficiency are kept the same in the 2 degree

LIMITS – LOW CLIMATE IMPACT SCENARIOS AND THE IMPLICATION OF
REQUIRED TIGHT EMISSION CONTROL STRATEGIES PROJECT NO 282846
DELIVERABLE NO.D3.1
132
scenario. With these, it is possible for China to peak CO2 emission before 2025, and start reducing CO2 emissions largely afterwards. In the 2 degree scenario, renewable energy is more prominent than in the enhanced low- carbon scenario. In the enhanced low-carbon scenario, power generation from renewable energy (including large hydro) will be around 34%, ad nuclear will account for 35% by 2050. Installed capacity for wind, solar, hydro will be around 450GW, 360GW and 510GW by 2050. In the 2 degree scenario, power generation from renewable energy could reach 48% of total power generation, leaving only 17% of coal fired power generation. Installed capacity for wind solar and hydro is 930GW, 1040GW, 520GW respectively by 2050. Another key factor to go to the 2 degree emission pathway is increasing of natural gas use in China. In the enhanced low-carbon scenario, natural gas use will be 350BCM by 2030, and 450BCM by 2050. In the 2 degree scenario, natural gas would be around 480BCM by 2030, and 590BCM by 2050. Due to the growth in renewable energy, coal use in China by 2050 will be lower than 1billion ton. CCS could be then used by all coal fired power plants, and half of natural gas power plants. In this way, CO2 emissions in China could be reduced after 2025 and achieve 70% reduction by 2050 compared to 2020 levels. The renewable energy scenario in the 2 degree scenario is feasible because recent progress on renewable energy development in China. The cost learning curve for wind and solar is much stronger than our regional model used. The learning curve comes from IPAC’s study on technology. Technology perspective studies are also one of key research area in IPAC modeling team, which has detailed analysis on selected technologies, such as electric car, nuclear energy, renewable energy, electric appliances(Jiang et al, 2009; Jiang, 2011; Jiang et al, 2012). Figure 21 presents the cost learning curve used in the model compared with actual data by 2010. Such kind of technology progress made the cost of wind power and solar power decrease a lot within 2 years. Currently, power generation cost for some wind farms already can compete with coal fired power plants.
Technology learning curve
0
0,2
0,4
0,6
0,8
1
1,2
2005 2010 2020 2030 2050
Year
Inde
x, 2
005=
1
Hydrate
Ethanol
IGCC
Fuel Cell IGCC
Hydrogen Car
Poly-Generation
Solar Thermal Power
PV
4th Generation Nuclear
Off shore wind
on shore wind
Biomass Power
Advanced NGCC
Electic Car
Wind 2010
Solar 2010

LIMITS – LOW CLIMATE IMPACT SCENARIOS AND THE IMPLICATION OF
REQUIRED TIGHT EMISSION CONTROL STRATEGIES PROJECT NO 282846
DELIVERABLE NO.D3.1
133
Figure 21. Technology learning curve used in IPAC/AIM-technology model and data for 2010.
The progress for end use technologies also move faster than the model assumptions. Electric appliances such as LED TV, higher efficiency air conditioner and high efficiency car already have higher penetration rates by 2011 than the model has assumed. With the appropriate policies, lower energy demand in the 2 degree scenario will be much feasible by 2020 and after. In the meantime, rapid GDP growth rate provide strong support for low carbon development in China. In 11th Five Year Plan period (2006-2010), annual GDP growth rate is 11.2%. But it is 16.7% annual growth rate if calculated based on current value (China Statistic Yearbook, 2011, 2011). It is expected by 2015, GDP in China could reach 75trillion Yuan (in current value), newly added accumulated GDP is 450 Trillion Yuan, and cumulated GDP is 860 Trillion Yuan. The investment need in all modelling study is much small compared with GDP; normally it is smaller than 2 to 4%. If think about the investment in China, new and renewable energy is one of key sector to be promoted in China inside government policies and planning, there could be much more investment on renewable energy in future, even though China already is the biggest country in the world for renewable energy investment in 2010, which accounts for 24% of the world (UNEP, 2011). Reviewing the progress on renewable energy planning in China, the target for renewable energy was revised to be much higher in recent years. Renewable Energy Planning 2006 set up the target is wind 30GW, solar 2GW by 2020. By 2009 National Energy Administration (NEA) announced the installed Wind power generation will be 80WG by 2020. By 2010 NEA said installed Wind power generation will be 150 GW, solar 20GW by 2020. By the end of 2011, they discussed to increase the target to be wind 200GW to 300GW, and solar 50WG to 80 GW. Based on the conclusion from Chinese Academy for Engineering, grid in China could adopt these renewable energy power generation in short term.
Nuclear energy development:
It has been estimated that the nuclear installed capacity in China by 2020 will achieve more than 80GW based on new nuclear planning, which is much bigger than the original planning with 40GW by 2020. After Fukushima nuclear accident, there is much discussion on nuclear development in China. However there is not much choice for China in future for power generation. In last several years, coal fired power generation increased rapidly with annual newly installed capacity more than 60GW. Compared with nuclear power generation, coal fired power generation is much environment damaged and life lost. Due to large amount of energy use in China, by 2050 there is no future major role of renewable energy in China. Therefore

LIMITS – LOW CLIMATE IMPACT SCENARIOS AND THE IMPLICATION OF
REQUIRED TIGHT EMISSION CONTROL STRATEGIES PROJECT NO 282846
DELIVERABLE NO.D3.1
134
nuclear power generation will play important role in future Chinese energy system. The target for 2020 to have 70 to 80GW nuclear power generation still survived.
Carbon capture and storage (CCS): China has to use CCS in the case of large amount of coal use for next several decades. Even with the enhanced low carbon scenario, there will be around 1.8 billion ton coal used by 2050. CCS is essential for China to deep cut CO2 emissions after 2030. Based on the study of the IPAC team involved for CCS implementation in China, the learning effect will be too big to foresee the cost reduction in the future. The total cost to apply CCS in 100 coal fired power plants is not very high, and will increase 3 cent/kWh on top of electricity price over grid. In the Enhanced low carbon scenario (ELC), CCS was adopted as one of key mitigation options. For CO2 emission, removed CO2 emission is given in figure 22. Key assumptions are given in table 13 and 14 (Kejun, 2011). Lower removed rate for different power generation technologies is assumed because of technology development is not yet mature at beginning of adoption of CCS. In the Enhanced low carbon scenario (ELC), CCS was included for deep CO2 emission cuts in China. It was assumed that IGCC would be implemented after 2020, and all the IGCC and Natural Gas Combine Cycle(NGCC) power plants will be fully equipped with CCS in China, together with 22% Ultra-Super critical, 10% Super critical unit with CCS (see figure 4 to 6 ). With this assumption, by 2050, in the ELC scenario, there will be 560GW units with CCS, which is around 800 units, accounting for 48% of fossil fuel fired power generation capacity, 19.8% of total installed capacity. Total CO2 captured is 1589 MtCO2 per year in 2050. The designed CCS roadmap for this study could be described as, 5 to 7 full size of CCS by 2020, in order to identify suitable technologies for it, and then around 100 full scale CCS by 2030, which means it will be widely implemented after 2020 if suitable technology for CCS could be fixed.

LIMITS – LOW CLIMATE IMPACT SCENARIOS AND THE IMPLICATION OF
REQUIRED TIGHT EMISSION CONTROL STRATEGIES PROJECT NO 282846
DELIVERABLE NO.D3.1
135
0
200
400
600
800
1000
1200
1400
1600
1800
2000 2005 2010 2020 2030 2040 2050
million ton‐CO2
CO2 removed by CCS, ELC scenario
Figure 22. CO2 removed by CCS in power generation sector Table 13. removal rate for CO2 by CCS in ELC scenario, %
Super
Critical US-
Critical IGCC IGCC-
Fuel Cell NGCC
2020 80.0 80.0 85.0 85.0 85.0
2030 85.0 85.0 90.0 90.0 90.0
2040 85.0 85.0 90.0 90.0 90.0
2050 85.0 85.0 90.0 90.0 90.0
Table 14. power generation capacity with CCS in ELC scenario , TWh
Super Critical US-
Critical IGCC IGCC-Fuel Cell NGCC
2020 0 0 1316 0 203
2030 217 379 6310 701 3411
2040 1319 2184 12890 2275 9679
2050 2822 8465 22045 5144 21514
18.2 Policy analysis for a low-carbon scenario Even without the inclusion of climate change oriented policies, the scenario analysis showed a wide range of possible futures (in terms of emissions). Key driving forces of a low carbon future include economic development (GDP growth), social efficiency change, technology progress etc. Factors and related policies considered
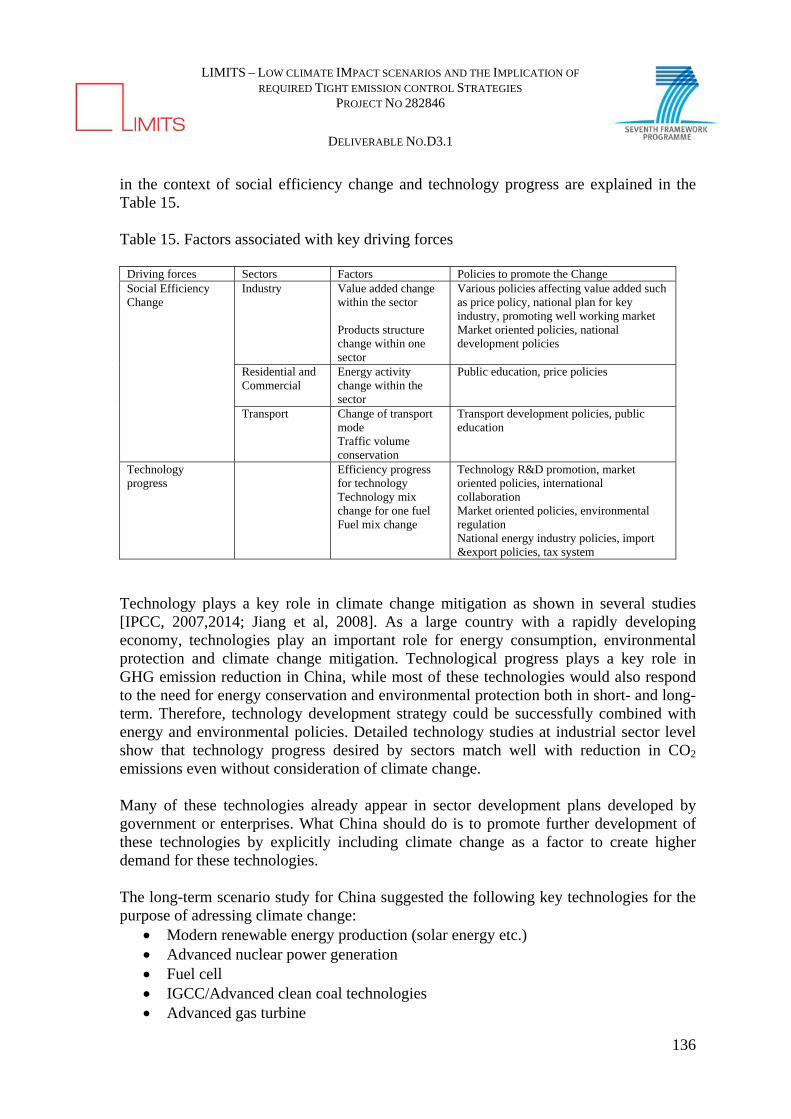
LIMITS – LOW CLIMATE IMPACT SCENARIOS AND THE IMPLICATION OF
REQUIRED TIGHT EMISSION CONTROL STRATEGIES PROJECT NO 282846
DELIVERABLE NO.D3.1
136
in the context of social efficiency change and technology progress are explained in the Table 15. Table 15. Factors associated with key driving forces
Driving forces Sectors Factors Policies to promote the Change Social Efficiency Change
Industry Value added change within the sector Products structure change within one sector
Various policies affecting value added such as price policy, national plan for key industry, promoting well working market Market oriented policies, national development policies
Residential and Commercial
Energy activity change within the sector
Public education, price policies
Transport Change of transport mode Traffic volume conservation
Transport development policies, public education
Technology progress
Efficiency progress for technology Technology mix change for one fuel Fuel mix change
Technology R&D promotion, market oriented policies, international collaboration Market oriented policies, environmental regulation National energy industry policies, import &export policies, tax system
Technology plays a key role in climate change mitigation as shown in several studies [IPCC, 2007,2014; Jiang et al, 2008]. As a large country with a rapidly developing economy, technologies play an important role for energy consumption, environmental protection and climate change mitigation. Technological progress plays a key role in GHG emission reduction in China, while most of these technologies would also respond to the need for energy conservation and environmental protection both in short- and long-term. Therefore, technology development strategy could be successfully combined with energy and environmental policies. Detailed technology studies at industrial sector level show that technology progress desired by sectors match well with reduction in CO2 emissions even without consideration of climate change. Many of these technologies already appear in sector development plans developed by government or enterprises. What China should do is to promote further development of these technologies by explicitly including climate change as a factor to create higher demand for these technologies. The long-term scenario study for China suggested the following key technologies for the purpose of adressing climate change:
Modern renewable energy production (solar energy etc.) Advanced nuclear power generation Fuel cell IGCC/Advanced clean coal technologies Advanced gas turbine
LIMITS – LOW CLIMATE IMPACT SCENARIOS AND THE IMPLICATION OF
REQUIRED TIGHT EMISSION CONTROL STRATEGIES PROJECT NO 282846
DELIVERABLE NO.D3.1
137
Unconventional nature gas and crude oil production technologies Syn-fuel production technology
In practice, most of these technologies are being considered by the government except for unconventional energy technologies. However, because of the lack of investments in technological R&D, most of these technologies are expected to be developed in other countries. Development of these technologies is demanded across the world, however some of the technologies could have more interest for China and attract more investment in China for R&D. For example, IGCC and clean coal technologies have large potential on the domestic market while looking for a market in a country with insignificant coal use would be uncertain for a technology developer. If China can become a leader in the development of these technologies, both environment and economic development could benefit from it. In such a case, policy for technology development could be revised to consider climate change. International collaboration on development of these technologies is, however, necessary. In the modelling analysis, several policy options were simulated. One of the key policy options is carbon pricing. Introducing carbon pricing including carbon tax or emission trading could be an effective way to control CO2 emission in China. Another key policy options is setting cap for CO2 emission in China, which is an effective way to limit CO2 emission increase in recent years.
19 Conclusions
The main findings of this study are: If globally 2 degree target will be implemented, China’s CO2 emission has to be
peak before 2025 and to start decreasing after that. By 2050, it would be reduced more than 70% compared to 2025 levels.
Modelling results show that it is feasible for China to peak CO2 emissions before 2025, and to start deep reducing them after that, reaching more than 70% reduction by 2050 compared to 2020 levels.
Meeting the 2 degree goal in the next 40 years will be challenging enough. A reduction of that magnitude would require the successful deployment of all available low-carbon energy technologies and massive international cooperation.
To reach a 2 degree target, China needs to do much more than the government target announced in Copenhagen. There is still possible to do this due to domestic effort and international collaboration and by assuming technology progresses. China’s low carbon development planning and additional efforts should be encouraged in the future; as well as designing an international regime to work towards a low-carbon pathway.
Renewable energy development policies are crucial for China to reach the 2 degree target. With the current technology progress, much more renewable energy could be utilized in China.

LIMITS – LOW CLIMATE IMPACT SCENARIOS AND THE IMPLICATION OF
REQUIRED TIGHT EMISSION CONTROL STRATEGIES PROJECT NO 282846
DELIVERABLE NO.D3.1
138
Nuclear is still an important option for China, even though recent accident in Japan slowed down the development of nuclear. China’s energy system has to be diverse and nuclear is still a relatively clean and safe energy supply.
Carbon pricing could be introduced in coming years. Even though it is hard to implement this in the whole country in the short term, it will have significant influence on economy optimization and technology progress. For China there are needs for more policy support to make technology turn over.
Setting a cap for CO2 emission in China has been an effective way to limit CO2 emission increase in recent years. China is now implementing caps on energy demand in its 12th Five Year Plan, together with targets for non-fossil fuel energy by 2020. China can use this experience to set up a cap on CO2 emission after 2015. China is also implementing domestic emission trading schemes in pilot cities and provinces.
Specific policy recommendations could be given as following: - Bigger efforts to optimize economic development are needed. For long time China announced
to adjust the economy development pattern away from heavy industry-based development to service industry-based economy. However this has not happened in reality. The newly announced 12th Five Year Plan set up the GDP growth target to 7%, which implies strong signal on economy optimization. Recent government action on lower economic development growth rate started to show its effects. This should be also applying for the long-term.
- Long-term target on CO2 emissions with specific total amount control(emission cap) need to be set. China is currently trying an energy total amount control target, and it will provide good basis for controlling total CO2 emissions. It is important to make a long-term target for CO2
emissions up to 2030, 2050, to give a clear message to future CO2 emission reduction.
- Introduce shortly measures for carbon pricing, such as carbon tax or emission trading schemes. This will be very helpful for economy optimization toward a low-carbon economy.
- Make energy efficiency efforts deeper and covering a wider range. Even though there is huge achievement on energy efficiency in the 11th Five Year Plan, there is still much space for further action on energy efficiency. Some policy such as energy efficiency standard could be accelerated due to rapid progress on technologies.
- Support renewable energy development by providing enough market for low-carbon technologies with feed-in tariff, or subsidy schemes. Recently there is discussion on limiting wind and solar energy because of its high cost and some difficulties to connect with grid. However, these technical problems should not be the reason to slow down renewable energy growth because there is much need to adopt renewable energy, especially for power generation, in the future.
- Continue to support nuclear energy development while improving the security in this energy source. In China, nuclear power generation is still one of the cleanest and most safe energy supply compared with fossil fuel energy which will continue dominating China’s energy system for decades. The strategy should be clear and efforts to make the technology better should be hold on.

LIMITS – LOW CLIMATE IMPACT SCENARIOS AND THE IMPLICATION OF
REQUIRED TIGHT EMISSION CONTROL STRATEGIES PROJECT NO 282846
DELIVERABLE NO.D3.1
139
- Make pilot phase project as soon as possible for CCS in China. A plan should be made to have 7 to 10 set of CCS projects by 2020 to test the technology and to figure out the choice for specific CCS technology suitable for China. This will be crucial for enlarged utilization of CCS projects after 2020.
- Put more effort on public awareness on low-carbon development. Much more involvement of public in low-carbon development could heavily change the manufacture pattern of industry.
20 References
CEC, 2011, Annual Development Report of China’s Power Industry 2011, China Electricity Council(CEC), Beijing China Energy Statistic Yearbook 2011, 2011, China Energy Statistic Year Book 2011, China Statistic Publishing House, Beijing China Statistic Yearbook 2011, 2011, China Statistic Year Book 2011, China Statistic Publishing House, Beijing IEA, 2011, World Energy Outlook 2011, IEA publication IPCC, 2007, Climate Change: Mitigation, Cambridge University Press, UK. Jiang, K., Hu, X., Matsuoka, Y., Morita, T. (1998) Energy Technology Changes and CO2 Emission Scenarios in China. Environment Economics and Policy Studies 1:141-160. Jiang, K., and H. Xiulian, 2006a, Energy Demand and Emission in 2030 in China: Scenarios and Policy Options, Environment Economics and Policy Studies Vol.7, No.3:233-250 Jiang, K., Hu, X., Zhu, S.,2006b, Multi-Gas Mitigation Analysis by IPAC, Volume Multi-Greenhouse Gas Mitigation and Climate Policy, Issue Special Issue #3,The Energy Journal, 425-440 Jiang Kejun, 2011, Green Low Carbon Roadmap for China’s Power Industry, China Environment Science Publishing House, Beijing Jos G.J. Olivier, Greet Janssens-Maenhout, Jeroen A.H.W. Peters, Julian Wilson, 2013 LONG-TERM TREND IN GLOBAL CO2 EMISSIONS 2013 report, PBL publication number 500253004 Kejun,J., Xiulian, H., Xing, Z., Qiang, L., Songli Z., 2008, China’s Energy Demand and Emission Scenarios by 2050, Climate Change Research Review, Vol 4, No.5: 296-302.
LIMITS – LOW CLIMATE IMPACT SCENARIOS AND THE IMPLICATION OF
REQUIRED TIGHT EMISSION CONTROL STRATEGIES PROJECT NO 282846
DELIVERABLE NO.D3.1
140
Kejun, J., Xiulian, H., Qiang, L., Xing, Z., Hong, L., 2009, China’s Energy and Emission Scenario, In China’s 2050 Energy and CO2 Emission Report, China Science Publishing House, Beijing, 856-934. Kejun, J., Xing, Z., Chenmin, H., 2012, China’s Energy and Emission Scenario with 2 Degree target, Energy of China, 2012 No.2. Kejun Jiang, Xing Zhuang, Ren Miao, He Chenmin(2013) China’s Role in Attaining the Global 2 Target, Climate Policy, Vol.13, No.S01, S55-S69, http://dx.doi.org/10.1080/14693062.2012.746070 Mark, L., Lynn, P.,Nan, Zhou., David, F., Nathaniel, A.; Hongyou, L., Michael, M., Nina, Z., Yining, Q., 2010, Assessment of China’s Energy-Saving and Emission-Reduction Accomplishments and Opportunities During the 11th Five Year Plan, Lawrence Berkeley National Laboratory, Publication Number: LBNL-3385E NDRC, 2007, Long-term Development of Renewable Energy Planning, NDRC NDRC, 2008, China’s Long-tern Development Plan Framework on Nuclear Power Generation, Shantong, L., 2011, China’s Economy in 2030, Economy Science Publishing House, Beijing State Council, 2011, China's Policies and Actions for Addressing Climate Change UNEP, 2010, Emission Gap Report UNEP, 2011, Bridging The Emission Gap UNEP, 2012, Emission Gap Report 2012 UNEP, 2013, Emission Gap Report 2013 Xueyi, W., Xiangxu, Z., 2007, Recent Year’s Population Forecast Study Review, Theory and Reforming, No.6, 2007. Wigley, T.M.L., Raper, S., 2001, Interpretation of high projections for global-mean warming. Science 293, 451–454. DOI: 10.1126/science.1061604 WWF, 2010, 100% Renewable Energy by 2050, WWF
LIMITS – LOW CLIMATE IMPACT SCENARIOS AND THE IMPLICATION OF
REQUIRED TIGHT EMISSION CONTROL STRATEGIES PROJECT NO 282846
DELIVERABLE NO.D3.1
141
Annex 5: Alternate Development Pathways for India: Aligning Copenhagen Climate Change Commitments
with National Energy Security and Economic Development
Lead Authors : Amit Garg, P. R. Shukla, Bhushan Kankal,
Contributing Authors : Shivika Mittal, Abha Sharma, Hem Dholakia, Sugandha Raina, Bhuvanesh Kumar and Jigeesha Upadhyay
Indian Institute of Management, Ahemdabad
Vastrapur, Ahmedabad 380015 www.iimahd.ernet.in
2014

LIMITS – LOW CLIMATE IMPACT SCENARIOS AND THE IMPLICATION OF
REQUIRED TIGHT EMISSION CONTROL STRATEGIES PROJECT NO 282846
DELIVERABLE NO.D3.1
142
Contents 1 INTRODUCTION .............................................................................................................. 146
2 POLICIES AND MEASURES ........................................................................................... 148
2.1 National Action Plan on Climate Change ................................................... 148 2.2 State Action Plans on Climate Change ....................................................... 149 2.3 Policies in the Energy sector ....................................................................... 155 2.4 Policies in the sector of Renewable Energy ................................................ 161 2.5 Policies in the Industry sector ..................................................................... 165 2.6 Policies in the Transport sector ................................................................... 166 2.7 Policies in the Agriculture sector ................................................................ 168 2.8 Policies in the Forestry sector ..................................................................... 170 2.9 Cross-Cutting Sectoral Policies .................................................................. 172
2.9.1 Infrastructure development and PPPs ....................................................................................172 2.9.2 Technology Transfer ...............................................................................................................173 2.9.3 Technology Transfer under the GEF mechanism ...................................................................173 2.9.4 Technology transfer associated with CDM projects ...............................................................174
3 PAST TRENDS IN EMISSION INTENSITY ..................................................................... 176
3.1 Energy Demand and Supply Trends in India .............................................. 176 3.2 Energy intensity .......................................................................................... 179 3.3 Sectoral Trends ........................................................................................... 180 3.4 State level trend and share .......................................................................... 181
4 COMPARING GLOBAL AND REGIONAL RESULTS ..................................................... 185
4.1 Comparing Model Drivers for India ........................................................... 185 4.1.1 Economic Growth ...................................................................................................................185 4.1.2 Population ..............................................................................................................................186
4.2 Comparing Model Results .......................................................................... 187 4.2.1 Primary Energy Supply and Energy Consumption .................................................................187 4.2.2 Profile of Electricity Generation ............................................................................................190 4.2.3 Indian CO2 Emission Projections ...........................................................................................193 4.2.4 Energy Intensity of Economy ..................................................................................................197 4.2.5 Carbon Intensity of Energy .....................................................................................................198 4.2.6 Electricity Per Capita .............................................................................................................199 4.2.7 CO2 per Capita .......................................................................................................................200 4.2.8 Energy imports and exports (by fuel) .....................................................................................201 4.2.9 Non CO2 Emissions (CH4, N2O, F-GASES) ............................................................................202
5 CONCLUSIONS AND POLICY INSIGHTS ...................................................................... 213
5.1 Policies and Measures ................................................................................. 213 5.2 Status and trends of Emissions in India ...................................................... 213 5.3 Greenhouse Gas Emissions Trends ............................................................. 214 5.4 Comparing Model results ............................................................................ 214

LIMITS – LOW CLIMATE IMPACT SCENARIOS AND THE IMPLICATION OF
REQUIRED TIGHT EMISSION CONTROL STRATEGIES PROJECT NO 282846
DELIVERABLE NO.D3.1
143
6 APPENDIX A: MODELLING METHODOLOGY .............................................................. 216
7 APPENDIX B: DATA USED ............................................................................................ 224
8 APPENDIX C: FIRM LEVEL EMISSION TRENDS .......................................................... 259
8.1 Emission Intensity Trends for Companies .................................................. 259 9 APPENDIX D: EMISSION INTENSITY TRENDS FOR SECTORS .................................. 264
9.1.1 Power Sector ..........................................................................................................................264 9.1.2 Iron and Steel Sector ..............................................................................................................268 9.1.3 Cement Sector .........................................................................................................................271 9.1.4 Fertilizer Sector ......................................................................................................................276 9.1.5 Refineries ................................................................................................................................278 9.1.6 Paper Industry ........................................................................................................................279
10 APPENDIX E: CAPACITY ADDITION AND INVESTMENTS .......................................... 284
11 REFERENCES ................................................................................................................. 287
LIMITS – LOW CLIMATE IMPACT SCENARIOS AND THE IMPLICATION OF
REQUIRED TIGHT EMISSION CONTROL STRATEGIES PROJECT NO 282846
DELIVERABLE NO.D3.1
144
Abbreviation ADB Asian Development Bank AIBP Accelerated Irrigation Benefit Programme AT&C Aggregate Technical and Commercial BAU Business as Usual BEE Bureau of Energy Efficiency BLY Bachat Lamp Yojna BPCL Bharat Petroleum Corporation Limited BRTS Bus Rapid Transit System BSE Bombay Stock Exchange CAGR Compound Annual Growth Rate CAMPA Compensatory Afforestation Fund Management and Planning Authority CCAP Climate Change Action Programme CCS Carbon Capture and Storage CDM Clean Development Mechanism CH4 Methane CNG Compressed Natural Gas CO2 Carbon Dioxide CO2e Carbon Dioxide Equivalent CPCL Chennai Petroleum Corporation Limited EJ Exa Joules FDI Foreign Direct Investment GCal Giga Calorie GEF Global Environmental Faciltiy GHG Greenhouse Gas GoI Government of India GW Giga Watt HPCL Hindustan Petroleum Corporation Limited HSD High Speed Diesel INM Integrated Nutrient Management IOCL Indian Oil Corporation Limited IPCC Intergovernmental Panel on Climate Change JNNURM Jawaharlal Nehru National Urban Renewable Mission JSW Jindal Steel Works kCal Kilo Calorie km Kilo Meters kVA Kilo Volt Ampere kW Kilo Watt kWh Kilo Watt hour LNG Liquid Natural Gas LPG Liquefied Petroleum Gas M ha Million Hectare MMTPA Million Metric Ton Per Annum
LIMITS – LOW CLIMATE IMPACT SCENARIOS AND THE IMPLICATION OF
REQUIRED TIGHT EMISSION CONTROL STRATEGIES PROJECT NO 282846
DELIVERABLE NO.D3.1
145
MoPNG Ministry of Petroleum and Natural Gas MS Motor Spirit MT Million Tons MTOE Million Ton of Oil Equivalent MW Mega Watt N2O Nitrous Oxide NAMAs Nationally Appropriate Mitigation Actions NAPCC National Action Plan on Climate Change NEF National Energy Fund NSDP Net State Domestic Product NSSO National Sample Survey Organization NUTP National Urban Transport Policy OECD Organization for Economic Co-operation and Development OMC Oil Marketing Companies ONGC Oil and Natural Gas Corporation PoA Programme of Activities PPP Purchasing Power Parity REC Rural Electrification Corporation RGGVY Rajiv Gandhi Grameen Vidyutikaran Yojana RINL Rashtriya Ispat Nigam Limited RPL Reliance Petroleum Limited SAIL Steel Authority of India Limited SAPCC State Action Plan on Climate Change SDAs State Designated Agencies SEB State Electricity Board SERC State Electricity Regulatory Commission SO2 Sulphur Dioxide Tg Tera Gram toe Ton of oil equivalent TWh Tera Watt hour UN United Nations UNFCCC United Nations Framework Convention on Climate Change

LIMITS – LOW CLIMATE IMPACT SCENARIOS AND THE IMPLICATION OF
REQUIRED TIGHT EMISSION CONTROL STRATEGIES PROJECT NO 282846
DELIVERABLE NO.D3.1
146
21 INTRODUCTION
This report looks at various conservative and stringent mitigation strategies in India, using a multi-model comparison.
India is an emerging economy with the second largest population (World Bank, 2014) in the world (1.21 billion in 2011) and the fourth largest economy (1.86 trillion US$ in 2012) . GHG emissions in India have shown a rising trend since 1990, although there has been a slowing down of these trends in recent years. The emissions were 1955 million tone (CO2) 21 million ton (CH4) 0.33 million ton (N2O) and 2502 million ton (CO2e) in 2012, a contribution of around 3 per cent to global greenhouse gas emissions.
India is a party to the United Nations Framework Convention on Climate Change (UNFCCC) and the Government of India gives great importance to climate change issues (INC, 2004; SNC, 2010). India has taken several measures that have a direct bearing on mitigating climate change. Some of these measures are – enhancing energy efficiency of Indian economy, promoting renewable energy, reforms in energy intensive sectors and promoting sustainable development. Sustainable development is one of the central themes of Indian planning process, wherein five year plans form the core. The Twelfth Five Year Plan (Planning Commission, 2014) is in force currently (2012-2017).
India has voluntarily committed to UNFCCC to reduce its emissions intensity of its economy by 20-25 per cent during 2005-2020. Towards meeting this commitment, the Government of India has initiated various policies and measures since 2005, where the Tenth Five Year Plan (2002-2007) (Planning Commission, 2003), Eleventh Five year plan (2007-2012) (Planning Commission, 2008), the National Action Plan on Climate Change (2008 onwards) (NAPCC, 2008) and the Twelfth Five Year Plan (2012-2017) are the most important climate actions. Additionally, the Thirteenth Five Year Plan is expected to further enhance these efforts. Also, the National Action Plan on Climate Change (NAPCC) that envisages eight National Missions, of which three include mitigation actions: National Mission on Enhanced Energy Efficiency, National Solar Mission and National Mission on Sustainable Habitats. Within the NAPCC 28 states and 7 union territories are preparing their action plans to tackle challenges posed by climate change, including impact, vulnerability and adaptation.
The LIMITS project assesses different mitigation scenarios consistent with business-as-usual trends, current policies and the 2°C target and analyses how issues like technology development, investments, energy security and air pollution develop. The project uses multiple models to provide an indication of the range of possible outcomes.
This report presents a comparative analysis done within the LIMITS project focusing on long-term mitigation efforts in India. It looks at the regional and global projections of the Indian energy system from various international and regional modelling teams.
LIMITS – LOW CLIMATE IMPACT SCENARIOS AND THE IMPLICATION OF
REQUIRED TIGHT EMISSION CONTROL STRATEGIES PROJECT NO 282846
DELIVERABLE NO.D3.1
147
This report explores and discusses the trends in India’s energy efficiency and GHG emission intensity of economy at a national and sectoral levels and for various time periods (1990-2020). The report also analyses how the Indian economy is responding to meeting its Copenhagen voluntary commitments during 2005-2012. The implications of various developmental paradigms, pathways, structural shifts and technology changes through articulation of three scenarios are assessed. The future projects and its implications are covered in the last chapter.
Implementing strategies in order to keep temperature increase to less than 2°C between pre industrial times and 2100 would require substantial changes in energy infrastructure and land use patterns in major economies of the world. The rate at which these changes need to be implemented is considerable. For instance, while historically the carbon intensity of economy has improved by about 1-2 per cent globally, under a 2°C scenario this rate may need to be improved to around 5-6 per cent annually. This would require major increase in low carbon supply option and energy efficiency enhancement along with lifestyle changes.
India is home to largest energy poor population in the world. The world Energy Outlook (WEO, 2013) has estimated it to be around 400 million people which is about a third of total Indian population. These use of solid fuels for cooking is also considerable in India. These people have to be provided access to affordable clean energy for their daily use while also meeting the Millennium Development Goals and India’s inclusive developmental targets. This would require increase in energy supply and consumption. All the global models under LIMITS project indicate that Indian emissions will not peak until 2100 under Business As Usual scenario. This report analyses the implications of forcing an early peaking for India, for e.g. in 2020, 2030 and 2040.
Coal is the mainstay of Indian energy system and the resource that provides energy security to India. Since more than 75 per cent of crude oil demand is met by imports. Although coal is a domestic resource, coal imports have been rising at a fast rate since the last decade and have reached above 20 per cent in 2012-13 from below 5 per cent a decade earlier. On the other hand India has a strong renewable energy programme, with 17,352 MW of wind capacity, 941 MW of solar PV capacity and 3,225 MW of biomass power (MNRE, 2014). 5 per cent ethanol blending has been made mandatory in gasoline since 2010. Solar home systems and home based biogas plants are also part of India’s renewable menu. Even then renewable energy continues to remain around 7-8 per cent of total commercial energy consumption. Of course traditional biomass provides main energy supply to vast rural population.
This report is structured as follows. The current mitigation policies and measures taking place in India are elucidated in Chapter 2 of the report. Chapter 3 follows by discussing the emission trends in energy efficiency and GHG emission intensity. Finally, Chapter 4 compares the different development pathways projected by our regional model with those projected by various global models for the Indian region.

LIMITS – LOW CLIMATE IMPACT SCENARIOS AND THE IMPLICATION OF
REQUIRED TIGHT EMISSION CONTROL STRATEGIES PROJECT NO 282846
DELIVERABLE NO.D3.1
148
22 POLICIES AND MEASURES
The Government of India has voluntarily committed to reduce the Greenhouse Gas (GHG) emissions intensity of its Gross Domestic Product (GDP) by 20-25 per cent except from the agriculture sector over the period of 2005 to 2020. India is committed to the United Nations Framework Convention on Climate Change and the Government of India attaches great importance to climate change issues (SNC, 2012). The convention aims at stabilizing the greenhouse gas concentration in the atmosphere at safer levels that would prevent dangerous anthropogenic interference with the climate system. Eradication of poverty, avoiding risks to food production and sustainable development are three integrated principles deeply embedded in the convention.
The Twelfth Five Year Plan (2012-2017) of India has laid down a detailed agenda for sustainable development and include several plans to be taken towards initiating a low carbon economy in the coming years. Several policies and measures have been undertaken in the sectors of environment, sustainable development, renewable energy, energy efficiency, agriculture, forestry and land use, transportation and power.
Besides to the Twelfth Five Year Plan, this chapter describes two other major climate plans in the country, the Eleventh Five Year Plan (2007-12), and the National Action Plan on Climate Change (2008 onwards). It should be noted that the list of policies mapped is a non-exhaustive list, since the policies mapped here are 2005 onwards. Several other ministerial documents like the sectoral working groups for the Eleventh and Twelfth Plans, State Action Plans for Climate Change, and sectoral perspective plans have also been referred to examine the policies and measures in various sectors.
There are also some policies overlapping across sectors and reported elsewhere. For example, Energy Conservation Building Code can be considered either as a policy for the energy sector or a policy for the buildings sector. Similarly, Programme on Recovery of Energy from Industrial Wastes can be either be considered a program for the industry sector or for the waste sector. To avoid duplication, such policies and measures are mapped only in one of the sectors, which is more befitting. Table 2.1 and Table 2.2 classify the total national and state policies in India with respect to the types of policy instruments.
22.1 National Action Plan on Climate Change The National Action Plan on Climate Change (NAPCC) was launched in 2008 in order to address climate change concerns and promote sustainable development. This is sought to be achieved through eight National Missions and several other specific initiatives in several sectors. Specific areas included in the NAPCC are renewal energy/solar energy, enhanced energy efficiency, agriculture, urban habitat, water, Himalayan eco-system, forest cover, and strategic knowledge-base. These missions are discussed in Table 2.3.

LIMITS – LOW CLIMATE IMPACT SCENARIOS AND THE IMPLICATION OF
REQUIRED TIGHT EMISSION CONTROL STRATEGIES PROJECT NO 282846
DELIVERABLE NO.D3.1
149
It is important to highlight that several of the programmes enumerated under NAPCC are already being undertaken under various schemes/programmes of Government of India (GoI) but in the present context would require a change in direction, enhancement of scope and accelerated implementation.
22.2 State Action Plans on Climate Change As a second step, after the National Action Plan on Climate Change (NAPCC) was announced, all States were asked to prepare a State level action plan to deal with the challenges of climate change. These action plans are envisioned to be an extension of the NAPCC at various levels of governance, aligned with the 8 National Missions. States can take their lead from the Mission documents while formulating mitigation/adaptation strategies under the State level strategy and Action plan (SAPCC). As of now, State Action Plans for 9 states have been endorsed by National Steering Committee on Climate Change although all State governments are implementing climate-friendly strategies (broadly aligned with the missions) as a part of their development programmes, some states have taken specific leads in the matter. For instance, Himachal Pradesh became the first state to negotiate a large loan (US$ 450 million) on sustainable environmental growth and climate change and Himachal Pradesh is setting up a Centre for Climate Change, Disaster Management and Snow & Glacier Studies.
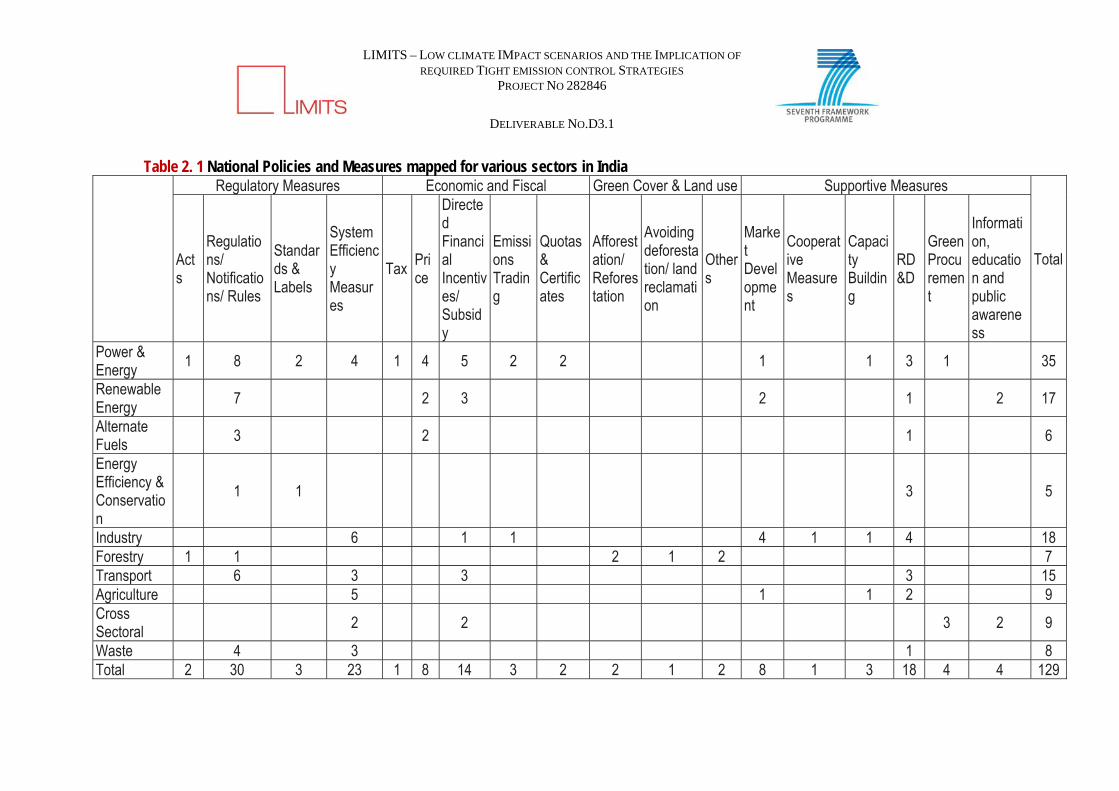
LIMITS – LOW CLIMATE IMPACT SCENARIOS AND THE IMPLICATION OF
REQUIRED TIGHT EMISSION CONTROL STRATEGIES PROJECT NO 282846
DELIVERABLE NO.D3.1
Table 2. 1 National Policies and Measures mapped for various sectors in India
Regulatory Measures Economic and Fiscal Green Cover & Land use Supportive Measures
Total Acts
Regulations/ Notifications/ Rules
Standards & Labels
System Efficiency Measures
Tax Price
Directed Financial Incentives/ Subsidy
Emissions Trading
Quotas & Certificates
Afforestation/ Reforestation
Avoiding deforestation/ land reclamation
Others
Market Development
Cooperative Measures
Capacity Building
RD&D
Green Procurement
Information, education and public awareness
Power & Energy
1 8 2 4 1 4 5 2 2 1 1 3 1 35
Renewable Energy
7 2 3 2 1 2 17
Alternate Fuels 3 2 1 6
Energy Efficiency & Conservation
1 1 3 5
Industry 6 1 1 4 1 1 4 18 Forestry 1 1 2 1 2 7 Transport 6 3 3 3 15 Agriculture 5 1 1 2 9 Cross Sectoral
2 2 3 2 9
Waste 4 3 1 8 Total 2 30 3 23 1 8 14 3 2 2 1 2 8 1 3 18 4 4 129
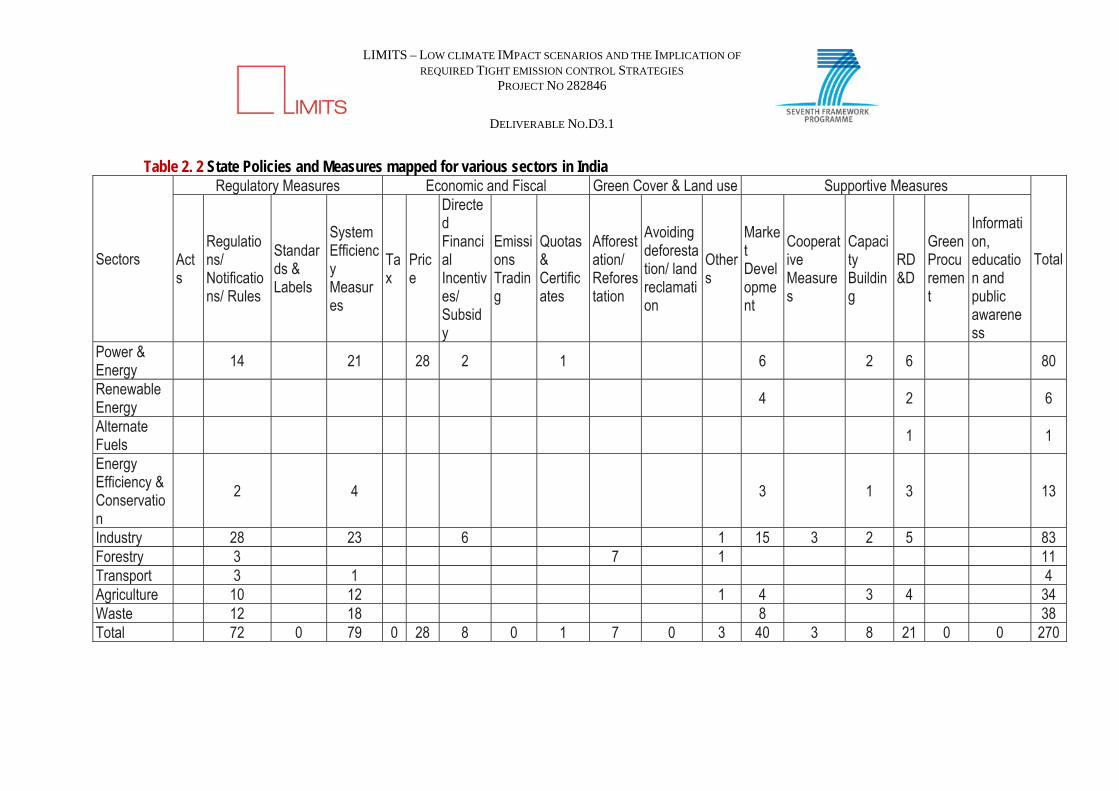
LIMITS – LOW CLIMATE IMPACT SCENARIOS AND THE IMPLICATION OF
REQUIRED TIGHT EMISSION CONTROL STRATEGIES PROJECT NO 282846
DELIVERABLE NO.D3.1
Table 2. 2 State Policies and Measures mapped for various sectors in India
Sectors
Regulatory Measures Economic and Fiscal Green Cover & Land use Supportive Measures
Total Acts
Regulations/ Notifications/ Rules
Standards & Labels
System Efficiency Measures
Tax
Price
Directed Financial Incentives/ Subsidy
Emissions Trading
Quotas & Certificates
Afforestation/ Reforestation
Avoiding deforestation/ land reclamation
Others
Market Development
Cooperative Measures
Capacity Building
RD&D
Green Procurement
Information, education and public awareness
Power & Energy
14 21 28 2 1 6 2 6 80
Renewable Energy
4 2 6
Alternate Fuels 1 1
Energy Efficiency & Conservation
2 4 3 1 3 13
Industry 28 23 6 1 15 3 2 5 83 Forestry 3 7 1 11 Transport 3 1 4 Agriculture 10 12 1 4 3 4 34 Waste 12 18 8 38 Total 72 0 79 0 28 8 0 1 7 0 3 40 3 8 21 0 0 270
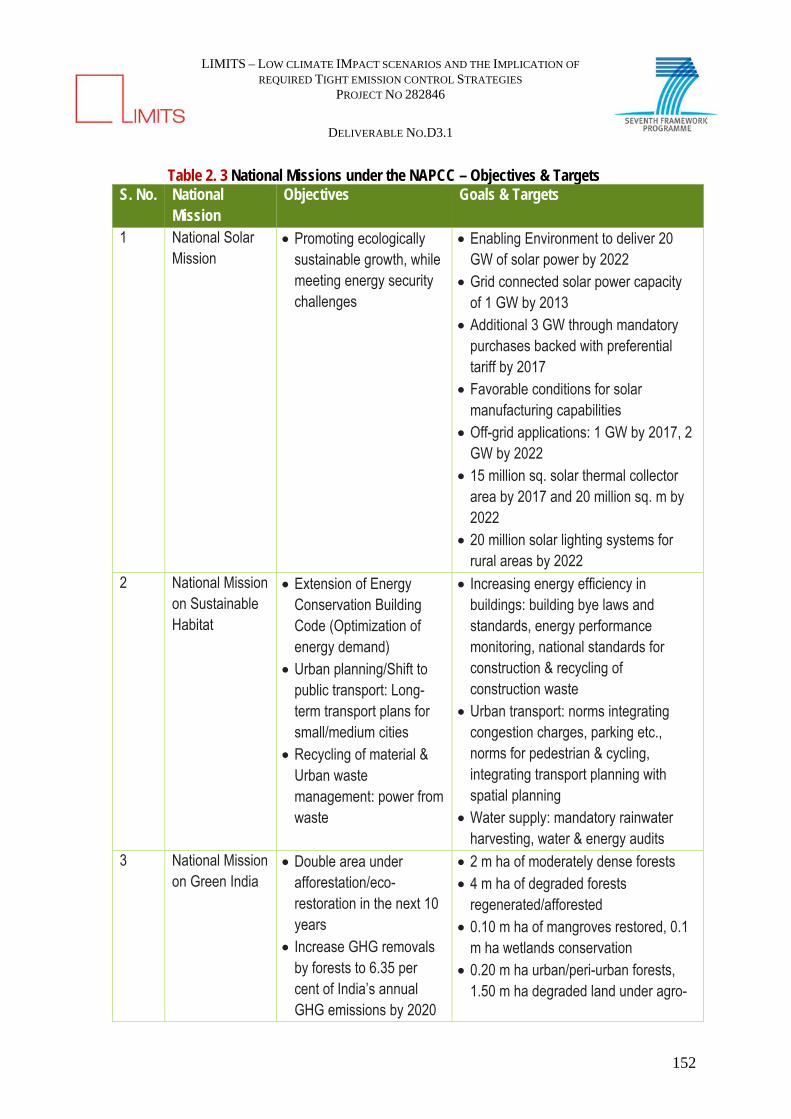
LIMITS – LOW CLIMATE IMPACT SCENARIOS AND THE IMPLICATION OF
REQUIRED TIGHT EMISSION CONTROL STRATEGIES PROJECT NO 282846
DELIVERABLE NO.D3.1
152
Table 2. 3 National Missions under the NAPCC – Objectives & Targets S. No. National
Mission Objectives Goals & Targets
1 National Solar Mission
Promoting ecologically sustainable growth, while meeting energy security challenges
Enabling Environment to deliver 20 GW of solar power by 2022
Grid connected solar power capacity of 1 GW by 2013
Additional 3 GW through mandatory purchases backed with preferential tariff by 2017
Favorable conditions for solar manufacturing capabilities
Off-grid applications: 1 GW by 2017, 2 GW by 2022
15 million sq. solar thermal collector area by 2017 and 20 million sq. m by 2022
20 million solar lighting systems for rural areas by 2022
2 National Mission on Sustainable Habitat
Extension of Energy Conservation Building Code (Optimization of energy demand)
Urban planning/Shift to public transport: Long-term transport plans for small/medium cities
Recycling of material & Urban waste management: power from waste
Increasing energy efficiency in buildings: building bye laws and standards, energy performance monitoring, national standards for construction & recycling of construction waste
Urban transport: norms integrating congestion charges, parking etc., norms for pedestrian & cycling, integrating transport planning with spatial planning
Water supply: mandatory rainwater harvesting, water & energy audits
3 National Mission on Green India
Double area under afforestation/eco-restoration in the next 10 years
Increase GHG removals by forests to 6.35 per cent of India’s annual GHG emissions by 2020
2 m ha of moderately dense forests 4 m ha of degraded forests
regenerated/afforested 0.10 m ha of mangroves restored, 0.1
m ha wetlands conservation 0.20 m ha urban/peri-urban forests,
1.50 m ha degraded land under agro-
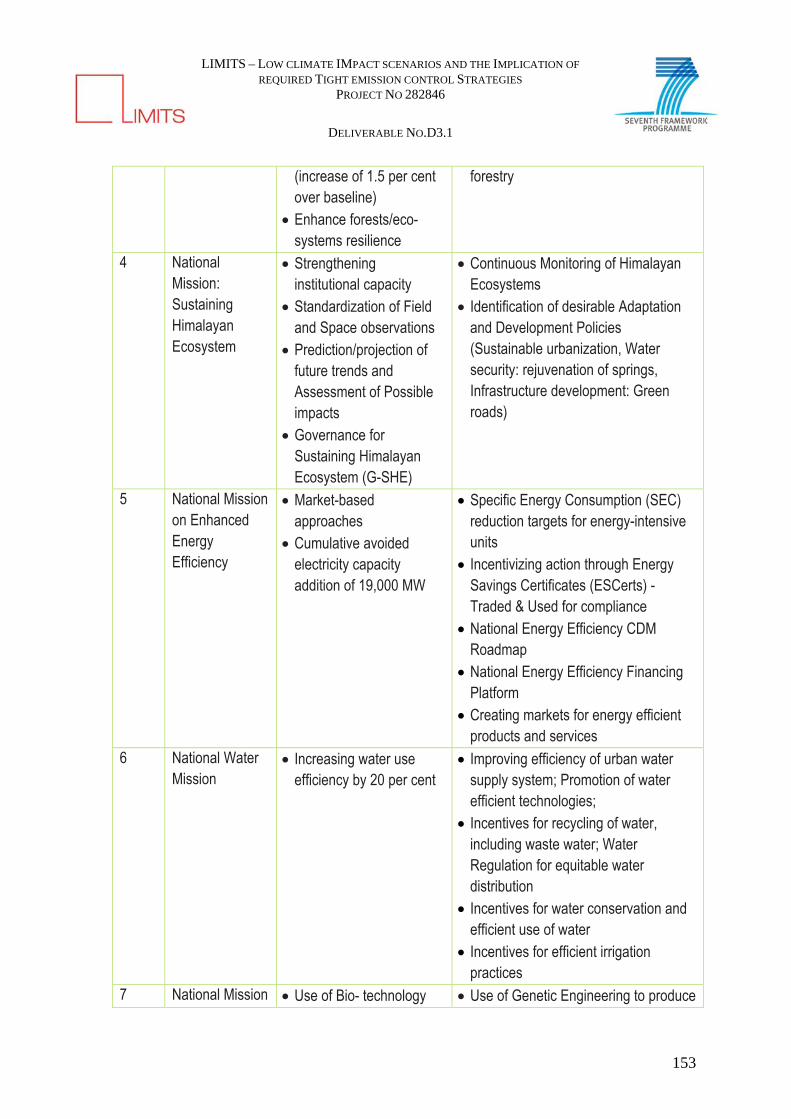
LIMITS – LOW CLIMATE IMPACT SCENARIOS AND THE IMPLICATION OF
REQUIRED TIGHT EMISSION CONTROL STRATEGIES PROJECT NO 282846
DELIVERABLE NO.D3.1
153
(increase of 1.5 per cent over baseline)
Enhance forests/eco-systems resilience
forestry
4 National Mission: Sustaining Himalayan Ecosystem
Strengthening institutional capacity
Standardization of Field and Space observations
Prediction/projection of future trends and Assessment of Possible impacts
Governance for Sustaining Himalayan Ecosystem (G-SHE)
Continuous Monitoring of Himalayan Ecosystems
Identification of desirable Adaptation and Development Policies (Sustainable urbanization, Water security: rejuvenation of springs, Infrastructure development: Green roads)
5 National Mission on Enhanced Energy Efficiency
Market-based approaches
Cumulative avoided electricity capacity addition of 19,000 MW
Specific Energy Consumption (SEC) reduction targets for energy-intensive units
Incentivizing action through Energy Savings Certificates (ESCerts) - Traded & Used for compliance
National Energy Efficiency CDM Roadmap
National Energy Efficiency Financing Platform
Creating markets for energy efficient products and services
6 National Water Mission
Increasing water use efficiency by 20 per cent
Improving efficiency of urban water supply system; Promotion of water efficient technologies;
Incentives for recycling of water, including waste water; Water Regulation for equitable water distribution
Incentives for water conservation and efficient use of water
Incentives for efficient irrigation practices
7 National Mission Use of Bio- technology Use of Genetic Engineering to produce
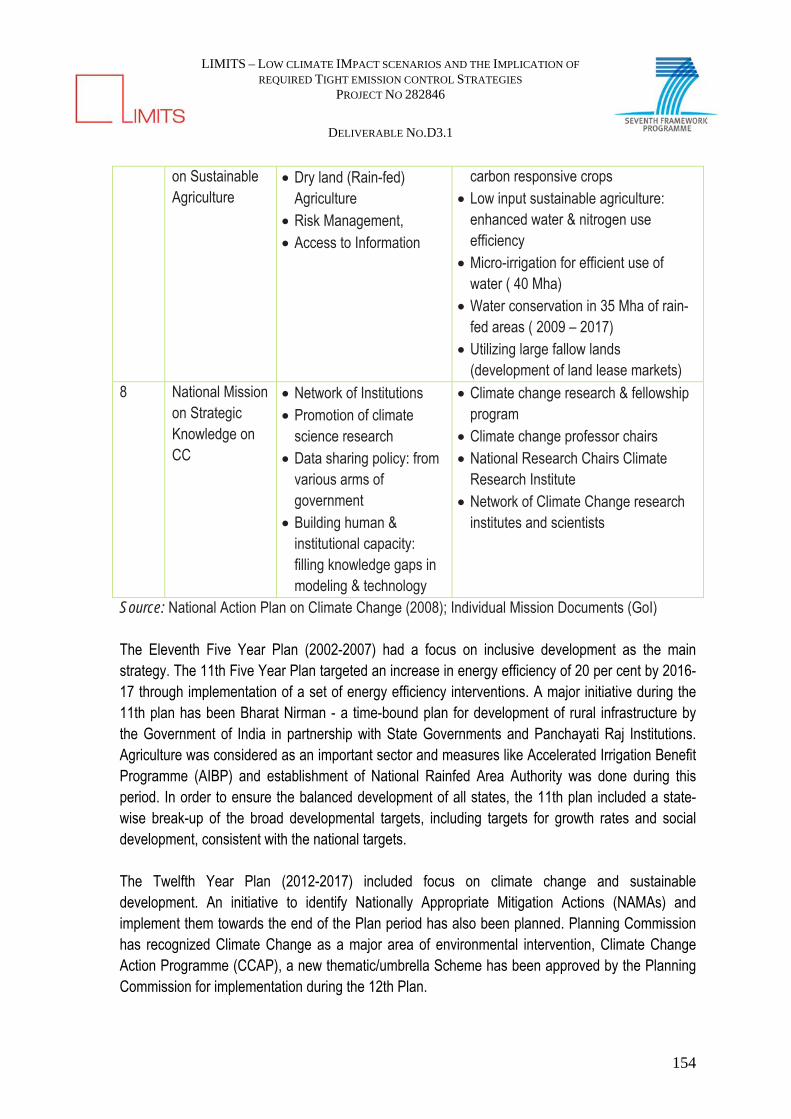
LIMITS – LOW CLIMATE IMPACT SCENARIOS AND THE IMPLICATION OF
REQUIRED TIGHT EMISSION CONTROL STRATEGIES PROJECT NO 282846
DELIVERABLE NO.D3.1
154
on Sustainable Agriculture
Dry land (Rain-fed) Agriculture
Risk Management, Access to Information
carbon responsive crops Low input sustainable agriculture:
enhanced water & nitrogen use efficiency
Micro-irrigation for efficient use of water ( 40 Mha)
Water conservation in 35 Mha of rain-fed areas ( 2009 – 2017)
Utilizing large fallow lands (development of land lease markets)
8 National Mission on Strategic Knowledge on CC
Network of Institutions Promotion of climate
science research Data sharing policy: from
various arms of government
Building human & institutional capacity: filling knowledge gaps in modeling & technology
Climate change research & fellowship program
Climate change professor chairs National Research Chairs Climate
Research Institute Network of Climate Change research
institutes and scientists
Source: National Action Plan on Climate Change (2008); Individual Mission Documents (GoI) The Eleventh Five Year Plan (2002-2007) had a focus on inclusive development as the main strategy. The 11th Five Year Plan targeted an increase in energy efficiency of 20 per cent by 2016-17 through implementation of a set of energy efficiency interventions. A major initiative during the 11th plan has been Bharat Nirman - a time-bound plan for development of rural infrastructure by the Government of India in partnership with State Governments and Panchayati Raj Institutions. Agriculture was considered as an important sector and measures like Accelerated Irrigation Benefit Programme (AIBP) and establishment of National Rainfed Area Authority was done during this period. In order to ensure the balanced development of all states, the 11th plan included a state-wise break-up of the broad developmental targets, including targets for growth rates and social development, consistent with the national targets. The Twelfth Year Plan (2012-2017) included focus on climate change and sustainable development. An initiative to identify Nationally Appropriate Mitigation Actions (NAMAs) and implement them towards the end of the Plan period has also been planned. Planning Commission has recognized Climate Change as a major area of environmental intervention, Climate Change Action Programme (CCAP), a new thematic/umbrella Scheme has been approved by the Planning Commission for implementation during the 12th Plan.

LIMITS – LOW CLIMATE IMPACT SCENARIOS AND THE IMPLICATION OF
REQUIRED TIGHT EMISSION CONTROL STRATEGIES PROJECT NO 282846
DELIVERABLE NO.D3.1
155
Other policies and measures covered in this two plan documents have been covered sectorally in the following sections.
22.3 Policies in the Energy sector Integrated Energy Policy launched in 2006 is a comprehensive and significant policy with an aim of meeting the energy demand of all the sectors. The policy not only focuses on production of energy but also on its cost effective transfer. It has necessary provisions for promoting renewable energy, exploring alternative technologies, increasing energy efficiency, along with necessary fiscal and pricing mechanisms. The policy envisages a competitive energy market with market determined energy pricing instead of the price determination by the government that happens as of now. It also recommends a transparent and targeted subsidy system. The policy has a provision for setting up a National Energy Fund (NEF) to finance Research and Development in the Energy sector. Rajiv Gandhi Grameen Vidyutikaran Yojana (RGGVY), a flagship program of the Ministry of Power was launched in 2005 with the aim of electrifying the un-electrified villages and providing free electricity connections to 33.4 million rural BPL households. The program was later brought under the ambit of Bharat Nirman. Rural electrification and universal access to electricity is still one of the most important goals of the government. RGGVY has been a critical program in improving the access to electricity in rural households. The scheme provided a subsidy of 90 per cent of the total project cost and balance 10 per cent of the project cost was to be provided by the Rural Electrification Corporation (REC) as loan. According to a survey conducted by National Sample Survey Organization (NSSO) in 2010, the per cent of rural households with access to electricity has gone up from 55 per cent in 2005 to 67 per cent in 2010. Owing to the success of this program, the Government has decided to extend it to every habitation irrespective of the size of the population, during the 12th Plan period of 2012-17. Around 20 million free electricity connections have been released to BPL households till December 2013. Some of the deficiencies of the RGGVY programme pointed out by the 12th Plan are limited access to electricity in rural areas, especially in smaller hamlets. Also, nearly 6000 villages electrified till December 2011 were still not energized due to lack of supporting network or other resources. The number of hours of electricity supply is also unreliable and intermittent in several villages. The 12th Plan also highlights the importance of supplying kerosene/liquefied petroleum gas (LPG) at affordable prices. The Energy Conservation Act 2001 provides for the regulatory, legal and institutional framework for promoting and implementing energy efficiency measures. Some of the major provisions of the Act include Standard and Labelling of Appliances, Energy Conservation Building Codes, setting up of BEE and Establishment of Energy Conservation Fund.

LIMITS – LOW CLIMATE IMPACT SCENARIOS AND THE IMPLICATION OF
REQUIRED TIGHT EMISSION CONTROL STRATEGIES PROJECT NO 282846
DELIVERABLE NO.D3.1
156
The Bureau of Energy Efficiency (BEE) was set up under this Act to design programs that result in conservation and efficient use of energy. In the Eleventh Five Year Plan, BEE was been strengthened as a nodal organization at the national level and was empowered to provide direction to the energy conservation programmes in the States. An ‘Energy Conservation Information Centre’ has been set up within BEE to collate energy use data and analyze energy consumption trends and monitor energy conservation achievements in the country. Supporting organizational set-up has been strengthened as the State designated agencies (SDAs) in various States and UTs. BEE has been focusing on energy conservation programmes in various targeted sectors. Some such measures include developing 15 industry-specific energy efficiency manuals/guides, follow up activities to be taken up by the State SDAs and dissemination of the manuals to all the concerned units in the industries. BEE has prepared building specific energy efficiency manuals covering specific energy consumption norms, energy-efficient technologies and best practices. As a follow up, SDAs has initiated energy audits and their implementation in 10 government buildings in each State and one or two buildings at union territory level. The Energy Conservation Building Code was launched in 2007 with an aim of providing minimum energy performance standards for new commercial buildings having a connected load of 100 kW or contract demand of 120 kVA. It is mandatory for commercial buildings or building complexes that have a connected load of 500 kW or greater or a contract demand of 600 kVA or greater. The code is also applicable to all buildings with a conditioned floor area of 1,000 m3. The code is recommended for all other buildings. Standards and Labelling Scheme aims at providing information on energy performance of appliances based on the standards issued by BEE so that the consumers can make informed decisions about energy saving while purchasing appliances. Under this scheme, twelve appliances namely frost free (no-frost) refrigerator, tubular fluorescent lamps, room air conditioners, direct cool refrigerator, distribution transformer, induction motors, pump sets, ceiling fans, LPG stoves, electric geysers and color television were covered initially under the voluntary labelling categories, out of which four appliances/ equipment namely tubular fluorescent lamps, room air conditioners, distribution transformer and household frost free refrigerators are under the mandatory labelling program. It has been proposed to widen the coverage to 21 appliances. According to the 12th Plan, the total energy savings in terms of avoided capacity addition from S&L scheme has been about 7000 MW by 2013. The Bachat Lamp Yojana (BLY) conceived as Clean Development Mechanism (CDM) Programme of Activity (PoA) for mass distribution of compact fluorescent lamp (CFL) in India has been registered successfully by the CDM Executive Board. The Programme has been developed to promote energy efficient lighting. The various measures taken by the Government of India in the energy sector are listed in Table 2.4.
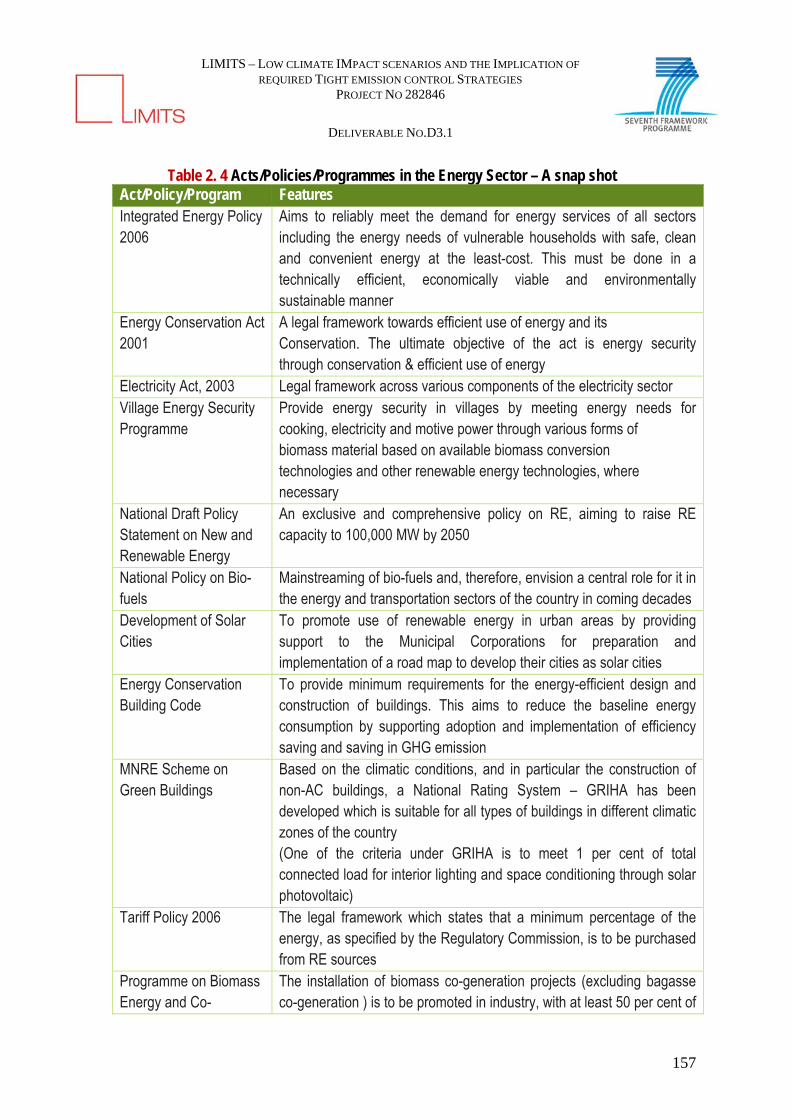
LIMITS – LOW CLIMATE IMPACT SCENARIOS AND THE IMPLICATION OF
REQUIRED TIGHT EMISSION CONTROL STRATEGIES PROJECT NO 282846
DELIVERABLE NO.D3.1
157
Table 2. 4 Acts/Policies/Programmes in the Energy Sector – A snap shot Act/Policy/Program Features Integrated Energy Policy 2006
Aims to reliably meet the demand for energy services of all sectors including the energy needs of vulnerable households with safe, clean and convenient energy at the least-cost. This must be done in a technically efficient, economically viable and environmentally sustainable manner
Energy Conservation Act 2001
A legal framework towards efficient use of energy and its Conservation. The ultimate objective of the act is energy security through conservation & efficient use of energy
Electricity Act, 2003 Legal framework across various components of the electricity sector Village Energy Security Programme
Provide energy security in villages by meeting energy needs for cooking, electricity and motive power through various forms of biomass material based on available biomass conversion technologies and other renewable energy technologies, where necessary
National Draft Policy Statement on New and Renewable Energy
An exclusive and comprehensive policy on RE, aiming to raise RE capacity to 100,000 MW by 2050
National Policy on Bio-fuels
Mainstreaming of bio-fuels and, therefore, envision a central role for it in the energy and transportation sectors of the country in coming decades
Development of Solar Cities
To promote use of renewable energy in urban areas by providing support to the Municipal Corporations for preparation and implementation of a road map to develop their cities as solar cities
Energy Conservation Building Code
To provide minimum requirements for the energy-efficient design and construction of buildings. This aims to reduce the baseline energy consumption by supporting adoption and implementation of efficiency saving and saving in GHG emission
MNRE Scheme on Green Buildings
Based on the climatic conditions, and in particular the construction of non-AC buildings, a National Rating System – GRIHA has been developed which is suitable for all types of buildings in different climatic zones of the country (One of the criteria under GRIHA is to meet 1 per cent of total connected load for interior lighting and space conditioning through solar photovoltaic)
Tariff Policy 2006 The legal framework which states that a minimum percentage of the energy, as specified by the Regulatory Commission, is to be purchased from RE sources
Programme on Biomass Energy and Co-
The installation of biomass co-generation projects (excluding bagasse co-generation ) is to be promoted in industry, with at least 50 per cent of

LIMITS – LOW CLIMATE IMPACT SCENARIOS AND THE IMPLICATION OF
REQUIRED TIGHT EMISSION CONTROL STRATEGIES PROJECT NO 282846
DELIVERABLE NO.D3.1
158
generation (non-bagasse) in Industry
power for captive use, and a provision for the surplus power to be exported to the grid
National Electricity Policy 2005
Stipulates that progressively the share of electricity from non-conventional sources would need to be increased. It also envisages appropriate preferential pricing to promote non-conventional technologies before they can compete with the conventional sources in terms of cost.
Scheme on Biogas based Distributed / Grid Power Generation Programme
To promote biogas based power generation, especially in the small capacity range, based on the availability of large quantity of animal wastes and wastes from forestry, rural based industries
Remote Village Electrification Programme (RVE)
To provide access to electricity through renewable to households in remote villages, which are not likely to get covered through grid extension.
Rajeev Gandhi Grameen Vidyutikaran Yojana
Aims at providing electricity to 100 per cent rural households. It has the provision of Decentralized Distribution and Generation (DDG) through use of renewable energy sources.
The State Electricity Boards (SEBs) end-use electricity tariffs vary widely according to customer category. The major categories are households, agriculture, commercial activities, industry and railways. There are large cross-subsidies between customer categories in India: tariffs for households and agriculture are generally well below actual supply costs, while tariffs to other customer categories are usually above the utilities’ reported average cost of supply. Table 2.5 captures these variations across states and sectors. Special category states like Sikkim and Jammu and Kashmir enjoy the least tariff in domestic, commercial, agriculture, industrial and railway categories. Maharashtra pays the highest domestic and commercial tariff, whereas Assam pays the highest agriculture and industrial power tariff, Jharkhand pays the highest railway traction tariff and Andhra Pradesh pays the highest outside tariff. Agriculture tariff is the lowest amongst all categories and almost US$ 44.8 billion were given as subsidy to agriculture over the period of 2007-13. The average tariff which varies across states, increases every year for agriculture but it still remains the lowest, on account of high subsidies in the sector. 15 states have set up their respective State Electricity Regulatory Commissions (SERC). The SERCs of Odisha, Haryana, Andhra Pradesh, Gujarat, Karnataka, Uttar Pradesh and Rajasthan have already issued tariff orders with the objective of rationalizing the tariff structure and improving the revenue realization in the respective states.

LIMITS – LOW CLIMATE IMPACT SCENARIOS AND THE IMPLICATION OF
REQUIRED TIGHT EMISSION CONTROL STRATEGIES PROJECT NO 282846
DELIVERABLE NO.D3.1
159
Table 2. 5 Average cost of power and tariff for various consumer categories in India, 2011-12
cents/kwh
State Cost of power supply
Domestic
Commercial
Agri/ Irrigatio
n
Industrial
Railway traction
Outside state
Overall average
State Power Utilities Andhra Pradesh
8.5 6.3 12.9 0.7 9.4 10.1 36.3 6.5
Assam 12.8 8.7 15.0 10.7 12.8 0.0 12.4 11.4 Bihar 17.5 5.1 12.7 1.8 12.3 12.9 8.5 8.3 Chhattisgarh 9.0 4.3 9.2 2.5 8.3 9.6 9.0 6.9 Gujarat 9.6 8.3 12.8 4.0 11.9 12.8 7.6 9.0 Haryana 11.9 8.5 10.5 0.9 10.3 10.3 0.0 7.8 Himachal Pradesh
11.0 6.9 12.3 0.0 9.4 0.0 16.8 10.7
Jammu & Kashmir
15.7 2.6 6.0 2.1 6.3 0.0 0.0 6.0
Jharkhand 12.8 2.2 11.6 1.3 10.7 22.4 10.1 7.6 Karnataka 10.3 8.1 6.9 4.7 12.7 0.0 0.0 9.4 Kerala 11.0 4.5 17.2 2.5 9.6 9.0 0.0 7.8 Madhya Pradesh 12.5 8.5 15.4 6.7 11.2 11.9 0.0 8.3
Maharashtra 10.7 9.8 16.6 4.9 11.6 12.2 0.0 10.5 Meghalaya 10.7 7.4 11.9 4.0 11.2 0.0 2.7 9.2 Punjab 11.6 8.5 11.6 7.2 10.3 12.1 0.0 8.7 Rajasthan 12.9 8.5 12.1 2.7 10.5 8.7 6.3 6.9 Tamil Nadu 11.4 4.0 15.7 0.0 11.9 0.0 6.9 7.8 Uttar Pradesh 10.7 7.8 11.9 5.4 14.3 10.3 0.0 9.0 Uttarakhand 10.3 5.4 9.0 4.5 9.0 9.8 0.0 7.8 West Bengal 10.7 9.4 12.4 6.0 12.5 11.9 9.8 11.0 Average of SEBs 11.0 7.2 12.0 2.4 11.2 12.1 10.5 8.5
Electricity Departments Arunachal Pradesh 8.7 8.1 9.4 0.0 7.8 0.0 4.9 6.5
Goa 7.6 4.5 12.5 2.4 8.5 0.0 14.1 8.5 Manipur 18.8 5.8 6.7 4.5 6.7 0.0 9.0 7.2 Mizoram 19.5 5.1 10.3 0.0 9.0 0.0 9.8 7.4 Nagaland 14.5 5.4 8.5 0.0 6.7 0.0 9.0 6.7 Pondicherry 7.2 2.7 8.5 0.0 8.7 0.0 6.7 6.7 Sikkim 4.3 2.6 5.8 0.0 5.8 0.0 5.6 4.9 Tripura 10.5 7.2 10.7 7.4 12.3 0.0 7.8 8.1
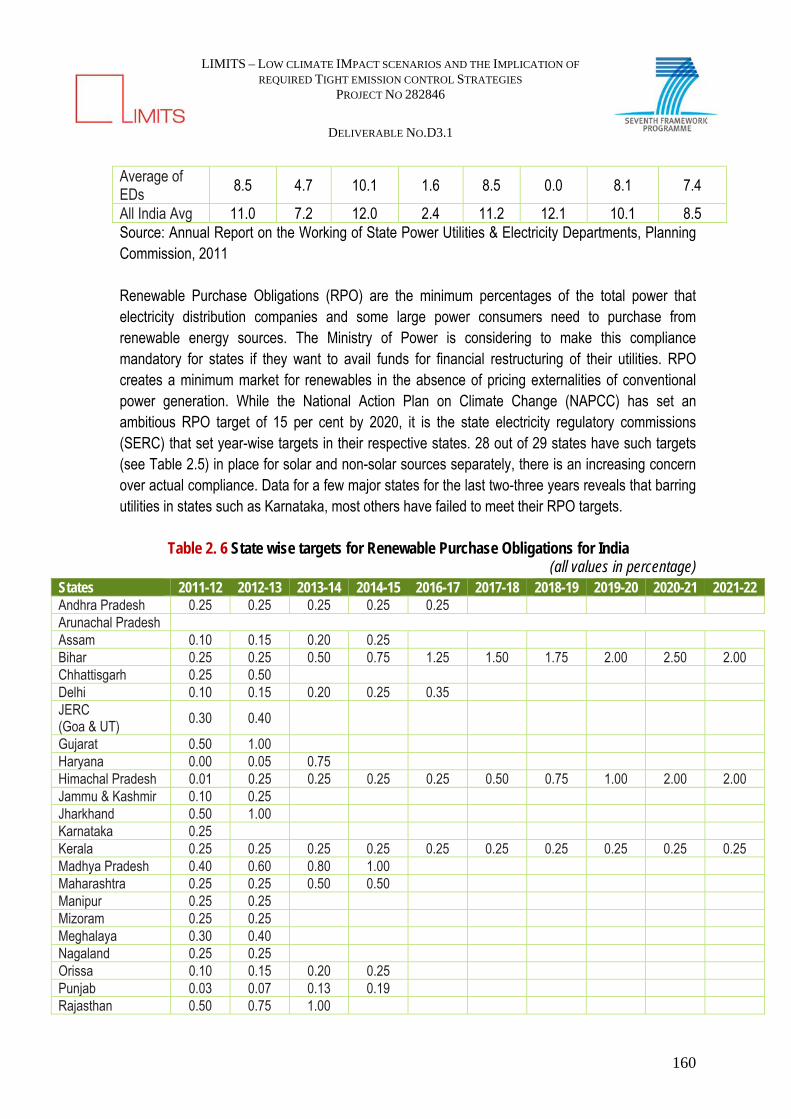
LIMITS – LOW CLIMATE IMPACT SCENARIOS AND THE IMPLICATION OF
REQUIRED TIGHT EMISSION CONTROL STRATEGIES PROJECT NO 282846
DELIVERABLE NO.D3.1
160
Average of EDs
8.5 4.7 10.1 1.6 8.5 0.0 8.1 7.4
All India Avg 11.0 7.2 12.0 2.4 11.2 12.1 10.1 8.5 Source: Annual Report on the Working of State Power Utilities & Electricity Departments, Planning Commission, 2011 Renewable Purchase Obligations (RPO) are the minimum percentages of the total power that electricity distribution companies and some large power consumers need to purchase from renewable energy sources. The Ministry of Power is considering to make this compliance mandatory for states if they want to avail funds for financial restructuring of their utilities. RPO creates a minimum market for renewables in the absence of pricing externalities of conventional power generation. While the National Action Plan on Climate Change (NAPCC) has set an ambitious RPO target of 15 per cent by 2020, it is the state electricity regulatory commissions (SERC) that set year-wise targets in their respective states. 28 out of 29 states have such targets (see Table 2.5) in place for solar and non-solar sources separately, there is an increasing concern over actual compliance. Data for a few major states for the last two-three years reveals that barring utilities in states such as Karnataka, most others have failed to meet their RPO targets.
Table 2. 6 State wise targets for Renewable Purchase Obligations for India (all values in percentage)
States 2011-12 2012-13 2013-14 2014-15 2016-17 2017-18 2018-19 2019-20 2020-21 2021-22 Andhra Pradesh 0.25 0.25 0.25 0.25 0.25
Arunachal Pradesh Assam 0.10 0.15 0.20 0.25
Bihar 0.25 0.25 0.50 0.75 1.25 1.50 1.75 2.00 2.50 2.00 Chhattisgarh 0.25 0.50
Delhi 0.10 0.15 0.20 0.25 0.35
JERC (Goa & UT)
0.30 0.40
Gujarat 0.50 1.00
Haryana 0.00 0.05 0.75
Himachal Pradesh 0.01 0.25 0.25 0.25 0.25 0.50 0.75 1.00 2.00 2.00 Jammu & Kashmir 0.10 0.25
Jharkhand 0.50 1.00
Karnataka 0.25
Kerala 0.25 0.25 0.25 0.25 0.25 0.25 0.25 0.25 0.25 0.25 Madhya Pradesh 0.40 0.60 0.80 1.00
Maharashtra 0.25 0.25 0.50 0.50
Manipur 0.25 0.25
Mizoram 0.25 0.25
Meghalaya 0.30 0.40
Nagaland 0.25 0.25
Orissa 0.10 0.15 0.20 0.25
Punjab 0.03 0.07 0.13 0.19
Rajasthan 0.50 0.75 1.00
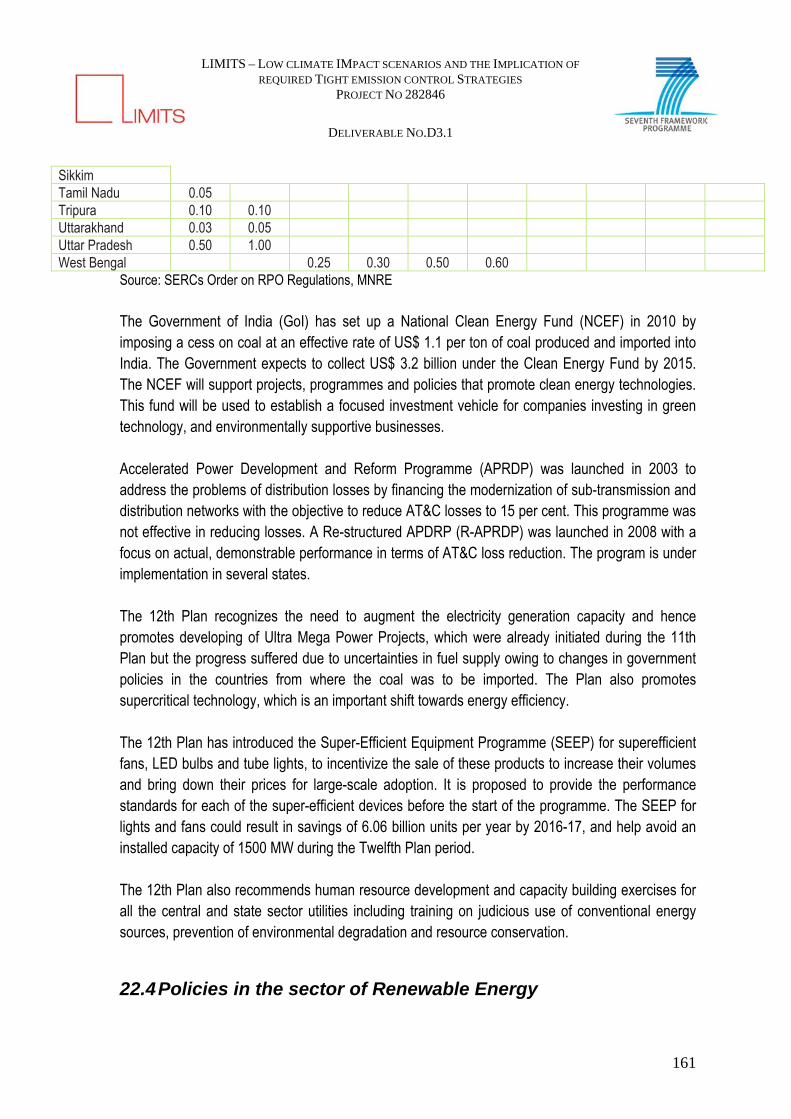
LIMITS – LOW CLIMATE IMPACT SCENARIOS AND THE IMPLICATION OF
REQUIRED TIGHT EMISSION CONTROL STRATEGIES PROJECT NO 282846
DELIVERABLE NO.D3.1
161
Sikkim Tamil Nadu 0.05
Tripura 0.10 0.10
Uttarakhand 0.03 0.05
Uttar Pradesh 0.50 1.00
West Bengal
0.25 0.30 0.50 0.60
Source: SERCs Order on RPO Regulations, MNRE The Government of India (GoI) has set up a National Clean Energy Fund (NCEF) in 2010 by imposing a cess on coal at an effective rate of US$ 1.1 per ton of coal produced and imported into India. The Government expects to collect US$ 3.2 billion under the Clean Energy Fund by 2015. The NCEF will support projects, programmes and policies that promote clean energy technologies. This fund will be used to establish a focused investment vehicle for companies investing in green technology, and environmentally supportive businesses. Accelerated Power Development and Reform Programme (APRDP) was launched in 2003 to address the problems of distribution losses by financing the modernization of sub-transmission and distribution networks with the objective to reduce AT&C losses to 15 per cent. This programme was not effective in reducing losses. A Re-structured APDRP (R-APRDP) was launched in 2008 with a focus on actual, demonstrable performance in terms of AT&C loss reduction. The program is under implementation in several states. The 12th Plan recognizes the need to augment the electricity generation capacity and hence promotes developing of Ultra Mega Power Projects, which were already initiated during the 11th Plan but the progress suffered due to uncertainties in fuel supply owing to changes in government policies in the countries from where the coal was to be imported. The Plan also promotes supercritical technology, which is an important shift towards energy efficiency. The 12th Plan has introduced the Super-Efficient Equipment Programme (SEEP) for superefficient fans, LED bulbs and tube lights, to incentivize the sale of these products to increase their volumes and bring down their prices for large-scale adoption. It is proposed to provide the performance standards for each of the super-efficient devices before the start of the programme. The SEEP for lights and fans could result in savings of 6.06 billion units per year by 2016-17, and help avoid an installed capacity of 1500 MW during the Twelfth Plan period. The 12th Plan also recommends human resource development and capacity building exercises for all the central and state sector utilities including training on judicious use of conventional energy sources, prevention of environmental degradation and resource conservation.
22.4 Policies in the sector of Renewable Energy

LIMITS – LOW CLIMATE IMPACT SCENARIOS AND THE IMPLICATION OF
REQUIRED TIGHT EMISSION CONTROL STRATEGIES PROJECT NO 282846
DELIVERABLE NO.D3.1
162
The 12th Plan promotes the use of renewable sources of energy. As per the projected mix of generation of fuel supply suggested in the Plan, the share of renewables in electricity generated is expected to rise from around 6 per cent in 2012 to 9 per cent in 2017 and 16 per cent in 2030. Taking all the clean energy sources together, the share of hydro, renewables plus nuclear energy is expected to rise from 26 per cent in 2012 to 39 per cent by 2030. The Government has taken several initiatives to promote renewable energy in India. Some of these are listed in Table 2.7.
Table 2. 7 Programmes & its features for the promotion of renewable energy in India Program Features National Biogas and Manure Management Programme (NBMMP)
Apart from providing clean bio- gaseous fuel for reducing use of LPG and other conventional fuels; mitigation of Climate Change by preventing black carbon and methane emissions is also one of the objectives of the programme
Accelerated Programme on Energy Recovery from Urban Wastes – Sanction for the Year 2005-06
To accelerate the promotion of setting up of projects for recovery of energy from urban wastes; To create conducive conditions and environment, with fiscal and financial regime, to develop, demonstrate and disseminate utilization of wastes for recovery of energy; It also targets to harness the available potential of MSW-to-energy by the year 2017
Scheme on Biogas based Distributed / Grid Power Generation Programme
The main objective is to promote biogas based power generation, especially in the small capacity range, based on the availability of large quantity of animal wastes and wastes from forestry, rural based industries (agro / food processing), kitchen wastes, etc.,
Programme on Recovery of Energy from Industrial Wastes
The scheme provides for Central Financial Assistance in the form of capital subsidy and Grants-in-Aid in respect of the following activities: (i) Industrial waste to biogas (ii) Power generation from biogas (iii)Power generation from solid industrial waste. (iv) Promotional activities. (v) R&D, Resource assessment, technology upgradation and performance evaluation, etc.
MNRE programmes include (i) grid connected and stand-alone power generation from small hydro, wind, solar, biomass, and industrial/urban wastes; (ii) rural energy programmes such as electrification of remote villages, biogas, and improved challahs for cooking; (iii) solar energy applications such as thermal water heaters, solar photovoltaic applications for lighting and water pumping; and (iv) integrated rural energy programme (IREP). Research, development, and demonstration programmes in new technologies such as geo-thermal, hydrogen energy, fuel cells,

LIMITS – LOW CLIMATE IMPACT SCENARIOS AND THE IMPLICATION OF
REQUIRED TIGHT EMISSION CONTROL STRATEGIES PROJECT NO 282846
DELIVERABLE NO.D3.1
163
alternative fuels for surface transport, etc., are also being undertaken by MNRE. Table 2.8 highlights the facts and national targets for renewable energy development in India. The Twelfth Plan proposes setting up a National Wind Energy Mission, similar to the National Solar. This mission would include incentives for design, manufacture and installation of turbines, land tenure policies encouraging mixed land use for wind generation and agriculture, approaches for feed-in tariff through independent regulator and mechanisms for using the National Clean Energy Fund (NCEF) to finance development of local grids by state utilities and distribution companies.
Table 2. 8 Renewable energy development in India: Facts and National Targets Some Facts & Figures on India’s Renewable Energy Development India is fifth worldwide in total existing wind power capacity and is rapidly expanding many
forms of rural renewable such as biogas and solar PV India was among the top five countries for renewable power capacity in 2009, including small
hydropower. India added nearly 130 MW of hydropower in 2009, for a total of more than 2.5 GW of small
hydro, and total domestic hydropower capacity approached 37 GW by early 2010 In India, an estimated 20,000 solar hot water systems are installed each year India’s current five-year plan targets 12.5 GW of added renewables by 2012 (including wind,
small hydro, and bio- mass power), and in 2009 the country adopted targets for solar power of 1 GW by 2013 and 20 GW by 2022 (including 1 GW of off-grid solar PV by 2017)
India is home to some 4 million biogas systems, according to recent figures from the Ministry of New and Renewable Energy
In India today there are approximately 7,000 solar-powered irrigation pumps National targets for Renewable Energy Renewable capacity: 12.5 GW added 2007–2012; 15 per cent share of added power
capacity 2002–2022 Solar PV and CSP: 1.1 GW by 2013, 10 GW by 2017, 20 GW by 2022 Wind power: 9 GW added 2007–2012 Small hydro: 1.4 GW added 2007–2012 Biomass/cogeneration: 1.7 GW added 2007–2012 Waste-to-energy: 0.4 GW added 2007–2012 Solar hot water: 15 million m2 by 2017; 20 million m2 by 2022 Rural lighting systems: 20 million by 2022 Source: Renewables 2010 Global Status Report & Plan documents The Central Electricity Regulatory Commission (CERC) has notified Terms and Conditions for the recognition and issuance of Renewable Energy Certificate for Renewable Energy Generation Regulations 2010. The Renewable Energy Certificate (REC) framework is expected to give a push

LIMITS – LOW CLIMATE IMPACT SCENARIOS AND THE IMPLICATION OF
REQUIRED TIGHT EMISSION CONTROL STRATEGIES PROJECT NO 282846
DELIVERABLE NO.D3.1
164
to renewable energy capacity addition in the country. The REC is a market-based instrument to promote renewable energy and facilitate renewable purchase obligations (RPOs). It can make the renewable electricity market stable and predictable by maximizing the benefits of renewable generation while reducing costs. It could also be used by those States that do not have substantial renewable energy resources to meet their RPOs. The CERC and State Electricity Regulatory Commission (SERCs) have created the necessary regulatory and institutional framework and rolled out the scheme from November 2010. The REC mechanism sets the way forward for encouraging competition and eventually mainstreaming renewable energy. The 12th Plan lays down the design and implementation of the Perform, Achieve and Trade (PAT) framework (Table 2.9), which has been developed as per the legal requirement under the Energy Conservation Act 2001 and situation analysis of the designated consumers.
Table 2. 9 PAT Framework Main Elements of the PAT Framework 1. Methodology for setting specific energy consumption (SEC12) for each DC in the baseline
year. 2. Methodology for setting the target to reduce the Specific Energy Consumption (SEC) by the
target year from the baseline year. 3. The process to verify the SEC of each DC in the baseline year and in the target year by an
accredited verification agency. 4. The process to issue energy savings certificates (ESCerts) to those DCs who achieve SEC
lower than the specified value. 5. Trading of ESCerts. 6. Compliance and reconciliation of ESCerts. 7. Cross-sectoral use of ESCerts and their possible synergy with renewable energy
certificates. PAT Cycles First Cycle (2012-15): In the first phase, the energy-intensive DCs will be assigned individual SEC targets and allotted a 3-year time period to accomplish it. The Monitoring and Verification (M&V) is carried out from the second year onwards. After the completion of M&V, energy saving certificates will be issued and trading will be permitted. Second Cycle (post 2015): the number of DCs may get revised as more plants and sectors could be added. Petroleum refineries, petrochemicals, gas crackers/naphtha crackers, sugar, chemicals, port trusts, transport (industries and services), electricity transmission and distribution companies, and commercial buildings and establishments are some of the probable DCs that could be added in the second PAT cycle.
Source: 12th Plan
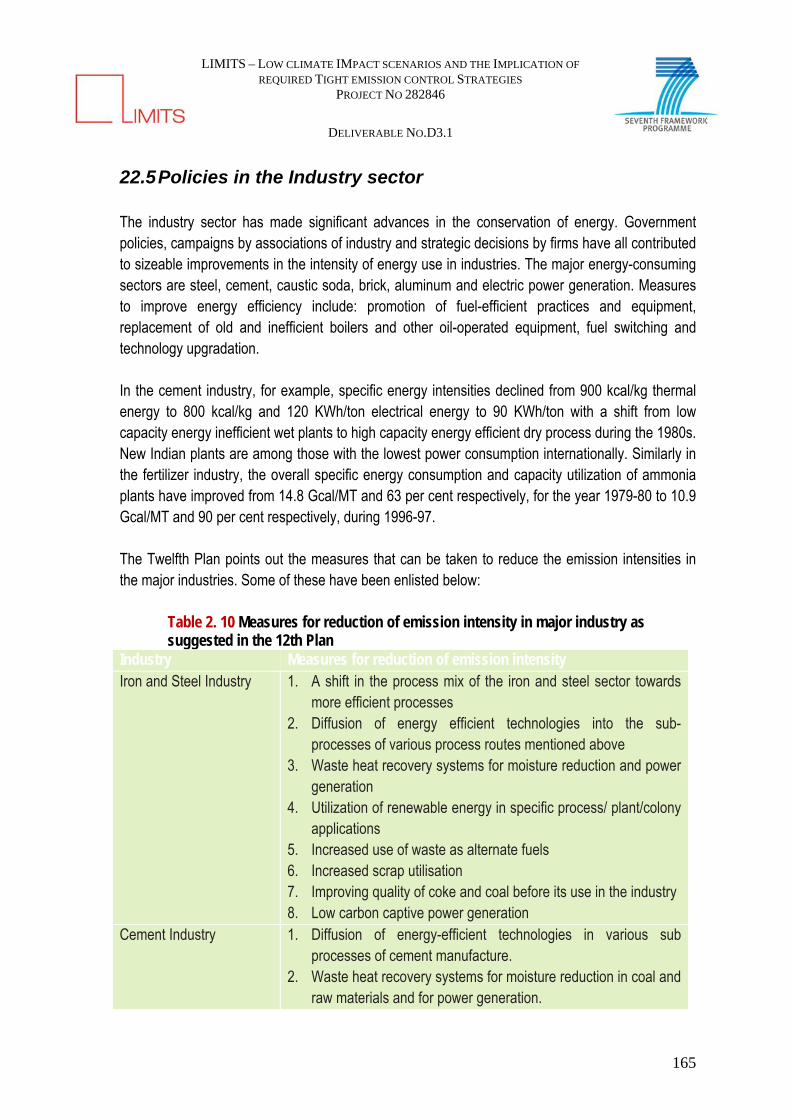
LIMITS – LOW CLIMATE IMPACT SCENARIOS AND THE IMPLICATION OF
REQUIRED TIGHT EMISSION CONTROL STRATEGIES PROJECT NO 282846
DELIVERABLE NO.D3.1
165
22.5 Policies in the Industry sector The industry sector has made significant advances in the conservation of energy. Government policies, campaigns by associations of industry and strategic decisions by firms have all contributed to sizeable improvements in the intensity of energy use in industries. The major energy-consuming sectors are steel, cement, caustic soda, brick, aluminum and electric power generation. Measures to improve energy efficiency include: promotion of fuel-efficient practices and equipment, replacement of old and inefficient boilers and other oil-operated equipment, fuel switching and technology upgradation. In the cement industry, for example, specific energy intensities declined from 900 kcal/kg thermal energy to 800 kcal/kg and 120 KWh/ton electrical energy to 90 KWh/ton with a shift from low capacity energy inefficient wet plants to high capacity energy efficient dry process during the 1980s. New Indian plants are among those with the lowest power consumption internationally. Similarly in the fertilizer industry, the overall specific energy consumption and capacity utilization of ammonia plants have improved from 14.8 Gcal/MT and 63 per cent respectively, for the year 1979-80 to 10.9 Gcal/MT and 90 per cent respectively, during 1996-97. The Twelfth Plan points out the measures that can be taken to reduce the emission intensities in the major industries. Some of these have been enlisted below:
Table 2. 10 Measures for reduction of emission intensity in major industry as suggested in the 12th Plan
Industry Measures for reduction of emission intensity Iron and Steel Industry 1. A shift in the process mix of the iron and steel sector towards
more efficient processes 2. Diffusion of energy efficient technologies into the sub-
processes of various process routes mentioned above 3. Waste heat recovery systems for moisture reduction and power
generation 4. Utilization of renewable energy in specific process/ plant/colony
applications 5. Increased use of waste as alternate fuels 6. Increased scrap utilisation 7. Improving quality of coke and coal before its use in the industry 8. Low carbon captive power generation
Cement Industry 1. Diffusion of energy-efficient technologies in various sub processes of cement manufacture.
2. Waste heat recovery systems for moisture reduction in coal and raw materials and for power generation.

LIMITS – LOW CLIMATE IMPACT SCENARIOS AND THE IMPLICATION OF
REQUIRED TIGHT EMISSION CONTROL STRATEGIES PROJECT NO 282846
DELIVERABLE NO.D3.1
166
3. Utilisation of renewable energy in specific process/ plant/colony applications.
4. Increased use of waste as alternate fuels, rationalizing the various policies that regulate this activity.
5. Increased blending using fly ash from thermal power plants and granulated blast furnace slag from steel plants, and the increased use of composite cements.
6. Improving quality of coke and coal before its use in the industry. 7. Low carbon captive power generation. 8. Increase of blended cements in the public procurement
process. Source: (Planning Commission, 2013)
22.6 Policies in the Transport sector A major initiative in the transportation sector has been the upgradation of vehicular emission norms. A norm called the ‘Bharat 2000’, similar to Euro-I norms was implemented throughout the country on 1 April, 2000 for all categories of vehicles manufactured in India. Emission standards (Bharat Stage II) for motor cars and passenger vehicles came into force in the National Capital Region (NCR) on 1st April, 2000 and has been extended to Mumbai, Chennai and Kolkata. Apart from reducing pollution locally, these norms result in increased energy efficiency and therefore, reduced GHG emissions. A drive for awareness and training of drivers has been undertaken and the commercial manufacture of battery operated vehicles has begun in India. This will promote low/no carbon emitting vehicles. In Delhi, large-scale switch has taken place from petrol and diesel to Compressed Natural Gas (CNG) with over 50,000 vehicles having already been converted. To control vehicular pollution, mass emission standards for various categories of motor vehicles have been progressively tightened. Bharat Stage III emission norms were effective in 11 mega cities namely National Capital Region, Mumbai, Kolkata, Chennai, Bengaluru, Ahmedabad, Hyderabad/Secunderabad, Kanpur, Pune, Surat and Agra whereas Bharat Stage II emission norms were applicable in the rest of the country. Bharat Stage IV emission norms have been effective from 1.4.2010 in the 11 mega cities and Bharat Stage III emission norms for the rest of the country from the same date, as notified on 9.3.2009. As per the road map given in the Auto Fuel Policy, supply of Euro-IV MS and HSD in NCR/Delhi and in the cities of Mumbai, Kolkata, Chennai, Bengaluru, Hyderabad (including Secunderabad), Ahmedabad, Pune, Surat, Kanpur, Agra, Lucknow and Sholapur has commenced w.e.f. 1st April, 2010. Supply of Euro-III MS/HSD in the rest of the country has been implemented in a phased
LIMITS – LOW CLIMATE IMPACT SCENARIOS AND THE IMPLICATION OF
REQUIRED TIGHT EMISSION CONTROL STRATEGIES PROJECT NO 282846
DELIVERABLE NO.D3.1
167
manner between 1st April, 2010 to 1st October 2010. All the oil companies are making necessary arrangements to adhere to these deadlines. In line with the policy of finding alternate to oil for the transport sector, the Ministry of Petroleum & Natural Gas has set up a Hydrogen Corpus Fund with a corpus of USD 22.7 million, with contribution from five major oil companies and Oil Industry Development Board (OIDB), for supporting research and development in various aspects of hydrogen, which could substitute part of natural gas as transport fuel in future. R&D Centre of Indian Oil Corporation Ltd. has taken following steps for promoting Hydrogen as auto fuel with the help of Hydrogen Corpus Fund:
(i) A Hydrogen-CNG dispensing station has been set up in R&D Centre at Faridabad to cater to the re-fuelling needs of test/demo vehicles operating on H2-CNG blends.
(ii) A Project for development and optimization of two heavy duty engines i.e. TATA Motors & Ashok Leyland, running on H2-CNG blended fuel has also been initiated by Indian Oil R&D.
(iii) A project has been initiated by Indian Oil R&D for conversion of a gasoline fuel injected car (Maruti Swift) to gaseous fuel injection system in collaboration with M/s. Harit Energy Solutions Ltd.
(iv) Indian Oil R&D has signed a MoU with M/s. Korea Gas Corporation (KOGAS) for mutually sharing the data on application of LNG and H-CNG in automotive vehicles. Further, collaborations with the leading organizations of the world such as National Renewable Energy Laboratory (NREL) of USA has been explored for hydrogen research.
(v) Indian Oil R&D and Mahindra & Mahindra have agreed to jointly develop fuel cell vehicles. In this regard a joint proposal on ‘Development of Fuel Cell Vehicles” has been submitted to Scientific Advisory Committee of MOPNG for funding from Hydrogen Corpus Fund.
To encourage production of bio-diesel in the country, the Ministry of Petroleum and Natural Gas has announced a bio-diesel Purchase Policy in October, 2005, which became effective from 1.1.2006. Under this scheme Oil Marketing Companies (OMC) will purchase bio-diesel for blending with High Speed Diesel to the extent of 5 per cent at identified purchase centers across the country. The policy has identified 20 purchase centers of the OMCs all over the country. The bio-diesel industry is still at nascent stage of growth and efforts are being made to make the bio-diesel industry a sustainable feature of the economy. Ministry of Petroleum & Natural Gas vide its notification dated 20th September, 2006 has directed the OMCs to sell 5 per cent Ethanol-Blended Petrol (EBP) subject to commercial viability as per Bureau of Indian Standards specifications in the entire country except North-Eastern States, Jammu & Kashmir, Andaman & Nicobar Islands and Lakshadweep with effect from 1st November,
LIMITS – LOW CLIMATE IMPACT SCENARIOS AND THE IMPLICATION OF
REQUIRED TIGHT EMISSION CONTROL STRATEGIES PROJECT NO 282846
DELIVERABLE NO.D3.1
168
2006. Efforts are being made to ensure availability of ethanol on consistent basis for the EBP Programme and OMC’s are in discussion with the sugar industry to firm up the status of availability at various locations. Urban transport is one of the key elements of urban infrastructure. As compared to private modes of transport, public transport is energy efficient and less polluting. The public transport system also helps improve urban-rural linkage and improves access of the rural/semi-urban population in the periphery to city centers for the purpose of labor supply without proliferation of slums within and around cities. In this background, the major objective of urban transport initiatives is to provide efficient and affordable public transport. A National Urban Transport Policy (NUTP) was laid down in 2006, with the objectives of ensuring easily accessible, safe, affordable, quick, comfortable, reliable, and sustainable mobility for all. In order to provide better transport, proposals for bus rapid transit system (BRTS) were approved for Ahmedabad, Bhopal, Indore, Jaipur, Pune, Rajkot, Surat, Vijayawada, and Vishakhapatnam cities under the JNNURM. During 2009-10, one more proposal for a BRTS in Kolkata has been approved under the JNNURM taking the number of cities supported for BRTS to 10, covering a total length of 453.20 km. Till December 2010, more than 10,000 modern intelligent transport system(ITS)-enabled, low floor and semi-low floor buses have been delivered to States/Cities. The Government of India had approved the implementation of the Bangalore Metro Rail Project of 43.3 km length by Bangalore Metro Rail Corporation Ltd. (BMRCL). The Government of India had approved implementation of the east-west metro corridor of 14.67 km length in Kolkata by Kolkata Metro Rail Corporation Ltd (KMRCL). The Government of India had also approved the implementation of the Chennai Metro Rail Project of 46.5 km length by Chennai Metro Rail Ltd. (CMRL). In addition, metro rail projects have been taken up on PPP basis in Mumbai for Versova- Andheri-Ghatkopar (11.07 km), Charkop to Mankhurd via Bandra (31.87 km) and Hyderabad Metro (71.16 km) with viability gap funding (VGF) support from the Government of India. In order to give proper legal cover to metro projects, the Metro Railways Amendment Act 2009 was brought into effect in September 2009, providing an umbrella 'statutory' safety cover for metro rail work in all the metro cities of India. The Act was extended to the National Capital Region, Bangalore, Mumbai, and Chennai metropolitan areas with effect from 16th October 2009.
22.7 Policies in the Agriculture sector Agriculture is a critical component of Indian sustainable developmental policies, since more than 650 million people depend on agriculture. The Green Revolution during the 1970s made India self-
LIMITS – LOW CLIMATE IMPACT SCENARIOS AND THE IMPLICATION OF
REQUIRED TIGHT EMISSION CONTROL STRATEGIES PROJECT NO 282846
DELIVERABLE NO.D3.1
169
sufficient in food production through increased agricultural output based on high- yielding seeds, irrigation and fertilizers. The National Agricultural Policy (2000) targeted to achieve an output growth in excess of 4 per cent per year in a manner that is technologically, environmentally and economically sustainable. During the 11th plan, agriculture is considered to be a key area for addressing multiple aspects of the economy such as food security, economic growth, rural livelihoods and rural resilience. There is a programme to evolve suitable strategies on agro-climatic zone to reduce yield gap (Rashtriya Krishi Vikas Yojana) and public investment in developing irrigation has been increased (includes modernization to improve efficiency and launching of water shed programmes for dry land areas). There has been a provision for increasing private investments (provision of credit for farmers) to develop land, buy pump sets and install drip irrigation systems. There is also a programme for revival of the cooperative banking system (on the lines of the recommendation of the Vaidyanathan committee). Restructuring of fertilizer subsidy on nutrient basis & awareness building about soil health, increase in supply of certified seeds and to achieve credibility in the quality of seeds, a strong effort in expanding food grain production (National Food Security Mission), incorporation of diversification on the lines of technical appropriateness, assured market & logistics linkages (several states have amended the Agricultural Produce Marketing Committee Acts to facilitate private markets creation), improvements in market linkages through development of rural infrastructure (Pradhan Mantri Grameen Sadak Yojana and Rajiv Gandhi Grameen Vidyutikaran Yojana) have been some of the thrust areas during the 11th plan to boost the agriculture sector, within the broader principles of achieving a growth that is sustainable. Several measures/strategies have evolved during the Eleventh Five Year Plan period to address various issues pertaining to the agriculture sector. In the medium term, the focus has been on improving yields with the existing available technology, timely availability of water through expansion of the irrigation system and also improvement of existing irrigation systems. Development of watersheds, implementing rain water harvesting in farm ponds and tanks, and improved methods of ground water recharge are other coping strategies under implementation to achieve planned growth in agriculture. A major expansion in the Accelerated Irrigation Benefit Programme (AIBP) has been undertaken during the 11th plan. The National Rainfed Area Authority, which was established in 2006 is now fully operational, and is expected to help converge different programmes in rain-fed areas to achieve better water management & improve agricultural productivity. The new National Food Security Mission aims at increasing cereal and pulses production by 20 million tons by concentrating on those areas which have the greatest potential for increase in yields with the given technology. The National Horticulture Mission has also been expanded. Rashtriya Krishi Vikas Yojana (RKVY) is a focused programme that provides additional financial resource to the state governments to finance agriculture development programmes. The strategy is also aided by the NREG Act, by building projects that help in the larger objectives of enhancing agricultural
LIMITS – LOW CLIMATE IMPACT SCENARIOS AND THE IMPLICATION OF
REQUIRED TIGHT EMISSION CONTROL STRATEGIES PROJECT NO 282846
DELIVERABLE NO.D3.1
170
productivity because the first priority is being given to projects aimed at water conservation. The following table (2.11) gives a snap-shot of the various policies/programmes of Government of India and its key features, aimed at promoting sustainable development.
Table 2. 11 Policies/Programmes promoting sustainable development in Agriculture Sector
Policy/Program Features National Policy on Agriculture Attain output growth rate in excess of 4 per cent per annum
based on efficient use of resources Integrated Watershed Management Programme
Restore ecological balance by harnessing, conserving and developing degraded natural resources such as soil, vegetative cover and water
National Watershed Development Project for Rainfed Areas
Sustainable management of natural resources, enhancement of Agricultural production, restoration of ecological balance in the degraded and fragile rainfed ecosystems, reduction in regional disparity between irrigated and rainfed areas and; creation of sustained employment opportunities for the rural community including the landless
Rashtriya Krishi Vikas Yojana Assist States in development and implementation of district level agricultural plans (based on local agro-climatic conditions) and bring about quantifiable changes in the production and productivity of various components of agriculture and allied sectors
National Food Security Mission Aims at increasing production of rice, wheat and pulses through area expansion and productivity enhancement in a sustainable manner; restoring soil fertility and productivity at the individual farm level
National Project on Organic Farming
Aims to promote production, promotion and market development of organic farming in the country
Micro Irrigation Scheme Increase the area under efficient methods of irrigation viz drip and sprinkler irrigation
Weather Based Crop Insurance Scheme
Aims to mitigate against the likelihood of financial loss on account of anticipated crop loss resulting from incidence of adverse conditions
National Horticulture Mission To provide holistic growth of horticulture sector through regionally differentiated strategies
National Project on Management of Soil Health and Fertility
Facilitate and promote Integrated Nutrient Management (INM) through judicious use of chemical fertilizers in conjunction with organic manures and bio-fertilizers
22.8 Policies in the Forestry sector

LIMITS – LOW CLIMATE IMPACT SCENARIOS AND THE IMPLICATION OF
REQUIRED TIGHT EMISSION CONTROL STRATEGIES PROJECT NO 282846
DELIVERABLE NO.D3.1
171
Forest conservation and enhancement are the stated objectives of national Forest policy. Various policy initiatives have resulted in the increase of forest cover and a reduction in the per capita deforestation rate. The National Forests Policy envisages peoples' participation in the development of degraded forests to meet their fuel, fodder and timber needs, as well as to develop the forests for improving the environment through Joint Forest Management. India has implemented a large number of progressive policies, programmes and measures to conserve and develop the forests, wildlife, mangroves and coral-reefs, such as: the Forest Conservation Act, 1980, the National Forest Policy, 1988, the Wildlife Act, Joint Forest Management, Social Forestry, banning of timber extraction in reserve forests, improved cook-stove programme and biogas to conserve fuel-wood. Similarly, there are conservation programmes for mangroves, coral reefs and lake ecosystems. The National Wasteland Development Board is responsible for re-generating degraded non-forest and private lands. The National Afforestation and Eco-Development Board is responsible for regenerating degraded forest lands, the land adjoining forest areas, as well as ecologically-fragile areas. The Forest Survey of India monitors changes in the forest area. All these measures have led to some stabilization of the forest area, a reduction in deforestation, afforestation, significantly contributing to conservation of the forest carbon sink. The Ministry of Environment & Forests (MoEF) notified the constitution of Compensatory Afforestation Fund Management and Planning Authority (CAMPA) on 23rd April 2004 for management and use of the fund generated by levying cost of compensatory afforestation in equivalent forest lands offered by the user agencies or in degraded land whenever there is a diversion of forest lands for non-forestry purposes under the Forest (Conservation) Act 1980. The apex court of the country had observed that this fund was being appropriated to the implementing authorities. As a consequence of this observation, the MoEF issued guidelines for State CAMPA on 2nd July 2009, with the objective of putting in place a funding mechanism for enhancing forest and tree cover and conservation and management of wildlife by utilizing the funds currently available with the Adhoc CAMPA. Table 3.12 gives a summary snap shot of sustainable development initiatives in the forestry sector.
Table 2. 12 Acts/Policies/Programmes in the Forestry sector Policy/Program Features Forest (Conservation) Act, 1980-ongoing
To check further deforestation, the Forest (Conservation) Act was enacted by Government of India.
National Forest Policy, 1988-ongoing
National Forest Policy acknowledges the importance and primacy of local communities and provided for a sustainable management approach with maintenance of environmental stability as the prime objective
Participatory Forest Management / Joint Forest Management Programme (JFM), 1990-ongoing
Initiated on 1 June 1990, Joint Forest Management (JFM) has emerged as an important intervention in management of forest resources in India. The JFM approach optimizes the returns, minimizes conflicts and links the forestry development works with the overall development of land based resources. It also aims at

LIMITS – LOW CLIMATE IMPACT SCENARIOS AND THE IMPLICATION OF
REQUIRED TIGHT EMISSION CONTROL STRATEGIES PROJECT NO 282846
DELIVERABLE NO.D3.1
172
building technical and managerial capability at the grassroots level. National Afforestation Programme (NAP), 2001-ongoing
The National Afforestation Programme (NAP) Scheme was initiated by scaling-up the Samnavit Gram Vanikaran Samridhi Yojana (SGVSY) project experience and converging all afforestation schemes of the 9th Plan period. The overall objective of the scheme is to develop the forest resources with people’s participation, with focus on improvement in livelihoods of the forest fringe communities, especially the poor
National Watershed Development Project for Rainfed Areas (NWDPRA), 1991-ongoing
The NWDPRA programme was initiated in 1990-91 with the twin objectives of improving agricultural production in rainfed areas and to restore ecological balance.
22.9 Cross-Cutting Sectoral Policies
22.9.1 InfrastructuredevelopmentandPPPs Given the enormity of the investment requirements and limited availability of public resources for investment in physical infrastructure, the Government has offered various incentives for the infrastructure sector for sustained economic growth. These include: allowing 100 per cent Foreign Direct Investments (under the automatic route) in all infrastructure sectors including the roads, power, ports, and airport sectors; 74 per cent in telecom services and 100 per cent in telephone equipment; 49 per cent to100 per cent for various services in the aviation sector; extended tax holiday periods up to ten-year tax holidays (under section 80-IA of the Income Tax Act 1961) to enterprises engaged in the business of development, operation, and maintenance of infrastructure facilities; and emphasis on PPP as one of the preferred modes for project implementation. The Department of Economic Affairs (DEA), in collaboration with the Asian Development Bank (ADB) initiated the PPP Pilot Projects Initiatives where the process of structuring of PPP projects is closely watched over by the Central Government to develop demonstrable PPP projects in challenging sectors. Sixty PPP projects in various States, municipalities, and Central Ministries have been identified and are being thus developed, encompassing sectors such as rural secondary education, elementary education, greenfield hospitals and diagnostic centers, water supply and sanitation, affordable housing, training centers, and rural infrastructure. As part of a wide-ranging effort to create an enabling environment for PPPs, the DEA has developed the National PPP Capacity Building Programme, in collaboration with the World Bank and the German KfW. The strategy is essentially aimed at enhancing the capacities of public functionaries engaged in identification, conceptualizing, structuring, and management of the PPP project development cycle. It also enhances awareness of key decision makers regarding the critical issues and choices in a PPP context.
LIMITS – LOW CLIMATE IMPACT SCENARIOS AND THE IMPLICATION OF
REQUIRED TIGHT EMISSION CONTROL STRATEGIES PROJECT NO 282846
DELIVERABLE NO.D3.1
173
Many State Governments have institutionalized measures to encourage private sector engagement in creation of infrastructure and delivery of services. Infrastructure Development and Enabling Acts have been developed by Andhra Pradesh, Bihar, Gujarat, and Punjab. PPP policies and guidelines to facilitate PPP projects have been notified by Karnataka, Haryana, Orissa, Assam, Goa, Madhya Pradesh, and West Bengal. Other measures include development of sectoral policies for promoting PPPs, establishing nodal departments/ PPP cells, establishing VGFs (to supplement the VGF provided by the Central Government), establishing Project Development Fund (supplement GOI grant under IIPDF), establishing panels of transaction advisers, and developing standardized bid documents, sectoral templates, and handbooks on PPPs.
22.9.2 TechnologyTransferFor developing and emerging countries like India, economic development is a must in order to tackle the issues of poverty and achieving the Millennium Development Goals (MDGs). Under the UN Framework Convention on Climate Change (UNFCCC), which supports the principle of common but differentiated responsibility” affords greater responsibility to the developed countries in addressing climate change issue. India’s take on climate change therefore is that of avoidance as against reduction. However, in order to contain the disastrous effects of global warming, the developing countries will need to embrace climate-effective technologies. Technology transfer has therefore been awarded key significance in climate change negotiations. Two mechanisms directly or indirectly contribute to technology transfer. The UNFCCC-related mechanisms where technology transfer is an explicit objective, such as projects supported by the Global Environment Facility (GEF) and those where technology transfer is a co-benefit, such as projects funded under the Clean Development Mechanism (CDM).
22.9.3 TechnologyTransferundertheGEFmechanismGlobal Environment Facility (GEF) is an operating entity of the financial mechanism of the UNFCCC. The GEF has become the largest public-sector funding source to support the transfer of environmentally sound technologies to developing countries. The climate change focal area strategy programming has evolved over the years through the different replenishment cycles. During the GEF 4 (2006-2010), the latest cycle, it committed to two strategic programs on renewable energy: one that promotes market approaches for the supply of and demand for renewable electricity in grid-based systems, and one that promotes sustainable energy production from biomass. The emphasis is upon developing policies and regulatory frameworks that provide limited incremental support to strategically important investments.
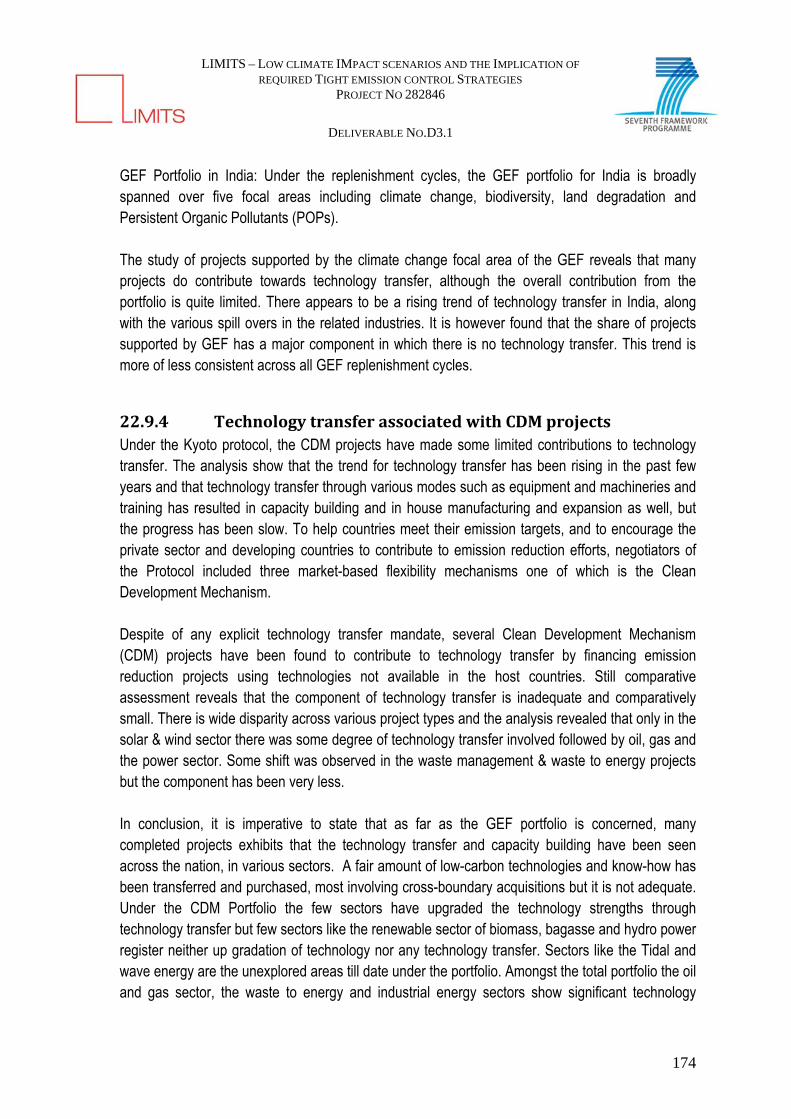
LIMITS – LOW CLIMATE IMPACT SCENARIOS AND THE IMPLICATION OF
REQUIRED TIGHT EMISSION CONTROL STRATEGIES PROJECT NO 282846
DELIVERABLE NO.D3.1
174
GEF Portfolio in India: Under the replenishment cycles, the GEF portfolio for India is broadly spanned over five focal areas including climate change, biodiversity, land degradation and Persistent Organic Pollutants (POPs). The study of projects supported by the climate change focal area of the GEF reveals that many projects do contribute towards technology transfer, although the overall contribution from the portfolio is quite limited. There appears to be a rising trend of technology transfer in India, along with the various spill overs in the related industries. It is however found that the share of projects supported by GEF has a major component in which there is no technology transfer. This trend is more of less consistent across all GEF replenishment cycles.
22.9.4 TechnologytransferassociatedwithCDMprojectsUnder the Kyoto protocol, the CDM projects have made some limited contributions to technology transfer. The analysis show that the trend for technology transfer has been rising in the past few years and that technology transfer through various modes such as equipment and machineries and training has resulted in capacity building and in house manufacturing and expansion as well, but the progress has been slow. To help countries meet their emission targets, and to encourage the private sector and developing countries to contribute to emission reduction efforts, negotiators of the Protocol included three market-based flexibility mechanisms one of which is the Clean Development Mechanism. Despite of any explicit technology transfer mandate, several Clean Development Mechanism (CDM) projects have been found to contribute to technology transfer by financing emission reduction projects using technologies not available in the host countries. Still comparative assessment reveals that the component of technology transfer is inadequate and comparatively small. There is wide disparity across various project types and the analysis revealed that only in the solar & wind sector there was some degree of technology transfer involved followed by oil, gas and the power sector. Some shift was observed in the waste management & waste to energy projects but the component has been very less. In conclusion, it is imperative to state that as far as the GEF portfolio is concerned, many completed projects exhibits that the technology transfer and capacity building have been seen across the nation, in various sectors. A fair amount of low-carbon technologies and know-how has been transferred and purchased, most involving cross-boundary acquisitions but it is not adequate. Under the CDM Portfolio the few sectors have upgraded the technology strengths through technology transfer but few sectors like the renewable sector of biomass, bagasse and hydro power register neither up gradation of technology nor any technology transfer. Sectors like the Tidal and wave energy are the unexplored areas till date under the portfolio. Amongst the total portfolio the oil and gas sector, the waste to energy and industrial energy sectors show significant technology

LIMITS – LOW CLIMATE IMPACT SCENARIOS AND THE IMPLICATION OF
REQUIRED TIGHT EMISSION CONTROL STRATEGIES PROJECT NO 282846
DELIVERABLE NO.D3.1
175
transfer unlike the other sectors where wither there is no or less technology transfer involved for projects. After mapping the various polices and measures at central and state level, these are incorporated appropriately in the modelling efforts to ascertain their contribution to GHG emission mitigation in future. These are modeled as groups of policies. The next chapter provides our estimation of Indian greenhouse gas emission trends over the last two decades at sectoral and sub-regional levels.

LIMITS – LOW CLIMATE IMPACT SCENARIOS AND THE IMPLICATION OF
REQUIRED TIGHT EMISSION CONTROL STRATEGIES PROJECT NO 282846
DELIVERABLE NO.D3.1
176
23 PAST TRENDS IN EMISSION INTENSITY
This chapter captures trends in Indian energy intensity of GDP and GHG emission intensity of GDP since 1990 at national and sectoral levels. These trends incorporate the structural changes in the Indian economy over the years wherein the share of agriculture sector has been declining continuously from 53.7 per cent in 1951 to 15.9 per cent in 2012, share of service sectors has increased from 11 per cent to 27.5 per cent during the same period, while industrial sector share has also increased from 13.4 per cent to 23.4 per cent (Economic Survey, 2013). Coal has continued to remain the mainstay of Indian commercial energy, resulting in increasing greenhouse gas emissions over the years, although renewable energy is expanding at a fast pace albeit from a low base. The electricity generation base has increased 2 folds since 1990-2010.
23.1 Energy Demand and Supply Trends in India In 2011-2012, primary energy production added up to 1.637 EJ. The share of Crude oil accounted for 23 per cent, renewable energy represented 54 per cent, nuclear energy contributed with 2 per cent and coal with 20 per cent India continued to be a net importer of primary energy, as it imported 255 EJ in 2011-2012. 69 per cent of such imports corresponded to crude oil. Total imports represents 13 per cent of the total primary energy supply and 2 per cent of the primary production was exported. In 2011-2012, national energy consumption was 281 PJ. The industrial sector used 47 per cent (Figure 3.1) of the total final energy consumption (MoSPI, 2013). About 25 per cent of total Energy supply in India was from non-commercial energy sources, mainly traditional biomass (Planning Commission, 2013).
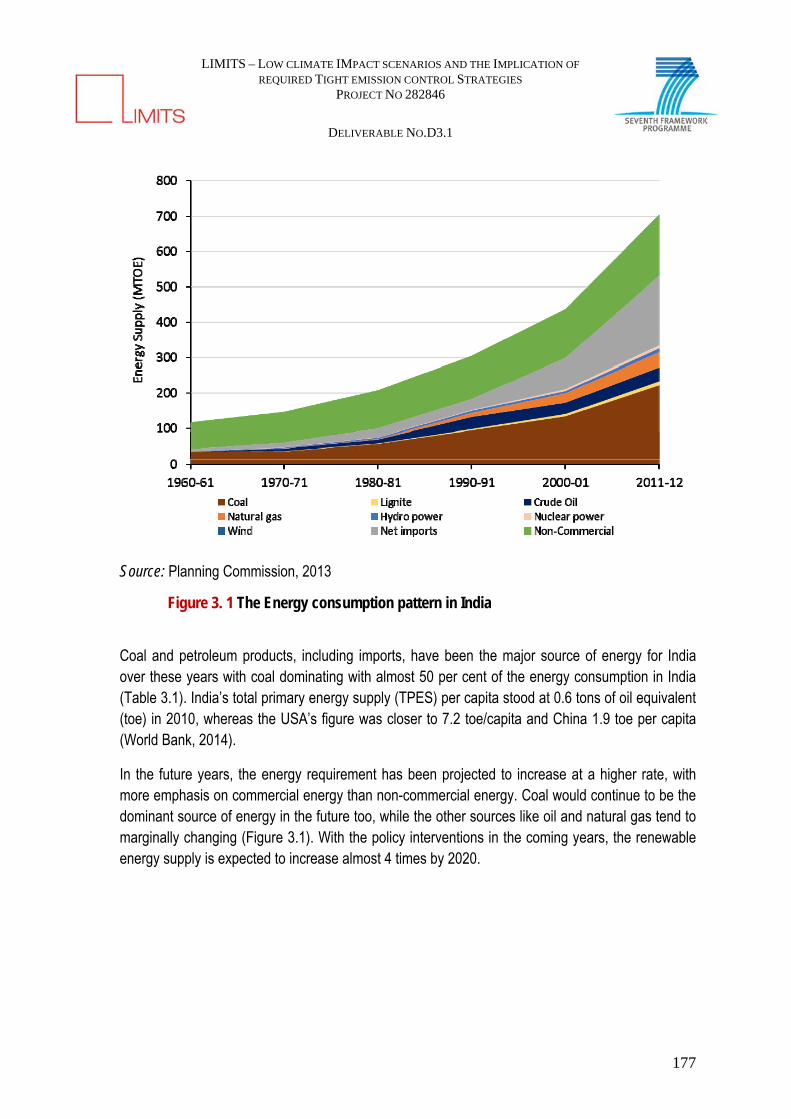
LIMITS – LOW CLIMATE IMPACT SCENARIOS AND THE IMPLICATION OF
REQUIRED TIGHT EMISSION CONTROL STRATEGIES PROJECT NO 282846
DELIVERABLE NO.D3.1
177
Source: Planning Commission, 2013
Figure 3. 1 The Energy consumption pattern in India
Coal and petroleum products, including imports, have been the major source of energy for India over these years with coal dominating with almost 50 per cent of the energy consumption in India (Table 3.1). India’s total primary energy supply (TPES) per capita stood at 0.6 tons of oil equivalent (toe) in 2010, whereas the USA’s figure was closer to 7.2 toe/capita and China 1.9 toe per capita (World Bank, 2014).
In the future years, the energy requirement has been projected to increase at a higher rate, with more emphasis on commercial energy than non-commercial energy. Coal would continue to be the dominant source of energy in the future too, while the other sources like oil and natural gas tend to marginally changing (Figure 3.1). With the policy interventions in the coming years, the renewable energy supply is expected to increase almost 4 times by 2020.

LIMITS – LOW CLIMATE IMPACT SCENARIOS AND THE IMPLICATION OF
REQUIRED TIGHT EMISSION CONTROL STRATEGIES PROJECT NO 282846
DELIVERABLE NO.D3.1
178
Table 3. 1 Share of Each Fuel in Total Energy Production and Consumption (In percentage)
2000–01 Actual
2006–07 Actual
2011–12 (Provisional*)
2016–17 (Projected)
2021–22 (Projected
) Share in Commercial Energy Production Coal and Lignite 66 77 69 68 67 Crude Oil 16 13 12 9 7 Natural Gas 12 11 13 15 16 Hydro Power 3 4 3 3 3 Nuclear Power 2 2 3 4 5 Renewable Energy 0.1 0.3 2 2 3 Share in Total Commercial Energy Supply Coal and Lignite 50 53 54 54 57 Crude Oil 38 33 32 26 23 Natural Gas 9 7 10 14 13 Hydro Power 2 3 2 2 2 Nuclear Power 2 1 2 2 3 Renewable Energy 0.0 0.2 1 1 2 *Provisional: numbers would be finalized when the Planning Commission reports in 2014
Source: Planning Commission, 2013
With the new capacity additions in the 11th Five year plan and increase in the generation units, the efficiency of the electricity transmission and distribution has seen an improvement. The Aggregate Technical and Commercial (ATC) losses has been showing a steady decrease over the years, however it does varies for different states. Some states have shown marked improvement, such as Rajasthan, Gujarat, Kerala, and New Delhi; while some have shown a deterioration such as Jammu & Kashmir, some north-eastern states, West Bengal, and Odisha. This increased efficiency reduces the need for generation of more power. The power saved with the control of these losses is power generated.
Higher ATC losses and cross subsidy of electricity could render state utilities financially unviable. Table 3.2 indicates that average cost of supply of power has been up to 20-25 per cent higher than the average tariff charged for the same. The resulting commercial losses are almost 10 billion US$ per year which is equivalent to installing about 10 GW of new power capacity every year.
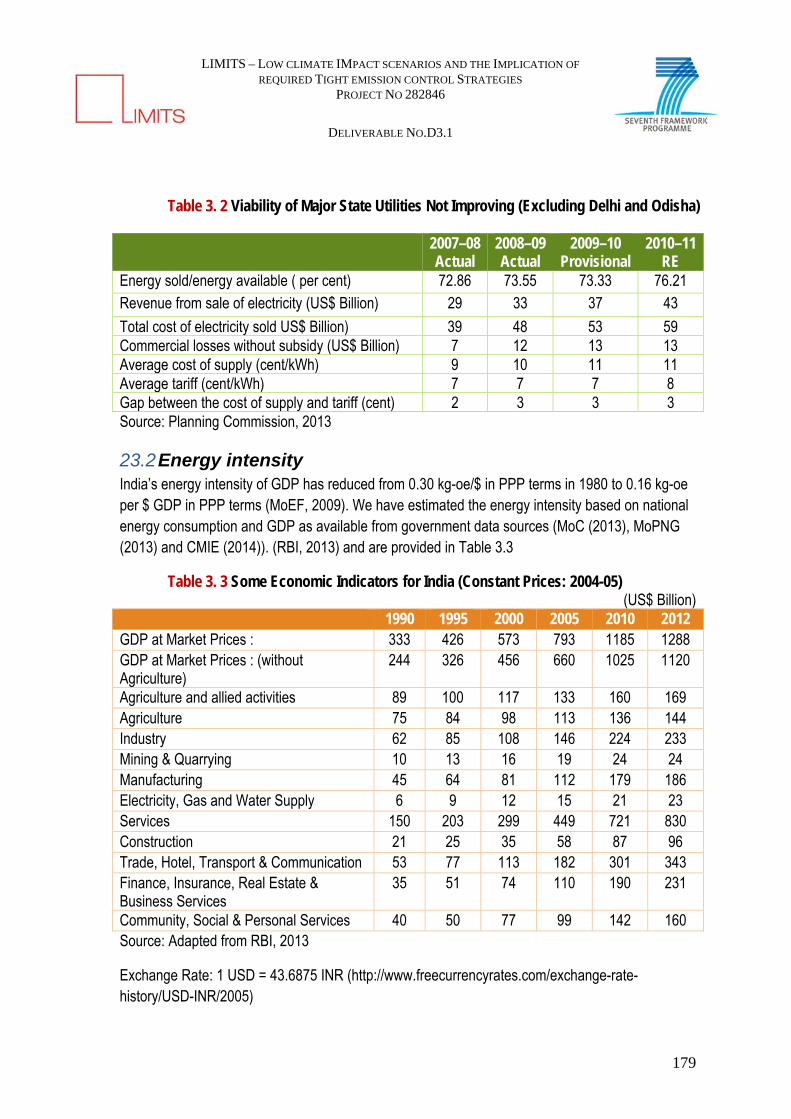
LIMITS – LOW CLIMATE IMPACT SCENARIOS AND THE IMPLICATION OF
REQUIRED TIGHT EMISSION CONTROL STRATEGIES PROJECT NO 282846
DELIVERABLE NO.D3.1
179
Table 3. 2 Viability of Major State Utilities Not Improving (Excluding Delhi and Odisha) 2007–08
Actual 2008–09 Actual
2009–10 Provisional
2010–11 RE
Energy sold/energy available ( per cent) 72.86 73.55 73.33 76.21 Revenue from sale of electricity (US$ Billion) 29 33 37 43
Total cost of electricity sold US$ Billion) 39 48 53 59 Commercial losses without subsidy (US$ Billion) 7 12 13 13 Average cost of supply (cent/kWh) 9 10 11 11 Average tariff (cent/kWh) 7 7 7 8 Gap between the cost of supply and tariff (cent) 2 3 3 3 Source: Planning Commission, 2013
23.2 Energy intensity India’s energy intensity of GDP has reduced from 0.30 kg-oe/$ in PPP terms in 1980 to 0.16 kg-oe per $ GDP in PPP terms (MoEF, 2009). We have estimated the energy intensity based on national energy consumption and GDP as available from government data sources (MoC (2013), MoPNG (2013) and CMIE (2014)). (RBI, 2013) and are provided in Table 3.3
Table 3. 3 Some Economic Indicators for India (Constant Prices: 2004-05) (US$ Billion)
1990 1995 2000 2005 2010 2012 GDP at Market Prices : 333 426 573 793 1185 1288 GDP at Market Prices : (without Agriculture)
244 326 456 660 1025 1120
Agriculture and allied activities 89 100 117 133 160 169 Agriculture 75 84 98 113 136 144 Industry 62 85 108 146 224 233 Mining & Quarrying 10 13 16 19 24 24 Manufacturing 45 64 81 112 179 186 Electricity, Gas and Water Supply 6 9 12 15 21 23 Services 150 203 299 449 721 830 Construction 21 25 35 58 87 96 Trade, Hotel, Transport & Communication 53 77 113 182 301 343 Finance, Insurance, Real Estate & Business Services
35 51 74 110 190 231
Community, Social & Personal Services 40 50 77 99 142 160 Source: Adapted from RBI, 2013
Exchange Rate: 1 USD = 43.6875 INR (http://www.freecurrencyrates.com/exchange-rate-history/USD-INR/2005)
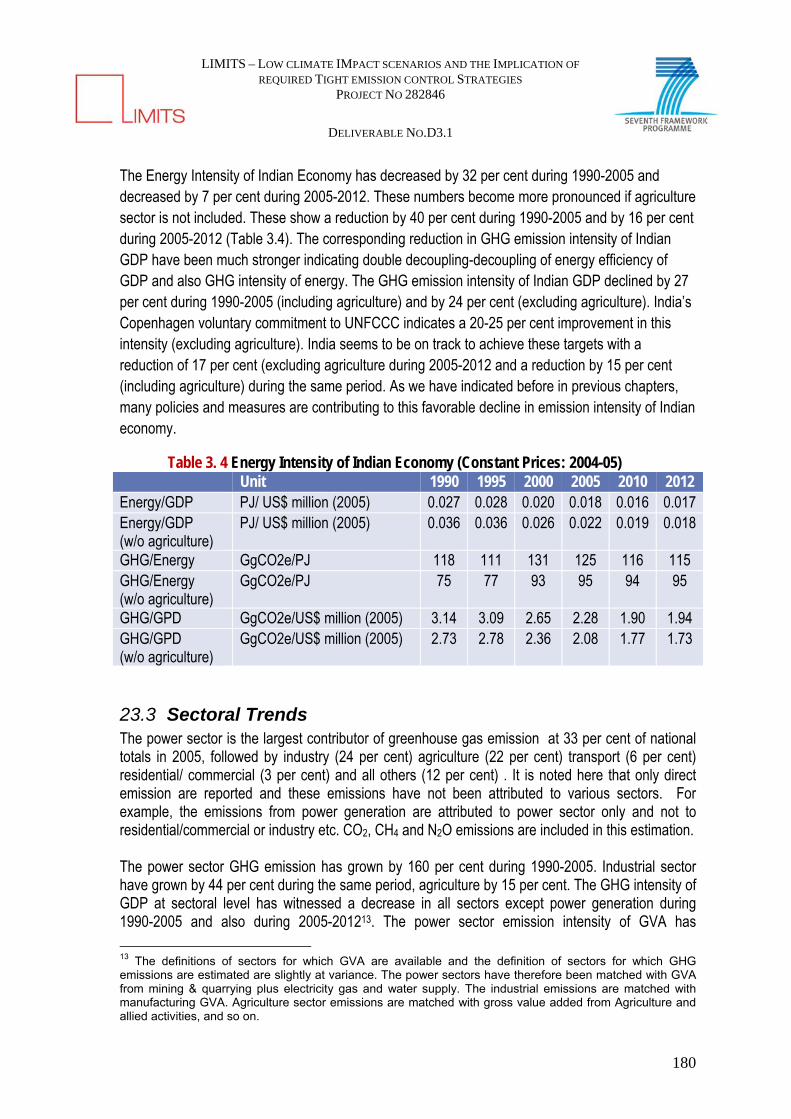
LIMITS – LOW CLIMATE IMPACT SCENARIOS AND THE IMPLICATION OF
REQUIRED TIGHT EMISSION CONTROL STRATEGIES PROJECT NO 282846
DELIVERABLE NO.D3.1
180
The Energy Intensity of Indian Economy has decreased by 32 per cent during 1990-2005 and decreased by 7 per cent during 2005-2012. These numbers become more pronounced if agriculture sector is not included. These show a reduction by 40 per cent during 1990-2005 and by 16 per cent during 2005-2012 (Table 3.4). The corresponding reduction in GHG emission intensity of Indian GDP have been much stronger indicating double decoupling-decoupling of energy efficiency of GDP and also GHG intensity of energy. The GHG emission intensity of Indian GDP declined by 27 per cent during 1990-2005 (including agriculture) and by 24 per cent (excluding agriculture). India’s Copenhagen voluntary commitment to UNFCCC indicates a 20-25 per cent improvement in this intensity (excluding agriculture). India seems to be on track to achieve these targets with a reduction of 17 per cent (excluding agriculture during 2005-2012 and a reduction by 15 per cent (including agriculture) during the same period. As we have indicated before in previous chapters, many policies and measures are contributing to this favorable decline in emission intensity of Indian economy.
Table 3. 4 Energy Intensity of Indian Economy (Constant Prices: 2004-05) Unit 1990 1995 2000 2005 2010 2012 Energy/GDP PJ/ US$ million (2005) 0.027 0.028 0.020 0.018 0.016 0.017 Energy/GDP (w/o agriculture)
PJ/ US$ million (2005) 0.036 0.036 0.026 0.022 0.019 0.018
GHG/Energy GgCO2e/PJ 118 111 131 125 116 115 GHG/Energy (w/o agriculture)
GgCO2e/PJ 75 77 93 95 94 95
GHG/GPD GgCO2e/US$ million (2005) 3.14 3.09 2.65 2.28 1.90 1.94 GHG/GPD (w/o agriculture)
GgCO2e/US$ million (2005) 2.73 2.78 2.36 2.08 1.77 1.73
23.3 Sectoral Trends The power sector is the largest contributor of greenhouse gas emission at 33 per cent of national totals in 2005, followed by industry (24 per cent) agriculture (22 per cent) transport (6 per cent) residential/ commercial (3 per cent) and all others (12 per cent) . It is noted here that only direct emission are reported and these emissions have not been attributed to various sectors. For example, the emissions from power generation are attributed to power sector only and not to residential/commercial or industry etc. CO2, CH4 and N2O emissions are included in this estimation. The power sector GHG emission has grown by 160 per cent during 1990-2005. Industrial sector have grown by 44 per cent during the same period, agriculture by 15 per cent. The GHG intensity of GDP at sectoral level has witnessed a decrease in all sectors except power generation during 1990-2005 and also during 2005-201213. The power sector emission intensity of GVA has
13 The definitions of sectors for which GVA are available and the definition of sectors for which GHG emissions are estimated are slightly at variance. The power sectors have therefore been matched with GVA from mining & quarrying plus electricity gas and water supply. The industrial emissions are matched with manufacturing GVA. Agriculture sector emissions are matched with gross value added from Agriculture and allied activities, and so on.

LIMITS – LOW CLIMATE IMPACT SCENARIOS AND THE IMPLICATION OF
REQUIRED TIGHT EMISSION CONTROL STRATEGIES PROJECT NO 282846
DELIVERABLE NO.D3.1
181
increased from 13.1 GgCO2e / US$ million in 1990 (2004-05 constant prices) to 17.6 GgCO2e / USD million in 2005, i.e. an increase by 25 per cent. This number has increased only slightly at 17.8 GgCO2e/USD million, i.e. an increase of 1 per cent during 2005-2012. Indian industry has shown a marked improvement in its GHG intensity of GVA – from 6.7 GgCO2e/US$ million (2004-05) in 1990 to 3.9 in 2005 to 3.4 in 2012 (Figure 3.2). The next chapter provides company level analysis of these trends. The transport sector has also shown a decline from 2.7 GgCO2e/US$ million in 1990 to 1 GgCO2e/US$ million in 2005 where it seems to have almost stabilized during 2005-2012. Agriculture sector has also shown considerable improvement from 4 GgCO2e/US$ million in 1990 to 3.1 GgCO2e/US$ million in 2005 and 2.4 GgCO2e/US$ million in 2012.
Figure 3. 2 Indian Emissions and GVA trend
23.4 State level trend and share India has 29 states and 7 union territories14 . The GDP intensity of the Indian State have been estimated using the Net State Domestic Product (NSDP) values (RBI, 2013) and the GHG emission values (Chapter 4). Most of the states, except the large states of Uttar Pradesh, Bihar, Madhya Pradesh and Rajasthan have shown a decline in their GHG intensity of their Net State Domestic Product (NSDP) over 1990-2005 (Figure 3.3 a and b). These four states, sometimes also termed as BiMaRU states, together account for almost 40 per cent of India’s population, 17 per cent of India’s GDP and around 33 per cent of national GHG emissions in 2005. These states have however
14 The state of Andhra Pradesh has split in two states of Telangana and Andhra Pradesh on June 02, 2014.
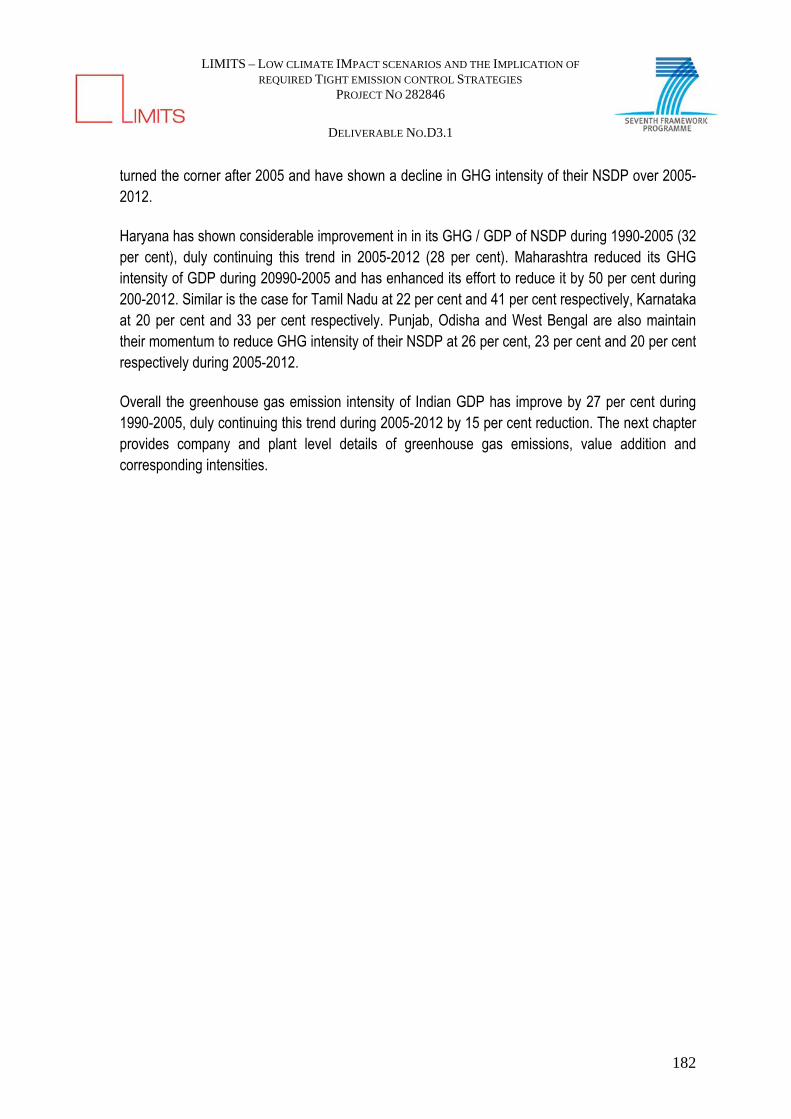
LIMITS – LOW CLIMATE IMPACT SCENARIOS AND THE IMPLICATION OF
REQUIRED TIGHT EMISSION CONTROL STRATEGIES PROJECT NO 282846
DELIVERABLE NO.D3.1
182
turned the corner after 2005 and have shown a decline in GHG intensity of their NSDP over 2005-2012. Haryana has shown considerable improvement in in its GHG / GDP of NSDP during 1990-2005 (32 per cent), duly continuing this trend in 2005-2012 (28 per cent). Maharashtra reduced its GHG intensity of GDP during 20990-2005 and has enhanced its effort to reduce it by 50 per cent during 200-2012. Similar is the case for Tamil Nadu at 22 per cent and 41 per cent respectively, Karnataka at 20 per cent and 33 per cent respectively. Punjab, Odisha and West Bengal are also maintain their momentum to reduce GHG intensity of their NSDP at 26 per cent, 23 per cent and 20 per cent respectively during 2005-2012. Overall the greenhouse gas emission intensity of Indian GDP has improve by 27 per cent during 1990-2005, duly continuing this trend during 2005-2012 by 15 per cent reduction. The next chapter provides company and plant level details of greenhouse gas emissions, value addition and corresponding intensities.

LIMITS – LOW CLIMATE IMPACT SCENARIOS AND THE IMPLICATION OF
REQUIRED TIGHT EMISSION CONTROL STRATEGIES PROJECT NO 282846
DELIVERABLE NO.D3.1
183
(a)
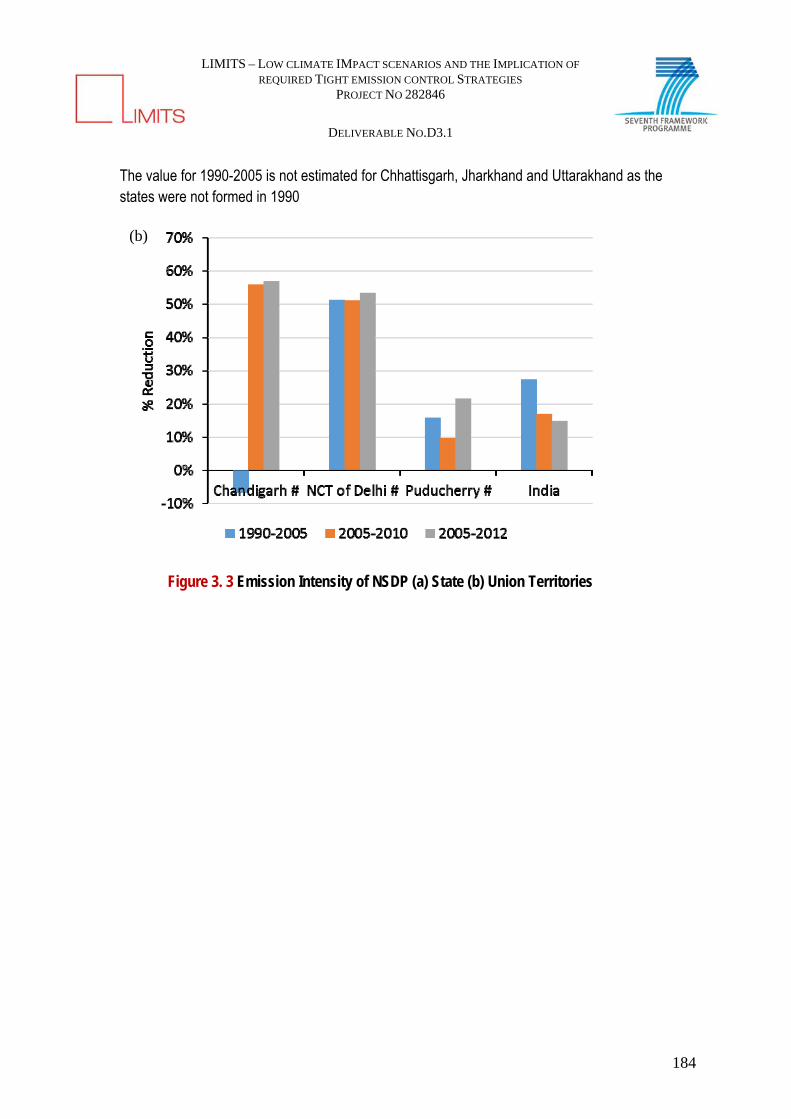
LIMITS – LOW CLIMATE IMPACT SCENARIOS AND THE IMPLICATION OF
REQUIRED TIGHT EMISSION CONTROL STRATEGIES PROJECT NO 282846
DELIVERABLE NO.D3.1
184
The value for 1990-2005 is not estimated for Chhattisgarh, Jharkhand and Uttarakhand as the states were not formed in 1990
Figure 3. 3 Emission Intensity of NSDP (a) State (b) Union Territories
(b)

LIMITS – LOW CLIMATE IMPACT SCENARIOS AND THE IMPLICATION OF
REQUIRED TIGHT EMISSION CONTROL STRATEGIES PROJECT NO 282846
DELIVERABLE NO.D3.1
185
24 COMPARING GLOBAL AND REGIONAL RESULTS
24.1 Comparing Model Drivers for India
Economic growth, demographic profile and rate and direction of technological change are recognized as the key driving forces behind the future GHG emission growth trajectories (IPCC, 2000). The assumptions related to the key scenario drivers considered in various models are mentioned below.
24.1.1 EconomicGrowthEconomic growth will be one of the key driving forces behind the future energy growth in the developing countries. Gross domestic product is used as a proxy for the economic growth. Indian GDP grew at a compounded average growth rate of 5.7 per cent during 1990-2000. The GDP growth rate increased to 7.7 per cent between 2000 and 2010. Although the Indian economy has slowed down in the last 5 years with an average GDP growth of 5.5 per cent mainly due to global economic recession, the future projections for GDP made by various modelling teams are around 6-8 per cent growth per year during 2010-2020(Figure 4.1, Table 4.1),. The GDP growth rate slows down towards the end of the modeling period (2050-2100).

LIMITS – LOW CLIMATE IMPACT SCENARIOS AND THE IMPLICATION OF
REQUIRED TIGHT EMISSION CONTROL STRATEGIES PROJECT NO 282846
DELIVERABLE NO.D3.1
186
Figure 4.1 Projected India’s GDP considered in various models Table 4.1 GDP growth assumptions in various models for baseline scenarios (per cent CAGR)
Model 2010-20 2020-30 2030-50 2050-2100 GCAM 5.4% 5.7% 4.7% 3.1% IMAGE 8.7% 5.3% 5.5% 3.3% MESSAGE 5.2% 5.0%-5.3% 5.2%-5.3% 2.3%-2.4% REMIND 8.8% 5.7% 4.8% 1.8%-2.0% TAIM-ECN 5.7% 5.9% 4.8% 2.9% WITCH 8.5%-8.7% 5.13%-5.6% 4.8% 1.8%-2.1% SLIMS 8.8% 5.7% 4.9%
24.1.2 PopulationIn 2011 India's total population was 1.21 billion as per National Census, (Census of India, 2011). According UN projections, India’s population will grow at the CAGR of 1.0 per cent between 2010 and 2030 and is likely to reach 1.5 billion by 2030. The population is projected to increase at least until 2065, saturate and then decline towards end of the 21st century. The various global models take this trend in their modelling exercises (Figure 4.2). However, the MESSAGE model considers India as South-Asian region and therefore the population projection are about 50 per cent higher than UN Indian population estimates. The urban share of total Indian population is 31 per cent
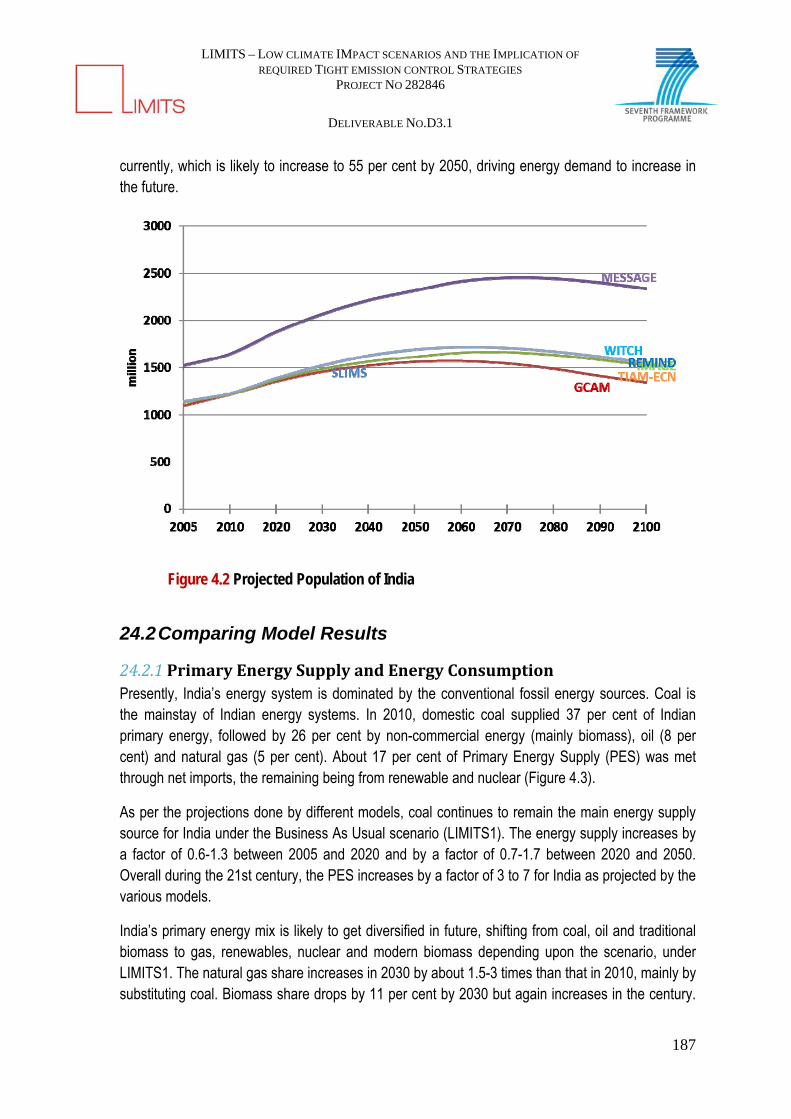
LIMITS – LOW CLIMATE IMPACT SCENARIOS AND THE IMPLICATION OF
REQUIRED TIGHT EMISSION CONTROL STRATEGIES PROJECT NO 282846
DELIVERABLE NO.D3.1
187
currently, which is likely to increase to 55 per cent by 2050, driving energy demand to increase in the future.
Figure 4.2 Projected Population of India
24.2 Comparing Model Results
24.2.1 PrimaryEnergySupplyandEnergyConsumptionPresently, India’s energy system is dominated by the conventional fossil energy sources. Coal is the mainstay of Indian energy systems. In 2010, domestic coal supplied 37 per cent of Indian primary energy, followed by 26 per cent by non-commercial energy (mainly biomass), oil (8 per cent) and natural gas (5 per cent). About 17 per cent of Primary Energy Supply (PES) was met through net imports, the remaining being from renewable and nuclear (Figure 4.3).
As per the projections done by different models, coal continues to remain the main energy supply source for India under the Business As Usual scenario (LIMITS1). The energy supply increases by a factor of 0.6-1.3 between 2005 and 2020 and by a factor of 0.7-1.7 between 2020 and 2050. Overall during the 21st century, the PES increases by a factor of 3 to 7 for India as projected by the various models.
India’s primary energy mix is likely to get diversified in future, shifting from coal, oil and traditional biomass to gas, renewables, nuclear and modern biomass depending upon the scenario, under LIMITS1. The natural gas share increases in 2030 by about 1.5-3 times than that in 2010, mainly by substituting coal. Biomass share drops by 11 per cent by 2030 but again increases in the century.

LIMITS – LOW CLIMATE IMPACT SCENARIOS AND THE IMPLICATION OF
REQUIRED TIGHT EMISSION CONTROL STRATEGIES PROJECT NO 282846
DELIVERABLE NO.D3.1
188
However, this increase is due to modern bioenergy as against traditional biomass energy, dominant until 2020. The share of large hydro in power generation reduces from 22 per cent in 2010 to 20 per cent in 2020 to around 15 per cent by 2050. It is worth mentioning here that the recent Land Acquisition Act (2013) in India has almost made it impossible to build large hydroelectricity projects. Some models have however projected a higher share from large hydro plants which is about 11-21 per cent of total primary energy.
Under a carbon constrained world. E.g., LIMITS2, LIMITS4 and LIMITS6, nuclear and modern biomass penetrate mainly replacing coal based power. Natural Gas based plants also kick-in due to lower carbon content of gas than coal, and also its ability to provide power during peak hours. The SLIMS numbers are generally higher for no and low carbon technologies in 2050 than various other modelling teams.

LIMITS – LOW CLIMATE IMPACT SCENARIOS AND THE IMPLICATION OF
REQUIRED TIGHT EMISSION CONTROL STRATEGIES PROJECT NO 282846
DELIVERABLE NO.D3.1
189
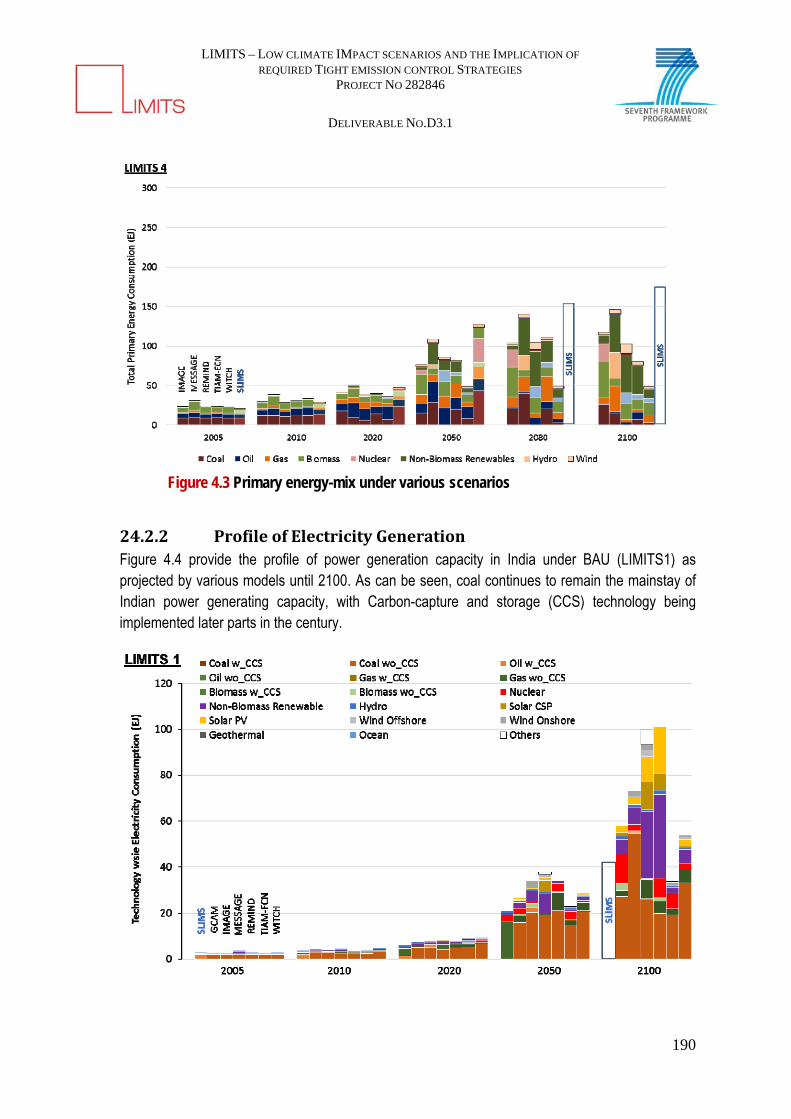
LIMITS – LOW CLIMATE IMPACT SCENARIOS AND THE IMPLICATION OF
REQUIRED TIGHT EMISSION CONTROL STRATEGIES PROJECT NO 282846
DELIVERABLE NO.D3.1
190
Figure 4.3 Primary energy-mix under various scenarios
24.2.2 ProfileofElectricityGenerationFigure 4.4 provide the profile of power generation capacity in India under BAU (LIMITS1) as projected by various models until 2100. As can be seen, coal continues to remain the mainstay of Indian power generating capacity, with Carbon-capture and storage (CCS) technology being implemented later parts in the century.

LIMITS – LOW CLIMATE IMPACT SCENARIOS AND THE IMPLICATION OF
REQUIRED TIGHT EMISSION CONTROL STRATEGIES PROJECT NO 282846
DELIVERABLE NO.D3.1
191
Figure 5.4 Fuel wise Power Generation in India (BAU)
Under a more restrictive scenario (e.g. LIMITS6), some models project more pronounced use of non-biomass renewable technologies and nuclear power beyond 2050. Non-biomass renewable would mainly include wind and solar technologies. Higher penetration would require reengineering of early wind farms so as to enhance their generation capacity as well as off-shore wind farms. Higher penetration of solar power would require roof-top solar, grid responsive buildings and micro-solar technologies to penetrate.
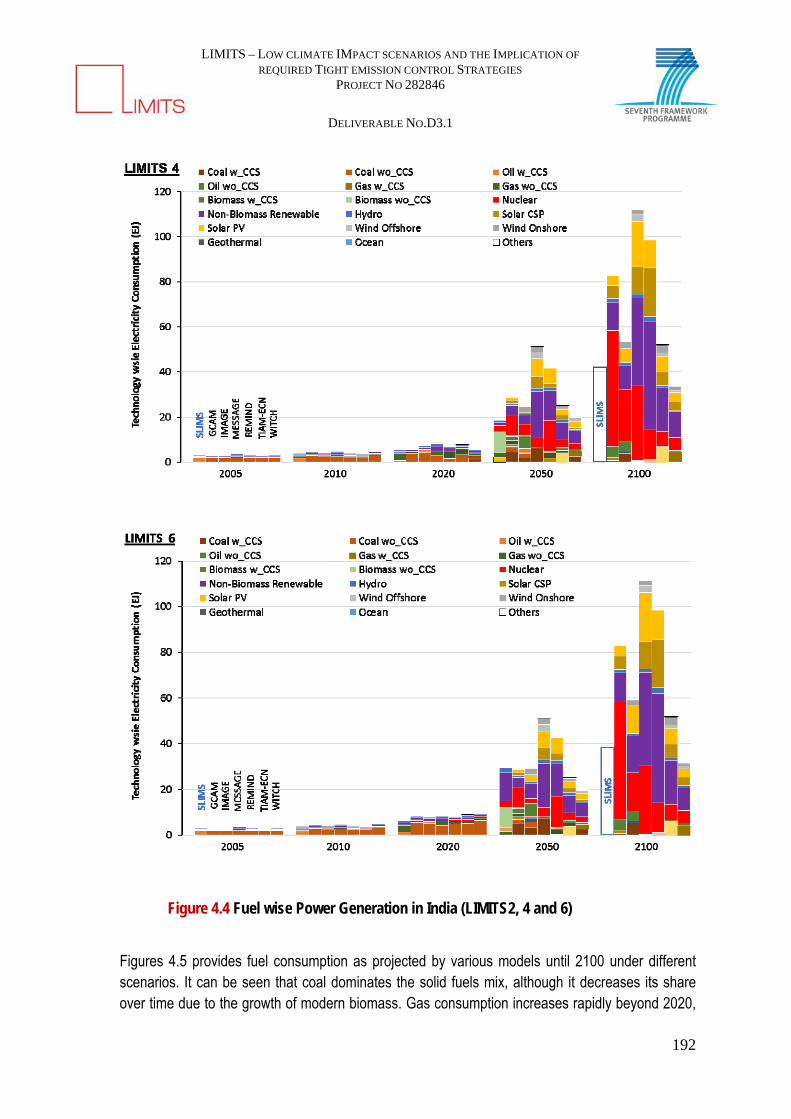
LIMITS – LOW CLIMATE IMPACT SCENARIOS AND THE IMPLICATION OF
REQUIRED TIGHT EMISSION CONTROL STRATEGIES PROJECT NO 282846
DELIVERABLE NO.D3.1
192
Figure 4.4 Fuel wise Power Generation in India (LIMITS2, 4 and 6)
Figures 4.5 provides fuel consumption as projected by various models until 2100 under different scenarios. It can be seen that coal dominates the solid fuels mix, although it decreases its share over time due to the growth of modern biomass. Gas consumption increases rapidly beyond 2020,
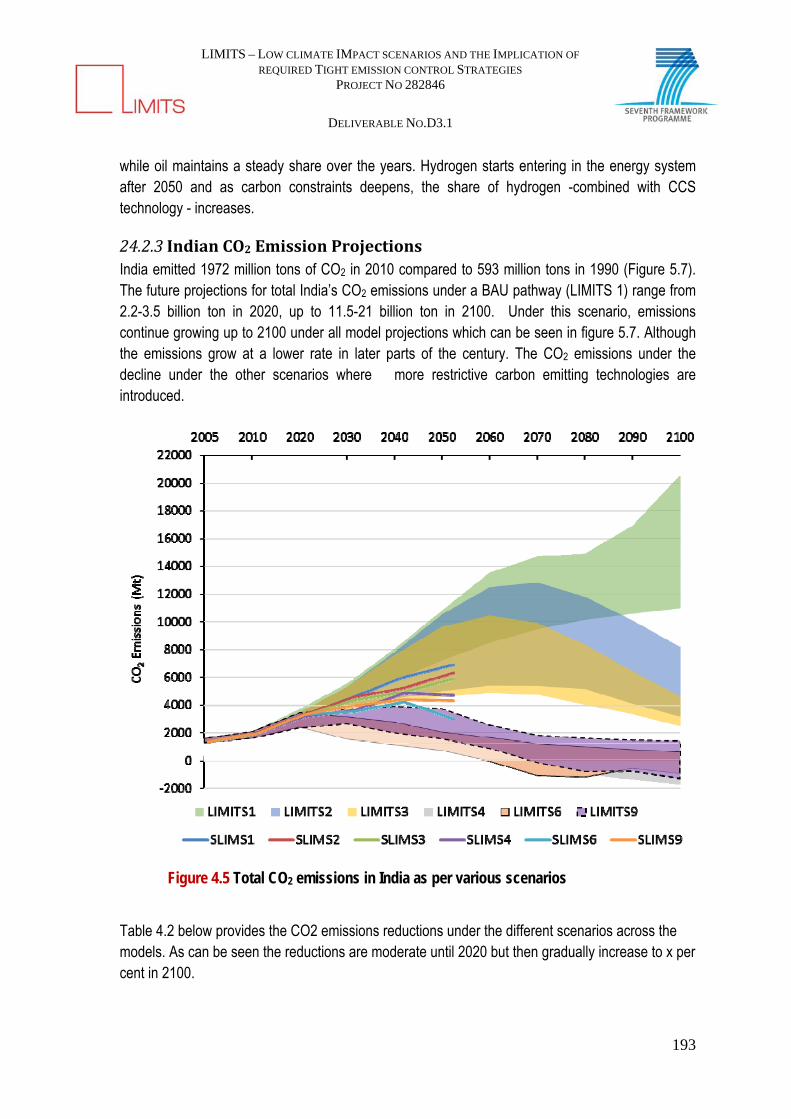
LIMITS – LOW CLIMATE IMPACT SCENARIOS AND THE IMPLICATION OF
REQUIRED TIGHT EMISSION CONTROL STRATEGIES PROJECT NO 282846
DELIVERABLE NO.D3.1
193
while oil maintains a steady share over the years. Hydrogen starts entering in the energy system after 2050 and as carbon constraints deepens, the share of hydrogen -combined with CCS technology - increases.
24.2.3 IndianCO2EmissionProjectionsIndia emitted 1972 million tons of CO2 in 2010 compared to 593 million tons in 1990 (Figure 5.7). The future projections for total India’s CO2 emissions under a BAU pathway (LIMITS 1) range from 2.2-3.5 billion ton in 2020, up to 11.5-21 billion ton in 2100. Under this scenario, emissions continue growing up to 2100 under all model projections which can be seen in figure 5.7. Although the emissions grow at a lower rate in later parts of the century. The CO2 emissions under the decline under the other scenarios where more restrictive carbon emitting technologies are introduced.
Figure 4.5 Total CO2 emissions in India as per various scenarios
Table 4.2 below provides the CO2 emissions reductions under the different scenarios across the models. As can be seen the reductions are moderate until 2020 but then gradually increase to x per cent in 2100.

LIMITS – LOW CLIMATE IMPACT SCENARIOS AND THE IMPLICATION OF
REQUIRED TIGHT EMISSION CONTROL STRATEGIES PROJECT NO 282846
DELIVERABLE NO.D3.1
194
Table 4.2 Total Emission Reductions and Sectoral Emission Reductions All values in per cent
2020 2050 2100 Max Min SLIMS Max Min SLIMS Max Min SLIMS
LIMITS2 8 -2 -2 32 3 8 78 60 - LIMITS3 7 -1 1 38 11 15 84 67 - LIMITS4 50 4 4 91 32 32 111 96 - LIMITS6 8 -1 0 90 58 58 107 97 - LIMITS9 7 -1 0 80 38 38 108 97 -
24.2.3.1 Peaking of Indian CO2 Emissions
As already indicated, under BAU scenario, there is no incidence of emission peaking by 2100 under any model projections. The emissions continue to rise although at a lower rate in later parts of the century. Under LIMITS2 scenario India’s GHG emissions generally peak between 2060 and 2080. The peaking range is between 5.4-13 BT per year.
Under a more strict carbon regime (LIMITS3) the emissions peaking happens almost a decade earlier and the peaking range reduces to 4.8-10.4 BT CO2 per year. Under LIMITS4 scenario, peaking would occur during 2040-2050 at around 3.5 BT per year. In LIMITS6, the most stringent scenario, the peaking occurs around 2020 and then CO2 emissions decline continuously thereafter. Huge investment in renewable technologies and carbon sequestration technologies is required in order to avoid emission peaking in 2020. As per some models like REMIND and TIAM-ECN, total required investment up to 2100 in the renewables technologies is in the range of 2.2-2.6 trillion US dollar. On the other hand, results from other models like MESSAGE and IMAGE where huge investment in renewables technologies is not considered, indicate substantial investment in nuclear and CCS technologies could also result in bringing down the total CO2 emissions required for early emission peaking. Some models (IMAGE, TIAM-ECN, GCAM, REMIND) project that India would have a net negative emissions from 2060 onwards under LIMITS6 scenario. However, other models such as MESSAGE maintain that Indian emission would never become negative by even 2100.
India is an emerging economy with considerable development still to take place. Issues like food security, poverty eradication and affordable clean energy access are high on the policy agenda. Exclusive climate centric vision with significant investments in the expensive low carbon technologies like CCS could hamper meeting these targets. India needs to therefore adopt inclusive low carbon development approach involving measures like dematerialization, integrated mobility plan, significant improvements in the end-use efficiency, energy plantation, and increased share of renewable technologies. From the below table, it can be observed that high carbon price would stimulate the investment in the CCS and renewables technologies required to achieve 2020 emission peaking. To achieve peaking of India’s CO2 emissions by 2020, a minimum carbon tax of

LIMITS – LOW CLIMATE IMPACT SCENARIOS AND THE IMPLICATION OF
REQUIRED TIGHT EMISSION CONTROL STRATEGIES PROJECT NO 282846
DELIVERABLE NO.D3.1
195
$200 per ton CO2e in 2050 is needed to be imposed from 2050 onwards, along with expedited phasing out of at least half of coal based energy infrastructure in next ten years. Although coal based power plants may continue to be built in later years, but all have to operate CO2 capture and storage facility.
Table 4.3 CO2 peaking scenarios in India as per SLIMS model CO2 emission Peaking Year
2020 2030 2035 2040 2045
C-tax in 2020 ($ per ton CO2, 2004-05 prices)
46 66 7 2 4
C-tax in 2050 ($ per ton CO2, 2004-05 prices)
200 149 123 98 76
CO2 Emissions (BT) In 2020 2.45 2.96 3.11 3.20 3.19 In 2050 1.67 1.9 1.88 2.88 4.20 CO2/per capita (tons/year) In 2020 1.81 2.18 2.3 2.37 2.36 In 2050 1.03 1.17 1.16 1.78 2.6 Electricity generated/capita (kWh/capita/year) In 2020 1704 1701 1703 1703 1704 In 2050 4508 4510 4498 4329 4319 Peak CO2 (BT in peaking year)
2.45 3.13 3.52 4.13 4.49
CO2/GDP (Tons/1000US$) In 2020 0.62 0 .75 0.79 0.81 0.81 In 2050 0.05 0 .05 0.05 0.09 0.13 CO2/Energy(MT/EJ) In 2020 50.04 62.22 65.05 65.78 65.56 In 2050 11.90 13.57 13.56 22.57 34.12 Coal Based Power (GW) In 2020 207 223 274 277 273 In 2050 502 556 600 672 746
24.2.3.2 Sectoral CO2 Emissions
The power sector is projected to contribute with more than 60 per cent of the total CO2 emissions under the BAU scenario until 2100 according to all models. (Figure 4.7) However, the AIM end-use model results indicate that industrial emissions from 2020 onwards will be larger than those from the power sector. Transport contribution remains in the range of 8 per cent to 15 per cent throughout the modeling period. CO2 emissions from residential and commercial sectors also remains in the range 5-6 per cent over time. This situation would change if power sector emissions are apportioned to various sectors. The residential and commercial sector would then account for about 25 per cent of Indian emissions which would increase to 35 per cent by 2100.

LIMITS – LOW CLIMATE IMPACT SCENARIOS AND THE IMPLICATION OF
REQUIRED TIGHT EMISSION CONTROL STRATEGIES PROJECT NO 282846
DELIVERABLE NO.D3.1
196
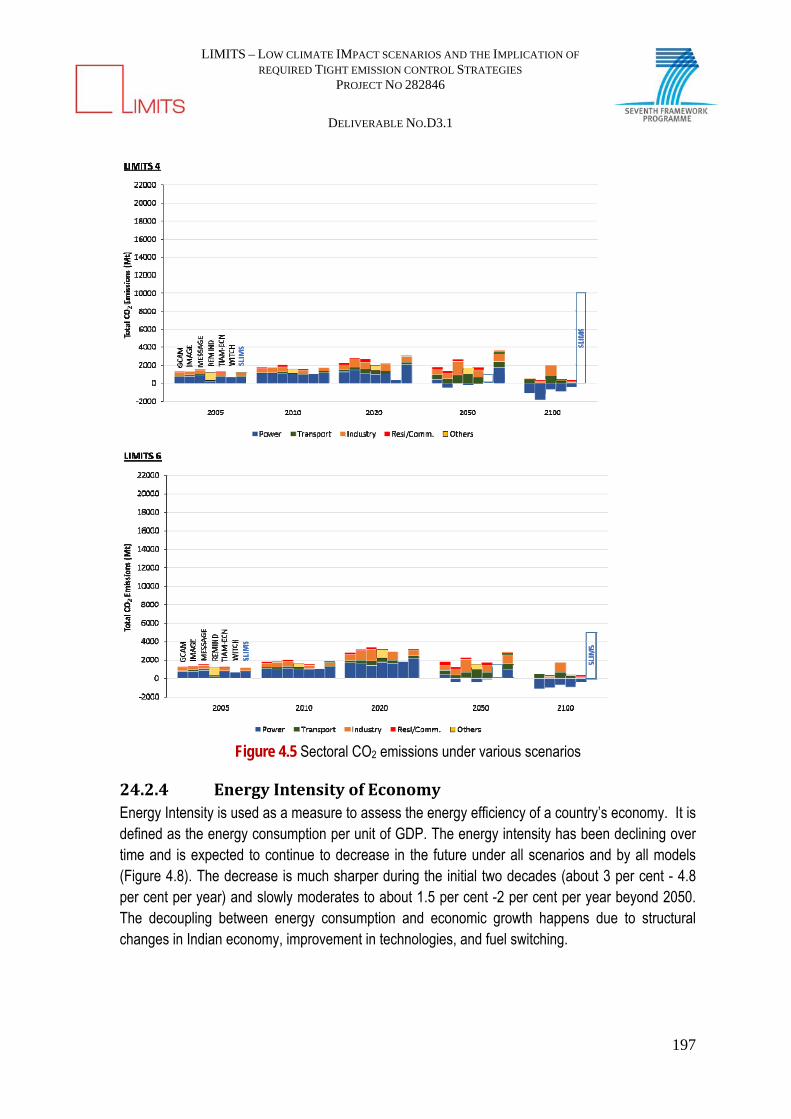
LIMITS – LOW CLIMATE IMPACT SCENARIOS AND THE IMPLICATION OF
REQUIRED TIGHT EMISSION CONTROL STRATEGIES PROJECT NO 282846
DELIVERABLE NO.D3.1
197
Figure 4.5 Sectoral CO2 emissions under various scenarios
24.2.4 EnergyIntensityofEconomyEnergy Intensity is used as a measure to assess the energy efficiency of a country’s economy. It is defined as the energy consumption per unit of GDP. The energy intensity has been declining over time and is expected to continue to decrease in the future under all scenarios and by all models (Figure 4.8). The decrease is much sharper during the initial two decades (about 3 per cent - 4.8 per cent per year) and slowly moderates to about 1.5 per cent -2 per cent per year beyond 2050. The decoupling between energy consumption and economic growth happens due to structural changes in Indian economy, improvement in technologies, and fuel switching.

LIMITS – LOW CLIMATE IMPACT SCENARIOS AND THE IMPLICATION OF
REQUIRED TIGHT EMISSION CONTROL STRATEGIES PROJECT NO 282846
DELIVERABLE NO.D3.1
198
Figure 4.6 India’s Energy intensity under various scenarios
24.2.5 CarbonIntensityofEnergyThe Indian energy system is carbon intensive due to dominance of coal in the primary fuel mix. Currently, India’s average carbon footprint of one unit of power generated is 0.82 tCO2/MWh which is relatively higher compared to current emission intensity level of different regions in the world (i.e. OCED Europe-0.33 tonCO2/MWh which is natural gas dominated and OCED North America 0.513 tonCO2/MWh). The various models project this to rise until 2050 and then start declining gradually under the BAU scenario (LIMITS 1). Under stringent climate change scenario (LIMITS 4, LIMITS 6 and LIMITS 9), the decoupling between energy and CO2 emissions happens much earlier and much sharply. For instance, under the 450 scenario (LIMITS 4), the CO2 intensity of energy reduces around 47 per cent by the year 2050 and by another 40 per cent by the end of the century. In fact some models project the energy sector to become CO2 positive by 2060 (IMAGE Model, TIAM-ECM, and GCAM) and by 2080 (REMIND). Due to the use of negative emission technologies (Bioenergy with CCS). Under the 450 scenario, TIAM-ECM and GCAM project this to happen around Under the LIMITS6 scenario, negative emissions is projected to happen at least a decade earlier.

LIMITS – LOW CLIMATE IMPACT SCENARIOS AND THE IMPLICATION OF
REQUIRED TIGHT EMISSION CONTROL STRATEGIES PROJECT NO 282846
DELIVERABLE NO.D3.1
199
Figure 4.7 India’s CO2 per Energy under various scenarios
24.2.6 ElectricityPerCapitaThe access and affordability of electricity is among the lowest in India as compared to other emerging economies and definitely when compared to industrialized countries. In 2010, about 400 million Indians didn’t have access to electricity (WEO, 2012) and the average per capita power consumption was 641 kWh/yr. for those who had access to power. This is abysmally low in comparison with China (2944 kWh/capita/yr.) with 98 per cent coverage in 2010, Brazil 2381 kWh/capita/yr. with 95 per cent coverage and South Africa (4571 kWh/capita/yr.) with 90 per cent coverage (World Bank, 2013). Various models project India’s electricity per capita to be in the range of 1000-2000 kWh/captia/yr. under various scenarios with a mean of 1200 and a median of 1500 kwh/capita/yr. Figure 4.10 shows the country wise range of per capita electricity consumption as projected by various models.

LIMITS – LOW CLIMATE IMPACT SCENARIOS AND THE IMPLICATION OF
REQUIRED TIGHT EMISSION CONTROL STRATEGIES PROJECT NO 282846
DELIVERABLE NO.D3.1
200
Chi
naU
SA
EU
Japa
nW
orld
Chi
naU
SA
EU
Japa
nW
orld
Chi
naU
SA
EU
Japa
nW
orld
Chi
naU
SA
EU
Japa
nW
orld
Chi
naU
SA
EU
Japa
nW
orld
Chi
naU
SA
EU
Japa
nW
orld
Ind
ia
Ind
ia
Ind
ia
Ind
ia
Ind
ia
Ind
ia
2005 2010 2020 2030 2050 2100
0
5000
10000
15000
20000
25000
30000
35000
40000
kWh/
capi
ta/y
ear
Figure 4.8 Projected Electricity per capita
24.2.7 CO2perCapitaIndia was the fourth largest CO2 emitter in the world in 2010 but due to its large population, India’s per capita CO2 emissions were much lower than the world average. Projected CO2 emissions per capita remain below the global average until 2050 in all scenarios and all models except in LIMITS6 scenario of MESSAGE and REMIND and LIMITS4 scenario of MESSAGE. Due to variable penetration among models of bioenergy with CCS after 2050, strong penetration of renewable energy and a stabilization in the Indian population growth, almost all models project that by 2100 Indian per capita CO2 emissions to decline in compared with current levels.
Indi
a
Chi
na
US
A
EU
Ja
pan
Wor
ld
Indi
a
Chi
na
US
A
EU
Ja
pan
Wor
ld
Indi
a
Chi
na
US
A
EU
Ja
pan
Wor
ld
Indi
a
Chi
na
US
A
EU
Ja
pan
Wor
ld
Indi
a
Chi
na
US
A
EU
Ja
pan
Wor
ld
Indi
a
Chi
na
US
A
EU
Ja
pan
Wor
ld
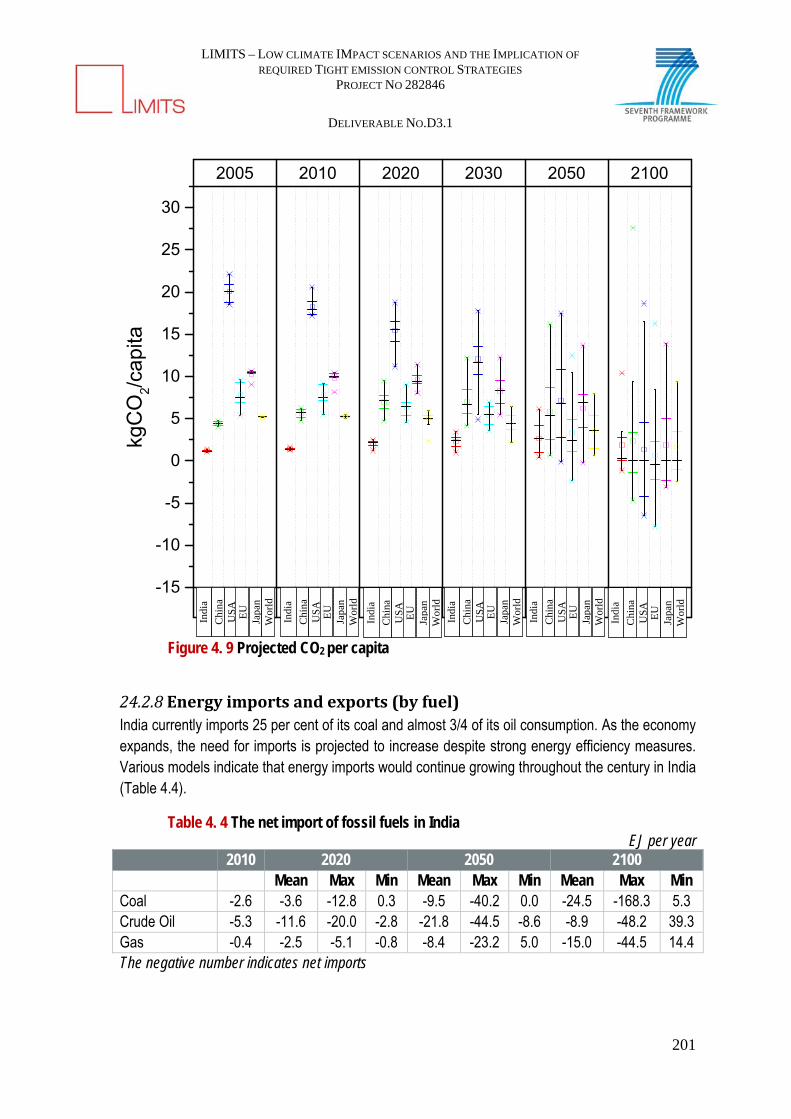
LIMITS – LOW CLIMATE IMPACT SCENARIOS AND THE IMPLICATION OF
REQUIRED TIGHT EMISSION CONTROL STRATEGIES PROJECT NO 282846
DELIVERABLE NO.D3.1
201
Ch
ina
US
AE
UJa
pan
Wor
ld
Ch
ina
US
AE
UJa
pan
Wor
ld
Ch
ina
US
AE
UJa
pan
Wor
ld
Ch
ina
US
AE
UJa
pan
Wor
ld
Ch
ina
US
AE
UJa
pan
Wor
ld
Ch
ina
US
AE
UJa
pan
Wor
ld
Ind
ia
Ind
ia
Ind
ia
Ind
ia
Ind
ia
Ind
ia
2005 2010 2020 2030 2050 2100
-15
-10
-5
0
5
10
15
20
25
30
kgC
O2/
capi
ta
Figure 4. 9 Projected CO2 per capita
24.2.8 Energyimportsandexports(byfuel)India currently imports 25 per cent of its coal and almost 3/4 of its oil consumption. As the economy expands, the need for imports is projected to increase despite strong energy efficiency measures. Various models indicate that energy imports would continue growing throughout the century in India (Table 4.4).
Table 4. 4 The net import of fossil fuels in India EJ per year
2010 2020 2050 2100 Mean Max Min Mean Max Min Mean Max Min Coal -2.6 -3.6 -12.8 0.3 -9.5 -40.2 0.0 -24.5 -168.3 5.3 Crude Oil -5.3 -11.6 -20.0 -2.8 -21.8 -44.5 -8.6 -8.9 -48.2 39.3 Gas -0.4 -2.5 -5.1 -0.8 -8.4 -23.2 5.0 -15.0 -44.5 14.4 The negative number indicates net imports
Indi
a
Chi
na
US
A
EU
Ja
pan
Wor
ld
Indi
a
Chi
na
US
A
EU
Ja
pan
Wor
ld
Indi
a
Chi
na
US
A
EU
Ja
pan
Wor
ld
Indi
a
Chi
na
US
A
EU
Ja
pan
Wor
ld
Indi
a
Chi
na
US
A
EU
Ja
pan
Wor
ld
Indi
a
Chi
na
US
A
EU
Ja
pan
Wor
ld
LIMITS – LOW CLIMATE IMPACT SCENARIOS AND THE IMPLICATION OF
REQUIRED TIGHT EMISSION CONTROL STRATEGIES PROJECT NO 282846
DELIVERABLE NO.D3.1
202
24.2.9 NonCO2Emissions(CH4,N2O,F‐GASES)In 2012 Indian methane (CH4) emissions and nitrous oxide (N2O) emissions - contributed with 18 per cent and 4 per cent respectively to greenhouse gas (GHG) emissions.
The future CH4 and N2O emissions and mitigation potential are analyzed for a reference scenario and CH4 for a mitigation scenario.
24.2.9.1 CH4 Emissions
Under the LIMITS1 scenario the emissions increase from about 21 Tg of CH4 in 2012 to about 25 Tg in 2030. The agriculture sector contributes more than 65 per cent of Indian methane emissions. The major sectors that contribute to increases in emissions over the base case are the coal-mining sector, livestock and municipal solid waste (MSW).
Coal bed methane emissions are projected to increase gradually over the years. Initially, the increase is due to the rising level of production mainly from opencast mines, while in later years it is from higher coal production from underground mines as opencast coalmines get exhausted. The present economic coal reserves in India are estimated at 76 billion tons, capable of supplying coal for over 100 years at expected demand levels (CMIE Energy, 2012). The higher growth in the economy leads to greater demand for coal especially in the power sector.
Almost 90 per cent of methane produced from livestock is from enteric fermentation. Following recent trends, the cattle population in the reference scenario is expected to be reduced in many Indian states. However, in cattle sub-categories, there is an increase in crossbred dairy cattle numbers while indigenous cattle population are being reduced. The crossbred dairy cattle have higher per head methane emissions as compared to indigenous cattle. Therefore the LIMITS1 trends indicate a marginal increase in methane emissions from enteric fermentation in India even though the livestock population is expected to be decreased.

LIMITS – LOW CLIMATE IMPACT SCENARIOS AND THE IMPLICATION OF
REQUIRED TIGHT EMISSION CONTROL STRATEGIES PROJECT NO 282846
DELIVERABLE NO.D3.1
203

LIMITS – LOW CLIMATE IMPACT SCENARIOS AND THE IMPLICATION OF
REQUIRED TIGHT EMISSION CONTROL STRATEGIES PROJECT NO 282846
DELIVERABLE NO.D3.1
204
Figure 4. 10 Methane Emissions in India as projected by various models
24.2.9.2 N2O Emissions
Agriculture sector activities account for more than 90 per cent of the total N2O emissions presently, mainly due to the use of synthetic fertilizers but also from field burning of agriculture residues,
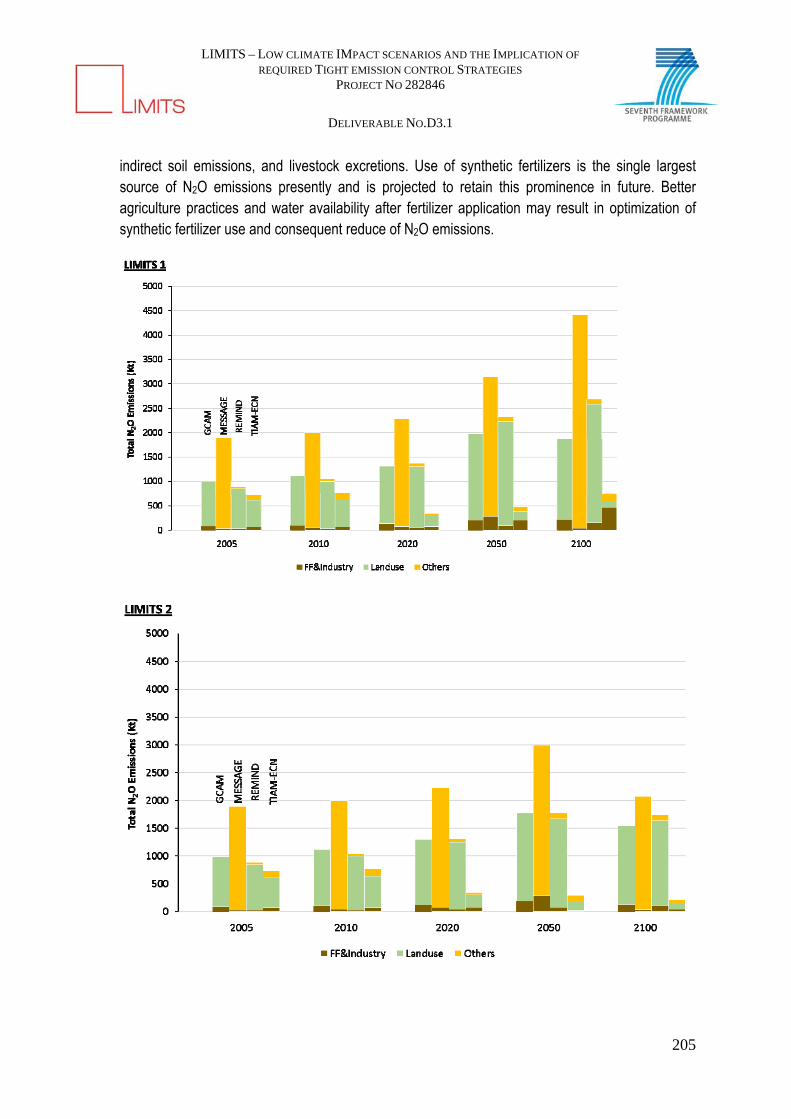
LIMITS – LOW CLIMATE IMPACT SCENARIOS AND THE IMPLICATION OF
REQUIRED TIGHT EMISSION CONTROL STRATEGIES PROJECT NO 282846
DELIVERABLE NO.D3.1
205
indirect soil emissions, and livestock excretions. Use of synthetic fertilizers is the single largest source of N2O emissions presently and is projected to retain this prominence in future. Better agriculture practices and water availability after fertilizer application may result in optimization of synthetic fertilizer use and consequent reduce of N2O emissions.

LIMITS – LOW CLIMATE IMPACT SCENARIOS AND THE IMPLICATION OF
REQUIRED TIGHT EMISSION CONTROL STRATEGIES PROJECT NO 282846
DELIVERABLE NO.D3.1
206
Figure 4. 11 N2O Emissions in India as projected by various models
24.2.9.3 Sector level emissions of SO2
Indian SO2 emissions are mostly contributed from coal combustion and follow almost a similar trend as those of CO2 emissions (Figure 4.14). Indian coal is low in sulphur content and therefore even with an increasing coal consumption, the SO2 emissions are not very high. Further policies on cleaning the local air have a bearing on reducing SO2 emissions earlier than GHG emissions. This indicates a disjoint in local and greenhouse gas pollution likelihood in India.

LIMITS – LOW CLIMATE IMPACT SCENARIOS AND THE IMPLICATION OF
REQUIRED TIGHT EMISSION CONTROL STRATEGIES PROJECT NO 282846
DELIVERABLE NO.D3.1
207

LIMITS – LOW CLIMATE IMPACT SCENARIOS AND THE IMPLICATION OF
REQUIRED TIGHT EMISSION CONTROL STRATEGIES PROJECT NO 282846
DELIVERABLE NO.D3.1
208
Figure 4. 12 SO2 Emissions in India as projected by various models
24.2.9.4 Sector level emissions of NOx
NOx emissions are mostly driven by road transport and by industry. Currently India does not have any specifications for industrial NOx emissions and mostly uncontrolled combustion takes place. In future NOx emissions from road transport are projected to increase (Figure 4.15).
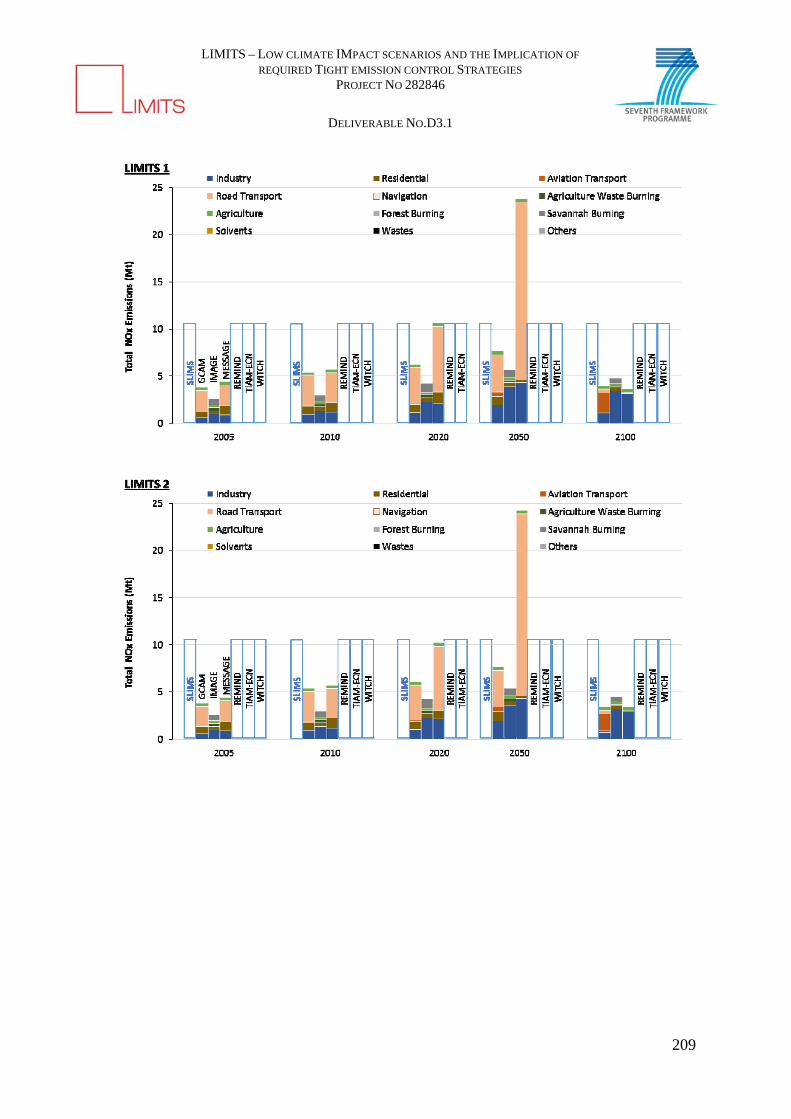
LIMITS – LOW CLIMATE IMPACT SCENARIOS AND THE IMPLICATION OF
REQUIRED TIGHT EMISSION CONTROL STRATEGIES PROJECT NO 282846
DELIVERABLE NO.D3.1
209
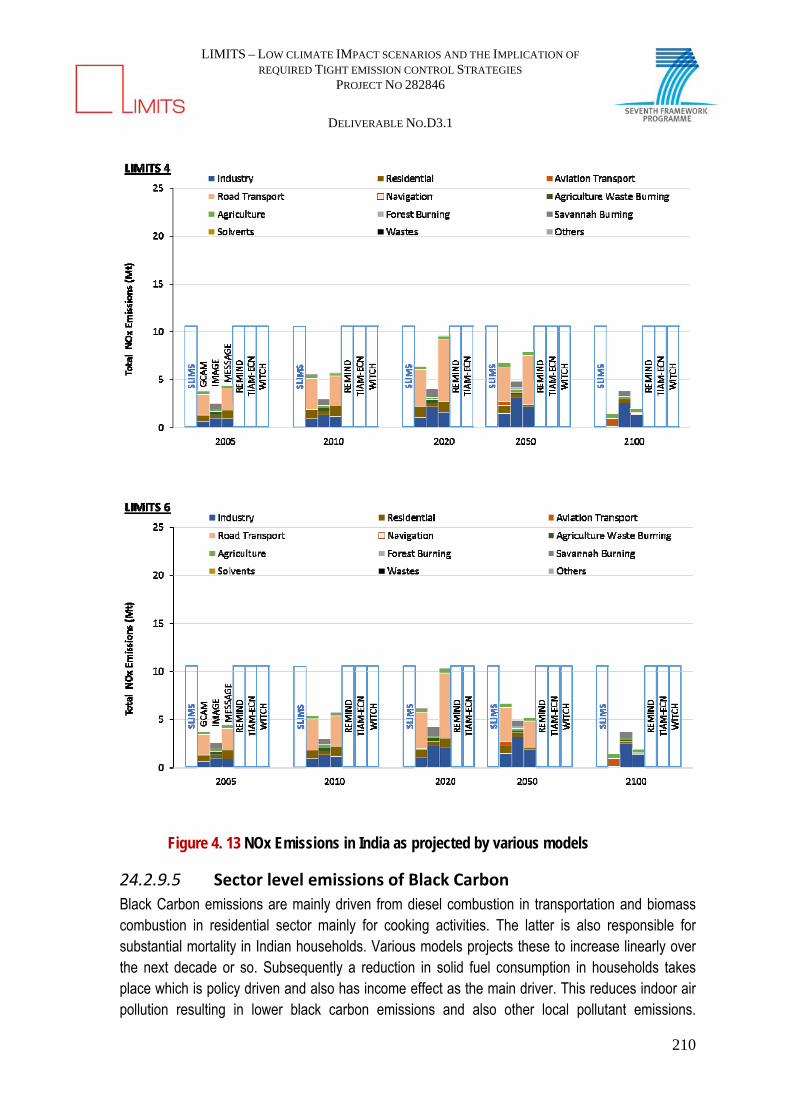
LIMITS – LOW CLIMATE IMPACT SCENARIOS AND THE IMPLICATION OF
REQUIRED TIGHT EMISSION CONTROL STRATEGIES PROJECT NO 282846
DELIVERABLE NO.D3.1
210
Figure 4. 13 NOx Emissions in India as projected by various models
24.2.9.5 Sector level emissions of Black Carbon
Black Carbon emissions are mainly driven from diesel combustion in transportation and biomass combustion in residential sector mainly for cooking activities. The latter is also responsible for substantial mortality in Indian households. Various models projects these to increase linearly over the next decade or so. Subsequently a reduction in solid fuel consumption in households takes place which is policy driven and also has income effect as the main driver. This reduces indoor air pollution resulting in lower black carbon emissions and also other local pollutant emissions.
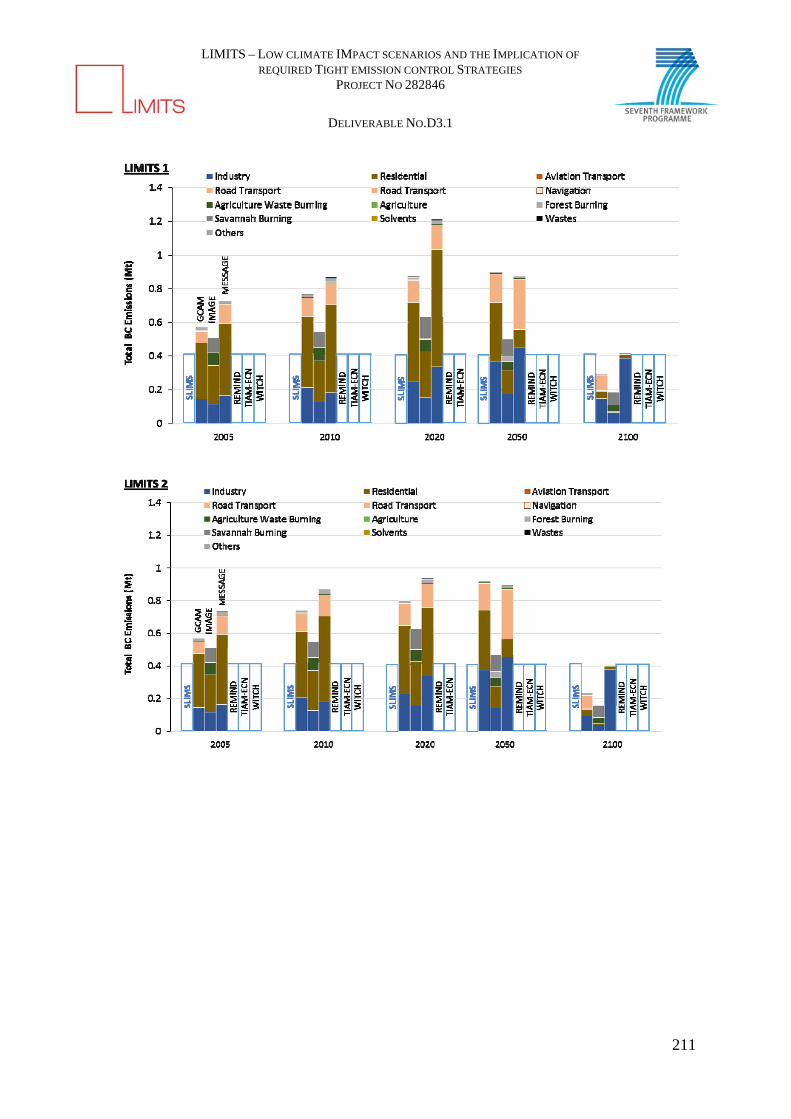
LIMITS – LOW CLIMATE IMPACT SCENARIOS AND THE IMPLICATION OF
REQUIRED TIGHT EMISSION CONTROL STRATEGIES PROJECT NO 282846
DELIVERABLE NO.D3.1
211
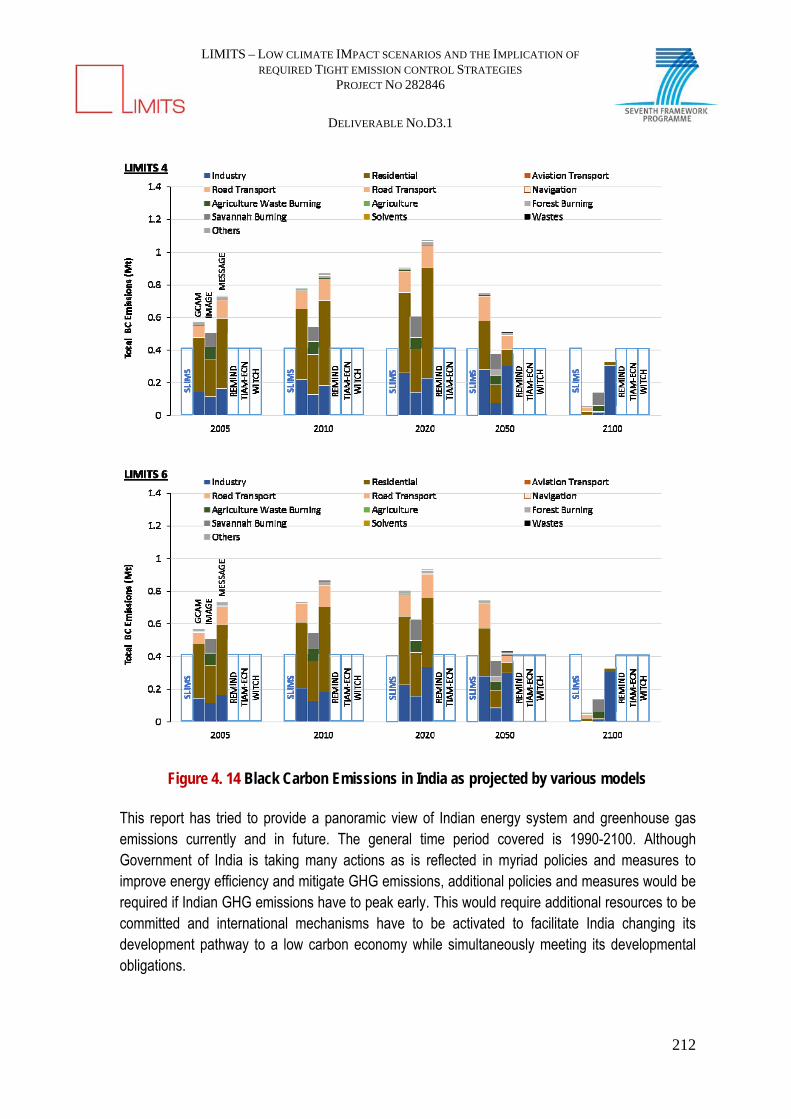
LIMITS – LOW CLIMATE IMPACT SCENARIOS AND THE IMPLICATION OF
REQUIRED TIGHT EMISSION CONTROL STRATEGIES PROJECT NO 282846
DELIVERABLE NO.D3.1
212
Figure 4. 14 Black Carbon Emissions in India as projected by various models
This report has tried to provide a panoramic view of Indian energy system and greenhouse gas emissions currently and in future. The general time period covered is 1990-2100. Although Government of India is taking many actions as is reflected in myriad policies and measures to improve energy efficiency and mitigate GHG emissions, additional policies and measures would be required if Indian GHG emissions have to peak early. This would require additional resources to be committed and international mechanisms have to be activated to facilitate India changing its development pathway to a low carbon economy while simultaneously meeting its developmental obligations.

LIMITS – LOW CLIMATE IMPACT SCENARIOS AND THE IMPLICATION OF
REQUIRED TIGHT EMISSION CONTROL STRATEGIES PROJECT NO 282846
DELIVERABLE NO.D3.1
213
25 CONCLUSIONS AND POLICY INSIGHTS
This report attempted to understand the progress made by India to adhere to the Copenhagen climate change commitments. As part of the Copenhagen commitment India aims a 20-25% reduction in GHG intensity of economy during 2005 - 2020. In doing so, it comprehensively mapped policies and measures across sectors – both at the national and sub-national levels. Furthermore, the future implications of these policies, as well as those of alternate development pathways were studied through scenario building and integrated modelling exercises. Here we highlight the key messages from each chapter in this analysis.
25.1 Policies and Measures Sustainable development is at the core of energy and climate change policies in India. To achieve these goals, about 440 policies both at the national and sub-national level are currently in place. These include general development policies, sector specific measures, targeted climate change policies as well as cross-sectoral policies to leverage co-benefits across policy domains.
The National Action Plan on Climate Change (NAPCC) has been instituted as the key driving force for sustainable development in India. The two main focus areas of the NAPCC are adaptation to climate change and enhancing energy efficiency. These goals will be met through eight missions aimed at enhancing ecological sustainability.
There has been a strong focus on renewable energy in India over the last four decades. This thrust will continue and be further strengthened in future. A testimonial to this includes investments in a strong solar energy programme under the NAPCC. Furthermore, since 2010, India has a carbon tax of INR 50/- ($ 1) per metric tons of coal. This tax is being used to boost penetration of renewables in the current energy mix.
In addition to GHG mitigation, emission norms equivalent to Euro III have been instituted to thwart local pollution from vehicles. These norms have been continually upgraded and in 26 cities norms equivalent to Euro IV are in place. It is envisaged that by 2025, the country would adopt Euro V standards.
25.2 Status and trends of Emissions in India The GHG intensity of Indian economy has reduced by 27% during 1990-2005, with power sector contributing 41% of this improvement. In the subsequent years (2005 – 2012) this intensity has reduced by 15%. The energy intensity of players in each sector also has wide variability, even though there is a discerning decreasing trend in almost all sectors over 2008-2013. These trends
LIMITS – LOW CLIMATE IMPACT SCENARIOS AND THE IMPLICATION OF
REQUIRED TIGHT EMISSION CONTROL STRATEGIES PROJECT NO 282846
DELIVERABLE NO.D3.1
214
are encouraging and indicate the potential for further reductions through improved energy efficiency measures.
There has been a significant investment in thermal power generation capacity. The present thermal power capacity may double by 2020, if all plants under construction become operational. However, discretion must be exercised as under construction coal based energy infrastructure could hamper India in achieving its Copenhagen commitment.
In addition to power plants, investments in industries may see coal based cement production and steel capacity go up by 33% and 20% respectively. There, however, remains a need to tighten industrial emission norms. For instance, While the European union emission standards for large cement plants is 30 mg/nm3, the Indian emission standards for large cement plants is 100 mg/nm3.
An interesting finding is that emission intensity of revenue of best performing companies in India is at par with global companies. However, the emission intensity spread is far wider for Indian companies indicating tremendous scope for improvement.
25.3 Greenhouse Gas Emissions Trends The results indicate that CO2 emissions for India are on the rise, though those of methane and nitrous oxide have stabilized significantly. Despite the dependence on coal, the weighted average of carbon content in the Indian power sector has been declining over time. The carbon content decreased from 1.09 kg CO2e per kWh in 1990, to 0.83 in 2005 and 0.82 in 2012.
The rate of increase of emissions from the agriculture sector (including those from electricity consumption) has declined over time. These emissions increased at a rate of 3.7% during 1990 – 2005 and at 2.9% during 2005 – 2012. These trends highlight that whereas policy measures are having a positive impact, there remains a scope for further improvement.
25.4 Comparing Model results Coal will remain the mainstay of the Indian energy system under the BAU scenario even by the end of the century. This is because energy security compulsions would require India to keep using coal albeit in a much cleaner way. Thus, a higher penetration of clean coal technologies such as Carbon Capture and Storage is expected in future.
As India is a developing country, it has the potential to reap benefits of low carbon growth through careful planning and implementation of the infrastructure sector. For this, an integrated mobility plan is required with low carbon transport at its core. In future, energy plantations an attractive policy option for inclusive low carbon growth could be hampered due to fresh water availability.

LIMITS – LOW CLIMATE IMPACT SCENARIOS AND THE IMPLICATION OF
REQUIRED TIGHT EMISSION CONTROL STRATEGIES PROJECT NO 282846
DELIVERABLE NO.D3.1
215
Energy poverty remains an important development concern. Affordable energy prices are required to reduce energy poverty. Policy intervention to correct market distortions, enhance generation capacity and provide sustainable off-grid solutions are crucial to achieving this.
Results from all modelling teams indicate that Indian CO2 emissions will not peak until 2100 under the BAU scenario. To achieve peaking of Indian emissions by 2030, a minimum carbon tax of US$150 per tonne would need to be imposed starting now. Under the most stringent scenario, peaking of CO2 emissions by 2020 can be achieved. However, to achieve peaking of Indian emissions by 2020, a minimum carbon tax of $200 per ton CO2e is needed to be imposed now onwards, along with expedited phasing-out of at least a third of coal-based energy infrastructure in the next ten years.
In conclusion, given the strong development trajectory of India, it remains possible for India to fulfil its voluntary Copenhagen commitments.
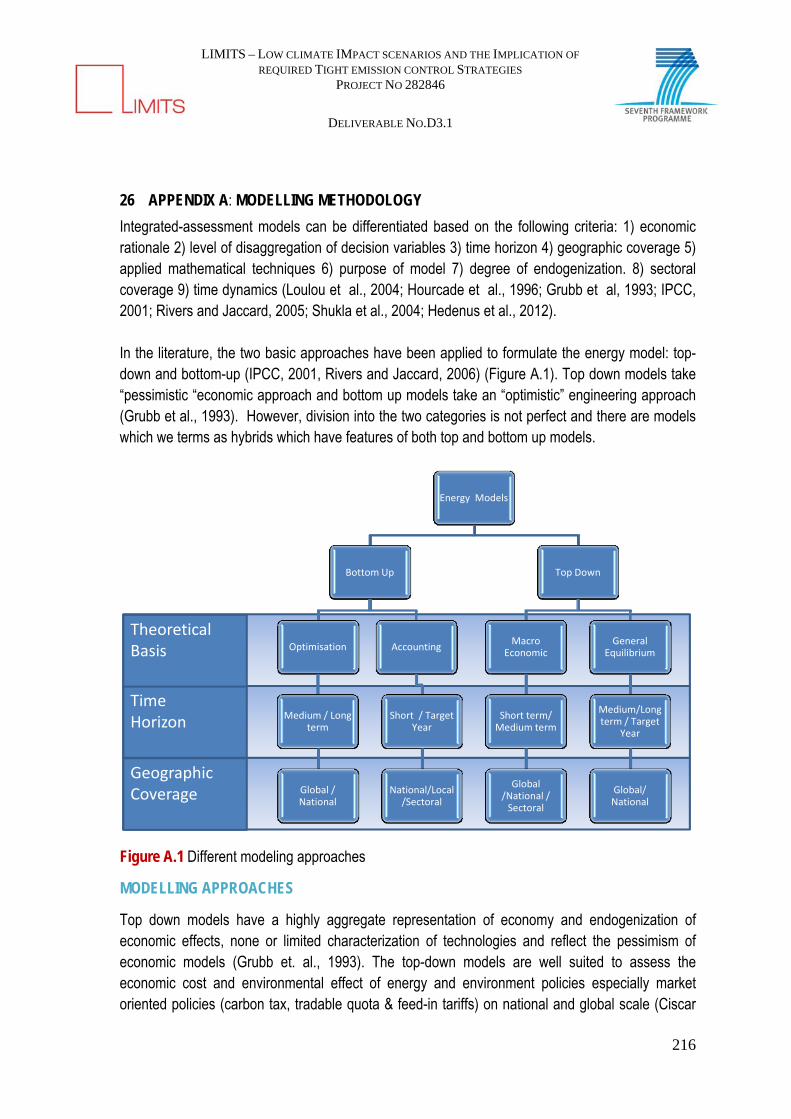
LIMITS – LOW CLIMATE IMPACT SCENARIOS AND THE IMPLICATION OF
REQUIRED TIGHT EMISSION CONTROL STRATEGIES PROJECT NO 282846
DELIVERABLE NO.D3.1
216
26 APPENDIX A: MODELLING METHODOLOGY
Integrated-assessment models can be differentiated based on the following criteria: 1) economic rationale 2) level of disaggregation of decision variables 3) time horizon 4) geographic coverage 5) applied mathematical techniques 6) purpose of model 7) degree of endogenization. 8) sectoral coverage 9) time dynamics (Loulou et al., 2004; Hourcade et al., 1996; Grubb et al, 1993; IPCC, 2001; Rivers and Jaccard, 2005; Shukla et al., 2004; Hedenus et al., 2012). In the literature, the two basic approaches have been applied to formulate the energy model: top-down and bottom-up (IPCC, 2001, Rivers and Jaccard, 2006) (Figure A.1). Top down models take “pessimistic “economic approach and bottom up models take an “optimistic” engineering approach (Grubb et al., 1993). However, division into the two categories is not perfect and there are models which we terms as hybrids which have features of both top and bottom up models.
Time Horizon
Energy Models
Bottom Up
Optimisation
Medium / Long term
Global / National
Accounting
Short / Target Year
National/Local /Sectoral
Top Down
Macro Economic
Short term/ Medium term
Global /National / Sectoral
General Equilibrium
Medium/Long term / Target
Year
Global/ National
Theoretical Basis
Geographic Coverage
Figure A.1 Different modeling approaches
MODELLING APPROACHES
Top down models have a highly aggregate representation of economy and endogenization of economic effects, none or limited characterization of technologies and reflect the pessimism of economic models (Grubb et. al., 1993). The top-down models are well suited to assess the economic cost and environmental effect of energy and environment policies especially market oriented policies (carbon tax, tradable quota & feed-in tariffs) on national and global scale (Ciscar

LIMITS – LOW CLIMATE IMPACT SCENARIOS AND THE IMPLICATION OF
REQUIRED TIGHT EMISSION CONTROL STRATEGIES PROJECT NO 282846
DELIVERABLE NO.D3.1
217
et.al., 2013;Massetti & Tavoni, 2012; Xu & Masui, 2009; Remme & Blesl, 2008). Top down models mainly depends on two methodologies: 1) computable general equilibrium models 2) Neo-Keynesian macroeconomic models. Energy is utilized as an input in most of the economic activities which indicates that energy and environment polices have ripple effect on other economic sectors also which is key motivation behind using the general equilibrium approach (Wing, 2006). General equilibrium models assume perfect markets equilibrium condition that equilibrium is achieved when supply equalizes demand across all the interconnected markets. On the other hand Neo-Keynesian macroeconomic models assume that every industry exist in an imperfect competition market and do not calculate equilibrium solution (Hourcade et al., 1996; Springer, 2003). In the top-down model, production of different sector is described by means of production functions which allow substitution of production factors through elasticities of substitution (Bohringer, 1998). On the contrary, bottom-up models are highly disaggregated with detailed technology representation. In case of bottom-up models, there is no feedback effect on prices as there are no linkages of energy sector with rest of the economy. The energy demand and prices are exogenously determined and specified in bottom-up models (Grubb et al., 1993). The bottom-up model is used to assess the impact of technology/fuel based policies (change in power generation mix, labels and standards) within a sector (Contreras et al., 2009; Masayuki and Eiichi, 2005). In case of bottom-up model, theoretically “most efficient” technology can lie beyond the production frontier determined by the market behavior which may not be actually adopted by the customers which provides evidence about the existence of efficiency gap (Hourcade et al., 1996). Optimization models can be further differentiated based on the solution approach (Babiker et al., 2009; Hedenus et al., 2012). Bottom up models can be further divided into optimization models and models providing accounting frameworks. The model using optimization algorithms finds the least system cost for the energy system for a given discount rate. The models follow a partial equilibrium approach with a focus on the energy sector assuming that other sectors are not affected by changes in energy demand or the way this demand is serviced. Some optimization models like MARKAL & TIMES assume perfect foresight behavior which means agents have rational expectation about the future events at the time of decision making whereas some models like AIM-enduse are solved assuming that market agents have myopic expectations and investment and consumption decisions are made taking into consideration the prices which prevails in that time period. The latter ones are also known as dynamic recursive models. Despite of their strength, these models have limitations in terms of representing actual economy and others sectors in details. Top down model is often criticized due to limited technological representation whereas in case of bottom up models; there are no linkages of energy sector with rest of the economy so they are not able to capture economic-wide feedback effects. Technologies, providing same service are assumed to be perfect substitutes in the bottom-up models except for their anticipated financial cost estimates. However, factors like long payback period risk, technologies attributes & consumers’ preferences which also play a role in technology penetration
LIMITS – LOW CLIMATE IMPACT SCENARIOS AND THE IMPLICATION OF
REQUIRED TIGHT EMISSION CONTROL STRATEGIES PROJECT NO 282846
DELIVERABLE NO.D3.1
218
are not taken into consideration. One of the limitations of CGE models stated in several research studies is that input substitution elasticities used in these models are usually computed based on the historical data and these values are assumed to be valid for future also (Hourcade et al., 2006; River & Jaccard, 2006). Top-down models with limited representation of technologies are not able to capture the effect of technology-oriented policies, on energy demand and related emissions LINKING TOP-DOWN AND BOTTOM-UP MODELS To overcome the limitations mentioned in the above section, researchers have attempted to develop hybrid model either by hard linking or by soft linking top-down and bottom up models. In case of soft linking, top-down and bottom up models are run for a given scenario ensuring the macroeconomic consistency by making GDP growth comparable whereas in case of hard-linking bottom up model are linked with general equilibrium model and are solved simultaneously using optimization technique. In case of soft linking, information is passed from one model to other and both the models are independently run until the occurrence of convergence of selected criterion (Shukla et al., 2008; Van den Broek et al., 2011; Shukla et al, 2010). Soft-linking of models is a practical strategy adapted is to assess a given scenario on both top down and bottom models. Figure 2.2 gives a stylized sketch of soft-linked modeling system. The macro-economic consistency between the models runs on two different kinds of models is ensured by making the key drivers of the scenario (e.g. GDP, population) comparable. The relevant output from the run of one model is used to modify the information inputs to the other model. For example, the GDP loss resulting from a carbon tax regime which is assessed endogenously by the top-down model can then be used to alter the exogenous GDP inputs or the end-use demands provided as the input to the bottom-up model (Shukla et. al., 2008). The altered results of bottom-up model, e.g. technology shares, are then passed to the top-down model. The iterations are done by passing of information exogenously and sequentially across the models. Thus, while the mathematical architectures of the models are not hard-linked, the models are soft-linked through information exchange. A short-coming of this approach is that it does not ensure theoretically consistency and full convergence of the results of both the models. Its key advantage is the simplicity of using models which follow two different paradigms and thereby receive deeper policy insights with less complexity of modeling. Researchers have attempted to develop hybrid model to bridge the gap between the top-down and bottom-up models either by incorporating macroeconomic feedback in the bottom-up models or by including technological details in the top-down models (Carraro et.al.2012; Scafer et.al.2006; Kim & Edmonds, 2006). Bossetti et.al (2006) developed WITCH model which allows improved representation of energy sector into the Ramsey- Cass- Koopman optimal growth model. MARKAL-MACRO model is developed by linking bottom-up technological rich MARKAL model with inter-temporal general equilibrium MACRO model which are solved simultaneously using non-linear optimization technique (Loulou, 2004). The major challenges that are faced by these hard-linked
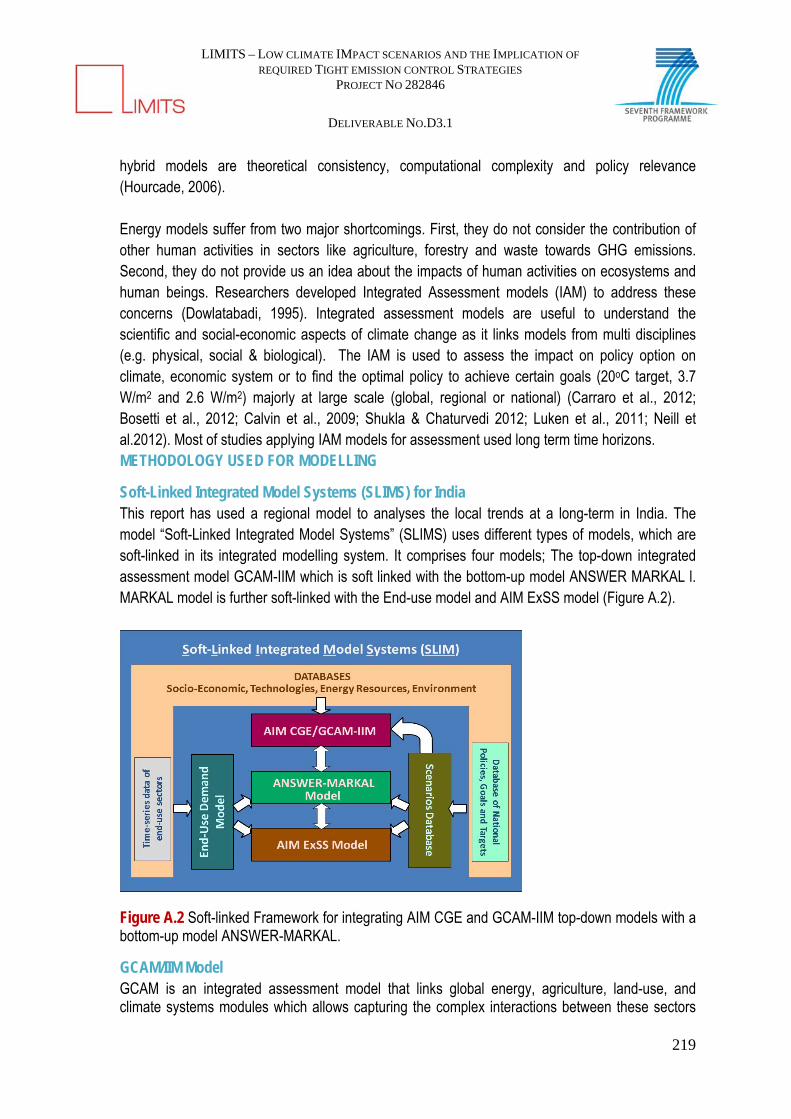
LIMITS – LOW CLIMATE IMPACT SCENARIOS AND THE IMPLICATION OF
REQUIRED TIGHT EMISSION CONTROL STRATEGIES PROJECT NO 282846
DELIVERABLE NO.D3.1
219
hybrid models are theoretical consistency, computational complexity and policy relevance (Hourcade, 2006). Energy models suffer from two major shortcomings. First, they do not consider the contribution of other human activities in sectors like agriculture, forestry and waste towards GHG emissions. Second, they do not provide us an idea about the impacts of human activities on ecosystems and human beings. Researchers developed Integrated Assessment models (IAM) to address these concerns (Dowlatabadi, 1995). Integrated assessment models are useful to understand the scientific and social-economic aspects of climate change as it links models from multi disciplines (e.g. physical, social & biological). The IAM is used to assess the impact on policy option on climate, economic system or to find the optimal policy to achieve certain goals (20oC target, 3.7 W/m2 and 2.6 W/m2) majorly at large scale (global, regional or national) (Carraro et al., 2012; Bosetti et al., 2012; Calvin et al., 2009; Shukla & Chaturvedi 2012; Luken et al., 2011; Neill et al.2012). Most of studies applying IAM models for assessment used long term time horizons. METHODOLOGY USED FOR MODELLING
Soft-Linked Integrated Model Systems (SLIMS) for India This report has used a regional model to analyses the local trends at a long-term in India. The model “Soft-Linked Integrated Model Systems” (SLIMS) uses different types of models, which are soft-linked in its integrated modelling system. It comprises four models; The top-down integrated assessment model GCAM-IIM which is soft linked with the bottom-up model ANSWER MARKAL l. MARKAL model is further soft-linked with the End-use model and AIM ExSS model (Figure A.2).
Figure A.2 Soft-linked Framework for integrating AIM CGE and GCAM-IIM top-down models with a bottom-up model ANSWER-MARKAL.
GCAM/IIM Model GCAM is an integrated assessment model that links global energy, agriculture, land-use, and climate systems modules which allows capturing the complex interactions between these sectors

LIMITS – LOW CLIMATE IMPACT SCENARIOS AND THE IMPLICATION OF
REQUIRED TIGHT EMISSION CONTROL STRATEGIES PROJECT NO 282846
DELIVERABLE NO.D3.1
220
and its impact on environment (Kyle and Kim, 2011). It is a long term partial equilibrium model that has 14 regions which runs in 15 time steps from 1990 to 2095. The end-use sector energy demand is aggregated into three energy services-- industrial energy services, building energy services, and transportation energy services. Energy demand is satisfied by various competing energy sources i.e. fossil fuels, bio-energy, electricity, hydrogen and synthetic fuels. The global carbon prices obtained from the top- down GCAM model pegged with different forcing level targets i.e. 2.7 W/m2, 5.7 W/m2 are exogenously given as an input to the ANSWER MARKAL model.
Answer- MARKAL Model MARKAL (MARKet ALlocation) model is an inter-temporal partial equilibrium bottom up model with a focus on the energy sector assuming that other sectors are not affected by changes in energy demand or the way this demand is serviced. It uses linear programming optimization technique to minimize the total energy cost of the system (Loulou, 2004). It contains information regarding technology‘s capital and operation cost and its operating efficiencies. It is based on the concept of Reference energy system (REF) which is a flowchart that represents the flow from primary energy sources to the end-use energy sector using various conversion technologies.
This is high disaggregated model with detail specification about the existing and future end-use and conversion technologies. This model assumes perfect foresight behavior which means agents have rational expectation about the future events at the time of decision making. The model relies on the basic assumption that we have perfect foresight about the changing technologies and economic situations. Technical details about the various technologies, future end-use demand projections and resource availability are key inputs to the model. Future sectoral GHG emissions, energy and technology mix are the major outputs of the MARKAL model that get stored in the scenario database for further analysis
End-Use Demand Model This model is used to estimate the future demand of end-use sectors like transport, cement and residential. Gross domestic product (GDP) is used as a proxy for economic growth which is one of the drivers of end-use demand. I Future GDP values follow a logistic curve. . The evolution of GDP in industrialized countries like US, Japan and even European Union follow a logistic curve, whereas GDP growth in developing countries are considered to be on the early stages of logistic curves where it is difficult to distinguish between exponential and logistic pattern (Modis, 2013).
The estimation of the final end-use demand is a two phase’s process. First, future Gross Value Added (GVA) shares are projected using GDP projections based on Government of India reports and expert judgment. In this study, India‘s GDP is assumed to grow at 8% from 2010-2035 to benchmark with planning commission scenarios after that the growth of GDP is assumed to follow logistic curve. Based on the experiences of developed countries, it is presumed that the sectoral share in the total GDP will stabilize with economic progress. Sectoral shares in 2070 are assumed to be stabilized with economic growth. The future end-use demand is calculated by multiplying the estimated future sectoral GVA series by the elasticities of individual end-use sectors which are given as an input to the MARKAL Model.
AIM-ExSS Model The AIM Extended Snapshot Tool is a Microsoft Excel-based energy accounting type model developed by Kyoto University. It’s used for a static snapshot analysis of a reference year and a target year in the context of a city or a region. ExSS is a system of simultaneous equation in which

LIMITS – LOW CLIMATE IMPACT SCENARIOS AND THE IMPLICATION OF
REQUIRED TIGHT EMISSION CONTROL STRATEGIES PROJECT NO 282846
DELIVERABLE NO.D3.1
221
the solution is uniquely defined given a set of exogenous variables and parameters. The results from the model is used to calibrate and update the various parameters of the ANSWER MARKAL model.
Strategic Databases (Socio-economic, Technical and Scientific Data) Integrated-assessment models require lot of inputs to represent the whole energy sector at national, regional and global scale. Therefore they require large and diverse data such as input – output tables, resource availability, economic growth, end-use sector production and technical parameters (e.g. efficiency and capacity of various technologies). As different models have different data input requirements, they interact through the Strategic Database in a soft-linked framework. Strategic databases like AIM database or IEA databases, OCED database helps to maintain consistency across various models which can be soft linked for comprehensive and integrated policy assessment.
SCENARIO ANALYSIS
Scenarios are neither predictions nor forecasts. They serve for the assessment of future developments in complex systems that are either inherently unpredictable, are insufficiently understood or have high uncertainties. To capture these scenarios in an analytical model framework and compare their implications, each scenario has to be defined by an internally consistent and reproducible set of assumptions about key relationships and driving forces of change. Some important exogenous model assumptions for bottom-up modeling system are economic growth, end-use demands, indigenous energy-resource supply constraints, energy prices, technology penetration levels, technology costs and performance parameters, and other environmental improvement measures.
Scenario analysis is a central task in the LIMITS project. The 12 scenarios used run by seven leading IAMs, are based on different policy assumptions for long-term international climate policy (Tables A.1 and A.2). The scenarios were tailored to represent a set of plausible outcomes of the Durban platform negotiations on a post 2020 climate treaty. The 2 degree Celsius (2oC) temperature increase has been evaluated with a more lenient reference policy (‘weak’) scenario reflecting the unconditional Copenhagen Pledges and a more stringent scenario (‘stringent’) based on conditional Copenhagen Pledges. The burden sharing scheme has also been assessed after 2020 (no sharing per capita convergence and equal effort).
Table A.1 The Integrated Assessment Models (IAM) used for LIMITS
Model Name Main Institute SLIMS Indian Institute of Management, Ahmedabad IMAGE Netherlands Environmental Assessment Agency MESSAGE International Institute for Applied Systems Analysis, Austria REMIND Potsdam Institute for Climate Impact Research, Germany TIAM-ECN Energy Research Centre of the Netherlands, The Netherlands WITCH Institute for Environment and Sustainability, European Commission, Italy
Table A.2 Scenario design of the LIMITS study

LIMITS – LOW CLIMATE IMPACT SCENARIOS AND THE IMPLICATION OF
REQUIRED TIGHT EMISSION CONTROL STRATEGIES PROJECT NO 282846
DELIVERABLE NO.D3.1
222
Scenario Description
Forcing level target (in 2010)
Before 2020
After 2020
Burden Sharing
LIMITS1 Base No Policy Baseline - No Policy -
LIMITS2 RefPol Weak Policy Reference Case
- Weak Policy -
LIMITS3 StrPol Stringent Policy Reference Case
- Strong Policy -
LIMITS4 450 2.8 W/m2 benchmark case 2.8 W/m2 2.8 W/m2 -
LIMITS5 500 3.2 W/ m2 benchmark case
3.2 W/m2 3.2 W/m2 -
LIMITS6 RefPol-450
Weak policy until 2020 then cooperation to 2.8 W/m2
2.8 W/m2 Weak policy
Global GHG tax
-
LIMITS7 StrPol-450
Stringent policy until 2020 then cooperation to 2.8 W/m2
2.8 W/m2 Strong policy
Global GHG tax
-
LIMITS8 RefPol-500
Weak policy until 2020 then cooperation to 3.2 W/m2
3.2 W/m2 Weak policy
Global GHG tax
-
LIMITS9 StrPol-500
Stringent policy until 2020 then cooperation to 3.2 W/m2
3.2 W/m2 Strong policy
Global GHG tax
-
LIMITS10 RefPol2030-450
Weak policy until 2030 then cooperation to 3.2 W/m2
3.2 W/m2
Weak policy (before 2030)
Global GHG tax (after 2030)
-
LIMITS11 RefPol-450-PC
Weak policy until 2020 then cooperation to 2.8 W/m2 with C&C burden sharing
2.8 W/m2 Weak policy
Global GHG tax
Contraction & Convergence
LIMITS12 RefPol-450-EE
Weak policy until 2020 then cooperation to 2.8 W/m2 with mitigation costs burden sharing
2.8 W/m2 Weak policy
Global GHG tax
Equal mitigation costs
LIMITS – LOW CLIMATE IMPACT SCENARIOS AND THE IMPLICATION OF
REQUIRED TIGHT EMISSION CONTROL STRATEGIES PROJECT NO 282846
DELIVERABLE NO.D3.1
223
There are many policies and measures that exist in India that directly or indirectly mitigate GHG emissions. The above table and scenario definitions may not necessarily capture all these explicitly. However in our modeling efforts, we model these policies under our business as usual scenario, either as independent policies or as groups of policies. The next chapter describes these policies and measures in detail.
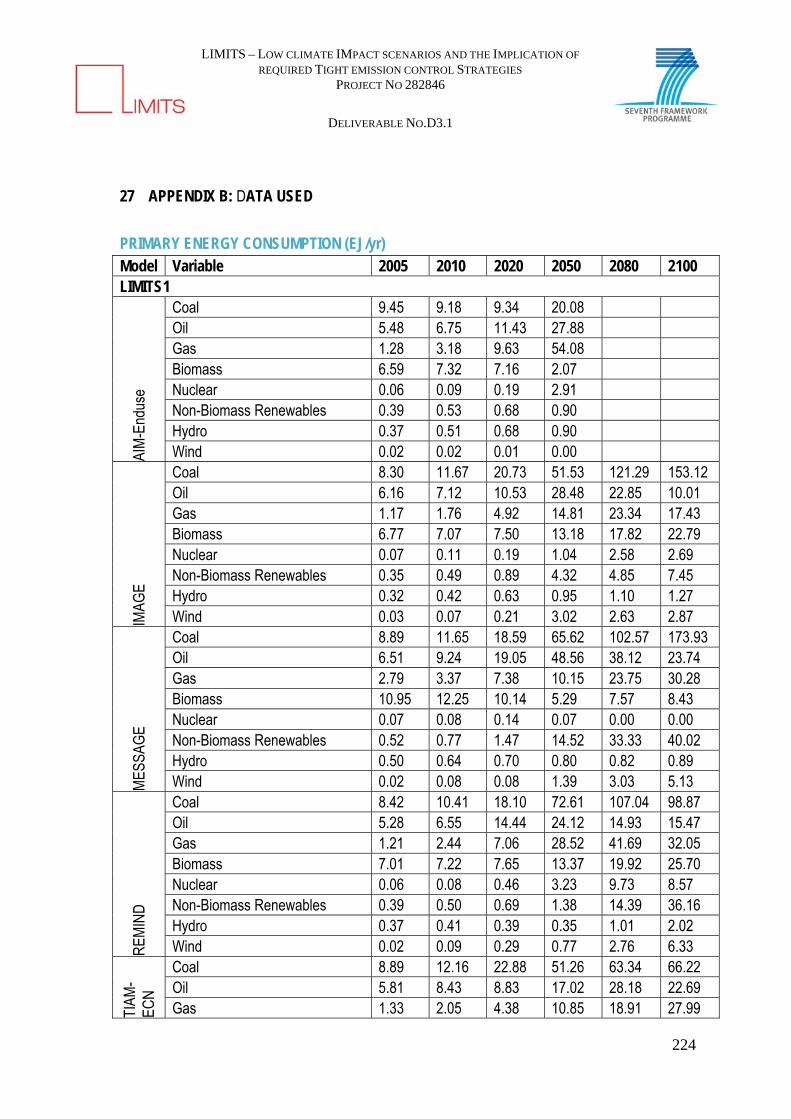
LIMITS – LOW CLIMATE IMPACT SCENARIOS AND THE IMPLICATION OF
REQUIRED TIGHT EMISSION CONTROL STRATEGIES PROJECT NO 282846
DELIVERABLE NO.D3.1
224
27 APPENDIX B: DATA USED
PRIMARY ENERGY CONSUMPTION (EJ/yr) Model Variable 2005 2010 2020 2050 2080 2100 LIMITS1
AIM
-End
use
Coal 9.45 9.18 9.34 20.08
Oil 5.48 6.75 11.43 27.88
Gas 1.28 3.18 9.63 54.08
Biomass 6.59 7.32 7.16 2.07
Nuclear 0.06 0.09 0.19 2.91
Non-Biomass Renewables 0.39 0.53 0.68 0.90
Hydro 0.37 0.51 0.68 0.90
Wind 0.02 0.02 0.01 0.00
IMAG
E
Coal 8.30 11.67 20.73 51.53 121.29 153.12 Oil 6.16 7.12 10.53 28.48 22.85 10.01 Gas 1.17 1.76 4.92 14.81 23.34 17.43 Biomass 6.77 7.07 7.50 13.18 17.82 22.79 Nuclear 0.07 0.11 0.19 1.04 2.58 2.69 Non-Biomass Renewables 0.35 0.49 0.89 4.32 4.85 7.45 Hydro 0.32 0.42 0.63 0.95 1.10 1.27 Wind 0.03 0.07 0.21 3.02 2.63 2.87
MES
SAG
E
Coal 8.89 11.65 18.59 65.62 102.57 173.93 Oil 6.51 9.24 19.05 48.56 38.12 23.74 Gas 2.79 3.37 7.38 10.15 23.75 30.28 Biomass 10.95 12.25 10.14 5.29 7.57 8.43 Nuclear 0.07 0.08 0.14 0.07 0.00 0.00 Non-Biomass Renewables 0.52 0.77 1.47 14.52 33.33 40.02 Hydro 0.50 0.64 0.70 0.80 0.82 0.89 Wind 0.02 0.08 0.08 1.39 3.03 5.13
REM
IND
Coal 8.42 10.41 18.10 72.61 107.04 98.87 Oil 5.28 6.55 14.44 24.12 14.93 15.47 Gas 1.21 2.44 7.06 28.52 41.69 32.05 Biomass 7.01 7.22 7.65 13.37 19.92 25.70 Nuclear 0.06 0.08 0.46 3.23 9.73 8.57 Non-Biomass Renewables 0.39 0.50 0.69 1.38 14.39 36.16 Hydro 0.37 0.41 0.39 0.35 1.01 2.02 Wind 0.02 0.09 0.29 0.77 2.76 6.33
TIAM
-EC
N
Coal 8.89 12.16 22.88 51.26 63.34 66.22 Oil 5.81 8.43 8.83 17.02 28.18 22.69 Gas 1.33 2.05 4.38 10.85 18.91 27.99
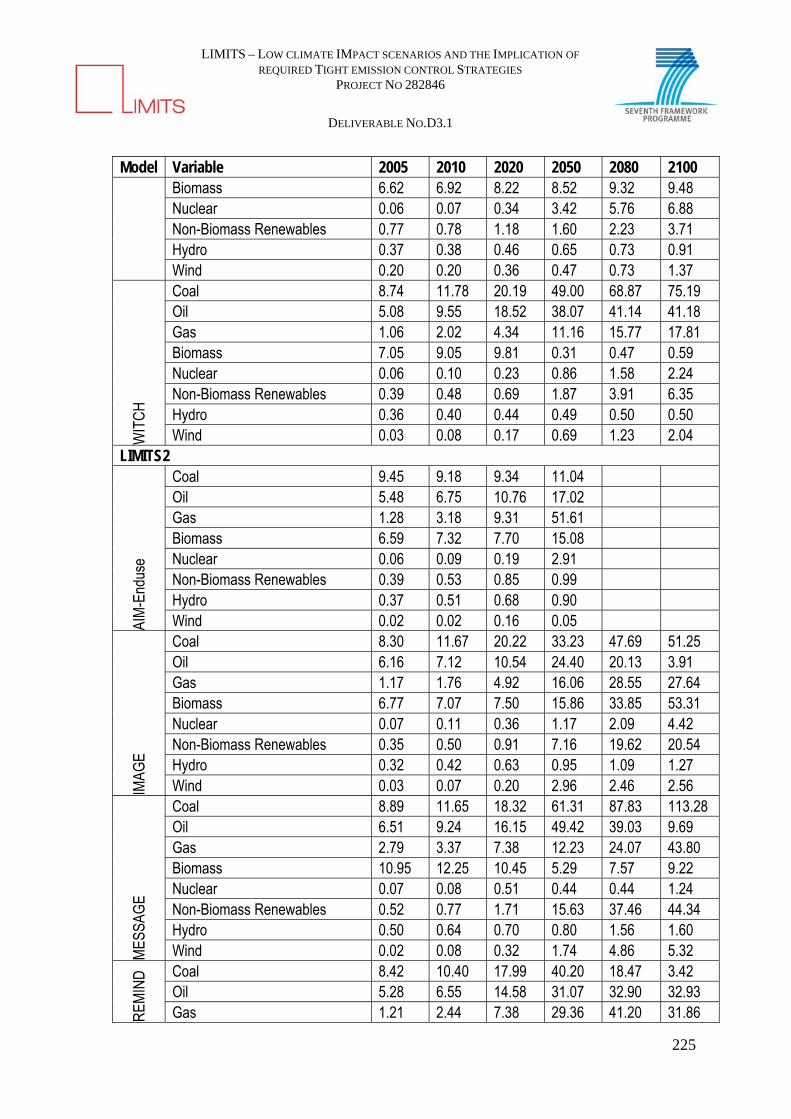
LIMITS – LOW CLIMATE IMPACT SCENARIOS AND THE IMPLICATION OF
REQUIRED TIGHT EMISSION CONTROL STRATEGIES PROJECT NO 282846
DELIVERABLE NO.D3.1
225
Model Variable 2005 2010 2020 2050 2080 2100 Biomass 6.62 6.92 8.22 8.52 9.32 9.48 Nuclear 0.06 0.07 0.34 3.42 5.76 6.88 Non-Biomass Renewables 0.77 0.78 1.18 1.60 2.23 3.71 Hydro 0.37 0.38 0.46 0.65 0.73 0.91 Wind 0.20 0.20 0.36 0.47 0.73 1.37
WIT
CH
Coal 8.74 11.78 20.19 49.00 68.87 75.19 Oil 5.08 9.55 18.52 38.07 41.14 41.18 Gas 1.06 2.02 4.34 11.16 15.77 17.81 Biomass 7.05 9.05 9.81 0.31 0.47 0.59 Nuclear 0.06 0.10 0.23 0.86 1.58 2.24 Non-Biomass Renewables 0.39 0.48 0.69 1.87 3.91 6.35 Hydro 0.36 0.40 0.44 0.49 0.50 0.50 Wind 0.03 0.08 0.17 0.69 1.23 2.04
LIMITS2
AIM
-End
use
Coal 9.45 9.18 9.34 11.04
Oil 5.48 6.75 10.76 17.02
Gas 1.28 3.18 9.31 51.61
Biomass 6.59 7.32 7.70 15.08
Nuclear 0.06 0.09 0.19 2.91
Non-Biomass Renewables 0.39 0.53 0.85 0.99
Hydro 0.37 0.51 0.68 0.90
Wind 0.02 0.02 0.16 0.05
IMAG
E
Coal 8.30 11.67 20.22 33.23 47.69 51.25 Oil 6.16 7.12 10.54 24.40 20.13 3.91 Gas 1.17 1.76 4.92 16.06 28.55 27.64 Biomass 6.77 7.07 7.50 15.86 33.85 53.31 Nuclear 0.07 0.11 0.36 1.17 2.09 4.42 Non-Biomass Renewables 0.35 0.50 0.91 7.16 19.62 20.54 Hydro 0.32 0.42 0.63 0.95 1.09 1.27 Wind 0.03 0.07 0.20 2.96 2.46 2.56
MES
SAG
E
Coal 8.89 11.65 18.32 61.31 87.83 113.28 Oil 6.51 9.24 16.15 49.42 39.03 9.69 Gas 2.79 3.37 7.38 12.23 24.07 43.80 Biomass 10.95 12.25 10.45 5.29 7.57 9.22 Nuclear 0.07 0.08 0.51 0.44 0.44 1.24 Non-Biomass Renewables 0.52 0.77 1.71 15.63 37.46 44.34 Hydro 0.50 0.64 0.70 0.80 1.56 1.60 Wind 0.02 0.08 0.32 1.74 4.86 5.32
REM
IND
Coal 8.42 10.40 17.99 40.20 18.47 3.42 Oil 5.28 6.55 14.58 31.07 32.90 32.93 Gas 1.21 2.44 7.38 29.36 41.20 31.86

LIMITS – LOW CLIMATE IMPACT SCENARIOS AND THE IMPLICATION OF
REQUIRED TIGHT EMISSION CONTROL STRATEGIES PROJECT NO 282846
DELIVERABLE NO.D3.1
226
Model Variable 2005 2010 2020 2050 2080 2100 Biomass 7.01 7.22 7.65 13.37 19.59 28.89 Nuclear 0.06 0.08 0.51 6.89 22.34 19.62 Non-Biomass Renewables 0.39 0.50 0.76 2.27 18.99 41.55 Hydro 0.37 0.41 0.39 0.46 1.20 2.17 Wind 0.02 0.09 0.30 1.02 3.60 8.74
TIAM
-EC
N
Coal 8.89 12.16 23.06 51.11 35.36 40.05 Oil 5.81 8.43 8.65 16.94 21.63 7.84 Gas 1.33 2.05 4.34 7.60 23.94 34.14 Biomass 6.62 6.92 7.88 10.31 14.91 16.81 Nuclear 0.06 0.07 0.53 3.42 5.76 6.88 Non-Biomass Renewables 0.77 0.78 1.35 2.04 13.20 25.34 Hydro 0.37 0.38 0.49 0.77 1.28 1.28 Wind 0.20 0.20 0.33 0.50 3.07 4.20
WIT
CH
Coal 8.74 11.78 18.96 40.54 21.76 17.64 Oil 5.08 9.55 19.10 36.98 37.07 35.31 Gas 1.06 2.02 4.19 10.98 13.58 12.62 Biomass 7.05 9.05 9.70 3.51 8.76 13.50 Nuclear 0.06 0.10 0.60 0.92 2.92 4.63 Non-Biomass Renewables 0.39 0.48 0.71 2.31 8.60 13.94 Hydro 0.36 0.40 0.44 0.49 0.50 0.50 Wind 0.03 0.08 0.17 0.87 2.72 3.65
LIMITS4
AIM
-End
use
Coal 9.45 9.18 5.20 6.35
Oil 5.48 6.75 8.61 15.60
Gas 1.28 3.18 8.81 23.29
Biomass 6.59 7.32 10.82 53.47
Nuclear 0.06 0.09 0.19 2.91
Non-Biomass Renewables 0.39 0.53 0.69 1.30
Hydro 0.37 0.51 0.68 0.90
Wind 0.02 0.02 0.01 0.17
IMAG
E
Coal 8.30 11.67 17.85 15.26 20.10 25.93 Oil 6.16 7.12 9.40 11.86 1.73 1.33 Gas 1.17 1.76 4.84 10.96 13.54 7.19 Biomass 6.77 7.07 7.29 25.95 37.67 44.61 Nuclear 0.07 0.11 0.21 5.04 21.91 23.36 Non-Biomass Renewables 0.35 0.49 0.89 3.97 5.53 10.53 Hydro 0.32 0.42 0.63 0.95 1.10 1.27 Wind 0.03 0.07 0.20 2.74 2.50 2.86
MES
SAG
E
Coal 8.89 11.65 9.36 28.39 39.45 15.31 Oil 6.51 9.24 18.51 26.45 2.54 1.45 Gas 2.79 3.37 6.82 8.73 19.04 32.41
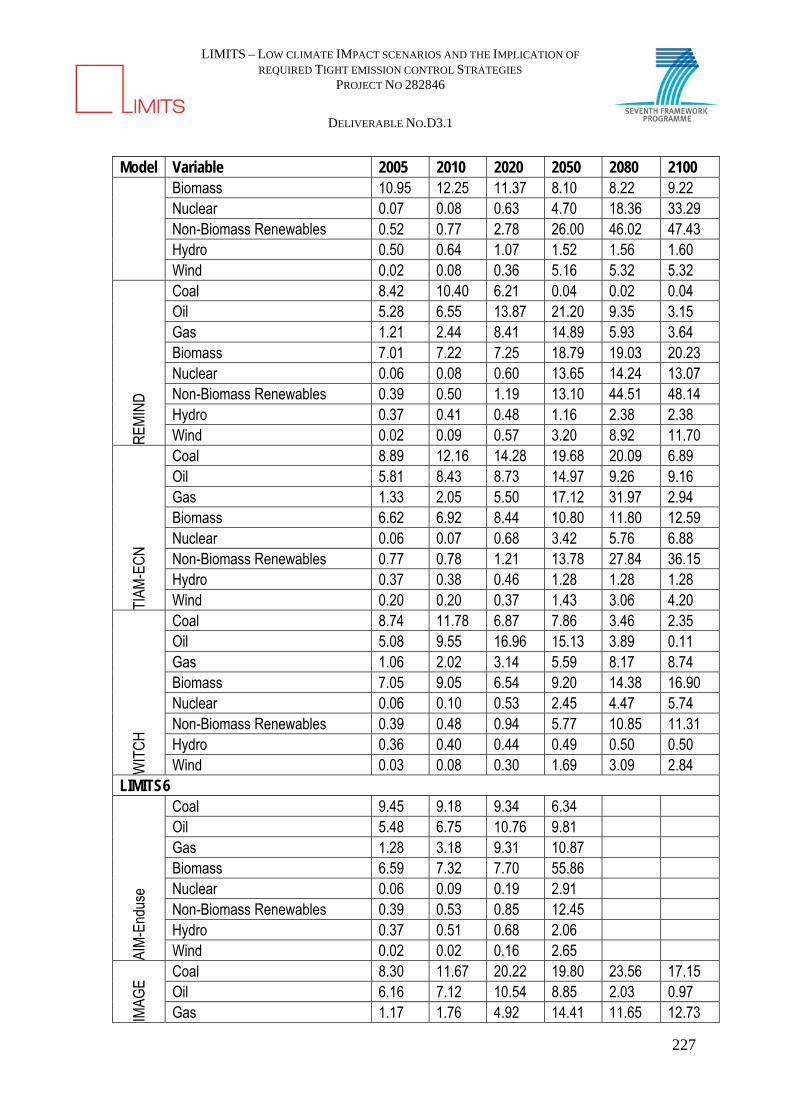
LIMITS – LOW CLIMATE IMPACT SCENARIOS AND THE IMPLICATION OF
REQUIRED TIGHT EMISSION CONTROL STRATEGIES PROJECT NO 282846
DELIVERABLE NO.D3.1
227
Model Variable 2005 2010 2020 2050 2080 2100 Biomass 10.95 12.25 11.37 8.10 8.22 9.22 Nuclear 0.07 0.08 0.63 4.70 18.36 33.29 Non-Biomass Renewables 0.52 0.77 2.78 26.00 46.02 47.43 Hydro 0.50 0.64 1.07 1.52 1.56 1.60 Wind 0.02 0.08 0.36 5.16 5.32 5.32
REM
IND
Coal 8.42 10.40 6.21 0.04 0.02 0.04 Oil 5.28 6.55 13.87 21.20 9.35 3.15 Gas 1.21 2.44 8.41 14.89 5.93 3.64 Biomass 7.01 7.22 7.25 18.79 19.03 20.23 Nuclear 0.06 0.08 0.60 13.65 14.24 13.07 Non-Biomass Renewables 0.39 0.50 1.19 13.10 44.51 48.14 Hydro 0.37 0.41 0.48 1.16 2.38 2.38 Wind 0.02 0.09 0.57 3.20 8.92 11.70
TIAM
-EC
N
Coal 8.89 12.16 14.28 19.68 20.09 6.89 Oil 5.81 8.43 8.73 14.97 9.26 9.16 Gas 1.33 2.05 5.50 17.12 31.97 2.94 Biomass 6.62 6.92 8.44 10.80 11.80 12.59 Nuclear 0.06 0.07 0.68 3.42 5.76 6.88 Non-Biomass Renewables 0.77 0.78 1.21 13.78 27.84 36.15 Hydro 0.37 0.38 0.46 1.28 1.28 1.28 Wind 0.20 0.20 0.37 1.43 3.06 4.20
WIT
CH
Coal 8.74 11.78 6.87 7.86 3.46 2.35 Oil 5.08 9.55 16.96 15.13 3.89 0.11 Gas 1.06 2.02 3.14 5.59 8.17 8.74 Biomass 7.05 9.05 6.54 9.20 14.38 16.90 Nuclear 0.06 0.10 0.53 2.45 4.47 5.74 Non-Biomass Renewables 0.39 0.48 0.94 5.77 10.85 11.31 Hydro 0.36 0.40 0.44 0.49 0.50 0.50 Wind 0.03 0.08 0.30 1.69 3.09 2.84
LIMITS6
AIM
-End
use
Coal 9.45 9.18 9.34 6.34
Oil 5.48 6.75 10.76 9.81
Gas 1.28 3.18 9.31 10.87
Biomass 6.59 7.32 7.70 55.86
Nuclear 0.06 0.09 0.19 2.91
Non-Biomass Renewables 0.39 0.53 0.85 12.45
Hydro 0.37 0.51 0.68 2.06
Wind 0.02 0.02 0.16 2.65
IMAG
E
Coal 8.30 11.67 20.22 19.80 23.56 17.15 Oil 6.16 7.12 10.54 8.85 2.03 0.97 Gas 1.17 1.76 4.92 14.41 11.65 12.73
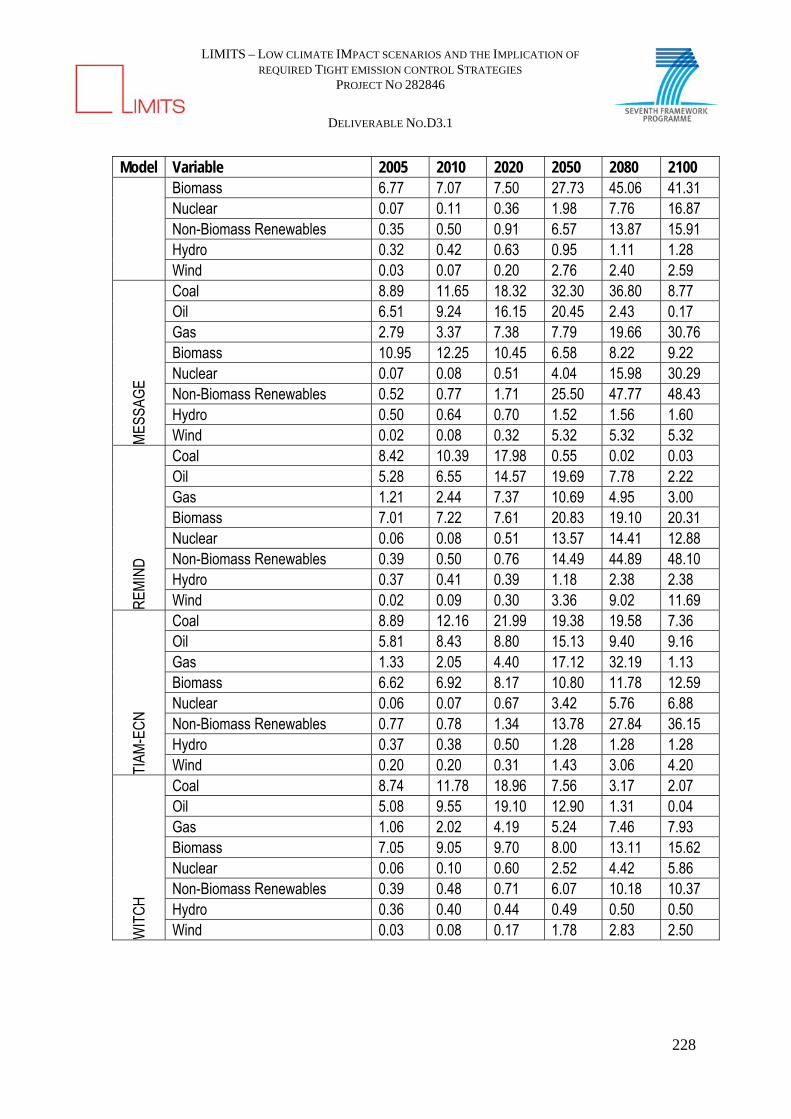
LIMITS – LOW CLIMATE IMPACT SCENARIOS AND THE IMPLICATION OF
REQUIRED TIGHT EMISSION CONTROL STRATEGIES PROJECT NO 282846
DELIVERABLE NO.D3.1
228
Model Variable 2005 2010 2020 2050 2080 2100 Biomass 6.77 7.07 7.50 27.73 45.06 41.31 Nuclear 0.07 0.11 0.36 1.98 7.76 16.87 Non-Biomass Renewables 0.35 0.50 0.91 6.57 13.87 15.91 Hydro 0.32 0.42 0.63 0.95 1.11 1.28 Wind 0.03 0.07 0.20 2.76 2.40 2.59
MES
SAG
E
Coal 8.89 11.65 18.32 32.30 36.80 8.77 Oil 6.51 9.24 16.15 20.45 2.43 0.17 Gas 2.79 3.37 7.38 7.79 19.66 30.76 Biomass 10.95 12.25 10.45 6.58 8.22 9.22 Nuclear 0.07 0.08 0.51 4.04 15.98 30.29 Non-Biomass Renewables 0.52 0.77 1.71 25.50 47.77 48.43 Hydro 0.50 0.64 0.70 1.52 1.56 1.60 Wind 0.02 0.08 0.32 5.32 5.32 5.32
REM
IND
Coal 8.42 10.39 17.98 0.55 0.02 0.03 Oil 5.28 6.55 14.57 19.69 7.78 2.22 Gas 1.21 2.44 7.37 10.69 4.95 3.00 Biomass 7.01 7.22 7.61 20.83 19.10 20.31 Nuclear 0.06 0.08 0.51 13.57 14.41 12.88 Non-Biomass Renewables 0.39 0.50 0.76 14.49 44.89 48.10 Hydro 0.37 0.41 0.39 1.18 2.38 2.38 Wind 0.02 0.09 0.30 3.36 9.02 11.69
TIAM
-EC
N
Coal 8.89 12.16 21.99 19.38 19.58 7.36 Oil 5.81 8.43 8.80 15.13 9.40 9.16 Gas 1.33 2.05 4.40 17.12 32.19 1.13 Biomass 6.62 6.92 8.17 10.80 11.78 12.59 Nuclear 0.06 0.07 0.67 3.42 5.76 6.88 Non-Biomass Renewables 0.77 0.78 1.34 13.78 27.84 36.15 Hydro 0.37 0.38 0.50 1.28 1.28 1.28 Wind 0.20 0.20 0.31 1.43 3.06 4.20
WIT
CH
Coal 8.74 11.78 18.96 7.56 3.17 2.07 Oil 5.08 9.55 19.10 12.90 1.31 0.04 Gas 1.06 2.02 4.19 5.24 7.46 7.93 Biomass 7.05 9.05 9.70 8.00 13.11 15.62 Nuclear 0.06 0.10 0.60 2.52 4.42 5.86 Non-Biomass Renewables 0.39 0.48 0.71 6.07 10.18 10.37 Hydro 0.36 0.40 0.44 0.49 0.50 0.50 Wind 0.03 0.08 0.17 1.78 2.83 2.50
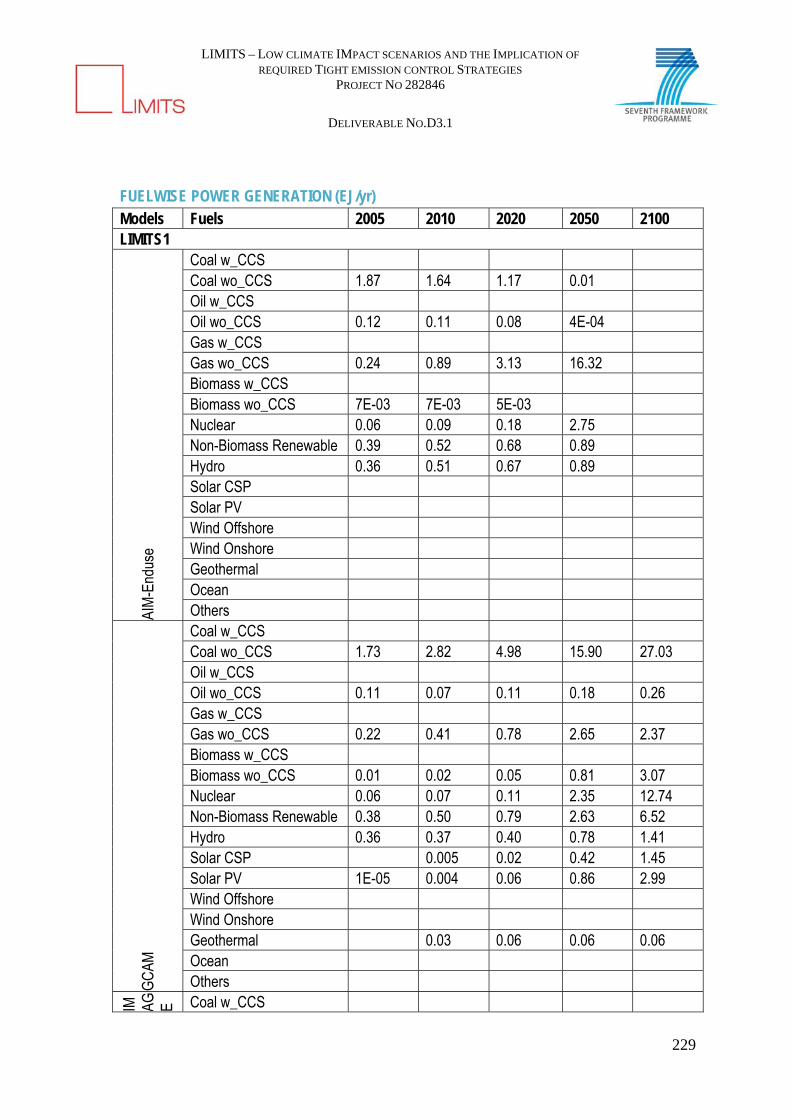
LIMITS – LOW CLIMATE IMPACT SCENARIOS AND THE IMPLICATION OF
REQUIRED TIGHT EMISSION CONTROL STRATEGIES PROJECT NO 282846
DELIVERABLE NO.D3.1
229
FUELWISE POWER GENERATION (EJ/yr) Models Fuels 2005 2010 2020 2050 2100 LIMITS1
AIM
-End
use
Coal w_CCS Coal wo_CCS 1.87 1.64 1.17 0.01 Oil w_CCS Oil wo_CCS 0.12 0.11 0.08 4E-04 Gas w_CCS Gas wo_CCS 0.24 0.89 3.13 16.32 Biomass w_CCS Biomass wo_CCS 7E-03 7E-03 5E-03 Nuclear 0.06 0.09 0.18 2.75 Non-Biomass Renewable 0.39 0.52 0.68 0.89 Hydro 0.36 0.51 0.67 0.89 Solar CSP Solar PV Wind Offshore Wind Onshore Geothermal Ocean Others
GC
AM
Coal w_CCS Coal wo_CCS 1.73 2.82 4.98 15.90 27.03 Oil w_CCS Oil wo_CCS 0.11 0.07 0.11 0.18 0.26 Gas w_CCS Gas wo_CCS 0.22 0.41 0.78 2.65 2.37 Biomass w_CCS Biomass wo_CCS 0.01 0.02 0.05 0.81 3.07 Nuclear 0.06 0.07 0.11 2.35 12.74 Non-Biomass Renewable 0.38 0.50 0.79 2.63 6.52 Hydro 0.36 0.37 0.40 0.78 1.41 Solar CSP 0.005 0.02 0.42 1.45 Solar PV 1E-05 0.004 0.06 0.86 2.99 Wind Offshore Wind Onshore Geothermal 0.03 0.06 0.06 0.06 Ocean Others
IM AG E Coal w_CCS
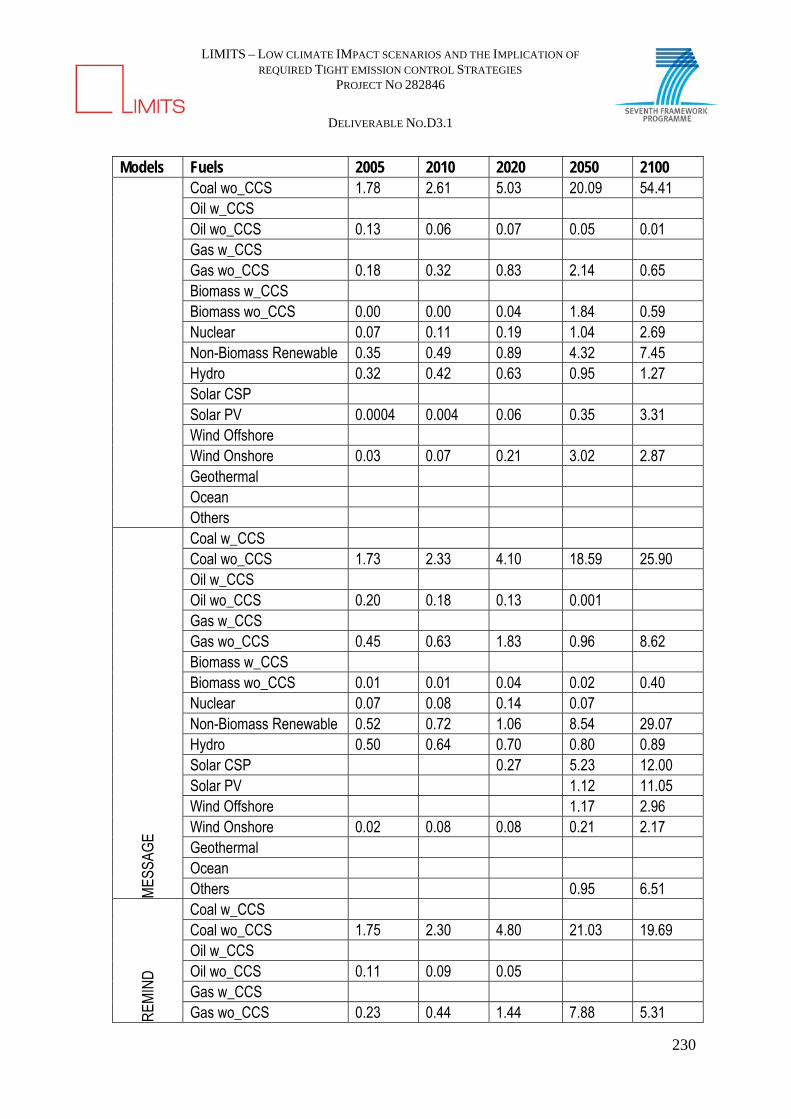
LIMITS – LOW CLIMATE IMPACT SCENARIOS AND THE IMPLICATION OF
REQUIRED TIGHT EMISSION CONTROL STRATEGIES PROJECT NO 282846
DELIVERABLE NO.D3.1
230
Models Fuels 2005 2010 2020 2050 2100 Coal wo_CCS 1.78 2.61 5.03 20.09 54.41 Oil w_CCS Oil wo_CCS 0.13 0.06 0.07 0.05 0.01 Gas w_CCS Gas wo_CCS 0.18 0.32 0.83 2.14 0.65 Biomass w_CCS Biomass wo_CCS 0.00 0.00 0.04 1.84 0.59 Nuclear 0.07 0.11 0.19 1.04 2.69 Non-Biomass Renewable 0.35 0.49 0.89 4.32 7.45 Hydro 0.32 0.42 0.63 0.95 1.27 Solar CSP Solar PV 0.0004 0.004 0.06 0.35 3.31 Wind Offshore Wind Onshore 0.03 0.07 0.21 3.02 2.87 Geothermal Ocean Others
MES
SAG
E
Coal w_CCS Coal wo_CCS 1.73 2.33 4.10 18.59 25.90 Oil w_CCS Oil wo_CCS 0.20 0.18 0.13 0.001 Gas w_CCS Gas wo_CCS 0.45 0.63 1.83 0.96 8.62 Biomass w_CCS Biomass wo_CCS 0.01 0.01 0.04 0.02 0.40 Nuclear 0.07 0.08 0.14 0.07 Non-Biomass Renewable 0.52 0.72 1.06 8.54 29.07 Hydro 0.50 0.64 0.70 0.80 0.89 Solar CSP 0.27 5.23 12.00 Solar PV 1.12 11.05 Wind Offshore 1.17 2.96 Wind Onshore 0.02 0.08 0.08 0.21 2.17 Geothermal Ocean Others 0.95 6.51
REM
IND
Coal w_CCS Coal wo_CCS 1.75 2.30 4.80 21.03 19.69 Oil w_CCS Oil wo_CCS 0.11 0.09 0.05 Gas w_CCS Gas wo_CCS 0.23 0.44 1.44 7.88 5.31

LIMITS – LOW CLIMATE IMPACT SCENARIOS AND THE IMPLICATION OF
REQUIRED TIGHT EMISSION CONTROL STRATEGIES PROJECT NO 282846
DELIVERABLE NO.D3.1
231
Models Fuels 2005 2010 2020 2050 2100 Biomass w_CCS Biomass wo_CCS 0.003 0.54 1.65 Nuclear 0.06 0.08 0.46 3.23 8.57 Non-Biomass Renewable 0.39 0.50 0.69 1.38 36.16 Hydro 0.37 0.41 0.39 0.35 2.02 Solar CSP 0.001 0.001 0.003 7.08 Solar PV 0.002 0.004 0.15 20.62 Wind Offshore Wind Onshore Geothermal 0.01 0.11 0.11 Ocean Others
TIAM
-EC
N
Coal w_CCS 1E-07 3E-06 2E-05 Coal wo_CCS 1.73 2.22 5.16 14.57 19.15 Oil w_CCS 3E-08 2E-07 Oil wo_CCS 0.10 0.09 0.06 7E-07 6E-06 Gas w_CCS 3E-08 1E-06 9E-06 Gas wo_CCS 0.22 0.40 1.17 1.96 2.60 Biomass w_CCS 1E-08 5E-07 4E-06 Biomass wo_CCS 0.01 0.01 0.18 0.54 0.01 Nuclear 0.06 0.07 0.34 3.42 6.88 Non-Biomass Renewable 0.39 0.45 0.82 1.13 2.34 Hydro 0.37 0.38 0.46 0.65 0.91 Solar CSP 4E-04 4E-04 4E-04 1E-04 2E-04 Solar PV 6E-09 3E-08 5E-07 2E-05 Wind Offshore 3E-06 0.02 0.04 Wind Onshore 0.20 0.20 0.36 0.45 1.33 Geothermal 2E-07 0.02 0.05 Ocean Others 0.03 0.07 0.00
WIT
CH
Coal w_CCS 3E-05 2E-05 2E-05 2E-05 2E-05 Coal wo_CCS 1.73 2.97 6.49 20.52 32.88 Oil w_CCS Oil wo_CCS 0.12 0.25 0.43 0.45 0.15 Gas w_CCS 2E-03 1E-03 7E-04 2E-04 2E-04 Gas wo_CCS 0.22 0.46 1.07 3.44 5.96 Biomass w_CCS 4E-11 4E-11 4E-11 4E-11 8E-06 Biomass wo_CCS 0.03 0.03 0.01 0.00 0.00 Nuclear 0.06 0.10 0.23 0.86 2.24 Non-Biomass Renewable 0.39 0.48 0.69 1.87 6.35 Hydro 0.36 0.40 0.44 0.49 0.50

LIMITS – LOW CLIMATE IMPACT SCENARIOS AND THE IMPLICATION OF
REQUIRED TIGHT EMISSION CONTROL STRATEGIES PROJECT NO 282846
DELIVERABLE NO.D3.1
232
Models Fuels 2005 2010 2020 2050 2100 Solar CSP 1E-05 4E-03 0.02 0.18 0.94 Solar PV 9E-06 2E-03 0.06 0.51 2.88 Wind Offshore 2E-04 4E-04 0.00 0.52 1.12 Wind Onshore 0.03 0.08 0.17 0.17 0.91 Geothermal Ocean Others 3E-06 2E-06 1E-06 3E-07 2E-08
LIMITS2
AIM
-End
use
Coal w_CCS 0.02 Coal wo_CCS 1.87 1.64 1.17 1E-04 Oil w_CCS Oil wo_CCS 0.12 0.11 0.05 5E-04 Gas w_CCS Gas wo_CCS 0.24 0.89 2.98 18.23 Biomass w_CCS Biomass wo_CCS 0.01 0.01 5E-03 Nuclear 0.06 0.09 0.18 2.75 Non-Biomass Renewable 0.39 0.52 0.84 0.98 Hydro 0.36 0.51 0.67 0.89 Solar CSP Solar PV Wind Offshore Wind Onshore Geothermal Ocean Others
GC
AM
Coal w_CCS 0.02 1.38 1.84 Coal wo_CCS 1.73 2.82 5.29 10.80 7.01 Oil w_CCS 0.00 0.03 0.02 Oil wo_CCS 0.11 0.07 0.11 0.17 0.14 Gas w_CCS 0.01 0.28 0.39 Gas wo_CCS 0.22 0.41 0.84 2.20 2.02 Biomass w_CCS 0.00 0.23 0.90 Biomass wo_CCS 0.01 0.02 0.05 0.76 3.76 Nuclear 0.06 0.07 0.57 3.82 26.13 Non-Biomass Renewable 0.38 0.50 0.89 3.03 9.62 Hydro 0.36 0.37 0.40 0.78 1.41 Solar CSP 5E-03 0.10 0.59 3.61 Solar PV 1E-05 4E-03 0.05 1.04 3.80 Wind Offshore Wind Onshore
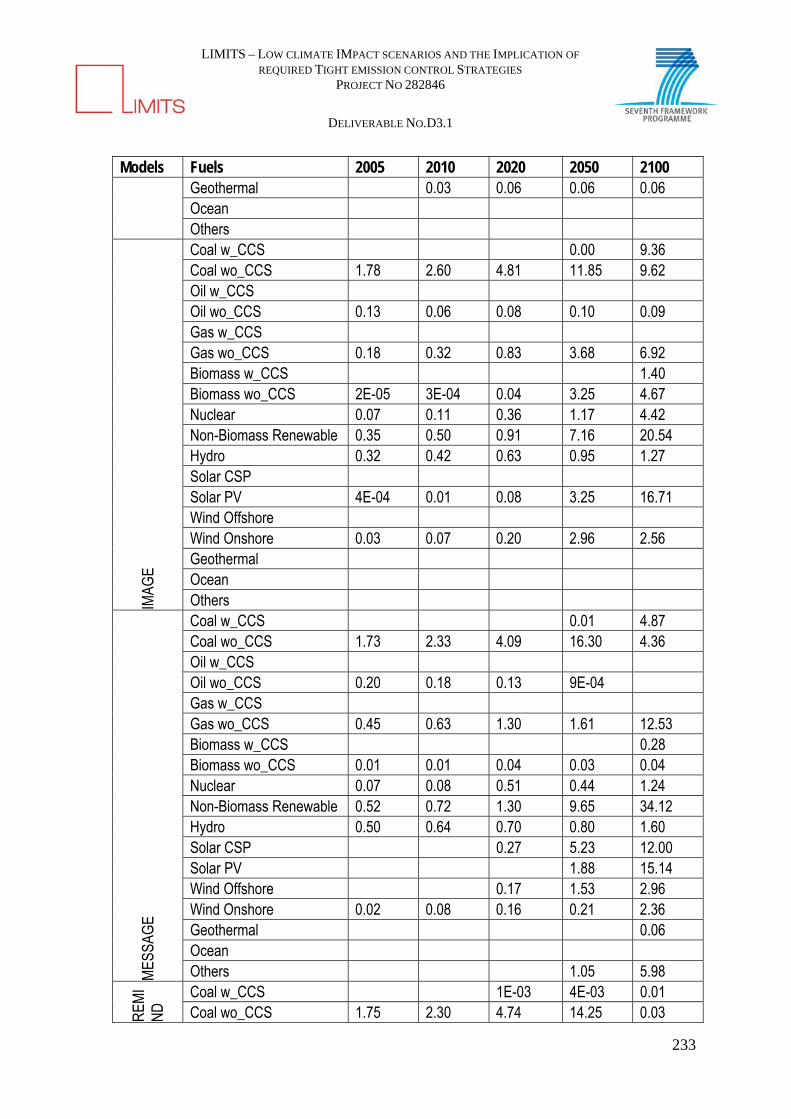
LIMITS – LOW CLIMATE IMPACT SCENARIOS AND THE IMPLICATION OF
REQUIRED TIGHT EMISSION CONTROL STRATEGIES PROJECT NO 282846
DELIVERABLE NO.D3.1
233
Models Fuels 2005 2010 2020 2050 2100 Geothermal 0.03 0.06 0.06 0.06 Ocean Others
IMAG
E
Coal w_CCS 0.00 9.36 Coal wo_CCS 1.78 2.60 4.81 11.85 9.62 Oil w_CCS Oil wo_CCS 0.13 0.06 0.08 0.10 0.09 Gas w_CCS Gas wo_CCS 0.18 0.32 0.83 3.68 6.92 Biomass w_CCS 1.40 Biomass wo_CCS 2E-05 3E-04 0.04 3.25 4.67 Nuclear 0.07 0.11 0.36 1.17 4.42 Non-Biomass Renewable 0.35 0.50 0.91 7.16 20.54 Hydro 0.32 0.42 0.63 0.95 1.27 Solar CSP Solar PV 4E-04 0.01 0.08 3.25 16.71 Wind Offshore Wind Onshore 0.03 0.07 0.20 2.96 2.56 Geothermal Ocean Others
MES
SAG
E
Coal w_CCS 0.01 4.87 Coal wo_CCS 1.73 2.33 4.09 16.30 4.36 Oil w_CCS Oil wo_CCS 0.20 0.18 0.13 9E-04 Gas w_CCS Gas wo_CCS 0.45 0.63 1.30 1.61 12.53 Biomass w_CCS 0.28 Biomass wo_CCS 0.01 0.01 0.04 0.03 0.04 Nuclear 0.07 0.08 0.51 0.44 1.24 Non-Biomass Renewable 0.52 0.72 1.30 9.65 34.12 Hydro 0.50 0.64 0.70 0.80 1.60 Solar CSP 0.27 5.23 12.00 Solar PV 1.88 15.14 Wind Offshore 0.17 1.53 2.96 Wind Onshore 0.02 0.08 0.16 0.21 2.36 Geothermal 0.06 Ocean Others 1.05 5.98
REM
IN
D Coal w_CCS 1E-03 4E-03 0.01
Coal wo_CCS 1.75 2.30 4.74 14.25 0.03

LIMITS – LOW CLIMATE IMPACT SCENARIOS AND THE IMPLICATION OF
REQUIRED TIGHT EMISSION CONTROL STRATEGIES PROJECT NO 282846
DELIVERABLE NO.D3.1
234
Models Fuels 2005 2010 2020 2050 2100 Oil w_CCS Oil wo_CCS 0.11 0.09 0.05 Gas w_CCS Gas wo_CCS 0.23 0.44 1.44 8.60 5.22 Biomass w_CCS 0.02 1.08 Biomass wo_CCS 0.00 0.52 0.69 Nuclear 0.06 0.08 0.51 6.89 19.62 Non-Biomass Renewable 0.39 0.50 0.76 2.27 41.55 Hydro 0.37 0.41 0.39 0.46 2.17 Solar CSP 0.00 0.01 10.02 Solar PV 2E-03 0.07 0.67 20.51 Wind Offshore Wind Onshore Geothermal 0.01 0.11 0.11 Ocean Others
TIAM
-EC
N
Coal w_CCS 0.03 2.93 0.00 Coal wo_CCS 1.73 2.22 4.96 9.38 1.67 Oil w_CCS 0.00 0.00 Oil wo_CCS 0.10 0.09 0.06 7E-07 7E-06 Gas w_CCS 3E-08 1E-06 9E-06 Gas wo_CCS 0.22 0.40 1.14 1.71 3.90 Biomass w_CCS 1E-08 8E-07 3E-06 Biomass wo_CCS 0.01 0.01 0.08 1.14 0.21 Nuclear 0.06 0.07 0.53 3.42 6.88 Non-Biomass Renewable 0.39 0.45 0.92 1.42 13.36 Hydro 0.37 0.38 0.49 0.77 1.28 Solar CSP 4E-04 4E-04 0.10 0.11 1.80 Solar PV 6E-09 4E-08 3E-07 5.98 Wind Offshore 6E-07 0.04 1.53 Wind Onshore 0.20 0.20 0.33 0.47 2.67 Geothermal 2E-07 0.03 0.10 Ocean Others 0.03 0.07 0.00
WIT
CH
Coal w_CCS 3E-05 2E-05 2E-05 0.00 5.72 Coal wo_CCS 1.73 2.97 5.98 16.77 1.02 Oil w_CCS Oil wo_CCS 0.12 0.25 0.44 0.62 0.61 Gas w_CCS 2E-03 1E-03 7E-04 2E-04 3.26 Gas wo_CCS 0.22 0.46 0.99 3.51 1.07 Biomass w_CCS 4E-11 4E-11 4E-11 4E-11 0.73
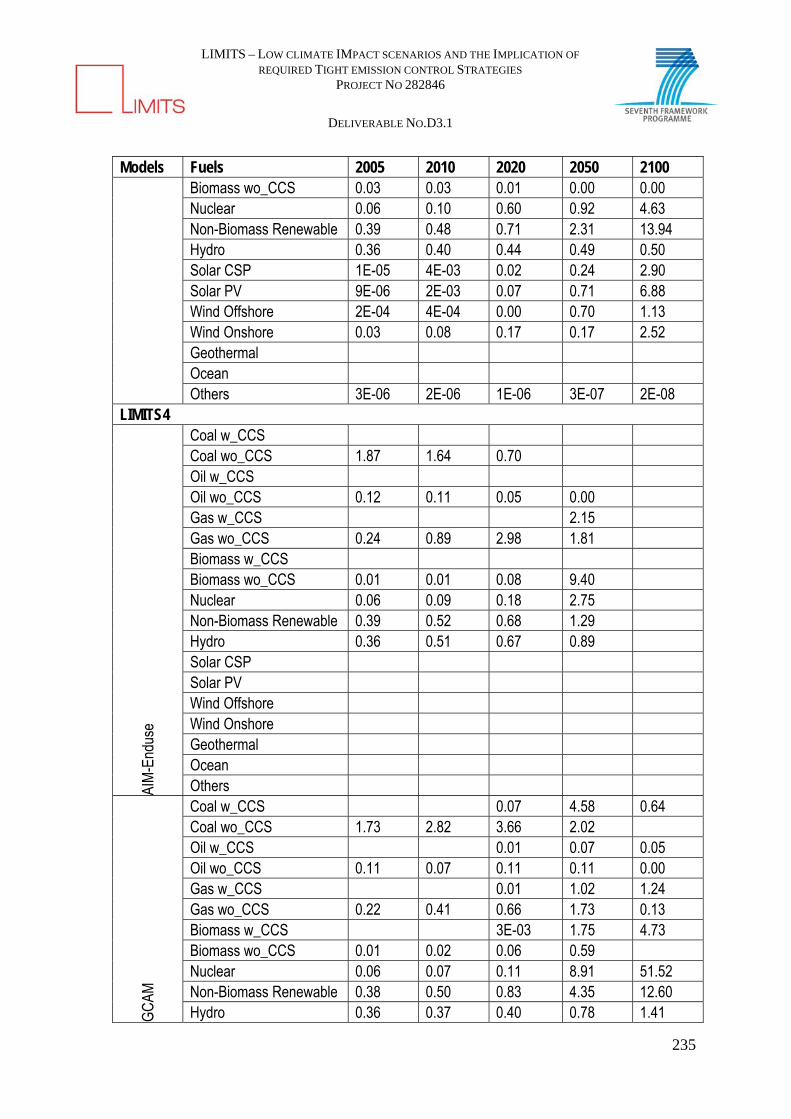
LIMITS – LOW CLIMATE IMPACT SCENARIOS AND THE IMPLICATION OF
REQUIRED TIGHT EMISSION CONTROL STRATEGIES PROJECT NO 282846
DELIVERABLE NO.D3.1
235
Models Fuels 2005 2010 2020 2050 2100 Biomass wo_CCS 0.03 0.03 0.01 0.00 0.00 Nuclear 0.06 0.10 0.60 0.92 4.63 Non-Biomass Renewable 0.39 0.48 0.71 2.31 13.94 Hydro 0.36 0.40 0.44 0.49 0.50 Solar CSP 1E-05 4E-03 0.02 0.24 2.90 Solar PV 9E-06 2E-03 0.07 0.71 6.88 Wind Offshore 2E-04 4E-04 0.00 0.70 1.13 Wind Onshore 0.03 0.08 0.17 0.17 2.52 Geothermal Ocean Others 3E-06 2E-06 1E-06 3E-07 2E-08
LIMITS4
AIM
-End
use
Coal w_CCS Coal wo_CCS 1.87 1.64 0.70 Oil w_CCS Oil wo_CCS 0.12 0.11 0.05 0.00 Gas w_CCS 2.15 Gas wo_CCS 0.24 0.89 2.98 1.81 Biomass w_CCS Biomass wo_CCS 0.01 0.01 0.08 9.40 Nuclear 0.06 0.09 0.18 2.75 Non-Biomass Renewable 0.39 0.52 0.68 1.29 Hydro 0.36 0.51 0.67 0.89 Solar CSP Solar PV Wind Offshore Wind Onshore Geothermal Ocean Others
GC
AM
Coal w_CCS 0.07 4.58 0.64 Coal wo_CCS 1.73 2.82 3.66 2.02 Oil w_CCS 0.01 0.07 0.05 Oil wo_CCS 0.11 0.07 0.11 0.11 0.00 Gas w_CCS 0.01 1.02 1.24 Gas wo_CCS 0.22 0.41 0.66 1.73 0.13 Biomass w_CCS 3E-03 1.75 4.73 Biomass wo_CCS 0.01 0.02 0.06 0.59 Nuclear 0.06 0.07 0.11 8.91 51.52 Non-Biomass Renewable 0.38 0.50 0.83 4.35 12.60 Hydro 0.36 0.37 0.40 0.78 1.41
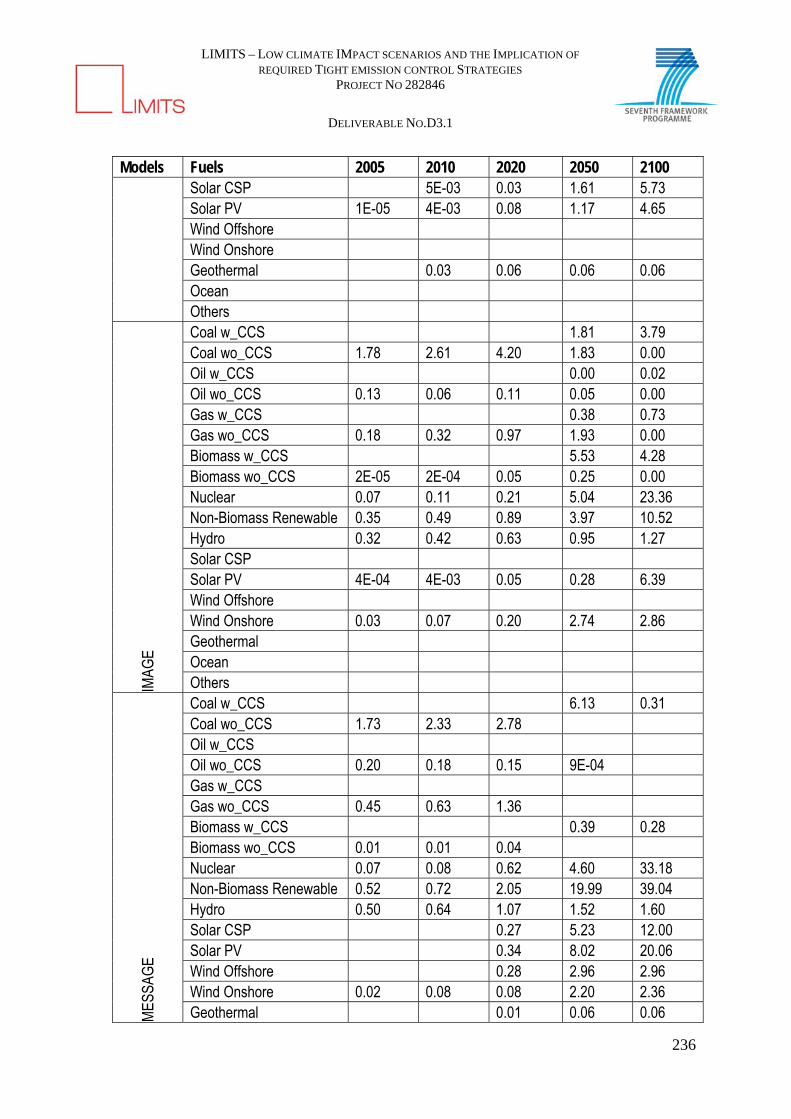
LIMITS – LOW CLIMATE IMPACT SCENARIOS AND THE IMPLICATION OF
REQUIRED TIGHT EMISSION CONTROL STRATEGIES PROJECT NO 282846
DELIVERABLE NO.D3.1
236
Models Fuels 2005 2010 2020 2050 2100 Solar CSP 5E-03 0.03 1.61 5.73 Solar PV 1E-05 4E-03 0.08 1.17 4.65 Wind Offshore Wind Onshore Geothermal 0.03 0.06 0.06 0.06 Ocean Others
IMAG
E
Coal w_CCS 1.81 3.79 Coal wo_CCS 1.78 2.61 4.20 1.83 0.00 Oil w_CCS 0.00 0.02 Oil wo_CCS 0.13 0.06 0.11 0.05 0.00 Gas w_CCS 0.38 0.73 Gas wo_CCS 0.18 0.32 0.97 1.93 0.00 Biomass w_CCS 5.53 4.28 Biomass wo_CCS 2E-05 2E-04 0.05 0.25 0.00 Nuclear 0.07 0.11 0.21 5.04 23.36 Non-Biomass Renewable 0.35 0.49 0.89 3.97 10.52 Hydro 0.32 0.42 0.63 0.95 1.27 Solar CSP Solar PV 4E-04 4E-03 0.05 0.28 6.39 Wind Offshore Wind Onshore 0.03 0.07 0.20 2.74 2.86 Geothermal Ocean Others
MES
SAG
E
Coal w_CCS 6.13 0.31 Coal wo_CCS 1.73 2.33 2.78 Oil w_CCS Oil wo_CCS 0.20 0.18 0.15 9E-04 Gas w_CCS Gas wo_CCS 0.45 0.63 1.36 Biomass w_CCS 0.39 0.28 Biomass wo_CCS 0.01 0.01 0.04 Nuclear 0.07 0.08 0.62 4.60 33.18 Non-Biomass Renewable 0.52 0.72 2.05 19.99 39.04 Hydro 0.50 0.64 1.07 1.52 1.60 Solar CSP 0.27 5.23 12.00 Solar PV 0.34 8.02 20.06 Wind Offshore 0.28 2.96 2.96 Wind Onshore 0.02 0.08 0.08 2.20 2.36 Geothermal 0.01 0.06 0.06
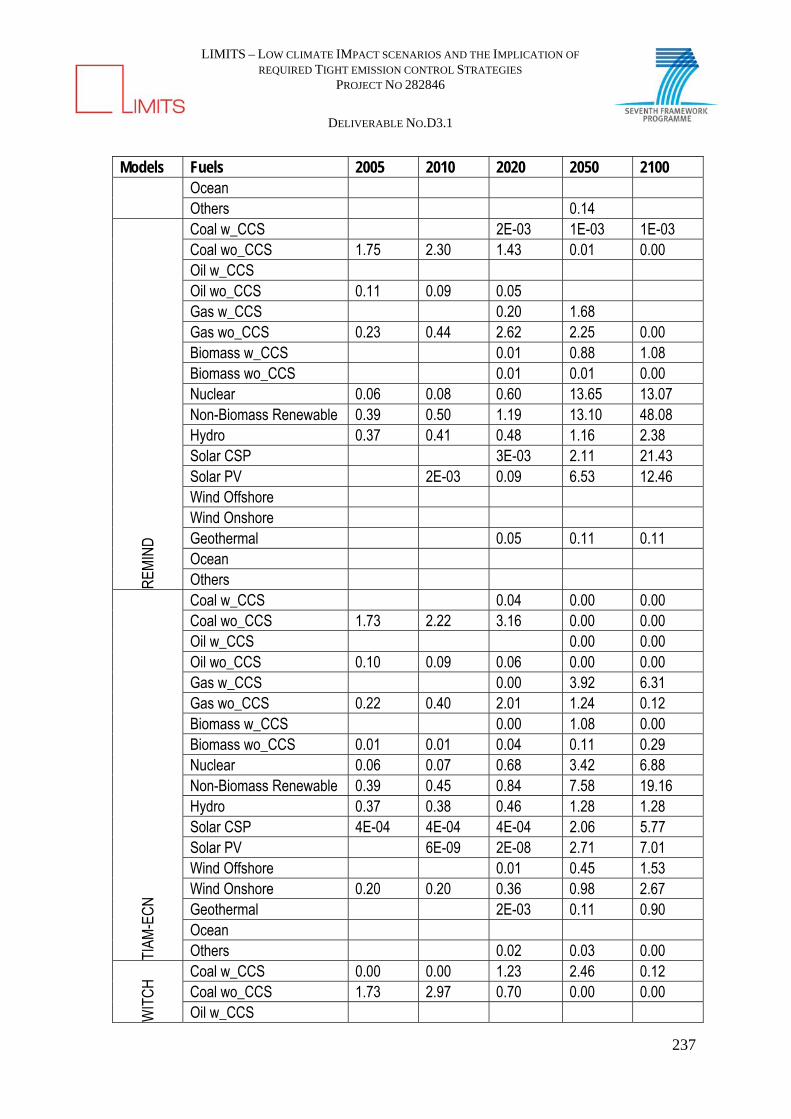
LIMITS – LOW CLIMATE IMPACT SCENARIOS AND THE IMPLICATION OF
REQUIRED TIGHT EMISSION CONTROL STRATEGIES PROJECT NO 282846
DELIVERABLE NO.D3.1
237
Models Fuels 2005 2010 2020 2050 2100 Ocean Others 0.14
REM
IND
Coal w_CCS 2E-03 1E-03 1E-03 Coal wo_CCS 1.75 2.30 1.43 0.01 0.00 Oil w_CCS Oil wo_CCS 0.11 0.09 0.05 Gas w_CCS 0.20 1.68 Gas wo_CCS 0.23 0.44 2.62 2.25 0.00 Biomass w_CCS 0.01 0.88 1.08 Biomass wo_CCS 0.01 0.01 0.00 Nuclear 0.06 0.08 0.60 13.65 13.07 Non-Biomass Renewable 0.39 0.50 1.19 13.10 48.08 Hydro 0.37 0.41 0.48 1.16 2.38 Solar CSP 3E-03 2.11 21.43 Solar PV 2E-03 0.09 6.53 12.46 Wind Offshore Wind Onshore Geothermal 0.05 0.11 0.11 Ocean Others
TIAM
-EC
N
Coal w_CCS 0.04 0.00 0.00 Coal wo_CCS 1.73 2.22 3.16 0.00 0.00 Oil w_CCS 0.00 0.00 Oil wo_CCS 0.10 0.09 0.06 0.00 0.00 Gas w_CCS 0.00 3.92 6.31 Gas wo_CCS 0.22 0.40 2.01 1.24 0.12 Biomass w_CCS 0.00 1.08 0.00 Biomass wo_CCS 0.01 0.01 0.04 0.11 0.29 Nuclear 0.06 0.07 0.68 3.42 6.88 Non-Biomass Renewable 0.39 0.45 0.84 7.58 19.16 Hydro 0.37 0.38 0.46 1.28 1.28 Solar CSP 4E-04 4E-04 4E-04 2.06 5.77 Solar PV 6E-09 2E-08 2.71 7.01 Wind Offshore 0.01 0.45 1.53 Wind Onshore 0.20 0.20 0.36 0.98 2.67 Geothermal 2E-03 0.11 0.90 Ocean Others 0.02 0.03 0.00
WIT
CH
Coal w_CCS 0.00 0.00 1.23 2.46 0.12 Coal wo_CCS 1.73 2.97 0.70 0.00 0.00 Oil w_CCS

LIMITS – LOW CLIMATE IMPACT SCENARIOS AND THE IMPLICATION OF
REQUIRED TIGHT EMISSION CONTROL STRATEGIES PROJECT NO 282846
DELIVERABLE NO.D3.1
238
Models Fuels 2005 2010 2020 2050 2100 Oil wo_CCS 0.12 0.25 0.72 0.31 0.04 Gas w_CCS 2E-03 1E-03 0.36 2.19 4.30 Gas wo_CCS 0.22 0.46 0.50 0.00 0.00 Biomass w_CCS 4E-11 4E-11 1E-05 0.73 0.75 Biomass wo_CCS 0.03 0.03 0.01 8E-04 7E-11 Nuclear 0.06 0.10 0.53 2.45 5.74 Non-Biomass Renewable 0.39 0.48 0.94 5.77 11.31 Hydro 0.36 0.40 0.44 0.49 0.50 Solar CSP 1E-05 4E-03 0.06 0.90 4.00 Solar PV 0.00 0.00 0.14 2.69 3.96 Wind Offshore 0.00 0.00 0.13 1.12 1.12 Wind Onshore 0.03 0.08 0.17 0.56 1.72 Geothermal Ocean Others 3E-06 2E-06 1E-06 3E-07 2E-08
LIMITS6
AIM
-End
use
Coal w_CCS Coal wo_CCS 1.87 1.64 1.17 Oil w_CCS Oil wo_CCS 0.12 0.11 0.05 3E-04 Gas w_CCS Gas wo_CCS 0.24 0.89 2.98 1.34 Biomass w_CCS 1.81 Biomass wo_CCS 0.01 0.01 5E-03 9.00 Nuclear 0.06 0.09 0.18 2.75 Non-Biomass Renewable 0.39 0.52 0.84 12.42 Hydro 0.36 0.51 0.67 2.04 Solar CSP Solar PV Wind Offshore Wind Onshore Geothermal Ocean Others
GC
AM
Coal w_CCS 0.02 4.72 0.65 Coal wo_CCS 1.73 2.82 5.29 2.06 Oil w_CCS 3E-03 0.07 0.06 Oil wo_CCS 0.11 0.07 0.11 0.10 0.00 Gas w_CCS 0.01 1.01 1.26 Gas wo_CCS 0.22 0.41 0.84 1.59 0.13 Biomass w_CCS 1E-03 1.89 4.85
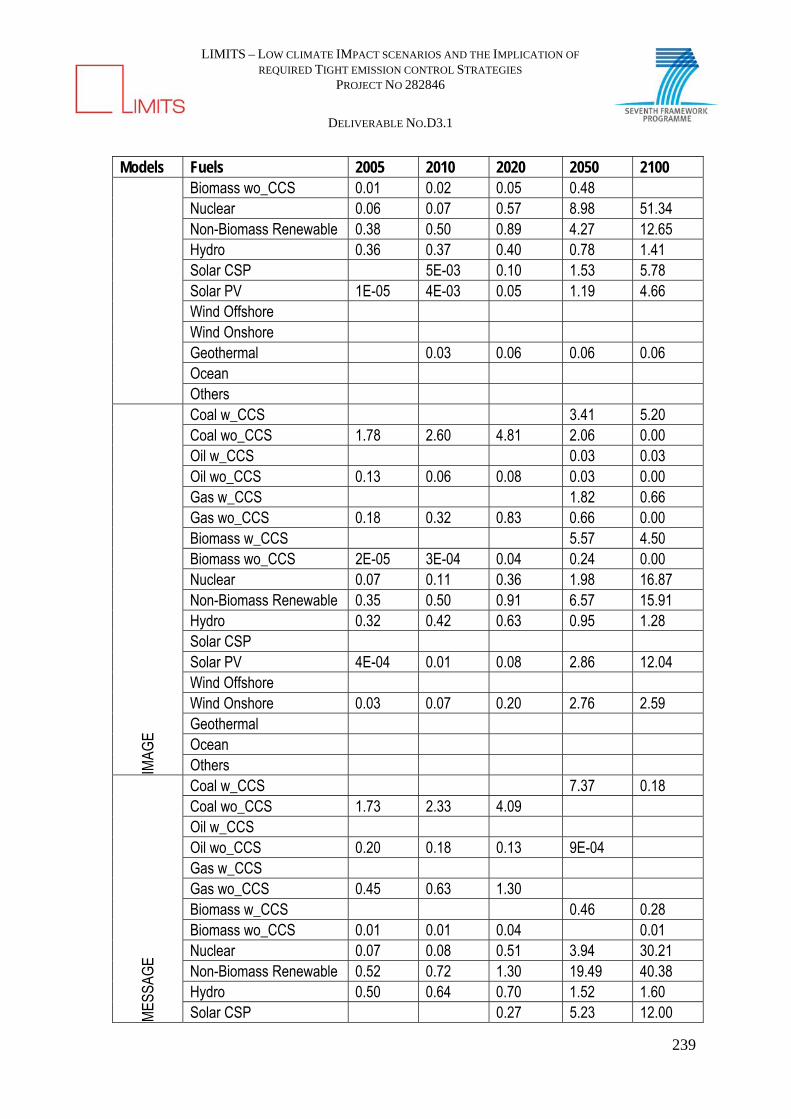
LIMITS – LOW CLIMATE IMPACT SCENARIOS AND THE IMPLICATION OF
REQUIRED TIGHT EMISSION CONTROL STRATEGIES PROJECT NO 282846
DELIVERABLE NO.D3.1
239
Models Fuels 2005 2010 2020 2050 2100 Biomass wo_CCS 0.01 0.02 0.05 0.48 Nuclear 0.06 0.07 0.57 8.98 51.34 Non-Biomass Renewable 0.38 0.50 0.89 4.27 12.65 Hydro 0.36 0.37 0.40 0.78 1.41 Solar CSP 5E-03 0.10 1.53 5.78 Solar PV 1E-05 4E-03 0.05 1.19 4.66 Wind Offshore Wind Onshore Geothermal 0.03 0.06 0.06 0.06 Ocean Others
IMAG
E
Coal w_CCS 3.41 5.20 Coal wo_CCS 1.78 2.60 4.81 2.06 0.00 Oil w_CCS 0.03 0.03 Oil wo_CCS 0.13 0.06 0.08 0.03 0.00 Gas w_CCS 1.82 0.66 Gas wo_CCS 0.18 0.32 0.83 0.66 0.00 Biomass w_CCS 5.57 4.50 Biomass wo_CCS 2E-05 3E-04 0.04 0.24 0.00 Nuclear 0.07 0.11 0.36 1.98 16.87 Non-Biomass Renewable 0.35 0.50 0.91 6.57 15.91 Hydro 0.32 0.42 0.63 0.95 1.28 Solar CSP Solar PV 4E-04 0.01 0.08 2.86 12.04 Wind Offshore Wind Onshore 0.03 0.07 0.20 2.76 2.59 Geothermal Ocean Others
MES
SAG
E
Coal w_CCS 7.37 0.18 Coal wo_CCS 1.73 2.33 4.09 Oil w_CCS Oil wo_CCS 0.20 0.18 0.13 9E-04 Gas w_CCS Gas wo_CCS 0.45 0.63 1.30 Biomass w_CCS 0.46 0.28 Biomass wo_CCS 0.01 0.01 0.04 0.01 Nuclear 0.07 0.08 0.51 3.94 30.21 Non-Biomass Renewable 0.52 0.72 1.30 19.49 40.38 Hydro 0.50 0.64 0.70 1.52 1.60 Solar CSP 0.27 5.23 12.00

LIMITS – LOW CLIMATE IMPACT SCENARIOS AND THE IMPLICATION OF
REQUIRED TIGHT EMISSION CONTROL STRATEGIES PROJECT NO 282846
DELIVERABLE NO.D3.1
240
Models Fuels 2005 2010 2020 2050 2100 Solar PV 7.36 21.40 Wind Offshore 0.17 2.96 2.96 Wind Onshore 0.02 0.08 0.16 2.36 2.36 Geothermal 0.06 0.06 Ocean Others 0.05
REM
IND
Coal w_CCS 1E-03 2E-03 1E-03 Coal wo_CCS 1.75 2.30 4.73 0.02 1E-03 Oil w_CCS Oil wo_CCS 0.11 0.09 0.05 Gas w_CCS 0.12 Gas wo_CCS 0.23 0.44 1.44 2.24 1E-03 Biomass w_CCS 1.00 1.09 Biomass wo_CCS 0.00 Nuclear 0.06 0.08 0.51 13.57 12.88 Non-Biomass Renewable 0.39 0.50 0.76 14.49 48.02 Hydro 0.37 0.41 0.39 1.18 2.38 Solar CSP 1E-03 3.06 21.21 Solar PV 2E-03 0.07 6.78 12.63 Wind Offshore Wind Onshore Geothermal 0.01 0.11 0.11 Ocean Others
TIAM
-EC
N
Coal w_CCS 0.04 2E-07 1E-07 Coal wo_CCS 1.73 2.22 4.84 1E-07 1E-07 Oil w_CCS 1E-08 2E-08 Oil wo_CCS 0.10 0.09 0.06 2E-07 1E-07 Gas w_CCS 2E-08 3.83 6.12 Gas wo_CCS 0.22 0.40 1.14 1.28 0.11 Biomass w_CCS 0.00 1.03 0.00 Biomass wo_CCS 0.01 0.01 0.07 0.11 0.29 Nuclear 0.06 0.07 0.67 3.42 6.88 Non-Biomass Renewable 0.39 0.45 0.92 7.58 19.16 Hydro 0.37 0.38 0.50 1.28 1.28 Solar CSP 4E-04 4E-04 0.11 2.06 5.77 Solar PV 6E-09 1E-08 2.71 7.01 Wind Offshore 2E-07 0.45 1.53 Wind Onshore 0.20 0.20 0.31 0.98 2.67 Geothermal 1E-07 0.11 0.90 Ocean
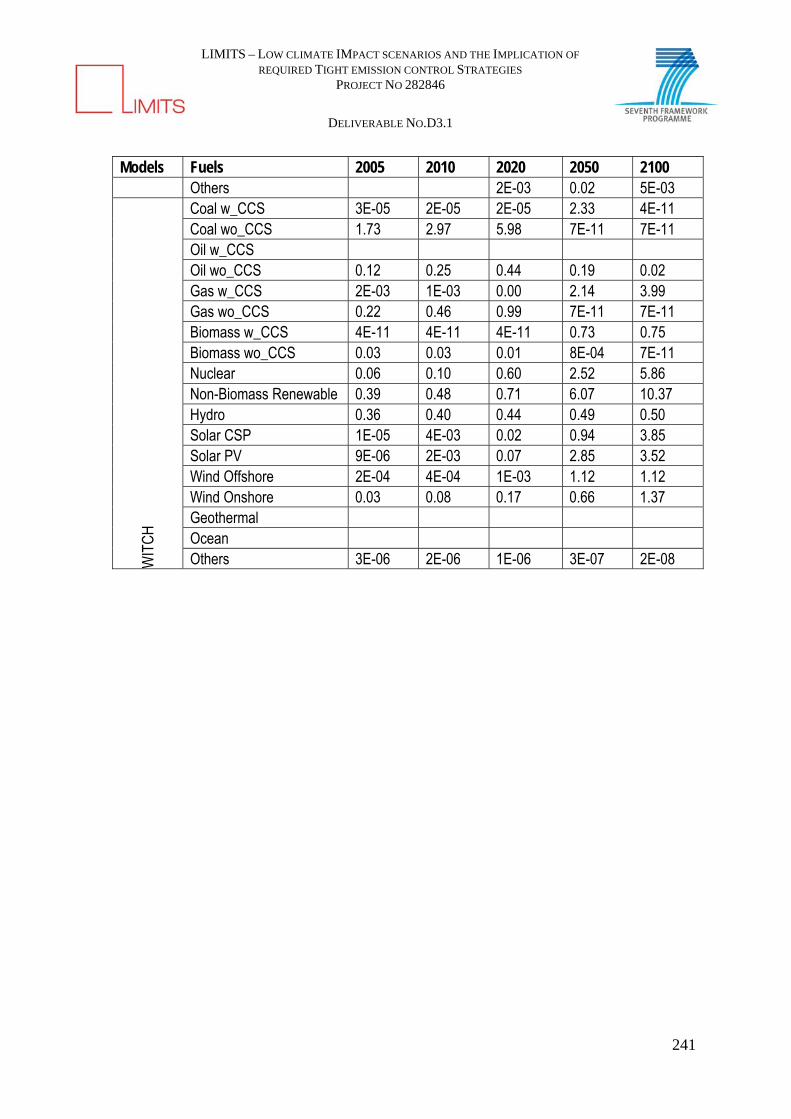
LIMITS – LOW CLIMATE IMPACT SCENARIOS AND THE IMPLICATION OF
REQUIRED TIGHT EMISSION CONTROL STRATEGIES PROJECT NO 282846
DELIVERABLE NO.D3.1
241
Models Fuels 2005 2010 2020 2050 2100 Others 2E-03 0.02 5E-03
WIT
CH
Coal w_CCS 3E-05 2E-05 2E-05 2.33 4E-11 Coal wo_CCS 1.73 2.97 5.98 7E-11 7E-11 Oil w_CCS Oil wo_CCS 0.12 0.25 0.44 0.19 0.02 Gas w_CCS 2E-03 1E-03 0.00 2.14 3.99 Gas wo_CCS 0.22 0.46 0.99 7E-11 7E-11 Biomass w_CCS 4E-11 4E-11 4E-11 0.73 0.75 Biomass wo_CCS 0.03 0.03 0.01 8E-04 7E-11 Nuclear 0.06 0.10 0.60 2.52 5.86 Non-Biomass Renewable 0.39 0.48 0.71 6.07 10.37 Hydro 0.36 0.40 0.44 0.49 0.50 Solar CSP 1E-05 4E-03 0.02 0.94 3.85 Solar PV 9E-06 2E-03 0.07 2.85 3.52 Wind Offshore 2E-04 4E-04 1E-03 1.12 1.12 Wind Onshore 0.03 0.08 0.17 0.66 1.37 Geothermal Ocean Others 3E-06 2E-06 1E-06 3E-07 2E-08
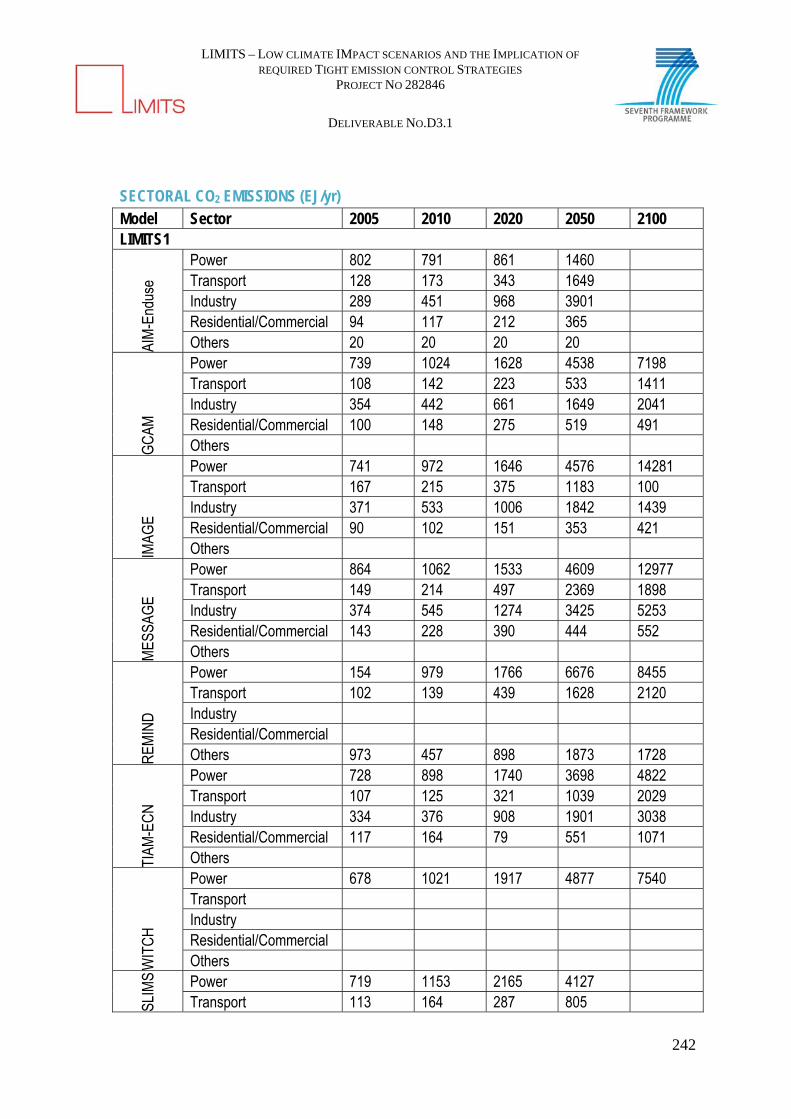
LIMITS – LOW CLIMATE IMPACT SCENARIOS AND THE IMPLICATION OF
REQUIRED TIGHT EMISSION CONTROL STRATEGIES PROJECT NO 282846
DELIVERABLE NO.D3.1
242
SECTORAL CO2 EMISSIONS (EJ/yr) Model Sector 2005 2010 2020 2050 2100 LIMITS1
AIM
-End
use
Power 802 791 861 1460 Transport 128 173 343 1649 Industry 289 451 968 3901 Residential/Commercial 94 117 212 365 Others 20 20 20 20
GC
AM
Power 739 1024 1628 4538 7198 Transport 108 142 223 533 1411 Industry 354 442 661 1649 2041 Residential/Commercial 100 148 275 519 491 Others
IMAG
E
Power 741 972 1646 4576 14281 Transport 167 215 375 1183 100 Industry 371 533 1006 1842 1439 Residential/Commercial 90 102 151 353 421 Others
MES
SAG
E
Power 864 1062 1533 4609 12977 Transport 149 214 497 2369 1898 Industry 374 545 1274 3425 5253 Residential/Commercial 143 228 390 444 552 Others
REM
IND
Power 154 979 1766 6676 8455 Transport 102 139 439 1628 2120 Industry Residential/Commercial Others 973 457 898 1873 1728
TIAM
-EC
N
Power 728 898 1740 3698 4822 Transport 107 125 321 1039 2029 Industry 334 376 908 1901 3038 Residential/Commercial 117 164 79 551 1071 Others
WIT
CH
Power 678 1021 1917 4877 7540 Transport Industry Residential/Commercial Others
SLIM
S Power 719 1153 2165 4127 Transport 113 164 287 805

LIMITS – LOW CLIMATE IMPACT SCENARIOS AND THE IMPLICATION OF
REQUIRED TIGHT EMISSION CONTROL STRATEGIES PROJECT NO 282846
DELIVERABLE NO.D3.1
243
Model Sector 2005 2010 2020 2050 2100 Industry 303 380 613 1522 Residential/Commercial 60 69 84 188 Others 19 32 58 160
LIMITS2
AIM
-End
use
Power 802 791 834 1716 Transport 128 173 343 890 Industry 289 451 968 2600 Residential/Commercial 94 117 172 363 Others 20 20 20 20
GC
AM
Power 739 1024 1703 3040 1736 Transport 108 142 222 524 1291 Industry 354 442 627 1257 1020 Residential/Commercial 100 148 249 476 354 Others
IMAG
E
Power 741 971 1597 3095 2793 Transport 167 215 374 996 92 Industry 371 533 1008 1522 549 Residential/Commercial 90 102 151 321 333 Others
MES
SAG
E
Power 864 1061 1388 4239 2509 Transport 149 214 490 2415 1267 Industry 374 545 1255 3423 4158 Residential/Commercial 143 228 280 457 454 Others
REM
IND
Power 154 978 1752 4102 154 Transport 102 139 442 1577 1796 Industry Residential/Commercial Others 973 457 925 1664 1469
TIAM
-EC
N
Power 728 898 1710 2433 965 Transport 107 125 318 1035 1292 Industry 334 376 916 1732 1528 Residential/Commercial 117 164 80 355 585 Others
WIT
CH
Power 678 1021 1792 4111 485 Transport Industry Residential/Commercial Others
SLIM
S Power 719 1237 2221 3706 Transport 113 164 287 787

LIMITS – LOW CLIMATE IMPACT SCENARIOS AND THE IMPLICATION OF
REQUIRED TIGHT EMISSION CONTROL STRATEGIES PROJECT NO 282846
DELIVERABLE NO.D3.1
244
Model Sector 2005 2010 2020 2050 2100 Industry 303 380 614 1424 Residential/Commercial 60 69 84 188 Others 19 32 58 160
LIMITS4
AIM
-End
use
Power 802 791 524 203 Transport 128 173 290 799 Industry 289 451 770 1184 Residential/Commercial 94 117 153 459 Others 20 20 20 20
GC
AM
Power 739 1024 1258 415 -1115 Transport 108 142 220 478 446 Industry 354 442 533 592 75 Residential/Commercial 100 148 228 329 9 Others
IMAG
E
Power 741 972 1450 -518 -1890 Transport 167 215 316 494 35 Industry 371 533 908 632 152 Residential/Commercial 90 102 139 240 195 Others
MES
SAG
E
Power 864 1061 1081 7 -672 Transport 149 214 464 855 846 Industry 374 545 773 1519 1097 Residential/Commercial 143 228 371 292 71 Others
REM
IND
Power 154 978 954 -264 -913 Transport 102 137 398 984 242 Industry Residential/Commercial Others 973 459 624 671 175
TIAM
-EC
N
Power 728 898 1029 -111 -445 Transport 107 125 298 672 64 Industry 334 376 806 761 84 Residential/Commercial 117 164 74 321 171 Others
WIT
CH
Power 678 1021 385 34 -47 Transport Industry Residential/Commercial Others
SLIM
S Power 719 1164 2031 1705 Transport 113 163 287 696
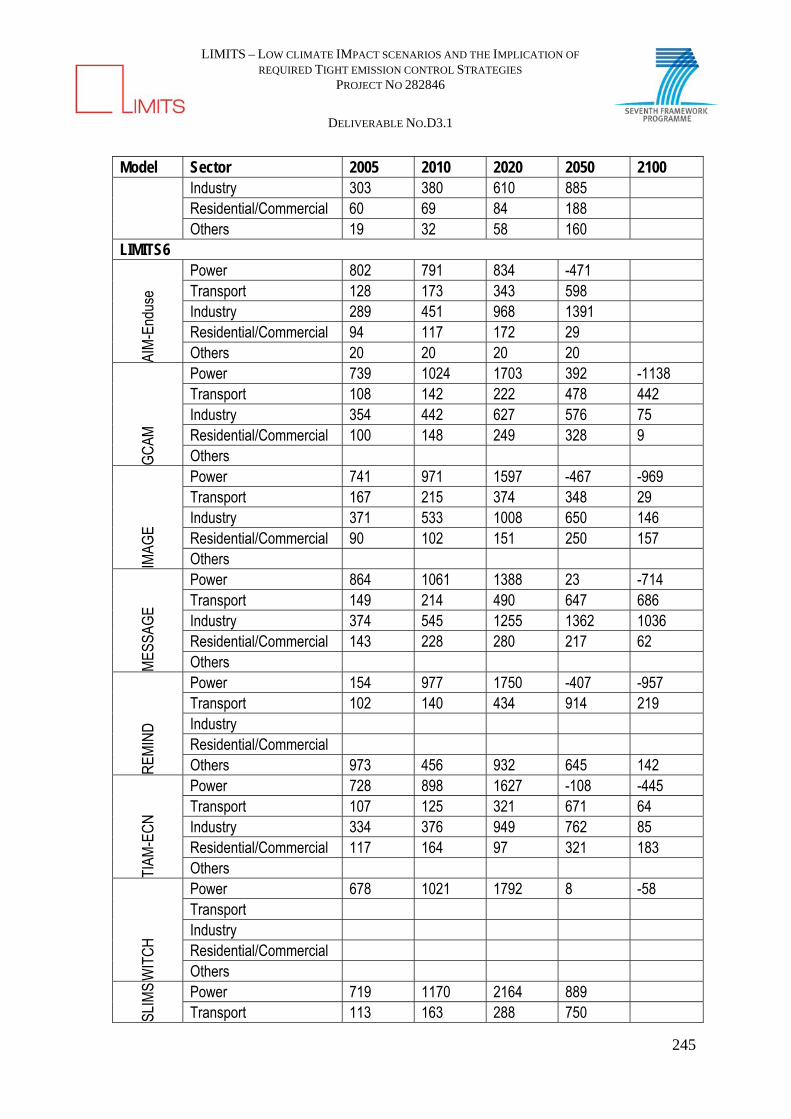
LIMITS – LOW CLIMATE IMPACT SCENARIOS AND THE IMPLICATION OF
REQUIRED TIGHT EMISSION CONTROL STRATEGIES PROJECT NO 282846
DELIVERABLE NO.D3.1
245
Model Sector 2005 2010 2020 2050 2100 Industry 303 380 610 885 Residential/Commercial 60 69 84 188 Others 19 32 58 160
LIMITS6
AIM
-End
use
Power 802 791 834 -471 Transport 128 173 343 598 Industry 289 451 968 1391 Residential/Commercial 94 117 172 29 Others 20 20 20 20
GC
AM
Power 739 1024 1703 392 -1138 Transport 108 142 222 478 442 Industry 354 442 627 576 75 Residential/Commercial 100 148 249 328 9 Others
IMAG
E
Power 741 971 1597 -467 -969 Transport 167 215 374 348 29 Industry 371 533 1008 650 146 Residential/Commercial 90 102 151 250 157 Others
MES
SAG
E
Power 864 1061 1388 23 -714 Transport 149 214 490 647 686 Industry 374 545 1255 1362 1036 Residential/Commercial 143 228 280 217 62 Others
REM
IND
Power 154 977 1750 -407 -957 Transport 102 140 434 914 219 Industry Residential/Commercial Others 973 456 932 645 142
TIAM
-EC
N
Power 728 898 1627 -108 -445 Transport 107 125 321 671 64 Industry 334 376 949 762 85 Residential/Commercial 117 164 97 321 183 Others
WIT
CH
Power 678 1021 1792 8 -58 Transport Industry Residential/Commercial Others
SLIM
S Power 719 1170 2164 889 Transport 113 163 288 750

LIMITS – LOW CLIMATE IMPACT SCENARIOS AND THE IMPLICATION OF
REQUIRED TIGHT EMISSION CONTROL STRATEGIES PROJECT NO 282846
DELIVERABLE NO.D3.1
246
Model Sector 2005 2010 2020 2050 2100 Industry 303 380 614 895 Residential/Commercial 60 69 84 188 Others 19 32 58 160

LIMITS – LOW CLIMATE IMPACT SCENARIOS AND THE IMPLICATION OF
REQUIRED TIGHT EMISSION CONTROL STRATEGIES PROJECT NO 282846
DELIVERABLE NO.D3.1
247
SECTORAL CH4 EMISSIONS (Mt/yr) Model Sector 2005 2010 2020 2050 2100 LIMITS1
AIM
-End
use
FF&Industry 39.38 40.32 42.20 47.12 Energy Supply 0.01 0.01 0.01 0.03 Demand_Industry 0.06 0.08 0.12 0.26 Demand_Residential 1.92 2.04 1.91 0.76 Aviation Ground Navigation Agri Waste burning Forest burning Savannah burning Solvents Waste 5.78 5.97 6.45 9.32 Others 4.83 4.92 5.48 6.48
GC
AM
FF&Industry 12.70 12.85 14.53 21.84 23.79 Energy Supply 2.31 1.40 1.54 7.60 17.68 Demand_Industry 0.06 0.08 0.12 0.28 0.40 Demand_Residential 3.16 3.51 4.23 4.20 1.06 Aviation 0.00 0.00 0.00 0.00 0.01 Ground 0.04 0.05 0.08 0.15 0.13 Navigation 0.00 0.00 0.00 0.00 0.00 Agri Waste burning 0.03 0.03 0.04 0.04 0.02 Forest burning 0.17 0.17 0.18 0.11 0.06 Savannah burning 0.03 0.03 0.02 0.02 0.02 Solvents Waste 7.13 7.81 8.56 9.62 4.51 Others
IMAG
E
FF&Industry Energy Supply 3.23 4.07 6.71 24.40 63.62 Demand_Industry 0.06 0.07 0.10 0.18 0.10 Demand_Residential 1.69 1.75 1.73 0.76 0.09 Aviation Ground Navigation Agri Waste burning 0.38 0.38 0.36 0.25 0.18 Forest burning 0.01 0.03 0.26 0.00 Savannah burning 0.46 0.49 0.68 0.54 0.41 Solvents
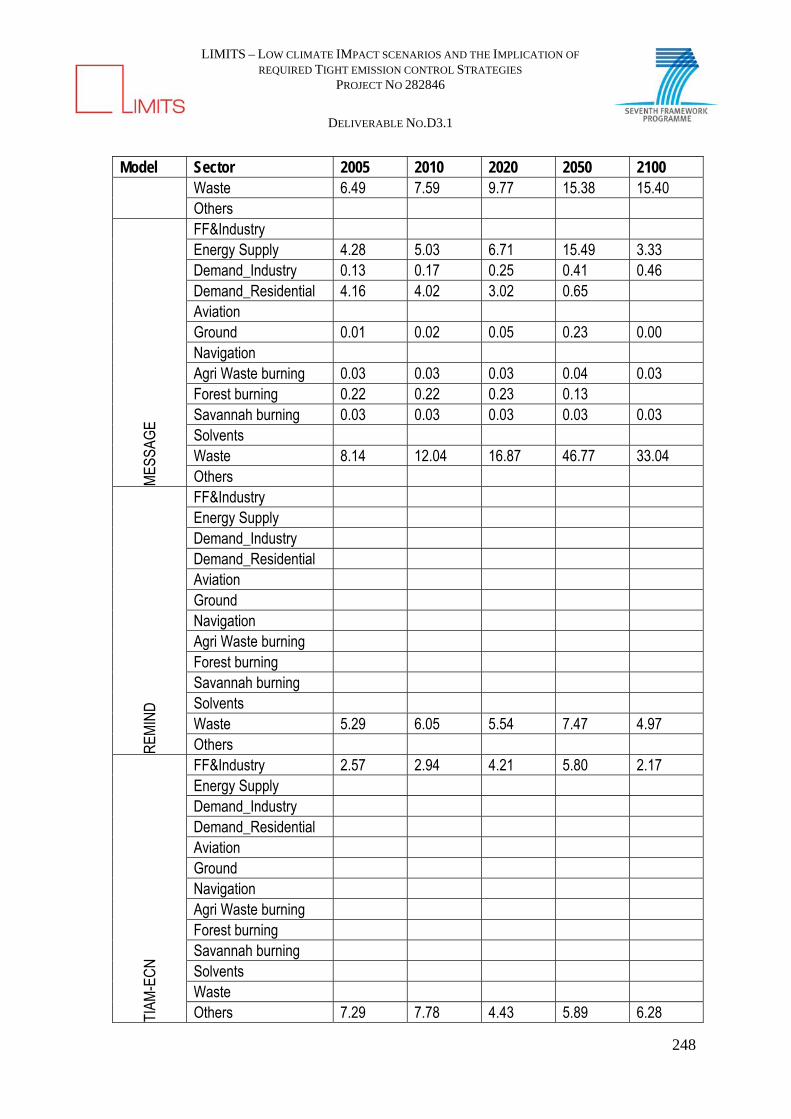
LIMITS – LOW CLIMATE IMPACT SCENARIOS AND THE IMPLICATION OF
REQUIRED TIGHT EMISSION CONTROL STRATEGIES PROJECT NO 282846
DELIVERABLE NO.D3.1
248
Model Sector 2005 2010 2020 2050 2100 Waste 6.49 7.59 9.77 15.38 15.40 Others
MES
SAG
E
FF&Industry Energy Supply 4.28 5.03 6.71 15.49 3.33 Demand_Industry 0.13 0.17 0.25 0.41 0.46 Demand_Residential 4.16 4.02 3.02 0.65 Aviation Ground 0.01 0.02 0.05 0.23 0.00 Navigation Agri Waste burning 0.03 0.03 0.03 0.04 0.03 Forest burning 0.22 0.22 0.23 0.13 Savannah burning 0.03 0.03 0.03 0.03 0.03 Solvents Waste 8.14 12.04 16.87 46.77 33.04 Others
REM
IND
FF&Industry Energy Supply Demand_Industry Demand_Residential Aviation Ground Navigation Agri Waste burning Forest burning Savannah burning Solvents Waste 5.29 6.05 5.54 7.47 4.97 Others
TIAM
-EC
N
FF&Industry 2.57 2.94 4.21 5.80 2.17 Energy Supply Demand_Industry Demand_Residential Aviation Ground Navigation Agri Waste burning Forest burning Savannah burning Solvents Waste Others 7.29 7.78 4.43 5.89 6.28

LIMITS – LOW CLIMATE IMPACT SCENARIOS AND THE IMPLICATION OF
REQUIRED TIGHT EMISSION CONTROL STRATEGIES PROJECT NO 282846
DELIVERABLE NO.D3.1
249
Model Sector 2005 2010 2020 2050 2100 W
ITC
H
FF&Industry Energy Supply Demand_Industry Demand_Residential Aviation Ground Navigation Agri Waste burning Forest burning Savannah burning Solvents Waste Others
LIMITS2
AIM
-End
use
FF&Industry 39.38 40.32 42.00 32.96 Energy Supply 0.01 0.01 0.01 0.03 Demand_Industry 0.06 0.08 0.12 0.24 Demand_Residential 1.92 2.04 2.09 0.76 Aviation Ground Navigation Agri Waste burning Forest burning Savannah burning Solvents Waste 5.78 5.97 6.45 4.42 Others 4.83 4.92 5.09 4.49
GC
AM
FF&Industry 12.70 12.85 13.97 20.58 20.62 Energy Supply 2.31 1.40 1.44 5.44 14.87 Demand_Industry 0.06 0.08 0.11 0.30 0.38 Demand_Residential 3.16 3.51 3.85 5.18 1.06 Aviation 0.00 0.00 0.00 0.00 0.01 Ground 0.04 0.05 0.08 0.14 0.12 Navigation 0.00 0.00 0.00 0.00 0.00 Agri Waste burning 0.03 0.03 0.04 0.04 0.02 Forest burning 0.17 0.17 0.20 0.10 0.19 Savannah burning 0.03 0.03 0.02 0.02 0.02 Solvents Waste 7.13 7.81 8.50 9.51 4.19 Others
IM AG E FF&Industry

LIMITS – LOW CLIMATE IMPACT SCENARIOS AND THE IMPLICATION OF
REQUIRED TIGHT EMISSION CONTROL STRATEGIES PROJECT NO 282846
DELIVERABLE NO.D3.1
250
Model Sector 2005 2010 2020 2050 2100 Energy Supply 3.23 4.07 6.59 6.81 4.31 Demand_Industry 0.06 0.07 0.10 0.16 0.08 Demand_Residential 1.69 1.75 1.73 0.75 0.08 Aviation Ground Navigation Agri Waste burning 0.38 0.38 0.36 0.25 0.18 Forest burning 0.01 0.01 0.32 Savannah burning 0.46 0.49 0.68 0.52 0.41 Solvents Waste 6.49 7.59 9.77 14.45 12.65 Others
MES
SAG
E
FF&Industry Energy Supply 4.28 5.03 6.83 15.77 3.09 Demand_Industry 0.13 0.17 0.25 0.39 0.45 Demand_Residential 4.16 4.02 3.06 0.65 Aviation Ground 0.01 0.02 0.05 0.24 Navigation Agri Waste burning 0.03 0.03 0.03 0.04 0.03 Forest burning 0.22 0.22 0.23 0.13 Savannah burning 0.03 0.03 0.03 0.03 0.03 Solvents Waste 8.14 12.04 16.71 46.60 32.34 Others
REM
IND
FF&Industry Energy Supply Demand_Industry Demand_Residential Aviation Ground Navigation Agri Waste burning Forest burning Savannah burning Solvents Waste 5.29 6.05 5.61 5.96 2.61 Others
TIAM
-EC
N
FF&Industry 2.57 2.94 4.48 1.23 3.19 Energy Supply Demand_Industry
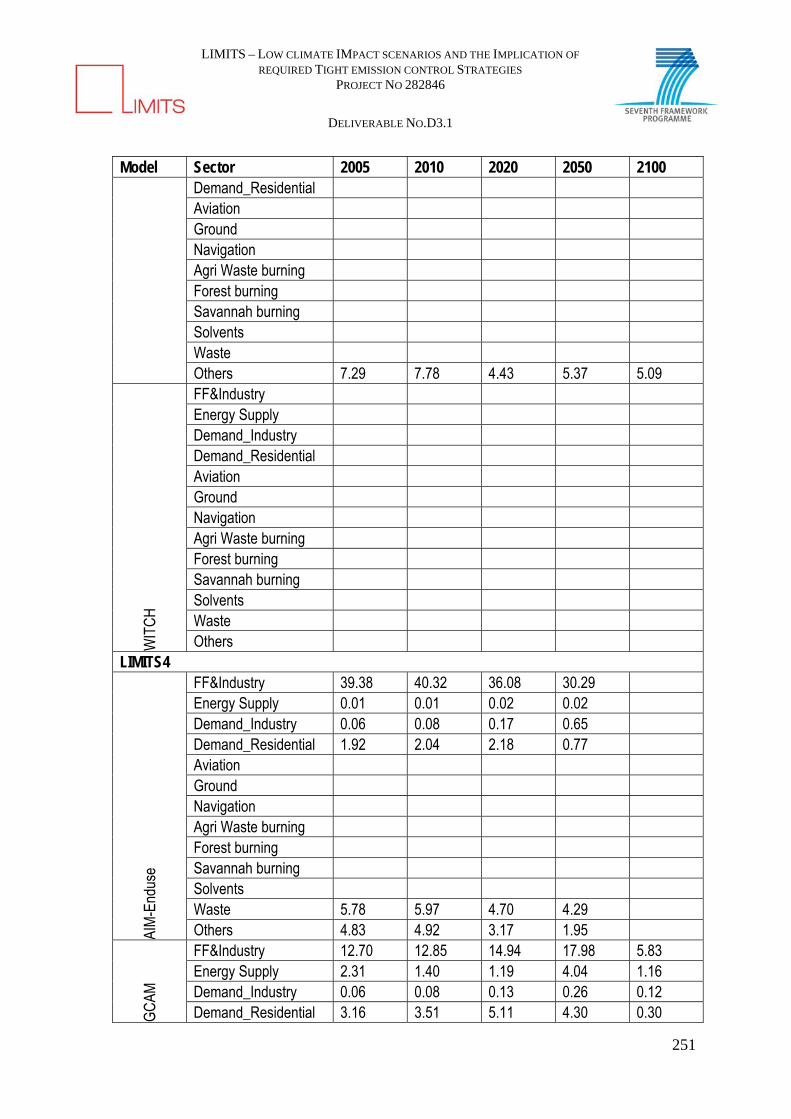
LIMITS – LOW CLIMATE IMPACT SCENARIOS AND THE IMPLICATION OF
REQUIRED TIGHT EMISSION CONTROL STRATEGIES PROJECT NO 282846
DELIVERABLE NO.D3.1
251
Model Sector 2005 2010 2020 2050 2100 Demand_Residential Aviation Ground Navigation Agri Waste burning Forest burning Savannah burning Solvents Waste Others 7.29 7.78 4.43 5.37 5.09
WIT
CH
FF&Industry Energy Supply Demand_Industry Demand_Residential Aviation Ground Navigation Agri Waste burning Forest burning Savannah burning Solvents Waste Others
LIMITS4
AIM
-End
use
FF&Industry 39.38 40.32 36.08 30.29 Energy Supply 0.01 0.01 0.02 0.02 Demand_Industry 0.06 0.08 0.17 0.65 Demand_Residential 1.92 2.04 2.18 0.77 Aviation Ground Navigation Agri Waste burning Forest burning Savannah burning Solvents Waste 5.78 5.97 4.70 4.29 Others 4.83 4.92 3.17 1.95
GC
AM
FF&Industry 12.70 12.85 14.94 17.98 5.83 Energy Supply 2.31 1.40 1.19 4.04 1.16 Demand_Industry 0.06 0.08 0.13 0.26 0.12 Demand_Residential 3.16 3.51 5.11 4.30 0.30

LIMITS – LOW CLIMATE IMPACT SCENARIOS AND THE IMPLICATION OF
REQUIRED TIGHT EMISSION CONTROL STRATEGIES PROJECT NO 282846
DELIVERABLE NO.D3.1
252
Model Sector 2005 2010 2020 2050 2100 Aviation 0.00 0.00 0.00 0.00 0.00 Ground 0.04 0.05 0.08 0.13 0.03 Navigation 0.00 0.00 0.00 0.00 0.00 Agri Waste burning 0.03 0.03 0.04 0.05 0.02 Forest burning 0.17 0.17 0.13 0.12 0.10 Savannah burning 0.03 0.03 0.02 0.01 0.01 Solvents Waste 7.13 7.81 8.44 9.26 4.22 Others
IMAG
E
FF&Industry Energy Supply 3.23 4.07 6.01 2.97 1.64 Demand_Industry 0.06 0.07 0.09 0.12 0.05 Demand_Residential 1.69 1.75 1.72 0.84 0.10 Aviation Ground Navigation Agri Waste burning 0.38 0.38 0.36 0.25 0.18 Forest burning 0.01 0.34 Savannah burning 0.45 0.48 0.69 0.51 0.42 Solvents Waste 6.49 7.46 6.20 3.99 -0.75 Others
MES
SAG
E
FF&Industry Energy Supply 4.28 5.03 3.65 10.05 3.17 Demand_Industry 0.13 0.17 0.26 0.28 0.29 Demand_Residential 4.16 4.02 2.83 0.65 Aviation Ground 0.01 0.02 0.05 0.06 Navigation Agri Waste burning 0.03 0.03 0.03 0.04 0.03 Forest burning 0.22 0.22 0.23 0.13 Savannah burning 0.03 0.03 0.03 0.03 0.03 Solvents Waste 8.14 12.04 15.96 43.98 30.11 Others
REM
IND
FF&Industry Energy Supply Demand_Industry Demand_Residential Aviation Ground

LIMITS – LOW CLIMATE IMPACT SCENARIOS AND THE IMPLICATION OF
REQUIRED TIGHT EMISSION CONTROL STRATEGIES PROJECT NO 282846
DELIVERABLE NO.D3.1
253
Model Sector 2005 2010 2020 2050 2100 Navigation Agri Waste burning Forest burning Savannah burning Solvents Waste 5.29 6.05 4.77 1.98 1.51 Others
TIAM
-EC
N
FF&Industry 2.57 2.94 4.37 5.88 1.79 Energy Supply Demand_Industry Demand_Residential Aviation Ground Navigation Agri Waste burning Forest burning Savannah burning Solvents Waste Others 7.29 7.78 4.42 5.50 5.02
WIT
CH
FF&Industry Energy Supply Demand_Industry Demand_Residential Aviation Ground Navigation Agri Waste burning Forest burning Savannah burning Solvents Waste Others
LIMITS6
AIM
-End
use
FF&Industry 39.38 40.32 42.00 29.33 Energy Supply 0.01 0.01 0.01 0.00 Demand_Industry 0.06 0.08 0.12 0.60 Demand_Residential 1.92 2.04 2.09 0.50 Aviation Ground Navigation

LIMITS – LOW CLIMATE IMPACT SCENARIOS AND THE IMPLICATION OF
REQUIRED TIGHT EMISSION CONTROL STRATEGIES PROJECT NO 282846
DELIVERABLE NO.D3.1
254
Model Sector 2005 2010 2020 2050 2100 Agri Waste burning Forest burning Savannah burning Solvents Waste 5.78 5.97 6.45 4.29 Others 4.83 4.92 5.09 1.43
GC
AM
FF&Industry 12.70 12.85 13.97 17.89 5.82 Energy Supply 2.31 1.40 1.44 3.99 1.15 Demand_Industry 0.06 0.08 0.11 0.25 0.12 Demand_Residential 3.16 3.51 3.85 4.26 0.30 Aviation 0.00 0.00 0.00 0.00 0.00 Ground 0.04 0.05 0.08 0.13 0.03 Navigation 0.00 0.00 0.00 0.00 0.00 Agri Waste burning 0.03 0.03 0.04 0.05 0.02 Forest burning 0.17 0.17 0.20 0.12 0.10 Savannah burning 0.03 0.03 0.02 0.01 0.01 Solvents Waste 7.13 7.81 8.50 9.26 4.22 Others
IMAG
E
FF&Industry Energy Supply 3.23 4.07 6.59 4.65 1.84 Demand_Industry 0.06 0.07 0.10 0.12 0.04 Demand_Residential 1.69 1.75 1.73 0.84 0.09 Aviation Ground Navigation Agri Waste burning 0.38 0.38 0.36 0.25 0.18 Forest burning 0.01 0.01 0.27 Savannah burning 0.46 0.49 0.68 0.51 0.42 Solvents Waste 6.49 7.59 9.37 7.15 1.98 Others
MES
SAG
E
FF&Industry Energy Supply 4.28 5.03 6.83 10.76 2.88 Demand_Industry 0.13 0.17 0.25 0.25 0.27 Demand_Residential 4.16 4.02 3.06 Aviation Ground 0.01 0.02 0.05 0.03 Navigation Agri Waste burning 0.03 0.03 0.03 0.04 0.03 Forest burning 0.22 0.22 0.23 0.13

LIMITS – LOW CLIMATE IMPACT SCENARIOS AND THE IMPLICATION OF
REQUIRED TIGHT EMISSION CONTROL STRATEGIES PROJECT NO 282846
DELIVERABLE NO.D3.1
255
Model Sector 2005 2010 2020 2050 2100 Savannah burning 0.03 0.03 0.03 0.03 0.03 Solvents Waste 8.14 12.04 16.71 43.58 29.85 Others
REM
IND
FF&Industry Energy Supply Demand_Industry Demand_Residential Aviation Ground Navigation Agri Waste burning Forest burning Savannah burning Solvents Waste 5.29 6.05 5.61 1.98 1.51 Others
TIAM
-EC
N
FF&Industry 2.57 2.94 5.54 5.88 1.79 Energy Supply Demand_Industry Demand_Residential Aviation Ground Navigation Agri Waste burning Forest burning Savannah burning Solvents Waste Others 7.29 7.78 4.82 5.50 5.02
WIT
CH
FF&Industry Energy Supply Demand_Industry Demand_Residential Aviation Ground Navigation Agri Waste burning Forest burning Savannah burning Solvents

LIMITS – LOW CLIMATE IMPACT SCENARIOS AND THE IMPLICATION OF
REQUIRED TIGHT EMISSION CONTROL STRATEGIES PROJECT NO 282846
DELIVERABLE NO.D3.1
256
Model Sector 2005 2010 2020 2050 2100 Waste Others

LIMITS – LOW CLIMATE IMPACT SCENARIOS AND THE IMPLICATION OF
REQUIRED TIGHT EMISSION CONTROL STRATEGIES PROJECT NO 282846
DELIVERABLE NO.D3.1
257
SECTORAL N2O EMISSIONS (Mt/yr) Model Sector 2005 2010 2020 2050 2100 LIMITS1
AIM
-En
duse
FF&Industry Landuse Others
GC
AM FF&Industry 84 97 129 208 219
Landuse 904 1017 1177 1760 1648 Others
IMAG
E
FF&Industry Landuse Others
MES
SAG
E
FF&Industry 30 44 76 281 37 Landuse Others 1856 1949 2202 2853 4371
REM
IND
FF&Industry 24 30 44 91 150 Landuse 815 963 1259 2128 2427 Others 43 49 63 98 108
TIAM
-EC
N
FF&Industry 71 71 79 205 466 Landuse 543 567 220 166 130 Others 116 125 42 111 153
LIMITS2
AIM
-En
duse
FF&Industry Landuse Others
GC
AM FF&Industry 84 97 117 190 131
Landuse 904 1017 1187 1574 1410 Others
IMAG
E
FF&Industry Landuse Others
MES
SAG
E
FF&Industry 30 44 76 284 34 Landuse Others 1856 1949 2149 2707 2037
REM
IND
FF&Industry 24 30 44 76 108 Landuse 815 963 1198 1593 1523 Others 43 49 63 98 108
TIAM
-EC
N
FF&Industry 71 71 79 24 43 Landuse 543 567 220 166 117 Others 116 125 41 103 50

LIMITS – LOW CLIMATE IMPACT SCENARIOS AND THE IMPLICATION OF
REQUIRED TIGHT EMISSION CONTROL STRATEGIES PROJECT NO 282846
DELIVERABLE NO.D3.1
258
Model Sector 2005 2010 2020 2050 2100 LIMITS4
AIM
-En
duse
FF&Industry Landuse Others
GC
AM FF&Industry 84 97 131 141 36
Landuse 904 1017 1142 1572 1334 Others
IMAG
E
FF&Industry Landuse Others
MES
SAG
E
FF&Industry 30 44 72 75 8 Landuse Others 1856 1949 2138 2591 2037
REM
IND
FF&Industry 24 30 37 68 96 Landuse 815 963 1044 1460 1419 Others 43 49 60 71 64
TIAM
-EC
N
FF&Industry 71 71 13 17 41 Landuse 543 567 220 114 62 Others 116 125 31 65 12
LIMITS6
AIM
-En
duse
FF&Industry Landuse Others
GC
AM FF&Industry 84 97 109 158 38
Landuse 904 1017 1216 1591 1333 Others
IMAG
E
FF&Industry Landuse Others
MES
SAG
E
FF&Industry 30 44 76 117 8 Landuse Others 1856 1949 2154 2596 2037
REM
IND
FF&Industry 24 30 44 69 96 Landuse 815 963 1180 1450 1411 Others 43 49 63 77 64
TIAM
-EC
N
FF&Industry 71 71 14 22 36 Landuse 543 567 220 154 62 Others 116 125 40 80 9
LIMITS – LOW CLIMATE IMPACT SCENARIOS AND THE IMPLICATION OF
REQUIRED TIGHT EMISSION CONTROL STRATEGIES PROJECT NO 282846
DELIVERABLE NO.D3.1
259
28 APPENDIX C: FIRM LEVEL EMISSION TRENDS
28.1 Emission Intensity Trends for Companies15 There have been continuous initiatives on policies and measures to enhance energy efficiency across various sectors in India. These measures are sometimes mandated through regulation by the Government of India and the state governments, while sometimes endogenously initiated by industry players due to market dynamics and technology development. The Indian corporate sector consists of thousands of companies operating in almost all sectors of the economy. Many of these are listed in various bourses around the world. We have analyzed the top 100 Indian companies on their energy consumption and emission intensity trends over 2008-09 until 2012-14. We have also compared the Indian top 100 companies, termed Bombay Stock Exchange (BSE) 100 with the global 100 companies for their GHG emission intensity of revenue.
The top 100 Global and Indian companies have been ranked based on their greenhouse gas emission intensity. The Global-100 listing was based on the Fortune 500 list for the calendar year (CY) 2013 and the Indian listing on the BSE 100 for the financial year (FY) 2012-1316. The highest ranked company is the one with the lowest emission intensity, which is a measure of a firm’s total GHG emissions per unit revenue. An overview of the trends helps highlight that the efforts to bring Indian companies at par with the top global performers in terms of energy efficiency and financial performance, will involve a realignment of investment and governance priorities. The first step in such realignment will involve the recognition of correlations between efficiency performance17 and financial performance. The second step would include an attempt by corporates to improve upon medium to long term financial gains through increased energy efficiency. Ranking companies by their emissions intensity is the first step in achieving a veritable normalization for comparison across sectors and geographies. Companies that are bigger in size are likely to have higher aggregate emissions than companies that are relatively smaller and in similar sectors. However, since emission intensity takes this into account, a fundamental comparison of efficiency performance can be made. In order to compare and analyze the top global and Indian companies across efficiency performance parameters, the companies have been grouped and divided into the following sets: the “Leaders”, the “Aspirants” and the “Laggards”18. These efficiency divisions are made on the
15 The findings for the BSE100 and Global100 companies and their sector analysis are drawn from the IIMA and Gtrade study for BSE on Mitigating Carbon Emissions in India, 2012 16 The top global and Indian companies are selected subject to availability of financial and environmental data 17 Greenhouse gas emissions (or carbon footprints colloquially) is used to indicate efficiency performance of an entity for this report. Although there may be many other dimensions to measure efficiency performance of a company, such as water use efficiency, resource utilization intensity, waste generation and management; we limit our assessment to GHG emission intensity for the purpose of this report. 18 Due to the difference in sectoral classification of the global Fortune 500 companies and the Indian companies listed on the Bombay Stock Exchange, direct sectoral comparisons are not possible. The global companies are listed in

LIMITS – LOW CLIMATE IMPACT SCENARIOS AND THE IMPLICATION OF
REQUIRED TIGHT EMISSION CONTROL STRATEGIES PROJECT NO 282846
DELIVERABLE NO.D3.1
260
basis on how the companies perform in terms of emission intensity only. The division are in no way indicative of financial performance or any other qualitatively defined performance parameters. It may however be noted here that some sectors would inherently be more emission intensive than others. For instance, coal-based power generation companies will be much more emission intensive than financial sector companies. The purpose of this classification is not to list companies as good or bad, but to create differentiation based on their emission performances. It is needless to say that national and global economic development would require all sectors to develop, including emission intensive sectors and not so emission intensive sectors. Further, there would be companies that are leaders in their specific sectors. For instance, National Thermal Power Corporation (NTPC) may be very emission intensive company because majority of its business is coal-based power generation, but it is the leader in power sector companies in India based on sectoral emission intensity. The difference between the highest carbon emitter and the lowest carbon emitter in the Leaders group, for global companies is large 196,134 tons of CO2 equivalent (here “tons of CO2” indicate tons of CO2 equivalent greenhouse gasses) while the same number for India is 16,018 tons of CO2 equivalent (a mere 8 percent of the number for global firms). This is indicative of the fact that the emission range for the most energy efficient Indian companies of the BSE 100 is relatively small. It is interesting to note that nearly all of the top efficiency performers across global and Indian firms are largely operating in the services sector. This is indeed not counterintuitive at the outset since companies within the services sector, and especially financial services which is heavily represented in the table, tend to have minimal emissions compared to other sectors such as energy, manufacturing, utilities etc., especially those operating within the larger energy intensive sectors of economies.
Table C.1 Global and Indian leaders Global Leaders Indian Leaders Firm Consolidated GHG
Emissions (tCO2e) Firm Consolidated GHG
Emissions (tCO2e) China State Construction Engineering
14566 Rural Electrification Corporation Limited
1811
Citigroup 35570 Power Finance Corporation Ltd
2473
Prudential 75703 Infrastructure Development Finance Company Limited
5985
Bank of America Corp 116667 LIC Housing Finance Ltd.
6883
McKesson 171589 Shriram Transport 12112 various stock exchanges around the world with differing definition of sectors. Based on factors such as largest reported business entity, independent business entities listed separately even if under one group etc.
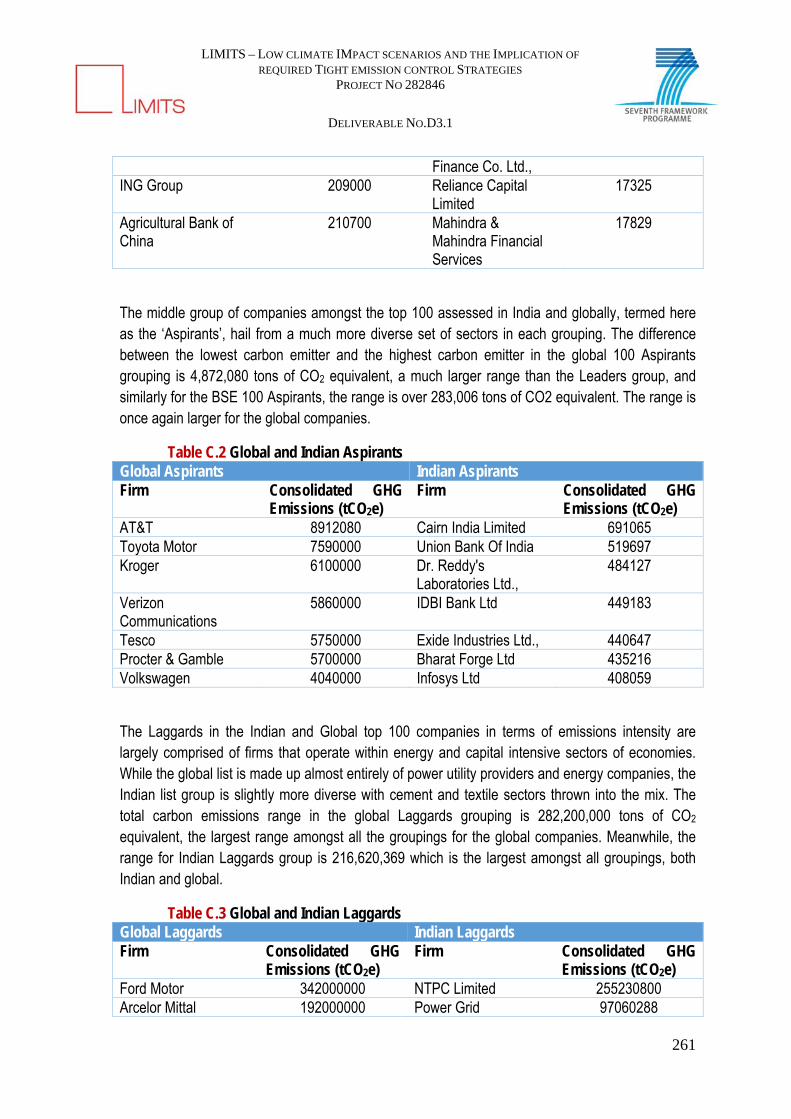
LIMITS – LOW CLIMATE IMPACT SCENARIOS AND THE IMPLICATION OF
REQUIRED TIGHT EMISSION CONTROL STRATEGIES PROJECT NO 282846
DELIVERABLE NO.D3.1
261
Finance Co. Ltd., ING Group 209000 Reliance Capital
Limited 17325
Agricultural Bank of China
210700 Mahindra & Mahindra Financial Services
17829
The middle group of companies amongst the top 100 assessed in India and globally, termed here as the ‘Aspirants’, hail from a much more diverse set of sectors in each grouping. The difference between the lowest carbon emitter and the highest carbon emitter in the global 100 Aspirants grouping is 4,872,080 tons of CO2 equivalent, a much larger range than the Leaders group, and similarly for the BSE 100 Aspirants, the range is over 283,006 tons of CO2 equivalent. The range is once again larger for the global companies.
Table C.2 Global and Indian Aspirants Global Aspirants Indian Aspirants Firm Consolidated GHG
Emissions (tCO2e) Firm Consolidated GHG
Emissions (tCO2e) AT&T 8912080 Cairn India Limited 691065 Toyota Motor 7590000 Union Bank Of India 519697 Kroger 6100000 Dr. Reddy's
Laboratories Ltd., 484127
Verizon Communications
5860000 IDBI Bank Ltd 449183
Tesco 5750000 Exide Industries Ltd., 440647 Procter & Gamble 5700000 Bharat Forge Ltd 435216 Volkswagen 4040000 Infosys Ltd 408059
The Laggards in the Indian and Global top 100 companies in terms of emissions intensity are largely comprised of firms that operate within energy and capital intensive sectors of economies. While the global list is made up almost entirely of power utility providers and energy companies, the Indian list group is slightly more diverse with cement and textile sectors thrown into the mix. The total carbon emissions range in the global Laggards grouping is 282,200,000 tons of CO2 equivalent, the largest range amongst all the groupings for the global companies. Meanwhile, the range for Indian Laggards group is 216,620,369 which is the largest amongst all groupings, both Indian and global.
Table C.3 Global and Indian Laggards Global Laggards Indian Laggards Firm Consolidated GHG
Emissions (tCO2e) Firm Consolidated GHG
Emissions (tCO2e) Ford Motor 342000000 NTPC Limited 255230800 Arcelor Mittal 192000000 Power Grid 97060288

LIMITS – LOW CLIMATE IMPACT SCENARIOS AND THE IMPLICATION OF
REQUIRED TIGHT EMISSION CONTROL STRATEGIES PROJECT NO 282846
DELIVERABLE NO.D3.1
262
Corporation Of India Limited
E.ON 125800000 Grasim Industries Ltd., 53448860 Exxon Mobil 125000000 Hindalco Industries
Ltd. 47207999
Royal Dutch Shell 72000000 Tata Chemicals Ltd 41355680 Petrobras 66000000 Steel Authority Of
India Ltd., 40647161
BP 59800000 Tata Power Co. Ltd 38610431 In order to further analyze the variations in energy efficiency performance across sectors and geographies, we captured the emissions intensities of the top 100 Indian and global companies in a Normal Distribution (see Figure C.1). A Normal Distribution has many convenient characteristics which help to attempt a scientific cross sectoral analysis. The following conclusions can be derived by analyzing the continuous probability distributions of emission intensities across global 10019 and BSE 100 companies:
Figure C.1 Normal Distribution Curves for Global 100 and BSE 100 companies i. The mean emission intensity for the BSE 100 companies is 353 tons of CO2 per Rs. crore (79
tons per million USD) of revenue, which is over 317 tons of CO2 per Rs. crore (71 tons per million USD) of revenue higher than the mean emission intensity for the global 100 at 2004-2005 USD/Rs. exchange rates.
ii. The standard deviation – a measure of the spread of emission intensities, was 986 for Indian companies, and 80 for global companies. This implies that efficiency performance of global companies is more predictable than that of Indian companies.
19 Emissions Intensities have been converted from Tons/Million (USD) to Tons/crore (Rupees) for comparison. Therefore the exchange rate (31st Dec 2010) comes into play, therefore absolute conclusions may be compromised but not relative conclusions.

LIMITS – LOW CLIMATE IMPACT SCENARIOS AND THE IMPLICATION OF
REQUIRED TIGHT EMISSION CONTROL STRATEGIES PROJECT NO 282846
DELIVERABLE NO.D3.1
263
iii. The skewness of emission intensities in the case of Indian companies; was around 5 compared with around 4 for global companies – indicative of the fact that the tail on the x axis is longer for BSE 100. This represents larger asymmetry in distribution than global peers.
iv. The kurtosis for Indian companies is around 28 as opposed to around 18 for global companies – indicative of the fact that more of the variance in emissions intensity of the Indian companies, is the result of infrequent extreme deviations in the distribution, as opposed to frequent modestly sized deviations in emission intensity in the global case. The last two observations strengthen the conclusion that global companies are more consistent in their GHG emission intensities across various players.
v. Some Indian companies are as good as the best in the world in terms of efficiency performance. However there are also some BSE-100 companies that are much too low on efficiency performance as compared to the most emission intensive in the Global-100. Some of the best and some of the worst global performing companies on GHG emission intensity co-exist in India.
Even though the total GHG emissions by Global 100 companies are higher on average than Indian counterparts, on a per unit revenue comparison, their overall energy efficiency is significantly greater as they exhibit lower mean emission intensities and lesser deviations from the mean.

LIMITS – LOW CLIMATE IMPACT SCENARIOS AND THE IMPLICATION OF
REQUIRED TIGHT EMISSION CONTROL STRATEGIES PROJECT NO 282846
DELIVERABLE NO.D3.1
264
29 APPENDIX D: EMISSION INTENSITY TRENDS FOR SECTORS
The major energy intensive sectors of the Indian economy viz., power, iron and steel, cement, chemical, paper and refineries have been analyzed to get an overview of the size and performance of these sectors. The firms listed and indexed on BSE500 have been classified into major sectors and examined for the normal distribution and overall trends.
29.1.1 PowerSectorIndia ranks fifth in terms of electricity generation capacity in the world. The sector is highly diversified, with electricity generation from sources coal, lignite, natural gas, oil, hydro and nuclear power as well as other viable non-conventional sources like wind, solar, agriculture and domestic waste. The electricity is rapidly growing and is expected to rise even more in the years to come. This calls for massive addition to the power generating capacity from various sources.
Electricity production in India was about 900 tera watt hour (TWh) in FY13, growing at 4 per cent over the previous fiscal year. Over FY07–13, electricity production has expanded at a CAGR of 5.5 per cent (Power Sector Working Group Report, 2012). The 12th Plan projects that total domestic energy production would reach 669.6 million tons of oil equivalent (MTOE) by 2016–17 and 844 MTOE by 2021–22.
The Indian power sector is mainly dependent on coal where the installed capacity from renewable sources consist of 99,503 MW (55 per cent) coal based, 17,706 MW (10 per cent) gas based, 1200 MW (1 per cent) diesel generation, 38,206 MW (21 per cent) hydro, 4,780 MW (2 per cent) nuclear and 20,162 MW (11 per cent). Due to the underlying advantages of using renewable sources, it is important to implement the use of these renewable energy sources such as hydro, gas, nuclear etc.
Source: Report of the Working Group on Power for the 12th Plan (2012-17)

LIMITS – LOW CLIMATE IMPACT SCENARIOS AND THE IMPLICATION OF
REQUIRED TIGHT EMISSION CONTROL STRATEGIES PROJECT NO 282846
DELIVERABLE NO.D3.1
265
For the 12th Five-Year Plan, a total of 88.5 GW of power capacity addition is targeted, of which 72.3 GW (82 per cent) constitutes thermal power, 10.8 GW (12 per cent) of hydro power and 5.3 GW (6 per cent) of nuclear power. The Ministry of Power has set a target for adding 76,000 MW of electricity capacity in the 12th Five Year Plan (2012-17) and 93,000 MW in the 13th Five Year Plan (2017-2022). The Government has set a target to generate 10,000 MW of power through solar energy by 2017 under Jawaharlal Nehru National Solar Mission, out of which 1,685 MW of solar power has already been generated till 2014. There are other ambitious targets in renewable energy, including expansion of wind power generation capacity to 20 GW by 2022.
Table D.4 Summary of Installed Capacity (2011) Sector
Capacity (MW) Hydro
Thermal Nuclear
R.E.S
Total Coal Gas Diesel Total
State 27,257 47,257 4,327 603 52,187 0 3,009 82,453 Private 1,425 12,616 6,677 597 19,891 0 15,446 36,761 Central 8,885 34,045 6,702 0 40,747 4,747 0 54,413 Total 37,567 93,918 17,706 1,200 1,12,824 1,12,824 18,455 1,73,626 Source: Report of the Working Group on Power for the 12th Plan (2012-17)
The rapid growth in the power sector has led to high investment flows including foreign direct investment (FDI) worth Rs 37,335.68 crore (US$ 4.01 billion) during April 2000 to July 2014. In order to attract foreign investments in the power sector, FDI up to 100 per cent is permitted under the automatic route for projects of electricity generation (except nuclear energy), transmission, distribution and power trading. Figures D.3 and Figure D.4 (a and b) show the geographical spread of existing and upcoming thermal power plants in India.
Figure D.2 Electricity Generation in India (MW capacity) in

LIMITS – LOW CLIMATE IMPACT SCENARIOS AND THE IMPLICATION OF
REQUIRED TIGHT EMISSION CONTROL STRATEGIES PROJECT NO 282846
DELIVERABLE NO.D3.1
266
Figure D.3 Coal based Power Plants in India (a) Existing (b) Under Implementation
(a)
(b)

LIMITS – LOW CLIMATE IMPACT SCENARIOS AND THE IMPLICATION OF
REQUIRED TIGHT EMISSION CONTROL STRATEGIES PROJECT NO 282846
DELIVERABLE NO.D3.1
267
Figure D. 4 Gas based Power Plants in India (a) Existing (b) Under Implementation
(a)
(b)
LIMITS – LOW CLIMATE IMPACT SCENARIOS AND THE IMPLICATION OF
REQUIRED TIGHT EMISSION CONTROL STRATEGIES PROJECT NO 282846
DELIVERABLE NO.D3.1
268
29.1.2 IronandSteelSectorThe Indian steel industry is a sector significantly responsible for the developing Indian economy contributing substantially towards growing GDP over last few years. Steel is used over various sectors such as construction, building, transport etc. and also at large scale for engineering firms, power and petro-refinery as well. For past few years, Indian steel sector alike other significant sectors has seen a valuable amount of advancement when it comes to global market, one major step being the acquisition of global steel capabilities following which there has been a significant increase in the energy efficiency. India stands 4th when it comes to being the largest crude steel producer, largest sponge iron producer and stands 3rd as largest consumer of finished steel in the world.
In 2011, India contributed around 4.7 per cent to global crude steel production making a benchmark globally. Also India stands on the top for producing sponge iron and at fourth position for production of crude steel in the world. India will witness a new growth of steel industry by raising per capita steel consumption with its 12th Five Year Plan (FYP: 2012-2017). Looking towards the previous years, from FY 07 to FY 12, crude steel production has seen reached growth of around 4.7 per cent CAGR (Industry Outlook Reference Report, 2013).
Initially it was public enterprise which had a major hold in Indian steel sector but with years this scenario changed as we have a lot of private names owning a significant share adding on to growing GDP. SAIL (Bhilai, Durgapur, Rourkela, Bokaro etc.), TATA Steel, ESSAR Hazira, JSW, RINL etc. are few of the major contributing players in India. Steel production in India was limited to public sectoral industries under the control of SAIL till 1990s leaving TATA Steel. After liberalisation (1991) large scale development in steel industry was seen with the participation of some private players and large scale inflow of foreign investment in Indian steel industry.
India has shown a significant growth in capacity after independence. Finished steel production increased during early 90s. And it kept on growing since then that too with a greater rate and finished steel production reached around 74.7 MT for 2011-12.
68 percent of total global steel production relies directly on coal inputs. 761 million tons of coking coal and pulverized coal injection coals are used annually in global steel production, which is around 12 percent of global hard coal consumption. About 770 kg of coal are required to produce 1 t of steel in BOF route, and 150 kg of coal are required to produce 1t of steel in EAF20.
It is estimated that in the last 30 years the steel industry has reduced its energy consumption per ton of steel produced by 50 percent. However, due to this dramatic improvement in energy
20 As per World Coal Association (2012).
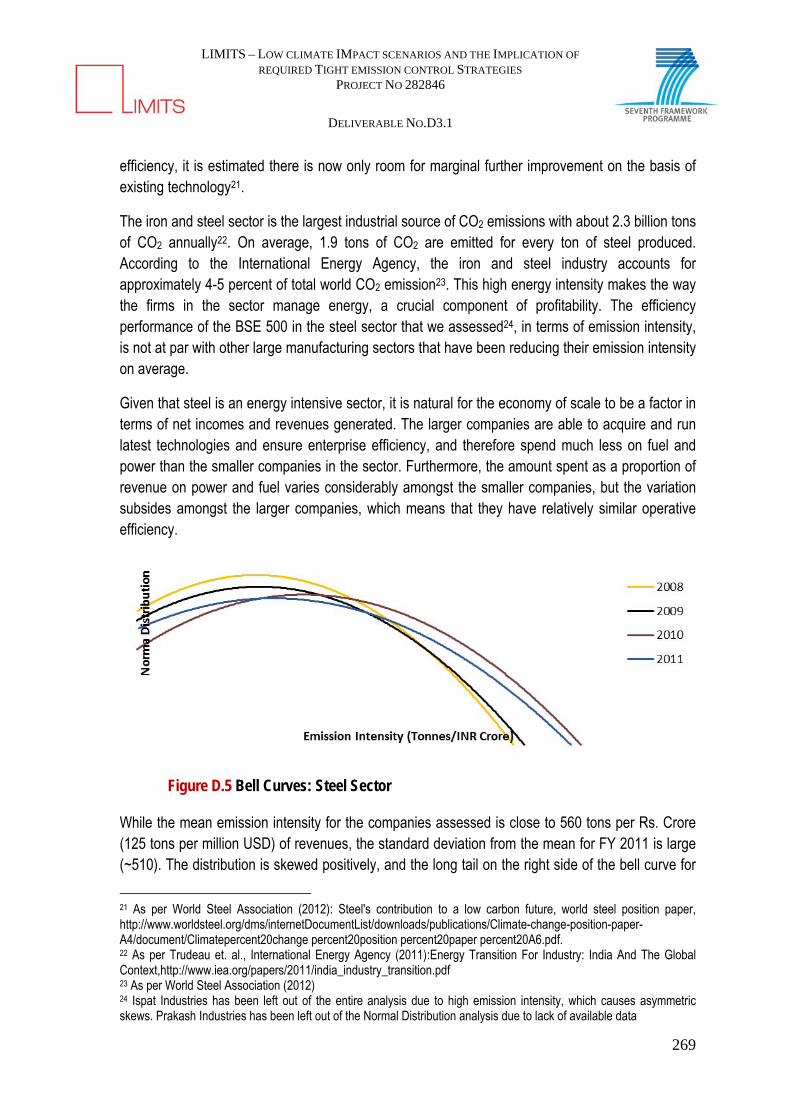
LIMITS – LOW CLIMATE IMPACT SCENARIOS AND THE IMPLICATION OF
REQUIRED TIGHT EMISSION CONTROL STRATEGIES PROJECT NO 282846
DELIVERABLE NO.D3.1
269
efficiency, it is estimated there is now only room for marginal further improvement on the basis of existing technology21.
The iron and steel sector is the largest industrial source of CO2 emissions with about 2.3 billion tons of CO2 annually22. On average, 1.9 tons of CO2 are emitted for every ton of steel produced. According to the International Energy Agency, the iron and steel industry accounts for approximately 4-5 percent of total world CO2 emission23. This high energy intensity makes the way the firms in the sector manage energy, a crucial component of profitability. The efficiency performance of the BSE 500 in the steel sector that we assessed24, in terms of emission intensity, is not at par with other large manufacturing sectors that have been reducing their emission intensity on average.
Given that steel is an energy intensive sector, it is natural for the economy of scale to be a factor in terms of net incomes and revenues generated. The larger companies are able to acquire and run latest technologies and ensure enterprise efficiency, and therefore spend much less on fuel and power than the smaller companies in the sector. Furthermore, the amount spent as a proportion of revenue on power and fuel varies considerably amongst the smaller companies, but the variation subsides amongst the larger companies, which means that they have relatively similar operative efficiency.
Figure D.5 Bell Curves: Steel Sector While the mean emission intensity for the companies assessed is close to 560 tons per Rs. Crore (125 tons per million USD) of revenues, the standard deviation from the mean for FY 2011 is large (~510). The distribution is skewed positively, and the long tail on the right side of the bell curve for
21 As per World Steel Association (2012): Steel's contribution to a low carbon future, world steel position paper, http://www.worldsteel.org/dms/internetDocumentList/downloads/publications/Climate-change-position-paper-A4/document/Climatepercent20change percent20position percent20paper percent20A6.pdf. 22 As per Trudeau et. al., International Energy Agency (2011):Energy Transition For Industry: India And The Global Context,http://www.iea.org/papers/2011/india_industry_transition.pdf 23 As per World Steel Association (2012) 24 Ispat Industries has been left out of the entire analysis due to high emission intensity, which causes asymmetric skews. Prakash Industries has been left out of the Normal Distribution analysis due to lack of available data
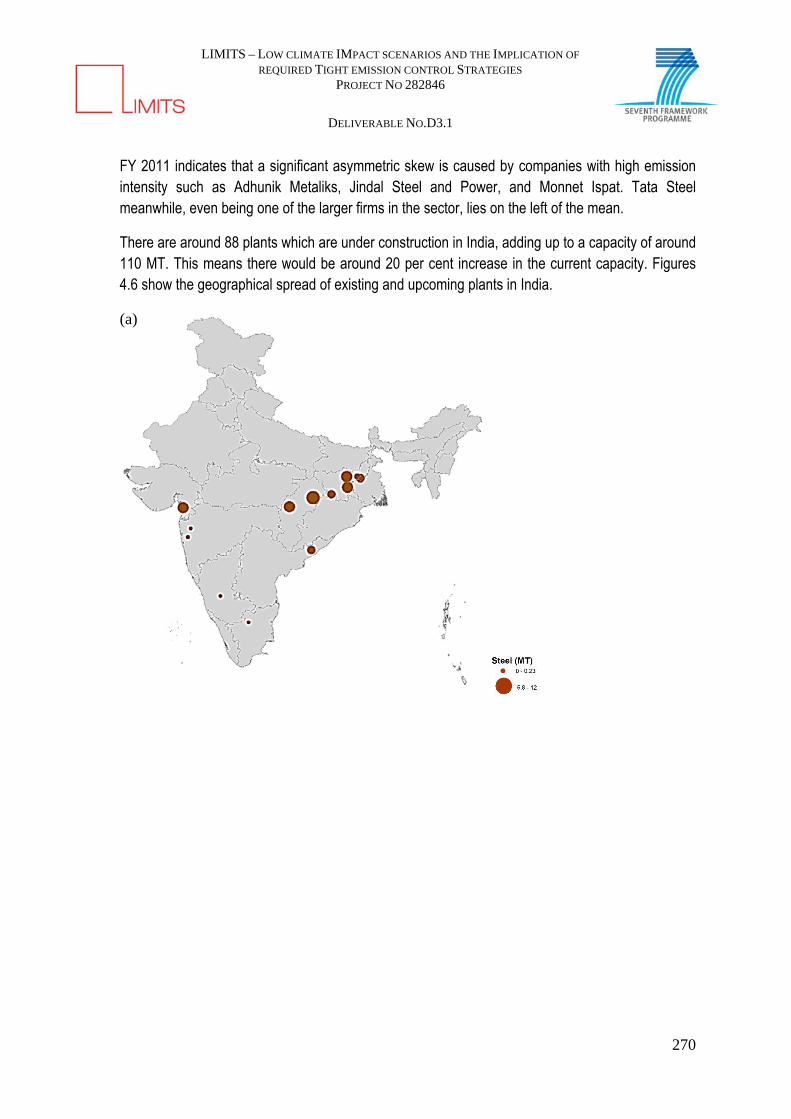
LIMITS – LOW CLIMATE IMPACT SCENARIOS AND THE IMPLICATION OF
REQUIRED TIGHT EMISSION CONTROL STRATEGIES PROJECT NO 282846
DELIVERABLE NO.D3.1
270
FY 2011 indicates that a significant asymmetric skew is caused by companies with high emission intensity such as Adhunik Metaliks, Jindal Steel and Power, and Monnet Ispat. Tata Steel meanwhile, even being one of the larger firms in the sector, lies on the left of the mean.
There are around 88 plants which are under construction in India, adding up to a capacity of around 110 MT. This means there would be around 20 per cent increase in the current capacity. Figures 4.6 show the geographical spread of existing and upcoming plants in India.
(a)
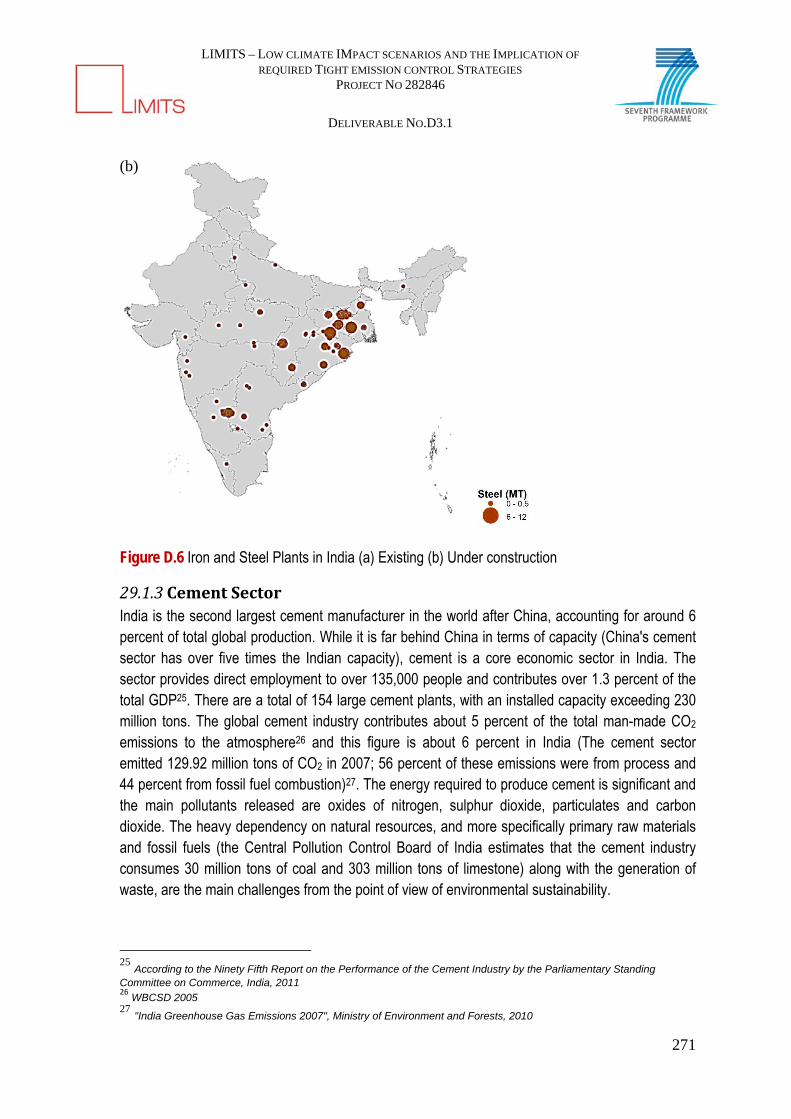
LIMITS – LOW CLIMATE IMPACT SCENARIOS AND THE IMPLICATION OF
REQUIRED TIGHT EMISSION CONTROL STRATEGIES PROJECT NO 282846
DELIVERABLE NO.D3.1
271
Figure D.6 Iron and Steel Plants in India (a) Existing (b) Under construction
29.1.3 CementSectorIndia is the second largest cement manufacturer in the world after China, accounting for around 6 percent of total global production. While it is far behind China in terms of capacity (China's cement sector has over five times the Indian capacity), cement is a core economic sector in India. The sector provides direct employment to over 135,000 people and contributes over 1.3 percent of the total GDP25. There are a total of 154 large cement plants, with an installed capacity exceeding 230 million tons. The global cement industry contributes about 5 percent of the total man-made CO2 emissions to the atmosphere26 and this figure is about 6 percent in India (The cement sector emitted 129.92 million tons of CO2 in 2007; 56 percent of these emissions were from process and 44 percent from fossil fuel combustion)27. The energy required to produce cement is significant and the main pollutants released are oxides of nitrogen, sulphur dioxide, particulates and carbon dioxide. The heavy dependency on natural resources, and more specifically primary raw materials and fossil fuels (the Central Pollution Control Board of India estimates that the cement industry consumes 30 million tons of coal and 303 million tons of limestone) along with the generation of waste, are the main challenges from the point of view of environmental sustainability.
25 According to the Ninety Fifth Report on the Performance of the Cement Industry by the Parliamentary Standing Committee on Commerce, India, 2011 26 WBCSD 2005 27 "India Greenhouse Gas Emissions 2007", Ministry of Environment and Forests, 2010
(b)

LIMITS – LOW CLIMATE IMPACT SCENARIOS AND THE IMPLICATION OF
REQUIRED TIGHT EMISSION CONTROL STRATEGIES PROJECT NO 282846
DELIVERABLE NO.D3.1
272
Various stages of production are responsible for the emissions of GHG gasses in the atmosphere; starting from mining of limestone and other raw materials up until the loading/unloading of finished product. The actual manufacturing process requires heat generation and electricity. The average thermal energy consumption for the sector in India during 2009 – 2010 was 725 kCal/kg per clinker and average electricity consumption was 667kCal/kg per clinker and 68kWh/ton of cement respectively28. Some critical technical and financial parameters for the Indian cement industry are presented for 1990-91 to 2010-11 in Table D.5. Installed capacity and cement production have respectively increased at around 4.1 per cent and 4.8 per cent compounded per year during 1990-91 to 2005-06, and at 14.2 per cent and 10 per cent per year respectively after 2005-04. Total GHG emissions and revenue generation from Indian cement industry have increased at around 4.9 per cent and 4.9 per cent per year respectively during 1990-91 to 2005-06 and at 8.8 per cent and 9.4 per cent CAGR respectively after 2005-04. The GHG intensity of cement production has declined by 0.8 per cent during 1990-2005 and at 1.1 per cent after 2005-04. The GHG intensity of revenue has increased by 3 per cent during 1990-2005 for the Indian cement industry however is now declining at 0.5 per cent per year 2005-06 onwards. This implies that the Indian cement industry is getting aligned with the Indian voluntary commitment to UNFCCC after 2005.
Table D.5 General and Financial Performance, Technological Change and Energy Intensity of Indian Cement Industry
Installed capacitya
(Mt)
Clinker productiona
(Mt)
Cement productiona
(Mt)
per cent Share of cement making technologya,b,c
Approx GHG
emissione (Mt
CO2e)
Revenuef at 2005-06 constant
price (billion US$)
Wet process
Semi dry/wet process
Dry process
1990-91 57 42 46 25 3 72 40 4.5 1991-92 59 44 48 24 3 73 47 4.68 1992-93 63 47 51 21 3 76 51 4.62 1993-94 66 50 54 18 3 80 54 4.66 1994-95 72 54 58 15 3 84 58 5.38 1995-96 81 59 65 12 2 86 61 4.23 1996-97 89 65 70 10 2 86 67 4.50 1997-98 97 71 77 9 2 87 72 4.44 1998-99 105 73 82 9 2 89 70 4.55 1999-00 109 86 94 8 2 91 79 4.91 2000-01 122 84 94 7 2 92 78 4.94 2001-02 135 88 102 5 2 93 82 4.03 2002-03 139 97 111 5 2 93 90 4.78 2003-04 146 103 118 4 2 94 96 4.92 2004-05 154 109 128 3 1 96 103 4.09
28 According to the Ninety Fifth Report on the Performance of the Cement Industry by the Parliamentary Standing Committee on Commerce, India, 2011
LIMITS – LOW CLIMATE IMPACT SCENARIOS AND THE IMPLICATION OF
REQUIRED TIGHT EMISSION CONTROL STRATEGIES PROJECT NO 282846
DELIVERABLE NO.D3.1
273
2005-06 160 116 142 2 1 97 109 4.95 2006-07 168 122 156 2 3 95 118 10.26 2007-08 198 130 168 0.7 4.5 95.8 127 11.57 2008-09 221 139 182 0.3 2.1 94.6 135 12.26 2009-10 271 159 207 0.5 1.6 94.8 152 11.85 2010-11 323 174 228 0.6 1.6 94.8 167 12.43 Source: Adapted from our ongoing work - Jigeesha and Garg, 2014, aJCMA, 2009; b CMA, 2011; c Parikhet al., 2009; the shares of wet, semi wet/dry and dry processes at all India level have been extrapolated for the years 1993-93, 1996-2001, 2002-05 based on data for the other years; d Ghosh, 2007; the thermal energy and electricity consumption for dry plants have been extrapolated for the years 2006, 2007 and 2008 based on data for the other years; eOwn estimates; fCMIE 2011
Indian cement industry has gone through major technological up-gradation especially after partial decontrol of cement industry from government in 1982 and total decontrol in 1989. During the last decade, entry of foreign players through mergers and acquisitions also led to technological up gradation and innovation. All the new cement plants established in India during this period used state-of-the-art technologies. Overall, the share of dry clinker making technology, being the most energy and GHG efficient, has increased from 1 per cent in 1960-61 to 33 per cent in 1980-81, to 76 per cent in 1990-91 and to 94.8 per cent in 2010-11 (BEE, 2010a).
Although the sector sees volatility in output, according to the Planning Commission, cement consumption has been growing steadily in the country, outpacing the growth of GDP by 2 to 3 percent on average. Thus if the Indian economy is projected to grow at an average rate of 7 to 8 percent over the next decade, the cement sector will grow at an average of around 9 to 10 percent year on year. This is a significant growth pattern, and the prominent role of the cement industry in infrastructure building, which is undoubtedly a necessity for the country's growth and development going forward, would help to leverage this growth even further.
The cement sector is an energy and capital intensive sector like many of the sectors analyzed in this report. As it is a highly energy intensive industry, energy costs are high, with many companies generating power from captive plants. Capital intensive production which requires sustained investment in energy and core production resources means that small players find it hard to compete. It is no surprise then that the production from large cement plants with capacity above 1 million tons per annum account for close to 90 percent of the total production in the country.
The mean emission intensity of the companies assessed in the sector29 has decreased over the period FY 2008 – FY 2011 by around 12 percent. However, interestingly, the variance has increased simultaneously, by approximately 90 percent. This is illustrated in the increase in the flatness of both the tails of the curves over the years. Furthermore, the curves are negatively skewed (except in FY 2009), which means that the left tails of the curves are longer, and that most of the observations are distributed towards the right. That is, most of the companies have been moving away from the mean towards the higher side of the emission intensity distribution.
29 Century Textiles has been excluded due to very high emission intensity in 2009, thereby heavily skewing the analysis.

LIMITS – LOW CLIMATE IMPACT SCENARIOS AND THE IMPLICATION OF
REQUIRED TIGHT EMISSION CONTROL STRATEGIES PROJECT NO 282846
DELIVERABLE NO.D3.1
274
Figure D.7 Bell Curves: Cement Sector
Larger companies which produce relatively larger amount of clinker and cement, have a higher market capitalization. Since the sector is primarily in the business of producing cement and clinker, which are high energy intensive processes and emit sizeable amounts of greenhouse gases, it's natural to have a positive correlation between emissions and market capitalization. But, the positive correlation of emission intensity and market capitalization is suggestive of the need for improving technology, upgrading plant facilities and increasing energy efficiency in the future. This will reduce emissions, increase revenues which will in return reduce emission intensity. At the same time, it will also reduce costs and increase profits. Companies in the cement sector have one of the highest expenditure on power and fuel as a percentage of the revenue. This is because large amount heat and electricity is required in the manufacturing process, to produce cement and clinker. Since cement is made by heating limestone and by adding other ingredients like clay.
The spread within each sector is very high for the Indian companies. There is a dependence on the historical path, which is distinctly observed in sectors like cement manufacturing. It is very difficult to retrofit the old plants, so in spite of new state of the art global technologies coming in the sectors, the old plants are dragging the performance of the entire sector.
Investment in augmenting cement capacity is happening in India. There are nearly 122 plants which are under construction, totaling a capacity of 127 MT of production. This would mean around 40 per cent increase in the current cement capacity. All the new plants are of dry technology and mostly deploy state of the Art cement making processes. This would result in reducing average energy consumption per unit of clinker produced and also greenhouse gas emissions per unit of production. Figures D.8 shows the geographical spread of existing plants in India.
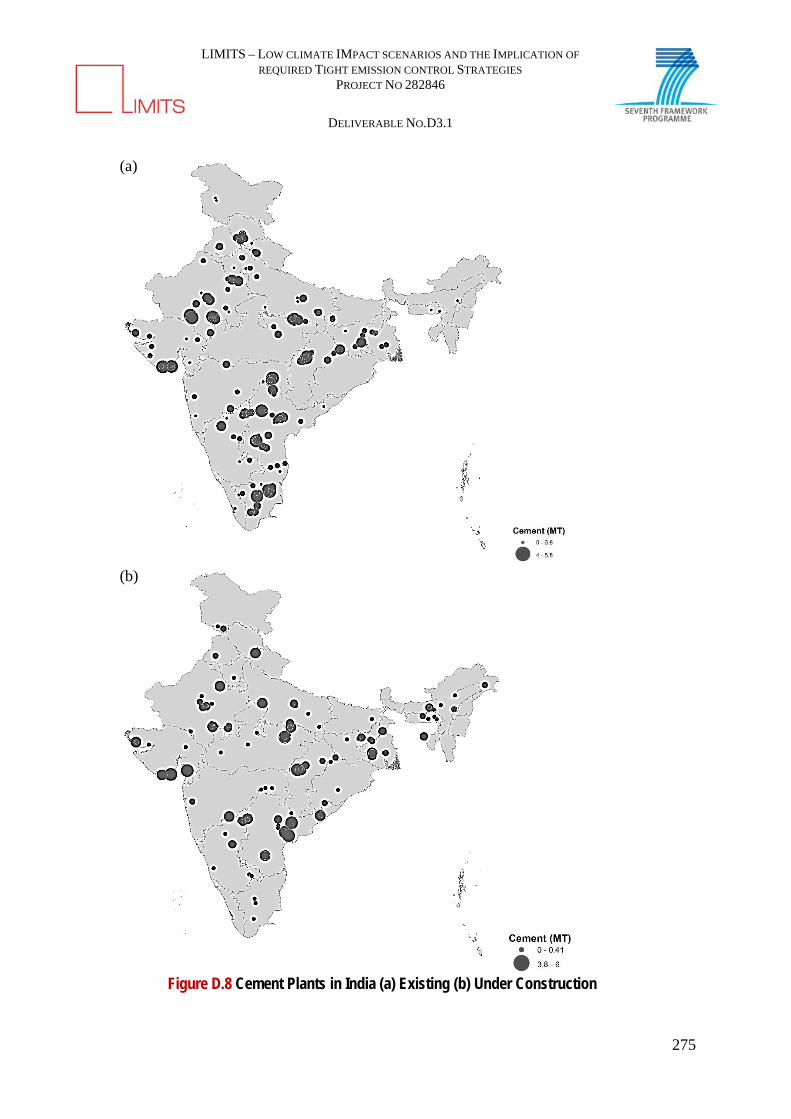
LIMITS – LOW CLIMATE IMPACT SCENARIOS AND THE IMPLICATION OF
REQUIRED TIGHT EMISSION CONTROL STRATEGIES PROJECT NO 282846
DELIVERABLE NO.D3.1
275
Figure D.8 Cement Plants in India (a) Existing (b) Under Construction
(a)
(b)

LIMITS – LOW CLIMATE IMPACT SCENARIOS AND THE IMPLICATION OF
REQUIRED TIGHT EMISSION CONTROL STRATEGIES PROJECT NO 282846
DELIVERABLE NO.D3.1
276
29.1.4 FertilizerSectorThe policies of the Government of India to ensure easy and affordable availability of chemical fertilizers to the farmers has been a major factor in enhancing the agricultural productivity. The consumption of NPK fertilizers (Nitrogen, Phosphorous, Potassium) has increased annually from 0.07 million MT in 1951-52 to more than 28 million MT in 2010-11. The per unit consumption has also substantially increased from less than 1 kg per hectare in 1951-52 to 128 kg per hectare in recent times (Working Group Report, Planning Commission). However, India still depends on imports to meet the requirement of K and P fertilizers. Urea (N) is the only fertilizer, the requirement of which is largely (around 80 per cent) met through indigenous resources.
Table D.6 Installed Capacity of various Fertilizer Plants Product No. of Units Total Installed Capacity ((in lakh MT) per annum)
Urea 31 210.84 DAP 12 72.99 Complexes 19 52.22 SSP 80 74.13 Source: Indian Fertilizer Scenario, 2010, Dept. of fertilizers, Ministry of Chemicals and Fertilizers, Govt. of India.
Table D.7 Production of Urea, DAP and Complexes (in lakh MT) Fertilizer 2002-03 2003-04 2004-05 2005-06 2006-07 2007-08 2008-09 2009-10 Urea 184.3 192 202.6 210 204.1 198.6 199.2 211.12 Dap 52.36 44.34 51.84 44.28 48.52 42.12 29.93 42.46 Complex Fertilizers 48.59 45.11 54.63 64.64 74.64 58.5 68.48 80.38 Source: Indian Fertilizer Scenario, 2010, Dept. of fertilizers, Ministry of Chemicals and Fertilizers, Govt. of India.
The investments in the fertilizers sectors has seen a decline over the past few decades. According to the 12th Plan, the total investment in the fertilizer sector by the end of 2010‐11 was 6097 million USD. To increase the capacity of urea by about 12 million tons to meet the projected demand by 2016-17, an investment of nearly 8951 million USD is needed in the sector. There are around 33 plants which are under construction in India, adding up to a capacity of around 4.5 MT. This means there would be around 16 per cent increase in the current capacity. Figures D.9 shows the geographical spread of existing and upcoming fertilizer plants in India.
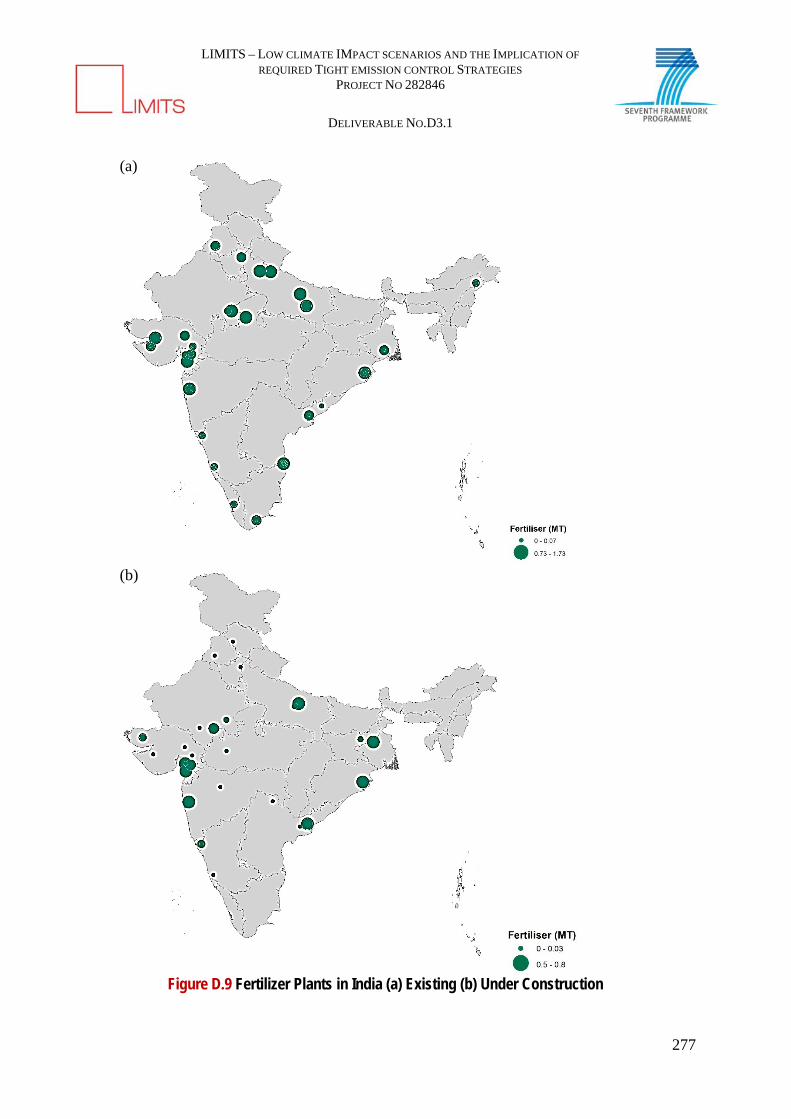
LIMITS – LOW CLIMATE IMPACT SCENARIOS AND THE IMPLICATION OF
REQUIRED TIGHT EMISSION CONTROL STRATEGIES PROJECT NO 282846
DELIVERABLE NO.D3.1
277
Figure D.9 Fertilizer Plants in India (a) Existing (b) Under Construction
(a)
(b)

LIMITS – LOW CLIMATE IMPACT SCENARIOS AND THE IMPLICATION OF
REQUIRED TIGHT EMISSION CONTROL STRATEGIES PROJECT NO 282846
DELIVERABLE NO.D3.1
278
29.1.5 RefineriesOver the previous years, the refining capacity of our nation has increased. Domestic refining capacity has increased by over 14.70 per cent reaching 214.066 Metric Million Ton Per Annum (MMMTPA) in 2012 as compared to 184.386 MMTPA in 2011. The refining capacity of India in 2013 is 215.066 MMTPA. And the refining capacity is further expected to increase reaching 304.366 MMTPA by the end of XII plan. It has been hence forecasted that India will become world’s third largest oil consumer by 2014.
Indian Oil Corporation, Hindustan Petroleum Corporation Limited, Bharat Petroleum Corporation Limited, Chennai Petroleum Corporation Limited, Numaligarh Refinery Ltd., ONGC are some of the major refineries of India helping towards the capacity growth. Along with this, there are quite a few more refineries in the pipeline that will add on to the existing capacity in India where our nation being the largest exporter of petroleum products over Asia since 2009.
Table D.8 Petroleum Refining Capacity in India Refinery Year of
Commissioning Installed Capacity as on 1.4.2013 (in MMTPA)
A. Public Sector 120.07 IOCL Refineries 54.2 IOC, Digboi 1901 0.65 IOC, Guwahati 1962 1 IOC, Barauni 1964 6 IOC, Koyali 1965 14.7 IOC, Haldia 1974 4.5 IOC, Mathura 1982 8 IOC, Panipat 1998 15 IOC, Bangaigaon 1979 2.35 BPCL Refineries 21.5 BPCL, Mumbai 1955 12 BPCL, Kochi 1966 9.5 HPCL Refineries 14.8 HPCL, Mumbai 1954 4.5 HPCL, Visakh 1957 8.3 CPCL, Refineries 11.5 CPCL, Manali 1969 10.5 CPCL, Nagapattinam 1993 1 NRL, Numaligarh 1999 3 ONGC, Tatipaka 2002 0.07 MRPL, Mangalore 1996 15 B. Private Sector 80 RPL Refineries 60 RIL, Jamnagar 1999 33
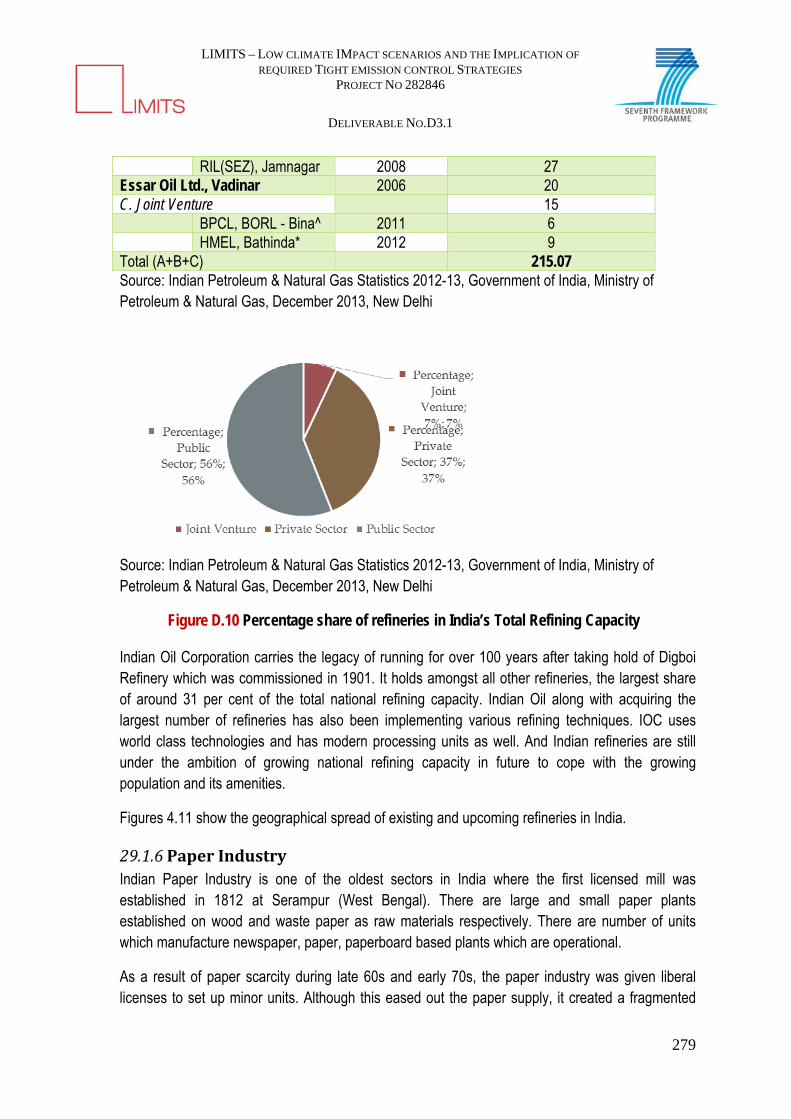
LIMITS – LOW CLIMATE IMPACT SCENARIOS AND THE IMPLICATION OF
REQUIRED TIGHT EMISSION CONTROL STRATEGIES PROJECT NO 282846
DELIVERABLE NO.D3.1
279
RIL(SEZ), Jamnagar 2008 27 Essar Oil Ltd., Vadinar 2006 20 C. Joint Venture 15 BPCL, BORL - Bina^ 2011 6 HMEL, Bathinda* 2012 9 Total (A+B+C) 215.07 Source: Indian Petroleum & Natural Gas Statistics 2012-13, Government of India, Ministry of Petroleum & Natural Gas, December 2013, New Delhi
Source: Indian Petroleum & Natural Gas Statistics 2012-13, Government of India, Ministry of Petroleum & Natural Gas, December 2013, New Delhi
Figure D.10 Percentage share of refineries in India’s Total Refining Capacity Indian Oil Corporation carries the legacy of running for over 100 years after taking hold of Digboi Refinery which was commissioned in 1901. It holds amongst all other refineries, the largest share of around 31 per cent of the total national refining capacity. Indian Oil along with acquiring the largest number of refineries has also been implementing various refining techniques. IOC uses world class technologies and has modern processing units as well. And Indian refineries are still under the ambition of growing national refining capacity in future to cope with the growing population and its amenities.
Figures 4.11 show the geographical spread of existing and upcoming refineries in India.
29.1.6 PaperIndustryIndian Paper Industry is one of the oldest sectors in India where the first licensed mill was established in 1812 at Serampur (West Bengal). There are large and small paper plants established on wood and waste paper as raw materials respectively. There are number of units which manufacture newspaper, paper, paperboard based plants which are operational.
As a result of paper scarcity during late 60s and early 70s, the paper industry was given liberal licenses to set up minor units. Although this eased out the paper supply, it created a fragmented

LIMITS – LOW CLIMATE IMPACT SCENARIOS AND THE IMPLICATION OF
REQUIRED TIGHT EMISSION CONTROL STRATEGIES PROJECT NO 282846
DELIVERABLE NO.D3.1
280
industry with low energy efficiency. After 1991, the paper industry was also reformed and licensing was stopped providing a boost to investment in the sector.
Figure D.11 Petroleum Refineries in India (a) Existing (b) Under Construction
(a)
(b)

LIMITS – LOW CLIMATE IMPACT SCENARIOS AND THE IMPLICATION OF
REQUIRED TIGHT EMISSION CONTROL STRATEGIES PROJECT NO 282846
DELIVERABLE NO.D3.1
281
According to the 2011 figures, there were around 759 Pulp & Paper mills producing around 10.11 million tons/annum with an installed capacity of 12.7 million tons and newsprint with an annual consumption of nearly 11.15 million tons.
Source: Working Groups / Steering Committees for the Twelfth Five Year Plan (2012-2017)
Figure D.12 Growth of Indian Paper Industry Out of the total world production of 394 million tons/annum of paper, paper board and newsprint, the Indian paper industry produce around 10.11 million tons paper per annum. We fall way behind Scandinavian countries like USA, the Russian Federation, China, Indonesia and Japan being the major players in the pulp and paper field. These countries have implemented cutting edge technologies using the best available raw materials for paper production thus dominating the global market. Whereas in Indian context, there are just few of the mills that employ highly developed technologies. The Indian paper industry is classified in small, medium and large sized mills carrying capacity from 10 to 1150 tons per day.
Indian paper industry uses raw materials such as wood, agriculture residues (e.g. bagasse and wheat straw), recycled fiber and waste paper.

LIMITS – LOW CLIMATE IMPACT SCENARIOS AND THE IMPLICATION OF
REQUIRED TIGHT EMISSION CONTROL STRATEGIES PROJECT NO 282846
DELIVERABLE NO.D3.1
282
Source: Working Groups / Steering Committees for the Twelfth Five Year Plan (2012-2017)
Figure D.13 Variety wise production of paper from different segments of Indian paper industry
Figures D.14 shows the geographical spread of existing and upcoming paper plants in India.
(a)

LIMITS – LOW CLIMATE IMPACT SCENARIOS AND THE IMPLICATION OF
REQUIRED TIGHT EMISSION CONTROL STRATEGIES PROJECT NO 282846
DELIVERABLE NO.D3.1
283
Figure D.14 Paper Plants in India (a) Existing (b) Under construction
(b)

LIMITS – LOW CLIMATE IMPACT SCENARIOS AND THE IMPLICATION OF
REQUIRED TIGHT EMISSION CONTROL STRATEGIES PROJECT NO 282846
DELIVERABLE NO.D3.1
284
30 APPENDIX E: CAPACITY ADDITION AND INVESTMENTS
India is an emerging economy and requires massive investments in all the sectors to meet its economic growth targets and for development and expansion of infrastructure. Tables E.9 and E.10 show the investment trends in India.
Table E.9 Infrastructure investment in India (in billion USD at 2004-05 prices) 2006-07 2011-12 2012-17
Investment Percentage of GDP
Investment Percentage of GDP
Investment Percentage of GDP
Public Sector (center + state)
34.17 4.23 80.56 4.45
Private sector
10.26 1.20 34.10 2.89
Total 44.43 5.43 114.66 9.34 1232 9.95 Source: Working Sub-Group on Infrastructure for 12th Plan and Managing climate-induced risks on Indian infrastructure assets, Current Science, 2011
Table E.10 Capacity addition and planned investment in some sectors in India Sector Unit Planned Capacity
addition (2012-2017) Planned Investment in Rs. billion
(2012-2017) Iron & Steel Million tons 78.43 1699.5 Cement Million tons 0.16 528.6 Fertilizers Million tons 11.95 254.9 Power GW 100 1135.1 Source: Compiled from Industry Outlook, CMIE
Table E.11 and Figure E.10 show the existing and the upcoming plants in various sectors that have been covered in our analysis. It is to be noted that the proposed capacity addition in the steel and cement sectors is substantial.
Table E.10 Large Point Sources covered in our analysis for India In Operation (2012) Under Construction Total
Sectors Unit of Capacity No. of Plants Total Capacity No. of Plants Total Capacity No. of Plants Total Capacity
Power Coal Based GW 111 93 315 196 426 289
Power Gas Based GW 49 15 47 32 96 47
Cement MT 183 307 121 127 304 434
Steel MT 14 40 88 112 102 152
Refinery MT 21 193 38 89 59 283
Fertilizer MT 93 33 30 7 123 40
Paper MT 222 15 14 1 236 16
Overall 693 653 1346
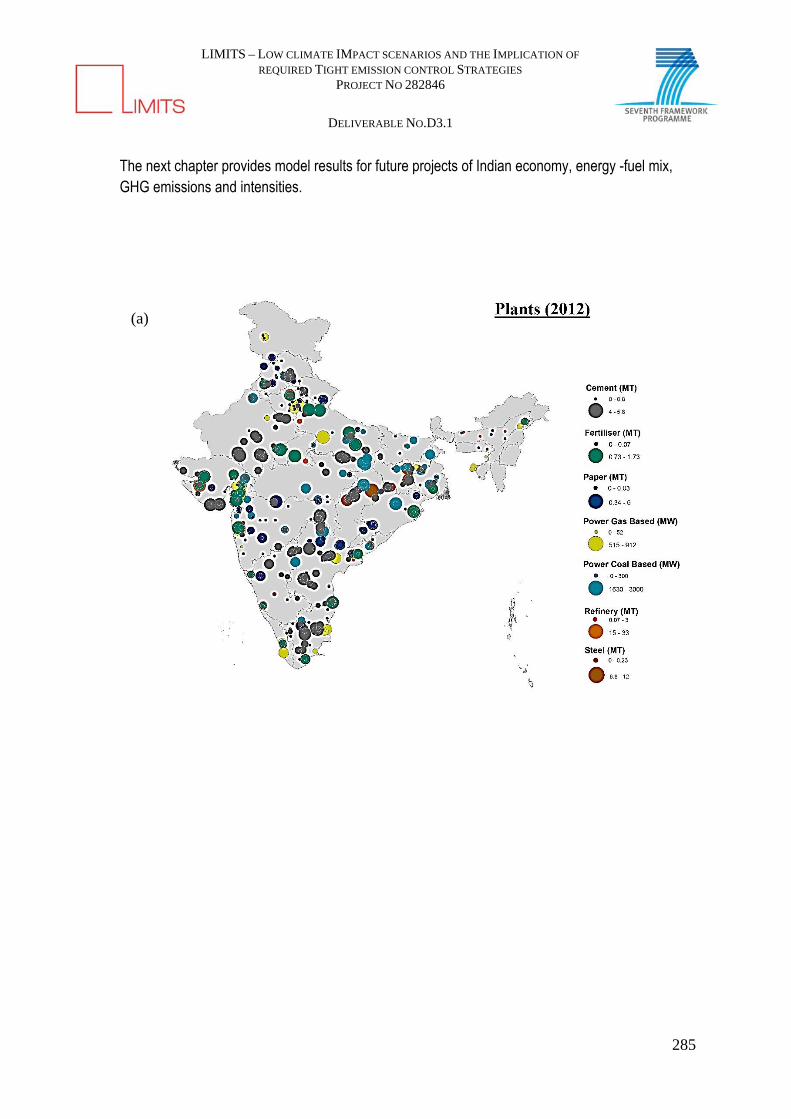
LIMITS – LOW CLIMATE IMPACT SCENARIOS AND THE IMPLICATION OF
REQUIRED TIGHT EMISSION CONTROL STRATEGIES PROJECT NO 282846
DELIVERABLE NO.D3.1
285
The next chapter provides model results for future projects of Indian economy, energy -fuel mix, GHG emissions and intensities.
(a)

LIMITS – LOW CLIMATE IMPACT SCENARIOS AND THE IMPLICATION OF
REQUIRED TIGHT EMISSION CONTROL STRATEGIES PROJECT NO 282846
DELIVERABLE NO.D3.1
286
Table E.11 Large Plants in India (a) Existing (b) Under Implementation
(b)

LIMITS – LOW CLIMATE IMPACT SCENARIOS AND THE IMPLICATION OF
REQUIRED TIGHT EMISSION CONTROL STRATEGIES PROJECT NO 282846
DELIVERABLE NO.3.1
287
31 REFERENCES
Ananda, S., Dahiya, R.P., Talyan, V., Vrat, P., 2003. Investigations of methane emissions from rice cultivation in Indian context. Environment International 31 (2005), 469-482.
Babiker, M., Gurgel, A., Paltsev, S., & Reilly, J. (2009). Forward-looking versus recursive-dynamic modeling in climate policy analysis: A comparison. Economic Modelling, 26(6), 1341–1354.
Bhushan C. (2010) “CHALLENGE OF THE NEW BALANCE - A study of the six most emissions intensive sectors to determine India’s low carbon growth options”, Center for Science and Environment, New Delhi. ISBN: 978-81-86906-52-1
Böhringer, C. (1998). The synthesis of bottom-up and top-down in energy policy modeling. Energy Economics, 20(3), 233–248.
Boretos, G. P. (2009). The future of the global economy. Technological Forecasting & Social Change, 316-326.
Bosetti, V., Carraro, C., & Tavoni, M. (2012). Timing of Mitigation and Technology Availability in Achieving a Low-Carbon World. Environmental and Resource Economics, 51(3), 353–369.
Calvin, K., Patel, P., Fawcett, A., Clarke, L., Fisher-Vanden, K., Edmonds, J., Wise, M. (2009). The distribution and magnitude of emissions mitigation costs in climate stabilization under less than perfect international cooperation: SGM results. Energy Economics, 31, Supplement 2(0), S187–S197.
Carraro, C., Favero, A., & Massetti, E. (2012). “Investments and public finance in a green, low carbon, economy”. Energy Economics, 34, Supplement 1(0), S15–S28.
CEA, 2011. Performance Review of Thermal Power Stations 2011-12. Central Electricity Authority, Government of India.
Ciscar, J.-C., Saveyn, B., Soria, A., Szabo, L., Van Regemorter, D., & Van Ierland, T. (2013). A comparability analysis of global burden sharing GHG reduction scenarios. Energy Policy, 55, 73–81.
Ciscar, J.-C., Saveyn, B., Soria, A., Szabo, L., Van Regemorter, D., & Van Ierland, T. (2013). A comparability analysis of global burden sharing GHG reduction scenarios. Energy Policy, 55, 73–81.

LIMITS – LOW CLIMATE IMPACT SCENARIOS AND THE IMPLICATION OF
REQUIRED TIGHT EMISSION CONTROL STRATEGIES PROJECT NO 282846
DELIVERABLE NO.3.1
288
Contreras, A., Guervós, E., and Posso, F. (2009). Market penetration analysis of the use of hydrogen in the road transport sector of the Madrid region, using MARKAL. International Journal of Hydrogen Energy, 34(1), 13–20.
DAHDF, 2008. 17th Indian Livestock Census 2003 e District Wise. Department of Animal Husbandry, Dairying and Fisheries, Government of India. <http://dms.nic.in/ami/home.htm> (accessed 13.06.08).
DoF (2013) Annual report 2012–13. Ministry of Chemicals and Fertilizers, Department of Fertilizer, Government of India. http://fert.nic.in/sites/default/files/Annual_Report2012-13.pdf. Accessed 7 March 2014
DoF (2014). Indian Fertilizers Statistics 2012. Department of Fertilizers, Government of India, New Delhi.
Dong, H., Yao, Z., Zheng, X., Mei, B., Xie, B., Wang, B., Deng, J., Cui, F., Zhu, J., 2011. Effect of ammonium-based, non-sulfate fertilizers on CH4 emissions from a paddy field with a typical Chinese water management regime. Atmospheric Environment 45 (5), 1095-1101.
Dowlatabadi, H. (1995). Integrated assessment models of climate change: An incomplete overview. Energy Policy.
Dowlatabadi, H. (1995). Integrated assessment models of climate change: An incomplete overview. Energy Policy.
Garg, A., Shukla, P.R., 2002. Emissions Inventory of India. Tata McGraw-Hill Publishing Company Limited, New Delhi.
Garg, A., Shukla, P.R., Kapshe, M., 2006. The sectoral trends of multigas emissions inventory of India. Atmospheric Environment 40, 4608-4620.
Garg, A., Shukla, P.R., Kapshe, M., Menon, D., 2003. Indian methane and nitrous oxide emissions and mitigation flexibility. Atmospheric Environment 38 (13), 1965-1977.
GoI, 2008. Rice Government of India. <http://india.gov.in/citizen/agriculture/rice.php> (accessed 13.08.08).
Grubb, M., Edmonds, J., Brink, P., & Morrison, M. (1993) The Cost of Limiting Fossil Fuel CO2 Emissions: A Survey and Analysis. Annual Review of Energy and the Environment.
Hedenus, F., Johansson, D., & Lindgren.K. (2012). A critical assessment of the energy- economy- climate models. Physical Resource Theory, 1-31.
LIMITS – LOW CLIMATE IMPACT SCENARIOS AND THE IMPLICATION OF
REQUIRED TIGHT EMISSION CONTROL STRATEGIES PROJECT NO 282846
DELIVERABLE NO.3.1
289
Economic Survey (2013) “Gross Domestic Product At Factor Cost By Industry Of Origin”, Economic Survey 2012-13, Ministry of Finance, Government of India, pp. A5 <http://indiabudget.nic.in/budget2013-2014/es2012-13/estat1.pdf>
Hourcade. J.C., Robinson. J., Richels. R. (1996). “Estimating the Cost of Mitigating Greenhouse Gases.” in: J.P. Bruce, H. Lee, and E.F.Haites (eds.), Climate Change 1995: Economic and Social Dimensions of Climate Change. Contribution of Working Group III to the Second Assessment Report of the IPCC. University Press, Cambridge, 263-296.
IBoM, 2012; Cement. Indian Minerals Yearbook 2011 (Part- II). 50th Edition. Indian Bureau of Mines, Nagpur. Ministry of Mines. Government of India.
INC (2004). India’s Initial National Communication to the United Nations Framework Convention on Climate Change. Ministry of Environment & Forests, Government of India, New Delhi.
IPCC, 2006. 2006 IPCC Guidelines for National Greenhouse Gas Inventories. Intergovernmental Panel on Climate Change.
IPCC. (2001). Climate Change 2001: Mitigation. Contribution of Working Group III to the Third Assessment Report of the Intergovernmental Panel on Climate Change Cambridge University Press, Cambridge.
IR, 2011. Annual Statistical Statement 2010-11. Indian Railways. Ministry of Railways, Government of India.
JPC, 2011. Performance Review - Iron & Steel: 2010-11. Joint Plant Committee. Constituted by Government of India.
Kim, S.H. & Edmonds, J. (2006). The objECTS Framework for integrated Assessment: Hybrid Modeling of Transportation. The Energy Journal, Hybrid Modeling (Special Issue #2), 63–92.
Kyle, P., and Kim, S. H. (2011). Long-term implications of alternative light-duty vehicle technologies for global greenhouse gas emissions and primary energy demands. Energy Policy, 39(5), 3012–3024.
Loulou, R., Goldstein, G., & Noble, K. (2004) Documentation for the MARKAL family of models. Energy Technology Systems Analysis Programme.
Luken, M., Edenhofer, O., Knopf, B., Leimbach, M., Luderer, G., and Bauer, N. (2011). The role of technological availability for the distributive impacts of climate change mitigation policy. Energy Policy, 39, pp. 6030-6039.

LIMITS – LOW CLIMATE IMPACT SCENARIOS AND THE IMPLICATION OF
REQUIRED TIGHT EMISSION CONTROL STRATEGIES PROJECT NO 282846
DELIVERABLE NO.3.1
290
Masayuki, I., and Eiichi, E. (2005). Analysis of the Vehicle Mix in the Automobile Sector in Japan for CO2 Emission Reduction by Using MARKAL Model. Energy and Resources, 26(2), 127–133. Retrieved from http://sciencelinks.jp/jeast/article/200509/000020050905A0323216.php
Massetti E., & M. Tavoni (2012). "A Developing Asia Emission Trading Scheme (Asia ETS)", Energy Economics, Vol. 34, Supplement 3, December 2012, Pages S436–S443.
MoA, 2013. Agricultural Statistics at a Glance 2013. Department of Agriculture and Co-operation, Ministry of Agriculture, Government of India. <http://eands.dacnet.nic.in/Publication12-12-2013/Agricultureat per cent20a per cent20Glance2013/page24-89.pdf> (accessed 03.03.14).
Modis, T. (2013). Long-term GDP forecasts and the prospects for growth. Technological Forecasting and Social Change, 1-6.
MoEF (2009) “India’s GHG Emission Profile - Results of Five Climate Modelling Studies”, Climate Modelling Forum, India; Supported by Ministry of Environment and Forests, Government of India
MoEF 2010. India: Greenhouse Gas Emissions 2007. INCCA Indian Network for Climate Change Assessment, Ministry of Environment and Forests, Government of India, New Delhi.
MoPNG, 2012; Indian Petroleum & Natural Gas Statistics 2011-12. Ministry of Petroleum & Natural Gas, Economic Division, Government of India, New Delhi
MoPNG, 2013. Basic Statistics on Indian Petroleum & Natural Gas. Ministry of Petroleum and Natural Gas, Government of India, New Delhi. <http:// petroleum.nic.in/petstat.pdf> (accessed 03.03.14).
INC (2004). “India’s Initial National Communication to the United Nations Framework Convention on Climate Change”. Ministry of Environment & Forests, Government of India, New Delhi.
MNRE (2013) “Annual Report”. Chapter 1- Overview. Ministry of New and Renewable Energy, Government of India. New Delhi. < http://mnre.gov.in/file-manager/annual-report/2012-2013/EN/overview.html> (accessed on 12 May, 2014)
NAPCC (2008) “National Action Plan on Climate Change”. Prime Minister’s Council on Climate Change, Government of India, New Delhi. < http://www.moef.nic.in/downloads/home/Pg01-52.pdf>
Planning Commission (2003). “Tenth Five Year Plan (2007-2012)”. Planning Commission. Government of India < http://planningcommission.nic.in/plans/planrel/fiveyr/10th/default.htm> (accessed on 19 April 2014)

LIMITS – LOW CLIMATE IMPACT SCENARIOS AND THE IMPLICATION OF
REQUIRED TIGHT EMISSION CONTROL STRATEGIES PROJECT NO 282846
DELIVERABLE NO.3.1
291
Planning Commission (2008). “Working Groups /Steering Committees / Task Force for the Eleventh Five Year Plan (2007-2012)”. Planning Commission. Government of India < http://planningcommission.nic.in/plans/planrel/11thf.htm> (accessed on 19 April 2014)
Planning Commission (2014). “Working Groups / Steering Committees for the Twelfth Five Year Plan (2012-2017)”. Planning Commission. Government of India < http://planningcommission.gov.in/aboutus/committee/index.php?about=12strindx.htm> (accessed on 19 April 2014)
SNC (2012). “India Second National Communication to the United Nations Framework Convention on Climate Change”. Ministry of Environment & Forests, Government of India, New Delhi.
WEO (2013). “World Energy Outlook” International Energy Agency. < http://www.worldenergyoutlook.org/publications/weo-2013/>
World Bank (2014). The World Bank-World Development Indicators, Country data – India. < http://data.worldbank.org/country/india> (accessed on 12 May 2014)
MoRTH (2012) Road Transport Year Book (2009-10 & 2010-11). Transport Research Wing, Ministry of Road Transport & Highways, Government of India. New Delhi
MoS, 2011. Report of the working group on Steel Industry for the twelfth five year plan (2012 – 2017), Ministry of Steel, Government of India.
O’Neill, B. C., Ren, X., Jiang, L., & Dalton, M. (2012). The effect of urbanization on energy use in India and China in the iPETS model. Energy Economics, 34, Supplement 3(0), S339–S345.
Olivier J.G.J., Maenhout G.J., Muntean M., and Peters, J. A.H.W. (2013). Trends in global CO2 emissions: 2013 Report. PBL Netherlands Environmental Assessment Agency.
Philips, F. (2007). On S-curves and tipping points. Technological Forecasting and Social Change, 715-730.
Planning Commission (2012) “Chapter 14 – Energy”, Economic Sectors, Vol 2, Twelfth Five Year Plan 2012-17, Planning Commission, Government of India.
Ravindranath. N.H., Deepak. P., Najeem, S., 2007. Biomass for Energy: Resource Assessment in India, submitted to Indian Institute of Technology, Bombay (Personal Communication).
RBI (2013), Handbook of Statistics on Indian Economy, Reserve Bank of India 2012-13
Remme, U., & Blesl, M. (2008). A global perspective to achieve a low-carbon society (LCS): scenario analysis with the ETSAP-TIAM model. Climate Policy, 8(sup1), S60–S75.

LIMITS – LOW CLIMATE IMPACT SCENARIOS AND THE IMPLICATION OF
REQUIRED TIGHT EMISSION CONTROL STRATEGIES PROJECT NO 282846
DELIVERABLE NO.3.1
292
Rivers, N., & Jaccard, M. (2006). Useful models for simulating policies to induce technological change. Energy Policy, 34(15), 2038–2047.
Schaefer, A., & Jacoby, H. D. (2006). Vehicle technology under CO2 constraint: a general equilibrium analysis. Energy Policy, 34(9), 975–985
Sharma S.K, Choudhury A., Sarkar P., Biswas S., Singh A., Dadhich P.K., Singh A.K., Majumdar S., Bhatia A., Mohini M., Kumar R., Jha C. S., Murthy M. S. R., Ravindranath N. H., Bhattacharya J.K., Karthik M., Bhattacharya S. and Chauhan R. (2011). Greenhouse gas inventory estimates for India. Current Science, vol. 101, no. 3.
Shukla, P R, Dhar, Subash and Mahapatra, Diptiranjan, (2008). Low Carbon Society Scenarios for India. Climate Policy, 8, S156-S176.
Shukla, P. R., & Chaturvedi, V. (2012). Low carbon and clean energy scenarios for India: Analysis of targets approach. Energy Economics, 34, Supplement 3(0), S487–S495.
Shukla, P. R., Dhar, S., & Fujino, J. (2010). Renewable energy and low carbon economy transition in India. Journal of Renewable and Sustainable Energy, 2(3), 031005–031005–15.
Shukla, P.R., Rana, A., Garg, A., Kapshe, M. & Nair, R. (2004) Climate policy assessment for India. Application of Asia-Pacific Integrated Model (AIM). Universities Press Private Limited.
Singhal, S., Pandey, S., 2001. Solid waste management in India: status and future directions. TERI Information Monitor on Environmental Science 6 (1), 1-3.
SNC (2012). India’s Second National Communication to the United Nations Framework Convention on Climate Change. Ministry of Environment & Forests, Government of India, New Delhi.
Springer, U. (2003). The market for tradable GHG permits under the Kyoto Protocol: a survey of model studies. Energy Economics, 25(5), 527–551.
Sun, X., Mu, C., Song, C., 2011. Seasonal and spatial variations of methane emissions from montane wetlands in Northeast China. Atmospheric Environment 45 (10), 1809-1816.
Swamy, M., Singhal, K.K., Gupta, P., Mohini, M., Jha, A.K., Singh, N., 2003. Reduction in uncertainties from livestock emissions. In: Mitra, A.P., et al. (Eds.), Climate Change and India: Uncertainty Reductions in Greenhouse Gas Inventory Estimates. Universities Press (India) Private Limited, Hyderabad, p. 236.
TERI (2011). IGES- TERI CDM Reform Paper: Linking Ground Experience with CDM Data in the Cement Sector in India. Institute for Global Environmental Strategies (IGES) and the Energy and Resources Institute (TERI), New Delhi.

LIMITS – LOW CLIMATE IMPACT SCENARIOS AND THE IMPLICATION OF
REQUIRED TIGHT EMISSION CONTROL STRATEGIES PROJECT NO 282846
DELIVERABLE NO.3.1
293
TERI, 2005. India – Canada Cooperation for Clean Development Mechanism, the Energy Research Institute. 2006.
UMP, 1999. Solid Waste Disposal in Asian Cities. Urban Management Program. http://www.serd.ait.ac.th/ump/newsletter per cent2520summer per cent252099.pdf (accessed 15.07.08).
Van den Broek, M., Veenendaal, P., Koutstaal, P., Turkenburg, W., & Faaij, A. (2011). Impact of international climate policies on CO2 capture and storage deployment: Illustrated in the Dutch energy system. Energy Policy, 39(4), 2000–2019.
Wing, I. S. (2006). The synthesis of bottom-up and top-down approaches to climate policy modeling: Electric power technologies and the cost of limiting US CO2 emissions. Energy Policy, 34(18), 3847–3869.
Xu, Y., & Masui, T. (2009). Local air pollutant emission reduction and ancillary carbon benefits of SO2 control policies: Application of AIM/CGE model to China. European Journal of Operational Research, 198(1), 315–325.
Yamaji, K., Ohara, T., Akimoto, H., 2003. A country-specific, high-resolution emission inventory for methane from livestock in Asia in 2000. Atmospheric Environment 37 (31), 4393e4406.

LIMITS – LOW CLIMATE IMPACT SCENARIOS AND THE IMPLICATION OF
REQUIRED TIGHT EMISSION CONTROL STRATEGIES PROJECT NO 282846
DELIVERABLE NO.3.1
294
Annex 6: An overview of adaptation policies in major economies and assessment of regional adaptation
costs
Executive summary
Humans have been adapting to their environments throughout history by developing practices, cultures and livelihoods suited to local conditions. Nevertheless, climate change increases the possibility that existing societies will experience climatic events (in for example, temperature, flooding and storm frequency) that prior experience has not prepared them for. Across the world, climate change is already affecting some communities and the environment severely. In response to this, governments are taking appropriate action to help citizens adapt to current and potential risks. Successful adaptation not only depends on governments but also on the active and sustained engagement of stakeholders including national, regional, multilateral and international organizations, the public and private sectors, civil society and other relevant stakeholders. Developing countries are particularly vulnerable to the adverse effects of climate change. The United Nations Framework Convention on Climate Change (UNFCCC) helps least developed countries (LDCs) to identify climate change adaptation needs by funding the development of National Adaptation Programme of Action (NAPA). As part of the NAPA process, LDC ministries, typically assisted by development agencies, assess their countries’ vulnerability to climate change and develop a prioritized list of adaptation projects that will help the country manage the adverse effects of climate change. To date, more than forty LDCs have written and submitted NAPAs to the UNFCCC. In this report, we first present the adaptation actions taken in key countries: the two largest developing economies (India and China) and two developed major countries (USA and Japan). The review shows that while India, China and the USA have already started establishing adaptation plans and programs in different sectors, Japan, on the contrary, has not approved yet concrete policies focusing on adaptation and its climate policy framework includes mostly mitigation activities. In a second step, this study makes an analysis on the finance required to meet adaptation needs. In that context, the analysis presents the costs of mitigation, adaption and damages in one framework to see the total impact of climate change. The analysis suggests that there are still considerable adaptation and residual impacts under a 2 degree Celsius policy. It also shows that to “compensate” those countries as part of an equal effort scheme, this would lead to a different allocation than focusing on a mitigation based perspective. Allocating emissions based on total climate change costs would increase the allocation especially for India and Africa, whereas notably North America would allocate fewer rights compared to mitigation-based allocation alone.
LIMITS – LOW CLIMATE IMPACT SCENARIOS AND THE IMPLICATION OF
REQUIRED TIGHT EMISSION CONTROL STRATEGIES PROJECT NO 282846
DELIVERABLE NO.3.1
295
An overview of adaptation policies in major economies and assessment of regional adaptation costs
Authors: Andries Hofa, Enrica Decianb, Giacomo Marangonib, Massimo Tavonib, Detlef P. van Vuurena, c and Sara Herrerasc a PBL Netherlands Environment Assessment Agency, PO Box 303, 3720 BA Bilthoven, The Netherlands b Fondazione Eni Enrico Mattei (FEEM), Euro-Mediterranean Center on Climate Change (CMCC), Isola di San Giorgio Maggiore, 30124 Venezia, Italy c Copernicus Institute of Sustainable Development, Utrecht University, Heidelberglaan 2, NL-3584 CS Utrecht, The Netherlands 32 Overview of adaptation policies
32.1 Adaptation policies in India
32.1.1 AgricultureAll the programmes that address the issue of adaptation of agriculture to climate change draw their goals/objectives from umbrella policies like the National Agriculture Policy, the National Water Policy or other acts like the National Rural Employment Guarantee Act, 2005. Even though the objectives of each of these policies may address a specific sector, their goals often overlap. In an attempt to account for most of the adaptation measures for the agricultural sector, we consider programmes by three ministries: The Ministry of Agriculture, The Ministry of Water Resources and The Ministry of Rural Development. The programmes promote adaptation options that seek to achieve biotechnological reforms for improved varieties of crops and livestock that are resistant to climatic changes, to increase efficiency of water use and development of water sheds that makes more land suitable for agriculture. Also, weather based insurance mechanisms to combat agricultural losses are in place. Policies that promote knowledge sharing within communities and also training progressive farmers for better farm practices have been undertaken. Several umbrella programmes of the ministry of agriculture like the National Food Security Mission and Macro Management of Agriculture attempt to look at all aspects of agricultural promotion. Such umbrella programmes address soil nutrition, development of new and improved varieties. Other programmes, like the Artificial groundwater recharge programme, the National Repair, Restoration and Renovation programme, Drought Prone Area Programme and the Drought Development programme, and the National Rural Employment Guarantee Scheme look at other issues that ensure development of land and irrigation water ways so as to complement agricultural stability and growth in future years. Under the National Mission on Sustainable Agriculture, a 4% growth in agricultural production is being targeted.

LIMITS – LOW CLIMATE IMPACT SCENARIOS AND THE IMPLICATION OF
REQUIRED TIGHT EMISSION CONTROL STRATEGIES PROJECT NO 282846
DELIVERABLE NO.3.1
296
32.1.2 WaterresourcesConservation of available water resources is being promoted through development of watersheds, artificial recharge to groundwater, rainwater harvesting etc. Revival of older water storage systems that were effective in the past are also promoted. To control overconsumption of water, water pricing has also been introduced in certain regions of the nation. To reduce the impact of extreme events like floods, construction, renovation and repair of infrastructure like embankments etc. along the banks of flood prone rivers is undertaken. Apart from this, development of channels that alleviate the threat of floods is also promoted. The National Water Mission targets development of water resources information system and expediency in formulation of river interlinking projects by March 2012. The Mission also aims to increase water use efficiency by introduction of guidelines for intensifying reuse of recycled water and water neutral and water saving technologies by March 2011. The mission also aims to improve water use efficiency in urban areas and release manuals for mandatory water audits. Besides, it promotes basin level integrated water resource management and revises the present water policy by releasing a new water policy by March 2013.
32.1.3 HealthIn the case of the health sector, most of the adaptation responses have been reactive instead of preventive. Lack of data in the health sector plagues the advancement of research in the area. Disease surveillance projects like the Integrated Disease Surveillance Programme (IDSP) aim at increasing the availability of data in the health sector. Most adaptive programmes can be found for malaria. Earlier programmes like the National Malaria Control Programme, 1953, National Malaria Eradication Programme, 1958, Enhanced Malaria Control Project, 1997-2005, to the most recent National Vector Borne Disease Control Programme (NVBDCP) programme have been attempts to eradicate the disease and in the case of NVBDCP, reduce malaria morbidity and mortality since its commencement in 2008. Other programmes that aim to improve the sanitation conditions and to improve water quality and waste disposal indirectly help in prevention of diarrhoea. Such components have been a part of major programmes for a long time like the Central Rural Sanitation Programme, 1986, The Accelerated Rural Water Supply, 1972 to the more recent Swajaldhara programme, 2002 and the Jalmani Initiative, 2008.
32.1.4 ForestsandecosystemsThe National Mission for Sustaining the Himalayan Ecosystem focuses on evolving suitable management and policy measures to sustain and safeguard the Himalayan glacier and mountain ecosystem. Large scale forest conservation programmes and programmes for conservation of wetland area and species have been promoted. Conservation of the gene pool of threatened species is also undertaken. Managing shifts in forest types due to climate change is a huge adaptation challenge. Dissemination of knowledge by providing information through communication and technology are part of several conservation programmes. Several programmes on reafforestation have been carried out on a large scale in a phased manner.
LIMITS – LOW CLIMATE IMPACT SCENARIOS AND THE IMPLICATION OF
REQUIRED TIGHT EMISSION CONTROL STRATEGIES PROJECT NO 282846
DELIVERABLE NO.3.1
297
The ‘Green India’ mission aims to address climate change by 1) enhancing carbon sinks in sustainable managed forests and other ecosystems; 2) enhancing the resilience and ability of vulnerable species/ecosystems to adapt to the changing climate; and 3) enabling adaptation of forest dependant local communities in the face of climatic variability (MoEF, 2010). The objectives of the mission are to: (MoEF, 2010)
Double the area to be taken up for afforestation /eco-restoration in India in the next 10 years, taking the total area to be afforested or eco-restored to 20 million ha. 10 million ha of additional forest/non forest area is to be treated by the Mission and another 10 million ha is likely to be treated by the Forest Department and other agencies.
Increase the GHG removals by India's forests to 6.35% of India's annual total GHG emissions by the year 2020 (an increase of 1.5% over what it would be in the absence of the Mission). This would require an increase in above and below ground biomass of 10 million ha of forests/ecosystems, resulting in increased carbon sequestration of 43 million tons CO2-e annually.
Enhance the resilience of forests/ecosystems being treated under the Mission by enhancing infiltration, groundwater recharge, stream and spring flows, biodiversity value, provisioning of services (fuel wood, fodder, timber, NTFPs, etc.) to help local communities adapt to climatic variability.
32.2 Adaptation policies in China Since 2012, China, specially the south of the country, has suffered from an increase in frequency of extreme weather conditions such as extremely high temperatures, increased floods and landslides. Severe droughts have also impacted the central and north‐west areas of Yunnan Province, affecting agriculture and people’s lives. In November 2013, China’s National Strategy for Climate Change Adaptation was published including clear guidelines and principles for climate change adaptation and proposes some specific adaptation goals. Some Chinese provinces such as Liaoning, Zhejiang and Henan have carried out parallely their own regional strategic studies for addressing climate change.
32.2.1 Agriculturemanagement
Since 2009, the government developed a series of policies and regulations supporting adaptation to climate change in agriculture. These include protection of tropical crop germplasm resources, monitoring and prevention of plant diseases and insect pests, conservation of new varieties of plants, safety of genetically modified organisms, selection breeding and demonstration of new varieties of super rice.
32.2.2 Waterresourcesmanagement
China has issued a series of policy arrangements to strengthen the integrated management of river basins and water resources. Since 2009, China has strengthened the construction of water
LIMITS – LOW CLIMATE IMPACT SCENARIOS AND THE IMPLICATION OF
REQUIRED TIGHT EMISSION CONTROL STRATEGIES PROJECT NO 282846
DELIVERABLE NO.3.1
298
conservancy and river training works, started the construction of a number of key projects for basin-wide flood prevention, sped up the construction of many key backbones and hubs for water sources, and increased soil erosion control. At the same time, investments in the safety of drinking water, especially in rural areas, have been increasing, mainly focusing on improving water supply capacity.
32.2.3 Marinemanagement
In the fields of the management and development of sea areas, China has issued a series of regulations and policies. The policies aim to actively enhance the monitoring and observation for marine climate, improve the management and protection of islands and coastal areas, increase the conservations and restorations of marine ecosystems and strengthen the risk management and emergency management of marine disasters in order to maximize the reduction of human activities on climate change.
32.2.4 Sanitationandhealthsectors
China has brought the health effects of climate change into the sanitation and health management, increased R&D in climate change and health fields, formulated relevant policies and regulations, established the emergency management mechanism of natural disasters, sped up the construction of public health infrastructure, and set up the framework of training, monitoring, and rapid response to disaster prevention and control.
32.2.5 MeteorologicalfieldsThe Meteorological department focuses on enhancing the scientific basis of climate change research and decision-making capacities. They have completed an assessment of climate and environment, carried out assessment tests for automatic climate stations, field observation tests using satellite remote sensing land surface radiation calibration, observational tests and models for the research on effects of drought on the natural grass prairie growth and its yield.
32.3 Adaptation policies in USA In 2009 a foundation for co‐ordinated action on climate change preparedness and resilience was established by Executive Order. This was the Interagency Climate Change Adaptation Task Force led by the institutions: the Council on Environmental Quality, the Office of Science and Technology Policy and the National Oceanic and Atmospheric Administration. Besides, through the US Global Change Research Programme, and agency programmes, the government is supporting scientific research and observational capabilities that are needed to enhance the responses to the impacts of climate change. There has also been active interest in the private sector where climate change vulnerabilities are salient, e.g., in insurance, agriculture, tourism, and sectors with infrastructures and vulnerable areas – although data on adaptation actions in the private sector are lacking. In November 2013, President Obama signed an Executive Order, which creates a Council on Climate Preparedness and Resilience, replacing the Interagency Climate Change Adaptation
LIMITS – LOW CLIMATE IMPACT SCENARIOS AND THE IMPLICATION OF
REQUIRED TIGHT EMISSION CONTROL STRATEGIES PROJECT NO 282846
DELIVERABLE NO.3.1
299
Task Force. The Council will include representatives from across the federal government and will work to integrate climate resiliency into federal programs; provide information, data, and tools for the public on climate change preparedness; and update the agency adaptation plans annually. In addition, the Executive Order creates a State, Local, and Tribal Leaders Task Force on Climate Preparedness and Resilience to inform Federal efforts. The NAS/NRC panel report on Adapting to the Impacts of Climate Change (NRC, 2010) identifies possible adaptation options for seven sectors (ecosystems, agriculture and forestry, water, health, transportation, energy, and ocean/coasts); but it notes that the knowledge base on adaptation options is still very limited, although the number of ideas about possible options is large indeed. Reasons include that, because the ability to attribute observed climate phenomena to climate change is still limited, it is difficult to evaluate the effectiveness of adaptation options in reducing climate change impacts; there has been relatively little support for research to clarify option costs, benefits, potentials and limits; and, most importantly, what makes sense in adapting to climate change impacts is very context-specific: as to threats, locations, sectors, scales, time frames, populations at risk, adaptive resources and capacities, and other variables.
Box 1. Illustrative US Adaptation Planning Efforts. New York City In December 2006, led by Mayor Bloomberg, New York City established a sustainability and growth management initiative, PlaNYC, which included a Climate Change Adaptation Task Force including a variety of private and public sector stakeholders. The Task Force used a common set of climate change projections to stimulate discussions among the stakeholders, associated with the concept of “acceptable levels of risk.” This risk management approach has led to the development of adaptation strategies imbedded in a continuing process of reassessment, including requirements for periodic progress reports and revised climate adaptation plans (NRC, 2010a) King County, WA In 2006, under the leadership of County Executive Ron Sims (now Deputy Secretary of the US Department of Housing and Urban Development), King County (in which Seattle is located) formed a climate change adaptation team to build capacities in county departments to consider climate change vulnerabilities in plans, policies, and investment decisions. Climate change is now incorporated in all country emergency response and resource management plans, consolidated into a King County Climate Plan that includes commitments to both mitigation and adaptation. In cooperation with the Climate Impacts Group at the University of Washington and ICLEI, the county has also produced Preparing for Climate Change: A Guidebook for Local, Regional, and State Governments.
LIMITS – LOW CLIMATE IMPACT SCENARIOS AND THE IMPLICATION OF
REQUIRED TIGHT EMISSION CONTROL STRATEGIES PROJECT NO 282846
DELIVERABLE NO.3.1
300
32.4 Adaptation policies in Japan In 2007 more than 40°C were recorder in various Japanese cities - the highest temperature on the country’s history. Agriculture and marine resources have also been affected by unusual phenomena. Although the country has experienced clear adverse climate impacts, adaptation to the impacts of global warming is still a relatively unexplored concept in Japan and the Japanese policy towards climate change is focused on how to meet the Kyoto target where mitigation is the priority rather than adaptation. The country does not have yet adopted policy on adaptation and it is only studying adaptive measures, mainly related to coastal areas, social infrastructure, and agriculture production. The government has released some studies that assess the impacts of climate change and draw some recommendation on potential adaptation policies. The report ‘Climate Change, and its Impacts in Japan’ (Ministry of Environment Japan 2009) published in 2009, is the most comprehensive study on analysing, qualitatively and quantitatively, climate change impacts on water resources, forestry, agriculture, coastal areas and health. The report also recommends which type of adaptation measures are needed to diminish the economic, social and environmental losses in the country. Another example is the ‘Wise Adaptation to Climate Change Report’ (Ministry of Environment Japan 2008) also published by the Ministry of Environment. A more recent research study on track since 2010 and led by the Environment Research and Technology Development Fund of the Ministry of the Environment (“Comprehensive Study on Impact Assessment and Adaptation for Climate Change”) aims to assess climate change impacts and effects of adaptation measures in various sectors by using integrated assessment modelling. The final objective of the research is to define the benefits and burdens of climate (adaptation and mitigation) policies. 33 Burden sharing taking into account adaptation costs and climate
change damage
Efficiency and equity have been key concepts in climate change policy making since the very first international environmental agreements on climate change. Over time, these principles have taken different forms. The Framework Convention on Climate Change (UNFCCC, 1992) indicates that countries have common but differentiated responsibilities in mitigation action, a general principle which translated into differentiated emission reduction targets under the Kyoto Protocol. Still, people have been calling for “fair” contributions of countries and more recently, climate policy has moved into a patchwork of GHG emission cuts, revealing a heterogeneous willingness to contribute to the mitigation problem.
The UNFCCC also addresses equity issues related to the incidence of climate change impacts and adaptation to them, indicating that actions to respond such impacts should be considered in terms of funding, insurance or technology. Usually, these equity concerns are addressed in a different policy discussion, leading to different instruments such as the adaptation fund (Decision 1/CMP.3 and Decision 10/CP.7). The more recent Decisions that have been formalized in the Cancun Agreements about technology, transfers, and finance, such as Cancun Technology Mechanism, Green Climate Fund and Fast-start fin, apply to both mitigation and adaptation. Whereas the Parties of the Convention do not lose sight on key priority of broadening the scope and the depth of mitigation action, the Warsaw Outcomes confirm the urgency of addressing the
LIMITS – LOW CLIMATE IMPACT SCENARIOS AND THE IMPLICATION OF
REQUIRED TIGHT EMISSION CONTROL STRATEGIES PROJECT NO 282846
DELIVERABLE NO.3.1
301
loss and damages caused by climate change and building adaptation capacity in developing countries.
The scientific literature on the environmental and economic implications of different burden sharing schemes has focused on the distribution of GHG mitigation costs (den Elzen and Höhne 2008, Ekholm et al. 2010, Luderer et al. 2012). Cost-effectiveness requires greater reduction of greenhouse gas (GHG) emissions where mitigation is cheapest, namely in many developing countries. Recent studies have shown in the context of a multi-model ensemble that the economic effort of achieving a 2 degree target in a cost-effective way would differ widely across regions because of diverse economic and energy structures, baseline emissions, and energy and carbon intensities (Edenhofer et al. 2010, den Elzen and Höhne 2010, Johansson 2012, Tavoni et al. 2014, Kriegler et. al 2014a, Kriegler et. al 2014b). Policy instruments, such as a fully-fledged, global emission trading scheme, can be used to pursue efficiency and equity at the same time, separating the question of who mitigates from the question of who pays for that. Studies based on Integrated Assessment Models (IAMs) have quantified the ability of global emission trading schemes to compensate the uneven distribution of the abatement effort, showing that these transfers could become a significant factor in the international distribution of wealth (De Cian and Tavoni 2012, Tavoni et al 2014).
While a different set of studies have looked at the question how much financing of developed to developing countries is needed to address climate change impacts in the latter region (Fujiwara et al., 2008; Hof et al., 2009; Schaeffer et al., 2013; UNFCCC, 2007; World Bank, 2010), only a few studies have handled equity considerations regarding mitigation, impacts, and adaptation jointly, using a consistent modeling framework. Hof et al. (2010) analyzes how taking a wider perspective on mitigation costs, residual damage, and adaptation costs influences the discussions on mitigation targets and their fairness. Different burden-sharing regimes can even affect the ability to finance the adaptation fund, as envisaged in the Decision CMP.3 taken by the UNFCCC at the Conference of the Parties (COP) 13 in Bali in 2007. As a matter of fact, residual damages and the associated adaptation costs could remain substantial even in under limited global warming, especially in developing countries, with the possibility of exceeding US$1 trillion in 2100, globally (Bosello et al. 2013).
In the following sections, we also take a wide perspective but take a different approach. Whereas in Hof et al. (2010), mitigation targets were based on mitigation costs only, we base the mitigation targets on the sum of mitigation costs, adaptation costs and residual damage. In this way, financial compensation for adaptation costs and residual damage is done through a global emission trading scheme. Although a global emission trading scheme currently does not seem realistic, this exercise shows how emission targets would change if the total costs of climate change would be taken into account instead of only mitigation costs. Our main question here is “How would emission rights be allocated if the sum of mitigation costs, residual damage, and adaptation costs as share of GDP would be equalized across regions, compared to a situation in which only mitigation costs are equalized?”
LIMITS – LOW CLIMATE IMPACT SCENARIOS AND THE IMPLICATION OF
REQUIRED TIGHT EMISSION CONTROL STRATEGIES PROJECT NO 282846
DELIVERABLE NO.3.1
302
33.1 Methods and scenarios
Uncertainties in mitigation costs, residual damage and adaption costs often play a key role. In order to take into account at least some of these uncertainties, we use two different IAMs – WITCH (Bosetti et al., 2006; De Cian et al., 2012) and FAIR (den Elzen et al., 2014; Hof et al., 2010), each with their own estimates of mitigation potential and costs – and two different sets of damage and adaptation cost curves (the latter two of which depend on each other). It should be mentioned that damage projections are often considered to be the weakest part of Cost-Benefit Analysis, due to their estimation in mostly exogenous growth models, the narrow focus on the relation between output reduction and same period temperature, limited distribution of risks and very little investigation for temperature increase above 3°C (Stern, 2013). Although we use two damage functions, one based on the ClimCost project (Bosello and De Cian, 2014) and one on de Bruin (de Bruin et al., 2009; Hof et al., 2009), we do not cover the full uncertainty range in damage and adaptation cost projections.
We consider a mitigation scenario that stabilizes CO2-equivalent concentrations at 450 ppm – consistent with a likely chance to achieve the 2 degree target. Emission rights are allocated either based on only mitigation costs (scenario ref450tax), or on the sum of mitigation costs, adaptation costs and residual damage (scenario ref450tax_adap),. For comparison, we also include a scenario in which emission rights are allocated in a cost-optimal way (equal tax) and a baseline scenario in which no mitigation is assumed (bau_adap).
33.2 Results
33.2.1 Damageprojections
Figure 1 shows the residual damage in Net Present Value using a 3% discount factor for the various regions of the model considered. Globally, limiting climate change to 2 degrees Celsius is projected to halve the damage associated with climate change. Nevertheless, global impacts would remain considerable: the projected global GDP loss due to climate change damage is 2.4-2.7% in the baseline and 1.3-1.5% in the mitigation scenario. Combining the global mitigation effort with a regional efficient adaptation is projected to reduce the global loss to about 0.9-1.2% of GDP. Regionally, under a 2 degree pathway, climate change impacts could remain as high as 4% and 3%, depending on whether adaptation is implemented.
Although there is considerable uncertainty in the damage projections, the damage functions strongly are in agreement with respect to which regions face the highest damage (India, Africa, Rest of Asia). In regions for which relatively low impacts are projected (North America, Pacific OECD, and China), adaptation does not significantly reduces damage compared to mitigation alone (purple bar versus red bar). In high-damage regions adaptation does significantly reduce the residual damage associated with a 2 degree warming (notably Asia and Africa). In some places with medium or high damages, such as Rest of Asia, Middle East and Europe, the implementation of national/regional optimal adaptation policies could actually achieve a greater damage reduction compared to the stabilization policy alone (green bar versus red bar).

LIMITS – LOW CLIMATE IMPACT SCENARIOS AND THE IMPLICATION OF
REQUIRED TIGHT EMISSION CONTROL STRATEGIES PROJECT NO 282846
DELIVERABLE NO.3.1
303
The uncertainty in residual damage is generally higher in the no policy case (bau) than in the mitigation and/or adaptation (adap) scenarios, with the exception of adaptation alone in Rest of Asia for which the models differ in the projected effectiveness of adaptation (with adaptation projected to be less effective in the WITCH model as compared to the FAIR model, especially in the sectors coastal, settlements, and catastrophic events). It should be noted that for the region Rest of Asia, although residual damages are lower in the bau+adap case than in the ref450tax_adap case, the sum of adaptation costs and residual damages are higher in the bau_adap case.
Figure 1. NPV of residual damage in the baseline compared to the mitigation scenarios
33.2.2 AllocationofemissionrightsEqualization of the sum of mitigation costs, adaptation costs, and residual damage – instead of only mitigation costs – has different effects on different regions. Regions such as Africa or India, who are projected to have high residual damage (Figure 1), would receive a larger allocation compared to allocation based on mitigation costs only. This is depicted in Figure 2, which shows the allocation of emission rights (in the case of the tax they coincide with emissions) under a global tax regime (dashed line), under the equal effort allocation (EE) scheme based on mitigation costs only (line with arrows), and under the equal effort allocation scheme based on the total climate change costs (sum of mitigation costs, residual damage, and adaptation costs). The dashed lines in Figure 2 represent the emission pathways with the tax. The pale filling is the change in emission allocation when moving from the tax to the EE. When the pale filling lies above the dashed line, the EE scheme increases the amount of emissions allocated. Consider for example the Middle East: in this region mitigation costs are large, between 1.7 and 3 times greater than the world average. The EE schemes give these countries more allocations to compensate their high mitigation costs. North America, Pacific OECD, and Europe have mitigation costs smaller than the world average. The pale filling lies below the dashed line, indicating that the EE scheme reduces the amount of emissions allocated to those regions. These are regions with relatively low mitigation costs, and

LIMITS – LOW CLIMATE IMPACT SCENARIOS AND THE IMPLICATION OF
REQUIRED TIGHT EMISSION CONTROL STRATEGIES PROJECT NO 282846
DELIVERABLE NO.3.1
304
therefore would undertake more emission reduction if allocation were based on total climate change costs. The dark filling in Figure 2 shows the change in allocation due to the inclusion of damages and adaptation. The solid line represents the resulting emission allocation when damages and adaptation are included. When the dark fill lies below the solid line: the net effect of the damage is to increase the allocation. The inclusion of damages and adaptation costs increases the allocation from the line with arrows to the solid line for a total change equal to the dark filling. Accounting for the damage and adaptation cost components of the climate change costs induces a more generous emission allocation in the countries with damages larger than the global average (Figure 1), namely India, Africa, Rest of Asia and to a lesser extent in Latin America, Middle East and Europe.
Figure 2. Allocation of emission rights based on mitigation costs only (EE NoDam) and based on total climate policy costs (EE w/Adap) compared to projected emissions resulting from a global carbon tax When the dark fill lies above the solid line, the net effect of damage and adaptation is to reduce the allocation. This is the pattern observed in relatively low damage regions, such as North America, Pacific OECD, and China. The arrows help visualizing the net effect of damages and adaptation on the allocation. The arrows pointing up indicate that accounting for damages and adaptation costs increases the allocation of emissions, while arrows pointing down indicate that accounting for damages and adaptation costs reduces the allocation of emissions.
LIMITS – LOW CLIMATE IMPACT SCENARIOS AND THE IMPLICATION OF
REQUIRED TIGHT EMISSION CONTROL STRATEGIES PROJECT NO 282846
DELIVERABLE NO.3.1
305
Note that although the qualitative pattern of the results is common to both models (arrows always point in the same direction), the magnitude of the effect is very different. The heterogeneity between the two models is a direct consequence of the very different structure of the two models used in this study.
33.3 Discussion and conclusion of analysis on burden sharing
Studies on burden sharing have focused on equal allocation of mitigation costs without considering the full cost of climate change, which also includes adaptation costs and residual damages. Since the distribution of adaptation costs and residual damages does not necessarily mirror the distribution of mitigation costs, accounting for adaptation costs and residual damage can change the picture of burden sharing.
Being aware of the huge uncertainty in damage and adaptation costs estimates, this paper does not intend to perform cost-benefit analysis, neither does it aim at covering the uncertainty space of regional damages. Instead, the purpose of this analysis is to show 1) there are still considerable adaptation and residual impacts under a 2 degree Celsius policy and that 2) to “compensate” those as part of an equal effort scheme – this would lead to a different allocation than focusing on a mitigation based perspective. Allocating emissions based on total climate change costs would increase the allocation especially for India and Africa, whereas notably North America would allocate fewer rights compared to mitigation-based allocation alone.
References
Bosetti, V., Carraro, C., Galeotti, M., Massetti, E., Tavoni, M., 2006. WITCH: A World Induced Technical
Change Hybrid Model. Energy J Special Issue. Hybrid Modeling of Energy-Environment Policies: Reconciling Bottom-up and Top-down, 13-38.
Bosello F., Carraro C., De Cian E. (2013). Adaptation Can Help Mitigation: An Integrated Approach to
Post-2012 Climate Policy. Environmental and Development Economics, Vol 18, pp. 270–290. Bosello, F, De Cian, E. (2014) Documentation on the development of damage functions and adaptation
module in the WITCH model, http://www.witchmodel.org/pag/publications.html de Bruin, K.C., Dellink, R.B., Tol, R.S.J., 2009. AD-DICE: An implementation of adaptation in the DICE
model. Clim Change 95, 63-81. De Cian, E., Bosetti, V., Tavoni, M., 2012. Technology innovation and diffusion in "less than ideal" climate
policies: An assessment with the WITCH model. Clim Change 114, 121-143. De Cian, E. and M. Tavoni (2012), 'Do technology externalities justify restrictions on emission permit
trading?', Resource and Energy Economics, 34(4), 624-646..dx.doi.org/10.1016/j.reseneeco.2012.05.009.
LIMITS – LOW CLIMATE IMPACT SCENARIOS AND THE IMPLICATION OF
REQUIRED TIGHT EMISSION CONTROL STRATEGIES PROJECT NO 282846
DELIVERABLE NO.3.1
306
den Elzen, M., Hof, A., van den Berg, M., Roelfsema, M., 2014. Climate Policy, In: Stehfest, E.,
van Vuuren, D., Kram, T., Bouwman, L. (Eds.), Integrated Assessment of Global Environmental Change with IMAGE 3.0. Model description and policy applications. PBL Netherlands Environmental Assessment Agency, The Hague, pp. 303-311.
den Elzen M, Höhne N (2008) Reductions of greenhouse gas emissions in Annex I and non-Annex I
countries for meeting concentration stabilisation targets. Climatic Change 91:249-274. den Elzen M, Höhne N (2010) Sharing the reduction effort to limit global warming to 2C. Climate Policy
10:247-260 Edenhofer, O., Knopf, B., Barker, T., Baumstark, L., Bellevrat, E., Chateau, B., Criqui, P., Isaac, M.,
Kitous, A., Kypreos, S., Leimbach, M., Lessmann, K., Magne, B., Scrieciu, Å., Turton, H., Van Vuuren, D., 2010. The economics of low stabilization: Model comparison of mitigation strategies and costs. Energy Journal 31, 11–48.
Ekholm, T., Soimakallio, S., Moltmann, S., Höhne, N., Syri, S., Savolainen, I., 2010. Effort sharing in
ambitious, global climate change mitigation scenarios. Energy Policy 38, 1797–1810. Fujiwara, N., Georgiev, A., Egenhofer, C., 2008. Financing mitigation and adaptation: Where should the
funds come from and how should they be delivered? ECP Report No. 7. Kriegler, E., Riahi, K., Bauera, N., Schwanitza, V.J., Petermanna, N., Bosettic, V., Marcuccid, A., Otto, S.,
Paroussosg, L., Raob, S., Arroyo Currása, T., Ashinah, S., Bolleni, J., Eomj, J., Hamdi-Cherifk, M., Longdenc, T., Kitousl, A., Méjeank, A., Sanom, F., Schaeffern, M., 2014a. Making or breaking climate targets: The AMPERE study on staged accesion scenarios for climate policy. Technology Forecasting and Social Change. In press.
Kriegler, E., Weyant, J. P., Blanford, G., J., Krey, V., Clarke, L., Edmonds, J., Fawcett, A., Luderer, G.,
Riahi, K., Richels, R., Rose, S.K., Tavoni, M., van Vuuren, D. P., 2014b. The role of technology for achieving climate policy objectives: overview of the EMF27 study on global technology and climate policy strategies. Climatic Change 123, 353-367
Hof, A.F., de Bruin, K.C., Dellink, R.B., den Elzen, M.G.J., van Vuuren, D.P., 2009. The effect of different
mitigation strategies on international financing of adaptation. Environ Sci Policy 12, 832-843. Hof, A.F., den Elzen, M.G.J., van Vuuren, D.P., 2010. Including adaptation costs and climate change
damages in evaluating post-2012 burden-sharing regimes. Mitigation and Adaptation Strategies for Global Change 15, 19-40.
Johansson, D.J.A., Lucas, P.L., Weitzel, M., Ahlgren, E.O., Bazaz, A.B., Chen, W., Den Elzen, M.G.J.,
Ghosh, J., Grahn, M., Liang, Q.M., 2012. Multi-model analyses of the economic and energy implications for China and India in a post-Kyoto climate regime. submitted to Energy Policy.
Luderer, G., De Cian, E., Hourcade, J.-C., Leimbach, M., Waisman, H., Edenhofer, O., 2012. On the
regional distribution of mitigation costs in a global cap-and-trade regime. Climatic Chang
Ministry of Environment Japan 2009. Climate Change and Its impacts in Japan. Available here: http://www.env.go.jp/en/earth/cc/report_impacts.pdf

LIMITS – LOW CLIMATE IMPACT SCENARIOS AND THE IMPLICATION OF
REQUIRED TIGHT EMISSION CONTROL STRATEGIES PROJECT NO 282846
DELIVERABLE NO.3.1
307
Ministry of Environment Japan 2008. Wise Adaptation to Climate Change. Available here: https://www.env.go.jp/en/earth/cc/wacc_080618.pdf
MoEF, 2010. National Missions for a Green India: Draft Mission Document Version 1.0 Ministry of Environment and Forests, Government of India, New Delhi, India. NRC, 2010. Adapting to Impacts of Climate Change, Report of the Panel on Adapting to Impacts of Climate Change, NAS/NRC Committee on America’s Climate Choices, Washington, DC. Schaeffer, M., Baarsch, F., Adams, S., Bruin, K.d., De Marez, L., Freitas, S., Hof, A., Hare, B., 2013.
Africa’s Adaptation Gap. Technical Report: Climate-change impacts, adaptation challenges and costs for Africa. AMCEN, UNEP, ClimateAnalytics.
Stern, N., 2013. The economics of climate change, In: Robin, L., Sörlin, S., Warde, P. (Eds.), The Future
of Nature: Documents of Global Change, pp. 465-475 Tavoni, M, E. Kriegler, T. Aboumahboub, K. Calvin, G. De Maere, J. Jewell, T. Kober, P. Lucas, G.
Luderer, D. McCollum, G. Marangoni, K. Riahi and D. Van Vuuren (2014), 'The distribution of the major economies' effort in the Durban platform scenarios', Forthcoming Special Issue Climate Change Economics.
UNFCCC, 2007. Climate change: Impacts, vulnerabilities and adaptation in developing countries. World Bank, 2010. The economics of adaptation to climate change - a synthesis report. The World Bank
Group, Washington, D.C.