Deformation behavior of steels in mushy state - Iran Mavad
10
Ž . Materials and Design 22 2001 83]92 Deformation behavior of steels in mushy state A.A. Tseng a, U , J. Horsky b , M. Raudensky b , P. Kotrbacek b ´ ´ ´ a Department of Mechanical and Aerospace Engineering, Arizona State Uni ¤ ersity, Tempe, AZ 85287-6106, USA b Fluid Flow and Heat Transfer Laboratory, Technical Uni ¤ ersity of Brno, Brno, Czech Republic Received 14 February 2000; accepted 3 April 2000 Abstract Processing metals in a semisolid or mushy state has emerged as a vital commercial process to produce metal and metal-matrix composite components. The understanding of the basic deformation behavior of materials in the mushy state is critical for better control of various semisolid processes. The aim of the present study is to quantify the flow stress of mushy-state steels under uniaxial deformation conditions. A hot compression tester has been developed to provide the high temperature setting required for testing mushy-state steels. An analytical scheme, which only requires measuring the dimensions of the final solidified specimen, has been developed to eliminate the barreling effects occurring in compression tests. The temperature of specimens has been carefully controlled to correlate the solid phase content. It has been found that the flow stress of steels in mushy states was highly dependent on the solid phase percentage. The relaxation of steel and stress reduction at mushy states is also discussed. Q 2000 Elsevier Science Ltd. All rights reserved. Keywords: Forming; Compression test steel; Mushy state; Stress ]strain curve; Barreling; Barreling factor 1. Introduction Increasing attention is being given to net shape pro- w x cessing of metals at semisolid or mushy states 1,2 . The semisolid or mushy-state process permits molten metals to partially solidify before shape-making operations. Among many benefits, it reduces the force requirement for the forging processes because of the lower flow stresses involved, or increases die life in die casting operations due to the lower temperature associated. To understand the mushy-state processing behavior of any metals, it is essential to have the basic data, especially the flow stress and strain relationship. A great amount of work has been done in studying the semisolid structure and its rheological properties as U Corresponding author. Tel.: q1-480-965-8201; fax: q1-480-965- 1384. Ž . E-mail address: [email protected] A.A. Tseng . well as the forming methodology. Most of the work has been focused on the determination of material charac- teristics of relatively low-melting temperature materi- als, including aluminum, magnesium, tin, lead and their w x composites 1 ] 6 . Because of the high-melting temper- atures and other related measurement difficulties, there is a relatively small amount of experimental data avail- able on steels. As a result, the purpose of the present study is to provide the basic deformation data for steel under mushy states. The flow stress of mushy-state steels under uniaxial conditions will be evaluated. A hot compression test is developed to generate the flow stress data. An analytical scheme will be used to elimi- nate the barreling effects inherited in the compression test. Semisolid specimens were evaluated at various solid phase contents. The changes in the percentage of solid phases are followed by changes in steel structures and rheology, which results in the change of the forming 0261-3069r01r$ - see front matter Q 2000 Elsevier Science Ltd. All rights reserved. Ž . PII: S 0 2 6 1 - 3 0 6 9 00 00058-3
-
Upload
khangminh22 -
Category
Documents
-
view
2 -
download
0
Transcript of Deformation behavior of steels in mushy state - Iran Mavad

Ž .Materials and Design 22 2001 83]92
Deformation behavior of steels in mushy state
A.A. Tsenga,U, J. Horskyb, M. Raudenskyb, P. Kotrbacekb´ ´ ´aDepartment of Mechanical and Aerospace Engineering, Arizona State Uni ersity, Tempe, AZ 85287-6106, USA
bFluid Flow and Heat Transfer Laboratory, Technical Uni ersity of Brno, Brno, Czech Republic
Received 14 February 2000; accepted 3 April 2000
Abstract
Processing metals in a semisolid or mushy state has emerged as a vital commercial process to produce metal and metal-matrixcomposite components. The understanding of the basic deformation behavior of materials in the mushy state is critical for bettercontrol of various semisolid processes. The aim of the present study is to quantify the flow stress of mushy-state steels underuniaxial deformation conditions. A hot compression tester has been developed to provide the high temperature setting requiredfor testing mushy-state steels. An analytical scheme, which only requires measuring the dimensions of the final solidifiedspecimen, has been developed to eliminate the barreling effects occurring in compression tests. The temperature of specimenshas been carefully controlled to correlate the solid phase content. It has been found that the flow stress of steels in mushy stateswas highly dependent on the solid phase percentage. The relaxation of steel and stress reduction at mushy states is also discussed.Q 2000 Elsevier Science Ltd. All rights reserved.
Keywords: Forming; Compression test steel; Mushy state; Stress]strain curve; Barreling; Barreling factor
1. Introduction
Increasing attention is being given to net shape pro-w xcessing of metals at semisolid or mushy states 1,2 . The
semisolid or mushy-state process permits molten metalsto partially solidify before shape-making operations.Among many benefits, it reduces the force requirementfor the forging processes because of the lower flowstresses involved, or increases die life in die castingoperations due to the lower temperature associated.
To understand the mushy-state processing behaviorof any metals, it is essential to have the basic data,especially the flow stress and strain relationship. Agreat amount of work has been done in studying thesemisolid structure and its rheological properties as
U Corresponding author. Tel.: q1-480-965-8201; fax: q1-480-965-1384.
Ž .E-mail address: [email protected] A.A. Tseng .
well as the forming methodology. Most of the work hasbeen focused on the determination of material charac-teristics of relatively low-melting temperature materi-als, including aluminum, magnesium, tin, lead and their
w xcomposites 1]6 . Because of the high-melting temper-atures and other related measurement difficulties, thereis a relatively small amount of experimental data avail-able on steels.
As a result, the purpose of the present study is toprovide the basic deformation data for steel undermushy states. The flow stress of mushy-state steelsunder uniaxial conditions will be evaluated. A hotcompression test is developed to generate the flowstress data. An analytical scheme will be used to elimi-nate the barreling effects inherited in the compressiontest. Semisolid specimens were evaluated at varioussolid phase contents. The changes in the percentage ofsolid phases are followed by changes in steel structuresand rheology, which results in the change of the forming
0261-3069r01r$ - see front matter Q 2000 Elsevier Science Ltd. All rights reserved.Ž .PII: S 0 2 6 1 - 3 0 6 9 0 0 0 0 0 5 8 - 3

( )A.A. Tseng et al. r Materials and Design 22 2001 83]9284
Table 1Chemical composition of steel sample
Ž . Ž . Ž .Element C % MN % SI %
Quantity 0.95]1.10 0.20]0.35 0.30
behavior. The correlation between the temperatureand the percentage of the solid phase will be used todefine the characteristics of the mushy state.
2. Material and microstructures
A high-carbon tool steel was selected for the presentdeformation study. Its composition is shown in Table 1.Because of its low content of additions, the equilibriumbinary phase diagram of Fe]C can be used to definethe solidus and liquidus temperatures as well as thepercentage contents of the solid phase.
Based on the Fe]C phase diagram shown in Fig. 1,the solidus temperature for the steel tested was foundto be approximately 13468C, and the liquidus tempera-
w xture 14658C 7 . These temperatures are consistent withthe measurement data obtained by a separate test. Thedifference between the liquidus and solidus tempera-tures is 1198C and the well-known lever rule is used toestimate the content of the solid and liquid phases byproviding the testing temperature.
The microstructures of the selected material arestudied. Material samples are first heated to a specifictemperature within the mushy state, and then arequenched to the room temperature in which themicrostructure and percentage of solid phase at theinstant of quenching can be preserved. The quenched
samples are examined with both optical and scanningelectron microscopes. Fig. 2 depicts the intercrystallinefracture after heating the steel sample to a tempera-ture of 14308C by an examination using a scanningelectron microscope, having visible melting down ofgrain boundaries prior to quenching. Fig. 3 shows thecorresponding optical micrograph for a sample exposedto 14308C for 1 h before quenching.
3. Apparatus and testing
The apparatus used for the compression test hasbeen specifically designed to accommodate the hightemperatures required to melt steels. As shown in Fig.4, it consists of an Instron load frame equipped with aposition measuring device and a dynamometer with arange of up to 2 kN. A furnace specially designed tomelt steels is situated within the load frame. Thefurnace is heated by two resistive heating elementsplaced at opposite ends of the furnace enclosure. Twothermocouples are placed inside the furnace; one isclose to the material sample to ensure that the pre-settemperature is achieved. Temperatures monitored fromeither location have been consistent with each other. Amicrocomputer-based data acquisition system collectsinformation from the dynamometer and records posi-tions while the experiment is performed. The schematicdiagram showing the major components of the appara-tus is depicted in Fig. 5.
The steel sample is placed between two corundumfine-grained ceramic discs with a smoothly ground sur-face within a ceramic crucible. The massive supportunder the crucible is made up of refractory concrete
Fig. 1. Iron]carbon metastable phase diagram.

( )A.A. Tseng et al. r Materials and Design 22 2001 83]92 85
Fig. 2. SEM image of quenched samples.
and located between the two heating elements. A re-fractory concrete rod with a diameter of 29 mm chuckedwith the dynamometer can easily slide down the cru-cible to allow compression as shown in Fig. 6. Thedesign of the set-up enables the steel sample to beaccessed from both the top and bottom sides. An inertprotective atmosphere is used around the steel sample
and is supplied by an inlet in the refractory concretebase.
A cylindrical specimen is used for the hot compres-Ž .sion test having an original diameter D of 15 mm0
Ž .and height H of 24 mm. The specimen is loaded into0the furnace and heated up to the required temperaturein the inert protective atmosphere. It is then homoge-
Fig. 3. Optical micrograph for quenched samples.

( )A.A. Tseng et al. r Materials and Design 22 2001 83]9286
Fig. 4. Experimental apparatus for hot compression test.
nized in the furnace for 30 min at the pre-set tempera-ture. The tested specimen is compressed by moving theconcrete rod down at the pre-set rate. Data on the
Fig. 5. Schematic diagram for hot compression test apparatus.
Fig. 6. Hot compression testing setup.
instantaneous position of the rod and the instanta-neous force acting on the rod are recorded by a com-puter. Once the steel specimen is deformed to one-thirdof its original height, the downward motion of the rodis stopped and the deformed specimen is then allowedto relax as shown in Fig. 7. The force relaxation withtime is also measured and recorded. Once the relax-ation process is completed, the refractory is movedback to its initial position, and the measurement isrepeated for a different compression temperature.
4. Stress and strain evaluation
The hot compression tests were conducted between1364 and 14138C, which correspond to 0.9 and 0.6 ofthe solid fraction, respectively. For testing tempera-tures higher than 14188C, the specimens consisting oftoo much liquid have difficulty to hold together underloading. No attempt has been made to test specimenshaving the solid fraction lower than 0.6. The solidfraction is defined as weight percentage of soliduscomponent in a mushy state. The compression velocityŽ . y5 Ž .V is controlled at 8.33=10 mrs 5 mmrmin . Fora 24-mm thick specimen, it takes 192 s to deform toone-third of its original thickness and the correspond-ing engineering strain rate is 3.47=10y3 1rs. The
Ž .force P applied to the test specimen and the heightŽ .of the specimen H were recorded. Then, the engi-
Fig. 7. Hot compression testing procedure.
( )A.A. Tseng et al. r Materials and Design 22 2001 83]92 87
Ž . Ž .neering stress S and engineering strain e can beestimated as:
2 Ž .Ss4Pr pD 1Ž .0
and
Ž . Ž .es H yH rH 20 0
where D and H are the original diameter and height0 0of the specimen, respectively. If the volume of the testspecimen is kept constant and the deformation is uni-
Ž . Ž .form, the true stress s and true strain « can be,respectively, calculated as:
Ž . 2 Ž .ss 4PH r pH D 3Ž .0 0
and
Ž . Ž .«s ln HrH 40
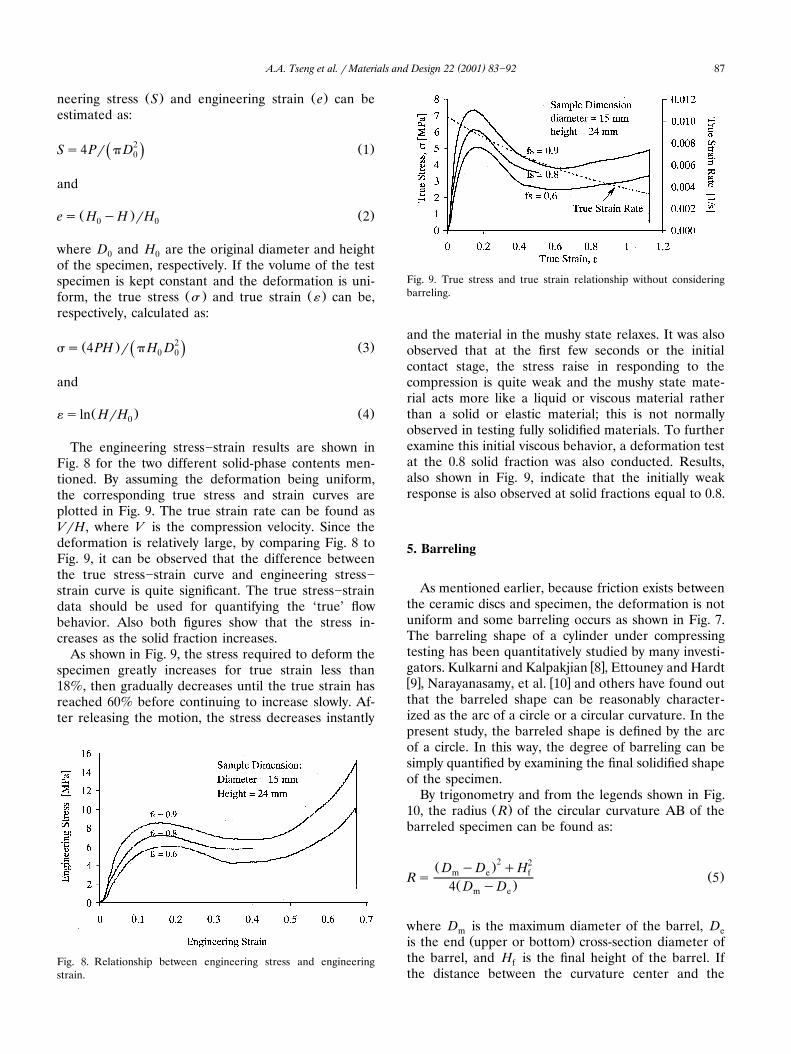
The engineering stress]strain results are shown inFig. 8 for the two different solid-phase contents men-tioned. By assuming the deformation being uniform,the corresponding true stress and strain curves areplotted in Fig. 9. The true strain rate can be found asVrH, where V is the compression velocity. Since thedeformation is relatively large, by comparing Fig. 8 toFig. 9, it can be observed that the difference betweenthe true stress]strain curve and engineering stress]strain curve is quite significant. The true stress]straindata should be used for quantifying the ‘true’ flowbehavior. Also both figures show that the stress in-creases as the solid fraction increases.
As shown in Fig. 9, the stress required to deform thespecimen greatly increases for true strain less than18%, then gradually decreases until the true strain hasreached 60% before continuing to increase slowly. Af-ter releasing the motion, the stress decreases instantly
Fig. 8. Relationship between engineering stress and engineeringstrain.
Fig. 9. True stress and true strain relationship without consideringbarreling.
and the material in the mushy state relaxes. It was alsoobserved that at the first few seconds or the initialcontact stage, the stress raise in responding to thecompression is quite weak and the mushy state mate-rial acts more like a liquid or viscous material ratherthan a solid or elastic material; this is not normallyobserved in testing fully solidified materials. To furtherexamine this initial viscous behavior, a deformation testat the 0.8 solid fraction was also conducted. Results,also shown in Fig. 9, indicate that the initially weakresponse is also observed at solid fractions equal to 0.8.
5. Barreling
As mentioned earlier, because friction exists betweenthe ceramic discs and specimen, the deformation is notuniform and some barreling occurs as shown in Fig. 7.The barreling shape of a cylinder under compressingtesting has been quantitatively studied by many investi-
w xgators. Kulkarni and Kalpakjian 8 , Ettouney and Hardtw x w x9 , Narayanasamy, et al. 10 and others have found outthat the barreled shape can be reasonably character-ized as the arc of a circle or a circular curvature. In thepresent study, the barreled shape is defined by the arcof a circle. In this way, the degree of barreling can besimply quantified by examining the final solidified shapeof the specimen.
By trigonometry and from the legends shown in Fig.Ž .10, the radius R of the circular curvature AB of the
barreled specimen can be found as:
2 2Ž .D yD qHm e f Ž .Rs 5Ž .4 D yDm e
where D is the maximum diameter of the barrel, Dm eŽ .is the end upper or bottom cross-section diameter of
the barrel, and H is the final height of the barrel. Iffthe distance between the curvature center and the

( )A.A. Tseng et al. r Materials and Design 22 2001 83]9288
Fig. 10. Circularly barreled specimen.
Ž .center of the barreled cylinder is b, the volume V ofa circular barrel can be found as
Vsp R2H yH3r12 qb2H yb½ f f f
2 2 2 y1 Ž . Ž .'= H R yH r4 q2 R sin H r2 R 65f f f
where b equals RyD r2 as shown in Fig. 10. If themcylinder specimen is under uniform deformation, Rapproaches infinity; from the above equation, V be-comes p D2 H r4, where D is the final diameter of thef f funiform deformed specimen. Since the volume of thespecimen has been assumed constant during the test-ing, the volume of the barreled specimen in the aboveequation also equals the original volume, i.e. Vs
2 2 Ž .p D H r4 or p D H r4. As a result, Eq. 6 becomes0 0 f f
D2 H y4 R2H yH3r12½0 0 f f
2 2Ž . Ž .q RyD r2 H y RyD r2M f M
2 2 2 y1 Ž .'= H R yH r4 q2 R sin H r2 R s05f f f
Ž .7
Mathematically, the deformed portion of the speci-Ž . Ž 2 2 .x 2Žmen DV is equal to p H D yD r4 or p D H yf f 0 0 0
.H r4; a part of this deformed portion contributes tofŽ .barreling and is called the barreling portion DV . Ifb
Ž .the degree of barreling B is defined as the volumed
Ž .ratio of the barreled portion DV to the total de-bŽ .formed portion DV , one can find that:
2Ž . Ž .B sDV rDVs H rH y D rDd b 0 f e 0
wŽ . x Ž .r H rH y1 80 f
Ž 2 2 . ŽHere DV s p H D y D r4 and D s H rb f f e f 0.1r2 Ž .H D . Since the end-section diameters D and Hf 0 e f
can be measured from the final shape of the deformedspecimen, the parameter B can conveniently definedthe shape of the barreled specimen by providing theknown original parameters, H and D . If the speci-0 0men is under uniform deformation, the degree of bar-
Ž . Ž .reling B become 0, the edge diameter D is equald eŽ .to the final diameter of uniform deformation D . Iff
the specimen is under 100% non-uniform deformation,Ž .B becomes 1, the diameter of the end section D isd e
Ž .unchanged and equal to the original diameter D .0Normally, the specimen is proportionally deformed
and the barreling parameter B can be assumed to bedconstant during testing. Based on the definition of Bd
Ž .in Eq. 8 , the instantaneous end-section diameter,Ž .D , at a specific height of the deformed specimen Heh
can be found as:
H0Ž . Ž .D s 1yB qB D 9(eh d d 0H
Ž .Based on Eq. 5 , the instantaneous radius of thebarreling curvature, R , can be found as:h
2 2Ž .D yD qHmh eh Ž .R s 10h Ž .4 D yDmh eh
Then the instantaneous maximum diameter, D , at amhspecific height of H can be numerically obtained by
Ž . Ž .solving the simultaneous equations of Eqs 7 and 10 .It is to be noted the ratio of D to D is called themh ehshape ratio used frequently in compression test studies.
6. Equivalent stress and strain relationship
If barreling occurs, the deformation is not uniform;the stress components including shear, radial, and cir-cumferential stresses also exit. The true stress obtained
Ž .from Eq. 3 should be considered as the mean axialstress only. As a result, the true stress estimation in Eq.Ž .3 should be modified to include the effects of otherexisting stress components:
Ž . 2 Ž .s sC 4PH r pH D 11Ž .e mh 0 0
( )A.A. Tseng et al. r Materials and Design 22 2001 83]92 89
where s is the equivalent flow stress which includesethe effect of all existing stress components and C ismhthe correction factor. The correction factor used in Eq.Ž .11 is similar to the correction factor for stresses in the
w xnecking region of a uniaxial tensile specimen 11 . Ifthe shape of the barreled surface can be characterizedby a circular curvature, the correction factor can be
w xfound from Ettouney and Hardt 9 :
y12 R Dh mh Ž .C s 1y ln 1y 12mh ½ 5D 2 Rmh h
Here, the instantaneous maximum diameter, D ,mhand the instantaneous radius of the barreling curva-ture, R , can be found from the procedures presentedhin Section 5. Again, if the specimen is uniformly de-formed, C becomes 1 and R approaches infinity.mh h
Based on the original and the final solidified geome-tries of the tested specimens, the dimensions of D ,0D , H , and H were measured and used to estimatee 0 fthe barreling parameter, B . In the present study, thedestimated barreling parameters, B , for all specimensdtested are approximately 0.25. It is to be noted thatfrictional restraint retards the growth of the end cross-section, and part of the new end cross-section is actu-ally formed by folding the sides of the original cylinder
Ž .onto the platen end surface. As a result, the degree ofbarreling, B , is normally smaller than 0.5.d
During testing, the barreling factor of the specimenhas also been assumed to be constant at approximately0.25. As a result, the instantaneous maximum diameterŽ . Ž .D , the instantaneous end-section diameter Dmh eh
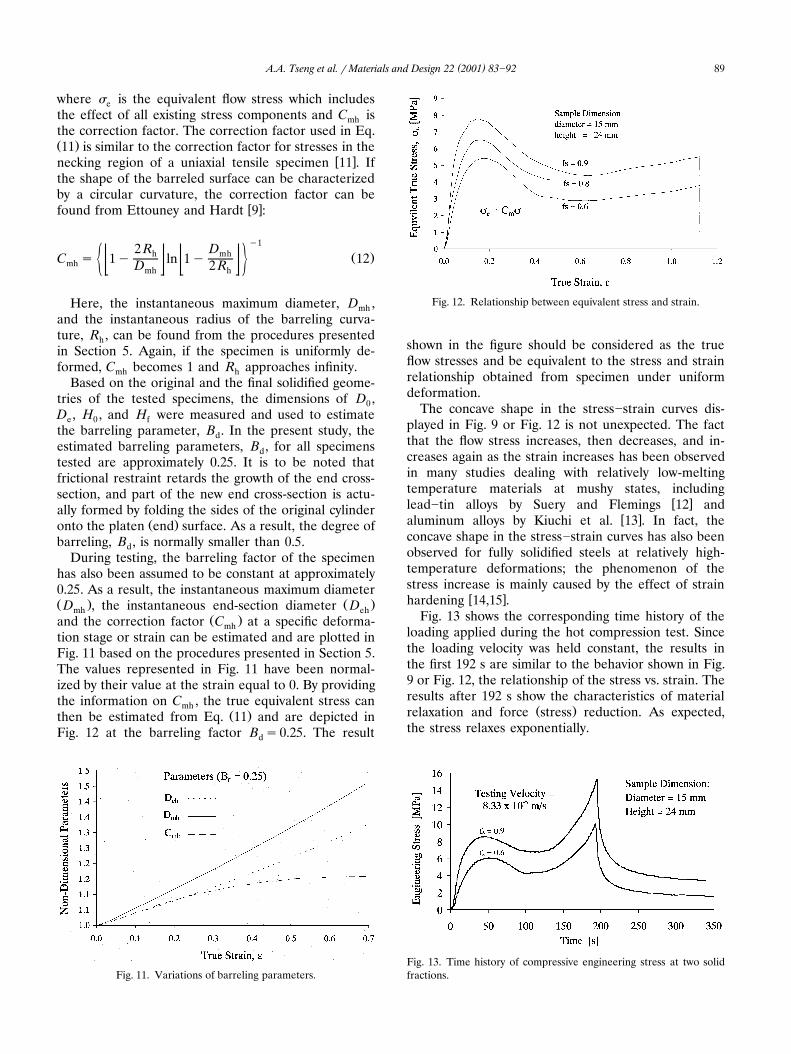
Ž .and the correction factor C at a specific deforma-mhtion stage or strain can be estimated and are plotted inFig. 11 based on the procedures presented in Section 5.The values represented in Fig. 11 have been normal-ized by their value at the strain equal to 0. By providingthe information on C , the true equivalent stress canmh
Ž .then be estimated from Eq. 11 and are depicted inFig. 12 at the barreling factor B s0.25. The resultd
Fig. 11. Variations of barreling parameters.
Fig. 12. Relationship between equivalent stress and strain.
shown in the figure should be considered as the trueflow stresses and be equivalent to the stress and strainrelationship obtained from specimen under uniformdeformation.
The concave shape in the stress]strain curves dis-played in Fig. 9 or Fig. 12 is not unexpected. The factthat the flow stress increases, then decreases, and in-creases again as the strain increases has been observedin many studies dealing with relatively low-meltingtemperature materials at mushy states, including
w xlead]tin alloys by Suery and Flemings 12 andw xaluminum alloys by Kiuchi et al. 13 . In fact, the
concave shape in the stress]strain curves has also beenobserved for fully solidified steels at relatively high-temperature deformations; the phenomenon of thestress increase is mainly caused by the effect of strain
w xhardening 14,15 .Fig. 13 shows the corresponding time history of the
loading applied during the hot compression test. Sincethe loading velocity was held constant, the results inthe first 192 s are similar to the behavior shown in Fig.9 or Fig. 12, the relationship of the stress vs. strain. Theresults after 192 s show the characteristics of material
Ž .relaxation and force stress reduction. As expected,the stress relaxes exponentially.
Fig. 13. Time history of compressive engineering stress at two solidfractions.
( )A.A. Tseng et al. r Materials and Design 22 2001 83]9290
7. Effects of solid fraction
The stress]strain curves represented in Figs. 9 and12 do not exhibit what is known as a sharp yield point,which often occurs in iron and steel alloys. Before thispoint, the stress rises with almost negligible plasticdeformation. At this point the material begins to yield.Frequently, the stress at this point is used to representthe strength of the metal considered and called theyield strength. In the present study, the representingstrength at the mushy state is selected based on theflow stress at 4% strain. The relationship between theflow stress at 4% strain and the solid fraction for thesteel considered is then studied. The peak flow stressand the stress at 10% strain are also selected forcomparison.
w xAs mentioned earlier, Kiuchi et al. 2,13 have alsoused the compression test to study the flow stress at themushy state and adopted the flow stress at 4% strain asthe representing flow stress; they developed the rela-tionship between the representing flow stress and thesolid fraction for many metals, including Pb, Al, and Cualloys and found that the flow stress increases exponen-tially as the solid fraction increases. Recently, in addi-
w xtion to Kiuchi and his associates’ data, Tseng et al. 16w xhave studied the data obtained by Flemings 1 , Kat-
w x w xtamis and Mehrabian 17 , and Dahle and Arnberg 18for the aluminum alloys at mushy states, and found outthat all the available data can indeed fit very well by:
B f s Ž .s sAe 13f
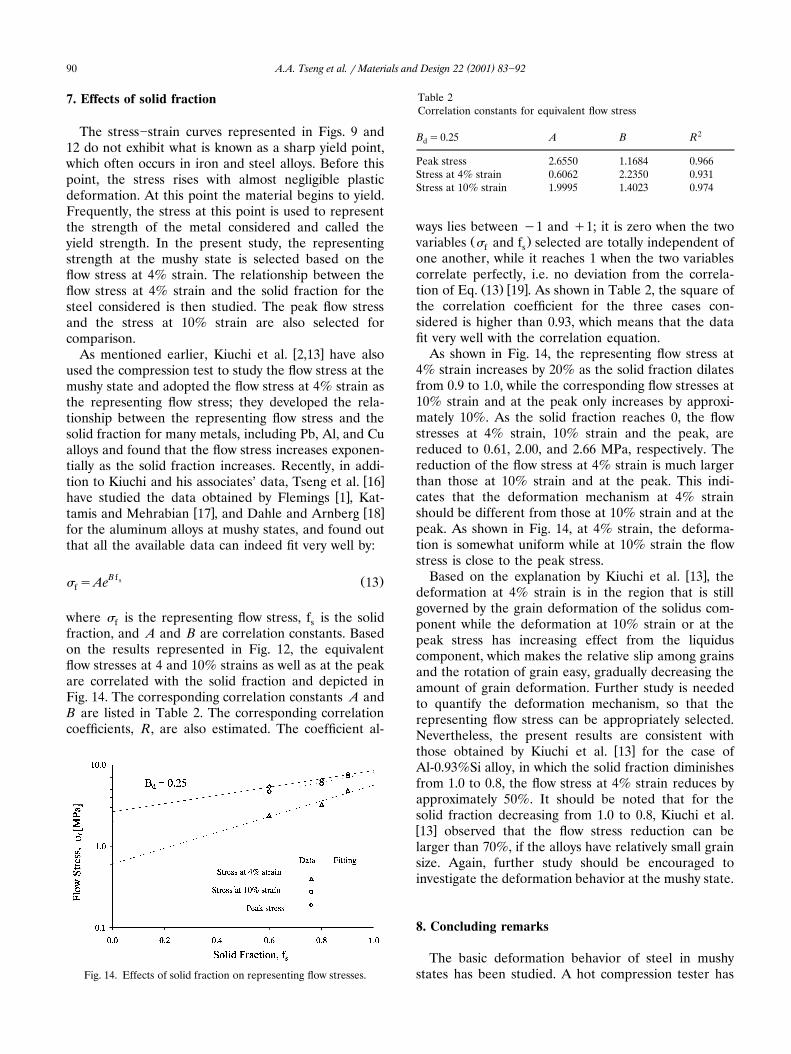
where s is the representing flow stress, f is the solidf sfraction, and A and B are correlation constants. Basedon the results represented in Fig. 12, the equivalentflow stresses at 4 and 10% strains as well as at the peakare correlated with the solid fraction and depicted inFig. 14. The corresponding correlation constants A andB are listed in Table 2. The corresponding correlationcoefficients, R, are also estimated. The coefficient al-
Fig. 14. Effects of solid fraction on representing flow stresses.
Table 2Correlation constants for equivalent flow stress
2B s0.25 A B Rd
Peak stress 2.6550 1.1684 0.966Stress at 4% strain 0.6062 2.2350 0.931Stress at 10% strain 1.9995 1.4023 0.974
ways lies between y1 and q1; it is zero when the twoŽ .variables s and f selected are totally independent off s
one another, while it reaches 1 when the two variablescorrelate perfectly, i.e. no deviation from the correla-
Ž . w xtion of Eq. 13 19 . As shown in Table 2, the square ofthe correlation coefficient for the three cases con-sidered is higher than 0.93, which means that the datafit very well with the correlation equation.
As shown in Fig. 14, the representing flow stress at4% strain increases by 20% as the solid fraction dilatesfrom 0.9 to 1.0, while the corresponding flow stresses at10% strain and at the peak only increases by approxi-mately 10%. As the solid fraction reaches 0, the flowstresses at 4% strain, 10% strain and the peak, arereduced to 0.61, 2.00, and 2.66 MPa, respectively. Thereduction of the flow stress at 4% strain is much largerthan those at 10% strain and at the peak. This indi-cates that the deformation mechanism at 4% strainshould be different from those at 10% strain and at thepeak. As shown in Fig. 14, at 4% strain, the deforma-tion is somewhat uniform while at 10% strain the flowstress is close to the peak stress.
w xBased on the explanation by Kiuchi et al. 13 , thedeformation at 4% strain is in the region that is stillgoverned by the grain deformation of the solidus com-ponent while the deformation at 10% strain or at thepeak stress has increasing effect from the liquiduscomponent, which makes the relative slip among grainsand the rotation of grain easy, gradually decreasing theamount of grain deformation. Further study is neededto quantify the deformation mechanism, so that therepresenting flow stress can be appropriately selected.Nevertheless, the present results are consistent with
w xthose obtained by Kiuchi et al. 13 for the case ofAl-0.93%Si alloy, in which the solid fraction diminishesfrom 1.0 to 0.8, the flow stress at 4% strain reduces byapproximately 50%. It should be noted that for thesolid fraction decreasing from 1.0 to 0.8, Kiuchi et al.w x13 observed that the flow stress reduction can belarger than 70%, if the alloys have relatively small grainsize. Again, further study should be encouraged toinvestigate the deformation behavior at the mushy state.
8. Concluding remarks
The basic deformation behavior of steel in mushystates has been studied. A hot compression tester has
( )A.A. Tseng et al. r Materials and Design 22 2001 83]92 91
been developed to provide the flow stress data of steelat various mushy-states. The tester has been specificallydesigned to accommodate the high temperatures re-quired to melt steels. The temperature of specimenswas carefully controlled to correlate the solid phasecontent. The mushy states for the solid fraction between0.6 and 0.9 were evaluated. It has been observed thatfor the solid fraction less than 0.6, the specimensconsisting of too much liquid had difficulty in holdingtogether stably under pressure. The relaxation of steeland stress reduction at mushy states were quantifiedand discussed.
All results indicate that the flow stresses of steels inmushy states are highly dependent on the solid phasepercentage or the solid fraction. Correlations have beendeveloped between the solid fraction and several levelsof flow stresses. The predictions from the correlationsdeveloped are consistent with those of the correlationdeveloped for other relatively low-melting temperaturemetals. The correlation developed here can be con-veniently used for predicting force or energy requiredin forming steel parts in mushy states.
Formulas have been developed to quantify the bar-reling effects occurring in compression tests. The for-mulas only need the information of the dimension ofthe original and the final solidified geometries of thetested specimens; since no extra effort is required toobtain this information, the formulation is relativelyeasy to be adopted. In fact, the formulas are based onthe assumption that the degree of barreling or thebarreling factor is constant during testing. This assump-tion is consistent with earlier experiment observationand the formulas should be general enough to beapplied to all kinds of compression tests. Although thepresent formulas do not require the information onfriction between the test plates and specimen, it isbelieved that the interface friction and the degree ofbarreling are somewhat related. This is similar to thesituation that uses the ring compression test to quantifythe interface friction coefficient between the die andthe cylinder specimen; in estimating the friction, onlythe dimension information of the original and final
w xgeometries of the cylindrical specimens is required 20 .Some further study to find the correlation between thefriction coefficient and the barreling factor should beencouraged.
Since the yield or ultimate strength is difficult to bedefined based on the stress and strain curves obtainedfor the steel in mushy states. In the present study, theflow stresses at three different strains have been se-lected as the reference strengths of mushy-state steels.However, the characteristics of the correlations betweenthe solid fraction and each flow stress selected aresomewhat different. It is believed that the deformationmechanism at different deformation regions should be
different. Further study is recommended to quantifythe deformation mechanism at different region, so thatthe representing strength can be appropriately defined.For the time being, however, the deformation behaviorat different regions should be studied to provide back-ground information for further study.
Acknowledgements
The authors gratefully acknowledge the support tothis research by the US]Czechoslovak Science andTechnology Program under Grant No. 94-045 throughUS National Institute of Standards and Technology,and by the US National Science Foundation underGrant No. DMI-9696062 and DMI-9812984.
References
w x1 Flemings MC. Behavior of metal alloys in the semisolid state.Metall Trans B 1991;22B:269]293.
w x2 Kiuchi M. Metal forming in mashy state. In: Blazynski TZ,editor. Plasticity and modern metal-forming technology, chap11. New York: Elsevier Applied Science, 1989:289]313.
w x3 Kattamis TZ, Piccone TJ. Rheology of semisolid Al-4.5% Cu-1.5% Mg alloy. Mater Sci Eng 1991:265]272.
w x4 Kiuchi M, Sugizama S. A new process to manufacture semi-solidmetals. In: Brown S, Flemings MC editors. Proceedings of the2nd International Conference on the Semi-Solid ProcessingAlloys and Composites, 1992:47]56.
w x5 Kumar P, Martin CL, Brown S. Shear rate thickening flowbehavior of semisolid slurries. Metall Trans A 1993;24A:1107]1116.
w x6 Worster MG. Convection in mushy layers. Annu Rev FluidMech 1997;29:91]122.
w x7 Boyer HE, Gall TL, editors. Metals handbook, desk ed, chap.Ž .28. Metal Park, OH: American Society for Metals, 1985 .
w x8 Kulkarni KM, Kalpakjian S. A study of barreling as an exampleof free deformation. ASME J Eng Ind 1969;91:743]754.
w x9 Ettouney O, Hardt OE. A method for in-process failure predic-Ž .tion in cold upset forging. Paper No. 83-Prod-6, ASME 1983 .
w x10 Narayanasamy R, Murthy RSN, Viswanatham K, Chary GR.Prediction of the barreling of solid cylinders under uniaxial
Ž .compressive load. J Mech Work Technol 1988;16 1 :21]30.w x11 Bridgman PW. Studies in large plastic flow and fracture. New
York, NY: McGraw-Hill, 1952.w x12 Suery M, Flemings MC. Effect of strain rate on deformation
behavior of semi-solid dendritic alloys. Metall Trans A 1982;13A:1809]1819.
w x13 Kiuchi M, Sugiyama S, Arai K. Study of metal forming in themashy state 1st report: flow stress and deformation behavior ofalloys in mashy state. Proceedings of the 20th InternationalMachine Tool Design and Research Conference 1979: 71]78.
w x14 Senuma T, Yada H, Matsumura Y, Hamauzu S, Nakajima K.Calculation model of resistance to hot deformation in consider-ation of metallurgical phenomena in continuous hot deforma-
Ž .tion processes. Trans Iron Steel Inst Jpn 1984;70 19 :78]85.w x15 Wang SR, Tseng AA. Macro- and micro-modeling of hot rolling
of steel coupled by a micro-constitutive relationship. MaterŽ .Des 1995;16 6 :315]336.
w x16 Tseng AA, Chaidilokpattanakul C, Chen JSJ. A versatile ther-mal-mechanical model for twin-roll casting, in Manufacturing

( )A.A. Tseng et al. r Materials and Design 22 2001 83]9292
Science and Engineering, MED, Am Soc Mech Eng 1999;10:57]65.
w x17 Kattamis TZ, Mehrabian R. Rheology of semisolid Al-4.5%Cu-1.5% Mg alloy. Mater Sci Eng 1991;A131:265]272.
w x18 Dahle AK, Arnberg L. The rheological properties of solidifyingŽ .aluminum foundry alloys. JOM 1996;48 3 :34]37.
w x19 Coleman HW, Steele WG. Experimentation and uncertaintyanalysis for engineers. New York, NY: John Wiley & Sons,1989.
w x20 Kalpakjian S. Manufacturing processes for engineering materi-als. 3rd ed Menlo Park, NY: Addison-Wesley Longman, 1997.