Sepsis causes neuroinflammation and concomitant decrease of cerebral metabolism
Upload
independentCategory
view
0download
0
On the Characterization of Intermediates in theIsodesmic Aggregation Pathway of Hen Lysozyme atAlkaline pHVijay Kumar Ravi, Tulsi Swain, Nividh Chandra, Rajaram Swaminathan*
Department of Biotechnology, Indian Institute of Technology Guwahati, Guwahati, Assam, India
Abstract
Protein aggregation leading to formation of amyloid fibrils is a symptom of several diseases like Alzheimer’s, type 2 diabetesand so on. Elucidating the poorly understood mechanism of such phenomena entails the difficult task of characterizing thespecies involved at each of the multiple steps in the aggregation pathway. It was previously shown by us that spontaneousaggregation of hen-eggwhite lysozyme (HEWL) at room temperature in pH 12.2 is a good model to study aggregation. Herein this paper we investigate the growth kinetics, structure, function and dynamics of multiple intermediate speciespopulating the aggregation pathway of HEWL at pH 12.2. The different intermediates were isolated by varying the HEWLmonomer concentration in the 300 nM—0.12 mM range. The intermediates were characterized using techniques likesteady-state and nanosecond time-resolved fluorescence, atomic force microscopy and dynamic light scattering. Growthkinetics of non-fibrillar HEWL aggregates were fitted to the von Bertalanffy equation to yield a HEWL concentrationindependent rate constant (k = (6.660.6)61025 s21). Our results reveal stepwise changes in size, molecular packing andenzymatic activity among growing HEWL aggregates consistent with an isodesmic aggregation model. Formation ofdisulphide bonds that crosslink the monomers in the aggregate appear as a unique feature of this aggregation. AFM imagesof multiple amyloid fibrils emanating radially from amorphous aggregates directly confirmed that on-pathway fibrilformation was feasible under isodesmic polymerization. The isolated HEWL aggregates are revealed as polycationic proteinnanoparticles that are robust at neutral pH with ability to take up non-polar molecules like ANS.
Citation: Ravi VK, Swain T, Chandra N, Swaminathan R (2014) On the Characterization of Intermediates in the Isodesmic Aggregation Pathway of Hen Lysozymeat Alkaline pH. PLoS ONE 9(1): e87256. doi:10.1371/journal.pone.0087256
Editor: Rizwan H. Khan, Aligarh Muslim University, India
Received August 25, 2013; Accepted December 25, 2013; Published January 28, 2014
Copyright: � 2014 Ravi et al. This is an open-access article distributed under the terms of the Creative Commons Attribution License, which permits unrestricteduse, distribution, and reproduction in any medium, provided the original author and source are credited.
Funding: RS acknowledges funding support from Department of Science and Technology, New Delhi under project SR/SO/BB-48/2009. VKR acknowledges RGNFfellowship from UGC, New Delhi. The funders had no role in study design, data collection and analysis, decision to publish, or preparation of the manuscript.
Competing Interests: The authors have declared that no competing interests exist.
* E-mail: [email protected]
Introduction
Accumulation of ordered protein aggregates like amyloid fibrils
in the intra or extracellular regions of human body is a common
symptom among protein misfolding diseases [1]. For example,
single amino acid mutations in human lysozyme (closely related to
HEWL in amino acid sequence) have been reported to cause
systemic non-neuropathic amyloidosis where in amyloid deposits
of mutant lysozyme were found in kidneys, gastrointestinal tract,
spleen and liver of affected patients [2]. For effective treatment of
such diseases, it is important to understand the molecular
mechanisms behind aggregation. Protein polymerization mecha-
nisms are broadly classified under two prevalent models, namely
the nucleation-elongation polymerization model and the isodesmic
polymerization model [3,4]. The latter however, is rarely
encountered with few reports in protein literature till date [5,6].
The absence of a critical concentration in isodesmic polymeriza-
tion implies that aggregation can occur at nanomolar monomer
concentrations which can be exploited to investigate molecular
features of aggregates. Several questions that arise are: A) Is it
possible to monitor the growth of aggregates at multiple monomer
concentrations and extract their kinetic parameters? B) Can
intermediates in isodesmic aggregation be isolated and character-
ized? C) Can amyloid fibrils originate under isodesmic aggregation
in the dilute monomer concentration regime? D) Do initial
amorphous aggregates formed under isodesmic mechanism
convert into amyloid fibrils (on-pathway) or are fibrils formed by
a separate pathway (off-pathway)? This work attempts to answer
the above questions.
Hen eggwhite lysozyme (HEWL), is a well known enzyme that
cleaves the glycosidic bond between alternating sugar residues of
peptidoglycan in bacterial cell walls [7]. It is widely employed as a
food preservative [8]. HEWL is an excellent model to investigate
protein aggregation. It has been shown to form aggregates under a
variety of conditions like acidic pH, alkaline pH, presence of zero
disulphide bond, ethanol and guanidine hydrochloride [9]. The
aggregation and amyloid formation among different proteins in
the lysozyme family has been reviewed previously [10].
HEWL, whose pI is 11.3 [11], is polycationic at acidic and
neutral pH. Consequently aggregation of polycationic HEWL at
acidic pH must be forced by high temperatures and mechanical
agitation [12]. In contrast, HEWL aggregation is facile and
spontaneous with rise in pH as shown previously [13,14].
Subsequent work from our lab has revealed that aggregation of
HEWL at pH 12.2 is a slow (0—12 hours) but concentration
dependent spontaneous process at 298 K [15]. This aggregation
was instantly triggered by negligible net charge and increased
PLOS ONE | www.plosone.org 1 January 2014 | Volume 9 | Issue 1 | e87256

exposure of hydrophobic surfaces in HEWL at high pH.
Interestingly, we discovered that HEWL aggregates at pH 12.2
are further reinforced by formation of intermolecular disulfide
bonds after ,100 hours [16].
In this paper, we attempt to unravel the mechanism of HEWL
aggregation at pH 12.2 by characterizing the molecular features of
different aggregate species populated at different times under
different HEWL monomer concentrations.
Materials and Methods
Protein labelingHEWL was covalently labeled with dansyl chloride (2-dimethyl
aminonaphthalene-6-sulfonyl chloride) following the protocol
recommended by Molecular Probes with minor modification as
reported previously[15]. For labeling with dabcyl (4-((4-(dimethy-
lamino) phenyl) azo) benzoic acid succinimidyl ester), the protocol
suggested by Molecular Probes was followed. The HEWL, dansyl
and dabcyl concentrations were estimated by measuring the
absorbance at 280 nm (e = 37,970 M21 cm21[17]), 380 nm
(16,000 M21cm21) and 453 nm (32,000 M21cm21), respectively.
The protein to dye labeling ratio in the conjugate were consistently
between 2—3. Henceforth, 0.5 mM dansyl (or dabcyl)-conjugated
HEWL refers to dye concentration. If the protein/dye labeling
ratio was 2.0, this would contain 1.0 mM of HEWL of which 50%
of HEWL is likely to be unlabeled.
Sample preparation and incubationHEWL stock (10 mg/mL or 699 mM) was freshly prepared
before use in deionised water (MilliQ, Millipore, India). For
control experiments this stock was diluted in 50 mM, pH 7
phosphate buffer. For inducing aggregation, the stock was diluted
in 50 mM, pH 12.2 phosphate buffer. In between measurements,
all samples were incubated at 22–28uC. All HEWL concentrations
refer to monomeric HEWL. All measurements were performed at
25uC.
Steady-state fluorescence measurementsAll steady-state fluorescence measurements were performed
using Fluoromax-3 spectrofluorometer (Jobin-Yvon Horiba Inc.,
USA). To minimize photobleaching, excitation light shutter was
kept open only when recording fluorescence.
Intermolecular Forster resonance energy transfer (FRET) measurements
for HEWL monomer concentrations 3—120 mM, were carried
out by mixing 0.5 mM dansyl-conjugated HEWL (donor) and
0.5 mM dabcyl-conjugated HEWL (acceptor) with excess of
unlabeled HEWL. Thus, unlabeled HEWL was at most 2 mM
for 3 mM HEWL sample, while it was similarly 119 mM for
120 mM HEWL sample. The 0.3 mM HEWL sample was
prepared by diluting the 3 mM HEWL sample above, by 10-fold
in the appropriate buffer. Samples were excited at 380 nm (slit
width 1 nm) and emission collected between 400 and 700 nm (slit
5 nm). For 0.3 mM samples, slit width was kept 10 nm. FRET
efficiency was calculated from average integrated total emission
counts under emission curve of donor alone (FD) & donor-acceptor
mixture (FDA) after subtraction of blank using equation 1.
E~1{FDA
FD
� �ð1Þ
For ANS (8-Anilino-1-naphthalene sulfonic acid ammonium salt)
binding experiments, the stock concentration of ANS (1 mg/mL
equivalent to 3.2 mM) in water was verified using extinction
coefficient of 4,950 M21cm21 at 350 nm. The HEWL concen-
tration dependent ANS binding assay was performed by employ-
ing a constant HEWL (3 mM) and constant ANS (10 mM)
concentration in cuvette for pH 7 (3 mM) or 12.2 (3 to 120 mM)
incubated samples. For 0.3 mM HEWL sample (in pH 12.2),
protein was retained at 0.3 mM, while ANS was added to a final
concentration of 10 mM in cuvette. Steady state fluorescence
intensity was measured after excitation at 380 nm (slit = 1 nm).
Emission (slit = 16 nm for 0.3 mM, 8 nm for rest) was collected in
the range 400-600 nm as reported previously [15]. For experi-
ments related to binding of ANS to HEWL aggregates transferred
to pH 7, 10 mM ANS was employed in all samples, while identical
slit widths were maintained throughout. Integrated fluorescence
intensity was computed by calculating area under emission
spectrum after subtraction of blank.
The fluorescence of tryptophan was quenched by adding KI (0
to 0.8 M) as described earlier [18]. Fluorescence quenching studies
were performed employing a dilute concentration of HEWL
(1.2 mM) in cuvette for 120 mM and 3 mM HEWL samples to
avoid inner filter effect. For 0.3 mM HEWL sample, protein was
retained at 0.3 mM, while KI was added to the desired
concentration in cuvette. NATA (5 mM in pH 12.2 buffer) was
used as a control. Steady state fluorescence of tryptophan in
HEWL was measured by exciting at 295 nm (1 nm slit) and
collecting emission between 310–400 nm (slit 20 nm for 0.3 mM,
10 nm for rest). The slopes reported from Stern-Volmer plots were
averaged from three sets of experiments. See below for tryptophan
lifetime measurement.
Steady-state fluorescence anisotropy measurementsThe steady-state fluorescence anisotropy, rss was measured after
G-factor correction and dark counts subtraction as described
previously [15,16]. For HEWL monomer concentrations 3—
120 mM, the concentration of dansyl-conjugated HEWL was
0.6 mM, while remaining protein was unlabeled. Similarly 0.3 mM
HEWL contained 0.16 mM of dansyl-conjugated HEWL. For
experiments related to robustness of polycationic HEWL aggre-
gates transferred to pH 7, the 120 mM and 40 mM HEWL samples
each contained 1 mM dansyl-conjugated HEWL before dilution.
Dansyl-labeled HEWL was excited at 380 nm (slit width =
1 nm) and emission at 438 nm was collected with a slit width
between 5—10 nm. Each measurement was done in duplicate,
while data reported are averages of three such measurements. The
increase in rss with time, in pH 12.2, for different HEWL
concentrations was modeled by the von Bertalanffy equation
below:
drss(t)
dt~k r?ss {rss(t)� �
, which can be solved to yield
rss(t)~r?ss { r?ss {r0ss
� �e{kt ð2Þ
Here, refers r?ss to rss at t = infinity, while r0ss refers same at t =
0. k denotes the rate constant for rise in anisotropy which
corresponds to growth of HEWL aggregates.
Time-resolved fluorescence measurementsTime-resolved fluorescence intensity and anisotropy (G-factor
corrected) measurements were carried out in LIFE SPEC II
spectrometer (Edinburgh Instruments, Livingston, UK) operating
in TCSPC mode, collecting emission decay in 4096 channels using
a microchannel plate PMT. Mean fluorescence lifetime of
tryptophan was measured by exciting samples with 295 nm
Intermediates on Hen Lysozyme Aggregation Pathway
PLOS ONE | www.plosone.org 2 January 2014 | Volume 9 | Issue 1 | e87256
nanosecond pulses (Instrument Response Function (IRF) fwhm
was ,0.6 ns, Nano LED) and collecting subsequent emission at
350 nm with a temporal resolution of 4.883 ps/channel. HEWL-
dansyl conjugates were excited with 375 nm (EPL-375, picosecond
pulsed diode laser, IRF fwhm ,150 ps) and emitted fluorescence
from dansyl probe was collected at 440 nm with a temporal
resolution of 24.414 ps/channel. For tryptophan lifetime mea-
surements, HEWL samples (3—120 mM) were diluted to 1.2 mM
in the cuvette, while 0.3 mM samples were used as is. For dansyl
probe lifetime measurements, the concentration of dansyl-conju-
gated HEWL was kept at 1.0 mM in HEWL samples (3—
120 mM), while rest of the protein was unlabeled. Similarly
0.3 mM contained 0.1 mM of dansyl-conjugated HEWL. Each
data reported is the average of three measurements. Intensity
decays were analysed by iterative reconvolution using the
Marquardt-Levenberg algorithm to extract lifetimes (ti) and
amplitudes (ai) as given in equation below.
I(t)~X
i
aie{t=ti where i = 1—3 and
Xi
ai~1:0 (3)
Mean fluorescence lifetime, tm~X
i
aiti (4)
The raw (G-factor corrected) anisotropy decays were tail-fitted
using a sum of two exponentials (equation 5), yielding two
rotational correlation times.
r(t)~Azb1e{t=w1zb2e
{t=w2 ð5Þ
Here, A is a constant dependent on G-factor, bi denotes the
amplitude for Qi, Q1 and Q2 refer to the fast and slow rotational
correlation times, respectively. The slower rotational correlation
time (Q2) corresponds to global rotational motion of the whole
HEWL aggregate. As the 0.15 ns IRF pulse-width is negligibly
small in comparison to the time scale of protein rotational motion
(. 4 ns), the extracted values of Q2 by this tail-fit approach are not
affected by consequences of IRF convolution. It must be
emphasized that Q2 values reported here for higher monomer
concentrations of HEWL are more reliable compared to our earlier
reports for 40 [15] and 120 [16] mM for two reasons: a) The
anisotropy decay here is sampled over a larger time window (0—
100 ns), yielding a complete decay for analysis, b) The decay here is
acquired in 4096 time channels with a time resolution of 24.4 ps/
channel compared to 1024 channels with 113 ps/channel earlier.
Multiangle and Dynamic light scatteringMultiangle light scattering measurements were performed on
WYATT DAWN 8 multi-angle light scattering system which has 8
detectors (1 for dynamic and remaining for static light scattering)
and uses a 658 nm laser. For molecular weight measurements
seven day old 120 mM HEWL samples in pH 12.2 were diluted
4.3 fold in 20 mM Tris buffer (pH 7) containing 50 mM NaCl and
filtered through 0.2 mm filter.
Dynamic light scattering experiments were carried out using the
Spectroscatterer 201 (RiNA GmbH, Germany) with a He-Ne laser
providing light of 690 nm wavelength and an output power in the
range of 10–50 mW. HEWL samples (120 mM, 30 mL) were
placed in a quartz cuvette and measured at a constant temperature
of 293 K using an autopilot function accumulating 30 measure-
ments per sample. The corresponding molecular sizes were
calculated by standard procedures.
Lysozyme activity measurementsThe enzymatic activity of HEWL was measured as described
earlier [16,19]. Briefly, a suspension of Micrococcus lysodeikticus
(78 mg/mL) in assay buffer (50 mM phosphate, pH 7.0), was
mixed with HEWL, diluted to 70 nM from aggregate/pH 7
sample. Activity assays could not be done with 0.3 mM monomer
concentration as lower dilutions (,10 fold) are likely to affect the
final pH. Each assay was performed in triplicate and averaged
over multiple sets of experiments.
Imaging aggregates by Atomic Force MicroscopyHEWL samples (10 ml) were applied on to freshly cleaved mica
in the presence of 10 mM Mg2+. After a few minutes, these were
rinsed with 0.2 mm filtered deionized water to remove unadsorbed
sample and were dried under nitrogen. Samples were imaged in
air under AAC or MAC MODE (non contact) in PICO PLUSTM
AFM purchased from Molecular Imaging, USA. Cantilever type
PPP-MFMR-20 (resonance frequency, 60—70 kHz ;Nanosensors)
was used for MAC mode, while type PPP-NCL-50 (resonance
frequency, 150 kHz ; Molecular Imaging) was used for AAC
mode. Images were acquired digitally at a scan speed of 1—2
lines/second with 256 data points per line.AFM images were
acquired at least three times for every sample condition.
MaterialsSodium dihydrogen phosphate dihydrate, potassium iodide,
sodium bicarbonate and sodium thiosulphate of analytical grade,
along with solvents like DMSO, DMF were purchased from
Merck Limited, Mumbai. ANS (8-Anilino-1-naphthalene sulfonic
acid ammonium salt), NATA (N-Acetyl-L-tryptophanamide),
DTNP (2,29-dithiobis(5-nitropyridine)),lyophilized cells of Micro-
coccus Lysodeikticus (ATCC 4698), hen eggwhite lysozyme (HEWL,
L6876/L7651) were procured from Sigma-Aldrich Chemicals Pvt.
Ltd., India. Dansyl chloride and Dabcyl SE were purchased from
Invitrogen, USA. AFM Cantilevers PPP-NCL-50 (Point probe
Plus/ Non- contact/ Long cantilever, part 65-262P) was
purchased from Molecular Imaging, USA. Muscovite mica, V-1
quality was purchased from Electron Microscopy Sciences, USA.
Results
Our previous work on HEWL aggregation at pH 12.2 had
shown that progress of HEWL aggregation was dependent on
monomer concentration (henceforth referred as [M]) in the range
of 4—200 mM [15]. However, it was not clear how change in [M]
affects growth kinetics, internal features, enzymatic activity, size
and other characteristics of the aggregates as a function of time.
Hence our objective was to track the progress of HEWL
aggregation for [M] between 0.3—120 mM, using multiple
analytical tools to unravel the characteristics of aggregates as they
grow with time. [M] . 120 mM was avoided to keep all aggregates
in soluble form.
HEWL aggregation observed using intermolecular FRETThe association of HEWL monomers is the first step in
aggregation, as revealed by the rise in intermolecular Forster
resonance energy transfer (FRET) efficiency [20] with time when
donor and acceptor labeled HEWL were mixed with excess of
unlabeled HEWL at pH 12.2 (Figure 1a). The apparent faster
kinetics and higher magnitude of FRET efficiency at lower (3 and
0.3 mM) as compared to higher (50 and 120 mM) [M] may be
attributed to the effect of dilution. There are 4 unlabeled proteins
for every labeled HEWL molecule at 3 and 0.3 mM, compared to
238 at 120 mM. The prospect of having more acceptors per donor
(3)
(4)
Intermediates on Hen Lysozyme Aggregation Pathway
PLOS ONE | www.plosone.org 3 January 2014 | Volume 9 | Issue 1 | e87256
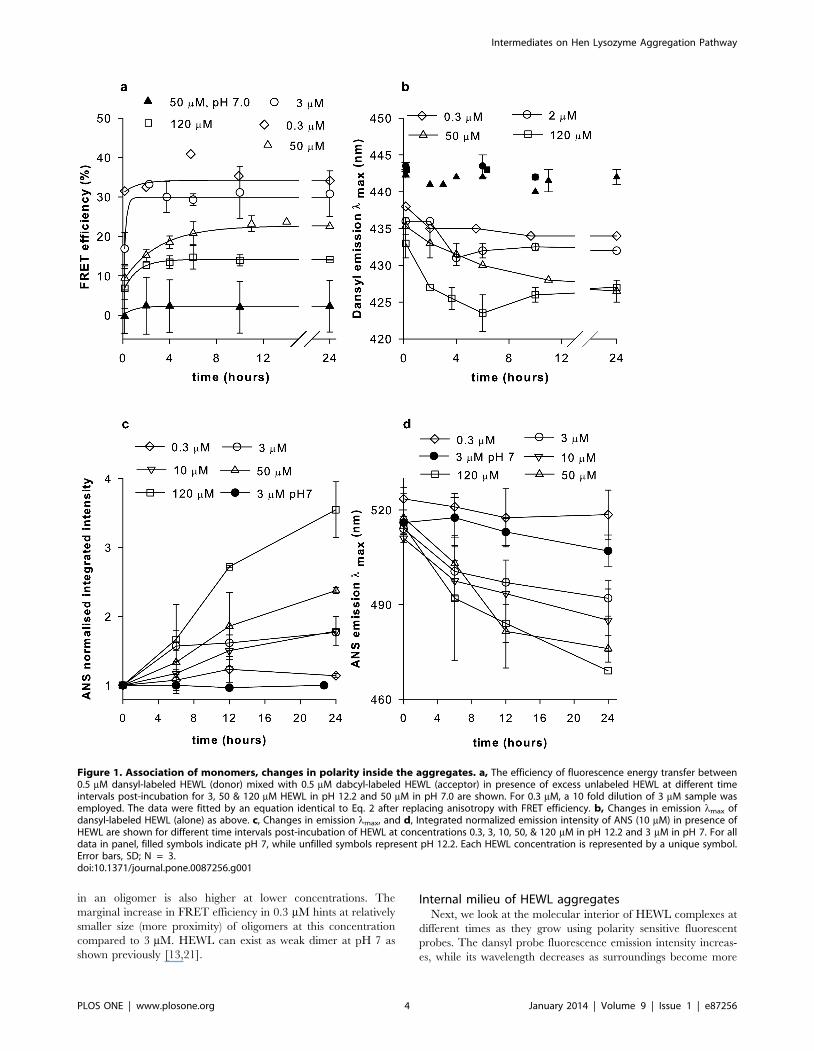
in an oligomer is also higher at lower concentrations. The
marginal increase in FRET efficiency in 0.3 mM hints at relatively
smaller size (more proximity) of oligomers at this concentration
compared to 3 mM. HEWL can exist as weak dimer at pH 7 as
shown previously [13,21].
Internal milieu of HEWL aggregatesNext, we look at the molecular interior of HEWL complexes at
different times as they grow using polarity sensitive fluorescent
probes. The dansyl probe fluorescence emission intensity increas-
es, while its wavelength decreases as surroundings become more
Figure 1. Association of monomers, changes in polarity inside the aggregates. a, The efficiency of fluorescence energy transfer between0.5 mM dansyl-labeled HEWL (donor) mixed with 0.5 mM dabcyl-labeled HEWL (acceptor) in presence of excess unlabeled HEWL at different timeintervals post-incubation for 3, 50 & 120 mM HEWL in pH 12.2 and 50 mM in pH 7.0 are shown. For 0.3 mM, a 10 fold dilution of 3 mM sample wasemployed. The data were fitted by an equation identical to Eq. 2 after replacing anisotropy with FRET efficiency. b, Changes in emission lmax ofdansyl-labeled HEWL (alone) as above. c, Changes in emission lmax, and d, Integrated normalized emission intensity of ANS (10 mM) in presence ofHEWL are shown for different time intervals post-incubation of HEWL at concentrations 0.3, 3, 10, 50, & 120 mM in pH 12.2 and 3 mM in pH 7. For alldata in panel, filled symbols indicate pH 7, while unfilled symbols represent pH 12.2. Each HEWL concentration is represented by a unique symbol.Error bars, SD; N = 3.doi:10.1371/journal.pone.0087256.g001
Intermediates on Hen Lysozyme Aggregation Pathway
PLOS ONE | www.plosone.org 4 January 2014 | Volume 9 | Issue 1 | e87256
non-polar [22]. Figure 1b, reveals a developing hydrophobic
environment around the dansyl probe for 120 mM HEWL, while
lower concentrations display progressively less non-polarity. A
similar concentration dependent increase in intensity with time
was also observed. Moreover, fluorescence quenching of six
tryptophans in HEWL by iodide revealed reduced solvent
exposure of tryptophans with increasing [M] at pH 12.2 (FigureS1).
A covalently conjugated probe like dansyl and an intrinsic probe
like tryptophan, are constrained in exploring the available
microenvironments, hence a freely diffusing probe like ANS was
tried. ANS preferentially and non-covalently binds to exposed
hydrophobic regions of protein displaying enhanced fluorescence
intensity and blue-shifted emission compared to water [23]. In
Figure 1c, the increase in normalized total intensity with time is
best highlighted by 120 mM, followed below by decreasing [M].
Figure 1d shows an opposite trend in emission lmax of ANS with
time.ANS is insensitive at 0.3 mM due to low protein concentra-
tion, while at pH 7, the unavailability of exposed hydrophobic sites
in the native protein may make ANS unresponsive.
The concentration dependent trends in tryptophan shielding,
emission spectra of ANS and dansyl probes with time highlight a
quantitative increase in accessible hydrophobic pockets inside
growing HEWL aggregates with increasing [M]. Growing HEWL
aggregates may acquire non-polar interiors when monomers
cluster and later undergo increased molecular packing. As a
consequence, HEWL aggregate volume must increase when [M] is
raised.
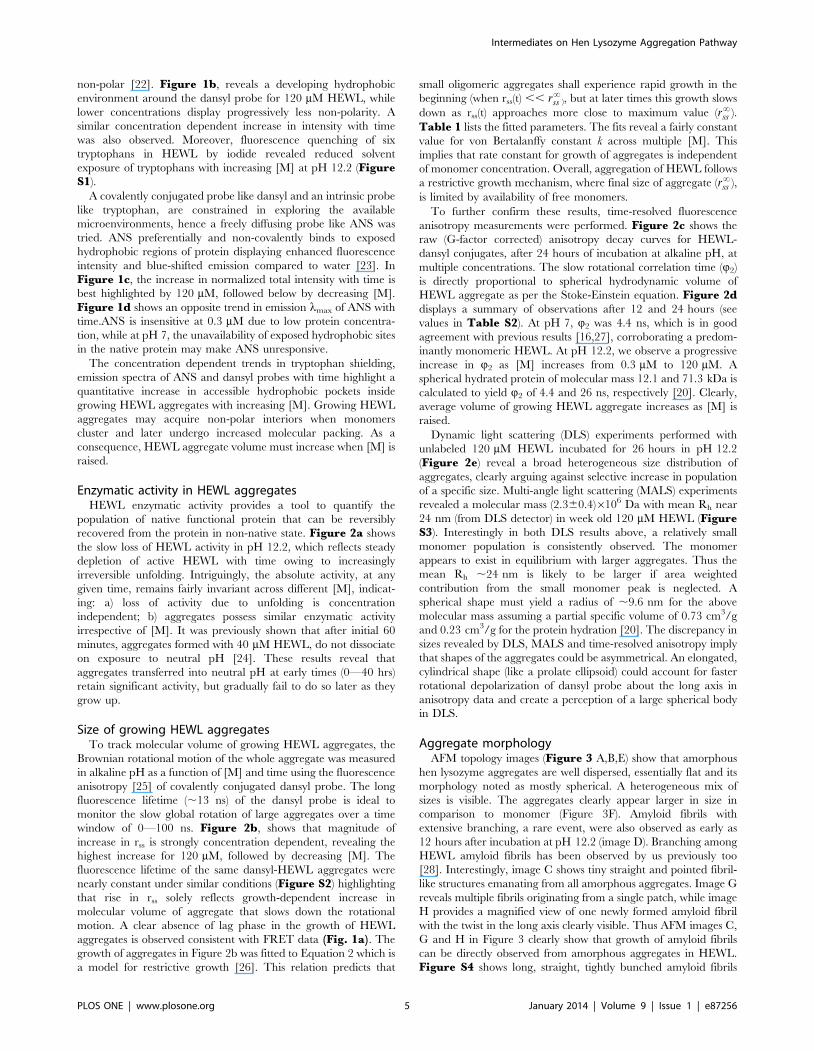
Enzymatic activity in HEWL aggregatesHEWL enzymatic activity provides a tool to quantify the
population of native functional protein that can be reversibly
recovered from the protein in non-native state. Figure 2a shows
the slow loss of HEWL activity in pH 12.2, which reflects steady
depletion of active HEWL with time owing to increasingly
irreversible unfolding. Intriguingly, the absolute activity, at any
given time, remains fairly invariant across different [M], indicat-
ing: a) loss of activity due to unfolding is concentration
independent; b) aggregates possess similar enzymatic activity
irrespective of [M]. It was previously shown that after initial 60
minutes, aggregates formed with 40 mM HEWL, do not dissociate
on exposure to neutral pH [24]. These results reveal that
aggregates transferred into neutral pH at early times (0—40 hrs)
retain significant activity, but gradually fail to do so later as they
grow up.
Size of growing HEWL aggregatesTo track molecular volume of growing HEWL aggregates, the
Brownian rotational motion of the whole aggregate was measured
in alkaline pH as a function of [M] and time using the fluorescence
anisotropy [25] of covalently conjugated dansyl probe. The long
fluorescence lifetime (,13 ns) of the dansyl probe is ideal to
monitor the slow global rotation of large aggregates over a time
window of 0—100 ns. Figure 2b, shows that magnitude of
increase in rss is strongly concentration dependent, revealing the
highest increase for 120 mM, followed by decreasing [M]. The
fluorescence lifetime of the same dansyl-HEWL aggregates were
nearly constant under similar conditions (Figure S2) highlighting
that rise in rss solely reflects growth-dependent increase in
molecular volume of aggregate that slows down the rotational
motion. A clear absence of lag phase in the growth of HEWL
aggregates is observed consistent with FRET data (Fig. 1a). The
growth of aggregates in Figure 2b was fitted to Equation 2 which is
a model for restrictive growth [26]. This relation predicts that
small oligomeric aggregates shall experience rapid growth in the
beginning (when rss(t) ,, r?ss ), but at later times this growth slows
down as rss(t) approaches more close to maximum value (r?ss ).
Table 1 lists the fitted parameters. The fits reveal a fairly constant
value for von Bertalanffy constant k across multiple [M]. This
implies that rate constant for growth of aggregates is independent
of monomer concentration. Overall, aggregation of HEWL follows
a restrictive growth mechanism, where final size of aggregate (r?ss ),
is limited by availability of free monomers.
To further confirm these results, time-resolved fluorescence
anisotropy measurements were performed. Figure 2c shows the
raw (G-factor corrected) anisotropy decay curves for HEWL-
dansyl conjugates, after 24 hours of incubation at alkaline pH, at
multiple concentrations. The slow rotational correlation time (Q2)
is directly proportional to spherical hydrodynamic volume of
HEWL aggregate as per the Stoke-Einstein equation. Figure 2ddisplays a summary of observations after 12 and 24 hours (see
values in Table S2). At pH 7, Q2 was 4.4 ns, which is in good
agreement with previous results [16,27], corroborating a predom-
inantly monomeric HEWL. At pH 12.2, we observe a progressive
increase in Q2 as [M] increases from 0.3 mM to 120 mM. A
spherical hydrated protein of molecular mass 12.1 and 71.3 kDa is
calculated to yield Q2 of 4.4 and 26 ns, respectively [20]. Clearly,
average volume of growing HEWL aggregate increases as [M] is
raised.
Dynamic light scattering (DLS) experiments performed with
unlabeled 120 mM HEWL incubated for 26 hours in pH 12.2
(Figure 2e) reveal a broad heterogeneous size distribution of
aggregates, clearly arguing against selective increase in population
of a specific size. Multi-angle light scattering (MALS) experiments
revealed a molecular mass (2.360.4)6106 Da with mean Rh near
24 nm (from DLS detector) in week old 120 mM HEWL (FigureS3). Interestingly in both DLS results above, a relatively small
monomer population is consistently observed. The monomer
appears to exist in equilibrium with larger aggregates. Thus the
mean Rh ,24 nm is likely to be larger if area weighted
contribution from the small monomer peak is neglected. A
spherical shape must yield a radius of ,9.6 nm for the above
molecular mass assuming a partial specific volume of 0.73 cm3/g
and 0.23 cm3/g for the protein hydration [20]. The discrepancy in
sizes revealed by DLS, MALS and time-resolved anisotropy imply
that shapes of the aggregates could be asymmetrical. An elongated,
cylindrical shape (like a prolate ellipsoid) could account for faster
rotational depolarization of dansyl probe about the long axis in
anisotropy data and create a perception of a large spherical body
in DLS.
Aggregate morphologyAFM topology images (Figure 3 A,B,E) show that amorphous
hen lysozyme aggregates are well dispersed, essentially flat and its
morphology noted as mostly spherical. A heterogeneous mix of
sizes is visible. The aggregates clearly appear larger in size in
comparison to monomer (Figure 3F). Amyloid fibrils with
extensive branching, a rare event, were also observed as early as
12 hours after incubation at pH 12.2 (image D). Branching among
HEWL amyloid fibrils has been observed by us previously too
[28]. Interestingly, image C shows tiny straight and pointed fibril-
like structures emanating from all amorphous aggregates. Image G
reveals multiple fibrils originating from a single patch, while image
H provides a magnified view of one newly formed amyloid fibril
with the twist in the long axis clearly visible. Thus AFM images C,
G and H in Figure 3 clearly show that growth of amyloid fibrils
can be directly observed from amorphous aggregates in HEWL.
Figure S4 shows long, straight, tightly bunched amyloid fibrils
Intermediates on Hen Lysozyme Aggregation Pathway
PLOS ONE | www.plosone.org 5 January 2014 | Volume 9 | Issue 1 | e87256
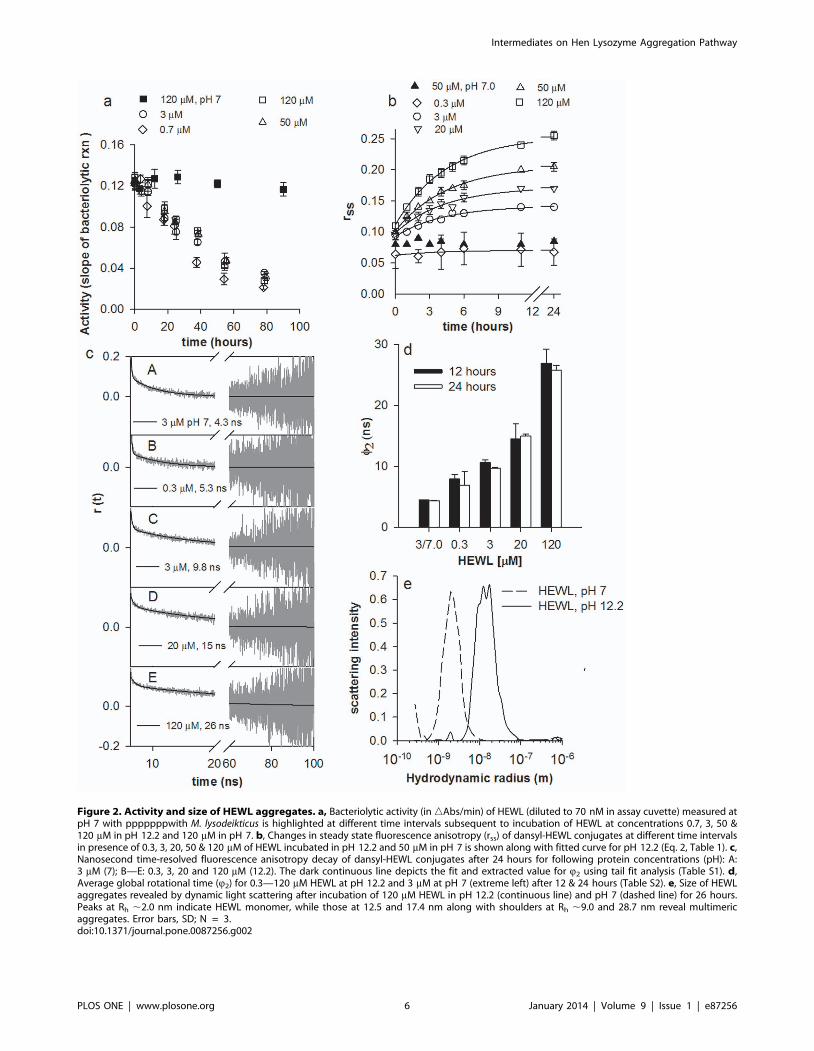
Figure 2. Activity and size of HEWL aggregates. a, Bacteriolytic activity (in nAbs/min) of HEWL (diluted to 70 nM in assay cuvette) measured atpH 7 with pppppppwith M. lysodeikticus is highlighted at different time intervals subsequent to incubation of HEWL at concentrations 0.7, 3, 50 &120 mM in pH 12.2 and 120 mM in pH 7. b, Changes in steady state fluorescence anisotropy (rss) of dansyl-HEWL conjugates at different time intervalsin presence of 0.3, 3, 20, 50 & 120 mM of HEWL incubated in pH 12.2 and 50 mM in pH 7 is shown along with fitted curve for pH 12.2 (Eq. 2, Table 1). c,Nanosecond time-resolved fluorescence anisotropy decay of dansyl-HEWL conjugates after 24 hours for following protein concentrations (pH): A:3 mM (7); B—E: 0.3, 3, 20 and 120 mM (12.2). The dark continuous line depicts the fit and extracted value for Q2 using tail fit analysis (Table S1). d,Average global rotational time (Q2) for 0.3—120 mM HEWL at pH 12.2 and 3 mM at pH 7 (extreme left) after 12 & 24 hours (Table S2). e, Size of HEWLaggregates revealed by dynamic light scattering after incubation of 120 mM HEWL in pH 12.2 (continuous line) and pH 7 (dashed line) for 26 hours.Peaks at Rh ,2.0 nm indicate HEWL monomer, while those at 12.5 and 17.4 nm along with shoulders at Rh ,9.0 and 28.7 nm reveal multimericaggregates. Error bars, SD; N = 3.doi:10.1371/journal.pone.0087256.g002
Intermediates on Hen Lysozyme Aggregation Pathway
PLOS ONE | www.plosone.org 6 January 2014 | Volume 9 | Issue 1 | e87256
observed at different [M] after 3—4 weeks of incubation at pH
12.2.
Role of disulphide bondsA uniformly slow decrease in –SH population was observed with
aggregate growth for different HEWL monomer concentrations
(Figure S5), hinting disulphide bond formation. Previous work
has shown that HEWL aggregation at pH 12.2 is abolished when
cysteine is maintained in a reduced form with DTT [16].
Additionally, blocking disulphide bond formation by modifying
few but not all –SH groups using iodoacetamide produced
drastically smaller HEWL aggregates in comparison to unblocked
samples [29]. These results substantiate the vital role of
intermolecular disulphide bridges in holding the aggregate
together.
Robustness of polycationic HEWL aggregates transferredto pH 7
An elegant way to ascertain the stability of HEWL aggregates
formed in pH 12.2 is to test their intactness after transfer to neutral
pH. Being polycationic at pH 7, coulombic repulsions can
destabilize larger HEWL aggregates more than smaller. The
robustness of aggregates was ascertained by: A) Observing the size
and integrity of the dansyl-HEWL aggregates, from rss of dansyl
probe, in a time-dependent way after transfer to pH 7, B)
Measuring the ability of HEWL aggregates to take up a probe like
ANS that displays enhanced fluorescence when bound to non-
polar interior in a protein [30,31]. Figure 4a shows a rise and dip
in rss of transferred samples (during 0—120 hrs) when transferred
at early times (12 and 24 hours of incubation) indicating disruption
of aggregate later. However samples transferred at 110 and
134 hours significantly retain their rss values even after 5 days in
pH 7 suggesting robust size and shape. Figure 4b shows that at
40 mM, the robustness is improved for HEWL aggregates
transferred early also, perhaps due to less repulsions in a smaller
aggregate. ANS binding data (Figure 4c) reveal that 12 hour
aggregates are disintegrating quickly, while one day old samples
acquiring shape with exposed interiors, take up ANS maximally,
consistent with rss data above. Later samples, which are fairly well
packed, reveal a steady and intense ability to bind ANS. A similar
trend is observed with 40 mM HEWL also (Figure 4d), however
here, like with rss, ANS binds better in samples transferred early
indicating better robustness. The 120 mM samples show signifi-
cantly higher ANS fluorescence intensity and more blue-shifted
spectra (Figure S6) compared to 40 mM. However, the ANS
fluorescence intensity values in Figure 4c cannot be compared with
Figure 4d as the HEWL concentrations interacting with ANS are
different. Figure 5 enables such comparison possible as HEWL
concentration is maintained constant (4 mM) for both 120 and
40 mM samples. 120 mM HEWL samples that are transferred early
(144 hours) show a tendency to lose ANS binding regions with
time in pH 7 and approach ANS intensities that are comparable
with 40 mM samples. In contrast, 120 mM HEWL samples that are
transferred later (264 hours) retain higher ANS fluorescence in
pH 7 compared to 40 mM samples after initial decline. In both
Figures 5a and 5b, the initial high ANS fluorescence in 120 mM
samples may arise from HEWL aggregate opening up after
suddenly experiencing electrostatic repulsions in pH 7. Subse-
Table 1. Parameters extracted (using eq. 2) from fits forgrowth in steady state anisotropy (rss) shown in Figure 2b.
[HEWL] pH rss‘ rss
0 k (hour21) R2
0.3 mM 12.2 0.070 0.062 0.274 0.46
3 mM 12.2 0.142 0.093 0.240 0.98
20 mM 12.2 0.172 0.098 0.231 0.97
50 mM 12.2 0.206 0.102 0.218 1.0
120 mM 12.2 0.254 0.117 0.224 1.0
doi:10.1371/journal.pone.0087256.t001
Figure 3. Morphology of HEWL aggregates. Observed morphology of HEWL aggregates after incubation in pH 12.2 (unless indicated otherwise)for 12 hours observed using non-contact mode atomic force microscopy with indicated monomer concentrations is shown. A: 3 mM; B: 120 mM; C:0.3 mM; D: 120 mM; E: 0.3 mM; F: 3 mM in pH 7; G: 0.3 mM; H: fibril in ‘G’ rescanned at higher magnification; Scale bar = 100 nm. Heights in Z-axis forall images were within 0—2 nm. See images of amyloid fibrils after 3 weeks in Figure S4.doi:10.1371/journal.pone.0087256.g003
Intermediates on Hen Lysozyme Aggregation Pathway
PLOS ONE | www.plosone.org 7 January 2014 | Volume 9 | Issue 1 | e87256
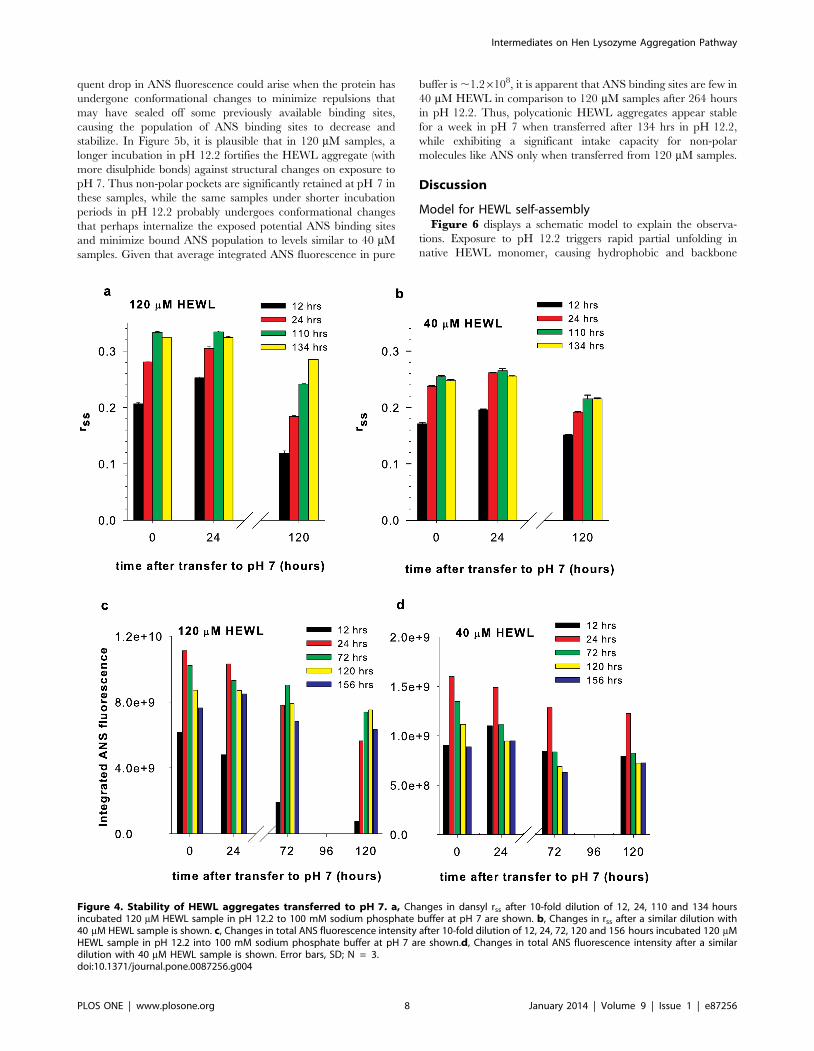
quent drop in ANS fluorescence could arise when the protein has
undergone conformational changes to minimize repulsions that
may have sealed off some previously available binding sites,
causing the population of ANS binding sites to decrease and
stabilize. In Figure 5b, it is plausible that in 120 mM samples, a
longer incubation in pH 12.2 fortifies the HEWL aggregate (with
more disulphide bonds) against structural changes on exposure to
pH 7. Thus non-polar pockets are significantly retained at pH 7 in
these samples, while the same samples under shorter incubation
periods in pH 12.2 probably undergoes conformational changes
that perhaps internalize the exposed potential ANS binding sites
and minimize bound ANS population to levels similar to 40 mM
samples. Given that average integrated ANS fluorescence in pure
buffer is ,1.26108, it is apparent that ANS binding sites are few in
40 mM HEWL in comparison to 120 mM samples after 264 hours
in pH 12.2. Thus, polycationic HEWL aggregates appear stable
for a week in pH 7 when transferred after 134 hrs in pH 12.2,
while exhibiting a significant intake capacity for non-polar
molecules like ANS only when transferred from 120 mM samples.
Discussion
Model for HEWL self-assemblyFigure 6 displays a schematic model to explain the observa-
tions. Exposure to pH 12.2 triggers rapid partial unfolding in
native HEWL monomer, causing hydrophobic and backbone
Figure 4. Stability of HEWL aggregates transferred to pH 7. a, Changes in dansyl rss after 10-fold dilution of 12, 24, 110 and 134 hoursincubated 120 mM HEWL sample in pH 12.2 to 100 mM sodium phosphate buffer at pH 7 are shown. b, Changes in rss after a similar dilution with40 mM HEWL sample is shown. c, Changes in total ANS fluorescence intensity after 10-fold dilution of 12, 24, 72, 120 and 156 hours incubated 120 mMHEWL sample in pH 12.2 into 100 mM sodium phosphate buffer at pH 7 are shown.d, Changes in total ANS fluorescence intensity after a similardilution with 40 mM HEWL sample is shown. Error bars, SD; N = 3.doi:10.1371/journal.pone.0087256.g004
Intermediates on Hen Lysozyme Aggregation Pathway
PLOS ONE | www.plosone.org 8 January 2014 | Volume 9 | Issue 1 | e87256
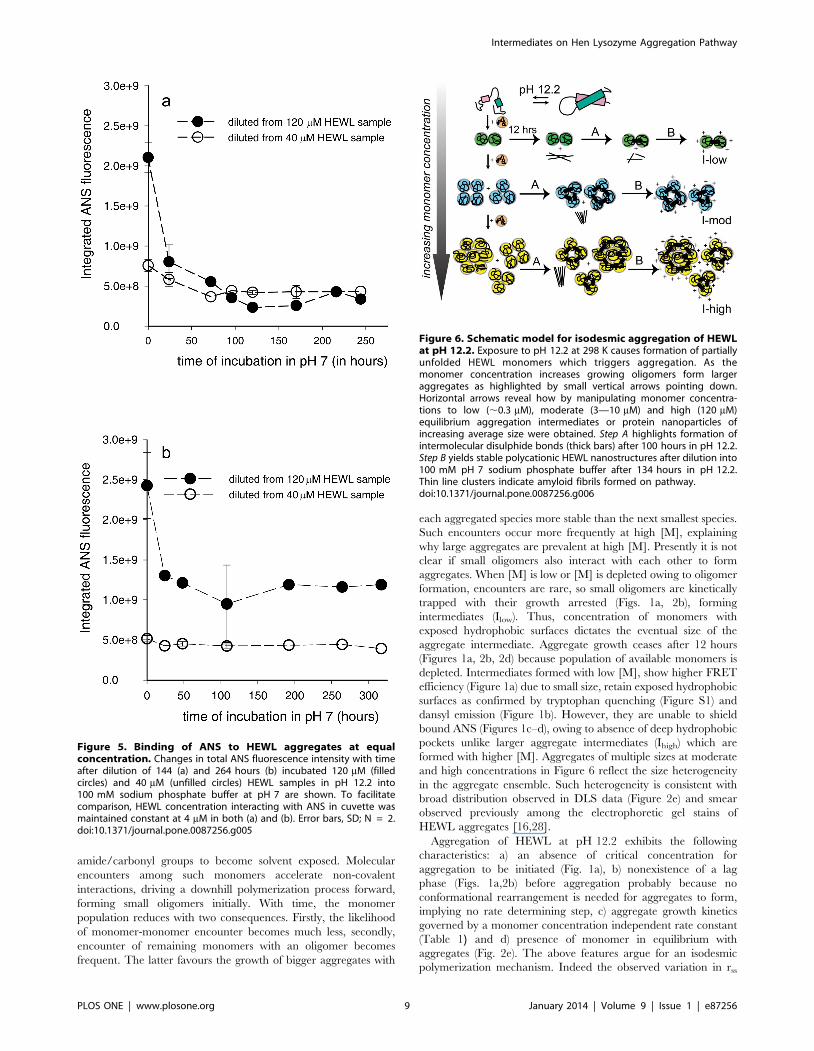
amide/carbonyl groups to become solvent exposed. Molecular
encounters among such monomers accelerate non-covalent
interactions, driving a downhill polymerization process forward,
forming small oligomers initially. With time, the monomer
population reduces with two consequences. Firstly, the likelihood
of monomer-monomer encounter becomes much less, secondly,
encounter of remaining monomers with an oligomer becomes
frequent. The latter favours the growth of bigger aggregates with
each aggregated species more stable than the next smallest species.
Such encounters occur more frequently at high [M], explaining
why large aggregates are prevalent at high [M]. Presently it is not
clear if small oligomers also interact with each other to form
aggregates. When [M] is low or [M] is depleted owing to oligomer
formation, encounters are rare, so small oligomers are kinetically
trapped with their growth arrested (Figs. 1a, 2b), forming
intermediates (Ilow). Thus, concentration of monomers with
exposed hydrophobic surfaces dictates the eventual size of the
aggregate intermediate. Aggregate growth ceases after 12 hours
(Figures 1a, 2b, 2d) because population of available monomers is
depleted. Intermediates formed with low [M], show higher FRET
efficiency (Figure 1a) due to small size, retain exposed hydrophobic
surfaces as confirmed by tryptophan quenching (Figure S1) and
dansyl emission (Figure 1b). However, they are unable to shield
bound ANS (Figures 1c–d), owing to absence of deep hydrophobic
pockets unlike larger aggregate intermediates (Ihigh) which are
formed with higher [M]. Aggregates of multiple sizes at moderate
and high concentrations in Figure 6 reflect the size heterogeneity
in the aggregate ensemble. Such heterogeneity is consistent with
broad distribution observed in DLS data (Figure 2e) and smear
observed previously among the electrophoretic gel stains of
HEWL aggregates [16,28].
Aggregation of HEWL at pH 12.2 exhibits the following
characteristics: a) an absence of critical concentration for
aggregation to be initiated (Fig. 1a), b) nonexistence of a lag
phase (Figs. 1a,2b) before aggregation probably because no
conformational rearrangement is needed for aggregates to form,
implying no rate determining step, c) aggregate growth kinetics
governed by a monomer concentration independent rate constant
(Table 1) and d) presence of monomer in equilibrium with
aggregates (Fig. 2e). The above features argue for an isodesmic
polymerization mechanism. Indeed the observed variation in rss
Figure 5. Binding of ANS to HEWL aggregates at equalconcentration. Changes in total ANS fluorescence intensity with timeafter dilution of 144 (a) and 264 hours (b) incubated 120 mM (filledcircles) and 40 mM (unfilled circles) HEWL samples in pH 12.2 into100 mM sodium phosphate buffer at pH 7 are shown. To facilitatecomparison, HEWL concentration interacting with ANS in cuvette wasmaintained constant at 4 mM in both (a) and (b). Error bars, SD; N = 2.doi:10.1371/journal.pone.0087256.g005
Figure 6. Schematic model for isodesmic aggregation of HEWLat pH 12.2. Exposure to pH 12.2 at 298 K causes formation of partiallyunfolded HEWL monomers which triggers aggregation. As themonomer concentration increases growing oligomers form largeraggregates as highlighted by small vertical arrows pointing down.Horizontal arrows reveal how by manipulating monomer concentra-tions to low (,0.3 mM), moderate (3—10 mM) and high (120 mM)equilibrium aggregation intermediates or protein nanoparticles ofincreasing average size were obtained. Step A highlights formation ofintermolecular disulphide bonds (thick bars) after 100 hours in pH 12.2.Step B yields stable polycationic HEWL nanostructures after dilution into100 mM pH 7 sodium phosphate buffer after 134 hours in pH 12.2.Thin line clusters indicate amyloid fibrils formed on pathway.doi:10.1371/journal.pone.0087256.g006
Intermediates on Hen Lysozyme Aggregation Pathway
PLOS ONE | www.plosone.org 9 January 2014 | Volume 9 | Issue 1 | e87256
against time (Fig. 2b) is identical with profiles reported previously
[32] for variation of the degree of polymerization for different [M]
against time in an isodesmic model (see Fig. 11[32]). A monomer-
dimer/isodesmic model has been proposed earlier for HEWL
association at vastly higher HEWL concentrations(1.5—10 mM),
acidic pH (3–8) in presence of 0–0.5 M NaCl [33].
The aggregates or nanoparticles are toughened by intermolec-
ular disulphide bonds after 100 hours in pH 12.2 [16], which
enables them to withstand strong coulombic repulsions in their
polycationic form at pH 7. In the absence of disulphide bonds to
fasten them, the 120 mM aggregates fall apart as observed when
transferred to pH 7 at early times (Fig. 4a,c). The absence of
intermolecular disulphide bonds at early times explains why
HEWL samples in pH 12.2 recover enzymatic activity when
transferred to pH 7 early on (Fig. 2a). Interestingly the loss in
enzymatic activity is not dependent on size of aggregates and
therefore not influenced by the restrictive growth mechanism. The
slow formation of inappropriate disulphide bonds during long
incubation in pH 12.2 probably curtails the protein chain
dynamics that is critical for enzyme function resulting in loss of
enzymatic activity. The intermolecular disulphide bonds therefore
serve an important role of fastening the monomers together in the
aggregate, not withstanding loss in HEWL enzymatic activity.
Intermolecular disulphide bonds in HEWL have been shown to
promote the growth of large aggregates by strengthening the non-
covalent forces [34]. Earlier work from our lab had revealed that
presence of DTT in the aggregation medium strongly inhibits
formation of HEWL aggregates, highlighting the critical role of
disulphide bonds in HEWL aggregation at alkaline pH [16]. The
role of incorrect disulphide bonds in promoting aggregation is a
symptom of several diseases like amyotrophic lateral sclerosis and
cataract. Thus this makes HEWL aggregation as a good model
system to investigate the etiology of such diseases.
Polycationic HEWL aggregates appear competent to bind non-
polar molecules like ANS (Fig. 4c,d and Fig. 5) due to availability
of hydrophobic space perhaps owing to flexible molecular packing
in the interiors. Aggregates from 120 mM samples bind more ANS
molecules (Fig. 5b) consistent with their larger size in comparison
aggregates from 40 mM samples. At this point it is not clear if ANS
is encapsulated inside the larger aggregates from 120 mM samples.
Such binding can have potential applications of polycationic
HEWL aggregates as a drug nanocarrier or DNA/RNA carrying
protein nanoparticle.
Two novel features are noteworthy among HEWL amyloid
fibrils. First, the fibrils appear in 300 nM HEWL samples soon
after 12 hours in pH 12.2. Second multiple fibrils are seen
growing outward from amorphous aggregates in AFM images (Fig.
3C,G,H). The latter is a direct confirmation of on-pathway
formation of amyloid fibrils from amorphous aggregates. Previous
reports on aggregation and amyloid formation of HEWL at acidic
pH stipulate incubation of high monomer concentrations (.
1 mM) for several weeks at 37—57uC [12,35]. Presumably, the
electrostatic repulsions between large positively charged HEWL
molecules act as a barrier against amyloid formation. In contrast,
the net charge of HEWL at pH 12.2 is likely to be small owing to
its pI at 11.3, thus enabling facile formation of oligomers and
amyloid fibrils even at sub-micromolar concentrations. Indeed the
experimentally measured and theoretically simulated values
second virial coefficient (B2) of lysozyme has been plotted against
pH [36]. They both reveal a clear decrease in B2 (positive to
negative) with increasing pH (4.5 to 10.5). This decrease is shown
to extend till isoelectric pH (,11.3) in another report [37]. Our
observations at pH 12.2 suggest that B2 continues to remain
negative at pH 12.2. Thus van der Waals attractions begin to
dominate over electrostatic repulsions in HEWL as pH becomes
more alkaline.
We observed that at short incubation times (,12 hours), fibrils
were more frequently seen at lower monomer concentrations (#
3 mM) compared to higher ($ 50 mM) using AFM. Indeed it has
been predicted that in the limit of high monomer concentrations,
rate of molecular contact between a growing fibril and a
monomer, varies inversely with protein concentration. Further
monomer addition to fibril is said to progress by dock-and-lock
mechanism, such that the rate-determining step in the monomer
addition is the lock phase in which both the preformed oligomer
and the monomer undergo combined conformational changes that
form a stable antiparallel higher-order oligomer [38]. In view of
their small size and unhindered dynamics, oligomers at low
concentrations probably adapt their conformation more rapidly to
enable locking onto the fibril. Perhaps, lower concentrations allow
sufficient relaxation time for oligomers to attain right orientation
to lock into ordered aggregates, like in protein crystallization [39].
In silico approaches to model the aggregation of proteins are now
emerging [40]. Such methods can yield residue wise structural
information on the different aggregate species populated at
different time points during aggregation. For example, it has been
shown that dimer formation in Ab peptide can lock few misfolded
conformations and shift equilibrium away from native state [41].
The self-association of HEWL in aqueous medium has been
modeled theoretically previously. Carlsson et. al., have investigat-
ed the self-association of HEWL (modeled as a hard sphere) by
Monte Carlo simulations as a function of protein concentration,
pH and ionic strength of surrounding medium [37]. Their results
reveal that HEWL aggregation is promoted by increasing
monomer concentration and conditions causing decreased elec-
trostatic repulsion between protein monomers. The latter can be
achieved by either increasing pH (which diminishes net charge) or
increasing ionic strength (which screens out electrostatic repul-
sions). Our results in this work reflect a similar trend. At pH 12.2
employed in our study, the low net charge facilitates HEWL
aggregation at 300 nM which is about ,1000 fold lower than the
lowest concentration employed by Carlsson and coworkers. The
increase in average size of aggregates with increasing protein
concentration (Figures 2b, 2c, 2d) observed by us is consistent with
the postulated role of increasing protein concentration in
promoting aggregation.
Pellicane has modeled protein interactions in HEWL aqueous
solution using the Derjaguin-Landau-Verwey-Overbeek (DLVO)
theory [42]. With increase in pH or ionic strength it was predicted
that short range attraction competes with long range repulsion to
promote formation of aggregates. In our case, at pH 12.2,
repulsions are likely to be less owing to diminished net charge
making aggregation spontaneous as observed by us and predicted
by DLVO theory. Indeed it has been hypothesized that protein
aggregation is caused by maximizing van der Waals interaction
between side chains and backbone hydrogen bonds [41]. In our
study of HEWL aggregation at alkaline pH, the formation of
intermolecular disulphide bonds is a unique feature that is not
accounted by any theory or model so far. In another work [34], it
has been demonstrated that presence of such disulphide bonds
reinforces the otherwise weak non-covalent forces that hold the
aggregates together. This probably explains the robust nature
HEWL aggregates in our study.
Earlier work with HEWL under acidic condition (pH 1.6 and
65uC) has revealed no amyloid fibril formation with 50 mM
lysozyme upto 170 hours, suggesting a critical concentration .
50 mM at this condition[43]. It was also shown that fragmentation
of the HEWL polypeptide by acid hydrolysis forming the 49–101
Intermediates on Hen Lysozyme Aggregation Pathway
PLOS ONE | www.plosone.org 10 January 2014 | Volume 9 | Issue 1 | e87256
peptide was essential for efficient fibril formation. In contrast, our
earlier work [16] has shown that significant fragmentation of
HEWL at pH 12.2 occurs only after 16 days, hence it is unlikely
that fragmentation has any role in fibril formation at alkaline pH
after 12 hours. In another work under acidic conditions (1.2 mM
HEWL, pH 2.0 with 175 mM NaCl), HEWL monomers have
been shown to form uniformly sized oligomers (Rh ,3.8 nm)
which after reaching a threshold concentration triggered proto-
fibril nucleation. Later protofibrils grew when oligomers added on
to ends of protofibrils [44].It is likely that high salt is essential for
screening out large net positive charge in HEWL at acidic pH to
facilitate protein-protein interaction, unlike our case here.
Moreover, no curly worm-like protofibrils were observed by us
in AFM suggesting perhaps their transient nature. Thus it is
evident that rapid amyloid formation by HEWL at sub-micromo-
lar concentrations is exclusively observed at pH 12.2.
Conclusions
We have isolated and characterized multiple oligomeric
intermediates on the aggregation pathway of HEWL in pH 12.2
at room temperature. Scrutiny of the structure, function and
dynamics of these intermediates revealed a stepwise incremental
increase in average size, internal molecular packing coupled with
decrease in enzymatic activity on maturation of aggregates
suggesting an isodesmic polymerization mechanism. Direct
observation of amyloid fibrils growing from amorphous HEWL
aggregates in AFM images, confirmed the on-pathway formation
of fibrils. Further, owing to unique formation of intermolecular
disulphide bonds these aggregates remain stable in their poly-
cationic form at neutral pH akin to protein nanoparticles. Such
stability augurs well for high resolution structural studies on these
isolated intermediates that can shed light on mechanism of the on-
pathway formation of amyloid fibrils from oligomers. Our results
suggest that amyloid fibril formation in HEWL at pH 12.2 is quick
and facile at sub-micromolar concentrations unlike other condi-
tions. Finally the isolated intermediates can be tried and tested as
prospective nanocarriers for non-polar drugs or polyanionic
nucleic acids.
Supporting Information
Figure S1 Fluorescence quenching of tryptophan(s) inHEWL by iodide during aggregation. A. Quenching of
tryptophan steady state fluorescence in HEWL (0.3 mM, 3 mM
and 120 mM) and model compound N-acetyl-L-tryptophanamide
(NATA, 5 mM) are shown at various time intervals after
incubation at pH 12.2. B. Fitted Stern-Volmer plots for fluorescence
quenching of tryptophan by iodide during aggregation. Stern-Volmer plots
for quenching of tryptophan in 0.3 mM HEWL are shown in top
row for different incubation times in pH 12.2 starting from 0 h
(leftmost) followed by 6, 12 and 24 hrs (rightmost). Similar plots
are shown for 3 mM HEWL (second row from top), 120 mM
HEWL (third row) and 3 mM NATA (bottom row). The dashed
lines reveal the linear regression fit used to calculate the KSV.
(TIF)
Figure S2 Mean fluorescence lifetime (tm) of dansyl-HEWL conjugates during aggregation. The variation in
mean fluorescence lifetime of dansyl probe in dansyl-HEWL
conjugates is shown against time of incubation in pH 12.2 for
different HEWL concentrations. The filled symbols show the
mean lifetime (tm), measured from emission collected at 438 nm
using a monochromator, while unfilled symbols show mean
lifetime measured from whole emission collected using an
excitation cutoff filter.
(TIF)
Figure S3 Molecular mass and size of HEWL nanopar-ticles determined by MALS. The molecular mass and
hydrodynamic radius of 120 mM HEWL samples, after 7 days of
incubation in pH 12.2 at room temperature, as determined using
multi-angle light scattering is shown. Note the minor presence of a
low molecular weight fraction similar to Fig. 2e.
(TIF)
Figure S4 Morphology of HEWL amyloid fibrils. Ob-
served morphology of HEWL fibrils using atomic force micros-
copy with different monomer concentrations incubated as
indicated is shown. The height of the fibril may be estimated
from observed range in Z axis indicated in square brackets with
minimum value being darkest region in image and maximum
value being most white. Details of each image are as follows: A:
3 mM, pH 12.2, 12 hours, [0—1.5 nm]; B: 50 mM, pH 12.2, 25
days, [0—0.8 nm]; C: 160 mM, pH 12.2, 31 days, [0—1.15 nm]
and D: 75 mM, pH 12.2, 30 days, [0—2.0 nm]. Scale bar =
100 nm.
(TIF)
Figure S5 Concentration of free –SH in HEWL duringaggregation using DTNP (2,2’-dithiobis(5-nitropyri-dine)). The variation of free –SH in HEWL (diluted to 2 mM
in assay cuvette) incubated at concentrations 20, 50 & 120 mM in
pH 12.2 is shown against time. HEWL has eight Cys residues per
polypeptide. The assay procedure used has been described
previously (16).
(TIF)
Figure S6 Emission maxima of ANS in presence ofHEWL nanoparticles transferred to pH 7. The variation in
emission maxima of ANS in presence of HEWL nanoparticles
with time after 10-fold dilution to pH 7 from 120 (Fig. 4c) or 40
(Fig. 4d) mM samples.
(PDF)
Table S1 Parameters extracted (using eq. 5) from tail fitanalysis of fluorescence anisotropy decays shown inFigure 2c. (Note: x2 reported here is reduced chisquare).
(PDF)
Table S2 Observed average ± std. dev. of globalrotational correlation time (Q2) extracted from multipleexperiments after 12 and 24 hrs of aggregation dis-played in Figure 2d.
(PDF)
Acknowledgments
We are grateful to Central Instruments Facility, IIT Guwahati for time-
resolved fluorescence; S. Kumar (Germany) for DLS; G. Krishnamoorthy
for MALS (TIFR, India) measurements. We thank G. Krishnamoorthy,
Carl Frieden, Kanchan Garai for their comments on the manuscript.
Author Contributions
Conceived and designed the experiments: VKR NC RS. Performed the
experiments: VKR NC TS. Analyzed the data: VKR RS. Contributed
reagents/materials/analysis tools: RS. Wrote the paper: RS.
Intermediates on Hen Lysozyme Aggregation Pathway
PLOS ONE | www.plosone.org 11 January 2014 | Volume 9 | Issue 1 | e87256
References
1. Ramirez-Alvarado M, Kelly JW, Dobson CM, editors (2010) Protein Misfolding
Diseases: Current and emerging principles and therapies. New Jersey: Wiley.
2. Pepys MB, Hawkins PN, Booth DR, Vigushin DM, Tennent GA, et al. (1993)
Human lysozyme gene mutations cause hereditary systemic amyloidosis. Nature
362: 553–557.
3. Kumar S, Udgaonkar JB (2010) Mechanisms of amyloid fibril formation by
proteins. Current Science 98: 639–656.
4. Frieden C (2007) Protein aggregation processes: In search of the mechanism.
Protein Science 16: 2334–2344.
5. Ooi T, Mihashi K, Kobayashi H (1962) On the polymerization of tropomyosin.
Archives of Biochemistry and Biophysics 98: 1–11.
6. Sekhar A, Udgaonkar JB (2011) Fluoroalcohol-induced modulation of the
pathway of amyloid protofibril formation by barstar. Biochemistry 50: 805–819.
7. Chipman DM, Sharon N (1969) Mechanism of lysozyme action. Science 165:
454–465.
8. Proctor VA, Cunningham FE (1988) The chemistry of lysozyme and its use as a
food preservative and a pharmaceutical. Critical reviews in food science and
nutrition 26: 359–395.
9. Swaminathan R, Ravi VK, Kumar S, Kumar MVS, Chandra N (2011)
Lysozyme: A model protein for amyloid research. In: Donev R, editor. Advances
in Protein Chemistry and Structural Biology, Vol. 84, Elsevier. pp. 63–111.
10. Trexler AJ, Nilsson MR (2007) The formation of amyloid fibrils from proteins in
the lysozyme family. Current Protein and Peptide Science 8: 537–557.
11. Wetter LR, Deutsch HF (1951) Immunological studies on egg white proteins. IV.
Immunochemical and. The Journal of biological chemistry 192: 237–242.
12. Krebs MRH, Wilkins DK, Chung EW, Pitkeathly MC, Chamberlain AK, et al.
(2000) Formation and seeding of amyloid fibrils from wild-type hen lysozyme
and a peptide fragment from the b-domain. Journal of Molecular Biology 300:
541–549.
13. Sophianopoulos AJ, Van Holde KE (1961) Evidence for dimerization of
lysozyme in alkaline solution. The Journal of biological chemistry 236: PC82–
PC83.
14. Sophianopoulos AJ, Vanholde KE (1964) Physical studies of muramidase
(Lysozyme). II. pH dependent dimerization. The Journal of biological chemistry
239: 2516–2524.
15. Homchaudhuri L, Kumar S, Swaminathan R (2006) Slow aggregation of
lysozyme in alkaline pH monitored in real time employing the fluorescence
anisotropy of covalently labelled dansyl probe. FEBS Letters 580: 2097–2101.
16. Kumar S, Ravi VK, Swaminathan R (2008) How do surfactants and DTT affect
the size, dynamics, activity and growth of soluble lysozyme aggregates?
Biochemical Journal 415: 275–288.
17. Arnaudov LN, Vries Rd (2005) Thermally induced fibrillar aggregation of hen
egg white lysozyme. Biophys J 88: 515–526.
18. Kumar S, Swaminathan R (2007) Employing the fluorescence anisotropy and
quenching kinetics of tryptophan to hunt for residual structures in denatured
proteins. Journal of Chemical Sciences 119: 141–145.
19. Davies RC, Neuberger A, Wilson BM (1969) The dependence of lysozyme
activity on pH and ionic strength. BBA - Enzymology 178: 294–305.
20. Lakowicz JR (2006) Principles of Fluorescence Spectroscopy. Singapore:
Springer.
21. Chan HY, Lankevich V, Vekilov PG, Lubchenko V (2012) Anisotropy of the
coulomb interaction between folded proteins: Consequences for mesoscopic
aggregation of lysozyme. Biophysical Journal 102: 1934–1943.
22. Brand L, Gohlke JR (1972) Fluorescence probes for structure. Annual Review of
Biochemistry 41: 843–868.
23. Stryer L (1965) The interaction of a naphthalene dye with apomyoglobin and
apohemoglobin. A fluorescent probe of non-polar binding sites. Journal of
Molecular Biology 13: 482–495.
24. Homchaudhuri L (2006) Influence of protein aggregation and macromolecular
crowding on the dynamics and function of proteins respectively. Ph.D. Thesis:Indian Institute of Technology Guwahati.
25. Steiner RF (1991) Fluorescence Anisotropy: Theory and Applications. In:Lakowicz JR, editor. Topics in Fluorescence Spectroscopy. New York: Plenum
Press. pp. 1–52.
26. Aitken M, Broadhurst B, Hladky S (2010) Mathematics for Biological Scientists.United Kingdom: Garland Science.
27. Nishimoto E, Yamashita S, Szabo AG, Imoto T (1998) Internal motion oflysozyme studied by time-resolved fluorescence depolarization of tryptophan
residues. Biochemistry 37: 5599–5607.
28. Kumar S, Ravi VK, Swaminathan R (2009) Suppression of lysozymeaggregation at alkaline pH by tri-N-acetylchitotriose. Biochimica et Biophysica
Acta - Proteins and Proteomics 1794: 913–920.29. Ravi VK, Goel M, Swaminathan R (2012) Carboxymethylation of cysteines
impedes aggregation of hen lysozyme in alkaline pH. Biophysical SocietyMeeting Abstracts: Biophys. J. Supplement. pp. 255a, Abstract 1291–Pos.
30. Rabbani G, Ahmad E, Zaidi N, Khan RH (2011) pH-Dependent Conforma-
tional Transitions in Conalbumin (Ovotransferrin), a Metalloproteinase fromHen Egg White. Cell Biochemistry and Biophysics 61: 551–560.
31. Rabbani G, Ahmad E, Zaidi N, Fatima S, Khan RH (2012) pH-Induced MoltenGlobule State of Rhizopus niveus Lipase is More Resistant Against Thermal and
Chemical Denaturation Than Its Native State. Cell Biochemistry and Biophysics
62: 487–499.32. Zhao D, Moore JS (2003) Nucleation-elongation: A mechanism for cooperative
supramolecular polymerization. Organic and Biomolecular Chemistry 1: 3471–3491.
33. Price WS, Tsuchiya F, Arata Y (1999) Lysozyme aggregation and solutionproperties studied using PGSE NMR diffusion measurements. Journal of the
American Chemical Society 121: 11503–11512.
34. Ravi VK, Goel M, Kotamarthi HC, Ainavarapu SRK, Swaminathan R (2014)Preventing Disulfide Bond Formation Weakens Non-covalent Forces Among
Lysozyme Aggregates. PLoS ONE doi 10.1371/journal.pone.008701235. McAllister C, Karymov MA, Kawano Y, Lushnikov AY, Mikheikin A, et al.
(2005) Protein interactions and misfolding analyzed by AFM force spectroscopy.
Journal of Molecular Biology 354: 1028–1042.36. Lund M, Jonsson B (2003) A Mesoscopic Model for Protein-Protein Interactions
in Solution. Biophysical Journal 85: 2940–2947.37. Carlsson F, Malmsten M, Linse P (2001) Monte Carlo simulations of lysozyme
self-association in aqueous solution. Journal of Physical Chemistry B 105:12189–12195.
38. Straub JE, Thirumalai D (2011) Toward a molecular theory of early and late
events in monomer to amyloid fibril formation. pp. 437–463.39. Zhang J, Liu XY (2003) Effect of protein-protein interactions on protein
aggregation kinetics. Journal of Chemical Physics 119: 10972–10976.40. Wei G, Mousseau N, Derreumaux P (2007) Computational simulations of the
early steps of protein aggregation. Prion 1: 3–8.
41. Ma B, Nussinov R (2006) Simulations as analytical tools to understand proteinaggregation and predict amyloid conformation. Current Opinion in Chemical
Biology 10: 445–452.42. Pellicane G (2012) Colloidal model of lysozyme aqueous solutions: A computer
simulation and theoretical study. Journal of Physical Chemistry B 116: 2114–2120.
43. Mishra R, Sorgjerd K, Nystrom S, Nordigarden A, Yu YC, et al. (2007)
Lysozyme Amyloidogenesis Is Accelerated by Specific Nicking and Fragmen-tation but Decelerated by Intact Protein Binding and Conversion. Journal of
Molecular Biology 366: 1029–1044.44. Hill SE, Robinson J, Matthews G, Muschol M (2009) Amyloid protofibrils of
lysozyme nucleate and grow via oligomer fusion. Biophysical Journal 96: 3781–
3790.
Intermediates on Hen Lysozyme Aggregation Pathway
PLOS ONE | www.plosone.org 12 January 2014 | Volume 9 | Issue 1 | e87256
Copyright © 2022 FDOKUMEN