Product Market Distortions and the Returns to Federal Laying-Hen Research in Canada
18
Product Market Distortions and the Returns to Federal Laying-Hen Research in Canada A. K. Enamul Haque,’ Glenn Fox’ and George L. Brinkman3 ‘Lecturer, Department of Economics, University of Chittagong, Bangladesh, and PhD candidate, Department of Agricultural Economics and Business, University of Guelph, Guelph, Ontario, NIG 2W1. 2Assistant professor, Department of Agricultural Economics and Business, University of Guelph, Guelph, Ontario, NIG 2W1, 3Professor, Department of Agricultural Economics and Business, University of Guelph, Guelph, Ontario, NlG 2Wl. Received 13 September 1988, accepted 29 December 1988 The role of market distortions has been largely neglected in efforts to estimate the net economic benefits of public sector agricultural research. This paper uses the economic surplus approach to measure the impact of agricultural research when output controls are used to support a formula price. The model is used to study the effect of distortions on the magnitude and distribution of benefits from federally funded laying-hen research in Canada. Net benefits of Canadian federal laying-hen research conducted between 1968 and 1984 were found to be high on average and at the margin. Distortions were found to have only minor effects on the rate of return to research but played a large role in the distribution of gains from research. On a largement nCglig6 le r6le des distorsions de march6 lorsqu’on a essay6 d’kaluer les avantages Cconomiques nets de la recherche publique en agriculture. Le pdsent document recourt i l’approche des excCdents pour dkterminer l’impact de la recherche agricole dans un systkme oh le contr6le de la produciton soutient la fixation des prix au moyen d’une formule. Le modkle retenu permet de dktenniner I’effet des distorsions sur l’importance et la distribution des Mn6fices qui rbsultent de la recherche sur les pondeuses financC par le gouvemement f6dCral au Canada. Les avantages nets Btaient ds tlevts en 1968 et 1984 pour la moyenne et pour les recherches marginales. On a constat6 que les distorsions n’avaient qu’un effet secondaire sur le rendement de la recherche mais jouaient un r6le primordial dans la r6partition des gains dsultant des travaux exphimentaux. INTRODUCTION AND BACKGROUND Public investments in agricultural research have generated high net social benefits’ in most countries. Very few studies, however, have incorporated the impact of market distortionson measurements of benefits generated by research.Fox (1985b) has shown that the marginal excess burden of tax collection can have important consequences in the measurement of net social benefits of research. Alston et a1 (1988) have provided a qualitativeanalysis of the effects of various product market Canadian Journal of Agricultural Economics 37 (1989) 29-46 29
Transcript of Product Market Distortions and the Returns to Federal Laying-Hen Research in Canada
Product Market Distortions and the Returns to Federal Laying-Hen Research in Canada
A. K. Enamul Haque,’ Glenn Fox’ and George L. Brinkman3 ‘Lecturer, Department of Economics, University of Chittagong, Bangladesh, and PhD candidate, Department of Agricultural Economics and Business,
University of Guelph, Guelph, Ontario, NIG 2W1. 2Assistant professor, Department of Agricultural Economics and Business,
University of Guelph, Guelph, Ontario, NIG 2W1, 3Professor, Department of Agricultural Economics and Business, University of
Guelph, Guelph, Ontario, N lG 2Wl . Received 13 September 1988, accepted 29 December 1988
The role of market distortions has been largely neglected in efforts to estimate the net economic benefits of public sector agricultural research. This paper uses the economic surplus approach to measure the impact of agricultural research when output controls are used to support a formula price. The model is used to study the effect of distortions on the magnitude and distribution of benefits from federally funded laying-hen research in Canada. Net benefits of Canadian federal laying-hen research conducted between 1968 and 1984 were found to be high on average and at the margin. Distortions were found to have only minor effects on the rate of return to research but played a large role in the distribution of gains from research.
On a largement nCglig6 le r6le des distorsions de march6 lorsqu’on a essay6 d’kaluer les avantages Cconomiques nets de la recherche publique en agriculture. Le pdsent document recourt i l’approche des excCdents pour dkterminer l’impact de la recherche agricole dans un systkme oh le contr6le de la produciton soutient la fixation des prix au moyen d’une formule. Le modkle retenu permet de dktenniner I’effet des distorsions sur l’importance et la distribution des Mn6fices qui rbsultent de la recherche sur les pondeuses financC par le gouvemement f6dCral au Canada. Les avantages nets Btaient d s tlevts en 1968 et 1984 pour la moyenne et pour les recherches marginales. On a constat6 que les distorsions n’avaient qu’un effet secondaire sur le rendement de la recherche mais jouaient un r6le primordial dans la r6partition des gains dsultant des travaux exphimentaux.
INTRODUCTION AND BACKGROUND Public investments in agricultural research have generated high net social benefits’ in most countries. Very few studies, however, have incorporated the impact of market distortions on measurements of benefits generated by research. Fox (1985b) has shown that the marginal excess burden of tax collection can have important consequences in the measurement of net social benefits of research. Alston et a1 (1988) have provided a qualitative analysis of the effects of various product market
Canadian Journal of Agricultural Economics 37 (1989) 29-46 29

30 CANADIAN JOURNAL OF AGRICULTURAL ECONOMICS
distortions on the magnitude of gross research benefits and their distribution within and across economies. The purpose of this paper is to empirically investigate the impact of a specific distortion in a product market for an agricultural commodity. This provides an indication of the order of magnitude of some of the qualitative effects discussed in the Alston paper, at least for this particular case. In addition, the effect of the marginal excess burden of taxes on returns to research is explored. An extension of the economic surplus approach is used. Both average and marginal net benefits are computed. Federally funded laying-hen research in Canada between 1968 and 1984 was selected for analysis.
MARKET STRUCTURE AND THE MEASUREMENT OF RESEARCH BENEFITS
The economic surplus approach to the estimation of research benefits views research expenditures as the source of technological change that shifts the supply function down and to the right. Gross benefits of research are estimated by com- paring the actual supply function to the supply function that would have existed had research not been undertaken. In the absence of distortions in the product market, as research shifts the supply function to the right, price falls and the quan- tity produced and consumed increases. As the market-clearing price falls, con- sumers' surplus increases. The net change in producers' surplus can be positive, zero or negative, depending on the elasticity of tHe demand function and the type of supply shift.
When the pricing function of the market is abrogated through public policy, the effects of changing technology on consumers and producers can change. Egg production in Canada has been regulated through the use of quotas since 1974.2 The price of output is determined on the basis of a cost-of-production formula, and the national quota is adjusted to satisfy expected demand at this price. Depar- ture from the market-clearing equilibrium price and quantity that would prevail in the absence of a quota imposes a deadweight loss on society. The imposition of a quota in the product market also reduces the gross benefits from research. In Figure 1, gross research benefits are the area C, B D C, , rather than C, E&, C,. S, is the actual industry level supply function in a particular year. So is the hypothetical supply function that would have existed in that same year if research had not been conducted during the period under study. All of the research benefits measured as C, B D C, in Figure 1 accrue to producers. Since the formula price P , is not determined by the interaction of supply and demand, supply shifts of the type illustrated in Figure 1 do not confer any benefits on cons~mers .~ If the shift in the supply function is sufficiently large, however, and/or if the quota is sufficiently close to the competitive market output level, then the supply function that would have existed had research not taken place, (So), can intersect domestic demand at a price higher than P,. This situation is illustrated in Figure 2 . In this situation, research can yield benefits for consumers even under supply management. As

LAYING-HEN RESEARCH IN CANADA 31
P r i c e
pF
p1
cO
c1
\
I; Demand
Quantity
Figure 1. Gross gains from research with an output quota, Case 1
research shifts the supply function, consumers can gain from the decline in price from Po to P,. As a result, consumers’ surplus increases by the area Po E, E, P,. The effect of research on producers’ surplus is ambiguous. Without research, pro- ducers’ surplus would have been Po E,, C,. Under s,, with a quota imposed at &, producers’ surplus is P, E, DC,. Depending on the elasticity of the domestic demand function and the type and size of the supply shift, P, E, DC, - Po E, C, can be positive, zero or even negative. This last possibility turns out to be more than an abstract curiosity. The impact of research on producers’ welfare was found to be negative in several years considered in this study, owing to the inelastic nature of the domestic demand function.
Intervention in the market for eggs reduces the net benefits of research relative to what benefits would have been in the absence of intervention. This reduction in
32
Price
pF
c O
c1
0 Quantity
Figure 2. Gross gains from research with an output quota, Case 2
benefits arises not because research has failed to generate new technology, but rather because distortions in the product market prevented the full exploitation of technological advance. Alston et a1 have analyzed the effects of selected policy distortions on the returns to research and on the distribution of research gains. In a research policy context, it would be useful to know the size of these effects in particular circumstances.
In order to estimate the effects of distortions on returns to research, areference point must be established to determine what returns would have been in competitive equilibrium. In the present context, two characterizations of the nondistorted product market are reasonable. One possibility is that domestic demand and supply would interact to determine a Canadian market-clearing price for eggs at essentially an autarkic equilibrium. Alternatively, Canadian producers could be thought of as participating in an integrated North American market, facing North American
LAYING-HEN RESEARCH IN CANADA 33
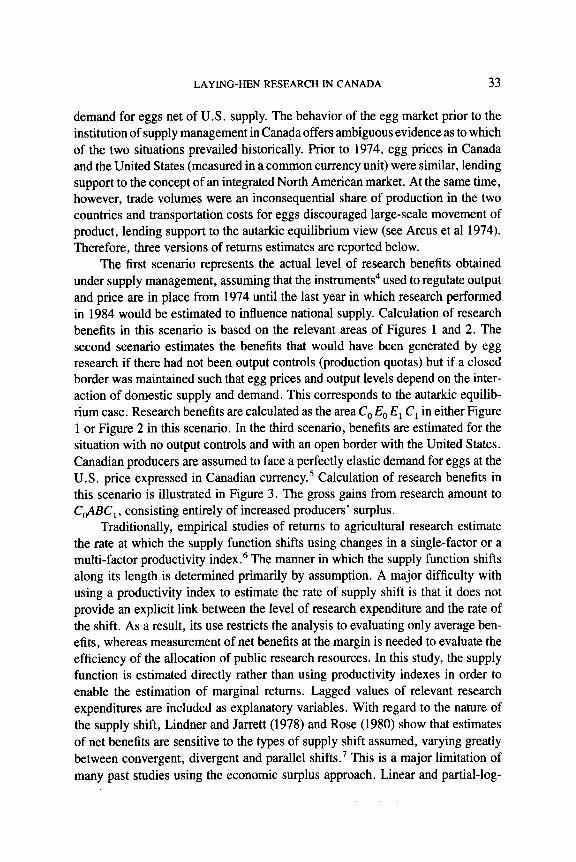
demand for eggs net of U.S. supply. The behavior of the egg market prior to the institution of supply management in Canada offers ambiguous evidence as to which of the two situations prevailed historically. Prior to 1974, egg prices in Canada and the United States (measured in a common currency unit) were similar, lending support to the concept of an integrated North American market. At the same time, however, trade volumes were an inconsequential share of production in the two countries and transportation costs for eggs discouraged large-scale movement of product, lending support to the autarkic equilibrium view (see Arcus et a1 1974). Therefore, three versions of returns estimates are reported below.
The first scenario represents the actual level of research benefits obtained under supply management, assuming that the instruments4 used to regulate output and price are in place from 1974 until the last year in which research performed in 1984 would be estimated to influence national supply. Calculation of research benefits in this scenario is based on the relevant areas of Figures 1 and 2. The second scenario estimates the benefits that would have been generated by egg research if there had not been output controls (production quotas) but if a closed border was maintained such that egg prices and output levels depend on the inter- action of domestic supply and demand. This corresponds to the autarluc equilib- rium case. Research benefits are calculated as the area C, E, E , C, in either Figure 1 or Figure 2 in this scenario. In the third scenario, benefits are estimated for the situation with no output controls and with an open border with the United States. Canadian producers are assumed to face a perfectly elastic demand for eggs at the U.S. price expressed in Canadian c~rrency .~ Calculation of research benefits in this scenario is illustrated in Figure 3. The gross gains from research amount to CflC,, consisting entirely of increased producers’ surplus.
Traditionally, empirical studies of returns to agricultural research estimate the rate at which the supply function shifts using changes in a single-factor or a multi-factor productivity index.6 The manner in which the supply function shifts along its length is determined primarily by assumption. A major difficulty with using a productivity index to estimate the rate of supply shift is that it does not provide an explicit link between the level of research expenditure and the rate of the shift. As a result, its use restricts the analysis to evaluating only average ben- efits, whereas measurement of net benefits at the margin is needed to evaluate the efficiency of the allocation of public research resources. In this study, the supply function is estimated directly rather than using productivity indexes in order to enable the estimation of marginal returns. Lagged values of relevant research expenditures are included as explanatory variables. With regard to the nature of the supply shift, Lindner and Jarrett (1978) and Rose (1980) show that estimates of net benefits are sensitive to the types of supply shift assumed, varying greatly between convergent, divergent and parallel shift^.^ This is a major limitation of many past studies using the economic surplus approach. Linear and partial-log-

34
P r i c e
c O
1 c
CANADIAN JOURNAL OF AGRICULTURAL ECONOMICS
I I
Quantity QO 01
Figure 3. Gross gains from research for the open economy scenario
arithmic forms of the supply functions are estimated in this paper.8 A linear func- tional form. for example:
Y = a + hP + cT (1)
where y =:
p - output.
product price and
= some technology shifter, generates a parallel shift in the supply function in price-output space. The effect of changes in T is incorporated into the intercept, and the supply function shifts

LAYING-HEN RESEARCH IN CANADA 35
by the same absolute vertical amount along its entire length. A partial-logarithmic function written as:
Y = a P P exp { y ~ } (2) generates a divergent proportional shift in the supply function in price-output space. The absolute magnitude of the vertical shift is smaller at lower levels of output. These two types of shift are identified by Lindner and Jarrett as being of most empirical relevance.
Returns to research at the margin are estimated by comparing the position of the actual supply function (see Figure 4) in a particular year, S,, with the supply function that would have existed if research funding had been increased by 1 % in each year from 1968 to 1984, S,. The area between these two supply functions up to the level of output determined by the quota is the gross benefit of this increased research. This gross benefit is compared with the dollar value of the 1% increase in funding to calculate net benefits. Figure 4 illustrates the procedure for the case of a binding quota. Calculations for other market conditions are performed analogously.
A number of factors could be thought to act as supply shifters over time. This paper focuses on the role of federal production-oriented laying-hen research, including breeding and nutrition and feeding research performed under the Animal Productivity Research program of Agriculture Canada, as well as relevant disease research performed by the Animal Pathology Division. By improving feed effi- ciency and egg quality as well as by reducing mortality, this research would be expected to shift farm-level cost functions down and to the right over time. This would be reflected in a rightward migration of the industry supply function in response to research. Research and extension performed by provincial ministries of agriculture, research spill-ins from the United States and farmers’ education levels may also act as supply shifters. All of these variables were included in preliminary versions of our supply functions, although education and extension were subsequently dropped as statistically insignificant. Inclusion of this extensive set of potential supply shifters was intended to prevent the attribution of effects of other variables to federal laying-hen research, which would have introduced an upward bias in the rate of return estimates.
ESTIMATION OF THE SUPPLY FUNCTION The supply function is estimated with annual time series data using ordinary least squares, since all of the right-hand side variables can be considered predetermined or exogenous to the decisions of egg producers.’ The structure of the supply equa- tion follows Kulshreshtha and Brasnett (1975) and Kulshreshtha and Ng (1977) as closely as possible. The coefficients on the price and research variables are esti- mated as polynomial distributed lags. The Canadian federal and U.S. research expenditure coefficients are estimated as quadratic distributed lags with zero con-

36
Price
0
CANADIAN JOURNAL OF AGRICULTURAL ECONOMICS
Quantity Q Figure 4. Marginal research benefits
strained end points, following the approach of Cline (1975)" A dummy variable is included to reflect the structural change in the national supply function after the introduction of supply management with the Canadian Egg Marketing Agency (CEMA) in 1974. As stated earlier, provincial extension expenditures and farmers' education levels were included in earlier versions of the supply function, but were found not to be significant.
Estimates of the linear and partial-logarithmic forms of the supply function are reported in Tables l a and lb, respectively. Based on the overall fit of the two equations and the sign and significance of individual coefficients, it is clear that the data indicate that neither functional form dominates. Only small differences are observed in the elasticity estimates. Since both types of supply shift suggested
LAYING-HEN RESEARCH IN CANADA 37
by Lindner and Jarrett (1978) are consistent with the data, estimates of returns to research for both types of shift are reported below.
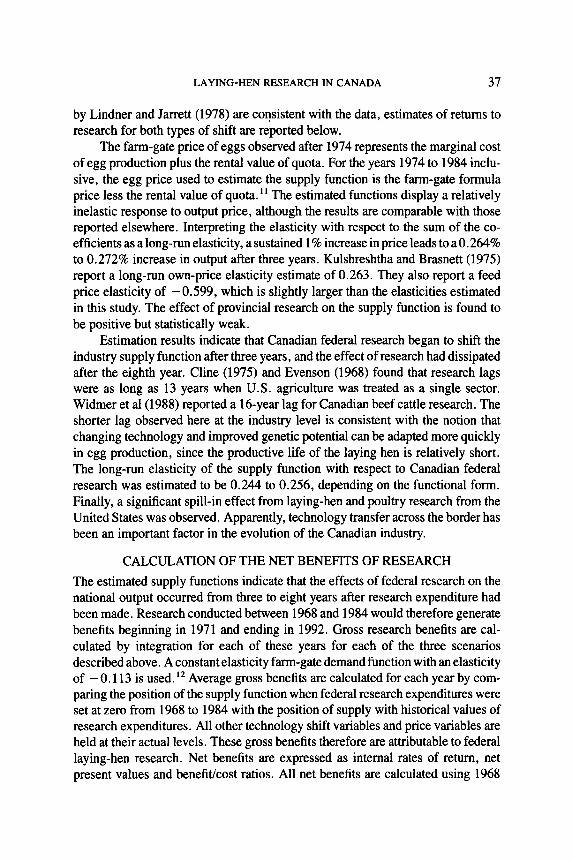
The farm-gate price of eggs observed after 1974 represents the marginal cost of egg production plus the rental value of quota. For the years 1974 to 1984 inclu- sive, the egg price used to estimate the supply function is the farm-gate formula price less the rental value of quota. l 1 The estimated functions display a relatively inelastic response to output price, although the results are comparable with those reported elsewhere. Interpreting the elasticity with respect to the sum of the co- efficients as a long-run elasticity, a sustained 1 % increase in price leads to a 0.264% to 0.272% increase in output after three years. Kulshreshtha and Brasnett (1975) report a long-run own-price elasticity estimate of 0.263. They also report a feed price elasticity of - 0.599, which is slightly larger than the elasticities estimated in this study. The effect of provincial research on the supply function is found to be positive but statistically weak.
Estimation results indicate that Canadian federal research began to shift the industry supply function after three years, and the effect of research had dissipated after the eighth year. Cline (1975) and Evenson (1968) found that research lags were as long as 13 years when U.S. agriculture was treated as a single sector. Widmer et al(1988) reported a 16-year lag for Canadian beef cattle research. The shorter lag observed here at the industry level is consistent with the notion that changing technology and improved genetic potential can be adapted more quickly in egg production, since the productive life of the laying hen is relatively short. The long-run elasticity of the supply function with respect to Canadian federal research was estimated to be 0.244 to 0.256, depending on the functional form. Finally, a significant spill-in effect from laying-hen and poultry research from the United States was observed. Apparently, technology transfer across the border has been an important factor in the evolution of the Canadian industry.
CALCULATION OF THE NET BENEFITS OF RESEARCH The estimated supply functions indicate that the effects of federal research on the national output occurred from three to eight years after research expenditure had been made. Research conducted between 1968 and 1984 would therefore generate benefits beginning in 1971 and ending in 1992. Gross research benefits are cal- culated by integration for each of these years for each of the three scenarios described above. A constant elasticity farm-gate demand function with an elasticity of - 0.113 is used. l2 Average gross benefits are calculated for each year by com- paring the position of the supply function when federal research expenditures were set at zero from 1968 to 1984 with the position of supply with historical values of research expenditures. All other technology shift variables and price variables are held at their actual levels. These gross benefits therefore are attributable to federal laying-hen research. Net benefits are expressed as internal rates of return, net present values and benefitkost ratios. All net benefits are calculated using 1968

38 CANADIAN JOURNAL OF AGRICULTURAL ECONOMICS
Table la. Estimated coefficients of the linear supply function
Explanatory variables Coefficients r-statistic Elasticity"
Constant Price of eggs (cents per dozen)b
t - I 1-2 1-3
Sum of coefficients Price of laying mash (cents/kg)b
t - I 1-2 t - 3 1-4
Sum of coefficients
Provincial research expenditures ($ million)b I - 1 1-2 t - 3 t - 4 t - 5
Sum of coefficients
Federal egg research expenditures ($ million)b 1 - 3 1-4 t - 5 1-6 I - 7 1-8
Sum of coefficients U.S. egg research expenditures ($ million)
t - 3 1-4 t - 5 t - 6 t - 7 t -8
Sum of coefficients Dummy variable Adjusted R-squared Durbin-Watson statistic F-statistic Dependent variable: million dozen eggs
272.394
0.637 0.424 0.212 1.273
- 2.756 - 2.067 - 1.378 -0.689 - 6.890
35.060 28.048 21.036 14.024 7.012
105.180
4.604 7.674 9.208 9.208 7.674 4.604
42.972
0.435 0.726 0.871 0.871 0.726 0.435 4.067
- 33.833
2.665
1.956 1.956 1.956
- 2.42 - 2.42 - 2.42 - 2.42
1.061 1.061 1.061 1.061 1.061
4.416 4.416 4.416 4.416 4.416 4.416
3.549 3.549 3.549 3.549 3.549 3.549
- 2.541 0.825 1.677
17.468
0.136 0.091 0.045 0.272
-0.173 -0.130 - 0.087 -0.043 -0.433
0.041 0.033 0.025 0.016 0.008 0.123
0.027 0.046 0.055 0.055 0.046 0.027 0.256
0.026 0.044 0.052 0.052 0.044 0.026 0.244
"All elasticities have been calculated at the midpoint of the sample. 'All Canadian monetary values are measured in constant 198 1 dollars.

LAYING-HEN RESEARCH IN CANADA 39
Table 1 b. Estimated coefficients of the partial-logarithmic supply function
Explanatory variables Coefficients t-statistic Elasticity"
Constant Logarithm of the price of eggs (cents per dozen)b
t - 1 t - 2 t - 3
Sum of coefficients Logarithm of the price of laying mash (cents/kg)b
t - 1 t - 2 t - 3 t - 4
Sum of coefficients Provincial research expenditures ($ million)b
t - 1 t - 2 t - 3 t - 4 t - 5
Sum of coefficients Federal egg research expenditures ($ million)b
t - 3 t - 4 t - 5 t - 6 t - 7 t - 8
Sum of coefficients U.S. egg research expenditures ($ million)
t - 3 t - 4 t - 5 t - 6 t - 7 t - 8
Sum of coefficients Dummy variable Adjusted R-squared Durbin-Watson statistic F-statistic Dependent variable: logarithm of million dozen eggs
5.758 13.360
0.132 2.208 0.088 2.208 0.044 2.208 0.264
-0.171 -2.631 -0.128 -2.631 -0.085 -2.631 -0.043 -2.631 -0.427
0.082 1.152 0.065 1.152 0.049 1.152 0.033 1.152 0.016 1.152 0.246
0.010 4.694 0.017 4.694 0.020 4.694 0.020 4.694 0.017 4.694 0.010 4.694 0.094
0.0010 3.995 0.0017 3.995 0.0020 3.995 0.0020 3.995 0.0017 3.995 0.0010 3.995 0.0090
-0.076 -2.77 0.837 1.697
18.971
0.132 0.088 0.044 0.264
-0.171 - 0.128 -0.085 -0.043 -0.427
0.043 0.034 0.026 0.017 0.008 0.130
0.027 0.046 0.054 0.054 0.046 0.027 0.244
0.027 0.046 0.054 0.054 0.046 0.027 0.244
"All elasticities have been calculated at the midpoint of the sample. bAll Canadian monetary values are measured in constant 198 1 dollars.
40 CANADIAN JOURNAL OF AGRICULTURAL ECONOMICS
as the starting point and are discounted for the net present values and benefit cost ratios using a 5% real discount rate. The selection of this discount rate is based on a paper by Kula (1984). Sensitivity analysis using real rates of 2% and 10% does not appreciably change the results reported below. Research costs used in the net benefit calculations are net of revenues generated from egg sales from research institutes. ''
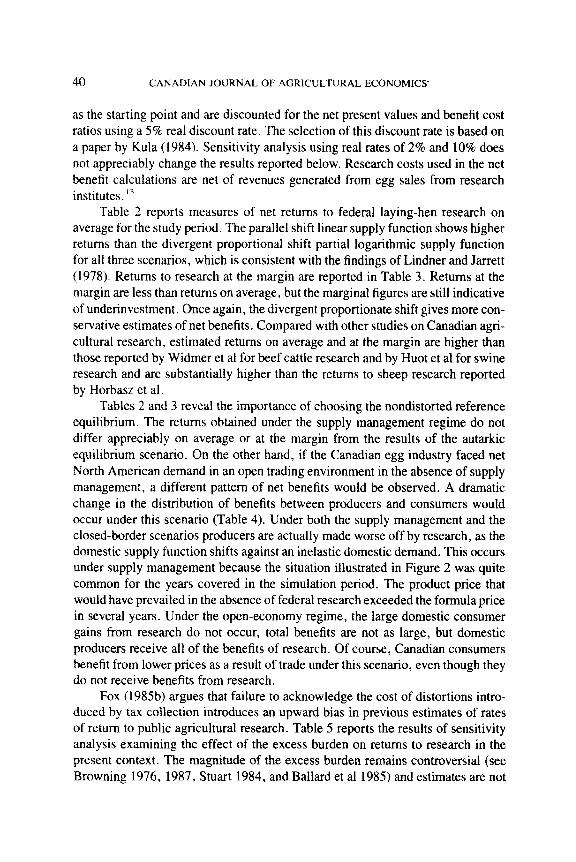
Table 2 reports measures of net returns to federal laying-hen research on average for the study period. The parallel shift linear supply function shows higher returns than the divergent proportional shift partial logarithmic supply function for all three scenarios, which is consistent with the findings of Lindner and Jarrett (1978). Returns to research at the margin are reported in Table 3 . Returns at the margin are less than returns on average, but the marginal figures are still indicative of underinvestment. Once again, the divergent proportionate shift gives more con- servative estimates of net benefits. Compared with other studies on Canadian agri- cultural research, estimated returns on average and at the margin are higher than those reported by Widmer et a1 for beef cattle research and by Huot et a1 for swine research and are substantially higher than the returns to sheep research reported by Horbasz et al.
Tables 2 and 3 reveal the importance of choosing the nondistorted reference equilibrium. The returns obtained under the supply management regime do not differ appreciably on average or at the margin from the results of the autarkic equilibrium scenario. On the other hand, if the Canadian egg industry faced net North American demand in an open trading environment in the absence of supply management, a different pattern of net benefits would be observed. A dramatic change in the distribution of benefits between producers and consumers would occur under this scenario (Table 4). Under both the supply management and the closed-border scenarios producers are actually made worse off by research, as the domestic supply function shifts against an inelastic domestic demand. This occurs under supply management because the situation illustrated in Figure 2 was quite common for the years covered in the simulation period. The product price that would have prevailed in the absence of federal research exceeded the formula price in several years. Under the open-economy regime, the large domestic consumer gains from research do not occur, total benefits are not as large, but domestic producers receive all of the benefits of research. Of course, Canadian consumers benefit from lower prices as a result of trade under this scenario, even though they do not receive benefits from research.
Fox (1985b) argues that failure to acknowledge the cost of distortions intro- duced by tax collection introduces an upward bias in previous estimates of rates of return to public agricultural research. Table 5 reports the results of sensitivity analysis examining the effect of the excess burden on returns to research in the present context. The magnitude of the excess burden remains controversial (see Browning 1976, 1987, Stuart 1984, and Ballard et a1 1985) and estimates are not

LAYING-HEN RESEARCH IN CANADA 41
Table 2. Average net benefits from Canadian federal laying-hen research"
Linear supply Partial-logarithmic function supply function
Supply management scenario: Internal rate of return (%) Net present value ($ billion) Benefitkost ratio
Autarkic equilibrium scenario: Internal rate of return (%) Net present value ($ billion) BenefiVcost ratio
98.114 90.652 1.4207 1.1539 42.50 34.71
98.115 90.653 1.4213 1.1546 42.52 34.73
Open economy scenario: Internal rate of return (%) 91.405 81.135 Net present value ($ billion) 0.993 0.7020 BenefiVcost ratio 30.00 21.50
"All calculations are made in constant 1981 dollars. A real discount rate of 5% is used to calculate net present values and benefitkost ratios.
available for Canada. An arbitrary value of 20% is assumed in the sensitivity analysis. Research costs are simply increased by 20%, and net benefits are recal- culated using the original annual gross research benefits. As expected, the net returns to research fall, but extremely high values for the excess burden would be necessary to overturn either the finding of high returns to research or of underinvestment.
Table 3. Net benefits from marginal increases in Canadian federal laying-hen research"
Linear supply Partial-logarithmic function supply function
Supply management scenario: Internal ratio of return (%) Benefitkost ratio
Autarkic equilibrium scenario: Internal rate of return (%) Benefivcost ratio
Internal rate of return (%) Benefitkost ratio
Open economy scenario:
91.20 83.57 29.30 23.96
91.30 83.74 29.89 24.49
91.40 83.81 30.00 24.60
"All calculations are made in constant 1981 dollars. A real discount rate of 5% is used to calculate net present values and benefitkost ratios.

R F Ta
ble
4. D
istri
butio
n of
res
earc
h be
nefit
s be
twee
n pr
oduc
ers
and
cons
umer
s, (p
rese
nt v
alue
”)
z -
> Z
G
ross
C
hang
e in
C
hang
e in
F
Val
ue
Prop
ortio
n V
alue
Pr
opor
tion
Val
ue
Prop
ortio
n 2 z $
Line
ar s
uppl
y fu
nctio
n:
4) Su
pply
man
agem
ent s
cena
rio
$I .
45
100
$3.0
5 20
9.7
$-
1.60
- 1
09.7
>
Aut
arki
c eq
uilib
rium
sce
nario
$1
.46
100
$3.1
9 21
9.4
$-
1.74
- 1
19.4
$i
ij 2
bene
fits
cons
umer
s’ s
urpl
us
prod
ucer
s ’ su
rplu
s
($ b
illio
n)
(%)
($ b
illio
n)
(%)
($bi
llion
) (%
)
Ope
n ec
onom
y sc
enar
io
$1.0
3 10
0 0
0 $
1.03
10
0
Parti
al-lo
garit
hmic
sup
ply
func
tion:
C
Supp
ly m
anag
emen
t sce
nario
$1
.19
100
$3.8
4 32
3.2
$-2.
65
-223
.2
;4 $ w x 8
Aut
arki
c eq
uilib
rium
sce
nario
$1
.19
loo
$3.9
9 33
5.9
-2.8
0 -2
35.9
0
Z 0
Ope
n ec
onom
y sc
enar
io
$0.7
36
100
0 0
$ 0.
736
100
‘Pre
sent
val
ues
are
eval
uate
d w
ith 1
968
as th
e ba
se y
ear.
A 5
% re
al d
isco
unt r
ate
is u
sed.

LAYING-HEN RESEARCH IN CANADA 43
Table 5. The impact of the marginal excess burden on returns to Canadian federal laying- hen researcha
Linear supply Partial-logarithmic function supply function
Supply management scenario: Internal rate of return (%) Net present value ($billion) Benefitkost ratio
Autarkic equilibrium scenario: Internal rate of return (%) Net present value ($ billion) Benefitkost ratio
Internal rate of return (%) Net present value ($ billion) Benefitkost ratio
Open economy scenario:
91.740 1.4139 35.42
91.745 1.4145 35.43
85.103 0.9860 25.00
84.577 1.1471 28.92
84.579 1.1477 28.94
75.130 0.6952
17.92
“Average returns reported in Table 2 are recalculated when research costs are increased by 20% to reflect the cost of distortions introduced by taxes. A real discount rate of 5% is used.
DISCUSSION Most attempts to estimate net social benefits of agricultural research focus on crop research or on overall research systems. Relatively few studies estimate rates of return to livestock research.14 One of the impediments to the estimation of the returns to livestock research is the pervasive use of product market distortions in many livestock industries. Alston et al (1988) give an indication of the effect of various types of distortions on the returns to research. This paper provides an estimate of the magnitude of some of the effects discussed in the Alston paper. In contrast to their general results, we find that consumers can gain from research, even in a closed economy with output quotas and no pass-through of technological change in the formula price, if the research shift is large enough. Under these circumstances, producers are made worse off by research, as the domestic price would be higher than the formula price if research had not been undertaken. l5
Net benefits from federal egg research in Canada are found to be higher than from Canadian beef cattle, swine and sheep research. Rates of return to laying- hen research also exceed those reported for rapeseed research in the Canadian Prairies (Ulrich and Furtan 1985), and for wheat research and extension (Zentner and Peterson 1984). The effect of distortions on the returns to research and on the distribution of benefits of research is found to depend on the choice of the reference point selected as the counterfactual nondistorted equilibrium. The estimated rates of return are indicative of underinvestment in egg research, even when the marginal excess burden is included in the net benefit calculations.

44 CANADIAN JOURNAL OF AGRICULTURAL ECONOMICS
NOTES 'See Ruttan (1982, Chapter 10) or Pinstrup-Anderson (1982) for a survey of this literature. 'For a detailed discussion of the economics of this scheme, see Borcherding (198 I), Forbes, Hughes and Warley (1982) and Arcus (1 98 1). The CanadianEgg Marketing Agency (CEMA) is the national body vested with regulatory power. 31n fact, procedures used to determine the formula price could be influenced by changing technology. In the case of eggs, however, the technical inpuVoutput coefficients used to estimate production costs are updated relatively infrequently and adjustments are reflected in P3 only after a considerable time lag. The effects of these adjustments on consumer welfare are expected to be small and are ignored in this analysis. If technological change is in fact captured by adjustments in the formula price, then the benefits of research to consumers would be even larger than the values reported below, and the effects of research on producers' surplus would be more negative. 4Supply management in Canadian egg production is accomplished through the use of three instruments: a formula price, national, provincial and farm-level output quotas and a closed border. -%is assumption is based on the fact that Canadian egg output constitutes a small proportion of total North American output. 'See Peterson (1967) and Akino and Hayami (1975). 7A convergent supply shift occurs when the size of the vertical shift is larger at lower output levels than at higher output. With a divergent shift, the size of the shift increases with the level of output. When the supply curve shifts down by a constant amount along its entire length, a parallel shift is said to occur. 'See Widmer et a1 (1988) for a discussion of the properties of these functional forms. Fo r detailed definitions for each of the variables in the supply function, see Haque (1987). ' m e hypothesis of zero end-point constraints could not be rejected at the 1% level. Pro- cedures used to test this hypothesis follow Meilke (1975). "The rental value of quota is calculated as 5% of the egg quota sale prices reported in Forbes et a1 (1982), adjusted to constant 1981 dollars. Since all calculations are performed in constant dollars, this rental rate should be interpreted as the real rental rate based on a real discount rate of 5%. '*This value is based on a retail elasticity of -0.130 (Agriculture Canada 1980). A market- ing margin equation is estimated and the farm-level elasticity is derived (see Tomek and Robinson 1972 for procedures). I3These sales represent about 4% of budgeted research costs annually. ''Exceptions to this generalization are Peterson (1967), Bredahl and Peterson (1976) and Fox (1985a). '% the present context, producers and quota holders are the same people. Alston et al entertain the possibility that quota ownership and production could be separate and derive differential welfare effects.
ACKNOWLEDGMENT The authors wish to thank Nancy Brown-Andison, Ellen Goddard, Chris Horbasz, Marie- France Huot, Bruce Roberts and Oswald Zachariah for helpful suggestions and comments on an earlier version of this paper. George Patterson, Carol Motuz, Paul Culliford and Paul

LAYING-HEN RESEARCH IN CANADA 45
Finn of the Program Evaluation Division of Agriculture Canada assisted in the development of the data base for this study.
REFERENCES Agriculture Canada. 1980. Food andAgriculture Regional Model. Part II. Ottawa: Agri- culture Canada, Policy Planning and Economics Branch. Akino, M. and Y. Hayami. 1975. Efficiency and equity in public research: Rice breeding in Japan’s economic development. American Journal of Agricultural Economics 57( 1): 1- 10. Alston, J. M., G. W. Edwards and J. W. Freebairn. 1988. Market distortions and benefits from research. American Journal of Agricultural Economics 70(2): 28 1-288. Arcus, P. L. 1981. Broilers andEggs. Technical Report E113. Ottawa: Economic Council of Canada. Arcus, P. L., J. D. Forbes, R. M. A. Loyns, M. M. Veeman, T. S. Veeman and A. W. Wood. 1974. Consumer Interest in Marketing Boards. Report prepared for the Canadian Consumer Council. Ottawa: CCC, March. Ballard, C. L., J. B. Shoven and John Whalley. 1985. General equilibrium computations of the marginal welfare costs of taxes in the United States. American Economic Review 75(1): 128-38. Borcherdmg, T. 1981. The Egg Marketing Board: A Case Study ofMonopoly andlts Social Costs. Vancouver: The Fraser Institute. Browning, E. K. 1976. The marginal cost of public funds. Journal of Political Economy
Browning, E. K. 1987. On the marginal welfare cost of taxation. American Economic Review 77(1): 11-23. Bredahl, M. and W. E. Peterson. 1970. The productivity and allocation of research: U S . agricultural experiment stations. American Journal of Agricultural Economics 58(4): 684- 92. Cline, P. 1975. Sources of productivity change in U. S. agriculture. PhD dissertation, Okla- homa State University, Stillwater, Okla. Evenson, R. E. 1968. The contribution of agricultural research and extension to agricultural production. PhD dissertation, University of Chicago, Chicago, Ill. Forbes, J. D., R. D. Hughes and T. K. Warley. 1982. Economic Intervention and Reg- ulation in Canadian Agriculture. Economic Council of Canada. Ottawa: Supply and Ser- vices Canada. Fox, G. C. 1985a. Optimal public investment in U.S. agricultural research: A study in the management of technical change. PhD dissertation, University of Minnesota, Minneapolis, Minn. Fox, G. C. 1985b. Is the United States really underinvesting in agricultural research? American Journal of Agricultural Economics 67(4): 806-12. Haque, A. K. Enamul. 1987. Returns to egg research in Canada. MSc thesis, University of Guelph, Guelph, Ontario. Huot, M-F, G. Fox and G. L. Brinkman. 1989. The returns to swine research in Canada. North Central Journal of Agricultural Economics 1 l(2): (in press).
84(2): 283-98.
46 CANADIAN JOURNAL OF AGRICULTURAL ECONOMICS
Kuia, E. 1984. Derivation of social time preference rates for the United States andCanada. Quarterly Journal of Economics 99(4): 873-82. Kulshrethsha, S. N. and R. A. Brasnett. 1975. Canadian egg and poultry supply: A polynomial distributed lag analysis. Technical Bulletin BL75- 1 1 . Saskatoon: University of Saskatchewan. Department of Agricultural Economics, November. Kulshrethsha, S. N. and C. Ng. 1977. An econometric analysis of the Canadian egg industry. Canadian Journal of Agricultural Economics 25(2): 1-1 3. Lindner, R. V. and F. G. Jarrett. 1978. Supply shifts and the size of research benefits. American Journal of Agricultural Economics 60( 1): 48-58. Meilke, K. 1975. The use of zero constraints in polynomial distributed lags. Canadian Journal of Agricultural Economics 23(2): 53-60. Peterson, W. L. 1967. Return to poultry research in the United States. Journal of Farm Economics 49(3): 65&69. Pinstrup-Anderson, P. 1982. Agriculrural Research and Technology in Economic Devel- opment. New York: Longman. Rose, R. N. 1980. Supply shifts and the size of research benefits: Comments. American Journal of Agricultural Economics 62(4): 834-37. Ruttan, V. W. 1982. Agricultural Research Policy. Minneapolis: University of Minnesota Press. Stuart, C. 1984. Welfare costs per dollar of additional tax revenue in the United States. American Economic Review 74(3): 352-62. Tomek, W. G. and K. L. Robinson. 1972. Agricultural Product Prices. Ithaca, N.Y.: Cornell University Press. Ulrich, A. and W. H. Furtan. 1985. An investigation in the rate of return from the Cana- dian crop breeding program. Report prepared for the Program Evaluation Division, Agri- culture Canada, Ottawa. Widmer, L., G. Fox and G. Brinkman. 1988. The rate of returns to agricultural research in a small country: The case of beef cattle research in Canada. Canadian Journal of Agri- cultural Economics 36(1): 23-35. Zentner, R. P. and W. L. Peterson. 1984. Aneconomic evaluationofpublic wheat research and extension expenditures in Canada. Canadian Journal of Agricultural Economics 32(2): 327-54.