Predicting hotel booking cancellations to decrease uncertainty ...
Upload
manoa-hawaiiCategory
view
2download
0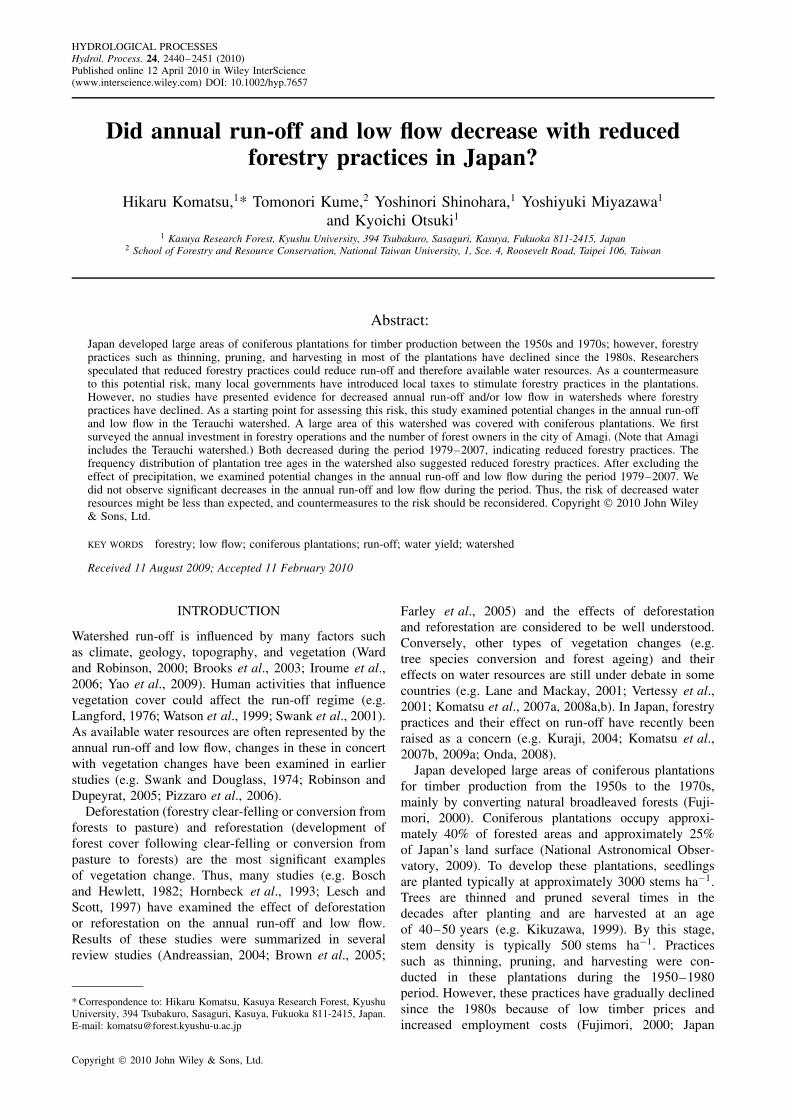
HYDROLOGICAL PROCESSESHydrol. Process. 24, 2440–2451 (2010)Published online 12 April 2010 in Wiley InterScience(www.interscience.wiley.com) DOI: 10.1002/hyp.7657
Did annual run-off and low flow decrease with reducedforestry practices in Japan?
Hikaru Komatsu,1* Tomonori Kume,2 Yoshinori Shinohara,1 Yoshiyuki Miyazawa1
and Kyoichi Otsuki1
1 Kasuya Research Forest, Kyushu University, 394 Tsubakuro, Sasaguri, Kasuya, Fukuoka 811-2415, Japan2 School of Forestry and Resource Conservation, National Taiwan University, 1, Sce. 4, Roosevelt Road, Taipei 106, Taiwan
Abstract:
Japan developed large areas of coniferous plantations for timber production between the 1950s and 1970s; however, forestrypractices such as thinning, pruning, and harvesting in most of the plantations have declined since the 1980s. Researchersspeculated that reduced forestry practices could reduce run-off and therefore available water resources. As a countermeasureto this potential risk, many local governments have introduced local taxes to stimulate forestry practices in the plantations.However, no studies have presented evidence for decreased annual run-off and/or low flow in watersheds where forestrypractices have declined. As a starting point for assessing this risk, this study examined potential changes in the annual run-offand low flow in the Terauchi watershed. A large area of this watershed was covered with coniferous plantations. We firstsurveyed the annual investment in forestry operations and the number of forest owners in the city of Amagi. (Note that Amagiincludes the Terauchi watershed.) Both decreased during the period 1979–2007, indicating reduced forestry practices. Thefrequency distribution of plantation tree ages in the watershed also suggested reduced forestry practices. After excluding theeffect of precipitation, we examined potential changes in the annual run-off and low flow during the period 1979–2007. Wedid not observe significant decreases in the annual run-off and low flow during the period. Thus, the risk of decreased waterresources might be less than expected, and countermeasures to the risk should be reconsidered. Copyright 2010 John Wiley& Sons, Ltd.
KEY WORDS forestry; low flow; coniferous plantations; run-off; water yield; watershed
Received 11 August 2009; Accepted 11 February 2010
INTRODUCTION
Watershed run-off is influenced by many factors suchas climate, geology, topography, and vegetation (Wardand Robinson, 2000; Brooks et al., 2003; Iroume et al.,2006; Yao et al., 2009). Human activities that influencevegetation cover could affect the run-off regime (e.g.Langford, 1976; Watson et al., 1999; Swank et al., 2001).As available water resources are often represented by theannual run-off and low flow, changes in these in concertwith vegetation changes have been examined in earlierstudies (e.g. Swank and Douglass, 1974; Robinson andDupeyrat, 2005; Pizzaro et al., 2006).
Deforestation (forestry clear-felling or conversion fromforests to pasture) and reforestation (development offorest cover following clear-felling or conversion frompasture to forests) are the most significant examplesof vegetation change. Thus, many studies (e.g. Boschand Hewlett, 1982; Hornbeck et al., 1993; Lesch andScott, 1997) have examined the effect of deforestationor reforestation on the annual run-off and low flow.Results of these studies were summarized in severalreview studies (Andreassian, 2004; Brown et al., 2005;
* Correspondence to: Hikaru Komatsu, Kasuya Research Forest, KyushuUniversity, 394 Tsubakuro, Sasaguri, Kasuya, Fukuoka 811-2415, Japan.E-mail: [email protected]
Farley et al., 2005) and the effects of deforestationand reforestation are considered to be well understood.Conversely, other types of vegetation changes (e.g.tree species conversion and forest ageing) and theireffects on water resources are still under debate in somecountries (e.g. Lane and Mackay, 2001; Vertessy et al.,2001; Komatsu et al., 2007a, 2008a,b). In Japan, forestrypractices and their effect on run-off have recently beenraised as a concern (e.g. Kuraji, 2004; Komatsu et al.,2007b, 2009a; Onda, 2008).
Japan developed large areas of coniferous plantationsfor timber production from the 1950s to the 1970s,mainly by converting natural broadleaved forests (Fuji-mori, 2000). Coniferous plantations occupy approxi-mately 40% of forested areas and approximately 25%of Japan’s land surface (National Astronomical Obser-vatory, 2009). To develop these plantations, seedlingsare planted typically at approximately 3000 stems ha�1.Trees are thinned and pruned several times in thedecades after planting and are harvested at an ageof 40–50 years (e.g. Kikuzawa, 1999). By this stage,stem density is typically 500 stems ha�1. Practicessuch as thinning, pruning, and harvesting were con-ducted in these plantations during the 1950–1980period. However, these practices have gradually declinedsince the 1980s because of low timber prices andincreased employment costs (Fujimori, 2000; Japan
Copyright 2010 John Wiley & Sons, Ltd.

RUN-OFF CHANGE WITH REDUCED FORESTRY PRACTICES 2441
Forestry Agency, 2007). Thus, many plantations in Japanare now unmanaged.
Researchers in Japan (Tsukamoto, 1998; Yorimitsu,2001, 2004; Kuraji, 2003) have speculated that reducedforestry practices could have reduced available waterresources. This speculation is based on the following.First, several previous studies have reported positive cor-relations between stem density and interception evapo-ration (e.g. Komatsu et al., 2008b, 2009a) and betweenleaf area and canopy-tree transpiration (e.g. Granier et al.,2000; Vertessy et al., 2001). In areas of reduced forestrypractices, leaf area and stem density would be high, whichimplies reduced annual run-off and low flow in associatedwatersheds (e.g. Komatsu et al., 2009a; Reid and Lewis,2009). Second, several studies have reported reduc-tions in canopy-tree transpiration (Morikawa et al., 1986)and interception evaporation (Hattori and Chikaarashi,1988; Murai and Kumagai, 1989) due to the thinningof Japanese coniferous plantations. This suggests that anabsence of forestry practices could increase evapotran-spiration and therefore reduce run-off.
On the basis of researchers’ speculation (Tsukamoto,1998; Yorimitsu, 2001, 2004; Kuraji, 2003), 16 of the 51prefectures in Japan have introduced local taxes, referredto as water or forest taxes, to stimulate forestry practices(Imawaka and Sato, 2008), and 8 further prefectures arenow considering similar measures. Japanese researchers(e.g. Nakane, 2004; Nakashizuka, 2004; Ohgaki, 2005;Onda, 2008) have also noted other potential problemsresulting from reduced forestry practices, including soilprotection and fertility, water quality, flood control,carbon sequestration, and biodiversity.
In reality, no studies have presented evidence forreductions in the annual run-off and low flow due toreduced forestry practices on the basis of watershed run-off data. Although there are numerous studies examiningthe effects of vegetation change on annual run-off andlow flow in Japan, most of these have focused on theeffects of harvesting or natural disturbance such as winddamage and insect infestation (e.g. Abe and Tani, 1985;Fujieda et al., 1996; Maita et al., 2005). Thus, the riskof decreased water resources due to reduced forestrypractices has not been assessed. As a starting point forassessing this risk, this study examines potential changesin the annual run-off and low flow (i.e. changes inthe annual run-off and low flow when precipitation isassumed to be unchanged) in a watershed where forestrypractices are known to have declined.
STUDY AREA
The study area was the Terauchi watershed located innorthern Kyushu, Japan (Figure 1). This watershed is51 km2 in area and ranges 120–720 m in elevation.The mean annual precipitation in the watershed dur-ing the 1979–2007 period, measured at Ohshiro sta-tion (approximately 460 m in elevation), was 2176 mm.Although temperature measurements were not conducted
Figure 1. Study area location
in the watershed, data recorded at Asakura station located³10 km to the southwest were available from the JapanMeteorological Agency (http://www.jma.go.jp/jma/index.html). The mean annual temperature during the 1978–2007 period at Asakura station was 15Ð5 °C. The geol-ogy of the watershed was Tertiary formations, withbedrock comprising black schist according to the geo-logical map produced by the Geological Survey of Japan(http://www.gsj.jp/geomap/indexE.html).
The watershed was selected for three reasons. First,run-off data before the 1980s are available for thiswatershed. We aimed at examining changes in theannual run-off and low flow with reduced forestrypractices. Forestry practices in Japan generally beganto reduce in the 1980s. Second, the watershed areawas extensively covered with coniferous plantations.This was unlike other watersheds in Japan whereconiferous plantations occupied a relatively small por-tion of the watershed area. Third, the watershed waslocated in the wider catchment area of the city ofFukuoka (Figure 1), which suffers the highest fre-quency of water shortages in Japan (Jinno et al., 2005;http://www.mlit.go.jp/tochimizushigen/mizsei/hakusyo/index5.html). Because Fukuoka is a major economic andhighly populated centre in Kyushu, water shortages canhave significant adverse effects on the economic activ-ity and human welfare. Furthermore, Fukuoka introducedlocal taxes to aid forestry in 2009 for the purpose ofsecuring water resources. A portion of these taxes willbe used to stimulate forestry practices in the Terauchiwatershed.
Copyright 2010 John Wiley & Sons, Ltd. Hydrol. Process. 24, 2440–2451 (2010)

2442 H. KOMATSU ET AL.
DATA AND METHODS
Forestry activity
Before analysing the annual run-off and low flow,we examined evidence of reduced forestry practices.Forestry practices in the Terauchi watershed have beenundertaken mainly by the Fukuoka Water Source For-est Foundation since 1979. We examined changes in theannual investment in forestry operations and the num-ber of forest owners in the city of Amagi. This cityincludes the Terauchi watershed. (Note that the city wasincorporated as the city of Asakura in 2006.) Data wereobtained from the Fukuoka Water Source Forest Founda-tion (http://www.f-suigen.or.jp/) and Fukuoka Prefecture(http://www.pref.fukuoka.lg.jp/dataweb/index.html).
We obtained a vegetation zone map from FukuokaPrefecture and identified the areas within the Terauchiwatershed using a Geographical Survey Institute topo-graphic map (http://www.gsi.go.jp/). We then requestedvegetation data for these areas. The dataset was dividedinto sections according to the forest type (plantation ornatural), tree species, and age. Because earlier data hadbeen discarded by the Fukuoka Prefecture governmentfollowing its data reservation policy, our analysis wasconducted using observations from 2003.
Annual run-off and low flow
We obtained precipitation and run-off data for theperiod 1979–2007 from the Chikugo Regional Bureau,Japan Water Agency. We used daily precipitation datarecorded at the Ohshiro station in the Terauchi watershedand daily inflow data recorded at the Terauchi Damreservoir. The dam reservoir captured all run-off flowfrom the Terauchi watershed. Besides precipitation datafor Ohshiro station, we obtained daily precipitation datafor the period 1979–2007 recorded at two other stationsin the Terauchi watershed. The annual precipitationat these two stations correlated well with that of theOhshiro station for the period 1979–2007, and usingthese stations’ data did not qualitatively alter our resultsand conclusions.
We examined the relationship between the annual pre-cipitation and annual run-off for the period 1979–2007.After developing a regression model to predict the annualrun-off with the input of annual precipitation, we cal-culated the difference between the observed and themodelled run-off (i.e. observed minus modelled). Wethen investigated whether the difference decreased duringthe period 1979–2007. If the reduced forestry practicesincreased watershed evapotranspiration, the differencewould decrease with time (i.e. the annual run-off for agiven annual precipitation would decrease).
The decrease in the difference between the observedand the modelled run-off was tested using a non-parametric method described by Kundzewicz and Robson(2004). In employing the method, we first calculated theslope of linear regression, Spearman’s rho, and Kendall’stau from the original time-series of the difference between
the observed and the modelled run-off. We then cal-culated these parameters after resampling the originaltime-series data using the bootstrap method. This pro-cess was repeated 1000 times (note that our conclusionsdid not change when this process was repeated 5000 or10 000 times). From the parameter values obtained byresampling, we produced probability density functions forthe three parameters. We finally compared the parametervalues based on the original time-series data with theprobability density functions. If there was a significantincreasing or decreasing trend in the original time-seriesdata, the parameter values based on the original time-series data would be situated at the foot of the probabilitydensity functions.
We performed the same analysis for low flow as thatfor annual run-off. We defined ‘low flow’ as the annualminimum of daily run-off, following earlier studies(Pizzaro et al., 2006; Komatsu et al., 2008a). Otherstudies (e.g. Fahey and Jackson, 1997; Sikka et al., 2003;Maita et al., 2005; Komatsu et al., 2009b) have usedalternative low flow indices, such as the 7-day or 10-day average minimum run-off, and the daily run-off that97% of data exceed. We examined whether using theseindices altered our results and conclusions.
In addition, we conducted the same analysis for thebase flow ratio as that for low flow. The base flow ratiois defined as the annual base flow divided by the annualrun-off. Thus, the ratio represents run-off fluctuationsand is therefore an index for evaluating available waterresources. In this analysis, we separated daily run-offdata into base flow and storm flow components using thetime-based separation method (Hornberger et al., 1997;Ward and Robinson, 2000) and a line with a constantgradient. The gradient was determined following themethod described by Dingman (2002) and Blume et al.(2007) with the input of watershed area data.
Effects of changes in the precipitation pattern
The above analysis relates the annual run-off andlow flow to the annual precipitation without consideringchanges in the precipitation pattern (i.e. the numberof precipitation days and precipitation intensity) duringthe analysis period. If precipitation patterns changedsignificantly, this could mask possible decreases in theannual run-off and/or low flow.
To examine this possibility, we checked whether thenumber of days with daily precipitation of at least 5,10, and 30 mm changed significantly over the analysisperiod. The precipitation intensity and the number of pre-cipitation days are inversely related; i.e. when assumingconstant annual precipitation, higher precipitation inten-sity indicates a smaller number of precipitation days(Kumagai et al., 2004; Shinohara et al., 2009). Thus, weanalysed the number of precipitation days only and didnot directly analyse the precipitation intensity.
Run-off in low precipitation years
The analysis described above examines changes in theannual run-off, low flow, and the base flow ratio using
Copyright 2010 John Wiley & Sons, Ltd. Hydrol. Process. 24, 2440–2451 (2010)

RUN-OFF CHANGE WITH REDUCED FORESTRY PRACTICES 2443
all available data during the period 1979–2007. Watershortages occur in years with low precipitation. Thus,analysis of such years is also important.
We thus selected data for an early year and late yearwith low precipitation in the period 1979–2007. We thencompared the annual run-off, low flow, and the base flowratio between these two years.
RESULTS
Forestry activity
Figure 2 shows changes in the annual investment inforestry operations during the period 1979–2007. Themean annual investment was 360 million yen in theperiod 1979–1983 but decreased gradually and reached57 million yen in the period 2003–2007. The num-ber of forest owners in Amagi was 1539 in 1970 and655 in 2000, although the percentage of forested area(approximately 60%) and population of the city (approx-imately 43 000) were largely unchanged during the period1970–2000. These data suggest reduced forestry prac-tices in recent decades. Note that, although Japan hastried to promote the mechanization of forestry activitysince the late 1980s (Taniyama, 2005), such mechaniza-tion has not proceeded in northern Kyushu (http://www.rinya.maff.go.jp/puresu/h18-12gatu/1226ringyoukikai.html). Thus, the decrease in the investment and the num-ber of forest owners was not because of the developmentof an efficient forestry system due to mechanization.
There were 10 112 sections of vegetation data forthe Terauchi watershed. The total area registered in thevegetation data was 39 km2, while the entire watershedarea was 51 km2. Thus, 76% of the watershed areawas registered in the vegetation dataset. According tothe vegetation zone map, the remaining 24% consistedof mainly other land uses, such as water bodies andorchards. Within the 39 km2 vegetation area, coniferousplantations occupied 93%, while natural broadleavedforests and natural pine forests occupied 5%. The major
Figure 2. Changes in the annual investment in forestry operations for theperiod 1979–2007. One million Japanese yen is equivalent to US$10 190
on the basis of the exchange rate on 6 June 2009
coniferous plantation species were Cryptomeria japonicaand Chamaecyparis obtusa, occupying 61 and 32%of the area, respectively. C. japonica and C. obtusaare the most common plantation species in Japan andaccount for approximately 70 and 90% of the plantationarea nationally and in Kyushu respectively (NationalAstronomical Observatory, 2009).
Figure 3a shows the tree age frequency distributionversus coniferous plantation area in 2003. The verticalaxis indicates the area of each age class divided by thewhole area of coniferous plantations. Frequencies werelower for trees less than 35 years old, higher for trees35–55 years old, and lower again for trees more than55 years old. Figure 3b presents similar data, but for thewhole country. In 1985, frequencies were lower for treesless than 5 years old, higher for trees 5–35 years old, andlower again for trees more than 35 years old. In 2001,frequencies were lower for trees less than 20 years old,higher for trees 20–50 years old, and lower again fortrees more than 50 years old. Thus, national frequencies
Figure 3. Frequency distributions of coniferous plantation tree ages for(a) the Terauchi watershed and (b) the whole country. The vertical axisindicates the area of each age class divided by the whole area ofconiferous plantations. Data for the whole country were obtained from
the Japan Forestry Agency (2007)
Copyright 2010 John Wiley & Sons, Ltd. Hydrol. Process. 24, 2440–2451 (2010)

2444 H. KOMATSU ET AL.
Figure 4. Time-series of (a) annual precipitation, run-off, (b) low flow,and (c) base flow ratio
were higher for mid-age classes in 2001, similar to theTerauchi watershed distribution.
Timber harvesting of coniferous plantations in Japan isusually conducted when trees are older than 40 years. Ifforestry activity had been continuous, the age frequencyfor trees less than 40 years old should be nearly constantand the age frequency for trees more than 40 yearsold should decrease with age. Thus, the frequencydistribution suggests reduced forestry practices in theTerauchi watershed over recent decades.
Annual run-off and low flow
Figure 4 shows time-series of the annual precipitation,annual run-off, low flow, and base flow ratio. Themean annual precipitation and run-off during the period1979–2007 were 2176 and 1351 mm, respectively. Thus,the mean annual evapotranspiration, calculated as thedifference between annual precipitation and run-off, was825 mm, which is comparable to values reported forother forested watersheds in Kyushu (Shimizu et al.,2003; Komatsu et al., 2007c, 2008c). The mean lowflow and base flow ratio were 0Ð53 mm day�1 and 0Ð72,respectively.
Figure 5a shows the relationship between annual pre-cipitation and run-off. We obtained a positive (p <
Figure 5. (a) Relationship between annual precipitation and run-offfor the period 1979–2007. The solid line was determined usingthe least-squares method. The determination coefficient was 0Ð949.(b) Difference between observed run-off and run-off calculated by theregression equation. The solid line was determined using the least-squaresmethod. The determination coefficient was 0Ð00387 and the slope was
�0Ð689
0Ð001) correlation according to Pearson’s correlationcoefficient test. Using the least-squares method, themodel function was determined as Q D 0Ð958 P C 734,where Q and P are the annual run-off and precipitation,respectively. Figure 5b shows the difference betweenobserved and modelled run-off (i.e. observed minus mod-elled). The slope of linear regression, Spearman’s rho,and Kendall’s tau were �0Ð689, �0Ð00443, and 0Ð00493respectively. Figure 6 shows probability density func-tions for these three parameters obtained by resamplingoriginal time-series data. The three parameters based onthe original time-series data were higher than the lower5% threshold values of the probability density functions(�3Ð28, �0Ð303, and �0Ð261, respectively).
Figure 7a shows the relationship between annual pre-cipitation and low flow. We obtained a positive (p <0Ð005) correlation according to Pearson’s correlationcoefficient test. Using the least-squares method, themodel function was determined as q D 0Ð000190 P C0Ð118, where q is low flow. Figure 7b shows the dif-ference between observed and modelled low flow (i.e.observed minus modelled). The slope of linear regres-sion, Spearman’s rho, and Kendall’s tau were 0Ð00626,
Copyright 2010 John Wiley & Sons, Ltd. Hydrol. Process. 24, 2440–2451 (2010)

RUN-OFF CHANGE WITH REDUCED FORESTRY PRACTICES 2445
Figure 6. Probability density functions for (a) the slope of linear regres-sion, (b) Spearman’s rho, and (c) Kendall’s tau. These functions wereproduced by resampling original time-series data of the differencebetween observed and modelled annual run-off. Values of the threeparameters based on the original time-series data are indicated. The lower5% threshold values of the probability density functions are also indicated
0Ð276, and 0Ð177, respectively. Figure 8 shows probabil-ity density functions for these three parameters obtainedby resampling original time-series data. The three param-eters based on the original time-series data were higherthan the lower 5% threshold values of the probability den-sity functions (�0Ð00534, �0Ð328, and �0Ð291, respec-tively). We obtained qualitatively the same results whenusing other low flow indices, such as the 7- or 10-dayaverage minimum run-off, or the daily run-off that 97%of data exceed (data not shown).
Figure 9a shows the relationship between annual pre-cipitation and the base flow ratio. We obtained a negative(p < 0Ð001) correlation according to Pearson’s correla-tion coefficient test. Using the least-squares method, themodel function was determined as Rb D �0Ð000156 P C1Ð06, where Rb is the base flow ratio. Figure 9b shows
Figure 7. (a) Relationship between annual precipitation and low flowfor the period 1979–2007. The solid line was determined usingthe least-squares method. The determination coefficient was 0Ð322.(b) Difference between observed low flow and low flow calculatedusing the regression equation. The solid line was determined using theleast-squares method. The determination coefficient was 0Ð205 and the
slope was 0Ð00626
the difference between observed and modelled base flowratios (i.e. observed minus modelled). The slope of lin-ear regression, Spearman’s rho, and Kendall’s tau were�0Ð000205, 0Ð133, and 0Ð0739, respectively. Figure 10shows probability density functions for these three param-eters obtained by resampling original time-series data.The three parameters based on the original time-seriesdata were higher than the lower 5% threshold values ofthe probability density functions (�0Ð00333, �0Ð308, and�0Ð251, respectively).
Effects of changes in the precipitation pattern
Figure 11a shows the relationship between annual pre-cipitation and the number of days on which daily pre-cipitation was at least 5 mm. We obtained a positive(p < 0Ð001) correlation according to Pearson’s corre-lation coefficient test. Using the least-squares method,the model function was determined as N D 0Ð02185 P C34Ð7, where N is the number of days on which dailyprecipitation was at least 5 mm. Figure 11b shows thedifference between the observed and modelled numbersof precipitation days (i.e. observed minus modelled). Theslope of linear regression, Spearman’s rho, and Kendall’stau were �0Ð181, �0Ð153, and �0Ð09852 respectively.
Copyright 2010 John Wiley & Sons, Ltd. Hydrol. Process. 24, 2440–2451 (2010)
2446 H. KOMATSU ET AL.
Figure 8. Probability density functions for (a) the slope of linear regres-sion, (b) Spearman’s rho, and (c) Kendall’s tau. These functions wereproduced by resampling original time-series data of the differencebetween observed and modelled low flow. Values of the three param-eters based on the original time-series data are indicated. The lower 5%threshold values of the probability density functions are also indicated
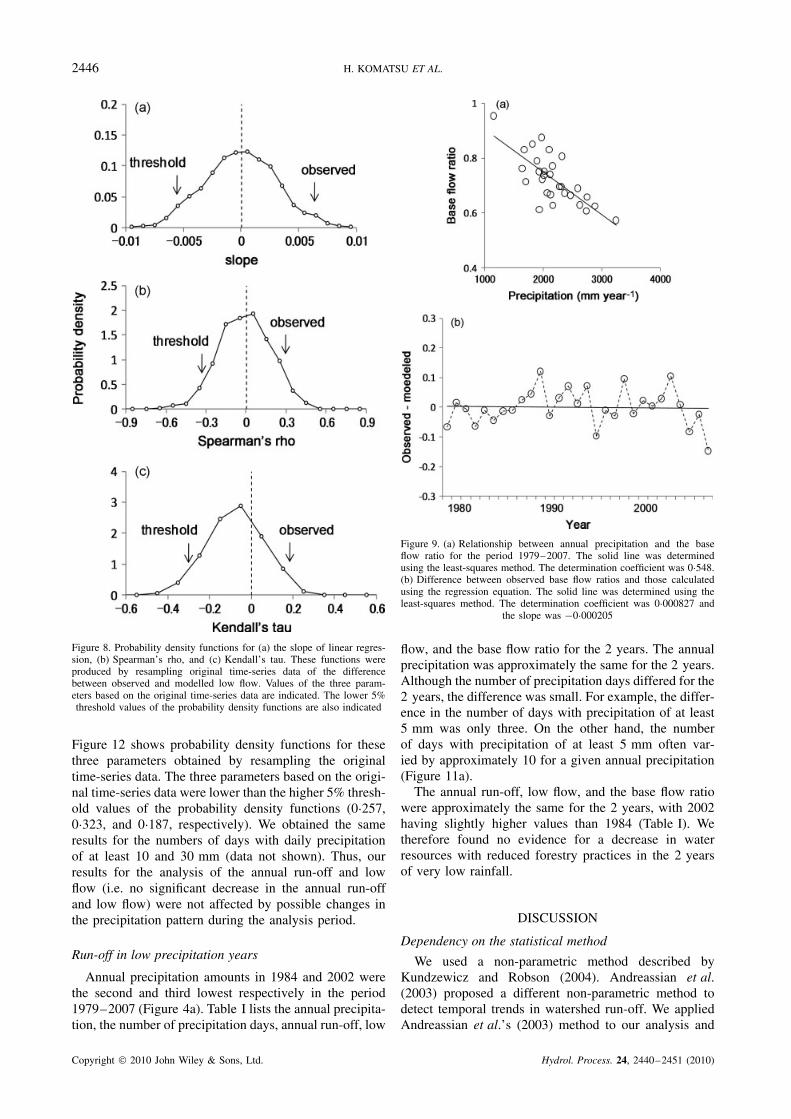
Figure 12 shows probability density functions for thesethree parameters obtained by resampling the originaltime-series data. The three parameters based on the origi-nal time-series data were lower than the higher 5% thresh-old values of the probability density functions (0Ð257,0Ð323, and 0Ð187, respectively). We obtained the sameresults for the numbers of days with daily precipitationof at least 10 and 30 mm (data not shown). Thus, ourresults for the analysis of the annual run-off and lowflow (i.e. no significant decrease in the annual run-offand low flow) were not affected by possible changes inthe precipitation pattern during the analysis period.
Run-off in low precipitation years
Annual precipitation amounts in 1984 and 2002 werethe second and third lowest respectively in the period1979–2007 (Figure 4a). Table I lists the annual precipita-tion, the number of precipitation days, annual run-off, low
Figure 9. (a) Relationship between annual precipitation and the baseflow ratio for the period 1979–2007. The solid line was determinedusing the least-squares method. The determination coefficient was 0Ð548.(b) Difference between observed base flow ratios and those calculatedusing the regression equation. The solid line was determined using theleast-squares method. The determination coefficient was 0Ð000827 and
the slope was �0Ð000205
flow, and the base flow ratio for the 2 years. The annualprecipitation was approximately the same for the 2 years.Although the number of precipitation days differed for the2 years, the difference was small. For example, the differ-ence in the number of days with precipitation of at least5 mm was only three. On the other hand, the numberof days with precipitation of at least 5 mm often var-ied by approximately 10 for a given annual precipitation(Figure 11a).
The annual run-off, low flow, and the base flow ratiowere approximately the same for the 2 years, with 2002having slightly higher values than 1984 (Table I). Wetherefore found no evidence for a decrease in waterresources with reduced forestry practices in the 2 yearsof very low rainfall.
DISCUSSION
Dependency on the statistical method
We used a non-parametric method described byKundzewicz and Robson (2004). Andreassian et al.(2003) proposed a different non-parametric method todetect temporal trends in watershed run-off. We appliedAndreassian et al.’s (2003) method to our analysis and
Copyright 2010 John Wiley & Sons, Ltd. Hydrol. Process. 24, 2440–2451 (2010)

RUN-OFF CHANGE WITH REDUCED FORESTRY PRACTICES 2447
Figure 10. Probability density functions for (a) the slope of linear regres-sion, (b) Spearman’s rho, and (c) Kendall’s tau. These functions wereproduced by resampling original time-series data of the differencebetween observed and modelled base flow ratios. Values of the threeparameters based on the original time-series data are indicated. The lower5% threshold values of the probability density functions are also indicated
found that our conclusions did not change. For simplic-ity, we present only the results for annual run-off trendsobtained using Andreassian et al.’s (2003) method.
The method separates the whole data period intoseveral periods of the same length. We separated thewhole period into four periods: 1979–1985, 1986–1992,1993–1999, and 2000–2006. We did not use data for2007 so that the four periods had the same length.
We then determined model parameters for each periodusing the least-squares method in the same way aswas done to obtain the results presented in Figure 5a.The annual run-off (Q) was modelled by the annualprecipitation (P) as Q D 1Ð09 P � 996 (Model I), Q D0Ð929 P � 719 (Model II), Q D 0Ð856 P � 489 (ModelIII), and Q D 0Ð966 P � 759 (Model IV) for the fourperiods separately. On the basis of these models, thematrix of Andreassian et al. was calculated as shown in
Figure 11. (a) Relationship between annual precipitation and the numberof days on which precipitation was at least 5 mm for the period1979–2007. The solid line was determined using the least-squaresmethod. The determination coefficient was 0Ð631. (b) Difference betweenobserved number of precipitation days and that calculated using theregression equation. The solid line was determined using the least-squaresmethod. The determination coefficient was 0Ð0464 and the slope was
�0Ð181
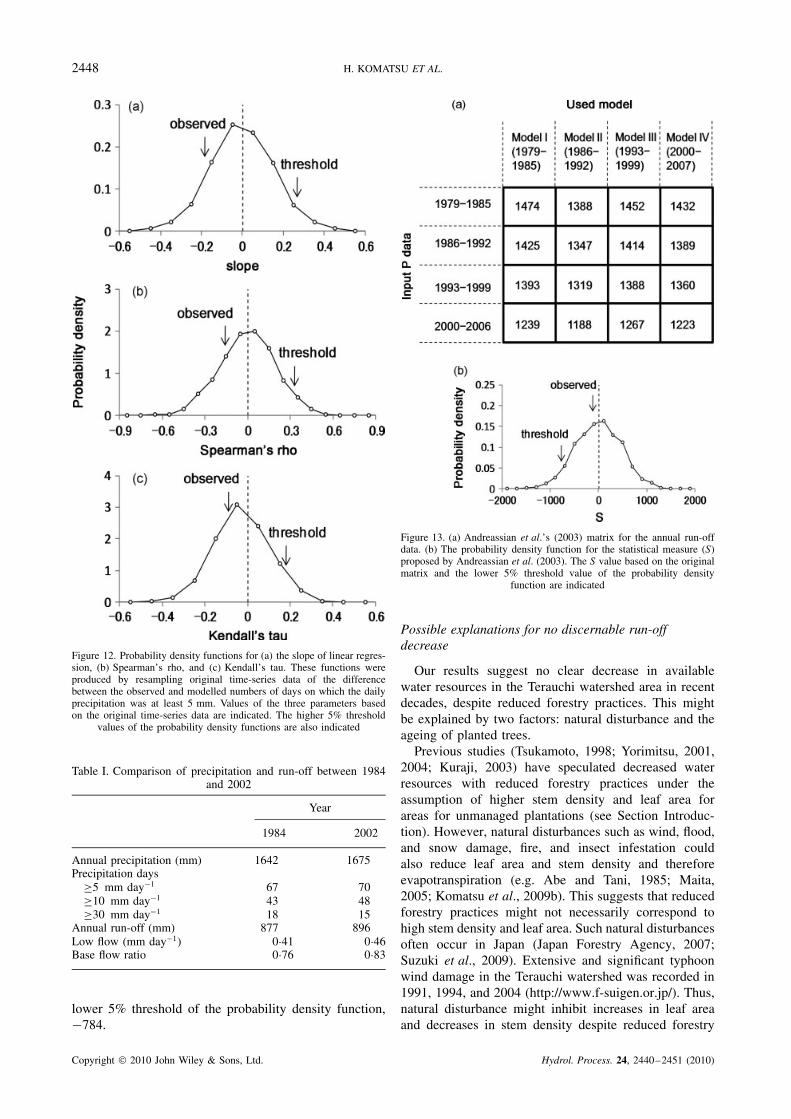
Figure 13a. The value in each cell indicates the meanannual run-off calculated by each model (note that ifwe calculate the total run-off for each 4-year periodrather than the mean annual run-off, our results do notchange because our models assume linear relationshipsbetween P and Q). Values in each row were based ondifferent precipitation data inputs: precipitation data for1979–1985, 1986–1992, 1993–1999, and 2000–2006.
The statistical measure S used by Andreassian et al.(2003) is calculated as:
S D4∑
iD1
i�1∑jD1
�Qi,i � Qi,j� C4∑
jDiC1
�Qi.j � Qi.i�
�1�
where Qi,j is the mean annual run-off for the cell (i, j).When there are increasing/decreasing trends in Q, S ispositively/negatively great. For the matrix in Figure 13a,S was calculated as �104. We produced matrixes byresampling numerals in cells of the original matrix.We iterated this process 1000 times and obtained theprobability density function for S (Figure 13b). The Svalue based on the original matrix was higher than the
Copyright 2010 John Wiley & Sons, Ltd. Hydrol. Process. 24, 2440–2451 (2010)
2448 H. KOMATSU ET AL.
Figure 12. Probability density functions for (a) the slope of linear regres-sion, (b) Spearman’s rho, and (c) Kendall’s tau. These functions wereproduced by resampling original time-series data of the differencebetween the observed and modelled numbers of days on which the dailyprecipitation was at least 5 mm. Values of the three parameters basedon the original time-series data are indicated. The higher 5% threshold
values of the probability density functions are also indicated
Table I. Comparison of precipitation and run-off between 1984and 2002
Year
1984 2002
Annual precipitation (mm) 1642 1675Precipitation days
½5 mm day�1 67 70½10 mm day�1 43 48½30 mm day�1 18 15
Annual run-off (mm) 877 896Low flow (mm day�1) 0Ð41 0Ð46Base flow ratio 0Ð76 0Ð83
lower 5% threshold of the probability density function,�784.
Figure 13. (a) Andreassian et al.’s (2003) matrix for the annual run-offdata. (b) The probability density function for the statistical measure (S)proposed by Andreassian et al. (2003). The S value based on the originalmatrix and the lower 5% threshold value of the probability density
function are indicated
Possible explanations for no discernable run-offdecrease
Our results suggest no clear decrease in availablewater resources in the Terauchi watershed area in recentdecades, despite reduced forestry practices. This mightbe explained by two factors: natural disturbance and theageing of planted trees.
Previous studies (Tsukamoto, 1998; Yorimitsu, 2001,2004; Kuraji, 2003) have speculated decreased waterresources with reduced forestry practices under theassumption of higher stem density and leaf area forareas for unmanaged plantations (see Section Introduc-tion). However, natural disturbances such as wind, flood,and snow damage, fire, and insect infestation couldalso reduce leaf area and stem density and thereforeevapotranspiration (e.g. Abe and Tani, 1985; Maita,2005; Komatsu et al., 2009b). This suggests that reducedforestry practices might not necessarily correspond tohigh stem density and leaf area. Such natural disturbancesoften occur in Japan (Japan Forestry Agency, 2007;Suzuki et al., 2009). Extensive and significant typhoonwind damage in the Terauchi watershed was recorded in1991, 1994, and 2004 (http://www.f-suigen.or.jp/). Thus,natural disturbance might inhibit increases in leaf areaand decreases in stem density despite reduced forestry
Copyright 2010 John Wiley & Sons, Ltd. Hydrol. Process. 24, 2440–2451 (2010)
RUN-OFF CHANGE WITH REDUCED FORESTRY PRACTICES 2449
practices, resulting in no net decrease in the annual run-off and low flow.
A decrease in transpiration with tree age (or height) hasbeen reported for many coniferous forests (Law et al.,2001; Komatsu, 2003, 2004, 2005; Irvine et al., 2004).Whether such decreases are common for coniferousplantations in Japan is still controversial (e.g. Murakamiet al., 2000; Komatsu et al., 2007a; Tsuruta et al., 2008).If this is the case, a decrease in transpiration due totree senescence might effectively balance the increase intranspiration and interception evaporation because of theleaf area increasing with declining forestry practices.
The present study did not evaluate changes in run-off in the absence of forestry practices and forest ageingseparately. From a scientific viewpoint, it is interesting toevaluate the effects of these two processes separately. Onthe other hand, the two processes occur simultaneously.Thus, evaluating changes in run-off due to both processesis more important from a practical viewpoint. This studymade this practical evaluation.
To evaluate the effect of each process separately,studies at catchment scale (typically several hectares)rather than watershed scale (typically several tens ofsquare kilometres) are required. For this purpose, catch-ments with different ages and intensities of forestrypractices should be prepared. Besides rainfall–run-offmeasurements, transpiration, and interception evapora-tion measurements should be made on the basis of sapflux measurements (e.g. Kumagai et al., 2008; Kumeet al., 2010) and throughfall and stemflow measure-ments (e.g. Onozawa et al., 2009; Shinohara et al., 2010),respectively. From these measurements, we can evaluatechanges in run-off caused by the high canopy density dueto the absence of thinning and pruning and those causedby forest ageing separately.
CONCLUSIONS
As a countermeasure to reduce the risk of decreasedwater resources due to reduced forestry practices, manylocal governments in Japan have introduced local taxesto stimulate forestry practices in coniferous plantationareas (Imawaka and Sato, 2008). However, we foundno evidence of decreasing water resources with reducedforestry practices. Therefore, the risk might be less thanexpected.
This study is the first to quantitatively assess such riskon the basis of watershed run-off data. Further stud-ies are required to generalize the results. This studywas conducted in northern Kyushu, where water short-ages frequently occur. Frequent water shortages alsooccur on Shikoku and western Honshu (http://www.mlit.go.jp/tochimizushigen/mizsei/hakusyo/index5.html), andstudies for these regions are highly recommended. If theresults of these future studies support ours, then counter-measures for reduced forestry practices might be unnec-essary. If different results are obtained among regions,current forest policies should be modified to accommo-date the risk for each region.
Researchers in Japan (Nakane, 2004; Nakashizuka,2004; Ohgaki, 2005; Onda, 2008) have noted other risksdue to reduced forestry practices from the viewpointsof soil protection and fertility, water quality, flood con-trol, carbon sequestration, and biodiversity. Although thisstudy has focused on water run-off processes, the forestwater cycle affects soil transport and forest carbon andnutrient cycling (Landsberg and Gower, 1997; Brookset al., 2003). Thus, the results of this study have impli-cations for research examining these risks.
ACKNOWLEDGEMENTS
We acknowledge Mr K. Takeda and Mr F. Yamamotofrom the Japan Water Agency for providing precipita-tion and run-off data for the Terauchi watershed. We alsothank Mr O. Funakoshi and Ms N. Ogawa from FukuokaPrefecture for providing vegetation data for the Terauchiwatershed. We are grateful to Ms A. Kawasaki and DrT. Kajisa from Kyushu University and Ms A. Miyazawafrom Fukuoka Prefecture for their assistance in collat-ing and analysing vegetation data. We express sincerethanks to Mr K. Tsuruta from Kyushu University, whointroduced us to several critical papers. Thanks are alsodue to Prof. A Iroume and two anonymous reviewersfor their critical comments. This research was supportedby the Japanese Ministry of Education, Culture, Sports,Science and Technology through a Grant-in-Aid for Sci-entific Research (#20780119) and by Core Research forEvolution Science and Technology of the Japan Scienceand Technology Agency.
REFERENCES
Abe T, Tani M. 1985. Streamflow changes after killing of pine treesby the pine-wood nematode. Journal of Japan Forestry Society 67:261–270 (in Japanese with English summary).
Anderassian V. 2004. Waters and forests: from historical controversyto scientific debate. Journal of Hydrology 291: 1–27, DOI:10.1016/j.jhydrol.2003.12.015.
Anderassian V, Parent E, Michel C. 2003. A distribution-free test todetect gradual changes in watershed behavior. Water ResourcesResearch 39: 1252, DOI: 10.1029/2003WR002081.
Blume T, Zehe E, Bronstert A. 2007. Rainfall–runoff response, event-based runoff coefficients and hydrograph separation. HydrologicalSciences Journal 52: 843–862.
Bosch JM, Hewlett JD. 1982. A review of catchment experiments todetermine the effect of vegetation changes on water yield andevapotranspiration. Journal of Hydrology 55: 3–23.
Brooks KN, Ffolliott PF, Gregersen HM, DeBano LF. 2003. Hydrologyand the Management of Watersheds . Iowa University Press: Ames, IA;574.
Brown A, Zhang L, McMahon TA, Western AW, Vertessy RA. 2005. Areview of paired catchment studies for determining changes in wateryield resulting from alterations in vegetation. Journal of Hydrology310: 28–61, DOI: 10.1016/j.jhydrol.2004.12.010.
Dingman SL. 2002. Physical Hydrology . Prentice Hall: Upper SaddleRiver, New Jersey; 600.
Fahey B, Jackson R. 1997. Hydrological impacts of converting nativeforests and grasslands to pine plantations, South Island, New Zealand.Agricultural and Forest Meteorology 84: 69–82.
Farley KA, Jobbagy EG, Jackson RB. 2005. Effects of afforestation onwater yield: a global synthesis with implications for policy. GlobalChange Biology 11: 1565–1576, DOI: 10.1111/j.1365–2486.2005.01011.x.
Copyright 2010 John Wiley & Sons, Ltd. Hydrol. Process. 24, 2440–2451 (2010)

2450 H. KOMATSU ET AL.
Fujieda M, Noguchi S, Ogawa M. 1996. Effects of changes in forestcondition on hydrologic environment—case study of areas clearcutand logged by skidders. Journal of the Japanese Forestry Society 78:43–49 (in Japanese with English summary).
Fujimori T. 2000. Living with Forests. Maruzen: Tokyo; 236 (inJapanese).
Granier A, Loustau D, Breda N. 2000. A generic model of forest canopyconductance dependent on climate, soil water availability and leaf areaindex. Annals of Forest Science 57: 755–765.
Hattori S, Chikaarashi H. 1988. Effect of thinning on canopy interceptionin a Hinoki stand. Journal of the Japanese Forest Society 70: 529–533(in Japanese with English summary).
Hornbeck JW, Adams MB, Corbett ES, Verry ES, Lynch JA. 1993.Long-term impacts of forest treatments on water yield—a summaryfor northeastern USA. Journal of Hydrology 150: 323–344.
Hornberger GM, Raffensperger JP, Wiberg PL, Eshleman KN. 1997.Elements of Physical Hydrology . Johns Hopkins University Press:Baltimore, MD.
Imawaka S, Sato N. 2008. Study on new forest maintenance projects by“Forest Environmental Tax”. Bulletin of Kyushu University Forest 89:75–126 (in Japanese with English summary).
Iroume A, Mayen O, Huber A. 2006. Runoff and peak flow responses totimber harvest and forest age in southern Chile. Hydrological Processes20: 37–50, DOI: 10.1002/hyp.5897.
Irvine J, Law BE, Kurpius MR, Anthoni PM, Moore D, Schwarz PA.2004. Age-related changes in ecosystem structure and function andeffects on water and carbon exchange in ponderosa pine. TreePhysiology 24: 753–763.
Japan Forestry Agency. 2007. Forest White Paper . Japan ForestryAgency: Tokyo; 165 (in Japanese).
Jinno K, Kawamura A, Satomura T, Sakata Y. 2005. The 2002 droughtof the Chikugo River and water resources operation. Journal of theJapan Society of Hydrology and Water Resources 18: 539–546 (inJapanese with English summary).
Kikuzawa K. 1999. Forest Ecology . Kyoritsu Shuppan: Tokyo; 198 (inJapanese).
Komatsu H. 2003. Relationship between canopy height and thereference value of surface conductance for closed coniferous stands.Hydrological Processes 17: 2503–2512, DOI: 10.1002/hyp.5141.
Komatsu H. 2004. A general method of parameterizing the big-leafmodel to predict the dry-canopy evaporation rate of individualconiferous forest stands. Hydrological Processes 18: 3019–3036, DOI:10.1002/hyp.5747.
Komatsu H. 2005. Forest categorization according to dry-canopyevaporation rates in a growing season: comparison of thePriestley–Taylor coefficient values from various observation sites.Hydrological Processes 19: 3873–3896, DOI: 10.1002/hyp.5987.
Komatsu H, Tanaka N, Kume T. 2007a. Do coniferous forests evaporatemore water than broad-leaved forests in Japan? Journal of Hydrology336: 361–375, DOI: 10.1016/j.jhydrol.2007.01.009.
Komatsu H, Kume T, Otsuki K. 2007b. Contemporary role of catchmentwater balance data for forest evapotranspiration research. Journal ofthe Japanese Forest Society 89: 345–358 (in Japanese with Englishsummary).
Komatsu H, Ide J, Shinohara Y, Haga H, Fujiyama Y, Miyano T,Maruno R, Chiwa M, Kume T, Higashi N, Otsuki K. 2007c. Evap-otranspiration from unmanaged coniferous plantations. Suiri Kagaku297: 107–127 (in Japanese).
Komatsu H, Kume T, Otsuki K. 2008a. The effect of converting a nativebroad-leaved forest to a coniferous plantation forest on annual wateryield: a paired-catchment study in northern Japan. Forest Ecology andManagement 255: 880–886, DOI: 10.1016/j.foreco.2007.10.010.
Komatsu H, Shinohara Y, Kume T, Otsuki K. 2008b. Relationshipbetween annual rainfall and interception ratio for forests acrossJapan. Forest Ecology and Management 256: 1189–1197, DOI:10.1016/j.foreco.2008.06.036.
Komatsu H, Maita E, Otsuki K. 2008c. A model to estimate annual forestevapotranspiration in Japan from mean annual temperature. Journal ofHydrology 348: 330–340, DOI: 10.1016/j.jhydrol.2007.10.006.
Komatsu H, Kume T, Otsuki K. 2009a. Effects of coniferous plantationthinning on annual wet-canopy evaporation: model verification.Journal of the Japan Forest Society 91: 94–103 (in Japanese withEnglish summary).
Komatsu H, Kume T, Otsuki K. 2009b. Low flow changes in runoffwith converting a coniferous plantation to a broad-leaved forest in theTatsunokuchi-Minami catchment, Japan. Ecohydrology 2: 164–172,DOI: 10.1002/eco.50.
Kumagai T, Katul GG, Saitoh TM, Sato Y, Manfroi OJ, Morooka T,Ichie T, Kuraji K, Suzuki M, Porporato A. 2004. Water cycling
in a Bornean tropical rain forest under current and projectedprecipitation scenarios. Water Resources Research 40: W01104, DOI:10.1029/2003WR002226.
Kumagai T, Tateishi M, Shimizu T, Otsuki K. 2008. Transpiration andcanopy conductance at two slope positions in a Japanese cedar forestwatershed. Agricultural and Forest Meteorology 148: 1444–1455,DOI: 10.1016/j.agrformet.2008.04.010.
Kume T, Tsuruta K, Komatsu H, Kumagai T, Higashi N, Shinohara Y,Otsuki K. 2010. Effects of sample size on sap flux-based stand-scale transpiration estimates. Tree Physiology 30: 129–138, DOI:10.1093/treephys/tpp074.
Kundzewicz ZW, Robson AJ. 2004. Change detection in hydrologicalrecords—a review of the methodology. Hydrological Sciences Journal49: 7–19.
Kuraji K. 2003. Effects of Forests on Stabilizing Streamflow . NihonChisan-chisui Kyokai: Tokyo; 75 (in Japanese).
Kuraji K. 2004. A review of world “Green Dam” Research. In GreenDams , Kuraji K, Hoyano H (eds). Tsukiji Shokan: Tokyo; 56–77 (inJapanese).
Landsberg JJ, Gower ST. 1997. Applications of Physiological Ecology toForest Management . Academic Press: San Diego, CA; 354.
Lane PNJ, Mackey SM. 2001. Streamflow response of mixed-specieseucalypt forests to patch cutting and thinning treatments. ForestEcology and Management 143: 131–142.
Langford KJ. 1976. Change in yield of water following a bushfire in aforest of Eucalyptus regnans. Journal of Hydrology 29: 87–114.
Law BE, Goldstein AH, Anthoni PM, Unsworth MH, Panek JA, BauerMR, Fracheboud JM, Hultman N. 2001. Carbon dioxide and watervapor exchange by young and old ponderosa pine ecosystems duringa dry summer. Tree Physiology 21: 299–308.
Lesch W, Scott DF. 1997. Streamflow responses to afforestation withEucalyptus grandis and Pinus patula and to felling in the Mokobulaanexperimental catchments, South Africa. Journal of Hydrology 199:360–377.
Maita E. 2005. Effects of forest clearcut on runoff at FukuroyamasawaCatchment in Chiba Research Forest. PhD thesis, The University ofTokyo, Tokyo; 194 (in Japanese).
Maita E, Suzuki M, Ohta T. 2005. Change in the annual discharge afterclear-cutting a 70-year-old mixed plantation of Sugi and Hinoki in aTertiary formation area. Journal of the Japanese Forestry Society 87:124–132 (in Japanese with English summary).
Morikawa Y, Hattori S, Kiyono Y. 1986. Transpiration of a 31-year-old Chamaecyparis obtusa Endl. stand before and after thinning. TreePhysiology 2: 105–114.
Murai H, Kumagai N. 1989. Studies on effect of some treatments to forestso as to control stream flow in small mountain watershed, III: influenceson hydrological cycle in forest land and runoff and sediment dischargein stream. Bulletin of Shizuoka University Forest 13: 1–25 (in Japanesewith English summary).
Murakami S, Tsuboyama Y, Shimizu T, Fujieda M, Noguchi S. 2000.Variation of evapotranspiration with stand age and climate in a smallJapanese forested catchment. Journal of Hydrology 227: 114–127.
Nakane K. 2004. How to evaluate “green dams” In Green Dams ,Kuraji K, Hoyano H (eds). Tsukiji Shokan: Tokyo; 104–116 (inJapanese).
Nakashizuka T. 2004. Sketch of Forests . Tokai University Press:Kanagawa, Japan; 235 (in Japanese).
National Astronomical Observatory. 2009. Chronological EnvironmentalTables MMIX/2010 . Maruzen: Tokyo; 398 (in Japanese).
Ohgaki S. 2005. Nutrients in Rivers . Gihodo: Tokyo; 179 (in Japanese).Onda Y. 2008. Water and Sediment Discharge in Abandoned Plantations .
Iwanami: Tokyo; 245 (in Japanese).Onozawa Y, Chiwa M, Komatsu H, Otsuki K. 2009. Rainfall intercep-
tion in a moso-bamboo (Phyllostachys pubescens) forest. Journal ofForest Research 14: 111–116, DOI: 10.1007/s10310-008-0108-2.
Pizzaro R, Araya S, Jordan C, Farias C, Flores J, Bro PB. 2006. Theeffects of changes in vegetation cover on river flows in the Purapelriver basin of central Chile. Journal of Hydrology 327: 249–257, DOI:10.1016/j.jhydrol.2005.11.020.
Reid LM, Lewis J. 2009. Rates, timing, and mechanisms of rainfallinterception loss in a coastal redwood forest. Journal of Hydrology375: 459–470, DOI: 10.1016/j.jhydrol.2009.06.048.
Robinson M, Dupeyrat A. 2005. Effects of commercial timber harvestingon streamflow regimes in the Plynlimon catchments, mid-Wales.Hydrological Processes 19: 1213–1226, DOI: 10.1002/hyp.5561.
Shimizu A, Shimizu T, Miyabuchi Y, Ogawa Y. 2003. Evapotranspira-tion and runoff in a forest watershed, western Japan. HydrologicalProcesses 17: 3125–3149, DOI: 10.1002/hyp.1261.
Copyright 2010 John Wiley & Sons, Ltd. Hydrol. Process. 24, 2440–2451 (2010)

RUN-OFF CHANGE WITH REDUCED FORESTRY PRACTICES 2451
Shinohara Y, Kumagai T, Otsuki K, Kume A, Wada N. 2009. Impact ofclimate change on runoff from a mid-latitude mountainous catchmentin central Japan. Hydrological Processes 23: 1418–1429, DOI:10.1002/hyp.7264.
Shinohara Y, Ide J, Higashi N, Komatsu K, Kume T, Chiwa M,Otsuki K. 2010. Observation of canopy interception loss in anabandoned coniferous plantation. Journal of the Japanese ForestrySociety 92: 54–59. (in Japanese with English summary).
Sikka AK, Samra JS, Samraj P, Lakshmanan V. 2003. Low flow andhigh flow responses to converting natural grassland into bluegum(Eucalyptus globulus) in Nilgiris watersheds of South India. Journalof Hydrology 270: 12–26.
Suzuki S, Yoshitake T, Goto Y. 2009. Values for forest damage causedby strong wind, heavy rain, snow and forest fire based on statisticscompiled in Japan from fiscal year 1954 to 2003. Bulletin of Forestryand Forest Products Research Institute 410: 71–100 (in Japanese withEnglish summary).
Swank WT, Douglass JE. 1974. Streamflow greatly reduced byconverting deciduous hardwood stands to pine. Science 185: 857–859.
Swank WT, Vose JM, Elliott KJ. 2001. Long-term hydrologic andwater quality responses following commercial clearcutting of mixedhardwoods on a southern Appalachian catchment. Forest Ecology andManagement 143: 163–178.
Taniyama T. 2005. How should we make use of a high-performanceforestry machine for thinning. Forest Science (Japan) 44: 13–17 (inJapanese).
Tsukamoto Y. 1998. Conservation of Forest, Water, and Soil . Asakura:Tokyo; 138 (in Japanese).
Tsuruta K, Kume T, Komatsu H, Higashi N, Kumagai T, Otsuki K.2008. Relationship between tree height and transpiration for individualJapanese Cypress (Chamaecyparis obtusa). Journal of the JapanSociety of Hydrology and Water Resources 21: 414–422 (in Japanesewith English summary).
Vertessy RA, Watson FGR, O’Sullivan SK. 2001. Factors determiningrelations between stand age and catchment water balance in mountainash forests. Forest Ecology and Management 143: 13–26.
Ward RC, Robinson M. 2000. Principles of Hydrology . McGraw-Hill:London; 450.
Watson FGR, Vertessy RA, Grayson RB. 1999. Large-scale modelling offorest hydrological processes and their long-term effect on water yield.Hydrological Processes 13: 689–700.
Yao HX, Hashino M, Xia J, Chen XH. 2009. Runoff reduction by forestgrowth in Hiji River basin, Japan. Hydrological Sciences Journal 54:556–570.
Yorimitsu R. 2001. Environmental Conservation at Catchment Scale.Nihon-Kezai-Hoso Shuppan: Tokyo; 245 (in Japanese).
Yorimitsu R. 2004. Recovery of rural regions and water environmentby green dams. In Green Dams , Kuraji K, Hoyano H (eds). TsukijiShokan: Tokyo; 192–206 (in Japanese).
Copyright 2010 John Wiley & Sons, Ltd. Hydrol. Process. 24, 2440–2451 (2010)
Copyright © 2022 FDOKUMEN