
Motor System Interactions in the Beta Band Decrease during Loss of Consciousness.
39
For Review Only Motor System Interactions in the Beta Band Decrease during Loss of Consciousness Nicole C. Swann 1* , Coralie de Hemptinne 1 , Ryan B. Maher 3 , Catherine A. Stapleton 4 , Lingzhong Meng 2 , Adrian W. Gelb 2 , Philip A. Starr 1 1. Department of Neurological Surgery, University of California San Francisco, 94143 2. Department of Anesthesia and Perioperative Care, University of California San Francisco, 94143 3. Fidere Anesthesia Consultants, 94040 4. Alta Bates Summit Medical Center, 94705 *Corresponding Author Health Sciences East, Rm # 823 513 Parnassus Avenue San Francisco, CA 94143 [email protected] Keywords: Electrocorticography, Local Field Potentials, Consciousness, Motor Cortex, Basal Ganglia-Thalamo-Cortical Loops, Electrophysiology Figures: 6; Tables: 1 Acknowledgements We would like to thank Dr. Jill Ostrem for help with patient recruitment, Dr. Oana Maties for help with anesthesia assessments, and Dr. Bradley Voytek for helpful comments on the manuscript. We would also like to thank all the patients who participated in this study. This work was supported by the National Institutes of Health (Grant R01NS069779 to PAS). Page 1 of 39 Journal of Cognitive Neuroscience 1 2 3 4 5 6 7 8 9 10 11 12 13 14 15 16 17 18 19 20 21 22 23 24 25 26 27 28 29 30 31 32 33 34 35 36 37 38 39 40 41 42 43 44 45 46 47 48 49 50 51 52 53 54 55 56 57 58 59 60
Transcript of Motor System Interactions in the Beta Band Decrease during Loss of Consciousness.

For Review Only
Motor System Interactions in the Beta Band Decrease during Loss of
Consciousness
Nicole C. Swann1*, Coralie de Hemptinne1, Ryan B. Maher3, Catherine A. Stapleton4,
Lingzhong Meng2, Adrian W. Gelb2, Philip A. Starr1
1. Department of Neurological Surgery, University of California San Francisco, 94143
2. Department of Anesthesia and Perioperative Care, University of California San
Francisco, 94143
3. Fidere Anesthesia Consultants, 94040
4. Alta Bates Summit Medical Center, 94705
*Corresponding Author
Health Sciences East, Rm # 823
513 Parnassus Avenue
San Francisco, CA 94143
Keywords: Electrocorticography, Local Field Potentials, Consciousness, Motor Cortex,
Basal Ganglia-Thalamo-Cortical Loops, Electrophysiology
Figures: 6; Tables: 1
Acknowledgements
We would like to thank Dr. Jill Ostrem for help with patient recruitment, Dr. Oana Maties for
help with anesthesia assessments, and Dr. Bradley Voytek for helpful comments on the
manuscript. We would also like to thank all the patients who participated in this study. This work
was supported by the National Institutes of Health (Grant R01NS069779 to PAS).
Page 1 of 39 Journal of Cognitive Neuroscience
123456789101112131415161718192021222324252627282930313233343536373839404142434445464748495051525354555657585960

For Review Only
Abstract
Communication between brain areas and how they are influenced by changes in consciousness
are not fully understood. One hypothesis is that brain areas communicate via oscillatory
processes, utilizing network-specific frequency bands, that can be measured with metrics that
reflect between-region interactions, such as coherence and phase amplitude coupling (PAC). To
evaluate this hypothesis, and understand how these interactions are modulated by state changes,
we analyzed electrophysiological recordings in humans at different nodes of one well-studied
brain network: the basal ganglia-thalamo-cortical (BGTC) loops of the motor system, during loss
of consciousness induced by anesthesia. We recorded simultaneous electrocorticography (ECoG)
over primary motor cortex (M1) with local field potentials (LFPs) from subcortical motor
regions (either basal ganglia or thalamus) in 15 movement disorder patients during anesthesia
(propofol) induction as a part of their surgery for deep brain stimulation. We observed reduced
coherence and PAC between M1 and the subcortical nuclei, which was specific to the beta band
(~18-24 Hz). The fact that this pattern occurs selectively in beta underscores the importance of
this frequency band in the motor system, and supports the idea that oscillatory interactions at
specific frequencies are related to the capacity for normal brain function and behavior.
Page 2 of 39Journal of Cognitive Neuroscience
123456789101112131415161718192021222324252627282930313233343536373839404142434445464748495051525354555657585960

For Review Only
Introduction
How do functionally related brain areas communicate over long distances? One
hypothesis is based on oscillatory synchronization in specific frequency bands, usually lower
than ~50 Hz (Siegel et al., 2012). Coherence is a simple measure of oscillatory synchronization
that may support long-distance neural interactions. It reflects interactions between brain areas
related to the consistency of the phases and amplitudes of their neuronal signals (Fries, 2005).
On the other hand, higher frequency, broad-band, activity (“broadband gamma”, 70-250 Hz)
seems to reflect local neural activity (Miller et al., 2007, Manning et al., 2009). Canolty and
colleagues demonstrated that, in some instances, broadband gamma amplitude is modulated by
the phase of lower frequency oscillatory rhythms (Canolty et al., 2006). This phase amplitude
coupling (PAC) provides a mechanism that could explain how low frequency oscillatory
changes, which are well suited to coordinate activity over long distances, can influence local
neuronal activity (Fries, 2005, Canolty and Knight, 2010). When PAC is calculated from the
phase and amplitude of signals recorded from two different brain areas, it may also reflect
interactions between brain regions.
Transitions in consciousness afford an opportunity to evaluate how these basic
measurements of brain interactions change in the context of profound behavior/state changes.
While the underlying causal mechanisms of consciousness remain unclear, there is converging
evidence that transitions of consciousness are characterized by a change of network dynamics
wherein local brain networks become more isolated from one another, disrupting the brain’s
ability to integrate information (Alkire et al., 2008, Lewis et al., 2012). Since all but the most
basic forms of behavior are only possible in the conscious state, we hypothesized that the most
functionally important network interactions are only present in the conscious state. To better
Page 3 of 39 Journal of Cognitive Neuroscience
123456789101112131415161718192021222324252627282930313233343536373839404142434445464748495051525354555657585960

For Review Only
understand how those interactions might mediate behavior, and perhaps relate to communication
in brain networks, we sought to study how simple metrics of brain interactions (coherence and
PAC) in the motor system change during anesthesia-induced transitions in consciousness.
To address this goal, we combined electrocorticography (ECoG) and subcortical local
field potential (LFP) recordings in movement disorder patients undergoing surgical implantation
of deep brain stimulation (DBS) leads (de Hemptinne et al., 2013, de Hemptinne et al., 2015).
This approach provides a unique opportunity to acquire field potential data from functionally
related cortical and subcortical structures (primary motor cortex (M1) and motor territories of
the basal ganglia and thalamus). Because DBS targets vary across individuals/diagnoses, we
have the opportunity to sample from a number of different subcortical nodes in the basal ganglia-
thalamo-cortical (BGTC) loop (although this does increase variability in our sample). The BGTC
circuit is particularly well suited to address questions concerning network interactions because
structural connectivity in the motor loop is relatively well defined, with connections from cortex
to basal ganglia to thalamus and then back to cortex (Alexander et al., 1986). Additionally, the
electrophysiological signatures in the motor system have been studied extensively. The beta
frequency range (13-30 Hz) dominates and is dynamically modulated during movement
(Pfurtscheller, 1981, Murthy and Fetz, 1992, Sanes and Donoghue, 1993, Crone et al., 1998b,
Cassidy et al., 2002, Brovelli et al., 2004, Kuhn et al., 2004). We hypothesized that loss of
consciousness would be characterized by reduced interactions between cortical and subcortical
regions, measured with coherence and inter-region PAC, and that this would be particularly
prominent in the beta frequency band.
Page 4 of 39Journal of Cognitive Neuroscience
123456789101112131415161718192021222324252627282930313233343536373839404142434445464748495051525354555657585960
For Review Only
Methods
Patients
Fifteen patients (4 females/11 males, average age 62 years) were recruited from the Surgical
Movement Disorders Clinic at the University of California, San Francisco (UCSF). Patients were
scheduled to undergo surgery to implant a permanent subcortical DBS lead to treat their
movement disorders. All patients were simultaneously participating in a study of the contribution
of cortical oscillatory activity to movement disorders pathophysiology, using ECoG from a
subdural strip array inserted through the standard frontal burr hole used for DBS insertion, and
temporarily placed over the primary motor cortex (Crowell et al., 2012, de Hemptinne et al.,
2013, Shimamoto et al., 2013). Our standard surgical procedure requires that patients be awake
for microelectrode mapping and DBS lead insertion, followed by anesthesia induction (for
wound closure). This procedure provides the opportunity for brain recording during anesthesia-
induced loss of consciousness, avoiding the need to administer anesthetics solely for research
purposes.
The goal of the present study was to examine interactions between nodes of the motor
system during loss of consciousness, rather than focusing on a specific movement disorder.
Therefore, we included patients with varying diagnoses and varying subcortical targets within
the motor network to enable the identification of network motifs common to changes in
consciousness independent of disease state. Twelve of the patients had Parkinson’s disease (PD),
two had Essential Tremor (ET), and one had primary Dystonia. Four PD patients had DBS leads
placed into the globus pallidus interna (GPi) while the other eight had subthalamic nucleus
(STN) leads, with target choice dictated by clinical criteria (Follett et al., 2010). The DBS target
for ET patients was the ventrolateral thalamus. The target for the dystonia patient was GPi. The
Page 5 of 39 Journal of Cognitive Neuroscience
123456789101112131415161718192021222324252627282930313233343536373839404142434445464748495051525354555657585960

For Review Only
study methodologies were approved by the institutional ethics committee and are in agreement
with the Declaration of Helsinki. All patients provided written informed consent to participate in
the study, and the use of a temporary cortical ECoG array placed for research purposes was an
explicit part of the consent discussion.
ECoG Strip Placement
ECoG was recorded from one hemisphere during the surgery. For patients receiving unilateral
DBS, the ECoG was placed ipsilateral to the side of the DBS. For patients receiving bilateral
surgery, the side of the ECoG was determined based on the clearest anatomic demarcation of the
central sulcus on preoperative magnetic resonance imaging (MRI). Eleven patients had left side
recordings, while four had right.
The data from the dystonia patient and 5 PD patients were collected with a 6 electrode
ECoG grid (1 cm spacing between electrodes, see Figure 1A), and the other 7 PD patients and
both ET patients were recorded with a 28-electrode ECoG strip (4 mm spacing between
electrodes, see Figure 1B). The type of ECoG strip used depended on the parent study of
movement disorders physiology, since during this study period we transitioned from the lower
spatial resolution recording to a higher resolution technique. Each strip was placed with at least
one electrode covering M1. The intended target location for the center of the ECoG strip was the
arm area of M1, 3 cm from the midline and slightly medial to the hand knob (Yousry et al.,
1997). Adequate localization of the ECoG strip was confirmed using either preoperative MRI
merged to an intraoperative CT (13 subjects) or using intraoperative lateral fluoroscopy with a
radio-opaque marker placed on the skin indicating the intended target in M1 that was visible
relative to the electrode strip (2 subjects), as previously described (Crowell et al., 2012, de
Page 6 of 39Journal of Cognitive Neuroscience
123456789101112131415161718192021222324252627282930313233343536373839404142434445464748495051525354555657585960
For Review Only
Hemptinne et al., 2013, Shimamoto et al., 2013, de Hemptinne et al., 2015). In all subjects
functional localization was also examined using somatosensory evoked potentials (SSEPs,
frequency = 2 Hz, pulse width = 200 µs, pulse train length = 160, amplitude = 25-40 mAmp), as
has been previously reported (Crowell et al., 2012, de Hemptinne et al., 2013, Shimamoto et al.,
2013). Note that for the 28-electrode strip, there were two rows of 14 electrodes (see Figure 1B),
so it was expected that 2 electrodes localized immediately anterior to the central sulcus would
show a phase reversal relative to the post-central sulcus electrodes.
DBS Electrode Implantation
Anatomic targeting of the desired subcortical structure was performed as previously described
(Starr et al., 2002, Papavassiliou et al., 2004, Starr et al., 2006). For the GPi and STN targets, the
proper location was verified by eliciting movement-related single cell discharge patterns (Starr et
al., 2002). For all regions, the correct placement was verified by test stimulation, as well as
intraoperative fluoroscopy (all patients), intraoperative CT (13 patients) (Shahlaie et al., 2011),
and post-operative MRI (all patients).
Consciousness Assessment and Anesthesia Parameters
Continuous recordings were taken after DBS placement, but prior to burr hole closure and DBS
pulse generator placement, while the patients were slowly anesthetized with propofol. Data from
PD patients were recorded after at least 12 hours off antiparkinsonian medications.
Consciousness was assessed every 3 minutes using the Modified Observers Assessment of
Alertness/Sedation Scale (MOAA/S, see Table 1, Chernik et al., 1990). Ratings were recorded by
an anesthesiologist (AG, LM). When the clock started for the assessment session (time zero), a
Page 7 of 39 Journal of Cognitive Neuroscience
123456789101112131415161718192021222324252627282930313233343536373839404142434445464748495051525354555657585960

For Review Only
button was pressed which generated a voltage deflection in an auxiliary channel digitized with
the electrophysiology data. This synchronized the times noted by the anesthesiologist with the
electrophysiology data.
Anesthesia induction with propofol was performed slowly with the goal of achieving an
estimated plasma level (Marsh Model) of 4 mcg/ml at approximately 15 minutes (Smith et al.,
1994). Induction ended when all patients no longer responded to painful stimulation according to
MOAA/S scale (see Table 1). Propofol sedation had also been used during the drilling of the
burr holes prior to intracranial recording, but was stopped for subcortical mapping and DBS lead
testing, at least 60 minutes prior to initiating the recordings analyzed here. This is ample time for
the effects of propofol to wear off (Fechner et al., 2004, Raz et al., 2010).
ECoG and LFP Recordings
ECoG recordings were performed using either the Alpha Omega Microguide Pro, Alpha Omega,
Inc (for the 6 electrode strip, Figure 1A) or the Tucker Davis Technologies Recording System
(for the 28 electrode strip, Figure 1B). For the Alpha Omega system data were sampled at 3000
Hz. Data from each of the 5 more posterior electrodes were referenced to the most anterior
electrode. A needle electrode in the scalp served as the ground. Data were band-pass filtered at 1-
500 Hz. For the Tucker Davis System, data were sampled at 3051 Hz. All electrodes were
referenced to a scalp needle electrode that also served as the ground. Data were low pass filtered
at 1500 Hz. Since there was no high pass filter applied during data acquisition, the mean of each
electrode was subtracted during offline preprocessing to detrend the data. See Figure 2A for an
example of the raw ECoG data.
Page 8 of 39Journal of Cognitive Neuroscience
123456789101112131415161718192021222324252627282930313233343536373839404142434445464748495051525354555657585960

For Review Only
LFP recordings were from the subcortical target ipsilateral to ECoG placement were
recorded in a bipolar configuration from the middle two cylindrical contacts (1.5 mm height, 1.2
mm diameter) of a quadripolar lead (Medtronic model 3389, 0.5 mm between contacts, 8 patients
or Medtronic model 3387, 1.5 mm between contacts, 7 patients), with electrode 1 as the active
and electrode 2 as the reference. The guide tube for the DBS lead served as ground. For the 6
patients for whom the 6-electrode cortical strip was used, the LFP recordings were done with the
Alpha Omega system using the same Alpha Omega parameters described above for ECoG. For
all the PD patients who were tested with the 28-electrode strip, LFP data was still collected using
the hardware from the Alpha Omega system (which was necessarily present as it is FDA
approved for clinical micro-electrode recordings for mapping), however the analog signal was
streamed to the Tucker Davis system and digitized there at 25,000 Hz sampling rate and then
subsequently down-sampled. For the sessions with ET patients, the Alpha Omega system was
not present in the room, as micro-electrode recordings were not used for ET. Thus, LFPs were
recorded in the same manner as the ECoG electrodes (data from electrode 1 and 2 of the DBS
electrode were both recorded with the needle electrode as the reference and ground), and then
subsequently referenced in a bipolar configuration offline. See Figure 2B for an example of the
raw LFP data.
Electrophysiological Pre-Processing
All data were initially down-sampled to 1000 Hz, and line frequency noise (at 60 Hz, 120 Hz,
and 180 Hz) was removed using a third-order Butterworth notch filter which spanned a 4 Hz
range centered at each frequency (i.e. 58-62 Hz for 60 Hz). Data were then re-referenced. For the
6 electrode strip a bipolar montage was used such that each electrode was referenced to the
Page 9 of 39 Journal of Cognitive Neuroscience
123456789101112131415161718192021222324252627282930313233343536373839404142434445464748495051525354555657585960

For Review Only
anterior electrode (C1-C2, C2-C3….). For the 28-electrode strip a common average reference
was used including all ECoG electrodes (excluding any with obvious, continuous, noise). Each
reference strategy is best suited for the given electrode configuration: an average reference
montage is not appropriate when there are only 5 active electrodes to contribute to the reference,
and a bipolar reference is less optimal for the 28 electrode strip with small contacts and very
close spacing. To determine if the different referencing schemes influenced our results we re-ran
our analyses using an average reference scheme for all subjects and the results were similar, thus
this difference in analysis is unlikely to have strongly influenced our findings. Subcortical LFP
electrodes were processed in the same way as above (down-sampled and filtered). All raw data
were manually inspected and periods of artifact (e.g., electrical artifact caused by medical
equipment or movement) were noted and excluded from analysis.
During data recording the anesthesiologist performed ratings every three minutes to
assess the patient’s level of consciousness (see Table 1). Data were assigned a consciousness
rating according to the assessment at the end of each three-minute time segment. For instance, if
after 3 minutes the anesthesiologist rated the patient’s alertness as a 5 and at 6 minutes rated it as
a 4, the segment of the electrophysiology data corresponding to 0-3 minutes would be marked as
‘state 5’ and times 3-6 minutes would be marked as ‘state 4’. Not all patients were observed at
each state. The longest artifact-free period of each state was used for analysis. On average this
was 218.1 seconds, and was always greater than 31 seconds. Because both coherence and PAC
can vary over time even without an overt change in behavioral state, we included the longest data
segments possible for each subject and each level of consciousness. However, because coherence
and PAC values can also be influenced by differences in the length of data analyzed, we
conducted a control analysis to verify that differences in data length were not systematically
Page 10 of 39Journal of Cognitive Neuroscience
123456789101112131415161718192021222324252627282930313233343536373839404142434445464748495051525354555657585960

For Review Only
driving our observed differences. In this analysis, for each subject, data of the same length from
each state were used for comparison.
For each patient the cortical electrode(s) that most closely corresponded to M1 were
selected based on both the anatomical localization and SSEP waveforms. This was done prior to
examining the data from the anesthesia induction file. For the 28-electrode strip, there were two
rows of 14 electrodes, so we selected one M1 electrode from each row that met these same
criteria. In this case, power, coherence, and PAC (described below) were calculated separately
for each of these electrodes and then averaged for each electrode pair. For the 6-electrode strip,
the electrode selection procedure described above typically led to the selection of one electrode
which clearly lay over M1 (at the border of the central sulcus and the pre-central gyrus), that also
showed a clear SSEP phase reversal. For the 28-electrode strip, where the electrodes were
smaller and spaced closer together, definitive selection of the two optimal M1 electrodes was
less clear (regardless of reference scheme used). In order to test whether ambiguous selection of
the M1 electrode may have influenced our results, we conducted a test wherein all electrodes on
each strip were included in the analysis. (In this case, signal processing calculations described
below were calculated for each electrode separately and then the final results were averaged,
such that each subject contributed only one data point to the group statistics.) While this method
clearly provides less spatial specificity, results were similar even when all electrodes were
included. Thus, ambiguity in the selection of the optimal M1 electrode did not distort our results.
The fact that results were similar for the M1 electrode and the entire strip most likely reflects the
fact that the strip was placed to span precentral and postcentral gyri, which generate similar
oscillatory signatures (Crone et al., 1998b).
Page 11 of 39 Journal of Cognitive Neuroscience
123456789101112131415161718192021222324252627282930313233343536373839404142434445464748495051525354555657585960

For Review Only
Electrophysiological Signal Processing
All analyses used a combination of custom Matlab scripts and EEGLAB functions (Delorme and
Makeig, 2004). We implemented two main types of analyses. First, we analyzed the activity of
each area (M1 and the subcortical region) separately. We calculated power spectral density
(PSD) and PAC (Canolty et al., 2006, Tort et al., 2008) within each region. Analyses for each
patient, state, and region (M1 and subcortical) were calculated separately in Matlab.
PSD analysis used the Welch method (pwelch function in Matlab with a 512 ms window,
256 ms of overlap, see Figure 2C and 2D for an example of PSD in one subject). Statistics were
then calculated based on the log PSD values. However, results were similar if non-log
transformed values were used.
PAC was calculated using the “Kullback-Leibler (KL)-based modulation index” method,
which has been previously described (Tort et al., 2008, de Hemptinne et al., 2013). In brief, the
M1 ECoG and subcortical LFP signal were filtered separately using a two-way FIR1 filter
(eegfilt with ‘fir1’ parameters). Low frequency signals were filtered individually at frequencies
ranging from 2-50 Hz, with a 2 Hz bandwidth, and the phase was extracted from this signal using
a Hilbert transform. Similarly, the amplitude of the high frequency broadband gamma signal was
extracted by taking the Hilbert transform of the band-pass filtered data (70-150 Hz). Then, the
distribution of the instantaneous amplitude envelope was computed for every 20° interval of the
instantaneous phase (see Figure 2F). The coupling (“modulation index”) between the phase of
each low frequency rhythm and the high frequency amplitude was then determined by computing
the entropy values of this distribution and normalizing by the maximum entropy value (Tort et
al., 2008).
Second, we analyzed subcortical-cortical interactions by calculating coherence and cross-
Page 12 of 39Journal of Cognitive Neuroscience
123456789101112131415161718192021222324252627282930313233343536373839404142434445464748495051525354555657585960

For Review Only
structure PAC. Analyses were performed for each subject and state separately, using signals
from both the M1 ECoG and the subcortical LFP. We calculated coherence for frequencies
ranging from 2-50 Hz, with a 2 Hz bandwidth, by filtering both the M1 ECoG and subcortical
LFP using the same two-way FIR1 filter used to calculate PAC. Complex signals were then
obtained for each filtered signal by taking the Hilbert transform. Coherence between the ECoG
electrode(s) and the subcortical LFP was calculated using the corresponding auto-spectra (Wxx
and Wyy ) and cross-spectra (Wxy) of the filtered complex signals.
Coh(f) = |Wxy(f)|
√Wxx(f)√Wyy(f)
Here x and y refer to data from the 2 regions (i.e. cortical and subcortical). Wxy was calculated by
taking the sum over time of the complex signal of x multiplied by the conjugate of the complex
signal of y. Wxx and Wyy were calculated as the sum over time of the amplitude of each (x and y)
complex signal. See Figure 2E for an example of coherence at all frequencies in one patient.
Between-region PAC was calculated in the same way as within-region PAC described
above, except that the low frequency phase component and the high frequency amplitude
component were derived from signals from different brain regions (M1 ECoG and subcortical
LFP). We examined PAC using both the phase of the subcortical LFP and amplitude of M1
ECoG and the opposite configuration. See Figure 2F for an example of PAC in one patient.
Statistical Analysis of Data Grouped Across Patients
For statistical comparisons of the change across patients during anesthesia induction a non-
parametric paired sign-rank test was computed comparing, for each patient, the metric of interest
Page 13 of 39 Journal of Cognitive Neuroscience
123456789101112131415161718192021222324252627282930313233343536373839404142434445464748495051525354555657585960

For Review Only
(power, within region PAC, coherence, or between region PAC) for data corresponding to the
state during which the patient was most awake (state 5, or closest to 5) to the data corresponding
to the state during which the patient was most asleep (state 0, or closest to 0). This was done
separately for each frequency. Results were then corrected for multiple comparisons (for all
frequencies examined) using a false discovery rate (FDR) correction.
Results
Propofol and Monitoring Results
Each patient reached an “unconscious” state (i.e. MOAA/S value = 0 or 1). This was achieved on
average in 22.5 minutes from the start of the file recording (SD = 8 minutes). For each patient a
minimum of 3 anesthetic states were observed.
High Frequency Spectral Power Decreases and Low Frequency Power Increases in the Cortex
and Subcortical Nuclei
The signal amplitudes were typical for ECoG and LFP data, with an average root mean square
value for M1 of 56 microvolts for the most awake state, and 64 microvolts for the most asleep
state (p<0.04, with a paired, sign-rank test). The subcortical LFP root mean square values were
on average 8 microvolts (not significantly different for awake versus asleep, p > 0.15, Figure 2).
During induction the subcortical LFP was characterized by an increase in low frequency
power (4-6 Hz, p<0.05, FDR corrected) and a decrease in higher frequency (broadband) activity
(all frequencies 20-250 Hz, p<0.05, FDR corrected) (Figure 3). In the cortex, a similar pattern
was observed for the low frequency power increase (2-6 Hz, p<0.05, FDR corrected) and high
frequency decreases (144-250 Hz, but not all frequencies in this range were significant, p<0.05).
Page 14 of 39Journal of Cognitive Neuroscience
123456789101112131415161718192021222324252627282930313233343536373839404142434445464748495051525354555657585960

For Review Only
However the decrease in high frequency power in the cortex was not significant when correcting
for multiple comparisons (Figure 4). While the cortical high frequency effect was weak,
previous ECoG work has shown similar cortical changes in these frequency ranges during
propofol induction (Breshears et al., 2010, Verdonck et al., 2014). Thus, while our result was not
statistically robust, it trends in the direction reported by others.
Of note, M1 beta power did not change with induction of anesthesia. While subcortical
beta power did decrease during induction, this was a non-specific effect, since all frequencies
above 20 Hz were reduced.
Coherence Between Cortex and Subcortical Nuclei Decreases During Induction
Across patients, there was a spectrally specific decrease in coherence in the beta band (18-24 Hz)
during propofol-induced loss of consciousness (p<0.05, FDR corrected) (Figure 5). This
occurred in the setting of no significant change in cortical beta power and a non-specific
decrease in power in all frequencies above 20 Hz in the subcortical LFP. The control analysis for
which the same recording durations were used for both the “awake” and “asleep” epochs,
produced similar results (significant decrease in coherence for 20-24 Hz, p<0.05 FDR corrected).
Thus, variability in data length is not driving the observed effect.
We also examined the change in the phase of the beta coherence, and, though some
patients showed a change, it was not consistent across patients (data not shown). Coherence
patterns at other frequencies were variable across patients.
Page 15 of 39 Journal of Cognitive Neuroscience
123456789101112131415161718192021222324252627282930313233343536373839404142434445464748495051525354555657585960
For Review Only
Phase Amplitude Coupling Between Cortex and Subcortical Nuclei Decreases During Induction
We calculated PAC in two ways. First we tested the within region PAC for M1 and the
subcortical target separately, and did not observe any significant effects associated with
anesthesia induction when correcting for multiple comparisons.
We then calculated inter-region PAC taking the phase from the subcortical target and the
amplitude from the M1 ECoG and vice versa. With phase from the subcortical target and
amplitude from the M1 ECoG, there was a significant decrease in PAC during induction, again
in the beta band (18-20 Hz, p<0.05, FDR corrected, see Figure 6). The control analysis for
which the same recording durations were analyzed for both the “awake” and “asleep” epochs
produced similar, though slightly weaker results (significant decrease in inter-region PAC for 18-
20 Hz, p<0.05, uncorrected). Thus variability in data length is unlikely to be driving the observed
effect.
Results in other frequency ranges were variable across subjects. Calculating the PAC
using the cortical phase and subcortical amplitude revealed no significant results associated with
anesthesia induction.
Discussion
To evaluate changes in interactions between connected brain regions of the motor network
associated with loss of consciousness, we collected multi-site field potential recordings from
structures in the motor network in 15 subjects undergoing DBS surgery, and examined changes
in oscillatory activity. We found a decrease in interactions, measured with coherence and inter-
region PAC, between brain regions in BGTC loops during loss of consciousness, specific to the
beta band. Importantly, the beta frequency band was the only band to have a consistent change in
Page 16 of 39Journal of Cognitive Neuroscience
123456789101112131415161718192021222324252627282930313233343536373839404142434445464748495051525354555657585960

For Review Only
between-structure coherence and PAC across subjects, and this was not the case for cortical or
subcortical spectral power. We also observed a decrease in broadband gamma activity in the
subcortical nuclei and a similar, though weaker, decrease in cortex. This was accompanied by an
increase in low frequency power in both cortex and subcortical nuclei.
Throughout the brain cortical structures communicate with functionally homologous
subcortical modulators, and this communication is thought be mediated in part by
synchronization in oscillatory activity. The motor system represents one such pair, with well-
characterized anatomic connections from cortical motor areas to basal ganglia and thalamus
(Alexander et al., 1986), and robust oscillatory activity that is predominantly in the alpha or beta
range (Pfurtscheller, 1981, Crone et al., 1998b, van Wijk et al., 2012). Our focus on the motor
system was motivated by the fact that it can be ethically studied using invasive
electrophysiological methods during DBS surgery. We expect that the motor system is a
reasonable model for other brain networks, and that some of the observed patterns may be
generally applicable, with network-dependent variation in the particular frequency that is most
strongly influenced. Changes in coherence and PAC, reflecting interactions between brain
regions have been shown to vary with changes in behavior in a number of different brain
networks (Canolty and Knight, 2010, Siegel et al., 2012). Furthermore, some of the cortical
patterns we observe in the motor system are similar to those observed in another ECoG study
which examined more widespread regions of cortex (Breshears et al., 2010). However, because
we focused specifically on the motor system, we cannot be sure of the generalizability of our
results.
Page 17 of 39 Journal of Cognitive Neuroscience
123456789101112131415161718192021222324252627282930313233343536373839404142434445464748495051525354555657585960
For Review Only
Support for the Importance of Synchronized Beta Activity in the Motor System
Converging evidence suggests that one consequence of loss of consciousness is functional
disconnection between distributed brain regions (Engel and Singer, 2001, Laureys, 2005, Alkire
et al., 2008, Lewis et al., 2012, Sarasso et al., 2014). For cortical and subcortical interactions, in
particular, this hypothesis is supported by functional imaging studies of the recovery of
awareness following traumatic unconsciousness (Goldfine and Schiff, 2011, Laureys and Schiff,
2012), and by the finding that cortical-subcortical structural connectivity correlates with levels of
awareness in patients with severe head trauma (Fernandez-Espejo et al., 2011, Zheng et al.,
2014). Our results support this hypothesis since two measures which reflect interactions between
brain regions, coherence and cross-structure PAC, both decrease during loss of consciousness.
These measures are not fully independent, since changes in coherence are likely to affect cross
structure PAC.
Communication in different brain networks may occur through synchronization at
particular frequencies, with the specific frequency varying depending on the brain network
(Fries, 2005, Siegel et al., 2012). The motor network is dominated by activity in the alpha-beta
range (Pfurtscheller, 1981, Murthy and Fetz, 1992, Sanes and Donoghue, 1993, Crone et al.,
1998b, Cassidy et al., 2002, Brovelli et al., 2004, Kuhn et al., 2004, Miller et al., 2012,
Yanagisawa et al., 2012). Thus, the reduction in beta coherence seen in this study would be
expected to impair communication between the motor cortex and its subcortical modulators,
consistent with the “communication through coherence” hypothesis (Fries, 2005). PAC provides
a mechanism to explain how coherence, might influence local neural activity (Canolty et al.,
2006, Canolty and Knight, 2010). Thus our observed coherence and PAC decreases are
consistent with a general reduction in motor network connectivity, and perhaps communication,
Page 18 of 39Journal of Cognitive Neuroscience
123456789101112131415161718192021222324252627282930313233343536373839404142434445464748495051525354555657585960

For Review Only
which can be detected with both metrics. We predict that a similar phenomenon might be
observed in a different frequency range if a different brain network (with a different predominant
frequency range) were studied.
Opposing Patterns of Functional Connectivity in Consciousness
Some studies, similar to our own, show a decrease in synchrony between distributed areas during
loss of consciousness (Laureys et al., 1999, Bonhomme et al., 2012, Massimini et al., 2012,
Chennu et al., 2014, Sarasso et al., 2014), while others showed an increase (Feshchenko et al.,
2004, Arthuis et al., 2009, Breshears et al., 2010, Ching et al., 2010, Mukamel et al., 2014). One
explanation for these seemingly contradictory findings may lie in the distinction between
‘healthy’ synchrony, necessary to coordinate communication between separated brain areas
(Fries, 2005, Siegel et al., 2012), and abnormal oscillatory pattern, which may break up normally
synchronized activity or constrain neural activity in an inflexible pattern. Anesthesia may cause
some populations of neurons to fire in an oscillatory, inflexible, way, which then precludes
patterns of synchronization necessary for conscious behavior. Indeed, there have been studies
that observe both patterns during loss of consciousness, i.e. both an increase in oscillatory
activity in certain frequency ranges or brain networks, coincident with a decrease in oscillatory
activity in others (Lewis et al., 2012, Purdon et al., 2013).
Alternative Interpretations of the Coherence and PAC Results
We have observed a decrease in coherence and PAC during anesthesia induction that is specific
to the beta band, and not accompanied by a change in beta power in cortex (and only a general
decrease in all frequencies > 20 Hz in subcortical areas.) We interpret this as a reflection of a
Page 19 of 39 Journal of Cognitive Neuroscience
123456789101112131415161718192021222324252627282930313233343536373839404142434445464748495051525354555657585960
For Review Only
reduction in communication throughout the motor system, which occurs specifically in beta.
However, alternative interpretations are possible. For instance, the power decrease in the
subcortical regions may make the subcortical phase estimate of beta less reliable, reducing
coherence. We cannot rule out this interpretation, however, if this were the only factor driving
the effect, we might expect more broadband coherence change, since all frequencies above 20 Hz
decreased in the subcortical areas. Furthermore, this interpretation is not necessarily mutually
exclusive with the hypothesis that communication at specific frequencies is decreased, since a
decrease in communication could also be driven by a decrease in power at the dominant
frequency for a particular structure within a brain network.
Another interpretation is that movement could have influenced the recordings, since beta
is modulated by movement (Pfurtscheller, 1981, Crone et al., 1998b). While all our patients were
at rest during the recordings, perhaps subtle, undetectable, movements were present in the early
portions of the recording that decreased over time with anesthesia induction. However, this
interpretation would predict changes opposite to those observed here (i.e. an increase in
coherence with anesthesia induction), since movement has been associated with a decrease in
coherence in the alpha/beta range between cortical and subcortical motor structures (Cassidy et
al., 2002, Lalo et al., 2008, Alegre et al., 2010).
Changes in Power in Specific Brain Regions May Reflect Reduced Neuronal Activity or Relate to
Disconnection Between Brain Regions
The propofol induced reduction in cortical broadband activity that we observed was weak, but is
in general agreement with previous human studies examining ECoG during anesthesia induction
(Breshears et al., 2010, Verdonck et al., 2014). The subcortical broadband gamma reduction
Page 20 of 39Journal of Cognitive Neuroscience
123456789101112131415161718192021222324252627282930313233343536373839404142434445464748495051525354555657585960

For Review Only
confirms similar findings in rodent studies (Reed et al., 2013), and in one small series of
thalamic recordings in humans (Verdonck et al., 2014). Broadband gamma power in cortex is
thought to be an index of local neural activity and a surrogate for neural spiking (Miller et al.,
2007, Manning et al., 2009). The interpretation of broadband gamma in subcortical structures is
less clear, but may similarly represent the sum of local neuronal spiking. Indeed, event-related
broadband gamma changes similar to those reported in cortex have been observed in subcortical
structures (Ray et al., 2012, Hamame et al., 2014).
Gamma power decreases are often associated with low frequency power increases (Crone
et al., 1998a, Crone et al., 1998b). The low frequency power increases (2-6 Hz) that we observe
in both cortex and subcortex may relate to this same process. Therefore, one interpretation is that
the changes in power observed during loss of consciousness relate to decreased neural activity in
regions that play key roles in generating behavior.
An alternative explanation is that the low frequency (2-6 Hz) power changes in both
cortex and subcortex have a different etiology than the high frequency power changes. Several
studies have reported low frequency power increases in cortex during anesthesia induction
(Breshears et al., 2010, Lewis et al., 2012, Purdon et al., 2013, Verdonck et al., 2014). In some
cases, this emerging low frequency activity is asynchronous across cortex and has been
interpreted as a mechanism whereby different brain networks become disconnected from one
another (Lewis et al., 2012, Purdon et al., 2013). In many of these studies, the low frequency
activity is in a slightly lower frequency range (<2 Hz) than is observed here, nevertheless, other
studies have shown these changes over a broader frequency range (Verdonck et al., 2014), and so
it is possible that a similar mechanism is involved.
Page 21 of 39 Journal of Cognitive Neuroscience
123456789101112131415161718192021222324252627282930313233343536373839404142434445464748495051525354555657585960

For Review Only
Limitations
There are several limitations to our study. While our recording methods have high temporal
resolution, the precision with which the state of consciousness is assessed, using standard
anesthesia scales, is less temporally precise. This may have limited the changes we could detect.
All our participants were movement disorder patients, who necessarily have abnormal motor
networks, and subcortical recording sites were limited to clinically indicated targets for ethical
reasons. We sought to minimize this problem by including patients with different diagnoses,
which presumably have different pathophysiologies, and by focusing on patterns that were
consistent across patients. Nevertheless, an alternative interpretation is that activity changes
associated with induction reflect the cessation of symptoms, which occurs with anesthesia.
Additionally, the inclusion of different diagnoses further increased the heterogeneity of our
sample, which may have decreased our sensitivity for finding effects, and makes interpretation
more complex. Likewise, while examination of multiple subcortical targets allowed us to focus
on motifs common to multiple nodes of the BGTC motor loop, it also increased the potential for
signal variability. Thus we may be insensitive to changes that are present most strongly in only
certain subcortical regions. Finally, the use of ECoG strip arrays that can be inserted via a burr
hole limited our spatial sampling. Our results may not generalize to the entire cortex (although
there are similarities between our data and that recorded with a greater spatial sampling, (see
Breshears et al., 2010)). Investigation of other, more distributed brain networks, was precluded
by the ethical constraints of working with human patients in the operating room.
Page 22 of 39Journal of Cognitive Neuroscience
123456789101112131415161718192021222324252627282930313233343536373839404142434445464748495051525354555657585960

For Review Only
Conclusion
Using a method that allowed us to simultaneously collect high spatial and temporal resolution
data from human cortex and subcortical nuclei, we have shown a narrowband reduction in motor
system interactions in the beta band across subjects during loss of consciousness. These results
support a mechanism for communication throughout brain networks that involves synchronous
oscillatory activity that is frequency-specific, and breaks down when organized recruitment of a
brain network for behavior is impossible (i.e. during unconsciousness). These results shed light
on possible general mechanisms of neural communication in the human brain.
Page 23 of 39 Journal of Cognitive Neuroscience
123456789101112131415161718192021222324252627282930313233343536373839404142434445464748495051525354555657585960

For Review Only
References
Alegre M, Rodriguez-Oroz MC, Valencia M, Perez-Alcazar M, Guridi J, Iriarte J, Obeso JA,
Artieda J (2010) Changes in subthalamic activity during movement observation in
Parkinson's disease: is the mirror system mirrored in the basal ganglia? Clin
Neurophysiol 121:414-425.
Alexander GE, DeLong MR, Strick PL (1986) Parallel organization of functionally segregated
circuits linking basal ganglia and cortex. Annual review of neuroscience 9:357-381.
Alkire MT, Hudetz AG, Tononi G (2008) Consciousness and anesthesia. Science (New York,
NY 322:876-880.
Arthuis M, Valton L, Regis J, Chauvel P, Wendling F, Naccache L, Bernard C, Bartolomei F
(2009) Impaired consciousness during temporal lobe seizures is related to increased long-
distance cortical-subcortical synchronization. Brain 132:2091-2101.
Bonhomme V, Boveroux P, Brichant JF, Laureys S, Boly M (2012) Neural correlates of
consciousness during general anesthesia using functional magnetic resonance imaging
(fMRI). Archives italiennes de biologie 150:155-163.
Breshears JD, Roland JL, Sharma M, Gaona CM, Freudenburg ZV, Tempelhoff R, Avidan MS,
Leuthardt EC (2010) Stable and dynamic cortical electrophysiology of induction and
emergence with propofol anesthesia. Proc Natl Acad Sci U S A 107:21170-21175.
Brovelli A, Ding M, Ledberg A, Chen Y, Nakamura R, Bressler SL (2004) Beta oscillations in a
large-scale sensorimotor cortical network: directional influences revealed by Granger
causality. Proc Natl Acad Sci U S A 101:9849-9854.
Canolty RT, Edwards E, Dalal SS, Soltani M, Nagarajan SS, Kirsch HE, Berger MS, Barbaro
NM, Knight RT (2006) High gamma power is phase-locked to theta oscillations in human
neocortex. Science (New York, NY 313:1626-1628.
Page 24 of 39Journal of Cognitive Neuroscience
123456789101112131415161718192021222324252627282930313233343536373839404142434445464748495051525354555657585960
For Review Only
Canolty RT, Knight RT (2010) The functional role of cross-frequency coupling. Trends in
Cognitive Sciences 14:506-515.
Cassidy M, Mazzone P, Oliviero A, Insola A, Tonali P, Di Lazzaro V, Brown P (2002)
Movement-related changes in synchronization in the human basal ganglia. Brain
125:1235-1246.
Chennu S, Finoia P, Kamau E, Allanson J, Williams GB, Monti MM, Noreika V, Arnatkeviciute
A, Canales-Johnson A, Olivares F, Cabezas-Soto D, Menon DK, Pickard JD, Owen AM,
Bekinschtein TA (2014) Spectral signatures of reorganised brain networks in disorders of
consciousness. PLoS computational biology 10:e1003887.
Chernik DA, Gillings D, Laine H, Hendler J, Silver JM, Davidson AB, Schwam EM, Siegel JL
(1990) Validity and reliability of the Observer's Assessment of Alertness/Sedation Scale:
study with intravenous midazolam. Journal of clinical psychopharmacology 10:244-251.
Ching S, Cimenser A, Purdon PL, Brown EN, Kopell NJ (2010) Thalamocortical model for a
propofol-induced alpha-rhythm associated with loss of consciousness. Proc Natl Acad Sci
U S A 107:22665-22670.
Crone NE, Miglioretti DL, Gordon B, Lesser RP (1998a) Functional mapping of human
sensorimotor cortex with electrocorticographic spectral analysis. II. Event-related
synchronization in the gamma band. Brain 121 ( Pt 12):2301-2315.
Crone NE, Miglioretti DL, Gordon B, Sieracki JM, Wilson MT, Uematsu S, Lesser RP (1998b)
Functional mapping of human sensorimotor cortex with electrocorticographic spectral
analysis. I. Alpha and beta event-related desynchronization. Brain 121 ( Pt 12):2271-
2299.
Crowell AL, Ryapolova-Webb ES, Ostrem JL, Galifianakis NB, Shimamoto S, Lim DA, Starr
PA (2012) Oscillations in sensorimotor cortex in movement disorders: an
electrocorticography study. Brain.
Page 25 of 39 Journal of Cognitive Neuroscience
123456789101112131415161718192021222324252627282930313233343536373839404142434445464748495051525354555657585960

For Review Only
de Hemptinne C, Ryapolova-Webb ES, Air EL, Garcia PA, Miller KJ, Ojemann JG, Ostrem JL,
Galifianakis NB, Starr PA (2013) Exaggerated phase-amplitude coupling in the primary
motor cortex in Parkinson disease. Proc Natl Acad Sci U S A 110:4780-4785.
de Hemptinne C, Swann N, Ostrem J, Ryapolova-Webb E, M SL, N G, P S (2015) Therapeutic
deep brain stimulation reduces cortical phase amplitude coupling in Parkinson’s disease.
Nat Neurosci in press.
Delorme A, Makeig S (2004) EEGLAB: an open source toolbox for analysis of single-trial EEG
dynamics including independent component analysis. Journal of neuroscience methods
134:9-21.
Engel AK, Singer W (2001) Temporal binding and the neural correlates of sensory awareness.
Trends Cogn Sci 5:16-25.
Fechner J, Ihmsen H, Hatterscheid D, Jeleazcov C, Schiessl C, Vornov JJ, Schwilden H,
Schuttler J (2004) Comparative pharmacokinetics and pharmacodynamics of the new
propofol prodrug GPI 15715 and propofol emulsion. Anesthesiology 101:626-639.
Fernandez-Espejo D, Bekinschtein T, Monti MM, Pickard JD, Junque C, Coleman MR, Owen
AM (2011) Diffusion weighted imaging distinguishes the vegetative state from the
minimally conscious state. Neuroimage 54:103-112.
Feshchenko VA, Veselis RA, Reinsel RA (2004) Propofol-induced alpha rhythm.
Neuropsychobiology 50:257-266.
Follett KA, Weaver FM, Stern M, Hur K, Harris CL, Luo P, Marks WJ, Jr., Rothlind J, Sagher
O, Moy C, Pahwa R, Burchiel K, Hogarth P, Lai EC, Duda JE, Holloway K, Samii A,
Horn S, Bronstein JM, Stoner G, Starr PA, Simpson R, Baltuch G, De Salles A, Huang
GD, Reda DJ, Group CSPS (2010) Pallidal versus subthalamic deep-brain stimulation for
Parkinson's disease. The New England journal of medicine 362:2077-2091.
Fries P (2005) A mechanism for cognitive dynamics: neuronal communication through neuronal
coherence. Trends in Cognitive Sciences 9:474-480.
Page 26 of 39Journal of Cognitive Neuroscience
123456789101112131415161718192021222324252627282930313233343536373839404142434445464748495051525354555657585960

For Review Only
Goldfine AM, Schiff ND (2011) Consciousness: its neurobiology and the major classes of
impairment. Neurologic clinics 29:723-737.
Hamame CM, Alario FX, Llorens A, Liegeois-Chauvel C, Trebuchon-Da Fonseca A (2014)
High frequency gamma activity in the left hippocampus predicts visual object naming
performance. Brain and language 135:104-114.
Kuhn AA, Williams D, Kupsch A, Limousin P, Hariz M, Schneider GH, Yarrow K, Brown P
(2004) Event-related beta desynchronization in human subthalamic nucleus correlates
with motor performance. Brain 127:735-746.
Lalo E, Thobois S, Sharott A, Polo G, Mertens P, Pogosyan A, Brown P (2008) Patterns of
bidirectional communication between cortex and basal ganglia during movement in
patients with Parkinson disease. J Neurosci 28:3008-3016.
Laureys S (2005) The neural correlate of (un)awareness: lessons from the vegetative state.
Trends Cogn Sci 9:556-559.
Laureys S, Goldman S, Phillips C, Van Bogaert P, Aerts J, Luxen A, Franck G, Maquet P (1999)
Impaired effective cortical connectivity in vegetative state: preliminary investigation
using PET. Neuroimage 9:377-382.
Laureys S, Schiff ND (2012) Coma and consciousness: paradigms (re)framed by neuroimaging.
Neuroimage 61:478-491.
Lewis LD, Weiner VS, Mukamel EA, Donoghue JA, Eskandar EN, Madsen JR, Anderson WS,
Hochberg LR, Cash SS, Brown EN, Purdon PL (2012) Rapid fragmentation of neuronal
networks at the onset of propofol-induced unconsciousness. Proc Natl Acad Sci U S A
109:E3377-3386.
Manning JR, Jacobs J, Fried I, Kahana MJ (2009) Broadband shifts in local field potential power
spectra are correlated with single-neuron spiking in humans. J Neurosci 29:13613-13620.
Page 27 of 39 Journal of Cognitive Neuroscience
123456789101112131415161718192021222324252627282930313233343536373839404142434445464748495051525354555657585960

For Review Only
Massimini M, Ferrarelli F, Sarasso S, Tononi G (2012) Cortical mechanisms of loss of
consciousness: insight from TMS/EEG studies. Archives italiennes de biologie 150:44-
55.
Miller KJ, Hermes D, Honey CJ, Hebb AO, Ramsey NF, Knight RT, Ojemann JG, Fetz EE
(2012) Human motor cortical activity is selectively phase-entrained on underlying
rhythms. PLoS computational biology 8:e1002655.
Miller KJ, Leuthardt EC, Schalk G, Rao RPN, Anderson NR, Moran DW, Miller JW, Ojemann
JG (2007) Spectral Changes in Cortical Surface Potentials during Motor Movement.
Journal of Neuroscience 27:2424-2432.
Mukamel EA, Pirondini E, Babadi B, Wong KF, Pierce ET, Harrell PG, Walsh JL, Salazar-
Gomez AF, Cash SS, Eskandar EN, Weiner VS, Brown EN, Purdon PL (2014) A
transition in brain state during propofol-induced unconsciousness. J Neurosci 34:839-
845.
Murthy VN, Fetz EE (1992) Coherent 25- to 35-Hz oscillations in the sensorimotor cortex of
awake behaving monkeys. Proc Natl Acad Sci U S A 89:5670-5674.
Papavassiliou E, Rau G, Heath S, Abosch A, Barbaro NM, Larson PS, Lamborn K, Starr PA
(2004) Thalamic deep brain stimulation for essential tremor: relation of lead location to
outcome. Neurosurgery 54:1120-1129; discussion 1129-1130.
Pfurtscheller G (1981) Central beta rhythm during sensorimotor activities in man.
Electroencephalogr Clin Neurophysiol 51:253-264.
Purdon PL, Pierce ET, Mukamel EA, Prerau MJ, Walsh JL, Wong KF, Salazar-Gomez AF,
Harrell PG, Sampson AL, Cimenser A, Ching S, Kopell NJ, Tavares-Stoeckel C, Habeeb
K, Merhar R, Brown EN (2013) Electroencephalogram signatures of loss and recovery of
consciousness from propofol. Proc Natl Acad Sci U S A 110:E1142-1151.
Ray NJ, Brittain JS, Holland P, Joundi RA, Stein JF, Aziz TZ, Jenkinson N (2012) The role of
the subthalamic nucleus in response inhibition: Evidence from local field potential
recordings in the human subthalamic nucleus. Neuroimage 60:271-278.
Page 28 of 39Journal of Cognitive Neuroscience
123456789101112131415161718192021222324252627282930313233343536373839404142434445464748495051525354555657585960

For Review Only
Raz A, Eimerl D, Zaidel A, Bergman H, Israel Z (2010) Propofol decreases neuronal population
spiking activity in the subthalamic nucleus of Parkinsonian patients. Anesthesia and
analgesia 111:1285-1289.
Reed SJ, Plourde G, Tobin S, Chapman CA (2013) Partial antagonism of propofol anaesthesia by
physostigmine in rats is associated with potentiation of fast (80-200 Hz) oscillations in
the thalamus. British journal of anaesthesia 110:646-653.
Sanes JN, Donoghue JP (1993) Oscillations in local field potentials of the primate motor cortex
during voluntary movement. Proc Natl Acad Sci U S A 90:4470-4474.
Sarasso S, Rosanova M, Casali AG, Casarotto S, Fecchio M, Boly M, Gosseries O, Tononi G,
Laureys S, Massimini M (2014) Quantifying cortical EEG responses to TMS in
(un)consciousness. Clinical EEG and neuroscience 45:40-49.
Shahlaie K, Larson PS, Starr PA (2011) Intraoperative computed tomography for deep brain
stimulation surgery: technique and accuracy assessment. Neurosurgery 68:114-124;
discussion 124.
Shimamoto SA, Ryapolova-Webb ES, Ostrem JL, Galifianakis NB, Miller KJ, Starr PA (2013)
Subthalamic nucleus neurons are synchronized to primary motor cortex local field
potentials in Parkinson's disease. J Neurosci 33:7220-7233.
Siegel M, Donner TH, Engel AK (2012) Spectral fingerprints of large-scale neuronal
interactions. Nat Rev Neurosci 13:121-134.
Smith C, McEwan AI, Jhaveri R, Wilkinson M, Goodman D, Smith LR, Canada AT, Glass PS
(1994) The interaction of fentanyl on the Cp50 of propofol for loss of consciousness and
skin incision. Anesthesiology 81:820-828; discussion 826A.
Starr PA, Christine CW, Theodosopoulos PV, Lindsey N, Byrd D, Mosley A, Marks WJ, Jr.
(2002) Implantation of deep brain stimulators into the subthalamic nucleus: technical
approach and magnetic resonance imaging-verified lead locations. Journal of
neurosurgery 97:370-387.
Page 29 of 39 Journal of Cognitive Neuroscience
123456789101112131415161718192021222324252627282930313233343536373839404142434445464748495051525354555657585960

For Review Only
Starr PA, Turner RS, Rau G, Lindsey N, Heath S, Volz M, Ostrem JL, Marks WJ, Jr. (2006)
Microelectrode-guided implantation of deep brain stimulators into the globus pallidus
internus for dystonia: techniques, electrode locations, and outcomes. Journal of
neurosurgery 104:488-501.
Tort AB, Kramer MA, Thorn C, Gibson DJ, Kubota Y, Graybiel AM, Kopell NJ (2008)
Dynamic cross-frequency couplings of local field potential oscillations in rat striatum and
hippocampus during performance of a T-maze task. Proc Natl Acad Sci U S A
105:20517-20522.
van Wijk BC, Beek PJ, Daffertshofer A (2012) Neural synchrony within the motor system: what
have we learned so far? Frontiers in human neuroscience 6:252.
Verdonck O, Reed SJ, Hall J, Gotman J, Plourde G (2014) The sensory thalamus and cerebral
motor cortex are affected concurrently during induction of anesthesia with propofol: a
case series with intracranial electroencephalogram recordings. Canadian journal of
anaesthesia = Journal canadien d'anesthesie 61:254-262.
Yanagisawa T, Yamashita O, Hirata M, Kishima H, Saitoh Y, Goto T, Yoshimine T, Kamitani Y
(2012) Regulation of motor representation by phase-amplitude coupling in the
sensorimotor cortex. J Neurosci 32:15467-15475.
Yousry TA, Schmid UD, Alkadhi H, Schmidt D, Peraud A, Buettner A, Winkler P (1997)
Localization of the motor hand area to a knob on the precentral gyrus. A new landmark.
Brain 120 ( Pt 1):141-157.
Zheng Z, Reggente N, Lutkenhoff E, Owen AM, Monti M (2014) Structural connectivity
between the thalamus and fronto-temporal regions predicts level of awareness in
disorders of consciousness. Society for Neuroscience Conference (Abs).
Page 30 of 39Journal of Cognitive Neuroscience
123456789101112131415161718192021222324252627282930313233343536373839404142434445464748495051525354555657585960

For Review Only
Table 1. MOAA/S Responsiveness Scale. Rating criteria for each state.
State Responsiveness
5 Responds readily to name spoken in normal tone
4 Lethargic response to name spoken in normal tone
3 Responds only after name is called loudly and/or repeatedly
2 Responds only after mild prodding or shaking
1 Responds only after painful trapezius squeeze
0 No response after painful trapezius squeeze
Page 31 of 39 Journal of Cognitive Neuroscience
123456789101112131415161718192021222324252627282930313233343536373839404142434445464748495051525354555657585960

For Review Only
Figure Legends
1. 3D brain reconstructions of each subject’s MRI with the low resolution (A) and high
resolution (B) ECoG strips, and the subcortical DBS electrode, positioned in STN (indicated
with red arrows) (C). Electrode locations (shown in red) are visualized by merging an
intraoperative CT with a preoperative MRI.
2. Example data from individual subject #6. One second of raw M1 ECoG (A) data and raw LFP
data (from STN) (B). Log PSD from M1 (C) and STN (D). The gray bars indicate 60 Hz noise
and the harmonics. (E) Coherence between M1 and STN (F). Histogram of mean M1 broadband
gamma amplitude (70-150 Hz) binned by subcortical beta phase (18-20 Hz). Here modulation is
apparent. A flat distribution would suggest no PAC.
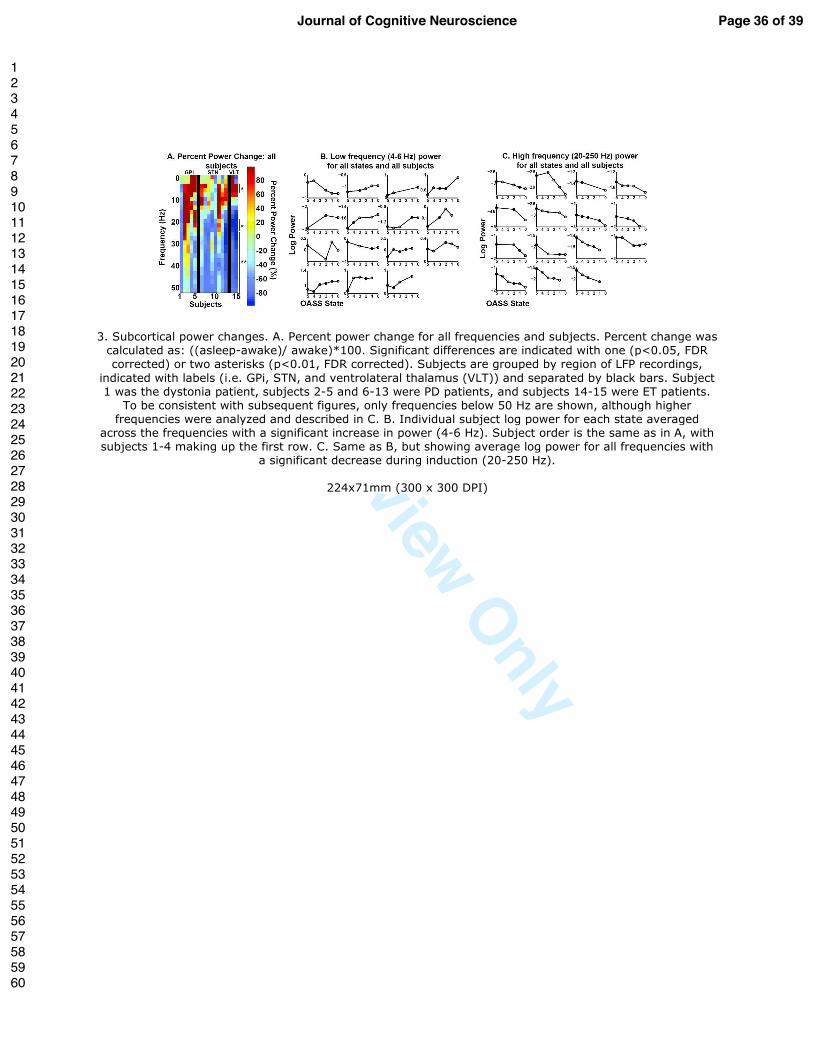
3. Subcortical power changes. A. Percent power change for all frequencies and subjects. Percent
change was calculated as: ((asleep-awake)/ awake)*100. Significant differences are indicated
with one (p<0.05, FDR corrected) or two asterisks (p<0.01, FDR corrected). Subjects are
grouped by region of LFP recordings, indicated with labels (i.e. GPi, STN, and ventrolateral
thalamus (VLT)) and separated by black bars. Subject 1 was the dystonia patient, subjects 2-5
and 6-13 were PD patients, and subjects 14-15 were ET patients. To be consistent with
subsequent figures, only frequencies below 50 Hz are shown, although higher frequencies were
analyzed and described in C. B. Individual subject log power for each state averaged across the
frequencies with a significant increase in power (4-6 Hz). Subject order is the same as in A, with
Page 32 of 39Journal of Cognitive Neuroscience
123456789101112131415161718192021222324252627282930313233343536373839404142434445464748495051525354555657585960

For Review Only
subjects 1-4 making up the first row. C. Same as B, but showing average log power for all
frequencies with a significant decrease during induction (20-250 Hz).
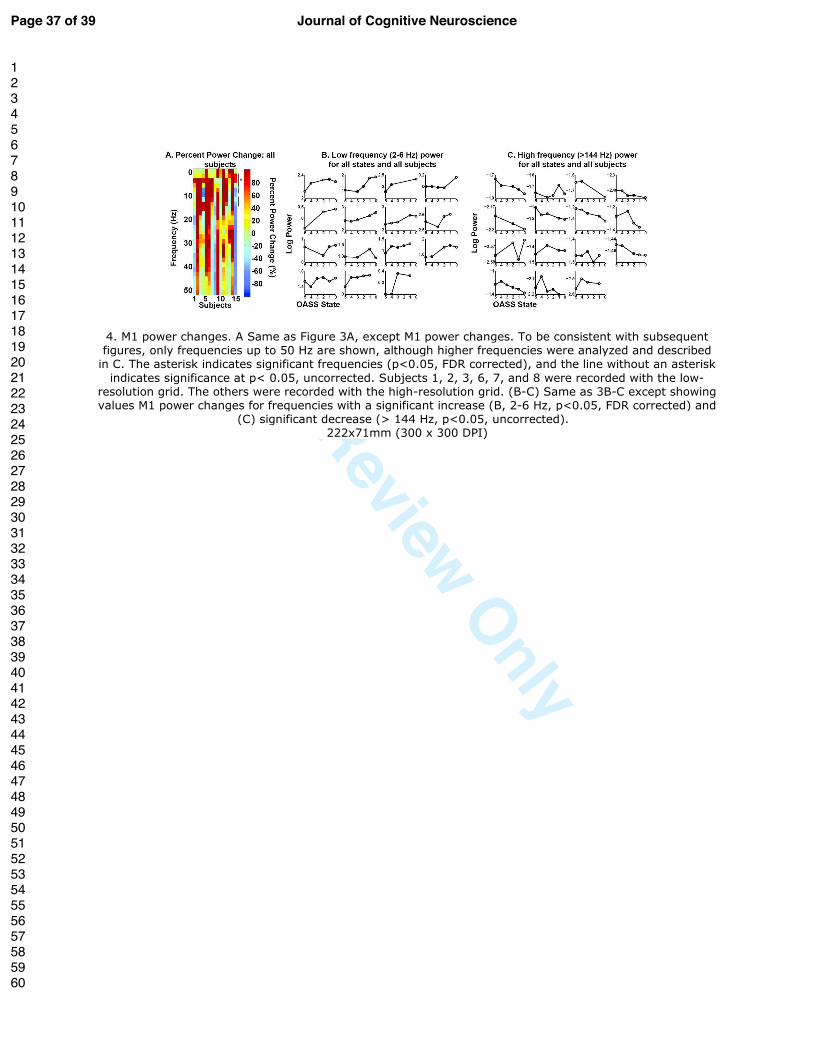
4. M1 power changes. A Same as Figure 3A, except M1 power changes. To be consistent with
subsequent figures, only frequencies up to 50 Hz are shown, although higher frequencies were
analyzed and described in C. The asterisk indicates significant frequencies (p<0.05, FDR
corrected), and the line without an asterisk indicates significance at p< 0.05, uncorrected.
Subjects 1, 2, 3, 6, 7, and 8 were recorded with the low-resolution grid. The others were recorded
with the high-resolution grid. (B-C) Same as 3B-C except showing values M1 power changes for
frequencies with a significant increase (B, 2-6 Hz, p<0.05, FDR corrected) and (C) significant
decrease (> 144 Hz, p<0.05, uncorrected).
5. M1 and subcortical coherence changes. A. Same as Figure 3A, except M1 and subcortical
coherence changes. Significant differences are indicated with one (p<0.05, FDR corrected) or
two asterisks (p<0.01, FDR corrected). B. Individual subject coherence shown for each state for
18-24 Hz. Subject order is the same as in Figure 3B.
6. M1 and subcortical PAC changes. PAC is calculated using subcortical phase and broadband
M1 amplitude (70-150 Hz). A. Same as Figure 3A, except PAC changes. Significant differences
are indicated with one (p<0.05, FDR corrected) or 2 asterisks (p<0.01, FDR corrected). B.
Individual subject PAC averaged between 18-20 Hz. Subject order is the same as in Figure 3B.
Page 33 of 39 Journal of Cognitive Neuroscience
123456789101112131415161718192021222324252627282930313233343536373839404142434445464748495051525354555657585960

For Review Only
1. 3D brain reconstructions of each subject’s MRI with the low resolution (A) and high resolution (B) ECoG strips, and the subcortical DBS electrode, positioned in STN (indicated with red arrows) (C). Electrode
locations are visualized by merging an intraoperative CT with a preoperative MRI. 92x24mm (300 x 300 DPI)
Page 34 of 39Journal of Cognitive Neuroscience
123456789101112131415161718192021222324252627282930313233343536373839404142434445464748495051525354555657585960

For Review Only
2. Example data from individual subject #6. One second of raw M1 ECoG (A) data and raw LFP data (from STN) (B). Log PSD from M1 (C) and STN (D). The gray bars indicate 60 Hz noise and the harmonics. (E) Coherence between M1 and STN (F). Histogram of mean M1 broadband gamma amplitude (70-150 Hz)
binned by subcortical beta phase (18-20 Hz). Here modulation is apparent. A flat distribution would suggest no PAC.
127x144mm (300 x 300 DPI)
Page 35 of 39 Journal of Cognitive Neuroscience
123456789101112131415161718192021222324252627282930313233343536373839404142434445464748495051525354555657585960
For Review Only
3. Subcortical power changes. A. Percent power change for all frequencies and subjects. Percent change was calculated as: ((asleep-awake)/ awake)*100. Significant differences are indicated with one (p<0.05, FDR corrected) or two asterisks (p<0.01, FDR corrected). Subjects are grouped by region of LFP recordings,
indicated with labels (i.e. GPi, STN, and ventrolateral thalamus (VLT)) and separated by black bars. Subject 1 was the dystonia patient, subjects 2-5 and 6-13 were PD patients, and subjects 14-15 were ET patients.
To be consistent with subsequent figures, only frequencies below 50 Hz are shown, although higher frequencies were analyzed and described in C. B. Individual subject log power for each state averaged
across the frequencies with a significant increase in power (4-6 Hz). Subject order is the same as in A, with subjects 1-4 making up the first row. C. Same as B, but showing average log power for all frequencies with
a significant decrease during induction (20-250 Hz).
224x71mm (300 x 300 DPI)
Page 36 of 39Journal of Cognitive Neuroscience
123456789101112131415161718192021222324252627282930313233343536373839404142434445464748495051525354555657585960
For Review Only
4. M1 power changes. A Same as Figure 3A, except M1 power changes. To be consistent with subsequent figures, only frequencies up to 50 Hz are shown, although higher frequencies were analyzed and described
in C. The asterisk indicates significant frequencies (p<0.05, FDR corrected), and the line without an asterisk indicates significance at p< 0.05, uncorrected. Subjects 1, 2, 3, 6, 7, and 8 were recorded with the low-
resolution grid. The others were recorded with the high-resolution grid. (B-C) Same as 3B-C except showing values M1 power changes for frequencies with a significant increase (B, 2-6 Hz, p<0.05, FDR corrected) and
(C) significant decrease (> 144 Hz, p<0.05, uncorrected). 222x71mm (300 x 300 DPI)
Page 37 of 39 Journal of Cognitive Neuroscience
123456789101112131415161718192021222324252627282930313233343536373839404142434445464748495051525354555657585960

For Review Only
5. M1 and subcortical coherence changes. A. Same as Figure 3A, except M1 and subcortical coherence
changes. Significant differences are indicated with one (p<0.05, FDR corrected) or two asterisks (p<0.01, FDR corrected). B. Individual subject coherence shown for each state for 18-24 Hz. Subject order is the
same as in Figure 3B. 142x69mm (300 x 300 DPI)
Page 38 of 39Journal of Cognitive Neuroscience
123456789101112131415161718192021222324252627282930313233343536373839404142434445464748495051525354555657585960

For Review Only
6. M1 and subcortical PAC changes. PAC is calculated using subcortical phase and broadband M1 amplitude (70-150 Hz). A. Same as Figure 3A, except PAC changes. Significant differences are indicated with one (p<0.05, FDR corrected) or 2 asterisks (p<0.01, FDR corrected). B. Individual subject PAC averaged
between 18-20 Hz. Subject order is the same as in Figure 3B.
142x75mm (300 x 300 DPI)
Page 39 of 39 Journal of Cognitive Neuroscience
123456789101112131415161718192021222324252627282930313233343536373839404142434445464748495051525354555657585960