Decomposing the variation in population growth into contributions from multiple demographic rates
13
Journal of Animal Ecology 2005 74, 789–801 © 2005 British Ecological Society Blackwell Publishing, Ltd. Decomposing the variation in population growth into contributions from multiple demographic rates TIM COULSON*, JEAN-MICHEL GAILLARD† and MARCO FESTA-BIANCHET‡ *Department of Biological Sciences, Imperial College at Silwood Park, Ascot, Berks SL5 7PY, UK; †Laboratory ‘Biométrie et Biologie Evolutive’, Unité Mixte de Recherche 5558, Bât. 711, University Lyon 1, 43 Boulevard du 11 Novembre 1918, F-69622 Villeurbanne Cedex, France; and ‡ Département de biologie, Université de Sherbrooke, Sherbrooke, Québec J1K 2R1, Canada Summary 1. The decomposition of variation in population growth into the relative contributions from different demographic rates has multiple uses in population, conservation and evolutionary biology. Recent research has favoured methods based on matrix models termed ‘life-table-response experiments’ or more generally ‘the retrospective matrix method’, which provide an approximation of a complete demographic decomposition. The performance of the approximation has not been assessed. 2. We compare the performance of the retrospective matrix method to a complete decomposition for two bighorn sheep populations and one red deer population. 3. Different demographic rates make markedly different contributions to variation in growth rate between populations, because each population is subject to different types of environmental variation. 4. The most influential demographic rates identified from decomposing observed variation in population growth are often not those showing the highest elasticity. Consequently, those demographic rates most strongly associated with deterministic population growth are not necessarily strongly associated with temporal variation in population growth. 5. The retrospective matrix method provides a good approximation of the demo- graphic rate associated most strongly with variation in population growth. However, failure to incorporate the contribution of covariation between demographic rates when decomposing variation in population growth can lead to spurious conclusions. Key-words: bighorn sheep, critical life history stage, demographic variation, elasticity, red deer, retrospective matrix method, vital rates. Journal of Animal Ecology (2005) 74, 789–801 doi: 10.1111/j.1365-2656.2005.00975.x Introduction Ecologists are interested in the relative contribution of different demographic rates to variation in population growth, because knowledge of these contributions is required to inform wildlife-management strategies (Caswell, Fujiwara & Brault 1999) and to explore selec- tion on life-history traits (Benton, Grant & Clutton-Brock 1995; Saether & Bakke 2000; van Tienderen 2000). For example, to halt a decline in population size, an obvious first step is to identify the demographic cause of the decline. Several methods to identify the relative contri- butions of demographic rates to variation in popula- tion growth have been developed (Varley & Gradwell 1960; Brown & Alexander 1991; Brault & Caswell 1993; Horvitz, Schemske & Caswell 1997; Sibly & Smith 1997) and have been used widely for ungulates (Brown et al . 1993; Coulson et al . 1999; Albon et al . 2000; Gaillard et al . 2000), birds (Erikstad et al . 1998; Saether & Bakke 2000; Wisdom, Mills & Doak 2000), reptiles (Mills, Doak & Wisdom 1999; Caswell 2001), small mammals (Dobson & Oli 2001) and marine mammals (Brault & Caswell 1993). Reviews of this literature have led to proposed generalizations (outlined later) about the associations between demographic rates and variation in population growth. These generalizations, Correspondence: Tim Coulson, Department of Biological Sciences, Imperial College at Silwood Park, Ascot, Berks, SL5 7PY, UK. E-mail: [email protected]
-
Upload
universite-lyon -
Category
Documents
-
view
0 -
download
0
Transcript of Decomposing the variation in population growth into contributions from multiple demographic rates

Journal of Animal Ecology
2005
74
, 789–801
© 2005 British Ecological Society
Blackwell Publishing, Ltd.
Decomposing the variation in population growth into contributions from multiple demographic rates
TIM COULSON*, JEAN-MICHEL GAILLARD† and MARCO FESTA-BIANCHET‡
*
Department of Biological Sciences, Imperial College at Silwood Park, Ascot, Berks SL5 7PY, UK;
†
Laboratory ‘Biométrie et Biologie Evolutive’, Unité Mixte de Recherche 5558, Bât. 711, University Lyon 1, 43 Boulevard du 11 Novembre 1918, F-69622 Villeurbanne Cedex, France; and
‡
Département de biologie, Université de Sherbrooke, Sherbrooke, Québec J1K 2R1, Canada
Summary
1.
The decomposition of variation in population growth into the relative contributionsfrom different demographic rates has multiple uses in population, conservation andevolutionary biology. Recent research has favoured methods based on matrix modelstermed ‘life-table-response experiments’ or more generally ‘the retrospective matrixmethod’, which provide an approximation of a complete demographic decomposition.The performance of the approximation has not been assessed.
2.
We compare the performance of the retrospective matrix method to a completedecomposition for two bighorn sheep populations and one red deer population.
3.
Different demographic rates make markedly different contributions to variation ingrowth rate between populations, because each population is subject to different typesof environmental variation.
4.
The most influential demographic rates identified from decomposing observedvariation in population growth are often not those showing the highest elasticity.Consequently, those demographic rates most strongly associated with deterministicpopulation growth are not necessarily strongly associated with temporal variation inpopulation growth.
5.
The retrospective matrix method provides a good approximation of the demo-graphic rate associated most strongly with variation in population growth. However,failure to incorporate the contribution of covariation between demographic rates whendecomposing variation in population growth can lead to spurious conclusions.
Key-words
: bighorn sheep, critical life history stage, demographic variation, elasticity,red deer, retrospective matrix method, vital rates.
Journal of Animal Ecology
(2005)
74
, 789–801doi: 10.1111/j.1365-2656.2005.00975.x
Introduction
Ecologists are interested in the relative contribution ofdifferent demographic rates to variation in populationgrowth, because knowledge of these contributionsis required to inform wildlife-management strategies(Caswell, Fujiwara & Brault 1999) and to explore selec-tion on life-history traits (Benton, Grant & Clutton-Brock1995; Saether & Bakke 2000; van Tienderen 2000). Forexample, to halt a decline in population size, an obviousfirst step is to identify the demographic cause of the
decline. Several methods to identify the relative contri-butions of demographic rates to variation in popula-tion growth have been developed (Varley & Gradwell1960; Brown & Alexander 1991; Brault & Caswell 1993;Horvitz, Schemske & Caswell 1997; Sibly & Smith 1997)and have been used widely for ungulates (Brown
et al
.1993; Coulson
et al
. 1999; Albon
et al
. 2000; Gaillard
et al
. 2000), birds (Erikstad
et al
. 1998; Saether &Bakke 2000; Wisdom, Mills & Doak 2000), reptiles(Mills, Doak & Wisdom 1999; Caswell 2001), smallmammals (Dobson & Oli 2001) and marine mammals(Brault & Caswell 1993). Reviews of this literature haveled to proposed generalizations (outlined later) aboutthe associations between demographic rates andvariation in population growth. These generalizations,
Correspondence: Tim Coulson, Department of BiologicalSciences, Imperial College at Silwood Park, Ascot, Berks, SL57PY, UK. E-mail: [email protected]

790
T. Coulson, J. M. Gaillard & M. Festa-Bianchet
© 2005 British Ecological Society,
Journal of Animal Ecology
,
74
, 789–801
however, are speculative because (i) comparisons of thevarious methods have not been made, (ii) most researchhas ignored the contribution of the covariationbetween demographic rates on variation in populationgrowth and (iii) there are few comparisons betweenmultiple populations of the same species living in con-trasting environments.
The first method developed to decompose the vari-ation in population growth into the relative contribu-tions of different demographic rates was
k
-value analysis(Varley & Gradwell 1960). This involves regressing
k
-values describing state-specific per generation mortal-ity and recruitment rates against the sum of the
k
-values.
K
-value analysis was used widely until Manly (1990)and Royama (1996) highlighted several problemswith the method. At this point, ecologists began usingapproaches developed in demography (e.g. Tuljapurkar1982; Lande 1988) or developed their own approaches(e.g. Sibly & Smith 1997). The most accurate of thesemethods is structured accounting of the variance ofdemographic change (SDA, Brown & Alexander 1991),which provides a complete account of causes of variationin a time series of per capita change [(
N
t
+1
−
N
t
)
/N
t
where
N
t
is population size in year
t
]. Because it requiresperfect demographic knowledge of a population, how-ever, the method has been rarely applied.
Another method based on matrix models (Caswell2001) has been applied widely by researchers interestedin stochastic demography. Following Caswell’s (2000)definitions, we call this approach the retrospective matrixmethod. It provides an asymptotic first-order linearapproximation of a complete decomposition of vari-ation in the natural rate of increase (
N
t
+1
/N
t
; Lande 1988;Brault & Caswell 1993; Horvitz
et al
. 1997; Gaillard
et al
. 2000). The approximation is asymptotic becauseit is based on elasticities (or sensitivities) of the domin-ant eigenvalue (
λ
) to elements of a deterministic matrix:the method assumes that temporal fluctuations in thedemographic structure of the population do not have asubstantial impact on variation in a time-series of
N
t
+1
/N
t
. In contrast, SDA incorporates any influence ofdemographic fluctuations on variation in the per capitachange [(
N
t
+1
−
N
t
)
/N
t
=
N
t
+1
/N
t
−
1]. The natural rate ofincrease (
N
t
+1
/
N
t
) and per capita change (
N
t
+1
/N
t
−
1) arequantities with different means (1 and 0, respectively)but equivalent variances. Consequently, the decom-position provided by the retrospective matrix methodcan be compared with the decomposition provided bySDA. Having made the distinction between the twoquantities for brevity we will refer to both
N
t
+1
/N
t
and
N
t
+1
/N
t
−
1
as population growth and the asymptoticapproximation of
N
t
+1
/N
t
as
λ
.The retrospective matrix method differs from the
prospective matrix method, which determines the func-tional dependence of deterministic population growthon a demographic rate. Specifically, the prospectivematrix method determines how much
λ
would changeif a change in a demographic rate were to occur, while theretrospective matrix method extends the prospective
matrix method to approximate a decomposition of vari-ation in population growth by incorporating variationin demographic rates.
Research developing the retrospective matrix methodwas initiated by Tuljapurkar (1982), who providedthe first analytical approximation of a link betweendemographic rates and variation in population growth,by decomposing the dominant Lyapunov exponent ofpopulation growth [specifically ln(
λ
)]. Lande (1988)and Brault & Caswell (1993) introduced the now widelyused decomposition of variance in population growthwhich was subsequently made popular by, among others,Horvitz
et al
. (1997), Saether & Bakke (2000) andGaillard
et al
. (2000). As far as we are aware there havebeen no comparisons of the performance of the first-order linear approximations of the decomposition ofvariance in population growth provided by the retro-spective matrix method with the complete decomposi-tion provided by the SDA method.
Most applications of the retrospective matrix methodhave been based on a yearly description of the life cycle,and have reported contribution to age- or stage-specificdemographic rates to variation in population growth.In contrast, most applications of the SDA approachhave reported results from a seasonal description ofthe life cycle and have reported contributions of age-classes, or of demographic rates to variation in popu-lation growth. Both the retrospective matrix methodand SDA can be applied to seasonal and non-seasonaldescriptions of the life cycle, and both methods allowvariance decompositions to be reported across ageclasses, across demographic rates or across class-specificdemographic rates. We report decompositions thatare comparable to previous publications using bothapproaches. As the retrospective matrix method hasbeen applied mainly to non-seasonal descriptions of lifecycles and has been applied more widely than SDAwe compare the two approaches with a non-seasonaldescription of the life cycle.
Here we present the first comparison between theSDA and the retrospective matrix method using detailedindividual-based life-history data from two populationsof bighorn sheep (
Ovis canadensis
, Shaw) in Alberta,Canada (Jorgenson
et al
. 1997; Festa-Bianchet &Jorgenson 1998) and a population of red deer on Rum,Scotland (Clutton-Brock, Guinness & Albon 1982;Coulson
et al
. 2003b). First we present a completedecomposition of variation in population growth forthe bighorn sheep populations using SDA and a sea-sonal description of the life cycle. These results can becompared with previous publications using SDA,including application of the approach to the red deerdata (Albon
et al
. 2000). Next, we use SDA to provideresults from a non-seasonal description of the life cyclethat are compared with results from the retrospectivematrix method. We report results that (i) supportRoyama’s (1992) observation that results depend onthe description of the life cycle used, (ii) show that forungulate populations the retrospective matrix method

791
Variation in population growth
© 2005 British Ecological Society,
Journal of Animal Ecology
,
74
, 789–801
provides an acceptable approximation of the completedecomposition of population growth provided by SDA,(iii) report that in all populations examined covariationbetween demographic rates contributed substantiallyto variation in population growth and (iv) suggest thatcross-population generalizations concerning the asso-ciation between demographic rates and variation inpopulation growth may be unwarranted if covariationbetween demographic rates is strongly associated withvariation in population growth. Finally we cautionagainst the unfettered use of prospective and retrospec-tive matrix methods for conservation.
Methods
Each study followed a similar data-collection protocol,where individuals are captured within a few days (reddeer) to a few months (bighorn sheep) of birth, tagged,weighed and then monitored throughout life withdeath dates and breeding attempts recorded. Over 95%of yearling and adult females were individually recog-nizable in all populations each year. Genotyping andbehavioural observation identify mother–young rela-tionships. Yearly resighting probabilities are > 99% forfemales and > 95% for males in all populations, andpopulation size and age and sex structure are knownexactly. Further details of study areas and data collec-tion methods are published elsewhere (Jorgenson
et al
.1997; Festa-Bianchet, Gaillard & Jorgenson 1998a; forbighorn sheep; Clutton-Brock
et al
. 1982; Clutton-Brock& Coulson 2002 for red deer).
Bighorn sheep ewes at Ram Mountain were experi-mentally transplanted to another population from1972 to 1980; complete data on population size andcomposition exist from 1976 to the present. An averageof 2·6 (range 0–6) mature rams each year was shot byhunters between 1976 and 1997. In 1997, 14 more eweswere removed as part of an experimental manipulationand mortality was affected by a subsequent substantialincrease in cougar predation, so we chose to concen-trate on detailed data up to the summer of 1997 only.Consequently, the Ram Mountain data set consists ofyearly population composition and demographic ratesfor the years 1976–96. Ewes transplanted in 1976–80(
n
= 39) or that died in trapping accidents (
n
= 3) wereexcluded from the analyses. Between 1976 and 1987 thepopulation increased in size (‘increase period’); between1988 and 1996 the population showed no persistenttemporal trend (‘no trend period’) (Fig. 1). We analysedata for all years (1976–96) and for the ‘increase’ and‘no trend’ periods separately.
We used detailed data on the bighorn sheep popula-tion at Sheep River from 1983 to 2000. Over this periodthe population showed no persistent temporal trend(Fig. 1) so we only consider the data set as a whole.
The red deer population living in the North Blockof Rum was released from culling in 1972, increased
during the 1970s and has been comparatively stablesince the early 1980s. Albon
et al
. (2000) applied the SDAapproach to data from this population for the years1971–97, and for comparison with these results we con-sider the same data set. We consider an ‘increase period
’
from 1971 to 1981 and a ‘no trend period’ when thepopulation was fluctuating around ecological carryingcapacity (1982–97), as well as considering the data setas a whole.
For both bighorn sheep populations we consideredthree age classes
−
yearlings, adults (aged between 2and 7) and older adults (Loison
et al
. 1999). The yearran from 1 May in year
t
to 30 April in year
t
+ 1, withall births assumed to happen on 1 May (Festa-Bianchet1988a). For red deer we considered yearlings, adults
Fig. 1. Time-series of counts (solid symbols) and populationgrowth (Nt+1/Nt: open symbols) for the female component(yearlings and adults) of the population for the bighorn sheeppopulations at Ram Mountain and Sheep River and for thered deer population in the North Block of Rum.

792
T. Coulson, J. M. Gaillard & M. Festa-Bianchet
© 2005 British Ecological Society,
Journal of Animal Ecology
,
74
, 789–801
(aged between two and 10) and older adults. The onsetof survival senescence is at about 8 years for bighornsheep (Loison
et al
. 1999) and about 11 years for reddeer (Benton
et al
. 1995). We consider only the femalecomponents of our study populations.
We used structured accounting of the variance ofdemographic change (SDA) to produce an exact decom-position of the variation in population growth for eachstudy and subset of years defined above. Full metho-dological details of SDA have been published elsewhere(Brown & Alexander 1991) and the method has beenimplemented for large vertebrate data sets (Brown
et al
.1993; Coulson
et al
. 1999; Albon
et al
. 2000). Below wegive a verbal account of the philosophy underlyingSDA.
If complete demographic information is known itis possible to decompose the variation in populationgrowth over a period of time into contributions fromage-specific demographic rates, fluctuations in the age-structure and covariation between the demographicrates. To do this an equation that describes the popu-lation dynamics needs to be formulated. We firstconsider an equation incorporating seasonal variationin survival rates to allow comparison with previousapplications of the SDA approach. When this equationis parameterized and observed initial conditions set, itwill produce the observed change in population sizebetween two time steps. For example, eqn 1 describesthe population growth in population size between years
i
and
i +
1 (
δ
N
= (
N
t
+1
−
N
t
)
/N
t
) caused by age-specificbirth and death processes in a seasonal environment asused by Coulson
et al
. (1999) and Albon
et al
. (2000)
eqn 1
This equation can be rewritten as:
eqn 2
where
n
is the total number of age/stage groups,
a
j
is theproportion of the population in age group
j
,
b
j
is thebirth rate of individuals in age groups
j
,
s
j
and
t
j
are,respectively, the summer and winter survival rates ofoffspring born to individuals in group
j
,
S
j
and
T
j
are,respectively, the summer and winter survival rate ofindividuals in group
j
. Summer survival was measuredfrom 1 May to 1 October, and winter survival wasmeasured from 1 October to 1 May in the following year.Note that in this formulation recruits to the populationare described as the product of age-specific birth rate,summer survival rate and winter survival rate foreach age class (yearlings, prime aged adults and olderadults).
Over
i
years, there will be
i
−
1
values of
δ
N
. Because allanimals in each population were individually markedand closely monitored, each
δ
N
is known exactly, as is
the value of each of the parameters that determine each
δ
Ni. SDA then decomposes the variation in populationgrowth [specifically var(δN)] into contributions fromthe variation of each age-class specific demographicrate and all the covariations between model parameters.The method produces a structured demographicaccount that is the variance in the relative change in sizeof the whole population expressed as a sum over ageclasses and/or demographic rates, each expressed interms of products of elements such as birth rate, off-spring and adult survival rates (Brown et al. 1991). Theaccount can be presented in a variety of ways. In theresults section we initially follow the protocol of Brown& Alexander (1991) by providing two accounts. Firstwe present the contribution of variation in demographicrates to variation in population growth. In other wordsvar(δNt ) is described by contributions from variationin the age-structure (a), in the birth rate (b), in offspringsummer survival (s), in offspring winter survival (t), inadult summer survival (S), i n adult winter survival (T)and all the covariances between these demographic rates.This decomposition does not distinguish betweendemographic rates of specific age classes − for example,the account reports the contribution of variation in thebirth rate pooled across yearlings, prime-aged adultsand older adults rather than contributions from eachage class. The second account reports the contributionof variation in demographic rates pooled for each ageclass and covariation between pooled demographicrates between age-classes. For example, this accountreports that variation in demographic rates in age-classx explained y% of variation in var(δN). Results fromthis decomposition are comparable with previouspublications using the SDA method and a seasonaldescription of the life cycle (Brown & Alexander 1991;Coulson et al. 1999; Albon et al. 2000).
To make our results comparable with the retrospec-tive matrix method described below, however, wesimplify eqn 1 to remove the seasonal components andestimate annual survival rates, re-run the analyses andthen report the account in a third way. We do this byre-running the SDA analysis on a non-seasonal (yearly)description of variation in population growth using thefollowing demographic rates:• recruitment rate of prime-aged adult females (AR):the number of daughters aged 1 year that enter thepopulation at the beginning of year t + 1 per prime-aged adult female in the population at the beginning ofyear t.• recruitment rate of older adult females (SR): thenumber of daughters aged 1 year that enter the popu-lation at the beginning of year t + 1 per older adultfemale in the population at the beginning of year t.• yearling survival (YS): the proportion of femalesaged one year at the beginning of year t that survive tothe beginning of year t + 1.• adult survival (AS): the proportion of adult femalesthat survived from the beginning of year t to the beginningof year t + 1.
δN a b s t a S Tt j j j j j j j
j
n
( ( ))= − −=
∑ 11
δN a b s t a a S Tt j j j j j j j j
j
n
( )= − +=
∑1
793Variation in population growth
© 2005 British Ecological Society, Journal of Animal Ecology, 74, 789–801
• older adult survival (SS): the proportion of olderfemales that survived from the beginning of year t tothe beginning of year t + 1.
This third account reports the contribution of vari-ation in AR, SR, YS, AS and SS and their covariances.For brevity, we did not report various other termsthat include variation and covariation involving age-structure, a.
For each of the five demographic rates described abovewe estimated means and variances over the time periodsbeing considered. We used the mean values to constructa prebreeding census Leslie matrix model (Caswell2001), e.g.
eqn 3
for red deer.From this matrix we analytically estimated elasticities
of λ (i.e. change in λ resulting from a proportionalchange in a demographic rate) for each demographic rateindependently (see Caswell 2001 for further details).For AS and AR we summed the appropriate age-specificelasticities to generate a single value for each age-class-specific demographic rate. Matrix algebra wasperformed in (version 6·1).
The approximation of the association between vari-ation in a demographic rate and variation in popula-tion growth is estimated by multiplying the square ofthe elasticity by the square of the CV of the associateddemographic rate. Identical results can be obtained byusing the square of the sensitivity of a demographicrate multiplied by the variance in that demographicrate (e.g. Horvitz et al. 1997; Gaillard & Yoccoz 2003).
The approximation of the association between thecovariation between two demographic rates (VR1 andVR2) and variation in population growth can be esti-mated by e1 * CV1 * e2 * CV2 * cor(VR1,VR2) where ei
is the elasticity of VRi, CVi, is the coefficient of varia-tion of VRi, and cor(VR1,VR2) is the parametric cor-relation between VR1 and VR2.
There are two important differences between the SDAapproach and the retrospective matrix method. First,the retrospective matrix method assumes that the popu-lation age structure is at equilibrium, while the SDAapproach does not. Second, the retrospective matrixmethod provides an asymptotic linear approximationof the decomposition of variation in population growth,while the SDA approach provides an exact decom-position of variation in population growth. If variation
in population growth is small, then we would expect thefirst order linear approximation to work well and thepopulation to remain relatively close to its equilibriumage structure. Any lack of fit of a correlation betweenestimates from the SDA method and estimates from theretrospective matrix method will provide an idea of theeffects of variation in age structure and covariationbetween age-structure and demographic rates uponvariation in population growth. We describe the simi-larity between the approaches using r 2 values fromparametric regression fits and ρ-values from non-parametric regression fits between the contributions ofthe SDA and retrospective analyses.
Results
Using our population model we report the contribu-tions of the recruitment component (ajbjsjtj), themortality component (aJTj), the covariation betweenrecruitment and mortality and all components com-bined (‘performance’ sensu Brown & Alexander 1991).We do this across all age classes (the top row of tables inTable 1) for the birth rate, summer offspring survival,winter offspring survival and mortality pooled acrossyearlings, adults and older adults, and by age class (thesecond row of tables in Table 1) pooled across demo-graphic rates. This decomposition cannot be compareddirectly with the retrospective matrix method as appliedhere, but allows comparison with the published workof Brown et al. (1993), Albon et al. (2000) and Coulsonet al. (1999).
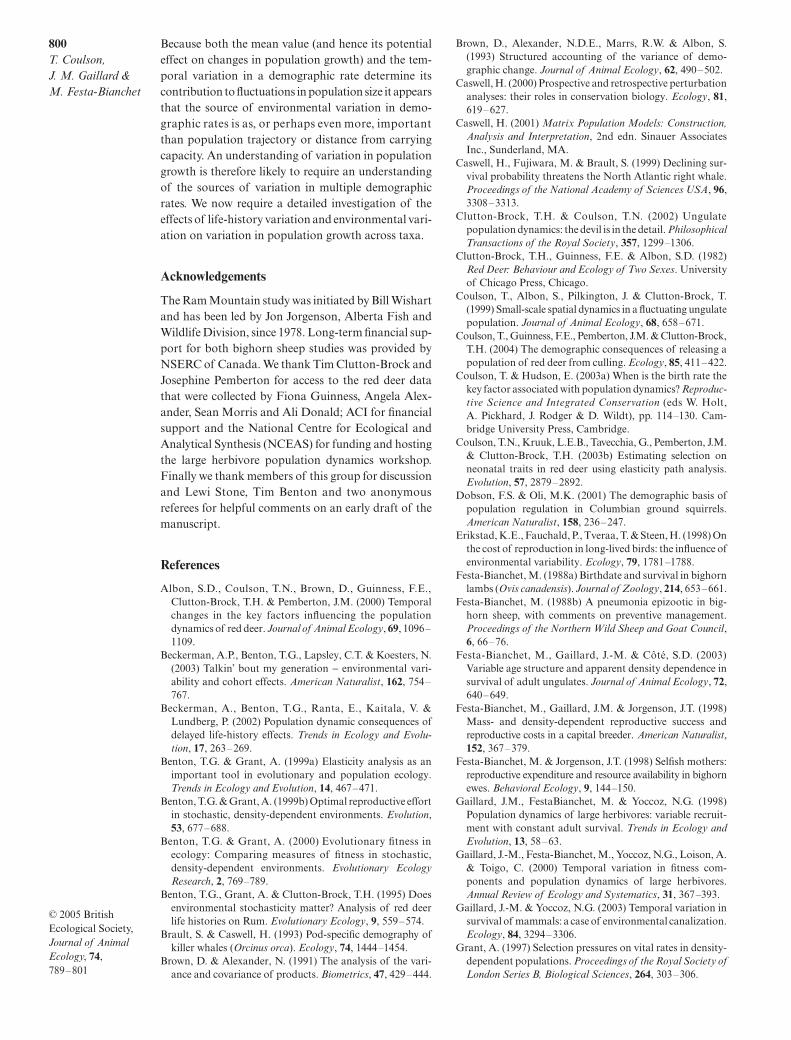
To illustrate how to interpret these results we providea specific description of Table 1. At Ram Mountain thevariation in birth rate across all age classes contributed9·2% to the variation in population growth and thecovariation between the birth rate and adult survival con-tributed 1·8% (first row of tables). The age class columnreports how much variation in population growth isexplained by variation in the age structure over the timeperiod considered. For example, covariation betweenthe age structure and the birth rate explained −3·7% ofvariation in population growth at Ram Mountain. Anegative percentage represents a pairwise covariationbetween age-structure variation and birth rate variationthat decreases variation in population growth. Whenwe consider the contribution of different age classes(second row of tables) we can see that yearlings con-tributed 3·7% to the variation in growth, entirely viathe mortality component (value of 3·7 in the mortalitypart in the second row of Table 1), because yearlings donot reproduce. The covariation between adult andolder adult mortality contributed 0·2% and mortalityacross all age classes contributed a total of 12·3% tovariation in per capita growth. The correlation coeffi-cient between yearling and prime adult mortality was0·4 (third row of tables). The values in the above para-graph are highlighted with cell borders in Table 1.
T
AR SRYS
ASAS
SS
=
0 00 0 0
0 00
L
L
L
L
O

794T. Coulson, J. M. Gaillard & M. Festa-Bianchet
© 2005 British Ecological Society, Journal of Animal Ecology, 74, 789–801
Table 1. Results from a decomposition of variation of per capita change for two bighorn sheep populations using a structured demographic account(SDA). The first row of tables reports the contributions of each demographic rate across all ages. The central diagonal represents the contribution of eachdemographic rate; off-diagonals in the upper right-hand corner of the top row of matrices represent the pairwise covariation between demographic ratesand off-diagonals in the lower left-hand corner of the matrices represent the simultaneous independent variation in each pair of demographic rates (seeBrown & Alexander 1991). Values represent mean percentage contributions from 1000 bootstraps, and values in the shaded cells give the bootstrapstandard errors. Only two-way covariances are reported. The second row of tables reports the contribution of different age-classes across demographicrates and decomposed into the contributions from recruitment, mortality and their covariation. Again, values represent percentage contributions. Thethird (and final) row of tables reports correlation coefficients between the age-specific demographic rates for performance, recruitment, mortality and theircovariation. Boxed values are referred to in the text
Ram Mountain 1976−1996 Sheep River 1976−1996
Age structure
Birth rate
Lamb summer survival
Lamb winter survival
Adult survival
Age structure
Birth rate
Lamb summer survival
Lamb winter survival
Adult survival
Age structure 3·5 −3·7 −0·3 −0·3 −0·7 0·5 0·3 −0·1 −0·1 −0·61·10 2·82 2·30 3·37 5·67 0·15 0·46 0·75 1·57 2·90
Birth rate 0·5 9·2 2·6 0·7 1·8 0·1 1·7 1·2 −0·3 2·00·13 3·02 3·43 4·78 4·94 0·02 0·49 1·13 2·11 3·22
Lamb summer survival 0·3 0·4 8·0 3·2 13·0 0·1 0·1 4·1 −2·6 10·00·07 0·11 1·29 0·54 2·05 0·03 0·01 0·32 0·21 0·69
Lamb winter survival 0·8 1·1 0·6 21·2 17·5 0·3 0·4 0·6 13·9 34·90·23 0·28 0·10 3·41 3·00 0·10 0·04 0·05 1·04 2·41
Adult survival 1·9 0·0 0·0 0·0 15·3 1·2 0·0 0·0 0·0 44·00·47 0·00 0·00 0·00 2·64 0·24 0·00 0·00 0·00 3·08
Performance Performance
Yearlings 2−7 years > 7 years Total Yearlings 2−7 years > 7 years Total
Yearlings 3·7 2.82−7 years 11·4 47·5 4.8 35.5> 7 years 0·2 21·8 15·3 100 5.1 32.9 18.9 100
Recruitment RecruitmentYearlings2−7 years 42·5 10.7> 7 years 5·4 7·6 55·5 2.5 10.8 23.9
Mortality MortalityYearlings 3.7 2.82−7 years −2.0 4·0 1.0 17.7> 7 years 1.6 0·2 4·7 12·3 4.5 6.0 12.5 44.5
Recruitment mortality Recruitment mortalityYearlings2−7 years 13.5 0·9 19·1 3.8 7.1 8.0> 7 years −1.4 −2·9 3·0 32·2 0.7 16.4 −4.4 31.6
Performance Performance
Yearlings 2−7 years > 7 years Yearlings 2−7 years > 7 years
Yearlings 1 12−7 years 0·4 1 0·2 1> 7 years 0·0 0·4 1 0·4 0·6 1
Recruitment RecruitmentYearlings2−7 years 1 1> 7 years 0·0 1 0·1 1
Mortality MortalityYearlings 1 12−7 years 0·4 1 0·1 1> 7 years 0·0 0·2 1 0·4 0·2 1
Recruitment mortality Recruitment mortalityYearlings2−7 years 0·5 0·0 0·7 0·351 0·257 0·347> 7 years −0·1 −0·3 0·3 0·061 0·595 −0·191

795Variation in population growth
© 2005 British Ecological Society, Journal of Animal Ecology, 74, 789–801
Results differed between the Ram Mountain and SheepRiver populations (Table 1), demonstrating that vari-ation in growth in two populations of the same speciescan be affected in different ways by variation in demo-graphic rates, even though they exhibited similar vari-ation in population growth (Sheep River var(δNt) =0·015, Ram Mountain var(δNt) = 0·012). At RamMountain the direct contribution of mortality pooledacross yearlings, prime adults and older adults explained15·3% of the variation in population growth comparedto 44% at Sheep River. Lamb winter survival, explained21·2% and 13·9% of the variance in the two popula-tions. The contributions of covariation between demo-graphic rates to variation in population growth weresimilar and substantial (32·2% at Ram Mountain a31·6% at Sheep River). The contribution of individualcovariances, however, did vary between the two studies.For example, the covariation between lamb wintersurvival and adult survival was larger at Sheep River(34·9% vs. 17·5% at Ram Mountain).
All the results reported above suggest a strikingdifference between the two populations, but are thedifferences significant? As well as the estimated contri-butions of each demographic rate to variation in popu-lation growth, Table 1 reports standard errors from1000 bootstraps of the data. If statistical significance isassessed by comparing the means ± 1·96 times the boot-strap standard errors the differences reported above arestatistically significant.
‘ ’ ‘ ’
Bighorn sheep on Ram Mountain and red deer on Rumshow similar patterns of variation in direct contribu-tions of demographic rates to variation in populationgrowth during their respective increase periods (Fig. 2).A linear regression between the direct contributions foreach population was highly significant (F1,30 = 24·11,P = 0·016, r2 > 0·5). For both populations the birth ratewas the dominant demographic rate explaining 38·6%and 29·9% of the variation for bighorn sheep and red deer,respectively; the second most dominant demographicrate was survival pooled across yearlings, prime agedadults and older adults: it explained 22·3% and 28·1%,respectively. Differences between these two popula-tions arose when the impact of covariation betweendemographic rates was explored; the most importantcovariation for bighorn sheep was between lamb sum-mer survival and survival pooled across yearlings,prime aged adults and older adults (17·9%), while forred deer it was between birth rate and pooled survival(22·6%). A linear regression comparing all contribu-tions (both direct and from the covariances) betweenthe populations was significant (F1,16 = 6·27, P = 0·026,r2 = 0·33: Fig. 2). For both populations the prime-aged
adult class dominated the account explaining 50·7% ofthe variation for bighorn sheep and 54·7% of the vari-ation for red deer. Note that demographic rates are pooledacross age classes for this comparison.
There was very good agreement in the direct contri-bution of demographic rates and covariation betweendemographic rates to variation in growth between thered deer population during the ‘no trend’ period andthe Sheep River bighorn sheep population (Fig. 3:F1,13 = 281·5, P ∼ 0, r2 = 0·98). In both populationspooled survival was the dominant demographic rate(bighorn sheep 44%, red deer 40·6%) followed byjuvenile winter survival (bighorn sheep 13·9%, red deer14·1%). The most important covariation was betweenadult survival and juvenile winter survival (bighornsheep 34·9%, red deer 40·6%).
The bighorn sheep population at Ram Mountainduring the ‘no trend’ period differed substantially fromeither the bighorn sheep population at Sheep River orthe ‘no trend’ period for the red deer population in twocontributions (Fig. 3). The contribution of pooled sur-vival and the covariation between pooled survival andjuvenile winter survival contributed only 13·47% and18·05%, respectively, at Sheep River, so were approxi-mately half as important as the covariation in the othertwo study systems. This suggests that the differencebetween the two bighorn sheep populations is not sim-ply a result of the different population trajectories. Inaddition, the dominant demographic rate at SheepRiver was lamb winter survival (19·9%) compared tosurvival pooled across yearlings, prime aged adults andolder adults at Ram Mountain and on Rum. Finally,there was a substantial contribution of the covariationbetween juvenile summer survival and juvenile winter
Fig. 2. Scatter plot of the relationship between the contri-butions of demographic rates to population growth for the reddeer population and the bighorn sheep population at RamMountain during their increase phases. Values on the axesrepresent percentage contribution to demographic rates. A =age group, B = birth rate, S = adult survival, s = offspringsummer survival, w = offspring winter survival and two lettercombinations of these demographic rates represent pairwisesimultaneous covariation between the demographic rates.

796T. Coulson, J. M. Gaillard & M. Festa-Bianchet
© 2005 British Ecological Society, Journal of Animal Ecology, 74, 789–801
survival (12·1%) at Sheep River that was not observedin either of the other studies. However, if we exceptthe two markedly lower contributions of covariationbetween pooled survival and juvenile winter survivaland of pooled survival observed at Ram Mountain,the contributions across studies were well correlated(Fig. 3).
We next report a demographic account to produceestimates of the contribution of age-specific demo-graphic rates to variation in population growth that arecomparable with results from the retrospective matrixmethod reported in Table 2. Table 2 reports the contri-bution of age-specific recruitment and survival rates onvariation in population growth but does not show thecontribution of age-structure variation or covariationwith demographic rates.
Means and variances of demographic rates that wereused to compare the SDA method run on a yearly basisand the retrospective matrix method are displayed inTable 4. Parametric and non-parametric linear regres-sions between the SDA contributions and contribu-tions from the retrospective matrix method are allsignificant (Table 5) and, with the exception of red deerat high density (r2 = 0·46, ρ < 0·05), all had r2 valuesgreater than 0·7. Examination of the residuals revealedno consistent patterns of positive or negative residualsbetween methods. The retrospective matrix methodidentified the same important contributions of demo-graphic rate covariation as the SDA method. Covari-ation between demographic rates explained between 1/
Fig. 3. Scatter plots of the relationships between the contributions of demographic rates to population growth for the red deerpopulation and the two bighorn sheep populations for the no trend periods. Values represent percentage contributions. Fittedlines represent regression fits – all of which are significant (Sheep River vs. Ram Mountain F1,13 = 11·94, r = 0·004; Ram Mountainvs. red deer F1,13 = 13·4, P = 0·0028 and Sheep River vs. red deer F1,13 = 281·5, P ∼ 0).
Table 2. Results from the simplified SDA approach. Values on the diagonal represent the percentage contribution of eachdemographic rate to variation in population growth and values below the main diagonal represent the pairwise covariationbetween demographic rates. We report only contributions of the terms that provide comparisons with the retrospective matrixmethod
Increase No trend All years
Red deerAdult recruitment 27·1 25·5 3·9 0·7 1·2 8·4 4·6 3·0 3·3 5·6 15·3 13·9 3·3 3·3 7·2Older adult recruitment 18·5 13·8 3·3 3·1 9·5 4·2 2·3 14·5 13·8 7·0 3·8 11·2Yearling survival 11·4 −0·5 −4·4 2·7 2·8 10·3 4·4 1·9 3·4Adult survival 4·7 7·6 1·9 5·7 2·7 6·4Older adult survival 9·3 17·6 11·9
Bighorn sheep, Ram MountainAdult recruitment 49·3 −0·8 27·1 2·0 5·8 23·0 33·4 10·8 −1·6 15·0 37·5 13·9 21·1 3·9 11·0Older adult recruitment 6·3 −6·1 −5·7 −5·6 22·8 8·5 −5·7 15·0 10·6 2·6 −4·6 3·0Yearling survival 21·6 −28·2 −0·8 6·5 −1·4 5·6 8·7 −2·4 3·4Adult survival 23·6 −10·0 4·5 −4·4 6·1 −0·9Older adult survival 22·5 7·2 5·4
Bighorn sheep, Sheep RiverAdult recruitment 0·5 6·3 3·5 6·8 4·6Older adult recruitment 7·8 1·2 13·2 3·6Yearling survival 3·2 0·5 3·3Adult survival 16·5 9·6Older adult survival 11·4

797Variation in population growth
© 2005 British Ecological Society, Journal of Animal Ecology, 74, 789–801
3 and 1/2 of the variation in population growth (Fig. 4).Survival of prime-aged females had the highest elastic-ties of λ in all five case studies. However, the demo-graphic rate showing the largest contribution (excluding
covariation between demographic rates) to variation inλ differed among case studies: recruitment by prime-aged females was the critical demographic rate in reddeer and bighorn sheep at Ram Mountain during the
Table 3. Comparison between the impact of the recruitment and mortality components and their covariances between the fulland the simplified SDA approaches
Bighorn sheep, Ram Mountain Red deer
Simple Full Simple Full
Increase periodRecruitment 54·8 52·1 71·1 51·2Mortality 28·8 28·1 27·7 27·6Covariation 17·4 13·8 26·0 21·2
Bighorn sheep, Ram Mountain
Bighorn sheep, Sheep River Red deer
Simple Full Simple Full Simple Full
No trend periodRecruitment 79·2 49·4 14·6 18·5 22·5 23·4Mortality 18·0 16·2 44·6 44·0 41·0 41·0Covariation 42·0 31·1 32·9 46·9 31·9 39·8
Table 4. Means and variances for the five demographic rates used for the retrospective matrix analysis by study and period
Demographic rate
Red deer Bighorn sheep (Ram Mountain)
Bighorn sheep (Sheep River)
Mean Variance Mean Variance Mean Variance1971–1997 1976–1997 1983–2000
AR 0·1729 0·0037 0·2005 0·0117 0·1317 0·0045SR 0·2111 0·0069 0·2459 0·0316 0·1593 0·0121YS 0·9230 0·0038 0·7718 0·0403 0·8795 0·0274AS 0·9550 0·0009 0·9403 0·0017 0·9029 0·0081SS 0·8862 0·0075 0·8374 0·0155 0·7890 0·0173
1971–1980 1976–1987AR 0·2044 0·0032 0·2554 0·0068SR 0·2614 0·0066 0·2390 0·0183YS 0·9327 0·0037 0·8462 0·0197AS 0·9721 0·0005 0·9485 0·0020SS 0·9124 0·0034 0·8499 0·0187
1980–1997 1988–1997AR 0·1546 0·0032 0·1457 0·0113SR 0·1815 0·0050 0·2529 0·0492YS 0·9173 0·0039 0·6974 0·0540AS 0·9449 0·0008 0·9321 0·0015SS 0·8708 0·0095 0·8250 0·0141
Table 5. Summary of parametric and non-parametric regressions between results from the SDA analysis and the retrospectivematrix methods for bighorn sheep and red deer
Data set F(1,13) r2 P-value rho P-value
Red deer – low density 34·2810 0·7250 <0·0001 0·918 <0·0001Red deer – high density 11·1020 0·4610 0·0054 0·7320 0·0062Red deer – all years 12·0800 0·4816 0·0041 0·729 0·0065Bighorn sheep, Ram Mountain: low density 80·8010 0·8610 <0·0001 0·925 0·0005Bighorn sheep, Ram Mountain: high density 25·2490 0·6600 0·0002 0·8880 0·0009Bighorn sheep, Ram Mountain: all years 36·4500 0·7344 <0·0001 0·889 0·0009Bighorn sheep, Sheep River: all years 39·4170 0·7520 0·0001 0·862 0·0012

798T. Coulson, J. M. Gaillard & M. Festa-Bianchet
© 2005 British Ecological Society, Journal of Animal Ecology, 74, 789–801
‘increase’ period as well as in bighorn sheep at RamMountain during the ‘no trend’ period (along withrecruitment by older females in that latter case), whereasvariation in the survival of old females and in theprime-aged survival accounted for most changes in reddeer during the ‘no trend’ period and in bighorn sheepat Sheep River, respectively (Table 2).
Discussion
Our analyses produced five important results. First,populations of the same species living in different en-vironments can have contrasting associations betweenvariation in demographic rates and variation in popu-lation growth. Second, demographic rates with thehighest elasticities of λ are not often those showing thelargest contributions to variation in population growth.Third, there is little evidence that either of the pre-vious generalizations (Gaillard et al. 2000; Coulson &Hudson 2003) is supported. Fourth, any decomposi-tion of variation in population growth should considercovariation between demographic rates. Finallly, theretrospective matrix method provides a satisfactorydecomposition under the majority of circumstances weinvestigated.
The proximate reason for the contrasting resultsbetween the two bighorn sheep populations is theirdifference in variation around demographic rates. Forlarge mammals, adult survival will invariably have thelargest potential impact (elasticity) as adult survivalrates are high and the majority of animals within apopulation are adults (Gaillard, Festa-Bianchet &Yoccoz 1998; Gaillard et al. 2000). The contribution ofa demographic rate to variation in population growth,however, is also dependent on its temporal variation.Because adult survival at Sheep River was high butvariable it accounted for three times as much variationin population growth compared to Ram Mountain,where adult survival rates were high and constant. Theultimate reason for the contrasting results is differencesin the ecological processes that generate variation in
population growth [pneumonia and predation at SheepRiver (Festa-Bianchet 1988b; Jorgenson et al. 1997;Ross et al. 1997) and density-dependence at RamMountain (Festa-Bianchet & Jorgenson 1998; Festa-Bianchet et al. 1998a; Festa-Bianchet, Gaillard & Côté2003)].
The large diversity of ecological processes that affectpopulations of large vertebrates generates differentdemographic responses that potentially allow all life-history stages to play a substantial role in contributingto distributions of population growth characterizedfrom a time series. As Gaillard et al. (2000) and Caswell(2000) observed, prospective and retrospective matrixmethods can identify different demographic ratesinfluencing different moments of a distribution ofpopulation growth. Although this result is not surpris-ing − there is no a priori expectation for a demographicrate to be strongly associated with both the mean (theprospective matrix method) and the variance (the retro-spective matrix method) of a time-series of populationgrowth − some conservation managers may considerthe prospective and retrospective matrix methods asaddressing the same question (see Caswell 2000 for anexcellent discussion of the two methods).
Our two SDA analyses also provide support forRoyama’s (1992) observation that the way the life his-tory is described can influence the interpretation of ananalysis of population dynamics. The different ways ofreporting the SDA analyses also demonstrate there arevarious ways to report a decomposition of variation inpopulation growth. Retrospective matrix methods typ-ically report contributions of age-specific demographicrates measured on an annual scale. However, there arecircumstances − for example, estimating the role ofrecruitment or survival across age-classes to variationin population growth − when it could also be illuminat-ing to report the contribution of age-classes acrossdemographic rates, or the contribution of demographicrates across age-classes. This can be achieved using theretrospective matrix method by summing contribu-tions across rates or classes. Recently Lande, Engen &Saether (2003) showed how to decompose variation inpopulation growth into contributions from density-dependence, environmental and demographic stochas-ticity. It may prove useful to combine the variousdecomposition methods available to estimate the con-tribution of different ecological processes within andbetween age-classes and demographic rates.
With detailed data on three populations we can onlymake a limited number of comparisons. Our results,however, do not completely support either of two pre-viously suggested generalizations. First, although thedominant demographic rate contributing to variationin population growth in increasing populations of bothred deer and bighorn sheep was adult recruitment asproposed by Coulson & Hudson (2003), results fromRam Mountain in the ‘no trend’ period do not supporttheir argument that prime-aged and older adult sur-vival are the dominant demographic rates in static
Fig. 4. The relative contribution of direct effects and covari-ation between demographic rates on variation in populationgrowth for each species and period from the retrospectivematrix method. Values have been transformed to percentagesto aid comparison between analyses.

799Variation in population growth
© 2005 British Ecological Society, Journal of Animal Ecology, 74, 789–801
populations; in this population during the ‘no trend’period, recruitment of yearlings by prime-aged andolder adults was the dominant demographic rate.Second, results from Sheep River and Rum (see alsoAlbon et al. 2000) demonstrate that the contribution ofvariation in juvenile survival to variation in populationgrowth is not necessarily dominant as reported byGaillard et al. (2000). The generalizations proposed byGaillard et al. (2000) and Coulson & Hudson (2003)were based on studies that ignored covariation betweendemographic rates. Before any new generalizations canbe proposed further studies examining the associationbetween demographic rate covariation and variation inpopulation growth are required. The probable reasonfor the differences between the results reported hereand the results reported by Gaillard et al. (2000) for thesame populations is that Gaillard et al. (2000) did notincorporate demographic rate covariation into theiranalyses.
The result that covariation between demographicrates provides a substantial contribution to variation inpopulation growth is unsurprising from a life-historyperspective. This is because life-history variation −including cohort effects − generates variation in demo-graphic rates that can be correlated (Benton & Grant1999b, 2000; Beckerman et al. 2002; Beckerman et al.2003). Genetic constraints (Lande 1982) and environ-mental variation (Coulson et al. 2004) can generateboth life-history variation and covariation in demo-graphic rates. For example, an environmentally favour-able year may lead to elevated survival and fecundityleading to no detectable survival costs to reproduction.In contrast, an environmentally challenging year maygenerate a survival cost of reproduction (Marrow et al.1996; Tavecchia et al. 2005). Across a series of goodand bad years this will generate covariation betweensurvival and fecundity rates that could impact on vari-ation in population growth. Given that environmentsand limiting factors differ between populations of thesame species it is also unsurprising that differentpopulations exhibit different associations between thecovariation in demographic rates and variation inpopulation growth. A critical question for ecologistsconcerns how these differences manifest themselvesbetween populations and species.
Failure to ignore the contribution of covariationbetween demographic rates on variation in populationgrowth can lead to misleading conclusions, withimportant implications for applied ecology. Conserva-tion biologists, for example, are often interested indevising strategies that target demographic rates thatcontribute most to variation in population growth.Considering only the direct effects each demographicrate has on variation in population growth could leadto flawed conservation strategies if demographic ratescovary and impact on population dynamics. Althoughprevious analyses using the SDA method reported sub-stantial contributions of demographic rate covariation(Brown et al. 1993; Coulson et al. 1999; Albon et al.
2000) few retrospective analyses considered suchcontributions (but see Dobson & Oli 2001). Part of thereason could be that few demographic studies reportdemographic rate covariation (Wisdom et al. 2000).We found that demographic rate covariation can explainbetween one-third and one-half of the variation inpopulation growth. When using the retrospective matrixmethod we estimated only the contribution of secondorder covariances. We did not consider higher-ordercovariances, as the SDA method has never found theseto be important for large mammals (Brown et al. 1993;Coulson et al. 1999; Albon et al. 2000). Although weare now hesitant to propose generalities, it is noticeablethat the contribution of demographic rate covariationto variation in population growth is greatest in thosepopulations that show no temporal trend. As success-ful population management and conservation candepend on the accurate decomposition of variation inpopulation growth, we recommend that future appli-cation of the retrospective matrix method shouldconsider demographic rate covariation.
The retrospective matrix method is a first-order lin-ear approximation of the decomposition of variation inpopulation growth (Horvitz et al. 1997; Caswell 2001).Although the approximation ignores fluctuations inage structure, our analyses suggest that the retrospec-tive matrix method generally performs well for un-gulate life histories. Given that the retrospective matrixmethod does not require the complete demographicinformation necessary for a complete decompositionof variation in population growth, this result is reas-suring. There are, however, cases when the retrospec-tive matrix method does not perform particularly well.For example, in the red deer population at high densitythe r2 value between the SDA contributions and theretrospective contributions is only 0·46. We do notknow under what circumstances the performance ofthe retrospective approximation becomes unsatisfactory− although it should be noted that the red deer popu-lation experienced a long-term age-structure transientfollowing release from culling, which generated markedage-structure effects on the population dynamics(Coulson et al. 2004). The non-parametric correlationsare considerably higher than the parametric correla-tions for red deer, suggesting that although the retro-spective matrix method does not always generateparticularly accurate estimates of demographic ratescontributions, it does tend to rank contributions in thecorrect order. In general, we consider the retrospectivematrix method a very useful method for decomposingvariation in population growth.
The many applications of understanding the asso-ciation between demographic rates and populationgrowth range from management to understandingevolutionary processes (Grant 1997; Benton & Grant1999a; Caswell 2001), and any generalizations couldprove useful. Our results, however, suggest that therelationship between variation in a demographicrate and variation in population growth is complex.
800T. Coulson, J. M. Gaillard & M. Festa-Bianchet
© 2005 British Ecological Society, Journal of Animal Ecology, 74, 789–801
Because both the mean value (and hence its potentialeffect on changes in population growth) and the tem-poral variation in a demographic rate determine itscontribution to fluctuations in population size it appearsthat the source of environmental variation in demo-graphic rates is as, or perhaps even more, importantthan population trajectory or distance from carryingcapacity. An understanding of variation in populationgrowth is therefore likely to require an understandingof the sources of variation in multiple demographicrates. We now require a detailed investigation of theeffects of life-history variation and environmental vari-ation on variation in population growth across taxa.
Acknowledgements
The Ram Mountain study was initiated by Bill Wishartand has been led by Jon Jorgenson, Alberta Fish andWildlife Division, since 1978. Long-term financial sup-port for both bighorn sheep studies was provided byNSERC of Canada. We thank Tim Clutton-Brock andJosephine Pemberton for access to the red deer datathat were collected by Fiona Guinness, Angela Alex-ander, Sean Morris and Ali Donald; ACI for financialsupport and the National Centre for Ecological andAnalytical Synthesis (NCEAS) for funding and hostingthe large herbivore population dynamics workshop.Finally we thank members of this group for discussionand Lewi Stone, Tim Benton and two anonymousreferees for helpful comments on an early draft of themanuscript.
References
Albon, S.D., Coulson, T.N., Brown, D., Guinness, F.E.,Clutton-Brock, T.H. & Pemberton, J.M. (2000) Temporalchanges in the key factors influencing the populationdynamics of red deer. Journal of Animal Ecology, 69, 1096–1109.
Beckerman, A.P., Benton, T.G., Lapsley, C.T. & Koesters, N.(2003) Talkin’ bout my generation − environmental vari-ability and cohort effects. American Naturalist, 162, 754–767.
Beckerman, A., Benton, T.G., Ranta, E., Kaitala, V. &Lundberg, P. (2002) Population dynamic consequences ofdelayed life-history effects. Trends in Ecology and Evolu-tion, 17, 263–269.
Benton, T.G. & Grant, A. (1999a) Elasticity analysis as animportant tool in evolutionary and population ecology.Trends in Ecology and Evolution, 14, 467–471.
Benton, T.G. & Grant, A. (1999b) Optimal reproductive effortin stochastic, density-dependent environments. Evolution,53, 677–688.
Benton, T.G. & Grant, A. (2000) Evolutionary fitness inecology: Comparing measures of fitness in stochastic,density-dependent environments. Evolutionary EcologyResearch, 2, 769–789.
Benton, T.G., Grant, A. & Clutton-Brock, T.H. (1995) Doesenvironmental stochasticity matter? Analysis of red deerlife histories on Rum. Evolutionary Ecology, 9, 559–574.
Brault, S. & Caswell, H. (1993) Pod-specific demography ofkiller whales (Orcinus orca). Ecology, 74, 1444–1454.
Brown, D. & Alexander, N. (1991) The analysis of the vari-ance and covariance of products. Biometrics, 47, 429–444.
Brown, D., Alexander, N.D.E., Marrs, R.W. & Albon, S.(1993) Structured accounting of the variance of demo-graphic change. Journal of Animal Ecology, 62, 490–502.
Caswell, H. (2000) Prospective and retrospective perturbationanalyses: their roles in conservation biology. Ecology, 81,619–627.
Caswell, H. (2001) Matrix Population Models: Construction,Analysis and Interpretation, 2nd edn. Sinauer AssociatesInc., Sunderland, MA.
Caswell, H., Fujiwara, M. & Brault, S. (1999) Declining sur-vival probability threatens the North Atlantic right whale.Proceedings of the National Academy of Sciences USA, 96,3308–3313.
Clutton-Brock, T.H. & Coulson, T.N. (2002) Ungulatepopulation dynamics: the devil is in the detail. PhilosophicalTransactions of the Royal Society, 357, 1299–1306.
Clutton-Brock, T.H., Guinness, F.E. & Albon, S.D. (1982)Red Deer: Behaviour and Ecology of Two Sexes. Universityof Chicago Press, Chicago.
Coulson, T., Albon, S., Pilkington, J. & Clutton-Brock, T.(1999) Small-scale spatial dynamics in a fluctuating ungulatepopulation. Journal of Animal Ecology, 68, 658–671.
Coulson, T., Guinness, F.E., Pemberton, J.M. & Clutton-Brock,T.H. (2004) The demographic consequences of releasing apopulation of red deer from culling. Ecology, 85, 411–422.
Coulson, T. & Hudson, E. (2003a) When is the birth rate thekey factor associated with population dynamics? Reproduc-tive Science and Integrated Conservation (eds W. Holt,A. Pickhard, J. Rodger & D. Wildt), pp. 114–130. Cam-bridge University Press, Cambridge.
Coulson, T.N., Kruuk, L.E.B., Tavecchia, G., Pemberton, J.M.& Clutton-Brock, T.H. (2003b) Estimating selection onneonatal traits in red deer using elasticity path analysis.Evolution, 57, 2879–2892.
Dobson, F.S. & Oli, M.K. (2001) The demographic basis ofpopulation regulation in Columbian ground squirrels.American Naturalist, 158, 236–247.
Erikstad, K.E., Fauchald, P., Tveraa, T. & Steen, H. (1998) Onthe cost of reproduction in long-lived birds: the influence ofenvironmental variability. Ecology, 79, 1781–1788.
Festa-Bianchet, M. (1988a) Birthdate and survival in bighornlambs (Ovis canadensis). Journal of Zoology, 214, 653–661.
Festa-Bianchet, M. (1988b) A pneumonia epizootic in big-horn sheep, with comments on preventive management.Proceedings of the Northern Wild Sheep and Goat Council,6, 66–76.
Festa-Bianchet, M., Gaillard, J.-M. & Côté, S.D. (2003)Variable age structure and apparent density dependence insurvival of adult ungulates. Journal of Animal Ecology, 72,640–649.
Festa-Bianchet, M., Gaillard, J.M. & Jorgenson, J.T. (1998)Mass- and density-dependent reproductive success andreproductive costs in a capital breeder. American Naturalist,152, 367–379.
Festa-Bianchet, M. & Jorgenson, J.T. (1998) Selfish mothers:reproductive expenditure and resource availability in bighornewes. Behavioral Ecology, 9, 144–150.
Gaillard, J.M., FestaBianchet, M. & Yoccoz, N.G. (1998)Population dynamics of large herbivores: variable recruit-ment with constant adult survival. Trends in Ecology andEvolution, 13, 58–63.
Gaillard, J.-M., Festa-Bianchet, M., Yoccoz, N.G., Loison, A.& Toigo, C. (2000) Temporal variation in fitness com-ponents and population dynamics of large herbivores.Annual Review of Ecology and Systematics, 31, 367–393.
Gaillard, J.-M. & Yoccoz, N.G. (2003) Temporal variation insurvival of mammals: a case of environmental canalization.Ecology, 84, 3294–3306.
Grant, A. (1997) Selection pressures on vital rates in density-dependent populations. Proceedings of the Royal Society ofLondon Series B, Biological Sciences, 264, 303–306.

801Variation in population growth
© 2005 British Ecological Society, Journal of Animal Ecology, 74, 789–801
Horvitz, C., Schemske, D.W. & Caswell, H. (1997) Therelative ‘importance’ of life-history stages to populationgrowth: prospective and retrospective analyses. In: Struc-tured Population Models in Marine, Terrestrial and FreshwaterSystems (eds S. Tuljapurkar & H. Caswell), pp. 247–264.International Thomson Publishing, New York.
Jorgenson, J.T., FestaBianchet, M., Gaillard, J.M. & Wishart,W.D. (1997) Effects of age, sex, disease, and density on sur-vival of bighorn sheep. Ecology, 78, 1019–1032.
Lande, R. (1982) A quantitative theory of life history evolu-tion. Ecology, 63, 607–615.
Lande, R. (1988) Demographic models of the northernspotted owl (Strix occidentalis caurina). Oecologia, 75,601–607.
Lande, R., Engen, S. & Saether, B.-E. (2003) StochasticPopulation Dynamics in Ecology and Conservation. OxfordUniversity Press, Oxford.
Loison, A., Festa-Bianchet, M., Gaillard, J.M., Jorgenson, J.T.& Jullien, J.M. (1999) Age-specific survival in five popula-tions of ungulates: evidence of senescence. Ecology, 80,2539–2554.
Manly, B.F.J. (1990) Stage-Structured Populations. SamplingAnalysis and Simulation. Chapman & Hall, London.
Marrow, P., McNamara, J.M., Houston, A.I., Stevenson, I.R.& Clutton-Brock, T.H. (1996) State dependent life historyevolution in Soay sheep dynamic modeling of reproductivescheduling. Philosophical Transactions of the Royal Societyof London Series B, Biological Sciences, 351, 17–32.
Mills, L.S., Doak, D.F. & Wisdom, M.J. (1999) Reliability ofconservation actions based on elasticity analysis of matrixmodels. Conservation Biology, 13, 815–829.
Ross, P.I., Jalkotzy, M.G. & Festa-Bianchet, M. (1997) Cou-gar predation on bighorn sheep in southwestern Albertaduring winter. Canadian Journal of Zoology, 75, 771–775.
Royama, T. (1992) Analytical Population Dynamics.Chapman & Hall, London.
Royama, T. (1996) A fundamental problem in key factoranalysis. Ecology, 77, 87–93.
Saether, B. & Bakke, O. (2000) Avian life history variation andcontribution of demographic traits to the population growthrate. Ecology, 81, 642–653.
Sibly, R.M. & Smith, R.H. (1997) Identifying key factorsusing 1 contribution analysis. Journal of Animal Ecology,67, 17–24.
Tavecchia, G., Coulson, T., Morgan, B.J.T., Pemberton, J.M.,Pilkington, J., Gulland, F. & Clutton-Brock, T.H. (2005)Predictors of reproductive cost in female Soay sheep. Jour-nal of Animal Ecology, 74, 201–213.
van Tienderen, P.H. (2000) Elasticities and the link betweendemographic and evolutionary dynamics. Ecology, 81,666–679.
Tuljapurkar, S.D. (1982) Population dynamics in variableenvironments. 3. Evolutionary dynamics of r selection.Theoretical Population Biology, 21, 141–165.
Varley, G.C. & Gradwell, G.R. (1960) Key factors in popula-tion studies. Journal of Animal Ecology, 29, 399–401.
Wisdom, M.J., Mills, L.S. & Doak, D.F. (2000) Life stagesimulation analysis: estimating vital-rate effects on popu-lation growth for conservation. Ecology, 81, 628–641.
Received 23 July 2004; revised version accepted 27 January2005