
Decision Support Systems - Open Research Library
20
Chapter 2 Decision Support Systems Maria Rashidi, Maryam Ghodrat, Bijan Samali and Masoud Mohammadi Additional information is available at the end of the chapter http://dx.doi.org/10.5772/intechopen.79390 Abstract The current decision-making problems is more complex than it was in the past, prompting the need for decision support. Most real-world decision-making situations are subject to bounded rationality; whereby the technical and economic evaluation of all solution alter- natives (branches) is bounded by the consideration of dominant subjective constraints. The early definition of DSS introduced it as a system that intended to support decision makers in semi-structured problems that could not be completely supported by algo- rithms. DSSs were planned to be an accessory for managers to expand their capabilities but not to replace them. Decision support systems could provide the means to comple- ment decision makers by quantitatively supporting managerial decisions that could oth- erwise be based on personal intuition and experience. In addition to the traditional DSS characteristics (i.e., data and model orientation, interactivity), the inclusion of an intelli- gent knowledge base would be required to quantify the impacts of both technical (hard) and subjective (soft) constraints. Keywords: decision support system, decision analysis, decision alternatives, criteria, weight 1. Introduction As a matter of fact, nowadays, decision-making is more complicated than it was in the past for two governing reasons. Firstly, growing technology and communication systems have spawned a greater number of feasible solution alternatives from which a decision-maker can select. Secondly, the increased level of structural complexity of today’s problems can result in a chain reaction of magnification of costs if an error should occur [1]. © 2018 The Author(s). Licensee IntechOpen. This chapter is distributed under the terms of the Creative Commons Attribution License (http://creativecommons.org/licenses/by/3.0), which permits unrestricted use, distribution, and reproduction in any medium, provided the original work is properly cited.
-
Upload
khangminh22 -
Category
Documents
-
view
5 -
download
0
Transcript of Decision Support Systems - Open Research Library
Chapter 2
Decision Support Systems
Maria Rashidi, Maryam Ghodrat, Bijan Samali andMasoud Mohammadi
Additional information is available at the end of the chapter
http://dx.doi.org/10.5772/intechopen.79390
Abstract
The current decision-making problems is more complex than it was in the past, promptingthe need for decision support. Most real-world decision-making situations are subject tobounded rationality; whereby the technical and economic evaluation of all solution alter-natives (branches) is bounded by the consideration of dominant subjective constraints.The early definition of DSS introduced it as a system that intended to support decisionmakers in semi-structured problems that could not be completely supported by algo-rithms. DSSs were planned to be an accessory for managers to expand their capabilitiesbut not to replace them. Decision support systems could provide the means to comple-ment decision makers by quantitatively supporting managerial decisions that could oth-erwise be based on personal intuition and experience. In addition to the traditional DSScharacteristics (i.e., data and model orientation, interactivity), the inclusion of an intelli-gent knowledge base would be required to quantify the impacts of both technical (hard)and subjective (soft) constraints.
Keywords: decision support system, decision analysis, decision alternatives, criteria,weight
1. Introduction
As a matter of fact, nowadays, decision-making is more complicated than it was in the past for
two governing reasons. Firstly, growing technology and communication systems have
spawned a greater number of feasible solution alternatives from which a decision-maker can
select. Secondly, the increased level of structural complexity of today’s problems can result in a
chain reaction of magnification of costs if an error should occur [1].
© 2018 The Author(s). Licensee IntechOpen. This chapter is distributed under the terms of the CreativeCommons Attribution License (http://creativecommons.org/licenses/by/3.0), which permits unrestricted use,distribution, and reproduction in any medium, provided the original work is properly cited.
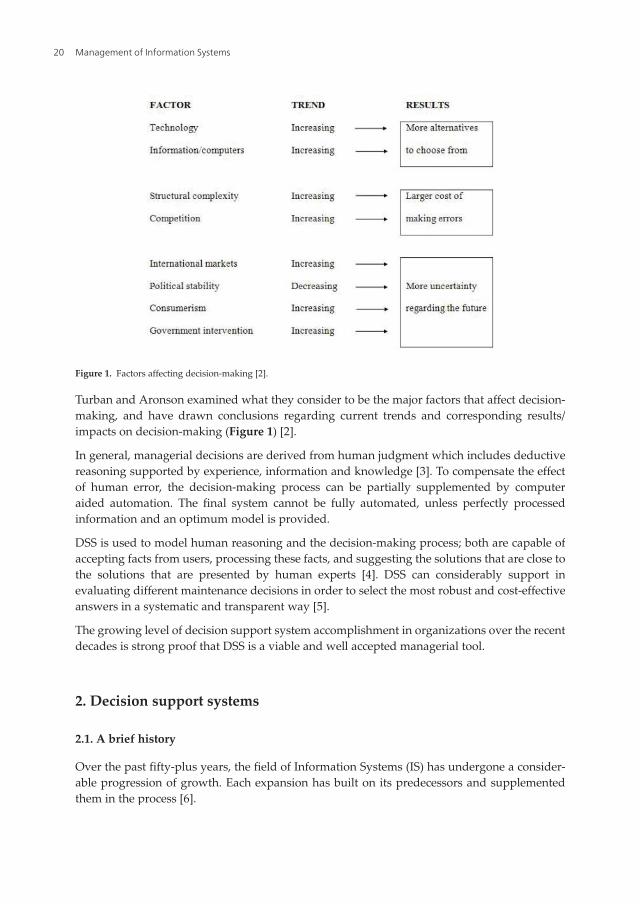
Turban and Aronson examined what they consider to be the major factors that affect decision-
making, and have drawn conclusions regarding current trends and corresponding results/
impacts on decision-making (Figure 1) [2].
In general, managerial decisions are derived from human judgment which includes deductive
reasoning supported by experience, information and knowledge [3]. To compensate the effect
of human error, the decision-making process can be partially supplemented by computer
aided automation. The final system cannot be fully automated, unless perfectly processed
information and an optimum model is provided.
DSS is used to model human reasoning and the decision-making process; both are capable of
accepting facts from users, processing these facts, and suggesting the solutions that are close to
the solutions that are presented by human experts [4]. DSS can considerably support in
evaluating different maintenance decisions in order to select the most robust and cost-effective
answers in a systematic and transparent way [5].
The growing level of decision support system accomplishment in organizations over the recent
decades is strong proof that DSS is a viable and well accepted managerial tool.
2. Decision support systems
2.1. A brief history
Over the past fifty-plus years, the field of Information Systems (IS) has undergone a consider-
able progression of growth. Each expansion has built on its predecessors and supplemented
them in the process [6].
Figure 1. Factors affecting decision-making [2].
Management of Information Systems20
Before 1965, it was extremely expensive to build a large-scale information system. Around
this time, the establishment of the IBM System 360 and other more powerful processor
systems made it more practical and cost-effective to build management information systems
(MIS) in large corporations. The pre-specified reports (e.g., budget, cumulative cost and
progress statements) output from MIS are data-oriented and restrict decision-makers to
gathering the necessary information for making choices, but do not supply a framework to
model decision problems. At that point, it was recognized that technological support for
decision-making must facilitate ad hoc (problem-specific) recovery of data and managerial
control over model manipulation. Decision-makers did not wish to be locked into systems
they could not control [7].
In the late 1960s, model-oriented DSS or management decision systems became practical. Two
DSS pioneers, Peter Keen and Charles Stabell, stated the concept of decision support which
was extracted from the theoretical studies of organizational decision-making during the late
1950s and early 1960s and the technical work on interactive computer systems that mostly
carried out in the 1960s [8].
In 1961, Michael S. Scott Morton published “Management Decision Systems: Computer-Based
Support for Decision Making.” Later, in 1968–1969, he studied the effect of computers and
analytical models in critical decision-making. His research played a “key role in launching the
DSS movement” [9].
In 1980, Steven Alter published an important book titled “Decision Support Systems: Current
Practice and Continuing Challenge.”His research founded a structure for identifying manage-
ment DSS [10].
Bonczek et al. established a theory based on knowledge-based DSS [11]. Their research
presented how Artificial Intelligence and Expert System technologies were applicable to devel-
oping DSS. They also introduced four essential “aspects” or components of all DSS [12], these
are:
1. A Language System (LS) which includes all the recognizable messages.
2. A Presentation System (PS) for all messages emitted by DSS.
3. A Knowledge System (KS) addressing all the imbedded knowledge in a DSS.
4. A Problem-Processing System (PPS) that tries to diagnose and solve problems.
In the early 1990, business intelligence, data warehousing and On-Line Analytical Processing
(OLAP) software began expanding the potential of DSS [10]. Around 1997, the data warehouse
became the cornerstone of an integrated knowledge environment that granted a higher level of
information sharing, facilitating faster and better decision-making [13].
Decision support systems have experienced a noticeable growth in scholarly attention over the
past two decades. In according to Google Scholar (October 2007), the rate has increased from
less than three publications per week in 1980 to over 20 publications per day twenty-five years
later [14]. The Internet and Web have also accelerated developments in decision support and
have provided a new way of capturing and documenting the development of knowledge in
this research area [10].
Decision Support Systemshttp://dx.doi.org/10.5772/intechopen.79390
21

2.2. DSS definitions
According to Mora et al., the decision maker employs computer technology to: (a) organize the
information into problem factors, (b) attach all the attributes to a model, (c) use the framework/
model to simulate alternatives, and (d) select the best course of action [15]. The outcomes are
reported as parameter conditions, experimental forecasts, and/or recommended actions. A
typical architecture of DSS provided by Mora et al. is shown in Figure 2 [15].
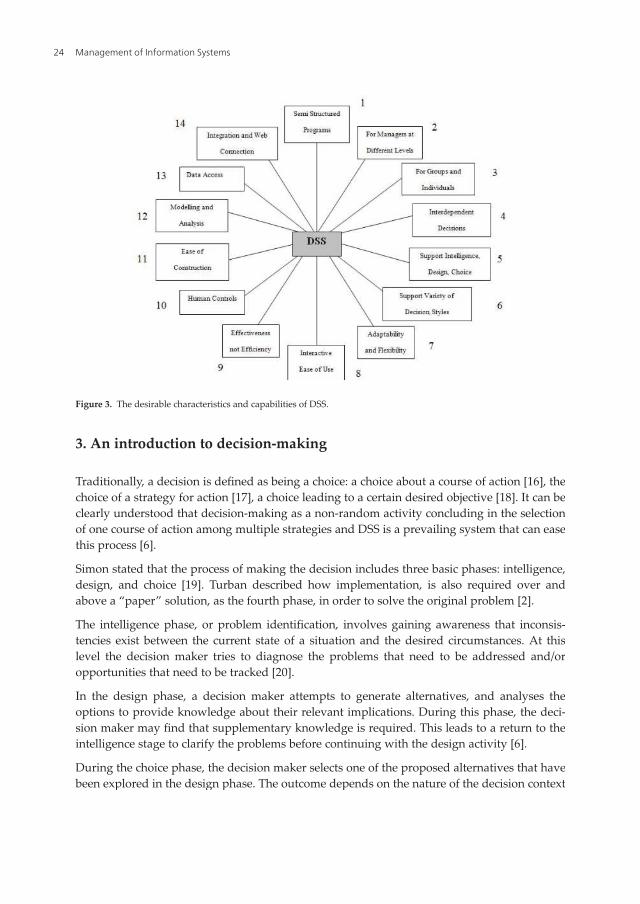
2.3. DSS ideal characteristics and capabilities
Defining standard characteristics of DSS is not viable but the major features that distinguish
DSS from other previously established systems can be summarized from Turban and Aronson
as follows [2]:
• DSS assists decision makers in semi-structured and unstructured problems (which cannot
be solved by standard procedural methods or tools), employing human judgment and
computers.
Figure 2. Typical architecture of decision support system (Mora et al., [15]).
Management of Information Systems22
• It covers a vast spectrum of managerial levels, from top executive to line managers.
• Support is provided to both individuals and groups. Less structured situations often
require the intervention of several individuals from different divisions and organizational
levels or sometimes even from different organizations.
• DSS facilitates several interdependent and/or sequential decisions that may be made once,
several times, or repeatedly.
• DSS carries out all parts of the decision-making process: intelligence, design, choice and
implementation.
• It covers a variety of decision analysis tools.
• DSS is adaptive and flexible, and sousers can add, change, delete, or reorganize basic elements.
• DSS should be user friendly and have strong graphical interfaces.
• DSS tries to improve the effectiveness of decision-making (appropriateness and quality)
rather than its efficiency (the cost of decision-making).
• DSS attempts to support the decision makers not to replace them. Therefore they will have
control over all levels of the process.
• End users should be able to build (and modify) simple systems. Complicated systems can
be constructed with assistance from information system (IS) experts.
• A DSS generally employs models for analysing problems since modeling enables
experimenting with different strategies under different configurations.
• DSS should be able to supply access to a variety of data sources and formats.
• A DSS can be integrated with other systems and/or applications, and it can be distributed
through networking and web technologies.
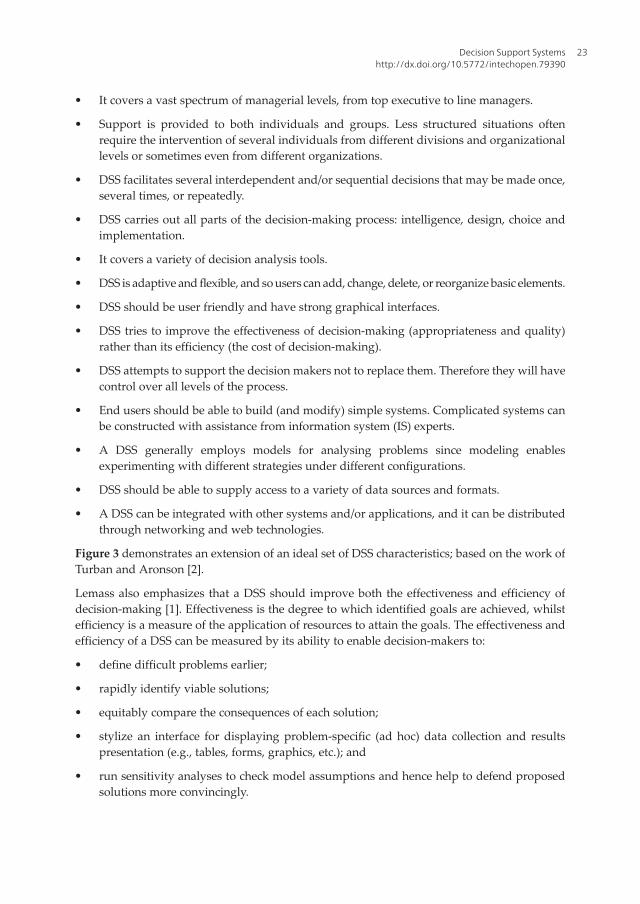
Figure 3 demonstrates an extension of an ideal set of DSS characteristics; based on the work of
Turban and Aronson [2].
Lemass also emphasizes that a DSS should improve both the effectiveness and efficiency of
decision-making [1]. Effectiveness is the degree to which identified goals are achieved, whilst
efficiency is a measure of the application of resources to attain the goals. The effectiveness and
efficiency of a DSS can be measured by its ability to enable decision-makers to:
• define difficult problems earlier;
• rapidly identify viable solutions;
• equitably compare the consequences of each solution;
• stylize an interface for displaying problem-specific (ad hoc) data collection and results
presentation (e.g., tables, forms, graphics, etc.); and
• run sensitivity analyses to check model assumptions and hence help to defend proposed
solutions more convincingly.
Decision Support Systemshttp://dx.doi.org/10.5772/intechopen.79390
23
3. An introduction to decision-making
Traditionally, a decision is defined as being a choice: a choice about a course of action [16], the
choice of a strategy for action [17], a choice leading to a certain desired objective [18]. It can be
clearly understood that decision-making as a non-random activity concluding in the selection
of one course of action among multiple strategies and DSS is a prevailing system that can ease
this process [6].
Simon stated that the process of making the decision includes three basic phases: intelligence,
design, and choice [19]. Turban described how implementation, is also required over and
above a “paper” solution, as the fourth phase, in order to solve the original problem [2].
The intelligence phase, or problem identification, involves gaining awareness that inconsis-
tencies exist between the current state of a situation and the desired circumstances. At this
level the decision maker tries to diagnose the problems that need to be addressed and/or
opportunities that need to be tracked [20].
In the design phase, a decision maker attempts to generate alternatives, and analyses the
options to provide knowledge about their relevant implications. During this phase, the deci-
sion maker may find that supplementary knowledge is required. This leads to a return to the
intelligence stage to clarify the problems before continuing with the design activity [6].
During the choice phase, the decision maker selects one of the proposed alternatives that have
been explored in the design phase. The outcome depends on the nature of the decision context
Figure 3. The desirable characteristics and capabilities of DSS.
Management of Information Systems24

and the decision maker’s own traits and idiosyncrasies. It may be that none of the alternatives
are satisfying (return to the design phase), that several competing alternatives gain high scores,
or that the state of the context has changed dramatically after analysis of alternatives (return to
the intelligence phase). However, one option must be chosen for implementation [21].
The fourth and final step is implementation. This phase includes a set of chosen solutions that
need to be approved by stakeholders and put into action over time [20]. This requires cautious
planning and sensitivity to those involved in the process and/or those affected by it. The
resolution must then be monitored to guarantee that the problem has been corrected. If the
problem has been rectified, then the decision-making procedure is finalized [22]. Generally, the
outcome of successful implementation is solving the real problem while any failure results in
returning to a former phase of the process [2].
3.1. The structure of decisions
There is a variety of decision types which can be classified based on specific factors. An
appreciation of decision types can assist decision makers understand what knowledge and
knowledge manipulation features would be required in decision support system [6]. The level
of “programmability” or structuredness is a helpful aspect for understanding and classifying
decisions. Simon argued that decisions could be placed along a spectrum from highly struc-
tured to completely unstructured [23]. Decisions may also be further classified as single-stage
and multiple-stage, with either risk, certainty or uncertainty of outcome.
Structured decisions are made when well-known procedures can be readily applied to all the
phases of decision-making to provide standard solutions for repetitive problems. They are
characterized by definite decision criteria, a limited number of precise alternatives whose
consequences can be worked out without any complexity [24].
Structured decisions Unstructured decisions
Routine, repetitive Unexpected, infrequent
Established and stable context Emergent and turbulent contexts
Alternatives clear Alternatives unclear
Implications of alternatives straightforward Implications of alternatives indeterminate
Criteria for choosing well defined Criteria for choosing ambiguous
Specific knowledge needs known Specific knowledge needs unknown
Needed knowledge readily available Needed knowledge unavailable
Result from specialized strategies
(i.e., procedures that explicitly pre-specify full set of
steps to follow in order to reach decisions)
Result from general strategies (e.g., analogy, lateral thinking,
brainstorming, synthesis used in the course of reaching decisions)
Reliance on tradition Reliance on exploration, creativity, insight, ingenuity
Table 1. Decision structuredness [6].
Decision Support Systemshttp://dx.doi.org/10.5772/intechopen.79390
25
A semi-structured decision is made when some, but not all, of the phases of decision-making
are structured. While some standard solution procedures may be applicable, human judgment
is also called upon to develop decisions which tend to be adaptive in nature [1].
When none of the phases of decision-making are structured, the resulting decisions are classi-
fied as unstructured. Lack of clear decision criterion and the difficulty in identifying a finite set
of alternatives and high levels of uncertainty concerning the consequences of the known
alternatives at most of the decision levels, are all symptoms of this unstructuredness [25].
Semi-structured and unstructured decisions are made when problems are ill-defined (ill-
structured). Srinivasan et al. notes that most real-world problems fall towards the unstructured
end of this spectrum [20]. Table 1 demonstrates the characteristics of structured and unstruc-
tured decisions.
4. Multi attribute decision-making methods
Engineering or management decisions are generally made through available data and infor-
mation that are mostly vague, imprecise, and uncertain by nature [26]. The decision-making
process in bridge remediation is one of these ill-structured occasions, which usually need a
rigorous approach which applies explicit subject domain knowledge to ill-structured (adap-
tive) problems in order to reformulate them as structured problems. Multi-attribute decision-
making (MADM) is an efficient tool for dealing with uncertainties.
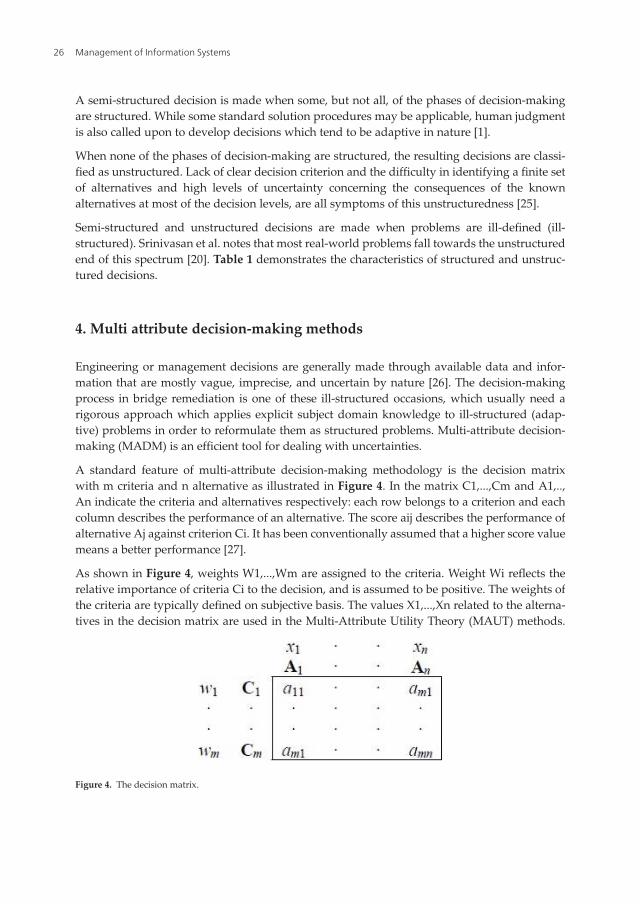
A standard feature of multi-attribute decision-making methodology is the decision matrix
with m criteria and n alternative as illustrated in Figure 4. In the matrix C1,...,Cm and A1,..,
An indicate the criteria and alternatives respectively: each row belongs to a criterion and each
column describes the performance of an alternative. The score aij describes the performance of
alternative Aj against criterion Ci. It has been conventionally assumed that a higher score value
means a better performance [27].
As shown in Figure 4, weights W1,...,Wm are assigned to the criteria. Weight Wi reflects the
relative importance of criteria Ci to the decision, and is assumed to be positive. The weights of
the criteria are typically defined on subjective basis. The values X1,...,Xn related to the alterna-
tives in the decision matrix are used in the Multi-Attribute Utility Theory (MAUT) methods.
Figure 4. The decision matrix.
Management of Information Systems26
Generally, higher ranking value represents a higher performance of the alternative, so the item
with the highest ranking is the best action item [27].
In addition to some monetary based and elementary methods, the two main families in the
multi-attribute decision-making methods are those founded on the MAUT and Outranking
Methods.
4.1. Elementary methods of MADM
These elementary approaches are characterized by their simplicity and their independence to
computational support. They are suitable for problems with a single decision maker, limited
alternatives and criteria which can rarely occur in engineering decision-making [28]. Maximin
and Maximax methods, Pros and Cons analysis, Conjunctive and Disjunctive methods and the
Lexicographic method are all in this category [29].
4.1.1. Maximin and Maximax methods
The Maximin method’s strategy is to avoid the worst possible performance, maximizing the
minimal performing criterion. The alternative, for which the score of its weakest criterion is the
highest, is preferred. For example, a weight of one is given to the criterion which is least best
achieved by that choice and a weight of zero to all other criteria. The strategy with the maximum
minimum score will be the optimum choice. In contrast to the Maximin method, The Maximax
method selects an alternative by its best attribute rather than its worst. This method is particu-
larly useful when the alternatives can be specialized in use based upon one attribute and
decision maker has no prior requirement as to which attribute this is [30].
4.1.2. Pros and cons analysis
Pros and Cons analysis is a qualitative comparison method in which positive and negative
aspect of each alternative are assessed and compared. It is easy to implement since no mathe-
matical skill is required [29].
4.1.3. Conjunctive and disjunctive methods
The conjunctive and disjunctive methods are non-compensatory screening methods. They do
not need criteria to be estimated in commensurate units. These methods require satisfactory
rather than best performance in each attribute, i.e., if an action item passes the screening, it is
adequate [31].
In Conjunctive method, an alternative must meet a minimal threshold for all attributes while in
disjunctive method; the alternative should exceed the given threshold for at least one attribute.
Any option that does not meet the rules is deleted from the further consideration [28].
4.1.4. Decision tree analysis
Decision trees provide a useful schematic representation of decision and outcome events,
provided the number of courses of action, ai, and the number of possible outcomes, Oij, not
Decision Support Systemshttp://dx.doi.org/10.5772/intechopen.79390
27

large. Decision trees are most useful in simple situations where chance events are dependent
on the courses of action considered, making the chance events (states of nature) synonymous
with outcomes [25].
Square nodes correspond to decision events. Possible courses of action are represented by
action lines which link decision events and outcome (chance) events. Circular nodes differen-
tiate the outcome events from the decision events in order to underline that the decision-maker
does not have control when chance or Nature determines an outcome [1].
The outcomes for each alternative, originates from the chance nodes and terminate in a
partitioned payoff/expected value node. The expected value for each course of action is
achieved by summing the expected values of each branch associated with the action [25].
A decision tree representation of a problem is shown below as an example. Three strategies
(courses of action) are investigated (See Figure 5):
a1: replace the distressed bridge section (it would soon be unsafe)
a2: rehabilitate the bridge (repair costs will not be prohibitive)
a3: do nothing (the symptoms are more superficial than structural)
The estimated costs of replacement and rehabilitation are $6.3 M and $1.1 M respectively. If the
road section is replaced, it is assumed that no further capital costs will be incurred. If the road
is rehabilitated and repairs are not satisfactory, an additional $6.3 M replacement cost will
result. If no action is taken and the road consequently requires major repairs or becomes totally
unserviceable, respective costs of $6.3 M and $18 M will apply (Lemass [1]).
Figure 5. A decision tree for selecting the best remediation strategy of a bridge.
Management of Information Systems28

In this example, states of nature are the same as possible outcomes. The outcomes and associ-
ated negative payoffs (costs in millions of dollars) can be considered as follows:
Payoff
S1 = O11: the bridge section is successfully replaced u11 = � $ 6.3
S2 = O22: the repairs are satisfactory u22 = � $ 1.1
S3 = O23: the repairs are unsatisfactory u23 = � $ 7.4
S4 = O34: the bridge section fails, becoming unserviceable u34 = � $ 18.0
S5 = O35: the bridge section requires major repairs u35 = � $ 6.3
S6 = O36: the bridge section remains satisfactory u36 = � $ 0.0
The expected value (cost) of action a2 is the lowest, based on the probability (likelihood of
occurrence) assigned for each outcome, pij and this course of action can be followed [9].
4.1.5. Lexicographic method
In lexicographic analysis of problems, a chronological elimination process is continued until either a
single solution is found or all the problems are solved. In this method criteria are first rank-ordered
in terms of importance. The alternative with the best performance score on the most important
criterion is selected. If there are ties related to this attribute, the performance of the joined option on
the nextmost important factor will be compared until the unique alternative is chosen [31].
4.1.6. Cost-benefit analysis (CBA) and cost-effectiveness analysis (CEA)
The concept of cost–benefit analysis (CBA) originated in the United States in the 1930s where it
was used to find a solution to problems of water provision. This method is used to estimate all
the costs and benefits associated with a particular project which is usually defined in money
terms, in order to weigh up whether a project will bring a net benefit to the public and to be
able to compare the possible options for limited resources. It is one of the most comprehensive
and at the same time the most difficult technique for decision-making [32].
According to Kuik et al. the application of CBA in an integrated assessment causes the
following concerns [33]:
• First, CBA measures costs and benefits on the basis of subjective preferences given objec-
tive resource constraints and technological possibilities and should probably be evaluated
on a case�by�case basis as an open question.
• Second, certain costs and benefits which are in the social and environmental domains
might be difficult to quantify in monetary terms.
4.2. Multi attribute utility theory (MAUT)
MAUT is based upon the use of utility functions. Utility functions are employed to quantify
the preference of the decision-maker by allocating a numerical index to different degrees of
Decision Support Systemshttp://dx.doi.org/10.5772/intechopen.79390
29
satisfaction as the attribute under consideration takes values between the most and least
defined limits [34]. They are considered a compliant tool of representing how much an attri-
bute (or a measure) satisfies the decision-maker objectives to transform the raw performance
values of the alternatives against diverse criteria, both factual (quantitative) and judgmental
(qualitative), to a general dimensionless scale [35]. They represent a means to translate attri-
butes units into utility units. Utility functions can be specified in terms of a graph, table or
mathematical expression. Mathematical expressions of utility functions include: straight-line,
logarithmic, or exponential functions [34].
The utility values are estimated by normalizing the output of the simulation tests. Normaliza-
tion of performance measures is conducted utilizing the minimum and maximum limits that
are obtained from the simulation. Moreover, they are commonly checked against the outputs
and replaced if there are values beyond the limits. The utility functions can be monotonic in a
way that the least desirable scenario corresponds to the lowest utility [U(xi) =0] while the most
desirable scenario matches with the highest utility [U(xi) =1.0], the interval [0,100] can also be
used for this purpose [34].
4.2.1. Simple multi-attribute rating technique (SMART)
Simple Multi Attribute Rating Technique (SMART) is a method that used to determine the
weights of the attributes. This method was initially developed by Edwards [50] and is based on
direct numerical ratings that are aggregated additively. There are many derivates of SMART,
also including non-additive methods. In a basic format of SMART, there is a rank-ordering of
action items for each criterion setting the worst to zero and the best to 100 and interpolating
between [27]. By filtering the performance values with associated weights for all criteria a
utility value for each option is estimated [36].
SMART is independent of the action items/alternatives. The advantage of this approach is that
the assessments are not relative; hence shifting the number of options will not change the final
outcomes. If new alternatives are likely to be added, and the action items are compliant to a
rating model, then SMART can be a better option [37].
One of the limitations of this technique is that it disregards the interrelationships between
parameters. However, SMART is a valuable technique since it is uncomplicated, easy and
quick which is quite important for decision makers. In SMART, changing the number of
alternatives will not change the decision scores of the original alternatives and this is useful
when new alternatives are added [37]. He also argued that using SMART in performance
measures can be a better alternative than other methods.
4.2.2. Analytical hierarchy process (AHP)
AHP is a multi-attribute decision-making technique which belongs to the class of methods
known as “additive weighting methods” [28]. The AHP was suggested by Saaty and uses an
objective function to aggregate various features of a decision where the main goal is to select
the decision alternative that has the maximum value of the objective function [38]. The AHP is
based on four clearly defined axioms (Saaty [39]). Similar to MAU/VT and SMART, the AHP is
Management of Information Systems30
classified as a compensatory technique, where attributes/criteria with low scores are compen-
sated by higher scores on other attributes/criteria, but contrasting the utilitarian models, the
AHP employs pair wise comparisons of criteria rather than value functions or utility where all
criteria are compared and the end results accumulated into a decision-making matrix [40].
The process of AHP includes three phases: decomposition, comparative judgments, and syn-
thesis of priority. Through the AHP process, problems are decomposed into a hierarchical
structure, and both quantitative and qualitative information can be used to develop ratio scales
between the decision elements at each level using pair wise comparisons. The top level of
hierarchy corresponds to overall objectives and the lower levels criteria, sub-criteria, and
alternatives. Users are asked to set up a comparison matrix (with comparative judgments) by
comparing pairs of criteria or sub-criteria. A scale of quantities -ranging from 1 (indifference)
to 9 (extreme preference) is used to identify the users priorities. Eventually, each matrix is then
solved by an eigenvector technique for measuring the performance [41].
The comparisons are normally shown in a comparative matrix A, which must be transitive such
that if, i > j and j > k then i > k where i, j, and k are action items; for all j > k > i and reciprocal,
aij ¼ 1=aji. Preferences are then calculated from the comparison matrix by normalising the
matrix, to develop the priority vector, by A.W = λmax.W; where A is the comparison matrix; W
is the Eigen vector and λmax is the maximal Eigen value of matrix A [42].
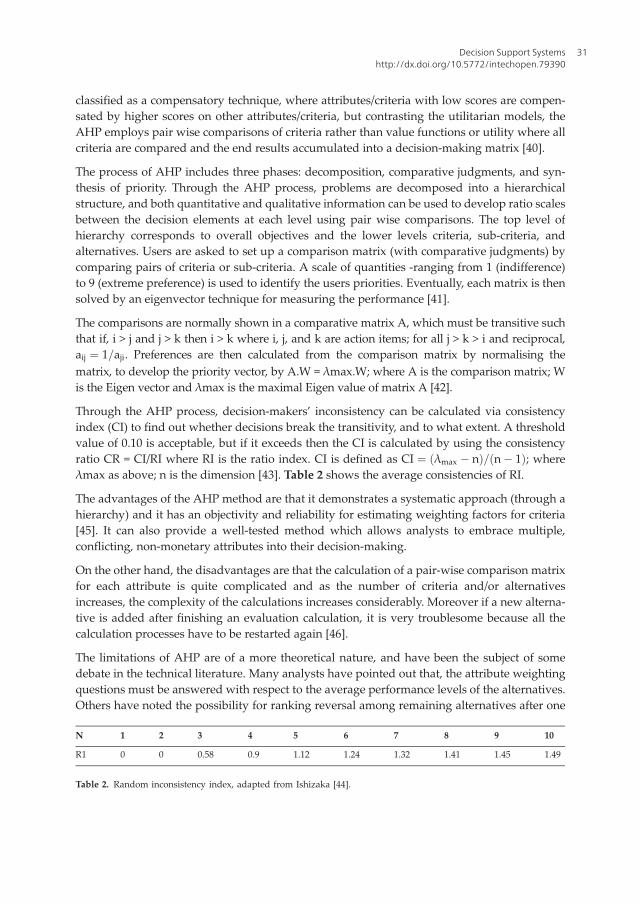
Through the AHP process, decision-makers’ inconsistency can be calculated via consistency
index (CI) to find out whether decisions break the transitivity, and to what extent. A threshold
value of 0.10 is acceptable, but if it exceeds then the CI is calculated by using the consistency
ratio CR = CI/RI where RI is the ratio index. CI is defined as CI ¼ λmax � nð Þ= n� 1ð Þ; where
λmax as above; n is the dimension [43]. Table 2 shows the average consistencies of RI.
The advantages of the AHP method are that it demonstrates a systematic approach (through a
hierarchy) and it has an objectivity and reliability for estimating weighting factors for criteria
[45]. It can also provide a well-tested method which allows analysts to embrace multiple,
conflicting, non-monetary attributes into their decision-making.
On the other hand, the disadvantages are that the calculation of a pair-wise comparison matrix
for each attribute is quite complicated and as the number of criteria and/or alternatives
increases, the complexity of the calculations increases considerably. Moreover if a new alterna-
tive is added after finishing an evaluation calculation, it is very troublesome because all the
calculation processes have to be restarted again [46].
The limitations of AHP are of a more theoretical nature, and have been the subject of some
debate in the technical literature. Many analysts have pointed out that, the attribute weighting
questions must be answered with respect to the average performance levels of the alternatives.
Others have noted the possibility for ranking reversal among remaining alternatives after one
N 1 2 3 4 5 6 7 8 9 10
R1 0 0 0.58 0.9 1.12 1.24 1.32 1.41 1.45 1.49
Table 2. Random inconsistency index, adapted from Ishizaka [44].
Decision Support Systemshttp://dx.doi.org/10.5772/intechopen.79390
31
is deleted from consideration. Finally, some theorists go so far as to state that as currently
practiced, “the rankings of (AHP) are arbitrary.” Defenders of AHP, such as Saaty himself,
answered that rank reversal is not a fault because real-world decision-making shows this
characteristic as well [47].
4.3. Outranking methods
The most important outranking methods assume data availability roughly similar to what
required for the MAUTmethods. Fundamental problems with most MAUTandMAUT-related
methods are handling uncertain or fuzzy information and dealing with information stated in
other than ratio or interval scale. In some conditions, instead of quantitative measures descrip-
tive expressions are frequently faced [48]. The outranking method acts as one alternative for
approaching complex choice problems with multiple criteria and multiple participants.
Outranking shows the degree of domination of one alternative over another and facilitates
the employment of incomplete value information and, for example, judgments on ordinal
measurement scale. They provide the (partial) preference ranking of the alternatives, not a
principal measure of the preference relation [48]. Here the two most famous categories of the
outranking methods, the ELECTRE and the PROMETHEE methods are briefly explained.
4.3.1. The ELECTRE methods
The ELECTRE method is a part of MCDA (multi criteria decision-aid). The main aim of the
ELECTRE method is to choose alternative that unites two conditions from the preference
concordance on many evaluations with the competitor and preference discordance was super-
vised by many options of the comparison. The starting point is the data of the decision matrix
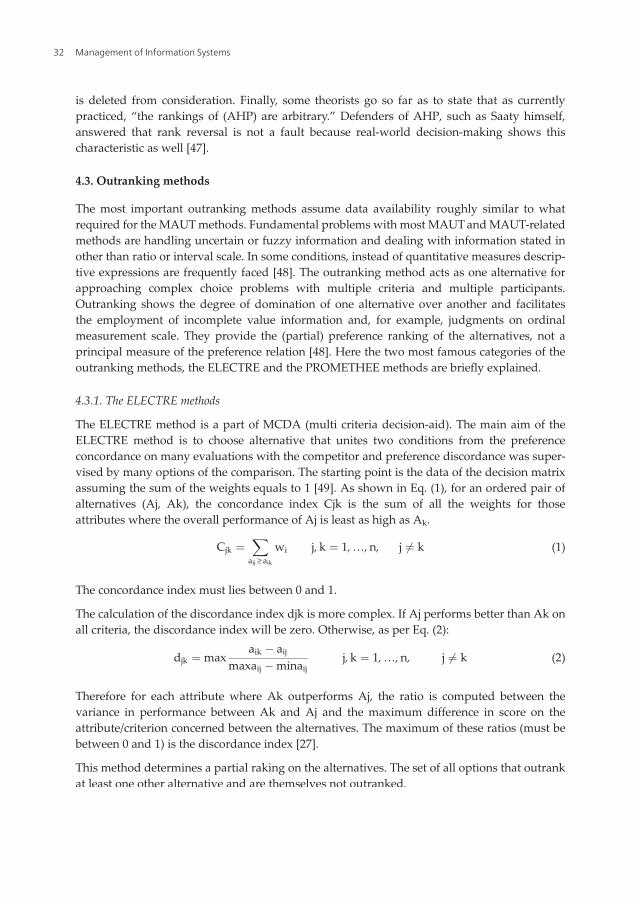
assuming the sum of the weights equals to 1 [49]. As shown in Eq. (1), for an ordered pair of
alternatives (Aj, Ak), the concordance index Cjk is the sum of all the weights for those
attributes where the overall performance of Aj is least as high as Ak.
Cjk ¼X
aij ≥ aik
wi j, k ¼ 1,…,n, j 6¼ k (1)
The concordance index must lies between 0 and 1.
The calculation of the discordance index djk is more complex. If Aj performs better than Ak on
all criteria, the discordance index will be zero. Otherwise, as per Eq. (2):
djk ¼ maxaik � aij
maxaij �minaijj, k ¼ 1,…,n, j 6¼ k (2)
Therefore for each attribute where Ak outperforms Aj, the ratio is computed between the
variance in performance between Ak and Aj and the maximum difference in score on the
attribute/criterion concerned between the alternatives. The maximum of these ratios (must be
between 0 and 1) is the discordance index [27].
This method determines a partial raking on the alternatives. The set of all options that outrank
at least one other alternative and are themselves not outranked.
Management of Information Systems32

4.3.2. The PROMETHEE methods
This method was introduced by Brans and Vincke [47], Brans et al. [17], and Edwards [50]. The
scores of the decision table need not necessarily be normalized or transformed into a dimen-
sionless scale. Higher score value indicates a better performance. It is also assumed that a
preference function is associated to each attribute. For this aim, a preference function PFi(Aj,
Ak) is defined showing the degree of the preference of option Aj over Ak for criterion Ci:
0≤PFi(Aj, Ak) ≤1 and
PFi(Aj, Ak) = 0 no indifference pr preference,
PFi(Aj, Ak) ≈ 0 weak preference,
PFi(Aj, Ak) ≈ 1 strong preference, and
PFi(Aj, Ak) = 1 strict preference.
In most realistic cases, Pi is a function of the deviation d = aij-aik, i.e., PFi(Aj, Ak) = PFi(aij-aik),
where PFi is a non-decreasing function, PFi(d) = 0 for d ≤ 0 and 0 ≤ PFi(d) < 1 for d > 0. The main
benefit of these preferences functions is the simplicity since there are no more than two
parameters in each case.
As shown in Eq. (3), multi criteria preference index π (Aj, Ak) of Aj over Ak can then be
calculated considering all the attributes:
π Aj,Ak
� �
¼
X
m
i¼1
wi Pi Aj;Ak
� �
(3)
The value of this index is between 0 and 1, and characterises the global intensity of preference
between the couples of choices [27].
For ranking the alternatives, the following outranking flows (Eq. (4) and Eq. (5)) are classified:
Positive outranking flow:
φþ Aj
� �
¼1
n� 1
X
n
k¼1
π Aj;Ak
� �
(4)
Negative outranking flow:
φ� Aj
� �
¼1
n� 1
X
n
k¼1
π Ak;Aj
� �
(5)
The positive outranking describes how much each option is outranking the other items. The
higher φþ Aj
� �
, the better the alternative. The negative outranking flow shows the power of
Aj its outranking character.
The negative outranking flow shows how much each alternative is outranked by the others.
The smaller φ� Aj
� �
, the better the alternative. φ� Aj
� �
depicts the weakness of Aj its
outranked character (ibid).
Decision Support Systemshttp://dx.doi.org/10.5772/intechopen.79390
33
4.3.3. TOPSIS methods
Technique for Order Preference by Similarity to Ideal Solution (TOPSIS) which was firstly
proposed by Hwang and Yoon (1981) is one of the mostly used multi-criteria decision-making
techniques [45]. The basic concept of TOPSIS is that the selected option should have the
shortest distance from the positive ideal solution and the farthest distance from the negative-
ideal solution in a geometrical sense. Within the process an index called “similarity index” is
defined to the positive-ideal option by combining the proximity to the positive-ideal and the
remoteness from the negative solution- ideal option. Then the method selects a solution with
the maximum similarity to the positive-ideal solution. The default assumption is that the larger
the outcome, the greater the preference for benefit attributes and the less the preference for cost
attributes [51]. The idea of TOPSIS can be expressed in a series of steps:
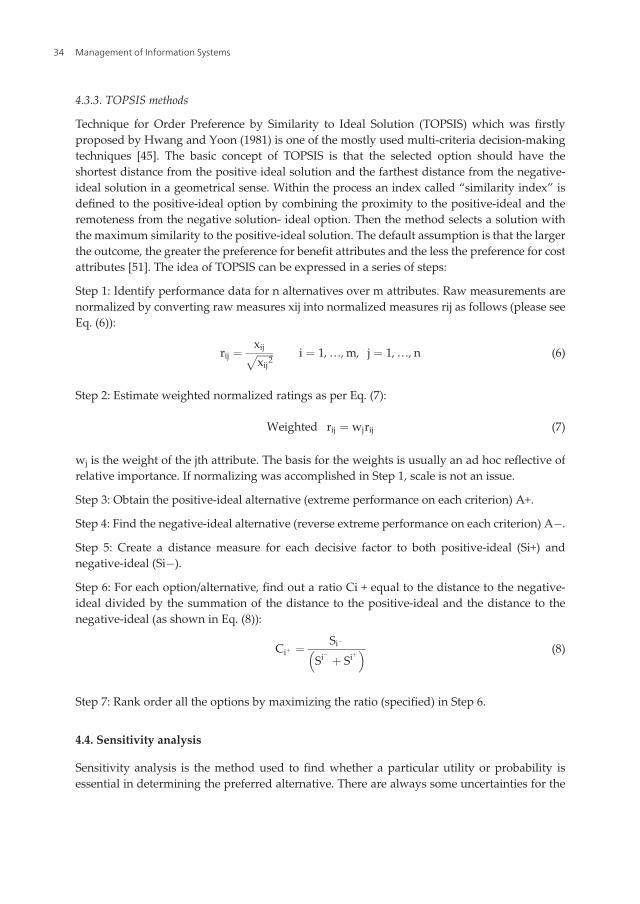
Step 1: Identify performance data for n alternatives over m attributes. Raw measurements are
normalized by converting raw measures xij into normalized measures rij as follows (please see
Eq. (6)):
rij ¼xijffiffiffiffiffiffiffi
xij2p i ¼ 1,…,m, j ¼ 1,…,n (6)
Step 2: Estimate weighted normalized ratings as per Eq. (7):
Weighted rij ¼ wjrij (7)
wj is the weight of the jth attribute. The basis for the weights is usually an ad hoc reflective of
relative importance. If normalizing was accomplished in Step 1, scale is not an issue.
Step 3: Obtain the positive-ideal alternative (extreme performance on each criterion) A+.
Step 4: Find the negative-ideal alternative (reverse extreme performance on each criterion) A�.
Step 5: Create a distance measure for each decisive factor to both positive-ideal (Si+) and
negative-ideal (Si�).
Step 6: For each option/alternative, find out a ratio Ci + equal to the distance to the negative-
ideal divided by the summation of the distance to the positive-ideal and the distance to the
negative-ideal (as shown in Eq. (8)):
Ciþ ¼Si�
Si�
þ Siþ
� � (8)
Step 7: Rank order all the options by maximizing the ratio (specified) in Step 6.
4.4. Sensitivity analysis
Sensitivity analysis is the method used to find whether a particular utility or probability is
essential in determining the preferred alternative. There are always some uncertainties for the
Management of Information Systems34
weights of the criteria and the scores of the alternatives against the subjective (judgmental)
criteria [52]. As a result an important question is how the final ranking or the ranking values of
the alternatives is sensitive to the changes of some input parameters of the decision model [27].
4.5. Summary
This chapter covers the definition of decision support system, its ideal characteristics and its
background history. Different decision analysis methods including elementary methods, multi
attribute utility theory and outranking methods have also been introduced and compared.
Author details
Maria Rashidi*, Maryam Ghodrat, Bijan Samali and Masoud Mohammadi
*Address all correspondence to: [email protected]
Centre for Infrastructure Engineering, Western Sydney University, Sydney, New South Wales,
Australia
References
[1] Lemass B. Structured Conceptual Design: The New Frontier. Sydney: Pearson Prentice
Hall; 2004
[2] Turban E, Aronson J. Decision Support Systemsand Intelligent Systems. NewDelhi, India:
Prentice Hall; 2001
[3] Faiz R, Edirisinghe E. Decision making for predictive maintenance in asset information
management. Interdisciplinary Journal of Information, Knowledge and Management.
2009;4:23-36
[4] Yehia S, Abudayyeh O, Fazal I, Randolph D. A decision support system for concrete
bridge deck maintenance. Advances in Engineering Software. 2007;39(3):202-210
[5] Zoeteman A. A life cycl costing based approach to design and maintenance of railway
infrastructure. Journal on Transport and Infrastructure Research. 2001;1(4):391-413
[6] Burstein F, Holsapple C. Handbook on Decision Support Systems. New York: Springer-
Verlag; 2008
[7] Silver M. Systems that Support Decision Makers: Description and Analysis. New York:
John Wiley; 1991
[8] Keen P, ScottMortonM.Decision Support Systems: AnOrganisational Perspective. Reading,
MA: Addison-Wesley; 1978
Decision Support Systemshttp://dx.doi.org/10.5772/intechopen.79390
35
[9] Rashidi M, Ghodrat M, Samali B, Kendall B, Zhang C. Remedial modelling of steel bridges
through application of analytical hierarchy process (AHP). Applied Sciences. 2017;7(2):1-20
[10] Power D. Decision Support Systems Concepts and Resources for Managers. London:
Greenwood Publishing Group; 2002
[11] Bonczek R, Holsapple C, Whinston A. The evolving roles of models in decision support
systems. Decision Sciences. 11(2):337-356
[12] Rashidi M, Samali B, Sharafi P. A new model for bridge management: Part a: Condition
assessment and priority ranking of bridges. Australian Journal of Civil Engineering.
2016a;14(1):35-45
[13] Rashidi M, Samali B, Sharafi P. A new model for bridge management: Part B: Decision
support system for remediation planning. Australian Journal of Civil Engineering. 2016b;
14(1):46-53
[14] Rashidi M, Gibson P. A methodology for bridge condition evaluation. Journal of Civil
Engineering and Architecture. 2012;6(9)
[15] Mora M, Forgionne G, Gupta J. Decision Making Support Systems: Achievements and
Challenges for the New Decade. Natural Resources Planning, Silva Fennica: Harrisburg,
PA; 2003
[16] Costello T, Zalkind SS. Psychology in Administration. New Jersey: Prentice Hall; 1963
[17] Brans J, Vincke P, Mareschal B. How to select and how to rank projects: The Promethee
method. European Journal of Operational Research. 1986;24(2):228-238
[18] Churchman C. Challenges to Reason. New York: McGraw-Hill; 1968
[19] Simon H. The New Science of Management Decisions. New Jersey: Prentice-Hall; 1977
[20] Srinivasan A, Sundaram D, Davis J. Implementing Decision Support Systems: Methods,
Techniques and Tools. McGraw-Hill; 2000
[21] Ghodrat M, Rashidi M, Samali B. Life cycle assessments of incineration treatment for
sharp medical waste. In: Energy Technology: Carbon Dioxide Management and Other
Technologies. Switzerland: Springer; 2017
[22] Bartol K, Tein M, Matthews G, Sharma B. Management: A Pacific Rim Focus. Australia:
McGraw Hill; 2007
[23] Rashidi M, Kempton S, Samali B. Analysis of bridge abutment movement through a case
study. In: Mechanics of Structures andMaterials: Advancements and Challenges. London:
2017
[24] Rashidi M, Lemass B. A decision support methodology for remediation planning of
concrete bridges. Journal of Construction Engineering and Project Management (JCEPM).
2011;1(2):1-10
Management of Information Systems36
[25] Lemass B, Carmichael D. Front-End Project Management. Sydney: Pearson Prentice Hall;
2008
[26] Devi K, Yadav S, Kumar S. Vague sets extension of fuzzy TOPSIS method. International
Journal of Computational Cognition. 2009;7(4)
[27] Fülöp J. Introduction to decision making methods. The Journal of the Operational
Research Society. 2005;56(1):119-122
[28] Linkov I, Satterstorm F, Kiker G, Batchelor C, Bridges T, Ferguson E. From comparative
risk assessment to multi-criteria decision analysis and adaptive managament: Recent
developments and applications. Environment International. 2006;32(8):1072-1093
[29] Baker D, Bridges D, Hunter R, Johnson G, Krupa J, Murphy J, Sorenson K. Guidebook to
Decision Making Methods. USA: Department of Energy; 2002
[30] Yoon P, Hwang C. Multiple attribute decision making: An introduction. Journal of Behav-
ioral Decision Making. 1995
[31] Zavadskas E, Ustinovichius L, Turskis Z, Shevchenko G. Application of verbal methods to
multi-attribute comparative analysis of investment risk alternatives in construction. Com-
puter Modelling and New Technologies. 2007;12(4):30-37
[32] Williams B. Cost-benefit analysis. Economic & Labour Market. Review. 2008
[33] Kuik O, Navrud S, Pearce D. Pearce, Pricing the European Environment. Benefits, Esti-
mates and Environmental Decision-Making; 1992
[34] Marzouk M. Utility theory model for equipment selection. Construction Innovation. 2006;
6(1):21-32
[35] Rashidi M, Lemass B, Gibson P. A decision support system for concrete bridge mainte-
nance. AIP. 2010
[36] Nemati S, Rashidi M, Samali B. Decision making on the optimised choice of pneumatic
formwork textile for foam-filled structural composite panels. International Journal of
GEOMATE. 2017;13(39):220-228
[37] Valiris G, Chytas P, Glykas M. Making decisions using the B alance scorecard and the
simple multi-attribute rating technique. Performance Measurement and Metrics. 2005;
6(3):159-171
[38] Saaty T. A scaling methods of priorities in hierarchical structures. Journal of Mathematical
Psychology. 1977;15(3):234-281
[39] Saaty T. Response to Holder's comments on the Analyic hierarchy process. Journal of the
Operational Research Society. 1991;42(10):918-924
[40] Bello-Dambatta A, Farmani R, Javadi AA, Evans BM. The analytical hierarchy process for
contaminated land management. Advanced Engineering Informatics. 23(4):433-441
Decision Support Systemshttp://dx.doi.org/10.5772/intechopen.79390
37

[41] Cheng S, Chen MY, Chang HY, Chou T. Semantic-based facial expression recognition
using analytical hierarchy process. Expert Systems with Applications. 3(1):86-95
[42] Saaty T. Decision making- the analytical hierarchy and network processes (AHP/ANP).
Journal of Systems Science and Systems Engineering. 2004;13(1):1-35
[43] Kim S, Song O. A MAUT approach for selecting a Dismantlin scenario for the thermal
column in KRR-1. Annals of Nuclear Energy. 2009;36(2):145-150
[44] Ishizaka A. Development of an Intelligent Tutoring System for AHP (Analytical Hierarchy
Process). University of Basel, ZDepartment of Business and Economics; 2004
[45] Kangas A, Kangas J, Pykalainen J. Outranking methods as tools in strategic natural
Resurces planning. In: Fennica S, editor. 2001. pp. 215-227
[46] Chih Huang W, Hua Chen C. Using the ELECTRE II Method to Apply and Analyse the
Differentiation Theory. The Eastern Asia Society for Transportation Studies; 2005
[47] Brans J, Vincke P. A preference ranking organisation method: (the PROMETHEE method
for multiple criteria decision making). Management Science. 1985;31(6):647-656
[48] Kilic H. Supplier selection application based on a fuzzy multiple criteria decision making
methodology. Online Academic Journal of Information Technology. 2012
[49] Elbehairy H, Hegazy T, Elbeltagi E, Souki K. Comparison of two evolutionary algorithms
for optimisation of bridge deck repairs. Computer-Aided Civil and Infrastructure Engi-
neering. 2006;21:561-572
[50] EdwardsW. The engineering economic summer symposium series. Social Utilities. 1971;6:
119-129
[51] Rashidi M, Ghodrat M, Samali B, Kendall B, Zhang C. Remedial modelling of steel bridges
through application of analytical hierarchy process (AHP). Applied Sciences. 2017;7(2)
[52] Rashidi M, Samali B, Azad A, Hatamian H. “Asset management of steel bridges,” in
Mechanics of Structures and Materials: Advancements and Challenges. Perth, W. A: CRC
Press; 2016
Management of Information Systems38