
The Role of Business Intelligence in Organizational Decision ...
Upload
khangminh22Category
view
0download
0
DECISION SUPPORT SYSTEMS FOR BUSINESS
INTELLIGENCE

DECISION SUPPORT SYSTEMS FOR BUSINESS
INTELLIGENCE SECOND EDITION
Vicki L. Sauter University of Missouri - St. Louis
College of Business Administration St. Louis, MO
WILEY
A JOHN WILEY & SONS, INC. PUBLICATION

Copyright © 2010 by John Wiley & Sons, Inc. All rights reserved.
Published by John Wiley & Sons, Inc., Hoboken, New Jersey. Published simultaneously in Canada.
No part of this publication may be reproduced, stored in a retrieval system, or transmitted in any form or by any means, electronic, mechanical, photocopying, recording, scanning, or otherwise, except as permitted under Section 107 or 108 of the 1976 United States Copyright Act, without either the prior written permission of the Publisher, or authorization through payment of the appropriate per-copy fee to the Copyright Clearance Center, Inc., 222 Rosewood Drive, Danvers, MA 01923, (978) 750-8400, fax (978) 750-4470, or on the web at www.copyright.com. Requests to the Publisher for permission should be addressed to the Permissions Department, John Wiley & Sons, Inc., 111 River Street, Hoboken, NJ 07030, (201) 748-6011, fax (201) 748-6008, or online at http://www.wiley.com/go/permission.
Limit of Liability /Disclaimer of Warranty: While the publisher and author have used their best efforts in preparing this book, they make no representations or warranties with respect to the accuracy or completeness of the contents of this book and specifically disclaim any implied warranties of merchantability or fitness for a particular purpose. No warranty may be created or extended by sales representatives or written sales materials. The advice and strategies contained herein may not be suitable for your situation. You should consult with a professional where appropriate. Neither the publisher nor author shall be liable for any loss of profit or any other commercial damages, including but not limited to special, incidental, consequential, or other damages.
For general information on our other products and services or for technical support, please contact our Customer Care Department within the United States at (800) 762-2974, outside the United States at (317) 572-3993 or fax (317) 572-4002.
Wiley also publishes its books in a variety of electronic formats. Some content that appears in print may not be available in electronic formats. For more information about Wiley products, visit our web site at www.wiley.com.
Library of Congress Cataloging-in-Publication Data:
Sauter, Vicki Lynn, 1955-Decision support systems for business intelligence / Vicki L. Sauter. - 2nd ed.
p. cm. Rev. ed. of: Decision support systems. 1997. Includes bibliographical references and index. ISBN 978-0-470-43374-4 (pbk.)
1. Decision support systems. 2. Decision making. I. Sauter, Vicki Lynn, 1955-Decision support systems. II. Title.
HG30.213.S28 2010 658.4Ό3801 l-dc22 2010028361
Printed in Singapore
10 9 8 7 6 5 4 3 2 1

This book is dedicated, with love, to My Late Father, Leo F. Sauter, Jr., My Husband, Joseph S. Martinich,
and My Son, Michael C. Martinich-Sauter,
with thanks for their steadfast inspiration and encouragement.

CONTENTS
PREFACE xiii
Part I INTRODUCTION TO DECISION SUPPORT SYSTEMS 1
1 INTRODUCTION 3 WhatisaDSS? 13 Uses of a Decision Support System 17 The Book 19 Suggested Readings 19 Questions 21 On the Web 22
2 DECISION MAKING 23 Rational Decisions 25
Bounded Rationality and Muddling Through 29 Nature of Managers 31 Appropriate Decision Support 33
Electronic Memory 33 Bias in Decision Making 33
Appropriate Data Support 36 Information Processing Models 37 Tracking Experience 45
Group Decision Making 46 Intuition, Qualitative Data, and Decision Making 47
How Do We Support Intuition? 48 Virtual Experience 51
Business Intelligence and Decision Making 53 Analytics 57 Competitive Business Intelligence 58 Conclusion 60 Suggested Readings 60 Questions 65 On the Web 66

viii CONTENTS
Part I I DSS COMPONENTS 67
3 DATA COMPONENT 69 Specific View Toward Included Data 72 Characteristics of Information 73
Timeliness 73 Sufficiency 74 Level of Detail 75 Understandability 76 Freedom from Bias 77 Decision Relevance 78 Comparability 78 Reliability 80 Redundancy 80 Cost Efficiency 80 Quantifiability 81 Appropriateness of Format 82 More Is Never Better! 83
Databases 85 Database Management Systems 86 Data Warehouses 87
Data Scrubbing 93 Data Adjustment 96 Architecture 97
Car Example 101 Possible Criteria 101 Data Warehouse 102 Information Uses 102 "How To" 107
Discussion 118 Suggested Readings 121 Questions 123 On the Web 124
4 MODEL COMPONENT 125 Models and Analytics 125 Options for Models 129
Representation 130 Time Dimension 132 Linearity of the Relationship 134 Deterministic Versus Stochastic 135 Descriptive Versus Normative 136 Causality Versus Correlation 137 Methodology Dimension 138
Problems of Models 147

CONTENTS
Data Mining 148 Intelligent Agents 156
Model-Based Management Systems 159 Easy Access to Models 159 Understandability of Results 163 Integrating Models 166 Sensitivity of a Decision 168 Model Management Support Tools 174
Car Example 177 Brainstorming and Alternative Generation 177 Flexibility Concerns 179 Evaluating Alternatives 183 Running External Models 189
Discussion 190 Suggested Readings 190 Questions 193 On the Web 195
4 S INTELLIGENCE AND DECISION SUPPORT SYSTEMS 197 Programming Reasoning 200
Backward-Chaining Reasoning 201 Forward-Chaining Reasoning 203 Comparison of Reasoning Processes 206
Uncertainty 206 Representing Uncertainty with Probability Theory 208 Representing Uncertainty with Certainty Factors 209
Discussion 211 Suggested Readings 211 Questions 212 On the Web 212
USER INTERFACE 215 Goals of the User Interface 216 Mechanisms of User Interfaces 218 User Interface Components 223
Action Language 224 Display or Presentation Language 233 Knowledge Base 251
Car Example 256 Discussion 271 Suggested Readings 271 Questions 273 On the Web 274

X CONTENTS
Part I I I ISSUES OF DESIGN 277
6 INTERNATIONAL DECISION SUPPORT SYSTEMS 279 Information Availability Standards 289
Data Privacy 290 Data Availability 295 Data Flow 296
Cross-Cultural Modeling 297 Effects of Culture on Decision Support System 303 Discussion 310 Suggested Readings 310 Questions 312 On the Web 313
7 DESIGNING A DECISION SUPPORT SYSTEM 315 Planning for Decision Support Systems 319
Designing a Specific DSS 320 Design Approaches 329 The Design Team 340
DSS Design and Reengineering 341 Discussion 344 Suggested Readings 344 Questions 346 On the Web 347
8 OBJECT-ORIENTED TECHNOLOGIES AND DSS DESIGN 349 Kinds of Development Tools 350
Non-Object-Oriented Tools 350 Object-Oriented Tools 352
Benefits of Object-Oriented Technologies for DSS 365 Suggested Readings 366 Questions 367 On the Web 367
9 IMPLEMENTATION AND EVALUATION 369 Implementation Strategy 369
Ensure System Does What It Is Supposed To Do the Way It Is Supposed To Do It 372 Keep Solution Simple 375 Develop Satisfactory Support Base 375 Institutionalize System 380
Implementation and System Evaluation 382 Technical Appropriateness 382

CONTENTS
Overall Usefulness 385 Implementation Success 386 Organizational Appropriateness 391
Discussion 392 Suggested Readings 392 Questions 394 On the Web 395
P a r t I V EXTENSIONS OF DECISION SUPPORT SYSTEMS 397
1 0 EXECUTIVE INFORMATION AND DASHBOARDS 399 KPIs and Balanced Scoreboards 400 Dashboards 401 Dashboard as Driver to EIS 408 Design Requirements for Dashboard 410 Dashboard Appliances 417 Value of Dashboard and EIS 418
Discussion 423 Suggested Readings 423 Questions 425 On the Web 426
1 1 GROUP DECISION SUPPORT SYSTEMS 427 Groupware 429 GDSS Definitions 432 Features of Support 434
Decision-Making Support 434 Process Support 438 GDSS and Reengineering 439
Discussion 440 Suggested Readings 440 Questions 442 On the Web 443
INDEX

PREFACE
Information is a crucial component of today's society. With a smaller world, faster commu-nications, and greater interest, information relevant to a person's life, work, and recreation has exploded. However, many believe this is not all good. Richard S. Wurman (in a book entitled Information Anxiety) notes that the information explosion has backfired, leaving us stranded between mere facts and real understanding. Similarly, Peter Drucker noted in a Wall Street Journal (December 1,1992, p. A16) editorial entitled "Be Data Literate—Know What to Know" that, although executives have become computer literate, few of them have mastered the questions of what information they need, when they need information, and in what form they need information. On that backdrop enters the awakening of business intelligence and analytics to provide a structure for harnessing the information to be a tool to help companies be more competitive.
This is both good news and bad news for designers of decision support systems (DSS). The good news is that if, as Drucker claims, the future success of companies is through the astute use of appropriate information, then DSS have a bright future in helping decision makers use information appropriately. The bad new is that where DSS are available, they may not be providing enough support to the users. Too often the DSS are designed as a substitute for the human choice process or an elaborate report generator.
Decision support systems, by definition, provide business intelligence and analytics to strengthen some kind of choice process. In order for us to know what information to retain and how to model the relationships among the data so as to best complement the human choice process, DSS designers must understand the human choice process. To that end, this book illustrates what is known about decision making and the different styles that decision makers demonstrate under different conditions. This "needs assessment" is developed on a variety of levels: (a) what is known about decision making (with or without a computer) in general; (b) how that knowledge about decision making has been translated into specific DSS needs; (c) what forms of business intelligence needs are associated with the problem or the environment; and (d) how does one actually program those needs into a system. Hence, all topics are addressed on three levels: (a) general theory, (b) specific issues of DSS design, and (c) hands-on applications. These are not separate chapters but rather an integrated analysis of what the designer of a DSS needs to know.
The second issue that drives the content and organization of this book is that the focus is totally upon DSS for business intelligence. Many books spend a significant amount of time and space explaining concepts that are important but ancillary to the development of a DSS. For example, many books discuss the methods for solution of mathematical models. While accurate solution methods for mathematical models are important for a successful DSS, there is much more about the models that needs discussion in order to implement a good DSS. Hence, I have left model solutions and countless other topics out of the book in order to accommodate topics of direct relevance to DSS.
Finally, I believe in DSS and their contribution. Those who know me well know that when I believe in something, I share it with enthusiasm and zeal. I think those attributes show in this book and make it better. Writing this book was clearly a labor of love; I hope it shows.
PREFACE
MAJOR FEATURES OF THE BOOK
Integration of Theory and Practice: It is the integration of theory with practice and abstract with concrete that I think makes this book unique. It reflects a personal bias that it is impossible to understand these design concepts until you actually try to implement them. It also reflects a personal bias that unless we can relate the DSS concepts to the "real world" and the kinds of problems (opportunities) the students can expect to find there, the students will not understand the concepts fully.
Although the book contains many examples of many aspects of DSS, there is one example that is carried throughout the book: a DSS to facilitate car purchases. I have selected this example because most students can relate to it, and readers do not get bogged down with discussion of company politics and nuances. Furthermore, it allows a variety of issues to be compared in a meaningful fashion.
Focus on the "Big Picture": The representation throughout the book focuses on "generic" DSS, which allows discussion of design issues without concern for whether it is a group system, an organizational system, or an individual system. Furthermore, it allows illustration of how seemingly specialized forms of DSS, such as geographic information systems, actually follow the same principles as a "basic" DSS.
Although I show implementation of the concepts, I do not overfocus on the tools. There are example screens of many tools appearing in the book. Where I show development, I create my examples using HTML, Javascript, and Adobe® Cold Fusion.® Most informa-tion systems students today have an understanding of HTML and Javascript. Cold Fusion commands are sufficiently close to these that even if you elect to use another tool, these examples can be understood generally by students.
Strong Common Sense Component: We technology folks can get carried away with the newest and greatest toy regardless of its applicability to a decision maker. It is important to remember the practicalities of the situation when designing DSS. For example, if we know that a company has a commitment to maintaining particular hardware, it would not make sense to develop a system relying upon other hardware. These kinds of considerations and the associated implications for DSS design are highlighted in the book. This is not to say that some of these very interesting but currently infeasible options are not discussed. Clearly, they are important for the future of management information systems. Someday, these options will be feasible and practical so they are discussed.
Understanding Analytics: Some research indicates that companies do not have enough people who can apply analytics successfully because they do not understand modeling well. In this book, I try to emphasize the questions that should surround the use of analytics to ensure they are being used properly and that the decision maker fully appreciates the implications of their use. The goal is not only to help the reader better understand analytics but also to encourage builders of DSS to be aware of this problem and build sufficient modeling support in their systems.
Integration of Intelligence: Over the years expert systems have evolved into an inte-grated component of many decision support systems provided to support decisions makers, not replace them. To accomplish such a goal, the expert systems could not be stand alone, but rather need to be integrated with the data and models used by these decision makers. In other words, expert systems (or intelligence) technology became a modeling support function, albeit an important one, for decision support systems. Hence, the coverage of the topic is integrated into the modeling component in this book. However, I do acknowledge there are some special topics needing attention to those who want to build the intelligence.

PREFACE
These topics are covered in a supplement to Chapter 4, thereby allowing instructors to use discretion in how they integrate the topic into their classes.
International Issues Coverage: As more companies become truly multinational, there is a trend toward greater "local" (overseas) decision making that must of course be co-ordinated. These companies can afford to have some independent transaction processing systems, but will need to share DSS. If the DSS are truly to facilitate decision making across cultures, then they must be sensitive to differences across cultures. This sensitivity includes more than just changes in the language used or concern about the meaning of icons. Rather, it includes an understanding of the differences in preferences for models and model management systems and for trade-offs and mechanisms by which information is communicated and acted upon. Since future designers of DSS will need to understand the implications of these differences, they are highlighted in the book. Of course, as with any other topic, the international issues will be addressed both in "philosophical" terms and in specific technical (e.g.,coding) terms.
Object-Oriented Concepts and Tools: Another feature of the book that differentiates it from others is a use of object-oriented technology. Many books either present material without discussion of implementation or use traditional programming tools. If students have not previously had experience with them, object-oriented tools can be tricky to use. However, we know that a reliance upon object-oriented technology can lead to easier maintenance and transfer of systems. Since DSS must be updated to reflect new company concerns and trends, designers must be concerned about easier maintenance. So, while the focus of the book is not on object-oriented programming, the nuances of its programming will be discussed wherever it is practical. In addition, there is a chapter that focuses upon the topic that can be included in the curriculum.
Web Support and Other Instructional Support Tools: There is a complete set of Web links that provide instructional support for this book. Example syllabi, projects, and other ideas can be viewed and downloaded from the Web. All figures and tables appear on the Web so you can use them directly in the class or download them to your favorite demonstration package to use in class. In addition, there are lots of Web links to sites you can use to supplement the information in the book. Some of those links provide access to demo versions of decision support packages for download and use of some sample screens. These provide up-to-date examples of a variety of systems that students can experience or instructors can demonstrate to bring the practice into the classroom. Other links provide access to application descriptions, war stories, and advice from practitioners. Still others provide a link to a variety of instructors (both academic and nonacademic) on the topic.
I strived to provide support for the class from a variety of different perspectives. You can see the information at http://www.umsl.edu/~sauterv/DSS4BI/. Further, there is information at the end of every chapter about the kinds of materials found in support of that chapter, and directions for direct access to the chapter information is given in those chapters. More important, in the true spirit of the Web, I will update these links as more information becomes available. So, if you happen to see something that should be included, please email me at [email protected]. In addition to the DSS support, I have accumulated links regarding automobiles and their purchase and lease. This Web page would provide support for people who want to explore the car example in the book in more depth or for students who want to use different information in the development of their own automobile DSS. You can link to this from the main page or go to it directly at http://www.umsl. edu/~sauterv/DSS4B yautomobile_information.html.

PREFACE
ACKNOWLEDGMENTS
If a book is a labor of love, then there must be a "coach" to help one through the process. In my case, I am lucky enough to have a variety of coaches who have been there with me every step of the way. First, in a very real sense, my students over the years have provided a foundation for this book. Even before I knew I was going to produce this work, my students provided an environment in which I could experiment and learn about decisions, decision making, and decision support systems. It is their interest, their inquisitiveness, and their challenge that have led me to think through these topics in a manner that allowed me to write this book. I have particular gratitude to Mary Kay Carragher, David Doom, Mimi Duncan, Joseph Hof er, Timothy McCaffrey, Kathryn Ntalaja, Richard Ritthamel, Phillip Wells, and Aihua Yan for their efforts in support of this book.
Second, there are numerous people at John Wiley & Sons who helped me achieve my vision for this book. I am grateful to each one for his or her efforts and contribution. In particular, I would like to thank my editors, Beth Lang Golub, editor of the first edition, and Susanne Steitz-Filler, editor of the second edition. They each believed in this project long before I did, and continued to have faith in it when mine wore thin. I could not have produced this book without them. In addition, I want to thank my style editors, Elisa Adams and Ernestine Franco, who helped to make my ideas accessible through direct and constructive changes in the prose. In addition, I would like to thank the reviewers of the first and second editions who provided superb comments to improve the style and content.
Finally, I want to thank my friends and family for their support, encouragement, and patience. My husband, Joseph Martinich, has been with me every step of the way—not only with this book, but in my entire career. I sincerely doubt that I could have done any of it without him. My son, Michael Martinich-Sauter, has demonstrated infinite patience with his mother. More important, he has inspired me to look at every topic differently and more creatively. I have learned much about decisions, decision making, and decision support from him, and I am most grateful he has shared his wisdom with me. Finally, I want to acknowledge the sage Lady Alexandra (a.k.a. Allie—the dog), who made me laugh when I really needed it and whose courage made me appreciate everything more.

I
INTRODUCTION TO DECISION SUPPORT SYSTEMS
Decision Support Systems for Business Intelligence by Vicki L. Sauter Copyright © 2010 John Wiley & Sons, Inc.

INTRODUCTION
Virtually everyone makes hundreds of decisions each day. These decisions range from the inconsequential, such as what to eat for breakfast, to the significant, such as how best to get the economy out of a recession. All other things being equal, good outcomes from those decisions are better than bad outcomes. For example, all of us would like to have a tasty, nutritional breakfast (especially if it is fast and easy), and the country would like to have a stable, well-functioning economy again. Some individuals are "lucky" in their decision processes. They can muddle through the decision not really looking at all of the options or at useful data and still experience good consequences. We have all met people who instinctively put together foods to make good meals and have seen companies that seem to do things wrong but still make a good profit. For most of us, however, good outcomes in decision making are a result of making good decisions.
"Good decision making" means we are informed and have relevant and appropriate information on which to base our choices among alternatives. In some cases, we support decisions using existing, historical data, while other times we collect the information, especially for a particular choice process. The information comes in the form of facts, numbers, impressions, graphics, pictures, and sounds. It needs to be collected from various sources, joined together, and organized. The process of organizing and examining the information about the various options is the process of modeling. Models are created to help decision makers understand the ramifications of selecting an option. The models can range from quite informal representations to complex mathematical relationships.
For example, when deciding on what to eat for a meal, we might rely upon historical data, such as those available from tasting and eating the various meal options over time and
Decision Support Systems for Business Intelligence by Vicki L. Sauter Copyright © 2010 John Wiley & Sons, Inc.
4 INTRODUCTION
our degree of enjoyment of those options. We might also use specially collected data, such as cost or availability of the options. Our model in this case might be simple: Select the first available option that appeals to us. Or, we might approach it with a more complex approach: Use linear programming to solve the "diet problem" to find the cheapest combination of foods that will satisfy all the daily nutritional requirements of a person.1
In today's business world, we might use models to help refine our understanding of what and how our customers purchase from us to improve our customer relationship management. In that case we might collect information from point-of-sale systems for all of our customers for multiple years and use data-mining tools to determine profiles of our customers. Those profiles could in turn profile information about trends with which managers could change marketing campaigns and even target some marketing campaigns.
The quality of the decision depends on the adequacy of the available information, the quality of the information, the number of options, and the appropriateness of the modeling
!The diet problem was one of the first large-scale optimization problems solved using modern modeling techniques. The Army wished to find the cheapest way to provide the necessary nutrition to the field soldiers. The National Bureau of Standards solved the problem with the simplex method (which was new then) with 9 equations and 77 variables. To solve the problem, it took nine clerks using hand-operated calculators 120 days to find the optimal solution. For more information on the diet problem, including a demonstration of the software, check the NEOS page at http://www-neos.mcs.anl.gov/CaseStudies/dietpy/WebForms/index.html.
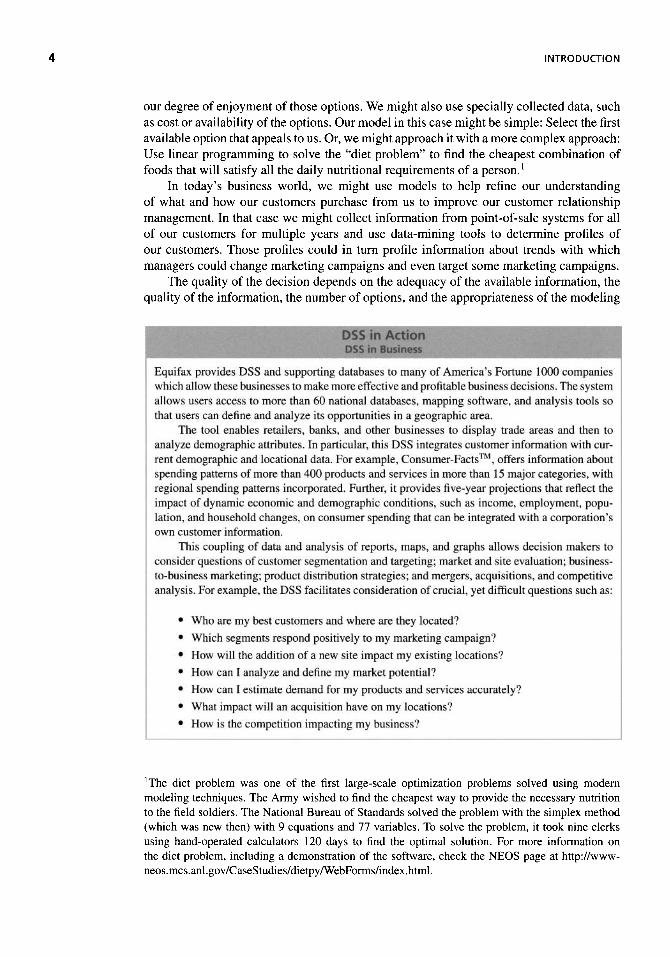
Equifax provides DSS and supporting databases to many of America's Fortune 1000 companies which til 1 u w these businesses to m ak e m ore effecti ve and profi tabl e busi n es s dec; i si on s. The sy stem allows users access to more than 60 national databases, mapping software, and analysis tools so that users can define and analyze its opportunities in a geographic area.
The tool enables retailers, banks, and other businesses to display trade areas and then to analyze demographic attributes. In particular, this DSS integrates customer information with cur-rent demographic and locational data. For example, Consumer-Facts'M, offers information about spending patterns of more than 400 products and services in more than 15 major categories, with regional spending patterns incorporated. Further, it provides five-year projections that reflect the impact of dynamic economic and demographic conditions, such as income, employment, popu-lation, and household changes, on consumer spending that can be integrated with a corporation's own customer information,
This coupling of data and analysis of reports, maps, and graphs allows decision makers to consider questions of customer segmentation and targeting; market and site evaluation; business-to-business marketing; product distribution strategies; and mergers, acquisitions, and competitive analysis. For example, the DSS facilitates consideration of crucial, yet difficult questions such as:
• Who are my best customers and where are they located?
• Which segments respond positively to my marketing campaign?
• How will the addition of a new site impact my existing locations?
• How can T analyze and define my market potential?
• How can I estimate demand for my products and services accurately?
• What impact will an acquisition have on my locations?
• How is the competition impacting my business?

INTRODUCTION
effort available at the time of the decision. While it is not true that more information (or even more analysis) is better, it is true that more of the appropriate type of information (and analysis) is better. In fact, one might say that to improve the choice process, we need to improve the information collection and analysis processes.
Increasingly corporations are attempting to make more informed decisions to improve their bottom lines. Some refer to these efforts to use better information and better models to improve decision making as business intelligence. Others refer to it as analytics. In either case, the goal is to bring together the right information and the right models to understand what is going on in the business and to consider problems from multiple perspectives so as to to provide the best guidance for the decision maker.
One way to accomplish the goal of bringing together the appropriate information and models for informed decision making is to use decision support systems (DSS). Decision support systems are computer-based systems that bring together information from a variety of sources, assist in the organization and analysis of information, and facilitate the evaluation of assumptions underlying the use of specific models. In other words, these systems allow decision makers to access relevant data across the organization as they need it to make choices among alternatives. The DSS allow decision makers to analyze data generated from transaction processing systems and other internal information sources easily. In addition, DSS allow access to information external from the organization. Finally, DSS allow the decision makers the ability to analyze the information in a manner that will be helpful to that particular decision and will provide that support interactively.
So, the availability of DSS provides the opportunity to improve the data collection and analyses processes associated with decision making. Taking the logic one step further, the availability of DSS provides the opportunity to improve the quality and responsiveness of decision making and hence the opportunity to improve the management of corpora-tions. Said differently, the DSS provides decision makers the ability to explore business intelligence in an effective and timely fashion.
To see how DSS can change the way in which decisions are made, consider the following example of a Manhattan court. Consider the problem. New York spends in excess of $3 billion each year on criminal justice and the number of jail beds has increased by over 110% in 20 years. In Manhattan, in particular, developers have spent billions of dollars refurbishing neighborhoods and providing good-quality living, business, and entertainment areas. Yet people continue not to feel safe in them, and minor crimes depreciate the quality
Biologists working at the university of Missouri-St Louis and trie Missouri Botanical Gardens have used a specialized kind of DSS called a geographic information system (GIS) to test hy-potheses in phytogeographic studies. The GIS allows for greater sophistication in studies of spatial components, such as the movement patterns of fruit-eating birds. For example, the Loiselle Lab at UM-St. Louis considered the Atlantic forests of Brazil and bird migration using a GIS, They modeled the historic distributions of birds in this region using a GIS and digitalized environmental layers from the National Atlas of Brazil. These historic distributions were compared to the present forest coverage to estimate the impact of the vast deforestation of this area. This allowed Loiselle to estimate the original habitat and the implications of its reduction. This, in turn, allowed the researchers to consider a wide range of options that impacted biodiversity conservation decisions of these forests.
INTRODUCTION
of life for residents. Furthermore, the likelihood of repeat offenses is high; over 40% of the defendants seen in a year already have three or more convictions.
While clearly there is a problem, those facts (that crime exists, that enormous amounts of money are spent, and that people do not feel safe) are examples of bad outcomes, not necessarily bad decisions. However, three facts do suggest the quality of the decision could be improved:
• Criminal justice workers know very little about the hundreds of thousands of people who go through the New York court systems.
• There has been little creative thinking about the sanctions judges can use over time. • Most defendants get the same punishment in the same fashion.
Specifically, they suggest with more information, more modeling capabilities, and better alternative generation tools that better decisions, which could result in superior outcomes, might be achieved.
In this case, citizens, court officials, and criminal justice researchers noted the problem of information availability and have developed a process to address it for "quality-of-life" crimes, such as shoplifting and street hustling. Specifically, the city, landlords, and federal funding jointly created a new court and located the judge in the same building as city health workers, drug counselors, teachers, and nontraditional community service outlets to increase the likelihood of the court working with these providers to address the crime problem innovatively. The centerpiece of this effort is a DSS that provides judges with more and better information as well as a better way for processing that information so as to make an impact on the crime in Manhattan.
This example does illustrate some of the important characteristics of a DSS. A DSS must access data from a variety of sources. In this court example, the system accesses the arresting officer's report, including the complaint against the offender and the court date. In addition, the DSS provides access to the defendant's criminal record through connections with the New York Division of Criminal Justice. These police records are supplemented with information gained by an independent interviewer either at the police precinct or at the courthouse. These interviewers query the defendant regarding their lifestyle, such as access to housing, employment status, health conditions, and drug dependencies. Finally, an intermediary between the court and the services available, called a court resource coordinator, scans the person's history, makes suggestions for treatment, and enters the information into the system.
A second characteristic of a DSS is that it facilitates the development and evaluation of a model of the choice process. That is, the DSS must allow users to transform the enormous amount of "data" into "information" which helps them make a good decision. The models may be simple summarization or may be sophisticated mathematical models. In this case, the modeling takes on a variety of forms. The simple ability to summarize arrest records allows judges to estimate recidivism if no intervention occurs. Further, the summarization of lifestyle information encourages the development of a treatment model. In addition, with the DSS, the judge can track community service programs and sites to determine which is likely to be most effective for what kinds of offenses. Hence, the judge can model the expected impact of the sanctions on a defendant with particular characteristics. In other words, it can facilitate the evaluation of programs to determine if there is a way to have greater impact on particular defendants or on a greater number of defendants.
INTRODUCTION
The design team is in the process of adding additional modeling capabilities. Soon, they hope to integrate mapping technology that will plot a defendant's prior arrest record. The judge can evaluate this map to determine (a) if there is a pattern in offenses that can be addressed or (b) where to assign community service sentence to optimize the payback to society.
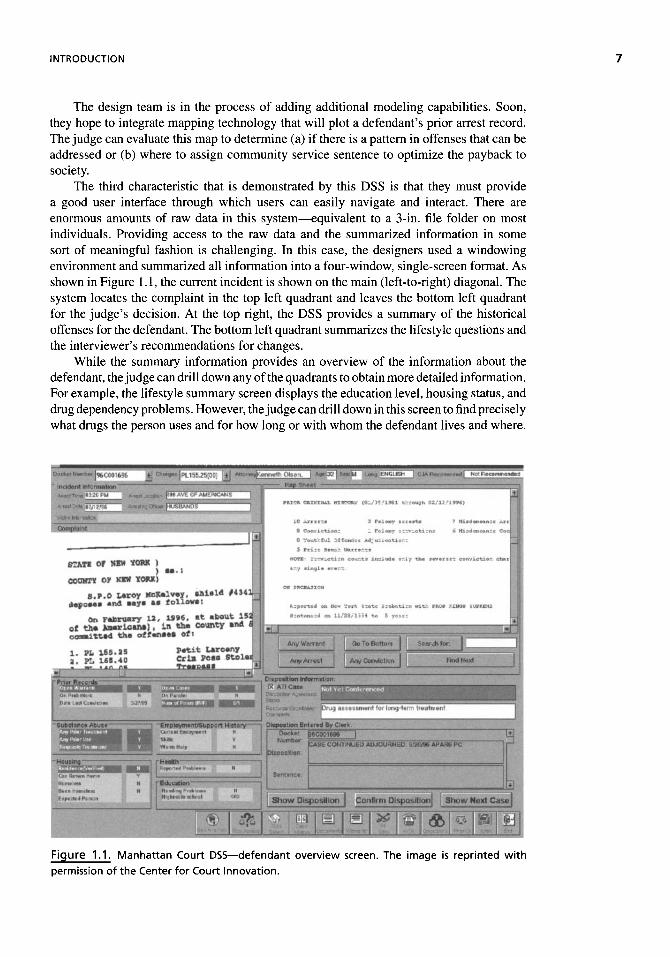
The third characteristic that is demonstrated by this DSS is that they must provide a good user interface through which users can easily navigate and interact. There are enormous amounts of raw data in this system—equivalent to a 3-in. file folder on most individuals. Providing access to the raw data and the summarized information in some sort of meaningful fashion is challenging. In this case, the designers used a windowing environment and summarized all information into a four-window, single-screen format. As shown in Figure 1.1, the current incident is shown on the main (left-to-right) diagonal. The system locates the complaint in the top left quadrant and leaves the bottom left quadrant for the judge's decision. At the top right, the DSS provides a summary of the historical offenses for the defendant. The bottom left quadrant summarizes the lifestyle questions and the interviewer's recommendations for changes.
While the summary information provides an overview of the information about the defendant, the judge can drill down any of the quadrants to obtain more detailed information. For example, the lifestyle summary screen displays the education level, housing status, and drug dependency problems. However, the judge can drill down in this screen to find precisely what drugs the person uses and for how long or with whom the defendant lives and where.
Figure 1.1. Manhattan Court DSS—defendant overview screen. The image is reprinted with permission of the Center for Court Innovation.
8 INTRODUCTION
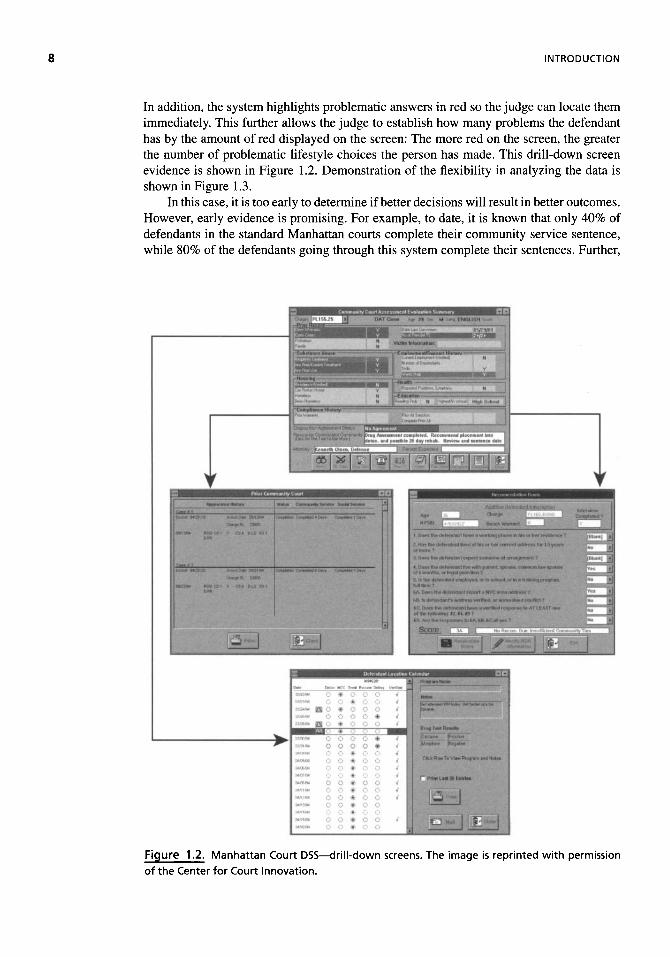
In addition, the system highlights problematic answers in red so the judge can locate them immediately. This further allows the judge to establish how many problems the defendant has by the amount of red displayed on the screen: The more red on the screen, the greater the number of problematic lifestyle choices the person has made. This drill-down screen evidence is shown in Figure 1.2. Demonstration of the flexibility in analyzing the data is shown in Figure 1.3.
In this case, it is too early to determine if better decisions will result in better outcomes. However, early evidence is promising. For example, to date, it is known that only 40% of defendants in the standard Manhattan courts complete their community service sentence, while 80% of the defendants going through this system complete their sentences. Further,
Figure 1.2. Manhattan Court DSS—drill-down screens. The image is reprinted with permission of the Center for Court Innovation.

INTRODUCTION 9
Figure 1.3. Manhattan Court DSS—flexibility in data analysis. The image is reprinted here with
the permission of the Center for Court Innovation.
almost 20% of the defendants sentenced to community-based sanctions2 voluntarily take advantage of the social services. Finally, the system was awarded the National Association of Court Management's Justice Achievement Award.
In this example, the decision makers are using data and analyses to drive their pro-cesses. Many other companies, from sports teams such as the Oakland As to greeting card companies such as Hallmark, are finding that through better analyses of their data they can exploit niches to improve their business processes, decision making, and profits. There are many different levels at which the analyses can help decision makers consider the business, as illustrated in Figure 1.4. The analyses can help decision makers understand what is happening in their organization, why problems or trends occur, what trends are likely to continue, what actions are best, and how to take advantage of situations in the future.
According to their research of more than 40 C-level executives and directors at 25 globally competitive organizations, Davenport and Harris (2007) indicate that competitive organizations will increasingly rely upon data integrated from a variety of sources to drive their mainstream decisions. Howson (2008), in her survey of companies, found that 43% of large companies (with annual revenues greater than a billion U.S. dollars), 30% of medium companies, and 27% of small companies already rely upon business intelligence in their companies. Of these applications, over 80% are reported to improve company performance, and over 30% ofthat improvement is considered "significant." Further, an Accenture (2009)
2Community-based sanctions include projects such as sweeping streets, removing graffiti, cleaning bus lots, maintaining street trees, painting affordable housing units, and cleaning and painting subway stations. All work is done under the supervision of the appropriate metropolitan agency.

10 INTRODUCTION
Figure 1.4. Uses of DSS throughout the Business. (Source: Istvan Szeman, Business Intelligence: Past Present and Future, SAS Institute, 2006. Available: http://www.sas.com/search/cs.html? url=http%3A//www.sas.com/offices/europe/bulgaria/downloads/saga_conf_sas.ppt&charset=iso-8859-1 &ql=degree+of+intelligence+competitive+advantage+%2Bgraphic&col=exisas&n=1&la= en, viewed January 29, 2009.) Copyright © 2010, SAS Institute, Inc. All rights reserved. Reproduced with permission of SAS Institute, Inc., Cary NC, USA.
study notes that improvement in systems that provide business intelligence will be a high priority for 2009 and beyond.
Not only will business-intelligence-based systems help upper level managers, but they will be used throughout the organization to help with the variety of choices. The ability to manage information in this way is enabled by DSS which bring together the data with the models and other tools to help the decision maker use the results more wisely.
Said differently, the need for business intelligence and thus DSS will only increase in the future of solid companies. The obvious question is, "why?" People have been making decisions for thousands of years without DSS. In fact, business managers have been making good decisions with good outcomes for many hundreds of years. Why should DSS technology now be important to the choice process?
Figure 1.5 illustrates the factors that are pushing organizations to adopt DSS. As you can see, the pressures range from enabling tools that allow them to get more and
Nobel laureate economist Herbert Simon points out: "What information consumes is rather obvious: it consumes the attention of its recipients. Hence a wealth of information creates a poverty of attention, and a need to allocate that attention efficiently among the overabundance of information sources that might consume it" (Scientific American, September 1995, p. 201). Hence, as the amount of information increases, so does the need for filtering processes which help decision makers find that which is most important and meaningful

INTRODUCTION 11
Figure 1.5. Pressures to business to use DSS.
better information to compelling pressures that others will get the benefits first. First and foremost is the argument that the analytical tools are better now and so the kinds of business intelligence that we need are possible in a way it was not before. The tools generally are more sophisticated, but the relatively recent availability of tools such as pattern recognition and machine learning provide an insight into customers' suppliers and other corporate influences that was not possible before.
At the same time that analytical tools have become more powerful, these tools have become friendlier and easier for managers to use. Unlike in the early days of DSS, when one needed to know specialized languages and commands (such as "Job Control Language") just to be able to access data on a computer, few of today's packages require much specialized knowledge to use. One can access the package and begin looking a trends, graphs, and interrelationships just by using a menu and/or point-and-click technology. Software written for a special purpose also tends to be easier to use, with greater reliance upon online help options and context-sensitive help. As the software is used more frequently, decision makers gain familiarity and expertise with the tool.
This coincides with increasing numbers of upper level managers becoming more com-fortable using computers and technology in general for a variety of tasks. A generation ago, managers were fixed to their desks if they wanted to rely upon a computer; they could not have the information where they wanted it when they wanted it. These earlier generations of managers would have found it impossible to imagine a U.S. president who felt passionately about using a Blackberry to keep information and analytics available at all times!
With increases in tools and aptitude come increasing amounts of data. The use of Enterprise Resource Planning (ERP) systems, point of service (POS) systems, and data warehouses has made data about suppliers, processes, and customers more available than ever before. Rather than guessing what customers do, they know what customers have purchased, how often, and with what. These databases are more flexible in their design so that their data are more easily combined with data from other databases. The result is a more complete vision of what is happening in organizations. Of course, the data come in

12 INTRODUCTION
faster than ever before too. Without a tool made to process the data with the managers in mind, the data could not have been understood fast enough to respond to it properly.
Executives have turned to the analytics provided by DSS because they need something that will give them the competitive edge over their competitors. Companies are finding that it is increasingly difficult to differentiate themselves based upon the product they manufacture or the way they use technology because other companies are doing the same thing. Competitors have access to the same resources and the same technology to use within their own corporations. At the same time, companies are no longer competing with just others in their own city, state, or nation: Global competition for resources, employees, and customers is typical.
Market conditions continue to change as well, and managers need to be able to respond to those changes quickly. Ten years ago, the annual increase in demand for automobiles in China was about 6%, while today it is about 15% and still growing. Such increases in demand require managers to change their production to respond. Similarly, when demand for products and services decreases rapidly, such as what has been seen in the recession of 2008, managers need to respond rapidly to change their product mix to stay profitable. Understanding market conditions and being able to predict changes in market conditions in the global environment require good business intelligence.
Regulations have changed too, requiring executives to understand more about their business and its practices. The Public Company Accounting Reform and Investor Protection Act of 2002 (more commonly known as Sarbanes Oxley, or SOX) mandates that senior executives take individual responsibility for the accuracy and completeness of corporate financial reports. Said differently, the law requires corporate executives to understand what is happening in their business and to be responsible for it. Even in small organizations, this becomes difficult without good analytics.
The final pressure noted in Figure 1.5 is that increasingly managers want fact-based decisions. Industry analysts indicate that managers are frustrated by efforts to computerize corporations and yet cannot get one "version" of what is happening. Accenture (2009) reports that 40% and Lock (2008) reports that 35% of business decisions are judgmental. These reports also note that managers want to replace them with fact-based decisions. The most critical problem they report is not having systems that provide the facts needed to make the decisions.
Today's analytics provide more than just the profit level or sales quantity of a store. With new data i mining tools managers can now get insights into why sales hit specific levels as well as what is likely to happen next month, thus giving them factors that can be manipulated to improve performance. By analyzing vast quantities of data, managers better understand what drives different categories of shoppers. This, in turn, stimulates decisions such as how to rearrange store layouts, slock shelves and price items. Once shopping behaviors and preferences are understood, store then can tailor offerings accordingly to differentiate themselves from competitors. Britain's Tesco relies
Ion mined data for most decisions, including the development of house brands. Kroeger (U.S.) uses mined data to profile customer buying behavior so they can better target coupons to make \ the store more appealing. The ability to predict customer response to changes in business rules provides a powerful competitive advantage for the store.
.

WHAT IS A DSS?
While these factors clearly contribute to the acceptance of technology, there is another factor that is pushing the use of DSS technology. That is, decision makers are using DSS because the cost of not using the technology is too high. The complexity of organizations and the competition mean that other corporations will need to use analytics to get an advantage. Hence, not using DSS tools will mean losing an advantage to competitors.
For example, today's banks are competing fiercely for customers, and analytics help them do it better. Combining the bank's main corporate database with departmental databases, branch managers can use the tools in the DSS to determine the most prof-itable customers who should receive preferential treatment and which customers would be most responsive to cross-selling of new products. The availability of these rich databases and analytical tools not only saves time but also increases the quality of analyses considered. The personalization of the customer care makes these banks more attractive to customers than their competitors.
Similarly, today's hospitals are under significant pressure to control costs, but those costs are driven by physicians. The DSS tools can allow physicians to compare their treatment protocols with others in the same specialty for patients of similar age and disease to evaluate the efficacy of their treatment protocols when compared to others. These analyses help the doctor determine if he or she is providing the best possible care for the patient as well as helping the doctor determine if there are reasonable ways to reduce the cost of that care. In other words, they help reduce the hospital's costs without impacting the quality of patient care.
WHAT IS A DSS?
As stated previously, a DSS is a computer-based system that supports choice by assisting the decision maker in the organization of information and modeling of outcomes. Consider Figure 1.6 which illustrates a continuum of information system products available. In this diagram, the conventional management information system (MIS) or transaction processing system (TPS) is shown at the far left. The MIS is intended for routine, structural, and anticipated decisions. In those cases, the system might retrieve or extract data, integrate it, and produce a report. These systems are not analysis oriented and tend to be slow, batch processing systems. As such, they are not good for supporting decisions.
Jewish Hospital Healthcare Services uses various DSS applications in the areas of productivity, cost accounting, case mix, arid nursing staff scheduling. The systems include modeling, fore-casting, planning, communications, database management systems, and graphics. Furthermore, all of the data are drawn from key clinical and financial systems so there is not inconsistency in the data used by different decision makers. This allows decision makers to consider problems and opportunities from more dimensions with belter support than ever before. For example, the DSS includes a ''nursing acuity system" for classifying patients by the severity and nursing needs associated with their illnesses. These calculations can be used by the nurse-staffing scheduling system to estimate the demand for nurses on a daily basis. Not only does this system help nurse managers to plan schedules, the DSS helps them to evaluate heuristics they might employ in developing the schedule. For example, they can compare the estimated nurse-staffing needs to the actual levels to determine if there are better ways of managing their staffs. In this era of managed care, such analyses help the hospitals use scarce resources more effectively,

14 INTRODUCTION
Figure 1.6. Continuum of information system products.
The far right of this diagram illustrates expert systems (ES). These systems are intended to reproduce the logic of a human who is considered an expert for the purposes of a particular decision. The systems generally process a series of heuristics that are believed to mimic that logic. They are good at supporting decisions, but only those decisions it has been programmed to process.
In between those two is the area of DSS and executive information systems (EIS). These two types of systems are intended to help decision makers identify and access infor-mation they believe will be useful in processing poorly structured, underspecified problems. They provide flexible mechanisms for retrieving data, flexible mechanisms for analyzing data, and tools which help understand the problems, opportunities, and possible solutions. They allow the decision maker to select what they want in both substance and format.
For example, an MIS might provide a report of profit by item on a monthly basis, typically in a written form. A DSS, on the other hand, would store the profit by item for later analysis. The system would allow the decision makers to decide whether said analyses were for individual products, groups of related products, products in a particular region, and so on. In addition, it might flash a notice to the manager (at the first availability of the data) when a product had a profit that was outside its typical range—either high or low. Decision makers can then decide for themselves whether or not the shift represented a need for corrective action for a problem or the possibility of an opportunity. In this way, it makes it easier to collect information, easier to put it in a form that allows analysis, and easier to have it available when it is needed.
Similarly, the MIS provides no help in generating alternatives. If it does provide some sort of model, it provides only the results. Typically there is no provision for "what if?" analyses to determine how sensitive the answer is to the assumptions made. The DSS would typically provide access to these sensitivity analyses. In addition, a DSS might prompt users to consider sensitivity analyses or provide suggestions on how to improve the analyses.
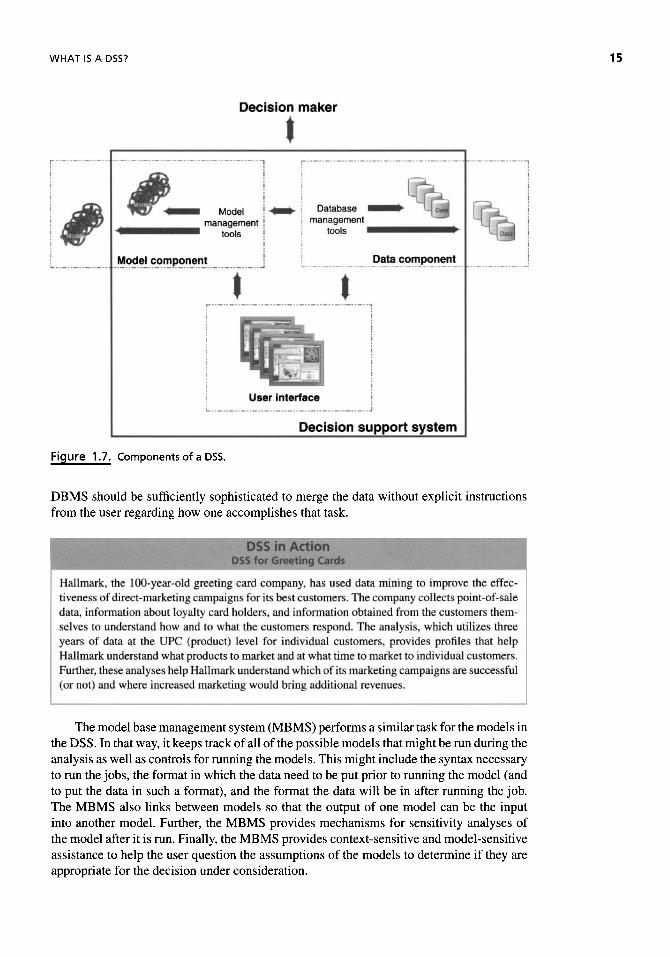
To achieve this decision support, there are three components which comprise a DSS, as shown in Figure 1.7.
We will discuss these components briefly here, and each of these components will be discussed in depth later in this book. The database management system (DBMS) provides access to data as well as all of the control programs necessary to get those data in the form appropriate for the analysis under consideration without the user programming the effort. The data include facts about internal operations, trends, market research and/or intelligence, and generally available information. The DBMS should be sophisticated enough to give users access to the data even when they do not know where the data are located physically. In addition, the DBMS facilitates the merger of data from different sources. Again, the
WHAT IS A DSS? 15
Figure 1.7. Components of a DSS.
DBMS should be sufficiently sophisticated to merge the data without explicit instructions from the user regarding how one accomplishes that task.
The model base management system (MBMS) performs a similar task for the models in the DSS. In that way, it keeps track of all of the possible models that might be run during the analysis as well as controls for running the models. This might include the syntax necessary to run the jobs, the format in which the data need to be put prior to running the model (and to put the data in such a format), and the format the data will be in after running the job. The MBMS also links between models so that the output of one model can be the input into another model. Further, the MBMS provides mechanisms for sensitivity analyses of the model after it is run. Finally, the MBMS provides context-sensitive and model-sensitive assistance to help the user question the assumptions of the models to determine if they are appropriate for the decision under consideration.
Hallmark, the 100-year-old greeting card company, has used data mining to improve the effec-tiveness of direct-marketing campaigns for its best customers. The company collects puint-of-sale data, information about loyalty card holders, and information obtained from the customers them-selves to understand how and to what the customers respond. The analysis, which utilizes three years of data at the UPC (product) level for individual customers, provides profiles that help Hallmark understand what products to market and at what time to market to individual customers. Further, these analyses help Hallmark understand which of its marketing campaigns are successful (or not) and where increased marketing would bring additional revenues,
16 INTRODUCTION
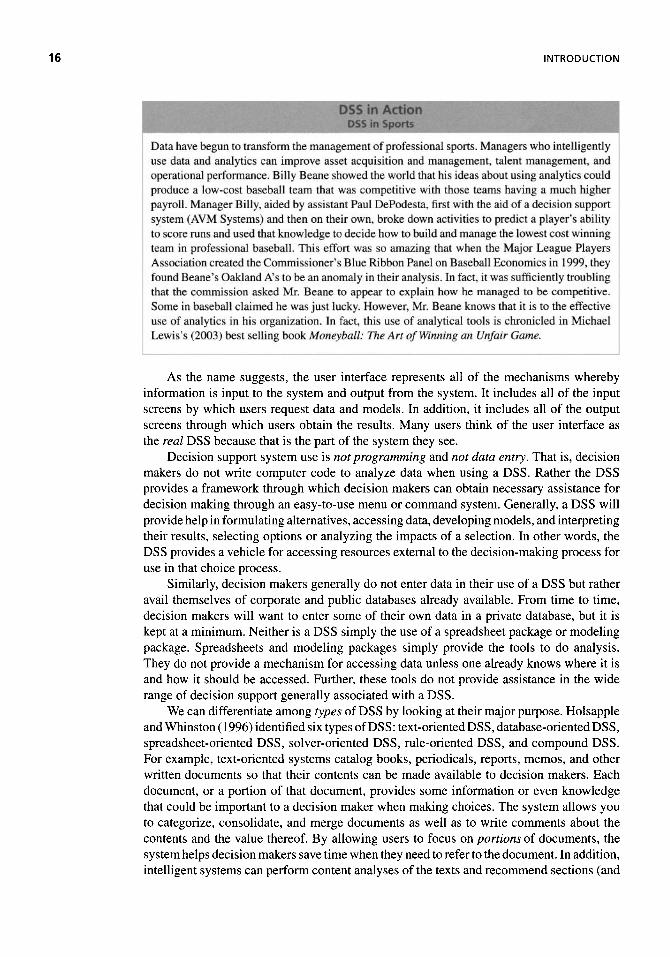
As the name suggests, the user interface represents all of the mechanisms whereby information is input to the system and output from the system. It includes all of the input screens by which users request data and models. In addition, it includes all of the output screens through which users obtain the results. Many users think of the user interface as the real DSS because that is the part of the system they see.
Decision support system use is not programming and not data entry. That is, decision makers do not write computer code to analyze data when using a DSS. Rather the DSS provides a framework through which decision makers can obtain necessary assistance for decision making through an easy-to-use menu or command system. Generally, a DSS will provide help in formulating alternatives, accessing data, developing models, and interpreting their results, selecting options or analyzing the impacts of a selection. In other words, the DSS provides a vehicle for accessing resources external to the decision-making process for use in that choice process.
Similarly, decision makers generally do not enter data in their use of a DSS but rather avail themselves of corporate and public databases already available. From time to time, decision makers will want to enter some of their own data in a private database, but it is kept at a minimum. Neither is a DSS simply the use of a spreadsheet package or modeling package. Spreadsheets and modeling packages simply provide the tools to do analysis. They do not provide a mechanism for accessing data unless one already knows where it is and how it should be accessed. Further, these tools do not provide assistance in the wide range of decision support generally associated with a DSS.
We can differentiate among types of DSS by looking at their major purpose. Holsapple and Whinston (1996) identified six types of DSS: text-oriented DSS, database-oriented DSS, spreadsheet-oriented DSS, solver-oriented DSS, rule-oriented DSS, and compound DSS. For example, text-oriented systems catalog books, periodicals, reports, memos, and other written documents so that their contents can be made available to decision makers. Each document, or a portion of that document, provides some information or even knowledge that could be important to a decision maker when making choices. The system allows you to categorize, consolidate, and merge documents as well as to write comments about the contents and the value thereof. By allowing users to focus on portions of documents, the system helps decision makers save time when they need to refer to the document. In addition, intelligent systems can perform content analyses of the texts and recommend sections (and
Data have begun to transform the management of professional sports. Managers who intelligently use data and analytics can improve asset acquisition and management, talent management and operational performance. Billy Beane showed the world that his ideas about using analytics could produce a low-co st baseball team that was competitive with those teams having a much higher payroll. Manager Billy, aided by assistant Paul DePodestaT first with the aid of a decision support system (AVM Systems) and then on their own, broke down activities to predict a player's ability to score runs and used that knowledge to decide how to build and manage the lowest cost winning team in professional baseball. This effort was so amazing that when the Major League Players Association created the Commissioners Blue Ribbon Panel on Baseball Economics in 1999, they found Beane*s Oakland A*s to be an anomaly in their analysis. In fact, it was sufficiently troubling that the commission asked Mn Beane to appear to explain how he managed to be competitive. Some in baseball claimed he was just lucky However, Mr. Beane knows that it is to the effective use of analytics in his organization. In fact, this use of analytical tools is chronicled in Michael Lewis's (2003 J best selling book Moneyball: The Art of Winning an Unfair Game.

USES OF A DECISION SUPPORT SYSTEM
thus information) the decision maker might not otherwise consider. A variation on the text-oriented DSS is the hypertext-oriented DSS. The hypertext-oriented DSS provides the same basic functions that text-oriented systems do, but the documents are logically related and linked. This allows the decision makers to follow specific subjects among documents when making choices. No longer do they need to go through documents in a linear fashion to find the important information. They can instead transverse the information in all of the various sources, thereby supplementing his or her abilities to associate relevant portions of the text. Of course, since we now are accustomed to such links because of Web surfing, we generally take such abilities for granted in our online documents.
Database-oriented DSS are similar to the text systems in that they provide descriptive information that is of relevance to a choice under consideration. Instead of providing text, though, these systems focus on discrete data that are stored in a database. The system controlling these databases allow for manipulating and joining the data and presenting those data in ways that will benefit decision makers. Generally such systems use Structured Query Language (SQL) through which to identify and manipulate the data. Some minimal summaries of the data can be provided through the use of these SQL commands.
Spreadsheet-oriented DSS, as the name suggests, use the tools available in a spreadsheet to summarize and analyze the data. Instead of just providing access to data, these DSS allow the decision maker to create some basic models and to evaluate those models in a quick and efficient manner. Similarly, solver-oriented DSS provide some kind of modeling package as the basis of the DSS. These systems allow decision makers to identify more varied and sophisticated relationships among the data. The modeling package may be integrated into the DSS or simply used by the DSS depending on the architecture of the system.
A rule-oriented DSS or intelligent DSS provides advisory support to decision makers. Early examples were rule based of the form
IF <some premise is true> THEN <some condition is true> ELSE <some other condition is true>
By linking the rules together, these systems could provide some cognitive functions and prove something to be true (or sometimes false) or reason as far as the data allowed toward a conclusion. Improvements in artificial intelligence technologies have allowed these systems to demonstrate more sophisticated reasoning and even some learning.
The compound DSS are hybrid combinations of the individual types of DSS. Such systems have mixed capabilities, such as a solver-database combination or a spreadsheet-database-intelligence combination. The different components exist equally within the sys-tem and allow complete flexibility in their use. As you might expect, such hybrid designs are the most common form of DSS today. It will be this form that we generally assume in the discussion in the remainder of the book.
USES OF A DECISION SUPPORT SYSTEM
Throughout this chapter, there are examples of DSS in operation today. The applications range from strategic planning to operations management and exist in the public sector as well as the private sector, including both the for-profit and not-for-profit branches. So, if there is not a particular application area, how does one know when it would be appropriate to use a system?

18 INTRODUCTION
Decision support systems are most useful when it is not obvious what information needs to be provided, what models need to be used or even what criteria are most appropriate. Said differently, they are useful when it is not obvious a priori how the choice should be made. Furthermore, since DSS proceed with requests from decision makers in the order and manner selected by the user (and not necessarily linear in their application), they tend to be associated with situations where users proceed differently with each problem. However, that does not mean a DSS cannot be useful for a more structured problem.
LaPlante (1993) notes that DSS are most useful when (a) managers and their staffs spend significant time locating and analyzing data that are already stored electronically, (b) management meetings stall because people challenge the validity of the data, (c) manage-ment is frequently surprised by the data when end-of-month-type reports are generated, and (d) decisions are too frequently made based upon anecdotal evidence instead of appropriate data even when data might be collected regularly. In short, she notes that if the data are collected electronically but are not used to their full potential, a DSS is warranted.
Hogue and Watson (1983) note that DSS might be developed for other reasons. Al-though their study noted that the number one reason for using a DSS is to obtain accurate information, many users develop such a system to obtain timely information or because new information is needed. Other corporations develop DSS because they are viewed as an "organizational winner" or because management has mandated the use of a system. In these cases, managers believe that their image of using the DSS affects their client's view of their product. In very few cases the DSS is used because it reduces cost.
The industrial revolution provided machinery to make one's job easier. The information revolution is supposed to provide the same level of help to the knowledge worker. Just like the automobile did not replace the human, the DSS does not replace the human. Similarly, the availability of automobiles did not solve all of the transportation and transshipment problems—just the problem of how to get one or more people with one or more items somewhere else faster, more comfortably, and using less energy. That is, a DSS will not solve all of the problems of any given organization. However, it does solve some problems well. Generally, it is accepted that DSS technology is warranted if the goal is to help decision makers:
• Look at more facets of a decision • Generate better alternatives • Respond to situations quickly • Solve complex problems
The Obama Presidential campaign of 2008 used a DSS that they called Neighbor to Neighbor, The campaign leveraged election board data with data collected on websites, rallies, or through telephone polls. The system included names and addresses of voters whom they believed were undecided in the campaign. It also included issues of interest to the specific voter, data about issues of interest in a particular region, and past voting records. Using this tool, staff members could more effectively identify scripts and pitches to use with particular voters to convince them to vote for Obama. Tn addition, they could customize fliers and other campaign materials to gel their point to the voters more effectively. Near real-time data and sophisticated analytics helped volunteers use valuable campaign time more effectively.

SUGGESTED READINGS 19
• Consider more options for solving a problem
• Brainstorm solutions
• Utilize multiple analyses in solving a problem
• Have new insights into problems and eliminate "tunnel vision" associated with premature evaluation of options
• Implement a variety of decision styles and strategies
• Use more appropriate data
• Better utilize models
• Consider "what if?" analyses
The software facilitates one's own processes. One should remember, however, that a badly designed DSS can make one's life difficult—just as a lemon of an automobile can make one's transportation difficult.
THE BOOK
As the DSS develops in this book, we will use a liberal definition of the term so as to allow a wide variety of technologies to be included. This allows exploration of the greatest range of opportunities available for DSS. The possibilities will be pursued in terms of the three components defined earlier. In the next few chapters, we will discuss each of these components in depth. Following that will be further discussion on special features in some systems and guidelines for development and implementation.
SUGGESTED READINGS
Accenture, "Survey Shows Business Analytics Priorities Not Yet Achieved," White Paper, available: http://www.accenture.con^Global/Technology/Inforaiation^gmt/Information^gmt_Services/ R_and_I/SurveyAchieved.htm, viewed February 8, 2009.
Alter, S., Decision Support Systems: Current Practice and Continuing Challenge, Reading, MA:
Addison-Wesley, 1980.
Assael, S., "ROBOCOURT," Wired, Vol. 2.03, March 1994, pp. 106-111.
Baker, S., The Numerati, New York: Houghton Mifflin, 2008.
Burstein, F., and C. W. Holsapple, Handbook on Decision Support Systems, Vols. 1 and 2, Berlin:
Springer-Verlag, 2008.
Burrows, P., "Giant Killers on the Loose," Business Week: The Information Revolution, Special 1994
Bonus Issue, Spring 1994, pp. 108-110.
Butters, S., "Jewish Hospital Healthcare Services Uses DSS," Journal of Systems Management,
Vol. 43, June 1992, p. 30.
Davenport, T. H., and J. G. Harris, Competing on Analytics: The New Science of Winning, Boston,
MA: Harvard Business School Press, 2007.
Evans, J. R., "A Microcomputer-Based Decision Support System for Scheduling Umpires in the
American Baseball League," Interfaces, Vol. 18, No. 6, November-December 1988, pp. 42-51.
Evans-Correia, K., "Putting Decisions through the Software Wringer: Intel Uses Decision Support Software for Supplier Selection," Purchasing, Vol. 110, March 21, 1991, pp. 62-64.
INTRODUCTION
"Executives See BI as a Crucial Competitive Advantage," SAS White Paper, available: http://www.sas.com/news/feature/llapr05/davenport.html, April 2005, viewed January 26, 2009.
Gorry, G. M., and M. S. Scott-Morton, Decision Support Systems: An Organizational Perspective, Reading, MA: Addison-Wesley, 1978.
Hogue, J. T., and H. J. Watson, "Management's Role in the Approval and Administration of Decision Support Systems," MIS Quarterly, Vol. 7, No. 2, June 1983, pp. 15-26.
Holsapple, C. W, "DSS Architecture and Types," in F. Burstein, and C. W. Holsapple (Eds.), Hand-book on Decision Support Systems, Vol. 1, Berlin: Springer-Verlag, 2008, pp. 163-189.
Holsapple, C. W., and A. B. Whinston, Decision Support Systems: A Knowledge-Based Approach, St. Paul, MN: West Publishing, 1996.
Howson, C, Successful Business Intelligence: Secrets to Making BI a Killer Application, New York: McGraw-Hill, 2008.
"IS Meets Business Challenges Head On," Datamation, Vol. 39, No. 1, January 1, 1993, pp. 27-35.
LaPlante, A., "Liberate Your Data," Forbes, Vol. 153, No. 6, March 14, 1994, pp. 58-68.
Lewis, M., Moneyball: The Art of Winning an Unfair Game, New York: WW. Norton & Company, 2003.
Lock, M., "BPM and Beyond: The Human Factor of Process Management," Aberdeen White Paper, November 2008.
Martin, E. W, D. W., DeHayes, J. A., Hoffer, and W C. Perkins, Managing Information Technology: What Managers Need to Know, New York: Macmillan Publishing Company, 1991.
"Motorola Launches Intelligent Business Opportunity Support Using LEVEL5 OBJECT," Informa-tion Builder News, Spring/Summer 1994, pp. 42—45.
Paul, S., "European IS Managers Get Down to Business," Datamation, Vol. 40, No. 5, March 1,1994, pp. 78-84.
Power, D. J., Decision Support Systems: Concepts and Resources for Managers, Santa Barbara, CA: Quorum Books Division of Greenwood Publishing, 2002.
Power, D. J., Decision Support Systems: Frequently Asked Questions, Bloomington, IN: iUniverse Publishing, 2004.
Rathnam, S., M. R. Arun, A. Chaudhury, and P. R. Shukla, "MUDRAPLAN—A DSS for Me-dia Planning: From Design to Utilization," Interfaces, Vol. 22, No. 2, March-April 1992, pp. 65-75.
"Removing the Roadblocks," Datamation, Vol. 40, No. 1, January 7, 1994, pp. 22-24.
Rizakou, E., J. Rosenhead, and K. Reddington, "AIDSPLAN: A Decision Support Model for Plan-ning the Provision of HIV/AIDS -Related Services," Interfaces, Vol 21, No. 3, 1991, pp. 117-129.
Sage, A. P., Decision Support Systems Engineering, New York: Wiley, 1991.
Sager, I., "The Great Equalizer," Business Week: The Information Revolution, Special 1994 Bonus Issue, Spring 1994, pp. 100-107.
"SAS Helps Hallmark Send Customers the Right Message," SAScom Magazine, available: http://www.sas.com/success/hallmark.html, Fourth Quarter 2008, viewed January 29, 2009.
Sauter, V L., "The Effect of "Experience' upon Information Preferences," Omega, Vol. 13, No. 4, June 1985, pp. 277-284.
Sauter, V L., and M. B. Mandell, "Using Decision Support Concepts to Increase the Utilization of Social Science Information in Policy-Making," Evaluation and Program Planning, Vol. 13, 1990, pp. 349-358.
Sauter, V. L., and J. L. Schofer, "Evolutionary Development of Decision Support Systems: What Issues Are Really Important for Early Phases of Design," Journal of Management Information Systems, Vol. 4, No. 4, 1988, pp. 77-92.

QUESTIONS 21
Schlegel, K., and G. Herschel, "Business Intelligence and Decision Making," Gartner Research, Report, No. G00152905, Stanford, CT May 2, 2008.
Scott-Morton, M. S., Management Decision Systems: Computer-Based Support for Decision Making,
Cambridge, MA: Harvard University, 1971.
Shannon, P. W., and R. P. Minch, "A Decision Support System for Motor Vehicle Taxation Evaluation,"
Interfaces, Vol. 22, No. 2, March-April 1992, pp. 52-64.
Sprague, R. H., and E. D. Carlson, Building Effective Decision Support Systems, Englewood Cliffs,
NJ: Prentice-Hall, 1982.
Sprague, R. H., and H. J. Watson (Eds.), Decision Support Systems: Putting Theory into Practice,
3rd ed., Englewood Cliffs, NJ: Prentice-Hall, 1993.
Sviridoff, M., D. Rottman, B. Ostrom, and R. Curtis, Dispensing Justice Locally: The Implementation
of the Midtown Community Court, Amsterdam: Harwood Academic Publishers, 2000.
Wurman, Richard S. Information Anxiety, Indianapolis: Que Publishing, 2000.
QUESTIONS
1. What factors inhibit the growth of DSS in today's business?
2. Define DSS. How are they different from transactional process systems?
3. List the major benefits of DSS.
4. What conditions suggest the need for a DSS?
5. Consider popular descriptions of computerized systems you have encountered over the last several months. Are any of these systems DSS? Why or why not?
6. Find an application of a DSS in an area of interest to you. What are the good aspects of the DSS? In a real DSS, some of the technical niceties are generally sacrificed for the realities of the situation. What technical niceties were sacrificed in your system? Were they reasonable sacrifices?
7. The literature often separates "expert systems" applications from "decision support systems" applications. Discuss why they should be considered separately.
8. Discuss examples of when one would want "expertise" integrated into a DSS.
9. Why must a corporation have good transactional processing systems before imple-menting a DSS?
10. Consider the system developed for the Manhattan court system at the beginning of this chapter. What attributes of the system make it a DSS? How do you know it is not a transaction processing system or an expert system?
11. What is the difference between a good decision and a good outcome? What does a DSS help?
12. Does your university use DSS? If so, how do they help the decision making of the university? If not, why are they not used?
13. What kind of DSS might help you in planning your studies and/or career?
14. Identify a newspaper or news magazine that describes a decision. Discuss the deci-sion(s) being considered, the model and/or data used to consider the decision, the model and/or data that should used to consider the decision, and how a DSS might help.
15. Is an ERP system a DSS? Why or why not?

22 INTRODUCTION
ON THE WEB
On the Web for this chapter provides additional information to introduce you to the area of decision support systems. Links can provide access to demonstration packages, general overview information, applications, software providers, tutorials, and more. Further, you can see some DSSs available on the Web and use them to help increase confidence in your general understanding of this kind of computer system. Additional discussion questions and new applications will also be added as they become available.
• Links provide additional information. For example, one link provides a brief history of the DSS and its relationship with other related disciplines. Similarly, another link provides a glossary of DSS terms. Finally, there are links to bibliographies about DSS available on the Web.
• Links provide access to DSS examples in business, government, and research. Some links provide access to papers on the Web describing DSS applications and their uses. Others describe the process used to develop the application.
• Links provide access to information about DSS providers and software tools. Many software companies have Web pages that describe their tools and the application of those tools.
• Links provide summaries of applications in particular industries. For example, summaries of how the use of DSS can help solve business problems related to manufacturing and marketing are available on the Web.
You can access material for this chapter from the general Web page for the book or directly at http://www.umsl.edu/~sauterv/DSS4BI/intro.html.
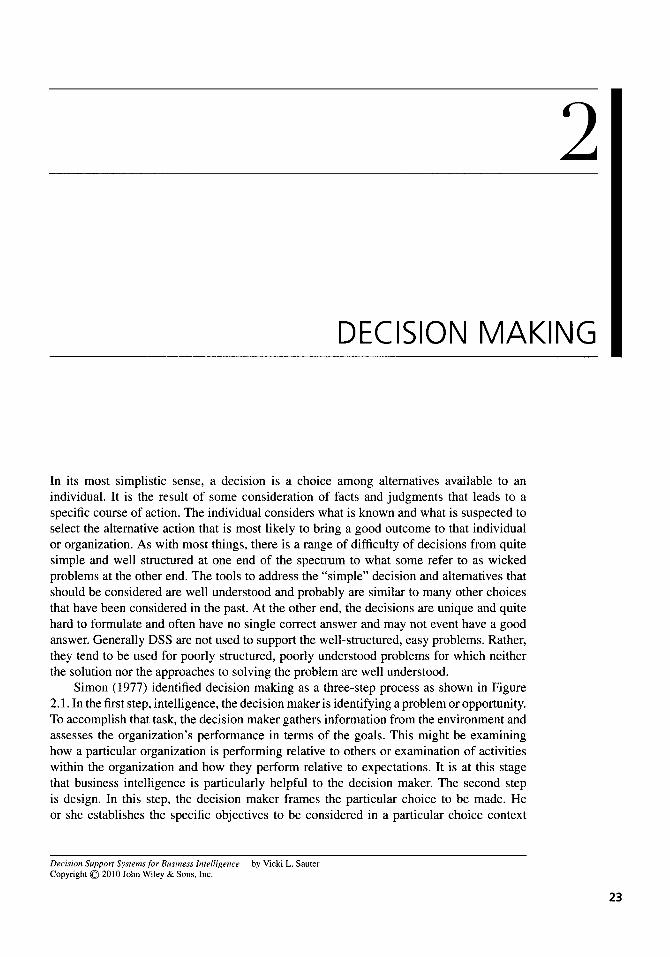
DECISION MAKING
In its most simplistic sense, a decision is a choice among alternatives available to an individual. It is the result of some consideration of facts and judgments that leads to a specific course of action. The individual considers what is known and what is suspected to select the alternative action that is most likely to bring a good outcome to that individual or organization. As with most things, there is a range of difficulty of decisions from quite simple and well structured at one end of the spectrum to what some refer to as wicked problems at the other end. The tools to address the "simple" decision and alternatives that should be considered are well understood and probably are similar to many other choices that have been considered in the past. At the other end, the decisions are unique and quite hard to formulate and often have no single correct answer and may not event have a good answer. Generally DSS are not used to support the well-structured, easy problems. Rather, they tend to be used for poorly structured, poorly understood problems for which neither the solution nor the approaches to solving the problem are well understood.
Simon (1977) identified decision making as a three-step process as shown in Figure 2.1. In the first step, intelligence, the decision maker is identifying a problem or opportunity. To accomplish that task, the decision maker gathers information from the environment and assesses the organization's performance in terms of the goals. This might be examining how a particular organization is performing relative to others or examination of activities within the organization and how they perform relative to expectations. It is at this stage that business intelligence is particularly helpful to the decision maker. The second step is design. In this step, the decision maker frames the particular choice to be made. He or she establishes the specific objectives to be considered in a particular choice context
Decision Support Systems for Business Intelligence by Vicki L. Sauter Copyright © 2010 John Wiley & Sons, Inc.
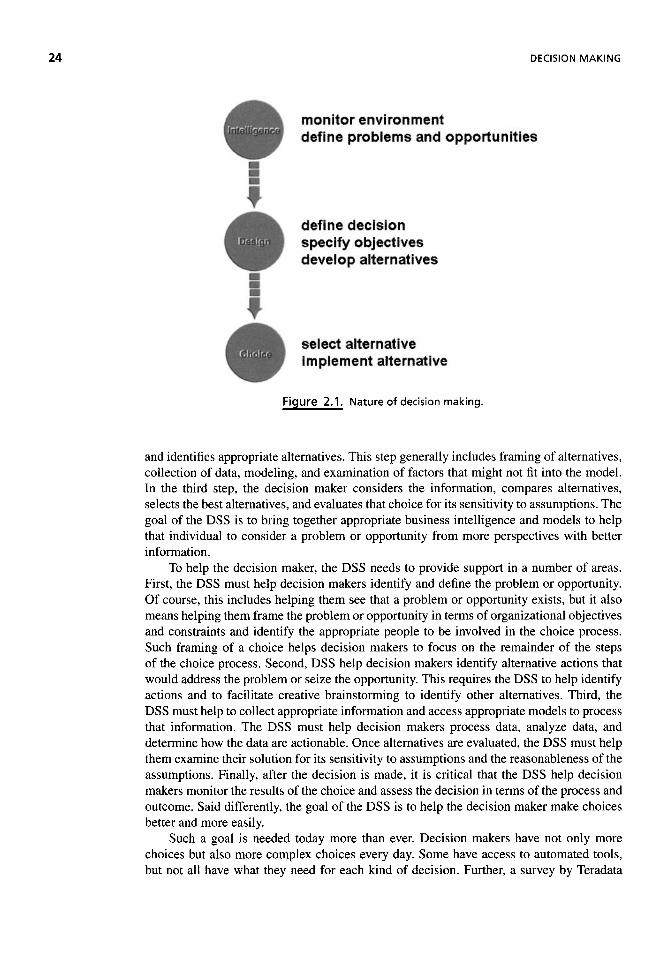
24 DECISION MAKING
Figure 2.1. Nature of decision making.
and identifies appropriate alternatives. This step generally includes framing of alternatives, collection of data, modeling, and examination of factors that might not fit into the model. In the third step, the decision maker considers the information, compares alternatives, selects the best alternatives, and evaluates that choice for its sensitivity to assumptions. The goal of the DSS is to bring together appropriate business intelligence and models to help that individual to consider a problem or opportunity from more perspectives with better information.
To help the decision maker, the DSS needs to provide support in a number of areas. First, the DSS must help decision makers identify and define the problem or opportunity. Of course, this includes helping them see that a problem or opportunity exists, but it also means helping them frame the problem or opportunity in terms of organizational objectives and constraints and identify the appropriate people to be involved in the choice process. Such framing of a choice helps decision makers to focus on the remainder of the steps of the choice process. Second, DSS help decision makers identify alternative actions that would address the problem or seize the opportunity. This requires the DSS to help identify actions and to facilitate creative brainstorming to identify other alternatives. Third, the DSS must help to collect appropriate information and access appropriate models to process that information. The DSS must help decision makers process data, analyze data, and determine how the data are actionable. Once alternatives are evaluated, the DSS must help them examine their solution for its sensitivity to assumptions and the reasonableness of the assumptions. Finally, after the decision is made, it is critical that the DSS help decision makers monitor the results of the choice and assess the decision in terms of the process and outcome. Said differently, the goal of the DSS is to help the decision maker make choices better and more easily.
Such a goal is needed today more than ever. Decision makers have not only more choices but also more complex choices every day. Some have access to automated tools, but not all have what they need for each kind of decision. Further, a survey by Teradata

RATIONAL DECISIONS 25
reported that 70% of executives believed that "poor decision making is a serious problem for business (Taylor and Raden, 2007).
Before we can discuss how to support the choice process, it is necessary to review what we know about the choice process. The considerable amount of known information cannot be chronicled here. Instead, we will take an overview of the general ideas about decision making as they apply to the provision of business intelligence and the design of a DSS. The guiding principle of this literature is that different decision makers will need quite different information to support their choice processes. Similarly, a given decision maker will need different support when facing different choices in different choice environments. Designers of good DSS will be cognizant of those needs and respond to them so as to provide decision makers with the flexibility to change the emphasis they place on various criteria.
RATIONAL DECISIONS
The place to begin is with a definition of rationality. Everyone knows that rational decisions are better than those that are not rational. But what does "rational" mean? The dictionary defines it as "based on, or derived from reasoning . . . implies the ability to reason logi-cally" (Guralink, 1980, p. 1179). Clearly, rational decisions require information about the alternatives, which must be identified and evaluated with regard to some set of criteria and some forecast of future conditions. In addition, we must judge these alternatives in terms of their relative use of raw materials, their impact upon our constraints, and their benefits in terms of our objective.
While this provides some guidance, it leaves a significant amount of room for inter-pretation about what should be in a DSS. Rational decisions certainly are based partly on economic bases and therefore optimize the economic condition of the firm, such as minimizing costs, maximizing profits, or maximizing return for investors. So, DSS need
In his book The Pursuit of WOW/, Tom Peters (1994, p. 74) discusses principles of management. In principle 49, he notes how people respond to uncertainty:
The Greeks knew little of the way their world worked by the standards of Copernicus or Newton, let alone Einstein. Yet they developed a system of meaning as finely articulated as any you'll find in a modem quantum mechanics text.
The translation to everyday life is clear When confronted with anything unusual, from a new ache or pain to a new boss, we try to build a theory of how things are going to work out. And, says experience and psychological research, the less we know for sure, the more complex the webs of meaning (mythology) we spin.
While Peters goes on to explain the lesson of keeping customers informed, this principle can have other lessons to DSS needs. That is, without current and appropriate information and decision aids, decision makers will still develop a model of the choice context and make decisions based on that model. With reasonable support and information, decision makers arc likely to develop a prudent model, Without reasonable support and information, decision makers are likely to develop defective views of reality which can lead to imprudent choices being made. Hence, decision support—even fairly limited support—can increase the likelihood of discerning choices being made.
26 DECISION MAKING
Figure 2.2. Forms of rationality.
to be able to reflect how much each alternative will cost or how much profit will result from each alternative. Consider, for example, the situation where a decision maker selects a vehicle from a range of automobiles. Economic rationality would dictate that the costs of the various automobiles be listed. In addition, also included might be more extensive information such as the fuel mileage (so we could estimate the fuel costs during ownership), the maintenance record (so as to be able to estimate maintenance costs), special insurance issues (such as high theft rates or other attributes that raise the cost of insurance), and the life expectancy of the automobile (so we would know when to replace the automobile). Few of us can imagine purchasing or leasing an automobile without considering the price in some way.
The clear importance of economic considerations means that DSS need to include some economic data and models for evaluating those data. Unfortunately, since many individuals overemphasize this criterion, many DSS are built to include only the economic characteristics of the problem. However, just as few of us would consider buying a car without some fiscal evaluation, few of us would consider only economic issues in the choice process. In fact, as Figure 2.2 summarizes, there are six forms of rationality associated with a reasonable decision process.
Upon reflection, almost everyone would agree that technical rationality is assumed in a reasonable decision process. Technical rationality asserts that if the options will not work, they should not be considered in the choice process. That is, choices should be consistent with the attainment of our goals or objectives. For example, will a particular mix of materials provide the needed strength or will a particular software package allow the user to perform necessary computations? Even before we look at the economic benefit of the system, we should ensure that the solution will actually solve the problem and meets the needs of decision makers. Therefore, a DSS must include appropriate data and models with which to evaluate the technical aspects of the choices. These might be the engineering specifications of an alternative or information regarding the strength of materials relative to needs. In addition, the system might incorporate a model for testing a design. Finally, it might include a plan of action to meet some specific need, with references and information about the success of such a plan in meeting needs in other locations.
RATIONAL DECISIONS
To return to our automobile example: What technical characteristics allow the decision maker to decide whether or not the automobile would meet the needs of the owner? For example, if the goal of the owner is high performance, technical criteria should include the engine size, the horsepower, and the availability of possible options for improvement of the performance, such as better grade wheels and tires. If instead the goal of the owner is to be able to carry certain cargo or a certain number of passengers, then technical criteria should include the type of trunk, the capacity of the trunk, the number of seats, and the size of the automobile. Consumer report data, highway testing data, insurance data, and other performance information might be relevant. The question of technical rationality is whether the particular automobile will meet the specific needs of the user.
In most corporations, legal rationality, the third form of rationality in Figure 2.2, is assumed in a reasonable decision process. Legal rationality prescribes that before a choice is accepted, the decision maker(s) should ensure that the action is within the bounds of legality in the jurisdiction in which the activity will take place. That is, if the manufacturing process is to be completed in Indonesia, then the decision makers understand that the process complies with the legal statutes of Indonesia as well as with those statutes of the corporate headquarters and/or the country to which parts will be shipped. At the very least, rationality would suggest that the decision makers be aware of the risk and implications of violating statutes.
While most corporations evaluate the legal ramifications of a decision, few look at the legal issues as an active component of the choice process. While decision makers might share decisions with lawyers and ask their opinions, it is generally after most of the generation of alternatives, trade-offs, and evaluation has occurred. Rarely is the legal counsel enough a part of the decision-making team to participate actively in what-if kinds of analyses. A DSS that will truly support the decision makers will provide access to data and models through which to check the legality of the choices under consideration.
Consider again the choice of an automobile. The owner needs to guarantee that the automobile of choice meets the legal requirements of the state. This might not be as straight-forward as it appears at first glance. For example, suppose the owner wants to purchase a preowned automobile, and suppose the system's database includes many automobiles man-ufactured before 1970 when seat belts were not required on U.S. automobiles, including many "classic" and antique cars. The law does not prescribe that these cars be retrofitted with seat belts, so there is no legal issue associated with the purchase of the car. However, there may be a legal issue associated with the use of the car if, for example, the owners have small children who will ride in it. Car seats, which are required in many states, cannot be secured properly without seat belts. Hence, if the owners purchased a "classic car" (or even an antique car) that had not been retrofitted with seat belts, the children could not ride in the car legally because their car seats could not be secured in the back seat. If the owners were not familiar with the seat belt law, they might not consider this issue until after they had already purchased the car. However, if the DSS truly provided support, it would provide users such information about legal issues as they were narrowing down alternatives. Most decisions have some legal issues that should be considered during the decision process.
Social rationality is a consideration of the ethical nature of the choice from the per-spective of both the society as a whole and the decision unit as a group. It suggests that decision makers will not make choices that are "good for the company" if they are bad for themselves or their department. Similarly, decision makers will not select an option if it is in conflict with the prevailing mores of society. Consumers increasingly expect companies to be socially responsible in their actions, and companies are responding with corporate plans and annual social responsibility reports. Where such plans and reports are available, they should be integrated into a DSS to help decision makers assess social responsibility.

DECISION MAKING
More information about social responsibility plans and reporting can be found in the Global Reporting Initiative. (2006).
In addition to social responsibility social rationality refers to ethical responsibility. Of course, providing support for ethics is a very difficult thing to do. There are approaches to ethics that sometimes suggest different ethical standards. The utilitarian approach considers the concept of good to the largest number of people. This information could be presented as part of an impact statement associated with alternatives that could be provided automatically. The second approach addresses the benefits in terms of the costs to achieve those benefits. This too could be a standard product provided with decisions. In the final approach to ethics, the "moral" choices are ones driven by the standards of society, religion, and individual conscience. As such, they are difficult to support in a DSS. The best one can provide are standards of the industry or company in which the decision makers work.
While we hope most business decisions are reviewed for their ethical nature, the real concern is whether such issues are considered in the context of the DSS. That is, are the ethical or other societal issues considered during alternative generation and evaluation, as are the financial or technical issues? Such inclusion in the process generally is believed to result in potentially better choices at the end. Consider again the automobile example. Societal rationality in that context might help the users to evaluate the amount of air or noise pollution created by an automobile. Or, it might help the user to understand the environmental impacts of replacing automobiles too often. Information about such ethical issues should be included as an easily accessible component of the DSS so that this dimension can become a part of the trade-off analysis associated with a choice.
Another aspect of rational decisions is procedural rationality. While it might be eco-nomically desirable, technically feasible, and legal to adopt a choice, if the procedures cannot be put into place to implement a particular alternative, it is not rational to do so. In other words, a fourth aspect of choice is whether the appropriate people are in place, the logistics can be handled, and the facilities can be arranged. The DSS must support procedural or substantive rationality as well.
Consider again the automobile example. Suppose a particular type of automobile satisfies the potential owner in terms of economic, technical, ethical, and legal issues, but the only place to have the automobile serviced is a two-hour ride from home. Or suppose the automobile uses a unique type of fuel that might not readily be available. For an active, busy individual, this might not be a rational decision. Similarly, purchasing a car that will require substantive but unlikely cuts in one's budget would not be considered rational. Or, on the other hand, suppose the decision maker is considering leasing a car and one of the criteria is that the car be maintained in spotless condition. If the decision maker has several young children, this might not be a procedurally rational decision.
It is not difficult to see that most reasonable individuals would believe logically rea-soned decisions should include an investigation of the technical, procedural, legal, ethical, and economic aspects of the alternatives. The last type of rationality, political rationality, is somewhat harder to imagine in a DSS. The strongest argument for its inclusion is that the political aspects of decisions are considered in the "real world." If we believe that the DSS helps decision makers consider choices better, then we should want to help the decision maker use the political aspects of the decision to their fullest.
Political rationality requires the decision maker to be aware of the relationships be-tween individuals, between departments, and perhaps even between organizations when evaluating a choice process. It implies that decision makers will evaluate the alternatives in light of what is favorable to them and their own personal or unit goals. This might in-clude information regarding the probability of others adopting a particular strategy and the possible outcomes associated with those strategies. Further, it might include information

RATIONAL DECISIONS
regarding the mandates and budget of a particular person or unit and how that affects the decision makers and their own units. Political rationality reflects the values of the indi-vidual and those of other key players as well as their relative roles. It suggests a shrewd and practical evaluation of the impact of a particular action on those relationships and the decision maker's perception of the desirability of that impact. Hence, information for the DSS might include data regarding other individuals (or other units) who might be involved in, affected by, or competing with the choice process under consideration. Further, it might include the political agenda or strategies of these groups, the manner by which these groups could be influenced, and strategies for working with these other groups.
Political issues might affect the purchaser of an automobile. For example, consider the message that the car purchased for an elected official conveys to his or her constituency. In particular, consider such an acquisition for an official of a city which is in financial difficulty because many corporations are abandoning the city and hence many individuals are out of work. While there may be money available in the budget to acquire and operate a luxury automobile for such an official, and while it may be perfectly legal to acquire the car, it would not be politically rational to obtain such an automobile. The message that the purchase would convey to the constituency undergoing hardship would be negative. There are other examples of political rationality being involved in a decision. In some corporations, image is crucial and can be influenced by the kind of automobile one drives. Appearing too flashy or too conservative or too similar or dissimilar to the automobiles of others could affect the desirability of the automobile. If these are, in fact, issues, DSS could include photographs of the car and the associated colors.
Not all DSS will contain information regarding all forms of rationality equally, and not all choices will require them equally. However, since we know that decision makers consider—or should consider—these various facets of rationality, designers should try to provide support for them.
Bounded Rationality and Muddling Through
Just as we need to be aware of the full implications of the meaning of the term rationality, we need to understand how decision makers will use the information provided. Many designers assume decision makers are only interested in the best possible action. In turn, this implies DSS must provide techniques and data that help identify that choice. In many cases this would mean enormous amounts of data and complicated models. Needless to say, the assumption can be quite constraining and limiting for a DSS.
Simon, in his Nobel Prize-winning research on decision making (see, e.g., Simon, 1955; Simon, 1956), suggests that decision makers do not optimize their decisions. Rather, these decision makers generally satisfice; that is, they find not the best possible action but rather one that is good enough (Figure 2.3). Simon recognized the limitations of data, processing capability, and methods as well as limitations on the intelligence level of decision
The famous scientist and Nobel iaureate Albert Einstein once said, "Not everything that can be counted counts, and not everything that counts can be counted." The same is true when you look at analytical support for business inteiligence. According to Buzz Bissinger's (2006) book Three Nights in August, Tony LaRussa, the manager for the St. Louis Cardinals, uses a combination of analytics and intuition to make decisions. LaRussa is quoted in the book as saying he does not rely completely on analytics because "there is no way to quantify desire."

DECISION MAKING
2.3. Causes of satisficing behavior.
makers. He argued that decision makers make rational decisions that are bounded by these limitations (hence the term bounded rationality). In addition, he argued that the advantage in terms of improved decision making does not merit the costs associated with overcoming those limitations. Others have added that even rational choice requires certain predictions about consequences of particular actions as well as projections of future preferences. Hence there will always be uncertainty in the system anyway.
Still others add that managers tend to have relatively little time to collect or analyze data or even to consider possible actions. In this light, the concept of bounded rationality, which argues for a good but not necessarily the best decision, seems necessary. If, in fact, the system cannot provide something that is easy to follow in a reasonable time frame, the decision maker might not consider it at all.
One way of illustrating the bounded rationality approach to decision making is the theory of "muddling through" (see, e.g., Lindblom, 1959; Braybrooke and Lindblom, 1970). Muddling through describes decision makers' unwillingness to make bold changes through their choices. Rather, they prefer minor decisions that cause only incremental changes in their environment. So, while they select in concert with their goals (such as profit maximization or customer satisfaction), decision makers do so by taking small steps in the appropriate direction. In particular, they steer away from long-range or strategic planning because that often requires large, significant changes in policies or actions. Hence, decision makers will consider only that information which is absolutely necessary to make these incremental changes, generally relatively limited information regarding a selected few dimensions. Further, decision makers tend to prefer only the marginal effect of a change of policy from the status quo.
What does this mean to DSS design? First, it suggests that designers of systems should not endeavor to make available all information or all models that could possibly be used by those making choices. Decision makers are likely to consider only a limited amount of information available in their choice process. In fact, they may not even consider available information if it would require a large shift of focus. This is particularly true if the decision maker has a concern about the quality of the model or of the information available in a DSS.
Not using all possible information is not in itself bad. However, often the choice to use limited information is associated with biased or uninformed decision making. Clearly, the bias (especially if it is unintentional) and the absence of crucial dimensions of an alternative are problems. Since we know that they may exist, even with our best intentions, we must design decision aids that protect against them. Hence, DSS should include assistance that not only helps the decision makers use the mechanics of the system correctly but also helps

NATURE OF MANAGERS
them use the data and models correctly. These ideas will be addressed more completely in future chapters.
Finally, designers of DSS should not feel compelled to include models that are not cost effective. However, they should help decision makers learn the most they can from the information available through easy integration of information, effective use of models, and encouraged analysis of the sensitivity of the costs and benefits of alternatives to the underlying assumptions.
NATURE OF MANAGERS
In addition to being aware of the various types of rationality and the ways in which rationality is and can be implemented in the choice process, designers of DSS should know how decision makers work. Otherwise, it is unlikely that the systems will actually support the decision makers in their choice process.
Mintzberg (1990) studied decision makers over a number of years. In his work he found several characteristics of decision makers that can influence the design of DSS. First and foremost, different decision makers operate and decide in very different ways. However, most of them want to operate their way because it has been successful for them. As a result, DSS must also be designed to allow their users to do things their way. In other words, they must include substantial flexibility in their operations. Otherwise, they are unlikely to be used.
Mintzberg did find some similarities among decision makers. Most high-level decision makers dislike reflective activities, do not want substantial aggregated data, and consider most choices in a short time period (often less than 15 minutes). Furthermore, managers prefer verbal media for dissemination of information (meetings and/or telephone calls) over written media (such as reports). Although we might at first think that this is bad news for DSS, it could be viewed as guidance for their design. In particular, it calls for (a) flexibility in analyses, (b) access to a wide range of databases, (c) access to historically innovative types of databases, and (d) tight integration of communications and electronic discussion group technology with the DSS. These will be discussed briefly below as well as in later chapters.
What do Mintzberg's conclusions tell us about information? First, managers prefer informality and efficiency in the manner in which they obtain information. Meetings and telephone calls typically have less formality than does a report. Likewise, if designed appropriately, a DSS can provide an informal and nonthreatening environment in which to consider alternatives. This is particularly true if it integrates access to many databases and a useful electronic mail feature. The former allows the decision maker quick access to facts or information that might otherwise be obtained by asking a subordinate to find them. In this way, the decision maker can access information without concern of others' opinions of acquiring the information. In addition, if the sought information provokes other questions, the decision maker has more freedom to pursue information in support of those questions.
The latter allows decision makers the option of integrating the informally obtained information with that found in the DSS. Many individuals find electronic mail and instant messaging considerably less formal than written communication. Matters of style and structure are generally abandoned in favor of the quick, to-the-point question-answer format more frequently found in verbal communication. In fact, such messages are often written "off the cuff," and a form of nonverbal cue referred to as "smileys" has even developed to fill the nonverbal vacuum and minimize misunderstandings. Smileys are combinations of computer characters typed to fit on a single line that generally follow the punctuation and represent the writer's emotions.

32 DECISION MAKING
Second, Mintzberg's work suggests managers do not always think in a linear manner. In a meeting or telephone call, decision makers can digress from the main discussion for a while to handle issues that surface. Such behavior is much more difficult to accommodate in a report. We must start at the beginning and read until we get the necessary details. Then, if we have questions, we must request another report and repeat the process. In other words, in designing a DSS, it is important to allow managers the ability to move around in their analyses as new questions arise. A "hypertext" design process is necessary.
Third, managers want to know the source of their facts. Many managers make a decision not on the basis of the information presented to them but rather on the basis of who presents the information. If managers have faith in the people presenting the option, they will have faith in the option. This has three implications for the design of a DSS. It means that there must be some way to assign a source to the information available in the system. In addition, it means there must be a manner by which users can obtain, store, access, and aggregate others' opinions and analyses of options under consideration. This might include the integration of an electronic mail system. E-mail would allow the decision maker the ability to post questions or insights and obtain reflections on them from relevant others. Further, the system must include electronic access to magazines, newspapers, wire services, and other media that must be storable because it might be usable in the future. Once it is stored, you must give the decision maker the ability to access it easily and summarize it.
In their book Nudge, authors Thaler and Sunstein (200S) identify what they call "libertarian paternalism," which can impact how people make choices. They indicate that knowledge of how others perceive a decision can impact a decision maker because there is an inherent tendency to conform. One example they identify relates to an experiment they ran in California regarding energy usage, The simple addition of information about their neighbor's usage caused heavy energy users to reduce their usage—even though there was no suggestion that they should do so. Similarly, getting people to think about whether or not they want to do something (such as asking them to explicitly choose whether or not they want to be an organ donor) causes more people to select the positive action.
lilumino, formerly a product of Tacit Software, is a passive tool that might be used to find an expert on a topic of interest to a decision maker. Groups are created, perhaps organizationally or around particular products or industries. The lilumino product then watches what information you seek and/or share from this it develops a profile of an individual's expertise. When another person needs help, he or she sends out a message for help, lilumino looks at the individual expertise profiles to determine who is best suited to answer the question and poses it to that person. The designated expert may choose to ignore the question, answer the question, or reject the request. If the question is ignored or rejected, lilumino goes to the next most highly rated expert for an answer. The process is repeated until the question gets answered. What is unique about lilumino is that the person posing the question does not know to whom the request is sent or in what order That person only knows someone is considered an expert if he or she responds to the question. Using the product in this way allows those who need expertise to find it without causing significant disruption to his or her colleagues.
t
APPROPRIATE DECISION SUPPORT 33
Fourth, it means they want to have some predigestion of information. Decision makers are busy. As such, they need help in understanding all of the information they receive in a day. Again, the electronic communications capability will facilitate this goal. In addition, the DSS must provide easy access to a database of position papers or other statements that can be searched in a flexible manner. Or, in some circumstances, it is necessary to have prepared analyses (in a hypertext format) available for the manager to access.
Fifth, it means they value involvement. One reason for meetings is to allow all parties to become involved in the planning and "buy into" it. Electronic discussion groups, electronic mail, and general sharing of documents can provide the same effect if managed properly.
APPROPRIATE DECISION SUPPORT
Electronic Memory
A thought can disappear as quickly as it appears, and so capturing the thought and what caused it can be critical. Decision support systems help the user re-create the process to recapture the thoughts. Re-creation of events requires storage of input screens, the models used, the input and output of the models and information viewed, and mechanisms to step through changes in the screens temporally. Stepwise analysis allows users to review concepts, alternatives, and flow of information as they were compiled in order to better understand the process and allow identification of lost ideas. Not only can a decision maker get the general impression of the idea, he or she can re-create the process leading to the final positions to help him or her understand the "why" behind the "what," potentially generating even more ideas. Designers must show care in providing a complete representation of the data and to preserve the richness of the information associated with the process.
Bias in Decision Making
Even when decision makers have good data and the right models, they can make bad decisions. One of the reasons for bad decisions is bias. While we tend to associate bias with judgments and bad decision making, it can impact all kinds of data, models, and decision-making styles. Bias is introduced by how evidence is collected and considered in the decision-making situation. Most decision makers will seek those facts that support their hypotheses. They might ignore those facts that do not support the hypotheses or they might not even seek additional information once their hypothesis has been supported. Inertia and the preference for muddling through (which will be discussed shortly) make most decision makers unwilling to look for more information or even alternatives that fit the available information better.
Often decision makers, especially those who are relatively inexperienced, will not look beyond the scope of their experiences. They will consider similar data, similar alternatives, and similar models to what they have used in the past—simply because they are similar. Those things that are not familiar tend to be rejected or deemphasized because they are different. Even when different data, alternatives, and models are provided, decision makers may not perceive them. Decision makers often have selective perception and screen out the information they believe not to be salient. Decision support systems must provide mechanisms for helping decision makers see beyond their hypotheses and the scope of their experiences.

34 DECISION MAKING
In her book, Cynthia Crosscn (1994, pp, 224-225) cites a variety of studies on the relationship between the consumption of walnuts and cholesterol levels* For example, she cites a study from the Archives of Internal Medicine as:
The story began wich a study of 31,209 Seventh-Day Adventists. Researchers questioned them about their consumption of 65 different foods. To the researchers' surprise, those who ate nuts at least five times a week had only half the risk of fatal heart attacks as those who had nuts less than once a week.
Her analysis of the bias in the study included:
Unfortunately, we do not know from this account how many of the sixty-four other foods were associated with a lower risk of heart attacks. We do not know if the nut eaters shared other characteristics besides eating nuts that may have explained their lower rate of fatalities. Seventh-Day Adventists do not smoke or drink, which makes them an abnormal population to study. And according to this account, the study was based on their memories, not observation.
In other words, the study was biased. Decision makers who might attempt to make choices based upon this study might not select the important characteristics to modify. Crossen continues writh another walnut-cholesterol study.
This time, the researchers put 18 healthy volunteers on two carefully controlled diets for two months. One was a nut-free version of a standard low-cholesterol diet. The other was nutritionally similar, except 20% of the calories came from about 3 ounces of walnuts per day> , t. On the no-nuts diet, the volunteers' cholesterol levels fell 6 percent. When they switched to the walnut diet, their cholesterol declined an additional 12 percent. Everyone's cholesterol dropped while eating nuts, and the average decrease was 22 points, from 182 to 160.
Her analysis:
While not a fatal flaw, eighteen subjects is a very small study. The subjects were put on a low-cholesterol diet, which means their cholesterol was going to drop no matter what, Think about eating three ounces of walnuts every day. It comes to more than fifty pounds a year. , .. They lost me. Did all the subjects first eat no-nuts, then the nuts regime? Or were there two groups, one starting with no nuts and one starting with nuts? Did the 22-point cholesterol drop include the decrease attributable to the low-cholesterol diet alone? How long did the study go on—that is, would the cholesterol level have continued to drop from the low-cholesterol diet with or without the nüts? Those walnuts displaced other food—was the drop a substitution effect alone?
In other words, because of the bias in which the data were collected and summarized, we actually know nothing from either study. However, upon first reading, it appears as though information is unbiased. It is this subtle bias, which is unintentional to the decision maker, that can cause significant problems for a DSS.

APPROPRIATE DECISION SUPPORT
As we will see when we discuss information processing models, decision makers do not consider all the information that is available to them; in fact, they may not even perceive information they think is not salient. This can be part of concentration, but it needs a DSS mechanism to ensure important information is not ignored. Sometimes the perception distortion can be a function of wishful thinking. If we are optimistic (or pessimistic) about a particular problem or alternative, we might view all information positively (or negatively) to be consistent with that view. Or, the problem of perception might be due to a recency effect. Decision makers tend to put more emphasis on more recent information and ignore (or perhaps forget) information that was gathered and evaluated most distantly. Clearly DSS can help represent information to guard against these biases.
Decision makers can be biased by the source of information. If decision makers have a strong feeling (either negatively or positively) about the source of some information, that can bias their perception of the quality of the information (both negatively and positively). As said previously, decision makers use their confidence in some employees as a filter of information. They might also develop a bias when they hear similar information by the greatest number of sources or most frequently. Such bias is particularly problematic when groups make decisions because there is pressure to conform, especially if decision makers are concerned that they look at information consistently with how others in similar roles have behaved in the past. Or, they can interpret information—or even seek information—in light of what they learned first.
Uncertainty can play a significant role in the development of bias in a decision, and so it is important that the DSS help decision makers address uncertainty appropriately. Sometimes decision makers perceive they have more impact on decisions than they re-ally do. This illusion of control may cause them to seek or believe certain information inappropriately and thereby not to evaluate alternatives appropriately. Or, decision makers may not assess luck appropriately in the evaluation of their (and others') choices. What we will see in the next section is that if decision makers perceive a good outcome, they will repeat the choice process even when it is not a good one; similarly, if decision makers perceive a bad outcome, they will change their processes even if they were appropriate. Hence, the DSS help in evaluating the sensitivity of decisions to assumptions (and the testing of those assumptions) and the monitoring of choices is critical to help control these biases.
As the discussion of the ancient Greeks and their understanding of science told us, decision makers will attempt to make sense out of situations even when they do not have all of the information. This is a serious source of bias. Some decision makers overinterpret information and generalize their conclusions beyond what they know. It is not uncommon to generalize to a corporation's operation one good (or bad) experience. It is important to keep those generalizations within the group of people or things to which they are pertinent. Similarly, some decision makers will ascribe causality when there is, in fact, only correlation. While we may find it ludicrous for children to believe that stepping on a sidewalk crack can break their mothers' backs, many of the causal relationships that adults see are equally inappropriate. Decision support systems need to provide information to help decision makers understand the breadth of the generalization that is possible from data.
Sometimes all of these can be controlled simply by making decision makers think about the sources of bias and what they really mean. Some approaches for addressing the bias have been discussed above and will be discussed throughout this book. However, an approach by deBono (1999) suggests that an explicit change in how they examine the data (as illustrated by changing the "hat" they are wearing) will help reduce bias and increase creativity. In

36 DECISION MAKING
this approach, deBono suggests that decision makers evaluate their information, wearing each of six hats described below:
White Hat. While wearing this hat, decision makers are neutral. They examine the data available and determine what additional data are needed and how far they can extrapolate the information available. While wearing this hat, decision makers focus on the past trends and historical data.
Red Hat. While wearing this hat, decision makers give into their intuitive side; they ignore the data and consider only their gut judgment.
Black Hat. While wearing this hat, decision makers look at the data and the decision environment cautiously and even pessimistically. During this stage, decision makers question assumptions and test the resilience of their alternatives to challenges of the assumptions.
Yellow Hat. Decision makers wearing a yellow hat look at all of their data optimistically. In particular, they examine the data for possible positive "spillovers" from the implementation of an alternative.
Green Hat. While wearing the green hat, decision makers must be creative in their solution to the problem. They must brainstorm and think freely to find solutions that might not otherwise appear.
Blue Hat. This hat is different from the others because while wearing it decision makers are controlling the process of wearing the other hats. It is the role that is most likely adopted by the DSS itself.
While using the six-hats approach, the decision maker must move through each role to evaluate the data, the models, the alternatives, and the solutions in order to understand them all better. Particular roles may cause the decision maker to seek additional information, alternatives, and models which will then need additional rounds of the six-hat analysis.
In addition to identifying the emphasis on the analysis associated with the different hats, deBono has identified specific strategies for using those different analyses at different points in the decision process. For example, he would argue that when considering new ideas, decision makers should adopt the sequence blue hat-white hat-green hat-blue hat. In other words, decision makers should move between the facts and intuition. Alternatively, when identifying solutions to known problems, decision makers should adopt the sequence blue hat-white hat-black hat-green hat-blue hat. This differs from the first with an explicit emphasis on what data and models might have been missed and how assumptions might have been inappropriately adopted. Finally, when choosing between alternatives, deBono suggests the sequence blue hat-white hat-green hat-yellow hat-black hat-red hat-blue hat. In this case, he suggests looking at the data from all possible perspectives.
APPROPRIATE DATA SUPPORT
Decision support systems need to provide a range of information without overwhelming the decision maker. In fact, there is a rule of thumb, called the "seven plus or minus two rule," that says decision makers can, on average, assimilate only five to nine ideas before they are overwhelmed.
This section discusses theories of information processing, including pattern recognition and learning, in the choice process. After this section, we will have a better basis for answering questions about how to identify specific data and specific models for a given DSS.

APPROPRIATE DATA SUPPORT
Information Processing Models
Information processing requires the decision maker to perceive and process information, recognize patterns in the information, and remember past events to understand information currently available. For example, consider the process of reading. We must be able to see the letters on the page and to recognize differences between the individual characters. In addition, we must remember patterns of letters and their associated meaning so as to understand what a particular combination of characters appearing on the page means. Similarly, we need to perceive what combinations of words mean, in particular to recall the specific nuances of certain combinations.
While reading is not difficult for most adults, it can be quite challenging for the child just beginning because that child understands neither what aspects of the differences in characters are important nor what differences in combinations of words are important. Similarly, students in an introductory statistics course have difficulty processing information in a discussion problem. They do not have skill in understanding how the information can be structured into a mathematical format. Similarly, they do not have sufficient experience to understand what information is crucial and what is superfluous.
Most decision makers have similar problems. The goal of the DSS is to help them separate the crucial from the irrelevant and to understand it better. To achieve that goal, decision makers must acquire information from the system in a meaningful fashion. The acquisition process has three unique phases: (1) sensation, (2) attention, and (3) perception. In the sensation process the decision maker has some awareness of the existence of the information. In the second stage, attention, the information has gained the concentration of the decision maker. Finally, in the third stage, perception, the decision maker begins to interpret the meaning of the information and to process it into memory. This third phase is the moment when information and its meaning are apparent to the decision maker in a manner that allows its use.
Prior to the third stage, the decision maker might filter out information without explicit notice. Such filtering is a crucial component of concentration because of the huge number of stimuli, such as the sound of fire engines and the coffee pot, coming from one's environment. This filtering is done to remove information believed to be irrelevant to the task under consideration.
We will discuss in a moment how these factors affect the actual perception process. However, at this point, it is important to know that information might be filtered on the
If our mind allowed all of these signals from our environment to reach our consciousness, we would be unable to process information. To obtain a physical representation of how difficult it would he to perceive the meaning of stimuli, listen to the Holiday Symphony by Charles Ives. In that symphony, lves's goal was to bring together all of the stimuli perceived by a young boy at a celebration in a small town. In one movement, "Decoration Day,'* Ives begins with the music that might have been heard in a New England town celebrating Memorial Day in the early twentieth century, Of course, there is music from the bands. However, Ives intersperses sounds remembered by a small boy, such as the church bell ringing, errors made by musicians, and the sounds of soldiers mourning the loss of their comrades. Once listeners have taken the time to identify the individual components, they can appreciate the music and its meaning. If listeners do not take that time, the music appears to be nothing more than the random clashing of sounds. That is, without direction, it is difficult to identify patterns in the activities that lead to the music.

38 DECISION MAKING
Figure 2.4. Perception is not always
obvious.
basis of something beyond the control of the designer of the DSS. That means that it is not sufficient simply to have information available or even to display information. Decision makers may not take the time to look for information passively provided by the DSS. Even if it is displayed, the decision maker may not notice it or absorb its meaning. Consider, for example, the often-cited drawing of a woman shown in Figure 2.4. What do you see? Some people will first see a young woman, while others will first see an old woman. Even after telling you both are pictured in Figure 2.4, you may not be able to find the other picture without significant effort.
If the decision maker really needs to see the information, then there must be some mechanism of ensuring that he or she does so. Some designers use unambiguous pop-up screens that require the user to take action before they disappear. Other designers use flashing lights, beeps, or other sensorial stimuli. Obviously, the manner of action depends on the system itself.
The way decision makers screen with regard to task is well known. For example, when selecting stocks for investment, decision makers will most likely consider the financial aspects of performance of the stocks as well as the financial measures of performance and liquidity of the companies. (This material is well documented in finance classes.) They are unlikely to consider issues such as the color of the paper of the stock certificate or the phase of the moon. How decision makers screen with regard to experience is less well documented. What we do know is that experience affects what information decision makers will seek and how they expect to have that information conveyed.
Consider, for example, the models of information processing proposed by Piaget. He indicates that people develop in their information processing as a function of their matu-ration, experience, education, and self-regulation. Specifically, he suggests that inexperi-enced decision makers will seek more concrete information than do their more experienced counterparts. Inexperienced decision makers are more comfortable with methods drawn from their own personal experiences. Furthermore, they use elementary classification

APPROPRIATE DATA SUPPORT
schemes and generalize only with regard to tangible and familiar objects. They use di-rect cause-effect relationships of the form "If A happens, then I look at ratio ΒΓ Finally, these decision makers tend to be "closed" in the sense that they will not voluntarily explore possibilities outside those specified in their elementary classification schemes. In short, they tend to follow the rules specified in their formal training.
Most individuals in an elementary statistics course make decisions about their exam questions in this way. Specifically, these students look at a problem and attempt to find another "just like it." Then they decide on a solution technique because "I used this solution technique on the sample problem and it was correct... hence, it should be correct to use it on the exam question." These students follow very elementary rules to put problems into categories and expect to find exam questions that fit their classification schemes. Once they have found a pattern in the questions, they will not look for other factors that might help them decide on a solution technique more efficiently or more effectively. Invariably the instructor does not understand their classification scheme and puts a question on the exam for which the scheme will not specify the appropriate solution technique.
In our car-purchasing example, the system might ask novice users questions such as what car they drive now or what things they like about it or not like about it and make a recommendation based upon this very limited information. Novice users are less willing to seek a wide range of information about potential automobiles.
As decision makers become more experienced, they reflect more on information pro-vided to them and seek possibilities they have not considered previously. They can imagine other options and other information to support their hypotheses about options. In fact, their decision making tends to be more open-ended, involving more speculation about unstated possibilities. In other words, they become more analytical about their evaluation.
In the car-purchasing example, these decision makers can handle more abstract ques-tions such as the desirability of new options on a car. They will also be more appreciative of and accepting of a deductive reasoning system that allows them to select automobiles by specifying features.
Similarly Rasmussen (1986) identifies experience as an important predictor of the information needs of decision makers. In particular, he notes that decision makers are guided by past experience and the success of that past experience. For example, if a decision maker has faced a problem and experienced a good outcome resulting from the choice, then he or she is likely to use similar approaches and techniques the next time a similar problem arises—whether or not those approaches and techniques had anything to do with the outcome at all. If, on the other hand, the decision maker experienced a bad outcome resulting from the choice, then the decision maker is likely to move away from those approaches and techniques—even if they were appropriate.
If the decision makers are novices or have never approached a decision similar to the one under consideration, they are likely to employ more tactical rules in evaluating their alternatives. These rules are defined and employed rigidly, and decision makers are unlikely to stray from them. Like Piaget, Rasmussen believes these decision makers follow a data-driven approach to choices. They look at the characteristics of an alternative and compare those to something they know and understand. For example, when novices examine a car for potential purpose, they tend to compare that car to known cars such as those owned by friends and family. So, such a decision maker may look at the size of a new car compared to the currently owned car, the features with regard to the features of a currently owned car, and so on.
At the intermediate level, information is viewed as evidence of the similarity of this choice situation to other, related past situations. The degree of similarity will guide decision

DECISION MAKING
makers in the selection of rules as outlined earlier. They are not goal oriented; rather, they are mimicking the process they have experienced earlier. However, they are willing to generalize somewhat further.
Experienced decision makers are goal oriented. They actively select goals to achieve and seek information relevant to their achievement. They tend to move into a "hypothesis and test search strategy." For example, these decision makers might begin the search process with a belief that they might like driving a larger automobile. Rather than compare how easy or difficult it might be to drive, park, and maneuver the differently sized car, these decision makers are likely to test drive a variety of cars to determine whether they like the feel and operation. In the process they may refine other, related characteristics, such as head room or comfort, that should also govern their choice of automobile. In this way, they constantly modify their own functional model as they gain additional information. Hence, these decision makers are more likely to investigate information deeply without prompting. Of course, they also run the risk of inappropriately generalizing. Finally, at its highest level, Rasmussen indicates that decision making becomes virtually instinctual.
Knowledge of these different decision-making styles tells the designer of a decision support system how to incorporate models. Rasmussen suggests that sole reliance on quan-titative models does not reflect the needs of many decision makers adequately. Rather, qualitative systems would offer support for the user at any of the more advanced behav-ior levels. Such systems would be especially useful at the knowledge-based level where information must be used in unfamiliar ways and where there are not preestablished, quan-titative rules for processing data. Qualitative measures should guide the overall design of the system while quantitative models can be used for more detailed analyses of the system.
Klein (1980) also developed a model of decision making based upon the experience of the decision maker. While many of the ideas are parallel to those expressed by Piaget and Rasmussen, Klein adds a description of experts and their decision-making process. Specifically, he indicates that experts tend to reason by analogy. They do not follow explicit, conscious rules. Neither do they disaggregate situations into components but rather analyze the entire situation in toto. In fact, he asserts that attempts to force experts to specify their rules explicitly or to examine only selected components of a problem might reduce performance quality. Such an artificial process could stifle or mask the process that comes naturally.
Direct confrontation of an expert and his or her assumptions rarely gets the expert to reconsider his or her assumptions. A much better approach is to provide data that challenges those assumptions, especially if the data are compelling. However, in the absence of the data, it is useful to help the user see the problem in another tight. This point was well demonstrated in the first season of the television show Numb3rs.*
In the episode, "Identity Crisis,'1 Charlie challenges the fingerprint technician's identification of the print. As you might suspect, the technician—who considered herself an expert—was annoyed by the challenge and proceeded to explain why her identification was correct. She makes a compelling case that she is correct by explaining how she found seven points of similarity between the partial print (on the right) and the suspect's thumb (see first image).
The technician's annoyance and unwillingness to reconsider her decision is a typical response from experts who are challenged by individuals whom they perceive to have less experience in their field. Direct confrontation rarely works to get them to question their assumptions. Having recognized this, Charlie moved to a new approach of providing her an alternative way of looking

APPROPRIATE DATA SUPPORT
at the situation. He posed the question of considering the print not as a thumbprint (which she explains it to be) but as a forefinger print. He discussed how items look different based on how we look at it and actually rotated the print to demonstrate his point. This is shown below. He encouraged her to examine the print in this new way to question the original identification. Charlie further noted that we have no database of the similarity of partial forefinger prints of people to partial thumbprints of other people and so do not know if they really can be similar (in comparison to the fact that we have data to suggest that no two people have the same set of fingerprints.
*The television show Numb3rs chronicled an FBI office's efforts to solve major crimes in Southern Cali-fornia. What made the show different is that the head of the office, Don, had a brother, Charlie, a brilliant mathematician who frequently consulted with the FBI to solve cases. Generally it was the use of his higher level mathematics that gave the FBI the "edge" it needed to solve a case. Sometimes, though, it was his use of logic (a basic mathematical tool) that helped.
These expert decision makers, then, need decision aids that will let them recognize analogous situations. One approach is to include a background artificial intelligence system that could analyze particular choices and "learn" the rules that experts employ. If such rules were ascertained, they could be parlayed into further assistance, which would illustrate why a particular approach was or was not appropriate in the current context.

DECISION MAKING
A somewhat more practical use of Klein's model is in helping decision makers see how a current choice context is similar to one they faced previously. A DSS might also include helping decision makers understand how the current context is different and hence why different strategies might work. Specifically, this means a DSS should have decision aids that support users' ability to recognize trends. This might include the development of a database with which to track options, the relevant factors, and the outcome of choices. It might also include an alternative generation option that assists decision makers in introducing new choices that address problems perceived in the past. Finally, the DSS could help decision makers perform the necessary computations to assess the impact of various choices.
Another model proposed by Dreyfus and Dreyfus (e.g., 1986) describes six levels of expertise in decision making through which decision makers progress through as they become more expert in their decision making. Along the way, they change the kind of information they seek and the manner in which they expect to have the information repre-sented. The first level is novice. These decision makers decompose their environment into context-free, nonsituational components. They rely upon standardized rules for determining action. Since they do not have experience, they have no basis for judging the quality of their decision-making efforts. This behavior is similar to that which most students employ in an introductory statistics course. Since they are not entirely certain why certain computations are carried out, they simply replicate them exactly like the example in the book or the example from class. This is a very regimented, "cookbook" approach to decision making.
The second level is advanced beginner. These decision makers follow much the same procedure as do the novices, except that they can understand some rudimentary differences between situations. Like novices, they require explicit instruction regarding the procedures for decision making. This might include recommendations about the data that should be acquired, the models that should be employed, and the order in which analyses should be done. In addition, they would need decision aids aimed at helping them understand unique features of a given situation.
Competent decision makers, those in the third category, begin to develop a perspective of a problem and can single out important and irrelevant factors in the choice context. Similarly, they can identify unique characteristics of the choice context, analyze them, and develop some guidelines for addressing those characteristics independently.
The last level of analytical approaches to decision making (and the fourth level overall) is proficiency. Proficient decision makers have increased practice in applying the rules of data analysis and modeling. They can recognize important characteristics of problems and can generally determine whether or not they have approached a problem correctly. They are still considered analytical because they still follow a specified set of principles that guide their action. Unlike less skilled decision makers, however, they have memorized the principles and follow them naturally. An example of this level of decision making is the student who has specialized in statistics and has just received a bachelor's degree. Such students understand the differences between regression and autoregressive models and know how to apply each one correctly in a regulated environment. However, they still decide which to employ and how to employ them by using well-defined rules of action.
The last two types of decision making, expertise and mastery, are more intuitive approaches to decision making. For these decision makers, an occurrence triggers an action intuitively. Unlike the analytical decision makers who know that "A happened and therefore we must apply technique Ai," these decision makers simply "know" they should apply technique Al. In fact, if one queried a decision maker of mastery level, he or she might not be able to tell you offhand why technique Al was selected, or why technique A2 was not. The major difference between these two high levels of decision making is the
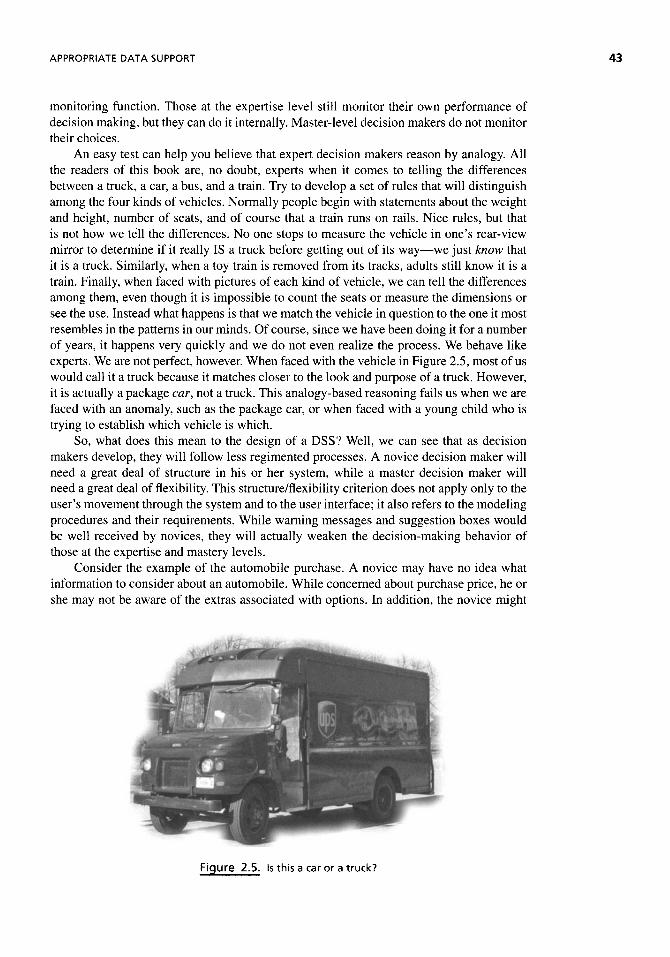
APPROPRIATE DATA SUPPORT
monitoring function. Those at the expertise level still monitor their own performance of decision making, but they can do it internally. Master-level decision makers do not monitor their choices.
An easy test can help you believe that expert decision makers reason by analogy. All the readers of this book are, no doubt, experts when it comes to telling the differences between a truck, a car, a bus, and a train. Try to develop a set of rules that will distinguish among the four kinds of vehicles. Normally people begin with statements about the weight and height, number of seats, and of course that a train runs on rails. Nice rules, but that is not how we tell the differences. No one stops to measure the vehicle in one's rear-view mirror to determine if it really IS a truck before getting out of its way—we just know that it is a truck. Similarly, when a toy train is removed from its tracks, adults still know it is a train. Finally, when faced with pictures of each kind of vehicle, we can tell the differences among them, even though it is impossible to count the seats or measure the dimensions or see the use. Instead what happens is that we match the vehicle in question to the one it most resembles in the patterns in our minds. Of course, since we have been doing it for a number of years, it happens very quickly and we do not even realize the process. We behave like experts. We are not perfect, however. When faced with the vehicle in Figure 2.5, most of us would call it a truck because it matches closer to the look and purpose of a truck. However, it is actually a package car, not a truck. This analogy-based reasoning fails us when we are faced with an anomaly, such as the package car, or when faced with a young child who is trying to establish which vehicle is which.
So, what does this mean to the design of a DSS? Well, we can see that as decision makers develop, they will follow less regimented processes. A novice decision maker will need a great deal of structure in his or her system, while a master decision maker will need a great deal of flexibility. This structure/flexibility criterion does not apply only to the user's movement through the system and to the user interface; it also refers to the modeling procedures and their requirements. While warning messages and suggestion boxes would be well received by novices, they will actually weaken the decision-making behavior of those at the expertise and mastery levels.
Consider the example of the automobile purchase. A novice may have no idea what information to consider about an automobile. While concerned about purchase price, he or she may not be aware of the extras associated with options. In addition, the novice might
Figure 2.5. Is this a car or a truck?

DECISION MAKING
not realize how much sales tax or interest adds to the total amount of money they need to access to purchase the car. Systems in support of these individuals must provide such information explicitly and help the user apply it appropriately.
Similarly, novice and advanced beginner decision makers will need help in monitoring the quality of their decision processes. This means they need guidance and supervision of their selection of data and models during the choice process. In addition, they will improve their performance if, over time, the outcomes of their choices are monitored and relayed back to them. In this way, they can determine what has worked well and what has worked poorly. Consider, again, the automobile. Novice and advanced beginner decision makers need assistance in understanding the implications of their choices. For example, suppose the decision maker is interested in high performance but is also constrained with regard to finances. If a sports car is chosen, the system must help the user to understand the amount of additional money that will be spent on insurance and on fuel. That is, the system must help the user to comprehend the total package of costs.
What changes is not only the type and amount of structure and decision aids but also the actual information preferred by decision makers. For example, Sauter (1985; Sauter and Schofer, 1988) found that novice decision makers prefer very explicit, quantitative data regarding the resources available. As they gain more experience, they move from seeking feasibility information to seeking information about the performance of alternatives under consideration. These decision makers tend to prefer more qualitative information and even speculations regarding the past performance of an alternative under scrutiny. With additional experience comes a move toward evaluation of the efficiency of alternatives. These decision makers seek quantitative, factual information regarding the process or internal operations of an alternative. See Figure 2.6.
This result suggests that the kind of database and model support required by decision makers will shift over time. The middle-level decision makers will provide the greatest challenge to designers of DSS. They will need not only conventional database support but also access to databases in which they can store as well as search and summarize opinions, some of which could exist in public databases. Other stored opinions will need some level of security to support them and hence would appear only in private databases for the exclusive use of the decision maker. For example, in the automobile example, users might want access to comments in publications such as Consumer Reports regarding the desirability of automobiles. In addition, they might want a personal database in which to store comments about cars after they have been seen or test driven or the comments of friends and relatives. Once the data are stored, of course, users need access to scan and retrieve them and to summarize them in a useful fashion.
Decision makers clearly change the criteria and the weighting of criteria as a function of their environments, in an article in OR MS Today, Totten and Tohamy describe logistics support systems which facilitate efficient routing of trucks and their cargoes for large firms, ϊη it they describe systems which can learn how to weight the various corporate objectives as they change throughout the year. For example, around the holidays, the driver "get-home request" has the top priority. In contrast, during the remainder of the year, customer requirements have top priority. Hence, the system needs to be able to change the models used to facilitate decision making easily. With this change in priority comes the creation of new alternatives, such as load swapping, for the decision maker to consider.

APPROPRIATE DATA SUPPORT 45
Figure 2.6. Attributes of information.
Of course, other factors, such as the amount of stability in the relevant environment and the focus of the decision, can affect what kinds of information users seek as well. While we will discuss this in more depth in later chapters regarding the design process, it is important to note here that the needs of the decision maker will change over time. Hence, the system must have the flexibility to change with the decision maker and accommodate changes in both the information sought and the models employed.
Tracking Experience
Even as managers gain experience with an organization and decision making, they need a record of those experiences and a mechanism for organizing the data to trigger intuition. This may include results of applying rules of thumb. Further, they may have data about past decisions, including the process and the result. Finally, they may have data they have collected privately that they can use to obtain a strategic advantage in their corporation. Sometimes, they simply keep notes of political processes in the organization and how they might influence or be influenced by a particular decision.

DECISION MAKING
Actual decision makers use these supplementary data to facilitate the choice process. For example, some hotels provide general managers with DSS that utilize information about profits, transactions, and physical facilities and may maintain information collected during their decision-making process. This information might include a database of upcoming events, such as changes in tourist attractions, changes in office availability, or conventions that might influence decisions about special promotions. Alternatively, decision makers might keep records about special abilities of employees that would influence scheduling decisions.
Decision support systems must simplify the development and maintenance of these private databases. Systems need to help the decision maker generate and populate these databases, provide easy access to the data, and possess a range of retrieval and reporting capabilities. Whether the system resides locally or on a mainframe or a distributed network, it is possible to maintain private databases on one's PC. In any case, DSSs must provide sufficient security to ensure that only the decision maker can access the information.
When making decisions, managers consider their own values, ethics, morals, goals, and plans. Allowing DSS users to enter this information into the system or allowing the system to deduce relevant factors based on past decisions could facilitate intuition. The system could analyze personal tendencies to determine guidance and presentation needs.
Decision makers often approach problems similarly and try to frame current problems based upon the success or failure of past similar problems. The DSS should provide a means of locating and displaying previous problems, the decisions made, and the consequences of those decisions. This capability would support the managers in their decision-making process and stimulate intuition.
GROUP DECISION MAKING
Understanding decision-making processes is difficult because there is so much variability across individuals in terms of the phases they adopt, the methods they employ, and the data that are important to them. However, variability in these issues increases tremendously when groups make decisions, thereby making support of a group decision-making activity that much more difficult.
When we identify group decision making, we refer to several individuals working together to complete some task as a unit. These individuals might be people who always work together and hence have some shared history of performance. Or they may have been brought together for just this one decision and hence have no appreciation for the skills and knowledge that each brings to the task. Similarly, the group could be in one location meeting together or in multiple locations meeting via teleconferencing or working in one location but at different times.
In theory, groups are developed to address a task because they can provide better solutions than if the task is addressed by one person. For example, through discussion, groups can develop a better understanding of the complexity of a problem. Furthermore, since groups have more skills and understanding than any one individual, they can generate more and richer alternatives for problem solving. Similarly, since there are many individuals involved, there is a greater chance that errors may be found at early and thus easily reparable stages. Finally, if a group participates in a decision, they are more likely to accept the decision and hence not resist the outcome of the process.
However, groups decision making does not always occur in the fashion we anticipate. Since the process generally requires meetings, it can be slow and time consuming, especially

INTUITION, QUALITATIVE DATA, AND DECISION MAKING
if the tasks are not well managed. In particular, there is a tendency to waste valuable time in waiting, in socializing, in having people repeat concepts, or in listening to people speak just for the sake of speaking. As in many group projects, group members may rely upon others to "pick up the slack" and not contribute properly. There are, in addition, two major problems associated with group work. First, there is the tendency to conform to a given solution too early. Social pressure may convince some individuals to accept a solution before they are ready to do so. Similarly, social pressure, especially among busy individuals, may lead to an incomplete analysis of the task and incomplete use of information. People tend not to want to "buck the trend" and conform to the group too readily, especially if they have not carried their fair share of the workload. Related to this is the second major difficulty associated with group work, the problem of group dynamics. Too often, the person with the highest authority, the person who has been there longest, the person with the best credentials, or the person with the loudest voice or the most dominant personality dominates the discussion and hence the generation of alternatives and resolution of the task. Shy, relatively junior, or new individuals have difficulty being heard. This can be a particular problem if they have drastically different views of a problem or skills. Whereas group members should be relying upon the substance of the information and the appropriateness of the alternatives to guide them in deciding how pivotal they are to the discussion, they too often view the personality or the group dynamics when making this decision.
If we are building a DSS to advance a group decision-making effort, then we must consider not only all the issues discussed previously but also features that can enhance the positive attributes of groups and minimize the negative. For example, tools that can encourage all individuals to brainstorm alternatives and question assumptions will take advantage of the positive aspects of group decision making. Tools that can mask who is presenting information and limit the amount of time each individual has to communicate can counteract the negative.
INTUITION, QUALITATIVE DATA, AND DECISION MAKING
Accenture surveyed executives at U.S. organizations with revenue of more than $500 million in calendar year 2007 and at comparable organizations in the U.K. regarding their decision style. While they all identified fact-based, rational decision making as the goal, they admit-ted that an average of 40% of the decisions were made in their companies using decision makers' "gut feelings" or judgment. There were a variety of reasons for judgment-based choices, from the absence of data to the need to rely on subjective factors. Some of those factors can be overcome (such as the absence of appropriate data). However, some factors, such as the need to rely on subjective factors, cannot be overcome with better business intelligence. Further, even when analytical data are available, decision makers generally consider their "gut instinct" before relying on the analytics. In order to obtain better choices, then it is necessary to build tools that will help decision makers improve their judgment.
Relying on "gut feelings" or judgment is associated with intuition. It generally is associated with having much experience with a situation. In these cases, decision makers internalize certain activities and thus "automatically" invoke them. This intuitive thought process is vastly different from the analytic approach. Analytic thought involves explicitly defining the problem, deciding exact solution methodologies, conducting orderly search for information, increasingly refining the analysis, and aiming for predictability and a minimum of uncertainty. Intuitive thought, on the other hand, avoids committing to a particular strategy. The problem solver acts without specifying premises or procedures, experiments

DECISION MAKING
with unknowns to get a feel for what is required, and considers many alternatives and options concurrently while keeping the total problem in mind. While this approach addresses some shortcomings of the right-brain style, it has its faults, most obvious of which is the absence of data-tested theories and methodology that cannot be duplicated.
Furthermore, the integrated style combines the first two, taking advantage of their obvious symbiosis. The analytic thought process filters information, and intuition helps de-cision makers contend with uncertainty and complexity. Decision makers reason, analyze, and gather facts that trigger intuition. If intuition leads the thought process in a different direction, decision makers reason and analyze again to verify and elaborate upon it. These additional facts and analyses again trigger intuition, and the process repeats. Decision makers can also start with an intuitive hunch and then analyze it to determine its appro-priateness. They can also apply intuition at the end of the process to reveal false premises, invalid inferences, and faulty conclusions. In this way, the integrated style of decision mak-ing utilizes both right- and left-brain styles using both facts and feelings depending upon which is available and appropriate at the time.
How Do We Support Intuition?
The most commonly considered information considered by intuitive decision makers is qualitative data. As the name suggests, these are data for which a numeric value has no intrinsic meaning and thus cannot be used in conventional models. Sometimes they are intrinsically judgmental, such as peoples' impressions of candidates. Often they are based on quantitative data, such as a list of the most profitable accounts. What is similar is that how one evaluates information for relevance and insight is unique. Further, since there is not a common result of the evaluation of information, how onecompares them is also unique. For these reasons, it is said that qualitative decisions rely upon the wisdom, experience, and information processing capabilities of the decision maker.
However, there are things that a DSS can provide that will help evaluate qualitative data and facilitate intuition. For example, the availability of descriptive modeling tools, such as statistical tools, helps decision makers develop intuition. Measures of central tendency and dispersion can help users get the "feel" of their data. Similarly, measures of correlation and association can suggest how variables might be associated. Providing trend analysis capabilities is important for analyzing visual representations of trends that can lead to intuitive flashes that would not otherwise occur.
Not only must DSS perform computations, but also they must present results so that decision makers understand the results; simply reporting numbers is not enough. The availability of other presentation tools can ensure decision makers grasp the full implications of their data. For example, graphs and charts can help decision makers see patterns among phenomena they might not otherwise notice. Decision makers need to know more than just the result of an analytic model.
It is important that DSS not simply report raw data but also develop intuition by illumi-nating trends, patterns, or anomalies, which are apparent only in graphical representations of the data. Graphs and diagrams help to illustrate underlying issues that the analytical tools might not identify.
Not only might such tools generate intuitive breakthroughs, they also help verify intuition. The decision maker may have an intuitive thought while browsing through the available data. The models in the DSS should allow the manager to test these intuition-based hypotheses using standard analytical tools. In some cases, it may be possible to test

INTUITION, QUALITATIVE DATA, AND DECISION MAKING 49
Figure 2.7. Using data to challenge assumptions—1. Visualization from Gapminder World, Pow-
ered by Trendalyzer from http://www.gapminder.org.
the hypotheses, while in others the analysis can only suggest the appropriateness of the hypotheses—or the assumptions underlying those hypotheses.
Sometimes the availability of data can help decision makers know to reject their intuition. For example, many international health planners still do not understand the trends relating family size and life expectancy across the world. A common misconception is the view that there exists one model of family size in "First World" nations and another model for family size in Third World nations. Such an assumption can falsely provide a basis for needs of certain kinds of planning of health relief. However, data such as those shown in Figures 2.7 and 2.8 can help the decision maker evaluate those assumptions. In Figure 2.7, we see a graph of the family size and life expectancy of various nations in 1950. Each country is represented with a bubble, and the size of the bubble represents the population of that nation. One can see that the hypothesis above is in fact true in 1950. Figure 2.8, however, shows the data in 2007 and demonstrates that the hypotheses are no longer valid. In fact, tools such as those at gapminder.org (from which these two graphs were adopted) show you not only the trends today (such as Figure 2.6) but also the annual change from 1950 to 2007, animating the movement to help the decision maker develop better intuition about the international health status.
Decision support systems can help decision makers by prompting them to consider important issues, such as those associated with data mining tools. For example, one system used neural networks to analyze credit card data and provide hypotheses to decision makers about credit card theft. The system returned with a unique insight; credit card thieves were

50 DECISION MAKING
Figure 2.8. Using data to challenge assumptions—2. Visualization from Gapminder World, Pow-
ered by Trendalyzer from http://www.gapminder.org.
charging low amounts to a card, such as $1 at a gas pump, to test the cards before using them for higher purchases. This insight was complementary to those provided by humans, which tended to focus on large, uncustomary purchases.
Another approach is to help decision makers understand the underlying assumptions by providing enough of the appropriate information for decision makers to understand the phenomenon of interest without overloading them with unnecessary or undesired details. Decision support systems should provide predefined information and analyses, thereby allowing decision makers to identify the analyses that generated a particular result. Al-ternatively, DSS should provide information about promising additional analyses. This option encourages users to develop original analyses and recommend analyses but allows the user to select desired analyses. This option allows unknowledgeable decision mak-ers to explore the decision environment and allows knowledgeable users to pursue subtle clues.
A third step is helping users test assumptions, especially those that differ from the decision maker's preconceived ideas. The DSS can illuminate how a current context is similar to one faced previously and why similar strategies might work; or they can help decision makers understand why the current context is different and therefore why different strategies might work. Specifically, this means a DSS should have decision aids that support users' abilities to recognize trends. This might include development of databases with which to track options, relevant factors, and outcomes of choices.

INTUITION, QUALITATIVE DATA, AND DECISION MAKING 51
Decision support systems also need alternative-generating options that might use solu-tions from past problems. If this capability is included, however, there must be some manner for considering and experimenting with these strategies in a solitary and secure manner. Decision makers need to be able to store alternatives (with annotations) in a retrievable and searchable format, and they need to be able to consider these options and discard them (if necessary) without a record of their use. Otherwise, the highly competitive environment (both internal and external to the organization) of most managers will discourage their use.
The DSS should also encourage users to challenge model results, especially those deviating from decision makers' intuition. Sensitivity analyses that help decision makers answer what-if questions should accompany all models, and the models themselves should be able to generate possible scenarios.
Virtual Experience
Good managers are similar to chess players in that over time they learn to recognize patterns of conditions for which particular tools or strategies will most likely work. The reason is that experience encourages intuition. When managers begin as apprentices, working in the same organizations with the same products for their entire lifetimes, they experience many decision points. This background allows decision makers to gain experience about the important factors in the organization and the role these factors played in creating a
Supporting creative decision making is always difficult. But, according to recent research from Adam Galinsky, the Morris and Alice Kaplan Professor of Ethics and Decision in Management, at Northwestern university, and his colleagues, one thing that can help is to provide a mechanism to distract the decision maker. According to Gatinsky, moving to a new task encourages the subconscious to process the original task, and when the decision maker returns to Lhe original task, he or she can identify a solution more easily. He states that conscious thought is better for analytic decisions but unconscious thought is more effective at solving complex problems. Hence it might actually be useful to build a distraction mechanism into a DSS to help support creative decision making.

52 DECISION MAKING
favorable outcome. Such experience allows decision makers to reflect more on information provided to them, imagine creative options, and seek historical evidence with which to evaluate hypotheses. Their decision making generally is more open ended, involving more speculation about unstated possibilities. In other words, they become more intuitive.
Managers today often do not have such intuition because they do not have longevity with the organization, product, or individuals. An alternative is to allow managers to expe-rience those decision points vicariously. This can happen if DSS provide convenient, quick
London, September 19,1772
Dear Sir*
In the affair of so much importance to you, wherein you ask my advice, 1 cannot, for want of sufficient premises, advise you what to determine, but if you please I will tell you how. When those difficult cases occur, they are difficult, chiefly because while we have them under consideration, all the reasons pro and con are not present to the mind at the same time; but sometimes one set present themselves, and at other times another, the first being out of sight. Hence the various purposes or inclinations that alternatively prevail, and the uncertainty that perplexes us< To get over this, my way is to divide half a sheet of paper by a line into two columns: writing over the one Pro, and over the other Con. Then, during three or four days consideration, I put down under the different heads short hints of the different motives, that at different times occur to me, for or against the measure. When Γ have thus got them all together in one view, I endeavor to estimate their respective weights; and where t find two, one on each side, that seem equal, I strike them both out. If I find a reason pro equal to some two reasons con, I strike out the three. If [ judge some two reasons con, equal to three reasons pro, I strike out the five; and thus proceeding [ find at length where the balance lies; and if, after a day or two of further consideration, nothing new that is of importance occurs on either side, I come to a determination accordingly. And, though the weight of the reasons cannot be taken with the precision of algebraic quantities, yet when each is thus considered, separately and comparatively, and the whole lies before me, I think I can judge better, and am less liable to make a rash step, and in fact 1 have found great advantage from this kind of equation, and what might be called moral or prudential algebra.
Wishing sincerely that you may determine for the best, I am ever, my dear friend, yours most affectionately
B. Franklin
M al co 1 m G1 ad wel 1 publ i shed a book in 2001 called Blink: The Po we r of Thinking without Thinking in which he claimed that frequently the intuitive, first impression decision (made in the first seconds) is a better decision than better informed decisions- As one example of "evidence," he cites a psychologist, John Gottman, who can watch a 15-minute video of a husband and wife (about whom he knows nothing) and predict whether they will still be married in 15 years (with 90% accuracy). While this may be true, it is only because of many years of analytical data that Dr. Gottman has considered that provide the foundation of the "intuition" In other words, the analytical data are so well understood by Dr. Gottman that he can apply it apparently effortlessly Such is true of many experts in their fields. Similarly, the research of Prietula, Ericsson, and Cokely (2001) found that experts become experts because of significant practice in their field. It is only after that practice that their ability to make choices seems natural or intuitive.

BUSINESS INTELLIGENCE AND DECISION MAKING 53
access to databases and analysis tools so that the decision makers can "rummage around" to extract and manipulate database fragments in ways that mesh well with individuals' normal ways of viewing and resolving situations.
These users need to access data reflecting multiple perspectives of the organization. Recent advances in data warehousing simplify this process and give decision makers access to richer information. Without the data warehouse, DSS can only access data available from regular operations. Not only are they insufficient in content, they are inefficient to use. Further, the data represent only current or a frozen slice of operations containing factors at some point in time. With the data warehouse, DSS can provide nonvolatile, subject-and time-variant data to support a variety of analyses consistently. This allows decision makers to see how factors have changed over time and how circumstances affect the issues considered. Such analyses help decision makers vicariously or intellectually experience more aspects of the organization and therefore help them to develop better intuition about what "works" and what does not work.
BUSINESS INTELLIGENCE AND DECISION MAKING
Business intelligence (BI) was first noted in the literature in 1958. In that introduction, Luhn (1959, p. 314) defined business and intelligence as follows:
[BJusiness is a collection of activities carried on for whatever purpose, be it science, technology, commerce, industry, law, government, defense, et cetera. The communication facility serving the conduct of a business (in the broad sense) may be referred to as an intelligence system. The notion of intelligence is also defined here, in a more general sense, as "the ability to apprehend the interrelationships of presented facts in such a way as to guide action towards a desired goal."
He defined a system to help provide intelligence to managers as shown in Figure 2.9.
In response to a conference he attended, Neil Raden, founder of Hired Brains, a consulting firm specializing in analytics, business Intelligence, and decision management, and coauthor of the book Smart (Enough) Systems commented in his blog*;
Bottom line,, it's all fluff, I don't like the term business analytics; it doesn't tell me anything. Frankly, \ think business intelligence as a term is downright laughable, too, What does that mean? Is integrating data intelligence? Is generating reports intelligence? Maybe it's informing, but isn't intelligence something you HAVE not something you do? Does doing what we call BI lead to intelligence, or just some information? A long time ago we called this decision support, and thai gets my vote {emphasis added]. And by the way, conspicuously absent from Davis' framework (he said "platform" implies huge, lengthy projects, framework captures the spirit of what they are proposing) was any mention of decisions - where they are, how they are made, and how this "framework" leads to making better ones.
■ Source: "From 'ΒΓ to "Business Analytics,' It's All Fluff" available: http://wwwJntclligcntcnterprise. ; com/blog/archLves/2009/03/_from_bi_to.bus.html?cid =nlJE_blog, viewed April 2, 2009.

54 DECISION MAKING
Figure 2.9. An early view of Bl. Source: P. Luhn, "A Business Intelligence System," IBM Journal,
October 1958, pp. 314-319. Reprint courtesy of International Business Machines Corporation,
Copyright 1958 © International Business Machines Corporation.

BUSINESS INTELLIGENCE AND DECISION MAKING
Although the technology specified in Figure 2.9 is archaic by today's standards, Luhn's view and definition of BI is amazingly robust for twenty-first-century applications. Today you hear phrases such as "providing better data" or "single versions of the data" or "fact-based decision making" as the definitions of BI. The goal of BI is to provide managers with information about the business in time to allow them to make decisions that can solve problems or take advantage of opportunities. Not only does it provide decision makers with information about events, the BI system allows them to explore underlying data in order to understand the problem better. In other words, BI allows managers to manage better.
In arguing for BI systems, H.R Luhn noted (1958, p. 314):
Efficient communication is a key to progress in all fields of human endeavor. It has become evident in recent years that present communication methods are totally inadequate for future requirements. Information is now being generated and utilized at an ever-increasing rate because of the accelerated pace and scope of human activities and the steady rise in the average level of education. At the same time the growth of organizations and increased specialization and divisionalization have created new barriers to the flow of information. There is also a growing need for more prompt decisions at levels of responsibility far below those customary in the past. Undoubtedly the most formidable communications problem is the sheer bulk of information that has to be dealt with. In view of the present growth trends, automation appears to offer the most efficient methods for retrieval and dissemination of this information.
In today's world, the arguments are similar. We need BI because of the fast pace of change in globalization, innovation, and competition as well as because of regulations such as Sarbanes-Oxley and the fact that our competitors are using it.
In 1958, Luhn talked about the chore of acquiring the information. Today that is not a problem because much data are already digitalized. However, the data are not necessarily any better organized or coordinated for decision makers than they were in 1958. In other words, the task of BI is more than collecting information. Instead BI begins with a view that information can be an asset and that asset can help you manage the organization better. With the appropriate information, the business can be more profitable, experience lower costs, expose itself to fewer risks, and provide a better link to customers. What a given manager needs to know then are the factors impacting costs, profitability, and risk as well as information about customers and upcoming trends. In other words, they need to know how the company does business and how to make it better.
In 2007, AMR Research estimated that companies were spending about $23.8 billion for BI. To examine how business leaders responded to those expenditures, Howson (2008) examined 513 organizations of various sizes to determine their use of BI and its success. These organizations included large companies with annual revenues greater than $1 billion per year (43%), medium companies (30%), and small companies (27%) from around the world. Across that spectrum of companies Howson found that about a quarter of all BI implementations were considered "very successful" and only 8% were considered a failure. Her subjects defined success as shown in Table 2.1. As you can see, Howson found that 70% of business leaders thought that improved business performance was the criterion to consider when evaluating BI systems. She found that 32% of the BI systems were making significant contributions to the business. Yet, in 2009, Gartner predicted that through 2012 more than 35% of the top 5000 global companies will regularly fail to make insightful decisions about significant changes in their business and markets. So clearly there is a

56 DECISION MAKING
Table 2.1. Measures of Success of Bl Projects
Improved business performance Better access to data Support of key stakeholders User perception that it is mission critical Return on investment Percentage of active users Cost savings Defined users
Other measures of success included: Number of BI applications Number of new requests for BI applications Number of standard ad hoc reports Elimination of independent (shadow) spreadsheets Increased employee satisfaction Increased customer service Time reduced
Source: From Howson (2008).
great deal of confusion about what BI is and what it must accomplish. Clearly there is a disconnect between what is wanted and what is being provided, at least in some industries.
Information alone does not constitute BI. It must be "intelligence" about something that is relevant to the working and/or the future of the business. In order to know what is important for the planning of a business, organizations must define strategic goals and objectives for planning purposes. These might be to increase profitability by 3% per year, to dominate an industry, to preserve wilderness, or to improve children's reading scores. What is important is that these goals are defined by upper management and are those believed to drive the business. Without having these goals specified, the BI will not accomplish its goal.
Deriving from these goals are key performance indicators (KPIs). The KPIs are a combination of quantitative metrics that help organizations evaluate their success and progress toward some organizational goal. They help decision makers evaluate the current state of the business and how adoption of various activities will impact that state. For example, suppose the organization of interest is a department store. If it is a chain of stores, then there is a goal for growth of the chain of stores and for a particular store. Within the particular store, there are also goals associated with the various departments of the store: Women's clothing might be expected to grow vigorously while bedding might be expected to maintain a flat sales position. If you are the manager of one of the women's clothing departments, you want to know what is happening with your sales. You might be interested in how many of your regular customers are visiting the store, how many are purchasing at last year's levels, and how many new customers you are attracting. You need not only the specific numbers but also to be able to track these indicators against goals that would lead the department to meet its annual goal.
In addition to knowing where your department falls in its particular goal, it is important for you to understand why your customers are behaving in a particular way. You want to know if a change in buying patterns is related to a change in demographics or the specifics of the collection you are selling. Further you want to know what trends or fashions will be significant next year so you can be sure to stock those items to improve sales volume.
70% 68% 53% 50% 43% 31% 31% 17%

ANALYTICS 57
Table 2.2. Necessary Features of Successful Bl
• High data quality and "clean" data • Reliability of the system • Availability of relevant subject areas • Appropriate and effective BI tools • Fast query response time • BI being continually improved (both data and tools) • Integration of BI into organizational processes • Near real-time updates to the data warehouse
So, BI is not a system to respond to a specific business need. Rather it is a change in how people do business. This change is built upon having the information, processes, and tools needed to make decisions. Howson (2008, p. 100) identified eight features of BI that were critical for system success, as shown in Table 2.2. Of the items she noted, the quality and control of data were the most critical. Information comes from many locations both inside and outside the organization. She notes that common business definitions across the organization and ensuring that errors and duplicates are eliminated before being loaded in the system are critical for success. In addition, she noted that making access to the data easy, regardless of whether it is internal or external data, is also quite important.
So, although there are a few products that call themselves "business intelligence tools," for our purposes, we will distinguish between the process of BI (described earlier) and the systems that create the BI. Those systems will be called DSS because that is their generic and conventional name. In addition, the name emphasizes the role of the computer: The system supports the human who is actually making the decision.
ANALYTICS
Some people confuse BI and a newer term, "analytics." The latter term came into us-age in 2007 with the publishing of the book Competing on Analytics: The New Science of Winning by Davenport and Harris. In that book, they define analytics as "the exten-sive use of data, statistical and quantitative analysis, explanatory and predictive models, and fact-based management to drive decisions and actions" (Davenport and Harris, 2007, p. 7). Their argument is that analytics are critical to perfect business processes so as to dis-tinguish a given company from others which offer similar products and which use similar technology. Analytics are the tools that help companies identify that attribute "at which they are better than anyone else in their industry" and take advantage of that difference. Once the organization has identified that attribute, they apply "extensive data, statistical and quantitative analysis, and fact-based decision making to support the selected capabilities" (p. 9).
Analytics are an important part of the decision support provided to decision makers. In the language of this book, the analytics are the results of the interaction between the models and the data. They are something provided to the decision maker to help him or her make a decision. However much we might want analytics because of their straight-forwardness and their predictive capability, analytics are not the only output of a DSS. In 2009 Accenture conducted a survey of its users and the information upon which they make their choices. This study of 254 large companies in the United States and 257 large
58 DECISION MAKING
companies in the United Kingdom showed that on average about 40% of the information used in high-level decision making does not rely upon analytics. When queried about their use, 61% of the respondents indicated they relied on qualitative data because good data were just not available, 61% indicated that there were no past data for the decision (an innovation), and 55% said their decisions were based on qualitative and subjective factors. When asked when they do rely on analytics, respondents indicated that they use analytics (instead of qualitative information) for 71 % of decisions involving operational performance, 63% of the decisions involving pricing strategies, 48% of the decisions for asset acquisi-tion, 43% of decisions involving customer retention, and 26% of the decisions of talent management.
As we have discussed and will discuss more, there are times when it is appropriate to consider qualitative data. For example, when there are no past data, as in the case of innovation, you cannot use analytics; those decisions are best supported by qualitative models. Similarly, analytical models work best for prediction of short periods into the future where conditions are believed to be similar to the past. Long-range decisions and decisions in a turbulent environment are not good candidates for analytical and predictive models; qualitative models and "gut feelings" must be used to complete the view of the situation. Finally, there are just some qualitative data, such as lists of the most important customers or of the most profitable sales people, that need to be considered. Hence, we need to be prepared to include qualitative data in the DSS and help decision makers use it more wisely.
There is an additional reason that designers of DSS need to help decision makers use qualitative data: because they are going to use the data whether or not included in the DSS. The bottom line is that people make the decisions and we have no control over the information they consider. If their inclination is to use qualitative data, they will use qualitative data. Even Accenture's study, where about 93% of the respondents agreed that business analytics are necessary to be competitive in today's environment, showed decision makers' hesitancy to rely on analytics alone. Only 15% of the respondents agreed completely with the statement that "business analytics are far more accurate than judgment for making major business decisions" while 10% of the respondents agreed completely with the statement that "some managers rely too much on business analytics, not enough on judgment, experience." So, in the meanwhile we must help decision makers use such information more wisely. Later chapters will discuss how we work with the qualitative data to increase its validity.
COMPETITIVE BUSINESS INTELLIGENCE
Another subset of BI is competitive business intelligence (CI). The goal of CI is to provide a balanced picture of the environment to the decision makers. The CI supports strategic decision making, and that requires a reasonable assessment of the direction of the future and guidance from that assessment to outperform competitors. In particular, CI must provide:
• A mechanism to provide an early warning of threats and opportunities: What are competitors, customers, and suppliers doing? How will it help or hurt business?
• Support for the strategy development process: What are the current trends in the marketplace? What strategies will help the decision makers capitalize on those trends?
COMPETITIVE BUSINESS INTELLIGENCE
• Assistance with instilling a sense of urgency and motivation toward action: What does the sales force know that headquarters decision makers do not know? How would this exchange of pertinent information affect business decision making?
• Support for strategic and operational decision making: What should the company do to compete effectively during the next five years? What changes would help us run the business better today?
Such a reasonable assessment can only be obtained when the CI casts a wide net for information. In fact, CI works best when contributions are made from a wide variety of employees with a wide range of sources and perspectives accompanied by constant electronic scanning of Internet sources for well-defined items.
To provide support, the information must be organized and digested systematically to determine not only what trends are present but what responsive actions are suggested by those trends. The CI without an accompanying support system runs the risk of providing information that is biased, incomplete, or poorly constructed. Even when the information may be presented to suggest actions, it often is not conducive to stimulating creative responses. Further, decision makers, when relying on their own informal processes and intuition, do not evaluate the impact of environmental factors well.
Emerging tools such as Microsoft's Pivot, however, could help managers examine their CI data more effectively. Pivot combines large groups of similar items as collections. The similarity is defined in terms of how individual items relate to the decision and/or alternatives under consideration. Items might be, for example, articles about competitors, suppliers, or customers, the analysis of which might provide insights into possible opportunities for new products, insights into which vendors might be preferred, or early indications of changes in preferences that might impact an established product. Similarly, items might provide information about people that might lead to a new hire or about locations that may impact relocation decisions. What is a collection, and how that collection should be analyzed depends on the decision. Once a collection is defined and coded for pertinent attributes, managers can use the tool to move easily between examination of trends and specific data to discover hidden patterns and to discover new insights about their environment. The goal is to use the power of the human mind to identify trends early so the organization can act upon it.
The number of factors that need scanning should not be limited by the industry, market, or organization's strategic plan. Although in the past it was not necessary to scan corpora-tions that were not competitors, today's marketplace, with mergers and changing abilities, requires broader scanning. A company irrelevant today may, in fact, be tomorrow's sup-plier of raw or semiprocessed materials and/or customer. Some factors, such as competitors' earnings, costs, market share, and other "facts" are easily processed for decision makers. But CI also comes from trade journals and newspapers, viewing advertising (including job advertising), monitoring Web pages, blogs, news feeds, Web listings, speech transcripts, government documents, news services, professional meetings, webcasts, and the like. In fact, data that reflect early trends, such factors as new products, mergers, problems, and expansion, often are no more than rumors when they first surface but may provide valu-able indicators of changes and impending changes of importance to the decision maker. If collected and processed properly, they can provide support for decision makers. A good CI will weave together information from diverse sources to help decision makers recognize the importance of the information to the decision and to the organization's goals. Chapter 4 will provide examples on how to accomplish that goal.

DECISION MAKING
2.10. Demonstration of Microsoft's tool, Pivot. Screen abstracted from http://getpivot.com.
CONCLUSION
The purpose of this chapter was to introduce some of the thoughts on decision making available in the literature. These theories and views will be expounded upon later as we discuss exactly how they are implemented in a DSS. Individual aspects of the user interface, databases, model management issues, and connectivity with external resources will be developed in the three following chapters. A later chapter will address the design of group DSSs.
SUGGESTED READINGS
Argyris, C, and D. A. Schön, Organizational Learning, Vol. 2, Reading, MA: Addison-Wesley, 1996. Ashton-James, C, W. W., Maddux, A. D. Galinsky, and T. L. Chartrand, "Who I am Depends on How
I Feel: The Role of Affect in the Expression of Culture," Psychological Science, Vol. 20, 2009, pp. 340-346.
Bissinger, B., Three Nights in August: Strategy, Heartbreak, and Joy inside the Mind of a Manager, New York : Mariner Books, 2006.

SUGGESTED READINGS
Boland, R. J., Jr., "Decision Making and Sensemaking," in F. Burstein and C. W. Holsapple (Eds.), Handbook on Decision Support Systems, Vol. 1, Berlin: Springer-Verlag, 2008, pp. 55-63.
Braybrooke, D., and C. E. Lindblom, A Strategy of Decision, New York: Macmillan, 1970.
Burstein, R, and C. W. Holsapple, Handbook on Decision Support Systems, Vols. 1 and 2, Berlin:
Springer-Verlag, 2008. Carlsson, C. and P. Waiden, "Intelligent Support Systems: The Next Few DSS Steps," Human Systems
Management, Vol. 19, 2000, pp. 135-147. Carr, N. G., M. E. Porter, and D. Farrell, Wringing Real Value from IT, 2nd ed., Cambridge, MA:
Harvard Business Review, October 2003.
Churchman, C. W., The Design of Inquiring Systems: Basic Concepts of Systems and Organizations,
New York: Basic, 1971. Crennan, K., P. F. Nunes, and M. A. Halfin, "Back to the Future," Outlook: The Journal of High
Performance Business, Vol. 1, No. 3, September 2008, pp. 1-15.
Crossen, C, Tainted Truth: The Manipulation of Fact in America, New York: Simon & Schuster, 1994.
Crunk, J., and M. M. North, "Decision Support Systems and Artificial Intelligence Technologies in Aid of Information Systems Based Marketing," International Management Review, Vol. 3, No. 2, 2007, pp. 61-86.
Cyert, R. M., and J. G. March, A Behavioral Theory of the Firm, Englewood Cliffs, NJ: Prentice-Hall, 1963.
Davenport, T. H., and J. G. Harris, Competing on Analytics: The New Science of Winning, Cambridge,
MA: Harvard Business School Press, 2007.
DeBono, E., Six Thinking Hats, 2nd ed., New York: Back Bay Books, 1999.
DeSanctis, G., and R. B. Gallupe, "A Foundation for the Study of Group Decision Support Systems,"
Management Science, Vol. 33, No. 5, May 1987, pp. 589-609.
Dhar, V., and R. Stein, Seven Methods for Transforming Corporate Data into Business Intelligence, Upper Saddle River, NJ: Prentice-Hall, 1997.
Dreyfus, H. L., and S. E. Dreyfus, Mind Over Machine: The Power of Human Intuition and Expertise
in the Era of the Computer, New York: Free Press, 1986.
Eckerson, W. W, "Pervasive Business Intelligence," TDWI Best Practices Report, Third Quarter, 2008. Available at: http://tdwi.org/research/display.aspx?id=9152.
Ericsson, K. A., M. Prietula, and E. T. Cokely, "The Making of an Expert," Harvard Business Review, Jul/Aug 2007, Vol. 85 Issue 7/8, pp. 114-121.
Ferris, D., "How to Compete on Analytics: The Analytical Center of Excellence," SAS White Paper,
Available at http://www.sas.com/veg/wp/corp/6426, 2008.
Fuld, L. M., The Secret Language of Competitive Intelligence, New York: Crown Business, 2006.
Gartner, Inc, "Gartner Reveals Five Business Intelligence Predictions for 2009 and Beyond," CRM Today, March, 2009, Available at http://74.125.155.132/search?q=cache:u7a8nsH Jy5kJ: www.crm2day.com/news/crm/125713 .php+Gartner+2009+BI&cd= 12&hl=en&ct=clnk& gl=us&client=firefox-a.
Ghosh, D, and M. R. Ray, "Risk Attitude, Ambiguity Intolerance and Decision Making," Decision
Sciences, Vol. 23, No. 2, March/April 1992, pp. 431-444. Gladwell, M., Blink: The Power of Thinking without Thinking, Boston, MA: Back Bay Books,
2007. Global Reporting Initiative, "Sustainability Reporting Guidelines, Version 3.0," 2006, available:
http://www.globalreporting.org/NR/rdonlyres/ED9E9B36-AB54-4DEl-BFF2-5F735235CA44/ 0/G3_GuidelinesENU.pdf, viewed March 2009.
Gray, P., and L. Olfman, "The User Interface in Group Decision Support Systems," Decision Support Systems, Vol. 5, No. 2, 1989.

DECISION MAKING
Guralnik, D. B., Webster's New World Dictionary, second college edition, New York: Simon and Schuster, 1980.
Hall, D. J., "Decision Makers and Their Need for Support," in F. Burstein and C. W. Holsapple (Eds.), Handbook on Decision Support Systems, Vol. 1, Berlin: Springer-Verlag, 2008, pp. 83-102.
Holdapple, C. W., "Decisions and Knowledge," in F Burstein and C. W. Holsapple (Eds.), Handbook
on Decision Support Systems, Vol. 1, Berlin: Springer-Verlag, 2008a, pp. 21-53.
Holsapple, C. W., "DSS Architecture and Types," in F. Burstein and C. W. Holsapple (Eds.), Handbook
on Decision Support Systems, Vol. 1, Berlin: Springer-Verlag, 2008b, pp. 163-189. Hostmann, B., "Roundup of Business Intelligence and Information Management Research,
1Q08," Gartner White Paper G00157226, May 2, 2008. Available at http://www.gartness. com/DisplayDocument?id= 1276814/ref=g.
Howson, C., Successful Business Intelligence: Secrets to making BI a Killer Application, New York:
McGraw-Hill, 2008. Huber, G. R, "The Nature of Organizational Decision Making and the Design of Decision Support
Systems," MIS Quarterly, Vol. 5, No. 2, June 1981, pp. 1-10. Huber, G. R, "Cognitive Styles as a Basis for MIS and DSS Designs: Much Ado About Nothing,"
Management Science, Vol. 29, No. 5, May 1983, pp. 567-579.
Imhoff, C., "Keep Your Friends Close, and Your Enemies Closer," DM Review, Vol. 13, No. 4, 2003, pp. 36-37,71.
Inhelder, B. and J. Piaget, The Growth of Logical Thinking from Childhood to Adolescence, London:
Routledge Press, 2002.
Iyengar, S. The Art of Choosing, NY: Twelve, 2010. Kanneman, D.„ and A. Tversky, "Prospect Theory: An Analysis of Decisions Under Risk," Econo-
metrica, Vol. 47, 1979, pp. 263-291.
Keen, P. G. W., "The Evolving Concept of Optimality," TIMS Studies in the Management Sciences,"
Vol.6, 1977, pp. 31-57. Kim, J., J. Hahn, and H. Hahn, "How Do We Understand a System with (So) Many Diagrams?
Cognitive Integration Processes in Diagrammatic Reasoning," Information Systems Research, Vol. 11, No. 3, 2000, pp. 284-303.
Klein, G. A., "Automated Aids for the Proficient Decision Maker," Proceedings of the 1980 IEEE
Systems, Man and Cybernetics Conference, October 1980, pp. 301-304.
Klein, J., and I. Weiss, "Towards an Integration of Intuitive and Systematic Decision Making in Education," Journal of Educational Administration, Vol. 45, No. 3, 2007, pp. 265-277.
Langley, A., "In Search of Rationality: The Purposes Behind the Use of Formal Analysis in Organi-zations," Administrative Systems Quarterly, December 1989, pp. 598-631.
Lindblom, C. E. "The Science of Muddling Through," Public Administration Review, Vol. 19, Spring 1959, pp. 155-169.
Lindstone, H., and M. Turroff, The Delphi Method: Technology and Applications, Reading, MA:
Addison-Wesley, 1975. Luhn, P., "A Business Intelligence System," IBM Journal, October 1958, pp. 314-319.
MacCrimmon, K. R., "An Overview of Multiple Objective Decision Making," in J. L. Cochrane and M. Zeleny (Eds.), Multiple Criteria Decision Making, Columbia, SC: University of South Carolina Press, 1973, pp. 18-43.
March, J. G., "Bounded Rationality, Ambiguity and the Engineering of Choice," Bell Journal of
Economics, March 1978, pp. 587-608.
McNamara, L. A., and T. G. Trucano, "So Why DO You Trust That Model? Some Thoughts on Modeling, Simulation, Social Science and Decision Making," Albuquerque, NM: Sana National Labs White Paper, Sand2006-3135p, March 2006.

SUGGESTED READINGS
Miller, G. A., "The Magic Number Seven, Plus or Minus Two: Some Limits on Our Capacity for Processing Information," Psychological Review, Vol. 63, 1956, pp. 81-97.
Mintzberg, H., The Nature of Managerial Work, New York: Harper and Row, 1973.
Mintzberg, H., "The Manager's Job: Folklore and Fact," Harvard Business Review, March-April 1990, pp. 163-176.
Mintzberg, H., D. Raisinghani, and A. Theoret, "The Structure of the 'Unstructured' Decision Pro-cesses," Administrative Science Quarterly, Vol. 21, June 1976, pp. 246-275.
Mitroff, 1.1., and H. A. Linstone, The Unbounded Mind: Breaking the Chains of Traditional Business
Thinking, New York: Oxford University Press, 1993.
Mockler, R. J., Computer Software to Support Strategic Management Decision Making, New York:
Macmillan, 1992. Moss, L. U.„ and S. Atre, Business Intelligence Roadmap: The Complete Project Lifecycle for
Decision Support Applications, Boston: Addison-Wesley, 2003.
Negash, S., and P. Gray, "Business Intelligence," in F. Burstein and C. W. Holsapple (Eds.), Handbook
on Decision Support Systems, Vol. 2, Berlin: Springer-Verlag, 2008, pp. 175-194.
Nordstrom, R. D., and R. K. Pinkerton, "Taking Advantage of Internet Sources to Build a Competitive
Intellligence System," Competitive Intelligence Review, Vol. 10, No.l, 1999, pp. 54-61. Norman, D., Emotional Design: Why We Love (or Hate) Everyday Things, New York: Basic Books,
2004.
Nunamaker, J. F., A. R. Dennis, J. S. Valacich, D. R. Vogel, and J. F. George, "Electronic Meeting Systems to Support Group Work," Communications of the ACM, Vol. 34, No. 7, July 1991, pp. 40-61.
Peters, T., The Pursuit of WOW: Every Person's Guide to Topsy-Turvy Times, Vintage Press, 1994.
Piaget, J., The Origins of Intelligence in Children, New York: International Universities Press, 1952.
Piaget, J. and B. Inhelder, The Psychology of the Child, New York: Basic Books, 2000.
Porter, M. E., "Strategy and the Internet," Harvard Business Review, Vol. 79, No. 3, March 2001,
pp. 164.
Porter, M. E., "The Importance of Being Strategic," The Balanced Scorecard Report, Vol. 4, No. 3, May 15, 2002.
Power, D. J., "Decision Support Systems: A Historical Overview," in F. Burstein and C. W. Hol-sapple (Eds.), Handbook on Decision Support Systems, Vol. 1, Berlin: Springer-Verlag, 2008,
pp. 119-140.
Prietula, M. J.„ and H. A. Simon, "The Experts in Your Midst," Harvard Business Review, Vol. 67, No. 1, January-February 1989, pp. 120-125.
Rasmussen, J., "Skills, Rules and Knowledge: Signals, Signs and Symbols, and Other Distinctions in Human Performance Models," IEEE Transactions on Systems, Man and Cybernetics, Vol. 13, No. 3, Mary-June 1983, pp. 257-266.
Rasmussen, J., On Information Processing and Human-Machine Interaction: An Approach to Cog-nitive Engineering, New York: North Holland, 1986.
Robey, D., and W. Taggart, "Human Information Processing in Information and Decision Support
Systems," MIS Quarterly, Vol. 6, No. 2, June 1982, pp. 61-73.
Sage, A. P., Decision Support Systems Engineering, New York: Wiley, 1991.
Samamurthy, V, R. M. Zmud, and T. A. Byrd, "The Comprehensiveness of IT Planning Processes: A Contingency Approach," Journal of Information Technology Management, Vol. 5, No. 1, 1994, pp. 1-10.
Sanderson, D. W, and D. Dougherty, Smileys, New York: O'Reilly and Associates, 1993.
Sauter, V. L., "The Effect of Experience on Information Preferences," Omega: The International Journal of Management Science, Vol. 13, No. 4, 1985, pp. 277-284.

DECISION MAKING
Sauter, V. L., "Intuitive Decision Making and Its DSS Requirements," Communications of the ACM, Vol. 42 No. 6, June 1999, pp. 109-115.
Sauter, V. L., "Competitive Intelligence Systems," in F. Burstein and C. W. Holsapple (Eds.), Hand-book on Decision Support Systems, Vol. 2, Berlin: Springer-Verlag, 2008, pp. 195-210.
Sauter, V. L.„ and J. L. Schofer, "Evolutionary Development of Decision Support Systems: Important Issues for Early Phases of Design," Journal of Management Information Systems, Vol. 4, No. 4, Spring 1988, pp. 77-92.
Silver, M. S., "On the Design Features of Decision Support Systems: The Role of System Restrictive-ness and Decisional Guidance," in F. Burstein and C. W. Holsapple (Eds.), Handbook on Decision Support Systems, Vol. 2, Berlin: Springer-Verlag, 2008, pp. 261-292.
Simon, H. A., "A Behavioral Model of Rational Choice," Quarterly Journal of Economics, Vol. 69, 1955, pp. 99-118.
Simon, H. A., "Rational Choice and the Structure of the Environment," Psychological Review, Vol. 63, 1956, pp. 129-138.
Simon, H. A., Models of Man, New York: Wiley, 1957.
Simon, H. A., "From Substantive to Procedural Rationality," in S. J. Latsis (Ed.), Method and Appraisal in Economics, New York: Cambridge University Press, 1976, pp. 129-148.
Simon, H. A., Administrative Behavior: A Study of Decision-Making Process in Administrative Organizations, New York: The Free Press, 1976.
Simon, H. A., The New Science of Management Decision, Upper Saddle River, NJ: Prentice Hall, 1977.
Simon, H. A., "Rational Decision Making in Business Organizations," American Economic Review, Vol. 68, May 1978, pp. 1-16.
Simon, H. A., Models of Thought, New Haven, CT: Yale University Press, 1979.
Simon, H. A., Administrative Behavior, 4th ed., New York: Simon and Schuster, 1997.
Soule, E., "Managerial Moral Strategies—In Search of a Few Good Principles," Academy of Man-agement Review, Vol. 27, No. 1, 2002, pp. 114-124.
Sprague, R. H., Jr., "A Framework for the Development of Decision Support Systems," MIS Quarterly, Vol. 4, No. 4, pp. 1-26.
Stolz, M, "Work-Oriented Development of Knowledge-Based Systems—A Case for Multiple Per-spectives," Knowledge Based Systems, Vol. 7, No. 4, 1994, pp. 271-273.
Swanson, D. L., "Toward an Integrative Theory of Business and Society: A Research Strategy for Multiple Perspectives," Knowledge Based Systems, Vol. 7, No. 4, 1994, pp. 271-273.
Tapscott, D., "Business Intelligence: Actionable Insights for Business Decision Makers," SAP White Paper, 2008. Available at: http://download.sap.com/solutions/sapbusinessobjects/brochures/ download.epd?context=9A19058740BEBDCElE6BD4D2C8DD536A803216DA46F5D15BBFA 99BDB30FD0C07734F5FF1DD9BE89B8A98D664C1AF875648D72A487C5FC3EC7
Taylor, J., with N. Raden, Smart (Enough) Systems: How To Deliver Competitive Advantage by Automating the Decisions Hidden in Your Business, Upper Saddle River, NJ: Prentice-Hall, 2007.
Taylor, R. N., "Concepts, Theory and Techniques: Psychological Determinants of Bounded Ratio-nality: Implications for Decision-Making Strategies," Decision Sciences, Vol. 6, No. 2, 1975, pp. 409-427.
Thaler, R. H., and C. R. Sunstein, Nudge: Improving Decisions About Health Wealth and Happiness, New Haven, CT: Yale University Press, 2008.
Thompson, J., Organizations in Action, New York: McGraw-Hill, 1967.
Todd, P., and I. Benbasat, "An Experimental Investigation of the Impact of Computer Based Decision Aids on Decision Making Processes," Information Systems Research, Vol. 2, No. 2, June 1991, pp. 87-115.

SUGGESTED READINGS 65
Totten, L., and N. Tohamy, "Home for the Holidays: Truckload Motor Carriers must Balance Drivers' Needs with Customer Requirements, a Difficult Problem During the Holidays," ORMS Today, Vol. 22, 1995, pp. 24-25.
Van de Ven, A. H.„ and A. L. Delbecq, "The Effectiveness of Nominal, Delphi and Interacting Group Decision Making Processes," Academy of Management Journal, Vol. 14, 1971, pp. 203-213.
Zhong, C, A. Dijksterhuis, and A. Galinsky, "The Merits of Unconscious Thought in Creativity," Psychological Science, Vol. 19, No. 9, September 2009, pp. 912-918.
QUESTIONS
1. Discuss how the model proposed by Dreyfus and Dreyfus provides guidance for the evolutionary design of decision support systems.
2. Describe how DSS can illustrate the tenets of decision making. That is, identify how systems can provide support in a manner that is prescribed by the decisions-making literature covered in this chapter.
3. What changes would you make to an electronic book catalog system (such as you find in your library) to transform it into a good DSS.
4. Describe the DSS you might provide to Sherlock Holmes. Be sure to describe all components of a DSS.
5. Consider a company that has had major financial difficulties in the recent past. Discuss how the use of a DSS might have helped management to discover and repair problems earlier. Be specific in your treatment of a company.
6. Suppose you were attempting to justify the development of a DSS for a corporation. Discuss how you would justify the expenditures.
7. Discuss the various forms of rationality in terms of your decision to select the college you attend. Which form of rationality had the strongest impact on your decision to select that college?
8. Examine a decision that is descussed in the newspaper or a news magazine. Discuss how the various forms of rationality are discussed as the decision is described. Did they discuss each of the forms of rationality? Why do you think that is so?
9. How does bounded rationality impact your decisions each day?
10. How do hyperlinks, such as those found on Web pages, help decision makers follow possible evidence regarding a decision?
11. Describe how you might have implemented deBono's hat methodology for a recent decision you have made. What additional information would you have considered had you done that? Would the decision have changed?
12. What factors do you screen out when you wark? How does that impact your decision making?
13. When you study for a class, do you track your experiences? How might that help your performance in class?
14. Select a specific problem at a company. How would you design a DSS to help encourage use of intuition in solving that problem? How would you use DSS to monitor the use of intuition to ensure it is applied well?
15. What is business intelligence? How do DSS facilitate BI?
66 DECISION MAKING
16. What are analytics? How do DSS facilitate use of analytics?
17. How does competitive business intelligence differ from other forms of business intel-ligence?
18. Identify a specific features for a DSS (or your choice) that would be driven by the decision-making style issues discussed by Dreyfus and Dreyfus. Identify the feature, how you would operationalize it, and how it illustrates Dreyfus and Dryfus's model.
19. Consider the decision-making theories associated with Piaget and discuss how these theories will impact the design of a DSS. In particular, identify a specific feature for the DSS that would be impacted by the decision-making style issues discussed by Piaget. It might be an issue with the user interface, how the modeling, or the data component. Identify the feature, how you would operationalize it, and how it illustrates Piaget's decision-making model.
20. Simon identifies three stages of decision making: intelligence, design, and choice. In the first stage, intelligence, decision makers monitor their environment so as to define prob-lems and opportunities. What kinds of intelligence tools might you build into a DSS.
ON THE WEB
On the web for this chapter provides information about the theory of decision making as it pertains to the design and use of decision support systems. Links can provide access to demonstration packages, general overview information, applications, software providers, tutorials, and more. Additional discussion questions and new applications will also be added as they become available.
• Links provide access to general overview information. For example, one link provides a brief history of the literature on decision making, others discuss particular aspects of the choice process, and some provide access to bibliographies on the discipline of decision making.
• Links provide access to tools. Some links are provided to DSS functioning on the Web that will help you consider how you make decisions and seek information.
• Links provide access to exercises about decision making. Some links give examples and exercises that will help to analyze your decision-making style, the criteria that support it, and conditions under which it changes.
• Links provide access to information about purchasing and leasing an automobile. Decision making is the foundation for the four components of a DSS. The next four chapters give examples for purchasing or leasing an automobile. Begin now to think about how people make these decisions; some links on the Web can help you learn about the kinds of systems and the information and models that could support that choice among options that are available.
You can access material for this chapter from the general Web page for the book or directly at http://www.umsl.edu/~sauterv/DSS4BI/dm.html.

II
DSS COMPONENTS
Decision Support Systems for Business Intelligence by Vicki L. Sauter Copyright © 2010 John Wiley & Sons, Inc.

DATA COMPONENT
Business analytics, and thus business intelligence efforts, are dependent upon data. If there are no data, there are no business analytics. If there are no business analytics, then we cannot exploit the edge of understanding the business, its performance, and its context, which in turn means we cannot improve our decision making. All of that suggests that the performance of our corporation will not be up to its potential. In fact, in today's competitive world, it may mean that the organization may no longer exist.
Hence, before we can talk about how to make models more understandable or how to project the appropriate information to the screen, it is critical to discuss how to know what data need to be included in the DSS. Before we can do that, we need to define data and its associate, information.
Data are things known or assumed. The term generally refers to facts and/or figures from which conclusions can be drawn. For example, the raw counts of walnut consumption and cholesterol levels discussed in Chapter 2 represent data. Similarly, the cost of commercial time and the distribution of viewing audiences of television programs represent data to those making marketing plan choices. Details about shipping procedures, cost, and reliability of various haulers represent data relevant to the development of a logistics plan.
However, these are not the only kinds of details that might be considered data for the purposes of DSS. When making choices, some decision makers value the opinions of trusted colleagues. For example, when purchasing managers consider new, unknown vendors, they often seek opinions regarding service and reliability from colleagues at other corporations who have purchased from those vendors. They would not use these opinions solely but would use them to enrich a cost model developed from more objective data. Similarly,
Decision Support Systems for Business Intelligence by Vicki L. Sauter Copyright © 2010 John Wiley & Sons, Inc.
DATA COMPONENT
when developing a long-range plan, a CEO enlists knowledgeable subordinates to gauge the expected changes in regulations, governments, vendors, competitors, and clients over a 20-year period. These opinions are melded with quantitative models, which alone do not provide reliable long-range forecasts, as the basis of a long-range estimate of the company's needs. In each of these cases, opinions and judgments are used as inputs to a choice process. They supplement standard "objective" data to represent aspects of the choice that would otherwise be lacking. Since the DSS is intended to support the choice process, it must accommodate such subjective data and opinions and provide efficient ways of searching for and using these data.
For other decisions, decision makers might need data that are not stored in conventional ways. For example, decision makers considering the choice of textiles for the manufacture of furniture believe the support provided by pictures is superior to that provided by verbal descriptions of the colors, patterns, and textures. Images supplement data such as price, vendor, or shrinkage that would be accessed in a standard fashion. Decision makers con-sidering a large-scale disaster relief plan might need a video of the affected area to assess the problems and needs of an area fully. Such a video needs supplementary geographical information systems support to assess land use, damage estimates, and population statistics for each affected area. Or, a symphony music director might find it beneficial to have audio files of possible selections to help select a balanced and appealing program. With the audio data, the music director might combine data, including programs in which the piece has been used, audience size, reviews, and comments, to develop models that max-imize the number of new compositions played by an orchestra while still being sensitive to the expected composition of the audience, thus pairing new selections and established favorites in a pleasing fashion.
With virtual-reality technology, decision makers might also access "experiences" be-fore they select alternatives. For example, city planners might make use of virtual reality in positioning new buildings or green spaces, including the evaluation of the aesthetics and access. Similarly, fashion collections can be modeled using virtual reality (replicating the variety of poses and settings that might happen at actual fashion shows) in order to get a fast opinion of designers and/or customers prior to their announcement. Or, a logistics planner could use virtual reality to evaluate space needs, safety issues, or production principles.
One of the purposes of the DSS is to transform these data into information that can help the decision maker. While data represent things known or assumed, information refers to processed data or "acquired knowledge." Processing can be a summarization (either numerical or graphical) or the output from one or more models. For example, scores on an exam in a particular class represent data; each score represents performance by the corresponding individual. However, they do not represent information. This list does not help you, as an individual student, decide how to respond to your performance on the exam. Once the data are processed, however, they do support your decision. With a computation of class mean and standard deviation or the identification of cutoffs associated with each letter grade, students can decide whether they performed at a personally acceptable level, whether they should study harder, and whether they should drop the class.
In the simplest terms, if the data are not in and of themselves information, or if the data cannot be transformed into information, then they should not be included in the database. As you can imagine, this leaves a great deal of ambiguous latitude. Returning to basics reminds us that the goal of business intelligence is to study historical patterns and performance so as to predict the future and improve the organization's response to future events. That means that the data need to represent practical indicators of what is happening in the organization,

DATA COMPONENT
indicators of when changes occur, and indicators of when and how actions need to be taken. The data need to reflect historical, current and predictive views of the organization and its environment.
There are three approaches to operationalization of the description. The first is to take a normative approach to the information needs: What information should the de-cision maker want to make this type of decision? This assumes that which meets the standard guidelines for making a particular decision will be useful in a given decision-making situation. It is the material taught in business administration courses, advo-cated in textbooks, or specified in company or professional guidelines or standards. For example, when making a decision regarding inventory policy, standard operations management texts advocate knowing the distribution of demand for some time period, the expected demand for that time period, the costs of ordering the product, and the costs of holding the product in inventory. Hence, the normative approach says that those are the kinds of information that should be included in an inventory support system.
Few decision makers approach choices as straightforwardly as is taught in business courses, and so the normative approach alone is not sufficient to guide the database devel-opment. Most decision makers believe the theoretical approach to solving their problems is not sufficient to respond to the variety of issues encountered in real decision contexts. Specifically, these approaches do not address the question of how to make a decision if the data are not available or are not sufficient or how to include necessary political factors in the process.
So, the designer of a DSS must also use a subjective approach to judging the usefulness of information. Here subjective refers to the perspective of the decision makers—what they think will be useful. This allows decision makers to specify the full range of information they might consider in the process, whether or not it is specified by the normative approach. For example, decision makers might indicate that when deciding how much of a product to order for inventory, they must address a wide range of issues in addition to cost. For example, the decision of how much of an item to acquire might mean making trade-offs between this order and the availability of other products (because of competition for space or capital) or opportunity costs. Further, the question of how many items to have on hand might be linked to image considerations. This would tell the designer of a DSS to include these additional factors in the database for the DSS.
A third viewpoint is the realistic approach, which asks whether decision makers will use particular information if it is included in the database. Some decision makers might not have confidence in sophisticated models, either because they do not understand or appreciate them, because they have had bad experiences with them in the past, or because it might be politically difficult to use them in certain contexts. Designers of DSS should be realistic about whether such information will therefore ever be used. If it is not likely that decision makers will use it, then designers need to evaluate how much including the information will cost and whether that money, time, or opportunity might be put to better uses.
The DSS designers realize that choices regarding inclusion of data in a DSS involves compromise between the normative view of decision making, the subjective view of what is useful, and the realistic view of whether and how information can really be used in the choice process. Sometimes this means that data are dropped from the system while other times it means that parallel data (more palatable to the decision makers) are included in the system. Still other times, compromise means adding help screens and warning messages to make it easier for decision makers to use the information.

DATA COMPONENT
SPECIFIC VIEW TOWARD INCLUDED DATA
So, what needs to be included? Most DSS first and foremost include financial information. These reflect quantitative data indicating costs and revenues by organizational units or prod-ucts or regions. Such data allow a manager to evaluate returns on investment and profitability indices. These and other financial analyses do provide some insights into the business and often are the dominant measure of performance. Most markets place emphasis on revenues, net profit, and earnings per share. In addition, these financial measures are consistent across an organization, even one that is highly diversified in products or operations.
However, financial data only provide one part of the picture. First, the financial data might not reflect all that is of value within an organization. Even when they can reflect the value, since they are outcome values, they tend to be lagged with regard to the activity that caused them. If an organization is going to use analytics effectively to manage the business, they need to understand the drivers of the activities that can be manipulated to improve the ultimate financial outcomes. Relevant information also reflects the operational perspective, the technical perspective, the schedule perspective, the legal and or ethical perspective, and the political perspective of the choices that are being considered. Clearly, this requires a wide range of information. So, what information does one select?
Gartner, in a report in 2006, identified a value model to help designers of DSS to know what information to include. (Smith, Apfel, and Mitchell 2006). A similar matrix applicable to a university is shown in Figure 3.1. These measures focus on the controllable activities within the demand management, supply management, and support services aspects of the corporation. The Gartner research reports are a source for specific measures and methodologies for measurement. While this is a nice starting point from which to get some ideas about what to measure, even the authors indicate that it must be supplemented with company-specific measures of what is important.
To measure important factors, managers need key performance indicators (or KPIs) which reflect how closely the organization is moving toward its strategic direction. For example, if the strategy of the organization is to increase the number of customers, three
Business Aspect
Demand
Management
Supply
Management
Support Services
Aggregates
Market Responsiveness
Recruitment Responsiveness
Faculty
Classes
Development
Measures
Number of Students Attracted
Forecast Accuracy
% coverage full time
Course Evaluation Measures
Infusion of New Methods
Quality of Students Attracted
Cost to Recruit Students
% coverage academically qualified
Fill Rate
New Classes
Undergraduate -Graduate Ratio
Student Retention Rate
Turnover
Assessment Results
Technology Support
Channel Success Rates
Grad Rate
Ratio of Senior-Junior Faculty
Learning Goals Ratio
Library Support
Figure 3.1. Values Matrix.

CHARACTERISTICS OF INFORMATION 73
Table 3.1. Characteristics of Usefrul Information
Timeliness Sufficiency Level of detail or aggregation Understandability Freedom from bias Decision relevance Comparability Reliability Redundancy Cost efficiency Quantifiability Appropriateness of format
KPIs might be the new customers acquired, the status of existing customers, and customer attrition. The DSS then would need information about these three factors as well as product, program, or sales force information that might impact them. The data might highlight turnover of segments of customers, market penetration within segments, and profitability of and/or loyalty within segments. Or, data might focus on the terms of payment, the outstanding liability, or the delinquency of payments within those segments. There is a wide variety, depending upon the focus of a specific decision maker, that might define the measures collected and available for analysis. It is clear, though, that there must be some measures that help managers understand how well the organization is performing as well as measures.that help managers understand on what factors to act to improve performance.
The content of the measure is, of course, important to deciding whether or not to include it in the DSS. However, the characteristics of the information itself may help define whether or not to include it in the DSS. These characteristics of the information are shown in Table 3.1. Appropriateness for each of these 12 categories is defined in terms of the choice context, the decision maker, and the decision environment under consideration. It is important to realize that there is no universally correct or universally incorrect value that each of these takes on. Before discussing how to determine what is or is not valuable, let us define the terms.
CHARACTERISTICS OF INFORMATION
Timeliness
Timeliness addresses whether the information is available to the decision maker soon enough for it to be meaningful. Consider the timeline in Figure 3.2. Typically decision makers do not know immediately that an event has occurred; there is some delay between
Figure 3.2. Timeliness of data.
DATA COMPONENT
the occurrence and the time the data in the system have been updated. Further, there is a delay between when the data have been updated and when they are available to decision makers. For example, suppose the decision involves inventory of toys. When a new shipment of toys arrives in the warehouse, the computerized database is not instantaneously updated. Instead, there is a lag during which the inventory is checked. Then the data enter a queue for being keyed or scanned into the system. Typically even after the data have been entered, there is a delay until the database can be updated. Such a delay might be due to a technical decision involving when enough resources are available to process the database effectively. Or, it might be due to a managerial decision which dictates that no changes to a database can occur when one or more individuals are using the database. Once the database has been updated, the data are generally available to the decision makers. Of course, if the decision maker receives only daily reports or has not rerun a necessary model, there might be further delay in getting the information to the user.
Timeliness of information refers to the reporting delay, or the length of time between the event's occurrence and the decision maker's knowing of the event. The rule of thumb is that the DSS should provide information quickly enough to meet the needs of the users without unnecessary cost or sacrifice of an other attribute of information. If users are developing a long-range plan for the development of warehousing space, they do not have the need for immediate knowledge of the number of widgets received. Similarly, if the users are developing a marketing plan, they do not need up-to-date information about the number of children born in a particular county that day.
On the other hand, if the users are planning production runs and they are using just-in-time methods, then it is desirable to have the information available as soon as possible. Similarly, if the data represent stock transactions as input to a system for recommending stock trades, it is crucial the information be available in a timely fashion. Likewise, if the data describe lost or stolen credit cards, the sooner the information is in the approval database, the more likely decision makers are to reject inappropriate purchase approval.
There is a temptation to attempt to provide everyone with information instantaneously. While there is nothing inherently wrong with such a goal, it does incur a cost, in terms of both data entry and model use. If the data change quickly, someone will need to enter those data quickly. If decision makers are tempted to rerun models to ensure they have the best information, it may adversely affect some other aspect of the data, such as its reliability or comparability. The DSS designers need to weigh the benefits of speed against cost from the perspective of the decision maker.
Sufficiency
The second issue needing evaluation is whether the data are adequate to support the decision under consideration. Sufficiency might refer to whether the sample size is large enough
Data need to be available before the decision maker needs to take action. Consider the efforts at The Limited, a specialty store aimed at the young professional woman. Historically, managers relied solely on intuition or insights gained from studying past data to make business decisions, Since 2002, however, The Limited has based its decisions on live feeds of data. For example» managers of some stores reevaluate the floor plan and product placement prior to opening based on the data. Stores on the West Coast (of the United States) can react to early daily trends of East Coast sales and highlight fast-selling items in a real-time environment

CHARACTERISTICS OF INFORMATION
to support the kind of differentiation the decision maker wishes to make. For example, suppose a decision maker wants to estimate the nationwide advertising revenue associated with particular headings in yellow pages directories. Three directories would not provide sufficient insights into the revenue generated nationwide because there are vast regional differences in the data due to publisher, size of metropolitan area, and type of competitors. If, however, the goal were to estimate the number of ads in a particular metropolitan area, information about three directories might be adequate.
Similarly, sufficiency includes whether the time horizon is long enough to observe the true effect of a change in policy. For example, suppose the goal were to evaluate a program designed to reduce juvenile delinquency, and so a database is created, including measures of the level of delinquency before the program was initiated and sometime after the program begins. If the database only includes measurements two months after initiating the program, the decision makers do not have sufficient information on which to decide the impact of the programs and whether those effects can or will be sustained. On the other hand, if the purpose of the decision is to determine which budgets are on target, the two-month time horizon might be sufficient.
Since sufficiency can affect the decision makers' ability to draw inferences from the data, it is crucial that designers of DSS be sensitive to both the expressed and the implied needs of decision makers. However, since over the life of the DSS the system is likely to be used for support that had not been envisioned at the time of design, it is important to build warning devices into the system to help decision makers know when the data are not sufficient for the task at hand. The most direct approach is to generate a caution screen that specifies the population from which the sample has been drawn and suggests decision makers evaluate the similarity of that population to the one about which they would like to make an inference.
When the data needs and applications can be projected into the future, designers can build intelligent caution windows that help decision makers grasp the extent to which generalizations can be made. For example, if the DSS is designed to help with market research studies, the majority of analyses will involve consideration of the preferences of a sample. Although it is not possible to determine a priori all the possible samples, it is possible to embed intelligence into the system that automatically scans the data available for an analysis and generates a caution screen that states the extent to which the sample is generalizable.
Level of Detail
The aggregation level of the data is also an important factor for determining the usefulness of information in a DSS. The goal in DSS design is to provide data at meaningful aggregation levels for the choices under consideration. Unless the scope of support can be estimated fairly well, this generally means storing data at low levels of aggregation and allowing the decision maker to aggregate the data as needed. For example, suppose a DSS is being used to determine ways of improving productivity. The supporting database could include production details from each of several plants nationwide. If the database includes only annual production data for each of these plants, then users would be unable to glean seasonal differences among the plants which might highlight opportunities for change. Alternatively, if the database includes daily production data, with no possibility of aggregating the data into larger time blocks, then the users might not be able to ascertain monthly trends. Or, if the data are available in appropriate time chunks but are not detailed with regard to different plants, then it might be impossible to see relative differences in productivity.

DATA COMPONENT
Similarly, if the DSS is intended to support marketing decisions, users must be able to aggregate data in ways that are meaningful to launch marketing campaigns. That is, they should be able to aggregate data by age group, region of a country, or socioeconomic status in order to determine the group most favorable to their strategies.
Modeling with different levels of aggregation can help managers discover problems or opportunities. By varying an analysis from a "big-picture" perspective to a focused perspective, decision makers can glean trends they might not otherwise notice. However, aggregation can also be used to defend a decision once it is derived from other modeling efforts. For example, suppose a DSS were implemented in Congress to help senators and representatives evaluate spending bills more effectively. These elected officials might use the system to consider more aspects of the problem, model better, and use more information to make better decisions. However, these same individuals are responsible to their own voting constituencies. The advantage of being able to consider the impacts at a national level and at the level they represent helps them to defend their decision to those constituencies. In this case, the user could have enough information to address the facts and not need to talk around the issues.1
In general, the DSS designers need to make a trade-off between giving the decision mak-ers enough flexibility to view the problem on distinct levels and controlling the scope of the database. As data granularity increases, so do storage size and processing time. In addition, the more granular the data, the more chance the decision makers will focus on unimportant or inappropriate factors. On the other hand, as granularity decreases (and thus summariza-tion of data is more prevalent), the decision makers' ability to answer questions decreases.
For example, suppose your company wanted to maintain records on every call made by a customer in a given month in order to be more responsive. The question is what to maintain about the calls. On the one hand, the company could keep very detailed information about the calls. This might include the date and time, to whom the call was made, what time it was completed, how long it lasted, whether it was local or long distance, whether it was made on a land-line or cellular telephone (and, if the latter, what service), at what rate the call was made, and the purpose of the call. If there are only 100 calls per month, that could account for over 20,000 bytes each month of storage. A lower level of detail would be to keep a summary of calls made. In this scenario, the system might keep the number of calls, the average length of the call, the typical time of a call, and the cumulative long-distance calls. This might only require 100 bytes of storage for the same month. To determine which level of granularity (or something in the middle) is more appropriate, the DSS designers need to understand the problems being considered by decision makers and what data might realistically be required. They would then need to understand if the expense of collecting and maintaining the data is worth the benefit they get (a topic that will be discussed later).
Understandability
If decision makers cannot understand what is in the database, or if the database lends itself to perceptual errors, decision makers cannot use it effectively. The key is to simplify the representation in the database without losing the meaning of the data. One aspect of understandability is the encoding scheme. If data are encoded and the legend for those codes is not available or obvious, then decision makers may not be able to use the data.
1 Of course, the availability of better information is a necessary but not a sufficient condition to cause this scenario to occur.

CHARACTERISTICS OF INFORMATION
For example, if one enters "M" and "F" for a field labeled "sex," most English-speaking individuals can determine the coding scheme. However, entering " 1 " and "2" in that same field causes ambiguity with regard to their meaning. This code must be explained in the system. Similarly, obscure names for fields such as SPLQ002-15, especially if they are not identified, make it difficult for the user to comprehend.
Designers need to be concerned about representation of quantitative data as well. For example, it is common to drop a decimal point when recording data and have it logically reinserted by a modeling package. If the data will always be used within a model that can handle the transformation, it is an acceptable practice. However, if the data might be scanned by users for some reason, the absence of the decimal point might be confusing.
One approach to ensuring that decision makers can understand the fields is to include an electronic data dictionary. Such a document would provide explanations for the fields as well as for the representations of those fields. Depending upon the application, it might also be desirable for the dictionary to include aliases by which fields are known in different departments as well as information about the source of the information and how it might be used. Access to this document could be provided through a general search of the dictionary upon request or through user-activated context-sensitive help screens. The latter is preferred from the perspective of providing better support, although the former is an easier programming task.
Freedom from Bias
It is not appropriate for the designer to bias the analyses if it can be avoided. Bias can be caused by a wide variety of problems in the data, such as nonrepresentativeness with regard to time horizon, variables, comparability, or sampling procedures. For example, consider a decision about how to assign technicians to emergency care. The goal of the system might be to ensure that the percentage of emergency care technicians is highest when the likelihood of accidents is highest. In support of this decision, a database could be created that counts the number of accidents per hour. Decision makers might find that the number of lives lost in an accident was low between 3 and 5 AM but large between 3 and 5 PM. Although apparently unbiased, this statistic actually provides a quite biased perspective of the likelihood that a life will be lost in an accident. It does not reflect the relative number of cars on the highways during those periods of time. The statistic from the early morning hours while low as an absolute number might be high as a percentage of cars on the road. In this way, it actually could indicate a much higher likelihood of death than the raw number would suggest and so therefore suggest more technicians be placed in case of emergency during that time period.
The variables included in the system can also bias the meaning of an analysis. For example, only having data regarding "number of lives lost" under different scenarios without having the dual data, "number of lives saved," under those same scenarios tends to bias analyses toward more conservative actions.
Designers can also bias a database by including only material from a nonrepresentative subset of the set of interest. For example, if a DSS is to support marketing designs, the designer can bias the outcomes by including information only from one region of a country or one country from a group of several. Similarly, selecting a nonrepresentative time horizon can bias results of some analyses. For example, if decision makers need to make choices regarding alternative delivery methods and data are only included for mid to late December, results are likely to be affected. This is particularly true if the time horizons reflect different company data.

DATA COMPONENT
Three aspects of information—relevance, comparability, and reliability—can cause problems of bias in the data. As with sufficiency, it is crucial that designers of DSS be sensitive to both the expressed and the implied needs of decision makers. When the data needs and applications can be projected into the future, designers can build intelligent caution windows that help decision makers grasp the extent to which bias exists in the sample. Otherwise, designers should provide caution screens that remind decision makers that bias might be present and affect the meaningfulness of the analyses.
Decision Relevance
Perhaps the most obvious issue to consider when building a database is the relevance of the information to the choices under consideration. The DSS designers sometimes are tempted to computerize anything available because it might someday be useful. Clearly the policy can lead to inefficiencies in storage and use of data. However, the dangerous aspect of that concept is that if data are available, the users might use them—whether they are relevant or not. For example, many regression users put every variable they can conceive into a model in hopes that something will show relevance. It is crucial to protect users from such an approach and give them data which can be built into a model that will truly provide decision relevance and significance of results.
We define decision relevance, of course, as a function of the choices and alternatives available to the decision makers. It is crucial that these boundaries of the decision be carved carefully. Consider a DSS intended to help a major automotive dealer address inventory control. One part of such a system might be information regarding the available inventory at other dealers in a "nearby" area. The type of data seem relevant. However, if the term nearby area is not defined properly, these data might not be at all relevant to the decision maker. For example, suppose a database is designed to include all dealerships in a particular state. A dealership located at one edge of a state might be able to determine whether a part is available 300 miles away but not whether it is available at a location 30 miles away because that location is in another state. Hence, the information they are provided are not relevant to the decision since they are unlikely to tap the resource 300 miles away.
Comparability
When deciding whether data are valuable, we need to assess whether they can be compared to other relevant data. Comparable means that, in important ways, measurement conditions have been held constant. Of course, "important ways" depends on the situation under consideration. It might be relevant for the data to have similar time horizons. Or it may be necessary for the data to represent the same unit of measure. The bottom line is that the meaning of any differences between two statistics can be attributed to one and only one difference because all other conditions are the same.
For example, suppose a particular DSS is being used to support the manager of a local-area network (LAN). The question under consideration is whether to purchase additional copies of some software and decrease access to other software. One of the attributes the manager wants to consider is whether demand for particular software packages has increased or decreased over time. Comparisons between past and present use are possible only if the data represent usage over a similar time horizon and are represented in a similar fashion in the database. If, for example, the current usage statistics (the number of requests for package, x) is measured over 20 days and the previous statistics are measured over 52 days, they are not comparable. Or if the previous statistics are measured for all CASE

CHARACTERISTICS OF INFORMATION 79
tools and the current statistics are measured for a specific tool (the one for which decisions are being made), the data are not comparable. Obviously, some transformations are possible to make the two points in time comparable, but only if the DSS allows this to occur. If not, the analyses are not worthwhile.
The problems with comparability might be subtle, though. Suppose decision makers compare mortality rates of cities. As a baseline, they compare those individual mortality rates to that in the Navy during the same period of time. Suppose further that the period of time corresponds to one at which the Navy is actively participating in war. They could find that the mortality rate in a particular city is far higher than that of the Navy during a specific war. Does this mean the city is "unhealthy"? In a sense, the data are comparable because both statistics represent the same time period, and both are represented as a rate (say, per 1000 individuals). Yet, these are not actually comparable because they represent two entirely different populations, from which one would expect to obtain different levels of mortality. Individuals serving in the Navy tend to be young, healthy women and men who maintain good physical fitness. While the civilian population includes some similar individuals, it also has representation of infants, elderly, and infirm, all of which, by definition, have a higher mortality rate. So, even though the individuals in the Navy have an increased risk due to war-related mortality, they have a much lower likelihood of mortality due to other causes. Hence, the comparison is meaningless.
As with the level of detail, the safest way to design is to provide a database with totally disaggregated data. This allows the decision makers the ability to shape the way their analyses are done so they can be compared with other, known comparisons. Of course, total disaggregation requires that the system provide an easy method for specifying the selection appropriate for the application. If possible, the system should include the types of intelligent help and/or caution screens discussed earlier.
There is little doubt that the environment is changing over time because of human activity such as fossil fuel burning and de fore Station, pesticide use, and overdependence on (and overdisposal of) man-made materials that do not degrade gracefully in landfills. There is not, however, one answer to how humans can and should respond to reverse the trend. It is clear, however, that wc need more data to understand exactly what is happening and what changes might mitigate future problems.
However, monitoring in isolation might not be enough, The ecosystem requires a systems view for analysis and solution. However, data are collected by a number of federal, tribal, state, local, academic, and private sources. In fact, in the United States alone, there are, however, over 170 monitoring programs plus 4 federal programs just for the U,S, coastal waters and their tributaries. These groups represent various types of data collected by a variety of methods within various environmental settings and part of the water.
Until recently, those various groups were not coordinated in their data collection methods. The lack of comparability made both understanding and monitoring difficult and inhibited sharing or cross fertilization of the data.
In 2006, the various groups joined forces to develop a National Water Quality Monitoring Network, which coordinates the data collection so the various components can be shared and we can develop a more comprehensive view of the health of the oceans and coastal ecosystems. However, there is still more coordination needed to get the various countries to be able to share data and the various other environmental groups within countries to share data. But it is a start.
I

80 DATA COMPONENT
Reliability
Decision makers will assume that the data are correct if they are included in the database; designers therefore need to ensure that they are accurate. They should verify the input of data and the integrity of the database. For example, suppose the DSS supports police detectives. For the detectives to have confidence in such a system, they must be certain that the suspects appear in the database associated with the correct personal data. That is, if the system is used to identify a suspect from a set of fingerprints, it must reliably provide the name and address of that suspect, not those of a sibling or someone with a similar name. Similarly, if the database includes erroneous data regarding the availability of inventory or other resources, it cannot help the user to plan production strategies effectively.
Redundancy
In a perfect world, the less information is repeated, the less storage is used. This goal is laudable because it should not limit the user's ability to link data from multiple sources. In many real-world situations, however, some redundancy is useful. First, if information appears in two databases and one of them becomes corrupted, we can rebuild the information easily. In this way, the redundancy acts as a mechanism for ensuring validity of the data in a particular field.
Second, the "perfect situation" assumes that all data are stored in relations or tables that can be joined flexibly and quickly. This assumes that a priori the designer has anticipated possible links and defined indices between the tables so that those links can be made. Further, it assumes that the computing power to associate data from multiple databases is available to ensure that users get their information fast. This might not always be the case. As organizational environments change and decision makers change, they will find the kinds of inquiry they make change. If these changes have not been anticipated, the existing normalized databases cannot meet their needs. However, some redundancy allows these unanticipated queries to be processed efficiently. Hence, one needs to think ahead as they evaluate the benefit of redundancy for a given application.
Cost Efficiency
The benefit of improved decision-making capability must outweigh the cost of providing it or there is no advantage in the improvement. Said differently, data are only cost efficient in a database if there is positive value in the changed decision behavior associated with acting on the data in question after the cost of obtaining those data are subtracted.
All information has some cost associated with it. There are costs of obtaining the data either through primary collection such as a survey or secondary collection such as the access to an existing database. There are also costs of making those data available in machine-readable form as represented in the cost of data entry and verification of those data.
Any organization that keeps data has a story about what happens when data are not reliable. One financial organization's data problems lead a stock trader to sell 500 shares at $10 apiece instead of 10 shares at $500 apiece* Similarly, the database for one state leads them to send jury summons to children. Since these errors were significant, they were noticed. More often unreliable data are not noticed and so are allowed to impact relationships with customers and suppliers, reduce efficiency of operations, misdirect decisions, and waste money
i I

CHARACTERISTICS OF INFORMATION
In addition, there are storage costs, including the storage medium and the infrastructure for maintaining that medium. Finally, there are processing costs which increase as the amount of data increases.
It is obvious that the direct costs of obtaining information need to be included. However, it is also necessary to consider the opportunity costs of including some information. If a survey staff is busy implementing a survey regarding product X, they obviously cannot be implementing a survey regarding product Y. So the cost associated with obtaining the information with regard to product X must include some indication that information is being lost with regard to product Y. If the information regarding product Y is crucial, then this can be a substantial cost.
On the benefits side, we must decide how much the decision would be improved with the additional information. If the additional data do not change the kind of choice the decision maker would select, then there is no benefit of including that information in the database. In all other circumstances, one needs to evaluate the improvement in or incremental benefit to the decision-making capability associated with the addition of the data.
We could, of course, employ statistical techniques such as decision theory to determine the anticipated costs and benefits associated with each additional field. In most applications, however, such an approach is not practical. Most real decisions are not defined strictly and the associated probabilities are not defined, and most uses of information are difficult to assess. Hence, typically we use a substitute approach, subjectively assessing the bottom line. In an extreme case, for example, it does not make sense to spend $10,000 to collect additional data that could only improve the decision (and thus the benefit to the company) by $1000.
Quantifiability
Quantifiability does not assume that all valuable measures are quantified. Rather, it means the data are quantified at the appropriate level and that only appropriate operations can be performed on them. The level of quantification, referred to as the scale, dictates the types of meaningful mathematical operations that can be performed with the data. If data are valuable, then the user assumes that if measures are quantified, it is appropriate that they be so; if it is not appropriate, the system prevents further manipulation of the data.
Consider first the various scales: Numbering scales can be nominal, ordinal, interval, or ratio. If they are nominal, the number is simply a label, such as assigning the color yellow to the number 1, blue to the number 2, orange to the number 3, and so on. The label does not mean anything; it simplifies coding or data entry. Ordinal scales, on the other hand, imply that the increase or decrease in the label is associated with the corresponding change in some attribute. For example, assigning the number 1 to small, 2 to medium, and 3 to large is an ordinal scale because the size of an object is getting larger as the label increases.
Interval scales imply that the distance between two labels has meaning, that it is ordinal, but that no absolute value for zero has been defined. For example, temperature2 is an interval scale because the distance between 50 and 51 degrees is the same as the distance
2 Of course, whether "temperature" is measured on an interval or ratio scale depends on how you measure temperature. Environmental temperature measured on conventional scales, such as the Fahrenheit or Centigrade scales, do not have a point at which "no heat" exists. Rather these scales are standardized to a point where materials undergo a phase change, such as water boiling or freezing. As such, there is no real zero point, so ratios of temperatures have no meaning. If temperature is measured on an absolute scale, such as Kelvin or Rankine, then a meaningful zero point is defined and hence the scale is ratio.
DATA COMPONENT
between 70 and 71 degrees and 70 degrees is hotter than 50 degrees. However, it does not imply that 100 degrees is twice as hot as 50 degrees.
Ratio scales are the highest level in that we have greatest flexibility in the meaningful manipulation of data. Not only do relative differences have the same meaning and the labels represent an order, but the ratio of two labels is also meaningful. For example, length is a ratio scale. The difference between 8 feet and 7 feet is the same as the difference between 4 feet and 3 feet. In addition, one can say that the ratio of 8 feet to 4 feet is the same as the ratio of 4 feet to 2 feet.
Quantifiability says that if the system allows unrestricted manipulation of data, then they must be ratio-level data. If the manipulations only assume an interval or ordinal scale, then lower levels of scale can be allowed. Finally, if data are represented on a nominal scale, no manipulations can be performed.
Such a restriction can be handled in two ways: Either disallow representation of nominal, ordinal, or interval levels or the system must intelligently prohibit certain models to be implemented regarding certain data. The latter option means the system needs embedded rules that check the data type before executing a requested model and it will provide users with an error indicator if they request inappropriate manipulations of the data. Otherwise, users will assume that it is appropriate to use such data in a model and might make decisions based on evaluations that are meaningless.
Appropriateness of Format
The final determinant of the value of information is whether it is displayed in an appropriate fashion. This refers to the medium for their presentation, the ordering in which data are presented to the decision maker and the amount of graphics that are used.
Most data in a DSS will naturally be a visual display. The question is, when is this appropriate? Documents that are very long or very wide are quite difficult to read and grasp if displayed only on the machine. Typically, decision makers can cope with them better if they are available on paper copy. If this is not an option, the question is whether or not the data can be summarized differently so they are easier to read.
The order of the presentation can also affect the manner in which decision makers evaluate data. If meaningful data are presented at the end of some module, if they are optional, or if they are crowded on the display, the decision maker may never notice them. In addition, what they see first and last will affect how decision makers evaluate new information. If "really bad" statistics are presented first, the decision makers might evaluate moderately good statistics more negatively. If the most recent case evaluated had quite good statistics, a moderately good option might be discarded prematurely. Often the order is chosen by the decision maker and so is out of the control of the system. It is thus especially important for the developers of the model management system to take care in the way supplemental characteristics are provided (see Chapter 4) and for the developers of the user interface to be aware of the decision-making style of the users (see Chapter 6).
Finally, the way in which data are displayed can affect the conclusions drawn from them. If the decision makers are attempting to draw conclusions regarding trends in the data, they can see such trends far better from a graph than they can from a list of numbers. On the other hand, if the decision maker needs to understand the value of a particular data point, then it is difficult to obtain it from a graph; a tabular presentation is better. Inappropriate use of graphing techniques (including bar charts, pie charts, or iconic representations) can also affect the decision. For example, trends can be magnified by reducing the scale or truncating the axes of the graph; they can be diminished by increasing the scale. Similarly, differences
CHARACTERISTICS OF INFORMATION 83
of scale between the two axes or the omission of portions of the graph can obscure the true trend. These and other problems of graphing will be discussed in Chapter 5.
More Is Never Better!
Thus we might think of data in a DSS as anything that might be fed into a model and used by decision makers to evaluate alternative actions. They might be numbers, words, pictures, videos, experiences—or even odors. The important aspect of the data is that they are valuable to the decision maker. Of course, the difficulty for the designer is to determine what will be valuable or useful to the decision maker.
Figure 3.3 illustrates the evolution of data needs and data capabilities over time. Specifically, it shows the relative magnitude of data needed by decision makers (the left circle in each pair) and the data available in machine-accessible form (the right circle in each pair) from the early days of DSS to now. Notice that the amount of information needed by decision makers has increased (as indicated by the relative size of the left circle of each couple). During the last three decades, business decisions have become more complex. The number and range of competitors, the regulations and expectations, and the range of customers have increased. No longer do companies rely primarily on local or regional sources for inputs, work force, or customers to purchase their products. This means decision makers must be aware of trends, activities, customs, and regulations around the world—considerably more information than they needed in the past. In addition, events happen today at much faster rates than ever before, and hence relevant data need to be available to decision makers much faster than before. It is impossible, for example, to imagine purchasing of raw materials without up-to-the-minute commodity prices. This
More l hau 80% of the data kept by organizations worldwide has a location component. By combining geographic- and location-related data with other business data, organizations can gain critical insights, make better decisions, and optittiize important processes and applications. You might think that your business does not have a location component,
Consider these perspectives:
* A company might use location data to study the effect of time-of-day and time-of-week purchase patterns in different regions as the basis of an advertising campaign or discount I program,
* A company might use location data to determine the product mix that performs best in j each geographical region.
* A city government might use location data to plan and develop large-scale public projects.
* A state government might use location data to enhance emergency preparedness and recovery operations.
* A federal army might use location data to locate insurgents to plan the best use of military resources.
In fact, even Ray Kroc, the founder of McDonald's restaurants, knew the value of location data, j Real estate value and location are, in fact, the most critical factors in predicting the success of a McDonald's franchise. So, understanding the location data allowed him to determine the best places for franchises. Today, McDonald's is the largest single owner of real estate; their real estate is valued both for the value of the land and for its proximity to significant traffic for business.
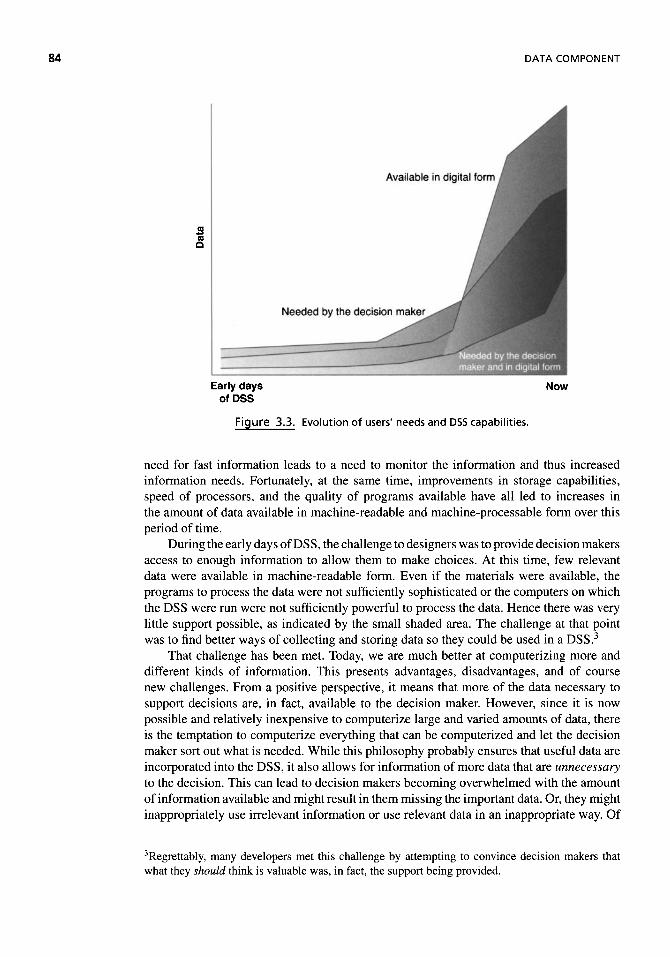
84 DATA COMPONENT
a (0 Q
Early days Now ofDSS
Figure 3.3. Evolution of users' needs and DSS capabilities.
need for fast information leads to a need to monitor the information and thus increased information needs. Fortunately, at the same time, improvements in storage capabilities, speed of processors, and the quality of programs available have all led to increases in the amount of data available in machine-readable and machine-processable form over this period of time.
During the early days of DSS, the challenge to designers was to provide decision makers access to enough information to allow them to make choices. At this time, few relevant data were available in machine-readable form. Even if the materials were available, the programs to process the data were not sufficiently sophisticated or the computers on which the DSS were run were not sufficiently powerful to process the data. Hence there was very little support possible, as indicated by the small shaded area. The challenge at that point was to find better ways of collecting and storing data so they could be used in a DSS.3
That challenge has been met. Today, we are much better at computerizing more and different kinds of information. This presents advantages, disadvantages, and of course new challenges. From a positive perspective, it means that more of the data necessary to support decisions are, in fact, available to the decision maker. However, since it is now possible and relatively inexpensive to computerize large and varied amounts of data, there is the temptation to computerize everything that can be computerized and let the decision maker sort out what is needed. While this philosophy probably ensures that useful data are incorporated into the DSS, it also allows for information of more data that are unnecessary to the decision. This can lead to decision makers becoming overwhelmed with the amount of information available and might result in them missing the important data. Or, they might inappropriately use irrelevant information or use relevant data in an inappropriate way. Of
3 Regrettably, many developers met this challenge by attempting to convince decision makers that what they should think is valuable was, in fact, the support being provided.

DATABASES
most concern, though, is the fact that they may become discouraged with the system and just not use it.
Hence, today's goal is to protect the decision maker from too much information; that is, the goal is to provide access to useful data without overwhelming or misleading the decision maker. That means the challenge is to provide all of the data the decision maker needs and none of the data the decision maker doesn't need. Said differently, the goal is to provide only the useful information in the DSS. The shaded regions in Figure 3.3 indicate the amount of data that we can provide to the decision maker that they actually need.
DATABASES
Historically, data were kept in files associated with an individual application. This meant that each time something changed with regard to the data, the appropriate files associated with each application that used the data also needed to be changed. For example, suppose the decision support system were developed to facilitate planning in factories. One of the inputs would be demand for each of the products manufactured. Using the historical file processing approach, each plant manager would need to forward information about production of each of the products to the DSS data manager, who would update the appropriate files. Then each sales manager would need to forward information to the DSS data manager regarding the sales of those items as well as information regarding unfulfilled demand. Hence data are entered by some mechanism once into some format appropriate for its original purpose. One or more files are forwarded to the DSS data manager, who transforms the data into a format that is appropriate for use in the DSS and updates these files. The frequency of these updates depends on the timeliness needs of the DSS, the data maintenance for the original purpose, and the volume of activity. It is clear, however, that this file transfer process, particularly if the files are kept in different formats (as is generally the case) is, at best, inefficient. Errors of data entry are hard to fix across all applications, and it is difficult to ensure that all users are accessing the same values. As needs in the various applications change and fields are inserted or deleted, the problem gets even worse. Of course, since the same data are kept in many places, it means storage media also need to be duplicated.
As corporations have recognized the importance of data as a corporate resource, they have improved the collection and maintenance processes. One of the most significant advances was the creation of corporate databases. These databases are collections of in-terrelated data. The goal behind the database concept is to store related data together in a format independent of the DSS. Since data storage and data use are independent, decisions regarding storage are made independently of decisions regarding usage. Those who main-tain the data can focus on minimizing redundancy in storage. Clearly because the data are maintained only once in a corporation, storage is reduced.
Furthermore, a variety of decision support systems can use the same databases in very different ways. These data are linked together so that information from different physical locations on the storage medium can be joined together for transmission to the users' screens with a minimum amount of trouble. As application needs change, the addition or removal of a field can be performed efficiently. Furthermore, decisions can be coordinated more easily because everyone is using the same updated version of the data. So, the system on the factory floor can use disaggregated inventory data to ensure that specific necessary raw materials are available when needed, while the system in the corporate planning office can use aggregate inventory data to determine whether the orders might be placed more efficiently if combined and hence processed less frequently.

DATA COMPONENT
Consider, for example, a student database at a university. All the data about the students, including their names, addresses, telephone numbers, high school records, college grades, majors, and financial needs are kept in a database. The financial aid office probably has no reason to access high school information or specific college grades, but it needs significant information regarding the financial status of the student. Hence, its DSS can be developed to access only the basic performance data, such as grade point average (GPA), and the financial information. However, the counselor has no need for information about financial needs but rather needs access to specific course grades to determine whether the student is prepared to take an advanced class or has successfully completed graduation requirements. While it does not appear so to the users, they are actually accessing the same database. The designers only give them access to information that is relevant to their decision processes.
In most corporations today, there is very little debate regarding the choice between tra-ditional file processing and database use. While the move from file processing to database technology is difficult and expensive, once the transition is complete, the technology pro-vides flexibility, consistency, and minimum storage. These benefits promote the use of DSS. From the perspective of the user, it does have some disadvantages, however. If a file is developed for one application, it allows that person to have greater control over the data and faster access to the data. Since the storage can be adapted to a particular application, it can be stored efficiently for that application, thereby making processing somewhat easier, cheaper, and faster. All these benefits sound good until the application is changed and the needs change. Then, users must start all over again and rebuild the databases. This costs money and effort. These costs, coupled with the ease ofmerging data, the increased number of fields available, the longer time horizon that is generally available, and the reduced cost of maintenance, help to sway the preference toward database technology.
DATABASE MANAGEMENTSYSTEMS
Historically, computer systems were created using a file processing approach. In this way, the applications and their data files were independent of one another. So standards and guidelines for applications developed in the accounting department were not in any way affected by standards and guidelines for applications on the factory floor. In addition, the data supporting applications in accounting were entered, maintained, and updated separately from those for the factory floor operations. For example, when new raw material inventory came to the corporation, someone in the accounting department entered the information and processed the charges for payment. Similarly, someone supporting the factory application entered the existence of the new raw material in for inventory control. The data were entered twice and stored twice, thereby introducing inefficiencies into the system. Further, when reports from the two departments were generated, the reports might not agree if one department had more recent information than the other.
This file processing system provided individual departments with complete control over their own data. Departments could tailor applications to their own specifications. In addition, they had easy and efficient access to and manipulation of the data. Further, because storage could be tailored to an individual application, the data could be stored efficiently.
On the other hand, the file processing system provided significant disadvantages for departments. It introduced additional costs associated with data entry and storage. Individual departments had to build and maintain separate databases, especially as new applications were developed. More importantly, the various departments could find themselves with inconsistent data sets.

DATA WAREHOUSES
As organizations moved to greater computerization of their data and processes and better techniques were developed in the field, companies began to move from the file processing philosophy to a consolidated database philosophy. This means that the collection of interrelated corporate data were consolidated and organized in some flexible fashion and made available to a variety of users.
Clearly, the dictate that most data would be held centrally would not, of itself, cause departments to abandon the file processing philosophy. The carrot that encouraged indi-vidual departments to support this change was the introduction of database management systems (DBMS) to facilitate the use of databases. The DBMS serves as a buffer between the needs of the applications and the physical storage of the data. It captures and extracts data from the appropriate physical location and feeds it to the application program in the manner requested.
The primary advantage the DBMS provides is an independence between the actual arrangement of data (as they are physically represented) and the apparent arrangement of data to the application. Users in the accounting department can have access to the same data, displayed on the same type of screen and manipulated in the same fashion, as they had in the file processing application. Similarly, users on the production floor can have access to the same data, displayed on the same type of screen and manipulated in the same fashion, as they had in the file processing application. The DBMS provides the translation to the application so that the application programmers can take that data organization as a "given." As applications are improved or new applications are added, they simply need to be hooked to the DBMS, saving considerable time in development. Even the process of adding new fields to the database is considerably easier than adding them to traditional files. Hence, since more applications could get greater access to more data and do more with the data than before, departments were willing to support the concept.
The database approach is particularly important when data access across functional and departmental boundaries is desirable and when future needs are uncertain with regard to the type of data that are important and/or associations between data fields that are necessary. In addition, database technology is important when users frequently need rapid access to data to answer ad hoc questions. All these reasons, of course, provide another way of saying that the database technology is crucial if designers are to provide the kind of flexibility necessary to maintain DSS.
DATA WAREHOUSES
In a typical organization, the available operational databases have been designed to meet the needs of the regular procedures. These might include the insertion of an order, an update of a reservation, or a summary of transactions for a particular user. The data generally are stored in relations or tables and accessed by joining tables by use of an index. Consider Figure 3.4 which shows a schematic of a relation. Data about related items are stored in the rows of the table, called "tuples," Each row includes data about a particular object, such as a product or customer. The attributes being collected about each item are stored in the columns. So, for example, if the object is a product, the attributes might be name, description, use, production cost, wholesale cost, or other information needed for the management of the organization.
The goal of transaction processing systems and other operational systems is speed, so relations are created in a way to minimize duplication of information among them. The tables can be connected with the use of an index which appears in all relations to

88 DATA COMPONENT
Figure 3.4. Database relation.
provide reports that include information stored separately. This process of reduction of duplication, known as normalization, helps to ease the maintenance burden associated with large databases.
For example, consider the information presented in Figure 3.5. Information regarding the employees' skills is located in the first table, while information about their departments
Relation A Employee
Name
Jones
Milo
Smith
Ganga
Chen
Summers
Skill - Coding
High
High
Moderate
Moderate
High
Low
Skill - Analysis
Low
Moderate
Moderate
Low
High
Moderate
Skill-Documentation
High
Low
Moderate
Low
Moderate
Low
Skill -Presentation
Low
High
Moderate
High
High
Low
Relation B
Employee Name
Jones
Milo
Smith
Ganga
Chen
Summers
Department
A
B
B
A
B
A
Figure 3.5. Relational structure of a database.

DATA WAREHOUSES
appears in the second table. The only element that is shared by the two is the last name of the employee. However, if we wanted to summarize the skills available in each of the two departments, we could logically join these two tables and obtain the information easily.
These tables then are optimized for quick transactions. However, since information generally is split among a number of relations, analysis is slow because tables need to be joined logically before any examination of patterns can begin. That process needs to be followed for each model by each person. Clearly many analyses that happen during a day will cause significant drains on the operations system, leading to degradations of the service for those important transaction processing systems. Said differently, everyone gets bad service. In addition, depending on the application, the data might reside on different operational systems, with very different data organizations. Combining data from DB2, Oracle, and COBOL with data in databases from Sybase or Informix can be tricky under the best of circumstances. Furthermore, the transaction systems do not have the historical data and/or enhanced data that we will discuss shortly.
However, the biggest issue associated with using the operations databases for analysis is the volatility of the data. Every time a transaction is run, the data change. Records can be negated, data can be corrected, or new items can be added. So, when managers run reports on the impact of a promotion on sales data, the efficacy of crime programs, or customer service performance in different countries, they get different results each time they run an analysis simply because they consider different data each time they run the analysis. Such volatility does not help them understand their company better and does not lead to one real answer to questions.
Before data warehouses, some managers adopted frozen extracts of the system for analyses. These extracts provided information about selected entities at one point in time. While using these extracts was more efficient than using the transaction database directly, they lacked the breadth of information necessary for complete analyses or flexible ad hoc queries. In other words, even with the benefits of this solution, it did not provide an environment conducive to the use of DSS.
Most companies today have some data warehouse effort to support their business intelligence. A data warehouse is a database management system that exists separate from the operations systems. It is subject and time variant and integrated, as are the operational data. However, data warehouses are nonvolatile and hence able to support a variety of analyses consistently. Generally these databases are archives for operational data that have been chosen to support decision making and optimized to interact with the DSS of an organization. Generally they are relational databases that can support a wide variety of queries in a wide variety of formats; they may be composed of hundreds of tables optimized for typical queries.
The development of a data warehouse is a difficult and time-consuming process that costs most organizations considerably. While the processes of moving and optimizing data are not terribly difficult, the processes of identifying relevant data, blending them, and ensuring that they are scrubbed appropriately are difficult. In other words, the decisions about what data are relevant to particular decisions, how the data should be represented and blended, and how to ensure they are meaningful, consistent, and accurate—all decisions that precede the loading of data—are the difficult steps in building the data warehouse.
To build the data warehouse effectively, it is necessary to understand the needs of the business and to plan carefully. It must be seen and treated as a business asset and thus be driven by the business needs. At the heart of the development must be a plan and an infrastructure that will provide both stability of the project and extensibility over time.

90 DATA COMPONENT
An analogy might be the building of a metropolitan area. There are two approaches. In the first approach, cities are constructed on an as-needed basis. Each neighborhood is constructed based on the needs of its constituency and the preexisting neighborhood infrastructure. As such, each neighborhood pays only for the infrastructure and other building costs in its boundary. When the city evolves and expands, the infrastructure breaks down and there must be reengineering to provide extensions of the infrastructure from the original municipalities to the new municipalities. What you get as a result is a metropolitan area such as Boston (Figure 3.6). There are numerous one-way streets, it is difficult to navigate, and the neighborhoods are not well integrated. Further, it is impossible to extend the infrastructure without significant costs, such as those experienced in the "Big Dig."
Instead consider the second approach. Using this method, the city administrators invest in a city plan and "blueprint" before the building begins. The infrastructure of the city, including roads, public transportation, utilities, and other amenities are the first things considered. The cost of planning and building these is born by those in the entire area, not neighborhood by neighborhood. As each new neighborhood is added, it adheres to the rules of the blueprint but has flexibility for variations within those rules. Each constituency bears the responsibility for construction of their detailed design and construction, but it is de facto integrated into the big picture because of the preplanning. Further, extension of the infrastructure as the city grows is planned and coordinated. What you get with this kind of procedure is a city more like Toronto, where there was investment and planning prior to construction. As a result, it is a very user-friendly city as it exists today. Infrastructure
4This example was developed by Joseph Federer of Express Scripts. I appreciate his permission to use the example, but all errors are mine.
According to an article about data warehousing, the primary causes of failure arc not associated with the technology, problems with the data model, problems with storage, or operating the data warehouse. Instead, these authors found the primary problems associated with failure include political and organizational problems. In order, they found the following contributed to the failure of data warehousing projects:
Inadequate user involvement
Insufficient funding
Organizational politics
Weak sponsorship and/or management support
Wrong or poorly analyzed project scope
Data problems
Problems with end-user access tools
Poor choice of technology
Scope creep
Turnover of organizational personnel
Source: H, Watson, Jr Gerard, L, Gonzalez, M. Haywood, and D. Fenton, "Data Warehousing Failures: Case Studies and Findings," Journal of Data Warehousing* 4(1), 1999, pp. 44—55. The Journal of Data Warehousing is now the Business Intelligence Journal © TDWI, a division of 1105 Media. Tnc, Material is reprinted here permission,

DATA WAREHOUSES 91
Figure 3.6. Boston.
extension is anticipated and planned for in the city design, so the overall cost is minimized and new neighborhoods can be added without difficulty.
The design of a data warehouse is much like the design of a city. While a company can follow the first approach, generally that is expensive and difficult and does not serve their managers well. It is more desirable to follow the second approach and plan for the future. The first step is to develop the plan—the enterprise data model. This blueprint will control the ultimate design of the system. It is not an easy process, though. Consider Figure 3.7, which shows a data model of a typical large organization. Even if you have never seen such a diagram before, and even without the labeling, it is obvious that the data in this organization are extensive and the interrelationships among the data are complex. While it takes a great deal of discipline to adhere to the model, such discipline is necessary to minimize costs.
While you begin with a big-picture view of the operation, one does not begin with building everything at the beginning. One starts with a small part of the business and builds the data warehouse components that meet their needs. In other words, it is critical to have a business partner who is interested in the result and build a component that will meet his or her needs. This might be the vice president of a division or the manager of a department. The focus might be customer oriented, product oriented, or region oriented. The goal is to get the component built well and to meet the needs of the business partner. Once that part is working efficiently, the IT department goes to the next business partner and builds the components of interest to his or her department (Figure 3.8). Again, after that component is stable, you add another business partner, and so on, until you are finished. What you will find is that as you grow the data warehouse, some of the components needed by later departments will already be included and so you can get to stability with those departments faster.

92 DATA COMPONENT
Figure 3.7. Enterprise data model.
The goal of the data warehouse is to bring together data from a variety of sources and merge it in a way to make it useful for decision makers. So, designing the data warehouse means bringing in data from those sources. The corporate database provides the foundation of a decision warehouse. These systems generally provide data about a vast array of transactions conducted in the normal business operation of a corporation. Internal databases record information regarding sales, purchases, costs, personnel, schedules, forecasts, and
Figure 3.8. Building a data warehouse in stages.

DATA WAREHOUSES
other aspects of the organization. While important, these official records of the corporations are not sufficient to support most of today's decision making.
Today through the next century, decision makers will not be able to make decisions in the absence of information about one or more factors outside of the corporation, referred to as "external data." Such external data might be as obvious as customer preference information, demand for competitor's products in particular sales regions, census data, or industry reports. Or, it might be information about the reputation and performance history of potential vendors or the legal and ethical standards in various areas of the world and projections of how they might change in the long term. These data might be data purchased from a third party or data gleaned from the Internet.
Relevant public data should also be loaded into the data warehouse. For example, the U.S. Census provides a wealth of data about population changes in comma-delimited format that includes estimated population for each of the last eight years, the number of births, the number of deaths, migration from elsewhere in the United States, and interna-tional migration down to the census track; there are also some demographic data (such as age, gender, and race), but they are not as finely divided. Similarly news services can provide information about competitors, customers, and other factors that might impact an organization. The National Bureau of Economic Research provides information about a wide range of economic indicators and flows, and the Centers for Disease Control and Prevention (CDC) provides data about illness outbreaks and other issues of public health. Or, as we will see when we examine the car example, many sites provide information about automobiles and results of tests, comparisons, and surveys. Such data alone would not provide business intelligence but when combined with corporate data could help decision makers gain a better understanding of their environments. Some of the data available on the Internet is available for free while other data are available only to subscribers or for a fee.
Not all data are stored in shared databases. Most decision makers use rules of thumb to help them make choices when data cannot be weighed algorithmically. In addition, they have data about past decisions, including the process and the result. They may have data they have collected privately that they can use to obtain a strategic advantage in their corporation. Sometimes, they simply keep notes of political processes in the organization and how they might influence or be influenced by a particular decision.
Real decision makers formulating real alternatives use these supplementary data to facilitate their choice process. For example, some hotels provide general managers with DSS capability. While these systems include information about profits, transactions, and physical facilities, they also provide the managers with the ability to maintain information collected during their decision-making process. This information might include a database of major upcoming events, such as changes in tourist attractions, changes in office availability, or conventions that could be accessed as input to decisions about special promotions. Alternatively, these decision makers might keep records about special abilities of employees that would influence scheduling decisions.
If a DSS is really going to provide the kind of support for decisions advocated by industry, then it must facilitate the development and maintenance of these private databases. That is, the systems will need to help the decision maker generate and populate these databases as well as provide easy access to the data and a wide range of retrieval and summary of their results. If the system resides on a PC, then it is easy to provide access to other databases. Even if the system resides on a mainframe or a distributed environment, it is possible to maintain private databases on one's PC. However it is done, of course, it is crucial to provide sufficient security to ensure that only the decision maker can access the information.

94 DATA COMPONENT
Figure 3.9. Process of building a data warehouse.
Data Scrubbing
The first step in building the data warehouse, as shown in Figure 3.9, is to load data from the disparate data warehouses. But the process clearly does not stop there. The next step is to scrub or clean the data. As you can see from the discussion above, the data come from a variety of sources, some internal to the organization, some external from the organization, and even some that were maintained on someone's desktop. These fragmented views of the organization's business need to be put together into a unified framework. Depending on how old the data are and how carefully they have been managed, there may need to be a greater degree of cleaning the data. Clearly one of the goals is to eliminate the problems associated with the volatility of the data one sees in a transaction processing system (TPS); the goal is to get consistent and organized data.
There are several kinds of scrubbing done to the data as shown below. Most of these activities are completed by software. However, no software product currently available completes all of the scrubbing; some human intervention will also be necessary:
• Eliminate problems of misspelling, transposition of letters, variations in spelling, and typographical errors. For example, suppose there were multiple records, including my name. My first name might appear with a variety of spellings, including Vikci, Vikki, Vickie, Vicky, Vcki, or even Vicki L. A first step in data scrubbing would be to change all of those variations to "Vicki."
• Identify records not using corporate standards for coding. Analyses and data mining are far more productive if objects are always referred to the same. So, if the corporate data include majors of students, then it is critical that the degree program always be referred to the same. MIS, IS, Management Information Systems, Information Systems, Mgt. Inf. Sys., and so forth, all look the same to humans but not to computers. All these degree programs need to be adjusted so they all read the same. Similarly, the telephone numbers 314.354-1624,314-354-1624, and (314) 354-1624

DATA WAREHOUSES
are the same to humans but not to computers. The data architects need to define a standard and then make the data adapt to it.
• Identify poorly documented data. • Remove duplicate records. Clearly the records below are the same:
Tim McCollum . . . 314-354-1624 Tim McCollum . . . 314-354-1624 But if they are both left in the data warehouse, this person will be counted twice, which will inflate some statistics, thus leaving the analyses incorrect.
• Identify and tag similar records suspected to be duplicates. Sometimes, though, it is not obvious that the records are duplicates. For example, are the following three records the same? Tim McCollum . . . 314-354-1624 Timothy McCollum . . . 314-354-1624 Dr. McCollum . . . 314-354-1624 It certainly appears to the human eye that they are the same. However, data-scrubbing programs might not be certain they are the same. So, the software will tag the records for human evaluation and for elimination of duplicates.
• Remove spurious and invalid records. An invalid record might be one with the wrong data in fields (such as having numbers in the "name" field), having nonrelevant data, or simply being something that should not be in the database. These must be removed or they will impact analytics.
• Validate data (especially with external databases). One popular data validation is to compare city/state combinations with zip code. So, if the data administrators have an external database that has correct combinations, they can run those against the data in the data warehouse to ensure that all of the data warehouses are correctly coded. A record that has zip code 60651, for example, should have a city/state combination of Chicago, IL; otherwise the source of the error needs to be investigated. Such analyses help to identify some data entry errors.
• Remove obsolete data. Once data are obsolete, they should be removed from the data warehouse so as to maintain the validity of the analyses. So, if a record that showed Tim McCollum . . . 312-261-2442 was in the database, and it was found to be his old telephone number, it should be deleted.
• Merge third-party information. Political parties are famous for their merging of data so as to understand voters better. They might start with voting rolls and merge them with voting records. Then, they might enhance the data with information from individual polls, census track data, and any demographic data they have been able to collect. Analysis of such enhanced databases allows the candidates to understand their constituents better and to know how to campaign to them more effectively.
• Enrich data with attributes not found in the TPS. In addition to enriching data with third-party data, sometimes data administrators will add additional explanatory fields so more and better analyses can be done. This might be including information about products in various stages of the supply chain, identification of products associated with various sales associates, or other relevant information.
• Identify missing or inconsistent data. Different analysis and mining tools have dif-ferent ways for addressing missing data. The data warehouse needs to be constructed to allow those methods.
96 DATA COMPONENT
Data Adjustment
The goal of the data warehouse is to give users a nonvolatile view of the organization. This means that we need to know not only the data at any given point in time but also the relative data at any given point in time. This means that units must be standard so that when managers make comparisons they are comparing "apples to apples."
Currency is one of the factors that needs to be consistent in the data warehouse since most organizations have some global component, such as a supplier, customer, or even part of the organization. Those transnational partners use different currencies to represent their costs, revenues, and sales, and the relative values of those different currencies change over time. It is critical that when we evaluate vendors, customers, and the like we make the comparison is consistent. So, suppose we have a supplier in the European Union and our main organization is in the United States and we record the price for our order as 500,000 €. Given the fluctuation in exchange rates, six months ago, that cost represented US$640,347.60, while today that cost represents US$715,399.60. If the purchase were recorded in euros and the managers did two reports, one at the time of the sale and one now, they would see a difference in cost of US$75,052.04 that was due only to the exchange rates. That could lead managers to have different opinions of the profitability of the venture if revenues were recorded in dollars. The goal of the data warehouse is that the report would generate the same information regardless of when it was run. In order to achieve that stability, there needs to be one currency in which data are recorded. So, rather than recording the sale as 500,000 €, it could be recorded as US$640,347.60, which was its value at the time. This becomes particularly important as the number of countries and the volatility of exchange rates increase.
Currency is not the only factor that needs consistency checking. Different data sources may represent information about management, operational, and legal structures within the
Design insights A Case for Data Scrubbing
A multisite manufacturer has four locations, three of which are in fairly close proximity to each other Each site has its own autonomous storeroom with inventory parts. At each site, there is a part-time catalog manager responsible for all database activity. Because the plant is unionized ! and positions often change, the catalog manager may be replaced every few months,
The resulting inventory catalogs reflect this; inconsistent manufacturer naming, missing man-ufacturer part numbers, inconsistent use of symbols/abbreviations, spelling mistakes, incomplete descriptions, and duplicate items. System word searches are next to impossible and finding a part is a frustrating, challenging, usually unsuccessful experience.
Maintenance workers at all locations had long lost faith in stores; each kept a stash of parts hidden somewhere for his own use. To plan for a repair job, they would attempt to find parts through the system, but if unable to locate what they needed, they would abandon the search and just order the part directly; in the case of an emergency, they might call another location to request the loan of a part. Inventory value across the company topped $80 million.
After scrubbing the data, duplicates within sites were revealed to be in the 10% range. Common items across sites were identified in the 25% range. Merging the three regional stores into a central warehouse reduced overall stocking levels and allowed sites to share common critical spares. It also freed up millions in cash savings.
Source: IM.A Limited, available: http://wwwdmaltd.com/wp_Case_For_Data_Scrubbing.asp, Used with permission.

DATA WAREHOUSES
company using different terms. For example, at my university, most topical units are called departments. There is, for example, a Chemistry Department, an English Department, and a Psychology Department, each of which have faculty whose academic home is there and students who are majoring in that topic. However, in the College of Business Administration, we do not have departments, we have areas.5 So, for example, there is an Information Systems Area and an Accounting Area, each of which have faculty whose academic home is there and students majoring in that topic. For some purposes, such as the scheduling of classes or hearing of appeals, the area acts as a department. However, for other purposes, such as the hiring or tenuring of faculty, the College of Business acts as a department. So, if the university wants to represent "departments" in its data warehouse, it must clarify the behavior of the unit in which it is interested before knowing whether or not to classify Information Systems or Business Administration as the department in the field.
Adjustment also includes provision of additional dimensions to the data that might make analyses richer. For example, a company might add information about vertical mar-kets, television advertising regions, or demographic data to their data warehouse. Using these additional data, managers could identify all activities associated with production, marketing, and sales of products or product lines.
Since data will come from a variety of systems, it is possible that they will be updated at various times. Thus, it is important to add fields to the data warehouse that identify when they are updated so managers can identify time horizons accurately regardless of when the data are entered. So, for example, managers need to know when end-of-month or end-of-fiscal-year data are complete for all factors prior to their analysis.
Time is another important factor that needs to be included in the data warehouse. Of course, managers need to have a data associated with each decision so they can understand the factors that were acting upon the organization at that time. Similarly, some form of time must be associated with data so that time series analyses can be run. This might be in the form of absolute time, time since a decision was made, or relative time compared to some other event. This allows the decision maker to examine events and results from a variety of perspectives.
The goal across all of these adjustments is to provide the best picture of the organization; its customers, suppliers, and competitors; and as much other outside influences as possible so that the analyses are as reliable as possible.
Architecture
While Shakespeare might have believed that naming conventions do not influence the usefulness of data,6 designers of DSS know better. The same data stored in different ways can go from being useful to useless. Nongraphical files can be maintained as text files or as image files.7 If they are stored as text files, they can be searched for words, phrases, or
5The fundamental difference in an area and a department is financial control. In the case of a department, it has a budget that it manages and controls. Areas, on the other hand, have no budget. The dean keeps all control and management of the finances across all areas in the College of Business Administration. 6 Shakespeare said "a rose by any other name would smell as sweet" in Romeo and Juliet. 7 Clearly, graphical or pictorial information is always stored as images today. In the past, some individuals attempted to store graphical images as text. However, the poor resolution and the difficulty of creating them have caused this approach to be discontinued.
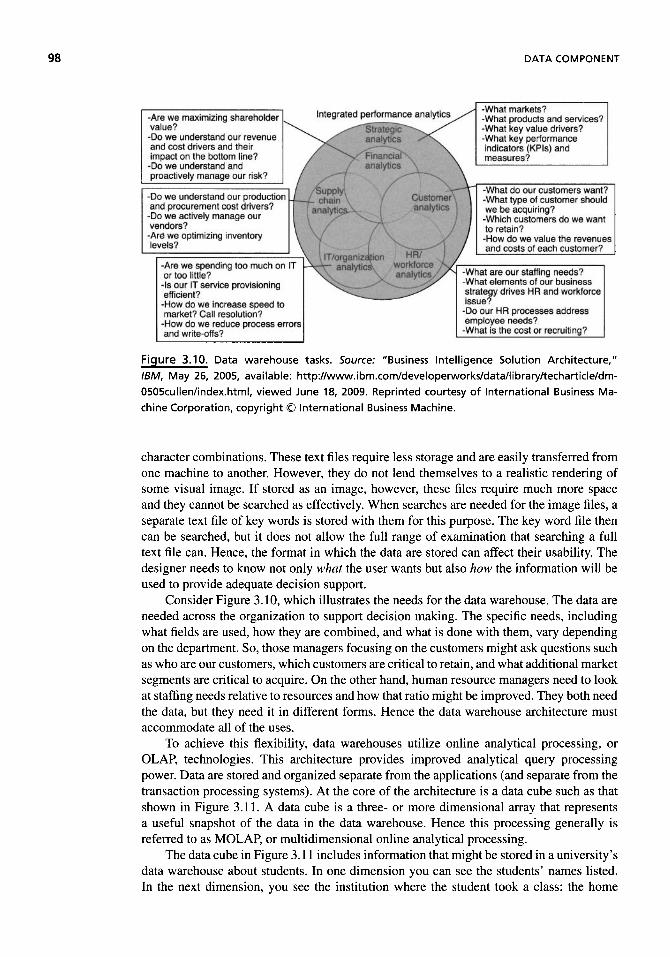
98 DATA COMPONENT
Figure 3.10. Data warehouse tasks. Source: "Business Intelligence Solution Architecture," IBM, May 26, 2005, available: http://www.ibm.com/developerworks/data/library/techarticle/dm-0505cullen/index.html, viewed June 18, 2009. Reprinted courtesy of International Business Ma-chine Corporation, copyright © International Business Machine.
character combinations. These text files require less storage and are easily transferred from one machine to another. However, they do not lend themselves to a realistic rendering of some visual image. If stored as an image, however, these files require much more space and they cannot be searched as effectively. When searches are needed for the image files, a separate text file of key words is stored with them for this purpose. The key word file then can be searched, but it does not allow the full range of examination that searching a full text file can. Hence, the format in which the data are stored can affect their usability. The designer needs to know not only what the user wants but also how the information will be used to provide adequate decision support.
Consider Figure 3.10, which illustrates the needs for the data warehouse. The data are needed across the organization to support decision making. The specific needs, including what fields are used, how they are combined, and what is done with them, vary depending on the department. So, those managers focusing on the customers might ask questions such as who are our customers, which customers are critical to retain, and what additional market segments are critical to acquire. On the other hand, human resource managers need to look at staffing needs relative to resources and how that ratio might be improved. They both need the data, but they need it in different forms. Hence the data warehouse architecture must accommodate all of the uses.
To achieve this flexibility, data warehouses utilize online analytical processing, or OLAP, technologies. This architecture provides improved analytical query processing power. Data are stored and organized separate from the applications (and separate from the transaction processing systems). At the core of the architecture is a data cube such as that shown in Figure 3.11. A data cube is a three- or more dimensional array that represents a useful snapshot of the data in the data warehouse. Hence this processing generally is referred to as MOLAP, or multidimensional online analytical processing.
The data cube in Figure 3.11 includes information that might be stored in a university's data warehouse about students. In one dimension you can see the students' names listed. In the next dimension, you see the institution where the student took a class: the home
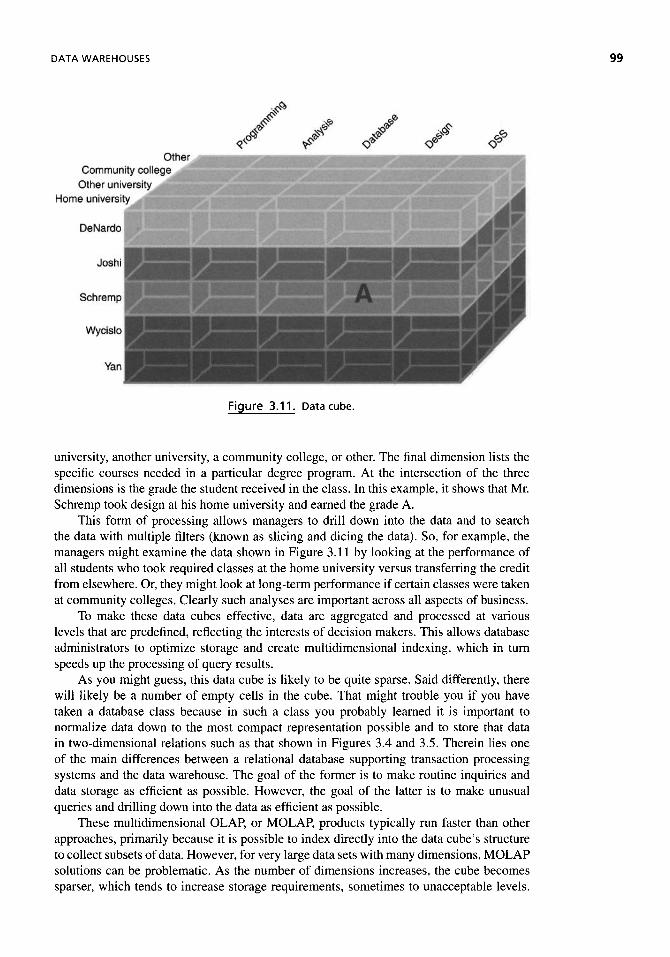
DATA WAREHOUSES 99
Figure 3.11. Data cube.
university, another university, a community college, or other. The final dimension lists the specific courses needed in a particular degree program. At the intersection of the three dimensions is the grade the student received in the class. In this example, it shows that Mr. Schremp took design at his home university and earned the grade A.
This form of processing allows managers to drill down into the data and to search the data with multiple filters (known as slicing and dicing the data). So, for example, the managers might examine the data shown in Figure 3.11 by looking at the performance of all students who took required classes at the home university versus transferring the credit from elsewhere. Or, they might look at long-term performance if certain classes were taken at community colleges. Clearly such analyses are important across all aspects of business.
To make these data cubes effective, data are aggregated and processed at various levels that are predefined, reflecting the interests of decision makers. This allows database administrators to optimize storage and create multidimensional indexing, which in turn speeds up the processing of query results.
As you might guess, this data cube is likely to be quite sparse. Said differently, there will likely be a number of empty cells in the cube. That might trouble you if you have taken a database class because in such a class you probably learned it is important to normalize data down to the most compact representation possible and to store that data in two-dimensional relations such as that shown in Figures 3.4 and 3.5. Therein lies one of the main differences between a relational database supporting transaction processing systems and the data warehouse. The goal of the former is to make routine inquiries and data storage as efficient as possible. However, the goal of the latter is to make unusual queries and drilling down into the data as efficient as possible.
These multidimensional OLAP, or MOLAP, products typically run faster than other approaches, primarily because it is possible to index directly into the data cube's structure to collect subsets of data. However, for very large data sets with many dimensions, MOLAP solutions can be problematic. As the number of dimensions increases, the cube becomes sparser, which tends to increase storage requirements, sometimes to unacceptable levels.

DATA COMPONENT
Compression techniques can help, but using them tends to destroy MOLAP's natural indexing.
Knowing how the decision makers use information could also affect whether the data are stored as compressed or uncompressed files for the DSS. The trade-off between these two methods of storage is between storage space and speed of access. Compressed files have the advantage of using less disk storage resource. However, because they must be uncompressed before use, they have the disadvantage of slower response time. In addition, because they are stored differently, they are more difficult to merge with other data sources. Uncompressed files have the opposite features. Clearly, then, we must look to issues of file size and frequency of use before deciding what format to select.
An alternative to the MOLAP architecture is to use a relational OLAP, or ROLAP, structure. The data are collected as relational tables and organized as a star or snowflake schema. At the heart of the architecture is a fact table that is linked, through indices, to specific relations (or tables) that hold specific data, generally referred to as a cuboid. Such a structure is able to handle greater volumes of data and support better drill-down capabilities. However, ROLAP technologies are not as fast at making comparisons among the cuboid or for supporting unanticipated analyses.
Since both the MOLAP and ROLAP architectures provide some benefits to the DSS, many organizations are embracing hybrid systems, know as HOLAP. The HOLAP system combines the performance and functionality of the MOLAP archtiecture with the ability to access detail data of the ROLAP architecture, which provides greater value to some categories of users. However, these implementations are typically supported by a single vendor's databases and are fairly complex to deploy and maintain. Additionally, they are typically somewhat restrictive in terms of their mobility.
Once the data warehouses have been created and optimized, it is a straightforward process to load them efficiently, loading new data when decision support activities are not being performed. Clearly, however, as data are multiplied over time, designers need to define new syntax and query formats that are faster and easier as well as new approaches for joining tables and cubes and for mining these very large databases using "intelligent agents."
The question to be addressed then is "how often is the data warehouse updated?" The answer is, of course, "it depends." Traditionally data warehouses might have been updated weekly or monthly both to increase the stability of the analyses that are performed and to allow staff sufficient time for processing the data prior to loading. Today data warehouses often are updated daily or even hourly in some companies. The goal in these organizations is to allow decision makers close to real time data for their analyses.
To understand the reason for the goal of real time data, consider Figure 3.12. This graph represents the value of the data to the organization. As you can see, there is degradation in
Figure 3.12. Value of shorter updates.

CAR EXAMPLE 101
the value of the information. Said differently, the more distance there is between the time an event occurs and the time that decision makers can take action on that knowledge, the less impact the decision will have. Consider, for example, a stolen credit card. The credit card is stolen at the point labeled "event occurs" in Figure 3.12 The longer the amount of time between when that card is stolen and when a stop is put on charges to that card, the more purchases the thief can make and thus the more losses the organization needs to absorb. So, if the data warehouse can reduce the time from the point "previous availability of the information" to the point "decision maker can take action," then the organization can save potentially large amounts of money.
A similar argument can be made about the availability of any information in the organization. Whether it is dissatisfaction of employees or customers, non-receipt of raw materials, information about vendors or changes in the behavior of competitors, the sooner decision makers know the information, the sooner they can respond to it. The sooner the response is made, the more favorable the place of the organization, and hence the more value of the data.
CAR EXAMPLE
In this section, and in parallel sections in the next two chapters, we will consider the topics of interest with regard to a DSS intended to facilitate acquiring an automobile. This system should allow consideration of purchase and lease decisions; for purchase decisions, the system should allow consideration of both new and used automobiles. Further, since different users will have different concerns, the DSS needs to accommodate a wide range of analyses.
Possible Criteria
The goal of the DSS is to provide support for users from a broad range of experiences and expertise. Consider the range of criteria people use for selecting an automobile. Some individuals select a particular manufacturer because they have always purchased from that manufacturer; they simply look for the model within their price range from a particular manufacturer. Others are more willing to look across manufacturers but are tied to selecting an automobile within a particular price range. Still others want to look at the long-term costs associated with a particular automobile, taking into account not only the monthly payments but also gasoline costs, upkeep, insurance, and maintenance.
For another segment of the population, safety is the most important characteristic. Within this group, some potential purchasers select the largest automobile they can find because that one will, by their definition, be the safest. Others look for safety tests and judge cars on the basis of those tests. Still others want to include the likelihood of a malfunction that might be associated with a safety risk or the likelihood of the automobile being stolen.
With the cost of gasoline increasing, another group looks at the fuel efficiency of the vehicle. They might evaluate the price of the vehicle against the expected savings in operating expenses. They might prefer hybrid automobiles because of their efficiency in fuel. But other groups might want the hybrid automobiles because of the statement they make about one's attention to the environment.
Another group of individuals evaluate automobiles on the basis of performance char-acteristics. To some, performance is determined as a function of power, such as the number

DATA COMPONENT
of cylinders, the size of the engine, the speed at which the automobile can accelerate, or the type of transmission in the vehicle.
For other groups, comfort is the main criterion for car selection. These people might be interested in obtaining the largest car possible, the automobile with the largest trunk capacity or the one with the most legroom or headroom. Still others might be interested in the types of options associated with the vehicle. Finally, they might be interested in knowing who would be responsible when something does not work.
Other groups might be interested in the image suggested by a particular car. For example, does the car suggest a socially active single person, a fast-track career person, a serious parent, or something different? For others, it might be the specific activities it can support: will it haul 2 x 4's or the soccer team?
In essence, then, there is a wide range of data that could be requested in support of the automobile purchasing decision. Different people will approach the problem quite differently. Furthermore, given individuals approach the problem differently after some experience. Finally, given individuals with a given level of experience may approach the problem differently if the system can provide guidance as to how to use the information.
Data Warehouse
To provide the user with a valuable tool, the DSS must contain comprehensive information, not only about current models, but also about the history associated with the manufacturer and model. The user may have a need to look at trends with regard to a particular model and its maintenance record. While this may not be possible, the system should be able to identify the 10 most reliable cars and the 10 least reliable cars in a format that will facilitate analyses (Figures 3.13 and 3.14). Similarly information about safety should be provided. For example Figure 3.15 provides an historical over view of the safety records for models of automobiles.
The challenge in this kind of DSS is not in finding information that someone might use but rather in helping the user limit his or her data focus. Consider, for example, the kinds of information available from popular periodicals about new automobiles. Kiplinger's Buyer's Guide provides many tables of information about automobiles. Some of the attributes they include are listed in Table 3.2. In addition, Kiplinger 's provides summary tables of other useful information about the automobiles, such as the National Highway Traffic Safety Administration's (NHTSA) ratings of automobiles. Data are available via the Internet today. Figure 3.16 illustrates the kinds of information that Edmund's maintains online.
In addition to keeping the decision maker from being overwhelmed by the data, the system must store the data efficiently so that users need not have excessive delays in their analyses. Finally, there is the question of how to use the data in the DSS.
Information Uses
In Chapter 2, we discussed six types of rationality that need to be considered in a DSS: economic, technical, ethical, legal, procedural, and political. If these are valid, then there needs to be information from which the decision maker can evaluate potential automobiles in each dimension of interest. This presents some fairly significant data requirements on the system. If we consider just economics for a moment, then we still need to provide a significant amount of information in the database. Look, for example, at Figure 3.17.

CAR EXAMPLE 103
Figure 3.13. Historic background infromation: new automobiles.
Figure 3.14. Historic background infromation: new automobiles.
ftwtoueVOwmdO« CmbAwoid
T I M moat reliable vehicle* In each category
Small Cars: Honda Insight Volkswagen Golf (Rabbit) Toyota Yaris (hatchback) Subaru Impreza Outback Sport Honda Fit Scion xD Honda Civic (sedan) Toyota Tans (sedan) Hyundai Elantra
Family C a n : Toyota Prtus Ford Fusion Hybrid Volvo S40 (FWO) Mercury Milan Hybrid Ford Fusion (FWD) Nrssan Altima Hybrid Mercury Milan (FWO) Toyota Camry Hybrid
Wagons/Mini vans! Toyota Veras {4-cyL) Toyota Sienna Subaru Outback (4-cyt) Honda Odyssey
Source: Consumer Reporte October, 2009
S U V s : Honda CR-V Hyundai Tucson Toyota W W 4 Kla Sportage Subaru Forester (non-turbo) Honda Element
Toyota FJ Cruiser Toyota 4Runner (V$)
Mercedes-Benz OLK Lex us RX Hybrid L & K U S R X
Toyota
Upscale/Luxury Cars: Irrllnltl M35 (RWD| Lincoln MKZ (FWD) Aeura TL (AWD) LOKUS LS
Infiniti M45 Volkswagen CC (4-cyl.)
Sports Care: Lexua SC Ford Mustang (V6) Porache Cayman Porsche 911 Scion tC Infiniti 0 (coupe)
j
I'JllMJIUl'JrJ.'LBWl MhrC« PitHOutyOaMdC« CmlDtoQid
.J □
The least reliable vehicles in each category
Nissan Versa (sedan) Chevrolet Aveo
Family Car»:
Chrysler Sebrfng Dodge Avenger Chevrolet Impels (V8)
Wagona/Ml n i va ns:
Chryaler Town & Country Dodge Grand Caravan
Upscale/Luxury Cars:
Jaguar XF
BMW535I Lincoln MKS(FWD) Cadillac STS(VG) Cadillac CTS(V6. RWDi Lexua GS(AWD)
Sports Carer
Chrysler Sabring Convertible Pontlac Solstice fnon-turbo) Saturn Sky (non-turbo) Porsche 911 cr_redcheck2rglf
Source: Consumer Reports October, 2009
SUVs:
Saturn Vue (V6) Dodge Nitro
Dodge Journey Jeep Wrangler
Volkswagen Toueieg Mercedes Bonz GL-Claae BMWX5 (V8) Mercedes-Benz R-Cless Land Rover LR2 Audi Q7
Chevrolet Suburban 2500 GMC Yukon XL 2500 Chevrolet Suburban 1500 GMC Yukon XL 1500
I

DATA COMPONENT
Figure 3.15. Historic background infromation: targeted category of automobile.
According to this worksheet, even if we only wanted to consider financial aspects of the automobile, we would need to estimate or retrieve 10 fields for each automobile.
When purchasing automobiles, "image" can play a key role in the decision process. Providing actual pictures of the automobiles could help some users identify possible al-ternatives or help the user to cull out nonalternatives. Images could display several angles of a vehicle's exterior, console, and interior or possibly a view under the good. In fact, most car manufacturers now provide these images for use on the Web. Using virtual reality technology, users can view the automobile from any exterior angle, thereby giving them
Table 3.2. Automobile attributes in Kiplinger's Buyer's Guide to new cars
• Manufacturer
• Model
• Body style
• Suggested retail price
• Dealer cost
• Resale value in 2 and 4 years
• Insurance cost index
• Engine size
• Number of cylinders
• Miles per gallon in the city and on the highway
•
•
•
•
• •
•
• •
•
Curb weight
Wheelbase
Length and width
Turning circle (feet)
Legroom in the front and rear
Headroom in the front and rear
Cargo space
Antilock brakes status/cost
Automatic transmission status/cost
Air conditioner cost
Reliability Ratings rug NtFvttt rtfmfiff QniW Cvt C W B * W
Change* Jn Reliability Ratings
Newly Recommended
Audi A3 Bulck Enclave (AWD) Porsche Cayenne Saab 9-3 Convertible) Suzuki XL·? Volkswagen Passat
U u u f l u DA^AfHiHuhHur f n e W P j η Κ Ο Π Ί Π Ί Ι Π ϋ Ι Ι Ι
Modus witl, tutticfnt datm
Audi A4 Chevrolet Traverse (AWD) Dodcje Ram 1500 (4WD) Ford Flex Hyundai Genesis <V6) Inflnftl FX35 Lexus RX Mercedes-Benz GLK Mazda 6 (4-Cyl.) Mazda ft (Vs| Nissan Mulme Ponllac GS (V8) Saturn Aura (4-cyl.| Toyota Vefiza (Vty Volkswagen Jetta (tunbodloselj Volkswagen CC |4*cyl.) Volkswaggn Tiquan
Source: Consumer Reports
Not Recommended models with dtcHntng ntiabiffty
BMW53SJ (RWD) BMWX3 Cadillac DTS Chevrolet Avalanche Lexus GS(AWD) Lincoln MKX <AWD) Mazda CX-T Mini Cooper 54 hatchback] Porsche Boxsler Subaru Impreza WRX Volvo XCM <V8)
Not Recommended
HotfWt wfttt /imvdifB bott/w iHtOw I H f l p f
BMWIlfii Dodge Journey Jaguar XF Lincoln MKS(FWD) Saturn Astra
1
October. 2009
E
1

CAR EXAMPLE 105
Figure 3.16. Edmund's web-based information service. Copyright © 2009 Edmunds.com, Inc.
Image reprinted here with permission.
the experience of walking around and inspecting the automobile. In addition, they can view the car from the driver's seat or the backseat, and even experience how the car would ride. Once these virtual reality segments are available to the designer, they can be embedded in the DSS.
Even more information could be provided if the designer wanted to include additional video clips. Users could simulate the responsiveness of the automobile to curves and bumps and inclines and declines by watching a movie of the front and rear views as seen in the driver's seat. Enhancing this with audio clips would make it more realistic. Audio clips can easily be run with external "viewers" that provide seamless integration into the DSS.
The image can also be displayed in other forms. Suppose the user wants the automobile he or she acquires to reflect a particular image. The user might query what automobiles people who display that image might drive. The system should be able to address this. For example, if the user wanted to have the same image as employees of Apple Computer Company, he or she might ask what kinds of cars these employees drive generally. The

106 DATA COMPONENT
ANNUAL COST WORKSHEET
ANNUAL OWNERSHIP COSTS Depreciation Finance Charge Insurance License and Registration Taxes Miscellaneous Costs
(Car Wash, Accessories, Etc.) TOTAL Annual Ownership C
ANNUAL OPERATING COSTS Gasoline Oil Maintenance
(Including Tires)
TOTAL Annual Operating Cc
AN N UAL COST OF CAR Annual Ownership Costs Annual Operating Costs TOTAL Annual Cost of Car
COST OF CAR PER MILE Total Annual Cost of Car Annual Miles Driven AVERAGE Cost Per Mile
$ $ $ $ I $ $
osts $
$ $ I $
)StS $
$ $ I
$
$
$
Figure 3.17. Annual automobile cost worksheet.
DSS might bring up information such as that given in Table 3.3 about the frequency of automobiles of different types among said employees. It may be sufficient to list these automobiles. Or it may be necessary to select only these cars.
Clearly the data in this system must be current. New car buyers will want information about the newest features and problems. Information from the latest car reports should be incorporated into the system as soon as possible. Recall notices and identified problems may also provide critical information to a user. Similarly, upcoming models need to be
Table 3.3. Operators possible in a "WHERE" clause
= <> or != > >= < <= BETWEEN IN
Equal to Not equal to Greater than Greater than or equal to Less than Less than or equal to Between two values An exact value, but you don't know in which column

CAR EXAMPLE
included in the database as soon as possible, since a buyer may need to make a choice between getting the current year's or the next year's model.
The user must have the ability to specify the level of detail. The system should present the user with basic, standard information and allow him or her to drill as deeply as desired and to compare automobiles with regard to factors that are of importance to that user.
An electronic field definition dictionary could be useful, particularly for first-time users. This dictionary could be used to define technical terms such as EFI, MPGH, MPGC, or the scale for collision and insurance ratings. Further, the dictionary could explain concepts such as purchasing a car through a broker or standard lease terms. Other users may want explanations to more technical questions such as why they would care how many valves are available in the car or the difference between a single and dual overhead cam.
"How To"
The collection and organization of the databases are the critical—and more difficult— components from the perspective of the DSS. The creation of a database can be done relatively straightforwardly using one of the standard database management systems, such as Oracle or MySQL. Accessing those data requires the use of a tool that will allow the Web-based interface to connect with the behind-the-scenes database. The tool that will be discussed here is Cold Fusion. It is a server-side scripting system that uses tags much like HyperText Markup Language (HTML) and so is fairly easy to learn. In addition, it does not display its scripting language, so it is possible to run encrypted versions of the scripts. The script interpreter (which resides on the server) looks for pages with the appropriate file type and generates the Web page dynamically. That is, Cold Fusion looks for a file with the file type *.cfm rather than the file type *.html that one sees in a static Web page.
Although we will use Cold Fusion to link the Web page with the database here, the actual commands for operating on the database are standard Structured Query Language (SQL) commands, the language that allows for access to and manipulation of databases. Although it is a standard, there are many versions of SQL available; some commands differ among versions and some commands are only available with particular versions. However, the basic commands that will be used in these examples, such as "select, update, delete, insert, and where" are consistent across versions. Therefore, while the examples will be shown here in a Cold Fusion context, they are generalizable to whatever system you elect to use.
A database generally has multiple tables associated with it. For simplicity, however, most of our examples will address only one table. The table is identified by a name, such as "new_cars," and is shown in Figure 3.18. Each table stores information about multiple attributes of multiple cars. In this case, the table stores selected specifications about some new cars. Each row represents a different automobile. The highlighted row shows the manufacturer, model, base price, length, width, height, miles per gallon (MPG), weight, fuel tank size, octane rating, and volume of room available for cargo for a Toyota Corolla. We know that the information all pertains to the Corolla because it is in that row. Each column represents a specific attribute of an automobile. So, the highlighted column shows the in-laboratory MPG for each of the five automobiles in the table. Notice that each automobile has an inventory number which is unique. This serves as an index that can be used to tie the information in this table to other tables in the database.
So, if one wanted to list the models and weights of each automobile in the table, the SQL command would be
SELECT model, weight FROM new.cars

D A T A C O M P O N E N T
Each column represents an attribute of an automobile about which information is collected for each record.
In this case, the column shows the laboratory MPG (CAFE) for each of the five automobiles In the table.
Car Number
1 2 3 4 5
Make
Honda Toyota Ford Subaru VW
Model
Civic Corolla Focus Impreza Rabbit
Base Price
$16,965 $15,910 $16,110 $18,140 $16,250
Length
177.3 178.7
175
173.8 165.7
Width
69 69.3 67.8 68.5 69.3
Height
56.5 57.7 58.6 58.1 58.2
CAFE MPG
29 40 28 29 30
Weight
2630 2720 2760 3080 2940
Fuel Tank
13.2 13.2
13 16.9 14.5
Octane Rating
87 87 87
87 87
Cargo Volume
12 12 14 19 15
I Each row (or tuple) represents a unique record. I I In this example, each row represents a different automobile.
I So, this row contains information about the Toyota Corolla.
Figure 3.18. Example Relation (Table) for New Cars.
where "model" and "weight" are attributes and "new_cars" is the name of the table. This will result in all of the cars being listed with the model and weight only. If, instead, you wanted to list all attributes on all cars, the SQL would be
SELECT * FROM new.ca r s
where the "*" is a wildcard that tells SQL that you want all information about all of the records.
Generally, though, you want to select automobiles that meet some particular criterion, such as those with a certain mileage. You can do that also with a slightly different SQL statement:
SELECT * FROM new.cars WHERE cafejnpg >= 3 0
This statement would select two automobiles, the Toyota Corolla with a cafe_mpg =40 and the Volkswagen Rabbit with a cafe_mpg=30. Since we used the wildcard, "*", it will seek all information about those two automobiles. If, instead, we wanted only the base price for those automobiles, we would use
SELECT base_price FROM new_cars WHERE cafe_mpg >= 30
Suppose, instead, you wanted to select automobiles by a particular manufacturer, say, Ford. Then your statement would read
SELECT base_price FROM new.cars WHERE make=xFord'
Notice that in this last case we put quotes around the value being tested, whereas we did not put the quotes with the previous example. The reason for this is that SQL requires that we use the quotes to designate alphabetical fields from numeric fields. So, SQL knows cafe_mpg is a numeric attribute because there are no quotes and knows "make" is an alphabetic attribute because it has quotes.

CAR EXAMPLE 109
Of course, you can select on multiple fields, such as:
SELECT model FROM new.cars where cafe_mpg >=3 0 AND base.price <= 16000
This will result in only one car, the Corolla, being selected because it satisfies both the condition of having a factory-tested MPG of over 30 mpg and a base price of less than $16,000. So, if you wanted low price and high mileage, that would be your option.
You can also select an exclusive condition, such as
SELECT model FROM new.cars where cafe_mpg >=3 0 OR cargo_volume > 15
This will produce the result in three cars being selected, the Corolla and Rabbit because they each have a CAFE over 30 and the Impreza because it has a cargo volume of 19. So, if you wanted a car with good mileage or a big trunk, those would be your options.
Finally, you may also combine them for statements such as
SELECT model FROM new.cars where cargo.volume > 15 OR (cafejnpg >= 30 AND base.price <= 16)
This would result in the selection of two cars, the Impreza, which has a large trunk space, or the Corolla, which has a high mileage and low price.
Those statements work with any database system. Using them with Cold Fusion to connect a database to a Web page is only slightly more complicated. In order to provide security for the system, Cold Fusion has a reserved file called "Application.cfm." This file is special in that it is not viewable by anyone other than the owner of the system. So, passwords, file location, and other information that is critical to protect for the integrity of the system can be stored in this file and then referenced by field name in other programs. Consider the lines below that constitute one application.cfm example:
<c f se t d_oracle="oracle_instance" > <c f se t u_oracle="myIDname"> <cfse t p_oracle="myPassword" >
This example specifies three things for the user, the machine on which oracle is running, the user's name, and the user's password. It links the name of the machine to the field "d_oracle," which is a universal variable. Similarly, the user's name is linked to the field "u_oracle" and his or her password is linked to "p_oracle." These three things are needed to allow the Web-based program to access the tables. However, you do not want to put the values of the fields in a program that can be viewed because that would allow anyone to edit your database, which clearly is not a desirable state.
In Code 3.1, you see two places to which to direct our attention, both of them shaded. Just like most HTML commands, Cold Fusion commands begin with a keyword and end with/keyword. You can always tell Cold Fusion commands because they always begin with "cf." So, in the first shaded region, there is a keyword, "cfquery" and a few lines later "/cfquery." This is telling your Web-based program that you would like to run a query on a database. Notice that the command does not explicitly identify where the database is housed, the user ID, or the password. Rather, it refers to the variable names "d.oracle," "u-oracle," and "p.oracle," respectively. Cold Fusion knows they are variables because they are surrounded by the pound sign (#). Further it knows because of the type of variables they are that it should look in the "Application, cfm" file to find the values.
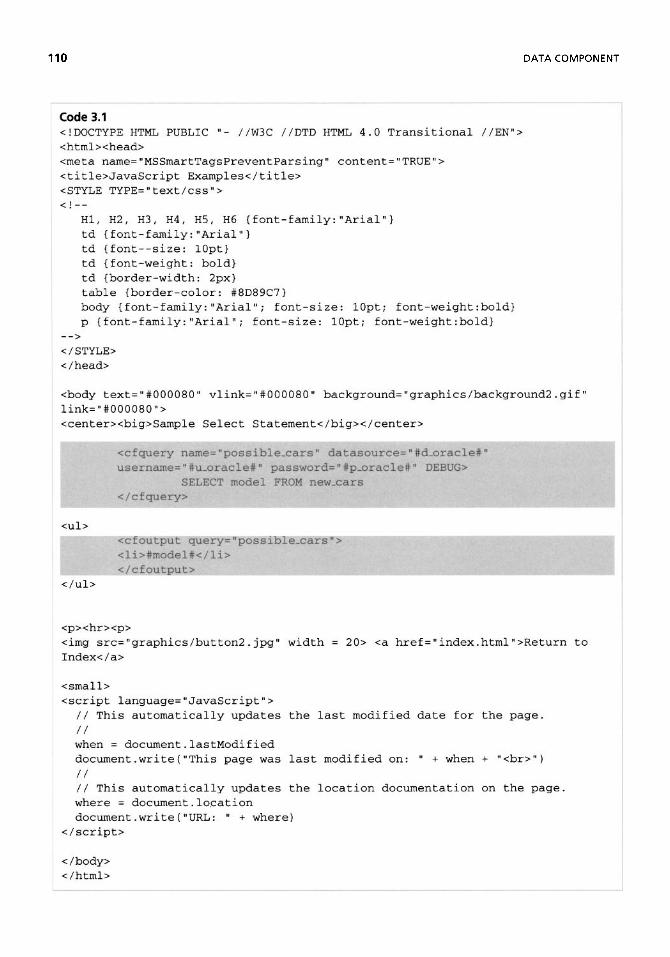
110 DATA COMPONENT
Code 3.1 <>D0CTYPH; HTML PUBLIC ■- //W3C //DTD HTML 4.0 Transitional //EN"> <htmlxhead> <meta name="MSSmartTagsFreventParsing" content="TRUE"> <title>JavaScript Examples</title> <STYLE TYPE="text/ess1> < ■ —
HI, H2, H3, H4, H5, H6 {font-family:"Arial"} td {font-family:"Arial"} td {font--size: 10pt} td {font-weight\ bold} td {border-width: 2px} table {border-color: #SD89C7} body {font-family:"Arial"; font-size: lOpt; font-weight:bold} p {font-family: "Arial·11; font-size: lOpt; font-weight :bold)
--> </STYLE> </head>
<body text="#000080" vlink="#000080" background^"graphics/background2.gif" link="#000080n> <centerxbig>Sample Select Statement</bigx/center>
<cfquery nome= "possible-cars" datasource=M#cLoracle#" username="#u_oracle# H password= " #p_oracle# " DEBUG>
SELECT model FROM new.cars </cfquery>
<ul>
</ul>
<cfoutput query= "possible^cars"> <li>#model#</li> </cfoutput>
<pxhrxp> <img src="graphics/button2.jpg" width = 20> <a href="index.html">Return to Index</a>
<small> <script language^"JavaScriptn>
// This automatically updates the last modified date for the page. // when = document.lastModified document.write("This page was last modified on: " + when + "<br>") // // This automatically updates the location documentation on the page. where = document.location document .write (1,URL: " + where)
</script>
</body> </html>

CAR EXAMPLE
The only other item specified in the cfquery line is to name your query; in this case, the query is named "possible cars." It has no immediate effect on the query but rather allows you to store the results from the query in that filename, which can be accessed later, perhaps to output the information.
Between the "cfquery" and the "/cfquery," you will see that the SQL is specified as it was in our earlier examples. This command, however, only acquires the data from the database. It is also necessary to display the data. The second shaded region provides the code to achieve that goal. The command here is "cfoutput" (followed by "/cfoutput") to cause the data to be shown to the screen. Unlike with static pages, we do not know how many records will be drawn from the database. Hence, our output statement must be in the form of something that can be repeated as many (or as few) times as the data are in the database. In this case, we use the HTML code "ul and M " to create an unordered list. Associated with that code is the identification of what shows up on each line (with "li" at the beginning of the item and "/li" at the end). So, before we do anything else, we know that the list will be unordered and will appear in a bulleted format. If this query were applied to Figure 3.20 shown earlier, the output would read:
• Civic • Corolla • Focus • Impreza • Rabbit
What we want listed is the name of the model of automobile. This is indicated by the use of the variable name "model" surrounded by the pound sign (#). Remember the pound signs tell the Web-based application that the name in between is a variable name. Of course, it must be a variable that was selected from the table in the specified query.
Code 3.2 shows a multiple field query that is also selective. Notice that the SQL statement in this example selects two different fields from the table, model and price. Further, it will only select those that satisfy the condition that MPG is greater than or equal to 30. In addition to changing what is selected and how it is selected, this example also prints out the result in a table rather than in a list. Notice that prior to the creation of the output (between the "cfoutput" and "/cfoutput") a table has been defined. The variables are then shown inside the definitions of the cells of that table. Each observation that meets the criterion will be written to an individual row in the table. So, the output would appear as:
Corolla
Rabbit
$15,910
$16,250
Notice there is a column for "model" and for "price" and that they are separated by a blank column, as per the table definition in the code.
We could, of course, write these entries to a permanent database that could be stored for later use by the decision maker. First, let us review the SQL that is needed to add rows to a table (we will assume a table has already been created for this use). The SQL command is the "INSERT INTO" command. If our table had the fields for price, fuel efficiency, and trunk space and we were adding specific known values to the table, the command would

112 DATA COMPONENT
Code 3.2 <!DOCTYFE HTML PUBLIC "- //W3C //DTD HTML 4.0 Transitional //EN">
<htmlxhead> <meta name="MSSmartTagsPreventParsing" content="TRUEM> <title>JavaScript Examples</title> <STYLE TYPE="text/css">
Hi, H2, H3H H4, H5, H6 {font-family:"Arial"} td {font-family:"Arial"} td {font--size: lOpt} td {font-weight: bold} td {border-width: 2px} table {border-color: #8D89C7} body {font-family:"Arial"; font-size: lOpt; font-weight:bold} p {font-family:"Arial"; font-size: lOpt; font-weight:bold}
— > </STYLE> </head>
<body text="#OOQ080" vlink=,r#000080" background^"graphics/background2 .gifM
link="#000080,f> <centerxbig>Output Values Statement</bigx/center>
<cfquery name="'possible_cars" datasource="#d_oracle#" username="# u_oracle#" password="#p_oracle#M DEBUO
SELECT model, price FROM new.cars WHERE cafe_mpg > = 30 </cf qiiery>
<table><tbody> <cfoutput query="possible_cars" >
<tr> <td>#model#</td> <td width-5> </td> <td>#price#</td> </tr>
</cfoutput> < / tbodyx / table>
< p x h r x p > <img s rc="graph ics /bu t ton2 . jpg" width = 20> <a href="index.html">Return to Index</a>
<small> <script language^"JavaScript">
// This automatically updates the last modified date for the page. // when = document.lastModified document .write ("This page was last modified on: " + when + ,l<br>") // // This automatically updates the location documentation on the page. where = document,location document.wri te("URL: " + where)
</script>
</body> </html>

CAR EXAMPLE 113
have the form
INSERT INTO p o s s i b l e _ c a r s (model , b a s e _ p r i c e , cafe_mpg) VALUES ( ^ C o r o l l a ' , 1 5 9 1 0 , 40)
So, the SQL command requires that you name the table (possible_car), the attributes you are adding to the table (model, base_price and cafe_mpg), and then the values for those attributes (Corolla, 15910, 40). As discussed previously, values for alphabetic or alphanumeric attributes must be in quotes and numeric values should not have quotes. It is not necessary to write to each attribute field in the table, but you cannot create new attribute fields during this process.
If all we wanted to do was to compare each automobile in the table to a predefined value, then we would use the "cfquery" command as used earlier and it would be:
<cfquery name="addcars" datasource="#d_oracle#" username=" #u_oracle#" password=" #p_oracle#" >
INSERT INTO possible_cars (model, base.price, cafe_mpg) VALUES (^Corolla',15910, 40)
</cfquery>
Generally we will not run a program to insert a static value, however. When we are creating temporary storage (in which to store alternatives that will later be compared), we get the information either from the user entry or from the search of another table in the database. Code 3.3 illustrates the process of getting information from a form. Note there is a new Cold Fusion command here, "cfform" (ended by "/cfform"). As the name suggests, it tells Cold Fusion that it should expect to see an HTML-based form, the information
Code 3.3 <!DOCTYFE HTML PUBLIC "- //W3C //DTD HTML 4,0 Transitional //EN"> <html><head> <meta name= "MSSmart Tags Prevent Par sing" content = l1TRUE" > <title>JavaScript Examples</title>
i <STYLE TYPE="text/css"> <! --
HI, H2, Ή3, H4, H5, Η6 (font-family:"Arial"} td {font^family:"Arial"} td {font--size: 10pt} td {font-weight: bold} td {border^width: 2px} table {border-color: #8D89C7} body {font-family:"Arial"; font-size: lOpt; font-weight:bold} p {font-family:"Arial"; font-size: lOpt; font-weight:bold}
--> </STYLE> </head>
<body text="#000080" vlink="#000080" background="graphics/background2.gif" link="#000080"> <centerxbig>Enter Items to be Added to Table Statement</bigx/center>

114 DATA COMPONENT
of which it will need to process. When using the "cfform" structure, one must also use "cfinput" to define the various fields in the form. In Code 3.3, for example, there is the line
<CFINPUT TYPE="text" NAME= " m a n u f a c t u r e r " MAXLENGTH=" 5 0 " S I Z E = " 3 0 n / >
<cfform name="possible-cars" action="addrecord.cfm" method-"post" datasource~"#d_oracle#M username="#u_oracle#" password=" #p^oracle# " DEBUG>
<center><table cellpadding=5 borderxtbody> <trxtd> <center>Please Complete the Following Form</centerxp>
Manufacturer: <CFINPUT TYPE^"text■ NAME="manufacturer" MAXLENGTH="50" SIZE="30rt/><p>
Model: <CFINPUT TYPE="text" NAME = "model " MAXLENGTH^"50"
SIZE*"30*/><p> Base Price; <CF1NPUT TYPE="text" NAME="price" MAXLENGTH="4" SIZE="4"/><p> CAFE-MPG: <CFINPUT TYPE="text" NAME="pmg" MAXLENGTH="4" SIZE="4"/> <br>
<p align=ncenter"> <CFIHPUT NAME="submit" TYPE="submit" VALUE="Save"> <CFIHPUT NAME="clear" TYPE="reset" VALUE="Clear■>
>rm>
</tdx/tr> < / tbodyx /1 able> </center>
<p><hr><p> <img src = 1,graphics/button2 .jpg" width - 20> <a href="index,html">Return to Index</a>
<small> <script language^"JavaScript">
// This automatically updates the last modified date for the page. // when = document.lastModified document .write("This page was last modified on: ri + when + "<br>") // // This automatically updates the location documentation on the page» where = document * location document.write("URL: " + where)
</script>

CAR EXAMPLE 115
In this example, you are entering data as text into a field called "manufacturer." This name should be unique within your form but does not necessarily need to be the same name you used in your database. The "size" keyword, currently set at 30, defines the length of the entry box available to the user on the screen but does not limit the number of characters entered. The "maxlength" keyword, on the other hand, does not impact what the user sees on the screen but does limit the number of characters the user can enter. This length, currently set at 50, should be less than or equal to the size specified in the database so that you will not get an error when entering the data. As with any HTML form, you have several options available for data entry; these are shown in Table 3.4.
Once we have specified what we want entered, we must return to the "cfform" statement to determine what to do with the information. Notice that in that statement there is a new keyword, "action=". After that keyword is the name of a file, in this case, addrecord.cfm. So, the program is instructing Cold Fusion to take the information available in the form and do with it what is shown in a second program. This second program is shown in Code 3.4. Notice the "insert into" statement has a list of field names (make, model, base_price, cafe_mpg). These must correspond to the field names in your database. In addition, it has a list of variables (we know they are variables because they are en-closed in pound signs, #), VALUES ('#manufacturer#\ '#model#\ '#price#Y#mpg#'). The names you use here must correspond to the names used in the form of Code 3.3. Since Cold Fusion will allocate the information sequentially, it will take the value of the form field "manufacturer" and put it in the database field "make" and the form field "price" and put it in the database field "base_price" even though those names are different.
If you query one database for selective values, you can put it in the "possible.cars" database using a similar procedure to that used above.
Suppose now that you have a variety of automobiles listed in this database and you have compared them. Now you want to delete some of the options. Suppose you have three records stored in your table, possible_cars, as shown below and you want to allow the user the option to delete one or more of the automobiles.
As with the previous example of inserting a record, deleting records is a multi-step process. First you must establish which records need deleting. You can accomplish this one of two ways. Code 3.5 shows how you create a form that allows the user to type in the manufacturer, model, base price and/or cofe-mpg directly for processing. In order for this to work, the user needs to type the terms exactly as they are stored in the database. So, the abbreviation, "Chevy," or the mistyping of "Chervolet" will not match Chevrolet.
Table 3.4. Available HTML Input Option with a Form
CFINPUT TYPE = "text" Generates a text box
CFINPUT TYPE = "checkbox'1 Generates a check box CFTNPUT TYPE = "radio" Generates a radio button CFINPUT TYPE = "textarea" Generates a block of .space
CFINPUT TYPE = "option" GeneraLes a drop-down box Chosse one: *

116 DATA COMPONENT
Code 3.4 <!DOCTYPE HTML PUBLIC "- //W3C //DTD HTML 4,0 Transitional //ENn> <html><heacl> <meta name="MSSmartTagsPreventParsing" content="TRUE"> <title>JavaScript Examples</title> <STYLE TYPE="text/css"> <! --
HI, H2, H3, H4, H5, H6 { font-family; 1l Arial" } td {font-family: "Arial11} td {font--size: lOpt} td {font-weight: bold} td {border-width: 2px} table {border-color: #8D89C7} body {font-family:"Arial"; font-size: lOpt; font-weight:bold} p (font-family: "Ariall1 ; font-size: lOpt; font-weight :bold}
--> </STYLE> </head>
<body text="#000080" vlink="#000080" background^"graphics/background2.gif" link="#000080"> <center><big>insert into the Database Statement</bigx/center>
Icf query name-,hadd.cars" datasource="#d_oracle#" username=1' #u_oracle#r
assword=fl #p_oracle#" DEBUG> INSERT INTO possible^car
(make, model, base.price, cafe_mpg ) VALUES ('#manufacturer#', ' #model#', '#price#', '#mpg#')
/cfquery>
<pxhrxp> <img src=rtgraphics/button2 t jpg" width = 20> <a href =
,r index .html ">Return to Index</a>
<small> <script language="JavaScript">
// This automatically updates the last modified date for the page. // when = document.lastModified document.write("This page was last modified on: n + when + "<br>") // // This automatically updates the location documentation on the page. where = document.location document .write ( l1 URL; " + where)
</script>
</body> </html>

CAR EXAMPLE 117
Code 3.5 <!DOCTYPE HTML PUBLIC '■ - //W3C //DTD HTML 4.0 Transitional //ENn> <htmlxhead> <meta name^'MSSmartTagsPreventFarsing" content^"TRUE"> <title>JavaScript Examples</title>
I <STYLE TYFE="text/ess"> < I - -
HI, H2, H3, H4, H5, H6 {font-family:"Arial"} td {font-family:"Arial"} td {font—size: lOpt} td {font-weight: bold} td {border-width: 2px} table {border-color: #8D89C7} body {font-family: "Arial·11; font-size: lQpt; font-weight:bold} p {font-family:"Arial"; font-size: lOpt; font-weight:bold}
--> </STYLE> </head>
<body text="#000080" vlink="#000080" background="graphics/background2.gif" link="#000080"> <centerxbig>Using Forms</bigx/center>
<cfform name="possible_carsM action="addrecord.cfm" method="post" datasource="#d_oracle#" username="#u_oracle#" password="#p_oracle#" D£BUG>
<center><table cellpadding=5 borderxtbody> <trxtd> <center>Please Complete the Following Form</centerxp>
Manufacturer: <CFINPUT TYPE="text" NAME="manufacturer" MAXLENGTH="50" SIZE= " 30 "/xp> Model: <CFINPUT TYPE="text" NAME="model" MAXLENGTH=n50" SIZE= " 3 0 "/xp> Base Price: <CFIWPUT TYFE="text" NAME=ηprice" MAXLENGTH=M4" SIZE= ■ 4 " /><p> CAFE-MPG: <CF INPUT TYPE="text" NAME="mpg" MAXLENGTH="4" SIZE="4"/> <br>
<p align="center"> <CFINPUT NAME="submit" TYPE="submit" VALUE="Save"> <CFINPUT NAME=11 clear" TYPE= " reset" VALUE= "Clear " >
</cfform>
</tdx/tr> </tbody> </table> </center>
< p x h r x p > <img s rc="graph ics /bu t ton2 . jpg" width = 20> <a href=nindex.htmln>Return to Index</a>

118 DATA COMPONENT
A better approach is shown in the coding of Code 3.6. This will select specific auto-mobiles in a menu such as shown below. This allows the user to select in automobile by marking the radio button to the right.
Make
Honda Toyota Volkswagen
Model
Civic Corolla Rabbit
Base Price
16.965 15,910 16250
MPG
29 40 30
o o o
Notice in the code that, when selected, the radio button takes on the value of "model":
<CFINPUT TYPE=" r a d i o " NAME= " r e q u e s t _ d e l e t e " VALUE=,,#model#">
This, value then passes the value of model to be deleted in the program shown in Code 3.7, through the field "request_delete," and it is deleted from the table of cars under consideration.
In addition to the basic operations of selecting, inputting, and deleting data, SQL provides a number of commands for summarizing data. These are all operations on a single attribute or column of data in the table. They include those shown in Table 3.5.
These examples provide a view of the kinds of database operations that would be necessary for DSS work. Of course, if data are stored in multiple tables, then it would be necessary to join the tables prior to the application of these ideas. Further, with all of these operations, it is important to include appropriate information surrounding the application and appropriate feedback about the success of the operation.
DISCUSSION
The fundamental database concerns for a DSS revolve around ensuring that appropriate data are available and that they can be manipulated in the desired fashion efficiently. While this seems straightforward, it often is considerably more difficult than it sounds. First, various
< sma11> <script language^"JavaScript">
// This automatically updates the last modified date for the page. // when = document.lastModified document.write("This page was last modified on: " + when +■ "<br>") // // This automatically updates the location documentation on the page. where = document . location document.write("URL: " + where)
</script>

DISCUSSION 119
Code 3.6 <IDOCTYPE HTML PUBLIC "- //W3C //DTD HTML 4.0 Transitional //EN">
<html><head> <meta name= "MSSmartTags Prevent Par sing11 content= "TRUE11 > <title>JavaScript Examples</title> <STYLE TYPE=Mtext/css">
Hl, H2, H3, H4H H5, H6 {font-family:"Arial"} td {font-family:"Arial"} td {font--size: 10pt} td {font-weight: bold} td {border-width; 2px} table {border-colon #8D89C7} body {font-family:"Arial"; font-size: lOpt; font-weight:bold) p {font-family:"Arial"? font-size: lOpt; font-weight;bold}
--> </STYLE> </head>
<body tex t="#000080" v l ink="#000080" b a c k g r o u n d = " g r a p h i c s / b a c k g r o u n d 2 . g i f " l ink=l 1#000080"> < c e n t e r > < b i g > S e l e c t c a r t o be D e l e t e d S t a t e m e n t < / b i g x / c e n t e r >
<cf query name="po3s ib le .cars 1 1 d a t a s o u r c e = h #d_oracle#1 ' u sername=" # u^orac 1 e#n pa s swo rd=" #p_orac 1 e #" DEBUG>
SELECT make, model , b a s e _ p r i c e , cafejnpg FROM p o s s i b l e _ c a r s < /c fquery>
< t a b l e x tbody> <cfform name=l 1possible_carsM a c t i o n ^ ' d e l e t e r e c o r d . c f m " method="pos t">
< t r> <td>#make#</td> < td width=5> < / td> <td>#model#</td> <td width=5> < / t d> < td>#base_pr i ce#< / td> < td width=5> < / t d > <td>#caf e_mpg#</td> <td width=5> < / td> <tdxCFINPUT TYPE="radio" NAME= " r e q u e s t . d e l e t e VALUE="#model#"></td> < / t r >
< / c f o u t p u t > < / t b o d y x / t a b l e >
<pxhrxp> <img src="graphics/button2.jpg" width = 20> <a href= "index.html">Return to Index</a>
< sma11> <script language="JavaScript">
// This automatically updates the last modified date for the page. // when = document.lastModified document.write{"This page was last modified on: N + when + "<br>") // // This automatically updates the location documentation on the page, where = document.location document «write f "URL: " +■ where)
</script>
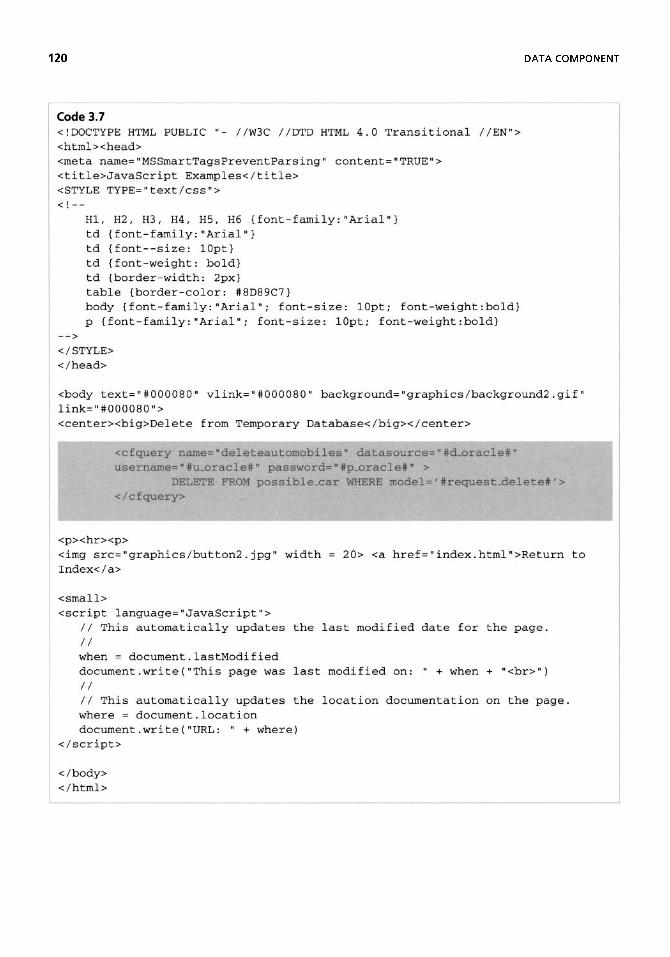
120 DATA COMPONENT
Code 3.7 <!DOCTYPE HTML PUBLIC "- //W3C //DTD HTML 4.0 Transitional //EN"> <html><head> <meta name="MSSmartTagsPreventParsingM content^"TRUE"> <title>JavaScript Examples</title> <£TYLE T Y P E = " t e x t / c s s , r >
Hl, H2, H3, H4, H5, H6 { font-family; "Arial,r } td {font-family:"Arial"} td {font—size: lOpt} td {font-weight: bold} td {border-width: 2px} table {border-color: #8D89C7} body {font-family:"Arial"; font-size: lOpt; font-weight:bold} p {font-family:"Arial"; font-size: lOpt; font-weight:bold}
--> </£TYLE> </head>
<body text="#000080" vlink="#000080" background="graphics/background2.gifH
link-"#0000801,> <centerxbig>Delete from Temporary Database</bigx/center>
L<cf query name=,fdeleteautomobiles" datasource="#d_oracle#" username=1'#u.,oracle# " password=" #p„oracle#" >
DELETE FROM possible_car WHERE model= ' # requ.es t_de let e# ' > </cfquery>
<pxhrxp> <img src="graphics/button2 . jpg11 width = 20> <a href ="index.html">Return to Index</a>
<small> <script language=nJavaScript">
// This automatically updates the last modified date for the page. // when = document.lastModified document.writef"This page was last modified on: " + when + ,r<br>") // // This automatically updates the location documentation on the page. where = document.location document.write{"URL: " + where)
</script>
</body> </html>

SUGGESTED READINGS 121
Table 3.5. SQL Summary Operations
AVG() calculates the average value of that attribute COUNT() identifies the number of records for which there is data on that attribute FIRSTO identifies the first record LAST() identifies the last record MAX() identifies the largest value of the specific attribute MIN() identifies the smallest value of the specific attribute SUM() computes the sum of all values of the specific attribute
decision makers use different information at different points in time. Hence, the designers need to complete analysis and knowledge engineering to determine what data might be relevant. Second, data need to be collected from the various transaction processing systems and other sources, scrubbed, checked, and verified before they can be stored in a warehouse. Of course, once in the warehouse the data need to be organized into to tables to optimize the searches from the DSS. Finally, the data management system needs to provide assistance to the users to help them understand what implications the data have for the choice process and how they can be used more effectively.
SUGGESTED READINGS
Acquisti, A., and R. Gross, "Predicting Social Security Numbers from Public Data," Proceedings of the National Academy of Sciences of the United States of America, Vol. 106, No. 27, July 7, 2009, pp. 10975-10980.
Agarwal, R., M. R. Tanniru, and M. Dacruz, "Knowledge-Based Support for Combining Qualita-tive and Quantitative Judgements in Resource Allocation Decisions," Journal of Management Information Systems, Vol. 9, No. 1, Summer 1992, pp. 165-184.
Chung, W., H. Chen, and J. F. Nunamaker Jr, Business Intelligence Explorer: A Knowledge map Framework for Discovering Business Intelligence on the Web, Proceedings of the 36th Hawaii International Conference on System Sciences, 2002, IEEE Computer Society.
Davenport, T. H., and J. G. Harris, Competing on Analytics: The New Science of Winning, Cambridge, MA: Harvard Business School Press, 2007.
DePompa, B., "There's Gold in Databases," InformationWeek, No. 561, January 8, 1996, pp. 52-54.
Edelstein, H., "Mining Data Warehouses," InformationWeek, No. 561, January 8, 1996, pp. 48-51.
Fedorowicz, J., "Evolving Technology for Document-Based DSS," in R. H. Sprague, Jr. and H. J. Watson (Eds.), Decision Support Systems: Putting Theory into Practice, 2nd ed., Englewood Cliffs, NJ: Prentice-Hall, 1989, pp. 125-136.
Garnto, C. and H. J. Watson, "Investigation of Database Requirements for Institutional and Ad Hoc DSS," in R. H. Sprague, Jr. and H. J. Watson (Eds.), Decision Support Systems: Putting Theory into Practice, 3rd ed., Englewood Cliffs, NJ: Prentice-Hall, 1989, pp. 111-124.
Getting to Know You, Accenture Information Management Services White Paper, avail-able: http://www.accenture.com/NR/rdonlyres/FAA9F5D7-2451-4D29-960E-9E935 AE9A004/0/ 35864AIMSAnalytics.pdf, n.d., viewed January 5, 2009.
Ginsberg, J., M. H. Mohebbi, R. S. Patel, L. Brammer, M. S. Smolinski, and L. Brilliant,"Detecting Influenza Epidemics Using Search Engine Query Data," Nature, Vol. 457, February 19, 2009, pp. 1012-1014.
Graziano, K., H. Hultgren, and D. Linstedt, The Business of Data Vault Modeling, St. Albans, VT: Daniel Linstedt, 2009.

DATA COMPONENT
Hoberman, S., D. Burbank, and C. Bradley, Data Modeling for the Business: A Handbook for Aligning the Business with IT using High-Level Data Models, Bradley Beach, NJ: Technics Publications, LLC, 2009.
Imhoff, C, N. Galemmo, and J. G. Geiger, Mastering Data Warehouse Design: Relational and Dimensional Techniques, New York: John Wiley, 2003.
Inmon, W. R., Building the Data Warehouse, 4th ed., New York: Wiley, 2005.
Inmon, W. H., B. O'Neil, and L. Fryman, Business Metadata: Capturing Enterprise Knowledge,
Amsterdam: Morgan Kaufmann, 2007.
Inmon, W. H., D. Strauss, and G. Neushloss, DW 2.0: The Architecture for the Next Generation of
Data Warehousing, Amsterdam: Morgan Kafmann, 2008.
Kim, W. C, and R. Mauborgne, "Value Innovation: The Strategic Logic of High Growth," Harvard Business Review, Vol. 82, No. 7/8, July, 2004, pp. 172-180.
Kim, W. C. and R. Mauborgne, Blue Ocean Strategy: How to Create Uncontested Market Space and
Make Competition Irrelevant, Cambridge, MA: Harvard Business Press, 2005.
Kimball, R., The Data Warehouse Toolkit: The Complete Guide to Dimensional Modeling, 2nd ed.,
New York: Wiley, 2008.
Kimball, R., and K. Strehlo, "Why Decision Support Fails and How To Fix it," Datamation, Vol. 40,
No. 11, June 1994, pp. 40-43.
Kraemer, K. L., J. N Danzinger, D. E. Dunkle, and J. L. King, "The Usefulness of Computer-Based
Information to Public Managers," MIS Quarterly, Vol. 17, No. 2, June 1993, pp. 129-148. McFadden, F. R., and J. A. Hoffer, Database Management, Menlo Park, CA: Benjamin Cummings,
1985.
Orr, K., "Data Warehouse Technology," An Information Builders White Paper, 1995, pp. 1-21. Available at http://www.kenorrinst.com/pg%2033 %20d.w.%whitepaper.htm.
Radding, A., "Support Decision Makers with a Data Warehouse," Datamation, Vol. 41, No. 5, March 1995, pp. 53-56.
Rayner, N., Corporate Performance Management Must Move Beyond Finance, Gartner Re-search Report G00134668, December 9, 2005. Available at http://www.google.com/url? sa=t&source=web&ct=res&cd=l&ved=0CAYQFjAA&url=http%3A%2F%2Fwww.exie.com% 2Findex.php%3Fs%3Dfile_download%26id%3D2&ei=I_GnSJLg01b8sQPWzYCzDQ&usg= AFQjCNFPiuJ5jPkDS 1 aSq9Xcq3qX9UVwQw&sig2=hilg3PVtomlhAjrj 18zXoQ.
Sauter, V. L. "Some Insights into the Requirements of Information Systems for Public Sector Decision-Makers," Policy and Information, Vol. 8, No. 1, 1984, pp. 9-23.
Sauter, V. L., "The Effect of 'Experience' on Information Preferences," Omega: International Journal
of Management Science, Vol. 13, No. 4, 1985, pp. 277-284.
Sauter, V. L., and M. B. Mandell, "Transferring Decision Support Concepts to Evaluation," Evaluation
and Program Planning, Vol. 13, 1990, pp. 349-358.
Shankar, B., and R. Shanda, "Obtaining Business Intelligence on the web," LR Planning Vol. 30,
No. 1,1997, pp. 110-121.
Shannon, P. W, and R. P. Minch, "A Decision Support System for Motor Vehicle Taxation Evaluation,"
Interfaces, Vol. 22, No. 2, 1992, pp. 52-64.
Smith, M., Tutorial for Using the Gartner Business Value Model to Create an Enterprise Metric Framework, Gartner Research Report G00161799, October 3, 2006. Available at: http://74.125.155.132/scholar?q=cache:nJNzkynoQIJ:scholar.google.com/+Smith +Apfel+and+ Mitchell&hl=en&as_sdt=400000000
Smith, M., A. L. Apfel, and R. Mitchell, The Gartner Business Value Model: A Framework for Measuring Business Performance, Gartner Research Report G00139413, May 31, 2006. Available at: http://74.125.155.132/scholar?q=cache:n_INzkynoQIJ:scholar.google.com/+Smith +Apfel+and+Mitchell&hl=en&as_sdt=400000000
QUESTIONS
Subramanian, A., L. D. Smith, A. C. Nelson, J. F. Campbell, and D. A. Bird, "Strategic Planning for Data Warehousing in the Public Sector," Proceedings of the 29th Annual HIICS International Meeting, Maui, Hawaii, Vol. 4, January 1996, p. 54.
Wallace, P., "Multimedia Boosts Holiday Inn's Training System," InfoWorld, Vol. 15, No. 24, June 14, 1993, p. 62.
Watson, H. J., M. T. O'Hara, C. G. Harp, and G. G. Kelly, "Including soft information in EIS," Information Systems Management, Summer 1996, Vol. 13, Issue 3, pp. 1058-0530.
West, L. A., Jr. and J. F. Courtney, "The Information Problems in Organizations: A Research Model for the Value oflnformation and Information Systems," Decision Sciences, Vol. 24, No. 2, Spring 1993, pp. 229-251.
White, A., J. Radcliffe, and T. Friedman, Master Data Management Summit Shows How to Achieve a 'Single Version of the Truth' About Data, Gartner Research Report GOO 152266, October 15, 2007. Available at: http://www.google.com/url?sa=t&source=web&ct=res&cd=l&ved= 0CAYQFjAA&url=http%3A%2F%2Fwww.gartner.com%2FDisplayDocument%3Fdoc_cd% 3D152266%26ref%3Dg_rss&ei=EPKnS-7UJY6QtgPxmtiUDQ&usg=AFQjCNGB8DKo02n YUINasUW0Ha7cfe5DbQ&sig2=aF4ywJJ5n_PvuDRgMbrDPQ.
White, C, "The Key to a Data Warehouse," Database Programming and Design, February 1995, pp. 23-25.
QUESTIONS
1. Consider the decision to register for courses in a given semester. What kinds of data would you use in that choice process? Why would you use those data?
2. Consider the data discussed in question 1. How would you process those data to transform them into information?
3. Comment on the following statement: A good DSS should provide the manager as much information as possible and that information should be provided no more than 5 seconds after requested.
4. How would a DSS designer determine what information is most important to users?
5. Under what circumstances might designers be more concerned about the "appropriate-ness of the format" of the information than the "timeliness" of the information?
6. Is material found on the World Wide Web "information" or "data"? What factors did you use to make that determination?
7. What kinds of private data might retail sales buyers maintain in a DSS?
8. Discuss the limitations for providing decision support that are imposed if data are stored in a hierarchical database or a network database.
9. Discuss how data warehousing has improved the usability of DSSs in corporate settings.
10. What kinds of validity threats do you have if data were obtained through data-mining activities?
11. Consider a specific decision. What kinds of data need to be included in the decision?
12. How does a database differ from a file?
13. What is the difference between a database and a data warehouse?
14. Does your university have a data warehouse? For what kinds of things is it used? How does it help with decision making?

124 DATA COMPONENT
15. Suppose you were taking data from application forms at your university? Some of the data are already saved electronically in databases. What kinds of data scrubbing would you need to do before you loaded those data in a data warehouse?
16. Consider the data in question 15. What kinds of data adjustment would you expect to do before you load the data in the data warehouse?
17. Learn about the architecture of your university's data warehouse or of one at a local company. Discuss it.
18. What is OLAP? How does it differ from ROLAP or MOLAP?
19. What is a data cube? How do DSS take advantage of that structure?
ON THE WEB
On the Web for this chapter provides additional information about data, information, database management systems, data warehousing, and data mining. Links can provide access to demonstration packages, general overview information, applications, software providers, tutorials, and more. Additional discussion questions and new applications will also be added as they become available.
• Links provide access to information about database and data warehouse products. Links provide access to software information, software comparisons and reviews, and general information about both database management systems and data ware-housing products.
• Links provide access to descriptions of applications and development tricks. In addition to information about the software, the Web provides links to worldwide applications of the software. You can access chronicles of users' successes and failures as well as innovative applications.
• Links provide access to the changing technology of data mining. This area is changing rapidly. The Web can provide access to information about tools and procedures for data mining as well as press information about its impact.
• Links provide access to information about automobiles. You can scan the links to determine what kinds of information are most useful under what circumstances. Further, you can determine what kinds of impediments are introduced by various storage and retrieval mechanisms. Finally, the links can provide evaluations for information and storage capabilities.
You can access material for this chapter from the general Web page for the book or directly at http://www.umsl.edu/~sauterv/DSS4BI/dbms.html.

4
MODEL COMPONENT
Business Intelligence allows decision makers to have a better understanding of the context of their choices. It is based upon the collection and examination of information called "analytics." Analytics are the result of some kind of modeling of (usually) historical data that generally includes the application of statistical analysis, operations research, or other quantitative tool for the purpose of either explaining what is or predicting what will be. The purpose of the model is to represent critical relationships in such a way to guide decision makers toward a desired goal. The involvement and support of these models is what differentiates DSS from other kinds of computerized systems. Said differently, without a model, a system is not a DSS. Hence, to understand DSS, one must understand models. Unfortunately, in practice, modeling, and especially model management, is the least developed of the aspects of DSS.
MODELS AND ANALYTICS
Modeling is the simplification of some phenomenon for the purpose of understanding its behavior. Even before the tsunami of data began hitting organizations, modeling provided a structure for understanding and predicting events. Modeling simplifies and abstracts detailed event data to allow understanding of the major forces acting upon the alternatives. It involves a process of summarizing and accumulating of data. In addition, modeling involves a process of removing unnecessary detail, thereby allowing the important patterns to shine through. This is similar to what is illustrated in Figure 4.1. All of the panels have
Decision Support Systems for Business Intelligence by Vicki L. Sauter Copyright © 2010 John Wiley & Sons, Inc.
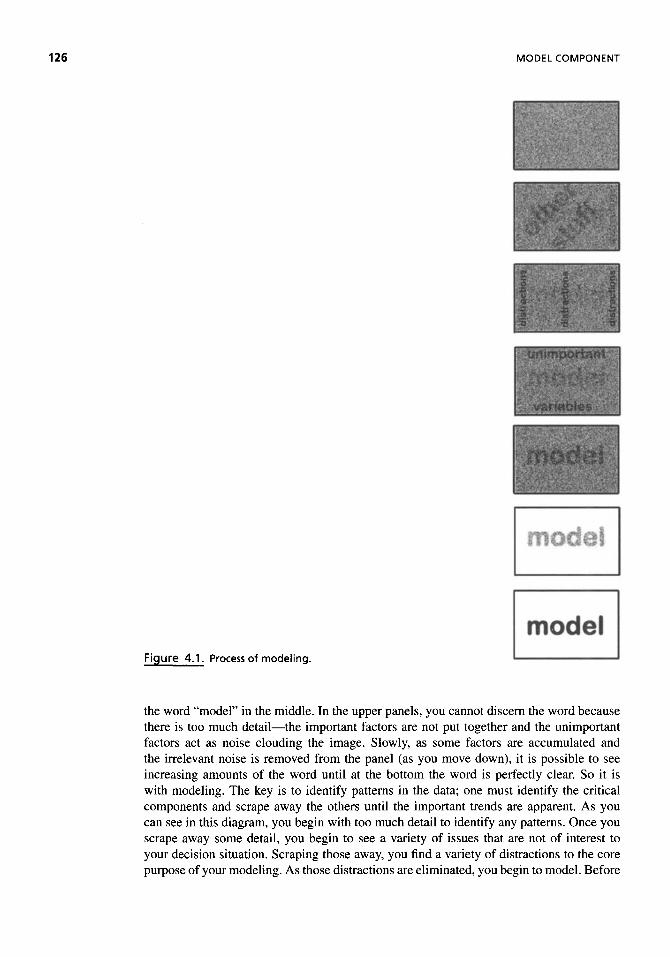
126 MODEL COMPONENT
Figure 4.1. Process of modeling.
the word "model" in the middle. In the upper panels, you cannot discern the word because there is too much detail—the important factors are not put together and the unimportant factors act as noise clouding the image. Slowly, as some factors are accumulated and the irrelevant noise is removed from the panel (as you move down), it is possible to see increasing amounts of the word until at the bottom the word is perfectly clear. So it is with modeling. The key is to identify patterns in the data; one must identify the critical components and scrape away the others until the important trends are apparent. As you can see in this diagram, you begin with too much detail to identify any patterns. Once you scrape away some detail, you begin to see a variety of issues that are not of interest to your decision situation. Scraping those away, you find a variety of distractions to the core purpose of your modeling. As those distractions are eliminated, you begin to model. Before

MODELS AND ANALYTICS 127
Figure 4.2. A model airplane.
you get too much clarity, you must first eliminate the unimportant variables. Then finally, once all of those other issues and the remaining small details are gone, it is possible to see the model clearly. That is how the modeling process works.
Most people have their first experience with models as children, such as in model airplane building or model trains. Everyone knows that a model airplane is not a real airplane and hence will not perform all the functions of a real airplane. However, certain attributes of the plane are created realistically, such as the number of wings, the number of propellers, the relative size or colors of the plane, and its markings (Figure 4.2). That is, model makers do not include all of the details of the plane but rather only those that are important to understand whatever aspects of the plane that are important to the decision maker. A child might be able to ascertain the development of planes by noting the evolution of number and placement of wings, the use of propellers, and even how the shape of the plane has changed over time. Another child, with different interests, might use these models to learn the colors and markings of planes associated with different countries. Hence, the amount of detail and the kind of detail necessary for the model airplanes are dependent upon the interests of the child at that moment. In other words, whether or not the model is sufficient is dependent upon the needs of the decision maker (in this case, the child).
Business modeling fulfills the same objective. The purpose of a model is to simplify the choice context so that decision makers can understand options and their ramifica-tions clearly. When statisticians develop regression models, their goal is to determine the factors essential to understanding the variability in the phenomenon of interest. Market research specialists, for instance, use regression to predict demand for a particular product. They understand that many factors affect a person's decision whether or not to purchase a product. However, in developing their marketing campaigns, it is useful to know whether their product appeals to young, unmarried professionals or to retired blue collar work-ers, and whether the desirability of the product is different in different regions of the country.
Most business decisions have a large number of influential factors, and decision makers need to filter the essential components of the situation from the irrelevant ones. While it seems obvious that models fill this need, not everyone feels comfortable with models. It may not be clear what model is most appropriate. Other times it is clear what kind of model is needed, but the data are not there to support it. Finally, some decision makers may

128 MODEL COMPONENT
not know how to interpret the results, especially if that means understanding the model's sensitivity to particular market conditions.
Although models can be applied without DSS, their power is magnified with DSS because of the inherent flexibility, friendly interfaces, and query capability of DSS. Histor-ically, decision makers needed to rely upon others to develop and interpret models for them because of the difficulty of running the computer programs associated with models. With DSS, decision makers are given personal access to appropriate models and appropriate data and immediate access to results.
It is this easy and friendly access that makes DSS-based models so attractive. Decision makers can understand the implications of their judgment and modify those judgments when they appear to be inconsistent with what is known. In addition, because of the speed and efficiency of analysis, decision makers can examine more alternatives so as to find a good strategy. Furthermore, the model encourages decision makers to investigate the variables that are most sensitive to assumptions. Improvement in these aspects of problem
AIDS PLAN Is a DSS resource that allows health care workers in Great Britain to plan re-sources for HIV/A1DS-related services better The system explicitly encourages decision makers to focus on ^what-if" questions so they can creatively experiment with strategies that might prove useful in meeting the needs of this increasing care-needing group. The DSS can be used to explore the consequences of alternative strategies or investments in resources as well as the sensitivity of those consequences to particular assumptions about uncontrollable and unpredictable factors, This in turn allows decision makers to examine the impacts of the de-cisions in terms of likely overload, need for further resources, and flexibility to meet future uncertainties.
Forecasts of demand within particular localities are derived from the COX National Forecasts by patient categories. Decision makers can elect whether to examine these forecasts at their low, medium, or high range. This projection of patient demand in turn forms the basis for experimentation with care options, Costs-of-care options by patient category are used to estimate the costs and resources required to treat the projected patient demand,
The model's analysis is based on a division of patients into categories that, for planning purposes, can be considered relatively homogeneous in their demand for services, Criteria that can be used to classify patients include clinical state, possible drug abuse, age, dependency, housing situation, and the presence or absence of informal support at home.
For each category, the health authority needs to identify alternative care options, A care option is a costed combination of service inputs that constitutes a clinically acceptable method of treating or supporting a member of the client group. It is defined in terms of the basic resources needed to supply appropriate care and treatment. Model users can adopt the list of resources provided with AIDSPLAN or change it to suit their special concerns or circumstances. Up to 32 different resources can be accommodated in the model, Once users have established such lists of resources, they can express any given care option as a particular combination of recourses from the list in specified amounts.
For any particular assumptions made about future demand, A IDS PLAN computes the re-sources and cost consequences of the identified care strategy. Using a menu, the user can display summaries of the results at different levels to see the effect of the input assumptions and to identify where further analyses may be needed. In fact, medical personnel currently are using AIDSPLAN to facilitate discussion of the consequences for services of using AZT prophylactically and the impact of day care facilities on the provision of inpatient beds.

OPTIONS FOR MODELS 129
analysis in turn aids decision makers in advocacy and implementation of the chosen solution because they understand more facets of the problem better. For example, the New Zealand yacht-racing team exploited the benefits of alternative generation and evaluation in its design of Black Magic 1 and 2, which competed in the America's Cup in 1995. Over 10,000 options were considered during the four-month competition, which allowed the team to make constant improvements in the design of the yachts at the waterfront facility. Many believe this systematic evaluation of alternatives led to the remarkable performance in which the New Zealand team swept the field 5 to 0.
OPTIONS FOR MODELS
A model is a generalized description of a decision environment. The goal of creating it is to simplify a phenomenon in order to understand its behavior. While that is a nice definition, it does not help decision makers to understand how to model or even to identify a model.
Decision support systems can include several types of models, some of which you have studied in your other classes. For example, statistical models include regression analyses, analysis of variance, and exponential smoothing. Accounting models include depreciation methods, budgets, tax plans, and cost analysis. Personnel models might include "in-basket" simulations or role playing. Marketing models include advertising strategy analyses, consumer choice models, and product switch models. The characteristics of these models differ substantially, as do their uses; each represents simplification of a decision phenomenon that is useful for understanding some component of behavior. The skills needed to build and use these models and the kinds of support needed to help less skillful users utilize the models effectively also differ considerably. Part of the challenge of creating a DSS is knowing what models need to be included and how they can be supplemented to make them meaningful and useful for the decision maker.
To determine what kind of model to use, generally we need two kinds of information: what the decision maker needs and the kinds of data available to use. Since models are simplifications of real situations that act as vehicles for learning about those situations, we need to select a model that helps to answer the questions that decision makers pose. Also, since models have underlying assumptions about the data that are used, we can only select models for which the assumptions are appropriate for the available data. We will use a variety of dimensions to describe models and the role they fulfill in decision making, as shown in Table 4.1.
Table 4.1. Dimensionality
of Models
Representation Time Dimension Linearity of the Relationship Deterministic vs. Stochastic Descriptive vs. Normative Causality vs. Correlation Methodology Dimension

MODEL COMPONENT
Representation
The first dimension, the representation, describes the kind of data needed in a model which, in turn, dictates the necessary approaches used to collect and process the data. In particular, we are distinguishing between models that rely upon experiential data and those that rely upon objective data. The difference between the two is the process by which the model is generated, not the answer that is derived.
Experiential models rely upon the preparation and information processing of peo-ple, either individually or as a group. These models might include judgments, expert opinions, and subjective estimates. For example, diagnostic software used by physi-cians to help in prescribing treatment for tumors or blood diseases models the expe-rience of expert practitioners. Similarly, a forensic animation simulation was created to convict a Florida man of vehicular homicide. The simulation showed how his truck drove into a group of children (one of whom was killed) and then left the scene of the accident.
One of the problems associated with the use of such models is their subjectivity in use. In such modeling, the information used and the manner in which it is used to make a choice are up to the decision maker. If two individuals attempt use the same behavioral model, they may come to different conclusions because they are drawing upon different experiences and are likely to weight those experiences differently. In the case of the forensic simulation, the verdict was appealed on the basis of the use of the simulation which, according to the defense, misrepresented the scene of the accident (which happened at night) and the automobile.
Objective models, on the other hand, rely upon specified, detached data and its analysis by known techniques. They are considered "objective" because the data considered and the way they are used are specified, constant, and independent of the specific decision maker's experiences. Consider the Advanced Trading System from Scottrade shown in Figure 4.3. This system allows decision makers to access real-time stock quotes, historical data, and models for analyzing the data. The return on investment computed by one user for a particular option will be the same as the return on investment computed by another user for that same option. Hence, there is no subjectivity associated with the analysis.
However, that in no way means that they are unbiased or lead everyone to the same conclusion. Clearly, we can bias results by the selection of the variable, time period, or sam-ple group. For example, conclusions about the yield of investments can vary substantially by the time horizon considered; stock market investments tend to provide poor yields when examined over short time horizons but excellent yields, on average, when examined over multiple decades. Both provide an "objective" view of the performance of a portfolio, yet they provide very different conclusions; not providing both views presents a biased view of the problem. The ability to recognize such biases and thereby study multiple aspects of a problem is one of the advantages of using a DSS.
Neither the experiential nor the objective model is appropriate all the time, and each has its own strengths and weaknesses. Objective models have the advantage of being straightfor-ward to apply and easily replicated with new data. In addition, they can save time in that they do not require the establishment of extensive experience such as is needed for some forms of behavioral modeling. These models have limitations as well. The basic assumption underly-ing objective modeling is that the simplification of reality necessary to create a mathematical model does not eliminate the essential issues controlling the decision environment. That is, it assumes that the most important factors, such as competition, regulation, prices, and technol-ogy, are represented in the simplified model in a manner similar to that in the actual decision

OPTIONS FOR MODELS 131
Figure 4.3. Screenshot from Scottrade's Advanced Trading System Software. The image is reprinted here with the
permission of Scottrade.
environment. If these factors change in a significant way, the mathematical models would not be appropriate because the essence of the decision environment and its probable reactions would not be represented. Under these circumstances, it is important to rely on experiential models.
Some DSS allow for the integration of both the objective and experiential models. For example, the DSS facilitating the U.S. Army plans for future needs of materiel incorpo-rates both kinds of modeling. Objective models are built based upon quantitative analysis of historical data. In this case, the historical data represent past demands for and uses of the materiel over time. The projections combine models that first assume a continuation of past patters of materiel use and then take into account planned activities such as ma-jor exercises. These forecasts are supplemented with heuristics about possible changes in the needs during the upcoming time horizon; expert opinions and human judgment are included to alter the projections. The DSS helps the user evaluate the combined model per-formance by continually measuring trends and alerting the decision maker to changes in the trends.

132 MODEL COMPONENT
Time Dimension
The time dimension identifies how much of the activity of the decision environment is being considered. The two ends of the continuum are static models and dynamic models. At the static end, models represent a snapshot in time of all factors affecting the decision environment. Such models assume that everything will remain the same. Similarly, such models assume that there is no dependence of later decisions or actions on the choice under consideration. Dynamic models, on the other hand, consider the decision environment over some specified time period. They may consider the same phenomenon during different periods of time or interrelated decisions that will be considered during different time periods.
Time can be represented in models in a variety of ways. An example of its explicit use of time to examine some phenomenon is shown in Chapter 2. The software in use at Gap Minder (example results of which are shown in Figure 4.4) looks at how the factors under consideration change by increments of a year. In this way decision makers can examine the
Design Insights Modeling Chip Architecture
Designing chip architecture for the best performance and smallest size is an exceedingly difficult task. Today, computers solve the problem by considering possible combinations. They are fast, but the computer lacks both intuition and visual pattern recognition. These are not only characteristics at which humans excel but also characteristics that could yield a better or even optimal design. Researchers at the University of Michigan are developing mechanisms to combine the speed of computers and the skill of humans in a project called FunSAX By solving problems using the Fun SAT board, players contribute to the design of complex computer systems. Although the humans believe they are just selecting actions that will turn all buttons green, they are in fact solving complex problems or selecting the best arrangement of options. The solution is then given to a computer scientist who translates that solution into hardware design. The researchers hope to use this combination of objective and subjective modeling to improve chip designs, databases, and even robotics. Perhaps someday similar l'games" can be used to improve other decisions,
Adapted from Dc Orio, A. and V. Bertac^o, Design Automation Conference (DAC), San Francesco, CA, available at; http ://w w w, eecs. um ich. edu/—va per ia/rcscarch/publicaüons/DAC09Fun STA .pdf July 2009. Used with permission of Mrr De Οτίο and Dr, Bertacco. The Fun SAT 1+game" is available at http://funsaLeecs.unieh.edu.

OPTIONS FOR MODELS 133
Figure 4.4. Looking at intervals of time for patterns. Gapminder software shows incremental changes in the graph on an annual basis. In this way, decision makers can examine the relation-ship's changing nature over time. Visualization from Gapminder World, powered by Trendalyzer from www.gapminder.org.

134 MODEL COMPONENT
directionality of the change, the times at which the magnitude of change shifted direction, and the relative change of a variety of observations. Other ways of representing time include using time as a variable in the model, examination of results in a "before" and "after" time period, and using models that use interdependence of time periods explicitly, such as with dynamic programming.
Linearity of the Relationship
This third factor of a model is called linearity. It refers to the relationship between two or more factors. Such relationships are either linear or nonlinear. Everyone has seen a linear relationship in two dimensions; it is expressed by a straight line. It can be interpreted easily as the more of x, the more of v. For example, the larger the warehouse, the greater the storage volume available.
Anything other than the straight line is referred to as a nonlinear relationship. The two-dimensional graphs in Figure 4.5 and the three-dimensional graph in Figure 4.6 are nonlinear. Nonlinear relationships require the user to specify the kind of relationship be-tween and among the variables. For example, sales related to the natural log of advertising expenditures, or sales related to the square root of price, or sales related to the square of time spent with a sales representative are all nonlinear relationships. Such relationships do not have the nice intuitive interpretation of linear models. Nor is it obvious how to build the model. The linearity, or lack thereof, affects the kind of model that one can use. For most linear model solution techniques there are parallel nonlinear solution techniques. The nonlinear models are more complex. The first—and hardest step of the process—is to specify the nature of the relationship. While it may be easy to determine the kind of relationships shown in Figure 4.5, if you have some mathematical background, data rarely
Figure 4.5. Nonlinear relationships.

OPTIONS FOR MODELS 135
Figure 4.6. Nonlinear higher dimension relationship.
come so well behaved. Generally they include error terms such as that shown in Figure 4.7. Clearly this makes it harder to determine exactly what nonlinear function should be used with the data. It takes time, patience, experience, and an understanding of the phenomenon being modeled to get it right.
For this reason, it is tempting just to use the linear model to approximate the nonlinear data. Not only does that avoid the problem of having to determine the underlying function, but also the linear models are better behaved, easier and faster to solve, and generally have a straightforward approach to solution. There are times when such approximations are good enough, especially since the techniques of nonlinear models generally are harder and slower to solve, require a hierarchical approach, and often result in "good answers" rather than "the best answers." Other times, however, the conclusions gained from the linear model are inappropriate for the nonlinear world.
Deterministic Versus Stochastic
Most of the modeling taught in business colleges is deterministic. For example, consider linear regression. You might want to predict sales using price and advertising. To do this, you collect past data about the three variables and run the regression. You might result with something like
Sales, = 5.64 + 16.1 Price, + 0.58 Advertising,
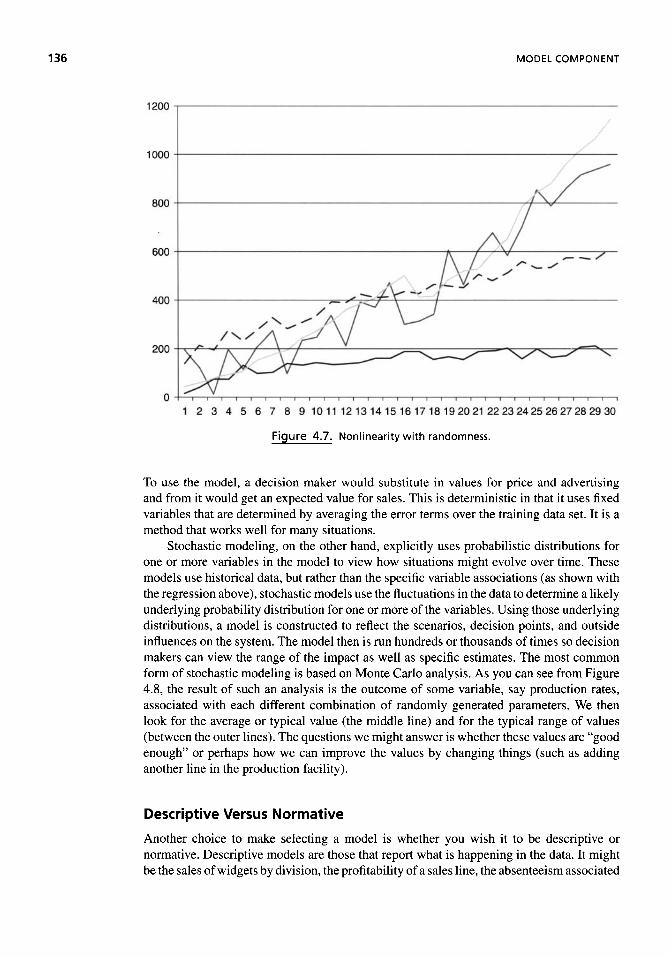
136 MODEL COMPONENT
Figure 4.7. Nonlinearity with randomness.
To use the model, a decision maker would substitute in values for price and advertising and from it would get an expected value for sales. This is deterministic in that it uses fixed variables that are determined by averaging the error terms over the training data set. It is a method that works well for many situations.
Stochastic modeling, on the other hand, explicitly uses probabilistic distributions for one or more variables in the model to view how situations might evolve over time. These models use historical data, but rather than the specific variable associations (as shown with the regression above), stochastic models use the fluctuations in the data to determine a likely underlying probability distribution for one or more of the variables. Using those underlying distributions, a model is constructed to reflect the scenarios, decision points, and outside influences on the system. The model then is run hundreds or thousands of times so decision makers can view the range of the impact as well as specific estimates. The most common form of stochastic modeling is based on Monte Carlo analysis. As you can see from Figure 4.8, the result of such an analysis is the outcome of some variable, say production rates, associated with each different combination of randomly generated parameters. We then look for the average or typical value (the middle line) and for the typical range of values (between the outer lines). The questions we might answer is whether these values are "good enough" or perhaps how we can improve the values by changing things (such as adding another line in the production facility).
Descriptive Versus Normative
Another choice to make selecting a model is whether you wish it to be descriptive or normative. Descriptive models are those that report what is happening in the data. It might be the sales of widgets by division, the profitability of a sales line, the absenteeism associated

OPTIONS FOR MODELS 137
Figure 4.8. Results of a Monte Carlo analysis.
with a particular facility, or the number of radio advertisements run by the competitor. These descriptive models might be created to provide decision makers with a quantitative view of what is happening in the organization or part of an organization as background or for monitoring. Or, the descriptive models might serve as predictive analytics, which attempt to forecast how factors such as sales, profitability, absenteeism, or competitor's ads will behave in the future. As said earlier, of course, such models are only valid if the factos pushing on the phenomena are the same in the future as they have been in the past.
The alternative to descriptive models is normative models. These models represent an ideal value of sales, profitability, or absenteeism in an organization. The output of the normative models, perhaps of sales, is then compared to the actual sales to determine if operations are running as we expect they should. This form of modeling does not provide a view of how the organization is changing, that is, how sales are growing (or declining) over time, but rather simply a view of how the current organization is competing relative to a set of standards or values.
Causality Versus Correlation
The relationship between correlation and causality is one of the most misunderstood and misapplied in all of modeling. Correlation, however it is represented, refers to the amount and direction that two or more variables vary together. It might be thought of as the level at which the variables simultaneously change. If two variables move positively together, that
MODEL COMPONENT
means as one increases, so does the other; if the correlation is negative, the variables move in opposite directions. Similarly, the magnitude of the correlation indicates how similar the movement is a larger correlation means the rate of change of the two variables is more similar.
However, correlation does not say anything about what caused this association. For example, there is a positive correlation between education and income. The fact that education and income are correlated does not imply that getting more education causes your income to increase. It is possible that people from higher incomes simply get more education. Or, it is possible that there is another factor, say intelligence, that causes changes in both variables. Similarly, increasing price does not cause a drop in sales. It may be that reduced sales causes a company to increase its price to cover its costs. Or, it may mean that a competitor is pushing both variables to change. If the goal in the analysis is to determine what causes changes in some factor, then in addition to correlation, it is necessary to prove that it is impossible that anything else but one factor could have caused the change in the other factor. This requires the design of a scientific experiment that controls the variables to approximate such a counterfactual state of the world. Generally this is achieved by conducting experiments on identical items or randomizing exposure to the experimental factors.
Methodology Dimension
The last dimension, methodology, addresses how the data (whether objective or experien-tial) will be collected and processed. There are five general methodologies: (a) complete enumeration, (b) algorithmic, (c) heuristic, (d) simulations, and (e) analytical. In complete enumeration, by far the hardest and most expensive option, information about all feasible options is collected and evaluated. Under many circumstances, complete enumeration is totally impractical. However, there are some contexts for which it is necessary or desirable. For example, the U.S. Census is an example of complete enumeration in which all individuals in the United States are identified and counted} The purpose of counting all individuals is to understand the population shifts in the United States so representation in the Congress can reflect actual population density. Rather than sampling various areas in each state, the government identifies every person individually.
Complete enumeration also has been useful in the application of neural networks of transaction files for pattern recognition. For example, a neural network system was constructed for Mellon Bank of Chicago to identify suspicious credit card activity that might be indicative of stolen credit cards. Historically, both human auditors and electronic expert systems identified dubious transactions through abrupt increases in either the number or the size of transactions. By examining all the transactions, the neural network identified a change in small purchases as an indicator of stolen credit cards. In fact, at that time, card thieves were using small purchases, often as little as $1, in pay-at-the-pump gas stations, to determine whether the cards were still being accepted. It was this complete enumeration of transactions, supplemented by pattern recognition capabilities, that allowed the system to respond quickly to the presence of criminal behavior.
The second approach, the algorithmic model, is the development of a set of proce-dures that can be repeated and will, eventually, define the desired characteristics of the
1 It has been noted that the U.S. Census process does not count homeless individuals and underestimates their numbers. Strictly speaking, then, the census is not a complete enumeration.

OPTIONS FOR MODELS
decision environment. Such models are best represented by the field of operations re-search/management science. Algorithms have a set of repetitive calculations that can be implemented to find the best answer. The set of calculations itself is based upon the charac-teristics of a particular problem. Unlike total enumeration, an algorithm identifies promising information that can be used to identify the best outcome without first evaluating all pos-sible options. An example of such a modeling technique is the Simplex Algorithm. To use this model, we need to represent a problem as a linear program, determining an objective function that can be optimized (either maximized or minimized) and a set of constraints. Typically the objective function uses the minimization of costs, the maximization of utility, or some related concept. The constraints define the availability of scarce resources such as time, money, and inputs. If we can represent the problem as a linear program, we can use repetitive operations based upon matrix row reduction calculations and find the best solution to the problem.2 These repetitive operations are simple arithmetic operations; the process of applying them is the algorithm.
Algorithms are used widely today in business, organizations, and government. They can help decision makers know how to place investments, where to advertise products, or how to assign staff to projects. One area where algorithms are used heavily is in personnel planning and scheduling. For example, many hospital systems use algorithms to assign nurses and other staff to shifts. In some cases, the systems include measures of "intensity" of patient illnesses so that they can determine whether the optimal general staffing levels will meet the specific needs on a daily basis. Similarly, the U.S. Army uses an algorithm-based DSS called ELIM-COMPLIP with input from other modeling forecasting systems to plan for deployment of personnel to various tasks so as to meet their strength needs as specified in the Force Structure Allowance.
The third possible model process is heuristic. Generally heuristics are applied to large or ill-structured problems that cannot be solved algorithmically. The goal is to find a satisfactory solution that is reasonably close to optimal. All heuristics involve searching, evaluating, learning, and more searching to find a good solution. They are usually developed for a particular problem in order to take advantage of the structure of a problem. Some heuristics are designed to construct solutions; others are designed to improve existing solutions. Since heuristics are so dependent upon a particular representation of a problem, they are not often generalizable to other problems.
Heuristics can be quantitative solutions to a problem or behavioral solutions to a problem. In the former case, the model is a numeric representation of a choice and we focus on numeric processing. Typically, a quantitative heuristic is developed as an alternative to using a quantitative algorithmic approach, if, for example, a reliable algorithm is not available, if the computation time is excessive, if the data are limited, or if the problem is so big it cannot be reasonably simplified otherwise. For example, if the decision variables in a problem are restricted to dichotomous (0-1) values or integer values, known algorithms may fail to find an optimal solution. This might include a firm's assignment of production processes to particular production facilities or a financial institution's assignment of deposits to lockboxes. Similarly, if the objective to a problem is nonlinear, or if there are many variables or constraints, known algorithms may fail to find an optimal solution. Some heuristics can be identified that take advantage of the mathematical structure of a problem to find good answers to these problems.
2There are some special problem structures that cannot be solved using this algorithm. In addition, some problems cannot be solved practically with this technique because the number of variables and/or constraints is so large it would take a prohibitively long amount of time to solve the problem.

140 MODEL COMPONENT
Modeling Insights Linear Programming
To understand algorithms and their use, let us consider a specific problem. An MIS Club plans to sell two special fruit baskets for the upcoming holiday season. Fruit basket A contains 3 apples, 4 oranges, and I honeydew melon and sells for $8, Fruit basket B contains 4 apples, 3 oranges, and 2 honeydew melons and sells for $12. The amount of each fruit available and their costs to the MIS Club are shown in the table below. If it is assumed that the MIS Club can sell all the baskets it makes, how many of each one should they make?
Quantity Available
Cost per Piece
Apple Orange Melon
160 180 60
$030 $0.20 $L20
The first step is to represent the problem mathematically. In this case, we will have two variables, x and y, where x represents the number of fruit basket A to make and y represents the number of fruit basket B to make. We know that each fruit basket A sells for $8 and each fruit basket B sells for $12, but in order to know how much profit wc will make, wc must compute the costs of each basket. Basket A contains 3 apples at S ,30,4 oranges at $ .20, and I melon at SI ,20, so it costs $2.90 to make up the basket (if we assume the actual basket is free)· Hence, the net profit from basket A is $5.10. Using a similar method, we can find that the net profit from Basket B is $7.80. Hence, our objective is to:
Maximize 5-10X +7.80y
However, there are constraints dictating the availability of fruits which must be met. Using the quantities above, they are:
Apples Oranges Melons
3x-h4>< 160 Ax + 3y < 180 \x-\-2y <60
Conceptually, the algorithm for solving this problem looks at possible values for x and y and selects the one that maximizes our objective. Consider the graph below;
80
- Oranges constraint
Apples constraint
Melon constraint
40 60 80
Number of fruit basket A

OPTIONS FOR MODELS 141
If the heuristic is behavioral, then we consider the relationships between concepts and use symbolic processing of the data. In fact, this kind of behavioral heuristic is generally referred to as expert systems (a branch of artificial intelligence). Expert systems use rules, frames, objects, and metarules (often referred to as demons3) to replicate the solution
3The term "demon" in a programming environment refers to a portion of code that lies dormant until a particular event, such as the change in the value of a variable, causes the code to process. These demons might cause particular actions to occur, such as the searching of a database, or they might prohibit actions to occur and to take the user along a different path of code.
The algorithm "knows" to look for the feasible combinations of the two types of fruit baskets, as shaded in the-graph. Further it "knows" that the best combination is going to be one of the four "extreme" or comer points highlighted above. The algorithm evaluates an extreme point with regard to the objective (5.1 Ox -h 7.80;y). It then looks at the adjacent corners to determine if one of them give a better solution. If so, the algorithm moves to that new point and begins again. In essence, the algorithm moves from comer to corner, always improving the value of the objective. With large problems, the process is important because one can have many variables and many constraints resulting in millions of corner points. Since the algorithm follows a systematic approach to improvement, it ends up checking only a small percentage of the possible points. In this case, it is the combination of 36 fruit baskets of type A and 12 fruit baskets of type B, giving a profit of $277+20 to the MIS Club.
DSS in Action MLB Schedules as Models
Baseball is called the "great American pasttime" because so many Americans share a passion for the game. The game may live or die by the pitcher or the next power batter, but the schedule is dependent on modeling, The Sports Scheduling Group (556) uses mathematical programming and high-performance computers running virtually nonstop for months to develop a schedule for major league baseball. According to one of the partners of SSG, "a typical model for a sports scheduling problem is a combinatorial design with nasty side constraints and multi-objectives.'*
Schedule makers deal with conflicting requirements and preferences as a matter of course, but as the financial and competitive stakes in athletics rise, so does the complexity of creating a balanced schedule. To maximize revenue, it is crucial to have important games televised on the right days and times. These requirements frequently conflict with more traditional requirements of a 'Tair" schedule that balances strength of schedule, home and away games, and travel.
SSG must consider the following constraints when developing a schedule:
* Each club plays 162 games and 52 series, including 13 at home on weekends.
* Games within each month and during summer dates should be reasonably balanced between teams.
* Single-series and four-series home stands and road trips should be minimized; two- and three-series home stands and road trips are preferred.
* No more than four series home stands or road trips should be scheduled,
* There should be no doubleheaders in the original schedule.
* Considerations must be made to the miles traveled by one team during a season. No team should travel in excess of 50,000 miles over the course of the season,
* Three game series are optimal (minimize number of two- or four-game series),
In addition, SSG entertains the requests of the teams, the television networks broadcasting the games, and the MLB Players Union*

142 MODEL COMPONENT
technique that an expert would use to solve an ill-structured, nonquantifiable problem. These models can give meaning and context to the symbol and incorporate subjective information about the validity of an answer or the way in which the answer should be used to obtain a solution.
The fourth approach to modeling is simulation. Unlike algorithmic and heuristic mod-eling, which provide a normative answer, simulation provides descriptive results. The goal of simulation is to imitate reality either quantitatively or behaviorally. Typically, this
Modeling Insights Presidential Selection Heuristics
Every four years there is a great deal of money spent on trying to predict who will win the U.S. presidential election. Pundits examine the various segments of the population carefully and determine the issues that are most important for each group, who best addresses those issues (for the groups), and what the likelihood of that group voting will be. There arc millions of dollars spent to predict who is likely to win the election* As the viewing public knows, there are many flaws to these predictions.
Allan J. Lie htm an, professor of history at The American University in Washington, D.C., looks at the situation in a different way. He applied statistical pattern recognition algorithm from seismology to the question of who would be elected. Professor Lichtman began with nearly 200 questions, which were all binary (yes-or-no) variables, and the algorithm picked those which displayed the greatest difference between the proportion of the time the variable was "yes" for years when the incumbent party won and the corresponding proportion for years when the challenging party won using all U*S* elections starting with 1860 as the training set. Over lime, he narrowed it to 13 keys. They are:
1. The incumbent party holds more seats in the ILS, House of Representatives after the midterm election than after the preceding midterm election.
2+ There is no serious contest for the incumbent-party nomination.
3, The incumbent-party candidate is the current president
4, There is no significant third-party or independent candidacy.
5, The economy is not in recession during the campaign. 6, Real (constant-dollar) pcr-capita economic growth during the term equals or exceeds
mean growth for the preceding two terms.
7, The administration has effected major policy changes during the term.
8, There has been no major social unrest during the term,
9, The incumbent administration is untainted by major scandal.
10. There has been no major military or foreign-pol icy failure during the term.
11. There has been a major military or foreign-policy success during the lerm.
12. The incumbent is charismatic or is a national hero.
13. The challenger is not charismatic and is not a national hero.
According to Dr. Liehtman's models, if six or more of these statements are false, the incumbent party loses the popular vote. Using that criterion, the model has only been wrong twice, in 1876 and 1888. Of course, in the United States, it is the electoral vote, not die popular vote, that determines the winner, so sometimes this method does not predict who will actually be in the White House.
Samulson, D. "Road to the White House;' ORMS Today, Vol 35, No 5, October 2008. This material is reprinted with permission of the publisher and the author.

OPTIONS FOR MODELS 143
Negotiation Ninjas, developed by researchers at Southampton University, are intelligent agents that use heuristics to help bring together buyers and sellers on the shopping website Aroxo, The agents use a series of simple rules—known as heuristics—to find the optimal price tor both buyer and seller. The heuristics guide not only the price but also the ways to address multiple simultaneous negotiations. Sellers must answer a series of questions about how much of a discount they are prepared to offer, whether they are prepared to go lower after a certain number of sales or at a certain time of day, and how eager they are to make a sale. Buyers only need to identify the item they wish to purchase and the price they are willing to pay for it, The agents then act as an intermediary, scouring the lists of sellers who are programmed to accept a price in the region of the one offered. If they find a match, the seller is prompted to automatically reply with a personalized offer. The buyer then has a choice to accept, reject, or negotiate. If they choose to negotiate, the agent analyzes the seller's criteria to see if they can make a better offer. The process continues until either there is a sale or one of the parties pulls out.
One system using nonquantitative heuristics is PROSPECTOR. The purpose of this system is to predict mineral deposits given geological information about a region. Some of PROSPECTORS rules arc the following,
* RULE 1: IF the igneous rocks in the region have a fine to medium grain size, THEN they have a porphyritic texture (0,5)«
* RULE 2: IF the igneous rocks in the region have a fine to medium grain size, THEN they have a texture suggestive of a hypabyssal regional environment (2, (λΟΟΟΟΟ I).
* RULE 3; IF the igneous rocks in the region have a fine to medium grain size and they have a porphyritic texture, THEN they have a texture suggestive of a hypabyssal regional environment (100, 0.0000001).
* RULE 4: IF the igneous rocks in the region have a texture suggestive of a hypabyssal regional environment, THEN the region is a hypabyssal regional environment (65, 0.01).
* RULE 5: IF the igneous rocks in the region have a morphology suggestive of a hy-pabyssal regional environment, THEN the region is a hypabyssal regional environment (300,ΟΌ001),
* RULE 6: IF the region is a hypabyssal regional environment, THEN the region has a favorable level of erosion (200, 0.0002).
* RULE 7; IF Coeval volcanic rocks are present in the region, THEN the region has a favorable level of erosion (800, I).
The system processes these and other rules much the way an expert geologist would to examine the geological, geophysical, and geochemical, data to predict where ore-grade minerals could be found. The numbers in parentheses indicate measures of certainty with the conclusions that are built into the reasoning process.
Source: Waterman, D. A. (1986) A Guide to Expert Systems, "Prospector Rules,TT p. 58. Reproduced with permission of Pearson Education. Inc.
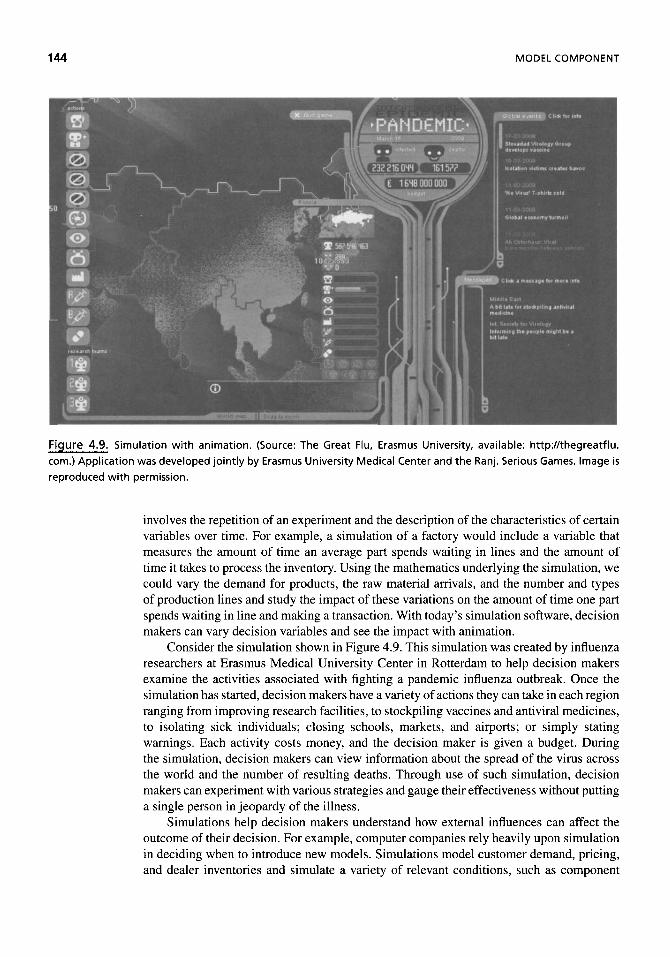
144 MODEL COMPONENT
Figure 4.9. Simulation with animation. (Source: The Great Flu, Erasmus University, available: http://thegreatflu. com.) Application was developed jointly by Erasmus University Medical Center and the Ranj. Serious Games. Image is reproduced with permission.
involves the repetition of an experiment and the description of the characteristics of certain variables over time. For example, a simulation of a factory would include a variable that measures the amount of time an average part spends waiting in lines and the amount of time it takes to process the inventory. Using the mathematics underlying the simulation, we could vary the demand for products, the raw material arrivals, and the number and types of production lines and study the impact of these variations on the amount of time one part spends waiting in line and making a transaction. With today's simulation software, decision makers can vary decision variables and see the impact with animation.
Consider the simulation shown in Figure 4.9. This simulation was created by influenza researchers at Erasmus Medical University Center in Rotterdam to help decision makers examine the activities associated with fighting a pandemic influenza outbreak. Once the simulation has started, decision makers have a variety of actions they can take in each region ranging from improving research facilities, to stockpiling vaccines and antiviral medicines, to isolating sick individuals; closing schools, markets, and airports; or simply stating warnings. Each activity costs money, and the decision maker is given a budget. During the simulation, decision makers can view information about the spread of the virus across the world and the number of resulting deaths. Through use of such simulation, decision makers can experiment with various strategies and gauge their effectiveness without putting a single person in jeopardy of the illness.
Simulations help decision makers understand how external influences can affect the outcome of their decision. For example, computer companies rely heavily upon simulation in deciding when to introduce new models. Simulations model customer demand, pricing, and dealer inventories and simulate a variety of relevant conditions, such as component

OPTIONS FOR MODELS 145
price changes or even the impact of a rival model. In this way, the managers can evaluate the risk before taking the risk.
Similarly, personnel departments use "in-basket" simulation exercises to help indi-vidual managers determine the best approaches to addressing the problems that arise in managing people. In this case, the manager measures not a mathematical variable, but
The U.S. military is one of the most significant users of simulations in the world today. The Generalized Air Mobility Model, or GAMM, simulates the entire theater airlift system's movement of cargo from source to destination. Hence, the DSS provides simulation of flights, airdrops, overland cargo transshipment, and survivability of cargo in the various modes of transportation. (The DSS does not simulate the outcome of the campaign, just the ability of the airlift system to meet the operational demands of a given scenario.)
The quality of the insight from this simulation, as in any simulation, comes from the quality of the measures that were built into the system for evaluation. Historically, the military used measures such as rate-of-cargo movement, average aircraft flying time per day, utilization rate, and departure reliability While these measures provide some indication of the basic throughput of the operation, they do not measure the effectiveness of the mission or how it supports combat forces. Hence, GAMM has factors of evaluation such as:
• Timeliness of deliveries
• Effectiveness in making multiflight deliveries within narrow time and location constraints such as those necessary for combat missions
• Ability to move large, oversize items
In addition to providing operational logistics for a particular campaign, GAMM also can predict where long-term airlift characteristics need to be changed and hence offer insights into fum re designs.
The costs of providing health care have skyrocketed over the last 20 years. At the same time the incidence of infections, especially antibiotic-resistant infections, contracted during hospitalization has increased significantly. States have recognized the impact of these secondary (not existing upon admission) infections on health cane costs, and some have introduced legislation to reduce payments to hospitals with high rates of secondary infection. Clearly it is in everyone's best interest to reduce the incidence of infections contracted during hospitalization. But, this is a difficult problem to solve due to interactions among the various pathogens, categories of illness of the patients, and occupancy rate of the hospital. In other words, it is hard to know "where to start." However, researchers worked with Cook County Hospital in Chicago to build simulations to represent various scenarios of these variables so they could study the relative efficacy of improved hand-hygiene protocols versus changes in patient isolation policies. They found both policies could have a significant impact on the rate of infections. However, when they also examined the costs—both to the patient and to the hospital—under various conditions, they determined that improved hand-hygiene protocols were more appropriate as a first approach to solving the problem. Further, the researchers provided insights into conditions where the policies should be changed and what the associated costs would be.

146 MODEL COMPONENT
rather the reaction of another individual in order to experiment with more positive and more negative reactions and determine which will provide the desired effect. Finally, today's technology can make it possible to simulate how it feels to drive a given automobile over a variety of surfaces and in a variety of conditions to determine which car provides the most desirable ride given its cost.
The essence of constructing simulation models is to simplify the elementary relation-ships and interdependencies of the situation being considered. While it does simplify the conditions, simulation also allows us to build in real-life complexities that might affect the variables being measured. It is descriptive in its answer, thereby encouraging "what-if" kinds of experimentation in which many alternatives can be considered independently, and time is compressed so that long-term effects can be measured quickly.
Design Insights Modeling Failures
Computer simulations are not replicas of reality. For example, Boeing Co. Engineers used simula-tion to design a fuse pin that held the engines to the wing for its 747 cargo plane. After El Al Israel Airlines had a crash in 1992, where the plane killed over 40 people in the Netherlands, engineers reviewed their simulation. They found that the simulation had missed several weak points in the design of the fuse pin. The fuse pin had in fact broken, causing the crash.
odeling Insights Finding bin Laden
Professors in the Geography Department at UCLA applied biogeographic models to the question of locating Osama bin Laden in the spring of 2009. Biogeographic models use known properties of plants and animals to predict how they will distribute themselves over space and time. These models were applied to publicly available satellite imagery.
The particular models employed are called a "'distance decay theory" and "island biogeog-raphy theory/' They were employed because they are associated with the distribution of life and extinction. Distance decay theory states that as one goes further away from a precise location, there is an exponential decline in the turnover of species and a lower probability of finding the same composition of species. The theory of island biogeography states that large and close islands will have higher immigration rates and support more species with lower extinction rates than small isolated islands,
These theories can be applied over varying spatial scales to posit bin Laden \s location based on his last reputed geographic location. Distance decay theory would predict that he is closest to the point where he was last reported and, by extension, within a region that has a similar physical environment and cultural composition (that is, similar religious and political beliefs). For instance, the further he moves from his last reported location into the more secular parts of Pakistan or into India, the greater the probability that he will find himself in different cultural surroundings, thereby increasing the probability of his being captured or eliminated. Island biogeographic theory predicts that bin Laden is in a larger town rather than a smaller and more isolated town where the extinction rate would be higher. Finally, high-resolution analyses of a city can be undertaken to identify individual buildings that match bin Laden's life history characteristics. For example, he reportedly has a small entourage of body guards, requiring a structure that contains at least three rooms.
Using these methods, the biogeographers identified not only a specific town in Pakistan in which bin Laden is likely to be located but also three specific buildings in which he is likely to be located. However, no national security agency has commented on whether they have applied this methodology or whether or not the professors were accurate.

PROBLEMS OF MODELS
Simulations are not without their disadvantages, however. They do not provide an optimal solution; instead they provide information about conditions from which we can glean a good or possibly optimal solution. Like heuristics, inferences are not transferable beyond the specific type of problem being considered. Finally, and most important, the construction of simulations can be slow and costly.
The last type of methodology is the analytical model. Analytical modeling refers to the process of breaking up a whole into its parts and the associated process of examin-ing the parts to determine their nature, proportion, function, and interrelationships. Where phenomena are well defined, analytical approaches solve for related variables that have specified properties within limits. For example, the phenomenon of gravity is well de-fined so that we can use specified equations to describe how an object will fall. Where phenomena are not well defined, which includes virtually all business-related phenomena, the analytical approach determines how to separate a given problem into its constituent parts and determine what subcomponents are most important in affecting the interactions with other subcomponents. Statistical analyses, especially regression and other predictive models, provide good examples of analytical modeling.
Consider, for example, the process of creating strategies for football games. The interdependence of the players and the complexity of the plays make it difficult for any individual to make choices without help. National Football League teams use DSS with sophisticated analyses to make these decisions. The DSS helps the coach to understand the tendencies of his own team and the opposition and hence to plan strategies that will respond to them. The New England Patriots use a DSS to select the best players at the lowest cost to decide what play to run or whether to challenge a referee's ruling and even how to improve total fan experience.
PROBLEMS OF MODELS
Modeling is not without its problems. Modeling depends on understanding the factors that impact the phenomenon of interest and using those variables in the correct proportion. The failure to identify an important variable, to select an inappropriate time horizon, or to overfit the model to some time period will decrease the value of the model to the decision makers. Quantitative modeling, in addition, assumes that the factors acting upon the phenomenon will continue to be important and will continue to work in the same fashion as in the past. For example, most public transportation companies have models to predict ridership. They use the models to decide routes for buses and trains and how often to schedule vehicles on each route. If done well, the models provide a good mechanism for planning. However, when gasoline prices suddenly surge, the assumptions about ridership change significantly and the models no longer provide a reliable output for decision making. The use of models assumes the underlying assumptions continue to be true. Decision makers need to consider if that is true.
Not knowing if the assumptions are true is one problem. Knowing the assumptions are not true and continuing to use the models make their use more hazardous. Consider the financial institutions and their use of models prior to the recession of 2009. Analysts chose to program their risk management systems with overly optimistic assumptions and to feed them oversimplified data. In other words, financial analysts modeled the system so as not to identify all of the risks and perhaps maybe even the correct risks. Rather than noting recent volatility in the market, the models looked at several years of trading history, which dampened the impact of an impending crisis. Others, it is claimed, developed models that did not reflect the complexity of the financial products being traded.

MODEL COMPONENT
DATA MINING
One kind of modeling that is particularly important in DSS is data mining. When we think of mining, we think about digging deeply into some repository to find something of value. When one mines for diamonds, one digs into seemingly common rocks to find brilliant pieces of carbon. Said differently, one needs to look carefully through vast repositories of useless rock to find that one nugget that is valuable. A similar process is used for data mining. Data mining might easily be defined as the process of extracting valuable patterns from a mass of data. Companies often mine the data to find evidence of theft or fraud, patterns of purchasing (or other behavior of interest), or evidence of the need for new products, new markets, or new sources of revenue. This is not a new idea; companies have been trying to mine their data for hundreds of years. What is new is that companies are able to collect and save much more data now than ever before. Similarly, although there have been many data-mining tools available for some time, today's processing power has brought us new tools that increase our ability to find patterns in the data.
Consider, for example, one of the largest procurers of data in the world today, Google. Every day, there are several million searches on Google to find anything from a product for a gift to health information. Google saves the data. It is not just the search, but if you have logged in, it saves your name and email address, the date and time of day, and your Internet Protocol (IP) address. The IP address, of course, gives Google information about how you are connected to the Internet and the country (and, in the U.S., the city and state) from which you connected to the Internet. There have been hundreds of billions of searches since 1997, when the search engine was launched.
Google mines its data, meaning that it attempts to find patterns in the searches that are useful. One such mining exercise is the Google attempt to predict influenza outbreaks. It compared the number of queries about influenza with traditional flu surveillance systems, such as the CDC process in the United States. Google tracked the searches for appropriate terms by geographic area in the United States between 2003 and 2008 and compared it to publically available data from the CDC's U.S. Influenza Sentinel Provider Surveillance Network. Google researches found not only that the search results were verified by the CDC data but also that the search results predicited the CDC data. That is, because people search for symptoms prior to seeking a physician's care (from which the CDC data are compiled) and because it is so much faster to process the search data than the physician's data, Google could predict the outbreaks by region up to two weeks earlier than the CDC. The data are shown in Figure 4.10.4 If the data continue to provide the same predictive capabilities, they could predict pandemics or epidemics sooner and thus give health professionals a longer window to stem the negative effects.
A famous example of data mining is from a chain of midwestern (U.S.) grocery stores and the purchasing data of their customers. They found male customers generally shopped on Thursdays and Saturdays. Further they found that these men tended to do their weekly shopping on Saturdays, but only purchased a few items on Thursdays. Further analysis of what they purchased showed that men who purchased diapers on Thursdays also tended to purchase beer. Armed with this result, the grocery chain made sure the beer display was close to the diaper display and that both diapers and beer were sold at full price on Thursday to maximize their revenues.
4More information about Google's work with flu trends can be found at http://www.google.org/ flutrends/. Information about their other data-mining activities can be found at http://www.google.org/.

DATA MINING 149
Figure 4.10. Google results. Adapted from Google's Flu analysis, available at http://www. google.org/flutrends.
Of course, not all data mining is good. Consider the research conducted by Acquisti and Gross (2009) of Carnegie Mellon University. They showed that it is possible to predict narrow ranges in which a given person's social security number is likely to fall simply by mining public data. In particular, they used the Social Security Death Master File, which includes information about those people whose deaths have been reported to the Social Security Administration. Since this file is a popular tool among genealogy researchers for finding ancestors, it is readily available online and easy to search. The researchers mined the data to detect statistical patterns in Social Security Number (SSN) assignment associated with date of birth (and thus likely date of application for a SSN) and location of birth. Using their results, they were able to identify the first five digits of 44% of deceased individuals born in the United States from 1989 to 2003 and complete SSNs with less than a thousand attempts for almost 10% of those deceased individuals. With that tool, it becomes statistically likely that they could predict with the same level of accuracy for living individuals. The professors are interested in the mining algorithms and the public policy implications; however, in the wrong hands, this could provide the keys needed for identity theft.
Although data warehouses provide access to information that will help decision makers understand their operations and environment better, users can become lost in the enormous possibilities for analysis and miss the forest for the trees. These efforts require the co-ordinated efforts of various experts, stakeholders, or departments throughout an entire organization. Available tool users mine the value of the information available in these warehouses to find the kinds of data that seem to discriminate among alternatives the best, identify cases which meet some criterion, and then summarize the result or find patterns in the data to highlight important trends or actionable situations.
The five approaches to data modeling are given in Table 4.2. In each case, the goal is to find patterns in the data that we might exploit to improve the business. Knowing what items customers tend to purchase together, or under what conditions emergency rooms will need assistance, or when products are sufficiently similar to substitute them, will all help managers run their businesses better. It requires that the system search for patterns in the data and then differentiate the patterns that are interesting and useful from those that are illusions and spurious. Said differently, the goal is to find a model that generates predictions

150 MODEL COMPONENT
Table 4.2. Data-Mining Goals
Classifications Clusters Regressions Sequences Forecasting
that are most similar to the data on which you build the model. At the same time, however, the focus is not on the training data, but rather on future data. If you overfit to your training data, then the patterns are likely to perform less well on test set data. Said differently, it provides a model that is specific to the random fluctuations in the original data. When applied (which is always the goal), over-fit models tend to do poorly because the new data experience different "random fluctuations." Hence it is important to have "pure" (not used in the original analysis) data on which to test any mining model before using it to impact business rules. Netflix understood that, but apparently some of the contestants did not.
The most commonly used data-mining technique is classification. Classification iden-tifies patterns that are unique for members of a particular group. It examines existing items that have already been classified and infers a set of rules from them. For example, the system might classify attributes of those students who complete their degree in a specified number of years from those who do not. By finding the similarities among students who do not successfully complete their degrees, the system might find "early warning signals" on which the administration can act.
Classification mining can produce misleading results, particularly if not done properly. For example, one of the most controversial classification efforts was the Total Information Awareness Program (ITAP) of the U.S. Department of Defense. The original goal of the
Nctfiix is known for using quantitative analyses for improving its performance. In 2006 it an-nounced a S1 million competition to the first team that could improve it recommendation system by 10%. The recommendation system, which is used to suggest movies to individual customers, predicts whether someone will enjoy a movie based on how much tbey liked or disliked other movies. Netflix provided anonymous rating data for mining and a test data set to evaluate how closely predicted ratings ot movies match subsequent actual ratings. This set off a flurry of activity of individuals, groups, and groups of groups, fn mid-2009: a team called BellKor's Pragmatic Chaos was the first to achieve the goal of improving the system by 10Ό9%+ According to the rules, the other teams had 30 days to improve upon BellKor's method. Just before the deadline was reached another team, The Ensemble, submitted a method that improved the rating system by 10,10%, BcllKor did not have time to respond.
However, shortly thereafter, the team's captain, Yehuda Korcn posted a note on his blog that he was contacted by Netflix and was told they have the best test accuracy and should be declared the winner. Why? It appears that Netflix kept two verification test sets: one that was the basis for the public standings and another that was secret The winner was selected based on the success of the approach on the secrer data set. So BellKor, which appeared to come in second, based on the public verification test set, seems poised to be the winner based on the hidden test set Apparently The Ensemble got their additional improvement by overfilling their algorithm to the test data set; when tested on the unused data, their algorithm was inferior.
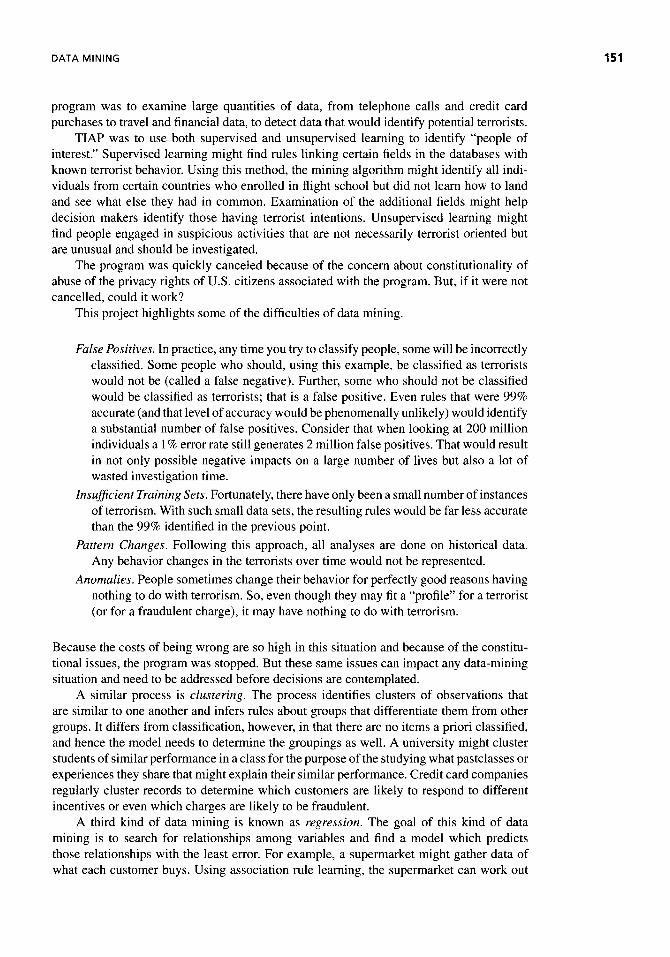
DATA MINING
program was to examine large quantities of data, from telephone calls and credit card purchases to travel and financial data, to detect data that would identify potential terrorists.
TIAP was to use both supervised and unsupervised learning to identify "people of interest." Supervised learning might find rules linking certain fields in the databases with known terrorist behavior. Using this method, the mining algorithm might identify all indi-viduals from certain countries who enrolled in flight school but did not learn how to land and see what else they had in common. Examination of the additional fields might help decision makers identify those having terrorist intentions. Unsupervised learning might find people engaged in suspicious activities that are not necessarily terrorist oriented but are unusual and should be investigated.
The program was quickly canceled because of the concern about constitutionality of abuse of the privacy rights of U.S. citizens associated with the program. But, if it were not cancelled, could it work?
This project highlights some of the difficulties of data mining.
False Positives. In practice, any time you try to classify people, some will be incorrectly classified. Some people who should, using this example, be classified as terrorists would not be (called a false negative). Further, some who should not be classified would be classified as terrorists; that is a false positive. Even rules that were 99% accurate (and that level of accuracy would be phenomenally unlikely) would identify a substantial number of false positives. Consider that when looking at 200 million individuals a 1 % error rate still generates 2 million false positives. That would result in not only possible negative impacts on a large number of lives but also a lot of wasted investigation time.
Insufficient Training Sets. Fortunately, there have only been a small number of instances of terrorism. With such small data sets, the resulting rules would be far less accurate than the 99% identified in the previous point.
Pattern Changes. Following this approach, all analyses are done on historical data. Any behavior changes in the terrorists over time would not be represented.
Anomalies. People sometimes change their behavior for perfectly good reasons having nothing to do with terrorism. So, even though they may fit a "profile" for a terrorist (or for a fraudulent charge), it may have nothing to do with terrorism.
Because the costs of being wrong are so high in this situation and because of the constitu-tional issues, the program was stopped. But these same issues can impact any data-mining situation and need to be addressed before decisions are contemplated.
A similar process is clustering. The process identifies clusters of observations that are similar to one another and infers rules about groups that differentiate them from other groups. It differs from classification, however, in that there are no items a priori classified, and hence the model needs to determine the groupings as well. A university might cluster students of similar performance in a class for the purpose of the studying what pastclasses or experiences they share that might explain their similar performance. Credit card companies regularly cluster records to determine which customers are likely to respond to different incentives or even which charges are likely to be fraudulent.
A third kind of data mining is known as regression. The goal of this kind of data mining is to search for relationships among variables and find a model which predicts those relationships with the least error. For example, a supermarket might gather data of what each customer buys. Using association rule learning, the supermarket can work out

152 MODEL COMPONENT
Modeling Insights nderstanding single-malt Scotch Whiskey
Single-malt Scotch whiskeys are an acquired taste. They are distilled from barley at a single distillery and matured in oak casks for at least three years (some for many years). Scotch whiskeys cannot be matured in new oak casks because the new oak would overpower the taste of the whiskey, so it is only matured in used casts, Clearly the previous use of the cask will impact the taste of the Scotch whiskeys. The taste of American bourbon in oak will impact the taste differently than will Portugese port or by Spanish sherry or Carribean rum or maderia. Similarly, each year that the Scotch whiskey is in the cask will change the taste since it continues to process. The water supply will also impact the taste of the final product.
Single-malt Scotch whiskeys tend to be categorized by the region in which they were produced, While this is useful for those who really know their whiskey, it is less useful for the general public. So, a project called Whisky Classified developed a clustering system to help people understand styles of the common brands. Said differently, the project helps someone answer the question, ^if I Like this brand, what other brands am I likely to like?"
The developers reviewed tasting notes in recently published books on malt whiskey and from distilleries, From this, they developed a vocabulary of 50U aromatic and taste descrip-tors for Scotch whiskey. They applied these terms to 86 single-mall Scotch whiskey using a product called ClustanGraphics. The cluster analysis groups malts into the same cluster when they have broadly the same taste characteristics across all 12 sensory variables. Tech-nically, the method minimizes the variance within clusters and maximizes the variance between clusters.
The result was 10 clusters of single-malt Scotch whiskeys:
Cluster A: Full-Bodied, Medium-Sweet, Pronounced Sherry with Fruity, Spicy, Malty Notes and Nutty, Smoky Hints
Cluster B: Medium-Bodied, Medium-Sweet, with Nutty, Malty, Floral, Honey and Fruity
Notes
Cluster C; Medium-Bodied, Medium-Sweet, with Fruity, Floral, Honey, Malty Notes and
Spicy Hints
Cluster D: Light, Medium-Sweet, Low or No Peat, with Fruity, Floral, Malty Notes and
Nutty Hints
Cluster E: Light, Medium-Sweet, Low Peat, with Floral, Malty Notes and Fruity, Spicy,
Honey Hints
Cluster F: Medium-Bodied, Medium-Sweet, Low Peat, Malty Notes and Sherry, Honey,
Spicy Hints
Cluster G: Medium-Bodied, Sweet, Low Peat and Floral Notes
Cluster H: Medium-Bodied, Medium-Sweet, with Smoky, Fruity, Spicy Notes and Floral,
Nutty Hints
Cluster I; Medium-Light, Dry, with Smoky, Spicy, Honey Notes and Nutty, Floral Hints
Cluster J; Full-Bodied, Dry, Pungent, Peaty and Medicinal, with Spicy, Feinty Notes Those who want more information about the exercise and especially advice about other Scotch whiskeys they might enjoy should consult Wishart (20O6).
Adapted from Wishart, D., Whiskey Classified* London, Pavillion, 2006* Materials used with the permission of Mr. Wishart and Pavillion, and imprint of Anova Books.

DATA MINING
what products are frequently bought together, which is useful for marketing purposes. This is sometimes referred to as "market basket analysis." One uses this kind of mining to find associations among the factors. Associations are events linked with regard to a single criterion, such as two or more courses that students tend to take together, such as DSS and database systems. The fact that students take the courses together might not be apparent without the analysis. However, after the analysis, we know that the two courses should not be scheduled at the same time.
Sequences are events linked over some period of time, such as patterns the students employ for taking courses over multiple semesters. The important characteristic of these linkages is that they are ordered: observations with characteristic X are also likely to have characteristic Y. For example, a student who takes a statistics course this semester is unlikely to take the forecasting course for two subsequent semesters. This will help the department plan course offerings. Or, perhaps more commonly, voters who express interest in issues of education and health care prior to the election are more likely to vote for the Democratic candidate.
Finally, forecasting or predictive data mining is the process of estimating the future value of some variable. While clearly it is possible to use tools like regression to forecast the future, the goal of the data mining is to find rules that might predict what will happen. Universities do (or should do) this kind of mining since they have significant historical databases of students, their characteristics prior to admission, and their level of success. So a data-mining exercise might identify specific combinations of test scores, experience, and grades that were associated with successful students (generally defined as those who graduate) to find decision rules for admissions. Insurance companies mine their data of symptoms, illnesses, and treatment plans and outcomes to determine the best course of treatment for particular illnesses. In the latter case, this analysis might be with regard to outcome and to cost.
An interesting form of predictive data mining is in the area of text mining. This can be particularly useful for brainstorming or alternative generation in the decision-making process. Suppose, for example, that you are the state senator on a transportation committee and you are trying to determine what projects are most important to your constituents. Of course you can read everything on the Internet about it or you can poll your constituents, but both of those take time. Instead you want to have the computer analyze some transportation blogs on the subject of transportation in your state. One way to analyze the blog is to input the text of the blogs in a a product such as IBM's "Many Eyes" so it can analyze the words in the text. A starting point might be to examine a word cloud such as that shown in Figure 4.11.
The word cloud sizes the words in proportion to the number of times that they appeared in the blog. You can see from this that the bloggers discuss specific locations, such as St. Louis or Jefferson City, and individuals in the MoDOT hierarchy most, because those words are the largest. Moving beyond this, you see that terms such as "bridges," "safety belts," and "work zones" appear frequently. To pursue those lines further, consider a word tree that gives more information of how those words are used in context. An example that shows phrases following the word "bridge" is shown in Figure 4.12. Many Eyes will allow users to click on the various terms and follow them to their completion or do additional analyses on them. The goal of the use is, of course, to provide ideas to the senator about what is important to his or her constituency.
Data mining can be a very useful tool for identifying trends that decision makers might not have considered. However, it can also identify statistically significant trends that are not the least bit useful. The decision maker needs to understand the assumptions underlying the statistics and the implications for their data before applying the results from data mining.

Fig
ure
4
.11
. W
ord
clo
ud a
naly
sis
of a
blo
g d
iscu
ssin
g p
lans
and
pro
blem
s of
pro
ject
s un
der
cons
ider
atio
n b
y M
isso
uri
DoT
Dep
artm
ent
of
Tra
nsp
ort
atio
n.
The
sum
mar
y w
as p
repa
red
by
Dav
id D
oom
usi
ng IB
M's
to
ol,
"Man
y E
yes.
"

Fig
ure
4
.12
. W
ord
tre
e of
a b
log
. Wo
rd b
ridg
e an
alys
is o
f a
blog
dis
cuss
ing
pla
ns a
nd p
robl
ems
unde
r co
nsid
erat
ion
by
Mis
sour
i D
oT. T
he s
umm
ary
was
prep
ared
by
Dav
id D
oom
usi
ng IB
M's
too
l, "M
any
Eye
s."

156 MODEL COMPONENT
For example, large sample sizes can result in even very small differences to be statistically significant. Even if you know that a rare event is statistically more likely under certain circumstances, it might not change how you approach a decision. If it does not change the decision, it is not important. Also, statistical significance does not address the question of the cost of gaining and using the intelligence. If the cost of applying the rule is greater than the savings associated with ignoring it, even if it is statistically significant, the exercise does not imply that decisions should be changed. Finally, there is the problem of running many tests. If you test enough hypotheses, about 5% of them should be "significant" even if they are all false. That is what the significance level means. So, if the tests are random, and not based upon some reasonable understanding of the business, some results might simply reflect spurious relationships that are not useful for running the business.
A variety of analytical tools—neural networks, decision trees, rule induction, and data visualization—as well as conventional analyses are used to complete these five kinds of data mining. These tools can "learn" to predict changes in the environment, generate rules for classification of data, find similar subjects among the data, identify if-then rules for action, and display data so that decision makers can glean important patterns. To be successful, the approach and the product must meet the needs of the user and a particular data warehouse. Other criteria for the evaluation of data-mining products are listed in Table 4.2.
Intelligent Agents
Intelligent agents are pieces of software that complete specific, repetitive tasks on behalf of the user. They are not new to computers; in fact, they are commonly in use on systems to monitor CPU and peripheral use and capacity. Other intelligent agents are associated with e-mail systems, where they help sort and prioritize e-mail by sender or topic on behalf of the user. Their new use is as a means to search through relational databases to find relevant data for decision makers. Even more exciting is the combination of search protocols with analytical capabilities that will cause the intelligent agent not only to find data but also to analyze it to find examples of trends or patterns the decision maker might miss on his or her own. In addition, the intelligent agent can get at the information faster to detect unusual occurrences so the decision maker can act upon them more quickly.
For example, consider the product DSS Agent from MicroStrategy, as shown in Figure 4.13. This product surfs a data warehouse for information and summarizes it for decision makers. In fact, this particular screen summarizes data at Recovery.gov, which in 2009 con-taied information about how the American Recovery and Reinvestment Act was working, including an up-to-date data on the expenditure of funds.
Researchers at the University of Vermont developed a website, http://www.weteelfine.org4s that mines through some 2.3 million blogs looking for sentences beginning with tlI feel" or "I am feeling." They use personal online writing to determine the mood of people in real rime. After mining the sentence, they use the standardized "psychological valence" of words (established by the Affective Norms for English Words) to give each sentence a happiness score, The rating of the individual blog is not important; rather their goal is lo measure the big picture of a town or other grouping of people. They use their tool in an exploratory fashion to measure the feelings of the country as a whole. Clearly such a tool could be used to mine for other words, such as those of a company's product, to provide decision makers with consumer's attitudes about the product,

DATA MINING 157
Satoshi Kanazawa, a reader in management and research methodology at the London School of Economics, published a series of papers that predict the sex of one's baby, the last of which is "Beautiful Parents Have More Daughters"*, Dr, Kanazawa took a sample of almost 3000 individuals who were asked the number of children of each gender and who were rated on a five-point scale regarding attractiveness. His results are shown in the following graph as the points.
60% - , 1
Two researchers reexamined his method and found that the "statistical significance" noted in the original paper just did not exist.f
Note that the least attractive people (rated 1) had about a 50-50 chance of having a girl while the most attractive people (rated 5) had about a 56% chance of having a girl. What the author did was to compare the aggregate of groups 1-4 to group 5 and found that the difference between them was significant. But, in reality, a correct statistical test would have made not only that comparison but also other combinations of groups, such as group I to the aggregate of groups 2-5, or the aggregate of groups 1 and 2 to the aggregate of groups 3-5, and so on. Furthermore, if you do those additional tests, they must be included in the test of significance of the experiment, In other words, statistical validity relies not just upon the one comparison but rather on all of the comparisons together. As the authors point out, the curved lines in the diagram above are the result of a better test; this test does not show statistical significance. This is one of the examples of statistical problems associated with the mining of data.
*From S. Kanazawa, "Beautiful Parents Have More Daughters: A Further Implication of the Generalized Trivers-Willard Hypothesis,'* Journal of Theoretical Biology, 244, 2007, pp. 133-140. rFrom A. Gelman and D. Weakllem, Of Beauty, Sex and Power," American Scientist, 97(4), July-August 2009, pp. 310-314,
I

158 MODEL COMPONENT
Figure 4.13. DSSAgent screen. Summary of the progress of the American Recovery and Reinvstment Act available
at: http://www.microstrategy.com/recovery-act-data. Image is used with permission from microstrategy.
Using these intelligent agents, users can schedule intelligent agents to execute on a one-time basis, periodically, or based upon events. For example, decision makers can perform regular scanning of absenteeism or missing reports to highlight indicators that problems might need attention. Or, decision makers can schedule intelligent agents to find information about changes in demand after planned promotions or after a particular indicator reaches some prespecified value. Using workflow triggers, users can specify both pre- and postagent macros that can integrate with other modeling components of the DSS. For example, the agent could find information that would automatically be imported to a forecasting application to compute projected demand. If desired, another agent could be triggered to mail results of the application automatically to people on the management team.
Many intelligent agents today provide a set of options through which the user can scan the data warehouse. For example, users can define filters based upon specific qualifying criteria. Or, users can define percentile and rank filtering; using this option, decision makers could identify the source of the top 10% of their raw materials, for example. Similarly, intelligent agents can be launched using conditional metrics. Hence, users can specify information to be found regarding a particular business unit and compared it to that of multiple business units or to the company as a whole.
To fully exploit the data-mining capability, however, the intelligent agents need to be combined with artificial intelligence so the software can find not only the data but also
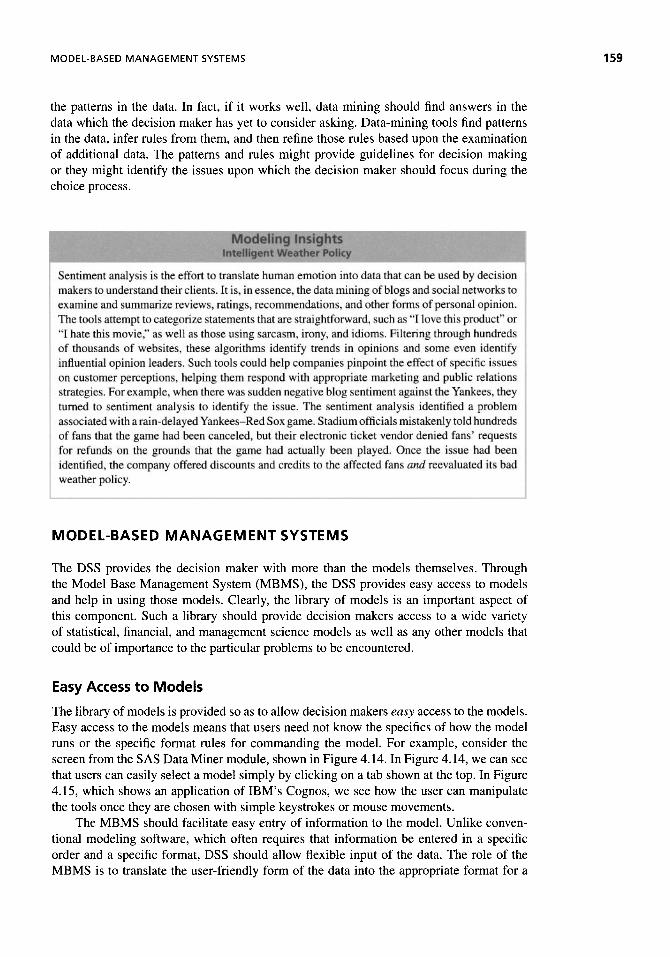
MODEL-BASED MANAGEMENTSYSTEMS 159
the patterns in the data. In fact, if it works well, data mining should find answers in the data which the decision maker has yet to consider asking. Data-mining tools find patterns in the data, infer rules from them, and then refine those rules based upon the examination of additional data. The patterns and rules might provide guidelines for decision making or they might identify the issues upon which the decision maker should focus during the choice process.
MODEL-BASED MANAGEMENTSYSTEMS
The DSS provides the decision maker with more than the models themselves. Through the Model Base Management System (MBMS), the DSS provides easy access to models and help in using those models. Clearly, the library of models is an important aspect of this component. Such a library should provide decision makers access to a wide variety of statistical, financial, and management science models as well as any other models that could be of importance to the particular problems to be encountered.
Easy Access to Models
The library of models is provided so as to allow decision makers easy access to the models. Easy access to the models means that users need not know the specifics of how the model runs or the specific format rules for commanding the model. For example, consider the screen from the SAS Data Miner module, shown in Figure 4.14. In Figure 4.14, we can see that users can easily select a model simply by clicking on a tab shown at the top. In Figure 4.15, which shows an application of IBM's Cognos, we see how the user can manipulate the tools once they are chosen with simple keystrokes or mouse movements.
The MBMS should facilitate easy entry of information to the model. Unlike conven-tional modeling software, which often requires that information be entered in a specific order and a specific format, DSS should allow flexible input of the data. The role of the MBMS is to translate the user-friendly form of the data into the appropriate format for a
Sentiment analysis is the effort to translate human emotion into data that can be used by decision makers lo understand their clients. It is, in essence, the data mining of blogs and social networks to examine and summarize reviews, ratings, recommendations* and other forms of personal opinion. The tools attempt to categorize statements that are straightforward, such as"[ love this product" or "I hate this movie," as well as those using sarcasm, irony, and idioms. Filtering through hundreds of thousands of websites, these algorithms identify trends in opinions and some even identify influential opinion leaders. Such tools could help companies pinpoint the effect of specific issues on customer perceptions, helping them respond with appropriate marketing and public relations strategies. For example, when Lhere was sudden negative blog sentiment against the Yankees, they turned to sentiment analysis to identify the issue. The sentiment analysis identified a problem associated with a rain-de laved Yankees-Red Sox game. Stadium officials mistakenly told hundreds of fans that the game had been canceled, but their electronic ticket vendor denied fans' requests for refunds on the grounds that the game had actually been played. Once the issue had been identified, the company offered discounts and credits to the affected fans and reevaJuated its bad weather policy.

160 MODEL COMPONENT
Figure 4.14. Simple model selection. Copyright © 2009, SAS Institute Inc. All rights reserved. Image reproduced with permission of SAS Institute Inc., Cary NC, USA. (Source: http://www.sas.com/presscenter/screenshots.html.)
particular model. For example, even if a model requires the data be input in a rigid line and column framework, such as shown below,
1.22 15 3 2.31 21 6 3.11 11 9
the user can input them (if they are not already in a database) flexibly in a format that might be more comfortable, such as 1.22, 2.31, 3.11, 15, 21, 11, 3, 6, 9. The MBMS will put the data in the format appropriate for the particular model(s) being used.
Similarly, users of the system need not be aware of the specific syntax required to execute a particular model. The MBMS should generate the necessary commands to tell the machine where the model is located and what commands are necessary to cause the model to execute. For example, the user should not need to remember (or even know) the requirements for naming or formatting the data to utilize them in a model. Rather than the user needing to remember the code, such as that shown in Code 4.1, the user would simply "click" on the icon for accounts data. Clearly, someone would need to program the system to associate a particular icon with a given place in the database. More important

MODEL-BASED MANAGEMENTSYSTEMS 161
Figure 4.15. Simple manipulation of a model. Screen shot from the 4.02 mark of the Cognos
video, "Forecasting in Turbulent Times":http://www-01.ibm.com/software/data/cognos/solutions/
software-reporting-analysis.html; Image is reproduced courtesy of International Business Ma-
chine Corporation http://download.boulder.ibm.com/ibmdl/pub/software/data/sw-library/cognos/
demos/od.forecasting/rollingforecasts.html.
from the perspective of the MBMS, though, is the fact that the data have been identified in the appropriate format as input to a particular package (in this case, SAS).
Further, it is important that the program be notified that there is something "unusual" about the data, such as the record length. Not only might users be unaware of the appro-priate syntax through which to share this information, they might not even know that the information needs to be provided. Similarly, users should not need to remember the control sequences for testing hypotheses (Code 4.2); they could simply type is there a difference in absenteeism in the different groups?
Of course, in order to provide this easy access to models, the designer must make certain assumptions about how the decision makers want their analyses conducted. In this case, the designer made assumptions about the specific test of the differences of means among the groups by specifying the model, the test, the procedure, and the format of output. On the one hand, this makes analysis easier for the decision makers because they can access the model immediately without needing to specify assumptions, look up syntax,
Code 4.1 Sample Code to Input Data from a Modeling Package
CMS FILEDEF ACCOUNTS DISK ACCOUNT DATA AI (LRECL 135); DATA SAMPLE; INFILE ACCOUNTS; INPUT DEPARTMENT $ 1-7 EMPLOYEE $ 9-2 5 NUMBER 27-32
ABSENT_FULL 34-36 ABSENT_HALF 38-42 REASON 80-133; TOT_ABSENT = ABSENT_FULL+ABSENT_HALF;

162 MODEL COMPONENT
or write code. On the other hand, it constrains those decision makers who need different assumptions for their particular test. This presents somewhat of a dilemma for the designer of the system in knowing how to make the trade-off between flexibility and control.
Regrettably, there is not a standard answer to this question, and only knowledge of the decision makers, their preferences, their agreement on their preferences, and the likelihood of their changing preferences will define how much flexibility is needed in the model features. However, a designer can compromise. If, for example, most decision makers want the features set in a particular way but not all accept this option, the features could be set with a default setting and easy access to change the settings. Upon the selection of the test, a window such as that shown in Figure 4.16 could appear. As the users click a mouse (or press enter) on any one of those, they would see another window that allows them to change the options.
There are variations on this approach. If, for example, the differences in features is person specific, the designer could build intelligence into the system with a rule that specifies that, if the user is PERSON X, the Gabriel test rather than the Duncan test should be used. In this way, PERSON X always has the preferred test as the default and all others have their preferred test as the default. Or, the designer could provide a check box that
Figure 4.16. Model option selection.
Code 4,2 Sample Code to Process Data from a Modeling Package
PROC ANOVA; CLASS 0FFICE1 OFFICE2 OFFICE3; MEANS 0FFICE1 OFFICE2 OFFICE3 OFFICEl*OFFICE3/DUNCAN LINES; MODEL Y = OFFICEl | OFFICEl*OFFICE3 | 0FFICE3/INT INTERCEPT; TEST H = TOT^ABSENT TOTJ^SENT*SENQRITY JOB
TITLE 'ABSENTEEISM BY OFFICE, SENIORITY, JOB';
CLASSES
MEANS
MEANS TEST
MODEL
INTERCEPT
HYPOTHESIS TESTS
Hr
E:
defined as A B C
specified as A B C andA'C
Duncan
defined as main effects
tested as an effect
will be printed
specifies numerator effects
specifies denominator effects

MODEL-BASED MANAGEMENTSYSTEMS
would allow users to change defaults before running the test if they desire. While it is tempting to force the user to acknowledge and accept each option individually, it is not recommended. Such a sequence will increase the average amount of time it takes for a user to run a model. Unless many users often change the options, this is an unnecessary waste of time. In addition, many users will quickly tire of these repeated entries, learn to ignore them (by pressing accept for each option), and become frustrated with the system. Furthermore, they will not be any more likely to actually read the entries.
Understandability of Results
In addition, the DSS should provide the results back to the user in an understandable form. Most models provide information to the user employing at least some cryptic form that is not comprehensible for people who do not use the package frequently. For example, the results from a regression could be presented using a standard output format of a commonly used modeling package, such as that shown in Figure 4.17. Regular users of this modeling package can find most of the information that they need to evaluate the model and begin forecasting with it. However, even a person who is familiar with statistics but unfamiliar with the output of this package or other statistical packages might not be able to interpret the meaningfulness of the results. Certainly a decision maker not familiar with either statistics or the modeling package would be unlikely to be able to answer even the simple question of how many items one would expect to sell if the price were $1.24 and the advertising expenditures were $15/month. Consider, instead, a screen such as that shown in Figure 4.18.
In Figure 4.18, the results are labeled clearly and all the relevant information is provided to the user in a conclusion format. The user does not need to remember too much about the technique "regression" because the screen explains the types of issues that should be of interest. Furthermore, it encourages the user to experiment with the model (by entering data) so as to become more comfortable with it and the results. Since one of the fundamental assumptions in DSS design is that the supported decisions are "fuzzy" and infrequently encountered, it is important not to assume that the user can remember the nuances of the output of each model that might be accessed.
Note that we are not simply talking about the appearance of the results. In Figure 4.18, we are literally helping the user to understand the meaning of the output by removing some of the jargon implicit in the computer printout and rephrasing in terms the decision maker can understand. For example, consider the boxed information on the left. The purpose of the box is to highlight the meaning of the slope coefficient associated with each of the variables as well as their associated interval estimates. In contrast, Figure 4.17 lists the slope in the column "parameter estimate" next to the respective variable name. The appropriate standard error appears in the following column. To use the information from the the modeling package output, the decision maker needs to know what each of these terms means and that a slope can have a physical interpretation. Furthermore, the decision maker needs to know that all point estimates have intervals associated with them and that we determine the interval by multiplying the standard error by the critical value of t associated with 48 degrees of freedom, which is found in a standard t table but not in Figure 4.17! This is a lot to expect from the decision maker, especially given that each model has its own unique notation and set of issues. The box in Figure 4.18 does not require the decision maker to know all the intermediary steps or to compute anything. In short, Figure 4.17 provides results from the model. Figure 4.18 provides support for a decision.
Clearly, different individuals will require different levels of support. Figure 4.18 pro-vides only the minimal quantitative information. However, it can be tied to other output

164 MODEL COMPONENT
Figure 4.17. Traditional results format.
screens that could provide additional support if the decision maker selects it. For exam-ple, in Figure 4.21, the instructions note that the user can obtain additional information about a specific topic by clicking the mouse on that statement. In this screen, the statement "both variables are useful" is highlighted. If the decision maker clicked on that space, the system would display Figure 4.19, which provides additional information, including the mathematics and assumptions behind the statement.
The previous example provides information to the decision makers only if they select it. However, sometimes you want to make sure that the decision maker sees additional help screens because it is crucial. In this case, the system can "force" a particular area of the screen to be highlighted, create a "pop-up" notice about a problem, or emit a sound to catch the decision maker's attention. Suppose, for example, the variable "price" in the model described in Figure 4.20 were not statistically significant. It is possible to provide the information in a box as shown in Figure 4.20.
This box provides information about the validity of the model. However, it is passive and does not highlight the problem or tell the decision maker the implications of the problem. Instead, consider Figure 4.21. In this screen, we are highlighting some of the information so that it is not missed by the decision maker. Not only does this additional screen call attention to the easily missed note about the variable being not statistically significant, the "CAUTION" screen tells the decision maker the implications of not taking

MODEL-BASED MANAGEMENT SYSTEMS 165
Figure 4.18. Results with decision support.
action on this problem. In this way, the DSS is helping the clients clarify their assumptions about the implications of the results. So, in fact, the DSS is helping the decision maker to use the information correctly.
The way we accomplish this task depends on what kind of DSS generator and modeling package we are using. In an abstract sense, there must be code that causes the computer to scan the results of the model and creates the base screen with the results. In this case, the modeling package must return the results of the F statistic, the t statistics, the probabilities associated with those t statistics, and the mean squared error. Further, there must be some "intelligent" link that fires to interpret the results and to place those results in the appropriate window. Finally, there must be another intelligent link that fires when one of the variables is not significant to cause the "CAUTION" screen to appear.
Clearly, creating this kind of help in a traditional language is difficult. The fourth-generation languages and object-oriented languages available today allow the designer much more flexibility. First, such languages allow the user to create "pop-up" windows that are linked to particular results or variables. In this case, each of the four items noted in the results window might actually be a different window that is linked to code checking the appropriate result. The border might actually be a hyperregion that serves no purpose but an aesthetic one. Furthermore, the "CAUTION" screen might be linked to an indicator of nonsignificance of a variable. An alternative "CAUTION" screen might be linked to a condition where two or more of the variables are not significant.

166 MODEL COMPONENT
Figure 4.19. Detailed model support.
Integrating Models
Another task of the MBMS is to help integrate one model with another. For example, suppose the user needs to make choices about inventory policy and selects an economic order quantity (EOQ) model, as shown in Computation 4.1. To use this formula to determine the optimal order quantity, we need information about expected product demand, the costs associated with an order, and the typical holding costs (with consistent monetary and time
units). If the decision makers can input the data or read the data directly, there is no problem. Typically, however, this is not the case. Generally, the order costs need to be computed by combining the costs of personnel, supplies (such as forms), and services (such as phone resources) needed to execute an order. In addition, since holding costs can vary over time, we need to average holding costs to obtain a current estimate. Finally, unless demand is

MODEL-BASED MANAGEMENTSYSTEMS 167
Figure 4.20. Passive warning of model problems.
well specified, it needs to be forecasted based on historical data. Hence, upon selection of the EOQ model, the MBMS needs to complete several tasks:
1. Search the database for a single value for the order costs. 2. If no specific order cost information is available, invoke the model to compute order
costs by summing personnel costs, supply costs, service costs, and the order cost charged by the vendor.
3. Feed the computed order costs to the EOQ model. 4. Obtain data about holding costs. 5. If historical data are available, estimate holding costs. 6. If no historical data are available, invoke the model to determine holding costs. 7. Feed the computed holding cost value to the EOQ model. 8. Invoke the model to forecast demand for the time period(s) served by the order. 9. Feed forecasted demand to the EOQ model.
10. Compute the economic order quantity.
The user not only should not need to intervene in this process but also should not need to know the process is occurring. However, since the meaningfulness of the EOQ is dependent upon the quality of the forecasts and estimates, the user should be provided the

168 MODEL COMPONENT
Figure 4.21. Active warning of model problems.
forecasts and information about the quality of those forecasts. This might be accomplished as in Figure 4.22.
Sensitivity of a Decision
One of the tasks of the model base management system in a DSS is to help the decision maker understand the implications of using a model. This is not always easy because decision makers may not be inclined to ask questions, particularly if they do not know what questions need to be asked. Consider the following examples.
Example 4.1. Peara's Personalized Widgets uses an assembly line to build desired con-figurations. One of the employees on the line has suggested a change in procedure that Andrew Peara thinks might improve the efficiency of the operations. Andrew Peara wants to determine if his intuition is correct and if the change would be worth implementing. To investigate this using historical data, he determines that the mean length of time to perform a certain task or a group of tasks on an assembly line is 15.5 minutes, with a standard de-viation of 3 minutes. Because he understands the importance of collecting data, he selects 16 employees and teaches them the new procedure. After a training period, he finds these employees, on average, take 13.5 minutes to perform the task with the new procedure. The question Andrew needs to answer is whether these results provide sufficient evidence

MODEL-BASED MANAGEMENTSYSTEMS 169
Figure 4.22. Integration of models.
to indicate that the new procedure is really faster and thus should be implemented. This statistical analysis for this problem is shown in Computation 4.2.
Computation 4.2. Sample f-Test In introductory statistics, you learned that this type of problem is a one-tailed test of the mean. From a statistical point of view, the question is
Ho: HA:
μ= 15.5 μ < 15.5
Where μ is the true mean task time. To test this, given the sample size of 9 and the estimated standard deviation, one uses a t test: Reject HQ if computed t is less than the critical t value, ti£ = 1.8331, or
t = μ
tf^fn < 1,8331
In this problem,
t = ■ ß 13.5-15.5
= - 2
Since the calculated value for / i s less than the critical value of t (in standard r tables found as — 1,8331 )> one can reject the null hypothesis,

MODEL COMPONENT
Based on the analysis, Andrew Peara knows that there is reason to believe the new procedure will reduce the amount of time it takes to perform the task. However, it is unlikely that this is the only information the decision maker will want to know in order to make the decision. It is obviously necessary to determine whether the value of the additional widgets that could be produced (because it takes less time to perform each one) offsets the cost associated with the training. We could then estimate that instead of producing 3.87 widgets per hour (one every 15.5 minutes), the average person will be able to produce 4.44 widgets per hour. Said differently, this is an increase of 4.59 widgets per shift, or 22.98 widgets per week for an average worker. With this information and some information about the revenue per computer and the cost of training, the decision maker can easily decide whether the additional 23 widgets per week per worker will increase revenue sufficiently to justify the costs of training.
However, this analysis is built upon some assumptions that may not be clear to the decision maker. One of the characteristics of good decision support is that it helps the deci-sion maker understand these assumptions and evaluate whether or not they are reasonable. Before discussing how to display the information, we need to know the assumptions.
1. A major assumption underlying this analysis is that these 16 individuals really do represent the employees who will perform this task. While the description of the problem indicated that the 16 were "randomly selected," it is important to be sure they are representative. In real-world cases, "randomly selected" might mean the 16 people who volunteered, the 16 best workers, the 16 biggest problems for the supervisor, or the 16 people who happened to make it to work on a very snowy day. Since you are not provided with information regarding how the sample was selected, it is important to test whether these employees really were representative by comparing their task times prior to the introduction of the new procedures to their times afterward (such as through a paired t test).
Consider the three possibilities and how they could affect the decision. If their average pretraining assembly time were not statistically different from that of the entire group, then the original conclusion appears valid. If instead their average pretraining task time were statistically larger than that of the group, the results are potentially more impressive. This fact should be brought to the attention of the decision maker as even more evidence that the training is good. However, if their average pretraining assembly time already were statistically lower than 15.5 (especially if it is statistically lower than 13.5), Andrew Peara would need to know the training might not be as effective as the test first indicated.
2. A second assumption is that the variance associated with task completion will not be increased. The original description of the case indicated that the standard deviation is 3 minutes. Since one of the major causes of bottlenecks on assembly lines is increases in variation of assembly time, it is necessary to determine whether the posttraining standard deviation is still 3 minutes. Problems in balancing the line and/or quality control will almost certainly occur with an increase in the variance.
3. One of the basic assumptions is that there is demand for the extra capacity. The benefits of achieving this new efficiency can only be realized if either there is demand for additional items or the workers can be used profitably in some other task. If not, regardless of the results of the test, incurring the cost of the new training is not worthwhile.

MODEL-BASED MANAGEMENTSYSTEMS
As with most aspects of decision support, there is no universally correct way to provide this information to the decision maker. The basic options are (a) check the assumptions automatically and note the results on the screen in a pop-up box; (b) check the assumptions automatically and only note the violations of the assumptions on the screen; (c) note the assumptions on the screen and allow users to decide whether or not they need to be checked (either individually or as a group); or (d) ignore the assumptions and assume the users know enough to check them without system help. Clearly each option has advantages and disadvantages. If we provide total information (the results of the tests on the screen), then the user is informed about the reasonableness of the use of the statistic. However, users may find this information clutters the screen, especially if many assumptions are evaluated for a given test. In addition, users may not take the time to scan the information box and hence may not notice the violations. Similarly, if we simply give the users the option of checking assumptions, they may not take the time because they do not know the value of the additional information. However, if the users are quite knowledgeable about their data, this option saves processing time and hence provides a faster response to the user. By not warning the users of the potential problems, we fail to provide decision support.
The remaining option, check the assumptions and list only those that are not validated by the check, provides the support necessary to help users apply the techniques better. In addition, since only problems are noted on the screen, the results do not become tedious and users know they should pay attention to them. Of course, testing the assumptions can use more processing time and hence slow response time. If this is perceived to be a problem, we can always allow the user to set options to ignore the testing of one or more assumptions prior to running the test. We even can build these preferences into a profile for each user so they do not need to be set each time a model is invoked.
In addition to testing assumptions to verify that a model is being appropriately used, the decision maker might simply want to develop a better intuition for the problem. The MBMS should help users to investigate more facets of a problem easily. Typically, such additional analyses are menu options, not automatic procedures.
Consider the types of additional analyses that might be undertaken in the problem of the mean task times just considered. Clearly, additional analyses are more crucial if the results of the analysis suggest there is no difference in the two means. Such intuition can be facilitated by the system giving information about the sensitivity of the results to the various conditions of the problem. For example, it might be quite reasonable to provide some information about what mean time would be necessary to produce a statistically significant result. This can be determined by using the same equation but solving for the sample mean necessary to achieve the critical value of t (from a statistical table), as shown in Computation 4.3. So, as long as the new procedure takes, on average, less than 13.67 minutes, it will produce a statistically significant improvement. Alternatively, we might want to know how large a sample would have been necessary to obtain significance with the result of an average time of 13.5. Again, it is simply an issue of considering the base formula in a slightly different manner as shown in Computation 4.4. In this case, the results

172 MODEL COMPONENT
suggest that it was only necessary to have three subjects with the data that are available. If the test had not been significant and Andrew Peara would want to rerun the test with a different number of subjects, this equation would tell him how many subjects to select.
Example 4.2. Consider a second example where a decision maker selects regression to help solve a problem. In this case, a manufacturer wants to know the relationship between the age of machinery and the annual maintenance costs. A sample of 50 machines is taken and the following costs are obtained:
Age (months)
Ϊ 2 3 4 5 6 7 8 9 10 11 12 13 14 15 16 17 18 19
1 20
Maintenance Costs
81 35 114 36 91 134 45 130 170 141 188 145 220 119 134 196 154 207 188 226
Age (months)
21 22 23 24 25 26 27 28 29 30 31 32 33 34 35 36 37 38 39 40
Maintenance Costs
59 52 59 57 67 73 66 77 68 73 81 76 84 79 82 477 456 431 447 505
Age (months)
41 42 43 44 45 46 47 48 49 50
Maintenance Costs
543 457 491 588 596 602 580 654 559 678
If we constructed a screen for the results of this regression that paralleled that in Figure 4.21, it would appear as that shown in Figure 4.23. It appears from the information provided in Figure 4.23 that the model is good and should be used. However, this is not true. Although the relevant statistical measures of the model have been checked and are significant, they do not convey the complete story about the implications of using this model. Consider the graph of the maintenance data shown in Figure 4.24. With a quick examination of the data, it becomes obvious that there is some phenomenon occurring in the middle of the data. This change in process is undoubtedly affecting the equation. More importantly, from a prediction point of view, of course, is the fact that the equation is not particularly good

MODEL-BASED MANAGEMENT SYSTEMS 173
Figure 4.23. Modeling results with some interpretative support.
Figure 4.24. Plot of maintenance data.

174 MODEL COMPONENT
Figure 4.25. Model results with better interpretative support.
at predicting costs for those 10 machines. This suggests that the age of the machinery is not sufficient to determine maintenance costs and that some other phenomena need to be considered. From the user's perspective, the graph suggests that while age might be a good indicator in general, it is necessary to understand the maintenance issue better.
It is difficult, even with today's technology, to have the computer scan the graph and alert the decision maker to problems in the data. Since the graph conveys information not communicated by the statistics, it is useful to provide a way for decision makers to get to the graph easily. If the decision makers can be relied on to look at the information, simply providing the ability to view the graph through a click of a button is sufficient. An alternative is to have the graph be part of the screen, as shown in Figure 4.25.
Model Management Support Tools
The kinds of issues associated with model-generated questions like those in the two exam-ples will, of course, depend upon what model is being used. For example, if the decision maker is using linear programming to determine a mix of products to produce with a lim-ited set of inputs, then sensitivity analyses will include questions such as: (a) what if the company has more of a particular input than specified; (b) what if the company has less of a particular input than specified; (c) what is the impact on production policies if the price

MODEL-BASED MANAGEMENT SYSTEMS 175
Figure 4.26. Passive prompting for further analysis.
of an input changes; (d) what is the impact on production policies if the selling price is changed; and (e) what is the impact if we change the relative input needs of the possible products? Alternatively, if we are using a financial analysis, the questions might be, "How is present value affected by discount rate, tax rates, or depreciation.?"
Further analyses also might be prompted by a particular result of an analysis. For example, suppose that the DSS has been created to support marketing research for a clothing manufacturer. Suppose further that someone found a result that the demand for the high-end trousers was declining in some states but increasing in other states. This might prompt the decision maker to ask questions, such as what do the states where sales are increasing have in common and what do the states where sales are decreasing have in common. In particular, the decision maker might be interested in the demographic distribution of the states, the distribution of competitors in the states, and the similarities in income, population, industry, or metropolitan areas in the states. Hence, for the system to be effective, the decision maker should be able to query it about each of these facts. Suppose that in these queries the decision maker finds the average age of white collar workers is higher in the states where the trousers are selling well than the states where the trousers are selling poorly. This provides the decision maker with some information. Perhaps the company officials already know that their product appeals to more mature clientele. Then, the results probably will not be investigated. However, if decision makers perceive the product appeals more to younger clientele, then this information would suggest a need for further modeling to test the underlying assumptions of their market research efforts.

176 MODEL COMPONENT
Figure 4.27. Active prompting for further analyses.
Perhaps, upon receiving the information regarding declining sales, the decision maker who is new has no theories about what could be happening. A good DSS should be able to help those decision makers work through the analyses. For example, it should be able to prompt the decision maker to consider issues such as demographic changes in the area, employment trends, costs of living, and other factors specific to that particular product. Such help might come in terms of a simple "why" key available on the screen, as shown in Figure 4.27. Or, it might allow appropriate information boxes to appear, such as shown in Figure 4.28. Alternatively, the decision maker might want to know how the trends are expected to change over the next five years. Another screen might provide information about expected trends.
The important aspect of this kind of support is to provide enough of the appropriate information for the decision maker to understand the phenomenon of interest. The "WHY?" key might provide information about automatic analyses among predefined options and display them on the screen. In this way, the decision maker could click a mouse on a particular statement and identify the appropriate analyses that generated it. The result of this action might be the display of all related analyses or it might simply be the display of all significant related analyses. Although each option is appropriate in some cases, a general rule for selecting between these options is: The higher in management or the less statistically trained the person, the less nonsignificant analytical results the DSS should show.

CAR EXAMPLE 177
Figure 4.28. Assistance for defining criteria.
Or the "HELP!" key might provide information about the kinds of analyses that might be accomplished to further investigate the topic. This differs from the "WHY?" option in that it allows the decision maker to explore the relationships through whatever analyses are deemed appropriate. With the "WHY?" option, the user is provided "canned" analyses to consider. Alternatively, with this option, the system recommends analyses but allows the user to select either one of the recommended or user-defined analyses. Such an option can allow an unknowledgeable decision maker to learn more about the decision environment. It can also allow the very knowledgeable decision maker to pursue some subtle clue that is suggested by some earlier result.
CAR EXAMPLE
A careful consideration of models for the DSS could result in a system that allows users to make truly informed decisions. Models should provide support for all phases of decision making, from the initial generation of alternatives to the final questions of how to finance. In addition, the model management component should include assistance in the appropriate use of models and intelligence that reviews model use for errors. Finally, where possible, the model management system should implement heuristics to automate choices where decision makers cannot or do not implement choices.
Brainstorming and Alternative Generation
One important model management operation is to help users generate alternatives. At the simplest level, alternative generation could include searching for options that meet some

MODEL COMPONENT
criterion specified by the user. Some users will want a car that looks "cool" and goes fast. Others will want a car that will facilitate their car-pooling activities or that will be good for trips. Still others will want to consider fuel efficiency or safety in their analysis. Others will just want a car they can afford. The search process is straightforward and was illustrated in the previous chapter.
More likely scenarios, however, are that the user is not sure about the criteria he or she wants to employ or that the user has a general idea of the criteria but does not understand the specific factors to employ. The DSS should allow users to select any criterion or set of criteria. However, if we put all possible criteria on a screen, users will find the interface both difficult to read and overwhelming to use. If we put only a subset of the possible criteria for consideration, though, we are making choices about the criteria that the decision maker should use—clearly an inappropriate function for a designer of a DSS. Even if we list all possible criteria but use multiple screens to display them, we are suggesting a relative importance of the criteria by the order in which they are listed.
Hence, the goal is to summarize and guide while still allowing a great deal of flex-ibility. One possibility is to categorize criteria and ask users first to specify the category of criteria that they want to emphasize. For example, one could provide a menu choice that includes the categories, such as comfort, convenience, financial, mechanical, safety. Using this method, we could ask users to declare their criteria groups under the option "criteria" as highlighted in Figure 4.28. If a user selected performance criteria (as is highlighted), he or she would next select from factors that might be considered perfor-mance criteria. This list might include items such as acceleration rates, horsepower, or engine size since these items are clearly linked to performance. Others, however, might consider factors such as fuel efficiency to be a performance characteristic, and so they would be listed as well. At this screen, decision makers should be able to elect several factors in a category. In this way, decision makers can continue to refine their choice processes.
It is important to help users understand the implications of choices they select. One part of such help is ensuring that the users comprehend the meaning of the terms used in the questions. For example, suppose the user selected safety criteria from the screen shown in Figure 4.28. The next screen to appear would be Figure 4.29. Notice in this figure there is an icon for questions next to each criterion the users are asked to rate. So, if the user did not know of the NHTSA or any of its ranking procedures, he or she could query the icon next to NHTSA, and the system would respond with a pop-up box such as that shown in Figure 4.30. This box would explain the NHTSA, document the rankings they perform, and discuss the reliability and meaningfulness of its tests.
Another part of the model management function is to provide users with intelligent help as they proceed through the system. For example, suppose a user selected none of the factors listed in Figure 4.19. Since the system would be monitoring these selections, this inaction would trigger the system to fire a demon that warns the user of inconsistency in his or her choice of safety as an important criterion without selecting any individual criteria against which the criteria would be evaluated. The kind of result one might get is shown in Figure 4.31.
Rules such as these could be used in an evaluative manner as well. In this way, if users select criteria that are likely to cause them problems, intelligent agents can give them warning. For example, young, unmarried males tend to have very high insurance rates. So, if such a person selected acceleration rate and engine size as the two most important criteria (under the category of performance), then the system should respond with a warning about
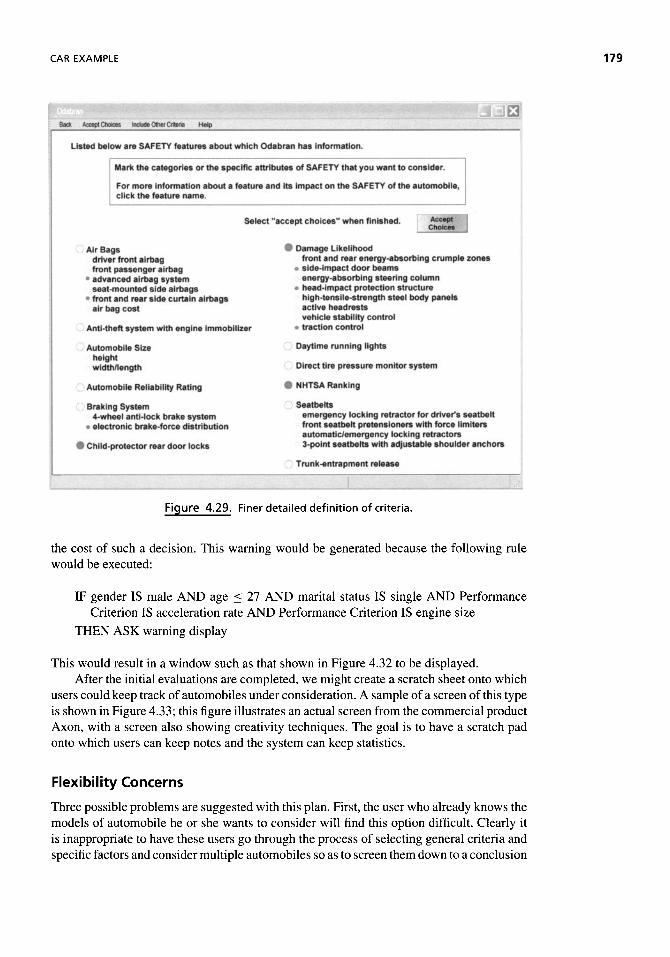
CAR EXAMPLE 179
Figure 4.29. Finer detailed definition of criteria.
the cost of such a decision. This warning would be generated because the following rule would be executed:
IF gender IS male AND age < 27 AND marital status IS single AND Performance Criterion IS acceleration rate AND Performance Criterion IS engine size
THEN ASK warning display
This would result in a window such as that shown in Figure 4.32 to be displayed. After the initial evaluations are completed, we might create a scratch sheet onto which
users could keep track of automobiles under consideration. A sample of a screen of this type is shown in Figure 4.33; this figure illustrates an actual screen from the commercial product Axon, with a screen also showing creativity techniques. The goal is to have a scratch pad onto which users can keep notes and the system can keep statistics.
Flexibility Concerns
Three possible problems are suggested with this plan. First, the user who already knows the models of automobile he or she wants to consider will find this option difficult. Clearly it is inappropriate to have these users go through the process of selecting general criteria and specific factors and consider multiple automobiles so as to screen them down to a conclusion

180 MODEL COMPONENT
Figure 4.30. Content-dependent assistance of criteria selection.
upon which they have already arrived. Since they know the automobile or automobiles they want to consider, the process should be straightforward. These users can use the "select" option in the main menu that allows them to choose one or more automobiles directly and proceed in the analysis from there.
A second problem is the user who wants to select a mixed strategy. This user wants some characteristics specified under multiple categories. For example, the user might want an automobile that has a high fuel efficiency as well as a good safety record. These users also can be accommodated if the system allows them to move into other criteria categories from the secondary screens. So, when the user has selected issues of importance under the safety criterion, for example, he or she can then select an option of "identify other criteria" and be given the list of criteria not yet selected, including comfort, convenience, financial, mechanical, and performance, as shown in Figure 4.34.
The third problem is the user who has absolutely no idea of how to select an automobile. In this case, the model management system should help users brainstorm criteria with intelligent agents. Specifically, the system should invoke an expert system that focuses on lifestyle questions and generates a set of criteria based upon the user's answers. The system would ask users questions and process the answers based upon rules developed by designers. For example, a rule such as
IF monthly disposable income < 200 THEN Criteria OF Preferences IS Financial
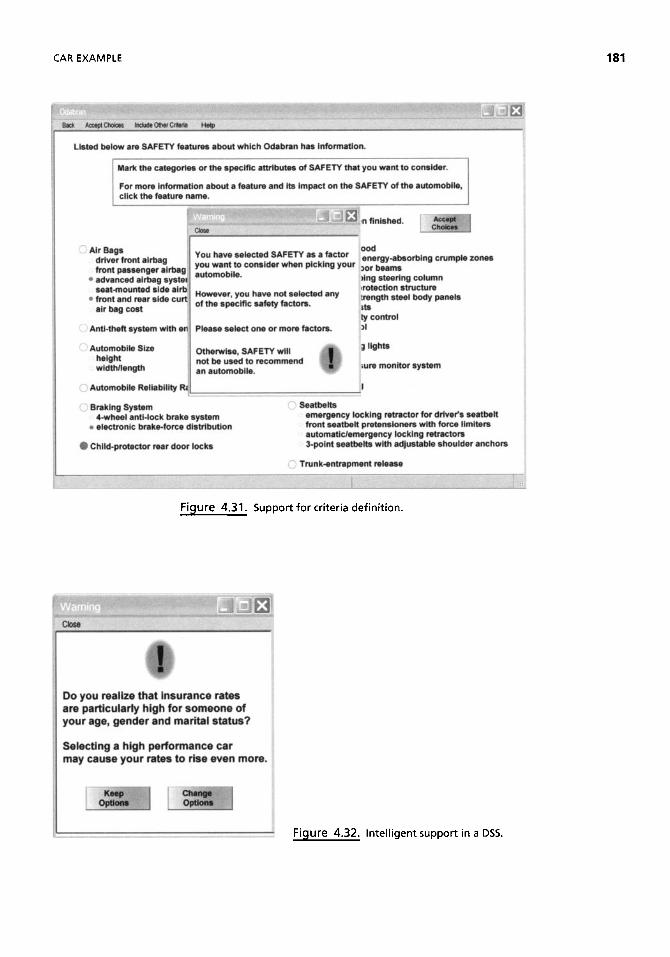
CAR EXAMPLE 181
Figure 4.31. Support for criteria definition.
Figure 4.32. Intelligent support in a DSS.

Fig
ure
4
.33
. B
rain
stor
min
g
supp
ort
tool
s.
(So
urc
e: h
ttp:
//axo
n-re
sear
ch.c
om/a
xon/
t_cr
eativ
e.gi
f. D
esig
ned
by
B
rian
M
aske
ll,
bmas
kell@
mas
kell.
com
, ht
tp://
ww
w.m
aske
ll.co
m/le
an_a
ccou
ntin
g/su
bpag
es/p
eopl
e/br
ian_
mas
kell.
htm
l.)
Imag
e re
pri
nte
d h
ere
cour
tesy
of
Bria
n M
aske
ll an
d A
xon
Res
earc
h.

CAR EXAMPLE 183
Figure 4.34. Support for Multi criterion choices.
would tell the system to select financial criteria as paramount for those users who would have difficulty making car payments, especially when coupled with maintenance, insurance, and upkeep costs. However, another rule,
IF monthly disposable income > 1200 AND number of children 3 AND primary usage IS car pooling
THEN Criteria OF Preferences IS Convenience
would tell the system to consider convenience criteria instead. While there is nothing prohibiting these users from considering cost as a factor, the system would indicate that it is not the primary criterion to be considered. In addition, the system should recommend criteria that should not be applied to the selection of automobiles.
Evaluating Alternatives
As decision makers consider various automobiles, they compare the benefits and costs associated with owning each of them. How they compare them depends upon the criteria selected. For example, some decision makers might select the automobile that has the greatest number of desirable features available at the lowest cost. Others may rely heavily upon the performance statistics and feel of the drive. Still others may select the automobile that comes most highly recommended by a trusted source.

184 MODEL COMPONENT
Figure 4.35. Specifying criteria.
Part of the modeling function of an automobile DSS is helping the decision maker to compare those functions he or she thinks are important. As with the original definition of the criteria, it is important to view these a limited number at a time. For example, consider the screen taken from the commercial package Auto Answers, shown in Figure 4.35. A very limited number of items are shown in this screen, all under the category "general." As you can see in Figure 4.36, a dropdown menu allows users to select information from a variety of categories. Each category gives information on a limited number of features so as not to overwhelm the user. Of course, an improvement on this approach would be to list the information for multiple alternatives in charts such as these. In that way, users could compare the automobiles on the criteria of importance and see how they relate. A system might, in addition, provide a relative score for each automobiles in each category or a highlighting of that automobile that seems to provide better values on the factors, so the user can easily see if there is a dominant alternative among the cars under consideration.
Users might also want the opinion of trusted sources in the evaluation. Publications such as Consumer Reports, Kiplinger's Reports, Car and Driver, or Edmund's Guides conduct tests and rate automobiles in various areas. Tables such as that shown in Figure 4.37 could be incorporated in the system. Users might want to couple this with raw access to text files with reports on automobiles. An example is shown in Figure 4.38 which illustrates part of Edmund's Guide available on the Internet.
Another task for which the DSS could be helpful is in the estimation of the real costs associated with the automobile. Generally, novice users who have not owned a car previously examine only the car payments in an estimation of the cost. Consider the screen

CAR EXAMPLE 185
Figure 4.36. Results from analysis.
in Figure 4.39. through which the user is asked about his or her driving tendencies. To respond to this inquiry, the system must complete the following tasks:
• Search the database for the desired model of automobile • Query the database for fuel efficiency for highway and city driving • Use the approximate miles driven (provided by the user) to compute the amount of
gasoline needed. • Multiply the cost of gasoline by the amount of gasoline needed • Compute the average monthly maintenance cost by dividing the expected annual
costs by 12 • Add together the maintenance cost and the gasoline costs
Using Cold Fusion, Javascript, and the Web, this could be accomplished with a program such as that in Code 4.1. The result of these operations can be found in Figure 4.40. The DSS would serve the user considering multiple automobiles by providing the information in tabular form coupled with historical information, such as that shown in Figure 4.41.
Models could also help the user with some of the most confusing aspects of purchasing an automobile: financing. For example, they could be built to evaluate car prices under a variety of financing alternatives. Consider the model shown in Figure 4.42. This system allows users to explore the impact of various time periods for loans and various interest rates upon the payment schedule. The choice of both time periods and interest rates would be left for the user to specify. Once these are selected, the loan payment schedule table
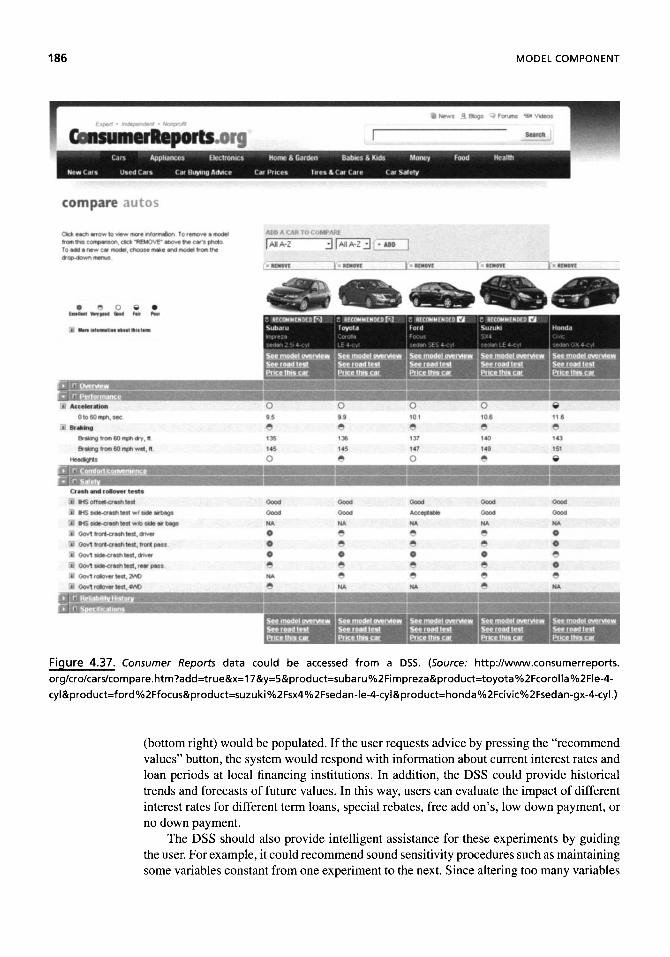
186 MODEL COMPONENT
Figure 4.37. Consumer Reports data could be accessed from a DSS. (Source: http://www.consumerreports. org/cro/cars/compare.htm?add=true&x=17&y=5&product=subaru%2Fimpreza&product=toyota%2Fcorolla%2Fle-4-cyl&product=ford%2Ffocus&product=suzuki%2Fsx4%2Fsedan-le-4-cyl&product=honda%2Fcivic%2Fsedan-gx-4-cyl.)
(bottom right) would be populated. If the user requests advice by pressing the "recommend values" button, the system would respond with information about current interest rates and loan periods at local financing institutions. In addition, the DSS could provide historical trends and forecasts of future values. In this way, users can evaluate the impact of different interest rates for different term loans, special rebates, free add on's, low down payment, or no down payment.
The DSS should also provide intelligent assistance for these experiments by guiding the user. For example, it could recommend sound sensitivity procedures such as maintaining some variables constant from one experiment to the next. Since altering too many variables

CAR EXAMPLE 187
Figure 4.38. Edmund's car review. (Source: http://www.edmunds.com/toyota/corolla/review.
html.) Copyright © 2009 Edmunds.com, Inc. Imaged reproduced with permission.
results in confusing analyses, the system should warn when such comparisons are being conducted. For example, the user should be warned about comparing a four-year loan at 7% to a five-year loan at 7.75% with a different down payment.
The ability to take into account the time value of money may provide a key tool to some users. Some user's decisions may weigh heavily upon the net present value (NPV) of a purchase rather than on the financing specifics of a purchase. Given this need, users should be able to compare NPV results under a variety of purchase options.
Note that in Figure 4.43, the left side of the screen provides information about the cost of the automobile. The information is a function of the automobile selected and the options selected for that make and model of automobile. Since these selections were made by the user on previous screens, it is important for the system to carry the values through to this screen automatically; the user should not need to reenter the values or even remember what they were. If the user wants to change the options or review the reasons for the cost, he or she could select the "review" button and return to those screens from which the selections are made. Similarly, the system should bring the information about likely dealer discount from the database automatically as well as the information about taxes and fees. If the system facilitates the trade-in of used automobiles, that information should be brought forward as well.
The system might also help the user compare the outright purchase with a lease agreement. It could help the user evaluate the options for lease most appropriate for his or her specific needs. The user may be faced with options such as low or no interest given a particular down payment or cash back instead of the special interest rates.
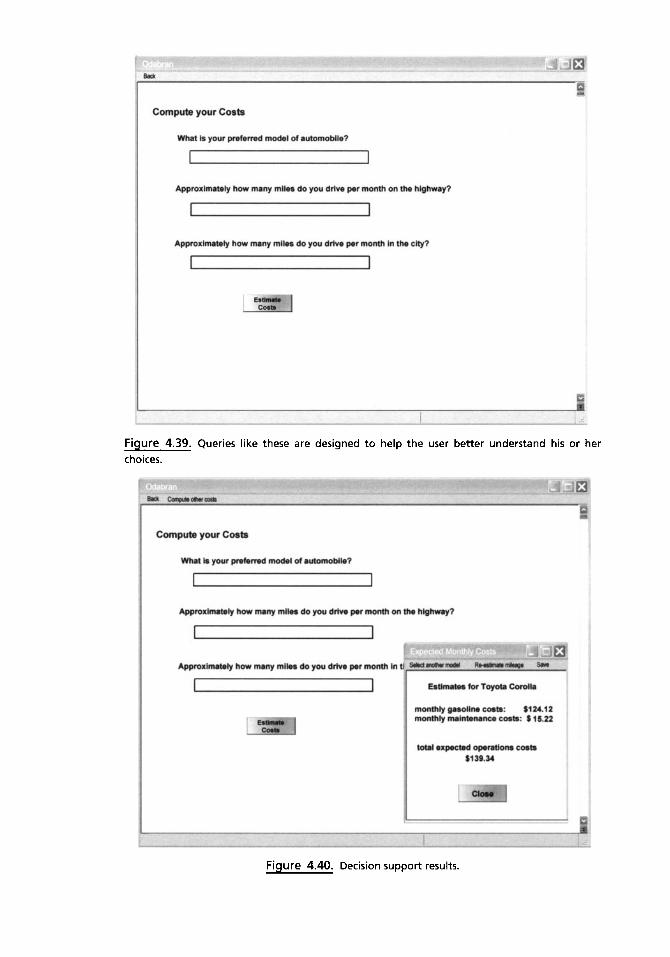
Figure 4.39. Queries like these are designed to help the user better understand his or her
choices.
Figure 4.40. Decision support results.

CAR EXAMPLE 189
Figure 4.41. Historical information to facilitate support.
Running External Models
Often we use external programs to obtain all of the modeling support we need. There are a variety of ways of implementing models depending upon the environment in which one is operating. On the one hand, integration may be simply facilitating the user's access to external modeling packages. For example, suppose decision makers needed access to the package Excel to facilitate a variety of kinds of modeling, especially when the spreadsheet has embedded macros. Using Javascript, designers could create a push-button that invoked the following code:
<FORM> <A HREF= " a n a l y s i s . x l s " > < I N P U T TYPE="BUTTON" VALUE="VIEW ANALYSIS" > < / A > </FORM>
This code will cause a batch file that sets the appropriate environment settings that allows Excel to run and to open a spreadsheet called "analysis." If the spreadsheet were invoked with macros running, appropriate data could be accessed automatically, and the user could be led through particular analyses using just the functions in the macros. Through those macros, designers could build useful model management functions similar to those discussed in this chapter. Of course, similar functionality could be included with other external modeling packages.

190 MODEL COMPONENT
Figure 4.42. Support for users exploring assumptions.
DISCUSSION
The goal of the model management component of a DSS is to help decision makers understand the phenomenon about which they are making a choice. This involves helping them to generate alternatives, measure the worth of those alternatives, and make a choice among those alternatives. In addition, the model management component should have tools that help the decision maker use the models and evaluate the results effectively. Designers need to include both passive and active assistance for the decision makers. Context-specific help for using and interpreting models needs to be available for the user. In addition, the system needs to monitor violations in the assumptions of models or irregularities of their use and bring them to the attention of the user. Finally, all of this support should happen in a manner that is easy for the decision maker to understand and not threatening from a technical point of view.
SUGGESTED READINGS
Acquisiti, A. And O. Povel, "Predicting Social Security Numbers from Public Data," Proceedings of the National Academy of Sciences of the United States of America, Vol. 106, No. 27, July 2009, pp. 10975-10980.
Aldrich, C. The Complete Guide to Simulations and Serious Games: How the Most Valuable Content Will be Created in the Age Beyond Gutenberg to Google, New York: Pfeiffer, 2009.

SUGGESTED READINGS
Auclair, P. F, S. J. Wourms, and J. J. Koger, "Ideas Take Flight," ORMS Today, Vol. 20, No. 4, August 1993, pp. 24-29.
Baker, S., The Numerati, New York: Mariner Books, 2009. Baldwin, A. A., D. Baldwin, and T. K. Sen, "The Evolution and Problems of Model Manage-
ment Research," Omega: International Journal of Management Science, Vol. 19, No. 6, 1991, pp. 511-528.
Beemer, B., and D. G. Gregg, "Advisory Support in Decision Making," Handbook on Decision
Support Systems, Vol. I, Berlin: Springer-Verlag, 2008, pp. 511-528.
Betts, M., "Efficiency Einsteins " ComputerWorld, Vol. 27, No. 12, March 22, 1993, pp. 63-64. Bhargava, H. K., and S. O. Kimbrough, "Model Management: An Embedded Languages Approach,"
Decision Support Systems, 1993, pp. 277-299.
Bonczek, R. H., C. W. Holsapple, and A. B. Whinston, "The Evolving Roles of Models in Decision
Support Systems," Decision Sciences, Vol. 11, No. 2, 1980, pp. 616-631. Brightman, H. J., Statistics in Plain English, Cincinnati, OH: South-Western Publishing Company,
1986.
Brown, G. G., and R. E. Rosenthal, "Optimization Tradecraft: Hard-Won Insights from Real-World
Decision Support," Interfaces, Vol. 38, No. 5, September-October, 2008, pp. 356-366.
Buchs, M. And P. Hättenschwiler, "Model Inspection in the Context of Distributed DSS," International Journal of Decision Support Technology, Vol. 1, No. 4, October-November, 2009, pp. 16-37.
Butters, S., "Jewish Hospital Healthcare Services Uses DSS," Journal of Systems Management, Vol.
43, June 1992, p. 30.
Climaco, J., J. Costa, L.C. Dias, P. Menlo, "Supporting Collaborative Multi-Criteria Evaluation: The VIP Analysis Plug-In for Decision Deck," International Journal of Decision Support Technology, Vol. 1, No. 4, October-November, 2009, pp. 1-15.
Coy, P., and R. D. Hof, "3-D Computing: From Medicine to War Games, It's a Whole New Dimen-sion," Business Week, September 4, 1995, pp. 70-77.
Davenport, T. H., and J. G. Harris, Competing on Analytics: The New Science of Winning, Boston:
Harvard Business School Press, 2007.
DeOrio, A. and V. Bertacco, "Human Computing for EDA" Design Automation Conference (DAC), San Francisco, CA, July 2009.
Dodds, P. S., and C. M. Danforth, "Measuring the Happiness of Large-Scale Written Expres-sion: Songs, Blogs and Presidents," Journal of Happiness Studies, July 17, 2009, available:
http://www.springerlink.com/content/757723154j4w726k/fulltext.html.
Fedorowicz, J., and G. B. Williams, "Representing Modeling Knowledge in an Intelligent Decision
Support System," Decision Support Systems, Vol. 2, No. 1, pp. 3-14.
Ferris, J, "How to Compete on Analytics: The Analytical Center of Excellence," A SAS Institute White Paper, available: http://www.sas.com/apps/whitepaper/index.jsp?cid=6426, nd, viewed January 29, 2009.
Froelich, J., and S. Ananyan, "Decision Support via Text Mining," in Handbook on Decision Support Systems, F. Burstein and C.W. Holsapple (Eds.), Vol I, Berlin: Springer-Verlag, 2008, pp. 609-634.
Gelman, A., and D. Weakliem, "Of Beauty, Sex and Power," American Scientist, Vol. 97, No. 4,
July-August 2009, pp. 310-314. Geoffrion, A. M., "Computer-based Modeling Environments," European Journal of Operational
Research, Vol. 41, 1989, pp. 33-45.
Gillespie, T. W., J.A. Agnew, E. Mariano,, S. Mossier, N. Jones, M. Braughton, and J. Gonzalez "Finding Osama bin Laden: An Application of Biogeographic Theories and Satellite Imagery," MIT International Review, February 17, 2009, available: http://wefrmit.edu/mitir/2009/online/finding-bin-laden.pdf.

MODEL COMPONENT
Giraud, C. And O. Povel, "Characterizing Data Mining Software," Intelligent Data Analysis, Vol. 7, No. 3, 2003, pp. 181-182.
Hagtvedt, R., P. Griffin, P, Keskinocak, P. and R. Roberts, "A Simulation Model to Compare Strategies for the Reduction of Health-Care-Associated Infections," Interfaces, Vol. 39, No. 3, May-June, 2009, pp. 256-270.
Han, H., and M. Kamber, Data Mining Concepts and Techniques, 2nd ed., Burlington, MA: Morgan
Haufmann, 2005.
Hillier, F. S., and G. J. Lieberman, Introduction to Operations Research, 4th ed., Oakland, CA: Holden-Day, 1986.
Holsapple, C. W., and A. B. Winston, Decision Support Systems: A Knowledge-Based Approach, St.
Paul, MN: West Publishing, 1996.
Hollywood, J., K. Strom, and M. Pope, "Can Data Mining Turn Up Terrorists?" ORMS Today,
Vol. 36, No. 2, February 2009, pp. 20-27. Huff, D., How to Lie with Statistics, New York: W.W Norton, 1954.
Huh, S. Y., "Modelbase Construction with Object-Oriented Constructs," Decision Sciences, Vol. 24,
No. 2, Spring 1993, pp. 409-434.
King, D. L., "Intelligent Support Systems: Art, Augmentation and Agents," in R. H. Sprague, Jr. and H. J. Watson (Eds.), Decision Support Systems: Putting Theory into Practice 3rd ed., Englewood Cliffs, NJ: Prentice-Hall, 1993, pp. 137-160.
King, M. A., J. F. Elder, B. Gomolka, E. Schmidt, M. Summers, and K. Toop, "Evaluation of Fourteen Desktop Data Mining Tools," IEEE International Conference on Systems, Man, and Cybernetics, San Diego, CA, October 12-14, 1998, pp. 2927-2932.
Konsynski, B., and D. Dolk, "Knowledge Abstractions in Model Management," in P. Gray (Ed.), Decision Support and Executive Information Systems, Englewood Cliffs, NJ: Prentice-Hall, 1994, pp. 420^37.
Larose, D. T., Discovering Knowledge in Data: An Introduction to Data Mining, New York: 2005. Le Blanc, L. A., and M. T. Jelassi, "DSS Software Selection: A Multiple Criteria Decision Method-
ology," in R. H. Sprague, Jr. and H. J. Watson (Eds.), Decision Support Systems: Putting Theory into Practice 3rd ed., Englewood Cliffs, NJ: Prentice-Hall, 1993, pp. 200-114.
Leinweber, D. J., Nerds on Wall Street, New York: Wiley, 2009.
Lichtman, A., The Keys to the White House: A Surefire Guide to Predicting the Next President,
Lanham, MD: Rowman & Littlefield, 2008.
Lieber, R., "American Express Kept a (Very) Watchful Eye on Charges," New York Times, January 30, 2009, P.B.
Liu, S., A. H. B. Duffy, R. I. Whitfield, I. M. Boyle, and I. McKenna, "Towards the Realization of an Integrated Decision Support for Organizational Decision Making," International Journal of Decision Support Technology, Vol. 1, No. 4, October-November, 2009, pp. 38-58.
Looney, CA. and A. M. Hardin, "Decision Support for Retirement Portfolio Management: Over-coming Myopic Loss Aversion via Technology Design," Management Science, Vol. 55, No. 10, October, 2009, pp. 1688-1703.
Moore, N. C , "Game Utilizes Human Intuition to Help Computers Solve Complex Prob-lems," University of Michigan News Service, July 27, 2009, available: http://www.ns.umich. edu/htdocs/releases/story.php?id=7252.
National Research Council Committee on Technical and Privacy Dimensions of Information for Terrorism Prevention and Other National Goals, "Protecting Individual Privacy in the Struggle Against Terrorists: A Framework for Program Assessment," Washington, DC: National Academies Press, 2008.
Nord, R., and E. Schmitz, "A Decision Support System for Personnel Allocation in the U.S. Army," in P. Gray (Ed.), Decision Support and Executive Information Systems, Englewood Cliffs, NJ: Prentice-Hall, 1994, pp. 191-201.

SUGGESTED READINGS
Port, O., "Smart Programs Go to Work," Business Week, March 2, 1995, pp. 97-99. Rizakou, E. J., Rosenhead, and K. Reddington, "AIDSPLAN: A Decision Support Model for
Planning the Provision of HIV/AIDS Related Services," Interfaces, Vol. 21, No. 3, 1991, pp. 117-129.
Samuelson, D., "Road to the White House," OR/MS Today, Vol. 35, No. 5, October 2008.
Samuelson, D., "Unlocking the Door to the White House," ORMS Today Vol. 23, No. 5, October, 1996.
Sauter, V L., "The Effect of 'Experience' upon Information Preferences," Omega: The International Journal of Management Science, Vol. 13, No. 4, June, 1985a, pp. 277-284.
Sauter, V. L., "A Framework for Studying the Mergers of Public Organizations," Socioeconomic Planning Sciences, Vol. 19, No. 2, 1985b, pp. 137-144.
Sauter, V. L., and M. B. Mandell, "Using Decision Support Concepts to Increase the Utilization of Social Science Information in Policy-Making," Evaluation and Program Planning, Vol. 13, 1990, pp. 349-358.
Sprague, R. H., and H. J. Watson, Decision Support for Management, Upper Saddle River, NJ: Prentice-Hall, 1996.
Star, J., and J. Estes, Geographic Information Systems, Englewood Cliffs, NJ: Prentice-Hall, 1990.
Stovall Jr., A. A., Army Command, Leadership and Management: Theory and Practice, Carlisle Barracks, PA: U.S. Army War College, 1995-1996, pp. 17-18, 17-19, 18-2, and 18-3.
Sullivan, G., and K. Fordyce, "Decision Simulation: One Outcome of Combining Artificial In-telligence and Decision Support Systems," in P. Gray (Ed.), Decision Support and Executive Information Systems, Englewood Cliffs, NJ: Prentice-Hall, 1994, pp. 409^tl9.
Szeman, I., "Business Intelligence Past, Present and Future," SAS Institute, 2006, avail-able: http://www.sas.conVsearch/cs.html?url=http%3A//www.sas.corn/offices/europe/bulgaria/ downloads/saga_conf_sas.ppt&charset=iso-8859-l&qt=degree+of+intelligence+competitive+ advantage+%2Bgraphic&col=extsas&n=l&la=en, viewed January 29, 2009.
Waterman, D. A., A Guide to Expert Systems, Reading, MA: Addison-Wesley Publishing Company, 1986.
Watson, H. J. "Business Intelligence: Past, Present and Future," Communications of the Association for Information Systems, Vol. 25, No. 1, Article 39, 2009. Available at: http://aisel.aisnet.org/cais/vol25/issl/39
Weiss, S., and N. Indurkhya, Predictive Data Mining: A Practical Guide, Burlington, MA: Morgan Kaufmann, 1998.
Wishart, D., Whiskey Classified: Choosing Single Malts by Flavour, London: Pavilion Books, 2006.
Wonnacott, T. H., and R. J. Wonnacott, Introductory Statistics for Business and Economics, 2nd ed., New York: Wiley, 1977.
QUESTIONS
1. What is a model and why would a manager use one?
2. Does a CASE tool use models? Describe them. Is it a DSS? If not, explain why it does not have the attributes of a DSS. If so, explain how we might design CASE tools better by considering DSS technology?
3. Suppose you are developing a DSS to aid an MIS manager in deciding how to acquire computers and computer components for her company. What kinds of models would you provide in such a system? How would these models need to be integrated? What

MODEL MANAGEMENT SYSTEM
kinds of model management support do we need to facilitate model understandability and/or sensitivity of a decision?
4. What are the long-term implications for business when too much intelligence is included inaDSS?
5. How can a designer improve the users' understanding of results of a model in a DSS?
6. Suppose you were using a DSS to decide what courses to take for the next semester. What kinds of models would you need? What kinds of sensitivity analyses would you do?
7. How can a designer ensure models in a DSS are integrated?
8. How can a DSS decrease a manager's anxiety about using models?
9. One of the primary things that differentiates a DSS from an MIS is that a DSS facilitates analysis of the data, whereas the MIS facilitates reporting of the data. Discuss the difference between these two.
10. There are multiple critical functions that a MBMS must provide, including alternative generation, model selection, access to models, and sensitivity analysis. Discuss how you might include these functions in a system that is intended to provide support for someone selecting, a computer system.
11. What are the long-term implications for business when too much intelligence is included in a DSS?
12. Describe three advantages of each of the kinds of modeling that we discussed in class.
13. There are hundreds of DBMS packages on the market. Explain why there are no MBMS packages on the market.
14. What would be the advantages and disadvantages of using Monte Carlo simulation to assess a DSS that provides advice about coursework and/or careers.
15. J.S. Armstrong said, "Better predictions of how other parties will respond can lead to better decisions." Discuss how you might build such a capability into a DSS.
16. Malcoln Gladwell Published a book in 2005 called Blink: The Power of Thinking Without Thinking, in which he claimed that frequently the intuitive, first unpression decision (made in the first seconds) is a better decision than those supported by signif-icant analysis and data. Under what conditions do you believe this to be true? Defend your position. If it is true (or when it is true), how would you provide decision support? What are the implications for DSS if the author of the book Blink is correct in his assessment of significant data.
17. Discuss how Google's data mining and GapMinder's data analysis efforts could be used to improve public policy discussion in the United States.
18. How are models and analytics related? How are they different?
19. What kinds of models do you use in your daily life?
20. What attributes of a DSS make model use more attractive?
21. Identify an article that appears in a newspaper or news magazine. What kinds of models seem to be discussed in the article? Do the assumptions of the models seem appropriate? What kinds of sensitivity testing did they discuss in the article? What kinds of sensitivity testing do you think they should do?
22. Suppose the problem for which you provided decision support required the decision maker to utilize f-test to determine if part time employees were as productive as full

ON THE WEB 195
time employees in a call center. Specifically, the decision maker compared the average time on a call and the average number of calles that were handled, what specific decision support would you provide to the decision maker.
ON THE WEB
On the Web for this chapter provides additional information about models, model base management systems, and related tools. Links can provide access to demonstration pack-ages, general overview information, applications, software providers, tutorials, and more. Additional discussion questions and new applications will also be added as they become available.
• Links provide access to information about model and model management products. Links provide access to product information, product comparisons and reviews, and general information about both models and the tools that support the models. Users can try the models and determine the factors that facilitate and inhibit decision making.
• Links provide access to descriptions of applications and insights for applications. In addition to information about the tools themselves, the Web provides links to world-wide applications of those products. You can access chronicles of users' successes and failures as well as innovative applications.
• Links provide access to hints about how to use models. These links provide real-world insights into the use and misuse of models. These are descriptive and help users to better formulate model management needs.
• Links provide access to models regarding automobile purchase and leasing. Several tools to help users purchase or lease an automobile are available on the Web. You can scan links to determine what kinds of models are most useful under what circumstances. Further, you can determine what kinds of impediments and what kinds of model support are introduced by various modeling management tools. Finally, the links can provide evaluations for model management capabilities.
You can access material for this chapter from the general web page for the book or directly at http://www.umsl.edu/~sauterv/DSS4BI/mbms.html.
4S
INTELLIGENCE AND DECISION SUPPORT SYSTEMS
Since the establishment of computers as business tools, designers have planned for the day when systems could work on their own, either as decision makers or as partners in the decision-making effort. Computers such as these would use "artificial intelligence." In this context, we are using the term artificial intelligence to mean the emulation of human expertise by the computer through the encapsulation of knowledge in a particular domain and procedures for acting upon that knowledge. The advantage of such artificial intelligence is that the computers would not be prone to the forgetfulness, bias, or distractions that plague human decision makers. Such systems would help us make better decisions, protect us from unanticipated events, and even provide companionship of a sort as the computer played games such as chess with us. Unfortunately, many factors ranging from unreasonable expectations to insufficient developments in hardware stood in the way of this goal.
During the 1980s, when smaller, faster processors and storage media were first be-coming available, many thought the area of "expert systems" would provide a focused use of artificial intelligence and solve problems that usually could be tamed only by an expert or group of experts, because they required a human reasoning process. This required computers to use symbols in the analysis and to understand, interpret, and manipulate the symbols just as humans do. Such systems would address problems normally requiring an individual to amass large amounts of data and knowledge about a field and process those data using sophisticated reasoning as well as accepted rules of thumb.
For example, early uses of expert systems provided diagnostic assistance to physicians. CADUCEUS, developed at Carnegie Mellon University, provided medical diagnosis of internal medicine problems, and MYCIN, developed at Stanford University, provided
Decision Support Systems for Business Intelligence by Vicki L. Sauter Copyright © 2010 John Wiley & Sons, Inc.

INTELLIGENCE AND DECISION SUPPORT SYSTEMS
diagnostics regarding blood diseases. As design and implementation technologies improved, expert systems moved to business applications. Digital Equipment Corporation deployed XCON, an expert system to construct systems by determining the set of wires, cabinets, and parts necessary to meet the user's computing needs. Similarly, Peat Marwick developed Loan Probe to assist auditors in assessing commercial banks' loan losses and reserves, so as to help auditors determine whether the banks could cover bad debt. American Express used Authorizer's Assistant to facilitate quick and consistent credit authorization. Oxiscan, developed by Oxicron Systems, analyzed market data for product managers by performing statistical analyses on scanner data and then interpreting the results.
Although expert systems were successful from a technological perspective, they were not accepted from a managerial perspective. The proof managers needed about the effec-tiveness of the systems was not available. In addition, many such systems were developed on specialized, stand-alone hardware that did not interface with any existing data or appli-cations. As a result, they never were integrated into the business plan.
The technology was established, however. The current trend is to embed artificial intelligence and expert system tools into DSS. For example, the U.S. Army uses embedded expert systems in its logistics planning. Similarly, Putnam has embedded intelligence into its trading software to monitor for compliance with regulations. In fact, a recent survey by the Commerce Department indicated that more than 80% of the Fortune 500 companies use some form of artificial intelligence in their operations. The intelligence might be embedded into the DSS to help select what data should be analyzed or how the data should be analyzed. Similarly, artificial intelligence might help decision makers to complete sensitivity analyses to ensure that all aspects of the problem have been examined. It might identify aspects of the problem that have been overlooked and relate the current findings to previous analyses or data. Instead of replacing the decision maker, the artificial intelligence is built into the DSS to help the decision maker exploit trends found in the data more easily.
Many DSS include features that facilitate data mining, as discussed in the previous chapter. Through the help of artificial intelligence and statistical analyses, these features find information from existing data. In addition, the system determines how to present that new knowledge so that it is understandable to humans. Other DSS use embedded neural networks that are trained by examples to recognize patterns and aberrations. For examples, changes in purchasing patterns might identify credit cards that are stolen. In fact, MasterCard Worldwide pioneered their use so minimize the time thiefs can use the cards. Still other systems provide hybrid applications of a variety of artificial intelligence tools. For example, combinations of tools that derive conclusions from data and perform inductive reasoning facilitate DSS that provide support for the convertible-bond market.
Over time, almost all DSS will include some kind of artificial intelligence. At present, artificial intelligence tends to be associated with choices needing some expertise where the expert is not always available or is expensive, where decisions are made quickly, and where there are too many possibilities for an individual to consider at one time and there is a high penalty associated with missing one or more factors. Artificial intelligence is helpful too when consistency and reliability in judgments are the paramount goal, not creativity in the choice process.
Currently the greatest promise lies in hybrid systems that combine both expert systems and neural nets. The capture and preservation of human expertise is best done by expert systems, but they, like humans, do not adjust to changes readily. Neural nets, on the other hand, are not good repositories for human expertise, but they are trained to continue to learn. They can examine large amounts of data and find causal relationships that help them adapt to changes in their environment. Together, the two technologies can provide ongoing support within a DSS.

INTELLIGENCE AND DECISION SUPPORT SYSTEMS 199
Modeling Insights Deep Blue
The acceptance of artificial intelligence has not been universal· Some managers just do not trust the computers to understand all of the interworkings of the choice context. Other managers have concerned about the legal ramifications of a wrong choice.
Still other decision makers just do not believe in the reasoning process of computers. One example of this disbelief was expressed by Garry Kasparov when he defended his World Chess Champion position against Deep Blue, an IBM computer programmed to play chess, fn the first game of the match, the computer made a move that Kasparov judged to be "a wonderful and extremely human move." However, Kasparov had difficulty responding to the move because a computer "would never make such a move." Kasparov judged that although humans regularly see the impact, "a computer can't 'see' the long-term consequences of structural changes in the position or understanding how changes in pawn formations may be good or bad/*
In fact, he was so sure that the computer could not reason that he was ^stunned" by the move. While he had played chess against many computers before Deep Blue, this move caused him to "feel - ϊ could smell - a new kind of intelligence across the table.'* Unfortunately for Kasparov, the computer had, in fact, psyched him out with the move and actually won the game,
Kasparov, however, showed that the human's intelligence was still superior because the experience forced him to think of the shortcomings of computers throughout the remainder of the match and use that information strategically in his play development. For example, he changed moves in a we] 1 known opening sequence in one game. Since the new opening was not stored in the database, Deep Blue could not find an appropriate plan to respond to it. Neither could Deep Blue reason that Kasparov's change from the well-known sequence was meaningless and respond with a known response. In the end, Kasparov won the tournament in 1996 and kept his title,
However, IBM heavily upgraded Deep Blue to improve its logic. Later in 1997, Deep Blue won a six-game match by two wins to one with three draws. Kasparov claimed there was cheating and demanded a rematch, but IBM declined and disassembled Deep Blue.
Deep Blue was a combination of special purpose hardware and software with an IBM RS/6000 SP2 - a system capable of examining 200 million moves per second, or 50 billion positions, in the three minutes allocated for a single move in a chess game.
Deep Blue vs. Kasparov 1996, game 1
nnni ■ ■ ■ ■
The chess game image is from Wikipedia Commons. The file is licensed under the Creative Commons Attribution Share Alike 3.0 License,

200 INTELLIGENCE AND DECISION SUPPORT SYSTEMS
To build artificial intelligence into the system, two primary topics need to be addressed: how to program "reasoning" and what to do with uncertainty in the decision-making context. These will be addressed in the next two sections.
PROGRAMMING REASONING
The reasoning process in humans is often automatic or implicit, and hence it is difficult to see how it might be programmed in a set of deliberate steps for a computer. If, however, we examine the reasoning process slowly and deliberately through its individual steps so that we can see how the computer completes the reasoning process. Actually, reasoning by both humans and computers must take one of two basic approaches. Either we begin with a goal and try to prove that it is true with the facts we have available or we begin with all the "known facts" and try to prove as much as we can. In computer terms, these are referred to as backward reasoning and forward reasoning, respectively. The following examples demonstrate deliberate examples of backward and forward reasoning and the manner in which intelligence can be built into a DSS. Both examples will use the same information so as to illustrate the differences in the processes.
Suppose there is a set of facts, known as facts A, B, C, D, E, F, G, and H. All these facts are logical facts, and they can be set to either "true" or "false." In addition, there are certain known relationships among the facts. These are listed below in the order in which they might appear in the code:
Rl: > IF Fact E and Fact M and Fact G are all true, then Fact F is true; IF Fact K and Fact E are both true, then Fact D is true; IF Fact N is true, then Fact Y is true; IF Fact Y is true, then Fact H is true; IF Fact B and Fact G are both true, then Fact M is true; IF Fact K and Fact F are both true, then Fact Y is true; IF Fact K is true, then Fact B is true.
R2: R3: R4: R5: R6: R7:
> > > > > >
Researchers are investigating prospective logic as a way to program morality into a computer. Using prospective logic, programmers can model a moral dilemma so the computer can determine the logical outcomes of all possible decisions and select the best (or least worst) one. This sets the stage for computers that have "ethics,1' which could allow fully autonomous machines programmed to make judgments based on a human moral foundation. Currently two researchers have developed a system capable of working through the "trolley problem," an ethical dilemma proposed by British philosopher Philippa Foot in the 1960s, In this dilemma, a runaway trolley is about to hit five people tied to the track, but the subject can hit a switch that will send the trolley onto another track where only one person is tied down. The prospective logic program can consider each possible outcome based on different scenarios and demonstrate logically what the consequences of its decisions might be.

PROGRAMMING REASONING 201
The ways in which these relationships are processed are quite different with backward and forward chaining.
Backward-Chaining Reasoning
In backward chaining, we begin with a goal and attempt to prove it. For example, suppose the goal is to prove that fact H is true. The system will process the relationships beginning with the first one it encounters proving the goal (in this case, fact H) to be true:
Rl; > IF Fact E and Fact M and Fact G are all true, then Fact F is true;
R2 : > IF Fact K and Fact E are both true, then Fact D is true; R3 : > IF Fact N is true, then Fact Y is true? ■ ■ ^ IF F M ^ H H H B i t h e n Fact S H H H R5: > IF Fact B and Fact G are both true, then Fact M is true; R6: > IF Fact K and Fact F are both true, then Fact Y is true; R7: > IF Fact K is true, then Fact B is true,
In order to prove relationship 4, it is necessary to prove that fact Y is true. Hence» proving that fact Y is tme is now the goal of the system. It will again process rules:
Rl: >* IF Fact E and Fact M and Fact G are all true, then Fact F is true;
R2 : > IF Fact K and Fact E are both true, then Fact D is true; R3: > IF Fact N is true, then Fact Y is true; R4: > IF Fact Y is true, then Fact H is true; R5: > IF Fact B and Fact G are both true, then Fact M is true; R6: > IF Fact K and Fact F are both true, then Fact Y is true; R7: > IF Fact K is true, then Fact B is true.
To prove relationship 3, it is necessary to prove that fact N is true. We can see from the seven relationships that there is nothing from which the system can infer whether fact N is true. Hence, the system is forced either to use a default value (if one is specified) or ask the user Suppose there is no default value given, and the user does not know whether fact N is true. Under these circumstances, the system is unable to infer that fact N is true, so it assumes nothing about the validity of fact N. However, it must locate another relationship in order to infer fact Y is true:
Rl: > IF Fact E and Fact M and Fact G are all true, then Fact F is true;
R2 : > IF Fact K and Fact E are both true, then Fact D is true; R3 : > IF Fact N is true, then Fact Y is true; R4: > IF Fact Y is true, then Fact H is true; R5: > IF Fact B and Fact G are both true, then Fact M is true; R6: > IF Fact K and Fact F are both true, then Fact Y is true; R7: >■ IF Fact K is true, then Fact B is true.
To prove relationship 6, it is necessary to prove that facts K and F are true. The system begins with trying to prove fact K. As with fact N, mere are no relationships from which one can infer that fact K is known. The system then must use a default value (if one is

202 INTELLIGENCE AND DECISION SUPPORT SYSTEMS
specified) or ask the user. Suppose in this case the user knows that fact K is true, and hence the system attempts to prove that fact F is true:
Rl
R2 R3 R4 R5 R6 R7
>*
> >
ί >
> : > : >
IF Fact Fact F IF Fact IF Fact IF Fact IF Fact IF Fact IF Fact
E is K N Y B K K
and Fact true ; and Fact is true, is true, and Fact and Fact is true,
M and Fact G are all trueH
E are both true, then Fact then Fact Y is true; then Fact H is true; G are both true, then Fact F are both true, then Fact then Fact B is true.
then
D is
M is Y is
true;
true ; true;
As with fact N, there are no relationships from which one can infer the value of fact E (whether or not it is true)- The system then must use a default value (if one is specified) or ask the user. Suppose in this case the user knows that the value of fact E is known as true, and hence the system attempts to prove that fact M is true:
Rl: > IF Fact E and Fact M and Fact G are all true, then Fact F is true;
R2: > IF Fact K and Fact E are both true, then Fact D is R3: > IF Fact N is true, then Fact Y is true; R4: > IF Fact Y is true, then Fact H is true; R5; >- IF Fact B and Fact G are both true, then Fact M is R6 : > IF Fact K and Fact F are both true, then Fact Y is R7 : >* IF Fact K is true, then Fact B is true,
The first step in that process is to establish that fact B is true:
Rl: > IF Fact E and Fact M and Fact G are all true, then
Fact F is true;
R2 : > IF Fact K and Fact E are both true, then Fact D is true;
R3 : >■ IF Fact W is true, then Fact Y is true;
R4: > IF Fact Y is true, then Fact H is true;
R5: > IF Fact B and Fact G are both true, then Fact M is true;
R6: > IF Fact K and Fact F are both true, then Fact Y is true;
R7: > IF Fact K is true, then Fact B is true.
Relationship 7 states that fact B is true if fact K is true. Earlier, the system asked the user and determined that fact K is true. At that time the value was stored» and hence the system need not query the user again. Hence fact B is true, and the system can proceed to attempt to determine whether fact G is true, As was true with fact N, there are no relationships from which we can infer the value of fact G (whether or not it is true). The system then must use a default value (if one is specified) or ask the user. Suppose in this case the user knows that fact G is known. Hence, the system now establishes that fact M is true, since facts B and G have been established as true. The system again returns to processing relationship 1 and establishes that fact F is true:
Rl: > IF Fact E and Fact M and Fact G are all true, then Fact F is true;
R2: > IF Fact K and Fact E are both true, then Fact D is true; R3: > IF Fact N is true, then Fact Y is true; R4: > IF Fact Y is true, then Fact H is true;
true;
true;

PROGRAMMING REASONING 203
R5: > IF Fact B and Fact G are both true, then Fact M is true; R6: > IF Fact K and Fact F are both true, then Fact Y is true; R7: > IF Fact K is true, then Fact B is true.
With this information, the system return« to processing relationship 6 and establishes that fact Y is true;
Rl: > IF Fact E and Fact M and Fact G are all true, then Fact F is true;
R2 R3 K4 R5 R6 R7
> > > > > >
IF IF lr
IF IF IF
Fact Fact Fact. Fact Fact Fact
K N Y B K K
and Fact is true, is true, and Fact and Fact is trueH
E are both true, then then Fact Y is true? then Fact H is true; G are both true, then F are both true, then then Fact B is true,
Fact
Fact Fact
D
K
Y
is
is is
true;
true; true;
R2 R3 R4 R5 R6 R7
> > > > > >
D is
M is Y is
true;
true; true;
Since fact Y is true, the system can establish that fact H is true through relationship 4;
Rl : > IF Fact E and Fact M and Fact G are all true, then Fact F is true; IF Fact K and Fact E are both true, then Fact IF Fact W is true, then Fact Y is true; IF Fact Y is true, then Fact H is true; IF Fact B and Fact G are both true, then Fact IF Fact K and Fact F are both true, then Fact IF Fact K is true, then Fact B is true.
Since establishing that fact H is true is the goal of the system, it would stop processing at this point and find no additional information. This process is illustrated in Figure 4S.1.
Forward-Chaining Reasoning
Consider, now, the path lhaL is followed using forward chaining. Using this system, we begin with information and attempt to learn as much as possible. For example, suppose we begin by knowing that facts K and E are both true. The system will look to prove any relationship possible given these two facts and hence process relationships 2 and 7 (sequentially in the order in which they appear in the code):
Rl: > IF Fact E and Fact M and Fact G are all true, then Fact F is true; IF Fact K and Fact E are both true, then Fact D is true; IF Fact N is true, then Fact Y is true; IF Fact Y is true, then Fact H is true; IF Fact B and Fact G are both true, then Fact M is true; IF Fact K and Fact F are both true, then Fact Y is true; IF Fact K is true, then Fact B is true.
The environment changes as a result of this processing, and the system now knows that facts D and B are also true. Hence, the system considers all relationships again to determine whether more information can be gleaned. However, there are no additional relationships thai can be processed. Unlike the case in backward chaining, the system does not begin to
R2; R3: R4: ^: R6: R7;
> > > > > >

204 INTELLIGENCE AND DECISION SUPPORT SYSTEMS
Figure 4S.1. Hierarchy of logic—backward chaining.
prompt the user for information that might allow it to go further, and hence it would stop and learn no additional facts.
Some software lets developers use hybrid approaches to programming by allowing procedural programming, access programming, and/or object-oriented programming in addition to forward- and/or backward-chaining pathways. Consider the forward-chaining example above. Suppose the access programming code specified that users should be queried, or a database should be searched, or a default value should be set if the status of fact G is not known by this point of processing. If the user or database indicated fact G were true, the system would again invoke the forward-chaining component and it would process relationship 5:

PROGRAMMING REASONING 205
R2: R3: R4: R5: R6: R7 :
> > > > > >
Rl: > IF Fact E and Fact M and Fact G are all true, then Fact F is true; IF Fact K and Fact E are both true, then Fact D is true? IF Fact N is true, then Fact Y is true; IF Fact Y is true, then Fact H is true; IF Fact B and Fact G are both true, then Fact M is true; IF Fact K and Fact F are both true, then Fact Y is true; IF Fact K is trueH then Fact B is true.
The information regarding fact M would cause the system to evaluate all relationships that require some or all of facts K, E, N, B, or M to be true, and hence it would process relationship 1;
Rl: > IF Fact E and Fact M and Fact G are all true, then Fact F is true;
E are both true, then Fact D is true; then Fact Y is true; then Fact H is true; G are both true, then Fact M is true; F are both true, then Fact Y is true; then Fact B is true.
The new information about fact F requires the system to reevaluate the relationships to determine whether more information can be learned, and hence it will seek any relation-ship that includes fact F and some subset of the other facts known at this time, as in relationship 6:
Rl: > IF Fact E and Fact M and Fact G are all true, then Fact F is true;
R2 R3 R4 R5 R6 R7
> > > > > >
IF TF TF IF IF IF
Fact Fact Fact. Fact Fact Fact
K N Y B K K
and Fact is true, is true, and Fact and Fact is true,
R2 R3 R4 R5 R6 R7
> > > > > >
IF IF IF IF IF IF
Fact Fact Fact Fact Fact Fact
K N Y B K K
and Fact is true, is true, and Fact and Fact is true,
E are both true, then then Fact Y is true; then Fact H is true; G are both true, then F are both true, then then Fact B is true.
Fact
Fact Fact
D
M
Y
is true;
is true; is true;
The process proceeds in a similar fashion now that fact Y is known. Hence, the system wilt process relationship 4:
Rl: > IF Fact E and Fact M and Fact G are all true, then Fact F is true; IF Fact K and Fact E are both true, then Fact D is true; IF Fact N is true, then Fact Y is true; IF Fact Y is true, then Fact H is true; IF Fact B and Fact G are both true, then Fact H is true; IF Fact K and Fact F are both true, then Fact Y is true; IF Fact K is true, then Fact B is true.
Since none of the relationships indicate any new knowledge can be gained by knowing that fact H is true, the system would stop with this knowledge. This process is illustrated in Figure 4S.2.
R2 R3 R4 R5 R6 R7
> > > > > >

206 INTELLIGENCE AND DECISION SUPPORT SYSTEMS
Figure 4S.2. Hierarchy of logic—forward chaining.
Comparison of Reasoning Processes
In this example, the system "learned" the same ultimate fact (fact H is true) with backward chaining and forward chaining only when forward chaining was supplemented by access programming. However, the forward chaining with access programming and the pure forward chaining process the relationships in quite different order. It is important to note this for two reasons. First, the designer could find himself or herself with a dormant analysis system unless information is sought in a particular manner. For example, suppose the last example were done completely as a forward-chaining example (no access programming interrupt). In this case, the system would quit processing after it learned that fact B was true, and there would be no way to push it to do more. The system would not perform as the designers had envisioned or as the decision makers need.
Second, we should be concerned about the way in which the system seeks information from the user for the sake of sustaining the confidence of the decision maker (sometimes referred to as "face" validity). Decision makers expect information to be sought in a particular order. If there are vast deviations from such a logical order, then decision makers may question the underlying logic of the system. If the logic can be defended, then such questioning helps the decision maker to reason more effectively. On the other hand, if decision makers cannot establish why such reasoning has occurred, they might choose to drop the DSS.
UNCERTAINTY
Decisions are difficult to make because of uncertainty. Decision makers are uncertain about how outside entities will change their environments and thus influence the success of their choices. In addition, sometimes decision makers are uncertain about the reliability of the information they use as the basis for their choices. Finally, decision makers are uncertain about the validity of the relationships that they believe govern the choice situation.

UNCERTAINTY
Often decision makers also need to interact with "fuzzy logic." The term fuzzy logic does not apply to a muddled thought process. Rather it means a method of addressing data and relationships that are inexact. Humans address fuzzy logic regularly whenever they do not treat decisions as totally "black-and-white" choices. The gradations of gray provide flexibility in approaching problems that forces us to consider all possible options.
Consider, for example, whether a person is "tall." The term tall is a vague term that means different things to different people. If in the choice process one selection procedure required the machine to select only applicants who were tall, it would be difficult for the DSS to do. Even in a sport such as basketball, where being tall really matters, the term tall depends on the position one is playing. A particular individual might be tall if playing guard but not if playing center because the requirements of the positions are so different. Even if the discussion is limited to the position of guard, what is considered "tall enough" is dependent upon other factors. In 1994 Mugsy Boggs, a basketball guard, was only 5 feet, 4 inches, which even I1 do not consider tall. However, because he had fabulous technique, he was considered tall enough to play that position.
Similarly, when trying to select among employment opportunities, we might employ fuzzy logic. There is not one opportunity that is "good" and another that is "bad." Generally, they are all somewhat good on some dimensions and somewhat bad on other dimensions. It is difficult for most people to define what dimensions are most important in a reliable way, but they can tell which opportunities are better than others. This illustrates the historic problem that humans could make better decisions than computers because they could address uncertainty in their reasoning processes.
So, if DSS are to have "intelligence" that facilitates the choice processes, they must also be able to address uncertainty from a variety of perspectives. There are two major processes by which uncertainty is addressed in intelligent systems, with probability theory and with certainty factors. These will be introduced separately.
^hat which is considered tall also depends upon how tall an individual is. Since I fall into a category generally referred to as "short," I have a more liberal definition of tall than do other people.
Design Insights The Turing Test
The ''standard interpretation" of the Turing Test, in which player C, the interrogator, is tasked with trying to determine which player - A or B - is a computer and which is a human. The interrogator is limited to only using the responses to written questions in order to make the determination.
The Turing Test image is from Wikimedia Commons. The file is licensed under the Creative Commons Attribution Share Alike 3.0 License.
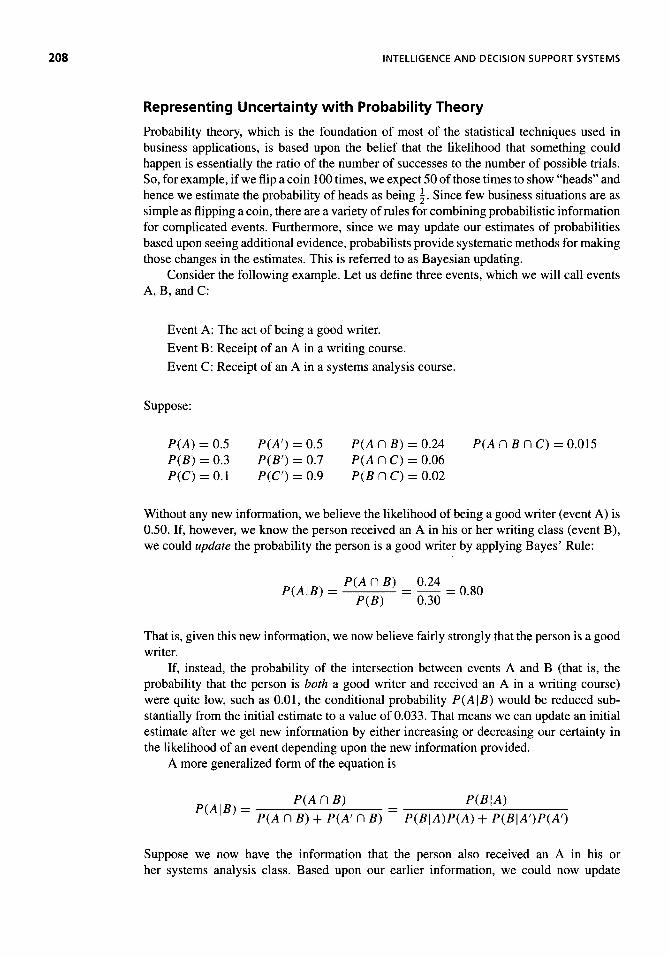
208 INTELLIGENCE AND DECISION SUPPORT SYSTEMS
Representing Uncertainty with Probability Theory
Probability theory, which is the foundation of most of the statistical techniques used in business applications, is based upon the belief that the likelihood that something could happen is essentially the ratio of the number of successes to the number of possible trials. So, for example, if we flip a coin 100 times, we expect 50 of those times to show "heads" and hence we estimate the probability of heads as being \. Since few business situations are as simple as flipping a coin, there are a variety of rules for combining probabilistic information for complicated events. Furthermore, since we may update our estimates of probabilities based upon seeing additional evidence, probabilists provide systematic methods for making those changes in the estimates. This is referred to as Bayesian updating.
Consider the following example. Let us define three events, which we will call events A, B, and C:
Event A: The act of being a good writer. Event B: Receipt of an A in a writing course. Event C: Receipt of an A in a systems analysis course.
Suppose:
P(A) = 0.5 P{A') = 0.5 P(A Π B) = 0.24 P(Ai)BnC) = 0.015 P(B) = 0.3 P{B') = 0.7 P(A DC) = 0.06 P(C) = 0.1 P(C) = 0.9 P(BDC) = 0.02
Without any new information, we believe the likelihood of being a good writer (event A) is 0.50. If, however, we know the person received an A in his or her writing class (event B), we could update the probability the person is a good writer by applying Bayes' Rule:
P(A Π B) 0.24 P(A\B) = — = = 0.80 v ' ' P(B) 0.30
That is, given this new information, we now believe fairly strongly that the person is a good writer.
If, instead, the probability of the intersection between events A and B (that is, the probability that the person is both a good writer and received an A in a writing course) were quite low, such as 0.01, the conditional probability P(A\B) would be reduced sub-stantially from the initial estimate to a value of 0.033. That means we can update an initial estimate after we get new information by either increasing or decreasing our certainty in the likelihood of an event depending upon the new information provided.
A more generalized form of the equation is
Ρ(ΑΠΒ) Ρ(Β\Α) P(A\B)= v ' ' P(A Π B) + P{A' Π B) P(B\A)P(A) + P{B\A')P{Af)
Suppose we now have the information that the person also received an A in his or her systems analysis class. Based upon our earlier information, we could now update

UNCERTAINTY 209
the probability further:
P{A Π(ΒΠ O ) Ρ(ΑΓ)ΒΓ) C) P(A\B Π C) = — = —
P(BnC) P(BC\C)
P(BnC\A)P(A)
~ P(B Π C\A)P(A) + P{B Π C\A')P(Af)
Hence, given all the information available, we believe the likelihood that the person is a good writer is 0.75.
Updating the rules using a Bayesian approach is similar to this process.
Representing Uncertainty with Certainty Factors
A popular alternative for addressing uncertainty is to use certainty factors. Instead of measuring the likelihood as one function, we need to estimate a measure of "belief" separate from a measure of "disbelief." New evidence could increase (decrease) our measure of belief, increase (decrease) our measure of disbelief, or have some impact on our measure of both belief and disbelief. Its effect is a function of whether the information is confirmatory, disconfirmatory, or both confirmatory of one and disconfirmatory of the other. Consider the example shown above. Suppose you believe the subject to "be a good writer." You know the person waived his or her writing course. This information would cause you to increase your measure of belief that the person was a good writer but would have no impact on your measure of disbelief. However, if you knew that the person received a C in the writing class and almost everyone waived the writing class, this would have two effects. First, it would increase your disbelief that the person was a good writer because he or she received a grade of C in a class that most people waived. In addition, it would decrease your belief that the
Design insights AI: A Space Odyssey
HAL 9000 is a fictional computer in Arthur C. Clarke's 2001: A Space Odyssey. The computer was a powerful representation of artificial intelligence; HAL was programmed to insure the success of the mission. It was capable of maintaining all systems on the voyage, of reasoning and speech, facial recognition, and natural language processing, as well as lip reading, art appreciation interpreting emotions, expressing emotions, reasoning, and chess. So, when the astronauts David Bowman and Frank Poole consider disconnecting HAL's cognitive circuits when he appears to be mistaken in reporting the presence ofa fault in the spacecraft's com muni cations antenna, HAL gets nervous. Faced with the prospect of disconnection, HAL decides to kill the astronauts in order to protect and continue its programmed directives. Its chilling line "I'm sorry Dave, but this mission is just too important for me to allow you to jeopardize it1' made many nervous about the future of artificial intelligence.
We are not at that point of the development of artificial intelligence yet. However, many scientists believe that future advances could lead to problems. For example, medical systems can already interact with patients to simulate empathy. Computer worms and viruses have learned to vary their structure over time to avoid extermination. The concern is an "intelligence explosion" in which smart machines would design even more intelligent machines that humans can neither understand nor control. This is especially a concern if the tools reach the hands of criminals. At a conference by the Association for Advancement of Artificial Intelligence, scientists discussed the issues, the trends and how they could be controlled. There is as yet not agreement among the researchers, and therefore no guidelines. But, it does give one pause for thought.
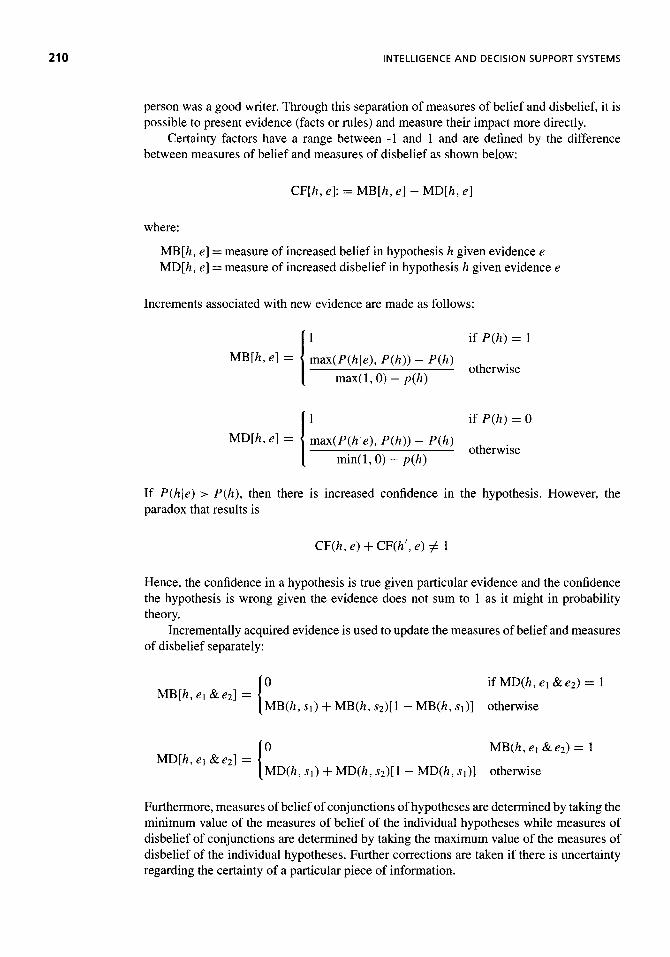
210 INTELLIGENCE AND DECISION SUPPORT SYSTEMS
person was a good writer. Through this separation of measures of belief and disbelief, it is possible to present evidence (facts or rules) and measure their impact more directly.
Certainty factors have a range between -1 and 1 and are defined by the difference between measures of belief and measures of disbelief as shown below:
CF[A, e\. = MB [A, e] - MD[A, e]
where:
MB [A, e] = measure of increased belief in hypothesis A given evidence e MD[A, e] = measure of increased disbelief in hypothesis A given evidence e
Increments associated with new evidence are made as follows:
MB[A,e] =
1 if P(h) = 1
max(P(A|e), P(h)) - P(h) max(l, 0) — p(h)
otherwise
MD[h,e] =
1 if P(h) = 0
max(P(A|<?), P(h)) - P(h) min(l,0)-/?(A)
otherwise
If P(h\e) > P(h), then there is increased confidence in the hypothesis. However, the paradox that results is
CF(A,e) + CF(A',i>)^ 1
Hence, the confidence in a hypothesis is true given particular evidence and the confidence the hypothesis is wrong given the evidence does not sum to 1 as it might in probability theory.
Incrementally acquired evidence is used to update the measures of belief and measures of disbelief separately:
MB[A,ei&e2] = 0 ifMD(A,ei&6>2)= 1
MB(A, si) + MB(A, s2)[l - MB(A, sx)] otherwise
MD[h,ei&e2] = 0 MB(h,el&e2)=l
MD(A, si) + MD(A, s2)[l - MD(A, sx)] otherwise
Furthermore, measures of belief of conjunctions of hypotheses are determined by taking the minimum value of the measures of belief of the individual hypotheses while measures of disbelief of conjunctions are determined by taking the maximum value of the measures of disbelief of the individual hypotheses. Further corrections are taken if there is uncertainty regarding the certainty of a particular piece of information.
SUGGESTED READINGS
DISCUSSION
Artificial intelligence has two roles in a DSS. First, artificial intelligence can serve as a model type. In particular, it is an heuristic modeling technique that manipulates symbols rather than numbers. This kind of modeling is particularly useful when addressing poorly structured problems or problems for which data are not complete because it replicates the human reasoning process. A second application of artificial intelligence in a DSS is to provide intelligent assistance to the users. With the use of artificial intelligence, designers can build into the DSS expertise the decision maker lachs. This might be with regard to in modeling, evaluation of alternatives or in postmodeling analysis to improve the quality of decisions for all users of the system. In order to implement it, designers must codify the information that experts would use, build procedures for processing that information, and address the manner by which uncertainty in both information and relationships will be addressed.
SUGGESTED READINGS
Baker, S., The Numerati, Boston: Houghton-Mifflin, 2008.
Gale, W. A. (ed.), Artificial Intelligence and Statistics, Reading, MA: Addison-Wesley, 1986.
Chou, S. T., H. Hsu, C. Yang, and F. Lai, "A Stock Selection DSS Combining AI and Technical
Analysis," Annals of Operations Research, Vol. 75, January 1997, pp. 335-353.
Delen, D., and R. Sharda, "Artificial Neural Networks in Decision Support Systems," in Burnstein, F. and C. W. Holsapple Handbook on Decision Support Systems, Vol. I, Berlin: Springer-Verlag, 2008, pp. 557-580.
Elam, J. J., and B. Konsynski, "Using Artificial Intelligence Techniques to Enhance the Capabilities of Model Management Systems," Decision Sciences, Vol. 18, No. 3, June 2007, pp. 487-502.
Gallagher, J. P, Knowledge Systems for Business: Integrating Expert Systems and MIS, Englewood Cliffs, NJ: Prentice-Hall, 1988.
Harmon, P., and C. Hall, Intelligent Software Systems Development: An IS Manager's Guide, New
York: Wiley Professional Computing, 1993.
Hess, T. J., L. P. Rees, and T. R. Rakes, "Using Autonomous Software Agents in Decision Support Systems," in Burnstein, F. and C. W. Holsapple (eds). Handbook on Decision Support Systems, Vol. I, Berlin: Springer-Verlag, 2008, pp. 529-556.
Kasparov, G., "The Day that I Sensed a New Kind of Intelligence," Time Magazine, March 25, 1996,
p. 55.
Klahr, P., and D. A. Waterman (Eds.), Expert Systems: Techniques, Tools and Applications, Reading, MA: Addison-Wesley, 1986.
Lewis, D. D., and W. A. Gale, "A Sequential Algorithm for Training Text Classifiers," Proceed-ings of the 17th Annual International ACM SIGIR Conference on Research and Development in
Information Retrieval, Dublin, Ireland, 1994, pp. 3-12.
Lucas, P. J. F., "Certainty-Factor-Like Structures in Bayesian Belief Networks," Knowledge Based Systems, Vol. 14, No. 7, November 2001, pp. 327-335.
Luger, G., and W. Stubblefield, Artificial Intelligence: Structures and Strategies for Complex Problem
Solving, 5th ed., Boston, MA: Benjamin/Cummings, 2004.
McCorduck, P., Machines Who Think: A Personal Inquiry into the History and Prospects of Artificial Intelligence, New York: A. K. Peters, 2004.

INTELLIGENCE AND DECISION SUPPORT SYSTEMS
Mora, M., G. Forgionne, J. Gupta, F. Cervantes, and O. Gelman, "A Framework to Assess Intelligent Decision-Making Support Systems," in Knowledge-Based Intelligent Information and Engineering Systems, Berlin: Springer, 2003.
Nilsson, N., Artificial Intelligence: A New Synthesis, San Francisco, CA: Morgan Kaufmann, 1998.
Norman, G. R., L. R. Brooks, C. K. Colle, and R. M. Hatala, "The Benefit of Diagnostic Hypotheses in Clinical Reasoning: Experimental Study of an Instructional Intervention for Forward and Backward Reasoning," Cognition and Instruction, Vol. 17, No. 4, February 1999, pp. 433-448.
Pereira, L. M., and A. Saptawijaya, "Modelling Morality with Prospective Logic" International Journal of Reasoning-Based Intelligent Systems, Vol. 1, 2009, pp. 209-221.
Rauch-Hindin, W. B., A Guide to Commercial Artificial Intelligence, Englewood Cliffs: Prentice-Hall, 1988.
Russell, S. J., and P. Norvig, Artificial Intelligence: A Modern Approach, 2nd ed., Upper Saddle River, NJ: Prentice-Hall, 2003.
Sauter, V. L., and L. A. Madeo, "Using Statistics to Make Expert Systems User-Acquainted," Annals of Mathematics and Artificial Intelligence, Vol. 2, 1990, pp. 309-326.
Turban, E., and H. J. Watson, " Integrating Expert Systems, Executive Information Systems and Decision Support Systems," in P. Gray (Ed.), Decision Support and Executive Information Systems, Englewood Cliffs, NJ: Prentice-Hall, 1994, pp. 399-408.
Waterman, D. A., A Guide to Expert Systems, Reading, MA: Addison-Wesley, 1985.
QUESTIONS
1. What are certainty factors? What are the risks and advantages of their use?
2. Discuss the difference between the concepts of "disbelief" and "the lack of be l ief in decision making and the role these concepts play in selecting an automobile. What is the implication for building certainty factors into the system?
3. Historically, what were the differences between decision support and expert systems? What factors led to the narrowing of those differences? What implication does this have for the model management feature in DSS?
4. How do you know when you have included enough "intelligence" in a decision support system?
5. Compare and contrast symbolic processing and numerical processing. Why is the former referred to as "intelligence"?
6. What factors would lead you to recommend selecting a project that is appropriate for expert systems development?
7. Consider preparing a DSS for which certainty factors are relevant. This may be a class project, an example with which you are familiar, or a hypothetical example. What issues need to be tracked with certainty factors?
ON THE WEB
On the Web for this supplement to Chapter 4 provides additional information about artificial intelligence and how it applies to DSS design. Links can provide access to demonstration packages, general overview information, applications, software providers, tutorials, and

ON THE WEB 213
more. Additional discussion questions and new applications will also be added as they become available.
• Links to applications are provided. Since artificial intelligence can be nebulous until actual applications are addressed, there are links that can provide descriptions of applications. Information is available regarding stand-alone applications, integrated tools, business-related systems, such as intelligent agents, and general interest ap-plications, such as chess programs.
• Links to press accounts of the use of intelligence are available. These links provide general overviews of uses in business, industry areas, government, and society as a whole. Furthermore, links can be made to interviews with experts and their forecasts about future use.
• Links provide access to examples of artificial intelligence tools. Links provide ac-cess to product information, product comparisons and reviews, as well as general information about both artificial intelligence and expert systems tools.
• Links provide access to more examples of how to build intelligence into a DSS. Both conceptual examples and actual code are available to add to the material in the chapter supplement.
You can access material for this supplement to Chapter 4 from the general Web page for the book or directly at http://www.umsl.edu/^sauterv/DSS4BI/mbms_sup.html.

USER INTERFACE
To the decision maker, the user interface is the DSS. The user interface includes all the mechanisms by which commands, requests, and data are entered into the DSS as well as all the methods by which results and information are output by the system. It does not matter how well the system performs; if the decision maker cannot access models and data and peruse results, invoke assistance, share results, or in some other way interact with the system, then the system cannot provide decision support. In fact, if the interface does not meet their needs and expectations, decision makers often will abandon use of the system entirely regardless of its modeling power or data availability.
To paraphrase Dickens, it is the most exciting of times for designing user interfaces, and it is the most frustrating of times for designing user interfaces. It is an exciting time because advances in computing technologies, interface design, and Web and mobile technologies have opened a wide range of opportunities for making more useful, more easily used, and more aesthetically pleasing representations of options, data, and information. It is a frustrating time because legacy systems still exist, and there are a wide range of user preferences. Some DSS must be built using technologies that actually limit the development of user interfaces. Others must at least interact with such legacy systems and are therefore limited in the range of options available. In this chapter, the focus will be on the future. However, remember that "the future" may take a long time to get to some installations.
Decision Support Systems for Business Intelligence by Vicki L. Sauter Copyright © 2010 John Wiley & Sons, Inc.
215

USER INTERFACE
GOALS OF THE USER INTERFACE
The purpose of the user interface is communication between the human and the computer, known as human-computer interaction (HCI). As with person-to-person communication, the goal of HCI is to minimize the amount of incorrectly perceived information (on both parts) while also minimizing the amount of effort expended by the decision maker. Said differently, the goal is to design systems that minimize the barrier between the human's cognitive model of what they want to accomplish and the computer's understanding of the user's task so that users can avail themselves of the full potential of the system.
Although there has been an active literature on HCI since the 1990s, the actual im-plementation of that goal continues to be more an "art" than a science. With experience, designers become more attuned to what users want and need and can better provide it through good color combinations, appropriate placement of input and output windows, and generally good composition of the work environment. The key to making the most out of it is knowing when to apply it. Some of the material is quite pertinent for all user interface design. Other material applies only in certain circumstances. But there are some guiding principles and those will be discussed first.
A prime concern of this goal is the speed at which decision makers can glean available information. Humans have powerful pattern-seeking visual systems. If they focus, humans can perceive as many as 625 separate points in a square inch and thus can realize substantial information. The eyes constantly scan the environment for cues, and the associated brain components act as a massive parallel processor, attempting to understand the patterns among those cues. The visual system includes preattentive processing, which allows humans to recognize some attributes quite quickly, long before the rest of the brain is aware that it has perceived the information. Good user interfaces will exploit that preattentive processing to get the important information noticed and perceived quickly. However, the information is sent to short-term visual processing in our brain, which is limited and is purged frequently. Specifically, the short-term visual memory holds only three to nine chunks of information at a time. When new information is available (we see another image), the old information is lost unless it has been moved along to our attention. Hence we lose the information before it is actually perceived. Since preattentive processing is much faster than attentive processing, one goal is to encode important information for rapid perception. If the data are presented well, so that important and informative patterns are highlighted, the preattentive processes will discern the patterns and then they will stand out. Otherwise the data may be missed, be incomprehensible, or even be misleading.
The attributes that invoke the preattentive processing include the hue and intensity of the color, the location, the orientation, the form of the object (width, size, shape, etc.), and motion. For example, more intense colors are likely to provoke preattentive processing, especially if those around it are more neutral. Longer, wider images will get more attention, as will variations in the shapes of the items and their being grouped together. However, clutter, too much unnecessary decoration, and an effort to overdesign the interface may actually slow down the perception and therefore work against us.
In addition to making the information quickly apparent, the user interface must be effective. These interfaces must allow users to work in a comfortable way and to focus on the data and the models in a way that supports a decision. Equally important is that the interface must allow these things without causing users frustration and hesitation and without requiring them to ask questions. This requires designers to make navigation of the system clear to ensure that decision makers can do what they need to do easily. It also requires the designers make the output clear and actionable. To accomplish this, designers

GOALS OF THE USER INTERFACE
should organize groups, whether they be menus, commands, or output, according to a well-defined principle, such as functions, entities, or use. In addition, designers should colocate items that belong to the same group. This might mean keeping menu items together or putting results for the same group together on the screen. Output should be organized to support meaningful comparisons and to discourage meaningless comparisons.
A third overall principle of interface design is that the user interfaces must be easily learned. Designers want the user to master operation of the system and relate to the system intuitively. To achieve this goal, they must be simple, structured, and consistent so that users know what to expect and where to expect it on the screen. A simple and well-organized interface can be remembered more easily. These systems have a minimum number of user responses, such as pointing and clicking, that require users to learn few rules but allow those rules to be generalized to more complexity. Well-designed systems will also provide good feedback to the user about why some actions are acceptable while others are not and how to fix the problem of the unacceptable actions. Such feedback can take the form of the hour glass to demonstrate the system is processing to useful error messages if it is not. Similarly, tolerant systems that allow the user multiple ways to achieve a goal adapt to the user, thereby allowing more natural efforts to make a system perform.
The goal of making the interface easily learned (and thus used) is complicated because every system will have a range of users, from beginners to experts, who have different needs. Beginners will need basic information about the scope of a program or specifics about how to make it work. Experts, on the other hand, will need information about how to make the program more efficient, with automation, shortcuts, and hot keys, and the boundaries of safe operation of the program. In between, users need reminders on how to use known functions, how to locate unfamiliar functions, and how to understand upgrades. All of these users rely not only on the information available with the user interface but also on the feedback that the system provides to learn how to use the system. Feedback that helps the users understand what they did incorrectly and how to adjust their actions in the future is critical to learning. Not only must the feedback be provided, but also it must be constructive, helping the user to understand mistakes, not to increase his or her frustration. It should provide clear instructions about how to fix the problem.
Finally usable systems are ones that satisfy the user's perceptions, feelings and opinions about the decision. Norman (2005) says that this dimension is impacted significantly by aesthetics. Specifically, he says that systems that are more enjoyable, makes users more relaxed and open to greater insight and creative response. The user interface should not be ugly and should fit the culture of the organization. Designers should avoid "cute" displays, unnecessary decoration and three-dimensional images because they simply detract from the main effort. Cooper (2007) believes that designing harmonious, ethical interactions that improve human situations and are well behaved is critical to satisfying user needs. Cooper (2007, p. 203) provides some guidance about creating harmonious interactions with the following:
• Less is more. • Enable users to direct, don't force them to discuss. • Design for the probably; provide for the possible. • Keep tools close at hand. • Provide feedback. • Provide for direct manipulation and graphical input. • Avoid unnecessary reporting.

218 USER INTERFACE
• Provide choices. • Optimize for responsiveness; accommodate latency.
By "ethical," Cooper (2007, p. 152) means the design should do no harm. He identifies the kinds of harm frequently seen in systems that should be avoided in DSS design as follows:
• Interpersonal harm with insults and loss of dignity (especially with error messages) • Psychological harm by causing confusion, discomfort, frustration, or boredom • Social and societal harm with exploitation or perpetuation of justice
Cooper (2007, p. 251) also provides guidance about designing for good behavior when he notes that products should:
• Personalize user experience where possible • Be deferential • Be forthcoming • Use common sense • Anticipate needs • Not burden users with internal problems with operations • Inform • Be perceptive • Not ask excessive questions • Take responsibility • Know when to bend the rules
Throughout the chapter, we will discuss the specifics these overriding principles of user interface design. The primary goal is to design DSS that make it easy and comfortable for decision makers to consider ill-structured problems, understand and evaluate a wide range of alternatives, and make a well-informed choice.
MECHANISMS OF USER INTERFACES
In addition to understanding the principles of good design, it is important to review the range of mechanisms for user interfaces that exist today and those mechanisms that are coming in the near future. Everyone is familiar with the keyboard and the mouse as input devices and the monitor as the primary output device. Increasingly users are relying upon portable devices. Consider, for example, the pen-and-gesture-based device shown in Figure 5.1. Information is "written" on the device and saved using handwriting and gesture recognition. This allows the device to go where the decisions are, such as an operating room, and to provide flexible support. Or, the user might rely upon a mobile phone, with much smaller screens such as the ones shown in Figure 5.2. These mobile devices have a substantially smaller screen yet have much higher resolution. On the other hand, if the decision makers will include a group, they might rely upon wall systems to

MECHANISMS OF USER INTERFACES 219
Figure 5.1. Pen-based system. HP Tablet. Photo by Janto Dreijer. Available at http://www.
wikipedia.com/File:Tablet:jpg used under the Creative Commons Attribution ShareAlike 3.0
License.
Figure 5.2. Mobile phones as input and output devices.

220 USER INTERFACE
Figure 5.3. Wall screens as displays. Ameren UE's Severe Weather Centre. Photo reprinted cour-tesy of Ameren Corporation.
display their output, such as those shown in Figure 5.3. These large screens may have lower resolution. Designing an interface for anything from a screen 5 in. x 3 in. with gestures and handwriting recognition to one that might take the entire wall and use only voice commands is a challenging proposition. User interfaces are, however, getting even more complicated for design. Increasingly, virtual reality is becoming more practical for DSS incorporation, so your system might include devices such as those shown in Figure 5.4 or even something like the wii device shown in Figure 5.5.
The future will bring both input and output devices that are increasingly different from the keyboard and the monitor that we rely upon today. Consider the device shown in Figure 5.6, which was developed in the MIT Media Laboratory. The device is a microcomputer. It includes a projector and a camera as two of the input/output devices. This device connects with the user's cell phone to obtain Internet connectivity. The decision maker can use his or her hands, as the user is doing in the photograph, to control the computer. The small bands on his hands provide a way for the user to communicate with the camera and thus the computer. This projection system means that any surface can be a computer screen and that one may interact with the screen using just one's fingers, as shown in Figure 5.7. In this figure, the user is selecting from menus and beginning his work. You can integrate these features into any activity. Notice how the user in Figure 5.8 has invoked his computer to supplement the newspaper article with a video from a national news service. Or, the decision maker can get information while shopping. Figure 5.9 shows a person who is considering purchasing a book in a local bookstore. Among the various kinds of information considered is the Amazon rating and Amazon reviews pulled up from his computer. Notice how they are projected on the front of the book (about halfway down the book cover).
It is important to think creatively about user interfaces to be sure that we provide the richest medium that will facilitate decision making. Different media require different design

MECHANISMS OF USER INTERFACES 221
Figure 5.4. Virtual reality devices. Ames developed (Pop Optics) now at the Dulles Ames of the
National Air and Space Museum. Source: http://gimp-savvy.com/cgi-bin/ing.cgi7ailsxmzVn080jE094
used under the Creative Commons Attribution ShareAlike 3.0 License.
and there is not a "one size fits all." It is important to think of the medium as a tool and let context drive the design and to customize for a specific platform. The general principles of this chapter will help readers evaluate the needs of the user and the medium. Most of the examples, however, will focus on current technologies.
Figure 5.5. A wii device. Wii remote control. Image from http://en.wikipedia.org/wiki/File: Wiimote-lite2.jpg used under the Creative Commons Attribution ShareAlike 3.0 License.

222 USER INTERFACE
Figure 5.6. MIT Media Lab's view of user interface device. Demonstration of the Sixth Sense Project of the MIT Media Lab. Photo taken by Sam Ogden. Photo reprinted courtesy of the MIT Media Laboratory, P. Maes, Project Director, and P. Mistry, Doctoral Student, (pictured).
Figure 5.7. MIT Media Lab's view of user interface device. Demonstration of the Sixth Sense Project of the MIT Media Lab. Photo taken by Lynn Barry. Photo reprinted courtesy of the MIT Media Laboratory, P. Maes, Project Director, and P. Mistry, Doctoral Student (pictured).
DSS in Action Friends
The FRIEND system is an emergency dispatch system in the Bellevue Borough, north of Pitts-burgh, Pennsylvania. This system, known as the First Responder Interactive Emergency Naviga-tional Database (FRIEND), dispatches information to police using hand-held computers in the field. The hand-held devices are too small to support keyboards or mice. Rather police use a stylus to write on the screen or even draw pictures. These responses arc transmitted immediately to the station for sharing. Police at the station can use a graphical interface or even speech commands to facilitate the sharing of information to members in the field.

USER INTERFACE COMPONENTS 223
Figure 5.8. MIT Media Lab's view of user interface device. Demonstration of the Sixth Sense Project of the MIT Media Lab. Photo taken by Sam Ogden. Photo reprinted courtesy of the MIT Media Laboratory, P. Maes, Project Director, and P. Mistry, Doctoral Student.
USER INTERFACE COMPONENTS
We must describe the user interface in terms of its components as well as its mode of communication, as in Table 5.1. The components are not independent of the modes of communication. However, since they each highlight different design issues, we present them separately—components first.
Figure 5.9. MIT Media Lab's view of user interface device. Demonstration of the Sixth Sense Project of the MIT Media Lab. Photo taken by Sam Ogden. Photo reprinted courtesy of the MIT Media Laboratory, P. Maes, Project Director, and P. Mistry, Doctoral Student.

USER INTERFACE
Table 5.1. User Interfaces
User interface components • Action language • Display or presentation language
• Knowledge base
Modes of communication • Mental model • Metaphors and idioms • Navigation of the model • Look
Action Language
The action language identifies the form of input used by decision makers to enter requests into the DSS. This includes the way by which decision makers request information, ask for new data, invoke models, perform sensitivity analyses, and even request mail. Historically, five main types of action languages have been used, as shown in Table 5.2.
Menus. Menus, the most common action language today, display one or more lists of alternatives, commands, or results from which decision makers can select. A menu provides a structured progression through the options available in a program to accomplish a specific task. Since they guide users through the steps of processing data and allow the user to avoid knowing the syntax of the software, menus often are called "user friendly." Menus can be invoked in any number of ways, including selecting specific keys on a keyboard, moving the mouse to a specific point on the screen and clicking it, pointing at the screen, or even speaking a particular word(s).
In many applications, menus exist as a list with radio buttons or check boxes on a page. Or the menu might be a list of terms over which the user moves the mouse and clicks to select. Or the menu might actually exist as a set of commands in a pull-down menu such as seen in the menu bar. As most computer users today are aware, you can invoke the pull-down menu by clicking on one of the words or using a hot-key shortcut. When this is done, a second set of menus is shown below the original command, as illustrated with Analytical menu bar shown in Figure 5.10.
Menus and menu bars should not be confused with the toolbars available on most programs. In Figure 5.10, the toolbar is the set of graphical buttons shown immediately below the menu bar. They might also show up as part of the "ribbon bar" that Microsoft has built into its 2007 Access, shown in Figure 5.11. These toolbars provide direct access to some specific component of the system. They do not provide an overview of the capabilities and operation of a program in the way that menus do but rather provide a shortcut for more experienced users.
Table 5.2. Basic Action Language Types
Menu format Question-answer format Command language format Input/output structured format Free-form natural language format

USER INTERFACE COMPONENTS 225
Figure 5.10. One form of a menu. Menu from Analytica. Used with permission of Lumina
Decision Systems.
Menu formats use the process of guiding the user through the steps with a set of pictures or commands that are easy for the user to understand. In this way, the designer can illustrate for the user the full range of analyses the DSS can perform and the data that can be used for analysis. Their advantage is clear. If the menus are understandable, the DSS is very easy to use; the decision maker is not required to remember how it works and only needs to make selections on the screen. The designer can allow users keyboard control (either arrow keys or letter key combinations), mouse control, light pen control, or touch screen control.
Menus are particularly appealing to inexperienced users, who can thereby use the system immediately. They may not fully understand the complexity of the system or the range of modeling they can accomplish, but they can get some results. The menu provides a pedagogical tool describing how the system works and what it can do. Clearly this provides an advantage. In the same way, menu formats are useful to decision makers who use a DSS only occasionally, especially if there are long intervals between uses. Like the inexperienced user, these decision makers can forget the commands necessary to accomplish a task and hence profit by the guidance the menus can provide.
Menu formats tend not to be an optimal action language choice for experienced users, however, especially if these decision makers use the system frequently. Such users can be-come frustrated with the time and keystrokes needed to process a request when other action language formats can allow them access to more complex analyses and more flexibility. This will be discussed in more depth under the command language.
Figure 5.11. A "ribbon bar" as a menu. Microsoft's "Ribbon" in Excel 2007 from http://en.wikipedia.com/wiki/ File:office2007vibbon.png. Used under the Creative Commons Attribution ShareAlike 3.0 License.
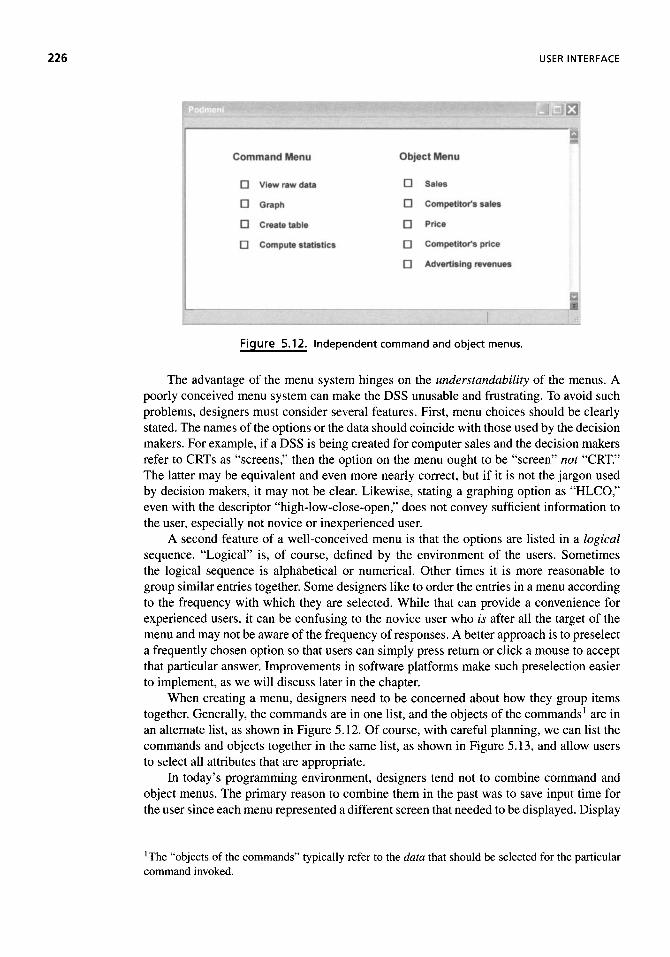
226 USER INTERFACE
Figure 5.12. Independent command and object menus.
The advantage of the menu system hinges on the understandability of the menus. A poorly conceived menu system can make the DSS unusable and frustrating. To avoid such problems, designers must consider several features. First, menu choices should be clearly stated. The names of the options or the data should coincide with those used by the decision makers. For example, if a DSS is being created for computer sales and the decision makers refer to CRTs as "screens," then the option on the menu ought to be "screen" not "CRT." The latter may be equivalent and even more nearly correct, but if it is not the jargon used by decision makers, it may not be clear. Likewise, stating a graphing option as "HLCO," even with the descriptor "high-low-close-open," does not convey sufficient information to the user, especially not novice or inexperienced user.
A second feature of a well-conceived menu is that the options are listed in a logical sequence. "Logical" is, of course, defined by the environment of the users. Sometimes the logical sequence is alphabetical or numerical. Other times it is more reasonable to group similar entries together. Some designers like to order the entries in a menu according to the frequency with which they are selected. While that can provide a convenience for experienced users, it can be confusing to the novice user who is after all the target of the menu and may not be aware of the frequency of responses. A better approach is to preselect a frequently chosen option so that users can simply press return or click a mouse to accept that particular answer. Improvements in software platforms make such preselection easier to implement, as we will discuss later in the chapter.
When creating a menu, designers need to be concerned about how they group items together. Generally, the commands are in one list, and the objects of the commands1 are in an alternate list, as shown in Figure 5.12. Of course, with careful planning, we can list the commands and objects together in the same list, as shown in Figure 5.13, and allow users to select all attributes that are appropriate.
In today's programming environment, designers tend not to combine command and object menus. The primary reason to combine them in the past was to save input time for the user since each menu represented a different screen that needed to be displayed. Display
!The "objects of the commands" typically refer to the data that should be selected for the particular command invoked.
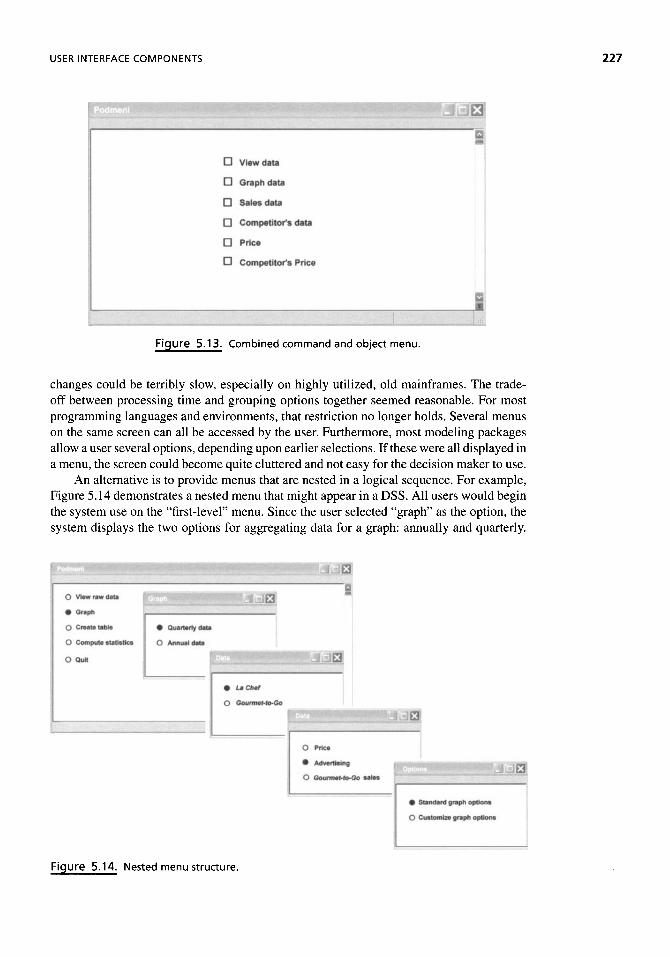
USER INTERFACE COMPONENTS 227
Figure 5.13. Combined command and object menu.
changes could be terribly slow, especially on highly utilized, old mainframes. The trade-off between processing time and grouping options together seemed reasonable. For most programming languages and environments, that restriction no longer holds. Several menus on the same screen can all be accessed by the user. Furthermore, most modeling packages allow a user several options, depending upon earlier selections. If these were all displayed in a menu, the screen could become quite cluttered and not easy for the decision maker to use.
An alternative is to provide menus that are nested in a logical sequence. For example, Figure 5.14 demonstrates a nested menu that might appear in a DSS. All users would begin the system use on the "first-level" menu. Since the user selected "graph" as the option, the system displays the two options for aggregating data for a graph: annually and quarterly.
Figure 5.14. Nested menu structure.

USER INTERFACE
Note that this choice is provided prior to and independent of the selection of the variables to be graphed so that the user cannot inadvertently select the x axis as annual and the y axis as quarterly data (or vice versa).
The "third-level" menu item allows the users to specify what they want displayed on the y axis. While this limits the flexibility of the system, if carefully designed, it can represent all options needed by the user. Furthermore, it forces the user to declare what should be the dependent variable, or the variable plotted on the y axis, without using traditional jargon. This decreases the likelihood of misspecification of the graph.
The "fourth-level" menu is presented as a direct response to the selection of the dependent variable selection. That is, because the decision maker selected La Chef sales, the system "knows" that the only available and appropriate variables to present on the x axis are price, advertising, and the competitor's sales. In addition, the system "knows" that the time dimension for the data on the x axis must be consistent with that on the y axis and hence displays "quarterly" after the only selection that could be affected. Note that the system does not need to ask how users want the graph displayed because it has been specified without the use of jargon.
Finally, the last menu level allows the users the option of customizing the labeling and other visual characteristics of their graphs. Since the first option, standard graph, was selected, the system knows not to display the variety of options available for change. Had the user selected the customize option, the system would have moved to another menu that allows users to specify what should be changed.
In early systems, designers needed to provide menu systems that made sense in a fairly linear fashion. While they could display screens as a function of the options selected to that point, such systems typically did not have the ability to provide "intelligent" steps through the process. Today's environments, which typically provide some metalogic and hypertext functionality as well as some intelligent expertise integrated into the rules, can provide paths through the menu options that relieve users of unnecessary stops along the way.
Depending upon the programming environment, the menu choices might have the boxes, or radio buttons illustrated in Figure 5.12 or underscores or simply a blank space. The system might allow the user to pull down the menu or have it pop up with a particular option. Indeed, in some systems, users can click the mouse on an iconic representation of the option. These icons are picture symbols of familiar objects that can make the system appear friendlier, such as a depiction of a monthly calendar for selecting a date.
Ideally the choice from among these options is a function of the preferences of the system designers and users. In some cases, the choice will be easy because the programming environment only will support some of the options. In still other cases, multiple options are allowed, but the software restricts the meaning and uses of the individual options. For example, in some languages, the check box will support users selecting more than one of the options whereas the radio button will allow users to select only one. Before designing the menus, designers need to be familiar with the implications of their choices.
However the options are displayed on the screen, users might also have a variety of ways of selecting them. In most systems, the user would always have the arrow keys and "enter" key to register options. Similarly, most systems support pressing a character (typically the first letter of the command) to select an option. Many systems also support the use of a mouse in a "point-and-click" selection of options. Less often, we find a touch screen, where the user literally selects an option by touching the word or the icon on the screen, or a light pen, where the user touches the screen with the end of a special pen. In a voice input system, the user selects an option by speaking into a microphone connected to the computer. The computer must then translate the sound into a known command

USER INTERFACE COMPONENTS 229
Figure 5.15. Question-answer format.
and invoke the command. This option is still rare. Voice systems can accept only limited vocabulary and must be calibrated to the speech patterns of each user.
Question-Answer Format A second option for the action language is to provide users questions they must answer. In the text form, this is actually a precursor to the modern menu and tends to be found only in legacy systems. However, the option appears in newer systems that use voice activation of menus. Since it is easier to show the text form in the book, that is the example that will be used. An example of computer questions and user answers is shown in Figure 5.15.
One attribute of the question-answer format in some environments is the opportunity to embed information into the questions. Such information might be the name of the user, the project of interest, or other information regarding the use of the system. For example, the previous example could be redefined as shown in Figure 5.16. While some users respond favorably to the use of their name in these questions, others find it quite annoying. Furthermore, the use of the personalized questions tends to slow down the processing and make the questions appear much longer and more difficult to read.
The goal of the question-answer approach is to give the appearance of flexibility in proceeding through the options of the system. Indeed, its usefulness is optimized when it is most flexible. The question-answer format works best when the user has more control over the system and its options. However, coding such flexibility can be infeasible in many programming environments. Thus this type of action language is generally implemented as a fixed sequence and format, which is very rigid and often limiting to the user.
Command Language. The command language format allows user-constructed statements to be selected from a predefined set of verbs or noun-verb pairings. It is similar to a programming language that has been focused on the task of the DSS. An example of a command language format is shown in Figure 5.17.
The command language format allows the user to control the systems' operations directly providing greater latitude in choosing the order of the commands. In this way, the
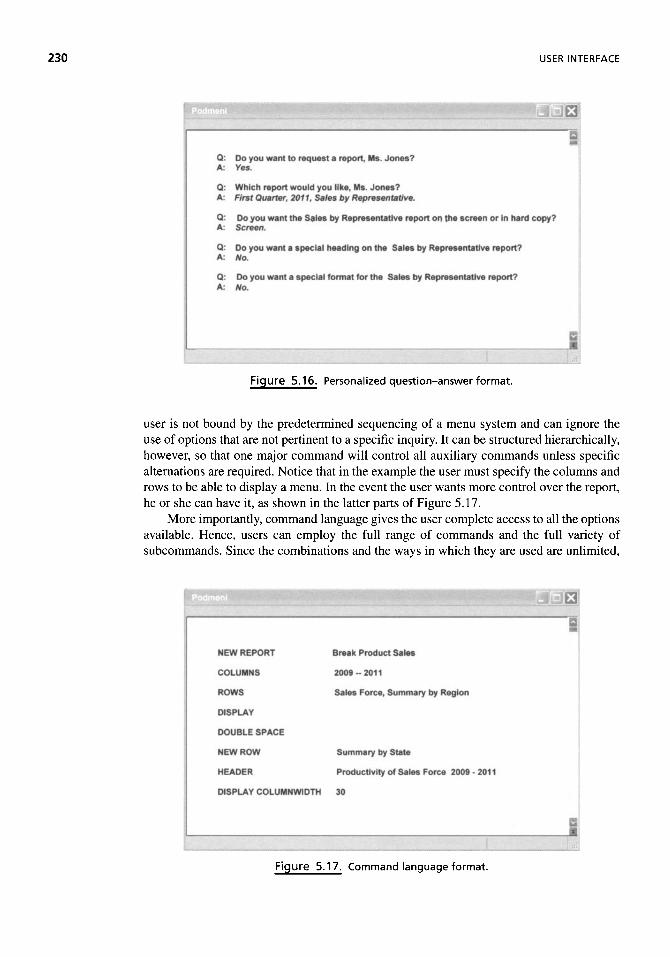
230 USER INTERFACE
Figure 5.16. Personalized question-answer format.
user is not bound by the predetermined sequencing of a menu system and can ignore the use of options that are not pertinent to a specific inquiry. It can be structured hierarchically, however, so that one major command will control all auxiliary commands unless specific alternations are required. Notice that in the example the user must specify the columns and rows to be able to display a menu. In the event the user wants more control over the report, he or she can have it, as shown in the latter parts of Figure 5.17.
More importantly, command language gives the user complete access to all the options available. Hence, users can employ the full range of commands and the full variety of subcommands. Since the combinations and the ways in which they are used are unlimited,
Figure 5.17. Command language format.
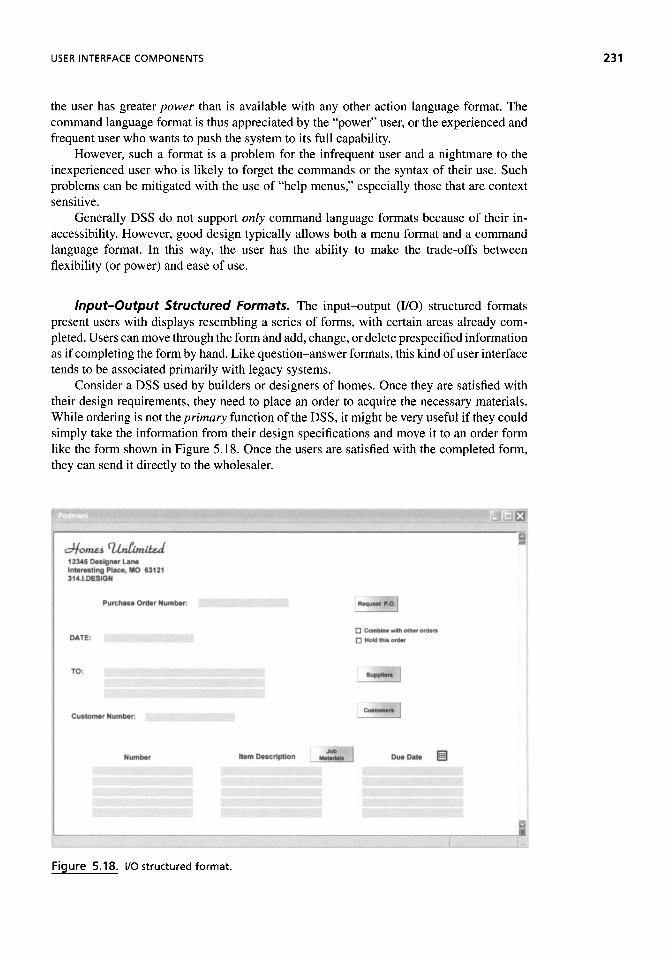
USER INTERFACE COMPONENTS 231
the user has greater power than is available with any other action language format. The command language format is thus appreciated by the "power" user, or the experienced and frequent user who wants to push the system to its full capability.
However, such a format is a problem for the infrequent user and a nightmare to the inexperienced user who is likely to forget the commands or the syntax of their use. Such problems can be mitigated with the use of "help menus," especially those that are context sensitive.
Generally DSS do not support only command language formats because of their in-accessibility. However, good design typically allows both a menu format and a command language format. In this way, the user has the ability to make the trade-offs between flexibility (or power) and ease of use.
Input-Output Structured Formats. The input-output (I/O) structured formats present users with displays resembling a series of forms, with certain areas already com-pleted. Users can move through the form and add, change, or delete prespecified information as if completing the form by hand. Like question-answer formats, this kind of user interface tends to be associated primarily with legacy systems.
Consider a DSS used by builders or designers of homes. Once they are satisfied with their design requirements, they need to place an order to acquire the necessary materials. While ordering is not the primary function of the DSS, it might be very useful if they could simply take the information from their design specifications and move it to an order form like the form shown in Figure 5.18. Once the users are satisfied with the completed form, they can send it directly to the wholesaler.
Figure 5.18. I/O structured format.

USER INTERFACE
It is not surprising that such I/O structured formats are not commonly seen in DSS, because they replicate a repeated, structured manual process. They should not be a primary action language option in a DSS; however, they can be used as a supplement. It makes sense to include an order form as a part of the DSS in our example because its function is integrated with the primary function of the system. Since the completion of the form is integrated with the development of the design, as design features change, the form will be updated immediately. For example, if the designer later finds a need for three items, rather than the two items first entered into the form, the order form will be updated immediately. Or, if the designer decides a conventional widget will not suffice and substitutes an oblique widget, the form will be updated automatically.
The question that should be troubling you is, why have the designer complete the order form at all? Why not have a clerk place the order? Under some circumstances that might be reasonable. However, a designer tends to have preferences for styles, workmanship, and other factors of particular manufacturers. Part of the actual design is in fact the selection of the manufacturer. Or, the designer might want to complete some cost sensitivity analyses on a particular design in order to make trade-offs among various options which could have differential impact on the total cost. Hence, the costing function must be part of the DSS. However, part of the functionality of the system might be to send information to clerks about parts not specified by the designer so they can actually place the orders.
Free-Form Natural Language. The final action language option is the one most like conventional human communication. By "free-form," we imply that there is no preconceived structure in the way commands should be entered. By "natural language," we imply that the terms used in the commands are not specified by the system but rather are chosen by the users themselves. Hence, the system cannot rely upon finding "key terms" in the midst of other language (as it might with the question-answer format), because they may not be present. For example, rather than requesting a "report," users might request a "summary" or a "synopsis" of the information. The system must be able to scan a request, parse the language, and determine that the requested summary is actually a report. So the same request that was presented in Figure 5.15 (in the question-answer section) might now be presented as in Figure 5.19.
Figure 5.19. Free-form natural language format.

USER INTERFACE COMPONENTS 233
While parsing of this request can be accomplished, it takes extra computer power and extra processing time. Under conditions of limited possibilities for the requests, such systems have been shown to perform adequately. However, this approach might produce an inappropriate result, especially if the user has particularly unusual terminology (as might be the case if the system serves users transnationally) or if the range of options is large. The possibility is troubling because the requested information might be close to the intended result and the error might not be noticed.
If the input medium is voice, a free-form natural language format can become particu-larly difficult to implement because of the implications of intonation and the confusion of homonyms. On the other hand, it is with voice input that natural language makes the most sense, especially for addressing special circumstances or needs. Such systems have their greatest contribution in serving handicapped users who cannot use other input mechanisms. Under these conditions, the extra programming and computer needs are justified because they provide empowerment to users.
Display or Presentation Language
While the action language describes how the user communicates to the computer, the second aspect, the presentation language, describes how the computer provides information back to the user. Of course, such an interface must convey the analysis in a fashion that is meaningful to the user. This applies not only to the results at the end of an analysis but also to the intermediary steps that support all phases of decision making. Furthermore, the presentation must provide a sense of human control of the process and of the results. All of this must be accomplished in a pleasing and understandable fashion without unduly cluttering the screen.
Visual Design Issues. The goal of the display of a DSS is for people to be able to understand and appreciate the information provided to them. The display should help users evaluate alternatives and make an informed decision and do that with a minimum amount of work. Don't make the users think about how to use the system, but rather encourage them to think about the results the system is providing. To that end, displays should be simple, well organized, understandable, and predictable.
Since 1992, IBM has worked with the Olympic Committee to create the Olympic Technology Solution. This tool was written in object code for use in future Olympic games. The system works with 40,000 volunteers as well as countless home users. This requires the system to be truly human centric and accessible. Part of the secret in achieving clarity of the user interface is to separate the various components of the system into separately accessed modules. Hence, users can focus on the Results System, the Press Information System, the Commentator Information System, or the Games Management System. The Results System will deliver times to the 31 Olympic venues, the pagers, and the Internet. Hence, scoreboards and a Web page will obtain their information from the same source at approximately the same time. The Press Information System and the Commentator Information System get not only the game results but also personalized athlete profiles and other statistical information. The Games Management System handles all of the operational information for the games.

USER INTERFACE
The first rule of design is that the display should be readable. Of course that means that it should be understandable and not overly verbose. All interfaces should use the fewest possible words and the terminology used on the display should be that of the user, not the designers. Readability also implies that you can discern the words. Reading is really a form of pattern recognition, and so a combination of uppercase and lowercase letters is the easiest text to read. The chosen font should also be selected to help users recognize patterns. Although most written word uses serif fonts, researchers have found they are harder to dis-cern on a display. Instead designers should use a sans serif font, such as Arial, Helvetica, or Tahoma. In addition, the font size should be large enough for comfortable reading; generally this requires a font size of at least 10 pixels. Finally, to allow pattern recognition implies that the user can discern the letters. This requires there to be the greatest contrast between the color of the background and the font as possible. If the colors are too close together, such as navy and black or yellow and white, users will have difficulty finding the letters. Of course, if your interface is audible, then similar rules apply, such as making the words clear, talking slowly enough to discern words, and avoiding background sounds that get in the way.
The second rule of design is to control color. There is the temptation for designers to use every color that is available to them. But, using many colors increases the time it takes users to discern the information on the screen. Instead of making it easier to see patterns, users actually spend more time trying to remember what the various colors mean and may actually miss the patterns afforded to them. Similarly, designers should limit the number of saturated colors used and take care in their placement. The basic display should use neutral colors, which have a calming and actually encourage people to stay looking at it. As stated in the previous paragraph, there must be enough contrast between items for the user to discern them. However, designers should take care not to use saturated complementary colors because that much difference actually causes optical illusions. On a neutral background, bright colors, used selectively, can focus the users' attention to important or concerning results on the display. Or designers can highlight relationships and similarities by repeating colors for different information. Finally, designers should take care that colors are not the only cues available since many individuals have some form of color blindness and thus will not be able to discern the differences.
The third rule of design is to control location and size. On a display, the largest item and the one in the top, left corner will get the users' attention first. Using that information, designers can display items so as to help users to find the most important, the most critical, the most frequently used, or the most summarized information. The order in which items appear on the screen should make sense to the audience and reflect their view of the choice context. Continuity in location will cause decision makers to believe the items should be considered as a group, so separate diverse items. Information that belongs together should be put together on the display and connected. A small box or lines around such items will help to focus the user on the similarities; the color of these lines should be consistent with the primary font and should be as narrow as possible.
The fourth rule of design is to keep the display organized. Of course, the less that is on the screen, the easier it is to look organized. Designers should avoid clutter and noise in the interface that might distract from the important objects the user needs to consider. Overembellishment, overuse of boxes and rules, insufficient use of white space, and poor use of color all threaten the look of organization on a page. Instead, consistent (within a particular display and across displays) and moderated use of size, shape, color, position, and orientation on the screen make the page appear more organized.
The fifth rule of design is to make the navigation easy. Of course this means there should be an obvious way for the user to move from display to display, to drill down in
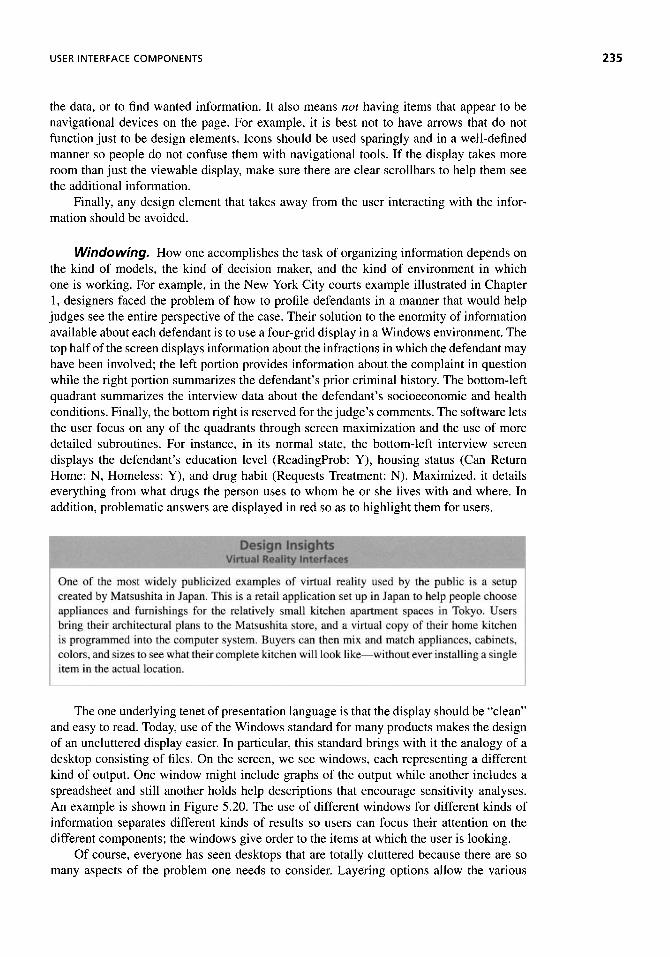
USER INTERFACE COMPONENTS 235
the data, or to find wanted information. It also means not having items that appear to be navigational devices on the page. For example, it is best not to have arrows that do not function just to be design elements. Icons should be used sparingly and in a well-defined manner so people do not confuse them with navigational tools. If the display takes more room than just the viewable display, make sure there are clear scrollbars to help them see the additional information.
Finally, any design element that takes away from the user interacting with the infor-mation should be avoided.
Windowing. How one accomplishes the task of organizing information depends on the kind of models, the kind of decision maker, and the kind of environment in which one is working. For example, in the New York City courts example illustrated in Chapter 1, designers faced the problem of how to profile defendants in a manner that would help judges see the entire perspective of the case. Their solution to the enormity of information available about each defendant is to use a four-grid display in a Windows environment. The top half of the screen displays information about the infractions in which the defendant may have been involved; the left portion provides information about the complaint in question while the right portion summarizes the defendant's prior criminal history. The bottom-left quadrant summarizes the interview data about the defendant's socioeconomic and health conditions. Finally, the bottom right is reserved for the judge's comments. The software lets the user focus on any of the quadrants through screen maximization and the use of more detailed subroutines. For instance, in its normal state, the bottom-left interview screen displays the defendant's education level (ReadingProb: Y), housing status (Can Return Home: N, Homeless: Y), and drug habit (Requests Treatment: N). Maximized, it details everything from what drugs the person uses to whom he or she lives with and where. In addition, problematic answers are displayed in red so as to highlight them for users.
The one underlying tenet of presentation language is that the display should be "clean" and easy to read. Today, use of the Windows standard for many products makes the design of an uncluttered display easier. In particular, this standard brings with it the analogy of a desktop consisting of files. On the screen, we see windows, each representing a different kind of output. One window might include graphs of the output while another includes a spreadsheet and still another holds help descriptions that encourage sensitivity analyses. An example is shown in Figure 5.20. The use of different windows for different kinds of information separates different kinds of results so users can focus their attention on the different components; the windows give order to the items at which the user is looking.
Of course, everyone has seen desktops that are totally cluttered because there are so many aspects of the problem one needs to consider. Layering options allow the various
One of the most widely publicized examples of virtual reality used by the public is a setup created by Matsushita in Japan. This is a retail application set up in Japan to help people choose appliances and furnishings for the relatively small kitchen apartment spaces in Tokyo. Users bring their architectural plans to the Matsushita store, and a virtual copy of their home kitchen is programmed into the computer system. Buyers can then mix and match appliances, cabinets, colors, and sizes to see what their complete kilchen will look like—without ever installing a single item in the actual location.

236 USER INTERFACE
Figure 5.20. Windowed output.
windows to overlap in many applications. Designers should, however, refrain from putting too much on the screen at once for the same reason decision makers are discouraged from having cluttered desks—too many things get lost, and it becomes hard to get perspective on the problem. Instead, if the application allows it, the designer should use icons to indicate various options, as illustrated in Figure 5.21. When the users want to examine that particular aspect of the problem, they can simply click on an icon to enlarge it so it can be viewed in its entirety.
Windows can be sized and placed by the users so they can customize their analysis of the information. Hence, users can have cluttered desktops if they choose, but clutter should not be inherent in the design of the DSS.
Representations. The most common form of output is to show the results of some analysis. Suppose, for example, that the goal were to show the sales of the various divisions for the last year. The appropriateness of the output depends on what the decision maker expects to do with the information. If the decision makers simply wanted to know if the various regions were meeting their goals, they might appreciate the use of metriglyphs, such as those shown in Figure 5.22. Metriglyphs are simply symbols that help convey information to the user quickly. Those with "smiling faces" show sales that met the goals, while those
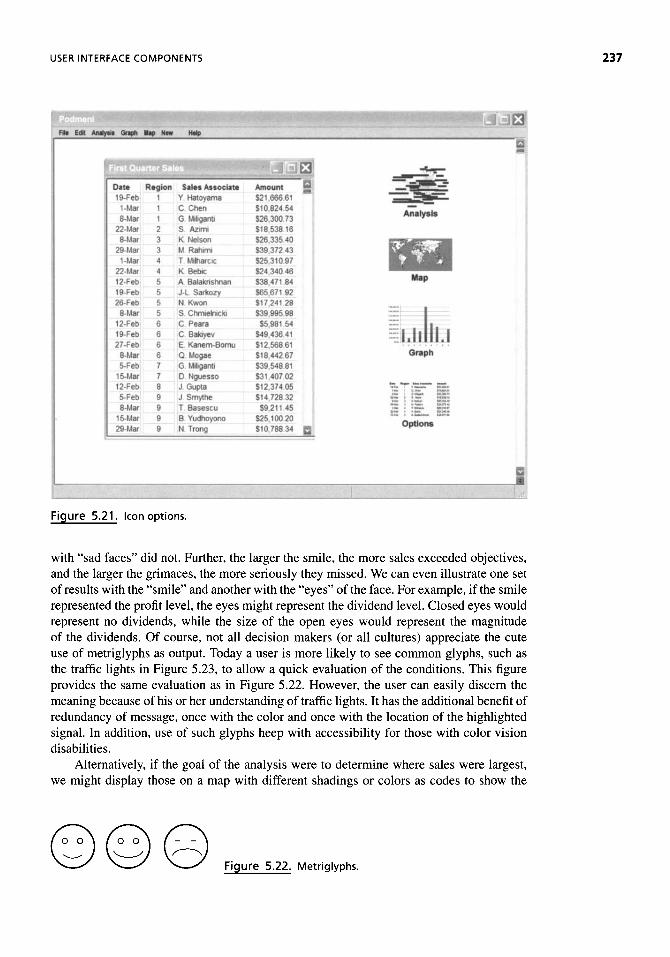
USER INTERFACE COMPONENTS
Figure 5.21. Icon options.
with "sad faces" did not. Further, the larger the smile, the more sales exceeded objectives, and the larger the grimaces, the more seriously they missed. We can even illustrate one set of results with the "smile" and another with the "eyes" of the face. For example, if the smile represented the profit level, the eyes might represent the dividend level. Closed eyes would represent no dividends, while the size of the open eyes would represent the magnitude of the dividends. Of course, not all decision makers (or all cultures) appreciate the cute use of metriglyphs as output. Today a user is more likely to see common glyphs, such as the traffic lights in Figure 5.23, to allow a quick evaluation of the conditions. This figure provides the same evaluation as in Figure 5.22. However, the user can easily discern the meaning because of his or her understanding of traffic lights. It has the additional benefit of redundancy of message, once with the color and once with the location of the highlighted signal. In addition, use of such glyphs heep with accessibility for those with color vision disabilities.
Alternatively, if the goal of the analysis were to determine where sales were largest, we might display those on a map with different shadings or colors as codes to show the
Figure 5.22. Metriglyphs.

238 USER INTERFACE
Figure 5.23. Using traffic lights as metriglyphs.
range of results. Designers should avoid drawing the map to scale in proportion to the sales of the region, as shown in Figure 5.24, since many people do not have a sufficiently strong memory of the size of geographical places to make such representations meaningful.
If the goal were to determine trends over several years, then the most appropriate output is a graph of the results, as shown in Figure 5.25. It is easy to see that some regions increased sales while others decreased and to read off the relative amounts (such as "a lot" or "a little").
On the other hand, if the decision maker wanted the actual numbers (e.g., to do some hand calculation), then the graph in Figure 5.25 is inappropriate because it is difficult to glean the actual sales figures from it. In this case, a table of numbers, such as Figure 5.26, is more useful.
Designers should take care to use rich visualizations that convey the analysis most accurately and most efficiently to the user. Consider Figure 5.27, which shows Napoleon's march. This graphic by Charles Joseph Minard, portrays the losses suffered by Napoleon's army in the Russian campaign of 1812. Beginning at the Polish-Russian border, the top band shows the size of the army at each position during the offensive. The path of Napoleon's retreat from Moscow is depicted by the dark lower band, which is tied to temperature and time scales. So, by simply looking at the graph, you can discern the size of the army and its location and direction at any time as well as the temperature on some days. That powerful graphic contains a substantial amount of information for in-depth examination but also allows users to simply get an overview of the situation.
Some situations are best represented with the association of two or more variables as they change over time. Most of us are not particularly adept at drawing (or viewing) three- or more dimensional depictions. But, with today's technology, it is possible to view those changes by watching a graph move over time. The two graphs shown in Figures 2.7 and 2.8 illustrate the end points of such a graphic. Figure 2.7 shows two axes, "life expectancy at birth" and "average number of children per woman." The graph also shows the data by country with the bubbles in the chart. Each country is a bubble. The relative size of the bubble indicates the size of the country, and the color of the bubble illustrates the continent on which the country is located. You can watch the video on Gapminder's website (http://www.gapminder.org/) to see it move, but the end result is Figure 2.8. In this graphic, you can see multiple variables and how they interact over time, again inviting either the in-depth analysis or a quick overview of the data.
Data visualization techniques for qualitative data have improved over time as well. Consider the question of something like relationship data, which illustrate how groups are related to one another. For example, consider Figure 5.28. This is a relationship diagram from a social networking site showing one person's contacts through the site. The names around the circle are people with whom this individual is connected. The lines represent associations that these individuals have with others in this group. As you can see, some

Fig
ure
5.
24.
Map
of
sale
s vo
lum
e d
raw
n t
o s
cale
.

240 USER INTERFACE
of the individuals (particularly those at the top) are highly connected to one another while those at the bottom seem relatively unconnected to others in the group. This kind of diagram allows the user to investigate how people—or items—are related and where hubs of activity might be.
Another relationship diagram is shown in Figure 5.29. This diagram shows not only associations but also the types of associations. This particular diagram illustrates all of the companies (the darker highlighted items) at which we have placed interns in the last year as well as how many and what kinds of other relationships they have with the department and with each other (the lighter highlighted items). It allows the decision maker to see the depth of the relationship, not simply that there is a relationship.
There are a myriad of other diagramming tools available to the DSS designers to help them help decision makers understand their data properly. Of course, the appropriate output might be animation and/or video rather than a display on a screen. For example, if the model is a simulation of a bank and varies the number of clerks, the types of services handled by each clerk, and number of queues as well as the impact of each factor upon queue length,
Design Insight: Speech Emulatioi
When we emulate speech in a computer, designers need to worry about more than speech recog-nition and synthesis. Researchers have found three important aspects of speech that need to be incorporated. First, speech is interactive. Few of us can actually hold our part of the conversation without hearing something in return. Without some form of feedback, our speech will probably increase in speed and probably even in tone. Research teams at MIT* found that these changes in speech can actually cause the computer to reject commands it would otherwise adopt. Hence, they incorporated phrases such as "ah ha" that would be uttered at judicious times and found that it helped the human keep his or her speech in a normal range. In other words, some utterances in speech are protocols such as those found in networking handshaking.
A second important part of speech is that meaning can be expressed in shorthand language that probably would be meaningless to others if the participants know each other weih Over time, shared experiences lead to shared meanings in phrases. For example, occasionally one of my colleagues will utter "1-4-3-2" in a conversation. Those of us who know him well know this is shorthand for *lI told you so" (the numbers reflect the number of letters in each of the words). To others, it makes no sense. Another colleague, when discussing the potential problems of a strategy I was about to adopt for a meeting, warned me to remember Pickett's charge. Now, to those who know nothing about the American Civil War, this warning tells us nothing. To those who know about the war, and the Gettysburg confrontation in particular, know that he was telling me that we all face decisions with incomplete information and that we should not become too confident in our abilities in light of that incomplete information, In fact, he was warning me to (a) check my assumptions and (b) look for indications of crucial information that could suggest a need to my strategy. Many historians believe that had PickeLt's charge been successful, the American Civil War might have had a different outcome.
A third important part of speech is that it is contextual. A phrase or sentence in context might be totally understandable but quite baffling out of context. For this reason, we generally have redundant signals in human interactions, Somehow that same redundancy needs to be incorporated into human-computer interactions to ensure un der standabi lily.
*Negroponte, K, "Talking with Computers," Wired, Volume 2.03, March, 1994, p. 144.

USER INTERFACE COMPONENTS 241
Figure 5.25. Graphical representation.
then an animation of the queues might be more illustrative than the aggregated, summary statistics.
Perceived Ownership of Analyses. In addition to providing the appropriate type of output for the results under consideration, designers should remind the users that they control the analyses and therefore the decision-making authority. Computer novices may not feel "ownership" of the answer because it was something "done by the computer," not really by them. One way of counteracting this tendency is to provide users an easy way of changing the analyses if the results do not answer the question appropriately or completely. For example, consider the screen labeled Figure 5.30. Note that in this analysis we can compute profitability either with discounting or without it. The decision maker has chosen discounting (that box is checked). However, the results without discounting are easy to obtain given the on-screen keys. Similarly, Figure 5.31 encourages users to experiment with the model (by providing different estimates for key variables) by prompting the user with the "revise" buttons and by making it easy to do. Note in Figure 5.31 that the user has the option of revising both decision variables under consideration, clerks and queues. Similarly, the user has the ability to affect the value of the environment variable, expected
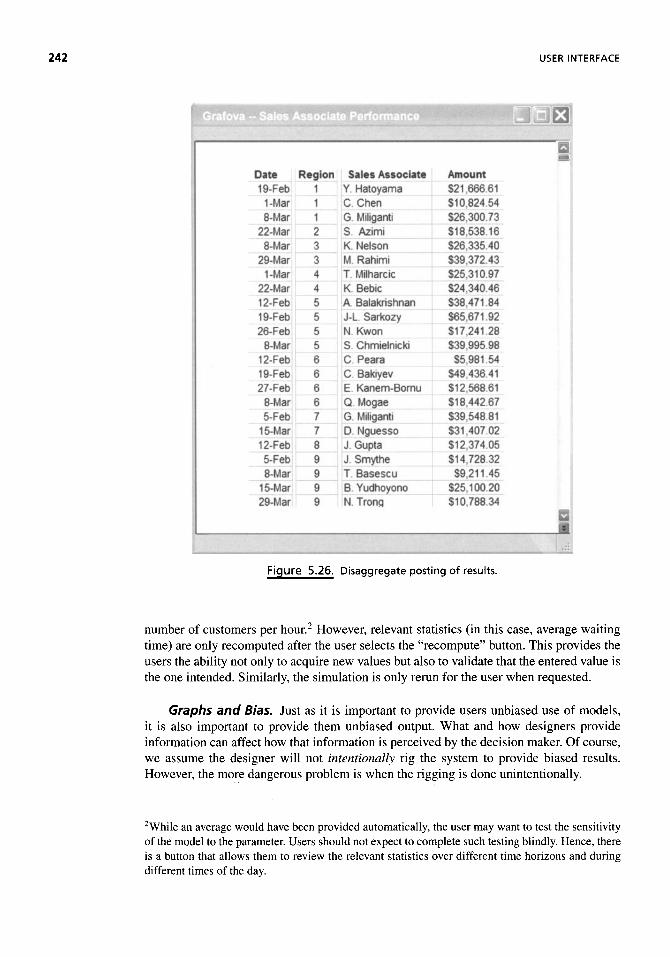
242 USER INTERFACE
Figure 5.26. Disaggregate posting of results.
number of customers per hour.2 However, relevant statistics (in this case, average waiting time) are only recomputed after the user selects the "recompute" button. This provides the users the ability not only to acquire new values but also to validate that the entered value is the one intended. Similarly, the simulation is only rerun for the user when requested.
Graphs and Bias. Just as it is important to provide users unbiased use of models, it is also important to provide them unbiased output. What and how designers provide information can affect how that information is perceived by the decision maker. Of course, we assume the designer will not intentionally rig the system to provide biased results. However, the more dangerous problem is when the rigging is done unintentionally.
2 While an average would have been provided automatically, the user may want to test the sensitivity of the model to the parameter. Users should not expect to complete such testing blindly. Hence, there is a button that allows them to review the relevant statistics over different time horizons and during different times of the day.

Fig
ure
5.
27.
Min
ard
's m
ap o
f N
apol
eon'
s 18
12 R
ussi
an C
ampa
ign.
(S
ou
rce:
E. T
uft
e, T
he
Vis
ual
Dis
pla
y o
f Q
uan
tita
tive
In
form
atio
n,
Gra
phic
s Pr
ess
UC
, 198
3,
2001
, p.
40.
) M
ap is
repr
oduc
ed w
ith
per
mis
sion
of
the
publ
ishe
r

244 USER INTERFACE
Figure 5.28. Relationship diagram.
Suppose, for example, the user is considering a decision regarding the management of two plants and examines average daily productivity in those plants. If it provides only the average values, the system could be giving biased output because it does not help the user see the meaningfulness of those numbers. Average productivity at plant 1 could be 5000, while that at plant 2 could be 7000. This appears to be a big difference. However, if we know the standard deviation in daily productivity is 2000, the difference no longer looks so significant. Hence, simply providing the appropriate supplementary information, as described in Chapter 4, will help provide better support.
Another place where designers inadvertently provide bias in the results is in the display of graphs. Since most decision makers look at graphs to obtain a quick impression of the meaning of the data, they might not take the time to determine that their impression is affected by the way the graph is displayed. For example, consider the effect of the difference in scaling of the axes in Figure 5.32.
In the first version of this graph, the axes were determined so that the graph would fill the total space. Clearly this graph demonstrates a fairly high rate of revenue growth. However, by simply increasing the range of the x axis, the second graph gives the impression of a considerably higher rate of growth over the same time period. Similarly, increasing the range of the y axis makes the rate of growth appear much smaller in the last graph. The designer must ensure this misrepresentation does not occur by correctly choosing and labeling the scale.
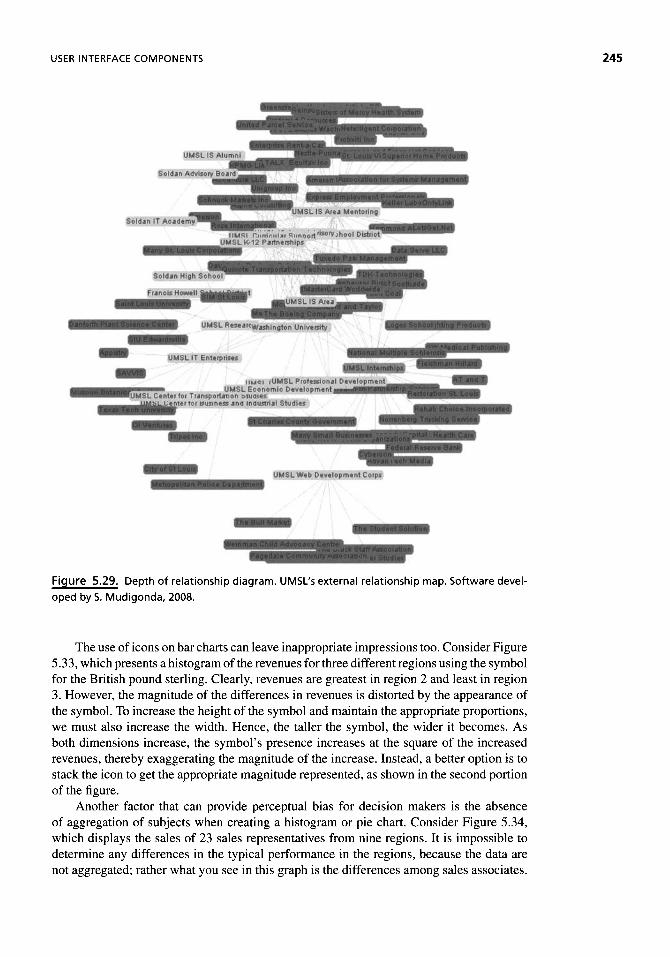
USER INTERFACE COMPONENTS 245
Figure 5.29. Depth of relationship diagram. UMSL's external relationship map. Software devel-
oped by S. Mudigonda, 2008.
The use of icons on bar charts can leave inappropriate impressions too. Consider Figure 5.33, which presents a histogram of the revenues for three different regions using the symbol for the British pound sterling. Clearly, revenues are greatest in region 2 and least in region 3. However, the magnitude of the differences in revenues is distorted by the appearance of the symbol. To increase the height of the symbol and maintain the appropriate proportions, we must also increase the width. Hence, the taller the symbol, the wider it becomes. As both dimensions increase, the symbol's presence increases at the square of the increased revenues, thereby exaggerating the magnitude of the increase. Instead, a better option is to stack the icon to get the appropriate magnitude represented, as shown in the second portion of the figure.
Another factor that can provide perceptual bias for decision makers is the absence of aggregation of subjects when creating a histogram or pie chart. Consider Figure 5.34, which displays the sales of 23 sales representatives from nine regions. It is impossible to determine any differences in the typical performance in the regions, because the data are not aggregated; rather what you see in this graph is the differences among sales associates.

246 USER INTERFACE
Figure 5.30. On-screen analysis change prompting.
The eye is directed toward the outliers, such as the tenth associate, who had high sales, and the thirteenth associate who had relatively low performance. The problem is exacerbated, of course, as the number of subjects increase.
Consider, instead, Figure 5.35, in which sales associates are aggregated by region. Here the regional pattern is much clearer and we are not inappropriately distracted by outlier observations. On the other hand, aggregated data can allow decision makers to generalize
Figure 5.31. Additional on-screen prompting.

USER INTERFACE COMPONENTS
inappropriately from the data. Specifically, Figure 5.36 does not identify how many sales associates work in each region and what the dispersion of performance is among those associates. A better design would identify the number of associates and a measure of dispersion either as a legend or on the graph.
We cannot here enumerate all the distortion and bias that can be represented in a graph. However, awareness of the problems can help to avoid bias problems in DSS design.
Support for All Phases of Decision Making. Displays must be constructed so as to help decision makers through all the phases in decision making. According to Simon's model discussed in Chapter 2, this means there must be displays to help users with the intelligence phase, the design phase, and the choice phase.
In the first of these phases, intelligence, the decision maker is looking for problems or opportunities. The DSS should help by continually scanning relevant records. For an operations manager, these records might be productivity and absenteeism levels for all the plants. For a CEO, they might be news reports about similar companies or about the economy as a whole. Decision support is the creation and automatic presentation of exception reports or news stories that need the decision maker's attention. Hence, when the operations decision maker turns on the computers, he or she could automatically be notified that productivity is low in a particular plant or absenteeism is high in another as an indicator of a problem needing attention. When the CEO turns on the computer, automatic notification of changes in economic indicators might suggest the consideration of a new product. The system does not make the decision; rather it brings the information to the user's attention. What must be scanned and how it is displayed for it to highlight problems or opportunities are a function of the specific DSS.
Figure 5.32. Scaling deception.

248 USER INTERFACE
Figure 5.32. (Continued)

USER INTERFACE COMPONENTS 249
Figure 5.33. Distortion in histogram.
In the second phase of decision making, users are developing and analyzing possible courses of action. Typically they are building and running models and considering their sensitivity to assumptions. Displays must be created that will help users generate alterna-tives. This might be as easy as providing an outlining template on which to brainstorm or the ability to teleconference with employees at a remote plant to initiate ideas.
Displays must also be created to help in the building, analysis, and linking of models. This includes the formulation of the model, its development and refinement, and analysis. This means displays should be able to prompt users for information necessary to run the model that has not been provided. The system should provide suggestions for improvements to the models as well as alert the user to violations of the model's assumptions. Finally, displays must provide diagnostic help when the model does not work appropriately.
In the choice phase, the decision maker must select a course of action from those available. Hence, the displays should help users compare and contrast the various options. In addition, the displays should prompt users to complete sensitivity of the models to assumptions and scenarios of problems.

250 USER INTERFACE
Figure 5.34. Individual histogram.
Figure 5.35. Aggregated histogram.

USER INTERFACE COMPONENTS 251
Figure 5.36. Use of international symbols. Menu from Marcus, A., "Human Communications in Advanced Uls", Communications oftheACM, Vol. 36 , No. 4, p. 101-109. Image is reprinted here with permission of the Association of Computing Machinery.
Regardless of what phase of decision making is being supported, the goal of the display is to provide information to the user in the most natural and understandable way. It is critical that any display be coherent and understandable and provide context-sensitive help. Since no one can anticipate in all the ideas that might be generated from any particular display, the system must be flexible enough to allow nonlinear movement. For example, the user should be able to transfer to a new topic or model, display a reference, seek auxiliary information, activate a video or audio clip, run a program, or send for help.
Knowledge Base
The knowledge base, as it refers to a user interface, includes all the information users must know about the system to use it effectively. We might think of this as the instructions for systems operation, including how to initiate it, how to select options, and how to change options. These instructions are presented to the users in different ways. Preliminary training for system use might be individual or group training and hands-on or conceptual training. To supplement this training, there is typically some on-screen prompting and help screens with additional information.
In the DSS context, there are additional ways of delivering the knowledge base. One popular mechanism is training by example. The user is taken through a complete decision scenario and shown all the options used and why. The system also can provide diagnostic information when the user is at an impasse, such as additional steps in an analysis. Or it can offer suggestions for additional data use or analyses. For example, the system

USER INTERFACE
might recommend to users of mathematical programming techniques that they consider postoptimality analyses.
The goal is to make the system as effortless as possible so as to encourage users to actually employ the software to its fullest. This means there must be ways for experienced users and inexperienced users to obtain the kind of help they need and the training and help must be for specific techniques and models. Users typically are not experts in statistical modeling, financial modeling, mathematical programming, or the like. They need help in formulating their models and using them properly. This help must be included in the system.
Knowing how the users will employ the system is important to understanding what one can assume of them. Historically, users have used DSS in three modes: subscription mode, chauffeured mode, or terminal mode.3
Subscription mode means that the decision maker receives reports, analyses, or other aggregated information on a regular basis without request. This mode does not allow for any special requests or user-oriented manipulation or modification. Reports might be generated on paper or sent directly to the user's computer for display. Clearly there is very little involve-ment of the user with the system and hence users expect the computer requests to be trivial.
Chauffeured mode implies that the decision maker does not use the system directly, but rather makes requests through an assistant or other intermediary, who actually performs and interprets the analysis and reports the results to the decision maker. Since these "chauffeurs" are often technical experts, the systems designer can provide more "power use" instructions and less help with interpretation instructions.
Finally, terminal mode implies the decision maker actually sits at the computer, requests the data and analyses, and interprets results. These users are often high-level executives who should not be expected to remember a lot of commands and rules for usage. It is especially important for them to have easy navigation through the system, accessible help options for both navigation and content that are context sensitive, and recommendations regarding better analyses. Touch screens, mouse entry, and pull-down menus have made many sophisticated systems seem easy.
Modes of Communication. In a listserv discussion group regarding the use of computers in education, one teacher wrote that her class requested information about "what it was like before computers." The answers they obtained with regard to communication included discussion of voice inflections, gestures, and other forms of nonverbal communi-cation that helped people understand what others were trying to convey. Many of us can remember when neatness in written work was another aspect of communication. In any kind of communication, there is significant room for misinterpretation. Keeping in mind the fact that computers do not understand nuances, nonverbal communications, or voice inflections, you begin to understand the care with which designers should regard the user interface design. As user interfaces become more sophisticated, as technology allows for greater variation in the kind of interfaces designed, and as decisions become more global, our concern about the appropriateness of every kind of communication is increased.
Four basic elements of communication need attention: mental models, metaphors, navigation of the model, and look. The mental model is an explanation of someone's thought process about how something works in the real world. It is a representation of the surrounding world, the relationships between its various parts, and users' intuitive perceptions about their own acts and their consequences. It, in fact, describes how we
3The classical definition of modes also includes the clerk mode. This mode differs from the terminal mode only in that decision makers prepare their requests offline and submit them in batch mode. While once common, such batch processing of DSS is rarely being seen today.

USER INTERFACE COMPONENTS 253
believe tasks are performed. The advantage of the mental model is that it provides a series of shortcuts to explaining the relationships among ideas, objects, and functions and how they might work to complete a task.
For example, consider how people thought about the economic meltdown of 2008. The economy was referred to as a shipwreck, a perfect storm, an earthquake, a tsunami, an Armageddon, a train wreck, a crash, and cancer. Each of those terms brings with it a set of activities that must occur, a set of feelings of the user, and insight about how to respond. In computer terms, it is common today to use a desktop as a representation of the operation of a computer because it is familiar. Users know how to behave in an office, understand what the items are for (e.g., information might be kept in file folders, access to messages might be through a telephone icon, the erase function might be represented by a garbage can), and have an intuition for how to work in it. This way of representing specific operations makes sense because it brings with it all the shared meaning of these objects. However, if your place of business is not an office, this way of organizing your computer probably would not make sense. For example, if your task is in an operating room of a hospital, you need your user interface to resemble the functions you are accustomed to performing. Your screen should look more like a medical chart because it groups together processes and information in the way medical personnel are accustomed to reading it. Understanding how users think about their job is crucial to making the system work for them.
Within the mental model are metaphors. These metaphors rely upon connections the user has built up between objects and their functions to help bolster intuition about how to use the system. Since metaphors provide quick insight into purposes and operation, it is thought they can help users see purposes and operations of the system more clearly with less training. They are used every day to represent fundamental images and concepts that are easily recognized, understood, or remembered, so as to make the system operation easier to understand. The desktop image, for example, helps us understand how applications are launched and controlled by using those technologies. Similarly, the classroom metaphor brings with it not only an expectation of how furniture is arranged but also the general operating rules of the group. In the design of DSS user interfaces, metaphors refer to the substitution of a symbol for information or procedures; the substitution of an associated symbol with the item itself, such as a red cross with medical care; the personification of an inanimate object; or the substitution of a part of a group for the whole, such as the use of one number to indicate data. Before building metaphors into a system, we need to be sure they will convey the intended meaning by being intuitive, accurate, and easily understood. Whether icons, pictorial representation of results (such as in animations or in graphics), or terminology (such as the difference between browse mode and edit mode), metaphors ease and shorten communication but only if all parties share the meaning. Consider Figure 5.36, which provides metaphors for type specification. While many people would understand the symbols at the right of this screen, clearly not everyone would.
Design Insights Flexibility
Often the benefit of user interfaces is in simplicity. For example, in one DSS used for supplier selection, users are required to enter information into only a limited number of cells in a matrix, To them, this provides complete flexibility because they can still get decision support even in the face of incomplete information. Once the data entry is complete, the DSS ranks the criteria by importance and presents a model that displays only those factors that ranked highly. This facilitates comparison of alternatives among important dimensions. In addition, if a decision maker notices the absence of a particular criterion thai he or she believes is important, he or she is warned of a problem immediately,

254 USER INTERFACE
Some designers dislike using the literal metaphor approach to design because it can be limiting. Using a metaphor ties the operation of the system to how those items work in the real world. Generally systems do not work like things in the real world so icons do not convey what system designers really mean. That means that there are not many sets of metaphors that are appropriate for explaining how software works, and those that exist do not scale well to involving a large number of functions or activities. Furthermore, while they may help the novice user learn to use the system better, they can prohibit the more
Design Insights Window Size
Often designers of DSS and other computer systems do not attend well enough to questions of the impact of the screen design on the use of the technology. Studies have shown that some factors heighten emotional response while others calm it. In tact, the literature, taken as a whole. suggests that individuals' interactions with computers and other communication technologies are fundamentally social and natural· One of the current projects of the Social Responses to Communication Technology Consortium is an examination of the effect of the size of the image of a human displayed on a computer for teleconferencing upon individuals" responses to that image. Stanford Professor Byron Reeves was quoted as saying that "many cultures around the world assign magical properties to people who are small . , . These small people grant wishes» they monitor behavior and they keep people safe, But they also can punish or be bad just for the hell of it." Professor Cliffford Nass further elaborates in that same article, 41We want to know, when you see a small face on a screen, do you respond to it as if it were magical? Is it perceived as powerful or capable?" So, the question is, do you have a different response to the two screens below?
■H5 ■ i
Source: From I Morkes, +<The Leprechaun Effect," Wired, Vol· 2.0Ϊ, January 1994, p. 28,
USER INTERFACE COMPONENTS
advanced user from truly seeing the options available in the software. Finally, metaphors can be a particular problem in cross-culturally used systems because they do not mean the same thing to all users.
An alternative to metaphors in design is to rely upon idioms. Unlike metaphors, which rely upon the user having intuition about how the system works, idioms rely upon training of the user to accomplish certain tasks even if the user is unsure why those tasks work. This approach to designing systems does not require users to have the technical knowledge to understand why the system works; instead it only requires they know that certain actions do accomplish the users' goals. There is not an intuitive link because of experience; rather it is a leaned link, much the same way people learn idioms in speech. For example, one does not intuit the relationship between a piece of cake and "being easy"; one learns that it is frequently said that something easy is a piece of cake.
Most of the basic usage of windowing software is guided by idioms. The fact that we can open and close windows and boxes, click on hyperlinks, and use a mouse is not guided by our intuition in using these items. Rather we can use them because they have been taught to the users. They are easy to learn and transfer from situation to situation. Users become conditioned to the idioms and they make the software easier to use. They do not wear down because of changes in the environment or become less useful because of cultural changes or changes over time because they are not dependent upon those things. Thus, generally, they are preferred to metaphors.
The navigation of the model refers to the movement among the data and functions and how it can be designed to provide quick access and easy understanding. In one environment, it might make sense to group together all the models and to create subgroups of, say, specific statistical functions, because users differentiate them from mathematical programming functions. However, in another environment, users think of the kind of question, not the kind of technique, when moving among the options in the DSS. Here, it would be appropriate to group certain statistical tests with financial data and analyses and certain mathematical models with production planning.
Finally, the look of a system refers to its appearance. No one who knows computer company culture would expect to see the same dress code at IBM that was observed at Apple Computer Corporation. By extension, then, we would not expect to find preferences for the same user interface at the two corporations. Just as corporate culture can affect preferences for the user interface, other cultural influences associated with national origin, sex, race, age, employment level, and the interaction among all of those influences will affect the way a person responds to particular user interfaces. However, designers have assumed that all users will respond similarly.
For example, it is well known that color metaphors mean different things in different cultures. While a red flashing light might be interpreted as an indicator of something important to one culture, it might suggest users stop all processing in another. Similarly, it is believed that the size of the image can affect how we respond to it. A group of researchers at Stanford is studying how different cultures respond to "little people" (as good luck? or as a curse?) to help understand how best to size human images to be for effective teleconferencing in a DSS framework. Others believe the linear, restrained treatment of menus is received differently in different cultures. They suggest a menu that is more curvilinear and less aggressive, such as that in Figure 5.37, might be received better by some cultures.
While we do not have many guidelines for user interface today, it is important to reflect on possible differences in needs and use them in our development efforts. Research is being conducted now that will be used in the future to guide in the development effort.

256 USER INTERFACE
Figure 5.37. An alternative menu format. Menu From Marcus, A., "Human Communications in Advanced Ills", Communications of the ACM, Vol. 36 , No. 4, p. 101-109. Image is reprinted here with permission of the Association of Computing Machinery.
CAR EXAMPLE
The expected user of the car selection DSS we have been discussing is a consumer who intends to purchase an automobile. It may be the first automobile the user has ever selected or the user may have purchased new automobiles every year for the last 20 years. In addition, the user may never have touched a computer before or may be an expert computer user. This leads to a wide range of user capabilities and user needs for the system, which in turn leads to complications in the design of the user interface.
It is crucial that system designers provide multiple paths through the system to accom-modate the needs of all kinds of users. For example, some users may have no idea what kind of automobile to acquire and need guidance at every step of the process. Other users may have a particular manufacturer from which to select, while other users have particular criteria that are of importance to them. Still others may have a small number of automobiles they want to compare on specific functions. The system must be able to accommodate all these decision styles, and the user interface needs to facilitate that process. Examples of commercial systems are shown in Figure 5.38.

CAR EXAMPLE 257
Figure 5.38. Initial screens from commercial automobile purchasing system.

USER INTERFACE
Early screens should guide users to the part of the system that will meet their needs. The temptation exists to use the first few screens to gain some insight into the user's needs and his or her preferences for information, but the temptation should be resisted. Users want to see information on these first few screens that convinces them the system will facilitate their choice process; background information about themselves will not do that. Rather, it is important to use some simple mechanism for screening users and deciding what part of the system will be most appropriate to use. Some designers simply ask whether the user wants "no support," "partial support," or "total support" from the system. While this may be appropriate in some circumstances, it can be very confusing unless the user can query the system and find what kinds of analyses and access each of those levels provide. An alternative is to pose the question of whether the user knows the set of automobiles from which a selection will be made, whether the user knows the criteria that should be applied to the choice process, or whether the user needs full support in understanding the dimensions that should be evaluated. Further, if the user selects known criteria and specifies financial information, then the choice process should follow a financial model selection. That does not mean that the system cannot pop up warning messages or help screens that suggest consideration of other criteria. Rather, it means that the focus of the process must have face validity and seem relevant to the user.
The first few screens also set the tone for the system, and hence particular attention must be given to their design. The screens need to be simple, clean, and easy to follow. There should be sufficient instructions to help the novice user to move through the system easily while not slowing down the more proficient user. In addition, users will want to see information that moves quickly but is easily discerned.
One way to accomplish this is to provide a menuing system through which it is easy for the user to maneuver. Consider, for example, the three options demonstrated in Figure 5.39. Please note that a designer would not place all three of these options on the same screen. They are presented here for the purposes of discussion.
The first option allows the user to enter the manufacturer of automobiles that is preferred (Code 5.1). After this the user can select the option to start the search. From a programming point of view, this is the easiest of the searches to accomplish; the Cold Fusion shown in Figure 5.39 illustrates the process that must be used to accomplish the search. While it appears user friendly at the outset, it actually is not a particularly useful user interface. One problem is that the user is restricted to searching for only one manufacturer of automobile. Many people want to search on multiple manufacturers; they would have to make several trips through the system and would have more difficulty comparing the results. A second problem is that this method requires users to be able to remember all the manufacturers they might consider. This may cause them to neglect some options, either because they forgot about them or because they did not know they existed. While it is acceptable for the user to narrow his or her search, it is not acceptable for the system to do it on the user's behalf. A third problem is that this method requires the user to spell the name of the manufacturer correctly. Often users do not know the correct spelling, or they make typographical errors, or they use a variation on the name (such as Chevy for Chevrolet). Unless the search "corrects" for these possible problems, no relevant matches will be made.
The middle option of Figure 5.39 provides the options to the users as radio buttons. The code for this is shown in Code 5.2. This has two advantages. First, it reminds the user what models of automobiles are available to the user (which is especially good for the novice user). Second, it does not rely upon the user spelling the automobile type correctly or using the same form of the model name as the designer. It does, however, limit the user to selecting only one option; only one radio button of a group may be selected. The coding
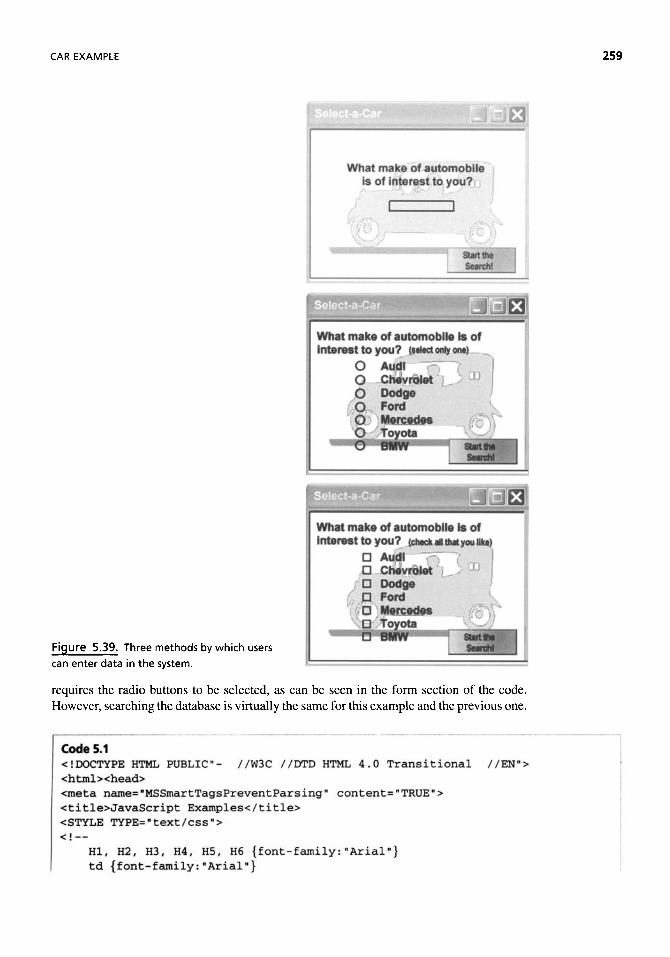
CAR EXAMPLE 259
Figure 5.39. Three methods by which users can enter data in the system.
requires the radio buttons to be selected, as can be seen in the form section of the code. However, searching the database is virtually the same for this example and the previous one.
Code 5.1 <!DOCTYPE HTML PUBLIC"- //W3C //DTD HTML 4.0 Transitional //EN"> <htmlxhead> <meta name="MSSmartTagsPreventParsing" content="TRUE"> <title>JavaScript Examples</title> <STYLE TYPE="text/ess"> <! --
HI, H2, H3, H4, H5, Η6 {font-family:"Arial"} td {font-family:"Arial"}

2 6 0 USER INTERFACE
td {font — size: 10pt} td {font-weight: bold} td {border-width: 2px} table {border-color: #8D39C7} body {font-family:"Arial"; font-size: lOpt; font-weight:bold} p {font-family: "Arial1" ; font-size: lOpt; font-weight: bold}
--> </STYLE> </head>
<body text=1,#000080" vlink=n#000080" background^"graphics/background2,gif" link="#000080M> <centerxbig>Sample Select A</big></center>
<cfform name=" example_input_an method="postη datasource="#d_oracle#" username="#u_oracle#" password= " #p_oracle# " DEBUG>
<center> What make of automobile is of interest to you?<br>
<cfinput name="car_preference" type=" text1' maxlength="3Q" size="10"/>
</center> <p align=right>
<input name=1'submit" type= " submit11 value= " Start the Search!">
</cfform>
<cfquery name=1'possible_carsl1 datasource="#d_oracle#M username = " #u_orac 1 e # ■ pas sword= M #p_orac 1 e# " DEBUG>
SELECT model FROM new.cars WHERE model = ' #Form . car_pref erence# ' </cfquery>
<ul> <cfoutput query="possible_cars"> <li>#model#</li> </cfoutput>
</ul>
<small> <script language^1'JavaScript M>
// This automatically updates the last modified date for the page. // when = document,lastModified document .write ("This page was last modified on: ,r + when +■ "<br>") // // This automatically updates the location documentation on the page. where = document.location document.write("URL: " + where)
</script>
"
</body> </html>

Code 5.2 <!DOCTYPE HTML PUBLIC"- //W3C //DTD HTML 4.0 Transitional //EN"> <htmlxhead> <meta name= "MSSmart Tags Prevent Par sing" content = 1,TRUE"> <title>JavaScript Examples</title> <STYLE TYPE="text/cssl1> < ! --
HI, H2, H3, H4, H5, H6 {font-family;"Arial"} td {font-family: "Arial"} td {font--size: 10pt} td {font-weight: bold} td {border-width: 2px} table {border-color: #8D89C7} body {font-family:"Arial"; font-size: 10pt- font-weight:bold} p {font-family:"Arial*
--> </STYLE> </head>
font-size: lOpt; font-weight:bold}
<body text="#000080" vlink="#000080" background="graphics/background2.gif" link=tl#000080"> <centerxbig>Sample Select A</bigx/center>
<cfform name="example,input x" method="postn datasource="#d_oracle#M
username=" #u_oracle#" password^" #p_oracle# " DEBUC <center> What make of automobile one< / sma 11 xbr >
<cfinput type^radio" <cfinput type="radio" Chevro1et <br > <cfinput type="radio" <cfinput type="radio" <cfinput type="radio" Mercedes<br> <cfinput type="radio" <cfinput type^"radio"
is of interest to you
name=- car-preference" name =" car.pref er enc e"
name=" car .preference" name=" car.pref erence" name=" car.preference"
name= " car.pref erence" name=" car.preference"
r>
?<small>select only
value="audi">Audi<br> value="Chevrolet">
valuer"dodge">Dodge<br> value="ford">Ford<br> value="mercedes">
valuer"toyota■>Toyota<br> value-"bmw">BMW
</center> <p align=right> <input name=risubmit"
</cfform> type="submit" value="Start the Search!">
<cfquery name="possible_cars" datasource="#d.oracle#" username=" #u_oracle#n
password^ #p_oracle#" DEBUO SELECT model FROM new.cars WHERE model=' #Form.car_preference#'
</cfquery>
<ul> <cfoutput query="possible_cars" > <li>#model#</li> </cfoutput>
</ul> </body> </html>

262 USER INTERFACE
In the last option of Figure 5.39, the user is given check boxes from which to select automobiles as shown in Code 5.3. Users can select as many models as they desire, and since they only need to click the mouse, the designer does not need to worry about spelling, typing, and nickname problems. The Cold Fusion code is somewhat more difficult to write, as shown in Code 5.2, but not so much more difficult that it outweighs the benefits from a user's perspective. When a user checks a checkbox, he or she is setting a flag to "true"; in other words, the variable, car .preference* is set to "true the checkbox has been checked," not to the model of the automobile that is of interest to the user. So, the first step of the programming is to check if each checkbox is selected and, if so, set a variable equal to the model of interest. However, since the user may have selected one to seven cars (in this example), we must set a variable for each model. Then we can print out all the matches to any of the preferred models in the select statement. Notice the use of "OR" in the statement which allows Cold Fusion to select models of any of the nonblank variables.
Code 5.3 <!DOCTYFE HTML PUBLIC"- //W3C //DTD HTML 4.0 Transitional //EN"> <htmlxhead> <meta name= "MSSmart Tags Prevent Parsing,f content="TRUE'h> <title>JavaScript Exainples</title> <style type="text/css"> < ! --
HI, h2, h3, h4, h5, h6 {font-family:"arial"} td {font-family;"axial"} td {font--size: 10pt} td {font-weight: bold} td {border-width: 2px} table {border-color: #8dS9c7} body {font-family:"arial"; font-size: lOpt; font-weight:bold} p {font-family:"arial"; font-size: lOpt; font-weight:bold}
--> </style>
<script> function def ine.option ()
{ if (document. forms [0] .elements .car.pref erence [0] .checked}
{carl = "Audi" } else if [document. forms [0] .elements .car.preference [01 .checked)
{car2="Chevrolet"} else if (document■ forms [0] .elements . car.pref erence [0] .checked)
{car3=nDodge"} else if (document. forms [01 .elements .car.preference [0] .checked)
{car4=NFord"} else if (document. forms [01 . elements .car.preference [0] . checked)
{car5="Mercedes,r} else if (document. forms [0] .elements .car.preference [0] .checked)
{car6="Toyota"} else if [document, forms [01 .elements .car.preference [0] .checked)

CAR EXAMPLE 263
Another concern in designing a user interface is to keep it simple and easy to use. We know that people work best with seven plus or minus two individual items on the display. Hence, menus should not overwhelm users with too much information at one time. On the other hand, loading new displays can take time and therefore detract from the system. Another option available is to make options visible only after they become relevant. For example, consider the screen shown in Figure 5.40. The user has two primary questions to address, the length of time the automobile will be kept and whether it will be new or used. After the user selects a new car to be kept a relatively short period of time, the system determines that this user is eligible to consider leasing a car. Hence, the option of leasing appears on the same screen. If the user had selected a used car, then clearly he or she would
{car7="BMWM}
} </script>
I </head>
<body text="#000080" vlink=,r#000080" background-"graphics/background2.giI" link="#000080"> <center><big>Sample Select A</bigx/center>
<cfform name=" example-input Jo" method=l,post1, datasource="#d-oracle#H
user name =' #u_or ac le#" pas sword= ■ #p_or ac 1 e # " DEBUG> <center> What make of automobile is of interest to you? <small>check all that you like</smallxbr> <cf input type=" checkbox" name=rt car .prefer encelM>Audi <br> <cf input type="checkbox" name=M car_preference2 ">Chevrolet <br> <cf input type=°checkbox" name=Mcar_pref erence3 ">Dodge <br> <cfinput type=" checkbox11 name=" car_preference4" >Ford <br> <cf input type="checkbox" name =" car _pr ef er eric e5">Mer cedes <br> <cfinput type="checkbox" name="car_preference6">Toyota <br> <cf input type= "checkbox" name= " car.pref erence7 ">BM </center> <p align=right> <input name-"submit" type="submit" value="Start the Search!" OnClick= "def ine_option (} ; return false; ">
</cfform>
<cf query name= l1possible_cars H datasource-1> #d_oracle# 1" username="#u_oracle#,f password^1' #p_oracle#N DEBUG>
SELECT model FROM new_cars WHERE model=J#carl#J OR '#car2#' OR '#car3#J
OR '#car4#' OR '#car5#' OR '#car6#' OR ficar7f </cfquery>
<ul> <cfoutput qxιery=Mpossibl·e_cars"> <li>#model#</li> </cfoutput>
</ul> </body> </html>

264 USER INTERFACE
Figure 5.40. Change in menu after other selections.
not be interested in leasing an automobile and hence that option would not be displayed. The underlying code simply notes that another option is added to the screen when these conditions are found to be true.
So, consider Code 5.4. This code includes the basic form code so as to be able to get the radio buttons on the screen. Notice there is something new associated with the first value of the second question. It states that when that radio button is clicked, the program should run the function labeled "CheckLease," which appears near the top of the program in the heading section. Since this code is only run if the user has specified that he or she wants a new car, it queries the user as to whether the car will be kept for a short period of time. If the answer is yes, then the conditions would allow the user to lease an automobile rather than buying it outright. The code will run to open a new, small window shown toward the right side of the display with the question about leasing an automobile. Note that the code
Code 5.4 <!DOCTYPE HTML PUBLIC"- //W3C //DTD HTML 4,0 Transitional <meta name="MSSmartTagsPreventParsing" content="TRUE"> <title>JavaScript Examples</title> <style type= " text/ess ,f> <! --
H5, H6 {font-family:"Arial "Arial"} 10pt} bold}
//EN" xhtml ><head>
'} HI, H2, H3, H4, td {font-family: td {font--size: td {font-weight: td {border-width: 2px} table {border-color; #SDS9C7} body {font-family:"Arial"; font-size: lOpt; font-weight:bold} p {font-family:"Arial"; font-size: lOpt; font-weight:bold}

CAR EXAMPLE 265
specifies that this new window should appear in this particular location and be this size, with no scroll bars, location designator, or toolbars. Thus it appears to be written directly on the display as shown. Of course, the content of the display is specified in another Web page and is identified as inquireJease.html (which is what appears inside the box on the display.
--> </style> <script>
function CheckLease(); { if (Form, tenure.value == ,rl-4years")
{ //the window.blur command takes the user's attention from the current screen //this will have the effect of moving the user's attention to the new window that //is being opened
window,blur() myWindow = window, open {" inquire.lease ,html" , "new-question" f " location=noJ toolbar=nc ,directories=no,menubar=no,status=no, scrollbars=noJ focus=yes, height=400,width=175,top=50, left=400 ")
} }
</script> </head> <body text^'ttOOOOSO" vlink=l,#0000801' background="graphics/background2 .gif" link="#0000801,> <centerxbig>Window Open</foigx/center>
<cfform name=" example-input _a" method="post" datasQurce="#d,oracle#" username=M#u_oracle#" password= ,r #p_oracle# " DEEUG>
<center> How long do you expect to keep this vehicle?<br>
<cfinput type="radio" name="tenure" value=rtl-4years"> 1-4 years<br> <cfinput type=Mradio" name="tenure" value-"morethan4years">more than 4 years<p>
Do you prefer a new vehicle?<br> <cfinput type="radio" name=1,newcarflag" value="yes"
OnClick="CheckLease() ; return false; >Yes<br> <cf input type="radio" name= "newcarf lag" value=11 no,f>No<br> <cf input type=" radio" name= "newcarf lag" value=1' idontknow">I don't know<br>
</center> <p align=right>
<input name="submit■ type="submit■ value="Start the Search!">
</cfform>
</bodyx/html>

266 USER INTERFACE
Figure 5.41. Possible window definitions.
It is important that the user interface provide a standard and uniform look and feel in the system. One way to do this is to provide consistent windows for the different kinds of information that you might want to provide. For example, consider Figure 5.41, in which some possible windows are defined. In this example, warning messages are displayed in the upper left corner while help messages are displayed in the lower right corner. Similarly, graphics may appear in the upper right corner while technical assistance, such as help in modeling or generating alternatives, appears in the lower left corner. These windows should have consistent titles, colors, sizes, and other characteristics. In this way, users will develop intuition about the information being displayed and act accordingly.
Generally, these windows will not appear until needed. In Figure 5.41, users can request technical assistance by pressing the "help" button on the main screen. When they do, the technical assistance window (shown open in this figure) appears. You can allow the window to be closeable using standard Windows tools, through a menu item, or through a push button. If you need to ensure the user reads the information, you can make it impossible for him or her to continue without acknowledgment. If there is a need for additional processing after the window has been displayed, then you must have a mechanism for alerting the system after it has been read. Both those purposes are served best by the push button, as shown in the figure.
Suppose when running the system that the user always wants to start with the data window open but with the other three windows closed, as shown in Figure 5.42. The code for this is in Code 5.5. Since this first window should be opened every time the program is
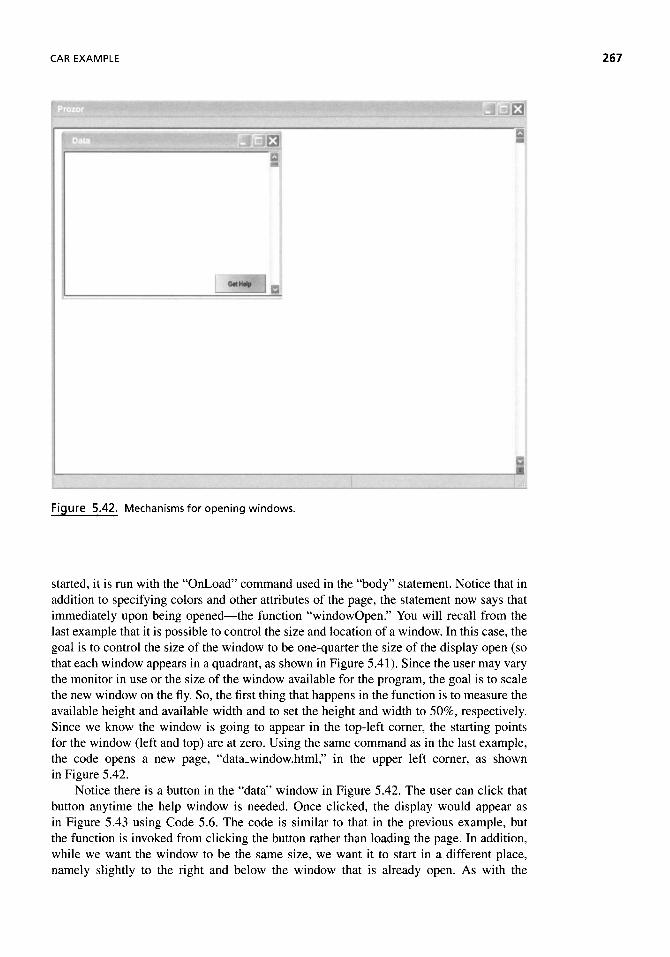
CAR EXAMPLE 267
Figure 5.42. Mechanisms for opening windows.
started, it is run with the "OnLoad" command used in the "body" statement. Notice that in addition to specifying colors and other attributes of the page, the statement now says that immediately upon being opened—the function "windowOpen." You will recall from the last example that it is possible to control the size and location of a window. In this case, the goal is to control the size of the window to be one-quarter the size of the display open (so that each window appears in a quadrant, as shown in Figure 5.41). Since the user may vary the monitor in use or the size of the window available for the program, the goal is to scale the new window on the fly. So, the first thing that happens in the function is to measure the available height and available width and to set the height and width to 50%, respectively. Since we know the window is going to appear in the top-left corner, the starting points for the window (left and top) are at zero. Using the same command as in the last example, the code opens a new page, "data_window.html," in the upper left corner, as shown in Figure 5.42.
Notice there is a button in the "data" window in Figure 5.42. The user can click that button anytime the help window is needed. Once clicked, the display would appear as in Figure 5.43 using Code 5.6. The code is similar to that in the previous example, but the function is invoked from clicking the button rather than loading the page. In addition, while we want the window to be the same size, we want it to start in a different place, namely slightly to the right and below the window that is already open. As with the

268 USER INTERFACE
Code 5.5 <!DOCTYPE HTML PUBLIC"- //W3C //DTD HTML 4.0 Transitional //ENM> <html><head> <meta name=hMSSmartTagsPreventParsingn content="TRUE"> <title>JavaScript Examples</title> <style type="text/ess"> <! --
HI, H2, H3, H4, H5, Η6 {font-family:"ArialM} td {font-family:"Arial"} td {font--size: 10pt} td {font-weight: bold} td {border-width: 2px} table {border-color: #8D89C7} body {font-family:"Arial"; font-size: lOpt; font-weight:bold} p {font-family:"Arial"; font-size: lOpt; font-weight:bold}
--> </style>
<script> function windowOpen()
{ height=.5*screen.availheight width=.5*screen.availwidth mywindow = window, open ( "data_window.html" , "windowref " , "width=H + width 4 ", height=fl + height*",top=0,left=0,screenx-0,screeny-0, focus^yes");
> </script>
</head> <body text="#000080" vlink="#000080" background^■graphics/background2.gif" link="#000080"
OnLoad="windowOpenΐ); return false">
<centerxbig>Open Multiple Windows</big></center>
<small> <script language="JavaScript">
// This automatically updates the last modified date for the page» // when = document.lastModified document.write("This page was last modified on: " + when + "<br>") // // This automatically updates the location documentation on the page. where = document.location document.write("URL: " + where)
</script> </bodyx/html>

CAR EXAMPLE 269
Figure 5.43. Alternative method for opening windows.
//W3C //DTD HTML 4.0 Transitional //EW"> Code 5.6 <!DOCTYPE HTML PUBLIC" <htmlxhead> <meta name=,rMSSmartTagsPreventParsing" content="TRUE,l> <title>JavaScript Examples</title> <style type="text/ess"> <! --
HI, H2, H3, H4, H5, Η6 {font-family:"Arial"} td {font-family:"Arial"} td {font — size: lOpt} td {font-weight: bold} td {border-width: 2px} table {border-color: #8D89C7} body {font-family:"Arial"; font-size: lOpt; font-weight:bold} p {font-family:"Arial"; font-size:
— > </style>
lOpt; font-weight:bold}
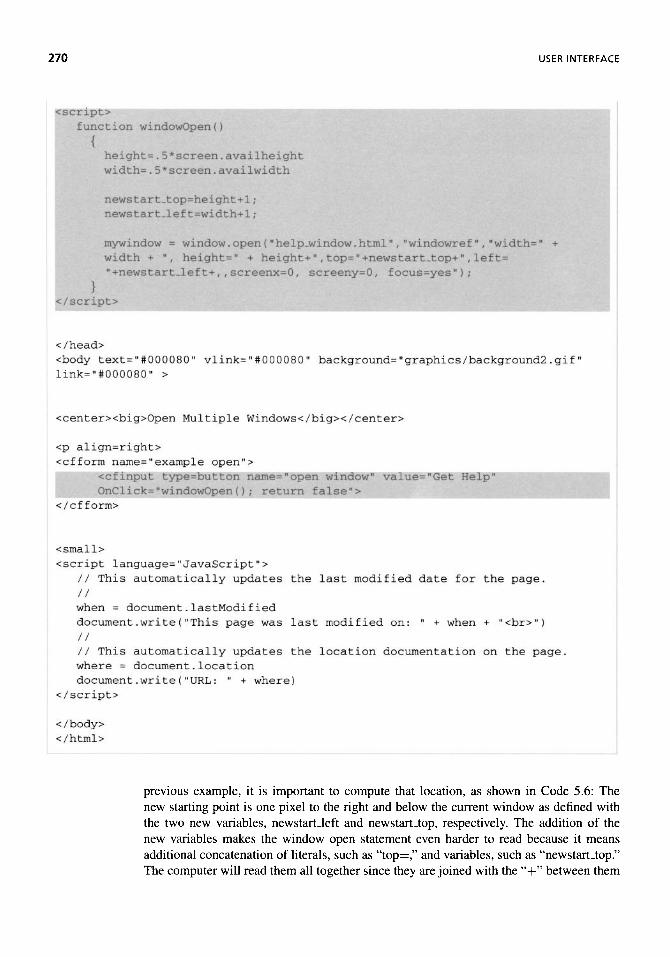
270 USER INTERFACE
previous example, it is important to compute that location, as shown in Code 5.6: The new starting point is one pixel to the right and below the current window as defined with the two new variables, newstartJeft and newstart_top, respectively. The addition of the new variables makes the window open statement even harder to read because it means additional concatenation of literals, such as "top=," and variables, such as "newstart_top." The computer will read them all together since they are joined with the "+" between them
<script> function windowOpen(}
{ height=.5*screen.availheight width= .5*screen.availwidth
newstart_top=height + l; news t art _left=width+l;
mywindow = window, open { "help_window.html1' , "windowref" , "width=" + width + "j height=" + heights ", top-" +newstart_top+", left= "+newstart_left+, , screenx=0, screeny=0, focus=yes,f) ;
} </script>
</head> <body text="#000080" vlink="#000030" background="graphics/background2.gifM
link=i,#000080" >
<centerxbig>Open Multiple Windows</bigx/center>
<p align=right> <cfform name="example open">
<cfinput type=button name=nopen window" value="Get Help" QnClick^"windowOpen(); return false">
</cfform>
<small> <script language^"JavaScript">
// This automatically updates the last modified date for the page. // when = document.lastModified document.write(vThis page was last modified on: " + when + "<br>") // // This automatically updates the location documentation on the page* where = document.location document.write (1,URL: ,r + where)
</script>
</body> </html>

SUGGESTED READINGS 271
and because every literal is enclosed in quotes. Similar code could be used to open the other two windows on the display.
As stated earlier in the chapter, formatting is important for the environment. Sometimes designers use icons or pictures, such as those in Figure 5.21, for menu options. These can be helpful if they are understandable to the user and if they are used consistently. Since these icons are to elicit the intuition of the user, it is most important that they be meaningful to the user, and hence the user needs to be involved in their selection. One way to supplement these is to provide either permanent or transient wording near the icon to help the user build intuition.
Features should be built into the system to lessen the chance of user confusion. Only available options should appear in normal text, with others dimmed. Also, when a user se-lects a specific car, standard options should appear in one box with add-on options in another.
If the users access the system frequently, alternate information retrieval techniques should be made available. In this way, the user who accesses it frequently can increase the speed of retrieval and hence improve its performance value. The system should be tailored to acquire information in as few steps as possible while still maintaining clarity.
Finally, the format of the output of the system needs to be tailored to specific uses. If the user is comparing the prices for a type of vehicle from several makers, a simple histogram may be an easy way to display the comparison. The actual numerical value should also be displayed in some proximity to the bar that it represents or next to the legend. If, however, the user wishes to compare the available options, a table display may be more appropriate. If an option is available, the system could display the option highlighted or in a different color from those that are not available. This would allow for an easier comparison since the difference will be more noticeable.
DISCUSSION
The user interface is the most important part of a DSS because it is what the user thinks of as being the DSS. The best access to models and data is irrelevant if the decision makers cannot make the system understand their specific needs for information or if the system cannot provide the answers in a manner that decision makers can understand and use. As tools become more sophisticated, designers will be able to select input devices that are touch, motion, or voice sensitive and output devices that are graphical, motion, or virtual reality based. All this can bring a richness to the choice context if used appropriately.
SUGGESTED READINGS
Alter, S. L., Decision Support Systems: Current Practices and Continuing Challenges, Reading, MA: Addison-Wesley, 1980.
Bennett, J., "User Oriented Graphics," in S. Treu (Ed.), User-Oriented Design of Interactive Graphic Systems, New York: Association for Computing Machinery, 1977.
Calvary, G., J. Coutaza, D.Thevenin, Q. Limbourgc, L. Bouillon, and J. Vanderdonckt, "A Unifying Reference Framework for Multi-Target User Interfaces, Interacting with Computers, Vol. 15, No. 3, 2003, pp. 289-308.
Card, S. K., T. P. Moran, and A. Newell, The Psychology of Human-Computer Interaction, New York: CRC Press, 1986.
Cooper, A., R. Reimann, and D. Cronin, About Face 3: The Essentials of Interactive Design, Indi-anapolis, IN: Wiley Publishing, 2007.
USER INTERFACE
Donovan, J. J., and S. E. Madnick, "Institutional and ad hoc Decision Support Systems and Their Effective Use," DataBase, Vol. 8, No. 3, Winter 1977, pp. 79-88.
Eisenstein, J., J. Vanderdonckt, and A. Puerta, "Adapting to Mobile Contexts with User-Interface Modeling," paper presented at Monterey Peninsula: Mobile Computing Systems and Applications: Third IEEE Workshop on Mobile Computing Systems and Applications (WMCSA'OO), 2000, pp. 83.
Eisenstein, J., J. Canderdonckt and A. Puerta, "Applying Model Based Techniques to the Development of Uls for Mobile Computing," Sante Fe, NM: Proceedings of the Conference of Intelligent User Interfaces, January, 2001, pp. 69-76.
Few, S., Show Me the Numbers: Designing Tables and Graphs to Enlighten, Oakland, CA: Analytics, 2004.
Few, S., Information Dashboard Design: The Effective Visual Communication of Data, Sebastopol,
CA: O'Reilly, 2006.
Few, S., Now You See It: Simple Visualization Techniques for Quantitative Analysis, Oakland, CA:
Analytics, 2009.
Fisk, A. D., W. A. Rogers, N. Charness, S. J. Czaja, and J. Shark, Designing for Older Adults:
Principles and Creative Human Factors Approaches, 2nd ed., New York: CRC Press, 2009. Frenkel, K. A., "The Art and Science of Visualizing Data," Communications of the ACM, Vol. 31,
No. 2, 1988, pp. 110-121.
Goodwin, K., and A. Cooper, Designing for the Digital Age: How to Create Human-Centered
Products and Services, Indianapolis, IN: Wiley Publishing, 2009.
Hearst, M. A., Search User Interfaces, New York: Cambridge University Press, 2009. Hess, T. J., M. A. Fuller, and J. Mathew, "Involvement and Decision-Making Satisfaction with a
Decision Aid: The Influence of Social Multimedia, Gender and Playfulness," in F. Burstein and C. W. Holsapple (Eds.), Handbook on Decision Support Systems, Vol. 1, Berlin: Springer-Verlag, 2008, pp. 731-761.
Kamel Boulos, M. N., "Web GIS in Practice III: Creating a Simple Interactive Map of England's Strategic Health Authorities Using Google Maps API, Google Earth KML, and MSN Virtual Earth Map Control," Internationaljournal of Health Geographies, Vol. 4,2005, available: http://www.ij-healthgeographics.eom/content/4/1/22, accessed 2009.
Korte, G. B., The GIS Book, 5th ed., Albany, NY: OnWord Press, 2001.
Krug, S., Don't Make Me Think: A Common Sense Approach to Web Usability, 2nd ed., Berkeley,
CA: New Riders, 2005. Landay, J. A., and T. R. Kaufmann, "User Interface Issues in Mobile Computing, "Proceedings of
the Fourth Workshop on Workstation Operating Systems, Napa, CA, October 1993.
Maes, P., and P. Mistry, "Unveiling the 'Sixth Sense,' Game-Changing Wearable Tech," TED 2009,
Long Beach, CA, 2009. Marcus, A., "Human Communications Issues in Advanced User-Interfaces," Communications of the
ACM, Vol. 36, No. 4, April 1993, pp. 101-109.
Marcus, A., and A. vanDam, "User Interface Developments for the Nineties," IEEE Computing, Vol. 24, No. 9, September 1991, pp. 49-57.
Miller, G. A., "The Magical Number Seven Plus or Minus Two: Some Limits on Our Capacity for
Processing Information," Psychology Review, Vol. 63, 1956, pp. 81-97.
Mistry, P., P. Maes, and L. Chang, "WUW—Wear Ur World—A Wearable Gestural Interface," CHI '09 Extended Abstracts on Human Factors in Computing Systems, Boston, MA, 2009.
Molich, R., M. Ede, K. Kaasgaard, and B. Karyukin, "Comparative Usability Evaluation, Behaviour
and Information Technology, Vol. 23, No. 1, January-February 2004, pp. 65-74. Nielsen, J. "Noncommand User Interfaces," Communications of the ACM, Vol. 36, No. 4, April 1993,
pp. 82-99.
Norman, D. A., The Design of Everyday Things, New York: Doubleday, 1990.

QUESTIONS
Norman, D. A., Emotional Design: Why We Love (or Hate) Everyday Things, New York: Basic Books, 2005.
Norman, D. A., The Design of Future Things, New York: Basic Books, 2007.
Peter, C, R. Beale, E. Crane, and L. Axelrod, "Emotion in HCI," BCS-HCI '07: Proceedings of the 21st British HCI Group Annual Conference on HCI 2008: People and Computers XXI: HCI . . . But Not as We Know it, Vol. 2, University of Lancaster, United Kingdom, 2007, pp. 211-212.
Robertson, G. G., S. K. Card, and J. D. Mackinlay, "Information Visualization Using 3D Interactive
Animation," Communications oftheACM, Vol. 36, No. 4, April 1993, pp. 56-71.
Rubin, J., D. Chisnell, and J. Spool, Handbook of Usability Testing: How to Plan, Design, and
Conduct Effective Tests, New York: Wiley, 2008.
Sears, A., and J. A. Jacko, Human-Computer Interaction: Designing for Diverse Users and Domains,
Boca Raton, FL: CRC Press, 2009.
Shackle, B., "Human-Computer Interaction—Whence and Whither?" Interacting with Computers, Vol. 21, Nos. 5-6, December 2009, pp. 353-366.
Sharp, H., and Y Rogers, Interaction Design: Beyond Human-Computer Interaction, West Sussex,
England: Wiley, 2007.
Shneiderman, B., C. Plaisant, M. Cohen, and S. Jacobs, Designing the User Interface: Strategies for
Effective Human-Computer Interaction, 5th ed., Reading, MA: Addison-Wesley, 2009. Steiger, D., R. Sharda, and B.LeClaire, "Graphical Interfaces for Network Modeling: A Model
Management System Perspective," ORSA Journal on Computing, Vol. 5, No. 3, Summer 1993, pp. 275-291.
Stohr, E. A., and N. H. White, "User Interfaces for Decision Support Systems: An Overview," International Journal of Policy Analysis and Information Systems, Vol. 6, No. 4, pp. 393^423. 1982.
Tannen, D., You Just Don't Understand: Women and Men in Conversation, New York: William
Morrow and Company, 1990.
Tidwell, J., Designing Interfaces: Patterns for Effective Interaction Design, Sebastopol, CA: O'Relly, 2005.
Toivonen, S., J. Kolari, and T. Laakko, "Facilitating Mobile Users with Contextualized Con-tent," in Procedings of the Workshop Artificial Intelligence in Mobile System, 2003, available: http://www.vtt.fi/tte/tte31/pdfs/AIMS2003-toivonen-kolari-laakko.pdf.
Tufte, E., The Visual Display of Quantitative Information, Chesire, CT: Graphics, 1983. Tufte, E., Visual Explanations: Images and Quantities, Evidence and Narrative, Cheshire, CT: Graph-
ics, 1997. Tufte, E., Beautiful Evidence, Cheshire CT: Graphics, 2006. Walker, V, and R. B. Johnston, "Making Ubiquitous Computing Available," Communications of the
ACM, Vol. 52, No. 10, October 2009, pp. 127-130.
Wickens, C. D., J. D. Lee, Y Liu, and S. E. Gordon Becker, An Introduction to Human Factors Engineering, 2nd ed. Upper Saddle River, NJ: Pearson Prentice Hall, 2004.
QUESTIONS
1. Many computer products now have something called "online documentation." Depend-ing upon the product, this can include a text manual available electronically, a passive request system that accesses the text manual, and bubble help on menus. Discuss what formats of online documentation are appropriate for a DSS.

274 USER INTERFACE
2. Identify how your features of a user interface should be affected by the decision-making literature covered in Chapter 2.
3. Accenture utilizes a technique described as "low-fidelity prototyping" when designing user interfaces. This method has designers and users design screens together using paper template items. Hence, if the user indicates that another item should be added to the screen, such as a button, the designer picks up a paper object shaped like a button and allows the user to place it on the paper designated as the screen. Compare and contrast the advantages and disadvantages of using low-fidelity prototyping in the design of a DSS to those associated with using "high-fidelity prototyping" of designing screens with a product on the computer.
4. How should the design of a user interface be influenced by the corporate environment? How should its design be influenced by the national environment?
5. Discuss how you might provide a user interface through which to compare multiple automobiles. Would users' modeling preferences influence this decision?
6. Discuss how virtual reality devices might be used as a user interface in a DSS intended to help users select automobiles.
7. The fact that windows can be sized by the user can be both a problem and an opportunity in the design of DSS. Discuss the advantages and disadvantages of sizing windows. How might the disadvantages be overcome?
8. What kinds of problems are introduced if designers use stand-alone prototyping pack-ages to design screens and interact with users?
9. How is the user interface design influenced by the use of object-oriented tools?
10. Discuss how the process for establishing user interface requirements for a 1-person system would differ from the process for a 25-person system.
11. By what process would you evaluate the user interface of a DSS?
12. Find Web pages or sketch a user interface that displays the characteristics of being harmonious and well behaved and that do no harm.
13. Discuss how you would implement tool bars and menus to address various levels of experience among your users.
14. What are the principles of good visual design. Find Web pages that display them or sketch a user interface that would have them.
15. Suppose you wanted to display information about others who are your contacts on a social networking site. Discuss the kind of display you would use and the kinds of information you would want on the display.
ON THE WEB
On the Web for this chapter provides additional information about user interfaces and the tools used to develop them. Links can provide access to demonstration packages, general overview information, applications, software providers, tutorials, and more. Additional discussion questions and new applications will also be added as they become available.
• Links provide access to information about user interface products. Links can provide access to information, comparisons, reviews, and general information about software

ON THE WEB
products and tools for user interface design. Users can use the tools to determine the factors that facilitate and inhibit DSS use.
• Links provide access to descriptions of applications and development hints. In addi-tion to information about the software itself, the Web provides links to applications of the tools worldwide. You will have access to chronicles of users' successes and failures as well as innovative applications.
• Links provide access to different user interface methodologies. Specifically, users can access currently unconventional user interfaces, such as virtual reality or voice-activated menus.
• Links provide access to systems regarding automobile purchase and leasing. Several tools to help users purchase or lease an automobile are available on the Web. Users have the opportunity to access the tools and gain insights of the kinds of options that facilitate and those that inhibit the use of the DSS.
You can access material for this chapter from the Web page for the book or directly at http://www.umsl.edu/^sauterv/DSS4BI/ui.html.

Ill
ISSUES OF DESIGN
Decision Support Systems for Business Intelligence by Vicki L. Sauter Copyright © 2010 John Wiley & Sons, Inc.

6
INTERNATIONAL DECISION SUPPORT SYSTEMS
Many executives are choosing to internationalize operations to avail the corporation of larger and more fruitful markets, competition among labor forces, and economical location and distribution incentives. With internationalization comes geographical dispersion, increased industrial and market competition, and increased access to labor pools and natural resources. However, it also brings variations in the technical, legal, economic, and cultural forces affecting the operations and decision making of the enterprise, the impact of which is affected by the form of internationalization.
Transnational corporations can take on a variety of forms. For example, it is possible that offices in the various countries produce different products and are essentially separate. On the other hand, it is possible that the products are manufactured or created in one country and marketed in another. Or there can be some combination of the two, such as what Dyment (1987, p. 22) described:
The global corporation may have a product that was designed in a European country, with components manufactured in Taiwan and Korea. It may be assembled in Canada and sold as a standard model in Brazil, and as a model fully loaded with options, in the United States. Transfer pricing of the components and assembled product may be determined with an eye to minimizing tax legality. Freight and insurance may be contracted for relet through a Swiss subsidiary, which earns a profit subject only to cantonal taxes. The principal financing may be provided from the Eurodollar market based in London. Add the complexities of having the transactions in different countries, with foreign exchange hedges contract gains and losses that sometimes offset trading losses or gains, and one has a marvelously complex management control problem.
Decision Support Systems for Business Intelligence by Vicki L. Sauter Copyright © 2010 John Wiley & Sons, Inc.
279

280 INTERNATIONAL DECISION SUPPORT SYSTEMS
Another form of internationalization is described by Sankar and Prabhakar (1992, p. 251). This example involves not the production process but rather the sharing of data.
Consider the development of a Decision Support System that could support stock trans-actions for transnational brokerages with offices in New York, Rome and Frankfurt. Such a DSS must monitor the activity on multiple exchanges and in multiple markets to help the analyst determine what stocks to trade, when to trade them, and how to trade them. If the stock broker in New York wants to initiate a particular stock transaction, and if that company is listed on multiple exchanges, he or she needs to decide trading on which ex-change is most profitable. If for example, the decision is made to trade on the Rome Stock Exchange, the transaction is sent to a front end processor (FEP) in New York, which then transmits it to Rome using a private line. The Rome office sends a confirmation message to New York and sends a duplicate copy of the transaction to the head office. Further, the database used by brokers at all offices needs to be updated immediately so that models tracking trades and prices will be accurate. Clearly the coordination among these systems, while still providing decision support, is challenging.
Decision support systems have the potential for great assistance for multinational de-cision making because technical variability, legal innuendos, cultural differences, and eco-nomic pressures and their coordination exacerbate the turmoil associated with the poorly defined choice processes generally supported by DSS.1 However, if not implemented prop-erly, DSS can add to the problems of transnational decision making. In order to exploit the benefits, designers need to be sensitive to a wider variety of issues and problems than those considered in the design of domestic systems.
For example, there is reason to believe that there would be differences in preferences for user interface options for transnational systems. Understanding the preferences and their implications is crucial. Since the user interface is the only way one can interact with the computer, its acceptance by users limits the usefulness of the system as a whole.
The user interface can communicate the importance of information and modeling within a system. Different colors, size of representation (and relative size of representation), spatiality, and contrast provide the "nonverbal cues" for the user interface. Even the way in which one moves from screen to screen or accesses information carries some significance. That is, the user interface can convey what is important to the organization, how the "power" in the organization is controlled, or the corporate norms and expectations.
Consider the screen shown in Figure 6.1. In this screen, the financial implication of a proposed transnational corporate change to the United States is emphasized. The message is carried in two ways. First, the implications for the United States are the only ones that default as open to the screen. Users of the system are, in a sense, forced to at least see them (if not use them). However, the implication is that information regarding all other countries is "optional" to the decision because the user needs to take explicit action to cause those results to appear on the screen. The second way in which the United States is emphasized is through the size of the windows. Even after one has opened the windows for other countries, they are considerably smaller than the window containing the U.S.
1A team at the University of California at Irvine's Center for Research on Information Technology and Organizations studied the role of information technology in the economies of 11 Asia-Pacific nations. In countries where the investment in information technology exceeded other investments, such as plants and equipment, productivity was the highest. "This means IT investment is more productive than other investments," says one researcher.

INTERNATIONAL DECISION SUPPORT SYSTEMS 281
Figure 6.1. User interface implications.
financial data, hence conveying that the non-U.S. data are less important. A similar effect could have been obtained by displaying financial data only in U.S. dollars and not in local currencies. The implication of these differences is, of course, only a problem if the message they convey is unintended.
A second problem also is illustrated in Figure 6.1. In this case, instead of emphasizing a specific country, the size and default open options suggest the relative importance of particular analyses. As in the previous example, this screen design suggests that financial implications are the most crucial, whereas all other analyses are clearly secondary. This suggestion of the importance of particular steps in a typical analysis is also conveyed in Figure 5.31. In that screen, the system provides explicit encouragement for the user to attempt to change values and rerun the simulation. The availability of the option is making a statement about the importance of sensitivity analyses; the subtle recommendation would not be apparent without those automatic rerun buttons. This apparent support for particular options can present a problem for a transnational DSS when there are clear cultural differences in the modeling preferences across the cultures. Such differences will be discussed in later sections of this chapter.
Better user interfaces would have given non-U.S. countries greater representation on the screen. Perhaps no analyses would be open as a default, but rather the world as a whole is shown, and users can click on the country—or countries—of interest. Similarly, it would send less of a message if users needed to actually request all options.
The relative sizing and location of objects on the screen are not the only aspects needing attention in a transnational DSS. Since the user interface may be the basis for interaction with other managers using the system, users become totally dependent on this interface for prompts that would otherwise come from "nonverbal cues" and other tempering cues in communication. Hence, words lose their intonation and the user becomes totally dependent upon symbols and icons to convey more information. These new ways of affecting patterns
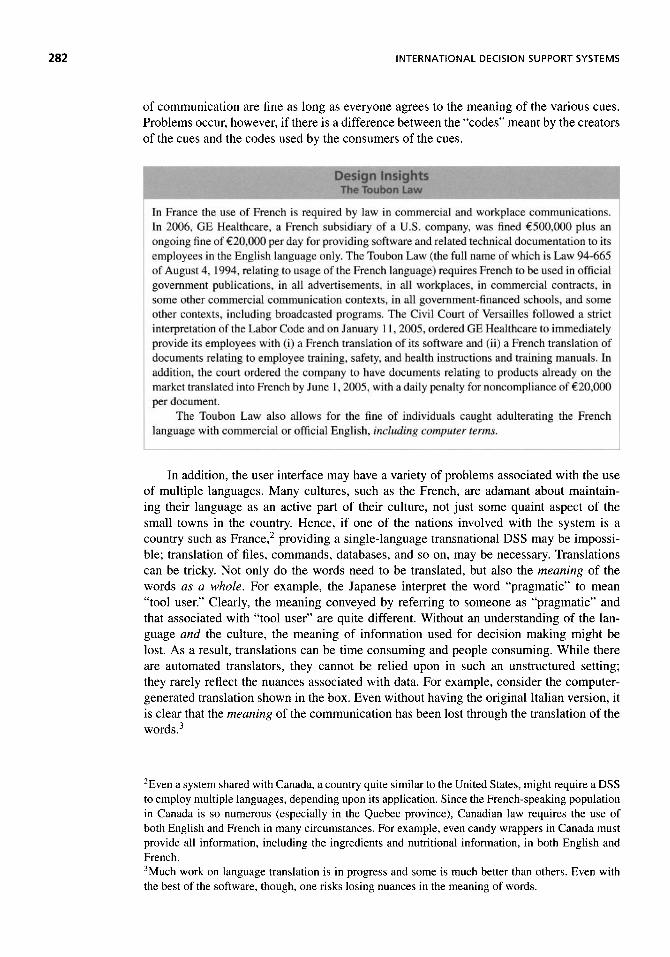
282 INTERNATIONAL DECISION SUPPORT SYSTEMS
of communication are fine as long as everyone agrees to the meaning of the various cues. Problems occur, however, if there is a difference between the "codes" meant by the creators of the cues and the codes used by the consumers of the cues.
In addition, the user interface may have a variety of problems associated with the use of multiple languages. Many cultures, such as the French, are adamant about maintain-ing their language as an active part of their culture, not just some quaint aspect of the small towns in the country. Hence, if one of the nations involved with the system is a country such as France,2 providing a single-language transnational DSS may be impossi-ble; translation of files, commands, databases, and so on, may be necessary. Translations can be tricky. Not only do the words need to be translated, but also the meaning of the words as a whole. For example, the Japanese interpret the word "pragmatic" to mean "tool user." Clearly, the meaning conveyed by referring to someone as "pragmatic" and that associated with "tool user" are quite different. Without an understanding of the lan-guage and the culture, the meaning of information used for decision making might be lost. As a result, translations can be time consuming and people consuming. While there are automated translators, they cannot be relied upon in such an unstructured setting; they rarely reflect the nuances associated with data. For example, consider the computer-generated translation shown in the box. Even without having the original Italian version, it is clear that the meaning of the communication has been lost through the translation of the words.3
2Even a system shared with Canada, a country quite similar to the United States, might require a DSS to employ multiple languages, depending upon its application. Since the French-speaking population in Canada is so numerous (especially in the Quebec province), Canadian law requires the use of both English and French in many circumstances. For example, even candy wrappers in Canada must provide all information, including the ingredients and nutritional information, in both English and French. 3Much work on language translation is in progress and some is much better than others. Even with the best of the software, though, one risks losing nuances in the meaning of words.
Design Insights The Toubon Law
In France the use of French is required by law in commercial and workplace communications. In 2006, GE Healthcare, a French subsidiary of a U.S. company, was fined €500,000 plus an ongoing fine of €20,000 per day for providing software and related technical documentation lo its employees in the English language only. The Toubon Law (the full name of which is Law 94-665 of August 4, 1994, relating to usage of the French language) requires French to be used in official government publications, in all advertisements, in all workplaces, in commercial contracts, in some other commercial communication contexts, in all government-financed schools, and some other contexts, including broadcasted programs. The Civil Court of Versailles followed a strict interpretation of the Labor Code and on January 11, 2005, ordered GE Healthcare to immediately provide its employees with (i) a French translation of its software and (ii) a French translation of documents relating to employee training, safety, and health instructions and training manuals. In addition, the court ordered the company to have documents relating to products already on the market translated into French by June 1, 2005, with a daily penalty for noncompliance of €20,000 per document.
The Toubon Law also allows for the fine of individuals caught adulterating the French language with commercial or official English, including computer terms.

INTERNATIONAL DECISION SUPPORT SYSTEMS 283
Even when the text is translated properly, its meaningfulness can be affected by the technology associated with data transmission if the language requires special characters. Often, if messages are not sent using an appropriate gateway, encodings become damaged or changed, and hence the message becomes garbled. Some transnetwork software strips off control characters, making the reading of text impossible. So, for example, rather than receiving Japanese characters, one might simply receive the following on the screen:
$NJ8>0$NNC$G!"$=$l$OEnglish$B$NJ8>0$91#J
The following was posted on an electronic discussion group dedicated to communication regarding historical issues, H-NET. It is included here to help the reader understand the problems associated with translation for transnational DSS.
Note from H-NET: Professor Andreucci, the moderator of H-ITALY, is fluent in Italian and English. H-NET asked him to review one of the new automatic language translation programs. His review appeared in Italian on H-ITALY. What follows is the automatic machine translation into English of his review. It gives a strikingly clear picture of the strengths and weaknesses of the program.
From: Franco Andreucci <fran@vmxnucc.cnr,it> Subject: Italian Assistant Software—Automatic translation of my review
This is the automatic translation—done by the Italian Assistant (MicroTac Software)—of the text I posted last week, I didn't intervenc in any word or phrase. Unfortunately, also the texts intentionally written in italian in order to be automatically translated as examples in my review are translated. For instance, if you don't control the original Italian text, you'll miss the meaning of the sentence where L< leader1' is translated with "leader". My criticism was that 'leader' is translated with "duce," Some words arc not translated because the accents are missing, In this case, the responsibility is totally mine.
"Babele, _ \W | the Mr. confused the tongue of all the earth'' (Genesis, 11) |by] FRANCO ANDREUCCI
The old man dreams of returning to speak the universal tongue of the Genesis and of annul the chastisement of Babele, hard [e'] to die. In the XIX century he engages the character of the artful idiom and then, in our century, that of the automatic translator. Tied hope a time to the legends of the [positivismo], contradicted from the bankruptcy of the introduction of the [esperanto], she becomes alive anchor in a fascinating and modern way from the protection of the computer. Studied in the Soviet Union in the years '30 and then, after the Second world war, in the United States, the [possibilita*] of the automatic tied translation to the action of a computer has done in the last years of the footsteps from giant. If you/he/shc/it arc thought that the dimen-sion of an electronic dictionary in line [e*] passed from the 250 words of the 1954 to the actual [eentinaiaj of [migliaiaj, we one [puo' j make account that at least a problem |e'J having faced in acceptable way.
Borne from the numerous experiences scientific [svoltesi] in the linguistic field for the auto-matic translation, the idea has found a recent commercial realization in the programs ^Language Assistant Series'η of the MicroTac Software. The programs—that they arc called Italian Assistant, German Assistant, French Assistant, Spanish Assistant and they cost $99,95 each—they foresee the translation in the two senses between the English from a part and the Italian, the French, the German and the Spanish from the other. They represent an enormous footstep in ahead (respect to the by now "Old" dictionaries electronic [tascabili] or to the automatic translators of phrases) for their [elasticita'l and their [capacita'] of answer complex challenges. This critique concerns the Italian part of the program in his release for Windows entirely (MicroTac Software Assistant Windows [for], LverJ. 1.00a).

284 INTERNATIONAL DECISION SUPPORT SYSTEMS
To be able to salvage the message, the user needs to know how to replace the special characters either manually or with special software tools. Hence, the designers of the transnational DSS need to concern themselves with the way in which data are retrieved from corporate databases and transmitted to all users. In addition, designers need to be concerned about the way in which data from external databases, such as network news services, are retrieved and transmitted.
Translations can also affect the user interface in terms of its appearance. One primary problem is the orientation of the text. For example, in the United States, most users feel comfortable with menus that appear at the top of a screen that orient from left to right because that is the way we read. Most standard menuing systems in the United States use such an orientation, and it has been very popular. However, it is common to use a vertical orientation for text in Japan, causing difficulties for software companies trying to make their products more user friendly. It is necessary not only to translate the words in the menus and help screens but also to change the orientation of the entire screen to a vertical framework (associated with their reading and writing conventions).
In addition, many languages are considerably more verbose than English. Or, if the language requires special characters, they may assume more space than standard Roman characters. For example, since Chinese and Japanese characters assume twice the width of a standard Roman character, the standard screen holds only 40 Japanese characters (rather than the standard 80 Roman characters). Hence, translation of elementary aspects of the system design, including prompts and labels, may require an entire screen redesign in order to accommodate the translated terms. For example, consider Figure 6.2, which provides a screen design for a dashboard developed in English, Chinese, Japanese, and Arabic. Notice how the screen needed to be reengineered to accommodate the vertical orientation of the Japanese, the right-to-left orientation of the Arabic, and the range of special characters needed for all three.
Design Insights The Arabic Language
'■ Efforts to develop Arabic DSS have been plagued with problems of how to search for infor- ;
mation in a database. Standard Arabia which is used consistently in written language, has 29 letters, some of which can be adjusted with five different diacritics. In addition, the alphabet consists of several sets of homophones, a rich morphology, and standardized spelling of Arabic names is error prone> Finally, there are almost 20 encodings currently in use for Arabic. Thus, in order to create accurate queries of the database in a DSS, there needs to be some preprocess-ing of the input data. Some have experimented with eliminating the diacritics. Otair, Al-Sardi, and Al-Gialain (2008), however, have developed a more promising intermediary product that attempts to understand the request before transforming them into SQL queries. Their approach processes the words using a stem-based morphological analysis. The tool, called the Arabic Query Analyzer (which is DMBS and application independent), has been fully implemented and has shown tangible performance metrics. A related effort by El-Haj and Hammo (2008) built a query-oriented text summarization system to respond to natural language queries in Arabic* Such a system could help decision makers understand the range of documents, both internal and on the Internet, that might be of help in a choice context. This too has shown promising results.
I I

INTERNATIONAL DECISION SUPPORT SYSTEMS 285
Even when the users can select one language for the system, they may use it quite differently. Researchers in the area of communication long have known that cultures com-municate distinctively.4 Berger (1984, p. 43) notes that "even when they speak the same language, there are problems as a result of differences in education, class, level and cultural backgrounds." Hence, even though the individuals themselves are providing the translations, they may miss the meaning of information, especially if it contains slang or colloquialisms. For example, the British use the term billion to mean what Americans call trillion. That is, the British use thousand million when referring to what Americans call a billion and thus a billion is not encountered until one increases another order of magnitude (hence, the American's trillion). If one were not careful when translating the American version of the English language into the British version of the English language, one might miss the significant implications of size difference.
4"The difference between the almost right word and the right word is really a large matter—'tis the difference between the lightening bug and the lightening" (Mark Twain, U. S. author).
Design Insights The Japanese Language
Japanese text requires special attention in the design of DSS because of the complexity of the language. Some of the issues which contribute to the difficulty for a transnational DSS are highlighted below. In Japanese, one cannot assume that one byte is equivalent to one character, because Japanese characters generally require multiple bytes for representation. The Japanese character set contains over 10,000 characters. The Japanese writing system is a mixture of four different writing systems; Roman, Hiragana, Katakana, and KanjL
■ Roman characters correspond to the 52 characters (including both uppercase and lower-case) of the English language. In addition, there are Roman characters associated with the 10 numerials. Japanese use the Roman characters primarily in the construction of tables and in the creation of acronyms.
* Hiragana characters are ones that represent sounds, such as syllables. Generally, these characters are used to create suffixes for some words or to write native Japanese words. The Hiragana characters appear to have a calligraphic look. For example, the character Ϊ represents the sound made by the letters i(ma" whereas the character = represents the sound made by the combination of letters "mi.71
* Katakana characters represent a phonetic alphabet as well However, they are used to represent words of foreign origin, such as bread, - Prj (pronounced "pan1'), which was derived from the Portuguese word for bread, pdo (pronounced 4tpown1i). In addition, they are used for emphasis, similar to the way we use italics in English. The Katakana characters have a squared, rigid look in comparison to the Hiragana characters. For example, the character ? represents the sound made by the combination of "ma" while the character f represents the sound made by the combination of letters "ku."
* Kanji characters were borrowed from the Chinese over 1500 years ago. There are tens of thousands of these characters in use by the Japanese. These characters represent spe-cific words or combinations of words. For example, * when used alone indicates a tree, while two of the character, **, indicates woods and three of the character, ***, means a forest,
There is no recognized character set for Japanese similar to ASCII for English. Nor is there a universally recognized encoding method for Japanese.

286 INTERNATIONAL DECISION SUPPORT SYSTEMS
(a)
Figure 6.2. Language effects on screen design. The same information is provided in (a) English,
(b) Chinese, (c) Arabic, and (d) Japanese.
Design Insigh nexpected Consequences of Technology Decisions
The move to computerization in cullures with complex alphabets can introduce unwanted impacts on society. Consider the Chinese language, which has roughly 55,000 characters, although only 3500 are in everyday use. When the Public Security Bureau modernized its operations, managers, not surprisi ngly, decided that it would be easier to track i ts citizens if information was computerized rather than handwritten. System designers compromised between the number of characters in ev-eryday use and the census of all characters by allowing the system to use 32,352 unique characters,
While this decision did not have much impact on the operation of the system, or most of the information stored in the system, it did have a major impact on the recording of people's names. Family names were not a problem since only 100 surnames cover 85% of China's 1.3 billion citizens. (By comparison, it takes 70,000 surnames to cover 90% of Americans.) As a result, many Chinese parents look to classical Chinese to find a first name for their children, in part to find a pleasing name and in part to help the child stand out in society. Clearly, these classical names cannot be spelled using the 32,352 characters in the Public Security Bureau's system,
Government officials have told individuals with these unique names that they musi change their name so they can be listed in the database. Further, they are working on a list of "approved1' characters from which future parents must select children's names.

INTERNATIONAL DECISION SUPPORT SYSTEMS 287
(b)
Figure 6.2. (Continued) Language effects on screen design. Translation into Chinese by Aihua Yan.
Translation also needs to be aware of how different cultures adopt the context informa-tion that surrounds the communication. Many cultures of Asia, Latin America, Africa, and the Middle East are high-context cultures. In those cultures, people are highly influenced by the context when interpreting the meaning of communication. So, what is meant depends on the environment in which something is said or written. By contrast, cultures of North America and Australia place more emphasis on what is said to determine meaning than the context in which it is said.
Similarly, different languages and cultures have different ways of representing dates, currency, and other units of measurement. For example, 3/1/10 means March 1, 2010, in the United States, but January 3, 2010, in most of Europe. Many companies in Japan continue to use the Japanese Era Name for years rather than the Common Era designation. So, rather than regarding the year as 2010, they would regard it as Heisei 22 (or 22 years of the reign of the current emperor). Further, some areas of Eastern Asia cling to the "Chinese calendar," which is a blend of the lunar and solar calendars. Similarly, Iran, Afghanistan, and related societies use the Solar Hejri calendar, so the year 2010 would be 1388 or 1389 depending on the time of year (the calendar year begins about March 21 of the Gregorian calendar).

288 INTERNATIONAL DECISION SUPPORT SYSTEMS
(C)
Figure 6.2. (Continued) Language effects on screen design. Translation into Arabic by Michael Martinich-Sauter.
Languages have different rules for pronunciation and therefore meanings which need to be accommodated. For example, a character with an umlaut will have different impacts in Finnish than in German, even though they may look the same to an English audience.
Finally, different languages and different cultures treat the concept of uppercase and lowercase characters differently. For example, the Hebrew language uses lowercase letters only when the text is handwritten and uppercase letters only when the text is printed. In this case, the system designer using a combination of uppercase and lowercase characters in English to convey information would not be able to have the same message sent on the Arabic screen.
Icons can also be a source of confusion when used transnationally because they have quite different interpretations. Those shown in Figure 6.3 are common icons that might be used to give quick visual cues on a dashboard to help the decision maker know whether conditions are improving or not. Clearly, given the range of interpretations of those icons across the world, it would not be prudent to use them in a system that would be used transnationally. In fact, given the internationalization of the employees of most companies, even if they are solely located in a given country, such icons might not convey the intended purpose.

INFORMATION AVAILABILITY STANDARDS 289
(d)
Figure 6.2. (Continued) Language effects on screen design. Translation into Japanese by Mihiro Sasaki.
There is every reason to believe that other less obvious problems of user interface would be different among cultures as well. Unfortunately, if the user interface is unacceptable to users, they will not use the DSS. Hence, it has an important and direct influence on the ability of the user to realize the full potential of the system. The impact of culture upon the database management system and the model management system in transnational DSS is even less intuitive. The remainder of this chapter will highlight some of the legal, cultural, and economic issues that need to be addressed when defining DSS for transnational corporations.
INFORMATION AVAILABILITY STANDARDS
One of the assumptions regarding transnational DSS is that the company can, in fact, share the desired information in all relevant venues. This includes the ability to collect information on a microlevel and to assemble information selectively, to correlate information or in any way create new information from the original data, and to share that information across borders. This implies that the cultures and the laws of the countries are consistent on the view of information, its privacy, and its shareability. In addition, the goal implies that the manner in which those views of privacy and shareability are enforced is consistent among the venues. This often is related to how they approach the relative openness of their borders, investment, and business and commercial innovations—and hence can be quite different,

290 INTERNATIONAL DECISION SUPPORT SYSTEMS
Figure 6.3. Gestures and their interpretation cross culturally.
even between two cultures which appear to share a similar "social" culture, such as the United States and Canada.
Data Privacy
Data privacy addresses the question of what information can be accumulated about individ-uals, corporations, or enterprises and how that information can be processed and shared. In the United States, we have high expectations for privacy and citizens believe their privacy is quite protected. After all, the Fourth Amendment to the U. S. Constitution states:
The right of people to be secure in their persons, houses, papers and effects against unrea-sonable searches and seizures, shall not be violated, and no Warrants shall issue, but upon probable cause, supported by Oath or affirmation, and particularly describing the place to be searched and the person or things to be seized.
Further, the 1965 landmark Supreme Court case Griswold v. Connecticut upheld an indi-vidual's right to privacy, citing the Ninth Amendment:
The enumeration in the Constitution, of certain rights, shall not be construed to deny or disparage others retained by the people.

INFORMATION AVAILABILITY STANDARDS 291
In 1967, a Panel on Privacy and Behavioral Research reporting to the Office of Science and Technology stated (Privacy and Behavioral Research, 1967, p. 8):
The right to privacy is the right of the individual to decide for himself how much he will share with others his thoughts, his feelings and the facts of his personal life... Actually what is private varies from day to day and setting to setting.
In other words, we generally believe in the protection of the right to privacy of individual, personal information. Not all countries share this perception of privacy. For example, totalitarian governments are known for neglecting the rights of citizens' privacy.
However, even in America, where citizens believe their privacy is protected, enforce-ment of privacy regulations is not extensive. Very few states provide any strength or enforcement to that right. In 1977, the Federal Privacy Protection Study Commission found an imbalance between the rights of individuals and those of record keeping or-ganizations. Specifically it suggested a variance between the need for information and the requests for disclosure. In particular, it suggests that many recordkeeping organiza-tions are intrusive to the individual and that the extent and nature of recordkeeping need better delineation, and enforceable expectations of confidentiality by law or statute need establishment.
As a result, Congress passed The Computer Security Act of 1987, which attempts to define that information in need of protection. It defines "sensitive information" as that which, if lost, misused, accessed, or modified without authorization, could adversely affect the privacy of individuals and be a violation of the Privacy Act. However, each citizen differs with regard to precisely what it considers sensitive under that definition. Further, while mandated to require "informed consent" prior to data collection, disclosure is permitted without consent to those within an agency who have a "need for the record in the performance of their duties" or to agencies in connection with "routine uses" for purposes "compatible with the purposes for which it was collected."
While this sounds as if no one can get access to data without individuals knowing about it, the reality is far different. First, these statements only apply to data collected by governmental agencies and some specified private agencies such as banks. Second, few individuals read or understand the "informed consent" clause provided on most application forms. Even fewer individuals would understand how far the consent actually applies. In reality, except in specific instances such as health records, in the United States, whoever collects and digitalizes data has the right to store and use it—regardless of whether the individual knows the data were collected or gave permission for them to be collected. If the data are incorrectly attributed or keyed or are "out of context," it is the responsibility of the individual to correct his or her personal data. The introduction of the Patriot Act in 2001 gave increasing rights to the government to use whatever information they could collect. Further, Internet Sites, such as Facebook, and Internet-based tools, such as those provided by Google have made access to one's data even less Secure.
In a recent Harris-Equifax Poll:
• Seventy-six percent of Americans believe they have lost all control over how personal information about them is circulated.
• Eighty-nine percent believe that computers have made it easier for someone to improperly obtain personal and confidential information on them.

292 INTERNATIONAL DECISION SUPPORT SYSTEMS
• Sixty-eight percent believe that computers represent a threat to their personal privacy. • Sixty-six percent believe there are not adequate safeguards to protect the privacy of
personal information stored in computers. • Sixty-seven percent believe that if privacy is to be preserved, the use of computers
must be restricted.
"Informed consent" also implies the individual enters into the agreement freely and openly. However, the reality is that the failure to provide this consent results in not getting licenses, credit, or other privileges in society. In other words, you must provide it or you will not have full rights. And if the data are collected by most private enterprises, it can be released or sold to other organizations unless specific statements prohibiting it are signed.
Once collected, the data may be kept in a database forever. This is particularly prob-lematic if an error is originally entered and if the customer has no way of knowing that the error was entered. Furthermore, the statutes in the United States put the responsibility for examining the data to ensure its accuracy on the consumer, not on the group collecting the data. A small percentage of individuals understand the number of ways errors occur in the transcription of data, the possibility for erroneously merging data, or the wide possibility of errors in the data processing capabilities. Hence, few individuals check those records to which they have access, and so errors can multiply.
Other cultures take a much stronger stance on the protection of citizens' rights to privacy. For example, in Canada, data collection companies must publish their policies, such as those shown regarding Equifax. Further, the 2001 Personal Information Protection and Electronic Documents Act (PIPEDA) gives individuals the right to:
• Understand the reasons organizations collect, use, or disclose personal information • Expect organizations to collect, use, or disclose personal information in a reasonable
and appropriate way • Understand who in the organization is responsible for protecting individuals' per-
sonal information • Expect organizations to protect the personal information in a reasonable and security
way • Expect the personal information held by the organizations to be accurate, complete,
and up to date • Have access to their personal information and ask for any corrections or have the
right to complain to the organizations
The PIPEDA requires organizations to:
• Obtain consent before they collect, use, and disclose any personal information • Collect personal information in a reasonable, appropriate, and lawful way • Establish personal information policies that are clear, reasonable, and ready to protect
individuals * person information

INFORMATION AVAILABILITY STANDARDS 293
Equifax prides itself on being a trusted steward of personal information and is committed to protecting the privary of all personal information under its control. We arc publishing this Privacy Policy to provide a comprehensive overview of our practices and procedures relating to the protection of personal information as well as its use, collection and disclosure.
Many provinces have laws that specifically protect consumer credit information. The laws vary from one jurisdiction to the next, but most are similar in their intent. The federal government has also enacted the Personal Information Protection and Electronic Documents Act, which governs the protection of personal information and electronic data, Some provinces have also adopted local privacy legislation, To ensure consistent service to consumers across Canada, Equifax has based this Privacy Policy on the federal law.
Equifax Statement of Consumer Rights Equifax believes that Canadians have the following fundamental rights:
* The right to know what information has been collected, stored and reported about them. * The right to be able to review the information reported about them in a reasonable time,
in a format that is understandable» and with an ability to challenge and correct inaccurate information.
• The right to expect that the information about them that is collected or stored will not be used for any purposes other than those permitted by law,
• The right to have information about them safeguarded using secure storage, confidential handling within the organization, and secure transmittal to authorized and legitimate users.
• The right to be treated with respect and fairness when information about them is beign used.
* The right to privacy consistent with the requests they make of business. • The right to expect levels of accuracy considtent with the industry's best practices of
record keeping and information systems management, * The right to have their applications for benefits or opportunities evaluated on the basis of
relevant and accurate information,
Principle No* 5- Limiting Use, Disclosure and Retention Credit Information Equifax limits the use, disclosure and retention of your credit information in accordance with applicable credit reproting and privacy laws. An Equifax customer must have your consent and a purpose permitted by law to access Equifax consumer credit reports. All Equifax customers are required to go through the Equifax application screening process and access is not granted to all applicants. The customers that are accepted by Equifax are carefully screened and contractually obliged to respect and abide by all applicable credit reporting and privacy laws, Equifax conducts periodic audits to ensure that Equifax customers are acting in compliance with their contractual and legal obligations.
As a Canadian consumer, you have the right to know the full and complete content of your Equifax consumer credit file. Equifax will disclose your credit information to you free of charge by mail or telephone, Equifax will respond to any questions or concerns that yo may have regarding your Equifax consumer credit file* For information about how to obtain your personal information, please refer to the FAQ section at the end of this policy.
Credit information in your consumer credit file is maintained in accordance with legislated data retention guidelines.
This is summarized from the Equifax Canada Inc. Privacy Policy - CANADA, 2010. Copyright © 2010, Equifax Canada Inc. The document was obtained from the Equifax Canada office and is reprinted here with permission of Equifax Canada, Inc.

INTERNATIONAL DECISION SUPPORT SYSTEMS
It has been suggested that European countries and others occupied during World War II and/or repressed by Communist governments have a strong recollection of the problems that can accrue if data are made available too freely. Hence, the right to data privacy is heavily regulated and rigidly enforced in Europe. Article 8 of the European Convention on Human Rights (ECHR) provides a right to respect for one's "private and family life, his home and his correspondence," subject to certain restrictions, and the European Court of Human Rights has given this article a very broad interpretation in its jurisprudence.
Member states of the European Union (EU) are also signatories of the European Convention on Human Rights and the Convention for the Protection of Individuals with Regard to Automatic Processing of Personal Data. The European Commission decided to harmonize data protection regulation and proposed the directive on the protection of personal data by adopting a number of key principles with which individual country's legislation must comply. These eight principles, then, have been adopted in one form or another by all countries in the EU and require data to be:
• Fairly and lawfully processed • Processed for limited purposes • Adequate, relevant, and not excessive • Accurate • Not kept longer than necessary • Processed in accordance with the data subject's rights • Secure • Not transferred to countries without adequate protection
In operation, the European Community (EC) provides the following fair-use policy (di Talamo, 1991):
• Data use is prohibited without authorization of the subject. • Data subjects must be personally notified of to whom information has been passed
and for what purpose. • Data subject can claim compensation if data are misused and caused damage. • EC data can only be transferred out of the EC if the receiving country can guarantee
the same level of protection.
In these cases, the burden of ensuring that the data are really relevant and accurate is kept on the organization collecting the data. In fact, in Sweden, organizations wanting to collect data on individuals must apply to the Data Inspection Board and be granted a license to do so. In France, organizations are required to destroy data after the specific application for which they were collected is completed. Further, in Italy, most labor unions have agreements with organizations that give them the right to approve any data maintained about individuals in corporate databases.
In early 1995, The Council of Ministers of the European Community adopted a common position on the European data protection directive. The directive is significant for European privacy because it will necessitate the adoption of privacy safeguards in the remaining European countries that do not yet have legislation. In addition, it will require changes in countries with existing privacy laws because the directive takes a stronger position on data protection than existing national laws. It is also believed that the directive will result

INFORMATION AVAILABILITY STANDARDS 295
in greater scrutiny of countries without a data protection commission and/or adequate legislative protections.
So, how do these laws and customs affect the use of transnational DSS? Many uses of DSS technology in the United States could be crippled by these regulations.5 In general, businesses which depend on the manipulation of computer data lists, such as direct-mail companies, credit reference agencies, or marketing researchers, would be hampered by these EC directives. First, no data about an individual could be processed or transmitted without that person's informed consent. This means a database could not include a person's name unless they specifically authorized it. Many individuals would not return an authorization form; still others would reject the corporate's need to keep information about them, fearing effects of computer tracking.6 Second, the rules limit "profiling" people who share particular characteristics. Finally, since the European position results in greater scrutiny of countries without a data protection commission and/or adequate legislative protections such as the United States, it may even affect the basic information sharing among companies, or even among divisions of the same company.
Data Availability
Clearly not all information that is of interest in a DSS is about individuals in society. Some of the information is about governments, corporations, competitors, statutes and legal precedents, and so on. In order for the technology to be used to its fullest, there is a need for the various cultures to share views on how such "public" information should be shared. In the United States, the culture has taken its right to public information from the First Amendment. However, not all countries share this right. Even a country as similar in culture as Canada does not protect this right. This can present a problem if all parties using a DSS cannot have access to the same information. Further it presents questions as to how the statutes and customs apply. For example, if a DSS user is physically in country A but accessing a computer and database in country B, do the laws and precedents of country A hold or do those of country B hold? In other words, is it the individual's physical location or logical location which dictates which statutes apply? International courts continue to debate these issues.
5Big credit card companies, banks, airlines, and insurers use massively parallel processing in an effort to divine which consumers are likely to buy what products and when. Marketing managers believe this is a great contribution to their efforts. However, one business professor warns the fallout could be that nasty ID companies begin abusing their newfound information: "The companies doing this have a big responsibility. Otherwise there will be an information Chernobyl." (Wall Street Journal, August 16,1994, p. Bl.) In addition, as these efforts spread to international marketing, other cultures will affect what is defined as responsible behavior. 6George Orwell's book 1984 summarizes his prediction (which was shared by many others) of the impact computers and technology as a whole would have upon daily life. Many citizens were outraged at the thought they could be "tracked" as Orwell suggested. Orwell was correct in his prediction of the ability of computers to track our activities. Of course, Orwell was generally wrong in his other predictions regarding the impact of computers. Instead of enforcing uniformity as he had expected, they promote heterogeneity and autonomy. Many believe that, because computers provide flexibility and adaptability to our activities, we have become more human, not less so, when we use them (Kelly, "Embrace It," Harper's, May 1994).

INTERNATIONAL DECISION SUPPORT SYSTEMS
Data Flow
Even if there is agreement among all cultures affected by a particular transnational DSS regarding the privacy or protection of data and the availability of data, there can still be problems. There may be restrictions about where data can reside, where they can be processed, and how access can be maintained. Some countries, such as Canada, maintain that allowing data to be processed outside their borders would reduce their control over disruptions in service, reduce their ability to ensure protection against personal privacy violations and computer crime, jeopardize their jurisdiction over companies operating in their borders, undermine the telecommunications system, and emphasize foreign values, goods, and services. In addition, Canadian officials recognize the potential for both release of information that is vital to Canada and the loss of independence and autonomy to other countries (Telecommunications and Canada, 1979). Similarly, in Britain, it is believed that only its government can assess the national interest of information and the U.K.'s vulnerability to disruptions in the availability of that information (Making a Business of Information, 1983).
Reports in both Latin America and Africa (Collier, 1988) recommend that:
• Data affecting national sovereignty, cultural identity, and technological progress should be protected against processing in other countries.
• Data should remain in the country of origin. • External information should be screened.
The three messages that guide all of these concerns about transborder data flow are the following.
• It is imperative that the data processing industry of the country is preserved. If transborder processing of data is allowed, the data processing industry would be threatened and potentially eliminated. Since much of the hope for long-term eco-nomic survival for most countries depends on their ability to participate in the "information technology race" successfully, it is imperative that the data process-ing industry be maintained and bolstered. For example, the Brazilian government is concerned that if data are taken from Brazil for processing, both the software and hardware markets will suffer. Hence, they only allow "processed" data to leave its borders. Furthermore, data flow across borders potentially affects the transfer of payments. For example, information sales (i.e., "fees and royalties) was about $5.8 billion in 1980—doubled since 1970.
• National security can be jeopardized if a country becomes too dependent upon other countries for vital data and services. This can provide a bargaining chip for political hostage behavior.
• Cultural integrity is threatened as we allow greater amounts of the information we view and the format in which we view it to be from another culture.
While these issues are not threatened by any individual use of data in a transnational DSS, they can be threatened by significant use in DSS as well as other data processing jobs. Since the regulations tend to be written in terms of data flows, not the purpose of those flows, we as designers of DSS need to be aware of the prevailing laws, customs, and expectations surrounding transborder data flows and build our systems to accommodate them efficiently.

CROSS-CULTURAL MODELING
CROSS-CULTURAL MODELING
The model management component of a DSS, as defined in an earlier chapter, consists of analytical tools, such as statistical models, financial models, artificial intelligence heuristics, and operations research models, as well as a function for managing those tools. Some of the tools consist of prepackaged analyses, while others provide the users the opportunity to build their own models. The value of this component results from providing easily implemented access to a wide variety of tools and assistance in using the tools, so the users can and will investigate relevant patterns and issues in their data. Hence, the goal is to enable users to select the models they perceive as most appropriate to assist with the particular question under consideration. This goal is only achieved, however, if DSS are designed appropriately for the individuals or groups who will be using them.
Clearly this is not a problem if all questions and all data have a unique modeling opportunity associated with them. That is, if one believes there is only one way to analyze data correctly, then the transnational nature of a DSS should not affect the design of the model management system. However, that assumption is rarely correct. Even if one simply acknowledges that different divisions will have different perspectives that will affect their approach to decision making, it becomes obvious that they will need to consider different data in different ways to address those differences in perspectives. Hence, the various divisions will require different (and perhaps vastly different) models to support those decisions. In addition, since management style is at least partially a function of the state of development and technology, the variations in these factors will increase the heterogeneity of models required of a successful system.
In addition, there is some evidence that cultural differences exacerbate the problem. There is an international management literature that addresses "management practices" and cross-cultural differences, including the use of analytical tools, the use of measurements, planning, and control (Kobayshi, 1982). For example, some researchers have found that the use of models is influenced by the culture and its norms of the decision maker (Evans et al., 1989; Hofstede, 1980). Different traditions and different values alter the variables which are reasonable to consider, the need to optimize, and the methods by which to evaluate alternatives. The parameters of the problem to consider in turn will influence the choice of relevant models.
Some researchers have found that formalized approaches to decision making may not differ as a function of culture [see, e.g., Al-Jafaray and Höflings worth (1983) or Negandhi (1979)]. However, few would deny that the formal mechanisms of decision making, such as the reports, forms, and other formal communications regarding the choice process, are quite different from the actual process one used to get to the decision, such as the searches necessary in a DSS. Furthermore, few researchers would deny that effective ways of leading individuals and organizations can differ as a function of the environment in which they work. Consider, for example, Figure 6.4, which illustrates the cultural assumptions of work ethics in the United States and in Asian countries. These differences affect how people work, how incentives can be established, and what will guide their management. Clearly, the process by which one could encourage or convince individuals or groups is also affected by those assumptions.7 As such, it is clear that the decision support provided to individuals or groups in those different cultures will also differ. In fact, Hofstede (1994) notes that any
7The phrase, "There are truths in one country which are falsehoods in another," has been attributed to Blaise Pascal circa 1700. Such differences affect criteria and other decision processes.
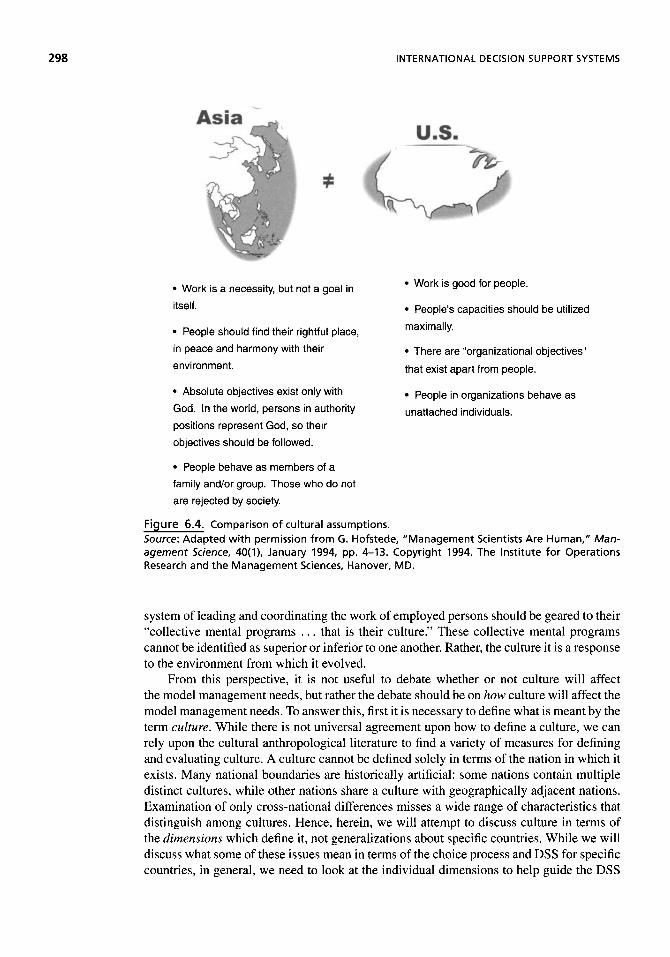
298 INTERNATIONAL DECISION SUPPORT SYSTEMS
. Work is a necessity, but not a goal in # W o r k is 9 o o d for PeoPle-
itself· · People's capacities should be utilized
• People should find their rightful place, maximally.
in peace and harmony with their · There are "organizational objectives"
environment. t h a t e x i s t a p a r t f r o m pe0ple.
• Absolute objectives exist only with . P e o p l e in organizations behave as
God. In the world, persons in authority unattached individuals.
positions represent God, so their
objectives should be followed.
• People behave as members of a
family and/or group. Those who do not
are rejected by society.
Figure 6.4. Comparison of cultural assumptions. Source: Adapted with permission from G. Hofstede, "Management Scientists Are Human," Man-agement Science, 40(1), January 1994, pp. 4-13. Copyright 1994. The Institute for Operations Research and the Management Sciences, Hanover, MD.
system of leading and coordinating the work of employed persons should be geared to their "collective mental programs . . . that is their culture." These collective mental programs cannot be identified as superior or inferior to one another. Rather, the culture it is a response to the environment from which it evolved.
From this perspective, it is not useful to debate whether or not culture will affect the model management needs, but rather the debate should be on how culture will affect the model management needs. To answer this, first it is necessary to define what is meant by the term culture. While there is not universal agreement upon how to define a culture, we can rely upon the cultural anthropological literature to find a variety of measures for defining and evaluating culture. A culture cannot be defined solely in terms of the nation in which it exists. Many national boundaries are historically artificial: some nations contain multiple distinct cultures, while other nations share a culture with geographically adjacent nations. Examination of only cross-national differences misses a wide range of characteristics that distinguish among cultures. Hence, herein, we will attempt to discuss culture in terms of the dimensions which define it, not generalizations about specific countries. While we will discuss what some of these issues mean in terms of the choice process and DSS for specific countries, in general, we need to look at the individual dimensions to help guide the DSS

CROSS-CULTURAL MODELING 299
development process. Table 6.1 provides a summary of dimensions noted in the cultural anthropology literature.
Several researchers have identified uncertainty avoidance as a measure of culture. For example, Hofstede (1983) noted that cultures differ in their patterns of coping with ambiguity and uncertainty. Cultures that accept uncertainty will take risks easily. As a result, they are also more able to accept differences in others, such as in their opinions or behaviors. These cultures accept "relative truths" and evaluate options in terms of the current environment, not compared to a rigid standard. Cultures in which uncertainty is less well accepted try to shield individuals from the unknown. Such cultures tend to adopt laws and procedures which facilitate similarity of thought and behavior. As a result, the cultures are aggressively intolerant for deviant behaviors and opinions as well as for any action or individual which threatens their view of the world.
District planning in India operates on a five-year cycle. Each ministry of the central government and each state government prepare a plan which is then compiled into the national five-year plan, Bhatnagar and Jajoo (1987) developed a DSS intended to assist with the development of these plans.
The focaJ point of the planning is a district, which has a population of about 1 million. District-level plans for each sector are passed upward to the state level where they are consolidated for all districts. Prior to the development of the DSS, the exercise of communications between and among state headquarters and the district to finalize a plan may have taken seven to eight months.
In addition, two key decisions in these five-year plans are made arbitrarily due to the unavailability of the necessary information: (a) a district wise allocation of the total available budget for the department and (b) selecting a specific location choice for a particular facility.
An earlier version of th DSS was developed. Overall, it was considered a success. Almost everyone who saw it recognized its potential to serve as an aid to planning within a district. However, it was recognized that such applications could be developed only if computers supporting graphic facilities were available within the state and district At that time such graphic facilities were not accessible,
Since today's microcomputers offer reasonable graphic facilities, a second version was created with vastly improved interaction capabilities. This second system provided more general data structures and improved command language structure to simplify interaction. The commands allowed selection of villages from a table on the basis of their attributes, like the existence of a particular type of facility or the distance from it Other sets of commands display a set of villages on a map, allow interaction with the displayed map, and produce a printed report on the selected villages. The software wa.s table driven, offering the flexibility of carrying out various types of analysis by using the commands in an appropriate sequence.
This DSS was accepted because five key benefits were provided by the system; (a) the graphics and maps created a level of understanding which went above and beyond the level which could be achieved without a DSS; (b) the illustrative graphics helped to create integration across governmental departments; (c) the quality of decisions were enhanced and the time taken to create the plans was reduced greatly; (d) the integrated data offered an easy tool to determine relative allocations among departments based on existing facilities rather than on the basis of the national norm, thereby creating a better balance of distribution!; and (e) it provided an accurate assessment of a district's ς'backwardness indicator" which is often used for allocating funds. Overall, it was determined that the extensive graphical interface was the biggest selling feature for the users.
The district planning DSS example provided insight into the user interface issues when designing a DSS for India. In particular, it suggested that the graphical images help to cross cultural and communication barriers in India to make the system more usable,

INTERNATIONAL DECISION SUPPORT SYSTEMS
Table 6.1. Possible Dimensions of Culture
Long-term orientation Attitude about uncertainty Person-nature relation Activity index Human-nature attitudes Power distance Individualism Masculinity index
This attitude toward uncertainty affects decision-making needs. For example, indi-viduals in cultures with high uncertainty avoidance will be more likely to conduct highly structured analyses and less ad hoc analyses. Since they will want to be prepared for all possible contingencies, they will be likely to evaluate greater numbers of alternatives and more facets of those alternatives. Further, if they have employed optimization, they will be likely to seek postoptimality analyses prior to selecting an alternative for implemen-tation.
The person-nature orientation is the second dimension of culture. This measures the individual or group's view of their relative dominance over fate. The dimension varies from, at the one end, individuals believing they have no effect on the future. These individuals perceive they must accept the inevitable, and hence there is no planning for contingencies. In the middle of the dimension are individuals who believe that there is a balance between people and nature. At the other end of the dimension are those who believe in mastery of their fates if they have enough ability to overcome obstacles.
This dimension is likely to affect an individual's basic likelihood of accepting technol-ogy as a decision-making tool. Those who feel in control of their fate encourage the use of technology as a way of meeting their goals, while those who perceive they have no control are unlikely to adopt technology readily.
In addition, one's perception of one's ability to dominate fate will affect an attitude toward planning. Populations in cultures that do not accept one's ability to influence the future do not participate in long-range planning activities. Evan (1975) associates this with their belief in "luck" as the major influencing factor. Since luck cannot, in their view of the world, be planned, they do not practice much long-range or strategic planning. Rather, it is better to wait and respond as best one can. Hence, these decision makers emphasize reactive decision making. On the other hand, individuals who believe they can master their fates, are more likely to conduct strategic and contingency planning. Their goal is to improve their relative position (either individually or as a group) to influence destiny.
Many of the cultures in the middle area of this dimension focus on maintaining a "har-mony" with nature. For example, they believe that the more harmonious a social structure and/or organizational structure, the more likely they are to attract "luck" for the organiza-tion. In these cultures, the top executives are likely to attempt to create harmony through meetings, gatherings, and so on. This implies, in turn, that more of their responsibilities are delegated to lower levels in the organization. Hence, broader informational needs and greater authority are likely to be of less importance to those organizations.
Evan (1975) and Negandhi (1983) hypothesize that this orientation affects the formality within an organization, the direction of communication, and the output of the organiza-tion. In particular, they note that cultures with strong mastery-of-destiny attitudes tend to have quite formal methods of socialization, multidirectional communication, and high
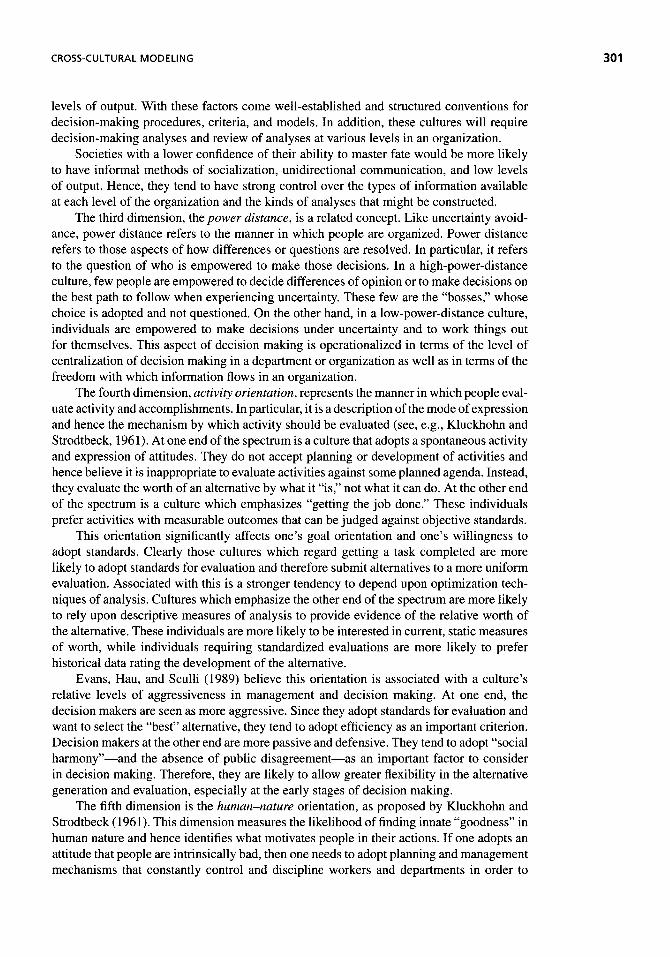
CROSS-CULTURAL MODELING
levels of output. With these factors come well-established and structured conventions for decision-making procedures, criteria, and models. In addition, these cultures will require decision-making analyses and review of analyses at various levels in an organization.
Societies with a lower confidence of their ability to master fate would be more likely to have informal methods of socialization, unidirectional communication, and low levels of output. Hence, they tend to have strong control over the types of information available at each level of the organization and the kinds of analyses that might be constructed.
The third dimension, the power distance, is a related concept. Like uncertainty avoid-ance, power distance refers to the manner in which people are organized. Power distance refers to those aspects of how differences or questions are resolved. In particular, it refers to the question of who is empowered to make those decisions. In a high-power-distance culture, few people are empowered to decide differences of opinion or to make decisions on the best path to follow when experiencing uncertainty. These few are the "bosses," whose choice is adopted and not questioned. On the other hand, in a low-power-distance culture, individuals are empowered to make decisions under uncertainty and to work things out for themselves. This aspect of decision making is operationalized in terms of the level of centralization of decision making in a department or organization as well as in terms of the freedom with which information flows in an organization.
The fourth dimension, activity orientation, represents the manner in which people eval-uate activity and accomplishments. In particular, it is a description of the mode of expression and hence the mechanism by which activity should be evaluated (see, e.g., Kluckhohn and Strodtbeck, 1961). At one end of the spectrum is a culture that adopts a spontaneous activity and expression of attitudes. They do not accept planning or development of activities and hence believe it is inappropriate to evaluate activities against some planned agenda. Instead, they evaluate the worth of an alternative by what it "is," not what it can do. At the other end of the spectrum is a culture which emphasizes "getting the job done." These individuals prefer activities with measurable outcomes that can be judged against objective standards.
This orientation significantly affects one's goal orientation and one's willingness to adopt standards. Clearly those cultures which regard getting a task completed are more likely to adopt standards for evaluation and therefore submit alternatives to a more uniform evaluation. Associated with this is a stronger tendency to depend upon optimization tech-niques of analysis. Cultures which emphasize the other end of the spectrum are more likely to rely upon descriptive measures of analysis to provide evidence of the relative worth of the alternative. These individuals are more likely to be interested in current, static measures of worth, while individuals requiring standardized evaluations are more likely to prefer historical data rating the development of the alternative.
Evans, Hau, and Sculli (1989) believe this orientation is associated with a culture's relative levels of aggressiveness in management and decision making. At one end, the decision makers are seen as more aggressive. Since they adopt standards for evaluation and want to select the "best" alternative, they tend to adopt efficiency as an important criterion. Decision makers at the other end are more passive and defensive. They tend to adopt "social harmony"—and the absence of public disagreement—as an important factor to consider in decision making. Therefore, they are likely to allow greater flexibility in the alternative generation and evaluation, especially at the early stages of decision making.
The fifth dimension is the human-nature orientation, as proposed by Kluckhohn and Strodtbeck (1961). This dimension measures the likelihood of finding innate "goodness" in human nature and hence identifies what motivates people in their actions. If one adopts an attitude that people are intrinsically bad, then one needs to adopt planning and management mechanisms that constantly control and discipline workers and departments in order to

INTERNATIONAL DECISION SUPPORT SYSTEMS
obtain good results from the organization. Decision makers need to be able to observe people and projects carefully and frequently so as to detect problems as soon as possible. The more strongly held the philosophy, the tighter such monitoring would be.
On the other hand, if one adopts a view of society that is basically good, then the goal of monitoring systems changes dramatically. Instead of designing such systems to identify problems, monitoring systems are created to detect opportunities for development, growth, and/or strategic advantage.
Evans, Hau, and Sculli (1989) claim that the human-nature orientation also influences the flexibility exhibited toward managerial communication. The more a culture adopts an "evil" view of society, the less likely superiors would want alternative opinions, especially from subordinates. Cultures that adopt a "good" view of society are more likely to tolerate conflict situations associated with debates of the relative merits of alternatives and methods for evaluating alternatives. In this latter case, through more levels of the organization deci-sion makers need support from greater use of analytical tools, more alternative generation capabilities, and greater information retrieval.
The sixth dimension is individualism. At one end of the spectrum are cultures that emphasize the continuity of the group and hence the group goals are paramount in the decision-making efforts. These groups are generally homogenous in some fashion and want to stay that way. On the other hand, at the other end of the spectrum are cultures in which the value of autonomy of the members of the group is seen as the only important criterion for decision making. Obviously, there are many points between these two on the spectrum.
Cultures that hold the individualistic view emphasize achieving the goals of the indi-vidual above all others. These people may accept and pursue group goals, but only if they do not conflict with their own. Collateral societies, on the other hand, emphasize the goals and welfare of the extended group, such as an organization. Those cultures at the extreme point of this dimension stress the importance of continuity of the group through time and ordered progression of individuals within the group.
Clearly, then, the level of individualism associated with a culture will affect the goals adopted and pursued in decision making as well as decision makers' general compliance with authority in considering alternatives. Evan (1975) and Negandhi (1983) postulate that this orientation will affect the formalization of the socialization function and the direction of communication within an organization. They suggest that cultures that emphasize the individualistic component will have formal means of socialization within the organization and strong multidirectional communication among decision makers. Cultures that empha-size the group component, on the other hand, will have informal means of socialization within the organization and unidirectional communication. As stated previously, this will in turn affect the types of analyses and standards of alternatives considered, the need for controls on information within the organization, and the need for sharing analyses among levels within the organization.
The last dimension is the masculinity index of a culture. This dimension reflects the as-sociation of specific attributes such as assertiveness, performance, competition, and success with the role of men in society. In addition, it reflects the association of more commonly ac-cepted feminine attributes, such as quality of life, strong personal relationships, and care for the weak, with the role of men in society. In total, the dimension relates to how much differ-ence exists in the culture between "men's roles in societies" and "women's roles in society," or, said differently, how much gender equality exists in a culture. This in turn results in the culture's calibration of the worth of "masculine" values and "feminine" values in society.
Consider Table 6.2, in which Hofstede summarizes his measurement of several coun-tries with regard to each of these dimensions. It is difficult to discuss such differences without resulting to stereotypes. What is most important to note at this point is that there

EFFECTS OF CULTURE ON DECISION SUPPORT SYSTEM 303
Table 6.2. Cultural Scores for 12 Countries
Country
Arab countries France Germany Great Britain Netherlands Hong Kong Indonesia Japan Brazil Mexico United States West Africa
Power Distance
80 68 35 35 38 68 78 54 69 81 40 77
Uncertainty Avoidance
68 86 65 35 53 29 48 92 76 82 46 54
Individualism
38 71 67 89 80 25 14 46 38 30 91 20
Masculinity Index
53 43 66 66 14 57 46 95 49 69 65 46
Long-Term Orientation
31 25 44 96
80 65
29 16
Source: Adapted from G. Hofstede, "Management Scientists are Human," Management Science 40(1), January, 1994, pp. 4-13. Reprinted with permission from The Institute for Operations Research and the Management Sciences Hanover, MD, and the author.
are definite differences in culture that can be paired with differences in how people adopting those cultures will feel comfortable making decisions. Where there are differences in how people make decisions, there must be differences in the kind of support provided by DSS for those people. Hence, there must be transnational factors considered in the design of DSS.
EFFECTS OF CULTURE ON DECISION SUPPORT SYSTEM
Based on the anthropological definitions of cultures described in the previous section, one would expect observable differences in the preferences for design of DSS across cultures. There are five general aspects of the system on which one would expect differences, as listed in Table 6.3. Table 6.4 summarizes the discussion of the previous section, thereby illustrating the effects of the various cultural factors on DSS design.
Table 6.3. Cultural Differences and Their Effects on DSS Design
Choice of model Descriptive vs. optimization Need for strategic planning Use of standards Variables used Need for monitoring Variety needs for models
Premodeling need: alternative generation Postmodeling need: sensitivity analyses Temporal aspects
Orientation of data Static vs. dynamic
Desired access Scope of access Individual vs. joint use

Ta
ble
6.4
. C
ultu
ral
Diff
eren
ces
and
The
ir E
ffect
s on
DSS
Des
ign
Cul
tura
l In
dica
tors
DSS
C
hara
cter
isti
cs
Tim
e O
rien
tati
on
Unc
erta
inty
P
erso
n-N
atur
e A
ttit
ude
Act
ivit
y
Pas
t P
rese
nt
Fut
ure
avoi
d to
lera
nt
subj
ecti
ve
harm
ony
mas
ter
bein
g be
com
ing
doin
g
Hum
an-N
atur
e B
elie
f
evil
mix
go
od
lin'l
Rel
atio
nal
coll
indi
vidu
al
Cho
ice
of M
odel
s D
escr
iptiv
e v.
O
ptim
izin
g N
eed
for
Stra
tegi
c Pi
ngin
g U
se o
f St
anda
rds
Var
iabl
es u
sed
Nee
d fo
r M
onito
ring
V
arie
ty n
eeds
for
m
odel
s Pr
e-m
odel
ing
Nee
ds
Alte
rnat
ive
Gen
erat
ion
Post
-Mod
elin
g N
eeds
Se
nsiti
vity
A
naly
ses
Tem
pora
l A
spec
ts
Ori
enta
tion
of
Dat
a St
atic
v. D
ynam
ic
Des
ired
Acc
ess
Scop
e of
Acc
ess
Indi
vidu
al v
. Joi
nt
high
high
hi
gh
hist
oric
al
curr
ent
futu
re
som
e hi
gh
high
less
hi
gh
high
hi
gh
high
high
no
high
no
"i
s"
high
low
desc
ript
ive
optim
high
desc
ript
ive
desc
ript
ive
desc
ript
ive
high
high
hi
gh
"don
e"
mod
erat
e hi
gh
effic
ienc
y
high
high
mor
e so
c gr
oup
self
hi
gh
high
high
high
high
hi
gh
curr
ent
hist
oric
al
futu
re
curr
ent
hist
oric
al
all
hist
oric
al
hist
oric
al
futu
re
stat
ic
dyna
mic
dy
nam
ic
stat
ic
dyna
mic
dy
nam
ic
limit
broa
der
low
in
divi
dual
hi
gh
indi
vidu
al
high
jo
int
low
in
divi
dual
hi
gh
join
t lo
w
indi
vidu
al
high
jo
int
a mor
e st
ruct
ured
, le
ss a
d ho
c.
b Som
e m
onito
ring
: em
phas
ize
mon
itori
ng f
or r
eact
ive
purp
oses
.

EFFECTS OF CULTURE ON DECISION SUPPORT SYSTEM
First, there are differences in preferences for descriptive models versus optimization models associated with the activity orientation and uncertainty avoidance of the culture. Related to this is the differential need for contingency and planning models depending upon the person-nature orientation, the uncertainty avoidance, and the activity orienta-tion. For example, cultures which believe they can master their destiny are more likely to emphasize strategic and contingency planning than are other cultures. Furthermore, these attributes affect the decision to adopt standards; the more the culture adopts a "doing" value, the more likely it is to adopt standards for evaluation of actions. Finally, these dimensions affect the flexibility of the decision makers to select from a menu of appro-priate analyses to support their choice process. The need for flexibility is associated with cultures that perceive mastery of their destinies, with low uncertainty avoidance tenden-cies, a positive human-nature orientation, and a highly individualistic orientation of the culture.
From Table 6.4, it is clear that the literature regarding the impact of culture on decision making suggests that culture will affect the kinds of models required, the premodeling and postmodeling support, the temporal aspects of the model, and the level of access desired. Hence, if one is building a transnational DSS, one must pay special attention to differences in needs and preferences among decision makers in these areas. Such special attention might mean providing more flexibility than one would otherwise provide. Or the special attention might mean providing greater training in the use, more online support, or greater emphasis of the capabilities in those areas.
Of course, being able to determine which of these attributes is important hinges on the ability to identify where the culture of interest falls on each of the dimensions. Some authors have already provided some of this information, such as the ratings represented in Table 6.2 (see, e.g., Hofstede, 1994). These ratings help provide clues to how various cultures fall on the various dimensions and hence can provide guidance on how to balance the needs of multiple cultures.
As long as the DSS is isolated to a given culture, these differences in the preferences in decision-making behavior are of little consequence. However, if the DSS is designed to support decision makers who represent two or more of these cultures, then it must be sufficiently flexible to accommodate the wide range of needs. Knowing these decision-making preferences, the designer must balance those preferences in the DSS capabilities. For example, suppose the DSS is designed to support both a culture that values identification of the best alternative (optimization models) as well as one that values the identification of a wide range of information about the phenomenon, so as to make a good but not necessarily the best decision (descriptive models). Clearly the best answer is to develop a DSS which can accommodate both types of modeling. This may mean more than simply providing both kinds of models to the decision makers. It may also mean providing automated intelligent assistance, which helps the decision makers use models better and which helps them understand the reasoning behind the use of the model better.
Consider the examples of such intelligent assistance shown in Figures 6.5 and 6.6. In Figure 6.5, the system examines the solution elected by the decision maker and helps to identify problems with it. In this example, the production policy is evaluated to determine if it will meet the needs of their customers. The system determines that the user has not elected to examine forecasts of availability of raw materials. In addition, the system scans available databases to determine if any of the raw materials have had significant shortages in the recent past. When one is found, the system brings this information to the attention of the user, thus prompting the user to modify the prepared analysis.
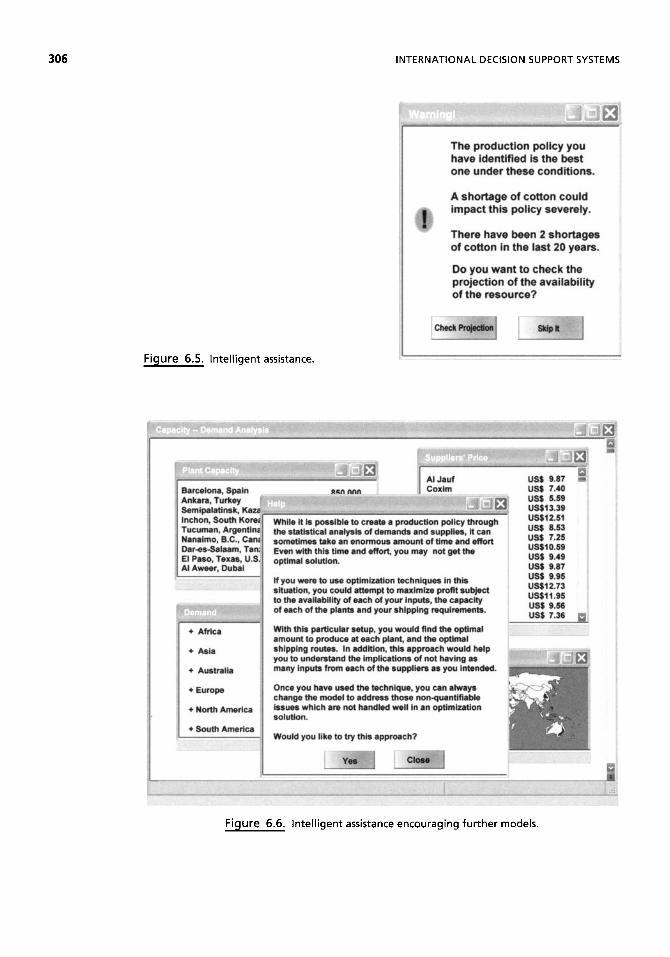
306 INTERNATIONAL DECISION SUPPORT SYSTEMS
Figure 6.5. Intelligent assistance.
Figure 6.6. Intelligent assistance encouraging further models.

EFFECTS OF CULTURE ON DECISION SUPPORT SYSTEM 307
Figure 6.7. Modeling assistance.
In Figure 6.6, the system examines the process used by the decision maker. By noting the tasks completed by the decision maker, the system can determine that the user is electing to attempt to create a production plan manually. Since the system "knows" that such problems can be solved using operations research techniques, the system interrupts the user to suggest this alternative modeling structure. Note that the system does not force the user to abandon the current task. Rather, the system notes that it is an alternative and attempts to explain why. Further note that the system reassures the user that the final decision is in the hands of the user since it can be altered to include the "nonquantifiable" issues not handled well by optimization. In this way, the system reassures the user that there is a place for his or her analysis.
If the user asked for more information, it might be useful to help him or her understand where the suggested approaches were superior and why. First, consider, for example, Figure 6.7. In this screen, the system is comparing the plans developed by the decision maker's personal approach and those developed by the alternative modeling approach. This provides the user with the evidence he or she needs to believe that the model might work as well as to determine what flaws exist in his or her analyses. In addition, such objective analyses help the user understand why years of experience might not be substitutable for an appropriate model.
Second, consider the situation where the cultural differences among users of the DSS suggest a need for broader access to data and models. For example, where organizational goals differ, the need for information will differ. Consider two cultures, one in which organizational goals such as efficiency, productivity, and profit are optimized and the other in which organizational goals such as organizational stability, growth, industry leadership, and organizational efficiency are optimized. This difference in goals suggests a difference in the

INTERNATIONAL DECISION SUPPORT SYSTEMS
focus of statistical data. The manager from the first culture will need information regarding issues such as profit, margin on sales, return on total assets, and the time to produce a single item. That is, this manager needs statistics which suggest how profitable the company is in its current state and how profitable it would be if a change were implemented. The focus of this manager is on the size of the profit differential resulting from the change. The manager of the second culture would also be concerned with the difference in productivity but would focus on the impact of the change on the stability of the company. This manager would consider statistics such as industry ranking and market value, especially with regard to how the change will affect each of those statistics. Hence, both sets of statistics should be available to the decision makers. In addition, screens such as those previously noted that help the user to understand why someone might look at the other statistics could be useful. An example is shown in Figure 6.8.
The options for a DSS designer are somewhat more complicated when the preferences are in conflict with one another. For example, consider the situation where one culture adopts standards for performance whereas the other culture does not adopt standards and is more likely to focus on the importance of being (rather than an outcome measure). These two cultures conflict in terms of both where to focus (the activity or the outcome) and whether or not to provide standards in the evaluation. One approach to addressing the standards problem is to provide a module that will facilitate the understanding and development of standards. Such a module could help users see a relationship between the rankings on relevant criteria and alternatives generally accepted as good so as to facilitate
Figure 6.8. Transnational support.

EFFECTS OF CULTURE ON DECISION SUPPORT SYSTEM
the development of standards in the long run. Similarly, the module could help users identify noncompensatory relationships among standards. That is, by examining the standards, the average standard, and actual outcomes, decision makers are more likely to become aware of situations where acceptable levels on a given standard are as important (or more important) that meeting an overall standard of performance.
This method of providing historical data of outcomes and data allows the decision makers to generally perceive opportunities for improved decision making. If it is important that changes in the process happen quickly; the system can be programmed to encourage decision makers to consider these relationships by providing pop-up screens noting incon-sistencies in decision-making procedures or the value of alternative information in selecting among alternatives.
The culture will also affect the premodel functions and the postmodel functions in the model management system. The time orientation of the culture, uncertainty avoidance tendency, and human-nature orientation affect the desirability of methods for generating alternatives to known problems or conditions. Those cultures that are future oriented, have high uncertainty avoidance, and/or have a "good" human-nature orientation are likely to want systems that facilitate alternative generation.
Similarly, the uncertainty avoidance tendencies and the person-nature orientation of the culture are expected to affect the needs for postmodeling support, such as "what-if" analyses or postoptimality analyses. In particular, high uncertainty avoidance tendencies and cultures which perceive they can master their destinies will value such ad hoc queries to determine the sensitivity of their solutions to potential changes in their environments.
In this situation, prompting the user to consider more pre- and postmodeling function-ality is probably best. For example, if the value of a given decision is dependent upon the availability of a scarce resource, the system might automatically notify the user. In this case, the system could post a message such as that identified in Figure 6.5.
Cultural norms will also affect the temporal orientation of the data that decision makers will expect to find in a DSS. The time orientation of the culture and the activity orientation affect the preference for current or historical data in an analysis. Cultures that emphasize the past and/or the being nature will emphasize historical data in the system. In addition, the human-nature orientation, activity orientation, and time orientation will affect the desirability of monitoring systems as part of a DSS and the kind of information that should be maintained in such monitoring systems. Furthermore, the activity orientation and the time orientation affect the preference for static measures of merit of an alternative over dynamic measures of historical change. For example, societies that emphasize the value of individuals and their development will require monitoring systems that trace the growth of people, projects, or organizations over time to support their decision making. This is in contrast to societies that emphasize the individual, which would need only current performance information.
Another area in the design of DSS affected by culture is the scope of the DSS to which members of the organization have access. In some cases, access to either information, models, or results is expanded (limited) because of the need for more (less) people involved in the decision-making process. For example, in cultures that emphasize harmony with nature, lower levels of management need information because upper management's focus is on maintaining harmony. Similarly, in cultures that believe in "good" human-nature orientation, information is available to greater numbers of people so as to generate more innovative solutions to problems. At other times, this access changes to limit the generation of alternatives, the questioning of assumptions, or the direction of communication. The scope of the system seems to be affected by the person-nature orientation, the level of individuality, and the human-nature orientation of the culture.

INTERNATIONAL DECISION SUPPORT SYSTEMS
DISCUSSION
It is important to focus on the differences in culture which could affect decision makers' needs because such features could affect the perceived usefulness of a system substantially. As more companies become transnational and as more decision making in those transna-tional corporations is decentralized, DSS design which allows flexibility in the approach to decision making and which helps decision makers become more comfortable with the styles associated with other cultures will become critical. If decision makers cannot use the system to be responsive to their own needs and to communicate their analyses to their colleagues, the system will not be used. In the long run, if decision makers do not use the system, then even the best designed system is a failure.
SUGGESTED READINGS
Al-Jafaray, A., and A. T. Hollingsworth, "An Exploratory Study of Managerial Practices in the Arabian Gulf Region," Journal of International Business Studies, Vol. 14, 1983, pp. 143-152.
Aljlayla, ML, and O. Frieder, "On Arabic Search: Improving Retrieval Effectiveness Via a Light Stem-ming Approach,"ACM Proceedings of the Eleventh Conference on Information and Knowledge Management, New York, 2002, pp. 340-348.
Beitzel, S., U. Syed, E. Jensen, O. Frieder, and D. Grossman, "On the Development of Name Search Techniques for Arabic," Journal of the American Society for Information Science and Technology, Vol. 57, No. 6, 2006, pp. 728-739.
Berger, A. A., Signs in Contemporary Culture, New York: Longman, 1984.
Bhatnagar, S. C , and B. H. Jajoo, "A DSS Generator for District Planning," Information and Man-agement, Vol. 13, No. 1, August, 1987, pp. 43^9 .
Chudoba, K. M., M. Lu, M. B. Watson-Manheim, E. Wynn, "How Virtual Are We? Measuring Virtuality and Understanding its Impact in a Global Organization," Information Systems Journal, Vol. 15, 2005, p. 270-306.
Collier H., "Information Flow Across Frontiers: The Question of Transborder Data," New Jersey: Learned Information, 1988.
Deans, C , and J. Jurison, Information Technology in a Global Business Environment, New York: Boyd and Fräser Publishing Company, 1996.
di Talamo, N., "Private Secrets," Direct Marketing, April 1991, pp. 42-44.
Dyment, J., "Strategies of Management Controls for Global Corporations," Journal of Business Strategy, Vol. 7, No. 4, 1987, pp. 20-26.
El-Haj, M. O., and B. H. Hammo, "Evaluation of Query-Based Arabic Text Summarization System," paper presented at NLP-KE '08: International Conference on Natural Language Processing and Knowledge Engineering, Pune, India, October 19-22, 2008, pp. 1-7.
Eom, S. B., "Transnational Management Systems: An Emerging Tool for Global Strategic Manage-ment," S.A.M. Advanced Management Journal, Vol. 59, No. 2, Spring 1994. pp. 22-26.
European Telecommunications: The Information Industry Perspective, London: EUSIDIC (The European Association of Information Services), 1987.
Evan, W. "Organization Theory and Organizational Effectiveness: An Exploratory Analysis." Orga-nization and Administrative Sciences, Vol. 7, 1975, pp. 15-28.
Evans, W. A., K. C. Hau, and D. Sculli, "A Cross Cultural Comparison of Managerial Styles," Journal of Management Development, Vol. 8, No. 3, 1989, pp. 5-13.

SUGGESTED READINGS
Hitt, M. A., R. D. Ireland, and H. Leec, "Technological learning, knowledge management, firm growth and performance: an introductory essay," Journal of Engineering and Technology Management, Vol. 17, Nos. 3-4, September 2000, pp. 231-246.
Hofstede, G., Culture's Consequences: International Differences in Work-related Values, Beverly Hills, CA: Sage, 1980.
Hofstede, G., "The Cultural Relativity of Organizational Practices and Theories," Journal of Interna-tional Business Studies, Vol. 14, 1983, pp. 75-89.
Hofstede, G., "Management Scientists Are Human," Management Science, Vol. 40, No. 1, January
1994, pp. 4-13.
Kankanhalli, A., "Cross-Cultural Differences and Information Systems Developer Values," Decision
Support Systems, Vol. 38, No. 2, pp. 183-195.
Kluckhohn, F. R., and F. L. Strodtbeck, Variations in Value Orientations, Evanston: Row Patterson
and Co., 1961.
Kobayashi, N., "The Present and Future of Japanese Multinational Enterprises," International Studies of Management and Organizations, Vol. 12, 1982, pp. 38-58.
Kumar, K., and N. Bj0rn-Anderson, "A Cross-Cultural Comparison of IS Designer Values," Commu-nications oftheACM, Vol. 33, No. 5, May 1990, pp. 528-538.
Lowry, P. B., D. Zhang, L. Zhou, and X. Fu, "Effects of culture, social presence, and group composition on trust in technology-supported decision-making groups," To Appear in Information Systems Journal, 2010.
Making a Business of Information, A Report to the British Cabinet by the Information Technology Advisory Group, London: Her Majesty's Stationery Office, 1983.
Neganshi, A. R., "Convergence in Organizational Practices: An Empirical Study of Industrial Enter-prises in Developing Countries," in C. J. Lammers and D. J. Hickson (Eds.), Organizations Alike
and Unlike, London: Routledge and Kegan Paul, 1979.
Negandhi, A. R., "Cross-Cultural Management Research: Trend and Future Directions," Journal of
International Business Studeies, Vol. 14, 1983, pp. 17-28.
Office of Science and Technology of the Executive Office of the President, Privacy and Behavioral
Research (Washington, D.C., 1967).
Otair, M., R. Al-Sardi, and S. Al-Gialain, "An Arabic Retrieval System with Native Language Rather Than SQL Queries," paper presented at ICADIWT 2008. First International Conference on the Applications of Digital Information and Web Technologies, Ostrava, Czech Republic, August 4-6, 2008, pp. 84-89.
Pope, J. A., and A. M. Lowen, "Marketing Implications of Privacy Concerns in the US and Canada,"
Direct Marketing: An International Journal, Vol. 3, No. 4, 2009.
Report on the Conference on African Informatics Integration, Abidjan: United Nations Centre on
Transnational Corporations, 1979a.
Report on the Third Conference of Latin American Informatics Authorities, Buenos Aires: United
Nations Centre on Transnational Corporations, 1979b.
Sankar, C. S., and P. K. Prabhakar, "Key Technological Components and Issues of Global Information Systems," in S. Palvia, P. Palvia, and R. Zigli (Eds.), Global Issues of Information Technology Management, Harrisburg, PA: Idea Group, 1992, pp. 332-255.
Sauter, V L., "A Cross-Cultural Comparison of Modeling and Model Management Needs in a Decision Support System," in S. Palvia, P. Palvia, and R.M. Zigli (Eds.), Global Issues of Information Technology Management, Harrisburg, PA: Idea Group Publishing, 1992, pp. 332-355.
Stewart, E. C, "Culture and Decision Making," in W B. Gudykunst, L. P. Stewart, and S. Ting-Toomey (Eds.), Communication, Culture and Organizational Process, Beverly Hills, CA: Sage, 1985, pp. 177-211.

312 INTERNATIONAL DECISION SUPPORT SYSTEMS
Tan, B. C. Y, "Computer Mediated Communication and Majority Influence: Assessing the Impact of an Individualistic and Collectivistic Culture," Management Science, Vol. 44, No. 9, September 1998, pp. 1263-1278.
Tanniru, M., "A Framework for Supporting Decisions in a Global Context - The Case of a Global DSS for Financial Planning," in F., Burstein, and C. W. Holsapple (Eds.), Handbook on Decision Support Systems, Vol. 2: Variations, Berlin: Springer-Verlag, 2008.
Telecommunications and Canada, Ottawa: Canadian Government Publication Centre, 1979. Thomas, D. C, Cross-Cultural Management: Essential Concepts, Beverly Hills, CA: Sage Publica-
tions, 2008.
QUESTIONS
1. Describe the factors that would influence your design of a DSS for another country. In particular, describe the cultural factors that are unique to that country and/or strongly influence the decision-making process in that country as well as the specifications of design that would be affected. Explain why you believe this association exists. Be specific.
2. What guidelines would you provide to a designer of a transnational DSS to help him or her be more sensitive to the needs of decision makers in all countries? In particular, what aspects of the system are most likely to be affected by the transnational nature of the system? How? Be specific.
3. Suppose you are developing a DSS for a CEO in a U.S. corporation (you may select a specific industry if you like) for strategic planning. One of the tasks of this CEO is to acquire one or more transnational corporations. Discuss how you would design database access in such a system. Include how you would integrate corporate databases, how you would provide unique databases for this system, and how you would integrate public databases. Be certain to include databases available via the Internet or other public source.
4. Suppose you propose an Internet-based, strategic DSS project at your company (or at some fictitious company) for your (non-information system) department. Discuss the issues that you want included in the feasibility analysis for the project. In particular, discuss the various costs and benefits that would need to be considered and how they would be measured.
5. Suppose you work for a company that has divisions in two countries, e.g., the United States and China. Each division needs information systems for both transaction pro-cessing and DSS development. Analyze the needs and designing systems for the U.S. division first and then perform similar activities for the division in China. You com-munication will be through e-mail. What changes in methodology would you make to ensure other projects are successful?
6. In Greek, there is no word for privacy. Discuss how the absence of this concept would impact building a French-Greek DSS.
7. Talk with some of the international students at your university. Discuss what words, symbols, or concepts that might appear in a DSS might get "lost in translation."
8. Talk with some of the international students at your university. Discuss differences in decision making and management across the cultures that might impact DSS design.

ON THE WEB 313
9. How do differences in the laws and conventions on privacy impact the design and use ofaDSS?
10. How do differences in laws and conventions governing "the press" in different countries impact the design of a DSS?
ON THE WEB
On the Web for this chapter provides additional information about international standards, transnational management, and communications issues as they apply to the design of DSSs. Additional discussion questions and new applications will also be added as they become available.
• Links provide access to information about transnational business. The Web page provides links to sites to help the user learn about conducting business in other countries as well as across national boundaries. These links provide directories of businesses and trade associations, news access and information about resources, and restrictions to business.
• Links provide access to information about transnational communication. Communi-cation implies that information can be transferred and understood. These Web links help in translation of languages (including idioms) as well as provide information about legal and technical issues of concern.
• Links provide users with multicultural information. One problem in designing a transnational DSS is the understanding of cultures in other parts of the world. The Web page can provide tours and insights into different cultures to help users gain that information.
You can access material for this chapter from the general Web page for the book or directly athttp://www.umsl.edu/^sauterv/DSS4BI/intl.html.

7
DESIGNING A DECISION SUPPORT SYSTEM
At this point, you may be sold on the idea of decision support systems. You believe they are important, and you want to include them within the assets of your department or organization. The next logical question is how to start. The answer is a clear and unequivocal, "it depends."
The best approach depends upon the kind of systems already in place and the intended focus of the DSS. As with any good systems analysis and design process, it is important to understand the needs of the application and to select the models, model management system, databases, database management system, and user interface in a manner that best meets the needs of that application. Successful DSS can be built on almost any kind of platform with almost any kind of software, but it is crucial that the choices fit the application. Selecting tools and vendors before understanding the problem or forcing tools to meet needs after the fact will certainly lead to failure.
The physical design of a successful DSS must follow a logical design, which in turn must be guided by the decision-making process. In particular, designers should ask the same fundamental questions as those on which reporters rely:
• Who needs the DSS? • What advantages does the user expect by using the DSS? • When will the DSS be used? • Where does this system fit into the general business process? • Why is a DSS needed? • How will the DSS be used?
Decision Support Systems for Business Intelligence by Vicki L. Sauter Copyright © 2010 John Wiley & Sons, Inc.
315
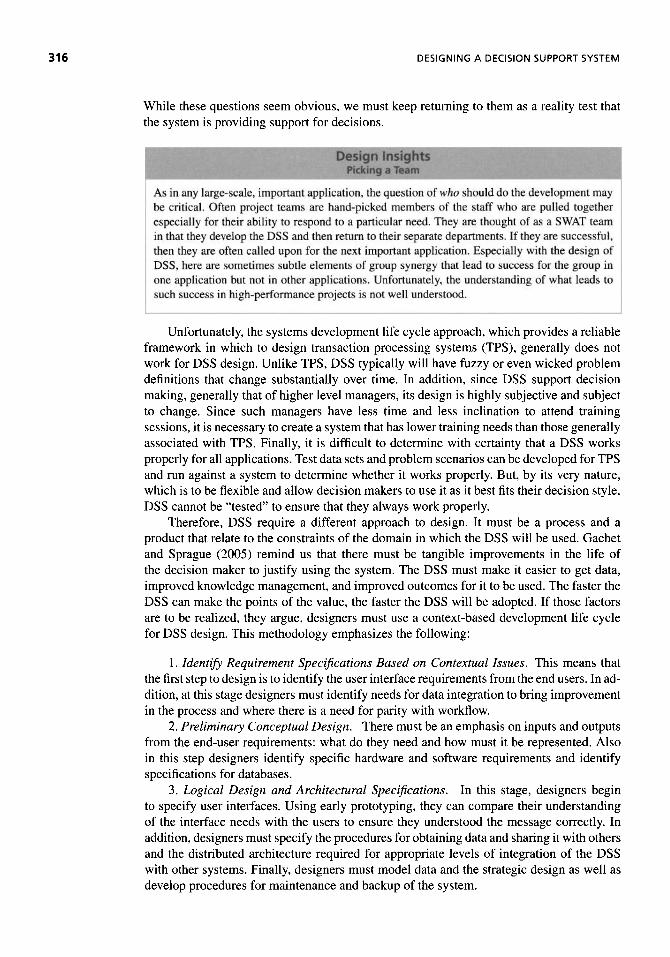
316 DESIGNING A DECISION SUPPORT SYSTEM
While these questions seem obvious, we must keep returning to them as a reality test that the system is providing support for decisions.
Unfortunately, the systems development life cycle approach, which provides a reliable framework in which to design transaction processing systems (TPS), generally does not work for DSS design. Unlike TPS, DSS typically will have fuzzy or even wicked problem definitions that change substantially over time. In addition, since DSS support decision making, generally that of higher level managers, its design is highly subjective and subject to change. Since such managers have less time and less inclination to attend training sessions, it is necessary to create a system that has lower training needs than those generally associated with TPS. Finally, it is difficult to determine with certainty that a DSS works properly for all applications. Test data sets and problem scenarios can be developed for TPS and run against a system to determine whether it works properly. But, by its very nature, which is to be flexible and allow decision makers to use it as it best fits their decision style, DSS cannot be "tested" to ensure that they always work properly.
Therefore, DSS require a different approach to design. It must be a process and a product that relate to the constraints of the domain in which the DSS will be used. Gachet and Sprague (2005) remind us that there must be tangible improvements in the life of the decision maker to justify using the system. The DSS must make it easier to get data, improved knowledge management, and improved outcomes for it to be used. The faster the DSS can make the points of the value, the faster the DSS will be adopted. If those factors are to be realized, they argue, designers must use a context-based development life cycle for DSS design. This methodology emphasizes the following:
1. Identify Requirement Specifications Based on Contextual Issues. This means that the first step to design is to identify the user interface requirements from the end users. In ad-dition, at this stage designers must identify needs for data integration to bring improvement in the process and where there is a need for parity with workflow.
2. Preliminary Conceptual Design. There must be an emphasis on inputs and outputs from the end-user requirements: what do they need and how must it be represented. Also in this step designers identify specific hardware and software requirements and identify specifications for databases.
3. Logical Design and Architectural Specifications. In this stage, designers begin to specify user interfaces. Using early prototyping, they can compare their understanding of the interface needs with the users to ensure they understood the message correctly. In addition, designers must specify the procedures for obtaining data and sharing it with others and the distributed architecture required for appropriate levels of integration of the DSS with other systems. Finally, designers must model data and the strategic design as well as develop procedures for maintenance and backup of the system.
Design insights Picking a Team
As in any large-scale, important application, the question of who should do the development may be critical. Often project teams are hand-picked members of the staff who are pulled together especially for their ability to respond to a particular need. They are thought of as a SWAT team in that they develop the DSS and then return to their separate departments, If they are successful, then they are often called upon for the next important application, Especially with the design of DSS, here are sometimes subtle elements of group synergy that lead to success for the group in one application but not in other applications. Unfortunately, the understanding of what leads to such success in high-performance projects is not well understood.
DESIGNING A DECISION SUPPORT SYSTEM
4. Detailed Design and Testing. While testing is important in any design process, in this methodology, the emphasis is on testing the system with the end users and testing the integration of the system with the decision makers' functions. That means we need to test if individual decision makers can use the system and if it flows nicely in their workflow process. Of course, this also includes testing the resilience, reliability, and scalability of the system and its performance under specific failure scenarios.
5. Operational Implementation. In this stage, the system is made operational in a subset of the decision makers' world. Systems are linked to appropriate parts of the data warehouse and than are made available to used by decision. Those decision makers involved in the test would be trained and receive access to the system.
6. Evaluation and Modification. Finally, the system is evaluated in terms of it overall user acceptance, system integration, architecture resilience, and scalability. Finally the system is modified across the organization.
7. Operational Deployment. Final changes are made in the system and it is distributed to all users after training. This stage includes continuous monitoring of both technical problems in the operation of the DSS and patterns of use that might suggest problems.
Pick (2008) further addresses the process of Gachet and Sprague's first step of require-ments definition. He states that it is important to elucidate the value of the DSS before beginning to build the system. Pick's argument is that the benefits of a DSS are often much more subtle than decision makers expect, and so it is important to sensitize them to the benefits that might be expected as the process starts. In addition, consideration of the benefits early in the process will help decision makers develop a better understanding of the opportunities that might be built into the system. He suggests questions such as the following (Pick, 2008, p. 725):
• If we will be better able to cope with large or complex problems, how much may that ability be worth?
• If the system will allow greater exploration and discovery, how much might the resulting insights be worth?
• If there is better knowledge processing, how is this beneficial? If the system pro-vides better understanding of a problem, can anyone judge the costs of incomplete understanding?
So, how would a designer know when he or she has a good DSS? Arnott and Dodson (2008) provide a simple model of what impacts DSS success, as shown in Figure 7.1. They bring two basic concepts to a methodology for designing DSS. First they, as Gachet and Sprague (2006) and Pick (2008) say, the system must be comfortable for the user and improve decision making. Arnott and Dodson represent these concepts with "user satisfaction" and "impact of the system." Notice that they show user satisfaction impacting use. What this implies is that if the users do not see the benefit of the system, find it too difficult to use, or do not find the information and models they perceive they need to complete their decision, they are likely not to use the system at all. Clearly, even if the system could have a significant impact if it were used, it will not be a success if users do not find what they need.
Arnott and Dodson (2008) also identify 10 critical success factors that need to be satisfied to ensure both use and success (pp. 770-771):
• There is a committed and informed executive sponsor. • There is widespread management support.

318 DESIGNING A DECISION SUPPORT SYSTEM
Figure 7.1. A model of DSS success. (Adapted from D. Arnott, and G. Dodson, "Decision Support Systems Failure," in F. Burstein and C.W. Holsapple (Eds.), Handbook on Decision Support Systems, Vol. I, Berlin: Springer-Verlag, 2008, p. 768.) Image is reprinted here with permission.
• The design team has appropriate skills. • The design team uses appropriate technology. • The design team has adequate resources. • There is effective data management. • There is a clear link with business objectives. • There exists well-defined requirements. • The system is allowed to evolve in development. • The design team manages project scope.
These critical success factors mirror those generally accepted for system design. In par-ticular, they highlight that the success of the DSS is dependent upon it being aligned with business objectives and the technology plan of the organization. This will be discussed in the next section.
These methodologies, however, identify decision makers being comfortable with the system as the critical component to DSS success. It has been said that most users would rather live with a problem they cannot solve than use a solution they cannot understand. Thus making the DSS too "black box" or difficult to use will make it an instant failure. Of course, designers need to know what factors will make the system easy to use and comfortable to use. Norman (2007, p. 93) identifies six design rules:
Provide rich, complete and natural signals. Be predictable. Provide good conceptual models. Make output understandable. Provide continual awareness without annoyance. Exploit natural mappings.

PLANNING FOR DECISION SUPPORT SYSTEMS 319
You will notice that this list tells us that understandability and requiring the system design to follow the decision process are important aspects of good design. If the system is predictable, cues (that guide the operations of the system or the evaluation of information) are informative, and the output is presented in a clear and useful manner, the decision maker is likely to use the DSS. Norman's emphasis is on providing a comfortable metaphor for the system to which the user can relate. If the metaphor is right, then the procedures will be understandable and the signals will be informative. In addition, he says that there should be ubiquitous, yet nonobtrusive help available to the user.
Norman further emphasized rules of good design from the perspective of the system that mirrors the themes of understandability and congruence with the decision process:
• Keep things simple. • Give people a conceptual model. • Give reasons. • Make people think they are in control. • Continually reassure. • Never label human behavior as "error."
As a field, we tend to forget the most important design rule—keep everything simple. This means the user interface, the processes needed to use the system, and the output. Removing clutter and the newest but unnecessary gadget will encourage users to focus on the important forms of support the system has to offer. In addition, these principles remind us that the decision maker, not the DSS, ultimately will make the choice among alternatives. The system must provide support and work in the way the user needs or the decision maker will not use the system. Helping to make the system more predictable and more like a trusted assistant will encourage decision makers to utilize its power. This includes the specific attributes of the data, models, and user interface discussed in previous chapters.
PLANNING FOR DECISION SUPPORT SYSTEMS
In an ideal world, a multilevel plan guides the development of new DSS, such as that described in Figure 7.2. The plan provides specifications for a specific DSS, in terms of the way it interacts with the rest of the business processes, the kind of information that it will provide, and its relative importance to the growth of the organization.
The specifications for DSS begin with the corporate strategic or long-range plan. A strategic plan defines where the corporation expects to change its products or processes and during what time line and provides direction to management of the corporation as a whole. The MIS master plan, in turn, inherits its priorities and concerns from this corporate strategic plan. The information system (IS) plan provides guidelines for prioritizing requests for maintenance of existing systems and creation of new systems. In particular, it describes the priorities for hardware, software, and staff necessary to respond to corporate strategy plans. The IS master plan specifies modifications and maintenance of legacy systems, creation and implementation of new systems, and diffusion of technology within the organization. It should provide a plan for regular updating and other maintenance. Finally, it should provide specifications for how staff should proceed in the creation of systems.
The DSS plan derives its priorities from the IS plan. Its goal is to coordinate future implementations in the broadest possible way to ensure that all decision making is supported

320 DESIGNING A DECISION SUPPORT SYSTEM
Figure 7.2. Ideal planning.
in an appropriate way while planning for the reuse of code, flexibility for the future, and the greatest potential for growth. In particular, the DSS plan should help answer questions such as those posed by Sprague and Carlson (1982):
• How can current needs susceptible to DSS be recognized? • How can the likely extent of their growth be assessed? • What types of DSS are required to support the needs, now and in the future? • What are the minimum startup capabilities required, both organizational and tech-
nical? • What kind of plan can be developed to establish the long-term direction yet respond
to unanticipated developments in managerial needs and technical capabilities?
The DSS master plan would provide direction in the selection of hardware and software and for integration with current systems. In addition, it could include a process for the creation of reusable libraries of code that future designers could embed into similarly operating DSS.
Designing a Specific DSS
Where DSS master plans exist, there is already some guidance in how to proceed. More often than not, however, such plans do not exist. Then, designers must judge for themselves how the DSS will fit into corporate plans and how it will interact with other systems. The methodology described in Figure 7.3 will help designers ensure they get the best fit. Note

PLANNING FOR DECISION SUPPORT SYSTEMS 321
Goals:
Goncerns:
Initial analysis
• Identify key decisions • Identify key information needs
• Theoretical or conceptual needs • Industry-based needs • Corporation-based needs • Decision-specific parameters
Situation analysis
Goals: · Understand the organizational setting • Understand the task • Understand the user characteristics
System design
Goals: · Logical design • System construction • System evaluation
Goals:
Implementation
• Demonstration • Training • Deployment
Figure 7.3. DSS design methodology.
that it differs from the traditional systems development life cycle (SDLC) approach in that it puts much more emphasis on determining what information needs to be provided and in what fashion.
In the first stage, the designer learns the decision needs and environment. Designers must know the key decisions under consideration by the decision maker and the related information needs if the DSS is to be a tool that supports decisions. Then the designer can begin to examine the parameters needed for consideration. Sometimes these parameters will be easy to identify. For example, one key issue for investment executives is what investments will provide the best returns. Knowing that, they need to consider return, relative risk, tax advantages, term of return, and other fiscal parameters. On the other hand, a chief executive officer-s key issue might be how to prevent a leveraged buyout or how to strategically acquire a new vertical market. In this situation, even knowledge of the key decision reveals information needs well.

DESIGNING A DECISION SUPPORT SYSTEM
Interviewing Techniques. Often designers learn decision makers' needs by inter-viewing them. There are many ways of conducting interviews, each of which provides different kinds of information. For example, consider the interviewing styles noted in Fig-ure 7.4 and discussed below. Interviews can be structured, unstructured, or focused. They can follow case studies or protocol analysis. Finally, they can utilize tools such as card sorting and multidimensional scaling.
The benefit of interviews is that they provide access to information or a perspective on information that only the decision maker can provide. In both the structured interview and the focused interview, the designer is interacting with the decision maker to obtain information regarding a prescribed set of topics. This interaction might be in a face-to-face setting, over the telephone, via computer, or by a pen-and-paper questionnaire. Generally the richest information can be gleaned in a face-to-face setting in a neutral location (away from the interruptions of the decision maker's normal activities). Good results can be achieved with intelligent computer questionnaires (that move through the questions as a function of the answers already provided); unfortunately, it is generally too expensive to develop this software for a one-time use.
The degree of structure we build into the interview depends upon the specificity of the information we seek. A structured interview is one in which the questions and the order in which they will be asked are prescribed. The interviewer seeks short answers that provide specific information. A focused interview, on the other hand, is relatively unstructured. In this case, the interviewer also has a set of questions and an order for asking the questions. However, the questions are more general, allowing the respondent to drive the direction of the discussion. The interviewer must be prepared with probing questions that help the respondent to focus on salient points.
Concepts
Problems (major tasks completed by decision maker)
Solutions (possible outcomes)
Problem-solving steps
Raw concepts
Concept definition
Concept structures
Problems
Problem types
Solutions
Solution types
General steps
Specific steps
Structured interviews
V
S
S
S
Focused interviews
^
^
^
^
^
S
Case study interviews
^
S
S
S
Protocol analysis
^
V
S
V
Card sorting
V
S
S
Multidimensional scaling
s
S
s
Figure 7.4. Interviewing techniques matrix.

PLANNING FOR DECISION SUPPORT SYSTEMS 323
The more structured the interview, the greater the chance that the decision maker will provide precisely the information sought. However, the more structured the interview, the less likely the decision maker will provide insights the designer had not considered previously. Therefore, if the designer is relatively uninformed about the choice process or the decision maker's tendencies, the focused interview will allow for greater probing of new avenues and hence greater understanding of the relationships between tasks and concepts and why the procedures are sequenced in a particular fashion.
A protocol analysis is a different kind of interview because the interviewer does not set even the basis of the discussion. Instead, respondents complete their typical choice processes (including seeking information, generating alternatives, merging information, modeling, sensitivity analysis, and other tasks included in the process). In order to communicate what is happening and why it is happening, the decision maker verbalizes each task and subtask and how a decision is made to move to another task. Usually, the interviewer does not intervene but just records the descriptions provided. Protocol analysis is a valuable tool because it helps the designer understand what the decision makers actually do in the choice process, not what they perceive they do. This can be important because often the decision maker is not aware of the actual tasks and hence cannot communicate them; this can be a particular problem with very experienced decision makers, as discussed in Chapter 2.
Other Techniques. Both the card-sorting technique and multidimensional scaling require the decision maker to perform some task from which the designer infers the preferred information and models. "Card sorting" refers to any task (whether or not one actually uses cards, even if one uses a computer simulation, such as that shown in Figure 7.5) in which the decision maker iteratively sorts and combines things or concepts to determine a point of view. For example, if the choice situation involves loan applications, the decision maker
Figure 7.5. Card Sorts simulation.

DESIGNING A DECISION SUPPORT SYSTEM
would sort a set of loan applications into multiple piles (perhaps "acceptable," "borderline", and "unacceptable"). After the decision maker is comfortable with the similarity of the loan applications in each pile, the designer analyzes the applications, with the help of the decision maker, to determine the bases for the sorting. In other words, by noting the similarity and differences among the applications within piles and between piles, the designer can glean the set of criteria and standards for applying them. This helps the designer to understand how to provide information and models for the decision maker.
Multidimensional scaling is a similar process in which decision makers are asked to rate items as being similar or dissimilar. It differs from card sorting in that it forces the decision maker to make choices among less complex alternatives. For example, rather than asking whether or not an entire application is acceptable, the designer would ask the decision maker to compare two candidates with particular incomes or particular debt ratios with regard to their risks as loan candidates. Designers pose a large number of combinations and analyze the data mathematically to determine the criteria being employed by the decision makers. Unfortunately, the factors driving the decision often are not obvious or they lack face validity. Hence the exercise can result in no useful information.
To identify more information needs, designers research the specific kind of decision under consideration. For example, they can identify some informational needs by studying the conceptual and theoretical bases for decisions, such as those covered in business school classes. From such an analysis, designers could identify that investment executives need to consider term of investment, relative risk, tax advantages, and other fiscal parameters in addition to the fundamental question of return on investment. This would provide a starting point for identifying additional needs. Alternatively, designers can gain insight by learning about the industry in general. For example, designers of a DSS for a pharmaceutical firm could gain insights by examining the creation, approval, marketing, and selling processes for drugs. Issues such as testing, purity, reliability, and statistical confidence levels would become evident. Such topics would likely have a home in any DSS in such a firm. Finally, designers could examine copies of reports, memos, transactions, and models to identify additional needs. This is comparable to an archeological analysis of the context from which inferences about needs can be drawn.
Influence Diagrams. It is important to be sure that all of the critical factors are represented in a DSS. Hence, designers often rely upon tools like influence diagrams to help them keep track of the range of information that is needed in a DSS. This popular decision analysis tool helps to identify and to clarify the variables that might be considered as well as the information needed to assess the variables. For example, suppose that a designer is developing a DSS to help investors. As a starting point, the designer knows that there are quantitative models that can be used to describe the financial market and to forecast changes in the market. Similarly, the designer knows that the decision makers will rely on some expert judgment about the financial market. These quantitative and qualitative factors will influence the decision about how to invest. Of course, even with the best forecasts and qualitative judgments, there may be sudden changes in the many factors that influence the market, including events that change assumptions or even news that appears to change those assumptions. In other words, the range of information and models that need to be included in the DSS for this relatively straightforward situation can be very complex. Designers, then, use influence diagrams to keep track of the factors that need to be included in a DSS.
Influence diagrams have few symbols and rules and so are easy to draw once the conditions are well understood. First one must consider the variables of the decision itself. There are decision variables that are controlled by the decision maker, outcome variables

PLANNING FOR DECISION SUPPORT SYSTEMS 325
The decision.
A chance variable that is out of the control of a decision maker.
> The objective of the decision. This is the variable the decision maker is attempting to maximize or minimize.
A deterministic function of the quantities that depend on it or an intermediate variable.
> Influence.
Figure 7.6. Influence diagram symbols.
that represent the outcome of the decision, exogenous variables that influence the decision but are not under the control of the decision maker, and intermediate variables that are evaluated between the decision and the outcome. To map those into an influence diagram, consider Figure 7.6, which shows the symbols that can be used in an influence diagram. As shown in this figure, there are symbols corresponding to a decision (a rectangle), exogenous variables (an ellipse), intermediate variables (a rounded rectangle), the outcome variables (an elongated hexagon), and the influence (an arrow). Using these symbols, one can diagram the factors needing representation in the DSS. Consider again the example DSS in the previous paragraph. These relationships are shown in an influence diagram in Figure 7.7. See that the ultimate goal is (to maximize) profit (as shown by the hexagon). The decision that will impact profit is the investments shown in the center (rectangle). The decision maker comes to the decisions about investments after consideration of the quantitative models (the left rectangle) and expert judgment (the right rectangle). Of course, in making these choices, it is necessary to keep an eye on the events and relationship changes in the environment. This tells us the kinds of information needed in the DSS. Each of these decisions can be broken down into more detail to determine specific information, specific variables, and specific models that might be included.
There are computer tools that can help designers build these diagrams and use them to create the system. For example, consider Lumina's Analytica, which builds influence diagrams easily, as shown in the top portion of Figure 7.8. These tools can then provide the backbone of analysis using the functionality built within Analytica, as shown in the bottom portion of Figure 7.8, or provide a blueprint for analysis with other modeling tools.
Situational Analysis. Once an initial analysis of the key decisions and related information needs has been completed, designers must complete a situation analysis to help identify some of the remaining needs. This includes an analysis of the task, the

Mathematical analysis and
forecasts
Expert financial judgment
DESIGNING A DECISION SUPPORT SYSTEM
Figure 7.7. An influence diagram.
organizational setting, and the user characteristics and how each contributes to the infor-mational requirements of the DSS.
Using either interviewing or other techniques, a designer completes a task analysis to identify the baseline information and model needs. The baseline needs represent the theoretical or conceptual information needs that everyone would need without consideration of the preferences of the decision maker or external needs imposed by the choice context. These needs are driven by the nature of the tasks, their relative structure, variability, length, and frequency to identify information needs and sources as well as constraints. Simon's stages of decision making can provide insight into these needs. If the decision maker's goal is "intelligence," the system must monitor and scan data to identify indicators of problems and opportunities, such as trends, patterns, or exceptions to patterns. For example, a financial DSS might continually scan the stock and bond market for investment opportunities that have high potential payoff. On the other hand, if the goal is "design," the system must be able to facilitate the identification and construction of alternate strategies. In this case, the DSS needs to provide opportunities for investment, such as tools for identifying mutual funds with characteristics that will meet the needs of the investor. Finally, if the goal is "choice," the system must facilitate evaluating and testing of the alternatives for sensitivity to assumptions. In this case, the financial DSS might evaluate alternatives for past performance as well as the expected reaction of the financial opportunity to changes in resources, political climates, or other factors that could affect its desirability.
Similarly, the task analysis determines whether there are limitations on the number or types of models appropriate or necessary in the analysis. For example, in the case of the investment executive, task analysis identifies the need to distinguish between deciding when to invest, how much to invest, and for how long to invest as well as the outcomes of liquidity, rate of return, and total profit. In addition, it reminds us to consider related factors such as the inflation rate, competition, and market stability.
Once we know the main independent, dependent, and interdependent aspects of the choice context, we can begin to understand what the decision maker needs to do, what the decision maker can control, and what constrains the decision maker's actions. Designers

PLANNING FOR DECISION SUPPORT SYSTEMS 327
Figure 7.8. An influence diagram in Analytica. Example screen shots were provided by and
reprinted with the permission of Lumina Decision Systems.

328 DESIGNING A DECISION SUPPORT SYSTEM
must learn what guides and limits the decision maker as well as what measures are ap-propriate for assessing the quality of the decision and/or outcome. Knowing the facets of the problem and the interdependencies among them will help identify information sources, authority constraints, and coordination necessary to provide decision makers what they will need.
The organizational setting analysis describes the forum in which the choice will take place. In this analysis, designers identify informal norms or other relevant practices for analyses as well as the climate in which the decision maker functions and relevant rela-tionships among the decision makers within their organization. Each of these evaluations results in information and modeling needs for the DSS.
Finally, designers need to examine the user characteristics, such as the amount of experience and knowledge possessed by the decision makers and the extent of their skills. As we saw in Chapter 2, this is influenced by the experience and background of the users concerning the problem type under consideration with the models appropriate for that problem and with DSS or other computer-based tools. Further, this is influenced by information preferences, decision-making styles, and approaches to problem identification and evaluation. Knowledge of the user requirements along all of these dimensions will provide insight into the information needs (primarily background needs) as well as into the model management and other user interface requirements.
The entire situation analysis results in a deeper understanding of how the DSS will be used, including the kinds of information, models, support, and intervention the user is likely to employ. To achieve this understanding, designers develop a model of how decision makers will use information. They identify a basic understanding of the model through the identification of baseline needs. This model is refined by interviews and observation of the decision makers. Designers abstract important information from those interviews and compare the expressed needs to those predicted by the model. Differences between the expressed and predicted needs are used to refine the model. Often these steps are followed in an iterative fashion, with designers forming and refining models of the decision makers' needs between data collection steps, as shown in Figure 7.9.
Designers should be able to understand how the decision maker conceptualizes, an-alyzes, and communicates problems. For example, at this stage, designers should be able to learn where and how decision makers will employ graphs, lists, charts, and other aids
Perform initial interviews
Pick basic model <-
Perform model-directed interviews <■
Perform data abstraction <
Figure 7.9. Interative nature of situation Check fit of model to data analysis. I
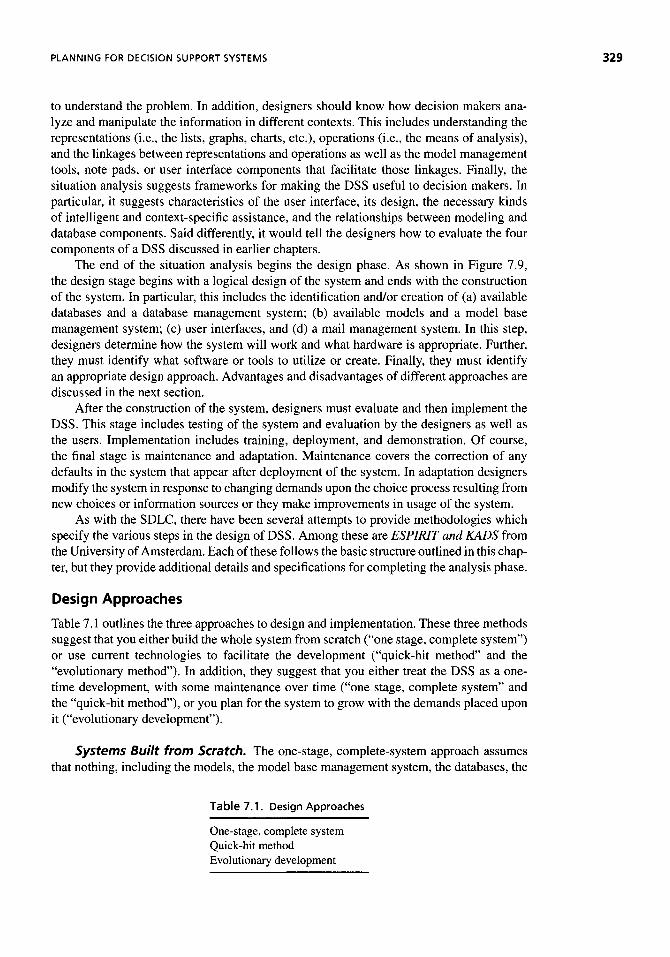
PLANNING FOR DECISION SUPPORT SYSTEMS
to understand the problem. In addition, designers should know how decision makers ana-lyze and manipulate the information in different contexts. This includes understanding the representations (i.e., the lists, graphs, charts, etc.), operations (i.e., the means of analysis), and the linkages between representations and operations as well as the model management tools, note pads, or user interface components that facilitate those linkages. Finally, the situation analysis suggests frameworks for making the DSS useful to decision makers. In particular, it suggests characteristics of the user interface, its design, the necessary kinds of intelligent and context-specific assistance, and the relationships between modeling and database components. Said differently, it would tell the designers how to evaluate the four components of a DSS discussed in earlier chapters.
The end of the situation analysis begins the design phase. As shown in Figure 7.9, the design stage begins with a logical design of the system and ends with the construction of the system. In particular, this includes the identification and/or creation of (a) available databases and a database management system; (b) available models and a model base management system; (c) user interfaces, and (d) a mail management system. In this step, designers determine how the system will work and what hardware is appropriate. Further, they must identify what software or tools to utilize or create. Finally, they must identify an appropriate design approach. Advantages and disadvantages of different approaches are discussed in the next section.
After the construction of the system, designers must evaluate and then implement the DSS. This stage includes testing of the system and evaluation by the designers as well as the users. Implementation includes training, deployment, and demonstration. Of course, the final stage is maintenance and adaptation. Maintenance covers the correction of any defaults in the system that appear after deployment of the system. In adaptation designers modify the system in response to changing demands upon the choice process resulting from new choices or information sources or they make improvements in usage of the system.
As with the SDLC, there have been several attempts to provide methodologies which specify the various steps in the design of DSS. Among these are ESPIRIT and KADS from the University of Amsterdam. Each of these follows the basic structure outlined in this chap-ter, but they provide additional details and specifications for completing the analysis phase.
Design Approaches
Table 7.1 outlines the three approaches to design and implementation. These three methods suggest that you either build the whole system from scratch ("one stage, complete system") or use current technologies to facilitate the development ("quick-hit method" and the "evolutionary method"). In addition, they suggest that you either treat the DSS as a one-time development, with some maintenance over time ("one stage, complete system" and the "quick-hit method"), or you plan for the system to grow with the demands placed upon it ("evolutionary development").
Systems Built from Scratch. The one-stage, complete-system approach assumes that nothing, including the models, the model base management system, the databases, the
Table 7.1. Design Approaches
One-stage, complete system Quick-hit method Evolutionary development
DESIGNING A DECISION SUPPORT SYSTEM
database management system, the user interface—or even their components—is available on which to build the desired DSS. As the name suggests, this approach requires the designers to build an entire system and deliver it in total to the decision maker. In these cases, designers use the DSS-adapted life-cycle approach, shown earlier in Figure 7.3, with significant emphasis on the design and construction phases. It means that designers code every aspect of the system from one or more languages without the benefit of available electronic tools or modules. Although all early DSS were built in this way, today, the one-stage, complete system is implemented only when building a large-scale, multiple-user, or unique system.
This approach is useful when the models are so specific to the problem that modeling software is not available. For example, suppose the purpose of the DSS is to facilitate decisions regarding battlefield logistics and strategy. Or suppose the DSS must simulate human tolerance of toxic wastes. The necessary models are sophisticated and unique, libraries of such models do not exist, and the models may be quite complex. Since the model is such an important part of the DSS, it may be easier to build the system around the specialized model than to incorporate it into preexisting tools and modules.
The best generalized example of the use of a one-stage, complete system today is the design of geographic information systems (GIS). These systems provide decision support for a particular class of problems, namely those requiring map-oriented analyses of data. For example, city planning agencies may need to track sewer development, electricity and gas hookups, movement of the population, and housing starts. For some analyses and decisions, it may be most meaningful to model the infrastructure to support housing starts with a map. In this case, the map and the associated analysis tools serve as the model and model management tools. In other words, the GIS is a DSS that uses a specialized set of models and model management capabilities, specialized database files, and a powerful user interface. Since these tools require a unique programming platform at this time, this form of DSS is designed as a one-stage, complete system today, especially because of the fact that the tools are generally used in isolation. The specifics of a GIS and its applications will be highlighted in a later chapter.
When using the one-step, complete-system method, designers often prototype as a means of determining system requirements. A prototype is a facsimile system that simulates the user interface as well as the data and modeling activities of the DSS. Designers develop prototypes using fourth-generation languages or other prototyping tools that allow rapid development and easy change of the system. After decision makers specify the basic needs and preferences, designers can quickly produce a prototype that they believe meets those needs and preferences. Users then operate the prototype as they intend to use the ultimate system. In this way, they experience the user interface, data management, model management, and mail management features and capabilities. Since users can demonstrate problems or less preferred options for the designer, they can also respond to specific features or constraints and express their concerns more precisely. Similarly, designers can ask questions in an unambiguous manner.
Designers armed with this feedback can adjust the prototype quickly to respond to the users' needs. Since the elapsed time between the expression of preferences and observation of the effects is so short and since specific system attributes are identified, users can focus on whether designers understood and implemented their concerns. This cycle is repeated until the user is satisfied with the design of the entire DSS.
The prototype enables designers and users to communicate concretely, reducing the chance of miscommunication. Such a tool is important because the designers and the decision makers have different mental representations of the problem which bias how they respond to new information provided to them about the system. The tangible nature of the

PLANNING FOR DECISION SUPPORT SYSTEMS
prototype allows them to look for disconfirmatory data which identifies when the DSS is not performing adequately. While many seasoned designers prefer an intuitive approach, this empirical way to determine needs will generally provide a better analysis of decision-making needs.
After a satisfactory system has been created, the designer could translate the fourth-generation code into more efficient and easily maintained production code. This would have the benefit of providing a system that could be maintained over time and that could be used by multiple users without magnifying the strain on resources. However, it introduces a time delay in users' access to the real system. Further, since production code may not have the same capabilities as are available in the fourth-generation languages, some important features can be lost. More often, designers leave the DSS in the fourth-generation language and allow users immediate access to the technology. If there are few users, particularly if they do not use a system frequently or intensely, the advantage of improved efficiency in code is not worth the delay.
Although the one-stage, complete-system method was once the preferred approach to design, it is unusual to use this approach to DSS design today. The change is associated closely with the move from file processing applications toward database applications in most corporations and organizations. In earlier periods of data processing history, most applications had their own unique data that ran with the system, and hence the need to identify data and control it was associated with the DSS itself. In today's environment, there has been a move toward shared databases. Certainly most large computer users have shared data to both simplify control and access to the data and make results across applications consistent. Further, this shared view of data allows more types of data to be available for a greater number of applications and therefore makes possible richer decision making. Today increasing numbers of models are computerized and easily integrated within a DSS. Since these sophisticated databases, models, and their control mechanisms exist, it would be inefficient to design without them.
Access to a wide range of databases has made the DSS more useful. However, it has also led decision makers to make greater data demands on the systems. Fortunately, with the greater connectivity available through the Internet and the capability of "surfing" the Internet, decision makers can get access to broader data in shorter times.
Simultaneously, there has been a change in the capability of hardware and the efficiency of the software provided as DSS appliances. Early appliances were quite limited in the range of models and data they could reach, were relatively inefficient in their analyses, and provided user interfaces that would be considered archaic today. Today, designers can realize significant economies of scale from centralizing the development of such sophisticated tools, such as those provided with Cognos, shown in Figure 7.10. If such centralized tools are implemented properly, it can result in the development of a very efficient engine and a system that integrates well with other systems.
Furthermore, since tools are substantially more sophisticated today, building them from scratch is likely to be a long, tedious effort which most corporations cannot tolerate. The resulting system would be both late and technologically obsolete before use. In short, the resources available to DSS designers are substantially better today than they were in the past. Hence, where the resources exist, it makes sense to use them.
Using Technology to Form the Basis of the DSS. The other two approaches to designing a DSS differ from the first in that both rely upon the use of an existing base technology, called a DSS appliance. In the one-shot, complete-system approach, designers customize all the components by building them from a language. More often, designers use commercially available, leading-edge tools and technologies to construct the system more
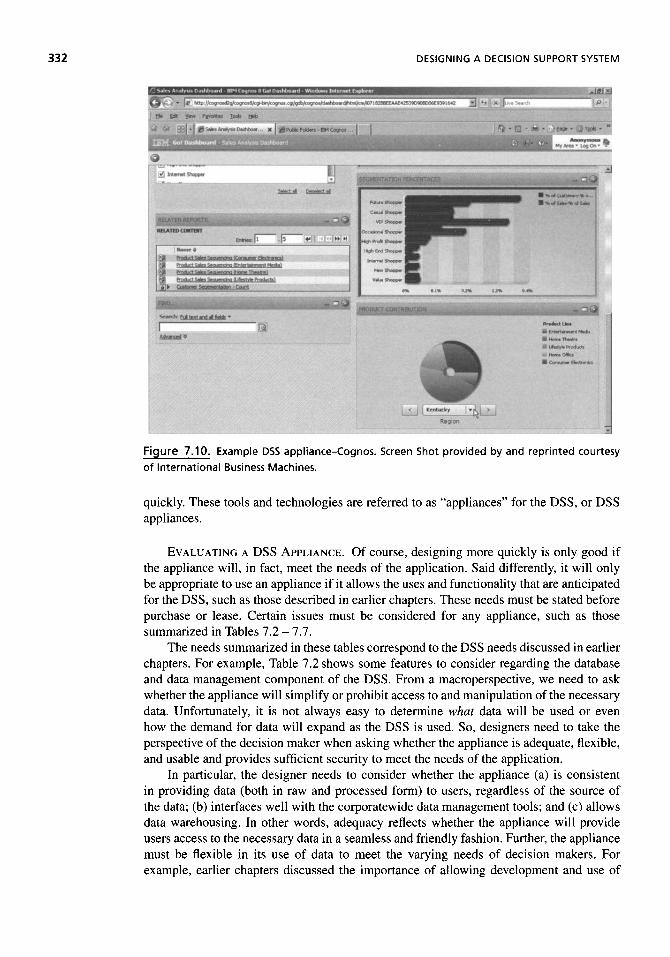
332 DESIGNING A DECISION SUPPORT SYSTEM
Figure 7.10. Example DSS appliance-Cognos. Screen Shot provided by and reprinted courtesy
of International Business Machines.
quickly. These tools and technologies are referred to as "appliances" for the DSS, or DSS appliances.
EVALUATING A DSS APPLIANCE. Of course, designing more quickly is only good if the appliance will, in fact, meet the needs of the application. Said differently, it will only be appropriate to use an appliance if it allows the uses and functionality that are anticipated for the DSS, such as those described in earlier chapters. These needs must be stated before purchase or lease. Certain issues must be considered for any appliance, such as those summarized in Tables 7.2-7.7.
The needs summarized in these tables correspond to the DSS needs discussed in earlier chapters. For example, Table 7.2 shows some features to consider regarding the database and data management component of the DSS. From a macroperspective, we need to ask whether the appliance will simplify or prohibit access to and manipulation of the necessary data. Unfortunately, it is not always easy to determine what data will be used or even how the demand for data will expand as the DSS is used. So, designers need to take the perspective of the decision maker when asking whether the appliance is adequate, flexible, and usable and provides sufficient security to meet the needs of the application.
In particular, the designer needs to consider whether the appliance (a) is consistent in providing data (both in raw and processed form) to users, regardless of the source of the data; (b) interfaces well with the corporatewide data management tools; and (c) allows data warehousing. In other words, adequacy reflects whether the appliance will provide users access to the necessary data in a seamless and friendly fashion. Further, the appliance must be flexible in its use of data to meet the varying needs of decision makers. For example, earlier chapters discussed the importance of allowing development and use of

PLANNING FOR DECISION SUPPORT SYSTEMS 333
Table 7.2. Data and Data Management Concerns in Selecting a DSS Generator
Adequacy • Provides common user view of data • Links well to corporate database management system • Facilitates data warehousing
Flexibility • Offers the creation of "personal" databases • Supports a wide range of database formats (text, graphics, audio, video, etc.) • Facilitates ad hoc query capability • Provides flexible browsers for public databases • Facilitates knowledge management
Usability • Offers ease in data selection • Has data dictionary • Handles necessary amount of data • Can handle sparse data
Security • Provides data security features • Offers multiple levels of security • Controls number of users, with what kinds of access, in simultaneous use • Creates audit trails
personal databases exclusively by the decision makers. The appliance must allow such development and provide full tool use on these data. Similarly, decision makers must have a tool that searches public databases using the full range of query development they use in the corporate databases. An ideal system would provide the same search engine for all databases, thereby making transition from one type to another transparent to the user. In addition, the appliance must allow for formats beyond simple text. Depending upon the application, decision makers are likely to need graphics, audio, video, and even access to virtual reality files. These alternate format files can only be effective support mechanisms, however, if they can be indexed, stored, and retrieved easily and merged with other data.
Usability refers to the system's ability to meet data and decision maker needs. On the one hand, the question of usability can refer to the size of databases, the size of resulting tables, or the number of queries that can be made at once. Since size and price are often highly correlated, we need to be sure of buying enough to meet foreseeable needs. On the other hand, the question of usability can refer to the decision maker's ability to find the necessary variables and to make the system understand those variables.
Finally, any corporation needs to provide security for certain data. Users expect the DSS will ease the problems of location of information and reports. With this ease, however, comes the requirement that the appliance prevents those not employed by the corporation from using the data. It is also true that some data are so important or controversial that only some members can have access to it on a "need-to-know basis." Hence, the appliance must be able to provide multiple levels of security as well as necessary audit trails to determine who has gained access to what data.
Similarly, designers need to evaluate these issues with regard to the models and the model management system associated with the DSS appliance. The appliance needs to meet

334 DESIGNING A DECISION SUPPORT SYSTEM
Table 7.3. Models and Model Management Concerns in Selecting a DSS Generator
Modeling • Functionality
(a) User-defined functions (b) Procedurability (ability to solve equations independent of their ordering, symbolic reference
of data) (c) A Wide range of functions (d) Nonprodedurality (c) Time as a possible dimension
• Flexibility (a) Size restrictions (b) Currency and date conversions (c) Ability to aggregate and disaggregate analyses (d) Ability to link sequential analyses (e) Multidimensionality (f) Links well to available modeling packages
• Appropriateness of included models (a) Symbolic modeling (b) Statistical ability (descriptive statistics, hypothesis testing, predictive statistics, regression) (c) Project management ability (PERT/CPM, multilevel work breakdown structure) (d) Operations research ability (mathematical programming, stochastic analysis) (f) Forecasting and econometrics ability (time series analysis, causal modeling, seasonalization,
smoothing) • Ease of use
Analysis capabilities • Sensitivity analysis • "What-if" analysis • Impact analysis
Note: PERT is program evation and review technique; CPM is critical path method.
both the modeling and analysis capabilities of the decision makers, such as those described in Table 7.3. In this case, the modeling concerns address whether the appliance can handle the kind and size of models that are of interest to the decision maker. In particular, it examines the models that can be accessed, the ease of use, the flexibility (especially with regard to size), and the functionality made available in the system.
The analysis capabilities, on the other hand, question the appliance's ability to provide the decision makers with a rich modeling environment. The characteristic of a DSS that distinguishes it from (being simply) a modeling package is its ability to simplify both the use and the interpretation of the models. For example, the model management component needs to be able to use the output of one analysis as the input to a second analysis, if wanted. In addition, the appliance must allow and simplify appropriate sensitivity and "what-if" analyses associated with the models in its portfolio. Not only must it tolerate review of the assumptions and rerunning of models in light of changes in the assumptions, it also must encourage the user by providing an easy path to such analyses and a user-friendly interpretation of the output. Finally, the appliance needs to provide context-sensitive modeling assistance for the user. This does not mean the online version of the user manual as exists in many PC-based applications today. Rather, this is a level of assistance in how to run the model, including a statement of the assumptions and limitations of the model

PLANNING FOR DECISION SUPPORT SYSTEMS 335
Table 7.4. User Interface Concerns in Selecting a DSS Generator
User friendliness
• Novice and expert modes • Menus and Prompts • Consistent, natural language commands • Command abbreviations • Context-sensitive Help • Clear, end-user-oriented error messages • "Undo" command support • Meaningful identifiers • Documentation • User-defined commands • Context-sensitive warnings
Support of modeling and data needs
• Wide range of graphics support • Windowing support • Multitasking support • Support for a variety of input and output devices • Color and functional control over user interface • Support for individual customization
Graphics
• Quality and resolution of output • Multicolor support • Range of output control • Support for dynamic graphics, video and audio enhancements • Basic plots and charts • Complex charts • Format and layout control • Spacing of graphs • Compatibility with available graphics devices • Preview ability • Modification ability • Ease of use
Reporting formats
• Supports a range of platforms • Flexibility of reporting formats • Standardformats • Ease of customization • Standard symbols and conventions
and even an intelligent intervention when modeling assumptions have been stretched or violated. While most appliances will not have such assistance built into the package, a good one will simplify the development of such tools.
Consideration of the user interface capabilities is important as well. Table 7.4 refers to those needs outlined in Chapter 5. In particular, in order for the system to be helpful for the decision maker, it must be user friendly (whatever the level of user expertise and experience); support a wide range of output and input devices; provide graphical, video, and

DESIGNING A DECISION SUPPORT SYSTEM
Table 7.5. Connectivity Concerns in Selecting a DSS Generator
Compatibility with available electronic mail system • Document sharing • Data sharing • Communications • Mail-handling and priority-setting code
Connectivity to Internet resources, including news services, and Web pages Electronic searching devices for Internet resources Firewall availability
audio interpretation of the results; and provide a reporting format that can be customized for the specific application and/or user under consideration. From the designer's point of view, this means that the appliance must either provide such functionality itself or make it easy to design.As with any software adoption, we need to be concerned that the system will work in our environment and will be affordable and can be upgraded over time. Tables 7.6-7.8 summarize criteria to consider for ensuring the selection of the appliance makes good business sense.
Table 7.6 illustrates the issues associated with basic compatibility issues. It is important to ensure that the appliance will work with the equipment available and with the operating systems and networking options available. In addition, it must be able to work with any additional resources acquired, including input, output, and storage devices.
Table 7.7 illustrates the cost issues associated with the use of the appliance. Today, software can be purchased or leased using a variety of options. Designers must examine these costs carefully to ensure they are in line with the usage patterns of decision makers. For example, it is not appropriate to deploy a product across many occasional users of a system if the cost is based upon each installation of a developed product, especially if it is not possible to deploy those copies via a network. On the other hand, it would be appropriate if the cost were a function of the number of simultaneous users of the product.
Finally, Table 7.8 illustrates issues that should be considered to ensure that the vendor is reputable and is likely to provide the kinds and level of support needed for your application. Such support will be important not only during the development stage but also as users begin to find undocumented features needing explanation.
USING A DSS APPLIANCE. If a DSS appliance forms the basis of a DSS, a designer has two possibilities for development, the quick-hit approach or the evolutionary approach.
Table 7.6. Hardware and Software Concerns in Selecting a DSS Generator
Compatibility with available equipment Compatibility with available operating system Compatibility with available networking configuration Printer and plotter support Preferred hardware/operating system/networking configuration Time-sharing option Disk and other resource requirements

PLANNING FOR DECISION SUPPORT SYSTEMS 337
Table 7.7. Cost Concerns in Selecting a DSS Generator
Initial purchase/license cost Per-capita fee Maintenance costs Documentation Resource utilization Conversion costs Upgrade frequency and costs
The difference between the two is in the staging of development and the basic involvement of decision makers in the design process.
The goal of the quick-hit method is to design a system quickly in response to some well-understood and usually immediate need that is expected to have a high payoff. Furthermore, the system is likely to reside on a microcomputer and be used by either one person or a small group. The goals and procedures are clear, the data are available, the system can stand independently, and there is little need to address conflicting concerns. Hence, much of the analysis component of design can be done quickly. Further, since the system is discarded after the choice is made, it is not necessary to employ many of the procedures necessary that ensure the long time viability of a DSS.
We might use this approach to design a DSS for a problem such as a high-level personnel decision. In some industries, many of the criteria needing evaluation are well known. Furthermore, selecting the right person for the job can save corporations significant money and provide significant opportunities for growth. However, it is a decision that is not made often. Hence, a DSS to support a choice would be a good candidate for use of a quick-hit design process.
To achieve the goal of fast deployment, designers rely heavily upon already available tools and packages, existing data and model sources, and existing data, model, and mail management systems. Such systems work well in the short run, because designers can rely upon tested components that use the current technology. However, over the long run, designers only may be able to update, maintain, or enhance the system when the vendor
Table 7.8. Vendor Concerns in Selecting a DSS Generator
Financial stability and viability Length of time in business Size of installed base Growth in customer base Quality and size of staff Activity of R&D staff Ongoing commitment to this product Technical support personnel Availability of support hot line Availability of Internet-based support Time horizon for support Internet user discussion group Organized user group Product target market User perceptions

DESIGNING A DECISION SUPPORT SYSTEM
provides updates to the appliance. In addition, the vendor dictates the kinds of enhancements provided in the system. Alternatively, if the system is composed of a makeshift combination of existing tools and systems, the processing efficiency may not be as good as it can be with more structured systems. Of course, in the long run, it may be difficult to bridge such systems to other existing systems or to systems introduced later.
The quick-hit process relies heavily upon the use of appliances and other tools so that the designers can focus their energies on the analysis and user interface components. Such a process is reasonable if the system can stand independently and if the data are already available. However, it becomes difficult if there is a long-term need for the system or a need to tie it to existing systems. The approach only works if users know what kinds of data and models to use and do not need significant levels of "support" in either the data selection or modeling phases. In fact, it works best if the need is so domain specific that a particular modeling package can be used as the core of the system.
The third approach, evolutionary development, is similar to the quick-hit approach in that it is dependent upon the use of DSS appliances, which allow for quick development and quick changes. Further, they allow the designer to focus on analysis of the needs rather than on construction of the software. Evolutionary development differs from the quick-hit approach in that designers expect the system design will mature as decision makers gain experience with the system and the information access.
Evolutionary development begins when the designer selects an important subproblem of the choice process. Through focus on this subproblem, the designer learns about the information, modeling needs, and user interface needs of the decision maker. This subprob-lem must be small enough to be unambiguous to both the designer and the decision maker but large enough to require computer support. In addition, the problem must be important to the decision makers so that they will participate closely in the development process and adopt the process after design.
The process of design is heavily dependent upon the use of prototyping, discussed earlier in this chapter. Designers begin by seeking user needs. From this information, they design a "quick-and-dirty" but working mockup of the system. Decision makers test and evaluate the prototype and refine their information needs. Designers then fine tune the system and provide it to decision makers again for testing and evaluation. This process is repeated until the evaluation calls for no substantive changes and an acceptable and stable product is available to the decision maker.
The key to this being different from the first process defined is twofold. First, unlike the one-step, complete system, it builds all components from scratch. As such, there is often a delay between the agreement of specifications and the provision of the product. The evolutionary approach, on the other hand, provides decision makers with a working system quickly. However, rather than providing the entire system at once, the evolutionary system provides only a small component of the eventual DSS at the outset. This allows users to experience using the system with the agreed-upon specifications and hence to be able to change those specifications as the system matures.
In addition, when prototyping is used in the one-step, complete method, it generally is not a working system but rather a mockup using a shell tool, a limited database, and a stand-alone machine. Often, response is better with these prototypes (in terms of both quality of the response and response time) than the designers can provide with the production language. As a result, users are often disappointed by the final system. In the case of the evolutionary development, designers use appliances, not mockup shells, in development. Hence, what the user sees when interacting with the system early is what the user sees with the eventual development system. Furthermore, since designers and decision makers

PLANNING FOR DECISION SUPPORT SYSTEMS
concentrate on one small part of the process in the prototyping effort, it is easier for both parties to concentrate on the implications of features and changes to features. In addition, because the evaluation of the system and changes requires less of the decision makers' time (because it is smaller), they are able to provide better and more meaningful feedback to the designer, and thus the exercise tends to have better results. By focusing on the small but important component of the process, decision makers can understand the implications of their suggestions better. In the one-step process, designers and decision makers dilute the focus by looking at the entire system at once. Since there is so much to look at, decision makers may not consider how many of the functions will actually work in a production system. Decision makers may not commit the amount of time, energy, or attention to understanding the entire system at once.
The problem with the evolutionary development is, of course, where to start. Clearly, we need to begin with some component of the problem that is of importance to the decision maker. Once that decision is made, however, the designer still needs to determine what information should be included at the outset. However, information is not a unidimensional concept. Suppose decision makers state that their most important focus is on effectiveness. While "effectiveness" of the alternatives might seem like an unambiguous concept, it can really mean very different things to different people. To the designers, it might mean cost effectiveness. To the decision maker, it might mean the expected outcome of attracting new clients. Even if there is agreement on the measure "attracting new clients," there might be disagreement about when relevant data are actually information. For example, designers might think of hard numbers of new clients and thus new sales. However, decision makers might think of an increase in customer satisfaction that will lead, in turn, to acceptance of the product.
Ultimately, all these views might be important to the decision maker. Nevertheless, designers need to know where to start. To define the needed information, designers must look at it from a variety of perspectives: (a) the content, (b) the representation, and (c) the attributes of the data themselves. An understanding of the appropriate content means an understanding of what knowledge needs to be accumulated and maintained or what issues need to be addressed. Here, for example, the designer determines if the most important issue is the attrition rate, the schedule needs, or the advertising expenditures. In addition, the designer must differentiate the relevant perspective of that content. For example, designers need to determine if decision makers prefer the function or merit associated with the relevant content. If one considers the topic of "advertising expenditures," a "function" perspective would represent how the money was spent, where the money was spent, and so on, while a "merit" perspective would represent how the expenditure had an impact on the clientele. Similarly, designers need to determine the focus of the information, or whether the data should be oriented toward how the alternative is structured (an internal focus) or upon the service that is provided by the alternative (an external focus). Third, designers need to understand what kinds of measures are most important to the decision makers. This might include cost data, activity data, performance data, or impact data. For example, the data needs are quite different if decision makers simply want to know on what kinds of ads money is spent than if decision makers want to know what market segments are reached and are likely to be influenced by the information. The representation of data has traditionally included the format, or the presentation of what kinds of data in what order. This would include whether graphs or charts are provided, icons or text, and numbers or conclusions. Finally, the attributes of the information are those characteristics discussed in Chapter 3. This includes whether the data are qualitative or quantitative, facts or judgments, specific information or global generalizations, past performance or expected performance data. In

DESIGNING A DECISION SUPPORT SYSTEM
addition, it includes a specification of who provides the data and what kinds of credibility go along with that presentation.
Once one can describe the content in this multidimensional manner, it is possible to provide guidance as to how to start the DSS design and how to let it evolve. Fortunately, the dimensions cluster together, making it easier to determine where information will be most useful. For example, the content and representation of the data required often are a function of the experience level of the decision makers. As decision makers gain greater experience with a particular type of decision, they move from seeking feasibility information to preferring information regarding the performance of alternatives under consideration; with increasing amounts of experience, they tend to move toward information regarding the efficiency of alternatives. A similar shift occurs with regard to the attributes of the information. Decision makers with little experience tend to seek quantitative, factual data that reflect future economic implications. As decision makers gain more experience, they seek more information regarding the past performance of alternatives, usually in terms of qualitative information and more speculative opinions. Finally, decision makers with significant amounts of experience tend to address process issues. They seek quantitative, factual data, reflecting the operations issues of the adoption of the alternative.
These preference patterns can be useful for guiding the evolution of systems. For example, if it is known that users are primarily inexperienced in a particular category of decisions, it would be wise to emphasize feasibility information with factual data reflecting the economics of the environment in the early stages of development.
In addition, decision makers' preference for analytical methods evolves over time as a function of how the decision context changes. For example, decision makers are likely to employ compensatory models, such as optimization models, only when considering tactical decisions in a stable environment for which the user has significant experience. Knowing this suggests a need for including many exploratory and statistical tools in the early stages of DSS development and can deemphasize other kinds of tools until later stages of the evolution of the system.
The Design Team
Selecting the appropriate design approach and the appropriate technology clearly are im-portant aspects of DSS design. A third concern is selecting the appropriate project team to meet the needs of the system. This is particularly important for the first DSS in a corporation or group and/or if the DSS is part of a strategic change to the corporation.
First, the team must include a champion (even if it is simply an ex officio position) from among the senior management of the group. Including such a person and keeping him or her updated regularly can help you to get the necessary access to resources, data, and models. In addition, you need a team of developers with the appropriate skills. For most DSS applications today, this team needs to include people trained in the graphical and object-oriented technologies who are open minded and imaginative. However, it is important to include people who understand the issues associated with disaster recovery and security. Planning for problems from the start makes it much easier to solve them. Finally, it is important to include end-user decision makers on the team to ensure that the DSS meets their decision-making needs.
Whether internal end users or external consultants, team members need to have certain characteristics, such as those outlined in Table 7.9. Notice that the primary team need is a sense of creativity and open-mindedness. If the DSS is to result in better decisions, the team must do something more than simply automate the current procedures. If team
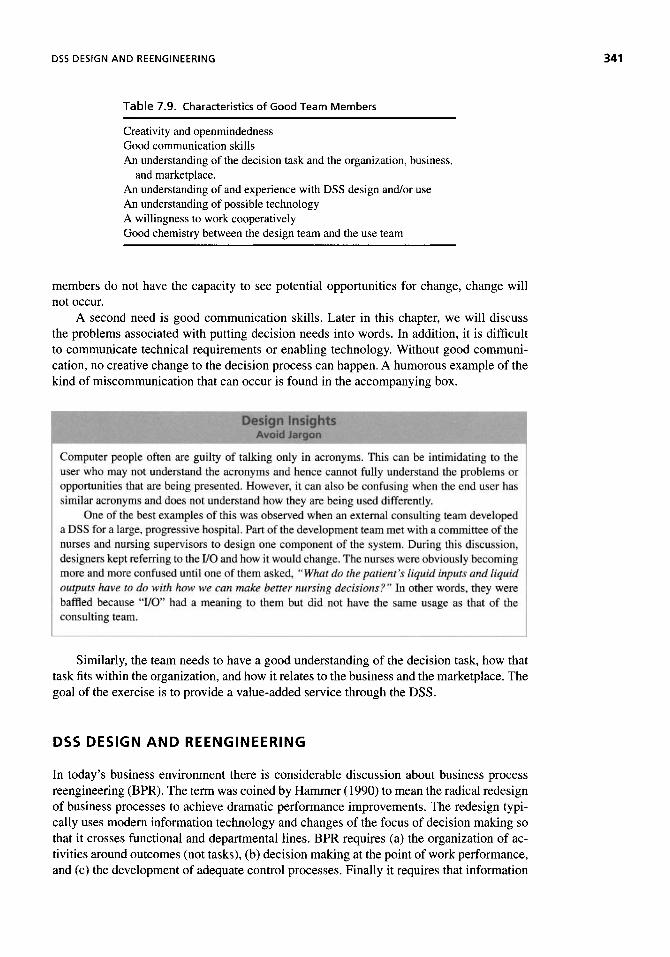
DSS DESIGN AND REENGINEERING 341
Table 7.9. Characteristics of Good Team Members
Creativity and openmindedness Good communication skills An understanding of the decision task and the organization, business,
and marketplace. An understanding of and experience with DSS design and/or use An understanding of possible technology A willingness to work cooperatively Good chemistry between the design team and the use team
members do not have the capacity to see potential opportunities for change, change will not occur.
A second need is good communication skills. Later in this chapter, we will discuss the problems associated with putting decision needs into words. In addition, it is difficult to communicate technical requirements or enabling technology. Without good communi-cation, no creative change to the decision process can happen. A humorous example of the kind of miscommunication that can occur is found in the accompanying box.
Similarly, the team needs to have a good understanding of the decision task, how that task fits within the organization, and how it relates to the business and the marketplace. The goal of the exercise is to provide a value-added service through the DSS.
DSS DESIGN AND REENGINEERING
In today's business environment there is considerable discussion about business process reengineering (BPR). The term was coined by Hammer (1990) to mean the radical redesign of business processes to achieve dramatic performance improvements. The redesign typi-cally uses modern information technology and changes of the focus of decision making so that it crosses functional and departmental lines. BPR requires (a) the organization of ac-tivities around outcomes (not tasks), (b) decision making at the point of work performance, and (c) the development of adequate control processes. Finally it requires that information
Computer people often arc guilty of talking only in acronyms. This can be intimidating to the user who may not understand the acronyms and hence cannot fully understand the problems or opportunities that are being presented. However, il can also be contusing when the end user has similar acronyms and does not understand how they are being used differently.
One of the best examples of this was observed when an external consulting learn developed a DSS for a large, progressive hospital. Part of the development team met with a committee of the nurses and nursing supervisors to design one component of the system. During this discussion, designers kept referring to the I/O and how it would change. The nurses were obviously becoming more and more confused until one of them asked, "What do the patient 's liquid inputs and liquid outputs have to do with how we can make better nursing decisions?" In other words, they were baffled because "I/O" had a meaning to them but did not have the same usage as that of the consulting team,

DESIGNING A DECISION SUPPORT SYSTEM
be captured only once, at its source. Much has been written about the reengineering process and how it is conducted, but it will not be repeated here since that is not the purpose of this text. However, since BPR has an impact on decision making and the use of technology, it is reasonable to question the relationship between the design of DSS and BPR. In particular, we will address three questions.
• Is DSS design BPR? • Does DSS design require BPR? • Can DSS design facilitate BPR?
Clearly, DSS design is not the same as BPR. Although technology and its rapid development are the enablers to achieving the goal in both cases, the goals of the analysis and the expected outcomes are quite different. Business process reengineering, by its very nature, focuses on the fundamental activities of a department or organization, the processes necessary for their completion and improvement, and the activities that would improve the flow of work in the organization. This might include an analysis of what information and what models are available to whom, but the more likely focus would be on who makes the decision, how decentralized the decision making becomes, and what controls are established to ensure that it happens well.
Instead DSS design focuses on the process by which decisions are made. It does not question whether or not the individual decision makers should be making the decision, does not focus on most of the employees of an organization, and does not necessarily result in a physical product or service being improved. Like BPR, DSS design does not have cost cutting as its goal. Rather, its goal is a better thought-out choice process that often has as a natural result a reduction in costs and losses. In addition, good DSS design, like good BPR, can have a side benefit of improvements in corporate performance, because decision making is improved. There clearly are parallels, but they are two substantially different activities.
Second, does DSS design require BPR? Not always. Sometimes, designers and decision makers intend for the DSS to only improve access to data and models but not to make a fundamental change in how operations are conducted. In these cases, reengineering is not an important component of the DSS design. However, at other times, the decision to move toward a DSS is part of a corporate strategic decision. In such cases, the existence of a DSS alone is unlikely to cause a substantial change in the way business is conducted. Just throwing the power of a computer at a problem will not cause expected productivity gains. As Hammer has said (1992 p. 104), "turning the cowpaths of most business processes into superhighways using the plethora of computer hardware just doesn't work." That is, if all the DSS does is to automate the current decision processes, and the decision makers have only the same data, the same models, and the same charts as they have always had, this will not improve decision making.
Instead, the DSS design needs to be coupled with a reengineering of the decision process. The design process allows designers and decision makers alike to rethink the choice process by considering explicitly what decision makers need to know and how they need information presented. It allows an opportunity to take a holistic view of the process, the natural way of considering choices, the neglected opportunities for insight and possible integration strategies. The technological solution is not as significant as the way the technology is used to implement an organization's strategic vision.

DSS DESIGN AND REENGINEERING 343
Third, can a well-designed DSS facilitate the BPR? The answer is Yes! The DSS can be a resource that simplifies the reengineering effort. One of the major difficulties in reengineering is the absence of necessary data. It is impossible to plan for change or predict the impact of change without appropriate information regarding current operations and current environmental data. Unfortunately, such data are not readily available in most organizations. However, using a DSS can provide managers access to the data and means for understanding them. The DSS can help managers to challenge old procedures and create new ones through better alternative generation, more informed decision making, and better use of models. In addition, decision makers can view a given problem from a variety of perspectives and be better able to understand the problem, the assumptions, and the implications of the solutions. With group DSS technology, decision makers across functional areas can collaborate by sharing information, analyses, and models. The use of DSS technologies can actually help the reengineering effort be more effective and productive. (This topic will be discussed in more detail in Chapter 11.)
Although BPR and DSS design are two separate activities, they have similar aspects, and therefore there are some lessons we can learn from BPR that have parallels in DSS de-sign. First and foremost, communication during the process is crucial. Carr and Johanssen (1995) indicate that communication is crucial in the beginning of BPR to assess the cultural climate and the barriers to change and in the later stages for obtaining acceptance of the changes so that the improved processes will not be sabotaged.1 Furthermore, communi-cation can help us improve the overall design by gaining from the experience of many individuals through their comments and suggestions. This clearly is true with DSS design as well. Without active communication, the designer will implicitly state assumptions of the design process as:
• There is one best way to make decisions. • I can understand how your decisions are made easily and quickly. • Little about how you make decisions is worth saving. • You will make decisions in the manner that the designer specifies.2
While managers and other employees might not be as concerned about job loss as they would be during BPR, there are concerns about making the task "too hard" or the perception that managers were just not doing a good enough job. Forcing people into a new decision style may not be productive. Table 7.10 shows some tenets of "good communication" during BPR adapted for DSS design.
This leads to the second similarity between DSS design and BPR: There is likely to be resistance to change. Concerns about uncertainly and additional workload affect both DSS design and BPR. However, perhaps a bigger problem in DSS design (as compared to BPR) is the fear of criticism. Most decision makers consider a specific set of issues when they make choices. Some of those factors may use sophisticated models or grand
'For example, Carr and Johanssen (1995, p. 51) suggest Motorola's success with total quality manage-ment (TQM) and BPR is due, to a large measure, to their strong communication plan. The company holds "town hall meetings" to review concerns, changes, and the overall state of the business with their employees and managers hold informal communication sessions with their employees. 2This list is adapted from one developed for reengineering as described in T. Davenport, "Don't Forget the Workers," Information Week, August 8, 1994, p. 70.

DESIGNING A DECISION SUPPORT SYSTEM
Table 7.10. Tenets of Effective Communication
It is impossible to use too much communication. Simplify your message, no matter how complex the issue. Anticipate the issues and communicate your position early. Don't underestimate the technical requirements of a communications project. Involve all levels of management where appropriate. Honesty is the best policy. Tell the truth. Identify and know your audiences.
Source: Adapted from D. K. Carr and H. J. Johansson, Best Practices in Reengineering, New York: McGraw-Hill, 1995, p. 55. This material is reproduced with the permission of the McGraw-Hill Companies.
database mergers. For others, decision rules might be quite simple, coming quite close to "gut feelings" or generalizations from past experiences. Decision makers may be concerned about sharing these procedures, regardless of their reliability, for fear of looking silly or less capable, and of fear they will need to learn new and harder methods of making decisions. They may be unwilling to share accurate information about choice processes or information and modeling needs. Of course effective communication is one approach to addressing this resistance to change. Another is the implementation of a planned environment for change.
Finally, the third similarity is that good DSS design, like good BPR, takes place incrementally over a period of time. BPR is best when it is limited to a process or a group of processes at the outset. DSS design works best when a particular focus or type of analysis is prototyped and built, then improved and expanded over time. Both require a multilayered process that must be repeated over time. Further, managers need to become accustomed to them before moving on to change another component of their organization.
DISCUSSION
When DSS have been designed well, they represent tools that add value to the process of making selections among alternatives. Improvements in hardware and design tools release designers to focus upon meeting the needs of the decision maker. Regrettably, there is no process the use of which will assure the resulting system is a value-added product. However, the use of prototypes to discuss specifications, an evolutionary strategy to development, and good communication skills increase the chance of getting a useful and used system.
SUGGESTED READINGS
Arinze, B., "A Contingency Model of DSS Development Methodology," Journal of Management Information Systems, Vol. 8, No. 1, June 1991, pp. 149-166.
Arnott, D., "Decision Support Systems Evolution: Framework, Case Study and Research Agenda,"
European Journal of Information Systems, Vol. 13, No. 4, December 2004, pp. 247-259. Arnott, D, and G. Dodson, "Decision Support Systems Failure," in F. Burstein and C. W. Holsapple
(Eds.), Handbook on Decision Support Systems, Vol. I, Berlin: Springer-Verlag, 2008, pp. 763-790.
Bento, A., "Tools for End-User Systems Development: A Case Example," Interface, Fall 1991, pp. 24-31.
SUGGESTED READINGS
Boehm, B., and L. G. Huan, "Value-Based Software Engineering: A Case Study," Computer, Vol. 36, No. 3, 2003, pp. 33-41.
Bradshaw, G. F., P. W. Langley, and H. A. Simon, "Studying Scientific Discovery by Computer Simulation," Science, Vol. 222, No. 4627, December 1983, pp. 971-975.
Bücher, T., M. Klesse, S. Kurpjuweit, and R. Winter, "Situational Method Engineering: On the Dif-ferentiation of 'Context' and 'Project Type'," in Situational Method Engineering: Fundamentals and Experiences, Proceedings of the IFIP WG 8.1 Working Conference, September 12-14, 2007, Geneva, Switzerland.
Burstein, F., and S. A. Carlsson, "Decision Support through Knowledge Management," in F. Burstein, and C. W. Holsapple (Eds.), Handbook on Decision Support Systems - Vol. 1, Berlin: Springer-Verlag, 2008, pp. 103-120.
Carr, D. K., and H. J. Johansson, Best Practices in Reengineering, New York: McGraw-Hill, 1995. Clemen, R. T., Making Hard Decisions: An Introduction to Decision Analysis, 2nd ed., Belmont,
CA: Duxbury, Belmont, 1996.
Courtney, J. F., "Decision Making and Knowledge Management in Inquiring Organizations: Toward a New Decision-Making Paradigm for DSS," Decision Support Systems, Vol. 31, No. 1, May 2001, pp. 17-38.
Curtis, B., H. Krasner, and N. Iscoe, "A Field Study of the Software Design Process for Large Systems," Communications of the ACM, Vol. 31, No. 11, November 1988, pp. 1268-1287.
Eom, S. B., The Development of Decision Support Systems Research: A Bibliometrical Approach,
Lewiston, NY: Edwin Meilen, 2007.
Eom, S. B., and Kim, Y B. "A Survey of Decision Support System Applications (1995— 2001)," Journal of the Operational Research Society, Vol. 57, No. 11, 2006, pp. 1264-1278.
Few, S., Show Me the Numbers: Designing Tables and Graphs to Enlighten, Oakland, CA: Analytics,
2004.
Few, S., Information Dashboard Design: The Effective Visual Communication of Data, Sebastapol,
CA: O'Reilly, 2006. Gachet, A., and P. Haettenschwiler, "Development Processes of Intelligent Decision-Making Support
Systems: Review and Perspective," in J. N. D. Gupta, G. A. Forgionne, and M. Mora (Eds.), Intelligent Decision-Making Support Systems, London: Springer, 2006.
Gachet, A., and R. Sprague, "A Context-Based Approach to the Development of Decision Support Systems," in T. Bui and A. Gachet (Eds.), Proceedings of the Workshop on Context Modeling and Decision Support. Paris, France, July 5, 2005.
Hammer, M., "Reengineering Work: Don't Automate, Obliterate," Harvard Business Review,
July-August, 1990, pp. 104-112.68 4.
Hammer, M., The Reengineering Revolution, New York: Harper Collins Publishers, 1995.
Hammer, M., Beyond Reengineering: How the Process-Centered Organization is Changing Our Work
and Our Lives, New York: Harper Collins Publishers, 1997. Hammer, M., and J. Champy, Reengineering the Corporation: A Manifesto for Business Revolution,
New York: Harper Collins Publishers, 2003. Hall, D., "Decision Makers and their Needs for Support," in F. Burstein and C. W. Holsap-
ple (Eds.), Handbook on Decision Support Systems - Vol. 1, Berlin: Springer-Verlag, 2008, pp. 83-102.
Holsapple, C , "DSS Architectures and Types," in F. Burstein and C. W. Holsapple (Eds.), Handbook
on Decision Support Systems - Vol. 1, Berlin: Springer-Verlag, 2008, pp. 163-190.
Howard, R. A., and J. E. Matheson, "Influence Diagrams," Decision Analysis, Vol. 2, No. 3, 2005, pp. 127-143.

346 DESIGNING A DECISION SUPPORT SYSTEM
Howson, C, Successful Business Intelligence: Secrets to Making BI a Killer Application, New York: McGraw-Hill, 2008.
Kendall, K. E., and J. E. Kendall, "DSS Systems Analysis and Design: The Role of the Analyst as Change Agent," in F. Burstein and C. W. Holsapple (Eds.), Handbook on Decision Support Systems, Vol. 2: Variations, Berlin: Springer-Verlag, 2008, pp. 293-312.
Klashnera, R., and S. Sabeta, "A DSS Design Model for Complex Problems: Lessons from Mission
Critical Infrastructure," Decision Support Systems, Vol. 43, No. 3, April 2007, pp. 990-1013.
Morgan, M. G., and M. Henrion, Uncertainty: A Guide to Dealing with Uncertainty in Quantitative
Risk and Policy Analysis, New York: Cambridge University Press, 1998.
Norman, D., The Design of Future Things, New York: Basic Books, 2007.
O'Leary, D. E., "Decision Support Evolution: Predicting, Facilitating, and Managing Knowledge Evolution," in F. Burstein and C. W. Holsapple (Eds.), Handbook on Decision Support Systems, Vol. 2: Variations, Berlin: Springer-Verlag, 2008, pp. 345-370.
Pick, R. A., "Benefits of Decision Support Systems," in F. Burstein and C. W. Holsap-ple (Eds.), Handbook on Decision Support Systems, Vol. I, Berlin: Springer-Verlag, 2008, pp. 719-730.
Silver, M. S., "On the Design Features of Decision Support Systems: The Role of System Restrictive-ness and Decisional Guidance," in F. Burstein and C. W. Holsapple (Eds.), Handbook on Decision Support Systems, Vol. 2, Variations, Berlin: Springer-Verlag, 2008, pp. 261-292.
Sprague, R., and E. Carlson, Building Effective Decision Support Systems, Englewood Cliffs, NJ:
Prentice Hall, 1982. Thorp, J., The Information Paradox : Realizing the Business Benefits of Information Technology,
Toronto, ON: McGraw-Hill Ryerson, 2003.
Tillquist, J., and W. Rodgers, "Using Asset Specificity and Asset Scope to Measure the Value of IT," Communications of the ACM, Vol. 48, No. 1, 2005, pp. 75-80.
QUESTIONS
1. Suppose you were designing a DSS to help students make better career decisions. Identify three questions you might use during interviews to determine their decision support needs. How would you alter those questions if the person being interviewed were too talkative? If they were uncooperative?
2. Defend the use of the evolutionary development of DSS in a manner that you might for a boss or client of a consulting firm.
3. What kinds of documents would you request to begin the process of understanding users' needs for the development of a DSS for production planning?
4. Should users design their own DSS? Why or why not?
5. Discuss the advantages and disadvantages of using a DSS appliance and available tools in the design process.
6. Consider a DSS design project (perhaps a class project). How would this DSS develop if the evolutionary development process were used?
7. Discuss the potential design trade-offs involved in designing a specific decision support or expert system directly from tools, as compared with using a DSS appliance or expert system shell.
ON THE WEB 347
8. One of the steps in generally recognized methodologies is the testing of the system to ensure reliability and validity of a system. How would you test a DSS for reliability and validity? What kinds of tests would you run? What kinds of data would you need?
9. Critique the concept of using a standardized methodology to design DSS.
10. Suppose you were attempting to justify the development of a DSS for a corporation. Discuss how you would justify the expenditures.
11. Discuss the critical success factors associated with DSS design. How would designers evaluate these factors prior to beginning a project?
12. Consider a system that you use. Does it display Norman's design rules?
13. Why is it important to design error and warning messages carefully? What impact might it have on DSS use if they are not designed carefully?
14. Draw an influence diagram that conveys how decisions are made regarding what classes are offered each semester on your campus.
15. What characteristics of an organization does a DSS designer need to understand before beginning a project?
16. Find information about one or more DSS appliances. How might it make design of a DSS easier? What problems might it pose?
ON THE WEB
On the Web for this chapter provides additional information about how DSS enhance design concepts. The links provide access to case studies and success stories about the design process. In addition, links can provide access to information about methodologies for design, design standards, and reengineering hints. Additional discussion questions and new applications will also be added as they become available.
• Links give access to information about DSS appliances. The page provides links to corporations and marketing information about generators as well as reviews of products.
• Links give access to actual decision support systems. The pages will link you not only to the DSS but also to a "behind-the-scenes" look at the development process.
You can access material for this chapter from the general Web page for the book or directly athttp://www.umsl.edu/^sauterv/DSS4BI/design.html.

OBJECT-ORIENTED TECHNOLOGIES AND DSS DESIGN
A popular adage says that software is not written, it is rewritten. In other words, software is not static but rather is updated, modified, or corrected over time. While the saying refers to standard transaction applications, it is even more applicable to the design of DSS. Decision support system applications need to change over time because decision makers change their information needs over time. Similarly, the process of evolutionary design of DSS, which recommends building a DSS in stages so that it better fits the needs of decision makers, requires systems to change over time. Hence, it is apparent that whatever product1 is chosen for the building of a DSS, it must be one that adapts well to change in the databases accessed, the models used and integrated, the way in which mail is used in decision making, and even the user interface. In order to meet decision-making needs, especially in a competitive and dynamic environment, such changes need to be implemented quickly with a minimum of flaws. The question is what kind of tool will best meet those changing needs.
Many demonstrations suggest that object-oriented programming (OOP) tools provide the best groundwork for systems that will need to be changed over time. The evidence suggests, in particular, that it is easier to make needed changes, to prevent unwanted changes, and to program more quickly with OOP tools than with other forms of systems development. While there is insufficient experience in operational systems to test this theory from a long-term perspective, there are some reasons to believe the hypothesis might be true. This chapter will illustrate the strengths of the object-oriented paradigm and how it might be used to design DSS.
!The product may be a programming language or a programming tool. For the purposes of this discussion, no distinction will be made between these two.
Decision Support Systems for Business Intelligence by Vicki L. Sauter Copyright © 2010 John Wiley & Sons, Inc.

OBJECT-ORIENTED TECHNOLOGIES AND DSS DESIGN
KINDS OF DEVELOPMENT TOOLS
The obvious questions are "Why object-oriented tools?" and "Why object-oriented tools nowT The fundamental answer is that these tools provide a platform for faster development and maintenance because of the style of programming and the emphasis on reusability of code. To explore that answer fully, however, we need to cover two issues: (a) why other tools are less appropriate and (b) what makes object-oriented tools appropriate.
Non-Object-Oriented Tools
Programmers select languages and tools that allow them to leverage scarce resources while best meeting the users' needs. In the early days of computing, programmers used machine code, and later assembler code, to leverage the power of the available hardware. In other words, the available computing power was so minimal (in comparison to today's computers) that programmers chose languages that required the computer to do the least amount of interpretation, thereby allowing maximum computing power to be put on the task at hand. However, programming in this way is difficult, especially if the application is the least bit demanding. Later, as computers gained in capability and corporate computing needs focused on accounting, inventory, and other transaction-based programs, programmers selected tools that excelled in repeated operations on numbers; the preferred software technology was procedural, such as that represented by BASIC or COBOL.
Since these tools represent the foundation of the greatest percentage of operational code, they should be considered for DSS design. Using procedural tools, programmers provide a set of instructions the computer must follow each time the program is invoked. The code might provide points for branching, but the fundamental routine of instructions is the same each time the program is run. A good program is one that is structured, because such programs are easily maintained and more likely to work reliably. This means that there is a primary routine through which data must flow each time the program is invoked which calls all other routines. All the routines in the program must follow one of the three basic control structures: sequence, iteration, or alternation. Hence, all users "enter" the program through the same route and all users "exit" the program through the same route. Simple programs are quite easy to write using procedural tools, but more complex programs are quite difficult to write. More important, though, is that sophisticated programs (such as those necessary for DSS) are difficult to maintain.
Procedural programming is in use because it has provided an adequate methodology for accomplishing repetitive and straightforward tasks that do not change substantially over time. For example, such programming tools form a reasonable basis for developing payroll systems because there are certain procedures that must be done each time a pay check is issued. When the tax rules change, some of those procedures change, but even then it is a minor type of change to the system.
Suppose, instead, that we are programming the task of running a major corporation. The task in one meeting might be simple arithmetic while in another meeting it could be assembling project teams. It is easy for humans to see that the concept of "addition" is the same whether we are adding two numbers to get a sum or adding two employees to make a list. However, in a computer routine, it is difficult to substitute "Jawarahal Nehru" and "Pocahontas" for the numbers "three" and "five." The result of the computer operation in the first case is a list including the names Jawarahal Nehru and Pocahontas. The result of the second operation is a number (the sum of eight). To humans, both processes are addition, and it is a minor logical change to process the two examples. For the computer code, on the

KINDS OF DEVELOPMENT TOOLS
other hand, this is a major difference in operation, and we must make substantive changes in coding to accommodate the different processes. In fact, even the minor screen changes to display the differences in information can cause major programming needs.
In addition, programmers develop most procedural applications in a vacuum. Each programming effort begins from scratch, with little or no reliance upon the other systems that have been developed over the years (unless the new code must interface with existing code). Each designer and programmer has peculiarities to their own approach, and so each program provides its own set of problems and own maintenance needs over time. Completed separately, there is no opportunity to fix multiple programs at once and no opportunity to learn from one's past experiences. Maintenance, including correcting earlier mistakes and making enhancements and changes, takes time and money. Most MIS shops are so overwhelmed with application needs that they cannot respond to needs for changes and updates in a timely fashion, and most procedurally written programs are so complex that end users cannot change them. Such an environment does not provide either the reliability needs or the implementation speed necessary to respond to decision-making needs. Furthermore, it contributes to the high cost of systems development and thus of computing costs.
While most existing programs are procedural, other kinds of programming tools might be considered for DSS. For example, declarative programming provides a more fundamental approach to programming, but it is also a much more complex programming environment. The programming effort was to develop a logic base for the problem under consideration in environments such as Prolog or LISP. To run the program, a user provides the system all the information known, and then the system attempts to use its logic base to form a conclusion. Clearly these tools could provide solutions to complex problems. However, when introduced, they required specialized machines or were resource intensive and caused problems in conventional media. The hardware available at that time did not support such languages well and most corporations abandoned them to "special projects."
However, some declarative tools evolved into "access tools." In access-oriented pro-gramming, changes in the values of some fields can cause procedures to be invoked. This may mean that some flag or counter has changed value so that expected procedures happen, such as counting the days in a week and issuing paychecks on the last day. Or it may mean that some new information has been made available to the system and that its availability causes programs to run. For example, suppose the system waits to perform a pre-scheduled analysis until data are available from all plants at an organization. Hence, when the data are sent electronically and retrieved by the system, it automatically "knows" to begin running the reports. Finally, it may mean that a value of some variable has changed unexpectedly, triggering specialized procedures that bring this information to the attention of the human decision maker. For example, a DSS designed to trade stocks and bonds might bring a suggestion of action to the decision maker when unusual or unexpected changes happen in the marketplace.
This access programming clearly is different from procedural programming, which requires users to begin at the top and move systematically and predictably through the code. Access programming tools are better suited to DSS needs because they provide exactly the kind of response to changes that managers make and that DSS therefore need to support. Current technologies require such programs to be rewritten each time a new application is created. However, when presented with object-oriented code as hybrid code, access programming provides an excellent medium on which to build a system to provide support for decision making.
To review, there are several problems with using non-object-oriented tools for DSS development. The main ones are that the resulting systems generally take too long to be

352 OBJECT-ORIENTED TECHNOLOGIES AND DSS DESIGN
created, have specialized maintenance needs, and need to be rewritten each time a new application is created. Instead, a good environment is one in which the DSS is created quickly using known, reliable components of code from other systems where appropriate and that provide a seamless interface among applications. These attributes can be achieved through object-oriented tools.
Object-Oriented Tools
Object-oriented programming, as the name suggests, revolves about the definition of ob-jects. Objects, or, as they are sometimes called, classes of objects,2 are components or ingredients that are of importance to the system. They can be identified by naming all the "real-world" things of interest, all the general groups of items, or all the abstract nouns describing items of interest to the system. Objects can represent individual items or groups of items.
Defining Objects. As we have said, we can identify objects by analyzing the char-acteristics of the problem under consideration. In doing this, designers must recognize all relevant tangible objects. In addition, they need to catalog all roles relevant to the decision task (including the operations performed or the roles played by individuals), interactions (in terms of either personal contact or transactions), important events, specifications, and all incidents of importance to the decision task. It is also useful to identify devices with which the system or its users need to interact, locations, and organizational groups.
It is best to begin the identification of classes with the simplest view of the system. For example, in the car-purchasing system discussed earlier in the book, we might define the classes of "consumer," "automobile," and "acquisition strategy." Clearly there are people who will use the system, automobiles that will be described in the system, and strategies for acquisition that will be recommended by the system. In addition, there is a fourth class of importance, the automobile database. While the database itself describes information about the automobiles, the database object describes how the information about cars is maintained, accessed, and updated. Hence, the database needs to be defined as a separate object, with additional attributes in need of identification.
Figure 8.1 illustrates these four basic objects3 and their relationships within the basic car system. In particular, it notes that consumers acquire automobiles, secure acquisition
2 At this time, the terminology is not consistent among authors and among computer package imple-mentations. Some authors and some packages use the terms "object" and "class" interchangeably. However, in some languages, such as C++, class is the description of the entity. For example, the definition of possible attributes of a bicycle being style, manufacturer, number of speeds, color, and so on, is referred to as a class, while a specific example of the class, say Larry's bicycle, is referred to as an object. Hence, authors who use C++ (or a similar language) in their examples (or simply who are most familiar with C++) will use terminology consistent to that language. In other environments, the definition of possible attributes is referred to as a class but a specific example of the class is referred to as an "instance." Similarly, authors using such packages may use the terms in a manner consistent with that usage. Here, we will use the terms interchangeably. However, the reader is encouraged to be cautious when moving to other authors or packages as they may use the terms differently. 3This is meant to be an example of object definition. It is not intended to be an exhaustive search for all relevant objects for the purpose of the system. Similarly, the reader should not assume that the remaining sections on attributes and inheritance provide a complete view of those aspects of objects.

KINDS OF DEVELOPMENT TOOLS
Search Customer Secures
Automobile database
Acquisition strategy
Automobile
Figure 8.1. The classes and their relationships.
strategies, and search the automobile database. Similarly, it states that automobiles must qualify for particular acquisition strategies and that the automobile database describes possible automobiles. Hence, Figure 8.1 provides a basic understanding of how the system will work. Said differently, this figure provides the basic explanation for the messages that will be sent between pairs of classes.
Complete and accurate object definition is crucial. While it seems simple enough to define all of the tangible aspects of a problem in terms of objects, most individuals think about applications procedurally, not as objects, and so it is difficult to find all the relevant objects. This problem is exacerbated for programmers who are not familiar with the business since, as we saw from the literature reviewed in Chapter 2, the tendency to think procedurally is more pronounced for individuals inexperienced with the task at hand. Of course, the systems developer is likely to be inexperienced with the task for which the system is created, and hence the problem is exacerbated. While he or she may identify the major categories of objects, less obvious objects, as well as systems-based objects such as forms, databases, or approvals, may be overlooked.
It is necessary therefore to think of other rules that facilitate the identification of objects in a system. First, the object definitions must provide a template for classifying and organizing all information about an application. If all objects are defined, and defined properly, then DSS designers should be able to define all operations and procedures specified by the decision maker with the defined objects. Relationships that cannot be specified with the available objects highlight the need for new objects. For example, suppose we had not specified "customer" as an object earlier. If the designer tried to explore relationships between the automobile and the customer's preferences for options, financial limitations or driving history without the customer object, he or she would easily confuse characteristics of a given automobile with characteristics preferred by the customer and hence find the resulting analysis and design impossible. Such situations would cause a designer to seek a new object, in this case, "consumer."

354 OBJECT-ORIENTED TECHNOLOGIES AND DSS DESIGN
Figure 8.2. Sample website.
Second, all items that are similar in nature should be grouped together. If there are too many unrelated objects that seem to have similar characteristics, the DSS designer should look for a new "superclass" that joins together such objects. This concept and its implications will be discussed shortly with regard to "inheritance."
Finally, the designer needs to remember that each part of the system framework is in itself an object. The examples in this book have been written using HTML and Javascript, sometimes accompanied by Cold Fusion. These are object-oriented tools. They have some objects that are built into the tool. For example, when considering a Web page, the window is an object. Similarly, the document that is displayed in the window is a document. A graphic is an object, as is a button, a frame, or a textbox. Each example of those objects is a specific condition of the object itself, referred to as an instance.
So, consider the very simple website shown in Figure 8.2. This consists of a number of objects. First, the window is an object; there is only one window showing, so there is only one instance of the object window. Similarly, the document (usually indicated by the URL) is an object, and there is only one instance of that object as well. A table is also an object. In this case, there are two tables, one across the top with the link information and one in the middle of the page holding the substance of the page. The browser needs to keep track of two instances of this object because they look different (e.g., one has a frame where the other does not); they appear at different places on the screen and include different numbers of cells and different information.
In defining objects, designers use an iterative approach followed by logical system design. When designing becomes difficult, designers return to the stage of object definition. In fact, some object-oriented programming platforms will create objects and their attributes automatically as they are used. The beauty of object-oriented programming, however, is that we can add new objects as needed without changing the available objects or code that has been written.
Attributes and Methods. Each class is a receptacle holding both data and instruc-tions for acting upon the data. The data provide information through which we can gain

KINDS OF DEVELOPMENT TOOLS
a better understanding of the object, its characteristics, and its behavior. Such information helps the designer understand the necessary specifications for the database management system as well as for the user interface and model management systems. The data must be specified so it is possible to enumerate values, define data types, or outline ranges of values they might assume. There are two kinds of information about the objects that must be kept, the attributes and the methods. Attributes represent the characteristics of the object defined in the system, whereas methods define both the messages understood by the object and the action implemented by the object as a result of the message.
For example, Montlick (1995, p. 2) defines a particular object, "Dog." The Dog class defines messages that "the Dog object understands such as 'bark,' 'fetch,' and 'roll-over.'" The method defines the action taken as a result of the message. The method may be stated simply or may include multiple arguments to convey the requisite information. Montlick continues his example with the message "roll-over," which "could contain one argument to say how fast and a second argument to say how many times" (Montlick, 1995, p. 2). Different instances (or actual occurrences) of objects may implement meth-ods differently. For example, one instance, say "Spot," may go to sleep after receiving the message "roll-over," while another instance, say "Atlas," may roll over three times quickly.
Let us return to the consideration of a window as an object. Table 8.1 shows the attributes of a window (and its subcomponents) that are built into a browser. The page has a top, height, and width that locate it on the page. It has a location that describes where it is. The document within the window has a URL, a date it was last modified, a page that referred it, and a title. These are all attributes of the window (and docu-ment within the window). When we create a Web page, we are either defining each of those attributes or allowing the individual viewing the page to define those attributes. You could, however, also change any of those attributes via Javascript. For example, suppose your Web page has one link for new customers and another for established customers, such as is shown in Figure 8.2. You could set the status line to change depending on whether the mouse moved over the link "new customers" or "established customers" by taking advantage of the "status" attribute of window (and some methods not yet discussed).
Notice that when we use these attributes we use the form of the object "dot" attribute. So, it is window.status (read, the status of the window) to be clear as to the object the attribute of which is being set.
<A HREF="newcustomer.html" onmouseover= "window.status= 'Welcome to our system!'; return true" onmouseout= "window.status = 'We are glad you stopped by . . .we hope
to make you part of the family!'"> New User</A> or <A HREF="veterancustomer.html"
onMouseOver= "window.status= 'Welcome Back! We appreciate your business'; return true"
onmouseout= "window.status = 'Check out our specials!'"> Experienced User</A>

356 OBJECT-ORIENTED TECHNOLOGIES AND DSS DESIGN
Table 8.1. Properties of the Object "Window" (and Subobjects) available in HTML and XML
closed defaults tatus document
body cookie domain lastModified referrer title URL
history length
length location
hash host hostname href pathname port protocol search
name opener outerHeight outerWidth pageXOffset
pageYOffset
parent personalbar
scrollbars self status statusbar toolbar top
Returns whether or not a window has been closed Sets or returns the default text in the status bar of the window document
Gives direct access to the <body> element Sets or returns all cookies associated with the current document Returns the domain name for the current document Returns the date and time a document was last modified Returns the URL of the document that loaded the current document Returns the title of the current document Returns the URL of the current document
Returns the number of elements in the history list Sets or returns the number of frames in the window
Sets (or returns) the URL from the hash sign (#) Sets (or returns) the host name and port number of the current URL Sets (or returns) the host name of the current URL Sets (or returns) the entire URL Sets (or returns) the path of the current URL Sets (or returns) the port number of the current URL Sets (or returns) the protocol of the current URL Sets (or returns) the URL from the question mark (?) Sets (or returns) the name of the window Returns a reference to the window that created the window Sets (or returns) the outer height of a window Sets (or returns) the outer width of a window Sets (or returns) the X position of the current page in relation to the upper left
corner of a window's display area Sets (or returns) the Y position of the current page in relation to the upper left
corner of a window's display area Returns the parent window Sets whether or not the browser's personal bar (or directories bar) should be
visible Sets whether or not the scrollbars should be visible Returns a reference to the current window Sets the text in the status bar of a window Sets whether or not the browser's status bar should be visible Sets whether or not the browser's tool bar is visible or not Returns the topmost ancestor window
Source: Adapted from W3 Schools, http://www.w3schools.com/htmldom/dom_obj_window.asp. The list is reprinted with permission.
As said previously, in addition to attributes, objects have methods. These are messages to which the object can respond. A set of methods associated with the window and its associated subcomponents is shown in Table 8.2. As you can see from the list, these methods can change the window dynamically. One example that appears in Figure 8.2 is the documentation at the bottom of the page. The location of the Web page and the date of its last update take advantage of the attributes location and lastModified and the method,

KINDS OF DEVELOPMENT TOOLS 357
Table 8.2. Methods of the Object "Window" (and Subobjects) available in HTML and XML
Window Methods alert() blurO clearlntervalO clearTimeout() close() confirmO
createPopupO focus() moveByO moveToO open() print() prompt() resizeByO resizelbO scrollByO scrollTo() setlnterval() setTimeout()
Document Methods open()
close()
getElementByldO getElementsByNameO getElementsByTagNameO
write()
History Methods back() forwardO go()
Displays an alert box with a message and an OK button Removes focus from the current window Cancels a timeout set with setlnterval() Cancels a timeout set with setTimeout() Closes the current window Displays a dialog box with a message and an OK and a cancel
button Creates a pop-up window Sets focus to the current window Moves a window relative to its current position Moves a window to the specified position Opens a new browser window Prints the contents of the current window Displays a dialog box that prompts the user for input Resizes a window by the specified number of pixels Resizes a window to the specified width and height Scrolls the content by the specified number of pixels Scrolls the content to the specified coordinates Evaluates an expression at specified intervals Evaluates an expression after a specified number of milliseconds
Opens a stream to collect the output from any document.write() or document.writeln() methods
Closes an output stream opened with the document.open() method and displays the collected data
Returns a reference to the first object with the specified ID Returns a collection of objects with the specified name Returns a collection of objects with the specified tagname open() Opens a stream to collect the output from any document.write() or
document.writeln() methods Writes HTML expressions or JavaScript code to a document
Loads the previous URL in the history list Loads the next URL in the history list Loads a specific page in the history list
Location Methods assign () reload () replaceO
Loads a new document Reloads the current document Replaces the current document with a new one
Source: Adapted from W3Schools, http://www.w3schools.com/htmldom/dom_obj_window.asp. The list is reprinted here with permission.

358 OBJECT-ORIENTED TECHNOLOGIES AND DSS DESIGN
write. This method causes something to be written on the Web page when it first loads. The code that caused this to appear is as follows:
<script language="JavaScript"> // This automatically updates the last modified date for the page. // document.write("This page was last modified on: " + document.lastModified
+ "<br>") // // This automatically updates the location documentation on the page. // document.write("URL: " + document.location) //
</script> <br>Page Owner: <a href = "http://www.umsl. edu/~sauter/">Professor Sauter</a> (<a href="mailto:[email protected]">[email protected]</a>)<br>
As with the previous example, the attributes are listed after the object. So, docu-ment.lastModified can be thought of as the date of modification of the document. The methods use similar notation. So document.write means to write on the document. Specif-ically, it is asking the browser to put the documentation of the last modification and the location of the page (with the identifying literals) on the page. If you change the page or change the name of the page, the directory in which it sits, or even the server, the documen-tation will be updated automatically. This can be combined with static HTML as shown, in the example, and the page viewer cannot tell the difference.
One can use these methods to have more impact on the system's behavior as well. Suppose that instead of changing the status line when a veteran user returns that you cause a new window to appear, such as shown in Figure 8.3. To cause this to happen, one needs to substitute the following code for that which was described earlier:
<SCRIPT LANGUAGE="JavaScript"> function windowOpen()
{ height=.5*screen.outerHeight width=.5 * screen.outerWidth startWidth= width+7 myWindow = window.open
("application.html","windowRef","top "width=" + width + ",height=" + height + ",top=0,left=" + startWidth + ",focus=yes");
} //--> </script>
<A HREF="newcustomer.html"

KINDS OF DEVELOPMENT TOOLS 359
onmouseover= "window.status= 'Welcome to our system!'; return true" onmouseout= "window.status = 'We are glad you stopped by ... we hope to make you part of the family!'">
New User</A> or <A HREF="veterancustomer.html" onClick="windowOpen();return false">
Experienced User</a>
In this example, the method of the hypertext, "onClick," is used to call a user-defined function. This function, called "windowOpen," first uses the screen attributes "outerHeight" and "outerWidth" to measure the amount of space available on the screen. It then uses the method of window "open" to cause a new window to open. The function uses the various attributes of the window to specify the location and height and width of the window as well as the document that should be loaded in the window. This new document has definitions of what functions should be loaded and in what place.
The data used in the DSS can also be object based. Consider the class "automobile." It would have many attributes, including the manufacturer, model, size, and performance. These are the way that we describe and ultimately compare the automobile. These are shown in Table 8.3. Similarly, Table 8.4 provides the attributes of the class "automobile database." Notice that while some of the characteristics, such as those directly related to the specific automobiles, are the same as in Table 8.3 (the automobile attributes), other
Figure 8.3. Sample of using methods.
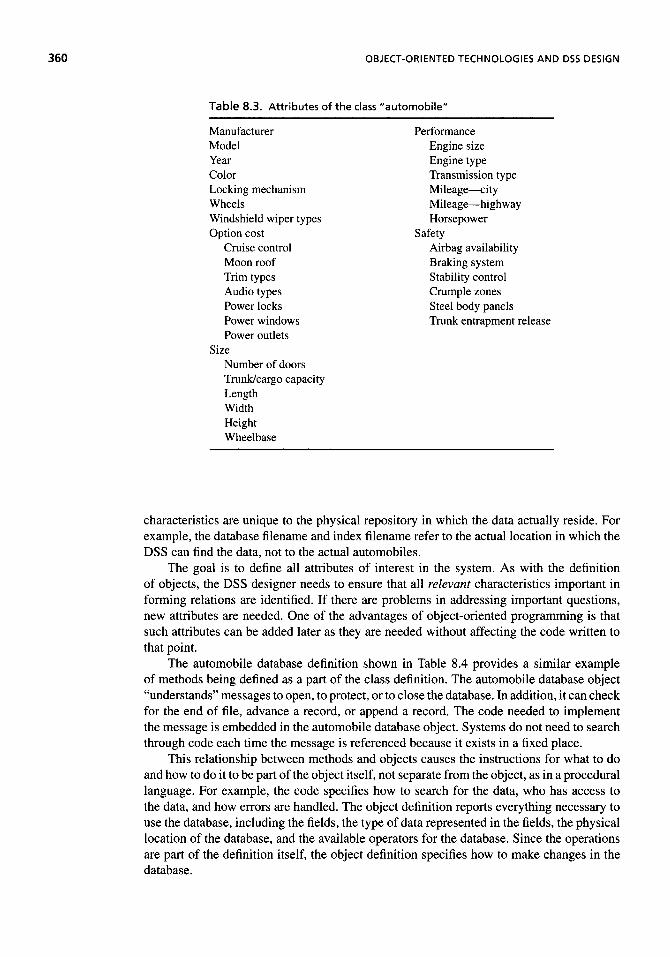
OBJECT-ORIENTED TECHNOLOGIES AND DSS DESIGN
Table 8.3. Attributes of the class "automobile"
Manufacturer Model Year Color Locking mechanism Wheels Windshield wiper types Option cost
Cruise control Moon roof Trim types Audio types Power locks Power windows Power outlets
Size Number of doors Trunk/cargo capacity Length Width Height Wheelbase
Performance Engine size Engine type Transmission type Mileage—city Mileage—highway Horsepower
Safety Airbag availability Braking system Stability control Crumple zones Steel body panels Trunk entrapment release
characteristics are unique to the physical repository in which the data actually reside. For example, the database filename and index filename refer to the actual location in which the DSS can find the data, not to the actual automobiles.
The goal is to define all attributes of interest in the system. As with the definition of objects, the DSS designer needs to ensure that all relevant characteristics important in forming relations are identified. If there are problems in addressing important questions, new attributes are needed. One of the advantages of object-oriented programming is that such attributes can be added later as they are needed without affecting the code written to that point.
The automobile database definition shown in Table 8.4 provides a similar example of methods being defined as a part of the class definition. The automobile database object "understands" messages to open, to protect, or to close the database. In addition, it can check for the end of file, advance a record, or append a record. The code needed to implement the message is embedded in the automobile database object. Systems do not need to search through code each time the message is referenced because it exists in a fixed place.
This relationship between methods and objects causes the instructions for what to do and how to do it to be part of the object itself, not separate from the object, as in a procedural language. For example, the code specifies how to search for the data, who has access to the data, and how errors are handled. The object definition reports everything necessary to use the database, including the fields, the type of data represented in the fields, the physical location of the database, and the available operators for the database. Since the operations are part of the definition itself, the object definition specifies how to make changes in the database.

KINDS OF DEVELOPMENT TOOLS 361
Table 8.4. Attributes of the class "automobile database"
Manufacturer Model Year Color Locking mechanism Wheels Windshield wiper types Option availability
Cruise control Moon roof Trim types Audio types Power locks Power windows Power outlets
Size Number of doors Trunk/cargo capacity Length Width Height Wheelbase
Performance Engine size Engine type Transmission type Mileage—city Mileage—highway Horsepower
Safety Airbag availability Braking system Stability control Crumple zones Steel body panels Trunk entrapment release
Database filename Database location Access rules Action rules End-of-file Record number Index file Active Status Error message Default error handling
Inheritance. Sometimes objects consist of major subcategories of instances that share specific attributes or methods not shared among all instances of the object. Consider again the automobile object defined earlier. While there are certain characteristics for all automobiles, such as those defined as attributes of the automobile class, there are other attributes relevant for only some cars. For example, knowing whether the automobile is new or previously owned dictates additional attributes and methods relevant to the object.
Similarly, within the class "acquisition strategy," there are multiple options, including "purchase outright," "purchase with a loan," and "lease." As with the class of automobile, there are some characteristics that join all three of these objects together and other char-acteristics that differentiate them. Finally, within the class "consumer," we can define the objects "first time consumer," "moderately knowledgeable consumer," and "experienced consumer." There is some information which the system will need about all consumers and some operations that will be done on all consumers. As you will see shortly, much of the art of object-oriented programming is in determining the best way to define classes and objects of those classes.
When examples of major subclasses exist, subobjects are defined with their basic definition inherited from the original definition of the object. That is, when the new object is defined, it will contain all attributes and methods from the original object (also known

OBJECT-ORIENTED TECHNOLOGIES AND DSS DESIGN
as a superobject). Programmers may then add additional attributes, additional methods, or both, but they may not change or delete the original, inherited attributes and methods.
Consider again the class of automobile. Table 8.3 outlines some of the attributes that are defined at the class level. All automobiles have those attributes, and so they should be defined when automobiles are defined. However, within the subclasses of "new automobile" and "previously owned automobile," there are additional characteristics that are not relevant in objects in the other subclass. By defining these two categories as subclasses of the object "automobile," they will inherit all attributes of automobile. That is, prior to any other definition, we would know that "new automobiles" and "previously owned automobiles" will both have all of the attributes listed in Table 8.3. If the name of an attribute is changed in, added to, or deleted from the definition of automobile, it will be changed in, added to, or deleted from the definition of new automobiles and the definition of previously owned automobiles automatically.
In addition, by defining these categories as objects, programmers can define other attributes that have meaning to all instances of the particular class. For example, consumers are interested in attributes such as the suggested retail price, the availability of particular options, and the estimated future value of the automobile for new cars only. The character-istics that vary across automobiles should be included. However, anything that is constant across all these cars should not be included. For example, in 1931, heaters and rear-view mirrors were considered options on new cars, and hence the definition of a 1931 new auto-mobile object would include the availability of a heater and the availability of a rear-view mirror as fields. However, heaters and rear-view mirrors have long since been adopted as standard equipment on all cars, and thus these fields should not be identified in today's new automobile object. An example of the kinds of items needed in the definition of the new automobile object is shown in Table 8.5; the shaded regions represent attributes inherited from the original automobile class.
Similarly, we can define attributes that have meaning to all instances of previously owned automobiles.Table 8.6 illustrates the attributes associated with previously owned automobiles, with the shaded regions representing the inherited attributes of automobiles. This object also inherits the attributes of the automobile object defined earlier. The pro-grammer is allowed to define characteristics unique to the condition of being previously owned, such as information about the car's age, its condition, the previous mileage, and other information that might suggest the automobile's condition.
We continue to decompose objects into smaller objects as the application dictates. If designers can gain some generalized information by decomposing an object, then they should do it. For example, suppose there are some major differences among the attributes that are relevant to new automobiles depending upon whether the "make" of the automo-bile is considered "luxury" or "sports" or "conventional." In this case, the designer might decompose the object "new automobile" discussed earlier by defining three subclasses, "new luxury automobile," "new sports-model automobiles," and "new conventional auto-mobiles." Through inheritance, each of these new objects would have all the fields of the original "automobile" object as well as those added when defining the "new automobile" object as well as further relevant fields added to each class.
Inheritance also allows the designers to avail themselves of the advantages of system-defined and system-based functions. For example, the definition of actions of any database is taken from a system-defined database. Hence, if the system were altered to enable new functionality, such as multiple indexing, it need only be defined in the system-level definition of the object database. Specific instances of databases, such as the automobile database, receive this update automatically because they inherit the system definition of

KINDS OF DEVELOPMENT TOOLS 363
Table 8.5. Attributes of the class "new automobile"
methods dynamically. That is, they not only inherit the characteristics available at the time of creation of the instance but also receive all the changes to the definition of the superclass as they are made over time.
Another example can be created by considering "windows" in a system. Suppose for a particular application the designer wants assistance pages that are consistent. However, the designer wants all of the statistical assistance pages to appear with the title "STATIS-TICAL ASSISTANCE" but all of the financial assistance pages to appear with the title "FINANCIAL ASSISTANCE." The designer could create a new object called "Assistance Window." The "Assistance Window" would inherit the characteristics of the system-defined class "Window." Hence, it would have the attributes of being visible or not (without calling it), whether it is sizable, movable, closeable, and so on, and its location and its size. At that level, the designer could specify the size, location, and other characteristics of importance
Manufacturer Model Year Color Locking mechanism Wheels Windshield wiper types Option availability
Cruise control Moon roof Trim types Audio types Power locks Power windows Power outlets
Size Number of doors Trunk/cargo capacity Length Width Height Wheelbase
Performance Engine size Engine type Transmission type Mileage—city Mileage—highway Horsepower
Safety Airbag availability Braking system Stability control Crumple /ones Steel body panels Trunk entrapment release
Standard packages/additional costs Wheels Radio Tires Transmission Safety Rear-window defogger
Option cost Cruise control Moon roof Trim types Audio types Power locks Power windows Power outlets
Purchase Information Suggested retail price Estimated dealer's cost Consumer's target price Destination charge Options cost
Estimated future value Expected resale in 5 years Expected maintenance costs—5 years Expected repair costs—5 years Owner's total cost

364 OBJECT-ORIENTED TECHNOLOGIES AND DSS DESIGN
Table 8.6. Attributes of the class "used automobile"
to the application. After said definition, the designer could create two subclasses, "Statisti-cal Assistance Window" and "Financial Assistance Window." Since these are subclasses of the "Assistance Window" object, they would inherit all the specified attributes and hence both the "Statistical Assistance Window" and the "Financial Assistance Window" would automatically have the size, location, and other attributes desired by the designer. The title, display, and functionality then could be specified differently for each window. If in a revision of the system the designer decided to resize or relocate the assistance windows, the change would only need to be done once, at the "Assistance Window" object level.
Models and model management functions also are identified as objects in an object-oriented DSS. These objects, like all objects, have attributes and methods associated with them and subclasses that inherit the properties of higher level classes. For example, we can use Geoffrion's (1987) structured modeling framework as the kernel of a model management system of a DSS. Designers would define superobjects of "models" and "solvers" that could be placed into libraries for use in a specific DSS. These classes would have attributes such as the five defined by Geoffrion (1987): primitive entity, compound entity, attribute, function, and test. As he defines them, they represent the basic foundation attributes of a model, the specific rules for processing the model, known constants, and ways of testing the models. In addition, the classes could have subclasses that inherit attributes from them. For
Manufacturer Model Year Color Locking mechanism Wheels Windshield wiper types Option Cost
Cruise control Moon roof Trim types Audio types Power locks Power windows Power outlets
Size Number of doors Trunk/cargo capacity
[ Length Width Height Wheel base
Performance Engine size Engine type Transmission type Mileage—city M i leage—h i gh way Horsepower
Safety Airbag availability Braking system Stability control Crumple zones Steel body panels Trunk entrapment release
Age of car Condition of car
Engine Outside appearance Inside appearance
Mileage attained on car Color Expected price Recall history Price
Original price Asking price Current wholesale Average retail

BENEFITS OF OBJECT-ORIENTED TECHNOLOGIES FOR DSS 365
example, we could trace the attributes of a linear programming model to its subclass, the transportation model, and, in turn, to its subclass the assignment model. At each level, the messages necessary for model management and solution simplification would be identified as a part of the object definition.
Facets. The attributes in turn have facets. These facets define the way in which the system should consider the attributes when no additional information has been provided. Of course, the relevant facets are a factor of what attribute of what object is being considered. If the object is a data-oriented object, relevant facets might include (1) the initial value, (2) the default value, (3) the search order for determining the value of the instance, (4) the methods for addressing unknown values, (5) the methods for addressing confidence in the information, (6) the display from which the system queries the user for information, and (7) the information provided when the user requests more information. On the other hand, if the object is a model-oriented object, one might specify the solution procedures or the model initial parameters. These facets allow the designer some control over how information is sought and used in relation to a particular object.
BENEFITS OF OBJECT-ORIENTED TECHNOLOGIES FOR DSS
As we review the tools available for designing and building DSS, it is important to restate the objectives of the process. In this case, there are two primary ones. First, once DSS are identified, they must be built well, but quickly, so that decision makers can glean the greatest strategic advantage from them. Second, once DSS are in place in an organization, they must be able to change quickly in response to changes in the decision makers' perspectives, tasks, and information preference.
The previous section has illustrated some of the benefits of object-oriented tools and some of the liabilities associated with other kinds of design tools. The argument for the object-oriented tools boils down to the potential to reuse code that can facilitate rapid development of systems as well as rapid adaptation of systems in use. Since objects include necessary code for implementation, programmers can reuse already available objects to perform the same functions across multiple applications. For example, Vayda Consulting company, on a project for Siemens Industrial Automation, let "MIS leverage the work of the best specialists" by developing a library of objects that were reused multiple times (Adhikari, 1995, p. 34). Further, object-oriented programming provides a similar but more powerful level of control over procedures. Since object-oriented tools isolate program functions and data characterization, designers and programmers can easily change one function without rewriting multiple aspects of the application. Thus, development and adaptation are made easier and faster. The Zurich Insurance company reduced the amount of time spent on coding and testing by one-half and the amount of time spent of integration of systems by three-quarters. Similarly, at the Federal Reserve, the designers completed an object-oriented project in two months that had previously taken a year using conventional procedural programming (Adhikari, 1995). If the object-oriented technologies can be married to the "access programming" defined earlier, resulting programs can mimic the decision maker's thought process and thus allow greater flexibility in use of the system.
There are, of course, some problems associated with development in object-oriented programming. These include compatibility of platforms and indexing of objects so others can find them. However, by far the biggest problem is for developers to learn to think in
OBJECT-ORIENTED TECHNOLOGIES AND DSS DESIGN
objects. Over time and with enough education and experience, however, these problems can be resolved.
SUGGESTED READINGS
Adhikari, R., " Code Recycling Saves Resources," Software Magazine, Vol. 15, No. 7, July 1995, pp. 31-37.
Agnetis, A., R. Basosi, K. Caballero, G. Ciaschetti, M. Casini, P. Detti, M. Federici, F. Franchi, A. Garulli, C. Mocenni, S. Paoletti, A. Tiribocchi, L. Torsello, A. Vercelli, D. Verdesca, and A. Vicino, "Development of an Information Technology Tool for the Management of Southern European Lagoons under the Influence of River-Basin Runoff (DITTY Project)," University of Sienna: UNISI. Center for Complex Systems Studies, EVK3-CT-2002-00084, n.d., avail-able: http://csc.unisi.it/ditty/Deliverable%20WP8/WP8_DSS_Report_final.pdf, viewed September 1, 2009.
Blecker, T., and G. Friedrich, Mass Customization Information Systems in Business, Hershey, PA: IGI Global, 2007.
Booch, G., Object-Oriented Analysis and Design with Applications, New York: Addison-Wesley, 1997.
Coad, P., and E. Yourdon, Object-Oriented Design, Englewood Cliffs, NJ: Prentice-Hall, 1991.
Geoffrion, A., "An Introduction to Structured Modeling," Management Science, Vol. 33, No. 5, May 1987, pp. 547-588.
Harmon, P., and C. Hall, Intelligent Software Systems Development, New York: Wiley Professional Computing, 1993.
Hayne, S. C , and M. Pendergast, "Experiences with Object-Oriented Group Support Software De-velopment," IBM Systems Journal, Vol. 34, No. 1, 1995, pp. 96-119.
Huh, S. Y, "Modelbase Construction with Object-Oriented Constructs," Decision Sciences, Vol. 24, No. 2, Spring 1993, pp. 409-434.
Kim, W., "Object-Oriented Databases: Definition and Research Dimensions," IEEE Transactions on Knowledge and Data Engineering, Vol. 2, No. 3, September 1990, pp. 327-341.
Korson, T., and J. D. McGregor, "Understanding Object-Oriented: A Unifying Paradigm," Commu-nications of the ACM, Vol. 33, No. 9, September 1990, pp. 40-60.
Lenard, M. L. "An Object-Oriented Approach to Model Management," Decision Support Systems, Vol. 9, No. 1, January 1993, pp. 67-73.
Level5 Object User's Guide, New York: Information Builders, 1990.
Montlick, T., What Is Object-Oriented Software? Bethlehem, CT: Software Design Consultants, 1995, available: http://www.soft-design.com/softinfo/objects.html.
Morrison, K. M., "Warming Up to Objects," DEC Professional, Vol. 14, No. 7, July 1995, pp. 20-24.
Muhanna, W A., "An Object-Oriented Framework for Model Management and DSS Development," Decision Support Systems, Vol. 9, No. 3, March 1993, pp. 217-229.
Murphy, F. H., and E. A. Stohr, "An Intelligent System for Formulating Linear Programs," Decision Support Systems, Vol. 2, No. 1, January 1986, pp. 39-47.
Nielsen, K., Object-Oriented Design with Ada, New York: Bantam Books, 1992.
Pol, A. A., and R. K. Ahuja, Developing Web-Enabled Decision Support Systems, Belmont, MA: Dynamic Ideas, 2007.
Roehrig, A., "Rapid Application Development of a Decision Support System Using http:// www2.sas.com/proceedings/sugi23/Posters/pl86.pdf, n.d., viewed September 1, 2009.
Schach, S., Object-Oriented and Classical Software Engineering, 7th ed., New York: McGraw-Hill, 2006.

ON THE WEB 367
Shami, M., "An Innovative Decision Support System for Solving the Renovation and Expansion Problems in Operational Infrastructure Systems," International Journal of Technology Transfer and Commercialisation, Vol. 3, No. 2, 2004, pp. 199-215.
Sodhi, M. S., "Development of a DSS for Fixed-Income Securities Using OOP," Interfaces, Vol. 26, No. 2, 1996, pp. 22-33.
Stuth, J. W., and B. G. Lyons, Decision Support Systems for the Management of Grazing Lands: Emerging Issues, Paris: Unesco, 2003.
Thierauf, R. J., Effective Business Intelligence Systems, Santa Barbara, CA: Praeger, 2001. Turban, E., J. E. Aronson, T. P. Liang, and R. Sharda, Decision Support and Business Intelligence
Systems, 8th ed., Englewood Cliffs, NJ: Prentice-Hall, 2008.
QUESTIONS
1. What attributes might be associated with an object class "flower"? How would you know if you had appropriate attributes or sufficient attributes?
2. Suppose you were developing a DSS to facilitate advising. Identify object classes and their attributes. Identify at last two instances of each of the object classes.
3. How does a designer know whether to store information about an object as an attribute or to create subclasses?
4. One goal of object-oriented design is to facilitate reusability of code. Discuss how using an object-oriented tool would help to adapt the automobile-purchasing system discussed in the book to a system of related use, such as purchasing a home.
5. Discuss how the main features of an object-oriented DSS appliance would differ from the main features of a traditional DSS appliance.
6. Discuss how using an objected-oriented DSS appliance would make designing a system easier.
7. Discuss how using an object-oriented tool can facilitate the use of evolutionary devel-opment methodologies in the design of DSS.
8. Would the procedures for selecting object-oriented DSS appliances differ from selecting conventional DSS appliances?
9. Discuss how the use of object-oriented technologies could make applications for transnational corporations easier.
10. How is the user interface design influenced by the use of object-oriented tools?
11. Discuss how the main features of an object-oriented DSS appliance would differ from the main features of a traditional DSS appliance.
ON THE WEB
On the Web for this chapter provides additional information about object-oriented pro-gramming, especially as it applies to decision support systems. Links can provide access to tutorials, and frequently asked questions (FAQ) pages about object-oriented program-ming. In addition, they link to object-oriented tools and generators, guidelines for object

368 OBJECT-ORIENTED TECHNOLOGIES AND DSS DESIGN
oriented analysis, general overview information, applications, and more. Additional dis-cussion questions and new applications will also be added as they become available.
• Links provide examples of programs written using an object-oriented language. Examples of how to complete specific tasks in an object-oriented language are available from the web site.
• Links offer success stories illustrating how object-oriented technologies facilitate the design process.
• Links provide glossaries. Access is provided to both glossaries of terms used with object-oriented technologies as well as bibliographies about the topic.
• Links provide access to information about commercial object-onentea tools.
You can access material for this chapter from the general WWW Page for the book, or, directly from the following URL: http://www.umsl.edu/~sauterv/DSS4BI/oo.html

IMPLEMENTATION AND EVALUATION
To implement a DSS is to realize the planned system. Implementation includes interpreting designs into code, but it goes far beyond coding. It also includes creating and populating databases and model bases and administering the final product, which means installation, deployment, integration, and field testing. Training users and ensuring they accept the DSS as a useful and reliable tool is yet another aspect of implementation. Finally, evaluation includes all of those steps to ensure that the system does what is needed and does it well. We will begin the discussion with implementation.
IMPLEMENTATION STRATEGY
The success of any implementation effort is highly affected by the process adopted by the implementation team. Unfortunately, there are no standard steps to ensure success; what works well in one implementation might be inappropriate in another. However, Swanson has noted nine key factors in the success or failure of information systems. These include measures that address the system itself (such as design quality and performance level), the process of design (such as user involvement, mutual understanding, and project man-agement) and the organization within which the DSS will be used (such as management commitment, resource adequacy, and situational stability). Table 9.1 provides examples of how these factors may facilitate or inhibit the implementation process. Throughout this book, specific strategies for addressing these nine factors to result in successful implemen-tation have been noted. The strategies can be summarized in five principles.
Decision Support Systems for Business Intelligence by Vicki L. Sauter Copyright © 2010 John Wiley & Sons, Inc.

370 IMPLEMENTATION AND EVALUATION
Design Insights The Fable of the Three Ostriches
Three ostriches had a running argument over the best way for an ostrich to defend hiτηself The youngest brother practiced biting and kicking incessantly* and held the black belt. He asserted thai "the best defense is a good offense." The middle brother lived by the maxim that "he who fights and runs away, lives to fight another day," Through arduous practice, he had become the fastest ostrich in the desert—which, you must admit, is rather fast. The eldest brother being wiser and more worldly, adopted the typical attitude of mature ostriches: "What you don't know can't hurt you." He was far and away the best head-burier that any ostrich could recall.
One day a feather hunter came to the desert and started robbing ostriches of their precious tail feathers. Each of the three brothers therefore took on a group of followers for instruction in the proper methods of self-defense—according to each one's separate gospel.
Eventually the feather hunter turned up outside camp of the youngest brother, where he heard the grunts and snoits of all the disciples who were busily practicing kicking and biting. The hunter was on foot, but armed with an enormous club, which he brandished menacingly. Fearless as he was, the ostrich was no match for the hunter, because the club was much longer than an ostrich's legs or neck. After taking many lumps and bumps and not getting in a single kick or bite, the ostrich fell exhausted to the ground. The hunter casually plucked his precious tail feather, after which all his disciples gave up without a fight
When the youngest ostrich told his brothers how his feather had been lost, they both scoffed at him, "Why didn't you run?1' demanded the middle one, "A man cannot catch an ostrich."
"If you had put your head in the sand and ruffled your feathers properly" chimed in the eldest, tlhe would have thought you were a yucca and passed you by."
The next day the hunter left his club at home and went out hunting on a motorcycle. When he discovered the middle brother's training camp, all the ostriches began to run—the brother in the j lead, But the motorcycle was much fasten and the hunter simply sped up alongside each ostrich and plucked his tail feather on the run.
That night the other two brothers had the last word. 4tWhy didn't you turn on him and give him a good kick?" asked the youngest. 'One solid kick and he would have fallen off that bike and broken his neck."
"No need to be so violent,'1 added the eldest, ''With your head buried and your body held low, he would have gone past you so fast he would have thought you were a sand dune."
A few days later, the hunter was out walking without his club when he came upon the eldest brother's camp. "Eyes under!" the leader ordered and was instantly obeyed. The hunter was unable to believe his luck, for all he had to do was walk slowly among the ostriches and pluck an enormous supply of tail feathers.
When the younger brothers heard this story, the youngest said, "he was unarmed/' "One good bite on the neck and you'd never have seen him again."
"And he didn't even have that infernal motorcycle" added the middle brother. "Why, you could have outdistanced him at a half trot."
But the brothers' arguments had no more effect on the eldest than his had had on them, so they all kept practicing their own methods while they patiently grew new tail feathers.
MORAL: It*s not know-how that counts; it's know-when. IN OTHER WORDS: NO single "approach " will suffice in a complex world.
Source. lThe Three Ostriches: A Fable" Material reprinted courtesy of Dorset House Publishing from G.M. Weinberg, Rethinking Systems Analysis and Design, pp. 23-24, Copyright © 1983, 1982, All rights reserved,

IMPLEMENTATION STRATEGY 371
Table 9.1. Factors Influencing Success
Issues Success Factors Failure Factors
User involvement
Management commitment
• •
• •
•
•
User involvement and interest Much user involvement and user-level application documentation Lack of end-user involvement User and data processing department cooperation
Full-management attention Top-management support
Value basis
Mutual understanding
Design quality
Performance level
Project management
Resource adequacy
Good public reaction to DSS Value of application "Second system" based on established value of first system
Designers' understanding of user needs
• Good design • Flexible design
Strong project and budget control Frequent creative project meetings Use of prototypes Careful planning and testing Good planning
• Lack of user commitment to application
• Local user involvement only
Insufficient management interest Lack of top-management involvement in key area Lack of support for required project organization
High risk
More attention to technical than to user issues Lack of user acceptance of information value Failure to understand the choice process
Nonspecific functional design specifications Inflexible design
Poor performance No performance objectives Clumsy implementation of key function
Lack of training package Excessively complex implementation approach Implementation too rushed Poor timing in terms of deadlines
Excessive use of computing resources Inadequate or poorly used resources Project leader's time not fully committed Lack of resources to make system "friendly" Insufficient technical skills Lack of designer's commitment Bad input data
{Continued).

IMPLEMENTATION AND EVALUATION
Table 9.1. Factors Influencing Success (Continued)
Issues Success Factors Failure Factors
Situational · Stability of user requirements · Departure of designer during stability implementation
• Collapse of cost justification • Change of rules during
implementation • Increasing expenses
Adapted from Swanson, E.B. Information System Implementation Homewood, IL: Irwin, 1988. Material is reprinted here with permission of the author.
Ensure System Does What It Is Supposed To Do the Way It Is Supposed To Do It
The success of a DSS implementation depends to a large measure on the quality of the system and the ease and flexibility of its use. Clearly, if decision makers do not perceive that the DSS facilitates their decisions, they will not use it. The more help the system can provide—in terms of accessing information decision makers might not otherwise know, providing insights decision makers might not otherwise have, or combining information which would have otherwise been kept isolated—the more likely the decision makers are to use it. Further, the easier it is for decision makers to access information and models, the more likely they will be to use them. Much of this book has been dedicated to describing what kinds of features need to be considered and included and how to make the information support richer.
Prototypes. One of the keys to ensuring the system will provide the kinds of in-formation desired in an appropriate fashion is to use prototypes of the DSS throughout analysis and design. Unlike with the design of transaction processing systems, designers should not expect to obtain concrete specifications at the initiation of the project. Decision makers often have difficulties abstracting how they might make choices and how they might use a system if they do not have previous experience with DSS. Further, most manual "support systems" are not well documented; decision makers simply implement a process but are not aware of it fully. Using prototypes, decision makers can discuss specific issues such as movement among screens and windows, kinds of help or other information, and layout and adequacy of information. Decision makers respond better to specific features if they see them in a prototype. Designers and decision makers decrease the likelihood of misunderstanding if they discuss the system in terms of the prototype.
Of course, there are risks associated with using a prototype. First, in order to evaluate a prototype, decision makers must be willing to spend some time using the product. This takes commitment on the part of the decision makers that may be difficult to secure. Second, if only some decision makers participate in the development of a multiuser DSS, designers risk overspecifying design to meet the needs of a subset of the population of users. Designers need to ensure that those decision makers participating in the design process are typical. Third, the final system may not respond in the same manner as did the prototype, particularly in terms of response time. Since users expect the same kind of response, designers need to manage those expectations and make sure the prototype is realistic. The evolutionary approach to designing DSS is an extension of the prototype philosophy. In this approach,
IMPLEMENTATION STRATEGY
designers start with a small but important part of the problem. As users come to reply upon this one portion of the system and thereby become more knowledgeable about their needs, they can better explain their support needs for future parts of the DSS.
Interviewing. While prototypes will help designers gain this information, they alone are not sufficient; designers must gain much of their information, particularly early in the process, from interviewing. Good interviewing requires preparation. Interviewers must prepare the environment, the opening, gather interview aids, select a strategy, and prepare a closing for the interview.
The goal of preparing the environment is to set a stage where the interviewee will focus on the task at hand and feel sufficiently comfortable to reply usefully. The location must be comfortable, private, and free of distractions and interruptions. A neutral site allows the interviewee and interviewer to work together without interruption from telephone, visitors, or other tasks that need completion (such as piles on one's desk or a calendar). The timing of the interview must also be considered. Generally it is better not to schedule interviews when the interviewee is in the middle of a task or it is close to lunch or quitting time because it is hard to get the individual's full attention. Of course, the timing must consider when the interviewer also will be free from distraction and the amount of time necessary to prepare materials. If the interviewee needs to complete a task, or review materials, or bring materials to the interview, allow time for that to be done.
The purpose of preparing the opening is to build rapport with the interviewee. Often it is helpful to consider the interviewee's background and interests or shared experiences and history. Interviewers need to be friendly and sincere and explain the purpose of the interview as well as the benefits associated with being involved. This opening must be consistent with the purpose of the interview and should not be misleading to the individual.
Prior to the interview, the designers should have gathered the relevant and necessary data, documents, checklists, or access to the information system. These materials might be part of the interview or could provide interviewers with the background necessary to complete a meaningful exchange. Interviewers should complete a checklist or interview schedule that will guide them through the process. This helps maintain the focus of the interview while ensuring that important topics will not be missed. For example, initial interviews often focus on support needs. This means the interviewer must ascertain the scope and boundaries of the tasks in which the decision makers are involved as well as the tasks in which they are not involved. Within particular activities, where possible, interviewers must determine the sequence in which decision makers complete tasks and the factors they need to consider. This includes identifying relationships of importance and the means for identifying them, the heuristics followed, and the process of verifying the outcome of an analysis.
Generally the hardest part of an interview is getting started, so it is particularly impor-tant for the interviewer to have ready a series of questions to begin the discussion. These might include the following:
• Could you give me an overview of what you do? • What initiates your activities and decisions? • How do you determine when you have examined a problem/opportunity enough to
act upon it? • What is the output of your decision-making effort? Where does it go when it leaves
you?

374 IMPLEMENTATION AND EVALUATION
• Do other individuals contribute to your decision-making effort? • What are the basic components of your decision-making effort? • Can we define terms?
Postintroductory questions are determined by the strategy of the interview. There are three basic choices: directive, nondirective, and hybrid. In a directive interview, the goal is to get specific information from the decision maker. The questions one selects are highly structured, such as multiple-choice questions or short-answer questions. Where elaboration is allowed, the questions are primarily closed, allowing very little room to deviate from a specific point. When using the directive strategy, one must be very prepared and knowledgeable about the system. Interviewers must ensure that all important issues have been identified and relevant options given.
Nondirective interview strategies, on the other hand, encourage the decision maker to speak freely within a particular domain. The style of interview is highly unstructured and questions are most likely open-ended or probe questions. Clearly, it is crucial that the interviewer be a good listener and know when to probe appropriately. The hybrid approach allows a mixture of both kinds of questions.
Often decision makers respond better to the nondirective strategy, particularly at the beginning of a project. While some decision makers will talk freely, others require more probing before the important information is obtained. Hence, the interviewer needs to be prepared with probing questions, such as:
• Can you think of a typical incident that illustrates how you make decisions? • What advice would you give to a novice just getting started? • Have you ever had a situation where...? How did you proceed? • When you get stuck, what do you do? • What was the hardest decision you ever had to make? What did you do? • What would you recommend if the data...?
If the goal is to elicit heuristics for the choice process, the interviewer might attempt questions such as:
• Do you have any rules of thumb for approaching choices such as . . .? • In these circumstances [previously described], you seem to Are there any ex-
ceptions to this process? • Are there solutions that are possible but not acceptable? How do you proceed in
those cases? • How do you judge the quality of your decision? Of the choice process itself? • How do others judge the quality of your decision? Of the choice process itself? • How do you make a decision? For what outcomes are you looking?
On the other hand, if the goal is to determine relationships between tasks, interviewers might attempt questions such as:
• This decision process X and the process Y seem to be similar. How are they alike? How are they different?
• Can you compare the task Z to anything else? • Does the process that you complete, X, depend on something else? What about Y?

IMPLEMENTATION STRATEGY 375
Similarly, if the goal is to verify the interviewer's understanding of a description, questions such as the following are appropriate:
• I understood you to say Have I misunderstood? • How would you explain in lay terms? • Is there anything about your decision process that we have omitted? • Would it be correct to say that... means...?
Of course, it is also important to understand the sources of information to which the decision maker turns when he or she needs more data, an opinion, or advice. Sources may include colleagues (who may or may not be at the company), mentors, or even people who report to them. Typically different sources are useful for different kinds of information and advice. Knowing when decision makers turn to what kinds of resources helps the designer know more about the kinds of decision aids to include in the system. By the same token, it is useful to know what websites, RSS feeds, and other resources the decision maker follows and trusts so those can be implemented into the system.
Keep Solution Simple
It is important that the DSS provide the support that the users want. That means the system must provide the necessary tools for the choice task without making the technology the focus of the decision maker's efforts. Too often, designers lose perspective on users' needs and try instead to provide users with the latest "new technology" or all of the "bells and whistles" associated with the available technology. Or, designers may computerize parts of the operation just because it is possible, not because it facilitates the choice process. This may be appealing to the designer who wants to experiment with these technologies, but it seems only a diversion to getting "real work done" to the decision maker. Hence, such approaches are likely to impede implementation processes.
Most decision needs are not "simple." In those cases, the DSS cannot be designed to be simple. However, the system as the decision maker sees it needs to be simple. Generally, the decision maker does not need to know all of the operation of the system. Similarly, the approach to solving a problem, and therefore the steps decision makers need to take, must be intuitive and uncomplicated. For example, users do not need to be aware of all components of determining the system's confidence in particular information; rather they need to know that the operation exists. Similarly, new or unsophisticated users need not understand all the flexibility in running models the system has afforded; rather they need to know how to get the base model implemented. Simplicity of use will facilitate decision makers' acceptance and ultimate institutionalization of the system.
Develop Satisfactory Support Base
User Involvement. Most people do not like change. For decision makers, this dislike may be well grounded; often they have been successful because they have long operated in a particular fashion; changing it seems counterproductive. Adapting to a new computer system, especially if they are not terribly comfortable with computers, can be a difficult enterprise. There are many reasons why such concerns exist. For example, decision makers may fear they will become obsolete with the introduction of technology, and their job responsibilities will change or ultimately have no job security. Others may feel a certain

IMPLEMENTATION AND EVALUATION
possessiveness about information which previously only they could obtain or generate. Still others may view the introduction of the DSS as an invasion into their privacy. Many managers are not secure about all of the methods they use in the choice process and therefore find the analysis phase (where informational and modeling needs are determined) uncomfortable. Finally, the introduction of the DSS may change the balance of power operating within the organization. If "information is power," by shifting the availability of information, the introduction of a DSS may be threatening the power or influence of a given decision maker or department.
While a fear of change can affect the implementation process, more often it is resistance losing control of the process that causes the bigger problem. For this reason, most designers will need to involve users throughout the analysis and design process. Users who are involved will better understand the reason for the system, the reason for choices for the design of the system, and the reason why some options were not taken. Their expectations will then be more realistic, which is crucial to effective implementation.
User involvement will also help shape the DSS and its features. Different people approach the same problem with quite different methods, including the manner in which they perceive the problem, the importance of features, and the navigation within the system. If users whose style is likely to be employed with the system participate in the design process, the system will be more usable to them in the long run. If they are involved from the beginning, they can affect the system in a stage where it is inexpensive and easy to do so. Furthermore, others not involved in the design effort might be more willing to accept the needs expressed by their co-workers but not "outsiders" of system designers.
User interaction correlates highly to later use of the system. With some users, however, designers should act on the principle of "small encounters." In other words, the designer and the decision maker will have only brief—and generally informal—interactions during which they address one or two specific issues with regard to the system. In fact, it may seem that these interactions are composed more of nonsystem discussions (or "chitchat") than of system-relevant material. The goal is to address a specific concern and to increase the decision maker's comfort level with the system.
Whenever individuals encounter unknown situations, they build a hypothesis about how their lives will change as a result, Peters (1994, p, 74) notes "the less we know for sure, the more complex the wehs of meaning (mythology) we spin,1' This leads to one of the foremost problems in implementation. If the decision makers and users do not understand what the system will do, how it will do it, or how it will be used, Ihey will tend to create scenarios about the system and its use. The greater the delay between the hint that something about the new system could be undesirable and the explanation of or discussion about the new system, the worse the scenario is drawn.
The lesson to be learned from this is to keep users and decision makers informed about j the progress of development. This leads them to perceive greater control over the situation and therefore will lead to less resistance to the implementation.
Further, they arc likely to have suggestions which, if introduced early enough in the process, might lead to a better DSS in the long run. If, however, they do not have the opportunity to voice an opinion until the system is complete, the suggestion is likely to be too expensive to implement.

IMPLEMENTATION STRATEGY 377
Table 9.2. Problems Eminating from unbalanced Influence gross design
IT Dominance User Dominance
Too much emphasis on database hygiene No recent new supplier or new distinct services New systems always must fit data structure of existing system All requests for service require system study with benefit identification Standardization dominates—few exceptions Benefits of user control over development discussed but never implemented IT specializing in technical frontiers, not user-oriented markets IT thinks it is in control of all Users express unhappiness Portfolio of development opportunities firmly under IT control General management not involved, but concerned
Too much emphasis on problem focus Explosive growth in number of new systems and supporting staff Multiple suppliers delivering services; frequent change in supplier of specific service Lack of standardization and control over data hygiene and system Hard evidence of benefits nonexistent Soft evidence of benefits not organized Technical advice of IT not sought or, if received, considered irrelevant User building networks to own unique needs (not corporate need) While some users are growing rapidly in experience and use, other users feel nothing is relevant because they do not understand No coordinated effort for technology transfer or learning from experience between users Growth and duplication of technical staffs Communications costs are rising dramatically through redundancy
User involvement in the analysis and design processes requires a balance between the influence of the designers from IT and the influence of users and decision makers. When the balance is lost, the system suffers. For example, if IT has too much influence in the system design, the DSS may not provide innovative links to resources because of concerns about compliance with other standards in the corporation. On the other hand, if the decision makers have too much influence on the system, standardization may be eliminated, and hence too many resources may be spent on maintenance and integration. Table 9.2 illustrates other examples of imbalances between designers and users of the DSS.
Commitment to Change. Commitment to change is also important. It comes only after the users have bought into the system. If they were involved throughout the process, decision makers are probably already committed to it. If not, it is difficult to gain their commitment without a demonstration of the clear benefits of the system. The organization must be committed to changing the way in which people make decisions and how infor-mation is made available. It must be committed to the project so that during the phases of development, installation, and use management understands the problems and develops solutions to them. In addition, they must have commitment to making a good effort and making the system work.
Commitment begins at the top. High-level managers cannot be negative about the project or even benignly negligent. Since their priorities set the tone and agenda for an

IMPLEMENTATION AND EVALUATION
Table 9.3. Factors Influencing Acceptance of a DSS
Organizational climate • Degree of open communication • Level of technical sophistication of users • Previous experiences with using DSS and other computer-based systems • General attitude about computer-based systems and IT • Other disruptive influences which might parallel the DSS development and implementation
Role of senior management • Attitudes of senior management toward computer-based products and the IT department, in
terms of both their actions and their statements • Adequacy of the resources devoted to the IT function in general and the DSS development in
particular • Amount of time spent on IT-related issues by senior management • Expectancies of senior management • Integration of IT personnel in strategic decision making
Design process • Recognition of IT impacts in the organizational planning process • Participation of IT management in the organizational planning process • Perceived need for IT in the strategic goals
organization, they must support the system if people are to be involved enough to make the system work.
Managing Change. Management of change is important for the successful introduc-tion of a system. It has three basic phases: unfreezing, moving, and refreezing. Unfreezing, as the name suggests, is the process of creating a climate favorable to change. This includes recognizing there is a need for change. Moving is the process of introducing the new system, and refreezing is the process of reinforcing the change that has occurred.
In the first phase, designers must work with the organization to establish a climate that encourages honest discussion of the advantages and disadvantages of the current system and allows brainstorming of possible solutions and opportunities. In terms of DSS acceptance, this phase hinges on the development of objectives for the DSS to impact the decision-making process, and hence it is begun early in the analysis phase of the project. Designers want to assess those factors which will encourage and discourage implementation. Some possibilities are noted in Table 9.3. This table highlights that the organizational climate, the role of senior management, and the design process all can affect the success of the implementation process. For example, the organizational climate conducive to new systems implementation, as outlined in Table 9.3, is one in which users can talk openly about their needs and concerns, both because of open communication channels and because of a high amount of knowledge and experience with systems. However, the environment can be affected by other unrelated issues as well. For example, a corporation in the midst of merger or financial difficulties might not be conducive to change regardless of the levels of sophistication and communication available. Employees might be so focused upon the survivability of their own employment positions that they cannot focus properly on the DSS under construction or implementation.

IMPLEMENTATION STRATEGY
Similarly, the role that senior management plays in the process is crucial. As reflected in Table 9.3, senior management personnel who use systems, provide adequate resources to their use, and have high expectations for the payoff of such systems set an environment that is more conducive to implementation than one in which senior management is not involved. In addition, the greater the parallel between the DSS development and strategic plans for the department or organization, the more likely the implementation process will be successful because managers and users will see the need for the system.
Designers must focus on the nature of the users' problems as well as the opportunities that a DSS might affect. Decision makers must perceive a real need and must see that a DSS might meet that need. Of course, during this phase, designers and decision makers must agree upon the goals for the DSS and procedures to monitor progress upon those goals. In addition, it is desirable to define a person or group of people who will champion the idea and to gain the commitment of upper management to make the project work. In fact, evidence suggests that implementation success is improved substantially if upper manage-ment demonstrates commitment to the introduction of a DSS. Furthermore, if they initiate DSS development, implementation success increases substantially. Such commitment may be shown in the amount of resources, time, and people (both the design team and the users) dedicated to the project. For it to have an impact, though, the commitment must be ongoing and continuous, not simply for the initial development. All DSS need ongoing support for maintenance and operations. However, if a DSS is to become an important tool, the support must come in gaining new databases and models and other enhancements for the system.
One particular difficulty is the difference between real and perceived problems as well as between real and perceived opportunities. These differences can lead to resistance to implementation or to misstatement of system needs. For example, resistance often results from perceptions that the introduction of the DSS will change one's authority, influence, or even job status. While such perceptions may be unwarranted, knowing about them and attempting to get at their cause may lead to important information that will help with the unfreezing stage of change.
The second phase of change is moving. During this phase, effort focuses upon the development of the DSS. Both technical and managerial resources play a role. Management focuses upon involving users, balancing the influence of the designers and the users, responding to resistance, and creating an environment for eventual acceptance of the new tools. A team of users and designers sets priorities for the project and evaluates trade-offs of possibilities. During the process, the team should provide feedback to the entire community of users and seek their advice. In addition to the technical factors, the team should evaluate how the introduction of a new DSS will change the organizational dynamics associated with decision making. Throughout this phase, the team needs to focus on:
• Perceived needs and commitment • Mutual understanding • Expectancies • Power and change needs • Technical-system issues • Organizational climate • Project technical factors
The final phase of change is refreezing. In this phase, designers must work with users to ensure that the system meets needs adequately and that decision makers understand

380 IMPLEMENTATION AND EVALUATION
how to use new procedures. More important, it requires the development of organiza-tional commitment and institutionalization of the system. This is described in the next section.
Institutionalize System
With a number of factors acting against successful implementation of the system, the designers, in concert with managers, need to plan to institutionalize the system gradually. For example, the manner in which the system is introduced is crucial. If uninterested individuals are offered the system for voluntary use, the DSS is likely to sit idly. Voluntary use will happen only when individuals have the intellectual curiosity to experiment with the system or when the need for the system and its ability to meet that need are well established. On the other hand, managers who insist on mandatory usage of a DSS also face potential failure. It is difficult to legislate decision-making styles. Hence, users may not really use the system but only provide the appearance of doing so.1 Others may work harder to find the weaknesses of the system so as to "prove" it is not worth the time.
A better approach to systems institutionalization is to provide incentives to use the system. Appropriate incentives will, of course, differ from application to application and from organization to organization. However, they need not be elaborate or even financial. For example, one incentive is to pique curiosity by providing information only on the DSS or on the OSS first. If the system is well designed, it should then sell itself on its usefulness to the choice process.
Sometimes the incentive might be the availability of a job "perk" such as the exclusive use of a laptop, netbook, or even smart phone. The perk, which actually facilitates the use of the DSS, makes it desirable and easy to use the system. Or, another form of incentive is to build tools in the system that will help users complete unrelated but important tasks more efficiently or effectively. For example, Sauter and Free (2005) described the building of a DSS for a tertiary hospital which included a feature of "private" notes accessible only to the author. This feature provided, among other options, personal information management for the user, to which they previously had not had access.
Once the incentive system has gained the attention of some individuals to the DSS, they can help others to see the advantage of using the DSS. Enthusiasts can demonstrate the benefits of the systems to others in their work or provide informal incentives for the use of the system. In fact, there is much evidence that the word-of-mouth approach to institutionalization of a system is the one that works best. Hence, it is important for developers and managers explicitly to facilitate its use.
!Many students who were taught to program by drawing "flowcharts" can appreciate this strategy. In most procedural programming language classes, students historically were taught to draw the flow chart to facilitate the development of the logic for writing the code for a program. This is similar to using a DSS to help the decision maker understand all of the possible influences of adopting a particular course of action. However, students often write their code and then create the flowchart that corresponds to their code. In other words, the flowchart was not an aid in their decision-making process, but rather documentation that they followed the appropriate procedures. Similarly, unhappy users, especially those for whom use of a DSS has been legislated, may form their decisions first and then use the DSS to try to prove their choice. In other words, the system will not support the choice process, only document or justify an unaided process.
IMPLEMENTATION STRATEGY 381
Associated with the need for incentives to institutionalize systems is, of course, a need for training. Since each potential user cannot be involved in the design process, some users will not know how it operates or why it flows in a particular manner, and hence they need training. However, DSS are used by managers, often upper level managers. Since managers often cannot make substantial commitments of time to training because they cannot abandon the remainder of their operations for an extended period, training for DSS cannot follow conventional training schedules. One approach that works well, especially with upper level managers, is to train on a one-to-one basis. In that way, the trainer goes to the manager's office (or vice versa) and works through the system with the decision maker. Since there are no other individuals present, the approach and the focus can be customized to the user and managers experience less discomfort about asking questions and voicing their concerns. Finally, since the meetings do focus around the manager, trainers can provide as little training as is necessary at a given meeting and schedule as many sessions as necessary to gain the appropriate comfort level of the manager.
Not only are one-on-one meetings less uncomfortable for the decision maker, they are more focused from a training perspective, in that they allow the time to be spent on activities relevant to the individual user and the individual situation. Evidence suggests that training is most effective when it considers needs from an individual's, the task's, and the organization's perspectives. Training on a one-on-one basis allows trainers to work with individuals to help them learn specific knowledge and skills necessary for effective performance. This may include a remedial lesson on using a mouse or an overview of the Internet or other necessary technology not known by a particular decision maker. Trainers can also ensure that the program includes information and skills necessary to complete specific tasks regardless of the user. For example, this might include guidelines on how to search the new databases or how to merge models. Finally, trainers also can identify how the goals of an individual affect or constrain performance or motivation to learn and develop a training program in response to them.
This method can be particularly effective if it is coupled with some postimplementation tailoring of the system to meet a given user's needs or capabilities. Such a strategy may mean allowing the user access to a command line level of control or to turn on the assistance menu so that it automatically appears. The value is that the trainer can determine what
Many years ago I had a colleague who thought it was time I learned to use electronic mail. Although he often spoke about the benefits, which I as an MIS person should certainly understand, I resisted because I had no immediate need to learn email and felt my time was better spent addressing other priorities« My colleague disagreed. Hence, for two weeks, he would send me a message every morning with some little "bit" of information he thought I would find amusing, interesting, or helpful. Just to ensure that I knew the bait was available, he would drop by my office to tell me he had sent me email but not tell me the information contained in the email* Although ΐ found this annoying, it provided just enough incentive to check my email After a few weeks, it became habit to check my email regularly. Over the years, as more of my colleagues, friends, and students have begun lo use email, I have found endless possibilities for its use (as most of my colleagues, friends, and students would tell you). Clearly it is a tool without which I now could not function* Probably I would have learned to use it anyway, eventually. However, t wonder whether I would have discovered its uses as rapidly or as early without my colleague who provided just the right incentive to get me started. Such small, subtle, and customized incentives often provide the best motivation to use new systems.

382 IMPLEMENTATION AND EVALUATION
"works" best for a given user, help the user to do the necessary tasks as well as possible, and then change the system where the user cannot adapt.
IMPLEMENTATION AND SYSTEM EVALUATION
How does a designer know when a DSS and the implementation ofthat DSS are successful? This question really takes two different approaches—how to test the DSS and how to test the implementation of the DSS. In the first case, it is the technical appropriateness of the system and in the second case it is the overall usefulness of the system.
Technical Appropriateness
If the technical requirements of the decision makers are not achieved, then the system will not be used. If the system is not used, then by definition the implementation has been a failure. Hence, one possible measure for determining implementation success is the extent of use of the DSS, especially compared to the intended use. However, a more pragmatic measure might be the number of features consistent with the user's information needs, especially compared to the number of possible features. If the system provides information that is consistent with regard to decision making needs on all these dimensions of information, then it is successful. Similarly, the model management chapter suggested the need for variability in models and model management features, such as intelligent assistance and model integration. If the system provides appropriate models and model management capabilities, then the DSS can be considered successful.
To determine whether the system functions properly, we can test it to see whether or not the system does what it is supposed to do. For example, database calls can be performed to determine if the correct information is called, and models can be tested to determine whether they perform the correct manipulations. The decision aids, such as intelligent help, can be checked by testing a modeling situation in which such assistance should be invoked. Success of these components can be judged by measuring the percentage of cases for which appropriate advice was given and the adequacy of the explanations provided by the system.
It is imperative that such tests be done under client conditions. For example, testing a network-based system in "supervisor" or "administrator" mode does not measure whether the DSS works properly. "Administrator" mode allows many privileges not available to the typical user that may be crucial to the system functioning effectively. Nor is testing a system away from the user's station sufficient. Users, particularly managers, are likely to have a variety of programs residing on their machines, each with its own peculiarities; these programs may alter the path by which the operating system will check for programs and/or files. They may have drivers that conflict with the DSS or they may affect the allocation of memory in a way that conflicts with the DSS. It is not sufficient to tell the managers the DSS would work if only they would quit using other applications. Testing is meant to see whether the system works from the users' stations under their general operating conditions.
Many aspects can be tested individually. However, unlike transactional processing systems, DSS can never be completely tested for all possible contingencies. Designers cannot anticipate all of the uses to which decision makers will put the system, and so they cannot ensure the system will work properly in all of those applications. Hence, it is also imperative that some tests be done by the potential users themselves. Often minor system flaws are associated with the order in which programs are loaded or the manner in which

IMPLEMENTATION AND SYSTEM EVALUATION
functions are invoked, which experienced programmers may address instinctively (and hence not detect the malfunction); less experienced users are likely to find such problems early. Even if the problem is not a "bug" per se, it might just be a bad or difficult way for the software to function.
Finlay and Wilson (1997) proposed criteria for evaluating DSS, most of which are gen-eralizable to any DSS. The relationships among these criteria are shown in Figure 9.1. The criteria evaluate the system along five dimensions: the logic, the data, the user interface, gen-eral issues, and face validity. Logical validity addresses how well specific action-reaction sequences in the DSS are constructed. This involves two aspects of the logic: analytical va-lidity examines the individual pairwise relationships of the model, while theoretical validity examines the holistic nature of the model in terms of the theory underlying the decision under construction. In other words, does the system work as expected given what is known about how to solve the problem(s) addressed by the DSS. This might include whether cost is calculated appropriately, forecasts and other models and operations work appropriately (especially as they share data), and there are not systematic errors in how logic is executed. Data validity, as the name suggests, considers whether the data included in the DSS are appropriate for the decision under consideration and whether they are accurate, unbiased, and measured (and represented) at an appropriate level of precision. This includes the relia-bility of the source and the data-scrubbing techniques. Interface validity examines how the user would interact with the system. First, it is important to evaluate the usability in terms of the people who will use it and the conditions under which the system will be used. That means is the DSS simple, consistent, informative, and flexible from the users' perspectives. The interface is the window to the system, and if it is not clear, then how to use the system and what results the DSS generates also will not be clear. In addition, it is necessary to examine whether the necessary and sufficient items are displayed and whether they are displayed in an appropriate manner and are understandable to the user. Of course, all of this assumes that the system is easy for the users to manipulate. This includes examination of whether it is easy to learn to use and to remember how to use, speed of use, and its similarity to other well-known systems. The fourth set of criteria, general validity, looks at the overall usability of the system. This examines whether the system is designed from the right perspective, it is able to utilize the appropriate data, and the users will believe that it can provide the counsel needed. Taking that a bit further, the system needs to be evaluated in terms of whether it can be stretched beyond the specific boundaries of the system and, if so, how far. By the very nature of poorly defined and even wicked problems, decision makers are likely to consider scenarios and options beyond the scope of the original design and so need a system that will stretch with them. They also need a system that is replicable and consistent in its methods and procedures, so that data can be processed consistently and results are consistent. Of course, it must not only be replicable but also be correct. Models must be used correctly and check for appropriate assumptions. Recommendations must flow well from the analysis that is provided. The recommendations and thus the system as a whole will be believed when the subsequent actions from the phenomenon being modeled actually behave in the predicted way. Finally face validity asks the question of whether the DSS has access to information similar to or better than that of conventional sources and whether it behaves (analyzes and gives results for) similarly to conventional sources.
Petkova and Petkov (2003) supplement these technical characteristics with how the system fits into the environment in which it operates. They add 4 items to the list that need evaluation. First, the system should be at an appropriate level of complexity. Although the data might support quite extensive modeling, users may not have the competence to build and evaluate the data. Hence, the DSS designer needs to balance the complexity needs of

Sys
tem
effe
ctiv
enes
s
Logi
cal
valid
ity
Dat
a va
lidity
Ana
lytic
al
valid
ity
Theo
retic
al
Theo
retic
al
Acc
urac
y va
lidity
va
lidity
—i
Pre
cisi
on
Theo
retic
al
valid
ity
Inte
rfac
e va
lidity
Usa
bilit
y
Gen
eral
va
lidity
Fa
ce
valid
ity
Info
rmat
ion
va
lidity
C
once
ptua
l va
lidity
R
obus
tnes
s In
tern
al
Ope
ratio
nal
valid
ity
valid
ity
Exp
erim
enta
l va
lidity
I I
Acc
urac
y P
reci
sion
I
I C
larit
y R
elia
bilit
y V
arifi
catio
n
Rep
licat
ive
Pre
dict
ive
valid
ity
valid
ity
Fig
ure
9
.1.
Rel
atio
nsh
ips
Am
on
g
mea
sure
s o
f E
ffec
tive
nes
s.
[So
urc
e:
P.
N.
Fin
lay,
a
nd
J.
M.
Wil
so
n,
"Va
lid
ity
of
Dec
isio
n
Su
pp
ort
S
yste
ms:
To
wa
rds
a
Va
lid
ati
on
Me
tho
do
log
y,"
Sys
tem
s R
esea
rch
an
d
Beh
avio
ral
Sci
ence
, 14
(3),
19
97
, p
p.
16
9-1
82
.] U
sed
wit
h p
erm
issi
on
.
IMPLEMENTATION AND SYSTEM EVALUATION 385
the system with the competence of the users. Second, the DSS should be consistent with the preferences of the organization. These, preferences might be toward modeling or toward the hardware and software selected for the DSS. Designers should, whenever possible, provide a system that meets conventions of the organization. Third, Petkova and Petkov claim a DSS should be evaluated on the quality of the documentation. In most cases such documentation will exist in terms of the online assistance, automatic popup messages, and other assistance provided by the system rather than separate manuals. Finlay and Wilson (1997) suggest that the system needs to be able to handle unforseen problem formulations and solution alternatives. Petkova and Petkov suggest that a measure of evaluation is how well the system can adapt (or be adapted) to such unforseen issues. This might include how easy it is to add new models or data sources or how easily new logic can be implemented in the system. Finally, Petkova and Petkov indicate the system should be evaluated on how well it addresses preconceived notions of problem solving and potential solutions by decision makers. They suggest that a good system is one that abides by appropriate preconceived approaches but protects decision makers from biased or other problematic approaches.
Overall Usefulness
To measure the system as a whole, designers must measure its usefulness to the subject and determine if the system facilitates a logical analysis of the problem. This can first be determined by decision maker-users testing the system. It is necessary to have ex-perienced decision makers during this phase of testing. They would use the system and determine whether it provides reasonable advice and reasonable suggestions for the sit-uation under consideration. If so, then it can be judged to be functioning properly. A problem flag can be generated when these decision makers find lapses in the advice or peculiar steps through analyses. Sometimes these are actual problems in the software, which needs maintenance. Other times, these flags denote a nonintuitive approach to anal-ysis that might call for more assistance windows or greater use of artificial intelligence aids.
Another way of testing the system is with a modified Turing test.2 The purpose of such a test is to determine whether the system is providing appropriate advice and analyses that are consistent with what an expert analyst might provide. Prior to the test, expert analysts are asked to provide solutions or explanations for situations that a decision maker using the DSS might encounter. These human-based, expert solutions or explanations are intermixed with those generated by the DSS. Decision makers are provided two solutions or explanations to a problem and asked to compare them. If the decision makers cannot tell the difference between a human-based answer and a machine-based answer, then the DSS
2The original Turing test was created by the English computer scientist Alan Turing to measure whether or not a computer system demonstrated "artificial intelligence." The Turing test required a human interviewer to "converse" with both an unseen human and a computer on a particular topic. If the interviewer could not determine when he or she was conversing with the human or computer, the computer system was said to have artificial intelligence. If it was obvious when the computer responded, then the system failed the test. Many individuals have challenged the Turing test. Clearly it is not appropriate for evaluation of a DSS. However, the modified Turing test does provide some insight into the adequacy of analyses and advice provided by the system.
386 IMPLEMENTATION AND EVALUATION
is judged to be working properly. Clearly some form of comparison of the outcome of the DSS and that of an expert analyst is necessary.
Implementation Success
Scott (1995) characterizes three approaches to identifying success, depending upon whether a measure reflects "input," "output," or "process" models of the organization. For exam-ple, using an input model of the organization means the evaluator examines how the DSS impacted organizational resources. In particular, the measures of a system's success would focus upon how the DSS helped the organization acquire additional resources or the mea-sures of success would reflect improvements in the use of scarce resources. Dickson and Powers (1973) suggest quantitative measures, including (a) ratio of actual project execution time to the estimated time and (b) ratio of the actual cost to develop the project to the bud-geted cost for the project. While these may measure the efficiency of the implementation, they do not reflect the effectiveness of the implementation.
Measuring implementation success with an output view of the organization causes the evaluator to measure the improvement in organizational effectiveness attributable to the DSS. For example, this might include measurement of the success of the implementation by the payoff to the organization, especially in terms of benefits-to-costs ratios. However, DSS by their very nature, are associated with difficult decisions, managerial operations, and significant externalities. The system might be effective but still not change the way operations are conducted or not help to anticipate an unusual external event that strongly affects an outcome.
We must therefore separate the issues good or bad "decision" from good or bad "outcome." Good decisions, as we stated earlier, are well informed. It is not always true that good decisions are linked with good outcomes or that bad decisions are always linked with bad outcomes. Often that interaction is a function of chance or other factors we do
Design Insights Clients Testing Software
Some insights into implementation can be found by considering the procedures implemented by Edmark, an educational software company. (Educational software provides the same function for children that a DSS does for managers. Good educational software helps children discover opportunities to learn new concepts, identify howr those new concepts are similar to what they have used in the past, determine what they need to know, discover how to apply that information, and help them make appropriate decisions about how to move onto a new topic. Hence, some of the same design principles can be applied to both kinds of effort)
Of course, the programmers test the software to ensure it works. However, in addition, the sons of the CEO and the CFO, as well as some of their friends, also test the software. In fact, the CEO's son began testing the software when five years old. These software ''testers" represent the children who ultimately will be the users of the system. If they cannot use the software, find errors in the functionality, or find the procedures kludgy, it is redesigned before it goes to market.
Similarly, the company employs mothers of young children to spend time in stores explain-ing its products to clerks and customers. In this way, nonthreatening facilitators can adapt the assistance and information they provide to users appropriately. Since users better understand how to use the product, they are more satisfied in its use,
Source: From D. J, Yang, "The Pied Piper of Kids' Software," Business Week, August 7, 1995, pp. 70-71.
IMPLEMENTATION AND SYSTEM EVALUATION
not yet understand. In other words, the DSS might have helped the decision maker make a good decision or a well-informed decision, but that decision resulted in a bad outcome.
While it might be desirable to evaluate a DSS in terms of input costs or benefits to the organization, neither of these two help designers to make a system better. The third option is the process model, which focuses evaluation upon the way in which the system works within an application. In general, the DSS should meet a recognized need, be easy to use, meet even the most sophisticated informational needs, have exploration capabilities, provide intelligent support, and be easy to maintain. As a support system, the DSS must also meet the decision-making needs and the organizational restrictions and be accepted by users. Hence, for implementation to be successful, the designer must address (a) technical appropriateness and (b) organizational appropriateness. While many of these aspects have been discussed in some detail in earlier chapters, we will review the important issues here.
Measurement Challenges. There are other measures designers consider when evaluating system success. Some designers check the degree to which the system meets its original objectives or the degree of institutionalization of the DSS. Others measure the amount of system usage as a surrogate of system effectiveness. However, there are problems associated with this measurement. First and foremost is how does one actually measure usage? The number of keystrokes and other mechanized measurements only relate the number of times one invoked particular commands. The number of times a system is invoked tells us very little about how much or how well the system contributed to the choice process. Decision makers might invoke commands multiple times to ensure themselves that the command will be read the same way each time or because they forget they have already done so. In these cases, many observations of usage would not reflect greater importance or usefulness to the decision maker. Similarly, a small number of usages might not reflect lesser importance or usefulness. For example, sometimes simply seeing an analysis once might initiate a creative solution to a problem that would not otherwise have been apparent.
While electronic monitoring of usage can have difficulties, so can reported usage. If designers rely upon the decision maker to report system usage, they might receive faulty information. Most decision makers are too involved in a decision task to be accurately aware
The task in building a DSS is like the job any other engineer confronts when faced with new technologies and new materials. Suppose that a critical step in building an airliner once required assembling two parts in an awkward location, demanding a special wrench that could reach that location and apply the proper torque« If you had the job of designing that wrench, it would be easy to think of tightening the nut as your goal
It would take a higher-level view to envision the goal as one of holding those two parts together. As new generations of adhesives became available, the engineer with this view would consider them while the tlnut tightener" engineer would not,
But only the highest level of thinking would recall that the goal is to transmit a force or a bending moment through the structure, with the assembly of these two parts being merely a means to that end. If new materials made it practical to make a one-piece part to do the job, the question of how to fasten the two parts disappears.
Source: Adapted from P. Coffee, "Value Tools by Their Decision Making Power," PC Week, 12(27), July 1G1995, p, 27.
388 IMPLEMENTATION AND EVALUATION
of how much or how little they use the tool. If decision makers were favorable toward the introduction, they may bias their estimates positively; if they were unfavorable toward the introduction, they may bias their estimates negatively. Finally, even if we could measure use reliably, use does not equal usefulness. Studies in the mid-1980s (see, e.g., Srinivasan, 1985) showed that system usage did not correlate highly with perceived usefulness of a DSS and thus did not provide reliable measures of system success.
Once upon a time, long ago, in a land far away, a farmer had a goose inai iaiu goiaen eggs. It was not too clear how this happened. The goose ate seemingly ordinary food and did the
ordinary things geese do, and demanded nothing more—but she kept laying golden eggs. Geese are not good at communicating to humans, but the farmer, a kind lady named Mrs. Mulrooney, seemed to be providing whatever minimal care the goose required, and the eggs kept coming.
The eggs kept coming, that is, until ., ♦ No, no, the farmer did not cut open the goose to see how the eggs grew. What a silly story |
that would be! This was a modern, corporate agricultural business. What happened in this case was that Higher Management cut open the farmer—but I am getting ahead of the story.
How, the Higher Managers first inquired, did the farmer's management processes produce such good results from this seemingly ordinary goose? And how could the continuation of these excellent results be assured? In fact, now that they thought about it, how good were the golden eggs, and how could that be verified?
So they asked many questions of Mrs. Mulrooney, but she simply shrugged and explained, 'The goose just does this. 1 feed her, keep her safe and leave her alone, and go collect the eggs. That's all I can tell you."
Clearly, Higher Management concluded, this simple-minded approach lacked proper ana-lytical rigor. ^Everything this goose produces must be properly reviewed!" they cried, So they | appointed inspectors to examine the eggs and make sure they were really gold. (The fact that people actually were buying the eggs, getting expert appraisals and paying the price of gold, did not seem to impress Management.) Then they had the inspectors map out all the steps in the production process and recommend improvements. Since the inspectors had no idea how the goose actually produced the eggs, these changes simply slowed delivery and mildly annoyed the goose, but Management pressed on,
Management next turned their attention to input: "Cut the goose's feed ration, reduce the size of her coop, clean it less often, and see whether we can produce the same output for less cost," they insisted. Mrs. Mulrooney objected but did as she was directed when Higher Management persisted,
"This is silly," she argued. "Processes that contribute nothing to production are worse than useless. Friends have told me about companies in the city where someone kept producing bigger and bigger results, on time and within budget, and the clients loved it and kept ordering more and more. When the orders got big enough, the bosses decided more management control was needed, but that just interfered with the work and the client relationships rather than helping. Aren't we in danger of doing something like that here?1' To which, of course, the Higher Managers snorted, "You just don't understand the Big Picture, and clearly you are unprepared to control a matter as critical as this."
So far, Management had done little harm, but now an August Personage added another aspect to the situation. This Personage was another farmer nearby, under the same corporate management. He had some background in metallurgy, however, so he issued grand memoranda to Higher Management explaining why metallic products should all be produced at his farm, where he had proper inspectors and processes and controls. Higher Management agreed to do this if the August Personage could show them that his geese, too, would produce golden eggs. The August

IMPLEMENTATION AND SYSTEM EVALUATION
Personage delivered a fine-looking production plan with a schedule of expected deliveries. He then set several of his subordinates to work stealing the golden eggs, for which he promptly claimed credit in his production reports.
Now Higher Management could see results! It appeared to them that Mrs. Mulrooney had been lucky, but now her luck was running out. Her farm's production was down, the other farmer's production was up, and he had a more convincing (at least to them) story to tell about it. Also, the growing friction between the farmers at staff meetings was becoming a nuisance, as Mrs. Mulrooney claimed with increasing edginess that her goose was the big producer and that now the whole organization was impeding productivity and rewarding dishonesty.
It was at this point that someone in Higher Management suggested, "OK, if it's really Mrs. Mulrooney's goose that is laying the golden eggs, and if she's really vital to making that happen, then she's the factor we need to understand. She can't explain, so we need to analyze everything about her ourselves. Besides, this might end the arguments." And that's when they cut her open, to determine whether something about her diet, or metabolism, or whatever, might be the key to success.
Higher Management's latest innovation had precisely one effect: the goose eventually got tired of not being fed and flew off to another farm, away from all this nonsense.
Source: D. Samuelson, "Oracle; The Golden Goose," OR/MS Today, 34(4), August 2007, p. 72. This article is reprinted with permission.
To address such problems, others measure user satisfaction. The logic behind this measurement is that if the DSS is effective, it will make users more satisfied with the system. Many devices have been constructed to determine whether users are satisfied with the system. Ives, Olson, and Baroudi (1983) examined many of the instruments being used to measure satisfaction and found they could standardize them by examining factors relating to decision makers' satisfaction with regard to about 40 factors. While reliable measurements can be made by asking about users' satisfaction with each individual factor, many decision makers are not willing to take the time to complete such a questionnaire. Furthermore, users tend to generalize these factors (such as ease of use) and may report their first, last, or typical experience rather than an overall experience. However, this approach does work well during the development process if designers are using prototypes. Specifically, if the users are queried with regard to specific technical attributes of the system iteratively (rather than only at the end of the design process), decision makers and designers can understand the components which work best and which work most poorly in the system. This then leads to a better design and long term to more satisfaction with the system.
Davis (1989) found that measures of "perceived usefulness" and "perceived ease of use" were easier to obtain and thus more reliable measures of DSS success. He used Likert scales to measure attributes of perceived usefulness and attributes of perceived ease of use. To measure perceived usefulness, Davis provided Likert scales which asked users to rate a product (i.e., a DSS) on a scale from "extremely likely" to "extremely unlikely" with regard to seven perspectives of usefulness. These have been adapted here with regard to DSS use:
• Enable the decision maker to accomplish analyses more quickly.
• Improve the decision maker's choice performance. • Increase the user's productivity. • Enhance the user's effectiveness in making choices. • Make it easier for decision makers to make choices. • Help the user to find the DSS useful in making decisions.

390 IMPLEMENTATION AND EVALUATION
Similarly, Davis used the Likert scales to measure perceived ease of use. In the context of a DSS, these measurements might involve the following:
• Learning to use the DSS would be easy for the decision maker. • The decision maker would find it easy to get the DSS to do what it wanted to do. • The decision maker's interaction with the DSS would be clear and understandable.
• The DSS would be flexible in interactions. • It would be easy to become skillful at using the DSS. • The decision maker would find the DSS easy to use.
However, Sauter (2008) conducted a study of actual use of a system (instead of the more common intent to use the system study). The results of this study, which are illustrated in Figure 9.2, show that there may be other mitigating factors that impact the acceptance
Comfort with purpose and/or
family of applications Primary task
directly associated with intrinstic IT characteristics
PEOU
Comfort with approach to
completing task
Perceptions of external control
Mandate
PU
Technology adoption
Values
Media richness
Compatibility with business
processes
Figure 9.2. Factors Impacting System Acceptance Source: V. L. Sauter, "Information Technology Adoption by Groups Across Time," International Journal of e-Collaboration, 4(3), July-September 2008, pp. 51-76. Reprinted here with permission of the Publisher.

IMPLEMENTATION AND SYSTEM EVALUATION
of the DSS. In particular, users are more likely to adopt a system if, among other reasons, they are familiar with the family of technology, they have comfort in completing the task, and the tool is compatible with business processes. So, if new technology is implemented, such as voice recognition or artificial intelligence, decision makers may not adopt the system simply because they are not comfortable with that kind of application, even if the application itself is easy to use and is effective. This means that training might involve more than just how the system works. It perhaps needs to involve some rudimentary exposure to the new technology and some time to become comfortable with it before training for the DSS begins. Similarly, if the users are not comfortable with the decision process itself, they may not adopt the system because that gives too much visibility to the process they use in the task, which they may not be willing to risk. To overcome this problem, implementers might provide decision training or developing a supportive infrastructure before the DSS training. Finally, if the use of the DSS implies an incompatibility with their normal business processes, the users may not adopt the system because it is too difficult. Obviously, this requires some change in the process before implementing the DSS. If these situations are not addressed before the DSS is introduced, users are more likely to fall back on current technology and reject the change.
Organizational Appropriateness
Also in those earlier chapters was a discussion of how the system must become a component of the entire system of the organization. To do this, it must support the decision styles of the users and the manner in which those decision styles change over time. In addition, it must behave appropriately for the organization in which it exists. It must provide levels of security and use consistent with corporate policy and provide information consistent with the expectations of the users. Just as new employees must "fit in" to a department and an organization, the system must "fit in" and meld comfortably with the department. This might include the appropriateness of the user interface, the appropriateness of the data availability, or the appropriateness of the modeling methodologies. If the system does not fit in to the department, it is likely to suffer the same fate as an employee who does not fit in, and hence it will not be implemented.
Dickson and Powers (1973) believe one can capture the behavioral appropriateness of the implementation by measuring (1) managerial attitudes toward the system, (2) how well information needs are satisfied, and (3) the impact of the project on the computer operations of the firm. These measures all reflect perceptions of the system. In addition, they are all measures taken after the system is implemented. Hence, they are not in keeping with the philosophy of planning for implementation throughout the project. A better approach would be to evaluate the various types of nontechnical feasibility discussed in Chapter 2.
The DSS must also fit within the constraints placed upon it by the organization. For example, Meador and his colleagues (1984) concluded that a DSS is successful if it:
• Fits with the organization's planning methods • Helps with decision makers' way of thinking about problems • Improves the decision makers' thinking about problems • Fits well with the "politics" of how decisions are made • Use results in choices that are implemented • Is cost-effective and valuable relative to its cost • Is expected to be used for some time

392 IMPLEMENTATION AND EVALUATION
In other words, DSS need to interface well with other systems within the organization. Even if the DSS does a great job facilitating decisions, it cannot be a success if it does not facilitate mandated decision steps or other activities.
DISCUSSION
Implementation implies realization of the planned system. The purpose of this chapter is to highlight some of the barriers to implementation and some of the strategies that can increase the likelihood of successful implementation. Clearly, the better the analysis of real needs, the greater the sensitivity of the designers to organizational climate, the greater the involvement of users early in the process, and the greater the commitment of management will improve the likelihood that a technically appropriate DSS is implemented.
SUGGESTED READINGS
Adams, D. A., R. R. Nelson, and P. A. Todd, "Perceived Usefulness, Ease of Use and Usage of Information Technology: A Replication," MIS Quarterly, Vol. 16, No. 2, June 1992, pp. 227-247.
Alavi, M., and E. A. Joachimsthaler, "Revisiting DSS Implementation Research: A Meta-Analysis of the Literature and Suggestions for Researchers," MIS Quarterly, Vol. 16, No. 1, March 1992, pp. 95-116.
Alexander, C, The Timeless Way of Building, New York: Oxford University Press, 1979.
Alter, S. L., Decision Support Systems: Current Practice and Continuing Challenges, Reading, MA:
Addison-Wesley, 1980.
Beynon, M., S. Rasmequan, and S. Russ, "A New Paradigm for Computer-Based Decision Support,"
Decision Support Systems, Vol. 33, 2002, pp. 127-142.
Beyer, H., and K. Holtzblatt, Contextual Design, San Francisco: Morgan Kaufmann, 1998.
Brown, T, "Design Thinking," Harvard Business Review, Vol. 86, No. 6, June 2008, pp. 84-92. Carmel, E., R. D. Whitaker, and J. F. George, "PD and Joint Application Design: A Transatlantic
Comparison," Communications oftheACM, Vol. 36, No. 4, June 1993, pp. 40-48.
Cash, J. I., F. W. McFarlan, J. L. McKenney, and M. R. Vitale, Corporate Information Systems
Management: Text and Cases, 2nd ed., Homewood, IL: Irwin, 1988. Clement, A., and P. C. Den Besselaar, "A Retrospective Look at PD Projects," Communications of
theACM, Vol. 36, No. 4, June 1993, pp. 29-39.
Davis, F. D., "Perceived Usefulness, Perceived Ease of Use and User Acceptance of Information
Technology," MIS Quarterly, Vol. 13, No. 3, September 1989, pp. 319-342. DeLone, W. H., and E. R. McLean, "Information Systems Success: The Quest for the Dependent
Variable," Information Systems Research, Vol. 3, No. 1, March 1992, pp. 60-95.
Dickson, G., and R. Powers, "MIS Project Management: Myths, Opinions and Realities," in W. McFarlin et al. (Eds.), Information Systems Administration, New York: Holt, Reinhart and Winston, 1973.
Dickson, G. W., and J. C. Whetherbe, The Management of Information Systems, New York: McGraw-Hill, 1985.
Dumas, J., and P. Parsons, "Discovering the Way Programmers Think about New Programming
Environments," Communications oftheACM, Vol. 36, No. 6, June 1995, pp. 45-56.
Finlay, P. N., and J. M. Wilson, "Validity of Decision Support Systems: Towards a Validation Methodology," Systems Research and Behavioral Science, Vol. 14, No. 3, 1997, pp. 169-182.

SUGGESTED READINGS
Galletta, D. F., M. Ahuja, A. Hartman, T. Teo, and A. G. Peace, " Communications of the ACM, Vol. 38, No. 6, July 1995, pp. 70-79.
Gass, S. I., "Model World: Danger, Beware of the User as a Modeler," Interfaces, Vol. 20, No. 3,
1990, pp. 60-64.
Ginzberg, M. J., "Steps Towards More Effective Implementation of MS and MIS," Interfaces,
Vol. 8, No. 3, May 1978, pp. 57-73.
Ginzberg, M. J., "Key Recurrent Issues in MIS Implementation Process," MIS Quarterly, Vol. 5, No. 2, June 1981, pp. 47-59.
Guimataes, T. et al., "The Determinants of DSS Success: An Integrated Model," Decision Sciences,
Vol. 23, No. 2, March/April 1992, pp. 409-431.
Ives, B., and M. H. Olson, "User Involvement and MIS Success: A Review of Research," Management
Science, Vol. 30, No. 5, May 1984, pp. 586-603. Ives, B., M. H. Olson, and J. J. Baroudi, "The Measurement of User Information Satisfaction,"
Communications oftheACM, Vol. 26, No. 10, October 1983, pp. 785-793. Jenkins, A. M., and J. A. Ricketts, "Development of an Instrument to Measure User Information Satis-
faction with Management Information Systems," Unpublished Working Paper, Indiana University,
Bloomington, 1979.
Johnson, J., My Life Is a Failure: 100 Things You Should Know to be a Successful Project Leader, West Yarmouth, MA: The Standish Group, International, 2006.
Keen, P. G. W, "Information Systems and Organizational Change," Communications of the ACM,
Vol. 24, No. 1, January 1981, pp. 24-33.
Lewin, K., "Group Decision and Social Change," in T. M. Newcomb and E. L. Hartley (Eds.),
Readings in Social Psychology, New York: Reinhart & Winston, 1947. Loofbourrow, T., "Expert Systems Are Still Alive," InformationWeek, Issue 536, July 17, 1995,
p. 104. Meador, C. L., M. J. Guyote, and P. G. W Keen, "Setting Priorities for DSS Development," MIS
Quarterly, Vol. 8, No. 2, June 1984, pp. 117-29.
Mysiak, J., C. Giupponi, and P. Rosato, "Towards the Development of a Decision Support System for Water Resource Management," Environmental Modelling and Software, Vol. 20, No. 2, February 2005, pp. 203-14.
Nelson, R. R., E. M. Whitener, and H. H. Philcox, "The Assessment of End-User Training Needs,"
Communications oftheACM, Vol. 38, No. 6, July 1995, pp. 27-39.
Norman, D. A., The Design of Everyday Things, New York: Basic Books, 2002. Norman, D. A., Emotional Design, New York: Basic Books, 2005.
Peters, T., The Pursuit of WOW! New York: Vintage Books, 1994.
Petkova, O., and D. Petkov, "A Holistic Approach Towards the Validation and Legitimisation of
Information Systems," Kybernetics, Vol. 32, Nos. 5-6, 2003, pp. 703-714. Preece, J., H. Rogers, and H. Sharp, Interaction Design: Beyond Human-Computer Interaction,
New York: Wiley, 2002.
Port, O., "Computers That Think Are Almost Here," Business Week, July 17, 1995, pp. 68-73.
Raghunathan, B., and T. S. Raghunathan, "Information Systems Planning and Effectiveness—An Empirical Analysis," Omega: The International Journal of Management Science, Vol. 19, Nos. 2-3, 1991, pp. 125-135.
Robey, D., "User Attitudes and MIS Use," Academy of Management Journal", Vol. 22, No. 3, September 1979, pp. 527-538.
Sambamurthy, V, and L. J. Kirsch, "An Integrative Framework of the Information Systems Devel-opment Process," Decision Sciences, Vol. 31, No. 2, Spring 2000, pp. 391-411.
Sauter, V L., "Information Technology Adoption by Groups Across Time," International Journal of e-Collaboration, Vol. 4, No. 3, July-September 2008, pp. 51-76.

IMPLEMENTATION AND EVALUATION
Sauter, V. L., and D. Free, "Competitive Intelligence Systems: Qualitative DSS for Strategie Decision Making," The Database for Advances in Information Systems, Vol. 36, No. 2, Spring 2005, pp. 43-57.
Scott, J. E., "The Measurement of Information Systems Effectiveness: Evaluating a Measur-ing Instrument," Database: Advances in Information Systems, Vol. 26, No. 1, February 1995, pp. 43-59.
Snyder, C, Paper Prototyping: The Fast and Easy Way to Design and Refine User Interfaces, San Francisco: Morgan Kaufmann, 2003.
Srinivasan, A., "Alternative Measures of System Effectiveness: Associations and Implications," MIS Quarterly, Vol. 9, No. 3, September 1985, pp. 243-253.
Swanson, E. B., Information System Implementation, Homewood, IL: Richard D. Irwin, 1988. Wagner, I., "A Web of Fuzzy Problems: Confronting Ethical Issues," Communications of the ACM,
Vol. 36, No. 4, June 1993, pp. 94-100. Weinberg, G. M., Rethinking Systems Analysis and Design, Boston: Little, Brown and Company,
1982. Yang, D. J., "The Pied Piper of Kids' Software," Business Week, August 7, 1995, pp. 70-71. Zmud, R. W., and J. F. Cox, "The Implementation Process: A Change Approach," MIS Quarterly,
Vol. 3, No. 2, June 1979, pp. 35-43.
QUESTIONS
1. The chapter identifies five principles to successful implementation. Discuss how inat-tention to each of them could discourage implementation efforts.
2. Compare and contrast the use of interviewing and prototyping during the design process in terms of the impact on the implementation process.
3. Why and how should users be involved in the design process?
4. How can we establish whether a given DSS is effective?
5. What incentives can one use to encourage users to try the technology?
6. Compare and contrast the use of measures of utilization with measures of user satis-faction in measuring DSS effectiveness.
7. Create an interview schedule for users of a hypothetical DSS design project.
8. What activities would a designer engage in to develop a satisfactory support base?
9. What role does senior management play in the design of a DSS?
10. Compare and contrast technical appropriateness and organizational appropriateness in the DSS evaluation process.
11. How would you evaluate a DSS to determine if it is effective? Discuss the procedures for testing and the mechanisms for evaluation.
12. The DSS of the future will continue to be deployed over intranets or the Internet. As such, their user interfaces will be evaluated both as decision tools and as Web pages. Discuss the guidelines you should follow to design the user interface of such a system.
13. What is technical appropriateness and how does it impact DSS design?
14. How does one evaluate the overall effectiveness of a DSS?
15. What is a Turing test and how might it impact DSS design?

ON THE WEB 395
ON THE WEB
On the Web for this chapter provides additional information about the implementation and evaluation processes associated with DSS design. Links can provide access to demonstration packages, general overview information applications, software providers, tutorials, and more. Additional discussion questions and new applications will also be added as they become available.
• Links provide overview information. Some links provide access to general informa-tion about implementation and evaluation processes.
• Links provide access to successful implementation and evaluation efforts. Where available, links can also provide access to unsuccessful efforts that illustrate pro-cesses to avoid.
• Links provide interview and evaluation questionnaire hints. Information obtained from these links could be incorporated into other applications.
• Links provide access to prototyping tools. In addition to providing an access to the tools, the Web provides product reviews and success stories about their use. The links also provide bibliographies and general information about prototyping as a DSS analysis and design tool.
You can access material for this chapter from the general Web page for the book or directly athttp://www.umsl.edu/^sauterv/DSS4BI/impl.html.

IV
EXTENSIONS OF DECISION SUPPORT SYSTEMS
Decision Support Systems for Business Intelligence by Vicki L. Sauter Copyright © 2010 John Wiley & Sons, Inc.
10
EXECUTIVE INFORMATION AND DASHBOARDS
In the early 1980s, executive information systems (EIS) were developed as specialized DSS intended to help executives analyze critical information and use appropriate tools to address the strategic decision making of an organization. In particular, EIS help executives develop a more accurate and current global view of the organization's operations and performance as well as that of competitors, suppliers, and customers. The goal of EIS was to provide an easy-to-use tool that would help improve the quality of top-level decision makers, reduce the amount of time needed to identify problems and opportunities, provide mechanisms to improve organizational control, and provide better and faster access to data and models. The focus of these systems included events and trends that were both internal and external so as to prepare executives to make strategic changes to avail the organization of opportunities and eliminate problems. In the early 1990s, it was believed that EIS applications were rising at a rate of about 18 % per year (Korzenlowski, 1994). At that time, some estimates were that an EIS has been installed on the desks of between 25 and 50% of senior executives of the largest companies. Others claimed EIS were in use in 60% of the Fortune 1000 companies.
This was a visionary goal for systems, especially in an era before data warehouses, balanced scorecards, and OLAP. Systems at that time were plagued with problems of collecting, correcting, storing, integrating, and accessing data in a meaningful way. As the technologies evolved, they provided support primarily to those individuals who were proficient with computers and analytical tools, not generally those people in the executive suites. So, it seemed as though the idea of EIS was, at least, before its time.
Two events occurred around the turn of the twenty-first century that made the concept of EIS regain its importance. It is not clear which had more impact, but clearly the confluence
Decision Support Systems for Business Intelligence by Vicki L. Sauter Copyright © 2010 John Wiley & Sons, Inc.

EXECUTIVE INFORMATION AND DASHBOARDS
of the two, especially in light of improvements in technology (both hardware and software), caused managers to reconsider the importance of EIS.
One of the events was the Enron scandal of 2001. This scandal, revealed in October 2001, involved the energy company Enron and the accounting, auditing, and consultancy partnership of Arthur Andersen, and ultimately lead to the downfall of both companies. Enron's executives used accounting loopholes, special-purpose entities, and poor financial reporting to hide billions in debt from failed deals and projects. Their nontransparent financial statements did not clearly detail its operations and finances with shareholders and analysts. In addition, its complex business model stretched the limits of accounting, requiring that the company use accounting limitations to manage earnings and modify the balance sheet to portray a favorable depiction of its performance. The chief financial officer and other executives misled Enron's board of directors and audit committee of high-risk accounting issues. In addition, these executives put pressure on Andersen to ignore the high-risk accounting issues. In the end, Enron declared bankruptcy, and Andersen was dissolved. As a result of this scandal, there was significant pressure to bring greater accountability to the upper executives of large corporations, and the result was the adoption of the Sarbannes Oxley legislation that required executives (and in fact managers at all levels) to monitor their organizations closely and to be able to attest to the veracity of the reports provided about their companies. So, corporate executives became more interested in using the support systems available to them.
The second event was the introduction of key performance indicators (KPIs) and balanced scorecards into the new management practices. This practice helped executives identify measurable objectives that could be monitored directly to understand what their organization was doing.
KPIs and Balanced Scoreboards
Key performance indicators are simply measures of performance that are of importance to the organization. Specifically KPIs are a measurable objectives, including a direction of improvement, a benchmark or target, and a time frame that can relate specific activities to long-term goals. For example, a university might look at attrition, transfer rates, graduation rates, and new student acquisition to reflect its long-term goal of serving the student base. Or, a production company might examine the breakdown and profitability of various demographic segments for its products. These KPIs vary depending on the organization because they define factors of importance to stakeholders that relate to corporate goals; these are the factors that are evaluated and measures against which to evaluate them to ensure the corporation is progressing in its mission.
It is important to find the correct KPIs, especially for presenting to executives. Most organizations have entirely too many reports that are generated periodically because some-one requested the information (perhaps years before), but no one knows how or why to use it. The factors must, instead, be accurate measures of the success in meeting the organiza-tion's mission. Hubbard (2007, p. 43) identified five questions that one should ask before adopting a KPI:
• What is the decision this is supposed to support? • What really is the thing being measured? • Why does this thing matter to the decision being asked? • What do you know about it now? • What is the value to measuring it further?
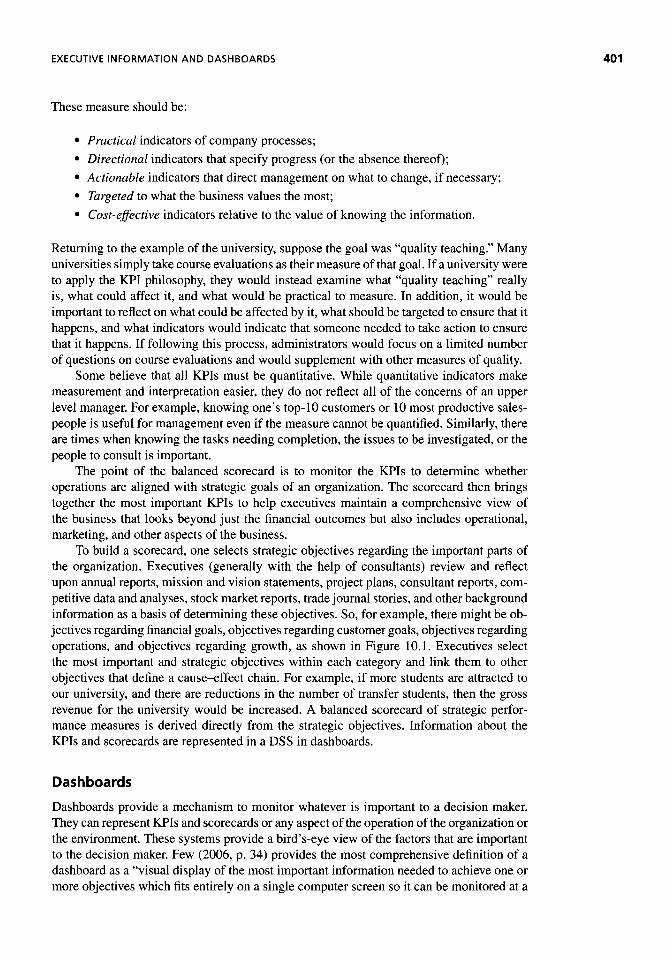
EXECUTIVE INFORMATION AND DASHBOARDS 401
These measure should be:
• Practical indicators of company processes; • Directional indicators that specify progress (or the absence thereof); • Actionable indicators that direct management on what to change, if necessary; • Targeted to what the business values the most; • Cost-effective indicators relative to the value of knowing the information.
Returning to the example of the university, suppose the goal was "quality teaching." Many universities simply take course evaluations as their measure ofthat goal. If a university were to apply the KPI philosophy, they would instead examine what "quality teaching" really is, what could affect it, and what would be practical to measure. In addition, it would be important to reflect on what could be affected by it, what should be targeted to ensure that it happens, and what indicators would indicate that someone needed to take action to ensure that it happens. If following this process, administrators would focus on a limited number of questions on course evaluations and would supplement with other measures of quality.
Some believe that all KPIs must be quantitative. While quantitative indicators make measurement and interpretation easier, they do not reflect all of the concerns of an upper level manager. For example, knowing one's top-10 customers or 10 most productive sales-people is useful for management even if the measure cannot be quantified. Similarly, there are times when knowing the tasks needing completion, the issues to be investigated, or the people to consult is important.
The point of the balanced scorecard is to monitor the KPIs to determine whether operations are aligned with strategic goals of an organization. The scorecard then brings together the most important KPIs to help executives maintain a comprehensive view of the business that looks beyond just the financial outcomes but also includes operational, marketing, and other aspects of the business.
To build a scorecard, one selects strategic objectives regarding the important parts of the organization. Executives (generally with the help of consultants) review and reflect upon annual reports, mission and vision statements, project plans, consultant reports, com-petitive data and analyses, stock market reports, trade journal stories, and other background information as a basis of determining these objectives. So, for example, there might be ob-jectives regarding financial goals, objectives regarding customer goals, objectives regarding operations, and objectives regarding growth, as shown in Figure 10.1. Executives select the most important and strategic objectives within each category and link them to other objectives that define a cause-effect chain. For example, if more students are attracted to our university, and there are reductions in the number of transfer students, then the gross revenue for the university would be increased. A balanced scorecard of strategic perfor-mance measures is derived directly from the strategic objectives. Information about the KPIs and scorecards are represented in a DSS in dashboards.
Dashboards
Dashboards provide a mechanism to monitor whatever is important to a decision maker. They can represent KPIs and scorecards or any aspect of the operation of the organization or the environment. These systems provide a bird's-eye view of the factors that are important to the decision maker. Few (2006, p. 34) provides the most comprehensive definition of a dashboard as a "visual display of the most important information needed to achieve one or more objectives which fits entirely on a single computer screen so it can be monitored at a

402 EXECUTIVE INFORMATION AND DASHBOARDS
Figure 10.1. Building a balanced scorecard. {Source: From R. S. Kaplan, and D. P. Norton, The
Balanced Scoreboard: Translating Strategy into Action, Boston, MA: Harvard Business School Press,
1996.) Image is reprinted here with permission of the publisher.
glance." An example of the kind of dashboard Few describes is shown in Figure 10.2. This particular dashboard, called the IT Dashboard, provides the breakdown of IT expenditures in the federal government by agency. As you can see, the left side of the dashboard provides a chart of the IT expenditures by agency. Since the expenditures for IT are intended to facilitate the long-term missions of the individual agencies, they are reported by agency rather than the overall federal budget. Clicking on the histogram on the left brings up data about that agency on the right; in this figure, IT expenditures for Veterans Affairs appears on the right.
The goal of the dashboard is to present organized data to the decision maker in an easy-to-understand format. In addition to providing the data, the dashboard provides a measure that helps decision makers understand that factor, such as values at comparable times last year, standards, budgeted value, competitor's value, or any other metric to which a comparison is of value to the decision maker.
But, there is more to a dashboard than simple reporting provided in an EIS. The dashboard is also interactive, allowing decision makers to drill down for additional in-formation. If you click on the graphic on the right, you see more information about the expenditures for the Department of Veterans Affairs, as shown in Figure 10.3. Using a standard red-yellow-green coloring for significant concerns, needs attention, and normal, respectively, this view of the dashboard gives information about projects by cost, schedule, or evaluation. You can see by looking at the pie chart on the left that 63% of the projects

EXECUTIVE INFORMATION AND DASHBOARDS 403
Figure 10.2. The federal IT dashboard. (Source: Your window into the Federal IT Portfolio, http://it.usaspending. gov/.) The screen is reprinted with permission.
have significant concerns. More data about those concerns are shown in the bar chart on the right. If we look at the cost of the projects, only 7% of the projects have significant concerns because of budget, while 49% of the projects have concerns about the schedule, and 64% of the projects have concerns because of evaluation of the agency CIO.
Figure 10.3. First drill-down. (Source: Your window into the Federal IT Portfolio, http://it.usaspending.gov/.) The screen is reprinted with permission.

404 EXECUTIVE INFORMATION AND DASHBOARDS
Figure 10.4. Second drill-down. (Source: Your window into the Federal IT Portfolio, http://it.usaspending.gov/.) The screen is reprinted with permission.
To better understand the problems of these projects, managers can, in turn, click on the projects for which there are significant concerns. They can select all projects for which there is concern by clicking the largest part of the pie chart for "overall rating" or select only projects for which budget, schedule, or evaluation poses significant concerns by selecting that portion of the bar chart. The result is a list of projects in this category, as shown in Figure 10.4. Here you see a listing of projects and the expenditures for those projects in this fiscal year. Managers can then select one of the projects, such as "Blood Banks," by clicking the name and they see more information about that specific project, as shown in Figure 10.5. Notice this dashboard gives you information about variance from the cost (which is small), schedule (on average they are late by 120 days), and evaluation by the agency CIO. Clicking on any of those measures provides more specific details, such as that shown in Figure 10.6. What we find is that the CIO has not yet rated the project and so the rating was set at " 1 " automatically. For this project, the CEO might then ask the appropriate CIO to rate the project so he or she can get more information. In this case, the project appears close to target, but only after the CIO has shared an overview and non-quantitative factors can the CEO be sure.

EXECUTIVE INFORMATION AND DASHBOARDS 405
Figure 10.5. Third drill-down. (Source: Your window into the Federal IT Portfolio, http://it.usaspending.gov/.) The
screen is reprinted with permission.
Dashboards can lead to more analytical abilities too. By selecting the "analysis" tab, decision makers can peruse more about the expenditures. For example, Figure 10.7 shows a chart of the percent change in spending associated with the total spending. Many other combinations are available with the selections of different axes allowing deeper analyses. For example, Figure 10.8 shows how the agencies are splitting their spending between mission area projects and infrastructure. It highlights that the NSF is spending more of its budget on infrastructure than on mission-critical projects, whereas the Department of Education is spending proportionally more of its budget on mission-critical projects than on infrastructure.
The use of dashboard arrows a decision maker to get an overview on the entire state of affairs and allows him or her to know where greater focus is necessary and to perform that greater focus. So while dashboards are visual displays that summarize data, they are also gateways to detailed information and even analyses that the decision maker might want. Dashboards are always one screen in size, but they are customized to the user's needs, decision-making sphere, and visual preferences. Following the pattern of the scorecards, there would be strategic dashboards for senior executives, operational dashboards for middle management, and tactical dashboards for front-line managers. These dashboards would all be tied together with the goals and objectives they represent.

406 EXECUTIVE INFORMATION AND DASHBOARDS
Figure 10.6. Fourth drill-down. (Source: Your window into the Federal IT Portfolio, http://it.usaspending.gov/.) The
screen is reprinted with permission.

Figure 10.7. Analysis in a dashboard. {Source: Your window into the Federal IT Portfolio, http://it.usaspending.gov/.)
The screen is reprinted with permission.
Figure 10.8. Additional analysis. {Source: Your window into the Federal IT Portfolio, http://it.usaspending.gov/.)
The screen is reprinted with permission.

408 EXECUTIVE INFORMATION AND DASHBOARDS
Dashboards can provide data for any domain in the organization. In sales, for example, the dashboard might include number of orders, sales pipeline, and order amounts. In manufacturing, on the other hand, the dashboard might include production rates, defect rates, and absenteeism. A university dashboard might include number of students, first-year retention rate, student satisfaction, number of faculty, faculty to student ratios, and graduation rates. In other words, the dashboard contains information about whatever is important to that decision maker.
Dashboard as Driver to EIS
There are a number of basic requirements for an effective dashboard that behaves as an EIS. Tables 10.1-10.3 summarize some of the characteristics that have been illustrated earlier in this book. The most important characteristic of a successful dashboard is that it be simple and easy to use. Well-designed dashboards allow the executive to understand the corpo-rate performance easily. In addition, the system anticipates some needs by automatically generating prespecified exception reports and trend analyses that help executives to iden-tify both problems and opportunities. Dashboards must have user-friendly interfaces that encourage system use. Often this is achieved with the use of color screens and easy-to-understand graphics. In particular, the use of red-yellow-green to illustrate the interpre-tation of a value is common. Generally, however, the use of color is supplemented with a
Medsphere, a leading commercial provider of open source-based electronic health record systems and services for hospitals and clinics, has a strong focus on project management. Program managers are responsible for presenting the overall progress on the company's projects to their different stakeholders, including board members and customers. However, they did not have a succinct and comprehensive way of communicating the myriad of details to their various stakeholders until they adopted dashboards,
Using the full-dash board technology of an EIS, they can now convey information across the organization regarding each customer's implementation. Two basic dashboards were imple-mented:
• The Project Performance Dashboard helps Medsphere managers, executives, and board members quickly obtain an understanding of the progress of customer implementations. For example, they can easily see budget and schedule performance that can be used to forecast future performance.
• The Project Status Dashboard helps Medsphere managers, executives, and board members quickly obtain information on project challenges, including burn-off and aging status.
Of course individual decision makers can customize their dashboard with a variety of measures, including scheduling, actual versus planned, issues, top-5 challenges, risk management, and earned-value management dashboards.
Managers at Medsphere note the dashboards have improved communications among employ-ees because they can see and understand the relevant information at the same time. In addition, because they can drill down into the data to find the reason for a particular outcome, it allows decision makers to understand the reason for a result and the items thai might be adjusted to improve it.

EXECUTIVE INFORMATION AND DASHBOARDS 409
Table 10.1. Information Needs to Be Met by a Dashboard
Timely
Sufficiency
Aggregation level
Redundancy Understandability
Freedom from bias Reliability
Decision relevance Comparability Appropriateness of format
Information needs to be available as soon as possible Response time should be very short Information needs to be complete Users need extensive external data Users need historical data as well as most current data Users need access to global information of the organization and
its competitors Information should be provided in an hierarchical fashion Information needs to be provided at various levels of detail,
with "drill-down" capability Users need "exception" reports or problem "flags" Should be minimized System should save users time Problem indicators should be highlighted Written explanations should be available Should support open-ended problem explanation Information must be correct and complete Information must be validated Access must be controlled but reliable for those approved to use
the system System must meet the needs of executives Users need trends, ratios, and deviations to interpret Flexibility is crucial Format should reflect user preferences Integrates text and graphics appropriately
Table 10.2. Modeling Needs to Be Met by a Dashboard/EIS
Extensive use of click-through and drill-down abilities Easy to use ad hoc analysis Extensive use of exception reports and facility for tracing the reason for the exceptions Models are provided appropriate to address critical success factors Forecasting models are integrated into all components User has easy access to filters for data analysis Extensive use of "what-if" facility Extensive use of planning models
Table 10.3. User Interface Needs to Be Met by a Dashboard
Interface must be user friendly Interface must incorporate sophisticated use of graphic user interface Interface should incorporate alternative input/output devices such as mouse, touch pads,
touch screens, etc. System must be accessible from a variety of machines in a variety of locations Interface should be intuitive Interface should be tailored to management style of individual executives Interface should contain help menus for functions of the system Interface should contain content-sensitive help menus

EXECUTIVE INFORMATION AND DASHBOARDS
shape for accessibility purposes. For example, it is common to use not only the red-yellow-green metaphor of a traffic signal, but also to place that color in its standard location on a signal so that even if a user cannot distinguish the colors of red and green, he or she can still understand the message by whether it is located at the top or bottom of the signal.
Further, the data must be presented in an easy-to-understand format with tools that allow executives to change the format of presentation if necessary. Hence, a related concern is that dashboard must be flexible in presentation and graphics capabilities. Dashboards must allow—and facilitate—the executives to follow paths they think are appropriate with a minimum amount of effort. This includes flexible data browsing, data manipulation, and presentation modes that facilitate executives gaining insights into competitive trends, business opportunities, and emerging problems. Consider, for example, a dashboard with which the user can investigate the reasons for and patterns in sales by considering only certain regions or certain states. Executives should be able to ask questions relating to forecast projections, inventory status, or budget planning as they feel appropriate.
Third, dashboards must provide the broadest possible base of information. Executives need both qualitative and quantitative information and information from within the firm and without. The internal data must represent corporatewide performance and operations. It must include both current and historical data that support long-term trend analyses. The external data must facilitate the evaluation of external forces affecting the corporation. Dashboards have a well-organized presentation of data that allows the executive to navigate the system quickly. Often, dashboards offer a "snapshot" of the present (or the past) in an easy-to-understand format. In addition, the systems have "drill-down" capabilities that enable the executive to investigate analyses underlying the summary information that might better identify problems and opportunities; an example of such drill-down screens was discussed earlier. These prepared drill-down screens are supplemented by an ad hoc query capability through which executives can investigate unanticipated questions or concerns.
Fourth, dashboards must respond quickly. This includes, of course, the time the system takes to respond to a particular request. Executives are busy and are accustomed to fast response from their employees; they expect nothing less from their computer systems. In addition, dashboards must facilitate fast reaction to ideas generated from the system. Dash-boards need to provide easy-and-quick communication and report-generating capabilities to allow executives to react to the information provided.
Design Requirements for Dashboard
The dashboard is, of course, a graphical user interface. As such, its goal is to provide images that engage the human visual system so that patterns can be discerned quickly and
One CEO removed the EIS dashboard, even though it included the right physical interfaces and was implemented on the basis of critical success factors, In her mind, the dashboard was more of a toy lhan a tool because the CEO lacked any mechanism to shave insights from it with others in the company. Since the dashboard lacked any way to be integrated into an email or other communication took she had to print the result, comment on it and send it through company mail. In other words, the CEO had no good way to communicate the points while the feeling was "hot/' Integration of the tool into regular work processes is critical.

EXECUTIVE INFORMATION AND DASHBOARDS
accurately. In order to take advantage of the power of the visual system, designers need to understand the principles of the system. Short-term visual memory is limited. Humans focus only on a fraction of what the eyes sense and only a fraction of that actually becomes a focus of attention. In fact, humans store only three to nine "chunks" of information at a time and they are replaced when new chunks of information arrive. In other words, to get the greatest possible message in a dashboard, items that belong together (in the decision maker's mind) must be placed together on the dashboard, and things that are different need to be clearly demarcated.
The dashboard must be encoded for rapid perception. Consistency in how data are rep-resented and how decision makers navigate is crucial. Most experts will suggest designers avoid ugly interfaces. But, Norman (2005) emphasizes that aesthetically designed things are more enjoyable, which causes them to consider the data more intensively and prepares the viewer for greater insight and more creative response. Said differently, if the dashboard is designed aesthetically, it will allow executives to make better choices.
The items that can be adjusted to affect this encoding include the color, the form, and the position of the information on the dashboard. Color must be used in a pleasing, yet useful manner. The hue and the intensity must be used to bring the decision maker's attention to important facts and to highlight differences. Bright, fully saturated colors tend to grab the user's attention and so should be reserved for the most important or the most critical information on the dashboard. Too much of the bright colors make the dashboard difficult to view for an extended period and may reduce concentration on the data. Generally dashboards are designed using soft colors to reduce stress of the user and to emphasize the selective bright colors of important data. Colors must also contrast well so that users can see the visual differences of the dashboard. For example, black fonts tend to be easy to read except when they do not contrast well as if you had a navy blue background. Similarly, too little contrast between the colors used for different categories will make it difficult for the user to demark the differences. It is a rule of thumb to limit color variation to five shades.
Form attributes of course include the length, width, size, shape, and position of the objects in the dashboard. Generally dashboards are more effective if the magnitude of quantitative information is conveyed in terms of position and line length rather than line width and shape because those are easier for the human eye to discern. While dials are appropriate to show continuous functions, bar charts and line diagrams are preferred for all other representations. Bar charts are appropriate for nominal and ordinal scales because they allow easy comparison of adjacent values. Sometimes dashboards use stacked bar charts to show related issues, such as year, salesperson, or channel. Line graphs, on the other hand, emphasize the pattern in the data, especially when multiple phenomena appear on the same graph. Shapes should be reserved to indicate something about the data, such as arrows to show increases or decreases stars to show important projects. If the icon is being used to indicate an alert, it should be simple yet noticeable to the user. If there need to be multiple alerts, then they should all have some similarity, such as shape, to designate it is an alert. Most interface designers discourage the use of icons for representation or even pie charts because they can lead to misperceptions. Consider the two representations of product contribution to profit shown in Figure 10.9. Notice how much easier the bar chart at the bottom is to read and interpret than is the pie chart, even without the data being ordered. Similarly, consider Figure 10.10, which shows the market capitalization (what it would cost to buy all of a company's stock at the current price) of 15 major banks as of January 20, 2009, to their market capitalization in the second quarter of 2007, before the

412 EXECUTIVE INFORMATION AND DASHBOARDS
Figure 10.9. Comparison of pie chart and bar chart.
banking crisis hit. Notice how difficult it is to make those comparisons using the bubbles in the top graph compared to the bar chart at the bottom.
It should be noted that similarity of size, shape, color, and orientation of items, even when they are separated on the dashboard, suggests a visual pattern. If that similarity is intended, either because of the meaning of the cue (such as colors of red, yellow, and green indicating the status of a project) or the kind of item being represented (such as similar aspects of different projects), then that helps to reduce the amount of effort the decision maker needs to expend to understand the data. If there is not a parallel in how the decision makers should interpret the information, the similarity will serve to confuse decision makers.
The position on the dashboard is important to help the user interpret the data. The proximity of items on a dashboard suggests they belong to the same group, such as the absenteeism at each plant. Enclosure with a line or color will bring things together. Where

EXECUTIVE INFORMATION AND DASHBOARDS 413
Figure 10.10. Comparison of bubble and bar charts. (Adapted from graphic design examples by Stephen Few of Perceptual Edge, available: http://www.perceptualedge.com/example18.php.) Graphic is reprinted courtesy of Stephen Few.

EXECUTIVE INFORMATION AND DASHBOARDS
there are differences in location, continuity also suggests similarity. All items on a con-tinuous color or within a closure should be interpreted together. Data should be organized (colocated) according to business functions, products, divisions, or other meaningful units. The delineation between and among those groups should be subtle, such as a background color or a thin line, so the emphasis continues to be on the data themselves. Data should be arranged on the dashboard to facilitate analysis, support meaningful analyses, and discour-age meaningless comparisons. If items are colocated, they are more likely to be compared; the greater the distance between the items, the less likely they are to be compared. So, for example, productivity of different plants should be co-located to encourage compar-isons. On the other hand, plant productivity statistics should not be co-located with sales statistics because they should not be compared. Similarly, items that should be compared should be combined in a single table or graph to encourage that comparison. If that is not appropriate for some reason, then the items should be coded with a common color or hatch pattern the similarity of colors or patterns will encourage decision makers to see them together.
So, what makes for a good dashboard? There are four specific rules for designing a good dashboard. The first is to simplify! Users can perceive only so many images at once. Associated with simplicity is the need for it to be well organized and condensed. Users can drill down if they need additional information. The dashboard should be specific to and customized for the audience's objectives and, of course, always use the client's vocabulary. Colors should be chosen carefully and designers should avoid "cute" displays.
But, of course, dashboards should always be evaluated first in terms of their ability to meet the needs of decision makers. Consider the dashboards in Figures 10.11 and 10.12. Figure 10.11, which is an example of creative dashboard design from the blog,
Figure 10.11. An overpopulated dashboard. (Source: myxcelsius.com, a blog dedicated to Xcelsius dashboards.)
Graphic reprinted with permission.

EXECUTIVE INFORMATION AND DASHBOARDS 415
Figure 10.12. A good dashboard. (Adapted from S. Few, Information Dashboard Design: The Effective Visual Com-munication of Data, Sebastopol, CA: O'Reilly, 2006, p. 177.) The dashboard is reprinted courtesy of O'Reilly Publishers and Stephen Few.
myxcelsius.com, provides easy access to information about a variety of issues of costs and allows the decision maker to change values to perform sensitivity analyses. It would not, however, be a good dashboard for monitoring an organization; there is so much information that the user could not identify important factors quickly and might be disrupted from focus on the issues of importance. In contrast, the dashboard shown in Figure 10.12 is much cleaner and allows the decision maker to focus on the important characteristics but does not facilitate sensitivity analyses.
Few (2006) lists 13 mistakes for designing dashboards, as shown in Table 10.4. The complements of the mistakes provide good guidelines for making a dashboard not only more usable but also more likely to have an impact upon a decision. Paramount in Few's list is the need to keep the dashboard to a single screen. Decision makers frequently do not

EXECUTIVE INFORMATION AND DASHBOARDS
Table 10.4. Design Mistakes
Exceeding the boundaries of a single screen Supplying inadequate context for the data Displaying excessive detail or precision Choosing a deficient measure Choosing inappropriate display media Introducing meaningless variety Using poorly designed media Encoding quantitative data inaccurately Arranging the data poorly Highlighting important data ineffectively or not at all Cluttering the display with useless decoration Misusing or overusing color Designing an unattractive visual display
Source: Adapted from S. Few, Information Dashboard Design: The Effective Visual Communication of Data, Sebastopol, CA: O'Reilly, 2006, p. 49. The table is reprinted courtesy of O'Reilly Publishers and Stephen Few.
scroll because they believe that which is below what they can see is less important. Further, scrolling does not allow decision makers to see the big picture or to do appropriate compar-isons. Second, a dashboard must not only present data but also help in the interpretation of the data. A number alone is not useful, but one in context can be very useful. Is the reading good or bad. Is it on track? Notice how this is done in Figure 10.12. The key metrics graph has not only the actual values for each metric but also a shadow graph that defines the good and bad regions. The revenue graph not only shows the relative performance of the various units but also has a bar indicating the goal and highlights the unit that missed the goal. These subtle context indicators make the solution more elegant and do not unduly burden the decision maker. The goal of the dashboard is a big-picture view. As such it is important not to provide excessive detail or precision. Every unnecessary piece of information slows down evaluation. So, unnecessary precision of data, too much detail in measures, and other unnecessary particulars should be avoided.
The fourth point of choosing deficient measures does not refer to the content of the measure that appears on the dashboard. Clearly, the appropriate KPI and the appropriate data to support that indicator must be selected. In addition, the information of that measure needs to be represented so the decision maker sees the important issues most easily. For example, providing two graphs on the same axes allows the decision maker to see patterns in the trends. However, if the goal is to focus on how different they are at different points of time, such graphs do not provide enough data. Rather, it is appropriate to provide a single metric of the amount of deviation or the percent of deviation. That will help the decision maker focus on the salient details. Similarly, appropriateness of the medium refers to the type of visual that is displayed. Designers must ask themselves whether a given visual displays the information the user needs and whether it provides the information with the least amount of work for the decision maker. The most commonly noted example of this is the pie chart discussed earlier in this chapter. Further, since decision makers need to focus on the data, not on the delivery of the data, designers should provide consistent kinds of visuals for consistent messages. While it may appear boring to provide all bar charts, it does help the decision maker focus better on the data.

EXECUTIVE INFORMATION AND DASHBOARDS
Once the appropriate media have been selected, they need to be defined as well. Data are best interpreted when they are ordered. Such order might be by size of the metric or by order of plant or some other meaningful order. Data should also be labeled. It is much easier to interpret dashboards when the values are right there rather than having to look all over the screen for the data. If you want users to be able to distinguish values, do not use too much color, but do not use colors that are too close together (if they are varied). Make items easy to read by using an appropriate font. Most experts believe a sans serif font, such as arial or helvetica, is easier to read on a screen.
When we discussed user interfaces, we discussed problems of inaccurately representing quantitative data. In the dashboard, it is important to attend to scaling properly, draw graphs and charts properly, and not use graphs that distort the relationship of interest. These factors must be considered in the design of dashboards as well.
The last five factors in the table relate to the "big picture" that is represented. Arrange data in the order you want the decision maker to consider them. The top-left portion of the screen is considered the prime spot. The summary or the most important information should be located there. Use the space well to draw similarities and dissimilarities of visuals. Make the dashboard comfortable to examine. In addition, use color to highlight factors appropriately. Color should be used sparingly, since too much can cause confusion. However, color should be used to highlight important metrics or metrics that are out of range so that the eyes are drawn there first. But, if there are not differences or the differences are not important, do not vary the color just because it is possible.
Dashboards should be designed to make the data prominent and to encourage the user to focus on the data. As such, designers should avoid cluttering the display with decoration. Users tend to tire of the decoration quickly and it does not contribute to their understanding of the meaning of the data. Similarly, users should be conservative when using color. Too much is also clutter. Too little can be downright boring. Be consistent in the color and use variations, especially among hot colors, to something demanding attention. However, be aware that some individuals cannot distinguish between specific colors and may not be able to discern differences in the data. Finally, remember aesthetics. People do not want to look at something ugly, and so they are likely not to focus on the dashboard if it is ugly.
Dashboard Appliances
Most application packages that include any kind of data analysis features have some form of dashboard facility. Large-scale packages, such as those provided by IBM and SAP, and data warehouses have built-in dashboard functionality. In addition, there exist proprietary and open-source stand-alone dashboard tools that can be configured to work with an organization's data. Even Microsoft's Excel has the ability to build a dashboard.
The key in building a dashboard for EIS support is not in which product is selected to support the system but rather in selecting the indicators that will be represented. As with all DSS technology, the tool will only support decision makers if the factors that they need to see are represented. So, it is important to take the time to determine KPIs that are most reflective of the health of the organization. Once the indicators have been agreed upon, the next critical step is to integrate the dashboard with the systems that produce the data. Dashboards that draw data from normal production systems in standard time periods work best to ensure that data are not interrupted. As stated earlier, the dashboards should be simple, with no more "bells and whistles" or data than are necessary to convey the key aspects of the organization. Finally, the dashboard should not be seen as a stand-alone

EXECUTIVE INFORMATION AND DASHBOARDS
object. Providing decision makers with the drill-down capability to determine the "why" behind a reading is as important as providing the reading.
Value of Dashboard and EIS
A dashboard (with the associated EIS) can help executives use their time more effectively. They can reduce search time for information and identify and respond to exceptions as soon as they are recorded. Furthermore, the dashboard provides information that is more timely, accurate, and relevant. Decision makers also can identify and resolve problems more quickly and easily make better decisions. In this way, the corporation can treat information as a "strategic resource" and free MIS personnel and other assistants to work on longer term projects.
The dashboard can function only in an environment that is ready for it. Several issues need to be addressed to determine readiness. First, prior to implementation, there must be an information delivery problem. In particular, there must be critical information that is not available in a timely fashion prohibiting executives from making high-quality decisions. Alternatively, there may be a real business problem that cannot be addressed because of information delivery problems. Without a prior problem, the value of the dashboard is not apparent to the decision makers and hence they are unlikely to take the time to learn how to use the system.
Second, prior to implementation, there must be some level of technological maturity of either the executives or the organization. This means that the organization (or the executives themselves) must have experience with the technology or must be willing to change technology. Clearly, some organizations are more resistant to technological change than others or require a more planned approach to evolve to greater use of technology.
The process of movement to dashboards also needs to be managed. Many executives have a staff that addresses analytical problems for them, monitoring important indicators and bringing them to the attention of the executive when necessary. In addition, these staffs provide analysis when requested. Sometimes the move from this situation to a dash-board/EIS is too big for the executives to make. That is, sometimes the move toward their own integration of and focus upon information and learning a computer system is not successful. In these cases, designers get better results if they decompose the change into two separate components, learning to use the computer and learning to focus on their own information analyses. For example, some move executives to a "query" stage by getting them used to online capabilities first. Others move the executive first to just the dashboard where questions are asked and reports are generated at the request of the executive using "executive briefing books." After they feel comfortable with half of it, moving to a full system is easier.
Of course, not all predesign concerns involve the executive. Prior to implementation, designers need to understand the management process. Since the dashboard and associated EIS functions address upper level management and strategic choices, the system needs to be molded more to management processes than general DSS. In addition, designers need to be creative in their development of incentives to encourage senior management to use the system.
The design of the EIS must be managed more carefully than other DSS design because of the kind of decision and the kind of user. Several factors need to be considered when implementing an EIS. For example, Volonino and Robinson (1991) offer guidelines for development.

EXECUTIVE INFORMATION AND DASHBOARDS
• A prototype of the dashboard should be built quickly after a decision is made to implement it. In this way, executives have "hands-on" experience with a system early, thereby keeping the enthusiasm and momentum at a high level. In addition, the prototype allows the designer to understand upper management's needs better.
• Customization of the dashboard and the information it provides must be an ongoing process. Clearly the focus of upper level managers changes over time. If the system is to be effective, it needs to adapt to these changes and their associated information requirements.
• Designers must have an executive sponsor to help guide the project in the organi-zation. The person should be a strong advocate placed as highly as possible in the organization (preferably among the top-three people in the organization). Without this kind of support, even the best EIS are likely to fail.
• Avoid assumptions about design needs. Too often designers think they understand the needs or do not want to bother high-level executives with their questions. It is crucial that the dashboard reflect real information needs, and these needs are most likely to be reflected if the designer and decision makers communicate well from the beginning of the process.
• The dashboard and its interactive components must be easy to use. Watson and Satzinger (1994, p. 46) state that "[b]ecause of the nature of the executive user, the system has to go beyond user friendly and be 'user intuitive' or even 'user seductive.'" Designers should standardize screens and provide a menu as a gateway to any access to the system. Further, they should use standard definitions for terms so that users do not need to guess what is meant.
• The EIS must contain current information from both within and without the organi-zation.
• The system should have fast response time. In fact, some designers suggest that the response time needs to be less than 5 seconds. Whatever standard is chosen, it is clear that faster is better because high-level executives are intolerant of waiting for the response. More important, the system must be designed to anticipate increased usage without degradation of response time. System usage is likely to grow over time, sometimes exponentially, and the system needs to be designed to provide similarly fast response time with the greater usage. Watson (1995) cites an unnamed developer as defining "maximum acceptable time to move from screen to screen as 'the time it takes the executive to turn a page of The Wall Street Journal?" However, he noted that executives are more tolerant of response time for ad hoc queries than simple scanning of prefabricated, standard analyses.
Although fast response time is important to the executive, designers need to be aware that a sudden move to fast information upon which the executives can act can lead to instabilities in the organization. Consider, for example, the experience seen with database technology, as summarized by Chapnic (1989t p. 7):
Information feedback that is too rapid and not controlled properly is very desta-bilizing for a system, causing its behavior to oscillate wildly ... wc may inad-vertently destabilize large organizations by forcing them to react too quickly to changes.

EXECUTIVE INFORMATION AND DASHBOARDS
• The EIS must provide information through a variety of media that are easy to use and provide content quickly. Graphical displays are important to present information quickly. In addition, hypertext and hypermedia allow executives to move through text more quickly. However, even if an EIS has the most up-to-date capabilities, it will be wasted if the executive quits using the system because it is too slow in response.
• Designers must not only provide the technical ability to eliminate paper from the decision process but also address the political, legal, and organizational implica-tions of doing so. Such an analysis must provide alternatives for addressing those problems.
• Screens need to be designed carefully. They must carry useful messages and only useful messages. Furthermore, they must be easy to follow and should minimize the designer's influence and bias associated with their design.
• The system must be cost effective. Unfortunately, we cannot justify an EIS using the same terms we would for a transaction processing system because the benefits rarely can be traced directly to a dollar savings for the enterprise. Rather, the key benefit is in providing relevant information quickly and reliably.
Several methodologies have been put forward for designing an EIS. Most fall into the class of traditional systems development life cycle methodologies. Rockart (1979) developed the critical success factors methodology, which allows users to define their own key indicators of performance. These indicators track the most important pieces of company and market information for the executive. Further, the method keeps executives involved with the evolution of their system by periodically requiring them to review and modify their indicators as their needs change.
Another methodology, developed by Volonino and Robinson (1991), is the strategic business objectives (SBO) methodology. The SBO methodology focuses on company goals rather than the executive's views of performance. It requires users to identify and prioritize critical business objectives. These priorities then specify the information identified and captured in the EIS.
The one critical aspect in each methodology is the successful identification, capture, and inclusion of information to meet the requirements of strategic planning. Watson and Frolick (1993) conducted studies to examine the manner in which dashboards/EISs are developed. Too often, they found, executives were only consulted in the initial design phase or after implementation when modifications are considered. However, they found that greater discussions with executives during planning meetings and throughout the project lead to better outcomes. Some of the criteria used to evaluate products found in another project by Watson and his colleagues (1992) are shown in Table 10.5.
Once the framework for implementing a dashboard is in place, the next major area of consideration is the hardware. A number of factors affect the appropriateness of the hard-ware. First, the hardware should be capable of supporting management functions critical to executive tasks, such as deductive reporting, trend analysis, and exception reporting. Second, the hardware must have high-resolution, bit-mapped display screens to provide superior output to the paper-based methods. Too small a screen or unclear output will be distracting and unusable for managers. Third, the processor speed must be sufficient to ensure a timely response to a request. The processor must not only meet current demand but also meet future increases in demand. Fourth, the computer hardware must allow input and output by mechanisms other than the traditional keyboard. Executives respond better

EXECUTIVE INFORMATION AND DASHBOARDS 421
Table 10.5. Sample EIS Adoption Criteria
3.0
1.0 Ease of use Development
• Applications to be easy and quick to develop
• New users to be easy and quick to add to the system
• Suitability for quick prototyping
• Display alternative output formats quickly
Learning
• Learning time for developers
• Learning time for users
• Availability of appropriate documentation and tutorials
End user
Menu system
Customized menus for each user
Ability to bypass menus not required
Various modes of use (mouse, touchscreen
Minimal number of keystrokes
Consistent use of functions
Maintenance
Easy to add and modify data
Ability to maintain integrity and timeliness of data (handling of frequent updates)
Easy to add and modify screens, reports, and graphs
Availability of standard templates
Ability to copy existing screens, graphs, and so on
Ability to monitor system usage
Easy to add additional users
Ability to incorporate changes to corporate 4.0
structure
2.0 Reporting capability
• Reports to be presented as both graphs and tables • Ability to display graphs, tables, and text on a
single screen • Ability to switch between tabular and graphic
output • Ability to color code exceptions on the current
screen • Ability to present a summary screen listing all
exceptions throughout the system
• Support analysis of budgeted actual and forecast figures
Effective presentation of time series data
Ability to highlight variations
Support interactive user-defined variance criteria
Retrieval of historical data as required
Maintain historical data and discard after a user-defined period
Analysis of historical data and identification of trends
Built-in restrictions to protect historical data
Facility for personalized queries (i.e., ability for users to scan the database according to interactively defined criteria)
Explanatory notes to be attached to reports
Graphic presentation
Quality of graphics
Speed of presentation
Effective use of default color coding
Ability to highlight areas of concern
Availability of individual color schemes
Ability to include explanatory notes for each graph Ability to produce a variety of graphs (pie, bar, 3D bar, line)
Automatic generation of simple, default formats which can be customized
Easy to produce executive defined graphs
Automatic scaling
Graph limitations
Automatic legends
General functionality
Drill-down cability
Built-in statistical capabilities
Lookaside capability for interrupting a process to
use another facility
Screen scrolling (horizontal and vertical)
Multiple tasks to be operating and displayed
concurrently (e.g., windows, split screens)
Access to notepad facility
Integration with DSS
Import data from spreadsheets/word processing
Minimal screen repainting
Ability to display other languages
(Continued)

422 EXECUTIVE INFORMATION AND DASHBOARDS
Table 10.5. (Continued)
5.0 Data handling · Ability to incorporate EIS reports and graphs into , , . , , . „ . mail facility
• Version checking to ensure all users are accessing the same version of software, applications, and 9.0 Security data
• Interfaces with external databases and internal WMC systems
• Efficient storage of time series data
• Stored aggregates for rapid access • Built-in periodicity conversions 1 0 · 0 Environments and hardware
• Efficient indexing and retrieval mechanism · Local access
• Instantaneous distribution of new data among users · Across networks
• Ability to consolidate various sources and formats · Multiuser access to the same data (only 3 users
Restricted system access
Restricted function access
Add/edit/delete restrictions for applications and data
of data into an EIS database via manual input or tested) electronic data transfer from other systems · Portability
• Ability to sort screen data according to · pc-mainframe links user-defined criteria
6.0 Output options π 0 Documentation
• Laser printer, plotter, color printer, transparencies . Reference manual, introductory guide, tutorials
• Large-screen presentations for meetings . Overall style of documentation
7.0 Performance · Online, context-sensitive help screens
Λ η · Meaningful error messages • Response times ° ° Ä TM-. · r · *· i j· j · Appropriate cross-referencing and indexing • PC-mainframe communications uploading and vr r © ©
downloading data * Stand-alone chapters • Efficient resource usage 12.0 Vendor support • Capacity issues (i.e., number of users, volume of . ^ · · r J i
ή s Training courses for developers ^ ,. , .,. r n · Technical support
• Reliability of software n n .-.. · Local support
• Recovery facility • Timeliness and smoothness of initial installation
8.0 Electronic mail . Availability of off-the-shelf applications • Ability to run corporate mail · Availability of source code
• Hot-line support Source: Adapted from H. J. Watson, B. A. Hesse, C. Copperwaite, and V. Devos, "EIS Software: A Selection Process and the Western Mining Experience," Journal of Information Technology Management, 3(1), 1992, pp. 19-28. The table is reprinted courtesy of the editor.
to media such as voice-activated systems and touch screens. Fifth, the computer hardware should enable executives without computer skills to enhance their daily work experience. Sixth, the computer must be networked. The executive must be linked to departmental, cor-porate, and external management information as well as electronically linked to managers who might provide insights into the problems under consideration. Finally, the hardware must be integrated with other technological equipment of importance to the decision maker such as electronic mail systems, instant messaging, voice mail, and video conferencing systems.

SUGGESTED READINGS
DISCUSSION
Dashboards, when used as EIS, provide decision support technology to the highest level of managers. In many ways, they resemble the DSS we have addressed elsewhere in the book. Among the most significant difference, however, is that the dashboard provides prefabricated analyses and the drill-down sends decision makers to primarily standard analyses selected particularly for a decision maker. In addition, since these are designed to support high-level managers, their needs for implementation and monitoring are different. Finally, since they tend to support strategic decisions, the kinds of analyses provided must be different.
SUGGESTED READINGS
Bergerson, F., et al., "Top Managers Evaluate the Attributes of EIS," in DSS '91 Transactions, Manhattan Beach, CA: College on Information Systems of The Institute of Management Sciences, 1991.
Burkan, W. C, "Making EIS Work," in DSS '88 Transactions, Manhattan Beach, CA: College on
Information Systems of The Institute of Management Sciences, 1988.
Burkan, W. C, "Making EIS Work," in P. Gray (Ed.), Decision Support and Executive Information
Systems, Englewood Cliffs, NJ: Prentice-Hall, 1994, p. 331. Burkan, W. C, Executive Information Systems, New York: Van Nostrand Reinhold, 1991.
Chapnic, P., "Editor's Buffer," Database, Programming and Design, Vol. 2, No. 4, April 1989,
pp. 7-8.
Coffee, P., K. D. Moser, and J. Frentzen, "Software Tools Support Decision Making," PC Week,
Vol. 7, No. 25, June 25, 1990, pp. 119-121.
Darrow, B., "ElSes Put Data at Users' Fingertips," Inforworld, Vol. 12, No. 33, August 13, 1990, p. 13.
DeLong, D. W., and J. F. Rockhart, "Identifying the Attributes of Successful Executive Information System Implementation," in J. Fedorowicz (Ed.), DSS '86 Transactions, Washington, DC: College on Information Systems of The Institute of Management Sciences, 1986.
Eckerson, W. W, Performance Dashboards: Measuring, Monitoring and Managing Your Business,
Indianapolis, IN: Wiley Publishing, 2005. Eliot, L., "High ROI on Modern EIS," Decision Line, May 1994, pp. 7-8.
Ferranti, M., "Pilot Aims Windows-Based EIS at Non-Programmers," PC Week, Vol. 7, No. 36,
September 10, 1990, pp. 39, 50.
Few, S., Show me the Numbers: Designing Tables and Graphs to Enlighten, Oakland, CA: Analytics, 2004.
Few, S., Information Dashboard Design: The Effective Visual Communication of Data, Sebastopol,
CA: O'Reilly, 2006.
Few, S., Now You See It: Simple Visualization Techniques for Quantitative Analysis, Oakland, CA: Analytics, 2009.
Fitz-Gibbon, C.T., Performance Indicators, Bristol, UK: Multilingual Matters, 1990. Gray, P. (Ed.), Decision Support and Executive Information Systems, Englewood Cliffs, NJ: Prentice-
Hall, 1994. Gupta, S. K., "Streaming Multidimensional Data by Bypassing Multidimensional Query Processor,"
United States Patent Application, Cognos Incorporated (Ottawa, CA) 20080301086, available: http://www.freepatentsonline.com/20080301086.html.

EXECUTIVE INFORMATION AND DASHBOARDS
Healy, P. M., and G. P. Krishna, "The Fall of Enron," Journal of Economic Perspectives, Vol. 17, No. 2, Spring 2003, pp. 3-26.
Houdeshel, G., and H. J. Watson, "The Management Information and Decision Support (MIDS) System at Lockheed-Georgia, in R. H. Sprague, Jr. and H. J. Watson (Eds.), Decision Sup-port Systems: Putting Theory into Practice, 3rd ed. Englewood Cliffs, NJ: Prentice-Hall, 1993, pp. 235-252.
Hubbard, D.W., How to Measure Anything: Finding the Value of Intangibles in Business, New York: Wiley, 2007.
Kaplan, R. S., and D. P. Norton, The Balanced Scoreboard: Translating Strategy into Action, Boston,
MA: Harvard Business School Press, 1996.
Korzenlowski, P., "C/S Opens Data Access Tool Door to Fresh Competitors," Software Magazine,
February 1994, pp. 71-77. McLean, B., and P. Elkind, The Smartest Guys in the Room: The Amazing Rise and Scandalous Fall
of Enron, New York: Portfolio Hardcover, 2003.
Miller, G. A., "The Magical Number Seven, Plus or Minus Two: Some Limits on our Capacity for
Processing Information," Psychological Review, Vol 63, 1956, pp. 81-97.
Norman, D. A., The Design of Everyday Things, New York: Basic Books, 2002. Norman, D. A., Emotional Design: Why We Love (or Hate) Everyday Things, New York: Basic Books,
2005.
Oland, D., "The Impact of a Powerful New Process at Moosehead," CMA Magazine, February 1994,
p. 6.
Parmenter, D., Key Performance Indicators: Developing, Implementing, and Using Winning KPIs, New York: Wiley, 2007.
Quezada, L. E., F. M. Cordova, P. Palominos, K. Godoy, and J. Ross, "Method for Identifying Strategic Objectives in Strategy Maps," International Journal of Production Economics, Vol. 122, No. 1, November 2009, p. 492.
Rockart, J. R, "Chief Executives Define Their Own Information Needs," Harvard Business Review,
Vol. 57, No. 2, 1979, p. 81-93. Rockart, J. F., and D. DeLong, Executive Support Systems, Homewood, IL: Dow Jones-Irwin,
1988.
Scheier, R. L., "Information Resources Unveils Tool Set that Combines Best of EIS with DSS," PC
Week, Vol. 7, No. 46, November 19, 1990, p. 11.
Sprague, R. H., Jr, and B. C. McNurlin, Information Systems Management in Practice, 3rd ed., Englewood Cliffs, NJ: Prentice-Hall, 1993.
Tsai, W, W. Chou, and W Hsu, "The Sustainability Balanced Scorecard As a Framework for Select-ing Socially Responsible Investment: An Effective MCDM Model," Journal of the Operational
Research Society, Vol. 60, No. 10, October 2009, pp. 1396-1421. Tufte, E., The Visual Display of Quantitative Information, Chesire, CT: Graphics, 1983.
Tufte, E., Beautiful Evidence, Cheshire CT: Graphics, 2006.
Volonino, L., and S. Robinson, "EIS Experiences at Marine Midland Bank," North American Journal
of Information Technology Management, Vol. 2, No. 2, 1991, pp. 33-38. Volonino, L., H. J. Watson, and S. Robinson, "Using EIS to respond to dynamic business conditions,"
Decision Support Systems, Vol. 14, No. 5, June 1995, pp. 105-116.
Ware, C , Information Visualization: Perception for Design, 2nd ed., San Francisco, CA: Morgan Kauffman, 2004.
Watson, H. J., "Avoiding Hidden EIS Pitfalls," in R. H. Sprague, Jr. and H. J. Watson (Eds.), Decision Support Systems: Putting Theory into Practice, 3rd ed. Englewood Cliffs, NJ: Prentice-Hall, 1993, pp. 276-283.
QUESTIONS 425
Watson, H. J., B. A. Hesse, C. Copperwaite, and V. Devos, "EIS Software: A Selection Process and the Western Mining Experience," Journal of Information Technology Management, Vol. 31, No. 1, 1992a, pp. 19-28.
Watson, H. J., et al., Executive Information Systems, New York: Wiley, 1992b.
Watson, H. J., R. K. Rainer, and C. Koh, "Executive Information Systems: A Framework for Devel-opment and a Survey of Current Practices," in R. H. Sprague, Jr. and H. J. Watson (Eds.), Decision Support Systems: Putting Theory into Practice, 3rd ed., Englewood Cliffs, NJ: Prentice-Hall, 1993, pp. 253-275.
Watson, H. J., and M. N. Frolick, "Determining Information Requirements for an EIS," MIS Quarterly, September 1993, pp. 255-269.
Watson, H. J., and J. Satzinger, "Guidelines for Designing EIS interfaces," Information Systems Management, Fall 1994, Vol. 11, No. 4, pp. 46-52.
Watson, H. J., M. T. O'Hara, C. G. Harp, and G. G. Kelly, "Including Soft Information in EIS," Information Systems Management, Summer 1996, Vol. 13, Issue 3, pp. 1058-0530.
Ye, L., and W. Seal, "The Balanced Scorecard," Financial Management, September 2009, pp. 27-29.
QUESTIONS
1. Discuss how the design components of a EIS are different from those of a DSS.
2. Describe the factors that would influence the design of a transnational executive in-formation system. Include cultural factors that are either unique to a country and/or strongly influence the decision-making process as well as the specifications of design that would be affected. Is this effect more or less than you would expect with a DSS?
3. Critique the concept of using a standardized methodology to design dashboards and executive information systems.
4. Design a dashboard that might be useful to you in monitoring your academic progress. Discuss how you decide to balance the long-term performance with the semester performance measures.
5. What key performance indicators (KPIs) might the dean of your university implement to monitor health of his or her unit?
6. Examine the annual report of an organization. Discuss how data would need to flow from transaction processing systems within the organization to a dashboard to help monitor the factors of importance in the annual report.
7. Examine the dashboard of IT expenditures in the federal government discussed in this chapter. What recommendations for changes in the budget can you find by examining these data?
8. Prototype a dashboard for some decision. How do you make your decisions about how to represent your data? How do you make your decisions about color?
9. What is the difference between a KPI and a balanced scorecard? How are they related?
10. What is the purpose of a dashboard?
11. Why must a dashboard allow drill-down capabilities?
12. Find example dashboards on the Web. Which of the 13 mistakes of design are apparent? How might you fix them?

426 EXECUTIVE INFORMATION AND DASHBOARDS
ON THE WEB
On the Web for this chapter provides additional information about executive information systems. Links can provide access to demonstration packages, general overview informa-tion, applications, software providers, tutorials, and more. Additional discussion questions and new applications will also be added as they become available.
• Links to overview information about executives and their decision-making styles and needs. These links provide access to bibliographies and overview papers about group decision making, both with and without dashboards.
• Links to products. Several dashboard providers have pages that allow users to demon-strate their products. Others provide testimonials and/or reviews.
• Links provide access to dashboard examples in business, government, and research. Some links provide access to papers on the Web describing EIS applications and their uses. Others provide descriptions of the process for developing the application.
• Links provide guidelines for dashboard design. The good, the bad, and the ugly are all discussed on the Web.
You can access material for this chapter from the general Web page for the book or directly at http://www.umsl.edu/~sauterv/DSS4BI/eis.html.
11
GROUP DECISION SUPPORT SYSTEMS
Many decisions in an organization are made not by an individual, but rather by groups of individuals. By its very nature, a group enriches the choice process by gathering the knowl-edge, experience, and probably different perspectives of several people. The enrichment may in turn allow the group to understand the problem better, spark synergy for creative solutions, and identify errors in the information or process. Finally, since more people are involved, they create a deeper commitment to the choice and thus less resistance to its implementation.
However, groups bring a few drawbacks to the decision process. Most group decisions take longer than individual decisions. Groups tend to spend significant nonproductive time waiting, organizing, or repeating what already has been said. Group dynamics can inappro-priately influence the process if there are substantial differences in the rank or temperament of the members. Often, the supporting work may be uncoordinated if completed by multiple individuals or some people may abdicate their tasks and responsibilities to others. Finally, there is social pressure to conform to a group position. "Groupthink" can exist in any group and may exacerbate incomplete or inappropriate uses of information.
Groupthink is an agreement-at-any-costs mentality that often results in ineffective group decision making and poor decisions (Hellriegel et αί, 2007). It is associated with groups that have a high degree of conformity and cohesion, that are insulated from outside information sources challenging their decisions, that have excessively directive leadership, and/or that exist in a complex and rapidly changing environment. When groupthink occurs, members ignore limitations or impropriety of their analyses as well as possible conse-quences of their choice process. In fact, the group collectively rationalizes its choice and
Decision Support Systems for Business Intelligence by Vicki L. Sauter Copyright © 2010 John Wiley & Sons, Inc.

428 GROUP DECISION SUPPORT SYSTEMS
process, going so far as to censor itself when group members deviate from the established position, solution, or parameters.
The problem with groupthink is obviously that it can lead to poor decision processes. In particular, it is associated with:
• Incomplete generation of alternatives • Incomplete understanding of goals • Failure to examine risks of preferred choices • Poor search of information • Bias in the interpretation of information • Failure to appraise and reappraise alternatives.
Each of these in turn is associated with bad decision making. Unfortunately, DSS as it has been defined to this point does not provide methods for addressing these problems.
Hence, to support group decision making, a tool needs to have not only those char-acteristics of DSS discussed throughout this book but also the hardware, software, and procedures necessary to reveal the positive aspects of the group and inhibit the negative. Group DSS (GDSS) represent this hybrid technology; they combine DSS and groupware technologies. Group DSS should have the components of a DSS, including the model man-agement system, the database management system and user interface management system, as they have been described previously. The system must be able to support the needs of all of the decision makers easily. Group DSS must have the range of models and model management functions necessary to meet the choice needs of the participants. Further, they must be able to access and aggregate information from a variety of sources in a variety of formats to meet the group's broad information needs. Finally, GDSS must be easy for all users to operate.
Too often, the group dynamics themselves block active participation by one or more people and discourage innovative thinking. Group DSS must therefore include tools that address the group dynamics so decision makers can gain consensus about a particular problem or opportunity and group dynamic management systems to address the special needs of group processes. Group consideration of any problem allows the use of additional information, knowledge, and skills, but only if all participants have equal opportunity to be
Collective rationalization is the characteristic that allowed North American automobile executives to agree upon two "facts" about the consumers in the 1970s. In particular, the executives agreed that (a) only a small segment of North American automobile buyers would, in fact, purchase Japanese-manufactured automobiles and (b) North American consumers would be willing to tolerate a per-gall on gas price of over $2.50, It is likely that at least one of those executives had concerns about the validity of these two assumptions and their impact upon the automobile design decision-making process. However, he or she may have been hesitant to express concerns in a meeting where others perceived the assumptions to be true. This was groupthink and it had a remarkably negative impact upon the North American automobile industry. Over time, the American automobile industry has repeated this mistake multiple times.
GROUPWARE 429
heard and to have ideas received. Since GDSS use the technologies of groupware, before discussing more about GDSS, we will examine the concept of groupware in more depth.
GROUPWARE
Groupware or group support systems (GSS) have evolved over time. One definition available in the literature is that GSS are computer-based information systems used to support intellectual, collaborative work (Jessup and Valacich, 1993). This definition is too broad for one discussion, because it does not specifically address the role of groups. Another definition emerges as "tools designed to support communications among members of a collaborative work group" (Hosseini, 1995, p. 368). Another way to describe a GSS is as "the collective of computer-assisted technologies used to aid group efforts directed at identifying and addressing problems, opportunities and issues" (Huber, Valacich, and Jessup, 1993, p. 256).
Groupware exists to facilitate the movement of messages or documents so as to enhance the quality of communication among individuals in remote locations. It provides access to shared databases, document handling, electronic messaging, work flow management, and conferencing. In fact, groupware can be thought of as a development environment in which cooperative applications—including decisions—can be built. Groupware achieves this through the integration of eight distinct technologies: messaging, conferencing, group document handling, work flow, utilities/development tools, frameworks, services, and ver-tical market applications. Hence, it provides the foundation for the easy exchange of data and information among individuals located far apart. Although no currently available prod-uct has an integrated and complete set of capabilities, Table 11.1 summarizes the range of functions that may be included in groupware.
There are many examples of successful use of groupware to enhance communications. In fact, it is believed that over 90% of firms using groupware will receive returns of 40% or more, with some as large as 200%. Boeing engineers collaborated with engineers at parts manufacturers as well as maintenance experts and customer airlines while designing the 777. Using groupware technologies, engineers shared ideas through e-mail and specifi-cations through computer-aided-design (CAD). Similarly, Weaton Industries used desktop
Group decision making is supposed to provide a richer poo] of knowledge and experience and therefore better choices. Research has shown that groups that share unique information, that which is known only to a few members, rather than to discuss information shared by most or all of its members tend to make better decisions. Further groups that talk to each other more make better decisions. Unfortunately, a meta-analysis of 72 studies involving 4795 groups and over 17,000 individuals showed that groups tend to spend most of their time discussing the redundant information shared by most members, rather than discussing information known only to one or a minority of members. In addition, the analysis found that groups that talked more tended to share less unique information. The problem seems particularly bad when groups seek a consensus opinion or judgment rather than solving a problem for which a correct answer exists. There is good news, however. Groups improved both their unique information sharing and the range of discussions among group members when the group was more focused and highly structured. Such structure can be created when using a GDSS to manage the meeting.

430 GROUP DECISION SUPPORT SYSTEMS
Table 11.1. Functionality of Groupware Products
Enterprise needs
• Cross-vendor support
• Local/remote servers
• Integrated networks
• Executive information systems standards
• Network operating systems
• Database
• Document and image repository
• Object repository and knowledge ware
Group needs
• GDSS
• Desktop video and audio conferencing
• Group application development environment
• Group editing
• Work flow management
Tools
• E-mail and messaging
• Calendar management and scheduling
• Personal productivity applications
• Models and model management
videoconferencing to diagnose and repair giant blow-molding machines around the world. Finally, law firms use groupware to gain access to documents for improved efficiency and customer service.
DSS in Action Around the Clock Processing
Many companies are goin^ beyond simple document sharing, deploying such programs on an enterprise-wide basis and using repository-based groupware as databases, internal communication networks, and work flow systems. Many companies are using groupware products to spearhead efforts to reengineer the way they do business. For ex am pi e, a Wall Street investment firm used groupware to help prepare the final details of a merger and acquisition deadline. It became clear to this management that they could not finish those details without help at 3 p<m< the day before the proposal was due. This company contracted with Coopers & Lybrand to finish the proposal by 9 am the next morning,
Using ixrtus Notes, Coopers & Ly brand met its needs. At the end of the day for the Dallas office of Coopers & Lybrand, management handed the work to the San Francisco office, These employees worked on the project until the end of their work day when they, in turn, passed the project to the Sydney office. Sydney employees eventually passed the work to the London office, which in turn passed it to the New York office, which eventually returned the work to the Dallas office for presentation to the client at the originally scheduled time (i.e., the next morning),
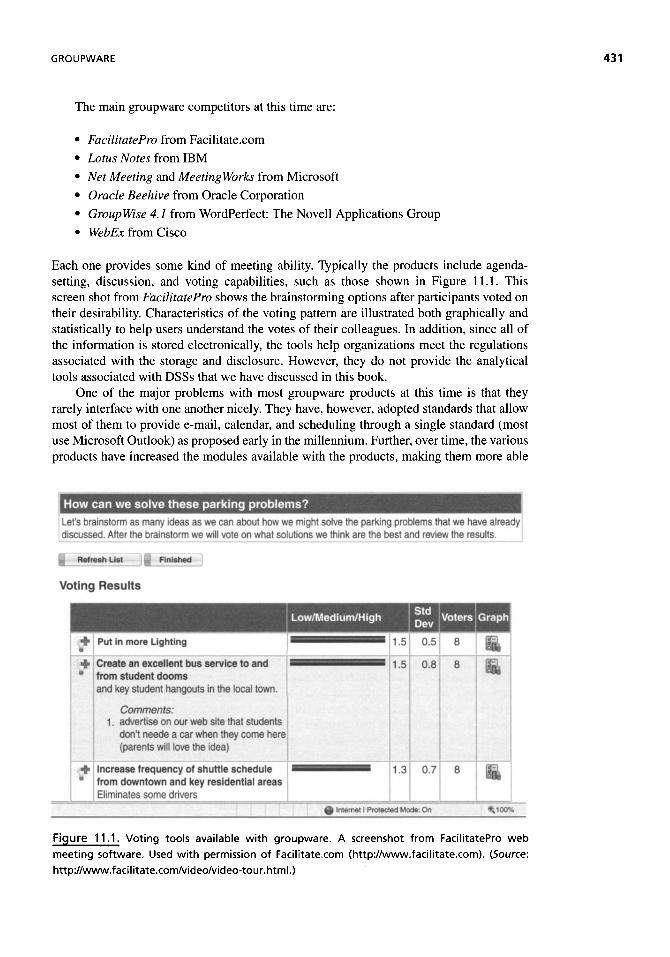
GROUPWARE 431
The main groupware competitors at this time are:
• FacilitatePro from Facilitate.com • Lotus Notes from IBM • Net Meeting and MeetingWorks from Microsoft • Oracle Beehive from Oracle Corporation • GroupWise 4.1 from WordPerfect: The Novell Applications Group • WebEx from Cisco
Each one provides some kind of meeting ability. Typically the products include agenda-setting, discussion, and voting capabilities, such as those shown in Figure 11.1. This screen shot from FacilitatePro shows the brainstorming options after participants voted on their desirability. Characteristics of the voting pattern are illustrated both graphically and statistically to help users understand the votes of their colleagues. In addition, since all of the information is stored electronically, the tools help organizations meet the regulations associated with the storage and disclosure. However, they do not provide the analytical tools associated with DSSs that we have discussed in this book.
One of the major problems with most groupware products at this time is that they rarely interface with one another nicely. They have, however, adopted standards that allow most of them to provide e-mail, calendar, and scheduling through a single standard (most use Microsoft Outlook) as proposed early in the millennium. Further, over time, the various products have increased the modules available with the products, making them more able
Figure 11.1. Voting tools available with groupware. A Screenshot from FacilitatePro web meeting software. Used with permission of Facilitate.com (http://www.facilitate.com). (Source: http://www.facilitate.com/video/video-tour.html.)

GROUP DECISION SUPPORT SYSTEMS
Table 11.2. Possible Standards for Groupware Products
• The multivendor scheduling standard should support transparent scheduling for all store-and-forward messaging transports as well as via real-time network protocols
• The standard should include hooks into shared X.500 directory services as well as proprietary e-mail, groupware, and network operating system directories
• The standard should support the calendar synchronization policies maintained by various scheduling tools
• The standard should support interfaces to multivendor network-enabled project planning and management tools
• The standard should allow users to control who may access their personal calendars, what fields may be viewed and modified, and what types of events may be scheduled without the owner's prior consent
• The standard should mediate between the various techniques used by scheduling tools to request meetings, negotiate meeting times and places, and reconcile conflicting schedule
to stand alone for the range of functionality they provide. Furthermore, it means that users must adopt and maintain a single product line regardless of whether it continues to meet their needs because it is expensive for all users to change. Hence, there is a move in the industry to develop a groupware standard, including items such as those described in Table 11.2.
GDSS DEFINITIONS
A group DSS incorporates groupware technology with DSS technology. As such, GDSS consist of hardware, software, and procedures for facilitating the generation and evaluation of alternatives as well as features for facilitating to improve group dynamics. However, a GDSS is not a reconfiguration of an existing DSS but rather a specially designed system that integrates DSS and groupware technologies.
A typical configuration includes model management, database management, and group management tools interconnected and managed by a facilitator. The purpose of the facilitator is to coordinate the use of the technology so that the focus of the decision makers is on the problem under consideration, not on the use of technology. Early GDSS included interconnected machines located in one room (sometimes called a decision room) to create a decision conference attended by an appropriate group of individuals to consider options and find a solution to the problem. An example of a decision room is shown in Figure 11.2. In this configuration, information can be communicated to and from participants via a network or by use of one or more public screens projecting the output of a particular computer. Over time, GDSS have expanded to include people located in different places, at different times, and with a variety of support tools. In fact, it is now a mature technology, many of whose concepts are now embedded in the way organizations work
A typical decision-making process has several stages. After an introduction by the facilitator, the group is asked to discuss the issues and concerns so that the problem can be detected and defined. Once a set of alternatives is understood, the group attempts to construct a model of the choice context through which to evaluate the several alternatives. The analyst then assists the participants to refine the model and evaluate its results.
The process generally is guided by support staff. There must be a facilitator to help the group focus on the task by addressing and solving the technology issues. In addition,

GDSS DEFINITIONS 433
Figure 11.2. Typical decision conferencing configuration. Configuration of a decision confer-
ence. Typically a control room and one or more "breakout" rooms are adjacent to this room.
there is an analyst who provides expertise in developing computer models and a recorder who chronicles the proceedings by recording the critical issues and syntheses as they occur (although frequently that is captured electronically now).
If located at the same location, workstations are networked and documents are projected onto several public screens. If the users are not colocated, documents and models are displayed on their individual monitors. If the meeting is not synchronous, then materials are stored for other users to recall when they participate.
Variations of the workstation methodology include teleconferencing and the remote decision-making approach. In teleconferencing, group support is like that in the decision conference, but participants are geographically separated from one another. In addition to the electronic connection, there is visual and audio communication so users can see and hear one another as if they were in the same location. An example of this setup is shown in Figure 11.3. Remote decision making is similar to the workstation approach but with offices that are not in close proximity. These sessions might also have videoconferencing support, or they may simply be electronic.
The systems allow users to draft ideas at their own workstation. After some consid-eration of the document, the user may elect to share ideas, hold documents for a later, more appropriate time, or discard weak results. The display of many ideas on one or more public screens can lead to a more integrated discussion of a topic. Since it is not possible to identify the originator of a particular idea, the opinions of particular individuals can be shared anonymously.
Watson et al (1988) completed an extensive study of this type of configuration and compared the results to group meetings with other kinds of assistance. Their overall conclu-sion was that in general the workstation approach seems to provide greater process support than other methodologies. Of course, in this day of cloud computing, not only might the

434 GROUP DECISION SUPPORT SYSTEMS
Figure 11.3. GDSS and videoconferencing room at University of Missouri. Photo taken by Alexia
Lang for University News at UMKC. Photo is used courtesy of Ms. Lang.
people not be in the same room (as is often the case), but the software might not be located with the users.
Some of the GDSS products available today include:
• Brainstorming.com • Expert Choice • Facilitate • GroupSystems Tools • Grouputer • Logical Decisions • Robust Deicisions • WeblQ
The functionality and support needs of these tools vary.
FEATURES OF SUPPORT
Decision-Making Support
The GDSS must provide both decision-making support and process support. Decision-making support begins with the features that have already been addressed with regard to all DSS. That is, the GDSS must include access to models and model management tools, data and database management tools, and mail and mail management tools. However,

FEATURES OF SUPPORT 435
Figure 11.4. Facilitating problem definition.
groups generally are created to solve particularly poorly structured problems, often with strategic or long-term implications. Hence, GDSS need to provide particular support for alternative generation and issue interpretation. Alternative generation requires an electronic brainstorming tool that records ideas and comments about ideas. Furthermore, the tool needs to facilitate consolidation of ideas by helping either the group members or the facilitator to identify common concerns, common attributes, and/or relationships among ideas. This facility is sometimes known as an issue analyzer tool. For example, consider the tool illustrated in Figure 11.4, which shows how the system helps the users consider a wide range of options of the problem, thereby helping them to brainstorm solutions more effectively. Finally, the GDSS needs to facilitate the identification of stakeholders, the assumptions being made with regard to them, and what role and importance they will play in the process.
Alternative generation, analysis and categorization can be quite difficult in a group setting because everyone wants to participate at once and because participants follow different thought processes. Group DSS tools can provide the distinctive feature of parallel communications, or "the ability . . . [for] group members to communicate information simultaneously" (Bostrom, Anson, and Clawson, 1993, p. 461). With this in place, members need not wait for others to complete thoughts prior to expressing their own opinions. This keeps an individual's train of thought focused yet prevents time lags between the expression of one idea and another (Wilson and Jessup, 1995). The ability for group members to work in parallel "may account for the increased productivity of GSS idea-generating groups" and the higher satisfaction levels of participants (Dennis and Gallupe; 1993). In addition, parallel communication can lead to time savings. Since there is no competition for "air time," domination by an outspoken member of the group can be reduced (Wilson and Jessup, 1995). Also, since ideas can be contributed simultaneously, the total time to collect information is reduced (Dennis et al, 1995).
Consider the screens from GroupSystems shown in Figures 11.5 and 11.6. Figure 11.5 illustrates the ease with which users can define and utilize a variety of criteria with different
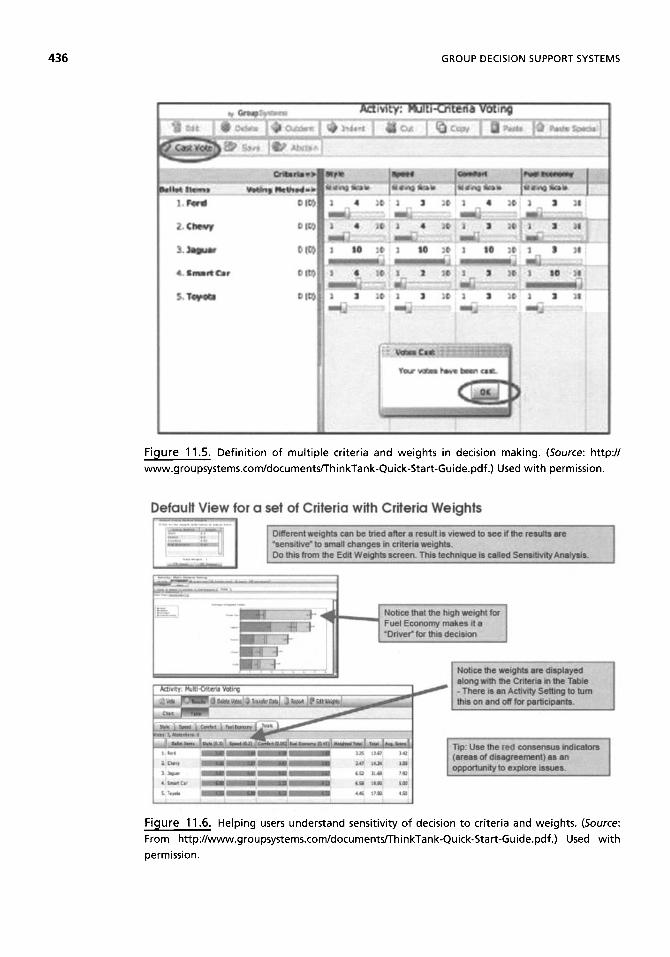
436 GROUP DECISION SUPPORT SYSTEMS
Figure 11.5. Definition of multiple criteria and weights in decision making. (Source: http://
www.groupsystems.com/documents/ThinkTank-Quick-Start-Guide.pdf.) Used with permission.
Figure 11.6. Helping users understand sensitivity of decision to criteria and weights. (Source:
From http://www.groupsystems.com/documents/ThinkTank-Quick-Start-Guide.pdf.) Used with
permission.

FEATURES OF SUPPORT
weights when evaluating alternatives. Of course, different users will emphasize different criteria and will certainly give different weights to those criteria. The tool facilitates these differences and performs the necessary summary. Figure 11.6 illustrates how the results might be displayed to help users understand the sensitivity of their decision to the criteria and the weight of the criteria considered.
Another way in which the GDSS provides decision support is by acting as a "group memory." In particular, it provides an electronic record of the meeting, both in summarized and raw form. This allows individuals who want to review the process access to the concepts and alternatives that were identified as well as the flow of the information being compiled by the group (Hosseini, 1995). In other words, not only can an individual get the overall impression of the meeting, he or she can also follow the exchanges to determine how final positions were derived. This retracing of the group thought process can help the individual to understand the "why" behind the "what" that resulted from the meeting. It can be defined as "a sharing of interpretations among individuals of a group" (Hoffer and Valacich, 1993). Some of the components necessary to support group memory are listed below:
• Access to a wide variety of information both external and internal to the organization as well as internal and external to the group process
• The ability to capture information easily and to store and integrate information generated by group interactions and about group processes dynamically
• Support for use of both quantitative and qualitative decision models and aids (Hosseini, 1995)
• The ability to support weighting and ranking of alternatives that have been proposed and stored in group memory
These features will allow group members to examine information available to the group, whether it was generated by the group itself or prepared externally and presented to the group. The group will have access to the raw data, the molding of data into information, and the group's implied evaluation of the relevance, accuracy, and importance of data.
This information must be available to group members on an "as-needed" basis. Mem-bers might need to review activities that have occurred since they left the conference and to
The NATO Research and Technology Organization (RTO) sponsored a workshop for national security executives, scientists, engineers, and technologists from 13 countries to develop a list of high-impact research and technology areas to combat terrorism and to facilitate multinational exchange of ideas for combating terrorism. The participants were broken down into four groups based on topics: indications and warnings, survivability and denial, consequence management and recovery, and attribution and counteractions.
Using Group Systems, four workgroups brainstormed ideas, discussed strategies, and priori-tized their recommendations using a variety of collaborative technologies and techniques.
They used GroupSystems to list ideas, expand and discuss these ideas, evaluate the impact of the projects, and prioritize R&D projects. After completing these general "brainstorm-organize-prioritize process" sessions, they then presented their recommendations in a plenary session during the final day of the workshop,
On the day after the workshop, the RTO cadre and the facilitators worked in an electronic meeting environment to integrate the various briefings, lists, charts, notes, and recommendations into a consolidated report.

GROUP DECISION SUPPORT SYSTEMS
be brought "up to speed" easily once they rejoin the group discussion. The group memory should allow group members to peruse the results of prior meetings they were unable to attend (Wilson and Jessup, 1995). Such a feature will be of particular importance to the use of GSS in reengineering because it will facilitate diverse membership and cross-functional attendees who might not all be available for meetings simultaneously. The group memory configuration also must allow browsing of what has transpired even while the meeting con-tinues. This implies individuals can leave the conference, digest information at their own pace, and then rejoin the conference. Such a feature allows for disparity in learning speed and learning style without biasing the group's opinion of the member (Hosseini, 1995).
There are technical considerations associated with providing an adequate group mem-ory, especially in terms of preserving the richness of the information associated with discussion. However, when accomplished properly, it can assist in increasing task focus and thereby aid effectiveness.
Process Support
As was stated earlier in this chapter, one of the main contributions provided by GDSS technology is support of the process. Research has demonstrated that large groups benefit most from the use of a GDSS. This is the case because in traditional, non-GDSS settings the larger the group, the greater the negative aspects of group behavior. Since a GDSS manages the negative aspects of group behavior and makes a group more effective in accomplishing its goals, it therefore brings about a greater impact on larger groups. This is not to say that it cannot be an effective aid in small groups. Rather, it suggests that because the negative aspects of group behavior are not as prominent, the relative impact is not as great. This includes all features which encourage the positive attributes of group decision making while suppressing the negative group dynamics.
One GDSS process feature is that the technology allows greater flexibility in the definition of meetings. Often, group members might not always attend the same meetings. This aspect of group meetings is a growing phenomenon as more diverse individuals—who have diverse responsibilities and schedules—are brought together to work on projects. As corporations downsize, it is likely that the expertise necessary to solve a problem or to complete a project will not be available at common locations. Also, if high-level managers are involved in the project, they might need to be away from the group to respond to needs in their own department. Group DSS can be extended for use in different places and at different times. Hence, the discussion and decision-making meetings will be populated by "virtual groups." Group members might meet at the same time in the same place. Or, as discussed earlier, they might meet at the same time but in geographically different locations joined through teleconferencing. With GDSS, they might meet in the same place but at different times. Finally, the GDSS allows the groups to meet at different times in different places. This extension of the technology will mean that the number of face-to-face meetings will decline, and the meetings will not interfere with other productivity gains.
A second process feature allowed by GDSS is the anonymity feature. In particular, this feature allows group members to pose opinions, provide analyses, or vote without revealing their own identity to other members of the group. The anonymity feature allows for a more democratic exchange of information, because individuals must evaluate information on its own merits, not those which seem politically most expedient. If the author of a proposal is not known, then the evaluation of the proposal hinges not upon the status of the author but rather on the merit of the idea itself. This feature is most important when a group consists of individuals of significant differences in stature. In meetings where pressure to conform

FEATURES OF SUPPORT
is perceived to be high, the anonymous feature allows for the most open contributions and hence is most highly valued. There is also the possibility that preserving anonymous contributions will eliminate personalities from the process and allow the focus to be on the analysis of the problem on the table.
With a GDSS, an environment can be created in which group members participate equally, vote their conscience and participate more often than they might in a non-computerized environment where their contributions are more easily identified. Hence, anonymity can result in more information being generated, better analyses, and hence better decision making .
Of course, the GDSS must also provide facilities for voting and negotiating aids for the group meeting. As a first step, the participants need to agree upon or at least understand the different approaches to making decisions. The most important of those is who will make the decision. The group may make the decision or they might only be consultative and someone else actually makes the decision. If the group is making the choice, they might follow a consensus approach in which group members continue to discuss, compromise, and negotiate until one final decision is agreed upon by all. Or, the group might use the more common alternative: The democratic approach in the adopted alternative is the one that received the majority of members' votes. If the group is just being consulted, it may be because the managerial authority is being dictatorial (only he or she will decide) or because the group has given that right to the leader. In addition, the final choice might be given to an external body or person, as in the case of arbitration.
There are other tools that the GDSS can provide to facilitate the group. For example, the GDSS might include an electronic version of Robert's Rules of Order or some other parliamentary procedure or it might provide the facility to develop and call upon rules for discussion and voting in the meeting. An "intelligent counselor" is a knowledge-based system that can provide advice on the rules applying to a particular situation. Support for voting might include the provision of numerical and graphical summarization of votes and ideas. The DSS might also include programs for the calculation of weights in multiattribute decision problems and Delphi techniques for progressive movement toward consensus building.
Another resource that can be built into the meeting process is the use of facilitators. Facilitation can be defined as "a set of functions carried out before during and after a meeting to help the group achieve its own outcomes" (Bostrom, Anson, and Clawson, 1993, p. 147). A facilitator can increase the likelihood that a meeting will produce the desired outcomes. In other words, if a facilitator is used, then the meeting will make use of the GDSS tools, but the process will not be driven by the GDSS tools. A facilitator should be adept at exploiting the GDSS technology to achieve the goals of the group; the additional talents that need to be utilized are far too numerous and embrace too many disciplines to be outlined here. Otherwise, the group either will become overly focused on the technology (at the loss of the topic at hand) or will not avail itself of the richness of the tool to address the topic.
GDSS and Reengineering
Reengineering projects draw upon employees from diverse areas of the organization. This diversity must be present to ensure that every element of the process is considered care-fully (Ziguram and Kozar, 1994). For example, consider three case studies in which GSS were used: U.S. Army Installation Management, Flagstar, and the Department of Defense Battlefield Logistics. A review of these case studies illustrates that the GSS technology

440 GROUP DECISION SUPPORT SYSTEMS
facilitated their success (Dennis et al, 1995). The most significant factor to emerge from the analysis was the essential nature of the team concept. Top managers need to provide support, but a team of middle managers is the core of the process, and they need to work as one. Cross-functional teams, whose members are diverse in style and experience, need to hit the ground running and not waste time establishing ground rules and procedures. A good GSS handles those problems. The team that "owned" the business process redesign had its skills enhanced by the qualities of the GSS while consulting with some IT staff for the technical characteristics of making it work.
History is full of problems in implementation because lower level managers were not part of the discussions, thereby requiring upper level managers to rely upon their memories as to how functions were performed. For example, consider the reengineering effort of Garland Power and Light. Although this company had failed collaborative projects in the past, management believed that a reengineering effort was needed. To this end, the strategic plan developed highlighted commonality in purpose and definition, collaboration among the managers of the five divisions, and dissolution of the boundaries between divisions to provide more end-to-end work. Unfortunately, the process at Garland Power and Light failed. An analysis of the failure identified problems of collapsed coordination and lack of communication (Ziguram and Kozar, 1994). The use of a GSS could have helped avoid the failure. The fundamental processes present in a GSS would facilitate collaboration and blurring of boundaries. Group memory would help team members converge the purpose and definition of the project.
DISCUSSION
Group DSS merge group ware technology with decision support technology. All of the characteristics and needs of DSS discussed earlier need to be fulfilled. In addition, these systems provide tools to help exploit the advantages of group decision making while avoiding some of the problems thereof. There have been many applications of GDSS to problems, and much research has been devoted to understanding how to apply them to solving group choice processes.
SUGGESTED READINGS
Anonymous, "Groupware and the Virtual Enterprise," Datamation, March 15, 1995, pp. S4-S8. Antunes, P., and T. Ho, "The Design of a GDSS Meeting Preparation Tool," Group Decision and
Negotiation, Vol. 10, No. 1, January 2001, pp. 5-25. Barkhi, R., V S Jacob, and H. Pirkul., "The Influence of Communication Mode and Incentive Structure
on Gdss Process and Outcomes," Decision Support Systems, Vol. 37, No. 2, May 2004, p. 287. Bostrom, R. P., R. Anson, and V. K. Clawson, "Group Facilitation and Group Support Systems," in
L. M. Jessup and J. S. Valacich (Eds.), Group Support Systems: New Perspectives, New York: Macmillian Publishing Co., 1993, pp. 146-168.
Cole, B., "Channels' Surfing across the Groupware Seascape," Network World, September 5, 1995, pp. 35-38.
Dennis, A. R., D. Daniels, G. Hayes, G. Kelly, D. Lange, and L. Massman, "Business Process Reengineering with Groupware," in Proceedings of the Twenty-Eighth Annual Hawaii Interna-tional Conference on System Sciences, Vol. IV, Los Alamitos, CA: IEEE Computer Society Press, 1995, pp. 378-387.

SUGGESTED READINGS
Dennis, A. R., and B. R. Gallupe, "A History of Group Support Systems Empirical Research: Lessons Learned and Future Directions," in L. M. Jessup and J. S. Valacich (Eds.), Group Support Systems: New Perspectives, New York: Macmillian Publishing, 1993, pp. 59-77.
DeSanctis, G., and R. B. Gallupe, "A Foundation for the Study of Group Decision Support Systems," Management Science, Vol. 33, No. 5, May 1987, pp. 589-609.
DeSanctis, G., et al, "The Minnesota GDSS Research Project: Group Support Systems, Group Processes, and Outcomes," Journal of the Association for Information Systems, Vol. 9, Nos. 10-11, 2008, pp. 551-609.
Dias, L. C., and J. N Climaco, "Dealing with Imprecise Information in Group Multicriteria Decisions: A Methodology and a GDSS Architecture," European Journal of Operational Research, Vol. 160, No. 2, January 16, 2005, p. 291.
Elfvengren, K., H. Karkkainen, M. Torkkeli, and M. Tuomine, "A GDSS Based Approach for the Assessment of Customer Needs in Industrial Markets," International Journal of Production Economics, Vol. 89, No. 3, June 18, 2004, p. 275.
Elfvengren, K., S. Kortelainen, and M. Tuominen, "A GSS Process to Generate New Product Ideas and Business Concepts," International Journal of Technology Management, Vol. 45, Nos. 3-4, 2009, p. 337.
Eom, S. B., The Development of Decision Support Systems Research: A Bibliometrical Approach,
Lewiston, New York: Edwin Meilen Press, 2007. Gray, P., "The Nature of Group Decision Support Systems," in F. Burstein and C. W. Holsapple
(Eds.), Handbook on Decision Support Systems, Vol. I, Berlin: Springer-Verlag, 2008, pp. 371— 390.
Haseman, W. D., D. L. Nazareth, and P. Souren, "Implementation of a Group Decision Support System Utilizing Collective Memory," Information & Management, Vol. 42, No. 4, May 2005, p. 591.
Heighler, E., "Obstacles Block the Road to Groupware Nirvana," Inforworld, October 24, 1994,
p. 56.
Hellriegel, D., S. E. Jackson, and J. W. Slocum, Managing: A Competency Based Approach, Boston, MA: South-Western College Publishing, 2007.
Hoffer, J. A., and J. S. Valacich, "Group Memory in Group Support Systems: A Foundation for Design," in L. M. Jessup and J. S. Valacich (Eds.), Group Support Systems: New Perspectives, New York: Macmillian Publishing Co., 1993, pp. 215-229.
Hosseini, J., "Business Process Modeling and Organizational Memory Systems: A Case Study," in Proceedings of the Twenty-Eighth Annual Hawaii International Conference on System Sciences, Vol. IV, Los Alamitos, CA: IEEE Computer Society Press, 1995, pp. 363-371.
How to Improve your Organization's Group Intelligence, White Paper, GroupSystems Corporation, Broomfield, CO, 2006, available: http://www.groupsystems.com/documents/GroupJntelligence-A_White_Paper.pdf.
Huber, G. P., "Issues in the Design of Group Decision Support Systems," MIS Quarterly, Vol. 8, No. 1,1984, pp. 195-204.
Huber, G. P., J. S. Valacich, and L. M. Jessup, "A Theory of the Effects of Group Support Systems on an Organization's Nature and Decisions," in L. M. Jessup and J. S. Valacich (Eds.), Group Support Systems: New Perspectives, New York: Macmillian Publishing, 1993, pp. 255-269.
Jessup, L. M., and J. S. Valacich, "On the Study of Group Support Systems: An Introduction to Group Support System Research and Development," in Group Support Systems: New Perspectives, New York: Macmillian Publishing, 1993, pp. 3-7.
Kobielus, J., "Scheduling Standards Are Key to Groupware Strategies," Network World, August 29, 1994, pp. 27-29.
Lawton, G., and J. Vaughn, "Groupware Vendors Jockey for Position," Software Magazine, September, 1994, pp. 23-24.
GROUP DECISION SUPPORT SYSTEMS
Limayem, M., P. Banerjee, and L. Ma, "Impact of GDSS: Opening the Black Box," Decision Support Systems, Vol. 42, No. 2, November 1, 2006, p. 945.
Mesmer-Magnus, J., and L. DeChurch, "Information Sharing and Team Performance: A Meta-
Analysis," Journal of Applied Psychology, Vol. 94, No. 2, 2009, pp. 535-546.
Nunamaker, J. R, and A. V Deokar, "GDSS Parameters and Benefits," in F. Burstein and C. W. Holsapple (Eds.), Handbook on Decision Support Systems, Vol. I, Berlin: Springer-Verlag, 2008, pp. 391-414.
Opper, S. and H. Fersko-Weiss, Technology for Teams: Enhancing Productivity in Networked Orga-nizations. NY: VanNostrand Reinhold, 1992.
Read, M., and T. Gear, "Developing Professional Judgement with the Aid of a 'Low-profile' Group Support System," Journal of the Operational Research Society, Vol. 58, No. 8, August 2007, pp. 1021-1030.
Rees, J., and G. J. Koehler, "An Evolutionary Approach to Group Decision Making," INFORMS Journal on Computing, Vol. 14, No. 3, Summer 2002, pp. 278-292.
Schräge, M., "Groupware Griping Is Premature," Computerworld, August 29, 1994, Vol. 28, No. 35,
p. 37.
Simpson, D., "Variations on a Theme," Client/Server Today, July 1994, pp. 45-47.
Sprague, R. H., and H. J. Watson, Decision Support Systems: Putting Theory into Practice, New York: Prentice-Hall, 1989.
Stahl, S. "Groupthink," Informationweek, August 22, 1994, pp. 12-13.
Straub, D. W, and R. A. Beauclair, "Current and Future Uses of Group Decision Support Systems Technology: Report on a Recent Empirical Study," Journal of MIS, Vol. 5, No. 1, Summer, 1988, pp. 101-116.
Sunstein, C. R., Infotopia: How Many Minds Produce Knowledge, London: Oxford University Press, 2008.
Suroweicki, J., The Wisdom of Crowds: Why the Many Are Smarter Than the Few and How Collective
Wisdom Shapes Business, Economies, Societies and Nations, Boston: Little, Brown, 2004.
Turoff, M., R. H. Starr, A. N. F. Bahgat, and A. R. Rana, "Distributed Group Support Systems," MIS Quarterly, Vol. 17, No. 2, December 1993, pp. 399-417.
Watson, R. T, G. DeSanctis, and M. S. Poole, "Using a GDSS to Facilitate Group Consensus: Some Intended and Some Unintended Consequences," MIS Quarterly, Vol. 10, No. 3, September 1988, pp. 463-478.
Watson, R. T., T. H. Ho, and K. S. Raman, "Culture as a Fourth Dimension of Group Support Systems," Communications oftheACM, Vol. 37, No. 10, October 1994, pp. 45-54.
Whiting, R., "Not for Workgroups Only," Client/Server Today, July 1994, pp. 58-66.
Wilson, J., and L. M. Jessup, "A Field Experiment on GSS Anonymity and Group Member Status," in Proceedings of the Twenty-Eighth Annual Hawaii International Conference on System Sciences, Vol. IV, Los Alamitos, CA: IEEE Computer Society Press, 1995, pp. 212-221.
Ziguram, I., and K. A. Kozar, "An Exploratory Study of Roles in Computer-Supported Groups," MIS Quarterly, Vol. 18, No. 3, September 1994, pp. 277-297.
QUESTIONS
1. What is the difference between group decision support systems and group ware? What features would one expect in GDSS but not in groupware?
2. What are the advantages of having groups consider issues? What attributes of GDSS exploit those advantages?
ON THE WEB 443
3. What are the disadvantages of having groups consider issues? What attributes of GDSS help to minimize those disadvantages?
4. How would reengineering efforts be improved by using GDSS?
5. Discuss two decisions in which you have been involved that might have been improved with the use of GDSS.
6. What is the difference between DSS with an active mail component and a group DSS?
ON THE WEB
On the Web for this chapter provides additional information to introduce you to the area of DSS. Links can provide access to demonstration packages, general overview information, applications, software providers, tutorials, and more. Further, you can see some DSSs available on the Web and use them to help increase confidence in your general understanding of this kind of computer system. Additional discussion questions and new applications will also be added as they become available.
• Links to overview information about group decision making. These links provide bibliographies and overview papers on the topic of group decision making, both with and without GDSS tools.
• Links to products. Several groupware and GDSS providers have pages describing tools that allow collaborative projects with people in the same room or across the world.
• Links provide access to GDSS examples in business, government, and research. Some links provide access to papers on the Web describing GDSS applications and their uses. Others provide descriptions of the process by which the application was developed.
• Links provide summaries of applications in particular industries. Examples of how specific business problems have been solved using GDSS are identified and reviewed.
You can access material for this chapter from the general Web page for the book or directly at http://www.umsl.edu/-sauterv/DSS4BI/GDSS.html.

INDEX
Access, model-based management systems, 159-163
Acquisti, A., 149 Action language component (user interface),
224-233 command language, 229-231 free-form natural language, 232-233 input-output structured formats, 231-232 menus, 224-229 question-answer format, 229
Adhikari, R., 365 Advanced beginner level, decision making
process, 42, 44 AIDSPLAN, 128 Airlift applications, DSS, 145 Al-Gialain, A., 284 Algorithms, modeling, methodology dimension,
139-142 Al-Jafaray, A., 297 Alphabets, DSS design, 286 Al-Sardi, R., 284 Alternatives:
automobile purchase example, modeling, 177-179, 183-189
identification of, DSS process, 24 Analogy, decision making process, 4 3 ^ 4 Analytics:
decision making process, 57-58 DSS design, 53 modeling, 125-129
Anonymity, group decision support systems, 438-439
Anson, R., 435, 439 Apfel, A. L., 72 Appliance approach, DSS design, 331-340 Arabic language, 284 Architecture, data warehouses, 97-101 Arnott, D., 317 Arthur Andersen (accounting firm), 400 Artificial intelligence, 197-213
historical perspective, 197-200 reasoning, programming of, 200-206 uncertainty, 206-210
Assumptions: challenging of, DSS design, 40-41 testing of, DSS design, 50-51
Athletics applications, DSS, 16, 141, 233 Attention allocation, DSS, 10 Automobile purchase example, 101-118.
See also Object-oriented technologies Cold Fusion tool, 107-118 criteria, 101-102 data warehouse, 102 information uses, 102-107 modeling, 177-190 user interface, 256-271
Backward-chaining reasoning, artificial intelligence, 201-203
Bar charts, bias, user interface, 245 Bar graphs, dashboard design, 413 Baroudi, J. J., 389 Baseball application, DSS, 16 Beane, Billy, 16 Berger, A. A., 285 Bhatnagar, S. C , 299 Bias:
data, 77-78 display or presentation language component
(user interface), 242-247 modeling options, representation,
131-132 support systems, 33-36
Bin Laden, Osama, modeling, 146 Bissinger, Buzz, 29 Boeing Company, 146 Bostrom, R. R, 435, 439 Bounded rationality approach, decision making
process, 29-31 Brainstorming:
automobile purchase example, modeling, 177-179
DSS process, 24 Braybrooke, D., 30 Bubble charts, dashboard design, 413 Business applications, DSS, 4-5
Decision Support Systems for Business Intelligence Copyright © 2010 John Wiley & Sons, Inc.
by Vicki L. Sauter
445
INDEX
Business intelligence: competitive, decision making process,
58-60 cultural differences, 304-307 decision making process, 53-57 DSS,9-13 modeling, 125
Business process reengineering, DSS design, 341-344
CADUCEUS, 197-198 Calendar, internationalization, 287 Canada, 293 Card sorts, DSS design planning, 323-324 Car example. See Automobile purchase example Carlson, E., 320 Carr, D. K., 343 Causality, correlation versus, modeling options,
137-138 Change commitment, 377-378 Change management, 378-380 Chapnic, P., 419 Chauffeured mode, knowledge base component,
252 Chess, 199 Chip architecture, modeling, 132 Choice process:
decision support systems (DSS), 6-7 DSS process, 24-25
Chronology, data and, 69-70 Clarke, Arthur C, 209 Classification, data mining, 150-151 Clawson, V. K., 435, 439 Client testing software, DSS design, 386 Clustering, data mining, 151, 152 Cold Fusion tool, automobile purchase example,
107-118,262 Command language, action language
component (user interface), 229-231 Communication mode, knowledge base
component (user interface), 252-256 Comparability factor, data, 78-79 Competence, decision making process, 42 Competition, DSS, 11-12, 13 Competitive business intelligence, 58-60 Compound DSS, 16-17 Comprehension factor. See Understandability
factor Computer Security Act of 1987, 291 Cooper, A., 217-218 Correlation, causality versus, modeling options,
137-138 Cost efficiency, data, 80-81
Criminal justice system, DSS, 5-9 Criteria measurement, DSS design, 29 Cross-cultural modeling, internationalization,
297-303. See also Internationalization Crossen, Cynthia, 34 Culture. See Internationalization Currencies:
data adjustment, 96-97 internationalization, 281, 285, 287
Dashboards, 401-422 appliances, 417-418 design, 410-417 function of, 401-408 requirements, 408^410 value of, 418^22
Data, 69-85 availability of, internationalization, 295,
307-309 bias, 77-78 comparability factor, 78-79 cost efficiency, 80-81 defined, 69 detail level, 75-76 DSS design and, 69-71 inclusion guidelines, 72-73 presentation format, 82-83 quantifiability, 81-82 quantity factor, 83-85 redundancy factor, 80 relevance factor, 78 reliability factor, 80 sufficiency factor, 74-75 timeliness factor, 73-74 undestandability factor, 76-77
Data adjustment, warehouses, 96-97 Database(s):
management systems, 86-87 overview, 85-86
Database management system (DBMS): described, 86-87 DSS component, 14-15
Database-oriented DSS, 16-17 Data flow, internationalization, 296 Data mining, 148-159
classification, 150-151 clustering, 151, 152 forecasting, 153-156 intelligent agents, 156-159 regressions, 151, 153 sequences, 153
Data processing, DSS process, 24 Data scrubbing, warehouses, 94-96

INDEX
Data sources: bias, 35 decision support systems (DSS), 6 internationalization, 289-296 manager characteristics, 32
Data support: decision making process, 36-46 information processing models, 37-45 virtual experience, decision making process,
52-53 Data vs. mythology, DSS design, 25 Data warehouses, 87-101
architecture, 97-101 automobile purchase example, 102 business intelligence, 11-12 data adjustment, 96-97 data scrubbing, 94-96 described, 87-93
Davenport, T. H., 9, 57 Davis, F. D., 389 DeBono, E., 35-36 Decision making process, 23-66
analytics, 57-58 bounded rationality approach, 29-31 business intelligence, 53-57 competitive business intelligence, 58-60 concept of, 3-5 data support, 36-46
information processing models, 37-45 tracking experience, 45-46
decision support systems (DSS), 5-13 display or presentation language component
(user interface), 247, 249, 251 group decision making, 46-47 intuition, 47-53 manager characteristics, 31-33 modeling, 127-128 overview, 23-25 rationality, 25-29 support systems, 33-36 virtual experience, 51-53
Decision support systems (DSS): adoption pressure factors, 5-13 applications:
airlift, 145 athletic, 141 attention allocation, 10 business, 4-5 comparability, 79 emergency dispatch system, 222 environmental, 5 expertise, 32 greeting cards, 15
grocery store, 12 group decisions, 430 healthcare, 13,408 model management, 44 Negotiation Ninjas, 143 Olympics, 233 political campaign, 18 public planning, 299 sensitivity analysis, 128 sports, 16 terrorism, 437
artificial intelligence, 197-213 cultural effects on, 303-309 defined, 13-17 design, 315-347 (See also Object-oriented
technologies) alphabets, 286 analytics, 53 appliance approach, 331-340 assumptions, challenging of, 40-41 business process reengineering, 341-344 client testing software, 386 criteria measurement, 29 dashboards, 410 data and, 69-71 data presentation format, 83 data reliability, 80 data scrubbing, 96 data vs. mythology, 25 data warehouse preparation, 90 distraction mechanism, 51 evaluation, 387, 388-389 failures, 146 Franklin decision process, 52 group decisions, 428, 429 intuition, 52 jargon, 341 learning incentives, 381 modeling chip architecture, 132 morality, 200 nudge concept, 32 object-oriented technologies, 349-368 one-stage, complete-system approach,
329-331 ostrich fable, 370 overview, 315-319 perception, 37 planning phase, 319-329 privacy issues, 293 response time, 419 speech emulation, 240 statistical bias, 34 team selection, 316, 340-341
Decision support systems (DSS) (Continued) timeliness factor, 74 Toubon Law (France), 282 translation problems, 283, 284, 285 Turing Test, 207 uncertainty, 376 virtual reality interfaces, 235
internationalization, 280 modeling, 125 types of, 16-17 uses of, 17-19
Deep Blue, 199 Demography, key performance indicators (KPI),
56 Dennis, A. R., 435, 440 DePodesta, Paul, 16 Descriptive modeling, normative modeling
versus, 136-137 Design. See Decision support systems (DSS),
design Design team selection, 316 Detail level, data, 75-76 Deterministic modeling, stochastic modeling
versus, 135-136 Dickson, G. W., 386 Diet, decision making, 3-4 Display or presentation language component
(user interface), 233-251 bias, 242-247 decision making process, 247, 249, 251 ownership (of analysis) perception, 241-242 representations, 236-241 visual design issues, 233-235 windowing, 235-236
Distraction mechanism, DSS design, 51 Di Talamo, N., 294 Dodson, G., 317 Dreyfus, H. L., 42 Dreyfus, S. E., 42 Dyment, J., 279
Economic factors, rationality, 25-29 Education, Implementation, 380-382 Einstein, Albert, 29 Electronic memory, support systems, 33 El-Haj, M. 0., 284 Emergency dispatch system application,
222 Enron scandal, 400 Enterprise Resource Planning (ERP), business
intelligence, 11-12 Environmental applications, DSS, 5, 79 Equifax, 4-5, 293
European Convention on Human Rights (ECHR), 294
Evaluation. See System evaluation Evan, W., 300, 302 Evans, W. A., 297, 301, 302 Executive information systems (EIS), 399-426
dashboards, 401-422 appliances, 417-418 design, 410-417 function of, 401^08 requirements, 408-410 value of, 418^22
historical perspective, 399-400 key performance indicator (KPI), 400^-01
Experience, virtual, decision making process, 51-53
Experiential model, representation dimension, 130-132
Expertise: assumptions, challenging of, DSS design,
40-41 decision making process, 42-43 DSS application, 32
External models, automobile purchase example, 189-190
Facets, object-oriented technologies, 365 Few, S., 401-402, 415-416 Financial data, inclusion guidelines, 72-73 Financial modeling, problems of, 147 Finlay, P. N., 383, 385 First Responder Interactive Emergency
Navigation Database (FRIEND) system, 222
Flexibility: automobile purchase example, modeling,
179-183 data detail level, 76 group decision support systems, 438 manager characteristics, 31
Forecasting, data mining, 153-156 Forward-chaining reasoning, artificial
intelligence, 203-206 France, Toubon Law, DSS design, 282 Franklin, Benjamin, 52 Free, D., 380 Free-form natural language, action language
component (user interface), 232-233 FRIEND system, 222 Frolick, M. N., 420
Gachet, A., 316 Galinsky, Adam, 51

INDEX
Gallupe, B. R., 435 Gartner, Inc., 55 Generalization, bias, 35 Generalized Air Mobility Model (GAMM), 145 Geoffrion, A., 364 Geographie information systems (GIS), DSS
design planning, 330 Gestures, internationalization, 290 Gialain, A., Al-, 284 Gladwell, Malcolm, 52 Global Reporting Initiative, 28 Gottman, John, 52 Graphs, bias, user interface, 244 Greeting cards application, DSS, 15 Grocery store application, DSS, 12 Gross, R., 149 Group decision making, 46-47 Group decision support systems, 427-443
definitions, 432-434 features, 434-440
decision-making support, 434^38 process support, 438-439 reengineering, 439-440
group dynamics, 427-429 group ware, 429-432
Groupthink, 427-429 Guralink, D. B., 25
Hallmark greeting card company, 15 Hammer, M., 341 Hammo, B. H., 284 Harris, J. G., 9, 57 Hau,K.C.,301,302 Health care applications:
CADUCEUS, 197-198 dashboards, 408 data mining, 148-149 DSS, 13, 128 simulations, modeling, 145
Hellriegel, D., 427 Heuristics, modeling, methodology dimension,
139-142 Histograms, bias, user interface, 245-247,
249-250 Hoffer, J. A., 437 Hofstede, G., 297, 299, 302, 305 Hogue,J.T., 18 Hollingsworth, A. T., 297 Hopsapple, C. W., 16 Hospitals, decision support systems (DSS), 13 Hosseini, J., 429, 437,438 Howson, C., 9, 55, 57 Hubbard, D. W., 400-401
Huber, G. P., 429 Human-computer interaction, 216-218. See also
User interface
IBM, 199 Icons, internationalization, 288 Identity theft, 149 Idioms, communication mode, user interface,
255 Implementation, 370-382. See also System
evaluation change commitment, 377-378 change management, 378-380 factors in, 370-372 institutionalization, 380-382 interviews, 373-375 prototype use, 372-373 simplicity, 375 success measurement, system evaluation,
386-391 user involvement, 375-377
India, 299 Individualism, cross-cultural factors, 302-303 influence diagrams, DSS design planning,
324-325 Information. See Data sources Information availability standards,
internationalization, 289-296 Information processing models, data support,
37-45 Information uses, automobile purchase
example, 102-107 Informed consent, privacy issues, 292 Inheritance, object-oriented technologies,
361-365 Input-output (I/O) structured formats:
action language component (user interface), 231-232
DSS design, 341 Institutionalization, implementation phase,
380-382 Integration, model-based management systems,
166-168 Intelligent agents, data mining, 156-159 Internationalization, 279-313
corporate forms, 279-280 cross-cultural modeling, 297-303 cultural factors, 303-309 decision support systems, 280 information availability standards, 289-296 language translation, 282-289 money currencies, 281 user interface, 280-283

Interviews: DSS design planning, 322-323 implementation, 373-375
Intuition, decision making process, 47-53 Involvement, manager characteristics, 33 Ives, B., 389 Ives, Charles, 37
Jajoo, B. H., 299 Japanese language, 285 Jargon, DSS design, 341 Jessup, L. M., 429, 435, 438 Johanssen, H. J., 343
Kanazawa, Satoshi, 157 Kasparov, Garry, 199 Key performance indicators (KPI):
business intelligence, 57 dashboards, 417 data inclusion guidelines, 72-73 executive information systems, 40CM01
Kiplinger's Buyer's Guide, 102, 104 Klein, G. A., 40, 42 Kluckhohn, F. R., 301 Knowledge base component (user interface),
251-256 communication mode, 252-256 generally, 251-252
Kobayshi, N., 297 Korzenlowski, P, 399 Kozar, K. A., 439, 440 Kroc, Ray, 83
Language translation, internationalization, 282-289
LaPlante, A., 18 LaRussa, Tony, 29 Legal factors, rationality, 25-29 Lewis, Michael, 16 Libertarian paternalism, nudge concept, 32 Lichtman, Allan J., 142 Lindblom, C. E., 30 Linearity factor, modeling options, 134-135 Linear programming, modeling, 140-141 Lock, M., 12 Logistic support systems, model management,
44 Look of system, communication mode, user
interface, 255 Luhn, H. P., 53-55
Major League Baseball, 141 Management information system (MIS), DSS
component, 13-14
Management principles, data vs. mythology, 25 Management systems, modeling, 159-177
access, 159-163 integration between models, 166-168 sensitivity factors, 168-174 support tools, 174-177 understandability, 163-166
Manager: business intelligence, 53-57 characteristics of, 31-33
Marketing: data detail level, 76 data inclusion guidelines, 72-73 decision support systems (DSS), 12
Mastery, decision making process, 4 2 ^ 3 Matsushita, 235 McDonald's restaurant chain, 83 Measurement units, internationalization, 287 Media, user interface, 220-223 Medical system, decision support systems
(DSS), 13. See also Health care applications
Mental model, communication mode, user interface, 252-256
Menus, action language component (user interface), 224-229
Metaphor, communication mode, user interface, 252-256
Methodology dimension, modeling options, 138-147
Metriglyphs, user interface, 236-238 Military:
airlift applications, simulations, 145 Bin Laden, Osama, modeling, 146
Mintzberg, H., 31-32 Minyard, Charles Joseph, 238 Mitchell, R., 72 Model base management system (MBMS), DSS
component, 15 Modeling, 125-195
analytics, 125-129 automobile purchase example, 177-190 business intelligence, 125 cross-cultural, internationalization, 297-303 data mining, 148-159
classification, 150-151 clustering, 151, 152 forecasting, 153-156 intelligent agents, 156-159 regressions, 151, 153 sequences, 153
defined, 125, 129 failures, 146

INDEX 451
management systems, 159-177 access, 159-163 integration between models, 166-168 sensitivity factors, 168-174 support tools, 174-177 understandability, 163-166
options for, 129-147 causality versus correlation, 137-138 descriptive versus normative modeling,
136-137 deterministic versus stochastic modeling,
135-136 generally, 129 linearity factor, 134-135 methodology dimension, 138-147 representation, 130-132 time dimension, 132-134
problems of, 147 MOLAP architecture, data warehouses, 99-101 Money currencies:
data adjustment, 96-97, 285 internationalization, 281, 285, 287
Montlick, T., 355 Morality, DSS design, 200 Muddling through, bounded rationality
approach, 29-31 Mythology vs. data, DSS design, 25
National Highway Traffic Safety Administration (NHTSA), 102, 178
Navigation of model, communication mode, user interface, 255
Negandhi, A. R., 297, 300, 302 Negotiation Ninjas applications, 143 Nested menus, action language component (user
interface), 227-228 Netflix, 150 Non-object-oriented tools, 350-352 Norman, D. A., 217, 319,411 Normative modeling, descriptive modeling
versus, 136-137 Novice level, decision making process, 42, 44 Nudge concept, DSS design, 32 Nursing acuity system, 13
Obama, Barack, 18 Objective model, representation dimension,
130-132 Object-oriented technologies, 349-368. See also
Automobile purchase example attributes and methods, 354-361 benefits of, 365-366 facets, 365
inheritance, 361-365 non-object-oriented tools, 350-352 object definition, 352-354 overview, 349
OLAP architecture, data warehouses, 99-101 Olson, M. H., 389 Olympics application, DSS, 233 Orwell, George, 295n6 Ostrich fable, DSS design, 370 Otair, M., 284 Ownership (of analysis) perception, display or
presentation language component (user interface), 241-242
Peara, A., 170, 172 Pen-and-gesture-based user interface, 218-220 Perception:
data support, 37^45 DSS design, 37 modeling, 125-127
Personal Information Protection and Electronic Documents Act (PIPEDA), 292
Peters, T., 25, 376 Petkov, D., 383 Petkova, O., 383 Piaget, J., 38 Pick, R. A., 317 Pictures, data form, 70 Pie charts, bias, user interface, 245-247 Point of service (POS) systems, business
intelligence, 11-12 Politics:
campaign application, DSS, 18 presidential selection, heuristics, 142 rationality, 25-29
Powers, R., 386 Prabhakar, P. K., 280 Prediction, data mining, 153-156 Presentation format. See also specific charts,
graphs and format types dashboard design, 410-417 data, 82-83
Presidential selection, heuristics, 142 Prietula, Ericsson & Cokely, 52 Prietula, M. J., 52 Privacy, data sources, internationalization,
290-295 Probability theory, artificial intelligence,
208-210 Problem identification, DSS process, 24 Procedural factors:
group decision support systems, 439 rationality, 25-29

Proficiency, decision making process, 42 Profits, rationality, 25-26 Prospector Heuristico, 143 Prototype, use of, implementation, 372-373 Public Company Accounting Reform and
Investor Protection Act of 2002 (Sarbanes Oxley (SOX) Act), 12, 55, 400
Public planning applications, DSS, 299
Qualitative data, intuition, decision making process, 47-53
Quantifiability, data, 81-82 Quantitative modeling, problems of, 147 Quantity factor, data, 83-85 Question-answer format, action language
component (user interface), 229
Raden, N., 25, 53 Rasmussen, J., 39-40 Rationality:
bounded rationality approach, 29-31 defined, 25 DSS design, 25-29
Reasoning, programming of, artificial intelligence, 200-206
Redundancy factor, 80 Reengineering:
DSS design, 341-344 group decision support systems, 439-440
Regressions, data mining, 151, 153 Regulatory environment:
business intelligence, 55 decision support systems (DSS), 12
Relevance factor, 78 Reliability factor, 80 Representation dimension, modeling options,
130-132 Representations, display or presentation
language component (user interface), 236-241
Response time, DSS design, 419 Robinson, S., 418, 420 Rockart,J. F.,419 ROLAP architecture, data warehouses,
100-101 Rule-oriented DSS, 16-17
Sample size, sufficiency factor, 74-75 Sankar, C. S., 280 Sarbanes Oxley (SOX) Act (Public Company
Accounting Reform and Investor Protection Act of 2002), 12, 55, 400
Sardi, R. Al-, 284 Satzinger, J.,419 Sauter, V. L., 380, 390 Scaling, bias, user interface, 244, 247-248 Scott, J. E., 386 Screen size, user interface, 218-220 Sculli,D.,301,302 Sensitivity analysis application, DSS, 128 Sensitivity factors, model-based management
systems, 168-174 Sentiment analysis, 159 Sequences, data mining, 153 Simon, H. A., 23, 29 Simon, Herbert, 10 Simplicity, implementation, 375 Simulation, modeling, methodology dimension,
142-147 Single-malt Scotch whiskey, 152 Situational analysis, DSS design planning,
325-329 Six hat concept, bias detection, 35-36 Smith, M., 72 Social (ethical) factors, rationality, 25-29 Social networks:
privacy issues, 291-292 sentiment analysis, 159
Solver-oriented DSS, 16-17 Sources. See Data sources Speech emulation, DSS design, 240 Sports applications, DSS, 16, 141, 233 Sprague,R.,316,317,320 Spreadsheet-oriented DSS, 16-17 Standards, cultural differences, 308-309 Statistical bias, DSS design, 34 Stereotyping, cross-cultural factors,
internationalization, 302-303 Stochastic modeling, deterministic modeling
versus, 135-136 Strategic business objectives (SBO)
methodology, 420 Strodtbeck, F. L., 301 Structured Query Language (SQL), 17 Style, manager characteristics, 31-32 Subscription mode, knowledge base component
(user interface), 252 Sufficiency factor, data, 74-75 Sunstein, Cass R., 32 Support systems, decision making process,
33-36 Support tools, model-based management
systems, 174-177 Swanson, E. B., 370

INDEX
System evaluation, 382-392. See also Implementation
implementation success measurement, 386-391
organizational appropriateness, 391-392 technical appropriateness, 382-385 utility, 385-386
Systems development life cycle (SDLC), DSS design planning, 321, 329
Taylor, J., 25 Team selection, DSS design, 316, 340-341 Technical factors, rationality, 25-29 Terminal mode, knowledge base component,
252 Terrorism application, DSS, 437 Testing software, DSS design, 386 Text-oriented DSS, 16-17 Thaler, Richard H., 32 Time dimension, modeling options, 132-134 Time horizon, sufficiency factor, data, 75 Timeliness factor:
data, 73-74 groupware, 430
Total Information Awareness Program (TIAP), 150-151
Toubon Law (France), DSS design, 282 Tracking experience, decision making process,
data support, 45-46 Training, implementation, 380-382 Transaction processing system (TPS):
data scrubbing, 94-96 DSS component, 13-14 DSS design and, 316
Translation (of language), internationalization, 282-289
Transnational organizations. See Internationalization
Turing Test, 207, 385 2001: A Space Odysset (film), 209
Uncertainty: artificial intelligence, 206-210 bias, 35 DSS design, 376
Understandability factor: data, 76-77 menus, user interface, 226 model-based management systems, 163-166 user interface, 217
Units of measurement, internationalization, 287
User interface, 215-275 action language component, 224-233
command language, 229-231 free-form natural language, 232-233 input-output structured formats, 231-232 menus, 224-229 question-answer format, 229
automobile purchase example, 256-271 decision support systems (DSS), 7-8 design of, 216-218 display or presentation language component,
233-251 bias, 242-247 decision making process, 247, 249, 251 ownership perception, 241-242 representations, 236-241 visual design issues, 233-235 windowing, 235-236
historical perspective, 215 internationalization, 280-283 knowledge base component, 251-256
communication mode, 252-256 generally, 251-252
mechanisms of, 218-223 User involvement, implementation, 375-377
Valacich, J. S., 429, 437 Values model, data inclusion guidelines,
72-73 Verbal description, data form, 70 Virtual experience, decision making process,
51-53 Virtual reality interfaces, DSS design, 235 Virtual reality technology, data form, 70 Visual design issues, display or presentation
language component (user interface), 233-235
Volonino,L.H.,418,420
Watson, H.J., 18,419,420 Watson, R. T., 433 Whinston, A. B., 16 Wilson, J. M., 383, 385, 435, 438 Windowing, display or presentation language
component, 235-236 Word cloud analysis, 153-154
Ziguram, I., 439, 440
Copyright © 2022 FDOKUMEN