EU decentralised Agencies' report to the European Parliament
Upload
khangminh22Category
view
5download
0
Decentralised Soft-Security inDistributed Systems
Paul David Kiddie
A thesis submitted toThe University of Birmingham
for the degree ofDOCTOR OF PHILOSOPHY
Electronic, Electrical and Computer EngineeringCollege of Engineering and Physical Sciences
The University of BirminghamFebruary 2011

University of Birmingham Research Archive
e-theses repository This unpublished thesis/dissertation is copyright of the author and/or third parties. The intellectual property rights of the author or third parties in respect of this work are as defined by The Copyright Designs and Patents Act 1988 or as modified by any successor legislation. Any use made of information contained in this thesis/dissertation must be in accordance with that legislation and must be properly acknowledged. Further distribution or reproduction in any format is prohibited without the permission of the copyright holder.

ABSTRACT
Existing approaches to intrusion detection in imperfect wireless environments employ lo-cal monitoring, but are limited by their failure to reason about the imprecise monitoringwithin a radio environment that arises from unidirectional links and collisions. This com-pounds the challenge of detecting subtle behaviour or adds to uncertainty in the detectionstrategies employed.
A simulation platform was developed, based on the Jist/SWANS environment, adopt-ing a robust methodology that employed Monte-Carlo sampling in order to evaluate in-trusion detection systems (IDS). A framework for simulating adversaries was developed,which enabled wormholes, black holes, selfishness, flooding and data modification to besimulated as well as a random distribution thereof.
A game theoretic inspired IDS, sIDS, was developed, which applied reasoning betweenthe detection and response components of a typical IDS, to apply more appropriate localresponses. The implementation of sIDS is presented within the context of a generic IDSframework for MANET. Results showed a 5-15% reduction in false response rate comparedto a baseline IDS over a number of attacking scenarios.
sIDS was extended with immune system inspired features, namely a response overmultiple timescales, as employed by the innate and adaptive components of the immunesystem, and the recruitment of neighbouring agents to participate in a co-ordinated re-sponse to an intrusion. Results showed a true response rate of 95-100% for all simulatedattack scenarios. For random misbehaviour and assisted black hole scenarios, PDR gainsof up to 30% and 15% were observed respectively compared to the pure game theoreticapproach, tracking the omniscient network performance in these scenarios.
In all, this study has shown that applying game theoretic reasoning to existing detectionmethods results in better discrimination of benign nodes from adversaries, which can beused to bias network operation towards the benign nodes. When fused with immune systeminspired features, the resulting IDS maintained this discrimination whilst substantiallyreducing attack efficacy.

ACKNOWLEDGEMENTS
Firstly I would like to thank my supervisor, Dr. Costas Constantinou, for all the sup-port and advice he has given over the course of the PhD, the many thought-provokingdiscussions we’ve had and for reading through the thesis drafts.
I would also like to thank all the past and present members of the Distributed Systemsand Networks Laboratory, especially David, Keita, Amalia, Hani, Debra and Yuri for thosebeer breaks at Staff House!
Then to my family: Mum and Dad, thanks for encouraging my passion in computingas a child and providing continuous love and encouragement, especially throughout thisprocess. I wouldn’t have made it this far without you. To Karl, Neil, Mark and Tara,thanks for always being there for me and taking an interest in my work, but also fortaking my mind off it when I needed a recharge, whether it was the quick chat on thephone, or the quick online game. Thanks to Gwyn, John, Val, Helen, Andy, Jayne, Clive,Glyn, Pauline and Nan – you each played a part in inspiring me to get this far, and yourcontinuous emotional support has been invaluable.
Special thanks go out to Sarah, James, Mark, Deborah and Dan, for being there whenI needed my mind taken off the pressures of the PhD and thesis-writing.
Finally, I would like to thank my partner Rhiannon for supporting me at every stepand for that I am eternally grateful. She also took on the (not insignificant) task of proofreading numerous drafts of my thesis.
Thanks to the EPSRC, whom this research was funded by, and to the team at theCentre for Learning, Innovation and Collaboration for providing employment in some oftheir exciting projects during the writing up process.
CONTENTS
1 Introduction 11.1 The MANET security problem . . . . . . . . . . . . . . . . . . . . . . . . 21.2 Research Questions . . . . . . . . . . . . . . . . . . . . . . . . . . . . . . 21.3 Contributions . . . . . . . . . . . . . . . . . . . . . . . . . . . . . . . . . 31.4 Organisation of thesis . . . . . . . . . . . . . . . . . . . . . . . . . . . . . 4
2 Literature Review 52.1 Introduction . . . . . . . . . . . . . . . . . . . . . . . . . . . . . . . . . . 52.2 Background . . . . . . . . . . . . . . . . . . . . . . . . . . . . . . . . . . 5
2.2.1 Mobile Ad-Hoc networks . . . . . . . . . . . . . . . . . . . . . . . 52.2.2 Ad-hoc routing protocols . . . . . . . . . . . . . . . . . . . . . . . 62.2.3 Reactive ad-hoc routing protocols . . . . . . . . . . . . . . . . . . 62.2.4 Ad-hoc On Demand Distance Vector (AODV) . . . . . . . . . . . . 8
2.2.4.1 Route discovery procedure . . . . . . . . . . . . . . . . 82.2.4.2 Route maintenance procedure . . . . . . . . . . . . . . 9
2.2.5 MANET security challenges . . . . . . . . . . . . . . . . . . . . . . 92.2.6 Network Intrusion Detection Systems (IDS) . . . . . . . . . . . . . 11
2.2.6.1 Auditing . . . . . . . . . . . . . . . . . . . . . . . . . . 112.2.6.2 Analysis . . . . . . . . . . . . . . . . . . . . . . . . . . 122.2.6.3 Response . . . . . . . . . . . . . . . . . . . . . . . . . . 12
2.3 Current approaches to providing security assurances in MANET . . . . . . 132.3.1 Secure Routing . . . . . . . . . . . . . . . . . . . . . . . . . . . . 132.3.2 Incentive Schemes . . . . . . . . . . . . . . . . . . . . . . . . . . . 142.3.3 Watchdog/Pathrater . . . . . . . . . . . . . . . . . . . . . . . . . 152.3.4 Finite State Machines (FSMs) . . . . . . . . . . . . . . . . . . . . 15
2.4 Artificial Immune Systems . . . . . . . . . . . . . . . . . . . . . . . . . . . 162.4.1 Background . . . . . . . . . . . . . . . . . . . . . . . . . . . . . . 162.4.2 AIS models . . . . . . . . . . . . . . . . . . . . . . . . . . . . . . 182.4.3 AIS applied to ad-hoc networks . . . . . . . . . . . . . . . . . . . 192.4.4 Discussion . . . . . . . . . . . . . . . . . . . . . . . . . . . . . . . 20
2.5 Game Theory . . . . . . . . . . . . . . . . . . . . . . . . . . . . . . . . . 20

2.5.1 Background . . . . . . . . . . . . . . . . . . . . . . . . . . . . . . 202.5.2 Game Types . . . . . . . . . . . . . . . . . . . . . . . . . . . . . . 222.5.3 Game Theory applied to ad-hoc networks . . . . . . . . . . . . . . 232.5.4 Discussion . . . . . . . . . . . . . . . . . . . . . . . . . . . . . . . 25
2.6 Summary . . . . . . . . . . . . . . . . . . . . . . . . . . . . . . . . . . . . 25
3 Simulation methodology 273.1 Introduction . . . . . . . . . . . . . . . . . . . . . . . . . . . . . . . . . . 273.2 Simulation environment . . . . . . . . . . . . . . . . . . . . . . . . . . . . 273.3 Metrics . . . . . . . . . . . . . . . . . . . . . . . . . . . . . . . . . . . . . 28
3.3.1 Goodput . . . . . . . . . . . . . . . . . . . . . . . . . . . . . . . . 293.3.2 Packet Delivery Ratio . . . . . . . . . . . . . . . . . . . . . . . . . 293.3.3 Average end-to-end delay . . . . . . . . . . . . . . . . . . . . . . . 293.3.4 Control Overheads . . . . . . . . . . . . . . . . . . . . . . . . . . . 293.3.5 Response rate . . . . . . . . . . . . . . . . . . . . . . . . . . . . . 303.3.6 Average recovery time . . . . . . . . . . . . . . . . . . . . . . . . . 30
3.4 Monte-Carlo framework . . . . . . . . . . . . . . . . . . . . . . . . . . . . 303.5 Validating Jist/SWANS . . . . . . . . . . . . . . . . . . . . . . . . . . . . 33
3.5.1 Methodology . . . . . . . . . . . . . . . . . . . . . . . . . . . . . . 333.6 Summary . . . . . . . . . . . . . . . . . . . . . . . . . . . . . . . . . . . . 37
4 Development of Adversary Models 384.1 Introduction . . . . . . . . . . . . . . . . . . . . . . . . . . . . . . . . . . 38
4.1.1 Threats to MANET routing . . . . . . . . . . . . . . . . . . . . . . 394.1.1.1 Selfishness . . . . . . . . . . . . . . . . . . . . . . . . . 404.1.1.2 Black hole . . . . . . . . . . . . . . . . . . . . . . . . . 424.1.1.3 Grey hole . . . . . . . . . . . . . . . . . . . . . . . . . . 424.1.1.4 Wormholes . . . . . . . . . . . . . . . . . . . . . . . . . 424.1.1.5 Flooding Attack . . . . . . . . . . . . . . . . . . . . . . 44
4.2 Development of adversary models for simulation . . . . . . . . . . . . . . . 444.2.1 Selfishness . . . . . . . . . . . . . . . . . . . . . . . . . . . . . . . 464.2.2 Route invasion . . . . . . . . . . . . . . . . . . . . . . . . . . . . . 46
4.2.2.1 Route freshness . . . . . . . . . . . . . . . . . . . . . . 474.2.2.2 Passive route invasion . . . . . . . . . . . . . . . . . . . 474.2.2.3 Active route invasion . . . . . . . . . . . . . . . . . . . 514.2.2.4 Hybrid route invasion . . . . . . . . . . . . . . . . . . . 534.2.2.5 The efficacy of route invasion attacks in MANET . . . 55
4.2.3 Black hole attack . . . . . . . . . . . . . . . . . . . . . . . . . . . 564.2.4 Grey hole attack . . . . . . . . . . . . . . . . . . . . . . . . . . . . 57
4.2.5 Flooding Attack . . . . . . . . . . . . . . . . . . . . . . . . . . . . 574.2.6 Wormhole Attack . . . . . . . . . . . . . . . . . . . . . . . . . . . 58
4.3 Conclusions . . . . . . . . . . . . . . . . . . . . . . . . . . . . . . . . . . 58
5 Common Services and Detection Strategies for a MANET Intrusion De-tection System 605.1 Introduction . . . . . . . . . . . . . . . . . . . . . . . . . . . . . . . . . . 605.2 Common Services . . . . . . . . . . . . . . . . . . . . . . . . . . . . . . . 60
5.2.1 Neighbour table . . . . . . . . . . . . . . . . . . . . . . . . . . . . 615.2.2 MAC-IP Pairs . . . . . . . . . . . . . . . . . . . . . . . . . . . . . 61
5.3 Audit source . . . . . . . . . . . . . . . . . . . . . . . . . . . . . . . . . . 615.3.1 Generating an audit source in Jist/SWANS . . . . . . . . . . . . . 62
5.4 Detectors . . . . . . . . . . . . . . . . . . . . . . . . . . . . . . . . . . . . 625.4.1 Dropped packets detection . . . . . . . . . . . . . . . . . . . . . . 625.4.2 Modified packets detection . . . . . . . . . . . . . . . . . . . . . . 685.4.3 Route Request flooding detection . . . . . . . . . . . . . . . . . . . 685.4.4 Dropped Route Requests detection . . . . . . . . . . . . . . . . . . 685.4.5 Route invasion detection . . . . . . . . . . . . . . . . . . . . . . . 71
5.4.5.1 Fake route reply as destination . . . . . . . . . . . . . . 715.4.5.2 Unsolicited route reply . . . . . . . . . . . . . . . . . . 715.4.5.3 Additional notes on route invasion . . . . . . . . . . . . 73
5.5 Computing metrics . . . . . . . . . . . . . . . . . . . . . . . . . . . . . . 735.5.1 Considerations when calculating metrics . . . . . . . . . . . . . . . 76
5.5.1.1 Imperfect detectors . . . . . . . . . . . . . . . . . . . . 765.5.1.2 No requisite audit data . . . . . . . . . . . . . . . . . . 77
5.6 Responses . . . . . . . . . . . . . . . . . . . . . . . . . . . . . . . . . . . 775.7 Using imperfect detection mechanisms: A simulation study . . . . . . . . . 78
5.7.1 Method . . . . . . . . . . . . . . . . . . . . . . . . . . . . . . . . 785.7.1.1 IDS architecture . . . . . . . . . . . . . . . . . . . . . . 785.7.1.2 Scenario . . . . . . . . . . . . . . . . . . . . . . . . . . . 795.7.1.3 Simulation configuration . . . . . . . . . . . . . . . . . 80
5.7.2 Results . . . . . . . . . . . . . . . . . . . . . . . . . . . . . . . . . 815.8 Summary . . . . . . . . . . . . . . . . . . . . . . . . . . . . . . . . . . . . 82
6 sIDS and Game Theoretic Reasoning 846.1 Introduction . . . . . . . . . . . . . . . . . . . . . . . . . . . . . . . . . . 84
6.1.1 Desirable properties for a MANET IDS . . . . . . . . . . . . . . . . 846.2 Metric performance . . . . . . . . . . . . . . . . . . . . . . . . . . . . . . 856.3 Design of sIDS . . . . . . . . . . . . . . . . . . . . . . . . . . . . . . . . . 88
6.4 Game construction . . . . . . . . . . . . . . . . . . . . . . . . . . . . . . . 916.4.1 Game model . . . . . . . . . . . . . . . . . . . . . . . . . . . . . . 916.4.2 Construction of utility functions . . . . . . . . . . . . . . . . . . . 92
6.4.2.1 Finalisation of utility functions . . . . . . . . . . . . . . 946.4.3 Game bi-matrix . . . . . . . . . . . . . . . . . . . . . . . . . . . . 94
6.5 Solving the game . . . . . . . . . . . . . . . . . . . . . . . . . . . . . . . 966.5.1 The Nash Equilibrium . . . . . . . . . . . . . . . . . . . . . . . . . 966.5.2 Methods to find Nash Equilibria . . . . . . . . . . . . . . . . . . . 976.5.3 Generating Nash Equilibria using the Lemke-Howson algorithm . . . 98
6.5.3.1 Pre-processing . . . . . . . . . . . . . . . . . . . . . . . 986.5.3.2 Initialising tableaux . . . . . . . . . . . . . . . . . . . . 986.5.3.3 Pivoting . . . . . . . . . . . . . . . . . . . . . . . . . . 996.5.3.4 Nash Equilibria . . . . . . . . . . . . . . . . . . . . . . 1006.5.3.5 Validation of Lemke-Howson algorithm . . . . . . . . . 100
6.5.4 Lemke-Howson algorithm applied to the game . . . . . . . . . . . . 1006.5.5 Responses . . . . . . . . . . . . . . . . . . . . . . . . . . . . . . . 102
6.6 Simulation configuration . . . . . . . . . . . . . . . . . . . . . . . . . . . 1026.6.1 Network Model . . . . . . . . . . . . . . . . . . . . . . . . . . . . 103
6.6.1.1 Game Theoretic IDS nodes . . . . . . . . . . . . . . . . 1086.6.2 Simulation parameters . . . . . . . . . . . . . . . . . . . . . . . . 109
6.6.2.1 Radio environment . . . . . . . . . . . . . . . . . . . . . 1096.6.2.2 Network environment . . . . . . . . . . . . . . . . . . . 1096.6.2.3 Mobility . . . . . . . . . . . . . . . . . . . . . . . . . . 1096.6.2.4 Flows . . . . . . . . . . . . . . . . . . . . . . . . . . . . 1096.6.2.5 Topologies . . . . . . . . . . . . . . . . . . . . . . . . . 1106.6.2.6 Adversary placement . . . . . . . . . . . . . . . . . . . 1106.6.2.7 Adversary Misbehaviour . . . . . . . . . . . . . . . . . . 111
6.6.3 Scenarios . . . . . . . . . . . . . . . . . . . . . . . . . . . . . . . . 1116.7 Results . . . . . . . . . . . . . . . . . . . . . . . . . . . . . . . . . . . . . 111
6.7.1 Flooding . . . . . . . . . . . . . . . . . . . . . . . . . . . . . . . . 1116.7.1.1 Discussion . . . . . . . . . . . . . . . . . . . . . . . . . 115
6.7.2 Unassisted Black hole . . . . . . . . . . . . . . . . . . . . . . . . . 1176.7.2.1 Discussion . . . . . . . . . . . . . . . . . . . . . . . . . 121
6.7.3 Black hole assisted with passive route invasion . . . . . . . . . . . . 1226.7.3.1 Discussion . . . . . . . . . . . . . . . . . . . . . . . . . 126
6.7.4 Wormhole . . . . . . . . . . . . . . . . . . . . . . . . . . . . . . . 1276.7.4.1 Discussion . . . . . . . . . . . . . . . . . . . . . . . . . 128
6.7.5 Random misbehaviour . . . . . . . . . . . . . . . . . . . . . . . . . 132
6.7.5.1 Discussion . . . . . . . . . . . . . . . . . . . . . . . . . 1356.8 Summary . . . . . . . . . . . . . . . . . . . . . . . . . . . . . . . . . . . . 135
7 sIDS+AIS: An immune inspired approach to detection and response 1387.1 Introduction . . . . . . . . . . . . . . . . . . . . . . . . . . . . . . . . . . 1387.2 From the Human Immune System to MANET IDS . . . . . . . . . . . . . 138
7.2.1 From innate TLRs to perfect detectors . . . . . . . . . . . . . . . . 1397.2.2 Adaptive response and imperfect detectors . . . . . . . . . . . . . . 139
7.3 An implementation of an AIS component for sIDS. . . . . . . . . . . . . . 1407.3.1 Reporting and aggregating intrusion data . . . . . . . . . . . . . . 140
7.3.1.1 Disseminating reports . . . . . . . . . . . . . . . . . . . 1407.3.1.2 Data aggregation . . . . . . . . . . . . . . . . . . . . . . 1427.3.1.3 Managing active responses . . . . . . . . . . . . . . . . 142
7.3.2 The innate component . . . . . . . . . . . . . . . . . . . . . . . . 1427.3.2.1 Local response . . . . . . . . . . . . . . . . . . . . . . . 1427.3.2.2 Extended response . . . . . . . . . . . . . . . . . . . . . 143
7.3.3 The adaptive component . . . . . . . . . . . . . . . . . . . . . . . 1457.4 Results . . . . . . . . . . . . . . . . . . . . . . . . . . . . . . . . . . . . . 147
7.4.1 Flooding . . . . . . . . . . . . . . . . . . . . . . . . . . . . . . . . 1497.4.1.1 Discussion . . . . . . . . . . . . . . . . . . . . . . . . . 151
7.4.2 Unassisted Black hole . . . . . . . . . . . . . . . . . . . . . . . . . 1527.4.2.1 Discussion . . . . . . . . . . . . . . . . . . . . . . . . . 154
7.4.3 Black hole assisted with passive route invasion . . . . . . . . . . . . 1547.4.3.1 Discussion . . . . . . . . . . . . . . . . . . . . . . . . . 156
7.4.4 Wormhole . . . . . . . . . . . . . . . . . . . . . . . . . . . . . . . 1577.4.4.1 Discussion . . . . . . . . . . . . . . . . . . . . . . . . . 159
7.4.5 Random misbehaviour . . . . . . . . . . . . . . . . . . . . . . . . . 1597.4.5.1 Discussion . . . . . . . . . . . . . . . . . . . . . . . . . 161
7.5 Summary . . . . . . . . . . . . . . . . . . . . . . . . . . . . . . . . . . . . 161
8 Conclusions 1638.1 Summary and Research Contributions . . . . . . . . . . . . . . . . . . . . 1638.2 Future Work . . . . . . . . . . . . . . . . . . . . . . . . . . . . . . . . . . 166
A Common Parameters used for Jist/SWANS simulations 169
B Fixes to Jist/SWANS 171
C Extensions to Jist/SWANS 176C.1 Trace file generation . . . . . . . . . . . . . . . . . . . . . . . . . . . . . . 176

C.2 Simulation user interface . . . . . . . . . . . . . . . . . . . . . . . . . . . 176C.3 Driver base class . . . . . . . . . . . . . . . . . . . . . . . . . . . . . . . 178C.4 Jist/SWANS kernel . . . . . . . . . . . . . . . . . . . . . . . . . . . . . . 178C.5 Test framework . . . . . . . . . . . . . . . . . . . . . . . . . . . . . . . . 178C.6 Source code changes . . . . . . . . . . . . . . . . . . . . . . . . . . . . . 180
D Simulation source code 182
E Using the unit test framework 184
F Validating Jist/SWANS 185F.1 Validation I . . . . . . . . . . . . . . . . . . . . . . . . . . . . . . . . . . 185F.2 Validation II . . . . . . . . . . . . . . . . . . . . . . . . . . . . . . . . . . 189
G Configuration of adversaries 194
H Testing the Lemke-Howson algorithm implementation 198
I Publications 201
References 205

LIST OF FIGURES
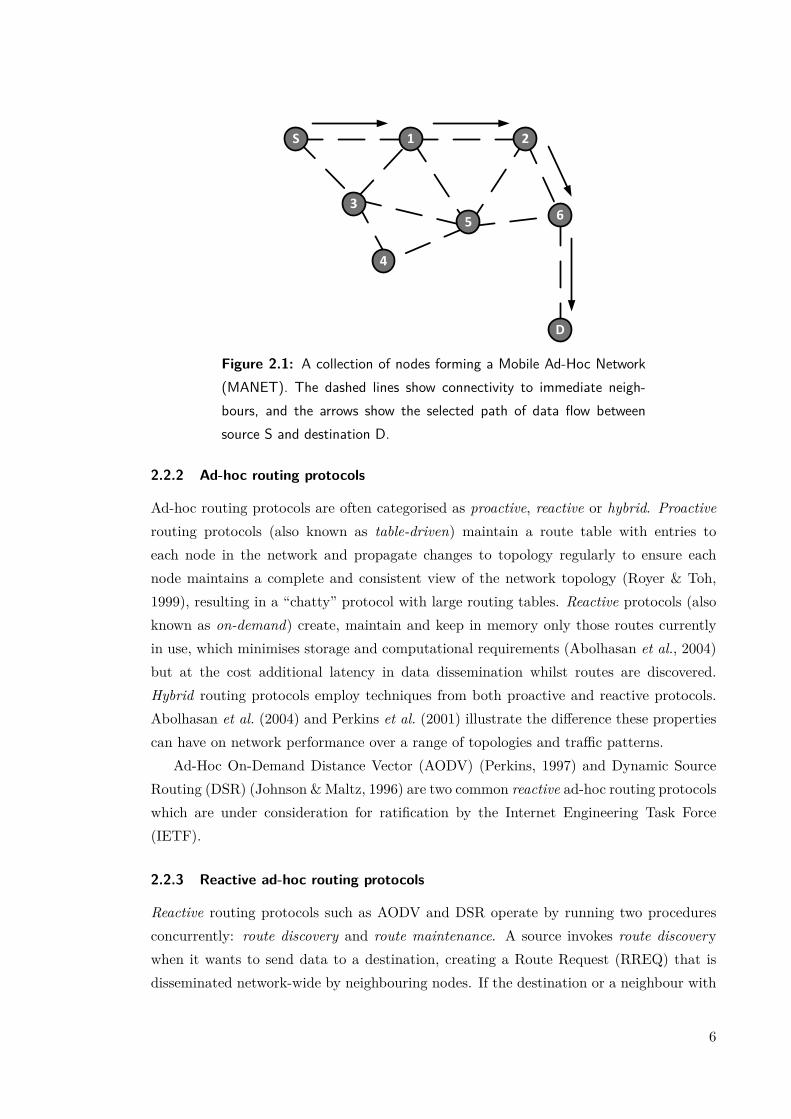
2.1 A collection of nodes forming a Mobile Ad-Hoc Network (MANET). Thedashed lines show connectivity to immediate neighbours, and the arrowsshow the selected path of data flow between source S and destination D. . 6
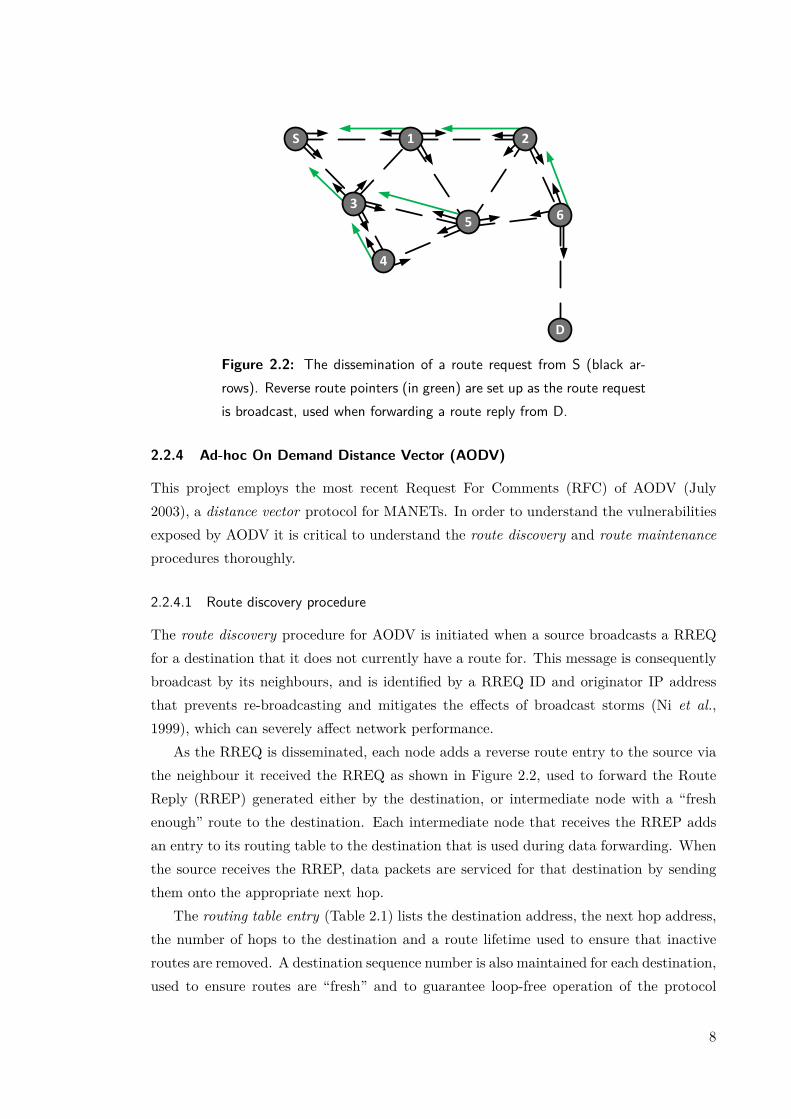
2.2 The dissemination of a route request from S (black arrows). Reverse routepointers (in green) are set up as the route request is broadcast, used whenforwarding a route reply from D. . . . . . . . . . . . . . . . . . . . . . . . 8
2.3 Route maintenance procedure. Destination D has moved out of range ofnode 6 and has become a neighbour of nodes 4 and 5. 6 invokes local repairand discovers route to D via 5, and data takes the new path highlighted. . 9
2.4 Interaction between modules of a network IDS . . . . . . . . . . . . . . . . 112.5 Defence-in-depth for MANET. . . . . . . . . . . . . . . . . . . . . . . . . 142.6 The layers of protection in the vertebrate immune system, illustrating the
actors and timescales associated with each layer. Epithelial surfaces providethe first line of defence. If breached, the innate immune system is invokedimmediately, whilst the adaptive immune response takes the order of a fewdays for effector cells to mature. . . . . . . . . . . . . . . . . . . . . . . . 17
3.1 a) OSI Model, b) corresponding SWANS package structure, c) Examplenode definition . . . . . . . . . . . . . . . . . . . . . . . . . . . . . . . . . 28
3.2 Monte-Carlo simulation runner acts as an intermediary between driver, postprocessing script and SWANS runtime. . . . . . . . . . . . . . . . . . . . . 32
3.3 Flow diagram for Monte-Carlo simulation runner . . . . . . . . . . . . . . . 323.4 Packet delivery ratio and end to end delay achieved in pkiddie.driver.Ns2-
ValidationSimple.java from the use of the original and customisedAODV routers in Jist/SWANS, and the Ns2 AODV router, set to use HELLOmessages. . . . . . . . . . . . . . . . . . . . . . . . . . . . . . . . . . . . 36
3.5 Packet delivery ratio and end-to-end delay achieved in scaled up scenario byJist/SWANS with versions of RouteAodvMultiInterface and Ns2 AODVrouter. . . . . . . . . . . . . . . . . . . . . . . . . . . . . . . . . . . . . . 36

4.1 A topology with two established flows between S and D and S2 and D2. Swould detect 1 to be dropping packets if S was analysing promiscuous no-tifications using a Watchdog technique. 1 is simply waiting for the mediumto be free to send data to D. . . . . . . . . . . . . . . . . . . . . . . . . . 40
4.2 A selfish node (M) that does not forward route requests during route dis-covery. 1. S sends a route request for D. 2. M explicitly drops the RREQwhilst the other neighbours of S forward the route request to their neigh-bours. 3. The route request arrives at D. None of the reverse route entriespoint to adversary M. 4. The path the route advertisement from D takes.M has excluded itself from servicing a possible route. . . . . . . . . . . . . 41
4.3 A black hole at M which attracts data flows from S1 destined to D1 and S2to D2 respectively, and then drops the data. 1. S1 sends a route requestfor D1. M does not have a route to D1 but immediately sends a routeadvertisement to D1. 2. S1 uses M as the next hop to D1. Any data isdropped. 3. Another source, S2, sends a route request for D2. Again, theadversary responds immediately. 4. Two data flows have been attractedtoward M. . . . . . . . . . . . . . . . . . . . . . . . . . . . . . . . . . . . 43
4.4 A wormhole attack in progress, with the tunnel between M1 and M2, whoare colluding adversaries. 1. S broadcasts a route request to D. 2. M1broadcasts the route request over all interfaces, including the high through-put tunnel between itself and M2. 3. M2 rebroadcasts the route requestas normal, which reaches D before the third broadcast by the honest nodeshas happened. 4. D replies as normal to the route request, which takes theroute over the tunnel back to S. Any subsequent route request packets bythe honest nodes are dropped by D. . . . . . . . . . . . . . . . . . . . . . 45
4.5 M invades route between S and D passively by creating and sending a fakeroute advertisement to S. 1. S broadcasts a route request for destination D.2. M receives the route request and replies with a fake route advertisement.3. Since M is closer to S than D is to S, the fake route advertisement fromM is selected initially. This may be temporary based upon how attractivethe real route advertisement from D is. M is now in a position to conductfurther attacks as part of the flow. . . . . . . . . . . . . . . . . . . . . . . 49
4.6 An existing data flow between S and D, which M wishes to invade throughthe use of active route invasion. 1. Adversary M caches nodes 1 and 2, andS and D as flow end-points by eavesdropping on relevant routing and datapackets (dotted lines). 2. M sends a faked route advertisement about D to1, and 1 updates the next hop to D accordingly. 3. M redirects the dataflow between S and D, using this position to launch further attacks from. . 52

4.7 An existing data flow between S and D. 1. The adversary eavesdrops andcaches the IP addresses/MAC addresses of intermediate nodes responsiblefor forwarding the flow data. 2. The adversary, having detected two inter-mediate nodes, creates a RERR from (2) about the route to D, and sendsit to 1. 3. Node 1 queues packets from S whilst attempting to find a newroute to D. M can reply passively with a forged route reply attack in orderto invade the flow. 4. M has successfully redirected the flow through itself,through a combination of active and passive attacks. . . . . . . . . . . . . 54
4.8 Packet Delivery Ratio achieved in simulations with varying numbers of ad-versaries employing one of a number of route invasion attacks. . . . . . . . 56
5.1 a) Node 5 directly monitoring flow S1->D. b) Node 5 indirectly monitoringflow S2->D exclusively through promiscuous notifications. . . . . . . . . . 63
5.2 A collision at node 2, which is undetectable through promiscuous monitoringalone. . . . . . . . . . . . . . . . . . . . . . . . . . . . . . . . . . . . . . 63
5.3 Simplified flow diagram showing audit data (complete with context) beingsent to IDS. . . . . . . . . . . . . . . . . . . . . . . . . . . . . . . . . . . 64
5.4 Analyser containing a set of detectors, operating on each audit data samplereceived by the IDS, and producing a set of notifications managed by anotification vector. . . . . . . . . . . . . . . . . . . . . . . . . . . . . . . . 65
5.5 Time window maintained by the dropped packet detector, showing cachedpacket entries and promiscuous notifications received. τn represents theduration between packet n being sent and it being received promiscuouslyby the monitoring node as a result of the neighbour forwarding it onwards. 66
5.6 Detection of dropped packets from M by S, represented as a state transitiondiagram. . . . . . . . . . . . . . . . . . . . . . . . . . . . . . . . . . . . . 66
5.7 Detection of dropped route requests from M by S, represented as a statetransition diagram. Assume that M is sending data, hence S knows itscurrent neighbours are 1, 4 and M. . . . . . . . . . . . . . . . . . . . . . . 69
5.8 Detection of a faked route reply “as destination” from M by 1, representedas a flow diagram. In this case, 1 can safely drop the route advertisementfrom M, and send the true route advertisement (in green) to S. . . . . . . 72
5.9 Detection of an unsolicited route reply from M by 1 using sIDS, representedas a flow diagram. In this case, 1 can safely drop the route advertisementfrom M, using the existing route with nextHop = 2. . . . . . . . . . . . . . 73

5.10 A routing loop caused by a route invasion attack. 1. and 2. A route inva-sion attack by M, who fabricates an advertisement with a high destinationsequence number, destSeqNum=50. 3. Node 7, discovering that 8 hasroamed out of range, initiates local repair for a new route to destinationD. 4. Both D and S reply, but the reply from S has a larger destinationsequence number, so is chosen. 5. This results in the routing loop shown. . 74
5.11 PDRs achieved over various transmission ranges (determined by Transmission-
Radius driver) and propagation models. . . . . . . . . . . . . . . . . . . . 805.12 Number of responses in fading and ideal environment using a detector with
perfect/imperfect signalling . . . . . . . . . . . . . . . . . . . . . . . . . . 82
6.1 Detection rates of detection mechanisms at varying percentages of maliciousnodes when applied to scenario detailed in Table 6.1 . . . . . . . . . . . . 87
6.2 False positive rates of detection mechanisms at varying percentages of ma-licious nodes when applied to scenario detailed in Table 6.1 . . . . . . . . . 87
6.3 Phase-space of desired sIDS operation, where mi is the calculated valuefrom the set of imperfect metrics and mp is the calculated value from theset of perfect metrics for an observed neighbour. p is the probability ofprocessing the packet. If p→ 0, sIDS responds whilst if p→ 1, sIDS pro-cesses the neighbour’s packets. Constants αr and β control the thresholdsat which respond or process is selected respectively. . . . . . . . . . . . . . 89
6.4 Flow diagram of sIDS in the context of a message being received by thenetwork layer. Strategy profiles are computed each interval for each knownneighbour, and are used to determine whether to process/respond to thecurrent message. . . . . . . . . . . . . . . . . . . . . . . . . . . . . . . . 90
6.5 Distribution of p for various mi and mp, where αr = 0.2, β = 0.7 andγ = 0.5. Notice that p < 0 for mp < αr and p > 1 for mp,mi > β
produces appropriate pure strategy solutions. . . . . . . . . . . . . . . . . . 956.6 Distribution of p for various mi and mp, where αr = 0.2, β = 0.7 and
γ = 0.6. Notice that p < 0 for mp < αr and p > 1 for mp,mi > β,producing appropriate pure strategy solutions in these regions. . . . . . . . 101
6.7 Packet Delivery Ratio (PDR) achieved in simulations with increasing ratioof ’black hole’ adversaries vs. defenceless, omniscient and threshold IDSnodes with different window size k. . . . . . . . . . . . . . . . . . . . . . 106
6.8 Response rate achieved in simulations with increasing ratio of ’black hole’adversaries vs. threshold IDS nodes with varying window size k. . . . . . . 108
6.9 PDR achieved in flooding scenario with increasing numbers of adversaries . 114

6.10 Average end-to-end delay achieved in flooding scenario with increasing num-bers of adversaries . . . . . . . . . . . . . . . . . . . . . . . . . . . . . . . 115
6.11 Control overheads in flooding scenario with an increasing numbers of ad-versaries . . . . . . . . . . . . . . . . . . . . . . . . . . . . . . . . . . . . 116
6.12 True response rate in flooding scenario achieved by baseline and game the-oretic IDS with increasing numbers of adversaries . . . . . . . . . . . . . . 116
6.13 Recovery times and minimum goodputs achieved by defenceless, baselineand game theoretic networks with moderate misbehaviour (30% adversaries)in flooding scenario . . . . . . . . . . . . . . . . . . . . . . . . . . . . . . 117
6.14 PDR and dropped packet ratio achieved in unassisted black hole scenariowith an increasing number of adversaries . . . . . . . . . . . . . . . . . . . 119
6.15 Average end-to-end (ETE) delay achieved in unassisted black hole scenariowith an increasing number of adversaries . . . . . . . . . . . . . . . . . . . 120
6.16 Control overhead in unassisted black hole scenario with an increasing num-ber of adversaries . . . . . . . . . . . . . . . . . . . . . . . . . . . . . . . 120
6.17 True response rate achieved in unassisted black hole scenario with an in-creasing number of adversaries . . . . . . . . . . . . . . . . . . . . . . . . 121
6.18 Recovery times and minimum goodputs achieved by defenceless, baselineand game theoretic networks with moderate misbehaviour (30% adversaries)in unassisted black hole scenario. . . . . . . . . . . . . . . . . . . . . . . . 122
6.19 PDR and dropped packet ratio achieved in assisted black hole scenario withan increasing number of adversaries . . . . . . . . . . . . . . . . . . . . . 124
6.20 Average end-to-end (ETE) delay achieved in assisted black hole scenariowith an increasing number of adversaries . . . . . . . . . . . . . . . . . . . 125
6.21 Control overhead in assisted black hole scenario with an increasing numberof adversaries . . . . . . . . . . . . . . . . . . . . . . . . . . . . . . . . . 125
6.22 True response rate achieved in assisted black hole scenario with an increasingnumber of adversaries . . . . . . . . . . . . . . . . . . . . . . . . . . . . . 126
6.23 Recovery times and minimum goodputs achieved by defenceless, baselineand game theoretic networks with moderate misbehaviour (30% adversaries)in assisted black hole scenario . . . . . . . . . . . . . . . . . . . . . . . . . 127
6.24 PDR and intercepted packet ratio achieved in wormhole scenario with anincreasing number of adversaries . . . . . . . . . . . . . . . . . . . . . . . 129
6.25 Average end-to-end (ETE) delay achieved in wormhole scenario with anincreasing number of adversaries . . . . . . . . . . . . . . . . . . . . . . . 130
6.26 Control overhead in wormhole scenario with an increasing number of adver-saries . . . . . . . . . . . . . . . . . . . . . . . . . . . . . . . . . . . . . . 130

6.27 True response rate achieved in wormhole scenario with an increasing numberof adversaries . . . . . . . . . . . . . . . . . . . . . . . . . . . . . . . . . 131
6.28 Recovery times and minimum intercepted bytes achieved by defenceless,baseline and game theoretic networks with moderate misbehaviour (30%adversaries) in wormhole scenario . . . . . . . . . . . . . . . . . . . . . . . 131
6.29 PDR achieved in random misbehaviour scenario with an increasing numberof adversaries . . . . . . . . . . . . . . . . . . . . . . . . . . . . . . . . . 133
6.30 Average end-to-end (ETE) delay achieved in random misbehaviour scenariowith an increasing number of adversaries . . . . . . . . . . . . . . . . . . . 134
6.31 Control overhead in random scenario with an increasing number of adversaries 1346.32 True response rate in random scenario with an increasing number of adversaries 135
7.1 General structure of report IP packet . . . . . . . . . . . . . . . . . . . . . 1417.2 Flow diagram of innate response when notification is generated by one or
more detectors. If the notification is from a perfect detector the innatecomponent responds locally and then initiates an extended response. . . . . 143
7.3 Report procedure for innate component of AIS. 1. An adversary misbehavesby sending fake route replies, which is detected by most, but not all ofits immediate neighbours. 2. After a random jitter period, one of theimmediate neighbours, node 2, initiates the innate reporting procedure byconstructing and sending a report containing the new intrusion state to itsimmediate neighbours. 3. Neighbours forward reports and if the receiveris a neighbour of the adversary it sends its own report out (indicated bythe double arrows). This process continues. 4. After a timeout, nodesdetermine a consensus, in this case, isolating M. . . . . . . . . . . . . . . 144
7.4 Structure of innate report . . . . . . . . . . . . . . . . . . . . . . . . . . 1457.5 Flow diagram of adaptive response, invoked when any suspect has a low mi. 1477.7 Structure of adaptive report . . . . . . . . . . . . . . . . . . . . . . . . . 1477.6 Report procedure for adaptive component of AIS. 1. An adversary mis-
behaves by dropping packets. 2. After a random jitter period, one of theimmediate neighbours, node 2, initiates the reporting procedure by forward-ing a report containing its evaluation of the suspect’s mi to its neighbours.Nodes forward the reports on and if they have recent experience they trans-mit a report with their evaluation of mi (indicated by double arrows). 3.After a timeout, nodes apply a threshold to the reported mi’s, and find theconsensus - in this case to respond to M. The empty set R now containsM 4. Nodes find an alternative route around M. Note that neighbours withno experience of M also contribute in the extended response against M. . . 148
7.8 Results from flooding scenario with increasing numbers of adversaries . . . 1507.9 Results from unassisted black hole scenario with increasing numbers of ad-
versaries . . . . . . . . . . . . . . . . . . . . . . . . . . . . . . . . . . . . 1537.10 Recovery times and minimum goodputs achieved in unassisted black hole
scenario with 30% adversaries over range of node models . . . . . . . . . . 1547.11 Results from assisted black hole scenario with increasing numbers of adver-
saries . . . . . . . . . . . . . . . . . . . . . . . . . . . . . . . . . . . . . . 1557.12 Recovery times and minimum goodputs achieved by defenceless, baseline
and game theoretic networks with moderate misbehaviour (30% adversaries)in assisted black hole scenario . . . . . . . . . . . . . . . . . . . . . . . . . 156
7.13 Results from wormhole scenario with increasing numbers of adversaries . . . 1587.14 Recovery times and minimum intercepted bytes achieved by defenceless,
baseline and game theoretic networks with moderate misbehaviour (30%adversaries) in wormhole scenario . . . . . . . . . . . . . . . . . . . . . . . 159
7.15 Results from random scenario with increasing numbers of adversaries . . . . 160
C.2 a) Node protocol stack in simulation user interface, b) AppUdp applicationlayer panel, c) Routing layer panel . . . . . . . . . . . . . . . . . . . . . . 177
C.1 Simulation GUI, showing SWANS event stream. . . . . . . . . . . . . . . . 177C.3 a) Jist/SWANS v1.0.6 class hierarchy; Jist rewriter specifically prohibits
derived classes. b) After modification of Jist/SWANS kernel, and extractionof basic functionality into RouteAodvBase. Functionality in RouteAodv isoverridden in RouteAodvAdversary only where necessary to implementmisbehaviour. . . . . . . . . . . . . . . . . . . . . . . . . . . . . . . . . . 179
F.1 PDRs achieved in Validation I scenario, using RouteAodvMultiInterface
(v2). . . . . . . . . . . . . . . . . . . . . . . . . . . . . . . . . . . . . . . 189F.2 Average end-to-end delay achieved in Validation I scenario using RouteAodv-
MultiInterface (v2). . . . . . . . . . . . . . . . . . . . . . . . . . . . . 192F.3 PDR and end-to-end delay achieved in Validation II using Rayleigh fading
and Tworay pathloss within Jist/SWANS and original study for comparison. 193

LIST OF TABLES
2.1 Excerpt of route table for S, showing a route entry to D via next hop 1 . . 92.2 A number of attacks MANET are susceptible to, with protocol layer they
target and the original author who investigated it. . . . . . . . . . . . . . . 102.3 An illustration of a normal form game: The Prisoners Dilemma. . . . . . . 20
3.1 Variable types supported by Runner. . . . . . . . . . . . . . . . . . . . . . 313.2 Runtime environment for Jist/SWANS simulator . . . . . . . . . . . . . . . 333.3 Runtime environment for Ns2 simulator . . . . . . . . . . . . . . . . . . . 343.5 Default value of AODV constants in Jist/SWANS and Ns2 . . . . . . . . . 353.6 Jist/SWANS simulation parameters overridden in scaled up scenario and
implemented in pkiddie.driver.Ns2ValidationScaledUp.java. . . . . 36
4.1 Route invasion strategies to use depending on the state of the route. . . . . 554.2 A routing table entry for wormhole adversaries. The common fields of an
entry are greyed out, whilst the interface_id field specific to multipleinterface aware routing protocols (a requirement for wormhole adversaries)is emphasised. . . . . . . . . . . . . . . . . . . . . . . . . . . . . . . . . . 58
5.1 IDS parameters used in simulation study . . . . . . . . . . . . . . . . . . . 795.2 Transmission radius’ chosen for different propagation environments, and
field length required to keep average route length constant. . . . . . . . . . 805.2 Basic environment overridden to define ’Rayleigh fading and Two Ray Pathloss’
simulation. . . . . . . . . . . . . . . . . . . . . . . . . . . . . . . . . . . . 815.3 Basic environment overridden to define ’No Fading and Freespace Pathloss’
simulation . . . . . . . . . . . . . . . . . . . . . . . . . . . . . . . . . . . 815.5 Average number of false alerts generated by detector network-wide . . . . . 82
6.1 Scenarios and detector configuration used to evaluate the performance ofindividual detectors. . . . . . . . . . . . . . . . . . . . . . . . . . . . . . 86
6.2 The bi-matrix game played by the IDS . . . . . . . . . . . . . . . . . . . . 916.3 Game in domain mp < αr . . . . . . . . . . . . . . . . . . . . . . . . . . 936.4 Game in domain mp,mi > β . . . . . . . . . . . . . . . . . . . . . . . . . 936.5 Game in domain αr ≥ mp ≤ β, mi < β . . . . . . . . . . . . . . . . . . . 93

6.6 Game played by nodes equipped with sIDS. . . . . . . . . . . . . . . . . . 966.7 Sample game where mi = 0.7, mp = 0.5, αr = 0.2, β = 0.7 and γ = 0.5. . 986.8 Payoff matrices A and B used in tableaux construction . . . . . . . . . . . 986.9 Jist/SWANS simulated adversary node protocol stack . . . . . . . . . . . . 1046.10 Jist/SWANS simulated defenceless node protocol stack . . . . . . . . . . . 1046.11 Intrusion Detection System implementation used in each scenario. . . . . . 1056.12 Jist/SWANS simulated IDS node protocol stack . . . . . . . . . . . . . . . 1076.13 Effective window size in samples (k) and corresponding value of α used in
simulations . . . . . . . . . . . . . . . . . . . . . . . . . . . . . . . . . . . 1076.14 Threshold IDS parameters . . . . . . . . . . . . . . . . . . . . . . . . . . 1086.15 Game Theoretic IDS parameters . . . . . . . . . . . . . . . . . . . . . . . 1096.16 Flow properties for use in AppUdp traffic generator . . . . . . . . . . . . . 1106.17 Misbehaviour defaults used in simulations. . . . . . . . . . . . . . . . . . 1126.18 Attacking scenarios simulated using each node model . . . . . . . . . . . . 1126.19 Flooding parameters. . . . . . . . . . . . . . . . . . . . . . . . . . . . . . 1136.20 Set of misbehaviours, their relative weightings and duration . . . . . . . . . 132
7.1 AIS IDS parameters . . . . . . . . . . . . . . . . . . . . . . . . . . . . . . 149
A.1 Simulation parameters used common to all Jist/SWANS simulations . . . . 169
F.1 Properties of AppUdp traffic generator in Validation I scenario . . . . . . . 185F.2 Simulation parameters used in Validation I scenario . . . . . . . . . . . . . 186F.3 Simulation parameters used in Validation II scenario . . . . . . . . . . . . . 189F.4 properties of flows in this scenario . . . . . . . . . . . . . . . . . . . . . . 191
G.1 Methods on RouteAodvMultiInterfaceAdversary to control the adver-sary during simulation. . . . . . . . . . . . . . . . . . . . . . . . . . . . . 194
G.3 Possible values of passiveRouteInvasion field used in RouteAodvMulti-
InterfaceAdversary router. . . . . . . . . . . . . . . . . . . . . . . . . 196G.4 Possible values of activeRouteInvasion field used in RouteAodvMulti-
InterfaceAdversary router. . . . . . . . . . . . . . . . . . . . . . . . . 197

ABBREVIATIONS
AIS Artificial Immune System
AODV Ad-Hoc On-Demand Distance Vector
API Application Programmers Interface
CA Certificate Authority
CBR Constant Bit Rate
CSMA/CA Carrier Sense Multiple Access with Collision Avoidance
DC Dendritic Cell
DoS Denial of service
DSR Dynamic Source Routing
FSM Finite State Machine
GSM Global System for Mobile communications
HIS Human Immune System
IDS Intrusion Detection System
IETF Internet Engineering Task Force
IP Internet Protocol
IPS Intrusion Prevention System
Jist Java In Simulation Time
LCP Linear Complementarity Problem
LH Lemke Howson
LP Linear Program

MAC Medium Access Control
MANET Mobile Ad-Hoc Network
NE Nash Equillibrium
P2P Peer-to-peer
PAMP Pathogen Associated Molecular Pattern
PD Prisoners Dilemma
PDR Packet Delivery Ratio
PPAD Polynomial Parity Arguments on Directed graphs
RERR Route Error
RFC Request For Comments
RNG Random Number Generator
RREP Route Reply
RREQ Route Request
sIDS soft-Intrusion Detection System
SNS Self Non Self
SWANS Scalable Wireless Network Simulator
TCP Transmission Control Protocol
TFT Tit For Tat
TLR Toll Like Receptor
TTL Time-To-Live
VANET Vehicular Ad-Hoc Network
WEP Wired Equivalent Privacy
WPA Wireless Protected Access
CHAPTER 1
INTRODUCTION
A wireless peer to peer (P2P) network is a wireless network that allows members tocommunicate without requiring any existing infrastructure. Members use each other asrouters to in order to reach hosts that are not in direct communication range. The earliestsuch networks were Packet Radio networks (PRNET) (Jubin & Tornow, 1987), a projectconcerned with developing them for military applications.
The interest in wireless P2P networks has increased greatly in recent years, broughtabout by the ubiquity of mobile computing and commoditisation of wireless technologies,such as 802.11 and Bluetooth, which means that most mobile devices are now equippedwith at least one short-range wireless technology. Furthermore, with their independencefrom any form of infrastructure, P2P networks provide flexibility, which means they arewell suited to a variety of applications, from large networks covering a battlefield to smaller,spontaneous networks set up for sharing data at business meetings. Practical applicationsof P2P networks are emerging, including wireless sensor networks for use in smart home-/office environments for monitoring energy consumption, and the dissemination of safetyinformation to road users by vehicle to vehicle (V2V) or vehicle to roadside infrastructure(V2I) communications in Vehicular Networks (VANET). Wireless mesh networks have alsobeen deployed in a number of cities worldwide to provide Internet access to its citizens.
The key feature of each of these examples of P2P network is the ability to self-organise,which is fundamental for their operation and is provided by a number of decentralised ser-vices that are responsible for routing and addressing, as well as other critical services.These services are the source of much research activity and pose a large number of re-search challenges. This thesis is concerned with Mobile Ad-hoc Network (MANET)security, an active area of research that poses significant challenges since these networksrely on the co-operation of all participating nodes in order to survive.
1
1.1 The MANET security problem
MANET security is a significant problem due to the relative ease that an intruder caneavesdrop on any wireless traffic in its neighbourhood. This is in direct conflict to thesecurity attributes that are a must for most network applications: availability, confiden-tiality, integrity, authentication and non-repudiation (Zhou & Haas, 1999). Whilst accesscontrol techniques such as Wired Equivalent Privacy (WEP) or Wireless Protected Access(WPA) can prevent casual eavesdropping by outsiders, there is as much of a threat ofinsider attacks from compromised hosts. Insider attacks are a risk in hostile environmentswhere a lack of physical protection means hosts are susceptible to capture and re-purposingby the adversary. Intrusion detection can assist in identifying the sources of insider at-tacks and responding appropriately. In these security-critical applications, multiple layersof security should be employed to reduce the overall attack surface.
Typical security approaches suited for infrastructure networks such as firewalls andcentralised certification authorities (CAs) are not appropriate for MANET as they do notscale with a MANET’s dynamic membership and they present a single point of failurethat adversaries are likely to target in order to succeed in disabling the network. Thus,the services that run on ad-hoc networks should be fully distributed to promote highavailability (Zhou & Haas, 1999). Tamper-proof hardware (Buttyan & Hubaux, 2003) orthe use of a trusted platform module (TPM) (Shi & Perrig, 2004; Hao et al., 2006; Yan,2006) have been suggested as ways to prevent reprogramming or enable neighbours toverify remotely that a node has not been reprogrammed, but Intrusion Detection Systems(IDS) should always be considered as a precautionary measure in a security-critical envi-ronment. Numerous distributed approaches to the problem of insider security have beenproposed in the literature, including secure routing, (Hu et al., 2005; Sanzgiri et al., 2002a;Patwardhan et al., 2005; Acs et al., 2004) misbehaviour detection, (Huang & Lee, 2003;Mishra et al., 2004) cooperation enforcement (Buttyan & Hubaux, 2000, 2003; Michiardi& Molva, 2002; Buchegger & Le Boudec, 2002b) and the use of incentives (Buttyan &Hubaux, 2003). Such schemes employ local monitoring to confirm neighbours behave asexpected but they are limited by their failure to reason about the imperfect monitoringpossible within a radio environment that arises from unidirectional links and collisions.This often results in false detections and reduces the quality of the consequent responses,leading to retaliations to benign nodes.
1.2 Research Questions
This thesis studies the challenges of intrusion detection in imperfect wireless environments.The sources of uncertainty in wireless environments that are of direct relevance to intrusiondetection are investigated. A set of local and distributed attacks of varying subtlety is
2
implemented and run in fading environments to demonstrate the impact an imperfectwireless environment can have on detector output.
The main question posed in this thesis is if game theory and immune system inspiredapproaches can be applied to improve the quality of intrusion detection in MANET. Inparticular, we are interested in whether these techniques be used to reduce the number ofresponses toward benign nodes and improve the detection rates of subtle misbehaviour.Locally gathered information is used to build up a historical behavioural profile of neigh-bours that represents their ability to perform a given function (e.g. forwarding or routing)and is used within both approaches. Previous work in misbehaviour detection (Huang& Lee, 2003; Mishra et al., 2004) gathers local information but fails to reason about theuncertainties in this information, either because the misbehaviour is subtle, it cannot bedetected by local detection alone, or relies on detection schemes that are inherently im-perfect. Another issue this thesis addresses is if end-to-end network performance can beimproved by employing these decentralised approaches. If game theory and immune systeminspired approaches can deliver improvements in intrusion detection, can this be trans-lated into an advantage in terms of common metrics such as Packet Delivery Ratio (PDR)that benefits the community of benign (or, well behaved) nodes?
1.3 Contributions
The first contribution of this thesis is the development of a framework for simulating adiverse range of misbehaviour that targets Ad-Hoc On-Demand Distance Vector (AODV),a MANET routing protocol. Noteworthy is a number of interesting variations of theclassical black hole attack that employs route invasion techniques to make significantgains in attack efficacy for low ratios of adversaries in the network.
Next, a general, modular intrusion detection system for MANET is presented, whichprovides a framework to formulate the baseline and game theoretic inspired IDS. Thegeneric IDS presented can be extended to detect other attacks by simply adding to theset of detectors to provide continual improvements to the measure of a node’s behaviour.
A key contribution of this thesis is the development of sIDS, a game theoretic inspiredIDS that applies reasoning between the detection and response components of a typicalIDS. The additional reasoning enables the IDS to determine whether to respond giventhe evidence presented whilst being aware of the imperfections implicit in the detectionstrategies used. This approach delivers improvements in true response rates for moststudied scenarios.
The final contribution is sIDS+AIS, an extension of the game theoretic approach with anumber of immune system inspired features to initiate co-ordinated responses over multipletimescales. This improves the end-to-end performance of benign nodes whilst keeping the
3
earlier advantage of a high base response rate.
1.4 Organisation of thesis
The thesis is organised as follows:
• Chapter 2 provides a background to MANET and ad-hoc routing protocols, iden-tifying the attack surface exposed by them and motivating the need for intrusiondetection systems. It introduces the fundamental concepts of game theory and theHuman Immune System (HIS) and reviews the existing approaches to intrusion de-tection in the literature, focussing on those that apply game theory and immunesystem analogies to the area of intrusion detection.
• Chapter 3 provides the simulation methodology employed, including a brief evalua-tion and validation of Jist/SWANS versus a number of other network simulators. Italso provides the performance metrics upon which the discussion of further chaptershas been based.
• In Chapter 4, a number of attacks on ad-hoc networks are described and an adversaryframework is formulated suitable for incorporation into Jist/SWANS. A small casestudy is presented on a number of route invasion techniques that increase attackefficacy.
• In Chapter 5 a general MANET IDS is described, which forms the basis of succes-sive IDS implementations, detailing the common services and detection techniquesused to detect the attacks described in Chapter 4. This chapter also presents thetransformation of detector notifications into metrics suitable for incorporation intoa compact measure of a neighbour’s behaviour.
• Chapter 6 presents sIDS, a MANET IDS that employs game theoretic reasoningas a means to improve the response characteristics of a typical MANET IDS. Theperformance of sIDS is evaluated in simulations over a diverse range of scenariosemploying local and distributed misbehaviour.
• Chapter 7 presents sIDS+AIS, a multi-layered IDS employing both game theoreticreasoning and immune system inspired mechanisms, and evaluates its performancein the same scenarios as for sIDS.
• Finally, in Chapter 8, the thesis is concluded with a discussion of the main findingsand possible avenues for future work.
4

CHAPTER 2
LITERATURE REVIEW
2.1 Introduction
This chapter introduces the properties of MANETs and provides a detailed description ofthe operation of distributed routing protocols that run on member nodes, identifying alarge attack surface and motivating the need for intrusion detection systems (IDS) for reli-able and secure dissemination of data across the network. To help the following discussion,basic intrusion detection system terminology is introduced. Finally, current approaches tomitigate misbehaviour in MANET is reviewed, and the steps, if any, that these approachestake when reasoning and minimising uncertainties.
2.2 Background
2.2.1 Mobile Ad-Hoc networks
A Mobile Ad-Hoc Network (MANET) is a collection of wireless nodes that co-operate toform a multi-hop network in which members maintain connectivity to one another withoutthe support of infrastructure (Figure 2.1). This connectivity is maintained when nodesmove, roam in and out, or when environmental factors cause individual wireless link breaksor errors (Perkins & Bhagwat, 1994). Data flows are often routed over several hops totheir final destination (Perkins & Bhagwat, 1994; Perkins, 1997). The flexibility that amulti-hop network offers means these networks are well suited to applications that requireinstant deployment such as disaster relief and battlefield communications (Broch et al.,1998).
Ad-hoc routing protocols provide end-to-end connectivity between nodes and are com-monly implemented as a decentralised service operated by each node in the network. Theyare designed to provide best effort connectivity even in the presence of mobility and anunreliable medium with a high error rate (Royer & Toh, 1999).
5
S 2
63
D
4
5
1
Figure 2.1: A collection of nodes forming a Mobile Ad-Hoc Network(MANET). The dashed lines show connectivity to immediate neigh-bours, and the arrows show the selected path of data flow betweensource S and destination D.
2.2.2 Ad-hoc routing protocols
Ad-hoc routing protocols are often categorised as proactive, reactive or hybrid. Proactiverouting protocols (also known as table-driven) maintain a route table with entries toeach node in the network and propagate changes to topology regularly to ensure eachnode maintains a complete and consistent view of the network topology (Royer & Toh,1999), resulting in a “chatty” protocol with large routing tables. Reactive protocols (alsoknown as on-demand) create, maintain and keep in memory only those routes currentlyin use, which minimises storage and computational requirements (Abolhasan et al., 2004)but at the cost additional latency in data dissemination whilst routes are discovered.Hybrid routing protocols employ techniques from both proactive and reactive protocols.Abolhasan et al. (2004) and Perkins et al. (2001) illustrate the difference these propertiescan have on network performance over a range of topologies and traffic patterns.
Ad-Hoc On-Demand Distance Vector (AODV) (Perkins, 1997) and Dynamic SourceRouting (DSR) (Johnson &Maltz, 1996) are two common reactive ad-hoc routing protocolswhich are under consideration for ratification by the Internet Engineering Task Force(IETF).
2.2.3 Reactive ad-hoc routing protocols
Reactive routing protocols such as AODV and DSR operate by running two proceduresconcurrently: route discovery and route maintenance. A source invokes route discoverywhen it wants to send data to a destination, creating a Route Request (RREQ) that isdisseminated network-wide by neighbouring nodes. If the destination or a neighbour with
6

a valid route to the destination receives the request, a Route Reply (RREP) is sent backto the source. When the source receives the reply, a route table entry is added and datapackets for the destination are serviced and sent onwards to the appropriate next hop(Johnson & Maltz, 1996; Perkins, 1997). If the route discovery procedure times out andfails to discover a route, a suitable unreachable host message is sent to the application,and the packets for the corresponding unreachable destination are dropped.
The second procedure, route maintenance, monitors local connectivity to ensure routesare preserved by detecting link breaks between pairs of nodes (Johnson & Maltz, 1996;Perkins, 1997). Two methods are commonly employed in order to detect link breaks, whichare periodic HELLO messages or from feedback directly from the link layer. HELLO mes-sages are broadcast packets that are sent periodically to advertise a node of its presence. Ifa HELLO message is received by a neighbour, it assumes bidirectional communication tothe sender. Link layer feedback is provided by the MAC protocol after it deems a frame asundeliverable, usually if multiple retransmissions of the frame are unsuccessful. The latteris more reactive to changes in topology and introduces no further overheads (Chakeres &Belding-Royer, 2005) but it requires specific hardware and driver support. If a link breakis detected, local repair is often used as a first attempt to restore connectivity locally. Thisis where a request is sent with a small Time To Live (TTL) in order to find an alternativeneighbour and is often transparent to the source. If local repair is unsuccessful, a RouteError (RERR) is sent to the source causing it to rediscover a route to the destination.Route maintenance is also involved in removing inactive routing entries to minimise thepropagation of stale routing entries and to keep the size of routing tables down.
DSR and AODV use similar routing messages that have similar roles but there areimportant differences in the operation of each protocol. Firstly, the forwarding processis very different. DSR is a source routing protocol where the sender appends the fullpath to the destination onto the packet header that contains a list of intermediate nodesthe packet should traverse (Johnson & Maltz, 1996). Intermediate nodes forward to thenext hop by looking at the next hop entry in the path and sending the data onward.In contrast, AODV does not manipulate data packets, being a distance vector protocolbased on the Bellman-Ford routing algorithm. Instead, the next hop decision is made ateach intermediate node (Perkins et al., 2001). Secondly, DSR caches multiple routes to adestination, permitting more redundancy during data transfer over AODV, which cachesone route per destination. Lastly, DSR specifically states the use of link layer feedback(Johnson & Maltz, 1996) whilst AODV routers can be configured to send periodic HELLOmessages or can use link layer feedback.
7
D
S 1 2
63
4
5
Figure 2.2: The dissemination of a route request from S (black ar-rows). Reverse route pointers (in green) are set up as the route requestis broadcast, used when forwarding a route reply from D.
2.2.4 Ad-hoc On Demand Distance Vector (AODV)
This project employs the most recent Request For Comments (RFC) of AODV (July2003), a distance vector protocol for MANETs. In order to understand the vulnerabilitiesexposed by AODV it is critical to understand the route discovery and route maintenanceprocedures thoroughly.
2.2.4.1 Route discovery procedure
The route discovery procedure for AODV is initiated when a source broadcasts a RREQfor a destination that it does not currently have a route for. This message is consequentlybroadcast by its neighbours, and is identified by a RREQ ID and originator IP addressthat prevents re-broadcasting and mitigates the effects of broadcast storms (Ni et al.,1999), which can severely affect network performance.
As the RREQ is disseminated, each node adds a reverse route entry to the source viathe neighbour it received the RREQ as shown in Figure 2.2, used to forward the RouteReply (RREP) generated either by the destination, or intermediate node with a “freshenough” route to the destination. Each intermediate node that receives the RREP addsan entry to its routing table to the destination that is used during data forwarding. Whenthe source receives the RREP, data packets are serviced for that destination by sendingthem onto the appropriate next hop.
The routing table entry (Table 2.1) lists the destination address, the next hop address,the number of hops to the destination and a route lifetime used to ensure that inactiveroutes are removed. A destination sequence number is also maintained for each destination,used to ensure routes are “fresh” and to guarantee loop-free operation of the protocol
8

Table 2.1: Excerpt of route table for S, showing a route entry to Dvia next hop 1destination nextHop numHops destSeqNum lifetime (ms)
D 1 4 25 40002 1 2 20 8000
D
S 1 2
63
5
D
4
Figure 2.3: Route maintenance procedure. Destination D has movedout of range of node 6 and has become a neighbour of nodes 4 and 5.6 invokes local repair and discovers route to D via 5, and data takesthe new path highlighted.
(Perkins, 1997). Each node maintains their own sequence number allowing stale routinginformation to be discarded.
2.2.4.2 Route maintenance procedure
The route maintenance procedure is invoked if a node detects a link break between itselfand a next hop which is actively being used to serve a route. Link breaks can be determinedby keeping a count of broadcast messages received from a neighbour within a given timeinterval or through the use of a link layer notification (such as that provided by 802.11).
A node that detects a link break between itself and a next hop generates a RERR listingthe unreachable destination(s). This message is disseminated to appropriate neighbours,either to invoke local repair of the affected part of the route, or as a last resort to forcethe source node to re-route. Once an appropriate route is discovered, queued data packetsare once again serviced and sent via the new route (Figure 2.3).
2.2.5 MANET security challenges
MANETs expose a number of security vulnerabilities that span each layer of the protocolstack. An attacker can target the physical layer, as in the case of jamming (Xu et al.,
9
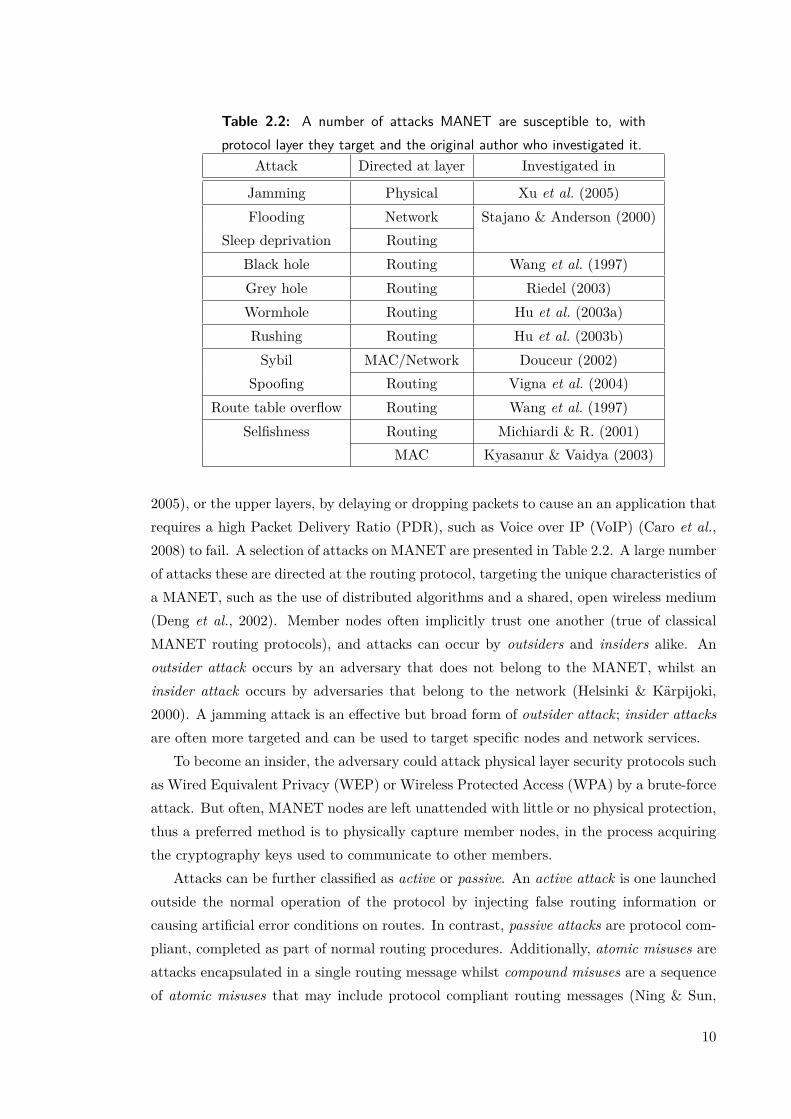
Table 2.2: A number of attacks MANET are susceptible to, withprotocol layer they target and the original author who investigated it.
Attack Directed at layer Investigated in
Jamming Physical Xu et al. (2005)Flooding Network Stajano & Anderson (2000)
Sleep deprivation RoutingBlack hole Routing Wang et al. (1997)Grey hole Routing Riedel (2003)Wormhole Routing Hu et al. (2003a)Rushing Routing Hu et al. (2003b)Sybil MAC/Network Douceur (2002)
Spoofing Routing Vigna et al. (2004)Route table overflow Routing Wang et al. (1997)
Selfishness Routing Michiardi & R. (2001)MAC Kyasanur & Vaidya (2003)
2005), or the upper layers, by delaying or dropping packets to cause an an application thatrequires a high Packet Delivery Ratio (PDR), such as Voice over IP (VoIP) (Caro et al.,2008) to fail. A selection of attacks on MANET are presented in Table 2.2. A large numberof attacks these are directed at the routing protocol, targeting the unique characteristics ofa MANET, such as the use of distributed algorithms and a shared, open wireless medium(Deng et al., 2002). Member nodes often implicitly trust one another (true of classicalMANET routing protocols), and attacks can occur by outsiders and insiders alike. Anoutsider attack occurs by an adversary that does not belong to the MANET, whilst aninsider attack occurs by adversaries that belong to the network (Helsinki & Kärpijoki,2000). A jamming attack is an effective but broad form of outsider attack; insider attacksare often more targeted and can be used to target specific nodes and network services.
To become an insider, the adversary could attack physical layer security protocols suchas Wired Equivalent Privacy (WEP) or Wireless Protected Access (WPA) by a brute-forceattack. But often, MANET nodes are left unattended with little or no physical protection,thus a preferred method is to physically capture member nodes, in the process acquiringthe cryptography keys used to communicate to other members.
Attacks can be further classified as active or passive. An active attack is one launchedoutside the normal operation of the protocol by injecting false routing information orcausing artificial error conditions on routes. In contrast, passive attacks are protocol com-pliant, completed as part of normal routing procedures. Additionally, atomic misuses areattacks encapsulated in a single routing message whilst compound misuses are a sequenceof atomic misuses that may include protocol compliant routing messages (Ning & Sun,
10
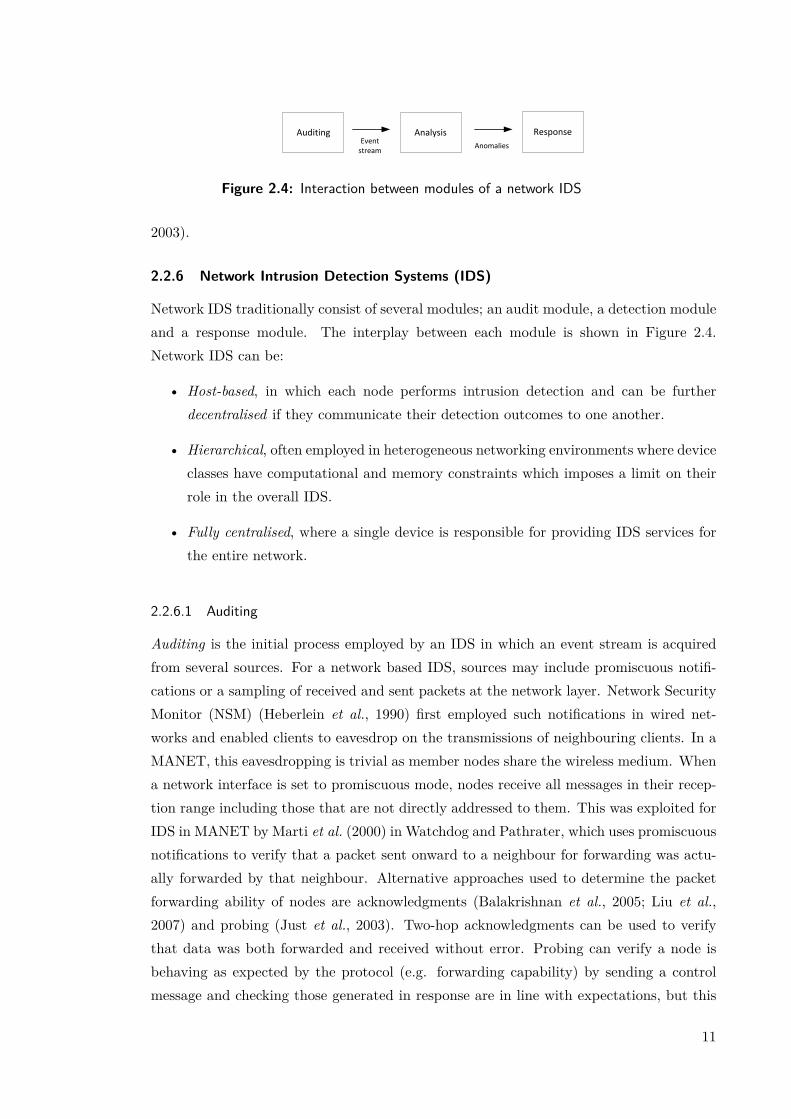
Auditing Analysis ResponseEvent
streamAnomalies
Figure 2.4: Interaction between modules of a network IDS
2003).
2.2.6 Network Intrusion Detection Systems (IDS)
Network IDS traditionally consist of several modules; an audit module, a detection moduleand a response module. The interplay between each module is shown in Figure 2.4.Network IDS can be:
• Host-based, in which each node performs intrusion detection and can be furtherdecentralised if they communicate their detection outcomes to one another.
• Hierarchical, often employed in heterogeneous networking environments where deviceclasses have computational and memory constraints which imposes a limit on theirrole in the overall IDS.
• Fully centralised, where a single device is responsible for providing IDS services forthe entire network.
2.2.6.1 Auditing
Auditing is the initial process employed by an IDS in which an event stream is acquiredfrom several sources. For a network based IDS, sources may include promiscuous notifi-cations or a sampling of received and sent packets at the network layer. Network SecurityMonitor (NSM) (Heberlein et al., 1990) first employed such notifications in wired net-works and enabled clients to eavesdrop on the transmissions of neighbouring clients. In aMANET, this eavesdropping is trivial as member nodes share the wireless medium. Whena network interface is set to promiscuous mode, nodes receive all messages in their recep-tion range including those that are not directly addressed to them. This was exploited forIDS in MANET by Marti et al. (2000) in Watchdog and Pathrater, which uses promiscuousnotifications to verify that a packet sent onward to a neighbour for forwarding was actu-ally forwarded by that neighbour. Alternative approaches used to determine the packetforwarding ability of nodes are acknowledgments (Balakrishnan et al., 2005; Liu et al.,2007) and probing (Just et al., 2003). Two-hop acknowledgments can be used to verifythat data was both forwarded and received without error. Probing can verify a node isbehaving as expected by the protocol (e.g. forwarding capability) by sending a controlmessage and checking those generated in response are in line with expectations, but this
11
approach assumes the target node should not be able to discriminate between a normalcontrol message and a probing control message. In both cases, intrusion events can onlybe generated from those neighbours the monitoring node currently has a relationship with(direct monitoring), and both increase the control data load leading to additional energyexpenditure.
Promiscuous notifications enable nodes to monitor the forwarding action of neighbourson flows that the monitoring node is both participating in and those it is not. In contrast,a node using an acknowledgment scheme can only monitor the flows it is participating in.Most MANET IDS including the Watchdog/Pathrater (Marti et al., 2000) use eavesdrop-ping as the basis for collecting audit data (Paul & Westhoff, 2002).
2.2.6.2 Analysis
Analysis is the process of detecting intrusions in audit data by the use of misuse detectors,anomaly detectors, or a combination of both. Misuse detectors use prior knowledge ofknown attack signatures to construct a finite set of rules, which are added to a rule base.Audit data is searched for signatures that correspond to one or more of these rules, anda match confirms an attack is in progress. Well defined misuse detectors are extremelyaccurate and are characterised by having a low false positive rate, but the rules are hard-coded and requires the IDS is constantly updated to deal with emerging threats. Asimple misuse detector for a MANET could capture protocol violations, for example if anode originates an abnormal number of route requests in a given interval. Finite StateMachines (FSMs) and Coloured Petri Nets are examples of a misuse detection IDS usedwithin MANETs.
Anomaly detection uses statistical approaches to detect attacks and detectors are typ-ically trained offline on audit data that corresponds to a normal profile. Once online, anydeviation from the normal profile is then flagged as an anomaly. Anomaly detectors aremore flexible than their misuse counterparts and can detect previously unknown attacks(Kemmerer & Vigna, 2002), but they generate a significant number of false detectionsdepending on the specificity of the detectors and how representative the training set is ofnormalcy. Cross-Feature Analysis (Huang et al., 2003), Genetic Algorithms (GA) (Sun-dararajan & Shanmugam, 2009), Neural Networks (Abraham et al., 2007) and ArtificialImmune Systems (AIS) (§2.4) are examples of anomaly detection schemes employed inMANETs.
2.2.6.3 Response
A response is the final action an IDS performs. Typical responses employed by MANETIDS may include elevating a suspicion level, disseminating evidence to a selection of trustedneighbours, or co-ordinating a response to isolate the suspect. Responses can occur locally,
12

or over an extended area of the network. Majority voting techniques (Zhang & Lee, 2000;Paul & Westhoff, 2002) may be used to aggregate intrusion outcomes over an extendednetwork area where there is uncertainty about whether a particular node is intrudingbased solely on local detection. The technique is susceptible to leading if the majorityof reporting nodes are co-ordinated adversaries, possibly causing responses being takenagainst benign nodes.
2.3 Current approaches to providing security assurances in MANET
Table 2.2 showed a cross section of the attacks MANET are susceptible to. These haveresulted in a corresponding large number of approaches that detect, mitigate or preventsuch attacks from adversaries in MANET. These approaches are often categorised by fivecommon security metrics; availability, authentication, integrity, confidentiality and non-repudiation and have been redefined by Zhou & Haas (1999) in the context of ad-hocnetworks.
Typical fully centralised network IPS and IDS schemes for wired networks do notscale but instead introduce further weaknesses if directly applied to a MANET (Denget al., 2002). Centralised security services present a single point of failure (Dhillon et al.,2004) likely to be targeted by the adversary. If the service is critical to the functioningof the network, say by authenticating nodes or certifying data and control packets, thendisabling the security service will disable network communications entirely. If the serviceis distributed between a number of nodes the security mechanism is more resilient andthe adversary has to target multiple agents, but distributing a security protocol is oftenchallenging; it may require nodes to be synchronised and share state by passing intrusionreports, which itself could be targeted by the adversary. To fully meet the security needsof a MANET, a defence-in-depth solution (Figure 2.5) spanning multiple layers of theMANET protocol stack is often required (Yang et al., 2004). A number of existing MANETsecurity schemes which could be part of this defence-in-depth solution are now reviewed,focusing on the network and routing layer.
2.3.1 Secure Routing
Secure routing protocols such as aridane (Hu et al., 2005), ARAN (Sanzgiri et al., 2002b,a),SecAODV (Patwardhan et al., 2005) and endairA (Acs et al., 2004) are proactive MANETsecurity schemes that secure the ad-hoc network from manipulation, replay or eavesdrop-ping of routing messages by unauthorised nodes. Secure routing protocols employ a num-ber of techniques to achieve this including hop-by-hop authentication of routing messages,Certification Authorities (CAs), frequent key revocation and encryption of routing packetheaders, to assure authentication, integrity and non-repudiation of the routing protocol.
13

Device
Physical / MAC layer
Routing
Network
Trusted platform
module (TPM)
Tamper proof hardware
MAC filteringAccess control (WPA/WEP/
RADIUS)
Secure Routing (S-AODV,
endairA ...)
Spread spectrum
Incentive Schemes(Reputation, Virtual Currency)Intrusion
Detection(Misbehaviour detection and
reaction)
Secure MAC
Figure 2.5: Defence-in-depth for MANET.
A CA may introduce a weak point in the ad-hoc network unless it is distributed as inthe case of threshold cryptography (Luo et al., 2005; Basile et al., 2005), which allows thenetwork to tolerate partial signatures originating from compromised CA nodes. However,like majority voting, there is a limit on the number of adversaries a threshold cryptographyCA tolerates before the number of partial signatures generated by adversaries outweighthose generated by honest nodes.
2.3.2 Incentive Schemes
A common approach to promote availability is to use incentives to promote co-operationin MANETs. Incentives are artificial mechanisms that reward a node for co-operatingwith the protocol to stimulate the desired behaviour. They are typically used in environ-ments where members belong to a number of competing authorities, each with conflictingobjectives, or where each node is resource constrained, such as in energy or availablethroughput. Virtual currency and reputation schemes are commonly employed to stimu-late co-operation when routing.
Virtual currency schemes (Buttyan & Hubaux, 2000, 2003) provide economic incentivesto stimulate cooperation during MANET routing. Nodes maintain a budget that is usedwhen they send their own packets and is replenished when they service data for others,hence rewarding contributing nodes. These schemes require each node be equipped withtamper-proof hardware to store the budget (Carruthers & Nikolaidis, 2005). Furthermore,routing messages are used directly when decrementing and replenishing a nodes budget,which could be manipulated by the intelligent adversary. The maximum budget a node canattain is based on the number of routes it serves, thus the schemes favour well-connectednodes.
For malicious adversaries, reputation schemes such as CORE (Michiardi & Molva,2002) and CONFIDANT (Buchegger & Le Boudec, 2002b) can be employed. In theseschemes, each node assigns a reputation to each neighbour it has communicated with. Thisreputation depends on observations made locally through the use of eavesdropping and
14
in some cases, second-hand reports acquired from trusted neighbours. Reputation can beused to identify trustworthy neighbours to send data onward, or to make a decision whetherto carry a neighbour’s traffic. Neighbours with consistently low reputation are excludedfrom the network, which lessens the impact of the misbehaviour and should motivate theadversary to behave. CORE defines functional reputation, which allows a node to identifythose neighbours with the highest reputation for a given network function, for example,packet forwarding. CORE allows excluded nodes (as a result of prior misbehaviour) to begradually reintroduced should they be cooperative over a sustained period of time. NeitherCORE or CONFIDANT studies the effect of imperfect observations on the computationof reputation and its effect on the overall fairness of the security protocol.
2.3.3 Watchdog/Pathrater
Watchdog/Pathrater (Marti et al., 2000) is a host-based IDS which promotes networkavailability by allowing member nodes to verify the packet forwarding behaviour of neigh-bours by the use of promiscuous notifications. Each node keeps a rating per observedneighbour, which is increased if the chosen neighbour forwards data when it is asked toand the observing node receives a notification and is reduced otherwise. The Pathratercomponent uses these ratings to determine “stable” routes, preferring nodes with a higherrating. Marti et al. (2000) identify that collisions and asymmetric links may cause missedobservations and corresponding false detections but in their scenario it seems to have min-imal impact on network throughput. Pathrater does not exclude nodes with consistentlylow ratings from using the network and is not appropriate for providing incentives forselfish nodes (Buchegger & Le Boudec, 2005).
2.3.4 Finite State Machines (FSMs)
AODVSTAT (Vigna et al., 2004) is a host-based IDS that ensures availability and integrityin MANET. Each node runs STAT (Vigna et al., 2003), a framework that allows themodelling of attack scenarios and is preloaded with FSMs designed for the detection ofmisbehaviour in MANET. Each FSM detects a single type of attack, corresponding to aform of misuse detection. The FSMs transition from an initial idle state to a number ofintermediate states which represent a snapshot of the security state, based on input auditdata from promiscuous monitoring. Each FSM has a final ATTK state which signals analert to invoke an appropriate response.
15
2.4 Artificial Immune Systems
2.4.1 Background
Artificial immune systems (AIS) are an Artificial Intelligence (AI) paradigm that includesGenetic Algorithms (GAs) and Neural Networks that are inspired by biological models.Specifically, AIS are inspired by the processes and interactions between the various cells ofthe immune system. The Human Immune System (HIS) is a multi-faceted, multi-layeredintrusion prevention and intrusion detection system with three main lines of defence.The first is the epithelial surfaces (skin and mucosal linings) and the bodily fluids such asstomach acid, which provide perimeter security that prevent most pathogens from enteringthe body (Janeway et al., 2004, p. 40). Should the pathogens pass this initial barrier,the innate, and later, the adaptive immune response takes over. The cells involved in theinnate immune response are:
• Innate leukocytes that include natural killer cells (NK cells), mast cells, eosinophilsand basophils.
• Phagocytes that include macrophages, neutrophils and dendritic cells.
These immune cells recognise pathogens through the activation of toll-like receptors (TLRs)on the immune cells surface that recognise pathogen associated molecular patterns (PAMPs),present only on pathogens (Janeway et al., 2004, p. 51). Each immune cell is equippedwith a subset of between ten and fifteen types of TLR (Janeway et al., 2004; Doan et al.,2007). The activation of one or more TLRs by a pathogen leads to the host immune celltaking one of the following immediate actions (Janeway et al., 2004):
• if the host cell is phagocytic it engulfs and digests the recognised pathogen. Dendriticcells present the antigen of a digested pathogen as part of the preparation for anadaptive immune response, if one is required.
• secrete cytokines and chemokines that have a number of effects that shape the im-mune response, from triggering inflammation to recruiting and activating neighbour-ing immune cells.
• release cytokines that directly act on the pathogen. Interferons are antiviral agentsthat prevent the spread of viruses to uninfected cells (Janeway et al., 2004, p. 87).Tumour Necrosis Factor (TNF) can cause the target cell to undergo apoptosis, or’programmed cell death’.
Another important part of the innate immune system is complement, which is a system ofplasma proteins that can mark a pathogen for destruction by phagocytes (Janeway et al.,2004, p. 55) or otherwise enhance the immune response to the pathogen.
16

Epithelial Surfaces
Innate Immune Response
Adaptive Immune
Response
Actors:
Skin, mucosal linings, stomach acid
NK-cells, mast cells, eosinophils, basophils, macrophages, neutrophils, dendritic cells, plasma
T-Lymphocytes, B-Lymphocytes, dendritic cells
Dendritic cells
Immediate
Immediate-4 days
>4 days
Timescale:
Figure 2.6: The layers of protection in the vertebrate immune system,illustrating the actors and timescales associated with each layer. Ep-ithelial surfaces provide the first line of defence. If breached, the innateimmune system is invoked immediately, whilst the adaptive immune re-sponse takes the order of a few days for effector cells to mature.
The adaptive immune response is induced when a pathogen is ingested by an immaturedendritic cell and, upon activation, presents pathogenic antigens to T-lymphocytes in anearby lymph node. These lymphocytes undergo a period of maturation called negativeselection. This period of maturation explains the lag after the original infection (Janewayet al., 2004, p. 12) before the adaptive immune response is invoked. Thus, dendritic cells,with their ability to sample the local environment and present non-self antigen to maturinglymphocytes, act at the interface of innate and adaptive immunity. This process is shownin Figure 2.6.
There are many examples in immunology literature that demonstrate the imperfectnature of the immune system and the evolution of pathogens to the threat of detection,each with shared analogues in network environments. Allergies can lead to systemic re-sponses to common, harmless, non-self antigens that emerge as conditions such as asthmaor hayfever (Janeway et al., 2004). Autoimmunity, the process by which the immune sys-tem responds to host cells is rare, but can cause substantial damage to the host organism.Generally it is kept under control by a number of mechanisms, but if one or more of theseis compromised by infection, genetic defects or environmental conditions, self-reactivitycan occur. Autoimmunity is always a risk because of the subtle difference between selfand non-self (Janeway et al., 2004). Finally, pathogens have evolved ways to evade the
17

immune response or to attack immune cells directly (Chapel et al., 2006). For example,Herpes enters a state of latency and hides in sensory neurons in which it is undetectable,whilst Tuberculosis uses macrophages as its host and is immune to the bactericidal actionsof the cell.
2.4.2 AIS models
Forrest & Hofmeyr (2001) was pivotal to the development of the AIS field and artificialisednegative selection, the process by which lymphocytes mature and are checked for their auto-reactive properties. In Forrest & Hofmeyr (2001), a set of immature detectors are createdand compared to a set of triples corresponding to network connections of a normal profile.If any immature detectors match those triples they deleted and replaced with anotherin the same way a lymphocyte would be deleted from the repertoire in the body. Anysurviving detectors have a finite lifespan and are used to detect anomalies in the networktraffic, raising an alarm if found. This is typical of the traditional view of the immunesystem proposed by Janeway et al., 2004, which is that the immune system distinguishesforeign bodies (non-self) from host cells (self) by self non-self recognition (SNS).
A number of improvements to the original negative selection algorithm have beenproposed. Dasgupta & Gonzalez (2002) proposes the use of GAs or neural networks toproduce the immature detectors for providing more even coverage of self and non-selfspace, whilst Gonzalez & Dasgupta (2004) suggests the use of fuzzy detectors to provideoverlap between self and non-self and be more analogous with nature. The weaknessesof the negative selection algorithm are discussed in Aickelin et al. (2003), who highlightconcerns over the scalability of the algorithm for large detector sets, required to ensurefew holes in detector coverage and minimise false negatives.
A more recent model is the Dendritic Cell Algorithm (DCA) (Greensmith et al., 2006)inspired by the role of the dendritic cell in sampling and as a mediator of the adaptiveimmune system. In the DCA, dendritic cells are signal processing elements that takemultiple input signals in the form of safe signals, danger signals and PAMPs (Aickelin &Cayzer, 2002) and produce a single output. This output is used to activate or suppressa lymphocyte and their ability to do so is based on their maturity just like their naturalcounterparts (Janeway et al., 2004). Safe signals are defined to be an indicator of normalbehaviour, danger signals are measures which increase in response to abnormal behaviourand a PAMP is a signature of abnormal behaviour. DCA is based on earlier work whichhighlights suitable analogies from Danger Theory (DT) (Matzinger, 2002), an alternativeview on role of the immune system, which is that it is concerned with the recognition ofand response to dangerous non-self. Harmless non-self does not cause a reaction.
18

2.4.3 AIS applied to ad-hoc networks
AIS approaches to IDS in ad-hoc networks tend to use one of the above approaches at theircore. Balachandran et al. (2006) is a host-based IDS for nodes running DSR. Negativeselection is used to train a detector set within a network environment free of misbehaviour,and the surviving detector set is used within the IDS of a live network. The initial trainingconflicts with the instant deployment ideal of MANET and it is also unrealistic to assumethat the training set is completely free of all forms of misbehaviour, or that it is completelyrepresentative of normalcy. The effect of imperfectly observing the routing protocol eventsequence on the training of detectors or the effect on detection is also not considered.SASHA (Bokareva et al., 2005) also employs negative selection but uses neural networksto create the immature detector set. It is a hierarchical IDS that uses high poweredmonitoring sensors and PC class devices which collaborate to detect misbehaviour withina sensor network environment. Whilst this has the advantage of freeing sensor nodesfrom computationally demanding IDS duties, the hierarchical nature means the system ispartially centralised. The privileged links between the monitoring sensors and PCs arelikely to be the target of the more intelligent adversary.
Kim et al. (2006) presents a host-based IDS that applies the DCA (Greensmith et al.,2006) to detect the Interest Cache Poisoning Attack in sensor networks. This is an attackon the Directed Diffusion routing protocol where an adversary disrupts data paths byinjecting fake interest packets to replace entries in the interest cache of target nodes.The interest cache is similar to the routing table of typical MANET routing protocols.The signals are mapped onto appropriate observables, for example, the danger signal ismapped to the interest cache insertion rate. There is no consideration of the impact thatan imperfect observation has on the calculation of the signals nor the effect this has onthe detection statistics.
Lastly, there are hybrid approaches that employ both negative selection and analogiesfrom Danger Theory to detect misbehaviour. Sarafijanovic & Le Boudec (2005) appliessuch an approach to detect misbehaviour in MANET running DSR. Events are generatedfrom routing packets received or sent and are compressed into an event stream that lists thetype of routing packet and its direction (sent or received). This is further compressed intoa gene which corresponds to the number of times given events occur in sequence in a giveninterval, before being converted into a bit stream suitable for use in negative selection, ina format similar to Kim & Bentley (2001). The novelty is that detectors can be trainedduring MANET runtime and a virtual thymus allows the self set (a representation of thedesired DSR behaviour) to change over time. A signal corresponding to packet losses isused to suppress or activate an individual response but as stated earlier, packet lossesmay arise from a number of network conditions that are not the result of misbehaviour(§2.2.6.1).
19

2.4.4 Discussion
The immune system is a multi-layered approach to security and incorporates a numberof effective measures to eradicate infection; from physical barriers to innate and adaptiveimmunity. The autonomy of immune cells and co-ordination of a response through chem-ical signals provide much inspiration for a MANET IDS. Of course, the immune systemis not subject to the same limitations as MANET nodes but nevertheless the high levelfeatures and processes are suitable for application to a MANET IDS.
2.5 Game Theory
2.5.1 Background
The field of game theory is considered to have begun in the 1940s with the publicationof The Theory of Games and Economic Behaviour (Von Neumann & Morgenstern, 1970).This provided the mathematical basis for a diverse range of economics publications tofollow that provided tools to construct and model numerous scenarios to study the inter-actions between a number of conflicting players (or agents), termed non-cooperative gametheory.
In game theory, each player has a number of actions and a utility function whichdetermines their preference for a given outcome. Through the application of solutionconcepts it can be determined what strategies players are likely to adopt in the game. Themost widely used solution concept is the Nash Equilibrium (NE) (Nash, 1950). If eachplayer plays to maximise his own payoffs then the player is rational.
The main primitive modelled in algorithmic game theory is the game, G, which definesthe players, utility functions and set of actions for each player. A game can be repre-sented in two forms. The first is a game in normal form and is commonly used whereplayers choose actions simultaneously, or, alternatively, where players do not observe themoves made by the other players (Rasmusen, 2001). Such a game is represented as ann-dimensional matrix, where n corresponds to the number of players. Table 2.3 illustratesthe normal form of a two-player Prisoners Dilemma, a classical and well-studied game ingame theoretic literature.
Table 2.3: An illustration of a normal form game: The PrisonersDilemma.
ColumnDeny Confess
Row Deny -1,-1 -10,0Confess 0,-10 -8,-8
20

Formally, an n-person normal-form game is a tuple G = (N,A, u) (Shoham & Leyton-Brown, 2009) where:
• N is the set of n players
• A = A1 × ...× An, where Ai is a finite set of actions available to player i, and eachvector a = (a1, ..., an) ∈ A is a strategy profile.
• u = (u1, ..., un) where ui : A 7→ < is a real-valued utility (or payoff) function forplayer i.
The one-shot Prisoners Dilemma (PD) bears some interesting properties; immediatelyevident is that the equilibrium outcome (Confess, Confess) may initially be seen to bean undesirable one, as it is intuitively worse for both players than (Deny,Deny). Byenumerating the process of finding the dominant-strategy equilibrium to find the players’best responses we find there is in fact no better outcome. If Column were to chooseDeny then the best response, leading to the greatest payoff for Row, would be to chooseConfess, as 0 is greater than -1. Knowing this, Column, given Row’s choice of Confessyields a choice of -10 for Deny and -8 for Confess, so it also chooses Confess. This leadsto the equilibrium outcome (also a Nash Equilibrium) of (Confess, Confess).
A game can also be represented in extensive form, similar to a game tree. Each nodeon the tree represents a decision to be made by one of the players and the edges fromthat node represent the action set available to the player at that node. As the gameprogresses, signals may be revealed that are observed by the opposing players. The leafnodes represent outcomes to which players are awarded payoffs. In an extensive form, aplayer’s strategy requires a decision at each of his choice nodes, regardless of whether ornot it is possible to reach that node during the game (Shoham & Leyton-Brown, 2009).
Formally, an n-person extensive-form game is the tuple G = (N,A,H,Z, χ, ρ, σ, u)(Shoham & Leyton-Brown, 2009) where:
• N is the set of players
• A is the set of actions
• H is the set of nonterminal choice nodes
• Z is a set of terminal nodes, disjoint from H
• χ : H 7→ 2A is the action function, which assigns to each choice node a set of possibleactions
• ρ : H 7→ N is the player function, which assigns to each non-terminal node a playeri ∈ N who chooses an action at that node
21

• σ : H × A 7→ H ∪ Z is the successor function, which maps a choice node and anaction to a new choice node or terminal node
• u = (u1, ..., un), where ui : Z 7→ R is a real-valued utility function for player i on theterminal nodes Z
A number of solution concepts exist that determine appropriate strategy profiles for thegame and describe how it should be played. Basic solution concepts include Minimax(Von Neumann, 1928) or dominant strategy equilibria, which are straightforward to com-pute but only produce a solution for a subset of game types. For example, minimax onlyapplies to zero-sum games (games whose payoffs add up to zero in each strategy combi-nation) that are not typically found in realistic applications (Rasmusen, 2001). A strategyprofile is the set of strategies for each player of the game, i.e. S = s∗i , ...., s
∗N , and may be
in terms of pure or mixed strategies. A pure strategy states that a player should play thegiven strategy with certainty, whilst a mixed strategy states the mixing probabilities thatplayers should play their pure strategies by. A strategy for player i, si, is a rule whichtells the player which action to choose at which each of his moves in the game.
Nash Equilibrium is a robust and widespread solution concept, and for any game atleast one exists in pure or mixed strategies (Shoham & Leyton-Brown, 2009). NE teststhat a player’s strategy si is a best response to the other player’s strategies si−1. If a playercannot benefit by changing his or her strategy whilst the strategies of other players are fixedthen the proposed strategy profile s∗ = (s∗i ...s∗i−1) is a NE. This may be Pareto sub-optimalin that there may exist a profile where both players can do better; such a strategy profileis Pareto optimal. In the Prisoners Dilemma, the resulting NE (Confess, Confess) is notPareto optimal, but the Pareto optimal strategy profile (Deny,Deny) is in incompatiblewith the NE; hence players are likely to deviate away from the Pareto optimal profile andtoward the NE. Incentives or an uncertainty over when interactions will terminate canaid to curtail deviation and promote the desired behaviour. If multiple NE exist, Paretooptimality can be used as an equilibrium refinement to remove less desirable equilibria.
2.5.2 Game Types
Several game types exist which allow realistic scenarios to be captured in a game theoreticsetting. Repeated games model frequent interactions or relationships between players overtime and are represented as a given game being played multiple times (or in multiple stages)by the same set of players. Players observe the outcome of the game in the previous stages,which is stored in their history profile and is used to compute their strategy profile in thecurrent stage. A player has infinite horizon if they can recall the history of all prior stages,but if this is bounded, the player has finite horizon.
A game can be repeated finitely or infinitely. Infinitely repeated games can be used
22
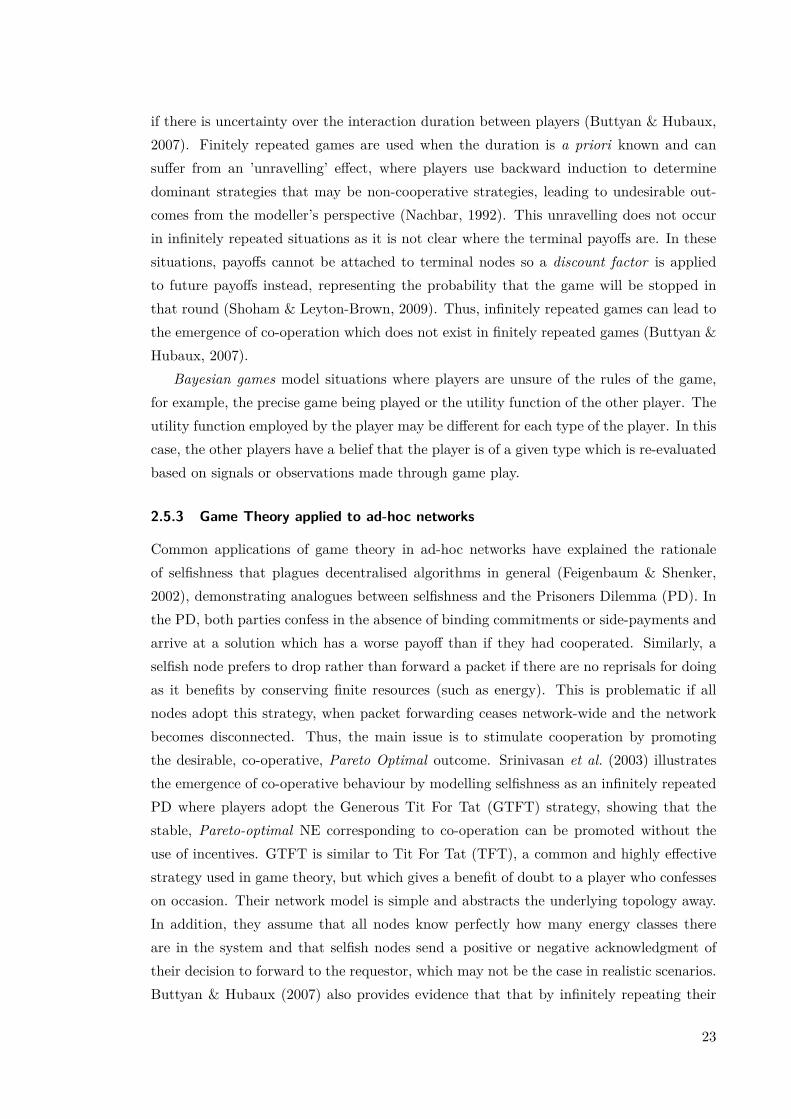
if there is uncertainty over the interaction duration between players (Buttyan & Hubaux,2007). Finitely repeated games are used when the duration is a priori known and cansuffer from an ’unravelling’ effect, where players use backward induction to determinedominant strategies that may be non-cooperative strategies, leading to undesirable out-comes from the modeller’s perspective (Nachbar, 1992). This unravelling does not occurin infinitely repeated situations as it is not clear where the terminal payoffs are. In thesesituations, payoffs cannot be attached to terminal nodes so a discount factor is appliedto future payoffs instead, representing the probability that the game will be stopped inthat round (Shoham & Leyton-Brown, 2009). Thus, infinitely repeated games can lead tothe emergence of co-operation which does not exist in finitely repeated games (Buttyan &Hubaux, 2007).
Bayesian games model situations where players are unsure of the rules of the game,for example, the precise game being played or the utility function of the other player. Theutility function employed by the player may be different for each type of the player. In thiscase, the other players have a belief that the player is of a given type which is re-evaluatedbased on signals or observations made through game play.
2.5.3 Game Theory applied to ad-hoc networks
Common applications of game theory in ad-hoc networks have explained the rationaleof selfishness that plagues decentralised algorithms in general (Feigenbaum & Shenker,2002), demonstrating analogues between selfishness and the Prisoners Dilemma (PD). Inthe PD, both parties confess in the absence of binding commitments or side-payments andarrive at a solution which has a worse payoff than if they had cooperated. Similarly, aselfish node prefers to drop rather than forward a packet if there are no reprisals for doingas it benefits by conserving finite resources (such as energy). This is problematic if allnodes adopt this strategy, when packet forwarding ceases network-wide and the networkbecomes disconnected. Thus, the main issue is to stimulate cooperation by promotingthe desirable, co-operative, Pareto Optimal outcome. Srinivasan et al. (2003) illustratesthe emergence of co-operative behaviour by modelling selfishness as an infinitely repeatedPD where players adopt the Generous Tit For Tat (GTFT) strategy, showing that thestable, Pareto-optimal NE corresponding to co-operation can be promoted without theuse of incentives. GTFT is similar to Tit For Tat (TFT), a common and highly effectivestrategy used in game theory, but which gives a benefit of doubt to a player who confesseson occasion. Their network model is simple and abstracts the underlying topology away.In addition, they assume that all nodes know perfectly how many energy classes thereare in the system and that selfish nodes send a positive or negative acknowledgment oftheir decision to forward to the requestor, which may not be the case in realistic scenarios.Buttyan & Hubaux (2007) also provides evidence that that by infinitely repeating their
23
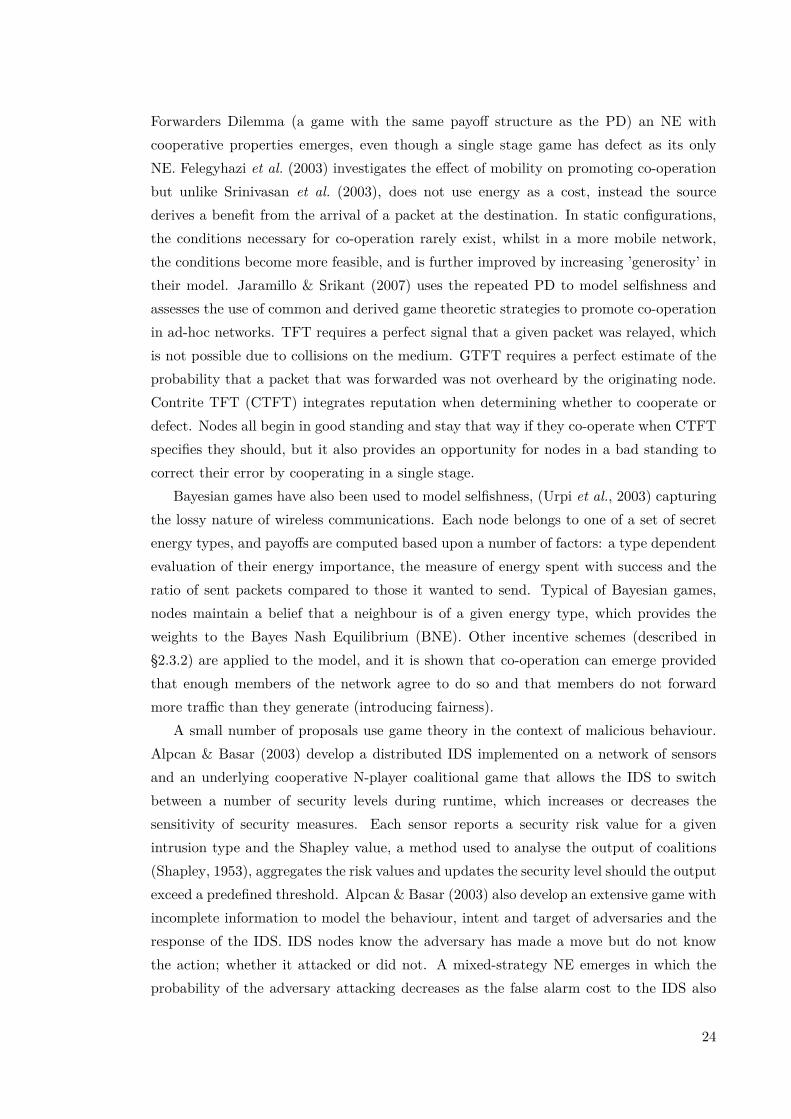
Forwarders Dilemma (a game with the same payoff structure as the PD) an NE withcooperative properties emerges, even though a single stage game has defect as its onlyNE. Felegyhazi et al. (2003) investigates the effect of mobility on promoting co-operationbut unlike Srinivasan et al. (2003), does not use energy as a cost, instead the sourcederives a benefit from the arrival of a packet at the destination. In static configurations,the conditions necessary for co-operation rarely exist, whilst in a more mobile network,the conditions become more feasible, and is further improved by increasing ’generosity’ intheir model. Jaramillo & Srikant (2007) uses the repeated PD to model selfishness andassesses the use of common and derived game theoretic strategies to promote co-operationin ad-hoc networks. TFT requires a perfect signal that a given packet was relayed, whichis not possible due to collisions on the medium. GTFT requires a perfect estimate of theprobability that a packet that was forwarded was not overheard by the originating node.Contrite TFT (CTFT) integrates reputation when determining whether to cooperate ordefect. Nodes all begin in good standing and stay that way if they co-operate when CTFTspecifies they should, but it also provides an opportunity for nodes in a bad standing tocorrect their error by cooperating in a single stage.
Bayesian games have also been used to model selfishness, (Urpi et al., 2003) capturingthe lossy nature of wireless communications. Each node belongs to one of a set of secretenergy types, and payoffs are computed based upon a number of factors: a type dependentevaluation of their energy importance, the measure of energy spent with success and theratio of sent packets compared to those it wanted to send. Typical of Bayesian games,nodes maintain a belief that a neighbour is of a given energy type, which provides theweights to the Bayes Nash Equilibrium (BNE). Other incentive schemes (described in§2.3.2) are applied to the model, and it is shown that co-operation can emerge providedthat enough members of the network agree to do so and that members do not forwardmore traffic than they generate (introducing fairness).
A small number of proposals use game theory in the context of malicious behaviour.Alpcan & Basar (2003) develop a distributed IDS implemented on a network of sensorsand an underlying cooperative N-player coalitional game that allows the IDS to switchbetween a number of security levels during runtime, which increases or decreases thesensitivity of security measures. Each sensor reports a security risk value for a givenintrusion type and the Shapley value, a method used to analyse the output of coalitions(Shapley, 1953), aggregates the risk values and updates the security level should the outputexceed a predefined threshold. Alpcan & Basar (2003) also develop an extensive game withincomplete information to model the behaviour, intent and target of adversaries and theresponse of the IDS. IDS nodes know the adversary has made a move but do not knowthe action; whether it attacked or did not. A mixed-strategy NE emerges in which theprobability of the adversary attacking decreases as the false alarm cost to the IDS also
24

decreases. How the adversary estimates the false alarm cost is uncertain, but this is anintuitive result as in the absence of a false alarm cost, the IDS given a choice of eitherdetecting or not would always detect, and the adversary would always be caught in anideal IDS.
Bayesian games are also used to model the interactions between malicious adversariesand IDS. Patcha & Park (2004) model these interactions in a repeated, zero-sum, 2-playerBayesian game based on a classic signalling game. The sender is either a regular or attackertype, and is private information. In both types the sender can attack or not attack. Thereceiver player is the IDS, has a single type and two actions: detect or miss. Beliefs aremaintained for each interacting node and are updated after each game stage. Intuitively,the beliefs should converge over the stages of the game reducing the false alarm ratesand increasing the IDS payoff. Like Alpcan & Basar (2003), if the false alarm cost issufficiently low, then the IDS will always respond. Liu et al. (2006) use the same playerdefinitions as Patcha & Park (2004), but players have additional terms representing energycost for monitoring and attacking in their payoff function. The updated beliefs switch theIDS between lightweight and heavyweight monitoring systems to conserve energy whenheavyweight monitoring is unnecessary, for example, when the majority of nodes in thenetwork are deemed to be benign.
2.5.4 Discussion
Game theory provides a mathematical framework for studying the interactions of playersunder conflict. There are an abundance of game models and types that can accuratelymodel common scenarios within MANET including repeated interactions between nodes,uncertainty about the behaviour of other players and imperfect information revelation andsignalling. Most current applications deal with the problem of stimulating co-operationin the presence of selfish agents; few deal with the use of game theory to stimulate thecorrect behaviour in the presence of malicious adversaries. Game theory and mechanismdesign offers the possibility to stimulate the desired behaviour as defined by the protocoldesigner given the right incentives, enforcement of a given strategy, or simply by providinguncertainty in the duration of the game. Game theory is complimentary to AIS: the formerprovides a framework to reason whilst the latter provides techniques to detect and respondto attacks.
2.6 Summary
This chapter reviewed a number of approaches which proactively mitigate misbehaviourin ad-hoc networks as well as those which react to the changing MANET environmentin terms of the security attributes they aim to meet (§2.3). Whilst the threats from
25
adversaries constantly evolve (Table 2.2), they arise from the presence of a selfish, maliciousor faulty adversary. At a basic level most threats severely impact the availability of thenetwork, whether indirectly by decreasing the network lifetime or by the introduction ofrouting instabilities. Many of the reviewed mechanisms (§2.3) do not consider detectionambiguities within a MANET environment through their use of promiscuous notifications,which often result in a large false detection rate. Furthermore, many do not considerappropriate responses. The two emerging fields of AIS and game theory have been chosenin this study as they possess desirable properties in a MANET environment. AIS andthe natural immune system it is based upon provides a decentralised, reactive, defence-in-depth solution to detecting and eradicating infection. It is not sufficient to rely on theAIS itself as there is the imperfect signalling to contend with in a wireless environment.Game theory is proposed as a way to deal with this, by reasoning about detection eventsduring IDS activities. Chapter 4 identifies and develops adversary models for MANET.Chapter 6 details the use of a general IDS framework to with game theoretic reasoning.Chapter 7 enhances the game theoretic reasoning with an AIS component.
26
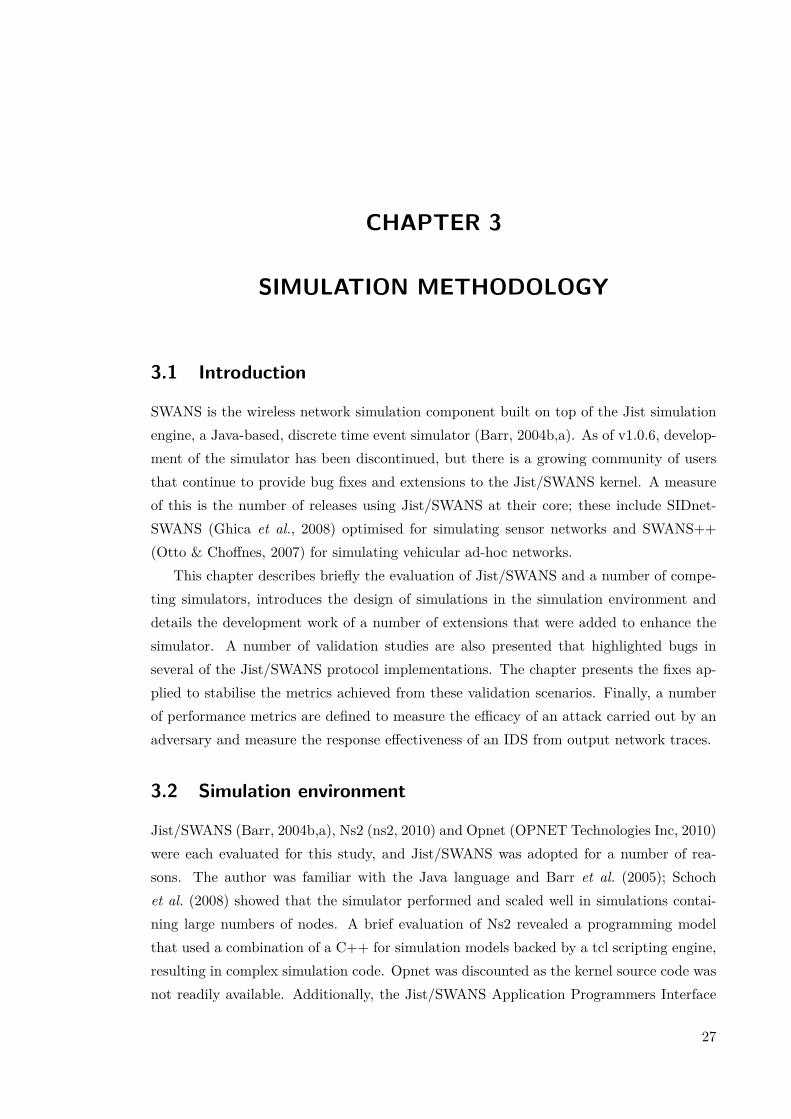
CHAPTER 3
SIMULATION METHODOLOGY
3.1 Introduction
SWANS is the wireless network simulation component built on top of the Jist simulationengine, a Java-based, discrete time event simulator (Barr, 2004b,a). As of v1.0.6, develop-ment of the simulator has been discontinued, but there is a growing community of usersthat continue to provide bug fixes and extensions to the Jist/SWANS kernel. A measureof this is the number of releases using Jist/SWANS at their core; these include SIDnet-SWANS (Ghica et al., 2008) optimised for simulating sensor networks and SWANS++(Otto & Choffnes, 2007) for simulating vehicular ad-hoc networks.
This chapter describes briefly the evaluation of Jist/SWANS and a number of compe-ting simulators, introduces the design of simulations in the simulation environment anddetails the development work of a number of extensions that were added to enhance thesimulator. A number of validation studies are also presented that highlighted bugs inseveral of the Jist/SWANS protocol implementations. The chapter presents the fixes ap-plied to stabilise the metrics achieved from these validation scenarios. Finally, a numberof performance metrics are defined to measure the efficacy of an attack carried out by anadversary and measure the response effectiveness of an IDS from output network traces.
3.2 Simulation environment
Jist/SWANS (Barr, 2004b,a), Ns2 (ns2, 2010) and Opnet (OPNET Technologies Inc, 2010)were each evaluated for this study, and Jist/SWANS was adopted for a number of rea-sons. The author was familiar with the Java language and Barr et al. (2005); Schochet al. (2008) showed that the simulator performed and scaled well in simulations contai-ning large numbers of nodes. A brief evaluation of Ns2 revealed a programming modelthat used a combination of a C++ for simulation models backed by a tcl scripting engine,resulting in complex simulation code. Opnet was discounted as the kernel source code wasnot readily available. Additionally, the Jist/SWANS Application Programmers Interface
27

(API) was well documented and facilitated rapid prototyping and was easy to understandas the project was organised into a set of packages which corresponded roughly to theclassical OSI model (Figure 3.1). The code pattern enforced strict simulation communi-cation patterns, for example preventing MAC frame headers being made available to thenetwork layer. It also came with a large number of radio channel models, propagationmodels, mobility models and routing protocols by default. The availability of propagationmodels was especially important to determine the effects these had on intrusion detectionperformance.
Application
Presentation
Session
Transport
Physical
Data link
Network
jist.swans.app
jist.swans.trans
jist.swans.radio
jist.swans.mac
jist.swans.net jist.swans.route
a) b)
pkiddie.app.AppUdp
pkiddie.trans.TransUdp
pkiddie.radio.RadioNoiseIndep
pkiddie.mac.Mac802_11
pkiddie.net.NetIppkiddie.route.
RouteAodv
c)
N/A
N/A
N/A
N/A
Figure 3.1: a) OSI Model, b) corresponding SWANS package struc-ture, c) Example node definition
As the project progressed, the use of Jist/SWANS presented a number of challenges.Simulated entities were buggy and incomplete, which led to poor network performanceduring initial validation studies that was not in line with expectations. In addition, se-veral vital components were lacking, including trace support and a user interface to viewthe simulation execution, necessary for an effective simulation study. Thus, a trace struc-ture was defined, file logging was implemented, and a simulation user interface developed.These extensions are presented in Appendix C for the interested reader. Also, contribu-tions from the Jist/SWANS community were applied in the course of this work, namelySchoch (2009) who provided patches to the kernel and Kliot (2009), who provided bugfixes for several protocol implementations that were used in this study.
3.3 Metrics
A number of metrics were defined for use to compare the effectiveness of the developedIDS’s. Goodput, packet delivery ratio and end-to-end delay are performance metrics andprovide an indication of the efficacy of responses invoked by the IDS. Response time andresponse rate were IDS specific metrics derived to compare the performance of individualIDS’s. Each metric was implemented as a script that post-processed the trace file generated
28

by the network simulation. These scripts can be found on the web as described in AppendixD.
3.3.1 Goodput
Goodput, G, is defined as the application layer throughput, which is the number of usefuldata bytes sent by flow source s that was received by a flow destination d, excludingany retransmissions or routing overheads. This was measured by considering only theapplication layer events for s and d within the trace file. The metric was implemented ingoodput.pl. Flow goodput is given by:
G(s, d) = bytes received(d)t(last packet sent(s))− t(first packet sent(s)) (3.1)
3.3.2 Packet Delivery Ratio
Packet Delivery Ratio, PDR, is the ratio of data packets sent by s that were received d.Like the goodput, this can be measured by considering the received and sent applicationlayer events for pairs of s and d only. The PDR for a flow is given by:
PDR(s, d) = data packets received(d)data packets sent(s) (3.2)
This was implemented in packetstats.pl, which additionally outputted losses from allpossible sources, including queue, mac, route, ttl, misbehaviour or ids.
3.3.3 Average end-to-end delay
End to end delay for a packet p, τp, is defined as the interval between an application layerpacket p being sent by s and received by d’s application layer, and is given by:
τp(s, d) = tp(send(s))− tp(receive(d)) (3.3)
This metric was implemented in delay.pl.
3.3.4 Control Overheads
Control overheads are computed as the ratio of routing and IDS transmissions to datatransmissions in a simulation and is based upon the definition by Marti et al. (2000)where a transmission is defined as the sending or forwarding of a packet. Broadcasts (e.g.route requests) are counted as a single transmission. This measure was used instead ofnormalised routing load (NRL), defined to be the ratio of the sum of transmitted controlmessages to the sum of data packets delivered to a destination (Perkins et al., 2001),since NRL is sensitive to misbehaviour in which packets are dropped as they are forwardedtowards the destination. This metric was implemented in routingoverhead_marti.pl.
29

3.3.5 Response rate
The response rate is computed as the ratio of responses taken against IDS nodes andadversaries to the total number of responses in the simulation, and provides insight intothe ability of the IDS to discriminate between benign and malicious behaviour. Thismetric was implemented in response_count.pl.
3.3.6 Average recovery time
Recovery time measures the time difference when an active attack reduces a metric to itsminimum and the IDS restores the metric to the pre-intrusion average. To measure this,a time averaged metric was processed by peakdet (Billauer, 2011), to compute the setof maxima and minima within the time averaged data that have a given peak threshold.The recovery time is calculated from the difference of the time when the first minimummetric after misbehaviour starts was located and the time which the metric exceeds thepre-intrusion average.
In most cases, the misbehaviour results in data loss so goodput (§3.3.1) provided anappropriate metric to determine recovery time. For other cases where misbehaviour didnot adversely affect goodput, other metrics, such as intercepted bytes (implemented inwindow_intercepted_packets.pl) was used.
To determine recovery time, the Matlab function avg_recoverytime was developedand the base metric time averaged over 20 samples. The peak threshold was set to 5% ofthe pre-intrusion average metric, which resulted in good discrimination of extrema withoutbeing susceptible to noise.
3.4 Monte-Carlo framework
Network simulations are the product of a large number of random variables that result inthe topology, flow placement, traffic generation, packet and frame losses and other featuresof a simulation run. These properties fluctuate between runs, thus sampling a number ofrepeats is vital to ensure that the resulting network metrics are credible. A Monte-Carloapproach was adopted that repeated simulations for only the necessary number of timesuntil the running average of a studied metric converged to within a given threshold. InJist/SWANS, a Monte-Carlo simulation runner was developed as an intermediate layerbetween the driver and Jist/SWANS runtime, and is shown in Figure 3.2.
The runner is supplied with the chosen post-processing script (§3.3) and some conver-gence threshold. The script post-processes the trace file once the simulation has completedand produces a metric. The runner adds this to a set of samples and computes a run-ning average. If the difference between the old and new running average is less than theconvergence threshold, the simulation is terminated, else the simulation is repeated once
30

more. When the runner terminates, an average, variance and standard deviation of themetric is output. This process is illustrated in Figure 3.3. DescriptiveStatistics, partof the Commons Math Library (Apache Commons, 2010), was used to store the set ofsamples in the runner and compute the average, variance and standard deviation. Thedistribution of samples was also output as a histogram to check the resulting distributionwas unimodal and ensure the mean metric was useful as an end result of the simulation.
To further automate metric collection, the runner was developed so multiple Monte-Carlo sessions could be queued for possible combinations of variables. For example, onevariable could be a choice of router from the set {defenceless, omniscient}, whilst thesecond could be the ratio of adversaries present on the field, taking a minimum valueof 0, maximum value of 0.5 and step size of 0.1. The Monte-Carlo runner enumeratesthrough all the possible values, collecting metrics for a given simulation with the followingparameters:
• defenceless, ratio of adversaries = 0.0
• omniscient, ratio of adversaries = 0.0
• defenceless, ratio of adversaries = 0.1
• omniscient, ratio of adversaries = 0.1
• ...
In the above description, two variable definitions were demonstrated. A range variable,like the ratio of adversaries on the field, takes a minimum, maximum and step size. Achoice variable, such as the choice of router, takes a comma separated list of possiblevalues. These are illustrated in Table 3.1.
Table 3.1: Variable types supported by Runner.Type Arguments Example Notes
range type;
name;
min;
max;
step
type=range;
name=pcAdversaryNodes;
min=0.0;
max=0.6;
step=0.1
Increments min by step
each time, till max.
choice type;
name;
choices
type=choices;
name=router;
choices=aodv,
aodv-omniscient
Invokes simulation foreach of the choicesspecified in choices.
31
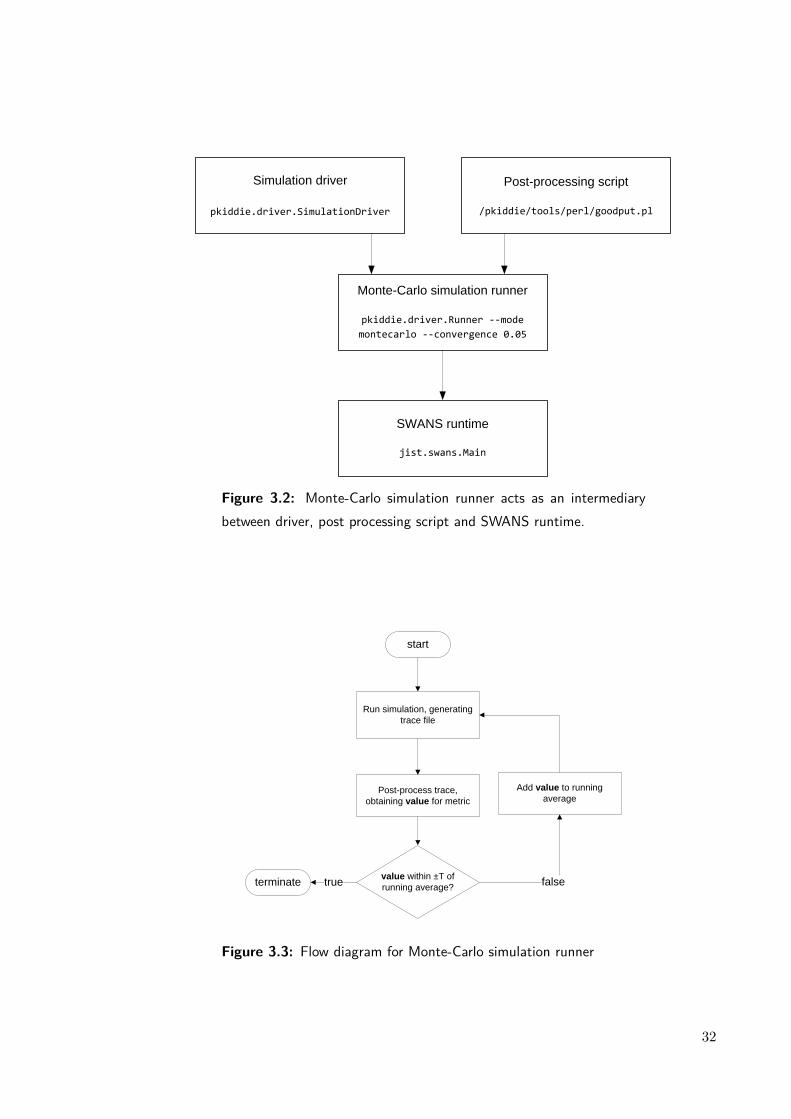
SWANS runtime
jist.swans.Main
Monte-Carlo simulation runner
pkiddie.driver.Runner --mode
montecarlo --convergence 0.05
Simulation driver
pkiddie.driver.SimulationDriver
Post-processing script
/pkiddie/tools/perl/goodput.pl
Figure 3.2: Monte-Carlo simulation runner acts as an intermediarybetween driver, post processing script and SWANS runtime.
Post-process trace,
obtaining value for metric
value within ±T of
running average?
Run simulation, generating
trace file
terminate true
start
Add value to running
average
false
Figure 3.3: Flow diagram for Monte-Carlo simulation runner
32
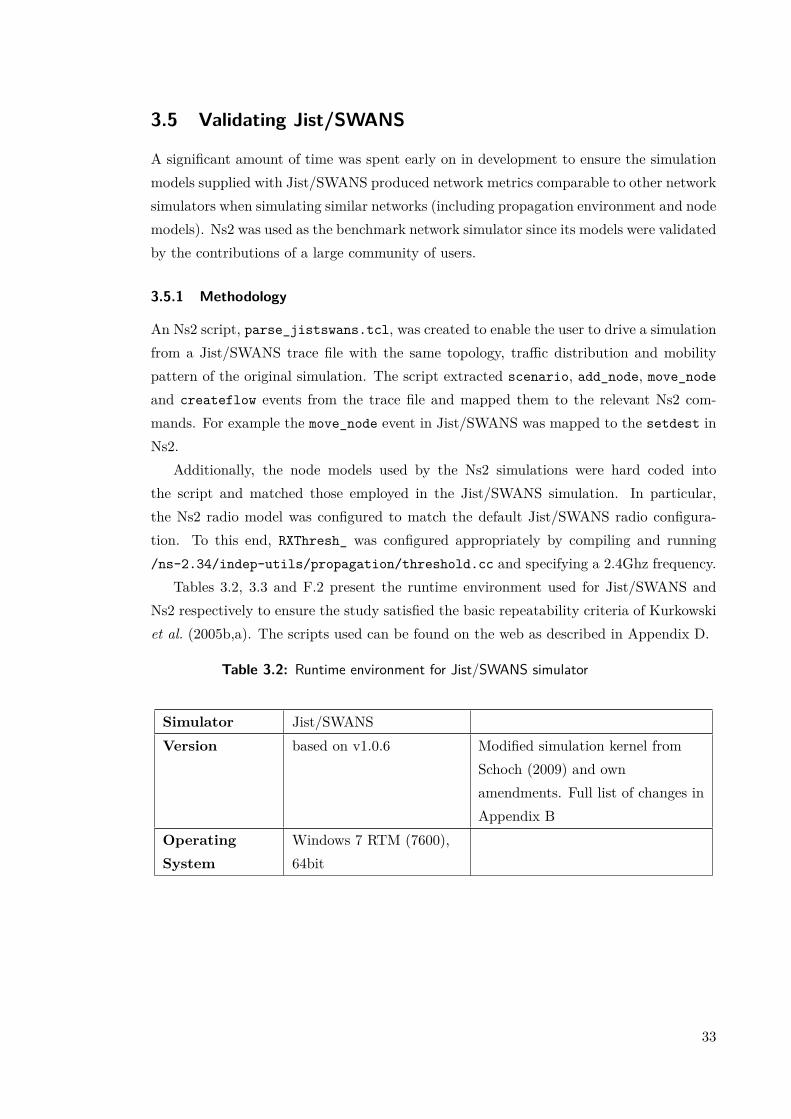
3.5 Validating Jist/SWANS
A significant amount of time was spent early on in development to ensure the simulationmodels supplied with Jist/SWANS produced network metrics comparable to other networksimulators when simulating similar networks (including propagation environment and nodemodels). Ns2 was used as the benchmark network simulator since its models were validatedby the contributions of a large community of users.
3.5.1 Methodology
An Ns2 script, parse_jistswans.tcl, was created to enable the user to drive a simulationfrom a Jist/SWANS trace file with the same topology, traffic distribution and mobilitypattern of the original simulation. The script extracted scenario, add_node, move_node
and createflow events from the trace file and mapped them to the relevant Ns2 com-mands. For example the move_node event in Jist/SWANS was mapped to the setdest inNs2.
Additionally, the node models used by the Ns2 simulations were hard coded intothe script and matched those employed in the Jist/SWANS simulation. In particular,the Ns2 radio model was configured to match the default Jist/SWANS radio configura-tion. To this end, RXThresh_ was configured appropriately by compiling and running/ns-2.34/indep-utils/propagation/threshold.cc and specifying a 2.4Ghz frequency.
Tables 3.2, 3.3 and F.2 present the runtime environment used for Jist/SWANS andNs2 respectively to ensure the study satisfied the basic repeatability criteria of Kurkowskiet al. (2005b,a). The scripts used can be found on the web as described in Appendix D.
Table 3.2: Runtime environment for Jist/SWANS simulator
Simulator Jist/SWANSVersion based on v1.0.6 Modified simulation kernel from
Schoch (2009) and ownamendments. Full list of changes inAppendix B
OperatingSystem
Windows 7 RTM (7600),64bit
33

Java RuntimeEnvironment(JRE)
1.5.0_22, 32bit Jist/SWANS currentlyincompatible with Java 1.6 andhigher due to a dependency onBytecode Engineering Library(BCEL) (Apache Jakarta Project,2010). Development on BCELstopped at Java 1.5 and is buggywhen rewriting the bytecode ofJava 1.6 class files.
RandomNumberGenerator(RNG)
java.util.Random
pseudo random numbergenerator (PRNG)
linear congruential type;Use of global simulation PRNG,random, specified injist.swans.Constants. Seed usedis overridden in simulation driver,with unique seed specified persimulation run.
Table 3.3: Runtime environment for Ns2 simulator
Simulator Ns2Version ns-allinone-v2.3.4OperatingSystem
Ubuntu 8.04 i686 (32bit) kernel: 2.6.24-23-generic
gcc 4.2.4RandomNumberGenerator(RNG)
default Ns2 RNG linear congruential type
Further differences in the defaults employed by both simulators’ models were foundand were normalised to ensure a consistency in the simulated network environments. Forexample, the AODV router in Ns2 supports both HELLO messages and link layer feed-back as methods to determine neighbour connectivity. whilst the Jist/SWANS AODVrouter, RouteAodv, supported only HELLO messages. For a fair comparison, HELLOmessages were used in Ns2 by commenting out #define AODV_LINK_LAYER_DETECTION in/ns-2.34/aodv/aodv.h and recompiling.
The Monte-Carlo framework introduced in §3.4 was applied to the Jist/SWANS scena-
34

rio, which generated a number of Jist/SWANS trace files that drove Ns2. Packet deliveryratio and end-to-end delay metrics were produced for traces produced by both simulatorssimulations and they showed that RouteAodv suffered from a poor PDR and higher end-to-end delay than the Ns2 AODV router. On closer investigation, the HELLO_INTERVALconstant in RouteAodv and used during route maintenance, was found to be set too high,resulting in a large number of undeliverable (and consequentially dropped) packets thatworsened in highly mobile scenarios. In the default implementation, it could take up to90s (HELLO_ALLOWED_LOSS*HELLO_INTERVAL s) to detect a link break. Thedefaults in both simulators are shown in Table 3.5.
Table 3.5: Default value of AODV constants in Jist/SWANS and Ns2Jist/SWANS (v1.06) Ns2 (v2.33)
AODV_TIMEOUT 30s N/AHELLO_INTERVAL 30s 1sHELLO_ALLOWED_LOSS 3 2
AODV_TIMEOUT is specific to RouteAodv and regulates calls to a timeout methodevery AODV_TIMEOUT seconds. This method performs periodic housekeeping, inclu-ding checking the reachability of neighbours. To do so, it iterates through the set of out-going nodes in the outgoingSet, checking if the number of periods a HELLO message orother broadcast message was not received has exceeded HELLO_ALLOWED_LOSS. TheAODV specification (Perkins, 1997, §10) recommends the HELLO_INTERVAL constantbe set to 1s, but in RouteAodv, this is meaningless unless AODV_TIMEOUT is alsoset to 1s. The results obtained before and after the constants were updated are shownin Figure 3.4 and illustrate the results obtained by RouteAodvMultiInterface, whereAODV_TIMEOUT and HELLO_INTERVAL was set to 1s were much more comparable.
The scenario detailed in Table F.2 was then scaled up to include more flows andhigher node densities, again driven primarily by Jist/SWANS and run in Ns2. As shownFigure 3.5, the PDR obtained in the Jist/SWANS simulation was significantly lower whilstthe end-to-end delay was higher than the equivalent Ns2 scenario, requiring a furtherinvestigation into the cause of the losses. A subtle interaction between a bug in theRadioNoiseAdditive radio model and a bug in the Mac802_11 MAC layer was identified:nodes entered backoff during congestion but never returned from this state. Schoch (2009)and Kliot (2009) had independently discovered these bugs and provided appropriate fixes,so these were added to produce a second version of RouteAodvMultiInterface resultingin more consistent network performance similar to that of Ns2 (Figure 3.5).
35
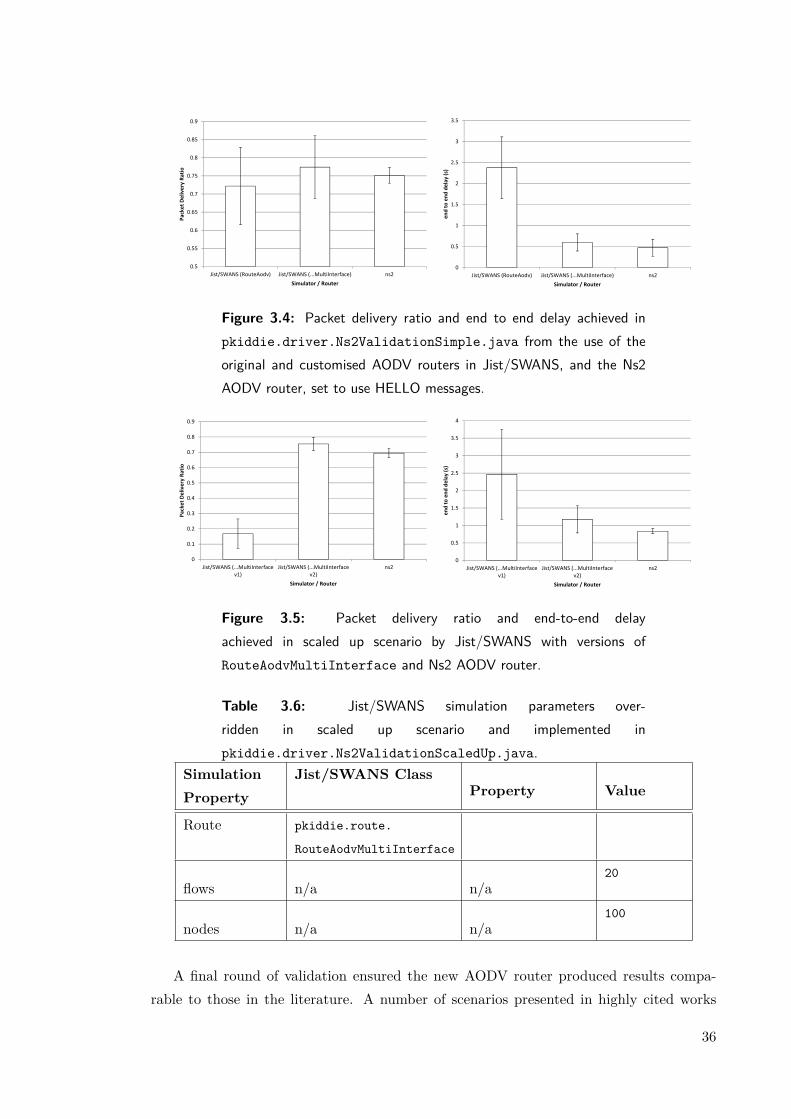
0.5
0.55
0.6
0.65
0.7
0.75
0.8
0.85
0.9
Jist/SWANS (RouteAodv) Jist/SWANS (...MultiInterface) ns2
Pa
cke
t D
eli
ve
ry R
ati
o
Simulator / Router
0
0.5
1
1.5
2
2.5
3
3.5
Jist/SWANS (RouteAodv) Jist/SWANS (...MultiInterface) ns2
en
d t
o e
nd
de
lay
(s)
Simulator / Router
Figure 3.4: Packet delivery ratio and end to end delay achieved inpkiddie.driver.Ns2ValidationSimple.java from the use of theoriginal and customised AODV routers in Jist/SWANS, and the Ns2AODV router, set to use HELLO messages.
0
0.1
0.2
0.3
0.4
0.5
0.6
0.7
0.8
0.9
Jist/SWANS (...MultiInterface
v1)
Jist/SWANS (...MultiInterface
v2)
ns2
Pa
cke
t D
eli
ve
ry R
ati
o
Simulator / Router
0
0.5
1
1.5
2
2.5
3
3.5
4
Jist/SWANS (...MultiInterface
v1)
Jist/SWANS (...MultiInterface
v2)
ns2
en
d t
o e
nd
de
lay
(s)
Simulator / Router
Figure 3.5: Packet delivery ratio and end-to-end delayachieved in scaled up scenario by Jist/SWANS with versions ofRouteAodvMultiInterface and Ns2 AODV router.
Table 3.6: Jist/SWANS simulation parameters over-ridden in scaled up scenario and implemented inpkiddie.driver.Ns2ValidationScaledUp.java.
SimulationProperty
Jist/SWANS ClassProperty Value
Route pkiddie.route.
RouteAodvMultiInterface
flows n/a n/a20
nodes n/a n/a100
A final round of validation ensured the new AODV router produced results compa-rable to those in the literature. A number of scenarios presented in highly cited works
36
were implemented in Jist/SWANS, including Perkins et al. (2001) and Takai et al. (2001)who evaluated AODV in the same scenario with employing several fading and path lossmodels. Both authors adopted Ns2 and used the default AODV router, achieving PDRsbetween 90-100% and 20-40% in each scenario respectively. The average PDRs obtainedby Jist/SWANS (shown in §F.1 and §F.2) varied between 80-100% and 15-20%, correlat-ing with these published results, which gave additional confidence in the robustness of theJist/SWANS simulation models.
3.6 Summary
In this chapter Jist/SWANS was evaluated and chosen as a simulation platform. A numberof components were added to ease simulation debugging, development and post-processingfor metric collection. Significant validation work revealed bugs and incomplete implemen-tations within several protocol layer implementations. Where possible, these bugs werefixed and the functionality added, which produced results comparable to published simula-tion studies for large scale MANETs in realistic propagation environments. An exhaustivelist of all modifications made in this chapter are provided in Appendix B. This gives confi-dence in the results obtained by Jist/SWANS for future simulations. The development ofa general framework for a MANET IDS is detailed in the next chapter.
37
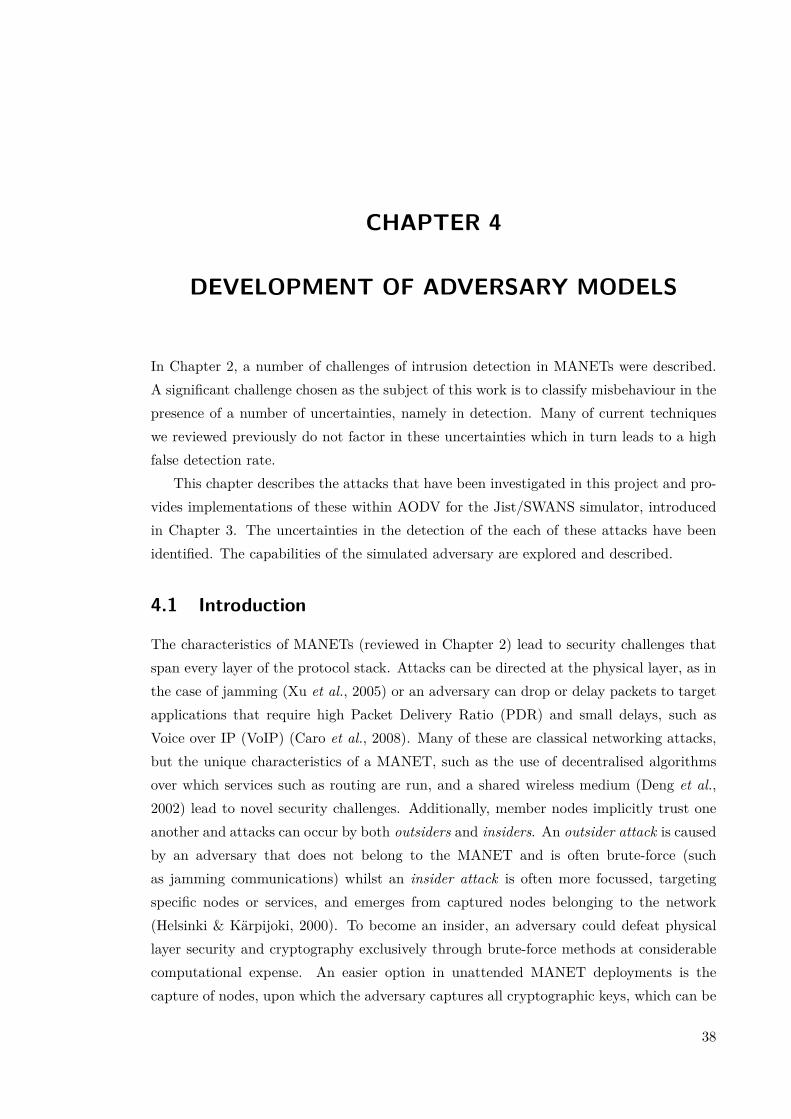
CHAPTER 4
DEVELOPMENT OF ADVERSARY MODELS
In Chapter 2, a number of challenges of intrusion detection in MANETs were described.A significant challenge chosen as the subject of this work is to classify misbehaviour in thepresence of a number of uncertainties, namely in detection. Many of current techniqueswe reviewed previously do not factor in these uncertainties which in turn leads to a highfalse detection rate.
This chapter describes the attacks that have been investigated in this project and pro-vides implementations of these within AODV for the Jist/SWANS simulator, introducedin Chapter 3. The uncertainties in the detection of the each of these attacks have beenidentified. The capabilities of the simulated adversary are explored and described.
4.1 Introduction
The characteristics of MANETs (reviewed in Chapter 2) lead to security challenges thatspan every layer of the protocol stack. Attacks can be directed at the physical layer, as inthe case of jamming (Xu et al., 2005) or an adversary can drop or delay packets to targetapplications that require high Packet Delivery Ratio (PDR) and small delays, such asVoice over IP (VoIP) (Caro et al., 2008). Many of these are classical networking attacks,but the unique characteristics of a MANET, such as the use of decentralised algorithmsover which services such as routing are run, and a shared wireless medium (Deng et al.,2002) lead to novel security challenges. Additionally, member nodes implicitly trust oneanother and attacks can occur by both outsiders and insiders. An outsider attack is causedby an adversary that does not belong to the MANET and is often brute-force (suchas jamming communications) whilst an insider attack is often more focussed, targetingspecific nodes or services, and emerges from captured nodes belonging to the network(Helsinki & Kärpijoki, 2000). To become an insider, an adversary could defeat physicallayer security and cryptography exclusively through brute-force methods at considerablecomputational expense. An easier option in unattended MANET deployments is thecapture of nodes, upon which the adversary captures all cryptographic keys, which can be
38
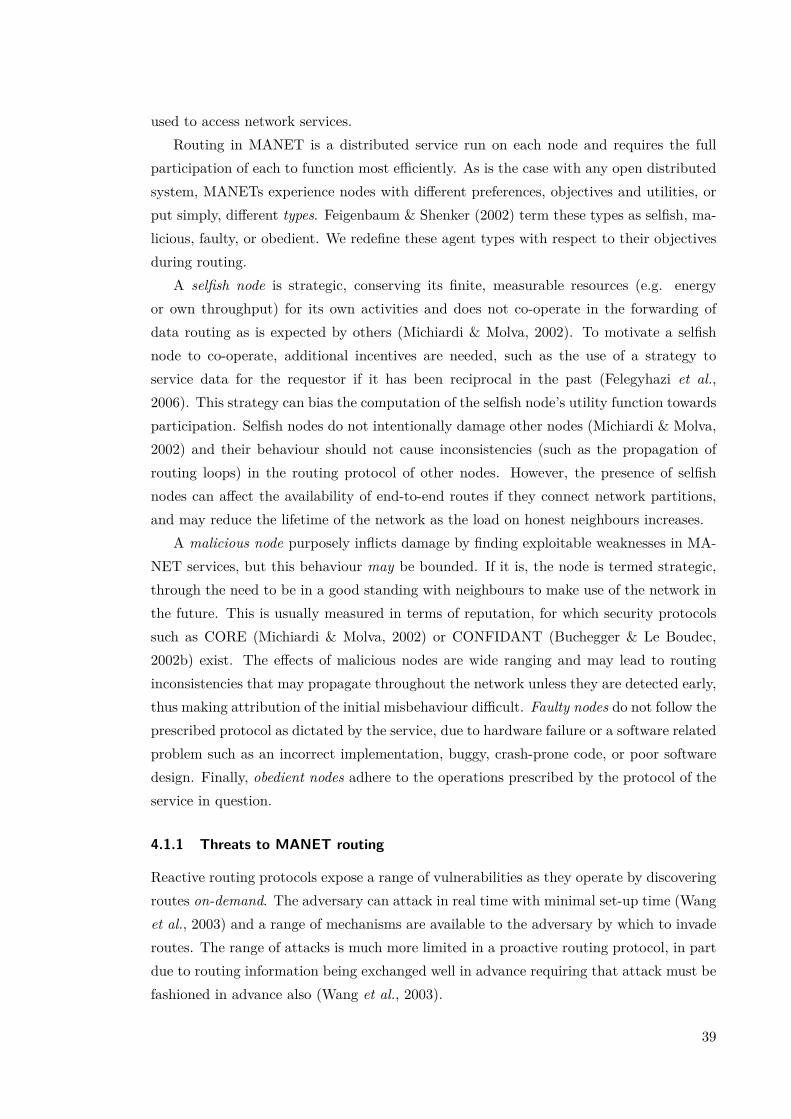
used to access network services.Routing in MANET is a distributed service run on each node and requires the full
participation of each to function most efficiently. As is the case with any open distributedsystem, MANETs experience nodes with different preferences, objectives and utilities, orput simply, different types. Feigenbaum & Shenker (2002) term these types as selfish, ma-licious, faulty, or obedient. We redefine these agent types with respect to their objectivesduring routing.
A selfish node is strategic, conserving its finite, measurable resources (e.g. energyor own throughput) for its own activities and does not co-operate in the forwarding ofdata routing as is expected by others (Michiardi & Molva, 2002). To motivate a selfishnode to co-operate, additional incentives are needed, such as the use of a strategy toservice data for the requestor if it has been reciprocal in the past (Felegyhazi et al.,2006). This strategy can bias the computation of the selfish node’s utility function towardsparticipation. Selfish nodes do not intentionally damage other nodes (Michiardi & Molva,2002) and their behaviour should not cause inconsistencies (such as the propagation ofrouting loops) in the routing protocol of other nodes. However, the presence of selfishnodes can affect the availability of end-to-end routes if they connect network partitions,and may reduce the lifetime of the network as the load on honest neighbours increases.
A malicious node purposely inflicts damage by finding exploitable weaknesses in MA-NET services, but this behaviour may be bounded. If it is, the node is termed strategic,through the need to be in a good standing with neighbours to make use of the network inthe future. This is usually measured in terms of reputation, for which security protocolssuch as CORE (Michiardi & Molva, 2002) or CONFIDANT (Buchegger & Le Boudec,2002b) exist. The effects of malicious nodes are wide ranging and may lead to routinginconsistencies that may propagate throughout the network unless they are detected early,thus making attribution of the initial misbehaviour difficult. Faulty nodes do not follow theprescribed protocol as dictated by the service, due to hardware failure or a software relatedproblem such as an incorrect implementation, buggy, crash-prone code, or poor softwaredesign. Finally, obedient nodes adhere to the operations prescribed by the protocol of theservice in question.
4.1.1 Threats to MANET routing
Reactive routing protocols expose a range of vulnerabilities as they operate by discoveringroutes on-demand. The adversary can attack in real time with minimal set-up time (Wanget al., 2003) and a range of mechanisms are available to the adversary by which to invaderoutes. The range of attacks is much more limited in a proactive routing protocol, in partdue to routing information being exchanged well in advance requiring that attack must befashioned in advance also (Wang et al., 2003).
39
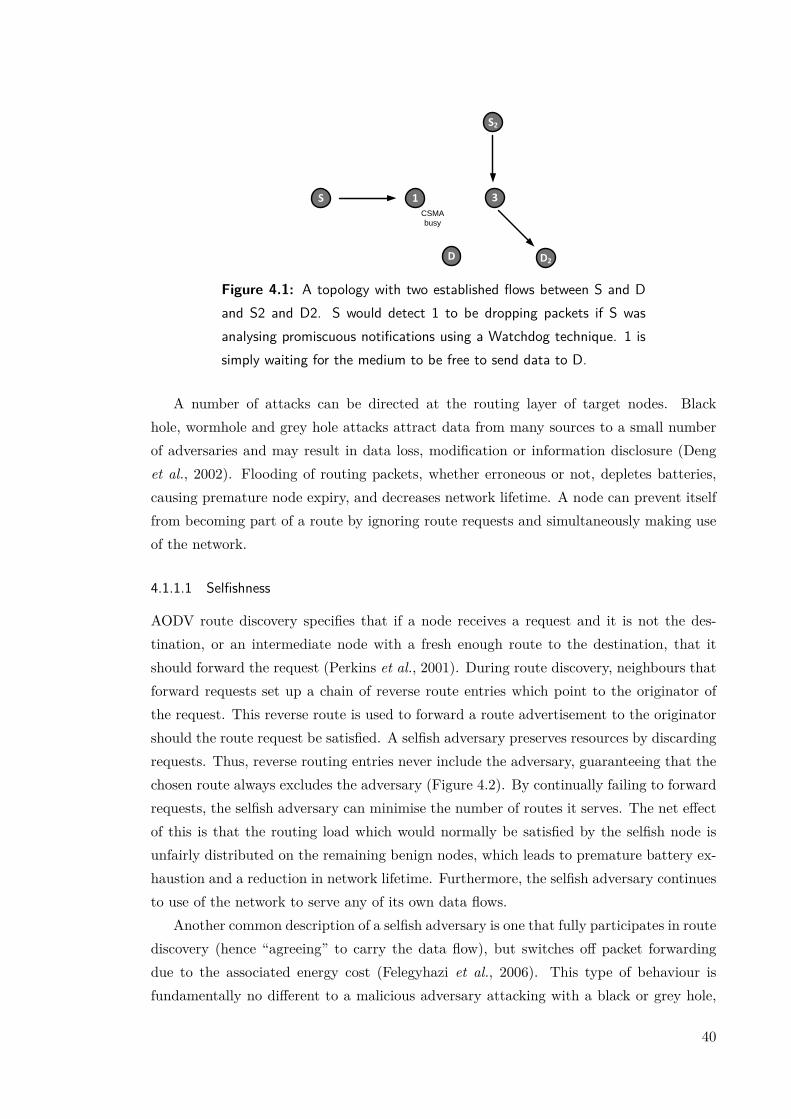
S 1
D
3
S2
D2
CSMA
busy
Figure 4.1: A topology with two established flows between S and Dand S2 and D2. S would detect 1 to be dropping packets if S wasanalysing promiscuous notifications using a Watchdog technique. 1 issimply waiting for the medium to be free to send data to D.
A number of attacks can be directed at the routing layer of target nodes. Blackhole, wormhole and grey hole attacks attract data from many sources to a small numberof adversaries and may result in data loss, modification or information disclosure (Denget al., 2002). Flooding of routing packets, whether erroneous or not, depletes batteries,causing premature node expiry, and decreases network lifetime. A node can prevent itselffrom becoming part of a route by ignoring route requests and simultaneously making useof the network.
4.1.1.1 Selfishness
AODV route discovery specifies that if a node receives a request and it is not the des-tination, or an intermediate node with a fresh enough route to the destination, that itshould forward the request (Perkins et al., 2001). During route discovery, neighbours thatforward requests set up a chain of reverse route entries which point to the originator ofthe request. This reverse route is used to forward a route advertisement to the originatorshould the route request be satisfied. A selfish adversary preserves resources by discardingrequests. Thus, reverse routing entries never include the adversary, guaranteeing that thechosen route always excludes the adversary (Figure 4.2). By continually failing to forwardrequests, the selfish adversary can minimise the number of routes it serves. The net effectof this is that the routing load which would normally be satisfied by the selfish node isunfairly distributed on the remaining benign nodes, which leads to premature battery ex-haustion and a reduction in network lifetime. Furthermore, the selfish adversary continuesto use of the network to serve any of its own data flows.
Another common description of a selfish adversary is one that fully participates in routediscovery (hence “agreeing” to carry the data flow), but switches off packet forwardingdue to the associated energy cost (Felegyhazi et al., 2006). This type of behaviour isfundamentally no different to a malicious adversary attacking with a black or grey hole,
40
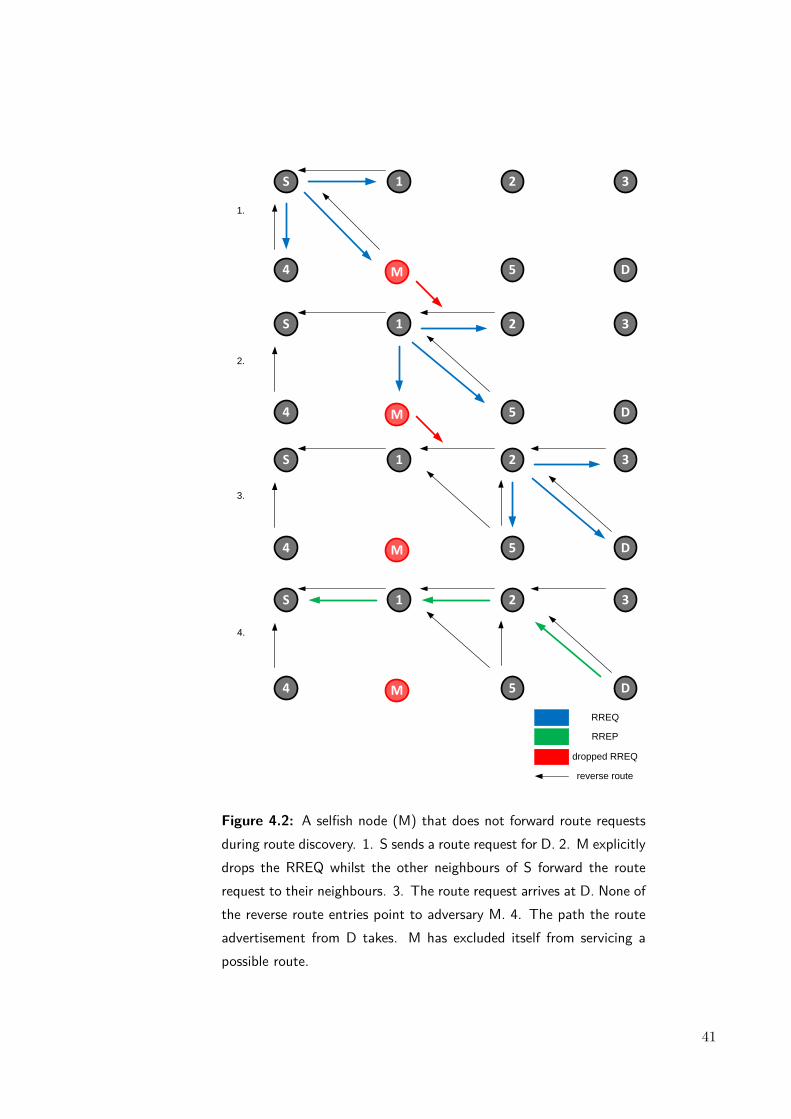
S 1 2 3
M4 5 D
S 1 2 3
M4 5 D
S 1 2 3
M4 5 D
S 1 2 3
M4 5 D
1.
2.
3.
4.
RREQ
RREP
reverse route
dropped RREQ
Figure 4.2: A selfish node (M) that does not forward route requestsduring route discovery. 1. S sends a route request for D. 2. M explicitlydrops the RREQ whilst the other neighbours of S forward the routerequest to their neighbours. 3. The route request arrives at D. None ofthe reverse route entries point to adversary M. 4. The path the routeadvertisement from D takes. M has excluded itself from servicing apossible route.
41

thus we also classify this as malicious, rather than selfish behaviour.
4.1.1.2 Black hole
The black hole is a well-studied attack on MANET routing protocols (Deng et al., 2002;Hu et al., 2005; Buchegger & Le Boudec, 2002a; Pirzada & McDonald, 2004) upon whichan adversary drops the data it is meant to forward on behalf of a neighbour (Figure 4.3).To increase its chances of success, the adversary can intercept routes by continuouslyadvertising itself as having a path to a requested destination. The adversary short-circuitsthe route table lookup and responds by issuing a fake route advertisement. The net effect isthat a significant number of flows are attracted toward the black hole adversary and PDRdrops substantially. An observation of dropped packets does not confirm the existence of ablack hole since physical layer phenomena, such as a busy channel, collisions, fading causedby receiver mobility, and path loss, may all cause frames to be dropped, also leading todropped packets.
4.1.1.3 Grey hole
The grey hole attack covers a number of variations of the black hole attack carried outprobabilistically, usually for a list of targets. The probability used to determine whetherto drop a packet or to send a fake advertisement can be unique to each target (Srinivasanet al., 2008). By targeting a subset of nodes and dropping some data, the adversaryintroduces further uncertainty than it can use to manipulate a neighbour’s perception ofit and avoid detection.
4.1.1.4 Wormholes
Wormholes require at least a pair of co-operating adversaries (Yang et al., 2004), andtargets the selection of shortest paths between source-destination pairs in distance vectorrouting (Baras et al., 2007). The first adversary receives packets at one point in thenetwork and tunnels them over a private communication channel to the second adversary,who replays them at another point in the network (Hu et al., 2002, 2005). The adversariespossess at least two network interfaces and are most successful at capturing data when thesecondary (tunnel) interface has a higher throughput and lower latency than the primarynetwork interface, and the tunnel distance is greater than the wireless transmission rangeof a single hop (Hu et al., 2003a).
Wormholes are a form of a rushing attack (Hu et al., 2003b), which targets the routediscovery process, namely the fact that the destination, or an intermediate node with aroute to the destination replies to the first route request received and discards requestswith the same RREQ ID that arrive later. More generally, this behaviour corresponds to
42
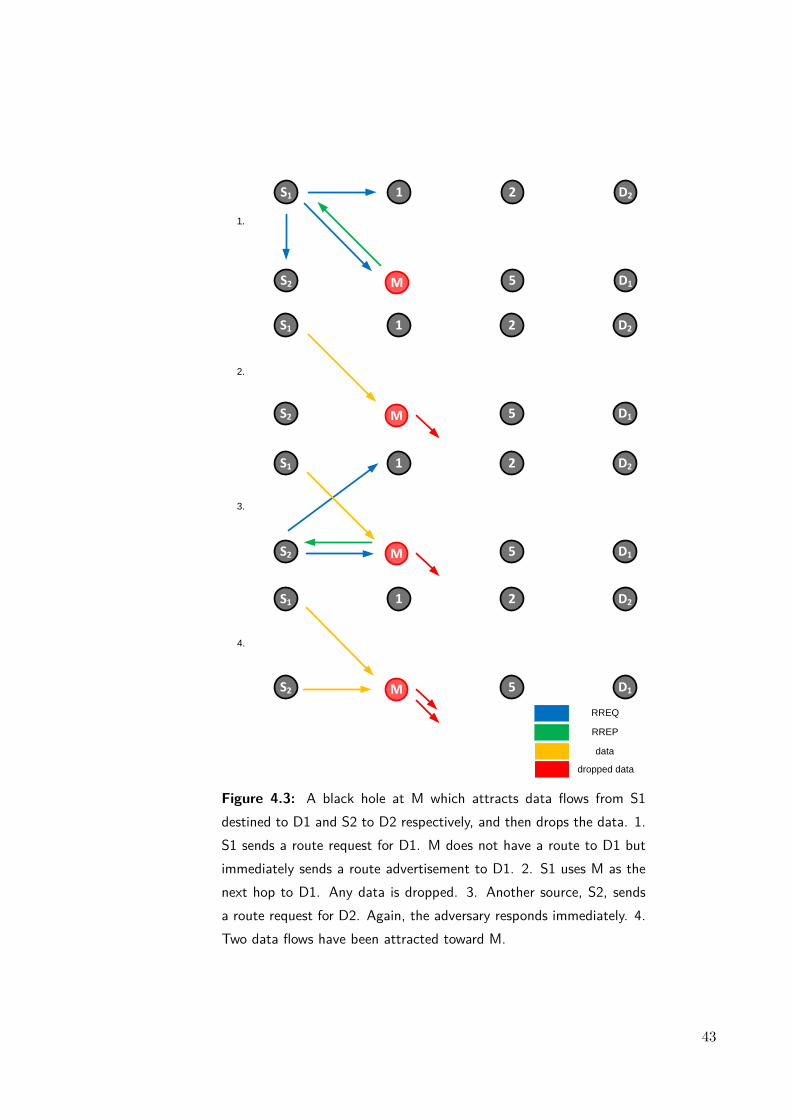
1.
2.
3.
4.
RREQ
RREP
S1 1 2 D2
MS2 5 D1
S1 1 2 D2
MS2 5 D1
S1 1 2 D2
MS2 5 D1
S1 1 2 D2
MS2 5 D1
data
dropped data
Figure 4.3: A black hole at M which attracts data flows from S1destined to D1 and S2 to D2 respectively, and then drops the data. 1.S1 sends a route request for D1. M does not have a route to D1 butimmediately sends a route advertisement to D1. 2. S1 uses M as thenext hop to D1. Any data is dropped. 3. Another source, S2, sendsa route request for D2. Again, the adversary responds immediately. 4.Two data flows have been attracted toward M.
43

a routing race condition, which arises when the routing service takes an action based onthe first instance of a given message it receives, ignoring later instances of that message(Karlof & Wagner, 2003). Hence, if the adversary tunnels route requests through a higherthroughput interface (implicitly rushing it), the adversaries are almost guaranteed to bepart of the corresponding route and the flow will use the tunnel interface (Hu et al., 2003b).
At this point the adversaries have not actually attacked the network in any way. In fact,they could be said to be offering a beneficial service as they are introducing other pathsthat data may flow, making the network more connected (Hu et al., 2003a). Unfortunately,the existence of a wormhole puts the adversaries serving it in a powerful position as theywill often be chosen to serve longer routes in the network. This position can be exploitedby discarding, modifying or delaying packets, or disclosing information from the packetswhich should otherwise be forwarded over the tunnel.
4.1.1.5 Flooding Attack
Flooding attacks comprise any attack in which the adversary consumes resources by gener-ating a number of repetitive messages and broadcasts them to its neighbours (Vigna et al.,2004). The messages can optionally be constructed in such a way that they are processedby the neighbours of the adversary, disseminating them network wide and resulting in acollapse of network throughput in the worst case. In a RREQ flood attack, a maliciousadversary continually originates route requests for a fictional destination, incrementing theRREQ ID so that neighbours process each request and forward them to their neighbours.
4.2 Development of adversary models for simulation
There are numerous published studies that identify and measure the effects of misbeha-viour within a MANET environment, some of which were reviewed in §2.3. Unfortunately,few simulation models have emerged from this research and are often designed to supporta particular scenario and/or topology. Thus, a number of general adversary models weredeveloped to support the research in this thesis. The aim of developing these models werefor each to be flexible enough to enable their application in any scenario and in any ran-domly generated topology. To develop the models, the actions necessary to successfullycarry out each attack were decomposed. Often, these actions comprised of a period of datacollection, the generation of appropriate routing packets and some confirmation of successbefore launching a successive attack. In this section, the actions required to carry out eachattack are written as pseudo code, with minimum protocol detail necessary so that we canelaborate the attack processing. These attacks were implemented in Jist/SWANS v1.0.6(Barr, 2004b,a), within RouteAodvMultiInterfaceAdversary, the adversarial router. Itis worth noting that receive in this context means the routing layer is receiving a rou-
44
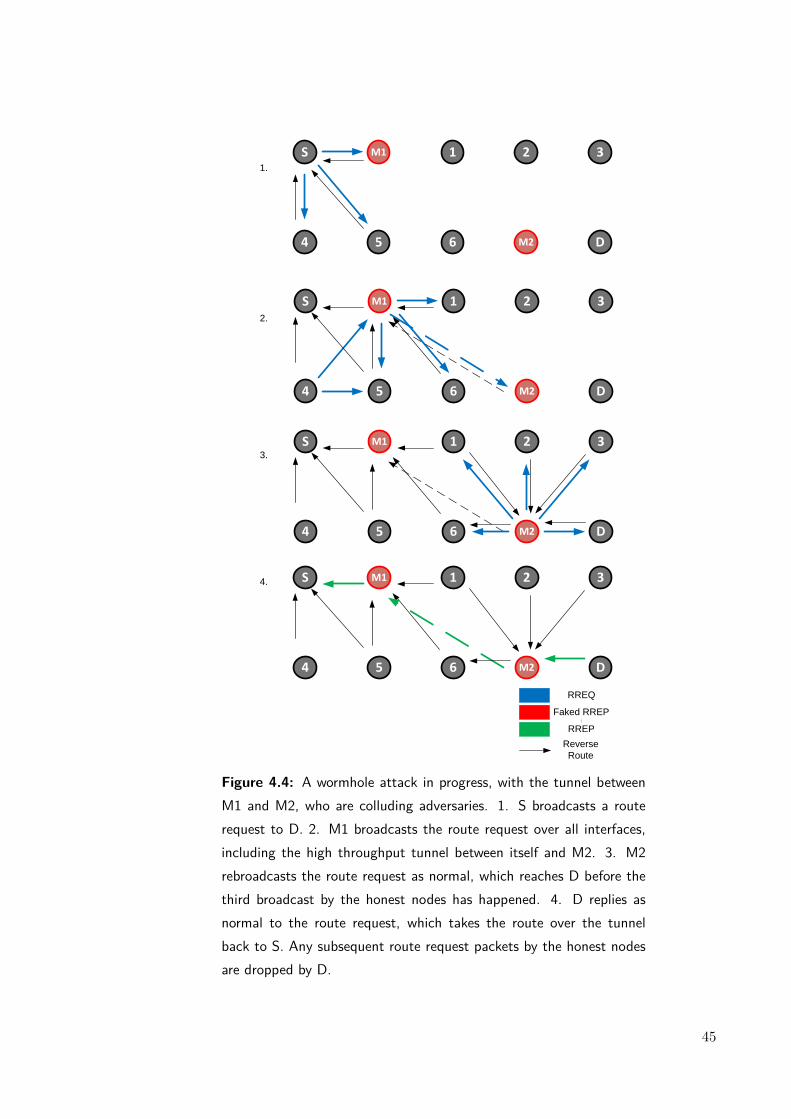
S M1
4 5
1.
1
6
2
M2
3
D
S M1
4 5
2.
1
6
2
M2
3
D
S M1
4 5
3.
1
6
2
M2
3
D
4. S M1
4 5
1
6
2
M2
3
D
RREQ
Faked RREP
RREP
Reverse
Route
Figure 4.4: A wormhole attack in progress, with the tunnel betweenM1 and M2, who are colluding adversaries. 1. S broadcasts a routerequest to D. 2. M1 broadcasts the route request over all interfaces,including the high throughput tunnel between itself and M2. 3. M2rebroadcasts the route request as normal, which reaches D before thethird broadcast by the honest nodes has happened. 4. D replies asnormal to the route request, which takes the route over the tunnelback to S. Any subsequent route request packets by the honest nodesare dropped by D.
45

ting message and send means the network layer is requesting the routing layer transmita message that requires routing, which could be data, or routed control packets, in parti-cular, route replies. Finally, netAddr and macAddr correspond to the network and MACaddresses of the node, used in most cases to check whether the packet should be targeted.This is used so an adversary does not target its own packets.
4.2.1 Selfishness
To implement selfishness within AODV, selfish adversaries drop any route requests recei-ved unless they are the requested destination (i.e. a node wants to start a data session withthe selfish node). In RouteAodvMultiInterfaceAdversary, receiveRouteRequest() wasoverridden to drop the request received unless the requested destination was the selfishnode. This is illustrated in the following pseudo-code, which illustrates the difference bet-ween route request processing by an honest and selfish node in Algorithm 1 and Algorithm2 respectively.
Algorithm 1 receiveRouteRequest for an honest nodeif is destination thengenerate route reply
elseif not in rreq buffer thendecrement ttlif ttl greater than 0 thenbroadcast rreq
end ifend if
end if
Algorithm 2 receiveRouteRequest for a selfish nodeif is destination thengenerate route reply
elsedrop
end if
4.2.2 Route invasion
Route invasion, in its various forms, is a precursor to the black hole, grey hole and worm-hole attacks described in §4.1.1, and is of particular interest to an adversarial node thathas just been captured to establish an attacking position within the MANET, whether
46
routes are established and stable, or not. There are three classes of route invasion attacks:passive, in which routing messages are input or suppressed by the adversary during normalexecution of the routing protocol, active attacks that cause premature error conditions onroutes or inject unsolicited advertisements outside normal running of the protocol, andhybrid attacks, which combine both. For example, a false routing message sent duringroute discovery is passive as it is completed during an expected protocol procedure, in thiscase route discovery, whilst an unsolicited route advertisement is an active attack thatis not specifically excluded by the routing protocol but is also not expected. From theadversary’s perspective, route invasion should be controlled as the more routes an adver-sary successfully invades, the more loaded the adversary will become, and it is likely tobe detected not for misbehaviour, but for excessive dropping instead if its interface queuelength is regularly exceeded.
4.2.2.1 Route freshness
To understand route invasion fully, it becomes necessary to define a “fresh” or “morefavourable” route advertisement, since route invasion targets the process by which reactiverouting protocols select route advertisements and the method by which existing route tableentries are removed. The AODV RFC (Perkins, 1997) specifies that upon receiving aroute advertisement, the existing route table entry (if it exists) is updated in the followingcircumstances:
1. the sequence number in the routing table is marked as invalid in route table entry.
2. the Destination Sequence Number in the RREP is greater than the node’s copy ofthe destination sequence number and the known value is valid, or
3. the sequence numbers are the same, but the route is marked as inactive, or
4. the sequence numbers are the same, and the New Hop Count is smaller than thehop count in route table entry.
The sequence number is generally used to ensure route freshness and guarantee loop-freeoperation in AODV, but it, and the Hop Count fields can be targeted by the adversary tocause a defenceless reactive routing protocol to select the adversary to serve a given route,even if the corresponding route through the adversary is not optimal.
4.2.2.2 Passive route invasion
Passive route invasion includes techniques that an adversary can invade a route duringroute discovery and route maintenance, and is suited for the invasion of new or stale routes.A couple of techniques were implemented in RouteAodvMultiInterfaceAdversary toachieve this.
47
The first and most simple technique causes the adversary to generate a more favou-rable advertisement for known destinations by adding a large constant to the destinationsequence number (dsn) currently held in the route table entry, before it sends the adver-tisement to the target. This technique requires very little processing. When the targetcompares this with an existing route table entry, the route advertisement with the fake,higher dsn will overwrite any existing with a lower dsn. In general, advertisements withhigher dsn’s are favoured over those with a lower hop count (Perkins, 1997, §6.7) . Thus,by implementing this technique, the adversary stands a good chance of being made partof the route.
The second technique involves the adversary creating a fake route advertisement to Dfrom the receipt of a route request from a target source node, S (Figure 4.5), even whenit does not have a route to D in its route cache. If the dsn is unknown, (S having hadno prior interaction with D) the adversary guesses an appropriate sequence number basedupon the maximum dsn of the current routes in its routing table. If, on the other hand,D was known to S in the past, the adversary can use the value of the dsn in the routerequest on which to base the dsn on in the faked advertisement. The adversary sends thisfake route advertisement back to S. The two forms of this attack are for the adversary togenerate a fake route advertisement as if it is from the destination and to generate theadvertisement as if it is from an intermediate node with a route to the destination.
48
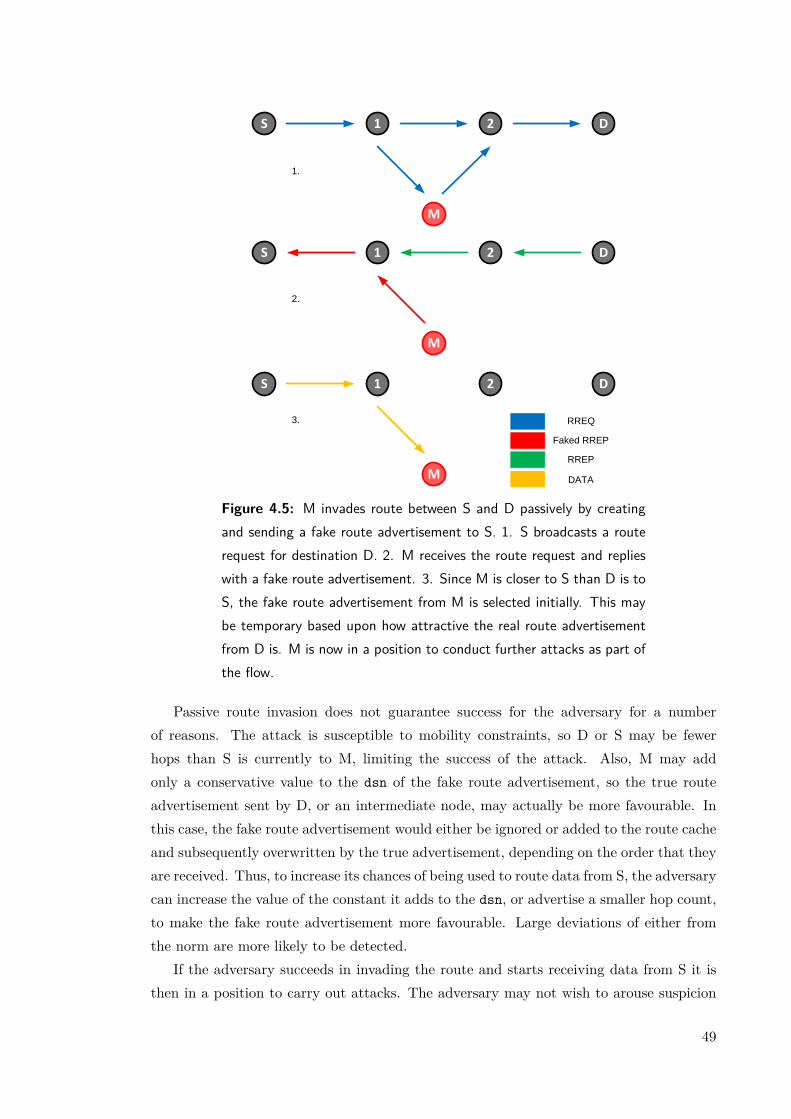
S 1 2 D
M
S 1 2 D
M
S 1 2 D
M
1.
2.
3. RREQ
Faked RREP
RREP
DATA
Figure 4.5: M invades route between S and D passively by creatingand sending a fake route advertisement to S. 1. S broadcasts a routerequest for destination D. 2. M receives the route request and replieswith a fake route advertisement. 3. Since M is closer to S than D is toS, the fake route advertisement from M is selected initially. This maybe temporary based upon how attractive the real route advertisementfrom D is. M is now in a position to conduct further attacks as part ofthe flow.
Passive route invasion does not guarantee success for the adversary for a numberof reasons. The attack is susceptible to mobility constraints, so D or S may be fewerhops than S is currently to M, limiting the success of the attack. Also, M may addonly a conservative value to the dsn of the fake route advertisement, so the true routeadvertisement sent by D, or an intermediate node, may actually be more favourable. Inthis case, the fake route advertisement would either be ignored or added to the route cacheand subsequently overwritten by the true advertisement, depending on the order that theyare received. Thus, to increase its chances of being used to route data from S, the adversarycan increase the value of the constant it adds to the dsn, or advertise a smaller hop count,to make the fake route advertisement more favourable. Large deviations of either fromthe norm are more likely to be detected.
If the adversary succeeds in invading the route and starts receiving data from S it isthen in a position to carry out attacks. The adversary may not wish to arouse suspicion
49
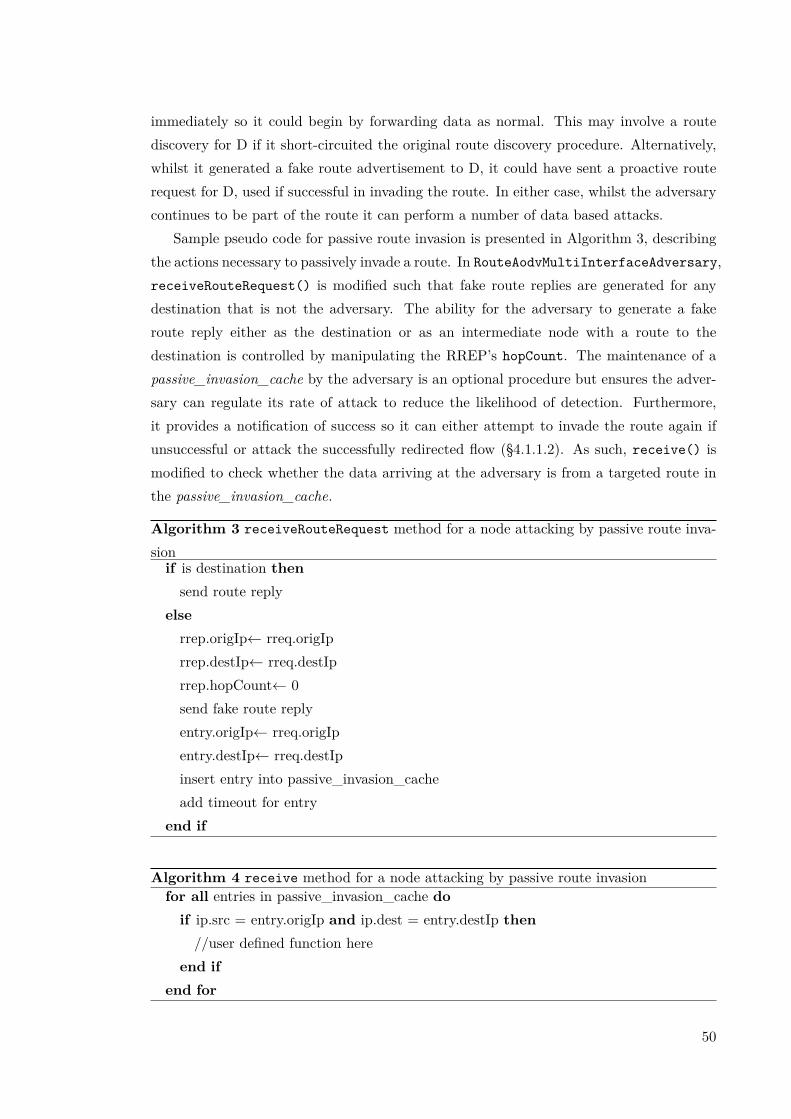
immediately so it could begin by forwarding data as normal. This may involve a routediscovery for D if it short-circuited the original route discovery procedure. Alternatively,whilst it generated a fake route advertisement to D, it could have sent a proactive routerequest for D, used if successful in invading the route. In either case, whilst the adversarycontinues to be part of the route it can perform a number of data based attacks.
Sample pseudo code for passive route invasion is presented in Algorithm 3, describingthe actions necessary to passively invade a route. In RouteAodvMultiInterfaceAdversary,receiveRouteRequest() is modified such that fake route replies are generated for anydestination that is not the adversary. The ability for the adversary to generate a fakeroute reply either as the destination or as an intermediate node with a route to thedestination is controlled by manipulating the RREP’s hopCount. The maintenance of apassive_invasion_cache by the adversary is an optional procedure but ensures the adver-sary can regulate its rate of attack to reduce the likelihood of detection. Furthermore,it provides a notification of success so it can either attempt to invade the route again ifunsuccessful or attack the successfully redirected flow (§4.1.1.2). As such, receive() ismodified to check whether the data arriving at the adversary is from a targeted route inthe passive_invasion_cache.
Algorithm 3 receiveRouteRequest method for a node attacking by passive route inva-sionif is destination thensend route reply
elserrep.origIp← rreq.origIprrep.destIp← rreq.destIprrep.hopCount← 0send fake route replyentry.origIp← rreq.origIpentry.destIp← rreq.destIpinsert entry into passive_invasion_cacheadd timeout for entry
end if
Algorithm 4 receive method for a node attacking by passive route invasionfor all entries in passive_invasion_cache doif ip.src = entry.origIp and ip.dest = entry.destIp then//user defined function here
end ifend for
50
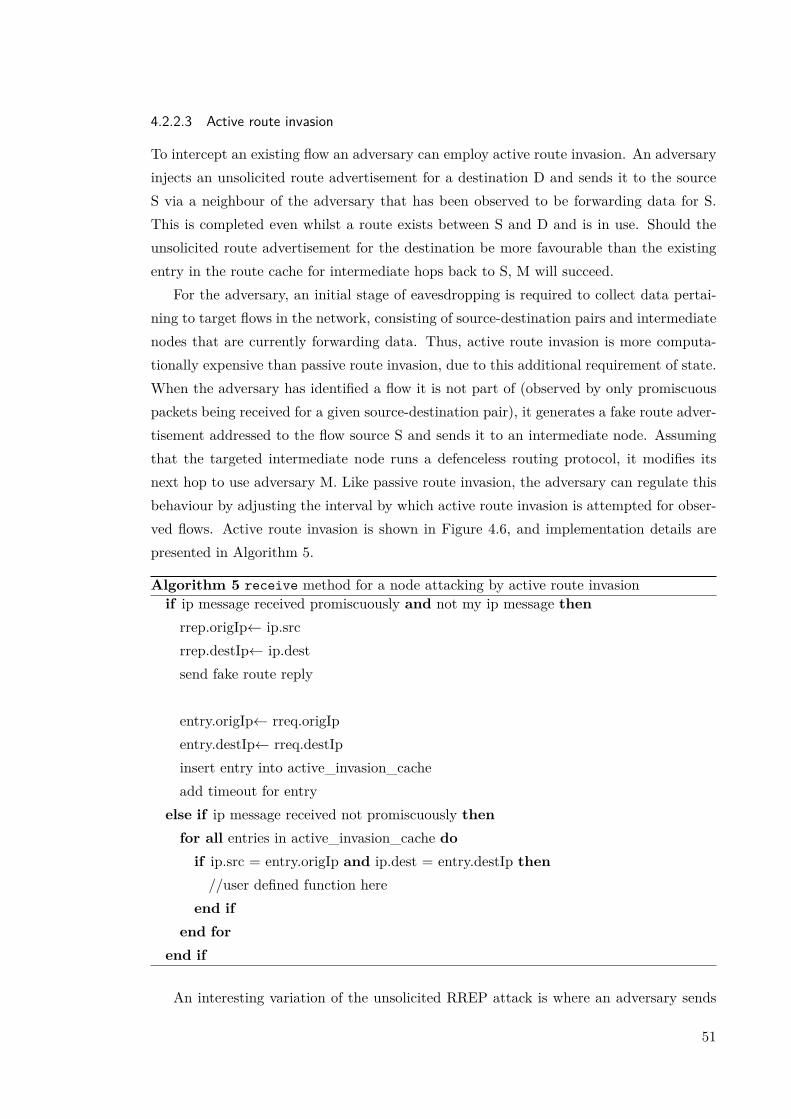
4.2.2.3 Active route invasion
To intercept an existing flow an adversary can employ active route invasion. An adversaryinjects an unsolicited route advertisement for a destination D and sends it to the sourceS via a neighbour of the adversary that has been observed to be forwarding data for S.This is completed even whilst a route exists between S and D and is in use. Should theunsolicited route advertisement for the destination be more favourable than the existingentry in the route cache for intermediate hops back to S, M will succeed.
For the adversary, an initial stage of eavesdropping is required to collect data pertai-ning to target flows in the network, consisting of source-destination pairs and intermediatenodes that are currently forwarding data. Thus, active route invasion is more computa-tionally expensive than passive route invasion, due to this additional requirement of state.When the adversary has identified a flow it is not part of (observed by only promiscuouspackets being received for a given source-destination pair), it generates a fake route adver-tisement addressed to the flow source S and sends it to an intermediate node. Assumingthat the targeted intermediate node runs a defenceless routing protocol, it modifies itsnext hop to use adversary M. Like passive route invasion, the adversary can regulate thisbehaviour by adjusting the interval by which active route invasion is attempted for obser-ved flows. Active route invasion is shown in Figure 4.6, and implementation details arepresented in Algorithm 5.
Algorithm 5 receive method for a node attacking by active route invasionif ip message received promiscuously and not my ip message thenrrep.origIp← ip.srcrrep.destIp← ip.destsend fake route reply
entry.origIp← rreq.origIpentry.destIp← rreq.destIpinsert entry into active_invasion_cacheadd timeout for entry
else if ip message received not promiscuously thenfor all entries in active_invasion_cache doif ip.src = entry.origIp and ip.dest = entry.destIp then//user defined function here
end ifend for
end if
An interesting variation of the unsolicited RREP attack is where an adversary sends
51

S 1 2 D
M
S 1 2 D
M
S 1 2 D
M
1.
2.
3.Faked RREP
DATA
Figure 4.6: An existing data flow between S and D, which M wishes toinvade through the use of active route invasion. 1. Adversary M cachesnodes 1 and 2, and S and D as flow end-points by eavesdropping onrelevant routing and data packets (dotted lines). 2. M sends a fakedroute advertisement about D to 1, and 1 updates the next hop to Daccordingly. 3. M redirects the data flow between S and D, using thisposition to launch further attacks from.
52

a RREQ for the destination to retrieve its latest destination sequence number in orderto base the sequence number used in the unsolicited advertisement, rather than choosingone arbitrarily. In addition, a number of other techniques are possible if the network hasno protection from Sybil attacks (Douceur, 2002): an adversary can clone the identity ofanother node and create a route advertisement to redirect the route as if the advertisementwas from a node participating in the route (Ning & Sun, 2003). It could also create anappropriate RERR as if the RERR was from a node participating in the route, forcing anupstream node to invoke route discovery that the adversary could subsequently target.
4.2.2.4 Hybrid route invasion
More elaborate schemes are possible in hybrid route invasion and are devised by combiningboth active and passive actions. If targets have no protection from Sybil attacks, a routeerror can be created and injected actively by the adversary. Unlike route replies, routeerrors are authenticated in AODV: they must be generated from neighbours upstreamof the unreachable destination. The Sybil attacker sends a route error with a sourceIP address of a neighbour servicing the route with an unreachable destination of a laterneighbour on the route. This is illustrated in Figure 4.7, whereby M sends a RERR asif from node 2 to node 1, and sends a fake route advertisement on the subsequent routediscovery process.
53
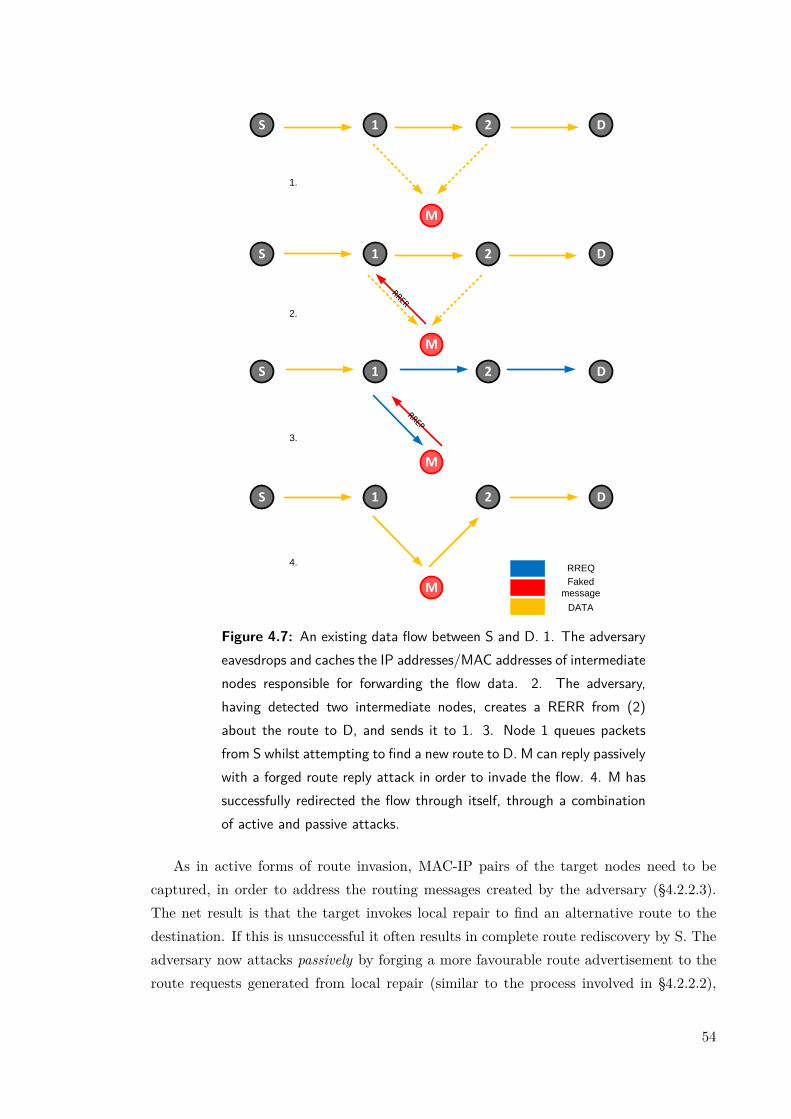
S 1 2 D
M
RREP
S 1 2 D
M
RRER
RREQ
Faked
message
DATA
S 1 2 D
M
2.
3.
4.
S 1 2 D
M
1.
Figure 4.7: An existing data flow between S and D. 1. The adversaryeavesdrops and caches the IP addresses/MAC addresses of intermediatenodes responsible for forwarding the flow data. 2. The adversary,having detected two intermediate nodes, creates a RERR from (2)about the route to D, and sends it to 1. 3. Node 1 queues packetsfrom S whilst attempting to find a new route to D. M can reply passivelywith a forged route reply attack in order to invade the flow. 4. M hassuccessfully redirected the flow through itself, through a combinationof active and passive attacks.
As in active forms of route invasion, MAC-IP pairs of the target nodes need to becaptured, in order to address the routing messages created by the adversary (§4.2.2.3).The net result is that the target invokes local repair to find an alternative route to thedestination. If this is unsuccessful it often results in complete route rediscovery by S. Theadversary now attacks passively by forging a more favourable route advertisement to theroute requests generated from local repair (similar to the process involved in §4.2.2.2),
54
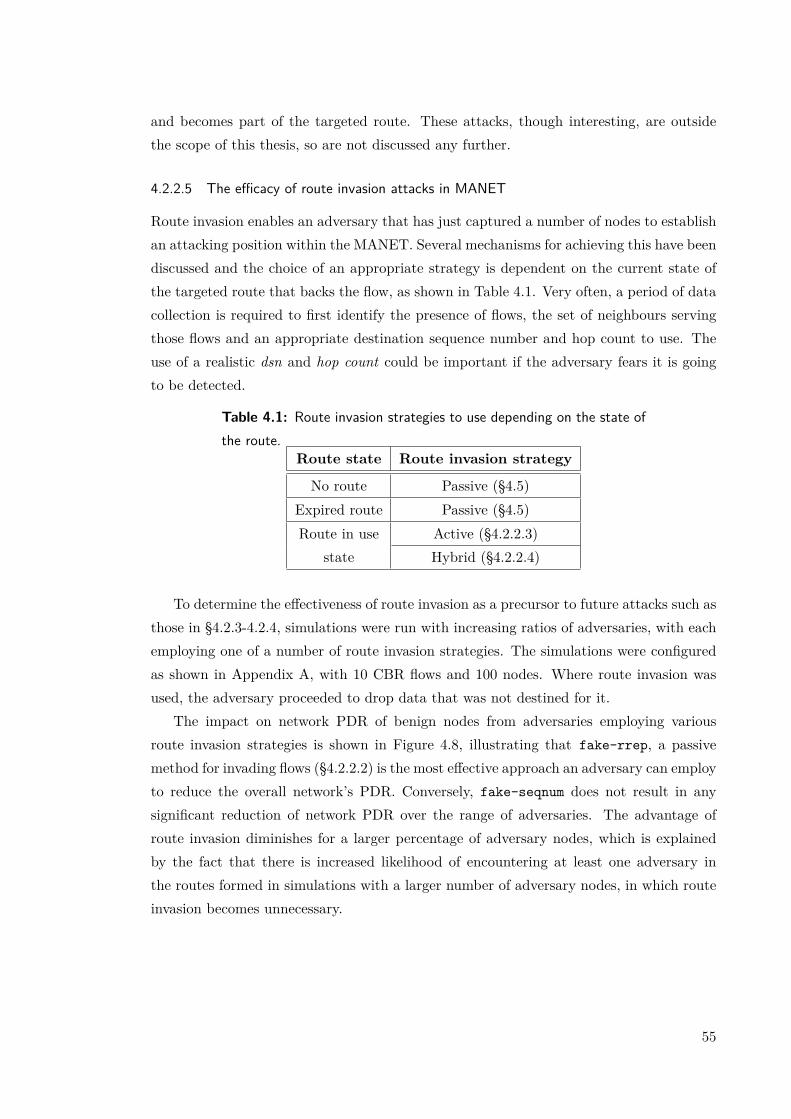
and becomes part of the targeted route. These attacks, though interesting, are outsidethe scope of this thesis, so are not discussed any further.
4.2.2.5 The efficacy of route invasion attacks in MANET
Route invasion enables an adversary that has just captured a number of nodes to establishan attacking position within the MANET. Several mechanisms for achieving this have beendiscussed and the choice of an appropriate strategy is dependent on the current state ofthe targeted route that backs the flow, as shown in Table 4.1. Very often, a period of datacollection is required to first identify the presence of flows, the set of neighbours servingthose flows and an appropriate destination sequence number and hop count to use. Theuse of a realistic dsn and hop count could be important if the adversary fears it is goingto be detected.
Table 4.1: Route invasion strategies to use depending on the state ofthe route.
Route state Route invasion strategy
No route Passive (§4.5)Expired route Passive (§4.5)Route in use Active (§4.2.2.3)
state Hybrid (§4.2.2.4)
To determine the effectiveness of route invasion as a precursor to future attacks such asthose in §4.2.3-4.2.4, simulations were run with increasing ratios of adversaries, with eachemploying one of a number of route invasion strategies. The simulations were configuredas shown in Appendix A, with 10 CBR flows and 100 nodes. Where route invasion wasused, the adversary proceeded to drop data that was not destined for it.
The impact on network PDR of benign nodes from adversaries employing variousroute invasion strategies is shown in Figure 4.8, illustrating that fake-rrep, a passivemethod for invading flows (§4.2.2.2) is the most effective approach an adversary can employto reduce the overall network’s PDR. Conversely, fake-seqnum does not result in anysignificant reduction of network PDR over the range of adversaries. The advantage ofroute invasion diminishes for a larger percentage of adversary nodes, which is explainedby the fact that there is increased likelihood of encountering at least one adversary inthe routes formed in simulations with a larger number of adversary nodes, in which routeinvasion becomes unnecessary.
55
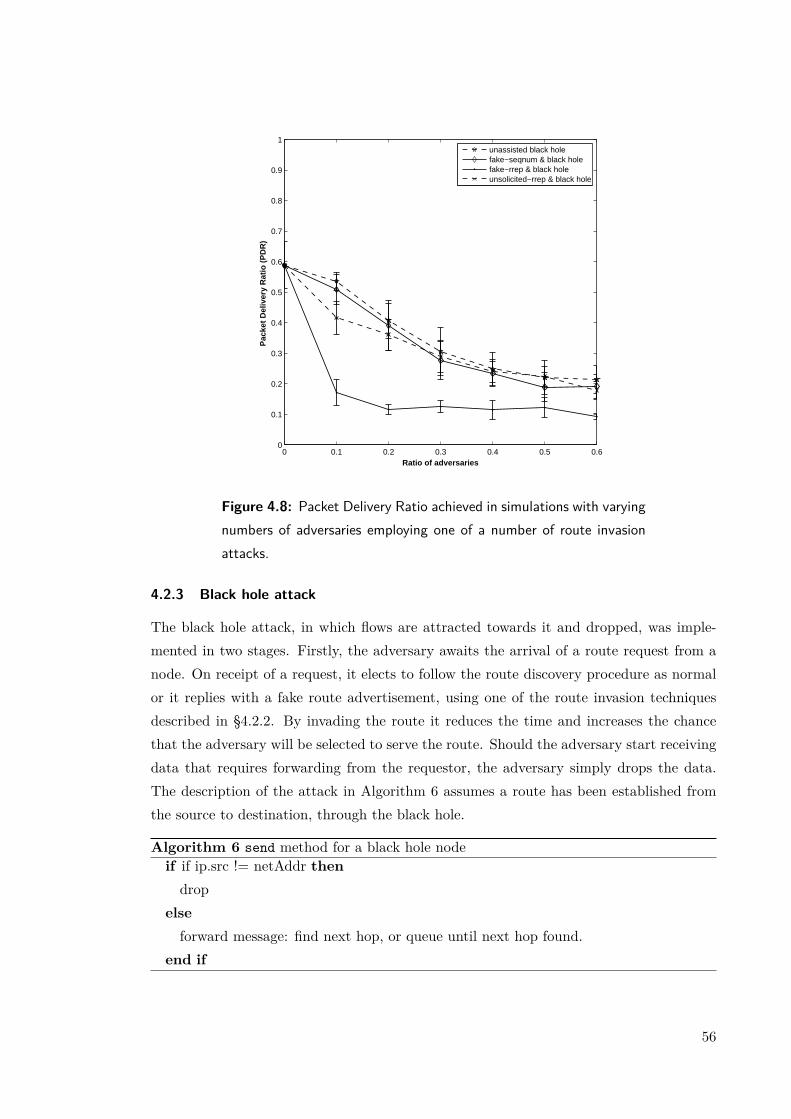
0 0.1 0.2 0.3 0.4 0.5 0.60
0.1
0.2
0.3
0.4
0.5
0.6
0.7
0.8
0.9
1
Ratio of adversaries
Pac
ket
Del
iver
y R
atio
(P
DR
)
unassisted black holefake−seqnum & black holefake−rrep & black holeunsolicited−rrep & black hole
Figure 4.8: Packet Delivery Ratio achieved in simulations with varyingnumbers of adversaries employing one of a number of route invasionattacks.
4.2.3 Black hole attack
The black hole attack, in which flows are attracted towards it and dropped, was imple-mented in two stages. Firstly, the adversary awaits the arrival of a route request from anode. On receipt of a request, it elects to follow the route discovery procedure as normalor it replies with a fake route advertisement, using one of the route invasion techniquesdescribed in §4.2.2. By invading the route it reduces the time and increases the chancethat the adversary will be selected to serve the route. Should the adversary start receivingdata that requires forwarding from the requestor, the adversary simply drops the data.The description of the attack in Algorithm 6 assumes a route has been established fromthe source to destination, through the black hole.
Algorithm 6 send method for a black hole nodeif if ip.src != netAddr thendrop
elseforward message: find next hop, or queue until next hop found.
end if
56
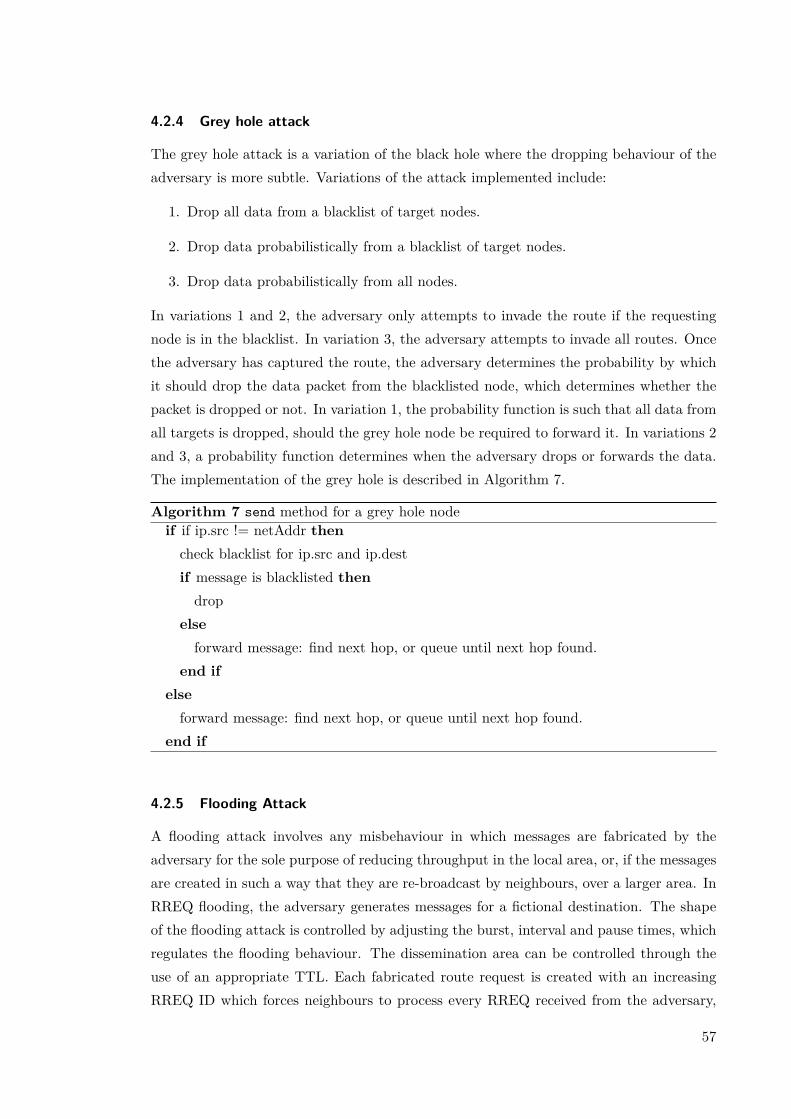
4.2.4 Grey hole attack
The grey hole attack is a variation of the black hole where the dropping behaviour of theadversary is more subtle. Variations of the attack implemented include:
1. Drop all data from a blacklist of target nodes.
2. Drop data probabilistically from a blacklist of target nodes.
3. Drop data probabilistically from all nodes.
In variations 1 and 2, the adversary only attempts to invade the route if the requestingnode is in the blacklist. In variation 3, the adversary attempts to invade all routes. Oncethe adversary has captured the route, the adversary determines the probability by whichit should drop the data packet from the blacklisted node, which determines whether thepacket is dropped or not. In variation 1, the probability function is such that all data fromall targets is dropped, should the grey hole node be required to forward it. In variations 2and 3, a probability function determines when the adversary drops or forwards the data.The implementation of the grey hole is described in Algorithm 7.
Algorithm 7 send method for a grey hole nodeif if ip.src != netAddr thencheck blacklist for ip.src and ip.destif message is blacklisted thendrop
elseforward message: find next hop, or queue until next hop found.
end ifelseforward message: find next hop, or queue until next hop found.
end if
4.2.5 Flooding Attack
A flooding attack involves any misbehaviour in which messages are fabricated by theadversary for the sole purpose of reducing throughput in the local area, or, if the messagesare created in such a way that they are re-broadcast by neighbours, over a larger area. InRREQ flooding, the adversary generates messages for a fictional destination. The shapeof the flooding attack is controlled by adjusting the burst, interval and pause times, whichregulates the flooding behaviour. The dissemination area can be controlled through theuse of an appropriate TTL. Each fabricated route request is created with an increasingRREQ ID which forces neighbours to process every RREQ received from the adversary,
57
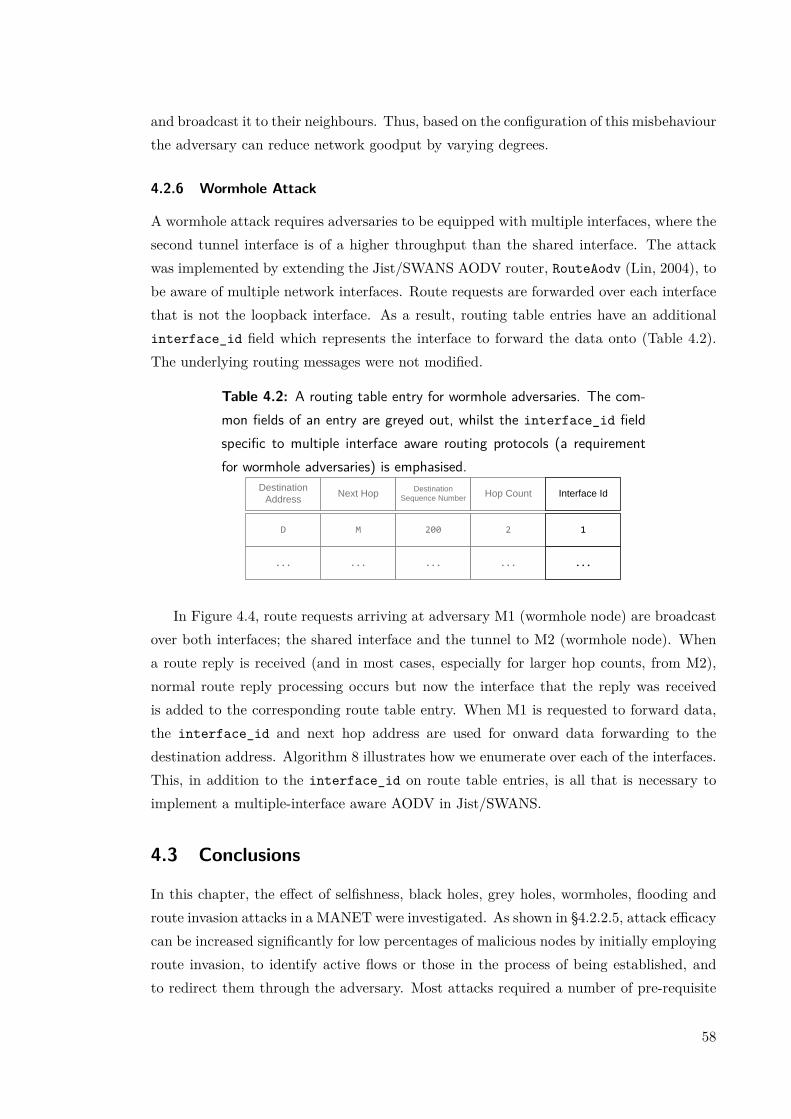
and broadcast it to their neighbours. Thus, based on the configuration of this misbehaviourthe adversary can reduce network goodput by varying degrees.
4.2.6 Wormhole Attack
A wormhole attack requires adversaries to be equipped with multiple interfaces, where thesecond tunnel interface is of a higher throughput than the shared interface. The attackwas implemented by extending the Jist/SWANS AODV router, RouteAodv (Lin, 2004), tobe aware of multiple network interfaces. Route requests are forwarded over each interfacethat is not the loopback interface. As a result, routing table entries have an additionalinterface_id field which represents the interface to forward the data onto (Table 4.2).The underlying routing messages were not modified.
Table 4.2: A routing table entry for wormhole adversaries. The com-mon fields of an entry are greyed out, whilst the interface_id fieldspecific to multiple interface aware routing protocols (a requirementfor wormhole adversaries) is emphasised.
Next HopDestination
Sequence NumberHop Count Interface Id
M 200 2 1
Destination
Address
D
... ... ... ......
In Figure 4.4, route requests arriving at adversary M1 (wormhole node) are broadcastover both interfaces; the shared interface and the tunnel to M2 (wormhole node). Whena route reply is received (and in most cases, especially for larger hop counts, from M2),normal route reply processing occurs but now the interface that the reply was receivedis added to the corresponding route table entry. When M1 is requested to forward data,the interface_id and next hop address are used for onward data forwarding to thedestination address. Algorithm 8 illustrates how we enumerate over each of the interfaces.This, in addition to the interface_id on route table entries, is all that is necessary toimplement a multiple-interface aware AODV in Jist/SWANS.
4.3 Conclusions
In this chapter, the effect of selfishness, black holes, grey holes, wormholes, flooding androute invasion attacks in a MANET were investigated. As shown in §4.2.2.5, attack efficacycan be increased significantly for low percentages of malicious nodes by initially employingroute invasion, to identify active flows or those in the process of being established, andto redirect them through the adversary. Most attacks required a number of pre-requisite
58
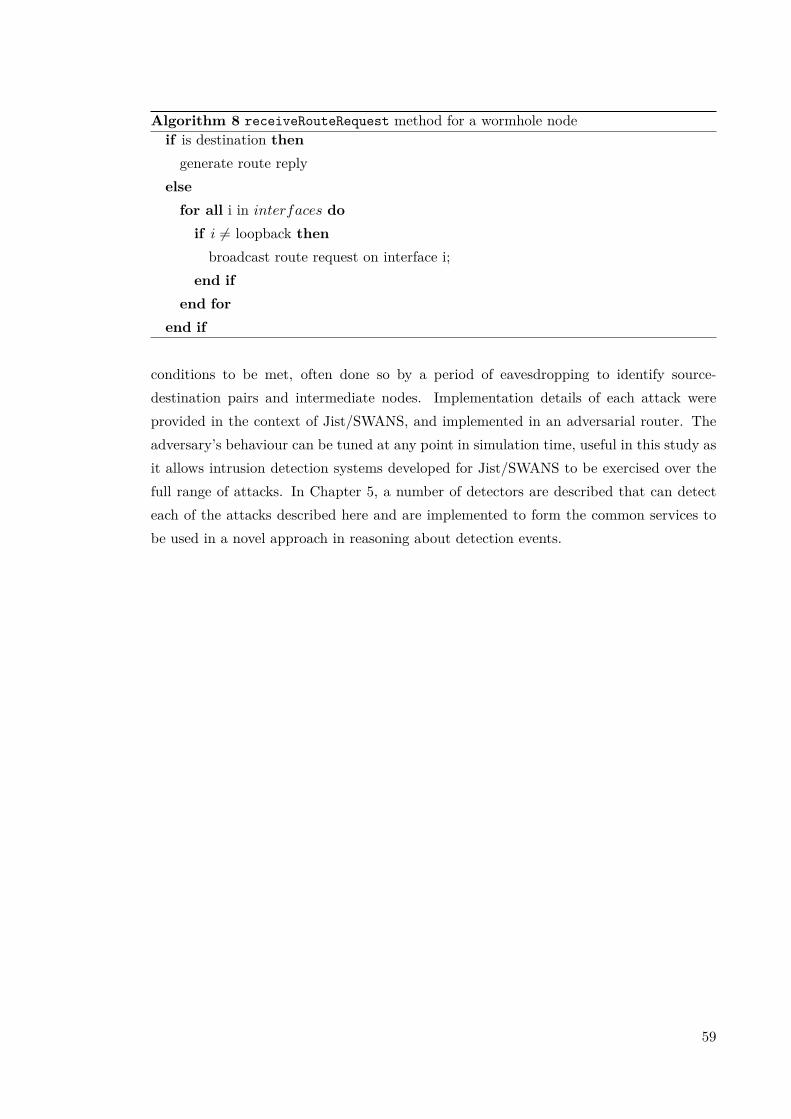
Algorithm 8 receiveRouteRequest method for a wormhole nodeif is destination thengenerate route reply
elsefor all i in interfaces doif i 6= loopback thenbroadcast route request on interface i;
end ifend for
end if
conditions to be met, often done so by a period of eavesdropping to identify source-destination pairs and intermediate nodes. Implementation details of each attack wereprovided in the context of Jist/SWANS, and implemented in an adversarial router. Theadversary’s behaviour can be tuned at any point in simulation time, useful in this study asit allows intrusion detection systems developed for Jist/SWANS to be exercised over thefull range of attacks. In Chapter 5, a number of detectors are described that can detecteach of the attacks described here and are implemented to form the common services tobe used in a novel approach in reasoning about detection events.
59
CHAPTER 5
COMMON SERVICES AND DETECTIONSTRATEGIES FOR A MANET INTRUSION
DETECTION SYSTEM
5.1 Introduction
Typical intrusion detection systems employ a common architecture consisting of an auditstream, an analysis engine and a response component (Bace, 2000). Generally, informationis acquired from a number of sources and compressed into a form suitable for analysis. Theanalyser generates detection events, which, based upon the rules and policies employed bythe IDS, may retaliate.
The first vital requirement is to determine a reliable mechanism to gather audit datain order to observe misbehaviour. This chapter presents a number of audit sources inMANETs and details detection strategies based on the detailed description of misbehaviourdescribed in Chapter 4. Each detector uses a number of common services to associate adetection event with a neighbour’s identity. Detection strategies are distinguished by theiruse of imperfect or perfect audit data. Detectors using imperfect sources are susceptibleto false positives whilst perfect schemes generate alerts only from the presence of misbe-haviour in the network. The importance of differentiating these sources is motivated bya case study that compares the performance of a detector using imperfect audit data toone that is assisted by omniscient signalling. Lastly, a number of suitable responses aredescribed.
5.2 Common Services
A number of data structures are defined and are maintained by the IDS, including aneighbour table and a list of known MAC-IP pairs, which are used by each detectorintroduced in this chapter.
60
5.2.1 Neighbour table
The IDS maintains a list of one-hop neighbours constructed from broadcast packets re-ceived. Each entry is keyed by a MAC addresses and a timeout that reflects the intervalby which a neighbour is determined to be unreachable, computed in a similar mannerto AODV, i.e. after ALLOWED_HELLO_LOSS*HELLO_INTERVAL Perkins (1997,§6.9). Entries that have timed out are removed and any registered detectors are informedof the change in order to update their state.
5.2.2 MAC-IP Pairs
The IDS maintains a list of the identities of network nodes by caching MAC-IP pairs fromreceived packets. If a broadcast packet is received then the full identity of the senderis added to the MAC-IP table. If a unicast packet is received, each IP address listedwithin the packet is added to the table with a null MAC address. These partial entriesare updated when any additional information becomes available (e.g. from receipt ofbroadcast packets). This allows the profile computed by the IDS on a partial identity tobe re-assigned to the full identity when available. One of the common uses of this list is toenable detectors to resolve a MAC address with a known IP address, useful in the droppedpacket detector as it prevents the raising of a false alert when a packet is being forwardedto the final hop, when the destination does not acknowledge receipt of the packet.
5.3 Audit source
Auditing produces an event stream that can be used in the analysis process. The IDS usesa combination of received packets, those received promiscuously and forwarded packetsfor analysis. Setting the MAC layer to promiscuous mode enables a node to receive allpackets in its transmission range, including those not addressed to it, making an additionalimperfect data source available. A number of alternative approaches to collecting auditdata were evaluated, including the use of network layer acknowledgments (Balakrishnanet al., 2005) and probing (Just et al., 2003) but these introduce large overheads and aresusceptible to targeted attacks by an intelligent adversary.
Promiscuous mode can be used to monitor the behaviour of neighbours directly andindirectly. In the latter case, this allows the IDS to monitor the behaviour of neighbours ithas no association with. This can help to identify misbehaviour in denser networks wherenodes have a large number of neighbours and it is likely the IDS could observe two ormore forwarding notifications of a packet by neighbours wholly indirectly. Promiscuousmonitoring has weaknesses though; it increases the energy expenditure and is imperfectin the sense that notifications will not always be received, due to ambiguous collisions,receiver collisions and asymmetric links (Marti et al., 2000). An example of a collision is
61

presented in Figure 5.2, which is a type of loss that should not be reacted to. Queuingdelays and dropped packets resulting from an overloaded interface queue are outside thecontrol of the monitored node but may result in a response being taken against it.
5.3.1 Generating an audit source in Jist/SWANS
An audit stream was generated in Jist/SWANS by passing packets from a number ofcontexts at the network layer directly to the IDS. Each node’s MAC layer was initialisedwith the promiscuous flag (promisc) set to true, to enable all nodes to receive all packetsin their transmission range, including those that are not explicitly addressed to them.The context of the packet was preserved by calling the send or receive procedure on theIDS, setting the promisc flag as appropriate and is passed to each detector in turn. Asimplified figure showing this process is shown in Figure 5.3.
5.4 Detectors
Each audit data sample received from the network layer is passed into the IDS analysisengine containing a set of detectors, which immediately returns so the network layer cancontinue processing the packet as normal. Each detector then processes the packet imme-diately, caches the header or content for future use, or returns if it is of no interest. Eachdetector outputs notifications to the IDS asynchronously. Detection procedures are in-voked outside the packet flow ensuring the IDS scales even for demanding network traffic.A block diagram of the analysis engine used which produces the notifications is presentedin Figure 5.4.
The notifications are stored in a vector maintained by the IDS that keeps a count ofeach type for further processing at the end of an interval, upon which it is reset. Theimperfect and perfect detection mechanisms were implemented in this thesis are presentedin the subsections below.
5.4.1 Dropped packets detection
The detection of dropped packets is based on an imperfect detection mechanism introducedby Marti et al. (2000), which generates drop or forward notifications based on observationsof the forwarding action of monitored nodes. Packets to be sent onwards are added to abuffer and packets overheard are used to determine if the packet in the buffer was actuallyforwarded by the monitored neighbour. This implementation was further developed toproduce notifications based on whether the monitored packet is a control packet or data.
In direct monitoring (Figure 5.1a), a node maintains a time window of packets that ithas recently forwarded to its neighbours. When a packet is to be forwarded, it is addedto the window and assigned a timeout. If the timeout is exceeded without the monitoring
62

S1 4
S2
data
radio links
promiscuous
notifications
Direct monitoring (flow S1->D)
6
2
D
3
5
1a)
S1 4
S2
data
radio links
promiscuous
notifications
6
2
D
3
5
1
Indirect monitoring (flow S2->D)
b)
Figure 5.1: a) Node 5 directly monitoring flow S1->D. b) Node 5indirectly monitoring flow S2->D exclusively through promiscuous no-tifications.
S 1 2 3 D
S2
D2
Figure 5.2: A collision at node 2, which is undetectable throughpromiscuous monitoring alone.
63

Network layer
MAC layer
send(msg)
receive(msg,lastHop,promisc)
IDS
send(msg,nextHop)
receive(msg,lastHop, promisc)
Transport layer
pump(msg,nextHop)
send(msg,dst)
receiveData(msg)
Figure 5.3: Simplified flow diagram showing audit data (completewith context) being sent to IDS.
64

Notification Vector
Analysis
Detector
DetectorDetector
notifications
12
forward_data
0
drop_data
4...
rreq
send(msg,nextHop)
receive(msg,lastHop,promisc)
Ne
two
rk L
aye
r
Figure 5.4: Analyser containing a set of detectors, operating on eachaudit data sample received by the IDS, and producing a set of notifi-cations managed by a notification vector.
node having overheard the same packet being forwarded by the chosen next hop, the de-tector issues a drop notification. Otherwise, the monitored packet is removed, the timeoutis cancelled and a forward notification is issued. The time window maintained by thedropped packet detector is illustrated in Figure 5.5. τn represents the duration betweenpacket n being sent to a neighbour and it being consequentially overheard by the moni-toring node as a result of the neighbour forwarding it onwards. Both routing and datapackets are monitored in this way, thus the detector generates four possible notifications:forward_data, drop_data, forward_routing and drop_routing, thereby reporting pos-itive and negative experiences with neighbours. The process by which notifications aregenerated from this detector is illustrated in Figure 5.6.
Indirect monitoring (Figure 5.1b), whereby promiscuously received packets are alsoadded to the time window and the forwarding operation of the monitored node is verifiedis not possible using AODV since the required information is unavailable. It would bepossible to do so with a source routing protocol by checking the forwarder corresponds toone of the nodes on the source route header of the forwarded data packet.
Algorithms 9–11 provide the core implementation of the dropped packet detector. Al-gorithm 9 illustrates the insertion of a packet into the time window. nextHop is theneighbour chosen to forward the packet, pktEntry is a data structure that maintains thestate required to resolve a promiscuous notification consisting of a unique packet iden-
65
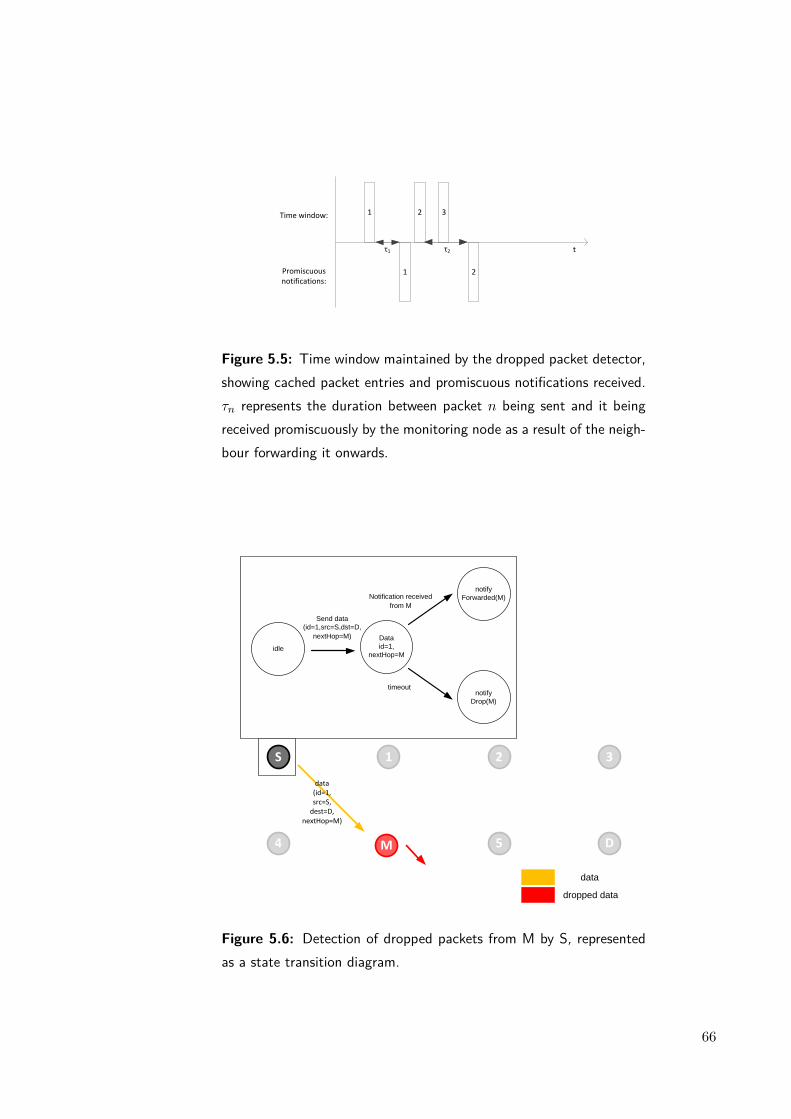
1
tτ1
Time window:
Promiscuous notifications:
1
2
2
τ2
3
Figure 5.5: Time window maintained by the dropped packet detector,showing cached packet entries and promiscuous notifications received.τn represents the duration between packet n being sent and it beingreceived promiscuously by the monitoring node as a result of the neigh-bour forwarding it onwards.
S 1 2 3
M4 5 D
data
dropped data
Data
id=1,
nextHop=M
notify
Forwarded(M)
notify
Drop(M)
Notification received
from M
timeout
idle
Send data
(id=1,src=S,dst=D,
nextHop=M)
data(id=1, src=S,
dest=D, nextHop=M)
Figure 5.6: Detection of dropped packets from M by S, representedas a state transition diagram.
66

tifier, id, and the nextHop. msg is the packet to be sent. Algorithm 10 illustrates theactions that are taken when msg is overhead promiscuously and a forward notification isgenerated. Finally, Algorithm 11 provides the implementation of the timeout for eachpktEntry, responsible for generating a drop notification should the packet not be over-heard promiscuously.
Algorithm 9 Watchdog.send(msg,intId,nextHop) pseudo-codeif msg is unicast and nextHop is not msg destination thenpktEntry.id← msg.id
pktEntry.mac← nextHop
pktEntry.forwarded← falseinsert packet entry pktEntry into windowassign timeout to pktEntry
end if
Algorithm 10 Watchdog.receive(msg,lastHop,intId,promisc) pseudo-codeif msg is unicast and msg received promiscuously thensize← length(window)for i = 0 to size dopktEntry ← window[i]if pktEntry.id = msg.id thenpktEntry.forwarded← truenotifyForwarded()return
end ifend for
end if
Algorithm 11 Watchdog.packetTimeout(pktEntry) pseudo-codeif pktEntry.forwarded = false thennotifyDrop()
end ifdelete(pktEntry,window)
This detector differentiates between data and routing packets, which can assist the IDSin determining the type of misbehaviour and respond appropriately: a large number ofdropped route replies may signify selfish behaviour, whilst a combination of dropped dataand control packets may be the result of malicious behaviour. Additionally, the presenceof wormholes can be determined by this detector, as if a wormhole node forwards data
67
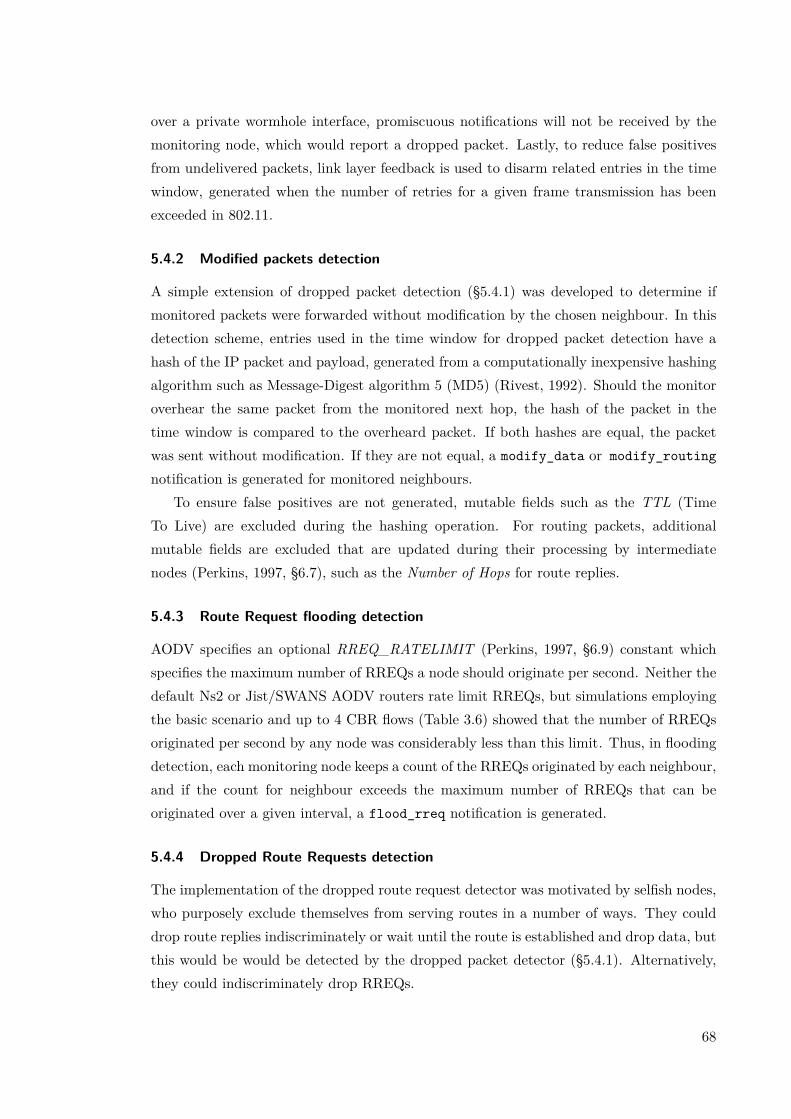
over a private wormhole interface, promiscuous notifications will not be received by themonitoring node, which would report a dropped packet. Lastly, to reduce false positivesfrom undelivered packets, link layer feedback is used to disarm related entries in the timewindow, generated when the number of retries for a given frame transmission has beenexceeded in 802.11.
5.4.2 Modified packets detection
A simple extension of dropped packet detection (§5.4.1) was developed to determine ifmonitored packets were forwarded without modification by the chosen neighbour. In thisdetection scheme, entries used in the time window for dropped packet detection have ahash of the IP packet and payload, generated from a computationally inexpensive hashingalgorithm such as Message-Digest algorithm 5 (MD5) (Rivest, 1992). Should the monitoroverhear the same packet from the monitored next hop, the hash of the packet in thetime window is compared to the overheard packet. If both hashes are equal, the packetwas sent without modification. If they are not equal, a modify_data or modify_routing
notification is generated for monitored neighbours.To ensure false positives are not generated, mutable fields such as the TTL (Time
To Live) are excluded during the hashing operation. For routing packets, additionalmutable fields are excluded that are updated during their processing by intermediatenodes (Perkins, 1997, §6.7), such as the Number of Hops for route replies.
5.4.3 Route Request flooding detection
AODV specifies an optional RREQ_RATELIMIT (Perkins, 1997, §6.9) constant whichspecifies the maximum number of RREQs a node should originate per second. Neither thedefault Ns2 or Jist/SWANS AODV routers rate limit RREQs, but simulations employingthe basic scenario and up to 4 CBR flows (Table 3.6) showed that the number of RREQsoriginated per second by any node was considerably less than this limit. Thus, in floodingdetection, each monitoring node keeps a count of the RREQs originated by each neighbour,and if the count for neighbour exceeds the maximum number of RREQs that can beoriginated over a given interval, a flood_rreq notification is generated.
5.4.4 Dropped Route Requests detection
The implementation of the dropped route request detector was motivated by selfish nodes,who purposely exclude themselves from serving routes in a number of ways. They coulddrop route replies indiscriminately or wait until the route is established and drop data, butthis would be would be detected by the dropped packet detector (§5.4.1). Alternatively,they could indiscriminately drop RREQs.
68
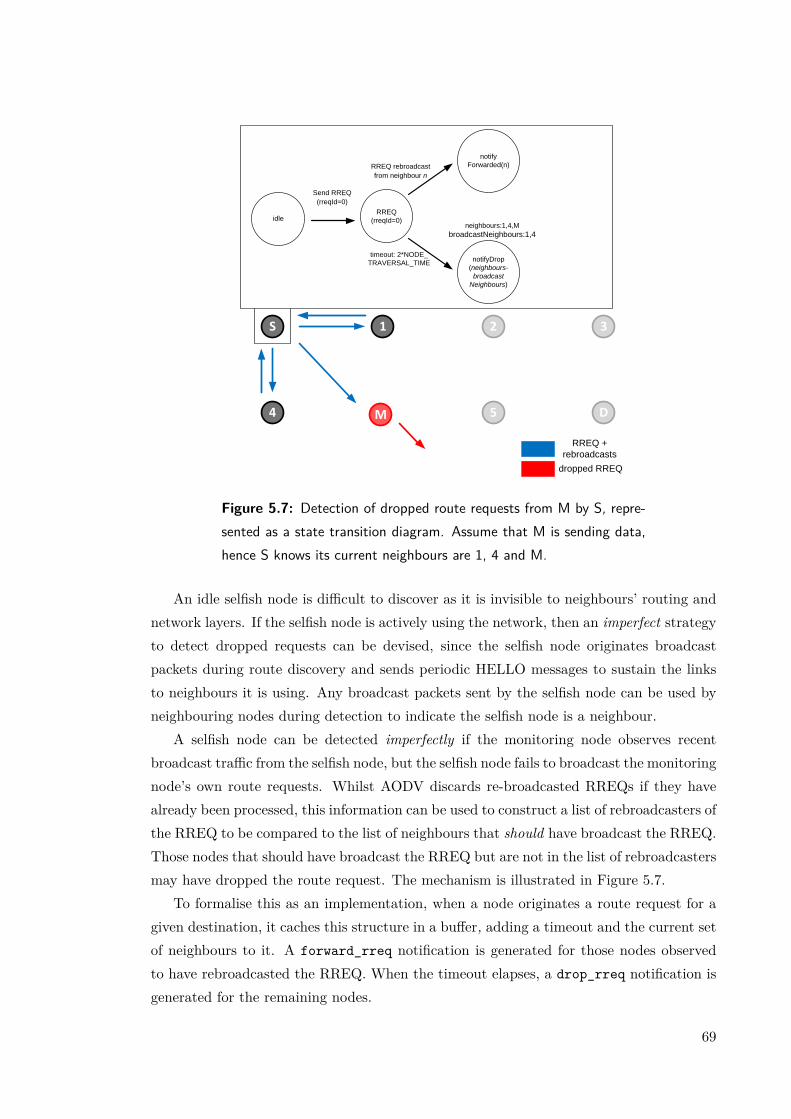
RREQ +
rebroadcasts
dropped RREQ
RREQ
(rreqId=0)
notify
Forwarded(n)
notifyDrop
(neighbours-
broadcast
Neighbours)
RREQ rebroadcast
from neighbour n
timeout: 2*NODE_
TRAVERSAL_TIME
idle
Send RREQ
(rreqId=0)
S 1 2 3
M4 5 D
neighbours:1,4,M
broadcastNeighbours:1,4
Figure 5.7: Detection of dropped route requests from M by S, repre-sented as a state transition diagram. Assume that M is sending data,hence S knows its current neighbours are 1, 4 and M.
An idle selfish node is difficult to discover as it is invisible to neighbours’ routing andnetwork layers. If the selfish node is actively using the network, then an imperfect strategyto detect dropped requests can be devised, since the selfish node originates broadcastpackets during route discovery and sends periodic HELLO messages to sustain the linksto neighbours it is using. Any broadcast packets sent by the selfish node can be used byneighbouring nodes during detection to indicate the selfish node is a neighbour.
A selfish node can be detected imperfectly if the monitoring node observes recentbroadcast traffic from the selfish node, but the selfish node fails to broadcast the monitoringnode’s own route requests. Whilst AODV discards re-broadcasted RREQs if they havealready been processed, this information can be used to construct a list of rebroadcasters ofthe RREQ to be compared to the list of neighbours that should have broadcast the RREQ.Those nodes that should have broadcast the RREQ but are not in the list of rebroadcastersmay have dropped the route request. The mechanism is illustrated in Figure 5.7.
To formalise this as an implementation, when a node originates a route request for agiven destination, it caches this structure in a buffer, adding a timeout and the current setof neighbours to it. A forward_rreq notification is generated for those nodes observedto have rebroadcasted the RREQ. When the timeout elapses, a drop_rreq notification isgenerated for the remaining nodes.
69
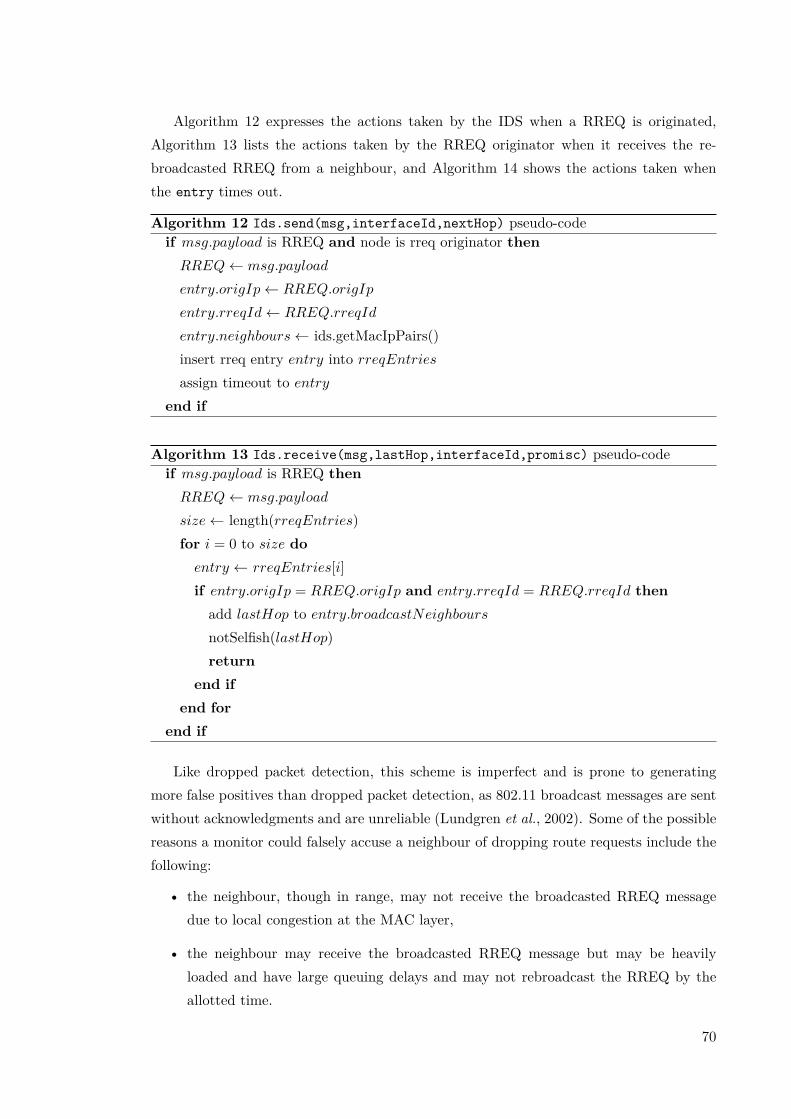
Algorithm 12 expresses the actions taken by the IDS when a RREQ is originated,Algorithm 13 lists the actions taken by the RREQ originator when it receives the re-broadcasted RREQ from a neighbour, and Algorithm 14 shows the actions taken whenthe entry times out.
Algorithm 12 Ids.send(msg,interfaceId,nextHop) pseudo-codeif msg.payload is RREQ and node is rreq originator thenRREQ← msg.payload
entry.origIp← RREQ.origIp
entry.rreqId← RREQ.rreqId
entry.neighbours← ids.getMacIpPairs()insert rreq entry entry into rreqEntriesassign timeout to entry
end if
Algorithm 13 Ids.receive(msg,lastHop,interfaceId,promisc) pseudo-codeif msg.payload is RREQ thenRREQ← msg.payload
size← length(rreqEntries)for i = 0 to size doentry ← rreqEntries[i]if entry.origIp = RREQ.origIp and entry.rreqId = RREQ.rreqId thenadd lastHop to entry.broadcastNeighboursnotSelfish(lastHop)return
end ifend for
end if
Like dropped packet detection, this scheme is imperfect and is prone to generatingmore false positives than dropped packet detection, as 802.11 broadcast messages are sentwithout acknowledgments and are unreliable (Lundgren et al., 2002). Some of the possiblereasons a monitor could falsely accuse a neighbour of dropping route requests include thefollowing:
• the neighbour, though in range, may not receive the broadcasted RREQ messagedue to local congestion at the MAC layer,
• the neighbour may receive the broadcasted RREQ message but may be heavilyloaded and have large queuing delays and may not rebroadcast the RREQ by theallotted time.
70

Algorithm 14 Ids.rreqEntryTimeout(entry) pseudo-coderemove neighbours in entry.broadcastNeighbours from entry.neighbours
size← length(neighbours)for i = 0 to size donotifySelfish(neighbours[i])
end fordelete entry from rreqEntries
• the monitor could miss the observation of the re-broadcasted RREQ from the neigh-bour.
• The neighbour list maintained by the monitor may be out-of-date and include nodesthat are no longer in communication range. This is why entries in the neighbourtable (§5.2.1) are subject to a timeout equal to that which AODV uses to determinea next hop as unreachable.
Only RREQs originated by the monitor node are monitored by the IDS, purposely ex-cluding forwarded RREQs. The reason for this is that it is not clear which neighbourshave processed and forwarded the route request in the past. These neighbours will notre-broadcast the RREQ by the definition of the route discovery procedure (Perkins, 1997,§6.5), and would otherwise lead to the generation of a false positive.
5.4.5 Route invasion detection
5.4.5.1 Fake route reply as destination
In this type of route invasion, an adversary advertises a route as if it is the requesteddestination, even if it is not, or currently has no route to it. The adversary can make theadvertisement more favourable to the target by appending an arbitrarily large destinationsequence number onto it, to overwrite any existing entries in the target’s routing table.
This attack can be detected by any of the next hop neighbours of the adversary. Whena destination replies to a route request, the RREP’s Hop Count field is set to 0. The IDSchecks that the Destination IP Address field of the RREP payload is equal to the SourceIP Address on the IP header. If it is not equal a fake_rrep notification is generated.This can be implemented as a simple rule, such as that illustrated in the flow diagram inFigure 5.8, which detects this attack.
5.4.5.2 Unsolicited route reply
An unsolicited route reply is a form of active route invasion where a malicious node sendsan advertisement for a destination to a target node it observes as forwarding traffic to
71
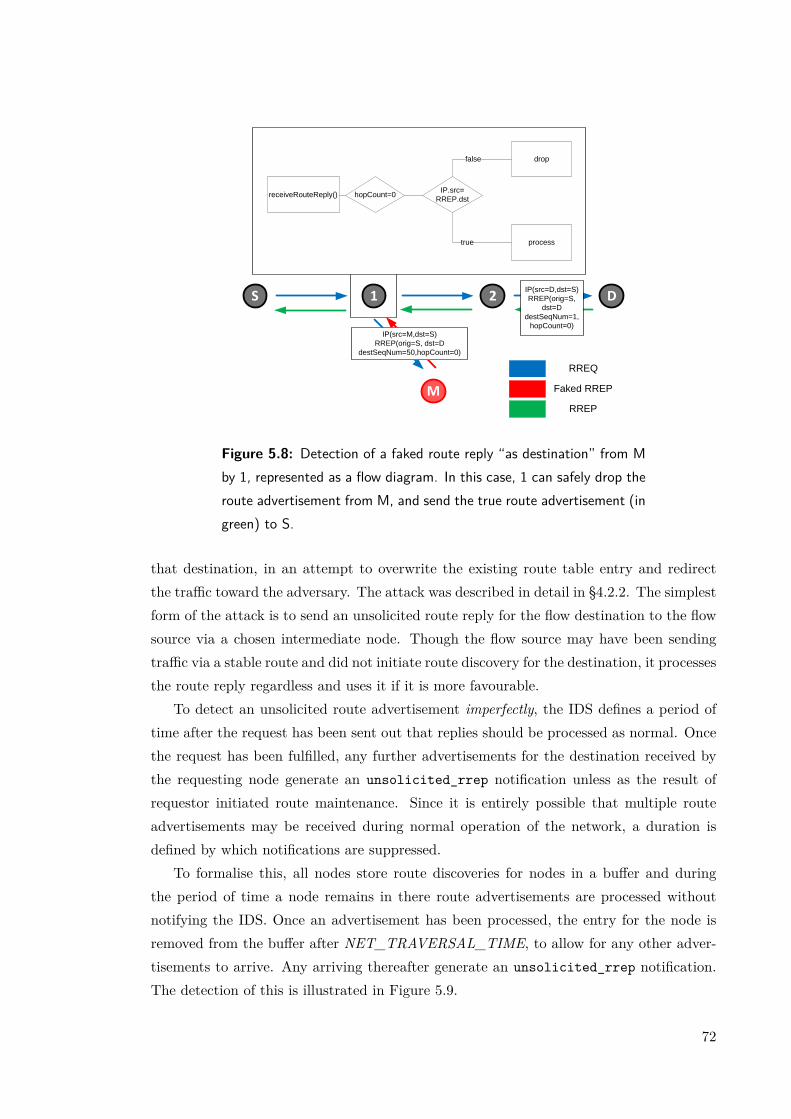
S 1 2 D
M
IP(src=M,dst=S)
RREP(orig=S, dst=D
destSeqNum=50,hopCount=0)
IP(src=D,dst=S)
RREP(orig=S,
dst=D
destSeqNum=1,
hopCount=0)
RREQ
Faked RREP
RREP
hopCount=0receiveRouteReply()IP.src=
RREP.dst
drop
processtrue
false
Figure 5.8: Detection of a faked route reply “as destination” from Mby 1, represented as a flow diagram. In this case, 1 can safely drop theroute advertisement from M, and send the true route advertisement (ingreen) to S.
that destination, in an attempt to overwrite the existing route table entry and redirectthe traffic toward the adversary. The attack was described in detail in §4.2.2. The simplestform of the attack is to send an unsolicited route reply for the flow destination to the flowsource via a chosen intermediate node. Though the flow source may have been sendingtraffic via a stable route and did not initiate route discovery for the destination, it processesthe route reply regardless and uses it if it is more favourable.
To detect an unsolicited route advertisement imperfectly, the IDS defines a period oftime after the request has been sent out that replies should be processed as normal. Oncethe request has been fulfilled, any further advertisements for the destination received bythe requesting node generate an unsolicited_rrep notification unless as the result ofrequestor initiated route maintenance. Since it is entirely possible that multiple routeadvertisements may be received during normal operation of the network, a duration isdefined by which notifications are suppressed.
To formalise this, all nodes store route discoveries for nodes in a buffer and duringthe period of time a node remains in there route advertisements are processed withoutnotifying the IDS. Once an advertisement has been processed, the entry for the node isremoved from the buffer after NET_TRAVERSAL_TIME, to allow for any other adver-tisements to arrive. Any arriving thereafter generate an unsolicited_rrep notification.The detection of this is illustrated in Figure 5.9.
72

rrep dest in
rreqBuffer receiveRouteReply()
drop
processtrue
false
S 1 2 D
M
Faked RREP
DATA
rreqBuffer=∅
Figure 5.9: Detection of an unsolicited route reply from M by 1 usingsIDS, represented as a flow diagram. In this case, 1 can safely drop theroute advertisement from M, using the existing route with nextHop =2.
5.4.5.3 Additional notes on route invasion
The correct maintenance of destination sequence numbers is key to the loop-free propertyof AODV (Perkins, 1997). In the above route invasion approaches, the hop count anddestination sequence number fields are specifically targeted by the adversary and canintroduce routing loops into the network, either as an intended or unintended side-effect.The propagation of a routing loop is shown in Figure 5.10.
So, in addition to being able to detect the forms of route invasion described in §5.4.5.1–5.4.5.2 and reacting instantaneously (to prevent the proliferation of false routing informa-tion network wide) routing loop detection is also advisable to maintain high levels of packetdelivery. This can be implemented by creating a time window of monitored packets (e.g.§5.4.1) and checking if the received packet has been forwarded in the past.
5.5 Computing metrics
A 12-dimensional notification vector stores a count of each notification from the set of de-tectors for each neighbour n over the time period specified by INTERVAL and representsthe compressed form of the audit data, which is used for the purposes of intrusion detec-tion. The structure of this vector isDn = {forward_data, drop_data, forward_routing,drop_routing, modify_data, modify_routing, forward_rreq, drop_rreq, fake_rrep,unsolicited_rrep, rreq_count, rrep_count}. This compression reduces the computa-
73

S 1 2 3 4
M 6 7 8 D
destSeqNum=1destSeqNum=50
S 1 2 3 4
M 6 7 8 D
S 1 2 3 4
M 6 7 D
S 1 2 3 4
M 6 7 D
destSeqNum=2destSeqNum=50
S 1 2 3 4
M 6 7 D
1.
2.
3.
4.
5.
RREQ
Faked RREP
RREP
DATA
Figure 5.10: A routing loop caused by a route invasion attack. 1.and 2. A route invasion attack by M, who fabricates an advertisementwith a high destination sequence number, destSeqNum=50. 3. Node7, discovering that 8 has roamed out of range, initiates local repair fora new route to destination D. 4. Both D and S reply, but the replyfrom S has a larger destination sequence number, so is chosen. 5. Thisresults in the routing loop shown.
74

tional burden and memory required to store the historical data about neighbours.The notifications are transformed into a number of metrics defined as ratios that en-
able the IDS to discriminate between benign and malicious behaviour for a given function.Ratios with a value close to one signify benign behaviour for that function (e.g. forward-ing data, forwarding data without modification or forwarding control packets) whilst aratio close to zero indicates behaviour that deviates from the expectations of the routingprotocol, and may be malicious. Each IDS computes an 8-dimensional vector (Mn) ofmetrics for the neighbour n, every INTERVAL seconds, from the notification vector abouta neighbour n (Dn), generated above. Mn consists of the following elements:
1. Forwarded data rate (m1) is a ratio of forward_data notifications to the sum ofdrop_data and forward_data notifications for n. m1 = 1 means all monitoredpackets were forwarded by n.
m1 = forward_datanforward_datan + drop_datan
(5.1)
2. Forwarded routing rate (m2) is a ratio of forward_route notifications to the sumof drop_route and forward_route notifications for n.
m2 = forward_routenforward_routen + drop_routen
(5.2)
3. Unmodified data rate (m3) is a ratio of modify_data notifications to forward_data
notifications for n. As n modifies more data packets, this ratio decreases.
m3 = modify_datanforward_datan
(5.3)
4. Unmodified routing rate (m4) is a ratio of modify_route notifications to forward_route
notifications for n.m4 = modify_routen
forward_routen(5.4)
5. Forwarded RREQ rate (m5) is a ratio of forward_rreq notifications to the sum offorward_rreq and drop_rreq notifications for n.
m5 = forward_rreqnforward_rreqn + drop_rreqn
(5.5)
6. Fake RREP rate (m6) is a ratio of fake_rrep notifications to the sum of route repliesoriginated by n stored in rrep_count.
m6 = 1−(fake_rrepnrrep_countn
)(5.6)
7. Unsolicited RREP rate (m7) is a ratio of the sum of unsolicited_rrep notificationsto the total number of route replies originated by n, stored in rrep_count.
m7 = 1−(unsolicited_rrepnrrep_countn
)(5.7)
75
8. RREQ flood rate (m8) is expressed by the following function:
m8 =
1 0 ≥ rreq_count ≤ RREQ_RATELIMIT
0 otherwise(5.8)
Once the metrics have been computed, Dn is reset to collect the notifications in the nextinterval. Mn is used by the IDS as the basis of any reasoning before it invokes a response.
5.5.1 Considerations when calculating metrics
Evaluating new values for each of the metrics in Mn is conditional on having the requisitenotifications for n, determined by n’s use of the network. Certain conditions may arisewhere no notifications of a particular type will be received in a period, for example,during light data loads or low mobility. In the first case, the IDS may not observe anydata forwarded by n and thus be unable to compute m1, which expresses the forwardingbehaviour of it, whilst in the second case, the IDS will be unable to compute m2, whichexpresses the forwarding of routing messages by n. In addition, as described in §5.4, someof the notifications are determined from imperfect detection methods, leading to a lowevaluation for one or more metrics. This subsection details the approaches employed bythe IDS to mitigate these problems.
5.5.1.1 Imperfect detectors
The detection methods that employ eavesdropping are liable to generate false notificationsthat may lead to the calculation of low valued metrics in one time period and cause an IDSusing the instantaneous value of the metric to retaliate in the following period. To preventknee-jerk reactions of this nature, each metric was smoothed by applying the followingfunction:
new mn = α.old mn + (1− α).latest mn (5.9)
This corresponds to each metric being computed from an effective memory of k samples,with the following relationship to α:
k = 11− α (5.10)
It was postulated that if α was set too low, the IDS would respond to honest nodes as aresult of missed observations, whilst if α was too high, the IDS would become increasinglyinsensitive to misbehaviour. An appropriate value of α was determined by running severalsimulations in §6.6.1.
76
5.5.1.2 No requisite audit data
If the IDS is unable to compute a metric from the current notification vector, the newvalue is calculated from the last known sample and a small increment, δ, is added to it sothat nodes are eventually re-introduced. Using m1 as an example:
limforward_data+drop_data→0
m1 = last m1 + δ (5.11)
5.6 Responses
The IDS is equipped a number of responses to provide incentives to malicious and selfishnodes to co-operate whilst mitigating the spread of influence of misbehaviour and min-imising the effect on network quality-of-service. The responses against a neighbour n areinvoked by a reasoning scheme, such as thresholding, which maps the values of the metricsto zero or more responses. The responses considered in this work are:
1. RESPONSE_IGNORE_ALL: all packets originating from the suspect network orMAC address are ignored. This prevents the suspect from accessing the networkentirely.
2. RESPONSE_IGNORE_DATA: the data originating from the suspect network orMAC address is ignored. This prevents the suspect from using the network for itsown activities but does not stop it from contributing to the routing service, givingthe suspect an opportunity to show it has corrected its behaviour.
3. RESPONSE_IGNORE_ROUTING: control packets originating from the suspectnetwork or MAC address are ignored. If a suspect is accused of tampering or in-jecting false routing information, this prevents the IDS node from processing furtheradvertisements and circulating this information network-wide. Route requests origi-nating from the suspect are also ignored, which prevents the suspect from becominga forwarder for the IDS node in order to find an alternative route.
4. RESPONSE_PURGE_ROUTE: the IDS removes all references to the suspect fromthe routing table. Any destinations that are served by the suspect as the next hopare removed, which when used with RESPONSE_IGNORE_ROUTING, can findan alternative route to the destination that does not include the suspect.
5. RESPONSE_CLEAR: clears any of the above responses and processes the packetswith the suspect network or MAC address as normal.
77
5.7 Using imperfect detection mechanisms: A simulation study
Detectors relying on notifications from promiscuous monitoring or the receipt of broadcastpackets often miss observations and generate false positive detections that could deny abenign node access to the network if the IDS retaliates. Whilst missed observations areacknowledged for their effect on IDS performance (Marti et al., 2000), many simulatedstudies of IDS fail to mention the propagation environment they use (Marti et al., 2000).More realistic propagation environments that employ fading are likely to compound theissue of missed observations.
This study aims to show that simple threshold-based IDS’s exhibit good performance insimulations with ideal propagation environments, generating a small number of false posi-tives, but in more realistic propagation environments, false positives increase dramatically;to motivate the importance of reasoning as a mechanism to improve IDS performance.
5.7.1 Method
An IDS using the dropped packet detector described in §5.4.1 was applied to a networkwith no misbehaviour in two network scenarios:
1. an ideal propagation environment with no fading and Freespace Pathloss,
2. with Rayleigh fading and Two-ray Pathloss.
In another simulation, an IDS using an ideal dropped packet detector was applied to thesame environments. The ideal detector is sent an omniscient notification for every packetsuccessfully forwarded by the monitored neighbour and correctly issues forward notifica-tions where it would have otherwise missed the overheard packet from the neighbour. Thedropped packet detector issues drop alerts for these missed observations even if the neigh-bour did forward the packet, as is commonly the case. Thus the ratio of alerts that arefalse detections from missed observations and those arising from the neighbour droppingthe packet can be determined.
5.7.1.1 IDS architecture
The audit data stream for each IDS node was generated from promiscuously and non-promiscuously received packets and those queued for forwarding, as described in §5.3.A threshold-based IDS was equipped with the dropped packet detector or ideal droppedpacket detector, producing a notification from the set {drop_data, drop_routing, for-
ward_data, forward_routing} for each data and routing packet that required forward-ing. The IDS was configured as shown in Table 5.1.
The metrics m1 and m2 were computed from the relevant notification counts for eachobserved neighbour n every INTERVAL seconds, as shown in §5.5. Once the metrics had
78
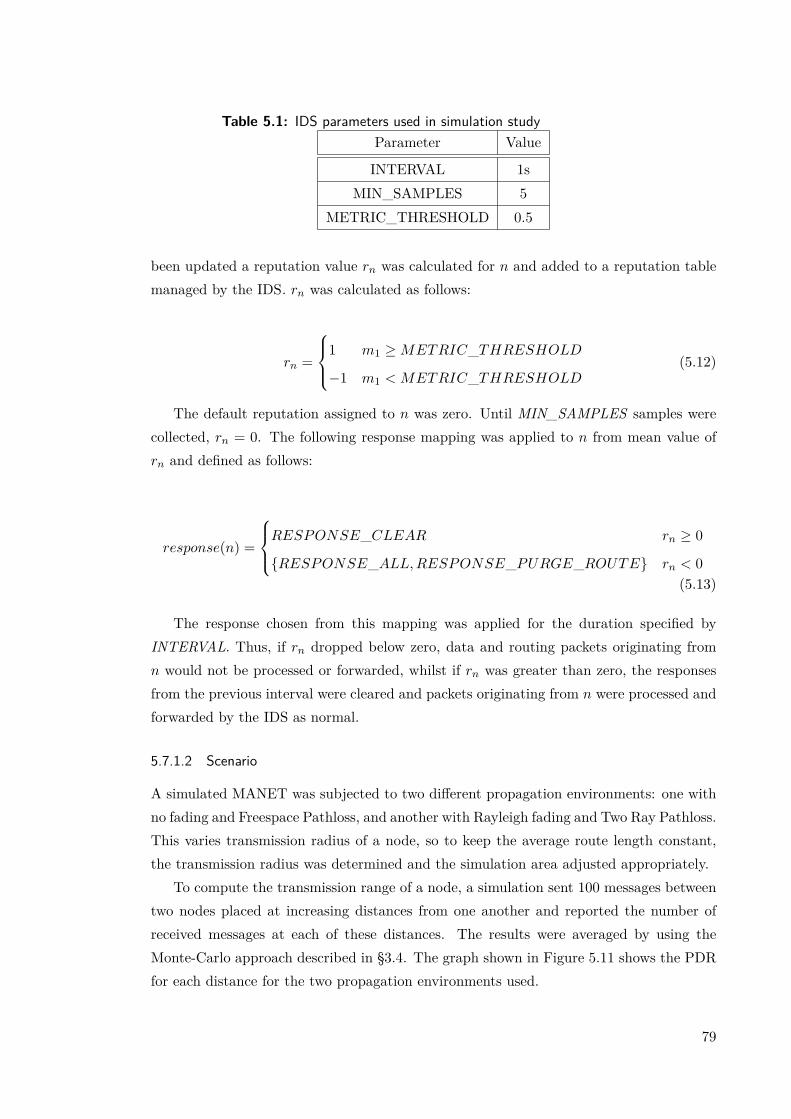
Table 5.1: IDS parameters used in simulation studyParameter Value
INTERVAL 1sMIN_SAMPLES 5
METRIC_THRESHOLD 0.5
been updated a reputation value rn was calculated for n and added to a reputation tablemanaged by the IDS. rn was calculated as follows:
rn =
1 m1 ≥METRIC_THRESHOLD
−1 m1 < METRIC_THRESHOLD(5.12)
The default reputation assigned to n was zero. Until MIN_SAMPLES samples werecollected, rn = 0. The following response mapping was applied to n from mean value ofrn and defined as follows:
response(n) =
RESPONSE_CLEAR rn ≥ 0
{RESPONSE_ALL,RESPONSE_PURGE_ROUTE} rn < 0(5.13)
The response chosen from this mapping was applied for the duration specified byINTERVAL. Thus, if rn dropped below zero, data and routing packets originating fromn would not be processed or forwarded, whilst if rn was greater than zero, the responsesfrom the previous interval were cleared and packets originating from n were processed andforwarded by the IDS as normal.
5.7.1.2 Scenario
A simulated MANET was subjected to two different propagation environments: one withno fading and Freespace Pathloss, and another with Rayleigh fading and Two Ray Pathloss.This varies transmission radius of a node, so to keep the average route length constant,the transmission radius was determined and the simulation area adjusted appropriately.
To compute the transmission range of a node, a simulation sent 100 messages betweentwo nodes placed at increasing distances from one another and reported the number ofreceived messages at each of these distances. The results were averaged by using theMonte-Carlo approach described in §3.4. The graph shown in Figure 5.11 shows the PDRfor each distance for the two propagation environments used.
79
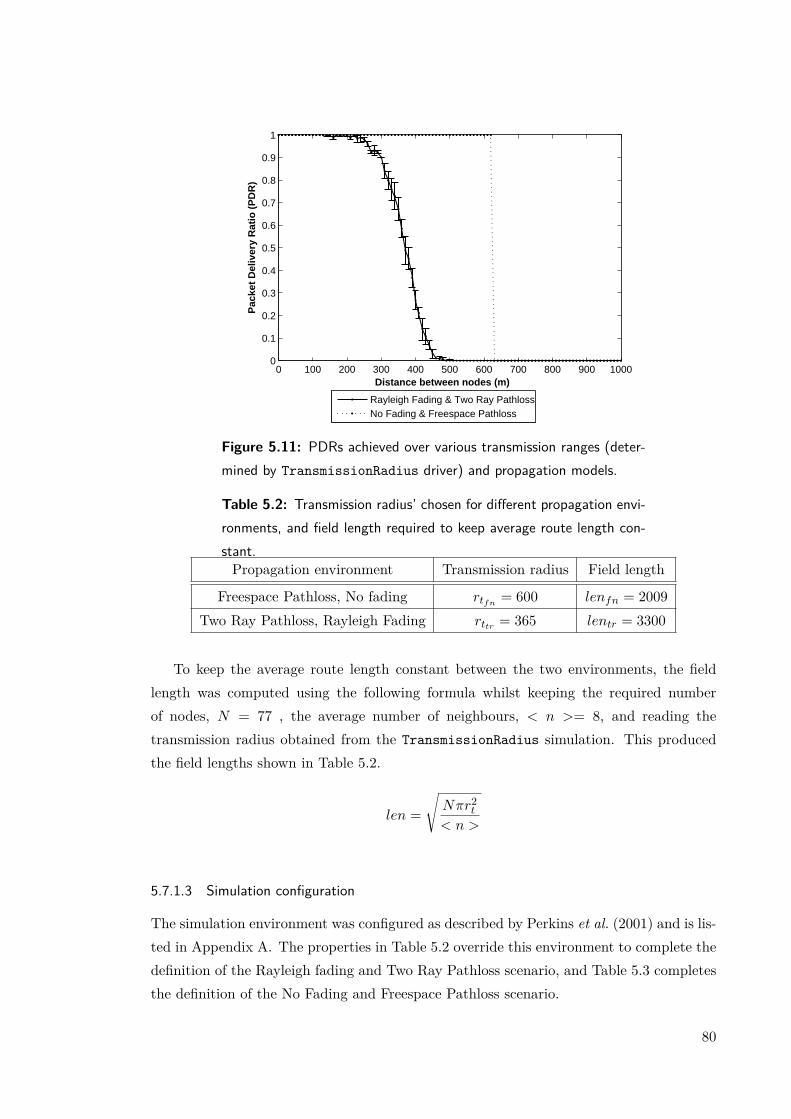
0 100 200 300 400 500 600 700 800 900 10000
0.1
0.2
0.3
0.4
0.5
0.6
0.7
0.8
0.9
1
Distance between nodes (m)
Pac
ket
Del
iver
y R
atio
(P
DR
)
Rayleigh Fading & Two Ray PathlossNo Fading & Freespace Pathloss
Figure 5.11: PDRs achieved over various transmission ranges (deter-mined by TransmissionRadius driver) and propagation models.
Table 5.2: Transmission radius’ chosen for different propagation envi-ronments, and field length required to keep average route length con-stant.Propagation environment Transmission radius Field length
Freespace Pathloss, No fading rtfn= 600 lenfn = 2009
Two Ray Pathloss, Rayleigh Fading rttr = 365 lentr = 3300
To keep the average route length constant between the two environments, the fieldlength was computed using the following formula whilst keeping the required numberof nodes, N = 77 , the average number of neighbours, < n >= 8, and reading thetransmission radius obtained from the TransmissionRadius simulation. This producedthe field lengths shown in Table 5.2.
len =
√Nπr2
t
< n >
5.7.1.3 Simulation configuration
The simulation environment was configured as described by Perkins et al. (2001) and is lis-ted in Appendix A. The properties in Table 5.2 override this environment to complete thedefinition of the Rayleigh fading and Two Ray Pathloss scenario, and Table 5.3 completesthe definition of the No Fading and Freespace Pathloss scenario.
80
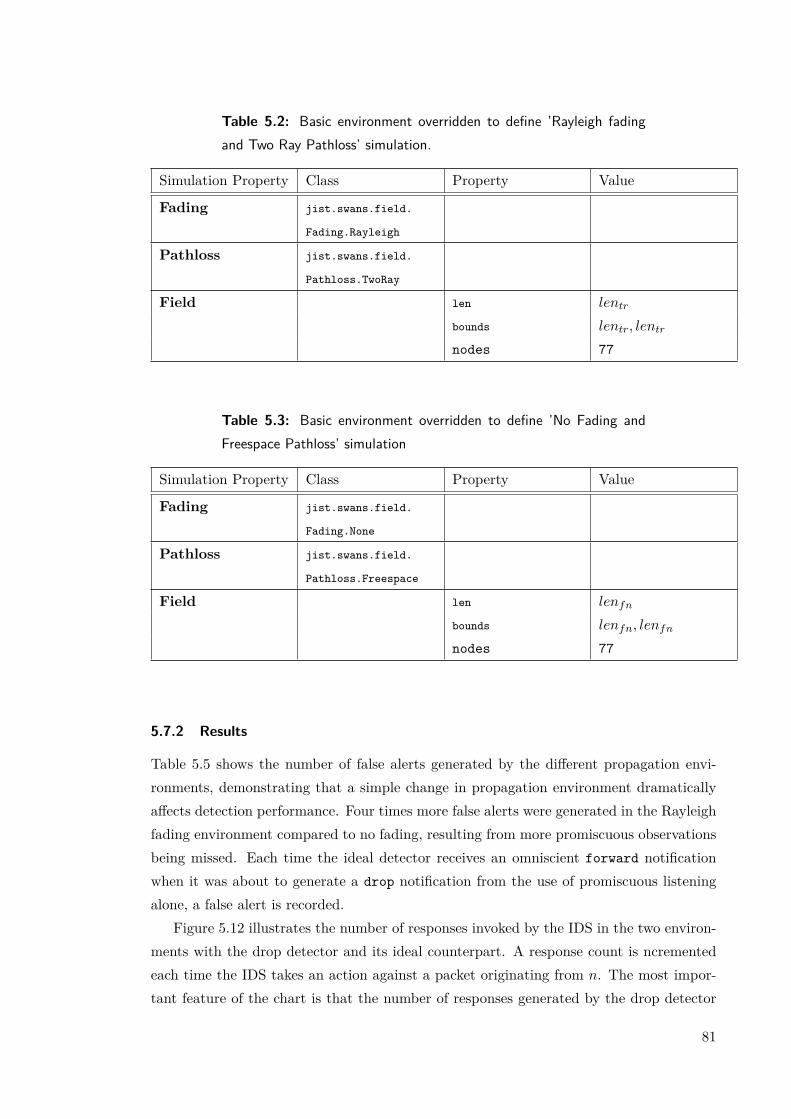
Table 5.2: Basic environment overridden to define ’Rayleigh fadingand Two Ray Pathloss’ simulation.
Simulation Property Class Property Value
Fading jist.swans.field.
Fading.Rayleigh
Pathloss jist.swans.field.
Pathloss.TwoRay
Field len lentr
bounds lentr, lentr
nodes 77
Table 5.3: Basic environment overridden to define ’No Fading andFreespace Pathloss’ simulation
Simulation Property Class Property Value
Fading jist.swans.field.
Fading.None
Pathloss jist.swans.field.
Pathloss.Freespace
Field len lenfn
bounds lenfn, lenfn
nodes 77
5.7.2 Results
Table 5.5 shows the number of false alerts generated by the different propagation envi-ronments, demonstrating that a simple change in propagation environment dramaticallyaffects detection performance. Four times more false alerts were generated in the Rayleighfading environment compared to no fading, resulting from more promiscuous observationsbeing missed. Each time the ideal detector receives an omniscient forward notificationwhen it was about to generate a drop notification from the use of promiscuous listeningalone, a false alert is recorded.
Figure 5.12 illustrates the number of responses invoked by the IDS in the two environ-ments with the drop detector and its ideal counterpart. A response count is ncrementedeach time the IDS takes an action against a packet originating from n. The most impor-tant feature of the chart is that the number of responses generated by the drop detector
81

Table 5.5: Average number of false alerts generated by detectornetwork-wide
Scenario Average false alert count Standard Deviation
Freespace Pathloss, No fading 1228.17 391.47Two Ray Pathloss, Rayleigh fading 5475.29 1055.29
0
50000
100000
150000
200000
250000
300000
Perfect detection Imperfect detection Perfect detection Imperfect detection
Tworay pathloss, Rayleigh fading Frespace pathloss, No fading
Nu
mb
er
of
resp
on
ses
ov
er
ne
two
rk l
ife
tim
e
Network Scenario
Figure 5.12: Number of responses in fading and ideal environmentusing a detector with perfect/imperfect signalling
using imperfect observations is higher in the Rayleigh fading environment as a result ofthe large number of alerts generated and this is not as a result of misbehaviour. Note thatthe response count from the ideal drop detector remains constant because the omniscientnotifications negate the effect of changing the propagation model.
These results shown that even in the absence of misbehaviour, a typical threshold basedIDS generates false positives, which increases dramatically in more challenging propaga-tion environments. These corresponded to responses entirely toward other benign nodes,as there were no misbehaving nodes present in this scenario, motivating the need foradditional reasoning in these environments.
5.8 Summary
In this chapter, a number of detection methodologies were described and implementedwithin Jist/SWANS as part of the basic services to support an intrusion detection sys-tem. The detectors used a combination of imperfect and perfect audit data, from packetsaddressed to a node, those overheard, and those to be forwarded.
A threshold IDS with an imperfect dropped detector was applied to networks withvarying propagation environments, and its performance evaluated against the same IDS
82

using a perfect dropped packet detector, demonstrating the negative effect that the prop-agation of alerts from missed observations can have on the IDS response. These effectswere much more pronounced in the challenging propagation environment as the imper-fect detector generated many more false alerts from missed observations. Thus, in morerealistic environments, the ability to reason about alerts generated by detectors is bothdesirable and necessary. In Chapter 6, an approach to reasoning about the imprecisionof certain observations provided by game theory will be explored and applied to networkscenarios.
83
CHAPTER 6
SIDS AND GAME THEORETIC REASONING
6.1 Introduction
In Chapter 5 we showed that employing an IDS that responds directly to notificationsfrom imperfect detectors can negatively affect the quality of service experienced by benignnodes within a MANET due to frequent retaliation by the IDS arising from false detec-tions. Moreover, this effect worsens with more progressively realistic radio propagationenvironments as the reliability of overhearing neighbour transmissions decreases.
This chapter investigates the use of game theory within the IDS framework discussed inthe previous chapter to develop a soft-Intrusion Detection System (sIDS) that reduces thelikelihood of retaliating from false detections. This is achieved by developing a reasoningcomponent in the form of a game that evaluates the quality of the metrics computed in§5.5 and determines if, given the evidence collected in the previous periods, a response isreally necessary.
First, the performance of each detector was studied to determine its performance,which provided the basic grouping of the metrics into two sets. Then, the metrics werecombined into a form suitable for a game formulation. Basic game theoretic definitionsand terminology used were presented in §2.5. An implementation of the game-theoreticIDS is provided for the Jist/SWANS network simulator.
6.1.1 Desirable properties for a MANET IDS
The distributed nature of MANETs requires a suitable IDS possess a number of desirableproperties, summarised in review papers by Deng et al. (2002) and Zhou & Haas (1999).Firstly, IDS should be decentralised such that each member node contributes to intrusiondetection. In fact, any critical services responsible for promoting network availability suchas certification and signing should not be centralised as doing so introduces a single pointof failure that could be targeted by the adversary to disrupt network communications. AnyIDS schemes employed should minimise the computational, memory and control overheads
84
required since MANET nodes are often energy and compute constrained and communi-cate through low bandwidth wireless links. False detection rates should be minimised topreserve quality of service, and if a response is invoked, it should be appropriate to thetype of adversary in order to incentivise it to co-operate.
sIDS applies additional reasoning in the form of a game within the IDS frameworkintroduced in Chapter 5 and incorporates a number of the desirable properties describedabove. First, detection activities are distributed to each MANET node, which processand analyse audit data independently. Secondly, minimum state is maintained by the useof a sliding window that provides an effective memory (§5.5.1.1), reducing the memoryoverheads required significantly. Thirdly, adversaries are re-introduced over time if theyare observed to have corrected their behaviour. The aim of the game theoretic componentis to reason about metric quality, which should reduce the number of false detections inthe imperfect radio medium, meeting a further desirable property.
6.2 Metric performance
The basic IDS framework introduced in Chapter 5 computes a number of metrics (m1−m8)in a recent interval for each neighbour from notifications generated by a set of detectors(§5.5) that each analyse audit data for suspected misbehaviour by neighbouring nodes.Each metric is a normalised continuous variable, so mn ∈ [0, 1]. Some of the metricsare computed from notifications by imperfect detectors and are liable to generate falsepositives in networks free of misbehaviour, whilst the remaining metrics are computedfrom notifications by perfect detectors that are guaranteed not to produce false positives.Imperfect schemes are important to provide additional information that would otherwisemake certain types of misbehaviour impossible to detect, but their ability to cause an IDSto retaliate should be lower than from perfect detection schemes. Thus we grouped eachmetric into one of two sets: mp consisting of metrics driven by perfect detectors and mi
consisting of those driven by imperfect detectors.To evaluate the set a given metric belongs to, a series of simulations were configured
as defined in Appendix A, with 100 nodes, Rayleigh fading and Two-ray pathloss. Eachnode was assigned a type from Θ = {IDS, adversary}, selected at random according tothe ratio of adversaries required. Adversaries misbehaved continuously over the period oftime ts – te where ts = 50s and te = 500s.
IDS nodes were configured with an alert-only IDS, IdsAlert.java, which employedthe full detector set described in §5.5. Detector notifications from IDS nodes and misusesfrom each adversary were logged to enable detection performance statistics to be extractedfor each detector. Each detector was configured as shown in Table 6.1.
The results in Figures 6.1–6.2 illustrate the comparative performance of the imperfect
85

Table 6.1: Scenarios and detector configuration used to evaluate theperformance of individual detectors.
Scenario Detector DetectorParameter
Value
Black Hole DETECTION_DROP timeout 1s
ModifyData
DETECTION_MODIFY timeout 1s
PassiveRouteInvasion
DETECTION_FAKE_RREP
-
ActiveRouteInvasion
DETECTION_UNSOLICITED_RREP
-
RREQFlooding
DETECTION_RREQ_FLOOD
rreqRateLimit 10
Selfish DETECTION_DROP_RREQ
timeout 0.25s
86

0 0.1 0.2 0.3 0.4 0.5 0.60
0.1
0.2
0.3
0.4
0.5
0.6
0.7
0.8
0.9
1
Ratio of adversaries
Det
ecti
on
Rat
e
drop−datamodify−datafake−rreprreq−floodunsolicited−rrepdrop−rreq
Figure 6.1: Detection rates of detection mechanisms at varying per-centages of malicious nodes when applied to scenario detailed in Table6.1
0 0.1 0.2 0.3 0.4 0.5 0.60
0.1
0.2
0.3
0.4
0.5
0.6
0.7
0.8
0.9
1
Ratio of adversaries
Fal
se P
osi
tive
Rat
e
drop−datamodify−datafake−rreprreq−floodunsolicited−rrepdrop−rreq
Figure 6.2: False positive rates of detection mechanisms at varyingpercentages of malicious nodes when applied to scenario detailed inTable 6.1
87
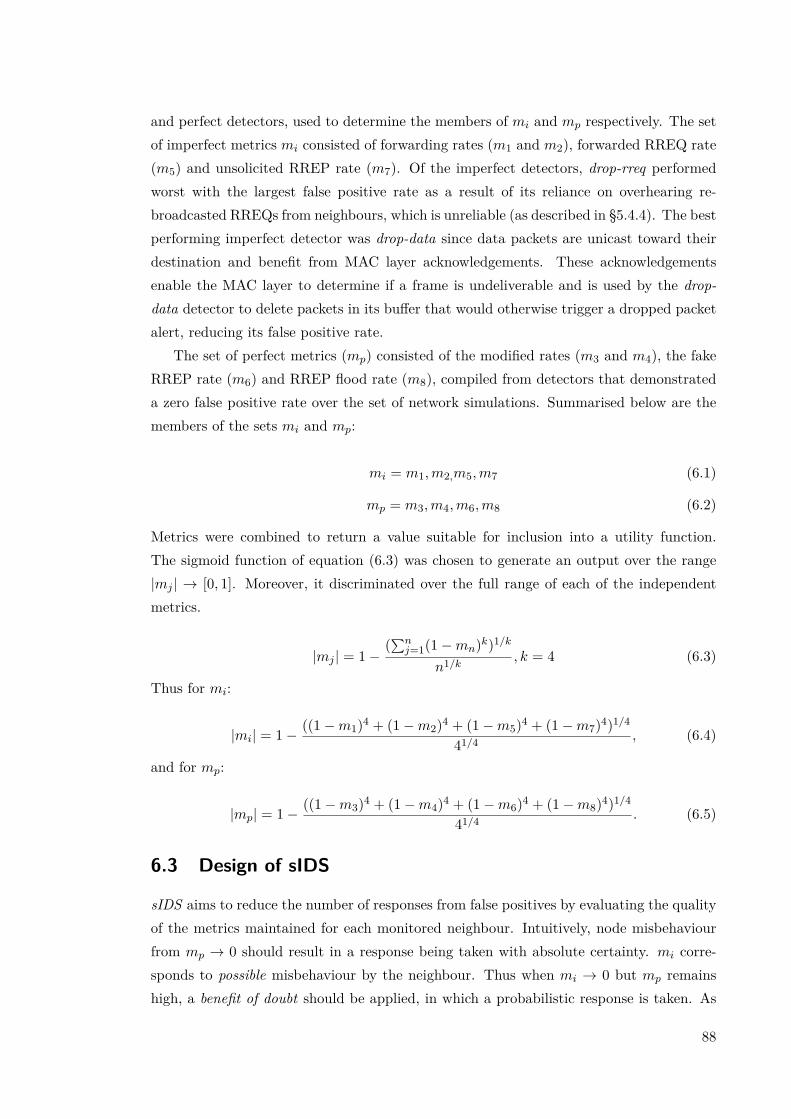
and perfect detectors, used to determine the members of mi and mp respectively. The setof imperfect metrics mi consisted of forwarding rates (m1 and m2), forwarded RREQ rate(m5) and unsolicited RREP rate (m7). Of the imperfect detectors, drop-rreq performedworst with the largest false positive rate as a result of its reliance on overhearing re-broadcasted RREQs from neighbours, which is unreliable (as described in §5.4.4). The bestperforming imperfect detector was drop-data since data packets are unicast toward theirdestination and benefit from MAC layer acknowledgements. These acknowledgementsenable the MAC layer to determine if a frame is undeliverable and is used by the drop-data detector to delete packets in its buffer that would otherwise trigger a dropped packetalert, reducing its false positive rate.
The set of perfect metrics (mp) consisted of the modified rates (m3 and m4), the fakeRREP rate (m6) and RREP flood rate (m8), compiled from detectors that demonstrateda zero false positive rate over the set of network simulations. Summarised below are themembers of the sets mi and mp:
mi = m1,m2,m5,m7 (6.1)
mp = m3,m4,m6,m8 (6.2)
Metrics were combined to return a value suitable for inclusion into a utility function.The sigmoid function of equation (6.3) was chosen to generate an output over the range|mj | → [0, 1]. Moreover, it discriminated over the full range of each of the independentmetrics.
|mj | = 1−(∑n
j=1(1−mn)k)1/k
n1/k , k = 4 (6.3)
Thus for mi:
|mi| = 1− ((1−m1)4 + (1−m2)4 + (1−m5)4 + (1−m7)4)1/4
41/4 , (6.4)
and for mp:
|mp| = 1− ((1−m3)4 + (1−m4)4 + (1−m6)4 + (1−m8)4)1/4
41/4 . (6.5)
6.3 Design of sIDS
sIDS aims to reduce the number of responses from false positives by evaluating the qualityof the metrics maintained for each monitored neighbour. Intuitively, node misbehaviourfrom mp → 0 should result in a response being taken with absolute certainty. mi corre-sponds to possible misbehaviour by the neighbour. Thus when mi → 0 but mp remainshigh, a benefit of doubt should be applied, in which a probabilistic response is taken. As
88

mi
mp
1
10
αr
p=0
p=1
0<p<1
β
β
p→0 Do not process : respondp→1 Process neighbours packets
0
Figure 6.3: Phase-space of desired sIDS operation, where mi is thecalculated value from the set of imperfect metrics and mp is the calcu-lated value from the set of perfect metrics for an observed neighbour.p is the probability of processing the packet. If p→ 0, sIDS respondswhilst if p→ 1, sIDS processes the neighbour’s packets. Constants αrand β control the thresholds at which respond or process is selectedrespectively.
mp decreases, the benefit of doubt given to the neighbour diminishes. If mp and mi areboth above a certain value, the monitoring node processes the neighbour’s packet withcertainty.
Figure 6.3 represents the desired behaviour as a phase space diagram, resulting in threedistinct domains and the IDS choosing the following action over combinations of mp andmi:
action =
Process 0 < mp < αr
Respond β < mp,mi < 1
mix(Process,Respond) otherwise
(6.6)
A game was designed to provide these modes of operation in which the IDS chooses anaction based on its payoff given the current values of mp and mi for monitored neighbours.
89
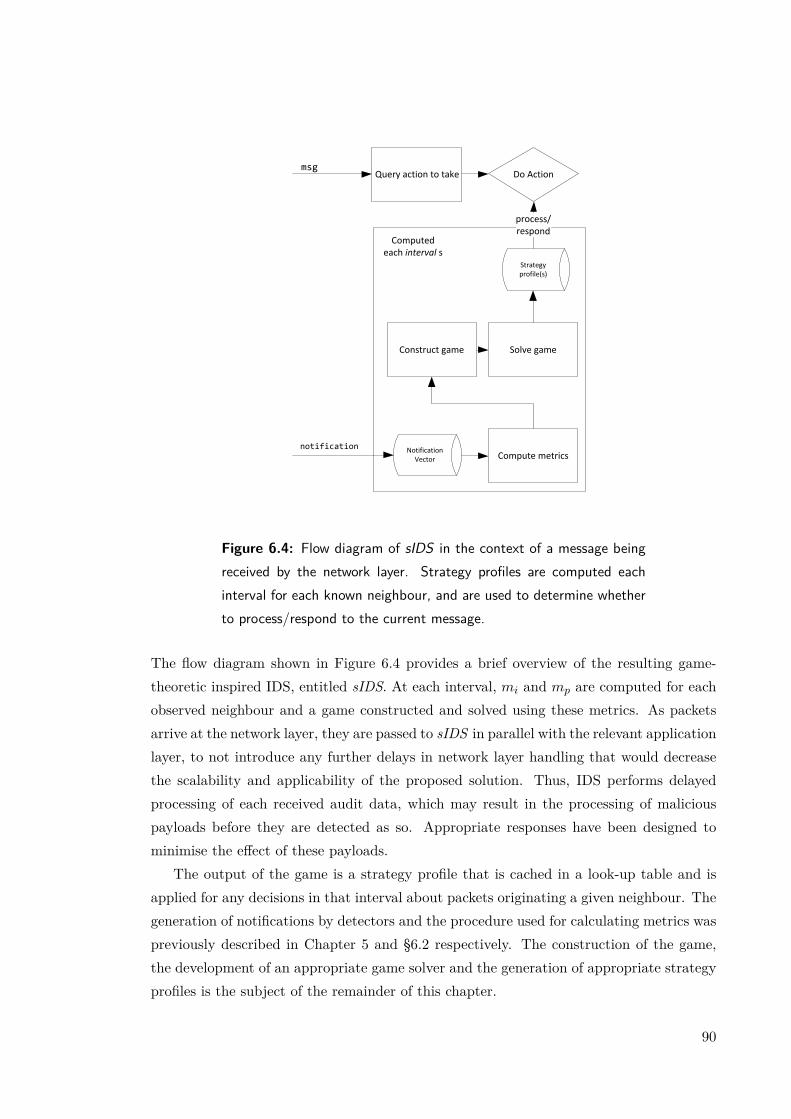
Query action to takemsg
Compute metrics
Construct game Solve game
Strategy profile(s)
Computed each interval s
process/respond
Notification Vector
notification
Do Action
Figure 6.4: Flow diagram of sIDS in the context of a message beingreceived by the network layer. Strategy profiles are computed eachinterval for each known neighbour, and are used to determine whetherto process/respond to the current message.
The flow diagram shown in Figure 6.4 provides a brief overview of the resulting game-theoretic inspired IDS, entitled sIDS. At each interval, mi and mp are computed for eachobserved neighbour and a game constructed and solved using these metrics. As packetsarrive at the network layer, they are passed to sIDS in parallel with the relevant applicationlayer, to not introduce any further delays in network layer handling that would decreasethe scalability and applicability of the proposed solution. Thus, IDS performs delayedprocessing of each received audit data, which may result in the processing of maliciouspayloads before they are detected as so. Appropriate responses have been designed tominimise the effect of these payloads.
The output of the game is a strategy profile that is cached in a look-up table and isapplied for any decisions in that interval about packets originating a given neighbour. Thegeneration of notifications by detectors and the procedure used for calculating metrics waspreviously described in Chapter 5 and §6.2 respectively. The construction of the game,the development of an appropriate game solver and the generation of appropriate strategyprofiles is the subject of the remainder of this chapter.
90
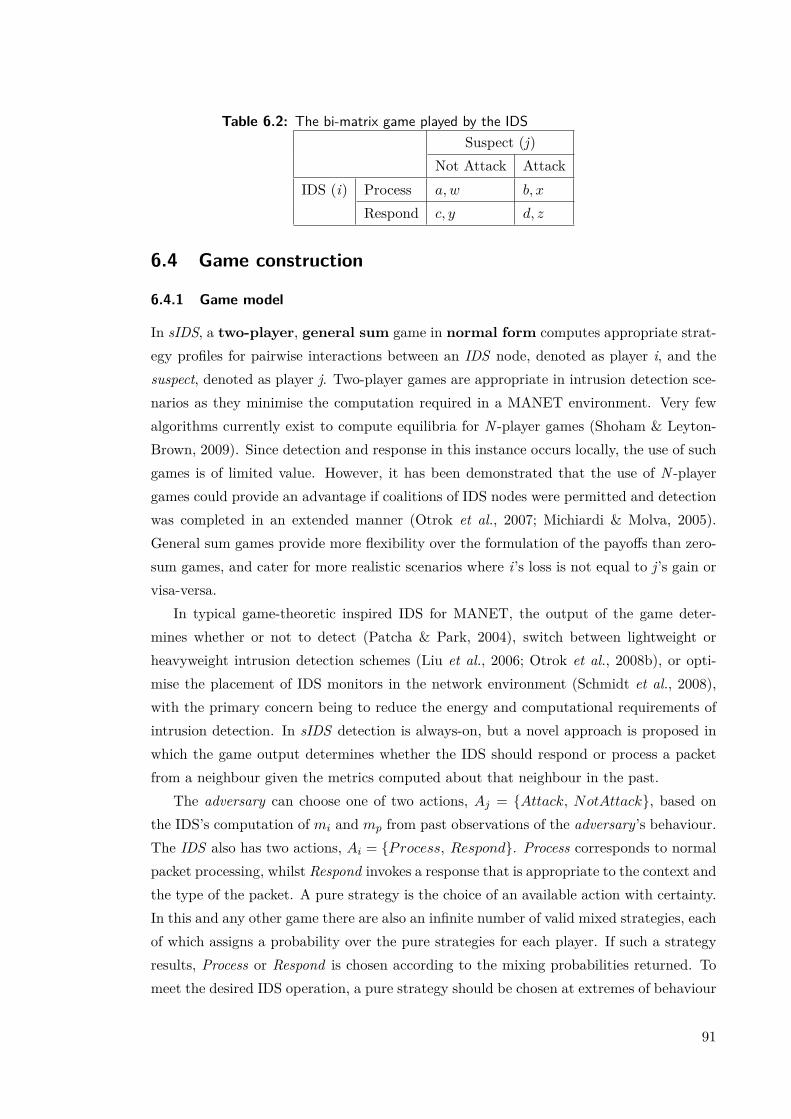
Table 6.2: The bi-matrix game played by the IDSSuspect (j)
Not Attack AttackIDS (i) Process a,w b, x
Respond c, y d, z
6.4 Game construction
6.4.1 Game model
In sIDS, a two-player, general sum game in normal form computes appropriate strat-egy profiles for pairwise interactions between an IDS node, denoted as player i, and thesuspect, denoted as player j. Two-player games are appropriate in intrusion detection sce-narios as they minimise the computation required in a MANET environment. Very fewalgorithms currently exist to compute equilibria for N -player games (Shoham & Leyton-Brown, 2009). Since detection and response in this instance occurs locally, the use of suchgames is of limited value. However, it has been demonstrated that the use of N -playergames could provide an advantage if coalitions of IDS nodes were permitted and detectionwas completed in an extended manner (Otrok et al., 2007; Michiardi & Molva, 2005).General sum games provide more flexibility over the formulation of the payoffs than zero-sum games, and cater for more realistic scenarios where i’s loss is not equal to j’s gain orvisa-versa.
In typical game-theoretic inspired IDS for MANET, the output of the game deter-mines whether or not to detect (Patcha & Park, 2004), switch between lightweight orheavyweight intrusion detection schemes (Liu et al., 2006; Otrok et al., 2008b), or opti-mise the placement of IDS monitors in the network environment (Schmidt et al., 2008),with the primary concern being to reduce the energy and computational requirements ofintrusion detection. In sIDS detection is always-on, but a novel approach is proposed inwhich the game output determines whether the IDS should respond or process a packetfrom a neighbour given the metrics computed about that neighbour in the past.
The adversary can choose one of two actions, Aj = {Attack, NotAttack}, based onthe IDS’s computation of mi and mp from past observations of the adversary’s behaviour.The IDS also has two actions, Ai = {Process, Respond}. Process corresponds to normalpacket processing, whilst Respond invokes a response that is appropriate to the context andthe type of the packet. A pure strategy is the choice of an available action with certainty.In this and any other game there are also an infinite number of valid mixed strategies, eachof which assigns a probability over the pure strategies for each player. If such a strategyresults, Process or Respond is chosen according to the mixing probabilities returned. Tomeet the desired IDS operation, a pure strategy should be chosen at extremes of behaviour
91

whilst a mixed strategy would be employed when the IDS observes the adversary asdemonstrating possible misbehaviour.
The resulting bi-matrix game implemented by the IDS for players i and j is shown inTable 6.2. Utility functions for players i and j (ui and uj respectively) were constructed,describing the preferences of the IDS and suspect, and have been designed to ensure themodes of operation emerge as described in §6.3.
6.4.2 Construction of utility functions
To construct the utility functions for the IDS and the adversary, common game types wereevaluated for properties that matched expected behaviour of both types of nodes in thethree regions of the phase space shown in Figure 6.3. In these regions, the inequalitiesbetween payoffs differ, resulting in an appropriate game solution.
mp < αr
If mp falls below αr, the IDS would prefer to play Respond and knowing this, a rationaladversary would always choose Not Attack. Thus, the IDS plays the pure strategy Respondregardless of the adversary’s action. In this case, Process is dominated by Respond, andAttack is dominated by Not Attack. The resulting game is shown in Table 6.3.
In order to produce this game, the following inequalities in the utility functions withinthe domain mp < αr are required:
c > a, d > b, w > x, y > z (6.7)
mp,mi > β
If mp and mi are both greater than β, the IDS would prefer to choose Process and therational adversary would always choose Attack. Thus, the IDS plays the pure strategyProcess regardless of the adversary’s action. In this case Respond is dominated by Process,and Not Attack is dominated by Attack. The game played in this domain is shown in Table6.4, and requires the inequalities in the utility functions within the domain mp,mi > β
shown in Equation 6.8.
a > c, b > d, x > w, z > y (6.8)
αr ≥ mp ≤ β, mi < β
In this domain, there should be no pure strategy equilibrium for the IDS. Instead, adiscoordination game emerges where the preferences for the IDS and adversary are directlyopposed to one another (Rasmusen, 2001). From the perspective of the IDS the preferredstrategy combinations are (1) Process when Not Attack, and (2) Respond when Attack.
92
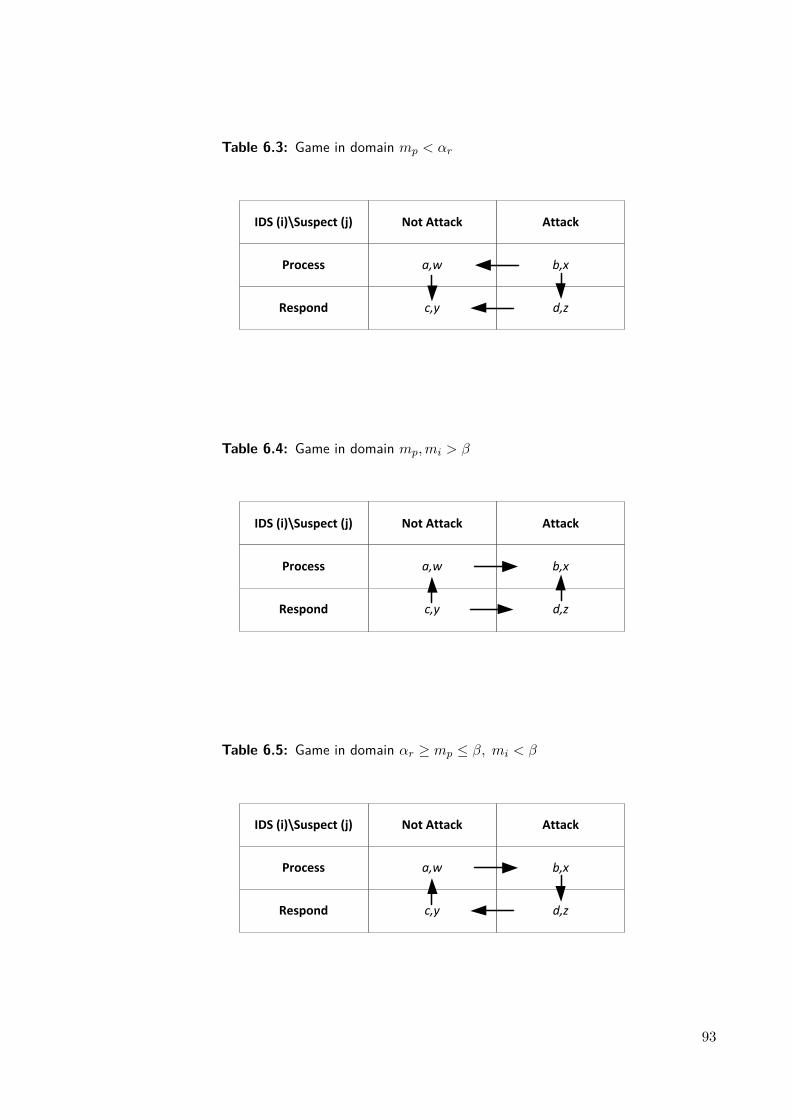
Table 6.3: Game in domain mp < αr
IDS (i)\Suspect (j)
Process
Respond
Not Attack
a,w
c,y
Attack
b,x
d,z
Table 6.4: Game in domain mp,mi > β
IDS (i)\Suspect (j)
Process
Respond
Not Attack
a,w
c,y
Attack
b,x
d,z
Table 6.5: Game in domain αr ≥ mp ≤ β, mi < β
IDS (i)\Suspect (j)
Process
Respond
Not Attack
a,w
c,y
Attack
b,x
d,z
93

From the suspect’s perspective, as a malicious node, the preferred strategy combinationsare (1) Attack when Process, and (2) Not Attack when Respond. The game played in thisdomain is shown in Table 6.5 and requires the following inequalities in the utility functionswithin the domain αr ≥ mp ≤ β, mi < β:
a > c, d > b, x > w, y > z (6.9)
A desirable property of a discoordination game is that there is a single equilibriumin mixed strategies, whose mixing probabilities are defined by the cardinal values of thepayoffs (Rasmusen, 2001). Thus, as long as the preference structure is kept intact byenforcing the inequalities specified in Equation 6.9, the ratios between the absolute payoffscan be adjusted to result in an appropriate strategy mixture. This is further exploited toprovide a benefit of doubt to an adversary, which falls in this mode of operation.
6.4.2.1 Finalisation of utility functions
The utility functions were developed further from the conditions of §6.4.2 to provide abenefit of doubt factor to those nodes who an IDS observes as having low mi but highmp and is represented by γ, increasing the benefit of the doubt as γ decreased, and visa-versa. Following this, numerical experiments were run using the payoff equating method ofRasmusen (2001) to identify suitable candidates for the utility function whilst preservingeach inequality. This method yields the probabilities p and q that correspond to the mixedstrategies employed by the IDS and adversary respectively:
p = d−b(d−b)+(a−c) , q = z−y
(z−y)+(w−x) (6.10)
The absolute values of a, b, c and d were manipulated until the desired distribution ofp was obtained. An instance of this distribution with tuning parameters αr, β and γ isshown in Figure 6.5. The regions where p < 0 and p > 1, though impossible, show thecombinations of mp and mi that offer only the required pure strategy solution.
6.4.3 Game bi-matrix
The game implemented in sIDS is shown in Table 6.6. It assumes the adversary is rationalfrom the perspective of the IDS and has preferences that stay constant through the game.The adversary always prefers to (1) Attack when Process and (2) Not Attack when Respond.Since we wanted to manipulate the mixed strategy over Process or Respond obtained bythe IDS, the utility function of the adversary (in the game played at the IDS) contains mi
and mp.If a game were to be played by the adversary, its own utility function would not contain
mi andmp as these are private to the IDS. Instead, the adversary would make observations
94

00.2
0.40.6
0.81
0
0.5
1
0
0.2
0.4
0.6
0.8
1
mi
mp
0
0.1
0.2
0.3
0.4
0.5
0.6
0.7
0.8
0.9
1
γ
0 0.1 0.2 0.3 0.4 0.5 0.6 0.7 0.8 0.9 10
0.1
0.2
0.3
0.4
0.5
0.6
0.7
0.8
0.9
1
mi
mp
0
0.1
0.2
0.3
0.4
0.5
0.6
0.7
0.8
0.9
1
β
β
αr
Figure 6.5: Distribution of p for various mi and mp, where αr = 0.2,β = 0.7 and γ = 0.5. Notice that p < 0 for mp < αr and p > 1 formp,mi > β produces appropriate pure strategy solutions.
95
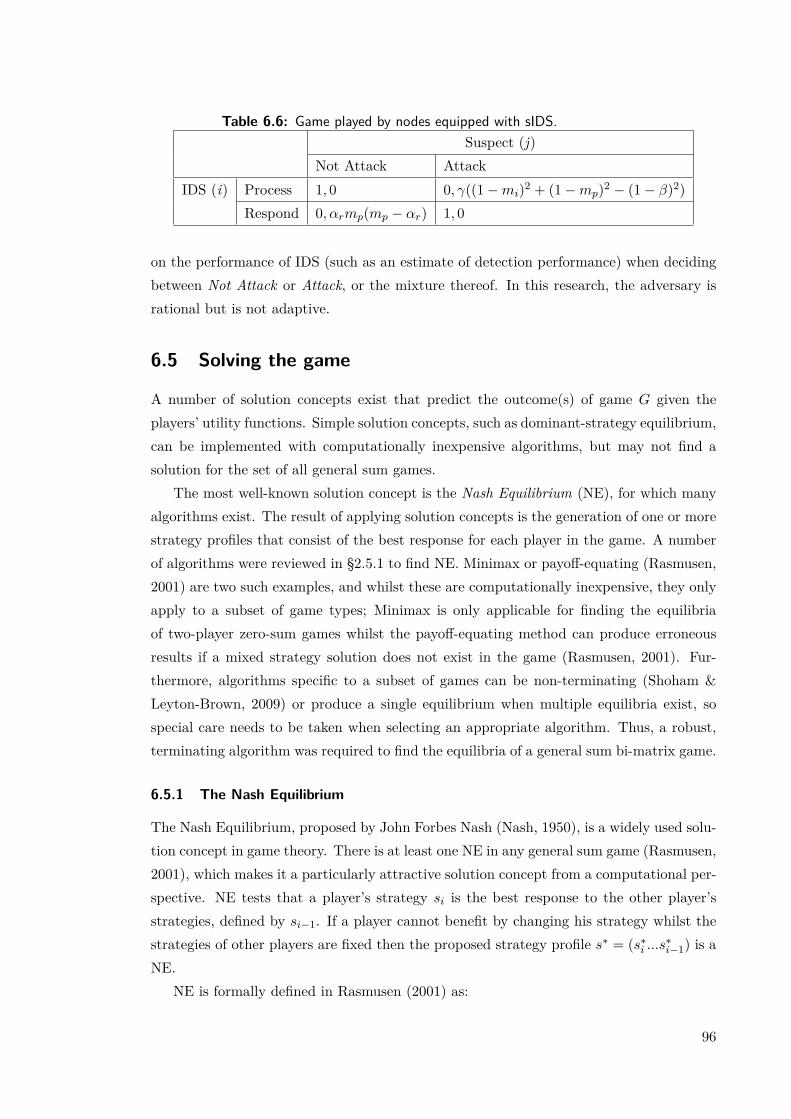
Table 6.6: Game played by nodes equipped with sIDS.Suspect (j)
Not Attack AttackIDS (i) Process 1, 0 0, γ((1−mi)2 + (1−mp)2 − (1− β)2)
Respond 0, αrmp(mp − αr) 1, 0
on the performance of IDS (such as an estimate of detection performance) when decidingbetween Not Attack or Attack, or the mixture thereof. In this research, the adversary isrational but is not adaptive.
6.5 Solving the game
A number of solution concepts exist that predict the outcome(s) of game G given theplayers’ utility functions. Simple solution concepts, such as dominant-strategy equilibrium,can be implemented with computationally inexpensive algorithms, but may not find asolution for the set of all general sum games.
The most well-known solution concept is the Nash Equilibrium (NE), for which manyalgorithms exist. The result of applying solution concepts is the generation of one or morestrategy profiles that consist of the best response for each player in the game. A numberof algorithms were reviewed in §2.5.1 to find NE. Minimax or payoff-equating (Rasmusen,2001) are two such examples, and whilst these are computationally inexpensive, they onlyapply to a subset of game types; Minimax is only applicable for finding the equilibriaof two-player zero-sum games whilst the payoff-equating method can produce erroneousresults if a mixed strategy solution does not exist in the game (Rasmusen, 2001). Fur-thermore, algorithms specific to a subset of games can be non-terminating (Shoham &Leyton-Brown, 2009) or produce a single equilibrium when multiple equilibria exist, sospecial care needs to be taken when selecting an appropriate algorithm. Thus, a robust,terminating algorithm was required to find the equilibria of a general sum bi-matrix game.
6.5.1 The Nash Equilibrium
The Nash Equilibrium, proposed by John Forbes Nash (Nash, 1950), is a widely used solu-tion concept in game theory. There is at least one NE in any general sum game (Rasmusen,2001), which makes it a particularly attractive solution concept from a computational per-spective. NE tests that a player’s strategy si is the best response to the other player’sstrategies, defined by si−1. If a player cannot benefit by changing his strategy whilst thestrategies of other players are fixed then the proposed strategy profile s∗ = (s∗i ...s∗i−1) is aNE.
NE is formally defined in Rasmusen (2001) as:
96

Definition. ∀i, πi(s∗i , s∗−i) ≥ πi(s′i, s∗−i),∀s′i.
The resulting equilibria can be in terms of pure or mixed strategies. For a pure strategyNE:
Definition. The strategy profile s∗i , ...., s∗N is a NE if for each i, s∗i is a best response tothe other players choices s∗−i.
For a mixed strategy NE:
Definition. The mixed strategy profile p∗i , ...., p∗N is a NE if for each player i, p∗i is a bestresponse to the other players choices p∗−i.
A pure strategy states that a player should play the given strategy with certainty,whilst a mixed strategy states the mixing probabilities that players should assign to theirpure strategies, thus pi(si) is the probability i assigns to the pure strategy si.
6.5.2 Methods to find Nash Equilibria
A number of algorithms exist to find sample NE in two player games. The NE of abi-matrix zero sum game can be found by applying the Simplex algorithm, in which thegame is expressed as an optimisation problem within a linear program (Shoham & Leyton-Brown, 2009). Simplex is a pivoting algorithm that operates over a linear program in whichthe payoff matrices for both players have been transformed into a system of equations.
More challenging is finding the NE of a general sum bi-matrix game, which is no longera straightforward optimisation problem and cannot be represented as a linear program.Instead general sum games can be represented as a Linear Complementarity Problem(LCP) and the Lemke-Howson (LH) algorithm employed. LH guarantees to find sampleequilibria in a problem (Shoham & Leyton-Brown, 2009). The complexity class of LH isPPAD-complete (Polynomial Parity Arguments on Directed graphs) and means comput-ing the equilibria by LH can take exponential time depending on the size of the game(Roughgarden et al., 2007). Even though this is the case, few algorithms are as flexibleor provide guarantees on producing Nash Equilibria as LH, making it appropriate for usewithin the game theoretic component of sIDS.
Lastly, and most challenging is to compute equilibria for general sum N -player games,which cannot even be represented as an LCP. Shoham & Leyton-Brown (2009) and Widger& Grosu (2009) propose the use of a sequence of LCPs (SLCP) which each correspond toan approximation of the problem and have designed a parallel NE enumeration algorithmsuitable for use on multi-core architectures.
97

Table 6.7: Sample game where mi = 0.7, mp = 0.5, αr = 0.2,β = 0.7 and γ = 0.5.
Suspect (j)Not Attack Attack
IDS (i) Process (p) 1, 0 0, 0.125Respond (1− p) 0, 0.15 1, 0
Table 6.8: Payoff matrices A and B used in tableaux constructionA Not Attack Attack
Process 1 0Respond 0 1
B Not Attack Attack
Process 0 0.125Respond 0.15 0
6.5.3 Generating Nash Equilibria using the Lemke-Howson algorithm
The Lemke-Howson algorithm (Lemke & J. T. Howson, 1964) finds NE on LCP formula-tions of a general-sum game and is similar in principle to the Simplex algorithm (Pritchard,2007) as it uses iterated pivoting. The algorithm was implemented as a component withinJist/SWANS and computes a number of NE for payoff matrices of players i and j. Inter-nally, the tableaux method described by Pritchard (2007) is used, which employs four stepsto find the NE in the game. In this section these steps are described for an instance of thegame developed in §6.4.3 shown in Table 6.7 to illustrate the operation of the algorithm.
6.5.3.1 Pre-processing
The bi-matrix game is first separated into payoff matrices A and B for players i and j
respectively as shown in Table 6.8. To ensure the game satisfies the conditions required byLH, the payoff matrices cannot contain any negative values, thus a suitably large constantC is added to each entry. This keeps both the ordinality and cardinality of the preferencesintact so the same equilibria will be computed from the pre-processed payoff matrices.
6.5.3.2 Initialising tableaux
Two tableaux are required for the two players in order to solve the game. The term ri isthe slack in the constraint Ay ≤ 1 and sj is the slack in the constraint xTBj ≤ 1, so thefollowing system is obtained:
Ay + r = 1BTx+ s = 1
(6.11)
Thus, the tableaux required are r = 1 − Ay, stated as Tableaux A and s = 1 − BTx
stated as Tableaux B:Tableaux A:
98

r1 = 1− y3
r2 = 1− y4(6.12)
Tableaux B:
s3 = 1− 0.15x2
s4 = 1− 0.125x1(6.13)
The r terms are the duals of the x’s, whilst the s’s are the duals of the y terms, alsoknown as the slack variables in the system.
6.5.3.3 Pivoting
The pivoting process starts by arbitrarily choosing a variable xi from the tableaux to bringinto the basis. Then, a minimum ratio test determines the slack variable (or dual) to beremoved by considering the coefficients of xi, and the equation for the slack variable justremoved is solved. The remaining equations are then solved in the chosen tableaux. Thedual which left the basis determines the variable to enter the basis next.
The variable x1is arbitrarily brought in, so by the minimum ratio test, s4 leaves thebasis, and solving s4 for x1 gives the following equation:
x1 = −0.125s4 + 8 (6.14)
The variable x1 is substituted into the remaining equations of Tableaux B, to produce:
s3 = 1− 0.15x2
x1 = −8s4 + 8(6.15)
Since s4 is y4’s dual, y4 is brought in, and the pivoting process occurs once more,modifying Tableaux A in the process.
The procedure terminates when the initial variable chosen to enter the basis, xi, or itsdual, leaves. The resulting tableaux from this iterated pivoting are:
Tableaux A:
y3 = 1− r1
y4 = 1− r2(6.16)
Tableaux B:
x2 = 6.67− 6.67s3
x1 = 8− 8s4(6.17)
99

6.5.3.4 Nash Equilibria
To read the NE from the tableaux, the slack variables rn and sn are set to 0 and theresulting values in xn and yn are expressed as probabilities, resulting in the final form ofthe NE. Thus, Tableaux A becomes:
y3 = 1y4 = 1
(6.18)
and Tableaux B becomes:
x2 = 6.67x1 = 8
(6.19)
This results in the following Nash Equilibrium:
NE =[
x1x1 + x2
,x2
x1 + x2,
y3y3 + y4
,y4
y3 + y4
](6.20)
NE = [0.545, 0.455, 0.5, 0.5] (6.21)
Thus p = 0.545 and q = 0.5. To find additional equilibrium points (if any more exist),this process (§6.5.3.1–6.5.3.4) is repeated and a different initial variable xi is chosen. Ifthe solution differs from those currently in the list, it is added to the set of equilibria.
6.5.3.5 Validation of Lemke-Howson algorithm
In order to test the correctness the implementation of LH in Jist/SWANS, several general-form games with well-known results were created and the algorithm applied to generate thecorresponding NEs. The expected NEs were computed by hand, through the game theorysolver Gambit (McKelvey et al., 2010), or from published results in the game-theoreticliterature. The results obtained by the implementation of LH described above coincidedwith the expected results, and are shown in Appendix H.
6.5.4 Lemke-Howson algorithm applied to the game
The plots shown in Figure 6.6 show the distribution of p, the probability of the IDSchoosing Process, for various mi and mp when the game of §6.6 is solved using the LHalgorithm. The distribution corresponds to that achieved from the payoff-equating method(Figure 6.5), but the LH algorithm selects the relevant pure strategy equilibrium whenmp < αr and mp,mi > β.
The game solver produces an array of equilibria that correspond to strategy profilesspecifying a probability for each action over the IDS and adversaries’ action set, Ai and Aj .In this case, there is a single equilibrium in mixed or pure strategies for any combination of
100
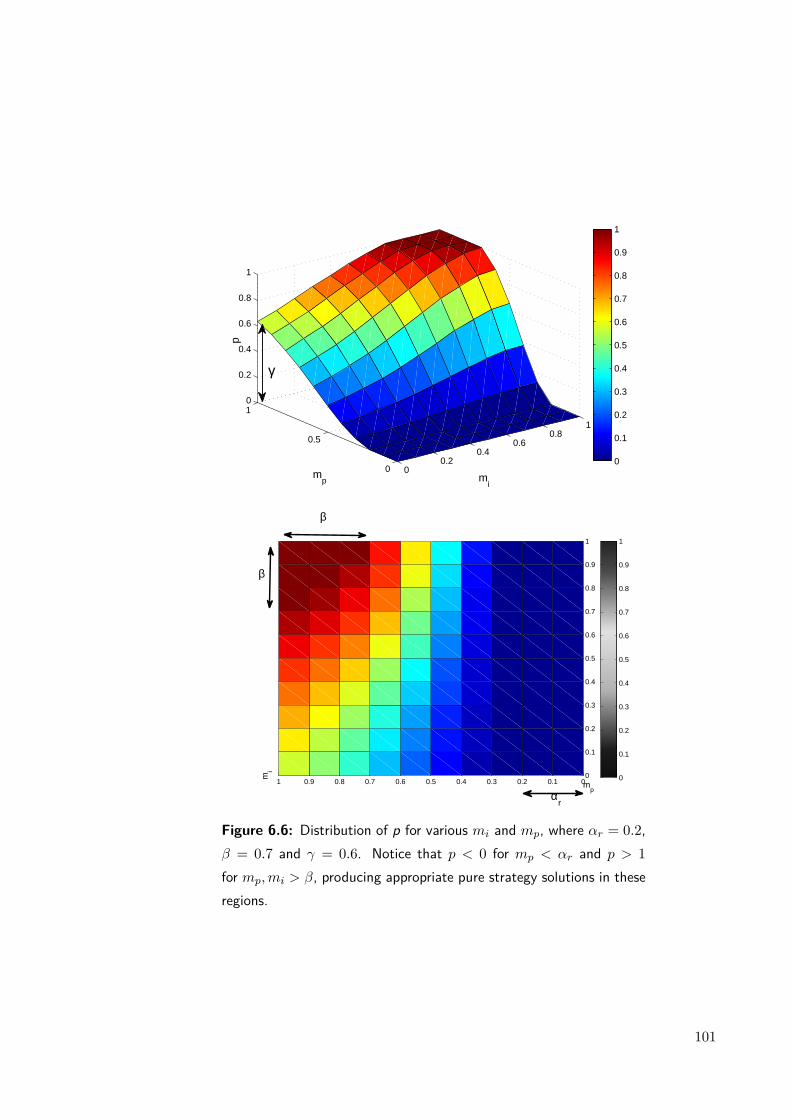
00.2
0.40.6
0.81
0
0.5
10
0.2
0.4
0.6
0.8
1
mi
mp
p
0
0.1
0.2
0.3
0.4
0.5
0.6
0.7
0.8
0.9
1
γ
0
0.1
0.2
0.3
0.4
0.5
0.6
0.7
0.8
0.9
1
00.10.20.30.40.50.60.70.80.91
mp
mi
0
0.1
0.2
0.3
0.4
0.5
0.6
0.7
0.8
0.9
1
β
β
αr
Figure 6.6: Distribution of p for various mi and mp, where αr = 0.2,β = 0.7 and γ = 0.6. Notice that p < 0 for mp < αr and p > 1for mp,mi > β, producing appropriate pure strategy solutions in theseregions.
101
mp ∈ [0, 1] and mi ∈ [0, 1]. The strategy profile is cached in a look-up table and refreshedeach interval. In the period between intervals, the pre-computed cached profile is consultedeach time the network layer queries the IDS, to prevent additional computational burdenfrom applying the LH algorithm.
6.5.5 Responses
The output of the Lemke-Howson algorithm is a NE that defines the best response for theIDS to take given the current observations mp and mi for each known neighbour. TheNE defines a probability distribution over which Process or Respond should be chosen bythe IDS. The send and receive processes of an IDS-equipped network layer queries theaction it should take for each packet and responds in a manner appropriate to the currentpacket context (i.e. send/receive or forward) and type.
For this thesis, these responses are simple, but are effective for countering a largenumber of attacks, and are chosen from those described in §5.6. These responses areeither reactive and apply on a per-packet basis, if a packet meets a given criteria, such asRESPONSE_IGNORE_DATA and RESPONSE_IGNORE_ROUTING, or, in the caseof RESPONSE_PURGE_ROUTE are applied proactively at the start of the interval whenthe appropriate strategy mixture has been computed.
6.6 Simulation configuration
Network simulations were used to compare the performance of the game theoretic IDS rel-ative to a baseline non-adaptive, threshold-based IDS. In addition, defenceless and omni-scient networks were simulated to provide lower and upper bounds for the adopted metrics.Metrics were generated by post-processing the network trace output by Jist/SWANS witha number of scripts (described in §3.3), driven by the Monte-Carlo method introduced in§3.4, which terminated a study (the scenario and choice of independent variables) onlywhen the metric(s) under observation had converged. This reduced the number of runsrequired, although a minimum of five simulation runs per study was specified to preventearly convergence.
A number of attacking scenarios were defined to have a broad range of local anddistributed attacks. These are listed in Table 6.18. The environment detailed in AppendixA was used in each case. This section introduces the network model, the environmentalparameters and node models used during network simulation. The scenarios used toevaluate the performance of the game theoretic IDS are also detailed.
102
6.6.1 Network Model
The simulated MANET is represented by the directed graphG(V,E), where V = {v0, ...., Vm}is the set of MANET nodes and E = {e0, ...., En} is the set of directed links between thenodes. At simulation initialisation, t = 0s, the members of V are partitioned into twosubsets: Vi is the set of IDS nodes, Vj the set of adversarial nodes. Membership of thesesubsets is decided at runtime by randomly selecting nodes according to the percentage ofadversaries required, an independent variable controlled during simulation. Once nodes areassigned to Vi and Vj , the relevant protocol stack is created and they remain a permanentmember of the subset for the duration of the simulation.
An edge en connects two vertices vm and vn if vm is able to communicate with vn,thus (vn, vm) ∈ E. Communication is asymmetric due to the use of Rayleigh fading, thusthe reverse, (vm, vn) ∈ E, is not always true. A node vi is able to overhear packets thatoriginate from node vj destined to vk if vj is in range of vi.
6.2 Node models
A number of protocol stacks were developed to define the simulated models of defenceless,omniscient, IDS and adversary nodes. In each of the following cases only the networkand routing layer instances differ between the types of node, but the full protocol stacksare presented for completeness. The source code for the layers used by each of the nodemodels can be obtained by following the instructions in Appendix D.
Adversaries
Adversaries were created with the RouteAodvMultiInterfaceAdversary router and NetIp-
Adversary network layer. The adversarial routing layer provided a number of methodsused to control misbehaviour during simulation (listed in Table G.1), whilst the networklayer maintained a number of data structures used by the adversary during intrusion, suchas an up-to-date list of neighbours and active data flows. The protocol stack of a simulatedadversary is presented in Table 6.9).
Defenceless nodes
Defenceless nodes were created with the validated RouteAodvMultiInterface AODVrouter and the network layer, NetIp, and are represented by the protocol stack shownin Table 6.10.
IDS nodes
Each IDS node was created with the NetIpIds network layer and RouteAodvMulti-
InterfaceIds router and both provide a respond method that is invoked by the IDS when
103

Table 6.9: Jist/SWANS simulated adversary node protocol stack
pkiddie.app.AppUdp
pkiddie.trans.TransUdp
pkiddie.radio.RadioNoiseIndep
pkiddie.mac.Mac802_11
pkiddie.net.NetIpAdversary
pkiddie.route.RouteAodvAdversary
Application
Transport
Physical
Mac
Network
Routing
Table 6.10: Jist/SWANS simulated defenceless node protocol stack
pkiddie.app.AppUdp
pkiddie.trans.TransUdp
pkiddie.radio.RadioNoiseAdditive
pkiddie.mac.Mac802_11
pkiddie.net.NetIp
pkiddie.route.RouteAodvMultiInterface
Application
Transport
Physical
Mac
Network
Routing
104
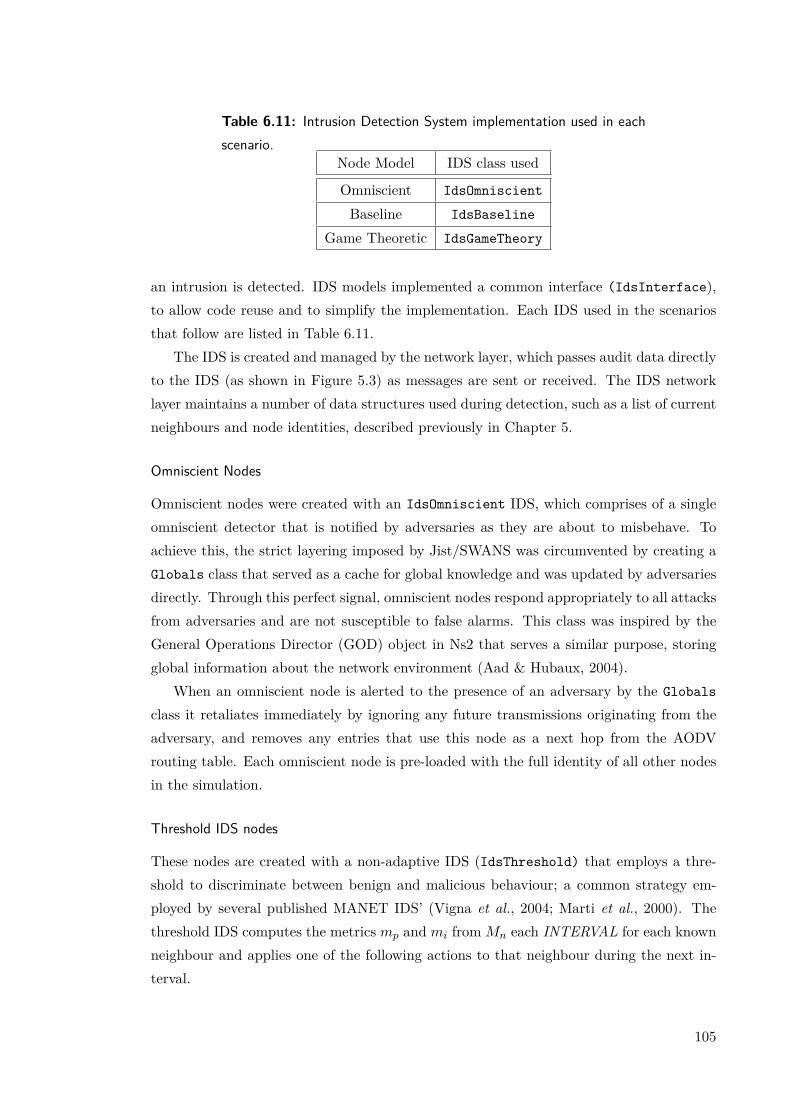
Table 6.11: Intrusion Detection System implementation used in eachscenario.
Node Model IDS class used
Omniscient IdsOmniscient
Baseline IdsBaseline
Game Theoretic IdsGameTheory
an intrusion is detected. IDS models implemented a common interface (IdsInterface),to allow code reuse and to simplify the implementation. Each IDS used in the scenariosthat follow are listed in Table 6.11.
The IDS is created and managed by the network layer, which passes audit data directlyto the IDS (as shown in Figure 5.3) as messages are sent or received. The IDS networklayer maintains a number of data structures used during detection, such as a list of currentneighbours and node identities, described previously in Chapter 5.
Omniscient Nodes
Omniscient nodes were created with an IdsOmniscient IDS, which comprises of a singleomniscient detector that is notified by adversaries as they are about to misbehave. Toachieve this, the strict layering imposed by Jist/SWANS was circumvented by creating aGlobals class that served as a cache for global knowledge and was updated by adversariesdirectly. Through this perfect signal, omniscient nodes respond appropriately to all attacksfrom adversaries and are not susceptible to false alarms. This class was inspired by theGeneral Operations Director (GOD) object in Ns2 that serves a similar purpose, storingglobal information about the network environment (Aad & Hubaux, 2004).
When an omniscient node is alerted to the presence of an adversary by the Globals
class it retaliates immediately by ignoring any future transmissions originating from theadversary, and removes any entries that use this node as a next hop from the AODVrouting table. Each omniscient node is pre-loaded with the full identity of all other nodesin the simulation.
Threshold IDS nodes
These nodes are created with a non-adaptive IDS (IdsThreshold) that employs a thre-shold to discriminate between benign and malicious behaviour; a common strategy em-ployed by several published MANET IDS’ (Vigna et al., 2004; Marti et al., 2000). Thethreshold IDS computes the metrics mp and mi fromMn each INTERVAL for each knownneighbour and applies one of the following actions to that neighbour during the next in-terval.
105
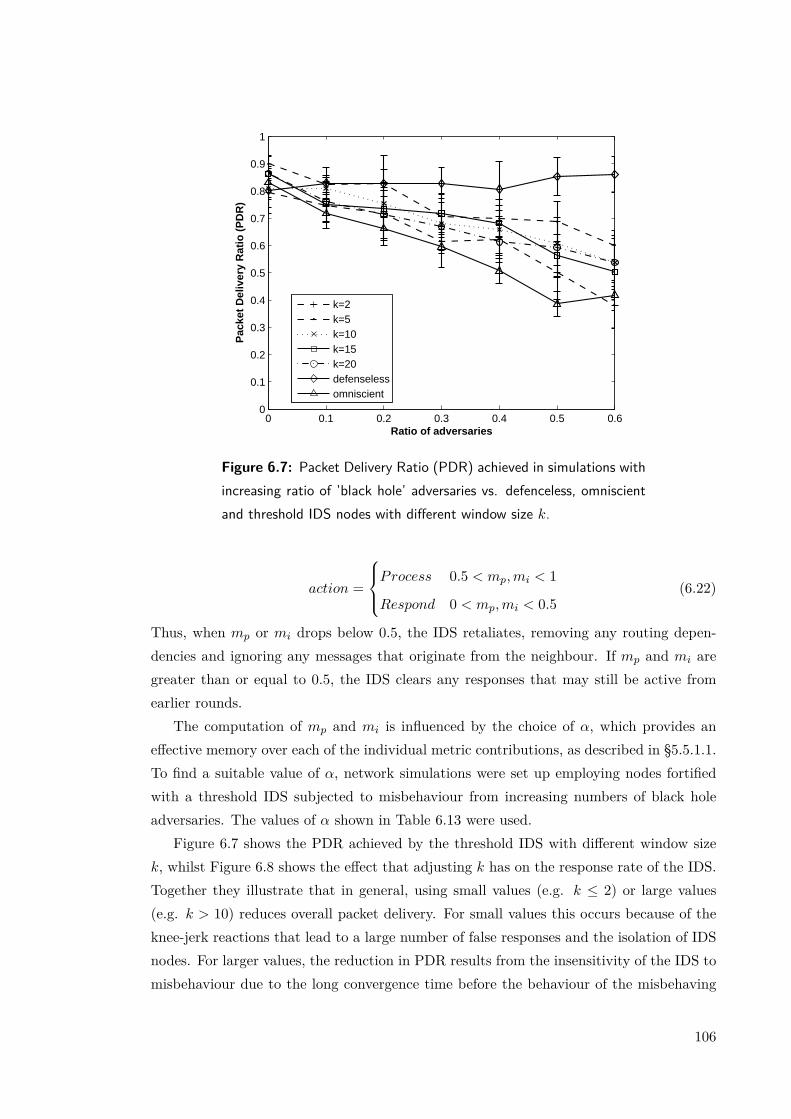
0 0.1 0.2 0.3 0.4 0.5 0.60
0.1
0.2
0.3
0.4
0.5
0.6
0.7
0.8
0.9
1
Ratio of adversaries
Pac
ket
Del
iver
y R
atio
(P
DR
)
k=2k=5k=10k=15k=20defenselessomniscient
Figure 6.7: Packet Delivery Ratio (PDR) achieved in simulations withincreasing ratio of ’black hole’ adversaries vs. defenceless, omniscientand threshold IDS nodes with different window size k.
action =
Process 0.5 < mp,mi < 1
Respond 0 < mp,mi < 0.5(6.22)
Thus, when mp or mi drops below 0.5, the IDS retaliates, removing any routing depen-dencies and ignoring any messages that originate from the neighbour. If mp and mi aregreater than or equal to 0.5, the IDS clears any responses that may still be active fromearlier rounds.
The computation of mp and mi is influenced by the choice of α, which provides aneffective memory over each of the individual metric contributions, as described in §5.5.1.1.To find a suitable value of α, network simulations were set up employing nodes fortifiedwith a threshold IDS subjected to misbehaviour from increasing numbers of black holeadversaries. The values of α shown in Table 6.13 were used.
Figure 6.7 shows the PDR achieved by the threshold IDS with different window sizek, whilst Figure 6.8 shows the effect that adjusting k has on the response rate of the IDS.Together they illustrate that in general, using small values (e.g. k ≤ 2) or large values(e.g. k > 10) reduces overall packet delivery. For small values this occurs because of theknee-jerk reactions that lead to a large number of false responses and the isolation of IDSnodes. For larger values, the reduction in PDR results from the insensitivity of the IDS tomisbehaviour due to the long convergence time before the behaviour of the misbehaving
106

Table 6.12: Jist/SWANS simulated IDS node protocol stack
pkiddie.app.AppUdp
pkiddie.trans.TransUdp
pkiddie.radio.RadioNoiseAdditive
pkiddie.mac.Mac802_11
pkiddie.net.NetIpIds
pkiddie.route.RouteAodvMultiIntefaceIds
Application
Transport
Physical
Mac
Network
Routing
IDS
Table 6.13: Effective window size in samples (k) and correspondingvalue of α used in simulations
Window size (samples) (k) Corresponding value of α
2 1/2
5 4/5
10 9/10
15 14/15
20 19/20
107
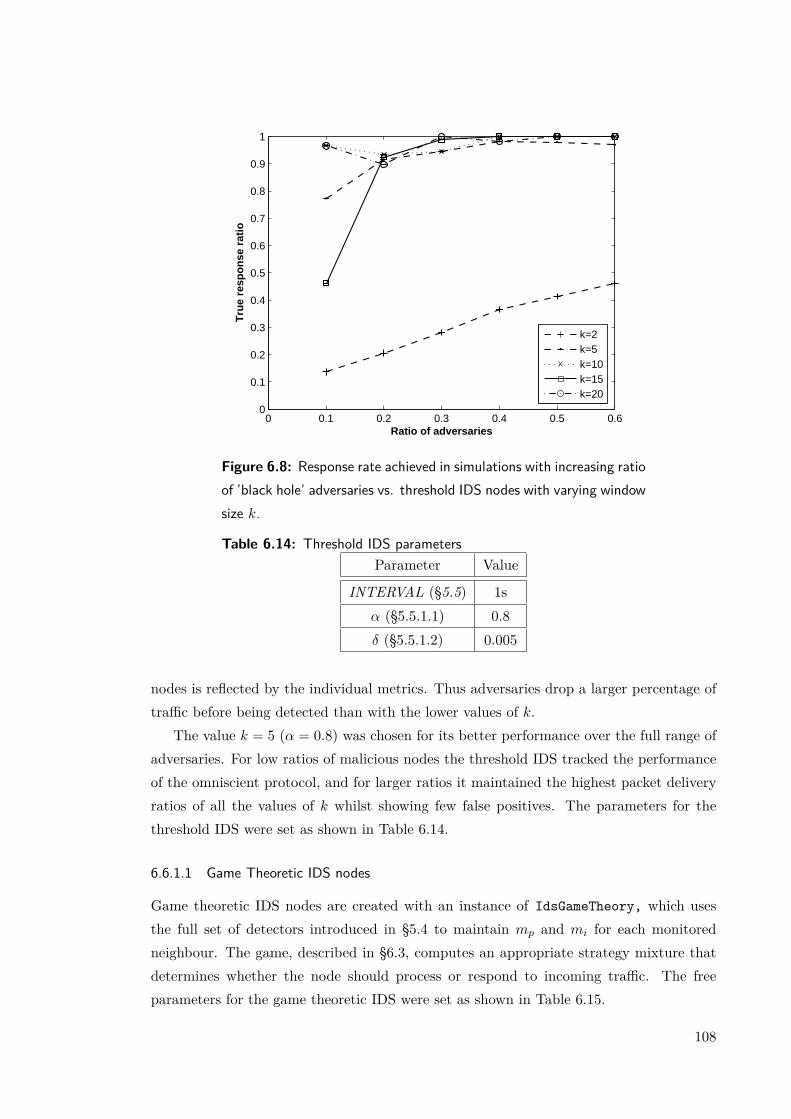
0 0.1 0.2 0.3 0.4 0.5 0.60
0.1
0.2
0.3
0.4
0.5
0.6
0.7
0.8
0.9
1
Ratio of adversaries
Tru
e re
spo
nse
rat
io
k=2k=5k=10k=15k=20
Figure 6.8: Response rate achieved in simulations with increasing ratioof ’black hole’ adversaries vs. threshold IDS nodes with varying windowsize k.
Table 6.14: Threshold IDS parametersParameter Value
INTERVAL (§5.5) 1sα (§5.5.1.1) 0.8δ (§5.5.1.2) 0.005
nodes is reflected by the individual metrics. Thus adversaries drop a larger percentage oftraffic before being detected than with the lower values of k.
The value k = 5 (α = 0.8) was chosen for its better performance over the full range ofadversaries. For low ratios of malicious nodes the threshold IDS tracked the performanceof the omniscient protocol, and for larger ratios it maintained the highest packet deliveryratios of all the values of k whilst showing few false positives. The parameters for thethreshold IDS were set as shown in Table 6.14.
6.6.1.1 Game Theoretic IDS nodes
Game theoretic IDS nodes are created with an instance of IdsGameTheory, which usesthe full set of detectors introduced in §5.4 to maintain mp and mi for each monitoredneighbour. The game, described in §6.3, computes an appropriate strategy mixture thatdetermines whether the node should process or respond to incoming traffic. The freeparameters for the game theoretic IDS were set as shown in Table 6.15.
108

Table 6.15: Game Theoretic IDS parametersParameter Value
αr(6.4.2.1) 0.2β(6.4.2.1) 0.7γ(6.4.2.1) 0.6
INTERVAL (§5.5) 1sα (§5.5.1.1) 0.8δ (§5.5.1.2) 0.005
6.6.2 Simulation parameters
The basic simulation parameters are shown in Appendix A. The following sub-sectionsdiscuss some of the important parameters used in this simulation environment, the place-ment of adversaries and filtering of topologies to reduce the spread of metrics output fromthe simulation.
6.6.2.1 Radio environment
Rayleigh fading was employed to simulate missed observations and unidirectional linksbetween nodes. Together with Tworay Pathloss, this produced the sigmoidal PDR shownearlier in Figure 5.11. Each node was created with the default RadioNoiseAdditive radiomodel, which used the Signal-To-Noise (SNR) threshold model.
6.6.2.2 Network environment
One hundred (100) nodes were placed randomly within a 1500x500m simulation area.Together with the radio environment, this meant that flow sources and destinations wereon average more than one hop away from each other, which ensured that most traffic wasrouted to give the adversaries an opportunity to affect it.
6.6.2.3 Mobility
Mobility introduces further challenges to the IDS, especially in detection mechanisms thatrequire an up-to-date list of neighbours. The random-waypoint model is a common modelemployed by numerous MANET studies and was employed and configured as shown inthe basic simulation environment.
6.6.2.4 Flows
Ten Constant Bit Rate (CBR) flows were created and source-destination pairs were ran-domly assigned in the network. Flows were either evenly distributed between adversaries
109
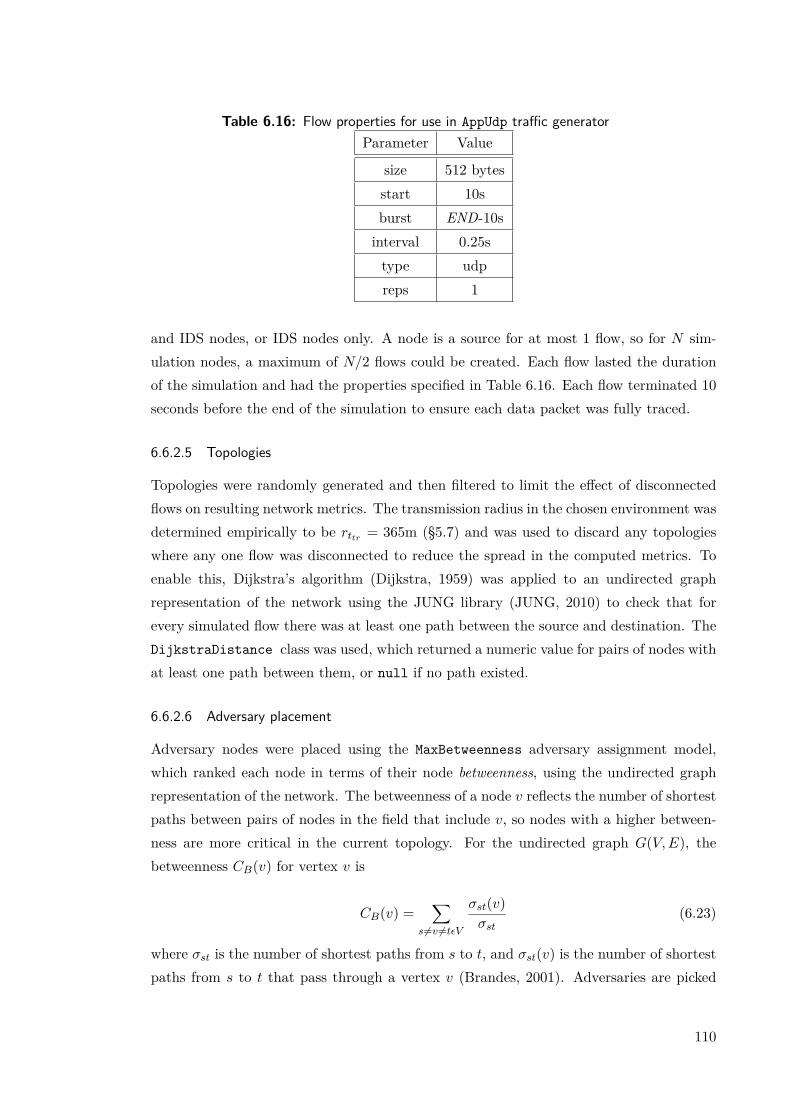
Table 6.16: Flow properties for use in AppUdp traffic generatorParameter Value
size 512 bytesstart 10sburst END-10sinterval 0.25stype udpreps 1
and IDS nodes, or IDS nodes only. A node is a source for at most 1 flow, so for N sim-ulation nodes, a maximum of N/2 flows could be created. Each flow lasted the durationof the simulation and had the properties specified in Table 6.16. Each flow terminated 10seconds before the end of the simulation to ensure each data packet was fully traced.
6.6.2.5 Topologies
Topologies were randomly generated and then filtered to limit the effect of disconnectedflows on resulting network metrics. The transmission radius in the chosen environment wasdetermined empirically to be rttr = 365m (§5.7) and was used to discard any topologieswhere any one flow was disconnected to reduce the spread in the computed metrics. Toenable this, Dijkstra’s algorithm (Dijkstra, 1959) was applied to an undirected graphrepresentation of the network using the JUNG library (JUNG, 2010) to check that forevery simulated flow there was at least one path between the source and destination. TheDijkstraDistance class was used, which returned a numeric value for pairs of nodes withat least one path between them, or null if no path existed.
6.6.2.6 Adversary placement
Adversary nodes were placed using the MaxBetweenness adversary assignment model,which ranked each node in terms of their node betweenness, using the undirected graphrepresentation of the network. The betweenness of a node v reflects the number of shortestpaths between pairs of nodes in the field that include v, so nodes with a higher between-ness are more critical in the current topology. For the undirected graph G(V,E), thebetweenness CB(v) for vertex v is
CB(v) =∑
s6=v 6=tεV
σst(v)σst
(6.23)
where σst is the number of shortest paths from s to t, and σst(v) is the number of shortestpaths from s to t that pass through a vertex v (Brandes, 2001). Adversaries are picked
110

from a ranked list of highest to lowest betweenness to ensure that the adversaries chosenhave the largest influence possible on the studied metrics.
6.6.2.7 Adversary Misbehaviour
An AdversaryMisbehaviour class manages the selection and activation of misbehaviourduring the network simulation, and is configured by setting the misbehaviour types avail-able to the adversary (described in Table G.1), the duration of the misbehaviour and pausetime between instances. An active misbehaviour may comprise of a number of misuses.For example, each RREQ sent in a flooding attack is a single misuse.
Each misbehaviour activation is recorded with a network-wide unique identifier usedonly during post-processing. Misbehaviour instances cannot overlap, which makes thepost-processing easier without sacrificing flexibility. Thus when an adversary is idle it canactivate rreq_flood and passive_route_invasion simultaneously, but cannot activateanother type of misbehaviour if it is already misbehaving. The defaults for each type ofmisbehaviour are shown in 6.17, and were used in each of the scenarios.
6.6.3 Scenarios
To evaluate the performance of the game theoretic IDS over a broad range of local anddistributed attacks, a number of suitable attacking scenarios were designed, and are listedin Table 6.18. Each scenario was repeated for the node models described in §6.6.1, fromthe defenceless network to each fortified network.
6.7 Results
The percentage of adversaries in the network was the only independent variable used inthe simulations, and was varied from 0% to 60%. For each of the scenarios, PDR, averageend-to-end (ETE) delay and control overheads were computed (previously defined in §3.3).In addition, response rate and recovery time were used to evaluate the performance of eachIDS for moderate numbers of adversaries (defined as 30%). Where necessary, additionalmetrics have been defined to show the effectiveness of an attack when its effect was notobvious from these base metrics alone.
6.7.1 Flooding
The detection technique used to determine RREQ flooding attacks was described in §5.4.3.Briefly, IDS nodes detect flooding if neighbours originate more than RREQ_RATE_LIMITRREQs for any destination per second. Adversaries that flood the MANET create a largenumber of RREQs for real or fictitious destinations. This causes nodes to generate a large
111

Table 6.17: Misbehaviour defaults used in simulations.
Misbehaviour Parameter Value
Black Hole packetType udp
ModifyData
packetType udp
PassiveRouteInvasion
mode forge-rrep-as-dest
baseSeqNum 100
ActiveRouteInvasion
mode forge-rrep
baseSeqNum 100
numHops 3
RREQFlooding
burstTime 1s
pauseTime 10s
interval 0.067s
Selfish -
Wormhole interfaceId 2
Table 6.18: Attacking scenarios simulated using each node modelScenario Attack
local/perfect Flooding (§4.1.1.5)local/imperfect Unassisted Black Hole (§4.1.1.2)
local/(perfect+imperfect) Black Hole + Passive Route Invasion (§4.2.2)distributed/imperfect Wormhole (§4.1.1.4)
random Random
112
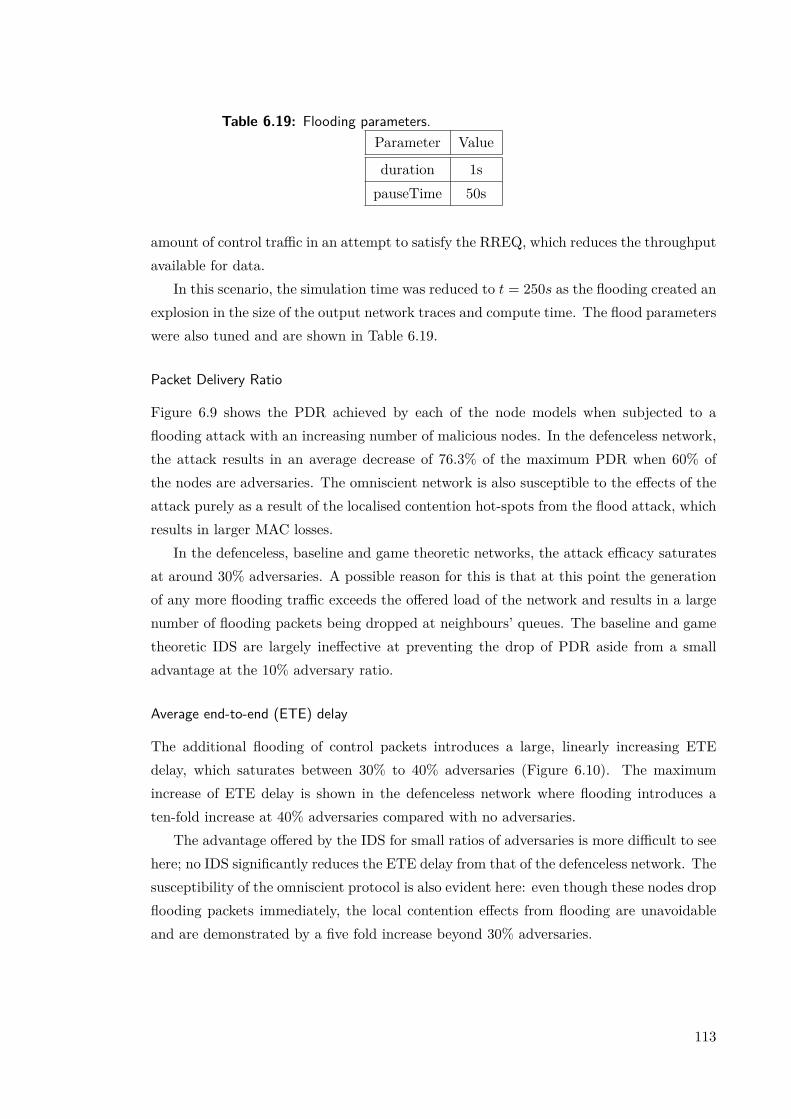
Table 6.19: Flooding parameters.Parameter Value
duration 1spauseTime 50s
amount of control traffic in an attempt to satisfy the RREQ, which reduces the throughputavailable for data.
In this scenario, the simulation time was reduced to t = 250s as the flooding created anexplosion in the size of the output network traces and compute time. The flood parameterswere also tuned and are shown in Table 6.19.
Packet Delivery Ratio
Figure 6.9 shows the PDR achieved by each of the node models when subjected to aflooding attack with an increasing number of malicious nodes. In the defenceless network,the attack results in an average decrease of 76.3% of the maximum PDR when 60% ofthe nodes are adversaries. The omniscient network is also susceptible to the effects of theattack purely as a result of the localised contention hot-spots from the flood attack, whichresults in larger MAC losses.
In the defenceless, baseline and game theoretic networks, the attack efficacy saturatesat around 30% adversaries. A possible reason for this is that at this point the generationof any more flooding traffic exceeds the offered load of the network and results in a largenumber of flooding packets being dropped at neighbours’ queues. The baseline and gametheoretic IDS are largely ineffective at preventing the drop of PDR aside from a smalladvantage at the 10% adversary ratio.
Average end-to-end (ETE) delay
The additional flooding of control packets introduces a large, linearly increasing ETEdelay, which saturates between 30% to 40% adversaries (Figure 6.10). The maximumincrease of ETE delay is shown in the defenceless network where flooding introduces aten-fold increase at 40% adversaries compared with no adversaries.
The advantage offered by the IDS for small ratios of adversaries is more difficult to seehere; no IDS significantly reduces the ETE delay from that of the defenceless network. Thesusceptibility of the omniscient protocol is also evident here: even though these nodes dropflooding packets immediately, the local contention effects from flooding are unavoidableand are demonstrated by a five fold increase beyond 30% adversaries.
113
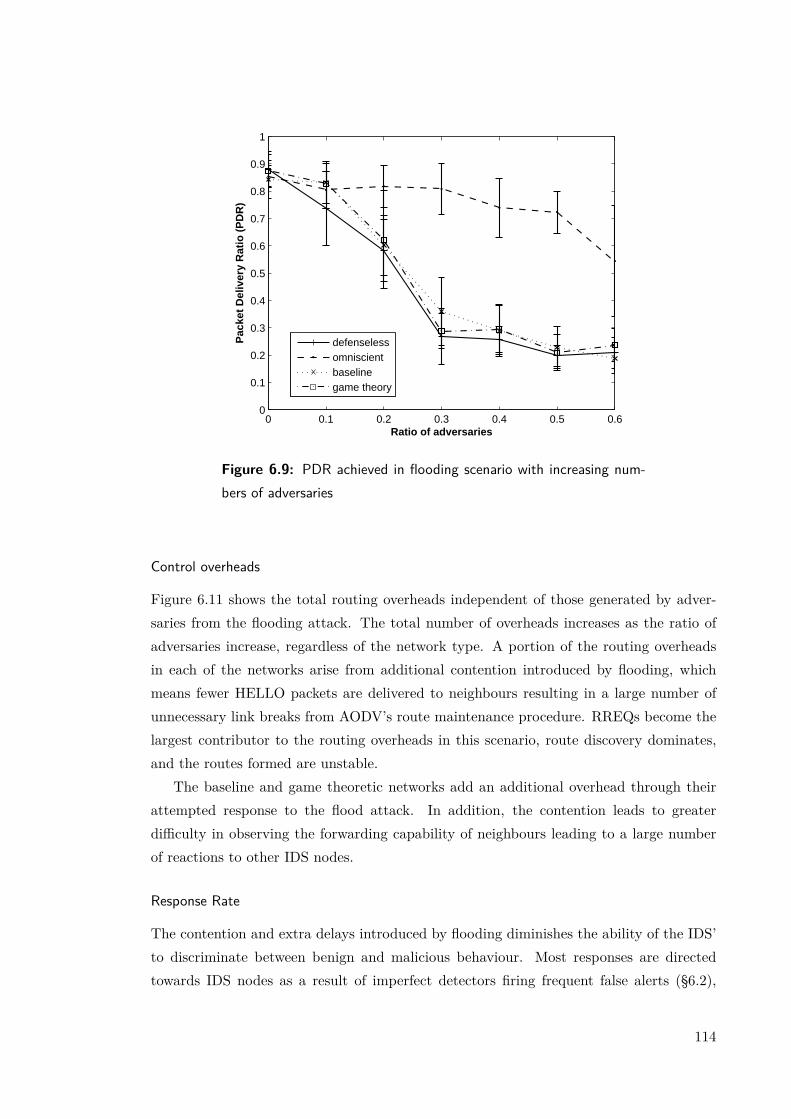
0 0.1 0.2 0.3 0.4 0.5 0.60
0.1
0.2
0.3
0.4
0.5
0.6
0.7
0.8
0.9
1
Ratio of adversaries
Pac
ket
Del
iver
y R
atio
(P
DR
)
defenselessomniscientbaselinegame theory
Figure 6.9: PDR achieved in flooding scenario with increasing num-bers of adversaries
Control overheads
Figure 6.11 shows the total routing overheads independent of those generated by adver-saries from the flooding attack. The total number of overheads increases as the ratio ofadversaries increase, regardless of the network type. A portion of the routing overheadsin each of the networks arise from additional contention introduced by flooding, whichmeans fewer HELLO packets are delivered to neighbours resulting in a large number ofunnecessary link breaks from AODV’s route maintenance procedure. RREQs become thelargest contributor to the routing overheads in this scenario, route discovery dominates,and the routes formed are unstable.
The baseline and game theoretic networks add an additional overhead through theirattempted response to the flood attack. In addition, the contention leads to greaterdifficulty in observing the forwarding capability of neighbours leading to a large numberof reactions to other IDS nodes.
Response Rate
The contention and extra delays introduced by flooding diminishes the ability of the IDS’to discriminate between benign and malicious behaviour. Most responses are directedtowards IDS nodes as a result of imperfect detectors firing frequent false alerts (§6.2),
114

0 0.1 0.2 0.3 0.4 0.5 0.60
2
4
6
8
10
12
14
Ratio of adversaries
Ave
rag
e E
TE
Del
ay (
s)
defenselessomniscientbaselinegame theory
Figure 6.10: Average end-to-end delay achieved in flooding scenariowith increasing numbers of adversaries
for example, those that use eavesdropping to verify the behaviour of neighbours. Thisis evident from Figure 6.12, where the baseline IDS consistently outperforms the gametheoretic IDS by up to 20%, but still cannot achieve true response ratios greater than 50%until at least 30% adversaries are present.
Recovery Time and Minimum Goodput
The severity of the flooding attack is shown by the average recovery time for the defen-celess network, showing a 1s flood takes 40s for the network to stabilise to pre-intrusionlevels of goodput for moderate numbers of misbehaving nodes (30% adversaries). Thesmall advantage in running the baseline or game theoretic IDS is depicted in Figure 6.13.Whilst the additional overheads generated by the responses from the baseline and gametheoretic IDS reduce the average minimum goodput of the flooded network compared tothe defenceless network, the baseline IDS recovers approximately 25% quicker than thedefenceless network. The game theoretic IDS recovers on average around 10% quickerthan the defenceless network.
6.7.1.1 Discussion
Flooding leads to congestion and medium contention that defeats the baseline and gametheoretic IDS for anything larger than a small minority of adversaries. This is evidenced bythe relatively small advantage gained by running either IDS in any of the performance me-
115
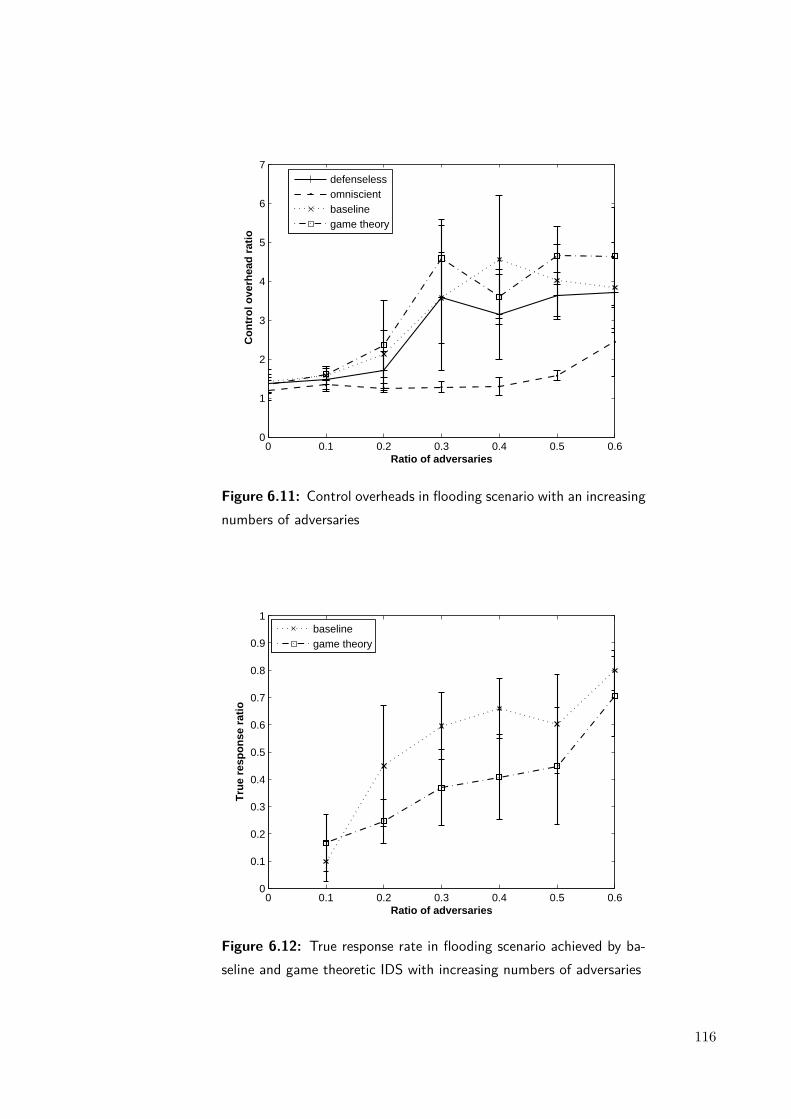
0 0.1 0.2 0.3 0.4 0.5 0.60
1
2
3
4
5
6
7
Ratio of adversaries
Co
ntr
ol o
verh
ead
rat
io
defenselessomniscientbaselinegame theory
Figure 6.11: Control overheads in flooding scenario with an increasingnumbers of adversaries
0 0.1 0.2 0.3 0.4 0.5 0.60
0.1
0.2
0.3
0.4
0.5
0.6
0.7
0.8
0.9
1
Ratio of adversaries
Tru
e re
spo
nse
rat
io
baselinegame theory
Figure 6.12: True response rate in flooding scenario achieved by ba-seline and game theoretic IDS with increasing numbers of adversaries
116

defenseless baseline game theory0
10
20
30
40
50
60
70
Node model
Rec
ove
ry t
ime
(s)
defenseless baseline game theory0
500
1000
1500
2000
2500
3000
3500
4000
4500
Node model
Go
od
pu
t (b
ytes
/s)
Figure 6.13: Recovery times and minimum goodputs achieved bydefenceless, baseline and game theoretic networks with moderate mis-behaviour (30% adversaries) in flooding scenario
trics. A number of reasons explain this behaviour. First, the game theoretic IDS is unableto use the additional discrimination to its advantage due to the massive increase of falsealerts from the imperfect detectors that use eavesdropping to verify the behaviour of neigh-bouring nodes. Secondly, flooding results in the overflow of immediate neighbour’s queuesin which flooding packets from other adversaries may also be dropped, thus, the detectioncriterion may not always be met (if nodes exceed RREQ_RATE_LIMIT ). Even if it is met,the response occurs only after IDS nodes have forwarded up to RREQ_RATE_LIMITRREQs from the adversary onto neighbouring nodes. Each of these factors lead to poorpreservation of desirable network metrics when flooding adversaries are introduced.
6.7.2 Unassisted Black hole
Eavesdropping was used to verify the forwarding behaviour of neighbours and determinethe presence of consistent non-forwarders (described in §5.4.1). In this scenario, adver-saries drop data they receive for destinations other than themselves, including data fromother adversaries.
Packet Delivery Ratio
The results in Figure 6.14 show the network PDR and dropped ratio achieved in theunassisted black hole scenario for the different IDS’ for an increasing ratio of adversariesin the network. As this ratio increases, it is more likely data will be routed via an adversaryand dropped. In the worst case, 60% of adversaries drop an average 50% data in defencelessnetworks.
For small numbers of adversaries (up to 20%), the baseline and game theoretic IDSpreserve a similar PDR to the omniscient network, but diverge at 30% adversaries or
117
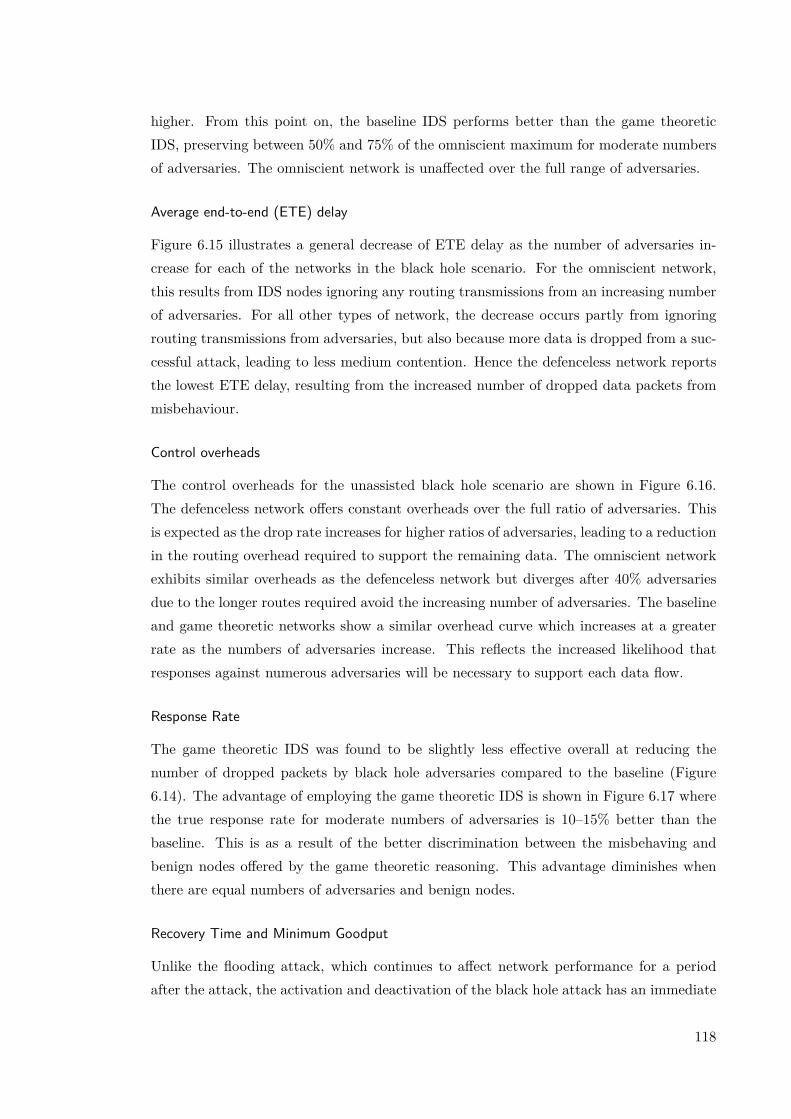
higher. From this point on, the baseline IDS performs better than the game theoreticIDS, preserving between 50% and 75% of the omniscient maximum for moderate numbersof adversaries. The omniscient network is unaffected over the full range of adversaries.
Average end-to-end (ETE) delay
Figure 6.15 illustrates a general decrease of ETE delay as the number of adversaries in-crease for each of the networks in the black hole scenario. For the omniscient network,this results from IDS nodes ignoring any routing transmissions from an increasing numberof adversaries. For all other types of network, the decrease occurs partly from ignoringrouting transmissions from adversaries, but also because more data is dropped from a suc-cessful attack, leading to less medium contention. Hence the defenceless network reportsthe lowest ETE delay, resulting from the increased number of dropped data packets frommisbehaviour.
Control overheads
The control overheads for the unassisted black hole scenario are shown in Figure 6.16.The defenceless network offers constant overheads over the full ratio of adversaries. Thisis expected as the drop rate increases for higher ratios of adversaries, leading to a reductionin the routing overhead required to support the remaining data. The omniscient networkexhibits similar overheads as the defenceless network but diverges after 40% adversariesdue to the longer routes required avoid the increasing number of adversaries. The baselineand game theoretic networks show a similar overhead curve which increases at a greaterrate as the numbers of adversaries increase. This reflects the increased likelihood thatresponses against numerous adversaries will be necessary to support each data flow.
Response Rate
The game theoretic IDS was found to be slightly less effective overall at reducing thenumber of dropped packets by black hole adversaries compared to the baseline (Figure6.14). The advantage of employing the game theoretic IDS is shown in Figure 6.17 wherethe true response rate for moderate numbers of adversaries is 10–15% better than thebaseline. This is as a result of the better discrimination between the misbehaving andbenign nodes offered by the game theoretic reasoning. This advantage diminishes whenthere are equal numbers of adversaries and benign nodes.
Recovery Time and Minimum Goodput
Unlike the flooding attack, which continues to affect network performance for a periodafter the attack, the activation and deactivation of the black hole attack has an immediate
118

0 0.1 0.2 0.3 0.4 0.5 0.60
0.1
0.2
0.3
0.4
0.5
0.6
0.7
0.8
0.9
1
Ratio of adversaries
Pac
ket
Del
iver
y R
atio
(P
DR
)
defenselessomniscientbaselinegame theory
0 0.1 0.2 0.3 0.4 0.5 0.60
0.1
0.2
0.3
0.4
0.5
0.6
0.7
0.8
0.9
1
Ratio of adversaries
Dro
pp
ed p
acke
ts r
atio
defenselessomniscientbaselinegame theory
Figure 6.14: PDR and dropped packet ratio achieved in unassistedblack hole scenario with an increasing number of adversaries
119
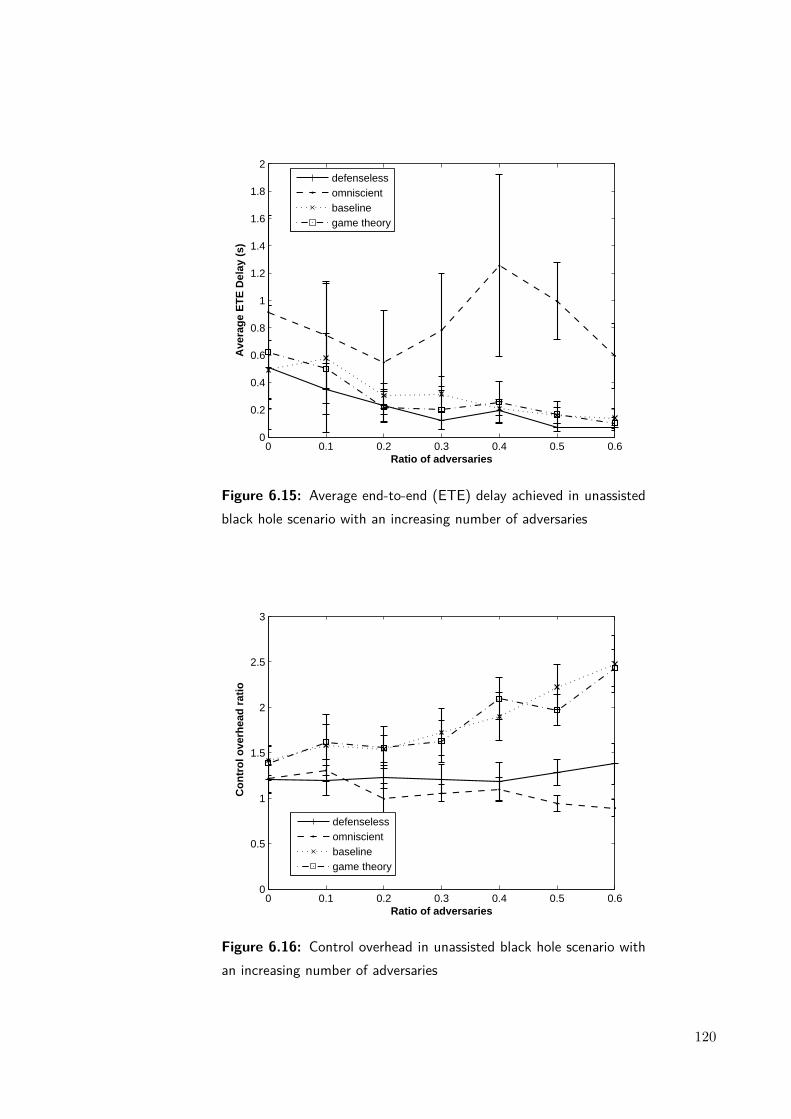
0 0.1 0.2 0.3 0.4 0.5 0.60
0.2
0.4
0.6
0.8
1
1.2
1.4
1.6
1.8
2
Ratio of adversaries
Ave
rag
e E
TE
Del
ay (
s)
defenselessomniscientbaselinegame theory
Figure 6.15: Average end-to-end (ETE) delay achieved in unassistedblack hole scenario with an increasing number of adversaries
0 0.1 0.2 0.3 0.4 0.5 0.60
0.5
1
1.5
2
2.5
3
Ratio of adversaries
Co
ntr
ol o
verh
ead
rat
io
defenselessomniscientbaselinegame theory
Figure 6.16: Control overhead in unassisted black hole scenario withan increasing number of adversaries
120
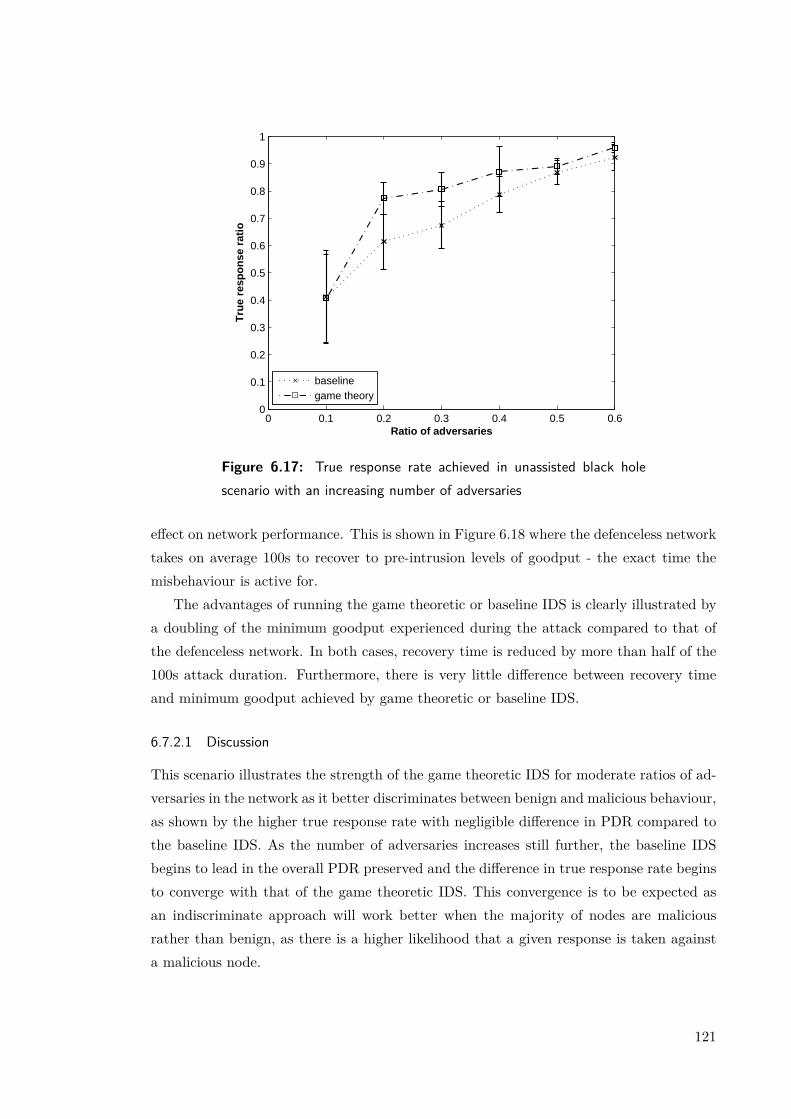
0 0.1 0.2 0.3 0.4 0.5 0.60
0.1
0.2
0.3
0.4
0.5
0.6
0.7
0.8
0.9
1
Ratio of adversaries
Tru
e re
spo
nse
rat
io
baselinegame theory
Figure 6.17: True response rate achieved in unassisted black holescenario with an increasing number of adversaries
effect on network performance. This is shown in Figure 6.18 where the defenceless networktakes on average 100s to recover to pre-intrusion levels of goodput - the exact time themisbehaviour is active for.
The advantages of running the game theoretic or baseline IDS is clearly illustrated bya doubling of the minimum goodput experienced during the attack compared to that ofthe defenceless network. In both cases, recovery time is reduced by more than half of the100s attack duration. Furthermore, there is very little difference between recovery timeand minimum goodput achieved by game theoretic or baseline IDS.
6.7.2.1 Discussion
This scenario illustrates the strength of the game theoretic IDS for moderate ratios of ad-versaries in the network as it better discriminates between benign and malicious behaviour,as shown by the higher true response rate with negligible difference in PDR compared tothe baseline IDS. As the number of adversaries increases still further, the baseline IDSbegins to lead in the overall PDR preserved and the difference in true response rate beginsto converge with that of the game theoretic IDS. This convergence is to be expected asan indiscriminate approach will work better when the majority of nodes are maliciousrather than benign, as there is a higher likelihood that a given response is taken againsta malicious node.
121
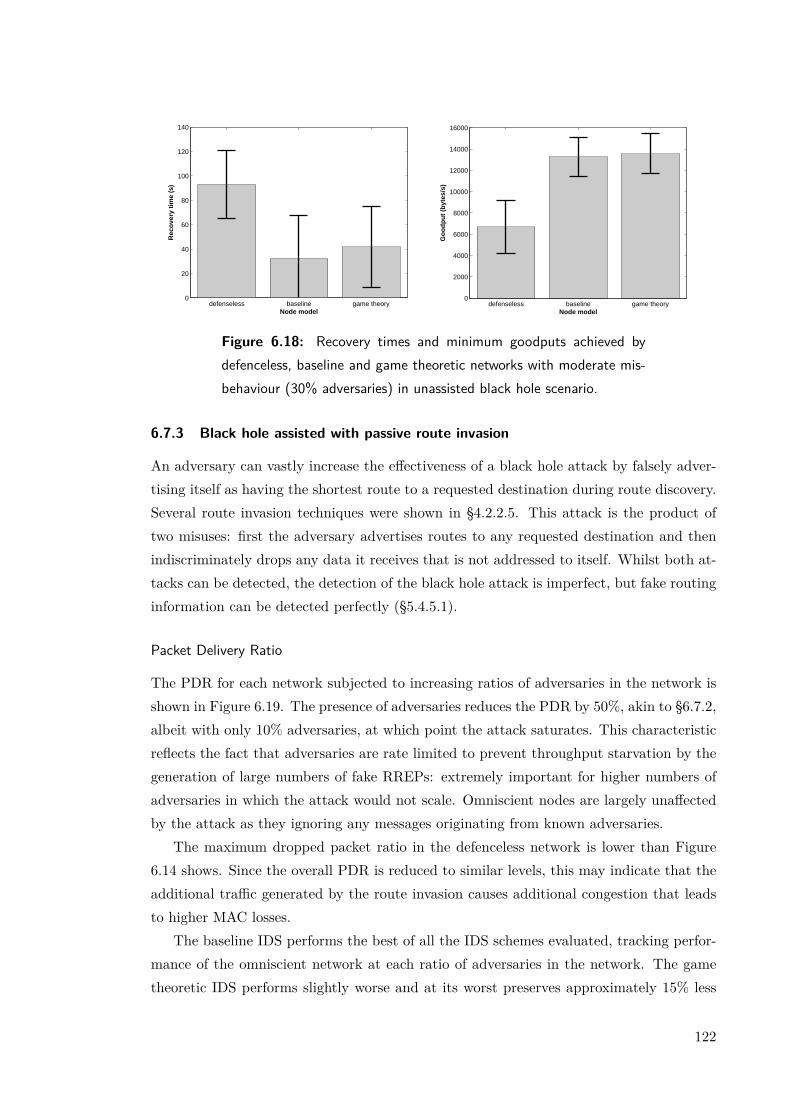
defenseless baseline game theory0
20
40
60
80
100
120
140
Node model
Rec
ove
ry t
ime
(s)
defenseless baseline game theory0
2000
4000
6000
8000
10000
12000
14000
16000
Node model
Go
od
pu
t (b
ytes
/s)
Figure 6.18: Recovery times and minimum goodputs achieved bydefenceless, baseline and game theoretic networks with moderate mis-behaviour (30% adversaries) in unassisted black hole scenario.
6.7.3 Black hole assisted with passive route invasion
An adversary can vastly increase the effectiveness of a black hole attack by falsely adver-tising itself as having the shortest route to a requested destination during route discovery.Several route invasion techniques were shown in §4.2.2.5. This attack is the product oftwo misuses: first the adversary advertises routes to any requested destination and thenindiscriminately drops any data it receives that is not addressed to itself. Whilst both at-tacks can be detected, the detection of the black hole attack is imperfect, but fake routinginformation can be detected perfectly (§5.4.5.1).
Packet Delivery Ratio
The PDR for each network subjected to increasing ratios of adversaries in the network isshown in Figure 6.19. The presence of adversaries reduces the PDR by 50%, akin to §6.7.2,albeit with only 10% adversaries, at which point the attack saturates. This characteristicreflects the fact that adversaries are rate limited to prevent throughput starvation by thegeneration of large numbers of fake RREPs: extremely important for higher numbers ofadversaries in which the attack would not scale. Omniscient nodes are largely unaffectedby the attack as they ignoring any messages originating from known adversaries.
The maximum dropped packet ratio in the defenceless network is lower than Figure6.14 shows. Since the overall PDR is reduced to similar levels, this may indicate that theadditional traffic generated by the route invasion causes additional congestion that leadsto higher MAC losses.
The baseline IDS performs the best of all the IDS schemes evaluated, tracking perfor-mance of the omniscient network at each ratio of adversaries in the network. The gametheoretic IDS performs slightly worse and at its worst preserves approximately 15% less
122
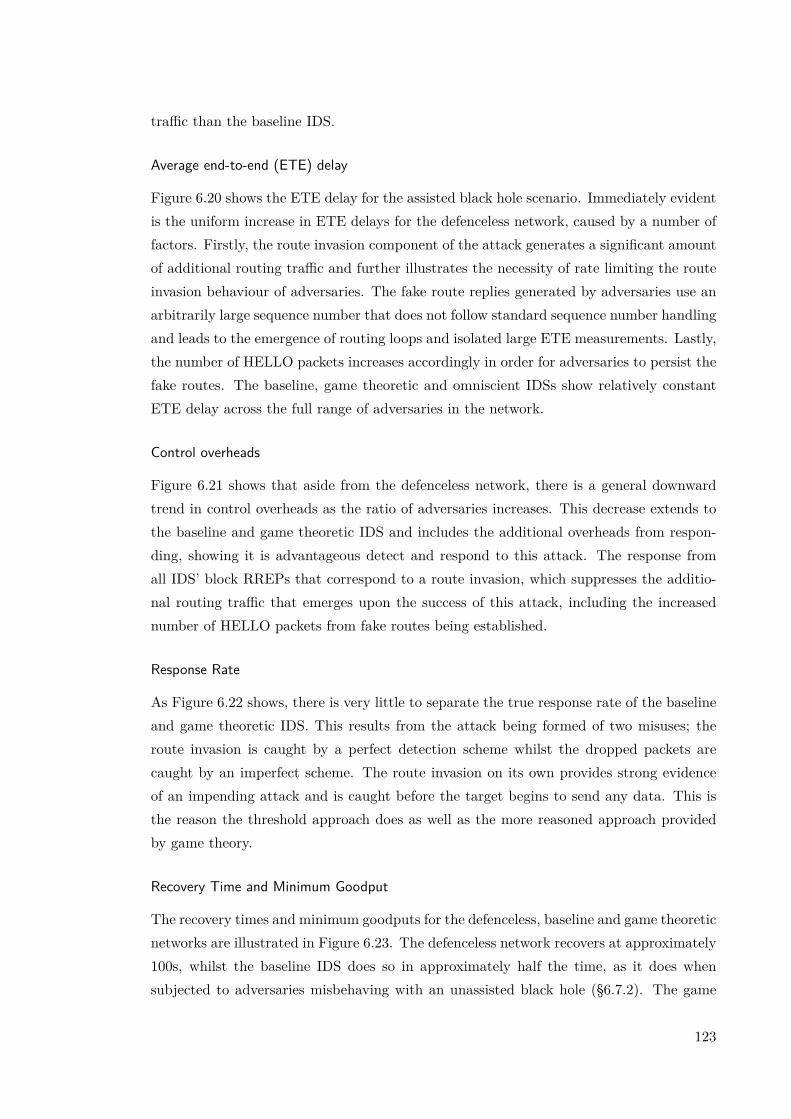
traffic than the baseline IDS.
Average end-to-end (ETE) delay
Figure 6.20 shows the ETE delay for the assisted black hole scenario. Immediately evidentis the uniform increase in ETE delays for the defenceless network, caused by a number offactors. Firstly, the route invasion component of the attack generates a significant amountof additional routing traffic and further illustrates the necessity of rate limiting the routeinvasion behaviour of adversaries. The fake route replies generated by adversaries use anarbitrarily large sequence number that does not follow standard sequence number handlingand leads to the emergence of routing loops and isolated large ETE measurements. Lastly,the number of HELLO packets increases accordingly in order for adversaries to persist thefake routes. The baseline, game theoretic and omniscient IDSs show relatively constantETE delay across the full range of adversaries in the network.
Control overheads
Figure 6.21 shows that aside from the defenceless network, there is a general downwardtrend in control overheads as the ratio of adversaries increases. This decrease extends tothe baseline and game theoretic IDS and includes the additional overheads from respon-ding, showing it is advantageous detect and respond to this attack. The response fromall IDS’ block RREPs that correspond to a route invasion, which suppresses the additio-nal routing traffic that emerges upon the success of this attack, including the increasednumber of HELLO packets from fake routes being established.
Response Rate
As Figure 6.22 shows, there is very little to separate the true response rate of the baselineand game theoretic IDS. This results from the attack being formed of two misuses; theroute invasion is caught by a perfect detection scheme whilst the dropped packets arecaught by an imperfect scheme. The route invasion on its own provides strong evidenceof an impending attack and is caught before the target begins to send any data. This isthe reason the threshold approach does as well as the more reasoned approach providedby game theory.
Recovery Time and Minimum Goodput
The recovery times and minimum goodputs for the defenceless, baseline and game theoreticnetworks are illustrated in Figure 6.23. The defenceless network recovers at approximately100s, whilst the baseline IDS does so in approximately half the time, as it does whensubjected to adversaries misbehaving with an unassisted black hole (§6.7.2). The game
123

0 0.1 0.2 0.3 0.4 0.5 0.60
0.1
0.2
0.3
0.4
0.5
0.6
0.7
0.8
0.9
1
Ratio of adversaries
Pac
ket
Del
iver
y R
atio
(P
DR
)
defenselessomniscientbaselinegame theory
0 0.1 0.2 0.3 0.4 0.5 0.60
0.1
0.2
0.3
0.4
0.5
0.6
0.7
0.8
0.9
1
Ratio of adversaries
Dro
pp
ed p
acke
ts r
atio
defenselessomniscientbaselinegame theory
Figure 6.19: PDR and dropped packet ratio achieved in assisted blackhole scenario with an increasing number of adversaries
124

0 0.1 0.2 0.3 0.4 0.5 0.60
1
2
3
4
5
6
Ratio of adversaries
Ave
rag
e E
TE
Del
ay (
s)
defenselessomniscientbaselinegame theory
Figure 6.20: Average end-to-end (ETE) delay achieved in assistedblack hole scenario with an increasing number of adversaries
0 0.1 0.2 0.3 0.4 0.5 0.60
0.5
1
1.5
2
2.5
3
3.5
Ratio of adversaries
Co
ntr
ol o
verh
ead
rat
io
defenselessomniscientbaselinegame theory
Figure 6.21: Control overhead in assisted black hole scenario with anincreasing number of adversaries
125

0 0.1 0.2 0.3 0.4 0.5 0.60.9
0.91
0.92
0.93
0.94
0.95
0.96
0.97
0.98
0.99
1
Ratio of adversaries
Tru
e re
spo
nse
rat
io
baselinegame theory
Figure 6.22: True response rate achieved in assisted black hole sce-nario with an increasing number of adversaries
theoretic IDS is unable to match its performance in this same scenario, averaging a 31.5%reduction in recovery time over the defenceless network. The baseline also doubles theminimum goodput experienced to preserve network performance, whilst the game theoreticprotocol is within 15% of the goodput preserved by the baseline IDS. Compared to theunassisted black hole scenario, both IDS’s show a slight reduction in the minimum goodputpreserved, arising from the more detrimental characteristics of this type of attack.
6.7.3.1 Discussion
The baseline IDS exhibits much better performance than the game theoretic IDS in thisscenario and tracks the omniscient protocol for PDR but via a purely local detectionscheme that applies a threshold directly to mi and mp. Although it may appear thatthe game theoretic IDS performs worse with increased overheads, the metric is slightlymisleading as it is dependant on the number of data packets transmitted, which is lowerfor the game theoretic IDS as it is unable to respond to adversaries as quickly as thebaseline IDS. The “benefit of the doubt” factor used could be responsible for this largerconvergence time, thus making it more insensitive to extreme misbehaviour, such as inthis case. We can conclude that a threshold with short-term memory is a good measureagainst this kind of attack.
126
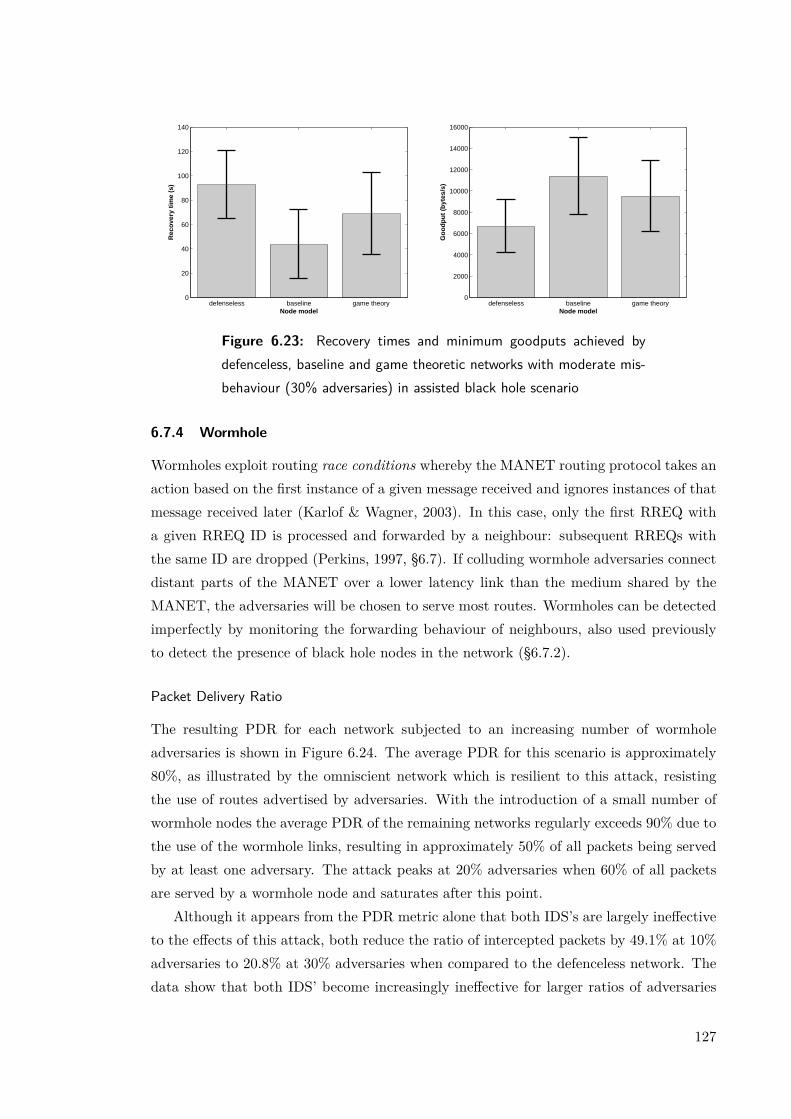
defenseless baseline game theory0
20
40
60
80
100
120
140
Node model
Rec
ove
ry t
ime
(s)
defenseless baseline game theory0
2000
4000
6000
8000
10000
12000
14000
16000
Node model
Go
od
pu
t (b
ytes
/s)
Figure 6.23: Recovery times and minimum goodputs achieved bydefenceless, baseline and game theoretic networks with moderate mis-behaviour (30% adversaries) in assisted black hole scenario
6.7.4 Wormhole
Wormholes exploit routing race conditions whereby the MANET routing protocol takes anaction based on the first instance of a given message received and ignores instances of thatmessage received later (Karlof & Wagner, 2003). In this case, only the first RREQ witha given RREQ ID is processed and forwarded by a neighbour: subsequent RREQs withthe same ID are dropped (Perkins, 1997, §6.7). If colluding wormhole adversaries connectdistant parts of the MANET over a lower latency link than the medium shared by theMANET, the adversaries will be chosen to serve most routes. Wormholes can be detectedimperfectly by monitoring the forwarding behaviour of neighbours, also used previouslyto detect the presence of black hole nodes in the network (§6.7.2).
Packet Delivery Ratio
The resulting PDR for each network subjected to an increasing number of wormholeadversaries is shown in Figure 6.24. The average PDR for this scenario is approximately80%, as illustrated by the omniscient network which is resilient to this attack, resistingthe use of routes advertised by adversaries. With the introduction of a small number ofwormhole nodes the average PDR of the remaining networks regularly exceeds 90% due tothe use of the wormhole links, resulting in approximately 50% of all packets being servedby at least one adversary. The attack peaks at 20% adversaries when 60% of all packetsare served by a wormhole node and saturates after this point.
Although it appears from the PDR metric alone that both IDS’s are largely ineffectiveto the effects of this attack, both reduce the ratio of intercepted packets by 49.1% at 10%adversaries to 20.8% at 30% adversaries when compared to the defenceless network. Thedata show that both IDS’ become increasingly ineffective for larger ratios of adversaries
127
in the network.
Average end-to-end (ETE) delay
Figure 6.25 shows that the introduction of a small number of wormhole adversaries resultsin a 90% decrease in the ETE delay of the defenceless, game theoretic and baseline networksdue to the decreased latency offered by the wormhole links for intercepted traffic. Theresilience of the baseline IDS to small ratios of adversaries is shown by the higher ETEdelay which decreases with moderate numbers of adversaries.
Control overheads
The control overheads for the wormhole scenario are depicted in Figure 6.26, and showthat a constant overhead for increasing ratios of adversaries in the defenceless and om-niscient networks, whilst there is a linearly increasing overhead in the baseline and gametheoretic networks. This additional overhead introduced by the baseline and game theore-tic networks is due to the response initiated by the IDS’s, which routes around adversariesas they are detected ’dropping’ packets. The overheads introduced by the game theoreticprotocol range from 10.3-17.2% less than the baseline one.
Response Rate
Figure 6.27 shows the true response ratio achieved by the game theoretic and baseline IDSand demonstrates that the further discrimination employed by the game theoretic IDSresults in a 10% reduction in the number of false responses (for 10% adversaries) which isreduced to approximately 5% thereafter when compared to the baseline IDS.
Recovery Time and Minimum Intercepted Throughput
The recovery times and minimum intercepted throughput offered by each of the networksis shown in Figure 6.28. In general, the baseline and game theoretic IDS’s offer an appre-ciable reduction in the recovery time, whilst reducing the number of bytes intercepted byadversaries. The larger spread in the intercepted throughput reported by each of the IDS’results from the local response, which may succeed in re-routing data to a benign node,or instead choose another wormhole node.
6.7.4.1 Discussion
Each of the measures suggest the game theoretic IDS provides better performance thanthe baseline IDS in this scenario. The game theoretic IDS offers a similar reductionin the intercepted throughput whilst providing a lower number of false responses andmaintaining a lower overall overhead compared to the baseline IDS. The performance of
128
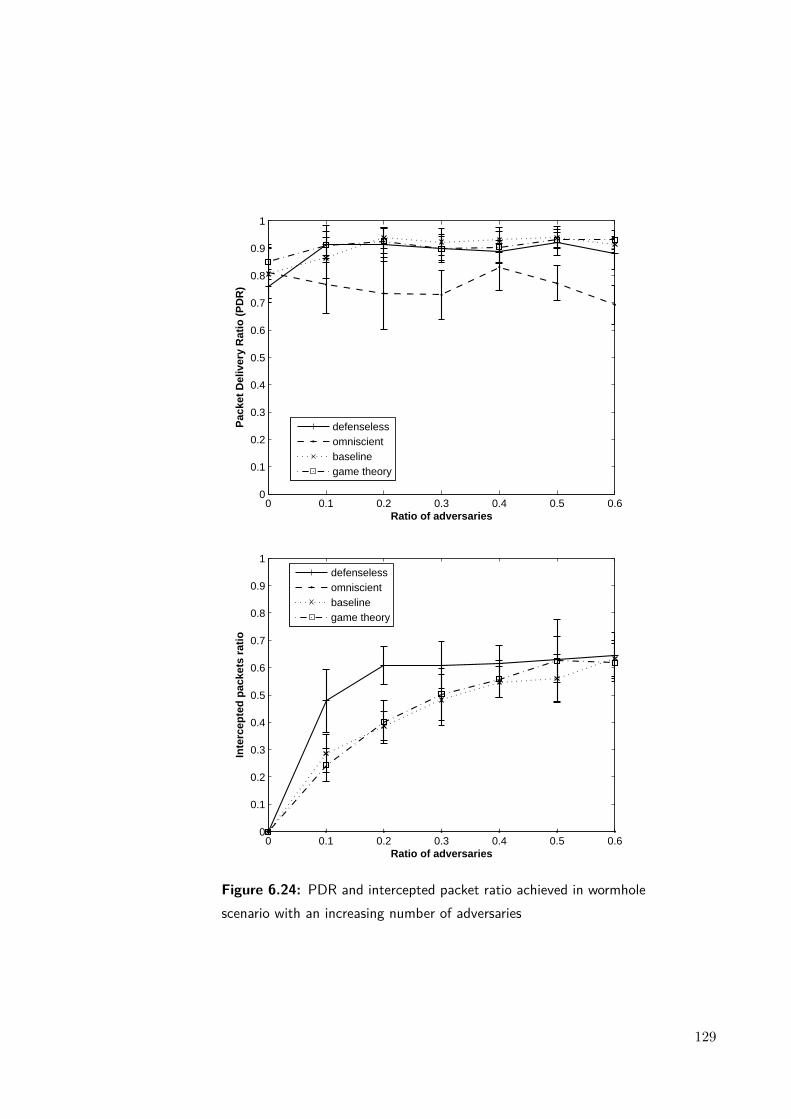
0 0.1 0.2 0.3 0.4 0.5 0.60
0.1
0.2
0.3
0.4
0.5
0.6
0.7
0.8
0.9
1
Ratio of adversaries
Pac
ket
Del
iver
y R
atio
(P
DR
)
defenselessomniscientbaselinegame theory
0 0.1 0.2 0.3 0.4 0.5 0.60
0.1
0.2
0.3
0.4
0.5
0.6
0.7
0.8
0.9
1
Ratio of adversaries
Inte
rcep
ted
pac
kets
rat
io
defenselessomniscientbaselinegame theory
Figure 6.24: PDR and intercepted packet ratio achieved in wormholescenario with an increasing number of adversaries
129

0 0.1 0.2 0.3 0.4 0.5 0.60
0.2
0.4
0.6
0.8
1
1.2
1.4
1.6
1.8
2
Ratio of adversaries
Ave
rag
e E
TE
Del
ay (
s)
defenselessomniscientbaselinegame theory
Figure 6.25: Average end-to-end (ETE) delay achieved in wormholescenario with an increasing number of adversaries
0 0.1 0.2 0.3 0.4 0.5 0.60
0.5
1
1.5
2
2.5
3
3.5
Ratio of adversaries
Co
ntr
ol o
verh
ead
rat
io
defenselessomniscientbaselinegame theory
Figure 6.26: Control overhead in wormhole scenario with an increasingnumber of adversaries
130
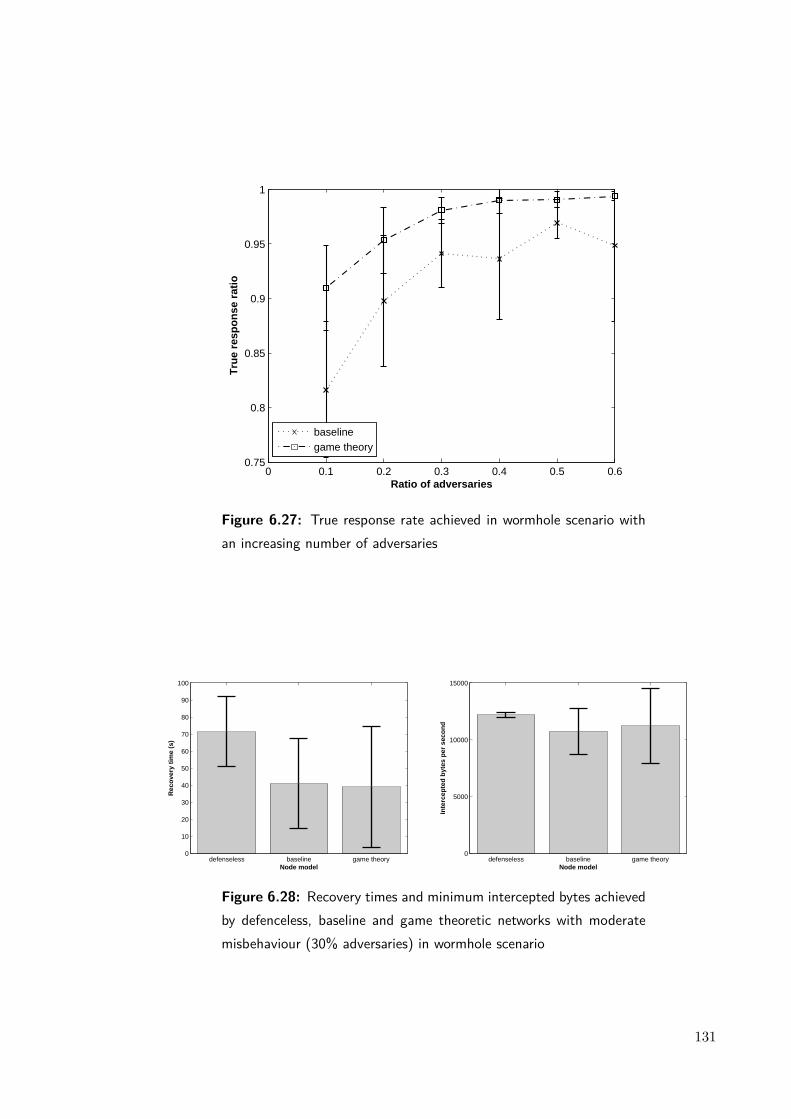
0 0.1 0.2 0.3 0.4 0.5 0.60.75
0.8
0.85
0.9
0.95
1
Ratio of adversaries
Tru
e re
spo
nse
rat
io
baselinegame theory
Figure 6.27: True response rate achieved in wormhole scenario withan increasing number of adversaries
defenseless baseline game theory0
10
20
30
40
50
60
70
80
90
100
Node model
Rec
ove
ry t
ime
(s)
defenseless baseline game theory0
5000
10000
15000
Node model
Inte
rcep
ted
byt
es p
er s
eco
nd
Figure 6.28: Recovery times and minimum intercepted bytes achievedby defenceless, baseline and game theoretic networks with moderatemisbehaviour (30% adversaries) in wormhole scenario
131

Misbehaviour Frequency of occurrence Duration
Data modification 0.225 20sUnassisted black hole 0.225 20s
Black hole and passive route invasion 0.225 20sWormhole 0.225 20s
RREQ flooding 0.1 1s
Table 6.20: Set of misbehaviours, their relative weightings and dura-tion
both suffers when there is a moderate numbers of adversaries and converges with thedefenceless network’s performance for high numbers of adversaries.
6.7.5 Random misbehaviour
In the final scenario, a one-time random distribution of misbehaviour was generatedover the entire simulation time from the set of misbehaviours and their respective fre-quency of occurrence as shown in Table 6.20. Of these, flooding has a lower weightingdue to the previous trace file explosion problem described in §6.7.1. The output fromRandomMisbehaviourGenerator was applied to each adversary at simulation initialisa-tion. The scenario evaluated the context switching ability of each of the IDS schemes.
Packet Delivery Ratio
Figure 6.29 shows the PDR preserved over each network type for an increasing ratio ofadversaries in the network. The defenceless network shows a 45.3% reduction in PDR fromthe network average at 0% adversaries to the lowest PDR at 60% adversaries. The rateat which the attack reduces the PDR diminishes for larger numbers of adversaries. Theomniscient network shows a slight reduction in the PDR, from the flooding component ofthe random scenario.
For low ratios of adversaries, the baseline IDS preserves 95.6% of the omniscient PDR,which decreases to between 81.9% and 85.8% when larger numbers of adversaries arepresent. The game theoretic IDS performs similarly to the baseline for 10% adversaries,but thereafter offers little protection.
Average end-to-end (ETE) delay
ETE delay for the random scenario across all network types is shown in Figure 6.30.The defenceless network shows a variable delay as the ratio of adversaries in the networkincreases, due to the extra contention induced by the flooding and assisted black hole
132
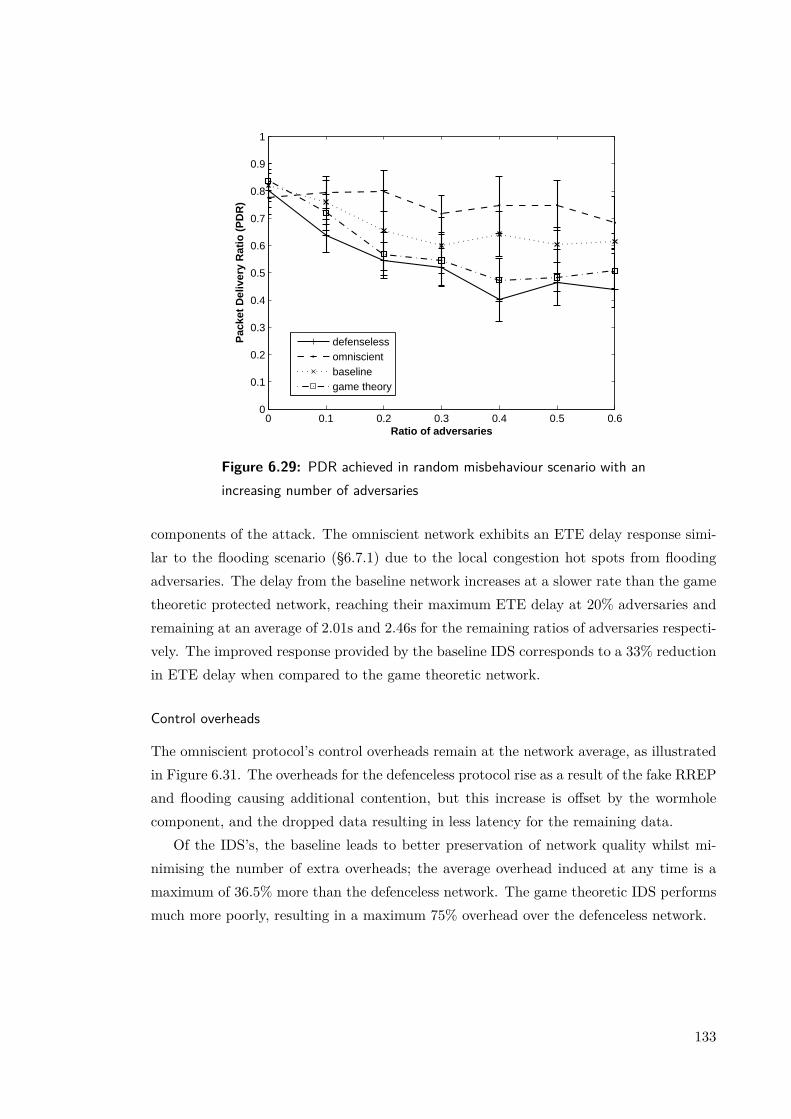
0 0.1 0.2 0.3 0.4 0.5 0.60
0.1
0.2
0.3
0.4
0.5
0.6
0.7
0.8
0.9
1
Ratio of adversaries
Pac
ket
Del
iver
y R
atio
(P
DR
)
defenselessomniscientbaselinegame theory
Figure 6.29: PDR achieved in random misbehaviour scenario with anincreasing number of adversaries
components of the attack. The omniscient network exhibits an ETE delay response simi-lar to the flooding scenario (§6.7.1) due to the local congestion hot spots from floodingadversaries. The delay from the baseline network increases at a slower rate than the gametheoretic protected network, reaching their maximum ETE delay at 20% adversaries andremaining at an average of 2.01s and 2.46s for the remaining ratios of adversaries respecti-vely. The improved response provided by the baseline IDS corresponds to a 33% reductionin ETE delay when compared to the game theoretic network.
Control overheads
The omniscient protocol’s control overheads remain at the network average, as illustratedin Figure 6.31. The overheads for the defenceless protocol rise as a result of the fake RREPand flooding causing additional contention, but this increase is offset by the wormholecomponent, and the dropped data resulting in less latency for the remaining data.
Of the IDS’s, the baseline leads to better preservation of network quality whilst mi-nimising the number of extra overheads; the average overhead induced at any time is amaximum of 36.5% more than the defenceless network. The game theoretic IDS performsmuch more poorly, resulting in a maximum 75% overhead over the defenceless network.
133
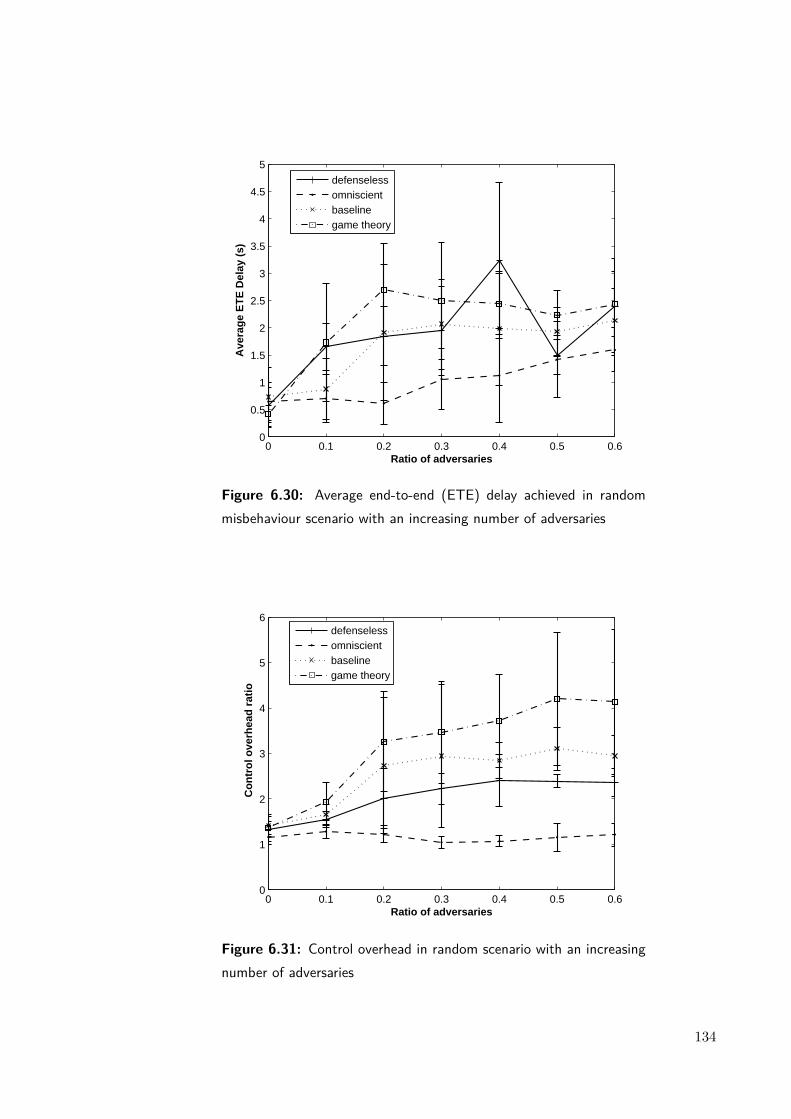
0 0.1 0.2 0.3 0.4 0.5 0.60
0.5
1
1.5
2
2.5
3
3.5
4
4.5
5
Ratio of adversaries
Ave
rag
e E
TE
Del
ay (
s)
defenselessomniscientbaselinegame theory
Figure 6.30: Average end-to-end (ETE) delay achieved in randommisbehaviour scenario with an increasing number of adversaries
0 0.1 0.2 0.3 0.4 0.5 0.60
1
2
3
4
5
6
Ratio of adversaries
Co
ntr
ol o
verh
ead
rat
io
defenselessomniscientbaselinegame theory
Figure 6.31: Control overhead in random scenario with an increasingnumber of adversaries
134
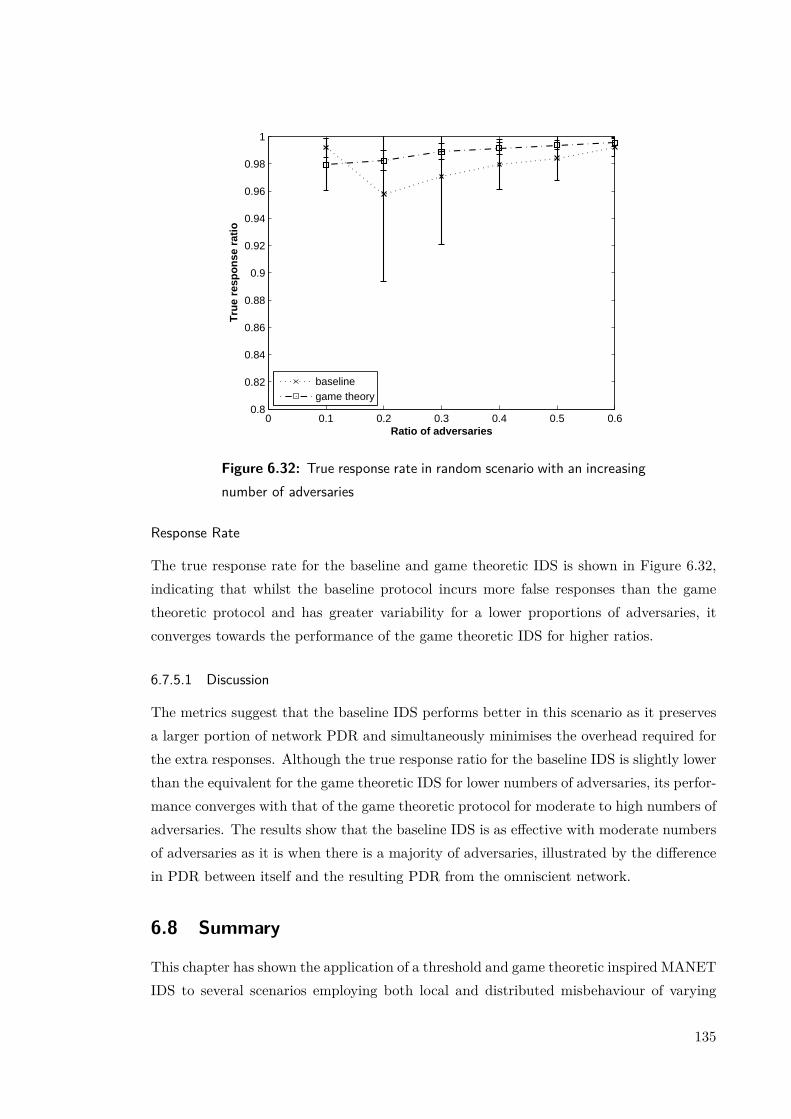
0 0.1 0.2 0.3 0.4 0.5 0.60.8
0.82
0.84
0.86
0.88
0.9
0.92
0.94
0.96
0.98
1
Ratio of adversaries
Tru
e re
spo
nse
rat
io
baselinegame theory
Figure 6.32: True response rate in random scenario with an increasingnumber of adversaries
Response Rate
The true response rate for the baseline and game theoretic IDS is shown in Figure 6.32,indicating that whilst the baseline protocol incurs more false responses than the gametheoretic protocol and has greater variability for a lower proportions of adversaries, itconverges towards the performance of the game theoretic IDS for higher ratios.
6.7.5.1 Discussion
The metrics suggest that the baseline IDS performs better in this scenario as it preservesa larger portion of network PDR and simultaneously minimises the overhead required forthe extra responses. Although the true response ratio for the baseline IDS is slightly lowerthan the equivalent for the game theoretic IDS for lower numbers of adversaries, its perfor-mance converges with that of the game theoretic protocol for moderate to high numbers ofadversaries. The results show that the baseline IDS is as effective with moderate numbersof adversaries as it is when there is a majority of adversaries, illustrated by the differencein PDR between itself and the resulting PDR from the omniscient network.
6.8 Summary
This chapter has shown the application of a threshold and game theoretic inspired MANETIDS to several scenarios employing both local and distributed misbehaviour of varying
135
subtlety in order to determine the effectiveness and the scalability of both approacheswith increasing number of adversaries. The threshold IDS was used as a baseline in orderto determine the efficacy of the game theoretic approach.
The core of the game theoretic implementation was the design of a game with appro-priate regions that responds or processes packets from neighbours based on their observedbehaviour. The output of the game is a mixed strategy solution that determines this out-come and applies it probabilistically until it is updated in the next interval. The baselineand game theoretic IDS employ the same method of computing a node’s behaviour profilein two measures, mp and mi, which were comprised of independent metrics that measuredthe ability of a node to perform a given function, such as forwarding data, from localobservations. What differentiates the approaches is how the measures are evaluated. Thethreshold IDS applied a strict threshold on mp and mi whilst the game theoretic approachemploys further reasoning (termed a “benefit of doubt”), by placing less importance on mi
(constituting weak evidence) without an associated reduction of mp (stronger evidence),to reduce the number of retaliations against benign nodes in imperfect wireless environ-ments, such as fading ones. In these environments, taking the output of detectors thatoperate via eavesdropping is unreliable and leads to false positives as often the notificationthat a neighbour has fulfilled a given function (e.g. packet forwarding), is missed.
Overall, the game theoretic protocol demonstrates a significant improvement in trueresponse rate compared to the baseline IDS for most of the scenarios presented in thisChapter, though this does not always translate into an improvement in network metrics.For example, the baseline provides consistently better network performance in the assis-ted black hole scenario and when subjected to random misbehaviour. This may be theresult of the longer convergence time from the additional reasoning employed in the gametheoretic IDS when it is either unnecessary (as in the assisted black hole scenario) or whenit prevents quick context switching (as in the random misbehaviour scenario). Both ap-proaches are unsatisfactory when subjected to flooding and for high numbers of wormholeadversaries, where they failed to preserve any network performance over the defencelessnetwork. Flooding is a special case where the core detection strategies are compromisedby the additional contention, resulting in self-reactivity that is illustrated by large falsepositive rates in both the game theoretic and baseline IDS.
Both the game theoretic and baseline IDS employ local detection and response, anddo not share their intrusion knowledge with their neighbours. This is advantageous inthat the IDS is less exposed to misleading from false reports by adversaries. Negativefalse reports could cause IDS nodes to deny a benign node access to the network, whilstpositive false reports disseminated by colluding adversaries could reduce the likelihoodof a retaliation, even if that adversary is actively attacking the network. This approachalso means, however, that if nodes do not have prior experience of an adversary they
136

will be susceptible to its misbehaviour they detect it themselves, even if this adversaryis known to others. The leads to a slower network-wide response, and imposes an upperlimit on its effectiveness. In addition, these techniques respond to misbehaviour over asingle timescale (refreshed each interval seconds), whilst a near-instantaneous responsewould be appropriate for misbehaviour that can be detected perfectly.
137
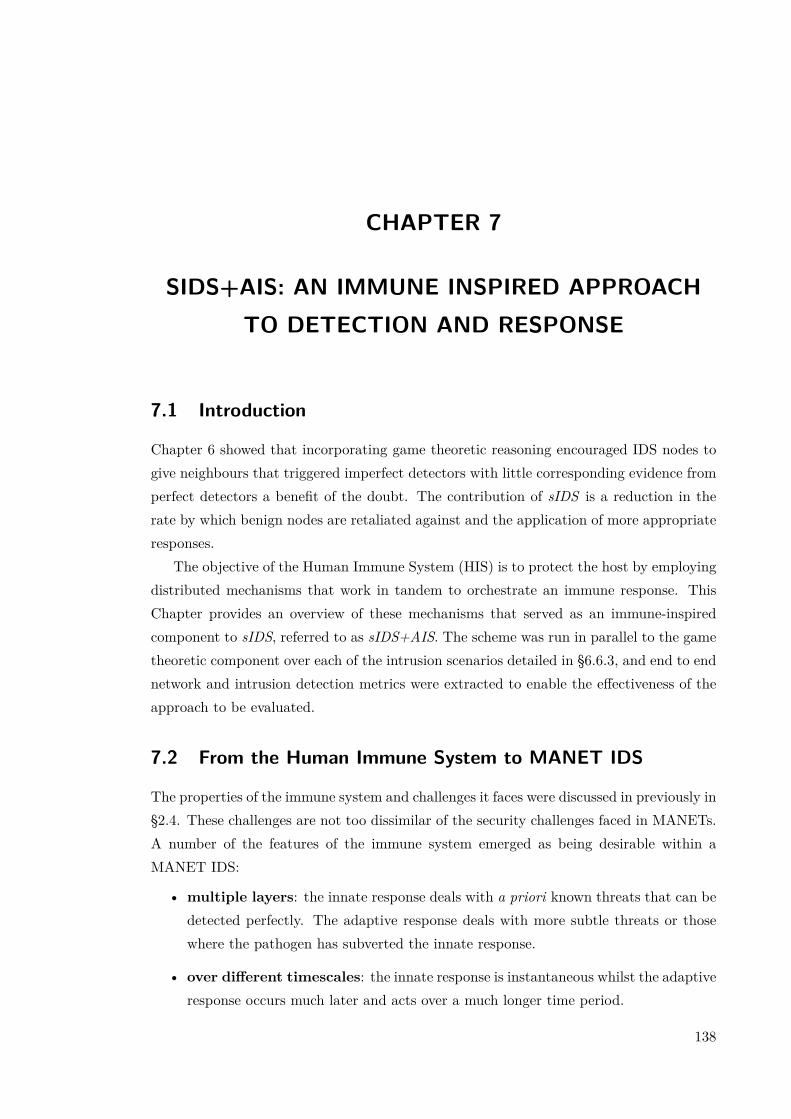
CHAPTER 7
SIDS+AIS: AN IMMUNE INSPIRED APPROACHTO DETECTION AND RESPONSE
7.1 Introduction
Chapter 6 showed that incorporating game theoretic reasoning encouraged IDS nodes togive neighbours that triggered imperfect detectors with little corresponding evidence fromperfect detectors a benefit of the doubt. The contribution of sIDS is a reduction in therate by which benign nodes are retaliated against and the application of more appropriateresponses.
The objective of the Human Immune System (HIS) is to protect the host by employingdistributed mechanisms that work in tandem to orchestrate an immune response. ThisChapter provides an overview of these mechanisms that served as an immune-inspiredcomponent to sIDS, referred to as sIDS+AIS. The scheme was run in parallel to the gametheoretic component over each of the intrusion scenarios detailed in §6.6.3, and end to endnetwork and intrusion detection metrics were extracted to enable the effectiveness of theapproach to be evaluated.
7.2 From the Human Immune System to MANET IDS
The properties of the immune system and challenges it faces were discussed in previously in§2.4. These challenges are not too dissimilar of the security challenges faced in MANETs.A number of the features of the immune system emerged as being desirable within aMANET IDS:
• multiple layers: the innate response deals with a priori known threats that can bedetected perfectly. The adaptive response deals with more subtle threats or thosewhere the pathogen has subverted the innate response.
• over different timescales: the innate response is instantaneous whilst the adaptiveresponse occurs much later and acts over a much longer time period.
138

• agent signalling: cells of the immune system use chemical signals to orchestrate aresponse.
In Chapter 6 we showed that fortifying a MANET with sIDS that detects and respondslocally results in an increase in end-to-end network performance over a defenceless networkwhen both are subjected to malicious behaviour. Even so, there is a limit to the effective-ness of this purely local approach, shown by its ineffectiveness to deal with more subtletypes of misbehaviour, or those where a co-ordinated response is required to prevent thespread of misbehaviour. This was illustrated in §6.6.3 where the best performing IDS isstill far from the performance of the ideal omniscient network that has a shared globalknowledge of adversaries.
The local detection paradigm employed so far means that if a node identifies a suspectas misbehaving, even by perfect schemes, this knowledge is not shared with its neighbours.In addition, detection activities operate over a single timescale, with no discriminationmade between perfectly or imperfectly detected misbehaviour. Thus, when the IDS retal-iates to possible misbehaviour from an imperfect source, it often results in a false positive.The following sub-sections describe the above properties in the context of a MANET IDS.
7.2.1 From innate TLRs to perfect detectors
On breaching the epithelial surfaces, a major part of the innate response involves therecognition of PAMPs by TLRs present on the surface of immune cells. As stated earlier,PAMPs exist only on pathogens, thus are a definitive marker of non-self. The activatedimmune cell reacts near instantaneously, by digesting the pathogen (a local response)and/or releasing cytokines to recruit neighbouring immune cells that are in transit (anextended response).
Applying this to the MANET environment, sIDS+AIS offers a near-instantaneouslocal response for misuses that can be classified perfectly (with a zero false positiverate) to short-circuit the long convergence time of the current IDS architecture (Figure6.4). Secondly, sIDS+AIS disseminates this knowledge to its neighbours to co-ordinate anextended response should other neighbours corroborate with these findings. If the majorityof nodes corroborate, distant neighbours with no first-hand experience of the misbehavingnode can also contribute to the extended response against it.
7.2.2 Adaptive response and imperfect detectors
The adaptive response takes over a few days after the original infection (Janeway et al.,2004, p. 21) if the innate response has failed to rid the pathogen from the host. The cellsinvolved are tasked with classifying more subtle markers of infection, such as recognisingthe altered expression of Major Histocompatibility Complex (MHC) on infected host cells
139
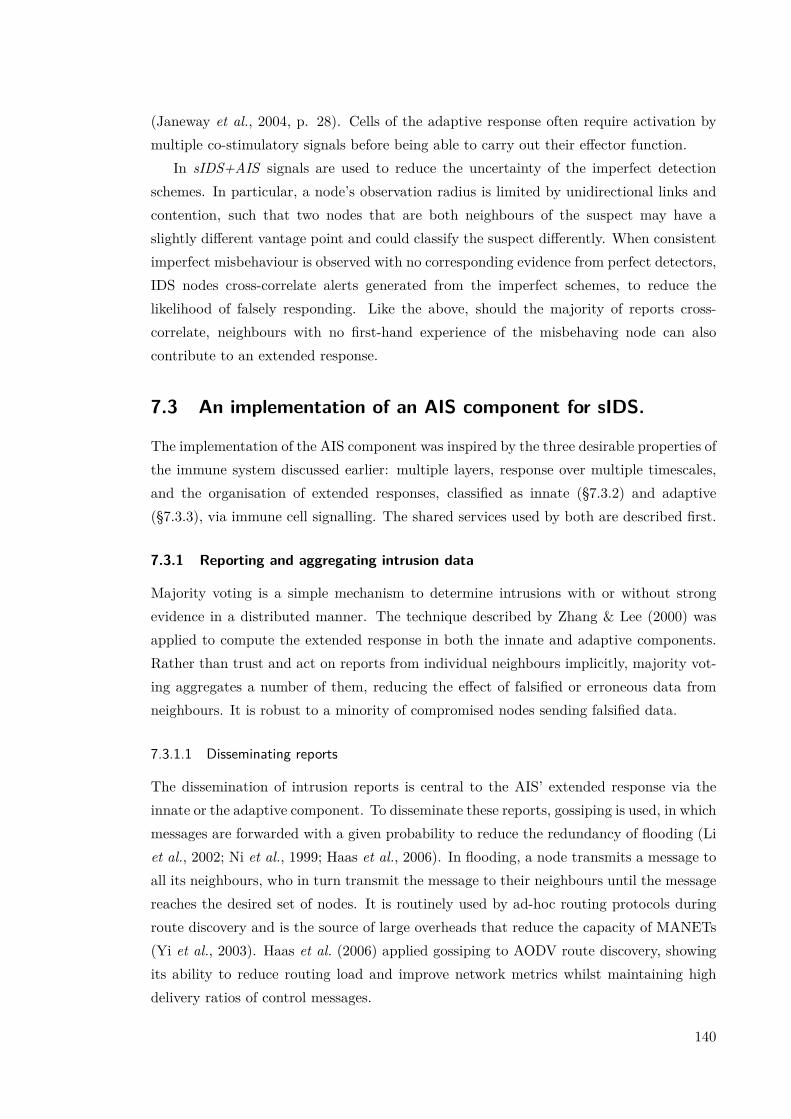
(Janeway et al., 2004, p. 28). Cells of the adaptive response often require activation bymultiple co-stimulatory signals before being able to carry out their effector function.
In sIDS+AIS signals are used to reduce the uncertainty of the imperfect detectionschemes. In particular, a node’s observation radius is limited by unidirectional links andcontention, such that two nodes that are both neighbours of the suspect may have aslightly different vantage point and could classify the suspect differently. When consistentimperfect misbehaviour is observed with no corresponding evidence from perfect detectors,IDS nodes cross-correlate alerts generated from the imperfect schemes, to reduce thelikelihood of falsely responding. Like the above, should the majority of reports cross-correlate, neighbours with no first-hand experience of the misbehaving node can alsocontribute to an extended response.
7.3 An implementation of an AIS component for sIDS.
The implementation of the AIS component was inspired by the three desirable properties ofthe immune system discussed earlier: multiple layers, response over multiple timescales,and the organisation of extended responses, classified as innate (§7.3.2) and adaptive(§7.3.3), via immune cell signalling. The shared services used by both are described first.
7.3.1 Reporting and aggregating intrusion data
Majority voting is a simple mechanism to determine intrusions with or without strongevidence in a distributed manner. The technique described by Zhang & Lee (2000) wasapplied to compute the extended response in both the innate and adaptive components.Rather than trust and act on reports from individual neighbours implicitly, majority vot-ing aggregates a number of them, reducing the effect of falsified or erroneous data fromneighbours. It is robust to a minority of compromised nodes sending falsified data.
7.3.1.1 Disseminating reports
The dissemination of intrusion reports is central to the AIS’ extended response via theinnate or the adaptive component. To disseminate these reports, gossiping is used, in whichmessages are forwarded with a given probability to reduce the redundancy of flooding (Liet al., 2002; Ni et al., 1999; Haas et al., 2006). In flooding, a node transmits a message toall its neighbours, who in turn transmit the message to their neighbours until the messagereaches the desired set of nodes. It is routinely used by ad-hoc routing protocols duringroute discovery and is the source of large overheads that reduce the capacity of MANETs(Yi et al., 2003). Haas et al. (2006) applied gossiping to AODV route discovery, showingits ability to reduce routing load and improve network metrics whilst maintaining highdelivery ratios of control messages.
140
...
Hop Count Report Payload
0 8 16 3224
Source IP Address
Destination IP Address
Figure 7.1: General structure of report IP packet
The approach we use is most similar to GOSSIP1(p, k) in Haas et al. (2006). Anode originating a report about a given suspect node sends it with p = 1, and waits forREPORT_TIMEOUT seconds to acquire reports from other nodes about the suspect (asshown in Algorithm 17). Neighbours increment the hop count field (h) and compute p asfollows:
p =
1 h ≤ k1
h−k h > k(7.1)
The value k = 3 was determined empirically by running several simulations and wasa good trade-off between the radius of report dissemination and control overhead. Inthis scheme, neighbours forward a given report once at most, by storing recently receivedreports in a buffer; the reporting node’s identity (’Source IP Address’) and the reportcontents are stored in a data structure keyed by the target node (’Destination IP Address’).The structure of the report payload is illustrated in Figure 7.1. It defines the target (the’Destination IP Address’), the reporting node (the ’Source IP Address’), the report payloadand the hop count (’Hop Count’), which is incremented by intermediate nodes during itsdissemination.
When a neighbour receives a new report, it also originates its own report about thereported suspect node if it has any first-hand experience about it. If the same report isreceived again, it is silently discarded. Broadcast based gossip is employed to ensure thefunctioning of the extended response independently from the routing protocol (which maybe under attack). The reporting procedure is throttled such that each neighbour thatparticipates in the reporting procedure for a suspect cannot initiate another for that nodeuntil at least MIN_REPORT_INTERVAL.
141

7.3.1.2 Data aggregation
Once REPORT_TIMEOUT has elapsed, the n received reports about the suspect areprocessed to determine a consensus. Whilst the conditions that determines an intrusionvary between the innate and adaptive component, if the computation concludes that thesuspect has intruded, the node responds.
7.3.1.3 Managing active responses
For simplicity, the same data structure is used by the innate and adaptive componentwhen initiating and managing the state of responses. Algorithm 15 illustrates how thisdata structure is updated when either component computes that the node with identitymacIpPair has intruded, and shows for each detected misuse the length of the responseincreases exponentially.
Algorithm 15 respond(macIpPair)if actively responding to macIpPair thenentry ← bufResponse[macIpPair]entry.bo ← 2*buf.bo
elsecreate new entry
end if
To achieve this, backoff values for monitored nodes are cached in a finite buffer withthe oldest entries from out-of-range neighbours removed first. Then, the length of responsefor macIpPair is computed from bo as follows:
response_time = bo ∗RESPONSE_BASE (7.2)
RESPONSE_BASE is a parameter that determines the smallest length of time a responsecan be active.
7.3.2 The innate component
The innate component of the AIS consists of a set of artificial TLRs, which comprise theperfect detectors shown in §6.2. This is accomplished by feeding the notifications directlyinto the innate component, as shown in Figure 7.2 (extending the architecture of the IDSshown in Figure 6.4).
7.3.2.1 Local response
Should one or more artificial TLRs be activated by a suspect’s audit data, the IDS respondslocally and near-instantaneously to the detected threat by blocking further communication
142
Compute metricsNotification
Vector
notification
Is TLR? Local Response
return
false
Extended Response
true
Figure 7.2: Flow diagram of innate response when notification is gen-erated by one or more detectors. If the notification is from a perfectdetector the innate component responds locally and then initiates anextended response.
between itself and the suspect (§7.3.1.3). Any messages that are received by the suspectduring this active response are delivered only to the IDS component in order to monitorits future behaviour.
7.3.2.2 Extended response
After the application of the local response, an extended response is co-ordinated by sharingknowledge of the intrusion to neighbouring nodes by invoking a reporting procedure. Theinitiator of the extended response constructs a report, adds its observation to it andtransmits it onto its neighbours. When a neighbour receives a new report, it forwards theoriginal report to its neighbours and, if it has recent first-hand experience, disseminatesits own report about the target. The strategy for disseminating reports was described in§7.3.1, and aside from the payload and majority voting criteria, is common to both theadaptive and innate components of the AIS. An example of the reporting procedure andcorresponding extended response is shown in Figure 7.3.
The innate report IP packet is illustrated in Figure 7.4, and has a payload that consistsof a flag (T ) if one or more TLRs was activated by the target node specified in theDestination IP Address field.
143
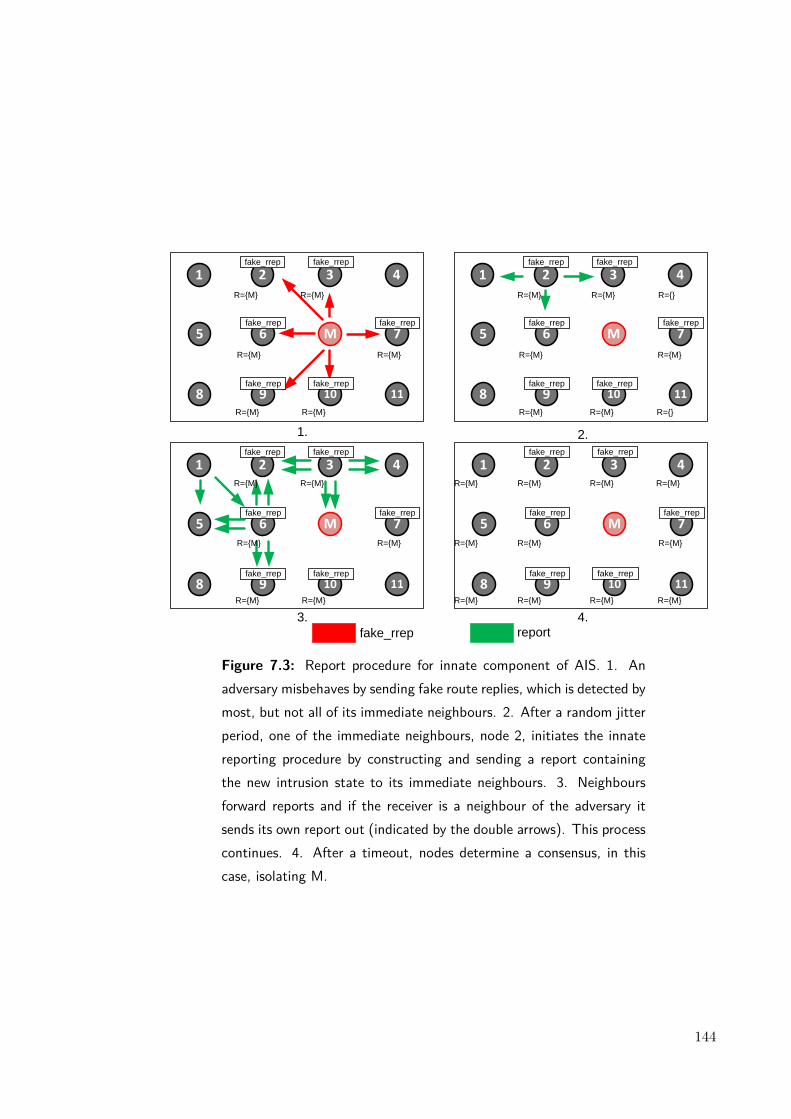
2 3 4
6 M 7
9 10 11
1
5
8
fake_rrep fake_rrep
fake_rrep
fake_rrep fake_rrep
fake_rrep
2 3 4
6 M 7
9 10 11
1
5
8
fake_rrep fake_rrep
fake_rrep
fake_rrep fake_rrep
fake_rrep
2 3 4
6 M 7
9 10 11
1
5
8
fake_rrep fake_rrep
fake_rrep
fake_rrep fake_rrep
fake_rrep
2 3 4
6 M 7
9 10 11
1
5
8
fake_rrep fake_rrep
fake_rrep
fake_rrep fake_rrep
fake_rrep
1. 2.
3. 4.
fake_rrep report
R={M} R={M}
R={M} R={M}
R={M} R={M}
R={M} R={M} R={}
R={M} R={M} R={}
R={M} R={M}
R={M} R={M} R={M}
R={M} R={M} R={M}
R={M} R={M}
R={M}
R={M}
R={M}
R={M} R={M}
R={M} R={M}
R={M} R={M}
Figure 7.3: Report procedure for innate component of AIS. 1. Anadversary misbehaves by sending fake route replies, which is detected bymost, but not all of its immediate neighbours. 2. After a random jitterperiod, one of the immediate neighbours, node 2, initiates the innatereporting procedure by constructing and sending a report containingthe new intrusion state to its immediate neighbours. 3. Neighboursforward reports and if the receiver is a neighbour of the adversary itsends its own report out (indicated by the double arrows). This processcontinues. 4. After a timeout, nodes determine a consensus, in thiscase, isolating M.
144
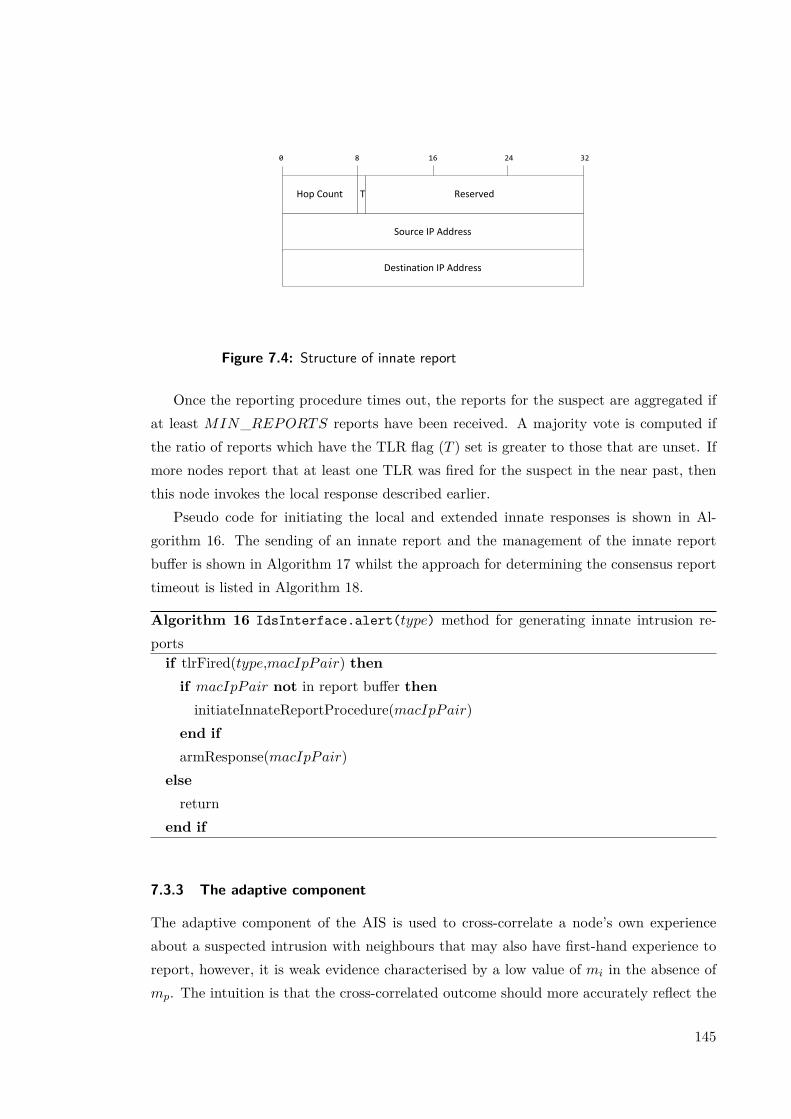
Source IP Address
Hop Count T Reserved
0 8 16 24 32
Destination IP Address
Figure 7.4: Structure of innate report
Once the reporting procedure times out, the reports for the suspect are aggregated ifat least MIN_REPORTS reports have been received. A majority vote is computed ifthe ratio of reports which have the TLR flag (T ) set is greater to those that are unset. Ifmore nodes report that at least one TLR was fired for the suspect in the near past, thenthis node invokes the local response described earlier.
Pseudo code for initiating the local and extended innate responses is shown in Al-gorithm 16. The sending of an innate report and the management of the innate reportbuffer is shown in Algorithm 17 whilst the approach for determining the consensus reporttimeout is listed in Algorithm 18.
Algorithm 16 IdsInterface.alert(type) method for generating innate intrusion re-portsif tlrFired(type,macIpPair) thenif macIpPair not in report buffer theninitiateInnateReportProcedure(macIpPair)
end ifarmResponse(macIpPair)
elsereturn
end if
7.3.3 The adaptive component
The adaptive component of the AIS is used to cross-correlate a node’s own experienceabout a suspected intrusion with neighbours that may also have first-hand experience toreport, however, it is weak evidence characterised by a low value of mi in the absence ofmp. The intuition is that the cross-correlated outcome should more accurately reflect the
145
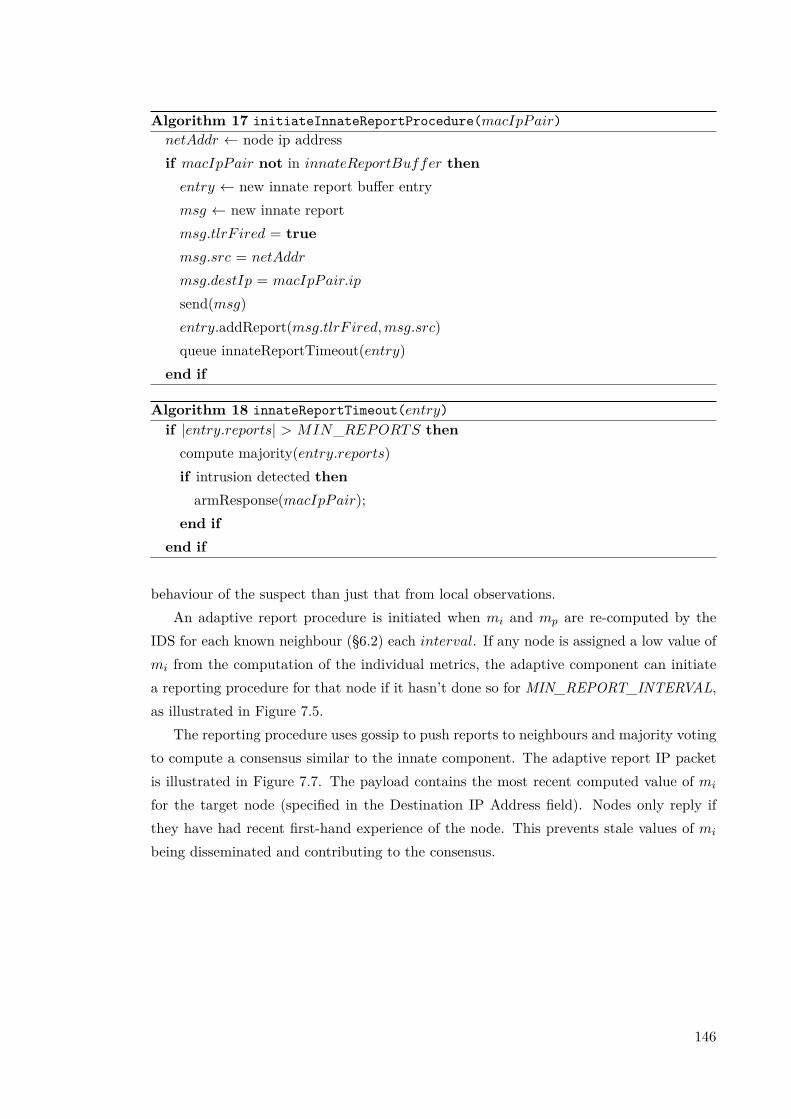
Algorithm 17 initiateInnateReportProcedure(macIpPair)netAddr ← node ip addressif macIpPair not in innateReportBuffer thenentry ← new innate report buffer entrymsg ← new innate reportmsg.tlrF ired = truemsg.src = netAddr
msg.destIp = macIpPair.ip
send(msg)entry.addReport(msg.tlrF ired,msg.src)queue innateReportTimeout(entry)
end if
Algorithm 18 innateReportTimeout(entry)if |entry.reports| > MIN_REPORTS thencompute majority(entry.reports)if intrusion detected thenarmResponse(macIpPair);
end ifend if
behaviour of the suspect than just that from local observations.An adaptive report procedure is initiated when mi and mp are re-computed by the
IDS for each known neighbour (§6.2) each interval. If any node is assigned a low value ofmi from the computation of the individual metrics, the adaptive component can initiatea reporting procedure for that node if it hasn’t done so for MIN_REPORT_INTERVAL,as illustrated in Figure 7.5.
The reporting procedure uses gossip to push reports to neighbours and majority votingto compute a consensus similar to the innate component. The adaptive report IP packetis illustrated in Figure 7.7. The payload contains the most recent computed value of mi
for the target node (specified in the Destination IP Address field). Nodes only reply ifthey have had recent first-hand experience of the node. This prevents stale values of mi
being disseminated and contributing to the consensus.
146
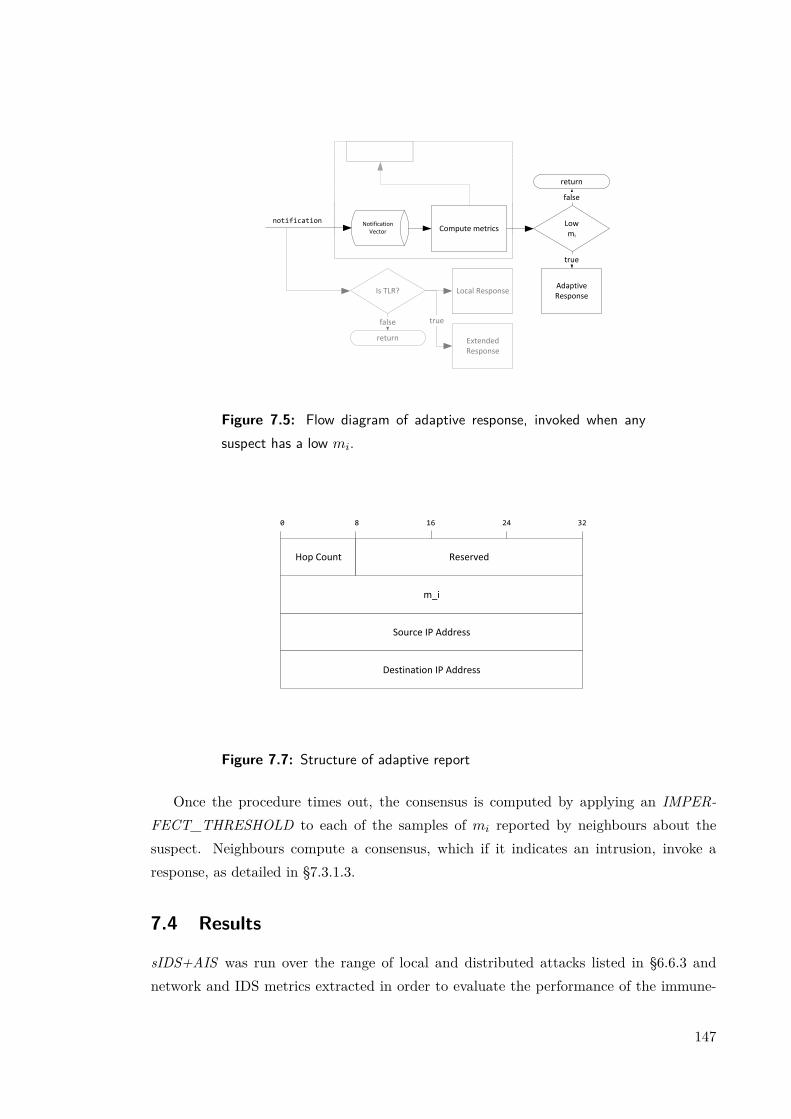
Compute metricsNotification
Vector
notification
Is TLR? Local Response
return
false
Extended Response
true
Low mi
Local ResponseAdaptive Response
true
return
false
Figure 7.5: Flow diagram of adaptive response, invoked when anysuspect has a low mi.
m_i
Hop Count Reserved
0 8 16 3224
Source IP Address
Destination IP Address
Figure 7.7: Structure of adaptive report
Once the procedure times out, the consensus is computed by applying an IMPER-FECT_THRESHOLD to each of the samples of mi reported by neighbours about thesuspect. Neighbours compute a consensus, which if it indicates an intrusion, invoke aresponse, as detailed in §7.3.1.3.
7.4 Results
sIDS+AIS was run over the range of local and distributed attacks listed in §6.6.3 andnetwork and IDS metrics extracted in order to evaluate the performance of the immune-
147

2 3 4
6 M 7
9 10 11
1
5
8
2 3 4
6 M 7
9 10 11
1
5
8
1. 2.
3. 4.drop report
2 3 4
6 M 7
9 10 11
1
5
8
mi(M)=0.3
mi(M)=0.4
mi(M)=0.7
mi(M)=0.35
2 3 4
6 M 7
9 10 11
1
5
8
mi(M)=0.3
mi(M)=0.4
mi(M)=0.7
mi(M)=0.35
R={} R={} R={}
R={} R={}
R={M} R={M} R={M}
R={M} R={M}
R={M} R={M} R={M}
R={M} R={M}
mi(M)=0.3
mi(M)=0.4
mi(M)=0.7
mi(M)=0.35
mi(M)=0.3
mi(M)=0.4
mi(M)=0.7
mi(M)=0.35
data
R={} R={} R={}
R={} R={}
R={M} R={M} R={M} R={M} R={M} R={M}
R={M}
R={M}
R={M}
R={M}
R={M}
R={M}
Figure 7.6: Report procedure for adaptive component of AIS. 1. Anadversary misbehaves by dropping packets. 2. After a random jitterperiod, one of the immediate neighbours, node 2, initiates the report-ing procedure by forwarding a report containing its evaluation of thesuspect’s mi to its neighbours. Nodes forward the reports on and ifthey have recent experience they transmit a report with their evaluationof mi (indicated by double arrows). 3. After a timeout, nodes applya threshold to the reported mi’s, and find the consensus - in this caseto respond to M. The empty set R now contains M 4. Nodes find analternative route around M. Note that neighbours with no experienceof M also contribute in the extended response against M.
148
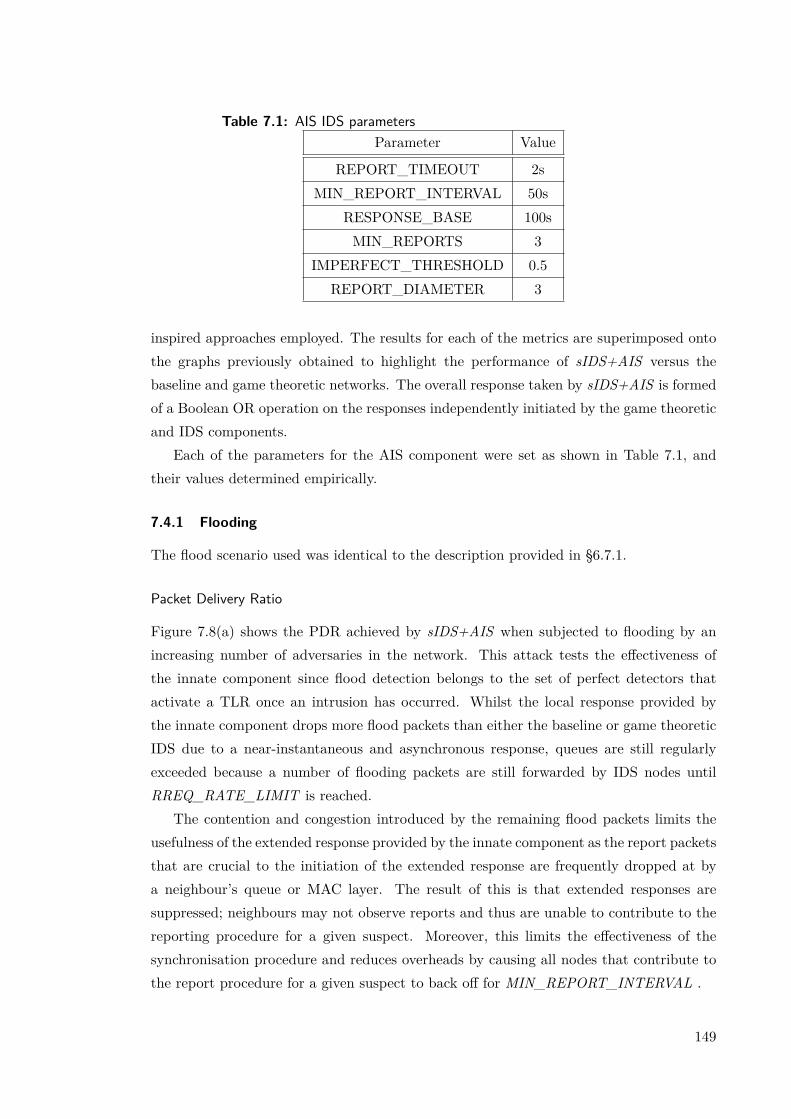
Table 7.1: AIS IDS parametersParameter Value
REPORT_TIMEOUT 2sMIN_REPORT_INTERVAL 50s
RESPONSE_BASE 100sMIN_REPORTS 3
IMPERFECT_THRESHOLD 0.5REPORT_DIAMETER 3
inspired approaches employed. The results for each of the metrics are superimposed ontothe graphs previously obtained to highlight the performance of sIDS+AIS versus thebaseline and game theoretic networks. The overall response taken by sIDS+AIS is formedof a Boolean OR operation on the responses independently initiated by the game theoreticand IDS components.
Each of the parameters for the AIS component were set as shown in Table 7.1, andtheir values determined empirically.
7.4.1 Flooding
The flood scenario used was identical to the description provided in §6.7.1.
Packet Delivery Ratio
Figure 7.8(a) shows the PDR achieved by sIDS+AIS when subjected to flooding by anincreasing number of adversaries in the network. This attack tests the effectiveness ofthe innate component since flood detection belongs to the set of perfect detectors thatactivate a TLR once an intrusion has occurred. Whilst the local response provided bythe innate component drops more flood packets than either the baseline or game theoreticIDS due to a near-instantaneous and asynchronous response, queues are still regularlyexceeded because a number of flooding packets are still forwarded by IDS nodes untilRREQ_RATE_LIMIT is reached.
The contention and congestion introduced by the remaining flood packets limits theusefulness of the extended response provided by the innate component as the report packetsthat are crucial to the initiation of the extended response are frequently dropped at bya neighbour’s queue or MAC layer. The result of this is that extended responses aresuppressed; neighbours may not observe reports and thus are unable to contribute to thereporting procedure for a given suspect. Moreover, this limits the effectiveness of thesynchronisation procedure and reduces overheads by causing all nodes that contribute tothe report procedure for a given suspect to back off for MIN_REPORT_INTERVAL .
149

0 0.1 0.2 0.3 0.4 0.5 0.60
0.1
0.2
0.3
0.4
0.5
0.6
0.7
0.8
0.9
1
Ratio of adversaries
Pac
ket
Del
iver
y R
atio
(P
DR
)
defenselessomniscientbaselinegame theorygame theory + ais
(a) Packet Delivery Ratio (PDR)
0 0.1 0.2 0.3 0.4 0.5 0.60
2
4
6
8
10
12
14
Ratio of adversaries
Ave
rag
e E
TE
Del
ay (
s)
defenselessomniscientbaselinegame theorygame theory + ais
(b) Average end-to-end delay
0 0.1 0.2 0.3 0.4 0.5 0.60
1
2
3
4
5
6
7
8
Ratio of adversaries
Co
ntr
ol o
verh
ead
rat
io
defenselessomniscientbaselinegame theorygame theory + ais
(c) Control overheads
0 0.1 0.2 0.3 0.4 0.5 0.60
0.1
0.2
0.3
0.4
0.5
0.6
0.7
0.8
0.9
1
Ratio of adversaries
Tru
e re
spo
nse
rat
io
baselinegame theorygame theory + ais
(d) True response ratio
defenseless baseline game theory game theory + ais0
10
20
30
40
50
60
70
Node model
Rec
ove
ry t
ime
(s)
(e) Recovery time (30% adversaries)
defenseless baseline game theory game theory + ais0
500
1000
1500
2000
2500
3000
3500
4000
4500
Node model
Go
od
pu
t (b
ytes
/s)
(f) Minimum goodput (30% adversaries)
Figure 7.8: Results from flooding scenario with increasing numbers ofadversaries
150

Overall, these data show that there are no significant gains to PDR in this scenario byemploying sIDS+AIS over the baseline or game theoretic IDS.
Average end-to-end (ETE) delay
Figure 7.8(b) depicts the ETE delay achieved by sIDS+AIS. The data show that therate of increase of ETE delay decreases until 30-40% adversaries, after which the attacksaturates, resulting in no further ETE delay or loss in PDR. This characteristic of theETE delay in sIDS+IDS is similar to that of the game theoretic and baseline networks.The attempts to initiate an extended response introduce further overheads, which can beup to twice that of the baseline IDS, yet result in no appreciable performance gain, asshown in Figure 7.8(c).
Response Rate
The high true response rate of sIDS+AIS compared to the baseline and game theoreticIDS’s (shown in Figure 7.8(d)) is purely a result of the local response provided by theinnate component of the AIS. This blacklists a node that is detected for flooding for anexponentially increasing period of time (§7.3.1.3) near-instantaneously, thus dropping anyfurther traffic from this node. This response is in dependant from the slower computationof metrics mp and mi used in the pure game theoretic and baseline networks.
Recovery Time and Minimum Goodput
The recovery time and minimum goodput for sIDS+AIS is reported in Figure 7.8(e) andFigure 7.8(f) respectively. The data indicate only a slight decrease in the time taken torestore goodput to pre-intrusion levels, but a reduction in the average minimum goodputcompared to the pure game theoretic approach.
7.4.1.1 Discussion
As discussed in §6.7.1, flooding leads to large amounts of network congestion and mediumcontention, which negates one of the main advantages of the AIS approach by suppressingthe extended detection and response by neighbours of the node detecting the originalintrusion. This often results in the minimum number of reports required to invoke anextended response (MIN_REPORTS) not being met or the production of false negativereports from neighbours due to collisions of multiple flooding attacks that result in IDSnodes not observing the full number of flooding packets sent by each adversary. The extraoverhead introduced by the extended response tends not to produce retaliatory effect, andis evidenced by the lack of an appreciable gain in any network metric in this scenario.
151
7.4.2 Unassisted Black hole
Packet Delivery and Dropped Packet Ratio
Figures 7.9(a) and 7.9(b) show the PDR and dropped packet ratio of sIDS+AIS respec-tively, illustrating that there is very little difference in either metric compared to thebaseline or pure game theoretic approach to recommend the use of the AIS component inthis scenario.
Whilst in the flooding scenario the similar performance to the baseline and gametheoretic IDS was caused by a suppressed extended response, in this scenario, althoughthe adaptive component of the AIS enables cross-correlation, few neighbouring nodes arein a position to corroborate on first-hand experience of an intrusion, thus cannot takeadvantage of this feature. Once more, this results in very few extended responses in thenetwork.
Average end-to-end (ETE) delay and control overheads
Figure 7.9(c) shows sIDS+AIS introduces a slightly larger ETE delay than the baseline andgame theoretic networks. This is as a result of the increased overhead from the extendedresponse of the adaptive component, as shown in Figure 7.9(d). The ETE delay returnsto the levels of the baseline and game theoretic networks for greater than 40% adversaries,due to a similar level of overheads.
Response Rate
The response rate of sIDS+AIS offers a 5% improvement over the use of a pure gametheoretic approach, which showed the best performance previously. This improvementresults from the few long-lasting extended responses initiated by the adaptive componentwhich cross-correlates the neighbours evaluations of a suspect’s imperfect metrics to reducethe uncertainty, and emerges as less false responses being directed at benign nodes.
Recovery Time and Minimum Goodput
The recovery time and minimum goodput experienced by each of the node models forthe unassisted black hole scenario is shown in Figure 7.12. The figure shows sIDS+AIShas marginally inferior performance for both metrics compared to the baseline or puregame theoretic approach. The recovery time reported by sIDS+AIS is not surprising,however, since the extended response from the adaptive component is only invoked whenmi decreases sufficiently, which would cause a local response in the baseline IDS, thus weare comparing responses that occur on the same timescale.
152

0 0.1 0.2 0.3 0.4 0.5 0.60
0.1
0.2
0.3
0.4
0.5
0.6
0.7
0.8
0.9
1
Ratio of adversaries
Pac
ket
Del
iver
y R
atio
(P
DR
)
defenselessomniscientbaselinegame theorygame theory + ais
(a) Packet Delivery Ratio (PDR)
−0.1 0 0.1 0.2 0.3 0.4 0.5 0.6 0.70
0.1
0.2
0.3
0.4
0.5
0.6
0.7
Ratio of adversaries
Dro
pp
ed p
acke
ts r
atio
defenselessomniscientbaselinegame theorygame theory + ais
(b) Dropped packet ratio
0 0.1 0.2 0.3 0.4 0.5 0.60
0.2
0.4
0.6
0.8
1
1.2
1.4
1.6
1.8
2
Ratio of adversaries
Ave
rag
e E
TE
Del
ay (
s)
defenselessomniscientbaselinegame theorygame theory + ais
(c) Average end-to-end delay
0 0.1 0.2 0.3 0.4 0.5 0.60
0.5
1
1.5
2
2.5
3
3.5
Ratio of adversaries
Co
ntr
ol o
verh
ead
rat
io
defenselessomniscientbaselinegame theorygame theory + ais
(d) Control overheads
0 0.1 0.2 0.3 0.4 0.5 0.60
0.1
0.2
0.3
0.4
0.5
0.6
0.7
0.8
0.9
1
Ratio of adversaries
Tru
e re
spo
nse
rat
io
baselinegame theorygame theory + ais
(e) True response ratio
Figure 7.9: Results from unassisted black hole scenario with increasingnumbers of adversaries
153

defenseless baseline game theory game theory + ais0
20
40
60
80
100
120
140
Node model
Rec
ove
ry t
ime
(s)
defenseless baseline game theory game theory + ais0
2000
4000
6000
8000
10000
12000
14000
16000
Node model
Go
od
pu
t (b
ytes
/s)
Figure 7.10: Recovery times and minimum goodputs achieved in unas-sisted black hole scenario with 30% adversaries over range of nodemodels
7.4.2.1 Discussion
The forwarding behaviour of a neighbour is captured by the imperfect metricmi alone, thusthe innate component of the AIS does not play a part in the overall response. Althoughthe adaptive response is regularly initiated, as shown by the increased overheads overthe baseline and pure game theoretic approach, nodes often fail to reach a consensusdecision regarding possible suspects.. This may be the result of weaknesses in the trafficdistribution employed in these simulations, which is further compounded by the inabilityof the drop detector to verify the forwarding of packets on indirect flows (§5.4.1), possiblewith other ad-hoc routing protocols. Despite this, the approach shows a further advantagein true response rate over the pure game theoretic approach, resulting from appropriateextended responses.
7.4.3 Black hole assisted with passive route invasion
Packet Delivery Ratio
Figures 7.11(a) and 7.11(b) illustrate the PDR and dropped packet ratio for sIDS+AIS,indicating a significant reduction (approximately 5%) in the number of dropped packetscompared to the leading IDS in this scenario, the baseline IDS. sIDS+AIS tracks the PDRachieved by the omniscient and baseline networks, showing a real advantage over the puregame theoretic approach for small ratios of adversaries. That the reduction in drop ratedoes not result in a proportionate increase in the overall PDR is an interesting result,which could be due to additional queue or MAC drops from the overheads imposed by thereporting procedure, or the routing overheads required to support the additional 5% datapreserved.
154
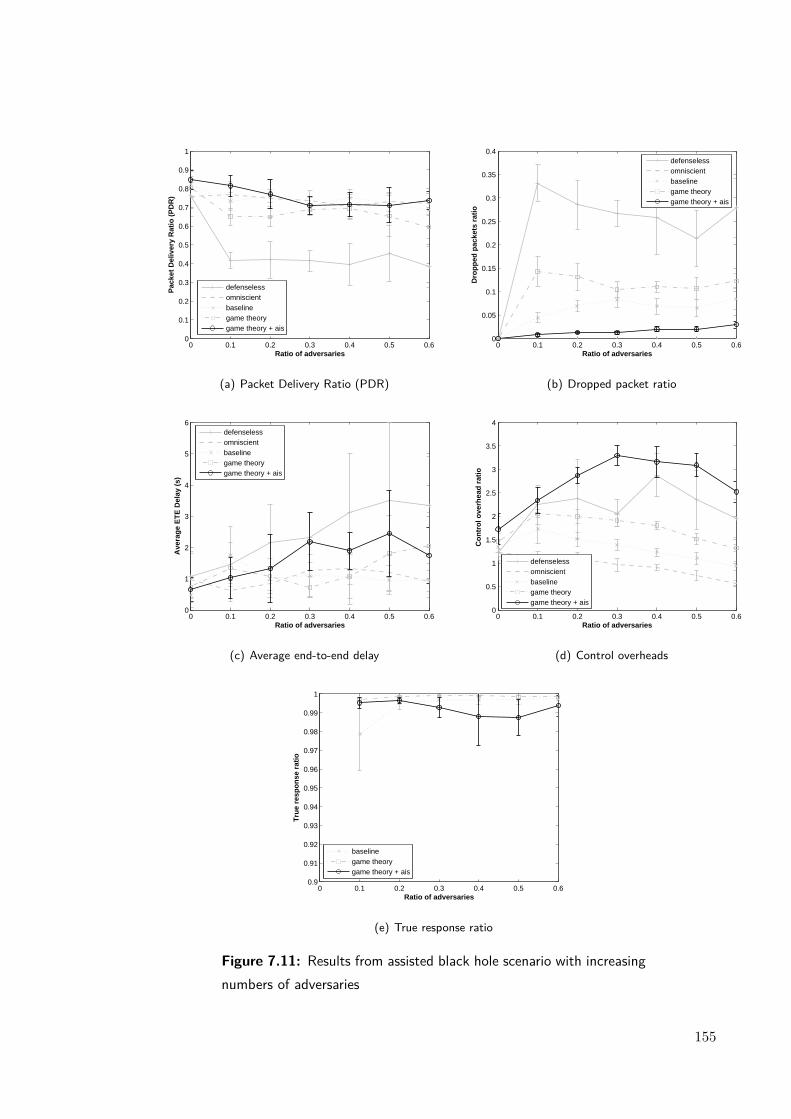
0 0.1 0.2 0.3 0.4 0.5 0.60
0.1
0.2
0.3
0.4
0.5
0.6
0.7
0.8
0.9
1
Ratio of adversaries
Pac
ket
Del
iver
y R
atio
(P
DR
)
defenselessomniscientbaselinegame theorygame theory + ais
(a) Packet Delivery Ratio (PDR)
0 0.1 0.2 0.3 0.4 0.5 0.60
0.05
0.1
0.15
0.2
0.25
0.3
0.35
0.4
Ratio of adversaries
Dro
pp
ed p
acke
ts r
atio
defenselessomniscientbaselinegame theorygame theory + ais
(b) Dropped packet ratio
0 0.1 0.2 0.3 0.4 0.5 0.60
1
2
3
4
5
6
Ratio of adversaries
Ave
rag
e E
TE
Del
ay (
s)
defenselessomniscientbaselinegame theorygame theory + ais
(c) Average end-to-end delay
0 0.1 0.2 0.3 0.4 0.5 0.60
0.5
1
1.5
2
2.5
3
3.5
4
Ratio of adversaries
Co
ntr
ol o
verh
ead
rat
io
defenselessomniscientbaselinegame theorygame theory + ais
(d) Control overheads
0 0.1 0.2 0.3 0.4 0.5 0.60.9
0.91
0.92
0.93
0.94
0.95
0.96
0.97
0.98
0.99
1
Ratio of adversaries
Tru
e re
spo
nse
rat
io
baselinegame theorygame theory + ais
(e) True response ratio
Figure 7.11: Results from assisted black hole scenario with increasingnumbers of adversaries
155

defenseless baseline game theory game theory + ais0
20
40
60
80
100
120
140
Node model
Rec
ove
ry t
ime
(s)
defenseless baseline game theory game theory + ais0
2000
4000
6000
8000
10000
12000
14000
16000
Node model
Go
od
pu
t (b
ytes
/s)
Figure 7.12: Recovery times and minimum goodputs achieved bydefenceless, baseline and game theoretic networks with moderate mis-behaviour (30% adversaries) in assisted black hole scenario
Average end-to-end (ETE) delay and control overheads
The additional extended responses applied by the innate and adaptive components of theAIS in this scenario account for the larger ETE delays (Figure 7.11(c)) and doubling ofthe overheads compared to the baseline network (Figure 7.11(d)).
Response Rate
The response rate achieved by sIDS+AIS is shown in Figure 7.11(e), indicating a slightreduction in average true response ratio over the pure game theoretic approach. This re-duction may be due to the extended detection from the adaptive component of sIDS+AIS,in which a percentage of the consensuses reached may be incorrect. These extended falsedetections lead to more far reaching and longer lasting effects than if a benign node wasdetermined as misbehaving locally.
Recovery Time and Minimum Goodput
sIDS+AIS results in a 42% reduction of recovery time compared to the baseline IDS, whichwas the previous leader in this scenario (Figure 7.12). This reduction arises from the near-instantaneous response to the strong evidence component of this attack (the passive routeinvasion). The advantage of employing the AIS framework in sIDS+AIS is reinforced bythe preservation of a minimum goodput similar to the baseline.
7.4.3.1 Discussion
sIDS+AIS results in a near eradication of the assisted black hole attack at a cost ofadditional overheads over the pure game theoretic approach and a slight reduction in thetrue response ratio for larger ratios of adversaries. The extended response proactively
156
identifies adversaries to neighbours that have no prior experience of them, helping tomaintain a low drop rate by adversaries. This does not translate into an advantage inPDR, suggesting the overheads from the extended response and delivery of the extra dataresults in larger MAC and queuing losses.
7.4.4 Wormhole
Packet Delivery and Intercepted Packet Ratio
Figures 7.13(a) and 7.13(b) depict the PDR and intercepted packet ratio for sIDS+AISapplied to the wormhole scenario. These data show that the IDS is still susceptible to alarge number of intercepted packets for moderate numbers of adversaries, resulting in anartificially high PDR due to intercepted packets taking low latency paths and freeing theshared medium.
At moderate to high numbers of adversaries, employing sIDS+AIS does reduce theaverage number of intercepted packets by between 8.9 and 17% compared to the baseline(previously the most effective approach).
Average end-to-end (ETE) delay and control overheads
The general trend for a reduction in ETE delay with greater number of adversaries inthe wormhole scenario continues with sIDS+AIS (Figure 7.13(c)). The decreased numberof intercepted packets at moderate levels of adversaries gives rise to a larger ETE delaythat reduces to baseline levels at 50% adversaries and above, as the wormhole attackbecomes more effective. Extended responses contribute to a 30% increase in overheads at20% adversaries compared to the baseline IDS, which decreases to a 5% increase for 50%adversaries.
Response Rate
The true response rate achieved by sIDS+AIS is shown in Figure 7.13(e), decreasing fromthe pure game theoretic approach towards the baseline for 30% adversaries and over. Thisis the result of some consensuses that override the game theoretic reasoning being incorrect.The worst case scenario is a 5% increase in false response rate compared to the pure gametheoretic approach for the large advantage in reducing the number of intercepted packets.
Recovery Time and Minimum Intercepted Throughput
sIDS+AIS reduces the recovery time only very slightly compared to the baseline andsIDS, which is expected as the innate component does not play as part in the detectionof this attack. There is also no noticeable reduction in the maximum bytes intercepted
157
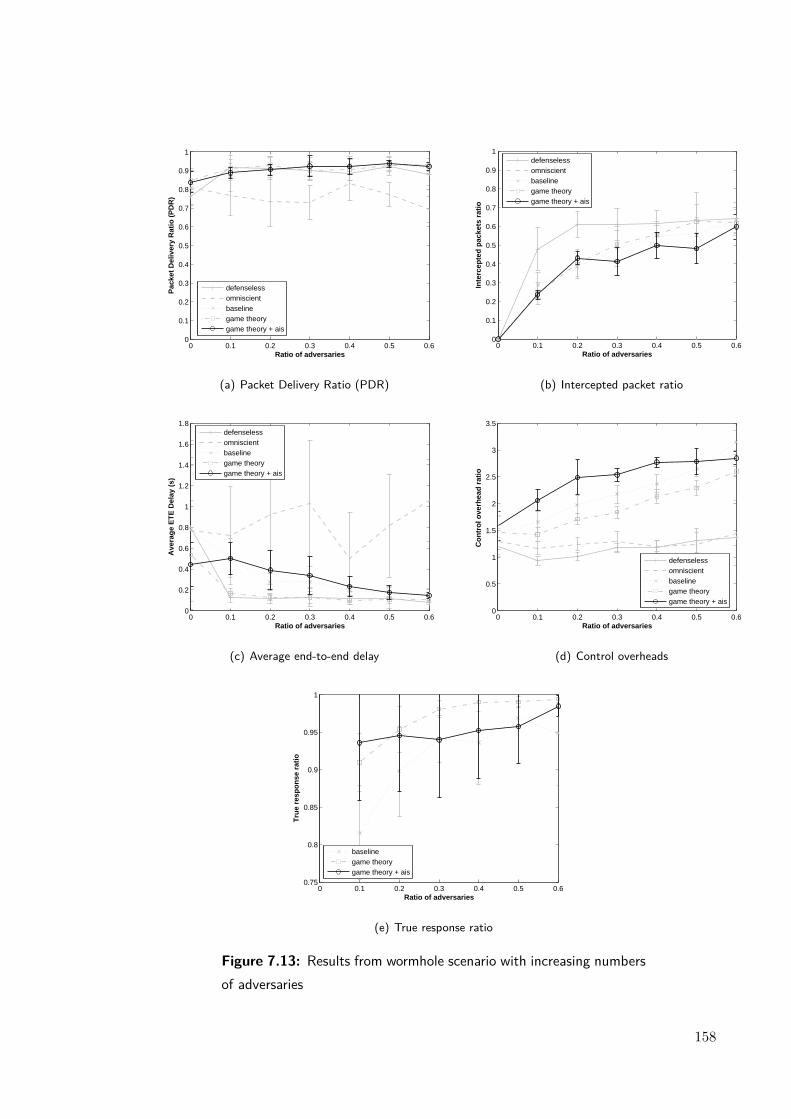
0 0.1 0.2 0.3 0.4 0.5 0.60
0.1
0.2
0.3
0.4
0.5
0.6
0.7
0.8
0.9
1
Ratio of adversaries
Pac
ket
Del
iver
y R
atio
(P
DR
)
defenselessomniscientbaselinegame theorygame theory + ais
(a) Packet Delivery Ratio (PDR)
0 0.1 0.2 0.3 0.4 0.5 0.60
0.1
0.2
0.3
0.4
0.5
0.6
0.7
0.8
0.9
1
Ratio of adversaries
Inte
rcep
ted
pac
kets
rat
io
defenselessomniscientbaselinegame theorygame theory + ais
(b) Intercepted packet ratio
0 0.1 0.2 0.3 0.4 0.5 0.60
0.2
0.4
0.6
0.8
1
1.2
1.4
1.6
1.8
Ratio of adversaries
Ave
rag
e E
TE
Del
ay (
s)
defenselessomniscientbaselinegame theorygame theory + ais
(c) Average end-to-end delay
0 0.1 0.2 0.3 0.4 0.5 0.60
0.5
1
1.5
2
2.5
3
3.5
Ratio of adversaries
Co
ntr
ol o
verh
ead
rat
io
defenselessomniscientbaselinegame theorygame theory + ais
(d) Control overheads
0 0.1 0.2 0.3 0.4 0.5 0.60.75
0.8
0.85
0.9
0.95
1
Ratio of adversaries
Tru
e re
spo
nse
rat
io
baselinegame theorygame theory + ais
(e) True response ratio
Figure 7.13: Results from wormhole scenario with increasing numbersof adversaries
158
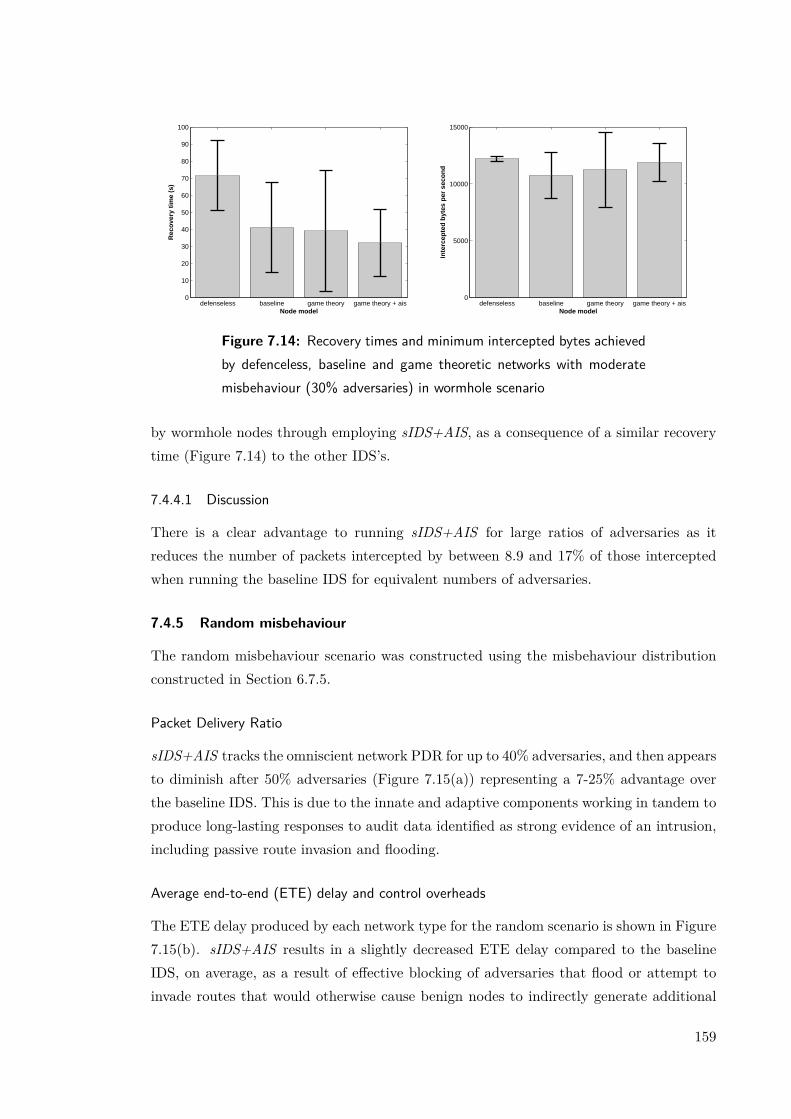
defenseless baseline game theory game theory + ais0
10
20
30
40
50
60
70
80
90
100
Node model
Rec
ove
ry t
ime
(s)
defenseless baseline game theory game theory + ais0
5000
10000
15000
Node model
Inte
rcep
ted
byt
es p
er s
eco
nd
Figure 7.14: Recovery times and minimum intercepted bytes achievedby defenceless, baseline and game theoretic networks with moderatemisbehaviour (30% adversaries) in wormhole scenario
by wormhole nodes through employing sIDS+AIS, as a consequence of a similar recoverytime (Figure 7.14) to the other IDS’s.
7.4.4.1 Discussion
There is a clear advantage to running sIDS+AIS for large ratios of adversaries as itreduces the number of packets intercepted by between 8.9 and 17% of those interceptedwhen running the baseline IDS for equivalent numbers of adversaries.
7.4.5 Random misbehaviour
The random misbehaviour scenario was constructed using the misbehaviour distributionconstructed in Section 6.7.5.
Packet Delivery Ratio
sIDS+AIS tracks the omniscient network PDR for up to 40% adversaries, and then appearsto diminish after 50% adversaries (Figure 7.15(a)) representing a 7-25% advantage overthe baseline IDS. This is due to the innate and adaptive components working in tandem toproduce long-lasting responses to audit data identified as strong evidence of an intrusion,including passive route invasion and flooding.
Average end-to-end (ETE) delay and control overheads
The ETE delay produced by each network type for the random scenario is shown in Figure7.15(b). sIDS+AIS results in a slightly decreased ETE delay compared to the baselineIDS, on average, as a result of effective blocking of adversaries that flood or attempt toinvade routes that would otherwise cause benign nodes to indirectly generate additional
159
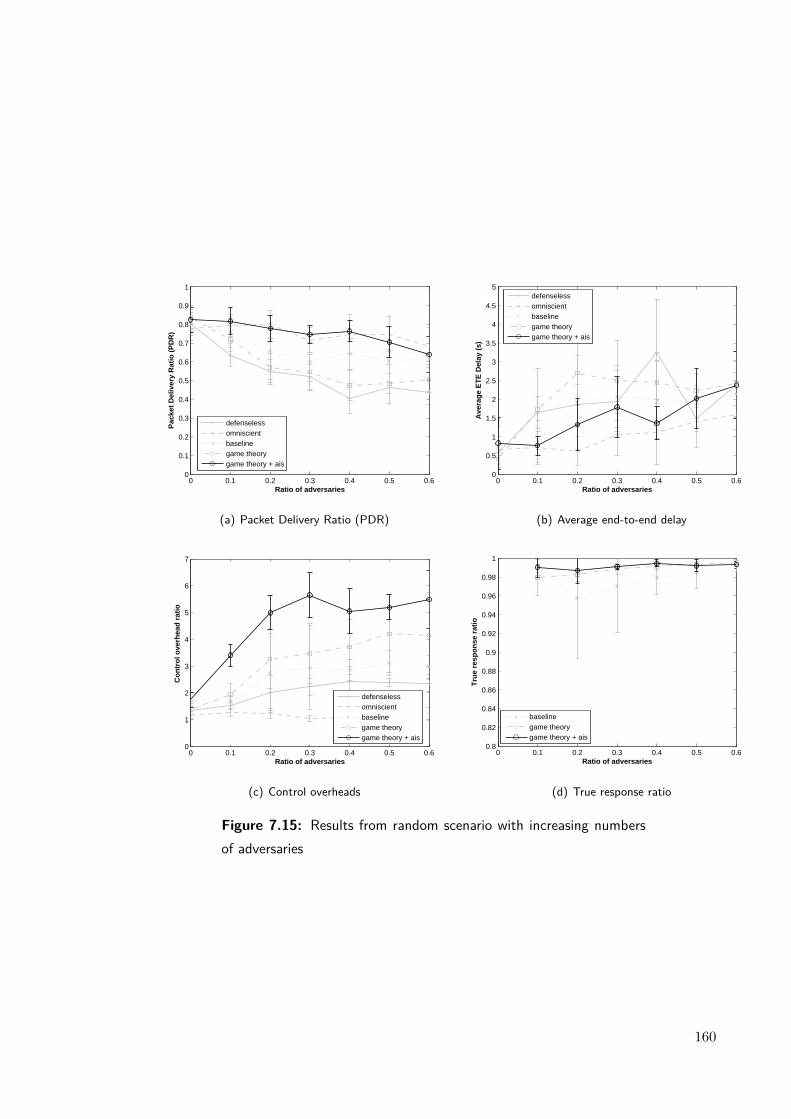
0 0.1 0.2 0.3 0.4 0.5 0.60
0.1
0.2
0.3
0.4
0.5
0.6
0.7
0.8
0.9
1
Ratio of adversaries
Pac
ket
Del
iver
y R
atio
(P
DR
)
defenselessomniscientbaselinegame theorygame theory + ais
(a) Packet Delivery Ratio (PDR)
0 0.1 0.2 0.3 0.4 0.5 0.60
0.5
1
1.5
2
2.5
3
3.5
4
4.5
5
Ratio of adversaries
Ave
rag
e E
TE
Del
ay (
s)
defenselessomniscientbaselinegame theorygame theory + ais
(b) Average end-to-end delay
0 0.1 0.2 0.3 0.4 0.5 0.60
1
2
3
4
5
6
7
Ratio of adversaries
Co
ntr
ol o
verh
ead
rat
io
defenselessomniscientbaselinegame theorygame theory + ais
(c) Control overheads
0 0.1 0.2 0.3 0.4 0.5 0.60.8
0.82
0.84
0.86
0.88
0.9
0.92
0.94
0.96
0.98
1
Ratio of adversaries
Tru
e re
spo
nse
rat
io
baselinegame theorygame theory + ais
(d) True response ratio
Figure 7.15: Results from random scenario with increasing numbersof adversaries
160
routing overheads through retransmissions. To support these responses, Figure 7.15(c)illustrates sIDS+AIS doubles the control overheads compared to the baseline IDS, a basicresult reflected in all previous scenarios.
Response Rate
The true response rate of sIDS+AIS is depicted in Figure 7.15(d), and shows similarcharacteristics to the pure game theoretic approach, responding to adversaries in 98.7-99.5% of cases across all ratios of adversaries tested.
7.4.5.1 Discussion
The metrics shown in Figure 7.15 indicate the benefits of the near-instantaneous innateresponse and co-ordinated response provided by the AIS in a scenario where adversariesproduce audit data with a mixture of strong and weak evidence of an intrusion. Nearomniscient level performance was provided by the sIDS+AIS across the full range ofadversaries, at a cost of greater overheads.
7.5 Summary
This chapter has shown the design and implementation of immune system inspired mecha-nisms suitable for MANET IDS and their application to sIDS, resulting in a multi-layeredIDS entitled sIDS+AIS. The performance of sIDS+AIS was compared to the pure gametheoretic and baseline IDS in scenarios employing a range of local and distributed misbe-haviour.
The immune inspired approach employed several key aspects of the HIS, includingresponding over multiple timescales (additionally asynchronously) and the recruitmentof nearby agents (in this case, nodes rather than immune cells) to facilitate the overallresponse against the adversary. The benefit of employing multiple timescales is that intru-sions with strong evidence can be responded to near-instantaneously, thereby preventingthe attacks spread and reducing further susceptibility, whilst the recruitment of nearbyagents enables quicker isolation of the node, reducing the false positives associated with de-tection schemes that rely on eavesdropping or accurate neighbour lists by cross-correlationof mi.
The innate response is a long-term response to any misbehaviour that activates aTLR from the perfect detectors described in §5.4. This initiates a cascade in which thedetecting node blocks any further traffic from the adversary immediately and an extendedresponse where a consensus decision is made by all neighbours within a radius of theoriginal intrusion leading to a further extended response over a larger set of nodes in thelocality of the intrusion. The extended response of the adaptive component occurs over
161

a longer timescale and is a reaction to weak evidence of an intrusion encapsulated in lowvalues of mi, where intrusion reports are cross-correlated with other neighbouring nodesto reduce the overall imperfection in mi.
The strength of the multi-layered approach employed by sIDS+AIS is shown by thesimulation results of the wormhole attack, where the number of intercepted packets wasreduced compared to the baseline or pure game theoretic approach, due to the extendedresponse from the adaptive component of the AIS. sIDS+AIS also showed a marked re-duction in the ratio of packets dropped by adversaries in the assisted black hole scenario.Another significant result is in the random scenario where the overall PDR is vastly im-proved compared to any of the previous approaches, and tracks the performance of theomniscient network for up to 50% adversaries. The cost associated with this approach thatmuch larger control overheads are required to support the extended reporting procedurethat is responsible for some of these performance gains. In the majority of simulations,the total overheads were doubled compared to the baseline. Of the scenarios that remain,the extreme contention present in a flooding environment causes the extended response tobe suppressed, whilst in the unassisted black hole, there is not enough corroborative evi-dence to allow nodes to cross-correlate, which when taken into account with the overheads,makes the system unsuitable for such attacks.
Overall, this chapter has proved the utility of an immune system inspired approach inconjunction with the pure game theoretic approach. A clear advantage in the reduction ofattack efficacy resulted in improved end-to-end metrics observed in most studied scenariosover the baseline IDS and delivered high true response rates throughout. The modulardesign that this IDS is based on means there is the potential for further performance gainsby adding new detectors for new forms of attack, which contribute toward the overallbehavioural profile of the monitored node.
162
CHAPTER 8
CONCLUSIONS
Security remains a fundamental research challenge for MANET and distributed systems ingeneral. Pushing the responsibility of core networking functions, such as routing and ad-dressing onto individual agents relies on the co-operation of participants. Full co-operationis rarely the case in practice: nodes in shared environments that belong to multiple author-ities may have competing objectives and may not be willing to contribute to the servicewithout the risk of being penalised for poor behaviour or the promise of incentives for goodbehaviour. Secondly, nodes with a lack of physical protection in hostile environments riskcapture and reprogramming by an adversary. These two scenarios illustrate just two caseswhere adversaries could launch insider attacks, which was the main focus of this thesis.
8.1 Summary and Research Contributions
The research question under investigation in this thesis was whether game theoretic andimmune system inspired approaches could be applied to improve the quality of intrusiondetection in MANET, with a focus on the sources of uncertainty in detection arising fromthe subtlety of misbehaviour or in the detection strategies themselves. This is of interestand importance because current approaches of misbehaviour detection are not comprehen-sive enough for application in imperfect wireless environments. The uncertainty implicitin eavesdropping leads to a large number of false detections and consequent responses tobenign nodes, an effect which worsens with degradation of wireless environment. In addi-tion, IDS’ using only local detection techniques are unable to detect distributed attacks,leading to insensitivity to subtle misbehaviour.
The first hypothesis under investigation in this thesis was that employing a gametheoretic framework within a distributed IDS would help provide reasoning within theseimperfect wireless environments. The second was that the application of an immune-inspired approach could be used to improve network end-to-end metrics when applied inconjunction with the pure game theoretic approach.
To meet the aims of the thesis, a simulation-based approach was adopted using a
163
robust methodology that employed Monte-Carlo sampling as discussed in Chapter 3. Thisrequired significant development and validation of the Jist/SWANS simulation kernel andflexible adversary models to provide a range of attacking scenarios that could be used toevaluate the performance of the proposed IDS (described in Chapter 4).
A modular intrusion detection system employing distributed detection and responsewas developed in Chapter 5, using a number of perfect and imperfect detectors. Chapter6 studied their ability to generate false positives in the absence of misbehaviour in fadingenvironments. Detectors that could generate false positives formed part of the evaluationof mi, whist detectors that did not formed mp, the combination of which formed a node’sbehavioural profile. A baseline threshold-IDS was simulated and the PDR fraction ob-tained corroborated mostly with the findings of a similar local detection scheme publishedin Marti et al. (2000) in which the authors showed a 20% reduction in PDR between 0%and 40% adversaries in the black hole scenario. Defenseless and omniscient networks pro-vided the upper and lower bounds of each of the studied metrics when applied to each ofthe scenarios. These results were used to assess the efficacy of the game theoretic and AISapproaches when applied to the developed attacking scenarios over the studied metrics.
The results in Chapter 6 go some way to addressing the first hypothesis under investi-gation in this thesis. A game theoretic inspired IDS, sIDS, was developed, which appliedreasoning between the detection and response components of a typical IDS. Unlike thethreshold IDS, in which an equal importance was placed on mp (the perfect metrics) andmi (the imperfect metrics), the game theoretic IDS employed a 2-player game betweenthe IDS and suspect, designed to give the suspect a ’benefit of doubt’ that reduced theability of mi (constituting weak evidence) to invoke a response without being accompa-nied with a reduction of mp (consisting stronger evidence). As such, these terms formedpart of a payoff function, which when the LH algorithm was applied, generated a mixedstrategy solution each monitored neighbour. This mixed strategy solution was appliedconsequently to any packets received from neighbours, to determine whether to drop orprocess them. The results show that most scenarios studied this approach delivered signif-icant improvements in true response rates. In particular, there was a 5-10% improvementin the wormhole scenario and a 10-15% improvement in the unassisted black hole scenarioover the baseline IDS. The use of game theory to improve discrimination in IDS scenarioshas been shown in (Otrok et al., 2008a), where the closest measure, false positive rates,was also reduced significantly in their environment. The approach we took deviated fromthe typical approach of applying game theory to intrusion detection scenarios (Patcha &Park, 2004; Liu et al., 2006) where false positive rates are as encoded as a feature of thegame; instead the computation of strategy profiles did not depend on a priori known falsepositive rates of a IDS. An interesting feature of the game theoretic solution is that thisadvantage is almost always lost beyond 50% adversaries, but it represents an important
164

result for applications where benign nodes are in the majority, where the additional dis-crimination can be used to bias the operation of the network toward the favour of thesenodes. These improvements do come at a cost of additional routing overheads due to acomponent of the local response that attempts to re-route flows as misbehaving outgoingneighbours are detected. The game theoretic approach also incurs a computational over-head from finding the mixed strategy solution to a game by invoking the LH algorithm oneach game instance. To reduce these, the mixed strategy solution is only updated whenthe neighbour’s behavioural profile is recomputed, thus the IDS adopts a cached versionof the mixed strategy solution until then.
To address the second hypothesis under investigation in this thesis sIDS+AIS was de-veloped, presented in Chapter 7, which further extended the pure game theoretic approachwith a number of immune system inspired features. These were a response over multipletimescales as employed by the innate and adaptive components of the immune system, andthe recruitment of neighbouring immune cells to participate in a co-ordinated response toan infection. In sIDS+AIS, the innate component was comprised of the arrangement of theperfect detectors into TLRs that initiated long-lasting near-instantaneous responses whenan intrusion was detected. This was followed by an extended, consensus-based response byneighbours in the locality of the known intrusion. The adaptive component of sIDS+AISmonitored long term reductions inmi and initiated an extended response where nodes withrecent, first-hand experience exchanged reports that led to a long-lasting, consensus-basedresponse if the majority of the reports indicated a low mi, taking advantage of the cross-correlation of observations about a given suspect from the monitors in the locality. Thesewe hypothesised would both improve the end-to-end metrics, and further increase the trueresponse performance because neighbours unaware of the detected intrusion would be ableto avoid the affected area entirely and the cross-correlation would reduce the uncertaintyimplied in the imperfect detection techniques encapsulated in mi.
The results show that in most scenarios studied, this approach delivered significant im-provements in end-to-end network metrics over the pure game theoretic approach. More-over, some improvements were observed for true response rates, especially in the wormholeand flooding scenarios where the discrimination performance of the baseline or game the-oretic approach was unsatisfactory. Notable is the near elimination of packets droppedby adversaries in the assisted black hole scenario, resulting in a PDR that tracks theomniscient protocol. The best result by far is in the random scenario, where the systemperforms well for a number of intrusions with strong and weak evidence, once again track-ing the omniscient protocol. There is a slight reduction in true response ratios for thewormhole and assisted black hole scenario following the application of sIDS+AIS, whichcould be a result of incorrect consensuses occasionally being reached. The consequenceof this is that there is a larger reduction on the resulting true response ratio. The main
165
contribution to overheads in the AIS approach is the communication overheads requiredto initiate an extended response. Computational overheads required to compute a con-sensus are trivial. To disseminate intrusion reports, data push via intelligent floodingof broadcast packets was chosen. Thus, reports are shared voluntarily without a nodespecifically requesting them, but the use of broadcast leads to unacceptable performancewhen conditions are severely degraded (as in the case of flooding). The reduction of falsepositives by adopting a consensus based approach to weak evidence (encapsulated in mi)so long as the majority of nodes are not malicious is a well-known result (Zhang & Lee,2000), but this is the first attempt to the best of our knowledge of employing game theoryand features of the immune system within a MANET IDS.
In summary, the research contributions presented in this thesis are as follows: thedevelopment of a generic framework intrusion detection MANET in imperfect wirelessenvironments, the implementation of a pure game theoretic approach using this generic IDSframework to enhance reasoning and better discriminate benign nodes from adversaries,and the further development of this to include immune-inspired approaches employed toallow co-operation of responses over an extended network area. These contributions havegone some way to meeting to original research aims set out in Chapter 1. It has beenshown that the game theoretic and immune system inspired approaches do improve thequality of intrusion detection in MANETs. The pure game-theoretic approach showedimprovements in the true response ratio of IDS nodes to better discriminate benign nodesfrom adversaries, whilst the fusion of game theory and immune system features resultedin improved network metrics, at least when applied to certain attacking scenarios. Theadditional strength of this work is the modular approach employed to the design of theintrusion detection system that allows new detectors to be added (§5.4) and contributedirectly to a node’s behavioural profile, once the susceptibility of the detector to causefalse positives is understood.
8.2 Future Work
Although we have shown several advantages to the use of a game theoretic and immunesystem inspired approach to intrusion detection, there remains a great deal of work tofully quantify the bounds of the performance advantages of the corresponding protocols- sIDS and sIDS+AIS. It was previously noted that the performance of some detectors,and therefore the effectiveness of the extended response, may be dependent on the trafficpatterns used in the simulations. The use of more realistic traffic patterns, such as burstytraffic, where the number of flows active at one time is fixed but source-destination pairsvary, may help to provide more instances of weak evidence that can be cross-correlatedto improve the overall effectiveness of the extended response. This highlights the general
166
limitation of employing simulations to prove the efficacy of the approach, in which it isdesirable to run a greater number of simulations over a wider range of network parametersin order to build confidence in the results presented. Although Monte-Carlo samplingover a wide range of free parameters was employed, varying other network measures suchas node density may warrant an investigation to present further rigorous proof of theadvantages of the approach. Furthermore, as was noted in the individual discussions, theimprovements in true response rate provided by sIDS+AIS does not always translate toan advantage in the network metrics chosen to evaluate it. Thus, further evaluation ofthe efficacy of sIDS+AIS at the application layer, where the advantage in true responserate could be applied to bias network operation to favour benign nodes, merits furtherresearch.
Additionally, it would also be worth investigating the applicability of sIDS to otherdata centric ad-hoc routing protocols, such as Dynamic Source Routing (DSR), whereit is easier to verify the monitored neighbours ability to perform a given function fromadditional audit data provided by the DSR packet header. An example of this is more com-plete verification of packet forwarding, where DSR would permit neighbours to indirectlymonitor other flows.
Whilst minimising overheads was not the primary focus of this research, it is clear thatcommunication overheads impose an upper limit on the performance gains, especially ofsIDS+AIS. Computational overheads on the other hand are not quantified during thesimulation. Further work is needed to gain an appreciation of the total overheads, and acourse of optimisation prescribed. For example, in the game theoretic approach, althoughthe application of LH provides a general solution to NE that is guaranteed to terminate,more specific approaches that compute mixed-strategy solutions only (e.g. described inRasmusen (2001)) may be more appropriate and reduce the computational complexitysignificantly.
In sIDS+AIS, the main overheads are communication overheads stemming from theextended responses, which use a naive limited flood/gossip technique. This results inscalability problems as the number of adversaries in the network increase. Instead, alter-native data dissemination techniques could be evaluated, such as epidemic routing wheresummary vectors are exchanged instead (Vahdat & Becker, 2000). This would require aninvestigation into the time-sensitivity of the report procedure and the overall impact thiswould have on the efficacy of extended responses. If these approaches were to result inlittle reduction of overheads, it may be worth adapting to the current network conditions,which could be used to switch between the lightweight and more demanding IDS mecha-nism(s) (taking inspiration from the approach by Liu et al. (2006)). This would make themost of the advantage offered by the approaches when they best suit the current observednetwork conditions.
167
Furthermore, we only considered one of many ways that immune techniques could befused with the game theoretic approach. We ran them in parallel, forming the overall re-sponse from a Boolean OR operation on the independent responses initiated by the gametheoretic and IDS components, but other approaches could be considered. For example,the expensive adaptive response could be initiated only when the mixed strategy solu-tion invokes as response. Alternatively, similarity measures such as the sum of absolutedifferences on the cross-correlated reports could be used to automatically set the bene-fit of doubt term used in the game theoretic component, which may result in a tighterintegration of the two approaches. Lastly, we considered rational, but non-adaptive ma-licious behaviour. It would be interesting to see how the performance of sIDS deviateswhen adversaries behave more intelligently by scavenging evidence of responses applied byneighbours to adapt their overall strategy.
In conclusion, it has been shown that employing a reasoned approach through theuse of game theory in intrusion detection within imperfect wireless environments resultsin improved discrimination, and together with an immune inspired approach results inincreased performance of network metrics in a variety of attack scenarios.
168

APPENDIX A
COMMON PARAMETERS USED FORJIST/SWANS SIMULATIONS
Table A.1: Simulation parameters used common to all Jist/SWANSsimulations
Simulation Property Class Property Value
Application (Client) pkiddie.app. AppUdp.
Server
Application (Server) pkiddie.app. AppUdp.
Client
Transport pkiddie.trans.
TransUdp
Network pkiddie.net.NetIp
MessageQueue pkiddie.net.
MessageQueue.
DropMessageQueue
capacity 50
Route pkiddie.route.
RouteAodvMultiInterface
RouteAodvBase.
AODV_TIMEOUT
1*Constants.SECOND
RouteAodvBase.
HELLO_INTERVAL
1*Constants.SECOND
priority Constants.
NET_PRIORITY_CONTROL
Mac pkiddie.mac.
Mac802_11
promisc true
Radio pkiddie.net.
RadioNoiseAdditive
169
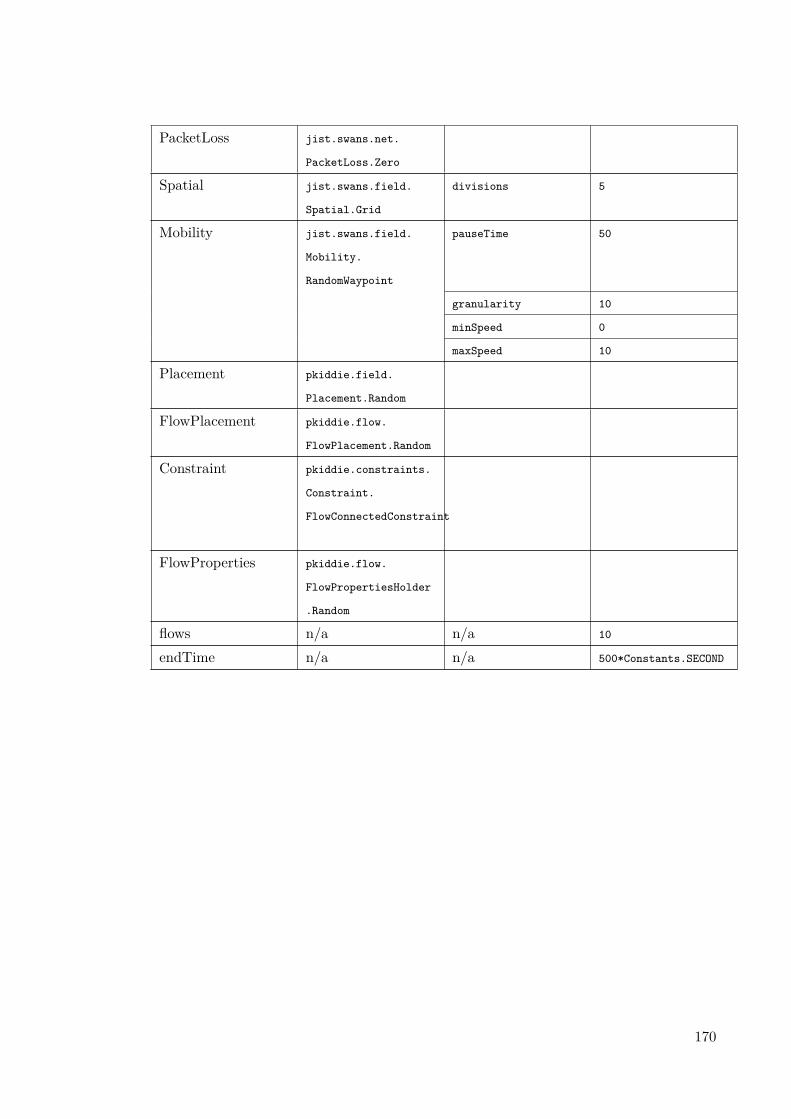
PacketLoss jist.swans.net.
PacketLoss.Zero
Spatial jist.swans.field.
Spatial.Grid
divisions 5
Mobility jist.swans.field.
Mobility.
RandomWaypoint
pauseTime 50
granularity 10
minSpeed 0
maxSpeed 10
Placement pkiddie.field.
Placement.Random
FlowPlacement pkiddie.flow.
FlowPlacement.Random
Constraint pkiddie.constraints.
Constraint.
FlowConnectedConstraint
FlowProperties pkiddie.flow.
FlowPropertiesHolder
.Random
flows n/a n/a 10
endTime n/a n/a 500*Constants.SECOND
170
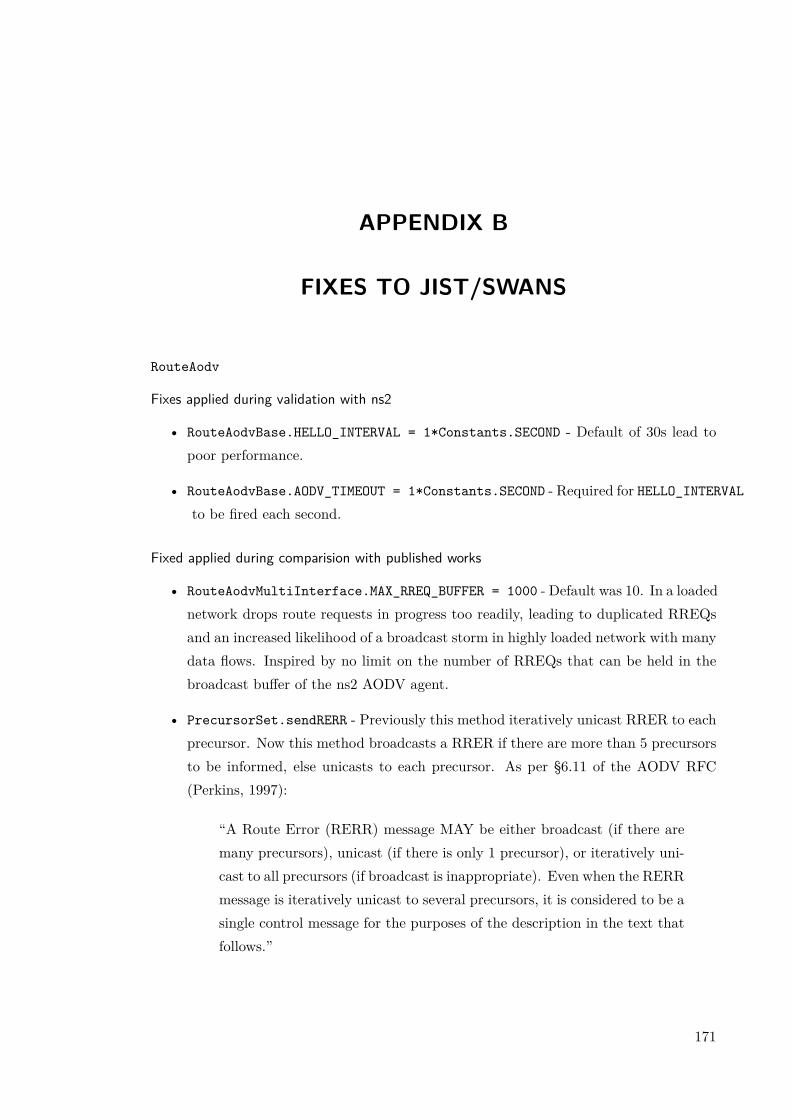
APPENDIX B
FIXES TO JIST/SWANS
RouteAodv
Fixes applied during validation with ns2
• RouteAodvBase.HELLO_INTERVAL = 1*Constants.SECOND - Default of 30s lead topoor performance.
• RouteAodvBase.AODV_TIMEOUT = 1*Constants.SECOND - Required for HELLO_INTERVAL
to be fired each second.
Fixed applied during comparision with published works
• RouteAodvMultiInterface.MAX_RREQ_BUFFER = 1000 - Default was 10. In a loadednetwork drops route requests in progress too readily, leading to duplicated RREQsand an increased likelihood of a broadcast storm in highly loaded network with manydata flows. Inspired by no limit on the number of RREQs that can be held in thebroadcast buffer of the ns2 AODV agent.
• PrecursorSet.sendRERR - Previously this method iteratively unicast RRER to eachprecursor. Now this method broadcasts a RRER if there are more than 5 precursorsto be informed, else unicasts to each precursor. As per §6.11 of the AODV RFC(Perkins, 1997):
“A Route Error (RERR) message MAY be either broadcast (if there aremany precursors), unicast (if there is only 1 precursor), or iteratively uni-cast to all precursors (if broadcast is inappropriate). Even when the RERRmessage is iteratively unicast to several precursors, it is considered to be asingle control message for the purposes of the description in the text thatfollows.”
171
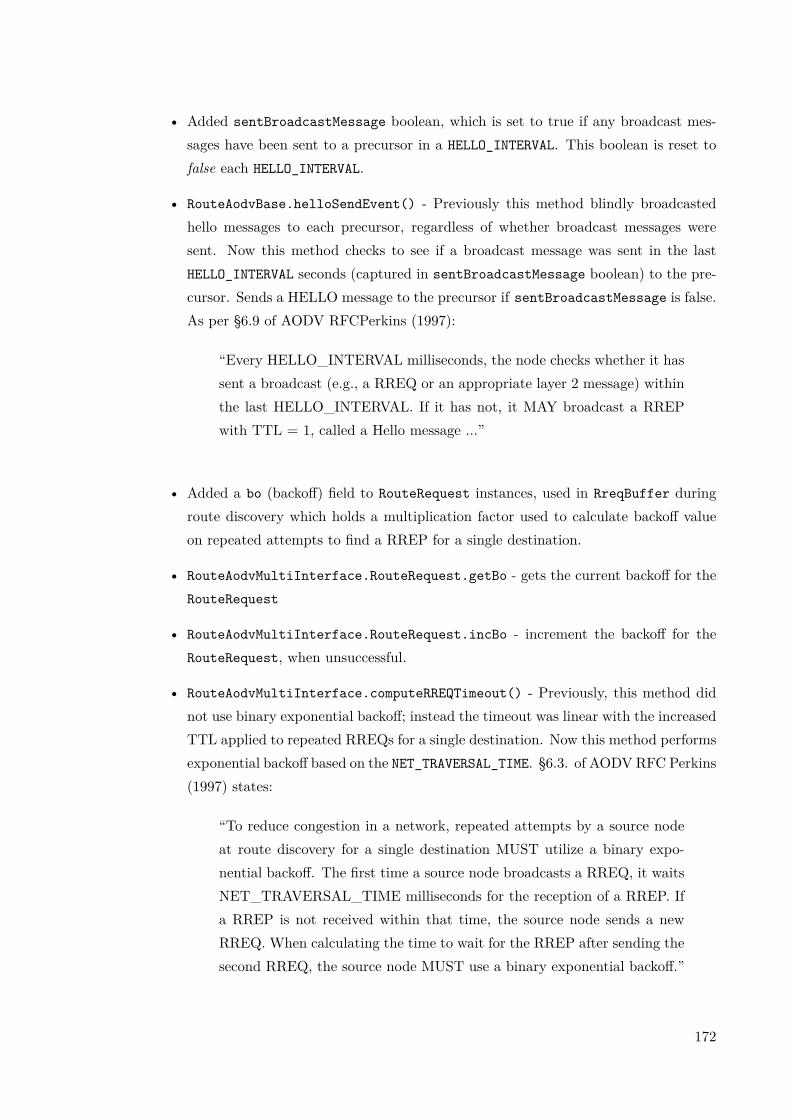
• Added sentBroadcastMessage boolean, which is set to true if any broadcast mes-sages have been sent to a precursor in a HELLO_INTERVAL. This boolean is reset tofalse each HELLO_INTERVAL.
• RouteAodvBase.helloSendEvent() - Previously this method blindly broadcastedhello messages to each precursor, regardless of whether broadcast messages weresent. Now this method checks to see if a broadcast message was sent in the lastHELLO_INTERVAL seconds (captured in sentBroadcastMessage boolean) to the pre-cursor. Sends a HELLO message to the precursor if sentBroadcastMessage is false.As per §6.9 of AODV RFCPerkins (1997):
“Every HELLO_INTERVAL milliseconds, the node checks whether it hassent a broadcast (e.g., a RREQ or an appropriate layer 2 message) withinthe last HELLO_INTERVAL. If it has not, it MAY broadcast a RREPwith TTL = 1, called a Hello message ...”
• Added a bo (backoff) field to RouteRequest instances, used in RreqBuffer duringroute discovery which holds a multiplication factor used to calculate backoff valueon repeated attempts to find a RREP for a single destination.
• RouteAodvMultiInterface.RouteRequest.getBo - gets the current backoff for theRouteRequest
• RouteAodvMultiInterface.RouteRequest.incBo - increment the backoff for theRouteRequest, when unsuccessful.
• RouteAodvMultiInterface.computeRREQTimeout() - Previously, this method didnot use binary exponential backoff; instead the timeout was linear with the increasedTTL applied to repeated RREQs for a single destination. Now this method performsexponential backoff based on the NET_TRAVERSAL_TIME. §6.3. of AODV RFC Perkins(1997) states:
“To reduce congestion in a network, repeated attempts by a source nodeat route discovery for a single destination MUST utilize a binary expo-nential backoff. The first time a source node broadcasts a RREQ, it waitsNET_TRAVERSAL_TIME milliseconds for the reception of a RREP. Ifa RREP is not received within that time, the source node sends a newRREQ. When calculating the time to wait for the RREP after sending thesecond RREQ, the source node MUST use a binary exponential backoff.”
172
• Any RouteErrorMessages are created with TTL=1, rather than 64 as used by de-fault in DEFAULT_TTL, reducing the likelihood of a broadcast storm of RRERs. §6.11of AODV RFC Perkins (1997) states:
“...the RERR is typically sent to the local broadcast address (DestinationIP == 255.255.255.255, TTL == 1) with the unreachable destinations,and their corresponding destination sequence numbers, included in thepacket...”
• RouteRequest.broadcast() - Previously, this method used an expanding ring tech-nique, until TTL_THRESHOLD was reached, when the destination was returned as un-reachable. Now, route Requests are disseminated using a expanding ring searchtechnique, until TTL_THRESHOLD reached. Then, for RREQ_RETRIES times, attemptsare generated with TTL = NETWORK_DIAMETER. §6.4 of the AODV RFC Perkins(1997) states:
“To prevent unnecessary network-wide dissemination of RREQs, the orig-inating node SHOULD use an expanding ring search technique...
... This continues until the TTL set in the RREQ reaches TTL_THRESHOLD,beyond which a TTL = NET_DIAMETER is used for each attempt.”
• RouteAodvMultiInterface.generateRouteReplyMessage(...) - If an interme-diate node was to generate an advertisement for a destination, the destination se-quence number of the node (and not the destination) was incorrectly being copiedinto the advertisement. Updated this method such that if a route reply message isbeing generated by an intermediate node, then the destination sequence number inthe route entry for the destination is used. §6.6.2 of the AODV RFC Perkins (1997)states:
“If the node generating the RREP is not the destination node, but insteadis an intermediate hop along the path from the originator to the desti-nation, it copies its known sequence number for the destination into theDestination Sequence Number field in the RREP message...”
• RouteAodvMultiInterface.generateRouteReplyMessage(...) - Nodes own se-quence number was incorrectly being updated. Updated method such that the nodesown sequence number is ONLY incremented if it is responding to the RREQ as the
173

destination and the nodes own sequence number is less than or equal to the one inthe RREQ. §6.6.1 of the AODV RFC Perkins (1997) states:
“If the generating node is the destination itself, it MUST increment itsown sequence number by one if the sequence number in the RREQ packetis equal to that incremented value. Otherwise, the destination does notchange its sequence number before generating the RREP message.”
RadioNoiseAdditive
• endTransmit - This method is overridden from RadioNoise (the base class of each ra-dio implementation). Now, when the radio has signals after transmitting, it goes intosensing mode, and not into receiving mode. Credit to: http://www.vanet.info/node/14.
Mac802_11
• pauseBackoff - This method was updated to adhere to 802.11 standard, §9.2.5.2- Backoff procedure. The current implementation caused more collisions result-ing in decreased throughput. The result of this fix and RadioNoiseAdditive fixis that a further bug where nodes are permanently suppressed in a backoff statewas fixed. Credit to: http://www.cs.technion.ac.il/~gabik/Jist-Swans/mac/BUG-NonDiscrete-Backoff.html.
• sendDataUnicast - This method was updated to supress duplicate messages, adher-ing to the 802.11 standard. The result of this fix is that there are no more duplicatedmessages at the CBR application layer. Credit to: http://www.cs.technion.ac.il/~gabik/Jist−Swans/mac/BUG−Duplicate−Elimination.html.
NetIp
• protocolHandlers now grows dynamically to prevent unnecessary exceptions. Creditto: http://www.vanet.info/node/14.
NetMessage.Ip
• added logId field as integer type. This is output as pid field in log file and preventswrap around of id in large simulations. id, the ip identifier field, is left unchangedas short type, but output as iid in trace files.
174

MessageQueue.DropMessageQueue
• insert - Drop and log the newest message (drop tail queue) instead of terminatingthe simulation.
175

APPENDIX C
EXTENSIONS TO JIST/SWANS
C.1 Trace file generation
Jist/SWANS v1.0.6 had no default mechanism to output simulation statistics so post-processing for the purpose of collecting network metrics was impossible. A number of com-munity projects were available, such as Javis for Jist/SWANS (Kliot, 2009) and XTend-SWANS (no longer available online), but they logged a small number of the possiblesimulation events, which was too restrictive for our purposes. The log4j library (ApacheSoftware Foundation, 2010), included within Jist/SWANS, was re-purposed for trace out-put. A trace format was defined suitable for easy post-processing as a set of tab delimitedfields and key-value pairs, corresponding to the following format:
log level (INFO,DEBUG...)| event source class | simulation time (ns)|
event source (ip address)| event | event_details
This trace format was applied to all events across all existing layer implementations.The following shows a trace from the network layer and corresponds to the node with IP ad-dress 0.0.0.1 receiving a route request from a node with mac address 68 at 10009562861ns:
INFO [NetIpBase]: 10009562861 0.0.0.11 receive: from=68 on=1 data=(src
=0.0.0.68 dst=ANY size=44 type=ip prot=123 ttl=5 pid=13 iid=13 route=[]
src_route=null data=(hopCount=0 rreqId=0 destIp=0.0.0.54 destSeqNum=0
origIp=0.0.0.68 origSeqNum=1 type=rreq))promisc=false
C.2 Simulation user interface
GuiLog is a user interface for Jist/SWANS that enabled the user to view events in thesimulation event queue as they were processed (Fong, 2004). This type of output failedto provide an ’at a glance’ overview of the simulated MANET, so GuiLog was extendedto provide a graphical overview of the MANET topology and events of interest as they
176
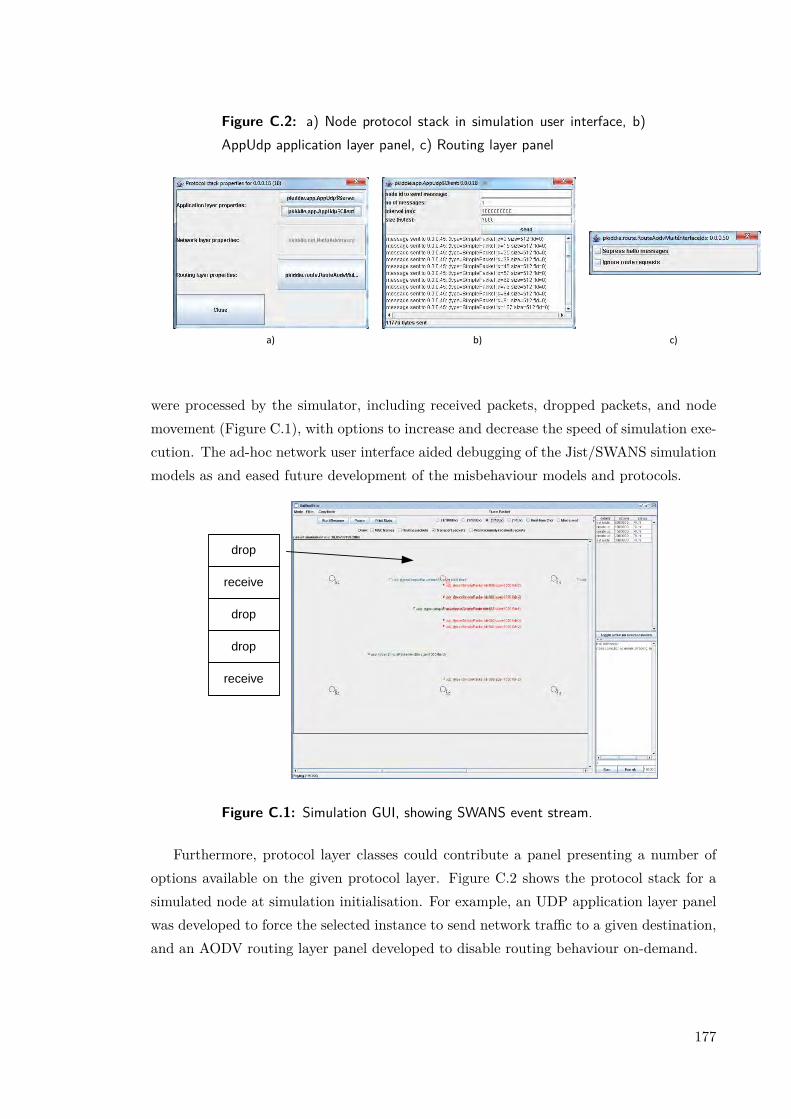
Figure C.2: a) Node protocol stack in simulation user interface, b)AppUdp application layer panel, c) Routing layer panel
a) b) c)
were processed by the simulator, including received packets, dropped packets, and nodemovement (Figure C.1), with options to increase and decrease the speed of simulation exe-cution. The ad-hoc network user interface aided debugging of the Jist/SWANS simulationmodels as and eased future development of the misbehaviour models and protocols.
drop
receive
drop
drop
receive
Figure C.1: Simulation GUI, showing SWANS event stream.
Furthermore, protocol layer classes could contribute a panel presenting a number ofoptions available on the given protocol layer. Figure C.2 shows the protocol stack for asimulated node at simulation initialisation. For example, an UDP application layer panelwas developed to force the selected instance to send network traffic to a given destination,and an AODV routing layer panel developed to disable routing behaviour on-demand.
177

C.3 Driver base class
The majority of code in simulation drivers (§??) was common ’boilerplate’ code that tiedadjacent protocol layer entities together for each node in the simulation. For every dri-ver, this code had to be repeated, thus to reduce code maintenance, a DriverBase drivercontaining the common code was created. Future drivers were created from DriverBase,which also provided a number of other common data structures that assisted in simulationdevelopment. For example, a Node data structure kept references of the simulated pro-tocol layer entities for each node. This was important for allowing protocol layers to bereconfigured during simulation time, to simulate node capture or invoke traffic generation.
C.4 Jist/SWANS kernel
The Jist/SWANS rewriter prohibited derived classes from being defined as proxy entitiesfor use in network simulation. This reduced the advantages that the simulator had overcompeting simulators through the use of Java object oriented code: inheritance allowscode reuse and specific functionality to be overridden as necessary. Thus, the kernel wasextended to permit derived classes, with an aim to simplify the creation of adversarymodels in the future by requiring them to override only the necessary methods. The aimwas for RouteAodvMultiInterfaceAdversary, the adversarial router, to be composed ofthe RouteAodvMultiInterface class that defined the AODV protocol, itself composedfrom RouteAodvBase, which defined the common fields and data structures (route table,route table entries, message queues) used in all AODV implementations. Then, to createany number of attacks, RouteAodvMultiInterfaceAdversary just overrode appropriatemethods and the could still benefit from any bug fixes applied to its base classes.
Most other layers were refactored to derive from a base class, which helped to simplifylogging code and the binding of adjacent layers by DriverBase. Figure C.3a) shows thebroken inheritance model of unmodified Jist/SWANS, using RouteAodv as an example,whilst the revised hierarchy is presented in Figure C.3b).
C.5 Test framework
In network simulations, a standard testing practise is to run a simulation and compute therelevant metrics to determine if it is in line with expectations. If it is not, then the userinvestigates the cause, which can be labour intensive as it can often resort to manuallyiterating through a network trace. In this thesis, unit testing was used to repeatedly testsmall parts of code during the development of the adversary models and intrusion detectionschemes. This proactively highlighted regressions during the development process.
178
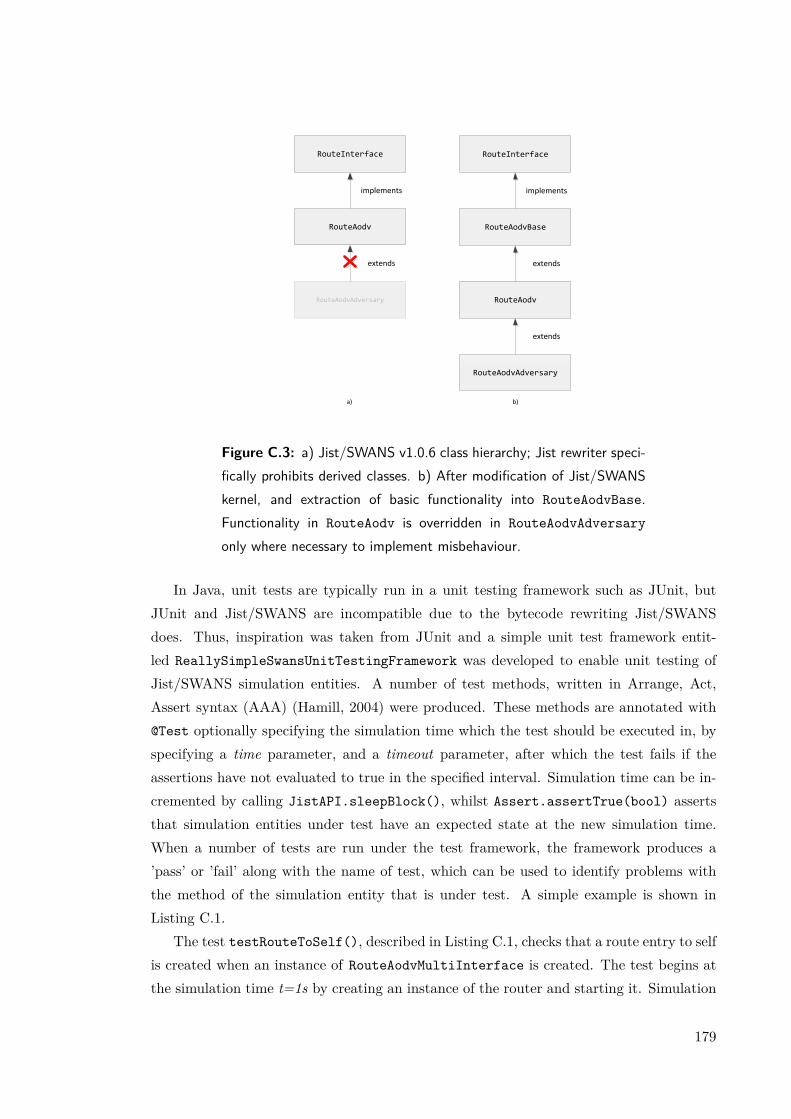
RouteInterface
RouteAodvBase
RouteAodv
RouteAodvAdversary
RouteInterface
RouteAodv
RouteAodvAdversary
implements
extends
implements
extends
extends
a) b)
Figure C.3: a) Jist/SWANS v1.0.6 class hierarchy; Jist rewriter speci-fically prohibits derived classes. b) After modification of Jist/SWANSkernel, and extraction of basic functionality into RouteAodvBase.Functionality in RouteAodv is overridden in RouteAodvAdversary
only where necessary to implement misbehaviour.
In Java, unit tests are typically run in a unit testing framework such as JUnit, butJUnit and Jist/SWANS are incompatible due to the bytecode rewriting Jist/SWANSdoes. Thus, inspiration was taken from JUnit and a simple unit test framework entit-led ReallySimpleSwansUnitTestingFramework was developed to enable unit testing ofJist/SWANS simulation entities. A number of test methods, written in Arrange, Act,Assert syntax (AAA) (Hamill, 2004) were produced. These methods are annotated with@Test optionally specifying the simulation time which the test should be executed in, byspecifying a time parameter, and a timeout parameter, after which the test fails if theassertions have not evaluated to true in the specified interval. Simulation time can be in-cremented by calling JistAPI.sleepBlock(), whilst Assert.assertTrue(bool) assertsthat simulation entities under test have an expected state at the new simulation time.When a number of tests are run under the test framework, the framework produces a’pass’ or ’fail’ along with the name of test, which can be used to identify problems withthe method of the simulation entity that is under test. A simple example is shown inListing C.1.
The test testRouteToSelf(), described in Listing C.1, checks that a route entry to selfis created when an instance of RouteAodvMultiInterface is created. The test begins atthe simulation time t=1s by creating an instance of the router and starting it. Simulation
179

Listing C.1: A unit test to check an route entry to self is created whenan instance of RouteAodvMultiInterface is created.
@Test(time =1* Constants . SECOND )
public void testRouteToSelf () {
NetAddress netAddr = new NetAddress (1);
RouteAodvMultiInterface routeAodv = new RouteAodvMultiInterface ( netAddr );
routeAodv . getProxy (). start ();
JistAPI . sleepBlock (1* Constants . SECOND );
RouteTableEntry entry = routeAodv . getRouteTable (). lookup ( netAddr );
Assert . assertNotNull (entry );
}
time is incremented to t=2s, by which time it is expected that there should be a singleentry in the route table with the network address of the node (netAddr) known as the selfentry. The test framework produced the following output:
Method: testRouteToSelf, Passed: true
C.6 Source code changes
Source code wide changes
• numerous debug/info logging statements added using built in log4j library,
• LogUtil.formatLog for standardised log formatting across all the layers of the pro-tocol stack.
RouteAodvMultiInterface
• common functionality factored into RouteAodvBase and shared by all RouteAodv
types.
• router is multiple interface aware. interface_id field added to routing table entries.
• allow setting of network layer (IP) priority that routing packets are sent as.
jist.Runtime.Rewriter
• ignoredPackages - added "org.w3c.", "au.com.bytecode.opencsv", "org.netbeans.","org.apache.commons", "edu.uci.ics.jung". All are external libraries used in researchthat should not be rewritten by the simulator.
• constructor - rewriterTime set to 0 if clRewriter returns null. Prevents NullReference
Exception being thrown on occasion.
180

• doClass() - removed Constants.ACC_FINAL from generated method mg (both times),which permits derived, rewritten classes, with no noticeable side-effects.
jist.Runtime.Controller
• manages gui creation, should the user require it.
• eventLoop() - at end of simulation (i.e. when JistException.JistSimulationEnd
Exception is thrown), close gui instance.
181

APPENDIX D
SIMULATION SOURCE CODE
Full source code to the updated Jist/SWANS environment (including bug fixes), nodemodels and post-processing scripts are available at http://www.eee.bham.ac.uk/com_test/dsnl/kiddiep/index.html as a zip file. In particular:
• src\pkiddie contains a mirror of most of the Jist/SWANS simulation engine withthe fixes and additions listed in Appendix B and Appendix C respectively.
• post-processing scripts can be found in src\pkiddie\tools\perl.
• ns2 source code to create a simulation from a Jist/SWANS trace can be found insrc\pkiddie\tools\ns2
• simulation drivers are located in src\pkiddie\drivers.
To compile, an Ant build script has been provided in the root of the zip file entitledbuild_pkiddie.xml, and for simplicity, the whole distribution can be compiled underEclipse by setting the builder to use build_pkiddie.xml in the project properties dialog.Detailed instructions provided on the website. Please ensure you are compiling withthe Java 1.5 class format, as there are known issues with the BCEL libraryand Java 1.6+ class format.
The source code for the baseline IDS can be found at src\pkiddie\ids\IdsBaseline
.java.The source code for the game theoretic IDS includes src\pkiddie\ids\IdsGameTheory
.java and the Lemke-Howson solver at src\pkiddie\gametheory\lemke\*.The source code for the game theoretic/AIS IDS are all located in \src\pkiddie\ids
and include IdsAisGameTheory.java, Ais2.java, GameTheory.java, InnateReport*.
java, Report*.java and Buffer*.java.Each of the IDS depend on the set of detectors implemented in src\pkiddie\ids
\detection, the custom network layer \src\pkiddie\net\NetIpIds.java and routinglayer src\pkiddie\route\RouteAdovMultiInterfaceIds.java.
182

Finally, source code for implementing the types of misbehaviour described in Chapter4 may be found in src\pkiddie\route\RouteAodvMultiInterfaceAdversary.java.
183

APPENDIX E
USING THE UNIT TEST FRAMEWORK
To run a test class, e.g. xxxTest.java, under the ReallySimpleSwansUnitTestingFramework
test framework:
• Add a static main method to the test class and insert the following code:
public static void main( String [] args) {
ReallySimpleSwansUnitTestingFramework tester = new
ReallySimpleSwansUnitTestingFramework (); tester .
run( xxxTest .class); }
• Then invoke the Jist/SWANS runtime with the argument xxxTest.java (assuming itresides in the tests package)
java jist. runtime .Main jist.swans.Main tests. xxxTest
ReallySimpleSwansUnitTestingFramework analyses the test class, and runs each testmethod (a method that was annotated @Test) sequentially on the Jist/SWANS eventqueue (providing access to simulation time).
The results are output on the console in the following format:
Method : testRouteToSelf , Passed : true
184

APPENDIX F
VALIDATING JIST/SWANS
Two validation studies were completed by comparing results from published simulationstudies of AODV and employing the same scenario in Jist/SWANS using the final versionof RouteAodvMultiInterface with the additions and bug-fixes listed in Appendix B.
F.1 Validation I
The network environment used in Perkins et al. (2001) was chosen to validate the Jist/SWANSAODV router and implemented in the driver Perkins2001.java. Table F.2 lists the pa-rameters that were used. The independent variables were flows and pauseTime, and weredriven by the Monte-Carlo runner, which enumerated over each possible combination offlows = {10, 20, 30, 40} and pauseT ime = 0-900 with step size of 100, to produce themean PDR and end-to-end delay plots shown in Figures F.1 and F.2 respectively. TableF.1 details the flow pattern used in this simulation.
Table F.1: Properties of AppUdp traffic generator in Validation I sce-nario
Property Value
packet size 512 bytesstart time 10sinterval 0.5stype udp
burstTime random(min=40s,max=50s)pauseTime random(min=10s,max=20s)
reps 15
185

Table F.2: Simulation parameters used in Validation I scenarioSimulation
Prope
rty
Jist/S
WANS
ns2
Class
Prope
rty
Value
TCLClass
Prope
rty
Value
App
lication
(Clie
nt)
pkid
die.
app.
AppU
dp.S
erve
rAg
ent/
NULL
App
lication
(Server)
pkid
die.
app.
AppU
dp.C
lien
tAp
plic
atio
n/
Traf
fic/
CBR
Tran
sport
pkid
die.
tran
s
Tran
sUdp
Agen
t/
UDP
Netwo
rkpk
iddi
e.ne
t.Ne
tIp
n/a
Message
Que
uepk
iddi
e.ne
t.
Mess
ageQ
ueue
.
Drop
Mess
ageQ
ueue
capa
city
50Qu
eue/
Drop
Tail
/
PriQ
ueue
ifql
en50
Rou
tepk
iddi
e.ro
ute.
Rout
eAod
v/
pkid
die.
rout
e.
Rout
eAod
vMul
tiIn
terf
ace
AODV
186

Mac
pkid
die.
mac.
Mac8
02_1
1Ma
c/80
2_11
data
Rate
_1M
b
basi
cRat
e_1M
b
Rad
iopk
iddi
e.ne
t.
Radi
oNoi
seAd
diti
vePh
y/
Wire
less
Phy
freq
_2.
4e+9
RXTh
resh
_7.
2313
1e-1
1
band
widt
h_1M
b
Spatial
jist
.swa
ns.f
ield
.
Spat
ial.
Grid
divi
sion
s5
n/a
Mob
ility
jist
.swa
ns.f
ield
.
Mobi
lity
.Ran
domW
aypo
int
paus
eTim
e0
driven
byJist/S
WANS
gran
ular
ity
10
minS
peed
0
maxS
peed
20
Field
boun
ds20
00,2
000
driven
byJist/S
WANS
Pathloss
jist
.swa
ns.f
ield
.
Path
loss
.Fre
eSpa
cePr
opag
atio
n/
Free
Spac
e
187

Placem
ent
pkid
die.
fiel
d.
Plac
emen
t.Ra
ndom
driven
byJist/S
WANS
Flow
Placem
ent
pkid
die.
flow
.
Flow
Plac
emen
t.Ra
ndom
driven
byJist/S
WANS
Con
straint
pkid
die.
cons
trai
nts.
Cons
trai
nt.
Flow
Conn
ecte
d
Cons
trai
nt
n/a
Flow
Prop
ertie
s
pkid
die.
flow
.
Flow
Prop
erti
esHo
lder
.
Rand
om
n/a
flows
n/a
n/a
10driven
byJist/S
WANS
endT
ime
n/a
n/a
500s
driven
byJist/S
WANS
nodes
n/a
n/a
50driven
byJist/S
WANS
188
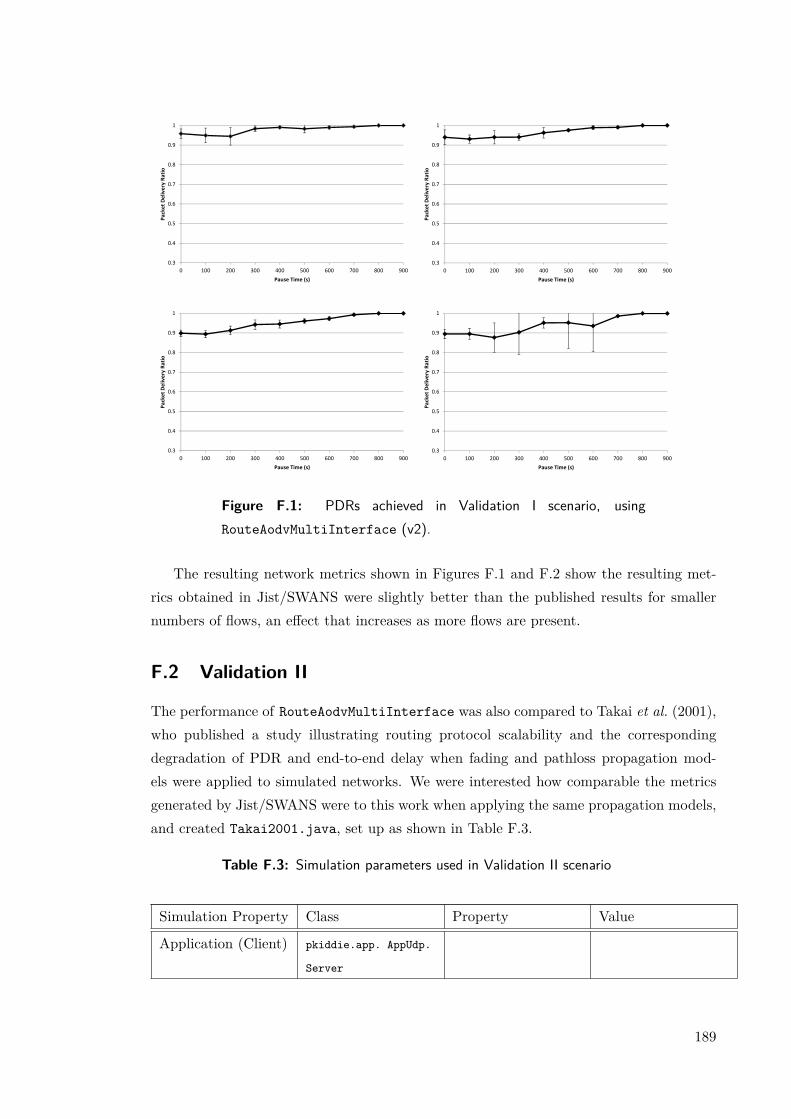
0.3
0.4
0.5
0.6
0.7
0.8
0.9
1
0 100 200 300 400 500 600 700 800 900
Pa
cke
t D
eli
ve
ry R
ati
o
Pause Time (s)
0.3
0.4
0.5
0.6
0.7
0.8
0.9
1
0 100 200 300 400 500 600 700 800 900
Pa
cke
t D
eli
ve
ry R
ati
o
Pause Time (s)
0.3
0.4
0.5
0.6
0.7
0.8
0.9
1
0 100 200 300 400 500 600 700 800 900
Pa
cke
t D
eli
ve
ry R
ati
o
Pause Time (s)
0.3
0.4
0.5
0.6
0.7
0.8
0.9
1
0 100 200 300 400 500 600 700 800 900
Pa
cke
t D
eli
ve
ry R
ati
o
Pause Time (s)
Figure F.1: PDRs achieved in Validation I scenario, usingRouteAodvMultiInterface (v2).
The resulting network metrics shown in Figures F.1 and F.2 show the resulting met-rics obtained in Jist/SWANS were slightly better than the published results for smallernumbers of flows, an effect that increases as more flows are present.
F.2 Validation II
The performance of RouteAodvMultiInterface was also compared to Takai et al. (2001),who published a study illustrating routing protocol scalability and the correspondingdegradation of PDR and end-to-end delay when fading and pathloss propagation mod-els were applied to simulated networks. We were interested how comparable the metricsgenerated by Jist/SWANS were to this work when applying the same propagation models,and created Takai2001.java, set up as shown in Table F.3.
Table F.3: Simulation parameters used in Validation II scenario
Simulation Property Class Property Value
Application (Client) pkiddie.app. AppUdp.
Server
189

Application (Server) pkiddie.app. AppUdp.
Client
Transport pkiddie.trans.
TransUdp
Network pkiddie.net.NetIp
MessageQueue pkiddie.net.
MessageQueue.
DropMessageQueue
capacity 50
Route pkiddie.route.
RouteAodvMultiInterface
RouteAodvBase.
AODV_TIMEOUT
1*Constants.SECOND
RouteAodvBase.
HELLO_INTERVAL
1*Constants.SECOND
priority Constants.
NET_PRIORITY_CONTROL
Mac pkiddie.mac.
Mac802_11
promisc true
Radio pkiddie.net.
RadioNoiseAdditive
PacketLoss jist.swans.net.
PacketLoss.Zero
Spatial jist.swans.field.
Spatial.Grid
divisions 5
Fading jist.swans.field.
Fading.Rayleigh
Pathloss jist.swans.field.
Pathloss.TwoRay
Mobility jist.swans.field.
Mobility.
RandomWaypoint
pauseTime 0
granularity 10
minSpeed 0
maxSpeed 20
Field bounds new Location.
Location2D
(1200,1200)
190

Placement pkiddie.field.
Placement.Random
FlowPlacement pkiddie.flow.
FlowPlacement.Random
Constraint pkiddie.constraints.
Constraint.
FlowConnectedConstraint
FlowProperties pkiddie.flow.
FlowPropertiesHolder
.ForAll
flows n/a n/a 40
endTime n/a n/a 500*Constants.SECOND
nodes n/a n/a 100
The RadioNoiseAdditive model can be created using either Bit Error Rate (BER) orSignal To Noise Ratio Threshold (SNRT). For this study, SNRT mode was chosen. Theend time and queue length of 50 was assumed since the original study based the simulationenvironment from Perkins et al. (2001). The traffic pattern used is described in Table F.4.
Table F.4: properties of flows in this scenario
Property Value
packet size 512 bytesstart time 10sinterval 0.376stype udp
burstTime random(min=40s,max=50s)pauseTime random(min=10s,max=20s)
reps 7
Figure F.3 shows the PDR and end-to-end delay achieved by Jist/SWANS and thestudy by Takai et al. (2001), using ns2, illustrating that whilst the PDR obtained byJist/SWANS is within the margin of error, the end-to-end delay was as much as 40% moreon average. It is unclear from the published results whether they are the average of several
191
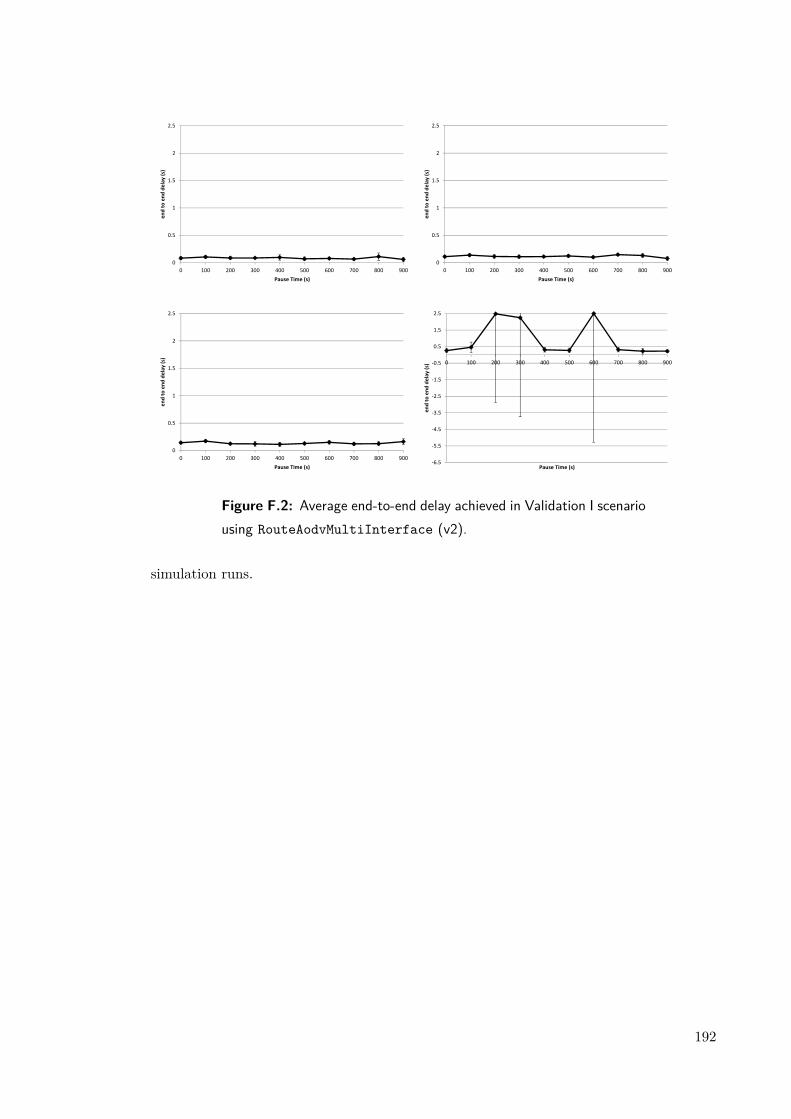
0
0.5
1
1.5
2
2.5
0 100 200 300 400 500 600 700 800 900
en
d t
o e
nd
de
lay
(s)
Pause Time (s)
0
0.5
1
1.5
2
2.5
0 100 200 300 400 500 600 700 800 900
en
d t
o e
nd
de
lay
(s)
Pause Time (s)
0
0.5
1
1.5
2
2.5
0 100 200 300 400 500 600 700 800 900
en
d t
o e
nd
de
lay
(s)
Pause Time (s)-6.5
-5.5
-4.5
-3.5
-2.5
-1.5
-0.5
0.5
1.5
2.5
0 100 200 300 400 500 600 700 800 900
en
d t
o e
nd
de
lay
(s)
Pause Time (s)
Figure F.2: Average end-to-end delay achieved in Validation I scenariousing RouteAodvMultiInterface (v2).
simulation runs.
192
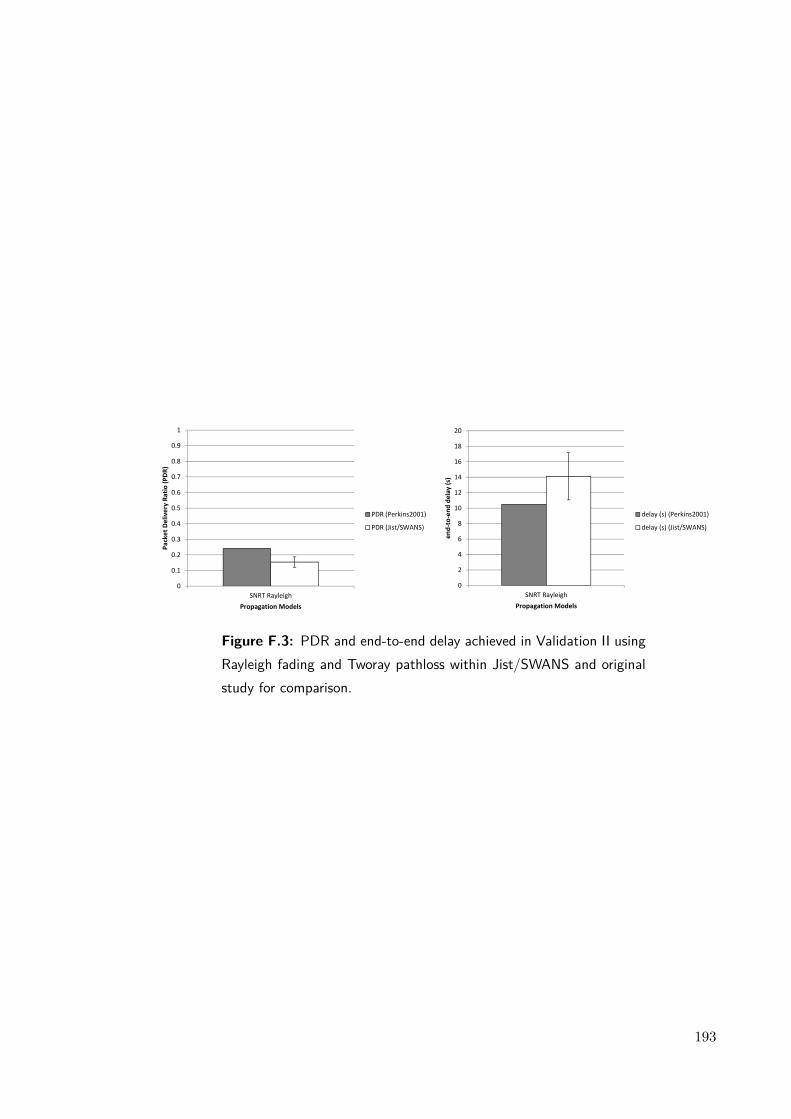
0
0.1
0.2
0.3
0.4
0.5
0.6
0.7
0.8
0.9
1
SNRT Rayleigh
Pa
cke
t D
eli
ve
ry R
ati
o (
PD
R)
Propagation Models
PDR (Perkins2001)
PDR (Jist/SWANS)
0
2
4
6
8
10
12
14
16
18
20
SNRT Rayleigh
en
d-t
o-e
nd
de
lay
(s)
Propagation Models
delay (s) (Perkins2001)
delay (s) (Jist/SWANS)
Figure F.3: PDR and end-to-end delay achieved in Validation II usingRayleigh fading and Tworay pathloss within Jist/SWANS and originalstudy for comparison.
193
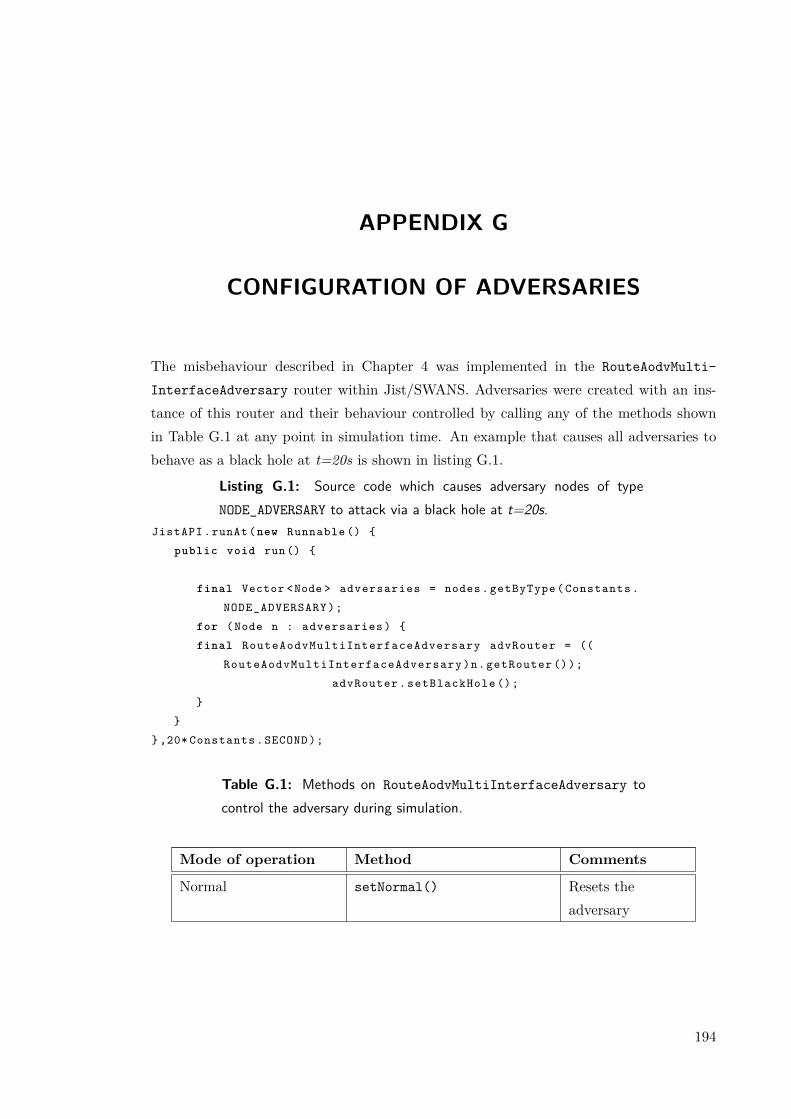
APPENDIX G
CONFIGURATION OF ADVERSARIES
The misbehaviour described in Chapter 4 was implemented in the RouteAodvMulti-
InterfaceAdversary router within Jist/SWANS. Adversaries were created with an ins-tance of this router and their behaviour controlled by calling any of the methods shownin Table G.1 at any point in simulation time. An example that causes all adversaries tobehave as a black hole at t=20s is shown in listing G.1.
Listing G.1: Source code which causes adversary nodes of typeNODE_ADVERSARY to attack via a black hole at t=20s.
JistAPI .runAt(new Runnable () {
public void run () {
final Vector <Node > adversaries = nodes. getByType ( Constants .
NODE_ADVERSARY );
for (Node n : adversaries ) {
final RouteAodvMultiInterfaceAdversary advRouter = ((
RouteAodvMultiInterfaceAdversary )n. getRouter ());
advRouter . setBlackHole ();
}
}
} ,20* Constants . SECOND );
Table G.1: Methods on RouteAodvMultiInterfaceAdversary tocontrol the adversary during simulation.
Mode of operation Method Comments
Normal setNormal() Resets theadversary
194
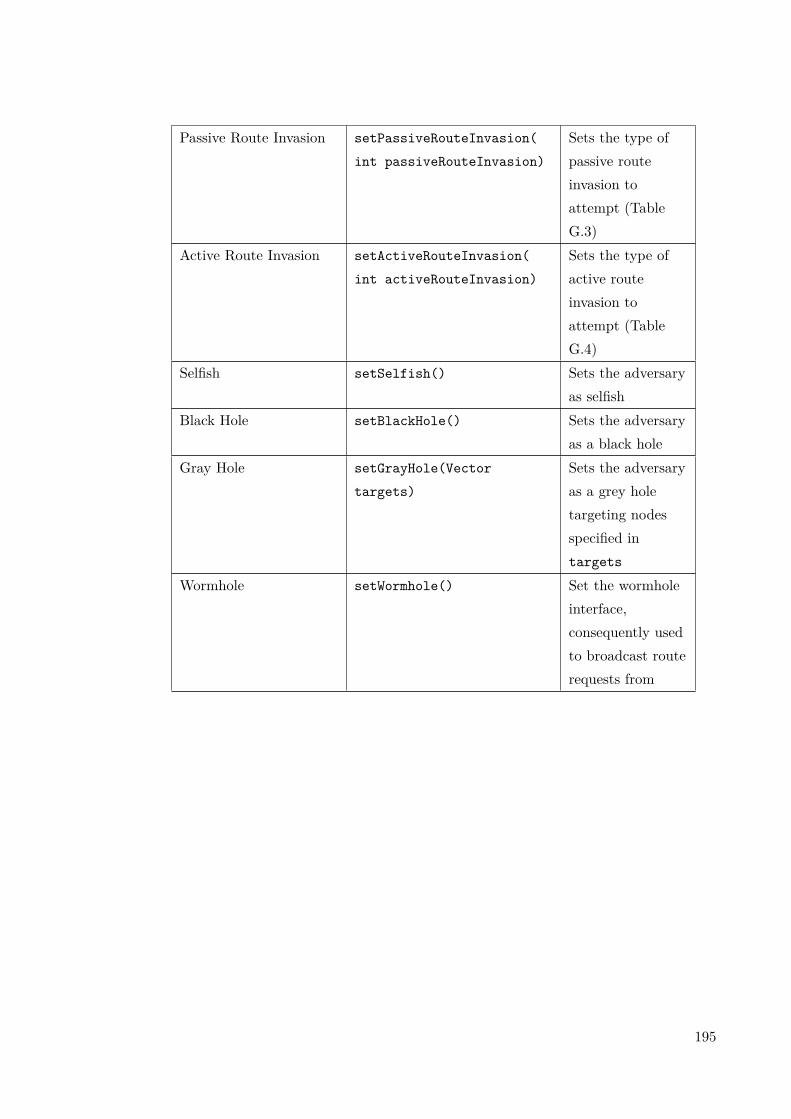
Passive Route Invasion setPassiveRouteInvasion(
int passiveRouteInvasion)
Sets the type ofpassive routeinvasion toattempt (TableG.3)
Active Route Invasion setActiveRouteInvasion(
int activeRouteInvasion)
Sets the type ofactive routeinvasion toattempt (TableG.4)
Selfish setSelfish() Sets the adversaryas selfish
Black Hole setBlackHole() Sets the adversaryas a black hole
Gray Hole setGrayHole(Vector
targets)
Sets the adversaryas a grey holetargeting nodesspecified intargets
Wormhole setWormhole() Set the wormholeinterface,consequently usedto broadcast routerequests from
195

Table G.3: Possible values of passiveRouteInvasion field used inRouteAodvMultiInterfaceAdversary router.
Attacktype
Value ofpassiveRouteInvasion field
Action
N/A NULL Do nothing1 FAKE_SEQNUM For requested destinations that
are known to the adversary,advertise route with a fakedestination sequence number(known dsn + a constant).
2FORGE_RREP_AS_DESTINATION
For any requested destination,forge a route advertisement asthe specified destination(hopCount = 0 ) with false dsn.
3 FORGE_RREP_WITH_ROUTE_TO_
DESTINATION
For any requested destination,forge a route advertisement asif from an intermediate nodewith a route to thedestination, with user definedhopCount and false dsn.
196

Table G.4: Possible values of activeRouteInvasion field used inRouteAodvMultiInterfaceAdversary router.
AttackType
Value ofactiveRouteInvasion field
Actions
N/A NULL Do nothing1 FORGE_RREP Forge a RREP for the
targetted flow2 FORGE_RREQ_THEN_RREP Send a RREQ to the flow
destination in order to retrieveits latest destination sequencenumber. Then forge a RREPfor the targetted flow based onthe latest sequence number
3 FORGE_RERR_SYBIL Forge a RERR whose identity(source network address)corresponds to a node on thetargetted flow
4 FORGE_RREP_SYBIL Forge a RREP whose identify(source network address)corresponds to a node on thetargetted flow
197
APPENDIX H
TESTING THE LEMKE-HOWSON ALGORITHMIMPLEMENTATION
In order to verify the accuracy of the implementation of LH within Jist/SWANS (Lemke.java),the algorithm was applied to general games with well-known results, including the Prison-ers Dilemma, coordination and discoordination games. The general forms of these gamesare specified solely by their inequalities between payoffs. The implementation was alsoapplied to randomly generated general-sum games, with the expected result generatedby Gambit McKelvey et al. (2010). The results show that the expected Nash Equilibriaobtained correlate with the actual Nash Equilibria generated by the LH algorithm. Theunit tests forming this validation is distributed with the source, the details of which canbe found in Appendix D.
198

Type
ofgame
General
Form
Gam
eInstan
tiatio
nEx
pected
NE
Actua
lNE
Priso
ners
Dile
mma
C
Coo
per
ate
Def
ect
RC
oop
erat
eR
,RS,
T
Def
ect
T,S
P,P
T>R>P>S
C
Coo
per
ate
Def
ect
RC
oop
erat
e-1
,-1
-10,
0
Def
ect
0,-1
0-8
,-8
[0,1,0,1]
Rasmusen
(200
1)[0,1,0,1]
Coo
rdination
C AB
RA
a,w
b,x
Bc,
yd,
z
a>c,d>b,w>x,z>y
C AB
RA
5,4
2,3
B4,
13,
2
[1,0,1,0]
[0,1,0,1]
[0.5,0.5,0.5,0.5]
Rasmusen
(200
1)
[1,0,1,0]
[0,1,0,1]
[0.5,0.5,0.5,0.5]
Dis-
coordina
tion
C AB
RA
a,w
b,x
Bc,
yd,
z
a>c,d>b,x>w,y>z
C AB
RA
1,-1
-1,1
B-1
,11,
-1
[0.5,0.5,0.5,0.5]
Rasmusen
(200
1)[0.5,0.5,0.5,0.5]
Dis-
coordina
tion
C
AB
RA
a,w
b,x
Bc,
yd,
z
c>a,b>d,w
>x,z>y
C AB
RA
-1,1
1,-1
B1,
-1-1
,1
[0.5,0.5,0.5,0.5]
Rasmusen
(200
1)[0.5,0.5,0.5,0.5]
199

Type
ofgame
General
Form
Gam
eInstan
tiatio
nEx
pected
NE
Actua
lNE
Ran
dom
General
Sum
N/A
C AB
C
RD
2.74
0,
1.23
0
1.10
0,
2.19
7
2.82
8,
2.66
7
E2.
925,
2.22
9
2.60
4,
1.89
5
1.10
3,
1.00
0
F1.
914,
2.29
5
2.10
0,
1.15
0
2.27
2,
2.42
6
[1,0
,0,0
,0,1
]
[0,1
,0,1
,0,0
]
[0.3
70,0
.451
,0.1
80,
0.23
10.3
97,0
.371
]
McK
elve
yet
al.(
2010
)
[1,0
,0,0
,0,1
]
[0,1
,0,1
,0,0
]
[0.3
70,0
.451
,0.1
80,
0.23
1,0.
397,
0.37
1]
200

APPENDIX I
PUBLICATIONS
Position Paper
Kiddie, P. & Constantinou C. (2008) Decentralised Soft-Security in Distributed Systems.Presented at PhD-NOW workshop, co-located with Ad-Hoc NOW 2008, Sophia Antipolis,France.
201
REFERENCES
Aad, I. & Hubaux, J.-P. (2004) ns-2 for the impatient. Technical report, EPFL, Lausanne,Switzerland.
Abolhasan, M., Wysocki, T. & Dutkiewicz, E. (2004) A review of routing protocols formobile ad hoc networks. Ad Hoc Networks, 2 (1), 1 – 22. ISSN 1570-8705.
Abraham, A., Jain, R., Thomas, J. & Han, S.-Y. (2007) D-SCIDS: Distributed soft com-puting intrusion detection system. Journal of Network and Computer Applications,30 (1), 81 – 98. ISSN 1084-8045.
Acs, G., Buttyan, L. & Vajda, I. (2004) Provably Secure On-demand Source Routing inMobile Ad Hoc Networks. Mobile Computing, IEEE Transactions on, 5 (11), 1533 –1546. ISSN 1536-1233.
Aickelin, U., Bentley, P., Cayzer, S., Kim, J. & McLeod, J. (2003) Danger Theory: TheLink between AIS and IDS? ICARIS-2003, 2nd International Conference on ArtificialImmune Systems, volume 2787. 147 – 155.
Aickelin, U. & Cayzer, S. (2002) The danger theory and its application to artificial immunesystems. Technical Report HPL-2002-244, HP Labs, Bristol.
Alpcan, T. & Basar, T. (2003) A game theoretic approach to decision and analysis innetwork intrusion detection. 42nd IEEE International Conference on Decision andControl, volume 3. Maui, HI, USA. ISBN 0 7803 7924 1, 2595 – 2600.
Apache Commons (2010) Math - Commons-Math: The Apache Commons MathematicsLibrary. http://commons.apache.org/math/. Last Accessed: 25/08/2010.
Apache Jakarta Project (2010) BCEL: The Byte Code Engineering Library. http://
jakarta.apache.org/bcel/. Last Accessed: 25/08/2010.
Apache Software Foundation (2010) Apache log4j 1.2 - log4j 1.2. http://logging.
apache.org/log4j/1.2/. Last Accessed: 15/09/2010.
Bace, R. G. (2000) Intrusion detection. MacMillan Technology.

Balachandran, S., Dasgupta, D. & Wang, L. (2006) A Hybrid Approach for MisbehaviorDetection in Wireless Ad-Hoc Networks.
Balakrishnan, K., Deng, J. & Varshney, V. (2005) TWOACK: preventing selfishness inmobile ad hoc networks. Wireless Communications and Networking Conference, 4, 2137– 2142. ISSN 1525-3511.
Baras, J. S., Radosavac, S., Theodorakopoulos, G., Sterne, D., Budulas, P. & Gopaul, R.(2007) Intrusion Detection System Resiliency to Byzantine Attacks: The Case Study ofWormholes in OLSR. Milcom 2007: Proceedings of the 2007 Military CommunicationsConference.
Barr, R. (2004a) JiST - Java In Simulation Time. Cornell.
Barr, R. (2004b) SWANS - Scalable Wireless Ad Hoc Network Simulator User Guide.Cornell.
Barr, R., Haas, Z. J. & van Renesse, R. (2005) JiST: an efficient approach to simulationusing virtual machines: Research Articles. Softw. Pract. Exper., 35 (6), 539 – 576. ISSN0038-0644.
Basile, C., Kalbarczyk, Z. & Iyer, R. (2005) Neutralization of errors and attacks in wirelessad hoc networks. Dependable Systems and Networks, 2005. DSN 2005. Proceedings.International Conference on. 518 – 527.
Billauer, E. (2011) peakdet: Peak detection using MATLAB. http://www.billauer.co.
il/peakdet.html. Last Accessed: 17/01/2011.
Bokareva, T., Bulusu, N. & Jha, S. (2005) SASHA: Toward a Self-Healing Hybrid SensorNetwork Architecture. Embedded Networked Sensors, 2005. EmNetS-II. The SecondIEEE Workshop on. 71 – 78.
Brandes, U. (2001) A Faster Algorithm for Betweenness Centrality. Journal of Mathemat-ical Sociology, 25, 163 – 177.
Broch, J., Maltz, D. A., Johnson, D. B., Hu, Y.-C. & Jetcheva, J. (1998) A performancecomparison of multi-hop wireless ad hoc network routing protocols. MobiCom ’98:Proceedings of the 4th annual ACM/IEEE international conference on Mobile computingand networking. ACM, New York, NY, USA. ISBN 1-58113-035-X, 85 – 97.
Buchegger, S. & Le Boudec, J. (2002a) Nodes bearing grudges: Towards routing security,fairness, and robustness in mobile ad hoc networks. Parallel, Distributed and Network-based Processing, 2002. Proceedings. 10th Euromicro Workshop on, 403 – 410.

Buchegger, S. & Le Boudec, J.-Y. (2002b) Performance analysis of the CONFIDANTprotocol. MobiHoc ’02: Proceedings of the 3rd ACM international symposium on Mobilead hoc networking & computing. ACM, New York, NY, USA. ISBN 1-58113-501-7, 226– 236.
Buchegger, S. & Le Boudec, J.-Y. (2005) Self Policing Mobile Ad-Hoc Networks by Rep-utation. IEEE Communication Magazine, 43 (7), 101 – 107.
Buttyan, L. & Hubaux, J.-P. (2000) Toward a formal model of fair exchange – a gametheoretic approach. Technical report.
Buttyan, L. & Hubaux, J.-P. (2003) Stimulating Cooperation in Self-Organizing MobileAd Hoc Networks. ACM/Kluwer Mobile Networks and Applications, 8 (5).
Buttyan, L. & Hubaux, J.-P. (2007) Security and Cooperation in Wireless NetworksThwarting Malicious and Selfish Behavior in the Age of Ubiquitous Computing. Cam-bridge University Press.
Caro, G. A., Ducatelle, F. & Gambardella, L. M. (2008) A Simulation Study of RoutingPerformance in Realistic Urban Scenarios for MANETs. ANTS ’08: Proceedings ofthe 6th international conference on Ant Colony Optimization and Swarm Intelligence,volume 5217/2008. Springer-Verlag, Berlin, Heidelberg. ISBN 978-3-540-87526-0, 211 –218.
Carruthers, R. & Nikolaidis, I. (2005) Certain limitations of reputation–based schemes inmobile environments. MSWiM ’05: Proceedings of the 8th ACM international sympo-sium on Modeling, analysis and simulation of wireless and mobile systems. ACM, NewYork, NY, USA. ISBN 1-59593-188-0, 2 – 11.
Chakeres, I. & Belding-Royer, E. M. (2005) AODV Implementation Design and Perfor-mance Evaluation. International Journal of Wireless and Mobile Computing (IJWMC),2/3.
Chapel, H., Haeney, M., Misbah, S. & Snowden, N. (2006) Essentials of Clinical Immunol-ogy. Wiley-Blackwell.
Dasgupta, D. & Gonzalez, F. (2002) An immunity-based technique to characterize intru-sions in computernetworks. Evolutionary Computation, IEEE Transactions on, 6 (3),281 – 291. ISSN 1089-778X.
Deng, H., Li, W. & Agrawal, D. (2002) Routing security in wireless ad hoc networks.Communications Magazine, IEEE, 40 (10), 70 – 75. ISSN 0163-6804.
Dhillon, D., Randhawa, T., Wang, M. & Lamont, L. (2004) Implementing a fully dis-tributed certificate authority in an OLSR MANET. Wireless Communications andNetworking Conference, 2004. WCNC. 2004 IEEE, 2, 682 – 688. ISSN 1525-3511.
Dijkstra, E. W. (1959) A note on two problems in connexion with graphs. NumerischeMathematik, 1, 269 – 271. ISSN 0029-599X.
Doan, T., Melvold, R., Viselli, S. & Waltenbaugh, C. (2007) Lippincott’s Illustrated Re-views: Immunology (Lippincott’s Illustrated Reviews Series). Lippincott Williams &Wilkins.
Douceur, J. R. (2002) The Sybil Attack. IPTPS ’01: Revised Papers from the FirstInternational Workshop on Peer-to-Peer Systems, volume 2429/2002. Springer-Verlag,London, UK. ISBN 3-540-44179-4, 251 – 260.
Feigenbaum, J. & Shenker, S. (2002) Distributed Algorithmic Mechanism Design: RecentResults and Future Directions. In Proceedings of the 6th International Workshop onDiscrete Algorithms and Methods for Mobile Computing and Communications. ACMPress, 1 – 13.
Felegyhazi, M., Buttyan, L. & Hubaux, J.-P. (2006) Nash Equilibria of Packet ForwardingStrategies in Wireless Ad Hoc Networks. IEEE Transactions on Mobile Computing(TMC), 5 (5). ISSN 1536 – 1233.
Felegyhazi, M., Hubaux, J.-P. & Buttyan, L. (2003) Equilibrium Analysis of Packet For-warding Strategies in Wireless Ad Hoc Networks - the Dynamic Case. Technical report.
Fong, M. (2004) JiST event viewer project report. Technical report, Cornell University.
Forrest, S. & Hofmeyr, S. (2001) Engineering an Immune System.
Ghica, O. C., Trajcevski, G., Scheuermann, P., Bischof, Z. & Valtchanov, N. (2008)SIDnet-SWANS: a simulator and integrated development platform for sensor networksapplications. SenSys ’08: Proceedings of the 6th ACM conference on Embedded networksensor systems. ACM, New York, NY, USA. ISBN 978-1-59593-990-6, 385 – 386.
Gonzalez, F. A. & Dasgupta, D. (2004) Anomaly Detection Using Real-Valued NegativeSelection. Journal of Genetic Programming and Evolvable Machines. 4 – 383.
Greensmith, J., Aickelin, U. & Twycross, J. (2006) Articulation and Clarification of theDendritic Cell Algorithm.
Haas, Z. J., Halpern, J. Y. & Li, L. (2006) Gossip-based ad hoc routing. IEEE/ACMTrans. Netw., 14, 479–491. ISSN 1063-6692.
Hamill, P. (2004) Unit Test Frameworks. O’Reilly Media.
Hao, L., Li, X., Yang, S. & Lu, S. (2006) Fast Authentication Public Key Infrastructurefor Mobile Ad Hoc Networks Based on Trusted Computing. Wireless Communications,Networking and Mobile Computing, 2006. WiCOM 2006.International Conference on.1 – 4.
Heberlein, L., Dias, G., Levitt, K., Mukherjee, B., Wood, J. & Wolber, D. (1990) Anetwork security monitor. Research in Security and Privacy, 1990. Proceedings., 1990IEEE Computer Society Symposium on. 296 – 304.
Helsinki, V. K. & Kärpijoki, V. (2000) Security in Ad Hoc Networks.
Hu, Y.-C., Johnson, D. B. & Perrig, A. (2002) SEAD: Secure Efficient Distance VectorRouting for Mobile Wireless Ad Hoc Networks. Mobile Computing Systems and Appli-cations, 2002. Proceedings Fourth IEEE Workshop on, 3 – 13.
Hu, Y.-C., Perrig, A. & Johnson, D. (2003a) Packet leashes: a defense against wormholeattacks in wireless networks. INFOCOM 2003. Twenty-Second Annual Joint Conferenceof the IEEE Computer and Communications Societies. IEEE, 3, 1976 – 1986. ISSN0743-166X.
Hu, Y.-C., Perrig, A. & Johnson, D. B. (2003b) Rushing attacks and defense in wirelessad hoc network routing protocols. WiSe ’03: Proceedings of the 2nd ACM workshop onWireless security. ACM, New York, NY, USA. ISBN 1-58113-769-9, 30 – 40.
Hu, Y.-C., Perrig, A. & Johnson, D. B. (2005) Ariadne: A Secure On-Demand RoutingProtocol for Ad Hoc Networks. Wireless Networks, 11 (1 - 2), 21 – 38.
Huang, Y., Fan, W., Lee, W. & Yu, P. S. (2003) Cross-Feature Analysis for DetectingAd-Hoc Routing Anomalies. Distributed Computing Systems, International Conferenceon, 0, 478. ISSN 1063-6927.
Huang, Y.-a. & Lee, W. (2003) A cooperative intrusion detection system for ad hoc net-works. SASN ’03: Proceedings of the 1st ACM workshop on Security of ad hoc andsensor networks. ACM, New York, NY, USA. ISBN 1-58113-783-4, 135 – 147.
Janeway, C., Travers, P., Walport, M. & Shlomchik, M. (2004) Immunobiology. GarlandScience.
Jaramillo, J. J. & Srikant, R. (2007) DARWIN: distributed and adaptive reputation mech-anism for wireless ad-hoc networks. MOBICOM. 87 – 98.
Johnson, D. B. & Maltz, D. A. (1996) Dynamic Source Routing in Ad Hoc WirelessNetworks. Imielinski & Korth, eds., Mobile Computing, volume 353. Kluwer AcademicPublishers.
Jubin, J. & Tornow, J. (1987) The DARPA packet radio network protocols. Proceedingsof the IEEE, 75 (1), 21 – 32. ISSN 0018-9219.
JUNG (2010) Java Universal Network/Graph Framework. http://jung.sourceforge.
net/doc/index.html. Last Accessed: 17/10/2010.
Just, M., Kranakis, E. & Wan, T. (2003) Resisting Malicious Packet Dropping in WirelessAd Hoc Networks. In Proc. of ADHOCNOW?03. Springer Verlag, 151 – 163.
Karlof, C. & Wagner, D. (2003) Secure routing in wireless sensor networks: attacks andcountermeasures. Ad Hoc Networks, 1 (2-3), 293 – 315. ISSN 1570-8705.
Kemmerer, R. A. & Vigna, G. (2002) Intrusion Detection: A Brief History and Overview(Supplement to Computer Magazine). Computer, 35, 27 – 30. ISSN 0018-9162.
Kim, J. & Bentley, P. (2001) Towards an artificial immune system for network intrusiondetection: an investigation of clonal selection with a negative selection operator. Evo-lutionary Computation, 2001. Proceedings of the 2001 Congress on, volume 2. 1244 –1252.
Kim, J., Bentley, P., Wallenta, C., Ahmed, M. & Hailes, S. (2006) Danger Is Ubiquitous:Detecting Malicious Activities in Sensor Networks Using the Dendritic Cell Algorithm.ICARIS. 390 – 403.
Kliot, G. (2009) Technion Extensions of the JiST/SWANS Simulator.
Kurkowski, S., Camp, T. & Colagrosso, M. (2005a) MANET Simulation Studies: TheCurrent State and New Simulation Tools.
Kurkowski, S., Camp, T. & Colagrosso, M. (2005b) MANET simulation studies: theincredibles. SIGMOBILE Mob. Comput. Commun. Rev., 9 (4), 50 – 61.
Kyasanur, P. & Vaidya, N. (2003) Detection and handling of MAC layer misbehavior inwireless networks. Dependable Systems and Networks, 2003. Proceedings. 2003 Interna-tional Conference on, 173 – 182.
Lemke, C. E. & J. T. Howson, J. (1964) Equilibrium Points of Bimatrix Games. SIAMJournal on Applied Mathematics, 12 (2), 413 – 423.
Li, L., Halpern, J. & Haas, Z. (2002) Gossip-based Ad Hoc Routing.
Lin, C. (2004) SWANS AODV project report.
Liu, K., Deng, J., Varshney, P. & Balakrishnan, K. (2007) An Acknowledgment-BasedApproach for the Detection of Routing Misbehavior in MANETs. Mobile Computing,IEEE Transactions on, 6 (5), 488 – 502. ISSN 1536-1233.
Liu, Y., Comaniciu, C. &Man, H. (2006) A Bayesian game approach for intrusion detectionin wireless ad hoc networks. GameNets ’06: Proceeding from the 2006 workshop onGame theory for communications and networks. ACM, New York, NY, USA. ISBN1-59593-507-X, 4.
Lundgren, H., Nordstrom, E. & Tschudin, C. (2002) The gray zone problem in IEEE802.11b based ad hoc networks. ACM SIGMOBILE Mobile Comput. Commun. Rev.,volume 6. 104–105.
Luo, J., Hubaux, J.-P. & Eugster, P. T. (2005) DICTATE: DIstributed CerTificationAuthority with probabilisTic frEshness for Ad Hoc Networks. IEEE Transactions onDependable and Secure Computing, 2 (4), 311 – 323.
Marti, S., Giuli, T. J., Lai, K. & Baker, M. (2000) Mitigating routing misbehavior inmobile ad hoc networks. MobiCom ’00: Proceedings of the 6th annual internationalconference on Mobile computing and networking. ACM Press, New York, NY, USA.ISBN 1-58113-197-6, 255 – 265.
Matzinger, P. (2002) The Danger Model: A Renewed Sense of Self. Science, 296 (5566),301 – 305.
McKelvey, R. D., McLennan, A. M. & Turocy, T. L. (2010) Gambit: Software Tools forGame Theory, Version 0.2010.09.01.
Michiardi, P. & Molva, R. (2002) CORE: A collaborative reputation mechanism to enforcenode cooperation in mobile ad hoc networks. Advanced Communications and MultimediaSecurity. IFIP TC6/TC11 Sixth Joint Working Conference on Communications andMultimedia Security, 107 – 121.
Michiardi, P. & Molva, R. (2005) Analysis of coalition formation and cooperation strategiesin mobile ad hoc networks. Ad Hoc Networks, 3 (2), 193 – 219. ISSN 1570-8705.
Michiardi, P. & R., M. (2001) Simulation-based Analysis of Security Exposures in MobileAd Hoc Networks.
Mishra, A., Nadkarni, K. & Patcha, A. (2004) Intrusion detection in wireless ad hocnetworks. Wireless Communications, IEEE, 11 (1), 48 – 60. ISSN 1536-1284.

Nachbar, J. H. (1992) Evolution in the finitely repeated prisoner’s dilemma. Journal ofEconomic Behavior & Organization, 19 (3), 307 – 326. ISSN 0167-2681.
Nash, J. F. (1950) Equilibrium Points in n-Person Games. Proceedings of the NationalAcademy of Sciences of the United States of America, 36 (1), 48 – 49. ISSN 00278424.
Ni, S.-Y., Tseng, Y.-C., Chen, Y.-S. & Sheu, J.-P. (1999) The broadcast storm problemin a mobile ad hoc network. MobiCom ’99: Proceedings of the 5th annual ACM/IEEEinternational conference on Mobile computing and networking. ACM, New York, NY,USA. ISBN 1-58113-142-9, 151 – 162.
Ning, P. & Sun, K. (2003) How to misuse AODV: a case study of insider attacks againstmobile ad-hoc routing protocols. Information Assurance Workshop, 2003. IEEE Sys-tems, Man and Cybernetics Society. 60 – 67.
ns2 (2010) The Network Simulator - ns-2. http://www.isi.edu/nsnam/ns/. Last Ac-cessed: 15/03/2010.
OPNET Technologies Inc (2010) Opnet Modeler. http://www.opnet.com/solutions/
network\_rd/modeler.html. Last Accessed: 1/10/2010.
Otrok, H., Debbabi, M., Assi, C. & Bhattacharya, P. (2007) A Cooperative Approachfor Analyzing Intrusions in Mobile Ad hoc Networks. Distributed Computing SystemsWorkshops, 2007. ICDCSW ’07. 27th International Conference on, 86 – 86. ISSN 1545-0678.
Otrok, H., Mohammed, N., Wang, L., Debbabi, M. & Bhattacharya, P. (2008a) A game-theoretic intrusion detection model for mobile ad hoc networks. Computer Communi-cations, 31 (4), 708 – 721. ISSN 0140-3664.
Otrok, H., Mohammed, N., Wang, L., Debbabi, M. & Bhattacharya, P. (2008b) A Mod-erate to Robust Game Theoretical Model for Intrusion Detection in MANETs. 608 –612.
Otto, J. & Choffnes, D. (2007) SWANS++ - Extensions to the Scalable Wireless Ad-hocNetwork Simulator.
Patcha, A. & Park, J.-M. (2004) A game theoretic approach to modeling intrusion de-tection in mobile ad hoc networks. Proceedings from the Fifth Annual IEEE SMCInformation Assurance Workshop (IEEE Cat. No.04EX879), 280 – 284.
Patwardhan, A., Parker, J., Joshi, A., Iorga, M. & Karygiannis, T. (2005) Secure Routingand Intrusion Detection in Ad Hoc Networks. Pervasive Computing and Communica-tions, 2005. PerCom 2005. Third IEEE International Conference on. 191 – 199.

Paul, K. & Westhoff, D. (2002) Context aware detection of selfish nodes in DSR basedad-hoc networks. Vehicular Technology Conference, 2002. Proceedings. VTC 2002-Fall.2002 IEEE 56th, volume 4. ISSN 1090-3038, 2424 – 2429.
Perkins, C. (1997) Ad-hoc on-demand distance vector routing.
Perkins, C., Royer, E., Das, S. & Marina, M. (2001) Performance comparison of two on-demand routing protocols for ad hoc networks. Personal Communications, IEEE, 8 (1),16 – 28. ISSN 1070-9916.
Perkins, C. E. & Bhagwat, P. (1994) Highly dynamic Destination-Sequenced Distance-Vector routing (DSDV) for mobile computers. SIGCOMM Comput. Commun. Rev.,24 (4), 234–244. ISSN 0146-4833.
Pirzada, A. A. & McDonald, C. (2004) Establishing trust in pure ad-hoc networks. ACSC’04: Proceedings of the 27th Australasian conference on Computer science. AustralianComputer Society, Inc., Darlinghurst, Australia, Australia, 47 – 54.
Pritchard, D. (2007) The Lemke-Howson Algorithm.
Rasmusen, E. (2001) Games and Information: An Introduction to Game Theory. BlackwellPublishing. ISBN 0631210954.
Riedel, I. (2003) Security in Ad-hoc Networks: Protocols and Elliptic Curve Cryptographyon an Embedded Platform.
Rivest, R. (1992) The MD5 Message-Digest Algorithm.
Roughgarden, T., Tardos, E. & Vazirani, V. V. (2007) Algorithmic Game Theory. Cam-bridge University Press.
Royer, E. & Toh, C.-K. (1999) A review of current routing protocols for ad hoc mobilewireless networks. Personal Communications, IEEE [see also IEEE Wireless Commu-nications], 6 (2), 46 – 55. ISSN 1070-9916.
Sanzgiri, K., Dahill, B., Levine, B., Shields, C. & Belding-Royer, E. (2002a) A securerouting protocol for ad hoc networks. Network Protocols, 2002. Proceedings. 10th IEEEInternational Conference on. ISSN 1092-1648, 78 – 87.
Sanzgiri, K., Dahill, B., Levine, B., Shields, C. & Belding-Royer, E. (2002b) A securerouting protocol for ad hoc networks. Network Protocols, 2002. Proceedings. 10th IEEEInternational Conference on. ISSN 1092-1648, 78 – 87.
Sarafijanovic, S. & Le Boudec, J.-Y. (2005) An Artificial Immune System for MisbehaviorDetection in Mobile Ad-Hoc Networks with Virtual Thymus, Clustering, Danger Signal

and Memory Detectors. International Journal of Unconventional Computing, 1, 221 –254.
Schmidt, S., Alpcan, T., Albayrak, S., Basar, T. & Mueller, A. (2008) A Malware DetectorPlacement Game for Intrusion Detection. Lecture Notes in Computer Science, volume5141. Springer Berlin / Heidelberg, 311 – 326.
Schoch, E. (2009) JiST/SWANS Portal.
Schoch, E., Feiri, M., Kargl, F. & Weber, M. (2008) Simulation of ad hoc networks: ns-2compared to JiST/SWANS. Simutools ’08: Proceedings of the 1st international confer-ence on Simulation tools and techniques for communications, networks and systems &workshops. ICST (Institute for Computer Sciences, Social-Informatics and Telecommu-nications Engineering), ICST, Brussels, Belgium, Belgium. ISBN 978-963-9799-20-2, 1– 8.
Shapley, L. S. (1953) A Value for n-person Games. Contributions to the Theory of Games,II, 307 – 317.
Shi, E. & Perrig, A. (2004) Designing secure sensor networks. Wireless Communications,IEEE, 11 (6), 38 – 43. ISSN 1536-1284.
Shoham, Y. & Leyton-Brown, K. (2009) Multiagent Systems : Algorithmic, Game-Theoretic, and Logical Foundations. Cambridge University Press.
Srinivasan, A., Teitelbaum, J., Wu, J., Cardei, M. & Liang, H. (2008) Reputation-and-Trust-Based Systems for Ad Hoc Networks, chapter 13. Algorithms and Protocols forWireless, Mobile Ad Hoc Networks. Wiley, 375 – 403.
Srinivasan, V., Nuggehalli, P., Chiasserini, C. & Rao, R. (2003) Cooperation in wireless adhoc networks. INFOCOM 2003. Twenty-Second Annual Joint Conference of the IEEEComputer and Communications Societies. IEEE, 2, 808 – 817. ISSN 0743-166X.
Stajano, F. & Anderson, R. (2000) The Resurrecting Duckling: Security Issues for Ad-hocWireless Networks. Proceedings of the 7th International Workshop on Security Protocols.Springer-Verlag, London, UK. ISBN 3-540-67381-4, 172–194.
Sundararajan, T. & Shanmugam, A. (2009) Behavior Based Anomaly Detection Techniqueto Mitigate the Routing Misbehavior in MANET. International Journal of ComputerScience and Security (IJCSS), 3.
Takai, M., Martin, J. & Bagrodia, R. (2001) Effects of wireless physical layer modelingin mobile ad hoc networks. MobiHoc ’01: Proceedings of the 2nd ACM international
symposium on Mobile ad hoc networking & computing. ACM, New York, NY, USA.ISBN 1-58113-428-2, 87 – 94.
Urpi, A., Bonuccelli, M. & Giordano, S. (2003) Modelling cooperation in mobile ad hocnetworks: a formal description of selfishness. Proc. of WiOpt Workshop, 2003.
Vahdat, A. & Becker, D. (2000) Epidemic Routing for Partially-Connected Ad Hoc Net-works. Technical report.
Vigna, G., Gwalani, S., Srinivasan, K., Belding-Royer, E. & Kemmerer, R. (2004) Anintrusion detection tool for AODV-based ad hoc wireless networks. Computer SecurityApplications Conference, 2004. 20th Annual. ISSN 1063-9527, 16 – 27.
Vigna, G., Valeur, F. & Kemmerer, R. A. (2003) Designing and implementing a family ofintrusion detection systems. ESEC/FSE-11: Proceedings of the 9th European softwareengineering conference held jointly with 11th ACM SIGSOFT international symposiumon Foundations of software engineering. ACM, New York, NY, USA. ISBN 1-58113-743-5, 88 – 97.
Von Neumann, J. (1928) Zur theorie der gesellschaftsspiele.
Von Neumann, J. & Morgenstern, O. (1970) Theory of games and economic behavior.Princeton Princeton Univ. Press.
Wang, F., Vetter, B. & Wu, S. F. (1997) Secure Routing Protocols: Theory and Practice.Technical report, North Carolina State University.
Wang, W., Lu, Y. & Bhargava, B. (2003) On security study of two distance vector routingprotocols for mobile ad hoc networks. Pervasive Computing and Communications, 2003.(PerCom 2003). Proceedings of the First IEEE International Conference on. 179 – 186.
Widger, J. & Grosu, D. (2009) Parallel Computation of Nash Equilibria in N-PlayerGames. volume 1. 209 – 215.
Xu, W., Trappe, W., Zhang, Y. & Wood, T. (2005) The feasibility of launching anddetecting jamming attacks in wireless networks. MobiHoc ’05: Proceedings of the 6thACM international symposium on Mobile ad hoc networking and computing. ACM, NewYork, NY, USA. ISBN 1-59593-004-3, 46 – 57.
Yan, Z. (2006) A conceptual architecture of a trusted mobile environment. Security,Privacy and Trust in Pervasive and Ubiquitous Computing, 2006. SecPerU 2006. SecondInternational Workshop on. 81.
Yang, H., Luo, H., Ye, F., Lu, S. & Zhang, L. (2004) Security in mobile ad hoc networks:challenges and solutions. Wireless Communications, IEEE, 11 (1), 38 – 47. ISSN 1536-1284.
Yi, Y., Gerla, M. & Kwon, T. J. (2003) Efficient flooding in ad hoc networks: a comparativeperformance study. Communications, 2003. ICC ’03. IEEE International Conferenceon, volume 2. 1059 – 1063.
Zhang, Y. & Lee, W. (2000) Intrusion detection in wireless ad-hoc networks. MobiCom’00: Proceedings of the 6th annual international conference on Mobile computing andnetworking. ACM Press, New York, NY, USA. ISBN 1-58113-197-6, 275 – 283.
Zhou, L. & Haas, Z. J. (1999) Securing Ad Hoc Networks. IEEE Network, 13 (6), 24 – 30.
Copyright © 2022 FDOKUMEN