DEC/15 - AGA-Portal
289
ENVIRONMENTAL IMPACT STUDY SUMMARY REPORT DEC/15 PROGEST – PROJECTOS TÉCNICOS, CONSULTORIA e GESTÃO, LDA. Rua Rainha Ginga, #147-2 / Luanda, Tel.: 00244 2 392246 / 397337, Fax: 00244 2 392245, Email: [email protected]
-
Upload
khangminh22 -
Category
Documents
-
view
1 -
download
0
Transcript of DEC/15 - AGA-Portal

ENVIRONMENTAL IMPACT STUDY
SUMMARY REPORT
DEC/15
PROGEST – PROJECTOS TÉCNICOS, CONSULTORIA e GESTÃO, LDA. Rua Rainha Ginga, #147-2 / Luanda, Tel.: 00244 2 392246 / 397337, Fax: 00244 2 392245, Email: [email protected]
EIS / SR 15.08 This document may not be partially copied. 1/280
1.1 GENERAL TABLE OF CONTENTS
GENERAL TABLE OF CONTENTS ....................................................................................................................1
1. INTRODUCTION ............................................................................................................................... 15
1.1. GENERAL CONSIDERATIONS ......................................................................................................... 15
1.2. PROJECT IDENTIFICATION .............................................................................................................. 16
1.2.1. Proponent Identification................................................................................................................ 16
1.2.2. Consulting Company Identification ............................................................................................ 17
1.2.3. Technical Team ............................................................................................................................... 18
1.3. EIS PREPARATION PERIOD .............................................................................................................. 20
2. PROJECT DESCRIPTION ................................................................................................................... 21
2.1. PROJECT OBJECTIVES AND SCOPE .............................................................................................. 21
2.2. PROJECT LOCATION ....................................................................................................................... 23
2.2.1. Geographical Location ................................................................................................................. 23
2.2.2. Administrative Location ................................................................................................................. 26
2.3. PROJECT SPECIFICATIONS ............................................................................................................. 28
2.3.1. Project .............................................................................................................................................. 28
2.3.1.1. Construction Details ....................................................................................................................... 29
2.3.1.2. Operating Conditions .................................................................................................................... 33
2.3.1.3. Supporting Infrastructures ............................................................................................................. 50
2.3.1.4. Expected Consumptions ............................................................................................................... 50
2.3.1.5. Labor ................................................................................................................................................. 51
2.3.1.6. Schedule .......................................................................................................................................... 53
EIS / SR 15.08 This document may not be partially copied. 2/280
2.3.1.7. Environmental Characterization .................................................................................................. 53
2.3.2. Investment Value of the Undertaking ........................................................................................ 57
3. REGIONAL SETTING – INSTITUTIONAL AND LEGAL FRAMEWORK .................................................... 58
3.1. INSTITUTIONAL FRAMEWORK .......................................................................................................... 58
3.1.1. Ministry of Environment .................................................................................................................. 58
3.1.2. Ministry of Energy and Water ....................................................................................................... 59
3.1.3. GAMEK – Middle Kwanza Development Department .............................................................. 60
3.1.4. North Kwanza Province Government ......................................................................................... 60
3.2. LEGAL FRAMEWORK ....................................................................................................................... 60
3.3. INTERNATIONAL STANDARDS AND GUIDELINES ........................................................................... 65
3.4. ENVIRONMENTAL IMPACT STUDY REQUIREMENTS ...................................................................... 67
4. EIS METHODOLOGY AND STRUCTURAL OVERVIEW ......................................................................... 70
4.1. EIS METHODOLOGY ........................................................................................................................ 70
4.2. EIS GENERAL STRUCTURE AND CONTENTS .................................................................................. 77
4.3. DEFINING THE AREA OF INFLUENCE .............................................................................................. 79
5. ANALYSING THE ALTERNATIVES TO THE PROJECT ............................................................................ 82
5.1. GENERAL CONSIDERATIONS ......................................................................................................... 82
5.2. DAM .................................................................................................................................................. 84
5.3. HYDRAULIC DAM DEVICES ............................................................................................................ 87
5.3.1. Flood Spillway.................................................................................................................................. 87
5.4. TEMPORARY DIVERSION ................................................................................................................ 87
5.5. HYDROELECTRIC POWER PLANT AND SUBSTATION .................................................................... 88
5.6. MAIN HYDRAULIC CIRCUIT ............................................................................................................. 92
5.7. FINAL CONSIDERATIONS ................................................................................................................ 96

EIS / SR 15.08 This document may not be partially copied. 3/280
6. ENVIRONMENTAL CHARACTERIZATION ........................................................................................... 98
6.1. GENERAL CONSIDERATIONS ......................................................................................................... 98
6.1.1. Methodology Aspects ................................................................................................................... 98
6.1.2. Area of Study ................................................................................................................................... 99
6.2. CLIMATE ......................................................................................................................................... 100
6.2.1. General Considerations .............................................................................................................. 100
6.2.2. Precipitation .................................................................................................................................. 100
6.2.3. Evaporation ................................................................................................................................... 103
6.2.4. Air Temperature ............................................................................................................................ 103
6.2.5. Air Humidity .................................................................................................................................... 104
6.2.6. Insolation ........................................................................................................................................ 105
6.2.7. Atmospheric Pressure ................................................................................................................... 106
6.2.8. Winds .............................................................................................................................................. 106
6.2.2. Climate Characterization............................................................................................................ 108
6.3. AIR QUALITY ................................................................................................................................... 110
6.3.1. Air Quality Characterization ....................................................................................................... 110
6.3.2. Legal Framework .......................................................................................................................... 110
6.3.3. Climate Changes ......................................................................................................................... 114
6.4. GEOLOGY ...................................................................................................................................... 116
6.4.1. General Considerations .............................................................................................................. 116
6.4.2. Geomorphology ........................................................................................................................... 117
6.4.3. Pedology........................................................................................................................................ 120

EIS / SR 15.08 This document may not be partially copied. 4/280
6.4.4. Regional Geology ........................................................................................................................ 122
6.4.5. Seismicity ........................................................................................................................................ 128
6.6. GEOTECHNICS ............................................................................................................................... 130
6.6.1. SEISMIC REFRACTION PROFILES .................................................................................................. 130
6.6.2. RESISTIVITY PROFILES ..................................................................................................................... 131
6.6.3. SURVEYS AND FIELD TESTS ............................................................................................................ 134
6.6.4. EARTHQUAKE RISK ......................................................................................................................... 134
6.6.5. CONCLUSIONS .............................................................................................................................. 136
6.7. HYDROLOGY ................................................................................................................................. 137
6.7.1. HYDROGRAPHY ............................................................................................................................ 144
6.7.2. PRECIPITATION ............................................................................................................................... 146
6.7.3. HYDROMETRY ................................................................................................................................ 147
6.7.4. FLOW RATES ................................................................................................................................... 149
6.7.5. RESERVOIR ..................................................................................................................................... 157
6.7.6. WATER QUALITY ............................................................................................................................. 159
6.8. ENVIRONMENTAL ASPECTS .......................................................................................................... 165
6.8.1. Prior Considerations 165
6.8.2. Areas Classified under Nature Conservation Status ............................................................... 166
6.8.3. Flora and Vegetation .................................................................................................................. 168
6.8.4. Fauna ............................................................................................................................................. 175
6.9. LANDSCAPE ................................................................................................................................... 183

EIS / SR 15.08 This document may not be partially copied. 5/280
6.9.1. Adopted Methodology ............................................................................................................... 183
6.9.2. Brief Regional Characterization ................................................................................................ 184
6.10. SOUND/NOISE ENVIRONMENT .................................................................................................... 186
6.10.1. Legal Framework .......................................................................................................................... 186
6.10.2. Sound/Noise Environment Characterization in the Project's Area of Influence ................. 189
6.11. SOCIAL, ECONOMICAL AND CULTURAL FRAMEWORK ........................................................... 190
6.11.1. Administrative Division ................................................................................................................. 191
6.11.2. Population and Land Use ............................................................................................................ 192
6.11.3. Social Characterization ............................................................................................................... 194
6.11.4. Economic Activities ...................................................................................................................... 196
6.11.5. Road Infrastructures ..................................................................................................................... 196
6.11.6. Energy Supply Infrastructures ..................................................................................................... 196
6.11.7. Water Supply Infrastructures ....................................................................................................... 197
6.11.8. Basic Sanitation Infrastructures and Rain Water Draining System ....................................... 197
6.11.9. Historical, Archaeological and Cultural Heritage ................................................................... 197
6.11.10. Inquiry to the Population ............................................................................................................. 198
7. ENVIRONMENTAL IMPACT IDENTIFICATION AND EVALUATION ................................................... 201
7.1. GENERAL CONSIDERATIONS ....................................................................................................... 201
7.2. IMPACTS ON BIOPHYSICS............................................................................................................. 204
7.2.1. Geology ......................................................................................................................................... 204
7.2.2. Climate ........................................................................................................................................... 208
7.2.3. Air Quality ...................................................................................................................................... 210

EIS / SR 15.08 This document may not be partially copied. 6/280
7.2.4. Soils .................................................................................................................................................. 214
7.2.5. Land Use ........................................................................................................................................ 216
7.2.6. Hydrology ...................................................................................................................................... 217
7.2.7. Biological and Ecological Factors ............................................................................................. 227
7.2.8. Landscape .................................................................................................................................... 231
7.2.9. Sound/Noise Environment .......................................................................................................... 233
7.3. SOCIAL AND ECONOMIC FACTORS.......................................................................................... 237
7.3.1. Methodology ................................................................................................................................ 237
7.3.2. Construction Phase ...................................................................................................................... 237
7.3.3. Operation Phase .......................................................................................................................... 238
7.4. CULTURAL, ARCHAEOLOGICAL AND NON-MOVABLE HERITAGE ......................................... 239
7.4.1. Methodology ................................................................................................................................ 239
7.4.2. Construction Phase ...................................................................................................................... 239
7.4.3. Operation Phase .......................................................................................................................... 240
8. MITIGATION MEASURES................................................................................................................... 241
8.1. GENERAL CONSIDERATIONS ....................................................................................................... 241
8.1.1. General Mitigation Measures ..................................................................................................... 242
8.1.1.1. Pre-Construction Phase ............................................................................................................... 242
8.1.1.2. Construction Phase ...................................................................................................................... 243
8.1.1.3. Post-Construction Phase ............................................................................................................. 249
8.1.1.4. Operation Phase .......................................................................................................................... 249
8.1.2. Mitigation Measures per Environmental Item.......................................................................... 250

EIS / SR 15.08 This document may not be partially copied. 7/280
8.1.2.1. Climate ........................................................................................................................................... 250
8.1.2.2. Air Quality ...................................................................................................................................... 250
8.1.2.3. Geology ......................................................................................................................................... 251
8.1.2.4. Hydrology ...................................................................................................................................... 251
8.1.2.5. Biological and Ecological Factors ............................................................................................. 253
8.1.2.6. Landscape .................................................................................................................................... 254
8.1.2.7. Noise ............................................................................................................................................... 254
8.1.2.8. Social and Economic Factors .................................................................................................... 255
9. IMPACT SUMMARY – GLOBAL IMPACT EVALUATION ................................................................... 256
10. ENVIRONMENTAL MONITORING AND MANAGEMENT PLAN ....................................................... 267
10.1. On-Site Environmental Follow-up and Management Program ............................................ 267
10.2. Environmental Management Plans .......................................................................................... 268
10.2.1. Introduction ................................................................................................................................... 268
10.2.2. Water Quality Monitoring ............................................................................................................ 268
10.2.3. Air Quality Monitoring .................................................................................................................. 270
10.2.3. Waste Monitoring.......................................................................................................................... 273
10.3. Environmental Follow-up and Management Program for the Caculo Cabaça
Reservoir 274
11. TECHNICAL INSUFFICIENCIES OR INSUFFICIENT EXPERTISE ........................................................... 275
12. FINAL CONSIDERATIONS ..................................................................................................................276
REFERENCES ............................................................................................................................................. 278

EIS / SR 15.08 This document may not be partially copied. 8/280
LIST OF TABLES AND FIGURES
Figure 1 – Middle Kwanza Hydroelectric Power Plant Stages ................................................................. 21
Figure 2 – Geographical Setting of the Caculo Cabaça HP .................................................................. 24
Figure 3 – Location Map of the Caculo Cabaça HP ............................................................................... 25
Figure 4 – Administrative Division of the South Kwanza Province ........................................................... 26
Figure 5 – Location of the Líbolo Municipality, South Kwanza Province ............................................... 27
Figure 6 – Area of Intervention within a 10 Km Radius .............................................................................. 30
Figure 7 – Characterization of the Multiple Areas Integrating the Project Implementation Area ... 31
Figure 8 – Road Hierarchy.............................................................................................................................. 32
Figure 9 – Hydraulic Excavator Figure 10 – Crawler Tractor ......................... 46
Figure 11 – Loader Figure 12 – Munck Crane ................... 47
Figure 13 – Truck Figure 14 – Excavator Pick ... 47
Figure 15 – Motor Grader Figure 16 – Tractor Shovel ............................ 48
Figure 17 – Road Roller Figure 18 – Heavy Transportation ......... 49
Figure 19 – Munck Truck ................................................................................................................................. 49
Figure 20 – Section of the Kwanza River Featuring Typical Vegetation ................................................ 53
Figure 21 – Reservoir of the Water Channeled in the River through Suction ........................................ 54
Figure 22 – Drilling Crane ............................................................................................................................... 55
Figure 23 – Workers Construction Site .......................................................................................................... 55
Figure 24 – General EIS Methodology ......................................................................................................... 70
Figure 25 – Area of Direct Influence ............................................................................................................ 81
Figure 26 – Summary Table of the Studied Alternatives (Intertechne – 0704-MK-RT-100-00-010-RB- 1.
2012) .................................................................................................................................................................. 83
Figure 27 – General Map – Dam Axis Alternatives (COBA, 2013) ........................................................... 86

EIS / SR 15.08 This document may not be partially copied. 9/280
Picture 28 – Upstream Alternative. Power Plant and Hydraulic Circuit (COBA, 2013) ........................ 89
Figure 29 – Downstream Alternative. Power Plant and Hydraulic Circuit (COBA, 2013) .................... 90
Figure 30 – Downstream Alternative. Power Plant and Hydraulic Circuit (COBA, 2013) .................... 91
Figure 31 – Downstream Alternative. Water Intake (COBA, 2013) ......................................................... 95
Figure 32 – Rainfall Distribution (Source: FAO, 2005) ............................................................................... 101
Figure 33 – Average Monthly Precipitation Chart for 1955–1990 .......................................................... 102
Figure 34 – Potential Evaporation Chart ................................................................................................... 103
Figure 35 – Average Monthly Maximum, Median and Minimum Temperature Chart for 1955–1990
.......................................................................................................................................................................... 104
Figure 36 – Air Humidity (%).......................................................................................................................... 105
Figure 37 – Insolation (hours/month) .......................................................................................................... 105
Figure 38 – Atmospheric Pressure (mbar) ................................................................................................. 106
Figure 39 – Frequency of Wind Direction (%) ........................................................................................... 107
Figure 40 – Climate Characterization (Source: infoangola) ................................................................. 109
Figure 41 – Ombrothermic Diagram .......................................................................................................... 110
Figure 42 – Estimated Carbon Emissions Worldwide (Source: Sadeck – Geotecnologias) 115 Figure
43 – Inselberg Oriented According to the Course of the Kwanza River, Right Bank ........................ 120
Figure 44 – Regional Geological Map of the Caculo Cabaça HP Implementation Area. 125
Figure 45 – Granite Intrusions from the Lower Proterozoic on the Right Bank of the Caculo Cabaça
HP Implementation Site ................................................................................................................................ 126
Figure 46 – Granite-Gneisses from the Upper Archean / Lower Proteozoic on the Left Bank of the
Dam Implementation Site ........................................................................................................................... 126
Figure 47 – Detail of a Granite-Gneiss from the Upper Archean / Lower Proteozoic on the Right
Bank of the Dam Implementation Site ...................................................................................................... 127
EIS / SR 15.08 This document may not be partially copied. 10/280
Figure 48 – Gneisses Settled with Amphibolites from the Upper Archean / Lower Proterozoic on the
Caculo Cabaça HP Tailrace Area ............................................................................................................ 128
Figure 49 – Africa's Seismic Risk Map. Source: USGS ............................................................................... 129
Figure 50 – Seismic Profile, Resistivity Profile and Survey Location Map .............................................. 130
Figure 51 – View of the Geological Fractures in the Region of the Caculo Cabaça HP Structures
.......................................................................................................................................................................... 134
Figure 52 – Tectonic Structure Diagram of the Capanda Plant Region ............................................. 136
Figure 53 – Global Water Cycle / Water Use Cycle ................................................................................ 138
Figure 54 – Outlook of the Flood Plains and Lower Kwanza Lake System near Bom Jesus ............. 140
Figure 55 – Outlook of the Kwanza River Valley near the Kwanza Location in Bié 170 Km from the
Spring ............................................................................................................................................................... 141
Figure 56 – Kwanza Falls in Camaça – Cangandala Municipality....................................................... 142
Figure 57 – Implementation Area of the Caculo Cabaça Dam .......................................................... 142
Figure 58 – View of the Valley from the Caculo Cabaça Tailrace Area ............................................ 143
Figure 59 – Rapids 800 m Upstream from Caculo Cabaça................................................................... 143
Figure 60 – Kwanza River Basin ................................................................................................................... 144
Figure 61 – Caculo Cabaça River Basin ................................................................................................... 145
Figure 62 – Drainage Basin between Caculo Cabaça and Laúca .................................................... 145
Figure 63 – Average Monthly Precipitation in the Caculo Cabaça River Basin (mm) ..................... 146
Figure 64 – Average Monthly Precipitation in the Caculo Cabaça River Basin (mm) ..................... 149
Figure 65 – Flow Rate Distribution ............................................................................................................... 150
Figure 66 – Monthly Discharge .................................................................................................................... 151
Figure 67 – Flow Rate Duration Curve ....................................................................................................... 151
Figure 68 – Section of the Riverbed between Dam and Tailrace ........................................................ 153

EIS / SR 15.08 This document may not be partially copied. 11/280
Figure 69 – Outlook of the Rapids between Dam and Tailrace ........................................................... 154
Figure 70 – Lagoon in the River Section between Dam and Tailrace ................................................. 154
Figure 71 – Caculo Cabaça Reservoir ...................................................................................................... 157
Figure 72 – Accumulated Flow Rates Curve ............................................................................................ 158
Figure 73 – Natural Parks and Reservations in Angola (Source: Dean, 2000) ..................................... 167
Figure 74 – Forest Density Found in the Project Implementation Area ................................................ 170
Figure 75 – Represents (English Baobab and Kimbundu Mbundu) Adansonia digitata Vulnerable
(VU) Conservation Status ............................................................................................................................. 171
Figure 76 – Albizia glaberrima. Low Risk (LR) Conservation Status ...................................................... 171
Figure 77 – Represents Sterculia setigera Undetermined (U) Conservation Status ........................... 172
Figure 78 – Represents (Kimbundu Nuance) Albizia gummifera. Low-Risk (LR) Conservation Status
................................................................................................................................................................... 172
Figure 79 – Represents (Kimbundu Mulembeira) Ceiba pentadra. Undetermined Conservation
Status ......................................................................................................................................................... 173
Figure 80 – Represents Celtis prantlii. Undetermined (U) Conservation Status .................................. 173
Figure 81 – Represents Flame Tree (Delonix regia) ............................................................................... 174
Figure 82 – Dende Oil Palm (Elaeis guineensis)..................................................................................... 174
Figure 83 – Mango Tree (Mangifera indica) ......................................................................................... 175
Figure 84 – Dense Moist Forest in the Area of Study................................................................................ 176
Figure 85 – Bird Specimens Present in the Caculo Cabaça Hydroelectric Power Plant Construction
Area ................................................................................................................................................................. 177
Figure 86 – “Paca” (Rodent) Terrestrial Mammal, Subject to Poaching ............................................. 177
Figure 87 – Specimens of River Kwanza Cyprinidae and Cichlidae. (C) ........................................... 179
Figure 88 – Specimens of Oreochromis moçambicus (Cichlidae) Present in the Kwanza River (D)180
Figure 89 – Specimen of Oreochromis sp. (Cichlidae) Present in the Kwanza River (E) ................... 180

EIS / SR 15.08 This document may not be partially copied. 12/280
Figure 90 – Specimens of Clarias gariepinus Fish (Hecht and Moor 2004) Present in the Kwanza
River. Source: Hecht, T. and Moor I. 2004. Small-scale aquaculture in sub-Saharan Africa. Rhodes
University. [December 27, 2005]. <http:/cdserver2.ru.ac.za/cd/011120 1/Aqua/SSA/trendal.htm.>
.......................................................................................................................................................................... 181
Figure 91 – Hippopotamus Territory: “Hippopotamus Lagoon” ............................................................ 182
Figure 92 – Caculo Cabaça Falls ............................................................................................................... 185
Figure 93 – Mountain Ranges from National Road 322 .......................................................................... 185
Figure 94 – Kwanza River .............................................................................................................................. 193
Figure 95 – Kissuba Village ........................................................................................................................... 195
Figure 96 – Filomeno da Camara Bridge .................................................................................................. 197
Figure 97 – Dumbo Ya Pepe Village .......................................................................................................... 199
Figure 98 – School / Chapel in the São Pedro da Quilemba Commune ........................................... 200
Table 1 – Proponent Identification ............................................................................................................... 16
Table 2 – Consulting Company Identification – PROGEST ........................................................................ 17
Table 3 – Consulting Company Identification – FLUIDEX .......................................................................... 18
Table 4 – Technical Team............................................................................................................................... 19
Table 5 – Technical Team (cont.) ................................................................................................................. 20
Table 6 – Expected Labor (Supplied by CCGC) ........................................................................................ 51
Table 7 – Expected Labor (Supplied by CCGC) (cont.) ........................................................................... 52
Table 8 – Environmental Items ....................................................................................................................... 73
Table 9 – Environmental Items (cont.) .......................................................................................................... 74
Table 10 – Characteristics of the Main Hydraulic Circuit in the Upstream and Downstream
Alternatives (EVTE, Intertechne, 2012) .......................................................................................................... 92
Table 11 – Characteristics of the Main Hydraulic Circuit in the Upstream and Downstream
Alternatives (EVTE, Intertechne, 2012) (cont.) ............................................................................................ 93

EIS / SR 15.08 This document may not be partially copied. 13/280
Table 12 – Characteristics of the Main Hydraulic Circuit in the Upstream and Downstream
Alternatives (EVTE, Intertechne, 2012) (cont.) ............................................................................................ 94
Table 13 – Average Monthly Precipitation (1955–1990)(mm) ................................................................ 102
Table 14 – Monthly Maximum and Minimum Temperatures (1955–1990)(mm) .................................. 104
Table 15 – Average and Maximum Velocities (m/s) for Monthly Predominant Directions 106 Table
16 – Frequency of Predominant Wind Directions and Velocities .......................................................... 107
Table 17– WHO Recommended Limits (Source: WHO, 2006) ................................................................ 112
Table 18 – Average Monthly Precipitation in the Caculo Cabaça River Basin (mm) ....................... 146
Table 19 – Average Monthly Flow Rate Series (1944/45 to 2012/13) ..................................................... 147
Table 20 – Average Monthly Flow Rate Series (1944/45 to 2012/13) (cont.) ........................................ 148
Table 21 – Average Monthly Flow Rates .................................................................................................... 149
Table 22 – Discharge ..................................................................................................................................... 150
Table 23 – Flood Flow Rates ......................................................................................................................... 152
Table 24 – Physical and Chemical Water Analysis ................................................................................... 164
Table 25 – Physical and Chemical Water Analysis ................................................................................... 165
Table 26 – Location of Districts in the Perimeter of the Project's Area of Influence
.......................................................................................................................................................................... 193
Table 27 – Location of Districts in the Perimeter of the Project's Area of Influence
.......................................................................................................................................................................... 194
Table 28 – Characterization of Social Assets in the Villages (S. Pedro da Quilemba), North Kwanza
.......................................................................................................................................................................... 194
Table 29 – Characterization of Social Assets in the Villages (Banza Cambuta Commune), South
Kwanza ........................................................................................................................................................... 195
Table 30 – Participants in the Inquiry to the Population .......................................................................... 198
Table 31 – Participants in the Inquiry to the Population (cont.) ............................................................. 199

EIS / SR 15.08 This document may not be partially copied. 14/280
Table 32 – Adopted Impact Classification ................................................................................................ 202
Table 33 – Identification of the Major Impacts on Soil (Construction Phase) ...................................... 215
Table 34 – Identification of the Major Impacts on Soil (Operation Phase) .......................................... 216
Table 35 – Distances for 65 dB (A), 55 dB(A), and 45 dB(A) LAeq during Construction Stage ......... 235
Table 36 – Global Impact Evaluation ......................................................................................................... 257
Table 37 – Global Impact Evaluation ......................................................................................................... 258
Table 38 – Global Impact Evaluation ......................................................................................................... 259
Table 39 – Global Impact Evaluation ......................................................................................................... 260
Table 40 – Global Impact Evaluation ......................................................................................................... 261
Table 41 – Global Impact Evaluation ......................................................................................................... 262
Table 42 – Global Impact Evaluation ......................................................................................................... 263
Table 43 – Global Impact Evaluation ......................................................................................................... 264
Table 44 – Global Impact Evaluation ......................................................................................................... 265
Table 45 – Global Impact Evaluation ......................................................................................................... 266
1.2 APPENDICES – DRAWN PARTS
01 – Scaling of the Middle Kwanza 02 –
General Disposition of the Caculo
Cabaça HP
03 – Location of the Environmental Hydraulic
Circuit 04 – Constructive Aspects of the Dam
05 – Constructive Aspects of the Main Hydraulic Circuit 06 –
Constructive Aspects of Power House 1
07 – Simplified Disposition of Caculo Cabaça 400
kV 08 – Schedule
09 – Soil Map of the Caculo Cabaça Dam Area
10 – Geological Map of the Caculo Cabaça Dam Area

EIS / SR 15.08 This document may not be partially copied. 15/280
11 – Hypsometric Map of the Caculo Cabaça Dam Area

EIS / SR 15.08 This document may not be partially copied. 16/280
1. INTRODUCTION
1.1. GENERAL CONSIDERATIONS
This document is the Summary Report of the Environmental Impact Study (EIS) for the “Caculo
Cabaça Hydroelectric Power Plant” project, which GAMEK – Middle Kwanza Development
Department, as a delegate of MINEA – the Ministry of Energy and Water, intends to implement in
the North Kwanza Province.
It features the key information, conclusions and recommendations taken into consideration
throughout the environmental studies and works conducted.
Given the project's characteristics, there is a clear interest in identifying, from a wide range of
potential impacts, those that may stand out as the most relevant and that will actually
contribute to the evaluation of the project, serving as basis for the subsequent Environmental
Impact Evaluation (EIE) process.
The hydric interventions to be undertaken cannot be limited to perceiving water surfaces,
reservoirs or aquifers as mere sources of water collection or wastewater disposal. The multiple
environmental and heritage values of the water resources must be considered, and their role in
preserving ecosystems highlighted.
Therefore, and considering the environmental characteristics of the undertaking's
implementation area, the recommended environmental evaluation methodology, in its broader
context, was guided by the identified complexity which intended, on one hand, to obtain the
best characterization of the area under study and on the other, to ensure the materialization of
the project – whose value to Angola is indisputable – in a territory with very specific features,
allowing potential impacts to be minimized by adhering to appropriate and effective measures.
It is also important to emphasize that the environmental evaluation herein is not considered final;
instead, this should be understood as a crucial step in the project's environmental execution as it
supports the EIE process – an element of Angola's environmental and regional planning strategy
on its own terms.

EIS / SR 15.08 This document may not be partially copied. 17/280
1.2. PROJECT IDENTIFICATION
The Environmental Impact Study herein concerns the “Caculo Cabaça Hydroelectric Power
Plant” Project.
The Caculo Cabaça Hydroelectric Power Plant is located in the middle course of the Kwanza
River, upstream from the Caculo Cabaça falls, on the border between the North Kwanza and
South Kwanza Provinces, about 270 Km from the city of Luanda.
1.2.1. Proponent Identification
The proponent, as a legal body filing a request for Project authorization or licensing, who submits
the Environmental Impact Study for the Environmental Impact Evaluation (EIE) process is GAMEK
– Middle Kwanza Development Department as a delegate of MINEA – the Ministry of Energy and
Water.
Table 1 – Proponent Identification
Proponent
Address: Rua Massangano, s/n, Luanda
Fax: (+244) 222 447 973
Corporate Name: GAMEK – Middle Kwanza Development Department
Telephone: (+244) 222 445 072 / 222 675 801
Website: www.gamek.co.ao

EIS / SR 15.08 This document may not be partially copied. 18/280
1.2.2. Consulting Company Identification
To prepare this EIS, a strategic partnership between PROGEST, Lda
and FLUIDEX, Lda was created where PROGEST is the company leading the process.
Table 2 – Consulting Company Identification – PROGEST
Consulting Company – PROGEST, Lda
Address: Rua Rainha Ginga n.º 147-2.º Andar, Luanda
Fax: (+244) 222 392 245
Corporate Registration No. 6139/1989
Intermediary: Virgínia Oliveira
(+244 925 038 097)
Corporate Name: PROGEST – Projectos Técnicos Consultoria e Gestão, Lda
Telephone: (+244) 222 392 246 / 222397 337
Website: www.progestangola.com

EIS / SR 15.08 This document may not be partially copied. 19/280
Table 3 – Consulting Company Identification – FLUIDEX
Consulting Company – Fluidex, Lda
Address: Avenida Pedro de Castro Van-Dúnem Loy (UGP) SB
Q3 – casa156 Luanda – Angola
Email: [email protected]
Corporate Registration No. 3076-09/091223
Legal Representative: Selene Pires
1.1.1. Technical Team
To perform the EIA in question, a multi-disciplinary team was assembled, comprised of
specialized technicians in the various relevant themes. They have vast experience in the
performance of these types of studies and are used to working as a team with a common goal.
Corporate Name: FLUIDEX, Lda
Telephone: (+244) 927 809 502 / 915 505 872
Tax Registration No.: 5417064351
Regis
No. of 057 Pp. 01 Book No. A-1
Environmental Consultant at
MINAMB
Contact Person: Juliana Manuel

EIS / SR 15.08 This document may not be partially copied. 20/280
Framework 4 – Technical Team
Technician Training Role
Virgínia Santana Oliveira
Manuel Resende de
Oliveira Roberto Pisoeiro
José Paulo
Nobrega
Mario Viegas
Carlos Viegas
Adilson Duarte
Tatiana Adauta
António Barros
Mostafha Diedhiou
Juliana Manuel
Nguinamau Domingos
Environmental
Engineer
EIA General Coordinator
Civil Engineer Engineering Expert
Civil Engineer Engineering Expert
Civil Engineer Engineering Expert
Geologist Geology
Civil Engineer Geology and Hydrology
Natural Resources
and
Environmental
Engineering
Environmental Diagnostics
Architecture and
Urbanism
Description of the
Project and its
Alternatives
Electrical Engineer
Description of the
Project and its
Alternatives
Aquaculture
engineering/Mas
ter in Biology -
Oceanography
Environmental Diagnostic of
the Area covered by the
Project (aquatic and terrestrial
flora and fauna), Impact
Analysis, Mitigation Measures,
Impact Survey and Monitoring
Program
Natural Resources and
Environmental
Engineering
Area Covered by the Project
Electrical Engineer
Project Description and
Description of the
Alternatives
Considered

EIA / RS 15.08 This document may only be reproduced in full. 20/280
Framework 5 – Technical Team (cont.)
Technician Training Role
Evaristo Baptista
Agricultural
Engineer
Environmental Diagnostic of
the Area covered by the
Project (flora and
environmental protection
areas), Impact Analysis,
Mitigation Measures, Impact
Survey and Monitoring
Program
Lucas Evangelista
Sociologist
Environmental Diagnostic of
the Area covered by the
Project (social and economic
environment), Impact Analysis,
Mitigation Measures, Impact
Survey and Monitoring
Program
Brancas Rodrigues
Biologist
Environmental Diagnostic of
the Area covered by the
Project (flora and bio-
indicators), Impact Analysis,
Mitigation Measures, Impact
Survey and Monitoring
Program
Bruno Constantino
Degree in Environmental
Studies and
Portuguese Literature
Environmental
Characterization.
1.2. PREPARATION TIME FOR EIA
This EIA took place from October to December 2015.

EIA / RS 15.08 This document may only be reproduced in full. 21/280
2. PROJECT DESCRIPTION
2.1. PROJECT GOALS AND SCOPE
The middle section of the Kwanza river features excellent conditions for the implementation of
hydroelectric schemes, furthermore its proximity to Luanda is of great strategic importance.
The hydroelectric scheme of the middle section of the Kwanza river is structured in tiers, as can
be seen in the following picture:
Picture 1 – Tiers of the Hydroelectric Scheme of the Middle Section of the Kwanza River
The Hydroelectric Scheme of Cambambe, with power rated at 180 MW and located
downstream of the project being considered, has operated since 1963. On the other hand, the
Hydroelectric Scheme of Capanda, with power rated at 520 MW, was finished in 2006/07.
Combined they total 700 MW of power, being widely considered the backbone of Angola's
electric power generation.
However, the applied power was not considered sufficient, which has led to the creation of the
Hydroelectric Scheme of Laúca, currently under construction upstream and to the Hydroelectric
Scheme being analyzed, in Caculo Cabaça.

EIA / RS 15.08 This document may only be reproduced in full. 22/280
It is expected for the Hydroelectric Scheme of Caculo Cabaça to have a power of 2172 MW,
clearly surpassing the total power in the existing Hydroelectric Schemes.
Taking all these elements into consideration, the generation of "clean" energy by building the
Caculo Cabaça Hydroelectric Scheme is regarded as an important strategic project for the
country's development, meeting current and future needs for power distribution.
Context in the Government's Program and Existing Energy Strategies1
To answer in the best possible way to the challenges faced by the Energy sector, the
Government has an important strategic planning and political tool - the Energy Security Plan,
comprised of four strategic guiding principles:
• Use energy as a springboard for economic development, guaranteeing quality and
controlling costs, in order to foster competition in corporate contexts;
• Promote a universal energy supply, developing the necessary infrastructures and offering
energy at accessible prices to the general population;
• Foster efficiency in the operation of the energy sector, applying regulations which promote
service quality and guarantee financial stability to those involved in the system;
• Promote a balanced development of Angola's society and economy, developing options
aiming to reduce social and geographical inequalities, creating a diverse energy mix privileging
endogenous energies, energy security and environmental sustainability.
In line with the strategic and political guidelines, specific goals were established for the five year
plan ranging from 2013-2017. The goals were presented in the Government's Program for the
electric subsector, indicated briefly below:
• Operationalization until the end of 2014 of a generation capacity up to
1.500 MW, part of a total of 5.000 MW to be installed until 2016;
• Establishment of public supply systems in 82 municipal headquarters (in a total of 166) and 271
commune headquarters (in a total of 531) until the end of 2014;
1 Source: Revista do Ministério da Energia e Águas, title: Plano de Acção do Sector da Energia e Águas 2013-2017.

EIA / RS 15.08 This document may only be reproduced in full. 23/280
• Rehabilitating and modernizing all supply networks of cities which are the capitals of their
provinces;
• Connection between North and Center systems and operationalization of the East System
(Lundas).
Following the Electric Sector's Development Strategy, as well as the general, specific goals
established in the five year Governance Program, a group of structuring projects were identified.
Those projects should contribute to the introduction in electric systems of significant power
generation capabilities and transmissions/distribution structures, able to cope with emerging
challenges and energy demand on a medium term.
In the production segment of these structuring projects we can find projects for large electric
energy plants, among which hydroelectric schemes stand out.
2.2. PROJECT LOCAT ION
2.2.1.Geographic Location
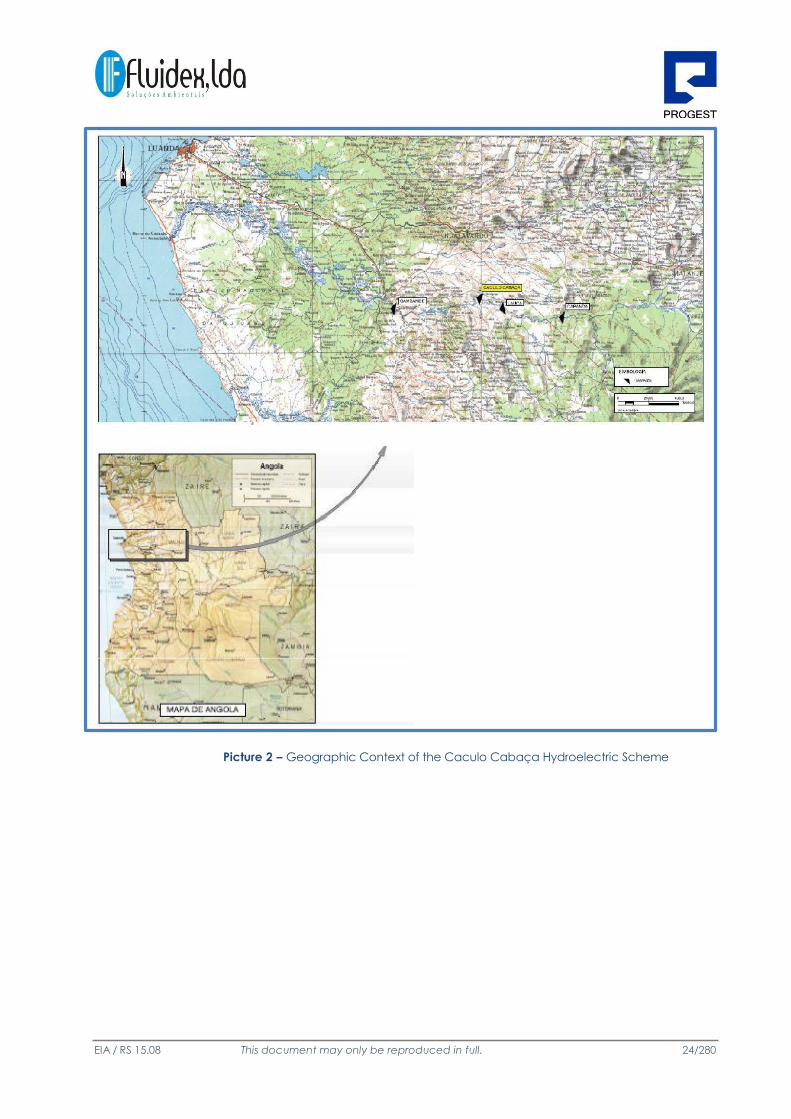
The Hydroelectric Scheme of Caculo Cabaça will be created, respectively, 66 Km and 19 Km
downstream of the Hydroelectric Schemes of Capanda and Laúca (see picture 1 - Tiers of the
Hydroelectric Scheme of the Middle Section of the Kwanza River), in the river's Km 289.
EIA / RS 15.08 This document may only be reproduced in full. 24/280
Picture 2 – Geographic Context of the Caculo Cabaça Hydroelectric Scheme

EIA / RS 15.08 This document may only be reproduced in full. 25/280
Picture 3 – Location Plan of the Caculo Cabaça Hydroelectric Scheme

EIA / RS 15.08 This document may only be reproduced in full. 26/280
2.2.2.Administrative Location
Caculo Cabaça's Hydroelectric Scheme is located in the border between the Kwanza Norte
and Kwanza Sul provinces, since they are divided in administrative terms by the river. However,
following instructions by GAMEK, we will consider the administrative location to belong to the
Kwanza Sul province, municipality of Libolo, commune of Cabuta.
The province of Kwanza Sul is located in Angola's Center-West shore, covering an area of 55.660
km2. It's delimited on the North and Northeast by the rivers Longa and Kwanza, the provinces of
Bengo, Kwanza Norte and Malanje, Benguela is to the South, Bié and Huambo to the Southeast
and the Atlantic Ocean is to the West.
Picture 4 – Administrative Division of the Kwanza Sul Province

EIA / RS 15.08 This document may only be reproduced in full. 27/280

EIA / RS 15.08 Este documento só pode ser reproduzido na íntegra. 28/280
The Province of Kwanza Sul is constituted by 12 municipalities: Amboim, Cassongue, Cela,
Conda, Ebo, Líbolo, Mussende, Porto Anboim, Quilenda, Quibala, Seles and Sumbe.
The municipality of Líbolo, where the Hydroelectric Scheme of Caculo Cabaça will be located,
is represented in blue in the following picture:
Picture 5 – Location of the municipality of Líbolo in the Kwanza Sul province
The commune headquarters of the municipality of Líbolo is Calulo. It represents an area of 9.000
Km2. It shares a border in the North with the municipalities of Cambambe and Cacuso, in the
East with the municipality of Mussende, in the South with the municipality of Quibala and in the
West with the municipality of Quiçama. It's comprised of the communes of Caluo, Cabuta
(where the project is planned), Munenga and Quissongo.

EIA / RS 15.08 Este documento só pode ser reproduzido na íntegra. 29/280
2.3. PROJECT SPECIFICATIONS
2.3.1. Project
Caculo Cabaça will be the third hydroelectric plant in a cascading structure of eight to be built
along the catchment of the middle section of the Kwanza river, with an estimated energy
potential of about seven thousand megawatts (7000 MW) (see drawing 01 attached).
Once built, it will be Angola's largest plant, with an operating capacity of 2120 MW supplied by
the main plant and 52 MW supplied by the ecological plant, in a total of 2172 MW.
Essentially, the scheme will be constituted by a concrete dam 103 meters high at most and a
crest development of 553 m, allowing the provision of a total volume of about 440 million m3 of
water.
Among its hydraulic devices will be a forward facing flood spillway with five spans controlled by
gates. Their dimensions are prepared for a flow of 10.020 m3/s in terms of water level at full
storage level (630,0) and 12.140 m3/s at maximum extraordinary level in elevation (632,0), as well
as a bottom discharge comprised of two gates with a diameter of 6 m.
The dimensions of the spillway intend to allow, with all spans in operating conditions, the passage
of floods greater than the return period of 10,000 years, corresponding to maximum effluent flow
of the discharge mechanism of the Capanda hydroelectric scheme. In case one of the spans is
not operational, the overspeed of the water's level above the full storage level will be of 2,0 m
for the discharge of a design flow of 10.020 m3/s.
Besides the dam's main structure there are two small gates, both on the left bank, which are
closed by concrete dykes with 525 m and 192 m of length and 36 m and 4 m of maximum
height, respectively.
This scheme will use the available head of 215 m between the reservoir and the tailwater
downstream of the natural head of Caculo Cabaça. It will integrate a plant and an hydraulic
circuit with an estimated flow of 1100 m3/s divided by four turbine-generator units with a rated
power of 530 MW.
The hydraulic circuit for the supply of the turbines is constituted by a water intake in the reservoir,
about 2,4 km upstream from the left abutment of the dam, a

EIA / RS 15.08 Este documento só pode ser reproduzido na íntegra. 30/280
headrace circuit with four tunnels with an inner diameter of 9 meters and a span of 300 m,
coated in reinforced concrete, underground powerhouse with a length of 26,5 m, 221 m of
span, 68 m of maximum height and two tailwater tunnels similarly coated in reinforced concrete,
with a length of 16 m and a span of about 5150 m.
The scheme will also integrate a second hydroelectric plant at the foot of the dam, intended to
produce the ecological flow of 60 m3/s.
Two substations will be built, a main one with 400 kV and an auxiliary one with 220 kV.
The energy produced on a yearly basis will be 8123 GWh in the main plant and 443 GWh in the
ecological flow plant.
2.3.1.1. Constructive Information
The analysis being considered has the goal of gathering information about significant elements
in the territory, in an adequate resolution, and allow an analysis of the characterization of the
various areas included in the project, as long as they are related to the applicable area of the
Caculo Cabaça Hydroelectric Plant. Type of occupation of spaces and their access, taking into
consideration the analysis performed of the area being considered in the study.
The pictures below show the implementation plants for the general project, using a 1: 1000.000
scale:

EIA / RS 15.08 This document may only be reproduced in full. 30/280
Picture 6 – Area covered by the intervention, within a radius of 10 Km
The location of the territory where the project will be applied covers three provinces: Cuanza
Norte, Cuanza Sul and Malanje.
The pictures below show the characterization of the various areas of the zone where the project
shall be implemented, as well as route hierarchy

EIA / RS 15.08 This document may only be reproduced in full. 31/280
Picture 7 – Characterization of the various areas integrating the Project's Area of Application

EIA / RS 15.08 This document may only be reproduced in full. 32/280
Picture 8 – Route hierarchy

EIA / RS 15.08 This document may only be reproduced in full. 33/280
2.3.1.2. Operational conditions
The main structures of the hydroelectric plant will include outdoors and underground
construction works which should be applied in sections, using a morphology favoring softer
slopes, where the flow possesses a natural distributed head of around 120 m and a span of 20
km.
These main structures include: reservoir, bypass tunnels, dams and hydraulic circuits,
powerhouses, substations, accesses and a village for those responsible for the operation.
a) Reservoir
The reservoir of the Hydroelectric Scheme of Caculo Cabaça shall have a maximum span of
around 16,3 km and a maximum width of 2,6 km, corresponding to a flooded area of around
16,6 km2. The reservoir will flood 9,32 km2 of a savannah with bushes and trees, 1,69 km2 of
vegetation on the banks or muxito woods, 3,33 km2 of rocky slopes and 2,52 km2 corresponding
to the river's bed.
The magnitude of the flooding, taking into account the operating power of 2.120 MW, will make
this scheme the one with the least flooding per operating power.
According to the filling studies performed, it's estimated that the reservoir's water level reaches
the value (630) in about four days, in a total volume stored of 436 hm3, of which 92,6 hm3
correspond to the net volume.
Silting studies estimate that the reservoir will last for 280 years.
b) Bypass Tunnels
To build the dam of the Caculo Cabaça plant, the Kwanza river will be deviated to the right
bank using a three section tunnel system with a rectangle inclination 14 m wide and 14 meters
high. The bypass system was designed for a flow of 3435 m³/s, corresponding to a return period
of 25 years.
Before the inlet of the bypass tunnels there will be an intake canal approximately 263 m long
and 94 m wide. At the inlet of the canal there will be an elevation level (537,0), followed by a
ramp up to the elevation (534,0). The final section of the inlet canal near the entrance will show
the bottom in the elevation (534,0).

EIA / RS 15.08 This document may only be reproduced in full. 34/280
To enable the closing of bypass tunnels after building the dam, an entrance structure was
designed, where gates will be triggered using a platform in the elevation (558,0).
The bypass tunnels will have an average length of 495 m, with inlets and outlets positioned at
elevations, featuring 534,m and 529,0 m, respectively.
The bypass tunnels will lead to an outlet canal with an approximate width of 88,00 m. Therefore,
downstream of the tunnels the outlet canal will present the bottom of the elevation (529,0),
followed by a ramp up to the elevation (533,5)m and an elevation level (533,5).
The Drawing Nr. 03 attached shows the location of the river's bypass tunnels.
To excavate the foundations and build the main dam at the river bed, stop logs will be built
upstream and downstream of the dam's location in order to delimit the river bed area where the
dam construction works will take place, featuring crests in elevations of 554,00 and 543,00,
respectively.
c) Dam
The main dam will be constructed after building the bypass tunnels and the stop logs. The
gravity dam will use roller compacted concrete (RCC) under the following construction:
foundation, bus bars (upstream and downstream), crest, abutments (left and right bank), flood
spillways and bottom discharge.
The foundation will be the lower surface of the dam, making contact with the bottom of the river
and placed on inclination (530,0). That inclination will be detailed in full based upon surveys and
observations performed after the river's bypass.
The bus bars upstream and downstream will be the relatively vertical surfaces limiting the dam's
body. The upstream bus bar will be against the river's current.
The upstream bus bar will be vertical, and the one downstream will have an approximate slope
of 0.85: 1 (H:V) relatively to horizontality. Both were designed according to

EIA / RS 15.08 This document may only be reproduced in full. 35/280
specifications of recent construction works in places with similar rock formations.
The Crest will be the surface delimiting the upper body of the dam, also known as the dam's
peak.
The abutments will be the dam's side surfaces in contact with the riverbanks.
Drawing nr. 04 (attached) presents the dam's construction elements.
Flood spillways will be the hydraulic devices discharging excess water from the reservoir during
floods, in case the reservoir reaches its maximum level. The spillways will be of the frontal type
with adherent blades.
The spillways' sill will have a crest at level (612,5) and will be constituted by 5 spans with 12,8 m
each, in a total effective span of 64 m.
The spans will be separated by pillars with an elliptic head 4,2 m thick. The sill will be straight and
tall, with an upstream bus bar in a slope of 2:3 (H:V).
The longitudinal profile will have a tangent in its downstream edge to the dam's face, in a slope
of 0,85: 1 (H:V).
The project foresees the application of walkways below the spillway pillars, to continue the
designed route across the dam's crest.
The spillway spans are equipped with segment type gates, whose spans are 12,8 m long and
19,2 m high, with a sill being placed on an elevation (611,8).
The gates will be triggered by two single effect articulated hydraulic-oil servomotors. The
operation stations for the respective servomotors will be installed in chambers on top of the
pillars, separating the spans from the spillway.
Upstream from the service gates, grooves are foreseen for the installation of a stop log gate, in
case of inspection or repair of the radial gate.

EIA / RS 15.08 This document may only be reproduced in full. 36/280
The stop log gate is comprised by elements to be stored on top of the spillway spans. They will
be moved using an automatically engaging lifting beam, operated by a gantry crane.
Drawing nr. 04 (attached) presents the positioning of the flood spillways.
Bottom discharge
The bottom discharge circuit will be constituted by a tunnel excavated in rock located on the
right bank, near the circuit of the provisional bypass. The bottom discharge's proximity canal will
be excavated in rock and have a sill on the inclination (549,0) of about 190 m long and a
variable width between 30 m and 15 m. It's connected to the proximity canal of the provisional
bypass, whose sill is on a lower elevation (537 m).
The tunnel will be coated in reinforced concrete, with an inner diameter of 8 m and an
approximate length of 532 m. In the final segment before the service gate, the tunnel shall be
shielded across 65 m to avoid risks of hydraulic fractures.
The connection to the tunnel will be performed by a reinforced concrete gallery with sections
sized 8,0 m x 6,5 m, where a floodgate will be installed, immediately followed by a trunk-conical
transition to the shielded circular gallery, having 50 m in length and a diameter of 6,0 m. At the
exit of the tunnel there will be a new transition into a rectangular section with dimensions 7,0 m x
4,8 m, at the end of which will be installed a segment type service gate, in a section with the
dimensions of 6,0 m x 4,8 m.
The bottom discharge circuit ends in a deflector whose sill is tilted at 15º regarding horizontality,
which makes it possible to direct the flow to the downstream river bed.
The circuit's inlet sill will be placed in elevation (551,0) while the outlet with the deflector's crest
will be at elevation (550,9).
The bottom discharge is a safety mechanism in the dam, responsible for reducing significantly
water levels on the reservoir. It has the following essential functions:
Appropriate control of the reservoir's filling;
Scheduled dewatering of the reservoir to allow maintenance or inspection operations;
EIA / RS 15.08 This document may only be reproduced in full. 37/280
Emergency dewatering of the reservoir in case its water level needs to be reduced on
short notice;
Passage of the flow downstream in case the Hydroelectric Plant cannot be operated.
The bottom discharge will also help the flood spillway in case floods need to be routed, such as
Full Maximum Flood.
The maximum bottom discharge capacity will be around 800 m3/s for a full storage level in the
reservoir (630,0). That capacity was set taking in consideration the volume of the reservoir and
the average effluent flow.
During the dry season (June to November) it will be possible to dewater almost all the Caculo
Cabaça Hydroelectric Scheme in just 10 days. It will take three days to lower the reservoir's level
to about 75% and about seven days to achieve 50% at dam height.
During wet seasons it will be possible to lower the reservoir's level to (614,50), corresponding to
approximately 50% of the reservoir's capacity. Inspection, maintenance and repair operations
are to take place during dry seasons.
Drawing 04 presents the location of the bottom discharge.
d) Main and Ecological Hydraulic Circuit
Main hydraulic circuit
The plant's hydraulic circuit will be located on the left bank of the Kwanza river, totally
independent and away from the dam's construction work. It will be set up in the following way:
Water intake with the respective inlet, gates tower and transition to the headrace
tunnel current stretch;
Headrace tunnels, one for each generator, coated in concrete and featuring a
circular section, part of it in a shaft and another part in a slope (6%), shielded in the
sections before the plant;
Surge tank applied in the initial section of the tailwater tunnels;

EIA / RS 15.08 This document may only be reproduced in full. 38/280
Tailwater tunnels, two non-coated sub-horizontal tunnels with a rectangle inclination,
transporting the flow until reaching the river Kwanza;
Tailwater canal with a non-grooved structure in its initial section to guide the stop log
gates, to dewater the tailwater tunnels.
Water intake means the hydraulic devices used to extract water from the reservoir into the
headrace tunnels. In this plant it will be located 2,4 km upstream of the dam's left abutment.
The water intake will be formed by four rectangular openings with the dimensions 13,8 x 12, 8 m2,
protected by movable grates on a sloped plane that double as grate cleaners and are
operated from a gantry installed at the water intake tower. The water intake track was placed
on elevation (608,1), with its upper edge at elevation (621,4), below the minimum extraordinary
level (NmE=624,0). This way, it can be ensured that the grating will always be fully submersed
regardless of the water level at the reservoir, thereby guaranteeing that suitable flow speeds are
produced.
The stop log gates, operated by the aforementioned traveling gantry, and service floodgates
triggered by oil-hydraulic servomotors have a 8,5 × 6,5 m2 section and will be watertight
downstream. The operation tower's placement is above the dam's crest elevation. In that
position will be placed the grille cleaning gantry, the servomotor for the service gates and their
respective operating stations.
A minimum submergence of 6,7 m was estimated for the stop log gate section. In these
conditions, taking into account the minimum operation level for the Caculo Cabaça reservoir,
an inclination below 624,0-6,7=617,3 m was established for the highest point of the gate section.
Headrace tunnels will be composed by four independent circuits, one for each generator
group. Each of them will have a shaft and a sloped section in a tunnel.

EIA / RS 15.08 This document may only be reproduced in full. 39/280
The total length will be approximately 305 m, being completely excavated in rock and coated
with reinforced concrete.
The initial section, which is 245 m long, will have an inner diameter of 7,50 m. The final section,
immediately upstream from the plant, will be shielded for 60,0 m, with a flow diameter of 4,90 m.
At the 185 m³/s nominal flow rate, the discharge speed varies between 4,2 m/s at the concrete
coated section and 9,8 m/s at the shielded section.
The headrace tunnel's circuit will have two curves in the vertical plane, separated by a vertical
185 m high shaft, followed by a 60 m long section on a longitudinal slope of 10%, ending on the
aforementioned shielded section upstream of the plant.
The shielded section starts in a trunk-conical transition 13,0 m long, which connects diameters
7,5 and 4,9 m, followed by an horizontal section which spans 47 m and 4,9 m in diameter, which
extends up to the entrance of the plant cave.
The headrace section will be completely coated in definitive concrete formwork with a
thickness of 0,50 m.
The shielded section also has a circular shape with an internal flow diameter of 4,9 m, which
corresponds to an excavated diameter of 8,5 m to allow the assembly of the shielded trunk-
conical transition.
The surge tank helps attenuate the inconvenient effects of water hammer in long tunnels. It
helps minimize pressure variations in the circuit following maneuvers which provoke changes in
the flow, helping regulate groups in turbine operation.
In this construction there will be two surge tanks, occupying a total area of 3500 m2, each of
them serving two groups and a tailwater tunnel. The surge tank dome will be connected to the
main access tunnel through a work tunnel used during the tank construction stage, located as
close to the plant as possible. The tank will be vented by this tunnel.
Excavations may be performed using explosives. The coating on the tank's body will be made of
reinforced concrete focused on containing the eventual fall of blocks,

EIA / RS 15.08 This document may only be reproduced in full. 40/280
which might become loose due to the pressure differentials to which they will be subjected by
the level fluctuations, which would compromise or prevent the proper operation of this hydraulic
element.
The tailwater tunnels are downstream from the surge tanks, and they will have a section with a
rectangle inclination 16 m high and 16 m wide, spanning about 5204 m until the tailwater canal
of the Kwanza river.
Two tunnels will be built, one for each group, with a discharge speed for a nominal flow of 2,4
m/s.
The two tunnels will not be coated, however the zones with inferior quality should have a
definitive coating in reinforced concrete about 0,50 m thick. The transitions between the
reinforced concrete coated sections and the adjacent sections should be made with special
care, particularly at the dome level, and they should be smoothed so as to avoid air trapping
during the hydraulic circuit operation .
The concrete jetting of the coating will be drained. For this, short drains will be placed
throughout its surface in a 3,0 m x 3,0 m square pattern.
The excavation of tailwater tunnels will be performed using explosives.
Tailwater canal. The tailwater of turbine flow will take place in the Kwanza river, upstream of the
natural falls of Caculo Cabaça, using the tailwater canal.
The tailwater canal will have a track at elevation (407) and an approximate length of 435 m and
a base width of 70 m. The canal's drainage speed for a rated flow is of 2,0 m/s.
The sill elevation by the discharge portal of the tunnel will be fixed at (398,0), with its upper edge
at elevation (414,0), one meter below water level in the Kwanza river (415,0 m). The goal of this
submersion is to avoid the transition of pressurized draining conditions to the free surface inside
the tailwater tunnel, which would be harmful for the hydraulic operation of the circuit.
Downstream of each tailwater tunnel is foreseen a structure with two spans, each of them 9 m
long, where stop log gates with a 18,0 x 9,0 m2 section will be placed, to allow the dewatering
of the tunnels. The operational walkway for the

EIA / RS 15.08 This document may only be reproduced in full. 41/280
stop log gate is located at elevation (420,0), where the monorail hoist for maneuvering the gate
will be installed.
Drawing 05 presents construction aspects for the main hydraulic circuit.
Ecological Hydraulic Circuit
To tend to flow requirements in ecological terms, applied to all operating conditions of the
venture, an hydraulic ecological circuit will be created and placed adjacent to the base of the
dam, on the left bank of the Kwanza river.
The production circuit for the use of ecological flows will be composed by: water intake,
headrace tunnel and a tailwater canal.
The tower's water intake is equipped with a rack installed 25 m high and a shielded headrace
tunnel with the diameter of 4,0 m.
It will have two stop logs, the first one will be a service floodgate with sizes 3,2 x 4,0 m2, the
second one will be of the sliding type with sizes 3,2 x 4,0 m2, designed for a flow of 60 m3/s.
Drawing 03 presents the location of the ecological hydraulic circuit.
e) Power house 1 and 2
Power house 1 will be underground, in a cavern located on the left bank of the river,
immediately after the headrace tunnels. It will have four generator groups (turbine plus
generator), set apart by 30 m. The blocks for the generator units will be 23,5 m long in the flow
direction and have a variable width between 24 and 26 m in the directions transversal to the
flow. The planned dimensions for the main floor and the assembly atrium will be 221 m long and
26 m wide.
Turbines will be vertical shaft Francis turbines, with a unit power of 530 MW. The turbine draft
tubes will excavated in rock and coated in concrete, with an approximate span of 25,5 m from
the unit's center line until the outlet sections, whose internal dimensions are 13,91 x 6,3 m.
The foreseen generators will be synchronous, three-phase machines with a vertical axis, with a
rated
power of 598 MVA, 21 kV, 50 Hz, cos φ = 0,9, installed inside the concrete shafts. They are

EIA / RS 15.08 This document may only be reproduced in full. 42/280
designed to operate at maximum turbine power, being directly coupled to them. They will be
fitted with auxiliary cooling, ventilation, anti-condensation heating, command and control
systems, which are required for their operation and protection.
There will be a single ventilation and access shaft with a larger diameter, connected to the
support building on the surface and to the three main floors (assembly, electrical and
mechanical atriums).
A drainage gallery will also be installed to collect drainage/dewatering tubes for the groups, the
auxiliary equipment of the plant and connect them to the drainage shaft. When moving for
assembly or maintenance the power house's electromechanical equipment, it will be performed
mainly using two traveling gantries, which will move using tracks on beams at elevation 420,5 m.
In the bus bar shafts will be placed the insulated phase bus bars, which will connect generator
terminals to step-up transformers terminals, having a bypass in cubicles to protect against
outbreaks, in auxiliary service transformer cubicles and in generator excitation transformer
cubicles.
The insulated phase bus bars will be metallic (aluminium) and their installation is foreseen outside
and inside the power house.
Drawing 06 A, B and C (7,8 and 9 of Coba) present the construction aspects for the
power house 1.
Power house 2 will be located on the left bank of the river, immediately after the headrace
tunnels, occupying an area of 42 x 18 m2, including the assembly atrium. It will have a generator
group (turbine plus generator). The turbine will be a vertical shaft Francis turbine.
Its installation capacity will be 52 MW, corresponding to a rated flow of 60 m3/s, a gross head of
96,1 m and a net head of 94,6 m.
f) 400 kV Substation
The 400 kV substation will be introduced in the two 400 kV transmission lines connecting the
hydroelectric scheme of LAÚCA and the substation of CATETE. An extra transmission line with
over 400 kV will also be included for connection to the substation of CATETE.

EIA / RS 15.08 This document may only be reproduced in full. 43/280
In this venture, the 400 kV substation will be located outdoors, on the surface near the support
building and connected to the power house through a shielded bus bar shaft.
The Drawing 05 (attached) presents the location of the substation.
The substation configuration will have a double bar, circuit breaker and a half, being composed
by 4 group panels and four line panels, justifying the occupation of an area of 27460 m2.
The substation will have two courtyards: one for step-up elevators with 21/400 kV and a 400 kV
courtyard. The step-up elevators will be connected to the power house 1 through insulated
phase bus bars.
The main 21/400 KV transformers shall be installed in the substation, inside open cells delimited by
walls or fire-walls. Furthermore, the substation will have a power of 610 MVA.
The proposed transformers are three-phase units with segregated phases, with a rated power of
610 MVA. They are intended for continued service and outdoors assembly, featuring two copper
windings and an oriented crystal plate magnetic circuit, with a low loss rate, immersed in a
mineral oil bath, cooled by ONAN/ONAF/ODAF.
The transformers shall be moved using bio-oriented wheels on tracks in the transformer platform,
in the substation's courtyard.
In the 400 kV courtyard are foreseen five exits to connect to the linked 400 kV system, whose
construction is planned, besides four inlet spans for generator units. The courtyard foresees the
existence of an extra exit in the future.
The physical layout for the 400 kV substation is presented on drawings 07-A and 07-B attached.
220 kV Substation
The 220 kV substation, connected to the power house 2, should have an outlet for connection to
the substation in power house 2 of the Laúca scheme.

EIA / RS 15.08 This document may only be reproduced in full. 44/280
In terms of the 220 kV substation to be built in Caculo Cabaça, it will be located outdoors, with
an implementation elevation of 549,9, a planned area of 940 m2, a 60 MVA power transformer
and a transformation ratio of 21 kV/220 kV.
The 400 kV and 220 kV substations will be composed by the following main elements:
Transformation equipment (power and instrument transformers);
Operational equipment (circuit breakers and disconnector switches);
Reaction compensation devices (reactor, capacitor, synchronous and static
compensator);
Protection equipment (lightning arrester, relays and fuses);
● Measuring equipment, including instruments used to measure values such as current,
voltage, frequency, active power, reactive power, etc.
g) Access and operators village
Considering the permanent access points to the scheme's structures, as well as the auxiliary
access points for construction purposes, it's estimated that their span will be of 40 km.
There will be a significant amount of underground access points (definitive and for construction
purposes), and their construction directly affects the timeline for construction works, particularly
the power house. During construction, the river will be crossed using the bridge, and from that
point will be built the remaining access points on the left bank.
After construction is finished, access from the right bank will be made using a road (five span
continuous deck) which will pass though the crests of the dam and flood spillway, following the
left bank, passing by the dyke crests until reaching the water intake structure. Water intake
towers will be connected by bridge sections in reinforced concrete 12,0 m long, which will
extend the path of the traveling gantry.
The operators village will have eight villas and an inn. It will be located on the right abutment of
the dam.

EIA / RS 15.08 This document may only be reproduced in full. 45/280
Like in any other construction work, when building the dam certain regulations for the control of
quality and operating conditions must be observed.
According to ISSO (International Standardization for Organization), quality is the degree of
adherence to requirements by a set of inherent characteristics. Some requirements worth
highlighting include the environmental protection covered by ISO 14001, an internationally
recognized standard for the Environmental Management System. It establishes guidelines on
how to manage efficiently environmental aspects of activities, products and services, taking
into consideration environmental protection, pollution prevention and socio-economical
needs. Workplace safety, better known as the OHSAS 18001 standard, is a guideline
containing requirements for Occupational Health and Safety Management Systems. It lets
organizations manage operational risks and improve their performances, aiming to prevent
accidents, reduce risks and collaborate to the well-being of employees. Generally, ISO
standards focus on people, machines and the environment.
Therefore, it is expected for equipment and operating practices to respect the 3 items
mentioned in the paragraph above.
EQUIPMENT USED WHEN BUILDING A DAM
The usage and preparation stage when the following operations take place, according to the
type of machinery:
1 - Opening of access routes in the relevant area (dam); 2 - Waste
removal;
3- Bypass of the river's course by placing devices on rocks; 4 - Transport of
gravel to be used further down the line;
Hydraulic backhoe
Backhoes are machines which enable the excavation of trenches. They're used in various types
of work, therefore useful in several kinds of construction projects. A hydraulic backhoe is
composed by three pieces of equipment used in construction works: tractor, loader and
backhoe. Each equipment of that type is appropriate for a specific task, and generally all three
components are used in a construction work. The tractor was designed to move in all types of
uneven terrains, becoming the backhoe's central structure.

EIA / RS 15.08 This document may only be reproduced in full. 46/280
Track-type tractor
Equipped with tracks instead of tyres, they have better grip and weight distribution, mainly in
loose soil and marshy terrains. They may be used when building roads, access routes or the
project's civil works.
Picture 9 – Hydraulic backhoe Picture 10 – Track-type tractor
Loader
A loading shovel machine. It carries debris in short distances, loads dumpers with sand, crushed
stone, soil or even cereals. It can also generally replace the work performed by track-type
tractors normally used to open roads, create landfills and farmyards.
Munck Truck
VW 24-250 truck equipped with an articulating crane (munck) with capacity for 50 metric tons
and a vertical reach of 32,80 meters. Electronic management of load lifting. It features 11
hydraulic cantilever arms and a mechanic cantilever arm. This crane has Fly-jib as an accessory,
so when necessary it can be transformed into a bi-articulated crane. The crane is controlled by
wireless remote controls.

EIA / RS 15.08 This document may only be reproduced in full. 47/280
Picture 12 – Munck Truck
Haul truck
A haul truck is a vehicle with two rear axes and able to support more weight in its chassis.
Backhoe breaker
The backhoe with an hydraulic breaker is a very common equipment in demolition services. The
hydraulic breaker is adapted into the backhoe, to set it apart from demolition works.
Picture 13 – Haul truck Picture 14 – Backhoe breaker
Picture 11 – Loader

EIA / RS 15.08 This document may only be reproduced in full. 48/280
Backhoe
A tractor with a digging shovel installed in the front and a smaller one on the back. Differing from
tractors used to pull loads, backhoes are applied in urban construction projects.
The backhoe was invented in England by Joseph Cyril Bamford, founder of J.C. Bamford (JCB).
Picture 15 – Grader Picture 16 – Backhoe
Roller Compactor
Self-propelled or towable by tractors, they vary in size, from small, medium and large dimensions.
They compact all types of soil, asphalt and other elements. There are many types of rollers, each
of them serving specific purposes (construction of roads, airports, dams, harbors, industrial
setups, sanitary landfills, etc.): heavy vibrating cylinder rollers, vibrating tandem rollers, combined
rollers, tyre compactors, trench compactors.
Heavy transport
The purpose of heavy transport is carrying heavy equipment between different locations, such
as transformers, boilers, cranes, tractors, generator units, windings, anchors and helixes,
machines and many others. Accomplishing such transport requires munck lifts in trucks, lowered
and plain flatbed plates with 2, 3 and 4 axles, extensible and pivoted flatbed trailers, hydro
pneumatic flatbed plate, gecko type flatbed plate, extensible trailer, special tractor-trailer,
intermediary dolly, pivoted flatbed with ramp, regular trailer, normal and four-wheeled tractors
and accredited convoy vehicles. The areas where

EIA / RS 15.08 This document may only be reproduced in full. 49/280
heavy transport is most used is heavy mechanics, civil constructions, hydroelectric schemes,
wind power, oil, machinery, tractors, naval industry, harbors and railways.
Munck Truck
Munck or crane trucks are pieces of equipment with hydraulic systems to move, hoist or remove
industrial equipment and machinery for civil construction purposes. The Munck truck has a
telescopic hydraulic arm and is used to load and unload general machines or materials, which
can be tied and hoisted. Currently, the most common models are roughly 15 to 20 m high and
have capacity for 40 tons. Most muncks are supported by a chassis, helping them in loading,
transport and unloading processes. They also have stabilizers, better known as struts, to keep the
vehicle from tipping when performing lifting procedures. To lift parts, normally special belts are
used, but when lifting loads, chains or steel cables are the elements adopted. Just like any lifting
equipment, the munck's load capacity is reduced according to the distance from the material
it's lifting, for that purpose this equipment has a loading chart.
Picture 17 – Roller Compactor Picture 18 – Heavy transport
Picture 19 – Munck Truck

EIA / RS 15.08 This document may only be reproduced in full. 50/280
Note: The images presented will not correspond with absolute accuracy to the models used
when building the dam, they are just prototypes used to give a general idea of the equipment
applied on the project. Any similarity is mere coincidence.
Likewise, we didn't receive quantitative information about the loads to be carried and stored,
and that is why they are not specified.
2.3.1.3. Support Infrastructures
South and North of the river will be built construction yards, to support construction when
building the plant. To improve machine circulation conditions, the construction of new access
points and the improvement of existing routes is foreseen. It should be noted that the current
routes are in average conservation conditions.
2.3.1.4. Predicted Consumption
The predicted consumption of water will originate from the Kwanza river. In order to supply a
reliable power source to the construction work, it will be necessary to install 15 km of 60 kV power
lines until Laúca, which itself will be connected to Capanda by a 30 km 60 kV power line. In
Capanda this line will be connected to a 60 kV - 220 kV substation. Auxiliary, diesel powered
generating units should also be present in the building yard.

EIA / RS 15.08 This document may only be reproduced in full. 51/280
2.3.1.5. Labor
Framework 6 – Foreseen labor (provided by CCGC)
2 Applied Human Resources Plan
Y/M 2016 2017
JAN. FEB.
MAR.
APR.
MAY
JUN.
JUL.
AUG.
SEP.
OCT.
NOV.
DEC.
JAN.
FEB.
MAR.
APR.
MAY
JUN.
JUL.
AUG.
SEP.
OCT.
NOV.
DEC. Administration staff 2
0 40
50
60
120
360
360
360
360
360
360
360
360
360
360
360
360
360
420
420
420
420
420
420
Construction class 1 technician 20
30
40
50
100
180
180
180
180
180
180
180
180
180
180
180
180
180
210
210
210
210
210
210
Construction class 2 technician 40
60
100
120
150
825
900
945
945
945
945
945
945
945
945
945
945
945
990
990
990
990
990
990
Construction class 3 technician 80
100
120
150
200
900
975
120 0
132 0
132 0
132 0
132 0
132 0
132 0
132 0
132 0
132 0
132 0
135 0
135 0
135 0
135 0
135 0
135 0
Construction class 4 technician 120
150
200
200
300
900
112 5
150 0
180 0
225 0
225 0
225 0
225 0
225 0
225 0
225 0
225 0
225 0
247 5
247 5
247 5
247 5
247 5
247 5
Installation mechanic 0 0 0 0 0 0 0 0 0 0 0 0 41
41
41
41
41
41
41
41
41
41
41
41
TOTAL 280
380
510
580
870
316 5
354 0
418 5
460 5
505 5
505 5
505 5
509 6
509 6
509 6
509 6
509 6
509 6
548 6
548 6
548 6
548 6
548 6
548 6
2018 2019
JAN. FEB.
MAR.
APR.
MAY
JUN.
JUL.
AUG.
SEP.
OCT.
NOV.
DEC.
JAN.
FEB.
MAR.
APR.
MAY
JUN.
JUL.
AUG.
SEP.
OCT.
NOV.
DEC. Administration staff 4
20
420
420
420
420
420
420
420
420
420
420
420
420
420
420
420
420
420
420
420
420
420
420
420
Construction class 1 technician 210
210
210
210
210
210
210
225
225
225
225
225
225
225
225
225
225
225
225
225
225
225
225
225
Construction class 2 technician 990
990
990
102 0
102 0
105 0
105 0
105 0
108 0
108 0
108 0
105 0
105 0
105 0
105 0
105 0
105 0
105 0
105 0
102 0
102 0
990
990
960 Construction class 3 technician
135 0
135 0
138 0
138 0
147 0
147 0
147 0
147 0
147 0
147 0
147 0
147 0
147 0
147 0
147 0
147 0
147 0
147 0
144 0
144 0
144 0
141 0
141 0
141 0
Construction class 4 technician 247
5 247
5 247
5 252
0 252
0 252
0 255
0 255
0 255
0 255
0 247
5 247
5 247
5 247
5 247
5 247
5 247
5 247
5 247
5 247
5 244
5 244
5 240
0 240
0
Installation mechanic 63
93
93
93
77
48
48
48
48
90
131
179
186
186
186
189
189
189
80
80
80
161
188
188 TOTAL
550 8
553 8
556 8
564 3
571 7
571 8
574 8
576 3
579 3
583 5
580 1
581 9
582 6
582 6
582 6
582 9
582 9
582 9
569 0
566 0
563 0
565 1
563 3
560 3

EIA / RS 15.08 This document may only be reproduced in full. 52/280

EIA / RS 15.08 This document may only be reproduced in full. 53/280
Framework 7 – Foreseen labor (provided by CCGC) (cont.)
2020 2021
JAN. FEB.
MAR.
APR.
MAY
JUN.
JUL.
AUG.
SEP.
OCT.
NOV.
DEC.
JAN.
FEB.
MAR.
APR.
MAY
JUN.
JUL.
AUG.
SEP.
OCT.
NOV.
DEC. Administration staff 4
20
420
420
420
420
420
420
420
420
420
420
420
420
420
420
420
420
405
405
390
390
360
360
360
Construction class 1 technician
210
210
210
210
210
210
195
195
180
180
165
165
165
165
165
165
150
150
135
135
105
105
105
90 Construction class 2
technician 960
960
960
960
960
960
930
930
885
885
870
870
840
840
840
840
750
750
675
675
600
600
540
540
Construction class 3
technician
141 0
141 0
141 0
141 0
141 0
141 0
135 0
135 0
132 0
132 0
129 0
129 0
129 0
129 0
129 0
129 0
108 0
108 0
945
945
870
870
825
825
Construction class 4
technician
240 0
240 0
240 0
240 0
240 0
240 0
217 5
217 5
210 0
210 0
202 5
202 5
202 5
202 5
150 0
150 0
120 0
120 0
105 0
105 0
900
900
750
450
Installation mechanic 204
204
204
234
234
240
240
336
371
500
512
686
704
755
785
785
785
755
755
710
710
710
710
710
TOTAL 560
4 560
4 560
4 563
4 563
4 564
0 531
0 540
6 527
6 540
5 528
2 545
6 544
4 549
5 500
0 500
0 438
5 434
0 396
5 390
5 357
5 354
5 329
0 297
5
2022 2023
JAN. FEB.
MAR.
APR.
MAY
JUN.
JUL.
AUG.
SEP.
OCT.
NOV.
DEC.
JAN.
FEB.
MAR.
APR.
MAY
JUN.
JUL.
AUG.
SEP.
OCT.
NOV.
DEC. Administration staff 3
60
360
360
360
360
360
300
300
225
225
225
75
30
Construction class 1
technician 90
90
90
90
90
90
90
90
75
60
60
45
10
Construction class 2 technician
540
540
540
540
450
450
450
450
375
300
225
150
20
Construction class 3
technician 825
825
825
825
750
750
600
600
450
375
300
270
50
Construction class 4
technician 450
450
450
450
450
450
450
450
390
300
270
225
80
Installation mechanic 635
635
633
633
561
554
479
450
308
221
152
0 0
TOTAL 290
0 290
0 289
8 289
8 266
1 265
4 236
9 234
0 182
3 148
1 123
2 765
190

EIA / RS 15.08 This document may only be reproduced in full. 53/280
2.3.1.6. Schedule
Presented attached - 08.
2.3.1.7. Environmental Characterization
The world seeks renewable energy sources to guarantee their sustainable development. 17% of
the energy used by developed countries comes from renewable sources. To reduce social
inequalities, produce clean energy, foster investment and ensure the creation of jobs for the
general population. The Angolan government has been investing in the country's hydrographic
potential, something which can be seen by the creation of several hydroelectric schemes, such
as the one in Caculo Cabaça.
To draft the project's environmental characterization, a field visit took place in the commune of
Caculo Cabaça, located on the Cuanza Norte province, most exactly in the municipality of
Cambambe. To check on location all the relevant details regarding the project's environmental
characteristics, as well as to perform an environmental pre-diagnosis which will then be
considered during the project's installation and operation stages.
Upon inspection, a thick forest vegetation was noted, characterized by high natural head
across a long section of the Kwanza river, with a vast amplitude of rocky terrain, as can be seen
in the picture below.
Picture 20 – Section of the Kwanza river showing the type of vegetation

EIA / RS 15.08 This document may only be reproduced in full. 54/280
In order to better understand the project's environmental aspects, we will divide the
environmental characteristic in two stages, which we'll call construction period and installation
period.
2.1 Construction Period
When building the Hydroelectric Plant, there must take place a significant multisectorial
engineering work, furthermore machines and engines will be used in different activities, which
will produce:
2.2 Liquid effluents
Water is vital to sustain life, and it's just as important for construction works. When building the
Caculo Cabaça Hydroelectric Scheme, a pump will be used to extract water from the river for
preliminary construction work, such as soil spraying to reduce dust caused by excavation, drilling
and other types of work. That can be seen in the pictures below.
Picture 21 - Reservoir of potable water extracted from the river.

EIA / RS 15.08 This document may only be reproduced in full. 55/280
Picture 22 – Crane drill
Besides those, liquid effluent is also created by unquantifiable domestic activities by the workers
living in the building yard adjacent to the construction work. Some of the liquid effluent originate
from: kitchens, dorms, workshops and offices. Burnt oils originating from workshops and kitchens
should be stored in drums until they're disposed of, if possible recycling should be undertaken.
Picture 23 – Worker's building yard

EIA / RS 15.08 This document may only be reproduced in full. 56/280
2.3 Solid waste
Generally, when building Hydroelectric Plants a great amount of solid waste is produced. In the
specific case of the Caculo Cabaça dam, which is located in a rocky terrain and will require an
excavation with a depth of over 100 m, a great amount of rocky debris will be generated,
however most of it will be used when building the stop log.
Solid waste will also be generated by the building yard's domestic activities, linked to the team
working on the project. Those will be treated accordingly.
2.4 Atmospheric emissions
Given the project's dimension, equipment such as Drilling Machines, Bulldozer, Dump Trucks or
Diesel Air Compressors will be used. All of them run on diesel, therefore they will produce
significant outdoors emissions of CO2. Besides CO2, the excavation and chipping process
required by the rocky nature of the soil will entail the production of large amounts of dust.
Emissions will also originate from the building yard's kitchen, workshops and generators.
2.5 Noise and vibration
It's considered as noise all unpleasant, unwanted sound which causes discomfort on those
subjected to it, taking into consideration its duration and intensity.
In excavation processes of this magnitude, noise and vibration are inevitable. Furthermore, they
may be even more intensive given the nature of the soil mentioned above. To have an idea of
the quantities involved, over a dozen Drilling Machines will be used, causing a double impact
seeing as they will generate both a deafening noise and excessive vibration. Therefore it will be
necessary to use a Micro Vibration Control Blasting to control and alternate excavation intervals
to reduce vibration.
Last but not least, explosive substances such as TNT (trinitrotoluene) and others yet to be
specified will be used when chipping rocks, which will generate high decibel values upon being
performed.

EIA / RS 15.08 This document may only be reproduced in full. 57/280
2.6 Liquid effluent from the
operation period
In this project, the use of water includes: personal hygiene, kitchens, refrigeration, etc. The
majority of waste water production originates from personal hygiene and kitchens.
2.7 Noise
a) Loading and unloading noise
Loading and unloading noise will occur intermittently during activities. In other words, it won't be
as constant as during the construction phase, seeing as the same number of machines, engines
and equipment will not be present on the location.
b) Equipment noise
These noises will generally be created by dynamic equipment such as the pump, the internal
mixer and lifting equipment, etc.
2.3.2. Venture's investment value
Presented in the protocol for the delivery of the Investment Statement drafted by GAMEK.

EIA / RS 15.08 This document may only be reproduced in full. 58/280
3. REGIONAL CONTEXT - INSTITUTIONAL AND LEGAL FRAMEWORK
3.1. INSTITUTIONAL FRAMEWORK
3.1.1. Ministry of Environment
The Ministry of Environment was created through Presidential Decree nr. 201/10 of September 13.
Its goals were the implementation of strategies and policies to preserve and manage
environmental issues.
The main roles of the Ministry of Environment are the following:
a) To ensure the implementation of strategies and policies to preserve and manage
environmental issues, as well as applying a rational usage of natural renewable resources;
b) Draft environmental impact evaluations for plans, projects and ventures created by public
and private organs;
c) Draft and ensure the implementation of strategies aiming to maintain biodiversity;
d) Raise awareness and recommend companies to use clean technologies.
The roles of the Ministry of Environment are put into effect by their central executive services,
namely Departments for Environment, Biodiversity or Environmental Technologies, as well as
Environmental Impact Prevention and Evaluation.
The National Department for the Prevention and Evaluation of Environmental Impacts (DNPAIA)
is the entity responsible for evaluating the Environmental Impact Studies (EIA), while the National
Environment Department (DNA) is responsible for drafting and implementing urban
management policies and strategies.
The Ministry of Environment is responsible for evaluating EIAs of projects liable to cause social
and environmental impacts, which includes the performance of one or more public surveys to
present the EIA Report using the Non-Technical Summary (RNT), aiming to obtain the required
commentary.
In case of approval, the Ministry of Environment will issue the relevant Environmental Licenses in
behalf of the project proponent, which will include measures for

EIA / RS 15.08 This document may only be reproduced in full. 59/280
mitigation to be implemented and the respective environmental monitoring program.
3.1.2. Ministry of Energy and Water
The Ministry of Energy and Water, commonly known as MINEA, is the Auxiliary Ministry
Department for the President of the Republic. Its goals are proposing the creation, guiding,
executing and controlling Executive policies in terms of Energy, Water and Sanitation.
MINEA's roles are:
a) Propose and promote the performance of policies to be undertaken by the energy and
water sector;
b) Establish strategies, promote and coordinate a rational usage and operation of energy
and hydro resources, ensuring their sustainable development;
c) To draft, within the country's general social and economic development planning
framework, sector plans for their areas of performance;
d) Propose and promote national policies for electrification, general use of hydro resource,
their protection and conservation, as well as water supply and sanitation policies;
e) Promote investigation activities which affect their respective areas of performance;
f) Propose and draft legislation establishing a legal and statutory framework for activities in
the energy, water and sanitation sectors;
g) Propose an institutional model for the performance of production, transport, distribution
and marketability activities for electric power, as well as promoting their
implementation;
h) Define, promote and ensure the quality of public services in their area of performance;
i) License, oversee and inspect the operation of services and installations on the energy
sector;
j) License, oversee and inspect hydraulic schemes and water supply and sanitation
systems;
k) Promote international exchange and cooperation activities in their area of
performance;
l) Promote the development of human resources in the energy, water and sanitation
sectors;

EIA / RS 15.08 This document may only be reproduced in full. 60/280
m) Cooperate with Local State Administration entities in the creation and implementation
of electrification programs, as well as supporting the development in rural, peri-urban
and urban areas.
n) Perform the remaining legally conferred duties.
3.1.3. GAMEK - Middle Kwanza Development Department
GAMEK is the entity delegated by MINEA, and it has both legal personality and
administrative/financial autonomy.
GAMEK is responsible for the creation and management of the Caculo Cabaça Hydroelectric
Scheme.
3.1.4. Government of the Kwanza Norte Province
The Province Governments will track the performance of public investment programs and
projects which feature an economic intervention in the Province. They promote measures to
protect hydro resources, for the conservation of soils and water, as well as trying to add value to
the cultural patrimony (extract of Law nr. 2/07).
Municipal administration will draft municipal plans for territorial planning and municipal
development plans.
3.2. LEGAL FRAMEWORK
The need and importance of protecting the environment, as well as the requirements to
achieve a sustainable development, have its main tenet in the right of every citizen to live in a
healthy environment, unpolluted, contrasting with the duty of defending and protecting the
aforementioned environment, as stipulated in art. 39º/1 of the Angolan Republic Constitution.
The Environmental Impact Study was developed according to the legal framework for the
Environmental Impact Evaluation, namely following the guidelines in Decree-Law nr. 51/04 of
July 23, published in Diário da República nr. 59, 1st series (Decree regarding the Environmental
Impact Evaluation), the Law nr. 5/98 of June 19, published in Diário da República nr. 27, 1st series
(Basic Environment Law) and Decree-Law nr. 59/07 of July 13, published in Diário da República
nr. 84, 1st series (Decree regarding Environmental Licenses).

EIA / RS 15.08 This document may only be reproduced in full. 61/280
According to the aforementioned legal diploma (Decree nr. 51/04 of July 23), namely Article nr.
4, Subparagraph 1 stipulating how "the licensing of projects which may affect environmental
and social balance and harmony will be subjected to previous Environmental Impact Evaluation
processes, entailing the creation of an Environmental Impact Study (EIA) to be submitted for
approval by the Government's department responsible for environmental issues."
It should be noted that the environmental legislation currently in effect in Angola will be taken
into account. Therefore, in terms of environmental aspects, the most important legal diplomas
will be cited, including the following:
A. General:
- Law nr. 5/98 of June 19 - Basic Environment Law - it stipulates basic principles and
concepts for the conservation, protection and preservation of the environment,
promotion of quality of life and a rational usage of natural resources. It should be noted
that article 16 stipulates how the Environmental Impact Study is mandatory for any
activities which may affect social and environmental balance and harmony. Another
relevant point is how nr. 1 of article 17 stipulates that "licensing is the registration of
activities which due to their nature, location or dimension might cause significant social
and environmental impact, and it is executed according to regimes to be established by
the government taking into account specific regulations".
- Decree nr. 51/04 of July 23 - Decree regarding Environmental Impact Evaluation -
Regulates Article 16 of Basic Environment Law and establishes that the Environmental
Impact Evaluation (AIA) is one of the main tools for the management and Protection of
the Environment, whose most important goal is determining the impact of specific public
or private projects on the environment. It defines a set of procedures to be taken into
account during Environmental Impact Studies, before the project's approval, subject to
an Environmental Impact Evaluation by government organs responsible for
environmental issues.
- Decree nr. 59/07 of July 13 - Decree regarding Environmental Licensing - Its goal is
establishing an administrative process for licensing, to ensure the application of basic
Environment Law elements, more specifically when establishing conditions, restrictions
and measures for environmental control to be observed, on a case by case basis, by
each of the activities requesting licensing.

EIA / RS 15.08 This document may only be reproduced in full. 62/280
- Joint Executive Decree nr. 96/09 of October 6 - Approval for the rates table to be used
when granting an Environmental License (Ministry of Finances and Environment). Defines
the values of the rates to be used when issuing and renewing environmental licenses for
the installation, operation, registry of consultants and evaluation costs in terms of
environmental impact, including public consultation processes.
The same legal document presents tables with values calculated based on a
percentage of the project's investment. The table of the aforementioned Joint Executive
Decree was altered in Order nr. 174/11 of March 11, defining the values for the rates to
be used in Fiscal Correction Units whose current value is Kz 88 for each unit.
Therefore, the calculation of the value for an environmental license of installation for
projects with an investment value above 1,5 million dollars is done multiplying the
investment value by 0,18%. In case of an environmental license for operation, the
investment value is multiplied by 0,3%.
- Decree nr. 1/10 of January 13 - It mandates the performance of environmental audits to
public or private activities which may affect the environment to a significant degree.
- Executive Decree 92/12 of March 01 - Stipulates the Reference Terms for the Creation of
an Environmental Impact Study.
- Executive Decree nr. 87/12 of February 24 - Regulates Public Consultations for projects
subjected to Environmental Impact Evaluations, referred in nr. 1 of article 20 in Decree
51/04 of July 23.
B. Surface and Underground Hydro Resources
- Law nr. 6/02 of June 21 - Water Law - Defines the general principles of the legal
framework related to the use of hydro resources. Having in mind an integrated
management, the development of hydro resources and at the same time their
protection and conservation. The diploma being analyzed institutes a new policy for the
administration of the water sector, which will cover the creation of a decentralized
system to control the use and protection of hydro resources.
Its goals include: granting access to citizens and collective entities, having in mind a
rational usage and application, appropriate sanitation of waste water and the
regulation of effluent discharge. The Water Law stipulates that zones adjacent to

EIA / RS 15.08 This document may only be reproduced in full. 63/280
springs and wells, their locations and respective adjacent areas of application of drinking
water extraction, subject to licensing or concession, the banks of artificial lakes and their
respective adjacent areas, are subjected to the "regime for protection areas" defined in
land legislation (art. 71/1).
- Presidential Decree nr. 141/12 - Approves the Regulation for the Prevention and Control
of the Pollution of National Water, whose focus will be pollutants mainly originating from
industrial activities, ships and platforms.
- Law nr. 6-A/04 of October 8 - Law for Aquatic Biological Resources - It defines areas for
aquatic protection, areas under special usage regimens, delimited according to
ecological and social criteria aiming to ensure: a) the preservation of species,
ecosystems and aquatic habitats, as well as their biological diversity;
b) the protection of cultural and aesthetic values; c) recreational use and tourism; d)
scientific investigation; e) contribution to the creation of a network of environmental
protection areas.
- Resolution nr. 15/15 of July 3 - Ratification of the Benguela Current Convention - The goal
of the Convention is promoting a coordinated regional approach to promote long-term
conservation, protection, recuperation and improvement of the Large Marine Ecosystem of
the Benguela Current, as well as fostering a sustainable usage in a way which brings about
economic, environmental and social benefits.
C. Waste:
- Presidential Decree nr. 196/12 of August 30 - The Strategic Plan for the Management of
Urban Waste (PESGRUI) is the reference tool on a national scale in terms of urban waste
management, defining a consistent set of proposals for action, supporting political
leaders when making decisions and guiding the main intervenients regarding strategic
options.
- Executive Decree nr. 17/13 of January 22 - Establishes the legal framework covering the
management of waste resulting from construction works, demolitions or landslides, known
in short as construction and demolition waste (RCD).

EIA / RS 15.08 This document may only be reproduced in full. 64/280
D. Ecological Systems:
- Decree nr. 40.040 of January 20, 1955 - The decree was created during the colonial era
and regulates in an integrated fashion Soil, Flora and Fauna. In legal terms it reflects the
unity between soil and its living tissue, fauna and flora, in natural protection terms. On the
other hand it shows the convenience of having a single Entity be responsible for
coordinating all necessary efforts to protect the soil, flora and fauna.
- Decree nr. 44.531 of August 21, 1962 - Approves the FOREST REGULATION, and just like the
previous decree, it was also developed during the colonial era. It aims to regulate forest
operations in Angola, Guinea-Bissau and Mozambique, in addition to efforts to protect
the soil, flora and fauna.
- Order nr. 149/00 of July 7 - Updates the Forest Regulation approved by Decree nr. 44.531
of August 21, 1962.
Ordinance nr. 10.375 of October 15, 1958 - REGULATION FOR NATIONAL PARKS
- It regulates in particular National Parks. The regulation stipulates that the creation of
local parks has the goal of not only protecting the fauna, flora and natural monuments
but also serving as a resource for scientific investigation and a cultural or recreational
centre.
- Executive Decree nr. 469/15 of July 13 - forbids the elimination in national territory of
protected wild fauna and flora species.
E. Regional Planning:
- Law nr. 3/04 of June 25 - Aims to establish a SYSTEM FOR REGIONAL AND URBAN
PLANNING and its political ramifications.
- Law nr. 9/04 of November 9 - The LAND LAW establishes the general tenets for the legal
framework regarding land integrated in property formerly owned by the Estate. It also
regulates their agrarian rights and the general regime for transference, constitution,
performance and cessation of those rights.
- Presidential Decree nr. 232/11 - Decree focusing on the deallocation of territory
belonging to the public sphere - Definition of the deallocation regime for territory
belonging to the public sphere, encompassing the coast's perimeter and intended for
the creation of support equipment to beaches and the entire coastal area, including the
foreshore and a terrestrial protection strip with the maximum width of 500, as well as the
transference to private property of

EIA / RS 15.08 This document may only be reproduced in full. 65/280
respective Province Governments, and the revocation of Decree nr. 4/01 of February 2,
which regulates the creation and approval of Territorial Planning for the Coastal Zone
(POOC).
- Law nr. 9/98 - Law for Port Areas - designed to apply a Development Plan for Port Areas,
the legal framework for private construction and activities in areas covered by port
jurisdiction, the definition of Port Authority and its respective powers and the definition of
duties to be observed by users of Port Territories.
F. Construction:
- Decree-Law nr. 13/07 - Legislation for the construction work - It stipulates that new
constructions cannot be started without the licensing entity supplying the elevation level
and the structural alignment, in case those are relevant.
G. Occupational health and safety:
Decree-Law nr. 32/94 - defines the principles for the prevention of work related accidents,
professional diseases and other inherent risks of the workplace.
3.3. INTERNATIONAL STANDARDS AND GUIDELINES
Further to the legal measures already mentioned, the studies that need to be developed will
also comply with the remainder of the specific legislation for the various environmental areas
and components, as well as the internationally established guidelines of good practices for
studies of this nature, of which the guidelines defined by the World Bank are of mention, namely
the Equator Principles.
Angola is a signatory of various international treaties, conventions and protocols related with the
issues of biodiversity, climate change, maritime pollution, social justice and human rights.
Following is a non-exhaustive list of the international conventions, treaties and protocols:
Convention on the Conservation of Migratory Species of Wild Animals - The signatories of the
Convention are bound to recognize the importance of migratory flows of species and their
conservation, and furthermore agree to take measures towards that end whenever possible.
Special attention should be given to migratory species whose state of conservation is
unfavorable.
IUCN - International Union for the Conservation of Nature - Angola became an ICUN

EIA / RS 15.08 This document may only be reproduced in full. 66/280
Member State in 8 November 2004. The statutes of this convention came into effect in Angola
on 27/05/03 (see Resolution 21/03 - 27/05/03).
Framework Convention on Climate Change, 1992 - The convention calls for preventive measures
to be taken to anticipate, prevent and minimize the causes of climate change and mitigate
their harmful effects. Note: this convention came into effect in Angola on August 28, 1998 (see
Resolution no. 13/98 - 28/08/1998).
Convention on Biological Diversity, 1992 - The signatories are encouraged to establish protected
areas and take measures to implement requirements for the elaboration of EISs, and as such
minimize adverse impacts. Members are required to monitor activities that may represent
environmental risks. Note: this convention came into effect in Angola on July 23, 1997 (see
Resolution no. 23/97 - 04/07/1997).
United Nations Convention to Combat Desertification - The aim of this convention is to combat
desertification and mitigate the effects of drought in countries affected by severe drought
and/or desertification.
Note: this convention came into effect in Angola on May 05, 2000 (see Resolution no. 12/00 -
05/05/2000).
Agenda 21 of the United Nations Conference on Environment and Development (UNCED), 1992 -
Coastal states are required to evaluate existing regulating measures with regards to pollution
from offshore oil and gas platforms. Angola signed Agenda 21 and the Johannesburg
Implementation Plan (2002) but the provided for in the plan was not implemented in its entirety.
The country is a member of the Southern African Development Community (SADC), whose
policies and strategy provide the basis for the application of Agenda 21. Agenda 21 has a
significant impact on the development of the Environmental Legislation in Angola.
Geneva Convention and the Montreal Protocol, 1985 - The Vienna Convention for the Protection
of the Ozone Layer establishes an international legal framework for the reduction of the emission
of substances that destroy the ozone layer. In 1987, the Montreal Protocol regarding substances
that destroy the ozone layer was established, requiring that industrialized member states reduce
their use of chemical products harmful to the ozone layer and that developing countries
suspend the greater part of their CFC consumption until July 1, 1999, based on averages
between 1995 and 1997, to reduce use by 50% until January 1, 2005 and totally eliminate CFCs
until January 1, 2010. Note: this convention came into effect in Angola on August 28, 1998 (see
Resolution no. 12/98 - 08/28/1998).

EIA / RS 15.08 This document may only be reproduced in full. 67/280
Rotterdam Convention on the Prior Informed Consent Procedure (PIC) for Certain Hazardous
Chemicals and Pesticides in the International Trade, 2004 - This is a multilateral environmental
agreement to promote shared responsibility and cooperative efforts to monitor and control the
trade of certain dangerous chemical products. Note: This convention was ratified by Angola on
09/11/1998, and came into effect on February 24, 2004, when it became international law.
RAMSAR Convention - Convention on Wetlands of International Importance. Angola joined in
2013 (25/04).
The Basel Convention - Control of Transboundary Movements of Hazardous Wastes and their
Disposal Angola joined in 2013 (25/04).
The Bamako Convention - Ban of the Import into Africa and the Control of Transboundary
Movement and Management of Hazardous Wastes within Africa. Angola joined in 2013 (25/04).
Agreement on the Conservation of Gorillas and their Habitats Angola joined in 2013 (25/04). The
Abidjan Convention - on the Protection and Development of the Marine and Coastal Environment
of the West and Central African Region Angola joined in 2013 (25/04).
3.4. REQUIREMENTS FOR THE ENVIRONMENTAL IMPACT STUDY
As previously referred, the preparation of an EIS in Angola is based on the General
Environmental Law, Law no. 5/98, dated June 19, that defines the main environmental principles
to take into account, and Decree no. 51/04, which provides the specific requirements for the
Assessment of the Environmental Impact. Article 6 requires that the Concessionaire and its
Associates carry out an Environmental Impact Study when undertaking the construction of new
facilities, or making modifications to any existing facilities, that may significantly affect the
environment.
The EIS should identify the environmental impacts caused by the proposed project and
determine the appropriate measures of mitigation for the negative impacts.
The EIS should at least contain the following:
The conditions at the construction site and the existing environment, as well as the
modifications introduced by the study;
The foreseen environmental impacts of the undertaking, including direct and indirect impacts
on the wear out of natural resources, the elimination and storage of waste and spills, are
considered important;
EIA / RS 15.08 This document may only be reproduced in full. 68/280
Legal, financial, economic and practical actions to be taken into account for the reduction
of impacts caused during the construction, operation and elimination of the undertaking;
The EIS should be submitted to the Ministry of the Environment by the proponent and, should
the Ministry's assessment be favorable, an Environmental License will be issued.
Decree no. 51/04 defines the development and implementation process for the EIs:
The authority responsible for the EIS approval process - the Environmental Impact Assessment
falls under the supervision of the Ministry responsible for the environment, who will appoint an
entity to monitor the process. This competence is exercised cooperatively by the Minister
responsible for the project being assessed and the Minister responsible for the administration
of the territory, in cases where the projects are situated within urban limits or cross villages.
Submittal of the EIS to the competent authorities and licensing stage - the applicant should
submit the Environmental Study to the authorized public entity for approval to initiate the
environmental licensing stage of the project. The public entity, 5 days after reception of the
EIS, will forward the following elements to the entity responsible for environmental policies:
o the project being licensed and approved;
o the Environmental Impact Study;
o other elements considered convenient for the correct appraisal of the project
Public consultation - the projects subject to EIS are necessarily required to be subjected to
public consultation, promoted by the Ministry responsible for the Environment. The public
consultation begins with the publication of a Non-Technical Summary of the EIS, emphasizing
the main impacts the project will have on the environment, as well as the mitigating measures
and socioeconomic aspects. The opinions, comments and suggestions of the interested
parties are taken into consideration by the competent authorities. The public consultation
should take place during a period not less than 5 nor greater than 10 days. Once the
deadline for public consultation has ended, a concise report is drawn up during the following
8 days stating the measures undertaken, the registered participation and conclusions
reached.
Opinions of the Ministry for the Environment - within 30 days, starting from the date of
reception of the required documentation, the Ministry responsible for the environment will
issue the respective report to the competent authority to license or authorize the project,
accompanied by the public consultation report they promoted and its respective analysis

EIA / RS 15.08 This document may only be reproduced in full. 69/280
. The opinion is considered to be favorable if, once the established deadline has come to
and end, nothing is reported to the competent authority to authorize or license the project.
This opinion is considered as binding, and a project that obtained a negative opinion from
the Minister responsible for the environment may not be authorized or be licensed. The final
decisions made regarding the projects assessed and their respective processes should be
published publicly, without prejudice of the limitations determined by law.

EIA / RS 15.08 The current document may only be reproduced in its entirety.
70/280
4. METHODOLOGY AND GENERAL DESCRIPTION OF THE EIS STRUCTURE
4.1. EIS METHODOLOGY
Figure 24 - General EIS Methodology

EIA / RS 15.08 The current document may only be reproduced in its entirety.
71/280
The aim of the EIS is fundamentally the analysis of the area in which the project will be inserted
into, and it focuses on the viability of the undertaking, the identification and evaluation of
impacts and the proposal for measures that contribute towards the optimization of solutions to
be developed during the subsequent stages of the project.
Figure 1 shows the general methodology adopted for the elaboration of the EIS, according to
the main stages that are usually covered during studies of this nature and are summarized next,
taking into account the analysis made regarding the undertaking and its area of influence.
i. Definition of Areas and Critical Aspects (Informal Definition of Scope)
According to current and more rational trends for impact studies, when the initial stage for the
informal definition of scope of the study is defined ("scoping"), the identification of areas and
critical environmental aspects, which were subjected to greater scrutiny during the following
stages of work, as well as a pre-selection of some impacts that were subjected to more detailed
study, based on the summary analysis of the region of implementation and on the project being
assessed.
Scoping is basically the process of identifying and selecting from among a series of potential
problems and a wide range of possible impacts, the environmental issues, aspects and impacts
that may be more relevant and that should be subject of more detailed and in-depth studies.
ii. Objectives, Rationale and Description of the Project and Alternatives Considered
The usefulness of the project was justified in terms of historical, present and foreseen needs, by
which the factors associated with the demand of goods or services produced and the
framework of the activity proposed in the development plans and programs at national,
regional and local levels are presented.
As such, in compliance with the local requirements, the project was defined and described in its
various forms and according to the alternatives considered, which are the following:
- Definition of the Undertaking:
Identification of the Proponent and Licensing Entity;
Rationale for the need and interest of the project;
summary information regarding associated projects.
- Description of the Project:
Its location;
Operational characteristics of the project;

EIA / RS 15.08 The current document may only be reproduced in its entirety.
72/280
Goods and services
produced; Emissions and
Waste.
iii. Characterization of the Reference Situation
This activity consists in the preparation of an environmental diagnosis related to its various
aspects, based on the analysis and description, directed and interpreted, of the project area,
without the deployment of the project,also called Alternative Zero, in other words, the
alternative consisting in not implementing the project.
As such, the main objective of this characterization and analysis stage of the existing situation was
to establish a reference framework of the current environmental conditions of the region that will
be affected by the undertaking being assessed, before its implementation.
The characterization was based on the survey, analysis and interpretation of the information
gathered by contacting national and local entities, by bibliographic research and field surveys
and the contact with privileged local and regional partners.
To define the Environmental Reference Situation, sectorial, global or regional programs, projects
and plans foreseen or under development in the study area were evaluated to aid in the
definition of an evolutionary framework of the region without the implementation of this
undertaking.
The elements necessary for the development of the works were obtained by means of
researching the existing information, namely by means of bibliographic consultation, - which
implied the survey, analysis and interpretation of specific existing information available on the
area of the undertaking and respective region of insertion (e.x.: statistics, reports, other EISs, etc.),
of which the most pertinent elements were the following:
geographic chart;
thematic cartography published;
consultation on specific databases;
contacts with local and regional entities;
measurement and analysis of environmental quality parameters;
local surveys and combined reconnaissance visits to the field;
consultation of available aerial photography/orthophotomaps or produced during the scope
of the current project;

EIA / RS 15.08 The current document may only be reproduced in its entirety.
73/280
consultation of Sector, Regional, Special and Municipal regional planning Plans;
consultation of Environmental Impact Studies undertaken for the region being assessed, in the
cases where they are available;
as well as various other elements available and whose information may prove to be
important.
Essentially, the aim of using this methodological approach was to develop a reference diagnosis
of the environmental situation. Among the environmental topics and aspects the need to be
analyzed during environmental characterization, are the following (Table 6):
Table 8 - Environmental Components
Important Environmental Topics Environmental Aspects
Biophysical Aspects Climate
Pedology
Geology, Geomorphology and hydrogeology
Hydrology and Drainage
Ecological Aspects (Fauna, Flora, Vegetation, Habitats)
Environmental Quality Surface and Subterranean Water Quality
Acoustic Environment and Vibrations
Landscape
Socioeconomic and Cultural Aspects Socioeconomic Aspects
Architectural and Archaeological Cultural Heritage
Uses and Management of Water Resources
Air Quality and Waste Management

EIA / RS 15.08 The current document may only be reproduced in its entirety.
74/280
Table 9 - Environmental Components (cont.)
Important Environmental Topics Environmental Aspects
Land Use and Regional Planning Land Use and Regional Planning
Conditions for Land Use
Regional and Urban Planning
iv. Identification and Evaluation of Impacts
The main objective of this stage is to identify and evaluate the more significant impacts resulting
from the undertaking that originate during the construction stage as well as the exploration
stage. Those actions or activities related with the undertaking, which can potentially generate
environmental change, were studied using appropriate techniques for systematization of the
analysis and assessment of impacts.
The essence of this evaluation resides in the development and comparison of environmental
scenarios: the environmental framework without the undertaking, will be used as a reference
against which the scenario with the implementation of the undertaking, which takes into
account the environmental effects, was compared to provide:
- Identification of the impacts: determination of potential impacts associated with the
generating actions considered;
- Prevision and measurement of the impacts: determination of the characteristics and
magnitude of impacts;
- Interpretation of the impacts: determination of the importance of each impact with regards to
the environmental factor affected, when assessed independently;
- Evaluation of the impacts: determination of the relative importance of each impact, when
compared to the other impacts associated with other environmental aspects or factors.
The main characteristics of the environmental impacts being considered in the analysis will be:
- nature: negative or positive;
- order: direct, indirect;
EIA / RS 15.08 The current document may only be reproduced in its entirety.
75/280
- duration: permanent, temporary;
- spatial occurrence: localized, disperse;
- magnitude (or degree of contribution of the environmental component): low, moderate, high.
The global evaluation of the impacts: is carried out based on the referred characteristics and
other information, such as the perception of the expectations of the population, local
characteristics and environmental aspects considered to be critical and/or sensitive and the
capability of the environment to recover, among others.
During global impact evaluation, taking into account the optimization of the necessary
resources to undertake the studies, the following types of evaluation methods were adopted:
- analogies with similar cases;
- analysis of checklists and pre-existing interaction matrixes;
- consultation with specialists.
In this manner, the impacts identified are classified according to their significance (or
importance) in relation to the other impacts under the following categories:
- Not Very Significant;
- Significant;
- Very Significant.
The evaluation of Residual Impacts, taking into account mitigation possibilities and effectiveness,
will be weighted in order to determine their Significance in real terms.
During this stage, cumulative impacts or impacts associated with complementary, associated or
subsidiary projects, were also evaluated to ensure the most complete environmental impact
evaluation possible associated with the implementation of the current undertaking.
A summary of the main environmental impacts associated with the undertaking is presented in
the form of an impact summary matrix, in which the more relevant impacts are referenced and
identified according to their characteristics, allowing for a global perception of the main critical
aspects associated with the construction of the undertaking, as well as with the various
alternatives being considered.
v. Minimization and Leveraging Measures and Monitoring Programs

EIA / RS 15.08 The current document may only be reproduced in its entirety.
76/280
Specific and objective actions and mechanisms that may prevent, mitigate or compensate
negative impacts were analyzed , or that may contribute towards the leverage valuation or
reinforcement of positive aspects of the undertaking, maximizing its benefits.
The formulation of control measures and technical and economic viability evaluation of the
recommended solutions is based, mainly, on previous experience with similar cases, the opinion
of specialists and on the combined analysis of project and environmental technicians and
specialists.
The control measures are formulated in the EIS at a level compatible with the project stage, by
which it is emphasized that it is important to identify minimization/valuation measures that may
be incorporated into the subsequent stages, in order to best adapt the undertaking to its
environment and simultaneously promote the maximization of its benefits.
The recommended measures are related to the project, construction or exploration of the
undertaking: they are linked to the project or suggest eventual adjustments to some of its
components (geotechnics or drainage, integration into the landscape or acoustic protection,
among others); they are related, during the construction stage, to appropriate environmental
procedures on site, adequate location, management and operation of construction sites and
other construction support and access areas, according to the expected impacts, by which the
environmental monitoring of construction, by an adequately trained sized team, should be
foreseen, taking into account the specialties that may be considered more relevant.
With regards to the exploration stage, the measures proposed were related with the adequate
management of the undertaking in terms of biophysical stabilization or maximization of
associated environmental benefits, for which the proponent is responsible, as well as with the
interaction with other entities that supervise regional planning of the municipality.
Finally, and as foreseen in the applicable legislation, the recommended Additional Studies
and/or Monitoring Programs are included, in order to ensure that its guidelines are included in
the scope of the Final Design, taking into account the detailing of aspects for which it is
considered justifiable to obtain a more appropriate knowledge of environmental component
evaluation of greater sensibility for the project.

EIA / RS 15.08 The current document may only be reproduced in its entirety.
77/280
4.2. EIS GENERAL STRUCTURE AND CONTENT
According to the general methodology proposed previously for carrying out the current EIS,
which is a result of the globally accepted and accepted approach for these type of studies, the
general structure of the EIS is set out below and its composition consists of the following individual
documents:
- Volume I - Summary Report: the current document that includes the more relevant information,
results, conclusions and recommendations of the environmental studies, which further contains
charts, figures and drawings essential for good reader comprehension;
- Volume II - Non-Technical Summary: document that contains the information mentioned in the
Summary Report, written in current and appropriate language for transcription and generalized
distribution;
- Volume III - Plans and Drawings (if applicable): drawings will be submitted at the most
appropriate scale and/or that prove to be more relevant for the adequate global comprehension
of the results presented in the Summary Report.
- Volume IV - Technical Studies (if applicable): document containing the detailed analyses of
some aspects assessed and that are considered to be more relevant, as well as eventual
technical justifications of information and results presented in the Summary Report, and/or data,
campaigns and other project or environmental study elements the prove to be important for the
adequate comprehension of the main issues being evaluated.
With regards to the current Summary Report, its general structure is presented next in an
abbreviated manner:
- Chapter 1 - Introduction. Consists of a brief general presentation of the undertaking, as well as
its objectives, history, legal framework, methodology and technical team appointed to conduct
the environmental studies.
- Chapter 2 - Project Description. In this chapter, the planning, strategic and environmental
framework, that sustains the undertaking under analysis, is developed with the inclusion of
respective preceding history.
Also listed are the legal, sector and regional planning instruments, in abbreviated format, that
sustain the justification of the project under analysis.

EIA / RS 15.08 The current document may only be reproduced in its entirety.
78/280
In this chapter, the project elements susceptible of causing impacts, be they negative or
positive, are listed in order to ensure comprehension of the Preliminary Draft, on one hand, and
the evaluation of impacts, on the other.
As such, the general order aspects are presented as the characteristics of the infrastructure, its
general layout, the associated projects, or the scheduling of the undertaking, as well as the
specific elements, such as streets, drainage, fencing, containment structures, among others.
- Chapter 3 - Regional Insertion. The institutional and legal framework of the project is developed
in this chapter.
- Chapter 4 - Methodology and General Description of the EIS Structure. In this chapter, the
methodology used to develop the Environmental Impact Study, as well as its structuring into
specific parts / volumes, is explained.
- Chapter 5 - Definition of Alternatives Considered. The alternatives taken into account for the
project under analysis are described.
- Chapter 6 - Environmental Characterization. In this chapter, the environmental characterization
of the study area is developed for the various environmental aspects usually taken into
consideration in studies of this nature.
- Chapter 7 - Identification and Evaluation of Environmental Impacts. Concerns the explanation of
the impact evaluation developed, taking into account all the descriptors considered during the
environmental characterization, with the objective of presenting the main impacts, be they
positive or negative, associated with the project during the construction and exploration stages,
as well as the cumulative impacts according to their existence, within the same space and/or
time, of other projects that have, or not, the same proponent.
- Chapter 8 - Minimization and Valuation Measures of Identified Impacts. Consists of the
presentation, with details necessarily adapted to the current stage of the Project, of measures to
be considered in the Final Design, at the works, or posteriorly, during the exploration stage of the
project under assessment.
- Chapter 9 - Summary of Impacts - Global Impact Evaluation. Lists the global environmental
impact matrix of the project under assessment.
- Chapter 10 - Monitoring and Environmental Management Plan. Consists of the Monitoring
Programs that are scheduled to be implemented during the construction and exploration stage of
the undertaking.
- Chapter 11 - Technical and Knowledge Flaws. In this stage of the study the gaps in knowledge
regarding environmental aspects that could be particularly relevant to the stages of subsequent
studies were identified, or Technical or Knowledge Flaws

EIA / RS 15.08 The current document may only be reproduced in its entirety.
79/280
verified during the preparation of the study that justify possible analysis limitations regarding
certain environmental factors.
- Chapter 12 - Conclusions and General Recommendations. Chapter where the main conclusion
of the EIS are listed, emphasizing the more relevant issues in order to make possible a global
evaluation of the consequences of the undertaking on the environment.
Further to the referred chapters, the Summary Report also contains the bibliographic references
used.
4.3. DEFINITION OF THE AREA OF INFLUENCE
The definition of the areas of influence of a project allow the geographic limits of the areas that
may suffer positive or negative, direct or indirect, changes to be established, making it possible
to establish guidelines for the evaluation of environmental impacts. Physiographic and
biological aspects were considered in order to define the influence areas of the project, as well
as possible alterations to the socioeconomic framework and quality of life of the populations
living directly or indirectly affected areas.
For the construction project of the Caculo Cabaça Hydroelectric Power Scheme, the limits of
the areas of influence that are susceptible to changes as a consequence of the leveling,
construction and operation of the Power Scheme were established, which take into account the
physical, biotic and anthropic environment.
to define the areas of influence of the physical and biotic environment, physiographic aspects
are considered, such as the catchment area feeding the reservoir and the biological
component present in the system. For the anthropic environment (socioeconomic studies),
possible alterations to the quality of life of the populations living directly or indirectly affected
areas, are considered.
Taking into account the characteristics of the project, and with the objective of clarifying the
degree of impact on the environmental and social issues, two project areas were defined,
namely:
- Area of Direct Influence (ADI): corresponds to those areas that will be subjected to direct
impacts, be they positive or negative, and for which an adequate program for
monitoring and mitigation measures should be developed. The areas considered are,
the construction area of the dam, the central water intake, the work site area and the
areas related with deposits of materials for construction. An

EIA / RS 15.08 The current document may only be reproduced in its entirety.
80/280
estimated area of 170 Km2 was considered, which includes the drainage basin, the
reservoir, the construction areas of the dam, the temporary diversion, the water intake,
discharge outlet, the valley section of the river between the dam and the discharge
outlet, the work site area and the areas attributed to the construction material borrow
areas.
-
- Area of Indirect Influence (AII): the basin (Kwanza sub-basin) area considered, with
incidence on the catchment area of the Middle Kwanza.

EIA / RS 15.08 The current document may only be reproduced in its entirety.
81/280
Figure 25 - Area of Direct Influence

EIA / RS 15.08 This document may only be reproduced in full. 82/280
5. ANALYSIS OF PROJECT ALTERNATIVES
5.1. GENERAL CONSIDERATIONS
To better define the Hydroelectric Schemes in the middle section of the Kwanza river, viability
studies were developed which defined a general design for the hydroelectric schemes, taking
into account the need for technical and economic viability as well as reaching the costs and
benefits associated.
In the 60's, SONEFE created a Study for Techno-Economic Viability (EVTE - Estudo de Viabilidade
Técnico Económica) in three selected schemes from previous studies of the river's tiers. As the
demand for energy rose, it became essential to review and consolidate the tiers in the middle
section of the Kwanza river.
The optimum tiering of the studied section was defined using five alternatives composed by nine
hydroelectric schemes, according to the following premises:
- The proposal of upstream schemes in each alternative, to allow the application of
reservoirs to regulate discharges;
- Their connection to other schemes, allowing the use of the total net head available;
- Go through every possibility for multiple schemes and evaluate a single scheme solution.

EIA / RS 15.08 This document may only be reproduced in full. 83/280
Picture 26 – Summary Table of Studied Alternatives (Intertechne – 0704-MK-RT-100-00-010-RB-1. 2012)

EIA / RS 15.08 This document may only be reproduced in full. 84/280
The studies performed have led us to conclude that the alternative proposed by the
Hydroelectric Schemes of Laúca Alto and Caculo Cabaça show the lowest cost benefit index
and the second lowest distributed negative environmental impact index, therefore it was
recommended as the studied section's optimum tiering.
In December 2013, COBA presented a review of the EVTE study created by Intertechne, where it
analyzes alternatives for the scheme, with the goal of streamlining the construction of the
scheme and selecting the best alternative for the construction of the dam, the routing of the
hydraulic circuit and for the plant's location.
5.2. DAM
In the intersection part of the dam in the upstream alternative, the valley is very large and
generally symmetrical to the banks, featuring slopes of 5 to 10º.
The dam, a rock fill solution with a concrete curtain upstream, presents a maximum height of 41
m above the lowest point of the foundation, therefore it should be built covered by stop logs
which are transversal to the river bed. The crest, located at elevation (633,0) has a span of 531 m
and a width of 9 m. The reservoir's full storage level is located at elevation (630,0) and the
clearance in relation to the full maximum level is 3 m.
In the intersection part of the dam in the downstream alternative, the valley is large, with a width
at river bed level of about 140 m. The banks are asymmetrical, with the left one presenting
slopes of around 35º from lower to intermediate inclinations and 50º for upper inclinations, while
the slopes on the left bank do not exceed an inclination of 20-25º.
Taking into account the geomechanical features of the foundation, composed by gneissic and
granitic rocks, the next step was the definition of a foundation surface which guarantees
resistance and deformability conditions appropriate to the expected stress. The estimated
excavation depth is around 3,5 m, although on occasion it might exceed those values on the
right bank, where indirect prospecting work (seismic profiles and electric routing sections) has
identified horizons with less favorable geothermal conditions up to the highest depths eventually
associated to

EIA / RS 15.08 This document may only be reproduced in full. 85/280
decompressed materials, namely sloped deposits accumulated on the base of the inclination.
The dam of the downstream alternative, a rock fill solution with a concrete curtain upstream,
presents a maximum height of 100 m above the lowest point of the foundation, therefore it
should be built covered by stop logs which are transversal to the river bed. The crest located at
elevation (633,0) has a span of 543 m and a width of 9 m. The rope-height ratio between
abutments presents a value of 5,4. The reservoir's full storage level is located at elevation (630,0)
and the clearance in relation to the full maximum level is 3 m.
In both alternatives, the dam's upstream face was foreseen with a 1,4 H: 1 V inclination; the face
downstream presents slopes with a similar inclination (1,4 H: 1 V) which are interrupted by
variable height berms.
Regarding the zoning of the dam's body in both alternatives, the embankment downstream will
be constituted by blocks with the maximum dimensions (Dmax) of 160 cm, obtained by breaking
gneissic rocks in good conditions without resorting to significant change, at most the material
alterations will be of 30%. These materials will mostly be obtained through excavation works
associated to the venture's construction. The protective rock fill of the downstream face, 1,20 m
thick, will be constituted by rock blocks in good conditions with Dmax=160 cm. The upstream
embankment will be constituted by rock fill in good conditions with Dmax=
80 cm. The transition to concrete slabs upstream takes into account the application of two
layers: an interior one formed by rock fill in good conditions with Dmax=40 cm, and a superior
one using granular materials (loose gravel) with Dmax=7,5 cm. The concrete slab will be built
using panels 15 m wide.
In the upstream alternative, the foreseen rock fill volume is of 565 938 m³ and the total volume of
concrete will be 9 465 m³.
In the downstream alternative, the foreseen rock fill volume is of 4 392 126 m³ and the total
volume of concrete will be 30 693 m³, divided between the plinth – 2 184 m³, Face – 27 159 m³,
parapet – 1 350 m³.

EIA / RS 15.08 This document may only be reproduced in full. 86/280
Picture 27 – General Plant - Axes alternatives for the dam (COBA, 2013)

EIA / RS 15.08 This document may only be reproduced in full. 87/280
5.3. HYDRAULIC DEVICES FOR THE DAM
5.3.1. Flood spillway
In both alternatives the flood spillway is of controlled surface type with a free blade and a
maximum flow capacity of 10 020 m3/s, the same as the discharge device for the Capanda
hydroelectric scheme. This flow corresponds to a return period above 10 000 years, as show in
point 2.1 - Hydrologic Studies.
In the upstream alternative, the flood spillway is constituted by an inlet structure located on the
dam's body, divided in 3 gates with 18,5 m of width each. In each of the gates, the frontal sill
has a WES profile with a vertical face and a crest located on elevation (610).
The flow plugging and regulating devices fitted to the spillway are composed of segmented
gates (22,0 m x 18,5 m) which are moved by articulated, hydraulic servo motors.
The maintenance and repair works on the segmented gates will be facilitated by a stop log
gate, that is shared by the three gates of the spillway and is formed by components which can
be stacked and moved by a traveling gantry.
In the downstream alternative, the flood spillway applied on the left bank is constituted by a
proximity canal, an inlet structure and a discharge canal. The proximity canal spans 280 m and
its width varies between 67,0 m and 113,0 m. The inlet structure is composed by three spans
controlled by segment gates with the same size as the upstream alternative. The discharge
canal is 560 m long and has a variable width between 63,5 m and 70 m, being coated in
concrete through the first 100 m and left without coating in the remaining parts of the section
until the tailwater on the bed of the river Kwanza.
5.4. TEMPORARY BYPASS
In the upstream alternative, the temporary bypass scheme is composed by the following
elements:
side stop logs on the right bank which guide the river to its central section and allow
the construction of the flood spillway structure;

EIA / RS 15.08 This document may only be reproduced in full. 88/280
the upstream and downstream stop logs installed so as to limit the river bed area
where the construction works on the dam will take place;
branching canal excavated on the right bank, bypassing the flow through six holes of
11,0 m x 7,25 laid out on the spillway's structure.
The topographic characteristics of the downstream alternative's location made necessary the
creation of a different temporary bypass scheme, composed by the following elements:
the upstream and downstream stop logs installed so as to limit the river bed area
where the construction works on the dam will take place;
three excavated tunnels in the slope of the right bank, bypassing the aforementioned
section in a rectangle inclination with 14,0 m of height and 1,40 m of width, as well as
an average span of 495 m, the respective proximity canal, an upstream face and
outlet canal.
The stop logs are composed by applying a rock fill.
The temporary bypass construction work, stop logs and holes on the spillway structure (upstream
alternative) and the tunnels (downstream alternative) were designed for a flow corresponding
to a return period of 50 years (Qdim=4335 m3/s).
5.5. HYDROELECTRIC PLANT AND SUBSTATION
The foreseen hydroelectric plant in Intertechne's EVTE anticipates the application of four vertical
shaft Francis turbines with 510 MW of rated power per unit. The plant and respective equipment
are described in chapters 12.7 and 12.8 of the viability study's technical report.
The study contemplates the application of two traveling cranes with the rated capacity of 400
ton each, which will be coupled to move the generators' rotors.
The report describes and represents the downstream alternative, corresponding to the solution
recommended by Intertechne. However, it's possible to see in the diagrams for the hydraulic
circuits that there's a difference in the draft level being considered (395,000) for the downstream
alternative (402,00) and for the upstream alternative.
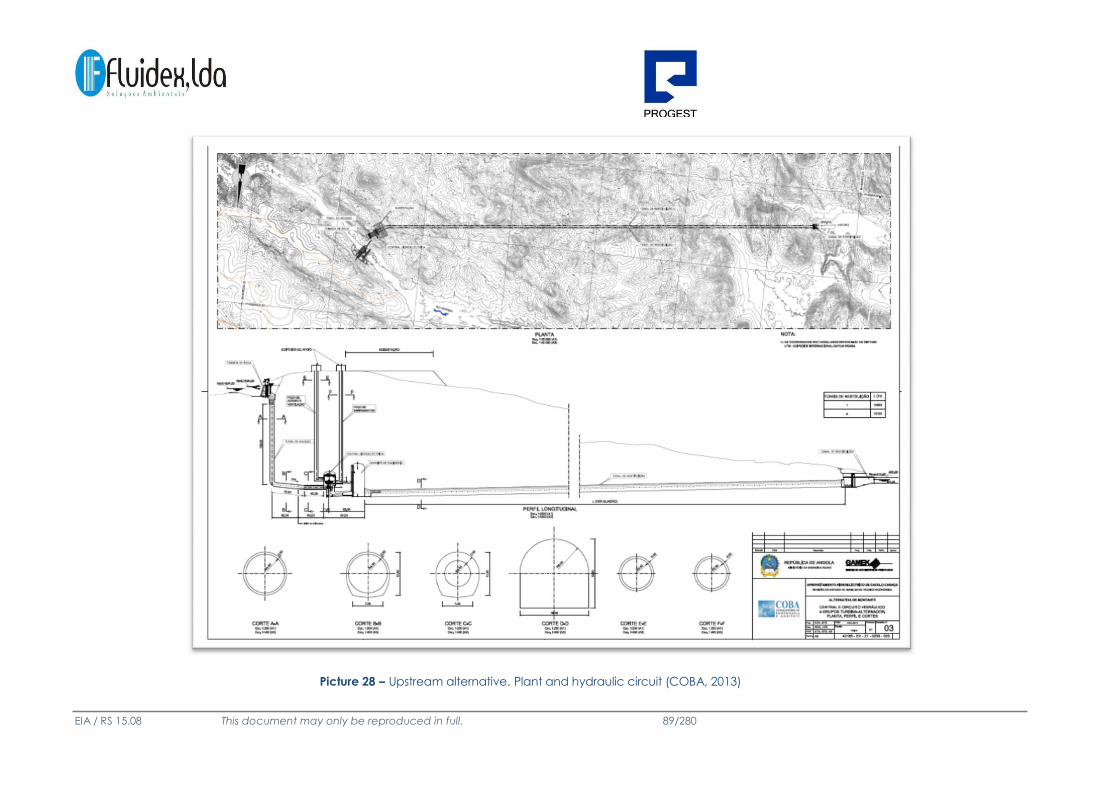
EIA / RS 15.08 This document may only be reproduced in full. 89/280
Picture 28 – Upstream alternative. Plant and hydraulic circuit (COBA, 2013)

EIA / RS 15.08 This document may only be reproduced in full. 90/280
Picture 29 – Downstream alternative. Plant and hydraulic circuit (COBA, 2013)

EIA / RS 15.08 This document may only be reproduced in full. 91/280
Picture 30 – Downstream alternative. Plant and hydraulic circuit (COBA, 2013)

EIA / RS 15.08 This document may only be reproduced in full. 92/280
5.6. CENTRAL HYDRAULIC CIRCUIT
The topographical configuration of the river Kwanza's valley has led, on both alternatives, to the
creation of an hydraulic circuit for the left bank's generating unit, being completely
independent and separated from the dam works.
From upstream to downstream, the circuit is composed by:
Water intake with the respective inlet, gates tower and transition to the headrace
tunnel current stretch;
headrace tunnels, one for each generator, coated in concrete and featuring a
circular section, part of it in a shaft and another part in a slope (6%), shielded in the
sections before the plant;
draft tubes equipped downstream with stop log gates to protect groups;
surge tank applied in the initial section of the tailwater tunnels
tailwater tunnels, two non-coated sub-horizontal tunnels with a rectangle inclination,
transporting the flow until reaching the river Kwanza;
tailwater canal with a non-grooved structure in its initial section to guide the stop log
gates, to dewater the tailwater tunnels.
The tailwater location is common to both alternatives, so the hydraulic circuit of the upstream
alternative is larger than the one on the downstream alternative.
The main characteristics of the various components of each alternative's hydraulic circuits are
presented in the following Framework:
Framework 10 - Characteristics of the central hydraulic circuit in the upstream and downstream alternatives
(EVTE, Intertechne, 2012)
Upstream alternative Downstream alternative
Water intake:
Trash rack nozzle sill
elevation
Emergency stop log gates
(607,0) (607,0)
8x 20,0 m x 6,0 m (un.x H x B) 8x 20,0 m x 6,0 m (un.x H x B)
4x 10,0m x 7,0 m (un. X H x B) 4x 10,0m x 7,0 m (un. X H x B)

EIA / RS 15.08 This document may only be reproduced in full. 93/280
Framework 11 - Characteristics of the central hydraulic circuit in the upstream and downstream alternatives (EVTE,
Intertechne, 2012) cont.
Upstream alternative Downstream alternative
Headrace tunnels:
Number
Section coated in concrete
Shaft length Shaft cross
section
Sloped length of the
tunnel
Cross section of the tunnel
Shielded section
Length of cross
section
Surge tank
Number
Area in the plan
Tailwater tunnels
Number Average
length
Cross section
4 4
203 m 153 m
circularnnnint=9,0 m circularnnnint=9,0 m
57,5 m 968 m
rectangle inclination, H=9,0 m e
B=9,0 m
rectangle inclination, H=9,0 m e
B=9,0 m
60 m 20 m
circular,nnint=9,0 m-nint=7,0 m (cone) circular,nnint=9,0 m-nint=5,2 m (cone)
and circular nint=7,0 m circular nint=5,2 m
1 1
3500 m2 3500 m2
2 2
10 080 m 4238 m
rectangle inclination, H=14,0m and
B=14,0m
rectangle inclination, H=16,0m and
B=16,0m

EIA / RS 15.08 This document may only be reproduced in full. 94/280
Framework 12 - Characteristics of the central hydraulic circuit in the upstream and downstream alternatives (EVTE,
Intertechne, 2012) cont.
Upstream alternative Downstream alternative
Tailwater canal
Nozzle sill elevation
Stop log gates Canal
track elevation
(401.0) (407.0)
1 x 14,0 m x 16,0 m (un. x H x B)
(407.0) (413.0)

EIA / RS 15.08 This document may only be reproduced in full. 95/280
Picture 31 – Downstream alternative. Water intake (COBA, 2013)

EIA / RS 15.08 This document may only be reproduced in full. 96/280
5.7. FINAL CONSIDERATIONS
We can make the following conclusions from the study regarding the venture's viability:
The average annual energy production values are similar to those obtained by
Intertechne's previous EVTE;
Geological and geothermal studies conclude that the chosen locations for both
analyzed alternatives are appropriate for rock fill and concrete gravity dams;
Comparing the alternative configurations for the venture has shown that the
downstream alternative is less expensive than the one upstream, if the same criteria
and principles are followed in their development;
Given the height difference of the dams on both alternatives, the larger amount of
power of the ecological plant in the downstream alternative should be considered an
additional advantage;
The comparison between dam types, in the downstream alternative, has indicated a
small cost difference between rock fill solutions with concrete curtains and roller
compacted concrete, as long as the configuration of the construction takes into
account specific aspects of each type of constructions, and if the cubic meter price
for roller compacted concrete is generally similar to the one used in the Laúca
Scheme;
The comparison between solutions with four to six groups indicates that adopting six
groups in the main plant will have an additional cost of about 16%.
The joint operation of the Caculo Cabaça and Laúca Schemes will be significantly
more simple if both groups have the same rated flow on both schemes.
According to the previous conclusions, the EVTE drafted by COBA in 2013 recommends the
following:
The adoption of the downstream alternative, as proposed on Intertechne's EVTE when
developing the Base Project;

EIA / RS 15.08 This document may only be reproduced in full. 97/280
The use of roller compacted concrete for the dam, leaving to be decided in the future
if competitors might present different types of rock fill with concrete curtain upstream;
The adoption of four generator groups in the main plant, unless a joint analysis with
GAMEK identifies extra advantages which may compensate the higher cost of the six
groups.
The flood spillways are technical solutions to be used in this project to guarantee flood discharge
and make sure that safety is maintained without external intervention and that populations and
transport routes are not affected.
Seeing as it's the only technical solution used in a constant fashion throughout the project, we
propose the inclusion of an intermediate and bottom discharge (already proposed in the base
project), to allow the reservoir to be dewatered at certain points in less time, making it also
possible to transport fine solid materials. It will also help mitigate the impact on the aquatic
fauna, especially fish, by creating a passage canal upstream-downstream of the dam for
migratory species.
The following alternatives are possible to enable the passage of fish from downstream to
upstream: stairs, elevator and a fish sluice.
The powerhouse and the substations must create conditions whereby the equipment's
mechanic oscillations are not transmitted to the respective hydraulic circuits, to avoid out of
control cracks from appearing in the tunnels and consequently causing the walls to give in.
In the substations' gantry there should be indicator lights for aviation, to warn aircrafts,
helicopters and more of the dangers of the location and the high voltages present.

EIA / RS 15.08 This document may only be reproduced in full. 98/280
6. ENVIRONMENTAL CHARACTERIZATION
6.1. GENERAL CONSIDERATIONS
According to the general methodological structure foreseen for this study, below will be
presented the Environmental Characterization of the area affected by the project of the
"Caculo Cabaça Hydroelectric Scheme", which aims to diagnose the current situation
according to various environmental aspects, to support the identification of the main impacts
associated with the project being considered.
Necessarily, the focus shall be placed on environmental aspects/descriptors considered
relevant, that is, which may effectively support the project's environmental evaluation in terms of
proposing balanced environmental solutions and measures.
6.1.1. Methodological Aspects
This stage aims to perform a general diagnosis of the area where the project is to implemented.
To characterize the current situation in terms of various environmental aspects, we resorted to
surveying and analyzing the available, systematized information about the aforementioned
aspects. The data was obtained by consulting available documents or those drafted in
connection with this project, as well as contacting directly local and regional entities or
performing field visitations to gather the necessary elements.
Therefore, the main goal of this stage is to provide a basis for the creation of a diagnosis of the
existing environmental conditions. Taking that as a starting point, we will be able to envision the
evolution of the present situation into the future without the implementation of the project, also
known as Alternative 0 or Option Zero, which will determine the Reference Location.
That projection of the current situation into the future will constitute the reference environmental
location, which will then be confronted with the possibility of the project's implementation,
determining the evolution of the analysis and impact evaluation.
Effectively and in methodological terms, the evaluation of the magnitude and significance of
impacts associated with a specific project is established taking into account two scenarios:

EIA / RS 15.08 This document may only be reproduced in full. 99/280
The scenario of the reference environmental location, composed by the projection of the
current environmental situation into the future without the implementation of the project;
And the scenario expected in that future considering the impact of the project.
Consequently, this approach presents a larger degree of uncertainty in face of the complexity of creating projection scenarios, therefore to ease comprehension, the Reference Location is generally considered the Current Environmental Situation.
2.8 6.1.2. 6.1.2 Field of Study
Depending on the aspects considered, two areas of influence were considered in this study.
- Area of Direct Influence (ADI): corresponds to those areas that will be subjected to direct
impacts, be they positive or negative, and for which an adequate program for
monitoring and mitigation measures should be developed. The areas considered are,
the reservoir, the construction area of the dam, the central water intake, the work site
area and the areas related with deposits of materials for construction.
- Area of Indirect Influence (AII): the areas considered were the basin (Kwanza sub-basin)
area, the section between HD (Hydroelectric Development) Laúca and a location 100m
downstream from the HD Caculo Cabaça discharge outlet.
With regards to map information, the studies and analyses were carried out using a scale or
scales that were most appropriate for each specific situation being assessed.
Taking into account the context of the area being studied and the characteristics of the project,
a pragmatic approach to construction work is adopted in the EIS (Environmental Impact Study),
in which emphasis is placed on the occupied areas closest to the project, as well as on those
areas that, due to their characteristics, demonstrate greater sensitivity from a socioeconomic
and environmental and ecological quality perspective.
On the other hand, according to specific aspects that need to be assessed and the expected
consequences, this area will be included in larger spaces, when the nature of the issues at hand
so justify, and thus, the area descriptors may define a surrounding area

EIA / RS 15.08 This document may only be reproduced in its entirety. 100/280
that is relatively homogenous, while, with regards to social and economic aspects, the
approach should be supported by values and analyses on a Provincial or Regional level, when
so justified.
6.2. CLIMATE
6.2.1. General Considerations
Climate is a set of atmospheric weather patterns that characterize the atmospheric environment
of a given region throughout the year. To define climate, it is necessary to take into account a
subset of possible atmospheric states and, as such, requires the analyzes of an extensive series of
meteorological and environmental data
To characterize the climate, data from the HD of Capanda and the HD of Cambambe, weather
stations were used, as well as data from regional studies and of territorial scope.
The climatological values chosen for analysis in this study were: precipitation (mm), evaporation
(mm), air temperature (C°), relative humidity (%), average solar insolation (hours/day),
atmospheric pressure (mBar) and winds (direction and speed).
The area is located in a region with a warm, humid, tropical climate with two well defined
seasons:
the rainy season, lasting 8 months (September to April), with an average annual precipitation
exceeding 1100 mm, and the dry (Cacimbo) season, lasting 4 months (May to August). The
months of higher precipitation are November and March, with values exceeding 200 mm. The
average maximum monthly temperatures varies between 30 and 34 C° and the average
minimum monthly temperatures varies between 9 and 16 C°. Wind speeds are weak to
moderate with maximum speeds up to 17 Km/h.
2.9 6.2.2 Precipitation
According to the isohyetal chart of Angola, the Caculo Cabaça region is located between the
1,000 and 1,250 mm annual precipitation lines.

EIA / RS 15.08 This document may only be reproduced in its entirety. 101/280
aFigure 32 – Rainfall Distribution (Source - FAO, 2005)
The arithmetic average of the two stations to calculate the precipitation at the Caculo Cabaça
region, taking into account a small spatial variability, was determined from the precipitation
data of the HD Capanda and HD Cambambe stations during the period 1955/1990, as shown in
the table below:

EIA / RS 15.08 This document may only be reproduced in its entirety. 102/280
Table 13 – Average Monthly Precipitation (1955-1990) (mm)
Station Oct Nov Dec Jan Feb Mar Apr May Jun Jul Aug Sep Total
Capanda -
Cambabe
Station Avg.
81.9 252 131 59.6 112 298 160 11.3 0 1 3.2 20 1129
103 183 184 174 148 206 135 18.1 0.6 0.3 2.6 30.1 1184
92.3 217 158 117 130 252 148 14.7 0.3 0.65 2.9 25.1 1157
A high seasonal rain variability can be verified, with a very dry season from June to August, and
a very humid season from October toApril. The month with the highest precipitation is March,
with 251.8 mm.
Figure 33 – Average Monthly Precipitation Chart for the period 1955 to 1990
350
300
250
200 Cambambe
150 Capanda
Caculo Cabaça
100
50
0
Oct Nov Dec Feb Mar Apr May Jul Sep

EIA / RS 15.08 This document may only be reproduced in its entirety. 103/280
250
200
150
100
50
0
Oct Dec Feb Mar Jun Aug Sep
2.10 6.2.3 Evaporation
The following is the potential evaporation chart for the region with maximum and average
monthly values during January and December. The potential annual evaporation was estimated
at 1,612 mm.
Figure 34 – Potential Evaporation Chart
6.2.4. Air Temperature
The available air temperature data is that of the HD Capanda weather station for the period
1955-1990 and are maximum and minimum monthly averages.

EIA / RS 15.08 This document may only be reproduced in its entirety. 104/280
Table 14 – Maximum and Minimum Monthly Temperatures (1955-1990) (mm)
Oct Nov Dec Jan Feb Mar Apr May Jun Jul Aug Sep Averag
e
Maximu
m
Averag
e
Minimum
32 30 30 32 31 30 31 32 33 31 31 34 31
21 22 22 23 23 23 23 23 23 21 20 21 22
16 11 11 16 16 16 15 15 11 9 10 12 13
Figure 35 – Chart with the Maximum, Medium and Minimum Monthly Averages 1955-1990
6.2.5. Air Humidity
The monthly air humidity averages are higher from October to April and lower from May to
September. The lowest humidity occurs in July, at 55%, and during December and March it
reaches 80%. The annual average is 74.1%.
40
35
30
25
20
15
Maximum
Minimu
m
10
5
0
Oct Nov

EIA / RS 15.08 This document may only be reproduced in its entirety. 105/280
Figure 36 – Air Humidity (%)
2.11 6.2.6 Insolation
The amount of sunlight is higher during the summer months (May, June and July), reaching a
maximum of 281 hours during May.
Figure 37 – Insolation (hours/month)
100
95
90
85
80
75
70
65
60
55
50
45
40
%
Oct Nov Dec
300
250
200
150 Hours/month
100
50
0
Oct Nov Dec Feb Mar Apr May Jul Aug Sep
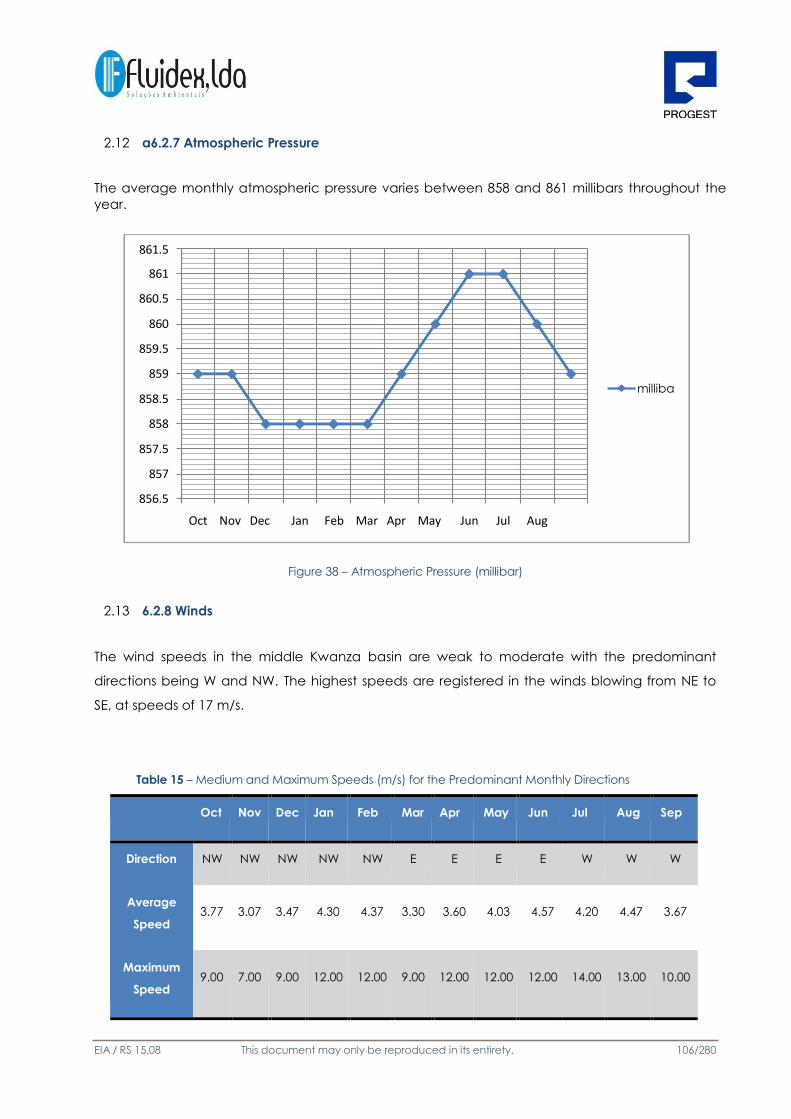
EIA / RS 15.08 This document may only be reproduced in its entirety. 106/280
2.12 a6.2.7 Atmospheric Pressure
The average monthly atmospheric pressure varies between 858 and 861 millibars throughout the
year.
Figure 38 – Atmospheric Pressure (millibar)
2.13 6.2.8 Winds
The wind speeds in the middle Kwanza basin are weak to moderate with the predominant
directions being W and NW. The highest speeds are registered in the winds blowing from NE to
SE, at speeds of 17 m/s.
Table 15 – Medium and Maximum Speeds (m/s) for the Predominant Monthly Directions
Oct Nov Dec Jan Feb Mar Apr May Jun Jul Aug Sep
Direction
Average
Speed
Maximum
Speed
NW NW NW NW NW E E E E W W W
3.77
3.07
3.47
4.30
4.37
3.30
3.60
4.03
4.57
4.20
4.47
3.67
9.00
7.00
9.00
12.00
12.00
9.00
12.00
12.00
12.00
14.00
13.00
10.00
861.5
861
860.5
860
859.5
859
858.5
858
857.5
857
856.5
millibar
Oct Nov Dec Jan Feb Mar Apr May Jun Jul Aug Sep

EIA / RS 15.08 This document may only be reproduced in its entirety. 107/280
Table 16 – Frequency of the Directions of Predominant Winds and Speeds
Direction N NE E SE S SW W NW Calm
%
Average
Speed
Maximum
Speed
2 2.23 21.33 10.63 1.97 5.17 25.07 25.40 6.2
2.27
2.60
3.47
2.73
2.00
2.13
3.80
3.97
0.00
12.00
17.00
12.00
17.40
7.00
7.00
13.00
14.00
0.00
Figure 39 – Frequency of Wind Direction (%)
N
NW
W
30
25
20
15
10
5
0
NE
E %
SW
SE
S

EIA / RS 15.08 This document may only be reproduced in its entirety. 108/280
2.14 6.2.2 Climatic Characterization
The Angolan territory possesses an important diversity of climate, resulting from the conjunction
of latitude and type of terrain with the effects of the cold ocean current of Benguela and the
continentality factor.
The climate is tropical to the north and sub-tropical to the south of Angola, and is temperate in
the areas of higher elevation. A diversified climate results in diverse vegetation, with a regions,
ranging from the desert regions in the Southeast, to the dense and humid savannahs and forests
with super humid climate.
Generally, it could be considered that there are two more or less well defined seasons across the
whole Country:
One is “cacimbo”, dry and cool, from June to the end of September;
The other is the warm, “rainy” season, which occurs between October and the end of
May.
At times, in certain regions, the rainy season is interrupted by a short dry period, known as
the “pequeno cacimbo”, which may occur between the end of December and the
beginning of February.
The climate chart for Angola classifies the Caculo Cabaça region as having a tropical
humid climate.

EIA / RS 15.08 This document may only be reproduced in its entirety. 109/280
Figure 40 – – Climatic Characterization (source: infoangola)
According to the Thornthwaite climate classification, the climate is B1 and B2 humid. According
to the Köpen classification, the climate is Aw. The climograph shows the small dry period, based
on the conditions of precipitation and average temperatures of the region. This condition is one
of the characteristics of humid tropical regions.

EIA / RS 15.08 This document may only be reproduced in its entirety. 110a/280
Figure 41 – Climograph
6.3. AIR QUALITY
6.3.1. Air Quality Characterization
The air quality characterization in the influence area of the project is based on the analysis of
the predominant local conditions, on the assessment of existing quantitative (or extrapolative)
information, on the possible survey of potential polluting sources that may contribute in some
way to the deterioration of the air quality and perception of the situation, on direct interaction
by visits to the location.
There are no air quality measuring stations in the study zone and adjacent areas that were
visited, nevertheless it can be considered that the air quality is good, and it can be expected
that the atmospheric pollution levels be significantly lower than the threshold levels considered
for harmful concentrations.
6.3.2. Legal Framework
There is no air quality legislation currently in force in Angola. As such, international conventions
and protocols in this field ratified by Angola were analyzed

EIA / RS 15.08 This document may only be reproduced in its entirety. 111a/280
as well as guideline values recmended by the WHO for protection of human health.
The United Nations Framework Convention on Climate Change (UNFCCC) is an international
treaty that resulted from the United Nations Conference on Environment and Development,
better know as the Earth Summit, which took place in Rio de Janeiro in 1992. This treaty was
signed by almost all countries worldwide and its objective is the stabilization of the concentration
of greenhouse gases (GHG) in the atmosphere to levels that may interfere dangerously with the
climate system.
The Montreal Protocol is a protocol that relates to substances that destroy the ozone layer. This
protocol was agreed upon at the Vienna Convention, in 22 March 1985, and signed in 16
September 1987. The participants are aware of their obligations, as imposed by the Convention,
to take appropriate measures to protect the health of Man and the Environment against the
harmful effects that result, or may result, from human activities that modify, or may modify, the
ozone layer. Furthermore, it was recognized that the emission of certain substances on a
worldwide scale may significantly destroy the ozone layer, increasing the risk of harmful effects
to human health and the environment.
Angola ratified the Vienna Convention and the Montreal Protocol in 18 June 1998 and is a
Signatory Party of the Montreal Protocol since 17 May 2000.
The Kyoto Protocol, held in the Japanese city of the same name and drawn up by the United
Nations Framework Convention on Climate Change, is an international agreement that aims at
reducing greenhouse gas (GHG) emissions, which are responsible for global warming, in at least
5% within the period between 2008 and 2012. This agreement came into force in 2005 and was
ratified by Angola in 2007.
The first edition of the World Health Organization (WHO) recommendations regarding air quality
(Air Quality Guidelines for Europe) was published in 1987. The objective of the recommended
reference values for various atmospheric pollutants was to provide

EIA / RS 15.08 This document may only be reproduced in its entirety. 112a/280
guide standards for the protection of human health from their harmful effects and support
national and local authorities in the management of air quality.
The referred reference values are shown in Table 17.
Table 17 – Reference values recommended by the WHO (Source, 2006)
Pollutant Reference
Period
Recommended Value
Nitrogen Dioxide Annual average 40 µg/m3
Ozone 8h average 100 µg/m3
PM10 Particles
(particles smaller than 10 µm)
Daily average
(24 horas)
50 µg/m3
There is no realtime data on the quality of the air in Angola due to the non-existence of a
monitoring network. Nevertheless, it can be presumed that the predominant emissions into the
atmosphere have their origin in the burning of fossil fuels. The following points of origin may be
identified in the Province of Luanda:
The circulation of motor vehicles;
Generators used to supply electricity;
Ground fires.
Road transportation is the origin of most of polluting emissions due to the combustion processes,
of which the most important are carbon monoxide (CO), nitrogen dioxide (NOx), hydrocarbons
(HC), lead compounds (Pb) and black smoke, and it is considered that these emissions may be
relevant by the way in which they dissipate into the atmosphere.
Carbon Monoxide --- µg/m3
Notrogen Dioxide
Value (average)
hourly
200 µg/m3
Sulfur Dioxide Daily average (24
hours)
20 µg/m3
PM2.5 Particles
(particles smaller than
2.5 µm)
Annual average
10 µg/m3

EIA / RS 15.08 This document may only be reproduced in its entirety. 113a/280
The frequent practice of lighting ground fires to clear areas for agriculture, as a hunting strategy,
for production of coal for domestic use (estimates point to 80% of the energy used in the country
originating in biomass, etc.), which is one of the main sources of emissions into the atmosphere in
the region and generates a significant amount of carbon monoxide (CO) and dust. This practice
frequently employed by the population is difficult to quantify, although it is considered,
especially during the dryer parts of the year, as very wide ranging due to the consequences it
has regarding air quality, which can be verified on a large scale.
Uncontrolled fires are lit practically every year throughout the country during the dry season. The
information available regarding the extent of these fires, their causes and damages, is limited.
It is a very serious problem, not only in Angola but also throughout the whole of Sub-Saharan
Africa, where more than 30% of the surface is burnt on average every year.
Another important source of dust in the air results from the natural erosion of fine materials by the
wind, during the dry season. When the soil becomes dry, the wind is responsible for the
suspension of large quantities of particles that form dust clouds. This phenomenon also has a
high expression in the region under study and, periodically, the concentration of particulate
material in the air is significant.
The practice of burning of solid waste in all provinces in Angola, not only by the population but
also by some small companies and sometimes even large companies, is also associated with
polluting emissions. Air quality deterioration factors in Angola are bad smells and smoke
originating in the burning of solid waste in the areas where these are accumulated (ex.: the Golf
II and Camama trash dumps in Luanda).
Seeing that no air quality data is known for the Project area and its immediate surroundings, it is
not possible to state precisely if the concentration of these pollutants exceeds or not the
reference values recommended by the WHO.

EIA / RS 15.08 This document may only be reproduced in its entirety. 114a/280
6.3.3. Climate Change
Climate change is a natural occurrence that has always existed. During the past century,
however, the changes registered have been more pronounced than those of any other period
until now. One of the conclusions drawn in the IPCC (Intergovernmental Panel on Climate
Change) report for 1995, points to intense human human intervention over the natural
environment as being the origin of these changes, which have repercussions on the climate at a
regional and global level.
Within this context, it is important to highlight related initiatives, namely the "Climate for
Development in Africa" (ClimDev Africa) Program and the need to apply and continue to
develop instruments related with climate change, namely the United Nations Framework
Convention on Climate Change of 1992, and the Kyoto Protocol, but also the United Nations
Convention to Combat Desertification. During the last century, we have been witnessing an
increase in the concentration of certain gases in the atmosphere, some of which absorb a part
of the infrared radiation that the Earth radiates into space, causing heat to be retained. This
phenomenon is usually referred to as the “greenhouse effect” and the gaseous emissions that
cause it as "Greenhouse Gases – GHG".
This effect is responsible for global warming, which is nothing more than an increase of earth's
average atmospheric temperatures and in the last century was 0.5 °C. Climate changes will
have negative direct impacts on earth's ecosystems, on the various socioeconomic sectors
worldwide, on public health and quality of life of the population in general.
Although Africa contributes with approximately only 3.8 percent of greenhouse gases, countries
in the African Continent are among the most vulnerable to climate change worldwide. This
vulnerability in the region stems from the various pressures associated with the low capability for
adaptation. First, the geographic location of many African countries is characterized by the
existence of very warm climates, peripheral regions that are more exposed to climatic
adversities and, secondly, the economies of a great part of African countries continue to
depend largely on sectors that are sensitive to climate changes, such as dry farming, fisheries,
natural resources and tourism. Thirdly, the African Continent is greatly punished by an
inadequate capability to respond to the direct and indirect effects of climate change due to
the spreading of poverty, inadequate economic and social infrastructures, conflict and

EIA / RS 15.08 This document may only be reproduced in its entirety. 115a/280
limited human, institutional and financial capabilities (in “Climate Change: African Perspectives
for a Post-2012 Agreement”, United Nations, 2008).
As can be seen in the following figure, Angola is one of the countries that, in a worldwide
context, less emissions produces, although in a regional context it stands out, as is the case with
South Africa, due to the emissions produced.
Figure 42 – World Carbon Emission Estimates (Source: Sadeck – Geotecnologias)
For African countries that depend largely on the agriculture, fisheries, forestry and tourism
sectors, which are particularly vulnerable to environmental change, and consequently to
climate change, this increase in temperature is one of the greatest challenges to sustainable
development in Africa.
Anthropogenic practices in the region, with emphasis on the production and consumption of
energy, were identified as the main sources of greenhouse gases that cause climate change,
although some reports highlight increasingly more often the recent importance of dust as an
essential factor for instability and climate change.
Although climate change is affecting all countries, it is foreseen that least developed countries
and other vulnerable developing countries will be affected more rapidly and more intensely.
Africa will be particularly affected in relation with food safety, sustainable water supply and
extreme meteorological phenomena, such as flooding, drought and the threat of
desertification.
The economies and livelihood of an increasing number of communities, countries and sub-
regions of Africa continue to deteriorate due to the spreading desertification, which is

EIA / RS 15.08 This document may only be reproduced in its entirety. 116a/280
partially a result of climate change and endogenous processes of soil degradation.
It is estimated that climate change will cause more frequent and severe droughts, flooding and
other extreme climatic events, which includes placing pressure on water resources, food safety,
health, infrastructures and global development. Most African communities, particularly those in
the area of the current study, are vulnerable to those effects mainly due to the high levels of
poverty, dependence on dry farming, the lack of access to better technology and better
cultivation practices.
The dynamics of the Carbon Cycle, which as a gas stands out as one of the main Greenhouse
Gases, is rather variable with regards to space and time. Carbon emissions are influenced by
factors of human and natural origin. It is very important to bear in mind that, although some
natural systems constitute large Carbon deposits (such as the ocean), their dynamics is mainly
controlled by those systems that have the capability of exchanging it physically with the
atmosphere, as is the case of vegetation and the soil.
The carbon retaining and storing capability of forests in the long term represents one important
point in the global carbon cycle debate and the impacts of climate change, in such a way that
it has been provided for in the Kyoto Protocol.
6.4. GEOLOGY
6.4.1. General Considerations
The current chapter is a summary of the geological characterization work carried out at the
construction area of the Caculo Cabaça dam, under the scope of the Environmental Impact
Study of the Caculo Cabaça Hydroelectric Power Development.
The work was undertaken from 20 October to 20 November 2015 and resulted in the production
of a 1:50,000 geological chart of the plan area of the Caculo Cabaça dam depicting the main
geological structures. A soil chart and hypsometric curve were also produced, both at a scale
of 1:50,000.
Initially, a bibliographic search was undertaken regarding previous works, with the aim of
identifying the main geological units and their stratigraphic positioning. Previous geological
charts

EIA / RS 15.08 This document may only be reproduced in its entirety. 117a/280
were compiled and georeferenced for use in a Geographic Information System (GIS)
Vectorization was carried out with ArcGIS 10.1 software.
A 1:1,000,000 geological chart of Angola, dated 1988, was used together with its respective
explanatory report edited by the Geological Institute of Angola (Instituto Geológico de Angola)
in 1992 and a preliminary study of the N'Hangue Development containing a geological chart of
the reservoir and geological and geotechnical considerations of the region of the scheme. This
report was produced by the Instituto Hidroproekt for GAMEK em 1992.
DATUM Camacupa, UTM projection, zone 33 South, was used as the geographic base.
2.15 6.4.2 Geomorphology
The Angolan terrain is characterized by a series of plateaus that descent from the interior to the
east and southeast and from the coastal plain to the ocean, some of which rise to elevations
higher than 1,500 m. A grouping of highlands occurs, delimited by a narrow strip of lowland
whose elevation varies between 0 to 200 m. Above 200 m mountains and plateaus may be
found, which make up the greater part of the territory. Morro de Moco (Moco hill), located in
the Huambo Province, is the highest point, reaching an altitude of approximately 2,620 m. The
coastal gradient is little pronounced with few bays and protrusions.
The terrain in the hydrographic basin of the Middle Kwanza is diverse, encompassing coastal,
sub-coastal, sub-plateau and plateau terrains. The coastal terrains presents altitudes between 50
and 100 m, and is intensely dissected and pronounced due to the extremely ramified
hydrographic network. It is in this context that the head office of the Dando municipality can be
found, as well as the Cambambe Development reservoir, which are located in the mountainous
foothills that mark the transition to the higher lands of the interior. The terrain is gently rolling and
transitions into more rugged and hilly terrain. Residual terrains with elevations of 800 m occur in
the Kwanza river valley as well as, frequently, inselbergs, also known as “montes ilhas”. Drainage
in some areas is endorheic, characterized by small interior basins that converge towards a
central point at a lower elevation and where water remains for a long period during the dry
season. These natural water reservoirs are regionally known as cacimbas.
The sub-coastal terrains present altitudes of around 400 to 600 m and are characterized by
features of intense or rugged relief, especially in a wide interior strip, which marks the transition
into the sub-plateau terrains. The escarpment steppe, originating at the Kwanza, takes form and
extends into the interior towards the south. The rugged terrain with steep features has a

EIA / RS 15.08 This document may only be reproduced in its entirety. 118a/280
difference in elevation of 600 to 750 m from the base (with contour lines from 300 to 400 m) until
it reaches the crest, which marks the start of the upper plains, with elevations that vary between
900 and 1,100 m. With an approximate bearing of N-S, the escarpment curves to the northwest
(10º30'), and its outline is, at times, almost abrupt. On other occasions, the difference in
elevation is marked by a succession of hills and ridges carved by deep valleys. Situations also
occur where the terrain relief is more or less level or gently rolling, through which the main rivers
pass, such as the Muconga and the Mucoso, and where expressive river banks are traced.
Nevertheless, a relief of rough and pointy features is predominant due to the concentration of
rocky outcrops at soil level, which constitute small protrusions where the inselbergs are found,
which, in some cases, form mountainous bodies. The hydrographic network is not very dense,
becoming more dense towards locations of temporary water courses, such as the Mucoso,
Moisés, Luime and Muconga Rivers; or dryer, with the exception of the Kwanza and Lua Rivers.
The course of the rivers is located almost at plateau level, and does not trace expressive valleys,
with the exception of the Kwanza river, which created a deep incision, cutting deeply into the
terrain along its rapid course of rocky and excavated river bed, with the frequent occurrence of
rapids and waterfalls.
Elevations between 700 and 800 m can be found on the sub-plateau terrains with a typical
rolling relief, where rocky outcrops occur as well as hilly terrain caused by small hills in certain
areas. The hydrographic network is of medium density, divided between the Lucala and Middle
Kwanza river basins, and the main watercourses have a reduced flow during the dry season,
turning into an intermittent flow along its course downstream, as is the case with the Mucosos
river.
The Malange Plateau region corresponds with a vast plateau of gentle to moderate rolling relief,
whose average elevations are situated between 1,050 and 1,250 m.
This terrain is integrated into an immense peneplain that extends from the Kwanza River towards
the north, in the direction of the Camabatela Plateau. This plateau terrain seems to constitute
the older regional plateau, above which no residual relief features can be observed to indicate
the existence of primitive erosion terrains. The aspect of the relief demonstrates a perfect
stabilization, with wide, rolling terrains with a leveled appearance in some places, crossed by
frequent water courses that define open valleys with wide bases, with slight differences in
elevation.
To the east and northeast, the Malange Plateau is abruptly interrupted by the crest of a singular
escarpment that marks the Baixa de Cassange limits. The Gango spring are situated in the old
plateaus of the interior, but the larger part of where its sub-basin is located

EIA / RS 15.08 This document may only be reproduced in its entirety. 119a/280
is integrated into a peneplain of moderately rolling relief, which extends from the crest of the
large Amboim-Seles escarpment and from its northeast extension (Libolo), and extends in depth
towards higher plateaus in the interior until it meets another escarpment that marks that abrupt
transition to the higher plateaus. At the escarpment that separates the local base levels from the
higher levels, the river courses develop into a succession of rapids and waterfalls, denoting
evidence of terrain movement due to deep recessing in the older terrain. As such, expressive
interfluves are defined that, through progressive evolution, result in inselbergs on the edge of the
escarpment.
The western portion of the Malange Plateau corresponds with another large geomorphologic
unit, separated from the upper plateau by an escarpment with differences in elevation between
100 and 150 m. The rivers, when crossing this escarpment, fall from these ledges, as in the Lucala
river and those of its effluent, the Luando river, or cross it by means of successive rapids and
waterfalls, is happens in the Lutete river. This lower terrain is already rather dissected, with
elevations that vary between 700 and 950 m, and is characterized by the irregularity and
roughness of the relief, presenting residual features as a consequence of the backward
movement of the escarpments and movement induced by the rivers, which define deeply
carved valleys that separate, in some areas, expressive interfluves. The direction of the relief is
shown by varied rejuvenating features, with various inselbergs and some rocky hills with the same
bearing as the watercourses. The crests of these hills rise to elevations almost identical to those of
the plateau of the upper level, which extends more towards the east, as can be seen between
the Lucala and Kwanza rivers.
The Lucala river, an important tributary of the Kwanza river, plays an important role in the
arrangement of the terrain. As such, upstream from the Duqye de Bragança waterfalls, whose
rocky sill serves as a dike, the entire hydrographic network has permanent flow, with slow flowing
rivers in deep valleys of swampy base that form meanders and in which the river beds are often
not defined. During the rainy season, the low banks are easily flooded, and stay that way during
long periods and, in a humid climate, create the ideal environment for the formation of organic
hydromorphic or tuff soils. After the fall, the Lucala river picks up speed in a deep river bed and
a more accentuated valley, where low terrains do not exist or, when they do occur, are limited
to narrow edges.

EIA / RS 15.08 The current document may only be reproduced in its entirety.
120/280
Figure 43 – Inselberg bearing in the same direction as the Kwanza river, right bank
6.4.3. Pedology
The Angolan territory has large expansions of fertile soils and abundant natural resources.
However, more than 50% of the soils suffer from constant or periodic erosion caused by rain and
sunlight. The most fertile soils are found along the rivers, where alluviums are concentrated,
which are generally rich in mineral elements and organic compounds, while in drier regions of
desert climate, the soil is not very fertile.
The predominant soils are, generally, Arenosols and Ferrasols, according to the classification
system of the Food and Agriculture Organization of the United Nations - FAO. According to the
classification system of the United States Department of Agriculture-USDA, the Angolan soils fall
into Entisols, Ultisols and Oxisols. The Huambo and Bie provinces contain various types and
combinations of these soils, depending on the detailed characteristics of horizons, such as
Ferralic arenosols, Gleyic arenosols and Acric ferrasol, which are predominantly arenosols and
ferrasols, but with several other detailed features such as moisture, mineralogy, presence of
specific horizons for the location.
The ferrasols are very developed and deep soils, of clayey or clay texture, with optimal porosity,
red to yellow in color, have good drainage, high acidity and low

EIA / RS 15.08 The current document may only be reproduced in its entirety.
121/280
natural fertility. In these soils, the migration processes are restricted by the high degree of stability
and stillness of clay, providing optimum physical properties, but requiring chemical and organic
fertilization, liming and erosion control, and are suitable for demanding cultures when well
managed. The ferrasols are more resistant to erosion.
The arenosols are poorly developed soils, very sandy, yellow in color, without natural structure,
deeply, moderately or extremely drained, acidic and low in nutrients, which find it difficult to
absorb. Soils that are unwieldy and unsuitable for demanding crops, and more susceptible to
erosion.
In the catchment area of the Middle Kwanza River, one can observe the distribution of soil types
associated with the climate and bedrock. In soils of dry climate areas, are mainly fluvial alluvial
soils. In the highlands, there are scattered areas of favorable topography and more or less deep
soils with good physical characteristics. The brown Limestone soils are (related to cretaceous
formations); the Aridic Tropical soils, especially the reddish brown Meso-aridic and the brownish
grey Ulti-aridic soils; Clays (clays - black and reddish brown Lithoclay); and Fersialitic Tropical
soils, and Tropical Eutrofersialic soils, especially brownish chromic clino clay.
further to the plains and some feature spots planed in the highlands, the undertaking is limited
due to unfavorable topographic conditions, dominated by Litholic soils and associated Lithosols,
in some cases, and rocky outcrops. Even in mild rolling relief surfaces, the occurrence of stony
elements should be noted, and in many cases the soils being less thick. In other areas Psammitic
soil can be found, with coarse or coarse/medium textures, sometimes made up of covering
quartz materials or originating in quartziferous Precambrian rocks containing weatherable
mineral reserves (feldspathic and micaceous materials) and little fine fraction of the soil related
fersialitic clay (Psamofersialitic soils), which may be suitable for agricultural irrigation. In this area
deep valleys filled by colluviums, corresponding to Coluvionais or C o l l u v i u m - a l l u v i a l
soils, can be found that are very fertile and suitable for agricultural irrigation.
In transition zones, climatic conditions favor the occurrence of Fersialitic Tropical soils, which
generally have fine textures and are well structured. In these areas, clino-argilic chromic
Tipofersialic soils with little mineral reserves, are predominant, but have good thickness.
EIA / RS 15.08 The current document may only be reproduced in its entirety.
122/280
In areas with humid climates, mainly Ferralitic soils occur in surfaces of level relief, related to
older Precambrian crystalline rock formations and ancient sedimentary rocks. These soils are
characterized by having good physical characteristics, low or very low fertility, usually occurring
in level reliefs.
Associated with Ferralitic soils, Paraferraliotic occur, but only in reliefs of high movement and high
fertility, due to the presence of minerals. They are found also, of coarse texture soils,
corresponding to deposits of sandy materials related to the Lower Kalahari and the Pleistocene.
Psammitic are the soils of humid regions (brownish or grayish in color), and Psamoferralic soil
(orange or red in color), both mainly consisting of quartz sand and reduced clay fractions. The
fluvial lowlands present Hydromorphic humic soils and also organic Hydromorphic soils. The latter
occurring in larger areas where water retention occurs permanently or for extended periods of
time. It also occurs in humid soil climates with lateritic materials near the surface (shallow soils).
6.4.4. Regional Geology
Regionally, the area under study is part of the Kwanza Horst, defined as one of the major
tectonic elements of the general Table of the Angolan Geological Chart (scale 1: 1,000,000). It is
a linear increase latitudinal base, about 300 km long and 25-50 km wide, limited to the north and
south by deep failures. This structure was covered in several cycles of the Upper Proterozoic, by
a thin cover of sedimentary deposits. The survey of the base block has reached its maximum
amplitude in the final phase (orogenic) of Upper Proterozoic cycle.
By analysis of existing maps are perceived failures alignments with some kilometers in length,
associated with systems management subvertical fractures N10o-40oW and N50o- 80oE, some
diaclases still occurring in some sub-horizontal contacts between strata. Generally speaking, the
Kwanza River valley and its tributaries were excavated in the areas of least resistance, both in
gneissic rocks as well as in sedimentary.
The portion of the Middle Kwanza river basin located in the region of the town of Dondo (coastal
area) encompasses the rock and crystal formations of the Hercynian Massif. Most of these rock
formations are characterized by a high degree of metamorphism, and are included in the
EIA / RS 15.08 The current document may only be reproduced in its entirety.
123/280
Base Complex, where the gneiss, paragneiss, migmatites, mica schists and granite gneisses are
the most abundant rock materials. These materials are generally very high in filonian quartz,
however, outcrops of little to not metamorphosed granitoid facies occur.
Between Alto Dondo and the Kwanza River there is an important area of schist rocks associated
with arkose (included in Sansikwa Series - Western Congo System). Sedimentary formations cover
first emerge in close edge, then widen considerably, coming to integrate into the sedimentary
basin of Kwanza where outcrop deposits ranging from the lower Cretaceous to the Holocene,
representing the first peripheral strip inside the spot, in contact with the crystalline rock complex
and the last, largely corresponding to the maritime lower edge.
In the region of the Malange Plateau, the Base Complex formations have wide distribution along
a central strip EW involving the west much of the river basin Lucala, indicate where frequent
rock outcrops. To these formations correspond metamorphic rocks, mainly gneisses, migmatites
and granite-gneisses, with abundant quartz veins characterized by its varied texture and
mineralogical composition also represented, though sporadically, quartzite and schist quartz
that give rise to rocky landforms much Surface and other highly metamorphosed rocks.
The largest representation is up to the ancient sedimentary formations of the upper
Precambrian, which covered largely crystalline rocks of the metamorphic base. Essentially they
consist of sandstones and conglomerates of reddish or pink colors and arkose, greywacke,
shales and silty. These formations include on xisto-gresoso group, the latest age of the Western
Congo System, the various constituents rocky materials of the series, the gresifero, coarse and
consolidated, are occupying larger areas, among which stand out the outcrops that make up
the falls of Lucala and Luando. The region of the Gango sub-basin is in the continental Ancient
Massif, in correspondence with Precambrian formations.
In the xisto-gresoso group are the layers of Pungo Andongo, consisting of arkosic sandston,
conglomeratic sandstones and conglomerates, with a predominance of shingle and
subrounded pebbles. The cement that aggregates these materials is of gresosa nature and
purple in color. The rocky monoliths that rise from the Pungo Andongo flat Savanna, known as
Pedras Negras and Guinga stones belong to these typical conglomerates. Apart from these
rocky outcrops, others occur in the lower flattening west of Pungo Andongo.

EIA / RS 15.08 The current document may only be reproduced in its entirety.
124/280
sometimes arranged in ridges along the banks and the very bed of the Kwanza River, causing
rapid and frequent falls (Jumping Horse and Mucala rapids). In these places, there is the
alternation of conglomerates and sandstones with frequent interbedded red mudstones.
Aside from these cases, outcrops of rock materials in sedimentary substrate surfaces of the upper
Pre Cambrian are rarely observed. It also pointed out various surfaces covered with coarse
unconsolidated deposits, mainly the Kalahari sands (Upper Tertiary and Pleistocene) to the
northeast, take great expression, and its limit set by the escarpment from the Baixa de (Lower)
Cassange which borders the plateau surface. The Kalahari system, which relates to continental
and tertiary quartz sediment consists essentially of coarse sandstones of yellowish, brownish or
grayish and friable consistence, often arranged in thick horizontal layers. The constituent quartz
elements are rounded due to wind transport and are agglomerated by ferruginous and mild
cement. Almost all the Kalahari is covered with mantle of unconsolidated sands and
predominantly aeolic of more recent age and whose deposition probably occurred in the
Pleistocene.
Besides the large patches of sand, other smaller and low thickness sporadically distribute the
plateau surface, more precisely in the northern portion, seating in sharp disagreement over the
ancient formations of xisto-gresoso, being composed of poorly consolidated sands or even loose
and outcrops of detrital sedimentary materials, rolled and sub-rolled, of gresífera, quartzite and
gneiss nature, mixed with abundant laterite material. Above this level of gravel a light layer of
quartz sand occurs.
In the region of the town of Calulo, in the Kwanza South province, the formations of the eruptive
complex Precambrian cover on the large batholith that begins with the Kwanza River and
spreads south, involving much of the subplanaltic and planaltic regions of the west-central
Angolan territory. Rocks are mainly composed of granite, granodiorite, quartzodiorite and
monzonitic granite.
South of the Kwanza river course occur rocks of the xisto-gresoso group and of the Base
Complex. The formations of the xisto-gresoso group are represented in the northern portion of
the outcrop area of compact sandstones, coarse or medium grain, purple colored and
physiographically identified with very flattened surfaces. The Base Complex features ofilic crystal
formations sharp metamorphism, with metamorphosed rocks and semi metamorphosed mainly
gneiss, granite-gneisses and various schist. The

EIA / RS 15.08 The current document may only be reproduced in its entirety.
125/280
tops of the mountain shapes are mainly of quartz and quartzite rocks. There are the formations
of the eruptive complex Precambrian, mainly composed of granite, granodiorite, quartzodiorite
and monzonitic granite, with wider representation of granitic rocks. To the west of the town of
Calulo occur sedimentary rocks spots Sansíkwa training related to outcrops of quartzite rocks
and quartziferous sandstone, in correspondence with the crownings of the most important
mountain ranges and schists more identified clay in flattened relief areas.
The study area consists of rocks of Precambrian age over age 540Ma, with the whole area of
Caculo-Cabaca of use consists mainly of gneisses, amphibolite migmatite and interleaves the
Base Complex (Arqueano- Lower Proterozoic). On the surface, the rock is shown fractured, with
indications of banding material and altered zones. The average particle size is fine and the rock
is shown with high hardness.
Picture 44 - Regional Geologic Chart of the Construction Area of the Hydroelectric Development of
Caculo- Cabaca.

EIA / RS 15.08 The current document may only be reproduced in its entirety.
126/280
Picture 45 - Lower Proterozoic Granitoid intrusions on the right banks of the construction site of the
Hydroelectric Development of Caculo-Cabaca
Picture 46 - Granite gneiss of the Upper Archean / Lower Proterozoic on the left bank of the construction site
of the dam.
Associated with gneiss-migmatitic land, occur bodies of intrusive granites and massive volcanic
rocks and intercalated and / or itabirites lenses, probably

EIA / RS 15.08 The current document may only be reproduced in its entirety.
127/280
controlled by regional structures previously mentioned. Gneisses overlaid on the slopes of the
river and above, there are sedimentary rocks of the Upper Proterozoic, correlated to the Slate
Group Gresoso and subordinate, to Shale-Limestone Group. Predominantly sandstones,
conglomerates and arkoses while limestones occupy only a few highs in the mid-west part of the
area. To note that, in the eastern portion, sandstone sequence appears to have lesser degrees
of fracturing and evidence of metamorphism.
There were two orogenies (Archaic - Eburiana and Slate - Kibariana Pan African) and was given
the utmost importance to technogenesis the Upper Precambrian (620Ma.), Which conditioned
the folds and intense metamorphism that hit both the sedimentary rocks as the Base Complex
and promoted the installation of basic and granitic intrusions.
Picture 47 - Detail of the granite gneiss of the Upper Archean / Lower Proterozoic on the right bank of the
construction site of the dam.
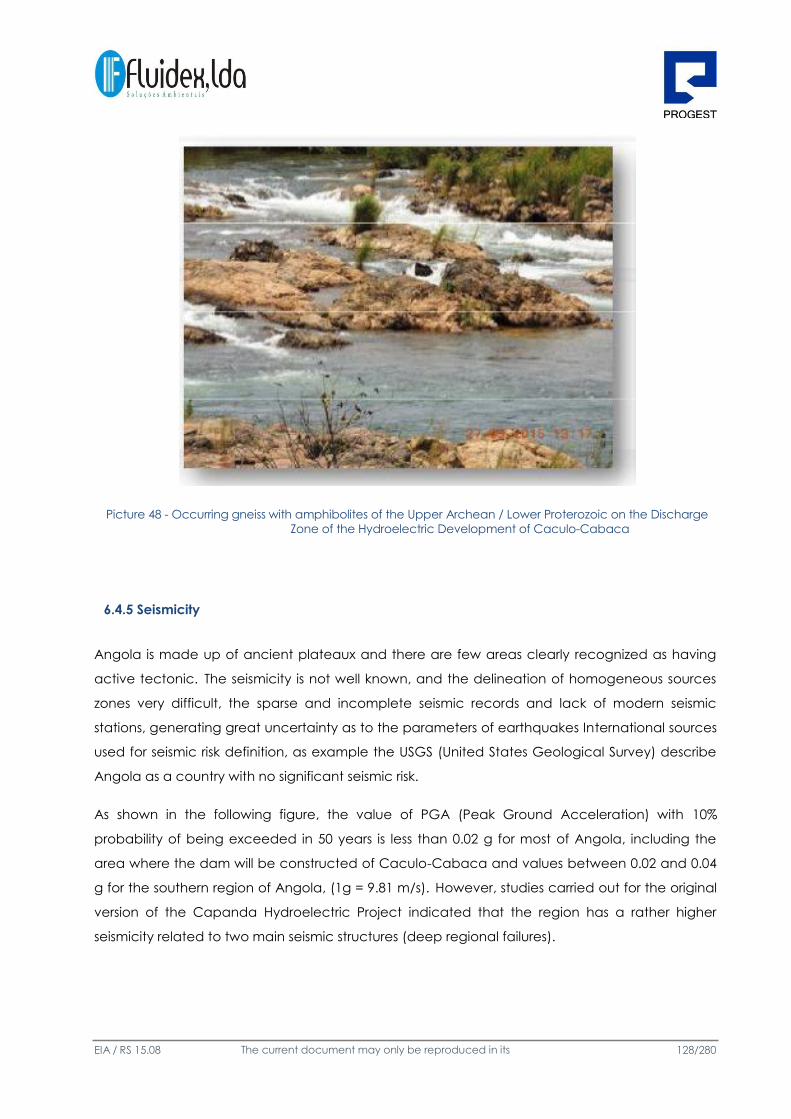
EIA / RS 15.08 The current document may only be reproduced in its entirety.
128/280
Picture 48 - Occurring gneiss with amphibolites of the Upper Archean / Lower Proterozoic on the Discharge
Zone of the Hydroelectric Development of Caculo-Cabaca
6.4.5 Seismicity
Angola is made up of ancient plateaux and there are few areas clearly recognized as having
active tectonic. The seismicity is not well known, and the delineation of homogeneous sources
zones very difficult, the sparse and incomplete seismic records and lack of modern seismic
stations, generating great uncertainty as to the parameters of earthquakes International sources
used for seismic risk definition, as example the USGS (United States Geological Survey) describe
Angola as a country with no significant seismic risk.
As shown in the following figure, the value of PGA (Peak Ground Acceleration) with 10%
probability of being exceeded in 50 years is less than 0.02 g for most of Angola, including the
area where the dam will be constructed of Caculo-Cabaca and values between 0.02 and 0.04
g for the southern region of Angola, (1g = 9.81 m/s). However, studies carried out for the original
version of the Capanda Hydroelectric Project indicated that the region has a rather higher
seismicity related to two main seismic structures (deep regional failures).

EIA / RS 15.08 The current document may only be reproduced in its entirety.
129/280
The first failure called Kwanza South, spends about 15 km from the Capanda dam, on the right,
being related to two earthquakes in 1968 and 1976, with magnitudes of 4.4 and 4.8 respectively.
The depth of this last earthquake was 33 km.
The second failure, without special designation, is now about 50 km from the Capanda dam
from the left flank, being related to a major earthquake in 1914, of magnitude 6.45 ± 0.46 and
two minor earthquakes, with magnitude 4 and 6. Probably these earthquakes were recorded in
regional seismograph stations and not given in the catalogs of international registrations.
Picture 49 – African Seismic Risk Chart Source: USGS

EIA / RS 15.08 The current document may only be reproduced in its entirety.
130/280
6.6. GEOTECHNICS
Various geologic, geotechnical and geophysical prospecting campaigns were undertaken with
the aim of producing a geomechanical model of the soil and rock massifs.
Picture 50 - Location plan of the sounding bores, Seismic profiles and Resistivity Profiles.
6.6.1. SEISMIC REFRACTION PROFILES
18 seismic cross-sections totaling 8,350 m in order to define the thickness of unconsolidated
material and contours of fresh rock were held.
In general, the location of the Hydroelectric Development of Caculo-Cabaca presents a seismic
frame three (3) layers arranged as follows: (1) surface layer consisting of residual soils

EIA / RS 15.08 The current document may only be reproduced in its entirety.
131/280
and/or transported cute with propagation velocity of seismic waves (Vp) between 0.4 and 0.75
km/s; (2) intermediate layer consists of compacted soils and/or fractured/weathered rock, Vp
between 1.10 and 1.80 km / s (3) rock massif consists of Base Complex rocks (mainly gneisses,
amphibolites, granites) with Vp values ranging between 5.0 and 5.8 km/s.
6.6.2. RESISTIVITY PROFILES
22.260 m of profiles were undertaken with the purpose of detecting the presence of structures
such as failures, alteration zones, fracturing, contacts, etc.
The Interteche company that conducted the studies wove the following considerations for the
structural characterization of the development of the site:
a) - Dam
In the dam area of the two conductive anomalies identified in the SCE-301 cross-sections (ME)
SCE-302 (MD) were treated as possible faulting (Picture 3.1). The information field indicate that
these alignments seem to sub parallel with the failure zone N60° W/subvertical that beacon
Kwanza river upstream of dam shaft and must dial the contact / transition between the main
units that occur in the area, as shown in Document 0704-CA-DE-110-12-103. On the left bank,
there is a more pronounced alignment gneissic banding in place, combined with a very
expressive relief break, but no significant evidence of brecciation. In any case, one would
expect a relative weakness (most fracturing and weathering) in these major geological contacts
of the rock mass. On the right bank, the failure is inferred, since the occurrence of talus along
almost the entire base of the slope complicate the direct field of view.
b) Left Bank - Dike
The SCE 303 anomalies (E16 / E17) and ESA-309 (E33-37) relate to a possible area of contact
between a predominant portion of metabasic rocks (amphibolite) occurring in the vicinity of the
water outlet location basis and gneiss. Probably it is associated with an inferred failure attitude
N65°W/80°SW and accompanying regional trend, and in the field we observe a narrow strip of
quartz schist (around 10-15 meters) weathered occurring in drainage bed that cuts the SS-310
and SCE-309 cross-sections, 300 meters SW of the SM-209 sounding bore.
c) - Left Bank – Generating Circuit

EIA / RS 15.08 The current document may only be reproduced in its entirety.
132/280
The SCE-303 anomalies (E55-E56) and SCE-306 (E21-E25) relate to probable failure of
N70°E/vertical attitude and approximate width of 10 meters (geophysical data) whose extension
to intercept the tunnel pressure and engine room access tunnel. Geomorphologically it is
embedded in drainage valley subparallel to the pressure tunnels and tailrace, at a distance of
155m from these. In that section of the SCE-303 occurs topography range planed with quartzitic
elluvium (milky quartz) and homogeneous and fine grain rock fragments. Soon after, toward the
powerhouse, the gneisses appear once again. Added to this data is sounding bore SR-221,
undertaken in order to reach the above-mentioned failure. 80 m deep and 30° angled toward
the failure, this sounding bore was moderately fractured, although it presented bedrock for most
of the sounding bore. Plans with features related to failures were observed (stretch marks and
rebounds), but can not confirm the presence of a significant failure zone since the rock mass has
good geomechanical indexes.
The interpretation of anomalies SCE-308 (E16/E20), SCE-306 (E17/E16) and SCE-311 (E16)
suggests that the failure above is apparently truncated by an attitude of failure
N52°W/vertical, which is partly embedded in a little dug drainage valley. This alignment
marks the area of contact between the gneissic base and a range of 200 to 300 meters wide
dominated by blocks and boulders of metabasic, greenish and compact rock (amphibolites).
Its extension to SW must intercept the opening stretch of tailrace tunnels.
As for the anomaly indicated on the SCE 304 (E90-E91) it is a likely contact between the "spot"
N-NW of amphibolite rock occurring interspersed in gneiss area. In the location, foliation
shows N23° W/vertical attitude.
Moreover, a NS/vertical failure occurs in a well embedded drainage passing just beyond the
end (P1 Point) of the geophysics section SCE-305, marking the contact region between gneiss
base (west) and predominant band of amphibolite (east) which usually occur as blocks and
boulders. Considering low resistivity stretches on section SCE-304 (E164-168), its extension
south is inferred, cutting a little excavated drainage valley and eventually intercepting the
tailrace tunnels.
Data from SCE sections (E97-E119) and also supported in sections SCE-202/208/209 of the
geophysical survey of the upstream alternative indicate an area of about 400m forming a
conductive anomaly that should be associated with rock changes and water saturation
(Picture 3.2). This is a major failure zone (N23-40° W, subvertical), located 1.7 km before the
end of the tailrace tunnels and separating

EIA / RS 15.08 The current document may only be reproduced in its entirety.
133/280
the gneissic base of granite. In the field, more deformed and brecciated tracks are noted near
these tectonic contacts.
Probably the anomaly indicated in the stretch E90 / E91 of the SCE-304 section refers to the
amount of large failure zone described above, perhaps marking the transition between
gnaissified granitic and homogeneous granitic, sound rock in the field.
After the execution of the geophysical surveys, two sounding bores were drilled in the
aforementioned anomaly region, to check the massive conditions along this probable zone of
failure. The SR-223 and SR-224 sounding bores are located respectively in the center of the
valley and laterally thereto, to a depth of 160 m each, and with inclinations of 35° and 30°
upstream along the axis of the tailrace tunnels.
The SR-223 sounding bore reached bedrock at 20.20 m. The reddish gneiss porphyroblastic rock
with occasional pegmatite veins - presents itself moderately fractured with sporadic streaks and
bumps and fragmented cross-sections. Loss of water tests showed generally very low to low
permeabilitis (H1 and H2), but with sections with corresponding moderate to high values, mostly
to more brecciated and fractured passages. Despite the fracturing, the rock is hard and very
little weathered.
On the other hand, sounding bore SR-224, located closest to the slope, has better
geomechanical characteristics than the SR-223 sounding bore. The bedrock is found at 11.20 m
(9.70 m vertically) to further reach sound rock, which is a gray and red porphyroblastic granite-
gneiss, occasionally a little fractured (F1 and F2) and with zero to very low permeability (H1) to
the end of the sounding bore.
Thus, the results of these sounding bores confirmed the presence of a failure zone and
lithological contact in inundated area in the middle section of the tailrace tunnel, however it is
worth mentioning that the resistive anomaly obtained in geoelectric section SCE-304 is probably
more closely related with the presence of water in the rock fracture planes than with the high
degree of weathering.
The failure indicated by the anomaly in the SCE-304 section (E48/E47) refers to a shear zone
with a dip angle of N26°W/vertical and is characterized in the field by a strip approximately
20m wide of brecciated quartzites with sericite , which cuts the sequence of intrusive rocks
(granite/granodiorite) dominant in the third end of the tailrace tunnels.
The inferred failure (N30°W/angled towards NE) occurring in the final stretch of the tailrace
tunnels is related to a high resistivity region in the SCE-304 section, also confirmed by a
conductive anomaly in the SCE-202 section (E16/E17). Although not visited in the field, it can
be part of intense fracturing. Although not visited in the field, it may be a zone of intense
fracturing.

EIA / RS 15.08 The current document may only be reproduced in its entirety.
134/280
Picture 51 – View of the Geological failures occurring in the region of the Hydroelectric Development of
Caculo-Cabaca.
6.6.3. SOUNDING AND FIELD STUDIES
13 percussion sounding bores were undertaken, totaling 1,055.54 m, whose depths varied
between 22 and 286 meters, with RQD, degree of weathering, degree of fracturing, SPT tests
and Lugeon and Lefran permeability tests. These sounding were undertaken in the dam, power
plant and water intake and tailrace tunnel areas.
6.6.4. RISK OF EARTHQUAKES
According to the report of the geotechnical designer company INTERTECHNE available
information indicates that in Angola there are few areas clearly recognized as having active
tectonic activity. The seismicity is not well known, and delineating areas.

EIA / RS 15.08 The current document may only be reproduced in its entirety.
135/280
homogeneous sources much hampered by sparse and incomplete seismic records and lack of
modern seismic stations, generating great uncertainty as to the parameters of earthquakes.
International sources used for seismic risk definition, as an example the USGS (United States
Geological Survey) describe Angola as a country with no significant seismic risk to the value of
PGA (Peak Ground Acceleration) with 10% probability of being exceeded in 50 years is less than
0.02 g for most of Angola, including the area where the Caculo-Cabaca dam will be built, and
values between 0.02 and 0.04 g for the southern region of Angola. (1g = 9,81 m/s²).
However, studies carried out for the original version of the Capanda Hydroelectric Project
indicated that the region has a rather higher seismicity related to two major seismogenic
structures (deep regional failures). The first failure called Kwanza South, passes about 15 km from
the Capanda dam, on the right, being related to two earthquakes in 1968 and 1976, with
magnitudes of 4.4 and 4.8 respectively. The depth of this last earthquake was 33 km. (In the
Capanda study, the maximum intensity of this failure M = 6.5, project value was adopted). The
second failure, without special designation, is now about 50 km from the Capanda dam from
the left flank, being related to a major earthquake in 1914, intensity 6.45 ± 0.46 and two smaller
earthquakes with intensity 4 and 6. (In the Capanda study, the maximum intensity of this failure
M = 7.0, project value was adopted). Probably these earthquakes were recorded in regional
seismograph stations and not given in the catalogs of international registrations.
Still according to the designing company Intertechne Consultores S.A., if for the Caculo-Cabaca
the same considerations as for Capanda are adopted, (most conservative) and using a
distance from the site of the Caculo dam to the Kwanza South failure of about 25 km, one
obtains a PGA = 0.24g for maximum intensity of M=6.5. For the ESF-IV failure using a distance
between this failure and the Caculo-Cabaca dam of 45 km, one obtains 0.21 g = a PGA for a
maximum intensity M = 7.0. Having adopted for the Caculo-Cabaca dam, a PGA = 0.25g.

EIA / RS 15.08 The current document may only be reproduced in its entirety.
136/280
Picture 52 – Tectonic Structural Configuration of the Capanda Development Region
2.16 6.6.5. 6.6.5 CONCLUSIONS
Although the scope of survey did not reach the levels defined for the main underground works,
the anomalies indicated in the geoelectric cross-sections are generally consistent. There is a
good relationship with the field information, highlighting the positioning of failures and/or
contacts between the main geological units (gneissic basement, amphibolite intercalations and
granites) occurring in the area of the dam and along the generating circuit of the Hydroelectric
Development of Caculo Cabaça.
The dam, spillway and river diversion locations are located over hard rock containing fractures,
which are generally closed, thus high permeability is not expected, especially in the gneiss. A
similar behavior is expected from the granite rocks. Nevertheless, at the contacts or in failure
zones, it is likely there is a greater amount of fracturing and permeability, which will require
systematic treatment.

EIA / RS 15.08 The current document may only be reproduced in its entirety.
137/280
The ground cover in this area is variable with thin covering over the hills and greater thickness
over the lower relief features or failure zones. The soil is sandy silt, a little clayey, demonstrating
stable behavior.
At foundation level of the dikes near the water intake, a considerably thick layer of weathered
soil and rock occurs, which is associated with the failure zones.
The slope excavation of exposed rock should show stable, except the areas of higher
concentration of fractures associated with unfavorable inclines of foliation ,which may form
unstable wedges of rock.
The rocks where the water intake, penstocks, power plant and discharge tunnel will be built,
show favorable geotechnical conditions for the implementation of structures. They are basically
very hard gneiss and granite, solid and of low permeability. At depth, a similar behavior is
expected from the amphibolites that will eventually intersect the discharge tunnels. The rock
mass, however, shows a system of localized fractures and failures that will require detailed study
during construction, such as mapping out the excavation fronts and additional field
investigations to determine the geomechanical classification of the rock body and identify
failure/shear zones which may require special treatment.
6.7. HYDROLOGY
Water as a natural resource, has an effective presence almost everywhere, whether in its liquid,
solid or gaseous state. Water is a powerful chemical reagent. The role it plays is crucial to the
emergence and maintenance of life.
One of the constituents of the Water Cycle is a new cycle - the Water Use Cycle, as illustrated in
the following Picture:

EIA / RS 15.08 The current document may only be reproduced in its entirety.
138/280
Picture 53 - Water Cycle / Water Use Cycle
The Water Use Cycle starts with the capture of this natural resource, where it is channeled into
the abduction and utilization infrastructures, and finishes where it started, with the discharge of
the used water into the environment.
Any type of use induces changes in the aquatic environment, either quantitatively, qualitatively
or even over time. Quantitative changes may only be temporary, or may correspond to losses
by evapotranspiration; qualitative changes are a result of pollution, through the introduction of
foreign substances into bodies of water and contamination by bacteria and viruses.
These changes cause more or less significant environmental impacts, depending on the case,
and it is therefore necessary to control the situation through water balance, which results in
obtaining a balance between the potential and actual needs, thus implying the planning of its
use.
The overall objective of water management is to develop and use water efficiently, in a way
that is economically sustainable and fair in order to meet the demand by society, and goods
and services related with it.
Global Cycle of
Water
Water Use Cycle
EIA / RS 15.08 The current document may only be reproduced in its entirety.
139/280
The hydrographic setting in Angola is closely related to its relief, since the origin of the rivers
(source) is in the plateaus and mountainous areas, which then flow to regions of lower relief.
According to the data collected, there are four aspects, regarding the water flow:
The Atlantic slope, with the Chiluango, Zaire or Congo rivers, the Bengo, Kwanza or Cuanza
rivers, the Queve or Cuvo river, Catumbela and the Cunene rivers;
The Zaire slope in the north of Angola, with the Cuango, Cassai rivers and their tributaries, the
Cuilo, Cambo, Lui, Tchicapa and Luachimo rivers;
The Zambezi slope, to which the rivers of eastern Angola belong, such as the Zambezi
tributaries, the Luena, the Lungué-Bungo and the Cuando;
The Kalahari slope, with many rivers of intermittent regime, where the Cubango rivers and its
Cuchi and Cuito tributaries are highlighted.
Although the Republic of Angola has a wealth of appreciable water sources, spread across 47
river basins, these resources are not available, in quantity and quality, where they are most
needed. Water scarcity increases from the north to the south of the Angolan territory, forcing the
use of water supply solutions based on surface and underground resources, or both.
The source of the Kwanza river lies in the southern edge of the Bié Province, in the Catota
Locality, Commune of Mumbué, Municipality of Chitembo, and flows approximately 1,000 km to
the river mouth approximately 60 km south of the city of Luanda. It crosses most of the Bié
Province in a South/North direction for 250 km and constitutes the border between the provinces
of Bié and Malanje (190 km), between Malanje and North Kwanza (220 km), between North
Kwanza and South Kwanza (65 km), between North Kwanza and Bengo (60 Km), it crosses the
Bengo Province from Canzongo to Bom Jesus (80 Km) and establishes the border between the
Luanda and Bengo Provinces on its way to the sea for approximately 60 Km.
The Kwanza River was divided into three (3) distinct hydromorphological levels:

EIA / RS 15.08 The current document may only be reproduced in its entirety.
140/280
the Lower Kwanza section, with approximately 180 km and an elevation difference of 30
meters, which extends from the Cambambe Dam discharge to the sea and is
characterized by the crossing of the peneplains of the pereoceanic depression, with
their extensive floodplains where large lacustrine complexes are formed. The river runs
slow and is somewhat meandering in a broad, shallow valley between the low hill
formations of the Luanda and Cacuaco formations, consisting of ferruginous sand, clay,
limestone, argillite, siltstone and sandstone. Its main tributary is the Lucala river.
Picture 54 – Aspect of the Lower Kwanza Floodplains and Lacustrine System near Bom Jesus
the Higher Kwanza section, approximately 570 Km in length and a 520 m difference in
elevation, extends from the Catota spring, Mumboé Commune, Monicipality of
Chitembo, Bié Province, to the Kwanza Falls in Camaça. It springs in very dendritic
network at elevation 1550 m and its course of flow is very meandering, sometimes
anastomosed during summer, it crosses the Kalahari System of the central plateau
pediplains until it joins the rugged terrain of the Malanje Horst. Its main tributaries are:
Luando, Cuiba, Coquema, Cunje, Cunhinga and Cutato.

EIA / RS 15.08 The current document may only be reproduced in its entirety.
141/280
Picture 55 – Aspect of the Kwanza river valley near the vKwanza village in Bié, 170 Km from its Source.
the Middle Kwanza section, between the Kwanza Falls in Camaça, Municipality of
Cangandala and the Cambambe Dam, has an extension of approximately
200 km and an elevation difference of approximately 1,000 meters. The river flows rapidly
in a Westerly direction embedded in tight rocky riverbed with many rapids. The river
valley is deep and narrow flanked by rugged and gently sloping hills where sandstone
rocks, gneiss and mica schists are predominant. Its main tributaries are the Lombe and
Gango rivers.

EIA / RS 15.08 The current document may only be reproduced in its entirety.
142/280
Picture 56 – Kwanza Falls at Camaça – Municipality of Cangandala
Set in the Lower Kwanza is the Caculo Cabaça dam, approximately 55 km upstream of the
Cambambe dam and approximately 17 km downstream from the Laúca dam. In the area
relating to Caculo Cabaça, the river flows predominantly to the West in a narrow bedded deep
valley surrounded by rock structures that confer it a fast and turbulent flow.
Picture 57 – Construction site of the Caculo Cabaça Dam

EIA / RS 15.08 The current document may only be reproduced in its entirety.
143/280
The Caculo Cabaça dam takes advantage of a narrow section between two hills with a height
of around 100 meters and an elevation difference of around 120 m from a meander to 6 km
downstream.
Picture 58 – View of the Valley at the Caculo Cabaça Discharge Area
Picture 59 – Rapids 800 m upstream of Caculo Cabaça

EIA / RS 15.08 The current document may only be reproduced in its entirety.
144/280
2.17 6.7.1 HYDROGRAPHY
The Kwanza river has a catchment area with of approximately 147,000 km2, with a perimeter of
2,700 km and an average elevation of 1,200 m.
Picture 60 - Kwanza River Catchment Area
The catchment area of the Caculo Cabaça dam has an area of 112,663 km2, a perimeter of
2,000 km, maximum elevation of 1,950 m, and an average elevation of 1,300 m, with an annual
average rainfall of 1,157 mm, and the river has an average annual specific discharge of 6,04
l/s/km2, which corresponds to an average annual rate of 112,663x0.00604 = 680 m3/s.

EIA / RS 15.08 The current document may only be reproduced in its entirety.
145/280
Picture 61 - Caculo Cabaça Catchment Area
The catchment area between the dam and the dam of Laúca Caculo Cabaça has an
approximate area of 112 km2 with a maximum altitude of 1,230 me minimum altitude of 530 m.
In considering the average annual specific discharge of 6.04 l / s / km2, the contribution of this
basin to the average flow drained in that part of the river would 112x0,00604 = 0.676 m3 / s, with
an annual sediment yield 8x112 = 896 tons.
Picture 62 - Drainage Basin between Caculo Cabaça and Laúca

EIA / RS 15.08 The current document may only be reproduced in its entirety.
146/280
2.18 6.7.2. PRECIPITATION
The data from several studies carried out for the Canbambe, Capanda and Laúca dams allow
for the ellaboration of the following average monthly rainfall table in the Caculo Cabaça dam
catchment area.
Table 18 - Average monthly rainfall in the Caculo Cabaça Catchment Area (mm)
Picture 63 - Average monthly precipitation in the Caculo Cabaça Catchment Area (mm)
With an average annual rainfall of 1,157 mm there is a strong seasonal variability during the
months of November and March, which present the highest values of precipitation at 200 and
250 mm, and the months of June, July and August, when there is no rainfall. This variability
provides a very asymmetrical flow regime, for which the hydraulic design of hydroelectric
schemes should take into account the need to create large reservoirs upstream for supply
during flow deficits during summer.
Oct Nov Dec Jan Feb Mar Apr May Jun Jul Aug Sep Year
92 217 158 117 129 252 148 15 0 1 3 25 1,157
Precipitation mm
300
250
200
150
100
50
0
Oct Feb Apr Jun Jul Aug Sep

EIA / RS 15.08 The current document may only be reproduced in its entirety.
147/280
2.19 6.7.3 HYDROMETRY
The average monthly flow series of the project for the period 1944/45 to 2012/13 allows the flow
regimes in the axis section of the Caculo Cabaça dam to be obtained without considering the
regulatory effect of dams upstream.
Series of average monthly flows during the period from 1944/45 to 2012/13.
Table 19– Series of Average Monthly Flows (1944/45 to 2012/13)
Water Year OCT NOV DEC JAN FEB MAR APR MAY JUN JUL AUG SEP YEAR
1944-45 176.6 410.5 265 485.9 586.7 971.1 775.5 523 278.2 181.3 147.3 123.5 409.2
1945-46 242.6 291.7 260.3 242.6 424.9 873.5 556.3 472.8 251.5 163.9 133.1 111.6 335.1
1946-47 220.6 296.5 595.9 816.5 781.8 882.8 1984.3 1070.2 533.6 348.6 259.2 195.7 663.6
1947-48 242.6 255.5 489.8 693 943.6 847.3 1304.8 846.5 422 275.8 204.8 154.2 554
1948-49 198.6 296.5 261.5 441.2 1172.5 1324 1641.9 781.4 417.3 311.2 249.9 224.8 605.4
1949-50 119.2 296.5 207.1 251.5 166.1 463.2 478.6 167.8 89.3 58.2 47.4 39.9 198.7
1950-51 154.3 182.5 419.2 662.2 781.8 1412.3 2097 1152 616.1 365.2 271.9 216.8 692.7
1951-52 310.5 471.5 748.6 974.4 955.2 945.2 658.4 480.8 321.7 244.3 208.5 176.6 539.6
1952-53 209.8 385.1 549.1 701.4 771.6 967.1 1468.1 1019.9 509.1 332.6 246.8 186.3 610.8
1953-54 164.8 247.3 371.1 457.3 523.6 988.8 1475.9 1128.7 577.2 355.8 270.4 224.9 565.1
1954-55 200.9 332.3 435.5 551 489.7 514 904.4 703.5 374.4 243.5 198.2 166.2 425.5
1955-56 170 365.4 685.3 847.2 971.5 808.4 1190.1 1185.6 533.2 306.6 231.6 204.9 623
1956-57 179.7 289.2 411 777.5 963.6 1187.1 1289.7 660.9 353.3 263.1 211.4 190 562.1
1957-58 205.6 308 559.4 683.6 479.5 443.6 513.7 328.6 191.1 170.7 151 132.4 346.9
1958-59 131.8 219.2 373.5 551.8 909.5 1273.1 1556.6 889.8 474.6 292.6 222.4 194.8 588.2
1959-60 178.3 248.6 461.1 694.1 1030.2 1629.8 1951.5 1228.3 657 389.1 290.4 230.9 746.7
1960-61 216.5 339.2 598.4 787.6 1334.6 1998.5 2822.9 1830.7 940.6 578 409.4 333.2 1012.4
1961-62 350.8 614.1 1256.4 2161.2 1667 1766.3 2795.8 1288.7 725.1 514.6 405.4 330.6 1152.9
1962-63 310.1 413.3 767.2 1017.6 1453.5 1537.4 1864.7 1173.8 674.7 465.2 359.6 286.6 856.4
1963-64 274 462.3 619.8 778.9 1138.4 1458.4 1293.8 643.5 363.7 285.7 238.1 205.7 643.9
1964-65 182.3 282.8 443.6 895.7 1062.6 1158.1 1235.1 720.3 405.4 285.7 232.9 199 589.1
1965-66 260.3 255.4 495.3 830.6 1514.7 2170 2069.6 1022.7 583 401.8 319.6 278.7 845.7
1966-67 292.6 385.8 410.5 536.2 777.7 1004.2 1253.5 1266.2 617.9 375.2 305 258.3 622.4
1967-68 258.4 577.5 990.8 1521.7 2075.9 2537.6 2039.4 1216.5 681 471.9 366.7 299.1 1081
1968-69 279.1 470.2 715.2 1441.4 1548.5 2407.3 2521.9 1134.5 638.6 447.4 370.3 287.3 1018.3
1969-70 367.2 554 1092.7 1310.3 1563.7 2351 1541.6 936.9 548.6 428.7 352.4 292.1 942.6
1970-71 318.5 476.7 669.9 1007.7 784.6 877.7 1283.8 810.9 453.1 346.4 299.3 268.3 632.1 1971-72 210.1 260.8 328.5 508.5 406.2 386.6 696.6 488.4 262.1 216.4 177.1 147.3 340.2
1972-73 181.2 342.3 548.8 990.3 1171.8 1131.9 1319 821.8 432.8 290.2 231.8 192.1 634.5
1973-74 176.5 311.8 547.8 425.1 391.7 493.2 996.3 635.5 336.2 242.7 195.1 171.5 409.9
1974-75 150.5 259.5 339.3 895.9 1306.3 1449.9 1137.8 827.1 466.8 317.1 252.9 213.1 630.9
1975-76 181.3 284.5 393.2 559 789.2 1129.2 1600.3 1407.5 710.2 397.1 291.2 237.4 663.6
1976-77 251 322.1 823.7 959.9 771 1226.7 2465.3 1351 711.4 369.4 283.3 221.7 812.1
1977-78 246.1 259.3 432.9 378.8 255 323.5 715 586.9 322.9 213.8 170.6 149.8 338.3
1978-79 142.7 431 558.4 782.4 1413.8 1460.8 2037 744.7 374.6 309.2 248.9 203.7 720
1979-80 167.8 295.2 740.3 1032 1202.2 970 970.3 568.1 317.8 232.5 191.8 138.8 565.6
1980-81 129.8 196 245.8 444.6 615.1 917.3 1495 687.6 326.1 228.2 196.1 176.4 469.6
1981-82 163.8 208.1 270.7 623.1 1008.8 1420.4 1312.7 956.3 487.2 311.2 221.7 185.2 594.9
1982-83 117 151.7 454.7 141.7 1451.5 1566.7 1881.8 1278.3 553.2 282.8 117 117 670.3
1983-84 117 191.8 358.7 633 854.5 1021 1136.1 692.5 331.5 254.4 240.5 154.9 496.7
1984-85 124.1 173.9 315.7 536 320.4 491.3 979.9 540.3 279 206.3 185.7 130.1 356.8
1985-86 168.2 152.7 184.7 257.3 464.4 1214 1218.4 512.8 258.2 200.6 203.2 128.8 525.8
1986-88 145.8 365.4 693.4 644.8 810.3 978.9 1117.1 506.8 313.7 250.3 212.3 152.3 514
1987-88 117 302.3 392.3 589.5 914.8 865.3 1055.5 815.9 408.8 277.2 176.5 138.4 501.7
1988-89 117 323.4 709.4 1290 864.5 1043.4 2100.5 1030 380.8 199.8 149 136.8 693.7

EIA / RS 15.08 The current document may only be reproduced in its entirety.
148/280
Table 20 – Series of Average Monthly Flows (1944/45 to 2012/13) (cont.)
8
1
1
5
Monthly historical minimum flow = 39.9 m3/s - September 1950
monthly historical maximum flow = 2822.9 m3/s - April 1961 average
annual flow = 591.1 m3/s
Water Year OUT NOV DEC JAN FEB MAR APR MAY JUN JUL AUG SEP YEAR
1989-90 169.7 133.4 128.3 137.9 443.5 813.7 1022.5 532.5 204.8 153.9 141.8 130.7 333.2
1990-91 213.2 285.6 441.6 560.3 576.5 820 1116.2 527.9 280.3 205 178.5 136.9 444.1
1991-92 163.8 359.1 346.7 451 978.2 1198.5 1145.6 635 301.1 295.7 237.2 188.5 521.9
1992-93 232.5 235 295.6 326.4 347.6 444.1 766.4 462.6 502.7 279.1 238.8 243.3 363.8
1993-94 277.7 251.9 484.7 415 289.5 388.8 478.7 267.3 215.7 159.6 155.4 119 292.2
1994-95 131.8 181.9 361.6 556.4 554.6 967.1 1091.4 570.4 297.5 198.5 171.5 165.6 436.5
1995-96 175.2 184.8 312.7 387.6 418.5 724.6 919.1 469.4 225.4 176.5 147.7 124.7 355
1996-97 123.8 228.1 268.1 487.6 225.8 201.1 167.4 249.1 168.9 124.1 123.7 118.6 207.5
1997-98 134 189.1 229.1 508.7 790.1 1106. 1211.9 578.4 303 201.8 173.1 129.4 460.5
1998-99 126.1 199.7 270.1 340.6 624.2 940.6 1130.1 534.5 266.7 182.2 114.7 157.8 405.3
1999-00 157.1 223.9 298.9 460.1 864.1 679.2 899 566.1 311.4 216.8 171.8 289.3 424.8
2000-01 119 144.7 182.3 336.5 448.4 855.3 1737.8 979.6 417.1 281.3 208.7 191 490.7
2001-02 149.3 231.6 357.3 739.9 840.3 1319. 1730.8 739.2 327.5 235.3 193 166.9 583.6
2002-03 134.6 227.1 439 465.7 482.8 1421.5 2068.3 1442.4 492.8 294.3 205.4 153.4 652.7
2003-04 138.7 142.3 290.5 791.5 2105.2 1804.6 1385.3 1043.6 459.9 320.7 238.9 173.4 733.1
2004-05 176.2 292.8 591.9 1114.3 2272.2 2248.7 1762.4 827.3 495.3 369.8 283.5 215.1 879.2
2005-06 196.9 309.4 402.4 1071.2 1258.2 1302.2 2276.7 1283 582 372.3 288.3 240.4 794.5
2006-07 236.9 397.9 1029. 1355 1777.1 1747.8 1201.2 674.5 458.5 329.8 259 205.8 801.4
2007-08 210.6 262 461.1 782.2 546.6 1231.5 1554.2 1042.1 559.3 379.6 302.8 216.3 629.4
2008-09 194.9 321.4 472.4 473.2 412.8 1027.6 1169.7 770.4 387.7 274.5 207.4 157.7 489.5
2009-10 211.1 299 429.9 800.2 1069. 1100.2 1591.1 1082.4 595.5 362.4 273.2 210.3 665.7
2010-11 179.1 338.7 929.1 1419.8 1577.1 1847.6 1181.6 1028.9 577.8 363.9 282.7 215.2 825.5
2011-12 188.1 285.1 668.7 871.3 776.3 1058.7 996.6 774.4 238.5 199.9 167.3 522.5 561.2
2012-13 415.9 429 610.6 584.1 840.9 1488.2 1407.4 769.6 381.9 287.4 215.4 173.5 632.5
Average 196.8 320.1 489.8 713.7 904.4 1154 1374.1 825.9 428.3 289.4 227.9 195 591.1
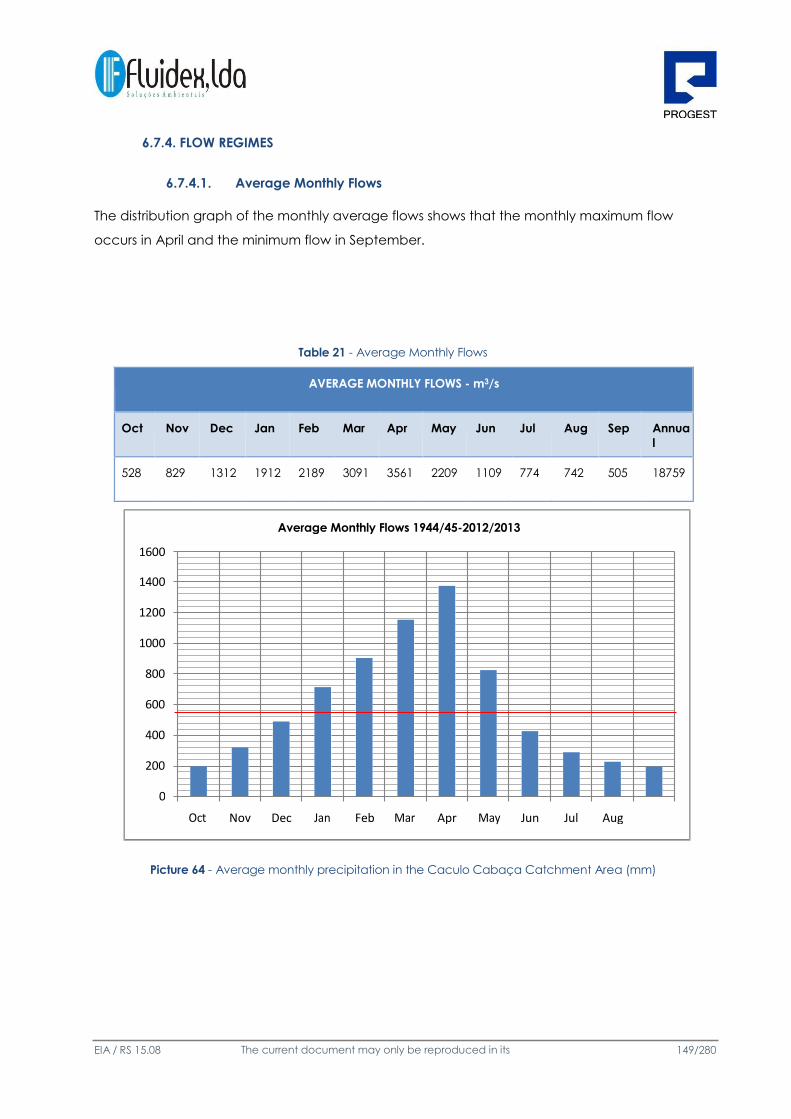
EIA / RS 15.08 The current document may only be reproduced in its entirety.
149/280
6.7.4. FLOW REGIMES
6.7.4.1. Average Monthly Flows
The distribution graph of the monthly average flows shows that the monthly maximum flow
occurs in April and the minimum flow in September.
Table 21 - Average Monthly Flows
AVERAGE MONTHLY FLOWS - m3/s
Oct Nov Dec Jan Feb Mar Apr May Jun Jul Aug Sep Annua
l
528 829 1312 1912 2189 3091 3561 2209 1109 774 742 505 18759
Picture 64 - Average monthly precipitation in the Caculo Cabaça Catchment Area (mm)
Average Monthly Flows 1944/45-2012/2013
1600
1400
1200
1000
800
600
400
200
0
Nov Dec Feb Apr Jun Jul Aug Sep

EIA / RS 15.08 The current document may only be reproduced in its entirety.
150/280
6.7.4.2. Annual Average, Minimum and Maximum Flows
3000 2900 2800 2700 2600 2500 2400 2300 2200 2100 2000 1900 1800 1700 1600 1500 1400 1300 1200 1100 1000
900 800 700 600 500 400 300 200 100
0
Distribution of the average, maximum and minimum annual flows 1944-2012
Picture 65 – Distribution of the Flows
6.7.4.3. FLOW RATE
The annual flow rate is 18,759 hm³ with the monthly distribution shown in the following graph.
Table 22 – Flow Rate
FLOW RATE - hm³
Oct Nov Dec Jan Feb Mar Apr May Jun Jul Aug Sep Annua
l
528 829 1312 1912 2189 3091 3561 2209 1109 774 742 505 18759
1944
19
45
1946
19
47
1948
19
49
1950
19
51
1952
19
53
1954
19
55
1956
19
57
1958
19
59
1960
19
61
1962
19
63
1964
19
65
1966
19
67
1968
19
69
1970
19
71
1972
19
73
1974
19
75
1976
19
77
1978
19
79
1980
19
81
1982
19
83
1984
19
85
1986
19
87
1988
19
89
1990
19
91
1992
19
93
1994
19
95
1996
19
97
1998
19
99
2000
20
01
2002
20
03
2004
20
05
2006
20
07
2008
20
09
2010
20
11
2012

EIA / RS 15.08 The current document may only be reproduced in its entirety.
151/280
Monthly discharge - hm3
4000
3500
3000
2500
2000
1500
1000
500
0
Oct Nov Dec Feb Apr Jun Jul Aug Sep
Picture 66 – Monthly Discharge
6.7.4.4. Flow Duration Curve
The flow duration curve, that expresses the relationship between the flows and the frequency
with which these flows are exceeded or equaled, makes it possible to notice that the flow
regime has a wide variation between maximum and flow rates.
Picture 67 – Flow Duration Curve
0
Flow m³ s-1 / %
3000 2800 2600 2400 2200 2000 1800 1600 1400 1200 1000
800 600 400 200
y = 2066,e-0,03x
0 10 20 30 40 50 60 70 80 90 100

EIA / RS 15.08 The current document may only be reproduced in its entirety.
152/280
Q10 = 1.300 m3/s
Q50 = 417 m3/s
Q90 = 116 m3/s
Q95 = 98 m3/s
Q100= 84 m3/s
6.7.4.5. Flood Flows
According to the Gumbel distribution, the following values were obtained:
Table 23 – Flood Flows
Return Periods (years) Flows m3/s
100 4,595
1,000 5,608
10,000 6,626
The flood flows obtained through the project design flows for return periods of
10,000 years is 6,626 m3/s, which conicides with the flood flows referred in the design. The dam
spillway was designed for flows of 10,000 m3 and is as such designed for safety.
6.7.4.6. Ecological Flow
The ecological flow can be defined as the minimum flow necessary to maintain the watercourse
downstream of a hydroelectric scheme which ensures the conservation and protection of
freshwater ecosystems.
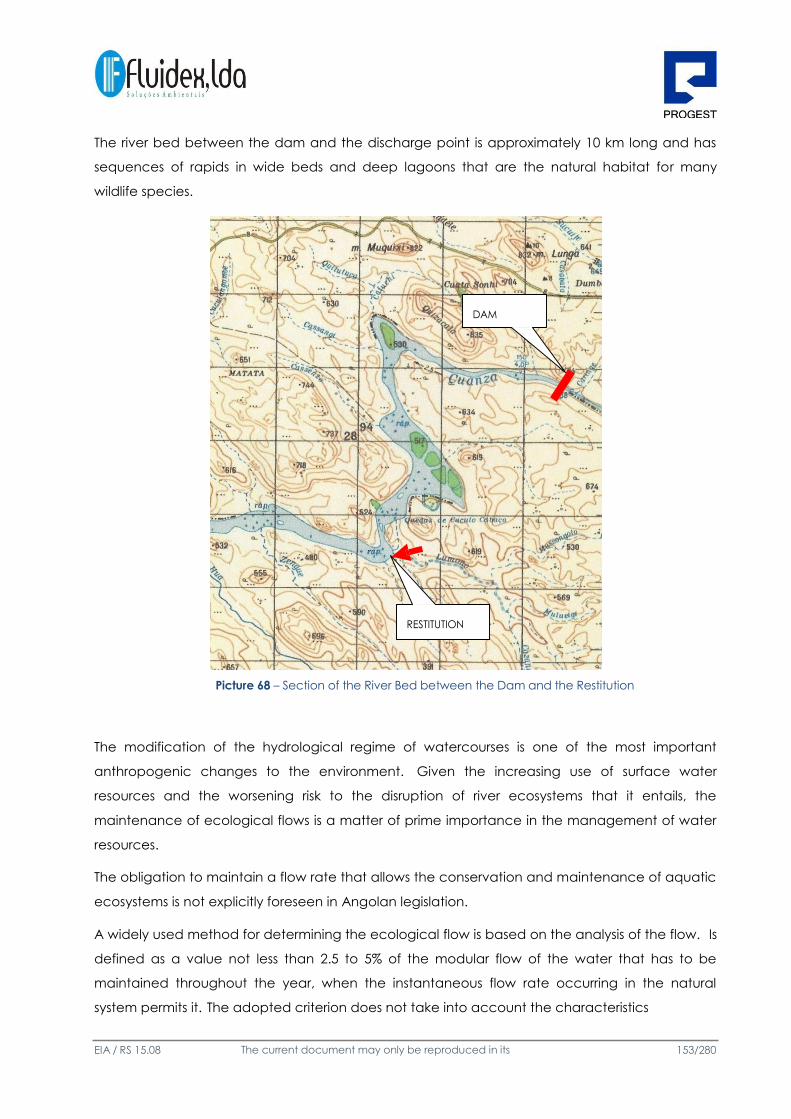
EIA / RS 15.08 The current document may only be reproduced in its entirety.
153/280
The river bed between the dam and the discharge point is approximately 10 km long and has
sequences of rapids in wide beds and deep lagoons that are the natural habitat for many
wildlife species.
Picture 68 – Section of the River Bed between the Dam and the Restitution
The modification of the hydrological regime of watercourses is one of the most important
anthropogenic changes to the environment. Given the increasing use of surface water
resources and the worsening risk to the disruption of river ecosystems that it entails, the
maintenance of ecological flows is a matter of prime importance in the management of water
resources.
The obligation to maintain a flow rate that allows the conservation and maintenance of aquatic
ecosystems is not explicitly foreseen in Angolan legislation.
A widely used method for determining the ecological flow is based on the analysis of the flow. Is
defined as a value not less than 2.5 to 5% of the modular flow of the water that has to be
maintained throughout the year, when the instantaneous flow rate occurring in the natural
system permits it. The adopted criterion does not take into account the characteristics

EIA / RS 15.08 The current document may only be reproduced in its entirety.
154/280
of the hydrological regime of the watercourse and ecosystems associated with it, so the
environmental quality objectives can not be achieved.
Picture 69 – Aspect of the Rapids between the Dam and the Restitution
Picture 70 – Lagoon in the River Section between the Dam and the Restitution

EIA / RS 15.08 The current document may only be reproduced in its entirety.
155/280
The flow rate plays a key role in the ecology of stream ecosystems, a key factor in the structure
and diversity of biotic communities.
Hydroelectric plants alter the hydrological regime downstream, reducing the annual average
flow, reducing the seasonal variation of the flow rate by changing the time of occurrence of
extreme flows, reducing the magnitude of floods and/or imposing unnatural discharges (Ward &
Stanford, 1987 ). The modification of the hydrological regime leads to changing the speed and
depth of the flow, the solid material transport regime and the morphology of the riverbed,
temperature and water quality. The habitat of freshwater species is consequently affected,
inducing impacts on biotic communities, namely on the specific composition, structure and
inter- and intraspecific relations (Sale, 1985; Ward & Stanford, 1987) - Petts (1989) considers three
types of impacts on freshwater ecosystems due to the construction of hydroelectric power
plants: i) the first order of impacts occurs after the construction of the scheme and include
changes to the hydrological regime, to the transportation of sediments, to energy flow, to water
quality and temperature; ii) the second order of impacts, which occur as a result of the first order
impacts, can be seen at a habitat structure level (river bed morphology and substrate
composition), riparian vegetation, sources of organic matter and periphyton and macrophyte
communities; iii) the third order of impacts occurs at a fish and macroinvertebrate community
level and is a consequence of first and second order impacts. The second order impacts can be
susceptible to more or less longer periods, in the order of tens of years in some cases, which, in
turn, is reflected in the time required to observe the third order impacts and time necessary for
the ecosystem to reach a new state of equilibrium.
The ecological flow, in a broad sense, can be defined as the flow that ensures the preservation
and maintenance of natural aquatic ecosystems, the production of species with sports or
commercial interest as well as the conservation and maintenance of riparian ecosystems and
aesthetic aspects landscape or other scientific or cultural interest (Wesche & Rechard, 1980;
Gordon et al, 1992).
Some authors refer to the ecological flow in a narrower sense, considering only the fish
resources, is assuming however that the flow rate will allow the maintenance and conservation
of ecosystems (Annear & Conder, 1984;. Belaud et al, 1989).

EIA / RS 15.08 Este documento só pode ser reproduzido na íntegra. 156/280
The ecological flow is defined as a time series of flow rates that consider the needs of the
species throughout their life cycles, flexible depending on the natural hydrological conditions
that occur each year (Gore, 1989; Stalnaker, 1990; Gordon et al., 1992).
The recommendation values for ecological flow may also include cleaning flows to remove
deposited fine materials, and flow rates to maintain the riverbed structure and the transportation
capacity (Gordon et al, 1992;.. Reiser et al, 1989).
The main difficulty in setting values for the environmental flow is the decision of changing levels
of natural hydrological regime that are considered acceptable, given the impacts on aquatic
and riparian ecosystems that this change will induce, particularly if one considers the level of
uncertainty that still exists in this area, in particular the quantitative aspects. This limitation
becomes particularly critical when they are in match other household interests of water, in which
the economic value, the short and medium term, is readily quantifiable, and that, in general,
decision making is not compatible with the slow pace of ecological studies that are needed to
perform a proper evaluation of impacts and to define the minimum flows to maintain the
watercourse.
The ecological flow setting process involves therefore, generally, a strong negotiating
component among multiple users water (Stalnaker, 1990; Gordon et al., 1992).
An ecological flow of 60 m3/s was defined in the design, which corresponds to approximately
50% of the duration of Q90 flow curve, i.e.: 50% of the flows that will be exceeded throughout
the year by 90%. Or otherwise we can say that the ecological flow of the project is 10% of the
average annual flow.
It should be noted that the environmental flow will be completely compatible with the turbine
flow of the auxiliary plant installed in the upstream dam face.
6.7.4.7. Flow of Solids
The studies undertaken resulted in an estimate of 720,000 tons per year of solid material
transported, which corresponds to 0.3654 hm³/year, taking into account a specific weight of the
suspended material of 1.2 t/m³.

EIA / RS 15.08 Este documento só pode ser reproduzido na íntegra. 157/280
6.7.4.8. Installed Water Flows
For the total installed capacity of 4x530+52 = 2,172 MW, a maximum power nominal flow of
275x4+60 = 1,160 m³/s is required. According to the flow duration curve, this value is reached
only 15% of the time (approximately 55 days per year). For three turbines, 885 m³/s would be
achievable in 23% of the time (84 days), with two turbines, 610 m³/s would be achieved in 34% of
the time (124 days) and with one turbine 335 m³/s would be available during 60% of the time
(219 days). This would be true if the Caculo Cabaca dam operated at run-of-river and did not
receive water flows adjusted by the Lauca dam.
Note that for the maximum load at Caculo Cabaca, an annual runoff of 36,000 hm³ would be
needed, for three turbines an annual runoff of 28,000 hm³ would be needed and two turbines
would require 19,000 hm³. The Capanda and Lauca reservoirs have the capacity to store a
volume of 10,600 hm³ that, added to the 18,700 hm³ annual runoff of the river, would reach a
volume of 29,300 hm³ capable of adjusting the 900 m³/s flow rate. The active storage capacity
of the Lauca and Capanda reservoirs is not known.
6.7.5 RESERVOIR
The Caculo Cabaca dam has a small reservoir whose main function is to level the flow rates
adjusted by the Lauca dam.

EIA / RS 15.08 Este documento só pode ser reproduzido na íntegra. 158/280
Figure 71 – Caculo Cabaca Reservoir

EIA / RS 15.08 Este documento só pode ser reproduzido na íntegra. 159/280
The reservoir, which will have a run of river operating system, has the following characteristics:
Flooded Area = 16.6 km2
Full supply level = 630 m Maximum flood
level = 630 m
Total Stored volume = 436 hm3
The reservoir of the Caculo Cabaca Hydroelectric development extends for approximately 16.3
km and has a maximum width of 2.6 km. Aggradation studies determined a 280 year useful life
for the reservoir.
The creation of the reservoir will result in the flooding of 16.6 km2. If we compare this figure with
the installed capacity of 2,180 MW, we see that this use has the lowest flooding / installed
capacity ratio possible.
For information purposes, we can roughly determine the active water storage capacity of the
reservoir necessary to adjust the average flow of 591 m3/s.
Image 72 – Cumulative Flow Curve
Cumulative flow curve months/flows
8000
7000
69 7167
6406 6695
72
6000 5978
5000 5153
4000 3779
3000 v
2625
2000 1721
1000 1007
517
0 0 197
0 2 3 4 5 6 7 8 9 10 11 12

EIA / RS 15.08 Este documento só pode ser reproduzido na íntegra. 160/280
According to the cumulative flow curve, a volume of 2,280 hm3 would be needed to maintain
the average flow constant.
As the flows that reach the Caculo Cabaca reservoir are adjusted by the Lauca dam, which has
a reservoir capable of storing 6,000 hm3, the operation flows in Caculo Cabaca are a function of
the adjusted discharge of Lauca.
6.7.6 WATER QUALITY
Law no. 6/02, dated 21 June 2002, known as the Water Law, states in paragraph 1 of Article 10
that "the national policy on water resources management is aimed at equal treatment and
opportunity for those involved in the water use process, the preservation of well-being and the
environment, the promotion of efficient water use practices, as well as the provision of incentives
for private initiative on the rational use of available water resources".
The Water Management Principles are intended to meet several objectives, among which the
following are highlighted, for example, "b) ensure the sustainable balance between available
water resources and demand;" "c) ensure the use of available water for all purposes through its
rational and planned use, with a view to the sustainable development of the national economy;"
"e) promote, define de scope and regulate the use of water for agricultural, livestock, industrial
and hydroelectric power use".
In order to characterize the quality of water of the Kwanza river, with the aim to select not only
the water treatment regimens (raw and potable) but also the materials and the constructive
solutions of the equipment, in the area of direct or indirect intervention for study, a sampling
campaign in the area of influence of the study was carried out by PROGEST and was analyzed
by Sonangol's Central Laboratory.
The Water Quality Index (WQI) was created in 1970 in the United States, by the National Sanitation
Foundation. The WQI was developed to evaluate the quality of raw water for use in public supply
after treatment.
Description of the WQI parameters considered as more significant in terms of their importance
and analyzed in laboratory:

EIA / RS 15.08 The current document may only be reproduced in its entirety.
160/280
Hydrogenionic Potential (pH): affects the metabolism of various aquatic species. In view
of the protection of aquatic life, pH should be between 6 and 9. Changes in pH values
may also increase the effect of chemicals that are toxic to aquatic organisms, such as
heavy metals.
Biochemical Oxygen Demand (BOD5): The biochemical oxygen demand is the amount
of oxygen necessary to oxidize the organic matter present in water through aerobic
microbial decomposition. The BOD5,20 is the amount of oxygen consumed for 5 days at
a temperature of 20 °C. High BOD5 values in a body of water are generally caused by
the release of organic loads, mainly domestic effluents. The occurrence of high values of
this parameter causes a decrease in oxygen levels dissolved in water, which may cause
mortality among fish and the elimination of other aquatic mechanisms.
Turbidity: indicates the degree of attenuation that a beam of light is subject to while
crossing water. This attenuation takes place by absorption and scattering of light and
caused by solids in suspension (silt, sand, clay, seaweed, debris, etc.). The main source of
turbidity is soil erosion, while in the rainy season, rainwater bring a significant amount of
solid material to the bodies of water. Mining activities, as well as the release of domestic
and industrial effluents are also important sources that cause an increase in the turbidity
of the water. The increase in turbidity causes a greater amount of chemicals (eg.
Coagulants) is used in water treatment stations, increasing treatment costs. Furthermore,
the high turbidity also affects the preservation of aquatic organisms, industrial use and
recreational activities.
Conductivity: refers to the ability the water has to transmit electrical current due to
cations (positive charges) and anions (negative charges) present therein, from the
dissociation of other substances.
Salinity: measure of the level of salts dissolved in water. Such salts favor the growth of
plants but in excess, become harmful.
Total Dissolved Solids (TDS): is the sum of all the chemical constituents dissolved in water, it
is considered an added indicator of the presence of chemical

EIA / RS 15.08 The current document may only be reproduced in its entirety.
161/280
contaminants. The primary sources of TDS into water are agricultural and residential soil
contamination from leachate and isolated sources of industrial polluted water
discharges or wastewater treatment plants.
Dry Residue: Physical-chemical parameter indicating solids and organic and inorganic
substances dissolved in water, which may have multiple sources, allowing for the
determination of the total mineralization of water. Although one can not establish a
direct relationship between this parameter and its effects on health, due to their nature,
if the waters present a very high value of suspended and dissolved substances, they can
be of poor quality, affecting their organoleptic characteristics, and may be corrosive.
Total Alkalinity (TA): is a measure of the ability the water has to neutralize acids, i.e.: the
amount of substances in water acting as a buffer. In natural waters, the pH and alkalinity
values are of great importance for the study of biological productivity, as they affect the
other physical and chemical processes in a body of water, affecting the biological
activity of aquatic organisms.
Free Carbon Dioxide: In gaseous form, CO2 is the product of combustion and the
breathing of Man and warm-blooded animals, and used by plants for photosynthesis. It is
one of the substances present in water that has more influence on pH and its free form is
related to aggressive CO2 fractions (excess of CO2, i.e.: there is an amount greater than
would be necessary to maintain the calcium bicarbonate solution) and balancing CO2
(a fraction that is not found in dissolution or precipitation phenomena). The balance of
the carbonate (CO32-), and CO2 can lead to the dissolution of calcium carbonate
(aggressive) or the production of incrustations, that depends on the calcium
bicarbonate concentration in the solution, which are phenomena that may sometimes
overlap with the electrochemical corrosion reactions occurring between metal and
water.
Acidity: the acidity of water mainly occurs due to the presence of dissolved carbon
dioxide (CO2), which can originate from the atmosphere or organic material (plant or
animal) that comes into contact with the water.

EIA / RS 15.08 The current document may only be reproduced in its entirety.
162/280
Oxidability, potassium permanganate (KMnO4): Parameter relating to undesirable
substances, which is a generally equivalent test of organic matter present in the water,
as it includes lowering substances capable of being oxidized by potassium
permanganate, which 0069s a strong oxidant. Together with other parameters, such as
Kjeldahl nitrogen, it is considered an indirect indicator of fecal contamination, as waste
water has a high content of organic matter.
Chlorides: The chlorides in natural water are a result of leaching from rocks and soil with
which water comes into contact and, in coastal areas, saline intrusion. Mountain water
generally has a low chloride content, while groundwater and rivers have high
concentrations. Furthermore, the waste water from agricultural, industrial and domestic
activities are another source of chloride.
Nitrates: the presence of nitrogen in water resources may appear in the form of nitrate,
nitrite, ammonia, molecular nitrogen and organic nitrogen, and the high levels of nitrates
indicate pollution that might be occurring for some time, because these are the final
products of nitrogen oxidation. Acute toxicity, caused by these compounds on humans
and animals, is associated with the reduction of nitrate to nitrite, which in turn oxidizes the
iron in hemoglobin transforming it into Fe’ ‘, forming methaemoglobin, which is unable
to carry oxygen to the cells.
Sulfates: Organic forms of sulfur are mineralized by the biodegradation of dead cells or
organic waste containing sulfur compounds. The most abundant inorganic sulfur
compounds are hydrogen sulfide (H2S), elemental sulfur and sulfates (SO4 2-).
Phosphates: The phosphorus cycle is confined to biochemical changes that mineralize
organic phosphorus, solubilize insoluble forms and assimilate inorganic phosphates in the
cells. The most common forms of phosphorus occurrence in natural waters include
orthophosphates (PO4 3-, 2- HPO2, H2PO4 - and H3 PO4), polyphosphates (molecular,
non-hydrated) and organic phosphates.

EIA / RS 15.08 The current document may only be reproduced in its entirety.
163/280
Sodium: very abundant in nature, its origins in fresh waters are saline intrusion and tidal
effects (occurring in the form of very soluble salts, such as sodium chloride), weather
conditions, some industrial activities and the nature of the terrain .
Potassium: natural and anthropogenic sources, namely some industries and fertilizer
remains, which intervene in the mechanisms of osmotic regulation. It is the 7th most
abundant element on Earth, and its concentration in most natural waters rarely exceeds
20 mg/L. It is essential to life, being absorbed from the soil by plant roots and absorbed
by animals through food.
Calcium and Magnesium: The hardness (expressed generally in mg/L of calcium
carbonate CaCO3) of water is due to the presence of bivalent metal cations, especially
calcium (Ca2+) and magnesium (Mg2+). A hard water is therefore one that contains
large quantities of calcium and magnesium.
Total Hardness (CaCO3): The hardness of natural waters varies considerably from place
to place, and generally the hardness of the surface water is lower than groundwater.
The hardness of a water reflects the nature of the geological formations with which it was
in contact. The hardness (expressed generally in mg/L of calcium carbonate CaCO3) of
water is due to the presence of bivalent metal cations, especially calcium (Ca2+) and
magnesium (Mg2+). A hard water is therefore one that contains large quantities of
calcium and magnesium. These bivalent metal ions are generally associated with
bicarbonate anions (HCO3-), sulfate (S042-
), Chloride (Cl) and nitrate (NO3-).
The table below shows the results obtained by the Laboratory for Chemistry and the Environment.

EIA / RS 15.08 The current document may only be reproduced in its entirety.
164/280
Table 24 – Physico-Chemical Analysis of the Water
Total Dissolved Solids
(115ºC)
mg/l 30.9 SMEWW 2540 B
Total Alkalinity (TAC) mg/l CaCO3 17.9 SMEWW 2320 B
Free Carbon Dioxide mg/l CO2 0.44 SMEWW 4500-CO 2 C
Oxidability, KMnO4 mg/l O2 2.29 NP/NE 731
Chlorides mg/l Cl < 2 (L.Q.) SMEWW 4110 B (CI)
Nitrates mg/l NO3 <1 (L.Q.) SMEWW 4110 B (CI)
Phosphates mg/l PO4 <1.5 (L.Q.) SMEWW 4110 B (CI)
2 L.Q. – Limit of Quantification
Date of Sampling: 21 October 2015
Time of Sampling: 11:00
Start of Analysis: 22 October 2015
Date of Issue of the
Results:
10 November 2015
Parameter Unit Result Method of Analysis
NTU
Turbidity (nephelometric unit of
turbidity)
1.20 SMEWW 2510 B.
pH Sorensen Scale
6.70 SMEWW4500H+B
Conductivity µS/cm 33.8 SMEWW 2510 B
Salinity g NaCl/Kg H2O 0.02 SMEWW 2510 B
Dry matter (180ºC) mg/l 33.5 SMEWW 2540 B
Bicarbonates mg/L (HCO3)
21.8 SMEWW 2320 B
Acidity mg/l 1.00 SMEWW 4500-CO 2 C
Fluorides mg/l F < 0.5 (L.Q.2) SMEWW 4110 B (CI)
Bromides mg/l Br <0.3 (L.Q.) SMEWW 4110 B (CI)
Sulfate mg/l SO4 <2.6 (L.Q.) SMEWW 4110 B (CI)
Sodium
mg/l Na 2.78 Ion Chromatography (PI)

EIA / RS 15.08 The current document may only be reproduced in its entirety.
165/280
Table 25 – Physico-Chemical Analysis of the Water
Calcium mg/l Ca <3.5 (L.Q.) Ion Chromatography (PI)
Total Hardness (CaCO3) mg/l CaCO3 <29.9 (L.Q.) Ion Chromatography (PI)
The physical-chemical analysis of the water quality in the area being assessed presents
favorable conditions, and the water presents satisfactory characteristics, without much influence
from polluting agents.
6.8. ECOLOGICAL ASPECTS
6.8.1. Prior Considerations
This chapter presents a general characterization of biocoenosis in the study area, in order to
support an assessment of potential allocations of ecological values involved, arising from the
implementation of project activities.
According to the Convention on Biological Diversity (CBD), it was established that states should
develop strategies, plans and programs for the conservation and sustainable use of biological
diversity, reflecting the measures set out in the CBD (Article 6/a ) and must identify the
components of biological diversity (Article 7/b); identify processes and categories of activities
which have or are likely to have significant adverse impacts on the conservation and
sustainable use of biological diversity (Article 7/c).
The implementation of the CBD in the Angola translates into the application of Constitutional
Law, where several instruments for the protection and preservation of the environment, natural
resources and pollution control are defined.
Potassium mg/l K <3.5 (L.Q.)
Ion Chromatography (PI)
Parameter Unit Result Method of Analysis
Magnesium mg/l Mg <3.8 (L.Q.)
Ion Chromatography (PI)
CBO5 mg/l O2 <10 (L.Q.)
SMEWW 5210 B

EIA / RS 15.08 The current document may only be reproduced in its entirety.
166/280
According to the General Environmental, in order to ensure the protection and preservation of
the environmental components, as well as the maintenance and improvement of ecosystems of
recognized ecological value and economic partner, the Government establishes a network of
environmental protection areas (Article 14/1); the areas of environmental protection are subject
to classification measures, conservation and supervision, which should always take into account
the need to preserve biodiversity, as well as the values of social, economic, cultural, scientific
and landscape (Article 14/3).
Biotic refers to that which is characteristic in living beings, or that is connected with it. It is also
that, which belongs or is related to biota (the set of Flora and Fauna in a given region). While the
biotic factors of an ecosystem are the flora and fauna. They include all beings/organisms,
whether animals, plants, bacteria, etc., their byproducts. Five areas of biota were studied,
namely: Flora, aquatic biota, terrestrial fauna, Bioindicators as well as the Environmental
Protection Areas near the project site.
To evaluate the Biotic Environment, an Exploratory method was used: bibliographic research,
visit the project area to carry out a field survey to essentially survey the Forest and Fauna
species, Bioindicators, probable area of Environmental Protection. On the other hand, interviews
were carried out with people living close to the project's area of influence (involving the three
provinces).
6.8.2. Areas with Nature Conservation Status Classification
Protected areas are parts of the country that, due to their environmental features, have been
endowed a special status in order to promote their protection and preservation.

EIA / RS 15.08 The current document may only be reproduced in its entirety.
167/280
Figure 73 – Natural Parks and Reserves in Angola (Source: Dean, 2000)
In accordance with the Forestry, Wildlife and Terrestrial Conservation Areas Law of the Ministry of
Agriculture and Ministry of Environment, and in Article 3 (Definitions), the environmental
protection or conservation area is defined as a geographic area that has been classified and
regulated to achieve specific conservation objectives, previously designated area of
environmental protection or protected area.
The project implementation area is located in the municipality of Cambambe belonging to the
province of Kwanza North, at the following coordinates:
S 09º41.164';
E 014º59.364'.
The same location does not offer an environmentally protected area, although within the
province, the Golungo Alto forest reserve exists. Other areas that we highlight are the
Cangandala and Quissama National Parks due to their proximity to the province and being
nurtured by the same river (Kwanza).

EIA / RS 15.08 The current document may only be reproduced in its entirety.
168/280
6.8.3 Flora and Vegetation
The term Flora refers to a group of plants growing in a region, in other words, it is the
corresponding term for plant, in other words, the set of plant taxa (usually, only the green plants)
characteristic of a region.
Forest resources have been considered as natural capital available, that require low levels of
investment, can generate economic, social and environmental benefits for the State and
society, through their exploration and sustainable use.
Angola has a forest area of approximately 53 million hectares, which corresponds to 43.3% of its
surface area. Forest formations are quite varied and include, among others, humid, dense high
productivity rainforests, which correspond to approximately 2% of the forest area. These
formations are located in the provinces of Cabinda, Zaire, Bengo and Kwanza-North.
Current Characterization of the Area
The Kwanza North province, whose capital is N'Dalatambo, has a land area of 24,110 Km², is
located in the north of the country and consists of 10 municipalities. The climate is humid and
tropical, and average annual temperatures range between 22ºC and 24ºC.
Its respective agricultural area is well defined to the east, seeing that its boundaries coincide
with the northern plateau rim, or the Congo plateau, which from there extends to the interior,
and to the west its boundaries are the base of the foothills of the rugged landforms, which
define the east coast of the territory; to the North its boundaries are practically those beyond
which the exploration of Robusta coffee practically ceased to be economic viable (due to
ecological constraint that determines the boundaries of culture) and to the south it roughly
follows the southern boundary of the coffee forests North of Kwanza.
Its vegetation falls almost entirely in the domain of the large Guinean phytogeographical region,
with possibly the exception of a narrow S-SE strip, covered with savannah formations, whose
floristic composition can already be considered as the transition to the sudan-zambezian
community type. Within the Guinean region, two major plant groups are represented, the "dense
semi-deciduous rainforest" and the "brush savannah".
EIA / RS 15.08 The current document may only be reproduced in its entirety.
169/280
The list of species made by J. Gossweiler and concerning the various strata of dense forest is
quite remarkable. We will limit ourselves to those most frequent, while focusing on those that,
with regard to the arboreus stratum, best characterize the formation.
Thus, among the most notable components, the following are referred: Albizia glaberrima,
Adansonia digitata, Sterculia setigera, Albizia gummifera, Ceiba pentadra, Celtis prantlii among
others.
From a physiographic point of view, the most remarkable feature that presented itself, is the
pronounced relief, which is at times very rugged. From the western border, approximately 250-
350 meters above sea level to the rim of the plateau, to the east, where elevations of
approximately 1300 m can be found, a continuous profusion of landforms, such as hills and
ridges, can be found that become increasingly less significant as one progresses from east to
west.
According to studies carried out, namely field visits, Participatory Rural Appraisals and review of
literature, the provinces of Malanje and Kwanza South are considered to be pertinent due to the
Kwanza river crossing them.
It is obvious that a wide range of species, forest and fauna, exists that are quite similar in the
three provinces; from a climatic point of view the province of Malanje has an annual average
temperature ranging between 23°C - 24°C (21°C in June, the coldest month; 25°C in March-
April, the hottest months).
In some regions of the provinces of Uíge, Bengo and Kwanza South, at an altitude of
approximately 300-1000 m, one can find specific type of vegetation near the semi-deciduous
rainforest, the so-called coffee forests. The most characteristic species belong to the genera
Celts, Albizia. Morus and Ficus.
The secondary forests in various stages of regeneration and forest-savanna, set out in mosaic
pattern, occupy much of the area of these provinces. In the grasslands and open forests, the
presence of grass species of the genus Hyparrebenia Andropogon, Pennisetum and Panicum, are
frequent. The presence of shrubs such as the Hymenocardia Tul., Erytbrina abyssinica Lam, is
common in these formations.
In the locations where the Hydroelectric Power Plant will be built, a forest formation with a high
level of deterioration can be found and this is due to the uncontrolled exploitation of various
native species, as can be seen in the picture below:

EIA / RS 15.08 The current document may only be reproduced in its entirety.
170/280
Picture 74 – Forest Den0073ity found in the Project Implementation Area
The presence of the technicians linked to project implementation has resulted in the felling of
various forest species due to various activities, such as the creation of ૌess roads, machine
movement, vehicle traffic, construction sites and the construction phase.
The frequent exploitation of the project area by the surrounding population for firewood, charcoal
and practice of subsistence agriculture, cause negative impacts due to the loss of some species
of great economic, medicinal and environmental importance, such as Andasonia digitata, Albizia
glaberrima, Sterculia setigera, Albizia gummifera, Ceiba pentadra, Celtis prantlii, Ficus mucuso,
which are represented in the following pictures:

EIA / RS 15.08 The current document may only be reproduced in its entirety.
171/280
Picture 75 – Representing (Portuguese Baobab tree and Mbondo Kimbundu) Adansonia digitata
Conservation state vulnerable (VU).
Picture 76 – Albizia glaberrima. Low Risk (LR) state of conservation.

EIA / RS 15.08 The current document may only be reproduced in its entirety.
172/280
Picture 77 – Representing the Sterculia setígera Undetermined state of conservation (I)
Picture 78 – Representing (Nuance Kimbundu) Albizia gummífera. Low Risk (LR) state of conservation.

EIA / RS 15.08 The current document may only be reproduced in its entirety.
173/280
Picture 79 – Representing (Mulembeira Kimbundu) Ceiba pentadra Undetermined state of conservation (I)
Picture 80 – Representing Celtis prantlii. Undetermined state of conservation (I)
We also highlight other fairly exploited tree species, namely the Eucalyptus (Eucalyptus sp.)
Planta-of-néen (Azadiratcha índica), the dendém palm tree (Elaeis guineensis), Acacia rubra
(Delonix regia) and mango tree (Magnifera Indica ), which are shown in the figures below.
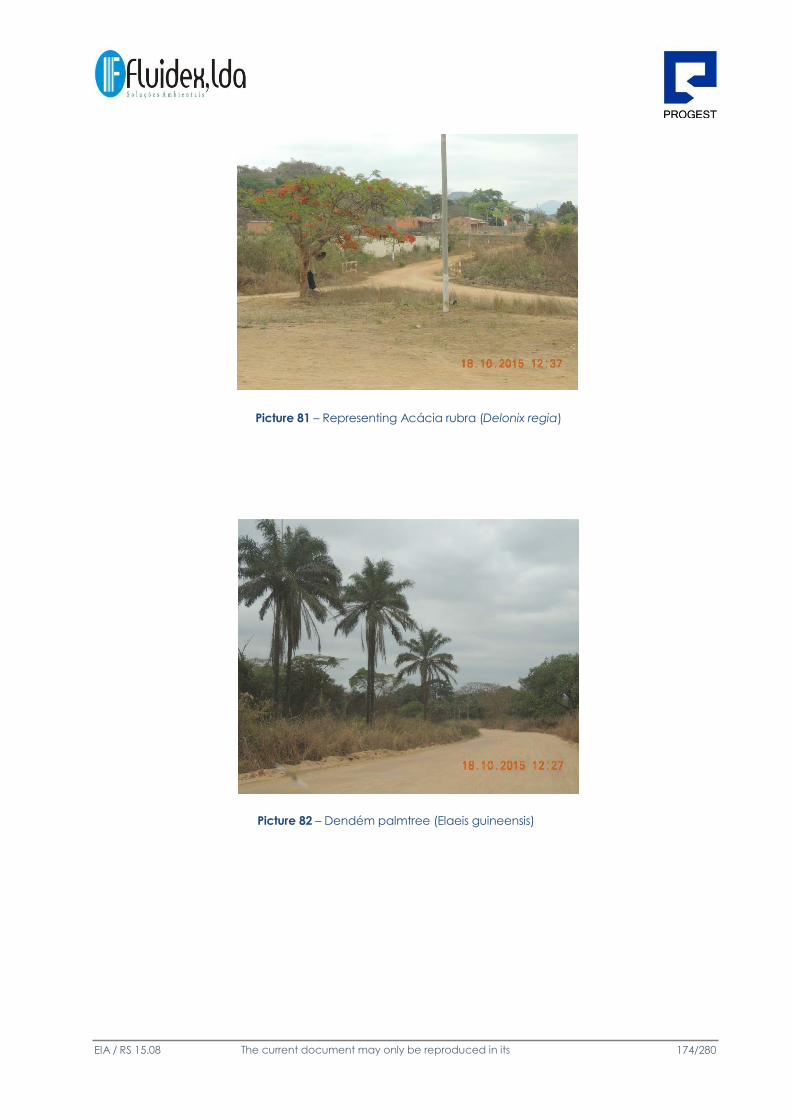
EIA / RS 15.08 The current document may only be reproduced in its entirety.
174/280
Picture 81 – Representing Acácia rubra (Delonix regia)
Picture 82 – Dendém palmtree (Elaeis guineensis)

EIA / RS 15.08 The current document may only be reproduced in its entirety.
175/280
Picture 83 – Mango tree (Magnífera índica)
6.8.4 Fauna
From a general point of view, fauna is the collective term for the animal life of a particular
region or period of time.
The existing pattern of vegetation in the study area, consists of various biotypes that can be
used by different species to find refuge, food and to reproduce. The biological diversity of
Angola is one of the richest in Africa; due to several factors, the main ones being: the area of
the country; geographic location; diversity of the ecosystem (land, sea and coast) and the fact
that Angola has been a safe haven during the glacial period.
The knowledge about the biological diversity of Angola's wildlife is, in most cases, limited. There is
very little information regarding small and medium animals and plants that have no immediate
economic interest. Comprehensively, the Angolan fauna is diverse and very rich, and very little
studied, especially the small vertebrates (mainly amphibians) and invertebrates; the available
information on diversity of fauna in Angola is, in most cases, limited to large animals. As such, we
chose a methodology (based on bibliographic research) that would allow for the collection of
information on as many species as possible and on in loco observation.
The literature and the observation of these areas identified a variety of species of animals
classes, such as insects, reptiles, birds and birds, mammals, fish,
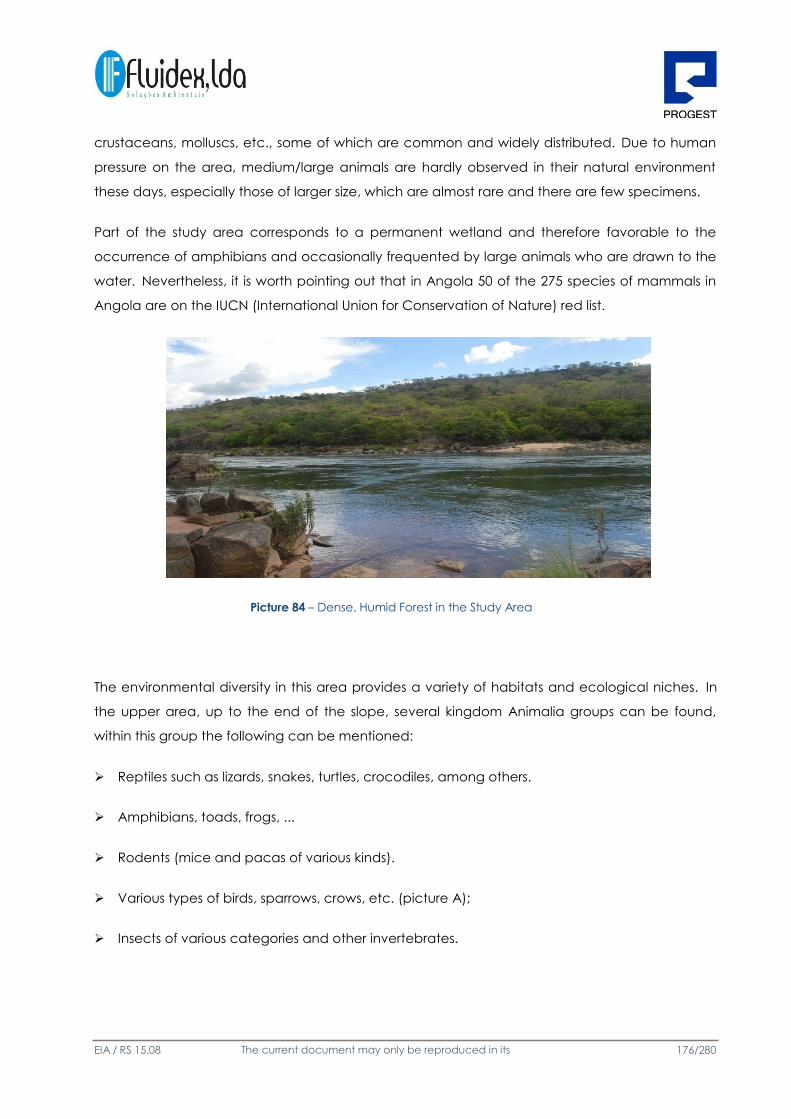
EIA / RS 15.08 The current document may only be reproduced in its entirety.
176/280
crustaceans, molluscs, etc., some of which are common and widely distributed. Due to human
pressure on the area, medium/large animals are hardly observed in their natural environment
these days, especially those of larger size, which are almost rare and there are few specimens.
Part of the study area corresponds to a permanent wetland and therefore favorable to the
occurrence of amphibians and occasionally frequented by large animals who are drawn to the
water. Nevertheless, it is worth pointing out that in Angola 50 of the 275 species of mammals in
Angola are on the IUCN (International Union for Conservation of Nature) red list.
Picture 84 – Dense, Humid Forest in the Study Area
The environmental diversity in this area provides a variety of habitats and ecological niches. In
the upper area, up to the end of the slope, several kingdom Animalia groups can be found,
within this group the following can be mentioned:
Reptiles such as lizards, snakes, turtles, crocodiles, among others.
Amphibians, toads, frogs, ...
Rodents (mice and pacas of various kinds).
Various types of birds, sparrows, crows, etc. (picture A);
Insects of various categories and other invertebrates.

EIA / RS 15.08 Este documento só pode ser reproduzido na íntegra. 177/280
Various annelids, ...
Zooplankton organisms and Icthioplancton.
Fish, molluscs (gastropods and bivalves) and crustaceans of various categories (freshwater
shrimp or Gamba).
A diversity of aquatic (hippos) and terrestrial (deer) mammals Picture B antelope bush goats
...
Picture 85 – Bird specimens occurring in the area of construction of the Caculo Cabaca Hydroelectric Plant.
Picture 86 – A "Paca" (rodent), a land mammal, target for poaching.

EIA / RS 15.08 Este documento só pode ser reproduzido na íntegra. 178/280
Zooplankton
Zooplankton diversity is extremely ample, and the species that live off it during only one stage of
their lives (larval stage) consist of larvae as well as adult animals. The larvae exhibit varied
morphological, physiological and behavioral characteristics, something that is linked to the
evolutionary history of the animal group to which they belong. Phyla or groups of phyla,
evolutionarily apparently tend to have characteristic planktonic larval stages.
The temporary zooplankton components, (mere plankton) are mainly of mollusk larvae, worms,
crustaceans and the fish eggs and fry, are an important group of zooplankton. The permanent
zooplankton (holoplankton) consists mainly of crustaceans and other organisms of the animal
kingdom and yet remain in the plankton throughout adulthood.
In addition to enable the survival of hundreds of thousands of species, zooplankton generally
constitutes the first level of consumption in freshwater ecosystem, and plays a crucial role in
maintaining the entire marine food chain.
Benthos
Benthic beings are animal or vegetable beings that do not move or depend on movements of
the riverbed for their survival or live near the riverbed, the benthic organisms that live near the
riverbed are the demersal group (composed only by animals). All benthic organisms greater
than 1 mm are called macrobenthos.
Ichthyofauna
The distribution of fish in the Kwanza Basin is based partly on eco-geographical characteristics
(topography and geology) and partly on convenience (main tributary systems, dams), and
corresponds to the river reach areas set out geomorphologically in the Lower, Middle and Upper
Kwanza.
The ichthyofauna is home to species ecologically adapted to local environmental conditions. In
a comprehensive manner, little is known about the fish fauna of the Kwanza river, INIP records
(National Institute for Fisheries Research of Angola) provide a general idea of its basic
composition:

EIA / RS 15.08 Este documento só pode ser reproduzido na íntegra. 179/280
As mentioned above, little is known about biodiversity in Angola. Generally, the known species
are those of commercial interest. These are:
- Cyprinidae: Varicorhinus stenostoma, Varicorhinus varicostoma, Varicorhinus ensifer,
Varicorhinus steindachneri, Varicorhinus latirostris, Labeobarbus gulielmi, Labeobarbus rocadasi,
Labeobarbus ensis, Labeobarbus girardi, Labeobarbus lucius, Labeobarbus rhinophorus,
Labeobarbus rosae, among others.
- Cichlid: Orthochromis sp, Serranochromis sp. Oreochromis andersonii, Oreochromi. niloticus,
Oreochromis. macrochir, Oreochromi. aureus Oreochromi. mossambicus, ...
- Clariidae: Rhabdalestes sp sp Clariallabes, Clarias gariepinus, Clarias ngamensi, ...
Cichlid (Cacussos. Picture C): Orthochromis p, Serranochromis sp. Oreochromis andersonii,
Oreochromi. niloticus, Oreochromis. macrochir, Oreochromis. aureus Oreochromis. Moçambicus
(Picture D), Oreochromissp. (Picture E).
Picture 87 – Specimens of Cyprinidae and Cichlids (C)

EIA / RS 15.08 The current document may only be reproduced in its entirety.
180/280
Picture 88 – Specimens of Oreochromis moçambicus (Cichlids) ocurring in the Kwanza River (D)
Picture 89 – Oreochromis sp. specimen (Cichlid) occurring in the Kwanza River (E)

EIA / RS 15.08 The current document may only be reproduced in its entirety.
181/280
Picture 90 – Specimens of Clarias gariepinus fish (Hecht and Moor 2004) occurring in the Kwanza River. Source:
Hecht, T. e Moor I. 2004. Small-scale aquaculture in sub-Saharan Africa. Rhodes University. [December 27, 2005].
<http:/cdserver2.ru.ac.za/cd/011120 1/Aqua/SSA/trendal.htm.>
- Other species: Kneria ansorgii, Parakneria marmorata, Rhabdalestes sp
Aquatic Mammals
The presence of hippopotamuses (Hippopotamus amphibius) has been recorded in both the
Lower and Middle Kwanza areas and have adapted to live in reservoir habitats such as the
Capanda Dam, and were registered in the Laúca dam area. Their densities decreased in most
places in the Lower Kwanza due to indiscriminate hunting, leading to their presence being rare
(Massangano, Quiçama, Muxima) or even becoming extinct. Andar). Near Bom Jesus, Cacungo
and Ventura, they are not considered as residents and are only seen during the floods.
Hippopotamuses have had a potentially important role in removing Invasive aquatic plants
(hyacinth) in lagoons and river banks, but their decline may have contributed to the further
spread of these plants.
The Picture below shows the presence of hippopotamuses in the river.

EIA / RS 15.08 The current document may only be reproduced in its entirety.
182/280
Picture 91 – Area of hippopotamus occurrence: “Lagoa dos hipopótamos”
Fauna may be affected by many factors, with emphasis on the cutting/barrier effect of
changes to the habitat and other systems such as the soil, water and vegetation, to the
increasing presence of humans.
Bioindicators
In recent decades aquatic ecosystems have been heavily modified due to the multiple
environmental impacts of human activities. Many rivers, streams, lakes and even reservoirs have
been heavily impacted due to the uncontrolled increase of human activities.
Animals and vegetation can become important allies of man and nature as environmental
indicators, by way of indicating various changes occurring in the environment, showing when it
is contaminated or destroyed by the presence of toxic chemicals in soil, water or air ,
contamination of rivers, deforestation and other effects.
These organisms, called bioindicators, appear in a given culture and in a quantity proportional
to the imbalance. They can be animals, insects, plants, fungi, bacteria, viruses, and others.

EIA / RS 15.08 The current document may only be reproduced in its entirety.
183/280
The proposed deployment area has no bioindicator plants, but the presence of birds, which are
among the most effective animals to provide environment quality indicators, is an indication of
possible bioindicators.
6.9. LANDSCAPE
Landscape refers to the comprehensive overall image, dynamic and evolving, of "an area of
the territory made up of a set of interacting ecosystems that are repeated through it in similar
form" (FORMAN, RTT and Godron, M. 1986. Landscape Ecology. Jonh Wiley &Sons, Inc.
Newyork) which "results from the combination between nature, the techniques and the culture
of man" (Pitte, J.R. 1983. Histoire du Paysage Français, Le Sacre: de la Préhistoire au XVe
Siecle.Thailandier. Paris.).
The landscape resulting from a site is, in each moment, the reflection of the interaction of various
factors, be they of a biophysical nature (among which the relief/geomorphology,
geology/lithology, the characteristics of the river system and the ground cover are emphasized)
or a socio-cultural nature (the latter being related with actions of an anthropogenic nature),
which have different manifestations in building the territory.
In this characterization, a description and analysis of the surrounding landscape of the project
implementation area is made, in order to enable further evaluation of its reaction to the new
infrastructure.
6.9.1. Methodology adopted
The most common method of characterizing landscapes consists in the definition (and
subsequent evaluation) of "landscape units," i.e., "territorial units embodying express and
biophysical characterization system (...)" based in "(...) homogeneity criteria relating to a number
of significant components (...)". (Abreu, 1989). This method has great practical utility since it
allows for the individualization of homogeneous zones, be it from a visual characteristics of
greater relevance point of view, or from a type of response to external disturbance point of
view.
In this sense, the landscape characterization and assessment of a given region should be
accompanied by an analysis of its intrinsic components, which can be classified as:

EIA / RS 15.08 The current document may only be reproduced in its entirety.
184/280
Biophysical/Ecological: related, basically, to the aspects of morphology and vegetation
cover resulting from natural components of the territories crossed, namely the interaction of
geology / lithology, type of soil, geomorphology, hydrographic network characteristics and
consequently in the type of vegetation;
Anthropic: integrate aspects that reflect the different forms that it takes from the human
activity on the landscape, be it social, cultural or economic (including the transformations of
agricultural and forestry nature), in short, this action is usually a factor of Soil occupation;
Aesthetic and Perceptional: related to the "result", in aesthetic terms, of the combination of all
the factors outlined above (taking into account that the same characteristics can be
combined in various ways), and how that "result" is perceived / seized by potential observers.
6.9.2. Brief Regional Characterization
To characterize the landscape of the study area and surroundings and in order to cover the
most relevant aspects of the current characteristics of the landscape, we used the available
cartography, the project elements and for the field recognition, analyzed the current use of soil
and other factors which characterize the landscape of the area.
The purpose of a construction should be to minimize the impact on the surrounding natural
environment, integrating the built environment with the ecological system and, where possible,
contribute to the production of energy and and the local environment.
The Municipalities (Cambambe, Mussende and Libolo) have beautiful scenery such as:
beaches, waterfalls (the Mulueigi River Falls), mountains, the forests of Upper Golungo and
Caculama, in which there are several types of local vegetation and flowers and the Santa
Isabel and Sobranceiro springs (which are located 2 km from N'dalatando). The Pictures below
illustrate the Caculo Cabaça falls, mountain ranges.

EIA / RS 15.08 The current document may only be reproduced in its entirety.
185/280
Picture 92 – Caculo Cabaça Falls
Picture 93 – Mountain ranges as seen from National Road 322
From an urban point of view, the municipalities have a variety of infrastructures, in particular
villages, huts, schools, medical center, administrative offices, enterprises, among others.

EIA / RS 15.08 The current document may only be reproduced in its entirety.
186/280
6.10. Sound/Noise environment
Noise is an environmental degradation factor that may cause negative impacts in terms of
physical and behavioral health of affected populations. The discomfort due to noise results
primarily from its intensity, expressed by the maximum exposure criteria, and the emergency with
regards to the existing noise environment, regulated by the discomfort criterion.
6.10.1. Legal Framework
In the absence of specific Angolan legislation on noise, the evaluation of the measured sound
levels is carried out based on the legal regime (International Law), approved by Decree-Law No.
278/2007 of 1 August) amending Decree-Law No. 9/2007, of January 17 which approved the
General Regulations on Noise. This regulation is aimed at protecting human health and the well-
being of populations, and defines the following:
Article 3
Definitions
a) a) permanent noise activity: an activity carried out on a permanent basis, although
seasonal, producing harmful or annoying noise to dwellers or residents where they feel
the effects of this noise source, namely the operating of industrial establishments and
commercial services;
b) b) temporary noise activity: an activity that, although not constituting an isolated act, is
not of a permanent character and does not produce harmful or annoying noise to
dwellers or residents in places where the effects of that noise source can be felt, such as
construction sites, shows, festivals or other entertainment events, fairs and markets;
c) Acoustic Assessment: compliance check of specific noise situations which have defined
limits
Noise source: an activity, permanent or temporary, equipment, structure or infrastructure that
produces harmful or annoying noise to dwellers or residents in places where the effects of that
noise source can be felt;
Noise indicator: the physical-mathematical parameter for the description of environmental noise
that has a relationship with a harmful effect on health or human welfare;
Day-evening-night noise indicator (Lden): the noise indicator in dB (A) associated with the
global annoyance, given by the expression:

EIA / RS 15.08 The current document may only be reproduced in its entirety.
187/280
Lden = 10 × log 1/24 [13×10Ld/10 + 3×10(Le+5)/10 + 3×10(Ln+10)/10]
Day noise indicator (Ld) or (Lday): the average long-term sound level, as defined in Standard NP
1730-1: 1996, or its corresponding updated version, defined during a series of representative
daytime periods during a year;
Evening noise indicator (Le) or (Lnight): the average long-term sound level, as defined in
Standard NP 1730-1: 1996, or its corresponding updated version, defined during a series of
representative evening periods during a year;
Night noise indicator (Ln) or (Lnight): the average long-term sound level, as defined in Standard
NP 1730-1: 1996, or its corresponding updated version, defined during a series of representative
nighttime periods during a year;
Noise map: the descriptor for external ambient noise, expressed by the indicators Lden and Ln,
outlined in the document where isophonic curves are defined as well as the areas delimited by
them, to which a determined class of values are expressed in dB (A);
Reference period: the time interval referred to a noise indicator, to cover the typical human
activity, defined as follows:
i) i) Daytime: 07:00-20:00 hours;
ii) ii) Evening period: 20:00-23:00 hours;
iii) iii) Night time: 23:00-07:00 hours;
Sensitive receptor: the residential building, school, hospital or similar and leisure space with
human use;
Ambient noise: the overall noise observed in a given circumstance at a given time due to all the
sound sources belonging to the close neighborhood or remote site in question;
Specific Noise: ambient noise component that can be specifically identified by acoustic means
and assigned to a particular sound source;
Residual Noise noise to the environment which suppress one or more particular sounds for a
given situation;

EIA / RS 15.08 The current document may only be reproduced in its entirety.
188/280
Mixed zone: a defined area on municipal plan of territorial planning, whose occupation has
other uses, existing or planned, others than those mentioned in the definition of sensitive area;
Sensitive area: the area defined in municipal plan of spatial planning as dedicated to residential
use, or for schools, hospitals or the like, or leisure facilities, existing or planned, and may contain
small trade and service units designed to serve the local population such as coffee shops and
other catering establishments, stationery and other traditional commercial establishments,
without operating at night time.
(...)
Clause 11 of the same law establishes the exposure limit values according to the classification of
areas as "sensitive" or "mixed".
Article 11
Exposure limit values
1 – According to the classification of a zone as mixed or sensitive, the following exposure limit
values should be respected:
Mixed areas should not be exposed to outside ambient noise exceeding 65 dB (A), expressed by
the Lden indicator, and more than 55 dB (A), expressed by the Ln indicator;
Sensitive areas should not be exposed to outside ambient noise exceeding 55 dB (A), expressed
by the Lden indicator, and more than 45 dB (A), expressed by the Ln indicator;
(…)
2 – The isolated sensitive receptors not integrated into the classified areas, due to their being
located outside urban perimeters, shall be considered equivalent, on the basis of existing uses in
the vicinity, to sensitive or mixed areas, for the purposes of the corresponding limit values set out
in this Article
3 – Up to the classification of sensitive and mixed zones, referred to in paragraphs 2 and 3 of
Article 6, for purposes of verification of the exposure limit value, the Lden limit values equal to or
less than 63 dB (A) and Ln equal to or less than 53 dB (A), are applied to the sensitive receptors .
(…)
Given that, in the present case, the classification of areas under review as "mixed" or "sensitive" is
not yet defined, according to Article 6 by the competent authorities (city of Luanda), the
provisions of paragraph 3 of Clause 11 will be considered.
The aforementioned law states, in addition, with regard to permanent noisy activities, the
following:

EIA / RS 15.08 The current document may only be reproduced in its entirety.
189/280
Article 13
Permanent noise activities
1 – The creation and operation of permanent noisy activities in mixed areas, adjacent to
sensitive or mixed areas or in the vicinity of isolated sensitive receptors are subject to:
a) Compliance with the limit values defined in Article 11;
b) Compliance with the discomfort criteria considered as the difference between the value of
the LAeq indicator of the determined ambient noise during the occurrence of the particular
noise of the activity or activities in assessment and the value of the LAeq indicator of the residual
noise, difference not exceeding 5 dB (A) during the day, 4 dB (A) in the evening period and 3 dB
(A) at night time, in accordance with Annex I to this Regulation, which is an integral part".
(…)
4 – The provisions of subparagraph b) of paragraph 1 shall not apply in any of the reference
periods, to a value of the LAeq indicator of the environmental noise on the exterior equal to
or less than 45 dB (A) or to a value of the indicator LAeq the ambient noise inside the
reception locations at or below 27 dB (A), considering the provisions of paragraphs 1 and 4
of Annex I.
6.10.2. Sound Environment Characterization in the Area of Influence of the Project
Given that, in the area where the project is located, a classification of mixed or sensitive areas in
that zone has not yet been undertaken, and after a survey of the areas adjacent to the project
implementation area, the area was considered to be mixed and should cumulatively be
ensured that no discomfort situations originating from the noise during the construction phase
and the operational phase is produced.
Therefore, and since there is still no classification, the provisions of paragraph 1 of Article 11 of
Decree - Law 278/2007, of August 1, namely Lden equal to or less than 65 dB (A ) and Ln equal
to or less than 55 dB (A) are adopted.
Article 13 of the same Decree provides that the difference between the noise level of "noise"
and "residual noise" under the conditions of interest (LAeq RAMB - LAeq Rres) may not exceed
the limit value for "Day Period "(≤5dB (A)), for" Sunsets Period "(≤4dB (A)) and the" Night Time
"(≤3dB (A)).

EIA / RS 15.08 The current document may only be reproduced in its entirety.
190/280
Note: Pursuant to paragraph 5 of Article 13, paragraph of the Decree Law 9/2007 the "criterion
of discomfort" shall not apply where LAeq RAmb ≤ 45 dB (A) abroad, or LAeq RAmb ≤ 27dB. (A)
inside the reception venues, considering the provisions of paragraph 1 and 4 of Annex I of
Decree n.º9 / 2007 Act.
6.11. SOCIOECONOMIC AND CULTURAL FRAMEWORK
The socio-economic description of the area under study is defined by identifying the main
human aspects that can be influenced by the panorama of transformation due to the
implementation of the Caculo Cabaça Hydroelectric Power Plant, and in much the same
manner highlight the potential direct and indirect impacts that may result from it.
Angola has a total surface extension of 1 246 700 km² and its capital, is the city of Luanda. In
administrative terms, Angola is divided into 18 provinces. Each province has a capital and
consists of municipalities that are divided into communes; Angola has in total 161 municipalities
that are divided in turn into communes and these, in neighborhoods.
The project implementation area will cover three provinces, namely:
North Kwanza (municipalities of Cambambe and Cazengo)
Malange (municipality of Cacuso);
South Kwanza (municipalities of Mussende and Libolo)
According to the UNCTAD (United Nations Conference on Trade and Development) report on
rural poverty in least developed countries, published on 27 November, 2015, which says; "More
than two thirds of people in least developed countries worldwide live in rural areas where poverty
is twice that of in the cities. In order to achieve the objectives of sustainable development in rural
areas, twice as many inhabitants in these regions need to have access to water every year, four
times more inhabitants need to have access to electricity and six times more, access to
sanitation".
The cconstruction of the Caculo Cabaça Hydroelectric Power Plant will put an end to many of
the obligations in force in the UNCTAD report, creating jobs and fostering

EIA / RS 15.08 The current document may only be reproduced in its entirety.
191/280
the creation of small businesses so that inhabitants of that region are able to earn the minimum
income required for survival.
6.11.1. Administrative Division
The province of North Kwanza has an area of 24,110 km² and is located in the north of Angola. It
borders with the province of Uíge to the North, with the Bengo Province to the West, with
Malange to the East and Luanda and South Kwanza to the South. Its capital is the city of
Ndalatando, which consists of 10 municipalities, namely:
Cazengo
Quiculungo
Bolongongo
Lucala
Golungo Alto
Samba Caju
Cambambe
Banga
Ambaca
Gongembo
The province of South Kwanza has an area of 55,660 km² and is located in the South of Angola. It
borders with the province of North Kwanza, Luanda and Malange to the North, with the Atlantic
Ocean to the West, with Bié to the East and Benguel and Huambo to the South. Its capital is the
city of Sumbe, which consists of 12 municipalities, namely:
Sumbe
Mussende
Amboim
Libolo
Cassongue
Porto Amboim
Cela
Quilenda
Conda

EIA / RS 15.08 The current document may only be reproduced in its entirety.
192/280
Quibala
Ebo
Seles
The province of Malange has an area of 98,302 km² and is located in the North of Angola. It
borders with Uíge and the Democratic Republic of Congo to the North, with North Kwanza and
South Kwanza to the West, with North Luanda and South Luanda to the East, and to the south
with the province of Bié. Its capital is the city of Malange, which consists of 14 municipalities,
namely:
Malange
Cacuso
Caombo
Kalandula
Cambundi – Catembo
Cagandala
Cuaba Nzogo
Cunda – dia – Baze
Luquembo
Marimba
Massambo
Mucari
Quela
Quirima
6.11.2. Population and Land Use
North Kwanza
With a total area of 24,110 km² and a population of approximately 654,000 inhabitants, the city
of Cambambe extends over a rural and urban area,as well as a vast extension of forest
vegetation that is watered by the great river Kwanza.
The area fo the current study is strongly influenced by the very different types of forest
vegetation and includes, among others, the dense, high productivity rainforest. The course of
the Kwanza river covers a distance of 960 Km curving widely to the north and to the west

EIA / RS 15.08 The current document may only be reproduced in its entirety.
193/280
before flowing into the Atlantic Ocean at Barra do Kwanza, south of Luanda, and its green banks
offer refreshing beaches, mainly in the city of Dondo.
Picture 94 – The Kwanza River
Along the course which provides access to the project, the following villages (neighborhoods)
were identified, namely:
Chart 26 - Location of the existing neighborhoods in the perimeter of the project's area of
influence
In accordance with certain local surveys, the majority of the main ethnic groups of the
Municipality represented by the Kimbundo tribe, although certain rural villages were also found
to speak Umbundo.
The soil is used for the practice of subsistence agriculture, although the animals (goats, sheep
and pigs) have been known to impair the cultivated products. One of the reasons that
agriculture is not produced on a larger scale is the fact that the Kwanza river is far away from
the villages.
Province Municipalities Communes Villages
Kwanza North Cambambe S. Pedro da Quilemba Dumbo Ya Pepe, Kisuba,
Bairro Novo, Candengue,
Camongo, Bungu
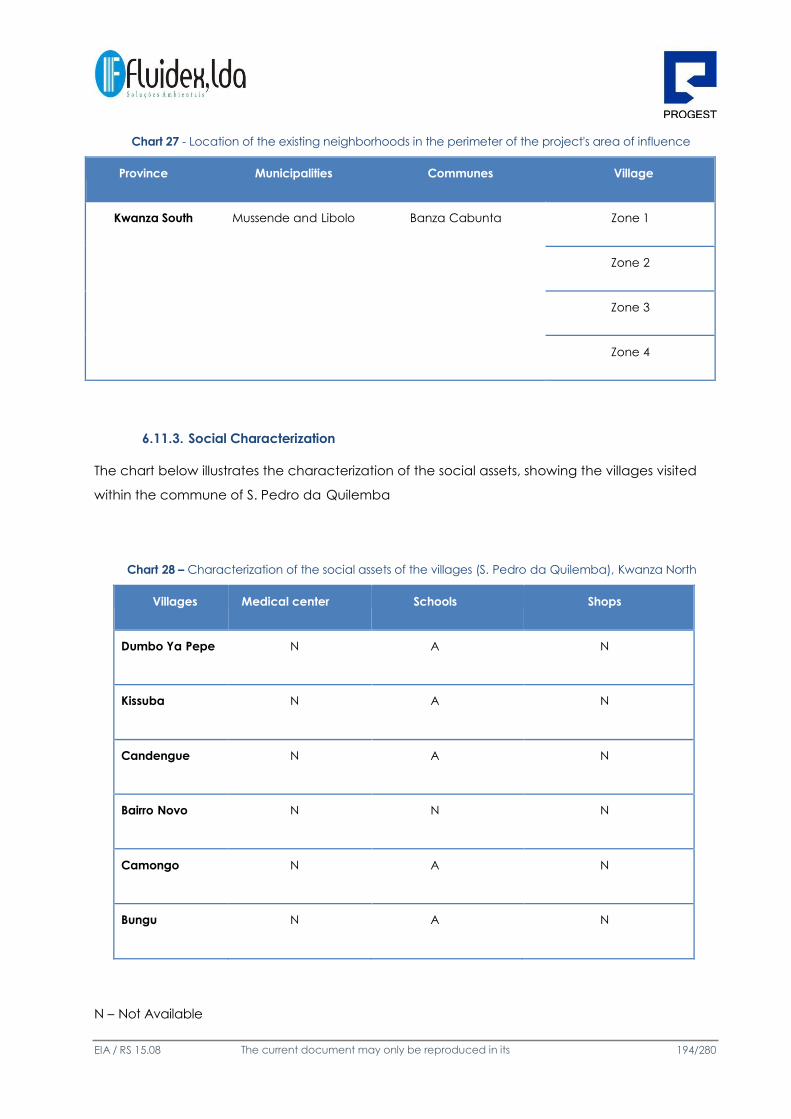
EIA / RS 15.08 The current document may only be reproduced in its entirety.
194/280
Chart 27 - Location of the existing neighborhoods in the perimeter of the project's area of influence
Province Municipalities Communes Village
Kwanza South Mussende and Libolo Banza Cabunta Zone 1
Zone 2
Zone 3
Zone 4
6.11.3. Social Characterization
The chart below illustrates the characterization of the social assets, showing the villages visited
within the commune of S. Pedro da Quilemba
Chart 28 – Characterization of the social assets of the villages (S. Pedro da Quilemba), Kwanza North
Villages Medical center Schools Shops
Dumbo Ya Pepe N A N
Kissuba N A N
Candengue N A N
Bairro Novo N N N
Camongo N A N
Bungu N A N
N – Not Available

EIA / RS 15.08 The current document may only be reproduced in its entirety.
195/280
A – Available
The picture below shows the village of Kissuba.
Picture 95 – Village of Kissuba
Chart 29– Characterization of the social assets of the villages (commune of Banza Cambuta), Kwanza South
Villages Medical center Schools Shops
Zone 1 N A N
Zone 2 N A N
Zone 3 N N N
Zone 4 N N N

EIA / RS 15.08 The current document may only be reproduced in its entirety.
196/280
6.11.4. Economic Activities
Economic activity is very weak and practically non-existent, the population only lives off of work
in the field, hunting, coal production and small-scale fishing. Of these aforementioned activities,
the more practiced is agriculture whereas the most cultivated products are corn, cassava, bean
and sweet potato.
In spite of being an agricultural subsistence activity, the cassava has been produced on a large
scale, although due to lack of transport it is not possible to shift the product to urban centers.
6.11.5. Road Infrastructures
As for access roads to the project, we have verified that there are non-improved roads,
improved roads, aqueducts, road cuts, footpaths and several bridges, among which the 1st
bridge located in the town of Quilemba; the 2nd and 3rd bridges located in the commune of
Quizanga, the 4th bridge located in Filomeno da Câmara and the 5th bridge in Quihoso,
thereby hindering circulation of the population.
Regarding local assessment, we have verified that the vehicles in circulation were mostly heavy
vehicles.
6.11.6. Energy Supply Infrastructures
In terms of electric energy the municipal districts (Cambambe, Mussende and Libolo) are served
by the public electric power supply grid of ENDE-EP. However, supply is not regular, leading most
of the Communes (São Pedro de Quilemba, Banza Cabunta) and the local business community
to use electric generators as alternative sources. However, the villages belonging to these
Communes do not have electric power supply (Dumbo Ya Pepe village, Kisuba, Bairro Novo,
Candengue, Camongo, Bungu, Zones 1,2,3,4)
To this extent, the Administrative Structures have made an admirable effort in improving the
supply of energy to all the municipal districts. The area for construction of the Hydroelectric Plant
will be served by the public grid with a 15kv Transmission Line and an alternative 60kv
Transmission Line.

EIA / RS 15.08 The current document may only be reproduced in its entirety.
197/280
6.11.7. Water Supply Infrastructures
The supply of Potable Water to the Municipality is provided by EPAL-E.P, although the amount of
water available is still scarce. However, many municipalities are still supplied by tankers. Those
living in the villages use water taken from the Kwanza river.
The Municipal Administration has plans for supporting the construction of water wells/fountains
within the scope of the water for everyone program. The area for construction of the
Hydroelectric Plant will be served by the Kwanza river.
6.11.8. Basic Sanitation Infrastructures and Rain Water Drainage System
It could be analyzed that in the area of Indirect Influence of the Project, i.e. the communes
outside the survey area, there is no basic sanitation nor a rain water drainage system.
6.11.9. Historical, Archeological and Cultural Heritage
In the enveloping area of the project, the following items were identified as historical and
cultural heritage: the Filomeno da Camara bridge, the church...
No archeological monuments in the project establishment area were identified.
Picture 96 – Filomeno da Camara Bridge

EIA / RS 15.08 The current document may only be reproduced in its entirety.
198/280
6.11.10. Consulting of the Population
Population consulting was performed in the villages of the Kwanza North and Kwanza South
province, within the enveloping area of the project. During the public consulting, 50 residents
spread out along the different villages were consulted. The table below summarizes the
consulting performed with some residents, namely:
Chart 30– Consultation Participants
NAME OCCUPATION Village AGE (Years)
Narciso João Soba Candengue 65
Adelino A. Resende Secretary of the MPLA Candengue 38
Evalina João Capulo Secretary of the OMA Candengue 52
Pedro Ferreira Resident/farmer São Pedro da 23
Quileba
Bernardo de Castro Resident São Pedro da 24
Quileba
Mateus Gerônimo Soba Bungu 50
Ana Cristina Bondo Resident Bungu 20
João Cristiano Farmer Dumbo ya Pepe 35
Ana Margarida Merchant Dumbo ya Pepe 51
Eduardo Pinto Hunting /farmers Zona 5 25
Francisco Alfredo Farmer Zona 5 27
Diamantino Correia Farmer Zona 5 30

EIA / RS 15.08 The current document may only be reproduced in its entirety.
199/280
Chart 31 – Consultation Participants (cont.)
NAME OCCUPATION Village AGE (Years)
Ana Farmer Bairro Novo 47
Silvestre Adelino Farmer Bairro Novo 62
The opinions obtained from these people were as follows:
They consider that the construction of the Hydroelectric Plant is very important, because
it will bring about more liveliness and movement;
They believe that the undertaking can generate jobs for the residents that live in the
areas surrounding the project;
They believe in a considerable increase in automotive traffic in the area;
When asked if it would hinder the farming of their products, they said no because the
area is vast;
They do not receive electric energy nor channeled water;
In need of schools and teachers;
The main activities of the inhabitants of this area include subsistence agriculture, riverside
fishing and hunting.
The pictures below illustrate the interaction of the sociologist with the population of some villages
during a field visit:
Picture 97 – Dumbo Ya Pepe village

EIA / RS 15.08 This document may only be reproduced in its entirety. 200/280
Picture 98 – School / chapel at the São Pedro da Quilemba commune

EIA / RS 15.08 This document may only be reproduced in its entirety. 201/280
7. IDENTIFICATION AND EVALUATION OF ENVIRONMENTAL IMPACTS
7.1. GENERAL CONSIDERATIONS
Given the specific characteristics of the project at issue and the phase in which it will be
subjected to the Environmental Impact Evaluation Process (EEP), the impact evaluation
methodology fundamentally seeks to obtain information which favors its environmental viability,
i.e. regarding territorial and qualitative interaction so as to intervene in later project phases, also
taking the environmental aspect into consideration.
All relevant direct or indirect changes that can alter the environmental characteristics of an
area, which are for instance associated with the establishment of a specific undertaking, are
considered as impacts.
The impact analysis to be developed within the scope of an Environmental Impact Survey (EIS) is
a complex process, given the intrinsic diversity of the affected environment, reflected in the high
degree of differentiation in the nature and typology of the impacts.
The array of the potential impacts on a project comprises the physical, ecological, socio-
economical and human factors, as well as the factors involving environmental quality. In this
way, the evaluation of impacts demands a specialized and multidisciplinary approach with
certain specificities, namely regarding the methodologies and techniques used.
In general, the evaluation of environmental impacts was developed according to the following
criteria:
identification of the impacts: definition of the potential impacts associated with the
considered generating actions;
forecast and measurement of the impacts: determination of the characteristics and
magnitude of impacts;
interpretation of the impacts: determination of the importance of each impact relative to the
affected environmental factor, when analyzed separately;
valuation of the impacts: determination of the relative importance of each impact when
compared to other impacts which are associated with other aspects or environmental
factors.
The specific per environmental factor analysis should be complemented by an effort for
integration which aims to, insofar as possible, serve as a basis for a Global Analysis. In that sense,
the present Chapter integrates the following aspects:

EIA / RS 15.08 This document may only be reproduced in its entirety. 202/280
Impact Evaluation per Thematic Area
Global Impact Evaluation.
For the evaluation of impacts per thematic areas, the current impacts resulting from the
establishment of the "Caculo Cabaça Hydroelectric Project" are identified, characterized and
evaluated.
For this evaluation, the two specific phases of the project, namely the Construction Phase and
the Exploration phase, were taken into consideration.
The impact evaluation was performed for the thematic areas previously characterized in
Chapter 6, presenting for each of them certain specific methodological aspects, which
accommodate the accomplished development and justify the options and structure defined in
the current chapter.
Also by thematic area, the minimization measures to be adopted for the reduction or
compensation of negative impacts and valuation of positive impacts, in a way which ensures
acceptable levels of environmental quality, are presented in Chapter 8 of this survey.
The impacts were classified as positive or negative and quantified as reduced, moderate or high.
They were defined by duration and, under these terms, classified as temporary or permanent and
evaluated according to their reversibility or irreversibility. Also considered was whether the
impact is direct or indirect.
The classification criteria adopted in this survey, by impact typology, are included in the
following Chart.
Chart 32 – Adopted Impact Classification
Classification Criteria Type of Impact
Importance
Magnitude
Duration
Reversibility
Significance
Positive or negative
Reduced, moderate or high
Permanent or temporary
Reversible or irreversible
A lot, a little
This classification necessarily contains a degree of subjectivity, and should be understood above
all as a relative evaluation of the importance of the different impacts.

EIA / RS 15.08 This document may only be reproduced in its entirety. 203/280
The Global Impact Evaluation was performed based on the obtained results, in which the
evaluation is summarized by thematic areas and aggregate impacts are analyzed, and in which
a chart having the main conclusions is presented.
The methodological option used was mainly based on prior experience acquired during studies
of this nature, in analogies with similar cases and according to experts. After establishing the
most significant impacts, definition of the mechanisms or actions which could contribute for
avoiding, reducing or compensating negative impacts, or otherwise promote, value or reinforce
the positive aspects of the undertaking, was performed.
In this context, the potentially significant impacts, which are naturally associated with the
intervention and characteristics of the target areas, are related to the following aspects:
Qualitative and quantitative water resource management;
Geological, geomorphological and landscape-related aspects;
Ecological aspects;
Socio-economical and cultural aspects (namely cultural and anthropological heritage);
Land resettlement and usage.
In this analysis, the impacts are generality presented in accordance with the two phases of the
undertaking:
The first one refers to the construction of the dam and respective plant, including filling of
the reservoir;
The second has to do with the exploration of the project, in other words, the permanent
state of the reservoir and exploration of the water stored for energy production.
It should be noted that the impacts relative to each one of these phases will be analyzed in a
different manner, namely:
During the construction phase, in which implications relative to the construction of the
dam and plant, the phase where in most cases impacts of high magnitude occur,
although contained and temporary, relative to disturbance induced by the works,
support locales, construction site and accesses, as well as the materialization of the
project at issue;
Also identified are significant impacts related to the creation of a water level (reservoir),
with implications in terms of changes imposed in the biophysical and man-made systems
of the respective flooding area;

EIA / RS 15.08 This document may only be reproduced in its entirety. 204/280
For the exploration phase, impacts related to the administration and operation of the
project are analyzed, and the most relevant have to do with the changes to the natural
system of the Kwanza river. Also mentioned for this phase are positive occurrences
related to prospective uses which, in the present case, are mostly associated with the
production of renewable energy and also being able to promote secondary activities.
Lastly, the analysis of cumulative impacts, either in function of existing undertakings or
prospective ones, are deemed as being relevant.
7.2. IMPACTS ON BIOPHYSICAL ASPECTS
7.2.1. Geology
7.2.1.1. Methodology
Qualitative methods were used for the evaluation of impacts in geology susceptible of being
caused by the establishment of the Project under analysis.
In this evaluation, the construction phase and the exploration phase were considered separately.
The project elements and information gathered within the scope of the characterization of the
reference situation (Chapter 6), were used as base elements for the qualifier under analysis.
Measures for mitigation of the identified impacts were also proposed (Chapter 8).
The construction of the Caculo Cabaça Hydroelectric Project implies a set of changes which
are more or less expressive in the morphology of the area directly affected, as a result of:
Sanitation and excavation of the foundation of the dam;
Excavation of the water bypass channel;
Exploration of borrow sites and quarries;
Deforestation and stripping of the area of the dam, and of the reservoir on a later date;
Clearance of accesses to the work areas;
Establishment of construction sites and facilities for work-related personnel;
Deposit of excess materials and / or materials inapplicable to the works.

EIA / RS 15.08 This document may only be reproduced in its entirety. 205/280
During the filling and exploration phases of the project, the main generating sources of impacts
will be the aspects related to the erosion downstream and of the margins of the reservoir, and
also the induced seismicity.
7.2.1.2. Construction Phase
Geological Element Impacts (reservoir construction and filling phase)
During the construction phase and filling of the reservoir, the impact on geological elements
may occur in the target areas, namely in the area of the dam, construction sites and works
support areas, as well as at the borrow sites and deposit.
Given the reduced size of the reservoir, compared to the extension of the outcrops of the
pertinent geological formations, it is foreseen that the creation of the reservoir practically has no
influence on eventual cultural geological heritage. Notwithstanding, recognition of the reservoir
area is foreseen along with the identification and stocktaking of eventual values with lithological
interest.
Mineral Resource Impacts (reservoir construction and filling phase)
The value of the mineral resources is susceptible of eventually becoming affected, in case this
occurs in the area of the future reservoir or in its vicinity in case the viability of its exploration is to
be conditioned or limited, i.e. by the rising of groundwater levels and the consequent
occurrence of underground waters at the exploitable mining areas.
Impacts due to the Exploration of Quarries and Borrow Sites
The production of aggregate and of other materials for the construction of the dam requires
that quarries and borrow sites be explored. The morphology may, in this case, be irreversibly
impacted. However, the practice of locating the explorations within the future reservoir allows
for minimizing the impact, which is confined to a limited period (during construction), which may
therefore be considered as certain, but of moderate importance and temporary in nature.
However, for the project at issue, the quarries and borrow sites are located outside of the area
of the reservoir, thereby aggravating respective impacts.

EIA / RS 15.08 This document may only be reproduced in its entirety. 206/280
Local Changes in Morphology (construction phase and reservoir filling, remaining in the
exploration phase)
It is considered that the morphology will always be affected by the creation of the reservoir,
namely by sedimentation in the immersed area and by erosion and/or sedimentation in the
flotation area. In the current case, the effect was considered as having a low to moderate
magnitude and importance, with characteristics of probable permanent impacts, and having a
long term (sedimentation) and medium term (erosion) significance.
It is therefore concluded that in geological and geomorphological terms, the impacts in this
phase, although negative, direct, localized, of moderate to high magnitude and having reduced
significance especially with the application of measures to be taken and recovery of the
landscape, habitual nowadays in works / interventions of this nature, it is therefore admitted that
in respect to residual impacts these are of reduced significance.
7.2.1.3. Exploration Phase
Local Changes in Morphology (phase and reservoir filling, remaining exploration phase)
Already described in the previous sub-chapter.
Increment of Sedimentation Processes / Degradation (filling of the reservoir and exploration
phase)
With the creation of the reservoir, the aggregation (sedimentation) processes suffer an
acceleration in the immersed area, while erosion in the downstream areas is increased. Given
the lithological characteristics of the present formations, it is expected that these effects have
reduced to moderate importance. Its occurrence is certain, permanent and commences on
day one of the undertaking's exploration.
Stability Impacts on the Slopes of the Reservoir

EIA / RS 15.08 This document may only be reproduced in its entirety. 207/280
The creation of the water level of the reservoir and subsequent ascent of the groundwater levels
is susceptible of altering the stability conditions of the slopes, which does not necessarily mean
that these changes result in their instability, as rocky masses suffer displacement towards the
inner area of the reservoir. The consideration of this effect is particularly pertinent in the situations
of quick draining of the reservoir, which are considered highly unfavorable actions towards the
stability of the slopes.
This influence is deemed as probable, with reduced magnitude and importance, given the
geomorphological, lithological and structural characteristics of the foundations of the reservoir,
which are not considered as favorable to the occurrence of instabilities of significant
magnitude; in other words, eventual slippage would be on a small scale, and would not
comprise a relevant hazard towards the safety of the dam or of the populations downstream.
Acceleration of the Erosion Processes of the Margins
Impacts relative to the increase in the erosion of the margins are foreseen on two levels: At the
margins of the reservoir - the flotation of the water at the reservoir (areas between levels, i.e.
between the minimum level of exploration and the full level of storage) will interfere in the
erosive process, given that it promotes its direct intensification, by the agitation of the waters
and by the deforestation / clearing of this area. This influence is certain, immediate and has a
permanent effect.
Along the margins of the Kwanza river and also downstream - downstream from the dam, this
influence is indirect when associated with the retention of sediments in the reservoir which may
provoke a deficit downstream, promoting an upturn in erosion in detriment of sedimentation.
This effect is certain, permanent, of immediate effect and shall have significant long term
effects. On the other hand, in case variations of the daily flow would also occur, the margins will
be subjected to pressures resulting from these water level oscillations, thereby favoring erosion.
Erosion due to Discharge
Discharging operations can have erosive effects which affect morphology. Given the nature of
the solid rocky foundations at the base of the valley and of the slopes at the location of the
dam, comprised of highly resistant rocks and, therefore, of reduced susceptibility to erosion, it is

EIA / RS 15.08 This document may only be reproduced in its entirety. 208/280
considered that the effects will however be of low magnitude and of little importance,

EIA / RS 15.08 This document may only be reproduced in its entirety. 209/280
although detrimental. Their influence is certain, although reduced and permanent, and
commences upon exploration.
Aggregation / degradation is unbalanced towards erosion given the large amount of energy
involved in the discharges and retention of sediments by the dam.
Erosion at the base of the slopes due to discharges can, in certain conditions, affect their
stability. Given the characteristics of the rocky foundations at the base of the slopes, it is
considered that this influence be very low or even non-existent.
Induced Seismic Activity (filling of the reservoir and exploration phase)
Induced seismicity is the term given to seismic activity susceptible of being related to the
creation of a dam reservoir and is essentially due to the pressure exerted by the body of water
on the subsoil (fractures and fissures) during the first filling. The adaptation of the underground to
this new situation can be prolonged for three to five years after the end of the first filling of the
dam.
From the experience of observation of the behavior of great dams around the world, it was
ascertained that the possibility of induced seismic activities exist whenever the work has more
than 1 000 hm3 of water storage or more than 100 m in height, but this is not the case of the
Caculo Cabaca Hydroelectric Project, which although having a height of 103m, presents a
storage volume of 436 hm3.
Concerning the safety of the dam itself, the induced seismic activity is also not relevant, as it
does not generate seismic activities with magnitude greater than the maximum seismic activity
of the project. Thus, once the safety of the dam for the maximum seismic activity of project is
verified, its safety is equally guaranteed relative to the eventual occurrence of a seismic activity
induced by the filling of the reservoir.
During the exploration phase, the impacts in the geological way and geomorphology are
classified of negatives, of reduced and located, little significant magnitude.
7.2.2. Climate
7.2.2.1. Methodology
The impacts on the climate resulting from the establishment of the project in survey, can result
from the morphologic alterations of the land, if these modify the drainage pattern

EIA / RS 15.08 This document may only be reproduced in its entirety. 210/280
the atmospheric pattern and of the pattern of local incidence of winds and breezes. It will still
be able to result from alterations in the radiation values due to modifications of the use of the
soil.
Evaluation of the impacts on the climate for the different phases of the project was performed
taking into account the involved interventions.
7.2.2.2. Construction Phase
In general, climate impact associated with the construction phase of the project is classified as
non-existent.
7.2.2.3. Exploration Phase
During the exploration of the undertaking, the main impact factors are related to the creation of
a plan of water, the creation of a reservoir, and for that the existence of a new mass of water, it
can implicate alterations of microclimatic character, with sensitive effects, although just at the
local level.
Increase in Relative Humidity of the Air
The increase of the relative humidity of the air, in the vicinity of the reservoir, will result in the
evaporation that the body of water will provide: this fact will immediately be able to originate
the increase of the frequency and intensity of cloudiness and located thick fog in the area
adjacent to the reservoir, as well as the decrease of the thermal widths, daily rate and annual,
for these be inversely related to the levels of relative humidity of the air.
Increase in the Absorbed Solar Radiation
The increase of the absorbed solar radiation will result from albedo, or coefficient of reflection of
the radiation, to become plenty minor for the surface of water, that for the natural surfaces with
vegetable covering. Like this being, the creation of a mirror of water will favor the increase of
the absorption of the solar radiation, due to the smallest power of reflection of the water
relatively to the vegetation. To the place of the reservoir, a reduction of the reflection of the

EIA / RS 15.08 This document may only be reproduced in its entirety. 211/280
radiation of the disposition of the 75% is foreseen, admitted albedo of 0.20 and 0.50 for natural
surfaces and for the water mirror, respectively.

EIA / RS 15.08 This document may only be reproduced in its entirety. 210/280
Because of this, it was concluded that the impact in terms of climate conditions due to the
exploration phase of the Undertaking could be classified as negative and direct, although
temporary, reversible, moderate in scale and barely significant.
7.2.3. Air Quality
7.2.3.1. Methodology
When analyzing impacts in air quality of the water, the impacts which are likely to occur during
the construction and exploration phases of the Project at issue, were considered.
The evaluation of impacts during the construction phase was performed in a qualitative way
with identification of the typical actions of construction and of the atmospheric pollutants
emitted.
In the construction phase they were still evaluated the current gaseous emissions of the
necessary road traffic for the transport of the materials and equipments during the work.
Measures for mitigation of the identified impacts were also proposed (Chapter 8).
7.2.3.2. Construction Phase -
Particle Emissions and their Resuspension
During the construction phase, the impacts foreseen in the quality of the air will be above all
associated with dust emissions, provoking a consequent increase in the concentrations of
particles in the air as a result of the different activities involved at the site (mainly during the initial
phase of the works), namely regarding deforestation operations, earthworks and transport of
earth and materials.
Particle emissions will mainly occur during the driest periods of the year and on the most windy
days, both due to the normal intensification of the works during these periods as well as due to
the ease of suspension of dust during less humid seasons, whereas these emissions are more
expressive in areas having work activities with greater intensity and at the accesses with heavy
circulation of vehicles and machinery (mainly unpaved access routes).

EIA / RS 15.08 This document may only be reproduced in its entirety. 211/280
Therefore, direct particle emissions and their resuspension due to deforestation activities and
operations, clearing and transport of earth (excavations at the dam and foundations), creation
of access routes, circulation of vehicles and machinery, operation of quarries and bituminous
plants as well as other activities favoring the construction of the hydroelectrical project, should
comprise the main impact of this phase of the project in terms of air quality.
The emission of particles resulting from the circulation of vehicles in the work areas and
construction site depend on the characteristics of the soil, of the volume and type of traffic, of
the distance traveled and of the speed in which the vehicles circulate.
However, the aforementioned activities will be temporary, limited to the duration of the works
and are localized, given their restriction to the target areas. Therefore, regarding the current
potential negative impacts of the construction phase, two main conclusions may be
highlighted: on one side, these impacts should be relative to emissions (mainly dust) generated
at the work sites, main accesses and exploration locations of inert matter; on the other hand, the
impacts are considered as potentially barely significant with regards to their temporary and
localized nature, and above all due to the fact that happen not occur close to areas in which
sensitive receivers (although they may be considered a nuisance to the residents at the social
constructions site) are present.
Emission of Smoke and Gases (such as nitrogen oxide, carbon monoxide, volatile organic
compounds, etc.) from Vehicles pertaining to the Works
There may be potential impacts associated with the production of gases resulting from the
operation of combustion engines, originating from transport vehicles and handling equipment
used during the course of the works. These potential impacts should, however, be insignificant
due to the good quality of the air currently present at the undertaking's construction site and
due to good atmospheric dispersion conditions.
The circulation and operation of mainly heavy machinery and vehicles related to the works will
originate temporary emissions of atmospheric pollutants, resulting from the burning of fuel such
as carbon monoxide (CO), sulfur dioxide (SO2), nitrogen oxides (NOx), volatile organic
compounds (VOCs: aldehydes, hydrocarbons, ketones, etc.), particles and black smoke, as well
as lead compounds (Pb) resulting from fossil fuels.

EIA / RS 15.08 This document may only be reproduced in its entirety. 212/280
In general, the presence of these pollutants in the atmosphere may be responsible for changes
in the quality of the air, which generally depend on a series of variables, mainly the weather
conditions of the site, the topography of the area, the nature and duration of the different
operations, and also the type of equipment used and their characteristics.
Because of this, it was concluded that the impact in air quality due to the construction phase of
the Undertaking could be classified as negative and direct, although temporary, reversible,
moderate magnitude and significant.
7.2.3.3. Exploration Phase
Climate Changes
Unlike the emissions resulting from the production of electrical energy from the burning of fossil
fuels, emissions associated with the production of hydroelectric energy are considerably more
difficult to measure or predict. During this phase, the emissions depend on two different
situations:
I. Positive Impacts of the Project on Climate Changes
It is considered that a potentially positive indirect impact regarding climate changes is
associated with the exploration of the project, due to the production of electricity from
renewable energies, thereby reducing the need to resort to fossil fuels.
In fact, on a generally positive note, hydroelectric production represents a means for obtaining
cleaner energy compared to the production methods using fossil fuels, which result in significant
emissions of CO2 and greenhouse gases in general, a fact which can contribute to attenuate
the general effects of energy production in terms of climate changes in accordance with the
provisions established, namely, in the Kyoto Protocol.
II. Carbon Emissions due to Flooded Organic Matter

EIA / RS 15.08 This document may only be reproduced in its entirety. 213/280
The decay of organic matter, occurring when the area to be flooded for the creation of the
reservoir (immersed vegetation subjected to anaerobic conditions) is not deforested, provokes
carbon emissions in quantities which depend on the amount of underwater organic matter.
These complex chemical cycles take place within the reservoirs and are governed by factors
which vary according to the dam, season and region, are related to the layering of water
columns, with anaerobic processes in the deeper areas, and in which decayed vegetation
eventually sinks due to rising water levels associated with the operation of the dams.
Within the scope of the generating system, the increase in production of electricity originating
from renewable energy sources has, as a result, less of a need to burn fossil fuels for the
production of electricity. The result of this process brings about a reduction in the growth of
carbon emissions associated with the burning of coal, fuel oil and natural gas, effectively
replacing these processes with a production of energy which does not release CO2 into the
atmosphere.
Hydroelectric power, being one of the renewable sources offering the lowest cost of production,
is a key factor for the decrease of GGE (Greenhouse Gas Emissions), therefore it is important to
consider the potential reduction of CO2 emissions resulting indirectly from the project given that
it corresponds to the reduction of the GGE emissions that are avoided when resorting to
hydroelectric energy as opposed to combustible energy sources.
On the other hand, with the creation of reservoirs, terrestrial plants die and stop assimilating CO2
through photosynthesis, resulting in the loss of atmospheric CO2 "sinks". The bacteria become
responsible for the decomposition of the organic carbon stored in the local biomass prior to the
filling of the reservoir, in aquatic plants living on the surface and in seepage originating from the
margins and soils of the reservoir, converting it into CO2 and methane (CH4). These compounds
are then released into the atmosphere, usually through diffusion processes, at the surface of the
reservoir.
The age of a reservoir is decisive in the production of GHG, given that the most unstable recently
flooded carbon materials, as well as the carbon found in leaves and debris, have a rapid rate of
decay; followed by a slow rate of decay of older carbon deposits such as those found in soils
and peat. To this extent, it is foreseen that the production of GGE in the reservoir decrease over
time. The dimension of the reservoir is also relevant, in terms of the area occupied as well as the
average depth and volume of stored water,

EIA / RS 15.08 This document may only be reproduced in its entirety. 214/280
including the duration of storage of the water, in other words its capacity for renewal, whereas
in the present case, these factors are quite favorable.
Therefore, when comparing the potential for reducing CO2 emissions based on the resulting
average emissions of a combined cycle thermoelectric plant for the production of energy
equivalent to that of a hydroelectric plant, in spite of the fact that the calculated values of
CO2equiv. released per year with the filling of the reservoirs may be underestimated, these
values are vastly inferior to the average annual values for potentially reducing CO2 emissions
with the implementation of the project.
Because of this, it was concluded that there are positive and indirect impacts associated with the
production of electricity by means of renewable energy, but there are also negative and direct
impacts, which are insignificant and small in magnitude, resulting from carbon emissions
originating from flooded organic matter.
7.2.4.Soil
So as to identify and evaluate the impacts in the soil pertinent to the establishment of the
project under study, a description of project actions which may generate potential impacts for
the construction and exploration phases was performed, given that they lead to impacts of a
different nature.
A qualitative analysis of the impacts based on the developed project and current mapping was
performed, whereas the recommended methods for minimizing these identified impacts were
also taken into account(Chapter 8).
7.2.4.2. Construction Phase
During the construction phase of a project such as this one, the main impacts which are likely to
occur along the pedologic substrate are shown in the following Chart, in which the actions and
potential changes caused are also identified.

EIA / RS 15.08 This document may only be reproduced in its entirety. 215/280
Chart 33 – Identification of the Main Impacts on Soil (Construction Phase)
The soil impacts during the construction phase are due to the destruction of the vegetation and
consequent instability of soils unprotected from earthmoving, compaction of the areas for
machine circulation, eventual contamination of the soil with oils and fuels, and interruption of
the drainage patterns during the periods in which earthmoving takes place.
As a consequence of these actions, a decrease in the quality of the soils which were
compacted, polluted or affected by the eventual increase of erosion, could be verified.
It should also be noted that additional impacts are foreseen relative to the soil used for
establishment of the work site, given the fact that it should be located in an area adjacent to
the place of establishment of the project.
In general, the impacts foreseen during the construction phase are negative, direct, permanent
and irreversible but significant and moderate in magnitude, taking into account the value of the
soil under consideration and the fact that these impacts may be controlled with the
implementation of appropriate management measures taken by the project owner and
construction company.
7.2.4.3. Exploration Phase
During the exploration phase of the project, significant soil impacts are not foreseen, as the
entire area comprising the undertaking will be stabilized, provided that the maintenance and
environmental control conditions are secured.
Action Modification
- Destruction of the vegetation covering;
- Soil compaction;
- Earth moving; - Erosion increase;
- Machinery circulation; - Contamination of the soil with
- Construction, operation and demobilization
of the site;
chemical
seepage
of products
Changes in morphology, to the network and
drainage pattern;
Particle emissions.

EIA / RS 15.08 This document may only be reproduced in its entirety. 216/280
The following Chart displays the typical soil impacts which may occur during the exploration
phase of the project.
Chart 34 – Identification of the Main Impacts on Soil (Exploration Phase)
Action Modification
Maintenance Works; Accidents
involving Spillage.
Increase of erosion; Seepage
contamination
As such, during this phase, impacts on soil are expected and are classified as
negative, direct, localized, permanent, of low magnitude and barely significant.
7.2.5. Soil Usage
7.2.5.1. Methodology
For the assessment of impacts regarding soil usage, qualitative methods were used to evaluate
the magnitude of the impacts during the construction and exploration phases of the project.
When evaluating the magnitude of the impacts which are likely to occur as a result of the
project, the current occupation characteristics were taken into account.
Ultimately, measures for the mitigation of impacts were proposed (Chapter 8).
7.2.5.2. Construction Phase
In terms of soil usage, the potential impacts are limited to the suppression of current usage in the
area of establishment of the project.
Therefore, taking into account the current occupation of the soil, impacts are generally classified
as negative, permanent, irreversible of moderate magnitude and significant.

EIA / RS 15.08 This document may only be reproduced in its entirety. 217/280
7.2.5.3. Exploration Phase
In this phase, the aforementioned impacts also apply to the construction phase regarding soil
usage; in addition, the project under study comprises a strategic investment for the economic
and social development of the country.
The impacts during this phase may therefore be generally classified as positive, direct, irreversible,
permanent, of moderate magnitude and significant.
7.2.6. Hydrology
7.2.6.1. Methodology
When analyzing impacts in the hydrology and quality of the water, the actions which are likely
to occur during the construction and exploration phases of the Project at issue, were
considered.
Measures for mitigation of the identified impacts were also proposed (Chapter 8).
The Caculo Cabaça Hydroelectric Project will increase the area controlled by dams within the
Kwanza basin, at the section of the dam, by 112,663 Km2. In turn, the storage volume of the
Caculo Cabaça reservoir only allows for daily flow regulation, to which extent a run-of-river dam
was considered, having very little capacity for altering the flow system reaching the dam.
In this context, new impacts in the superficial hydrological system created by the Caculo
Cabaça Hydroelectric Project, or the aggravation of those already present, are very reduced in
influencing the monthly or seasonal flow system. However, they are also foreseen for
underground water and for the quality of the water, due to the creation of new conditions on
behalf of the water system.
7.2.6.2. Construction Phase
Hydrology and Superficial Hydrological System
Downstream Flow Reduction While Filling the Reservoir
During the period following the construction of the dam, the filling of the reservoir shall
commence. During this period, which shall last around 9.47 days, inflows originating

EIA / RS 15.08 This document may only be reproduced in its entirety. 218/280
from Laúca will be partially retained until full storage is reached, thereby triggering exploration of
the project through power generation from the water.
During this short reservoir filling period, a significant reduction of downstream flows are foreseen,
however, a flow which fulfills the downstream requirements (the ecological flow) shall be
guaranteed.
Taking into consideration the biotic and anthropogenic support that the Kwanza River
represents, the impacts associated with an abrupt reduction in flow rate, however restricted
relative to duration, may be significant: both to the communities which use the river as well as to
the natural habitats which depend on it.
Hydrogeological System - Groundwater
Increase in the Waterproofed Area, Vulnerability to Pollution and Pollution Hazard
Common impact during the construction and exploration phases - described in sub-chapter
7.2.6.3
Potential Allocation of Eventual Suspended Water Sources and of the Geological Complex
(reservoir construction and filling phases)
During the construction phase of the dam foundation, cuttings and embankments lead to the
destruction or irreversible occupation of the geological environment, and will affect eventual
suspended water sources and destroy the current geological complex:
- upon executing excavations and embankments, leading to the destruction of the geological
environment or to its irreversible occupation thereby provoking changes to the geomorphology
of the area, i.e. by modifying the water infiltration conditions of rainfall and the drainage of small
discontinuous water sources which are outcropping or close to the surface of the valley hillsides
between which the dam will be built;
- upon occupation, deforestation, erosion and degradation of the soil in the areas used for the
works and construction site, for temporary access routes and for all construction activities, i.e. by
modifying the rainfall water infiltration conditions;
- due to dust propagation, which will fill eventual open cracks and fractures, thereby modifying
the rainfall water infiltration conditions;

EIA / RS 15.08 This document may only be reproduced in its entirety. 219/280
- upon the propagation of vibrations due to explosions of cuttings which, by opening cracks
and fractures, may improve the infiltration conditions: the use of explosives is a source of release
of certain pollutants which are dissolved in the infiltrated water and eventually propagated;
- in the area of the works and respective surroundings, there will be a strong circulation of
trucks/other vehicles and of heavy machinery. Consequences of this activity include an
increased risk of accidents and of pollution (accidental discharges) associated with circulation
by land;
- in the increase of the risk of pollution of the water environment and of the soil, since there will
be effluents produced at the construction sites and during the works: domestic effluents, waters
and oils from washing vehicles and at engine maintenance garages, production plants and
material deposits, oil losses or accidents with machines in labor, residual materials from the
works, hydrocarbon and dangerous product spills, etc. which can be transported, dissolved or in
suspension relative to the underground component of the hydrological cycle;
- in the interception and drainage of small suspended water sources from available water
resources and very limited emergent flow.
Changes in Water Quality - Potential Water Contamination
The first predictable repercussions relative to the quality of the superficial waters are associated
with the effects of earthmoving, excavations and the circulation of heavy vehicles and
machinery. These activities can lead to the contamination of nearby water courses, namely by
means of the significant increase in suspended solids.
During this phase, the deterioration in water quality could also be due to the discharge of
incoming effluents originating from the different facilities required for the construction of the
dam, namely the constriction sites among other things; these impacts should be conveniently
minimized by adopting preventive measures.
Increase in Water Turbidity (Suspended Solids) at the Reservoir Area (construction phase and
reservoir filling)
deforestation of the soil and the eventual use of temporary areas inside the reservoir, as well as
"loose" material in the sedimentary areas during the course of the works may lead to

EIA / RS 15.08 This document may only be reproduced in its entirety. 220/280
erosion of the soil and eventual partial silting of the water courses in the affected area, thereby
increasing turbidity of the waters.
A riparian gallery with an appreciable degree of development should also be expected, as well
as patches of forest and shrubbery in the areas to be flooded, in case complete deforestation is
not possible (this is foreseen although it can be conditioned due to difficulties in accessibility and
works in the field), which may pose problems regarding the quality of the stored water.
In effect, prior accumulated experience in surveys of other hydraulic projects indicates that
flooding of the vegetation can lead to the degradation of water quality due to the high
amounts of organic compounds and nitrogen/phosphorous salts which are released during the
decay of the vegetation.
Oxidation (both chemical and biological) of these organic compounds leads to decreased
dissolved oxygen, the formation of poisonous substances (i.e. ammonia, hydrogen sulphide),
corrosive substances (sulphidric acid), methane and substances with unpleasant odor.
On the other hand, water enrichment through nitrogen/phosphorous salts may trigger a process
of accelerated eutrophication and, consequently, the proliferation of algae, aquatic
macrophytes, reduction in the diversity of aquatic organisms, and the appearance of poisonous
substances and unpleasant odors, among others.
Globally, negative impacts of reduced magnitude relative to temporary impacts restricted to the
construction phase, are therefore admitted. However it is during this phase that permanent
impacts in water resources, related to changes in the Kwanza river system, commence.
7.2.6.3. Exploration Phase
Hydrology and Superficial Hydrological System
Passage from a Lentic to Lotic System along the stretch of the Kwanza, Caringe and Quixacala
rivers, as well as other less significant water lines which were flooded by the Reservoir (filling of the
reservoir and exploration phase)
Another irreversible and permanent impact is the passage of the stretch occupied by reservoir
from a lentic system (of running water) to a lotic system (of still water), a situation which triggers
negative impacts but also positive impacts.

EIA / RS 15.08 This document may only be reproduced in its entirety. 221/280
In terms of water, this change in water line system (and respective tributaries at the location of
the reservoir), drastically reduces flow speed, creating the sedimentation of solids present in the
flow and also creating important constraints regarding the quality of the water. On the other
hand, new conditions for the recharging of water sources are created in the reservoir. As
another means for biological support, the negative impacts are associated with the radical
changes in the conditions of the natural and positive habitat for the creation of a new habitat,
having other inherent characteristics.
It is important to bear in mind the significant changes provoked in the different aspects, which
are directly and indirectly related to the river due to modifications of its drainage system,
thereby being characterized as a lake-type system of semi-still water along the stretch which
comprises the scope of these changes. However, it is important to note that regarding the
foreseen (relatively reduced) storage capacity of the Caculo Cabaça reservoir and the effluent
flow system, it is predicted that the water be completely replaced within a period of roughly 10
days (9.47 days). During a flood scenario (considering a high-water flow with T = 10 years), the
time of renewal will be roughly 2 days, which thereby attenuates the effects due to lingering
water in the reservoir.
Retention of Solid Flows at the Reservoir
Considering that the totality of the sediments "drained" at Laúca are maintained within the
Caculo Cabaça reservoir, even during a high-water situation, some fine-grained sediments may
be released downstream. The Caculo Cabaça Hydroelectric Project will provoke a negative
impact, having cumulative effects with regards to Laúca, which will take place in a permanent
manner and during the service life of the undertaking, which may produce consequences in the
biotic environment as well as in the human environment downstream from the dam.
Flow System Change
One of the main expected impacts in the water environment during the useful life of a dam is
related to changes in the hydrological system which lead to changes in the speed and depth of
drainage, the solid matter transportation system and the morphology of the riverbed,
temperature and quality of the water and, consequently, also affect the habitat of freshwater
species, thereby introducing impacts in biotic communities.

EIA / RS 15.08 This document may only be reproduced in its entirety. 222/280
In fact, the flow plays a fundamental role in lotic ecosystems' ecology, becoming a decisive
factor in the structure and diversity of the biotic communities.
In the same way, the changes imposed in the river's aquatic system may be able to affect
current and predicted uses of the water downstream.
Therefore, in each hydroelectrical undertaking, on one hand the flow corresponding to the
highest value of the minimum calculated flow for each phase of the lifecycle of the selected
species should be guaranteed, considering that this corresponds to the flow that allows for
maintaining the fish population within the considered desirable levels.
This value is called the ecological flow and may therefore be defined as the necessary minimum
flow to be maintained downstream of a hydraulic project for securing the conservation and
protection of freshwater ecosystems.
Taking this into consideration, definition of the ecological flows of a certain hydroelectric
undertaking should have as its main purpose the guarantee of the maximum ecological
potential to be attained for the downstream water line stretch.
The value of the ecological flow is independent of the reserved flow which, on the other hand,
must always be guaranteed downstream of the hydraulic project for maintaining existing usage
of the water.
For the undertaking at issue, it is important to refer the particularity that this undertaking will
interfere in a previously altered hydrological system, is it will be located immediately downstream
of the Laúca Hydroelectric Project. Therefore, inflows ariving at Caculo Cabaça shall directly
depend on discharges from Laúca.
The main function of the dam in study is the production of electric energy, which implies a non-
consumptive usage and in which all inflowing water is passed downstream. For the water
storage capacity of the Caculo Cabaça reservoir, this dam does not permit flood regulation,
nor monthly or yearly flows, being only able to alter flow discharge during the day, thereby
securing the foreseen minimum discharges.
The ecological flow determined for the Caculo Cabaça Hydroelectric Project is of 60m3/ s,
which is in accordance with the guidelines determined by the "World Comission on Dams" as
being the minimum value and 10% of the annual average flow.

EIA / RS 15.08 This document may only be reproduced in its entirety. 223/280
Hydrogeological regime - Groundwater
Increase in the Waterproofed Area, Vulnerability to Pollution and Pollution Hazard (construction
and exploration phase)
Human occupation always leads to several types of contamination depending on the existing
urban equipment and on the project measures and conservation of this equipment.
- waterproofing of the areas destined for foreseen roads and buildings will reduce the
groundwater recharge rate;
- installation of the ducts for the water supply and effluent systems usually have leaks. Eventual
water leakage will increase the natural groundwater recharge rate, although this is to be
considered a loss in terms of good water resource management; leaks from the effluent
transportation systems will release contaminations beneath the soil. Therefore these systems
should foresee specific construction measures that warn or minimize the risk of leakage.
- produced wastewater should be treated in a proper WWTP and the resulting water should be
released in conditions of quality which comply with the national and international legal and
standard requirements. In case quality is not acceptable, the water should be released into the
underground drainage in accordance with the connection model between the underground
and superficial waters. Entry in the underground environment will be direct if they are released
onto the surface of the land or into intermittent drainage water lines.
- rainwater from roads and parking lots are potentially pollutant and should be subjected to a
hydrocarbon separation system before they are directed to the receiving medium, which should
not contain infiltration basins if their appropriate treatment cannot be guaranteed.
- solid domestic waste can be a very insidious source of specific groundwater contamination
when deposited in an unprotected waste bin. They should be deposited in a sanitary landfill,
built in accordance with the rules of the trade and in a way that no leachate seepage reaches
the underground environment.
- Dangerous industrial waste, when abandoned or deposited in garbage bins, are a potential
source of pollution. They should be stored in environmentally safe conditions until the
appropriate final destination of each of the products is reached, in accordance with the
Angolan legal provisions in force.

EIA / RS 15.08 This document may only be reproduced in its entirety. 224/280
- the road network is a source of diffused pollution, associated with combustion gasses, tires
and chassis wear and also oil and fuel leakage. Spills or leaks from gas station tanks, or the
rejection of effluents rich in hydrocarbons, can be responsible for punctual or topical cases of
contamination.
- eventual boreholes which already exist or are to be built, which are currently in a state of bad
conservation or whose construction does not comply with the rules of the trade and of the
discerning hydrogeological analysis, can be particularly insidious contamination points due to
the fact that they release the contaminations directly into the water sources. In case their
recovery is not viable, these should be eliminated by sealants.
All these aspects are sources of potential impacts, with repercussions in the quantity and quality
of the actual groundwater.
Potential Variation of Groundwater Levels (filling of the reservoir and exploration phase)
One of the most certain and evident effects resulting from the creation of a reservoir is the
change in variation of the groundwater levels of the bordering foundation blocks. The influence
will be greatest in the immersed area, and quickly attenuating in function of distance.
In the immersed area as well as in the neighborhood of the reservoir or underground waters,
impact due to the creation of the reservoir is certain and its importance is moderate (given the
moderate permeability of the foundations), although positive (because it favors the supply of
the water sources). Its influence immediately commences with the filling of the reservoir.
Change in Infiltration Conditions / Groundwater Storage
Normally, rivers with permanent drainage comprise large longitudinal drainage axes of adjacent
water source systems. Underground drainage is done along the direction of the river and along
the modern alluvium strip when available.
Besides their draining effect, during flooding periods these rivers have a seeping effect when the
river level rises above the piezometric level of the water source: the water therefore passes from
the river onto the banks, thereby creating so-called bank storage. As soon as the river water
level lowers, this storage is responsible for the increase in groundwater towards the flow of the

EIA / RS 15.08 This document may only be reproduced in its entirety. 225/280
river.

EIA / RS 15.08 This document may only be reproduced in its entirety. 226/280
By applying these principles to the filling of the reservoir, the result is that, as the water level rises,
the water begins to move exclusively towards the river banks, with the exception of the
suspended water sources having a piezometric level above the water level of the reservoir. Due
to the fact that, with the filling of the reservoir there are no periods in which the level of the
reservoir is inferior to the water level of the "flooded" water source, a system is established which
has a tendency towards permanent and centrifugal drainage from the reservoir. In other words,
the reservoir thereby becomes an important groundwater recharge area, in which the drainage
direction is opposite that which occurs in the natural system and flows towards a new base level,
which can be a Kwanza river tributary or the area downstream from the dam.
Direct downstream drainage beneath the foundation will be countered by a waterproofing
curtain which does not, however, prevent the downstream drainage from flowing outside of the
area which does not impair the stability of the dam.
Changes to the drainage flow only occur relative to discontinuous water sources, whose
hydraulic conductivity or permeability is very low, with the exception of the privileged flow areas
having continuity and a greater density of open faults (fault zones and other structures which
favor fracturing).
Eutrophication Phenomena within the Reservoir - Water Quality Degradation
Most of the great dams have a tendency to transform river systems into lacustrine systems. The
most significant characteristic of these systems is that the water is maintained for a longer period
than it would be in the river (Vörösmarty & Moore 1991), and this brings about changes relative
to the limnology of the system. This includes a thermal and oxygen stratification cycle, the
development of planktonic communities and the replacement of river-based fish with fish more
typically found in still water. In some cases, communities of floating and/or immersed vegetation
which generally do not survive in running water, might also evolve.
The Caculo Cabaça Hydroelectric Project features a relatively small reservoir, and as such it is
unlikely to develop many of the characteristics typically associated with lake-based systems.
Firstly, no significant aging of the water shall take place, as the hydraulic retention period is
between one and two weeks.
If by chance stratification does occur, it will likely be short-lived, occurring only during in the dry
and hot months when inflow is less pronounced, however even so

EIA / RS 15.08 This document may only be reproduced in its entirety. 227/280
non-oxygenated hypolimnion3 is unlikely to develop. This implies that nutrients will not be
contained in the hypolimnion and that biological productivity will continue to develop during
the year, without the seasonal decrease caused by stratification which typically occurs in lake
systems and without the destratification period of the bodies of water which usually replenish the
nutrient system by means of water circulation, an event which precedes greater primary and
secondary productivity.
Change in Downstream Water Quality
Problems associated with the quality of water discharged from hydroelectric dams may be due
to seasonal heating and thermal stratification of the water contained by the dam. The
decomposition of organic matter under chemical reduction conditions due to the lack of
oxygen dissolved in the hypolimnion may result in the increment of hydrogen sulphide and
ammonia, which are toxic and may mobilize iron, manganese and certain heavy metals from
the sediments of the reservoir. Discharges from hydroelectric dams with low concentrations of
dissolved oxygen and high concentrations of pollutants may affect other uses of the water
downstream.
However, not all reservoirs stratify or develop water quality problems. Stratification and low
concentrations of dissolved oxygen are influenced by factors such as area, depth and volume
of the reservoir, water renewal rate and wind protection class. The reservoir designed for the
Caculo Cabaça Hydroelectric Project will feature reduced surface and volume, as well as a
short water renewal period (measured in days and not in months or years).
As such, the aforementioned water quality problems are not expected for the Caculo Cabaça
Hydroelectric Project, and the impact in downstream water quality due to the discharges from
the turbines are likewise not foreseen.
In summary, and in accordance with the performed assessment, moderate magnitude
quantitative negative impacts, although significant, are acceptable; thereby securing
downstream activities.
3 in limnology, the deep layer of certain lakes on which stratification occurs is called the hypolimnion

EIA / RS 15.08 This document may only be reproduced in its entirety. 228/280
7.2.7. Biological and Ecological Factors
7.2.7.1. Methodology
The following item presents the identification and evaluation of the impacts to the biological
and ecological factors associated with the construction and exploration of the project under
analysis.
The impact analysis presented in this document addresses essentially, actions having direct
consequences on the flora and fauna of the intervention area, actions which may potentially
contaminate the area (or the adjacent area) and actions which may disturb the fauna and
flora of the area under study.
The impact analysis is performed separately for the construction and exploration phases, as they
imply very different activities as well as exclusive and specific time frames.
Measures for mitigation of the identified impacts were proposed at a later date(Chapter 8).
7.2.7.2. Construction Phase
7.2.7.2.1. Flora and Vegetation
During the construction phase, the main impacts relative to flora and vegetation are classified
as:
- negative, direct, permanent - due to the definitive destruction of the plant/habitat covering as
a result of the required deforestation at the location of the project's establishment, whereas these
impacts are considered as moderate magnitude but barely significant taking into account the
areas at issue;
- negative, indirect, temporary of low magnitude and barely significant, when associated with the
deposition of dust over the vegetation in the area at issue and surrounding area, resulting from the
operation of the construction sites and especially the movement of vehicles associated with the
works. Dust deposits on the vegetation results in a reduction of the plants' photosynthetic rate.
7.2.7.2.2. Fauna
During the construction phase, impacts on the fauna are associated with deforestation,
earthmoving, creation/recovery of access routes to the works and establishment of

EIA / RS 15.08 This document may only be reproduced in its entirety. 229/280
construction sites. The common factor in all of these is the destruction of the biotopes and
permanent withdrawal of habitats, the trampling of small vertebrates and increase in noise with
the consequent disturbance of the fauna.
The main issues affecting terrestrial ecological systems associated with the establishment of the
project will be related to the following inherent activities, either related to its establishment or
induced by it, as follows:
◆ Increase in disturbance:
– Increase in noise levels resulting from tasks which are inherent to the works;
– Increase in visual disturbance resulting from the presence of machinery and of personnel hired
for the works;
– Passage of vehicles provoking an increase in disturbance and noise levels during the
operational phase;
◆ Effects on ecosystems:
– Included in this group are the actions which require removal of the vegetation and impacts on
habitats: the establishment of construction sites, access routes to the earthmoving works,
excavations, access paths and modeling/construction of the new structures.
◆ Barrier Effect:
– Construction / remodeling of accesses, interventions in the river including refilling of the
reservoir, extension of the flooded area, etc
Increase in disturbance
The increase in direct disturbance is due to noise and the visual impact caused by personnel
and machinery during the construction works of the dam. The resulting impacts affect the
vertebrates, with special incidence in the greater vertebrates (i.e. family of three hippopotami
which inhabit the area near the future tailrace of the dam)
Many species react to the disturbance by fleeing the areas that they occupy, towards areas
which are less appropriate for survival. During mating periods, this type of impact is
EIA / RS 15.08 This document may only be reproduced in its entirety. 230/280
especially important, because it can lead to the withdrawal of reproductive activities, thereby
heavily interfering in the dynamics of the population.
These will mainly occur in the area where the construction works of the dam will take place and,
to a lesser extent, at the places in which the vegetation is to be felled prior to filling the reservoir.
Considering these factors, negative impacts, certain and partially reversible (temporary) impacts
are identified, granted some capacity of acclimatisation relative to the animals, globally of
moderate magnitude and significant.
Effects on Ecosystems
Several project components will determine the occurrence of transformations in the vegetation
within the area. Highlights include earth extraction, road construction and filling of the reservoir.
The impacts are therefore considered to be negative, certain, restricted to the construction
phase and partially reversible (temporary) in the event that restitution of the original structure of
the land is necessary. They are considered irreversible in areas where support structures remain
for operation of the dam and in the filling zone (surface), which will become a significant part of
the future affected area.
Increase of the Barrier Effect relative to the Fauna
This is considered to be an indirect impact, as it results from the cumulative effect of the
mechanical effort of transposing the structures to be built and also removal of the animals due
to the increase in the disturbance levels.
The creation of accesses for the works, transport of machinery, the transport of land and materials
will have a negative, direct and temporary impact on the vegetation covering in the areas in
which these activities will take place. In the surrounding areas, their effect on vegetation will be
indirect, negative and will be due to the deposition of dust and atmospheric pollutants emitted
by the vehicles in circulation. This is a temporary impact, restricted to the surrounding area
involving accesses and utilities for the works.
The establishment of construction sites and heaps may lead to the immediate destruction of the
vegetation. In this case, the impact will be negative, direct, irreversible and located. The
magnitude

EIA / RS 15.08 This document may only be reproduced in its entirety. 230/280
and significance of this impact will depend on the specific characteristics of the chosen
location. N e gative impacts can be identified in the area surrounding the construction sites and
heaps, and are due to the deposition of dust and atmospheric pollutants on the vegetation and
in the soil.
The impacts associated with the icthyofauna are not only associated with the current project, as
there is already a correlation with a Hydroelectric Development of Capanda and a
Hydroelectric Development of Laúca, aggravated by the fact that no passages for fish
transposition / stairways for fish are foreseen in the project. Impacts are therefore classified as
negative, direct, irreversible, of moderate magnitude and significant.
7.2.7.3. Exploration Phase
In the exploration phase of the undertaking, the impacts associated with the icthyofauna are
not only associated with the current project, as there is already a correlation with a
H yd roelectric Development of Capanda and a Hydroelectric Development of Laúca,
aggravated by the fact that no passages for fish transposition / stairways for fish are foreseen in
the project. Impacts are therefore classified as negative, direct, irreversible, of moderate
magnitude and significant.
In general, the environmental consequences of any human intervention depend on their nature
and on the sensibility of the systems acted upon. The particularities of the existence and
operation of the dams are the flow and the speed of the water, which can be particularly
impacting for certain faunistic species or groups, mainly species of fish from the consignment
areas with the loss of their habitats.
Regarding the remaining faunistic terrestrial groups relative to which a total loss of habitat and
niche in function of the length of the reservoir water level. Impacts relative to habitat
fragmentation and direct disturbances can also occur.
During this phase, the main negative impacts will be observed along the entire reservoir. The
entire immersed area will suffer irreversible negative impacts of great magnitude. In the
immersed area, the entire community (mainly the smaller organisms) will be irreversibly
destroyed. The fast change in water quality due to the decomposing of dead organisms will
also provoke a high mortality rate in the existing aquatic organisms, either in the reservoir or
washed in by the currents. However,

EIA / RS 15.08 This document may only be reproduced in its entirety. 231/280
with the improvement in water quality there will be a creation of new communities adapted to
the new physiochemical and biological conditions of the atmosphere.
Additional impacts will be generated by their own activity. These include: the direct disturbance
of the organisms by trampling, noises, movement of workers and equipment, gas emissions, solid
residues and dumps, maintenance residues from the vehicles and machines.
7.2.8.Landscape
7.2.8.1. Methodology
The introduction of the Caculo Cabaça Hydroelectric Project, will cause significant changes in
the local landscape, particularly due to changes in the magnitude of the affected scenes and
in their characteristic visual structure, accompanied by an increase in the degree of
homogenization of the landscape.
Usage replacement, with the creation of the Caculo Cabaça reservoir, will induce a loss in the
notion of the real magnitude of the landscape, mainly be means of a reduction in vertical
depth along the valley, due to the elevation of the water level. On the other hand, this change
in valley morphology, provoked by the enlargement of the visual backdrop, leads to the
disappearance of a series of visual elements associated with the river and which contribute to its
structure.
Measures for mitigation of the identified impacts were also proposed (Chapter 8).
7.2.8.2. Construction Phase
In general, the construction phase is associated with a series of negative impacts, although most
of them temporary in nature, whose rate of incidence, either in terms of space or in terms of
time, depends on the intensity of the action, i.e. on the Local Degree of Disorder and on the
Visibilities from the point of view of the main groups of observers.
It is during this phase that most definitive actions will also be implemented, these are extended
into the exploration phase and, therefore, will alter the landscape.

EIA / RS 15.08 This document may only be reproduced in its entirety. 232/280
Interference in Human-Sensorial Perceptions
These are a result of spatial and functional disorders of the target space and also of the
locations (however related to the works), such as construction sites and borrow sites, whose
impacts shall be felt not only at the directly affected location but also in the surrounding area,
with a particular occurrence in potential visual recipients which are external to the undertaking.
This impact will be originated by the following actions in the environment:
Introduction of foreign elements to the traditional environment, such as heavy machinery
and construction materials;
Decrease of the visibility in the places in construction, as a result of the increase of the
concentration of dust in the air, with consequent deposition in the surrounding space;
Modification of the morphology of the land due to earthmoving;
Construction of linear structures, corresponding to the access roads to the dam, which
produce a disturbing effect in the landscape due to their contrasting nature, whose
intensity is due particularly to the inability of the environment in absorbing such actions;
Spatial and temporary distribution of constructive actions.
Changes in Landscape (construction phase, reservoir filling and exploration phase)
Originated during the deforestation period and clearing of the area that will be flooded by the
reservoir (a foreseen activity although it must be planned and adapted to the conditions of the
access locations) and ending with the filling of the reservoir. It is at this time that the destruction
of the landscape sub-units, which characterize the lowest levels of the visual basin, takes place.
The morphology of the valley will be significantly affected due to the interruption of its natural
lines and shapes, by acquiring less vigorous outlines as a result of the relative reduction in
placement of the valleys, which contributes to approximate the visual planes comprising the
landscape.
Impact produced by the body of the dam itself, as a consequence of the concrete structure
having 103 m of maximum height, which will be recessed between two opposing hills. At the
downstream side, this impact will be particularly felt, as it interferes with the horizontal upstream
depth, as it will be cut-off by the dam.

EIA / RS 15.08 This document may only be reproduced in its entirety. 233/280
In turn, the water level at this high altitude landscape may become a landscape valuation
factor to be integrated into the Angolan tourist itineraries associated with the Lauca dam,
thereby changing the references of the visual scene in the promotion of the dam
Globally, the impacts on landscape during the construction phase are classified as negative, direct,
temporary, irreversible, of moderate magnitude and significant.
7.2.8.3. Exploration Phase
The main impacts to the landscape associated with the exploration phase are a result of the
different definitive changes which are triggered during the course of the construction phase,
relative to the reference landscape matrix.
Changes in Landscape (construction phase, reservoir filling and exploration phase)
Please refer to the previous sub-chapter.
It is during this phase that the landscape takes on a new form as a result of the introduction of
new elements built into the landscape, namely the project infrastructures.
It is verified that negative impacts on the landscape are mitigated and are classified as being
small in magnitude, direct, certain, local, permanent, irreversible, immediate and barely
significant.
7.2.9. Sound/Noise Environment
7.2.9.1. Methodology
The evaluation of the impacts in the sound environment as a result of the project at issue was
performed taking into account the construction and exploration phases of the project.
The evaluation of impacts in the construction phase was accomplished in a qualitative manner,
taking into consideration the characteristics of occupation in the surrounding area of the project
and respective typical sound levels

EIA / RS 15.08 This document may only be reproduced in its entirety. 234/280
associated with the equipment and activities associated with the present undertaking in the
establishment of the project at issue.
Measures for the mitigation of impacts were proposed (Chapter 8).
7.2.9.2. Construction Phase
During the construction phase, the developed activities and operation of several types of
equipment will be responsible for noise emissions and vibrations. Depending on the nature of the
undertaking, certain types of equipment will perform specific works, some of which large in scale
(crushers, concrete mixers, excavators, etc.).
Certain operations involving the use of explosives should also be referenced for the constant
circulation of vehicles and heavy machinery, besides the general movement of people and
vehicles assigned to the works.
Increase in Noise and Vibration Levels During the Works
Problems associated with the quality of water discharged from hydroelectric dams
During the construction phase of the dam, depending on the quantity and the characteristics of
the equipment to be used - in total and per type - and also of the obstacles hindering the sound
propagation between the work area and the receivers which are sensitive to these impacts,
substantial punctual and constant increases in noise levels and vibrations are to be expected.
Due to the specific characteristics of the construction phase, namely the existence of a great
number of noise and vibration sources, whose position in space and time is difficult to determine
with precision, it is usual to perform a quantitative approach of the noise levels associated with
the potential activities foreseen for the works.
In this context, some examples are indicated below, in which the distances correspond to the
Equivalent Continuous Sound Levels, Weighted A, 65 dB (A), 55 dB (A) and 45 dB (A),
considering:
Specific sound sources;
A homogeneous and stable means for propagation.
The following Chart displays the corresponding distances (LAeq) to the source, the power of
each foreseen equipment and the respective type of equipment.
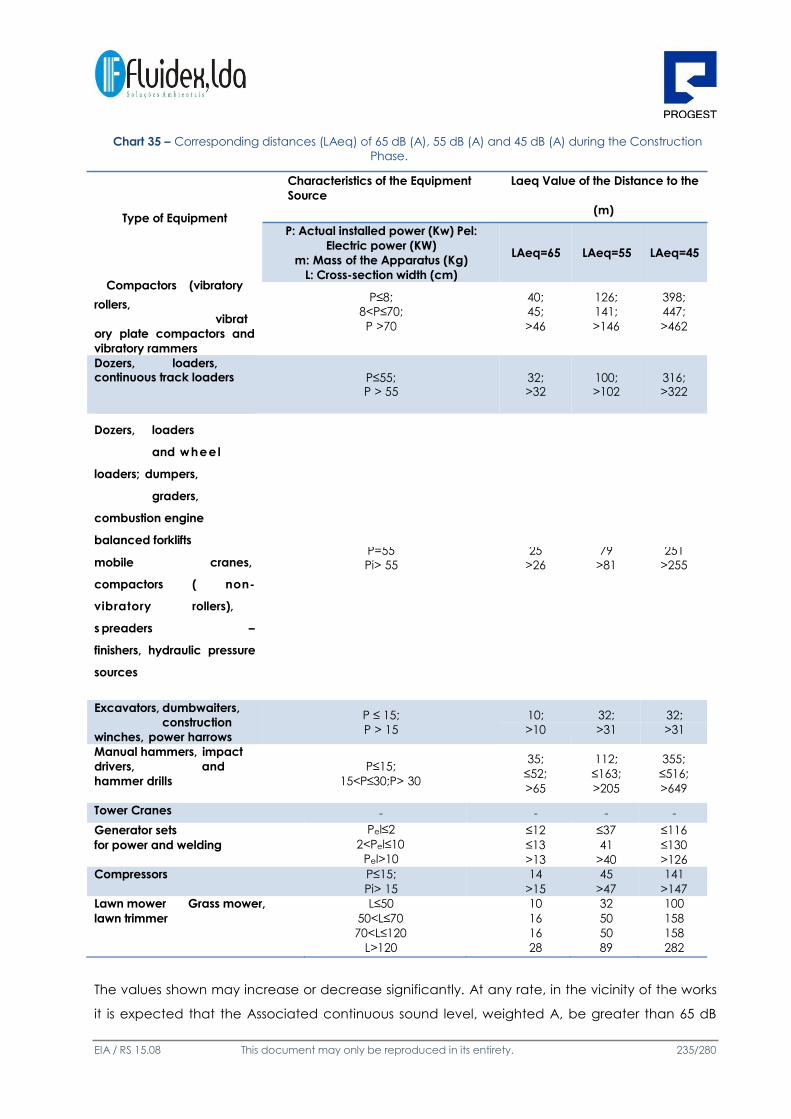
EIA / RS 15.08 This document may only be reproduced in its entirety. 235/280
Chart 35 – Corresponding distances (LAeq) of 65 dB (A), 55 dB (A) and 45 dB (A) during the Construction
Phase.
Characteristics of the Equipment Laeq Value of the Distance to the
Source
Type of Equipment
Compactors (vibratory
P: Actual installed power (Kw) Pel:
Electric power (KW) m: Mass of the Apparatus (Kg)
L: Cross-section width (cm)
(m)
LAeq=65 LAeq=55 LAeq=45
rollers,
vibrat
ory plate compactors and
vibratory rammers
P≤8;
8<P≤70;
P >70
40;
45;
>46
126;
141;
>146
398;
447;
>462
Dozers, loaders
and wheel
loaders; dumpers,
graders,
combustion engine
balanced forklifts
compactors ( non-
vibratory rollers),
s preaders –
finishers, hydraulic pressure
sources
Excavators, dumbwaiters,
construction
winches, power harrows
Manual hammers, impact
drivers, and
hammer drills
P≤15;
15<P≤30;P> 30
35;
≤52;
>65
112;
≤163;
>205
355;
≤516;
>649
Tower Cranes - - - -
Generator sets Pel≤2 ≤12 ≤37 ≤116
for power and welding 2<Pel≤10 ≤13 41 ≤130
Pel>10 >13 >40 >126
Compressors P≤15; 14 45 141
Pi> 15 >15 >47 >147
Lawn mower Grass mower, L≤50 10 32 100
lawn trimmer 50<L≤70 16 50 158
70<L≤120 16 50 158
L>120 28 89 282
The values shown may increase or decrease significantly. At any rate, in the vicinity of the works
it is expected that the Associated continuous sound level, weighted A, be greater than 65 dB
Dozers, loaders, continuous track loaders P≤55;
P > 55 32; >32
100; >102
316; >322
P=55 25 79 251 mobile cranes, Pi> 55 >26 >81 >255
P ≤ 15; 10; 32; 32;
P > 15 >10 >31 >31

EIA / RS 15.08 This document may only be reproduced in its entirety. 236/280
(A).

EIA / RS 15.08 This document may only be reproduced in its entirety. 237/280
It should also be referred that the noise emissions and vibrations due to the use of explosives can
be quite significant, as may also be the case with the creation of access routes and subsequent
circulation within them as well as in the entire industrial and social construction site (main
locations and accesses to be used for exploration and the transportation of materials for the
works).
Acoustic impacts throughout the entire deforestation target area will also occur, admitting
however a short incidence and activity period exclusively during the day, thereby reducing their
magnitude and significance.
We can therefore conclude that, in general, the impacts can be classified as negative, direct,
although reduced to moderate in magnitude (regarding certain actions in which noisy equipment
and / or explosives are used) and temporary in nature, reversible and barely significant, based on
the reduced human occupation in the target area.
7.2.9.3. Exploration Phase
During exploration of the undertaking, operation of the plant (turbines) and operation of the
unloaders will be the main sources of noise.
Increase in Actual Ambient Noise Levels
During the exploration phase, the potential ambient sound impacts susceptible of occurring
should be associated with the following:
a) Modification of the traffic in the road network, due to the creation of new access routes
and new residential areas;
b) Enhancement in road circulation, by means of inter-province attractivity promoted by
the new undertaking;
c) Plant exploration;
d) Modification of the natural river regime (water circulation sounds);
To finalize, during exploration the current calm ambient sounds, with no relevant anthropogenic
sources of noise, may be disturbed by the operation of the turbines and by the increased
presence of vehicles and people, such as workers at the plant as well as people who are
attracted to the newly created conditions.
As such, it is considered that the impacts in ambient sound during the exploration phase of the
project will be negative, reduced in magnitude and barely significant.

EIA / RS 15.08 This document may only be reproduced in its entirety. 238/280
7.3. SOCIO-ECONOMICAL FACTORS
7.3.1. Methodology
At this stage, the socio-economical impacts generated by the project, during the construction
and exploration phases, will be identified.
The socio-economical impacts generated by the project will be identified and evaluated
relative to the characteristics and scope of the project; the effects of its establishment relative to
demographics, employment, economical activities and standard of living of the local
population, will be evaluated. Measures for the mitigation of impacts will also be proposed
(Chapter 8).
7.3.2. Construction Phase
During the construction phase the main negative impacts are associated with:
Introduction of foreign elements to the traditional environment, such as heavy
machinery and construction materials;
Access route rehabilitation;
Impacts in agricultural area usage;
Impacts in current river usage;
Impacts in the current usage of areas in which materials are deposited;
Eventual social disturbance, due to the arrival of workers with different habits and
behaviors.
During this phase and so as to reduce impacts to a minimum, the adoption of measures to
mitigate the negative impacts generated by the project become necessary.
Relative to created jobs (previously calculated as roughly 5.800 job positions - for a peak work
throughput in 2019), a temporary increase in job positions in the construction industry is
expected, as a result of the required construction work for the project at issue, which will have a
positive effect locally if the labor is hired from within the region near the area of the dam.
It is considered a positive impact, of high magnitude, immediate, temporary and reversible, could
be significant at a local level and interprovincial (Kwanza North and Kwanza South).

EIA / RS 15.08 This document may only be reproduced in its entirety. 239/280
It should be noted that the works and the inflow of more or less specialized manpower, including
all technical supervision and monitoring personnel, will contribute to indirectly stimulate
commercial activity and services at a local level, thereby promoting employment and an
increase of the average family income, thereby comprising a positive, indirect impact,
predictably moderate in magnitude and in significance.
One of the main impacts to the population corresponds to the eventual occupation of lands
which serve current agricultural activities (for subsistence in most part). This occupation will be
foreseeably reduced, restricted to the areas adjacent to the reservoir and to the area to be
occupied by heaps (material deposits as a result of demolitions and silt removal in the target
area of the reservoir), it is assumed as negative, moderate in magnitude, barely significant
however local in terms of scope.
the barrier effect caused by the construction of the dam and by the preparation of the reservoir
target area may cause some inconvenience regarding the mobility conditions of the population
and is therefore considered a negative impact, moderate in magnitude, but barely significant.
During the construction phase, although minimal human occupation is verified within the target
area, negative impacts in the standard of living of the local populations are still foreseen, due to
the increased circulation of heavy vehicles, which can at times momentarily overload the
existing roads and having repercussions in terms of the densification of light traffic and in the
discomfort levels (noise, atmospheric pollution) generated. It is therefore concluded that the
considered impacts are, in general, negative, indirect, temporary and have a tendency to be
barely significant.
7.3.3. Exploration Phase
In the exploration phase of the current undertaking, negative and positive impacts can occur
which are associated with, on one hand, the extension of the impacts associated with the
construction phase and, on the other, the possibility of diversification for increasing the
availability of water and production of hydroelectric energy.
The production of electric energy from the hydroelectric potential of the Caculo Cabaça
Hydroelectric Project reservoir and consequently from renewable energy, will contribute to
reduce the production of fossil fuel based energy, thereby reducing the national energy
dependence at the same time. Therefore, construction of the dam and of the reservoir shall
meets the national energy policy, given that Angola is heavily dependent on the use of fossil
fuels.

EIA / RS 15.08 This document may only be reproduced in its entirety. 240/280
Therefore, the energy produced at the Caculo Cabaca Hydroelectric Plant is considered to be
a positive impact of high magnitude as it contributes towards reinforcing the production of
electric energy, in line with the defined national energy strategies in place, consequently
representing a significant contribution towards compliance with the national goals in terms of
energy production.
Another important positive impact is the contribution of the Project towards the containment of
greenhouse gas (GGE's) emissions. It is therefore considered that the aforementioned reduction
of emissions is a positive and immediate impact on a global level due to its contribution, in
accordance with its scale, towards the reduction of the greenhouse effect and, therefore,
climate changes. This positive impact has natural repercussions in the quality of life of the
populations, as it does not contribute towards the emission of gases and particles which are
detrimental to the health of the general public.
In summary, the environmental impact identified for the exploration phase of the Caculo Cabaca
Hydroelectric Project in terms of the promotion and diversification of the economy are classified as
positive, indirect, high in magnitude and very significant, thereby justifying the implementation of
the undertaking with the gains accrued.
7.4. CONSTRUCTED, ARCHEOLOGICAL AND CULTURAL
HERITAGE 7.4.1.Methodology
The evaluation of the impacts in heritage as a result of the "Caculo Cabaca Hydroelectric Project",
were based on the characterization of the patrimonial elements presented in Chapter 6 and on
the characteristics of the project.
Impacts occurring during the construction and exploration phases were analyzed.
7.4.2. Construction Phase
From the analysis performed in the reference case, it was verified that there were no locations
having patrimonial value in the target area, nor any type of patrimonial constraint regarding the
execution of the project.
Impacts in heritage during the construction phase of the project are therefore classified as
non-existent.

EIA / RS 15.08 This document may only be reproduced in its entirety. 240/280
7.4.3. Exploration Phase
During the exploration phase, no impacts on patrimonial elements are foreseen and are
therefore considered non-existent.

EIA / RS 15.08 This document may only be reproduced in its entirety. 241/280
8. MITIGATION MEASURES
8.1. GENERAL CONSIDERATIONS
In this chapter, suggestions for a set of measures which will contribute towards the prevention
and mitigation of negative (and other) impacts are given, thereby contributing towards
achieving positive impacts in the project.
The mitigation measures are presented in accordance with the following phases:
Pre-construction phase - these are related with the project; these measures seek to
minimize the impacts that could occur with the exploration of the project. These are
measures which contribute towards the optimization of the project, so as to not only
adopt more balanced environmental solutions, but also to predict and design systems for
protection and valuation.
Construction phase - these comprise a set of good environmental practices to be taken
into consideration by the Contractor / Project Owner. These measures are subdivided into
3 items: the measures applicable to the phase prior to the works (pre-
construction), the general measures applied to all of the phases and actions regarding
the works and the measures for each action to be developed during execution of the
works;
Post-Construction Phases - these are related to the actions associated with the
demobilization of all temporary infrastructures and recovery of the areas which were
affected during project construction;
Exploration phase. - Measures related to functional and maintenance aspects of the
project, with the intent of maximizing the benefits of the undertaking and frequently
related to the adoption of measures for supervision which seek to monitor the evolution
of the undertaking, allowing for the readjustment of the measures initially proposed.
Regarding the construction phase, whenever possible the measures are presented in function of
the actions responsible for the impact which should be minimized.

EIA / RS 15.08 This document may only be reproduced in its entirety. 242/280
8.1.1. General Mitigation Measures
These comprise a set of measures known as 'General Measures', which are not associated with a
single concrete action/activity and are applied to the works in their entirety and to their
complete duration period.
8.1.1.1. Pre-Construction Phase
Before commencement of the works, it is necessary to take into account the preparation of a
set of actions which must be carried out, namely:
Preparation of an Environmental Management Plan (EMP) for the Works, contemplating the
plans for execution of all the elements of the works, as well as the identification and detailing
of the mitigation measures to implement during their execution. The EMP should include a
Waste Management Plan for the Works and also a Construction Site Management Plan - as
the Environmental Management Plan for the Works developed for the current project did not
include the Construction Site Management Plan.
The EMP should be prepared by the Project Owner and should be integrated into the tender
process of the project, or otherwise prepared by the contractor prior to commencing
execution of the works as long as it is subjected to the prior approval of the Project Owner.
The technical environmental clauses stated in the EMP bind the contractor and the Project
Owner for the execution of all identified mitigation measures, in accordance with the
foreseen plan.
The measures presented in this Chapter for the execution phase of the works and for the final
execution phase of the works should be included in the EMP, notwithstanding any others which
may be required.
To disclose the works execution plan to the populations residing in the surrounding area. The
information made available should include the purpose, the nature, the locations where the
works will take place, the main actions to be performed, respective schedule and eventual
access route impacts. This action should be implemented prior to commencing the works,
this broadcasting has been performed by the social media as well as by reporting
mechanisms associated with the Ministry of Energy and Waters.
Implement and maintain a public service mechanism for the clarification of doubts, for
providing information regarding the project and for the handling of eventual suggestions and
complaints, so as to assess the effectiveness of the mitigation measures and verify the need
for implementing new measures in the future. This action should be implemented at the time

EIA / RS 15.08 This document may only be reproduced in its entirety. 243/280
in which the works execution program is disclosed to the population and should be
maintained during the course of the undertaking's construction, in other words, at the time in
which the most intense activities take place.
Whenever possible and as a way evaluating the economical impact on a local level, it is
recommended that in the direct subcontracting of companies, services, product
procurement and manpower recruitment, priority is given to the manpower and to the local
and provincial companies, a measure to preferentially be developed in conjunction with
local entities (administrations, job centers, business associations). This action should remain in
force during the entire construction period.
All of the areas in which works take place, including the construction sites and machines
parking areas, should be surrounded by siding, so as to avoid impacts resulting from their
normal operation, namely concerning the protection of the populations from dust.
Before commencing the works, the Landscape Integration Plan (if available) should be
presented and discussed with all intervening parties, so as to establish an appropriate
landscape framework which guarantees the mitigation of the visual impacts associated with
the presence of the works and respective integration of the surrounding area.
Perform Training and Awareness Sessions for all parties involved in the construction of the
undertaking (Project Management, Collaborators, Foremen, Team Leaders) relative to the
actions susceptible of causing environmental impacts and to provide knowledge of the
mitigation measures to be implemented during the construction of the undertaking, namely
rules and precautions to take into consideration during the course of the works.
8.1.1.2. Construction Phase
Execute the construction operations, especially those causing the most noise along with the
transportation of materials between 08h:00 and 20h00, thereby avoiding disturbing the
neighboring populations.
If, during the course of the works, damage to any buildings and infrastructures is to occur due
to the activities associated with the works, these should be immediately repaired.
The construction of the project should include archeological supervision during the
operations which require earthmoving, (deforestation, excavation, earthworks, inert material
deposits and borrow sites) during the construction phase or during the preparatory phases,
such as during the erection of construction sites, opening of roads, or deforestation.
Infrastructure interference (road network, electric power lines and other affected services)
should be compatibilized on a project level and performed in accordance with the legally
established regulations.

EIA / RS 15.08 This document may only be reproduced in its entirety. 244/280
The work fronts close to dwellings should be subjected to the necessary safety measures and
to a reduction of environmental impacts. Accesses to the dwellings should be secured and
functionality of the spaces should be maintained.
Installation/Operation/Deactivation of the Works Supporting Construction Site and Materials
Deposit
The construction sites and materials deposits should be located inside the target area or in
degraded areas. Locations having reduced slope and having close access to the project
establishment area should take priority, so as to avoid or minimize earthmoving operations
and the creation of new access routes.
All locations for the storage of fuels, lubricants or other substances should be waterproofed
and feature appropriately sized drainage for retention tanks, so as to contain the maximum
volume of pollutants likely to be spilled accidentally.
The construction sites should contemplate some space which is duly covered and
waterproofed for installation of a recipient for the collection and selective storage of the
different types of dangerous waste products produced on-site.
The discharge of inbound wastewater as a result of machine and used equipment washing
should be done in pre-established and pre-defined areas upon organization and
establishment of the construction site and be duly authorized for this purpose. For wastewater
resulting from concrete batching unit washing, its discharge should be done using dedicated
decantation basins.
Deforestation, clearing and stripping of the soil
Specific actions of deforestation, cleaning and scouring of the soil should be limited to the
areas which are strictly mandatory for the execution of the works.
Vegetable biomass and other waste resulting from deforestation should be removed and
properly forwarded to their appropriate final destination, whereas their reintroduction is
privileged.
Earthmoving
Landfills and excavation works should begin immediately after deforestation/clearing of the
land (thereby avoiding repeating these actions over the same areas).

EIA / RS 15.08 This document may only be reproduced in its entirety. 245/280
Whenever the target area may include eventual archeological heritage, the archeological
supervision of all actions that imply earthmoving, excavation works and landfills must be
performed.
To execute the works which involve open-air excavations and earthmoving so as to minimize
the exposure of the soil to periods of greater rainfall, so as to reduce erosion by water and the
transport of solid materials.
The execution of excavations and landfills should be interrupted during periods of greater
rainfall and due precautions should be taken to ensure the stability of the slopes and avoid
landslides.
Whenever possible, use materials resulting from excavations as landfill material, so as to avoid
their transportation outside of the target area.
Products resulting from excavations which are not used on-site should be stored at locations
having characteristics which are appropriate for their deposit.
In case excavation materials are found to be contaminated, these should be stored in
locations prepared for avoiding contamination of the soil and groundwater, by means of
rainwater infiltration or drainage, until those materials are forwarded to their proper final
destination.
The selection of the areas for depositing excess earth should exclude the following:
Water-related areas;
Floodable areas;
Groundwater protection areas (areas with a high degree of infiltration);
Water collection protection perimeters;
Other protection-related areas, namely within the scope of nature conservation;
Other areas in which species of flora and/or fauna protected by law may be affected;
Sensitive areas from a geotechnical point of view;
Sensitive areas from a landscape point of view;
Areas of agricultural occupation;
Proximity of urban and/or tourist areas;

EIA / RS 15.08 This document may only be reproduced in its entirety. 246/280
Heritage protection areas.
For earthmoving operations (excavations and landfill), during the summer or during periods of
low rainfall and greater wind intensity, these areas should be frequently wetted. This care
should be increased when the works are performed close to dwellings and agricultural areas.
This is done so as to avoid the production of dust which can affect plant
communities/agricultural crops in the adjacent areas.
In case it is necessary to resort to large amounts of borrowed earth for execution of the works,
the following criteria for selection of the borrow sites should be respected:
The borrowed earth should not be sourced from:
o Lands located above waterlines, river beds and banks of bodies of water;
o Areas threatened by floods, areas of high infiltration, perimeters for protection of
water collectors;
o Areas classified for nature conservation;
o Other areas in which earthmoving operations can affect species of protected
flora and of fauna;
o Sensitive areas from a geotechnical point of view;
o Areas with agricultural occupation;
o Areas in the vicinity of urban and/or tourist areas;
o Heritage protection areas.
Access Route Construction and Improvement
To privilege the use of existing roads, however, when necessary, proceed with the creation of
new access routes or the improvement of current ones. The works should be performed in a
way that any changes in occupation of the soil, in areas which will later will be used for
access routes, are reduced to a minimum.
To guarantee the regular cleaning of the accesses and target areas of the works, so as to
avoid the accumulation and re-suspension of dust, due to windy conditions or due to the
circulation of vehicles and work equipment.

EIA / RS 15.08 This document may only be reproduced in its entirety. 247/280
Heavy vehicle circulation/operation of machinery
The most appropriate routes for the transportation of equipment and materials to/from the
construction site should be studied and chosen, as well as those for borrow sites and/or
excess materials to be forwarded to their appropriate destination, while minimizing the
passage within residential areas and close to sensitive receivers (for instance schools, health
centers, etc).
The speed of circulation of the vehicles, especially over unpaved access routes and near
inhabited areas, should be reduced (< 30 km/h).
To ensure correct compliance with safety regulations and signaling of the works on public
roads, taking into consideration safety and the mitigation of disturbances in the activities of
the populations.
To assure that the roads or accesses are not obstructed or in bad circulation conditions,
thereby enabling their normal use on behalf of the local population.
The transportation of particle- or powder-based materials should be performed in closed
trucks, or in case of transport by open-type trucks, these should be covered with a canvas.
To only guarantee the usage of work equipment which is legally ratified in terms of noise
emissions and in a good state of conservation/maintenance.
To proceed with the maintenance and periodic revision of all machinery and vehicles
assigned to the works, so as to maintain their normal operation conditions and to assure the
mitigation of exhaust emissions and of the risk of soil and water contamination, so as to
comply with to the standards regarding noise emissions in accordance with the limits stated
under International Legislation.
To guarantee that the noisiest operations performed in the vicinity of residential areas are
limited to the daytime and to working days, in accordance with the legislation in force.
The exit of vehicles from construction site areas and work fronts onto public roads must
obligatorily be done so as to avoid impacts due to earth and mud slides resulting from the
spinning wheels of the vehicles. Whenever possible, devices for washing wheels should be
installed, as well as the employment of procedures for the use and maintenance of such
devices.
Management of Products, Effluents and Waste
To prohibit the open-air burning of waste materials.

EIA / RS 15.08 This document may only be reproduced in its entirety. 248/280
The oils, lubricants, paints, glues and resins used should be stored in appropriate airtight
containers, for subsequent forwarding to their required final destinations (preferably recycling
plants).
To assure the appropriate final destination for domestic effluents originating from the
construction site.
All accident situations should be contained (spilling of oils or of other substances used for
machinery operation) so as to not affect the quality of the waters.
Whenever an eventual spill of chemical products onto the soil takes place, the affected soil
must be collected, if necessary with the aid of an appropriate absorbent product and must
be stored and forwarded to a final destination or collected by a licensed operator.
Vehicle maintenance operations, namely oil change operations, should be correctly carried
out garages which are duly licensed for the effect.
To define and implement a Waste Management Plan for the Works, taking into account the
legislation in force regarding this matter, considering all of the waste susceptible of being
produced at the works, with its identification and classification, in accordance with the
Angolan List of Waste Products, the definition of management responsibilities and the
identification of the most appropriate final destinations for the different waste flows.
To proceed with the quantification and to ensure the correct temporary storage of the
produced waste, in accordance with its typology and in accordance with the legislation in
force. Containment/retention of eventual seepage/spillage situations must be foreseen. The
deposit of waste (even temporarily) in the margins, beds of waterlines, is completely
inadmissible.
Solid waste produced in the social areas, which is comparable to urban waste, should be
deposited in recipients specifically destined for this purpose, whereas separation at the place
of origin of the recyclable parts and subsequent forwarding for recycling, should be
promoted.
Periodic collection of the produced waste must be guaranteed, thereby ensuring an
appropriate final destination for each type of collected waste in accordance with the
applicable legal provisions.
The transportation of waste for treatment/valuation should be performed in accordance with
the legislation in force, which states the regulations under which the transportation of waste
inside national territory may be performed.
The companies selected by the promoter for the treatment and final destination of the
different waste products should be duly licensed and accredited by the Ministry of the
Environment.

EIA / RS 15.08 This document may only be reproduced in its entirety. 249/280
Waste which is comparable to commonplace industrial waste which is not susceptible for
benefit or valuation, should be forwarded to a landfill which is duly licensed to receive waste
of that type.
Means for immediate cleaning should be present at the construction site in case a spill of
oil/fuel or other dangerous products occurs, in which case the spilled products and/or
products used for collection of the spill should be treated as waste.
8.1.1.3. Post-Construction Phase
After termination of the works, the construction sites and all equipment, support machinery
and material deposits (among others) should be completely disassembled, thereby
guaranteeing the complete removal of debris, slag and/or waste which should be
transported immediately to their appropriate destination.
The work-related locations must be cleaned and the conditions present, prior to
commencement of the works, must be restored.
Perform the rehabilitation of roads and paths used as access routes to the work locations, as
well as the rehabilitation of pavements and public sidewalks which have eventually been
affected or destroyed.
To ensure the replacement and/or restitution of eventual existing infrastructures, equipment
and/or services in the work-related and adjacent areas, which have been affected during
the course of the works.
After termination of the works and when it is certain that these locations will not suffer any
future interventions, to proceed with the reestablishment and recovery of the landscape by
reforestation through indigenous species and the reestablishment of the natural conditions of
infiltration by means of decompacting of the soil.
8.1.1.4. Exploration Phase
Relative to the areas where one can foresee the establishment of a vegetable covering,
secure its preservation and also the recovery of slopes bearing signs of erosion. Resorting to
herbicides should be forbidden.
Removal and forwarding to a landfill or other appropriate destination of any solid vegetable
and non-vegetable waste (i.e. tires, debris resulting from the works, appliances, etc) or debris
which have been released onto the water line (bed and banks). Removal of dead plants
preventing the flow of water, or in any way obstruct the

EIA / RS 15.08 This document may only be reproduced in its entirety. 250/280
normal drainage of the water, in flood situations obstructing the lines of water or their restrain
in infrastructures originating backwater situations and deviation of water flow, rupture or
highly destructive flood waves.
Under no circumstances may the cleaning/maintenance operations involve the removal and
destruction of the characteristic riparian vegetation of the hydrographic sub-basin at issue,
solely its orientation and handling so as to guarantee that it fulfills the technical functions
assigned to it (in particular, its behavior in situations of flooding - drainage retention and
retardation or release of the channel for guaranteeing faster flow but without originating
erosion or degradation of the banks).
8.1.2. Mitigation Measures per Environmental Component
8.1.2.1. Climate
There are no mitigation measures for this descriptor.
8.1.2.2. Air Quality
The impacts in air quality associated with this undertaking can be minimized, if the
aforementioned recommended measures are adopted, namely during the construction phase.
Proceed with the periodic wetting, through controlled sprinkling of water, on locations
where works with a high rate of dust emissions (non-asphalted roads, work areas, soil
deposits, etc.) are likely to occur;
Covering heaps of debris and soil deposits, with the purpose of avoiding that these be
dragged by the wind, as well as ensuring that the rules in force are being correctly
executed relative to the covering of the loads of the vehicles which transport these types
of materials (soil, sand, etc.);
Maintaining the cleanliness of the accesses to the works and to the construction site, and
implementing control of the sanitary conditions at the workplaces and construction sites,
in the sense of avoiding the accumulation of dust which is susceptible of being re-
suspended, either due to the wind or to the movement of vehicles;
Maintenance of the equipment that produces ambient emissions and usage, whenever
possible, of the best less polluting practices.

EIA / RS 15.08 This document may only be reproduced in its entirety. 251/280
8.1.2.3. Geology
During the construction phase, the following measures are recommended:
Mitigation of the excavation areas - relative to the excavations, their execution should
be performed in an appropriate and controlled manner, so as to execute the proposed
excavation geometries and to ensure the safety conditions of the works and to allow the
management of the excavation products (separation of the vegetation soil and/or
rejected materials and earthy or rocky materials);
When it is necessary to lower the groundwater levels for the purpose of draining the work
surfaces, this should be accomplished so as to avoid, insofar as possible, interference
with wells and/or humid areas whose flora depends on the permanence of high
groundwater levels;
In the applicable cases, control of the discharge of effluents containing oils and other
poisonous substances, so as to minimize the risk of infiltrations in the soil and the
contamination of water sources.
In the sense of avoiding the occurrence of accidental spillages of oils or fuels, associated
with the operation of the machinery to be used during the construction phase, all supply
and maintenance operations of such machinery should be performed in appropriate
locations for the effect, within the area to be occupied by the construction sites and duly
waterproofed, in which the waste resulting from these operations should be stored in
watertight containers.
Therefore, it becomes relevant to minimize the maintenance actions during the exploration
phase, consequently determining a very particular care in the rehabilitation of the undertaking,
including strict compliance with the project, alongside proper supervision of the works.
8.1.2.4. Hydrology
In accordance with the analysis performed, the quality of the water will not be considerably
altered, although it is recommended that certain measures are adopted in the sense of
preventing the occurrence of eventual additional problems.
In that sense, taking into consideration the hydrodynamic conditions of the area, the following is
recommended:
Installation of construction sites and respective machinery parking lots, eventual
concrete or bituminous mixing plants, and preferred routes for the circulation of
machines, as distanced as possible from the existing water lines;

EIA / RS 15.08 This document may only be reproduced in its entirety. 252/280
Implementation of a drainage system at the construction sites, allowing for the isolation
of hazardous and/or dangerous products handled during the construction phase;
Collection of waste and oils resulting from spills and leaks during the construction phase,
and their appropriate disposal;
Usage, when necessary, of temporary sedimentation barriers for the collection of solids
dragged by rain waters;
It is suggested that the construction sites feature basic sanitation infrastructures which
provide treatment and an appropriate final destination,
Rebuilding of the vegetable covering setting in the areas to be affected by the works
outside the boundaries of the reservoir, so as to conserve the soil and avoid the
occurrence of major erosive actions;
For the reduction of particles in the hydroelectric systems, perform the wetting or
covering of mounts of soil so as to avoid seepage and subsequent infiltration of
pollutants in the soil;
Establishment of itineraries for machinery circulation, at the same time avoiding areas
considered as being more sensitive (especially near water lines) and also avoiding
disorderly traffic and the compacting of the soils of vast areas.
During the filling of the reservoir, a period in which the flows secured downstream may impose
restrictions to the water requirements (irrigation, supply and cattle drinking water) should be
recorded, for determining the maintenance periods of recommended ecological flows, when
applicable.
This measure seeks to minimize potential impacts that could occur relative to the deterioration of
the quality of the water downstream, which may effectively comprise one of the main negative
impacts associated with the construction phase and filling of the reservoir, wherefore it is
considered extremely important to adopt the following measures regarding the maintenance
and control of flows downstream:
Keeping an ecological flow that allows the maintenance of the riverside ecological
systems downstream;
Maintenance of a reserve flow that secures water usage downstream, although no
relevant needs are foreseen regarding scarce bank occupation.
Relative to the quality of the water of the reservoir, the complete deforestation of the vegetation in
the additional flooding target area should be highlighted as a fundamental preventive measure ,
seeking to remove great part of the organic matter to be immersed so as to avoid that its
anaerobic degradation provoke serious impacts in the

EIA / RS 15.08 This document may only be reproduced in its entirety. 253/280
water quality of the reservoir (eutrophication). This measure is deemed as very important, given
that the existing vegetation covering present on the
river banks may become quite dense at times, whereas, when not removed it can contribute
towards accelerated eutrophication phenomena that may jeopardize the usage of the
reservoir's water, as also occurs downstream with its restitution to the river.
It is further recommended, as detailed below, that a water quality monitoring program be
performed during the construction, filling and exploration phases with the purpose of monitoring
the qualitative state of the water, especially in the reservoir, therefore enabling a timely
response in the control of diminishing quality of the water
8.1.2.5. Biological and Ecological Factors
For mitigation of the current impacts due to the movements and interventions foreseen for the
execution phase, we propose the following biological and ecological factors:
Restriction of the target works area to an absolute minimum, thereby protecting the
bank areas;
The bank areas should be safeguarded from eventual current impacts resulting from the
works, which should be enclosed and should have recovery measures in place if they are
to be affected,
Recovery of the areas after finishing the project, through remixing or scarification of the
compacted lands and the planting of indigenous vegetable species;
Maintenance of the ecological river flow for the duration of the works, and the re-
establishment of the vegetation at the joints of the reservoir along the water lines, will
allow for the mitigation of the impact on species which depend on the river for survival, in
particular the family of hippopotami, amphibians and other insectivorous and fish-eating
species;
The required river bed interventions should be made so as to reduce the suspension of
sediments;
The following recommended with regards to icthyofauna:
During the construction period and filling of the reservoir, particular importance should
be given to maintaining a flow which reproduces the actual variations in the present
system;

EIA / RS 15.08 This document may only be reproduced in its entirety. 254/280
To ensure that the proposed mitigation measures are in place, it is essential to secure
effective supervision during the entire construction phase, by means of an Environmental
Supervision of the Works.
8.1.2.6. Landscape
The following proposed measures for mitigation of the visual impacts to the landscape envision
the framework and general integration of the Caculo Cabaca Hydroelectric Project, in all its
components within the surrounding landscape, as well as the mitigation of landscape
disturbance issues associated with the work phase of the undertaking. These measures should be
included within the scope of the Landscape Integration Project, and should comprise the
following aspects:
Establishment of the construction site, deposit and material borrow areas in locations
having minimum visual impact, namely inside of the target flood area, in degraded
areas or areas with a high capacity for visual absorption;
Modeling of the land in the heap (soil deposit) areas and in all areas subject to
earthmoving, so as to establish a certain continuity with the natural terrain and to allow
for the installation and maintenance of the vegetation, leaving only the bare minimum
for better control of erosion;
Vegetable covering of the space downstream of the dam so as to disguise the visual
impact developed by the attached bodies;
Definition of the landscape recovery project for the areas of the construction site, so as
to establish the subsequent use and function of that space, since the beginning of the
works, and recreation of the characteristic sceneries of the area for establishing
landscape continuity.
8.1.2.7. Noise
The project at issue was designed for an area without great occupational sensitivity to noise, as
the closest population is located at a considerable distance away from the location at issue;
however, the following general measures are recommended:
The occurrence of particularly noisy operations (i.e. use of explosives for excavation),
should be disclosed to the local populations with prior notice;
Noise generating activities should be implemented, whenever possible, in areas which
are far away from sensitive receivers - inhabited areas;

EIA / RS 15.08 This document may only be reproduced in its entirety. 255/280
Noisy equipment should state their sound power levels, which should comply with the
admissible limits (international standards), especially taking into consideration the health
of the workers on-site.
8.1.2.8. Socio-Economical Factors
In spite of there being globally positive impacts in this domain, there will be impacts which
determine the employment of measures for mitigating impacts occurring during the construction
phase, which should ensure a better acceptance and understanding of the undertaking on
behalf of the local population, namely:
The populations residing closest to the areas which are to be affected by the works
should be informed with prior notice (i.e. by means of reports and pamphlets distributed
throughout the villages, provincial administrations and governments of the provinces -
Kwanza North and Kwanza South), regarding the purpose, nature, location and foreseen
duration of the works;
Elaboration of a Compensation Plan for the impacts on the currently explored
agricultural plots, which could imply either a compensation or the the attribution of other
plot of land. The best solution should be considered in conjunction with the interests of
the population, in particular with those directly affected by the occupation of areas in
which they practice subsistence agriculture;
Preference should be given to the local population regarding the jobs associated with
the construction works of the undertaking at issue, so as to reduce the levels of local
unemployment and to allow for a better acceptance of the inconveniences related to
this phase, on behalf of the impacted population;
All target areas of the works should be appropriately signaled so as to avoid the
occurrence of accidents involving populations and users. In this context, definitive
measures for road safety should be proposed (appropriate signaling, foot paths, etc.), so
as to reduce accidents;
Waste generated during the course of the works should be appropriately conditioned,
transported and deposited.
In the exploration phase, the impacts are considerably positive, given that the main purposes
proposed for the project will be verified, an increment in the global hydroelectric productivity of
the Country and water requirements fulfillment take place along the river Kwanza, with proven
benefits for the affected populations.

EIA / RS 15.08 This document may only be reproduced in its entirety. 256/280
9. IMPACT SUMMARY - GLOBAL IMPACT EVALUATION
In Chart 36 and the following charts, a summary of the main identified environmental impacts due
to the construction and exploration phases of the "Caculo Cabaca Hydroelectric Project" is
presented.
It is highlighted that, as mentioned, the impacts were analyzed taking some of their
characteristics into account, namely:
Nature: negative, positive
Order: direct, indirect
Duration: permanent, temporary
Magnitude (or degree of impact): low, moderate, high
It should be noted that the analysis was performed by distinguishing the phase of the
undertaking (construction or exploration) in which the impact occurs, whereas several cases
exist in which the impact originates in the construction phase and continues to manifest itself in
the exploration phase, namely those having a permanent nature.
The global impact evaluation was performed based on these characteristics and on other
information, such as aspirations of the population, characteristics of the locations and of the
critical and/or sensitive aspects, as well as the environmental recovery capacity, among others.
As a result, the impacts were classified, in accordance with their significance relative to the
other impacts, in the following significance categories: barely significant, significant, very
significant.

Chart 36 – Global Impact Evaluation
EIA / RS 15.08 This document may only be reproduced in its entirety. 257/280
ENVIRONMANT
AL
COMPONENT
IMPACT
OCCURREN
CE PHASE
OCCURRENCE AREA
PROPOSED EVALUATION
OF THE IMPACT
MITIGATION MEASURES TO BE
PROPOSED
Geology
and
Geomorphology
Modifications Introduced in
the Physiography and
Geomorphology
Construction
Excavation areas,
material deposit areas;
construction sites and
accesses to the works
Permanent, Negative,
Direct, Moderate in
Magnitude, Barely
Significant
– minimization of the excavation
areas - in what it concerns the
excavations, its execution should be
performed in an appropriate and
controlled manner, seeking the
execution of the excavation
geometries proposed and to ensure
the conditions of safety of the work,
and to allow the administration of the
excavation (separation of the
vegetation soil and/or rejection
materials, earthy or rocky materials)
products.
– When it is necessary to lower the
groundwater levels for the purpose of
draining the work surfaces, this should
be accomplished so as to avoid,
insofar as possible, interference with
wells and/or humid areas whose flora
depends on the maintenance of high
groundwater levels;
Erosion
and
slopes of
the
reservoir
instability
and banks
of
th
e
Constructio
n and Filling
Areas immediately
adjacent to the reservoir
Permanent, Negative,
Indirect, Low in
Magnitude, Barely
Significant
– in the applicable cases, control of
the discharge of effluents containing
oils and other poisonous substances,
so as to minimize the risk of infiltrations
in the soil and the contamination of
water sources.
– in the sense of avoiding the
occurrence of accidental spillage of
oils or fuels,

EIA / RS 15.08 This document may only be reproduced in its entirety. 258/280
Chart 37 – Global Impact Evaluation
ENVIRONMANT
AL
COMPONENT
IMPACT
OCCURREN
CE PHASE
OCCURRENCE AREA
PROPOSED EVALUATION
OF THE IMPACT
MITIGATION MEASURES TO BE
PROPOSED
Geology
and
Geomorpholog
y (cont.)
associated with the operation of the
machinery to be used during the
construction phase, all supply and
maintenance operations of such
machinery should be performed in
appropriate locations for the effect,
within the area to be occupied by the
construction sites and duly
waterproofed, in which the waste
resulting from these operations should
be stored in watertight containers.
Climate
- Construction - Non-existent -
Increase in the the Relative
Humidity and increase in the
Solar Radiation absorbed
Exploration
Area of establishment of
the project, area of direct
and indirect influence
Negative, Direct, Irreversible, of
Moderate Magnitude, Barely
Significant.
_
Air Quality
Increase in Concentration of
Particle-based Materials
(Dust) and Pollutant Gases
Construction
Areas of Establishment of
the Project and Adjacent
Areas, Accesses,
Construction Sites,
Material Deposit and
Borrow Areas
Negative, Direct,
Reversible, Temporary,
Moderate in
Magnitude, Significant
– wet the areas in which dust
generation may occur (of the
contractor's responsibility);
– covering of heaps of debris, with
the purpose of avoiding that these be
dragged by the wind (of the
contractor's responsibility);
– maintaining the cleanliness of the
accesses to the works and to the
construction site, as well as the tires of
machines and vehicles assigned to
the works;
Production of Clean Energy
Exploration
Positive, Indirect,

EIA / RS 15.08 This document may only be reproduced in its entirety. 259/280
Chart 38 – Global Impact Evaluation
ENVIRONMANT
AL
COMPONENT
IMPACT
OCCURREN
CE PHASE
OCCURRENCE AREA
PROPOSED EVALUATION
OF THE IMPACT
MITIGATION MEASURES TO BE
PROPOSED
Air Quality
Cont.
with no GGE emissions
Moderate in
Magnitude,
Significant
- maintenance of the equipment that
produces ambient emissions and
usage, whenever possible, of the best
less polluting practices.
Hydrology
Change in hydrography
Construction
Temporar
y area
Const
ructio
n site
(bypass
Negative, Direct,
Temporary, Low in
Magnitude, Barely
Significant
- installation of construction sites and
respective machinery parking lots,
eventual concrete or bituminous
mixing plants, and preferred routes for
the circulation of machines, as
distanced as possible from the existing
water lines;
- Implementation, at the construction
sites, of
a drainage system at the construction
sites, allowing for the isolation of
hazardous and/or dangerous
products handled during the
construction phase;
- collection of waste and oils
resulting from spills and leaks during
the construction phase, and their
appropriate disposal;
- usage, when necessary,
of temporary sedimentation barriers
for the collection of solids dragged by
rain waters;
- It is suggested that the construction
sites feature (...)
Decrease of the infiltration
capacity in the work areas
(increase of the superficial
seepage)
Construction
Dam area, attached
bodies, construction sites
and accesses
Negative, Direct,
Temporary, Low in
Magnitude, Barely
Significant
Increase in infiltration capacity
Construction
Borrow Sites
Negative, Direct,
Temporary, Low in
Magnitude, Barely
Significant
Contamination of water lines
and water sources by
suspended solids and oils
Construction
Water lines and
water sources in the
area of direct
influence
Negative, Direct,
Temporary, Low in
Magnitude, Barely
Significant
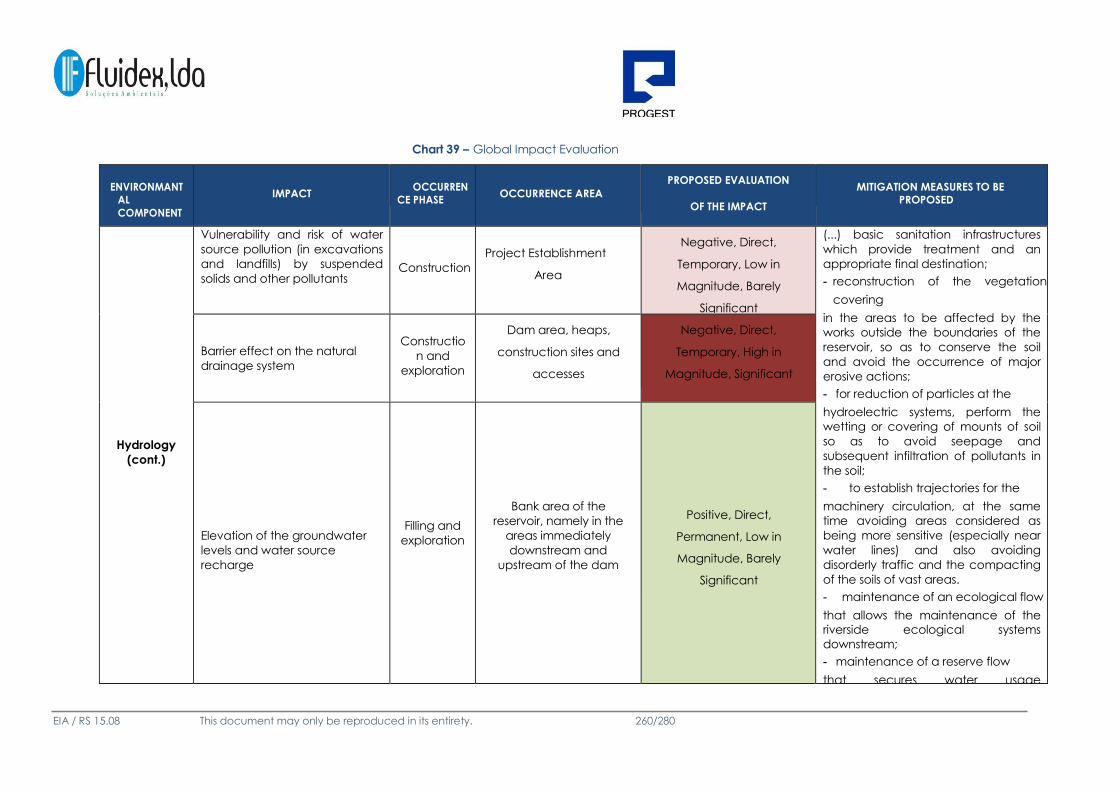
Chart 39 – Global Impact Evaluation
EIA / RS 15.08 This document may only be reproduced in its entirety. 260/280
ENVIRONMANT
AL
COMPONENT
IMPACT
OCCURREN
CE PHASE
OCCURRENCE AREA
PROPOSED EVALUATION
OF THE IMPACT
MITIGATION MEASURES TO BE
PROPOSED
Hydrology
(cont.)
Vulnerability and risk of water
source pollution (in excavations
and landfills) by suspended
solids and other pollutants
Construction
Project Establishment
Area
Negative, Direct,
Temporary, Low in
Magnitude, Barely
Significant
(...) basic sanitation infrastructures
which provide treatment and an
appropriate final destination;
- reconstruction of the vegetation
covering
in the areas to be affected by the
works outside the boundaries of the
reservoir, so as to conserve the soil
and avoid the occurrence of major
erosive actions;
- for reduction of particles at the
hydroelectric systems, perform the
wetting or covering of mounts of soil
so as to avoid seepage and
subsequent infiltration of pollutants in
the soil;
- to establish trajectories for the
machinery circulation, at the same
time avoiding areas considered as
being more sensitive (especially near
water lines) and also avoiding
disorderly traffic and the compacting
of the soils of vast areas.
- maintenance of an ecological flow
that allows the maintenance of the
riverside ecological systems
downstream;
- maintenance of a reserve flow
that secures water usage
downstream, although
Barrier effect on the natural
drainage system
Constructio
n and
exploration
Dam area, heaps,
construction sites and
accesses
Negative, Direct,
Temporary, High in
Magnitude, Significant
Elevation of the groundwater
levels and water source
recharge
Filling and
exploration
Bank area of the
reservoir, namely in the
areas immediately
downstream and
upstream of the dam
Positive, Direct,
Permanent, Low in
Magnitude, Barely
Significant

EIA / RS 15.08 This document may only be reproduced in its entirety. 261/280
Chart 40 – Global Impact Evaluation
ENVIRONMANT
AL
COMPONENT
IMPACT
OCCURREN
CE PHASE
OCCURRENCE AREA
PROPOSED EVALUATION
OF THE IMPACT
MITIGATION MEASURES TO BE
PROPOSED
Hydrology
(cont.)
no relevant needs are foreseen
regarding scarce bank occupation.
- It is also recommended, just as
detailed below, that a water quality
monitoring program be performed
during the construction, filling and
exploration phases with the purpose
of monitoring the qualitative state of
the water, especially in the reservoir,
therefore enabling a timely response
in the control of diminishing quality of
the water
Biological
and
Ecological
Factors
Destruction and disturbance of
the aquatic habitat due to the
works and the deviation of the
river
Construction
Borrow sites, sanitation
of the body of the
dam and river bypass
Negative, Indirect,
Permanent, Moderate in
Magnitude, Significant
– restriction of the target works area
to an absolute minimum, thereby
protecting the bank areas;
– the bank areas should be
safeguarded from eventual current
impacts resulting from the works,
which should be enclosed and should
have recovery measures in place if
they are to be affected,
– recovery of the areas after finishing
the project, through remixing or
scarification of the compacted lands
and the planting of indigenous
vegetable species;
Change in riverine habitats,
mainly regarding fish due to the
increase of solids and other
pollutants
Construction
River stretch downstream
from the dam
location
Negative, Indirect,
Permanent, Moderate in
Magnitude, Significant
Direct Impact on the present
Ecosystems - destruction of the
existing vegetation and of the
faunistic habitat.
Constructio
n and Filling
Work areas in the
reservoir (construction
sites, deposit areas and
borrow and materials,
temporary accesses)
and reservoir
Negative, Direct,
Permanent, Moderate in
Magnitude, Significant

EIA / RS 15.08 This document may only be reproduced in its entirety. 262/280
Chart 41 – Global Impact Evaluation
ENVIRONMANT
AL
COMPONENT
IMPACT
OCCURREN
CE PHASE
OCCURRENCE AREA
PROPOSED EVALUATION
OF THE IMPACT
MITIGATION MEASURES TO BE
PROPOSED
Biological
and
Ecological
Factors
(cont.)
Increase in the Barrier Effect
(habitat fragmentation)
Exploration
Kwanza River and
Bank Areas of the
Reservoir
Negative, Direct,
Permanent, Reduced in
Magnitude, Significant
– maintenance of the ecological
river flow for the duration of the works,
and the re-establishment of the
vegetation at the joints of the reservoir
along the water lines, will allow for the
mitigation of the impact on species
which depend on the river for survival,
in particular the family of
hippopotami, amphibians and other
insectivorous and fish-eating species;
– the required river bed interventions
should be made so as to reduce the
suspension of sediments;
– during the construction period and
refilling of the reservoir, particular
importance should be given to
maintaining a flow which reproduces
the actual variations in the present
system;
– to ensure that the proposed
mitigation measures are in place, it is
essential to secure effective
supervision during the entire
construction phase, by means of an
Environmental Supervision of the
Works.

EIA / RS 15.08 This document may only be reproduced in its entirety. 263/280
Chart 42 – Global Impact Evaluation
ENVIRONMANT
AL
COMPONENT
IMPACT
OCCURREN
CE PHASE
OCCURRENCE AREA
PROPOSED EVALUATION
OF THE IMPACT
MITIGATION MEASURES TO BE
PROPOSED
Landscape
Spatial disorder; change and
disturbance of the visual
structures and of the aesthetic
values of the landscape; loss of
landscape heritage (works and
deforestation)
Construction
Area of the Dam and
Reservoir, Construction
Sites, Materials Deposit
and Borrow Areas and
Accesses
Negative, Direct,
Permanent (temporary in
the adjacent areas),
Moderate in Magnitude,
Barely Significant
– to ensure the recovery
landscape, by project establishment
of the construction site areas, deposit
and borrow of materials in places of
minimum visual impact, namely inside
of the area to flood or in degraded
areas or high capacity of visual
absorption;
– modeling of the land in the heap
(soil deposit) areas and in all areas
subject to earthmoving, so as to
establish a certain continuity with the
natural terrain and to allow for the
installation and maintenance of the
vegetation, leaving only the bare
minimum for better control of erosion;
– vegetation covering of the space
downstream of the dam so as to
disguise the visual impact developed
by the attached bodies;
– definition of the landscape
recovery project for the areas of the
construction site, so as to establish the
subsequent use and function of that
space, since the beginning of the
works, and recreation of the
characteristic sceneries of the area
for establishing landscape continuity.
Structural, Visual and Functional
Change of the Present
Landscape Units
Constructio
n and
exploration
Area related to the Dam
and its surroundings,
Accesses
Negative, Direct,
Permanent (temporary in
the adjacent areas),
Moderate in Magnitude,
Barely Significant

EIA / RS 15.08 This document may only be reproduced in its entirety. 264/280
Chart 43 – Global Impact Evaluation
ENVIRONMANT
AL
COMPONENT
IMPACT
OCCURREN
CE PHASE
OCCURRENCE AREA
PROPOSED EVALUATION
OF THE IMPACT
MITIGATION MEASURES TO BE
PROPOSED
Landscap
e (cont.)
(...) landscape continuity.
Noise
Noise level increase
Construction
Area adjacent to the
dam and attached
bodies, accesses and
construction sites,
materials deposit and
borrow areas
Negative, Direct,
Temporary, Moderate in
Magnitude, Barely
Significant.
– the occurrence of particularly
noisy operations (i.e. use of explosives
for excavation), should be disclosed
to the local populations with prior
notice;
– noise generating activities should
be implemented, whenever possible,
in areas which are far away from
existing receivers - inhabited areas;
– of the noisy equipment should
state their sound power levels, which
should comply with the admissible
limits (international standards),
especially taking into consideration
the health of the workers on-site.
Socio-
economical
Factors
Job Creation
Constructio
n and
exploration
Interprovincial
Positive,
Direct,
Permanent and Progressive,
High in
Magnitude, Significant
- the populations residing closest to
the areas which are to be affected by
the works should be informed with
prior notice (i.e. by means of reports
and pamphlets distributed to people's
homes and at the administrative
headquarters), regarding the
purpose, nature, location and
foreseen duration of the works;
(…)
Degradation of the habitability
(work traffic, noise, dust)
conditions
Construction
Areas of Work, Accesses,
Construction Sites and
Materials Deposit and
Borrow Areas
Negative, Direct,
Temporary, Low in
Magnitude, Barely
Significant

EIA / RS 15.08 This document may only be reproduced in its entirety. 265/280
Chart 44 – Global Impact Evaluation
ENVIRONMANT
AL
COMPONENT
IMPACT
OCCURREN
CE PHASE
OCCURRENCE AREA
PROPOSED EVALUATION
OF THE IMPACT
MITIGATION MEASURES TO BE
PROPOSED
Socio-
economical
Factors
Cont.
Impacts in agricultural plots
Constructio
n and
Exploration
Dam and reservoir
area
Negative, Direct,
Permanent, Low in
Magnitude, Barely
Significant.
– elaboration of a Compensation
Plan for the impacts on the currently
explored agricultural plots, which
could imply either a compensation or
the the attribution of other plot of
land. The best solution should be
considered in conjunction with the
interests of the population, in
particular with those directly affected
by the occupation of areas in which
they practice subsistence agriculture;
– preference should be given to the
local population regarding the jobs
associated with the construction
works of the undertaking at issue, so
as to reduce the levels of local
unemployment and to allow for a
better acceptance of the
inconveniences related to this phase,
on behalf of the impacted
population;
– all target areas of the works should
be appropriately signaled so as to
avoid the occurrence of accidents
involving populations and users. In this
context, definitive measures for road
safety should be proposed
(appropriate signaling, foot paths,
etc.) so as to reduce accidents;
Production of clean energy
Exploration
Interprovincial, National
Positive, Direct,
Permanent, High in
Magnitude,
Significant
Improvement of the conditions
for the fundamental
economical activities in the
area
Exploration
Interprovincial, National
Positive, Indirect,
Permanent, High in
Magnitude.
Significant.

EIA / RS 15.08 This document may only be reproduced in its entirety. 266/280
Chart 45 – Global Impact Evaluation
ENVIRONMANT
AL
COMPONENT
IMPACT
OCCURREN
CE PHASE
OCCURRENCE AREA
PROPOSED EVALUATION
OF THE IMPACT
MITIGATION MEASURES TO BE
PROPOSED
Socio-
economical
Factors
Cont.
accidents;
- waste generated during the course
of the works should be appropriately
conditioned, transported and
deposited.

EIA / RS 15.01 This document may only be reproduced in its entirety. 267/280
10. ENVIRONMENTAL MONITORING AND MANAGEMENT PLAN
10.1. Environmental Management and Monitoring Program of the Project
For the construction phase, and taking into account the evaluations performed and the
dimension of the project, the implementation of an Environmental Management and Monitoring
Program of the Project is recommended.
Its purpose is to ensure compliance with the recommendations and to guarantee the effective
control of all developed actions, either foreseen or corresponding to amendments in the
project.
This program will allow the entity responsible for the project to ensure the best environmental
conditions of the works, allowing the entities responsible for the environment to verify
compliance with the proposed measures.
The general principles that should guide this program are proposed as follows:
a) Verification of Environmental Compliance at the Work site
To this extent, a verification of the Planning and Provisional Structures to be installed for
execution of the works should be performed, for the purpose of evaluating the areas to be
occupied, the control of wastewater, residues and noise, access routes and impacts on the
landscape, as well as the measures to control the actions of the works.
The environmental risk factors should be identified at the work site, as well as the best solutions
for their remedy and development of procedures for their control.
b) General Control and Monitoring of the Works
During the execution of the works, an environmental monitoring should be performed to verify
the compliance with the measures employed as well as the best practices for the environmental
management.
This verification will focus on controlling the relevant environmental factors and the relationships
with the environment itself, namely regarding the quality of the air and water and the control of
noise, cleanliness and operation of the work site, social economic impacts, etc.
To this extent, control and monitoring reports should be periodically produced.
The Environmental Monitoring Program should be carried out by a specialized team.

EIA / RS 15.08 This document may only be reproduced in its entirety. 268/280
10.2. Environmental Monitoring Plans
10.2.1. Introduction
The purpose of monitoring is the systematic collection of data relative to the state of the
environment or to the environmental effects of a certain project, so as to evaluate the efficiency
of the measures implemented to reduce the environmental impacts of that project.
Monitoring is therefore considered as an instrument serving, at least, two different purposes:
- To evaluate the environmental system's response to the effects of the project;
- To evaluate the efficiency of the environmental management methods employed.
In light of the project's characteristics, it is immediately possible to predict the need for the
Environmental Management and Supervision of the works, as well as the implementation of
specific programs to monitor the following factors:
Monitoring of Water Quality (Construction and Commissioning Phase)
Monitoring of Air Quality – (Construction Phase)
Monitoring of Waste Products (Construction Phase)
10.2.2. Monitoring of Water Quality
The implementation of the Water Quality Monitoring Program will contribute towards a more
precise assessment and quantification of the eventual impacts associated with the
Hydroelectric Development of Caculo Cabaça.
In this manner, the monitoring program seeks to perform a set of periodic evaluations involving
the pre-construction, construction and commissioning phases so as to identify, supervise and
evaluate eventual changes, thereby creating a historical record.
In summary, the goals of the proposed monitoring program are:
To contribute towards the verification of the estimates and analyses of impacts occurring
during the Environmental Impact Assessment (EIA);

EIA / RS 15.08 This document may only be reproduced in its entirety. 269/280
To supervise and evaluate the environmental impacts effectively associated with the
undertaking during the construction and commissioning phases;
To contribute towards evaluating the efficacy of the foreseen mitigating measures;
To supply information which may be useful in elaborating future EIA's for similar
undertakings.
i. Parameters to be Monitored
The parameters to be analyzed were considered, taking into account the activities foreseen for
the dam; these are the same activities for the pre-construction, construction and commissioning
phases, so as to have more complete data for the same parameters during both phases of the
project. These are the parameters which should be continuously analyzed:
Dissolved Oxygen;
pH;
Temperature;
Conductivity;
Alkalinity;
Oxidability;
Total Hardness;
Total Suspended Solids (TSS)
Nitrates;
Nitrites;
Total Phosphorous;
CLO (Chemical Lack of Oxygen);
Total Nitrogen;
Ammonia.
ii. Sampling Locations
Relative to the sampling points used during the construction phase, samples should be collected
within the inner perimeter of the undertaking's area of direct influence, namely: upstream of the
future structure of the dam, immediately downstream of this structure and 100 m downstream of
the area foreseen for the tailrace.
During the commissioning and monitoring phases, the monitoring locations chosen for the
construction phase should be successively adapted to the same location,
EIA / RS 15.08 This document may only be reproduced in its entirety. 270/280
but this time within the perimeter of the reservoir (the points mentioned upstream of the structure
of the dam)
iii. Sampling Frequency
The sampling frequency foreseen for the qualitative parameters corresponds to two annual
campaigns, to be performed during the wet and dry seasons (Cacimbo).
This frequency applies to both the construction and the commissioning phases.
It is highlighted, however, that a campaign be performed prior to any intervention on the land
and that these sampling campaigns be performed during at least the first five years after
commissioning.
iv. Sampling Methods and Data Treatment
In relation to sampling methodologies and data recording, as well as in relation to the treatment
of the data obtained, duly certified analysis techniques should be guaranteed or should at least
guarantee the quality in a manner which allows a correct comparison of the results obtained
with the values stated as recognized limit values (internal legislation or international standards).
v. Monitoring Reports
The recommended monitoring reports should be produced every year. The criteria for deciding
on the revision of the monitoring programs should be defined according to the results obtained,
whereas the program shall obviously be adjusted according to the needs verified.
However, it is expected that, in principle, the monitoring program may be reviewed in case
abnormally high or abnormally low results are found in at least 50% of the sampling points.
10.2.3. Monitoring of Air Quality
The main purpose of the air quality monitoring program during the project's construction phase is
to control the evolution of the concentration of pollutants in the atmosphere around the vicinity
of the intervention area, and whether or not these are responsible for significant changes in
ambient air quality.
EIA / RS 15.08 This document may only be reproduced in its entirety. 271/280
With this goal in mind, the monitoring program to be developed during the project's construction
phase is as follows.
During the construction phase, the air quality should be properly controlled and the
recommended measures should be applied.
The control should be performed by a specialized team, whereas eventual monitoring should be
decided according to the direct impacts verified and it is not expected that quantitative
measurements become a requirement.
i. Parameters to be Monitored
In regards to building a project with the characteristics of the current one, the concentration of
PM10 Particles should be monitored.
ii. Sampling Locations
The selection of the sampling locations should take into consideration sensitive environmental
receivers of the area to intervene; it is recommended that the sampling be performed at two
equidistant locations from the sensitive receivers.
iii. Frequency
The monitoring of PM10 Particle concentration should be performed during the dry season
(Cacimbo).
iv. Techniques and Methods for Data Analysis or Recording and Equipment Required
The methods to be adopted for the measurement, collection and analysis of the air pollutant
emissions should be in compliance with the best environmental practices of the international
legislation.
In the same manner, the measurement equipment to be used for sampling and for data
processing should guarantee results which allow for their correct comparison with the limit values
allowed, in compliance with international legislation.

EIA / RS 15.08 This document may only be reproduced in its entirety. 272/280
v. Relationship between the Environmental Factors to be Monitored and the Parameters
Characterizing the Commissioning of the Project
During the construction phase of the undertaking, air emissions associated with the equipment,
earthmoving, the construction process of the undertaking itself, etc. will occur.
Monitoring during this phase should allow for the evaluation of compliance with the applicable
international legislation.
Monitoring of these emissions shall allow for evaluating the effectiveness of the foreseen
methods for mitigation and of the compliance with the Emission Limit Values (ELV) stated under
the international legislation in force.
vi. Criteria for Data Evaluation
Processing of the information obtained from measurements will be done in a way which allows
for its comparison with the limit values defined. The ELV are considered to be compliant when
none of the resulting measured values surpasses the ELV values defined under the legislation in
force.
vii. Type of Environmental Management Methods to be Adopted according to the Monitoring
Program Results
In case the monitoring program reveals non-conformities relative to Emission Limit Values (ELV),
the following shall be adopted:
Adequate (immediate) corrective measures, including an appropriate surveillance program;
More frequent measurement procedures are to be performed until the non-compliance is
remedied.
viii. Frequency of the Monitoring Reports and Monitoring Program Revision
EIA / RS 15.08 This document may only be reproduced in its entirety. 273/280
The Monitoring Reports should have an identical frequency to that of the sampling procedures
foreseen in this document, and should integrate the data, its respective processing, evaluation
and respective conclusions of the monitoring campaigns.
The monitoring program revision should be evaluated in each report according to the verified
conditions and drawn conclusions, if necessary proposing a change in their criteria so as to best
adapt in response to the proposed objectives.
2.20 10.2.3. Monitoring of Waste Products
Waste is produced during the construction phases of the project, to which extent the following
actions are proposed:
a) Construction Phase
Waste produced on-site should be duly controlled and directed towards its appropriate final
destination, depending on the nature of the materials.
Handling of this waste should be done within the scope of the Environmental Supervision of the
Works, which should be developed with the purpose of verifying the compliance with the
proposed mitigation methods.
i. Handling of Produced Waste
Every type of waste product generated on-site should be identified, classified and quantified,
and their appropriate management must be carried out.
ii. Identification of the Final Destination of the Waste
Waste produced should be directed towards its appropriate final destination, depending on the
nature of the products.
iii. Inspection Frequency

EIA / RS 15.08 This document may only be reproduced in its entirety. 274/280
A periodic inspection, to be included in the Environmental Management Report of the Works,
should be performed.
b) Commissioning Phase
As referred to in Chapter 6, during the commissioning phase several types of waste products
namely CIW (commonplace industrial waste), eventual plant-based waste and waste products
resulting from maintenance of the undertaking.
Handling of these products shall involve their identification, quantification and transport towards
their appropriate final destination.
10.3. Environmental Management and Monitoring Program of the Caculo Cabaça
Reservoir
The environmental management and monitoring program of the reservoir created by the
Caculo Cabaça Hydroelectric Project has the purpose of warranting the appropriate multiple
uses of the reservoir and of its surrounding environment.
This program should incorporate the following principles:
To guarantee maintenance of a protective strip within a 100 meter radius of the perimeter of
the reservoir – priority environmental zoning;
Implementation of the reforestation program;
Definition of reservoir water usage;
Protection and reconstitution of the vegetation originating from the Kwanza river tributaries
(restricted by the sub-basin under study);
Fishing prohibition within a 500 meter radius, both upstream and downstream from the dam:
Prohibition of establishing potentially pollutant activities within the dam's direct area of
influence;
Legal order for soil usage and land occupation.

EIA / RS 15.08 This document may only be reproduced in its entirety. 275/280
11. TECHNICAL SHORTCOMINGS OR LACK OF KNOWLEDGE
The main difficulties found during the execution of the current survey were essentially due to the
difficulties experienced in obtaining certain indispensable and fundamental information for an
appropriate characterization of certain environmental aspects, such as the ecological aspects
and air quality, whereas efforts were developed to address these shortcomings by means of
diligent research of information immediately processed and available, whenever possible.

EIA / RS 15.08 This document may only be reproduced in its entirety. 276/280
12. FINAL CONSIDERATIONS
The developed studies allow for the sustained characterization of the actual situation of the
environment within the project area and to evaluate the main impacts associated with the
project, whereas no existing significant uncertainties can be found with regards to the
environmental factors.
The developed studies allow for the detailed characterization of all of the factors of
environmental interest, having the main impacts associated with the construction and
commissioning phases of the new "Caculo Cabaça Hydroelectric Project" been evaluated.
Therefore, as the main conclusions which may be drawn from the work performed, the following
positive aspects should be noted:
The Caculo Cabaça Hydroelectric Project falls under a political and economical energy
production strategy with recourse to renewable resources. Therefore, in economical and
financial terms the undertaking brings real benefits to the Country and, as such, translates
into positive and highly meaningful impacts which justify the undertaking.
To this extent, it is important to underline that the hydroelectric energy presents itself as a
cleaner, renewable, responsive and a flexibly controlled form of energy production
(secured by the created dam), a situation which reinforces these benefits, above all
when compared with systems based on fossil fuels (in terms of fossil fuel consumption as
well as consequent GHG emissions).
The creation of direct and indirect jobs, mainly associated with the construction phase
(to a lesser extent during commissioning, in spite of these jobs being more specialized
and long-lasting), it will represent positive benefits for an underprivileged area.
The new "Caculo Cabaça Hydroelectrical Project", to be developed by the Ministry of Energy and
Water (MINEA) by means of GAMEK - Cabinet of Middle Kwanza River Development, is presented
as positive and having environmental viability, considering that measures for minimization /
mitigation will be applied as provided in this report.

EIA / RS 15.08 This document may only be reproduced in its entirety. 277/280
Luanda, December 05 of 2015

EIA / RS 15.08 This document may only be reproduced in its entirety. 278/280
3 BIBLIOGRAPHY
ANTÓNIO G. Henriques (1991) - Processo de AIA - Avaliação de Impacte Ambiental, Laboratório
Nacional de Engenharia Civil, IGT21, Lisboa.
Azevedo, A., Refega, A., Sousa, E., Portas, C., Vilhema, M., Marques, M., Louro de Sá, V.
Caracterização Sumária das Condições Ambientais de Angola. Universidade de Luanda. Nova
Lisboa. 1972
Barbosa, L.A.G. – Carta Fitogeográfica de Angola, Instituto de Investigação Cientifica de
Angola. Luanda, Angola 1970
Baillie, J.E.M. et al. Red List of Threatened Species. A Global Species Assessment. IUCN
Publication Service Unit, Cambridge, 2004
BirdLife International, Threatened Birds of the World. Barcelona. Lynx Editions & Cambridge, UK.
BirdLife International, 2000
Branch, B. – Field guide to snakes and other reptiles os Southern Africa. Third Edition. STRUIK.
Cape Town, 1998
Channing, A. – Amphibians of Central and Southern Africa, Protea Bookhouse. Pretoria, 2001
Coelho, Antonieta. Colectânea de Legislação de Recursos Naturais, Volume 1, Faculdade de
Direito da Universidade Agostinho Neto, 2002
Crawford-Cabral, J, - The Ungulate Fauna of Angola. Systematic List, Distribution Maps,
Database Report.
Instituto de Investigação Tropical. Estudos, Ensaios e Documentos. Lisboa, Portugal,2005
Dean, WRJ., The Birds of Angola. BOU Checklist series: 18. British Ornithologists Union, Tring, UK,
2000
Dean, WRJ, Pages 71-91 in: Fishpool LDC and Evans MI (Eds) Important Bird Areas in Africa and
associated islands: Priority sites for Conservation. Pisces Publications and BirdLife International:
Newbury and Cambridge, UK, 2001
Gossweiler, J. & Mendonça, F.A. – Carta Fitogeográfica de Angola, Governo Geral de Angola,
1998
Governo de Angola, Lei Constitucional da República de Angola (Lei nº 23/92 de 16 de
Setembro).
Governo de Angola, Lei de Bases do Ambiente (Lei nº 5/98 de 19 de Junho). Governo de
Angola, Luanda, Angola, 1998
Governo de Angola, Lei de Águas (Lei nº 6/02 de 21 de Junho). Governo de Angola, Luanda,
Angola, 2002

EIA / RS 15.08 This document may only be reproduced in its entirety. 279/280
Governo de Angola, Decreto sobre Avaliação de Impacte Ambiental (Decreto nº51/04 de 23
de Julho), Governo de Angola, Luanda, Angola, 2004a
Governo de Angola, Lei de Terras (Lei nº9/04 de 9 de Novembro), Governo de Angola, Luanda,
Angola,2004
Governo de Angola, Decreto sobre Licenciamento Ambiental (Lei nº59/07 de 13 de Julho),
Governo de Angola, Luanda, Angola, 2007
Huntley, B.J. – Distribution of Larger mammals of Angola according to Vegetation Types –
Luanda, 1973
Kingdon, J.V. – A Field Guide to African mammals Princeton University Press, 1997
Ministério do Urbanismo e Ambiente – Estratégia e Plano de Acção Nacionais para a
Biodiversidade (Resolução n.º 42/06 de 26 de Julho) – Governo de Angola. Luanda, Angola,
2006
Perlo, B. – Birds of Southern Africa. Harper Collins Publishers, London, 1999
Pinto, A. A. – Ornitologia de Angola. IICT, Lisboa, 1983
Sinclair, I. & Ryan, P. – Birds of Africa South of Sahara. A comprehensive illustrated field guide.
Struik Publishers, Cape Town, 2005
Stuart, C. & Stuart, T. – A Field Guide to the Tracks & Signs of Southern and East African Wildlife.
Struik publishers, Cape Town, 2000
Taylor, M. A. – Check-list of Angolan birds. Publicações Culturais da Companhia de Diamantes
de Angola, 1963
3.1 Websites consulted
Governo de Angola - www.angola.gov.ao
Instituto de Estradas de Angola, INEA - www.inea.gov.ao
IUCN (2008) - Red List of Threatened Species. Address: [http://www.iucnredlist.org/]
MAT, (2009) – Documentação variada. Ministério da Administração do Território. Address:
[http://www.mat.gv.ao/portalmat/]
www.info-angola.com
Os números do Censo 2014 – http://fotos.sapo.pt
Ministério da Agricultura e Ministério do Ambiente. (2011). Lei de Florestas, Fauna Selvagem e
Áreas de Conservação Terrestres. Luanda – Angola;
Oliveira, F. N., Freire, F. d., & Aquino, A. R. (2004). Bioindicadores de Impacto Ambiental em
Sistemas Agrícolas Orgânicos. Documentos, 10 - 11.
Baptista, E. J. (2010). Apontamento de Legislação Florestal e Faunística. Ndalatando – Angola.

EIA / RS 15.08 Este documento só pode ser reproduzido na íntegra. 267/280
Costa E., Dombo, A., Paula M. (2009). Plantas Ameaçadas em Angola. Universidade Agostinho
Neto. Centro de Botânica.
Baptista, E. J. (2015). Caracterização físico-química dos frutos silvestres comestíveis do norte de
Angola. Huambo – Angola.
Diniz, C. (2006). Caracterização Mesológica de Angola. Lisboa – Portugal.
Conceito de biótico - O que é, Definição e Significado
http://conceito.de/biotico#ixzz3sOrgM7ql.