
Oct-Dec 2012 - Magicbricks.com
19
-
Upload
khangminh22 -
Category
Documents
-
view
0 -
download
0
Transcript of Oct-Dec 2012 - Magicbricks.com


A very Happy New Year to all our readers!
The 7th edition of PropIndex comes when real estate markets across the countryhave stabilized, home loan interest rates are finally coming down thanks to somevery welcome measures by the Reserve Bank of India. Also a hint by the Ministerfor Housing that affordable housing will get industry status and the bag of goodiesthat the announcement brings with it. Exciting times to make a good investmentin a house.
We have studied supply and demand trends to help you figure out what the bestdeals should cost. Even as we wait for the Finance Minister to unveil on what is instore for the real estate sector in the Union Budget, data and statistics already spellgood news. All Indian markets have posted stable values. The National Index is up3 points. The Noida market has shrugged off the land acquisition blues and hasposted positive growth. Ghaziabad emerged as the fastest growing real estate hub.Developers have continued to boost supply of luxury housing in the quarter,reflecting their continued confidence in the markets. The government’s move toboost affordable housing is well timed as buyers too have shown their optimism.
You have now got used to getting something new in each issue of PropIndex. Andwe cannot let you down. This issue carries the top 10 preferred cities by demandfor lease and sale at the city and locality levels. Demand analysis has beenpresented in an easy-to-use bulleted version. Also, read what industry experts sayon the prospects of each city. And, importantly, we now make it possible for you tosimply log in and read your PropIndex anytime anywhere – we are delighted tolaunch a soft copy of PropIndex to be accessed on Magicbricks.com!
PropIndex is based on listed properties and requirements on Magicbricks.com.These are evolved into statistics, cleaned up and experts consulted to analysetrends. For developers and agents, the changing patterns of demand is a clue towhat the buyers are looking for. For the buyer, these analytics give a crediblebenchmark against which to make property investments. Globally, real estateinvestments are driven with meticulous research. Clubbed with the various adviceinitiatives that are available to you on magicbricks.com, you as a buyer will be ableto make informed decisions.
With PropIndex into its 7th quarterly edition, we now have a bank of very usefultrends and content about market performance at a city/locality level. You may alsovisit MagicBricks.com and explore all our content/research sections which carryample information about property markets, news and trends. Do share with uswhether PropIndex has helped you in understanding property markets better andin making a more intelligent real estate decision. Our team puts its effort inimproving each new edition to meet this stated objective of PropIndex. Your inputswould direct our efforts much better. Do write in!
FOREWORD
Sudhir PaiBusiness Head, [email protected]

MagicBricksPropIndexMagicBricks.comPropIndex is a tool whichempowers propertyseekers and investors withdetailed information onthe movement ofresidential apartmentprices and supply ofproperties in India. Nocredible property indexcan be a function of directvalues as the changes aregoverned by multiplefactors.
MagicBricks.comPropIndex has taken thisreality into account andproduced an index basedon listing of apartmentsand their capital andrental values on thewebsite.
MagicBricks.com has over 400,000 active propertiesposted by more than1,00,000 active users in 300cities and 3,500 localities.Our users include owners,agents and developers.
MethodologyApartment values arebased on listings onMagicBricks.com. Theseinclude multistoreyapartments and singleunits on plotteddevelopments, referred toas builder floors onMagicBricks.com.
The Index is structured in
such a way that individualproperties are aggregatedinto their respective citiesand then to the NationalIndex. Weightages forPropIndex are based on thesupply of propertieswithin the locality/city.Based on this structure,PropIndex gives a realisticpicture of trends inprice/supply acrossdifferent property marketsin each city. We have useddifferent weightages forListed Price Monitor/RentMonitor. Therefore, read asa whole, PropIndex alongwith tables provided forListed Price Monitor, RentMonitor, Yield Monitor andCapital Values, gives anexcellent perspective ofthe property marketperformance in thequarter.
While listing and itsvalues/supply provide alevel of understandinginto the market, there aremeticulous data checks toprevent aberrationscreeping into the Index.These are based onstatistical calculations,industry inputs and logicalinterpretations.
The National PropertyIndex (NPI) is indicative ofthe extent of activity aswell as price movementsacross cities and localitiesin the major cities activeon MagicBricks.com. Theindex includes the top 11
cities (these have beenchosen based on theiractivity levels) and has anindividual city report foreach of these cities. Whilethe NPI and its movementsare of interest to theexpert community ofbankers, builders andinvestors, the PropIndexhas also taken care toexplain the nuances ofindex movements at thelocality level that wouldhelp the huge base ofMagicBricks.comconsumers.
Insights into consumerdemand have beengathered through analysisof search information onthe site. This helpsunderstand the bestlocalities by demand, thetype and configuration ofunits as well as the budget-wise preferences.
The PropIndex is the resultof meticulous research atthe locality level andthrough detaileddiscussions with experts atMagicBricks.com’s offlineand online initiatives.
The Indian real estatemarket is dynamic and thePropIndex reflects thosechanges. Since it is derivedfrom a dynamic database,additions and deletions oflocalities happen as afunction of marketdynamics.
METHODOLOGY

There is a wealth of information within these pages. For better readability, we have presented some data as tablesand others as graphs. Between them, you will find how property markets have performed in the Oct-Dec 2012 quarter from many different perspectives – from that of capital appreciation, from a rental/yieldrealisation perspective and from the stand of supply of properties. Also understand what consumers want in theDemand Analysis section.
We recommend that you evaluate the city report in its entirety and that will provide a rounded perspective of theperformance of the property market within each city. Here are details of what you will find in each of the cityreports enclosed within -
1. City Property Index – This is a composite index which is a function of supply of properties as well as theaverage capital appreciation/drop in various localities of the city in the quarter. The city index is theweighted average of the average rate per square foot in that locality and the supply of properties from thatlocality. Premium localities (with higher average rate per square foot) as well as localities with higher supplyof properties will have a bigger impact on the Index. For example, if the supply of properties from apremium locality drops, that locality will end up having a lower weightage in the index which in turn willpush the Index downwards (and vice-versa). On the other hand, supply of properties remaining unchanged,the index will be influenced by capital appreciation within the locality.
2. Listed Price Monitor – This metric shows the capital appreciation/drop within a locality and is calculatedon the basis of movement in the “average rate per square foot” within that locality. By and large, themovement in the “average rate per square foot” reflects capital appreciation/ drops. However, in a few selectcases, we have observed that the average rate per square foot moves due to a change in the mix of apartmentswithin that locality (e.g. if the ratio of premium apartments, which command a higher per square foot rate,changes over the quarter). In these few circumstances, the Listed Price Monitor will, in turn, reflect thisinput. Such changes have been explained in the text of the City Reports.
3. Rent Monitor – This reflects the rental appreciation/drop within a locality. It is calculated on the basis ofmovement in the “average rent per square foot” within that locality. By and large, the movement in the“average rent per square foot” reflects rental appreciation/drops. However, in a few selected cases, we haveobserved that the average rent per square foot moves due to a change in the mix of apartments within thatlocality (e.g. if the ratio of premium apartments, which command a higher per square foot rent, changes overthe quarter). In these few circumstances, the Rent Monitor will, in turn, reflect this input. Such changes havebeen explained in the text of the City Reports.
4. Yield Meter – Yield is the annual rate of return earned on property. The Yield Meter depicts the gross yieldpercentages across various localities. Gross yield is a ratio of average annual rental value to the averagecapital value of the property.
5. Capital Value Tables (given in Annexures) – This shows the actual range of prices within which propertieswere available in each locality in the quarter. Prices are shown in Rupees per square foot basis; these are theprevailing rates for properties in each locality.
6. Demand Analysis –This analysis of consumer demand is based on searches and requirements that usershave performed on MagicBricks.com. The top localities by demand gives an insight into consumerpeferences. The demand data has been used to arrive at various aspects of consumer requirements includingBudget-wise analysis, Property type analysis and BHK configuration analysis. This section also provides acomparison between demand and supply in the Oct-Dec, 2012 and Jul-Sept, 2012 quarters.
7. Realty News – Property market performance is also dependent on drivers outside the purview of buyingand selling. There are broadly four key drivers that determine the prospects of real estate – infrastructuresuch as water and power, transport links creating new growth corridors, policy such as rental laws, propertytax, etc and return on investment. From this issue onwards, PropIndex focuses on news bytes that impactfuture prospects of real estate in the city.
GLOSSARY & DEFINITIONS
OCT-DEC 2012
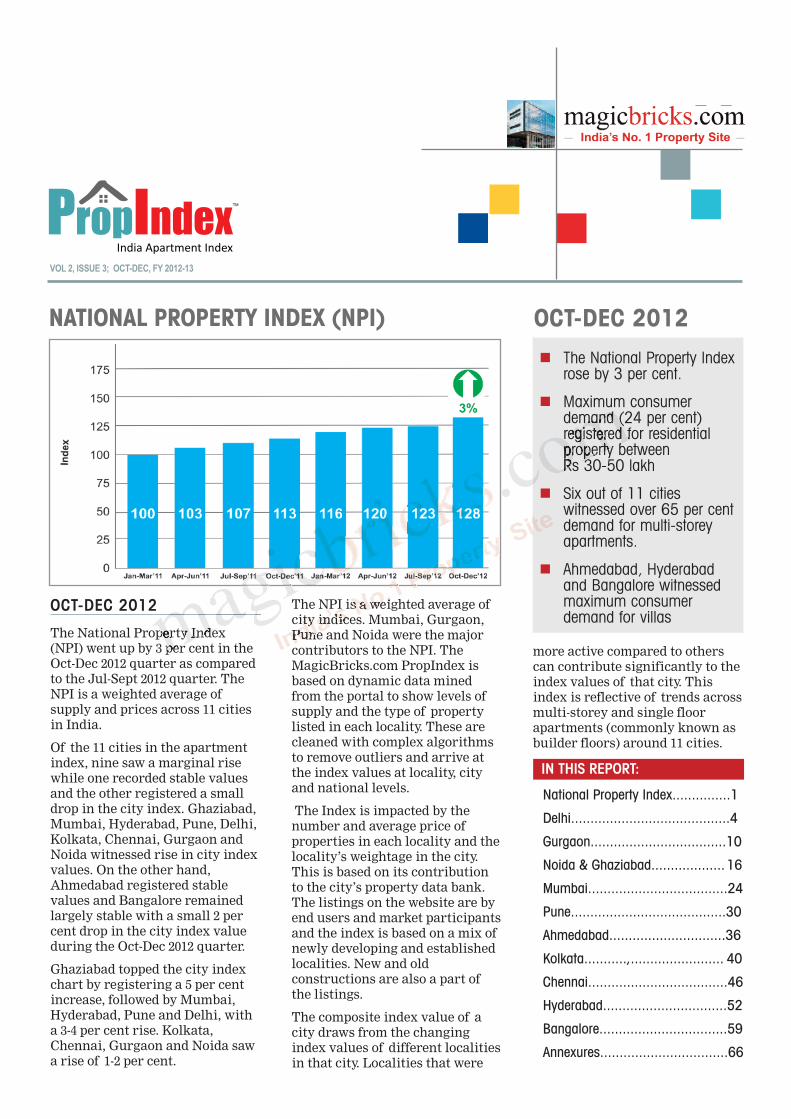
The National Property Index(NPI) went up by 3 per cent in theOct-Dec 2012 quarter as comparedto the Jul-Sept 2012 quarter. TheNPI is a weighted average ofsupply and prices across 11 citiesin India.
Of the 11 cities in the apartmentindex, nine saw a marginal risewhile one recorded stable valuesand the other registered a smalldrop in the city index. Ghaziabad,Mumbai, Hyderabad, Pune, Delhi,Kolkata, Chennai, Gurgaon andNoida witnessed rise in city indexvalues. On the other hand,Ahmedabad registered stablevalues and Bangalore remainedlargely stable with a small 2 percent drop in the city index valueduring the Oct-Dec 2012 quarter.
Ghaziabad topped the city indexchart by registering a 5 per centincrease, followed by Mumbai,Hyderabad, Pune and Delhi, witha 3-4 per cent rise. Kolkata,Chennai, Gurgaon and Noida sawa rise of 1-2 per cent.
The NPI is a weighted average ofcity indices. Mumbai, Gurgaon,Pune and Noida were the majorcontributors to the NPI. TheMagicBricks.com PropIndex isbased on dynamic data minedfrom the portal to show levels ofsupply and the type of propertylisted in each locality. These arecleaned with complex algorithmsto remove outliers and arrive atthe index values at locality, cityand national levels.
The Index is impacted by thenumber and average price ofproperties in each locality and thelocality’s weightage in the city.This is based on its contributionto the city’s property data bank.The listings on the website are byend users and market participantsand the index is based on a mix ofnewly developing and establishedlocalities. New and oldconstructions are also a part ofthe listings.
The composite index value of acity draws from the changingindex values of different localitiesin that city. Localities that were
more active compared to otherscan contribute significantly to theindex values of that city. Thisindex is reflective of trends acrossmulti-storey and single floorapartments (commonly known asbuilder floors) around 11 cities.
n The National Property Indexrose by 3 per cent.
n Maximum consumerdemand (24 per cent)registered for residentialproperty between Rs 30-50 lakh
n Six out of 11 citieswitnessed over 65 per centdemand for multi-storeyapartments.
n Ahmedabad, Hyderabadand Bangalore witnessedmaximum consumerdemand for villas
IN THIS REPORT:
National Property Index...............1
Delhi.........................................4
Gurgaon...................................10
Noida & Ghaziabad................... 16
Mumbai....................................24
Pune........................................30
Ahmedabad..............................36
Kolkata...........,........................ 40
Chennai....................................46
Hyderabad................................52
Bangalore.................................59
Annexures.................................66
NATIONAL PROPERTY INDEX (NPI)
VOL 2, ISSUE 3; OCT-DEC, FY 2012-13
OCT-DEC 2012
2VOL2, ISSUE 3; OCT-DEC, FY 2012-13
NATIONAL PROPERTY INDEX
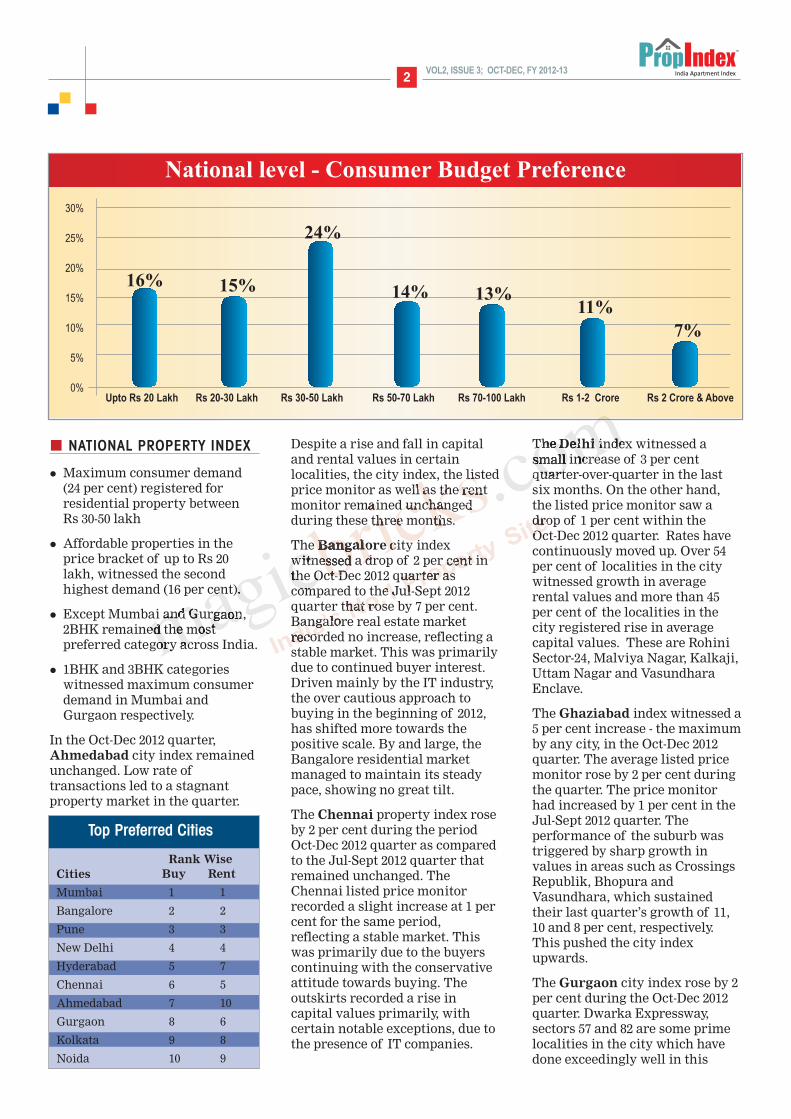
l Maximum consumer demand(24 per cent) registered forresidential property between Rs 30-50 lakh
l Affordable properties in theprice bracket of up to Rs 20lakh, witnessed the secondhighest demand (16 per cent).
l Except Mumbai and Gurgaon,2BHK remained the mostpreferred category across India.
l 1BHK and 3BHK categorieswitnessed maximum consumerdemand in Mumbai andGurgaon respectively.
In the Oct-Dec 2012 quarter,Ahmedabad city index remainedunchanged. Low rate oftransactions led to a stagnantproperty market in the quarter.
Despite a rise and fall in capitaland rental values in certainlocalities, the city index, the listedprice monitor as well as the rentmonitor remained unchangedduring these three months.
The Bangalore city indexwitnessed a drop of 2 per cent inthe Oct-Dec 2012 quarter ascompared to the Jul-Sept 2012quarter that rose by 7 per cent.Bangalore real estate marketrecorded no increase, reflecting astable market. This was primarilydue to continued buyer interest.Driven mainly by the IT industry,the over cautious approach tobuying in the beginning of 2012,has shifted more towards thepositive scale. By and large, theBangalore residential marketmanaged to maintain its steadypace, showing no great tilt.
The Chennai property index roseby 2 per cent during the periodOct-Dec 2012 quarter as comparedto the Jul-Sept 2012 quarter thatremained unchanged. TheChennai listed price monitorrecorded a slight increase at 1 percent for the same period,reflecting a stable market. Thiswas primarily due to the buyerscontinuing with the conservativeattitude towards buying. Theoutskirts recorded a rise incapital values primarily, withcertain notable exceptions, due tothe presence of IT companies.
The Delhi index witnessed asmall increase of 3 per centquarter-over-quarter in the lastsix months. On the other hand,the listed price monitor saw adrop of 1 per cent within the Oct-Dec 2012 quarter. Rates havecontinuously moved up. Over 54per cent of localities in the citywitnessed growth in averagerental values and more than 45per cent of the localities in thecity registered rise in averagecapital values. These are RohiniSector-24, Malviya Nagar, Kalkaji,Uttam Nagar and VasundharaEnclave.
The Ghaziabad index witnessed a5 per cent increase - the maximumby any city, in the Oct-Dec 2012quarter. The average listed pricemonitor rose by 2 per cent duringthe quarter. The price monitorhad increased by 1 per cent in theJul-Sept 2012 quarter. Theperformance of the suburb wastriggered by sharp growth invalues in areas such as CrossingsRepublik, Bhopura andVasundhara, which sustainedtheir last quarter’s growth of 11,10 and 8 per cent, respectively.This pushed the city indexupwards.
The Gurgaon city index rose by 2per cent during the Oct-Dec 2012quarter. Dwarka Expressway,sectors 57 and 82 are some primelocalities in the city which havedone exceedingly well in this
Upto Rs 20 Lakh Rs 20-30 Lakh Rs 30-50 Lakh Rs 50-70 Lakh Rs 70-100 Lakh Rs 1-2 Crore Rs 2 Crore & Above
National level - Consumer Budget Preference
30%
25%
20%
15%
10%
5%
0%
16% 15%
24%
14% 13%11%
7%
Top Preferred Cities
Rank WiseCities Buy Rent
Mumbai 1 1
Bangalore 2 2
Pune 3 3
New Delhi 4 4
Hyderabad 5 7
Chennai 6 5
Ahmedabad 7 10
Gurgaon 8 6
Kolkata 9 8
Noida 10 9
3VOL2, ISSUE 3; OCT-DEC, FY 2012-13
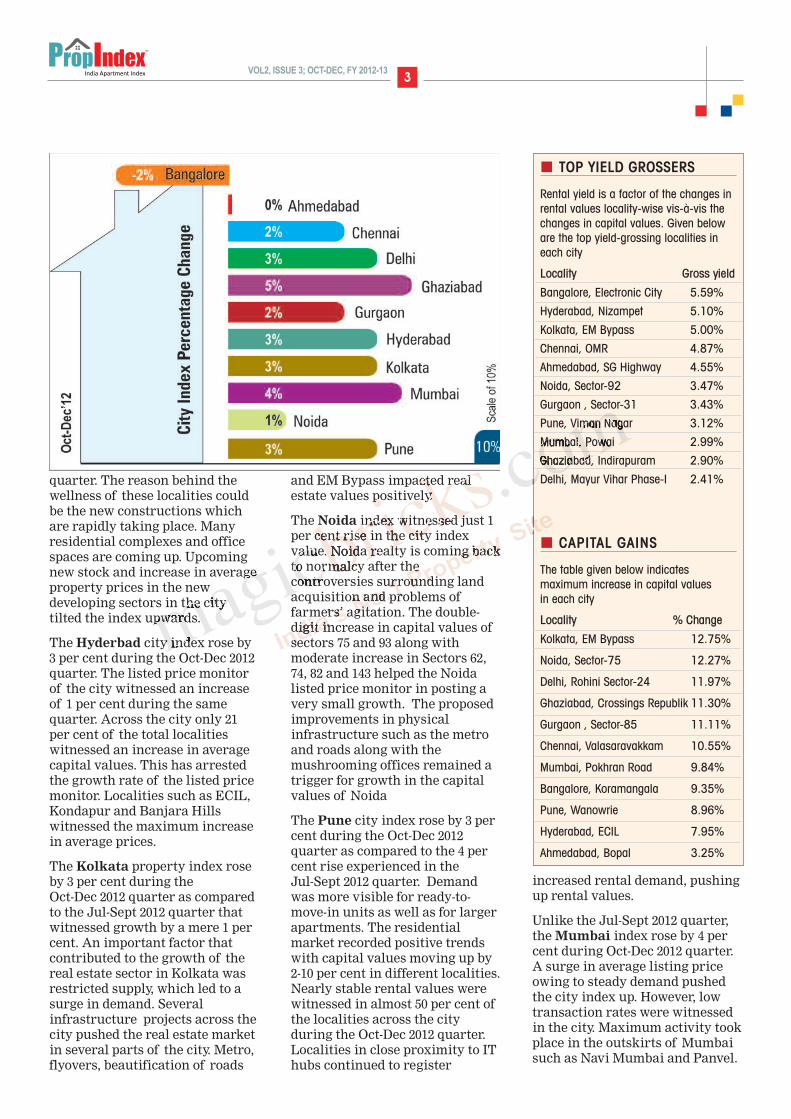
quarter. The reason behind thewellness of these localities couldbe the new constructions whichare rapidly taking place. Manyresidential complexes and officespaces are coming up. Upcomingnew stock and increase in averageproperty prices in the newdeveloping sectors in the citytilted the index upwards.
The Hyderbad city index rose by3 per cent during the Oct-Dec 2012quarter. The listed price monitorof the city witnessed an increaseof 1 per cent during the samequarter. Across the city only 21per cent of the total localitieswitnessed an increase in averagecapital values. This has arrestedthe growth rate of the listed pricemonitor. Localities such as ECIL,Kondapur and Banjara Hillswitnessed the maximum increasein average prices.
The Kolkata property index roseby 3 per cent during the Oct-Dec 2012 quarter as comparedto the Jul-Sept 2012 quarter thatwitnessed growth by a mere 1 percent. An important factor thatcontributed to the growth of thereal estate sector in Kolkata wasrestricted supply, which led to asurge in demand. Severalinfrastructure projects across thecity pushed the real estate marketin several parts of the city. Metro,flyovers, beautification of roads
and EM Bypass impacted realestate values positively.
The Noida index witnessed just 1per cent rise in the city indexvalue. Noida realty is coming backto normalcy after thecontroversies surrounding landacquisition and problems offarmers’ agitation. The double-digit increase in capital values ofsectors 75 and 93 along withmoderate increase in Sectors 62,74, 82 and 143 helped the Noidalisted price monitor in posting avery small growth. The proposedimprovements in physicalinfrastructure such as the metroand roads along with themushrooming offices remained atrigger for growth in the capitalvalues of Noida
The Pune city index rose by 3 percent during the Oct-Dec 2012quarter as compared to the 4 percent rise experienced in the Jul-Sept 2012 quarter. Demandwas more visible for ready-to-move-in units as well as for largerapartments. The residentialmarket recorded positive trendswith capital values moving up by2-10 per cent in different localities.Nearly stable rental values werewitnessed in almost 50 per cent ofthe localities across the cityduring the Oct-Dec 2012 quarter.Localities in close proximity to IThubs continued to register
increased rental demand, pushingup rental values.
Unlike the Jul-Sept 2012 quarter,the Mumbai index rose by 4 percent during Oct-Dec 2012 quarter.A surge in average listing priceowing to steady demand pushedthe city index up. However, lowtransaction rates were witnessedin the city. Maximum activity tookplace in the outskirts of Mumbaisuch as Navi Mumbai and Panvel.
TOP YIELD GROSSERS
Rental yield is a factor of the changes inrental values locality-wise vis-à-vis thechanges in capital values. Given beloware the top yield-grossing localities ineach city
Locality Gross yield
Bangalore, Electronic City 5.59%
Hyderabad, Nizampet 5.10%
Kolkata, EM Bypass 5.00%
Chennai, OMR 4.87%
Ahmedabad, SG Highway 4.55%
Noida, Sector-92 3.47%
Gurgaon , Sector-31 3.43%
Pune, Viman Nagar 3.12%
Mumbai, Powai 2.99%
Ghaziabad, Indirapuram 2.90%
Delhi, Mayur Vihar Phase-I 2.41%
CAPITAL GAINS
The table given below indicates maximum increase in capital values in each city
Locality % Change
Kolkata, EM Bypass 12.75%
Noida, Sector-75 12.27%
Delhi, Rohini Sector-24 11.97%
Ghaziabad, Crossings Republik 11.30%
Gurgaon , Sector-85 11.11%
Chennai, Valasaravakkam 10.55%
Mumbai, Pokhran Road 9.84%
Bangalore, Koramangala 9.35%
Pune, Wanowrie 8.96%
Hyderabad, ECIL 7.95%
Ahmedabad, Bopal 3.25%
KOLKATA 40VOL2, ISSUE 3; OCT-DEC, FY 2012-13
CITY PROPERTY INDEX
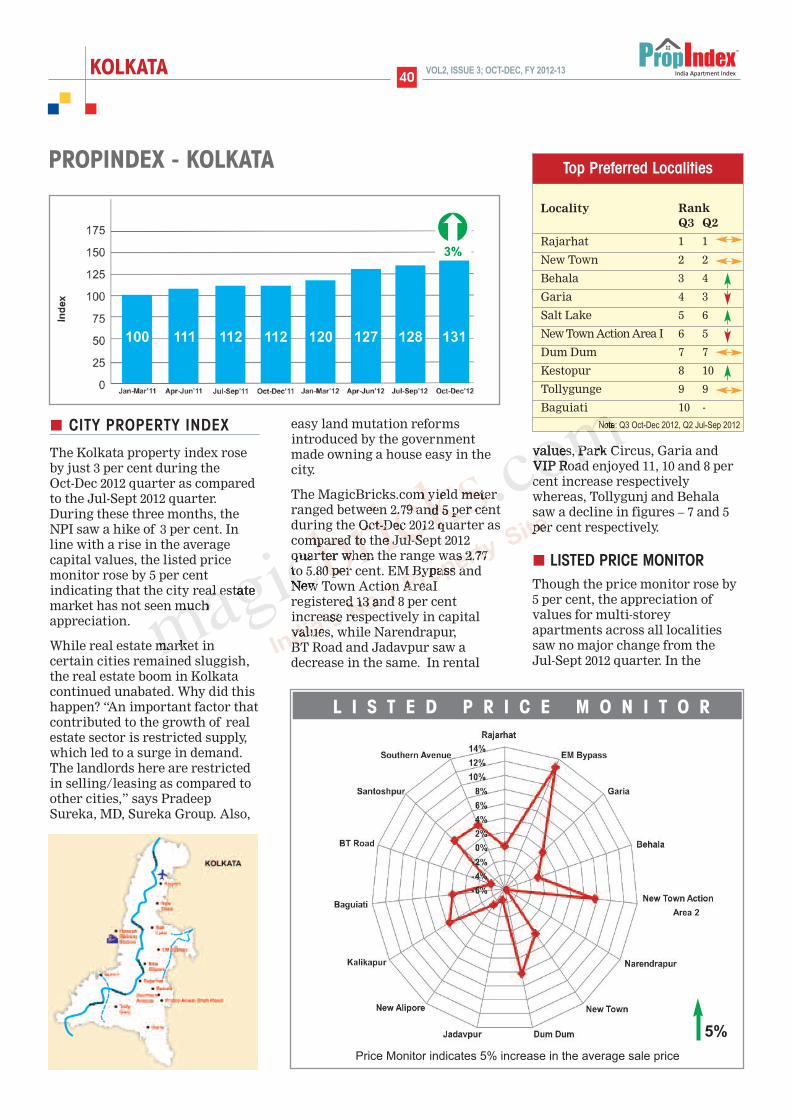
The Kolkata property index roseby just 3 per cent during the Oct-Dec 2012 quarter as comparedto the Jul-Sept 2012 quarter.During these three months, theNPI saw a hike of 3 per cent. Inline with a rise in the averagecapital values, the listed pricemonitor rose by 5 per centindicating that the city real estatemarket has not seen muchappreciation.
While real estate market incertain cities remained sluggish,the real estate boom in Kolkatacontinued unabated. Why did thishappen? “An important factor thatcontributed to the growth of realestate sector is restricted supply,which led to a surge in demand.The landlords here are restrictedin selling/leasing as compared toother cities,” says PradeepSureka, MD, Sureka Group. Also,
easy land mutation reformsintroduced by the governmentmade owning a house easy in thecity.
The MagicBricks.com yield meterranged between 2.79 and 5 per centduring the Oct-Dec 2012 quarter ascompared to the Jul-Sept 2012quarter when the range was 2.77to 5.80 per cent. EM Bypass andNew Town Action AreaIregistered 13 and 8 per centincrease respectively in capitalvalues, while Narendrapur, BT Road and Jadavpur saw adecrease in the same. In rental
values, Park Circus, Garia andVIP Road enjoyed 11, 10 and 8 percent increase respectivelywhereas, Tollygunj and Behalasaw a decline in figures – 7 and 5per cent respectively.
LISTED PRICE MONITORThough the price monitor rose by5 per cent, the appreciation ofvalues for multi-storeyapartments across all localitiessaw no major change from the Jul-Sept 2012 quarter. In the
5%
Price Monitor indicates 5% increase in the average sale price
L I S T E D P R I C E M O N I T O R
PROPINDEX - KOLKATA
Locality RankQ3 Q2
Rajarhat 1 1
New Town 2 2
Behala 3 4
Garia 4 3
Salt Lake 5 6
New Town Action Area I 6 5
Dum Dum 7 7
Kestopur 8 10
Tollygunge 9 9
Baguiati 10 -
Top Preferred Localities
Note: Q3 Oct-Dec 2012, Q2 Jul-Sep 2012

KOLKATA41VOL2, ISSUE 3; OCT-DEC, FY 2012-13
Oct-Dec 2012 period, capital valuesranged from 2 per cent in Garia,New Town and Baguiati to 13 percent in EM Bypass. Kalikapur,Santoshpur. Southern Avenuewitnessed 4 per cent increase incapital values as compared to theJul-Sept 2012 quarter. Dum Dumsaw an appreciation of 6 per cent.
According to MagicBricks.comdata, during the Jul-Sept 2012period, Narendrapur, Kalikapur,Behala and New Town ActionArea II witnessed the maximumappreciation, ranging between 7-8per cent. However, in the Oct-Dec 2012 quarter,Narendrapur witnessed 6 per cent
drop in values, whereas, Jadavpurand BT Road saw a drop of 4 percent in capital values. Rajarhatwas the only locality where thevalues remained the same as inthe Jul-Sept 2012 quarter.
“Several infra-projects across thecity have pushed the real estatemarket in several parts of the city.Metro, flyovers, beautification ofroads and EM Bypass haveimpacted real estate values in apositive way,” says RavindraChamaria of Infinity InfotechParks.
EM Bypass remained thefavourite amongst the highincome group (HIG) as this
category of buyers moved to theBypass area owing to lack ofsupply within the city. “This is theplace where growth and supplyis,” said Sureka, adding, “NewTown Action Areas II provedfeasible for those looking for ahome in the Rs 50 lakh to Rs 1
RENT MONITOR Rent Price Percentage Change
Y I E L D M E T E Rn EM Bypass continued to top the gross
yield chart. It remained the favouriteamongst the high income group (HIG)as buyers moved to the Bypass areaowing to lack of supply within the city.
n Southern Avenue continued to registerthe lowest gross yield quarter-over- quarter, with smallimprovement in gross yield by .02 percent in comparison to Jul-Dec 2012.
An important factor thatcontributed to thegrowth of real estatesector is restrictedsupply, which led to asurge in demand. Thelandlords here arerestricted inselling/leasing ascompared to other cities.
Pradeep SurekaManaging Directo,Sureka Group
QUICKSTATS
n Yield Meter: Yield ranges between2.79% to 5.00%
n Capital Values rose in 63% localities
n Rental Value rose in 54% localities
n City Index rose from 128 to 131
n Price Monitor rose from 150 to 158
KOLKATA 42VOL2, ISSUE 3; OCT-DEC, FY 2012-13
crore bracket. Also, sector 5 (IThub) and New Town areas haverobust commercial activities plusthe prospect of Metro, whichpushed capital values. Forhousing below Rs 50 lakh, DumDum, which merges with northand east Kolkata, Madhyamgram,Jessore Road proved goodoptions.” The Metro network willbe operational by 2016 and willconnect the New Town ActionArea II to the airport.
Narendrapur, Kalikapur,Santoshpur – all extensions ofsouth Kolkata, offer affordablehousing in the Rs 25-40 lakh
bracket. The metro is alreadyfunctional till Garia, because ofwhich residential demand hasgone up in these localities. “Bothcapital and rental values haveregistered an upward trend in theOct-Dec 2012 quarter in theselocalities,” said city-based realtorLalit Baid of SY Marketing.
“Both 2 and 3BHK units in theprice range of Rs 25-40 lakh sawmaximum demand from buyers inthe city,” added Baid.
RENT MONITORThe rental market remainedstable across localities such asRajarhat, Jadavpur, New Town,New Town Action Area III andKestopur. The heart of the city,Park Circus, saw a maximumjump of 11 per cent in the rentalvalues during the Oct-Dec 2012
period as compared to the Jul-Sep 2012 quarter. Other areasthat witnessed hike in rentalvalues were Garia, Narendrapur,VIP Road and Bansdroni. Theselocalities, which have robustsocial infrastructure, witnessedan increase in the range of 9-10per cent.
On the contrary, Tollygungewitnessed maximum drop of 7 per cent in rental values duringthe Oct-Dec 2012 period. Realtorsin the area attribute this to thealready high rental values andsaturation. Behala, EM Bypassand Lake Gardens were otherareas that witnessed a drop of 5 and 3 per cent respectively inresidential rental values.“Due tothe increased Metro connectivityacross the city, the real estatemarket remained positive in theOct-Dec 2012 quarter,” saysChamaria.
Several praiseworthy projects,continuity in market returns andreasonable land value purchasespushed growth in the real estatemarket in Kolkata. The confidenceof buyers and consistency in yieldserved as an impetus to growth inthe city. As compared to last year,this year looks positive. There isno new supply in the market,which has lead to a surge indemand. The price is established.The new growth corridors areHowrah, beyond the Hoogly.
Kolkata Govt to rethink on township barCash constraints, the need for new investment and a booming realestate sector have prompted the state government to review itsdecision to bar big, private townships in Bengal. The hint of arethink came on 15th from deliberations at a meeting of a taskforce headed by state finance minister Amit Mitra that has beenassigned to look into problems faced by real estate developers.State urban development minister Firhad Hakim, who is also amember of the task force, said developers were preparing a workpaper. At the recently held Bengal Leads conclave, buildersrequested the CM to repeal the Urban Land (Ceiling andRegulation) Act, which has been done away with in many states.
n The Times of India, Kolkata
KMC sticks to existing property tax rules Months after making a commitment to the funding agencies thatit will switch to unit area-based property assessment (UAA)system like it’s done in Delhi, Bangalore, Chandigarh or anyother metro city, the nearly-broke Kolkata Municipal Corporation(KMC) has decided to stick to its existing rental methodassessment system despite having all the papers ready for theswitchover. The civic body has decided to continue with theexisting system since it’s taking time to introduce the new systemand consequently, losing heavily in the form of unrealizedproperty tax.
n The Times of India, Kolkata
The city’s vibrant culture, its ethos and its infrastructure facelift is now giving returns. As Kolkata is now witnessing theexpansion of Metro rail network, areas along the proposed network is already witnessing price hike. Market has growthpotential as prices are still low and promise better returns in coming years
To read full story and more news go to www.content.magicbricks.com
Several infra-projectsacross Kolkata havepushed the real estatemarket in several partsof the city. Constructionof Metro, flyovers,beautification of roadsand EM bypass haveimpacted real estatevalues in a positive way.
Ravindra Chamaria Infinity Infotech Parks
Top Preferred Rental LocalitiesNew
Locality RankOct-Dec’12
Salt Lake 1
New Town 2
Rajarhat 3
Kestopur 4
Tollygunge 5
Dum Dum 6
Garia 7
New Town Action Area I 8
Behala 9
Jadavpur 10
R E A L T Y N E W S
KOLKATA43VOL2, ISSUE 3; OCT-DEC, FY 2012-13
Budget wise Analysis - DEMAND
120
100
80
60
40
20
0
Fig
ures
in p
erce
ntag
e(%
)
South Kolkata North Kolkata West Kolkata East Kolkata
<20 lakh Rs 20-40 lakh Rs 40-60 lakh Rs 60 lakh-1 crore Rs1 crore and above
Q2 Q3
4043
Q2 Q3 Q2 Q3
52
Q2 Q3
4358
5046
39
Budget wise Analysis - SUPPLY
120
100
80
60
40
20
0
Q2 (Jul-Sep 2012)
Q3 (Oct-Dec 2012)
Fig
ures
in p
erce
ntag
e(%
)
South Kolkata North Kolkata West Kolkata East Kolkata
upto Rs 30 lakh Rs 30-60 lakh Rs 60 lakh-1 crore Rs 1-2 crore Rs 2 crore and above
Q2 Q3
3634
Q2 Q3 Q2 Q3 Q2 Q3
62
20
32
72
31
27
15 17
39 43 3237
22
16 16
22
14
10
20 20
16 15
20 19
48 51
19 16 2622
11
21
25
22
12
21
9 11 7
12 13
100
80
60
40
20
0<20 20-40 40-60 60-100 100 &
above
29
Fig
ures
in p
erce
ntag
e(%
)
Figures in Rs lakh
28
42 41
15 169 10
5 5
(Jul-Sep 2012)
(Oct-Dec 2012)
Budget wise Analysis - City Level
DEMAND
100
80
60
40
20
0<20 20-40 40-60 60-100 100 &
above
13
Fig
ures
in p
erce
ntag
e(%
)
Figures in Rs lakh
14
36 38
20 19 17 15 14 14
(Jul-Sep 2012)
(Oct-Dec 2012)
SUPPLY
Q2 (Jul-Sep 2012)
Q3 (Oct-Dec 2012)
6 77 7 9
25
16
8 8 10
10
20
B U Y E R D E M A N D A N A LY S I S
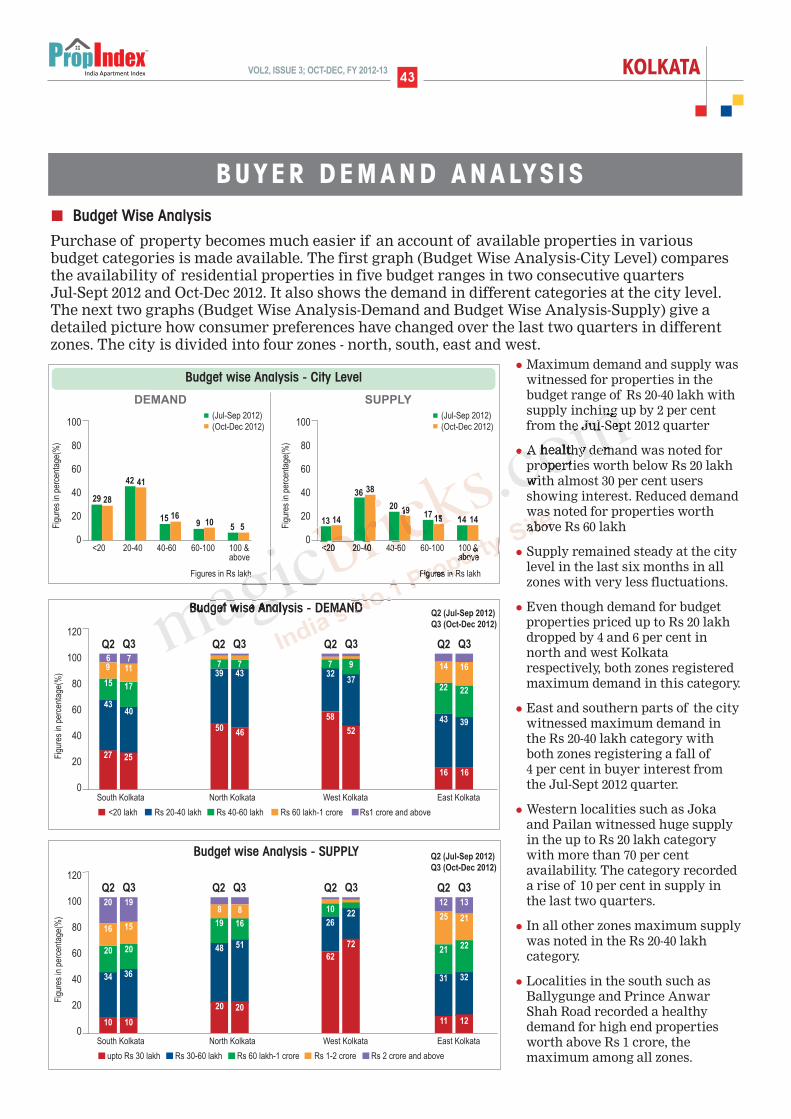
l Maximum demand and supply waswitnessed for properties in thebudget range of Rs 20-40 lakh withsupply inching up by 2 per centfrom the Jul-Sept 2012 quarter
l A healthy demand was noted forproperties worth below Rs 20 lakhwith almost 30 per cent usersshowing interest. Reduced demandwas noted for properties worthabove Rs 60 lakh
l Supply remained steady at the citylevel in the last six months in allzones with very less fluctuations.
l Even though demand for budgetproperties priced up to Rs 20 lakhdropped by 4 and 6 per cent innorth and west Kolkatarespectively, both zones registeredmaximum demand in this category.
l East and southern parts of the citywitnessed maximum demand inthe Rs 20-40 lakh category withboth zones registering a fall of 4 per cent in buyer interest fromthe Jul-Sept 2012 quarter.
l Western localities such as Jokaand Pailan witnessed huge supplyin the up to Rs 20 lakh categorywith more than 70 per centavailability. The category recordeda rise of 10 per cent in supply inthe last two quarters.
l In all other zones maximum supplywas noted in the Rs 20-40 lakhcategory.
l Localities in the south such asBallygunge and Prince AnwarShah Road recorded a healthydemand for high end propertiesworth above Rs 1 crore, themaximum among all zones.
Budget Wise Analysis
Purchase of property becomes much easier if an account of available properties in variousbudget categories is made available. The first graph (Budget Wise Analysis-City Level) comparesthe availability of residential properties in five budget ranges in two consecutive quarters Jul-Sept 2012 and Oct-Dec 2012. It also shows the demand in different categories at the city level.The next two graphs (Budget Wise Analysis-Demand and Budget Wise Analysis-Supply) give adetailed picture how consumer preferences have changed over the last two quarters in differentzones. The city is divided into four zones - north, south, east and west.
KOLKATA 44VOL2, ISSUE 3; OCT-DEC, FY 2012-13
Property wise Analysis - DEMAND
120
100
80
60
40
20
0
Q2 (Jul-Sep 2012)
Q3 (Oct-Dec 2012)
Fig
ures
in p
erce
ntag
e(%
)
South Kolkata North Kolkata West Kolkata East Kolkata
Multistorey apartment Single floor Residential house Residential plot
Q2 Q3 Q2 Q3 Q2 Q3 Q2 Q3
74
56 58
84 8276 76 74
8
12
8
118 914 13
28
12
29
10
9 11
Property wise Analysis - SUPPLY
120
100
80
60
40
20
0
Q2 (Jul-Sep 2012)
Q3 (Oct-Dec 2012)
Fig
ures
in p
erce
ntag
e(%
)
South Kolkata North Kolkata West Kolkata East Kolkata
Multistorey apartment Single floor Residential house Residential plot
Q2 Q3 Q2 Q3 Q2 Q3 Q2 Q3
78
32 33
75 7769 69 71
9
8
138
50
14
64
9
11
14 1316
14
12
9
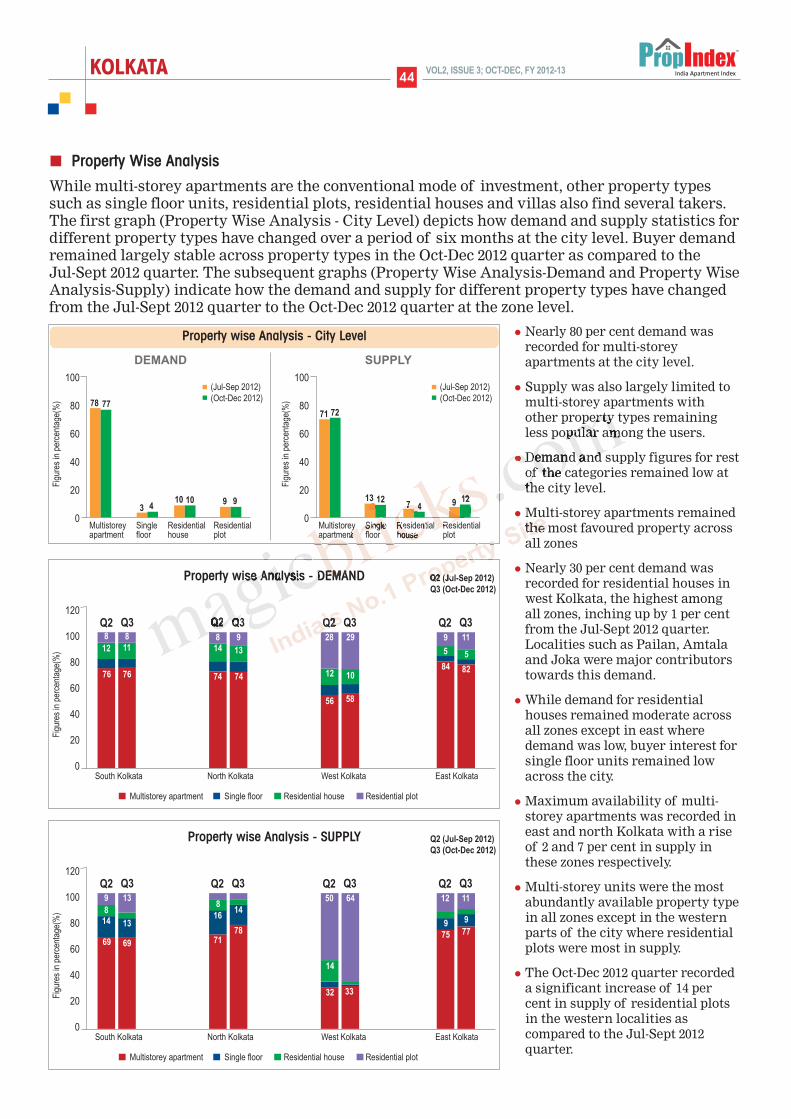
l Nearly 80 per cent demand wasrecorded for multi-storeyapartments at the city level.
l Supply was also largely limited tomulti-storey apartments withother property types remainingless popular among the users.
l Demand and supply figures for restof the categories remained low atthe city level.
l Multi-storey apartments remainedthe most favoured property acrossall zones
l Nearly 30 per cent demand wasrecorded for residential houses inwest Kolkata, the highest amongall zones, inching up by 1 per centfrom the Jul-Sept 2012 quarter.Localities such as Pailan, Amtalaand Joka were major contributorstowards this demand.
l While demand for residentialhouses remained moderate acrossall zones except in east wheredemand was low, buyer interest forsingle floor units remained lowacross the city.
l Maximum availability of multi-storey apartments was recorded ineast and north Kolkata with a riseof 2 and 7 per cent in supply inthese zones respectively.
l Multi-storey units were the mostabundantly available property typein all zones except in the westernparts of the city where residentialplots were most in supply.
l The Oct-Dec 2012 quarter recordeda significant increase of 14 percent in supply of residential plotsin the western localities ascompared to the Jul-Sept 2012quarter.
Property Wise Analysis
While multi-storey apartments are the conventional mode of investment, other property typessuch as single floor units, residential plots, residential houses and villas also find several takers.The first graph (Property Wise Analysis - City Level) depicts how demand and supply statistics fordifferent property types have changed over a period of six months at the city level. Buyer demandremained largely stable across property types in the Oct-Dec 2012 quarter as compared to the Jul-Sept 2012 quarter. The subsequent graphs (Property Wise Analysis-Demand and Property WiseAnalysis-Supply) indicate how the demand and supply for different property types have changedfrom the Jul-Sept 2012 quarter to the Oct-Dec 2012 quarter at the zone level.
Property wise Analysis - City Level
100
80
60
40
20
0
78 77
3 410 10 9 9
(Jul-Sep 2012)
(Oct-Dec 2012)
Fig
ures
in p
erce
ntag
e(%
)
Multistorey Single Residential Residentialapartment floor house plot
DEMAND SUPPLY
100
80
60
40
20
0
71 72
13 127 4 9 12
(Jul-Sep 2012)
(Oct-Dec 2012)
Fig
ures
in p
erce
ntag
e(%
)
Multistorey Single Residential Residentialapartment floor house plot
5 5
KOLKATA45VOL2, ISSUE 3; OCT-DEC, FY 2012-13
BHK Configuration - DEMAND
120
100
80
60
40
20
0
Fig
ures
in p
erce
ntag
e(%
)
South Kolkata North Kolkata West Kolkata East Kolkata
1 BHK 2 BHK 3 BHK 4 BHK & above
Q2 Q3 Q2 Q3 Q2 Q3 Q2 Q3
6146
52
58 58
4654
BHK Configuration - SUPPLY
120
100
80
60
40
20
0
Q2 (Jul-Sep 2012)
Q3 (Oct-Dec 2012)
Fig
ures
in p
erce
ntag
e(%
)
South Kolkata North Kolkata West Kolkata East Kolkata
1 BHK 2 BHK 3 BHK 4 BHK & above
Q2 Q3 Q2 Q3 Q2 Q3 Q2 Q3
53 44
5447
50
46
49
51
35
8 9
36
11
28 28
13
28 24
8
42 41
8
12 10
40 41
38
740
14
23 30
15
3135
12 12
57
Q2 (Jul-Sep 2012)
Q3 (Oct-Dec 2012)
13 13
10
10
11
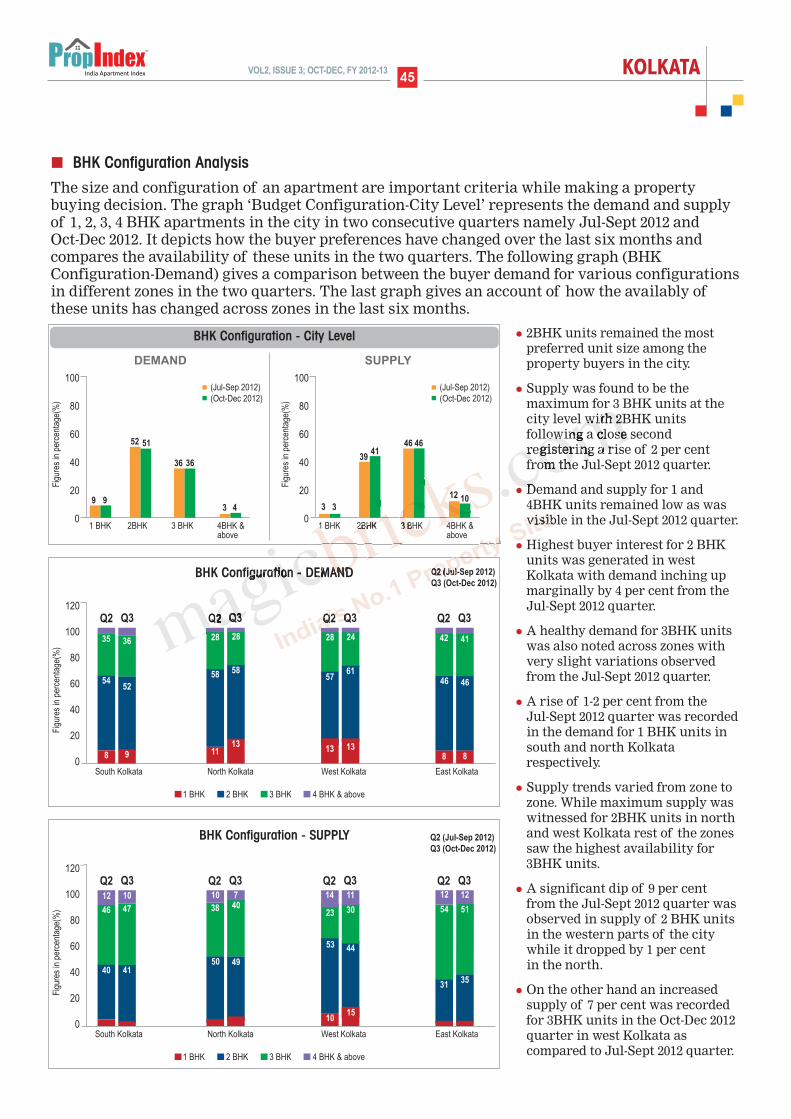
l 2BHK units remained the mostpreferred unit size among theproperty buyers in the city.
l Supply was found to be themaximum for 3 BHK units at thecity level with 2BHK unitsfollowing a close secondregistering a rise of 2 per centfrom the Jul-Sept 2012 quarter.
l Demand and supply for 1 and4BHK units remained low as wasvisible in the Jul-Sept 2012 quarter.
l Highest buyer interest for 2 BHKunits was generated in westKolkata with demand inching upmarginally by 4 per cent from theJul-Sept 2012 quarter.
l A healthy demand for 3BHK unitswas also noted across zones withvery slight variations observedfrom the Jul-Sept 2012 quarter.
l A rise of 1-2 per cent from the Jul-Sept 2012 quarter was recordedin the demand for 1 BHK units insouth and north Kolkatarespectively.
l Supply trends varied from zone tozone. While maximum supply waswitnessed for 2BHK units in northand west Kolkata rest of the zonessaw the highest availability for3BHK units.
l A significant dip of 9 per cent from the Jul-Sept 2012 quarter wasobserved in supply of 2 BHK unitsin the western parts of the citywhile it dropped by 1 per cent in the north.
l On the other hand an increasedsupply of 7 per cent was recordedfor 3BHK units in the Oct-Dec 2012quarter in west Kolkata ascompared to Jul-Sept 2012 quarter.
BHK Configuration Analysis
The size and configuration of an apartment are important criteria while making a propertybuying decision. The graph ‘Budget Configuration-City Level’ represents the demand and supplyof 1, 2, 3, 4 BHK apartments in the city in two consecutive quarters namely Jul-Sept 2012 and Oct-Dec 2012. It depicts how the buyer preferences have changed over the last six months andcompares the availability of these units in the two quarters. The following graph (BHKConfiguration-Demand) gives a comparison between the buyer demand for various configurationsin different zones in the two quarters. The last graph gives an account of how the availably ofthese units has changed across zones in the last six months.
BHK Configuration - City Level
100
80
60
40
20
0
9 9
52 51
36 36
3 4
(Jul-Sep 2012)
(Oct-Dec 2012)
Fig
ures
in p
erce
ntag
e(%
)
1 BHK 2BHK 3 BHK 4BHK &above
DEMAND SUPPLY
100
80
60
40
20
03 3
3941
46 46
12 10
(Jul-Sep 2012)
(Oct-Dec 2012)
Fig
ures
in p
erce
ntag
e(%
)
1 BHK 2BHK 3 BHK 4BHK &above

ANNExURES
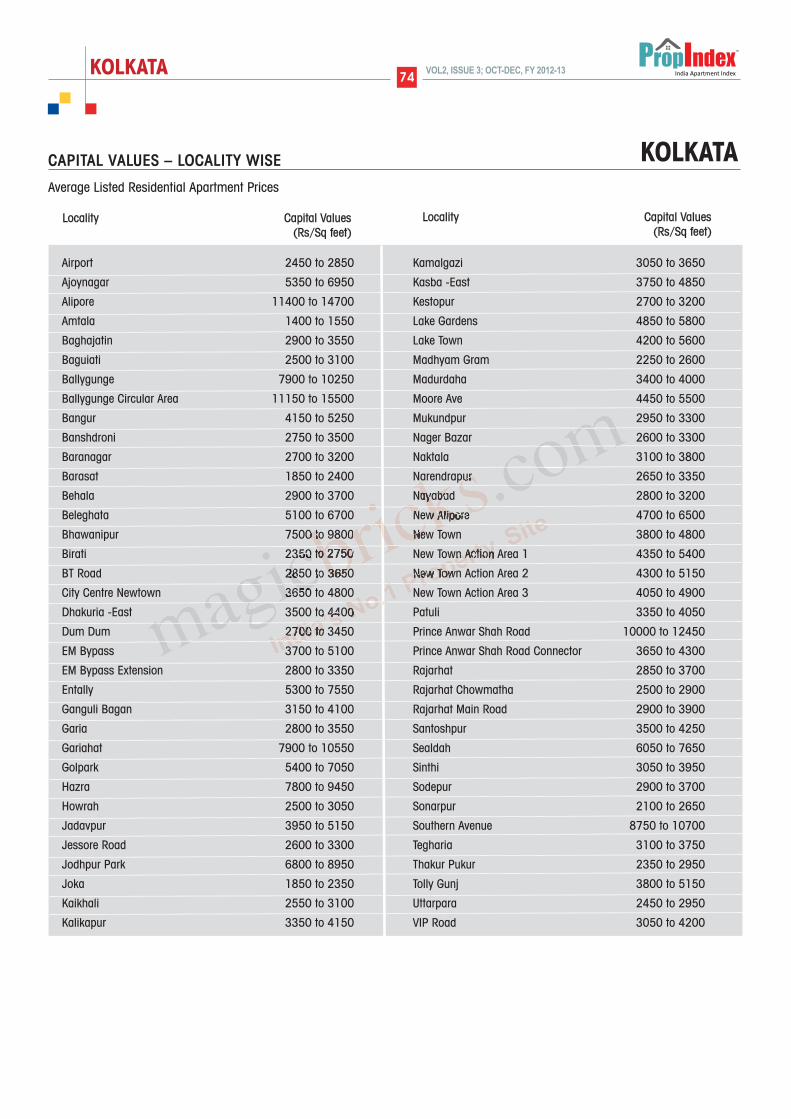
Airport 2450 to 2850
Ajoynagar 5350 to 6950
Alipore 11400 to 14700
Amtala 1400 to 1550
Baghajatin 2900 to 3550
Baguiati 2500 to 3100
Ballygunge 7900 to 10250
Ballygunge Circular Area 11150 to 15500
Bangur 4150 to 5250
Banshdroni 2750 to 3500
Baranagar 2700 to 3200
Barasat 1850 to 2400
Behala 2900 to 3700
Beleghata 5100 to 6700
Bhawanipur 7500 to 9800
Birati 2350 to 2750
BT Road 2850 to 3650
City Centre Newtown 3650 to 4800
Dhakuria -East 3500 to 4400
Dum Dum 2700 to 3450
EM Bypass 3700 to 5100
EM Bypass Extension 2800 to 3350
Entally 5300 to 7550
Ganguli Bagan 3150 to 4100
Garia 2800 to 3550
Gariahat 7900 to 10550
Golpark 5400 to 7050
Hazra 7800 to 9450
Howrah 2500 to 3050
Jadavpur 3950 to 5150
Jessore Road 2600 to 3300
Jodhpur Park 6800 to 8950
Joka 1850 to 2350
Kaikhali 2550 to 3100
Kalikapur 3350 to 4150
Kamalgazi 3050 to 3650
Kasba -East 3750 to 4850
Kestopur 2700 to 3200
Lake Gardens 4850 to 5800
Lake Town 4200 to 5600
Madhyam Gram 2250 to 2600
Madurdaha 3400 to 4000
Moore Ave 4450 to 5500
Mukundpur 2950 to 3300
Nager Bazar 2600 to 3300
Naktala 3100 to 3800
Narendrapur 2650 to 3350
Nayabad 2800 to 3200
New Alipore 4700 to 6500
New Town 3800 to 4800
New Town Action Area 1 4350 to 5400
New Town Action Area 2 4300 to 5150
New Town Action Area 3 4050 to 4900
Patuli 3350 to 4050
Prince Anwar Shah Road 10000 to 12450
Prince Anwar Shah Road Connector 3650 to 4300
Rajarhat 2850 to 3700
Rajarhat Chowmatha 2500 to 2900
Rajarhat Main Road 2900 to 3900
Santoshpur 3500 to 4250
Sealdah 6050 to 7650
Sinthi 3050 to 3950
Sodepur 2900 to 3700
Sonarpur 2100 to 2650
Southern Avenue 8750 to 10700
Tegharia 3100 to 3750
Thakur Pukur 2350 to 2950
Tolly Gunj 3800 to 5150
Uttarpara 2450 to 2950
VIP Road 3050 to 4200
KOLKATA 74VOL2, ISSUE 3; OCT-DEC, FY 2012-13
CAPITAL VALUES – LOCALITY WISE
Average Listed Residential Apartment Prices
Locality Capital Values (Rs/Sq feet)
Locality Capital Values (Rs/Sq feet)
KOLKATA


D I S C L A I M E REvery effort has been made to make this Index as complete and as accurate as possible. MagicBricksaccepts no responsibility for inaccuracies in the information/data contained in this book. It shall haveneither liability nor responsibility to any person or entity with respect to any loss or damage caused, oralleged to have been caused, directly or indirectly, by the information contained in this book. Theinformation/data in this book is subject to change from time to time due to market condition.
CONTACT US
l Post your feedback to -
propindex @timesgroup.com
l Join our discussion forum at -
openhouse.magicbricks.com
l For business enquiries -
PROPINDEX TEAM
l Content & Research: E Jayashree Kurup,
Dipti Tandon, Rishab Jain, Sruthi Kailas,
Indrani Rajkhowa Banerjee, Neha Nagpal,
Shradha Goyal, Bhawna Mongia, Namrata
Ekka, Ajay Modi, Renu Arya, Devesh Chandra
Srivastava, Puneet Kukreja & Bikash Kumar,
l Layout Design: Harsha Khattar
l Cover Page Design: Raghav Krishnan &
Rahul Nair
VOL2, ISSUE 3; OCT-DEC, FY 2012-13DELHI