
Debt Management Report 2020-21.pdf - National Treasury
76
DEBT MANAGEMENT REPORT 2020/21
-
Upload
khangminh22 -
Category
Documents
-
view
1 -
download
0
Transcript of Debt Management Report 2020-21.pdf - National Treasury

DEBT MANAGEMENT REPORT
2020/21


RP 222/2021 | ISBN: 978-0-621-49621-5Title: 2020/21 Debt Management Report
Private Bag X115, Pretoria, 0001 | 40 Church Square, Pretoria, 0002Tel: +27 12 315 5757 | Fax: +27 12 315 5126
Web: www.treasury.gov.za
DEBT MANAGEMENT REPORT
2020/21

1. FOREWORD ................................................................................................................................................ 9
2. THE SOUTH AFRICAN DEBT CAPITAL MARKET ..................................................................................11
LISTING ACTIVITY IN THE PRIMARY DEBT CAPITAL MARKET ........................................................................................................ 11
SECONDARY MARKET ACTIVITY IN SOUTH AFRICAN BONDS ..................................................................................................... 13
ELECTRONIC TRADING PLATFORM ........................................................................................................................................................ 16
3. NATIONAL GOVERNMENT’S BORROWING REQUIREMENT AND FINANCING ...............................17
BORROWING REQUIREMENT ................................................................................................................................................................... 17
DOMESTIC SHORT-TERM BORROWING ................................................................................................................................................ 18
DOMESTIC LONG-TERM BORROWING .................................................................................................................................................. 21
FOREIGN LONG-TERM BORROWING ..................................................................................................................................................... 31
INTEREST AND REDEMPTION PAYMENTS ON LONG-TERM LOANS ............................................................................................ 32
GOVERNMENT CASH BALANCES ........................................................................................................................................................... 32
4. HOLDINGS OF GOVERNMENT DEBT INSTRUMENTS .........................................................................34
HOLDINGS OF DOMESTIC MARKETABLE GOVERNMENT BONDS ............................................................................................... 34
HOLDINGS OF RETAIL SAVINGS BONDS .............................................................................................................................................. 38
5. GOVERNMENT DEBT PORTFOLIO AND RISK METRICS .....................................................................40
GOVERNMENT DEBT PORTFOLIO .......................................................................................................................................................... 40
PORTFOLIO RISK BENCHMARKS ............................................................................................................................................................. 42
PORTFOLIO RISK .......................................................................................................................................................................................... 43
GOVERNMENT MATURITY PROFILE ....................................................................................................................................................... 43
SOVEREIGN RISK ASSESSMENT ............................................................................................................................................................... 44
CONTENTS
DEBT MANAGEMENT REPORT
2020/21

CONTENTS
6. INVESTOR RELATIONS ............................................................................................................................47
INVESTOR ROADSHOWS ........................................................................................................................................................................... 47
INVESTOR RELATIONS WEBSITE .............................................................................................................................................................. 47
MARKETING AND PROMOTION OF RSA RETAIL SAVINGS BONDS .............................................................................................. 47
7. Annexures.................................................................................................................................................48
Annexure A: Redemption schedule of Treasury bills, 31 March 2021 .......................................................................48
Annexure B: Yield trends of government fixed-rate bonds, 2020/21 ........................................................................50
Annexure C: Fixed-rate bond yield spreads, 2020/21 ...................................................................................................54
Annexure D: Summary of 91-day and 182-day Treasury bill auctions, 2020/21 .....................................................56
Annexure E: Summary of 273-day and 364-day Treasury bill auctions, 2020/21 ...................................................58
Annexure F: Summary of fixed-rate bond auctions, 2020/21 .....................................................................................60
Annexure G: Summary of inflation-linked bond auctions, 2020/21 ..........................................................................65
Annexure H: Glossary .........................................................................................................................................................70
Annexure I: Acronyms .........................................................................................................................................................72
DEBT MANAGEMENT REPORT
2020/21
TABLES
Table 1: Financing of national government gross borrowing requirement, 2020/21............................................... 17
Table 2: Domestic short-term borrowing, 2020/21 ............................................................................................................... 18
Table 3: Treasury bill auction under-allotments, 2020/21 .................................................................................................. 20
Table 4: Treasury bill auction analysis, 2020/21 ...................................................................................................................... 20
Table 5: Interest rates on retail savings bonds, 2020/21 ...................................................................................................... 29
Table 6: Summary of financial cooperatives retail savings bonds, 2020/21 ................................................................. 30
Table 7: Borrowing from international finance institutions ............................................................................................... 31
Table 8: National government’s cash balances, 31 March 2020 and 31 March 2021 ................................................ 33
Table 9: US dollar flows on foreign exchange deposits, 2020/21 ..................................................................................... 33
Table 10: Total government debt, 2020/21 ................................................................................................................................. 40
Table 11: Composition of domestic debt by instrument, 2019/20-2020/21 .................................................................. 41
Table 12: Debt-service costs, 2020/21 .......................................................................................................................................... 41
Table 13: Performance of the government debt portfolio against risk benchmarks,
31 March 2020 and 31 March 2021 ............................................................................................................................. 42
Table 14: South Africa’s solicited credit ratings, 2020/21. ...................................................................................................... 45
CONTENTS
DEBT MANAGEMENT REPORT
2020/21

FIGURES
Figure 1: Primary listing of debt securities on the JSE, 31 March 2021 ............................................................................ 11
Figure 2: Composition of primary listings by instrument, 31 March 2021 ...................................................................... 12
Figure 3: Sectorial composition of primary listings of debt securities on the JSE, 31 March 2021 ........................ 13
Figure 4: South African bond market turnover, 2003-2020 .................................................................................................. 14
Figure 5: Government bond turnover ratios, 31 December 2020 ...................................................................................... 15
Figure 6: Electronic trading platform daily volumes and trades, January 2020 - December 2020 ........................ 16
Figure 7: Repo, Treasury bill and subscription rates, 2020/21 ............................................................................................. 19
Figure 8: Issuance of fixed-rate bonds (excluding non-competitive bid auctions), 2020/21 ................................... 22
Figure 9: Yield curve movement of fixed-rate bonds, 2020/21 ........................................................................................... 23
Figure 10: Primary dealer participation in fixed-rate bond auctions, 2020/21 ................................................................ 24
Figure 11: Non-competitive bond auction performance per bond, 2020/21 .................................................................. 25
Figure 12: Issuance of inflation-linked bonds, 2020/21 ........................................................................................................... 26
Figure 13: Yield curve movement of inflation-linked bonds, 2020/21 ............................................................................... 27
Figure 14: Scrip lending facility, 2020/21 ...................................................................................................................................... 28
Figure 15: Monthly retail savings bond deposits, including re-investments, 2020/21 ................................................. 29
Figure 16: Interest and redemption payments, 2020/21 ......................................................................................................... 32
Figure 17: Historical government bond holdings, 31 December 2011-31 March 2021 ............................................... 34
Figure 18: Foreign investor holdings of government bonds, 31 December 2011-31 March 2021 ........................... 35
Figure 19: Holdings of domestic fixed-rate and inflation-linked bonds, 31 March 2021 ............................................. 36
Figure 20: Holdings of domestic fixed-rate bonds by instrument, 31 March 2021 ........................................................ 37
Figure 21: Holdings of domestic inflation-linked bonds by instrument, 31 March 2021............................................. 38
Figure 22: Retail investor demographics, 31 March 2021 ........................................................................................................ 39
Figure 23: Weighted cost of funding and growth rates of total debt, 2016/17-2020/21 ............................................. 43
Figure 24: Maturity profile of government debt, 31 March 2021 ......................................................................................... 44
Figure 25: South Africa’s long-term foreign currency credit rating history, 1994-2021 ............................................... 46
CONTENTS
DEBT MANAGEMENT REPORT
2020/21


DEBT MANAGEMENT
REPORT
2020/21
9
1. FOREWORD
Director-GeneralDondo MogajaneNational Treasury
The 2020/21 financial year came to an end in a volatile environment where global investors feared the rise in United
States (US) yields underpinned by inflation expectations driven by a pickup in global growth rates and unprecedented
central bank stimulus. The Federal Reserve’s apparent lack of concern about inflation fuelled fears that the US’s interest
rates might start to rise faster and earlier than expected.
The global financial system was on the path to recovery, starting the year on a positive note following the inauguration
of President Joe Biden. Financial markets looked forward to a more stable trading environment, a rebound in commodity
prices and a global economic upturn from the impact of the COVID-19 pandemic.
On the local front, the country saw a fall in gross domestic product (GDP) of 6.9 per cent in 2020 with consensus
forecasts of a pick-up to 4.2 per cent in 2021. The first quarter of the year saw a decline of 3.3 per cent in real GDP while
unemployment rose to its highest recorded level of 33 per cent as the effects of the pandemic continued to severely
damage the fragile economy. Consumer price inflation fell to 3.1 per cent from 3.2 per cent in the fourth quarter of
2020. As a result, the Monetary Policy Committee (MPC) decided to keep the repurchase rate unchanged at 3.5 per
cent.
Rating agencies remained concerned about the state of South Africa’s finances which had been fragile before the
pandemic. In March 2021, Moody’s maintained its local and foreign currency rating at Ba2 with a negative outlook. The
key concerns were uncertainty about wage negotiations, elevated debt levels, state-owned companies (SOCs) and the
strain they place on the fiscus, rising unemployment and the slow pace of implementing reforms.

10
DEBT MANAGEMENT REPORT
2019/20
1. FOREWORD | continued
The optimism with which the 2021 calendar year started soon fizzled out and gave way to concerns which triggered a
sell-off in emerging market assets. Concerns about the slow pace of vaccination worldwide raised fears that widespread
lock-downs would return and put a damper on global growth. The emergence of a new South African strain of the
virus unnerved local investors while making foreign investors reluctant to hold long maturity paper. Foreign holders of
domestic debt fell from 30.2 per cent to 29.3 per cent at the end of the fiscal year. Domestic government bond yields
weakened by an average of 64 basis points between the beginning of January and the end of March 2021.
Despite these challenges, government was able to meet its gross borrowing requirement of R670 billion with a
net issuance of R50.7 billion raised in domestic short-term funding and R518.4 billion in domestic long-term loans.
Government adjusted its domestic bond issuance strategy by issuing short to mid-long bond maturities in order to
reduce the debt portfolio cost, average maturity and duration. An amount of US$5.6 billion was raised from multilateral
development banks rather than issuing in the international markets where conditions were unfavourable. The weighted
term-to-maturity decreased to 12.04 years in March 2021 from 12.70 years in March 2020.
Debt service costs continue to place a great strain on government cash resources, rising at an average of 13.1 per cent
per annum at the end of March 2021 and forecast to absorb 20.9 per cent of every rand that the government raises in
revenue over the medium-term.
Government is committed to ensuring debt sustainability by managing debt in a manner that minimises the impact on
the stock of debt and reduces the cost of borrowing.
Dondo Mogajane
Director-General
Date: 15 December 2021

DEBT MANAGEMENT
REPORT
2020/21
11
2. THE SOUTH AFRICAN DEBT CAPITAL MARKET
LISTING ACTIVITY IN THE PRIMARY DEBT CAPITAL MARKET
The total nominal amount outstanding for debt instruments listed on the Johannesburg Stock Exchange (JSE)
stood at R3.8 trillion as at 31 March 2021, R562.6 billion higher than the 31 March 2020 figure of R3.2 trillion. The
domestic debt capital market remains an important source of financing, especially for national government which
is the highest contributor to the total outstanding debt listed on the JSE. The COVID-19 pandemic, the deteriorating
economy, weakening public finances and lower revenue collection resulted in a R562.6 billion increase in outstanding
government debt in 2020/21. This was R261.6 billion higher than the R301 billion increase in 2019/20. SOCs reduced
R6.7 billion from their listed debt; in 2019/20 they added R4.7 billion. Driven by the banking sector, financials added
R20.3 billion to their listed debt; in 2019/20, they added R35.7 billion.
FIGURE 1: PRIMARY LISTING OF DEBT SECURITIES ON THE JSE, 31 MARCH 2021
Source: Johannesburg Stock Exchange and National Treasury
7,5%
1,5%
1,5%
1,0%
7,9%
Government
Special purpose vehicle
Other
Financials
State-owned companies
Manufacturing
Nominal primary listing by sector Net changes in nominal listing values by instrument
-50 80 210 340 470 600
Government
Financials
State-owned companies
Special purpose vehicle
Manufacturing
Other
7,9%
13,5%
74,5%
R billion

DEBT MANAGEMENT REPORT
2020/21
2. THE SOUTH AFRICAN DEBT CAPITAL MARKET | continued
12
Government’s debt contributed about 74.5 per cent of listed debt as at 31 March 2021, 4.5 per cent higher than the 70.0
per cent recorded on 31 March 2020. The next largest sectors were Financials and SOCs, with listings of 13.5 per cent
and 7.9 per cent respectively as at 31 March 2021.
The number of listed instruments has increased steadily over the past three years, with 1 885 recorded on 31 March
2021 compared with 1 734 in 2019 and 1 856 in 2020.
FIGURE 2: COMPOSITION OF PRIMARY LISTINGS BY INSTRUMENT, 31 MARCH 2021
Source: Johannesburg Stock Exchange and National Treasury
By a considerable margin, fixed-rate bonds make up the largest part of total primary listings. This is mainly because
government, the largest issuer of listed debt, mostly issues fixed-rate bonds. As at 31 March 2021, fixed-rate instruments
accounted for 70.8 per cent of total listed debt, marginally higher than the 68.8 per cent recorded on 31 March 2020.
As Figure 2 shows, at 14.4 per cent inflation-linked bonds had moved from making up the third largest to the second
largest element of total listed debt as at 31 March 2021. This is because the value of floating-rate notes (FRNs) decreased
from 16.1 per cent of the total on 31 March 2020 to 14.0 per cent on 31 March 2021.
Fixed-rate
Commercial paper
Inflation-linked
Floating-rate note
Other
Primary listing by instrument Net change in listing value by instrument
-100 100 200 300 400 5000
Fixed-rate
Inflation-linked
Floating-rate note
Commercial paper
Other
70,8%
14,4%
0,4%
0,4%
14,0%
R billion

DEBT MANAGEMENT
REPORT
2020/21
2. THE SOUTH AFRICAN DEBT CAPITAL MARKET | continued
13
FIGURE 3: SECTORIAL COMPOSITION OF PRIMARY LISTINGS OF DEBT SECURITIES ON THE JSE, 31 MARCH 2021
Source: Johannesburg Stock Exchange and National Treasury
The preference for FRN issuance outside the government and SOC sectors is apparent from Figure 3. FRNs provide a
good source of funding, while investor demand is high as the credit spread uplift in their portfolios is seen as having
the potential to generate higher returns during increasing interest rate cycles.
SECONDARY MARKET ACTIVITY IN SOUTH AFRICAN BONDS1
As Figure 4 shows, trading volumes in the secondary market decreased from R35.7 trillion as at 31 December 2019 to
R31.7 trillion on 31 December 2020, an 11.1 per cent decrease. 2020 was characterised by relatively high volatility in global
financial markets due to the COVID-19 pandemic, resulting in decreased trading activity in the secondary market.
1 Due to the availability of the source data, information provided in this section is as at 31 December 2020 and not 31 March 2021.
Amortising floating-rate note Amortising floating-rate note
Gov
ernm
ent
Fina
ncia
ls
SOCs
SPV
Man
ufac
turi
ng
Mun
icip
als
Customised instrument Customised instrument
Floating-rate note Floating-rate note Fixed-rate Fixed-rate
Commercial paper Commercial paper
Inflation-linked Inflation-linked
0
200
400
600
800
1000
1200
1400
1600
1800
2000
Serv
ices
Cons
truc
tion
Min
ing
Agr
icul
ture
0
2
4
6
8
10
12
14
16
R bi
llion
R bi
llion

DEBT MANAGEMENT REPORT
2020/21
2. THE SOUTH AFRICAN DEBT CAPITAL MARKET | continued
14
Repurchase (repo) transactions are an efficient source of money market funding, providing investors with a range of
options for investing surplus cash and helping to avoid settlement failures. As at 31 December 2020, the repo market
made up 65.6 per cent of total trading volumes in the interest rate market, a 5.9 percentage point decrease from the
71.5 per cent on 31 December 2019. Repo trades decreased by R4.7 trillion, other trades increased by R120.5 billion and
standard trades increased by R591.0 billion to R10.6 trillion, an increase of 5.9 per cent from 31 December 2019.
Repurchase (repo) marketRepos are classified as money-market instruments, normally used to raise short-term capital. For the party selling
the asset (usually fixed-income securities) and agreeing to repurchase it in the future, it is a repo; for the party on
the other end of the transaction, buying the security and agreeing to sell in the future, it is a reverse repurchase
agreement. If the seller defaults during the life of the repo, the buyer (as the new owner) can sell the asset to a
third party to offset the loss. The asset therefore acts as collateral and mitigates the credit risk that the buyer has
on the seller.
Source: International Capital Market Association
FIGURE 4: SOUTH AFRICAN BOND MARKET TURNOVER, 2003-2020
Source: Johannesburg Stock Exchange and National Treasury
0 0
55
10
1015
15
20
20
25
25
30
35
40
R tr
illio
n
Turn
over
ratio
2003
2004
2005
2006
2007
2008
2009
2010
2011
2012
2013
2014
2015
2016
2017
2018
2019
2020
Repo trades Other trades Standard trades Turnover ratio (rhs)

DEBT MANAGEMENT
REPORT
2020/21
2. THE SOUTH AFRICAN DEBT CAPITAL MARKET | continued
15
The turnover ratio is a measure of a bond’s market liquidity and is used to assess which bonds are most liquid or most
traded. The ratio shows the extent of trading in the secondary market relative to the total amount outstanding. The
larger the amount of trading activity, the higher the turnover ratio.
With a total of R31.7 trillion traded in the secondary market, government bonds made up 98.1 per cent of trading
volumes in 2020. As Figure 5 shows, the R186 (10.50%; 2025/26/27) bond had the highest turnover ratio of 73 times
followed by the R2048 (8.75%; 2047/48/49) bond with a turnover ratio of 30 times. The R186 bond, with a total issuance
of R340.8 billion as at 31 December 2020, is the most liquid bond in the government bond portfolio having traded R8.3
trillion on the exchange. R2.9 trillion was traded in the R2048 bond; the total issuance of this bond was R98.8 billion.
FIGURE 5: GOVERNMENT BOND TURNOVER RATIOS, 31 DECEMBER 2020
Source: Johannesburg Stock Exchange and National Treasury
The shorter maturity bonds, namely the R208 (6.75%; 2021) and R2023 (7.75%; 2023), have relatively higher turnover
ratios as a result of the fact that they have lower amounts outstanding than longer maturity fixed-rate bonds. A
contributing factor is that these bonds are nearing maturity and have been source bonds in government’s switch
auction programme. Among the inflation-linked bonds, the R212 (2.75%;2022) bond had the highest turnover ratio of
12 times during 2020. Overall, inflation-linked bonds have a lower turnover than fixed-rate bonds because investors,
particularly pension funds, tend to buy and hold these instruments to hedge against inflation.
0
10
20
30
40
50
60
70
80
Turn
over
ratio
R208
(202
1)
R212
(202
2)
R202
3(20
23)
R197
(202
3)
R186
(202
6)
I202
5(20
25)
R203
0(20
30)
R210
(202
8)
R213
(203
1)
R202
(203
3)
R203
2(20
32)
I202
9(20
29)
R203
5(20
35)
I203
3(20
33)
R209
(202
6)
I203
8(20
38)
R203
7(20
37)
I204
6(20
46)
R204
0(20
40)
I205
0(20
50)
R214
(204
1)
R204
4(20
44)
R204
8(20
48)
0
2
4
6
8
10
12
14
Turn
over
ratio

DEBT MANAGEMENT REPORT
2020/21
2. THE SOUTH AFRICAN DEBT CAPITAL MARKET | continued
16
ELECTRONIC TRADING PLATFORM
National Treasury, together with a multi-stakeholder group consisting of the JSE, Share Trading Transactions Totally
Electronic (STRATE), primary dealers, the South African Reserve Bank (SARB) and the Financial Sector Conduct Authority
(FSCA), with technical assistance from the World Bank, launched the electronic trading platform (ETP) for government
bonds in July 2018. The aim of the ETP is to improve liquidity, price discovery and transparency in the domestic
government bond market.
All nine primary dealers are required to quote prices on the following obligatory bonds: the R186 (10.25%; 2025/26/27),
R2030 (8.00%; 2030), R2035 (8.875%; 2035), R2040 (9.00%; 2040) and R2048 (8.75%; 2047/48/49). They are also obliged to
quote firm and executable current bid and ask prices/yields on the platform in specified amounts per maturity basket
and specified spreads. National Treasury incentivises primary dealer participation in the ETP by allocating a portion of
the non-competitive bids based on the volumes traded by each primary dealer on the platform.
FIGURE 6: ELECTRONIC TRADING PLATFORM DAILY VOLUMES AND TRADES, JANUARY 2020 - DECEMBER 2020
Source: MTS
In both 2019 and 2020, the average daily volume traded was R1.7 billion. Although the average daily volume remained
the same, the average number of trades per day decreased to 40 in 2020 from an average of 52 in 2019. As expected,
there were fewer trades in December 2020 because of the festive holidays.
0
1
2
3
4
5
6
7
Dai
ly tr
adin
g vo
lum
e (R
bill
ion)
Num
ber o
f tra
des
2003
2004
2005
2006
2007
2008
2009
2010
2011
2012
2013
2014
2015
2016
2017
2018
2019
2020
Daily trading volume Number of trades per day(rhs)
0
20
40
60
80
100
120
140

DEBT MANAGEMENT
REPORT
2020/21
17
3. NATIONAL GOVERNMENT'S BORROWING REQUIREMENT AND FINANCING
BORROWING REQUIREMENT
The 2020/21 fiscal year coincided with the global spread of COVID-19, with government’s fiscal position weakening due
to lower revenue and higher spending to finance essential health and economic measures to contain and mitigate the
effects of the pandemic.
Consequently, government’s gross borrowing requirement - the budget deficit including maturing loans - increased
significantly, from R432.7 billion initially budgeted in February 2019 to a preliminary outcome of R619.5 billion. To
finance the higher gross borrowing requirement, government adjusted its financing strategy to lower the impact on
debt and debt-service costs. This included drawing down on surplus cash balances, borrowing from international
finance institutions at lower interest rates and increasing Treasury bill issuances to reduce the impact on the domestic
bond market.
Table 1 shows the preliminary outcome of financing national government’s gross borrowing requirement. This was
financed through net issuance of domestic short-term loans of R95.3 billion, domestic long-term loans of R523.4 billion
and foreign loans of R91.9 billion. Cash and other balances increased by R91.1 billion during the year.
TABLE 1: FINANCING OF NATIONAL GOVERNMENT GROSS BORROWING REQUIREMENT, 2020/21
R MILLION BUDGET REVISED BUDGET PRELIMINARY OUTCOME
Main budget balance -367 999 -603 388 -551 858 Redemptions -64 699 -66 881 -67 639 Domestic long-term loans -52 465 -52 465 -53 223
Foreign loans -12 234 -14 416 -14 416
Borrowing requirement (gross) -432 698 -670 269 -619 497FinancingDomestic short-term loans 48 000 97 184 95 325 Treasury bills (net) 48 000 124 539 122 610
Corporation for Public Deposits – -27 355 -27 285
Domestic long-term loans 337 700 518 457 523 418
Market loans 337 700 518 500 523 376
Loans issued for switches – -43 42
Foreign loans 29 260 107 070 91 920
Market loans 29 260 107 070 91 920
Loans issued for switches – – –
Change in cash and other balances1 17 738 -52 442 -91 166 Total financing 432 698 670 269 619 497
1 A positive value indicates that cash is used to finance part of the borrowing requirementSource: National Treasury

18
3. NATIONAL GOVERNMENT'S BORROWING REQUIREMENT AND FINANCING | continued
DEBT MANAGEMENT REPORT
2020/21
DOMESTIC SHORT-TERM BORROWING
To finance the higher borrowing requirement and to compensate for revenue shortfall, in 2020/21 government issued
an additional R74.6 billion in Treasury bills above the 2020 Budget projection of R48 billion.
In 2020/21, National Treasury borrowed an average of R47.7 billion from the Corporation for Public Deposits (CPD) to
address the short-term liquidity pressures. However, as shown in Table 2, government closed the financial year with a
borrowing from the CPD of R70 million.
Government conducts weekly Treasury bill auctions. The net changes in maturities of the Treasury bills show that
issuance was concentrated in the longer-maturity bills. This assisted with managing refinancing risk as it extended
the days-to-maturity for the Treasury bill portfolio. Details of the 2020/21 weekly Treasury bill auctions, including the
allocated amount for each maturity, can be found in Annexures D and E.
TABLE 2: DOMESTIC SHORT-TERM BORROWING, 2020/21
R MILLION OPENING BALANCE
NET CHANGE
CLOSING BALANCE
Corporation for Public Deposits 27 355 -27 285 70
Treasury Bills 333 361 122 610 455 971
91-day 10 602 4 733 15 335
182-day 57 368 13 613 70 981
273-day 109 293 44 853 154 146
364-day 156 098 59 411 215 509
Total 360 716 95 325 456 041
Source: National Treasury
Treasury bill auction performance
Gross issuance of Treasury bills amounted to R644.4 billion in 2020/21. The Treasury bill weekly issuance levels were
adjusted to deal with the effects of the COVID-19 pandemic, relieve pressure from domestic long-term funding
instruments and address government’s short-term liquidity needs. Historically, Treasury bills served a greater role as
liquidity management instruments; due to higher budget deficits, they have gradually become funding instruments to
relieve pressure from long-term loans.

3. NATIONAL GOVERNMENT'S BORROWING REQUIREMENT AND FINANCING | continued
19
DEBT MANAGEMENT
REPORT
2020/21
Treasury bill issuance increased by a net amount of R98 billion to R146 billion at the time of the supplementary budget;
the net increase for 2020/21 was R122.6 billion. Movement in Treasury bill rates are to a great extent reflective of the
policy stance on short-term interest rates/repo rate. Between April and August 2020, the SARB adjusted the repo rate
downward by 175 basis points. The average Treasury bill rate declined by 203 basis points in the same period.
Although the repo rate has been unchanged since September 2020, as Figure 7 shows there was a clear upward trend
in the average Treasury bill rate (37 basis points) because of increased supply at the weekly auctions.
FIGURE 7: REPO, TREASURY BILL AND SUBSCRIPTION RATES, 2020/21
Source: National Treasury
Due to market volatility, R23.4 billion or approximately 3.6 per cent of the total gross issuance was not allotted. This is
shown in Table 3.
0 3.01
3.52
4.03
4.54
5.0
5
5.5
6
5.09
7
6.510
8
11
Subs
ctip
tion
rate
Per c
ent
3 A
pr
2020
18 D
ec 2
020
3 Ju
l 202
0
19 M
ar 2
021
2 O
ct 2
020
9 A
pr
2020
24 D
ec 2
020
10 J
ul 2
020
26 M
ar 2
021
9 O
ct 2
020
17 A
pr
2020
31 D
ec 2
020
17 J
ul 2
020
16 O
ct 2
020
24 A
pr
2020
8 Ja
n 2
021
24 J
ul 2
020
23 O
ct 2
020
30 A
pr
2020
15 J
an 2
021
31 J
ul 2
020
30 O
ct 2
020
8 M
ay 2
020
22 J
an 2
021
7 A
ug
202
0
6 N
ov
2020
15 M
ay 2
020
29 J
an 2
021
14 A
ug
202
0
13 N
ov
2020
22 M
ay 2
020
5 Fe
b 2
021
21 A
ug
202
0
20 N
ov
2020
29 M
ay 2
020
12 F
eb 2
021
28 A
ug
202
0
27 N
ov
2020
5 Ju
n 2
020
19 F
eb 2
021
4 Se
p 2
020
4 D
ec 2
020
12 J
un
202
0
26 F
eb 2
021
11 S
ep 2
020
11 D
ec 2
020
19 J
un
202
0
5 M
ar 2
021
18 S
ep 2
020
26 J
un
202
0
12 M
ar 2
021
25 S
ep 2
020
91-day 273-day Average TB yield (rhs)182-day 364-day Repo rate (rhs)

20
3. NATIONAL GOVERNMENT'S BORROWING REQUIREMENT AND FINANCING | continued
DEBT MANAGEMENT REPORT
2020/21
TABLE 3: TREASURY BILL AUCTION UNDER-ALLOTMENTS, 2020/21
R MILLION GROSS ISSUANCE¹
UNDER- ALLOTMENT
PERCENTAGE OF GROSS ISSUANCE
UNDERALLOTED
91-day 70 541 -2 359 -3,3
182-day 153 328 -6 507 -4,2
273-day 201 520 -6 550 -3,3
364-day 219 054 -7 977 -3,6
Total 644 443 -23 393 -3,6
1 Gross issuance takes into account the total amount of issuance rolled-over to the Treasury bill portfolio from 2019/20Source: National Treasury
Table 4 gives a summary of the auction bid-to-cover ratios and effective yields. Government can increase or reduce the
amount on offer in line with its funding requirements and market conditions. On average, Treasury bill auctions were
2.2 times over-subscribed, with market appetite reasonable across the Treasury bill curve. All Treasury bill maturities
were under-subscribed in a number of weekly auctions; the 182-day maturity had the lowest subscription of 0.3 times
in a single auction during the financial year.
TABLE 4: TREASURY BILL AUCTION ANALYSIS, 2020/21
91-DAY 182-DAY 273-DAY 364-DAY
Bid-to-cover-ratios (times)
Highest 10,0 6,3 4,2 4,5
Lowest 0,4 0,3 0,5 0,4
Average 2,2 2,1 2,1 2,2
Effective yields (%)
Highest 5,9 6,3 6,2 6,3
Lowest 3,4 3,6 3,7 3,7
Average 3,7 4,2 4,4 4,4
Source: National Treasury
Corporation for Public Deposits
The CPD is a wholly-owned subsidiary of the SARB. Its main function is to invest surplus cash received from provincial
governments and SOCs. Provincial governments and selected SOCs are required to invest their surplus cash with the
CPD. Government uses these funds to finance a portion of its borrowing requirement and for bridging finance. To finance
short-term cash shortfalls, provincial governments may borrow from the CPD for amounts up to pre-determined limits.

3. NATIONAL GOVERNMENT'S BORROWING REQUIREMENT AND FINANCING | continued
21
DEBT MANAGEMENT
REPORT
2020/21
In 2020/21, the average daily balance invested in the CPD was R81.0 billion. Government borrowed a daily average of
R47.7 billion or R4.9 billion more than the daily average of R42.8 billion borrowed in 2019/20.
DOMESTIC LONG-TERM BORROWING
Domestic long-term borrowing consists of the issuance of fixed-rate, inflation-linked and retail savings bonds. Fixed-
rate and inflation-linked bond auctions are conducted weekly in line with a pre-determined auction calendar. The
fixed-rate bond auctions are conducted through a panel of primary dealers. Inflation-linked bond auctions are open
to all members of the JSE. Retail savings bonds are available to South African citizens through the South African Post
Office (SAPO) and the RSA Retail Savings Bond website. In 2020/21, a total nominal amount of R560.8 billion was issued
in domestic long-term bonds.
Fixed-rate bonds
During the 2020/21 financial year, a total nominal amount of R480.8 billion was issued in fixed-rate bonds. Of this
amount, R305.4 billion was issued in the 49 weekly competitive bond auctions while the remaining R175.4 was raised
through non-competitive auctions. To cover the expected budget deficit resulting from the COVID-19 pandemic, the
weekly bond auctions were increased by R1.57 billion and R500 million in May and July 2020 respectively. This brought
the weekly fixed-rate bond auction levels to R6.6 billion for the remainder of the 2020/21 financial year. The non-
competitive auctions were increased from 50 per cent to 100 per cent of the weekly fixed-rate bond auctions.
Due to the volatility caused by the pandemic, the issuance was mostly concentrated at the short-end of the curve; with
69.4 per cent of the issuance between the 2-year and 14-year maturities. Due to the low cash prices on the R209 (6.25%;
2036) and R214 (6.5%; 2041), these bonds were not issued in 2020/21. Due to its scarcity in the secondary market, the
R213 (7.00; 2031) was repriced by investors; as a result, the bond was issued only twice during the year.
The R186 (10.50%; 2025/26/27) bond was the highest issued bond for the year followed by the R2030 (8.00%; 2030),
with R63.1 billion and R61.8 billion respectively. National Treasury had decided to stop issuing the R2023 (7.75%; 2023)
bond as it was maturing in 2023; this was therefore the least issued bond. The average bid-to-cover ratio for 2020/21
was 2.82 times.

22
3. NATIONAL GOVERNMENT'S BORROWING REQUIREMENT AND FINANCING | continued
DEBT MANAGEMENT REPORT
2020/21
FIGURE 8: ISSUANCE OF FIXED-RATE BONDS (EXCLUDING NON-COMPETITIVE BID AUCTIONS), 2020/21
Source: National Treasury
Yields curve movement
At the beginning of 2020/21, there was considerable volatility in the markets because of the COVID-19 pandemic.
South Africa’s situation was exacerbated by negative sovereign ratings from the credit rating agencies. As a result,
investor appetite for rand denominated equities and bonds was weaker than in prior years.
Following the US election results and developments in the manufacturing of COVID-19 vaccines, bond yields began
to recover. On average across all fixed rate bonds, the curve strengthened by 102 basis points from April 2020 to
March 2021.
Bid-
to-c
over
ratio
0
10
20
30
40
50
60
70
R bi
llion
R2023(2yr)
R186(5yr)
R2030(9yr)
R213(10yr)
R2032(11yr)
R2035(14yr)
R2037(16yr)
R2040(19yr)
R2044(23yr)
R2048(27yr)
Amount Bid-to-cover ratio (rhs)
0
1
2
3
4
5
6
5,05
3,20 3,16
1,80
2,82
2,231,95
2,57 2,67 2,71
Bonds

3. NATIONAL GOVERNMENT'S BORROWING REQUIREMENT AND FINANCING | continued
23
DEBT MANAGEMENT
REPORT
2020/21
!%"'
FIGURE 9: YIELD CURVE MOVEMENT OF FIXED-RATE BONDS, 2020/21
Source: Johannesburg Stock Exchange and National Treasury
Primary dealersThe primary dealer panel is a panel of banks that buy government bonds at weekly fixed-rate bond auctions.
Investors buy government bonds by submitting their bids at the auction through primary dealers. These dealers
are obliged to adhere to certain terms and conditions which can be found on National Treasury’s Investor Relations
website www.investor.treasury.gov.za. Below are the banks that are on National Treasury’s primary dealer panel:
• ABSA Group Limited
• Citibank
• Deutsche Bank
• FirstRand Bank Limited
• HSBC Bank
• Investec Bank Limited
• JPMorgan Chase Bank
• Nedbank Limited
• Standard Bank
3456789
101112
Per c
ent
Basi
s po
ints
5 10 15 20 25 30
Change in bps, 1 Apr 20 - 31 Mar 21 (rhs) 31-Mar-21 01-Apr-20
Years
-300
-200
-100
0
100
R208
R202
3
R186
R203
0
R213
R203
2
R203
5
R209
R203
7
R204
0R2
14
R204
4
R204
8

24
3. NATIONAL GOVERNMENT'S BORROWING REQUIREMENT AND FINANCING | continued
DEBT MANAGEMENT REPORT
2020/21
Primary dealer performance
Government’s primary dealer panel is made up of nine international and domestic banks. These primary dealers are
required to distribute government bonds, make markets and provide liquidity in the secondary market. The performance
of the nine primary dealers is shown in Figure 10. The top two primary dealers took up 41.7 per cent of the amount in
the auctions conducted during the year.
FIGURE 10: PRIMARY DEALER PARTICIPATION IN FIXED-RATE BOND AUCTIONS, 2020/21
Source: National Treasury
Non-competitive bid auction performance
Non-competitive bid auctionsPrimary dealers are entitled to take-up an additional 50 per cent of the successful allocation amount at the same
yield at which the fixed-rate competitive auction settled. The non-competitive auction window is open for 48
hours immediately after the auction. The 50 per cent is split between ETP and primary auctions, at 30 percentage
points and 20 percentage points respectively. To cover the expected budget deficit, the non-competitive bid
auction allocations were increased from 50 per cent to 100 per cent from April 2020 to March 2021.
0
5
10
15
20
25
30
Per c
ent
PD1 PD2 PD3 PD4 PD5 PD6 PD7 PD8 PD9
Primary Dealers (PD)

3. NATIONAL GOVERNMENT'S BORROWING REQUIREMENT AND FINANCING | continued
25
DEBT MANAGEMENT
REPORT
2020/21
A total amount of R175.4 billion was raised through the issuance of the fixed-rate bond non-competitive auctions.
The R2030 (8.00%; 2030) and R186 (10.50%; 2025/26/27) bonds were the most demanded bonds in the 2020/21 year,
accounting for 37.2 per cent of the total non-competitive take-up by the primary dealers. The bond with the third
greatest demand was the R2032 (8.25%; 2032), with a take-up of 14.0 per cent. Due to limited issuance in the R2023
(7.75%2023) and R213 (7.00%;2031) in the fixed-rate bond auctions, these two bonds had the lowest non-competitive
take-up.
FIGURE 11: NON-COMPETITIVE BOND AUCTION PERFORMANCE PER BOND, 2020/21
Source: National Treasury
Inflation-linked bondsA total nominal amount of R80.0 billion was issued in the 48 inflation-linked bond auctions conducted during 2020/21,
with an average bid-to-cover ratio of 2.3. The inflation-linked bond auction levels were increased by R360 million and
R600 million in May and July respectively. With a total nominal amount of R17.0 billion, the I2046 (2.50%; 2046) bond
was the most issued bond followed by the I2038 (2.25%; 2038) with a total issuance of R16.8 billion.
To mitigate cash pressures at the beginning of the financial year, the R212 (2.75%; 2022) bond was issued twice in April
2020 due to the comparatively high price of the bond. It was only issued twice due to the refinancing risk and the fact
that the bond is maturing in 2022. The R212 bond, with a total nominal amount of R1.4 billion, was the least issued bond.
0
5
10
15
20
25
30
35
R bi
llion
R2023(2yr)
R186(5yr)
R2030(9yr)
R213(10yr)
R2032(11yr)
R2035(14yr)
R2037(16yr)
R2048 (27yr)
R2040(19yr)
R2044(23yr)
Bonds

26
3. NATIONAL GOVERNMENT'S BORROWING REQUIREMENT AND FINANCING | continued
DEBT MANAGEMENT REPORT
2020/21
At 3.29, the R212 bond had the highest bid-to-cover ratio followed by the I2050 (2.50%; 2050) at 2.74. The I2033 (1.875%;
2033) bond had the lowest, at 1.74.
FIGURE 12: ISSUANCE OF INFLATION-LINKED BONDS, 2020/21
Source: National Treasury
Real yields movement
Similarly to the fixed-rate bond yield curve, the inflation-linked bond curve weakened in the beginning of the year. It
strengthened in the later part of the year, moving in tandem with the fixed-rate bonds. Between April 2020 and March
2021, the curve strengthened by an average of 130 basis points.
2
4
6
8
10
12
14
16
18
R bi
llion
Bid-
to-c
over
ratio
R212 (1yr)
I2025(4yr)
I2029(8yr)
I2033(12yr)
I2038(17yr)
I2046(25yr)
I2050(29yr)
Amount Bid-to-cover (rhs)
0
1
2
3
4
3,29
2,07
2,55
1,741,89
2,07
2,74
Bonds

3. NATIONAL GOVERNMENT'S BORROWING REQUIREMENT AND FINANCING | continued
27
DEBT MANAGEMENT
REPORT
2020/21
FIGURE 13: YIELD CURVE MOVEMENT OF INFLATION-LINKED BONDS, 2020/21
Source: Johannesburg Stock Exchange and National Treasury
Scrip lending facility
As a lender of last resort, National Treasury is obliged to support the market for government bonds by acting to avoid
settlement failures and subsequent systemic risk. The facility is available to the ETP, over-the-counter and interest rate
and currency derivative market transactions. The scrip lending facility is available strictly to primary dealers. Other
market participants can only access the facility through the JSE. It is used only if other avenues of obtaining the scrip
have been exhausted.
There was a slight decrease in demand for the facility during 2020/2021 compared to the previous financial year. A
nominal amount of R3.7 billion was taken; this was 17 per cent lower than the R4.5 billion take-up in 2019/20. Figure
14 shows the breakdown of the utilisation of the scrip lending facility per bond. In terms of the nominal value of scrip
lending, 51.4 per cent of the demand was for the R186 (10.50%; 2025/26/27) bond followed by the inflation-linked
bond R210 with 13.5 per cent of the take-up.
0
2
4
6
Per c
ent
Basi
s po
ints
5 10
-130
-50
15
-195
-67
20
-160
25
-235
30
-78
Change in bps, 1 Apr 20 - 31 Mar 21 (rhs) 01-Apr-20 31-Mar-21
Years
-10
R212
R197
I202
5
R210
I202
9
R202
I203
8
I204
6
I205
0
-186
-71

28
3. NATIONAL GOVERNMENT'S BORROWING REQUIREMENT AND FINANCING | continued
DEBT MANAGEMENT REPORT
2020/21
FIGURE 14: SCRIP LENDING FACILITY, 2020/21
Source: National Treasury
Bond switch auction programme
Government’s bond switch auction programme has been successful in managing government’s refinancing risk amid
protracted weak economic growth. Since the start of the programme in February 2015, a total of R253.8 billion has
been switched out of the R203 (8.25%; 2017), R204 (8.00%; 2018), R207 (7.25%; 2020), R208 (6.75%; 2021) and R2023
(7.75%; 2023) bonds.
The bond switch programme was reviewed and reintroduced in 2020/21. The revised programme aims to provide
transparency and reduce speculation around the switch auctions. Part of the revised programme included uploading
the switch auction calendar and terms and conditions onto National Treasury’s Investor Relations website.
Two switch auctions were conducted in 2020/21, with R6.8 billion switched out of the R2023 bond.
Retail savings bonds
The objective of retail savings bonds is to diversify government’s long-term funding sources and promote a household
savings culture. The total outstanding amount as at 31 March 2021 was R8.6 billion. As a result of higher interest rates in
Nominal Cash
0
500
1000
1500
2000
2500
R m
illio
n
R186(5yr)
R210(7yr)
I2029(8yr)
R213(10yr)
R2035(14yr)
R209(15yr)
R2040(19yr)
R2048(27yr)
R214(20yr)
R2044(23yr)
1944
2237
365 323
28 18 50 40
331 21790 74 50 40
510
1006
160 171250 212

3. NATIONAL GOVERNMENT'S BORROWING REQUIREMENT AND FINANCING | continued
29
DEBT MANAGEMENT
REPORT
2020/21
April and May 2020 and the revised promotions strategy that included digital and social media presence, retail savings
bonds managed to exceed the target of R2.5 billion by R2.1 billion as at 31 March 2021.
In addition to the conventional retail savings bonds, R2.1 billion was received in the Government Employees Housing
Scheme’s Internal Linked Savings Facility (GEHS: ILSF) on 31 March 2021.
FIGURE 15: MONTHLY RETAIL SAVINGS BOND DEPOSITS, INCLUDING RE-INVESTMENTS, 2020/21
Source: National Treasury
Table 5 shows the retail savings bond interest rates for 2020/21. The rates are published on the retail savings bonds
website (www.rsaretailbonds.gov.za).
TABLE 5: INTEREST RATES ON RETAIL SAVINGS BONDS, 2020/21
DATE 1-YEAR 2-YEAR 3-YEAR 5-YEAR 10-YEARFixed-rate30-Apr-20 7,75% 9,00% 11,50%31-Mar-21 6,00% 6,75% 8,00%Inflation-linked30-Apr-20 3,50% 3,75% 3,75%31-Mar-21 2,50% 3,75% 4,75%Financial Cooperatives30-Apr-20 6,25% 7,75% 9,00%31-Mar-21 4,49% 6,00% 6,75%
Source: National Treasury
0
500
1000
1500
2000
2500
3000
R m
illio
n
Apr-20 May-20 Jun-20 Jul-20 Aug-20 Sep-20 Oct-20 Jan-21 Mar-21Nov-20 Dec-20 Feb-21
Months

30
3. NATIONAL GOVERNMENT'S BORROWING REQUIREMENT AND FINANCING | continued
DEBT MANAGEMENT REPORT
2020/21
Financial co-operative retail savings bonds National Treasury launched the financial co-operatives retail savings bonds in October 2011 to provide a secure
savings instrument that co-operative financial institutions (CFIs) and co-operative banks can invest in. The bonds offer
competitive interest rates, calculated bi-annually. Additional features take into account the uniqueness of the CFI
model. Through top-ups, the model allows for preservation of capital and early withdrawals with no fees and charges
or penalties levied. The CFIs that continue to save in retail savings bonds have accumulated notable interest on their
capital amounts. The Co-operatives Bank Development Agency encourages CFIs to invest in this investment vehicle as
it is risk-free and provides guaranteed financial growth.
Table 6 shows that, as at 31 March 2021, R13.8 million was invested in financial co-operatives retail savings bonds
through 39 investments.
TABLE 6: SUMMARY OF FINANCIAL COOPERATIVES RETAIL SAVINGS BONDS, 2020/21
BOND AVERAGE RATE CAPITAL INVESTMENTS
FC01 4,89% 762 754,42 2
FC02 6,20% 2 084 273,29 15
FC03 7,48% 10 973 301,64 22
Source: National Treasury
Interest rates on fixed-rate, inflation-linked and financial co-operative retail savings bonds are derived from the
respective government bond and Treasury bill yields. The interest rates for the fixed-rate and financial co-operatives
retail savings bonds are reviewed monthly and those for the inflation-linked retail savings bonds semi-annually. During
the year, fixed-rate retail savings bonds rates declined by 175, 225 and 350 basis points for the 2-year, 3-year and 5-year
terms respectively. In the case of inflation-linked retail savings bonds, the 2-year term decreased by 100 basis points,
there was no net movement for the 3-year and the 5-year increased by 100 basis points.
FOREIGN LONG-TERM BORROWING
Government issues debt in global capital markets to meet its foreign-currency commitments, set benchmarks
and diversify funding sources. Due to the unfavourable market conditions resulting from the COVID-19 pandemic,
government did not tap the international capital markets in 2020/21. The Supplementary Budget tabled on 24 June
2020 announced that government would source US$7 billion in funding from multilateral development banks and
the International Monetary Fund (IMF) to finance the budget deficit resulting from the impact of COVID-19. As at 31
March, approximately $5.6 billion had been made available. Of this, $4.6 billion had been converted to rand to partially

3. NATIONAL GOVERNMENT'S BORROWING REQUIREMENT AND FINANCING | continued
31
DEBT MANAGEMENT
REPORT
2020/21
fund domestic currency commitments. As table 7 shows, the following amounts were received from the multilateral
development banks and the IMF:
• IMF: a US$4.28 billion loan under the IMF’s Rapid Response Facility was approved and disbursed in July 2020.
• New Development Bank (NDB): a US$1 billion loan under the NDB’s COVID-19 Emergency Program to fund
government’s health and social response was approved and disbursed in July 2020.
• African Development Bank (AfDB): in July 2020, the AfDB Board approved a R5.08 billion (US$288 million equivalent)
loan under the COVID-19 Response Support Programme. The loan disbursement took place in October 2020.
TABLE 7: BORROWING FROM INTERNATIONAL FINANCE INSTITUTIONS
INSTITUTIONS DISBURSEMENT DATE INTEREST RATE TERMS
(YEARS)
GRACE PERIOD1 (YEARS)
AMOUNT BILLIONS
New Development Bank 20 July 2020 6-month LIBOR2 plus 1.25% 30 5 US$1.0
International Monetary Fund 29 July 2020 1,066% 5 3 US$4.3
African Development Bank 15 October 2020 3-month JIBAR3 plus 0.8% 20 5 R5.04
1. A period after the disbursement where no capital repayments are required 2. LIBOR (London Interbank Offered Rate) 3. JIBAR (Johannesburg Interbank Average Rate) 4. The US dollar equivalent is US$0.29 billion
Source: National Treasury
INTEREST AND REDEMPTION PAYMENTS ON LONG-TERM LOANS
Figure 16 shows the composition of government’s interest and redemption payments for 2020/21. The payments are
split between domestic and foreign long-term loans and retail savings bonds.
Interest payments and redemptions for domestic and foreign debt amounted to R388.0 billion. Interest and redemptions
payments amounted to R315.9 billion and R72.1 billion respectively. The R208 fixed-rate bond redeemed in March
2021 with an outstanding amount of R49.0 billion. Monetary authorities followed by the foreign sector had the largest
percentage holdings of the bond.

32
3. NATIONAL GOVERNMENT'S BORROWING REQUIREMENT AND FINANCING | continued
DEBT MANAGEMENT REPORT
2020/21
FIGURE 16: INTEREST AND REDEMPTION PAYMENTS, 2020/21
Source: National Treasury
GOVERNMENT CASH BALANCES
Government’s primary objective in managing cash is to ensure that it has enough cash to meet its financial commitments
as they come due. As part of effective cash management, government aims to ensure that its financial obligations are
met and that weekly borrowings are predictable and stable.
Government’s total cash balances include deposits held by commercial banks and the SARB. Cash deposits with
the SARB include rand deposits in the sterilisation account and foreign currency deposits in the foreign currency
accumulation account.
Sterilisation deposits consist of excess cash deposits made with the SARB to counter the effects of increased money
supply as a result of accumulation of foreign currency reserves. These funds were usually used on an intra-month basis
for liquidity management. However, because of the increase in gross borrowing requirement a total of R26 billion was
utilised from National Treasury’s rand deposits in 2020/21. This reduced the balance to R41 billion.
Foreign currency deposits consist of funds borrowed in the international capital markets and/or from multilateral
institutions and are used to meet government’s foreign currency commitments. A total of US$5.6 billion was received
from multilateral institutions in 2020/21. The borrowings were conducted in line with government’s strategy to lower
the cost of funding. US$4.6 billion (R77.4 billion) of the foreign loan proceeds were converted to rands to cover local
currency denominated expenditure. Conversion of the funds was conducted in close collaboration with the SARB to
ensure that there was no adverse impact on the money market liquidity operation.
Domestic long-term bonds
Foreign long-term bonds
Retail savings bonds
88,5%
10,8%
0,8%

3. NATIONAL GOVERNMENT'S BORROWING REQUIREMENT AND FINANCING | continued
33
DEBT MANAGEMENT
REPORT
2020/21
Table 8 shows government’s cash balances at 31 March 2020 and 31 March 2021. During 2020/21, these balances
increased by R69.5 billion to R333.1 billion. The increases were largely due to higher than projected tax collections.
TABLE 8: NATIONAL GOVERNMENT’S CASH BALANCES, 31 MARCH 2020 AND 31 MARCH 2021
R BILLION MAR-20 MAR-21
Reserve bank 219,1 134,5
Sterilisation deposits 67,2 41,2
Foreign currency deposits 151,9 93,3
Commercial banks 44,5 198,6
Tax and loan accounts 44,5 198,6
Total 263,6 333,1
Source: National Treasury
Table 9 shows total foreign currency commitments of US$7.6 billion in 2020/21.This consisted of redemptions of foreign
loans amounting to US$824 million and interest on loans and departmental payments amounting to US$6.7 billion.
These commitments were financed by proceeds from the foreign currency loans.
TABLE 9: US DOLLAR FLOWS ON FOREIGN EXCHANGE DEPOSITS, 2020/21
US$ MILLION BUDGET REVISED BUDGET
PRELIMINARY OUTCOME
Opening balance 8 727 8 489 8 489
Inflows 5 422 6 704 5 405
Foreign loan 5 000 6 570 5 282
Purchases - - -
Interest 422 134 123
Outflows -5 660 -7 573 -7 573
Interest on debt portfolio -1 173 -1 154 -1 160
Loan redemptions -3 427 -824 -824
Payments by departments -1 060 -5 595 -5 589
Closing balance 8 489 7 620 6 321
Source: National Treasury

34
DEBT MANAGEMENT REPORT
2020/21
HOLDINGS OF DOMESTIC MARKETABLE GOVERNMENT BONDS
South African government bonds are mainly supported by foreign investors, pension funds, monetary institutions and
other financial institutions with a combined aggregate holding of about 91.6 per cent of outstanding government
bonds. As a result of low interest rates in developed countries, at 29.3 per cent as at 31 March 2021 foreign investors
were the largest holders of government bonds followed by monetary institutions and pension funds with 22.7 per cent
and 22.6 per cent respectively.
FIGURE 17: HISTORICAL GOVERNMENT BOND HOLDINGS, 31 DECEMBER 2011-31 MARCH 2021
Source: STRATE and National Treasury
Holdings by foreign investors ended the 2020/21 financial year at 29.3 per cent of South African government bonds,
after falling to a 9-year low of 29 per cent in October 2020. This decrease in domestic government bond holdings by
the foreign sector was offset by an increase by monetary institutions, as Figure 17 shows.
0
10,0
20,0
30,0
40,0
50,0
80,0
60,0
90,0
70,0
100,0
Per c
ent
33,3
28,6
7,5
16,9
11,6
29,8
35,9
5,8
17,0
9,4
29,2
36,4
8,2
14,6
8,6
31,7
36,1
8,7
14,7
8,2
30,6
32,4
10,3
17,6
8,3
28,3
36,0
10,3
17,8
7,2
26,6
41,4
9,9
15,0
6,7
22,4
29,9
17,6
22
7
22,6
29,3
17
22,7
7,3
25,8
37,7
13,6
16,1
6,4
24,9
37,1
14,7
16,7
6,1
Pension funds Monetary institutions InsurersForeign sector
Other financial institutions Other
2011 2012 2013 2014 2015 2016 2017 20202018 2019 MAR21
4. HOLDINGS OF GOVERNMENT DEBT INSTRUMENTS
Year

4. HOLDINGS OF GOVERNMENT DEBT INSTRUMENTS | continued
35
DEBT MANAGEMENT
REPORT
2020/21
Following extensive liquidity stimulus by developed economy central banks, emerging market portfolio inflows
rebounded steadily in the latter part of 2020/21 as investors searched for higher yield and risk-on sentiment amid
hopes for a fast economic return to normal in 2021. In nominal terms, foreign investor holdings of government bonds
increased by R78 billion between March 2020 and March 2021.
FIGURE 18: FOREIGN INVESTOR HOLDINGS OF GOVERNMENT BONDS, 31 DECEMBER 2011-31 MARCH 2021
Source: STRATE and National Treasury
Figure 19 shows the holdings of fixed-rate and inflation-linked bonds by investor type as at 31 March 2021. Foreign
investors held 34.9 per cent of fixed-rate bonds, a decline from 40.6 per cent in March 2020. Monetary authorities
increased their holdings from 19.3 per cent to 23.7 per cent. Official pension funds reduced their holdings of inflation-
linked bonds to 46.5 per cent from 50.7 per cent in March 2020. Monetary authorities’ inflation-linked bond portfolio
holdings changed marginally, from 17.6 per cent of the portfolio in March 2020 to 17.5 per cent as at 31 March 2021. The
percentage held by foreign investors remained relatively low at 2.2 per cent, up from 1.8 per cent in the previous year.
0
100
200
300
400
500
700
600
800
900
R bi
llion
2011
223.7
2012
337.6
2013
401.7
2014
448.9
2015
451.3
2016
557.6
2017
602.4
2020
800.4
2018
712.9
2019
808.2
MAR21
820.8
Years

36
4. HOLDINGS OF GOVERNMENT DEBT INSTRUMENTS | continued
DEBT MANAGEMENT REPORT
2020/21
FIGURE 19: HOLDINGS OF DOMESTIC FIXED-RATE AND INFLATION-LINKED BONDS, 31 MARCH 2021
Source: STRATE and National Treasury
Figure 20 shows holdings of domestic fixed-rate bonds by instrument as at 31 March 2021, with the foreign sector
holding the largest amount across all maturities. Foreign investors’ holdings of the R208 (6.75%; 2021) bond decreased
from 37.5 per cent in March 2020 to 9.8 per cent in March 2021 as the bond approached maturity. Given the short
maturity of the R208 bond, monetary authorities, for whom the bond formed part of their liquid assets, had become
the largest bondholder with 75.3 per cent.
Fixed-rate bonds holdings
Foreign sector
Short-term insurers
Other financial institutions
Monetary authorities
Long-term insurers
Official pension funds
Other sector
Private self-administered funds
Foreign sector
Short-term insurers
Other financial institutions
Monetary authorities
Long-term insurers
Official pension funds
Other sector
Private self-administered funds
Inflation-linked bonds holdings
35%
24%
7%
13% 17%
6%
46%
14%
12%
18%
3%
1%
1% 1% 2%
2%

4. HOLDINGS OF GOVERNMENT DEBT INSTRUMENTS | continued
37
DEBT MANAGEMENT
REPORT
2020/21
FIGURE 20: HOLDINGS OF DOMESTIC FIXED-RATE BONDS BY INSTRUMENT, 31 MARCH 2021
Source: STRATE and National Treasury
As at 31 March 2021, official pension funds held the largest percentages of instruments across all maturities of inflation-
linked bonds. Monetary authorities held marked percentages in shorter and longer maturities.
0
10
20
30
40
80
50
90
60
100
70
R208(2021)
R2023(2023)
R186(2026)
R2030(2030)
R213(2031)
R2032(2032)
R2035(2035)
R214 (2041)
R2040(2040)
R209(2036)
R2044 (2044)
R2037(2037)
R2048 (2048)
Foreign sector Short-term insurers
Other financial institutions
Monetary authorities Long-term insurers
Official pension funds
Other sector CSDP reporting error
Private self-administered funds
Per c
ent
Bonds

38
4. HOLDINGS OF GOVERNMENT DEBT INSTRUMENTS | continued
DEBT MANAGEMENT REPORT
2020/21
FIGURE 21: HOLDINGS OF DOMESTIC INFLATION-LINKED BONDS BY INSTRUMENT, 31 MARCH 2021
Source: STRATE and National Treasury
HOLDINGS OF RETAIL SAVINGS BONDS
The majority of investors in retail savings bonds are aged 50 years and older and make up over 69 per cent of the
number of active investors. This may be attributed to older investors saving for retirement and therefore benefiting
from the monthly payments
0
10
20
30
40
80
50
90
60
100
70
R208(2021)
R2023(2023)
R186(2026)
R2030(2030)
R213(2031)
R2032(2032)
R2035(2035)
R214(2041)
R2040(2040)
R209(2036)
R2044(2044)
R2037(2037)
R2048(2048)
Foreign sector Long-term insurers
Official pension funds
Monetary authorities
Private self-administered funds
Other financial institutions Other sector CSDP reporting error
Short-term insurers
Bonds
Per c
ent

4. HOLDINGS OF GOVERNMENT DEBT INSTRUMENTS | continued
39
DEBT MANAGEMENT
REPORT
2020/21
FIGURE 22: RETAIL INVESTOR DEMOGRAPHICS, 31 MARCH 2021
Source: National Treasury
Age
2
4
6
8
10
12
14
16
18
R m
illio
n
Thou
sand
s of
inve
stor
s
0 - 19 20 - 29 30 - 39 40 - 49 50 - 59 60 - 69 70+
Amount invested Male (rhs) Female (rhs)
0
1
2
3
4

40
DEBT MANAGEMENT REPORT
2020/21
GOVERNMENT DEBT PORTFOLIO
Government’s debt is influenced by the budget balance and by market variables including prevailing interest rates, the
exchange rate and the inflation rate. Government debt is presented on a gross and net basis. Table 10 shows that, in
2020/21, net loan debt (debt less cash balances) was R3.6 trillion or 72.4 per cent of GDP. The ratio of net foreign debt
to total net loan debt was 8.3 per cent in the same period.
TABLE 10: TOTAL GOVERNMENT DEBT, 2020/21
R BILLION BUDGET REVISED BUDGET
PRELIMINARY OUTCOME
Domestic debt
Gross loan debt 3 227,2 3 529,1 3 543,2
Cash balances -117,2 -175,5 -239,7
Net loan debt 3 110,0 3 353,6 3 303,5
Foreign debt
Gross loan debt 334,5 420,6 392,4
Cash balances -104,5 -116,5 -94,2
Net loan debt 230,0 304,1 298,2
Total gross loan debt 3 561,7 3 949,7 3 935,7
Total net loan debt 3 340,0 3 657,7 3 601,8
As percentage of GDP:
Total gross loan debt 65,6 80,3 79,1
Total net loan debt 61,5 74,3 72,4
Foreign debt as percentage of:
Gross loan debt 9,4 10,6 10,0
Net loan debt 6,9 8,3 8,3
Source: National Treasury
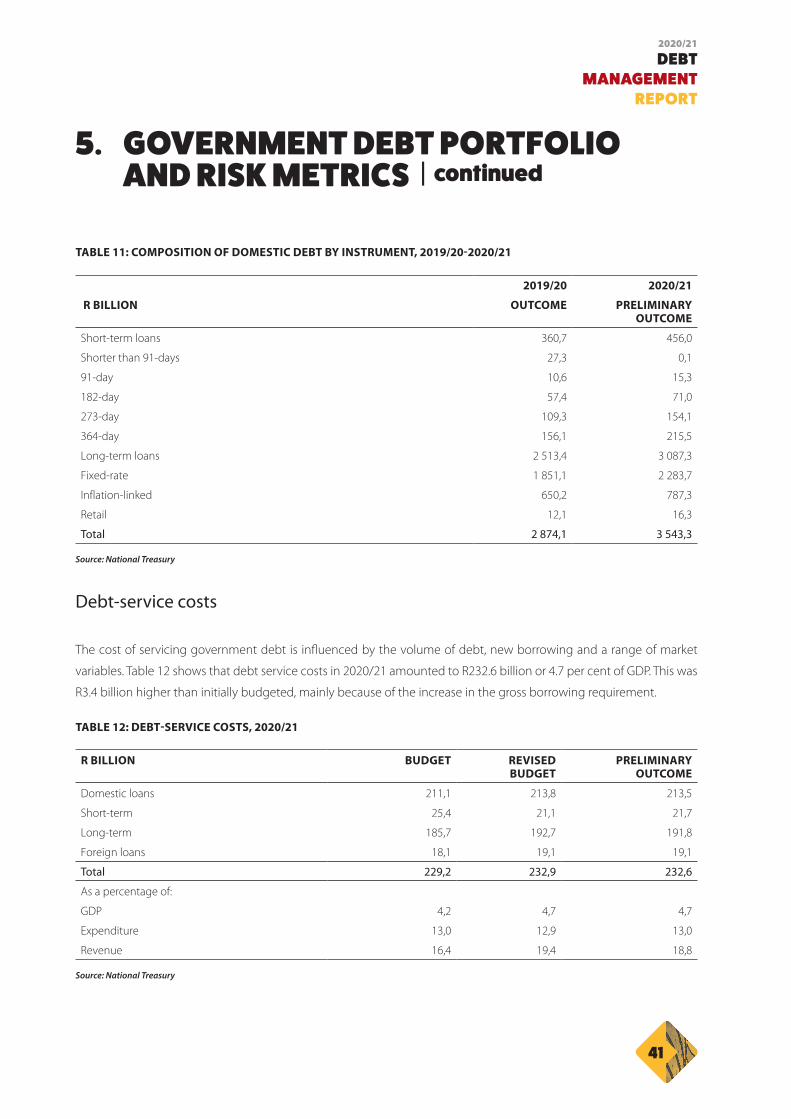
Table 11 shows the composition of domestic debt for the period 2019/20 to 2020/21. Of the total domestic debt
portfolio in 2020/21, 12.9 per cent (R456.0 billion) was made up of short-term loans.
5. GOVERNMENT DEBT PORTFOLIO AND RISK METRICS
5. GOVERNMENT DEBT PORTFOLIO AND RISK METRICS | continued
41
DEBT MANAGEMENT
REPORT
2020/21
TABLE 11: COMPOSITION OF DOMESTIC DEBT BY INSTRUMENT, 2019/20-2020/21
2019/20 2020/21
R BILLION OUTCOME PRELIMINARY OUTCOME
Short-term loans 360,7 456,0
Shorter than 91-days 27,3 0,1
91-day 10,6 15,3
182-day 57,4 71,0
273-day 109,3 154,1
364-day 156,1 215,5
Long-term loans 2 513,4 3 087,3
Fixed-rate 1 851,1 2 283,7
Inflation-linked 650,2 787,3
Retail 12,1 16,3
Total 2 874,1 3 543,3
Source: National Treasury
Debt-service costs
The cost of servicing government debt is influenced by the volume of debt, new borrowing and a range of market
variables. Table 12 shows that debt service costs in 2020/21 amounted to R232.6 billion or 4.7 per cent of GDP. This was
R3.4 billion higher than initially budgeted, mainly because of the increase in the gross borrowing requirement.
TABLE 12: DEBT-SERVICE COSTS, 2020/21
R BILLION BUDGET REVISED BUDGET
PRELIMINARY OUTCOME
Domestic loans 211,1 213,8 213,5
Short-term 25,4 21,1 21,7
Long-term 185,7 192,7 191,8
Foreign loans 18,1 19,1 19,1
Total 229,2 232,9 232,6
As a percentage of:
GDP 4,2 4,7 4,7
Expenditure 13,0 12,9 13,0
Revenue 16,4 19,4 18,8
Source: National Treasury

42
5. GOVERNMENT DEBT PORTFOLIO AND RISK METRICS | continued
DEBT MANAGEMENT REPORT
2020/21
PORTFOLIO RISK BENCHMARKS
Government debt portfolio benchmarks serve as a guideline for managing the potential impact of adverse movements
in various sources of risk as these relate to the debt portfolio. During 2020/21, all risk benchmark indicators remained
within their respective limits and ranges.
The share of short-term debt maturing in 12 months (Treasury bills) as a percentage of total domestic debt declined
by 0.86 percentage points from the previous year. This was primarily because the rate of growth in long-term debt
outpaced that of Treasury bills. The share of debt maturing within five years as a percentage of fixed-rate bonds and
inflation-linked bonds increased by 0.50 percentage points. This was due to the inclusion of a third of the outstanding
amount of the R186 (10.50%, 2025) bond into the 5-year maturity space. During 2020/21, inflation remained relatively
low and this contributed to the decline of 0.28 percentage points in the share of inflation-linked bonds as a percentage
of total domestic debt. Furthermore, total revaluations (due to inflation-related adjustments) as a percentage of
inflation-linked bond debt remained at 40 per cent. At 10.03 per cent, the share of foreign debt as a percentage of total
debt was lower by 1.21 percentage points than in the previous year. This was because of the stronger rand and the
redemption of one Japanese yen-denominated bond.
TABLE 13: PERFORMANCE OF THE GOVERNMENT DEBT PORTFOLIO AGAINST RISK BENCHMARKS, 31 MARCH 2020 AND 31 MARCH 2021
BENCHMARK DESCRIPTION RANGE OR LIMIT
BENCHMARK 31 MARCH 2020
31 MARCH 2021
Share of short-term debt maturing in 12 months (Treasury bills) as a
percentage of total domestic debt
15% 13,19% 12,93%
Share of long-term debt maturing in 5 years as a percentage of fixed-
rate bonds and inflation-linked bonds
25% 13,30% 13,87%
Share of inflation-linked bonds as a percentage of total domestic debt 20%-25% 22,57% 22,29%
Share of foreign debt as a percentage of total government debt 15% 11,23% 10,02%
Weighted term-to-maturity (fixed-rate bonds and Treasury bills in
years)
10-14 12,49 11,80
Weighted term-to-maturity (inflation-linked bonds in years) 14-17 13,66 13,22
Weighted term-to-maturity (total government debt in years) 12,61 12,04
Weighted term-to-maturity (foreign debt in years) 11,06 10,66
Source: National Treasury

5. GOVERNMENT DEBT PORTFOLIO AND RISK METRICS | continued
43
DEBT MANAGEMENT
REPORT
2020/21
PORTFOLIO RISK
Since 2016/17, structural weaknesses that led to wider budget deficits contributed to higher borrowing requirements
and thus higher debt levels. These attract a higher cost of funding. Figure 23 shows the growth rates of total debt
and the weighted cost of funding (WCF) for domestic long-term debt (fixed-rate and inflation-linked bonds) over the
period. In 2020/21, at 22.0 per cent, the rate of growth of debt was higher than in the preceding five financial years. The
WCF increased by 71 basis points from the previous year. An examination of the South African debt portfolio shows
that, when the stock of debt increases, the cost of raising debt follows suit about 79.4 per cent of the time. The funding
strategy over the reporting period has been anchored in reducing the cost of debt, which remains below 10 per cent.
FIGURE 23: WEIGHTED COST OF FUNDING AND GROWTH RATES OF TOTAL DEBT, 2016/17-2020/21
Source: National Treasury
GOVERNMENT MATURITY PROFILE
The affordable cash redemption line as identified by the smoothing curve indicates government’s ideal affordability
level for repayment of debt; this is shown in Figure 24. Any amount above this line poses refinancing risk (albeit not
immediate) and therefore has to be switched. As at 31 March 2021, R6.8 billion was successfully switched out of the
R2023 (7.75%, 2023) bond.
7
9
11
13
15
17
21
19
23
2016/17 2017/18 2018/19 2019/20 2020/21
Weighted Cost of Funding Debt Growth Rate
Per c
ent

44
5. GOVERNMENT DEBT PORTFOLIO AND RISK METRICS | continued
DEBT MANAGEMENT REPORT
2020/21
FIGURE 24: MATURITY PROFILE OF GOVERNMENT DEBT, 31 MARCH 2021
Source: National Treasury
SOVEREIGN RISK ASSESSMENT
The outbreak of the COVID-19 pandemic in 2020 had long-lasting and devastating economic effects around the world.
South Africa was already facing serious challenges: widespread fiscal pressures, rising debt and borrowing costs and
persistently low growth. As a result, the country received multiple credit rating downgrades from the solicited rating
agencies.
On 3 April 2020, Fitch Ratings (Fitch) downgraded the country’s long-term foreign and local currency debt ratings
to ‘BB’ from ‘BB+’ and maintained a negative outlook. On 29 April 2020, S&P Global Ratings (S&P) downgraded the
country’s long-term foreign and local currency debt ratings to ‘BB-’ and ‘BB’ respectively and revised the outlook to
stable from negative. The agency affirmed the country’s long-term foreign and local currency debt ratings at ‘BB-’ and
‘BB’ on 22 May 2020. On 5 June 2020, Rating and Investment Information, Inc. (R&I) lowered the country’s long-term
foreign and local currency debt ratings to ‘BBB-’ and ‘BBB’ respectively, maintaining a negative outlook.
0123456
9
7
10
8
11
Am
ount
Maturity
2020
/202
1
2033
/203
4
2046
/204
7
2021
/202
2
2034
/203
5
2047
/204
8
2022
/202
3
2035
/203
6
2048
/204
9
2023
/202
4
2036
/203
7
2049
/205
0
2024
/202
5
2037
/203
8
2050
/205
1
2025
/202
6
2038
/203
9
2051
/205
2
2026
/202
7
2039
/204
0
2027
/202
8
2040
/204
1
2028
/202
9
2041
/204
2
2029
/203
0
2042
/204
3
2030
/203
1
2043
/204
4
2031
/203
2
2044
/204
5
2032
/203
3
2045
/204
6TB’sDomestic Bonds Foreign bonds Smoothening Curve

5. GOVERNMENT DEBT PORTFOLIO AND RISK METRICS | continued
45
DEBT MANAGEMENT
REPORT
2020/21
Following the tabling of the 2020 Medium Term Budget Policy Statement (MTBPS), on 20 November 2020 Moody’s
and Fitch further downgraded the country’s credit ratings to ‘Ba2’ and ‘BB-’ respectively. Both agencies maintained a
negative outlook. In contrast to these agencies, on the same day S&P affirmed the country’s foreign and local currency
ratings at ‘BB-’ and ‘BB’ respectively and maintained a stable outlook.
Rating agencies remain concerned about South Africa’s fiscal position as it continues to weaken, with shrinking revenue
tied to the economic contraction and large COVID-19 related spending, constraining the already weak public finances.
In addition to this, the country continues to grapple with a large debt burden and sizable financial support to SOCs.
TABLE 14: SOUTH AFRICA’S SOLICITED CREDIT RATINGS, 2020/21
RATING AGENCY MOODY’S FITCH S&P R&I
DATE OF REVIEW 20-NOV-20 20-NOV-20 20-NOV-20 5-JUN-20
Current
rating
Previous
rating
Current
rating
Previous
rating
Current
rating
Previous
rating
Current
rating
Previous
rating
Foreign
currency credit
rating
Ba2 Ba1 BB- BB BB- BB- BBB- BBB
Domestic
currency credit
rating
Ba2 Ba1 BB- BB BB BB BBB BBB+
OUTLOOK NEGATIVE NEGATIVE NEGATIVE NEGATIVE STABLE STABLE NEGATIVE NEGATIVE
Both foreign and
domestic currency credit
ratings are two notches
below investment grade
Both foreign and
domestic currency credit
ratings are three notches
below investment grade
The foreign currency
credit rating is three
notches below
investment grade
while the domestic
currency credit rating
is two notches below
investment grade
The foreign currency
credit rating is one notch
above non-investment
grade while the domestic
currency credit rating is
two notches above non-
investment grade
Source: Moody’s, Fitch, S&P, R&I and National Treasury
Rating agencies indicated that a credit rating upgrade in the short-term is unlikely. However, the following factors could
lead to a positive outlook revision:
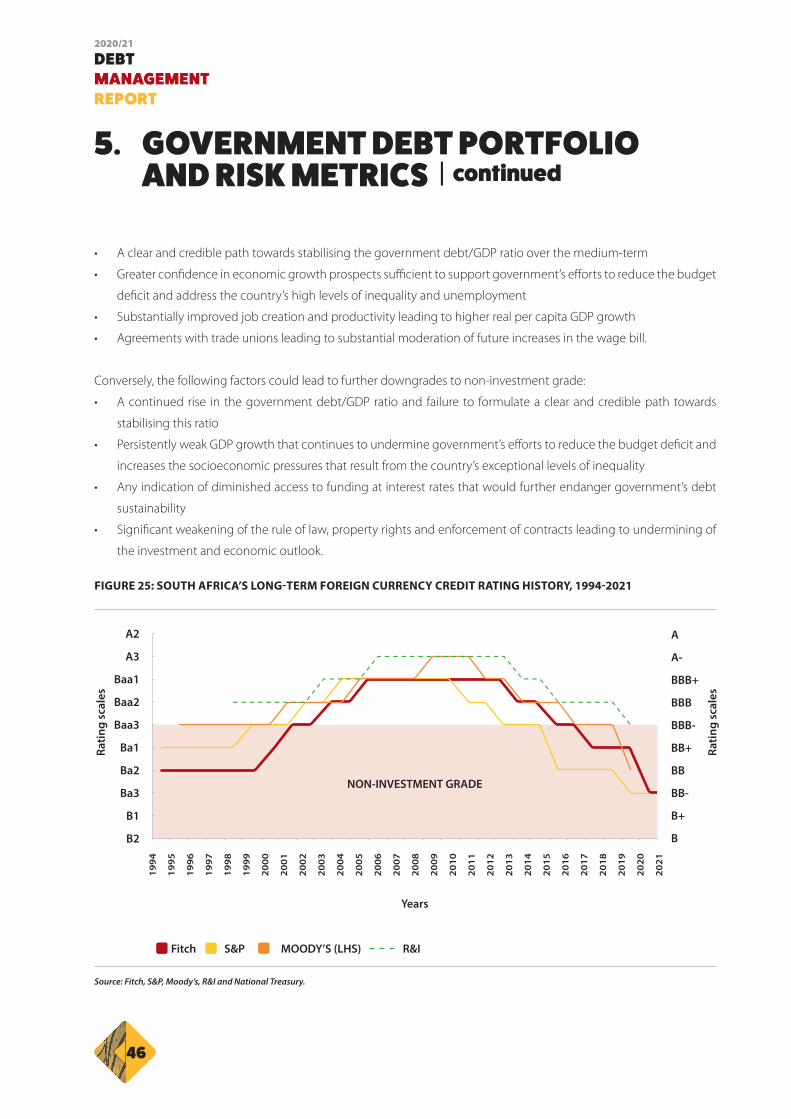
46
5. GOVERNMENT DEBT PORTFOLIO AND RISK METRICS | continued
DEBT MANAGEMENT REPORT
2020/21
• A clear and credible path towards stabilising the government debt/GDP ratio over the medium-term
• Greater confidence in economic growth prospects sufficient to support government’s efforts to reduce the budget
deficit and address the country’s high levels of inequality and unemployment
• Substantially improved job creation and productivity leading to higher real per capita GDP growth
• Agreements with trade unions leading to substantial moderation of future increases in the wage bill.
Conversely, the following factors could lead to further downgrades to non-investment grade:
• A continued rise in the government debt/GDP ratio and failure to formulate a clear and credible path towards
stabilising this ratio
• Persistently weak GDP growth that continues to undermine government’s efforts to reduce the budget deficit and
increases the socioeconomic pressures that result from the country’s exceptional levels of inequality
• Any indication of diminished access to funding at interest rates that would further endanger government’s debt
sustainability
• Significant weakening of the rule of law, property rights and enforcement of contracts leading to undermining of
the investment and economic outlook.
FIGURE 25: SOUTH AFRICA’S LONG-TERM FOREIGN CURRENCY CREDIT RATING HISTORY, 1994-2021
Source: Fitch, S&P, Moody’s, R&I and National Treasury.
B2 B
B1 B+
Ba3 BB-
Ba2 BB
Ba1 BB+
Baa3 BBB-
Baa2 BBB
Baa1 BBB+
A3 A-
A2 A
Ratin
g sc
ales
Years
NON-INVESTMENT GRADE
1994
2007
2020
1995
2008
2021
1996
2009
1997
2010
1998
2011
1999
2012
2000
2013
2001
2014
2002
2015
2003
2016
2004
2017
2005
2018
2006
2019
S&PFitch MOODY’S (LHS) R&I
Ratin
g sc
ales

47
DEBT MANAGEMENT
REPORT
2020/21
INVESTOR ROADSHOWS
National Treasury runs an active investor relations programme and, following the release of the Budget Review in
February and the MTBPS in October each year, conducts domestic and international roadshows with the SARB. The aim
of the roadshows is to strengthen relationships with investors and keep them informed about economic, fiscal, political
and social developments in the country.
Because of the COVID-19 travel restrictions, during the reporting year National Treasury and the SARB engaged domestic
and international investors through global investor calls. These took place after tabling of the Supplementary Budget in
June 2020 and the MTBPS and Budget Review in October 2020 and February 2021 respectively.
National Treasury also conducts frequent meetings with investors throughout the year and provides information about
funding programmes and strategies via the JSE Stock Exchange News Service (SENS).
INVESTOR RELATIONS WEBSITE
The Investor Relations Website (http://investor.treasury.gov.za), launched in June 2011, provides institutional investors
with relevant information. This includes the bond auction calendars, auctions’ historical results, sovereign credit ratings
and reports, holdings of domestic government bonds, policy documents, economic indicators, details of pending
events, investor presentations and links to other websites such as those of the SARB and Statistics South Africa.
MARKETING AND PROMOTION OF RSA RETAIL SAVINGS BONDS
Because of the COVID-19 lock-down restrictions, National Treasury was unable to participate in physical promotions. All
expos planned for 2020/21 were postponed to 2022/23.
National Treasury did, however, participate in the Homemakers virtual expo from 1 to 6 September 2020 and continued
with digital marketing throughout 2020/21 using emails and various social media platforms.
Plans are in place to enhance the RSA Retail Savings Bonds website to include blogs and podcasts.
6. INVESTOR RELATIONS

48
DEBT MANAGEMENT REPORT
2020/21
ANNEXURE A: REDEMPTION SCHEDULE OF TREASURY BILLS, 31 MARCH 2021
DATE 91-DAY 182-DAY 273-DAY 365-DAY TOTAL
2021/04/07/. 903 3 070 4 040 3 751 11 764
2021/04/14 1 400 3 070 4 040 3 340 11 850
2021/04/21 1 400 2 460 4 040 3 340 11 240
2021/04/28 1 400 3 070 4 040 3 340 11 850
2021/05/05. 1 400 3 070 4 040 4 040 12 550
2020/05/12 1 400 3 070 4 040 4 040 12 550
2020/ 05 /19. 946 3 070 4 040 4 040 12 096
2021/05/26 1 400 3 070 4 040 1 671 10 181
2021/06/02 815 3 070 4 040 1 855 9 780
2021/06/09 860 3 070 4 040 3 775 11 745
2021/06/17 1 400 835 4 040 4 440 10 715
2021/06/23 1 400 1 007 4 040 4 440 10 887
2021/06/30 611 347 4 040 5 219 10 217
2021/07/07 - 3 070 4 040 4 440 11 550
2021/07/14 - 3 070 3 268 4 440 10 778
2021/07/21 - 3 070 4 417 4 440 11 927
2021/07/28 - 3 070 4 040 4 627 11 737
2021/08/05 - 3 070 4 040 4 440 11 550
2021/08/11 - 3 070 4 040 4 440 11 550
2021/08/18 - 3 070 4 040 4 440 11 550
2021/08/25 - 3 070 4 040 4 440 11 550
2021/09/01 - 3 070 2 190 4 440 9 700
2021/09/08 - 1 862 3 601 4 440 9 903
2021/09/15 - 3 070 3 617 4 440 11 127
2021/09/23 - 3 070 4 040 4 440 11 550
2021/09/30 - 3 070 4 040 4 440 11 550
2021/10/07 - - 4 040 4 440 8 480
2021/10/13 - - 4 040 5 212 9 252
2021/10/20 - - 4 040 4 674 8 714
2021/10/27 - - 4 040 4 440 8 480
2021/11/03 - - 4 040 4 440 8 480
2021/11/11. - - 4 549 4 440 8 989
7. Annexures

7. Annexures | continued
49
DEBT MANAGEMENT
REPORT
2020/21
DATE 91-DAY 182-DAY 273-DAY 365-DAY TOTAL
202111/17 - - 3 226 4 440 7 666
2021/11/24 - - 4 040 4 440 8 480
2021/12/02 - - 4 040 4 051 8 091
2021/12/08 - - 4 040 4 440 8 480
2021/12/15 - - 4 040 4 440 8 480
2021/12/22 - - 4 040 4 054 8 094
2021/12/29 - - 4 040 1 853 5 893
2022/01/07 - - - 2 175 2 175
2022/01/12 - - - 4 440 4 440
2022/01/19 - - - 4 440 4 440
2022/01/26 - - - 4 440 4 440
02.02.2022 - - - 4 440 4 440
2022/02/09 - - - 3 931 3 931
2022/02/16 - - - 4 440 4 440
2022/02/23 - - - 4 440 4 440
2022/03/01 - - - 4 440 4 440
2022/03/08 - - - 4 440 4 440
2022/03/15 - - - 4 440 4 440
2022/03/23 - - - 4 440 4 440
2022/03/30 - - - 4 440 4 440
Total 15 335 70 980 154 147 215 509 455 971
ANNEXURE A: REDEMPTION SCHEDULE OF TREASURY BILLS, 31 MARCH 2021

50
7. Annexures | continued
DEBT MANAGEMENT REPORT
2020/21
ANNEXURE B: YIELD TRENDS OF GOVERNMENT FIXED-RATE BONDS, 2020/21
3.00
6.00
3.50
8000
3.50
6.50
4.00
8.500
4.00
7.00
4.50
9.000
4.50
7.50
5.00
9.500
5.00
8.00
9.50
5.50
10.000
7.50
11.500
5.50
8.50
10.00
6.50
10.500
8.00
12.000
6.00
9.00
10.50
7.00
11.000
Per c
ent
Per c
ent
Per c
ent
Per c
ent
Ap
r -2
0A
pr
-20
Ap
r -2
0A
pr
-20
May
- 20
May
- 20
May
- 20
May
- 20
Jun
- 20
Jun
- 20
Jun
- 20
Jun
- 20
Jul -
20
Jul -
20
Jul -
20
Jul -
20
Au
g -
20A
ug
- 20
Au
g -
20A
ug
- 20
Sep
- 20
Sep
- 20
Sep
- 20
Sep
- 20
Oct
- 20
Oct
- 20
Oct
- 20
Oct
- 20
No
v - 2
0N
ov
- 20
No
v - 2
0N
ov
- 20
Dec
- 20
Dec
- 20
Dec
- 20
Dec
- 20
Jan
- 21
Jan
- 21
Jan
- 21
Jan
- 21
Feb
- 21
Feb
- 21
Feb
- 21
Feb
- 21
Mar
- 21
Mar
- 21
Mar
- 21
Mar
- 21
30-Day moving average
30-Day moving average
30-Day moving average
30-Day moving average
5-Day moving average
5-Day moving average
5-Day moving average
5-Day moving average
R208 bond - 6.75% 25 March 2021
R186 bond - 10.5% 21 December 2026
R2023 bond - 7.75% 28 February 2023
R2030 bond - 8,00% 31 January 2030
ANNEXURE B: YIELD TRENDS OF GOVERNMENT FIXED-RATE BONDS, 2020/21

7. Annexures | continued
51
DEBT MANAGEMENT
REPORT
2020/21
ANNEXURE B: YIELD TRENDS OF GOVERNMENT FIXED-RATE BONDS, 2020/21
8.00
10.000
9.00
9.00
8.50
10.500
9.50
9.50
9.00
11.000
10.00
10.00
9.50
11.500
10.50
10.50
10.00
11.50
12.000
11.00
11.00
12.50
10.50
12.0.0
11.50
11.50
13.00
11.00
12.00
12.00
Per c
ent
Per c
ent
Per c
ent
Per c
ent
Ap
r -2
0A
pr
-20
Ap
r -2
0A
pr
-20
May
- 20
May
- 20
May
- 20
May
- 20
Jun
- 20
Jun
- 20
Jun
- 20
Jun
- 20
Jul -
20
Jul -
20
Jul -
20
Jul -
20
Au
g -
20A
ug
- 20
Au
g -
20A
ug
- 20
Sep
- 20
Sep
- 20
Sep
- 20
Sep
- 20
Oct
- 20
Oct
- 20
Oct
- 20
Oct
- 20
No
v - 2
0N
ov
- 20
No
v - 2
0N
ov
- 20
Dec
- 20
Dec
- 20
Dec
- 20
Dec
- 20
Jan
- 21
Jan
- 21
Jan
- 21
Jan
- 21
Feb
- 21
Feb
- 21
Feb
- 21
Feb
- 21
Mar
- 21
Mar
- 21
Mar
- 21
Mar
- 21
30-Day moving average
30-Day moving average
30-Day moving average
30-Day moving average
5-Day moving average
5-Day moving average
5-Day moving average
5-Day moving average
R213 bond - 7.00% 28 February 2031
R2035 bond - 8.875% 28 February 2035
R2032 bond - 8.25% 31 March 2032
R209 bond - 6.25% 31 March 2036

52
7. Annexures | continued
DEBT MANAGEMENT REPORT
2020/21
9.00
10.00
10.000
10.000
9.50
10.50
10.500
10.500
10.00
11.00
11.000
11.000
10.50
11.50
11.500
11.500
11.00
12.00
12.000
12.000
11.50
12.50
12.50
12.500
12.500
12.00
13.00
13.00
13.000
13.000
Per c
ent
Per c
ent
Per c
ent
Per c
ent
Ap
r -2
0A
pr
-20
Ap
r -2
0A
pr
-20
May
- 20
May
- 20
May
- 20
May
- 20
Jun
- 20
Jun
- 20
Jun
- 20
Jun
- 20
Jul -
20
Jul -
20
Jul -
20
Jul -
20
Au
g -
20A
ug
- 20
Au
g -
20A
ug
- 20
Sep
- 20
Sep
- 20
Sep
- 20
Sep
- 20
Oct
- 20
Oct
- 20
Oct
- 20
Oct
- 20
No
v - 2
0N
ov
- 20
No
v - 2
0N
ov
- 20
Dec
- 20
Dec
- 20
Dec
- 20
Dec
- 20
Jan
- 21
Jan
- 21
Jan
- 21
Jan
- 21
Feb
- 21
Feb
- 21
Feb
- 21
Feb
- 21
Mar
- 21
Mar
- 21
Mar
- 21
Mar
- 21
30-Day moving average
30-Day moving average
30-Day moving average
30-Day moving average
5-Day moving average
5-Day moving average
5-Day moving average
5-Day moving average
R2037 bond - 8.50% 31 January 2037
R214 bond - 6.50% 28 February 2041
R2040 bond - 9.00% 31 January 2040
R2044 bond - 8.75% 31 January 2044
ANNEXURE B: YIELD TRENDS OF GOVERNMENT FIXED-RATE BONDS, 2020/21

7. Annexures | continued
53
DEBT MANAGEMENT
REPORT
2020/21
10.00
10.50
11.00
11.50
12.00
12.50
13.00
Per c
ent
R2048 bond - 8.75% 28 February 2048
ANNEXURE B: YIELD TRENDS OF GOVERNMENT FIXED-RATE BONDS, 2020/21
Ap
r -2
0
May
- 20
Jun
- 20
Jul -
20
Au
g -
20
Sep
- 20
Oct
- 20
No
v - 2
0
Dec
- 20
Jan
- 21
Feb
- 21
Mar
- 21
30-Day moving average5-Day moving average
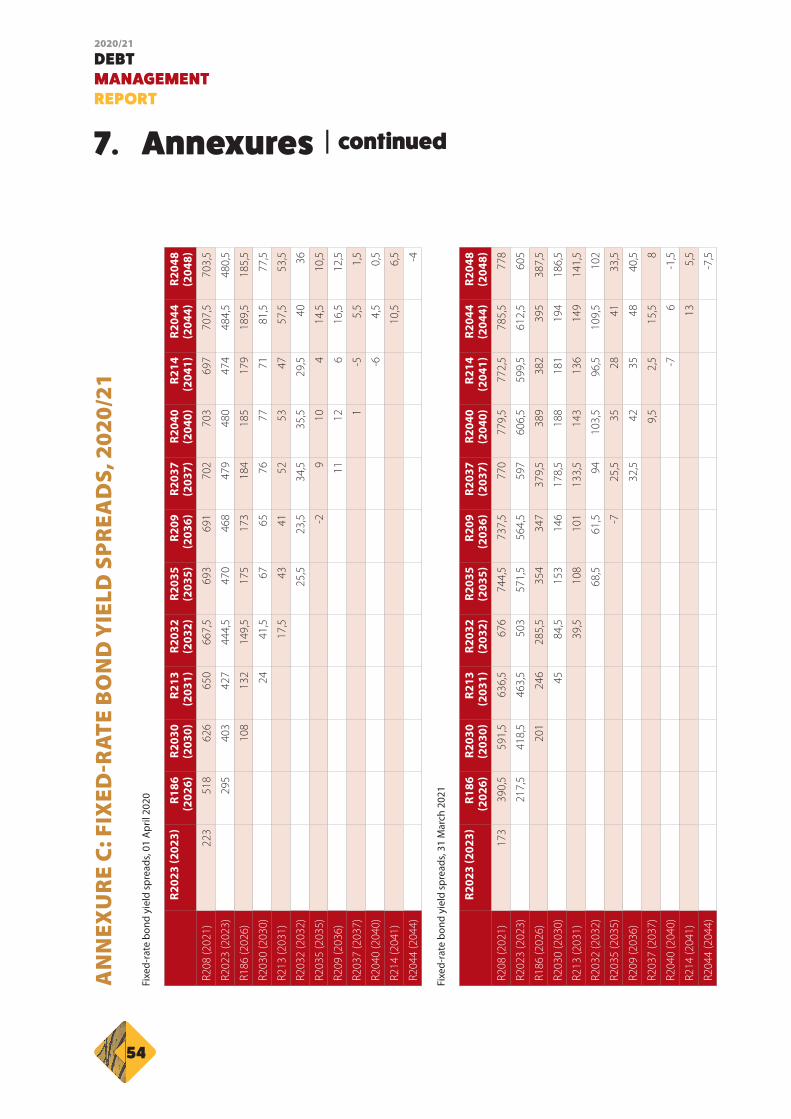
54
7. Annexures | continued
DEBT MANAGEMENT REPORT
2020/21
AN
NEX
UR
E C
: FIX
ED-R
AT
E B
ON
D Y
IELD
SP
REA
DS,
202
0/21
Fixe
d-ra
te b
ond
yiel
d sp
read
s, 01
Apr
il 20
20
R202
3 (2
023)
R186
(2
026)
R203
0 (2
030)
R213
(2
031)
R203
2 (2
032)
R203
5 (2
035)
R209
(2
036)
R203
7 (2
037)
R204
0 (2
040)
R214
(2
041)
R204
4 (2
044)
R204
8 (2
048)
R208
(202
1)22
351
862
665
066
7,5
693
691
702
703
697
707,
570
3,5
R202
3 (2
023)
295
403
427
444,
547
046
847
948
047
448
4,5
480,
5
R186
(202
6)10
813
214
9,5
175
173
184
185
179
189,
518
5,5
R203
0 (2
030)
2441
,567
6576
7771
81,5
77,5
R213
(203
1)17
,543
4152
5347
57,5
53,5
R203
2 (2
032)
25,5
23,5
34,5
35,5
29,5
4036
R203
5 (2
035)
-29
104
14,5
10,5
R209
(203
6)11
126
16,5
12,5
R203
7 (2
037)
1-5
5,5
1,5
R204
0 (2
040)
-64,
50,
5
R214
(204
1)10
,56,
5
R204
4 (2
044)
-4
Fixe
d-ra
te b
ond
yiel
d sp
read
s, 31
Mar
ch 2
021
R202
3 (2
023)
R186
(2
026)
R203
0 (2
030)
R213
(2
031)
R203
2 (2
032)
R203
5 (2
035)
R209
(2
036)
R203
7 (2
037)
R204
0 (2
040)
R214
(2
041)
R204
4 (2
044)
R204
8 (2
048)
R208
(202
1)17
339
0,5
591,
563
6,5
676
744,
573
7,5
770
779,
577
2,5
785,
577
8
R202
3 (2
023)
217,
541
8,5
463,
550
357
1,5
564,
559
760
6,5
599,
561
2,5
605
R186
(202
6)20
124
628
5,5
354
347
379,
538
938
239
538
7,5
R203
0 (2
030)
4584
,515
314
617
8,5
188
181
194
186,
5
R213
(203
1)39
,510
810
113
3,5
143
136
149
141,
5
R203
2 (2
032)
68,5
61,5
9410
3,5
96,5
109,
510
2
R203
5 (2
035)
-725
,535
2841
33,5
R209
(203
6)32
,542
3548
40,5
R203
7 (2
037)
9,5
2,5
15,5
8
R204
0 (2
040)
-76
-1,5
R214
(204
1)13
5,5
R204
4 (2
044)
-7,5

7. Annexures | continued
55
DEBT MANAGEMENT
REPORT
2020/21
AN
NEX
UR
E C
: FIX
ED-R
AT
E B
ON
D Y
IELD
SP
REA
DS,
202
0/21
Chan
ge In
bas
is p
oint
s, 20
20/2
1
R202
3 (2
023)
R186
(2
026)
R203
0 (2
030)
R213
(2
031)
R203
2 (2
032)
R203
5 (2
035)
R209
(2
036)
R203
7 (2
037)
R204
0 (2
040)
R214
(2
041)
R204
4 (2
044)
R204
8 (2
048)
R208
(202
1)-5
0-1
27,5
-34,
5-1
3,5
8,5
51,5
46,5
6876
,575
,578
74,5
R202
3 (2
023)
-77,
515
,536
,558
,510
1,5
96,5
118
126,
512
5,5
128
124,
5
R186
(202
6)93
114
136
179
174
195,
520
420
320
5,5
202
R203
0 (2
030)
2143
8681
102,
511
111
011
2,5
109
R213
(203
1)22
6560
81,5
9089
91,5
88
R203
2 (2
032)
4338
59,5
6867
69,5
66
R203
5 (2
035)
-516
,525
2426
,523
R209
(203
6)21
,530
2931
,528
R203
7 (2
037)
8,5
7,5
106,
5
R204
0 (2
040)
-11,
5-2
R214
(204
1)2,
5-1
R204
4 (2
044)
-3,5
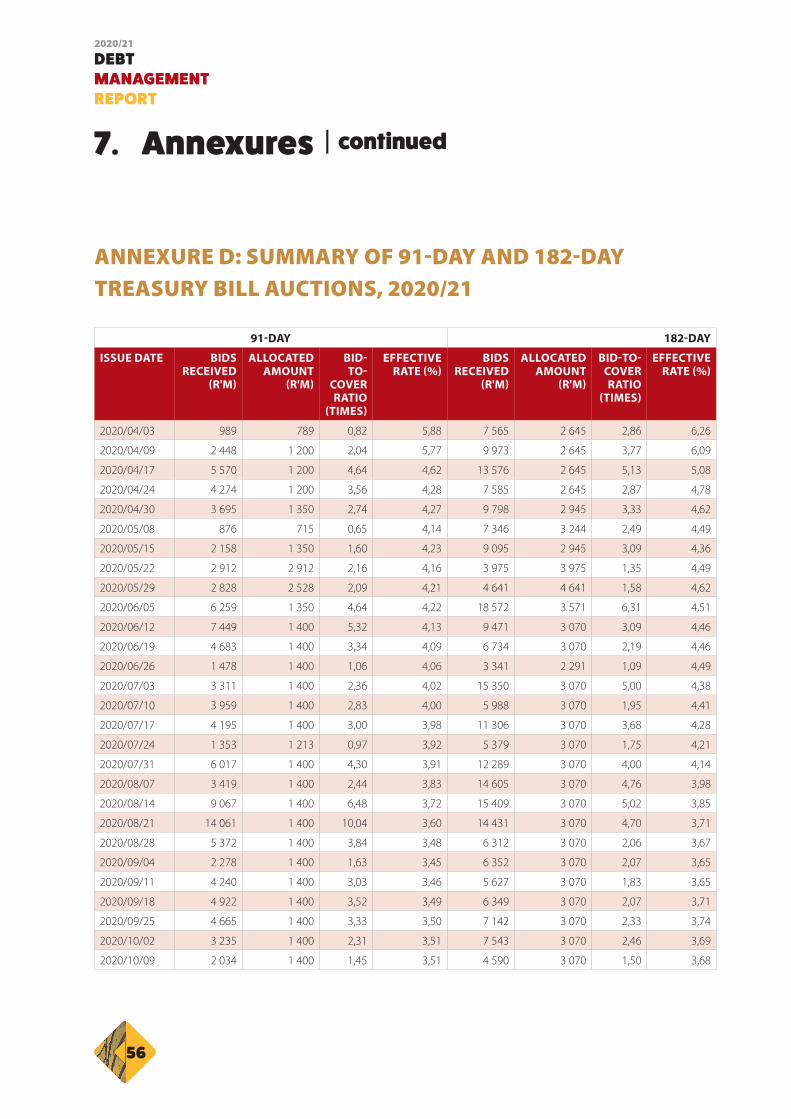
56
7. Annexures | continued
DEBT MANAGEMENT REPORT
2020/21
ANNEXURE D: SUMMARY OF 91-DAY AND 182-DAY TREASURY BILL AUCTIONS, 2020/21
91-DAY 182-DAY
ISSUE DATE BIDS RECEIVED
(R'M)
ALLOCATED AMOUNT
(R'M)
BID-TO-
COVER RATIO
(TIMES)
EFFECTIVE RATE (%)
BIDS RECEIVED
(R'M)
ALLOCATED AMOUNT
(R'M)
BID-TO-COVER RATIO
(TIMES)
EFFECTIVE RATE (%)
2020/04/03 989 789 0,82 5,88 7 565 2 645 2,86 6,26
2020/04/09 2 448 1 200 2,04 5,77 9 973 2 645 3,77 6,09
2020/04/17 5 570 1 200 4,64 4,62 13 576 2 645 5,13 5,08
2020/04/24 4 274 1 200 3,56 4,28 7 585 2 645 2,87 4,78
2020/04/30 3 695 1 350 2,74 4,27 9 798 2 945 3,33 4,62
2020/05/08 876 715 0,65 4,14 7 346 3 244 2,49 4,49
2020/05/15 2 158 1 350 1,60 4,23 9 095 2 945 3,09 4,36
2020/05/22 2 912 2 912 2,16 4,16 3 975 3 975 1,35 4,49
2020/05/29 2 828 2 528 2,09 4,21 4 641 4 641 1,58 4,62
2020/06/05 6 259 1 350 4,64 4,22 18 572 3 571 6,31 4,51
2020/06/12 7 449 1 400 5,32 4,13 9 471 3 070 3,09 4,46
2020/06/19 4 683 1 400 3,34 4,09 6 734 3 070 2,19 4,46
2020/06/26 1 478 1 400 1,06 4,06 3 341 2 291 1,09 4,49
2020/07/03 3 311 1 400 2,36 4,02 15 350 3 070 5,00 4,38
2020/07/10 3 959 1 400 2,83 4,00 5 988 3 070 1,95 4,41
2020/07/17 4 195 1 400 3,00 3,98 11 306 3 070 3,68 4,28
2020/07/24 1 353 1 213 0,97 3,92 5 379 3 070 1,75 4,21
2020/07/31 6 017 1 400 4,30 3,91 12 289 3 070 4,00 4,14
2020/08/07 3 419 1 400 2,44 3,83 14 605 3 070 4,76 3,98
2020/08/14 9 067 1 400 6,48 3,72 15 409 3 070 5,02 3,85
2020/08/21 14 061 1 400 10,04 3,60 14 431 3 070 4,70 3,71
2020/08/28 5 372 1 400 3,84 3,48 6 312 3 070 2,06 3,67
2020/09/04 2 278 1 400 1,63 3,45 6 352 3 070 2,07 3,65
2020/09/11 4 240 1 400 3,03 3,46 5 627 3 070 1,83 3,65
2020/09/18 4 922 1 400 3,52 3,49 6 349 3 070 2,07 3,71
2020/09/25 4 665 1 400 3,33 3,50 7 142 3 070 2,33 3,74
2020/10/02 3 235 1 400 2,31 3,51 7 543 3 070 2,46 3,69
2020/10/09 2 034 1 400 1,45 3,51 4 590 3 070 1,50 3,68

7. Annexures | continued
57
DEBT MANAGEMENT
REPORT
2020/21
91-DAY 182-DAY
ISSUE DATE BIDS RECEIVED
(R'M)
ALLOCATED AMOUNT
(R'M)
BID-TO-
COVER RATIO
(TIMES)
EFFECTIVE RATE (%)
BIDS RECEIVED
(R'M)
ALLOCATED AMOUNT
(R'M)
BID-TO-COVER RATIO
(TIMES)
EFFECTIVE RATE (%)
2020/10/16 2 351 1 400 1,68 3,49 3 085 3 070 1,00 3,69
2020/10/23 3 412 1 400 2,44 3,49 6 036 3 070 1,97 3,71
2020/10/30 2 250 1 400 1,61 3,51 4 731 3 070 1,54 3,76
2020/11/06 1 166 1 001 0,83 3,53 3 451 3 070 1,12 3,74
2020/11/13 1 934 1 400 1,38 3,61 4 184 3 070 1,36 3,81
2020/11/20 1 642 1 372 1,17 3,74 5 012 3 070 1,63 3,89
2020/11/27 3 772 1 400 2,69 3,75 4 195 3 070 1,37 3,93
2020/12/04 2 855 1 839 2,04 3,77 5 903 3 070 1,92 3,93
2020/12/11 1 613 1 266 1,15 3,79 1 733 835 0,56 4,02
2020/12/18 3 145 1 400 2,25 3,79 1 332 1 007 0,43 4,03
2020/12/24 923 688 0,66 3,87 852 347 0,28 4,20
2020/12/31 1 353 903 0,97 3,91 6 395 3 070 2,08 4,19
2021/01/08 1 942 1 400 1,39 3,89 4 522 3 070 1,47 4,14
2021/01/15 3 632 1 400 2,59 3,84 4 199 3 070 1,37 4,12
2021/01/22 2 298 1 400 1,64 3,78 3 739 3 070 1,22 4,09
2021/01/29 1 833 1 400 1,31 3,79 3 503 3 070 1,14 4,14
2021/02/05 1 780 1 400 1,27 3,79 4 056 3 070 1,32 4,27
2021/02/12 1 281 946 0,91 3,81 3 915 3 070 1,28 4,36
2021/03/19 1 787 1 400 1,28 3,83 4 327 3 070 1,41 4,41
2021/02/26 1 027 815 0,73 3,83 5 413 3 070 1,76 4,42
2021/03/05 1 320 860 0,94 3,86 3 217 1 862 1,05 4,52
2021/03/12 1 728 1 400 1,23 3,86 4 653 3 070 1,52 4,56
2021/03/19 1 792 1 400 1,28 3,86 6 487 3 070 2,11 4,63
2021/03/26 611 611 0,44 3,85 5 632 3 070 1,83 4,64
ANNEXURE D: SUMMARY OF 91-DAY AND 182-DAY TREASURY BILL AUCTIONS, 2020/21

58
7. Annexures | continued
DEBT MANAGEMENT REPORT
2020/21
273-DAY 364-DAY
ISSUE DATE BIDS RECEIVED
(R'M)
ALLOCATED AMOUNT
(R'M)
BID-TO-
COVER RATIO
(TIMES)
EFFECTIVE RATE (%)
BIDS RECEIVED
(R'M)
ALLOCATED AMOUNT
(R'M)
BID-TO-COVER RATIO
(TIMES)
EFFECTIVE RATE (%)
2020/04/03 4 671 3 190 1,46 6,22 10 166 3 751 3,04 6,25
2020/04/09 4 643 3 190 1,46 6,13 6 247 3 340 1,87 6,12
2020/04/17 10 966 3 190 3,44 5,24 12 086 3 340 3,62 5,25
2020/04/24 10 560 3 190 3,31 4,87 10 784 3 340 3,23 4,89
2020/04/30 7 962 3 740 2,13 4,67 8 467 4 040 2,54 4,66
2020/05/08 9 499 4 076 2,54 4,50 6 823 4 040 1,69 4,52
2020/05/15 5 814 3 740 1,55 4,43 5 175 4 040 1,28 4,48
2020/05/22 1 950 1 950 0,52 4,49 1 671 1 671 0,41 4,62
2020/05/29 2 098 2 098 0,56 4,64 1 855 1 855 0,46 4,76
2020/06/05 3 379 3 379 0,90 4,83 3 775 3 775 0,85 4,86
2020/06/12 11 879 4 040 2,94 4,78 18 535 4 440 4,17 4,89
2020/06/19 8 570 4 040 2,12 4,71 8 469 4 440 1,91 4,81
2020/06/26 7 098 4 040 1,76 4,64 10 744 5 219 2,42 4,71
2020/07/03 11 414 4 040 2,83 4,54 15 126 4 440 3,41 4,60
2020/07/10 10 049 4 040 2,49 4,50 12 066 4 440 2,72 4,53
2020/07/17 13 842 4 040 3,43 4,39 15 790 4 440 3,56 4,40
2020/07/24 8 436 4 040 2,09 4,32 8 015 4 627 1,81 4,35
2020/07/31 11 134 4 040 2,76 4,27 12 378 4 440 2,79 4,30
2020/08/07 14 822 4 040 3,67 4,12 17 111 4 440 3,85 4,12
2020/08/14 17 091 4 040 4,23 3,96 20 100 4 440 4,53 3,97
2020/08/21 12 199 4 040 3,02 3,85 14 504 4 440 3,27 3,88
2020/08/28 6 699 4 040 1,66 3,87 7 209 4 440 1,62 3,89
2020/09/04 9 888 4 040 2,45 3,84 13 248 4 440 2,98 3,86
2020/09/11 15 168 4 040 3,75 3,70 13 493 4 440 3,04 3,73
2020/09/18 10 989 4 040 2,72 3,73 11 843 4 440 2,67 3,75
2020/09/25 5 345 4 040 1,32 3,86 7 183 4 440 1,62 3,82
2020/10/02 9 048 4 040 2,24 3,77 5 914 4 440 1,33 3,91
ANNEXURE E: SUMMARY OF 273-DAY AND 364-DAY TREASURY BILL AUCTIONS, 2020/21

7. Annexures | continued
59
DEBT MANAGEMENT
REPORT
2020/21
273-DAY 364-DAY
ISSUE DATE BIDS RECEIVED
(R'M)
ALLOCATED AMOUNT
(R'M)
BID-TO-
COVER RATIO
(TIMES)
EFFECTIVE RATE (%)
BIDS RECEIVED
(R'M)
ALLOCATED AMOUNT
(R'M)
BID-TO-COVER RATIO
(TIMES)
EFFECTIVE RATE (%)
2020/10/09 3 718 3 268 0,92 3,79 9 656 4 440 2,17 3,84
2020/10/16 6 378 4 417 1,58 3,81 5 234 4 440 1,18 3,86
2020/10/23 10 475 4 040 2,59 3,78 8 184 4 627 1,84 3,92
2020/10/30 5 695 4 040 1,41 3,85 12 590 4 440 2,84 3,92
2020/11/06 4 176 4 040 1,03 3,86 10 263 4 440 2,31 3,89
2020/11/13 8 334 4 040 2,06 3,85 5 948 4 440 1,34 3,95
2020/11/20 4 688 4 040 1,16 4,00 5 328 4 440 1,20 4,05
2020/11/27 2 556 2 190 0,63 4,14 4 194 4 051 0,94 4,17
2020/12/04 4 291 3 601 1,06 4,29 8 740 4 440 1,97 4,31
2020/12/11 3 800 3 617 0,94 4,43 7 144 4 440 1,61 4,40
2020/12/18 6 604 4 040 1,63 4,47 4 581 4 053 1,03 4,49
2020/12/24 7 003 4 040 1,73 4,53 4 320 1 853 0,97 4,49
2020/12/31 10 940 4 040 2,71 4,50 6 177 4 440 1,39 4,51
2021/01/08 12 857 4 040 3,18 4,42 12 592 4 440 2,84 4,46
2021/01/15 13 434 4 040 3,33 4,33 15 242 4 440 3,43 4,35
2021/01/22 8 672 4 040 2,15 4,26 6 889 4 440 1,55 4,30
2021/01/29 4 981 4 040 1,23 4,29 7 435 4 440 1,67 4,30
2021/02/07 7 250 4 549 1,79 4,31 3 931 3 931 0,89 4,45
2021/02/14 3 946 3 226 0,98 4,47 8 473 4 440 1,91 4,52
2021/02/21 10 940 4 040 2,71 4,50 6 177 2 175 1,39 4,51
2021/02/28 4 356 4 040 1,08 4,78 6 215 4 440 1,40 4,78
2021/03/05 13 504 4 040 3,34 4,80 8 126 4 440 1,83 4,87
2021/03/12 13 006 4 040 3,22 4,79 9 607 4 440 2,16 4,90
2021/03/19 11 900 4 040 2,95 4,77 18 322 4 440 4,13 4,88
2021/03/26 6 277 4 040 1,55 4,79 15 267 4 440 3,44 4,86
ANNEXURE E: SUMMARY OF 273-DAY AND 364-DAY TREASURY BILL AUCTIONS, 2020/21

60
7. Annexures | continued
DEBT MANAGEMENT REPORT
2020/21
ANNEXURE F: SUMMARY OF FIXED-RATE BOND AUCTIONS, 2020/21
ISSUE DATE BOND CODE
MATURITY COUPON (%)
OFFER AMOUNT
(R'M)
ALLOCATED AMOUNT
(R'M)
BIDS RECEIVED
(R'M)
CLEARING YIELD (%)
2020/04/07 R2023 2023/02/28 7,750 1 510 1 510 5 400 7,100
2020/04/07 R2030 2030/01/31 8,000 1 510 1 510 5 515 10,030
2020/04/07 R2032 2032/03/31 8,250 1 510 1 510 4 270 11,445
2020/04/14 R186 2026/12/21 10,500 1 510 1 510 9 265 9,550
2020/04/14 R2032 2032/03/31 8,250 1 510 1 510 3 765 11,200
2020/04/14 R2037 2037/01/31 8,500 1 510 1 510 2 720 11,710
2020/04/21 R186 2026/12/21 10,500 1 510 1 510 9 125 8,980
2020/04/21 R2030 2030/01/31 8,000 1 510 1 510 5 005 10,355
2020/04/21 R2035 2035/02/28 8,875 1 510 1 510 3 510 11,220
2020/04/28 R186 2026/12/21 10,500 1 510 1 510 4 340 5,960
2020/04/28 R2023 2023/02/28 7,750 1 510 1 510 12 530 9,080
2020/04/28 R2030 2030/01/31 8,000 1 510 1 510 7 100 10,900
2020/05/05 R186 2026/12/21 10,500 1 510 1 510 11 070 8,075
2020/05/05 R2030 2030/01/31 8,000 1 510 1 510 12 515 9,950
2020/05/05 R2032 2032/03/31 8,250 1 510 1 510 7 215 10,565
2020/05/12 R186 2026/12/21 10,500 1 510 1 510 6 735 7,780
2020/05/12 R2030 2030/01/31 8,000 1 510 1 510 5 585 9,400
2020/05/12 R2035 2035/02/28 8,875 1 510 1 510 3 775 10,660
2020/05/19 R2023 2023/02/28 7,750 2 100 2 100 4 160 4,800
2020/05/19 R2030 2030/01/31 8,000 2 000 2 000 7 115 8,900
2020/05/19 R2035 2035/02/28 8,875 2 000 2 000 6 165 10,600
2020/05/26 R186 2026/12/21 10,500 2 100 2 100 4 580 7,550
2020/05/26 R2030 2030/01/31 8,000 2 000 2 000 4 280 8,960
2020/05/26 R2035 2035/02/28 8,875 2 000 2 000 4 555 10,240
2020/06/02 R2030 2030/01/31 8,000 2 100 2 100 4 810 8,685
2020/06/02 R2035 2035/02/28 8,875 2 000 2 000 4 560 10,290
2020/06/02 R2037 2037/01/31 8,500 2 000 2 000 4 000 10,560
2020/06/09 R186 2026/12/21 10,500 2 100 2 100 5 970 7,530
2020/06/09 R2030 2030/01/31 8,000 2 000 2 000 6 460 8,980
2020/06/09 R2048 2048/02/28 8,750 2 000 2 000 4 540 11,070
2020/06/17 R186 2026/12/21 10,500 1 500 1 500 3 515 7,795

7. Annexures | continued
61
DEBT MANAGEMENT
REPORT
2020/21
ISSUE DATE BOND CODE
MATURITY COUPON (%)
OFFER AMOUNT
(R'M)
ALLOCATED AMOUNT
(R'M)
BIDS RECEIVED
(R'M)
CLEARING YIELD (%)
2020/06/17 R2030 2030/01/31 8,000 3 100 3 100 8 610 9,295
2020/06/17 R2032 2032/03/31 8,250 1 500 1 500 2 640 10,185
2020/06/23 R2030 2030/01/31 8,000 2 100 2 100 8 940 9,180
2020/06/23 R2035 2035/02/28 8,875 2 000 2 000 3 595 10,890
2020/06/23 R2048 2048/02/28 8,750 2 000 2 000 4 755 11,370
2020/06/30 R186 2026/12/21 10,500 2 100 2 100 5 785 7,640
2020/06/30 R2030 2030/01/31 8,000 2 000 2 000 4 275 9,200
2020/06/30 R2035 2035/02/28 8,875 2 000 2 000 3 490 10,790
2020/07/07 R186 2026/12/21 10,500 2 200 2 200 3 845 7,900
2020/07/07 R2030 2030/01/31 8,000 2 200 2 200 3 705 9,700
2020/07/07 R2048 2048/02/28 8,750 2 200 2 200 5 420 11,750
2020/07/14 R186 2026/12/21 10,500 2 200 2 200 7 925 7,740
2020/07/14 R2030 2030/01/31 8,000 2 200 2 200 7 670 9,480
2020/07/14 R2048 2048/02/28 8,750 2 200 2 200 4 440 11,620
2020/07/21 R186 2026/12/21 10,500 2 200 2 200 9 905 7,490
2020/07/21 R2032 2032/03/31 8,250 2 200 2 200 6 050 10,310
2020/07/21 R2037 2037/01/31 8,500 2 200 2 200 4 470 11,400
2020/07/28 R186 2026/12/21 10,500 2 200 2 200 4 960 7,425
2020/07/28 R2030 2030/01/31 8,000 2 200 2 200 4 845 9,120
2020/07/28 R2032 2032/03/31 8,250 2 200 2 200 5 105 10,000
2020/08/04 R186 2026/12/21 10,500 2 200 2 200 4 605 7,500
2020/08/04 R2032 2032/03/31 8,250 2 200 2 200 5 060 10,220
2020/08/04 R2048 2048/02/28 8,750 2 200 2 200 6 975 11,525
2020/08/11 R2032 2032/03/31 8,250 2 200 2 200 3 990 10,190
2020/08/11 R2037 2037/01/31 8,500 2 200 2 200 3 440 11,285
2020/08/11 R2044 2044/01/31 8,750 2 200 2 200 7 000 11,520
2020/08/18 R186 2026/12/21 10,500 2 200 2 200 7 355 7,460
2020/08/18 R2032 2032/03/31 8,250 2 200 2 200 4 385 10,220
2020/08/18 R2048 2048/02/28 8,750 2 200 2 200 4 895 11,470
2020/08/25 R186 2026/12/21 10,500 2 200 2 200 6 155 7,330
2020/08/25 R2030 2030/01/31 8,000 2 200 2 200 5 790 9,260
ANNEXURE F: SUMMARY OF FIXED-RATE BOND AUCTIONS, 2020/21

62
7. Annexures | continued
DEBT MANAGEMENT REPORT
2020/21
ISSUE DATE BOND CODE
MATURITY COUPON (%)
OFFER AMOUNT
(R'M)
ALLOCATED AMOUNT
(R'M)
BIDS RECEIVED
(R'M)
CLEARING YIELD (%)
2020/08/25 R2048 2048/02/28 8,750 2 200 2 200 7 610 11,440
2020/09/01 R2032 2032/03/31 8,250 2 200 2 200 6 000 10,060
2020/09/01 R2040 2040/01/31 9,000 2 200 2 200 6 890 11,220
2020/09/01 R2044 2044/01/31 8,750 2 200 2 200 6 870 11,330
2020/09/08 R186 2026/12/21 10,500 2 200 2 200 5 085 7,220
2020/09/08 R2030 2030/01/31 8,000 2 200 2 200 3 815 9,190
2020/09/08 R2035 2035/02/28 8,875 2 200 2 200 4 205 10,840
2020/09/15 R2032 2032/03/31 8,250 2 200 2 200 4 995 10,180
2020/09/15 R2037 2037/01/31 8,500 2 200 2 200 4 595 11,185
2020/09/15 R2048 2048/02/28 8,750 2 200 2 200 6 740 11,320
2020/09/22 R2035 2035/02/28 8,875 2 200 2 200 4 330 11,130
2020/09/22 R2040 2040/01/31 9,000 2 200 2 200 5 245 11,510
2020/09/22 R2048 2048/02/28 8,750 2 200 2 200 4 895 11,525
2020/09/29 R186 2026/12/21 10,500 2 200 2 200 7 160 7,260
2020/09/29 R2030 2030/01/31 8,000 2 200 2 200 9 110 9,460
2020/09/29 R2037 2037/01/31 8,500 2 200 2 200 4 835 11,470
2020/10/06 R2030 2030/01/31 8,000 2 200 2 200 8 120 9,550
2020/10/06 R2040 2040/01/31 9,000 2 200 2 200 6 225 11,780
2020/10/06 R2048 2048/02/28 8,750 2 200 2 200 6 365 11,780
2020/10/13 R186 2026/12/21 10,500 2 200 2 200 6 235 7,150
2020/10/13 R2030 2030/01/31 8,000 2 200 2 200 7 950 9,400
2020/10/13 R2044 2044/01/31 8,750 2 200 2 200 5 180 11,700
2020/10/20 R186 2026/12/21 10,500 2 200 2 200 7 015 6,950
2020/10/20 R2032 2032/03/31 8,250 2 200 2 200 6 560 10,290
2020/10/20 R2040 2040/01/31 9,000 2 200 2 200 4 900 11,590
2020/10/27 R186 2026/12/21 10,500 2 200 2 200 6 425 7.07
2020/10/27 R2030 2030/01/31 8,000 2 200 2 200 7 255 9.165
2020/10/27 R2048 2048/02/28 8,750 2 200 2 200 6 535 11.43
2020/11/03 R2030 2030/01/31 8,000 2 200 2 200 6 335 9,300
2020/11/03 R2035 2035/02/28 8,875 2 200 2 200 4 625 11,170
2020/11/03 R2040 2040/01/31 9,000 2 200 2 200 4 100 11,610
ANNEXURE F: SUMMARY OF FIXED-RATE BOND AUCTIONS, 2020/21

7. Annexures | continued
63
DEBT MANAGEMENT
REPORT
2020/21
ISSUE DATE BOND CODE
MATURITY COUPON (%)
OFFER AMOUNT
(R'M)
ALLOCATED AMOUNT
(R'M)
BIDS RECEIVED
(R'M)
CLEARING YIELD (%)
2020/11/10 R186 2026/12/21 10,500 2 200 2 200 5 765 6,900
2020/11/10 R2032 2032/03/31 8,250 2 200 2 200 9 420 9,870
2020/11/10 R2048 2048/02/28 8,750 2 200 2 200 6 195 10,950
2020/11/17 R2030 2030/01/31 8,000 2 200 2 200 5 960 8,780
2020/11/17 R2032 2032/03/31 8,250 2 200 2 200 5 530 9,820
2020/11/17 R2044 2044/01/31 8,750 2 200 2 200 3 615 11,275
2020/11/24 R186 2026/12/21 10,500 2 200 2 200 6 540 6,950
2020/11/24 R2030 2030/01/31 8,000 2 200 2 200 5 160 8,850
2020/11/24 R2035 2035/02/28 8,875 2 200 2 200 7 130 10,550
2020/12/01 R186 2026/12/21 10,500 2 200 2 200 4 100 7,100
2020/12/01 R213 2031/02/28 7,000 2 200 2 200 3 340 9,500
2020/12/01 R2037 2037/01/31 8,500 2 200 2 200 3 330 11,050
2020/12/08 R186 2026/12/21 10,500 2 200 2 200 7 225 6,880
2020/12/08 R2032 2032/03/31 8,250 2 200 2 200 8 125 9,890
2020/12/08 R2048 2048/02/28 8,750 2 200 2 200 7 715 11,040
2020/12/15 R186 2026/12/21 10,500 2 200 2 200 6 565 6,820
2020/12/15 R2030 2030/01/31 8,000 2 200 2 200 8 000 8,750
2020/12/15 R2048 2048/02/28 8,750 2 200 2 200 8 370 10,820
2021/01/12 R186 2026/12/21 10,500 2 200 2 200 6 230 6,670
2021/01/12 R2032 2032/03/31 8,250 2 200 2 200 6 190 9,755
2021/01/12 R2035 2035/02/28 8,875 2 200 2 200 6 290 10,570
2021/01/19 R2030 2030/01/31 8,000 2 200 2 200 7 710 8,785
2021/01/19 R2037 2037/01/31 8,500 2 200 2 200 7 655 10,820
2021/01/19 R2048 2048/02/28 8,750 2 200 2 200 6 790 10,930
2021/01/26 R186 2026/12/21 10,500 2 200 2 200 7 305 6,690
2021/01/26 R2030 2030/01/31 8,000 2 200 2 200 8 390 8,805
2021/01/26 R2048 2048/02/28 8,750 2 200 2 200 8 485 10,810
2021/02/02 R2032 2032/03/31 8,250 2 200 2 200 10 660 9,440
2021/02/02 R2037 2037/01/31 8,500 2 200 2 200 11 920 10,425
2021/02/02 R2040 2040/01/31 9,000 2 200 2 200 9 920 10,570
2021/02/09 R2032 2032/03/31 8,250 2 200 2 200 6 820 9,400
ANNEXURE F: SUMMARY OF FIXED-RATE BOND AUCTIONS, 2020/21

64
7. Annexures | continued
DEBT MANAGEMENT REPORT
2020/21
ANNEXURE F: SUMMARY OF FIXED-RATE BOND AUCTIONS, 2020/21
ISSUE DATE BOND CODE
MATURITY COUPON (%)
OFFER AMOUNT
(R'M)
ALLOCATED AMOUNT
(R'M)
BIDS RECEIVED
(R'M)
CLEARING YIELD (%)
2021/02/09 R2037 2037/01/31 8,500 2 200 2 200 8 665 10,380
2021/02/09 R2044 2044/01/31 8,750 2 200 2 200 7 065 10,630
2021/02/16 R2035 2035/02/28 8,875 2 200 2 200 5 055 10,105
2021/02/16 R2040 2040/01/31 9,000 2 200 2 200 4 670 10,580
2021/02/16 R2044 2044/01/31 8,750 2 200 2 200 5 130 10,620
2021/02/23 R2032 2032/03/31 8,250 2 200 2 200 7 650 9,700
2021/02/23 R2037 2037/01/31 8,500 2 200 2 200 6 560 10,700
2021/02/23 R2044 2044/01/31 8,750 2 200 2 200 6 225 10,940
2021/03/02 R186 2026/12/21 10,500 2 200 2 200 4 920 7,230
2021/03/02 R2032 2032/03/31 8,250 2 200 2 200 4 770 9,680
2021/03/02 R2037 2037/01/31 8,500 2 200 2 200 5 110 10,545
2021/03/09 R213 2031/02/28 7,000 2 200 2 200 4 945 9,670
2021/03/09 R2035 2035/02/28 8,875 2 200 2 200 3 335 10,825
2021/03/09 R2040 2040/01/31 9,000 2 200 2 200 3 265 11,170
2021/03/16 R186 2026/12/21 10,500 2 200 2 200 5 960 7,380
2021/03/16 R2030 2030/01/31 8,000 2 200 2 200 4 945 9,230
2021/03/16 R2035 2035/02/28 8,875 2 200 2 200 3 695 10,810
2021/03/23 R2030 2030/01/31 8,000 2 200 2 200 3 645 9,500
2021/03/23 R213 2031/02/28 7,000 2 200 2 200 3 565 9,990
2021/03/23 R2032 2032/03/31 8,250 2 200 2 200 3 645 10,400
2021/03/30 R2037 2037/01/31 8,500 1 600 1 600 4 385 11,330
2021/03/30 R2044 2044/01/31 8,750 1 600 1 600 3 940 11,545
2021/03/30 R2048 2048/02/28 8,750 1 600 1 600 3 270 11,500

7. Annexures | continued
65
DEBT MANAGEMENT
REPORT
2020/21
ANNEXURE G: SUMMARY OF INFLATION-LINKED BOND AUCTIONS, 2020/21
ISSUE DATE
BOND CODE
MATURITY COUPON(%) OFFER AMOUNT
(R'M)
ALLOCATED AMOUNT
(R'M)
BIDS RECEIVED
(R'M)
CLEARING YIELD(%)
2020/04/03 R212 2022/01/11 2,750 1040 650 1 650 2,500
2020/04/03 I2025 2025/01/31 2,000 310 845 4,300
2020/04/03 I2050 2050/12/31 2,500 80 1 980 4,450
2020/04/17 I2025 2025/01/31 2,000 1040 400 1 610 3,850
2020/04/17 I2038 2038/01/31 2,250 150 680 4,000
2020/04/17 I2050 2050/12/31 2,500 490 1 230 4,100
2020/04/24 I2033 2033/03/28 1,875 1040 605 955 4,450
2020/04/24 I2038 2038/01/31 2,250 205 755 4,470
2020/04/24 I2046 2046/03/31 2,500 230 710 4,550
2020/05/08 I2025 2025/01/31 2,000 1040 160 640 3,840
2020/05/08 I2046 2046/03/31 2,500 380 820 4,200
2020/05/08 I2050 2050/12/31 2,500 500 1 350 4,230
2020/05/15 I2033 2033/03/28 1,875 1400 470 750 4,520
2020/05/15 I2038 2038/01/31 2,250 485 975 4,600
2020/05/15 I2050 2050/12/31 2,500 445 1 010 4,650
2020/05/22 I2025 2025/01/31 2,000 1400 555 645 3,800
2020/05/22 I2038 2038/01/31 2,250 445 845 4,660
2020/05/22 I2050 2050/12/31 2,500 400 920 4,680
2020/05/29 I2025 2025/01/31 2,000 1400 410 940 3,790
2020/05/29 I2038 2038/01/31 2,250 630 1 665 4,580
2020/05/29 I2046 2046/03/31 2,500 360 1 390 4,610
2020/06/05 I2029 2029/03/31 1,875 1400 250 1 185 4,150
2020/06/05 I2038 2038/01/31 2,250 460 795 4,570
2020/06/05 I2050 2050/12/31 2,500 690 755 4,650
2020/06/12 I2025 2025/01/31 2,000 1400 500 580 3,720
2020/06/12 I2033 2033/03/28 1,875 645 1 130 4,440
2020/06/12 I2046 2046/03/31 2,500 255 865 4,585
2020/06/19 I2025 2025/01/31 2,000 1400 505 555 3,750
2020/06/19 I2038 2038/01/31 2,250 640 1 460 4,560
2020/06/19 I2050 2050/12/31 2,500 255 490 4,610
2020/06/26 I2025 2025/01/31 2,000 1400 590 1 150 3,820

66
7. Annexures | continued
DEBT MANAGEMENT REPORT
2020/21
ISSUE DATE
BOND CODE
MATURITY COUPON(%) OFFER AMOUNT
(R'M)
ALLOCATED AMOUNT
(R'M)
BIDS RECEIVED
(R'M)
CLEARING YIELD(%)
2020/06/26 I2038 2038/01/31 2,250 305 580 4,580
2020/06/26 I2050 2050/12/31 2,500 505 720 4,660
2020/07/03 I2029 2029/03/31 1,875 2000 100 720 4,310
2020/07/03 I2038 2038/01/31 2,250 700 895 4,760
2020/07/03 I2046 2046/03/31 2,500 765 960 4,820
2020/07/10 I2025 2025/01/31 2,000 2000 500 800 3,980
2020/07/10 I2038 2038/01/31 2,250 745 955 4,950
2020/07/10 I2050 2050/12/31 2,500 755 1 395 4,970
2020/07/17 I2029 2029/03/31 1,875 2000 620 1 665 4,450
2020/07/17 I2038 2038/01/31 2,250 640 1 135 4,910
2020/07/17 I2046 2046/03/31 2,500 740 2 340 4,920
2020/07/24 I2025 2025/01/31 2,000 2000 725 2 075 3,810
2020/07/24 I2046 2046/03/31 2,500 685 1 190 4,910
2020/07/24 I2050 2050/12/31 2,500 590 1 195 4,925
2020/07/31 I2025 2025/01/31 2,000 2000 900 2 545 3,730
2020/07/31 I2033 2033/03/28 1,875 600 1 575 4,800
2020/07/31 I2046 2046/03/31 2,500 500 1 330 4,930
2020/08/07 I2029 2029/03/31 1,875 2000 860 1 670 4,410
2020/08/07 I2046 2046/03/31 2,500 600 1 170 4,870
2020/08/07 I2050 2050/12/31 2,500 540 1 125 4,850
2020/08/14 I2025 2025/01/31 2,000 2 000 770 2 740 3,450
2020/08/14 I2038 2038/01/31 2,250 605 1 915 4,780
2020/08/14 I2046 2046/03/31 2,500 610 1 865 4,840
2020/08/21 I2025 2025/01/31 2,000 2 000 665 2 530 3,350
2020/08/21 I2033 2033/03/28 1,875 680 1 705 4,570
2020/08/21 I2046 2046/03/31 2,500 655 2 060 4,780
2020/08/28 I2025 2025/01/31 2,000 2 000 700 2 025 2,950
2020/08/28 I2038 2038/01/31 2,250 610 930 4,580
2020/08/28 I2046 2046/03/31 2,500 690 1 330 4,640
2020/09/04 I2025 2025/01/31 2,000 2 000 870 2 185 2,750
2020/09/04 I2038 2038/01/31 2,250 405 500 4,530
ANNEXURE G: SUMMARY OF INFLATION-LINKED BOND AUCTIONS, 2020/21

7. Annexures | continued
67
DEBT MANAGEMENT
REPORT
2020/21
ISSUE DATE
BOND CODE
MATURITY COUPON(%) OFFER AMOUNT
(R'M)
ALLOCATED AMOUNT
(R'M)
BIDS RECEIVED
(R'M)
CLEARING YIELD(%)
2020/09/04 I2046 2046/03/31 2,500 725 1 320 4,535
2020/09/11 I2038 2038/01/31 2,250 2 000 660 950 4,630
2020/09/11 I2046 2046/03/31 2,500 640 705 4,670
2020/09/11 I2050 2050/12/31 2,500 700 845 4,670
2020/09/18 I2025 2025/01/31 2,000 1 915 200 200 2,800
2020/09/18 I2038 2038/01/31 2,250 800 800 4,690
2020/09/18 I2050 2050/12/31 2,500 915 915 4,700
2020/09/25 I2029 2029/03/31 1,875 2 000 690 910 4,150
2020/09/25 I2038 2038/01/31 2,250 690 1 115 4,800
2020/09/25 I2046 2046/03/31 2,500 620 1 140 4,840
2020/10/02 I2025 2025/01/31 2,000 2 000 365 490 3,040
2020/10/02 I2029 2029/03/31 1,875 540 965 4,250
2020/10/02 I2046 2046/03/31 2,500 1 095 1 360 4,850
2020/10/09 I2025 2025/01/31 2,000 2 000 395 395 3,045
2020/10/09 I2038 2038/01/31 2,250 1 030 1 660 4,820
2020/10/09 I2046 2046/03/31 2,500 575 1 325 4,800
2020/10/16 I2029 2029/03/31 1,875 2 000 700 1 010 4,180
2020/10/16 I2038 2038/01/31 2,250 650 905 4,820
2020/10/16 I2050 2050/12/31 2,500 650 1 120 4,800
2020/10/23 I2025 2025/01/31 2,000 2 000 75 75 3,000
2020/10/23 I2033 2033/03/28 1,875 955 4 690 4,730
2020/10/23 I2046 2046/03/31 2,500 970 4 820 4,850
2020/10/30 I2025 2025/01/31 2,000 2 000 120 3 010 3,020
2020/10/30 I2033 2033/03/28 1,875 940 4 750 4,780
2020/10/30 I2050 2050/12/31 2,500 940 4 870 4,930
2020/11/06 I2029 2029/03/31 1,875 2 000 615 2 965 4,230
2020/11/06 I2038 2038/01/31 2,250 775 2 970 4,840
2020/11/06 I2046 2046/03/31 2,500 610 1 570 4,910
2020/11/13 I2025 2025/01/31 2,000 2 000 695 1 500 2,750
2020/11/13 I2038 2038/01/31 2,250 660 1 160 4,670
2020/11/13 I2050 2050/12/31 2,500 520 520 4,740
ANNEXURE G: SUMMARY OF INFLATION-LINKED BOND AUCTIONS, 2020/21

68
7. Annexures | continued
DEBT MANAGEMENT REPORT
2020/21
ISSUE DATE
BOND CODE
MATURITY COUPON(%) OFFER AMOUNT
(R'M)
ALLOCATED AMOUNT
(R'M)
BIDS RECEIVED
(R'M)
CLEARING YIELD(%)
2020/11/20 I2029 2029/03/31 1,875 2 000 295 695 4,100
2020/11/20 I2033 2033/03/28 1,875 765 1 230 4,660
2020/11/20 I2046 2046/03/31 2,500 940 1 465 4,780
2020/11/27 I2025 2025/01/31 2,000 2 000 205 595 2,670
2020/11/27 I2033 2033/03/28 1,875 830 1 260 4,690
2020/11/27 I2038 2038/01/31 2,250 965 2 015 4,765
2020/12/04 I2029 2029/03/31 1,875 2 000 605 2 155 4,080
2020/12/04 I2033 2033/03/28 1,875 785 1 010 4,650
2020/12/04 I2046 2046/03/31 2,500 610 1 610 4,720
2020/12/11 I2025 2025/01/31 2,000 2 000 670 1 550 2,430
2020/12/11 I2033 2033/03/28 1,875 690 1 220 4,360
2020/12/11 I2046 2046/03/31 2,500 640 1 185 4,380
2020/12/18 I2025 2025/01/31 2,000 2 000 615 990 2,470
2020/12/18 I2038 2038/01/31 2,250 490 580 4,400
2020/12/18 I2050 2050/12/31 2,500 665 665 4,430
2021/01/15 I2025 2025/01/31 2,000 2 000 1 250 2 500 2,510
2021/01/15 I2038 2038/01/31 2,250 320 355 4,450
2021/01/15 I2046 2046/03/31 2,500 430 680 4,510
2021/01/22 I2025 2025/01/31 2,000 2 000 745 780 4,450
2021/01/22 I2029 2029/03/31 1,875 885 1 705 3,840
2021/01/22 I2050 2050/12/31 2,500 370 685 4,480
2021/01/29 I2025 2025/01/31 2,000 2 000 1 250 2 180 2,355
2021/01/29 I2038 2038/01/31 2,250 350 775 4,390
2021/01/29 I2046 2046/03/31 2,500 350 660 4,450
2021/02/05 I2025 2025/01/31 2,000 2 000 330 330 2,250
2021/02/05 I2033 2033/03/28 1,875 275 375 4,180
2021/02/05 I2050 2050/12/31 2,500 1 105 1 205 4,350
2021/02/12 I2029 2029/03/31 1,875 2 000 790 1 385 3,560
2021/02/12 I2038 2038/01/31 2,250 375 545 4,220
2021/02/12 I2046 2046/03/31 2,500 450 865 4,280
2021/02/19 I2029 2029/03/31 1,875 2 000 1 100 1 140 3,440
ANNEXURE G: SUMMARY OF INFLATION-LINKED BOND AUCTIONS, 2020/21

7. Annexures | continued
69
DEBT MANAGEMENT
REPORT
2020/21
ISSUE DATE
BOND CODE
MATURITY COUPON(%) OFFER AMOUNT
(R'M)
ALLOCATED AMOUNT
(R'M)
BIDS RECEIVED
(R'M)
CLEARING YIELD(%)
2021/02/19 I2033 2033/03/28 1,875 255 290 4,070
2021/02/19 I2050 2050/12/31 2,500 465 570 4,270
2021/02/26 I2033 2033/03/28 1,875 2 000 285 435 3,950
2021/02/26 I2038 2038/01/31 2,250 425 425 4,220
2021/02/26 I2046 2046/03/31 2,500 310 520 4,170
2021/03/05 I2029 2029/03/31 1,875 2 000 185 295 3,580
2021/03/05 I2038 2038/01/31 2,250 45 45 4,180
2021/03/05 I2050 2050/12/31 2,500 150 350 4,300
2021/03/12 I2029 2029/03/31 1,875 2 000 310 310 3,550
2021/03/12 I2033 2033/03/28 1,875 340 570 4,200
2021/03/12 I2046 2046/03/31 2,500 1 025 1 190 4,320
2021/03/19 I2029 2029/03/31 1,875 2 000 215 365 3,530
2021/03/19 I2038 2038/01/31 2,250 680 730 4,290
2021/03/19 I2050 2050/12/31 2,500 865 1 080 4,280
2021/03/26 I2033 2033/03/28 1,875 2000 60 180 3,930
2021/03/26 I2038 2038/01/31 2,250 700 710 4,290
2021/03/26 I2046 2046/03/31 2,500 525 525 4,270
ANNEXURE G: SUMMARY OF INFLATION-LINKED BOND AUCTIONS, 2020/21

70
7. Annexures | continued
DEBT MANAGEMENT REPORT
2020/21
ANNEXURE H: GLOSSARY
Auction A process in which participants can submit bids to purchase a given amount of a good or
service at a specific price.
Bid-to-cover ratio A ratio used to express the demand for a particular security during auctions. It is calculated by
dividing the total amount of bids received by the total amount of bids accepted.
Benchmark bond A bond that provides a standard against which the performance of other bonds can be
measured. Government bonds are almost always used as benchmark bonds.
Bond A certificate of debt issued by a government or corporation guaranteeing payment of the
original investment plus interest on a specified future date.
Contingent liabilities A government obligation that will only result in expenditure if a specific event occurs, such
as a default by a state-owned company which results in government being called on to meet
the obligation.
Coupon (bond) The periodic interest payment made to bondholders during the life of a bond. Interest is
usually paid twice a year.
DMTN A Domestic Medium-Term Note (DMTN) programme is a debt issuance note programme
registered with a securities exchange and continuously offered to investors through a
dealer. Notes and bonds can range between 1 and 30 years in maturity. A DMTN programme
allows an issuer to tailor its debt issuance to meet its financing needs over time.
GMTN A Global Medium-Term Note (GMTN) programme is a debt issuance note programme
registered with international securities exchanges and continuously offered to investors
through a trust. Notes and bonds can range between 1 and 30 years in maturity. A GMTN
programme allows a company to tailor its debt issuance to meet its financing needs over time.
Liquidity Ease of converting an asset into cash.
Perpetual bond A bond with no maturity date.
Primary dealer A firm that buys government securities directly from a government with the intention of
reselling them to others, thus acting as a market maker for the securities.
Primary listing The main exchange on which a stock is listed.
Provisions Liabilities for which the payment date or amount is uncertain. The provisions for multilateral
institutions are the unpaid portion of government’s subscription to these institutions, payable
on request.
Public debt All money owed at any given time by any branch of government. Also referred to as
government debt.

7. Annexures | continued
71
DEBT MANAGEMENT
REPORT
2020/21
Refinancing risk The possibility that a borrower will not be able to refinance by borrowing to repay existing
debt.
Secondary market A market in which an investor purchases a security from another investor rather than from
the issuer, subsequent to the original issuance in the primary market. It is also called the
aftermarket.
Sterilisation deposit Operations by central banks to mitigate potentially undesired effects (currency appreciation
or inflation) of inbound capital. The South African Reserve Bank “sterilises” excess cash created
in the money market when purchasing foreign currency.
STRATE Share Transactions Totally Electronic (STRATE) is the authorised central securities depository
for electronic settlement of financial instruments in South Africa.
Switch programme A liability management exercise where short-term debt is exchanged for long-term debt. The
purpose is to reduce near-term exposure to refinancing risk by exchanging short-term debt
for long-term debt.
Tenor The amount of time left for the redemption of a bond.
Three-legged bond A bond with three maturities and priced on the middle maturity (second leg); all maturities
have the same price. Investors are given the option to split the bond into three maturities two
years before the maturity of the first leg.
Yield A financial return or interest paid to buyers of bonds. The yield takes into account the total of
annual interest payments, the purchase price, the redemption value and the amount of time
remaining until maturity.
Yield curve A graph showing the relationship between the yield on bonds of the same credit quality but
different maturity at a given point in time.

72
7. Annexures | continued
DEBT MANAGEMENT REPORT
2020/21
ANNEXURE I: ACRONYMS
CFI Cooperative financial institution
CPD Corporation for Public Deposits
DMTN Domestic Medium-Term Note
ETP Electronic trading platform
Fitch Fitch Ratings
FRN Floating-rate note
GDP Gross Domestic Product
GMTN Global Medium-Term Note
IMF International Monetary Fund
JSE Johannesburg Stock Exchange
Moody’s Moody’s Investors Service
MPC Monetary Policy Committee
MTBPS Medium Term Budget Policy Statement
R&I Rating and Investment Information, Inc.
Repo Repurchase
RSA Republic of South Africa
S&P S&P Global Ratings
SARB South African Reserve Bank
SOC State-owned company
STRATE Share Trading Transactions Totally Electronic
US United States
WCF Weighted cost of funding


DEBT MANAGEMENT REPORT
2019/20
Private Bag X115, Pretoria, 0001 | 40 Church Square, Pretoria, 0002
Tel: +27 12 315 5944 | Fax: +27 12 406 9055
www.treasury.gov.za