daugavpils universitātes 60. starptautiskās zinātniskās ...
458
DAUGAVPILS UNIVERSITĀTES 60. STARPTAUTISKĀS ZINĀTNISKĀS KONFERENCES PROCEEDINGS OF RAKSTU KRĀJUMS THE 60 th INTERNATIONAL SCIENTIFIC CONFERENCE OF DAUGAVPILS UNIVERSITY 1 DAUGAVPILS UNIVERSITĀTE DAUGAVPILS UNIVERSITY DAUGAVPILS UNIVERSITĀTES ZINĀTŅU DAĻA SCIENCE DEPARTMENT OF DAUGAVPILS UNIVERSITY DAUGAVPILS UNIVERSITĀTES JAUNO ZINĀTNIEKU ASOCIĀCIJA DAUGAVPILS UNIVERSITY ASSOCIATION OF YOUNG RASEARCHERS DAUGAVPILS UNIVERSITĀTES 60. STARPTAUTISKĀS ZINĀTNISKĀS KONFERENCES RAKSTU KRĀJUMS PROCEEDINGS OF THE 60 th INTERNATIONAL SCIENTIFIC CONFERENCE OF DAUGAVPILS UNIVERSITY A. DAĻA. DABASZINĀTNES PART A. NATURAL SCIENCES DAUGAVPILS UNIVERSITĀTE AKADĒMISKAIS APGĀDS „SAULE” 2018
-
Upload
khangminh22 -
Category
Documents
-
view
1 -
download
0
Transcript of daugavpils universitātes 60. starptautiskās zinātniskās ...

DAUGAVPILS UNIVERSITĀTES 60. STARPTAUTISKĀS ZINĀTNISKĀS KONFERENCES PROCEEDINGS OF
RAKSTU KRĀJUMS THE 60th INTERNATIONAL SCIENTIFIC CONFERENCE OF DAUGAVPILS UNIVERSITY
1
DAUGAVPILS UNIVERSITĀTE DAUGAVPILS UNIVERSITY
DAUGAVPILS UNIVERSITĀTES ZINĀTŅU DAĻA
SCIENCE DEPARTMENT OF DAUGAVPILS UNIVERSITY
DAUGAVPILS UNIVERSITĀTES JAUNO ZINĀTNIEKU ASOCIĀCIJA DAUGAVPILS UNIVERSITY ASSOCIATION OF YOUNG RASEARCHERS
DAUGAVPILS UNIVERSIT ĀTES 60. STARPTAUTISKĀS ZINĀTNISKĀS KONFERENCES RAKSTU KRĀJUMS
PROCEEDINGS OF THE 60th INTERNATIONAL SCIENTIFIC CONFERENCE
OF DAUGAVPILS UNIVERSITY
A. DAĻA. DABASZINĀTNES
PART A. NATURAL SCIENCES
DAUGAVPILS UNIVERSITĀTE AKADĒMISKAIS APGĀDS „SAULE”
2018
DAUGAVPILS UNIVERSITĀTES 60. STARPTAUTISKĀS ZINĀTNISKĀS KONFERENCES PROCEEDINGS OF
RAKSTU KRĀJUMS THE 60th INTERNATIONAL SCIENTIFIC CONFERENCE OF DAUGAVPILS UNIVERSITY
2
Apstiprināts Daugavpils Universitātes Zinātnes padomes sēdē 2019. gada 16. janvārī, protokols Nr. 1. / Approved in the meeting of Daugavpils University Science Council on January 16, 2019; minutes No 1.
Kokina I., red. Daugavpils Universitātes 60. starptautiskās zinātniskās konferences rakstu krājums. A. daļa “Dabas zinātnes” = Proceedings of the 60th International Scientific Conference of Daugavpils University. Part A “Natural Sciences”. Daugavpils: Daugavpils Universitāte, 2018.
Daugavpils Universitātes 60. starptautiskās zinātniskās konferences Programmas komiteja / Programme Committee of
the 60th International Scientific Conference of Daugavpils University
Dr.biol., prof. Arvīds Barševskis (Daugavpils University, Latvia, Chairman of Scientific Committee) Dr. philol., prof. Maija Burima (Daugavpils University, Latvia, Vice Chairman) Dr. biol., prof. Ingrīda Šauliene (Siauliai University, Lithuania) Dr., assist. prof. Detlev Lindau-Bank (University of Vechta, Germany) PhD, asoc. prof. Enne Koresaare (University of Tartu, Estonia) PhD, prof. Yesudas Choondassery (Berkeley College, ASV) Dr. hum., prof. Genovaitė Kačiuškienė (Siauliai University, Lithuania) Dr. habil. philol., prof. Ina Druviete (University of Latvia) Dr. hab., prof. nadzw. Jakub Bartoszewski (State University of Applied Sciences in Konin, Poland) PhD, prof. Ulla Harkonen (Joensuu University, Finland) Dr. paed., prof. Małgorzata Suswillo (University of Varmia and Mazuri in Olsztyn, Poland) Dr. habil. sc. ing., prof. Sławomir Partycki (The John Paul II Catholic University of Lublin, Poland) Dr. oec., prof. Alena Vankevich (Vitebsk State University of Technology, Belarus) PhD, prof. Geoffrey R.Swain (University of Glasgow, United Kingdom) Dr. habil. biol., prof. Yarosław Sklodowski (Warsaw University of Life Sciences, Poland) Dr. habil. art., prof. Romualdas Apanavičius (Vytautas Magnus University, Lithuania) Dr. habil. art., prof. Ludmila Kazantseva (Astrakhan Conservatory and Volgograd Institute of Art and Culture, Russia) Dr. habil. oec. Manuela Tvaronavičiene (The General Jonas Žemaitis Military Academy of Lithuania, Lithuania) Dr. habil. sc. soc., prof. Antanas Makštutis (The General Jonas Žemaitis Military Academy of Lithuania, Lithuania) Dr. habil. philol., prof. emeritus Fjodors Fjodorovs (Daugavpils University, Latvia) Dr. philol., prof. Vilma Šaudiņa (Daugavpils University, Latvia) Dr. habil. philol., prof. Zaiga Ikere (Daugavpils University, Latvia) Dr. hist., prof. Aleksandrs Ivanovs (Daugavpils University, Latvia) Dr. hist., prof. Irēna Saleniece (Daugavpils University, Latvia) Dr. paed., prof. Elfrīda Krastiņa (Daugavpils University, Latvia) Dr. habil. paed., Dr. habil. psych., prof. Aleksejs Vorobjovs (Daugavpils University, Latvia) Dr. sc. soc., prof. Vladimirs Meņšikovs (Daugavpils University, Latvia) Dr. phys., prof. Valfrīds Paškevičs (Daugavpils University, Latvia) Dr. biol., prof. Artūrs Škute (Daugavpils University, Latvia) Dr. biol., prof. Inese Kokina (Daugavpils University, Latvia) Dr. phys., prof. Edmunds Tamanis (Daugavpils University, Latvia) Dr. art., prof. Ēvalds Daugulis (Daugavpils University, Latvia) Dr. iur., prof. Vitolds Zahars (Daugavpils University, Latvia) PhD, prof. Dzintra Iliško (Daugavpils University, Latvia) Dr. theol. prof. Anita Stašulāne (Daugavpils University, Latvia) Dr. psych., prof. Irēna Kokina (Daugavpils University, Latvia) Dr. paed., prof. Jeļena Davidova (Daugavpils University, Latvia) Dr. paed., asoc. prof. Edgars Znutiņš (Daugavpils University, Latvia)
Daugavpils Universitātes 60. starptautiskās zinātniskās konferences Rīcības komiteja / Organizing Committee of
the 60th International Scientific Conference of Daugavpils University
Maija Burima (Chairperson of Organizing Committee) Eva Kasparenoka (Vice Chairman) Zeltīte Barševska, Žans Badins, Juris Soms, Uldis Valainis, Kristīna Aksjuta, Diāna Ozola, Kristīne Bule, Valērijs Dombrovskis, Ilze Meldere, Zaiga Lāce, Miervaldis Mendriks, Laura Vilcāne
DAUGAVPILS UNIVERSITĀTES 60. STARPTAUTISKĀS ZINĀTNISKĀS KONFERENCES PROCEEDINGS OF
RAKSTU KRĀJUMS THE 60th INTERNATIONAL SCIENTIFIC CONFERENCE OF DAUGAVPILS UNIVERSITY
3
Daugavpils Universitātes 60. starptautiskās zinātniskās konferences rakstu krājuma redkolēģija / Editorial staff of
the 60th International Scientific Conference of Daugavpils University
Dr. psych., prof. Irēna Kokina – redaktore / editor Dr. oec, doc. Ludmila Aleksejeva Dr. biol., doc. Līga Antoņeviča Dr.art., Mg. paed., doc., pētn. Zeltīte Barševska Dr. biol., prof. Arvīds Barševskis Mg. biol., lekt. Jeļena Buiko Dr. philol., prof. Maija Burima Dr. oec, doc. Aina Čaplinska Dr. paed., prof. Jeļena Davidova Dr. psych., asoc.prof. Valērijs Dombrovskis PhD, pētn. Ilona Fjodorova PhD, prof. Dzintra Iliško Dr. hist, prof. Aleksandrs Ivanovs Dr. chem., doc. Jeļena Kirilova Dr. biol., prof. Inese Kokina Dr. paed., pētn. Mārīte Kravale-Pauliņa Dr. iur., doc. Anatolijs Kriviņš Dr. philol., doc. Ingrīda Kupšāne Mg. art., Mg. paed., lekt. Ilze Meldere Dr. phys., prof. Valfrīds Paškevičs Dr. iur. doc. Jānis Radionovs Dr. hist, prof. Irēna Saleniece Dr. paed., pētn. Astrīda Skrinda Mg. vid. plān., lekt. Anastasija Smoļakova Dr. hist, asoc. prof. Henrihs Soms Dr. geol., asoc. prof. Juris Soms Dr. iur., prof. Vitolds Zahars Dr. paed., pētn. Gaļina Zavadska
Atbildīgās par izdevumu / Responsible for the Edition Olita Miglāne ([email protected]) Anna Vanaga ([email protected]) ISSN 2500-9842 ISSN 2500-9850 © Daugavpils Universitāte, 2018 ISBN 978-9984-14-863-2 © Daugavpils Universitātes Jauno zinātnieku asociācija, 2018
DAUGAVPILS UNIVERSITĀTES 60. STARPTAUTISKĀS ZINĀTNISKĀS KONFERENCES PROCEEDINGS OF
RAKSTU KRĀJUMS THE 60th INTERNATIONAL SCIENTIFIC CONFERENCE OF DAUGAVPILS UNIVERSITY
4
Daugavpils Universitātē docētāju un studējošo zinātniskās konferences notiek kopš 1958. gada. Konferencēm ir starpdisciplinārs raksturs un tajās piedalās gan studējošie, gan docētāji, gan arī ievērojami zinātnieki no dažādām pasaules valstīm. Daugavpils Universitātes 60. starptautiskās zinātniskās konferences pētījumu tematika bija ļoti plaša – eksaktās, humanitārās, izglītības, mākslas un sociālo zinātņu jomās.
Zinātnisko rakstu krājumā Daugavpils Universitātes 60. starptautiskās zinātniskās konferences rakstu krājums = Proceedings of the 60th International Scientific Conference of Daugavpils University apkopoti 2018. gada 26.–27. aprīlī konferencē prezentētie materiāli.
Daugavpils Universitātes 60. starptautiskās zinātniskās konferences rakstu krājums tiek publicēts 3 daļās: A. daļa. Dabaszinātnes; B. daļa. Sociālās zinātnes; C. daļa. Humanitārās zinātnes.
The annual scientific conferences at Daugavpils University have been organized since 1958.
The themes of research presented at the conferences cover all spheres of life. Due to the facts that the conference was of interdisciplinary character and that its participants were students and outstanding scientists from different countries, the subjects of scientific investigations were very varied – in the domains of exact sciences, the humanities, education, art and social sciences.
The results of scientific investigations presented during the conference are collected in the collection of scientific articles Proceedings of the 60th International Scientific Conference of Daugavpils University.
Proceedings of the 60th International Scientific Conference of Daugavpils University are published in three parts: part A. Natural sciences; part B. Social Sciences; part C. Humanities.

DAUGAVPILS UNIVERSITĀTES 60. STARPTAUTISKĀS ZINĀTNISKĀS KONFERENCES PROCEEDINGS OF
RAKSTU KRĀJUMS THE 60th INTERNATIONAL SCIENTIFIC CONFERENCE OF DAUGAVPILS UNIVERSITY
5
SATURS / CONTENTS
FIZIKA / PHYSICS
Amosov Alexey, Kuprikov Mikhail
THEORY OF CURVILINEAR MOTION OF MULTI-LINK ROAD TRAINS 9
MATEM ĀTIKA / MATHEMATICS
Anna Amosova THE MANAGEMENT CONCEPT OF NORMATIVE-BACKGROUND INFORMATION IN PROCESSES OF CONTRUCTURE-TECHNOLOGICAL PROJECTING OF ROCKET-SPACE TECHNOLOGY COMPONENTS
16
DABAS AIZSARDZ ĪBA UN VIDES PĀRVALD ĪBA / NATURE PROTECTION AND ENVIRONMENTAL MANAGEMENT
Evita Muizniece-Treija
DISTRIBUTION OF ODORS CAUSED BY POLLUTANT ACTIVITY AND RELATED PROBLEMS IN RIGA
23
Zanda Penēze, Alīna Helde
FACTORS INFLUENCING USE OF AGRICULTURAL LANDS IN MARGINAL TERRITORIES OF NORTHWEST LATVIA
33
KVART ĀRVIDES PĒTĪJUMI / RESEARCHES OF QUARTERNARY ENVIRONMENT
Janis Krumins, Maris Klavins, Laimdota Kalnina
CONCEPTUAL DIFFERENCES BETWEEN FEN AND RAISED BOG PEAT 45
VESELĪBAS ZINĀTNES / HEALTHY SCIENCES
Zanda Arājuma, Leila Geibijeva, Ritvars Kalniņš, Juris Dzenis
COMPARISON OF STROKE RISK FACTORS BETWEEN PATIENTS WITH DIFFERENT LEVEL OF PHYSICAL ACTIVITIES
53
Zanda Arājuma, Elīza Liepiņa, Juris Dzenis
INTRACEREBRAL HEMATOMA SCORE IN LATVIAN PATIENTS 60
Kateryna Bulavkina, Laima Caunīte
CARDIOVASCULAR RISK FACTORS IN PATIENTS UNDERGOING
PERCUTANEOUS CORONARY ANGIOPLASTY IN LATVIAN CARDIOLOGY
CENTER
63
Santa Borisāne, Jekaterina Avdotina, Aleksandra Mežecka, Evija Miglāne
AN ACUTE CEREBRAL INFARCTION LESION SIZE CORRELATION WITH CLINICAL OUTCOMES IN PATIENTS WITHOUT DOCUMENTED ARTERIAL OCCLUSION
71
Gundega Ķauķe, Zane Ozolniece, Sofja Kauškale, Vita Lāčplēse
CLINICAL OUTCOMES OF PATIENTS WITH ACUTE POSTERIOR CIRCULATION CEREBRAL INFARCTION
79
Gundega Ķauķe, Zane Ozolniece, Sofja Kauškale, Gundega Akuratere
CLINICAL PRESENTATION OF ACUTE POSTERIOR CIRCULATION CEREBRAL INFARCTION: AN ASSOCIATION WITH NEUROIMAGING FINDINGS
86
Beāta Zaļaiskalna, Artūrs Miksons
CORRELATION BETWEEN EMOTIONAL SUPPORT IN SPOUSAL RELATIONSHIPS AND ANXIETY LEVELS IN PRETERM INFANT MOTHERS
92
Dagnija Brutāne SELF-MANAGEMENT APPROACH IN CARE OF PATIENT WITH CHRONIC LOWER BACK PAIN
98
DAUGAVPILS UNIVERSITĀTES 60. STARPTAUTISKĀS ZINĀTNISKĀS KONFERENCES PROCEEDINGS OF
RAKSTU KRĀJUMS THE 60th INTERNATIONAL SCIENTIFIC CONFERENCE OF DAUGAVPILS UNIVERSITY
6
Elīza Avotiņa, Viktorija Ma ļugina
EVALUATION OF THE EFFICACY OF WET AGE-RELATED MACULAR DEGENERATION TREATMENT BETWEEN THREE DIFFERENT AGE GROUPS
103
Anda Arbidāne, Gunta Sumeraga
DO WEATHER VARIABLES HAVE AN INFLUENCE ON NUMBER OF EPISTAXIS VISITS? A RETROSPECTIVE STUDY
110
Deniss Moisejevs THE COMPARISON OF CARPAL TUNNEL SYNDROME IN BOWED STRING INSTRUMENT TEACHERS AND PLUCKED STRING INSTRUMENT TEACHERS AND MUSICIANS IN LATVIA
119
Darja Nesterovica MUSCULOSKELETAL OVERUSE INJURY PREVALENCE AND COMFORT PERCEPTION OF MILITARY BOOTS
123
Oļegs Ribakovs, Deniss Anufrijevs
THE ANALYSIS OF FACTORS INFLUENCING ANKLE TRAUMAS AMONG VOLLEYBALL PLAYERS IN LATVIA AT THE AGE 15–30 YEARS
129
Aleksandra Borovika, Gunta Sumeraga
TASTE DISORDERS AFTER TONSILLECTOMY 132
Jūlija Pozņaka, Sabīne Grīnberga
COMPUTER VISION SYNDROME PREVALENCE AND ASSOCIATED RISK FACTORS AMONG THE MEDICAL STUDENTS AT R ĪGA STRADIŅŠ UNIVERSITY
137
Anna Krīgere, Linda Mežmale, Aija Žileviča
PREVALENCE OF STAPHYLOCOCCUS AUREUS NASAL AND DERMAL COLONIZATION
142
Aija Stankeviča, Nadežda Vorobjova, Olga Sjomina, Anna Proskurina, Anatolijs Turonoks
STAPHYLOCOCCAL TOXIC SHOCK SYNDROME: A CASE REPORT 151
Linda Mežmale, Anna Krīgere, Aldis Puķītis
TREATMENT APPROACHES OF GASTROESOPHAGEAL REFLUX DISEASE IN GENERAL PRACTICE
158
Vadim Nefjodov, Janis Zarins, Kalvis Pastars, Dzintars Ozols
MICROVASCULAR TISSUE TRANSFER SURGERY: FLAP SURVIVAL ANALYSIS
167
Antons Zakalkins, Sigita Kazūne
PREDICTIVE VALUE OF SIMPLIFIED AIRWAY RISK INDEX FOR DIFFIC ULT VIDEOLARYNGOSCOPIC TRACHEAL INTUBATION
172
Aleksandra Bukina, Anna Mihailova
UREAPLASMA AND MYCOPLASMA INFECTIONS ASSOCIATION WITH DIFFERENT TYPES OF ARTHRITIS
179
Kristiāna Čačka, Evelīna Korsaka, Līga Gaisiņa, Ingūna Lubaua
THE IMPACT OF DOWN SYNDROME ON THE EARLY POSTOPERATIVE PERIOD IN PATIENTS WHO HAD UNDERGONE AVSD CORRECTIVE OPEN HEART SURGERY TILL THREE YEARS OF AGE
187
Ieva Kārkli ņa-Kravale, Iveta Račko, Zane Ābola
INFLUENCE OF SELECTED FACTORS ON THE PROGNOSIS IN NEWBORNS WITH GASTROSCHISIS
192
Vita Lāčplēse, Gundega Akuratere, Gundega Ķauķe, Signe Tomsone
CORRELATION BETWEEN PHYSICAL ACTIVITY AND MENTAL HEALTH OF YOUNG ADULTS
199
Nadīna Paegle, Liene Vītola, Sandra Gintere
POST-VACCINATION REACTIONS: OPINIONS OF PARENTS IN LATVIA AND THEIR RESPONSE IN CASE OF OCCURANCE
207
Lauma Vasiļevska, Ilze Meldere
RECOMMENDATIONS FROM EARLY-ONSET SEPSIS CALCULATOR ON ANTIBIOTIC USE IN NEONATES WITH SUSPECTED INFECTION
215
Sņežana Romaņuka, Vadim Nefjodov
RIGA STRADINS UNIVERSITY MEDICAL STUDENTS KNOWLEDGE ABOUT CHILD VACCINATION AND ITS SUPPORT
223
Alise Lindermane MOST COMMON EXOGENOUS FACTORS AFFECTING PREMATURE SKIN AGING 230
Nadežda Vorobjova, Olga Sjomina, Pjotrs Vorobjovs, Aiga Vasiļvolfa, Ināra Ādamsone
MALNUTRITION IN DAUGAVPILS CHRONIC HEMODIALYSIS PATIENTS 234
DAUGAVPILS UNIVERSITĀTES 60. STARPTAUTISKĀS ZINĀTNISKĀS KONFERENCES PROCEEDINGS OF
RAKSTU KRĀJUMS THE 60th INTERNATIONAL SCIENTIFIC CONFERENCE OF DAUGAVPILS UNIVERSITY
7
Dārta Nīmane, Laura Grava, Igors Solomatins
VISUAL ACUITY AND INTRAOCULAR PRESSURE CHANGES AFTER CONVENTIONAL AND FEMTOSECOND LASER-ASSISTED CATARACT SURGERY
240
Dārta Nīmane, Laura Grava, Mārtiņš Blumbergs, Igors Solomatins, Aīda Macievska
ORTHOKERATOLOGY TO CONTROL MYOPIA PROGRESSION 246
Rita Partojeva, Lita Jēkabsone, Līva Strucinska, Viktorija Serova, Guna Laganovska
CHANGES OF SUBJECTIVE AND OBJECTIVE VISUAL ACUITY AND SYMPTOMS AFTER CATARACT SURGERY
251
Rita Partojeva, Anete Kursīte, Guna Laganovska
THE PREVELENCE OF DEMODEX SPP. IN PATIENTS WITH BLEPHARITIS 257
Lita Jēkabsone, Anete Kursīte, Guna Laganovska
INTRAVITREAL ANTI-VEGF INJECTION IMPACT ON VISUAL ACUITY IN PATIENTS WITH EXUDATIVE AGE-RELATED MACULAR DEGENERATION
265
Monta Baduna, Reinis Pitura, Ilze Apine
INFLUENCE OF AN ENTERIC OSMOTICALLY ACTIVE AGENT ON DIFFUSION ACTIVITY WITHIN FULLY DISTENDED BOWEL WALL – COMPAR ISON BETWEEN MAGNETIC RESONANCE ENTEROGRAPHY DIFFUSION SEQUENCES
271
Olga Demida MYELOMA CELLS IN PERIPHERAL BLOOD AS A PROGNOSTIC FACTOR OF MULTIPLE MYELOMA
278
Olga Jermakova, Larisa Umnova
CONTROL AND MANAGEMENT OF GLYCEMIA IN ACUTELY HOSPITALIZED DIABETES MELLITUS PATIENTS IN SURGERY DEPARTMENT
287
Dairis Meiers, Juris Vanags, Valdis Dakuļs, Guna Laganovska
REFRACTIVE OUTCOME AND IMPROVEMENT OF VISUAL ACUITY AFTER CATARACT SURGERY WITH SUBLUXATED LENSES
292
Agate Lūse, Laura Liepiņa, Gaida Krūmiņa, Roberts Stašinskis
BRAIN MAGNETIC RESONANCE IMAGING, CARBOXYHEMOGLOBIN LEVEL AND NEUROLOGICAL SYMPTOM COMPARISON IN PATIENTS WITH CARBON MONOXIDE POISONING
300
Valdis Dakuļs, Liene Rituma, Dairis Meiers
STRESS LEVELS, MAIN CAUSES OF STRESS AND DOCTOR SUGGESTED IMPROVEMENT IN FAMILY MEDICINE IN LATVIA
307
Valdis Dakuļs DILUTIONAL HYPONATREMIA CAUSED BY PSYCHOGENIC POLYDIPSIA: A CASE REPORT
313
Katrīna Džeriņa MEAN CORPUSCULAR VOLUME AND ASPARTATE AMINOTRANSFERASE LEVEL CHANGES AS PROGNOSTIC ETHANOL ABSTENTION DELIRIUM ASSOCIATED FACTORS FOR PATIENTS IN THE INTENSIVE CARE UNIT
317
Katrīna Džeriņa ILLICIT DRUG WITHDRAWAL DELIRIUM ASSOCIATED CHANGES IN THE LEVELS OF MEAN CORPUSCULAR VOLUME AND ASPARTATE AMINOTRANSFERASE IN THE INTENSIVE CARE UNIT PATIENTS
322
Marta Gēbele THE INCIDENCE OF BURNOUT SYNDROME AMONG YOUTH CENTRE STAFF 329
Lelde Logina, Anete Granovska
COMPARISON OF DEPRESSION AND ANXIETY LEVELS AND PREVALENCE AMONG RIGA STRADINS UNIVERSITY 1ST AND 6TH YEAR MEDICAL FACULTY STUDENTS
333
Jūlija Meščerjakova, Zanda Arājuma, Ņina Šakele, Ņikita Šakels, Santa Stūrīte, Dmitrijs Skicko, Jolanta Kalniņa
DIFFERENCE BETWEEN PATIENTS WITH SPECIFIC THERAPY FOR MULTIPLE SCLEROSIS AND PATIENTS WITH NON-SPECIFIC THERAPY AND THEIR VISION FUNCTIONS
339
Artūrs Pētersons, Alise Visocka, Vladimirs Voicehovskis
DEPRESSION SYMPTOMS IN LATVIAN CARDIOLOGY CENTRE INPATIENTS 344
DAUGAVPILS UNIVERSITĀTES 60. STARPTAUTISKĀS ZINĀTNISKĀS KONFERENCES PROCEEDINGS OF
RAKSTU KRĀJUMS THE 60th INTERNATIONAL SCIENTIFIC CONFERENCE OF DAUGAVPILS UNIVERSITY
8
Evija Tropiņa, Liene Sauša, Zanda Strode
CORRELATION BETWEEN ALEXITHYMIA AND SOMATISATION, ANXIETY, DISTRESS AND DEPRESSION AMOUNG MEDICAL STUDENTS
350
Eva Vanaga EPIDEMIOLOGICAL CHARACTERISTICS AND THERAPY OF STATUS EPILEPTICUS IN PAULS STRADINS CLINICAL UNIVERSITY HOSPITAL FRO M 2012 TO 2016
358
Anete Granovska, Madara Strassere, Lelde Logina
OBSTRUCTIVE SLEEP APNEA RISK CORRELATION WITH GLUCOSE AND HBA1C LEVEL IN TYPE 2 DIABETES PATIENTS IN LATVIA
363
Kaspars Rimicāns, Kristaps Jurjāns, Evija Miglāne, Andrejs Millers, Zanda Priede
PREVALENCE OF NEWLY DIAGNOSED ATRIAL FIBRILLATION AMONG PATIENTS HOSPITALIZED WITH CARDIOEMBOLIC CEREBRAL INFARCTION AT PAULS STRADINS CLINICAL UNIVERSITY HOSPITAL, RI GA, LATVIA IN 2016
369
Elina Silina, Arturs Viksne, Arnis Engelis, Aigars Petersons
THE PROFILE OF CHRONIC OSTEOMYELITIS CASES AFTER ACUTE HAEMATOGENOUS OSTEOMYELITIS IN CHILDREN
377
Aleksandra Mežecka, Jekaterina Avdotina, Santa Borisāne, Nikita Bezborodovs, Nataļja Sitņika
SOCIOECONOMIC STATUS, AGE, GENDER, CHILDREN NUMBER IN THE FAMILY DIFFERENCES ON THE CHILDREN’S DEPRESSION INVENTORY IN CHILDREN (7–17 YEARS OLD) WITH PSYCHIATRIC DISORDERS IN LA TVIA
383
Elīze Brokāne, Vija Veisa
VAGINAL BIRTH AFTER CESAREAN SECTION 390
Violeta Bule THE POTENTIAL BENEFITS OF MALE PARTICIPATION AT CHILDBIRTH 396
Anda Dubra PERINATAL OUTCOMES FROM THE USE OF ANTIEPILEPTIC DRUGS DURING PREGNANCY
405
Linda Rubene THE FREQUENCY OF DEPRESSION AND ANXIETY IN WOMEN OF REPRODUCTIVE AGE WITH PSYCHIATRIC DISORDERS AFTER DELIVERY
408
Liene Rucka, Santa Smilga, Sandija Skribāne, Ilze Meldere
A RARE CASE OF N. PERONEUS DAMAGE AS A COMPLICATION OF BIR TH INJURY
417
Santa Smilga, Liene Rucka, Anna Miskova, Dace Rezeberga, Santa Markova
EVALUATION OF POSTPARTUM ENDOMETRITIS RISK FACTORS 423
Jūlija Grigorjeva, Armands Kāpostiņš, Marija Ševčenko, Artem Kalinin
EVALUATION OF FUNCTIONAL CAPACITY IN DIABETES MELLITUS TYPE 2 PATIENTS WITH PRESERVED LEFT VENTRICULAR EJECTION FRACTION USING SIX MINUTE WALK TEST
428
Tarass Ivascenko, Vladimirs V. Voicehovskis, Julija G. Voicehovska, Andrejs Skesters, Oskars Kalejs, Ketija Apsite, Julija Grigorjeva
GPX AND MDA STRESS MARKERS AND DEPRESSION IN CORONARY HEART DISEASE PATIENTS
436
Lizete Kļaviņa, Beate Ulmane, Lāsma Milgrāve, Gunta Tīcmane
ASSOCIATION OF HBA1C LEVEL WITH LIPID RATIO IN DIABETIC PATI ENTS 441
Olga Muhina THE EFFECT OF CAFFEINE ON TEAR SECRETION, STABILITY AND SYMPTOMS OF DRY EYE
446
Alberts Berziņs, Mara Karakone, Janis Pudulis
TREATMENT OF ATYPICAL VASOVAGAL SYNCOPE, USING DUAL CHAMBER PACEMAKER IMPLANTATION: A CASE REPORT
454
DAUGAVPILS UNIVERSITĀTES 60. STARPTAUTISKĀS ZINĀTNISKĀS KONFERENCES PROCEEDINGS OF
RAKSTU KRĀJUMS THE 60th INTERNATIONAL SCIENTIFIC CONFERENCE OF DAUGAVPILS UNIVERSITY
9
FIZIKA / PHYSICS
THEORY OF CURVILINEAR MOTION OF MULTI-LINK ROAD TRAINS
Amosov Alexey Postgraduate student, Moscow Aviation Institute (National Research University), (Moscow, Russia), [email protected] Kuprikov Mikhail Doctor of Technical Sciences, Head of the Department 904 “Engineering Graphics” Moscow Aviation Institute (National Research University), (Moscow, Russia), [email protected] Abstract
Theory of curvilinear motion of multi-link road tra ins Key Words: transport aggregates, design, motion along a curve, laws of motion, kinematics of turn, dynamics of turn. The improvement of the fit ability in certain requirements is achieved by increasing the agility of long-legged semi-trailers that take the transport aggregates up. We understand the agility of the semitrailer as the qualitative peculiarity of the turning system of the wheels, thanks to which the semitrailer moves on the trajectory while turning, maximally closing to the trajectory of the tractor. It’s necessary to consider that good turning ability of the semi-trailer should be in harmony with the cheap costs, simplicity of the technical realization and high reliability of the turning wheel control system. Aside with the turning ability, one of the most important quality is the course sustainability, on which the component scheme creates a great influence on, mass parameters of the auto train, tire characteristics, that are quite difficult to be varied. Thus, the provision of the good turning ability and course sustainability of the transport aggregates is the technical issue, which could have been solved easily, if certain accurate and producing methods of the influence assessment of the parameters of the controlling system of the tire turning the semi-trails and other characteristics of the details on the way of movement as whole. Modern aggregates are created by the sitting auto trains schemes, that consist of the tractor and one or several semi-trails, and that is why their projecting should include the necessity and the opportunity of the result considering, that were sum up during automobile movement theory and the applied theory of the movement of a road train and other vehicles.
Introduction
The improvement of the fit ability in certain requirements is achieved by increasing the agility
of long-legged semi-trailers that take the transport aggregates up. We understand the agility of the
semitrailer as the qualitative peculiarity of the turning system of the wheels, thanks to which the
semitrailer moves on the trajectory while turning, maximally closing to the trajectory of the tractor.
It’s necessary to consider that good turning ability of the semi-trailer should be in harmony with the
cheap costs, simplicity of the technical realization and high reliability of the turning wheel control
system. Aside with the turning ability, one of the most important quality is the course sustainability,
on which the component scheme creates a great influence on, mass parameters of the auto train, tire
characteristics, that are quite difficult to be varied. Thus, the provision of the good turning ability
and course sustainability of the transport aggregates is the technical issue, which could have been
solved easily, if certain accurate and producing methods of the influence assessment of the
parameters of the controlling system of the tire turning the semi-trails and other characteristics of
the details on the way of movement as whole. Modern aggregates are created by the sitting auto
trains schemes, that consist of the tractor and one or several semi-trails, and that is why their
DAUGAVPILS UNIVERSITĀTES 60. STARPTAUTISKĀS ZINĀTNISKĀS KONFERENCES PROCEEDINGS OF
RAKSTU KRĀJUMS THE 60th INTERNATIONAL SCIENTIFIC CONFERENCE OF DAUGAVPILS UNIVERSITY
10
projecting should include the necessity and the opportunity of the result considering, that were sum
up during automobile movement theory and the applied theory of the movement of a road train and
other vehicles.
General Statements
Among the first works on the turning theory of the vehicles, we can bring here the works of
M. Bergman (1) and Z. Bloch (2). In these works, the graphical method of the details trajectory
building was used. Bloch was noticing the importance of the wide spreading the speeds and
accelerations. It was noted that in order for the point �� of the trailer end with the base �� to move
along the trajectory with the radius ��, the coupling point ��must move along the trajectory with the
radius ���� + ���,and also that the necessary and a sufficient condition for the uniform motion of
the points ��and ��along their trajectories is the coincidence of the centers of curvature of their
trajectories throughout the motion; The latter are concentric circles.
A.Ishlinsky (3) investigated in his work the process of changing the angle of folding in cases
where the point of the coupling moves along a straight line, a circle, and an arbitrary curve. He
noted that when the coupling point moves along an arbitrary curve, the equation for the folding
angle in the path function is reduced to the general Riccati equation.
A simple and sufficiently accurate graphical method for constructing the trajectories of trailed
links was proposed by G. Terekov (16). However, it should be noted that the graphical method for
constructing trajectory trains of a road train during turning is practically inapplicable for evaluating
various ways of steering the turn, and also in determining the influence of the parameters of the
steering systems on the rotation of wheels on the character of the shaping of the trajectories of the
links.
Among the first most extensive works on the theory of the motion of road trains are the works
of Ya. Zakin. (17-22)
When developing the questions of the kinematics of turning the road train to account for the
driving regimes and assessing their impact on maneuverability, this author introduced the concept
of the regime of the turning ratio , which is the ratio of the angular velocity of the which is the
steering wheels of the tractor to the translational speed of its driving wheel cart
The kinematic equations of the curvilinear motion developed by Ya. Zakin. That allowed him to
create a graphic-analytical method for constructing trajectory links of a road train from their
number. This method is based on the method of determining the relative location of the links in
terms of the angles of folding between them at all stages of rotation. The lack of accuracy and the
need for computation at each step of the construction, which makes the method very labor-
DAUGAVPILS UNIVERSITĀTES 60. STARPTAUTISKĀS ZINĀTNISKĀS KONFERENCES PROCEEDINGS OF
RAKSTU KRĀJUMS THE 60th INTERNATIONAL SCIENTIFIC CONFERENCE OF DAUGAVPILS UNIVERSITY
11
consuming, is one of the drawbacks of the graphic-analytical method of constructing the trajectories
of the road train links.
An article by N. Kryshenya is devoted to an analytical definition of the angle. The folding of a
semi-trailer with both uncontrolled and controlled wheels (10). He obtained the following
differential equation for the folding angle .
Where , - are the speed and radius of the tractor turning respectively
- the basis of the semi-trail.
In the article analytical expressions of dependence are brought:
, where for the cases at , .
In the work of I. Margolin (14). It is noted that the process of turning the road train is
characterized by four stages: an input transition path, a circular, output transitional, rectilinear
trajectory. The author emphasizes that in conditions when the speed of movement when
approaching the turn and turn does not exceed 3 m / s (8-10 km / h), due to the short length, it is
possible to neglect the input and output transition trajectories and assume that the turn is made in 2
stages: in the first stage, the driver moves the tractor instantly to a circular trajectory, the trailer
moves along some curvilinear trajectory; in the second stage - the tractor is instantly converted to
rectilinear motion, and the trailer continues to move along the curvilinear trajectory. In the
conclusions I. Margolin. noted the fact that the increase in the overall lane width at the turn reaches
considerable dimensions and should be taken into account when carrying out mine workings and
building roads.
A. Kolpakov in his work (6-7) showed that the rotation of a road train with an uncontrolled
semitrailer is characterized by the displacement of the trajectory of the semitrailer's wheels to the
center of the turn, as a result of which the overall corridor necessary for the passage of the road train
increases. The analysis carried out by him showed that the width of the overall traffic corridor when
the base of the semitrailer was raised above the tractor base by 1.5 times - sharply increased. In
view of this, the maximum base of uncontrolled semitrailers should be: for semi-trailers with a
locked drive of driving wheels and for inactive semitrailers intended for operation on a winding
narrow road 1.5 times the base of traction; for semitrailers of general purpose - 2.5 times more than
the base of the tractor.
An experimental attempt to assess the influence of the phenomenon of lateral drift, elastic
tires on the maneuverability of road trains with steering wheels of trailed links was made by A.
Kolpakov and S. Margolis.
DAUGAVPILS UNIVERSITĀTES 60. STARPTAUTISKĀS ZINĀTNISKĀS KONFERENCES PROCEEDINGS OF
RAKSTU KRĀJUMS THE 60th INTERNATIONAL SCIENTIFIC CONFERENCE OF DAUGAVPILS UNIVERSITY
12
In particular, A. Kolpakov showed that the greatest angles of lateral pulling were obtained
with controlled semitrailer wheels due to a smaller radius of rotation of the center of the semi-trailer
truck and a larger amount of centrifugal force. Thus, in an uncontrolled semi-trailer with an air tire
pressure of 3 kg / cm2 and a speed of 4 m / s (~ 15 km / h), the escape angle is less by 1.50
compared to the controllable one.
In addition, A. Kolpakov in the work (7-8) has analyzed the possibility of improving the
accuracy of the train on the road when it turns by introducing a certain lag in the working off of the
steering wheels of the trailing link of the driving force as which the angle of folding between the
links is used. If the rotation of the wheels is carried out using a hydro mechanical power follower,
this lag is achieved by underestimating the rated capacity of the pumping unit by 12-13%.
Meanwhile, the author did not propose an analytical method for calculating the trajectories of
trailed links with this phenomenon in mind, which does not allow us to draw conclusions about the
advantages of this method on different turning regimes.
The justification for the possibility of neglecting the withdrawal of tires while assessing the
maneuvering properties of road trains is contained in the following article [7]. To determine the
characteristics of the turn of the road train, the authors first choose a flat bicycle model of a road
train with elastic tires. Kinematic drift is introduced into consideration, associated with the
mismatching of the geometric and kinematic parameters of the road train, and the withdrawal of the
power train, caused by the action of tractive force. Modeling the mutual influence of the trailer and
the tractor with the force applied at the coupling point, the drivers consider first separately the
semitrailer and the tractor, and then the turn of the entire road train. In the general case of the
curvilinear motion of the road train, when there is a mutual angular displacement of the tractor and
semitrailer, their instantaneous rotation centers do not coincide. The analysis of the joint kinematics
of the tractor and semitrailer is based on the fact that the coupling point belongs simultaneously to
both the tractor and the semitrailer, and their trajectories in this place must coincide. The calculated
value of the folding angle of the 27 m long and 10 m trailer with a KAZ-258 tractor was taken into
account both with and without the tires. The maximum error in not taking into account the
kinematic drift of tires was when the tractor was turned by 160 ° for a long-bodied semitrailer 6.5%
and for a short-haul trailer 5.4%. The character of the curves in both cases is the same. With the
existing ratios of the structural parameters of the road train, the rigidity characteristics of the tires
and the drag coefficients, the failure to account for the power take-off of the tires gives an error
when calculating the angle of folding of the road train by no more than 5% when the tractor turns
by 180 °, the nature of the change in the folding angle remains unchanged.
V. Pavlov in his work (8), considered the kinematics of turning the curvilinear motion of a
trailer having front and rear turning wheels, noted that if there is a rigid connection between the
DAUGAVPILS UNIVERSITĀTES 60. STARPTAUTISKĀS ZINĀTNISKĀS KONFERENCES PROCEEDINGS OF
RAKSTU KRĀJUMS THE 60th INTERNATIONAL SCIENTIFIC CONFERENCE OF DAUGAVPILS UNIVERSITY
13
wheels, then the driver, setting the trajectory of the front wheels, simultaneously determines the
trajectory rear wheels, not allowing the rear wheels to repeat the trajectory of the front wheels.
Creation of a trailer with perfect agility, as noted by the author, is possible only with a continuous
change in the ratio between the angle of rotation of the wheels of the driving axle of the tractor and
the other wheels of the road train. He proposes to choose the ratio of the steering gear, based on the
circular motion of the road train, considering this way the simplest and at the same time providing
sufficient roadability for the road train. One of the factors that improve the agility of the trailer with
a mechanical drive for controlling the rotation of the wheels, the author considers a decrease in the
displacement of the trajectory of the links at the entrance to the turn. For this purpose, the author
investigated the effect of the mechanism of angular retardation. The experiments were carried out
on the model. The author has shown that the delay time can be different and depends on the driving
mode of the road train.
Sigal (15) implemented a software implementation on the computer methodology for
calculating the relative position of the links when turning the road train. The method is based on the
kinematics of the curvilinear motion of the road train. In the same work, the author gives
information on the system of turning the wheels of the rear truck of a road train, the design of which
introduces the mechanism of angular retardation. As shown by the results of the full-scale
experiment, this made it possible to reduce the deviation of the trajectory of the rear trolley from the
trajectory of the front by almost 30%.
However, in the work (10) the technique of a choice and calculation of design parameters of
the device for management of wheels of long-distance trailers built on the principle of "trajectory
memorizing" is provided to provide for the trailer's trailer to move along the trajectory of the trailer
with minimum permissible operating conditions and displacements.
G. Tseitlin (11) stressed that one way to improve the agility of the long-bodied articulated
transport means is to reduce the discrepancies between the trajectory of the front and rear bogies,
and in the extreme case, the combination of these trajectories. Such a solution of the problem can be
achieved with the help of control systems with memorization. To this end, the memory unit, which
is the main part of the memory management system, must record the steering angle of the front
wheel drive wheels and generate a command to rotate the steering wheels of the rear bogie after
moving the front wheel to a distance equal to the distance between the bogies measured along the
trajectory traversed by the front bogie. In addition, methods have been developed for constructing
transient trajectories, by which the rear trolley is returned to the trajectory of the front after a
random deviation. The analysis of the curvilinear motion of the road train was made proceeding
from kinematic dependencies, without taking into account the phenomenon of lateral deviation. The
speed of movement was limited (5 km / h).
DAUGAVPILS UNIVERSITĀTES 60. STARPTAUTISKĀS ZINĀTNISKĀS KONFERENCES PROCEEDINGS OF
RAKSTU KRĀJUMS THE 60th INTERNATIONAL SCIENTIFIC CONFERENCE OF DAUGAVPILS UNIVERSITY
14
Being engaged in the study of motion on the turn of multiaxial individual trains, Kulik (13)
noted that, since when moving with large angles of rotation of controlled wheels, the velocities are
usually small, then this motion can be regarded as having become established, which corresponds to
a circular motion, and if, for example, it is proved that the lateral the withdrawal of the tires of the
road train with a circular motion with one combination of parameters is less than with the other, that
is, there are sufficient grounds to state that this ratio will also be preserved when moving with a
variable radius with low speeds; the effects associated with unsteady motion are small. Azbel
showed that the turn of the road train with maneuver does not reduce the width of the corridor
occupied by it during the turn, but it is necessary in the event that a turn without going to an
external adjacent or even oncoming lane is impossible. It is also noted that the considered tractor-
trailer has a gear ratio of the drive of turning the wheels of the semi-trailer close to 0.6, and for any
other road train it is specified by an individual study.
Conclusions
Thus, according to the published papers on the theory of the curvilinear motion of road trains,
the following conclusions can be drawn.
1. There are two approaches which are kinematic and dynamic. In determining the agility of
saddle road trains, the kinematic approach has become most widespread. However, there are no
clear recommendations on the limits of applicability of the kinematic and dynamic approaches.
2. When studying the behavior of road trains on a turn, methods of mathematical and physical
modeling, as well as studies on prototypes, are widely used.
3. The behavior of long-base saddle road trains with various laws governing the rotation of the
wheels of semitrailers has not been studied sufficiently.
4. The choice of the parameters of steering systems for turning the wheels of semi-trailers is based
on the consideration of the kinematics of the circular motion of the road train, without taking
into account the transient modes of motion.
References 1. Bergman M.M. Graficheskoe issledovanie povorota avtomobilja bez pricepa i s pricepom. [Graphical study of the turning of a car without a trailer and with a trailer], 11 izd. Moscow: Motor [Enger], 1934. 2. Bloh Z. Sh. Kinematika povorota. [Kinematics of turning]. Sel'hozmashiny [Agricultural machines]. Moscow, 1937. 3. Ishlinskij A. Ju. Teorija dvizhenija pricepki traktora. [The theory of tractor tractor movement]. Sel'hozmashiny. [Agricultural machines]. Moscow, 1937. 4. Klychkov P. D. O krivolinejnom dvizhenii avtopoezda. [On the curvilinear motion of a road train]. Avtomobil'naja promyshlennost'. [Automobile industry]. 1979. № 3. 5. Kryshen' N. I. Analiticheskij metod opredelenija uglov skladyvanija avtopoezda. [Analytical method for determining the angles of folding a road train]. Avtomobil'naja promyshlennost'. [Automobile industry]. 1979. № 3.
DAUGAVPILS UNIVERSITĀTES 60. STARPTAUTISKĀS ZINĀTNISKĀS KONFERENCES PROCEEDINGS OF
RAKSTU KRĀJUMS THE 60th INTERNATIONAL SCIENTIFIC CONFERENCE OF DAUGAVPILS UNIVERSITY
15
6. Kolpakov A. P. Issledovanie povorota avtopoezda s upravljaemymi i vedushhimi kolesami polupricepa. [Study of the rotation of the road train with controlled and driving semi-trailer wheels]: dis. kand. teh. Moscow, 1979. 7. Kolpakov A. P., Ermilov S.S. Bokovoj uvod jelastichnyh shin upravljaemogo polupricepa. [Lateral removal of elastic tires of a controlled semitrailer]. Avtomobil'naja promyshlennost'. [Automobile industry]. 1979. № 3. 8. Kolpakov A. P. Issledovanie vlijanija konstrukcii povorotnyh ustrojstv na manevrennost' i iznos shin sochlenennyh avtobusov i trollejbusov. [Investigation of the effect of the design of rotary devices on maneuverability and wear of tires of articulated buses and trolleybuses]: dis. kand. teh. Moscow, 1979. 9. Kolpakov A. P. K voprosu rascheta privoda upravlenija kolesami polupricepa. [To the problem of calculation of the drive for controlling the wheels of a semitrailer]. Avtomobil'naja promyshlennost'. [Automobile industry]. 1981. № 4. 10. Kryshen' N. I. O trebovanijah k rulevomu privodu i k povorotnym ustrojstvam upravljaemyh koles polupricepov. [About the requirements to the steering gear and to the turning devices of the controlled wheels of semitrailers]. Avtomobil'naja promyshlennost'. [Automobile industry]. 1981. № 4. 11. Kryshen' N. I. O trebovanijah k rulevym privodam upravljaemyh koles polupricepov. [About requirements to steering drives of controlled wheels of semitrailers]. Avtomobil'naja promyshlennost'. [Automobile industry]. 1982. № 5. 12. Kryshen' N. I. Metod opredelenija konstruktivnogo parametra privoda povorota koles polupricepa. [Method for determining the design parameter of the drive of turning of the semitrailer wheels]. Avtomobil'naja promyshlennost'. [Automobile industry]. 1984. № 6. 13. Kulik B. F. Optimal'noe peredatochnoe otnoshenie privoda upravlenija povorotom dlinnobaznogo polupricepa. [Optimal gear ratio drive drive control of a long-arm semi-trailer]. Avtomobil'naja promyshlennost'. [Automobile industry]. 1984. № 6. 14. Margolin I. I. Krivolinejnoe dvizhenie avtopoezda. [Curvilinear motion of a road train]. Avtomobil'naja promyshlennost'. [Automobile industry]. 1972. № 2. 15. Sigal Ja. G. K teorii povorota avtopoezda s neupravljaemymi kolesami pricepnogo zvena. [Toward the theory of turning of a road train with uncontrolled wheels of a trailing link]. Avtomobil'naja promyshlennost'. [Automobile industry]. 1972. № 2. 16. Terekov G. L. Grafoanaliticheskoe opredelenie traektorii dvizhenija peredka pri neprjamolinejnom dvizhenii vedushhej tochki. [Graphoanalytical determination of the trajectory of the forward motion in the case of non-rectilinear motion of the leading point]. Teorija, konstrukcija i proizvodstvo sel'skohozjajstvennyh mashin. [Theory, Design and Production of Agricultural Machines]. 1936. № 4. 17. Zakin Ja. H. Avtopoezda. Razvitie konstrukcij avtomobilej. [Road trains. Development of car designs]. Leningrad, 1955. 18. Zakin Ja. H. Metody analiza manevrennyh svojstv avtopoezdov. [Methods for analyzing the maneuvering properties of road trains]. Moscow, 1961. 19. Zakin Ja. H. Ocenki manevrennosti avtopoezdov. [Evaluations of the maneuverability of road trains]. Avtomobiletsroenie. [Car production]. Moscow, 1965. 20. Zakin Ja. H. Metodika provedenija ispytanij po opredeleniju manevrennyh svojstv podvizhnogo sostava. [The test procedure for determining the maneuverability of rolling stock]. Leningrad, 1966. 21. Zakin Ja. H. Prikladnaja teorija dvizhenija avtopoezda. [Applied theory of the movement of a road train]. Moscow, 1967. 22. Zakin Ja. H., Puprik M. A. Opredelenie manevrennyh svojstv avtomobilej i avtopoezdov. [Definition of maneuverability of cars and road trains]. Avtomobil'naja promyshlennost' [Automobile industry]. 1974. № 2.

DAUGAVPILS UNIVERSITĀTES 60. STARPTAUTISKĀS ZINĀTNISKĀS KONFERENCES PROCEEDINGS OF
RAKSTU KRĀJUMS THE 60th INTERNATIONAL SCIENTIFIC CONFERENCE OF DAUGAVPILS UNIVERSITY
16
MATEM ĀTIKA / MATHEMATICS
THE MANAGEMENT CONCEPT OF NORMATIVE-BACKGROUND INFORMATION IN PROCESSES
OF CONTRUCTURE-TECHNOLOGICAL PROJECTING OF ROCKET-SPACE TECHNOLOGY COMPONENTS
Anna Amosova Moscow Aviation Institute (National Research University), 4 highway Volokolamskoe, Moscow 125993, Russia, [email protected] Abstract
The management concept of normative-background information in processes of contracture-technological projecting of reocket-space technology components
Key Words: Normative and reference information, information system, data, management system, optimizing the database, enterprise structure The task of normative and reference information (NRI) management is traditionally considered from the standpoint of the development and functioning of database management systems, including intellectual ones. The details of the formation of the databases themselves from the point of view of the necessity, sufficiency and convenience of their use in the practical activities of aerospace enterprises were not considered in detail. An attempt was made to consider the issue of forming the NRI structure from the viewpoint of ensuring a level of its effectiveness that will allow achieving a given level of the enterprise's performance as a measure of its ability to satisfy the demands of real and potential consumers of the enterprise's products. The consideration of the issue is built from the standpoint of the effectiveness of the data itself and the management system, from the point of view of ensuring a given level of the enterprise's performance, as a measure of its ability to satisfy the demands of the external environment. Based on the results of the conceptual and meaningful analysis of normative and reference documents, the conceptual image of the specialized segment of the NRI was formed.
Introduction
Traditionally the definition of normative and reference information (NRI) is explained as a
conditionally constant part of the informational flow, which is accompanying all the aspects of the
enterprise. These are the relevant versions of different documents for the enterprise: international
standards of ISO, technical regalements and national standards of RF and other countries, as well as
the standards of the organizations that the enterprise is affiliated with. To the number of the
organization’s standards the standards of the enterprise itself are included.
General Statements
The documents that create the basis of the NRI can be divided into two categories: normative
documents, claiming the rules of accomplishing certain works; documentary-technical conditions,
with the help of which the qualities of the material and recourses are established. Materials are
considered the substances of natural or artificial origin that should be transformed for the creating
the into the production of the enterprise. Resources are any technical devices, used for the
realization of the noticed transformations.
DAUGAVPILS UNIVERSITĀTES 60. STARPTAUTISKĀS ZINĀTNISKĀS KONFERENCES PROCEEDINGS OF
RAKSTU KRĀJUMS THE 60th INTERNATIONAL SCIENTIFIC CONFERENCE OF DAUGAVPILS UNIVERSITY
17
NRI are considered to be conditionally constant information. It is constant due to its
unchanged qualities during the quite long period of time. However, it is conditionally constant,
since NRI is to be changed for two reasons: firstly, it is quite changing while involving new
requirements to the documentary basis of NRI; secondly. The basis of NRI is changing during the
involving of requirements into the enterprise’s function and moreover, during the changing of the
enterprise’s direction of working.
The task of NRI management is traditionally considered from the standpoint of the
development and functioning of database management systems, including intellectual ones. The
details of the formation of the databases themselves from the point of view of the necessity,
sufficiency and convenience of their use in the practical activities of enterprises were not considered
in detail.
Analysis of the practice of developing and using the NRI led to the formation of a stable view
on the main problems of managing the NRI. They are reduced to the following provisions:
- Fragmentation of data. Elimination of this problem in the conduct of the NRI allows you to
provide NRI as a service. Thus, any information system, observing the established access rules,
can access a single NRI system and obtain the necessary data.
- Duplication of information. The lack of a normative and methodological base influences the
quality of the NRI and leads to the appearance of repeated information in the NRI management
system. Without solving this problem, it is impossible to manage business processes in a timely
manner.
- Directories available only to individual units. Under such circumstances, there are difficulties
associated with the update of information and its search due to the misunderstanding of terms,
as well as the complex process of distributing normative and reference information and
unauthorized information change by units. Uncoordinated and independent NRI systems in
divisions of one industry will lead to the inability to create a single NRI system.
- Untimely update the data directory, which in turn leads to errors in business processes.
- The complex process of access and dissemination of NRI influences the time of work with the
electronic reference book. The SU is responsible for extracting, converting, and distributing
collected reference data. In addition to data collection and data generation technologies,
technologies for ensuring safe access, mechanisms for the formation and support of
reconciliation chains, as well as modern reporting tools play an important role in the integrated
solution for NRI management.
- Complexity of administration of the SUNRI.
An attempt was made to consider the issue of forming the NRI structure from the viewpoint
of ensuring a level of its effectiveness that will allow achieving a given level of the enterprise's

DAUGAVPILS UNIVERSITĀTES 60. STARPTAUTISKĀS ZINĀTNISKĀS KONFERENCES PROCEEDINGS OF
RAKSTU KRĀJUMS THE 60th INTERNATIONAL SCIENTIFIC CONFERENCE OF DAUGAVPILS UNIVERSITY
18
performance as a measure of its ability to satisfy the demands of real and potential consumers of the
enterprise's products.
The consideration of the issue is built from the standpoint of the effectiveness of the data
itself and the management system, from the point of view of ensuring a given level of the
enterprise's performance, as a measure of its ability to satisfy the demands of the external
environment.
The presentation of the NRI management concept is based on the unified system development
process [2], UML (Universal Modeling Language) - language [3] and international standards of the
series 9000 and 10303 [4, 5]. The proposed version of the concept is developed with reference to
the production function of the enterprises of the rocket and space industry. The implementation of
the function is supported by a huge number of documents, and the amount of data used is close to
the category of big data. Therefore, the task of optimizing the database is as important as the
optimization of data management.
The entire volume of NRI is supposed to consist of specialized and self-living segments. The
essence and structure of each of these segments of the NRI is considered in the context of the
substance of the enterprise, its structure and the activities it carries out (Picture 1).
Picture 1. The concept of enterprise automation system
The enterprise exists in the economic system of society as an independent economic entity
whose function is to satisfy a certain set of social needs. The structure of the enterprise consists of
one or several component parts before which there are a common mission, goals and tasks for the
supply of their products to real or potential consumers as a result of their functioning [5]. We will
not dwell on the methods for developing the structure of an enterprise. Just assume that the
DAUGAVPILS UNIVERSITĀTES 60. STARPTAUTISKĀS ZINĀTNISKĀS KONFERENCES PROCEEDINGS OF
RAKSTU KRĀJUMS THE 60th INTERNATIONAL SCIENTIFIC CONFERENCE OF DAUGAVPILS UNIVERSITY
19
enterprise consists of a set of interacting parts - domains. The domain of the enterprise is any part of
it sufficient to implement a certain set of business tasks in conditions of really existing restrictions.
Domains can be divided into smaller subdomains.
The object of consideration in the work is the domain "Production", it consists of specialized
subdomains: workshops, sections, departments, services, etc. In the future, we will assume that each
of the selected subdomains can be put into correspondence independently by the existing system of
production automation (SAP). It combines the powerful cognitive capabilities of the human
operator and the performance capabilities of computer hardware and software for the rational use of
technical means (technological equipment) for the production of products.
In the internal environment of the enterprise, only the command principle of management is
realized, the basis of which is the will of the head. Therefore, any of the domains of the enterprise
implements an inherent structure or system of activity. For any of these systems, two
representations are possible: static, to define the system design, and dynamic, as a way of displaying
the behavior of the system.
Since any system is considered as an independent integrity, the joint functioning of
subdomains within the domain, and then domains within the enterprise, can only be considered as a
polystructure [6]. Since the polystructure is formed by specialized systems of subdomains, each of
which has its own sets of processes and created artifacts - products, the polystructure inevitably
acquires the property of heterogeneity. As a consequence, the output of the polystructure depends
not only (and perhaps not so much) on the perfection of each of the EPSs, but also on the level of
coordination of the results of their activities.
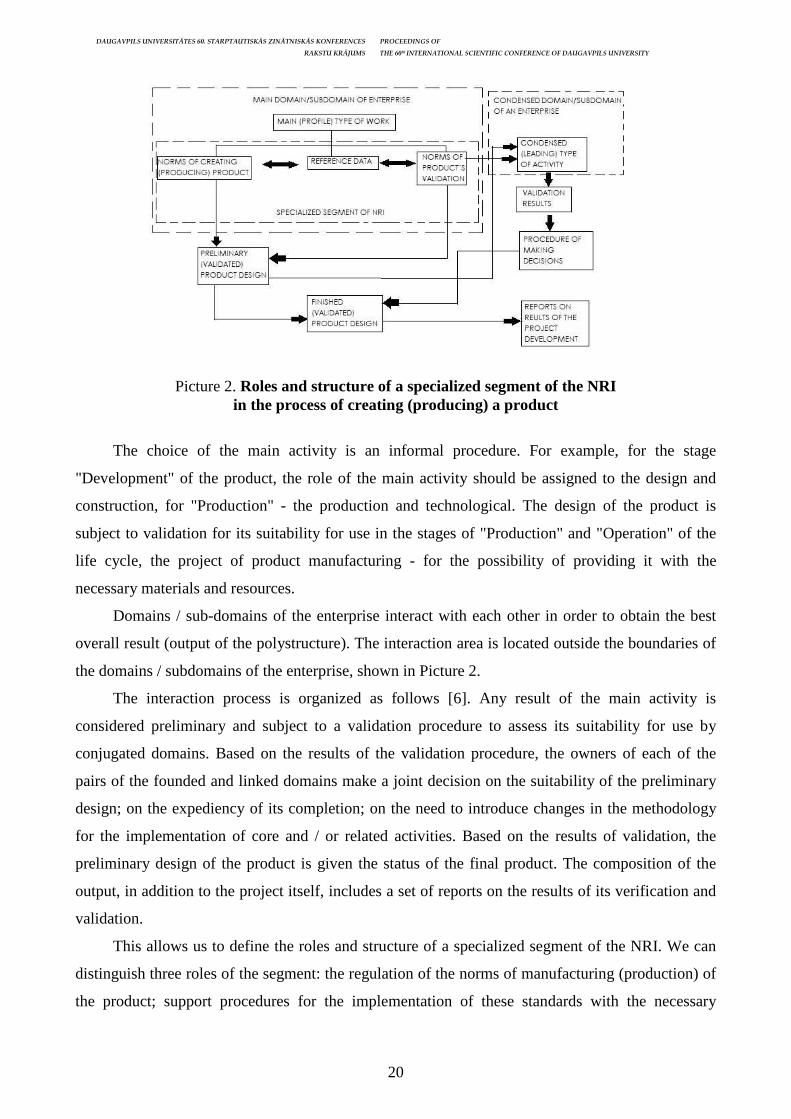
The organizational structure of the polystructure is shown in Figure 2. Each of the domains /
subdomains of the enterprise is assigned a unique specialized type of activity. Due to the
unevenness of the polystructure, one of the activities is assigned the status of the main (leader); All
other activities interacting with the main activity are assigned the status of conjugate (slave).
Similar statuses are assigned to the corresponding domains. The output of the interacting activities
is either the product design (for the "Development" stage of the product life cycle) or the product
itself.
DAUGAVPILS UNIVERSITĀTES 60. STARPTAUTISKĀS ZINĀTNISKĀS KONFERENCES PROCEEDINGS OF
RAKSTU KRĀJUMS THE 60th INTERNATIONAL SCIENTIFIC CONFERENCE OF DAUGAVPILS UNIVERSITY
20
Picture 2. Roles and structure of a specialized segment of the NRI
in the process of creating (producing) a product
The choice of the main activity is an informal procedure. For example, for the stage
"Development" of the product, the role of the main activity should be assigned to the design and
construction, for "Production" - the production and technological. The design of the product is
subject to validation for its suitability for use in the stages of "Production" and "Operation" of the
life cycle, the project of product manufacturing - for the possibility of providing it with the
necessary materials and resources.
Domains / sub-domains of the enterprise interact with each other in order to obtain the best
overall result (output of the polystructure). The interaction area is located outside the boundaries of
the domains / subdomains of the enterprise, shown in Picture 2.
The interaction process is organized as follows [6]. Any result of the main activity is
considered preliminary and subject to a validation procedure to assess its suitability for use by
conjugated domains. Based on the results of the validation procedure, the owners of each of the
pairs of the founded and linked domains make a joint decision on the suitability of the preliminary
design; on the expediency of its completion; on the need to introduce changes in the methodology
for the implementation of core and / or related activities. Based on the results of validation, the
preliminary design of the product is given the status of the final product. The composition of the
output, in addition to the project itself, includes a set of reports on the results of its verification and
validation.
This allows us to define the roles and structure of a specialized segment of the NRI. We can
distinguish three roles of the segment: the regulation of the norms of manufacturing (production) of
the product; support procedures for the implementation of these standards with the necessary
DAUGAVPILS UNIVERSITĀTES 60. STARPTAUTISKĀS ZINĀTNISKĀS KONFERENCES PROCEEDINGS OF
RAKSTU KRĀJUMS THE 60th INTERNATIONAL SCIENTIFIC CONFERENCE OF DAUGAVPILS UNIVERSITY
21
reference data. It should be noted that the specialized segments of the NRI should be determined for
all activities of the enterprise.
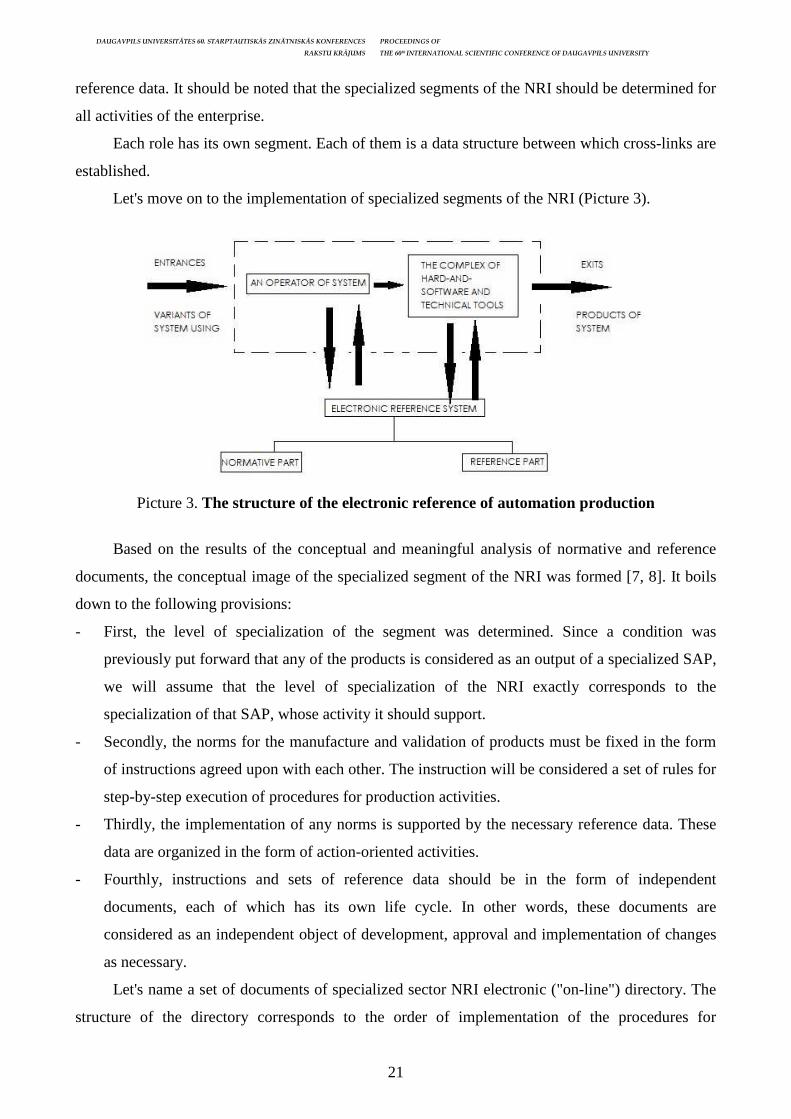
Each role has its own segment. Each of them is a data structure between which cross-links are
established.
Let's move on to the implementation of specialized segments of the NRI (Picture 3).
Picture 3. The structure of the electronic reference of automation production
Based on the results of the conceptual and meaningful analysis of normative and reference
documents, the conceptual image of the specialized segment of the NRI was formed [7, 8]. It boils
down to the following provisions:
- First, the level of specialization of the segment was determined. Since a condition was
previously put forward that any of the products is considered as an output of a specialized SAP,
we will assume that the level of specialization of the NRI exactly corresponds to the
specialization of that SAP, whose activity it should support.
- Secondly, the norms for the manufacture and validation of products must be fixed in the form
of instructions agreed upon with each other. The instruction will be considered a set of rules for
step-by-step execution of procedures for production activities.
- Thirdly, the implementation of any norms is supported by the necessary reference data. These
data are organized in the form of action-oriented activities.
- Fourthly, instructions and sets of reference data should be in the form of independent
documents, each of which has its own life cycle. In other words, these documents are
considered as an independent object of development, approval and implementation of changes
as necessary.
Let's name a set of documents of specialized sector NRI electronic ("on-line") directory. The
structure of the directory corresponds to the order of implementation of the procedures for

DAUGAVPILS UNIVERSITĀTES 60. STARPTAUTISKĀS ZINĀTNISKĀS KONFERENCES PROCEEDINGS OF
RAKSTU KRĀJUMS THE 60th INTERNATIONAL SCIENTIFIC CONFERENCE OF DAUGAVPILS UNIVERSITY
22
manufacturing and validating a group of products assigned to a particular SAP. The content of each
section of the directory corresponds to the order of execution from the operations of the procedure.
A directory is used in the on-line mode with the process implemented by SAP.
It is quite obvious that the number of electronic directories used by the enterprise is extremely
large, and the entire set of directories should ensure the integration of the enterprise by ensuring the
interaction of the automation systems of production with each other in order to achieve the goals of
the enterprises facing the domains, and then the entire enterprise.
The problem of providing the enterprise with the necessary electronic directories is solved
through a consistent solution of two independent but interrelated tasks [9]. As a solution to both
problems, architecture of systems is considered, as the descriptions of the structures of these
systems and the relationships between the elements of the structure.
The tasks differ by their outputs:
- System architectures, the action of which extends to the development of systems (in our case, a
class of similar SAP and their inherent electronic directories). System architectures are
accompanied by instructions that provide step-by-step assistance in the development of
systems;
- Typical projects of the enterprise, the purpose of which is to develop a specific instance of SAP
in accordance with the existing system architecture.
References Jim Arlow, Ila Neustadt. UML2 and the Unified Process Practical: Object-Oriented Analysis and Design. Андриченко А.Н., Щербаков Н.А. Управление НСИ в автоматизированном проектировании: принципы и перспективы. ГОСТ 1.1-2002. Interstate System for Standardization. Terms and definitions. ГОСТ 7.60-2003 System of standards on information, librarianship and publishing. Publications. Basic types. Terms and definitions. ГОСТ Р ИСО 15704-2008 Industrial automation systems. Requirements for enterprise-reference architectures and methodologies ГОСТ Р ИСО 9000-2001 Quality management systems. Fundamentals and vocabulary. ГОСТ Р 54136-2010 Industrial automation systems and integration. Guide for standards implementation, structure and dictionary.
DAUGAVPILS UNIVERSITĀTES 60. STARPTAUTISKĀS ZINĀTNISKĀS KONFERENCES PROCEEDINGS OF
RAKSTU KRĀJUMS THE 60th INTERNATIONAL SCIENTIFIC CONFERENCE OF DAUGAVPILS UNIVERSITY
23
DABAS AIZSARDZ ĪBA UN VIDES PĀRVALD ĪBA / NATURE PROTECTION AND ENVIRONMENTAL
MANAGEMENT
DISTRIBUTION OF ODORS CAUSED BY POLLUTANT ACTIVITY AND RELATED PROBLEMS IN RIGA
Evita Muizniece-Treija University of Latvia, Raina Boulevard 19, Riga, Latvia, LV-1586, [email protected] Abstract
Distribution of odors caused by pollutant activity and problems in Riga Kew Words: air pollution, odors, emissions Odor emissions have a negative impact on human health and well-being and this problem has become more acute in urban administrative areas, where manufacturing companies are relatively close to the construction of residential buildings. In recent years, attention has been paid to the reduction and elimination of odor emissions due to economic activity, as well as the development of odor emission limit projects, installed equipment for the measurement of odor emissions, and the conditions for reducing odor emissions, however, nevertheless, still controlling institutions competent Includes control of sources of pollutant emissions, annually receives about 2000 residents complaints about disturbing and severe smells in residential areas. In order to better understand the technological processes of polluting activities, which produce odors, odor distribution areas, identify smoke units (ouE/m3), odor research has begun in the administrative territory of Riga. The studies included analysis of both odor emission limits, analysis of complaints received, surveys, and the recording of smoke units with field olfactometer and the determination of substances in the air by gas analysers. According to the collected information and studies on the nature and localization of odors, it can be concluded that the smell of the most distressing smells in Riga causes odor of petroleum products. Thus, both the state controlling institutions and the municipality should pay more attention to solving this problem. Kopsavilkums Atslēgvārdi: gaisa piesārņojums, smakas, emisijas Smaku emisijas atstāj negatīvu ietekmi uz cilvēku veselību un labsajūtu, līdz ar to, šī problēma ir vairāk aktualizējusies pilsētu administratīvajās teritorijās, kur ražošanas uzņēmumi atrodas salīdzinoši tuvu dzīvojamo māju apbūvei. Pēdējos gados aizvien vairāk tiek pievērsta uzmanība saimnieciskās darbības rezultātā radīto smaku emisiju samazināšanai un novēršanai, gan tiek izstrādāti smaku emisiju limita projekti, uzstādītas iekārtas smaku indikatīvo mērījumu veikšanai, izvirzīti nosacījumi smaku emisiju samazināšanai, tomēr, neskatoties uz to, joprojām kontrolējošās institūcijas, kuru kompetencē ietilpst piesārņojošo vielu emisijas avotu kontrole, ik gadu saņem ap 2000 iedzīvotāju sūdzībām par traucējošām un stiprām smakām dzīvojamo māju apvidos. Lai labāk izprastu piesārņojošo darbību tehnoloģiskos procesus, kuru rezultātā rodas smakas, smaku izplatības areālus, identificētu smaku vienības (ouE/m3), Rīgas administratīvajā teritorijā ir uzsākti smaku pētījumi. Pētījumi ietvēra gan smaku emisijas limitu projektu analīzi, gan saņemto sūdzību analīzi, aptauju veikšanu, gan smaku vienību fiksēšanu ar lauka olfaktometru, gan gaisā esošo vielu noteikšanu ar gāzu analizatoru. Pēc apkopotās informācijas un veiktajiem pētījumiem par smakas raksturu un lokalizāciju, var secināt, ka vislielākās traucējošās smakas iedzīvotājiem Rīgā rada naftas produktu smakas. Tādējādi, gan valsts kontrolējošām institūcijām, gan pašvaldībai ir jāpievērš lielāka uzmanība šīs problēmas risināšanā.
Introduction
Measurements of air pollution in the administrative territory of Riga are carried out by both
the municipality, the Freeport of Riga Authority, state institutions, as well as certain companies
whose economic activity causes air pollution (Air monitoring in Riga 2017). Currently, in
accordance with the Directive 2008 / 50 / EC of the European Parliament and of the Council of 21
May, 2008 on ambient air quality and cleaner air for Europe, in Riga, the following air pollutants
are measured at monitoring stations in Riga: ozone (O3), nitrogen dioxide (NO2), particulates PM10,
sulfur dioxide (SO2), benzene, toulol, xylene (Air quality 2018). The monitoring results show the
DAUGAVPILS UNIVERSITĀTES 60. STARPTAUTISKĀS ZINĀTNISKĀS KONFERENCES PROCEEDINGS OF
RAKSTU KRĀJUMS THE 60th INTERNATIONAL SCIENTIFIC CONFERENCE OF DAUGAVPILS UNIVERSITY
24
overexertion of individual substances over a shorter time period, but in general monitoring data
(analysing the above-mentioned pollutants) indicates that air quality has improved in recent years
(Air quality 2018).
Meanwhile, mass media reports increasingly reveal information about strong distressing
smells in the vicinity of Riga, including the fact that in Riga, for several years, the permissible
concentration of dust and nitrogen dioxide has been exceeded, which in the long run has a
devastating impact on human health (Latvia is threatened with a half million the euro is a big
punishment ... 2014, Smirde in Vecmilgravis 2017).
However, despite the aforementioned air pollutants, other substances that cause disturbing
odors may also affect the well-being and health of a person, for example, mercaptan, a chemical
substance - carbon, hydrogen and sulfur, hydrogen sulfide, ethylbenzene, saturated hydrocarbons
(A, B permit 2017), hydrogen sulfide, ammonia, methane, ethylmercaptan, methylmercaptan (A, B
permit 2017) may be emitted from the operation of waste water treatment plants, the colour and
varnish production or painting facilities may be in the environment distilled white alcohol, butyl
alcohol, ethyl alcohol acetone, etc. (A, B permit 2017). There are many other types of economic
activity, such as waste storage, production of medicines, agriculture, etc., whose actions can lead to
the release of pollutants into the environment, including unpleasant and disturbing odors. Thus, in
areas where active economic activity takes place, it is problematic and relatively expensive to install
monitoring stations in order to keep track of all air pollutants that can have a significant impact on
human health. In addition, pollutants in the air can interact with each other and create additional
odor emissions, therefore, it is possible that the concentration of certain substances in the air
corresponds to the requirements of the regulatory enactments, while the overall disturbing odor may
be so severe that it can significantly affect respiratory organs, especially asthma patients, to irritate
eyes and mucous membranes, as well as on blood components.
For these reasons, both in Latvia and elsewhere in the world, stubborn research has attracted
increasing attention from scientists (Bokowa et al. 2010, Brattoli et al. 2011, Dravnieks et al. 2012,
Kala et al. 2015, Sironia et al. 2014, Zarra et al. 2012). In view of the fact that it is very important
to evaluate the odor units in residential buildings, public buildings, parks and greenery areas, to
study the sources of odor emissions, as well as to ascertain the opinion of the population on the
spread of odors, since the year 2016, studies have been started in the administrative territory of Riga
on the basis of economic activity odor emissions. The area under investigation is the most
appropriate, as air quality issues and odor emissions are a more acute problem in urban
administrative areas where there is a dense population and economic activity.
DAUGAVPILS UNIVERSITĀTES 60. STARPTAUTISKĀS ZINĀTNISKĀS KONFERENCES PROCEEDINGS OF
RAKSTU KRĀJUMS THE 60th INTERNATIONAL SCIENTIFIC CONFERENCE OF DAUGAVPILS UNIVERSITY
25
Material and methods
State control institutions regularly receive complaints from citizens about various distressing
smells. The State Environmental Service's competence includes the assessment of complaints about
disturbing odors and the monitoring of sources of emissions (Republic of Latvia Cabinet Regulation
No. 724 2014). However, despite this, the State Fire and Rescue Service also receives a significant
number of complaints about the smell of oil products, as citizens are suspected of leaking oil
products. Initially, an analysis of complaints from citizens was carried out to determine the
relevance of the problem. Data collection was based on data from both the State Environmental
Service Complaint Registry and the information provided by the State Fire and Rescue Service. The
data was compiled in a Microsoft Excel program that synthesized charts and records.
In order to find out the opinion of residents whether the problem of odor in districts of Riga is
topical, in 2017 a survey of residents was created on the website www.visisdati.lv. Taking into
account that the survey was targeted mostly by people living and / or working in Riga, the survey
was placed on the Riga City Council website and twitter account. The survey was able to take part
in the period from August 2017 to mid-May 2018. The obtained results were analysed in the
Microsoft Excel program.
For the analysis of the location of emission sources, permits issued to enterprises of the State
Environmental Service for Category A and B polluting activities were used, as well as an analysis
of projects for odor emission limits was carried out.
The GIS methods were used for visualization and analysis of the obtained data, i.e. ArcView
10.0 software module ArcMap using geospatial vector (SHP) file format files was prepared in maps
of the LKS-92 coordinate system.
Field studies were performed using the Scentroid SM100 field olfactometer (Fig. 1.) and
Gasmet DX-4030 gas analyser (Fig. 2.). Odor concentrations were measured with the Scentroid
SM100 field olfactometer, which was recognized as the most appropriate method (Scentroid Model
110C 2012). The operating principle of the field of the lactate is based on the dilution of the odor
sample with compressed neutral gas until the odor evaluator senses the olfactory irritation. The
clean air dilution range is controlled by the Scentroid Proven Flow Regulator Valve to the sample
air level, where you can select 15 discrete dilution levels. It is possible to determine the odor
concentration from 2 to 30,000 odor units (OUE/m3) (Scentroid Model 110C 2013). The study did
not detect odor units in emission sources, which may be 1000 times higher, but measurements were
made outside the premises of enterprises as the aim of the study was to assess the impact of smells
on the population, not on the company's work area. Similarly, measurements with the Gasmet DX-
4030 Portable Gas Analyzer were performed outside the premises of the companies. With this
equipment it is possible to determine the air temperature, humidity and 23 inorganic and organic

DAUGAVPILS UNIVERSITĀTES 60. STARPTAUTISKĀS ZINĀTNISKĀS KONFERENCES PROCEEDINGS OF
RAKSTU KRĀJUMS THE 60th INTERNATIONAL SCIENTIFIC CONFERENCE OF DAUGAVPILS UNIVERSITY
26
gases such as carbon monoxide, carbon dioxide, methane, benzene, acids, aldehydes and other
volatile substances (DX-4030 FTIR Gas Analyzer Instruction and Operating Manual 2009). This
machine does not require prior sampling and sampling, the air sample is immersed with a probe
containing a particulate filter. The Gasmet DX-4030 gas analyser can be measured at various
locations, as it is freely movable, and the measurement results are reflected in the Calcmet-Lite
software immediately after measurements, while data is further stored. Subsequent data is
transformed into a computer and aggregated with the Microsoft Excel program.
Fig. 1. Field measurements by the Fig. 2. Field measurements using the Scentroid SM100 field olfactometer Gasmet DX-4030 gas analyser
Results and discussion
Summing up the information on complaints received from the State Fire and Rescue Service
during the period from 2012 to 2015, it was found that the number of inbound complaints is up to
100, while in mass media (Smirde in Vecmilgravis 2017) information appears that in 2017 the State
Fire and Rescue Service have received around 400 complaints per day. The State Fire and Rescue
Service mainly receives complaints about possible spills related to smell of petroleum products,
therefore the data is reflected in the complaints received regarding smell of petroleum products.
When analysing the complaints received by the State Fire and Rescue Service within a 24-
hour interval, it appears that the highest percentage of complaints were received from the time of
16:00 to 24:00 (Fig. 3.). The data obtained allows us to conclude that complaints are more often
received outside of nature, causing the majority of people to experience disturbing smells directly to
their homes. Meanwhile, the analysis of complaints received during the month period (Fig. 4.)
indicates that there is no significant difference between 2013, 2014, and 2015, i.e., the amount of
complaints received does not change significantly depending on the time of year, however, in
summer 2012, there are large number of complaints as in other seasons.

DAUGAVPILS UNIVERSITĀTES 60. STARPTAUTISKĀS ZINĀTNISKĀS KONFERENCES PROCEEDINGS OF
RAKSTU KRĀJUMS THE 60th INTERNATIONAL SCIENTIFIC CONFERENCE OF DAUGAVPILS UNIVERSITY
27
Fig. 3. Complaints within the interval of 24 hours in 2013, 2014 and 2015 (data source: The State Fire and Rescue Service)
Fig. 4. Complaints at the monthly interval from 2012 to 2015 (data source: The State Fire and Rescue Service)
Taking into account that the State Environmental Service receives complaints from citizens
about various smells, the data also reflects information about all types of complaints related to
distressing odors.
In 2017, the State Environmental Service has received telephone complaints from 4046
residents in all of Latvia, including illegal waste sites, violation of protection zones, etc. Most of the
complaints received, or 2834 complaints, are registered in the Riga region. Of all complaints in
Riga and the near districts of Riga about 1446 complaints about distressing odors a year have been
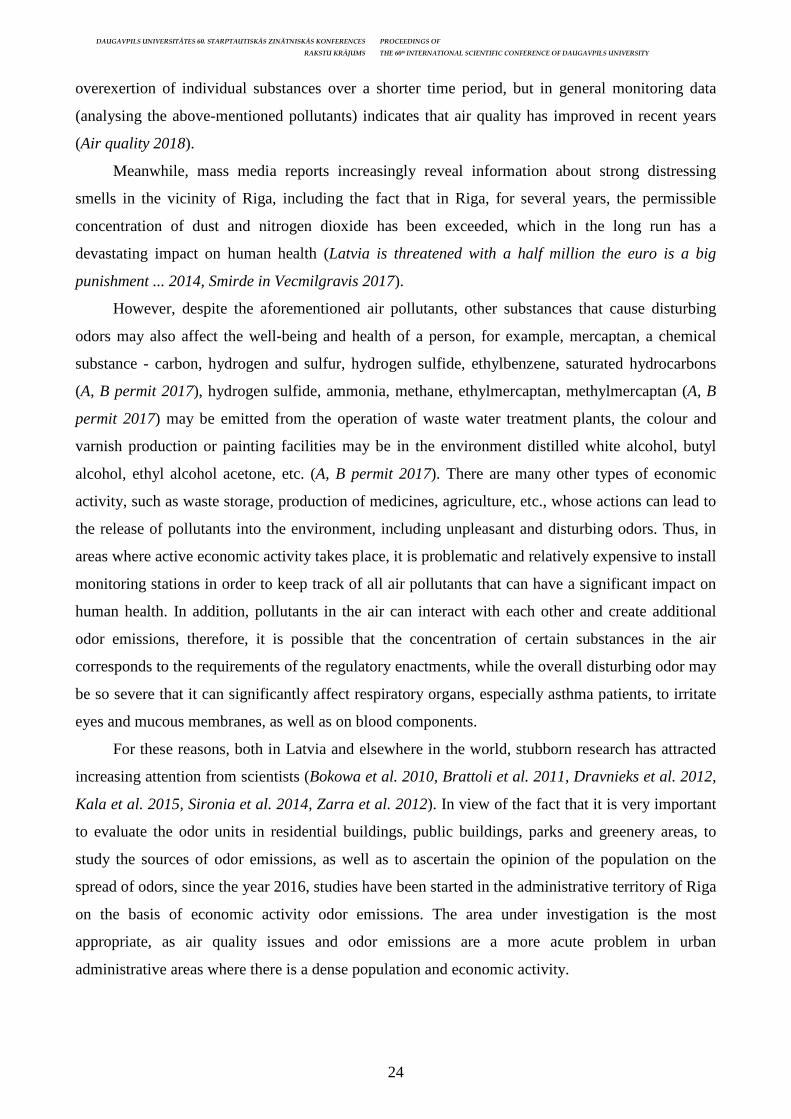
reported, while in the administrative territory of Riga there are registered 521 complaints about
distressing odors. Compared to the previous year, which received 384 complaints about distressing
odors from citizens, in 2017 the number of complaints has increased (Fig. 5).
DAUGAVPILS UNIVERSITĀTES 60. STARPTAUTISKĀS ZINĀTNISKĀS KONFERENCES PROCEEDINGS OF
RAKSTU KRĀJUMS THE 60th INTERNATIONAL SCIENTIFIC CONFERENCE OF DAUGAVPILS UNIVERSITY
28
Fig. 5. Received complaints about distressing odors from citizens in administrative territory of Riga (data source: The State Environmental Service)
The obtained results indicate that most complaints about distressing odors, i.e., 81% of
complaints received in Riga, were registered from the suburbs of Northern suburbs, i.e.,
Sarkandaugava, Vecmilgravis, Milgravis, Kundzinsala. In turn, when analysing the information
provided by the population about the type of odor, i.e., the type of odor of people experiencing, it
was found that the most complaints were received about the smell of oil products, i.e., 53% of the
total number of complaints.
Of the total number of complaints received in Riga (521 complaints) about distressing odors,
22% filed complaints about unpleasant smoke smells. Smoke smells recorded seasonally, in heating
periods. Also, residents have also reported disturbing sewage odors, chemical smells, smell of paint
and varnish, waste, cafes, rubber smells at vehicle racing sites, smells caused by street repairs, and
other types of smells.
Taking into account that the contribution of the population to the source of the odor and the
problem situation is significant, in September 2017 a poll on disturbing odors in the administrative
territory of Riga was published on the website of the Riga City Council with the aim of finding out
the opinion of the residents about the air quality and odor emissions in the Riga neighbourhoods.
Respondents have identified the neighbourhoods in Riga, where odors are most noticeable
(Fig. 6.), i.e., 31.5% of respondents indicate that odors are most susceptible to Vecmilgravis, 22.8%
indicate the presence of odors in Milgrāvis, 10.1% in Mangalsala, 8.7% Sarkandaugava, 6% - in
Kundzinsala. The presence of smell in other housing estates has been reported by more than 5% of
respondents. In general, 92% of the respondents believe that disturbing odors is a major
environmental problem.
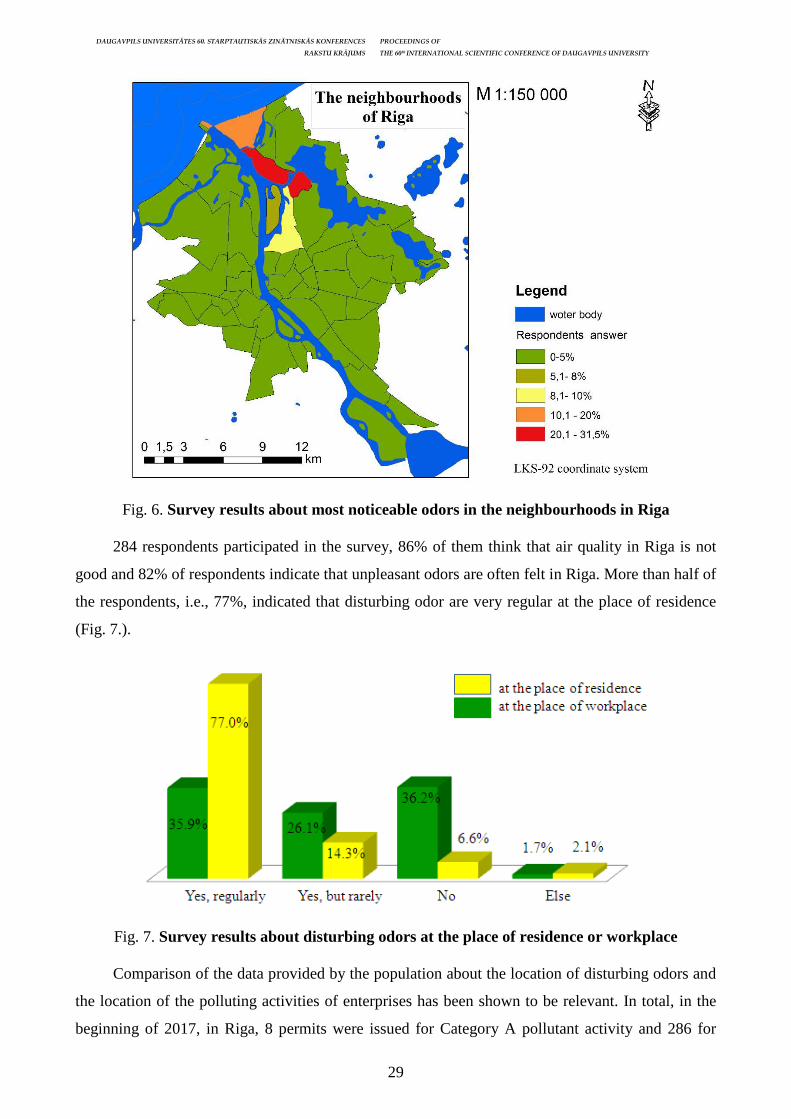
DAUGAVPILS UNIVERSITĀTES 60. STARPTAUTISKĀS ZINĀTNISKĀS KONFERENCES PROCEEDINGS OF
RAKSTU KRĀJUMS THE 60th INTERNATIONAL SCIENTIFIC CONFERENCE OF DAUGAVPILS UNIVERSITY
29
Fig. 6. Survey results about most noticeable odors in the neighbourhoods in Riga
284 respondents participated in the survey, 86% of them think that air quality in Riga is not
good and 82% of respondents indicate that unpleasant odors are often felt in Riga. More than half of
the respondents, i.e., 77%, indicated that disturbing odor are very regular at the place of residence
(Fig. 7.).
Fig. 7. Survey results about disturbing odors at the place of residence or workplace
Comparison of the data provided by the population about the location of disturbing odors and
the location of the polluting activities of enterprises has been shown to be relevant. In total, in the
beginning of 2017, in Riga, 8 permits were issued for Category A pollutant activity and 286 for
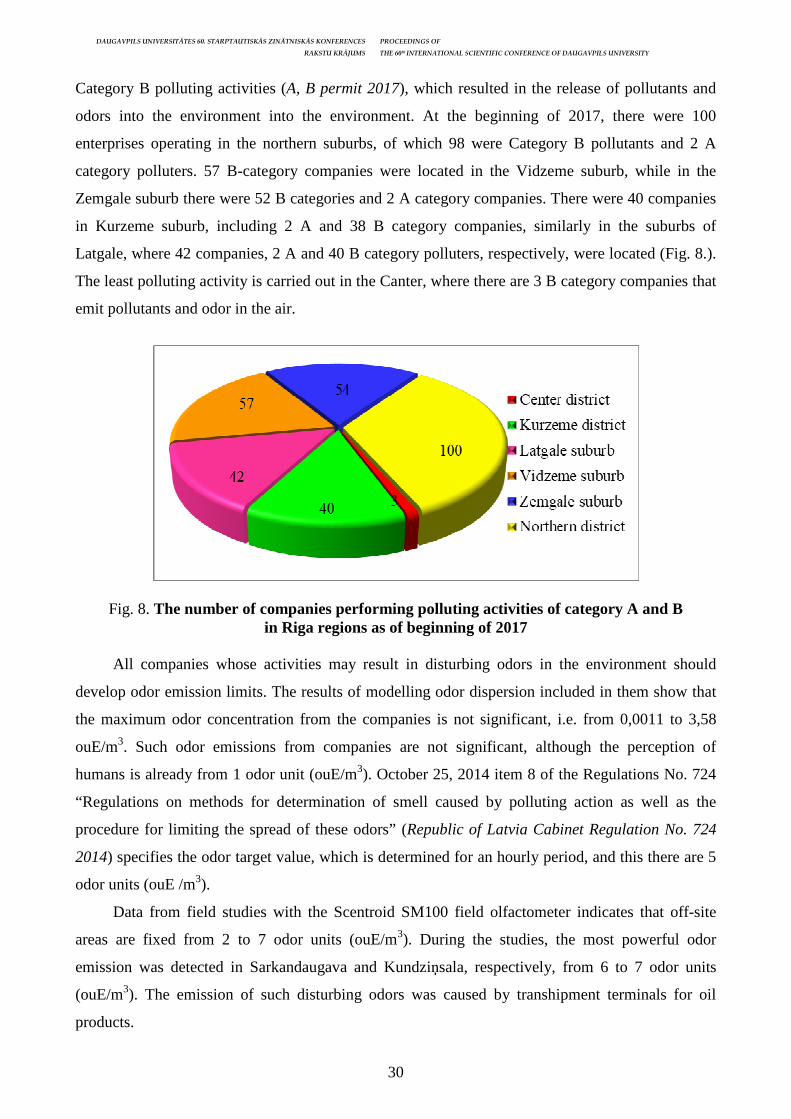
DAUGAVPILS UNIVERSITĀTES 60. STARPTAUTISKĀS ZINĀTNISKĀS KONFERENCES PROCEEDINGS OF
RAKSTU KRĀJUMS THE 60th INTERNATIONAL SCIENTIFIC CONFERENCE OF DAUGAVPILS UNIVERSITY
30
Category B polluting activities (A, B permit 2017), which resulted in the release of pollutants and
odors into the environment into the environment. At the beginning of 2017, there were 100
enterprises operating in the northern suburbs, of which 98 were Category B pollutants and 2 A
category polluters. 57 B-category companies were located in the Vidzeme suburb, while in the
Zemgale suburb there were 52 B categories and 2 A category companies. There were 40 companies
in Kurzeme suburb, including 2 A and 38 B category companies, similarly in the suburbs of
Latgale, where 42 companies, 2 A and 40 B category polluters, respectively, were located (Fig. 8.).
The least polluting activity is carried out in the Canter, where there are 3 B category companies that
emit pollutants and odor in the air.
Fig. 8. The number of companies performing polluting activities of category A and B in Riga regions as of beginning of 2017
All companies whose activities may result in disturbing odors in the environment should
develop odor emission limits. The results of modelling odor dispersion included in them show that
the maximum odor concentration from the companies is not significant, i.e. from 0,0011 to 3,58
ouE/m3. Such odor emissions from companies are not significant, although the perception of
humans is already from 1 odor unit (ouE/m3). October 25, 2014 item 8 of the Regulations No. 724
“Regulations on methods for determination of smell caused by polluting action as well as the
procedure for limiting the spread of these odors” (Republic of Latvia Cabinet Regulation No. 724
2014) specifies the odor target value, which is determined for an hourly period, and this there are 5
odor units (ouE /m3).
Data from field studies with the Scentroid SM100 field olfactometer indicates that off-site
areas are fixed from 2 to 7 odor units (ouE/m3). During the studies, the most powerful odor
emission was detected in Sarkandaugava and Kundziņsala, respectively, from 6 to 7 odor units
(ouE/m3). The emission of such disturbing odors was caused by transhipment terminals for oil
products.
DAUGAVPILS UNIVERSITĀTES 60. STARPTAUTISKĀS ZINĀTNISKĀS KONFERENCES PROCEEDINGS OF
RAKSTU KRĀJUMS THE 60th INTERNATIONAL SCIENTIFIC CONFERENCE OF DAUGAVPILS UNIVERSITY
31
Studies of airborne substances carried out at the same locations in the same locations with
Gasmet DX-4030 gas analysers indicate that concentrations of air pollutants do not differ
significantly, although the odor concentration was recorded in different, i.e., 2 to 6 odor units
(ouE/m3). Perhaps the difference is because the odor intensity changes very rapidly depending on
the direction and speed of the wind. The following measurements were performed on gas analysers
close to petroleum product terminals: benzene, tolulol, methane and nitromethane.
Conclusion
The results of the analysis of the complaints of citizens and the results of the survey suggest
that the problem of odors in the territory of Riga is very topical, besides, disturbing smell is more
perceptible to dwelling houses, which can lead to well-being and health disorders. The most
noticeable disturbance of smell is in the vicinity of the Freeport of Riga territory and in the near
neighbourhoods, up to 3 km from the source of emissions. In Riga, the biggest intensity of smells is
caused by oil product transhipment terminals, which are concentrated in the Northern suburbs,
therefore the inhabitants of Sarkandaugava, Kundziņsala, Mangalsala, Milgrāvja, Vecmilgravis are
more exposed to odor emissions than elsewhere.
Although odor emission limits indicate that odor emissions outside the company's borders
comply with the target value specified in regulatory enactments, field studies have shown greater
odor intensity, which allows us to think about failure to comply with the technological specifics of
the enterprises or complete non-reflection of the data on odor emission limits projects. The obtained
results indicate that concentrations of air pollutants do not differ significantly when there is a
disturbing smell - 6 odor units (ouE/m3) or very weak smells below 2 odor units (ouE/m3).
The obtained results also indicate the need for additional research, for example, analysis of
wind corridors, which would then allow us to judge the peculiarities of the spread of odors.
References A, B permit, 2017. The Environment State Bureau. URL: http://www.vpvb.gov.lv/lv/piesarnojums/ a-b-atlaujas, Viewed: 22.01.2017. Air monitoring in Riga, 2017. Department of Housing and Environment of Riga City Council. URL: http://mvd.riga.lv/nozares/vides-parvalde/gaisa-kvalitate/gaisa-monitorings-riga/, Viewed: 31.03.2018. Air quality, 2018. Department of Housing and Environment of Riga City Council. URL: http://mvd.riga.lv/nozares/vides-parvalde/gaisa-kvalitate/, Viewed: 31.03.2018. Bokowa A. H., 2010. Review of Odour Legislation, Chemical Engineering Transactions, Vol. 23. pp. 31–36. Brattoli M., De Gennaro G., De Pinto V., Demarinis Loiotile A., Lovascio S., Penza M., 2011. Odour Detection Methods: Olfactometry and Chemical Sensors. Sensors. Vol. 11, pp. 5290–5322. Dravnieks A., Masurat T., Richard A. Lamm, 2012. Hedonics of Odors and Odor Descriptors, Journal of the Air Pollution Control Association pp. 752–755.
DAUGAVPILS UNIVERSITĀTES 60. STARPTAUTISKĀS ZINĀTNISKĀS KONFERENCES PROCEEDINGS OF
RAKSTU KRĀJUMS THE 60th INTERNATIONAL SCIENTIFIC CONFERENCE OF DAUGAVPILS UNIVERSITY
32
DX-4030 FTIR Gas Analyser Instruction and Operating Manual, 2009. URL: http://pembrokeinstruments.com/_download_pdf_897/_Pembroke-PDF-Downloads/Gasmet-DX4030-Manual-Pembroke.pdf, Viewed: 22.10.2016. Kāla A., Beikulis O., Rubins J. 2015. Practical application of commercial ALPHA M.O.S. E-NOSE for air quality control in Riga. European Network on New Sensing Technologies for Air Pollution Control and Environmental Sustainability – EuNetAir COST Action TD1105. Latvia is threatened with a half million the euro is a big punishment because of the poor air quality in Riga, 2014. Latvian Radio and Latvian Television Internet News, URL: https://www.lsm.lv/ raksts/dzive--stils/veseliba/latvijai-draud-pusmiljonu-eiro-liels-sods-rigas-sliktas-gaisa-kvalitates-del.a94363/, Viewed: 31.03.2018. Republic of Latvia Cabinet Regulation No. 724 “Regulations Regarding the Methods for Determination of the Odours Caused by Polluting Activity, as well as the Procedures for Restricting the Spread of such Odours”, 2014. Latvijas Vestnesis, No. 250 (5310), 16.12.2014., Adopted 25.11.2014. Scentroid Model 110. Operating and maintenance manual. 2013. IDES Canada Inc. Version 2.0. Scentroid Model 110C. Operating and maintenance manual. 2012. IDES Canada Inc. Version 1.4. Sironia S., Eusebioa L., Capellia L., Remondinib M., Del Rossoa R. 2014. Use of an Electronic Nose for Indoor Air Quality Monitoring, Chemical engieneering transactions, Vol. 40, pp. 73–78. Smirde in Vecmīlgrāvis: the source of odor is not the company at the free port, the police conclude, 2017. Edition of Delfi. URL: http://www.delfi.lv/news/national/politics/smirde-vecmilgravi-smakas-avots-nav-uznemums-brivosta-secina-policija.d?id=49240809, Viewed: 31.03.2018. Zarra T., Reiser M., Naddeo V., Belgirno V., Kranert M., 2012. A comparative and Critical Evaluation of Sampling Marerials in the Measurement of Odour Concentratin by Dynamic Olfactometry, Chemical engieneering transactions, Vol. 30 (12), pp. 307–312.
DAUGAVPILS UNIVERSITĀTES 60. STARPTAUTISKĀS ZINĀTNISKĀS KONFERENCES PROCEEDINGS OF
RAKSTU KRĀJUMS THE 60th INTERNATIONAL SCIENTIFIC CONFERENCE OF DAUGAVPILS UNIVERSITY
33
FACTORS INFLUENCING USE OF AGRICULTURAL LANDS IN MARGINAL TERRITORIES OF NORTHWEST LATVIA
Zanda Penēze, Alīna Helde University of Latvia, Jelgavas iela 1, Rīga, Latvia, LV-1004, [email protected], [email protected] Abstract
Factors influencing use of agricultural lands in marginal territories of northwest Latvia Key Words: agricultural land, marginal territories, cultivation of farmland, driving forces, farmers’/landowners motivation Since the middle of the 20th century Latvian rural landscape has greatly changed due to the change in the proportion between land used in agricultural and forestry. The territory of agricultural land has decreased while woodland has increased almost twice. At present agricultural land occupies 36% but woodland 47% of the territory of Latvia. Territories of cultivated agricultural lands continue to decrease in marginal territories situated away from economic and administrative centres, which become depopulated. However, our study showed that such tendency cannot be observed in all marginal rural territories. The study was carried out in Lube rural district situated in the northeast of Latvia between the North Curonian Uplands and the Seaside Lowlands. It is away from economic and administrative centres. Since the beginning of the 21stcentury the number of inhabitants is decreasing. The territory of agricultural lands occupies 31% of the district. Within the framework of our research we mapped the territory for the present land use and interviewed the landowners and land users about their motivation to cultivate their land. The research showed that in Lube rural district the proportion of uncultivated land is only 3%, which is small in comparison with other marginal territories. Here cultivation of agricultural lands is encouraged by interaction of several factors, the most important being favourable agricultural conditions, good accessibility, the need for profit as a means for supporting family, and awareness of farmers that environment should be maintained in good order. Another driving factor may be farming experience accumulated during the times of collective farming. EU support payments are only as additional farming resource. Kopsavilkums
Lauksaimniecības zemju izmantošanu ietekmējošie faktori marginālās teritorij ās Ziemeļrietumu Latvij ā Atslēgvārdi: lauksaimniecības zeme, marginālās teritorijas, lauksaimniecības zemju izmantošana, ietekmējošie faktori, lauksaimnieku/zemes īpašnieku motivācija Kopš pagājušā gadsimta vidus ir būtiski mainījusies Latvijas lauku ainava. Ir samazinājušās lauksaimniecības zemju, bet palielinājušās meža zemju patības. Šobrīd Latvijā lauksaimniecības zemju platības aizņem 36%, bet mežu zemes – 47% no valsts kopplatības. Apsaimniekotas lauksaimniecības zemes turpina samazināties marginālās teritorijās, kas atrodas nomaļus no nozīmīgiem attīstības centriem un kur sarūk iedzīvotāju skaits. Mūsu pētījums lokālā līmenī - Lubes pagastā - parādīja, ka ne visās lauku teritorijās ar marginalitātes iezīmēm vērojamas šādas tendences. Pētījuma teritorija atrodas Ziemeļkursas augstienes un smilšainās Piejūras zemienes malu saskarē, nomaļus no valsts un reģiona attīstības centriem. Teritorijai raksturīga iedzīvotāju skaita samazināšanās. Lauksaimniecības zemes veido ap 31% no pagasta teritorijas. Pētījuma ietvaros tika kartēta pašreizējā zemes izmantošana un veiktas kartogrāfiskā materiāla studijas. Zemes īpašnieku/ apsaimniekotāju intervijās tika izzināta viņu motivācija zemju apsaimniekošanā. Pētījumi parādīja, ka mūsdienās neapsaimniekoto lauksaimniecības zemju platību īpatsvars ir zems (3%). Lauksaimniecības zemju izmantošanu pētītajā teritorijā veicina vairāku faktoru mijiedrabība. Svarīgākie ir: lauksaimniecībai piemēroti agroapstākļi, salīdzinoši laba lauksaimniecības zemju sasniedzamība, kā arī respondentu apziņa, ka apkārtējai videi ir jābūt sakoptai, un vajadzība nodrošināt savu ģimeni. Domājams, ka lauksaimniecības zemju izmantošanu veicina arī kolhozu laikā iegūtā un pārmantotā pozitīvā lauksaimniecības pieredze. Taču pieejamie ES atbalsta platību maksājumi respondentu skatījumā ir tikai papildus līdzekļi zemju apsaimniekošanai.
Introduction
It is common knowledge that land is the chief basis for agricultural production. Land
cultivation yields profit not only to its owner, but it is a driving force for the development of the
farm, the region and the country. The way land is used is one of the main causes of the change of
the quality of human environment and way of life (EEA 2013; Auziņš 2013)
Since the middle of the 20th century Latvian rural landscape has radically changed –
agricultural lands have decreased, while woodlands have increased. At present agricultural land
DAUGAVPILS UNIVERSITĀTES 60. STARPTAUTISKĀS ZINĀTNISKĀS KONFERENCES PROCEEDINGS OF
RAKSTU KRĀJUMS THE 60th INTERNATIONAL SCIENTIFIC CONFERENCE OF DAUGAVPILS UNIVERSITY
34
occupies 36.2% but woodland 47.6% of the territory of Latvia. However closer study of land use
show disproportion – vast fields of cultivated agricultural land are interspersed with patches of
abandoned uncultivated land. (Latvija 2018). This phenomenon is found in the whole of Europe, but
in particular in Eastern Europe. It is assumed that use of agricultural land has been determined by a
number of driving forces, such as geographical, agro-ecological, demographical, socio-economic
and other conditions (Keenleyside and Tucker 2010; Renwick et.al. 2013). The previous studies in
Latvia show that abandoned and overgrown land is mainly found in marginalised territories
characterised by remoteness from economic and administrative centres and decreasing population
(Latvija.. 2018; Penēze et al. 2013;). However, not all marginalised territories are characterised by
abandoned and overgrown areas. In some of them, on the contrary, cultivated agricultural lands are
expanded (Ārgalis et al. 2015). The goal of our study was to determine the driving forces
influencing land use in such marginalised territories.
Characterisation of the study area
The study area (Fig. 1) is located the North West of Latvia. It is one of the administrative
units of Talsi regional community with the territory 83.44 sq.km.
Figure 1. Location of Lubes pagasts (Envirotech 2013)
Lubes pagasts (a pagasts is the smallest territorial unit in Latvia) is located comparatively far
from Ventspils, the nearest national development centre (Tab. 1). It is also situated in the periphery
of the nearest regional development centre Talsi. Neither the place is close to the main motorway,
although it is crossed by several highways of secondary importance. Lubes pagasts is the smallest
territorial unit in Talsi regional community and Kurzeme (Couronian) region by number and density
of population. The density of population in Talsi regional community is 16 people per sq.km, and
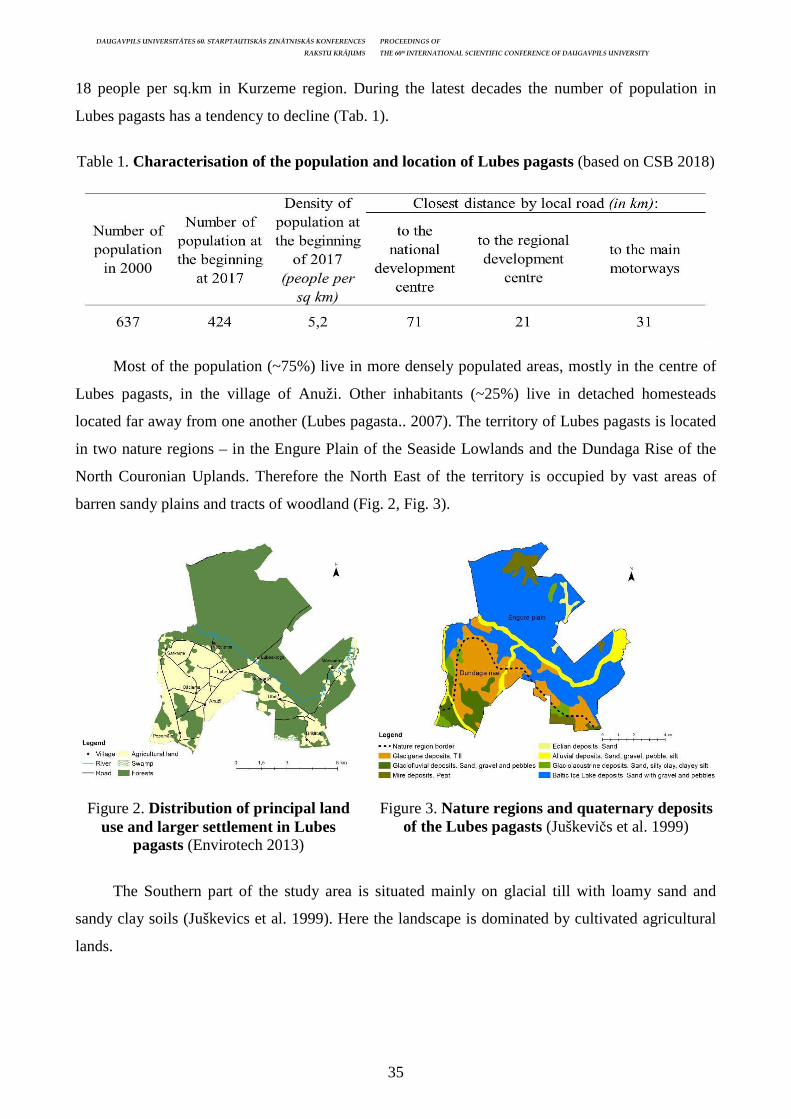
DAUGAVPILS UNIVERSITĀTES 60. STARPTAUTISKĀS ZINĀTNISKĀS KONFERENCES PROCEEDINGS OF
RAKSTU KRĀJUMS THE 60th INTERNATIONAL SCIENTIFIC CONFERENCE OF DAUGAVPILS UNIVERSITY
35
18 people per sq.km in Kurzeme region. During the latest decades the number of population in
Lubes pagasts has a tendency to decline (Tab. 1).
Table 1. Characterisation of the population and location of Lubes pagasts (based on CSB 2018)
Most of the population (~75%) live in more densely populated areas, mostly in the centre of
Lubes pagasts, in the village of Anuži. Other inhabitants (~25%) live in detached homesteads
located far away from one another (Lubes pagasta.. 2007). The territory of Lubes pagasts is located
in two nature regions – in the Engure Plain of the Seaside Lowlands and the Dundaga Rise of the
North Couronian Uplands. Therefore the North East of the territory is occupied by vast areas of
barren sandy plains and tracts of woodland (Fig. 2, Fig. 3).
Figure 2. Distribution of principal land use and larger settlement in Lubes
pagasts (Envirotech 2013)
Figure 3. Nature regions and quaternary deposits
of the Lubes pagasts (Juškevičs et al. 1999)
The Southern part of the study area is situated mainly on glacial till with loamy sand and
sandy clay soils (Juškevics et al. 1999). Here the landscape is dominated by cultivated agricultural
lands.

DAUGAVPILS UNIVERSITĀTES 60. STARPTAUTISKĀS ZINĀTNISKĀS KONFERENCES PROCEEDINGS OF
RAKSTU KRĀJUMS THE 60th INTERNATIONAL SCIENTIFIC CONFERENCE OF DAUGAVPILS UNIVERSITY
36
Material and Methods
The present study employed geographical and sociological methods. The land use map of
farmland maintenance was produced through field survey combined with orthophoto maps (scale 1:
10 000) acquired from the Latvian Geospatial Information Agency, produced from airborne remote
sensing images taken 2013. The obtained data were digitally processed. To study the relationship
between natural conditions and spatial distribution of types of agricultural land use, we created
schematic digital data layers showing quarternary sediment spatial distribution and borders of
natural areas (Juškevics et al. 1999). For studying the effects of human economic activities upon
agricultural land resources, we created digital data layers showing the quality assessment of
agricultural lands and distribution of ameliorated lands. The necessary data were obtained from the
digital cadastral map of ameliorated lands of Latvia (Meliorācijas.. S.a.), maps of land quality
assessment and local collective farm maps of Talsi region (Talsu.. 1978), as well as data provided
by the Agricultural Data Centre (LDC 2018). As an instrument for spatial procession of the data
GIS software ESRI (Arc View-ArcMap 10.3.1.) was used.
Nowadays farmers’ motivation is one of the driving forces causing changes in land use (Van
Vliet et al. 2015). To study this phenomenon we carried out the opinion poll of farmers and land
owners. We interviewed 55 respondents. 58% of them were of the age group between 41 and 60.
The interviews were direct, when the interviewer put down the respondent’s answers in a previously
prepared questionnaire, and indirect, when the respondent filled up the questionnaire himself. The
questionnaire contained questions about land management, cultivation, the EU support payments
and future prospects for agriculture in the study area. The results of the opinion poll were processed
and analysed by MS Office Excel 2013 software. The present article shows only the most essential
aspects of the opinion poll.
Results
Land use of farmland
Calculation shows that the study area comprises about 33% of agricultural land and 64% of
woodland from the total area of the pagasts. Field reviews showed that agricultural land is mostly
used as arable land, where cereal crops, such as wheat, oats, barley, rye and also rape seed are
grown for sale, but alfalfa, fodder beans and maize for fodder. Arable lands are chiefly located in
the central part of the pagasts around the regional road nearby Anužu village in the centre of Lubes
pagasts (Fig. 4). Grassland patches – meadows and pasture land – are scattered about the whole
pagasts. They are situated both in the central part and also in the outskirts of the pagasts, or at
places where arable lands alternate with woodlands. Grassland is mostly used as pasture land or for
making hay or silage. Detached homesteads are surrounded by well-kept orchards and allotments.
Abandoned and overgrown lands are very few (Fig. 4). The information obtained from the Rural
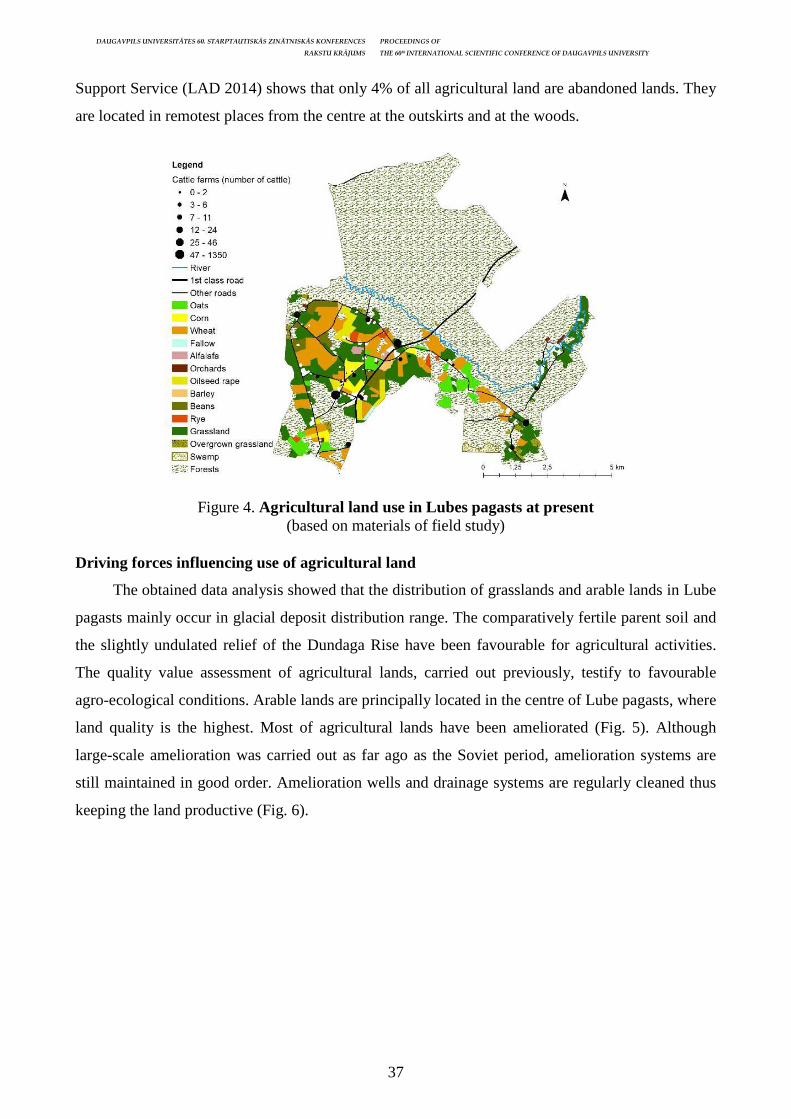
DAUGAVPILS UNIVERSITĀTES 60. STARPTAUTISKĀS ZINĀTNISKĀS KONFERENCES PROCEEDINGS OF
RAKSTU KRĀJUMS THE 60th INTERNATIONAL SCIENTIFIC CONFERENCE OF DAUGAVPILS UNIVERSITY
37
Support Service (LAD 2014) shows that only 4% of all agricultural land are abandoned lands. They
are located in remotest places from the centre at the outskirts and at the woods.
Figure 4. Agricultural land use in Lubes pagasts at present (based on materials of field study)
Driving forces influencing use of agricultural land
The obtained data analysis showed that the distribution of grasslands and arable lands in Lube
pagasts mainly occur in glacial deposit distribution range. The comparatively fertile parent soil and
the slightly undulated relief of the Dundaga Rise have been favourable for agricultural activities.
The quality value assessment of agricultural lands, carried out previously, testify to favourable
agro-ecological conditions. Arable lands are principally located in the centre of Lube pagasts, where
land quality is the highest. Most of agricultural lands have been ameliorated (Fig. 5). Although
large-scale amelioration was carried out as far ago as the Soviet period, amelioration systems are
still maintained in good order. Amelioration wells and drainage systems are regularly cleaned thus
keeping the land productive (Fig. 6).
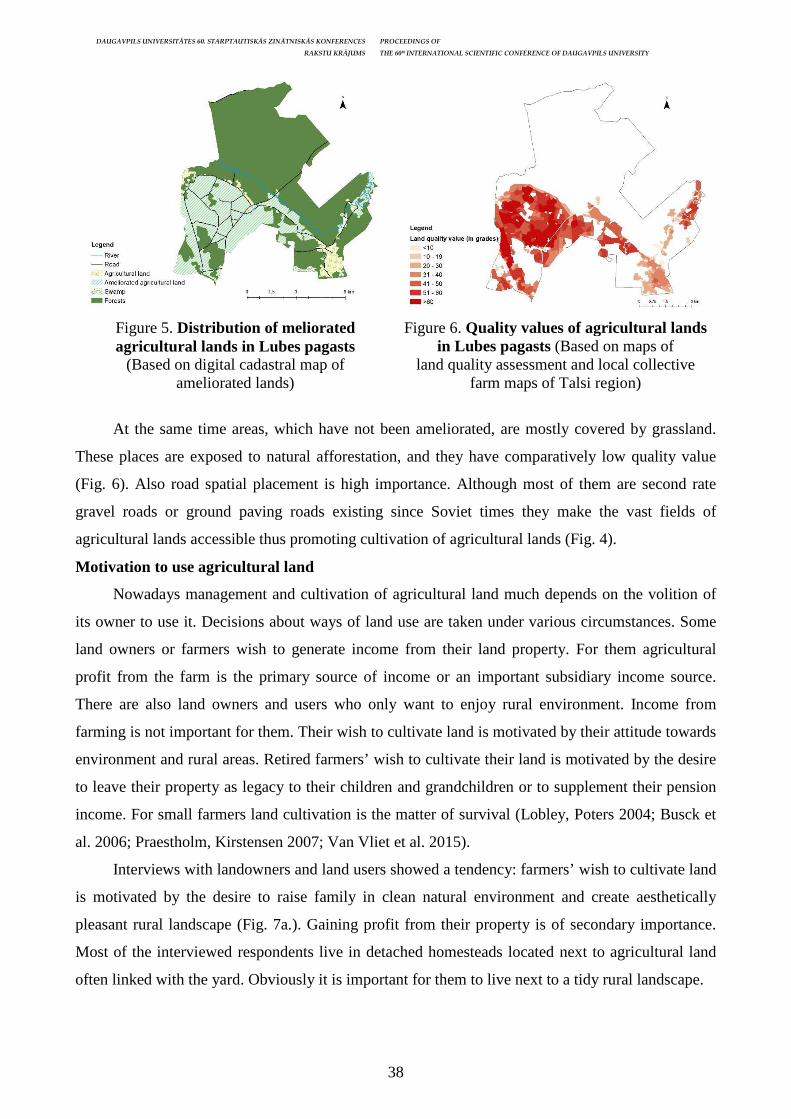
DAUGAVPILS UNIVERSITĀTES 60. STARPTAUTISKĀS ZINĀTNISKĀS KONFERENCES PROCEEDINGS OF
RAKSTU KRĀJUMS THE 60th INTERNATIONAL SCIENTIFIC CONFERENCE OF DAUGAVPILS UNIVERSITY
38
Figure 5. Distribution of meliorated agricultural lands in Lubes pagasts
(Based on digital cadastral map of ameliorated lands)
Figure 6. Quality values of agricultural lands in Lubes pagasts (Based on maps of
land quality assessment and local collective farm maps of Talsi region)
At the same time areas, which have not been ameliorated, are mostly covered by grassland.
These places are exposed to natural afforestation, and they have comparatively low quality value
(Fig. 6). Also road spatial placement is high importance. Although most of them are second rate
gravel roads or ground paving roads existing since Soviet times they make the vast fields of
agricultural lands accessible thus promoting cultivation of agricultural lands (Fig. 4).
Motivation to use agricultural land
Nowadays management and cultivation of agricultural land much depends on the volition of
its owner to use it. Decisions about ways of land use are taken under various circumstances. Some
land owners or farmers wish to generate income from their land property. For them agricultural
profit from the farm is the primary source of income or an important subsidiary income source.
There are also land owners and users who only want to enjoy rural environment. Income from
farming is not important for them. Their wish to cultivate land is motivated by their attitude towards
environment and rural areas. Retired farmers’ wish to cultivate their land is motivated by the desire
to leave their property as legacy to their children and grandchildren or to supplement their pension
income. For small farmers land cultivation is the matter of survival (Lobley, Poters 2004; Busck et
al. 2006; Praestholm, Kirstensen 2007; Van Vliet et al. 2015).
Interviews with landowners and land users showed a tendency: farmers’ wish to cultivate land
is motivated by the desire to raise family in clean natural environment and create aesthetically
pleasant rural landscape (Fig. 7a.). Gaining profit from their property is of secondary importance.
Most of the interviewed respondents live in detached homesteads located next to agricultural land
often linked with the yard. Obviously it is important for them to live next to a tidy rural landscape.
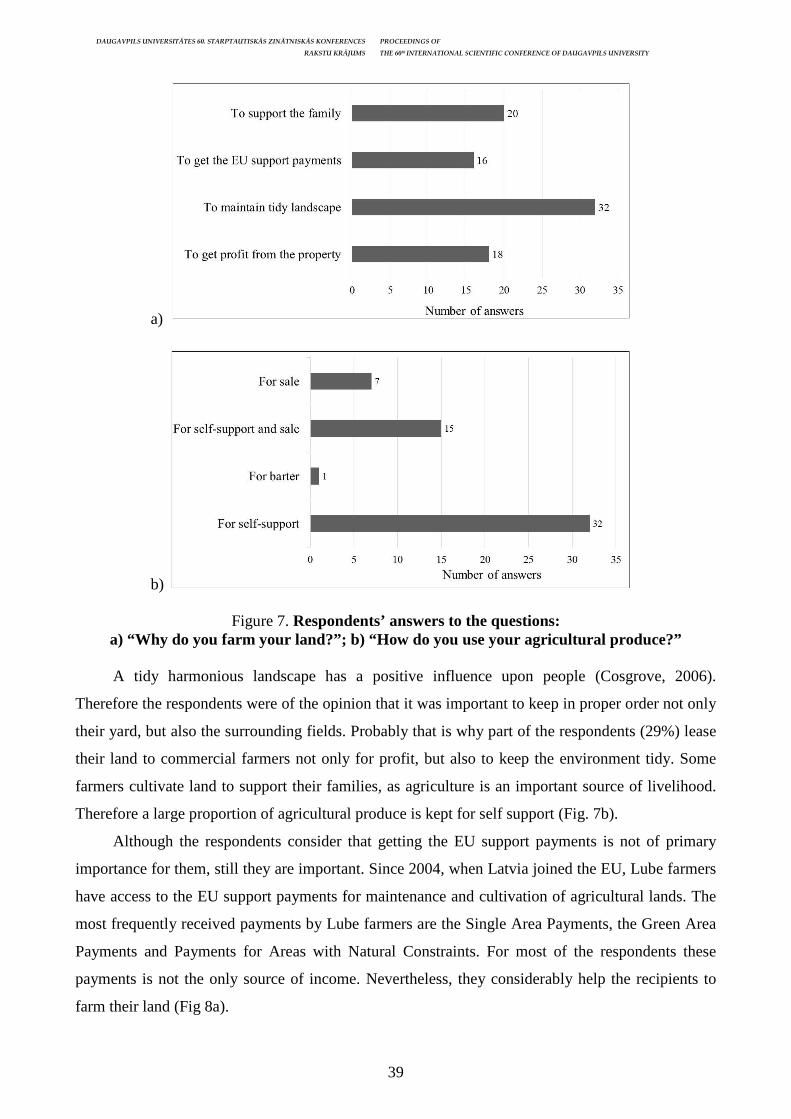
DAUGAVPILS UNIVERSITĀTES 60. STARPTAUTISKĀS ZINĀTNISKĀS KONFERENCES PROCEEDINGS OF
RAKSTU KRĀJUMS THE 60th INTERNATIONAL SCIENTIFIC CONFERENCE OF DAUGAVPILS UNIVERSITY
39
a)
b)
Figure 7. Respondents’ answers to the questions: a) “Why do you farm your land?”; b) “How do you use your agricultural produce?”
A tidy harmonious landscape has a positive influence upon people (Cosgrove, 2006).
Therefore the respondents were of the opinion that it was important to keep in proper order not only
their yard, but also the surrounding fields. Probably that is why part of the respondents (29%) lease
their land to commercial farmers not only for profit, but also to keep the environment tidy. Some
farmers cultivate land to support their families, as agriculture is an important source of livelihood.
Therefore a large proportion of agricultural produce is kept for self support (Fig. 7b).
Although the respondents consider that getting the EU support payments is not of primary
importance for them, still they are important. Since 2004, when Latvia joined the EU, Lube farmers
have access to the EU support payments for maintenance and cultivation of agricultural lands. The
most frequently received payments by Lube farmers are the Single Area Payments, the Green Area
Payments and Payments for Areas with Natural Constraints. For most of the respondents these
payments is not the only source of income. Nevertheless, they considerably help the recipients to
farm their land (Fig 8a).
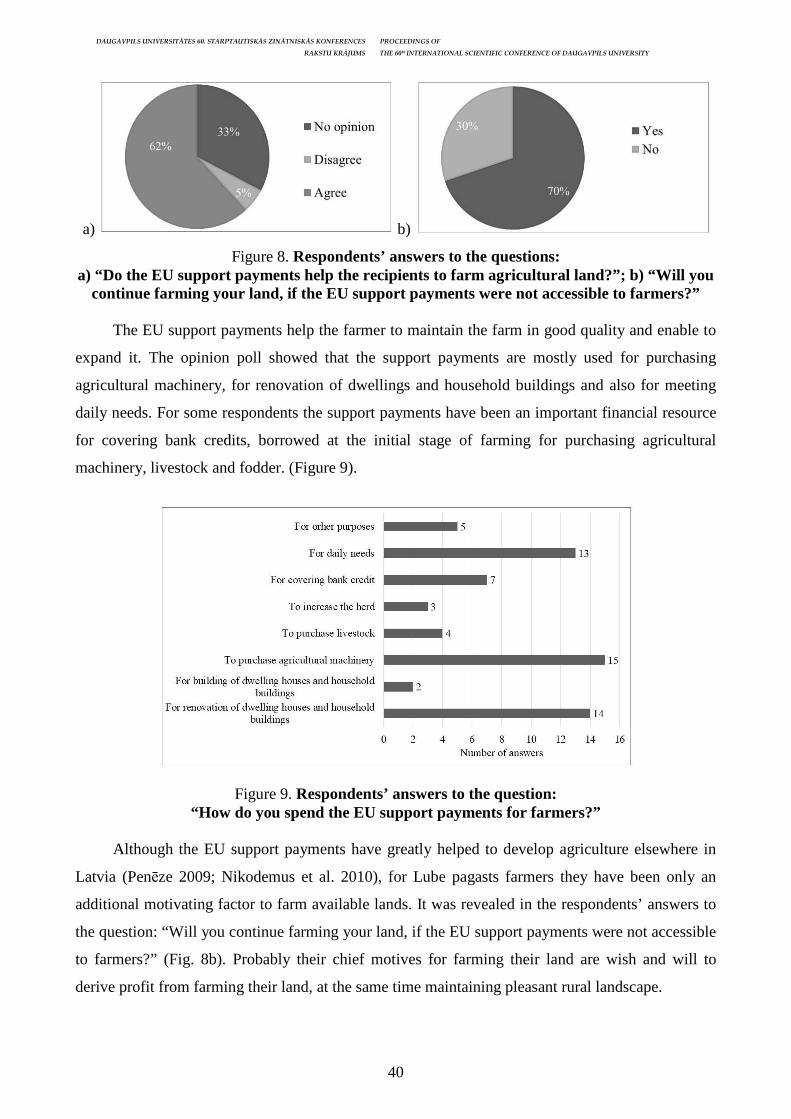
DAUGAVPILS UNIVERSITĀTES 60. STARPTAUTISKĀS ZINĀTNISKĀS KONFERENCES PROCEEDINGS OF
RAKSTU KRĀJUMS THE 60th INTERNATIONAL SCIENTIFIC CONFERENCE OF DAUGAVPILS UNIVERSITY
40
a) b)
Figure 8. Respondents’ answers to the questions: a) “Do the EU support payments help the recipients to farm agricultural land?”; b) “Will you
continue farming your land, if the EU support payments were not accessible to farmers?”
The EU support payments help the farmer to maintain the farm in good quality and enable to
expand it. The opinion poll showed that the support payments are mostly used for purchasing
agricultural machinery, for renovation of dwellings and household buildings and also for meeting
daily needs. For some respondents the support payments have been an important financial resource
for covering bank credits, borrowed at the initial stage of farming for purchasing agricultural
machinery, livestock and fodder. (Figure 9).
Figure 9. Respondents’ answers to the question: “How do you spend the EU support payments for farmers?”
Although the EU support payments have greatly helped to develop agriculture elsewhere in
Latvia (Penēze 2009; Nikodemus et al. 2010), for Lube pagasts farmers they have been only an
additional motivating factor to farm available lands. It was revealed in the respondents’ answers to
the question: “Will you continue farming your land, if the EU support payments were not accessible
to farmers?” (Fig. 8b). Probably their chief motives for farming their land are wish and will to
derive profit from farming their land, at the same time maintaining pleasant rural landscape.

DAUGAVPILS UNIVERSITĀTES 60. STARPTAUTISKĀS ZINĀTNISKĀS KONFERENCES PROCEEDINGS OF
RAKSTU KRĀJUMS THE 60th INTERNATIONAL SCIENTIFIC CONFERENCE OF DAUGAVPILS UNIVERSITY
41
Discussion
Our study again confirmed the fact that it is not in all territories located far away from
development centres and with declining population that agricultural lands are abandoned and get
overgrown (Latvija.. 2018; Vinogradovs et al. 2018). Like in some borderland territories (Ārgalis et
al. 2015), the proportion of overgrown lands in Lube pagasts is low. Obviously cultivation of
agricultural lands has been determined by favourable agro-ecological conditions (fertility of soils
and relief). Here the proportion of arable land is high, with a tendency to grow. Likewise elsewhere
in the country (Penēze 2009), also in Lubes pagasts location of agricultural lands close to local
roads is a driving force for land cultivation. Thus the Lubes pagasts example show the opposite to
conclusions drawn from other studies, namely, that each abandoned hectare of land is closely
related with declining number of population in rural territory (LLU 2015). Although the population
in Lubes pagasts is declining, agricultural lands do not overgrow rapidly. Thus we can conclude that
there is no intensive marginalisation of agricultural land. Features of spatial distribution of
overgrown agricultural lands in Lubes pagasts are similar to those in other regions (Nikodemus et
al. 2005; Penēze et al. 2013; Ārgalis et al. 2015). Statistical calculations show that in the Vidzeme
Uplands it is soil fertility, nearness of the wood, distance from the road and the farm and the size of
the field that promote abandonment and overgrowing of agricultural land (Vinogradovs et al. 2018).
Statistic data show that in recent years the number of bovine animals has grown (Fig. 10 a).
At the same time the number of animal holdings has fallen (Fig. 10 b). The opinion poll showed
that it is the number of small animal holdings that has fallen in recent years, while the number of
bovine animals has grown in larger farms. The largest farm in the pagasts has over 1000 animals. It
is the small farms, which use pasture land extensively, but not the big ones, where the animals are
kept in the holds all day. This situation raises the problem of extensive use of grasslands, which is
one of expressions of hidden marginalisation. Another fact mentioned in the interviews and raising
concern is that some respondents lease their land because it is unprofitable to farm it or because of
the lack of agricultural machinery. As Keenleyside and Tucker (2010) point out, hidden
marginalisation may appear as substitution of cereal areas by grassland, transition of a multi-
sectoral farm to cattle breeding, restructuring of the farm, leasing or selling it. Lubes pagasts is no
exception. Similar features have been found also in the Vidzeme Uplands (Penēze et al.2016).
However, this issue needs more detailed studies.
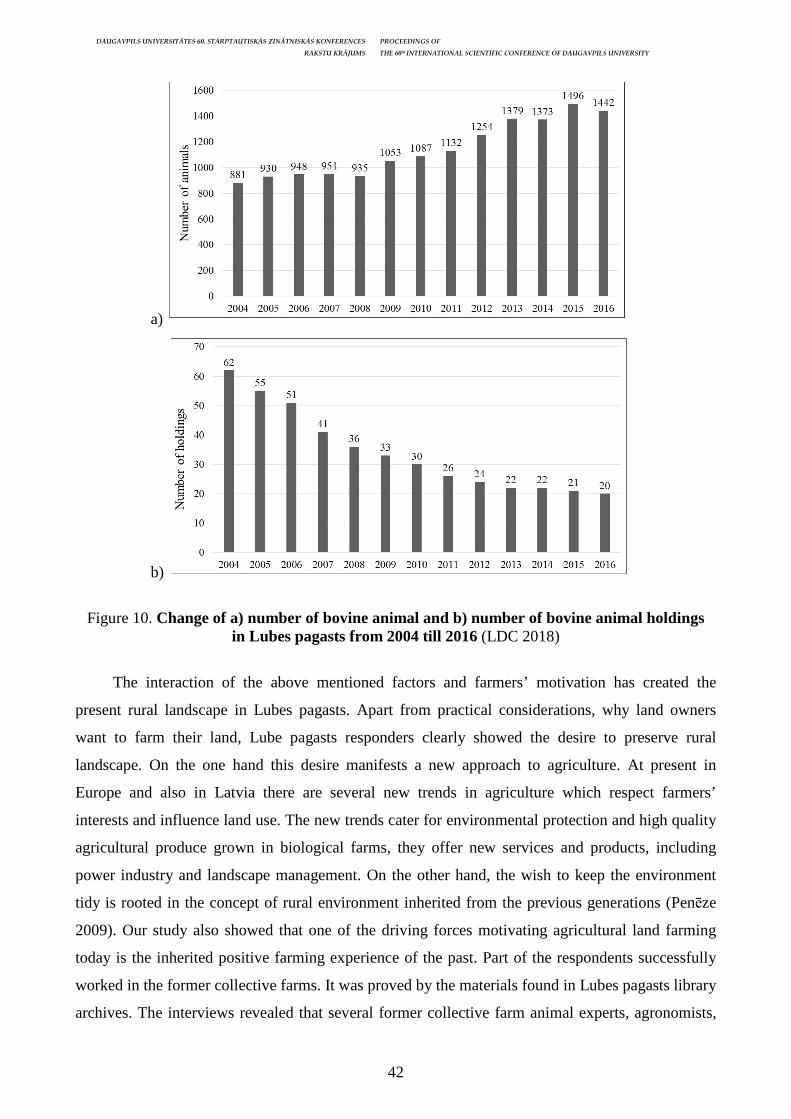
DAUGAVPILS UNIVERSITĀTES 60. STARPTAUTISKĀS ZINĀTNISKĀS KONFERENCES PROCEEDINGS OF
RAKSTU KRĀJUMS THE 60th INTERNATIONAL SCIENTIFIC CONFERENCE OF DAUGAVPILS UNIVERSITY
42
a)
b)
Figure 10. Change of a) number of bovine animal and b) number of bovine animal holdings
in Lubes pagasts from 2004 till 2016 (LDC 2018)
The interaction of the above mentioned factors and farmers’ motivation has created the
present rural landscape in Lubes pagasts. Apart from practical considerations, why land owners
want to farm their land, Lube pagasts responders clearly showed the desire to preserve rural
landscape. On the one hand this desire manifests a new approach to agriculture. At present in
Europe and also in Latvia there are several new trends in agriculture which respect farmers’
interests and influence land use. The new trends cater for environmental protection and high quality
agricultural produce grown in biological farms, they offer new services and products, including
power industry and landscape management. On the other hand, the wish to keep the environment
tidy is rooted in the concept of rural environment inherited from the previous generations (Penēze
2009). Our study also showed that one of the driving forces motivating agricultural land farming
today is the inherited positive farming experience of the past. Part of the respondents successfully
worked in the former collective farms. It was proved by the materials found in Lubes pagasts library
archives. The interviews revealed that several former collective farm animal experts, agronomists,
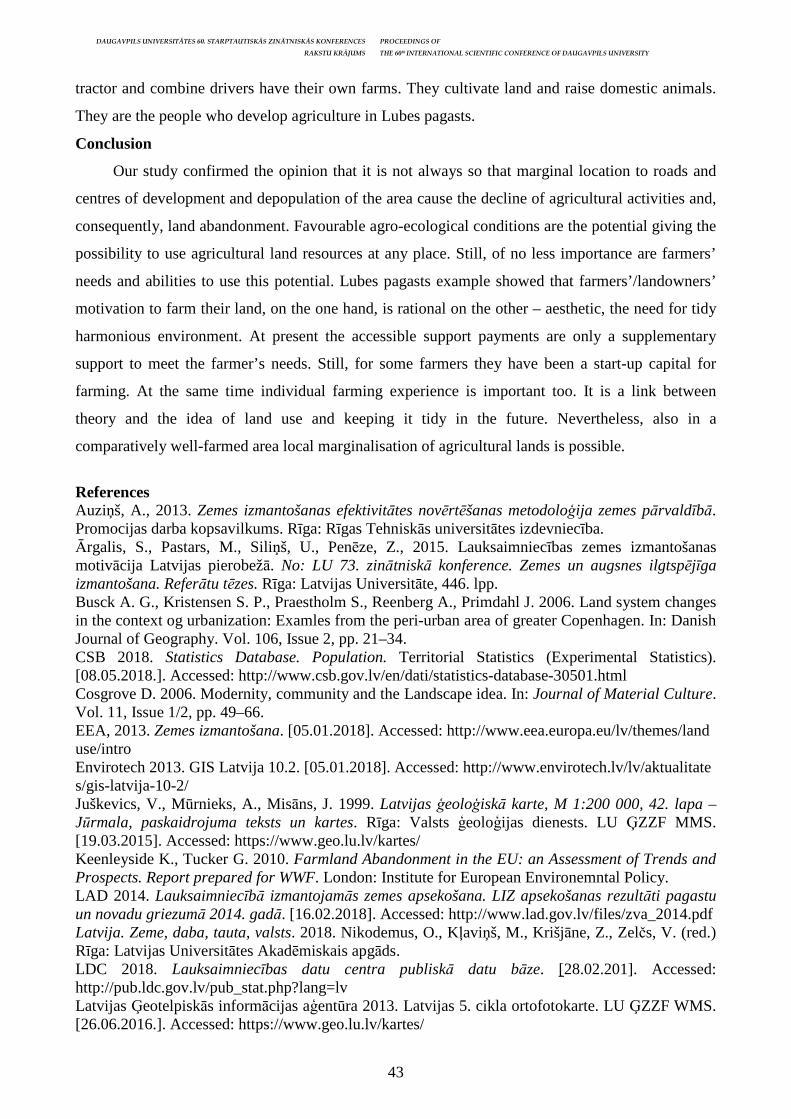
DAUGAVPILS UNIVERSITĀTES 60. STARPTAUTISKĀS ZINĀTNISKĀS KONFERENCES PROCEEDINGS OF
RAKSTU KRĀJUMS THE 60th INTERNATIONAL SCIENTIFIC CONFERENCE OF DAUGAVPILS UNIVERSITY
43
tractor and combine drivers have their own farms. They cultivate land and raise domestic animals.
They are the people who develop agriculture in Lubes pagasts.
Conclusion
Our study confirmed the opinion that it is not always so that marginal location to roads and
centres of development and depopulation of the area cause the decline of agricultural activities and,
consequently, land abandonment. Favourable agro-ecological conditions are the potential giving the
possibility to use agricultural land resources at any place. Still, of no less importance are farmers’
needs and abilities to use this potential. Lubes pagasts example showed that farmers’/landowners’
motivation to farm their land, on the one hand, is rational on the other – aesthetic, the need for tidy
harmonious environment. At present the accessible support payments are only a supplementary
support to meet the farmer’s needs. Still, for some farmers they have been a start-up capital for
farming. At the same time individual farming experience is important too. It is a link between
theory and the idea of land use and keeping it tidy in the future. Nevertheless, also in a
comparatively well-farmed area local marginalisation of agricultural lands is possible.
References Auziņš, A., 2013. Zemes izmantošanas efektivitātes novērtēšanas metodoloģija zemes pārvaldībā. Promocijas darba kopsavilkums. Rīga: Rīgas Tehniskās universitātes izdevniecība. Ārgalis, S., Pastars, M., Siliņš, U., Penēze, Z., 2015. Lauksaimniecības zemes izmantošanas motivācija Latvijas pierobežā. No: LU 73. zinātniskā konference. Zemes un augsnes ilgtspējīga izmantošana. Referātu tēzes. Rīga: Latvijas Universitāte, 446. lpp. Busck A. G., Kristensen S. P., Praestholm S., Reenberg A., Primdahl J. 2006. Land system changes in the context og urbanization: Examles from the peri-urban area of greater Copenhagen. In: Danish Journal of Geography. Vol. 106, Issue 2, pp. 21–34. CSB 2018. Statistics Database. Population. Territorial Statistics (Experimental Statistics). [08.05.2018.]. Accessed: http://www.csb.gov.lv/en/dati/statistics-database-30501.html Cosgrove D. 2006. Modernity, community and the Landscape idea. In: Journal of Material Culture. Vol. 11, Issue 1/2, pp. 49–66. EEA, 2013. Zemes izmantošana. [05.01.2018]. Accessed: http://www.eea.europa.eu/lv/themes/landuse/intro Envirotech 2013. GIS Latvija 10.2. [05.01.2018]. Accessed: http://www.envirotech.lv/lv/aktualitates/gis-latvija-10-2/ Juškevics, V., Mūrnieks, A., Misāns, J. 1999. Latvijas ģeoloģiskā karte, M 1:200 000, 42. lapa – Jūrmala, paskaidrojuma teksts un kartes. Rīga: Valsts ģeoloģijas dienests. LU ĢZZF MMS. [19.03.2015]. Accessed: https://www.geo.lu.lv/kartes/ Keenleyside K., Tucker G. 2010. Farmland Abandonment in the EU: an Assessment of Trends and Prospects. Report prepared for WWF. London: Institute for European Environemntal Policy. LAD 2014. Lauksaimniecībā izmantojamās zemes apsekošana. LIZ apsekošanas rezultāti pagastu un novadu griezumā 2014. gadā. [16.02.2018]. Accessed: http://www.lad.gov.lv/files/zva_2014.pdf Latvija. Zeme, daba, tauta, valsts. 2018. Nikodemus, O., Kļaviņš, M., Krišjāne, Z., Zelčs, V. (red.) Rīga: Latvijas Universitātes Akadēmiskais apgāds. LDC 2018. Lauksaimniecības datu centra publiskā datu bāze. [28.02.201]. Accessed: http://pub.ldc.gov.lv/pub_stat.php?lang=lv Latvijas Ģeotelpiskās informācijas aģentūra 2013. Latvijas 5. cikla ortofotokarte. LU ĢZZF WMS. [26.06.2016.]. Accessed: https://www.geo.lu.lv/kartes/

DAUGAVPILS UNIVERSITĀTES 60. STARPTAUTISKĀS ZINĀTNISKĀS KONFERENCES PROCEEDINGS OF
RAKSTU KRĀJUMS THE 60th INTERNATIONAL SCIENTIFIC CONFERENCE OF DAUGAVPILS UNIVERSITY
44
LLU 2015. Dažādu zemes apsaimniekošanas modeļu sociāli ekonomiskais novērtējums. Pētījuma atskaite. [12.05.2017]. Accessed: http://www.lvm.lv/images/lvm/Petijumi_un_publikacijas/Petijumi/Zemes_apsaimniekosanas_modeli_%20gala%20atskaite.pdf Lobley M., Potter C., 2004. Agricultural change and restructuring: Recent evidence from a survey of agricultural households in England. In: Journal of Rural Studies. Vol. 20, Issue 4, pp. 499–510. Lubes pagasta padome. 2007. Lubes pagasta teritorijas plānojums 2007-2019. I sējums. Paskaidrojuma raksts. [3.03.2016]. Accessed: http://talsi.case.lv/upload_file/Teritplanojums/Lube/ Paskaidrojuma%20raksts.pdf Meliorācijas digitālais kadastrs (S.a.) VSIA Zemkopības ministrijas nekustamie īpašumi, LVM, Latvijas Ģeotelpiskās informācijas aģentūra, Biznesa sistēmu risinājumi, SIA Envirotech. Nikodemus O., Bell S., Grīne I., Liepiņš I. 2005. The impact of economic, social and political factors on the landscape structure of the Vidzeme Uplands in Latvia. In: Landscape and Urban Planning. Vol. 70, pp. 57–67. Nikodemus O., Bell S., Penēze Z., Krūze I. 2010. The influence of European Uninon Single Area Payments and Less Favourable Area Payments on the Latvian landscape. In: European Countryside. Vol. 1, pp. 24–41. Penēze, Z., 2009. Latvijas lauku ainavas izmaiņas 20. un 21. gadsimtā: cēloņi, procesi un tendences. Promocijas darbs. Rīga: Latvijas Universitāte. Penēze, Z., Krūze, I., Medene, A., 2013. Ainavas Engures ezera sateces baseinā un tās ietekmējošie faktori. No: Kļaviņš, M., Melecis, V. (red.). Cilvēks un daba: Engures ekoreģions. Rīga: Latvijas Universitāte. Penēze, Z., Lakovskis, P., Krūze, I., Strods, K., 2016. ES platību maksājumu nozīme lauksaimniecības zemju izmantošanā Vidzemes augstienes paugurainēs. No: LU 74. zinātniskā konference. Zemes un augsnes ilgtspējīga izmantošana. Referātu tēzes. Rīga: Latvijas Universitāte, 57. lpp. Praestholm S., Kristensen S. P. 2007. Farmers as initiators and farms as attractors for non-agricultural economic activities in peri-urban areas in Denmark. In: Danish Journal of Geography. Vol. 107, Issue 2, pp. 13–27. Renwick A., Jansson T., Verburg P., H., Revoredo-Giha C., Britz W, Goscht A., McCracken D. 2013. Policy reform and agricultural land abandonment in the EU. In: Land Use Policy. Vol. 30, pp. 446-457. Šūmane, S., Kunda, I., Knickel, K., Strauss, A., Tisenkopfs, T, des los Rios, I., Rivera, M., Chebach, T., Ashenazy, A., 2017. Local and farmers' knowledge matters! How integrating informal and formal knowledge enhances sustainable and resilient agriculture. In: Journal of Rural Studies, pp. 1–10. In Press. Talsu rajona augšņu novērtējuma kartes un kolhozu plāni, M 1:10000. 1978. Rīga: Latvijas Valsts zemes ierīkošanas un projektēšanas institūts. LU ĢZZF MMS. [20.03.2017]. Accessed: https://www.geo.lu.lv/kartes/ Valsts reģionālās attīstības aģentūra 2012. Reģionu attīstība Latvijā 2011. Rīga: Vides aizsardzības un reģionālās attīstības ministrija. Van Vliet, J., de Groot, L.F.H., Rietveld, P., Verburg, H.P. 2015. Manifestations and underlying drivers of agricultural land use changes in Europe. In: Landscape and Urban Planning. Vol. 133, pp. 24–25. Vinogradovs I., Nikodemus O., Elferts D., Brūmelis, G. 2018. Assessment of site-spcific drivers od farmland abandonment in mosaic-type landscapes: A cas study in Vidzeme, Latvia. In: Agriculture, Ecosystmes and Environment. Vol. 253, pp. 113–121.

DAUGAVPILS UNIVERSITĀTES 60. STARPTAUTISKĀS ZINĀTNISKĀS KONFERENCES PROCEEDINGS OF
RAKSTU KRĀJUMS THE 60th INTERNATIONAL SCIENTIFIC CONFERENCE OF DAUGAVPILS UNIVERSITY
45
KVART ĀRVIDES PĒTĪJUMI / RESEARCHES OF QUARTERNARY ENVIRONMENT
CONCEPTUAL DIFFERENCES BETWEEN
FEN AND RAISED BOG PEAT Janis Krumins, Maris Klavins, Laimdota Kalnina University of Latvia, Raina Blvd. 19, Riga, LV-1586, Latvia, [email protected] Abstract
Conceptual differences between fen and raised bog peat Key Words: raised bog peat, fen peat, GHG emissions, fossil fuel, biomass The European Parliament states that peat is an intermediate between fossil fuel and biomass and use of it in the energy sector is subject to carbon dioxide emission tax. According to 2020 Climate and Energy Package and 2050 Low-carbon Economy, it is planned to reduce peat extraction in European Union significantly. However, it is based on the limitation of greenhouse gas emissions, while differences amongst different peat types or possibilities of mire re-cultivation are not taken into account. There is also no comprehensive scheme for the accounting of greenhouse gas emissions from peat extraction and abandoned extraction sites. Presently neglected fields of fen peat cause peat mineralization that increase greenhouse gas emissions. Fen peat is not used in the energy generation thus the extraction and industrial use would not significantly add to the greenhouse gas emissions. In turn, fen peat can be used in the production of environmentally friendly products that can improve environmental quality. In this study, we evaluated differences between peat types and described key findings drawn from this study. The main distinctive features of fen peat, in comparison to raised bog peat, are weathering and erosion of sedimentary rocks alongside mire, while main material carriers are ground and surface waters. Higher terrestrial plants produce biomass for fen peat; while lower plants produce scanty biomass for bog peat, thus peat composition and renewal speed significantly differ. We suggest revising the European Commission Directive and separate fen peat from raised bog peat when describing peat as a resource and to take into account that the neglectance of fen peat fields after raised bog peat removal increases greenhouse gas emissions. Kopsavilkums
Konceptuālās atšķir ības starp zemā un augstā tipa kūdru Atslēgvārdi: augstā tipa kūdra, zemā tipa kūdra, SG emisijas, fosilais kurināmais, biomasa Eiropas Savienības likumdošana nosaka, ka kūdra ir starpposms starp fosilo kurināmo un biomasas resursu un tās izmantošana enerģētikā ir apliekama ar oglekļa dioksīda emisijas nodokli. Saskaņā ar 2020. gada klimata un enerģētikas paketi un 2050. gada oglekļa mazietilpīgu ekonomiku līdz 2050. gadam Eiropas Savienībā tiek plānots ievērojami samazināt kūdras ieguves apjomus. Tomēr, tas balstīts uz siltumnīcas gāzu emisiju samazināšanu; kamēr tādi faktori kā atšķirības starp kūdras tipiem vai iespējamā rekultivācija netiek ņemti vērā. Trūkst arī visaptverošas shēmas, lai uzskaitītu siltumnīcas gāzu emisijas no kūdras atradnēm un no izstrādātajām kūdras atradnēm. Zināms, ka zemā tipa kūdra pamestajos kūdras laukos mineralizējas un rada pieaugumu siltumnīcas gāzu emisijās. Zemā kūdra tradicionāli netiek izmantota enerģētikā. Šīs kūdras ieguve var samazināt mineralizācijas negatīvo ietekmi un var tikt izmantota produktu ražošanā, kas var uzlabot vispārējo vides kvalitāti. Šajā pētījumā mēs izvērtējām atšķirības starp kūdras tipiem un aprakstījām galvenos secinājumus. Galvenās atšķirības starp augstā un zemā tipa kūdru ir nogulumiežu dēdēšana un erozija purva baseinā, kam ir ļoti būtiska loma zemās kūdras slāņa attīstībā; un gruntsūdeņu un virszemes ūdeņu darbība. Augstākie augi ražo zemā tipa kūdras biomasu, kamēr zemākie augi veido nabadzīgo augstā tipa kūdras biomasu, tādejādi kūdras uzkrāšanās ātrums būtiski atšķiras. Mēs rekomendējam izvērtēt Eiropas Komisijas direktīvas pārskatīšanu un nodalīt zemā tipa kūdru no augstā tipa kūdras; un ņemt vērā, ka zemās kūdras slāņa pamešana pēc augsto purvu izstrādes paaugstina siltumnīcas gāzu emisijas.
Introduction
The use of peat in the energy sector of the European Union (EU) is a subject to carbon
dioxide (CO2) emission tax. Mires are massive soil carbon storages and when they are drained,
excavated or peat is burned, this carbon is released in the atmosphere. Recent data show that from
drainage alone, mire-related CO2 emissions in the EU are 270 Mt per year (Peters and von Unger
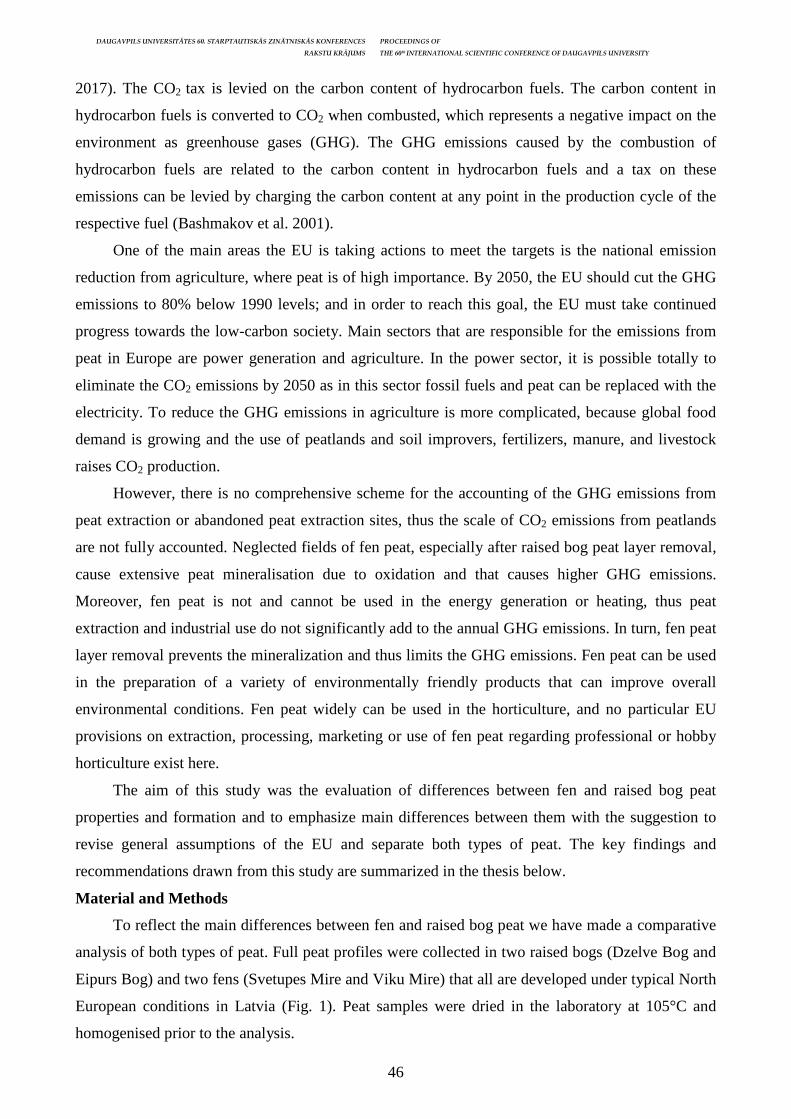
DAUGAVPILS UNIVERSITĀTES 60. STARPTAUTISKĀS ZINĀTNISKĀS KONFERENCES PROCEEDINGS OF
RAKSTU KRĀJUMS THE 60th INTERNATIONAL SCIENTIFIC CONFERENCE OF DAUGAVPILS UNIVERSITY
46
2017). The CO2 tax is levied on the carbon content of hydrocarbon fuels. The carbon content in
hydrocarbon fuels is converted to CO2 when combusted, which represents a negative impact on the
environment as greenhouse gases (GHG). The GHG emissions caused by the combustion of
hydrocarbon fuels are related to the carbon content in hydrocarbon fuels and a tax on these
emissions can be levied by charging the carbon content at any point in the production cycle of the
respective fuel (Bashmakov et al. 2001).
One of the main areas the EU is taking actions to meet the targets is the national emission
reduction from agriculture, where peat is of high importance. By 2050, the EU should cut the GHG
emissions to 80% below 1990 levels; and in order to reach this goal, the EU must take continued
progress towards the low-carbon society. Main sectors that are responsible for the emissions from
peat in Europe are power generation and agriculture. In the power sector, it is possible totally to
eliminate the CO2 emissions by 2050 as in this sector fossil fuels and peat can be replaced with the
electricity. To reduce the GHG emissions in agriculture is more complicated, because global food
demand is growing and the use of peatlands and soil improvers, fertilizers, manure, and livestock
raises CO2 production.
However, there is no comprehensive scheme for the accounting of the GHG emissions from
peat extraction or abandoned peat extraction sites, thus the scale of CO2 emissions from peatlands
are not fully accounted. Neglected fields of fen peat, especially after raised bog peat layer removal,
cause extensive peat mineralisation due to oxidation and that causes higher GHG emissions.
Moreover, fen peat is not and cannot be used in the energy generation or heating, thus peat
extraction and industrial use do not significantly add to the annual GHG emissions. In turn, fen peat
layer removal prevents the mineralization and thus limits the GHG emissions. Fen peat can be used
in the preparation of a variety of environmentally friendly products that can improve overall
environmental conditions. Fen peat widely can be used in the horticulture, and no particular EU
provisions on extraction, processing, marketing or use of fen peat regarding professional or hobby
horticulture exist here.
The aim of this study was the evaluation of differences between fen and raised bog peat
properties and formation and to emphasize main differences between them with the suggestion to
revise general assumptions of the EU and separate both types of peat. The key findings and
recommendations drawn from this study are summarized in the thesis below.
Material and Methods
To reflect the main differences between fen and raised bog peat we have made a comparative
analysis of both types of peat. Full peat profiles were collected in two raised bogs (Dzelve Bog and
Eipurs Bog) and two fens (Svetupes Mire and Viku Mire) that all are developed under typical North
European conditions in Latvia (Fig. 1). Peat samples were dried in the laboratory at 105°C and
homogenised prior to the analysis.

DAUGAVPILS UNIVERSITĀTES 60. STARPTAUTISKĀS ZINĀTNISKĀS KONFERENCES PROCEEDINGS OF
RAKSTU KRĀJUMS THE 60th INTERNATIONAL SCIENTIFIC CONFERENCE OF DAUGAVPILS UNIVERSITY
47
Figure 1. Location of the study sites
Peat botanical composition and decomposition degree were determined as suggested by
Lamcraft 1979 and Malterer et al. 1992. Peat quantitative composition was evaluated according to
loss on ignition method (Heiri et al. 2001). Peat elemental composition was determined using the
combustion technique, while the oxygen content was taken as a difference from 100% (Holmes
1963). Ultraviolet-visible light (UV-Vis) spectra were measured on UV spectrophotometer (UV-
1800 Shimadzu UV Spectrophotometer) using 1 cm quartz cuvette. Absorbance was determined at
280, 340, 465 and 665 nm and ratios E2/E6, E2/E3, E3/E4, E4/E6 derived (Chen et al. 1977).
Results and Discussion
Conceptual differences between fen and raised bog peat can be observed when evaluating
mire classification criteria such as peat properties and structure, mire properties, stratigraphy,
hydrology, morphology and vegetation – all these parameters significantly differ amongst peat
types allowing to differentiate peat (Krumins 2016). Our study shows the substantial differences in
the content of peat between peat types (Table 1) that result in different physicochemical reactions.
Table 1. Differences in parameter values between fen and raised bog peat
Parameter Fen peat (%) Raised bog peat (%)
Decomposition degree 27-45 9-27 Carbon 27-41 42-60 Hydrogen 1-5 4-6 Nitrogen 0.5-3.0 2.0-2.5 Oxygen 51-68 32-50 Sulphur 0.1-0.5 0.9-1.0 Organic matter 46-92 95-98 Carbonates 3-41 0.5-1.5 Minerals 5-35 0.5-1.5 H/C molar ratio 0.003-0.009 0.008 O/H molar ratio 231-824 133-145 O/C molar ratio 2.2-2.5 1.0-1.1
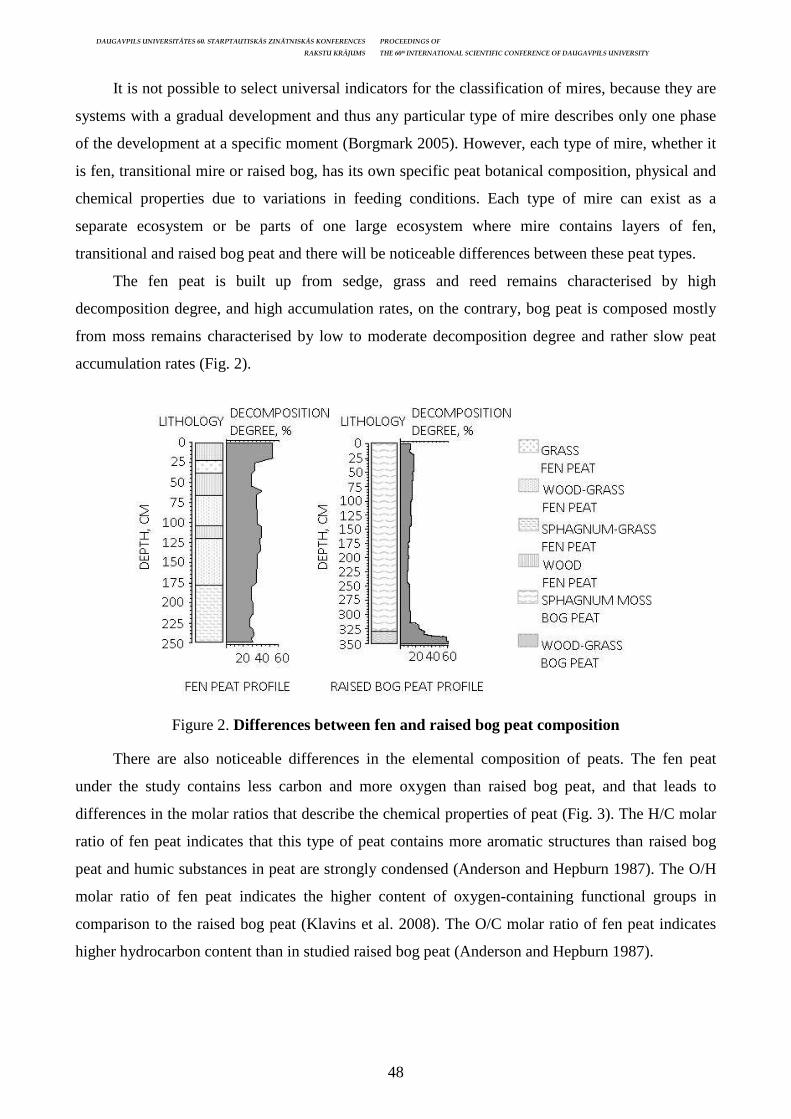
DAUGAVPILS UNIVERSITĀTES 60. STARPTAUTISKĀS ZINĀTNISKĀS KONFERENCES PROCEEDINGS OF
RAKSTU KRĀJUMS THE 60th INTERNATIONAL SCIENTIFIC CONFERENCE OF DAUGAVPILS UNIVERSITY
48
It is not possible to select universal indicators for the classification of mires, because they are
systems with a gradual development and thus any particular type of mire describes only one phase
of the development at a specific moment (Borgmark 2005). However, each type of mire, whether it
is fen, transitional mire or raised bog, has its own specific peat botanical composition, physical and
chemical properties due to variations in feeding conditions. Each type of mire can exist as a
separate ecosystem or be parts of one large ecosystem where mire contains layers of fen,
transitional and raised bog peat and there will be noticeable differences between these peat types.
The fen peat is built up from sedge, grass and reed remains characterised by high
decomposition degree, and high accumulation rates, on the contrary, bog peat is composed mostly
from moss remains characterised by low to moderate decomposition degree and rather slow peat
accumulation rates (Fig. 2).
Figure 2. Differences between fen and raised bog peat composition
There are also noticeable differences in the elemental composition of peats. The fen peat
under the study contains less carbon and more oxygen than raised bog peat, and that leads to
differences in the molar ratios that describe the chemical properties of peat (Fig. 3). The H/C molar
ratio of fen peat indicates that this type of peat contains more aromatic structures than raised bog
peat and humic substances in peat are strongly condensed (Anderson and Hepburn 1987). The O/H
molar ratio of fen peat indicates the higher content of oxygen-containing functional groups in
comparison to the raised bog peat (Klavins et al. 2008). The O/C molar ratio of fen peat indicates
higher hydrocarbon content than in studied raised bog peat (Anderson and Hepburn 1987).
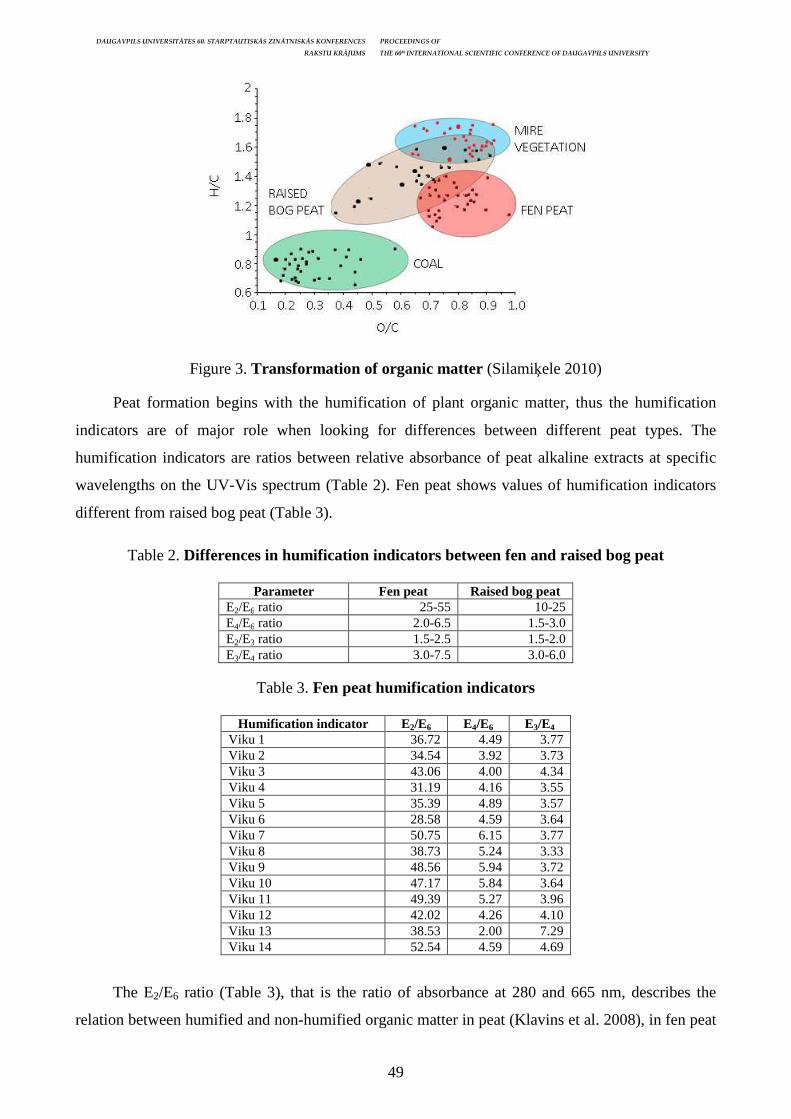
DAUGAVPILS UNIVERSITĀTES 60. STARPTAUTISKĀS ZINĀTNISKĀS KONFERENCES PROCEEDINGS OF
RAKSTU KRĀJUMS THE 60th INTERNATIONAL SCIENTIFIC CONFERENCE OF DAUGAVPILS UNIVERSITY
49
Figure 3. Transformation of organic matter (Silamiķele 2010)
Peat formation begins with the humification of plant organic matter, thus the humification
indicators are of major role when looking for differences between different peat types. The
humification indicators are ratios between relative absorbance of peat alkaline extracts at specific
wavelengths on the UV-Vis spectrum (Table 2). Fen peat shows values of humification indicators
different from raised bog peat (Table 3).
Table 2. Differences in humification indicators between fen and raised bog peat
Parameter Fen peat Raised bog peat
E2/E6 ratio 25-55 10-25 E4/E6 ratio 2.0-6.5 1.5-3.0 E2/E3 ratio 1.5-2.5 1.5-2.0 E3/E4 ratio 3.0-7.5 3.0-6.0
Table 3. Fen peat humification indicators
Humification indicator E 2/E6 E4/E6 E3/E4
Viku 1 36.72 4.49 3.77 Viku 2 34.54 3.92 3.73 Viku 3 43.06 4.00 4.34 Viku 4 31.19 4.16 3.55 Viku 5 35.39 4.89 3.57 Viku 6 28.58 4.59 3.64 Viku 7 50.75 6.15 3.77 Viku 8 38.73 5.24 3.33 Viku 9 48.56 5.94 3.72 Viku 10 47.17 5.84 3.64 Viku 11 49.39 5.27 3.96 Viku 12 42.02 4.26 4.10 Viku 13 38.53 2.00 7.29 Viku 14 52.54 4.59 4.69
The E2/E6 ratio (Table 3), that is the ratio of absorbance at 280 and 665 nm, describes the
relation between humified and non-humified organic matter in peat (Klavins et al. 2008), in fen peat
DAUGAVPILS UNIVERSITĀTES 60. STARPTAUTISKĀS ZINĀTNISKĀS KONFERENCES PROCEEDINGS OF
RAKSTU KRĀJUMS THE 60th INTERNATIONAL SCIENTIFIC CONFERENCE OF DAUGAVPILS UNIVERSITY
50
this indicator is comparatively higher than in raised bog peat and shows on a high lignin content in
peat mass – lignin is of major importance for plant development and terrestrial plants are the source
of this component in fen peat. The E4/E6 ratio (Table 3), that is the ratio of absorbance at 465 and
665 nm, indicates that fen peat has higher aromaticity than raised bog peat and high aromatic
hydrocarbon content (Stevenson 1994). The E3/E4 ratio (Table 3), that is the ratio of absorbance at
360 and 465 nm, shows that fen peat phenolic groups (hydrocarbons bounded with a hydroxyl
group) are more degraded than in raised bog peat (Sire 2010). This degradation usually appears due
to the activity of a large number of microorganisms and represents intensive microbial activity.
Fens are nutrient-medium to nutrient-rich mires with groundwater input that transfers oxygen
and dissolved mineral nutrients to mire. Fens are more abundant in nutrients and have higher pH
levels than raised bogs. In contrary to raised bog peat, fen peat has an additional factor affecting
chemical composition and physical properties, namely - ground and surface waters, the composition
of which depends on the local geology, with supplemental anthropogenic impact. The main
distinctive features of the mechanisms involved in the formation of fen peat material and its
properties in comparison with bog peat are weathering and erosion of sedimentary rocks alongside
mire area and atmospheric precipitation and pollution, while the main carriers are groundwater,
artesian water and surface runoff (Krumins 2016). Water table in fens usually is several times
higher than in a typical raised bog peat profile resulting in water affected chemical composition and
seasonal variations of values of peat parameters. In contrary to raised bogs, higher terrestrial plants
produce plant biomass for fen peat, while lower plants produce scarce plant biomass for bog peat.
Terrestrial plants and lower plants have different decomposition rates and processes that result in
different mechanisms between fen peat and bog peat formation. Aspects of weak acidic/neutral (and
alkaline) humification are not yet widely studied and, thus, are not known in high detail. Hence, the
chemical composition of fen peat delivers a more thorough picture of humification/transformation
of organic matter in all environments and defines the diagenesis of plant organic matter that
eventually results in coal deposits.
Although peat formation and development are both unique for each particular site, same
major mechanisms can be attributed to all mires. In general, it is possible to differentiate 4 groups
of mechanisms, which are involved into formation of mires and the development of peat properties
(Fig. 4). Those are:
1) Mechanisms within mire basin;
2) Mechanisms within mire territory;
3) Mechanisms within peat layer;
4) External mechanisms.
All groups are in constant interaction with one another and specific properties of each
mechanism are site dependent.
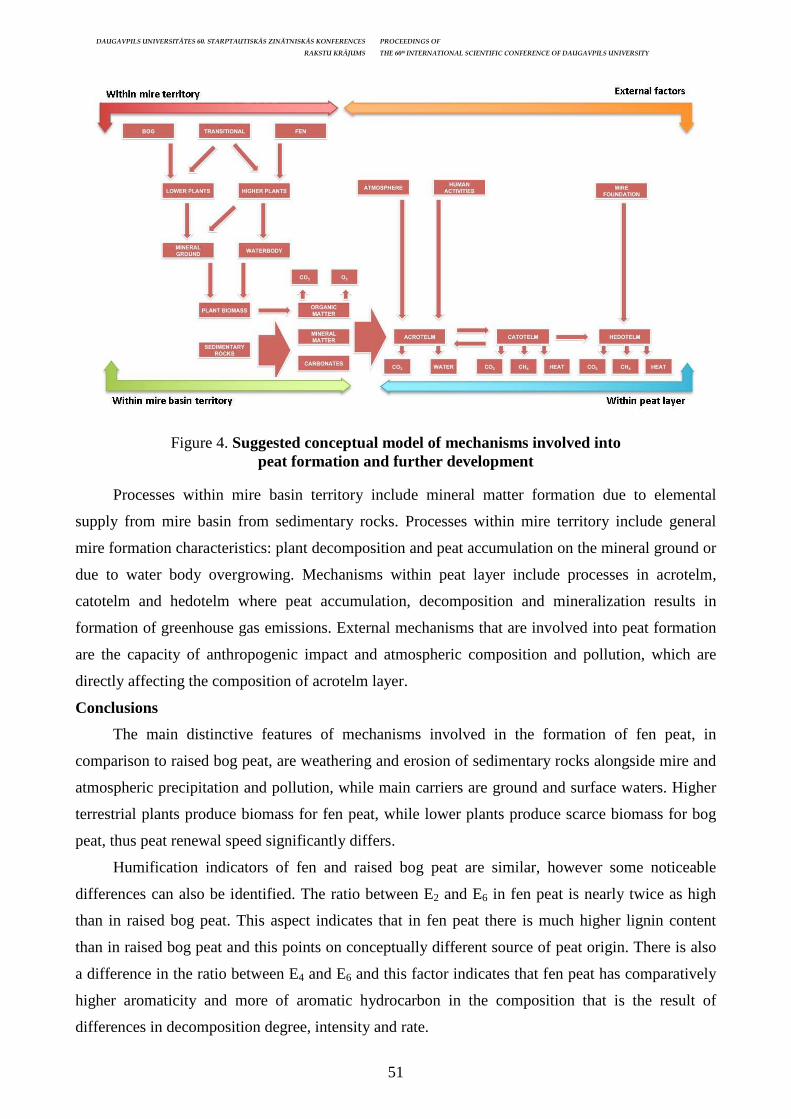
DAUGAVPILS UNIVERSITĀTES 60. STARPTAUTISKĀS ZINĀTNISKĀS KONFERENCES PROCEEDINGS OF
RAKSTU KRĀJUMS THE 60th INTERNATIONAL SCIENTIFIC CONFERENCE OF DAUGAVPILS UNIVERSITY
51
Figure 4. Suggested conceptual model of mechanisms involved into peat formation and further development
Processes within mire basin territory include mineral matter formation due to elemental
supply from mire basin from sedimentary rocks. Processes within mire territory include general
mire formation characteristics: plant decomposition and peat accumulation on the mineral ground or
due to water body overgrowing. Mechanisms within peat layer include processes in acrotelm,
catotelm and hedotelm where peat accumulation, decomposition and mineralization results in
formation of greenhouse gas emissions. External mechanisms that are involved into peat formation
are the capacity of anthropogenic impact and atmospheric composition and pollution, which are
directly affecting the composition of acrotelm layer.
Conclusions
The main distinctive features of mechanisms involved in the formation of fen peat, in
comparison to raised bog peat, are weathering and erosion of sedimentary rocks alongside mire and
atmospheric precipitation and pollution, while main carriers are ground and surface waters. Higher
terrestrial plants produce biomass for fen peat, while lower plants produce scarce biomass for bog
peat, thus peat renewal speed significantly differs.
Humification indicators of fen and raised bog peat are similar, however some noticeable
differences can also be identified. The ratio between E2 and E6 in fen peat is nearly twice as high
than in raised bog peat. This aspect indicates that in fen peat there is much higher lignin content
than in raised bog peat and this points on conceptually different source of peat origin. There is also
a difference in the ratio between E4 and E6 and this factor indicates that fen peat has comparatively
higher aromaticity and more of aromatic hydrocarbon in the composition that is the result of
differences in decomposition degree, intensity and rate.
DAUGAVPILS UNIVERSITĀTES 60. STARPTAUTISKĀS ZINĀTNISKĀS KONFERENCES PROCEEDINGS OF
RAKSTU KRĀJUMS THE 60th INTERNATIONAL SCIENTIFIC CONFERENCE OF DAUGAVPILS UNIVERSITY
52
From the point of elemental composition, the most pronounced differences between fen and
raised bog peat is in the carbon content. Fen peat comparatively contains less carbon due to major
differences in the ratio between organic and inorganic components – there is a major impact from
surrounding area of the mire basin that results in different from raised bog peat elemental
composition.
We suggest revising the EC Directive and separate fen peat from raised bog peat when
describing peat and to consider that neglectance of fen peat fields after raised bog peat removal
increases GHG emissions.
Acknowledgements
The financial support from the European Regional Development Fund of European Union
project No. 1.1.1.2/VIAA/1/16/001, post-doctoral project: “Innovative use of fen peat in
environmentally friendly technologies” No. 1.1.1.2/VIAA/1/16/008 is acknowledged.
References Anderson H., Hepburn A. 1987. Variation of humic substances within peat profile. In: Fuchsman C. H. (ed.). Peat and water. New York, Academic Press, pp. 177–194. Bashmakov I., Jepma C., Bohm P., Gupta S., Haites E., Heller T., Montero J-P., Pasco-Font A., Stavins R., Turkson J., Xu H., Yamaguchi M. 2001. Policies, measures and instruments. In: Metz B., Davidson O., Swart R., Pan J. (eds.). Climate Change 2001: Mitigation. Cambridge: Cambridge University Press, pp. 401–450. Borgmark A. 2005. Holocene climate variability and periodicities in south-central Sweden, as interpreted from peat humification analysis. Holocene. Vol. 15, pp. 387–395. Chen Y., Senesi N., Schnitzer, M. 1977. Information provided on humic substances by E4/E6 ratios. Soil Science Society of America Journal. Vol. 41, pp. 352–358. Heiri O., Lotter A. F., Lemcke G. 2001. Loss on ignition as a method for estimating organic and carbonate content in deposits: reproducibility and comparability of results. Journal of Paleolimnology. Vol. 25, pp. 101–110. Holmes F.L. 1963. Elementary Analysis and the Origins of Physiological Chemistry. Isis. Vol. 54(1), pp. 50–81. Klavins M., Sire J., Purmalis O., Melecis V. 2008. Approaches to estimating humification indicators for peat. Mires and peat. Vol. 3, pp. 1–15. Krumins J. 2016. The influence of peat composition on metallic element accumulation in fens. Doctoral thesis. University of Latvia. Riga, Latvia. 152 p. Lamacraft R. R. 1979. A method of displaying differences in botanical composition. Australian Journal of Ecology. Vol. 4, pp. 407–409. Malterer T. J., Verry E. S., Erjaves J. 1992. Fiber content and degree of decomposition in peats: review of natural methods. Soil Science Society of America Journal. Vol. 56, pp. 1200–1211. Peters J., von Unger M. 2017. Peatlands in the EU Regulatory Environment. Survey with case studies on Poland and Estonia. Federal Agency for Nature Conservation. Bonn, Germany. 103 p. Silamiķele I. 2010. Humifikācijas un ķīmisko elementu akumulācijas raksturs augsto purvu kūdrā atkarībā no tās sastāva un veidošanās. Promocijas darbs. Latvijas Universitāte. Rīga, Latvija. 172 lpp. Sire J. 2010. Composition and properties of rised bog peat humic acids. Thesis for Doctor’s Degree in Environmental Sciences. University of Latvia. 105 p. Stevenson F. J. 1994. Humus chemistry: genesis, composition, reactions. New York, Wiley, 443 p.
DAUGAVPILS UNIVERSITĀTES 60. STARPTAUTISKĀS ZINĀTNISKĀS KONFERENCES PROCEEDINGS OF
RAKSTU KRĀJUMS THE 60th INTERNATIONAL SCIENTIFIC CONFERENCE OF DAUGAVPILS UNIVERSITY
53
VESELĪBAS ZINĀTNES / HEALTH SCIENCES
COMPARISON OF STROKE RISK FACTORS BETWEEN PATIENTS WITH DIFFERENT LEVEL OF
PHYSICAL ACTIVITIES Zanda Arājuma1, Leila Geibijeva1, Ritvars Kalni ņš1, Juris Dzenis1, 2 1 Faculty of Medicine, University of Latvia, Riga, Latvia 2 Clinic of Neurosurgery, Pauls Stradins Clinical University Hospital, Riga, Latvia Abstract
Comparison of stroke risk factors between patients with different level of physical activities Key Words: Ischemic stroke risk, glucose, cholesterol, blood pressure Stroke is leading cause of mortality and morbidity worldwide. The role of physical activities is the primary prevention of stroke. Other risk factors like smoking, arrhythmia and high arterial blood pressure can also play a major role in this. Aim. Prove that a city with more activity opportunities will have a lower risk for stroke. Results: The risk among the groups (p = 0.005), the lowest risk is in the group with higher activity is in the Sigulda city 52% (n = 78) and the highest risk is in the Riga city with a low activity range 38% (n = 69) and the average range of activities is 45% (n = 72). Conclusion: Physical activity might be beneficial to prevent stroke in general population. Cities which have the highest risk of stroke should increase the availability of physical activities. Kopsavilkums Išēmisks insults ir galvenais mirstības un saslimstības iemesls visā pasaulē. Fizisko aktivitāšu loma ir galvenā insulta profilakse. Šajā sakarā var būt arī citi riska faktori, piemēram, smēķēšana, aritmija un paaugstināts arteriālais asinsspiediens. Mērķis: Pierādiet, ka pilsētai ar lielākām aktivitāšu iespējām būs mazāks insulta risks. Rezultāti: Risks starp grupām (p = 0,005), zemākais risks grupā ar augstāku aktivitāti ir Siguldas pilsētā 52% (n = 78), un visaugstākais risks ir Rīgas pilsētā ar zemu aktivitātes diapazonu 38% (n = 69) un vidējais aktivitāšu diapazons ir Bauskā 45% (n = 72). Secinājumi: Fiziskā aktivitāte var būt noderīga, lai novērstu insultu vispārējā populācijā. Pilsētās, kurām ir vislielākais insulta risks, vajadzētu palielināt fizisko aktivitāšu pieejamību.
Introduction
Stroke is leading cause of mortality and morbidity worldwide. The role of physical activities
is the primary prevention of stroke. The risk of stroke is assessed by the arterial blood pressure,
heart rhythm disorders, smoking, cholesterol, glucose, body mass index, inheritance and the level of
human activity.
Stroke may arise in different clinical situations with different etiologies, epidemiological
background and prognosis. Atrial fibrillation is being increasingly diagnosed after ischemic stroke.
Patient characteristics, frequency and duration of paroxysms, and the risk of recurrent ischemic
stroke associated with atrial fibrillation detected after stroke. We aim to summarize major recent
advances in the field, in the context of prior evidence, and to identify areas of uncertainty to be
addressed in future research (Cerasuola, 2017).
Many studies have suggested that smoking does not increase mortality in stroke survivors.
Index event bias, a sample selection bias, potentially explains this paradoxical finding. Levine with
colleagues mentioned that stroke survivors who smoke have an increased risk of all-cause mortality
which is largely due to cancer mortality. Socioeconomic and clinical factors explain stroke
survivors’ higher risk of CVD mortality associated with smoking (Levine, 2014).
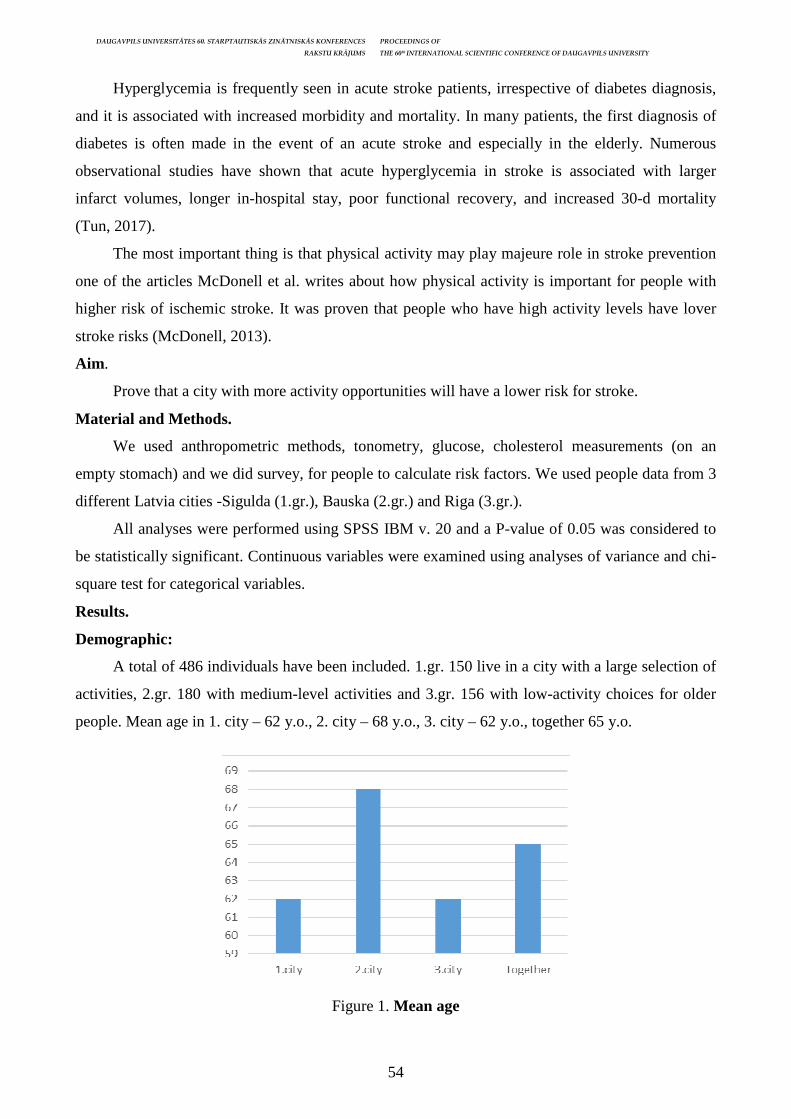
DAUGAVPILS UNIVERSITĀTES 60. STARPTAUTISKĀS ZINĀTNISKĀS KONFERENCES PROCEEDINGS OF
RAKSTU KRĀJUMS THE 60th INTERNATIONAL SCIENTIFIC CONFERENCE OF DAUGAVPILS UNIVERSITY
54
Hyperglycemia is frequently seen in acute stroke patients, irrespective of diabetes diagnosis,
and it is associated with increased morbidity and mortality. In many patients, the first diagnosis of
diabetes is often made in the event of an acute stroke and especially in the elderly. Numerous
observational studies have shown that acute hyperglycemia in stroke is associated with larger
infarct volumes, longer in-hospital stay, poor functional recovery, and increased 30-d mortality
(Tun, 2017).
The most important thing is that physical activity may play majeure role in stroke prevention
one of the articles McDonell et al. writes about how physical activity is important for people with
higher risk of ischemic stroke. It was proven that people who have high activity levels have lover
stroke risks (McDonell, 2013).
Aim .
Prove that a city with more activity opportunities will have a lower risk for stroke.
Material and Methods.
We used anthropometric methods, tonometry, glucose, cholesterol measurements (on an
empty stomach) and we did survey, for people to calculate risk factors. We used people data from 3
different Latvia cities -Sigulda (1.gr.), Bauska (2.gr.) and Riga (3.gr.).
All analyses were performed using SPSS IBM v. 20 and a P-value of 0.05 was considered to
be statistically significant. Continuous variables were examined using analyses of variance and chi-
square test for categorical variables.
Results.
Demographic:
A total of 486 individuals have been included. 1.gr. 150 live in a city with a large selection of
activities, 2.gr. 180 with medium-level activities and 3.gr. 156 with low-activity choices for older
people. Mean age in 1. city – 62 y.o., 2. city – 68 y.o., 3. city – 62 y.o., together 65 y.o.
Figure 1. Mean age
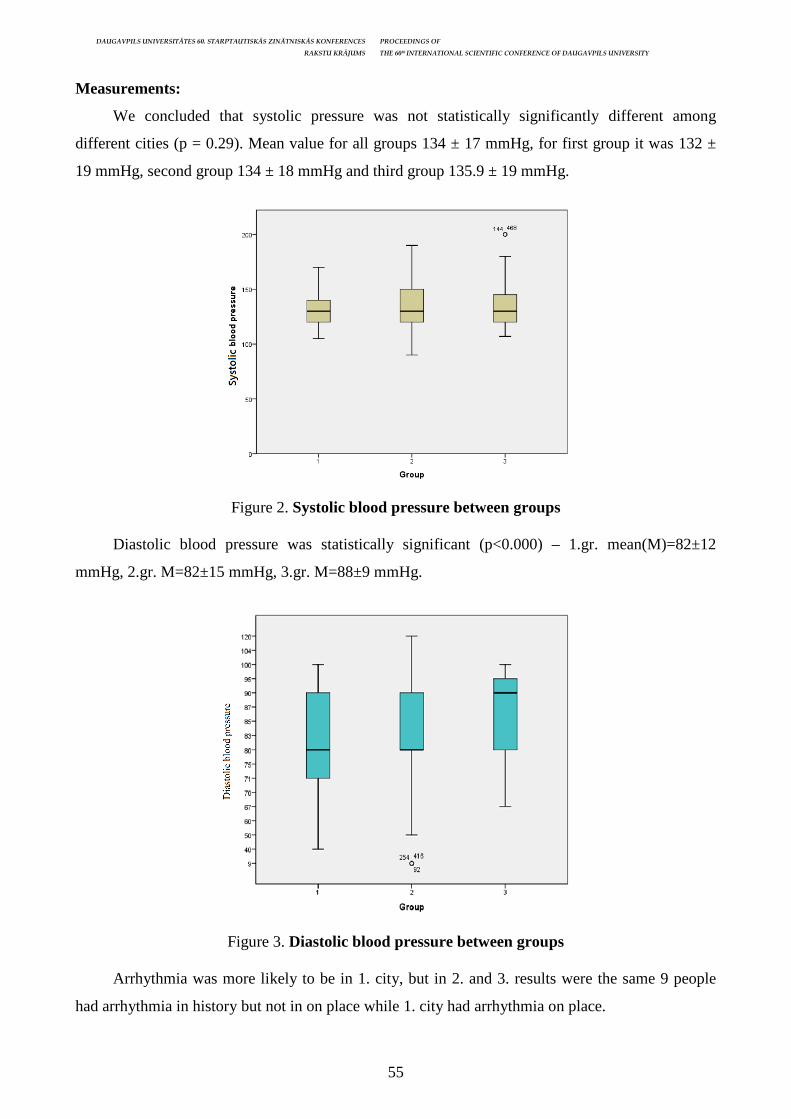
DAUGAVPILS UNIVERSITĀTES 60. STARPTAUTISKĀS ZINĀTNISKĀS KONFERENCES PROCEEDINGS OF
RAKSTU KRĀJUMS THE 60th INTERNATIONAL SCIENTIFIC CONFERENCE OF DAUGAVPILS UNIVERSITY
55
Measurements:
We concluded that systolic pressure was not statistically significantly different among
different cities (p = 0.29). Mean value for all groups 134 ± 17 mmHg, for first group it was 132 ±
19 mmHg, second group 134 ± 18 mmHg and third group 135.9 ± 19 mmHg.
Figure 2. Systolic blood pressure between groups
Diastolic blood pressure was statistically significant (p<0.000) – 1.gr. mean(M)=82±12
mmHg, 2.gr. M=82±15 mmHg, 3.gr. M=88±9 mmHg.
Figure 3. Diastolic blood pressure between groups
Arrhythmia was more likely to be in 1. city, but in 2. and 3. results were the same 9 people
had arrhythmia in history but not in on place while 1. city had arrhythmia on place.

DAUGAVPILS UNIVERSITĀTES 60. STARPTAUTISKĀS ZINĀTNISKĀS KONFERENCES PROCEEDINGS OF
RAKSTU KRĀJUMS THE 60th INTERNATIONAL SCIENTIFIC CONFERENCE OF DAUGAVPILS UNIVERSITY
56
Figure 4. History of arrhythmia between groups
Smoking in 1. and 2. city smoked only 6 people while in 3. city 12 people, which is much
higher number then in other cities.
Figure 5. History of smoking between groups
Body mass index the highest was in 1 city – 29 kg/m2, lowest 2.city - 24 kg/m2 and 3.city – 25 kg/m2.
Figure 6. Body mass index between groups
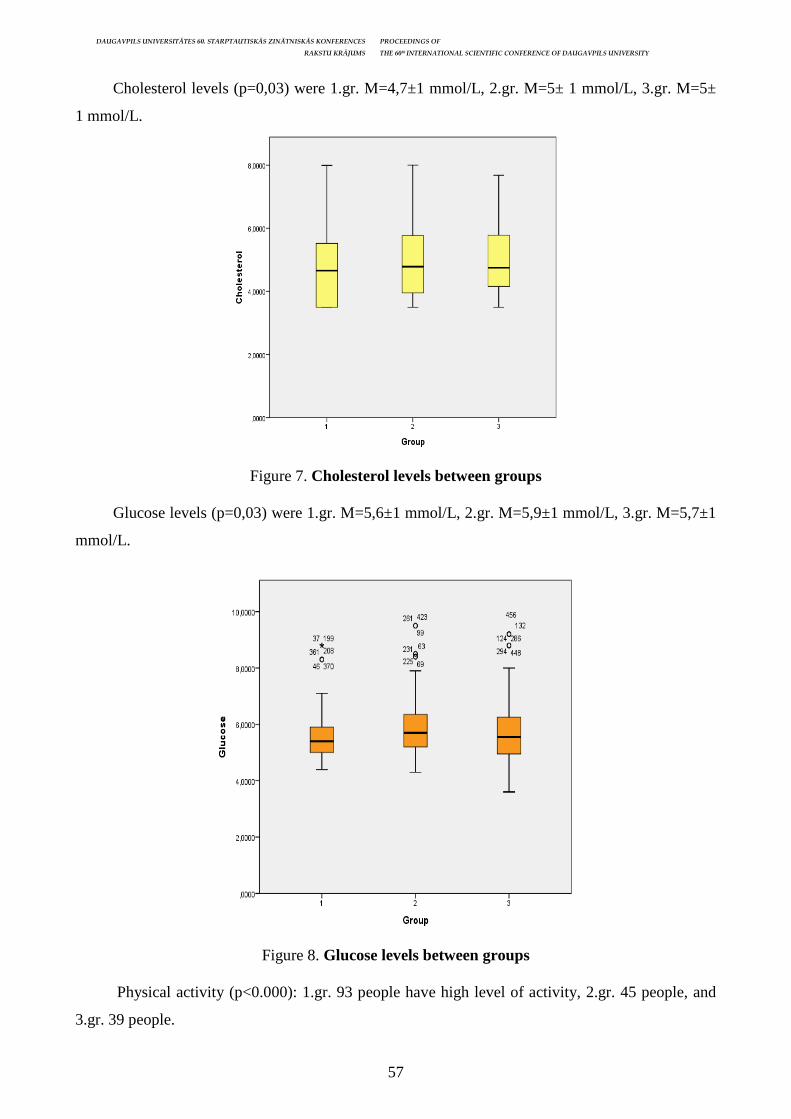
DAUGAVPILS UNIVERSITĀTES 60. STARPTAUTISKĀS ZINĀTNISKĀS KONFERENCES PROCEEDINGS OF
RAKSTU KRĀJUMS THE 60th INTERNATIONAL SCIENTIFIC CONFERENCE OF DAUGAVPILS UNIVERSITY
57
Cholesterol levels (p=0,03) were 1.gr. M=4,7±1 mmol/L, 2.gr. M=5± 1 mmol/L, 3.gr. M=5±
1 mmol/L.
Figure 7. Cholesterol levels between groups
Glucose levels (p=0,03) were 1.gr. M=5,6±1 mmol/L, 2.gr. M=5,9±1 mmol/L, 3.gr. M=5,7±1
mmol/L.
Figure 8. Glucose levels between groups
Physical activity (p<0.000): 1.gr. 93 people have high level of activity, 2.gr. 45 people, and
3.gr. 39 people.
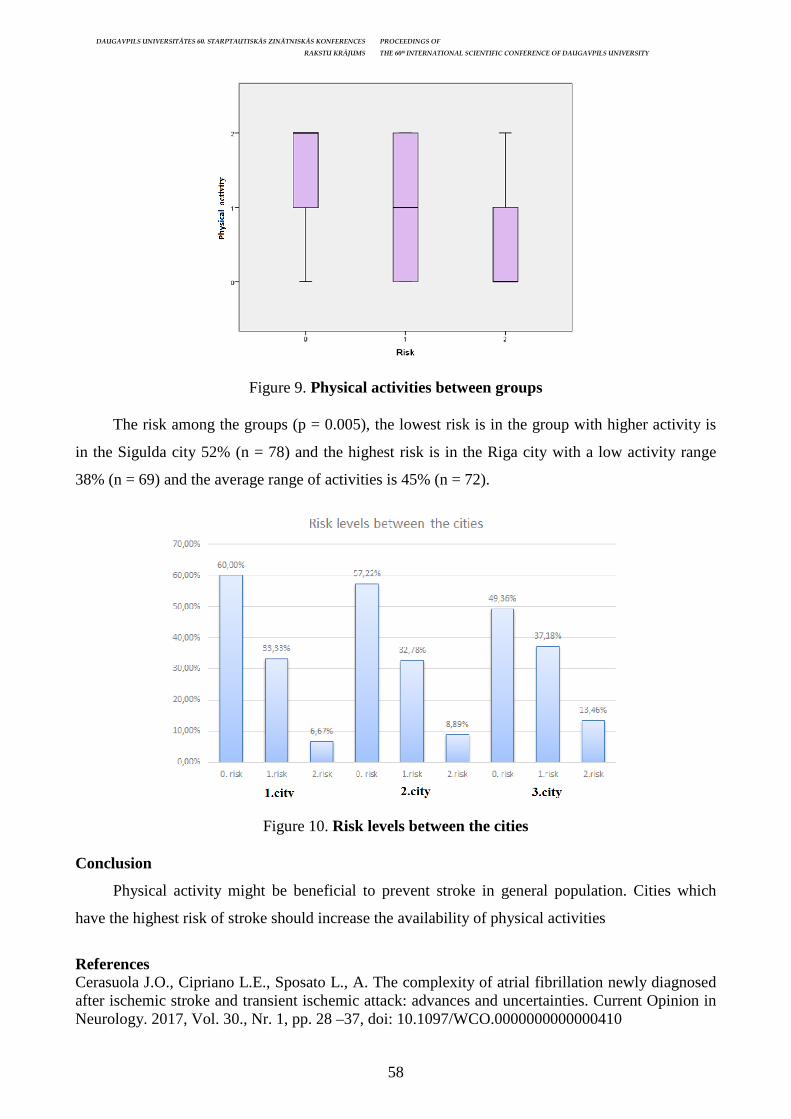
DAUGAVPILS UNIVERSITĀTES 60. STARPTAUTISKĀS ZINĀTNISKĀS KONFERENCES PROCEEDINGS OF
RAKSTU KRĀJUMS THE 60th INTERNATIONAL SCIENTIFIC CONFERENCE OF DAUGAVPILS UNIVERSITY
58
Figure 9. Physical activities between groups
The risk among the groups (p = 0.005), the lowest risk is in the group with higher activity is
in the Sigulda city 52% (n = 78) and the highest risk is in the Riga city with a low activity range
38% (n = 69) and the average range of activities is 45% (n = 72).
Figure 10. Risk levels between the cities
Conclusion
Physical activity might be beneficial to prevent stroke in general population. Cities which
have the highest risk of stroke should increase the availability of physical activities
References Cerasuola J.O., Cipriano L.E., Sposato L., A. The complexity of atrial fibrillation newly diagnosed after ischemic stroke and transient ischemic attack: advances and uncertainties. Current Opinion in Neurology. 2017, Vol. 30., Nr. 1, pp. 28 –37, doi: 10.1097/WCO.0000000000000410
DAUGAVPILS UNIVERSITĀTES 60. STARPTAUTISKĀS ZINĀTNISKĀS KONFERENCES PROCEEDINGS OF
RAKSTU KRĀJUMS THE 60th INTERNATIONAL SCIENTIFIC CONFERENCE OF DAUGAVPILS UNIVERSITY
59
Levine D.A., Walter J.M., Karve S., et al. Smoking and Mortality in Stroke Survivors: Can We Eliminate the Paradox?. Journal of stroke and cerebrovascular diseases. 2014, Vol. 23., Nr. 6, pp. 1282–1290, doi: 10.1016/j.jstrokecerebrovasdis.2013.10.026 Tun N.N., et al. Diabetes mellitus and stroke: A clinical update. World journal of diabetes. 2017, Vol. 8., Nr. 6, pp. 235–248, doi: 10.4239/wjd.v8.i6.235 McDonnell M.N., et al. Physical Activity Frequency and Risk of Incident Stroke in a National US Study of Blacks and Whites. Stroke. 2013,Vol. 44., Nr. 9, doi: 10.1161/STROKEAHA.113.001538

DAUGAVPILS UNIVERSITĀTES 60. STARPTAUTISKĀS ZINĀTNISKĀS KONFERENCES PROCEEDINGS OF
RAKSTU KRĀJUMS THE 60th INTERNATIONAL SCIENTIFIC CONFERENCE OF DAUGAVPILS UNIVERSITY
60
INTRACEREBRAL HEMATOMA SCORE IN LATVIAN PATIENTS
Zanda Arājuma1, Elīza Liepiņa1, Juris Dzenis1, 2 1 Faculty of Medicine, University of Latvia, Riga, Latvia 2 Clinic of Neurosurgery, Pauls Stradins Clinical University Hospital, Riga, Latvia Abstract
Intracerebral hematoma score in Latvian patients Key Words: Intracerebral hematoma score, mortality, Latvia Intracerebral hematoma score (ICH score) is a prediction scale for 30-day mortality risk of patients with intracerebral hematoma (ICH). For now the risk of dying from ICH in 30 days is at 50%. Since it is not mandatory to use ICH scale in Latvia it would be interesting to calculate the score of those patients who died and compare the likelihood of that event using ICH score. Aim. Find if ICH score is a safe way to predict 30-day mortality risk of patients suffering from intracerebral hematoma in Latvia. Conslusion: Comparing the prediction scale of ICH score with data that we got after reviewing patient records it is safe to conclude that the mortality rate of the patients was much more higher that it would be predicted using ICH score. Kopsavilkums Intracerebrālās hematomas (ICH) skala ir 30 dienu mirstības prognoze pacientiem ar intracerebrālo hematomu (ICH). Pašlaik 30 dienu letalitāte no ICH ir 50%. Tā kā Latvijā nav obligāti jāizmanto ICH skala, būtu interesanti apskatīt mirušo pacientu rezultātu un salīdzināt šī notikuma iespējamību, izmantojot ICH rādītāju. Mērķis Noskaidrot, vai ICH rezultāts ir drošs veids, kā prognozēt 30 dienu mirstības risku pacientiem, kas cieš no intracerebrālās hematomas Latvijā. Secinājumi: Salīdzinot ICH skalu ar datiem, kas iegūti pēc pacientu reģistru pārskatīšanas, var droši secināt, ka pacientu mirstība ir daudz augstāka, nekā to varētu prognozēt, izmantojot ICH rādītāju.
Introduction
Intracerebral hematoma score (ICH score) is a prediction scale for 30-day mortality risk of
patients with intracerebral hematoma (ICH). The ICH scale consists of 5 components – Glasgow
Coma score, age, ICH volume, the presence of intraventricular hemorrhage and infratentorial origin.
For now the risk of dying from ICH in 30 days is at 50%. Since it is not mandatory to use ICH scale
in Latvia it would be interesting to calculate the score of those patients who died and compare the
likelihood of that event using ICH score.
Clarke et al. study says that ICH score accurately stratifies outcome in an external patient
cohort. Thus, the ICH score is a validated clinical grading scale that can be easily and rapidly
applied at ICH presentation. A scale such as the ICH score could be used to standardize clinical
treatment protocols or clinical studies (Clarke, 2004; Hemphill, 2001).
Aim
Find if ICH score is a safe way to predict 30-day mortality risk of patients suffering from
intracerebral hematoma in Latvia.
Material and Methods
This study was made retrospectively using patient records from to main hospital archives in
Latvia (Pauls Stradins Clinical University Hospital and Riga East Clinical University Hospital
“Gailezers”). Data were taken from patient records and calculated using the ICH scale. Data were
processed using SPSS IBM v.20 and a P-value of 0.05 was considered to be statistically significant.

DAUGAVPILS UNIVERSITĀTES 60. STARPTAUTISKĀS ZINĀTNISKĀS KONFERENCES PROCEEDINGS OF
RAKSTU KRĀJUMS THE 60th INTERNATIONAL SCIENTIFIC CONFERENCE OF DAUGAVPILS UNIVERSITY
61
Continuous variables were examined using independent t-test and chi-square test for categorical
variables.
Results
Demographic:
A total of 153 patient histories were selected of which 55% were women and 45% were men.
Figure 1. Demographics between patients
Measurements:
It is stated that if a patient has ICH score - 0 points, the mortality risk is at 0%, however our
study showed 1 patient, who died even if the risk of mortality by ICH score was at 0%. That shows
3% mortality rate in this patient group compared to patients who survived. If a patient gets 1 point
in ICH scale, it means there is 13% risk of mortality, but our study showed that there was 24%
mortality rate in the same group. If a patient gets 2 points, the risk is at 26%, in our study it was
59%. If a patient gets 3 points the risk is 72%, but in our study it was 93%. If a patient gets 4 points,
the risk is at 97%, our study showed 90%. And if a patients gets 5 points, mortality risk is 100%,
our study showed the same rate. Statistical reliability p= 0.001.
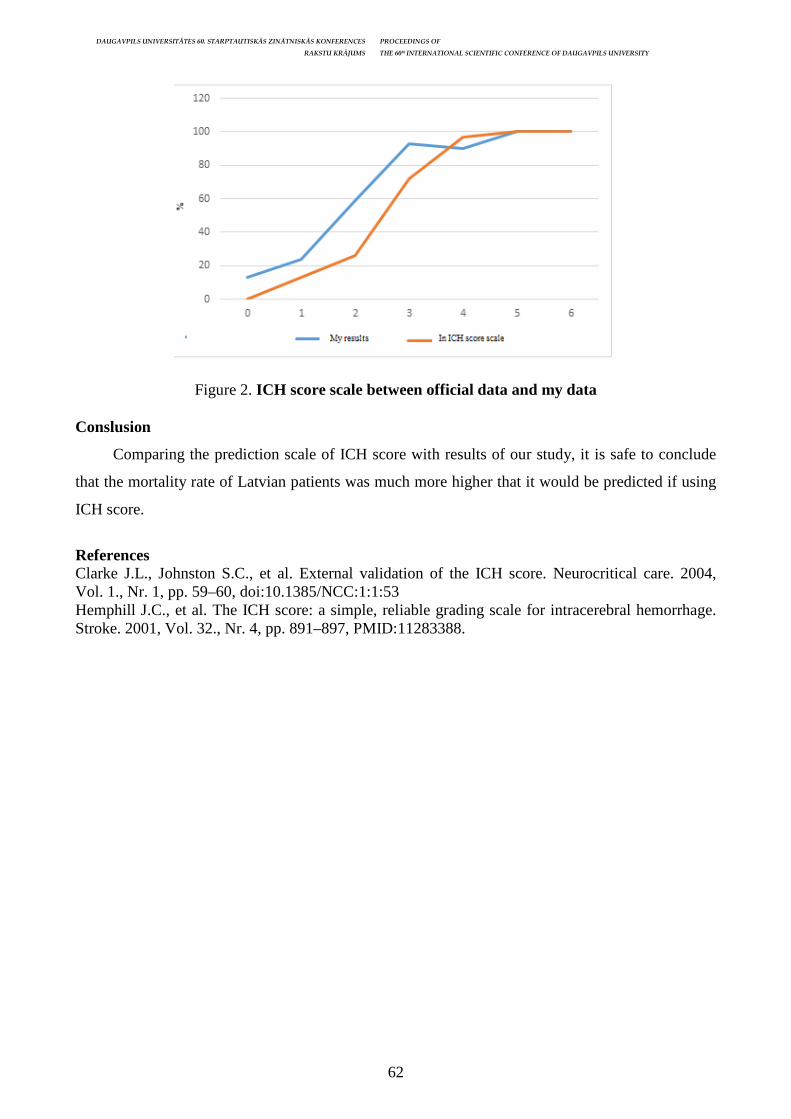
DAUGAVPILS UNIVERSITĀTES 60. STARPTAUTISKĀS ZINĀTNISKĀS KONFERENCES PROCEEDINGS OF
RAKSTU KRĀJUMS THE 60th INTERNATIONAL SCIENTIFIC CONFERENCE OF DAUGAVPILS UNIVERSITY
62
Figure 2. ICH score scale between official data and my data
Conslusion
Comparing the prediction scale of ICH score with results of our study, it is safe to conclude
that the mortality rate of Latvian patients was much more higher that it would be predicted if using
ICH score.
References Clarke J.L., Johnston S.C., et al. External validation of the ICH score. Neurocritical care. 2004, Vol. 1., Nr. 1, pp. 59–60, doi:10.1385/NCC:1:1:53 Hemphill J.C., et al. The ICH score: a simple, reliable grading scale for intracerebral hemorrhage. Stroke. 2001, Vol. 32., Nr. 4, pp. 891–897, PMID:11283388.

DAUGAVPILS UNIVERSITĀTES 60. STARPTAUTISKĀS ZINĀTNISKĀS KONFERENCES PROCEEDINGS OF
RAKSTU KRĀJUMS THE 60th INTERNATIONAL SCIENTIFIC CONFERENCE OF DAUGAVPILS UNIVERSITY
63
CARDIOVASCULAR RISK FACTORS IN PATIENTS UNDERGOING PERCUTANEOUS CORONARY ANGIOPLASTY
IN LATVIAN CARDIOLOGY CENTER
Kateryna Bulavkina, Laima Caunīte Riga Stradiņš university; Dzirciema street 16, Riga, Latvia LV-1007, [email protected] Abstract
Cardiovascular risk factors in patients undergoing percutaneous coronary angioplasty in Latvian cardiology center
Key Words: Cardiovascular risk factors, percutaneous coronary intervention Introduction: Cardiovascular disease is the most common cause of mortality. When cardiovascular (CV) risk factors (RF) add up and critical stenosis of coronary arteries develops, percutaneous coronary intervention (PCI) can be used to prevent myocardial infarction. Approximately 200-400 stents per million of population per year are placed in Latvia. Aim: To determine the most common CV RF among elective PCI patients in Latvian Cardiology Center (LCC) and compare to statistics of Europe. Materials and methods: In a cross-sectional study, 188 patients were interviewed and the data analysed via Microsoft Excel. Results: 188 patients aged 39 – 87 years (mean age 67.1), 63% male patients. 49.5% of all had previous myocardial infarction, 57.9% previous PCI and 3.2% coronary artery bypass grafting. Most common CV RF were age (males over 45 and females over 55 years) – 96%, elevated body mass index (BMI, kg/m2) - 82% (38.8% had a BMI >30), arterial hypertension – 71.8% (poorly controlled – 39%), abdominal obesity - 65%. According to EUROASPIRE IV data, the incidence of BMI >30 in Latvia and Europe is almost the same (38.8% vs. 38%). There are more smoking patients in Latvia - 20% (16% in Europe), but blood pressure is better controlled (39% vs 52% uncontrolled). Conclusion: Most common CV RF of the patients undergoing elective PCI in Latvia were age, elevated BMI, arterial hypertension and abdominal obesity. 63% already have two non-modifiable (age and gender) risk factors, therefore it is crucial to reduce the modifiable RF (body weight, blood pressure and physical inactivity). Kopsavilkums
Kardiovaskulārie riska faktori perkut ānas koronāras intervences pacientiem Latvijas kardioloģijas centrā Atslēgvārdi: Kardiovaskulārie riska faktori, perkutāna koronāra intervence Ievads: Kardiovaskulārās (KV) patoloģijas ir biežākais nāves cēlonis Latvijā. Viens no miokarda infarkta novēršanas un ārstēšanas veidiem ir perkutāna koronārā intervence (PCI). Latvijā katru gadu tiek implantēti 200-400 stentu uz miljonu iedzīvotāju. Mērķis: Noteikt biežāk sastopamos KV riska faktorus (RF) plāna PCI pacientiem Latvijā un salīdzināt tos ar Eiropas statistikas datiem. Materi āli un metodes: Šķērsgriezuma pētījumā tika intervēti 188 pacienti, dati analizēti ar Microsoft Excel. Rezultāti: Tika iekļauti 188 pacienti vecumā 39-87 gadi (vidēji 67,1 g.). 63% bija vīrieši. 49,5% jau iepriekš bija pārcietuši miokarda infarktu, 57,9% bija veikts PCI iepriekš un 3,2% - koronāro artēriju šuntēšana. Biežāk sastopamie RF bija vecums (vīriešiem > 45, sievietēm > 55 gadi) – 96%, paaugstināts ķermeņa masas indekss (ĶMI, kg/m2) – 82% (38,8% ĶMI bija > 30), arteriāla hipertensija -71,8% (slikti kontrolēta 39%), abdomināla aptaukošanās 65%. Salīdzinot ar EUROASPIRE pētījuma datiem, ĶMI >30 prevalence Latvijā un vidēji Eiropā ir līdzīga (38,8% pret 38%). Latvijā ir vairāk smēķējošu pacientu – 20% (Eiropā vidēji 16%), bet arteriāla hipertensija tiek labāk kontrolēta (39% pret 52% slikti kontrolēta). Secinājumi: Biežāk sastopamie KV RF plānveida PCI pacientiem Latvijā bija vecums, paaugstināts ĶMI, arteriāla hipertensija un abdomināla aptaukošanās. 63% pacientu jau ir divi nemodificējami fiska faktori (vecums un dzimums), tāpēc ir īpaši svarīgi koriģēt modificējamos (svars, arteriālais asinsspiediens un mazkustīgs dzīvesveids).
Introduction
Although in 2016 cardiovascular mortality in Latvia was less so than in 2015, with 808.9
cases per 100,000 population it still remains the most common cause of death (SPKC 2016).
Cardiovascular (CV) risk factors (RF) are well recognised and widely studied: they are
divided into non-lipid, lipid and anti-RF (or factors that reduce CV risk). Non-lipid RF are further
divided as non – modifiable and modifiable.
DAUGAVPILS UNIVERSITĀTES 60. STARPTAUTISKĀS ZINĀTNISKĀS KONFERENCES PROCEEDINGS OF
RAKSTU KRĀJUMS THE 60th INTERNATIONAL SCIENTIFIC CONFERENCE OF DAUGAVPILS UNIVERSITY
64
The non-modifiable CV RF are as follows: age > 45 in men and > 55 in women; and
unfavourable family history (early CV disease – men <55, women<65). (Kalvelis, 2014)
The modifiable RF are arterial hypertension (AH), diabetes mellitus (DM), smoking and
obesity (overweight if waist circumference in men >94 cm (102 cm considered obese), in women
>80 cm overweight (88 cm obese)).
Lipid RF are: total cholesterol > 5 mmol/l, low density lipocholesterol (LDLH)> 3 mmol/l,
triglycerides >1.7 mmol/l and high density lipocholesterol (HDLH) < 1 mmol/l in male and 1.2
mmol/l in female. (Kalvelis, 2014) The list is not exhaustive, because diet mistakes, sedentary
lifestyle, psycho-emotional stress, chronic kidney disease, impaired glucose tolerance, sleep apnoea,
elevated C reactive peptide, fibrinogen and thrombogenicity are just a few other RF that should be
taken in account when evaluating total CV risk in a patient.
Anti RF are high HDLH (above aforementioned levels), favourable family history, healthy
balanced diet and sufficient physical activity. The development of atherosclerotic vascular disease
is not a consequence of one particular risk factor, but rather a cluster of factors over continuous time
period. (Kalvelis, 2014; Piepoli, 2016)
There are excellent guidelines addressing preferable way of proceeding with modifiable CV
RF improvement, but real life experience proves that expected results are often not achieved, thus
aim of the particular study was firstly to determine the most common CV RF in patients undergoing
elective PCI. Patients with proven coronary heart disease are automatically considered being at very
high risk for cardiovascular events, but their CV risk profiles still differ significantly. Secondly,
methodical observation of RF and their correction results are awareness raising and motivating for
both the health specialists and patients themselves to strive for better RF control.
As to data of Europe, EUROASPIRE IV – A European Society of Cardiology survey on the
lifestyle, risk factor and therapeutic management of coronary patients from twenty four European
countries – study was published on 2015 and included 78 centres from 24 European countries
including Latvia (Kotseva, 2015).
Materials and methods
It was a cross-sectional study held in Latvian Cardiology Centre. All patients admitted for
elective PCI were included. Questionnaires were developed.
The surveys consisted of an anamnesis part, where patients were inquired about their daily
physical activity, psycho-emotional stress and their perception of it, smoking and other habits. It
was also clarified, whether patients had AH, DM, if they had suffered previous myocardial or
cerebral infarctions, hypertensive crises, etc. The final part of the survey was objective examination
and laboratory analyses - physical examination was performed in patient rooms (arterial blood
pressure, heart rate, and waist circumference), patients’ weight and height were registered and BMI
DAUGAVPILS UNIVERSITĀTES 60. STARPTAUTISKĀS ZINĀTNISKĀS KONFERENCES PROCEEDINGS OF
RAKSTU KRĀJUMS THE 60th INTERNATIONAL SCIENTIFIC CONFERENCE OF DAUGAVPILS UNIVERSITY
65
calculated, laboratory examination results were obtained when available. Both objective findings
and subjective patient estimates on risk factors were gathered. Data was analysed via Microsoft
Excel 2011. Results were compared with the ones from EUROASPIRE IV study to search for CV
risk profile differences.
Results
The study includes data from a total of 188 respondents. Patients’ age was 39 – 87 years
(mean age 67.1). There were 118 (63%) male and 70 (37%) female patients.
Most of the patients had already undergone previous revascularization – 109 (57.9%) PCI and
6 (3.2%) coronary artery bypass grafting. 93 (49.5%) had previously suffered from myocardial
infarction, 14 (7.4%) had previously had a cerebral infarction.
As for other pathologies – 40 (21%) had DM, 135 (71.8%) had AH. In 53 (39%) of patients
AH was poorly controlled (considering target BP value achievement and/or BP stability), 52
(38.5%) had suffered from a hypertensive crisis previously. 66 (35.1%) of patients had atrial
fibrillation or flutter at the time of interview or had had an episode of arrhythmia in past.
Non-modifiable risk factors: age (males over 45 and females over 55 years) – altogether 180
(96%) patients had their age as a risk factor for CVD. Analysing by gender: 115 (97.5%) males and
67 (95.7%) females were in the age risk group. Regarding unfavourable predisposition, 90 (48%) of
patients recalled early CV events in first line family members.
Habits: 37 (20%) of respondents admitted being regular smokers at the time of investigation,
on average 27 pack years. 28 (15%) of the rest of patients had quit smoking less than 15 years ago,
17 (9%) more than 15 years ago.
96 (51%) of patients admitted having increased psychoemotional stress levels (based on
subjective patient opinion). From all study population a total of 118 (62.7%) patients believed that
their stress levels had a negative impact on their health.
105 (56%) showed insufficient daily physical activity comparing to current recommendations
in 2016 European Guidelines on cardiovascular disease prevention in clinical practice.
Lipid profile: according to laboratory investigations, 45 (24%) had hypercholesterolemia (TC
>5mmol/l and/or LDLH >3 mmol/l), 6 (9.7%) of patients (with available laboratory data) had
hypertriglyceridemia (triglycerides >1.7 mmol/l). 8 (26%) female and 13 (32%) male had lowered
HLDL levels.
One of the most common risk factors was elevated body mass index (BMI) - in 154 (82%)
BMI was >25, in 97 males (82%) and 57 females (81.4%) when sorted by gender. 73 (38.8%) had
BMI>30 (41(34.5%) in male, 32 (45.7%) in female). Analysis by abdominal circumference
revealed 122 (65%) persons with abdominal obesity (waist circumference >102 cm in males, 64
(54.2%); >88 cm in females 58 (82.8%)).
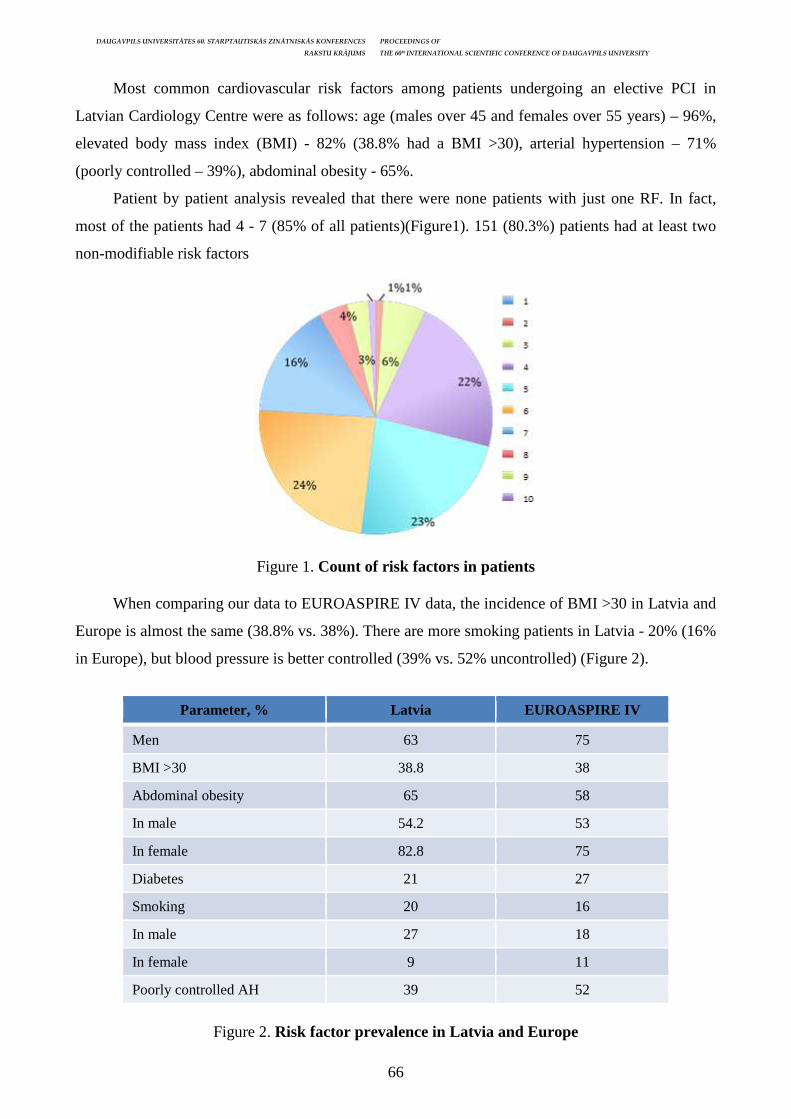
DAUGAVPILS UNIVERSITĀTES 60. STARPTAUTISKĀS ZINĀTNISKĀS KONFERENCES PROCEEDINGS OF
RAKSTU KRĀJUMS THE 60th INTERNATIONAL SCIENTIFIC CONFERENCE OF DAUGAVPILS UNIVERSITY
66
Most common cardiovascular risk factors among patients undergoing an elective PCI in
Latvian Cardiology Centre were as follows: age (males over 45 and females over 55 years) – 96%,
elevated body mass index (BMI) - 82% (38.8% had a BMI >30), arterial hypertension – 71%
(poorly controlled – 39%), abdominal obesity - 65%.
Patient by patient analysis revealed that there were none patients with just one RF. In fact,
most of the patients had 4 - 7 (85% of all patients)(Figure1). 151 (80.3%) patients had at least two
non-modifiable risk factors
Figure 1. Count of risk factors in patients
When comparing our data to EUROASPIRE IV data, the incidence of BMI >30 in Latvia and
Europe is almost the same (38.8% vs. 38%). There are more smoking patients in Latvia - 20% (16%
in Europe), but blood pressure is better controlled (39% vs. 52% uncontrolled) (Figure 2).
Parameter, % Latvia EUROASPIRE IV
Men 63 75
BMI >30 38.8 38
Abdominal obesity 65 58
In male 54.2 53
In female 82.8 75
Diabetes 21 27
Smoking 20 16
In male 27 18
In female 9 11
Poorly controlled AH 39 52
Figure 2. Risk factor prevalence in Latvia and Europe

DAUGAVPILS UNIVERSITĀTES 60. STARPTAUTISKĀS ZINĀTNISKĀS KONFERENCES PROCEEDINGS OF
RAKSTU KRĀJUMS THE 60th INTERNATIONAL SCIENTIFIC CONFERENCE OF DAUGAVPILS UNIVERSITY
67
Discussion
CVD remains a leading cause of morbidity and mortality in Latvia, despite improvements in
outcomes. Age-adjusted coronary artery disease (CAD) mortality has declined since the 1980s,
particularly in high-income regions (Moran, 2014).
Cardiovascular risk factors are widely studied and well known to most part of the population.
This study included patients specifically at an increased risk for CVD, yet they seem to be not
aware of the seriousness of the situation. It seems that either the patients underestimate the
significance of risk factors, or fail to recognize the risk in their present conditions. Many patients
tend to be sceptical about possibility to improve their modifiable risk factors, for example, reduce
body weight or quit smoking.
At the European Atherosclerosis Society meeting in May 2018, EUROASPIRE V data was
also published and the results called for more attention on modifiable risk factors as the set goals
still are not implemented sufficiently enough (Johansson, 2018).
Reducing or removing risk from an already present condition in an elderly, overweight and
sick patient is difficult, thus preventive measures should be taken timely. Prevention does not lose
its importance in primary, or tertiary healthcare level, thus general population should be provided
with information about healthy lifestyle and behaviour. Patients with established CV disease can
significantly reduce their risk of major CV events by eliminating risk behaviours (Piepoli, 2016)
In this section of the article some means of reducing cardiovascular risk will be briefly
discussed.
Latvia, alongside with Estonia, Hungary and United Kingdom, is currently rated second in
obesity prevalence. This study also proved the problem being significant, when comparing our
results of abdominal obesity to the mean European values in EUROSTAT IV study. Being
overweight is not only a significant CV RF by itself, but also promotes development of insulin
resistance and following DM, AH and dyslipidaemia. It also stimulates low grade chronic
inflammation altogether creating perfect environment for thrombotic events such as myocardial
infarction, cerebral infarction, acute limb ischemia, etc. (Piepoli, 2016). In coronary artery disease
patients, mortality has been reported to vary inversely with BMI (“obesity paradox”). In contrast,
central obesity is directly associated with mortality. Because of this bi-directional relationship, it is
hypothesized that patients with coronary artery disease and a normal BMI but with central obesity
can have worse survival compared with subjects with other combinations of BMI and central
adiposity. (Coutinho, 2012)
Principles of a healthy diet are well known. Currently in Latvian education system there is no
health education class for school children. Politics of food market and public catering are currently
not involved enough in promoting healthy diet or at least reducing unhealthy choices. Only
DAUGAVPILS UNIVERSITĀTES 60. STARPTAUTISKĀS ZINĀTNISKĀS KONFERENCES PROCEEDINGS OF
RAKSTU KRĀJUMS THE 60th INTERNATIONAL SCIENTIFIC CONFERENCE OF DAUGAVPILS UNIVERSITY
68
specialized stores or small store sections provide whole grain foods and locally grown organic
produce (plants, dairy and meats). Primary healthcare specialists should take up greater involvement
and responsibility in patient education and repetitive check-ups regarding healthy body weight
maintenance by means of adequate diet and physical activities.
Both quality and quantity of food should be assessed. Simple methods as the plate diagram
can be introduced to patients. Revision of daily food choices and comments with guideline
reference from a professional are appreciated. Patients should be reminded about dietary fat quality
(avoid trans-fats and increase fish intake), carbohydrate amount and quality (try to avoid white flour
baked products and foods containing high amount of sugar), restrict salt intake (preferably no more
than 3 grams total per day in patients with hypertension). It is not enough to remind patients to eat
more fruit and vegetables - exact examples are more efficient. Often patients believe that they need
the fruit and vegetables because of vitamins, but really it is dietary fibre amount that matters more.
Regarding food additives and supplements, fish oil has not proven its benefits on cardiovascular
risk reduction when taken as additional supplements, and there is no proven benefit of vitamins C,
A or E, while patients with low levels of vitamin D have higher overall mortality. (Piepoli, 2016)
While the eating habits of Latvian population are in line with the normative food pyramid,
average intake of salt is by 40% higher than recommended daily intake. (European Commision,
2016).
Latvian population is used to frequent and large portions of either fried or boiled potatoes.
Studies show that in 2013 there were about 117kg of potatoes consumed in Latvia per year, per
capita (HelgiLibrary, 2018). Meanwhile a study proved eating potatoes 4 times a week increases
blood pressure and hypertension risk (Borgi, 2016).
Regarding alcohol using habits, CV risk is lower in patients who do not consume any alcohol
at all (Piepoli, 2016), despite the widespread belief that a glass of red wine is good for one’s heart
health.
AS sedentary lifestyle increases CV risks, while increased physical activity aims at reducing
weight, blood glucose and blood pressure levels, health professionals should pay more attention to
patient’s daily activity levels. Patients most likely need help from a professional (doctor,
physiotherapist, or fitness instructor) to adjust their physical activity time and intensity according to
their age and overall health condition. Obstacles for physical activity should be identified and
tended to. In the study described in this article, most common physical activities mentioned by
patients were walking and gardening. Patients need to be encouraged to spend more time outdoors
and reduce their screen time.
DAUGAVPILS UNIVERSITĀTES 60. STARPTAUTISKĀS ZINĀTNISKĀS KONFERENCES PROCEEDINGS OF
RAKSTU KRĀJUMS THE 60th INTERNATIONAL SCIENTIFIC CONFERENCE OF DAUGAVPILS UNIVERSITY
69
A family doctor usually knows his/her patients well (better than cardiologists and
neurologists), thus can aid the patients to meet their targets via individual assessment and solution
finding.
Overall situation in both Latvia and Europe is upsetting. In this study results of patients from
Latvian Cardiology Centre (LKC) were compared to general population of Europe, yet it still
portrays the situation well, as the patients were not acute, and were of different ages, had different
clinical history. Even though compared to general population of Europe, some results (diabetes and
hypertension control levels) were better in LKC patients, and this indicates indirectly that the
comparison is still fair.
Conclusions
Most common cardiovascular risk factors of the patients undergoing an elective PCI in
Latvian Cardiology Center were: age (96% total; ? ), elevated BMI (82%), arterial hypertension
(71.8%), abdominal obesity (65%), male sex – 63%, low physical activity (56%) and high stress
levels (51%).
80.3% already have at least two cardiovascular risk factors, of which the most common one is
patient’s age, a non-modifiable factor, therefore it is crucial to reduce as many modifiable risk
factors as possible (body weight, blood pressure and physical inactivity), especially in patients of an
increased risk age.
According to EUROASPIRE IV data, the incidence of BMI >30 in Latvia and Europe is close
to being the same (38.8% vs. 38%). There are more smoking patients in Latvia - 20% (16% in
Europe), but blood pressure is better controlled (39% in Latvia vs 52% in Europe).
The situation of cardiovascular risk prevalence in patients of LKC and in Europe is upsetting,
and more input from primary healthcare professionals is required to aid in overall risk reduction by
means of influencing patients’ lifestyle changes.
To sum up, the aims of the study were achieved, main CV risk factors identified and assessed,
and compared to average data of Europe. The problem is clear and is being addressed continuously.
References Borgi L. et al. Potato intake and incidence of hypertension: results from three prospective US cohort studies. BMJ 2016;353:i2351 Coutinho T, Goel K, Correa de Sá D, et al. Combining body mass index with measures of central obesity in the assessment of mortality in subjects with coronary heart disease. Role of "normal weight central obesity." J Am Coll Cardiol 2012; 61: 553–560. European Comission. The Latvian Food Basket. Online: https://ec.europa.eu/social/main.jsp? catId=738&langId=en&pubId=7873&furtherPubs=yes [Acessed 09.12.2018.] Helgi Library. Potato Consumption Per Capita in Latvia. Online: https://www.helgilibrary.com/ indicators/potato-consumption-per-capita/latvia/ [Accessed 8.12.2018.] Johansson C. EAS2018 Late Breaking Clinical Trial: EUROASPIRE V. May 2018. Online: https://eas-society.site-ym.com/news/news.asp?id=399857 [Accessed 19.05.2018.]
DAUGAVPILS UNIVERSITĀTES 60. STARPTAUTISKĀS ZINĀTNISKĀS KONFERENCES PROCEEDINGS OF
RAKSTU KRĀJUMS THE 60th INTERNATIONAL SCIENTIFIC CONFERENCE OF DAUGAVPILS UNIVERSITY
70
Kalvelis A. Kardioloģija: Informācijas materiāls. Atkārtots un papildināts izdevums. Rīga, 2014. 240 lpp. Kotseva K., Wood D., et al. On behalf of the EUROASPIRE Investigators EUROASPIRE IV: A European Society of Cardiology survey on the lifestyle, risk factor and therapeutic management of coronary patients from 24 European countries. European Journal of Preventive Cardiology Vol 23, Issue 6, pp. 636–648. 16, 2015. Latvijas veselības aprūpes statistikas gadagrāmata 2016. Online: https://www.spkc.gov.lv/upload/ Gadagrāmata/Gadagrāmata%202016/2_mirstiba_2016.pdf [Accessed 19.05.2018.] Moran A.E., Forouzanfar M.H. Temporal trends in ischemic heart disease mortality in 21 world regions, 1980 to 2010: the Global Burden of Disease 2010 study. Circulation 2014; 129: 1483–1492. Piepoli M., Hoes A., et al. ESC Scientific Document Group; 2016 European Guidelines on cardiovascular disease prevention in clinical practice: The Sixth Joint Task Force of the European Society of Cardiology and Other Societies on Cardiovascular Disease Prevention in Clinical Practice (constituted by representatives of 10 societies and by invited experts). European Heart Journal, Volume 37, Issue 29, August 2016, Pages 2315–2381, https://doi.org/10.1093/eurheartj/ ehw106

DAUGAVPILS UNIVERSITĀTES 60. STARPTAUTISKĀS ZINĀTNISKĀS KONFERENCES PROCEEDINGS OF
RAKSTU KRĀJUMS THE 60th INTERNATIONAL SCIENTIFIC CONFERENCE OF DAUGAVPILS UNIVERSITY
71
AN ACUTE CEREBRAL INFARCTION LESION SIZE CORRELATION WITH CLINICAL OUTCOMES IN PATIENTS
WITHOUT DOCUMENTED ARTERIAL OCCLUSION Santa Borisāne1, Jekaterina Avdotina1, Aleksandra Mežecka1, Evija Migl āne2 1 Rīga Stradiņš University, Dzirciema street 16, Rīga, Latvia, [email protected] 2 Pauls Stradins Clinical University Hospital, Pilsoņu iela 13, Rīga, Latvia, [email protected] Abstract
An Acute Cerebral Infarction Lesion Size correlation with clinical outcomes in patients without documented arterial occlusion
Key Words: acute ischemic stroke, thrombolytic therapy, stroke volume, ischemic lesion, arterial occlusion Introduction. Cerebral infarction size measured by computed tomography (CT) is used by clinicians to assist in prognosis, even though evidence linking lesion size to prognosis is limited. Aim. The aim of this research was to determine the clinical and radiological outcomes of acute stroke patients, who had no arterial occlusion on CT angiography (CTA) and to evaluate correlation between lesion volume and functional outcome. Materials and methods. We selected patients without CTA proved arterial occlusion at admission. All patients (n=174) were divided into 2 groups: intravenous recombinant tissue type plasminogen activator group (rtPA group) – patients that received rtPA (n=87) and control group - did not receive rtPA therapy (n=87). From these patients we selected patients who had followed up CT scans within 48 hours of stroke onset and had ischemic lesion. For all patients National Institutes of Health Stroke Scale (NIHSS) scores and modified Rankin scores (mRS) were obtained. Results. Ischemic lesions in rtPA group were obtained to 28 patients and in control group to 29 patients. In rtPA group median lesion size was 2,3cm3 (range=0,01-9,8 cm3) but in control group - 2,9 cm3 (range=0,08-11,6cm3). In rtPA group 14 patients (50,0%) were functionally independent (mRS score ≤2) and in control group it was also 14 patients (48.3%) (p= 0.8988). NIHSS score ≥4-point reduction was observed in 19 patients (67,9%) in rtPA group, versus 6 patients (20,7%) in control group (p=0.0004) Conclusions. Patients who received rtPA in 4.5 hours after the onset of stroke had smaller infarct volumes and better clinical outcome despite of absence of proved arterial occlusion. Kopsavilkums
Akūta cerebrāla infarkta boj ājuma lieluma korelācija ar kl īnisko iznākumu pacientiem bez verificētas arteriālās oklūzijas
Atslēgvārdi: akūts išēmisks insults, trombolīzes terapija, insulta tilpums, išēmisks bojājums, arteriālā oklūzija Ievads. Nosakot klīnisko iznākumu var izmantot insulta tilpuma kompjūtertomogrāfijas (CT) mērījuma datus, lai gan atradnes, kas norādītu bojājuma lielumu, ir ierobežotas. Mērķis. Pētījuma mērķis ir noteikt klīnisko un radioloģisko iznākumu akūta išēmiska insulta pacientiem, kuriem CTA izmeklējumos netika verificēta arteriālā oklūzija, un noteikt korelāciju starp bojājuma tilpumu un klīnisko iznākumu. Materi āli un metodes. Pētījumā tika iekļauti 174 pacienti, kam CTA izmeklējumā netika verificēta arteriālā oklūzija. Pacienti tika iedalīti divās grupās: rtPA grupa - pacienti, kuri saņēma rtPA terapiju (n=87), un kontroles grupa (n=87) - pacienti, kas nesaņēma rtPA terapiju. No visiem pacientiem tika atlasīti pacienti, kam 48 h pēc kontroles CT izmeklējuma bija attīstījies išēmisks smadzeņu bojājums. Visiem pacientiem tika izvērtēta Nacionālās Veselības Institūta Insulta (NIHSS) un modificētā Rankina skala (mRS) tika izvērtētas visiem pacientiem. Tika veikta korelācijas analīze starp smadzeņu bojājuma tilpumu un klīnisko iznākumu. Rezultāti. Kopumā 28 pacientiem rtPA grupā un 29 kontroles grupā tika diagnosticēts išēmisks bojājums. Vidējais išēmijas tilpums rtPA grupā bija 2,3cm3 (diapazons =0,01-9,8 cm3), savukārt kontroles grupā - ievērojam lielāks - 2,9 cm3 (diapazons =0,08-11,6cm3). Abās grupās bija 14 funkcionāli neatkarīgi (mRS ≤2) pacienti, rtPA grupā 50,0%, kontroles grupā 48.3% (p= 0.8988). RtPA grupā NIHSS ≥4 samazinājums bija novērojams 19 pacientiem (67,9%) un kontroles grupā 6 pacientiem (20,7%) (P=0.0004). Secinājumi. Pacientu grupā bez verificētas arteriālas oklūzijas tika atrasta korelācija starp pacientiem, kuri saņēma rtPA terapiju 4.5h pēc insulta sākuma, un pacientiem, kuri nesaņēma rtPA terpaiju. rtPA terapijas pacientiem bija mazāks insulta tilpums un labāks klīniskais iznākums salīdzinājumā ar pacientiem, kas nesaņēma rtPA terapiju.
Introduction
Stroke is damage in any and all abnormalities of the blood supply of the neuraxis (Gomes &
Wachman). There are three main types of stroke: ischemic, hemorrhagic and transient. The most

DAUGAVPILS UNIVERSITĀTES 60. STARPTAUTISKĀS ZINĀTNISKĀS KONFERENCES PROCEEDINGS OF
RAKSTU KRĀJUMS THE 60th INTERNATIONAL SCIENTIFIC CONFERENCE OF DAUGAVPILS UNIVERSITY
72
common is ischemic stroke also called cerebral infarction that occurs as a result of interrupted or
reduced flow of blood to the brain (American Heart Association). The stroke is the main cause of
disability for the elderly people and the second leading cause of mortality worldwide (Patra et al.
2010). Every two seconds, someone in the world suffers from a stroke, however, 1 in 8 deaths are
caused by stroke (Lindsay et al. 2014). Moreover, it is estimated that death from stroke in low-
income countries will increase comparing with middle-income countries (Feigin et al. 2009)
(Lindsay et al. 2014) (Patra et al. 2010) (Strong et al. 2010). According to data available in the
Centre for Disease Prevention and Control (CDPC) of Latvia database, 272.7 per 100,000 people
have died from different cerebrovascular diseases in 2016, and 112.2 of them had stroke. However,
World Stroke Organization (WHO) data published in 2017 stroke deaths in Latvia reached 5,084 or
19.13% of total deaths (World Stroke Organization 2017). As acute cerebral infarction still is a
significant global health problem it is important to identify stroke symptoms and start appropriate
treatment (Dong et al. 2016). One of treatment choices is intravenous recombinant tissue-type
plasminogen activator (rtPA) in patients with acute ischemic stroke, administered it within 3 to 4.5
hours of onset of symptoms (Cheng et al. 2015). Several randomized control trials have proven the
efficacy of rtPA therapy (Cheng et al. 2015) (Hacke et al. 2008) (Smedslund et al. 2016), therefore,
rtPA therapy has become standard care in patients with acute ischemic stroke if there is no evidence
of bleed on non-contrast computed tomographic (CT) scan.
In literature there are many randomized trials on rtPA therapy (Lees et al. 2016) (Mocco et
al. 2016) (Mokin et al. 2016) (Mulder et al. 2018), however, only few of them investigate use of
rtPA therapy in patients without arterial occlusion (Lahoti et al. 2014). Moreover, use of rtPA in
patients without proved arterial occlusion is still unclear. The efficacy of thrombolysis up to 4,5
hours after stroke and whether acute stroke patients without proved arterial occlusion should be
treated with rtPA therapy are questionable. There is a lack of studies about clinical and radiological
outcomes of acute stroke patients without arterial occlusion in Latvia. The aim of our study was to
determine the clinical and radiological outcomes of acute stroke patients, who did not show any
occluded vessel on CTA scan and to evaluate correlation between lesion volume and functional
outcome.
Material and Methods
We selected patients without CTA proved arterial occlusion at admission between January
1st, 2016 and December 31th,2017. All patients (n=174) were divided into 2 groups: recombinant
tissue type plasminogen activator (rtPA group) - patients who received rtPA (n=87) and control
group-patients who did not receive rtPA therapy (n=87). From these 174 patients we selected
patients who had followed up CT scans within 48 hours of stroke onset and had ischemic lesion
(n=57). National Institutes of Health Stroke Scale (NIHSS) score and modified Rankin Scale (mRS)
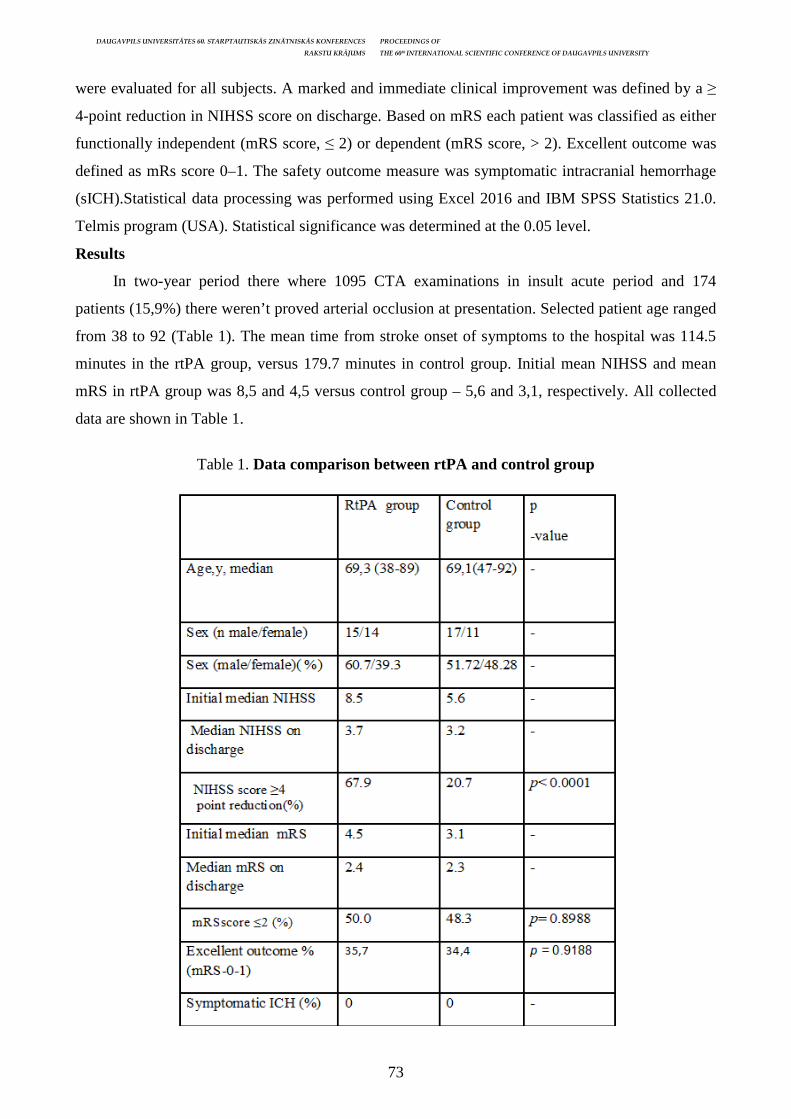
DAUGAVPILS UNIVERSITĀTES 60. STARPTAUTISKĀS ZINĀTNISKĀS KONFERENCES PROCEEDINGS OF
RAKSTU KRĀJUMS THE 60th INTERNATIONAL SCIENTIFIC CONFERENCE OF DAUGAVPILS UNIVERSITY
73
were evaluated for all subjects. A marked and immediate clinical improvement was defined by a ≥
4-point reduction in NIHSS score on discharge. Based on mRS each patient was classified as either
functionally independent (mRS score, ≤ 2) or dependent (mRS score, > 2). Excellent outcome was
defined as mRs score 0–1. The safety outcome measure was symptomatic intracranial hemorrhage
(sICH).Statistical data processing was performed using Excel 2016 and IBM SPSS Statistics 21.0.
Telmis program (USA). Statistical significance was determined at the 0.05 level.
Results
In two-year period there where 1095 CTA examinations in insult acute period and 174
patients (15,9%) there weren’t proved arterial occlusion at presentation. Selected patient age ranged
from 38 to 92 (Table 1). The mean time from stroke onset of symptoms to the hospital was 114.5
minutes in the rtPA group, versus 179.7 minutes in control group. Initial mean NIHSS and mean
mRS in rtPA group was 8,5 and 4,5 versus control group – 5,6 and 3,1, respectively. All collected
data are shown in Table 1.
Table 1. Data comparison between rtPA and control group

DAUGAVPILS UNIVERSITĀTES 60. STARPTAUTISKĀS ZINĀTNISKĀS KONFERENCES PROCEEDINGS OF
RAKSTU KRĀJUMS THE 60th INTERNATIONAL SCIENTIFIC CONFERENCE OF DAUGAVPILS UNIVERSITY
74
Ischemic lesions in rtPA group were obtained to 29 patients and in control group to 28
patients. Median lesion volume in rtPA group was 2,3cm3 (range = 0,01-9,8 cm3) and in control
group it was significant higher - 2,9 cm3 (range = 0,08-11,6cm3) (Figure 1).
NIHSS score ≥4 point reduction was observed in 19 patients (67,9%) in rtPA group, versus 6
patients (20,7%) in control group (p=0.0004) (Figure 3.) In rtPA group 14 patients (50,0%) were
functionally independent patients (mRS score ≤2) and in control group it was also 14 patients
(48.3%) (p= 0.8988). (Figure 4.) Excellent outcome (mRS 0-1) was observed to 10 patients in both
groups: 35,7% in rtPA group and 34,4% in control group, respectively (p= 0.9188). None of groups
sICH was diagnosed.
Discussion
The rates of favorable outcomes in acute ischemic stroke patients without CTA visible
occlusion ranged from 33% to 75% in previous studies (Arnold et al. 2014) (Derex et al. 2014)
(Qureshi et al. 2005) (Shah et al. 2008).

DAUGAVPILS UNIVERSITĀTES 60. STARPTAUTISKĀS ZINĀTNISKĀS KONFERENCES PROCEEDINGS OF
RAKSTU KRĀJUMS THE 60th INTERNATIONAL SCIENTIFIC CONFERENCE OF DAUGAVPILS UNIVERSITY
75
Lahoti et al. (2014) in their study examined 256 patients with ischemic stroke who did not
have arterial occlusion. Their obtained mean NIHSS at presentation in the rtPA group was 9.4, that
is similar to our result - 8.5. However, in control group mean NIHSS was 7.8, but in our study - 5.6.
The percentage of patients with excellent outcome (mRS, 0–1) was significantly higher in the rtPA
group (58%) when compared with that in rtPA group (40%) (p<0.01). In our study excellent
outcome was 35.7% in rtPA group, versus 34.4% in control group (p = 0.9188). The difference in
results may cause smaller patient group.
In “Guidelines for the early management of patients with acute ischemic stroke” main
treatment for acute ischemic stroke is intravenous thrombolytic therapy with recombinant tissue
plasminogen activator (rtPA) when administered within 4.5 hours of symptom onset. Moreover, the
treatment improves clinical outcomes at three months (Yaghi et al. 2014), one of the essential issues
regarding treating an acute ischemic stroke subjects with intravenous tissue plasminogen activator
(IV rtPA) is risk of important intracerebral hemorrhage (ICH) (Rao et al. 2014). The rate of
symptomatic hemorrhage in Lahoti et al. 2014 study was 4.9% in the rtPA group versus 0.7% in the
control group (p=0.04). However, in our study there were no symptomatic hemorrhage obtained.
In Fuentes et al. (2012) studies about 20-30% of acute ischemic stroke patients with clinical
deficits do not proved an arterial occlusion on a CTA, which performed within six hours of
symptom onset. In our study we selected patients who had no arterial occlusion on CTA. There are
some reasons why patient presents with clinical deficits without arterial occlusion is visible on
CTA:
• The patient could have an embolic stroke with spontaneous complete recanalization or partial
recanalization with embolic occlusion of peripheral branch arteries beyond the capability of
visualization by MR angiography or CTA (Lahoti et al. 2015). There could be isolated
occlusion of these peripheral branch arteries without preceding large vessel occlusion and
spontaneous recanalization, but it is unlikely to produce large clinical deficit (Khan et al. 2014).
• Second, it could be a lacunar stroke caused by small vessel disease.
• Third, it could be secondary stroke because of vasospasm.
• Fourth, a nonvascular cause, such as systemic hypoperfusion, stroke mimics, or a nonorganic
cause (Sims et al. 2005).
In acute stroke studies not only alteplase, but also other thrombolysis is used, such as
urokinase to evaluate the safety and efficacy using clinical and radiological data of acute ischemic
stroke (Shi et al. 2017). In our study we use alteplase as now in the majority of EU it is approved
for use within 4.5 hours from onset of symptoms in ischemic stroke (Hacke et al. 2018). In Shi et al.
2017 study the time window from symptoms to therapy was 6 h, but in our study 4.5 h. Immediate
clinical improvement (as defined by a ≥4 point reduction in NIHSS score) was seen in 56.9%

DAUGAVPILS UNIVERSITĀTES 60. STARPTAUTISKĀS ZINĀTNISKĀS KONFERENCES PROCEEDINGS OF
RAKSTU KRĀJUMS THE 60th INTERNATIONAL SCIENTIFIC CONFERENCE OF DAUGAVPILS UNIVERSITY
76
patients compering 67.9% in our study. In urokinase’s study in one patient developed a
symptomatic intracranial hemorrhage, however, in our study none of patients. At three months
posttreatment 74.5% patients were functionally independent (mRS ≤ 2) compering to our study
where on discharge day 50.0% patients where functionally independent. The difference between
results may cause not only treatment but also longer time window and point of mRS evaluation. In
our study we evaluated mRS on discharge day not after tree month.
Conclusion
The results of this study show that there is correlation between lesion size and clinical
outcome, if there is smaller stroke volume, there is better clinical outcomes. The obtained results
confirmed that rtPA given 4.5 hours after the onset of stroke symptoms is associated with smaller
infarct volumes and better improvement in the clinical outcome, without a higher rate of SICH in
patients without arterial occlusion. Future investigations should be performed increasing treatment
group.
References American Heart Association. Types of Stroke, what is stroke [viewed: 17.05.2018]. Accessed: http://www.strokeassociation.org/STROKEORG/AboutStroke/About-Stroke_UCM_308529_Sub HomePage.jsp Arnold M., Nedeltchev K., Brekenfeld C., Fischer U., Remonda L., Schroth G., Mattle H. 20004. Outcome of acute stroke patients without visible occlusion on early arteriography. In: Stroke. Vol. 35, USA, pp.1135–1138. Centre for Disease Prevention and Control. Mortality [viewed: 02.04.2018]. Accessed: https://www.spkc.gov.lv/upload/Gadagr%C4%81mata/Gadagr%C4%81mata%202016/2_mirstiba_2016.pdf Cheng N. T., Kim A. S. 2015. Intravenous Thrombolysis for Acute Ischemic Stroke Within 3 Hours Versus Between 3 and 4.5 Hours of Symptom Onset. In: Neurohospitalist. Vol. 5(3), USA, pp. 101–109. doi: 10.1177/1941874415583116 Derex L., Tomsick T. A., Brott T. G., Lewandowski C. A., Frankel M. R., Clark W., Starkman S., Spilker J., Udsten G. J., Khoury J., Grotta J. C., Broderick J. P.2001. EMS Bridging Trial.Outcome of stroke patients without angiographically revealed arterial occlusion within four hours of symptom onset. In: AJNR Am J Neuroradiol. Vol. 22, USA, pp. 685–690. Dong M. X., Hu Q. C., Shen P., Pan J. X., Wei Y. D., Liu T. F., Ren Y. L., Liang Z. H., Wang H. Y., Zhap L. B., Xie P. 2016 Recombinant Tissue Plasminogen Activator Induces Neurological Side Effects Independent on Thrombolysis in Mechanical Animal Models of Focal Cerebral Infarction: A Systematic Review and Meta-Analysis. In: PLoS One. Vol. 11(7), United Kingdom, pp. e0158848. doi: https://doi.org/10.1371/journal.pone.0158848 Feigin V. L., Lawes C. M. M., Bennett D. A., Barker-Collo S. L., Parag V. 2009. Worldwide stroke incidence and early case fatality reported in 56 population-based studies: a systematic review. In: Lancet Neurol. Vol. 8(4), USA, pp. 355–369. doi:10.1016/S1474-4422(09)70025-0 Fuentes B., Martínez-Sánchez P., Alonso de Leciñana M., et al. 2012. Efficacy of intravenous thrombolysis according to stroke subtypes: the Madrid Stroke Network data. In: Eur J Neurol. Vol. 19(21), USA, pp. 1568–1574. doi: 10.1111/j.1468-1331.2012.03790.x Gomes J., Wachsman M. A. 2013, pp. 15–31. In: M.L. Corrigan et al. (eds.), Handbook of Clinical Nutrition and Stroke, 15 Nutrition and Health. doi: 10.1007/978-1-62703-380-0_2 Hacke W., Kaste M., Bluhmki E., Brozman M., Dávalos A., Guidetti D., Larrue V., Lees K. R., Medeghri Z., Machnig T., Schneider D., von Kummer R., Wahlgren N., Toni D. 2008.
DAUGAVPILS UNIVERSITĀTES 60. STARPTAUTISKĀS ZINĀTNISKĀS KONFERENCES PROCEEDINGS OF
RAKSTU KRĀJUMS THE 60th INTERNATIONAL SCIENTIFIC CONFERENCE OF DAUGAVPILS UNIVERSITY
77
Thrombolysis with alteplase 3 to 4.5 hours after acute ischemic stroke. In: N Engl J Med. Vol. 359, United Kingdom, pp. 1317–1329. doi: 10.1056/NEJMoa0804656 Hacke W., Lyden P., Emberson J., et al. 2018. Effects of alteplase for acute stroke according to criteria defining the European Union and United States marketing authorizations: Individualpatient-data meta-analysis of randomized trials. In: International Journal of Stroke. Vol. 13(2), United Kingdom, 175–189. doi: 10.1177/1747493017744464 Khan M., Goddeau Jr. R. P., Zhang J., Moonis M., Henninger N. 2014. Predictors of Outcome following Stroke due to Isolated M2 Occlusions. In: Cerebrovasc Dis Extra. Vol. 4(1), Switzerland, pp. 52–60. doi: 10.1159/000360075 Lahoti S., Gokhale S., Caplan L., et al. 2014. Thrombolysis in Ischemic Stroke Without Arterial Occlusion at Presentation. In: Stroke. Vol. 45, USA, pp. 2722–2727. doi: 10.1161/STROKEAHA.114.005757 Lahoti S., Gokhale S., Caplan L., et al. 2015. Embolic stroke with spontaneous recanalization. In: Neurology. Vol. 84, USA, pp. P3.085. Lees K. R., Emberson J., Blackwell L., et al. 2016. Effects of Alteplase for Acute Stroke on the Distribution of Functional Outcomes A Pooled Analysis of 9 Trials. In: Stroke. Vol. 47, USA, pp. 00–00. doi: 10.1161/STROKEAHA.116.013644 Lindsay P., Furie K. L., Davis S. M., Donnan G. A., Norrving B. 2014. World Stroke Organization Global Stroke Services Guidelines and Action Plan. In: Int J. Stroke. Vol. 9, USA, pp. 4–13. doi: 10.1111/ijs.12371 Mocco J., Zaidat O. O., von Kummer R., et al. 2016. Aspiration Thrombectomy After Intravenous Alteplase Versus Intravenous Alteplase Alone. In: Stroke. Vol. 47, USA, pp. 00–00. doi: 10.1161/STROKEAHA.116.013372 Mokin M., Rojas H., Levy E.I. 2016. Randomized trials of endovascular therapy for stroke — impact on stroke care. In: Nature Reviews Neurology. Vol. 12, USA, pp. 86–94. doi: 10.1038/nrneurol.2015.240 Mulder J. H. L., Jansen I. G. H., Goldhom R. J. B., et al. 2018. Time to Endovascular Treatment and Outcome in Acute Ischemic Stroke: MR CLEAN Registry Results. In: Circulation. Vol. 137(20), USA, pp. 117.032600. doi: https://doi.org/10.1161/CIRCULATIONAHA.117.032600 Patra J., Taylor B., Irving H., Roerecke M., Baliunas D., Mohapatra S., Rehm J. 2010. Alcohol consumption and the risk of morbidity and mortality for different stroke types - a systematic review and meta-analysis. In: BMC Public Health. Vol. 10, United Kingdom, pp. 258. https://doi.org/10.1186/1471-2458-10-258 Qureshi A. I., Kirmani J. F., Siddiqui A. M., Hanel R. A., Kim S. H., Hopkins L. N. 2005. Outcomes in acute ischemic stroke patients without angiographically documented arterial occlusion. In: J Neuroimaging. Vol. 15, USA, pp. 37–42. Rao N. M., Levine S. R., Gornbei J., Saver J. L. 2014. Defining Clinically Relevant Cerebral Hemorrhage After Thrombolytic Therapy for Stroke: Analysis of the NINDS-tPA Trials. In: Stroke. Vol. 45(9), USA, pp. 2728–2733. 10.1161/STROKEAHA.114.005135 Shah Q. A., Zeeshan Memon M., Vazquez G., Suri M. F., Hussein H. M., Mohammad Y. M., Qureshi A. I. 2008. Clinical and radiological outcomes of acute ischemic stroke patients without angiographic occlusion on digital subtraction angiogram. A pooled analysis of case series. In: Neuroradiology. Vol. 50, USA, pp. 963–968. Shi M. C., Chu F. N., Li C., Wang S. C. 2017. Thrombolysis in acute stroke without angiographically documented occlusion. In: Eur Rev Med Pharmacol Sci. Vol.21(7), Italia, pp. 1509–1513. PubMed PMID: 28429356. Sims J. R., Rordorf G., Smith E. E., Koroshet W. J., Lev M. H., Buonanno F., Schwamm L. H. 2005. Arterial Occlusion Revealed by CT Angiography Predicts NIH Stroke Score and Acute Outcomes after IV tPA Treatment. In: AJNR. Vol. 26(2), USA, pp. 246–251. Smedslund G, Myrhaug HT, Hov L, Kirkehei I. 2016. Effect of thrombolytic treatment 3 to 4,5 hours after onset of stroke. In: Folkehelseinstituttet, Norvegia, digital: 978-82-8082-746-3. Available at www.fhi.no/en

DAUGAVPILS UNIVERSITĀTES 60. STARPTAUTISKĀS ZINĀTNISKĀS KONFERENCES PROCEEDINGS OF
RAKSTU KRĀJUMS THE 60th INTERNATIONAL SCIENTIFIC CONFERENCE OF DAUGAVPILS UNIVERSITY
78
Strong K., Mathers C., Leeder S., Beaglehole R. 2005. Preventing chronic diseases: how many lives can we save? In: Lancet. Vol. 4 (366(9496)), USA, pp. 1578–1582. doi: https://doi.org/10.1016/S0140-6736(05)67341-2 World Stroke Organization. Latvia (viewed: 20.04.2018). Accessed: http://www.world-stroke.org/index.php?option=com_content&view=article&layout=edit&id=298 Yaghi S., Eisenberger A., Willey J. Z. 2014. Symptomatic Intracerebral Hemorrhage in Acute Ischemic Stroke After Thrombolysis With Intravenous Recombinant Tissue Plasminogen Activator. In: JAMA. Vol. 71(9), USA, pp. 1181–1185. doi: 10.1001/jamaneurol.2014.1210
DAUGAVPILS UNIVERSITĀTES 60. STARPTAUTISKĀS ZINĀTNISKĀS KONFERENCES PROCEEDINGS OF
RAKSTU KRĀJUMS THE 60th INTERNATIONAL SCIENTIFIC CONFERENCE OF DAUGAVPILS UNIVERSITY
79
CLINICAL OUTCOMES OF PATIENTS WITH ACUTE POSTERIOR CIRCULATION CEREBRAL INFARCTION
Gundega Ķauķe, Zane Ozolniece, Sofja Kauškale, Vita Lāčplēse Riga Stradiņš University, Dzirciema Street 16, Riga, Latvia, LV-1007, [email protected], [email protected], [email protected], [email protected] Abstract
Clinical outcomes of patients with acute posterior circulation cerebral infarction Key Words: POCI, clinical outcome, reperfusion therapy, NIHSS, mRS Introduction. Posterior circulation infarctions (POCI), especially brainstem infarctions, often has more serious consequences than anterior circulation infarction. (Bähr et. al., 2012) Aim. To evaluate treatment efficiency and clinical outcomes in patients with confirmed diagnosis of POCI and to assess intrahospital, 30-day mortality rate and 90-day functional activity. Material and methods. Study included 278 cases of POCI (2016-2017) from one tertiary care centre in Latvia. All patients were evaluated using NIHSS and modified Rankin Scale (mRS) and were divided in groups based on NIHSS: no symptoms to minor stroke (NIHSS ≤4) and moderate to severe stroke (NIHSS ≥5). Clinical improvement was defined by a ≥4-point reduction in NIHSS. Based on mRS patients were classified as functionally independent (mRS≤2), dependent (mRS 3-5) or deceased (mRS 6). Information on 30-day mortality and 90-day functional outcome was obtained by phone interview. Comparison was made between patients who received (Group I) and patients who did not receive (Group II) reperfusion therapy. Results. On admission NIHSS ≥5 was found in 77,8% of Group I and 46,6% of Group II cases. Clinical improvement was observed in 58,3% of Group I and 12,6% of Group II patients on time of discharge. There was no significant difference in the independence rate between both groups on time of discharge, where 90-day outcomes showed greater independence rate in Group I patients. Conclusions. Group I showed greater clinical improvement on time of discharge and greater independence rate comparing to patients in Group II on 90-day follow up. Kopsavilkums
Mugur ējās cirkulācijas cerebrāla infarkta izn ākums Atslēgvārdi: POCI, klīniskais iznākums, reperfūzijas terapija, NIHSS, mRS Ievads. Mugurējās cirkulācijas infarktiem(POCI), īpaši smadzeņu stumbra infarktiem, ir daudz nopietnākas sekas nekā priekšējās cirkulācijas infarktiem. (Bähr et. al., 2012) Mērķis. Novērtēt terapijas efektivitāti un klīniskos iznākumus pacientiem ar apstiprinātu POCI diagnozi un izvērtēt intrahospitālo, 30-dienu mortalitāti un 90-dienu funkcionālo aktivitāti. Metodes un materiāli. Pētījumā tika iekļauti 278 POCI gadījumi (2016-2017) no viena terciārās aprūpes centra Latvijā. Visi pacienti tika novērtēti, izmantojot NIHSS un modificēto Rankina skalu, (mRS) un sadalīti grupās, balstoties uz NIHSS: insults bez simptomiem līdz viegls insults (NIHSS ≤4) un mērens līdz smags insults (NIHSS ≥5). Klīniskais uzlabojums tika definēts kā NIHSS vērtējuma samazināšanās par ≥4 punktiem. Balstoties uz mRS, pacienti tika klasificēti kā funkcionāli neatkarīgi (mRS≤2), funkcionāli atkarīgi (mRS 3-5) vai miruši (mRS 6). Informācija par 30-dienu mirstību un 90-dienu funkcionālo aktivitāti tika iegūta telefona intervijas laikā. Tika veikts salīdzinājums starp divām grupām - I grupa,kas saņēma reperfūzijas terapiju un II grupa,kas to nesaņēma. Rezultāti . Uzņemšanas nodaļā NIHSS ≥5 tika konstatēts 77,8% I grupā un 46,6% II grupā. 58,3% I grupas un 12,6% II grupas pacientu tika novērots klīniskais uzlabojums izrakstoties. Funkcionālā neatkarība izrakstoties nozīmīgi neatšķīrās starp abām grupām, toties 90-dienu vērtējumā tā bija labāka I grupas pacientiem. Secinājumi . I grupa uzrādīja lielāku klīnisko uzlabojumu izrakstoties un lielāku funkcionālu neatkarību salīdzinājumā ar II grupas pacientiem 90. dienā pēc insulta.
Introduction
Posterior circulation cerebral infarctions (POCI) account for 15-20% of all ischaemic strokes
and are associated with high disability. Infarction affecting brainstem often has more serious
consequences than infarction in the territory of the internal carotid artery. (Correia et.al., 2017)
The posterior cerebral circulation provides the blood supply to the posterior part of the brain,
including the occipital lobes, posteromedial temporal lobe, thalamus, cerebellum and brainstem.

DAUGAVPILS UNIVERSITĀTES 60. STARPTAUTISKĀS ZINĀTNISKĀS KONFERENCES PROCEEDINGS OF
RAKSTU KRĀJUMS THE 60th INTERNATIONAL SCIENTIFIC CONFERENCE OF DAUGAVPILS UNIVERSITY
80
The posterior circulation is supplied by the vertebral arteries that combine to form the basilar artery
which then divides into the posterior cerebral arteries. Posterior inferior cerebellar artery arise from
vertebral artery and together with anterior inferior cerebellar artery (AICA) that arise from basilar
artery supply parts of cerebellum, including vestibular apparatus and cochlea (AICA branches), and
distinct regions of the medulla and pons. From basilar artery arise paramedian and short
circumferential arteries that supply medial structures of brainstem and superior cerebellar artery that
supplies part of cerebellum and midbrain. Posterior cerebral artery and its branches supply occipital
lobes and posteromedial temporal lobes, thalamus and part of midbrain.
Figure 1. Anatomy of Posterior Circulation
Posterior circulation ischaemic stroke is a clinical syndrome associated with ischaemia related
to stenosis, in situ thrombosis, or embolic occlusion of the posterior circulation arteries—the
vertebral arteries in the neck, the intracranial vertebral, basilar, and posterior cerebral arteries, and
their branches. (Merwick et al., 2014)
Diagnosing posterior circulation stroke can be challenging, as the vascular anatomy can be
variable, and because presenting symptoms are often non-specific and fluctuating. (Schulz et al.,
2017) Variable and ill-defined symptoms may delay the diagnosis and increase morbimortality.
Early recanalization seems to be associated with better clinical outcomes.
Occlusion of the basilar artery including the basilar tip is uniformly fatal, because there is
only limited room in the posterior fossa for swollen brain tissue to expand, even a relatively small
cerebellar infarct can cause life-threatening intracranial hypertension. Compression of the aqueduct
or fourth ventricle by infarcted tissue can cause occlusive hydrocephalus, raising the intracranial
pressure even higher. Emergency external ventricular drainage with or without consecutive
neurosurgical decompression of the posterior fossa is a life-saving procedure in such cases. (Bähr et
al., 2012)

DAUGAVPILS UNIVERSITĀTES 60. STARPTAUTISKĀS ZINĀTNISKĀS KONFERENCES PROCEEDINGS OF
RAKSTU KRĀJUMS THE 60th INTERNATIONAL SCIENTIFIC CONFERENCE OF DAUGAVPILS UNIVERSITY
81
Different assessment tools and scales in different hospitalization and post-hospitalization
stages are used to evaluate and objectify signs and consequences of infarctions, to help follow-up
the patient. National Institutes of Health Stroke Scale (NIHSS) is a 15-item impairment scale used
to measure stroke severity. Modified Rankin Scale (mRS) measures the degree of disability or
dependence in the daily activities of people who have suffered a stroke or other causes of
neurological disability. Trial of Org 10172 in Acute Stroke Treatment or the TOAST classification
is the most common stroke classification, it classifies cerebral infarctions depending on their
etiopathogenetic mechanisms. (Adams et al. 1993).
The aim of the study was to evaluate treatment efficiency and clinical outcomes in patients
with confirmed diagnosis of POCI and to assess intrahospital,30-day mortality rate and 90-day
functional activity.
Material and Methods
The design of the study is retrospective cohort study with postdischarge interview. Study
included 278 cases of posterior circulation cerebral infarction selected from “Stroke register” data
from 2016 to 2017 under IDC-10 code I63.
Demographic data and etiopathogenic mechanisms according to TOAST classification were
assessed. All patients were evaluated using National Institutes of Health Stroke Scale (NIHSS) and
modified Rankin Scale (mRS). All cases were divided in groups based on NIHSS - no symptoms to
minor stroke (NIHSS ≤4) and moderate to severe stroke (NIHSS ≥5). (Figure 2.) Clinical
improvement was defined by a ≥4-point reduction in NIHSS.
Figure 2. NIH Stroke Scale Scoring and Interpretation
Based on mRS patients were classified as functionally independent (mRS≤2) or dependent
(mRS 3-5) and deceased (mRS 6). (Cooray et al., 2015)
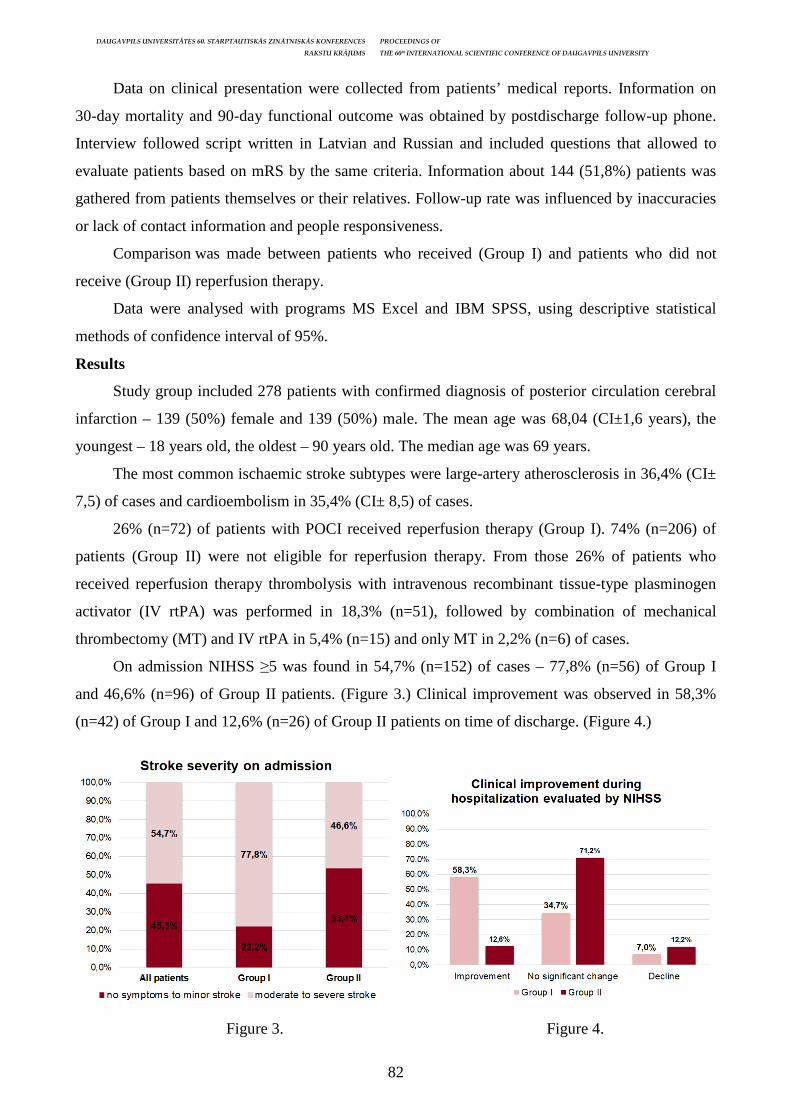
DAUGAVPILS UNIVERSITĀTES 60. STARPTAUTISKĀS ZINĀTNISKĀS KONFERENCES
Data on clinical presentation were collected from patients
30-day mortality and 90-day functional outcome was obtained by postdischarge follow
Interview followed script written in Latvian and Russian and included questions that allowed to
evaluate patients based on mRS by the same criteria. Information about 144 (51,8%) pat
gathered from patients themselves or their relatives. Follow
or lack of contact information and people responsiveness.
Comparison was made between patients who received (Group I) and patients who did not
receive (Group II) reperfusion therapy.
Data were analysed with programs MS Excel and IBM SPSS, using descriptive statistical
methods of confidence interval of 95%.
Results
Study group included 278 patients with confirmed diagnosis of posterior circulation
infarction – 139 (50%) female and 139 (50%) male. The mean age was 68,04 (CI±1,6 years), the
youngest – 18 years old, the oldest
The most common ischaemic stroke subtypes were large
7,5) of cases and cardioembolism in 35,4% (CI± 8,5) of cases.
26% (n=72) of patients with POCI received reperfusion therapy (Group I). 74
patients (Group II) were not eligible for reperfusion therapy. From those 26% of patien
received reperfusion therapy thrombolysis with intravenous recombinant tissue
activator (IV rtPA) was performed in 18,3
thrombectomy (MT) and IV rtPA in 5,4
On admission NIHSS ≥5 was found in 54,7
and 46,6% (n=96) of Group II patients. (Figure 3.) Clinical improvement was observed in 58,3
(n=42) of Group I and 12,6% (n=26) of Group II patients on tim
Figure 3.
STARPTAUTISKĀS ZINĀTNISKĀS KONFERENCES PROCEEDINGS OF
RAKSTU KRĀJUMS THE 60th INTERNATIONAL SCIENTIFIC CONFERENCE OF DAUGAVPILS UNIVERSITY
82
Data on clinical presentation were collected from patients’ medical reports. Information on
day functional outcome was obtained by postdischarge follow
Interview followed script written in Latvian and Russian and included questions that allowed to
evaluate patients based on mRS by the same criteria. Information about 144 (51,8%) pat
gathered from patients themselves or their relatives. Follow-up rate was influenced by inaccuracies
or lack of contact information and people responsiveness.
was made between patients who received (Group I) and patients who did not
ceive (Group II) reperfusion therapy.
Data were analysed with programs MS Excel and IBM SPSS, using descriptive statistical
methods of confidence interval of 95%.
Study group included 278 patients with confirmed diagnosis of posterior circulation
139 (50%) female and 139 (50%) male. The mean age was 68,04 (CI±1,6 years), the
18 years old, the oldest – 90 years old. The median age was 69 years.
The most common ischaemic stroke subtypes were large-artery atherosclero
7,5) of cases and cardioembolism in 35,4% (CI± 8,5) of cases.
n=72) of patients with POCI received reperfusion therapy (Group I). 74
patients (Group II) were not eligible for reperfusion therapy. From those 26% of patien
received reperfusion therapy thrombolysis with intravenous recombinant tissue
activator (IV rtPA) was performed in 18,3% (n=51), followed by combination of mechanical
thrombectomy (MT) and IV rtPA in 5,4% (n=15) and only MT in 2,2% (n=6)
≥5 was found in 54,7% (n=152) of cases – 77,8
n=96) of Group II patients. (Figure 3.) Clinical improvement was observed in 58,3
n=26) of Group II patients on time of discharge.
Figure 4.
INTERNATIONAL SCIENTIFIC CONFERENCE OF DAUGAVPILS UNIVERSITY
medical reports. Information on
day functional outcome was obtained by postdischarge follow-up phone.
Interview followed script written in Latvian and Russian and included questions that allowed to
evaluate patients based on mRS by the same criteria. Information about 144 (51,8%) patients was
up rate was influenced by inaccuracies
was made between patients who received (Group I) and patients who did not
Data were analysed with programs MS Excel and IBM SPSS, using descriptive statistical
Study group included 278 patients with confirmed diagnosis of posterior circulation cerebral
139 (50%) female and 139 (50%) male. The mean age was 68,04 (CI±1,6 years), the
90 years old. The median age was 69 years.
artery atherosclerosis in 36,4% (CI±
n=72) of patients with POCI received reperfusion therapy (Group I). 74% (n=206) of
patients (Group II) were not eligible for reperfusion therapy. From those 26% of patients who
received reperfusion therapy thrombolysis with intravenous recombinant tissue-type plasminogen
n=51), followed by combination of mechanical
of cases.
77,8% (n=56) of Group I
n=96) of Group II patients. (Figure 3.) Clinical improvement was observed in 58,3%
e of discharge. (Figure 4.)
Figure 4.
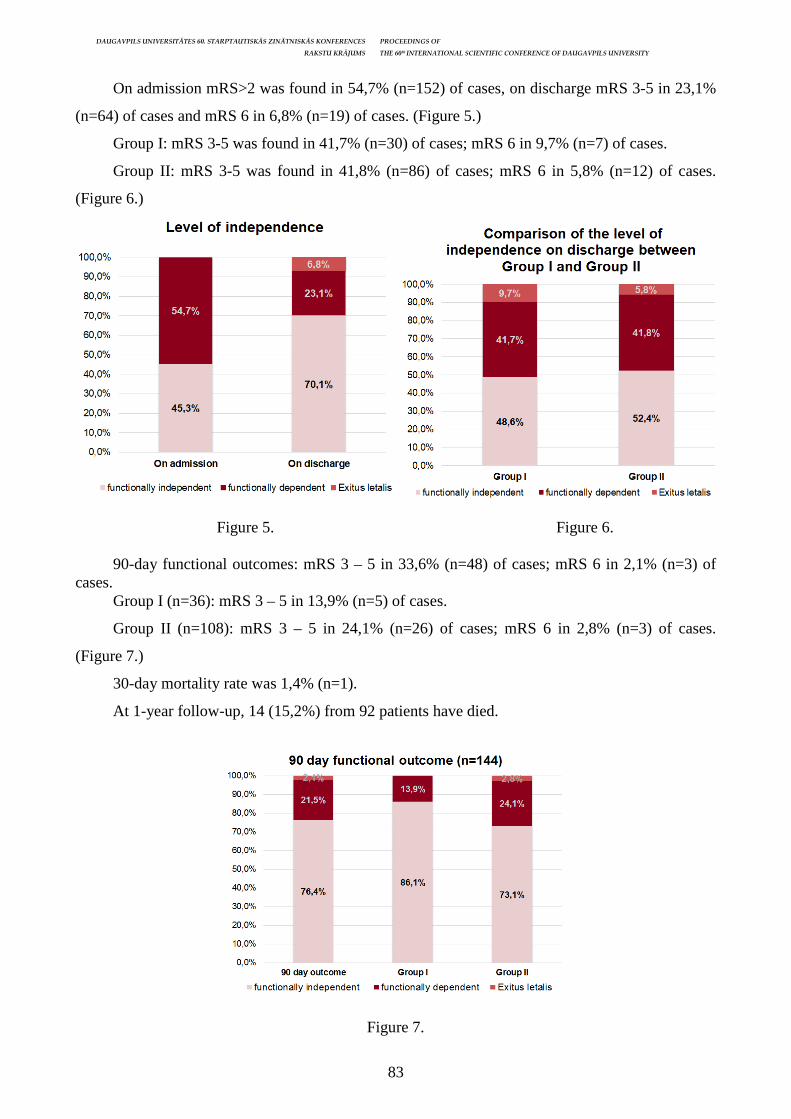
DAUGAVPILS UNIVERSITĀTES 60. STARPTAUTISKĀS ZINĀTNISKĀS KONFERENCES PROCEEDINGS OF
RAKSTU KRĀJUMS THE 60th INTERNATIONAL SCIENTIFIC CONFERENCE OF DAUGAVPILS UNIVERSITY
83
On admission mRS>2 was found in 54,7% (n=152) of cases, on discharge mRS 3-5 in 23,1%
(n=64) of cases and mRS 6 in 6,8% (n=19) of cases. (Figure 5.)
Group I: mRS 3-5 was found in 41,7% (n=30) of cases; mRS 6 in 9,7% (n=7) of cases.
Group II: mRS 3-5 was found in 41,8% (n=86) of cases; mRS 6 in 5,8% (n=12) of cases.
(Figure 6.)
Figure 5. Figure 6.
90-day functional outcomes: mRS 3 – 5 in 33,6% (n=48) of cases; mRS 6 in 2,1% (n=3) of cases.
Group I (n=36): mRS 3 – 5 in 13,9% (n=5) of cases.
Group II (n=108): mRS 3 – 5 in 24,1% (n=26) of cases; mRS 6 in 2,8% (n=3) of cases.
(Figure 7.)
30-day mortality rate was 1,4% (n=1).
At 1-year follow-up, 14 (15,2%) from 92 patients have died.
Figure 7.
DAUGAVPILS UNIVERSITĀTES 60. STARPTAUTISKĀS ZINĀTNISKĀS KONFERENCES PROCEEDINGS OF
RAKSTU KRĀJUMS THE 60th INTERNATIONAL SCIENTIFIC CONFERENCE OF DAUGAVPILS UNIVERSITY
84
Discussion
Currently used 30-day mortality rate and 90-day functional activity assessment using mRS
gives an accurate reflection of the overall treatment effect. 30-day mortality rate and 90-day
functional activity results are close to the data found in literature. Respectively, 30-day mortality
rate 1,4% against 3,6% in study of Merwick et al. (2014) and 90-day functional activity 33,6%
against 34,6% in study of Yang et al. (2016). Increasing the number of patients in the study group
would lead to more accurate results.
The study group included patients aged 18 to 90 years. The mean age was 68, but 92 (33,1%)
patients represented work age population (18 - 63). This fact shows a great significance of the study
as the outcome of POCI, functional activity and independence are very important in every age
group. Not only the personal life, growth, working efficiency and achievements of patient must be
considered as a crucial reason for better evaluation, detection and prevention of POCI, but also
governmental expenses for disabled people.
Reperfusion therapy significantly improves clinical outcomes if it is performed during
therapeutic time window, but stroke rehabilitation also is an important part of recovery after stroke.
Importance of rehabilitation must be understood in every stage of health care system. Ministry of
Health provides an opportunity to receive medical rehabilitation services not only in out-patient and
in-patient institutions, but also at home. But what is the real situation with a post stroke
rehabilitation and its’ availability? According to neurologist E. Malkiela: “It is necessary to
establish criteria for the targeted selection of patients with stroke among various providers of state-
funded rehabilitation services in order to prevent long waiting lists for high-level in-patient
rehabilitation patients with very low rehabilitation potential, which cannot be significantly
improved, or patients with a relatively small defect that could be prevented by outpatients. Also,
creating a system for patients with high rehabilitation potential would provide the rehabilitation
facility without delay.”
The 1-year follow-up rate in patients with POCI diagnosis is partly obtained because patients
with POCI diagnosed in 2017 are still in evaluation process but hopefully these results would not
change.
Conclusions
Cardioembolism is less frequent etiologic factor in POCI compared to anterior cerebral
infarctions.
Group I showed greater clinical improvement on time of discharge and greater independence
rate comparing to patients in Group II on 90-day follow up.
DAUGAVPILS UNIVERSITĀTES 60. STARPTAUTISKĀS ZINĀTNISKĀS KONFERENCES PROCEEDINGS OF
RAKSTU KRĀJUMS THE 60th INTERNATIONAL SCIENTIFIC CONFERENCE OF DAUGAVPILS UNIVERSITY
85
The follow-up rate was influenced by inaccuracies or lack of contact information and people
responsiveness. This reason could influence results. Verification of contact information, best
contact times, and notifying patients of impending follow-up calls may improve responsive rate.
References Adams H. P., Jr Bendixen B. H., Kappelle L. J., Biller J., Love B. B., Gordon D. L., Marsh E. E., 1993. Classification of subtype of acute ischemic stroke. Definitions for use in a multicenter clinical trial. TOAST. Trial of Org 10172 in Acute Stroke Treatment, Stroke. 1993; 24: 35–41, doi: 10.1161/01.STR.24.1.35 Bähr M., Frotscher M., Duus' Topical Diagnosis in Neurology: Anatomy – Physiology – Signs – Symptoms 4th edition Edition by Mathias Bähr, Michael Frotscher, 2005, Page 467. Cooray C., Matusevicius M., Wahlgren N., Ahmed N., 2015. Mobile Phone-Based Questionnaire for Assessing 3 Months Modified Rankin Score After Acute Stroke: A Pilot Study, Circ Cardiovasc Qual Outcomes. 2015 Oct; 8 (6Suppl 3): S125–30. doi:10.1161/CIRCOUTCOMES.115.002055. Correia M.A., Raposo F., Mendonça M., Guerreiro C., Teotónio P., Basílio G., Sequeira P., Biscoito, L., Neto, L.L., Campos, J., 2017. Endovascular treatment of acute posterior circulation ischemic stroke – outcomes of a single centre 14 months experience, International Journal of Clinical Neurosciences and Mental Health. Harrison J. K., McArthur K. S., & Quinn T. J., 2013. Assessment scales in stroke: clinimetric and clinical considerations. Clinical Interventions in Aging, 8, 201–211. http://doi.org/10.2147/ CIA.S32405 Kasner, Scott E., 2006. Clinical interpretation and use of stroke scales, The Lancet Neurology, Volume 5, Issue 7, 603–612. Merwick Á.,Werring D., 2014. Posterior circulation ischaemic stroke, BMJ 2014; 348: g3175. Olševska R., 2016. Rehabilitācija pēc insulta nedrīkst kavēties, jo smadzenes spēj atjaunoties, taču – ierobežotā laikā, [skatīts 10.05.2018]. Pieejams: http://veselam.la.lv/2016/04/04/rehabilitacija-pec-insulta-nedrikst-kaveties/ Schulz U.G., Fischer U., 2017. Posterior circulation cerebrovascular syndromes: diagnosis and management, J Neurol Neurosurg Psychiatry 2017; 88: 45–53. VM, 2017. Medicīniskā rehabilitācija insulta pacientiem, [skatīts 10.05.2018]. Pieejams: http://www.vm.gov.lv/lv/tava_veseliba/veselibas_aprupe_majas/mediciniska_rehabilitacija_insulta_pacientiem/ Yang, Y., Wang, A, Zhao X, Wang C, Liu L, Zheng H, Wang Y, Cao Y, Wang Y, 2016. The Oxfordshire Community Stroke Project classification system predicts clinical outcomes following intravenous thrombolysis: a prospective cohort study, Therapeutics and Clinical Risk Management, Volume 2016: 12. Pages 1049–1056, [seen 12.05.2018.]. Accessed: https://www.dovepress.com/ the-oxfordshire-community-stroke-project-classification-system-predict-peer-reviewed-fulltext-article-TCRM

DAUGAVPILS UNIVERSITĀTES 60. STARPTAUTISKĀS ZINĀTNISKĀS KONFERENCES PROCEEDINGS OF
RAKSTU KRĀJUMS THE 60th INTERNATIONAL SCIENTIFIC CONFERENCE OF DAUGAVPILS UNIVERSITY
86
CLINICAL PRESENTATION OF ACUTE POSTERIOR CIRCULATION CEREBRAL INFARCTION: AN ASSOCIATION
WITH NEUROIMAGING FINDINGS Gundega Ķauķe, Zane Ozolniece, Sofja Kauškale, Gundega Akuratere Riga Stradiņš University, Dzirciema Street 16, Riga, Latvia, LV-1007, [email protected], [email protected], [email protected], [email protected] Abstract
Clinical presentation of acute posterior circulation cerebral infarction: an association with neuroimaging findings
Key Words: POCI, signs and symptoms, neuroimaging Introduction . Diagnosing posterior circulation cerebral infarction (POCI) can be challenging, as the vascular anatomy can be variable, and presenting symptoms are often non-specific and fluctuating (Schulz et.al., 2017) Aim. To evaluate the frequencies of signs and symptoms in patients with POCI and to compare clinically determined location of the ischaemic lesion with neuroimaging findings. Material and methods. A retrospective study included 280 cases of POCI (2016 - 2017) from one tertiary care centre in Latvia. Data on clinical presentation and neuroimaging findings were collected from patients’ medical reports and AI_RIS database and analysed with programs MS Excel and IBM SPSS, using descriptive statistical methods of of confidence interval of 95%. Results. Common presenting symptoms were vertigo (33,8%), imbalance (33,1%) and nausea (20,2%). The most frequent signs were ataxia (61,1%), limb weakness (52,7%), dysarthria (39,2%) and nystagmus (28,6%). On admission clinical localisation of the site of the lesion was stated in 66,8% of cases, POCI (without specifying site of the lesion) in 23,2% and POCI as a differential diagnosis in 9,6% of cases. Site of the lesion or occlusion was correctly determined in 62,9% of cases. 90% and 80% of lesions located in pons and medulla oblongata were detected only by using MRI. The strongest association was found between homonymous hemianopsia and lesions detected in occipital cortex. Conclusions. Due to the variability of clinical symptoms in POCI, clinical determination of localisation of ischaemic lesion can often be inaccurate, therefore, neuroimaging is vital to ensure accurate localisation and extent of cerebral infarction. Kopsavilkums
Mugur ējās cirkulācijas cerebrāla infarkta kl īniskā aina: associācija ar neiroradioloģisko atradi Atslēgvārdi: POCI, pazīmes, simptomi, neiroradioloģija Ievads. Variablās vaskulārās anatomijas un nespecifisko, mainīgo simptomu dēļ mugurējās cirkulācijas cerebrāla infarkta (POCI) diagnostika var būt apgrūtināta. (Schulz et.al., 2017) Mērķis. Noteikt klīnisko pazīmju un simptomu biežumu pacientiem ar POCI un salīdzīnāt klīniski noteikto cerebrālā infarkta lokalizāciju ar neiroradioloģisko atradi. Materi āli un metodes. Retrospektīvs pētījums iekļāva 280 POCI gadījumus no viena terciārās aprūpes centra Latvijā. Kl īniskās atrades dati un attēldiagnostikas izmēklējumu rezultāti tika iegūti no pacientu slimības vēturēm un AI-RIS datu bāzes un tika analizēti ar MS Excel un IBM SPSS, izmantojot aprakstošas statistiskās metodes ar konfidences intervālu 95%. Rezultāti. Biežāk sastopamie simptomi bija vertigo (33,8%), līdzsvara trūkums (33,1%) un slikta dūša (20,2%). Visbiežāk novērotās pazīmes bija ataksija (61,1%), vājums ekstremitātēs (52,7%), dizartrija (39,2%) un nistagms (28,6%). Iestājoties slimnīcā, bojājuma klīniskā lokalizācija tika noteikta 66,8% gadījumu. POCI bez bojājuma vietas precizēšanas - 23,2% un kā diferenciāldiagnoze - 9,6% gadījumu. Bojājuma vai oklūzijas vieta tika precīzi noteikta 62,9% gadījumu. 90% pons un 80% iegareno smadzeņu bojājumu varēja noteikt vienīgi izmantojot MRI. Vislielākā saistība tika konstatēta starp homonīmo hemianopsiju un bojājumiem, kas lokalizēti pakauša daivā. Secinājumi. POCI klīnisko simptomu daudzveidības dēļ cerebrālā infarkta lokalizācijas noteikšana bieži var būt neprecīza, tāpēc neiroradioloģiskā izmeklēšana ir būtiska, lai skaidri noteiktu cerebrālā infarkta lokalizāciju un apjomu.
Introduction
Diagnosing posterior circulation cerebral infarction (POCI) can be challenging, as the
vascular anatomy can be variable, and presenting symptoms are often non-specific and fluctuating.
(Schulz et. al., 2017) Also POCI is less common than infarction in anterior circulation. (Helseth,
2017)
DAUGAVPILS UNIVERSITĀTES 60. STARPTAUTISKĀS ZINĀTNISKĀS KONFERENCES PROCEEDINGS OF
RAKSTU KRĀJUMS THE 60th INTERNATIONAL SCIENTIFIC CONFERENCE OF DAUGAVPILS UNIVERSITY
87
Patients with POCI present diverse spectrum of neurologic symptoms:
• motor deficits (weakness, clumsiness, or paralysis of any combination of arms and legs, up to
quadriplegia, sometimes changing from one side to another in recurrent strokes)
• alternating syndromes, consisting of ipsilateral cranial nerve dysfunction and contralateral
motor or sensory tract dysfunction (highly characteristic to posterior circulation stroke)
• sensory deficits (numbness, including loss of sensation or paraesthesia in any combination of
extremities, sometimes including all four limbs or both sides of the face or mouth)
• homonymous hemianopia - a visual field defect affecting either the two right or the two left
halves of the visual fields in both eyes
• ataxia, imbalance, unsteadiness, or disequilibrium
• vertigo, with or without nausea and vomiting
• diplopia as a result of ophthalmoplegia
• dysphagia, dysarthria or dysphonia
• disturbances of the autonomic nervous system
Isolated reduced level of consciousness is not a typical stroke symptom, but can result from
bilateral thalamic or brain stem ischaemia, especially from rostral basilar artery (AB) occlusion.
(Merwick et al., 2014)
In clinical practice it can be difficult to distinguish between posterior and anterior circulation
infarction, because some common syndromes (such as hemiparesis) are not specific for one or the
other. Visual deficit is often not recognized as a sign of infarction, this is why patients delay to seek
for medical intervention. (Tao et al., 2012) Vertigo (a feeling of true movement relative to the
environment) and “dizziness” are common symptoms in general practice and the emergency room
and present a particular challenge. It is crucial to elicit exactly what a patient means by dizziness
(true feeling of rotation, dissociation between the patient and the environment, or presyncopal
symptoms).
POCI is diagnosed on the basis of history and clinical examination, assisted by imaging. All
cases of suspected stroke require urgent brain imaging with CT or MRI to exclude haemorrhage.
Computed tomography angiography (CTA) and perfusion computed tomography (CTP) give
additive information about the site of vascular occlusion, infarct core, salvageable brain tissue and
degree of collateral circulation and helps to determine the most appropriate treatment for patient.
(Sabarudin et al., 2014)
Acute peripheral vestibular dysfunction, acute intracranial haemorrhage, subarachnoid
haemorrhage and tumour can mimic POCI. Basilar migraine, which may have aura features
including vertigo and diplopia, as well as severe occipital headache, toxic or metabolic
disturbances, infections, neuroinflammatory or chronic infectious disorders of the medulla, pons,
DAUGAVPILS UNIVERSITĀTES 60. STARPTAUTISKĀS ZINĀTNISKĀS KONFERENCES PROCEEDINGS OF
RAKSTU KRĀJUMS THE 60th INTERNATIONAL SCIENTIFIC CONFERENCE OF DAUGAVPILS UNIVERSITY
88
and cerebellum may initially present with features resembling cerebrovascular disease. (Merwick et
al., 2014)
The aim of the study was to evaluate the frequencies of signs and symptoms in patients with
POCI and to compare clinically determined location of the ischaemic lesion with neuroimaging
findings.
Material and Methods
A retrospective study comprised 280 cases of POCI selected from “Stroke register” data from
2016 to 2017 under IDC-10 code I63 in one tertiary care centre in Latvia.
Data on clinical presentation were collected retrospectively from patients’ medical reports,
including information about presenting symptoms and detailed neurological examination findings in
emergency department or stroke unit. Patients, whose condition did not allow to perform full
neurological examination, e.g. those who were unresponsive or in coma or there was information
missing, were excluded from analysis of specific presenting signs. Preliminary diagnosis, clinically
determined location of the ischaemic lesion in emergency department or stroke unit and final
diagnosis made after complete work-up were also collected from patients’ medical reports.
Data on neuroimaging findings has been gathered from Radiology Information System
AI_RIS database. CT, CTA, CTP and MRI were used for detection of stroke lesion localisation,
occlusion site, extent of salvageable brain tissue and degree of collateral circulation. Based on the
detected localisation of the stroke, data were divided and analysed in 3 groups: Group I - cerebral
infarctions in PCA territory, Group II - infarctions in brain stem, Group III - infarctions in
cerebellum. Collected data were analysed with programs MS Excel and IBM SPSS, using
descriptive statistical methods with confidence interval (CI) of 95%. Relationship between signs
and symptoms of POCI and specific sites of ischaemic lesion localisation was analysed with IBM
SPSS crosstabs.
Results
Study group included 280 patients with confirmed diagnosis of posterior circulation cerebral
infarction. 140 (50%) of them were female and 140 (50%) - male. The mean age was 68,04 (CI±1,6
years), the youngest was 18 years old, the oldest – 90 years old. The median age was 69 years.
The most common symptoms in patients with POCI were vertigo in 33,8% (n=89), imbalance
in 33,1% (n=87), nausea in 20,2% (n= 53) and headache in 10,3% (n=27) of cases. The most
frequent signs observed in patients with POCI were ataxia in 61,1% (n=162), limb weakness in
52,7% (n=145) 11 (4%) of those patients had tetraparesis, dysarthria in 39,2% (n=106), facial
muscle weakness in 31,8% (n=85), nystagmus in 28,6% (n=40), oculomotor disturbances in 24,6%
(n= 67), alterations of consciousness in 22,8% (n= 63) and homonymous hemianopsia 17,0% (n=
45). (Figure 1.) Limb sensory impairment was documented in 26,5% (n=70), mostly without
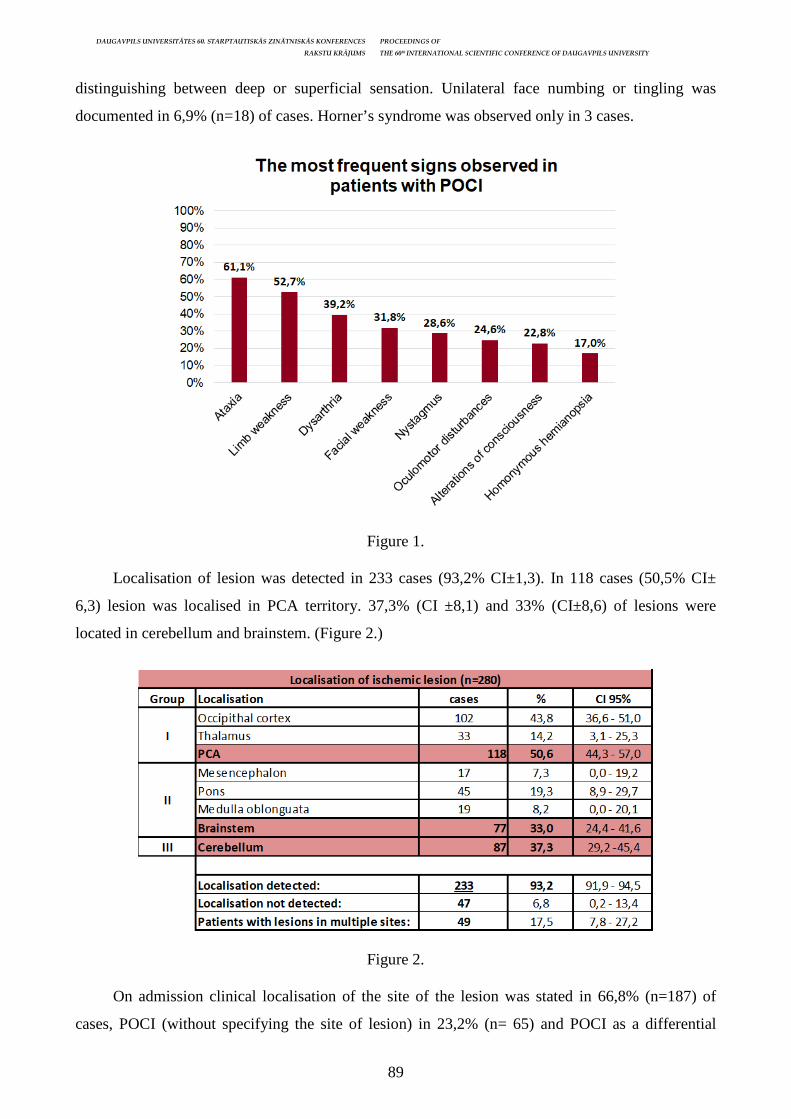
DAUGAVPILS UNIVERSITĀTES 60. STARPTAUTISKĀS ZINĀTNISKĀS KONFERENCES PROCEEDINGS OF
RAKSTU KRĀJUMS THE 60th INTERNATIONAL SCIENTIFIC CONFERENCE OF DAUGAVPILS UNIVERSITY
89
distinguishing between deep or superficial sensation. Unilateral face numbing or tingling was
documented in 6,9% (n=18) of cases. Horner’s syndrome was observed only in 3 cases.
Figure 1.
Localisation of lesion was detected in 233 cases (93,2% CI±1,3). In 118 cases (50,5% CI±
6,3) lesion was localised in PCA territory. 37,3% (CI ±8,1) and 33% (CI±8,6) of lesions were
located in cerebellum and brainstem. (Figure 2.)
Figure 2.
On admission clinical localisation of the site of the lesion was stated in 66,8% (n=187) of
cases, POCI (without specifying the site of lesion) in 23,2% (n= 65) and POCI as a differential
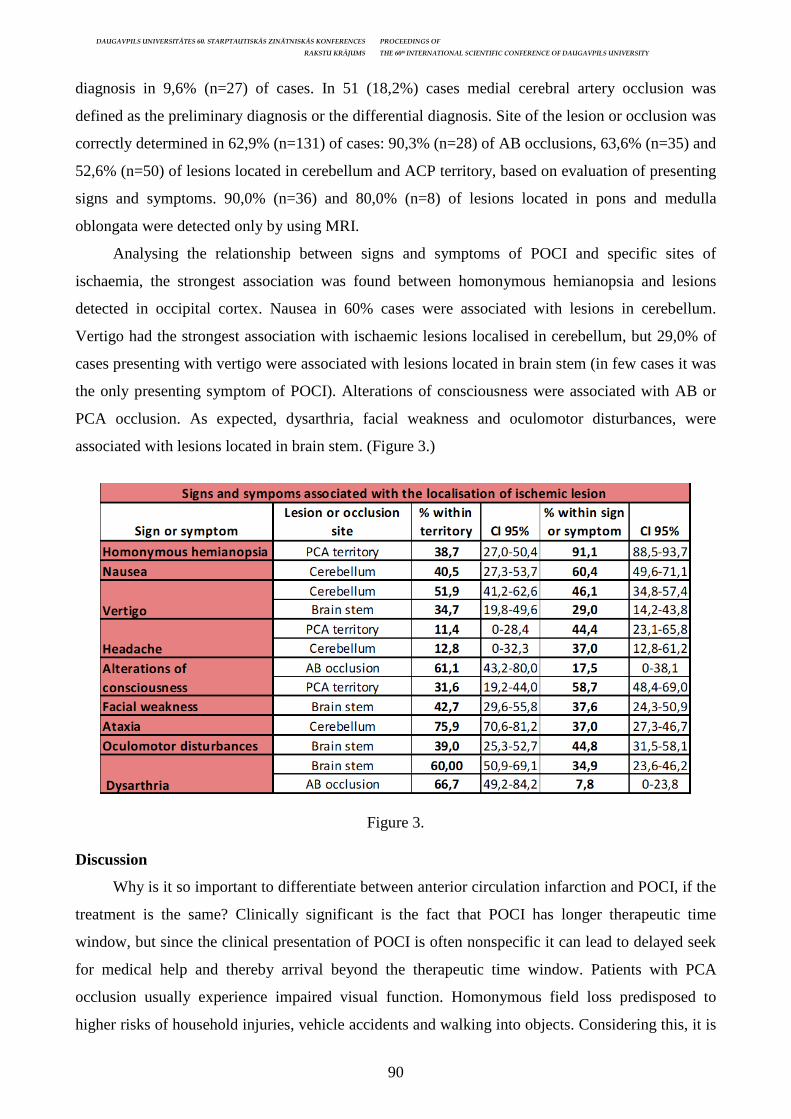
DAUGAVPILS UNIVERSITĀTES 60. STARPTAUTISKĀS ZINĀTNISKĀS KONFERENCES PROCEEDINGS OF
RAKSTU KRĀJUMS THE 60th INTERNATIONAL SCIENTIFIC CONFERENCE OF DAUGAVPILS UNIVERSITY
90
diagnosis in 9,6% (n=27) of cases. In 51 (18,2%) cases medial cerebral artery occlusion was
defined as the preliminary diagnosis or the differential diagnosis. Site of the lesion or occlusion was
correctly determined in 62,9% (n=131) of cases: 90,3% (n=28) of AB occlusions, 63,6% (n=35) and
52,6% (n=50) of lesions located in cerebellum and ACP territory, based on evaluation of presenting
signs and symptoms. 90,0% (n=36) and 80,0% (n=8) of lesions located in pons and medulla
oblongata were detected only by using MRI.
Analysing the relationship between signs and symptoms of POCI and specific sites of
ischaemia, the strongest association was found between homonymous hemianopsia and lesions
detected in occipital cortex. Nausea in 60% cases were associated with lesions in cerebellum.
Vertigo had the strongest association with ischaemic lesions localised in cerebellum, but 29,0% of
cases presenting with vertigo were associated with lesions located in brain stem (in few cases it was
the only presenting symptom of POCI). Alterations of consciousness were associated with AB or
PCA occlusion. As expected, dysarthria, facial weakness and oculomotor disturbances, were
associated with lesions located in brain stem. (Figure 3.)
Figure 3.
Discussion
Why is it so important to differentiate between anterior circulation infarction and POCI, if the
treatment is the same? Clinically significant is the fact that POCI has longer therapeutic time
window, but since the clinical presentation of POCI is often nonspecific it can lead to delayed seek
for medical help and thereby arrival beyond the therapeutic time window. Patients with PCA
occlusion usually experience impaired visual function. Homonymous field loss predisposed to
higher risks of household injuries, vehicle accidents and walking into objects. Considering this, it is
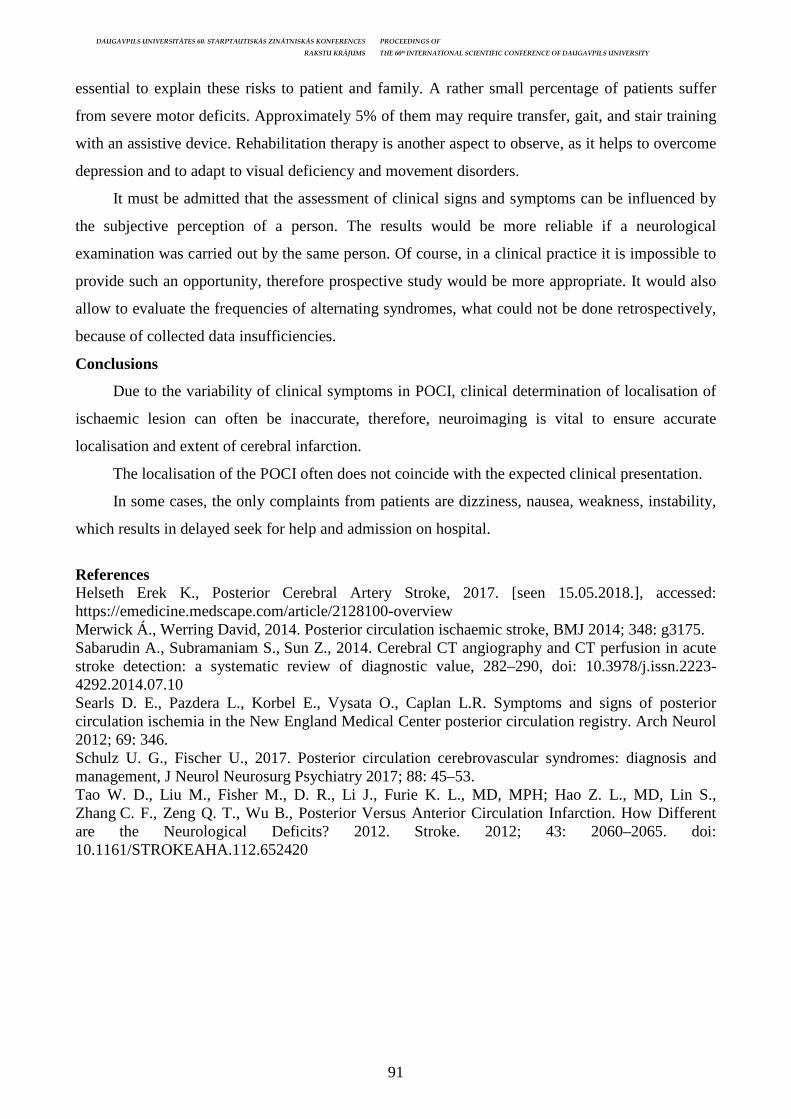
DAUGAVPILS UNIVERSITĀTES 60. STARPTAUTISKĀS ZINĀTNISKĀS KONFERENCES PROCEEDINGS OF
RAKSTU KRĀJUMS THE 60th INTERNATIONAL SCIENTIFIC CONFERENCE OF DAUGAVPILS UNIVERSITY
91
essential to explain these risks to patient and family. A rather small percentage of patients suffer
from severe motor deficits. Approximately 5% of them may require transfer, gait, and stair training
with an assistive device. Rehabilitation therapy is another aspect to observe, as it helps to overcome
depression and to adapt to visual deficiency and movement disorders.
It must be admitted that the assessment of clinical signs and symptoms can be influenced by
the subjective perception of a person. The results would be more reliable if a neurological
examination was carried out by the same person. Of course, in a clinical practice it is impossible to
provide such an opportunity, therefore prospective study would be more appropriate. It would also
allow to evaluate the frequencies of alternating syndromes, what could not be done retrospectively,
because of collected data insufficiencies.
Conclusions
Due to the variability of clinical symptoms in POCI, clinical determination of localisation of
ischaemic lesion can often be inaccurate, therefore, neuroimaging is vital to ensure accurate
localisation and extent of cerebral infarction.
The localisation of the POCI often does not coincide with the expected clinical presentation.
In some cases, the only complaints from patients are dizziness, nausea, weakness, instability,
which results in delayed seek for help and admission on hospital.
References Helseth Erek K., Posterior Cerebral Artery Stroke, 2017. [seen 15.05.2018.], accessed: https://emedicine.medscape.com/article/2128100-overview Merwick Á., Werring David, 2014. Posterior circulation ischaemic stroke, BMJ 2014; 348: g3175. Sabarudin A., Subramaniam S., Sun Z., 2014. Cerebral CT angiography and CT perfusion in acute stroke detection: a systematic review of diagnostic value, 282–290, doi: 10.3978/j.issn.2223-4292.2014.07.10 Searls D. E., Pazdera L., Korbel E., Vysata O., Caplan L.R. Symptoms and signs of posterior circulation ischemia in the New England Medical Center posterior circulation registry. Arch Neurol 2012; 69: 346. Schulz U. G., Fischer U., 2017. Posterior circulation cerebrovascular syndromes: diagnosis and management, J Neurol Neurosurg Psychiatry 2017; 88: 45–53. Tao W. D., Liu M., Fisher M., D. R., Li J., Furie K. L., MD, MPH; Hao Z. L., MD, Lin S., Zhang C. F., Zeng Q. T., Wu B., Posterior Versus Anterior Circulation Infarction. How Different are the Neurological Deficits? 2012. Stroke. 2012; 43: 2060–2065. doi: 10.1161/STROKEAHA.112.652420
DAUGAVPILS UNIVERSITĀTES 60. STARPTAUTISKĀS ZINĀTNISKĀS KONFERENCES PROCEEDINGS OF
RAKSTU KRĀJUMS THE 60th INTERNATIONAL SCIENTIFIC CONFERENCE OF DAUGAVPILS UNIVERSITY
92
CORRELATION BETWEEN EMOTIONAL SUPPORT IN SPOUSAL RELATIONSHIPS AND ANXIETY LEVELS
IN PRETERM INFANT MOTHERS Beāta Zaļaiskalna, Artūrs Miksons Riga Stradins University, Dzirciema str. 16, Riga, [email protected] Abstract
Correlation between emotional support in spousal relationships and anxiety levels in preterm infant mothers Key Words: Premature birth, anxiety, emotional support, partnership Aim. To determine correlation between emotional support in spousal relationship and anxiety in preterm infant mothers. Materials and methods. Cross-sectional study with anonymous survey which includes questions about demographic data (age, education level, relationship status), The State Trait Anxiety inventory (STAI), which was adapted to latvian by D. Šuškovnika in 2004. Evaluation and nurturing relationship issues, communications and happiness (ENRICH) scale, which was translated to latvian. All data was collected in stationary and surveys were filled independently. All data was analyzed using SPSS 25.0 and Excel 2010. Results. 40 preterm infant mothers filled the survey, but 33 were included in this study. Preterm infant mothers were aged from 21 to 39. Mean age was 30,36 years. 72,7% (n=24) of women had higher education, 27,3% (n=9) of women had secondary education. 57,6% (n=19) were married, 42,4% (n=14) were in a relationship. Mean STAI –Y scale score was 42,76 (SD = 12,78). 9,1% (n=3) had high stress level, 21,2% (n=7) of women had moderately high stress level, 54,6% (n=18) average stress level, 15,2% (n=5) moderately low stress level. Mean ENRICH scale score was 54,42 (SD = 8,45). 81,8% (n=27) respondents were satisfied with their relationship. Spearmen correlation coefficient rs=-0,077 showed no significant correlation between anxiety of preterm mothers and emotional support in spousal relationship (p>0,05). T test showed negative correlation between mother’s age and anxiety t(33) = -1,124 (p>0,05). Conclusion: 1. There was no significant correlation between anxiety of preterm born infant mothers and emotional support in
spousal relationship. 2. There is negative correlation between anxiety and mother’s age, meaning, the younger mother, the higher anxiety
level. Kopsavilkums
Emocionālā atbalsta partnerattiecībās korelācijas ar trauksmes līmeni priekšlaikus dzimušu bērnu mātēm Atslēgvārdi: priekšlaicīgas dzmedības, trauksme, emocionālais atbalsts, partnerattiecības Mērķis. Pētīt emocionālā atbalsta partnerattiecībās korelāciju ar trauksmes līmeni priekšlaikus dzimušu bērnu mātēm. Materi āli un metodes. Šķērsgriezuma pētījums, kurā izmantota anonīma anketa. Tā ietver jautājumus par demogrāfiskiem datiem (vecums, izglītības līmenis, attiecību statuss), Trauksmes stāvokļa – iezīmes pašnovērtējuma anketu (STAI jeb The State – Trait Anxiety inventory), un Attiecību komunikācijas un apmierinātības izvērtēšanas skalu (ENRICH jeb Evaluation and nurturing relationship issues, communication and happiness) Iegūtie dati apstrādāti ar programmu Microsoft Excel 2010 un statistiskās analīzes metodes programmu SPSS 25.0. Rezultāti. Pētījumā piedalījās 33 mātes vecumā no 21 līdz 39 gadiem. Pētījuma dalībnieču vidējais vecums ir 30,36 gadi. 72,7% (n=24) ir augstākā izglītība, 27,3% (n=9) ir vidējā vai vidējā speciālā izglītība. 57,6% (n=19) pētījuma dalībnieču ir precējušās, 42,4% (n=14) ir attiecībās. Vidējais trauksmes līmenis ir 42,76 punkti (SD = 12,78). 9,1% (n=3) pētījuma dalībnieču ir augsts trauksmes līmenis, vidēji augsts trauksmes līmenis ir 21,2% (n=7), 54,6% (n=18) - vidējs trauksmes līmenis, vidēji zems - 15,2% (n=5), taču nevienai pētījuma dalībniecei nebija zems trauksmes līmenis. Vidējais attiecību apmierinātības līmenis ir 54,42 punkti (SD = 8,45). Ar attiecībām apmierinātas 81,8% (n=27) jaunās māmiņas. Spīrmena korelācijas koeficients rs=-0,077 neuzrādīja nozīmīgu korelāciju. T tests uzrādīja negatīvu korelāciju starp trauksmes līmeni un mātes vecumu t(33) = -1,124 (p>0,05). Secinājumi: 1. Nepastāv korelācija starp emocionālo atbalstu partnerattiecībās un trauksmes līmeni priekšlaikus dzimušu bērnu
mātēm. 2. Pastāv negatīva korelācija starp trauksmes līmeni un mātes vecumu – jo jaunāka māte, jo lielāka trauksme.
Introduction
Anxiety is disturbing tense feeling which is characterized with inability to relax, nervousness,
worrying or anxiety about something with an uncertain outcome. Anxiety is easy to misdiagnose
DAUGAVPILS UNIVERSITĀTES 60. STARPTAUTISKĀS ZINĀTNISKĀS KONFERENCES PROCEEDINGS OF
RAKSTU KRĀJUMS THE 60th INTERNATIONAL SCIENTIFIC CONFERENCE OF DAUGAVPILS UNIVERSITY
93
with heart arrhythmia, bronchial asthma, coronary heart disease, cerebrovascular pathology or
endocrine pathology (Philbrick and Wise 2012). Usually moderate anxiety is not pathological state
and that can be reduced by reducing the stressor. Although there can be situations when moderate
and high anxiety can interfere with patient’s health by triggering chronic disease and it also can
affect treatment and diagnostics (Katon, Lin, and Kroenke 2007).
Anxiety usually presents with panic, fear, uneasiness, sleep problems, shortness of breath, dry
mouth, nausea, heart palpitations, sweating, dizziness etc. (Logins R., Paudere S., and Vrubļevska J.
2017). A lot of different surveys and tests are used to diagnose anxiety. The most common are
GAD7, Beck Anxiety Inventory (BAI) and The State Trait anxiety inventory (STAI). GAD7 has 7
questions and it takes only few minutes to complete it and usually is used to determine risk groups.
BAI is wider and has 21 different questions, each answer being scored on a scale value of 0 (not at
all) to 3 (severely). It standardizes anxiety levels in minimal, moderate and severe anxiety (Beck
1990). Another inventory for diagnosing anxiety is STAI. It takes around 15 to 20 minutes to
complete it and it has 2 parts or forms. Form Y has 20 items for assessing trait anxiety and Form X
has 20 items for state anxiety. Each answer is scored from 1 (almost never) to 4 (almost always).
This inventory also divides anxiety in minimal, moderate and severe groups (Julian 2011).
According to World Health organization (WHO) approx. 13% women postpartum feel anxious or
depressed (WHO 2017).
Preterm birth is defined as a birth before 37 completed weeks of gestation. Every year there
are approx. 15 million preterm births worldwide (WHO 2017) and around 1100 preterm births in
Latvia (Slimību profilakses un kontroles centrs 2016). Preterm birth can be divided in 3 groups:
• Very early (up to 28th week of gestation)
• Early (from 28th to 32nd week of gestation)
• Moderate (32nd to 37th week of gestation)
There are a lot of risk factors for premature birth. Some of them are
• Multiple pregnancies
• Mother’s age (teens and women over 35)
• Infections
• Mother’s chronic diseases
• Physical and emotional stress
• Bad habits as smoking, alcohol consuming etc (Centers for Disease Control and Prevention
2017).
Preterm birth is the most common mortality cause in children up to 5 years. Every year
approximately 1 million newborns are dying because of preterm birth and a lot of children become
disabled because of the complications (WHO 2017).

DAUGAVPILS UNIVERSITĀTES 60. STARPTAUTISKĀS ZINĀTNISKĀS KONFERENCES PROCEEDINGS OF
RAKSTU KRĀJUMS THE 60th INTERNATIONAL SCIENTIFIC CONFERENCE OF DAUGAVPILS UNIVERSITY
94
The most common complications for premature newborn are immature lungs, comgenital
heart diseases and brain problems because of uncompleted development, disturbed termoregulation,
stomach – intestine diseases and metabolic problems (Mayo Clinic 2017).
Anxiety risk in preterm infant mothers are 2,7 times higher than in term infant mothers.
Anxiety in preterm infant mothers occurs in 26,5% while in term infant mothers only 11,5% of
cases (Bener 2013).Psychosocial factors such as marital status and satisfaction with spousal
relationship can reduce or intensify anxiety.
Emotional support is an ability to show sympathy, empathy and care for others. Emotional
support is an important part of healthy relationships. Studies show that people with healthy
relationships have better emotional well-being, have reduced mental and physical illness incidence
and even have longer life expectancy (Umberson and Montez 2010). In other study, it is shown that
people who receive emotional support from others reduces mortality rate in illnesses like diabetes,
hipertensia, emphysema and improves state of arthritis (Reblin and Uchino 2008).
There are several studies that proves that anxiety level in preterm birth mothers is higher than
mothers with normal birth time (Bener 2013). To reduce this risk, it is important to provide not only
adequate medical help but also take care of emotional well-being.
Psychosocial factors such as family status and satisfaction with partnership can reduce or
increase anxiety (Beardslee, Chien, and Bell 2011). Women of preterm birth points out that family’s
and partner’s support should be provided without specific request (Negron et al. 2013). In NICE
guidelines it is written that psychoemotional questions in pregnant women and women, who just
gave birth, should be asked in every inspection (National Institute for Health and Care Excellence
2016). Mothers who have received support during their pregnancy had lower emotional distress
after the birth (Stapleton et al. 2012).
Materials and methods
Study was held in Riga Maternity hospital and Pauls Stradins Clinical University hospital.
This was a cross - sectional study.
Self reported anonymous survey was used that included questions about demographic data
(age, education level, relationship status), STAI (State - Trait Anxiety inventory) and ENRICH
(Evaluation and nurturing relationship issues, communication and happiness).
STAI survey includes 2 parts with 20 questions each. Surveys first part shows anxiety state at
the moment and the second part shows anxiety trait in person. Only the first part of the survey was
used in this study.
ENRICH scale includes 15 questions about different fields of partnership. Ten of the scale’s
items survey 10 domains of marital quality. The other 5 items compose a marital

DAUGAVPILS UNIVERSITĀTES 60. STARPTAUTISKĀS ZINĀTNISKĀS KONFERENCES PROCEEDINGS OF
RAKSTU KRĀJUMS THE 60th INTERNATIONAL SCIENTIFIC CONFERENCE OF DAUGAVPILS UNIVERSITY
95
conventionalization scale to correct for the tendency to endorse unrealistically positive descriptions
of the marriage.
Inclusion criteria:
• consent to participate in this study
• premature birth up to 36+6 week in the last 3 days.
Exclusion criteria:
• disagreement to participate in this study
• newborn’s death in the period till 3 days after the birth
All data was analyzed using SPSS 22.0 and Excel 2010.
Results
40 preterm infant mothers filled the survey but 33 were included in this study. 5 surveys were
not received back, 3 were incompleted. Response rate - 82,5%.
Preterm infant mothers were aged from 21 to 39. Mean age was 30,36 years. 72,7% (n=24) of
women had higher education, 27,3% (n=9) of women had secondary education. 57,6% (n=19) were
married, 42,4% (n=14) were in a relationship.
Mean STAI scale score was 42,76 (SD = 12,78). 9,1% (n=3) had high stress level, 21,2%
(n=7) of women had moderately high stress level, 54,6% (n=18) average stress level, 15,2% (n=5)
moderately low stress level.
Mean ENRICH scale score was 54,42 (SD = 8,45). 66,6% (n=22) respondents were satisfied
with their relationship.
Spearmen correlation coefficient r s =-0,077 showed no significant correlation between
anxiety of preterm mothers and emotional support in spousal relationship (p>0,05). There also were
no significant correlation between mother’s education and anxiety r s =-0,003 (p>0,05). T test
showed negative correlation between mother’s age and anxiety t (33) = -1,124 (p>0,05), but no
significant correlation between relationship status and anxiety level t(33)=0,277 (p>0,05).
All data were not statistically believable (p>0,05).
Discussion
According to other studies preterm birth mothers with lower education level have higher
postpartum anxiety level but the results of this study did not show such a correlation. Possible
reasons could be wide study’s participants group and undefined exclusion criteria. Mothers with
normal birth weight newborns and low birth weight newborns participated in this study as well as
early and late preterm birth (from 23th week of gestation till 36+6 week of gestation).
This study revealed negative correlation between anxiety level and mothers age. The younger
was the mother the higher was the anxiety level. Although this data was not statistically significant,
data in other studies showed exact correlation (Bener 2013). One of the explanations could be that
DAUGAVPILS UNIVERSITĀTES 60. STARPTAUTISKĀS ZINĀTNISKĀS KONFERENCES PROCEEDINGS OF
RAKSTU KRĀJUMS THE 60th INTERNATIONAL SCIENTIFIC CONFERENCE OF DAUGAVPILS UNIVERSITY
96
most likely for younger mothers this is the first birth and first child, which causes confusion and
anxiety about the upcoming.
All data in this study were not statistically significant which can be explained by small study
sample and its diversity. Number of pregnancies, births and children in family, multiple pregnancy,
birth time (early and late premature birth) and other mother’s diseases were not defined in
inclusion/ exclusion criteria.
Also, p value could be affected by very similar ENRICH scale score. In most of the surveys
(66,6%; n=22) scale score were 60 p. (+/- 2 p.). Mothers age, relationship status and other factors
did not interfere with this scale score. ENRICH scale consists of 15 questions of which 5 are
idealization questions, meaning, they show if survey filler has realistic expectations from
relationship. 45,5% of participants had the highest possible (25 p.) result in these questions, which
means that they have unrealistic hopes from their relationship. One of the reasons why this result is
so high are social stereotypes what is a good relationship and what society expects from newborn
parents. Survey included idealization questions like “My partner and I understand each other
perfectly”, “I have never regretted my relationship with my partner, not even for a moment” and
“Our relationship is a perfect success”. Results could also be affected by the fact that in some cases
the partner sat next to the study participant as the survey was filled, accordingly the participant
could be affected and probably she did not want to offend her partner by marking lower score in
some questions.
Further studies with more specific inclusion and exclusion criteria and narrower study
samples are needed.
Conclusion
1. There was no significant correlation between anxiety of preterm born infant mothers
and emotional support in spousal relationship (rs=-0,077; p>0,05).
2. There is negative correlation between anxiety and mother’s age, meaning, the younger the
mother, the higher the anxiety level (t (33) = -1,124; p>0,05).
3. There is no significant correlation between mother’s education level and anxiety level (rs=-
0,003; p>0,05), nor the relationship status and anxiety level (t (33) = 0,277; p>0,05).
References Beardslee, William R., Peter L. Chien, and Carl C. Bell. 2011. “Prevention of Mental Disorders, Substance Abuse, and Problem Behaviors: A Developmental Perspective.” Psychiatric Services 62 (3): 247–54. https://doi.org/10.1176/ps.62.3.pss6203_0247 Beck, Aaron T. 1990. “Beck Anxiety Inventory.” http://www.renewedfreedomcenter.com/wp-content/uploads/2016/02/BAI-Beck-Anxiety-Index.pdf Bener, Abdulbari. 2013. “Psychological Distress among Postpartum Mothers of Preterm Infants and Associated Factors: A Neglected Public Health Problem.” Revista Brasileira de Psiquiatria 35 (3): 231–36. https://doi.org/10.1590/1516-4446-2012-0821
DAUGAVPILS UNIVERSITĀTES 60. STARPTAUTISKĀS ZINĀTNISKĀS KONFERENCES PROCEEDINGS OF
RAKSTU KRĀJUMS THE 60th INTERNATIONAL SCIENTIFIC CONFERENCE OF DAUGAVPILS UNIVERSITY
97
Centers for Disease Control and Prevention. 2017. “Preterm Birth | Maternal and Infant Health | Reproductive Health | CDC.” 2017. https://www.cdc.gov/reproductivehealth/maternalinfanthealth/ pretermbirth.htm Julian, Laura J. 2011. “Measures of Anxiety: State-Trait Anxiety Inventory (STAI), Beck Anxiety Inventory (BAI), and Hospital Anxiety and Depression Scale-Anxiety (HADS-A).” Arthritis Care & Research 63 Suppl 11 (0 11). NIH Public Access: S 467–72. https://doi.org/10.1002/ acr.20561 Katon, Wayne, Elizabeth H. B. Lin, and Kurt Kroenke. 2007. “The Association of Depression and Anxiety with Medical Symptom Burden in Patients with Chronic Medical Illness.” General Hospital Psychiatry 29 (2). Elsevier: 147–55. https://doi.org/10.1016/J.GENHOSPPSYCH. 2006.11.005 Logins R., Paudere S., and Vrubļevska J. 2017. “Ģeneralizēta Trauksme Un Panika. Kas Jāzina Ģimenes Ārstam?” Doctus. https://www.doctus.lv/2017/1/generalizeta-trauksme-un-panika-kas-jazina-gimenes-arstam Mayo Clinic. n.d. “Premature Birth – Symptoms and Causes.” 2017. Accessed April 8, 2018. https://www.mayoclinic.org/diseases-conditions/premature-birth/symptoms-causes/syc-20376730 National Institute for Health and Care Excellence. 2016. “Antenatal and Postnatal Mental Health | Guidance and Guidelines | NICE.” In. NICE. https://www.nice.org.uk/guidance/qs115/chapter/ Quality-statement-4-Asking-about-mental-health-and-wellbeing Negron, Rennie, Anika Martin, Meital Almog, Amy Balbierz, and Elizabeth A Howell. 2013. “Social Support during the Postpartum Period: Mothers’ Views on Needs, Expectations, and Mobilization of Support.” Maternal and Child Health Journal 17 (4). NIH Public Access: 616–23. https://doi.org/10.1007/s10995-012-1037-4 Philbrick, Kemuel L., and Michael G. Wise. 2012. Clinical Manual of Psychosomatic Medicine : A Guide to Consultation-Liaison Psychiatry. American Psychiatric Pub. https://books.google.lv/ books?hl=en&lr=&id=xqCvBAAAQBAJ&oi=fnd&pg=PP1&dq=Clinical+Manual+of+Psychosomatic+Medicine.+Michael+G.+Wise,+James+R.+Rundell&ots=LwRSd8z5TN&sig=cmWPUblANwZ1wv8bqBQzb2WADNw&redir_esc=y#v=onepage&q=Clinical Manual of Psychosomatic Medicine. Michael G. Wise%2C James R. Rundell&f=false Reblin, Maija, and Bert N Uchino. 2008. “Social and Emotional Support and Its Implication for Health.” Current Opinion in Psychiatry 21 (2). NIH Public Access: 201–5. https://doi.org/10.1097/ YCO.0b013e3282f3ad89 Slimību profilakses un kontroles centrs. 2016. “Statistikas dati par 2016. gadu.” Dzemdības un jaundzimušie. 2016. https://spkc.gov.lv/lv/statistika-un-petijumi/statistika/veselibas-aprupes-statistika1/get/nid/14 Stapleton, Lynlee R. Tanner, Christine Dunkel Schetter, Erika Westling, Christine Rini, Laura M. Glynn, Calvin J. Hobel, and Curt A. Sandman. 2012. “Perceived Partner Support in Pregnancy Predicts Lower Maternal and Infant Distress.” Journal of Family Psychology 26 (3): 453–63. https://doi.org/10.1037/a0028332 Umberson, Debra, and Jennifer Karas Montez. 2010. “Social Relationships and Health: A Flashpoint for Health Policy.” Journal of Health and Social Behavior 51 Suppl (Suppl). NIH Public Access: S54-66. https://doi.org/10.1177/0022146510383501 WHO. 2017. “WHO | Preterm Birth.” WHO. World Health Organization. http://www.who.int/ mediacentre/factsheets/fs363/en/
DAUGAVPILS UNIVERSITĀTES 60. STARPTAUTISKĀS ZINĀTNISKĀS KONFERENCES PROCEEDINGS OF
RAKSTU KRĀJUMS THE 60th INTERNATIONAL SCIENTIFIC CONFERENCE OF DAUGAVPILS UNIVERSITY
98
SELF-MANAGEMENT APPROACH IN CARE OF PATIENT WITH CHRONIC LOVER BACK PAIN
Dagnija Brutāne Riga Stradin’s University, Dzirciema street 16, Riga, Latvia, LV Abstract
Self-management approach in care of patient with chronic lover back pain Key Words: chronic lover back pain, self-management approach, self-management support Back pain is a complex biopsychosocial phenomenon, so it is very important to understand that pain care should focus on the principle of caring for the whole person, rather than solely for the treatment of isolated back pain. One of the options for patient awareness and compliance in the process of treating their illness is to support patient self-management skills. Such programs include changing patient's perceptions of disease, problem detection and evaluation, self-efficacy. The aim of the study was to find out the self-management skills of chronic lower back pain patients, their willingness to take self-management approaches to their pain management and the need for self-management support. The study used a mixed research method – a qualitative and quantitative research model combining methods for collecting and analyzing data. The most important conclusion is the very high need for information on both the disease and its treatment and care methods, since it was recognized that the prescribed treatment was not applied directly due to lack of information. The study also showed that the higher the level of education of the respondent, the more willing it is to become involved in the development and implementation of self-management strategies in the process of the treatment and care of their chronic lower back pain treatment. Kopsavilkums
Hronisko muguras lejasdaļas sāpju pacientu gatavība pieņemt pašpalīdzības pieeju sāpju aprūpē Atslēgvārdi: hroniskas muguras lejas daļas sāpes, pašpalīdzības pieeja, pašpalīdzības atbalsts Muguras sāpes ir komplekss biopsihosociāls fenomens, tāpēc ir ļoti svarīgi saprast, ka sāpju aprūpei jābūt vērstai uz visas personas aprūpi, ne tikai izolēti uz muguras sāpēm. Viena no iespējām kā veicināt pacienta lielāku iesaistīšanos savu sāpju aprūpē, ir pašpalīdzības spēju atbalstīšana. Šādas programmas ietver pacienta paša uztveres un attieksmes maiņu pret savu saslimšanu, problēmu noteikšanu un pašefektivitātes attīstīšanu. Pētījuma mērķis bija noteikt pacientu pašpalīdzības prasmes, gatavību pieņemt pašpalīdzības pieeju viņu sāpju aprūpē un vajadzību pēc pašpalīdzības atbalsta. Pētījuma veikšanai tika izmantota jaukta metode – kombinēta kvalitatīvā un kvantitatīvā metode datu savākšanai un apstrādei. Nozīmīgākais secinājums bija atziņa, ka pacientiem bija ļoti liela vajadzība pēc informācijas gan par savu saslimšanu, gan tās aprūpi, jo tika secināts, ka nozīmētā aprūpe netika lietota informācijas trūkuma dēļ. Pētījumā arī tika noskaidrots, ka augstāks izglītības līmenis parādīja lielāku gatavību piedalīties savu sāpju aprūpē jeb nodarboties ar pašpalīdzību.
Introduction
Pain is one of the most challenging problems in medicine and biology. It is a challenge for
both - the sufferer, who needs to learn to live with pain and for medical professionals, who need to
look for opportunities to help the sufferer (Lynch et. al., 2010). Back pain is the most common pain
in society – studies, conducted in different countries, show different results, but around the world, it
is about 12%. The treatment and care of the back pain is about 25 to 50% of the work done by all
pain clinics (Mersky et. al., 2005). There are many scientific studies on back pain, and there is a
huge amount of medication management support programs and healing methods available, but still
there is a problem with back pain care. The care of the whole person, which can help the patient to
restore his autonomy, is very important. It means that the care of the back pain depends a lot on the
patient's own compliance, understanding and willingness to work together. The patient's sense of
strength and will also be important (Logina, 2006; Hayes et. al., 2012). One of the options for
patient awareness and compliance in the process of treating their illness is to support patient self-
DAUGAVPILS UNIVERSITĀTES 60. STARPTAUTISKĀS ZINĀTNISKĀS KONFERENCES PROCEEDINGS OF
RAKSTU KRĀJUMS THE 60th INTERNATIONAL SCIENTIFIC CONFERENCE OF DAUGAVPILS UNIVERSITY
99
management skills by developing self-management programms. Such programs include changing
patient's perceptions of disease, problem detection and evaluation, self-efficacy (Redman, 2004).
The Aim of study was to find out the self-management skills of chronic lower back pain
patients, their willingness to take self-management approaches to their pain management and the
need for self-management support. Several research questions were created:
1) Are patients with chronic lower back pain ready to take self-management approach to their pain
management?
2) Do patients with chronic lower back pain need self-management support?
Methods
To answer the research questions, it was used a mixed research method – a qualitative and
quantitative research model combining methods for collecting and analyzing data:
1. Pain Stages of Change Questionnaire (Kerns et al., 1997; Carr et al., 2006)
2. Semi-structured interview with open questions, created by author of research
3. Demographic data questionnaire.
Pain Stages of Change Questionnaire is an instrument measuring the readiness of a patient for
chronic pain to take a self-management approach to the treatment of chronic pain conditions ((Roe
et al., 2014; Carr et al., 2006). This instrument was created in 1997 by R.D. Kerns and colleagues,
based on a transteorethic behavioral change model, in which the individual undergoes several stages
of change in making decisions about change (Kerns et al., 1997; Carr et al., 2006). The survey
consists of 30 units, arranged in 4 different scales, which includes 4 dimensions (Roe et al., 2014;
Hadjistavropoulos & Shymkiw, 2007; Carr et al., 2006):
1. Precontemplation scale consisting of 7 allegations; representing stage, which does not see
changes in behavior
2. Contemplation scale consisting of 10 allegations; representing stage, in which there is a
reflection
3. Action scale consisting of 6 allegations; representing stage which takes active steps towards
change
4. Maintenance scale consisting of 7 allgations; representing stage in which maintenance takes
place.
Semi-structured interview was created by author of research. Ther was 12 questions which
showed patients' experience of back pain, treatment and care, barriers to care, and care issues.
Findings was analised with descriptive statistic methods, contentanalysis and Spearman’s rank
correlation coefficient and Kruskal-Wallis one-way analysis of variance.

DAUGAVPILS UNIVERSITĀTES 60. STARPTAUTISKĀS ZINĀTNISKĀS KONFERENCES PROCEEDINGS OF
RAKSTU KRĀJUMS THE 60th INTERNATIONAL SCIENTIFIC CONFERENCE OF DAUGAVPILS UNIVERSITY
100
Results
28 respondents aged 30-70 agreed to participate in the study. Of these, 18 were women, but
10 were men.
Through the analysis of the interview, different categories of concepts were identified. There
were concepts like “understanding of the disease”, “back pain cause”, “need for information”,
“difficulties in the lower back pain treatment and care process”, “need for support”, “need for
additional support” and “additional self-management options”.
Pain Stages of Change Questionnaire measurements are made on the Likert 5 point scale. The
results showed that higher score was in contemplations scale (3,29), and also in precontemplation
scale (3,15). The lowest rates were in actions scale (2,98), but maintenance scale was 3,09 points.
Discussion
When analyzing interviews, it became possible to find out patients' knowledge of the disease,
their understanding of the treatment and care they are undergoing, as well as what prevents them
from doing it. There was also an opportunity to see if patients needed support for care. Patients had
very little knowledge about their illness and most of them did not have the knowledge about it, but
they understand well the cause of back pain. The majority of respondents indicated a lack of
information as a result of which they were not involved in the care of their back pain and did not
apply the recommended methods of therapeutic exercises, swimming, acupuncture, etc.
Respondents also encountered difficulties in their care of the pain, such as the lack of motivation
and willpower, lack of attitude, prejudice about the use of medication, lack of time, fear of physical
overload, and lack of specialists. They also showed the need for support from both the family and
the medical staff. Respondents also wanted support in the process of pain management, mainly as
information provision and sufficient time for the treatment of patients. When patients were asked
how they could help themselves, they said they needed a change in attitude, a change in lifestyle,
physical activity. However, there was also a category such as the lack of ideas when patients
themselves could not say what could be done in their favor.
The results of Pain Stages of Change Questionnaire showed that higher score was in
contemplations scale, but the lover – in action scale.
In order to find out the harmony of the scale, the Kronbach alpha coefficient was calculated.
The obtained results showed that the "precontemplation" scale showed a coefficient of 0.4,
indicating an unacceptable coherence between the answers to the question, the contemplation scale
0.5 which indicates poor coherence, while the scale of action is 0.8 and the scale of maintenance is
0.9, which in turn means good and excellent coherence respectively. The possible reasons for such
divergent responses in the first and second scale of the survey may be due to the fact that
respondents mostly rely on the fact that the doctor will give them help in carrying out certain

DAUGAVPILS UNIVERSITĀTES 60. STARPTAUTISKĀS ZINĀTNISKĀS KONFERENCES PROCEEDINGS OF
RAKSTU KRĀJUMS THE 60th INTERNATIONAL SCIENTIFIC CONFERENCE OF DAUGAVPILS UNIVERSITY
101
actions in the hope that their involvement will not be necessary, respondents are not accustomed to
solving their own problems due to adequate information and education on health issues, as these
two parts have raised a number of additional questions to the respondents during the study. As in
the first two questionnaires, respondents had to respond to allegations of their reluctance to
intervene in the process of treatment and care of the back pain themselves or to a small degree of
involvement, respondents may not respond completely honestly because the interviewer was a
medical practitioner involved in their health process, despite the fact that the survey was completely
anonymous. On the other hand, high coherence rates in the two other survey scales, "activity" and
"maintenance", could indicate that respondents honestly answered questions about the current
activities in the process of treatment and care of their back pain, as, as has already been shown in
interviews, most respondents does not take any active steps to improve their health status. It is also
shown by the number of points scored in the operating scale, which is the lowest - 2.98 and the
application scale, the second lowest - 3.09 points.
However, analyzing the results of the survey, it can be said that they largely coincide with the
findings of the interviews about the lack of information that may prevent respondents from fully
engaging in their back pain treatment.
In order to assess whether there is any relationship between the demographic indicators of the
respondents and the results of the survey, it was suggested that the results differ in age groups.
In order to determine whether these differences exist, the Spearman’s rank correlation
coefficient, which is a non-parametric statistical method, was performed because one of the features
was qualitative. The obtained results showed that there is no correlation between age groups and the
questionnaire indicators, since none of the scales was lower than 0.05 (p <0.05). Consequently, it
can be said that age does not affect the extent to which respondents are in the stage of pain change.
The relationship between the level of education of the respondents and the extent to which
they are more in the stage of pain changes was also sought. For this purpose, a Spearman’s rank
correlation coefficient was performed. As a result, it was concluded that there is a correlation
between the level of education of the respondents and the stage of pain change, that is, the higher
the level of education was for the respondent, the further in the pain change process it was.
It was also suggested that the correlation was also between the respondent's marital status and
the results of the survey, after which a Kraskel-Wollis test was performed, however, the correlation
between these indices was not significant (p <0.05) and was therefore not taken into account.
Conclusions
Responding to research questions and analyzing the findings, conclusions were drawn:
1. Chronic lower back pain is more noticeable in ages in groups of 50 years of age, which is also
consistent with literature data, however, there were too few participants in this study to argue
with confidence.
DAUGAVPILS UNIVERSITĀTES 60. STARPTAUTISKĀS ZINĀTNISKĀS KONFERENCES PROCEEDINGS OF
RAKSTU KRĀJUMS THE 60th INTERNATIONAL SCIENTIFIC CONFERENCE OF DAUGAVPILS UNIVERSITY
102
2. Patients understand the causes of the onset of chronic lower back pain, but they do not have an
understanding of the illness itself. This understanding is an essential part of successful
treatment and care.
3. Mostly, medication and invasive manipulations are used, which dos not require much personal
input to the patient's own pain care.
4. The most important conclusion is the very high need for information on both the disease and its
treatment and care methods, since it was recognized that the prescribed treatment was not
applied directly due to lack of information.
5. The lack of motivation and correct attitude are also difficult to spot.
6. Patients with self-management approach in the care of chronic lower back pain are ready only
at the level of reflection, but additional information and education could motivate them to
become more active in self-management.
7. Patients need support in acquiring and performing self-management skills, both informative
and educational.
8. The study also showed that the higher the level of education of the respondent, the more willing
it is to become involved in the development and implementation of self-management strategies
in the process of the treatment and care of their chronic lower back pain treatment.
References Carr, J. L., Klaber Moffett J. A., Sharp, D. M. & Haines, D. R. (2006) Is the pain Stages of Change Questionnaire (PSOCQ) a useful tool for predicting participation in a self-management programme? Further evidence of validity, on a sample of UK pain clinics patients. BMC Musculosceletal Disorders, 7: 101. Doi: 10.1186/147-2474-7-101 Hayes, C., Naylor, R. & Egger, G. (2012). Understanding Chronic Pain in a Lifestyle Context: The Emergence of a Whole-Person Approach. American Journal of Lifestyle Medicine 6: 421. doi: 10.1177/1559827612439282 Hadjistavropoulos, H. & Shymkiw, J. (2007) Predicting readiness to Self-manage Pain.Clinical Journal of Pain, 23: 259–266. Kerns, R.D., Rosenberg, R., Jamison, R. N., Caudill, M. A. & Haythornthwaite, J. (1997) Readiness to adopt a self-management approach to chronic pain: the Pain Stages of Change Questionnaire (PSOCQ). Pain 72 (1997) 227–234. Logina I. (2006). Muguras sāpes. Rīga, Nacionālais apgāds. Lynch, M. E., Craig, K. D. & Peng, P. W. H. (Eds.). (2010). Clinical Pain Management: A Practical Guide. Hoboken, NJ, USA: Wiley – Blakcwell. Mersky, H., Loeser, J. D. & Dubner, R. (Eds.). (2005). The Paths of Pain 1975–2005. Seattle, WA, USA: IASP Press. Redman, B. K. (2004). Advances in Patient Education. New York, NY, USA: Springer Publishing Company. Roe, C., Damsgard, E., Fors, T & Anke, A. (2014) Psychometric properties of the pain stages of change questionnaire as evaluated by rasch analysis in patients with chronic musculosceletal pain. BMC. Musculosceletal disorders, 15: 95. Doi: 1471-2474/15/95
DAUGAVPILS UNIVERSITĀTES 60. STARPTAUTISKĀS ZINĀTNISKĀS KONFERENCES PROCEEDINGS OF
RAKSTU KRĀJUMS THE 60th INTERNATIONAL SCIENTIFIC CONFERENCE OF DAUGAVPILS UNIVERSITY
103
EVALUATION OF THE EFFICACY OF WET AGE-RELATED MACULAR DEGENERATION TREATMENT BETWEEN
THREE DIFFERENT AGE GROUPS Elīza Avotiņa1, Viktorija Ma ļugina1
Scientific research supervisor: Dr. Med. Irina Repina2, Asoc. Prof. Igors Solomatins1, 2, Doc. Renārs Erts1
1 University of Latvia, Faculty of Medicine, Raiņa Blvd 19, Riga, Latvia, [email protected], [email protected], [email protected] 2 Dr. Solomatin Eye Rehabilitation and Vision Correction Centre, Elizabetes street 75, Riga, Latvia, [email protected] Abstract
Evaluation of the efficacy of wet age-ralated macular degeneration treatment between three different age groups
Key Words: wAMD, anti-VEGF, intravitreal injection, age-related, CMT Introduction. Age-related wet macular degeneration (wAMD) is the major cause of blindness among the elderly over 60 years of age. In recent years it is treated with anti-vascular endothelial growth factor (anti-VEGF) injections. Despite the treatment of wAMD, the prevalence is expected to increase. Aim. Evaluate efficiency after 3 time anti-VEGF injections, depending on the age the injections were first started. Materials and methods. The study was conducted at the Dr. Solomatin Eye Rehabilitation and Vision Correction Centre. OCT images from 21 patient (36 eyes) aged 65 ± 5 years, 22 patients (42 eyes) aged 75 ± 5 and 23 patients (40 eyes) aged 85 ± 5 years. Data was analysed by paired t-test in SPSS statistics. Results. Using paired-t test in group of age 65 ± 5 average central macular thickness (CMT) OS before anti-VEGF injection was (M=372µm; SD=162µm), after (M=261µm; SD=94µm). The difference is 111µm and it is statistically believable (p=0,021), CMT OD before injection was (M=473µm; SD=172µm), after (M=344µm; SD=116µm). The difference is 129µm and it is statistically believable (p=0.031). Group of age 75 ± 5 average CMT OS before injection was (M=478µm; SD=180µm), after (M=339µm; SD=106µm). The difference is 138µm and it is statistically believable (P=0,000), CMT OD before injection was (M=419µm; SD=196µm), after (M=325µm; SD=112µm). The difference is 94µm and it is statistically believable (p=0.033). Group of age 85 ± 5 average CMT OS before injection was (M=379µm; SD=141µm), after (M=274µm; SD=75µm). The difference is 104µm and it is statistically believable (p=0,000), CMT OD before injection was (M=403µm; SD=128µm), after (M=299µm; SD=40µm). The difference is 104µm and it is statistically believable (p=0.033). Conclusion. OD: the best results was in group 65 ± 5 years, where 65% of patients had improvement of anti-VEGF therapy after 3 injections. OS: the best results was in group 85 ± 5 years where 55% of patients had improvement of anti-VEGF therapy after 3 injections. Kopsavilkums Atslēgvārdi: Vecuma makulas deģenrācijas mitrā forma, anit-VEGF, intravitreālas injekcijas, ar vecumu saistīta, makulas centrālās daļas biezums Ievads. Ar vecumu saistīta makulas deģenerācijas mitrā forma ir galvenais akluma iemesls, cilvēkiem pēc 60 gadu vecuma. Pēdējos gados tā tiek ārstēta ar anti-vaskulārā endotēlija augšanas faktora (anti-VEGF) injekcijām. Neskatoties uz terapiju, gaidāms, ka mitrās formas prevelance pieaugs. Mērķis. Izvērtēt anti-VEGF terapijas efektivitāti pēc 3 injekcijām, atkarībā no vecuma, kad injekcijas tika pirmo reizi uzsāktas. Materi āli un metodes. pētījums tika veikts Dr. Solomatina Acu Rehabilitācijas un Redzes Korekcijas Centrā. Optiskās koherences tomogrāfijas attēli no 21 pacienta (36 acis) vecumā 65 ± 5 gadi, 22 pacientiem (42 acis) vecumā 75±5 gadi un 23 pacientiem (40 acis) vecumā 85±5 gadi. Rezultāti. Izmantojot pāru t-testu SPSS programmā, vecuma grupā 65±5 gadi, vidējais makulas centrālās daļas biezums OS pirms anti-VEGF injekcijām bija (M=372µm; SD=162µm), pēc injekcijām (M=261µm; SD=94µm). Atšķirība ir 111µm un tā ir statistiski ticama (p=0,021), vidējais makulas centrālās daļas biezums OD pirms injekcijām bija (M=473µm; SD=172µm), pēc injekcijām (M=344µm; SD=116µm). Atšķirība ir 129µm un tā ir statistiski ticama (p=0,031). Vecuma grupā 75±5 vidējais makulas centrālās daļas biezums OS pirms anti-VEGF injekcijām bija (M=478µm; SD=180µm), pēc injekcijām (M=339µm; SD=106µm). Atšķirība ir 138µm un tā ir statistiski ticama (p=0,000), vidējais makulas centrālās daļas biezums OD pirms injekcijām bija (M=419µm; SD=196µm), pēc injekcijām (M=325µm; SD=112µm). Atšķirība ir 94µm un tā ir statistiski ticama (p=0,033). Vecuma grupā 85±5 vidējais makulas centrālās daļas biezums OS pirms anti-VEGF injekcijām bija (M=379µm; SD=141µm), pēc injekcijām (M=274µm; SD=75µm). Atšķirība ir 104µm un tā ir statistiski ticama (p=0,000), vidējais makulas centrālās daļas biezums OD pirms

DAUGAVPILS UNIVERSITĀTES 60. STARPTAUTISKĀS ZINĀTNISKĀS KONFERENCES PROCEEDINGS OF
RAKSTU KRĀJUMS THE 60th INTERNATIONAL SCIENTIFIC CONFERENCE OF DAUGAVPILS UNIVERSITY
104
injekcijām bija (M=403µm; SD=128µm), pēc injekcijām (M=299µm; SD=40µm). Atšķirība ir 104µm un tā ir statistiski ticama (p=0,033). Secinājumi. OD: labākie rezultāti bija vecuma grupā 65 ± 5 gadi, kur 65% pacientu pēc anti-VEGF trīs injekcijām bija uzlabojums. OS: labākie rezultāti bija vecuma grupā 85 ± 5 gadi, kur 55% pacientu pēc anti-VEGF trīs injekcijām bija uzlabojums.
Introduction
Age-related macular degeneration (AMD) is the leading cause of irreversible blindness among
the elderly worldwide, affecting patient’s quality of life. The cause of AMD is multifactorial and
influenced by age, ethnic background, and a combination of environmental and genetic factors.
Loss of visual acuity typically results from progressive degeneration of the choriocapillaris, retinal
pigment epithelium and photoreceptors although the earliest manifestation of the disease appears to
be abnormalities within Bruchs membrane. It is a common, chronic, progressive degenerative
disorder of the macula that affects older individuals and features central visual loss as a result of
drusen deposition, geographical atrophy, serous detachments of the retinal pigment epithelium, and
neovascularization. AMD is classified into dry (nonexudative) and wet (exudative or neovascular)
forms. The disease nearly always begins as the non-neovascular or dry form of AMD and may
progress to geographic atrophy or the neovascular (wet) form in one or both eyes. Dry AMD is
characterized by thinning of the macula and drusen (protein and lipid deposits under retina). When
neovascularization occurs, there is commensurate accumulation of fluid, hemorrhage, and lipid
exudation within the macula that can culminate in fibrosis referred to as a disciform scar. A patient
can have advanced dry AMD in both eyes, advanced wet AMD in both eyes, or dry AMD in one
eye and wet AMD in the fellow eye. There is no treatment for dry AMD yet. Although dry form
affects approximately 80% of individuals with AMD, wet form is responsible for the majority of the
severe vision loss. Wet AMD (wAMD) is characterized by the formation of new blood vessels that
leak and cause scarring of the macula. It is treated with anti-vascular endothelial growth factor
(anti-VEGF) drugs, because VEGF has important role in the pathogenesis of the neovascular form
of AMD. First of all it induces new capillary formation, secondly enchases vascular permeability.
Anti-VEGF intravitreal injections help reduce the number of abnormal blood vessels and leaking
from blood vessels. Despite the treatment of wAMD, the prevalence of wAMD is expected to
increase.
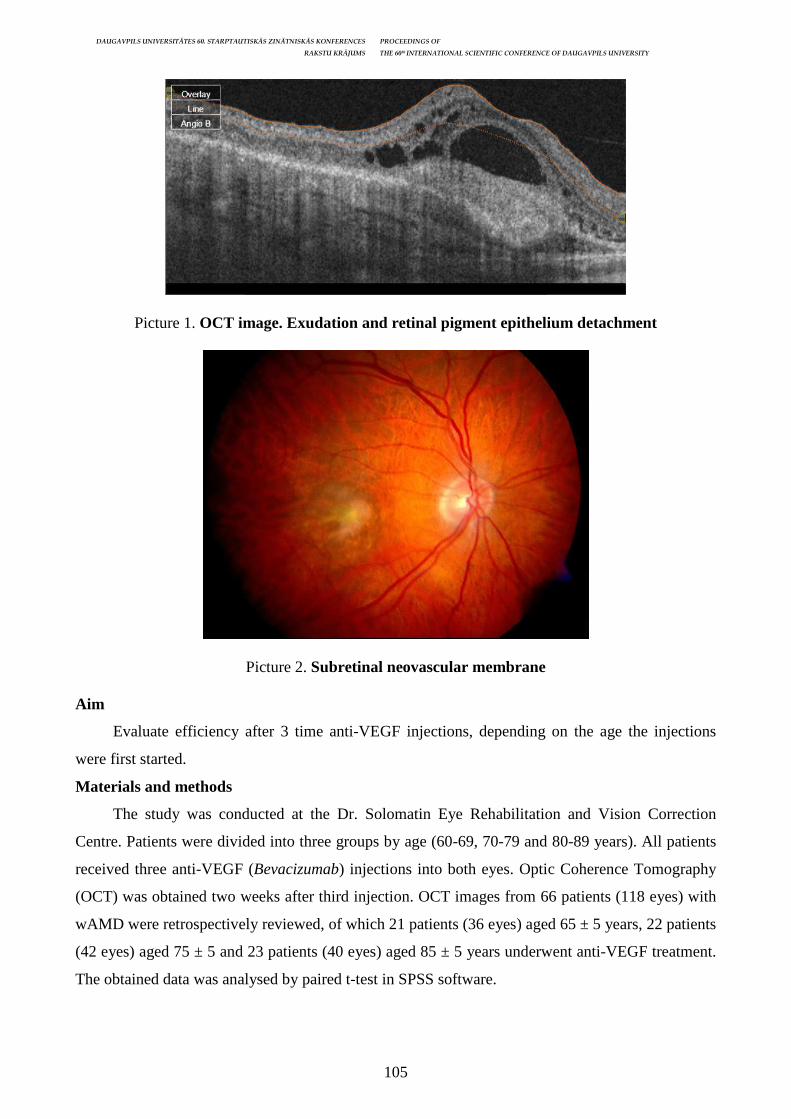
DAUGAVPILS UNIVERSITĀTES 60. STARPTAUTISKĀS ZINĀTNISKĀS KONFERENCES PROCEEDINGS OF
RAKSTU KRĀJUMS THE 60th INTERNATIONAL SCIENTIFIC CONFERENCE OF DAUGAVPILS UNIVERSITY
105
Picture 1. OCT image. Exudation and retinal pigment epithelium detachment
Picture 2. Subretinal neovascular membrane
Aim
Evaluate efficiency after 3 time anti-VEGF injections, depending on the age the injections
were first started.
Materials and methods
The study was conducted at the Dr. Solomatin Eye Rehabilitation and Vision Correction
Centre. Patients were divided into three groups by age (60-69, 70-79 and 80-89 years). All patients
received three anti-VEGF (Bevacizumab) injections into both eyes. Optic Coherence Tomography
(OCT) was obtained two weeks after third injection. OCT images from 66 patients (118 eyes) with
wAMD were retrospectively reviewed, of which 21 patients (36 eyes) aged 65 ± 5 years, 22 patients
(42 eyes) aged 75 ± 5 and 23 patients (40 eyes) aged 85 ± 5 years underwent anti-VEGF treatment.
The obtained data was analysed by paired t-test in SPSS software.
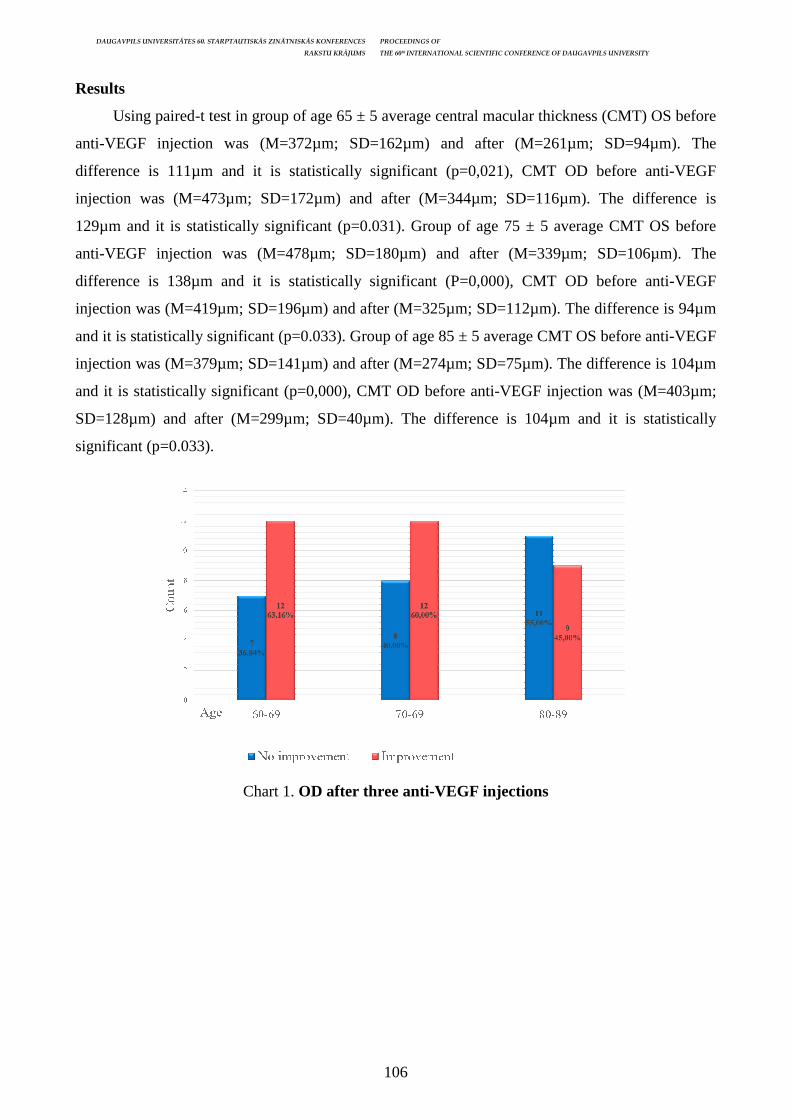
DAUGAVPILS UNIVERSITĀTES 60. STARPTAUTISKĀS ZINĀTNISKĀS KONFERENCES PROCEEDINGS OF
RAKSTU KRĀJUMS THE 60th INTERNATIONAL SCIENTIFIC CONFERENCE OF DAUGAVPILS UNIVERSITY
106
Results
Using paired-t test in group of age 65 ± 5 average central macular thickness (CMT) OS before
anti-VEGF injection was (M=372µm; SD=162µm) and after (M=261µm; SD=94µm). The
difference is 111µm and it is statistically significant (p=0,021), CMT OD before anti-VEGF
injection was (M=473µm; SD=172µm) and after (M=344µm; SD=116µm). The difference is
129µm and it is statistically significant (p=0.031). Group of age 75 ± 5 average CMT OS before
anti-VEGF injection was (M=478µm; SD=180µm) and after (M=339µm; SD=106µm). The
difference is 138µm and it is statistically significant (P=0,000), CMT OD before anti-VEGF
injection was (M=419µm; SD=196µm) and after (M=325µm; SD=112µm). The difference is 94µm
and it is statistically significant (p=0.033). Group of age 85 ± 5 average CMT OS before anti-VEGF
injection was (M=379µm; SD=141µm) and after (M=274µm; SD=75µm). The difference is 104µm
and it is statistically significant (p=0,000), CMT OD before anti-VEGF injection was (M=403µm;
SD=128µm) and after (M=299µm; SD=40µm). The difference is 104µm and it is statistically
significant (p=0.033).
Chart 1. OD after three anti-VEGF injections
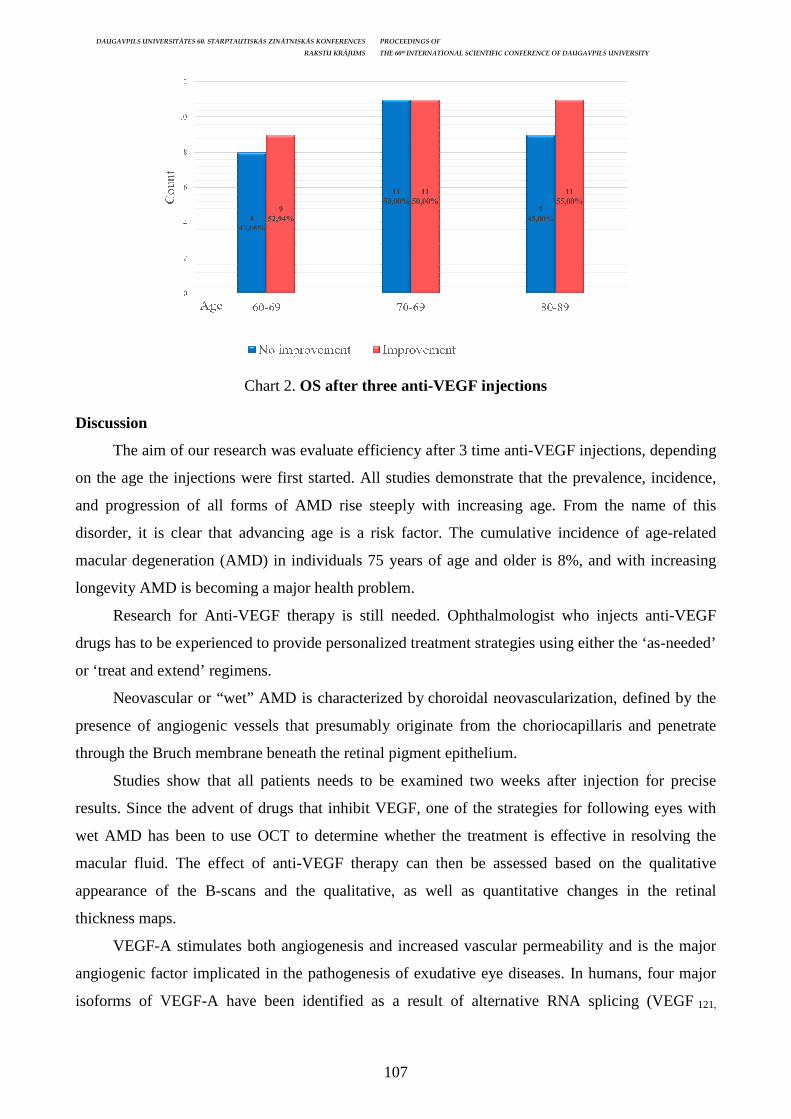
DAUGAVPILS UNIVERSITĀTES 60. STARPTAUTISKĀS ZINĀTNISKĀS KONFERENCES PROCEEDINGS OF
RAKSTU KRĀJUMS THE 60th INTERNATIONAL SCIENTIFIC CONFERENCE OF DAUGAVPILS UNIVERSITY
107
Chart 2. OS after three anti-VEGF injections
Discussion
The aim of our research was evaluate efficiency after 3 time anti-VEGF injections, depending
on the age the injections were first started. All studies demonstrate that the prevalence, incidence,
and progression of all forms of AMD rise steeply with increasing age. From the name of this
disorder, it is clear that advancing age is a risk factor. The cumulative incidence of age-related
macular degeneration (AMD) in individuals 75 years of age and older is 8%, and with increasing
longevity AMD is becoming a major health problem.
Research for Anti-VEGF therapy is still needed. Ophthalmologist who injects anti-VEGF
drugs has to be experienced to provide personalized treatment strategies using either the ‘as-needed’
or ‘treat and extend’ regimens.
Neovascular or “wet” AMD is characterized by choroidal neovascularization, defined by the
presence of angiogenic vessels that presumably originate from the choriocapillaris and penetrate
through the Bruch membrane beneath the retinal pigment epithelium.
Studies show that all patients needs to be examined two weeks after injection for precise
results. Since the advent of drugs that inhibit VEGF, one of the strategies for following eyes with
wet AMD has been to use OCT to determine whether the treatment is effective in resolving the
macular fluid. The effect of anti-VEGF therapy can then be assessed based on the qualitative
appearance of the B-scans and the qualitative, as well as quantitative changes in the retinal
thickness maps.
VEGF-A stimulates both angiogenesis and increased vascular permeability and is the major
angiogenic factor implicated in the pathogenesis of exudative eye diseases. In humans, four major
isoforms of VEGF-A have been identified as a result of alternative RNA splicing (VEGF 121,
DAUGAVPILS UNIVERSITĀTES 60. STARPTAUTISKĀS ZINĀTNISKĀS KONFERENCES PROCEEDINGS OF
RAKSTU KRĀJUMS THE 60th INTERNATIONAL SCIENTIFIC CONFERENCE OF DAUGAVPILS UNIVERSITY
108
VEGF 165, VEGF 189, and VEGF 206) and at least five minor isoforms exist as well (VEGF 145,
VEGF 148, VEGF 162, VEGF 165b, VEGF 183).
Bevacizumab is a full-length humanized monoclonal antibody that binds and inhibits all the
biologically active forms of VEGF-A. The FDA approved bevacizumab in 2004 for the systemic
(intravenous) treatment of metastatic colorectal cancer. At the time of Food and Drug
Administration approval in 2004, a study was initiated to explore the use of systemic bevacizumab
for the treatment of neovascular AMD.
Conclusion
Our hypothesis was: anti-VEGF therapy is related to patients age. But according to our study
anti-VEGF therapy is not related to patients age. Therapies effectiveness depends on the macular
thickness when injection was first started. In many studies pretreatment foveal thickness,
determined using optic coherence tomography (OCT) by measuring the central subfield foveal
thickness (CSFT), has been reported to be a strong predictor of anatomical and functional outcomes
in patients treated with intravitreal anti-vascular endothelial growth factor (anti-VEGF). The
magnitude of CSFT reduction during the first year, inseveral treatment regimens, has also been
associated with a better visual acuity outcome.
OD: the best results was in group 65 ± 5 years, where 65% of patients had improvement of
anti-VEGF therapy after 3 injections. In group 75 ± 5 year improvement was 60%, but in 85 ± 5 it
was only 45% of patients.
OS: the best results was in group 85 ± 5 years where 55% of patients had improvement of
anti-VEGF therapy after 3 injections. In group 65 ± 5 year improvement was 52%, but in 75 ± 5 it
was 50% of patients.
References Age-related macular degeneration NICE guideline [NG82], 2018. [viewed: 10.04.2018.] Accessed (pieejams): https://www.nice.org.uk/guidance/ng82 Christopher J. Brady, Neil M. Bressler and Susan B. Bressler. Ryan's Retina, Neovascular (Exudative or “Wet”) Age-Related Macular Degeneration, Sixth Edition, 2018: 1345–1372. F Ryan Prall, MD, Thomas A Ciulla, MD, Thomas A Ciulla, MD, Mark H Criswell, PhD, Alon Harris, PhD, Alon Harris, PhD, Exudative (Wet) Age-Related Macular Degeneration (AMD) [viewed: 10.04.2018.] Accessed (pieejams): https://emedicine.medscape.com/article/1226030-overview Jay S. Duker MD, Nadia K. Waheed MD MPH and Darin R. Goldman MD. Handbook of Retinal OCT: Optical Coherence Tomography, Wet Age-Related Macular Degeneration, 2014: 38–45. Jennifer Evans and Gianni Virgili, „Anti-VEGF drugs: evidence for effectiveness”, 2014. [viewed: 12.04.2018.] Accessed (pieejams): https://www.ncbi.nlm.nih.gov/pmc/articles/PMC4322740/ Johanna M. Seddon, Lucia Sobrin and Durga S. Borkar. Ryan's Retina, Epidemiology and Risk Factors for Age-Related Macular Degeneration, Sixth Edition, 2018: 1273–1284. Philip J. Rosenfeld, Matthew A. Windsor, William J. Feuer, Sissi J. J. Sun, Kevin D. Frick, Eric A. Swanson, DavidHuang, „Estimating Medicare and patient savings from the use of bevacizumab for

DAUGAVPILS UNIVERSITĀTES 60. STARPTAUTISKĀS ZINĀTNISKĀS KONFERENCES PROCEEDINGS OF
RAKSTU KRĀJUMS THE 60th INTERNATIONAL SCIENTIFIC CONFERENCE OF DAUGAVPILS UNIVERSITY
109
the treatment of exudative age-related macular degeneration”, 2018. [viewed:12.04.2018.] Accessed (pieejams): https://www.sciencedirect.com/science/article/pii/S0002939418301685 Renata Portella Nunes, Philip J. Rosenfeld, Carlos Alexandre de Amorim Garcia Filho, Zohar Yehoshua, Adam Martidis and Matthew T. S. Tennant. Ophthalmology, Fourth Edition, 2014: 6.28, 580-599.e3 Robert Folberg. Robbins and Cotran Pathologic Basis of Disease, Ninth Edition, 2015, Chapter 29, 1319–1343. Willmann G., Nepomuceno A. B., Messias K., Barroso L., U. I. Scott, André Messias, Rodrigo Jorge. Foveal thickness reduction after anti-vascular endothelial growth factor treatment in chronic diabetic macular edema.Int J Ophthalmol 2017; 10(5): 760–764. [viewed: 18.05.2018.] Accessed (pieejams): http://www.ijo.cn/gjyken/ch/reader/view_abstract.aspx?file_no=20170517&flag=1
DAUGAVPILS UNIVERSITĀTES 60. STARPTAUTISKĀS ZINĀTNISKĀS KONFERENCES PROCEEDINGS OF
RAKSTU KRĀJUMS THE 60th INTERNATIONAL SCIENTIFIC CONFERENCE OF DAUGAVPILS UNIVERSITY
110
DO WEATHER VARIABLES HAVE AN INFLUENCE ON NUMBER OF EPISTAXIS VISITS? A RETROSPECTIVE STUDY
Anda Arbid āne1, Gunta Sumeraga1, 2 1 Riga Stradiņš University, Dzirciema str. 16, Riga, [email protected] 2 Pauls Stradins Clinical University Hospital, Pilsoņu str. 13, Riga, [email protected] Abstract
Do weather variables have an influence on number of epistaxis visits? A retrospective study Key Words: Epistaxis, nosebleed, weather, climate Introduction: Epistaxis is a common emergency in otorhinolaryngology. The influence of weather variables on the occurrence of epistaxis is still uncertain. Aim: To investigate relationship between the number of epistaxis visits per day and weather variables: air temperature (T), atmospheric pressure (P), relative humidity, precipitation and wind speed. Material and methods: A retrospective study of patients with epistaxis treated at Pauls Stradiņš Clinical University Hospital in 2016. Meteorological data were obtained from weather observation station in Riga International Airport. Days were grouped by epistaxis occurrence; weather parameters were compared among groups of days using Kruskal-Wallis test. Results: Median, minimum and maximum daily, 3-day and 7-day T on days with ≥3 epistaxis visits was lower than on days with no epistaxis visits or 1-2 visits. 7-day P amplitude and maximum P was higher on days with ≥3 epistaxis visits. No relevant differences were found in relative humidity, precipitation and wind speed among the groups. Conclusion: Study shows a statistically significant association between number of epistaxis visits and some weather variables. The number of epistaxis visits is higher when T is lower, P amplitude and maximum P is higher. Kopsavilkums
Vai laika apstākļiem ir ietekme uz deguna asiņošanas gadījumu skaitu? Retrospektīvs pētījums Atslēgvārdi: Deguna asiņošana, laika apstākļi, klimats Ievads: Deguna asiņošana ir biežs neatliekamais stāvoklis otorinolaringoloģijā. Laika apstākļu ietekme uz deguna asiņošanas biežumu nav skaidra. Mērķis: Noskaidrot saistību starp deguna asiņošanas gadījumu skaitu un laika apstākļu parametriem: gaisa temperatūru (T), atmosfēras spiedienu (P), relatīvo mitrumu, nokrišņu daudzumu un vēja ātrumu. Materi āls un metodes: Retrospektīvs pētījums par pacientiem ar deguna asiņošanu, kuri 2016. gadā vērsušies Paula Stradiņa Klīniskajā universitātes slimnīcā. Laika apstākļu dati tika iegūti no meteoroloģiskās stacijas Starptautiskajā lidostā Rīga. Dienas tika grupētas pēc deguna asiņošanas gadījumu skaita; laika apstākļu parametri tika salīdzināti starp šīm grupām. Datu statistiskā apstrāde veikta, izmantojot Kruskala-Vallisa testu. Rezultāti: Vidējā, minimālā un maksimālā dienas, 3 dienu un 7 dienu T dienās ar ≥3 deguna asiņošanas gadījumiem bija zemāka kā dienās bez vai 1-2 deguna asiņošanas gadījumiem. 7 dienu P amplitūda un maksimālais 3 dienu un 7 dienu P bija augstāks dienās ar ≥3 deguna asiņošanas gadījumiem. Starp grupām netika atklātas nozīmīgas atšķirības laika apstākļu parametros, kā relatīvais mitrums, nokrišņu daudzums un vēja ātrums. Secinājumi: Pētījums pierāda statistiski nozīmīgu saistību starp deguna asiņošanas gadījumu skaitu un laika apstākļu parametriem. Deguna asiņošanas gadījumu skaits ir augstāks dienās ar zemāku T, augstāku maksimālo P un P amplitūdu.
Introduction
Epistaxis or nosebleed is the most common emergency in otorhinolaryngology and it affects
up to 60% of population in their lifetime; in 6% of cases medical attention is required (Small et al.,
1982). Epistaxis is a pathology of a multifactorial etiology (Camacho et al., 2017). Etiological
factors are usually divided in two categories – local factors such as trauma, inflammation of nose
and sinuses, diseases of septum etc., and systemic factors such as arterial hypertension (Monjas-
Canovas et al. 2010). Not always the cause of epistaxis is identifiable, epistaxis events are often
idiopathic (Ali, 2018). Diverse findings regarding weather variables and epistaxis occurrence have
been reported (Bray et al., 2005, Sowerby et al., 2014, Mangussi-Gomes et al., 2016).
DAUGAVPILS UNIVERSITĀTES 60. STARPTAUTISKĀS ZINĀTNISKĀS KONFERENCES PROCEEDINGS OF
RAKSTU KRĀJUMS THE 60th INTERNATIONAL SCIENTIFIC CONFERENCE OF DAUGAVPILS UNIVERSITY
111
There is some evidence, that the meteorological factors mainly affecting the occurrence of
epistaxis are mean, minimum and maximum daily temperatures and water vapour pressure
(Danielides et al., 2002). In a study of 1373 epistaxis patients over a five-year period no correlation
was found between ambient temperature and presentation rate for patients with epistaxis (Bray et
al., 2005). In other research of 4315 epistaxis cases over 3-year period association between
epistaxis presentation rate and daily temperatures was found, but there was no association regarding
relative humidity (Sowerby et al., 2014). A study of 508 patients found statistically significant
correlation between the number of epistaxis visits and mean temperature, mean relative humidity
and total rainfall (Mangussi-Gomes et al., 2016). The influence of weather variables on the number
of epistaxis visits is still uncertain.
Aim
The aim of this study was to investigate relationship between the number of epistaxis visits
per day and daily, 3-day and 7-day weather variables: air temperature, atmospheric pressure,
relative humidity, precipitation and wind speed.
Material and Methods
This was a retrospective study of patients with epistaxis treated at Pauls Stradiņš Clinical
University Hospital (PSCUH) in 2016. Patient medical records were reviewed. Meteorological data
were obtained from weather observation station in Riga International Airport. Patients with
coagulation defects were excluded. Days of year 2016 were grouped by epistaxis occurrence –
either there were none, 1-2 or ≥3 epistaxis visits per day; weather parameters were compared among
groups of days. Data were processed using Kruskal-Wallis test (IBM SPSS 22.0 software); p-value
p<0.05 was considered statistically significant.
Results
454 patients presented to Pauls Stradiņš Clinical University Hospital due to epistaxis. 64
patients were excluded due to coagulation defects (diseases affecting homeostasis or use of
anticoagulation therapy). There was 131 day without any epistaxis visit, 198 days with 1-2 epistaxis
visits and 37 days with ≥3 epistaxis visits per day (Figure 1).
DAUGAVPILS UNIVERSITĀTES 60. STARPTAUTISKĀS ZINĀTNISKĀS KONFERENCES PROCEEDINGS OF
RAKSTU KRĀJUMS THE 60th INTERNATIONAL SCIENTIFIC CONFERENCE OF DAUGAVPILS UNIVERSITY
112
Mean daily, 3-day and 7-day temperatures were compared among the groups - days with no
visits of epistaxis, days with 1-2 epistaxis visits and days with ≥3 epistaxis visits per day.
Median daily temperature was 10.2°C on the days with no epistaxis visits, 6.1°C on the days
with 1-2 epistaxis visits and 4°C on the days with ≥3 epistaxis visits. Differences in median daily
temperature were statistically significant (p=0.025) (Figure 2). Median 3-day temperature was
10.1°C on the days with no epistaxis visits, 5.8°C on the days with 1-2 epistaxis visits and 3.4°C on
the days with ≥3 epistaxis visits. Differences in median 3-day temperature were statistically
significant (p=0.009) (Figure 3). Also, median 7-day temperatures differed statistically significantly
among the groups - 12.1°C on the days with no epistaxis visits, 5.4°C on the days with 1-2 epistaxis
visits and 3.3°C on the days with ≥3 epistaxis visits (p=0.004) (Figure 4).
DAUGAVPILS UNIVERSITĀTES 60. STARPTAUTISKĀS ZINĀTNISKĀS KONFERENCES PROCEEDINGS OF
RAKSTU KRĀJUMS THE 60th INTERNATIONAL SCIENTIFIC CONFERENCE OF DAUGAVPILS UNIVERSITY
113
Minimum daily, 3-day and 7-day temperatures were also compared among the groups.
Minimum daily temperature was 7.1°C on the days with no epistaxis visits, 3.9°C on the days with
1-2 epistaxis visits and 2.6°C on the days with ≥3 epistaxis visits. Differences in minimum daily
temperature were statistically significant (p=0.021) (Figure 5). Minimum 3-day temperature was
6.2°C on the days with no epistaxis visits, 2.2°C on the days with 1-2 epistaxis visits and 1.2°C on
the days with ≥3 epistaxis visits. Differences in minimum 3-day temperature were statistically
significant (p=0.009) (Figure 6). Also, minimum 7-day temperatures differed statistically
significantly among the groups – 5.6°C on the days with no epistaxis visits, 1.4°C on the days with
1-2 epistaxis visits and -0.5°C on the days with ≥3 epistaxis visits (p=0.008) (Figure 7).
DAUGAVPILS UNIVERSITĀTES 60. STARPTAUTISKĀS ZINĀTNISKĀS KONFERENCES PROCEEDINGS OF
RAKSTU KRĀJUMS THE 60th INTERNATIONAL SCIENTIFIC CONFERENCE OF DAUGAVPILS UNIVERSITY
114
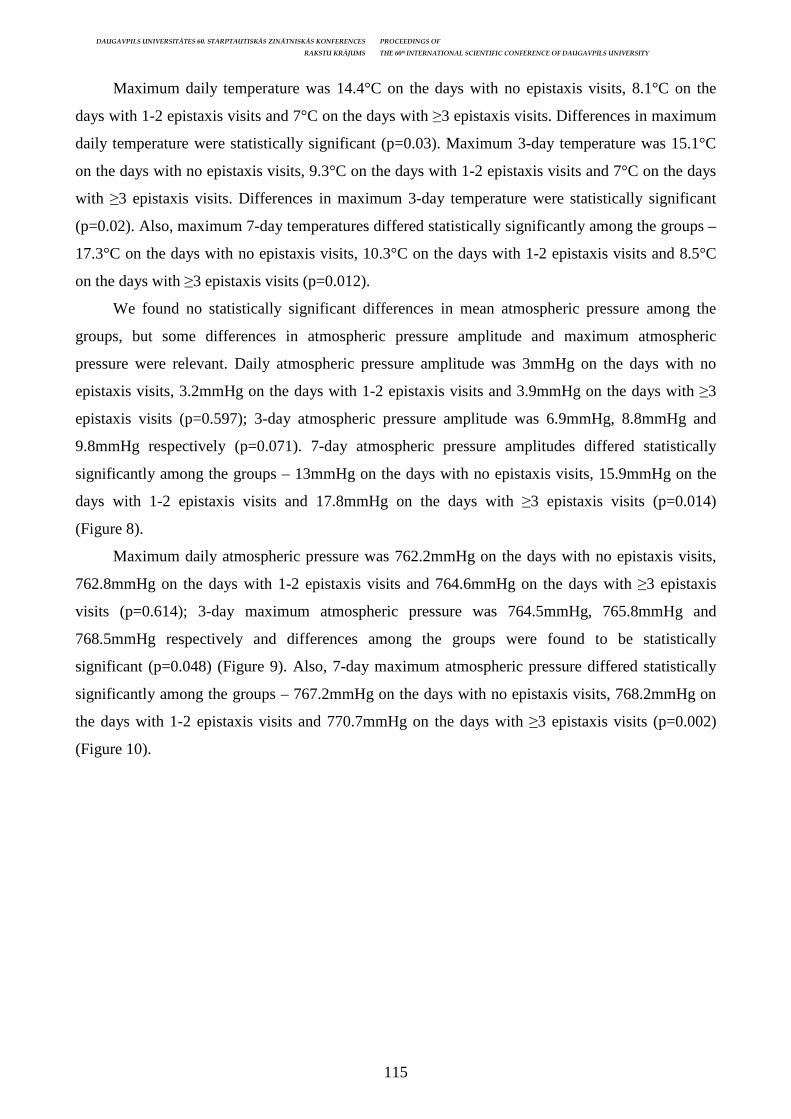
DAUGAVPILS UNIVERSITĀTES 60. STARPTAUTISKĀS ZINĀTNISKĀS KONFERENCES PROCEEDINGS OF
RAKSTU KRĀJUMS THE 60th INTERNATIONAL SCIENTIFIC CONFERENCE OF DAUGAVPILS UNIVERSITY
115
Maximum daily temperature was 14.4°C on the days with no epistaxis visits, 8.1°C on the
days with 1-2 epistaxis visits and 7°C on the days with ≥3 epistaxis visits. Differences in maximum
daily temperature were statistically significant (p=0.03). Maximum 3-day temperature was 15.1°C
on the days with no epistaxis visits, 9.3°C on the days with 1-2 epistaxis visits and 7°C on the days
with ≥3 epistaxis visits. Differences in maximum 3-day temperature were statistically significant
(p=0.02). Also, maximum 7-day temperatures differed statistically significantly among the groups –
17.3°C on the days with no epistaxis visits, 10.3°C on the days with 1-2 epistaxis visits and 8.5°C
on the days with ≥3 epistaxis visits (p=0.012).
We found no statistically significant differences in mean atmospheric pressure among the
groups, but some differences in atmospheric pressure amplitude and maximum atmospheric
pressure were relevant. Daily atmospheric pressure amplitude was 3mmHg on the days with no
epistaxis visits, 3.2mmHg on the days with 1-2 epistaxis visits and 3.9mmHg on the days with ≥3
epistaxis visits (p=0.597); 3-day atmospheric pressure amplitude was 6.9mmHg, 8.8mmHg and
9.8mmHg respectively (p=0.071). 7-day atmospheric pressure amplitudes differed statistically
significantly among the groups – 13mmHg on the days with no epistaxis visits, 15.9mmHg on the
days with 1-2 epistaxis visits and 17.8mmHg on the days with ≥3 epistaxis visits (p=0.014)
(Figure 8).
Maximum daily atmospheric pressure was 762.2mmHg on the days with no epistaxis visits,
762.8mmHg on the days with 1-2 epistaxis visits and 764.6mmHg on the days with ≥3 epistaxis
visits (p=0.614); 3-day maximum atmospheric pressure was 764.5mmHg, 765.8mmHg and
768.5mmHg respectively and differences among the groups were found to be statistically
significant (p=0.048) (Figure 9). Also, 7-day maximum atmospheric pressure differed statistically
significantly among the groups – 767.2mmHg on the days with no epistaxis visits, 768.2mmHg on
the days with 1-2 epistaxis visits and 770.7mmHg on the days with ≥3 epistaxis visits (p=0.002)
(Figure 10).
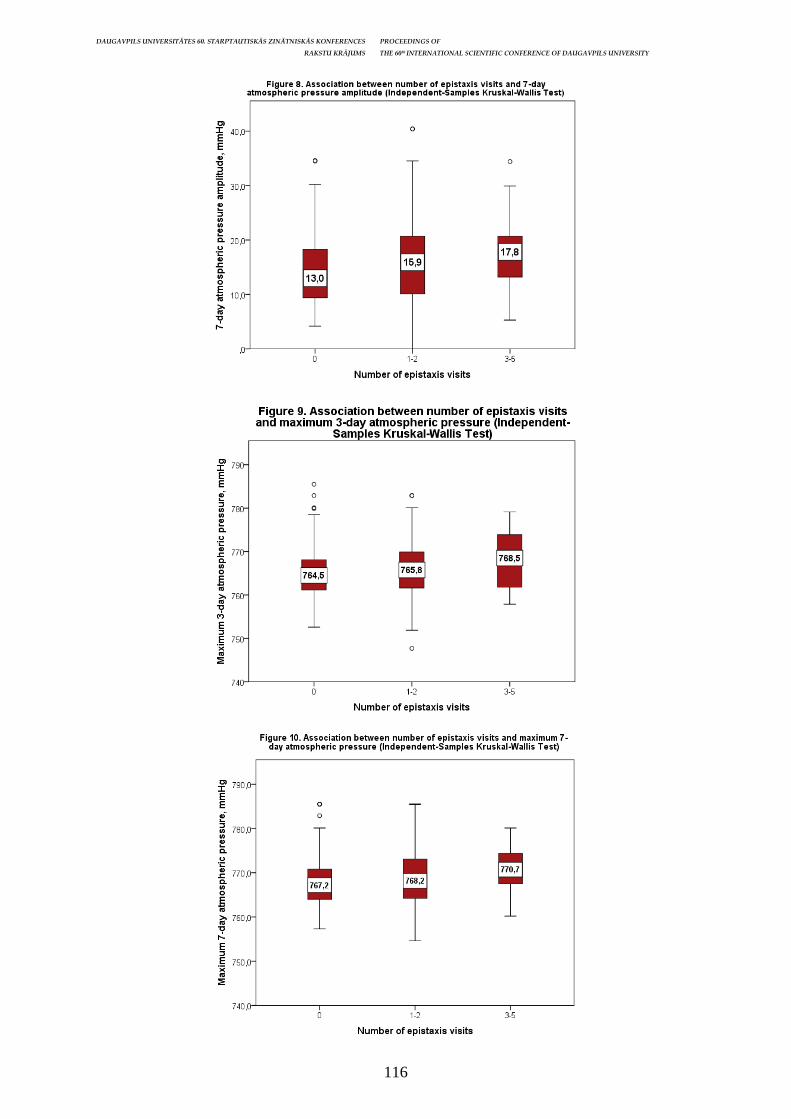
DAUGAVPILS UNIVERSITĀTES 60. STARPTAUTISKĀS ZINĀTNISKĀS KONFERENCES PROCEEDINGS OF
RAKSTU KRĀJUMS THE 60th INTERNATIONAL SCIENTIFIC CONFERENCE OF DAUGAVPILS UNIVERSITY
116

DAUGAVPILS UNIVERSITĀTES 60. STARPTAUTISKĀS ZINĀTNISKĀS KONFERENCES PROCEEDINGS OF
RAKSTU KRĀJUMS THE 60th INTERNATIONAL SCIENTIFIC CONFERENCE OF DAUGAVPILS UNIVERSITY
117
No relevant differences were found in relative humidity, precipitation and wind speed among
the groups (Table 1).
Table 1. Asociation between number of epistaxis visists and weather parameters (Independent-Samples Kruskal-Wallis test)
Weather parameter 0 epistaxis
visits 1-2 epistaxis
visits ≥3 epistaxis visits p-value
Daily relative humidity, % 79 81 78 0.47 3-day relative humidity, % 78 82 77 0.293 7-day relative humidity, % 77 80 80 0.108 Daily precipitation, mm 0 0.05 0 0.642 Mean daily wind speed, m/s 3 2.95 2.80 0.895 Daily wind speed maximum, m/s 4 4 4 0.799
Discussion
Diverse findings regarding weather variables and epistaxis occurrence have been reported. A
study by Bray et al. found no correlation between presentation rate for patients with epistaxis and
ambient temperatures. Over the five-year study period the two months with the highest number of
epistaxis visits - November and June – had widely different ambient temperatures (Bray et al.
2005).
Other study by Sowerby et al. demonstrated an inverse relationship between mean daily
temperature and epistaxis presentation rate, suggesting higher number of epistaxis visits when air
temperatures are lower. The authors report a decrease in number of epistaxis visits in summer
months compared to all other months of the year which demostrated similar epistaxis presentation
rates (Sowerby et al., 2014). Our study also shows statistically significant associations between the
number of epistaxis visits and mean, minimum and maximum air temperature, although
temperatures in this study were compared regardless of the month of the year.
A study of 508 patients by Mangussi-Gomes et al. found statistically significant correlation
between the number of epistaxis visits and some weather variables. The number of cases of
epistaxis was higher, when mean temperature was lower, mean relative humidity and total rainfall
was lower (Mangussi-Gomes et al., 2016). Unlike the study of Mangussi-Gomes et al., differences
neither in relative humidity, nor in precipitation were found comparing days with different number
of epistaxis visits.
A study by Nunez et al. found statistically significant association between hospital admissions
for epistaxis and weather variables such as mean, minimum and maximum daily temperature, but
association between hospital admissions and atmospheric pressure was insignificant. We found
statistically significant differences in maximum atmospheric pressure and atmospheric pressure
amplitude among the groups of days with none, 1-2 and ≥3 epistaxis visits. Our study included all
epistaxis visits, not only those who were admitted to hospital due to epistaxis. Also Bray et al.
DAUGAVPILS UNIVERSITĀTES 60. STARPTAUTISKĀS ZINĀTNISKĀS KONFERENCES PROCEEDINGS OF
RAKSTU KRĀJUMS THE 60th INTERNATIONAL SCIENTIFIC CONFERENCE OF DAUGAVPILS UNIVERSITY
118
emphasize, that usage of admission rates may introduce bias, because of a tendency to admit some
patients when ambient temperatures are lower due to socioeconomic reasons (Bray et al. 2005).
Because this was a retrospective study, it had some limitations. For more precise results, only
cases of spontaneous epistaxis would have to be included, excluding all cases of epistaxis of known
etiology. Nevertheless, this study demonstrates association between number of epistaxis visits and
assessed weather variables which requires further detailed research.
Conclusions
Our study shows a statistically significant association between number of epistaxis visits and
weather variables such as air temperature and atmospheric pressure. The number of epistaxis visits
is higher when air temperature is lower, atmospheric pressure amplitude is higher and maximum
atmospheric pressure is higher.
References Ali Tanya. Epistaxis. Ferri’s Clinical Advisor 2018, 463.e7-463.e8 Bray, D., Giddings, C., Monnery, P., Eze, N., Lo, S., & Toma, A. Epistaxis: Are temperature and seasonal variations true factors in incidence? The Journal of Laryngology & Otology, 2005, 119(9), 724–726. Camacho Corte Filipa, Orfao Tiago, Dias Claudia Camila, Pinto Moura Carla, Santos Margarida. Risk factors for the occurrence of epistaxis: prospective study. Auris Nasus Larynx, 2017, Volume 45, Issue 3, Pages 471–475. Danielides V., Kontogiannis N., Bartzokas A., Lolis C. J., Skevas A. The influence of meteorological factors on the frequency of epistaxis. Clinical Otolaryngology & Allied Sciences, 2002, 27: 84–88. Mangussi-Gomes J., Enout M. J., Castro T. C., de Andrade J. S., Penido N. O., Kosugi E. M. Is the occurrence of spontaneous epistaxis related to climatic variables? A retrospective clinical, epidemiological and meteorological study. Acta Otolaryngol. November 1, 2016, 136 (11), 1184–1189. Monjas-Cánovas I., Hernández-García I., Mauri-Barberá J., Sanz-Romero B., Gras-Alberta J.R. Epidemiology of epistaxis admitted to a tertiary hospital. Acta Otorrinolaringol. Esp 2010, 61: pp. 41–47. Nunez Desmond A., McClymont Leo G., Evans Robert A. Epistaxis: a study of the relationship with weather, Clin. Otolaryngol. 1990, 15, 49–51. Small M, Murray JAM, and Maran AGD. A study of patients with epistaxis requiring admission to hospital. Hospital Health Bulletin 1982; 40: pp. 20–29. Sowerby Leigh J., DeSerres Joshua J., Rudmik Luke, Wright Erin D. Role of season, temperature and humidity on the incidence of epistaxis in Alberta, Canada, Journal of Otolaryngology – Head and Neck Surgery, 2014, 43: 10.
DAUGAVPILS UNIVERSITĀTES 60. STARPTAUTISKĀS ZINĀTNISKĀS KONFERENCES PROCEEDINGS OF
RAKSTU KRĀJUMS THE 60th INTERNATIONAL SCIENTIFIC CONFERENCE OF DAUGAVPILS UNIVERSITY
119
THE COMPARISON OF CARPAL TUNNEL SYNDROME IN BOWED STRING INSTRUMENT TEACHERS AND PLUCKED STRING INSTRUMENT TEACHERS AND
MUSICIANS IN LATVIA Deniss Moisejevs Rīga Stradiņš University, Dzirciema iela 16, Rīga, Latvia, LV-1007, [email protected] Abstract
The comparison of carpal tunnel syndrome in bowed string instrument teachers and plucked string instrument teachers and musicians in Latvia
Key Words: Carpal tunnel syndrome, occupational medicine, music teachers, musicians. Introduction. Carpal tunnel syndrome (CTS) is a medical condition due to compression of the median nerve in the wrist at the carpal tunnel. People with CTS may be suffering from pain, numbness, tingling, or burning sensations in the thumb and fingers. String music teachers are in high risk group of developing CTS due to increased use of their hands. Aim. The goal of the research is to compare the prevalence of clinically diagnosed carpal tunnel syndrome and compression symptoms of the hand in guitar music teachers (plucked string instrument) and other string instrument teachers (such as violin, viola, cello, double bass). Despite that both groups use string instruments, the pressure on wrist is different using bowed and plucked instruments. Materials and methods. To investigate this matter, questionnaires were used, in which the music teachers were asked questions about first symptoms, chronic diseases, working experience, how many hours they spend playing on the musical instruments every day and others. Physical tests used on symptomatic patients - Phalen’s sign test and Tinel's sign test. Data were processed using MS Excel 2010 and SPSS 20. Results. Among 98 respondents 57 played on plucked string instruments and 41 played on bowed string instruments. Age ranged from 21 to 70 years. Average working and instrument playing experience - 21 year with 3-4 hours of instrument playing per day. From 41 bowed string instrument teachers - 12 had subjective symptoms and 11 of them positive compression test. From 57 bowed instrument teachers 6 had symptoms, but only 4 of them also had positive compression test. This allows to hypothesize, that percentage of bowed instrument music teachers having potential carpal tunnel syndrome (26.8%) is much higher, than percentage of plucked instrument music teachers having CTS (7.0%). Unfortunately, these data are still higher than official registered CTS numbers in Latvian workers (0.044%-0.049%) Conclusion. String music instrument teacher is clearly a profession with a high risk of having a carpal tunnel syndrome or other compression neuropathy. Results show us that bowed string instrument teachers are in higher risk group of having carpal tunnel syndrome than plucked instrument teachers. Kopsavilkums
Karp ālā kanāla sindroma prevalences salīdzinājums stīgu un ģitaru instrumentu skolotājiem un muzikantiem Latvij ā
Atslēgvārdi: Karpālā kanāla sindroms, arodmedicīna, mūzikas skolotāji, muzikanti. Ievads. Karpālā kanāla sindroms (KKS) ir klīniskā diagnoze, kas rodas vidusnerva kompresijas rezultātā plaukstas karpālā kanālā. Cilvēki ar KKS var ciest no sāpēm, jūšanas pazemināšanas, parestēzijam vai dedzināšanas sajūtām visos pirkstos vai plaukstā. Stīgu instrumentu skolotāji ir KKS riska grupā, jo bieži izmanto rokas darba laikā. Mērķis. Galvenais mērķis – salīdzināt karpālā kanāla sindroma un kompresijas neiropātijas simptomus ģitāristiem un pārējiem stīgu instrumentu skolotājiem (vijole, kontrabass, čells). Neskatoties uz to, ka abas grupas lieto stīgu instrumentus, spiediens uz plaukstu ir dažāds abām grupām. Materi āli un metodes. Tika pielietotas anketas, kur responedentiem prasija par pirmiem simptomiem, hroniskām slimībām, darba pieredzi, cik daudz stundas viņi tērē spēlējot instrumentus katru dienu un pārējie jautājumi. Fizikālie testi tika pielietoti simptomatiskiem respondentiem – Falēna un Tinēla testi. Datu apstrāde tika veikta pateicoties MS Excel 2010 un SPSS 20. Rezultāti. No 98 respondentiem 57 spēlē uz ģitāras un 41 uz pārējiem stīgu instrumentiem. Vecuma robežas no 21 līdz 70 gadiem. Vidējā darba pieredze – 21 gads un vidēji 3-4 stundas spēlējot dienā. No 41 stīgu instrumentu skolotājiem – 12 bija subjektīvi simptomi un 11 no viņiem arī pozitīvs kompresijas tests. No 57 ģitāristiem 6 tika konstatēti simptomi un 4 no viņiem bija pozitīvs kompresijas tests. Tas ļauj uzstādīt hipotēzi, ka karpālā kanāla sindroma prevalence stīgu instrumentu skolotājiem (26.8%) ir daudz lielāks nekā ģitāristiem (7.0%). Neskatoties uz to, abām grupām šie skaitļi ir daudz lielāki nekā oficiāli reģistrētiem datiem Latvijā starp visiem strādājošiem (0.044%-0.049%). Secinājumi . Stīgu instrumentu skolotājs ir profesija ar lielāko risku uz KKS vai citām kompresijas neiropātijam. Rezultāti arī parāda, ka stīgu instrumentu skolotāji ir augstākā riska grupā nekā ģitāristi.
DAUGAVPILS UNIVERSITĀTES 60. STARPTAUTISKĀS ZINĀTNISKĀS KONFERENCES PROCEEDINGS OF
RAKSTU KRĀJUMS THE 60th INTERNATIONAL SCIENTIFIC CONFERENCE OF DAUGAVPILS UNIVERSITY
120
Introduction
Carpal tunnel syndrome is a compressive neuropathy of the median nerve (Knipše 2009).
The carpal tunnel is between the middle part of retinaculum musculorum flexorum and sulcus carpi.
It contains: m.flexor digitorum superficialis, m.flexor digitorum profundus, m.flexor pollicis
longus, vagina synovialis communis musculorum flexorum, vagina synovialis tendinis musculi
flexoris pollicis longi, nervus medianus (Ashworth 2018).
The symptoms of CTS are: numbness, weakness, tingling in the palm of the hand and the
fingers (Knipše 2009).
The music teachers have an increased risk of developing carpal tunnel syndrome due to
increased use of the hands (Butler 2006).
Carpal tunnel syndrome is ranked on a third place among occupational deseases in Latvija. In
2012, 48.7 cases per 100 000 employees were detected (Ministru kabineta rīkojums Nr. 34 2016).
According to the observations of Latvian scientists, 83.1% of all cases of compressive neuropathy
are nerve compression syndromes of the hand. The most common (50.8%) compressive
neuropathy is carpal tunnel syndrome (Eglīte 2012).
Symptoms are – paresthesia in I-III fingers and wrist, night pain and decrease of sensitivity in
fingers (Aroori 2008). These symptoms can affect armpit or shoulder. Pain and hyposensitivity are
often higher at morning or night, but these symptoms decrease during the day. During the
progression of CTS patient wakes up at midnight because of pain. He often tries to massage his
fingers and palm. Sensitivity disorders(pain, temperature and crude touch sense) comes later. If
CTS becomes untreated, then patient starts suffering sensitive disorders along with motor
disorders(these are related with paresis of the hand muscles, which are inervated by n. medianus).
At the beginning thumb’s flexor muscles becomes parethic. Then they become hypotrophic and
atrophic. The strenght of the palm decreases. Patients consider, that it’s become hard to grab small
things, they often fall on the ground. There are four clinical stages: 1)periodic subjective symptoms,
2) regular subjective symptoms, 3) persistent sensitive disorders, 4) motor disorders (Eglīte 2012).
Ultrasound, neirography and MRI are the two imaging modalities which best lend themselves to
investigating entrapment syndromes. Next to directly visualising direct causes and anatomical,
recognising pathological muscle signal patterns on MRI can point to the affected nerve (Heyworth
2011).
Aim
The goal of the research is to compare the prevalence of clinically diagnosed carpal tunnel
syndrome and compression symptoms of the hand in guitar music teachers (plucked string
instrument) and other string instrument teachers (such as violin, viola, cello, double bass). Despite
DAUGAVPILS UNIVERSITĀTES 60. STARPTAUTISKĀS ZINĀTNISKĀS KONFERENCES PROCEEDINGS OF
RAKSTU KRĀJUMS THE 60th INTERNATIONAL SCIENTIFIC CONFERENCE OF DAUGAVPILS UNIVERSITY
121
that both groups use string instruments, the pressure on wrist is different using bowed and plucked
instruments.
Materials and methods
To investigate this matter, questionnaires were used, in which the music teachers were asked
questions about first symptoms, age, sex, chronic diseases, working experience, how many hours
they spent playing on the musical instruments every day and if there are some subjective symptoms
of CTS. If a person answers positive on that question, then he’s asked about symptoms, level of
pain, which hand is affected and about treatment.
Physical tests used on symptomatic patients – Phalen’s sign test and Tinel's sign test. The
Phalen’s test is performed by having the patient place the elbow on a table and flex the wrist for 60
seconds. The test is considered positive if the patient reports paresthesias in the median nerve
distribution (Hagert 2018). Sensitivity ranges from 51% o 87% and specificity ranges from 54% to
100%. Tinel’s sign test is performed when examiner supinates the patient’s hand and wrist,
stabilizes the forearm with one hand and then uses the other hand to test along the median nerve
pathway. Examiner taps over the carpal tunnel at the wrist with the index and/or middle finger,
working up the arm and following the path of the median nerve. Positive test result is indicated by
tingling or paresthesias into the thumb, index finger(forefinger), and middle and lateral half of the
ring finger (Magee 2011). Specificity ranges from 63% to 100% and sensitivity ranges from 23% to
64%.
Data were processed using MS Excel 2010 and SPSS 20.
Results
Among 98 teachers and musicians 57 played on plucked string instruments(first group) and
41 played on bowed string instruments(second group). Age ranged from 21 to 70 years. Mean age –
44 years. Mean age in first group – 43 years, in second group – 47 years. 55% were women(31% in
first group, 87% in second group) and 45% men(69% in first group and 13% in second group).
Average working and instrument playing experience – 21 year with 3-4 hours of instrument playing
per day. From 41 bowed string instrument teachers – 12 had subjective symptoms and 11 of them
positive compression test. From 57 bowed instrument teachers 6 had symptoms, but only 4 of them
also had positive compression test. From all the symptomatic teachers 11 had paresthesia as a first
symptom, 4 had persistent pain, 2 had muscles weakness and one had night pain. Level of pain was
from 1 to 7(according to visual analog pain scale from 1 to 10), with mean level at 4.55/10. This
allows to hypothesize, that percentage of bowed instrument music teachers having potential carpal
tunnel syndrome (26.8%) is much higher, than percentage of plucked instrument music teachers
having CTS(7.0%). Unfortunately, these data are still higher than official registered CTS
numbers in Latvian workers in 2012(0.044%-0.049%) (Martinsone 2015).
DAUGAVPILS UNIVERSITĀTES 60. STARPTAUTISKĀS ZINĀTNISKĀS KONFERENCES PROCEEDINGS OF
RAKSTU KRĀJUMS THE 60th INTERNATIONAL SCIENTIFIC CONFERENCE OF DAUGAVPILS UNIVERSITY
122
Only two respondents had chronic diseases(diabetes mellitus) and none of all 98 respondents had
diagnosed CTS before.
Discussion
A study carried out in Sweden shows the numbers of 14.4% of patients with pain, numbness,
and/or tingling in the median nerve distribution in the hands, 3.8% of clinical
examination(symptomatic subjects were diagnosed as having clinically certain CTS and 2.7%
Symptomatic subjects (had clinically and electrophysiologically confirmed CTS) (Atroshi 1999).
These numbers are much higher than official registered CTS numbers in Latvia - clearly because of
the big unregistered latvian worker numbers. Biggest difference in works is that we diagnosed only
clinical CTS cases, meanwhile they had also electrophysiologically registered CTS patients in
Swedish’s research, so we can’t compare those numbers. Swedish research included general
population from 25 to 74 years, which is not so different from our research. Unfortunatuly,
comparing these data is still very difficult for us because Swedish research has no data about
physical tests, no data about mean age, working experience and chronic diseases. We can only
compare clinical diagnosed CTS.
Acknowledgement
Author would like to thank advisor MD Maija Eglīte for guidance and support in process of
creating the work. I would also like to thank Riga Stradiņš University Student Council for technical
support.
References Aroori S., Spence R. A. Carpal tunnel syndrome; January 2008. Atroshi I., Gummesson C., Johnsson R., Ornstein E., Ranstam J., Rosén I. Prevalence of carpal tunnel syndrome in a general population. Butler K. B Ap Sc (OT), AHT (BAHT), A Mus A (flute) and Richard Norris MD. Assessment and Treatment Principles for the Upper Extremities of Instrumental Musicians. Rehabilitation of the Hand and Upper Extremity, Chapter 142, 1855-1877.e3. Hagert E. and Lalonde D. Nerve entrapment syndromes. In: Plastic Surgery: Volume 6: Hand and Upper Extremity, 24, 525-548.e5 2018. Heyworth and Radswiki et al. Carpal tunnel syndrome. (2011) Knipše G., Krūmiņa D., Kaminskis M., Pļaviņa L., Šavlovskis J. Cilvēka anatomija. Roka. Kāja. 223. lpp; 52. lpp. Magee PhD, BPT and Derrick Sueki DPT, GCPT, OCS. FOREARM, WRIST, AND HAND Orthopedic Physical Assessment: Atlas and Video, CHAPTER 6, 183–214. Maija Eglīte. Darba medicīna. – 2. pārstrādāts un papildināts izdevums – Rīga: Rīgas Stradiņa universitāte, 2012., 834 lpp; 609.–616. lpp. Ministru kabineta rīkojums Nr. 34, Rīgā 2016. gada 20. janvārī (prot. Nr. 3 46. §). Darba aizsardzības politikas pamatnostādnēm 2016.–2020. gadam. Martinsone Ž. Fizikālo darba vides riska faktoru novērtēšana (2015).
DAUGAVPILS UNIVERSITĀTES 60. STARPTAUTISKĀS ZINĀTNISKĀS KONFERENCES PROCEEDINGS OF
RAKSTU KRĀJUMS THE 60th INTERNATIONAL SCIENTIFIC CONFERENCE OF DAUGAVPILS UNIVERSITY
123
MUSCULOSKELETAL OVERUSE INJURY PREVALENCE AND COMFORT PERCEPTION OF MILITARY BOOTS
Darja Nesteroviča Riga Stradinš University, Dzirciema iela 16, Riga, Latvia, [email protected] Abstract
Musculoskeletal overuse injury prevalence and comfort perception of military boots Key Words: overuse, musculoskeletal injuries, military boots, injury prevention Load carriage and physical training causes lower leg biomechanical overuse musculoskeletal injuries (OMSKI). Biomechanical OMSKI is cumulative micro-trauma caused by altered load distribution. The purpose of this study: assess the OMSKI prevalence and comfort perception of military boots in Latvian infantry soldiers. Materials and methods: cross-sectional study among infantry soldiers during annual medical check-up. Injuries were classified according to body regions and injury types (acute or overuse). Military boot comfort was assessed for 6 dimensions: overall comfort, forefoot, arch and heel cushioning, arch and heel support using 10-point Likert scale. Results: 160 soldiers at average age 30.4±7.3 years participated in this research, with mean service time 7.8±4.1 years. 95% of all participants were males (n=152), 5% females. Prevalence of lower extremity OMSKI was 14.4%. Most common sites for OMSKI are lower leg and ankle (39%) and knee (23%). Military boots rate for forefoot cushioning, heel cushioning and for arch support was 6.1 (SD=2.0), arch cushioning rate 6.0 (SD=2.0), heel support rate 6.3 (SD=2.0) and overall comfort rate was 6.4 (SD=1.9). Presence of lower leg overuse injuries are associated with overall military boots comfort [χ2(9) =120.3; p<0.001]. Conclusions: Lower leg overuse injuries are common for infantry soldiers and it is suggested to provide proper fitted military boots according to foot types and lower leg alignments to prevent OMSKI. Kopsavilkums
Muskuloskeletālās pārslodzes traumu prevalence un militāro zābaku valkāšanas komforts Atslēgvārdi: pārslodze, muskuloskeletālā trauma, militārie zābaki, traumu profilakse Smagumu nešana un fiziskās sagatavotības treniņi izraisa apakšējo ekstremitāšu pārslodzes rakstura traumas karavīru vidū. Biomehāniskās pārslodzes traumas (PT) - kumulatīvās mikrotraumas nepareizas slodzes sadalījuma dēļ. Pētījuma mērķis: noskaidrot muskuloskeletālo PT prevalenci un rast sakarības ar zābaku izmantošanas komfortu Sauszemes spēku karavīriem. Materiāli un metodes: šķērsgriezuma pētījums, aptaujājot karavīrus ikgadējās veselības pārbaudes laikā. Traumu klasifikācija pēc bojātās ķermeņa daļas un traumas veida (akūta vai PT). Militāro zābaku komforta vērtējums 10-balļu Likerta skalā pēc 6 kritērijiem: kopējā apava ērtība, purngala, pēdas velves un papēžu amortizācija, pēdas velves atbalsts un papēža stabilitāte. Rezultāti: 160 karavīri vidējā vecumā 30,4±7,3 gadi, vidējā dienēšanas stāža 7,8±4,1 gadi. 95% no visiem pētījuma dalībniekiem ir vīrieši (n=152), 5% sievietes (n=8). Apakšējo ekstremitašu PT prevalence 14,4%. Biežākās PT lokalizācijas: apakšstilbs un potīte (39%), ceļa locītava (23%). Zābaku novērtējums pēdas priekšējās daļas, papēža amortizācijai un pēdas velves atbalsta kategorijās 6,1 (SD=2,0), pēdas velves amortizācija - 6,0 (SD=2,0), papēža stabilitātes novērtējums 6,3 (SD=2,0) and kopējā zābaku ērtība 6,4 (SD=1,9). Apakšējo ekstremitāšu PT esamība ir saistīta ar vispārējo zābaku komfortu [χ2(9) =120,3; p<0,001]. Secinājums: militārai populācijai ir raksturīgas PT un ir ieteicams nodrošināt zābaku ērtību atbilstoši pēdu morfoloģijai, lai novērstu PT.
Introduction
Load carriage, physical training and sports activities causes 90% of musculoskeletal injuries
among military populations, 80% of these injuries (Almeida 1999; Davidson 2008; Knapik 2004;
Ruscio 2006) are lower leg biomechanical overuse musculoskeletal injuries (MSKI).2,6,9,18
Biomechanical overuse MSKI are multifactorial and are defined as cumulative micro-trauma caused
by altered load distribution. Feet motion and load distribution during running and marching can be
altered with shoes, therefore footwear significantly effects gait and performance of tasks which can
lead to injury (Andersen 2016; Dobson 2017, Neal 2014).3,7,16 So the purpose of this study was to
assess the overuse MSKI prevalence and comfort perception of military boots in Latvian infantry
soldiers in order to identify possible risk factor for lower leg overuse injuries.
DAUGAVPILS UNIVERSITĀTES 60. STARPTAUTISKĀS ZINĀTNISKĀS KONFERENCES PROCEEDINGS OF
RAKSTU KRĀJUMS THE 60th INTERNATIONAL SCIENTIFIC CONFERENCE OF DAUGAVPILS UNIVERSITY
124
Material and methods
Survey-based cross-sectional study was performed to obtain self-reported data about injuries
occurred during one year period (2017) from active duty infantry soldiers of Latvian Land Forces.
Survey was performed at State Military medicine centre during annual medical check-up.
Questionnaire addressed subject’s demographic issues, injuries during one year period (2017) and
military boot comfort perception. Participation in this study was voluntary and written informed
consent was obtained from all participants after providing information about study purpose and data
publication. Riga Stradinš university Ethics committee (Nr.40/26.10.2017) and Land forces of
Latvia approvals for this research were admitted.
Table 1. Demographic data and injury prevalence
Total n=160
Males n=152 (95.0%)
Females n=8
Mean age, years (SD) 30.4 (7.3) 30.1 (7.3) 35.9 (7.4) Mean service time, years (SD)
7.8 (4.1) 7.6 (6.7) 9.3 (7.3)
Injury prevalence, % 53.8 (n=86) 51.3
(n=82) 2.5
(n=4) Lower extremity overuse injury prevalence
14.4% n=23 –
Injuries were classified according to body regions as it is in Barrel injury matrix4 (Barell
2002) and by injury type. Musculoskeletal injuries were divided into those that are acute trauma
(blunt, crushing, penetrating trauma) and those that are chronic/overuse injuries (Iannotti 2013).8
For example, injuries such as strains, sprains, ligament ruptures etc. were categorized as acute.
Chronic/overuse musculoskeletal injuries caused by repetitive and/or forceful tasks are the result of
repeated overstretching, overloading, deformation, compression, friction, or ischemia (Kernan
2008; McCarty 2017).11,12
Comfort perception of military boots was rated by respondents using previously published
method for six dimensions: overall comfort, forefoot cushioning, arch cushioning, heel cushioning,
arch support and heel support using 10-point Likert scale (Mills 2010).14
Relative frequency in percent was used to describe injury prevalence. Chi-square test was
used to examine the relationship between presence of overuse injury and military boot comfort
rating. Statistical analysis was performed with SPSS version 22.0 (IBM, USA). P-value less than
.05 was considered as statistically significant.
Results
Table 1 provides demographic and injury prevalence data. 160 infantry soldiers at average age
30.4±7.3 years participated in this research, with mean service time 7.8±4.1 years. Average male
soldiers age was 30.1±7.3 years, [95% CI 29.0-31.2]; for female soldiers 35.9±7.4 [95% CI 28.0-
DAUGAVPILS UNIVERSITĀTES 60. STARPTAUTISKĀS ZINĀTNISKĀS KONFERENCES PROCEEDINGS OF
RAKSTU KRĀJUMS THE 60th INTERNATIONAL SCIENTIFIC CONFERENCE OF DAUGAVPILS UNIVERSITY
125
43.8]. Significant differences were observed among demographic data for males and females
(p<0.05).
Total prevalence of MSKI in all body regions found was 53.8% (n=86) with 51.3% of males
(n=82) and 2.5% for females (n=4). Prevalence of lower extremity overuse MSKI was 14.4%, only
males injured (N=23). Males are more likely to get lower extremity overuse MSKI than females,
(χ2(1) =81.2, p<0.001). Most prevalent acutely injured body regions (fractures and sprains) among
Latvian infantry soldiers were lower leg, ankle injuries and foot injuries. See Fig.1 Most common
sites for overuse MSKI among Latvian infantry soldiers such as tendinitis and bursitis were lower
leg and ankle, knee, foot and toes. See Fig. 2.

DAUGAVPILS UNIVERSITĀTES 60. STARPTAUTISKĀS ZINĀTNISKĀS KONFERENCES PROCEEDINGS OF
RAKSTU KRĀJUMS THE 60th INTERNATIONAL SCIENTIFIC CONFERENCE OF DAUGAVPILS UNIVERSITY
126
Table 2 illustrates rating for comfort perception of military boots. Rate for comfort in average
was 6 points out of 10 among all boots categories with high forefoot blisters prevalence (39%)
observed (total n=62, n=58 males, n=4 females). Significant differences were observed among boot
comfort ratings for males and females (p<0.05), with tendency for lower ratings among female
soldiers. Overall military boot comfort rating strongly correlated with other boot parts comfort
dimensions: Pearson’s correlation coefficient 0.8 and p<0.001. Presence of lower leg overuse injury
among all body regions is associated with lower overall military boots comfort rating (χ2(9) =120.3;
p<0.001).
Table 2. Ratings for comfort perception of military boots
Overall comfort ±SD
Forefoot cushioning
±SD
Arch cushioning
±SD
Heel cushioning
±SD
Arch support
±SD
Heel support
±SD Males 6.4 ± 1,9 6.1 ± 2.0 6.0 ± 2.0 6.1 ± 2.0 6.2 ± 2.1 6.4 ± 2.0
Females 5.6 ± 2.0 5.5 ± 2.0 6.1 ± 1.9 5.0 ± 2.1 5.8 ± 2.0 5.5 ± 2.2 Total 6.4 ± 1.9 6.1 ± 2.0 6.0 ± 2.0 6.1 ± 2.0 6.1 ± 2.1 6.3 ± 2.0
Discussion
Present study showed high prevalence of lower leg MSKI both acute and overuse and low
rating for military boot comfort among Latvian infantry soldiers. To author’s knowledge, this is the
first cross-sectional study on MSKI injuries and military boots among Latvian infantry soldiers.
This research data provides basic information about acute and overuse injury locations and are
particularly important for injury prevention. Additionally, study results show low military boot
comfort ratings and high prevalence of forefoot blisters.
This study has several limitations inherent to cross-sectional study design, relatively small
and heterogeneous study population. Study population contained relatively few female soldiers and
it can reduce representativeness of injury incidence among other female soldier populations. Injury
prevalence rate was calculated based upon self-reported which is strength and a weakness at the
same time. According to previously published studies, approximately half of musculoskeletal
injuries are not reported to medical personnel (Smith 2016).19 Self-reported injury data can include
injuries that were concealed from State Military Medicine centre doctors and it helps to gain more
comprehensive insight of injury prevalence. Also, self-reported data can be affected by recall bias
and honesty. However, accepting these limitations, strength of this research is that it presents new
information about overuse injury incidence and possible association with military footwear usage.
Lower extremity acute and overuse MSKI remain common for different military populations.
Lower extremity overuse injury prevalence found in this study was 14.4% which is lower in
comparison with U.S. Army population (24.4%, Teyhen 2010) and is comparable with injury
prevalence (14.7%) in Chinese Navy (Qi 2016).17,20 Differences of prevalence rates appear because
DAUGAVPILS UNIVERSITĀTES 60. STARPTAUTISKĀS ZINĀTNISKĀS KONFERENCES PROCEEDINGS OF
RAKSTU KRĀJUMS THE 60th INTERNATIONAL SCIENTIFIC CONFERENCE OF DAUGAVPILS UNIVERSITY
127
of distinct research methodology and data types. Overall, acute musculoskeletal injuries identified
among infantry soldiers are preventable in nature and prevention strategies (Abt 2014) should
appear on physical training that involves running and landing.1
Furthermore, fairly strong and consistent relationship between military footwear comfort
perception and lower leg overuse injury was found and it has not been described previously.
Footwear is identified as a significant extrinsic causal factor of lower leg overuse injuries
(Braunstein 2010; Kaufman 2000; Milgrom 2016).5,10,13 It has been advised to focus on proper fit
and comfort (Molloy 2016), but military boot usage may be variable between countries, so
insufficiencies in military footwear design leading to overuse injury remain undetermined
(Andersen 2016).3,15 In future studies it would be useful to examine several lower leg overuse injury
types in association of military boot comfort perception and usage as well as foot type.
Conclusions
This research is a cross-sectional analysis of injury prevalence among infantry soldiers. Lower
leg overuse injuries are common for infantry soldiers and these injuries can be associated with
perceived military boot comfort. Uncomfortable military boots lead to foot blisters and can
contribute to foot and ankle overuse injuries due to gait adaptations. It is suggested to modify
military boots according to lower leg alignments and foot types in order to reduce prevalence of
forefoot blisters and lower leg injuries.
Acknowledgement
The author would like to thank soldiers who participated in the study and State Military
Medicine Centre for the support.
References Abt JP, Sell TC, Lovalekar MT, Keenan KA, et al. Injury epidemiology of U.S. Army Special Operations forces. Mil Med. 2014 Oct; 179(10): 1106–12. Almeida SA, Williams KM, Shaffer RA, Brodine SK; Epidemiological patterns of musculoskeletal injuries and physical training, Med Sei Sports Exerc 1999; 31: 1176–1182. Andersen KA, Grimshaw PN, Kelso RM, Bentley DJ. Musculoskeletal Lower Limb Injury Risk in Army Populations. Sport Med - Open. 2016; 2(1): 22. Barell V, Aharonson-Daniel L, Fingerhut LA, Mackenzie EJ, et al. An introduction to the Barell body region by nature of injury diagnosis matrix. Inj Prev 2002; 8(2): 91–96. Braunstein B, Arampatzis A, Eysel P, Brüggemann GP. Footwear affects the gearing at the ankle and knee joints during running. J Biomech. 2010 Aug 10; 43(11): 2120-5. Davidson PL, Chalmers DJ, Wilson BD, McBride D. Lower limb injuries in New Zealand Defence Force personnel: descriptive epidemiology. Aust N Z J Public Health. 2008; 32(2): 167–73. Dobson JA, Riddiford-Harland DL, Bell AF, Steele JR. Work boot design affects the way workers walk: A systematic review of the literature. Appl Ergon. 2017 May; 61: 53–68. Iannotti JP, Parker RD, Netter Collection of Medical Illustrations: Musculoskeletal System, Vol. 6., Elsevier, 2013, 271–297. Knapik JJ, Bullock SH, Canada S, et al.; Influence of an injury reduction program on injury and fitness outcomes among soldiers, Inj Prev 2004; 10; 37–42.
DAUGAVPILS UNIVERSITĀTES 60. STARPTAUTISKĀS ZINĀTNISKĀS KONFERENCES PROCEEDINGS OF
RAKSTU KRĀJUMS THE 60th INTERNATIONAL SCIENTIFIC CONFERENCE OF DAUGAVPILS UNIVERSITY
128
Kaufman KR, Brodine S, Shaffer R. Military training-related injuries: surveillance, research, and prevention. Am J Prev Med. 2000 Apr; 18(3 Suppl): 54–63. Review. Kernan M, Raja B, Matuszak J, The Collegiate/Professional Male Athlete, In Clinical Men's Health, edited by Joel J. Heidelbaugh, W.B. Saunders, Philadelphia, 2008, 487–522. McCarty EC, Walsh WM, Hald RD, Peter LE, Mellion MB. Netter's Sports Medicine, Elsevier, 2017, 317–321. Milgrom C, Sorkin A, Gam A, Singer J, Nir I, Kogan B, Finestone AS. The search for the best infantry boot. Disaster Mil Med. 2016 Oct 10; 2: 14. Mills K, Blanch P, Vicenzino B. Identifying clinically meaningful tools for measuring comfort perception of footwear. Med Sci Sports Exerc. 2010; 42(10): 1966–1971. Molloy JM. Factors Influencing Running-Related Musculoskeletal Injury Risk Among U.S. Military Recruits. Mil Med. 2016; 181(6): 512–523. Neal BS, Griffiths IB, Dowling GJ, Murley GS, Munteanu SE, Franettovich Smith MM, Collins NJ, Barton CJ. Foot posture as a risk factor for lower limb overuse injury: a systematic review and meta-analysis. J Foot Ankle Res. 2014 Dec 19; 7(1): 55. Qi RR, Wang JQ, Pan LL, et al. Descriptive epidemiology of deployment-related medical conditions and shipboard training-related injuries in a Chinese Navy population. Public Health. 2016; 141: 170–177. doi: 10.1016/j.puhe.2016.09.014. Ruscio B, Smith J, Amoroso P, Aslinger J, Bullock S. Burnham B, et al.; DoD Military Injury Prevention Priorities Working Group; Leading injuries, causes and mitigation recommendations, Washington, DC; Office of the Assistant Secretary of Defense for Health Affairs, Clinical and Program Policy, 2006. Smith L, Westrick R, Sauers S, et al. Underreporting of Musculoskeletal Injuries in the US Army: Findings From an Infantry Brigade Combat Team Survey Study. Sports Health. 2016; 8(6): 507–513. Teyhen D, Thomas R, Roberts C, et al. Awareness and compliance with recommended running shoe guidelines among U.S. Army soldiers. Mil Med. 2010; 175(11): 847–854.

DAUGAVPILS UNIVERSITĀTES 60. STARPTAUTISKĀS ZINĀTNISKĀS KONFERENCES PROCEEDINGS OF
RAKSTU KRĀJUMS THE 60th INTERNATIONAL SCIENTIFIC CONFERENCE OF DAUGAVPILS UNIVERSITY
129
THE ANALYSIS OF FACTORS INFLUENCING ANKLE TRAUMAS AMONG VOLLEYBALL PLAYERS IN LATVIA
AT THE AGE 15–30 YEARS Oļegs Ribakovs, Deniss Anufrijevs Rīgas Stradiņa universitāte, Dzirciema iela 16, [email protected] Abstract
The analysis of factors influencing ankle traumas among volleyball players in Latvia at the age 15–30 years Key Words: Trauma, Volleyball, Ankle sprain One of the most typical trauma in volleyball is ankle sprain. Injured athlete is unable to train efficiently and can range from mild to severe, depending on ligament damage level and how many ligaments are injured. There are some risk factors which affect frequency of ankle sprain among athletes, including elevated BMI, ankle ligament complex instability, congenital ankle loses his professional skills. In addition, ankle sprain lowers the sportsman's living standards. Ankle sprains pathology and repeated ankle sprains. Ankle spain prevention methods are limited and the most effective are: ankle ligament stretching, proprioception trainings, tapes and braces. Our study shows that stretching is the most commonly used ankle sprain trauma prevention method in LV EVL (enthusiastic volleyball league) and has high effectiveness rate.
Introduction
One of the most typical trauma in volleyball is ankle sprain. Injured athlete is unable to train
efficiently and can range from mild to severe, depending on ligament damage level and how many
ligaments are injured.
In addition, ankle sprain lowers the sportsman's living standards. Ankle sprains pathology and
repeated ankle sprains.
Ankle spain prevention methods are limited and the most effective are: ankle ligament
stretching, proprioception trainings, tapes and braces.
The aim of our study is to analyse the usage patterns and effectiveness of trauma prevention
methods applied by volleyball players in Latvia in the age group between 15 and 30 years; both
with and without ankle sprain traumas in anamnesis.
We used standardized survey to question athletes about frequency of ankle sprains and its
prevention method usage, which they used before and after traumas. In our study we included
volleyball players from Rīga Stradiņš University, Latvia University and other volleyball teams from
EVL (enthusiastic volleyball league) in the age group from 15 to 30 years.
Statistic data has been processed in Microsoft Excel and SPSS v22.0 softwares.
Results
The study included 58 volleyball players; 27 (47%) of included players were males. Average
number of years playing volleyball was 8.3 years and did not differ between male and female
players (p>0.05). [Table Nr.1]
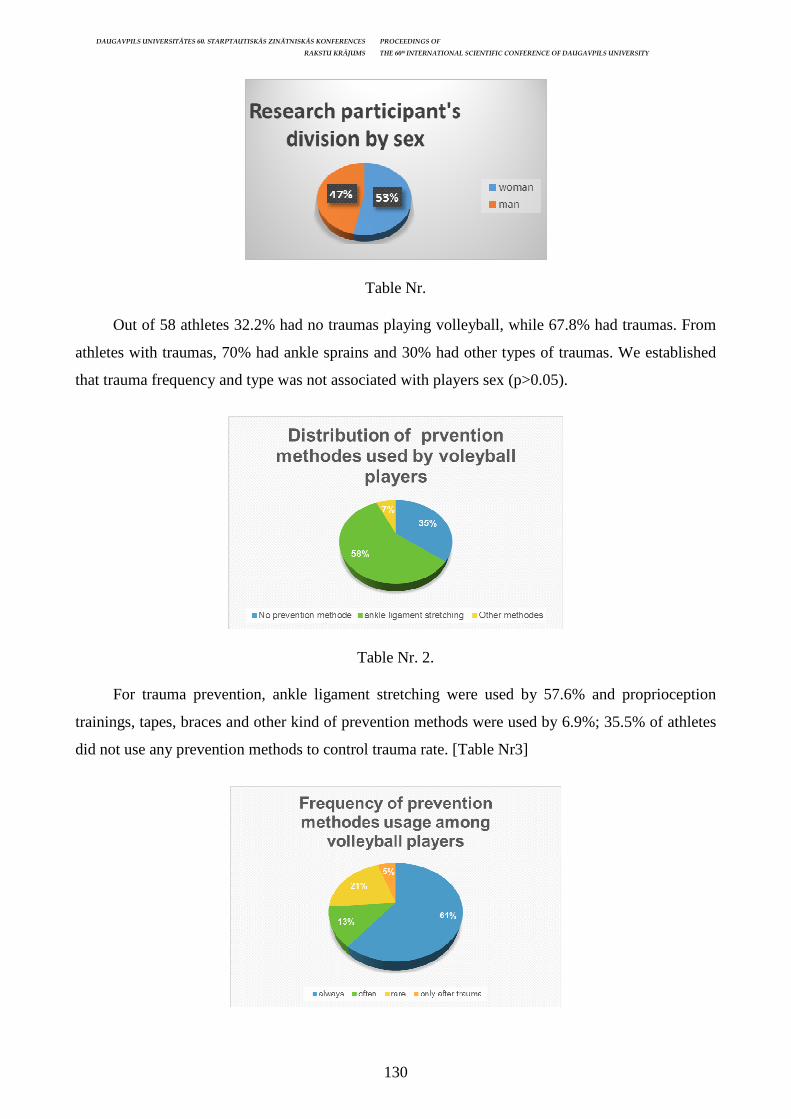
DAUGAVPILS UNIVERSITĀTES 60. STARPTAUTISKĀS ZINĀTNISKĀS KONFERENCES PROCEEDINGS OF
RAKSTU KRĀJUMS THE 60th INTERNATIONAL SCIENTIFIC CONFERENCE OF DAUGAVPILS UNIVERSITY
130
Table Nr.
Out of 58 athletes 32.2% had no traumas playing volleyball, while 67.8% had traumas. From
athletes with traumas, 70% had ankle sprains and 30% had other types of traumas. We established
that trauma frequency and type was not associated with players sex (p>0.05).
Table Nr. 2.
For trauma prevention, ankle ligament stretching were used by 57.6% and proprioception
trainings, tapes, braces and other kind of prevention methods were used by 6.9%; 35.5% of athletes
did not use any prevention methods to control trauma rate. [Table Nr3]
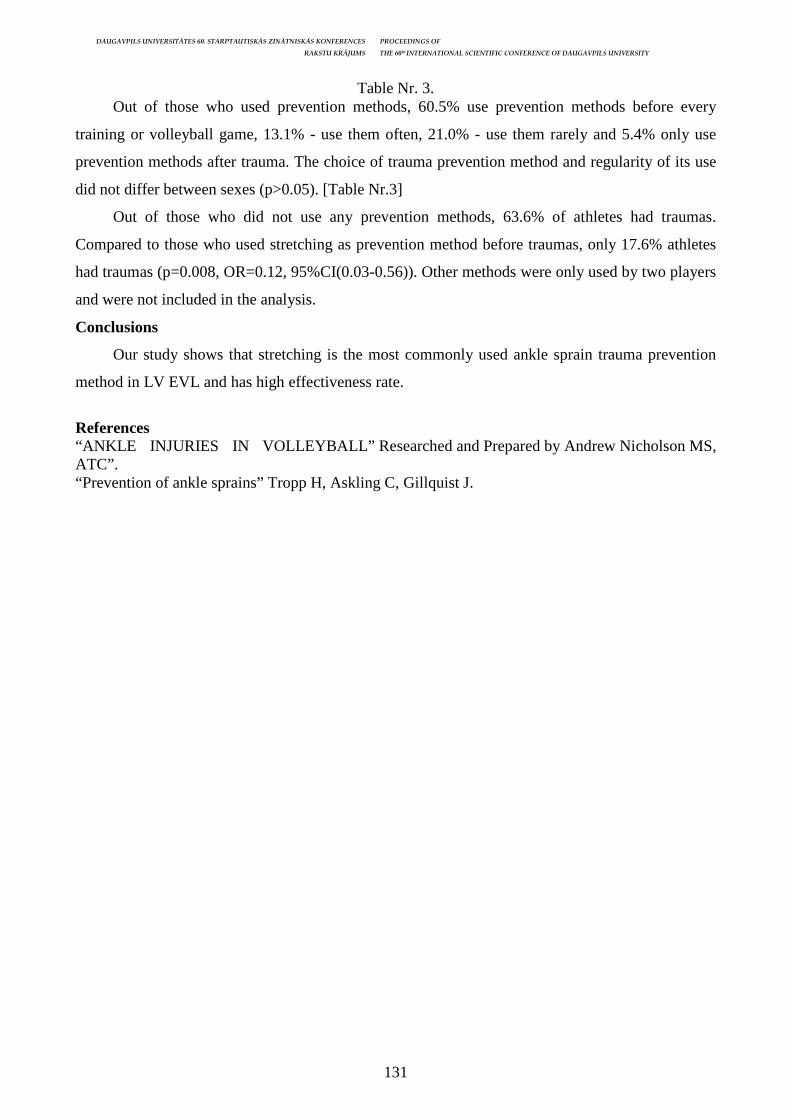
DAUGAVPILS UNIVERSITĀTES 60. STARPTAUTISKĀS ZINĀTNISKĀS KONFERENCES PROCEEDINGS OF
RAKSTU KRĀJUMS THE 60th INTERNATIONAL SCIENTIFIC CONFERENCE OF DAUGAVPILS UNIVERSITY
131
Table Nr. 3. Out of those who used prevention methods, 60.5% use prevention methods before every
training or volleyball game, 13.1% - use them often, 21.0% - use them rarely and 5.4% only use
prevention methods after trauma. The choice of trauma prevention method and regularity of its use
did not differ between sexes (p>0.05). [Table Nr.3]
Out of those who did not use any prevention methods, 63.6% of athletes had traumas.
Compared to those who used stretching as prevention method before traumas, only 17.6% athletes
had traumas (p=0.008, OR=0.12, 95%CI(0.03-0.56)). Other methods were only used by two players
and were not included in the analysis.
Conclusions
Our study shows that stretching is the most commonly used ankle sprain trauma prevention
method in LV EVL and has high effectiveness rate.
References “ANKLE INJURIES IN VOLLEYBALL” Researched and Prepared by Andrew Nicholson MS, ATC”. “Prevention of ankle sprains” Tropp H, Askling C, Gillquist J.
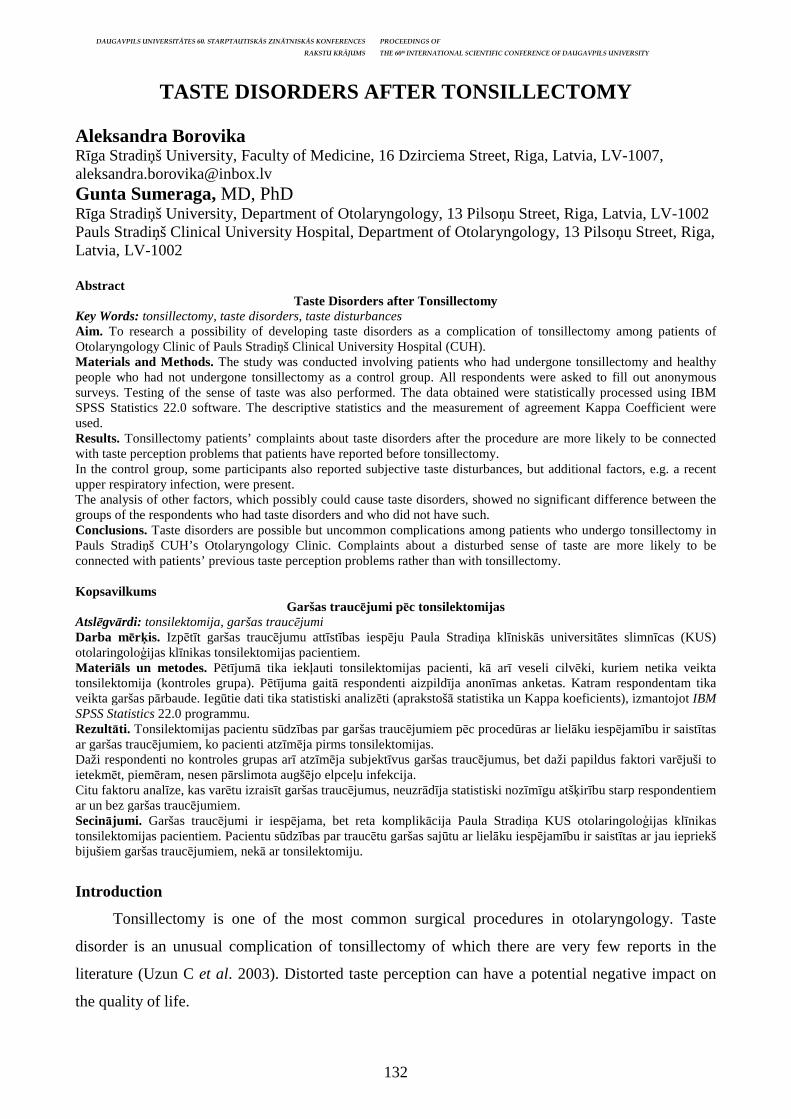
DAUGAVPILS UNIVERSITĀTES 60. STARPTAUTISKĀS ZINĀTNISKĀS KONFERENCES PROCEEDINGS OF
RAKSTU KRĀJUMS THE 60th INTERNATIONAL SCIENTIFIC CONFERENCE OF DAUGAVPILS UNIVERSITY
132
TASTE DISORDERS AFTER TONSILLECTOMY Aleksandra Borovika Rīga Stradiņš University, Faculty of Medicine, 16 Dzirciema Street, Riga, Latvia, LV-1007, [email protected] Gunta Sumeraga, MD, PhD Rīga Stradiņš University, Department of Otolaryngology, 13 Pilsoņu Street, Riga, Latvia, LV-1002 Pauls Stradiņš Clinical University Hospital, Department of Otolaryngology, 13 Pilsoņu Street, Riga, Latvia, LV-1002 Abstract
Taste Disorders after Tonsillectomy Key Words: tonsillectomy, taste disorders, taste disturbances Aim. To research a possibility of developing taste disorders as a complication of tonsillectomy among patients of Otolaryngology Clinic of Pauls Stradiņš Clinical University Hospital (CUH). Materials and Methods. The study was conducted involving patients who had undergone tonsillectomy and healthy people who had not undergone tonsillectomy as a control group. All respondents were asked to fill out anonymous surveys. Testing of the sense of taste was also performed. The data obtained were statistically processed using IBM SPSS Statistics 22.0 software. The descriptive statistics and the measurement of agreement Kappa Coefficient were used. Results. Tonsillectomy patients’ complaints about taste disorders after the procedure are more likely to be connected with taste perception problems that patients have reported before tonsillectomy. In the control group, some participants also reported subjective taste disturbances, but additional factors, e.g. a recent upper respiratory infection, were present. The analysis of other factors, which possibly could cause taste disorders, showed no significant difference between the groups of the respondents who had taste disorders and who did not have such. Conclusions. Taste disorders are possible but uncommon complications among patients who undergo tonsillectomy in Pauls Stradiņš CUH’s Otolaryngology Clinic. Complaints about a disturbed sense of taste are more likely to be connected with patients’ previous taste perception problems rather than with tonsillectomy. Kopsavilkums
Garšas traucējumi p ēc tonsilektomijas Atslēgvārdi: tonsilektomija, garšas traucējumi Darba mērķis. Izpētīt garšas traucējumu attīstības iespēju Paula Stradiņa klīniskās universitātes slimnīcas (KUS) otolaringoloģijas klīnikas tonsilektomijas pacientiem. Materi āls un metodes. Pētījumā tika iekļauti tonsilektomijas pacienti, kā arī veseli cilvēki, kuriem netika veikta tonsilektomija (kontroles grupa). Pētījuma gaitā respondenti aizpildīja anonīmas anketas. Katram respondentam tika veikta garšas pārbaude. Iegūtie dati tika statistiski analizēti (aprakstošā statistika un Kappa koeficients), izmantojot IBM SPSS Statistics 22.0 programmu. Rezultāti. Tonsilektomijas pacientu sūdzības par garšas traucējumiem pēc procedūras ar lielāku iespējamību ir saistītas ar garšas traucējumiem, ko pacienti atzīmēja pirms tonsilektomijas. Daži respondenti no kontroles grupas arī atzīmēja subjektīvus garšas traucējumus, bet daži papildus faktori varējuši to ietekmēt, piemēram, nesen pārslimota augšējo elpceļu infekcija. Citu faktoru analīze, kas varētu izraisīt garšas traucējumus, neuzrādīja statistiski nozīmīgu atšķirību starp respondentiem ar un bez garšas traucējumiem. Secinājumi. Garšas traucējumi ir iespējama, bet reta komplikācija Paula Stradiņa KUS otolaringoloģijas klīnikas tonsilektomijas pacientiem. Pacientu sūdzības par traucētu garšas sajūtu ar lielāku iespējamību ir saistītas ar jau iepriekš bijušiem garšas traucējumiem, nekā ar tonsilektomiju.
Introduction
Tonsillectomy is one of the most common surgical procedures in otolaryngology. Taste
disorder is an unusual complication of tonsillectomy of which there are very few reports in the
literature (Uzun C et al. 2003). Distorted taste perception can have a potential negative impact on
the quality of life.
DAUGAVPILS UNIVERSITĀTES 60. STARPTAUTISKĀS ZINĀTNISKĀS KONFERENCES PROCEEDINGS OF
RAKSTU KRĀJUMS THE 60th INTERNATIONAL SCIENTIFIC CONFERENCE OF DAUGAVPILS UNIVERSITY
133
The aim of our study was to research a possibility of developing taste disorders as a
complication of tonsillectomy among patients of Otolaryngology Clinic of Pauls Stradiņš Clinical
University Hospital.
Materials and Methods
A prospective study was conducted, involving patients who had undergone tonsillectomy and
healthy people who had not undergone tonsillectomy as a control group.
An anonymous survey in the pre-operative period, on the second post-operative day and in the
third week after the operation was performed.
The survey included questions about
• subjective taste disturbances before tonsillectomy, on the second post-operative day and in the
third week after tonsillectomy
• subjective smell disturbances.
Questions about other factors, which possibly could cause taste disorders, were also included
in the survey:
• upper respiratory tract infections (running nose, sore throat etc.) over the past two months
• smoking habits
• sinusitis over the past two months
• head or facial trauma/ surgery (middle ear surgery, oral or dental surgery etc.) over the past six
months
• medications (antibiotics, antidepressants, hypotensive drugs etc.) on a long-term basis
• chronic diseases (diabetes, renal or hepatic failure, HIV, cancer etc.)
• poor oral hygiene
• oral infection or inflammation (gingivitis, oral abscess, oral candidasis etc.) over the past three
months
• poisoning with any chemical agent recently
• poor nutrition
Taste testing with chlorhexidine (0.025%; 0.05%), glucose (2%; 10%), citric acid (0.5%;
7.5%) and sodium chloride (0.5%; 2.5%) on the second post-operative day as well as in the control
group was also performed. The taste test, which Windfuhr JP et al. (2010) used in their study, was
taken as an example. Precise solutions of mentioned chemicals were prepared in a certified
pharmacy store.
Chininsulfate solutions were substituted by chlorhexidine solutions because chininsulfate is
not avaliabe for purchase in Latvia.
DAUGAVPILS UNIVERSITĀTES 60. STARPTAUTISKĀS ZINĀTNISKĀS KONFERENCES PROCEEDINGS OF
RAKSTU KRĀJUMS THE 60th INTERNATIONAL SCIENTIFIC CONFERENCE OF DAUGAVPILS UNIVERSITY
134
The data obtained during the study were statistically processed using IBM SPSS Statistics
22.0 software. The descriptive statistics and measurement of agreement Kappa Coefficient were
used.
Results
69 participants took part in the research: 49.3% (n=34) – the tonsillectomy group (male -
55.9% (n=19), female - 44.1% (n=15); the average age 38 (SD=12.4)); 50.7% (n=35) – the control
group (male - 40% (n=14), female - 60% (n=21); the average age 29.8 (SD=15.2)).
In the tonsillectomy group: 17.6% (n=6) of participants admitted subjective taste disturbances
before the procedure (the main complaint was hypogeusia); 26.5% (n=9) had the same subjective
complaints on the second post-operative day; 5 of them mentioned taste disorders also before
tonsillectomy (Kappa=0.577, p=0.001).
The taste testing revealed taste disorders in 32.4% of the patients (n=11). In most cases the
respondents incorrectly identified salty solutions as bitter or sour (dysgeusia). Among those who
had subjective taste disorders after the procedure, in 55.6% of the cases, the taste testing detected
taste disturbances (Kappa=0.295, p=0.083).
In the group of patients where the taste testing revealed taste disorders 36.4% (n=4) still had
subjective complaints in the third post-operative week.
In the control group: 2.9% (n=1) of participants reported subjective taste disturbances
(phantogeusia). The taste testing detected disorders (a reduced sense of the sweet taste) in 8.6%
(n=3) of the respondents, but additional factors, e.g. a recent upper respiratory infection, were
present.
The analysis of other factors, which possibly could cause taste disorders, such as smell
disturbances etc., showed no significant difference between the groups of the respondents who had
taste disorders and who did not have such (p>0.05).
Discussion
As previously mentioned, disturbed sense of taste is an uncommon complication of
tonsillectomy. The authors of similar scientific works emphasize this fact in their studies (Uzun C at
al. 2003; Goins MR, Pitovski DZ 2004; Windfuhr JP at al. 2010; Heiser C at al. 2010). The results
of our study also demonstrate that taste disturbance is a rare complication of tonsillectomy: several
tonsillectomy patients had subjective taste perception problems after the procedure. That was also
revealed after the taste test. However, in some of the patients, these complaints seem to be
connected with previous taste perception problems not with tonsillectomy.
Uzun C at al. (2003) in their study mention the following causes of disturbed sense of taste
after tonsillectomy: 1) direct or indirect damage to the glossopharyngeal nerve or its lingual branch,
DAUGAVPILS UNIVERSITĀTES 60. STARPTAUTISKĀS ZINĀTNISKĀS KONFERENCES PROCEEDINGS OF
RAKSTU KRĀJUMS THE 60th INTERNATIONAL SCIENTIFIC CONFERENCE OF DAUGAVPILS UNIVERSITY
135
2) the lack of dietary zinc, and 3) habitual drug intake. In our study last two factors (the lack of
dietary zinc and habitual drug intake) were excluded in the surveys by all the respondents.
In its turn, direct or indirect damage of the glossopharyngeal nerve or its lingual branch
during the procedure depends on the anatomical localization of the nerve: the close anatomic
relationship between the palatine tonsil and lingual branch of the glossopharyngeal nerve makes the
nerve vulnerable during tonsillectomy (Goins MR, Pitovski DZ 2004).
Several authors (Windfuhr JP at al. 2010; Heiser C at al. 2010) evaluated the sense of taste
of their patients prior tonsillectomy, few days or weeks after tonsillectomy, as well as a few months
after the procedure.
In our study, similar methodology was used – the subjective sense of taste of patients was
evaluated before tonsillectomy, on second post-operative day and in the third week after surgery.
Additionally the taste testing with chemical solutions was made to assess taste disturbances of
patients more objectively. Not all the authors of similar studies used any kind of taste test in their
researches. Only two groups of authors (Windfuhr JP at al. 2010, Goins MR and Pitovski DZ
2004) had the objective evaluation of taste disorders in their studies. Windfuhr JP at al. (2010)
tried to assess taste disorders by using chemical solutions; that method was used by us. Goins
MR and Pitovski DZ (2004) used the most objective method of assessment of taste disorders -
electrogustometry and spatial taste testing - methods which are not widely available.
Windfuhr JP at al. (2010) reviewed 100 patients who had undergone tonsillectomy.
Twenty-nine (29%) of them had subjective taste dysfunction 4 days after surgery, which was also
approved by the taste test. According to the authors, the taste sensation problems in their patients
regressed within weeks.
Another experience is seen in the study by Heiser C et al. (2010), where 223 cases of patients
were analyzed. 32% (n = 60) of them reported taste disorders after tonsillectomy 2 weeks post-
operatively and 15 patients (8%) at 6-month follow-up, which shows that long term complaints are
possible.
Moreover, in further study, Heiser C et al. (2012) reported that some patients still had
subjectice taste disturbances 32 ± 10 months following surgery and concluded that a long-term
dysgeusia following tonsillectomy occurs in approximately 1% of patients.
The methodology of our study (the last evaluation of the sense of taste in patients was made
in the third week after the operation) do not allow to discuss about long-term complaints among our
respondents.
Altogether four types of taste disorders are distinguished: 1) ageusia or complete taste loss, 2)
dysgeusia (also known as parageusia) or distorted taste perception, 3) hypogeusia or reduced ability
to taste and 4) phantogeusia or gustatory hallucination (Malaty J, Malaty I AC 2013). In our study,
DAUGAVPILS UNIVERSITĀTES 60. STARPTAUTISKĀS ZINĀTNISKĀS KONFERENCES PROCEEDINGS OF
RAKSTU KRĀJUMS THE 60th INTERNATIONAL SCIENTIFIC CONFERENCE OF DAUGAVPILS UNIVERSITY
136
in tonsillectomy patients the following types of taste disturbances were found: hypogeusia as the
main subjective complaint before and after tonsillectomy and dysgeusia, which in almost eleven
patients was revealed after the taste test. In other studies, patients after tonsillectomy reported
ageusea, phantogeusia (Goins MR, Pitovski DZ 2004) and dysgeusia (Goins MR, Pitovski DZ
2004; Windfuhr JP at al. 2010; Heiser C at al. 2010).
Conclusions
Taste disorders are possible but uncommon complications among patients who undergo
tonsillectomy in Pauls Stradiņš Clinical University Hospital’s Otolaryngology Clinic. Complaints
about a disturbed sense of taste are more likely to be connected with patients’ previous taste
perception problems rather than with tonsillectomy.
Acknowledgements
We want to thank Sigita Čulkstena, M. Pharm., M. Sc. Sal., Head of Pharmacy “Dzirciema
aptieka” and Assoc. Prof. Leons Blumfelds for the consultations and advice during the preparation
of the study.
References Goins MR, Pitovski DZ. 2004. Posttonsillectomy Taste Distortion: A Significant Complication. In: Laryngoscope, 114(7): 1206-13. Heiser C et al. 2010. Taste disturbance following tonsillectomy- a prospective study. In: Laryngoscope, 120(10): 2119-24. Heiser C et al. 2012. Taste disordrs after tonsillectomy: a long-term follow-up. In: Laryngoscope, 122(6): 1265-6. Malaty J, Malaty I AC. 2013. Smell and Taste Disorders in Primary Care. In: Am Fam Physician, 88(12): 852-859. Uzun C et al. 2003. Unusual complication of tonsillectomy: Taste disturbance and the lingual branch of the glossopharyngeal nerve. In: The Journal of Laryngology & Otology, 117(4), 314–317. Windfuhr JP et al. 2010. Post-tonsillectomy taste disorders. In: Eur Arch Otorhinolaryngol, 267(2): 289-93.
DAUGAVPILS UNIVERSITĀTES 60. STARPTAUTISKĀS ZINĀTNISKĀS KONFERENCES PROCEEDINGS OF
RAKSTU KRĀJUMS THE 60th INTERNATIONAL SCIENTIFIC CONFERENCE OF DAUGAVPILS UNIVERSITY
137
COMPUTER VISION SYNDROME PREVALENCE AND ASSOCIATED RISK FACTORS AMONG THE MEDICAL
STUDENTS AT RĪGA STRADIŅŠ UNIVERSITY
Jūlija Pozņaka1, Sabīne Grīnberga2
1 Riga Stradiņš University, Dzirciema street 16, Rīga, [email protected] 2 Riga Technical University, Kronvalda boulevard 1, Rīga, [email protected] Abstract
Computer vision syndrome prevalence and associated risk factors among the medical students at Rīga Stradiņš University
Key Words: Computer vision syndrome, eye strain, prevalence, ocular symptoms, extraocular symptoms Introduction. Computer vision syndrome (CVS) encompasses ocular and extraocular symptoms related to the use of computers, tablets and cell phones. Nearly 60 million people suffer from CVS globally, resulting in reduced productivity at work and reduced quality of life. Until now there has been no similar study in Latvia to compare with. Aim. To describe the prevalence of CVS and its associated risk factors among the medical students. Materials and methods. 126 medical students fulfilled an anonymous questionnaire. It included 17questions about socio-demographic data, symptoms of CVS and its associated risk factors. Statistical analysis was done by using IBM SPSS. Results. The study involved 126 students - 16,7% male, 83,3% female. Mean age was 22,4 ± 2,5 years. The prevalence of CVS was 83,3%. The most common complaints when viewing digital screens were: eye strain (63,5%), neck, shoulder and backache (50,8%), dry eyes (38,1%) and blurred vision (31,7%). Less common complaints were: difficulty refocusing the eyes (29,4%), headaches (23,8%), light sensitivity (19,8%), eye redness (14,3%), excessive tear secretion (11,9%), grittiness (6,3%), double vision (3,2%) and changes in color perception (3,2%). Using a smartphone appeared to be statistically significant associated risk factor for eye strain (p=0,02) and double vision (p=0,02). Astigmatism was found statistically significant associated risk factor for light sensitivity (p=0,02). Conclusion. This study proved that CVS prevalence is high among the medical students since 83,3% of the respondents suffered from one or more CVS symptoms both ocular and extraocular. Risk factrors need to be studied in order to develop some prophylactic measures to reduce CVS. Further studies with larger polulation group need to be conducted. Kopsavilkums
Datora izraisītu redzes traucējumu sindroma prevalence un ar to saistītie riska faktori Rīgas Stradiņa universitātes Medicīnas fakultātes studentiem
Atslēgvārdi: Datoru izraisītu redzes traucējumu sindroms, acu nogurums, prevalence, okulārie simptomi, ekstraokulārie simptomi Ievads. Digitālo ierīču lietošanas laikā cilvēkiem var parādīties okulāras un ekstraokulāras sūdzības, ko devē par tā saucamo datora izraisītu redzes traucējumu sindromu, kas skar aptuveni 60 miljonu cilvēku visā pasaulē. Sindroms negatīvi ietekmē darba produktivitāti un dzīves kvalitāti. Latvijā nav datu par to, cik bieži sastopama ir minētā patoloģija un kādi faktori to veicina. Pētījuma mērķis. Noteikt datora izraisītu redzes traucējumu sindroma sastopamību Rīgas Stradiņa universitātes medicīnas studentu vidū un identificēt ar to saistītos riska faktorus. Materi āls un metodes. 126 dalībnieki tika iesaistīti aprakstošā šķērsgriezuma pētījumā. Dalībnieki elektroniski aizpildīja anonīmu anketu, kura iekļāva 17 jautājumus par sociāldemogrāfiskiem datiem, simptomiem, potenciāliem riska faktoriem. Dati tika apstrādāti ar IBM SPSS palīzību. Rezultāti. Respondentu vidū bija 16,7% vīriešu un 83,3% sieviešu. Vidējais vecums bija 22,4 ± 2,5 gadi. Viens vai vairāki datora izraisītu redzes traucējumu sindroma simptomi bija 83,3% (n=105) respondentu. Bija identificētas šādas biežākās sūdzības: acu nogurums (63,5%), sāpes kaklā, plecos un mugurā (50,8%), sausuma sajūta acīs (38,1%), neskaidra redze (31,7%), grūtības nofokusēt skatienu (29,4%). Ir atrasti ar datora izraisītu redzes traucējumu sindromu saistītie riska faktori: viedtālruņa lietošana (p=0,02) un astigmatisms (p=0,02). Secinājumi. Pētījums pierādījis, ka datora izraisītu redzes traucējumu sindroms ir bieža patoloģija (prevalence ir 83,3%). Pētījuma laikā respondentiem tika atrastas ļoti daudzveidīgas sindroma izpausmes. Ir atrasti daži ar datora izraisītu redzes traucējumu sindromu saistītie riska faktori. Ir nepieciešami turpmākie pētījumi.
Introduction
Many individuals who work at a computer report a high level of job-related complaints and
symptoms, including ocular discomfort, muscular strain and stress. These complaints are defined as

DAUGAVPILS UNIVERSITĀTES 60. STARPTAUTISKĀS ZINĀTNISKĀS KONFERENCES PROCEEDINGS OF
RAKSTU KRĀJUMS THE 60th INTERNATIONAL SCIENTIFIC CONFERENCE OF DAUGAVPILS UNIVERSITY
138
a computer vision syndrome (CVS) (American Optometric Association, 1995). Nearly 60 million
people suffer from computer vision syndrome globally, resulting in reduced productivity at work
and reduced quality of life of the computer worker (Ranasinghe et al., 2016). Until now there has
been no similar study in Latvia to compare with. Consequently, the aim of this research was to
describe the prevalence of computer vision syndrome and its associated risk factors among the
medical students.
Material and methods
A descriptive cross-sectional study was performed including 126 participants. An anonymous
questionnaire was fulfilled by participants. Questions were about socio-demographic data,
symptoms of CVS and potential risk factors. Statistical data analysis was performed with IBM
SPSS using Spearman’s correlation method. Quantitative data was described using mean and
standard deviation, as well as number and percentage.
Results
The study involved 126 students - 16,7% were male, 83,3% were female. Mean age was 22,4 ± 2,5
years. 83,3% (n=105) of students experienced one or more CVS symptoms. The most common
complaints when viewing digital screens were: eye strain (63,5%), neck, shoulder and backache
(50,8%), dry eyes (38,1%) and blurred vision (31,7%). Less common complaints were: difficulty
refocusing the eyes (29,4%), headaches (23,8%), light sensitivity (19,8%), eye redness (14,3%),
excessive tear secretion (11,9%), grittiness (6,3%), double vision (3,2%) and changes in color
perception (3,2%). The most common used devices were smartphones (41,5%), laptops (36,6%).
Others were tablets (12,3%) and personal computers (9,6%). The next question was about how
many hours the medical students usually were spending on their digital screens. The results were
following: 22% of smartphone users used to spend less than one hour per day, while majority of
respondents (31%) used to spend 2-3 hours on it per day, 22% - 4-5 hours, 14% - 6-7 hours, 8% - 8-
9 hours, 3% - more than 9 hours per day. 30% of laptop users used to spend 2-3 hours and 30% of
them - 4-5 hours on it per day, other 18% used to spend 6-7 hours, 6% - 8-9 hours, 3% - more than
9 hours. Tablet was used more often (by 51% respondents) 2-3 hours per day, while 40% of
respondents used to spend less than one hour per day on it, 3% - 4-5 hours, 6% - 6-7 hours per day
on it. Ordinary computer screen was used more often (by 41% respondents) – less than one hour per
day, while 16% used to spend 2-3 hours, 22% - 4-5 hours, 12% - 6-7 hours, 6% - 8-9 hours and 3%
- more than 9 hours per day. Hours spent on smartphone appeared to be a statistically significant
risk factor for computer vision syndrome as it was associated with eye strain (p=0,02) and double
vision (p=0,02). 77% (n=97) of respondents adjust their digital screen brightness to the room
lighting, while 23% (n=29) do not adjust it. The next question was about how many hours students
were spending on their digital devices in the dark room. 65% smartphone users used to spend less

DAUGAVPILS UNIVERSITĀTES 60. STARPTAUTISKĀS ZINĀTNISKĀS KONFERENCES PROCEEDINGS OF
RAKSTU KRĀJUMS THE 60th INTERNATIONAL SCIENTIFIC CONFERENCE OF DAUGAVPILS UNIVERSITY
139
than 1 hour, 17% - 2-3 hours, 4% - 4-5 h, 0,8% - 6-7 h, while 37% laptop users used to spend less
than 1 hour, 19% - 2-3 hours, 2% - 4-5 h, 0,8% - 8-9 h, 0,8% - more than 9 h. Majority of tablet
users (14%) used to spend less than 1 hour, 2% - 2-3 hours, majority personal computer (6,5%) -
less than 1 h, 2,4% - 2-3 hours, 0,8% - 6-7 hours. 44% of students took a break during the device
usage, while 56% - did not. 82% of students who were spending interrupted hours on their digital
screens took breaks after more than 20 minutes of working with the device. 18% took a break less
than 20 minutes after working with the device. The other question was about whether dry eye
disease was earlier diagnosed in the respondent. 8% (n=10) previously were diagnosed, while 92%
(n=116) – were not. On question whether they use any eye drops for treatment of the dry eye
disease 50% (n=5) said yes, they use drops, 50% (n=5) do not receive any treatment. The next
question was about whether student has any refractive error. 61% or respondents had refractive
error, while 49% did not. The most common refractive error was nearsightedness (49,2%), followed
by astigmatism (13,5%) and farsightedness (7,1%). Astigmatism was found statistically significant
associated risk factor for light sensitivity (p=0,02). On question whether students wear glasses or
contact lenses, 52% wear any of them, 48% do not wear any of them. The other question was about
the presence of any eye disease. The results of this question were, 2 cases of laser vision correction,
1 case of eye trauma, 3 cases of strabismus, in 1 case a surgical correction was done. The next
question was about the use of any medication. There were cases of usage non-steroidal anti-
inflammatory drugs (4 cases), levothyroxine (1 case), methimazole (1 case), antihistamine
medication (1 case). This study did not find statistically significant risk factors for computer vision
syndrome such as: screen adjustment to the room lighting, using device in the dark room,
continuous working hours, dry eye disease, treatment of dry eye disease, nearsightedness,
farsightedness, glasses or contact lens wearing, eye disease, use of systemic medication.
Discussion
There is different data about computer vision prevalence – it ranges from 64 to 90% among
computer users (Hayes et al., 2007). Studies of CVS prevalence exactly among students have shown
that the prevalence of CVS among engineering students was 81,9% comparing to 78,6% among
medical students (Logaraj et al., 2014). Reddy et. al. (2013) found high CVS prevalence – 89,9% in
the study that included 795 students. In our study 83,3% of respondents complained about at least
one CVS manifestation.
Our study found eye strain as the most common symptom (prevalence was 63,5%). This
finding was similar to 53,3% prevalence among university students in the United Arab Emirates
(Shantakumari et al., 2014) and to 54,6% prevalence among call center workers in Brazil (Sa et al.,
2012). The prevalence of eyestrain in university students in Malaysia was low – only 16,4% (Reddy

DAUGAVPILS UNIVERSITĀTES 60. STARPTAUTISKĀS ZINĀTNISKĀS KONFERENCES PROCEEDINGS OF
RAKSTU KRĀJUMS THE 60th INTERNATIONAL SCIENTIFIC CONFERENCE OF DAUGAVPILS UNIVERSITY
140
et al., 2013). On the contrary, very high prevalence of eyestrain was found by Bali et al. (2007) –
97,8%.
The other common complaint related to CVS in our study was neck, shoulder and backache
(50,8%). In the study conducted by Adedoyin et al. (2005) low back pain and neck pain were found
even with higher prevalence – 74% and 73% accordingly.
Dry eye prevalence in our study was 38,1%. This is similar to Logaraj et al. (2014) study
which showed 30% dry eye prevalence in male and 18,6% in female and 21,5% dry eye prevalence
in male and 10,1% in female in the other study (Uchino et al., 2008).
In our study blurred vision was reported by 31,8% respondents. Similar result was found in
Logaraj et al. (2014) study, where 31,6% of participants complained of this symptom. In other study
the prevalence was much higher – up to 59,4% (Edema and Akwukwuma, 2010).
In our study there is a statistically significant association between the usage of smartphone
and CVS symptoms such as eye strain (p=0,02) and double vision (p=0,02). Other researchers
found that CVS symptoms were reported more among users who spent six and more hours on
computer per day (Smita et al., 2013; Akinbinu and Mashalla, 2013).
This study found that astigmatism was statistically significant associated risk factor for light
sensitivity (p=0,02). In the literature it is suggested that even small amount of refractory error
(myopia, hyperopia or astigmatism) increase the subjective discomfort when using the digital
device. Even astigmatic errors as low as 0,12 D increase the eyestrain.
In this study there are some limitations. The first one, the design of the study – descriptive
cross-sectional study. Consequently, only associated risk factors can be established but in order to
establish the causality we need further research with the control group. The second limitation is the
quite small amount of respondents. Because of that it is difficult to find statistically significant
correlations.
Conclusions
CVS prevalence is high among medical students since 83,3% of the respondents suffered
from one or more CVS symptoms. The most common complaints when viewing digital screens
were: eye strain, neck, shoulder and backache, dry eyes and blurred vision. Such risk factors as
using a smartphone usage and astigmatism were found statistically significant associated risk
factors in this study. Further studies need to be conducted in order to identify causative factors to
facilitate prophylactic measures.
Acknowledgement
I would like to express me very great appreciation to Dr. Sabīne Grīnberga for her valuable
and constructive suggestions during the planning and development of this research work.
DAUGAVPILS UNIVERSITĀTES 60. STARPTAUTISKĀS ZINĀTNISKĀS KONFERENCES PROCEEDINGS OF
RAKSTU KRĀJUMS THE 60th INTERNATIONAL SCIENTIFIC CONFERENCE OF DAUGAVPILS UNIVERSITY
141
References Akinbinu T. R., Mashalla Y. J. Impact on computer technology on health: Computer Vision Syndrome (CVS). Academic journals. Vol. 5 (3), pp. 20–30, November 2014. American Optometric Association. The Effects of Computer Use on Eye Health and Vision, 1997. [last viewed – 09.05.2018.]. Available at: https://www.aoa.org/documents/optometrists/effects-of-computer-use.pdf P. Ranasinghe, W. S. Wathurapatha, Y. S. Perera, D. A. Lamabadusuriya, S. Kulatunga, N. Jayawardana, P. Katulanda. Computer vision syndrome among computer office workers in a developing country: an evaluation of prevalence and risk factors. BMC Res Notes. 2016; 9: 150. Parihar JK, Jain VK, Chaturvedi P, Kaushik J, Jain G, Parihar AK. Computer and visual display terminals (VDT) vision syndrome (CVDTS). Med J Armed Forces India. 2016 Jul; 72(3): 270–276.
DAUGAVPILS UNIVERSITĀTES 60. STARPTAUTISKĀS ZINĀTNISKĀS KONFERENCES PROCEEDINGS OF
RAKSTU KRĀJUMS THE 60th INTERNATIONAL SCIENTIFIC CONFERENCE OF DAUGAVPILS UNIVERSITY
142
PREVALENCE OF STAPHYLOCOCCUS AUREUS NASAL AND DERMAL COLONIZATION
Anna Kr īgere, Linda Mežmale, Dr. habil. med. prof. Aija Žilevi ča
University of Latvia, 9 Raina Blvd., Riga, Latvia, [email protected], [email protected], [email protected] Abstract
Prevalence of Staphylococcus aureus Nasal and Dermal Colonization Key Words: Staphylococcus aureus, microbiology, dermatology Introduction. Staphylococcus aureus is a common microorganism that causes suppurative infections and toxinoses, S.aureus carriage has long been known to be one of the most strongly associated risk factors for subsequent infection. Approximately 30% of healthy humans carry S.aureus, 20% of them are persistent carriers. Aim. To identify the factors affecting Staphylococcus aureus colonization. Materials and methods. Samples were taken from nasal mucosa and the dorsal surface of the hand and grown in Petri dishes on Baird-Parker agar. Results were obtained by quantitatively counting the visible black colonies. Statistical analysis was performed with Microsoft Excel and SPSS 22.0 by using Fisher's exact test. Level of statistical significance was set at p<0.05. Results. 150 samples from 75 individuals were obtained. Carriage of S.aureus in nasal musosa and on the hand was found in 33% of all respondents. 44% from these were female and 56% – male. 40% of all respondents were smokers, 33% of them carry S.aureus in nasal mucosa and on the dorsal surface of the hand. 29% of all respondents carry S.aureus only in nasal mucosa; 32% of them were male and 28% – female. 9% of respondents carry S.aureus only on the dorsal surface of the hand. 26% of all respondents do not carry S.aureus neither in nasal mucosa or dorsal surface of the hand. Conclusions. Most individuals that carry S.aureus in the nasal mucosa are also carriers on the dorsal surface of the hand. Statistical analysis proved (p=0.0096) that men are more likely to be S.aureus carriers and they carry S.aureus in nasal mucosa. When comparing the carriage of S.aureus between smokers and non-smokers statistical analysis suggests (p=0.8075) that the carriage is not affected by smoking. Kopsavilkums
Staphylococcus aureus nazālas un dermālas kolonizācijas izplatība. Atslēgvārdi: Staphylococcus aureus, mikrobioloģija, dermatoloģija Ievads. Staphylococcus aureus ir ļoti izplatīts mikroorganisms, kas izraisa strutainas infekcijas un toksikozes. Ir sen zināms, ka S.aureus nēsāšana ir nopietns riska faktors infekcijas attīstībai. Vidēji 30% veselu cilvēku nēsā S.aureus. 20% cilvēku to nēsā pastāvīgi. Mērķis. Noteikt S.aureus nēsāšanas deguna gļotādā un uz ādas ietekmējošos faktorus. Materi āli un metodes. Pētījumā tika ņemti uzsējumi no deguna gļotādas un plaukstas dorsālās virsmas. Paraugi tika uzsēti Petri platēs uz Baird-Parker barotnēm un ievietoti termostatā. Rezultāti tika iegūti, vizuāli novērtējot melnas kolonijas ar gredzenveida zonām. Kolonijas vērtējām skaitliski. Tika ņemts vērā respondentu vecums, dzimums, smēķēšanas paradums, anamnēzē strutainas infekcijas. Datu apstrāde veikta programmā Microsoft Excel, datu analīze veikta, izmantojot Fisher's Exact testu. Statistiskā nozīmība tika pieņemta, ja p<0.05. Rezultāti. Pētījumā tika veikti 150 uzsējumi no 75 veseliem respondentiem. No visiem respondentiem 33% (n=25) S.aureus nēsā gan deguna gļotādā, gan plaukstas dorsālajā virsmā. No šiem nēsātājiem 44% (n=11) ir sievietes un 56% (n=14) ir vīrieši. 40% (n=30) no respondentiem ir smēķētāji, no tiem 33% (n=10) ir nēsātāji gan deguna gļotādā, gan plaukstas dorsālajā virsmā. S.aureus nēsāšana tikai deguna gļotādā tika konstatēta 29% (n=22) gadījumu. No tiem 32% (n=8) ir vīrieši un 28% (n= 14) sievietes. S.aureus nēsāšana tikai plaukstas dorsālajā virsmā tika konstatēta 9% (n=7) gadījumu. 26% (n=20) no visiem respondentiem nenēsā S.aureus ne deguna gļotādā, ne plaukstas dorsālajā virsmā. Secinājumi. Lielāka daļa no S.aureus nēsātājiem deguna gļotādā, nēsā S.aureus ari uz plaukstas dorsālās virsmas. Statistiski pierādīts (p=0.0096), ka biežākie S.aureus nēsātāji būs vīrieši, kā arī vīrieši biežāk S.aureus nēsās deguna gļotādā. Salīdzinot smēķētājus ar nesmēķētājiem, statistiski pierādīts, ka S.aureus nēsāšanu neietekmē smēķēšana (p=0.8075).
Introduction
Staphylococci are aerobic or facultatively anaerobic gram-positive cocci, where
Staphylococcus aureus is the most virulent species of the genus Staphylococcus. S.aureus is
DAUGAVPILS UNIVERSITĀTES 60. STARPTAUTISKĀS ZINĀTNISKĀS KONFERENCES PROCEEDINGS OF
RAKSTU KRĀJUMS THE 60th INTERNATIONAL SCIENTIFIC CONFERENCE OF DAUGAVPILS UNIVERSITY
143
responsible for community- and healthcare-associated infections and toxin-mediated diseases, and it
is a major cause of mortality.
The genome of S.aureus has a circular chromosome of about 2.8 million base pairs that also
carries mobile genetic elements, such as plasmids, transposons, prophages, and pathogenicity
islands, many of which encode virulence factors or determinants of antibiotic resistance (Robert S.
Daum, 2018).
Clinical manifestations of S.aureus infection can result from tissue invasion, hematogenous
dissemination, or toxin release, which incite inflammatory cascades and tissue necrosis. Isolation
of S.aureus from skin and mucosal sites also may represent asymptomatic colonization because the
organism can be a commensal flora (Robert S. Daum, 2018).
S.aureus colonises the skin and mucosae of human beings and several animal species.
Although multiple body sites can be colonised in human beings, the anterior nares of the nose is the
most frequent carriage site for S.aureus. Extra-nasal sites that typically harbour the organism
include the skin, perineum, and pharynx. Other carriage sites including the gastrointestinal tract,
vagina, and axillae harbour S.aureus less frequently. There are three carriage patterns in healthy
individuals: persistent carriage, intermittent carriage, and non-carriage. This distinction is important
because persistent carriers have higher S.aureus loads and a higher risk of acquiring S.aureus
infections. About 20% of individuals are persistent nasal carriers, 30% are intermittent carriers and
about 50% non-carriers. Persistent carriers are often colonised by a single strain of S.aureus over a
long period of time periods, whereas intermittent carriers may carry different strains over time. The
load of S.aureus is higher in persistent carriers, resulting in increased risk of infection. Nasal
colonisation is thought to be the net result of repellent and attracting forces (Heiman F L et.al.
2005). There are four things needed to become a nasal carrier of S.aureus: there has to ba a contact
of the nose and S.aureus, S.aureus needs to adhere to receptors in the nose, S.aureus needs to evade
the host defences.
S.aureus cells can survive for months on any type of surface. Hands are the main vectors for
transmitting S.aureus from surfaces to the nasal niche – for example via nose picking. S.auseus are
found in the anterior nares (vestibulum nasi that is the “nose picking area). Therefore, S.aureus
nasal carriage and hand carriage are strongly correlated. The nose may be reached through air, but
this occurs less frequently, but airborne transmission is important for the dispersal of staphylococci
to many different reservoirs, from where, via the hands, they can reach the nose. Environmental
factors can also influence the S.aureus nasal carriage, where hospitalisation has been shown to be
an important risk factor. Moreover, there are studies that state that S.aureus carriers “impose” their
carrier state upon other household members (where large households are positively associated with
nasal carriage.

DAUGAVPILS UNIVERSITĀTES 60. STARPTAUTISKĀS ZINĀTNISKĀS KONFERENCES PROCEEDINGS OF
RAKSTU KRĀJUMS THE 60th INTERNATIONAL SCIENTIFIC CONFERENCE OF DAUGAVPILS UNIVERSITY
144
S.aureus carriage rates vary between ethnic groups, with higher rates in white people and in
men and depend on age. There are many studies indicating that patients with dialysis, end stage
liver disease, patients with HIV, S.aureus skin infections and skin disease, and obesity and a history
of cerebrovascular accident have higher S.aureus nasal carriage rates. Up to now no correlation has
been found between carriage rate and seasonality, temperature, or relative humidity. There are
observations that show that active cigarette smoking is associated with a lower S.aureus nasal
carriage rate, whereas passive smoking is associated with a higher S.aureus nasal carriage rate
(Heiman F L et.al. 2005).
In persistent S.aureus carriers (who all have S.aureus in their noses) the frequency of
colonization of other body sites is increased compared with the general population
(Figure 1) (Wertheim HF et al. 2005). Therefore, S.aureus also colonises the skin -
predominantly on the hands, chest and abdomen. Molecular determinants of staphylococcal skin
colonization include surface polymers and proteins that promote adhesion and aggregation, and
variety of mechanisms to evade acquired and innate host defences (Michael Otto 2010).
Figure 1. S.aureus carriage rates per body site in adults
Materials and Methods
Samples were taken from 75 randomly chosen participants. One nasal (vestibulum nasi) and
one dermal (dorsal surface of the hand) swab from each participant were taken and grown in Petri
dishes on Baird-Parker agar. Petri dishes were put in an incubator thermostat for 48 hours. After
48 hours results were obtained by quantitatively counting the visible black Staphylococcus aureus
colonies with a clear halo (Figure 2).
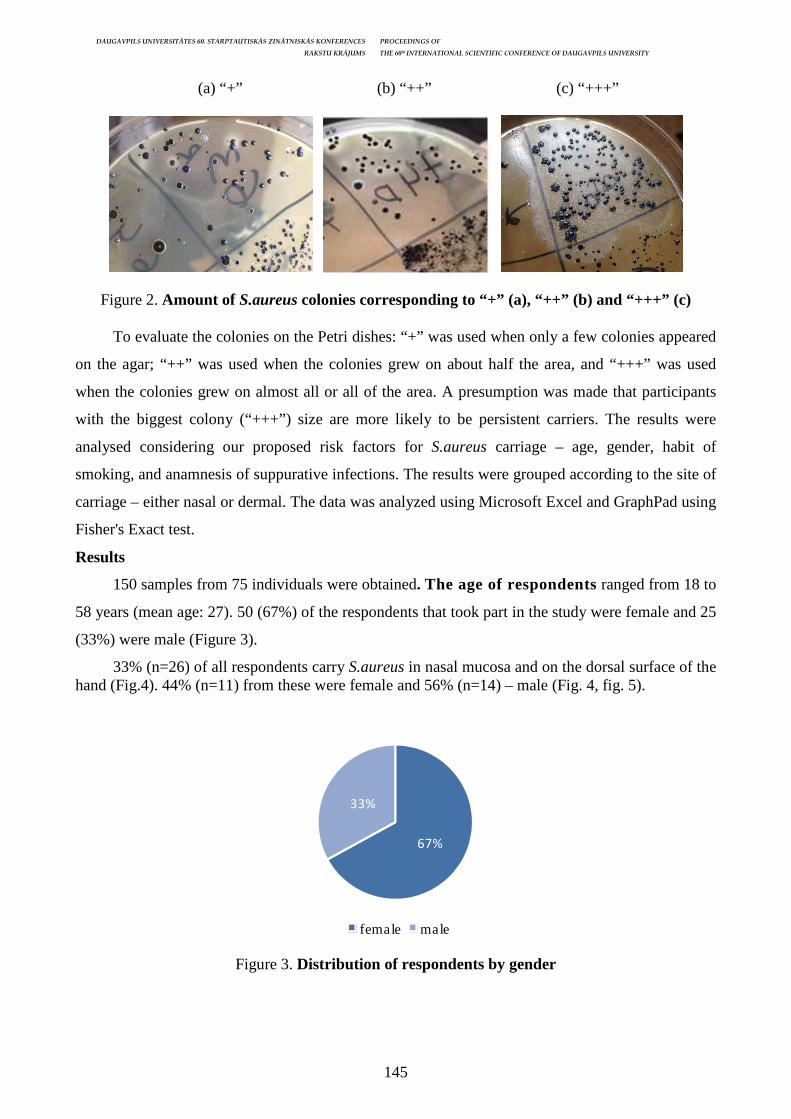
DAUGAVPILS UNIVERSITĀTES 60. STARPTAUTISKĀS ZINĀTNISKĀS KONFERENCES PROCEEDINGS OF
RAKSTU KRĀJUMS THE 60th INTERNATIONAL SCIENTIFIC CONFERENCE OF DAUGAVPILS UNIVERSITY
145
(a) “+” (b) “++” (c) “+++”
Figure 2. Amount of S.aureus colonies corresponding to “+” (a), “++” (b) and “+++” (c)
To evaluate the colonies on the Petri dishes: “+” was used when only a few colonies appeared
on the agar; “++” was used when the colonies grew on about half the area, and “+++” was used
when the colonies grew on almost all or all of the area. A presumption was made that participants
with the biggest colony (“+++”) size are more likely to be persistent carriers. The results were
analysed considering our proposed risk factors for S.aureus carriage – age, gender, habit of
smoking, and anamnesis of suppurative infections. The results were grouped according to the site of
carriage – either nasal or dermal. The data was analyzed using Microsoft Excel and GraphPad using
Fisher's Exact test.
Results
150 samples from 75 individuals were obtained. The age of respondents ranged from 18 to
58 years (mean age: 27). 50 (67%) of the respondents that took part in the study were female and 25
(33%) were male (Figure 3).
33% (n=26) of all respondents carry S.aureus in nasal mucosa and on the dorsal surface of the hand (Fig.4). 44% (n=11) from these were female and 56% (n=14) – male (Fig. 4, fig. 5).
Figure 3. Distribution of respondents by gender
67%
33%
female male

DAUGAVPILS UNIVERSITĀTES 60. STARPTAUTISKĀS ZINĀTNISKĀS KONFERENCES PROCEEDINGS OF
RAKSTU KRĀJUMS THE 60th INTERNATIONAL SCIENTIFIC CONFERENCE OF DAUGAVPILS UNIVERSITY
146
Figure 4. Distribution of carriage
Figure 5. Comparison of carriage sites of S.aureus
26% (n=20) of all respondents do not carry S.aureus neither in nasal mucosa or dorsal surface
of the hand (Fig.5). S.aureus carriage in nasal mucosa only was found in 29% (n=22) of all
respondents (Fig.5).
The carriage of S.aureus on the dorsal surface of the hand only was found in 9,3% (n=7) of
the cases (Fig. 5).
Our results show that 56% (n=14) of men, and 44% (n=22) of women were S.aureus
nasal and dermal carriers (Fig.6). Statistical analysis proved (p=0.0096) that men are more likely
to be S.aureus carriers (nasal and dermal carriage).
Non-carriers
67%
Female 44%
Male56%
Carriers33%
Non-carriers Female Male

DAUGAVPILS UNIVERSITĀTES 60. STARPTAUTISKĀS ZINĀTNISKĀS KONFERENCES PROCEEDINGS OF
RAKSTU KRĀJUMS THE 60th INTERNATIONAL SCIENTIFIC CONFERENCE OF DAUGAVPILS UNIVERSITY
147
Figure 6. Gender differences in carriage of S.aureus
Figure 7. Differences in nasal and dermal carriage of S.aureus between genders
Figure 8. Quantitative nasal mucosa and dermal carriage of S.aureus
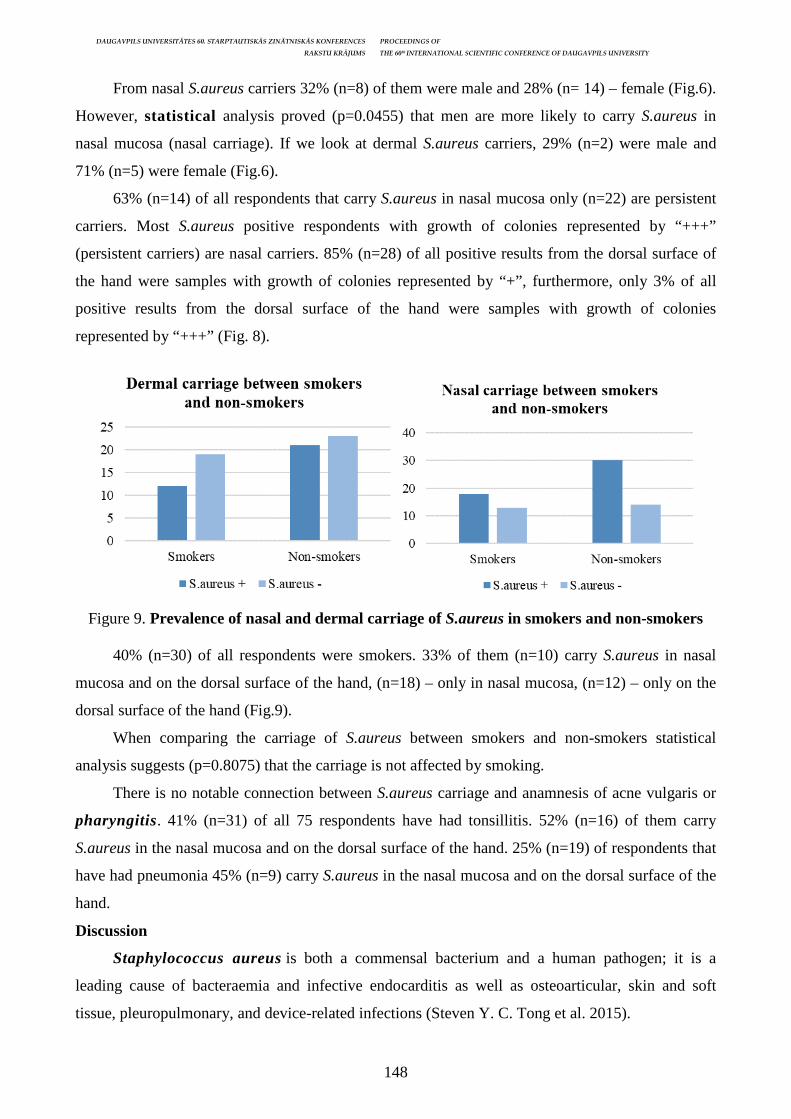
DAUGAVPILS UNIVERSITĀTES 60. STARPTAUTISKĀS ZINĀTNISKĀS KONFERENCES PROCEEDINGS OF
RAKSTU KRĀJUMS THE 60th INTERNATIONAL SCIENTIFIC CONFERENCE OF DAUGAVPILS UNIVERSITY
148
From nasal S.aureus carriers 32% (n=8) of them were male and 28% (n= 14) – female (Fig.6).
However, statistical analysis proved (p=0.0455) that men are more likely to carry S.aureus in
nasal mucosa (nasal carriage). If we look at dermal S.aureus carriers, 29% (n=2) were male and
71% (n=5) were female (Fig.6).
63% (n=14) of all respondents that carry S.aureus in nasal mucosa only (n=22) are persistent
carriers. Most S.aureus positive respondents with growth of colonies represented by “+++”
(persistent carriers) are nasal carriers. 85% (n=28) of all positive results from the dorsal surface of
the hand were samples with growth of colonies represented by “+”, furthermore, only 3% of all
positive results from the dorsal surface of the hand were samples with growth of colonies
represented by “+++” (Fig. 8).
Figure 9. Prevalence of nasal and dermal carriage of S.aureus in smokers and non-smokers
40% (n=30) of all respondents were smokers. 33% of them (n=10) carry S.aureus in nasal
mucosa and on the dorsal surface of the hand, (n=18) – only in nasal mucosa, (n=12) – only on the
dorsal surface of the hand (Fig.9).
When comparing the carriage of S.aureus between smokers and non-smokers statistical
analysis suggests (p=0.8075) that the carriage is not affected by smoking.
There is no notable connection between S.aureus carriage and anamnesis of acne vulgaris or
pharyngitis. 41% (n=31) of all 75 respondents have had tonsillitis. 52% (n=16) of them carry
S.aureus in the nasal mucosa and on the dorsal surface of the hand. 25% (n=19) of respondents that
have had pneumonia 45% (n=9) carry S.aureus in the nasal mucosa and on the dorsal surface of the
hand.
Discussion
Staphylococcus aureus is both a commensal bacterium and a human pathogen; it is a
leading cause of bacteraemia and infective endocarditis as well as osteoarticular, skin and soft
tissue, pleuropulmonary, and device-related infections (Steven Y. C. Tong et al. 2015).
DAUGAVPILS UNIVERSITĀTES 60. STARPTAUTISKĀS ZINĀTNISKĀS KONFERENCES PROCEEDINGS OF
RAKSTU KRĀJUMS THE 60th INTERNATIONAL SCIENTIFIC CONFERENCE OF DAUGAVPILS UNIVERSITY
149
S.aureus carriage has been identified as a risk factor for the development of nosocomial
infections in general hospital populations, surgical patients, and patients admitted to intensive care
units. Both community-associated and hospital-acquired infections with S.aureus have increased
in the past 20 years, and the rise in incidence has been accompanied by a rise in antibiotic-resistant
strains (Elizabeth P Baorto et al. 2017). The anterior nares have been demonstrated to harbour
staphylococci more than any other part of the body and in a very high percentage of the population.
The first person who reported that S.aureus carriage is associated with staphylococcal disease was
Professor Niels Danbolt (1931). He was a Norwegian dermatologist who proved that out of 24
patients with recurring furunculosis, 22 had staphylococci with the same biochemical properties
both in the lesions and in the nose. Therefore, he first imposed the idea that the bacteria in the nose
was responsible for the subsequent skin infection. Since then many researchers have carried out
studies to determine the incidence of carriage in the general population.
Miles, Williams, and Clayton-Cooper (1944), in a sample of a working-class population,
obtained a mean carriage rate of 47.4%; and Williams (1946), taking a series of eight weekly swabs
from a number of individuals, obtained an average carrier rate of 63% for any one week, and a total
carrier rate over the eight weeks 89% (L. G. Tulloch 1954). Nowadays it is known that 20% of the
population continuously carry S.aureus (Heiman F L et.al. 2005). Our study shows that from the
population that was included over 60% are persistent carriers, however, our study design was cross-
sectional, therefore we could analyse only the carriage amount at one specific point in time. In order
to estimate the true nature of carriage of our study participants, we had to repeat the sampling after
several weeks for multiple times, to exclude intermittent carriage. Also, our imposed method of
indicating the number of colonies representing persistent carriage might not be precise, as we did
not have any references to the exact amount of colonies needed to assume persistent carriage, even
though, it is said that the load of S.aureus is higher in persistent carriers (Heiman F L et.al. 2005).
Many studies have been published on the effect of smoking on S.aureus carriage, but the
findings are not always the same. McEachern et al. (2015) states that cigarette smoke extract
induces a general stress response leading to increased resistance to killing by macrophages, so
increasing the adherence and subsequent invasion of epithelial cells.
In a population based cohort by Bogaert, published in Lancet 2004, showed that cigarette
smoking is associated with a lower S.aureus nasal carriage rate, however, Durmaz et al. in 2001
conducted a study where an increasing colonisation rate was detected in accordance with the
increasing number of cigarettes smoked per day, and smoking period (Durmaz et al. 2001). Our
results show 33% positive carriage rate of participants with a smoking habit, and statistical analysis
did not show a connection between smoking and carriage of S.aureus. The studied population size
was only 75 individuals and most of them in the age group 20-40 years, so this finding might not
DAUGAVPILS UNIVERSITĀTES 60. STARPTAUTISKĀS ZINĀTNISKĀS KONFERENCES PROCEEDINGS OF
RAKSTU KRĀJUMS THE 60th INTERNATIONAL SCIENTIFIC CONFERENCE OF DAUGAVPILS UNIVERSITY
150
represent the true situation in the larger populations, but, as mentioned before, there are studies that
also do not find an association between smoking and S.aureus carriage, even more – they find that
in non-smoking populations, the carriage rates are lower.
The carriage rate in the general population varies with geographic location, age, sex, ethnicity
and body niches (J.U.E.Sollid 2013), these factors are not modifiable. We need to identify other
affecting factors of S.aureus colonisation and carriage that are possibly modifiable to generate new
tools for infection prevention and treatment as well as the knowledge of predicting host
susceptibility.
Conclusions
1. Most individuals that carry S.aureus in the nasal mucosa are also carriers on the dorsal surface
of the hand.
2. 63% of nasal S.aureus carriers are persistent carriers.
3. There is a connection between gender and the carriage of S.aureus.
4. Carriage of S.aureus is not affected by smoking.
5. More studies need to be conducted in order to find modifying factors that affect the
colonization and carriage of S.aureus.
References Coates T et al. Nasal decolonization of Staphylococcus aureus with mupirocin: strengths, weaknesses and future prospects, J Antimicrob Chemother. 2009 Jul; 64(1): 9–15. Durmaz R et al. Nasal carriage of methicillin-resistant Staphylococcus aureus among smokers and cigarette factory workers, New Microbiol. 2001 Apr; 24(2): 143–7. Elisa K. McEachern et al. Analysis of the Effects of Cigarette Smoke on Staphylococcal Virulence Phenotypes, 2015, Infect Immun 83: 2443–2452. Elizabeth P Baorto, et al. Staphylococcus Aureus Infection, Medcsape, Nov 01, 2017. Heiman FL Wertheim, Damian C Melles, Margreet C Vos, Willem van Leeuwen, Alex van Belkum, Henri A Verbrugh, Jan L Nouwen: The role of nasal carriage in Staphylococcus aureus infections, Lancet Infect Dis, Volume 5, No. 12, p. 751–762, Dec. 2005. J.U.E. Sollid et al. Staphylococcus aureus: Determinants of human carriage, Journal Infection, Genetics and Evolution, Volume 21, January 2014, Pages 531–541. L. G. Tulloch, Nasal carriage of staphylococcal skin infections, BMJ, Oct. 16, 1954. Otto M. Staphylococcus colonization of the skin and antimicrobial peptides. Expert review of dermatology. 2010; 5(2): 183–195. Robert S Daum et al. Skin and Soft-Tissue Infections Caused by Methicillin-Resistant Staphylococcus aureus, New England Journal of Medicine357(4): 380–90. August 2007. Tong SYC, Davis JS, Eichenberger E, Holland TL, Fowler VG. Staphylococcus aureus Infections: Epidemiology, Pathophysiology, Clinical Manifestations, and Management. Clinical Microbiology Reviews. 2015; 28(3): 603–661. Wesley E. et al. Distribution and Persistence of Staphylococcus and Micrococcus Species and Other Aerobic Bacteria on Human Skin, APPLIED MICROBIOLOGY, Sept. 1975, p. 381–395.
DAUGAVPILS UNIVERSITĀTES 60. STARPTAUTISKĀS ZINĀTNISKĀS KONFERENCES PROCEEDINGS OF
RAKSTU KRĀJUMS THE 60th INTERNATIONAL SCIENTIFIC CONFERENCE OF DAUGAVPILS UNIVERSITY
151
STAPHYLOCOCCAL TOXIC SHOCK SYNDROME: A CASE REPORT
Aija Stankeviča1, Nadežda Vorobjova1, Olga Sjomina2, Anna Proskurina3, Anatolijs Turonoks4 1 Daugavpils Regional Hospital, Vasarnīcu street 20, Daugavpils, Latvia; Riga Stradins University, Dzirciema street 16, Riga, Latvia, [email protected], [email protected] 2 Riga East University Hospital, 2 Hipokrāta Street, Riga, Latvia; University of Latvia, 1 Raina Blvd., Riga, Latvia, [email protected] 3 Pauls Stradiņš Clinical University Hospital Pilsoņu street 13, Riga, Latvia; University of Latvia, Raina blvd. 19, Riga, Latvia, [email protected] 4 Daugavpils Regional Hospital, Vasarnicu street 20, Daugavpils, Latvia, [email protected] Abstract
Staphylococcal toxic shock syndrome: a case report Key Words: Staphylococcus aureus, menstruation, toxic shock syndrome Introduction. Toxic shock syndrome (TSS) is acute multisystemic toxin-mediated condition, which results from superantigens produced by Staphylococcus aureus or A group Streptococcus. Prevalence of TSS is 0,3-1 cases per 100 000 and approximately 50% of TSS are associated with menstruation and tampon use. Clinical presentation includes fever, diffuse macular erythrodermia, desquamation of palms and soles 1-2 weeks after onset of rash, hypotension and multiorgan dysfunction. Case report. An 18-year-old woman was admitted to the department of infectology with 12-hour history of high grade temperature up to 40°C, fatigue and vomiting. Patient had a menstrual bleeding and she used a tampon on the fourth day of bleeding. Despite rehydration therapy patient remained hemodynamic unstable. Mechanical ventilation, vasopressor support, fluid resuscitation and antibacterial therapy was started, an acute kidney injury required renal replacement therapy. Patient was diagnosed with staphylococcal toxic shock syndrome because a case met the laboratory criteria - blood cultures were negative, in the same time vaginal and nasal swabs showed a growth of S. aureus. All five clinical criteria were present – fever, diffuse macular erythroderma on legs, desquamation, hypotension, multisystem involvement. The patient was discharged home following a 1-month hospital admission. Conclusion. The early recognition and appropriate management of TSS reduces mortality and other complications. Kopsavilkums
Stafilokoku toksiskā šoka sindroms: klīniskais gadījums Atslēgvārdi: Staphylococcus aureus, menstruācija, toksiskā šoka sindroms Ievads. Toksiskā šoka sindroms (TŠS) ir akūta, multisistēmu, toksīnu mediēta saslimšana. Tas ir superantigēna mediēts stāvoklis, kuru izraisa Staphylococcus aureus vai A grupas streptokoks. TŠS prevalence ir 0,3-1 gadījumi uz 100 000 un aptuveni 50% ir saistīti ar menstruāciju un tamponu lietošanu. Klīniskā prezentācija ietver drudzi, difūzu makulāru eritrodermiju, plaukstu un pēdu ādas deskvamāciju 1-2 nedēļas pēc izsitumu parādīšanās, hipotensiju un multiorgānu disfunkciju. Kl īniskais gadījums. 18 gadus veca sieviete stacionēta infektoloģijas nodaļā ar sūdzībām par ĶT līdz 40°C, nespēku un vemšanu, kas ilga 12 stundas. Pacientei iestāšanās brīdī bija menstruācija un viņa ceturtajā asiņošanas dienā lietoja higiēnisko tamponu. Neskatoties uz rehidratācijas terapiju pacientei saglabājās nestabila hemodinamika. Tika uzsākta mākslīgā plaušu ventilācija, vazopresoru atbalsts, škidruma aizvietojošā terapija un antibakteriāla terapija. Sakarā ar akūtu nieru bojājumu uzsākta nieru aizvietojoša terapija. Pacientei tika diagnosticēts stafilokoku toksiskā šoka sindroms, jo gadījums atbilda laboratoriem kritērijiem – asins kultūras bija negatīvas, tajā pašā laikā vaginālā un deguna iztriepe uzrādīja S. aureus augšanu. Sakrita pieci klīniskie kritēriji – drudzis, difūza makulāra eritrodermija uz kājām, deskvamācija, hipotensija, multisistēmu iesaiste. Paciente izrakstīta mājās pēc 1 mēneša. Secinājums. Agrīna TŠS atpazīšana un atbilstoša rīcība samazina mirstību un citas komplikācijas.
Introduction
Toxic shock syndrome (TSS) is a multi-system, acute, toxin-mediated condition caused
predominantly by superantigen toxin-producing strains of Staphylococcus aureus and Streptococcus
pyogenes (group A streptococcus) (Wilkins 2017, Gottlieb 2018). There are reports that other
infections like Streptococcus agalacticae, Streptococcus viridans, Yersinia pseudotuberculosis and
DAUGAVPILS UNIVERSITĀTES 60. STARPTAUTISKĀS ZINĀTNISKĀS KONFERENCES PROCEEDINGS OF
RAKSTU KRĀJUMS THE 60th INTERNATIONAL SCIENTIFIC CONFERENCE OF DAUGAVPILS UNIVERSITY
152
other group streptococci also may be associated with TSS but it occurs less often (Wilkins 2017,
Gottlieb 2018, Tang 2000, Baxter 2017). Superantigen stimulates immune-cell and cause cytokine
release resulting in "cytokine storm" (Lappin 2009). Supernatigen binding directly activates up to
20-40% of T-cells in comparing conventional antigen presentation activates only 0.01% of T-cells
(Lappin 2009).
Staphylococcal TSS was reported for the first time in 1978 by Todd et al., followed by
epidemic associated with highly-absorbing vaginal tampon use in 1980s (Lappin 2009, Todd 1978).
The incidence of staphylococcal TSS in 1980s among young menstruating women was 13.7 cases
per 100 000 persons (DeVries 2011). Decline of the incidence to 0.3-1 case per 100 000 inhabitants
of menstrual and non-menstrual TSS was observed after changes in tampon manufacture and usage
advices (Lappin 2009, DeVries 2011).
Non-menstrual staphylococcal TSS is more prevalent than menstrual TSS and accounts for
50- 60% of all cases (Descloux 2008, Venkataraman 2018). Risk factors for development of non-
menstrual TSS are postsurgical and postpartum wounds, soft tissue injuries, burns, gynecological
procedures, use of nasal tampons, osteomyelitis, and arthritis (Gottlieb 2018, Venkataraman 2018).
The Center for disease Control and Prevention provides the following criteria for the
diagnosis of staphylococcal TSS (Centers for Disease Control and Prevention 2011):
• Fever: temperature greater than or equal to 38.9°C
• Rash: diffuse macular erythroderma
• Desquamation (on the palms and soles): 1-2 weeks after onset of rash
• Hypotension: systolic blood pressure less than or equal to 90 mm Hg for adults or less than
fifth percentile by age for children aged less than 16 years
• Multisystem involvement (three or more of the following organ systems):
o Gastrointestinal: vomiting or diarrhea at onset of illness
o Muscular: severe myalgia or creatine phosphokinase level at least twice the upper limit
of normal
o Mucous membrane: vaginal, oropharyngeal, or conjunctival hyperemia
o Renal: blood urea nitrogen or creatinine at least twice the upper limit of normal for
laboratory or urinary sediment with pyuria (greater than or equal to 5 leukocytes per
high-power field) in the absence of urinary tract infection
o Hepatic: total bilirubin, alanine aminotransferase enzyme, or aspartate
aminotransferase enzyme levels at least twice the upper limit of normal for laboratory
o Hematologic: platelets less than 100,000/mm3
o Central nervous system: disorientation or alterations in consciousness without focal
neurologic signs when fever and hypotension are absent
DAUGAVPILS UNIVERSITĀTES 60. STARPTAUTISKĀS ZINĀTNISKĀS KONFERENCES PROCEEDINGS OF
RAKSTU KRĀJUMS THE 60th INTERNATIONAL SCIENTIFIC CONFERENCE OF DAUGAVPILS UNIVERSITY
153
• Negative results on the following tests, if obtained:
o Blood or cerebrospinal fluid cultures (blood culture may be positive for
Staphylococcus aureus)
o Negative serologies for Rocky Mountain spotted fever, leptospirosis, or measles.
A case is confirmed when it meets the laboratory criteria and all five of the clinical criteria
described above are present, including desquamation, unless the patient dies before desquamation
occurs (Centers for Disease Control and Prevention 2011).
We highlight a case report of a young female who presented with menstrual TSS. The aim of
this report is to deliver significant data and enhance understanding of this illness, its identification
and management.
Case report
An 18-year-old woman was admitted to the department of infectology with 12-hour history of
high grade temperature up to 40°C, fatigue and vomiting. None of her family members had signs of
similar illness. She had a menstrual bleeding and used a tampon on the fourth day of bleeding for
the first time in her life. Patient had a history of atopic dermatitis.
On initial examination, the patient had hypotension, tachycardia, fever and macular rash on
lower extremities. The initial diagnosis was acute gastroenteritis, but despite rehydration therapy
patient remained hemodynamic unstable and she also started to complain of lower abdominal
pain. She had raised levels of inflammatory and renal function markers (c-reactive protein –
93.8 mg/l; creatinine – 124 umol/l) and elevated serum lactate (10,8 mmol/l).
Patient was consulted by surgeon, gynecologist and intensive care physician. There were
transabdominal and transvaginal ultrasound findings of peritonitis and the patient underwent
emergency laparatomy, but no significant pathology was found during surgery. The patient
remained sedated, intubated, and ventilated in the intensive care department. Vasopressor support,
fluid resuscitation and treatment with broad-spectrum antibiotics were started. An acute kidney
injury manifested by an increase in serum creatinine level to 215 umol/l and anuria required renal
replacement therapy using continuous veno-venous hemodiafiltration. Management of the patient
was complicated by adult respiratory distress syndrome, disseminated intravascular coagulation,
that required fresh frozen plasma transfusions, and toe necrosis. Patient had significant increase in
levels of inflammatory markers in the first week of hospitalization (highest levels of c-reactive
protein and procalcitonin – 461.3 mg/l and 95.9 ng/ml, respectively). Leukocytosis was not present
on admission, but significant increase of white blood cell count was observed later (26.5 x 10 3/ µL).
Markers and cell count gradually normalized after intensive therapy.
Patient was diagnosed with staphylococcal toxic shock syndrome because a case met the
laboratory criteria - blood cultures were negative, in the same time vaginal and nasal swabs showed
DAUGAVPILS UNIVERSITĀTES 60. STARPTAUTISKĀS ZINĀTNISKĀS KONFERENCES PROCEEDINGS OF
RAKSTU KRĀJUMS THE 60th INTERNATIONAL SCIENTIFIC CONFERENCE OF DAUGAVPILS UNIVERSITY
154
a growth of methicillin-susceptible S. aureus. All five clinical criteria were present – fever
(temperature 40.0°C), rash (diffuse macular erythroderma on legs), desquamation (1 week after
onset of rash), hypotension (systolic blood pressure 60 mm Hg on admission), multisystem
involvement (gastrointestinal - vomiting at onset of illness, renal – the highest serum creatinine
level during hospitalization – 215umol/l, hepatic-alanine aminotransferase enzyme and aspartate
aminotransferase enzyme highest levels – 171 U/L and 165 U/L, hematologic – the lowest level of
platelets - 25,000/mm3).
The patient received treatment in intensive care unit for 2 weeks and was discharged home
following a 1-month hospital admission.
Discussion
S. aureus is a dangerous pathogen that can cause many severe and even life-threatening
diseases. It possesses a variety of virulence factors, including several toxins (Otto 2014). In 95% of
menstrual TSS and about 50% of non-menstrual TSS, staphylococcal toxic shock syndrome
toxin 1 (TSST-1) is identified as the causative agent (Lappin 2009). TSST-1 causes TSS by
stimulating massive release of IL-1, IL-2, TNF-α, and other cytokines (Otto 2014). S. aureus
produces TSST-1 up to a threshold concentration, which then enters the bloodstream and induces
systemic illness (Sarafian 1987, Davis 2003). It is thought that most people develop immunity to
TSST-1 superantigen early in life but those with insufficient antibody titers are at risk of TSS if
they are colonized with TSST-1 producing S. aureus (Parsonnet 2005). According to literature data,
up to 5% of healthy women have vaginal colonization with toxin-producing strains of S. aureus.
(Lappin 2009). As we reported, vaginal swabs of our patient also showed growth of S. aureus.
The first symptoms of the disease typically are myalgias, generalized weakness, sore throat
and headache, along with watery diarrhea. It then progresses rapidly, especially in previously
healthy subjects, with diffuse erythroderma, vomiting, oliguria, and extremity edema. Possible
neurologic signs and symptoms include headache, confusion, somnolence and agitation, with severe
neurologic manifestations commonly a result of cerebral edema. Pulmonary edema, decreased
cardiac contractility, and pleural effusion can also occur. Decreased vascular resistance and
increased fluid shift from intravascular space lead to hypotension. Skin changes are also a common
finding in TSS. Initially, the disease presents with diffuse erythroderma and can involve both the
skin and mucous membranes. Desquamation typically develops 1–3 weeks after the onset of
disease. Notably, patients with TSS due to TSST-1 demonstrate more symptoms due to the toxin,
and not the primary site of infection, as the toxin may suppress neutrophil function and thus reduce
the signs of infection (Gottlieb 2018). As the clinical presentation is initially nonspecific, patients
can be misdiagnosed with gastroenteritis, influenza, or other viral illness. It occurred in our
described case as well, where initial clinical presentation was interpreted as acute gastroenteritis.
DAUGAVPILS UNIVERSITĀTES 60. STARPTAUTISKĀS ZINĀTNISKĀS KONFERENCES PROCEEDINGS OF
RAKSTU KRĀJUMS THE 60th INTERNATIONAL SCIENTIFIC CONFERENCE OF DAUGAVPILS UNIVERSITY
155
Similar cases have been reported, with non-specific initial clinical picture, rapid worsening
and multiorgan disfunction. LeRiche reported a clinical case of a 15-year-old girl experiencing
nausea, vomiting, and diarrhea that worsened over a 3-day period. She presented to the hospital
with hypotension, febrility and tachycardia. Her condition deteriorated and within 36 hours she
required intubation and vasopressor treatment. The vaginal culture was positive for S. aureus. She
had a history of recent menses with tampon use (LeRiche 2012). TSS with non-specific clinical
picture at presentation was also described by McDermott - a 15-year-old girl presented to the
Emergency Department complaining of a single day history of lower abdominal pain, muscle aches,
diarrhoea, and vomiting. She had a tampon in situ for 24 hours for menstrual bleeding (McDermott
2015).
Treatment strategy of TSS includes supportive management and source control, antibacterial
therapy and adjuvant therapy (Wilkins 2017). Broad-spectrum antibiotics with coverage against S.
aureus and S. pyogenes should be administrated (Wilkins 2017, Gottlieb M). Adjuvant therapy
includes clindamycin to reduce bacterial superantigen production, intravenous immunoglobulin to
suppress T-cell activation and cytokine production (Wilkins 2017, Lappin 2009).
TSS can recur, more frequently with the menstrual form than non-menstrual, and is believed
to occur in up to one third of patients with a previous episode of menstrual TSS. Patients at risk for
recurrence are those with persistent colonization with toxin-producing S. aureus and at the same
time absence of neutralizing antibodies against the toxin. Patients at risk for recurrent TSS can be
identified by performing antibody testing and advised to avoid using tampons in the future
(Andrews 2001). Prompt administration of an anti-staphylococcal antibiotic is crucial for first-time
or recurrent menstrual TSS.
Intravaginal sanitary products such as tampons promote menstrual TSS indirectly by
providing a growth medium for S. aureus present in the vagina, with favorable temperature,
atmospheric (oxygen) and pH (acidic) conditions (Melish 1989). Menstrual TSS was initially
described with the use of tampons made of high-absorbency fibers, which favoured S. aureus
growth and toxin production (Kehrberg 1981). Although these materials are no longer used for
tampon production, menstrual TSS continues to occur in women using currently marketed tampons,
such as in the case presented here. A case of menstrual TSS in a woman using a silicone menstrual
cup was reported recently (Mitchell 2015). In a recent study Nonfoux et al. observed higher S.
aureus growth and toxin production in menstrual cups compared to tampons, potentially due to
additional air introduced with the insertion of cups. It was found that S. aureus forms a compact
biofilm on cups, which cannot be removed with simple washing with water (Nonfoux 2018).
DAUGAVPILS UNIVERSITĀTES 60. STARPTAUTISKĀS ZINĀTNISKĀS KONFERENCES PROCEEDINGS OF
RAKSTU KRĀJUMS THE 60th INTERNATIONAL SCIENTIFIC CONFERENCE OF DAUGAVPILS UNIVERSITY
156
Conclusion
Cases of menstrual TSS have decreased, but still occur despite changes in tampon
manufacture, the early recognition and appropriate management of TSS reduces mortality and
complications.
References Andrews MM, Parent EM, Barry M et al. 2001. Recurrent nonmenstrual toxic shock syndrome: clinical manifestations, diagnosis, and treatment. In: Clin Infect Dis: Vol. 32; pp. 1470. Baxter M., Morgan M. 2017. Streptococcal Toxic Shock Syndrome Caused by Group G Streptococcus, United Kingdom. In: Emerging Infectious Diseases. Vol. 23(1), pp. 127–129. Centers for Disease Control and Prevention. Toxic Shock Syndrome (Other Than Streptococcal) (TSS) 2011 Case Definition. [skatīts 14.05.2018]. Pieejams (Accessed): https://wwwn.cdc.gov/ nndss/conditions/toxic-shock-syndrome-other-than-streptococcal/case-definition/2011/ Davis C, Kremer M, Schlievert P et al. 2003. Penetration of toxic shock syndrome toxin-1 across porcine vaginal mucosa ex vivo: permeability characteristics, toxin distribution, and tissue damage. In: Am. J. Obstet. Gynecol. Vol. 189; pp. 1785–1791. Descloux E., Perpoint T., Ferry T. et al. 2008. One in five mortality in non-menstrual toxic shock syndrome versus no mortality in menstrual cases in a balanced French series of 55 cases. In: European Journal of Clinical Microbiology & Infectious Diseases. Vol. 27(1), pp. 37–43. DeVries A.S., Lesher L., Schlievert P.M. et al. 2011. Staphylococcal toxic shock syndrome 2000–2006: epidemiology, clinical features, and molecular characteristics. In: PLOS One. Vol. 6(8), pp. 22997. Gottlieb M., Long B., Koyfman A. 2018. The Evaluation and Management of Toxic Shock Syndrome in the Emergency Department: A Review of the Literature. In: The Journal of Emergency Medicine. Vol. 1, pp. 1–8. Kehrberg M., Latham R., Haslam B. et al. 1981. Risk factors for staphylococcal toxic-shock syndrome. In: Am. J. Epidemiol. Vol. 114; pp. 873–879. Lappin E., Ferguson A.J. 2009. Gram-positive toxic shock syndromes. In: The Lancet Infectious Diseases. Vol. 9(5), pp. 281–90. LeRiche T, Black AY, Fleming NA. 2012. Toxic Shock Syndrome of a Probable Gynecologic Source in an Adolescent: A Case Report and Review of the Literature. In: Journal of Pediatric and Adolescent Gynecology. Vol. 25, Issue 6, pp. 133–137. McDermott C, Sheridan M. 2015. Staphylococcal toxic shock syndrome caused by tampon use. In: Case Rep Crit Care. doi: 10.1155/2015/640373. [skatīts 12.05.2018.]. Pieejams (Accessed): https://www.hindawi.com/journals/cricc/2015/640373/ Melish M., Murata S., Fukunaga C. et al. 1989. Vaginal tampon model for toxic shock syndrome. In: Rev. Infect. Dis. 11 (Suppl 1) pp. 238–246. Mitchell M., Bisch S., Arntfield S. et al. 2015. A confirmed case of toxic shock syndrome associated with the use of a menstrual cup. In: Can. J. Infect. Dis. Med. Microbiol. 26, pp. 218–220. Nonfoux L., Chiaruzzi M., Badiou C. et al. 2018. Impact of currently marketed tampons and menstrual cups on Staphylococcus aureus growth and TSST-1 production in vitro. In: Appl Environ Microbiol. doi: 10.1128/AEM.00351-18, [skatīts 15.05.2018.] Pieejams (Accessed): http://aem.asm.org/content/early/2018/04/02/AEM.00351-18.abstract Otto M. 2014. Staphylococcus aureus toxins. In: Curr Opin Microbiol. February; 0; pp. 32–37. Parsonnet J, Hansmann MA, Delaney ML, et al.2005. Prevalence of toxic shock syndrome toxin 1-producing Staphylococcus aureus and the presence of antibodies to this superantigen in menstruating women. In: J Clin Microbiol; Vol. 43(9); pp. 4628–34. Sarafian S, Morse S. 1987. Environmental factors affecting toxic shock syndrome toxin-1 (TSST-1) synthesis. In: J. Med. Microbiol. 24; pp.75–78.

DAUGAVPILS UNIVERSITĀTES 60. STARPTAUTISKĀS ZINĀTNISKĀS KONFERENCES PROCEEDINGS OF
RAKSTU KRĀJUMS THE 60th INTERNATIONAL SCIENTIFIC CONFERENCE OF DAUGAVPILS UNIVERSITY
157
Tang W. M., Ho P. L., Yau W. P. et al. 2000. Report of 2 fatal cases of adult necrotizing fasciitis and toxic shock syndrome caused by Streptococcus agalactiae. In: Clinical Infectious Diseases. Vol. 31(4), pp. E15-7. Todd J., Fishaut M., Kapral F., Welch T. 1978. Toxic-shock syndrome associated with phage-group-I staphylococci. In: Lancet. Vol. 312, pp. 1116–1118. Venkataraman R., 2018. Toxic shock syndrome. [skatīts 14.05.2018]. Pieejams (Accessed): https://emedicine.medscape.com/article/169177-overview Wilkins A.L., Steer A.C., Smeesters P.R. et al. 2017. Toxic shock syndrome – the seven Rs of management and treatment. In: Journal of Infection. Suppl 1. pp. S147-S152.

DAUGAVPILS UNIVERSITĀTES 60. STARPTAUTISKĀS ZINĀTNISKĀS KONFERENCES PROCEEDINGS OF
RAKSTU KRĀJUMS THE 60th INTERNATIONAL SCIENTIFIC CONFERENCE OF DAUGAVPILS UNIVERSITY
158
TREATMENT APPROACHES OF GASTROESOPHAGEAL REFLUX DISEASE IN GENERAL PRACTICE
Linda Mežmale1, Anna Kr īgere1, scientific research supervisor: Aldis Puķītis1, 2
1 Faculty of Medicine, University of Latvia, Latvia, [email protected], [email protected] 2 Pauls Stradins Clinical University Hospital Gastroenterology, Hepathology and Nutrion Center, [email protected] Abstract
Treatment approaches of gastroesophageal reflux disease in general practice Key Words: GERD, proton pump inhibitors, lifestyle changes, general practitioners, omeprazole Introduction. Treatment of gastroesophageal reflux disease (GERD) is based on combination of diet, lifestyle recommendations and effective medicine. If any of the components are missing, the effectiveness of treatment drops. Aim. To evaluate pharmacological treatment and lifestyle recommendations for patients with GERD prescribed by general practitioners in Latvia. Material and methods. General practitioners (GP) registered in The National Health Service database filled quantitative survey questionnaire; 201 completed replies were received. Statistical analysis was performed with Microsoft Excel and SPSS 22.0 by using Pearson's chi-squared test. The level of statistical significance was set at p<0.05. Results. Most GPs from Riga 29%, Kurzeme 30% regions first line choice is esomeprazole (p=0.0000). GPs in Vidzeme 34% (p=0.0001) and Zemgale 33% (p=0.0000) regions choose pantoprazole, but in Latgale 37% (p=0.0063) omeprazole. Use of H2 antagonists was low in all groups. First choice antacids in all Latvian regions were aluminium and magnesium based. Most popular prokinetic in Riga 39% and Kurzeme 34% regions was domperidone (p=0.0000), but in Zemgale 39%, Vidzeme 42% and Latgale 36% was metoclopramide (p=0.0000). The most popular lifestyle recommendations were - stop smoking, reduce weight, avoid eating before lying down, avoid overeating. Majority recommended to avoid spicy foods, avoid sweets and to avoid citrus fruits. Conclusions. Our data showed existing differences in pharmacological treatment, diet and lifestyle recommendations for GERD patients in different regions of Latvia. The decision making for PPI varies between esomeprazole, pantoprazole and omeprazole. The most used antacids were aluminium and magnesium based, and the most used prokinetics were metoclopramide and domperidone. Kopsavilkums
Gastroezofegālā refluksa slimības ārstēšanas metodes ģimenes ārstu praksē Atslēgvārdi: GERS, protonu sūkņu inhibītori, dzīvesveida izmaiņas, ģimenes ārsti, omeprazols Ievads. Gastroezofageālās refluksa slimības ārstēšana balstās uz diētu, dzīvesveida rekomendācijām un effektīvām zālēm. Ja kāda no šīm sastāvdaļām trūkst, ārstēšanas efektivitāte samazinās. Mērķis. Izvērtēt farmakoloģisko ārstēšanu un dzīvesveida rekomendācijas pacientiem ar gastroezofegālo slimību, ko prakstizē Latvijas ģimens ārsti. Materi āli un metodes. Ģimenes ārsti, ka ir reģistrēti Valsts Veselības dienesta datubāzē aizpildīja kvantitatīvās aptaujas anketu. Kopumā tika saņemtas 201 aizpildītā anketa. Statistiskā analīze tika veikta ar Microsoft Excel un SPSS 22.0, izmantojot Perarson chi-squared testu. Statistiskās nozīmības līmenis tika noteikts p<0.05. Rezultāti. Lielākā daļa ārstu no Rīgas - 29% un Kurzemes - 30% reģioniem pirmās izvēles protonsūkņi bija esomeprazols (p=0.0000). Ģimenes ārsti no Vidzemes - 34% (p=0.0001) un Zemgales – 33% (0.0000) izvēlas pantoprazolu, bet Latgalē - 37% (p=0.0063) izvēlas omeprazolu. H2 antagonistu lietošana bija zema visās grupās. Pirmās izvēles antacīdi visos Latvijas reģionos bija alumīnija un magnija bāzes antacīdi. Populārākie prokinētiķi Rīgā - 39% un Kurzemē – 34% bija domperidons (p=0.0000), bet Zemgalē - 39%, Vidzemē – 43% un Latgalē – 36% bija metaklopramīds (p=0.0000). Populārākie dzīvesveida ieteikumi pacientiem bija – pārtraukt smēķēšanu, samazināt ķermeņa masu, izvairīties no ēšanas pirms gulētiešanas. Vairums ģimenes ārsu ieteica izvairīties no asiem ēdieniem, saldumiem un citrus augļiem.
Introduction
Gastroesophageal reflux disease (GERD) is defined as the retrograde movement of gastric
contents through the lower esophageal sphincter into the esophagus. The pathophysiology of GERD

DAUGAVPILS UNIVERSITĀTES 60. STARPTAUTISKĀS ZINĀTNISKĀS KONFERENCES PROCEEDINGS OF
RAKSTU KRĀJUMS THE 60th INTERNATIONAL SCIENTIFIC CONFERENCE OF DAUGAVPILS UNIVERSITY
159
involves impaired esophageal motility, lower esophageal sphincter, and gastric motility (Mikami et
al 2015).
GERD is an extremely common syndrome. The most common symptoms of GERD in adults
are acidic taste in the mouth, regurgitation, and heartburn (Zajac et al 2012). Besides heartburn, the
most common symptoms are dysphagia, noncardiac chest pain, cough, pharyngitis, sinusitis,
hoarseness, laryngitis, dental erosions. GERD has potentially serious complications, including
strictures, erosive esophagitis and the development of Barrett esophagus, a metaplastic change of
the lining of the esophagus that is associated with an increased risk of adenocarcinoma of the
esophagus (Shaheen et al 2002).
Treatment of GERD involves a stepwise approach. The goals are to control symptoms and to
prevent recurrent complication. Treatment of GERD is based on combination of diet, lifestyle
recommendations and effective medicine (Katz et al 2007). If any of the components are missing,
the effectiveness of treatment drops.
In mild cases of GERD, lifestyle modifications are the first line of therapy and can lead to
improvement or elimination of symptoms (Kiefer et al 2017), but reviewing the earlier literature
concluded that the effectiveness of this treatment has not been assessed (Katelaris 2002). That is
why nowadays acid suppression drugs are often used. Three types of medicines are commonly used
to treat GERD: proton pump inhibitors, antacids and h2-receptors.
As it is known, initially patients with first complain about GERD turn to their general
practitioners and if the patients are still complaining they turn to a gastroenterologist whose
treatment principles are well-known, but what about general practitioners? What kind of treatment
approaches they use? This is the first study about treatment approaches of GERD in general practice
in Latvia. The aim of the study was to evaluate pharmacological treatment and lifestyle
recommendations for patients with GERD prescribed by general practitioners in all Latvian regions.
Materials and methods
Participants
All practicing GPs (general practitioners) who registered in The National Health Service
database were surveyed using an electronic questionnaire. In Latvia GPs are divided into five
regional territories - Riga, Kurzeme, Latgale, Zemgale, Vidzeme. 1551 surveys were sent to GPs
from all regions of Latvia.
Questionnaire
The questionnaire contained 17 questions which sought information about the GPs and their
practice, what kind of treatment they choose to GERD patients, which is the best lifestyle and diet
recommendations to GERD patients, which pharmacological treatment they choose, their beliefs
DAUGAVPILS UNIVERSITĀTES 60. STARPTAUTISKĀS ZINĀTNISKĀS KONFERENCES PROCEEDINGS OF
RAKSTU KRĀJUMS THE 60th INTERNATIONAL SCIENTIFIC CONFERENCE OF DAUGAVPILS UNIVERSITY
160
about the effectiveness of such treatment, and their opinions about their patients' willingness to
make these changes.
The demographic questions provided information about GPs gender, age, age of work
experience, current work location (region), average number of patient consultations per week, and
the number of registered patients in practice.
The other questions were related to GERD. “The average age of a GERD patient in your
practice?” with response options: <25; 25-35; 36-55; 56-70; >70. “How many new patients with
GERD do you see per year?” with response options: 0-2; 3-6; 7-10; 11-15; 16-20; >20.
Then we asked about GERD treatment. “What is your first line of treatment for GERD
patients?” with response options: lifestyle changes, usage of proton pump inhibitors, surgical
treatment. “Which of the following diet changes do you consider as effective treatments for
GERD?” with response options: avoid sweets, observe low fat diet, avoid spicy food, avoid citrus
fruits, avoid drinking during a meal, avoid too cold or warm food, avoid milk products, use water
with high pH, other – please specify. The next question was “Which of the following lifestyle
changes do you think are effective treatments for GERD?” with response options: elevate the head
of the bed, sleep on the left side, sleep on the right side, eating regular, regular sleep schedule, avoid
eating before lying down, avoid physical exercises, avoid overeating, stop smoking, increase
physical activity to strengthen diaphragm, reduce weight if overweight, other – please specify. Then
we asked “What proportion of patients with GERD do you think could significantly reduce the
severity and frequency of their GERD symptoms by modifying their lifestyle?” with response
options: 5%, 10%, 15%, 20%, >20%. “What proportion of patients with GERD do you think are
prepared to make these changes?” with response options: 0%, <25%, 26%-50%, 51%-75%. “What
extend does lifestyle affect the improvement of GERD patients?” with response options: not
affected, strongly affected, moderately affected. The last three questions were: “What kind of
proton pump inhibitors you choose for GERD patients?” with response options: esomeprazolum,
omeprazolum, lansoprazolum, pantoprazolum, rabeprazolum. “What kind of antacid you choose for
GERD patients?” with response options: aluminium hydroxide and magnesium carbonate based,
aluminium hydroxide and magnesium hydroxide based, aluminium hydroxide, magnesium hydroxide
and benzocainum based, calcium carbonate and magnesium carbonate based. “Which of the
following medicine do you recommend using in addition to GERD patient?” with response options:
activated carbon, baclofen, bisbuthi subcitras, domperidon, metoclopramide, sucralfate, not
recommended.
Statistical analysis
Statistical analysis was performed with Microsoft Excel and SPSS 22.0 by using Pearson's
Chi-squared test. Pearson’s Chi-square tests were used to investigate the associations between
DAUGAVPILS UNIVERSITĀTES 60. STARPTAUTISKĀS ZINĀTNISKĀS KONFERENCES PROCEEDINGS OF
RAKSTU KRĀJUMS THE 60th INTERNATIONAL SCIENTIFIC CONFERENCE OF DAUGAVPILS UNIVERSITY
161
regions and lifestyle changes, diet recommendations and pharmacological treatment. The level of
statistical significance was set at p<0.05.
Results
Participants
Out of the 1551 sent surveys, 201 completed replies were received. The response rate from
Riga region was 32.3%, from Zemgale – 20.4%, from Kurzeme – 18.9%, from Vidzeme – 15.9%,
and from Latgale – 12.4%. Most respondents were female 86.1%, male were only 13.9%. GPs age
was between 27 and 78, median age was 51, but range of the work experience was between 0.5 and
55 years, median work experience was 25 years. The number of registered patients in each GPs
practice was significantly different – ranging from 400 to 4300 patients, depending on the work
area. The average number of patient consultations per week was 108 in each practice.
GERD patients
The following responses were provided to the question: “The average age of a GERD patient
in your practice?”: <25 (1.0%), 25-35 (19.9%), 36-55 (60.2%), 56-70 (17.9%), >70 (1%). “How
many new patients with GERD do you see per year?”: 0-2 (1.0%), 3-6 (24.4%), 7-10 (31.3%), 11-
15 (18.4%), 16-20 (19.4%), >20 (5.0%).
Treatment of GERD
The first question about GERD treatment was “What is your first line of treatment for GERD
patients?”: the lifestyle changes (32.0%), use proton pump inhibitors (67.0%), surgical treatment
(1.0%). In addition, 3 further comments were made about H2 antagonists regiments.
Lifestyle and diet recommendations were reviewed for each region individually. We asked all
GPs from five Latvia regions: “Which of the following diet changes do you think are effective
treatments for GERD?” – out of 8 options GPs from all regions chose different diet
recommendations, but all of them chose exactly the same 3 diet recommendations: avoid spicy food,
avoid citrus fruits and avoid sweets. These results show the most popular diet recommendation
among Latvian GPs, regardless of their practice region (Table 1).
Table 1. GPs responses to the question “Which of the following diet changes
do you think are effective treatments for GERD?”
Diet reccomendation Riga (%) Vidzeme (%) Zemgale (%) Kurzeme (%) Latgale (%) Avoid spicy food 27 24 25 28 29 Avoid citrus fruits 20 14 18 12 14 Avoid sweets 14 16 18 22 16 Observe low fat diet 12 12 9 9 11 Avoid drinking during a meal 11 10 9 7 11 Avoid too cold or warm food 9 11 11 10 11 Use water with high pH 4 6 1 5 7 Avoid milk products 3 7 8 7 1
P 0.0000 0.0196 0.0000 0.0000 0.0003
DAUGAVPILS UNIVERSITĀTES 60. STARPTAUTISKĀS ZINĀTNISKĀS KONFERENCES PROCEEDINGS OF
RAKSTU KRĀJUMS THE 60th INTERNATIONAL SCIENTIFIC CONFERENCE OF DAUGAVPILS UNIVERSITY
162
After diet recommendation we asked to choose from a list of lifestyle recommendation:
“Which of the following lifestyle changes do you think are effective treatments for GERD?” – our
results show that out of 12 options the largest part of GPs chose the same lifestyle recommendation,
regardless of their practice region. Top four recommendations were: avoid eating before lying
down, avoid overeating, stop smoking, and reduce weight, if overweight.
Table 2. GPs responses to the question “Which of the following lifestyle changes do you think are effective treatments for GERD?”
Lifestyle reccomendation Riga (%) Vidzeme (%) Zemgale (%) Kurzeme (%) Latgale (%)
Avoid eating before lying down 15 15 14 13 14 Avoid overeating 14 17 15 14 16 Stop smoking 16 13 15 15 14 Reduce weight, if overweight 14 13 13 14 16 Elevate the head of the bed 12 12 12 10 12 Sleep on the right side 1 2 1 1 0 Sleep on the right side 1 0 1 1 0 Eating regular 11 10 11 12 12 Regular sleep schedule 5 6 4 6 5 Avoid physical exercises 6 7 7 7 4 Increase physical activity to strengthen diaphragm
5 5 5 6 7
Other 1 1 2 0 0 P 0.0000 0.0000 0.0000 0.0000 0.0000
Based on the lifestyle and diet recommendation of the GPs, we wanted to find out what
proportion of patients with GERD could significantly reduce the severity and frequency of their
GERD symptoms by modifying their lifestyle and what proportion of patients with GERD are
prepared to make these changes. Our results show that the largest part - 48.8% of GPs believe that
lifestyle changes could help >20% patients (Table 3), but only <25% are ready to change their
lifestyle (Table 4).
Table 3. GPs responses to the question “What proportion of patients with GERD do you think could significantly reduce the severity and frequency of
their GERD symptoms by modifying their lifestyle?”
Patients (%) Patients who could significantly reduce symptoms (%) 5% 5.0% 10% 13.9% 15% 13.4% 20% 18.9%
>20%. 48.8%
Table 4. GPs responses to the question “What proportion of patients with GERD
do you think are prepared to make these changes?”
Patients (%) Patients who could significantly reduce symptoms (%) 0% 3.5%
<25% 70.6% 26%-50% 20.9% 51%-75% 5.0%
DAUGAVPILS UNIVERSITĀTES 60. STARPTAUTISKĀS ZINĀTNISKĀS KONFERENCES PROCEEDINGS OF
RAKSTU KRĀJUMS THE 60th INTERNATIONAL SCIENTIFIC CONFERENCE OF DAUGAVPILS UNIVERSITY
163
One of the last questions about GERD lifestyle recommendations was: “To what extent does
lifestyle affect the improvement of GERD patients?”. Our results show that 55.7% GPs believe that
lifestyle strongly affects the improvement of GERD patients, 43.8% believe that lifestyle
moderately affects and only 0.5% believe that lifestyle does not affect (Figure 1).
Figure 1. GPs responses to the question “What extent does lifestyle affects the improvement of GERD patients?”
The last three questions were about pharmacological treatment of GERD patient. We wanted
to know what kind of proton pump inhibitors, antacids and addition medication Latvian GPs chose
in their practice.
Our GPs responded about proton pump inhibitors: the Riga region GPs more often use
esomeprazolum (29%), the largest part of Vidzeme (34%) and Zemgale (33%) regions GPs use
pantoprazolum, Kurzeme’s GPs use esomeprazolum (30%) and pantoprazolum (30%), and
Latgale’s GPs use omepazolum (37%). Decision making in the pharmacological treatment of GERD
is related to GPs location of practice (p=0.0000).
Table 5. GPs responses to the question “What kind of proton pumps inhibitors
you choose for GERD patients?”
Unlike proton pump inhibitors all GPs chose the same antacid. First choice antacids in all
Latvian regions were aluminium hydroxide + magnesium hydroxide based: Riga (42%), Vidzeme
(35%), Zemgale (40%), Kurzeme (32%), Latgale (34%) (Table 6).
Medication Riga (%) Vidzeme (%) Zemgale (%) Kurzeme (%) Latgale (%) Esomeprazolum 29 22 29 30 28 Lansoprazolum 9 2 5 4 10 Omeprazolum 28 28 27 25 37 Pantoprazolum 27 34 33 30 21 Rabeprazolum 7 14 6 11 4
P 0.0000 0.0000 0.0000 0.0000 0.0001

DAUGAVPILS UNIVERSITĀTES 60. STARPTAUTISKĀS ZINĀTNISKĀS KONFERENCES PROCEEDINGS OF
RAKSTU KRĀJUMS THE 60th INTERNATIONAL SCIENTIFIC CONFERENCE OF DAUGAVPILS UNIVERSITY
164
Table 6. GPs responses to the question “What kind of antacid you choose for GERD patients?”
The last pharmacological question was about additional medicines. We gave a list of different
medicaments: metoclopramide, domperidone, bisbuthi subcitras, activated carbon, baclofen,
sucralfate and one option was – not recommend. The biggest part of all GPs, regardless of the
region, use metoclopramide and domperidone in their practice (p=0.0000).
Table 7. GPs responses to the question “Which of the following medicine do you recommend using in addition to GERD patient?”
Medication Riga (%) Vidzeme (%) Zemgale (%) Kuzeme (%) Latgale (%) Metoclopramide 31 42 39 31 36 Domperidone 39 33 35 34 24 Bisbuthi subcitras 10 2 11 10 12 Activated carbon 4 1 2 7 0 Baclofen 7 4 4 3 18 Sucralfate 7 9 9 13 7 not recommend 2 9 0 2 3
P 0.0000 0.0000 0.0000 0.0000 0.0001
Discussion
In general the evaluation of the study showed low responsiveness; from 1551 surveys only
201 completed replies were received. It should be noted that the surveys were sent again in a two
week interval. For the first time 157 replies were received, but after the reminder another 44 were
received back.
The major findings of our survey were that the major of Latvian GPs use proton pump
inhibitors as the first line treatment (67.0%) for GERD patient, which does not coincide with
recommendation of gastroenterologist guidelines (Katz et al 2013). More than a half (55.7%) of GPs
believe that lifestyle strongly affects the improvement of GERD patients, and the majority of GPs
believed that many of their patients would benefit from lifestyle and diet changes (48.8%), but
nonetheless their choice was pharmacological treatment as the first method. It is probable that this is
due to the fact that only <25% patients are prepared to make changes (70.6%) in their lifestyle.
Medication Riga (%) Vidzeme (%) Zemgale (%) Kurzeme (%) Latgale (%) aluminium hydroxide + magnesium carbonate
8 11 8 5 17
aluminium hydroxide + magnesium hydroxide
42 35 40 32 34
aluminium hydroxide + magnesium hydroxide + benzocainum
25 22 37 31 29
calcium carbonate + magnesium carbonate
23 22 9 29 20
P 0.0000 0.0000 0.0000 0.0000 0.0001
DAUGAVPILS UNIVERSITĀTES 60. STARPTAUTISKĀS ZINĀTNISKĀS KONFERENCES PROCEEDINGS OF
RAKSTU KRĀJUMS THE 60th INTERNATIONAL SCIENTIFIC CONFERENCE OF DAUGAVPILS UNIVERSITY
165
The largest part of included GPs in this study chose the same lifestyle and diet
recommendations, regardless of their practice region. Top three diet recommendations from GPs
were to avoid spicy food, avoid sweets and avoid citrus fruits, but from lifestyle recommendations
the majority chose - avoid eating before lying down, avoid overeating, stop smoking, and reduce
weight, if overweight. Similar study about lifestyle changes as a treatment of GERD patients in GPs
was created in Australia, 2005. Their results showed that the majority of GPs recommend: avoid
alcohol (71.3%), avoid eating before lying down (76.5%), elevate the head of the bed (72.1%),
reduce weight, if overweight (79.4%) (Nowak et al 2005). Two lifestyle recommendations from our
top four were the same as Australian GPs. Although in Latvia to stop smoking was one of the most
popular recommendations in all regions, in Australia this suggestion was rarely chosen (17.6%)
(Nowak et al 2005).
If we look at pharmacological treatment, our results show that Latvian GPs use different kind
of proton pump inhibitor in their practice, depending on the region of GPs practice, but their choice
for antacids and additional medicines was the same. It is worth noting that the H2-receptor
antagonists were selected by only 2 of the 201 GPs, but, as it is known, the two primary medications
used to treat GERD are proton pump inhibitors and H2-receptor antagonists (MacKnight et al 2005).
Conclusions
� Latvian GPs chose the first line treatment proton pumps inhibitors for GERD patients.
� The majority of GPs recommended the same diet suggestions: avoid spicy food, avoid citrus
fruits, avoid sweets; and the same lifestyle changes: avoid eating before lying down, avoid
overeating, stop smoking, reduce weight if overweight, regardless of their practice region.
� The decision making for proton pump inhibitors varies between esomeprazole, pantoprazole
and omeprazole, depending on the region of GPs practice.
� The most popular antacid which is chosen by GPs are aluminium hydroxide + magnesium
hydroxide based antacids in all Latvian regions.
� Of our additional medications, all GPs preferred metoclopramide and domperidone; other
medication had a low selection.
References Casey E, Mistry DJ, MacKnight JM. Training room management of medical conditions: sports gastroenterology. Clin Sports Med 24: 525–540, 2005. Katelaris P, Holloway R, Talley N, et al. Gastro-oesophageal reflux disease in adults: guidelines for clinicians. J Gastroenterol Hepatol. 2002; 17: 825–33. Digestive Health Foundation of the Gastroenterological Society of Australia. Katz PO. Medical therapy for gastroesophageal reflux disease in 2007. Rev Gastroenterol Disord. 2007 Fall. 7(4): 193–203. Mikami D.J., and Murayama K.M. Physiology and pathogenesis of gastroesophageal reflux disease. Surg Clin North Am 2015; 95: pp. 515–525.
DAUGAVPILS UNIVERSITĀTES 60. STARPTAUTISKĀS ZINĀTNISKĀS KONFERENCES PROCEEDINGS OF
RAKSTU KRĀJUMS THE 60th INTERNATIONAL SCIENTIFIC CONFERENCE OF DAUGAVPILS UNIVERSITY
166
Nowak, M., Büttner, P., Raasch, B., Daniell, K., McCutchan, C., & Harrison, S. (2005). Lifestyle changes as a treatment of gastroesophageal reflux disease: a survey of general practitioners in North Queensland, Australia. Therapeutics and Clinical Risk Management, 1(3), 219–224. Philip O. Katz, MD 1, Lauren B. Gerson, MD, MSc 2 and Marcelo F. Vela, MD, MSCR. Guidelines for the Diagnosis and Management of Gastroesophageal Refl ux Disease. Am J Gastroenterol 2013; 108: 308–328; doi: 10.1038/ajg.2012.444 Shaheen N, Ransohoff DF. Gastroesophageal Reflux, Barrett Esophagus, and Esophageal CancerScientific Review. JAMA. 2002; 287(15): 1972–1981. doi: 10.1001/jama.287.15.1972 Zajac P, Holbrook A, Super ME, Vogt M (March–April 2013). “An overview: Current clinical guidelines for the evaluation, diagnosis, treatment, and management of dyspepsia.” Osteopathic Family Physician. 5 (2): 79–85. doi: 10.1016/j.osfp.2012.10.005
DAUGAVPILS UNIVERSITĀTES 60. STARPTAUTISKĀS ZINĀTNISKĀS KONFERENCES PROCEEDINGS OF
RAKSTU KRĀJUMS THE 60th INTERNATIONAL SCIENTIFIC CONFERENCE OF DAUGAVPILS UNIVERSITY
167
MICROVASCULAR TISSUE TRANSFER SURGERY: FLAP SURVIVAL ANALYSIS
Vadim Nefjodov1, Janis Zarins2, Kalvis Pastars2, Dzintars Ozols2 1 Riga Stradins University, Dzirciema Str. 16, Riga, Latvia, LV-1007, [email protected] 2 The Centre of Plastic and Reconstructive Microsurgery of Latvia, Hipokrāta Str. 2, Riga, Latvia, LV-1038, [email protected], [email protected], [email protected] Abstract
Microvascular tissue transfer surgery: flap survival analysis Key Words: Reconstructive microsurgery, free laps, rheologic therapy Introduction. Nowadays free microvascular flap survival rate is reported nearly 100%, nevertheless, full flap necrosis still occurs. This can lead to patients’ prolonged hospitalization, greater morbidity and lower quality of life. Aim. To evaluate survival rate of free microvascular flaps in The Centre of Plastic and Reconstructive Microsurgery of Latvia. Materials and methods. A retrospective study was conducted from 2011 until 2016. Patients’ medical histories database was analyzed. Type of flap, recipient region, any early complications and therapy was recorded. Results. 214 cases of free microvascular flap transfer surgeries were analyzed. Mean patients’ age was 49 years (range 2-85), 80% were male patients. Reasons for reconstructive surgery included tumour (n=114), injury (n=47), soft-tissue infection (n=12) and osteomyelitis (n=25), scar tissue (n=7), pseudarthrosis (n=6). Flaps were transferred to head and neck (n=114), torso (n=3), upper limb (n=29), lower limb (n=68). Most popular flaps were radial artery flap (n=77), fibular osteocutaneous flap (n=46), lateral arm flap (n=22), but overall 14 different flaps were documented. Flap total necrosis occurred in 12 cases, thus survival rate was 94.4%. Minor complications (marginal or partial necrosis) in 10 cases (4.6%). All complications occurred in patients with trauma, infections or tumours. For rheologic therapy 10% dextran solution in 207 cases, antiaggregant in 3 cases and anticoagulant in 37 cases were prescribed. Conclusion. Free microvascular tissue transfer surgery is a reliable method for closure of complicated wounds. Kopsavilkums
Mikrovaskul āro lēveru pārstādīšanas ķirur ģija: l ēveru izdzīvošanas analīze Atslēgvārdi: Rekonstruktīvā mikroķirurģija, brīvi lēveri, reoloģiskā terapija Ievads. Mūsdienās brīvu mikrovaskulāru lēveru izdzīvošana tiek aprakstīta tuvu 100%, tomēr lēveru nekroze joprojām attītās. Tas var sekmēt pacienta ilgāku stacionēšanu, lielāku morbiditāti un zemāku dzīves kvalitāti. Mērķis. Izvērtēt brīvu mikrovaskulāru lēveru izdzīvošanu Latvijas Plastiskās, Rekonstruktīvās un Mikroķirurģijas centrā. Materi āli un metodes. Retrospektīvi tika izpētīta pacientu vēsturu datubāze no 2011 līdz 2016 gadam. Tipa reģistrēts lēvera veids, recipienta zona, agrīnās komplikācijas un terapija. Rezultāti. Tika fiksētas 214 brīvu mikrovaskulāru lēveru pārstādīšanas operācijas. Pacientu vidējais vecums bija 49 gadi (no 2 līdz 85), 80% bija vīrieši. Rekonstrukcijas iemesls bija audzējs (n=114), trauma (n=47), mīksto audu infekcija (n=12), osteomielīts (n=25), rētaudi (n=7), pseidartroze (n=6). Lēveri tika pārstādīti uz galvu un kaklu (n=114), rumpi (n=3), augšējām (n=29) un apakšējām (n=68) ekstremitātēm. Visbiežāk izmantotie lēveri bija radiālais apakšdelma lēveris (77), fibulas osteokutāns lēveris (n=46), laterālais rokas lēveris (n=22), savukārt kopumā 14 dažādi lēveri tika piefiksēti. Pilnīga lēvera nekroze attīstījās 12 gadījumos, attiecīgi izdzīvošana ir 94.4%. Mazāk nozīmīgas komplikācijas (margināla vai daļēja nekroze) attīstījās 10 gadījumos (4.6%). Visi sarežģījumi attīstījās pacientiem ar traumu, infekciju vai audzēju. Reoloģiskai terapijai tika nozīmēts 10% dekstrāna šķīdums (n=207), antiagregants (n=3) un antikoagulants (n=37). Secinājumi. Brīvi mikrovaskulāri lēveri ir droša metode komplicētu brūču ārstēšanai.
Introduction
The first case of using patient’s tissues to reconstruct a damaged body part is dated back to
800 years B.C. Indian physician Sushruta used a skin paddle from the forehand to cover a nose
defect. Local transposition flaps were used ever since. A serious progress of technologies and
detailed studies of the vascular anatomy were required for the development of the reconstructive
microsurgery. Thus in 1972, the first microvascular flap transfer was performed. (Vasconez and
DAUGAVPILS UNIVERSITĀTES 60. STARPTAUTISKĀS ZINĀTNISKĀS KONFERENCES PROCEEDINGS OF
RAKSTU KRĀJUMS THE 60th INTERNATIONAL SCIENTIFIC CONFERENCE OF DAUGAVPILS UNIVERSITY
168
Buseman, 2015) With further advancement of the microsurgical techniques and instruments, free
tissue transfer has become a reliable and commonly used method for closure of complicated
wounds. Reported success rate is high, ranging from 90% to 99%. (Kruse et al., 2010) Nevertheless,
flap necrosis can still occur. This can be a devastating burden for both, the patients and physicians.
A better understanding of possible failure’s risk factors is necessary to avoid these complications.
Numerous possible factors have been reported (age, sex, hypertensions, diabetes mellitus, tobacco
and alcohol use, previous radiation therapy, timing of the reconstruction, postoperative
anticoagulants), however no universal consensus has been established. (Zhou et al., 2017) In Latvia
reconstructive microsurgery has been practiced since 1985. The Centre of Plastic and
Reconstructive Microsurgery of Latvia is the only specialized department in the country, where
patients in need are treated. Free flap transfers are performed regularly. Reviewing the experience
and performance might reveal traits for better understanding factors, which affect transfer’s
outcome.
Aim
To evaluate survival rate of free microvascular flaps in The Centre of Plastic and
Reconstructive Microsurgery of Latvia.
Materials and methods
A retrospective study was conducted. Patients’ medical histories database was analyzed. Data
was reviewed from 2011 till 2016. Following factors were recorded:
• Patient’s age, sex, presence of chronic diseases
• Wounds etiology
• Type of flap (all muscle, fasciocutaneous, myocutaneus and osteocutaneous flaps were
included)
• Recipient region
• Postoperative rheologic therapy
• Early complications
• Salvage therapy
To establish possible correlation between risk factors and surgery outcomes Mann-Whitney
test was applied.
Results
During the period from 2011 to 2016 214 microvascular tissue transfer surgeries were
documented. Mean patient’s age was 49 years (ranged 2-85). 171 (80%) were males, 43 (20%) were
females. Significant chronic diseases, which affect structure and functionality of blood vessels and
can compromise blood flow after free tissue transfer (diabetes mellitus, cardiovascular diseases,
pulmonary diseases) were documented in 114 (53.3%) patients. Reasons for reconstructive surgery
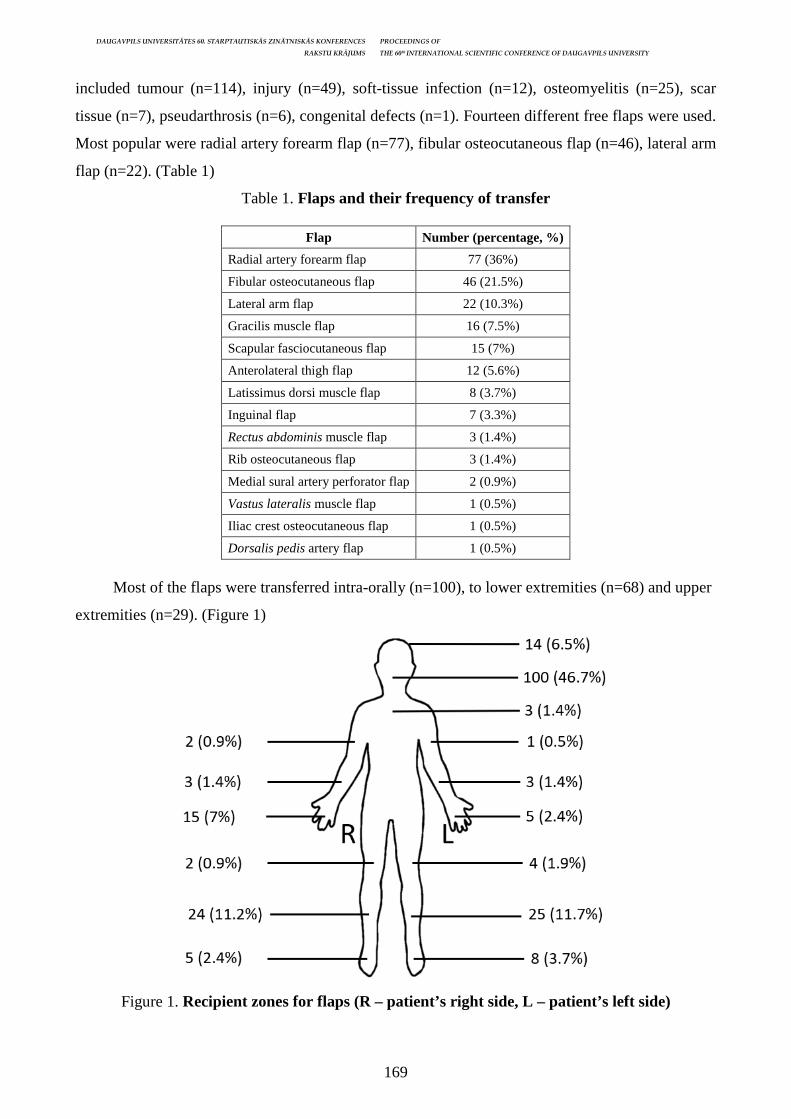
DAUGAVPILS UNIVERSITĀTES 60. STARPTAUTISKĀS ZINĀTNISKĀS KONFERENCES PROCEEDINGS OF
RAKSTU KRĀJUMS THE 60th INTERNATIONAL SCIENTIFIC CONFERENCE OF DAUGAVPILS UNIVERSITY
169
included tumour (n=114), injury (n=49), soft-tissue infection (n=12), osteomyelitis (n=25), scar
tissue (n=7), pseudarthrosis (n=6), congenital defects (n=1). Fourteen different free flaps were used.
Most popular were radial artery forearm flap (n=77), fibular osteocutaneous flap (n=46), lateral arm
flap (n=22). (Table 1)
Table 1. Flaps and their frequency of transfer
Flap Number (percentage, %)
Radial artery forearm flap 77 (36%)
Fibular osteocutaneous flap 46 (21.5%)
Lateral arm flap 22 (10.3%)
Gracilis muscle flap 16 (7.5%)
Scapular fasciocutaneous flap 15 (7%)
Anterolateral thigh flap 12 (5.6%)
Latissimus dorsi muscle flap 8 (3.7%)
Inguinal flap 7 (3.3%)
Rectus abdominis muscle flap 3 (1.4%)
Rib osteocutaneous flap 3 (1.4%)
Medial sural artery perforator flap 2 (0.9%)
Vastus lateralis muscle flap 1 (0.5%)
Iliac crest osteocutaneous flap 1 (0.5%)
Dorsalis pedis artery flap 1 (0.5%)
Most of the flaps were transferred intra-orally (n=100), to lower extremities (n=68) and upper
extremities (n=29). (Figure 1)
Figure 1. Recipient zones for flaps (R – patient’s right side, L – patient’s left side)

DAUGAVPILS UNIVERSITĀTES 60. STARPTAUTISKĀS ZINĀTNISKĀS KONFERENCES PROCEEDINGS OF
RAKSTU KRĀJUMS THE 60th INTERNATIONAL SCIENTIFIC CONFERENCE OF DAUGAVPILS UNIVERSITY
170
After a flap transfer surgery nearly all patients were prescribed certain medication to improve
flap’s blood supply. 211 patients received crystalloids infusions (normal saline for 8 patients,
Ringer lactate for 203 patients). 207 patients also received 10% dextran solution. Some patients
were prescribed other rheologic medication – colloid (n=6), low-molecular-weight heparin (n=17),
antiaggregant (n=3), heparin (n=5), new class anticoagulant (n=15). Flap total necrosis occurred in
12 cases. Thus overall survival rate is 94.4%. Minor complications (marginal or partial necrosis)
occurred in 10 cases (4.6%). All complications occurred in patients with injury, tumour or infection.
Mann-Whitney test revealed there is no correlation between presence of chronic diseases or choice
of post-operative pharmacological therapy and transfer’s outcome (p>0.05). In cases when flap’s
hypoperfusion was detected, revision surgery was performed in 28 cases. It was successful in most
of the times as only in 2 cases flap did not survive after a revision. Intra-operative findings were
hematoma (n=11), venous thrombosis (n=11), arterial thrombosis (n=3), arterial spasm (n=2),
infection (n=1). If a flap’s marginal necrosis occurred, additional wound closure techniques were
used – vacuum therapy (n=5), autodermoplasty (n=3), local flap transfer (n=4), free flap transfer
(n=1). When total flap necrosis occurred a new flap transferred in 9 cases, also vacuum therapy was
used in 3 cases, autodermoplasty in 2 cases, limb’s amputation in patients with severe polytrauma
was done in 3 cases.
Discussion
Free microvascular flap transfer success rate in The Centre of Plastic and Reconstructive
Microsurgery of Latvia is equivalent to reported outcomes in other publications. With proper pre-
operative planning, intra-operative technique execution and post-operative care free flaps provide a
successful closure for complicated wounds. Patient selection and timing of the transfer remains
upon surgeon’s decision and should evaluated individually with each patient. (Afridi et al., 2000)
Ongoing discussion regarding flap survival is whether any specific medication could improve it.
Studies have shown that excessive usage of crystalloids can deteriorate flap survival (Shetty et al.,
2009), so they should be administered only as much as physiologically necessary. Dextran solution,
which is used widely, also hasn’t shown any significant benefits in other studies. (Pohlenz et al.,
2007) In a meta-analytic study effects of different anticoagulants and antiaggregants were reviewed.
It was concluded that neither of these drugs can improve flap survival rate, moreover high-dose
heparin was associated with higher complication rate. (Pan et al., 2014) With number of patients
less than in mentioned studies, our results also do not show any traits that these medications
contributed to a successful outcome. Other studies are being focused on post-operative flap
monitoring. We are still using a simple visual evaluation of flap color, skin turgor, capillary refill
and other clinical signs. Evaluation of this kind is observer-specific and requires additional attention
from medical stuff and experience. A more precise and standardized flap monitoring could allow
DAUGAVPILS UNIVERSITĀTES 60. STARPTAUTISKĀS ZINĀTNISKĀS KONFERENCES PROCEEDINGS OF
RAKSTU KRĀJUMS THE 60th INTERNATIONAL SCIENTIFIC CONFERENCE OF DAUGAVPILS UNIVERSITY
171
early detection of those cases, when a flap needs additional interventions. This could potentially
minimize flap failure rate and detect early need for revision surgery, bringing success rate even
higher. In our experience successful revisions were done in the first 24 hours, when thrombosis was
detected early. Same as in other studies, venous thrombosis was observed more often. (Ashjian et
al., 2007) Various methods are being tested like uninterrupted temperature measuring, usage of
ultrasound or infrared rays. (Perng, 2013) Each method has its advantages and disadvantages, and
each has a practical potential. Nevertheless none of these methods are introduced to a common
clinical practice, thus more attention should be paid to this issue.
Conclusions
Free microvascular flap transfer has a high success rate in The Centre of Plastic and
Reconstructive Microsurgery of Latvia. With more than 30 years of experience our results can be
compared with other centers around the world. Furthermore, our data regarding effects of post-
operative medication and complications also is similar with studies with larger number of patients
are similar. As there is no clear evidence that rheologic drugs can significantly improve surgery’s
outcome, a closer attention should be paid to flap monitoring. Our results suggest if a flap’s
perfusion problems are suspected, revision surgery should be done as soon as possible. This might
prevent further complications. Further clinical studies are necessary to develop easy, low-cost and
effective method for post-operative flap monitoring to minimize flap loss.
References Afridi NS, Paletz J and Morris S. Free flap failures: What to do next? Canadian Journal of Plastic Surgery. 2000, 8: 30–2. Ashjian P, Chen CM, Pusic A, Disa JJ, Cordeiro PG and Mehrara BJ. The effect of postoperative anticoagulation on microvascular thrombosis. Ann Plast Surg. 2007, 59: 36–9; discussion 9–40. Kruse AL, Luebbers HT, Gratz KW and Obwegeser JA. Factors influencing survival of free-flap in reconstruction for cancer of the head and neck: A literature review. Microsurgery. 2010, 30: 242–8. Pan XL, Chen GX, Shao HW, Han CM, Zhang LP and Zhi LZ. Effect of heparin on prevention of flap loss in microsurgical free flap transfer: A meta-analysis. PLoS One. 2014, 9: e95111. Perng C-K. Recent advances in postoperative free microvascular flap monitoring. Formosan Journal of Surgery. 2013, 46: 145–8. Pohlenz P, Blessmann M, Heiland M, Blake F, Schmelzle R and Li L. Postoperative complications in 202 cases of microvascular head and neck reconstruction. Journal of Cranio-Maxillofacial Surgery. 2007, 35: 311–5. Shetty PS, Boyce H and Chisholm D. Anaesthesia for onco-plastic reconstructive surgery. Current Anaesthesia and Critical Care. 2009, 20: 18–21. Vasconez HC and Buseman J. Plastic & reconstructive surgery. In: Doherty GM (Ed.) Current diagnosis &treatment: Surgery, 14e. New York, NY, McGraw-Hill Education, 2015. Zhou W, Zhang WB, Yu Y et al. Risk factors for free flap failure: A retrospective analysis of 881 free flaps for head and neck defect reconstruction. Int J Oral Maxillofac Surg. 2017, 46: 941–5.

DAUGAVPILS UNIVERSITĀTES 60. STARPTAUTISKĀS ZINĀTNISKĀS KONFERENCES PROCEEDINGS OF
RAKSTU KRĀJUMS THE 60th INTERNATIONAL SCIENTIFIC CONFERENCE OF DAUGAVPILS UNIVERSITY
172
PREDICTIVE VALUE OF SIMPLIFIED AIRWAY RISK INDEX FOR DIFFICULT VIDEOLARYNGOSCOPIC
TRACHEAL INTUBATION
Antons Zakalkins1, Sigita Kazūne2 1 University of Latvia, Raina blvrd. 19, Riga, Latvia, [email protected] 2 Hospital of Traumatology and Orthopaedics, Duntes str. 22, Riga, Latvia, [email protected] Abstract
Predictive value of simplified airway risk index for difficult videolaryngoscopic trachel intubation Key Words: airway, risk, index, videolaryngoscopy, evaluation, intubation Introduction. Unanticipated difficult intubation may lead to serious hypoxia-related complications. Simplified airway risk index is a method of bedside airway evaluation. However, evidence of simplified airway risk index in prediction of difficult laryngeal visualization using videolaryngoscopes is lacking. Aim. To calculate predictive value of simplified airway risk index to predict difficult laryngeal exposure using GlideScope videolaryngoscope. Materials and methods. 36 patients were evaluated using simplified airway risk index. After induction of anaesthesia visualization grading was performed and number of intubation attempts recorded. Results. Simplified airway risk index showed high sensitivity and medium specificity in predicting difficult visualization using GlideScope videolaryngoscope. Kopsavilkums Atslēgvārdi: elpceļi, riska, indeksi, videolaringoskopija, intubācija Ievads. Hipoksija un tās kompilācijas bieži tiek saistītas ar grūtu intubāciju. Grūtas intubācijas riska indeksi spēj paredzēt grūtu intubāciju preoperatīvi. Grūtas videolaringoskopiskās intubācijas paredzēšana ar riska indeksiem ir maz pētīta. Mērķis. Noteikt grūtas intubācijas riska indeksu spēju prognozēt grūtu videolaringoskopisku balsenes vizualizāciju. Materi āli un metodes. Preoperatīvi ar grūtas intubācijas riska indeksu tika izmeklēti 36 pacienti. Pēc ievadanestēzijas tika aprakstīta balsenes vizualizācija un pierakstīts intubāciju mēģinājumu skaits. Rezultāti. Prognozējot grūtu videolaringoskopisku intubāciju, riska indekss uzrāda augstu sensitivitāti un vidējo specifiskumu.
Introduction
Unanticipated difficult intubation, which is commonly associated with inability to obtain
adequate laryngeal view or inability to pass endotracheal tube may lead to serious complications
such hypoxia-related brain damage or brain death. Percentage of difficult intubation, depending on
specifics of hospital and operating theatre varies from 1 to 18% (Naguib 2006). Simplified airway
risk index, introduced by El-Ganzouri and colleagues is a method of bedside airway evaluation, in
which seven patient’s variables – mouth opening, thyromental distance, Mallampati pharyngeal
visualization class, neck movement, mandible protrusion, body weight and previous difficult
intubation are combined (El-Ganzouri 1996). El-Ganzouri simplified airway risk index (Table 1) is
created to predict difficult intubation and choose most appropriate way of intubation for every
patient, when risk of difficult intubation is not clear. Nowadays there are many devices alternative
to standard laryngoscope, and GlideScope Titanium LoPro videolaryngoscope (Figure 1) is an
example of such device (Niforopoulou 2010). In studies, in which direct laryngoscopy and
videolaryngoscopy abilities were compared, videolaryngoscopy showed better results in laryngeal
visualization grade and it was clear that usage of videolaryngoscopes can reduce the percentage of
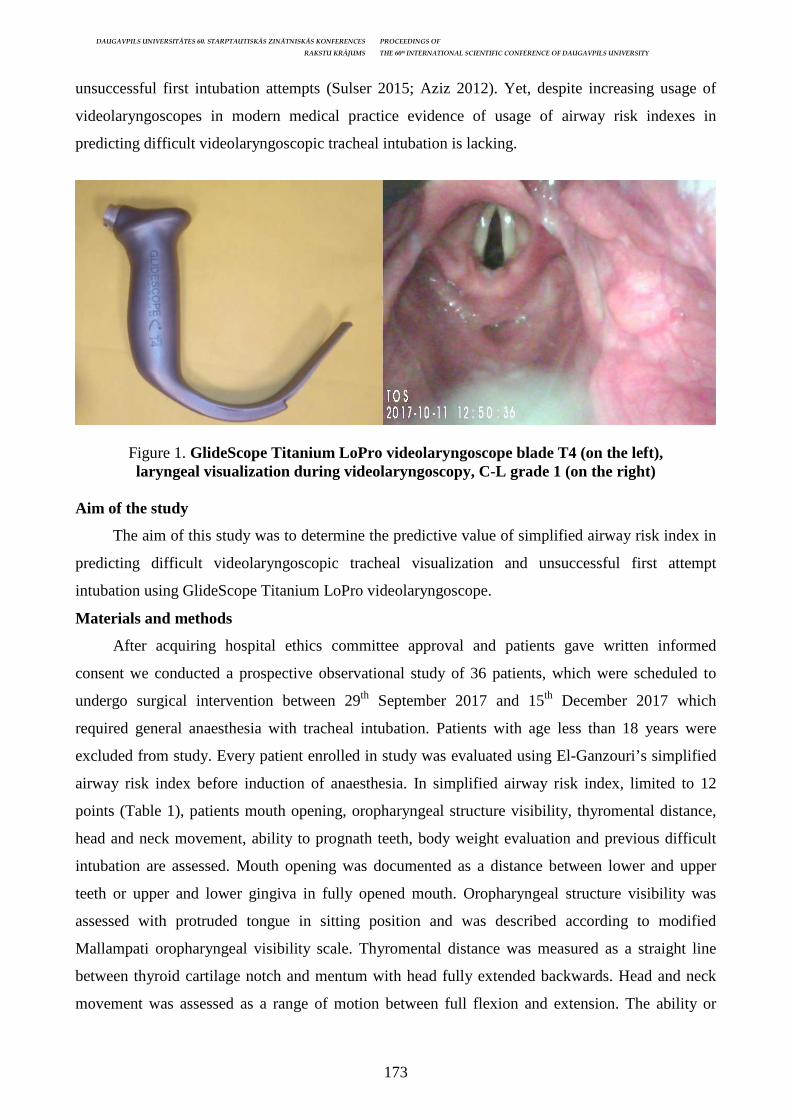
DAUGAVPILS UNIVERSITĀTES 60. STARPTAUTISKĀS ZINĀTNISKĀS KONFERENCES PROCEEDINGS OF
RAKSTU KRĀJUMS THE 60th INTERNATIONAL SCIENTIFIC CONFERENCE OF DAUGAVPILS UNIVERSITY
173
unsuccessful first intubation attempts (Sulser 2015; Aziz 2012). Yet, despite increasing usage of
videolaryngoscopes in modern medical practice evidence of usage of airway risk indexes in
predicting difficult videolaryngoscopic tracheal intubation is lacking.
Figure 1. GlideScope Titanium LoPro videolaryngoscope blade T4 (on the left), laryngeal visualization during videolaryngoscopy, C-L grade 1 (on the right)
Aim of the study
The aim of this study was to determine the predictive value of simplified airway risk index in
predicting difficult videolaryngoscopic tracheal visualization and unsuccessful first attempt
intubation using GlideScope Titanium LoPro videolaryngoscope.
Materials and methods
After acquiring hospital ethics committee approval and patients gave written informed
consent we conducted a prospective observational study of 36 patients, which were scheduled to
undergo surgical intervention between 29th September 2017 and 15th December 2017 which
required general anaesthesia with tracheal intubation. Patients with age less than 18 years were
excluded from study. Every patient enrolled in study was evaluated using El-Ganzouri’s simplified
airway risk index before induction of anaesthesia. In simplified airway risk index, limited to 12
points (Table 1), patients mouth opening, oropharyngeal structure visibility, thyromental distance,
head and neck movement, ability to prognath teeth, body weight evaluation and previous difficult
intubation are assessed. Mouth opening was documented as a distance between lower and upper
teeth or upper and lower gingiva in fully opened mouth. Oropharyngeal structure visibility was
assessed with protruded tongue in sitting position and was described according to modified
Mallampati oropharyngeal visibility scale. Thyromental distance was measured as a straight line
between thyroid cartilage notch and mentum with head fully extended backwards. Head and neck
movement was assessed as a range of motion between full flexion and extension. The ability or
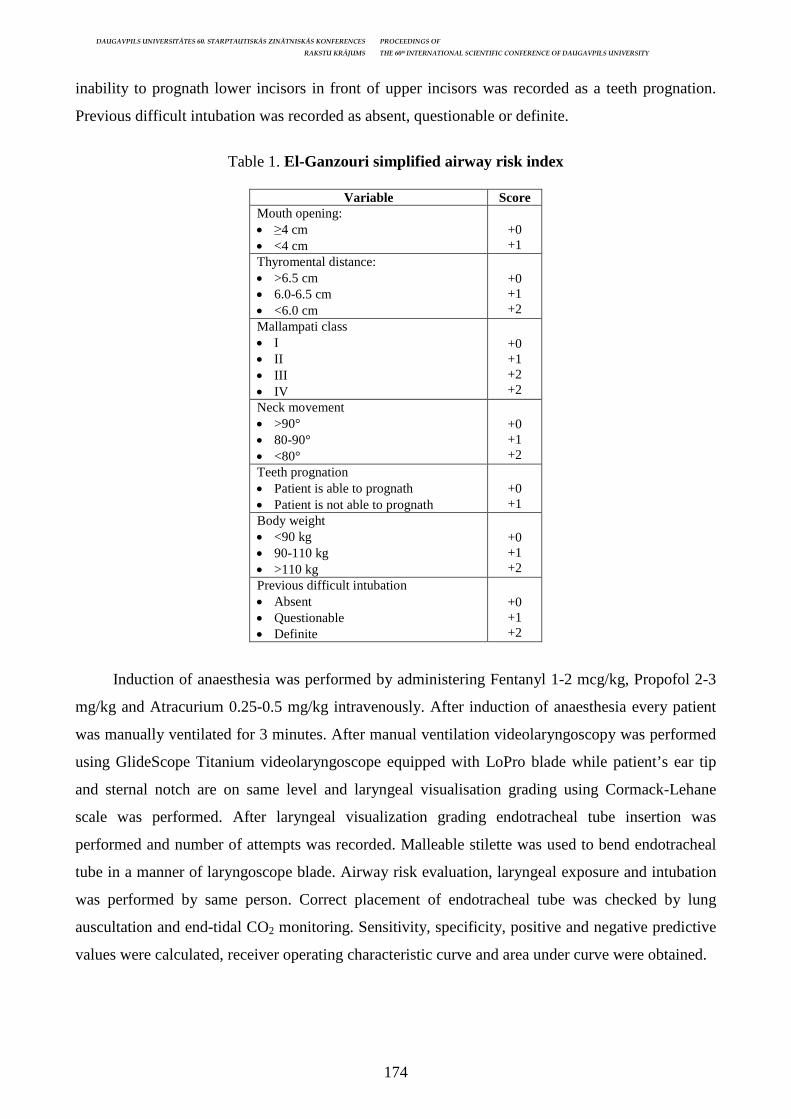
DAUGAVPILS UNIVERSITĀTES 60. STARPTAUTISKĀS ZINĀTNISKĀS KONFERENCES PROCEEDINGS OF
RAKSTU KRĀJUMS THE 60th INTERNATIONAL SCIENTIFIC CONFERENCE OF DAUGAVPILS UNIVERSITY
174
inability to prognath lower incisors in front of upper incisors was recorded as a teeth prognation.
Previous difficult intubation was recorded as absent, questionable or definite.
Table 1. El-Ganzouri simplified airway risk index
Variable Score
Mouth opening: • ≥4 cm • <4 cm
+0 +1
Thyromental distance: • >6.5 cm • 6.0-6.5 cm • <6.0 cm
+0 +1 +2
Mallampati class • I • II • III • IV
+0 +1 +2 +2
Neck movement • >90° • 80-90° • <80°
+0 +1 +2
Teeth prognation • Patient is able to prognath • Patient is not able to prognath
+0 +1
Body weight • <90 kg • 90-110 kg • >110 kg
+0 +1 +2
Previous difficult intubation • Absent • Questionable • Definite
+0 +1 +2
Induction of anaesthesia was performed by administering Fentanyl 1-2 mcg/kg, Propofol 2-3
mg/kg and Atracurium 0.25-0.5 mg/kg intravenously. After induction of anaesthesia every patient
was manually ventilated for 3 minutes. After manual ventilation videolaryngoscopy was performed
using GlideScope Titanium videolaryngoscope equipped with LoPro blade while patient’s ear tip
and sternal notch are on same level and laryngeal visualisation grading using Cormack-Lehane
scale was performed. After laryngeal visualization grading endotracheal tube insertion was
performed and number of attempts was recorded. Malleable stilette was used to bend endotracheal
tube in a manner of laryngoscope blade. Airway risk evaluation, laryngeal exposure and intubation
was performed by same person. Correct placement of endotracheal tube was checked by lung
auscultation and end-tidal CO2 monitoring. Sensitivity, specificity, positive and negative predictive
values were calculated, receiver operating characteristic curve and area under curve were obtained.
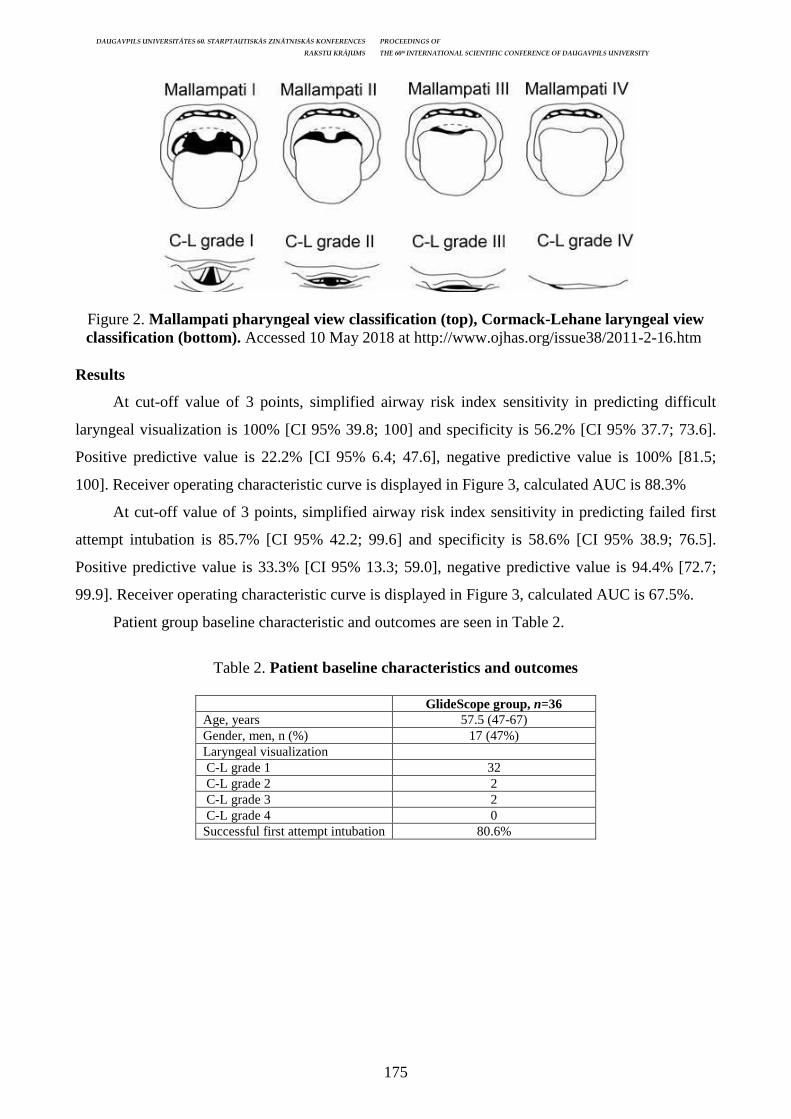
DAUGAVPILS UNIVERSITĀTES 60. STARPTAUTISKĀS ZINĀTNISKĀS KONFERENCES PROCEEDINGS OF
RAKSTU KRĀJUMS THE 60th INTERNATIONAL SCIENTIFIC CONFERENCE OF DAUGAVPILS UNIVERSITY
175
Figure 2. Mallampati pharyngeal view classification (top), Cormack-Lehane laryngeal view classification (bottom). Accessed 10 May 2018 at http://www.ojhas.org/issue38/2011-2-16.htm
Results
At cut-off value of 3 points, simplified airway risk index sensitivity in predicting difficult
laryngeal visualization is 100% [CI 95% 39.8; 100] and specificity is 56.2% [CI 95% 37.7; 73.6].
Positive predictive value is 22.2% [CI 95% 6.4; 47.6], negative predictive value is 100% [81.5;
100]. Receiver operating characteristic curve is displayed in Figure 3, calculated AUC is 88.3%
At cut-off value of 3 points, simplified airway risk index sensitivity in predicting failed first
attempt intubation is 85.7% [CI 95% 42.2; 99.6] and specificity is 58.6% [CI 95% 38.9; 76.5].
Positive predictive value is 33.3% [CI 95% 13.3; 59.0], negative predictive value is 94.4% [72.7;
99.9]. Receiver operating characteristic curve is displayed in Figure 3, calculated AUC is 67.5%.
Patient group baseline characteristic and outcomes are seen in Table 2.
Table 2. Patient baseline characteristics and outcomes
GlideScope group, n=36
Age, years 57.5 (47-67) Gender, men, n (%) 17 (47%) Laryngeal visualization C-L grade 1 32 C-L grade 2 2 C-L grade 3 2 C-L grade 4 0 Successful first attempt intubation 80.6%

DAUGAVPILS UNIVERSITĀTES 60. STARPTAUTISKĀS ZINĀTNISKĀS KONFERENCES PROCEEDINGS OF
RAKSTU KRĀJUMS THE 60th INTERNATIONAL SCIENTIFIC CONFERENCE OF DAUGAVPILS UNIVERSITY
176
Figure 3. Simplified airway risk score receiver operating curve for difficult visualization prediction (on the left), simplified airway risk score receiver operating curve for
failed first intubation attempt (on the right)
Discussion
The aim of this study was to determine the predictive value of simplified airway risk index in
predicting difficult videolaryngoscopic laryngeal visualization and unsuccessful first attempt
intubation using GlideScope Titanium LoPro videolaryngoscope. The results of this study show that
simplified risk index has high sensitivity and moderate specificity in predicting both difficult
videolaryngoscopic visualization and unsuccessful first attempt intubation. It is possible to detect
difficult visualization and difficult intubation patients using simplified risk index but at the same
time there may be some falsely-positive cases.
Airway management is one of the most crucial stages during general anaesthesia. Inability to
maintain airways leads to serious complications such as hypoxia-related brain damage or brain
death, so it is necessary to detect patients with possible difficult airway scenario.
During last decades videolaryngoscopy came as an alternative to direct laryngoscopy. Results
of studies comparing direct laryngoscopy versus videolaryngoscopy show that videolaryngoscopes
are superior to direct laryngoscopes in providing laryngeal visualization and successful first attempt
intubation (Cavus 2011; Roppolo 2016; Serocki 2013). It is clear, that technical properties of
videolaryngoscopy allow to obtain adequate laryngeal view in situations when direct laryngoscopy
is limited – for instance, cervical injury or cervical immobilisation.
In study of Teoh and colleagues (Teoh 2010), in which videolaryngoscopy was compared to
direct laryngoscopy, C-L grade I was acquired in 87% of patients, and C-L grade II was acquired in
11% of patients. In our study results were similar – C-L grade I was acquired in 89% of patients,
and C-L grade II was observed in 5.5% of patients.
In study of Serocki(Serocki 2013) and colleagues, where GlideScope and Storz C-MAC were
compared to direct laryngoscopy, insufficient laryngeal visualization (C-L grade III) was observed
in 2.2% of patients, which is less compared to our results, where C-L grade III was seen in 5.5% of

DAUGAVPILS UNIVERSITĀTES 60. STARPTAUTISKĀS ZINĀTNISKĀS KONFERENCES PROCEEDINGS OF
RAKSTU KRĀJUMS THE 60th INTERNATIONAL SCIENTIFIC CONFERENCE OF DAUGAVPILS UNIVERSITY
177
patients. This difference can be explained with much more experienced anaesthesia providers in
Serocki et al. study.
In contrast to direct laryngoscopy, where larynx is visualized directly, by visual and airway
axis alignment, during videolaryngoscopy larynx is visualized indirectly, using camera, attached to
the tip of videolaryngoscope. Both camera and acute angulation of videolaryngoscope blade provide
excellent visualization “around the corner”, which is confirmed in studies(Chemsian 2014).
There are many airway evaluation tests, in which many risk factors are combined, but not any
single one of them is hundred percent precise, since predictive value varies from one study to
another. Single risk factor airway evaluation tests exist, but according to study results, predictive
value of such tests is considered low. In the study of Cortellazzi and colleagues (Cortellazzi 2007),
where predictive value of simplified risk index was studied using GlideScope videolaryngoscopes,
sensitivity and specificity were 93.3 and 76.6%, which is much higher, compared to results of this
study.
According to Aziz (Aziz 2012) statement, videolaryngoscopy and direct laryngoscopy are
completely different methods of visualizing larynx. Therefore, high risk of difficult direct
laryngoscopy is not an indicator of the high risk of difficult intubation during videolaryngoscopy.
Nowadays videolaryngoscopes are mainly used as a “plan B” devices, when direct
laryngoscopy failed(Apfelbaum 2013; Cook 2018). According to published data videolaryngoscopy
is used in 3 to 5.8% of intubations, and data about videolaryngoscopy usage spread is lacking.
One of main limitations of this study is relatively small group of patients, and it could be
helpful to compare simplified risk index performance with other videolaryngoscopes.
Conclusions
Simplified airway risk index showed high sensitivity and medium specificity in predicting
difficult visualization and difficult intubation using GlideScope videolaryngoscope. It can be used
to predict difficult videolaryngoscopic visualization of glottis or difficult videolaryngoscopic
intubation.
References Apfelbaum JL. Practice Guidelines for Management of the Difficult Airway; Anesthesiology, 2013; 118: 251–270. Aziz MF, Dillman D, Fu R, Brambrink AM. Comparative Effectiveness of the C-MAC Video Laryngoscope versus Direct Laryngoscopy in the Setting of the Predicted Difficult Airway; Anesthesiology, 2012. Cavus E, Thee C, Moeller T, Kieckhaefer J, Doerges V, Wagner K. A randomised, controlled crossover comparison of the C-MAC videolaryngoscope with direct laryngoscopy in 150 patients during routine induction of anaesthesia; BMC Anesthesiol, 2011; 11: 6. Chemsian R, Bhananker S, Ramaiah R. Videolaryngoscopy; Int J Crit Illn Inj Sci, 2014; 4: 35.

DAUGAVPILS UNIVERSITĀTES 60. STARPTAUTISKĀS ZINĀTNISKĀS KONFERENCES PROCEEDINGS OF
RAKSTU KRĀJUMS THE 60th INTERNATIONAL SCIENTIFIC CONFERENCE OF DAUGAVPILS UNIVERSITY
178
Cook TM, Boniface NJ, Seller C, et al. Universal videolaryngoscopy: a structured approach to conversion to videolaryngoscopy for all intubations in an anaesthetic and intensive care department; Br J Anaesth, 2018; 120: 173–180. Cortellazzi P, Minati L, Falcone C, Lamperti M, Caldiroli D. Predictive value of the El-Ganzouri multivariate risk index for difficult tracheal intubation: A comparison of Glidescope® videolaryngoscopy and conventional Macintosh laryngoscopy; Br J Anaesth, 2007; 99: 906–911. El-Ganzouri AR, McCarthy RJ, Tuman KJ, Tanck EN, Ivankovich AD. Preoperative airway assessment: predictive value of a multivariate risk index; Anesth Analg, 1996; 82: 1197–1204. Naguib M, Scamman FL, O’Sullivan C, et al. Predictive performance of three multivariate difficult tracheal intubation models: A double-blind, case-controlled study; Anesth Analg, 2006; 102: 818–824. Niforopoulou P, Pantazopoulos I, Demestiha T, Koudouna E, Xanthos T. Video-laryngoscopes in the adult airway management: A topical review of the literature; Acta Anaesthesiol Scand, 2010; 54: 1050–1061. Roppolo LP, White PF, Hatten B, et al. Comparison of seven videolaryngoscopes with the Macintosh laryngoscope in manikins by experienced and novice personnel; Anaesthesia, 2016; 23: 1–7. Serocki G, Neumann T, Scharf E, Dörges V, Cavus E. Indirect videolaryngoscopy with C-MAC D-Blade and GlideScope: A randomized, controlled comparison in patients with suspected difficult airways; Minerva Anestesiol, 2013; 79: 121–129. Sulser S, Ubmann D, Brueesch M, et al. The C-MAC videolaryngoscope compared with conventional laryngoscopy for rapid sequence intubation at the emergency department: study protocol; Scand J Trauma Resusc Emerg Med, 2015; 23: 38. Teoh WHL, Saxena S, Shah MK, Sia ATH. Comparison of three videolaryngoscopes: Pentax Airway Scope, C-MACTM, Glidescope® vs the Macintosh laryngoscope for tracheal intubation; Anaesthesia, 2010; 65: 1126–1132.

DAUGAVPILS UNIVERSITĀTES 60. STARPTAUTISKĀS ZINĀTNISKĀS KONFERENCES PROCEEDINGS OF
RAKSTU KRĀJUMS THE 60th INTERNATIONAL SCIENTIFIC CONFERENCE OF DAUGAVPILS UNIVERSITY
179
UREAPLASMA AND MYCOPLASMA INFECTIONS ASSOCIATION WITH DIFFERENT TYPES OF ARTHRITIS
Aleksandra Bukina1, Anna Mihailova1, 2
1 Rīga Stradiņš University, Dzirciema street 16, Riga, Latvia, [email protected] 2 ORTO clinic, Bukultu street 1a, Riga, Latvia, [email protected] Abstract
Ureaplasma and Mycoplasma infections association with different types of arthritis Key Words: Ureaplasma, Mycoplasma, seronegative spondyloarthropathies, reactive arthritis Introduction. Ureaplasma un Mycoplasma infections are common around the world. Associations were detected between Mycoplasma and Ureaplasma inflammatory arthritidis, these bacteria can cause reactive arthritis. However, there are few studies about this problem and further research is required. Aim. Investigate the association of Ureaplasma and Mycoplasma infection with different types of arthritis. Materials and methods. Clinical data were collected from medical history, included demographic data, diagnosis, results of Ureaplasma and Mycoplasma urinary culture tests, HLA-B27 positivity. Results. 1377 patients (68% female and 32% male) with arthritis were examinated. 64.8% of patients were under 50 years old and 35.2% - over 50. Ureaplasma culture was positive in 21.6%, Mycoplasma culture - in 17.9% patients. In patients with seronegative spondyloarthropathies Ureaplasma were positive in 24.4%, Mycoplasma – 19.8%. In patients with rheumatoid arthritis - 15.3%, and 16%, osteoarthritis 5.2%, 5.2% and crystal arthropathies 8.9%, 4.4% accordingly. In patients with reactive arthritis Ureaplasma was positive in 26.1% and Mycoplasma in 20.8%, in ankylosing spondylitis - Ureaplasma in 16% and Mycoplasma in 14.5% of patients, in psoriatic arthritis - 14.7% and 14.7% accordingly. Conclusions. Ureaplasma and Mycoplasma infections have association with inflammatory arthropathies. These bacterial infections are most common in patients with seronegative spondyloarthropathies, especially in patients with reactive oligoarthritis. In patients with osteoarthritis and crystal arthropathies Ureaplasma and Mycoplasma infections are rare. Kopsavilkums
Ureaplazmas un mikoplazmas infekcijas saistība ar dažādu artr ītu veidiem Atslēgvārdi: ureaplazma, mikoplazma, seronegatīvas spondiloartropātijas, reaktīvs artrīts Ievads. Ureaplazmas un mikoplazmas infekcijas ir plaši izplatītas visā pasaulē. Ir novērota mikoplazmu un ureaplazmu saistība ar iekaisuma artrītiem, šis baktērijas var būt reaktīva artrīta izraisītāji. Tomēr šādu pētījumu nav daudz, un ir nepieciešama tālāka šis problēmas izpēte. Darba mērķis. Izpētīt mikoplazmas un ureaplazmas infekcijas saistību ar dažādām artrīta grupām. Materi āli un metodes. No pacientu ambulatorām kartēm bija savākti dati par pacientu dzimumu, vecumu, diagnozi, uzsējuma uz mikoplazmu un ureaplazmu rezultātiem, HLA-B27 antigēna esamību asinīs. Rezultāti. Pētījumā iekļauti 1377 artrīta pacienti (68% sievietes, un 32% vīrieši). 64,8% pacientu ir vecumā līdz 50 gadiem, savukārt 35,2% pacientu ir vecāki pār 50 gadiem. Uzsējums uz ureaplazmu bija pozitīvs 21,6%, uzsējums uz mikoplazmu – 17,9% pacientu. Pacientiem ar seronegatīvām spondiloartropātijām ureaplazmas bija noteiktas 24,4%, mikoplazmas - 19,8%. Reimatoīda artrīta pacientiem -15,3% un 16%, pacientiem ar osteoartrītu 5,2%, 5,2% un kristāliskām artropātijām 8,9%, 4,4% atbilstoši. Pacientiem ar reaktīvu artrītu ureaplazmas bija noteiktas 26,1% un mikoplazmas 20,8%. Ankilozējošā spondilīta pacientiem pozitīvs uzsējums uz ureaplazmu bija konstatētas 16%, uz mikoplazmu - 14,5% pacientu, psoriātiskā artrīta pacientiem – 14,7% un 14,7% pacientu. Secinājumi. Mikoplazmas un ureaplazmas infekcijām ir saistība ar iekaisuma artropātijām. Visbiežāk uroģenitālo mikoplazmu infekcijas ir novērotas pacientiem ar seronegatīvām spondiloartropātijām, sevišķi pacientiem ar reaktīvu oligoartrītu. Pacientiem ar kristāliskām artropātijām un osteoartrītu mikoplazmas un ureaplazmas infekciju novēro reti.
Introduction
Mycoplasma and Ureaplasma are the smallset free-living bacterium. These infections are
common around the world. These bacterium are frequently detected in the lower genitourinary tract
of sexually active adults: ureaplasma in 45-75% and mycoplasma in 21-53%. Only small part of
people have clinical symptoms such localized urogenital diseases (Murray 2016; Waites, 2017).
Mycoplasma and Ureaplasma have a lot of adhesion proteins and variable surface
lipoproteins, there are detected significant homology with people structural proteins. This molecular
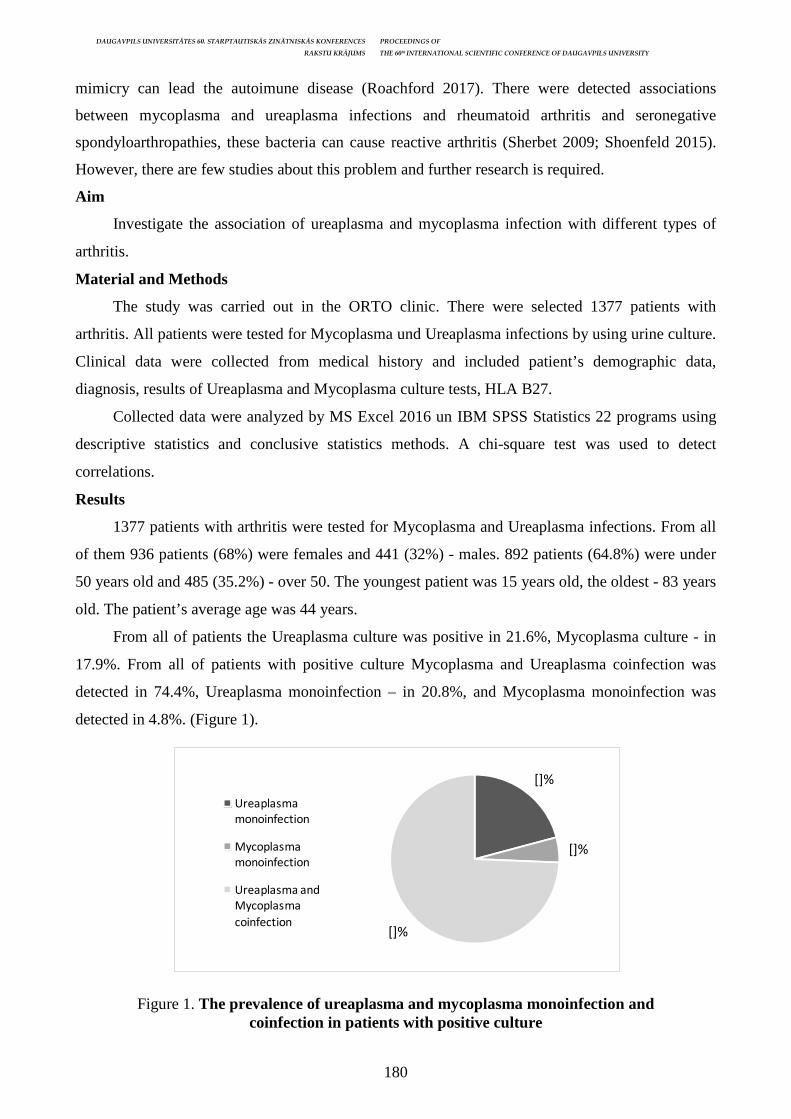
DAUGAVPILS UNIVERSITĀTES 60. STARPTAUTISKĀS ZINĀTNISKĀS KONFERENCES PROCEEDINGS OF
RAKSTU KRĀJUMS THE 60th INTERNATIONAL SCIENTIFIC CONFERENCE OF DAUGAVPILS UNIVERSITY
180
mimicry can lead the autoimune disease (Roachford 2017). There were detected associations
between mycoplasma and ureaplasma infections and rheumatoid arthritis and seronegative
spondyloarthropathies, these bacteria can cause reactive arthritis (Sherbet 2009; Shoenfeld 2015).
However, there are few studies about this problem and further research is required.
Aim
Investigate the association of ureaplasma and mycoplasma infection with different types of
arthritis.
Material and Methods
The study was carried out in the ORTO clinic. There were selected 1377 patients with
arthritis. All patients were tested for Mycoplasma und Ureaplasma infections by using urine culture.
Clinical data were collected from medical history and included patient’s demographic data,
diagnosis, results of Ureaplasma and Mycoplasma culture tests, HLA B27.
Collected data were analyzed by MS Excel 2016 un IBM SPSS Statistics 22 programs using
descriptive statistics and conclusive statistics methods. A chi-square test was used to detect
correlations.
Results
1377 patients with arthritis were tested for Mycoplasma and Ureaplasma infections. From all
of them 936 patients (68%) were females and 441 (32%) - males. 892 patients (64.8%) were under
50 years old and 485 (35.2%) - over 50. The youngest patient was 15 years old, the oldest - 83 years
old. The patient’s average age was 44 years.
From all of patients the Ureaplasma culture was positive in 21.6%, Mycoplasma culture - in
17.9%. From all of patients with positive culture Mycoplasma and Ureaplasma coinfection was
detected in 74.4%, Ureaplasma monoinfection – in 20.8%, and Mycoplasma monoinfection was
detected in 4.8%. (Figure 1).
Figure 1. The prevalence of ureaplasma and mycoplasma monoinfection and
coinfection in patients with positive culture
[]%
[]%
[]%
Ureaplasma
monoinfection
Mycoplasma
monoinfection
Ureaplasma and
Mycoplasma
coinfection
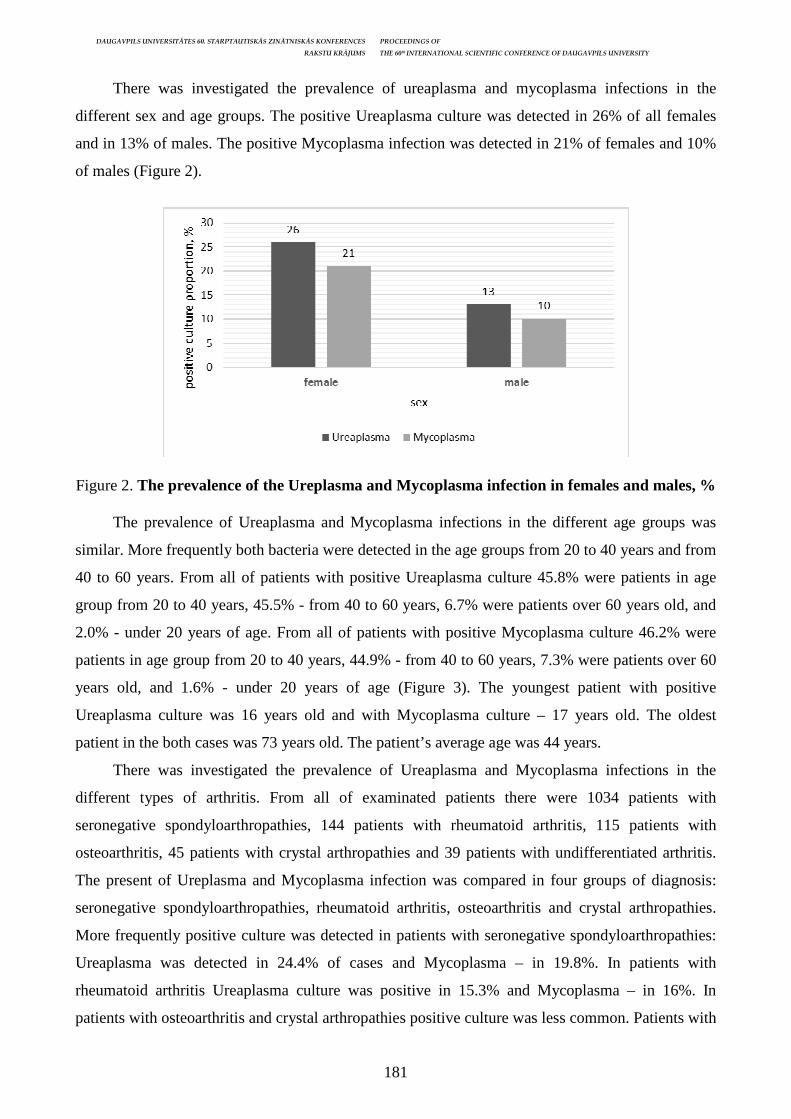
DAUGAVPILS UNIVERSITĀTES 60. STARPTAUTISKĀS ZINĀTNISKĀS KONFERENCES PROCEEDINGS OF
RAKSTU KRĀJUMS THE 60th INTERNATIONAL SCIENTIFIC CONFERENCE OF DAUGAVPILS UNIVERSITY
181
There was investigated the prevalence of ureaplasma and mycoplasma infections in the
different sex and age groups. The positive Ureaplasma culture was detected in 26% of all females
and in 13% of males. The positive Mycoplasma infection was detected in 21% of females and 10%
of males (Figure 2).
Figure 2. The prevalence of the Ureplasma and Mycoplasma infection in females and males, %
The prevalence of Ureaplasma and Mycoplasma infections in the different age groups was
similar. More frequently both bacteria were detected in the age groups from 20 to 40 years and from
40 to 60 years. From all of patients with positive Ureaplasma culture 45.8% were patients in age
group from 20 to 40 years, 45.5% - from 40 to 60 years, 6.7% were patients over 60 years old, and
2.0% - under 20 years of age. From all of patients with positive Mycoplasma culture 46.2% were
patients in age group from 20 to 40 years, 44.9% - from 40 to 60 years, 7.3% were patients over 60
years old, and 1.6% - under 20 years of age (Figure 3). The youngest patient with positive
Ureaplasma culture was 16 years old and with Mycoplasma culture – 17 years old. The oldest
patient in the both cases was 73 years old. The patient’s average age was 44 years.
There was investigated the prevalence of Ureaplasma and Mycoplasma infections in the
different types of arthritis. From all of examinated patients there were 1034 patients with
seronegative spondyloarthropathies, 144 patients with rheumatoid arthritis, 115 patients with
osteoarthritis, 45 patients with crystal arthropathies and 39 patients with undifferentiated arthritis.
The present of Ureplasma and Mycoplasma infection was compared in four groups of diagnosis:
seronegative spondyloarthropathies, rheumatoid arthritis, osteoarthritis and crystal arthropathies.
More frequently positive culture was detected in patients with seronegative spondyloarthropathies:
Ureaplasma was detected in 24.4% of cases and Mycoplasma – in 19.8%. In patients with
rheumatoid arthritis Ureaplasma culture was positive in 15.3% and Mycoplasma – in 16%. In
patients with osteoarthritis and crystal arthropathies positive culture was less common. Patients with

DAUGAVPILS UNIVERSITĀTES 60. STARPTAUTISKĀS ZINĀTNISKĀS KONFERENCES PROCEEDINGS OF
RAKSTU KRĀJUMS THE 60th INTERNATIONAL SCIENTIFIC CONFERENCE OF DAUGAVPILS UNIVERSITY
182
osteoarthritis had positive Ureplasma and Mycoplasma culture in 5.2% of cases, but patients with
crystal arthropathies had positive Ureaplasma culture in 8.9% and Mycoplasma – in 4.4%
(Figure 4).
Figure 3. The prevalence of Mycoplasma and Ureaplasma infection in different age groups, %
Figure 4. The prevalence of Ureaplasma and Mycoplasma infection in the different types of arthritis, %
There was investigated the prevalence of Ureaplasma and Mycoplasma infections in the group
of seronegative spondyloarthropathies. From all of seronegative spondyloarthropathies positive
culture more often was detected in patients with reactive arthritis: Ureaplasma culture was positive
in 26.1% and Mycoplasma in 20.8%. A chi-square tests show the correlation between Ureaplasma
and Mycoplasma infections and reactive arthritis, p < 0.05. The results in patients with ankylosing
spondylitis and psoriatic arthritis were similar: in patients with ankylosing spondylitis Ureaplasma
culture was positive in 16% and Mycoplasma in 14.5%. In patients with psoriatic arthritis both
bacteria were positive in 14.7% (Figure 5).
2.0
45.8 45.5
6.71.6
46.2 44.9
7.3
0,0
5,0
10,0
15,0
20,0
25,0
30,0
35,0
40,0
45,0
50,0
55,0
0-20 20-40 40-60 60-80
po
siti
ve c
ult
ure
pro
po
rtio
n,
%
age groups, years
Ureaplasma Mycoplasma
24.4
15.3
5.2
8.9
19.8
16
5.2 4.4
0,0
5,0
10,0
15,0
20,0
25,0
30,0
Seronegative
spondyloarthropathies
Rheumatoid arthritis Osteoarthritis Crystal arthropathies
po
siti
ve c
ult
ure
pro
po
rtio
n, %
diagnosis
Ureaplasma Mycoplasma
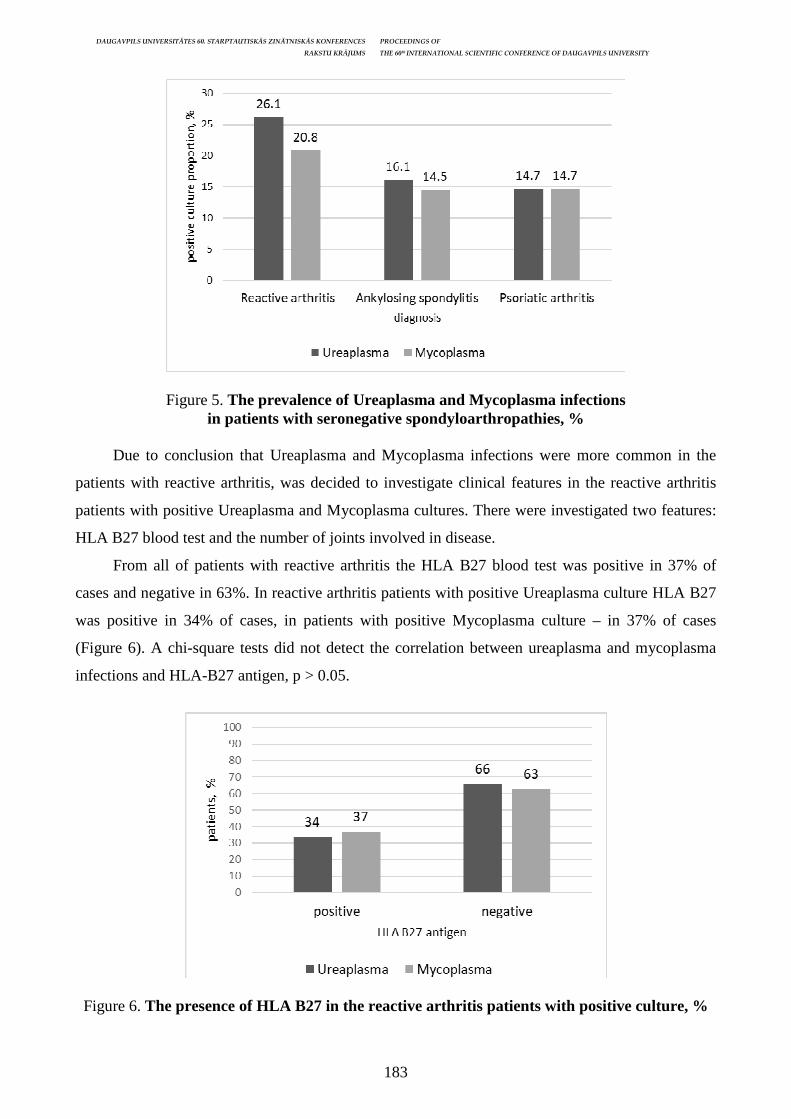
DAUGAVPILS UNIVERSITĀTES 60. STARPTAUTISKĀS ZINĀTNISKĀS KONFERENCES PROCEEDINGS OF
RAKSTU KRĀJUMS THE 60th INTERNATIONAL SCIENTIFIC CONFERENCE OF DAUGAVPILS UNIVERSITY
183
Figure 5. The prevalence of Ureaplasma and Mycoplasma infections in patients with seronegative spondyloarthropathies, %
Due to conclusion that Ureaplasma and Mycoplasma infections were more common in the
patients with reactive arthritis, was decided to investigate clinical features in the reactive arthritis
patients with positive Ureaplasma and Mycoplasma cultures. There were investigated two features:
HLA B27 blood test and the number of joints involved in disease.
From all of patients with reactive arthritis the HLA B27 blood test was positive in 37% of
cases and negative in 63%. In reactive arthritis patients with positive Ureaplasma culture HLA B27
was positive in 34% of cases, in patients with positive Mycoplasma culture – in 37% of cases
(Figure 6). A chi-square tests did not detect the correlation between ureaplasma and mycoplasma
infections and HLA-B27 antigen, p > 0.05.
Figure 6. The presence of HLA B27 in the reactive arthritis patients with positive culture, %

DAUGAVPILS UNIVERSITĀTES 60. STARPTAUTISKĀS ZINĀTNISKĀS KONFERENCES PROCEEDINGS OF
RAKSTU KRĀJUMS THE 60th INTERNATIONAL SCIENTIFIC CONFERENCE OF DAUGAVPILS UNIVERSITY
184
There was investigated the number of joints involved in disease. From all of patients with
reactive arthritis in 35% of cases was detected monoarthritis (one joint was involved in disease), in
49% of cases – oligoarthritis (from 2 to 4 joins were involved), and in 16% of cases was detected
polyarthritis (5 or more joints were involved). The results in reactive arthritis patients with positive
Ureaplasma and Mycoplasma culture were similar. More frequently was detected oligoarthritis: in
47% of patients with positive Ureaplasma culture and in 54% - with positive Mycoplasma culture.
Monoarthritis was detected in 36% of patients with Ureaplasma infection and 32% - with
Mycoplasma infection. Rarely was detected polyarthritis: in 17% of patients with Ureaplasma
infection and in 13% - with Mycoplasma infection (Figure 7).
36
47
17
32
54
13
0
10
20
30
40
50
60
monoarthritis oligoarthritis poliarthritis
pa
tie
nts
, %
the number of involved joints
Ureaplasma Mycoplasma
Figure 7. The number of involved joints in the reactive arthritis patients with positive culture, %
Discussion
In these research was investigated associations of Mycoplasma and Ureaplasma infections and
different types of arthritis. The research showed that Mycoplasma and Ureaplasma infections were
more common in females than in males. A lot of genitourinary tract infections are more common in
females; it can be connected with anatomic aspects of female genitourinary tract. Both Mycoplasma
and Ureaplasma infections were detected more frequently in patients from 20 to 60 years old. These
bacteria belong to the sexually transmitted infections, therefore they are rare in children and elderly
people. Clinical data were collected from patients with arthritis, which mostly belonged to the age
group from 20 to 60 years old. It also could influence the results. Therefore, our study results cannot
show exact Ureaplasma and Mycoplasma prevalence in the general population, but can show
general tendency.
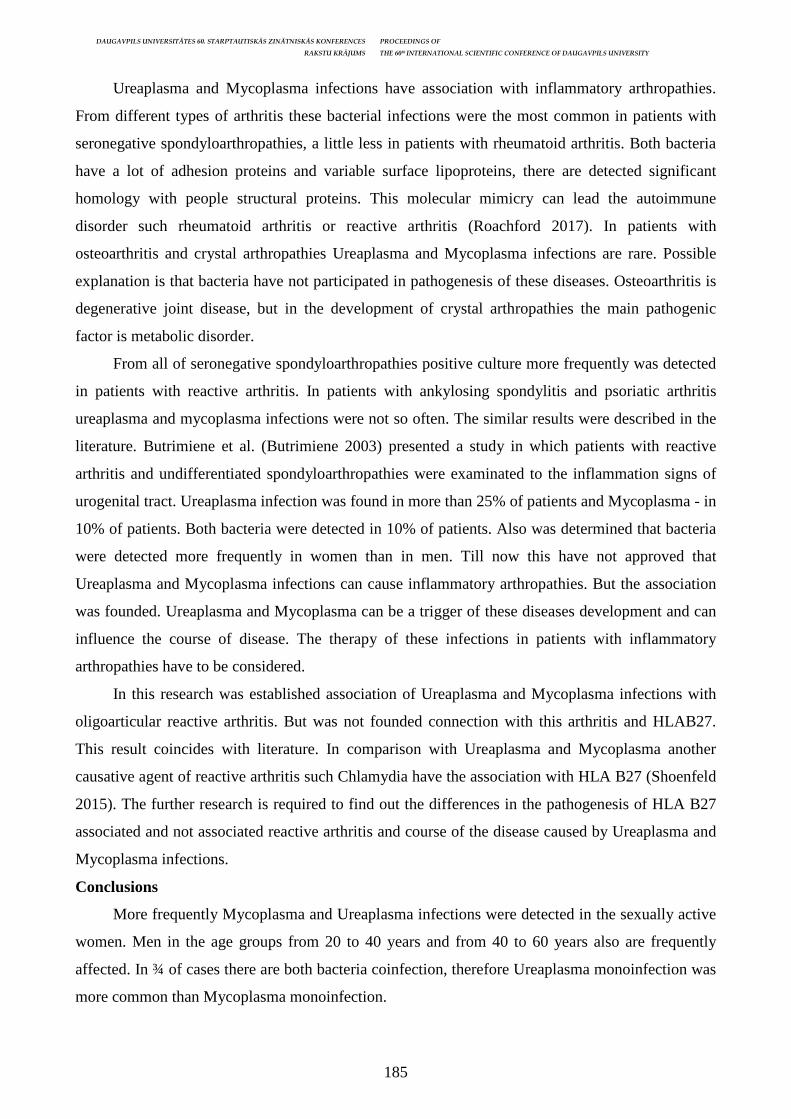
DAUGAVPILS UNIVERSITĀTES 60. STARPTAUTISKĀS ZINĀTNISKĀS KONFERENCES PROCEEDINGS OF
RAKSTU KRĀJUMS THE 60th INTERNATIONAL SCIENTIFIC CONFERENCE OF DAUGAVPILS UNIVERSITY
185
Ureaplasma and Mycoplasma infections have association with inflammatory arthropathies.
From different types of arthritis these bacterial infections were the most common in patients with
seronegative spondyloarthropathies, a little less in patients with rheumatoid arthritis. Both bacteria
have a lot of adhesion proteins and variable surface lipoproteins, there are detected significant
homology with people structural proteins. This molecular mimicry can lead the autoimmune
disorder such rheumatoid arthritis or reactive arthritis (Roachford 2017). In patients with
osteoarthritis and crystal arthropathies Ureaplasma and Mycoplasma infections are rare. Possible
explanation is that bacteria have not participated in pathogenesis of these diseases. Osteoarthritis is
degenerative joint disease, but in the development of crystal arthropathies the main pathogenic
factor is metabolic disorder.
From all of seronegative spondyloarthropathies positive culture more frequently was detected
in patients with reactive arthritis. In patients with ankylosing spondylitis and psoriatic arthritis
ureaplasma and mycoplasma infections were not so often. The similar results were described in the
literature. Butrimiene et al. (Butrimiene 2003) presented a study in which patients with reactive
arthritis and undifferentiated spondyloarthropathies were examinated to the inflammation signs of
urogenital tract. Ureaplasma infection was found in more than 25% of patients and Mycoplasma - in
10% of patients. Both bacteria were detected in 10% of patients. Also was determined that bacteria
were detected more frequently in women than in men. Till now this have not approved that
Ureaplasma and Mycoplasma infections can cause inflammatory arthropathies. But the association
was founded. Ureaplasma and Mycoplasma can be a trigger of these diseases development and can
influence the course of disease. The therapy of these infections in patients with inflammatory
arthropathies have to be considered.
In this research was established association of Ureaplasma and Mycoplasma infections with
oligoarticular reactive arthritis. But was not founded connection with this arthritis and HLAB27.
This result coincides with literature. In comparison with Ureaplasma and Mycoplasma another
causative agent of reactive arthritis such Chlamydia have the association with HLA B27 (Shoenfeld
2015). The further research is required to find out the differences in the pathogenesis of HLA B27
associated and not associated reactive arthritis and course of the disease caused by Ureaplasma and
Mycoplasma infections.
Conclusions
More frequently Mycoplasma and Ureaplasma infections were detected in the sexually active
women. Men in the age groups from 20 to 40 years and from 40 to 60 years also are frequently
affected. In ¾ of cases there are both bacteria coinfection, therefore Ureaplasma monoinfection was
more common than Mycoplasma monoinfection.
DAUGAVPILS UNIVERSITĀTES 60. STARPTAUTISKĀS ZINĀTNISKĀS KONFERENCES PROCEEDINGS OF
RAKSTU KRĀJUMS THE 60th INTERNATIONAL SCIENTIFIC CONFERENCE OF DAUGAVPILS UNIVERSITY
186
Ureaplasma and Mycoplasma infections have association with inflammatory arthropathies.
These bacterial infections are most common in patients with seronegative spondyloarthropathies: ¼
of patients had positive Ureaplasma culture and 1/5 – positive Mycoplasma culture. In patients with
osteoarthritis and crystal arthropathies both infections are rare. In group of seronegative
spondyloarthropathies Ureaplasma and Mycoplasma infections are most common in patients with
reactive oligoarthritis, HLA-B27 non-associated.
References Butrimiene I., Ranceva J., Griskevicius A. 2003. Mycoplasmal infection in patients with reactive arthritis and seronegative spondyloarthropathies. Medicina (Kaunas). Vol. 39(5), pp. 460–3. Murray P. R., Rosenthal K. S., Pfaller M. A. 2016. Medical Microbiology, Eight Edition. Philadelphia: Elsevier Inc., pp. 334–336. Roachford O. St. E., Nelson K. E., Mohapatra B. R. 2017. Comparative genomics of four Mycoplasma species of the human urogenital tract: Analysis of their core genomes and virulence genes. International Journal of Medical Microbiology. Vol. 307, pp. 508–520. Sherbet G. Bacterial Infections and the Pathogenesis of Autoimmune Conditions. 2009. British Journal of Medical Practitioners. Vol. 2(1), pp. 6–13. Shoenfeld Y., Agmon-Levin N., Rose N. R. 2015. Infection and Autoimmunity, Second Edition. Oxford: Elsevier B.V., Chapter 49, pp. 807–828. Waites K. B., Ureaplasma Infection. [skatīts 20.12.2017]. Pieejams: https://emedicine.medscape. com/article/231470-overview#a5

DAUGAVPILS UNIVERSITĀTES 60. STARPTAUTISKĀS ZINĀTNISKĀS KONFERENCES PROCEEDINGS OF
RAKSTU KRĀJUMS THE 60th INTERNATIONAL SCIENTIFIC CONFERENCE OF DAUGAVPILS UNIVERSITY
187
THE IMPACT OF DOWN SYNDROME ON THE EARLY POSTOPERATIVE PERIOD IN PATIENTS
WHO HAD UNDERGONE AVSD CORRECTIVE OPEN HEART SURGERY TILL THREE YEARS OF AGE
Kristi āna Čačka1, Evelīna Korsaka1, Līga Gaisiņa1, Ingūna Lubaua1, 2 1 Rīga Stradiņš University, Dzirciema street 16, Rīga, [email protected], [email protected], [email protected], [email protected] 2 Children’s Clinical University Hospital, Vienības gatve 45, Rīga, [email protected] Abstract
The impact of Down syndrome on the early postoperative period in patients who had undergone AVSD corrective open heart surgery till three years of age
Key Words: Atrioventricular septal defect, AVSD surgery outcome, early postoperative period, Down syndrome, pediatric cardiology Introduction An atrioventricular septal defect (AVSD) is the most frequent congenital heart defect found in children with Down syndrome (DS). Aim. The aim of this retrospective study was to evaluate the impact of DS on the early postoperative period in patients who had undergone AVSD correction and compare results with patients who do not have DS. Materials and methods. A retrospective study was carried out using the data of 51 patients who had undergone AVSD corrective open heart surgery till three years of age between the years 2007 and 2016 at the Children’s Clinical University Hospital. The data were collected from medical records. Results. A total of 51 patients participated in the study. Mean patient age was 10.75 months. Thirty-four of all patients had DS. Nine patients died. Out of all death cases 7 during the early postoperative period. 6 of the death cases were patients with DS. The early post-operative period was complicated in 56.86% of all patients. The most common reason was infection 33.03% (n=9), seven of patients were with DS; atelectasis in 17.24% (n=5), four of them with DS,16.66% (n=7) patients experienced AV block,4 of these patients were with DS. Mean drainage time was 7.08 days, in a patient group with DS -8.42 days. Antibiotics were used 10.81 days on average, patients with DS -11.83 days. Conclusions. There was no statistical difference between the groups. Down’s syndrome is not associated with a longer postoperative drainage and antibiotics usage time, higher risk of complications, including infections, atelectasis, AV block. Kopsavilkums
Dauna sindroma ietekmes uz agrīno pēcoperācijas periodu salīdzinājums pacientiem, kuriem ir bijusi atrioventrikul āra septālā defekta ķirur ģiska korekcija līdz tr īs gadu vecumam
Atslēgvārdi: Atrioventrikulārs septāls defekts, AVSD operācijas rezultāti, agrīnais pēcoperācijas periods, Dauna sindroms, bērnu kardioloģija Ievads. Atrioventrikulārs septāls defekts (AVSD) ir visbiežākā iedzimtā sirdskaite bērniem ar Dauna sindromu (DS). Darba mērķis. Šī retrospektīvā pētījuma mērķis bija izvērtēt DS ietekmi uz agrīnā pēcoperācijas perioda norisi pacientiem, kuriem tika veikta AVSD korekcija un salīdzināt iegūtos rezultātus ar pacientu grupu bez DS. Materi āli un metodes. Retrospektīvi tika analizēti 51 pacienta dati, vecumā līdz 3 gadiem, kuriem tikai veikta AVSD ķirurģiska slēgšana laika posmā no 2007.gada līdz 2016.gadam Bērnu klīniskās universitātes slimnīcā. Tika analizētas pacientu medicīniskās vēstures. Rezultāti. Kopā pētījumā piedalījās 51 pacients. Vidējais pacientu vecums bija 10.75 mēneši. Trīsdesmit četriem pacientiem bija DS. Kopā nomira 9 pacienti, septiņi no tiem agrīnajā pēcoperācijas periodā. Sešiem pacientiem no mirušajiem bija DS. 56.86% pacientu bija agrīnā pēcoperācijas perioda sarežģījumi. Visbiežākais iemesls bija infekcija-33.03% (n=9), septiņi pacientiem bija ar DS, 17.24% (n=5) pacientu attīstījās atelektāzes,), četri no tiem ar DS, 16.66% (n=7) pacientiem bija pilna AV blokāde,4 pacienti ar DS. Vidējais drenāžas laiks bija 7.08 dienas, pacientiem ar DS -8.42 dienas. Agrīnajā pēcoperācijas periodā antibiotikas vidēji tika ietotas 10.81 dienu, pacientiem ar DS – 11, 83 dienas. Secinājumi. Starp apskatītajām grupām netika atrasta statistiski ticama atšķirība. Dauna sindroms netiek asociēts ar garāku pēcoperācijas drenāžas un antibiotiku lietošanas laiku, augstāku komplikāciju attīstības risku, ieskaitot infekcijas, atelektāzes un pilnu AV blokādi.
DAUGAVPILS UNIVERSITĀTES 60. STARPTAUTISKĀS ZINĀTNISKĀS KONFERENCES PROCEEDINGS OF
RAKSTU KRĀJUMS THE 60th INTERNATIONAL SCIENTIFIC CONFERENCE OF DAUGAVPILS UNIVERSITY
188
Introduction
An atrioventricular septal defect (AVSD) is characterized by a deficiency of the atrium
premium septum and the inlet portion of the ventricular septum, with common atrioventricular
valve. An AVSD compiles from 4 to 5 percent of congenital heart defects with a reported
prevalence of 0.3 to 0.4 per 1000 live births (Nichols 2006). Down's syndrome is the most common
genetic disorder in children. The estimated prevalence of 21st chromosome trisomy Down
syndrome is 13.56 per 10,000 live births in the United States. Children with Down's syndrome and
congenital heart defects have multiple problems (Kliegman 2011). There is a strong association
between AVSD and Down syndrome, with a 40 to 50 percent risk of Down syndrome in fetuses in
whom an AVSD is detected (Layangool T 2014). Also, AVSD appears to be associated with
maternal obesity and diabetes. Surgery is the primary mode of therapy for patients with AVSD. The
majority of cases of AVSD are suitable for surgical intervention; this generally takes place within
the first six months of life, because of the early development of pulmonary vascular disease (Lange
R 2007). AVSD correction operation is performed via a median sternotomy on cardiopulmonary
bypass. Several studies from Germany, Italy, and the United States have identified that presence of
Down syndrome in patients with AVSD is not a risk factor for surgical repair. The research form
the USA has shown that mortality rates for patients with or without Down syndrome did not differ
significantly (Fudge 2010). However, few data are available about the comprehensive outcome of
all the cardiac surgical procedures in patients with DS.
The aim of this retrospective study was to evaluate the impact of Down syndrome on the early
postoperative period in patients who had undergone atrioventricular septal defects surgical
correction and compare results with patients who do not have Down syndrome.
Materials and methods
The retrospective study included 51 patients who had undergone AVSD corrective open heart
surgery till three years of age between the years 2007 and 2016 at the Latvian Children’s Clinical
University Hospital. Surgical management included AVSD repair with autopericard or
xenopericard. The selection of surgical technique was not based on the presence of DS. Patients
with other congenital heart defects were not included in this research, therefore, only patients with
AVSD were analyzed. Patients were sorted by the presence of DS. Then authors analyzed the early
postoperative period process. The mean drainage and antibiotic usage time, mortality rate,
development of atelectasis and infections, an onset of the complete atrioventricular block and
average time spent in hospital were compared between the groups. The data were collected from
electronic database Andromeda, ICU database ICIP and medical records. The analysis of gathered
data was carried out using IBM SPSS 23.0 and MS Excel. Mann-Whitney test was used to compare

DAUGAVPILS UNIVERSITĀTES 60. STARPTAUTISKĀS ZINĀTNISKĀS KONFERENCES PROCEEDINGS OF
RAKSTU KRĀJUMS THE 60th INTERNATIONAL SCIENTIFIC CONFERENCE OF DAUGAVPILS UNIVERSITY
189
continuous variables between categorical data groups. Categorical variables were compared using a
Chi-square test. P-value < 0.05 was considered statistically significant.
The results of the study
There were thirty-four (66.7%) patients with Down syndrome and eighteen (33,3%) patients
without Down syndrome, a total of 51 patients participated in the study. An average age of patients
at surgery was 10.75 months (min=1 month, max=36 months). Duration of surgery on average was
345.32 minutes (min=103, max=650), in comparison for patients with Down syndrome it was
355.76 minutes and for patients without Down syndrome =323.13 min (p=0.037). Analysis showed
statistical significance between compared groups. An average time of pleural drainage was 7.08
days (min=2 days, max=46 days), in a patient group with Down syndrome -8.42 days; in patient
group without Down syndrome – 4.62 days (p=0.140). Postoperative antibiotic therapy was used
10.81 days on average (min= 5 days, max=60 days), patients with Down syndrome mean antibiotics
usage time was 11.83 days; patients without Down syndrome - 8.92 days (p>0.999). 56.86% (n=
28) of all patients developed postoperative complications. The most common reason of
complications was infection 33.03% (n=9), seven of patients were with Down syndrome (p>0.999).
During early postoperative period five (17.24%) patients had atelectasis, which was second the
most common not cardial complication, four of patients were with Down syndrome (p=0.064).
There were seven (16.66%) patients who developed complete atrioventricular block, out of them
four were with Down syndrome (p=0.595). All patients with complete AV block required an
implantable permanent pacemaker. Average time spent in hospital was 22 days (minimal time was 5
days, maximal time spent in hospital was 114 days). Patients with Down syndrome spent 24.46
days in hospital and patients without Down syndrome spent 17.07 days in the hospital on average
(p=0.260). Nine (17.6%) patients died. Out of all death cases 2 of them died during operation and 7
during the early postoperative period. Six (66.7%) of the death cases were patients with Down
syndrome. Mostly patients died because of acute heart failure (n=7).
Discussion
The purpose of our study was to demonstrate the Down syndrome’s impact on the process of
an early postoperative period. Many studies had approached the question of Down syndrome as the
risk factor of surgical procedures. Our study results align with results of several large studies that
presence of Down syndrome may not be considered as the risk factor for negative postoperative
period outcome after AVSD surgical repair. Even more, in the study that was performed in Italy at
2004, the main conclusion was that Down patients showed a decreased risk for biventricular repair
and lower mortality and morbidity in cases of complex cardiac malformations requiring complex
palliative operations (Formigari 2004)
DAUGAVPILS UNIVERSITĀTES 60. STARPTAUTISKĀS ZINĀTNISKĀS KONFERENCES PROCEEDINGS OF
RAKSTU KRĀJUMS THE 60th INTERNATIONAL SCIENTIFIC CONFERENCE OF DAUGAVPILS UNIVERSITY
190
Between October 1974 and March 2005 in Germany was performed the large study which
included 476 patients with complete AVSD who underwent surgery, 341 (71.6%) of whom had
Down syndrome. The strict conclusion of this research was that the presence of Down syndrome in
patients with a complete atrioventricular septal defect is not a risk factor for surgical repair. In the
long term, reintervention on the left atrioventricular valve is more often required in children with a
normal chromosomal pattern (Lange R 2007). The results of our study are similar to the study that
was performed in Germany, however we cannot firmly claim that children with normal
chromosomal pattern require more reinterventions. Although, when the development of complete
AV block was compared, there was statistical difference between analyzed groups, this difference
was not statistically significant (p=0.595).
Conclusions
Analysis showed statistical significance when average operation length was compared
between the groups. There was no statistical difference with longer time spent in hospital,
postoperative drainage and antibiotics usage time between the groups
Down’s syndrome is not associated with higher risk of complications, including infections,
atelectasis, AV block. This study provides a world tendency that down syndrome may not be
considered as the risk factor for negative postoperative period outcome after AVSD surgical repair.
Also study included small number of patients which means that these findings cannot be used for
entire Latvian population and research should be continued.
Acknowledgement
This research was supported by Riga Stradins university and Children’s Clinical University
Hospital to whom we are grateful. We are also filled with gratitude to our scientific research
supervisor asoc.prof. Inguna Lubaua for the guidance of our work, making it possible for us to do
this research and assistance with clinical interpretation of our work. We are also immensely grateful
to I.Lubaua for her comments on earlier versions of the manuscript, although any errors are our own
and should not tarnish the reputations of this esteemed professional.
References Formigari R., Di Donato R.M., Gargiulo G., Di Carlo D., Feltri C., Picchio F. M., Marino B. 2004. Better surgical prognosis for patients with complete atrioventricular septal defect and Down's syndrome. Vol. 78(2), Bologna, pp. 666–72. Fudge J. C., Li S., Jaggers J., O'Brien S. M., Peterson E. D., Jacobs J. P., Welke K. F., Jacobs M. L., Li J. S., Pasquali S. K. 2010. Congenital heart surgery outcomes in Down syndrome: analysis of a national clinical database. Durham. pp. 315-22. Kliegman R. M., Stanton B. F., St Geme J. W., Schor N. F. 2016. Nelson Textbook of Pediatrics. Vol. 20 (2) Phialdelphia. pp. 2189–99. Lange R., Guenther T., Busch R., Hess J., Schreiber C. 2007. The presence of Down syndrome is not a risk factor in complete atrioventricular septal defect repair. Munich. pp. 304–10.

DAUGAVPILS UNIVERSITĀTES 60. STARPTAUTISKĀS ZINĀTNISKĀS KONFERENCES PROCEEDINGS OF
RAKSTU KRĀJUMS THE 60th INTERNATIONAL SCIENTIFIC CONFERENCE OF DAUGAVPILS UNIVERSITY
191
Layangool T., Sangtawesin C., Kirawittaya T., Prompan W., Prachasilchai P., Pechdamrongsakul. 2014. A. Survival analysis of Down syndrome with congenital heart disease: a 5-years registry a QSNICH. QSNICH. Bangkok. pp. 108–14. Nichols D., Ungerleider R., Spevak P. J., Greeley W., Cameron D., Lappe D., Wetzel R. 2006. Critical Heart Disease in Infants and Children. 2nd Ed, Philadelphia., pp. 507–608.
DAUGAVPILS UNIVERSITĀTES 60. STARPTAUTISKĀS ZINĀTNISKĀS KONFERENCES PROCEEDINGS OF
RAKSTU KRĀJUMS THE 60th INTERNATIONAL SCIENTIFIC CONFERENCE OF DAUGAVPILS UNIVERSITY
192
INFLUENCE OF SELECTED FACTORS ON THE PROGNOSIS IN NEWBORNS WITH GASTROSCHISIS
Ieva Kārkli ņa-Kravale1, Iveta Račko1, Assoc. prof. Zane Ābola2
1 Rīgas Stradiņš University, Dzirciema street 16, Rīga, Latvia, LV-1007, [email protected] 2 Children's Clinical University Hospital, Vienības gatve 45, Rīga, Latvia, LV-1004, [email protected] Abstract
Influence of selected factors on the prognosis in newborns with gastroschis Key Words: Gastroschisis, mechanical ventilation (MV), full enteral feeding (FEF), total hospitalization period (THP), Children's Clinical University Hospital (CCUH) Gastroschisis is a defect of the abdominal wall, resulting in congenital evisceration and requiring neonatal intensive care and early surgical correction. [1] This study evaluated newborns with gastroschisis, seeking the influence of selected risk factors on the three outcome factors: time of MV, time needed to achieve FEF, THP. A retrospective analysis of all newborns with gastroschisis treated between 2011-2017 in the CCUH was done. During this study period 25 newborns with gastroschisis were treated in the CCUH. Information was available for 23 newborns. Prenatal diagnosis was made in 14 patients. Average weight of the newborn - 2642g. Cesarean section (CS) was performed in 10 cases. Average time of MV-7,7 days, FEF was started in 39,3 days, THP - 60,6 days. Pearson Correlation showed that the mode of delivery influenced the outcome of gastroschisis patient. Those who were delivered by CS needed longer time to achieve FEF (r=0.523, p=0.026), they had a higher risk of long-standing MV (r=0.585, p=0.007) and a higher risk of longer THP (r=0.617, p=0.002). There was an association between birth weight and MV time - neonates with birth weight <2500g received it longer. In this study the mode of delivery was the main possible risk factor having influence on the prognosis of newborns with gastroschisis. Also neonates birth weight showed an influence on the MV time. Despite progress in medicine, gastroschisis patients still remain a serious therapeutic problem. Kopsavilkums Atslēgvārdi: Gastrošīze, mākslīgā plaušu ventilācija (MPV), pilna enterālā barošana (PEB), totālais hospitalizācijas periods (THP), Bērnu klīniskā universitātes slimnīca (BKUS) Gastrošīze ir iedzimts vēdera sienas defekts, kura rezultātā vēdera dobuma orgāni nonāk ārpus tā. Šī patoloģija pieprasa jaundzimušo intensīvo terapiju un agrīnu ķirurģisku korekciju. [1] Šajā darbā tika raksturoti gastrošīzes pacienti un meklēta sakritība starp izvēlētiem riska faktoriem un trīs iznākuma rādītājiem: MPV laiks, periods līdz PEB, THP. Retrospektīvi tika analizēti gastrošīzes jaundzimušie pacienti, kas ārstējās BKUS no 2011.-2017.gadam. Šajā laika periodā tie bija 25 jaundzimušie, adekvāta informācija bija pieejam par 23. Prenatāla diagnostika tika veikta 14 no šiem pacientiem. Vidējais jaundzimušā svars - 2642g. Ķeizargrieziens tika veikts 10 gadījumos. Vidējais MPV laiks - 7,7 dienas, PEB tika uzsākta 39,3 dienās, THP - 60,6 dienas. Pīrsona korelācija uzrādīja, ka ir cieša saistība starp dzemdību veidu un šo pacientu iznākumiem. Gastrošīzes pacientiem, kuri piedzima ķeizargrieziena operācijā, bija nepieciešams ilgāks laiks līdz PEB (r=0.523, p=0.026), viņiem bija lielāks risks ilgstošai MPV(r=0.585, p=0.007) un lielāks risks ilgākam THP (r=0.617, p=0.002). Tika novērota arī saistība starp dzimšanas svaru un MPV ilgumu - jaundzimušiem ar svaru <2500g MPV laiks bija lielāks. Šajā pētījumā, kā iespējamais ietekmējošais faktors uz gastrošīzes pacientu iznākumu, ir dzemdību veids. Tāpat arī novēroja jaundzimušā svara ietekmi uz MPV laiku. Antenatālā diagnostika bija veikta 61% pacientu, šo rādītāju ir ieteicams uzlabot.
Introduction
Gastroschisis is a congenital defect of the abdominal wall, characterized by extrusion of
bowel loops and other abdominal organs outside the abdominal wall with no covering membrane.
[5] This pathology requires neonatal intensive care and early surgical correction. [1] Our study
evaluated newborns with gastroschisis, seeking an influence of selected risk factors on the
prognosis in newborns with gastroschisis. The factors were selected and the association between
them and three outcome factors (time of MV, time needed to achieve FEF and THP) was analyzed.
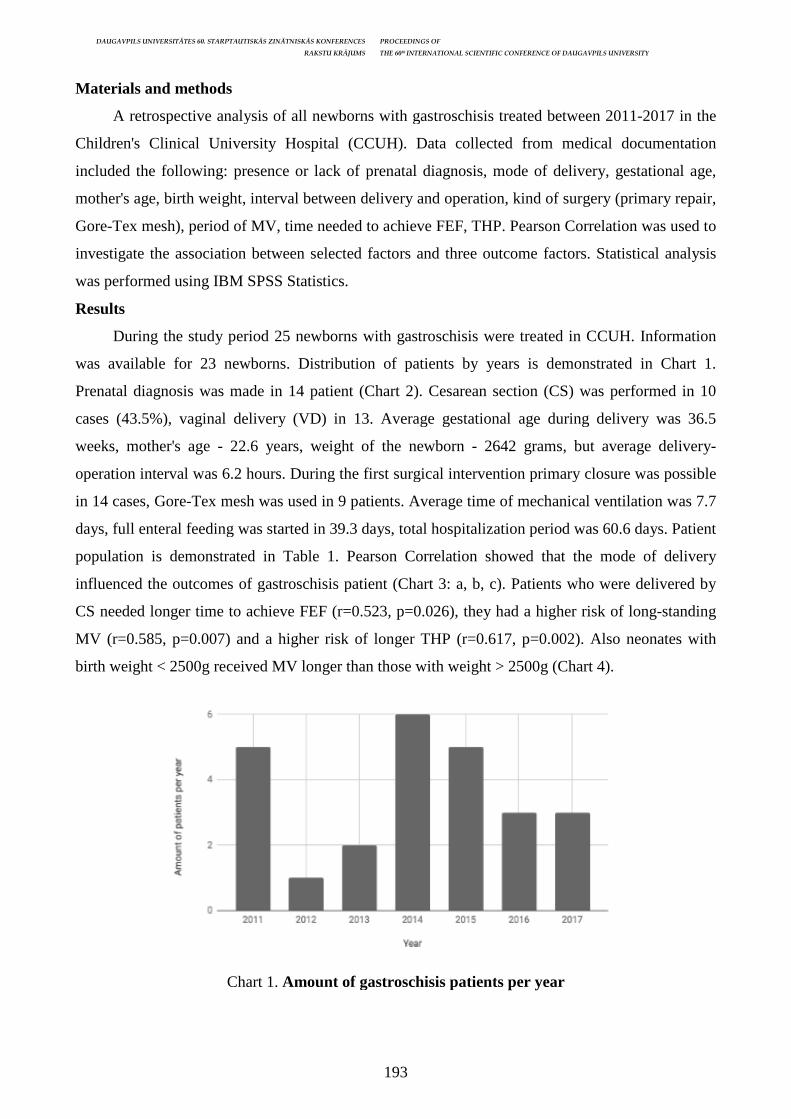
DAUGAVPILS UNIVERSITĀTES 60. STARPTAUTISKĀS ZINĀTNISKĀS KONFERENCES
Materials and methods
A retrospective analysis of all newborns with gastroschisis treated between 2011
Children's Clinical University Hospital (CCUH).
included the following: presence or lack of prenatal diagnosis, mode of delivery, gestational age,
mother's age, birth weight, interval between delivery and operation, kind of surger
Gore-Tex mesh), period of MV, time needed to achieve FEF, THP. Pearson Correlation was used to
investigate the association between selected factors and three outcome factors. Statistical analysis
was performed using IBM SPSS Statistics.
Results
During the study period 25 newborns with gastroschisis were treated in
was available for 23 newborns. Distribution of patients by years is demonstrated in Chart 1.
Prenatal diagnosis was made in 14 patient (Chart 2). Cesarean sec
cases (43.5%), vaginal delivery (VD) in 13. Average gestational age during delivery was 36.5
weeks, mother's age - 22.6 years, weight of the newborn
operation interval was 6.2 hours. During t
in 14 cases, Gore-Tex mesh was used in 9 patients. Average time of mechanical ventilation was 7.7
days, full enteral feeding was started in 39.3 days, total hospitalization period was 60.6 days. P
population is demonstrated in Table 1. Pearson Correlation showed that the mode of delivery
influenced the outcomes of gastroschisis patient (Chart 3: a, b, c). Patients who were delivered by
CS needed longer time to achieve FEF (r=0.523, p=0.026),
MV (r=0.585, p=0.007) and a higher risk of longer THP (r=0.617, p=0.002). Also
birth weight < 2500g received MV longer than those with weight > 2500g (Chart 4).
Chart 1. Amount of gastroschisis pati
STARPTAUTISKĀS ZINĀTNISKĀS KONFERENCES PROCEEDINGS OF
RAKSTU KRĀJUMS THE 60th INTERNATIONAL SCIENTIFIC CONFERENCE OF DAUGAVPILS UNIVERSITY
193
A retrospective analysis of all newborns with gastroschisis treated between 2011
cal University Hospital (CCUH). Data collected from medical documentation
included the following: presence or lack of prenatal diagnosis, mode of delivery, gestational age,
mother's age, birth weight, interval between delivery and operation, kind of surger
Tex mesh), period of MV, time needed to achieve FEF, THP. Pearson Correlation was used to
investigate the association between selected factors and three outcome factors. Statistical analysis
was performed using IBM SPSS Statistics.
During the study period 25 newborns with gastroschisis were treated in
was available for 23 newborns. Distribution of patients by years is demonstrated in Chart 1.
Prenatal diagnosis was made in 14 patient (Chart 2). Cesarean section (CS) was performed in 10
cases (43.5%), vaginal delivery (VD) in 13. Average gestational age during delivery was 36.5
22.6 years, weight of the newborn - 2642 grams, but average delivery
operation interval was 6.2 hours. During the first surgical intervention primary closure was possible
Tex mesh was used in 9 patients. Average time of mechanical ventilation was 7.7
days, full enteral feeding was started in 39.3 days, total hospitalization period was 60.6 days. P
population is demonstrated in Table 1. Pearson Correlation showed that the mode of delivery
influenced the outcomes of gastroschisis patient (Chart 3: a, b, c). Patients who were delivered by
CS needed longer time to achieve FEF (r=0.523, p=0.026), they had a higher risk of long
MV (r=0.585, p=0.007) and a higher risk of longer THP (r=0.617, p=0.002). Also
birth weight < 2500g received MV longer than those with weight > 2500g (Chart 4).
Amount of gastroschisis patients per year
INTERNATIONAL SCIENTIFIC CONFERENCE OF DAUGAVPILS UNIVERSITY
A retrospective analysis of all newborns with gastroschisis treated between 2011-2017 in the
Data collected from medical documentation
included the following: presence or lack of prenatal diagnosis, mode of delivery, gestational age,
mother's age, birth weight, interval between delivery and operation, kind of surgery (primary repair,
Tex mesh), period of MV, time needed to achieve FEF, THP. Pearson Correlation was used to
investigate the association between selected factors and three outcome factors. Statistical analysis
During the study period 25 newborns with gastroschisis were treated in CCUH. Information
was available for 23 newborns. Distribution of patients by years is demonstrated in Chart 1.
tion (CS) was performed in 10
cases (43.5%), vaginal delivery (VD) in 13. Average gestational age during delivery was 36.5
2642 grams, but average delivery-
he first surgical intervention primary closure was possible
Tex mesh was used in 9 patients. Average time of mechanical ventilation was 7.7
days, full enteral feeding was started in 39.3 days, total hospitalization period was 60.6 days. Patient
population is demonstrated in Table 1. Pearson Correlation showed that the mode of delivery
influenced the outcomes of gastroschisis patient (Chart 3: a, b, c). Patients who were delivered by
they had a higher risk of long-standing
MV (r=0.585, p=0.007) and a higher risk of longer THP (r=0.617, p=0.002). Also neonates with
birth weight < 2500g received MV longer than those with weight > 2500g (Chart 4).

DAUGAVPILS UNIVERSITĀTES 60. STARPTAUTISKĀS ZINĀTNISKĀS KONFERENCES
Chart 2.
Chart 3a. Relationship between the mode of delivery and time to achieve
Patients who were delivered by cesarean section needed longer time to achieve FEF (r=0.523,
p=0.026).
STARPTAUTISKĀS ZINĀTNISKĀS KONFERENCES PROCEEDINGS OF
RAKSTU KRĀJUMS THE 60th INTERNATIONAL SCIENTIFIC CONFERENCE OF DAUGAVPILS UNIVERSITY
194
Chart 2. Antenatal diagnostics per year
Relationship between the mode of delivery and time to achieve
full enteral feeding
Patients who were delivered by cesarean section needed longer time to achieve FEF (r=0.523,
INTERNATIONAL SCIENTIFIC CONFERENCE OF DAUGAVPILS UNIVERSITY
Relationship between the mode of delivery and time to achieve
Patients who were delivered by cesarean section needed longer time to achieve FEF (r=0.523,
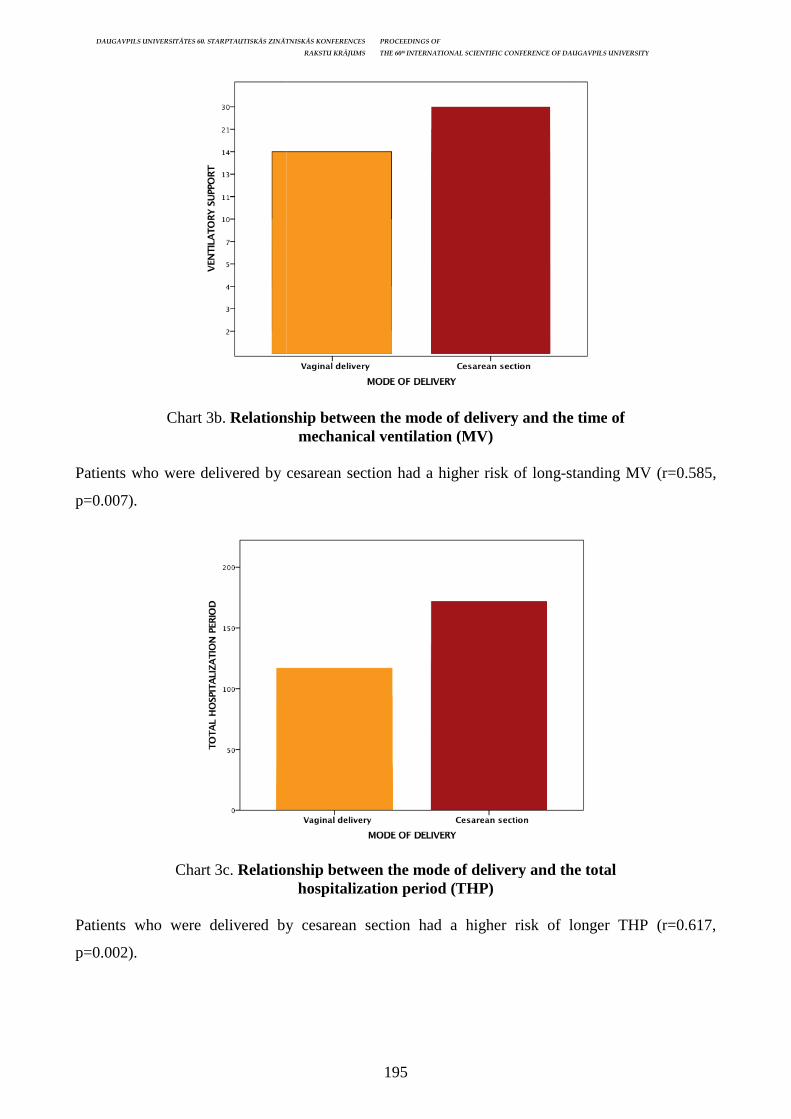
DAUGAVPILS UNIVERSITĀTES 60. STARPTAUTISKĀS ZINĀTNISKĀS KONFERENCES
Chart 3b. Relationship between the mode of delivery and the time
Patients who were delivered by cesarean section had a higher risk of long
p=0.007).
Chart 3c. Relationship between the mode o
Patients who were delivered by cesarean section had a higher risk of longer THP (r=0.617,
p=0.002).
STARPTAUTISKĀS ZINĀTNISKĀS KONFERENCES PROCEEDINGS OF
RAKSTU KRĀJUMS THE 60th INTERNATIONAL SCIENTIFIC CONFERENCE OF DAUGAVPILS UNIVERSITY
195
Relationship between the mode of delivery and the time
mechanical ventilation (MV)
Patients who were delivered by cesarean section had a higher risk of long-standing MV (r=0.585,
Relationship between the mode of delivery and the total
hospitalization period (THP)
Patients who were delivered by cesarean section had a higher risk of longer THP (r=0.617,
INTERNATIONAL SCIENTIFIC CONFERENCE OF DAUGAVPILS UNIVERSITY
Relationship between the mode of delivery and the time of
standing MV (r=0.585,
f delivery and the total
Patients who were delivered by cesarean section had a higher risk of longer THP (r=0.617,

DAUGAVPILS UNIVERSITĀTES 60. STARPTAUTISKĀS ZINĀTNISKĀS KONFERENCES
Chart 4. Relationship between the birth weight of neonate and the time of
Neonates with birth weight < 2500g received MV longer than those with weight > 2500g.
Gestational age (weeks)
Mother's age (years)
Weight of the newborn (grams)
Delivery-operation interval (hours)
Time of mechanical ventilation (days)
Time till full enteral feeding (days)
Total hospitalization period (days)
Discussion
Gastroschisis is a congenital anomaly with
variable postnatal outcomes. [3] The etiology of this pathology is unknown, but some risk factors
have been discovered. [4, 10] In this study we decided to seek an influence of selected risk factors
on the prognosis in newborns with gastroschisis.
During the study period (2011
CCUH. Information was available for 23 newborns. The prenatal diagnosis was made in 61% of
cases. Average gestational age duri
confirm that average gestational age at spontaneous delivery is < 37 weeks for neonates with
gastroschisis. [7, 8] Although, other studies revealed that total hospitalization period is significan
longer in those born at 34–36 + 6 gestational weeks (GW)
STARPTAUTISKĀS ZINĀTNISKĀS KONFERENCES PROCEEDINGS OF
RAKSTU KRĀJUMS THE 60th INTERNATIONAL SCIENTIFIC CONFERENCE OF DAUGAVPILS UNIVERSITY
196
Relationship between the birth weight of neonate and the time of
mechanical ventilation
Neonates with birth weight < 2500g received MV longer than those with weight > 2500g.
Table 1. Patient population
Average
36.5
22.6
Weight of the newborn (grams) 2642
operation interval (hours) 6.2
Time of mechanical ventilation (days) 7.7
Time till full enteral feeding (days) 39.3
Total hospitalization period (days) 60.6
Gastroschisis is a congenital anomaly with relatively easy prenatal diagnosis and extremely
variable postnatal outcomes. [3] The etiology of this pathology is unknown, but some risk factors
have been discovered. [4, 10] In this study we decided to seek an influence of selected risk factors
prognosis in newborns with gastroschisis.
During the study period (2011–2017) 25 newborns with gastroschisis were treated in the
CCUH. Information was available for 23 newborns. The prenatal diagnosis was made in 61% of
cases. Average gestational age during delivery was 36.5 weeks. Findings from other studies also
confirm that average gestational age at spontaneous delivery is < 37 weeks for neonates with
Although, other studies revealed that total hospitalization period is significan
36 + 6 gestational weeks (GW) compared with ≥ 37 GW. Also incidence
INTERNATIONAL SCIENTIFIC CONFERENCE OF DAUGAVPILS UNIVERSITY
Relationship between the birth weight of neonate and the time of
Neonates with birth weight < 2500g received MV longer than those with weight > 2500g.
Range
34 - 40
16 - 32
1755 - 4000
1 - 16
2 - 30
11 - 121
15 - 172
relatively easy prenatal diagnosis and extremely
variable postnatal outcomes. [3] The etiology of this pathology is unknown, but some risk factors
have been discovered. [4, 10] In this study we decided to seek an influence of selected risk factors
2017) 25 newborns with gastroschisis were treated in the
CCUH. Information was available for 23 newborns. The prenatal diagnosis was made in 61% of
ng delivery was 36.5 weeks. Findings from other studies also
confirm that average gestational age at spontaneous delivery is < 37 weeks for neonates with
Although, other studies revealed that total hospitalization period is significantly
≥ 37 GW. Also incidence

DAUGAVPILS UNIVERSITĀTES 60. STARPTAUTISKĀS ZINĀTNISKĀS KONFERENCES PROCEEDINGS OF
RAKSTU KRĀJUMS THE 60th INTERNATIONAL SCIENTIFIC CONFERENCE OF DAUGAVPILS UNIVERSITY
197
of sepsis is higher in infants born at 34–36 + 6 weeks vs. infants born at ≥ 37 weeks. There is an
association between early birth of fetuses with gastroschisis and delay in reaching full enteral
feeds. [2]
Average mother's age was 22.6 years. Young maternal age has been known as one consistent
risk factor for gastroschisis in all epidemiological studies. [6] Incidence of gastroschisis (cases per
10000 births) by maternal age < 20 years - 9.21, but by maternal age 25-29 years - 1.47. [9]
CS was performed in 10 cases (43.5%), VD in 13. In the literature this proportion varies.
There has been published a research where CS was performed in 78% of cases [7], but as opposed
to that, one research showed that CS was done in 36.5% of cases [4].
Pearson Correlation revealed that the mode of delivery influenced the outcomes of newborns
with gastroschisis. Patients who were delivered by CS needed longer time to achieve FEF, they had
a higher risk of long-standing MV and a higher risk of longer THP. Findings from other researches
suggest that attempted VD is becoming increasingly prevalent for women with pregnancies affected
by gastroschisis. Data from earlier reports and a meta-analysis demonstrated no benefit for cesarean
delivery. Given the increased maternal morbidity with cesarean delivery, and lack of neonatal
benefit, planned cesarean specifically for gastroschisis is not recommended. [4] Spontaneous or
induced VD after 36 GW is recommended unless obstetric indications dictate otherwise. [5]
In our research, neonates birth weight showed an association only with the time of MV. Those
with birth weight under 2500 grams received MV longer than those with weight > 2500 grams.
If we compared neonates who were delivered vaginaly with those who were delivered by CS,
in our study the average gestational age for both groups was: VD - 36.8 GW, CS - 36 GW, which
did not show significant difference. However, if we compared the birth weight of neonates in these
two groups, the average in VD group was 2955 grams, but in CS group - 2335 grams. Probably this
finding also impacted the outcome of gastroschisis patients, who were delivered by CS.
The main limitations of this study were represented by its retrospective design, relatively
small patient group and lack of sufficient information about mother's pregnancy. This research
could be developed by analyzing gastroschisis patients from other years and by collecting more
specific data from these patients and their mothers. That could help to improve the management of
gastroschisis patients and their outcomes in Latvia.
Conclusions
In this study the mode of delivery was the main possible risk factor having influence on the
prognosis of newborns with gastroschisis. Also neonate birth weight showed an influence on the
time of MV. Despite progress in medicine, gastroschisis patients still remain a serious therapeutic
problem, and we suggest that an improvement in the prenatal diagnosis of these patients is needed.
DAUGAVPILS UNIVERSITĀTES 60. STARPTAUTISKĀS ZINĀTNISKĀS KONFERENCES PROCEEDINGS OF
RAKSTU KRĀJUMS THE 60th INTERNATIONAL SCIENTIFIC CONFERENCE OF DAUGAVPILS UNIVERSITY
198
Acknowledgement
Not applicable.
References 1. Alves MS., Aguiar M., Bouzada V. Nutritional Management and Postoperative Prognosis of Newborns Submitted to Primary Surgical Repair of Gastroschisis. J Pediatr (Rio J). 2016 May-Jun; 92(3): 268–75. doi: 10.1016/j.jped.2015.07.009 2. Carnaghana H., Baud D., Lapidus-Krol E., Ryan G., S.Shah P., Pierro A., Eaton S. Effect of Gestational Age at Birth on Neonatal Outcomes in Gastroschisis. Journal of Pediatric Surgery Volume 51, Issue 5, May 2016, Pages 734–738. https://doi.org/10.1016/j.jpedsurg.2016.02.013 3. D’Antonio F., Virgone C., Rizzo G., Khalil A., Baud D., Cohen-Overbeek TE., Kuleva M., Salomon L. J., Flacco ME., Manzoli L., Giuliani S. Prenatal Risk Factors and Outcomes in Gastroschisis: A Meta-Analysis. Pediatrics July 2015, VOLUME 136 / ISSUE 1 From the American Academy of Pediatrics, Review Article. 4. Friedman AM., Ananth CV., Siddiq Z., D’Alton ME., Wright JD. Gastroschisis: Epidemiology and Mode of Delivery, 2005–2013. Am J Obstet Gynecol. Author manuscript; available in PMC 2017 Sep 1. Published in final edited form as: Am J Obstet Gynecol. 2016 Sep; 215(3): 348.e1–348.e9. Published online 2016 Mar 26. doi: 10.1016/j.ajog.2016.03.039 5. Gamba P, Midrio P. Abdominal Wall Defects: Prenatal Diagnosis, Newborn Management, and Long-term Outcomes. Semin Pediatr Surg. 2014 Oct; 23(5): 283–90. 6. Mastroiacovo P. Risk Factors for Gastroschisis. BMJ. 2008 Jun 21; 336(7658): 1386–1387. Published online 2008 Jun 16. doi: 10.1136/bmj.39577.589699.BE 7. Sawicka E., Wieprzowski L., Jaczyńska R., Maciejewski T. Influence of Selected Factors on the Treatment and Prognosis in Newborns with Gastroschisis on the basis of own experience. Med Wieku Rozwoj. 2013 Jan-Mar; 17(1): 37–46. 8. Skarsgard ED. Management of gastroschisis. Curr Opin Pediatr. 2016 Jun; 28(3): 363–9. doi: 10.1097/MOP.0000000000000336 9. Stoll C, Alembik Y, Dott B, Roth MP. Omphalocele and gastroschisis and associated malformations. Am J Med Genet A. 2008 May 15; 146A(10): 1280-5. doi: 10.1002/ajmg.a.32297 10. CDC: Centers for Disease Control and Prevention. Facts about Gastroschisis. [Skatīts 30.04.2018]. Pieejams (Accessed): https://www.cdc.gov/ncbddd/birthdefects/gastroschisis.html
DAUGAVPILS UNIVERSITĀTES 60. STARPTAUTISKĀS ZINĀTNISKĀS KONFERENCES PROCEEDINGS OF
RAKSTU KRĀJUMS THE 60th INTERNATIONAL SCIENTIFIC CONFERENCE OF DAUGAVPILS UNIVERSITY
199
CORRELATION BETWEEN PHYSICAL ACTIVITY AND MENTAL HEALTH OF YOUNG ADULTS
Vita L āčplēse, Gundega Akuratere, Gundega Ķauķe, Signe Tomsone
Rīga Stradiņš University, Dzirciema street 16, Riga, [email protected], [email protected], [email protected], [email protected]
Abstract Correlation between physical activity and mental health of young adults
Key Words: Physical activity, depression, young adults, IPAQ, PHQ-9 Introduction. Nowadays young adults have a lot of duties that can contribute to the emergence of depression. Depression is the most common psychiatric disorder and is thought to affect 121 million adults worldwide (Moussavi et al. 2007). Many studies show that exercise can improve symptoms of depression. An inverse relationship between high physical activity and lower risk of depression or vice versa has been established (Schuch et al. 2017). The aim of the study Evaluate the level of physical activity in young adults and assess its relation to mental health. Materials and methods. 209 adults in age group 18-30 years completed a questionnaire that included questions about anthropometric data, a short form of International Physical Activity Questionnaire (IPAQ) and Patient Health Questionnaire (PHQ-9) for assessment of depression severity. Collected data were analyzed with SPSS using descriptive statistical methods with confidence interval (CI) of 95%. Results. 209 adults from which 78 (37.3%) were male, 131 (62.7%) were female. Mean age was 24.61 [95% CI= 24.30-24.93], median age 24. Mean respondents body mass index was 23.3 [22.8-23.8]. 13 (6.2%) participants were underweight, 141 (67.5%) had normal weight, 42 (20.1%) was overweight and 13 (6.2%) were obese. 96 (45.9%) respondents were doing sedentary work, 28 (13.4%)- physical, but 85 (40.7%) respondents were involved in both types of work. According to IPAQ, respondents were graded as having low (39 or 18.7%), moderate (87- 41.6%) or high physical activity (83 or 39.7%). Data from PHQ-9 scale showed that 93 (44.5%) participants don’t have depression, 75 (35.9%) have mild depression, 25 (12.0%) have moderate depression, 10 (4.8%) have moderately severe depression, but 6 (2.9%)- severe. No significant correlation (p>0.05) was found between level of physical activity and depression. Conclusion. There was no significant correlation between level of physical activity and depression.
Introduction
Nowadays young adults have a lot of duties that can contribute to the emergence of
depression. Depression is the most common psychiatric disorder and is thought to affect 121 million
adults worldwide (Moussavi et al. 2007). A small part of depression is sadness. For some people
who have depression symptoms may differ from others, for example someone may not feel sad.
Other symptoms like physical ones can be seen in young adults with depression as well. (National
Institute of Mental Health 2015) Person with depression may experience any of the following signs
and symptoms: depressed mood, loss of interest or pleasure, feelings of guilt or low self-worth,
disturbed sleep or appetite, low energy, and poor concentration. Depression is the leading cause of
disability as measured by YLDs and the 4th leading contributor to the global burden of disease
(DALYs) in 2000. By the year 2020, depression is projected to reach 2nd place of the ranking of
DALYs calculated for all ages, both sexes (Debjit 2012).
Many studies show that exercise and physical activity can improve symptoms of depression.
Physical activity is defined as any bodily movement produced by skeletal muscles that requires
energy expenditure. Physical inactivity (lack of physical activity) has been identified as the fourth

DAUGAVPILS UNIVERSITĀTES 60. STARPTAUTISKĀS ZINĀTNISKĀS KONFERENCES PROCEEDINGS OF
RAKSTU KRĀJUMS THE 60th INTERNATIONAL SCIENTIFIC CONFERENCE OF DAUGAVPILS UNIVERSITY
200
leading risk factor for global mortality (6% of deaths globally). Moreover, physical inactivity is
estimated to be the main cause for approximately 21–25% of breast and colon cancers, 27% of
diabetes and approximately 30% of ischaemic heart disease burden (World Health Organization),
An inverse relationship between high physical activity and lower risk of depression or vice versa
has been established (Schuch et al. 2017).
Material and Methods
209 adults in age group 18-30 years completed a questionnaire that included questions about
anthropometric data, a short form of International Physical Activity Questionnaire (IPAQ) and
Patient Health Questionnaire (PHQ-9) for assessment of depression severity. Collected data were
analyzed with SPSS using descriptive statistical methods with confidence interval (CI) of 95%.
For assessment of physical activity level we used a short form IPAQ that contains questions
about frequency, duration, and intensity of physical activity during past week. The IPAQ
(Thirlaway 1992) was an instrument designed primarily for population surveillance of physical
activity among adults (Booth 2000). The validity and reliability of the instrument was established in
various studies (Craig 2003). Results can be further quantified into metabolic equivalents (MET).
One metabolic equivalent (MET) is defined as the amount of oxygen consumed while sitting at rest
and is equal to 3.5 ml O2 per kg body weight x min (Jetté 1990). Mild activities have an energy
expenditure of less than or equal to 3 metabolic units or MET; moderate activities have an energy
expenditure of 3-6 MET, and vigorous activities have an energy expenditure of 6 MET and higher
(Ainsworth 2000). The fallowing classification of MET is used in IPAQ-S scoring protocol:
• Low Physical Activity: 0-599 MET;
• Moderate Physical Activity: 600-1499 MET;
• Vigorous Physical Activity: ≥1500 MET.
The PHQ-9 is a 9-question instrument given to participants to screen for the presence and
severity of depression. The diagnostic validity of the PHQ-9 was established in studies involving 8
primary care and 7 obstetrical clinics. The questions are based on diagnostic criteria of depression
from DSM-IV and ask about the patient's experience in the last 2 weeks. Questions are about the
level of interest in doing things, feeling down or depressed, difficulty with sleeping, energy levels,
eating habits, self-perception, ability to concentrate, speed of functioning and thoughts of suicide.
Responses range from “0” (not at all) to “3” (nearly every day). The fallowing classification
according to scores is used:
• No depression: 0-4 points;
• Mild depression: 5-9 points;
• Moderate depression: 10-14 points;
• Moderately Severe depression: 15-19 points;
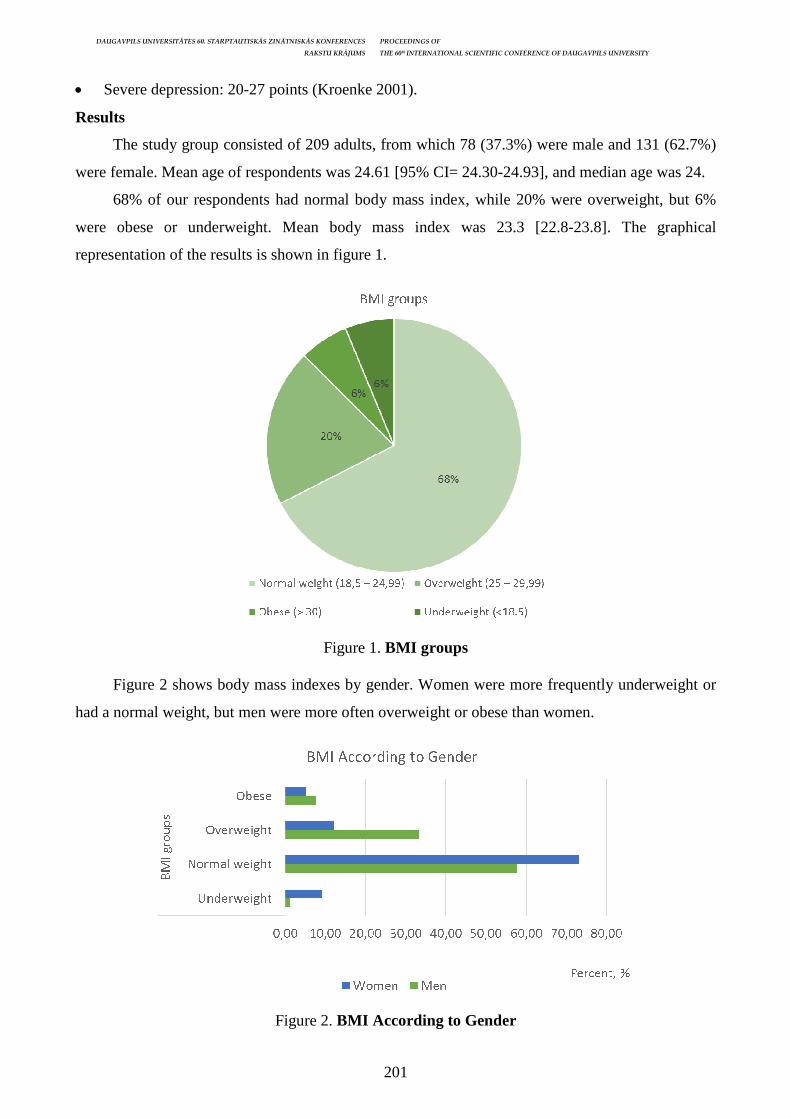
DAUGAVPILS UNIVERSITĀTES 60. STARPTAUTISKĀS ZINĀTNISKĀS KONFERENCES PROCEEDINGS OF
RAKSTU KRĀJUMS THE 60th INTERNATIONAL SCIENTIFIC CONFERENCE OF DAUGAVPILS UNIVERSITY
201
• Severe depression: 20-27 points (Kroenke 2001).
Results
The study group consisted of 209 adults, from which 78 (37.3%) were male and 131 (62.7%)
were female. Mean age of respondents was 24.61 [95% CI= 24.30-24.93], and median age was 24.
68% of our respondents had normal body mass index, while 20% were overweight, but 6%
were obese or underweight. Mean body mass index was 23.3 [22.8-23.8]. The graphical
representation of the results is shown in figure 1.
Figure 1. BMI groups
Figure 2 shows body mass indexes by gender. Women were more frequently underweight or
had a normal weight, but men were more often overweight or obese than women.
Figure 2. BMI According to Gender
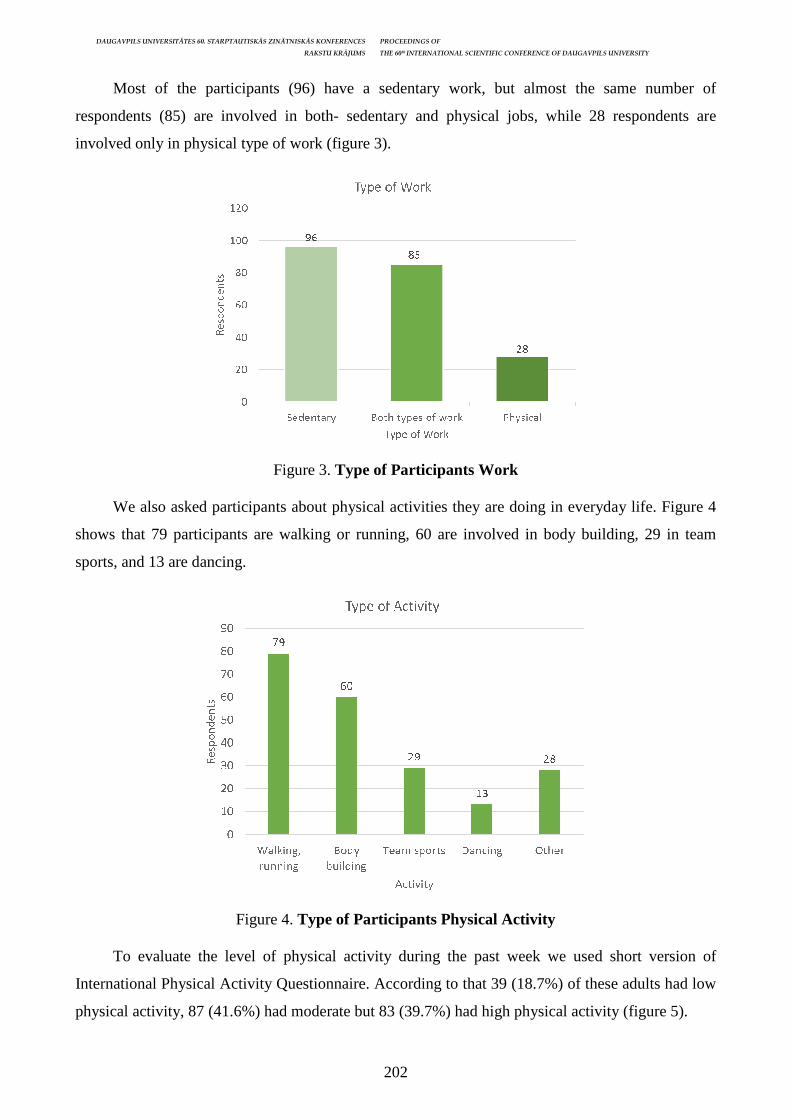
DAUGAVPILS UNIVERSITĀTES 60. STARPTAUTISKĀS ZINĀTNISKĀS KONFERENCES PROCEEDINGS OF
RAKSTU KRĀJUMS THE 60th INTERNATIONAL SCIENTIFIC CONFERENCE OF DAUGAVPILS UNIVERSITY
202
Most of the participants (96) have a sedentary work, but almost the same number of
respondents (85) are involved in both- sedentary and physical jobs, while 28 respondents are
involved only in physical type of work (figure 3).
Figure 3. Type of Participants Work
We also asked participants about physical activities they are doing in everyday life. Figure 4
shows that 79 participants are walking or running, 60 are involved in body building, 29 in team
sports, and 13 are dancing.
Figure 4. Type of Participants Physical Activity
To evaluate the level of physical activity during the past week we used short version of
International Physical Activity Questionnaire. According to that 39 (18.7%) of these adults had low
physical activity, 87 (41.6%) had moderate but 83 (39.7%) had high physical activity (figure 5).

DAUGAVPILS UNIVERSITĀTES 60. STARPTAUTISKĀS ZINĀTNISKĀS KONFERENCES PROCEEDINGS OF
RAKSTU KRĀJUMS THE 60th INTERNATIONAL SCIENTIFIC CONFERENCE OF DAUGAVPILS UNIVERSITY
203
Figure 5. Physical Activity Level According to IPAQ-S
Figure 6 shows activity levels by gender. In low activity group results were very similar.
Women were leading in moderate activity group, but men were having high physical activity more
often than women.
Figure 6. Activity Level According to Gender
To assess the presence and severity of depression we used Patient Health Questionnaire 9. It
was possible to earn 27 points. In our study the mean score was 6.24 points [5.56-6.92], and all
results ranged from 0 to 26. Figure 7 shows that almost half of participants (93) were not depressed,
while 75 had mild depression, 25 had moderate, 10 had moderately severe depression, and 6 of
them had severe depression.
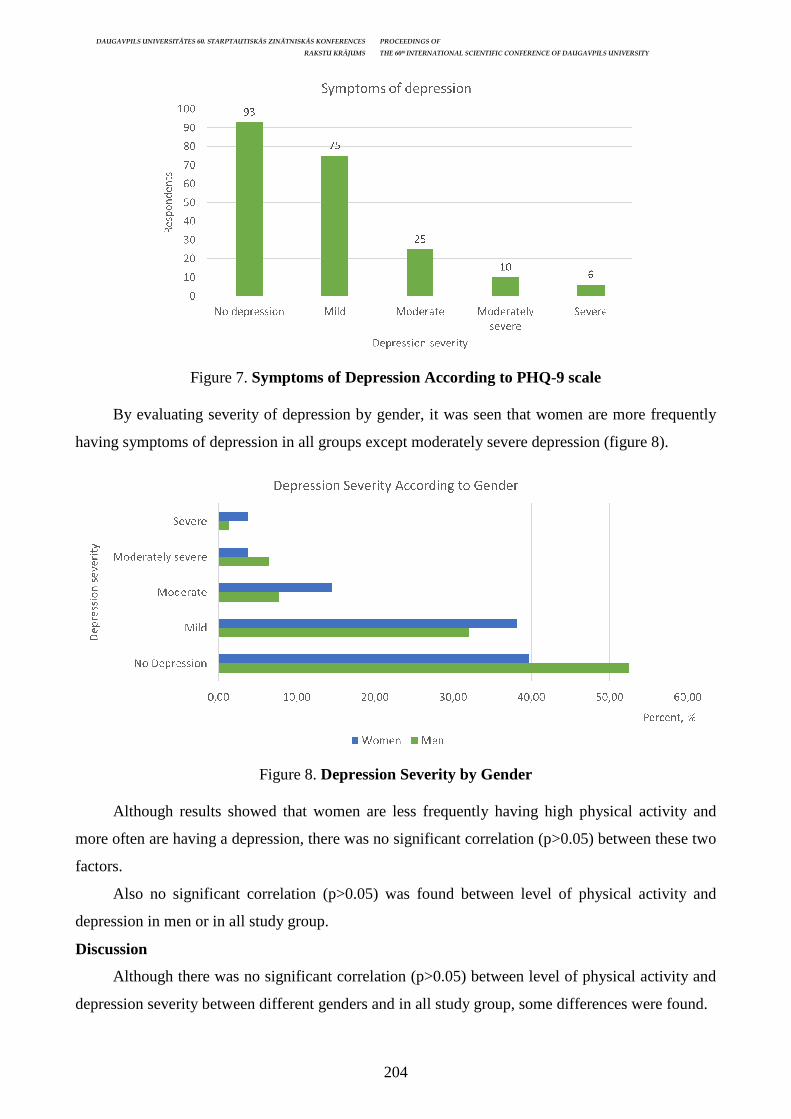
DAUGAVPILS UNIVERSITĀTES 60. STARPTAUTISKĀS ZINĀTNISKĀS KONFERENCES PROCEEDINGS OF
RAKSTU KRĀJUMS THE 60th INTERNATIONAL SCIENTIFIC CONFERENCE OF DAUGAVPILS UNIVERSITY
204
Figure 7. Symptoms of Depression According to PHQ-9 scale
By evaluating severity of depression by gender, it was seen that women are more frequently
having symptoms of depression in all groups except moderately severe depression (figure 8).
Figure 8. Depression Severity by Gender
Although results showed that women are less frequently having high physical activity and
more often are having a depression, there was no significant correlation (p>0.05) between these two
factors.
Also no significant correlation (p>0.05) was found between level of physical activity and
depression in men or in all study group.
Discussion
Although there was no significant correlation (p>0.05) between level of physical activity and
depression severity between different genders and in all study group, some differences were found.
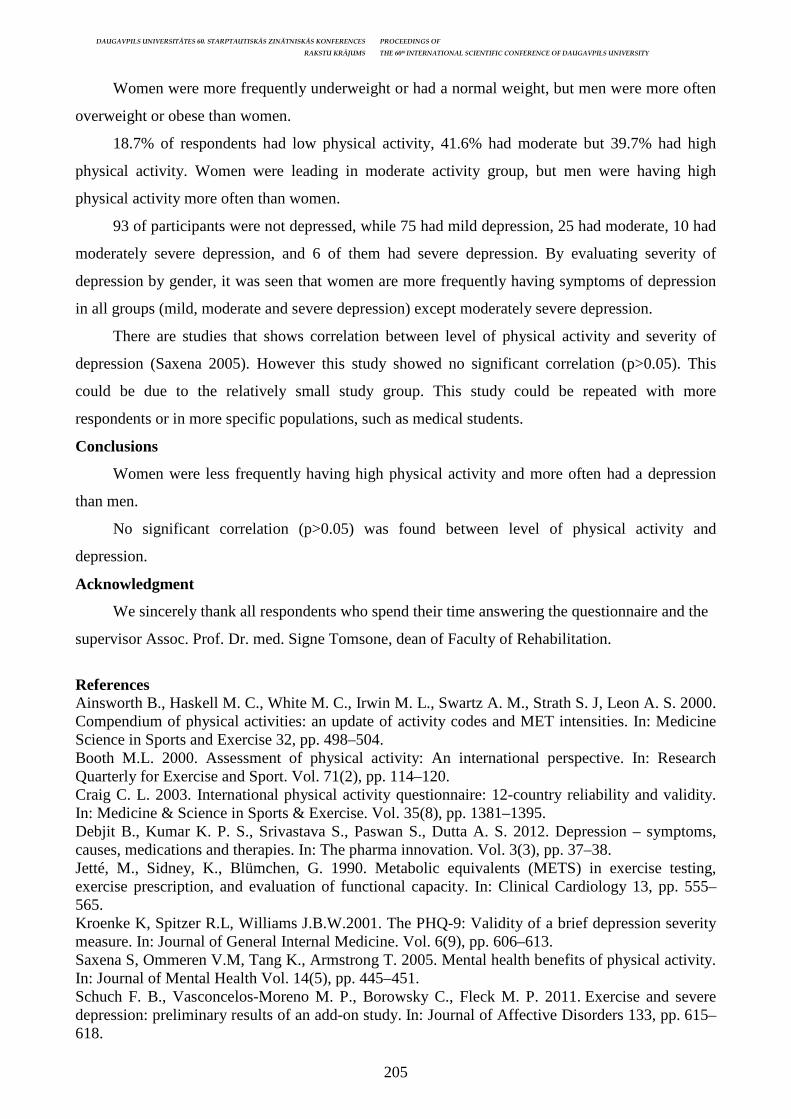
DAUGAVPILS UNIVERSITĀTES 60. STARPTAUTISKĀS ZINĀTNISKĀS KONFERENCES PROCEEDINGS OF
RAKSTU KRĀJUMS THE 60th INTERNATIONAL SCIENTIFIC CONFERENCE OF DAUGAVPILS UNIVERSITY
205
Women were more frequently underweight or had a normal weight, but men were more often
overweight or obese than women.
18.7% of respondents had low physical activity, 41.6% had moderate but 39.7% had high
physical activity. Women were leading in moderate activity group, but men were having high
physical activity more often than women.
93 of participants were not depressed, while 75 had mild depression, 25 had moderate, 10 had
moderately severe depression, and 6 of them had severe depression. By evaluating severity of
depression by gender, it was seen that women are more frequently having symptoms of depression
in all groups (mild, moderate and severe depression) except moderately severe depression.
There are studies that shows correlation between level of physical activity and severity of
depression (Saxena 2005). However this study showed no significant correlation (p>0.05). This
could be due to the relatively small study group. This study could be repeated with more
respondents or in more specific populations, such as medical students.
Conclusions
Women were less frequently having high physical activity and more often had a depression
than men.
No significant correlation (p>0.05) was found between level of physical activity and
depression.
Acknowledgment
We sincerely thank all respondents who spend their time answering the questionnaire and the
supervisor Assoc. Prof. Dr. med. Signe Tomsone, dean of Faculty of Rehabilitation.
References Ainsworth B., Haskell M. C., White M. C., Irwin M. L., Swartz A. M., Strath S. J, Leon A. S. 2000. Compendium of physical activities: an update of activity codes and MET intensities. In: Medicine Science in Sports and Exercise 32, pp. 498–504. Booth M.L. 2000. Assessment of physical activity: An international perspective. In: Research Quarterly for Exercise and Sport. Vol. 71(2), pp. 114–120. Craig C. L. 2003. International physical activity questionnaire: 12-country reliability and validity. In: Medicine & Science in Sports & Exercise. Vol. 35(8), pp. 1381–1395. Debjit B., Kumar K. P. S., Srivastava S., Paswan S., Dutta A. S. 2012. Depression – symptoms, causes, medications and therapies. In: The pharma innovation. Vol. 3(3), pp. 37–38. Jetté, M., Sidney, K., Blümchen, G. 1990. Metabolic equivalents (METS) in exercise testing, exercise prescription, and evaluation of functional capacity. In: Clinical Cardiology 13, pp. 555–565. Kroenke K, Spitzer R.L, Williams J.B.W.2001. The PHQ-9: Validity of a brief depression severity measure. In: Journal of General Internal Medicine. Vol. 6(9), pp. 606–613. Saxena S, Ommeren V.M, Tang K., Armstrong T. 2005. Mental health benefits of physical activity. In: Journal of Mental Health Vol. 14(5), pp. 445–451. Schuch F. B., Vasconcelos-Moreno M. P., Borowsky C., Fleck M. P. 2011. Exercise and severe depression: preliminary results of an add-on study. In: Journal of Affective Disorders 133, pp. 615–618.
DAUGAVPILS UNIVERSITĀTES 60. STARPTAUTISKĀS ZINĀTNISKĀS KONFERENCES PROCEEDINGS OF
RAKSTU KRĀJUMS THE 60th INTERNATIONAL SCIENTIFIC CONFERENCE OF DAUGAVPILS UNIVERSITY
206
Thirlaway K, Benton D. Participation in physical activity and cardiovascular fitness have different effects on mental health and mood. Journal of Psychosomatic Research 1992; 36(7): 657–665. U.S. Department of Health and Human Services, National Institutes of Health, National Institute of Mental Health. (2015). Depression (NIH Publication No. 15-3561). Bethesda, MD: U.S. Government Printing Office. [viewed 10.05.2018.]. Accessed: https://www.nimh.nih.gov/health/ publications/depression-what-you-need-to-know/depression-what-you-need-to-know-pdf_151827. pdf World Health Organization. Global Strategy on Diet, Physical Activity and Health [viewed 10.05.2018.]. Accessed: http://www.who.int/dietphysicalactivity/pa/en/
DAUGAVPILS UNIVERSITĀTES 60. STARPTAUTISKĀS ZINĀTNISKĀS KONFERENCES PROCEEDINGS OF
RAKSTU KRĀJUMS THE 60th INTERNATIONAL SCIENTIFIC CONFERENCE OF DAUGAVPILS UNIVERSITY
207
POST-VACCINATION REACTIONS: OPINIONS OF PARENTS IN LATVIA AND THEIR RESPONSE IN CASE OF OCCURANCE
Nadīna Paegle1, Liene Vītola1, Sandra Gintere2
1 Riga Stradins University, Latvia, [email protected], [email protected] 2 Department of Family Medicine, Riga Stradins University, Latvia Abstract
Post-vaccination reactions: opinions of parents in Latvia and their response in case of occurance Key Words: Vaccination, post-vaccination reactions, children, opinions of parents Introduction. Vaccination is an important method for prevention of serious diseases. A significant number of parents decide not to vaccinate their children, one reason is the possibility of post-vaccination reactions. It is necessary to find out the opinion of the society about this issue. Aim. To determine the opinion of parents about vaccination, post-vaccination reactions, and their action after them. Materials and methods. An anonymous questionnaire was disseminated in social media. Target audience was parents in Latvia with children under 24 years old. Results. 176 parents participated. 84% (n=148) of respondents had children with all vaccines required in the National vaccination calendar of Latvia. Parents were most afraid that their children after vaccination might experience febrile temperature 62.5% (n=110); seizures 57.4% (n=101); loss of consciousness 50.6% (n=89); inactivity or paleness 50% (n=88). 49.4% (n=87) of parents stated that their children have experienced post-vaccination reactions. Most common of them were elevated temperature 77% (n=67), pain and/or redness around the injection place 45% (n=39); anxiety or crying for a long time period after the vaccination 20% (n=17). 64.4% (n=56) of the parents whose children experienced post-vaccination reactions informed their general practitioners. If a child had elevated temperature after vaccination, 52% (n=92) of parents would consult with their doctor after some days; with pain and/or redness around the injection place, 45% (n=80) would contact their doctor after some days. Conclusions. A significant number of children are not fully vaccinated. Many parents do not consult with their doctors about post-vaccination reactions because they are not worried about them. Not discussing this issue might influence the spread of incorrect information. Kopsavilkums Pēcvakcinācijas reakcijas: Latvij ā dzīvojošo vecāku viedokļi un iespējamā r īcība reakciju parādīšanās gadījumā Atslēgvārdi: Vakcinācija, pēcvakcinācijas reakcijas, bērni, vecāku viedokļi Ievads. Vakcinācija ir nozīmīga metode nopietnu slimību prevencijas nodrošināšanā. Ievērojams skaists vecāku izvēlas savus bērnus nevakcinēt, viens no iemesiem - iespējamība attīstīties pēcvakcināciju reakcijām. Ļoti svarīgi būtu noskaidrot sabiedrībā valdošo viedokli par šo tēmu. Mērķis. Noskaidrot vecāku viedokli par vakcināciju, pēcvakcinācijas reakcijām un viņu iespējamo rīcību, ja tādas attītstītos. Materi āli un metodes. Tika izveidota anonīma anketa. Tā tika izplatīta sociālajos tīklos. Pētījuma mērķa grupa bija Latvijā dzīvojoši vecāki, kuru bērnu vecums ir līdz 24 gadiem. Rezultāti. Pētījumā piedalījās 176 vecāki. 84% (n=148) respondentu bērni bija saņēmuši visas vakcīnas, kas iekļautas Latvijas Nacionālajā vakcinācijas kalendārā. Vecāki visvairāk satraucas, ka viņu bērni pēc vakcinācijas varētu piedzīvot febrilu temperatūru 62,5% (n=110); krampjus 57,4% (n=101); bezsamaņu 50,6% (n=89); aktivitātes trūkumu vai bālumu 50% (n=88). 49,4% (n=87) vecāku uzskata, ka viņu bērni ir piedzīvojuši kādu no pēcvakcinācijas reakcijām. Biežākās no tām bija paaugstināta temperatūra 77% (n=67), sāpes un/vai apsārtums injekcijas vietā 45% (n=39); nemiers un raudulība ilgu laika periodu pēc vakcinācijas 20% (n=17). 64,4% (n=56) vecāku, kuru bērni piedzīvoja pēcvakcinācijas reakcijas, informēja savu ģimenes ārstu. Ja bērnam pēc vakcinācijas parādītos paaugstināta temperatūra, 52% (n=92) vecāku pēc dažām dienām konsultētos ar savu ģimenes ārstu. Ja bērnam vakcinācijas vietā attīstītos sāpes un/vai apsārtums, 45% (n=80) vecāku pēc dažām dienām konsultētos ar savu ģimenes ārstu. Secinājumi. Ievērojams skaits bērnu nav pilnībā vakcinēti. Daudzi vecāki nekonsultējas ar savu ģimenes ārstu, jo neuztraucas par pēcvakcinācijas reakcijām. Šīs aktuālās tēmas nepārrunāšana var veicināt nepareizas informācijas izplatīšanos sabiedrībā.
Introduction
Vaccination has ensured enormous advances in global health. Due to vaccination, two major
infections, smallpox and rinderpest, have been eradicated completely, and the spread of several
other illnesses has been significantly restricted. After the creation of such program and initiatives as
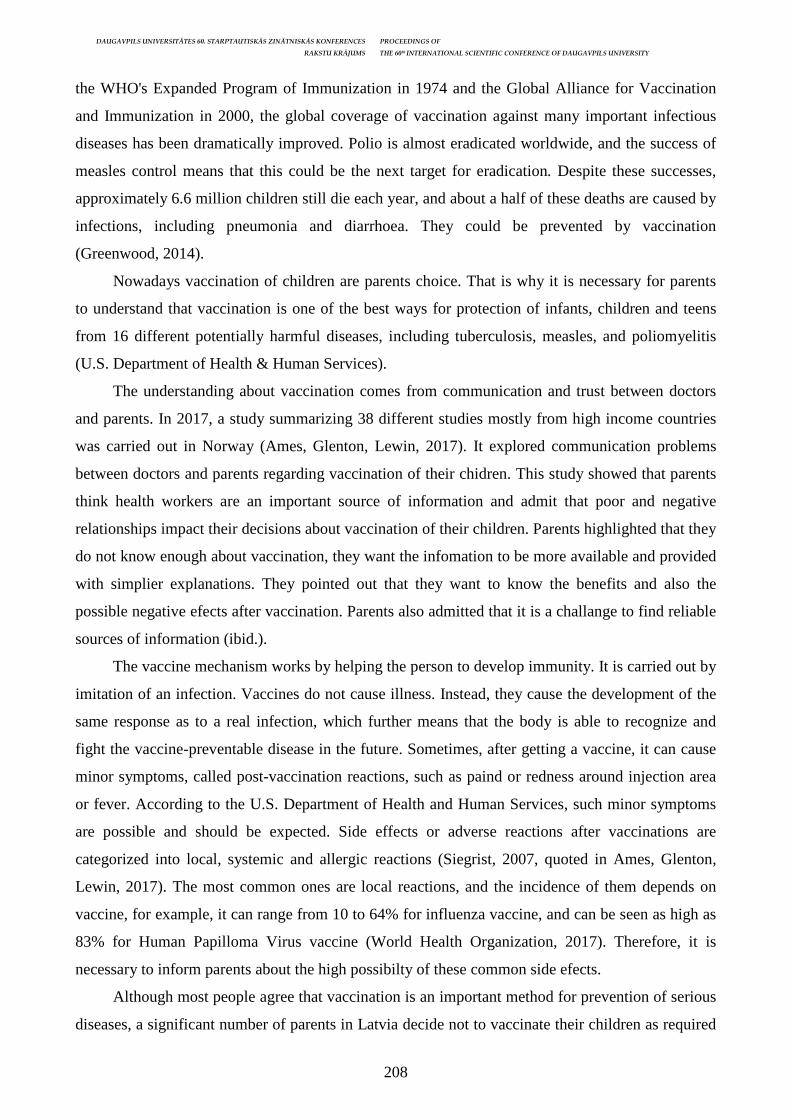
DAUGAVPILS UNIVERSITĀTES 60. STARPTAUTISKĀS ZINĀTNISKĀS KONFERENCES PROCEEDINGS OF
RAKSTU KRĀJUMS THE 60th INTERNATIONAL SCIENTIFIC CONFERENCE OF DAUGAVPILS UNIVERSITY
208
the WHO's Expanded Program of Immunization in 1974 and the Global Alliance for Vaccination
and Immunization in 2000, the global coverage of vaccination against many important infectious
diseases has been dramatically improved. Polio is almost eradicated worldwide, and the success of
measles control means that this could be the next target for eradication. Despite these successes,
approximately 6.6 million children still die each year, and about a half of these deaths are caused by
infections, including pneumonia and diarrhoea. They could be prevented by vaccination
(Greenwood, 2014).
Nowadays vaccination of children are parents choice. That is why it is necessary for parents
to understand that vaccination is one of the best ways for protection of infants, children and teens
from 16 different potentially harmful diseases, including tuberculosis, measles, and poliomyelitis
(U.S. Department of Health & Human Services).
The understanding about vaccination comes from communication and trust between doctors
and parents. In 2017, a study summarizing 38 different studies mostly from high income countries
was carried out in Norway (Ames, Glenton, Lewin, 2017). It explored communication problems
between doctors and parents regarding vaccination of their chidren. This study showed that parents
think health workers are an important source of information and admit that poor and negative
relationships impact their decisions about vaccination of their children. Parents highlighted that they
do not know enough about vaccination, they want the infomation to be more available and provided
with simplier explanations. They pointed out that they want to know the benefits and also the
possible negative efects after vaccination. Parents also admitted that it is a challange to find reliable
sources of information (ibid.).
The vaccine mechanism works by helping the person to develop immunity. It is carried out by
imitation of an infection. Vaccines do not cause illness. Instead, they cause the development of the
same response as to a real infection, which further means that the body is able to recognize and
fight the vaccine-preventable disease in the future. Sometimes, after getting a vaccine, it can cause
minor symptoms, called post-vaccination reactions, such as paind or redness around injection area
or fever. According to the U.S. Department of Health and Human Services, such minor symptoms
are possible and should be expected. Side effects or adverse reactions after vaccinations are
categorized into local, systemic and allergic reactions (Siegrist, 2007, quoted in Ames, Glenton,
Lewin, 2017). The most common ones are local reactions, and the incidence of them depends on
vaccine, for example, it can range from 10 to 64% for influenza vaccine, and can be seen as high as
83% for Human Papilloma Virus vaccine (World Health Organization, 2017). Therefore, it is
necessary to inform parents about the high possibilty of these common side efects.
Although most people agree that vaccination is an important method for prevention of serious
diseases, a significant number of parents in Latvia decide not to vaccinate their children as required

DAUGAVPILS UNIVERSITĀTES 60. STARPTAUTISKĀS ZINĀTNISKĀS KONFERENCES PROCEEDINGS OF
RAKSTU KRĀJUMS THE 60th INTERNATIONAL SCIENTIFIC CONFERENCE OF DAUGAVPILS UNIVERSITY
209
in the National vaccination calendar of Latvia. These parents give different reasons for not
vaccinating their children; one of the most frequent reasons for this decision is the possible
occurrence of post-vaccination reactions.
Moreover, it is important to understand what parents would do if their child experienced post-
vaccination reactions and determine how appropriate their actions would be. General practitioners,
pediatricians, and other doctors in Latvija should know the opinion of society regarding vaccination
and post-vaccination reactions to improve the information provided by them. More appropriate and
timely information could increase parents’ knowledge and satisfaction with the vaccination process,
which, in turn, would further increase the number of people vaccinated in Latvia and further limit
the spread of different potentially deadly illnesses.
The aim of the study was to determine the opinion of parents about vaccination, post-
vaccination reactions, and their action after them. To reach this aim, it was necessary to prepare and
disseminate a survey, and to collect and analyse data.
Materials and methods
An anonymous questionnaire about the attitude of parents in Latvia regarding post-
vaccination reactions and possible actions if they occur was created. The first part of the survey
included general questions about person’s sex, age, living area, and level of education. The second
part of the survey consisted of questions about the vaccination status of respondent’s child; what
post-vaccinations reactions would be frightening to them; what would they do if these reactions
occurred; and about the communication with their general practitioners regarding child’s health.
The survey was created on the basis of information in handout materials provided by the
Children vaccination centre of Children’s Clinical University Hospital in Riga. The surveys were
disseminated in social media. The target audience of the research was parents in Latvia with
children under 24 years old. Answers were collected and analyzed using Microsoft Excel 2010.
Descriptive statistics, such as frequency and percentage, were applied to report the results of
research.
Results
176 parents took part in the survey. 95.5% (n=168) were female, and 4.5% (n=8) were male.
82.4% (n=145) of the respondents were with higher (tertiary) education, 17% (n=30) were with
secondary education and 0.6% (n=1) were with primary education. 34.7% (n=61) of respondents
lived in nine main cities, e.g. Riga, Daugavpils and so on, 40.9% (n=72) lived in cities, and 24.4%
(n=43) lived outside cities.
42% (n=74) of respondents noted that their children have all vaccines required in the National
vaccination calendar of Latvia as well as additional vaccines, e.g. against influenza. 42% (n=74) of
respondents had children with only the vaccines required in the National vaccination calendar of

DAUGAVPILS UNIVERSITĀTES 60. STARPTAUTISKĀS ZINĀTNISKĀS KONFERENCES PROCEEDINGS OF
RAKSTU KRĀJUMS THE 60th INTERNATIONAL SCIENTIFIC CONFERENCE OF DAUGAVPILS UNIVERSITY
210
Latvia. 12.5% (n=22) were vaccinated against some diseases, and 3.5% (n=6) were not vaccinated
at all (Figure 1).
Figure 1. Vaccination status of respondents’ children
The respondents were asked several question regarding the post-vaccination reactions they
think their children might experience and which of them would be frightening to them. In this part
of questionnaire, a list of post-vaccination reactions was given to the respondents. The list was
made using handout materials from the Children Vaccination Centre at Children’s Clinical
University Hospital in Riga. 62.5% (n=110) of parents would be most afraid if their child
experienced temperature higher than 38 degrees, 57.4% (n=101) would be afraid of seizures, 50.6%
(n=89) - loss of consciousness. Also 50% (n=88) of parents would feel anxious if their child
experienced inactivity or paleness after the vaccination (Figure 2).
Figure 2. Post-vaccination reactions that parents are afraid their children might experience
Furthermore, 49.4% (n=87) of respondents admitted that, in their opinion, their children had
experienced post-vaccination reactions. Most common of them were the following: elevated
temperature - 77% (n=67), 36% (n=24) of these - febrile temperature; pain and/or redness around
the injection place - 45% (n=39); and anxiety or crying for a long time period after the vaccination -
20% (n=17). This information is provided in Figure 3.

DAUGAVPILS UNIVERSITĀTES 60. STARPTAUTISKĀS ZINĀTNISKĀS KONFERENCES PROCEEDINGS OF
RAKSTU KRĀJUMS THE 60th INTERNATIONAL SCIENTIFIC CONFERENCE OF DAUGAVPILS UNIVERSITY
211
Figure 3. Post-vaccination reactions that parents have noticed their children experienced
64.4% (n=56) of the parents whose children experienced post-vaccination reactions informed
their general practitioners. This shows that most of the reactions were not considered serious, as the
general practitioner was not consulted. At the same time, it means that the reaction might not be
related with the vaccination, as the relation has not been proven by a doctor.
All respondents needed to state what they would do if the listed post-vaccination reactions
occurred. The main attention was focused on the following post-vaccination reactions: elevated
temperature and pain/or redness around injection place, because these reactions are the ones
respondents stated they had experienced. Therefore, it is very important to find out their actions in
such situation. If a child had elevated temperature (less than 38 degrees) after vaccination, 52%
(n=92) of parents would consult with their doctor after some days, 40% (n=71) would not be
worried, 7% (n=13) would consult with their doctor immediately. If a child had elevated
temperature (more than 38 degrees) after vaccination, 52% (n=92) of parents would consult with
their doctor after some days, 36% (n=63) would consult with their doctor immediately, and 7%
(n=12) would not be worried. If the child had pain and/or redness around the injection place, 45%
(n=80) would contact their doctor after some days, 45% (n=80) would not be worried, and 8%
(n=14) would consult with their doctor immediately (Figure 4).
DAUGAVPILS UNIVERSITĀTES 60. STARPTAUTISKĀS ZINĀTNISKĀS KONFERENCES PROCEEDINGS OF
RAKSTU KRĀJUMS THE 60th INTERNATIONAL SCIENTIFIC CONFERENCE OF DAUGAVPILS UNIVERSITY
212
Figure 4. Possible actions of parents if their child had the specific post-vaccination reaction
Discussion
To make this study more reliable and relevant, more data need to be collected and analyzed.
To achieve this goal, the study is continued by spreading the questionnaire around offices of general
practitioners all around Latvia. There is a chance that larger group of respondents can highlight
different viewpoints and problems and provide more insight in the prevalence of different post-
vaccination reactions.
According to literature, various vaccines can cause different post-vaccination reactions. The
spectrum of reactions, the intensity of them, and the frequency of occurrence depend on the specific
vaccine. For example, according to the Center of Disease Control and Prevention (under U.S.
Department of Health and Social Services), after diphtheria, tetanus, and acellular pertussis
combined vaccine, one child out of four experiences elevated temperature, while after
pneumococcal polysaccharide vaccine (PPSV23) the probability of elevated temperature are less
than 1 out of 100. To better understand the connection between specific vaccine and particular post-
vaccination reactions, it would be favorable to carry out a similar study about each vaccine. In this
case, doctors could give the information about exact vaccine and its most popular side effects to
patients not only based in literature, but also based on findings in his country. It would provide a
more exact view on the situation in Latvia and more detailed information for doctors in Latvia,
because the findings would be from our own population with its representative features.
On the basis of findings from this study, it can be observed that respondents are more afraid
of post-vaccination reactions which are very rare in reality. Parents were worried about the idea of
their child experiencing seizures or loss of consciousness. In reality, the occurrence of seizure can
be seen in less than one person out of 14 000 people (U.S. Department of Health & Human
Services). Moreover, very few respondents stated that they are afraid of post-vaccination reactions
that occur more frequently; the exception is a fear of high temperature, which is a comparatively
DAUGAVPILS UNIVERSITĀTES 60. STARPTAUTISKĀS ZINĀTNISKĀS KONFERENCES PROCEEDINGS OF
RAKSTU KRĀJUMS THE 60th INTERNATIONAL SCIENTIFIC CONFERENCE OF DAUGAVPILS UNIVERSITY
213
often experienced reaction. This could be explained by the fact that people are more afraid of
conditions that they haven’t experienced, and the idea of this kind of post-vaccination reaction
seems terrifying itself, or to the fact that more serious post-vaccination reactions, such as seizures,
can pose significant harm to child’s health.
Fear of elevated temperature is not issue only in regards to post-vaccination reactions, but in
daily situations as well. Parents often think that elevated temperature automatically means that a
child is experiencing serious illnesses, are afraid of the causes of elevated temperature, and feel
anxious about successful situation management. However, in most cases with moderately elevated
temperature, emotional support and basic information about pathogenesis of temperature can be
sufficient (Ravanipour, Akaberian, and Hatami, 2014).
Parents should receive more information about vaccination and possible reactions and side
effects after vaccination. Information should not only be given by doctors, but also spread using
various sources of information - news, television, radio, and social media. The main aspect that
needs to be changed is the way facts about vaccination and possible side effects are presented.
Medical professionals often use language and terminology which is hard to understand for people
not related to medicine. Moreover, people who encourage other parents against vaccination usually
use easier language, therefore their ideas are easier to understand. It means that evidence-based
information is often seen as complex, unconvincing or even untrue by laypeople. This can be
changed by using less medical terminology and more comparisons that everyone, including people
from different age groups and education levels, can understand. It would help to inform people
about the main scientific facts regarding vaccination and provide an opportunity to ensure higher
vaccination rates and decrease in illnesses which are often fatal or have serious consequences to
quality of live of the patient.
Conclusions
It was found in the study that 16% of parents choose not to vaccinate their children according
to the National vaccination calendar of Latvia. This causes a higher risk for diseases to spread in
society; moreover, it is a threat to people who cannot be vaccinated due to different health issues,
such as immunosuppressive conditions.
Most parents are attentive towards their children’s health and notice changes in it after
vaccination. Almost half of parents who participated in the study think that their children have
suffered from post-vacciantion reactions. In our study, the most frequent post-vacciantion reactions
were elevated temperature (77%), pain or redness around injection area (45%) and anxiety or crying
for long time period (20%). More than 40% of parents are not worried and do not consult with their
doctors if they see pain or redness around injection area or elevated temperature below 38 degrees.
If temperature higher than 38 degrees or child is anxious or crying for a long time period, almost all
DAUGAVPILS UNIVERSITĀTES 60. STARPTAUTISKĀS ZINĀTNISKĀS KONFERENCES PROCEEDINGS OF
RAKSTU KRĀJUMS THE 60th INTERNATIONAL SCIENTIFIC CONFERENCE OF DAUGAVPILS UNIVERSITY
214
parents seek medical help. One third of parents do not inform their doctors about changes in child’s
health after vaccination. First of all, this complicates the determination of vaccine side effects;
secondly, parents do not find out whether the symptoms are related to vaccination. As observations
by parents can be misleading, they might influence the spread of incorrect information regarding
vaccination in wider society. To further increase vaccine coverage in Latvia, it is necessary to
inform parents in a language any layperson can understand and to provide different information
sources and help from general practitioners regarding vaccination and possible post-vaccination
reactions.
References Ames, H., Glenton, C., Lewin, S. (2017) Parents' and informal caregivers' views and experiences of communication about routine childhood vaccination: a synthesis of qualitative evidence. Cochrane Database Syst Rev. Available from: https://www.ncbi.nlm.nih.gov/pubmed/28169420?fbclid= IwAR2OK9xjhZNM-gjKQyhy4P7jLh4CXuM7r3WfuSa4IOsI9S7ID3SZfA8SYoQ (Accessed on December 9, 2018) Greenwood, B. (2014) The contribution of vaccination to global health: past, present and future. Philosophical Transactions of the Royal Society B: Biological Sciences. 369 (1645) doi: 10.1098/rstb.2013.0433 Ravanipour, M., Akaberian, S., Hatami, G. (2014) Mother’s perception of fever in children. Journal of Education and Health Promotion. 3: 97. doi: 10.4103/2277-9531.139679 Siegrist C. (2007) Mechanisms underlying adverse reactions to vaccines. J Comp Pathol. pp. S46–S50. U.S. Department of Health & Human Services. Centers for Disease Control and Prevention. For Parents: Vaccines for Your Children. Available at: https://www.cdc.gov/vaccines/parents/ index.html (Accessed on May 15, 2018) U.S. Department of Health & Human Services. Centers for Disease Control and Prevention. Vaccine Side Effects. Available at: https://www.cdc.gov/vaccines/vac-gen/side-effects.htm (Accessed on May 15, 2018) World Health Organization (2017) Information Sheet - Observed rate of vaccine reactions: Human Papilloma Virus Vaccine. Available from: https://www.who.int/vaccine_safety/initiative/tools/ HPV_vaccine_rates_information_sheet_1217.pdf (Accessed on December 9, 2018) World Health Organization (2012) Information Sheet – Observed rate of vaccine reactions: Influenza Vaccine. Available from: https://www.who.int/vaccine_safety/initiative/tools/Influenza_ Vaccine_rates_information_sheet.pdf?ua=1 (Accessed on December 9, 2018)
DAUGAVPILS UNIVERSITĀTES 60. STARPTAUTISKĀS ZINĀTNISKĀS KONFERENCES PROCEEDINGS OF
RAKSTU KRĀJUMS THE 60th INTERNATIONAL SCIENTIFIC CONFERENCE OF DAUGAVPILS UNIVERSITY
215
RECOMMENDATIONS FROM EARLY-ONSET SEPSIS CALCULATOR ON ANTIBIOTIC USE IN NEONATES
WITH SUSPECTED INFECTION Lauma Vasiļevska1, Ilze Meldere1, 2 1 Riga Stradiņš University, Dzirciema street 16, Riga, Latvia, LV-1007, [email protected] 2 Children’s Clinical University Hospital, Vienības gatve 45, Riga, Latvia, LV-1004 Abstract
Recommendations from early-onset sepsis calculator on antibiotic use in neonates with suspected infection Key Words: Early onset sepsis calculator, newborns, antibiotic treatment Introduction. A neonatal early-onset sepsis (EOS) calculator is a newly designed tool that allows to predict the risk for development of EOS based on 5 major risk factors and infant’s clinical presentation at birth. It could reduce newborn antibiotic over-treatment in practice. Aim. The aim was to compare actual antibiotic exposure to the calculated risk and recommendations based on the sepsis calculator in newborns with suspected infection and to mark the differences in EOS risk between early treatment (< 12 hours) and late treatment (≥ 12 hours of life) group. Materials and methods. Data were obtained retrospectively from medical records in Riga Maternity Hospital. Infants born ≥34 weeks of gestation who were started on antibiotic treatment for suspected EOS within 72 hours after birth were included. Statistical analysis was performed using MS Excel, IBM SPSS Statistics 22. Results. A total of 205 newborns were included in the study. Recommendations from the EOS calculator were not to start antibiotic therapy in 157 (77%) infants, to strongly consider starting empiric therapy in 38 (18%), to monitor and re-evaluate in 2 (1%) and to start empiric antibiotics in 8 (4%) infants. Newborns that received early antibiotics had significantly higher maternal EOS score (median 1.39) compared with newborns in the late treatment group (median 0.03). Clinical condition deteriorated in the late treatment group. Conclusion. Antibiotic use in newborns could be significantly reduced by more than 77%. EOS calculator could help guiding treatment decisions. Newborns with initial low sepsis risk score clinically deteriorated beyond 12 h of life. More safety data is needed. Kopsavilkums Agr īnas neonatālas sepses kalkulatora rekomendācijas antibakteriālās terapijas nozīmēšanai jaundzimušajiem
ar aizdomām par infekciju Atslēgvārdi: Agrīnas neonatālas sepses kalkulators, jaundzimušie, antibakteriālā terapija Ievads. Agrīnas neonatālas sepses (ANS) kalkulators ir jauna metode, kas ļauj paredzēt ANS attīstības risku, balstoties uz 5 riska faktoriem un jaundzimušā klīnisko stāvokli dzimšanas brīdī. Tam ir potenciāls samazināt pārmērīgu antibakteriālo terapiju jaundzimušajiem. Mērķis. Salīdzināt antibiotiku nozīmēšanu reālajā dzīvē ar ANS kalkulatora aprēķināto risku un rekomendācijām jaundzimušajiem ar aizdomām par infekciju un noteikt atšķirības starp agrīnas (<12 stundām) un vēlīnas terapijas (≥ 12 stundām no dzimšanas) grupām. Materi āli un metodes. Retrospektīvā pētījumā tika iegūti dati no pacientu medicīniskajām kartēm Rīgas Dzemdību Namā. Iekļauti jaundzimušie ≥ 34 gestācijas nedēļām, kam uzsāktas antibiotikas ar aizdomām par ANS 72 stundu laikā kopš dzimšanas. Statistiskā analīze veikta, izmantojot MS Excel 2010 un IBM SPSS Statistics 22. Rezultāti. Pētījumā iekļauti 205 jaundzimušie. ANS kalkulators rekomendēja neuzsākt antibakteriālo terapiju 157 (77%), nopietni apsvērt empīriskas antibiotikas 38 (18%), turpināt monitorēt un atkārtoti izvērtēt – 2 (1%) un uzsākt empīrisku terapiju 8 (4%) gadījumos Jandzimušajiem, kas saņēma agrīnu terapiju, bija nozīmīgi augstāks aprēķinātais ANS riska koeficients (mediāna 1.39) nekā vēlīnajā grupā (mediāna 0.03). Klīniskais stāvoklis pasliktinājās vēlīnās terapijas grupā. Secinājumi. Empīriska antibiotiku nozīmēšana varētu tikt samazināta par vairāk nekā 77%. ANS kalkulators varētu palīdzēt vadīt terapijas taktiku, tomēr jaundzimušo klīniskais stāvoklis ar sākotnēji zemu ANS risku pasliktinājās 12 stundas pēc dzimšanas. Nepieciešami vairāk drošības datu.
Introduction
Despite a decreasing incidence over the past decades, early onset neonatal sepsis (EOS)
remains a leading cause of neonatal morbidity and mortality worldwide. (Liu 2012; van Herk 2016)

DAUGAVPILS UNIVERSITĀTES 60. STARPTAUTISKĀS ZINĀTNISKĀS KONFERENCES PROCEEDINGS OF
RAKSTU KRĀJUMS THE 60th INTERNATIONAL SCIENTIFIC CONFERENCE OF DAUGAVPILS UNIVERSITY
216
The incidence of proven EOS in high-income countries varies from 0.01 per 1000 to 0.53 per
1000 live births in Europe. (Edmond 2012)
ANS is generally defined as the onset of symptoms of infection occurring within 72 h after
birth, and is commonly acquired by vertical transmission by contaminated amniotic fluid or during
vaginal delivery from bacteria in the maternal genital tract. (Cantey 2015, van Herk 2016).
Diagnosis remains a challenge due to frequently delayed onset of clinical signs, and the
relatively low specificity of available biomarkers for sepsis. (Deleon 2015) In order to identify
neonates at highest risk of EOS, guidelines by the Centers for Disease Control and Prevention
(CDC) give recommendations for treatment or monitoring based on factors including gestational
age, presence of chorioamnionitis and prolonged duration of rupture of membranes (ROM) before
birth. (Polin 2012, Verani 2010) Although these guidelines prompt early treatment of infants with
true sepsis, they have also resulted in approximately a 10-fold of newborns being empirically and
often unnecessarily treated with antibiotics (Benjamin 2003, Cantey 2015, Cotten 2009).
As the overuse of antibiotics increases healthcare costs, poses a risk of increased drug toxicity
and bacterial resistance, and has been associated with increased rates of invasive candidiasis and
necrotizing enterocolitis in fragile neonates, minimization of antibiotic therapy is paramount.
(Benjamin 2003, Cotton 2009)
A recently described neonatal early-onset sepsis calculator (EOSC) has the potential to reduce
newborn antibiotic exposure but real world data from its use remains sparse. (Escobar 2014,
Puopolo 2011, Warren 2017) It is a risk-based approach that predicts the probability of EOS risk
per 1000 live births based on five objective maternal risk factors available at the time of birth and
newborn’s objective status after birth, which then leads to clinical recommendation about the need
for empirical antibacterial treatment. (Kaiser Permanente 2015)
The search for new guidelines, methods and consensus proves that the question about EOS
diagnostics and empirical therapy is still a current problem. The aim of the research is to compare
the actual antibacterial exposure in newborns with suspected infection to the recommendations of
the EOSC based on the risk assessment, to mark the differences in EOS risk between early
treatment and late treatment group and to test the overall safety of EOSC approach.
Materials and Methods
Data was obtained retrospectively from medical records in Riga Maternity Hospital. Infants
born ≥34 weeks of gestation started on antibiotic treatment for suspected EOS within 72 hours after
birth were included. A total of 205 newborns were included in the study.
Data was obtained about 5 major risk factors - gestational age, time of rupture of membranes,
maternal group B streptococcal status, highest maternal intrapartum temperature, intrapartum
antibiotics (type and time).
DAUGAVPILS UNIVERSITĀTES 60. STARPTAUTISKĀS ZINĀTNISKĀS KONFERENCES PROCEEDINGS OF
RAKSTU KRĀJUMS THE 60th INTERNATIONAL SCIENTIFIC CONFERENCE OF DAUGAVPILS UNIVERSITY
217
A clinical classification was assigned for each newborn based on the information describing
the clinical appearance in the medical records. (Escobar 2014). Newborns who were immediately
after birth admitted to and cared throughout their stay in the mother’s room without observation
notes were considered to be “well appearing”. Those who presented with one persistent physiologic
abnormality ≥ 4 h or with two or more physiologic abnormalities lasting for ≥2 h, namely
tachycardia (heart rate (HR) ≥ 160/min), tachypnea (respiratory rate (RR) ≥ 60/min), temperature
instability (≥38.0°C or <36.4°C) or respiratory distress (grunting, flaring or retracting) not requiring
supplemental oxygen were considered to be “equivocal”. Finally, in case of persistent need for nasal
continuous positive airway pressure or mechanical ventilation (outside the delivery room),
hemodynamic instability requiring vasoactive drugs, neonatal encephalopathy/perinatal depression
(seizure or Apgar score at 5 min <5) or need for supplemental oxygen ≥ 2h to maintain oxygen
saturations >90% (outside the delivery room), were considered “clinical illness”. (Kaiser
Permanente 2015)
The EOS risk score per 1000 live births was calculated and each newborn was retrospectively
assigned to the recommended category by the Kaiser Permanente neonatal EOSC. As the statistical
data about EOS indicence in Latvia is unknown, the incidence of USA CDC value of 0.5 per
1000/births was used for calculation. (Kaiser Permanente 2015). In addition, the group, who
received early treatment (< 12 h after birth) was compared to the late treatment group (≥ 12 hours of
life).
Statistical analysis was performed using MS Excel, IBM SPSS Statistics 22 software and p <
0.05 was considered statistically significant. Data were tested for normality using Shapiro-Wilk test.
Cross tabulation with χ2 test and Fischer’s exact test were used for nominal data, Mann-Whitney
test and Kruskol-Wallis test for non-parametric data.
Results
From all the newborns 123 (60.0%) were male, 81 (39.5%) female and 1 (0.5%) unspecified.
Gestational age ranged from 34 to 42 weeks, on average - 39 weeks.
From 15 blood cultures with an isolated microorganism, 13 (6%) were considered positive
and2 contaminated.
The rest of the data is summarized in Table 1.
Based on the objective status, newborns were divided into three groups – 149 (73%) well-
appearing, 9 (4%) – equivocal and 47 (23%) – clinically ill. (Fig.1)

DAUGAVPILS UNIVERSITĀTES 60. STARPTAUTISKĀS ZINĀTNISKĀS KONFERENCES PROCEEDINGS OF
RAKSTU KRĀJUMS THE 60th INTERNATIONAL SCIENTIFIC CONFERENCE OF DAUGAVPILS UNIVERSITY
218
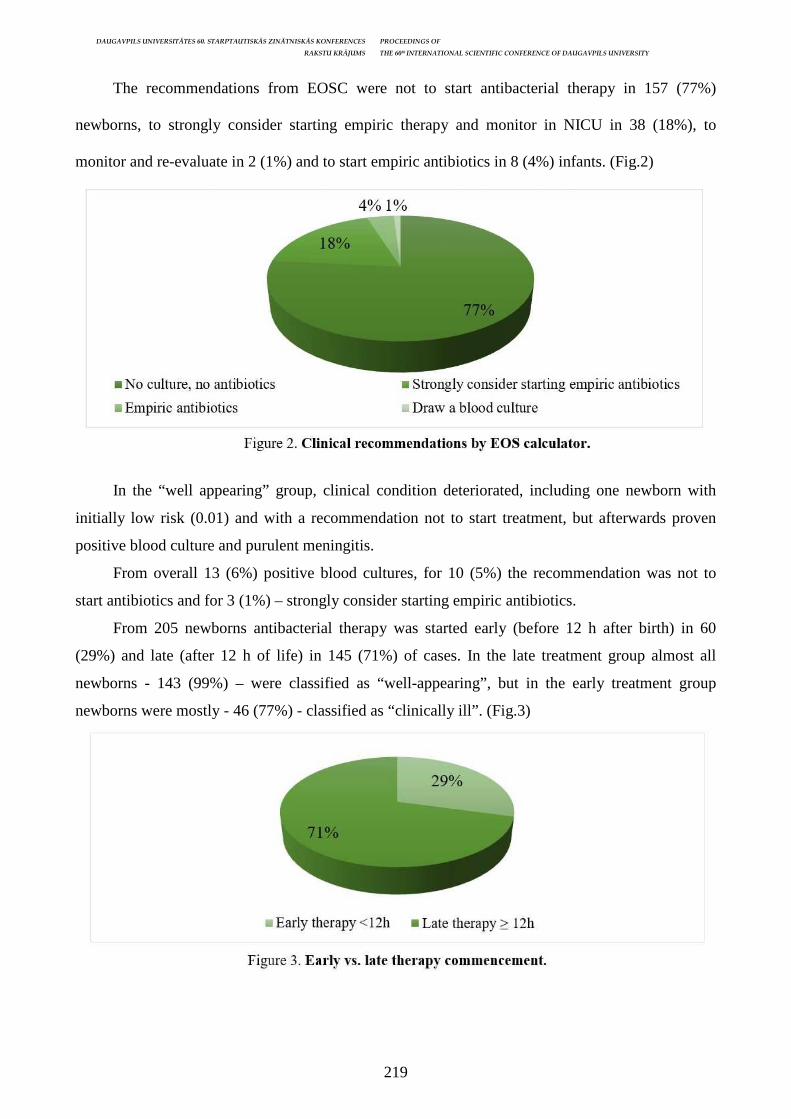
DAUGAVPILS UNIVERSITĀTES 60. STARPTAUTISKĀS ZINĀTNISKĀS KONFERENCES PROCEEDINGS OF
RAKSTU KRĀJUMS THE 60th INTERNATIONAL SCIENTIFIC CONFERENCE OF DAUGAVPILS UNIVERSITY
219
The recommendations from EOSC were not to start antibacterial therapy in 157 (77%)
newborns, to strongly consider starting empiric therapy and monitor in NICU in 38 (18%), to
monitor and re-evaluate in 2 (1%) and to start empiric antibiotics in 8 (4%) infants. (Fig.2)
In the “well appearing” group, clinical condition deteriorated, including one newborn with
initially low risk (0.01) and with a recommendation not to start treatment, but afterwards proven
positive blood culture and purulent meningitis.
From overall 13 (6%) positive blood cultures, for 10 (5%) the recommendation was not to
start antibiotics and for 3 (1%) – strongly consider starting empiric antibiotics.
From 205 newborns antibacterial therapy was started early (before 12 h after birth) in 60
(29%) and late (after 12 h of life) in 145 (71%) of cases. In the late treatment group almost all
newborns - 143 (99%) – were classified as “well-appearing”, but in the early treatment group
newborns were mostly - 46 (77%) - classified as “clinically ill”. (Fig.3)

DAUGAVPILS UNIVERSITĀTES 60. STARPTAUTISKĀS ZINĀTNISKĀS KONFERENCES PROCEEDINGS OF
RAKSTU KRĀJUMS THE 60th INTERNATIONAL SCIENTIFIC CONFERENCE OF DAUGAVPILS UNIVERSITY
220
EOS risk median was 0.04 (IQR 0.02-0.3) per 1000 live births and ranged from 0.00 to 18.90.
Newborns who received early antibacterial therapy had significantly higher calculated EOS risk
(1.39, IQR: 0.39-2.12) than in the late treatment group (0.03, IQR: 0.02-0.04). (Fig.4)
Discussion
The study analyzed and compared data of newborns, who were started on antibacterial
therapy during their first 3 days of life, to the recommendations from EOSC.
The results show that antibacterial overtreatment is still a current problem and more studies
are needed to evaluate the safety of EOSC.
In this study following the EOSC recommendations the antibiotics would have been
empirically started in 4% of the cases. In comparison with other studies the results are similar. For
example, in a particular Netherlands study, where 108 newborns with suspected infection were
analyzed in a similar way, recommendations for empirical therapy were for 5.3% of the cases
(Kerste 2016), but in a different California (USA) study, where 608 014 newborns were included,
recommendations for empirical therapy were in 4.1% of the cases. (Escobar 2014)
Applying the EOSC in this study, empirical therapy for newborns could be reduced by more
than 77%, which were advised to be observed, but not to be started on therapy. In the mentioned
Netherlands study – by more than 50%. (Kerste 2016)
However, in contrast to the expectations, newborns, who were “well-appearing” and with
initially low EOS risk, clinically deteriorated beyond 12 hours of life – for 71% of the newborns the
therapy was started 12 hours after birth, including one newborn with low risk and clinically well-
appearing, but afterwards clinical deterioration and proven purulent meningitis. Also, analysis of
other studies reveals this problem. In the already mentioned Netherlands study, for 48% of the
newborns the treatment was started 12 hours beyond birth, including 2 infants with positive culture
DAUGAVPILS UNIVERSITĀTES 60. STARPTAUTISKĀS ZINĀTNISKĀS KONFERENCES PROCEEDINGS OF
RAKSTU KRĀJUMS THE 60th INTERNATIONAL SCIENTIFIC CONFERENCE OF DAUGAVPILS UNIVERSITY
221
proven sepsis. (Kerste 2016) This leads to a conclusion that this method cannot be used alone, it
should be combined with others and careful continuous observation remains crucial.
In this study in the late treatment group the EOS risk was low and almost all infants (99%)
were “well-appearing” the first 12 hours of life. From a clinical point of view it is important to
understand that the newborn with initially low risk and well-appearing can deteriorate. (Kerste
2016)
Overall 13 (6%) positive blood cultures were found. In contrast to similar studies, for
example, in a Portland (USA) study with 205 infants no positive blood cultures were found (Warren
2017), but in the Netherlands study there were 1.9% positive cultures (Kerste 2016), which could
imply higher EOS incidence or higher contamination rates in Latvia.
Two cultures were considered contaminated, which is 1% from 205 newborns or 2% from all
the drawn cultures. In comparison - target contamination parameters were set to 2-3%, but the real
values differ between institutions and can range from 0.6% to 6%. (Hall 2006) In the Netherlands
study 3.7% of cultures were considered contaminated. (Kerste 2016)
Conclusions
Newborn antibacterial overtreatment and the question about treatment commencement is still
a current problem. In the first 72 h of life the recommendations from EOSC to start empirical
antibiotics were for 4% (n=8) of 205 infants ≥34 gestational weeks, who had received therapy in the
real life.
Using EOSC empirical therapy for newborns could be reduced by more than 77%.
In contrast to the expectations, newborns, who were “well-appearing” and with initially low
EOS risk, clinically deteriorated beyond 12 hours of life, including one newborn with low risk and
clinically well-appearing, but afterwards clinical deterioration and proven purulent meningitis,
which shows that more studies are needed to evaluate the safety of EOSC.
Newborns that received early antibiotics had significantly higher maternal EOS score (median
1.39) compared with newborns in the late treatment group (median 0.03).
Overall 13 positive blood cultures were found, which is 6% of 205 newborns or 14% of all the
drawn blood cultures (n=90).
Acknowledgements
The authors would like to thank Riga Maternity hospital and RSU Statistics laboratory.
DAUGAVPILS UNIVERSITĀTES 60. STARPTAUTISKĀS ZINĀTNISKĀS KONFERENCES PROCEEDINGS OF
RAKSTU KRĀJUMS THE 60th INTERNATIONAL SCIENTIFIC CONFERENCE OF DAUGAVPILS UNIVERSITY
222
References Benjamin DK, Delong ER, Steinbach WJ, Cotton CM, Walsh TJ, Clark RH. Empirical therapy for neonatal candidemia in very low birth weight infants. Journal of Pediatrics, 2003, N 112, p. 543–547. Cantey JB, Wozniak PS, Sánchez PJ. Prospective surveillance of antibiotic use in the neonatal intensive care unit: results from the SCOUT study. The Pediatric Infectious Disease Journal, 2015, N 34, vol. 3, p. 267–272. Cotten CM, Taylor S, Stoll B, Goldberg RN, Hansen NI, Sánchez PJ et al.Prolonged duration of initial empirical antibiotic treatment is associated with increased rates of necrotizing enterocolitis and death for extremely low birth weight infants. Pediatrics, 2009, N 123, vol.1, p. 58–66. Deleon C, Shattuck K, Jain SK. Biomarkers of Neonatal Sepsis. NeoReviews, N 16, vol. 5, p. 297–308. Edmond KM, Kortsalioudaki C, Scott S, Schrag SJ, Zaidi AK, Cousens S, et al. Group B streptococcal disease in infants aged younger than 3 months: systematic review and metaanalysis. Lancet, 2012, N 379, vol. 9815, p. 547–556. Escobar GJ, Puopolo KM, Wi S, Turk BJ, Kuzniewicz MW, Walsh EM, Newman TB, Zupancic J, Lieberman E, Draper D. Stratification of risk of early-onset sepsis in newborns > 34 weeks' gestation. Pediatrics, 2014, N 133, vol. 1, p. 30–36. Hall KK, Lyman JA. Updated review of blood culture contamination. Clinical Microbiology Reviews, 2006, N 19, p. 788–802. Kaiser Permanente Division of Research. Probability of Neonatal Early-Onset Sepsis Based on Maternal Risk Factors and the Infant's Clinical Presentation. 2015. [Tiešsaiste] – [atsauce 09.02.2018]. Pieejams: https://neonatalsepsiscalculator.kaiserpermanente.org/ Kerste M, Corver J, Sonnevelt MC, van Brakel M, van der Linden PD, M Braams-Lisman BA, et al. Application of sepsis calculator in newborns with suspected infection. Journal of Maternal-Fetal and Neonatal Medicine, 2016, N 29, vol. 23, p. 3860–3865. Liu L, Johnson HL, Cousens S, Perin J, Scott S, Lawn JE, Rudan I, Campbell H, Cibulskis R, Li M, Mathers C, Black RE; Child Health Epidemiology Reference Group of WHO and UNICEF. Global, regional, and national causes of child mortality: an updated systematic analysis for 2010 with time trends since 2000. Lancet. 2012, N 379, vol. 9832, p. 2151–2161. Polin RA. The committee on fetus and newborn. Management of Neonates With Suspected or Proven Early-Onset Bacterial Sepsis. Pediatrics, 2012, N 129, vol. 5, p. 1006–1015. Puopolo KM, Draper D, Wi S, Newman TB, Zupancic J, Lieberman E, Smith M, Escobar GJ. Estimating the probability of neonatal early-onset infection on the basis of maternal risk factors. Pediatrics, 2011, N 128, vol. 5, p. 1155–63. van Herk W, Stocker M, van Rossum AM. Recognising early onset neonatal sepsis: an essential step in appropriate antimicrobial use. Journal of Infection. 2016, N 72, p. 77–82. Verani J, McGee L, Schrag S. Prevention of perinatal group B streptococcal disease-revised guidelines from CDC, 2010. MMWR 2010, N 59, p. 1–32 Warren S, Garcia M, Hankins C. Impact of neonatal early-onset sepsis calculator on antibiotic use within two tertiary healthcare centers. Journal of Perinatology. 2017, N 37, vol. 4, p. 394–397.

DAUGAVPILS UNIVERSITĀTES 60. STARPTAUTISKĀS ZINĀTNISKĀS KONFERENCES PROCEEDINGS OF
RAKSTU KRĀJUMS THE 60th INTERNATIONAL SCIENTIFIC CONFERENCE OF DAUGAVPILS UNIVERSITY
223
RIGA STRADINS UNIVERSITY MEDICAL STUDENTS KNOWLEDGE ABOUT CHILD VACCINATION
AND ITS SUPPORT Sņežana Romaņuka, Vadim Nefjodov Riga Stradins University, Dzirciema Str. 16, Riga, Latvia, LV-1007, [email protected], [email protected] Abstract
Riga Stradins University medical students’ knowledge about child vaccination and its support Key Words: vaccine, vaccination, medical students, knowledge Introduction. The main source of information where parents can get information about vaccination is a doctor, so the doctor should be educated. Medical students are the ones who will have an impact on the vaccination coverage soon. Aim. To evaluate Riga Stradins University medical students’ knowledge about vaccination and attitude towards it. Materials and methods. A questionnaire was developed based on the information provided by the Center for Disease Prevention and Control about vaccination and distributed through social networks among medical students of Riga Stradins University. The questionnaire consists of 10 questions. The first seven questions have several correct answers. In questions 8, 9 and 10 should be answered "yes" or "no". For each correctly answered question, the respondent receives 1 point. In the end of the questionnaire was asked about the student's personal attitude to the child's vaccination. All the data was analyzed by Microsoft Office Excel 2016 and IBM SPSS 23 software. Results. The survey was attended by 214 medical students. 182 of them were women, while 32 were men. The survey was attended by students of all years of study. Of the maximum 10 possible points, the average grade for all students is 3.39 (0-8), mode is 3. The lowest average grade was among respondents of the first year of study (average 2.06 (0-4), mode 2), while the highest among respondents on the sixth course is the average 4.53 (3-8), mode 5. In general, the students' personal attitude towards vaccination is positive. Conclusion. Rīga Stradiņš University medical students’ knowledge about vaccination is mediocre and students' personal attitude towards vaccination is positive. Kopsavilkums
Rīgas Stradiņa universitātes topošo ārstu zināšanas bērnu vakcinācijas tēmā un tās atbalsts Atslēgvārdi: vakcīna, vakcinācija, medicīnas studenti, zināšanas Ievads. Galvenais informācijas avots, kur vecāki gūst informāciju par vakcināciju ir ārsts, tātad ārstam ir jābūt izglītotam vakcinācijas jautājumā. Topošie ārsti ir tie, kas tuvākā laikā ietekmēs vakcinācijas aptveri. Mērķis. Novērtēt Rīgas Stradiņa universitātes medicīnas fakultātes studentu zināšanas par bērnu vakcināciju un attieksmi pret to. Materi āls un metodes. Tika izstrādāta anketa balstīta uz informācijas, ko sniedz Slimības profilakses un kontroles centrs par vakcināciju un ar sociālo tīklu palīdzību izplatīta Rīgas Stradiņa universitātes medicīnas fakultātes studentu vidū. Anketā ir 10 jautājumi. Pirmie septiņi jautājumi ir ar atbilžu variantiem. Uz 8., 9. un 10. jautājumu ir jāatbild “jā” vai “nē”. Par katru pareizi atbildētu jautājumu respondents saņem vienu punktu. Anketas beigās pajautāts par studējošā personīgo attieksmi pret bērnu vakcināciju. Visi iegūtie dati tika analizēti ar datorprogrammu Microsoft Office Excel 2016 un IBM SPSS 23 un izmantoti apkopotā veidā. Rezultāti. Aptaujā piedalījās 214 medicīnas studenti. 182 no tiem bija sievietes, savukārt 32 – vīrieši. Aptaujā piedalījās visu studiju gadu studējošie. No maksimāli iespējamām 10 ballēm visu studējošo vidējā atzīme ir 3.39 (0-8), moda ir 3. Viszemākā vidējā atzīme bija pirmā studiju gada respondentiem (vidējā 2.06 (0-4), moda 2), savukārt visaugstākā bija sestā studiju gada respondentiem – vidējā 4.53 (3-8), moda 5. Kopumā studējošo personīgā attieksme pret vakcināciju ir pozitīva. Secinājumi. Kopumā Rīgas Stradiņa universitātes medicīnas fakultātes studentu zināšanas par bērnu vakcināciju ir viduvējas un studentu attieksme pret vakcināciju ir pozitīva.
Introduction
Vaccination is the most effective preventive measure for vaccine-preventable infectious
diseases. With help of vaccination, incidence rate of vaccine-preventable diseases is significantly
decreased. Mortality from measles has fallen by 84% from 550 000 lethal outbreaks in 2000 to 89
780 in 2016 (WHO, 2018). Not taking that into account, the global vaccination coverage has
stopped at 86% without significant changes within the last years (WHO/H. Dicko, 2018).

DAUGAVPILS UNIVERSITĀTES 60. STARPTAUTISKĀS ZINĀTNISKĀS KONFERENCES PROCEEDINGS OF
RAKSTU KRĀJUMS THE 60th INTERNATIONAL SCIENTIFIC CONFERENCE OF DAUGAVPILS UNIVERSITY
224
Associate Professor Baiba Rozentale in the interview with Veselības centrs 4 vaccination
service said: "Vaccination is one of the main and most effective ways of preventing health and is
generally cheaper and more cost-effective than treatment and rehabilitation, both for individuals and
for the country". Vaccination goals are protection of vaccinated and non-vaccinated individual and
forming of collective immunity. Collective immunity creates if 90-95% of society has immunity
against infectious disease, then it does not spread across the state territory, even if the infection has
been brought in from another country. That is why vaccination is important not only for individuals
but for the whole society as well (Slimību profilakses un kontroles centrs, 2018).
One of identified problems of society’s health guidelines, connected with immunization, is:
“Insufficient understanding of society and medical practitioners about significance of vaccination,
its efficiency and safety” (Sabiedrības veselības pamatnostādnes, 2014). Often, parents note the
doctor's recommendations as the main reason they vaccinate their children (Wilson et al 2008). In
the research “Children parents’ awareness and attitude toward vaccination in Latvia” 64.4% of the
respondents noted the treatment person as the main source of information related to vaccination
(Oksana Martiņuka, Ieva Kantsone, Irina Lucenko, Jurijs Perevoščikovs, Dzintars Mozgis, Andrejs
Ivanovs, 2017). As noted in the regulations No. 330 of Cabinet of Ministers, that is also a duty of
physicians to inform patients being under their care about necessity of vaccination (Ministru
kabineta noteikumi Nr. 330, 2000). However, according to a survey conducted by the research
center Berg Research, only 49% of patients receive a reminder of the need for vaccination. Part of
GPs do not support vaccination at all (Anna Strapcāne, 2017). A French study surveyed 329 GPs
and 96% of them supported vaccination, but only 80% regularly discuss the benefits and risks of
vaccination with their patients (Pulcini et al., 2012).
Upon entering the Faculty of Medicine, the student becomes a health care representative.
Future doctors are the ones who will influence the coverage of vaccination in the closest time. By
being sufficiently informed and educated in the question of vaccination, they will be able to educate
their patients as well, regularly remind them about necessity of vaccination and its importance, to
increase coverage of vaccination, thus decreasing prevalence of vaccine-preventable infectious
diseases.
According to the definition of World Health Organization, vaccine is a biological preparation,
which improves the immunity against specific disease. Vaccine stimulates immune system by
imitating infection, this infection cannot cause disease, but it causes production of T-lymphocytes
and antibodies. Antibodies are formed within 7-21 days. After destroying the agent in the body,
memory T-lymphocytes and B-lymphocytes remain which further, when facing with similar agent,
will remember, how to destroy it.
DAUGAVPILS UNIVERSITĀTES 60. STARPTAUTISKĀS ZINĀTNISKĀS KONFERENCES PROCEEDINGS OF
RAKSTU KRĀJUMS THE 60th INTERNATIONAL SCIENTIFIC CONFERENCE OF DAUGAVPILS UNIVERSITY
225
There are two main approaches used for the active immunization: alive or weakened agents,
for example, in vaccines against flu, poliomyelitis, rubella, etc., and killed or inactive agents, for
example, in vaccines against diphtheria, tetanus, hepatitis A, etc. (Vaccines 6th ed, 88-112).
It must be remembered that vaccine does not protect child completely from catching the
specific infectious disease but, if caught, then it is in lighter form.
All vaccines used in Latvia are safe and registered; it is determined by Epidemiological Safety
Law (Epidemioloģiskās drošības likums, 1997). Each country has its own vaccination calendar
approved by the relevant supervisory authorities, and it provides for age of child, interval between
vaccines, as well as list of specific diseases, against which the vaccination has been made.
In Latvia, decisions regarding the health of children are taken by their parents who have the
right to refuse the child's vaccination by signing the refusal form (Ministru kabineta noteikumi Nr.
330, 2000).
It is essential to distinguish between true and false or temporary contraindications for
vaccination. Absolute contraindications are those for which the vaccine should not be injected under
any circumstances because vaccination may endanger human life, and which are: severe or
moderate disease or exacerbation of a chronic disease, an anaphylactic reaction to a specific vaccine
during previous vaccination, a known life-threatening organism response reaction to any component
of the vaccine; live vaccines are contraindicated for pregnant and immunocompromised patients
(Slimību profilakses un kontroles centrs, 2018).”
Aim
To evaluate knowledge of Riga Stradins University medical students about children
vaccination and attitude towards it.
Materials and methods
A multi-option survey was developed based on the information provided by the Center for
Disease Prevention and Control about vaccination and distributed among the students of the Riga
Stradins University Medical Faculty through social networks.
The survey has 10 questions. The first seven questions are with multiple options for each
answer. From the options provided, you must select several correct answers. A question is
considered as answered correctly if all the right answers are noted. Questions 8, 9 and 10 should be
answered with "yes" or "no". For each correctly answered question, the respondent receives 1 point.
In this way, each student can get from 0 to 10 points. At the end of the questionnaire, students were
asked about the personal attitude towards the children vaccination, the question consisted of three
statements, each could agree: “I support childhood vaccination”, “I would vaccinate my children”
un “I would recommend others to vaccinate their children”.

DAUGAVPILS UNIVERSITĀTES 60. STARPTAUTISKĀS ZINĀTNISKĀS KONFERENCES PROCEEDINGS OF
RAKSTU KRĀJUMS THE 60th INTERNATIONAL SCIENTIFIC CONFERENCE OF DAUGAVPILS UNIVERSITY
226
All the data were analyzed by the Microsoft Office Excel 2016 and IBM SPSS 23 software
and used in collected form.
Results
The survey involved 214 medical students from which 182 were women and 32 men.
Students from all study years took part in the survey, however, the most (58 students) were from the
sixth year of study. Distribution of the surveyed students by study years you can be seen in the
Figure 1.
Figure 1. Distribution of the surveyed students by study years
Of the maximum possible 10 points, the average score for all students is 3.39 (0-8), mode is 3.
The average scores are the highest for the fifth- and sixth-year students, which is confirmed by
statistical reliability compared to all other study years. The lowest average grade was for
respondents in the first year of study (average 2.06 (0-4), mode 2), while the highest for respondents
in the sixth year of study - average 4.53 (3-8), mode 5. The results for different study years can be
seen in the table 1.
Table 1. Assessment of the test for different study years
Study year Average score Mode Minimum Maximum
1. 2.06 2 0 4 2. 2.80 3 1 4 3. 3.05 3 1 6 4. 3.07 3 1 6 5. 3.78 2 1 7 6. 4.53 5 3 8
Among all questions, students’ answers were the worst in question No. 3 “Against which
infectious diseases the live vaccines are used?”. One student answered this question correctly.
Students know the best that vaccine does not completely protect child from catching the specific
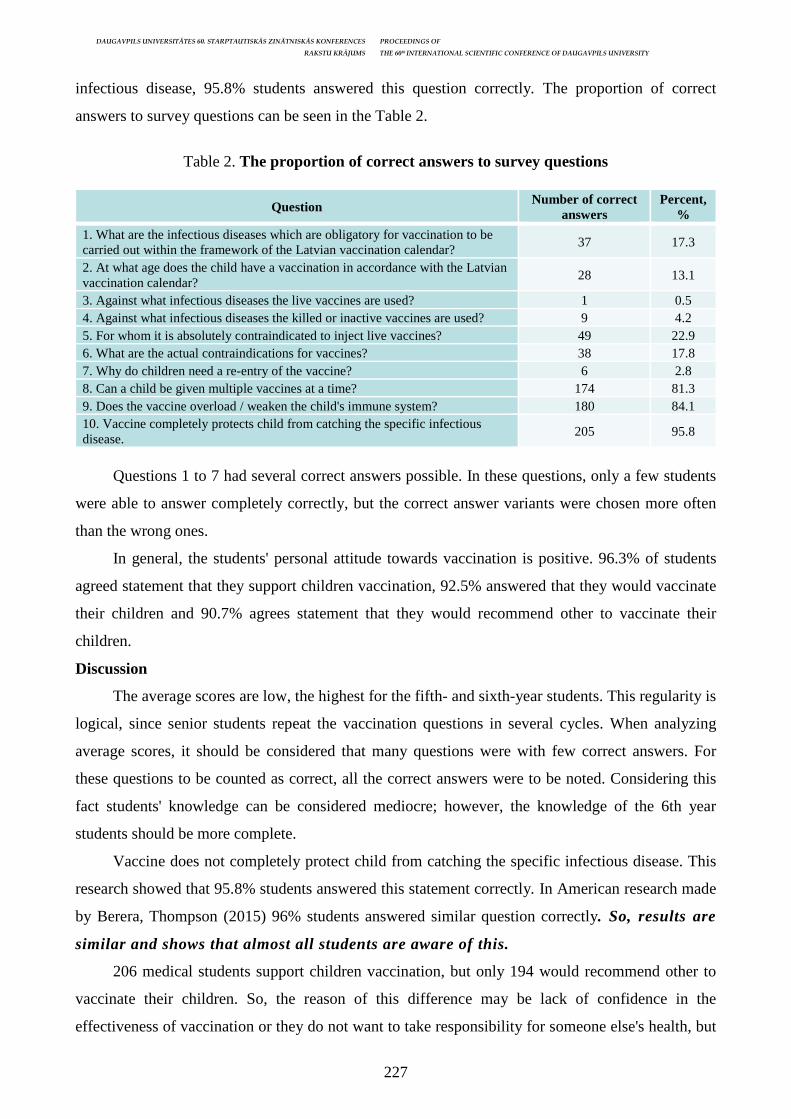
DAUGAVPILS UNIVERSITĀTES 60. STARPTAUTISKĀS ZINĀTNISKĀS KONFERENCES PROCEEDINGS OF
RAKSTU KRĀJUMS THE 60th INTERNATIONAL SCIENTIFIC CONFERENCE OF DAUGAVPILS UNIVERSITY
227
infectious disease, 95.8% students answered this question correctly. The proportion of correct
answers to survey questions can be seen in the Table 2.
Table 2. The proportion of correct answers to survey questions
Question Number of correct
answers Percent,
%
1. What are the infectious diseases which are obligatory for vaccination to be carried out within the framework of the Latvian vaccination calendar?
37 17.3
2. At what age does the child have a vaccination in accordance with the Latvian vaccination calendar?
28 13.1
3. Against what infectious diseases the live vaccines are used? 1 0.5 4. Against what infectious diseases the killed or inactive vaccines are used? 9 4.2 5. For whom it is absolutely contraindicated to inject live vaccines? 49 22.9 6. What are the actual contraindications for vaccines? 38 17.8 7. Why do children need a re-entry of the vaccine? 6 2.8 8. Can a child be given multiple vaccines at a time? 174 81.3 9. Does the vaccine overload / weaken the child's immune system? 180 84.1 10. Vaccine completely protects child from catching the specific infectious disease.
205 95.8
Questions 1 to 7 had several correct answers possible. In these questions, only a few students
were able to answer completely correctly, but the correct answer variants were chosen more often
than the wrong ones.
In general, the students' personal attitude towards vaccination is positive. 96.3% of students
agreed statement that they support children vaccination, 92.5% answered that they would vaccinate
their children and 90.7% agrees statement that they would recommend other to vaccinate their
children.
Discussion
The average scores are low, the highest for the fifth- and sixth-year students. This regularity is
logical, since senior students repeat the vaccination questions in several cycles. When analyzing
average scores, it should be considered that many questions were with few correct answers. For
these questions to be counted as correct, all the correct answers were to be noted. Considering this
fact students' knowledge can be considered mediocre; however, the knowledge of the 6th year
students should be more complete.
Vaccine does not completely protect child from catching the specific infectious disease. This
research showed that 95.8% students answered this statement correctly. In American research made
by Berera, Thompson (2015) 96% students answered similar question correctly. So, results are
similar and shows that almost all students are aware of this.
206 medical students support children vaccination, but only 194 would recommend other to
vaccinate their children. So, the reason of this difference may be lack of confidence in the
effectiveness of vaccination or they do not want to take responsibility for someone else's health, but
DAUGAVPILS UNIVERSITĀTES 60. STARPTAUTISKĀS ZINĀTNISKĀS KONFERENCES PROCEEDINGS OF
RAKSTU KRĀJUMS THE 60th INTERNATIONAL SCIENTIFIC CONFERENCE OF DAUGAVPILS UNIVERSITY
228
this is the duty of the doctor. But in Serbian research made by Cvjetkovic et al. (2017), similar
statement: “I would recommend my patient to vaccinate his/her child in accordance with
determined immunization program” was answered with “I agree completely” by 68.1%, and 15.5%
medical students chose answer “I agree”. In this research the result is 90.7% and that is positive that
most of students are ready to take responsibility and educate patients. However, there are students
who do not support vaccination – eight students didn’t agree to any of this statement.
In order to improve the global vaccination coverage, there is a need to make this topic more
actual for students and to start educating medical students on the topic of vaccination already in
their first years of study.
It would be worthwhile to repeat this study if the system for educating the medical students
about vaccinations would change and then compare the results to see if a better approach has been
found to actualize this topic and increase student knowledge.
Conclusions
In general, knowledge of Riga Stradins University Medical Faculty students on children
vaccination is mediocre. The worst knowledge of vaccination is for first-year students. The best
knowledge of vaccination is for the sixth-year students, but still it is not complete.
Students know the worst, against which infectious diseases the live and killed vaccines are
used. Students know the best that vaccine does not completely protect child from catching the
specific infectious disease.
Students know more about that live vaccines are contraindicated for immunocompromised
patients, than about fact that it is absolutely contraindicated to give live vaccines to pregnant
patients. Most often, as a genuine contraindication for the injection of vaccines, students mistakenly
consider the "uncarried or premature baby".
Most students know that children need a re-entry of the vaccine to provide stronger and
longer-lasting immunity.
In general, students’ personal attitude towards the vaccination is positive.
References 10 facts on immunization [tiešsaiste]. WHO, Updated March 2018 – [atsauce 20.03.2018.]. Pieejams internetā: http://www.who.int/features/factfiles/immunization/en/ Anna Strapcāne. Par vakcinācijas nepieciešamību dažreiz jāpārliecina pat ģimenes ārsts. Diena, 27. aprīlis, 2017, 16:27. [atsauce 30.03.2018.]. Pieejams internetā: https://www.diena.lv/raksts/latvija/ zinas/par-vakcinacijas-nepieciesamibu-dazreiz-japarliecina-pat-gimenes-arsts-14170942 Epidemioloģiskās drošības likums. Likums Saeimā pieņemts 1997. gada 11. decembrī. Oksana Martiņuka, Ieva Kantsone, Irina Lucenko, Jurijs Perevoščikovs, Dzintars Mozgis, Andrejs Ivanovs. Bērnu vecāku informētība un attieksme pret vakcināciju Latvijā. RSU ZINĀTNISKĀ KONFERENCE, 2017. gada 6.–7. aprīlis. [atsauce30.03.2018.]. Pieejams internetā: https://www.rsu.lv/sites/default/files/imce/Zin%C4%81tnes%20departaments/2017/I%20sekcija/vecaku_informetiba_attieksme_vakcinacija.pdf
DAUGAVPILS UNIVERSITĀTES 60. STARPTAUTISKĀS ZINĀTNISKĀS KONFERENCES PROCEEDINGS OF
RAKSTU KRĀJUMS THE 60th INTERNATIONAL SCIENTIFIC CONFERENCE OF DAUGAVPILS UNIVERSITY
229
Slimību profilakses un kontroles centrs, Informatīvs materiāls vecākiem par bērnu vakcināciju [tiešsaiste]. [atsauce 20.03.2018.]. Pieejams internetā: http://www.vm.gov.lv/images/userfiles/ Tava%20veseliba/Buklets_Vecakiem_par_vakcinaciju.pdf Slimību profilakses un kontroles centra speciālisti, Vecākiem par bērnu vakcināciju, buklets Sabiedrības veselības pamatnostādnes 2014.–2020. gadam, Latvija. Akceptēšanas datums: 14.10.2014. Veselības centrs 4 vakcinācijas dienests, IEGUVUMI UN DROŠĪBA, Intervija ar Latvijas Infektoloģijas centra direktori, Asoc. profesori Baibu Rozentāli [tiešsaiste]. [atsauce 20.03.2018.]. Pieejams internetā: http://vakcinejies.lv/lv/informacija/specialistu_viedokli/ieguvumi_un_drosiba/ Vakcinācijas noteikumi. Ministru kabineta noteikumi Nr. 330. Rīgā 2000. gada 26. septembris. Berera D, Thompson KM (2015) Medical Student Knowledge, Attitudes, and Practices Regarding Immunization. J Vaccines Vaccin 6: 268. doi: 10.4172/2157-7560.1000268 Cvjetkovic, Smiljana J. et al., Knowledge and attitudes toward vaccination: A survey of Serbian students. Journal of Infection and Public Health, Volume 10, Issue 5, 649–656. Immunization coverage, Fact sheet. WHO/H. Dicko, Reviewed January 2018 – [viewed 20.03.2018.]. Accessed (pieejams): http://www.who.int/mediacentre/factsheets/fs378/en/ Kroger AT, Atkinson WL, and Pickering LK: General immunization practices. In Plotkin SA, Orenstein WA, and Offit PA (eds): Vaccines, 6th ed. Philadelphia: Saunders, 2013. pp. 88–112. Pulcini, C., et al., Knowledge, attitudes, beliefs and practices of general practitioners towards measles and MMR vaccination in southeastern France in 2012. Clinical Microbiology and Infection. 20(1): p. 38–43. Wilson, K., et al., Parental views on pediatric vaccination: the impact of competing advocacy coalitions. Public Underst Sci, 2008. 17(2): p. 231–243.
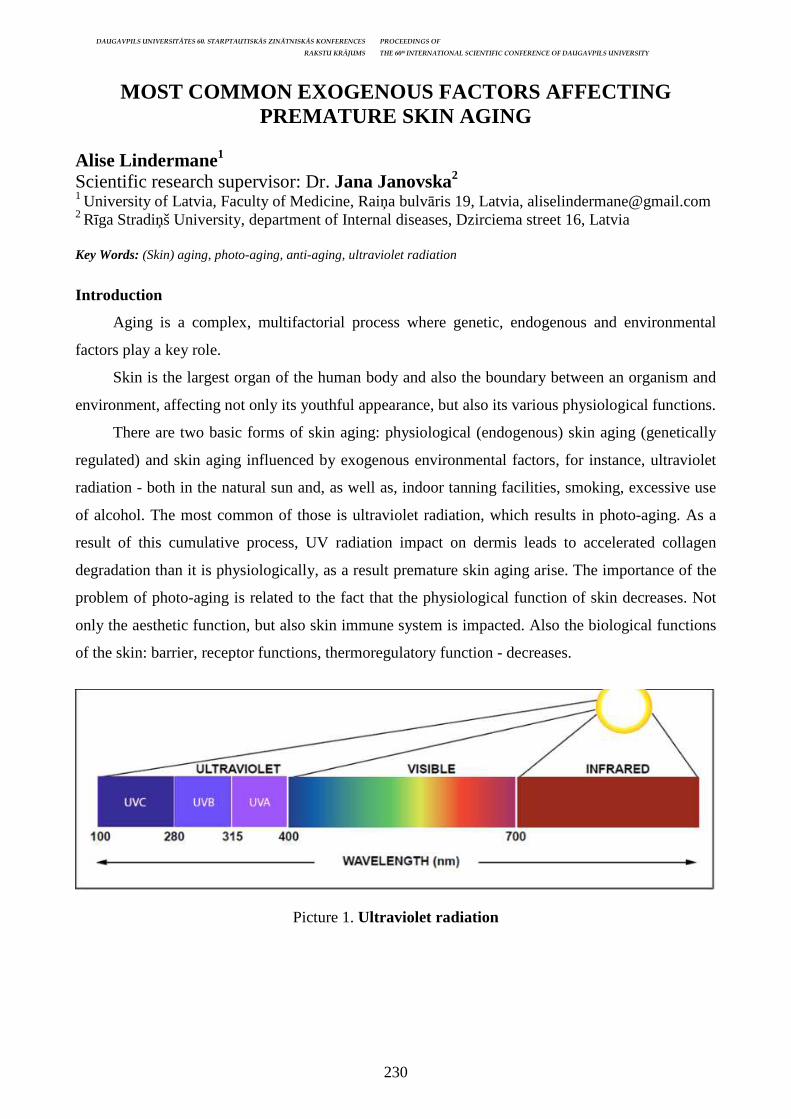
DAUGAVPILS UNIVERSITĀTES 60. STARPTAUTISKĀS ZINĀTNISKĀS KONFERENCES PROCEEDINGS OF
RAKSTU KRĀJUMS THE 60th INTERNATIONAL SCIENTIFIC CONFERENCE OF DAUGAVPILS UNIVERSITY
230
MOST COMMON EXOGENOUS FACTORS AFFECTING PREMATURE SKIN AGING
Alise Lindermane1 Scientific research supervisor: Dr. Jana Janovska2
1 University of Latvia, Faculty of Medicine, Raiņa bulvāris 19, Latvia, [email protected] 2 Rīga Stradiņš University, department of Internal diseases, Dzirciema street 16, Latvia Key Words: (Skin) aging, photo-aging, anti-aging, ultraviolet radiation
Introduction
Aging is a complex, multifactorial process where genetic, endogenous and environmental
factors play a key role.
Skin is the largest organ of the human body and also the boundary between an organism and
environment, affecting not only its youthful appearance, but also its various physiological functions.
There are two basic forms of skin aging: physiological (endogenous) skin aging (genetically
regulated) and skin aging influenced by exogenous environmental factors, for instance, ultraviolet
radiation - both in the natural sun and, as well as, indoor tanning facilities, smoking, excessive use
of alcohol. The most common of those is ultraviolet radiation, which results in photo-aging. As a
result of this cumulative process, UV radiation impact on dermis leads to accelerated collagen
degradation than it is physiologically, as a result premature skin aging arise. The importance of the
problem of photo-aging is related to the fact that the physiological function of skin decreases. Not
only the aesthetic function, but also skin immune system is impacted. Also the biological functions
of the skin: barrier, receptor functions, thermoregulatory function - decreases.
Picture 1. Ultraviolet radiation

DAUGAVPILS UNIVERSITĀTES 60. STARPTAUTISKĀS ZINĀTNISKĀS KONFERENCES PROCEEDINGS OF
RAKSTU KRĀJUMS THE 60th INTERNATIONAL SCIENTIFIC CONFERENCE OF DAUGAVPILS UNIVERSITY
231
Intrinsic skin ageing Extrinsic skin ageing Epidermis thins 10-50% Epidermis thickens Fine wrinkles (after 60) Coarse wrinkles (as early as 18), deep wrinkles Underlying fat of face decreases (especially fat pads above eyes and around mouth)
Mottled, uneven pigmentation
Decreasementof fibroblast (reduced strength) Accumulation of abnormal elastic fibers Decrease of skin appendages (lipid production, disturbed epithelisation)
Increased collagen degradation
Decreased mitotic activity (impaired desquamation) Impaired proliferation, desquamation and apoptosis of keratinocytes
Reduced nerve endings (disturbed sensory function) Increment of neutrophils
Chart 1. Difference between intrinsic and extrinsic skin ageing
Aim . So as to analyze most common exogenous premature skin aging factors.
Materials and methods. Prospective study was done. Both gender, 100 respondents were
analyzed, aged 18 and older, skin phototype was I-III. Data were obtained using a questioner and
expressed as count and percentage value.
Results. Most of respondents were female – 84% and male – 16%, with average age – 27.
Most of respondents (56%) had higher education. 81% of respondents are smokers. 31% admitted
not using UV protection cream. 56% are users of indoor tanning facilities, most commonly (38%)
aged 18–25. 16% of tanning facility visitors admitted having various skin changes as a
complication, bet 4% - preterm skin aging.
Graph 1. Sun protection creme usage
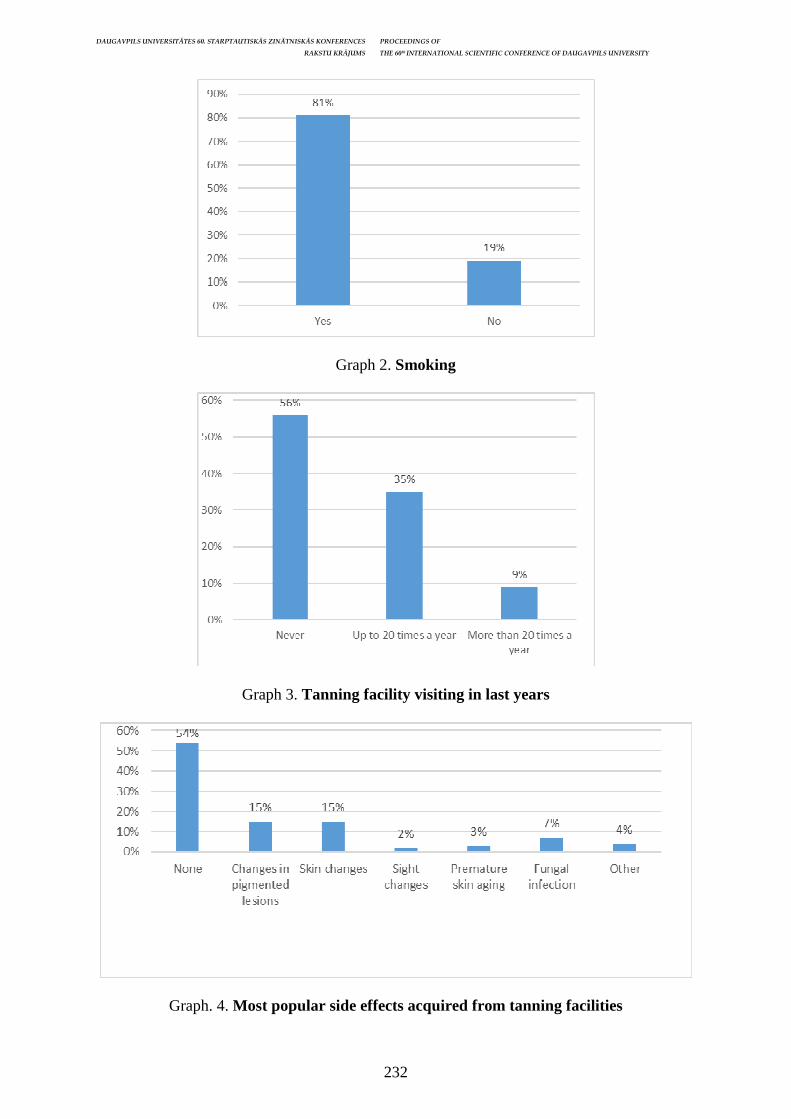
DAUGAVPILS UNIVERSITĀTES 60. STARPTAUTISKĀS ZINĀTNISKĀS KONFERENCES PROCEEDINGS OF
RAKSTU KRĀJUMS THE 60th INTERNATIONAL SCIENTIFIC CONFERENCE OF DAUGAVPILS UNIVERSITY
232
Graph 2. Smoking
Graph 3. Tanning facility visiting in last years
Graph. 4. Most popular side effects acquired from tanning facilities

DAUGAVPILS UNIVERSITĀTES 60. STARPTAUTISKĀS ZINĀTNISKĀS KONFERENCES PROCEEDINGS OF
RAKSTU KRĀJUMS THE 60th INTERNATIONAL SCIENTIFIC CONFERENCE OF DAUGAVPILS UNIVERSITY
233
Conclusion
Ultraviolet radiation is the main and most dangerous cause of premature skin aging. The
influence of it is cumulative, it pits up throughout life. For example, 15 minutes of tanning activates
the mechanisms of skin reparation for months. 5-15 minutes of UV exposure spends 70-80% of skin
antioxidant stocks. The total amount of UV radiation accumulated through life is directly related to
the risk of squamous cell carcinoma, which emphasizes the importance of the topic.
While we are not yet able to stop the physiological process of skin aging, we can prevent
external factors that accelerate skin aging. This may be done by investigating tendencies in the
society towards this topic, on which further society education may be based at the same promoting
preventive skin ageing cure.
DAUGAVPILS UNIVERSITĀTES 60. STARPTAUTISKĀS ZINĀTNISKĀS KONFERENCES PROCEEDINGS OF
RAKSTU KRĀJUMS THE 60th INTERNATIONAL SCIENTIFIC CONFERENCE OF DAUGAVPILS UNIVERSITY
234
MALNUTRITION IN DAUGAVPILS CHRONIC HEMODIALYSIS PATIENTS
Nadežda Vorobjova1, Olga Sjomina2, Pjotrs Vorobjovs3, Aiga Vasiļvolfa4, Ināra Ādamsone5 1 Daugavpils Regional Hospital, Vasarnīcu street 20, Daugavpils, Latvia; Riga Stradiņ University, Dzirciema street 16, Riga, Latvia, [email protected] 2 Riga East University Hospital, 2 Hipokrāta Street, Riga, Latvia; University of Latvia, 1 Raina Blvd., Riga, Latvia, [email protected] 3 Riga Stradiņš University, Dzirciema street 16, Kurzemes rajons, Riga, Latvia, [email protected] 4 Pauls Stradins Clinical University Hospital, Pilsonu street 13, Riga, Latvia; Universit of Latvia, 19 Raina Blvd., Riga, Latvia, [email protected] 5 Pauls Stradins Clinical University Hospital, Pilsonu street 13, Riga, Latvia; Riga Stradiņ University, Dzirciema street 16, Riga, Latvia, [email protected] Abstract
Malnutrition in Daugavpils chronic hemodialysis patients Key Words: Hemodialysis, malnutrition, SGA score Introduction. Malnutrition is common among chronic haemodialysis (CHD) patients accounting 20% to 70% depending on method used to evaluate the nutritional status. It is associated with decreased quality of life and increased mortality in CHD patients. Aim. To assess nutritional status of Daugavpils CHD patients. Materials and methods. Total of 33 CHD patients were screened using Subjective Global Assessment (SGA) score. Patients were divided into 3 groups according to SGA score: normal, mild-to-moderate and severe malnutrition. Anthropometric measurements, demographic data and medical history of patients were obtained. Results. 33 patients participated in research; 60.6% (n=20) were men. The mean age of patients was 67.9 years. Mean duration of CHD was 49.7 months. The most common reason of CHD starting was chronic interstitial nephritis (n=11), diabetic nephropathy (n=7) and hypertensive nephropathy (n=5). Based on SGA score results, 24 patients (72.7%) were not malnourished, 7 (21.2%) were mild-to-moderate, and 2 patients were severely malnourished (6.0%).). Significant correlation between SGA score and haemoglobin level (p=0.04), as well as phosphate level (p=0,044) was found. SGA score results correlated with anthropometric measurements. Conclusions. Malnutrition is widely spread among CHD patients. Quarter of the patients were moderately to severely malnourished. Timely prediction might be used in adjustment of patients’ diet and substitution therapy, which could improve life quality and reduce complications. Kopsavilkums
Malnutr īcija Daugavpils hroniskās hemodialīzes pacientiem Atslēgvārdi: hemodialīze, malnutrīcija, Subjektīvā Globālā Novērtējuma (SGN) skala Ievads. Malnutrīcija ir bieži sastopama hroniskiem hemodialīzes (HHD) pacientiem, 20 līdz 70% atkarībā no metodes, kas tiek izmantota barojuma izvērtēšanai. Malnutrīcija ir asociēta ar samazinātu dzīves kvalitāti un paaugstinātu mirstību HHD pacientiem. Mērķis. Noteikt barojuma pakāpi Daugavpils HHD pacientiem. Materi āli un metodes. Kopumā 33 HHD pacientiem veikts skrīnings, izmantojot Subjektīvo Globālā Novērtējuma (SGN) skalu. Pacienti tika sadalīti trīs grupās pēc SGN skalas: normāla barojuma, vieglas līdz vidējas pakāpes malnutrīcija un smagas pakāpes malnutrīcija. Tika apkopoti pacientu antropometriskie mērījumi, demogrāfiskie dati un anamnēze. Rezultāti. Pētījumā piedalījās 33 pacienti; no tiem 60.6% (n=20) vīrieši. Vidējais pacientu vecums bija 67.9 gadi. Vidējais HHD ilgums bija 49.7 mēneši. Biežākie HHD sākšanas iemesli bija hronisks intersticiāls nefrīts (n=11), diabētiska nefropātija (n=7) un hipertensīva nefropātija (n=5). Balstoties uz SGN skalas rezultātiem, 24 pacientiem (72.7%) nebija malnutrīcijas, 7 (21.2%) bija vieglas līdz vidēji smagas pakāpes malnutrīcija un 2 pacientiem bija smagas pakāpes malnutrīcija (6.0%). Tika konstatēta nozīmīga korelācija starp SGN skalu un hemoglobīna līmeni (p=0.04), kā arī fosfātu līmeni (p=0,044). SGN skalas rezultāti korelēja ar antropometriskiem mērījumiem. Secinājumi. Malnutrīcija ir plaši sastopama HHD pacientu vidū. Ceturtdaļai pacientu novēroja vidējas līdz smagas pakāpes malnutrīciju. Savlaicīga malnutrīcijas atpazīšana var tikt izmantota pacientu diētas koriģēšanai vai substitūcijas terapijas uzsākšanai, kas varētu uzlabot dzīves kvalitāti un mazināt komplikāciju biežumu.
DAUGAVPILS UNIVERSITĀTES 60. STARPTAUTISKĀS ZINĀTNISKĀS KONFERENCES PROCEEDINGS OF
RAKSTU KRĀJUMS THE 60th INTERNATIONAL SCIENTIFIC CONFERENCE OF DAUGAVPILS UNIVERSITY
235
Introduction
Malnutrition is the cellular imbalance between the supply of nutrients and energy and the
body's demand for them to ensure growth, maintenance, and specific functions. It is common
among chronic haemodialysis (CHD) patients accounting 20% to 70% depending on method used
to evaluate the nutritional status.
There are various factors that may cause malnutrition such as chronic inflammation, dialysis
associated amino acid and protein loss, metabolic acidosis, comorbidities, socioeconomic factors
and other complications of CHD – nausea, loss of appetite, depression. The assessment of
nutritional status should be based on a combination of clinical, biophysical and biochemical
parameters (Locatelli 2002). Clinical assessment includes loss of appetite, nausea, vomiting, ability
to prepare meals and signs of depression (Bansal 2018). Physical assessment of subcutaneous fat
mass, muscle mass, percentage of standard weight, body mass index and a history of weight loss are
important parts of nutritional assessment (Locatelli 2002). Assessment of co-comorbid conditions
and inflammation are also important (Stenvinkel 2000). The most commonly used laboratory
parameters are albumin, pre-albumin, transferrin, CRP, serum creatinine, total cholesterol and
bicarbonate (Locatelli 2002, Heimburger 2000). A low serum albumin is a strong predictor of
outcomes in dialysis patients (Kalantar-Zadeh 2005). Serum albumin levels may be reduced due to
non-nutritional factors including inflammation, acute or chronic stress, overhydration, urinary
losses and acidemia (Bansal 2018). The methods that are used to assess body composition include
anthropometry, creatinine kinetics, bioimpedance analysis, dual energy x-ray absorptiometry,
computer tomography or magnetic resonance (Bansal 2018). Subjective global assessment score is
based on subjective and objective aspects of patient’s medical history and physical examination
(Detsky 1987). SGA is a well - validated tool with correlates with other nutritional markers
(Heimbuerger 2000) and has a high predictive value for mortality (McCusker 1996).
Malnutrition is associated with decreased quality of life and increased mortality in CHD
patients. Early diagnosis and adequate therapeutic management of malnutrition may increase quality
of life of CHD patients.
Aim
To assess the nutritional status and relationship between various parameters used for assessing
malnutrition in Daugavpils Central Hospital chronic hemodialysis patients.
Materials and methods
Total of 33 patients that were treated with chronic HD at the Daugavpils Central Hospital
dialysis center were screened using Subjective Global Assessment (SGA) score. The SGA score
includes the following subjective categories - history of weight loss, changes in nutrient intake and
functional capacity, presence of gastrointestinal symptoms (anorexia, nausea, vomiting and
DAUGAVPILS UNIVERSITĀTES 60. STARPTAUTISKĀS ZINĀTNISKĀS KONFERENCES PROCEEDINGS OF
RAKSTU KRĀJUMS THE 60th INTERNATIONAL SCIENTIFIC CONFERENCE OF DAUGAVPILS UNIVERSITY
236
diarrhoea) and visual assessment of edema, subcutaneous fat and muscle mass. Each category was
subjectively rated on a seven point scale and each patient was given a score that reflected the
nutritional status. Patients were divided into 3 groups according to SGA score: normal, mild-to-
moderate and severe malnutrition.
Anthropometric measurements, demographic and medical history (age, gender, clinical and
CHD history, diagnosis, comorbidities, laboratory parameters) of patients were obtained.
Anthropometric measurements included: post-dialysis weight, height, triceps (TSF) and biceps
(BSF) skinfold thickness and mid-arm muscle circumference (MUAC). Body weight and height
were measured 10-15 minutes after the end of CHD session and body mass index (BMI) was
calculated. Muscle skinfold was measured with a skinfold caliper at 2 sites (triceps, biceps) on the
non-dominant arm of the patients with central venous catheter and in the fistula-free arm of the
patients with arteriovenous fistula. MUAC was measured on the same arm at the midpoint between
the acromion and olecranon process. Laboratory parameters included erythrocyte count and
haemoglobin level, leucocyte and platelet count, albumin, creatinine, urea, C-reactive protein
(CRP), calcium and phosphate level.
Collected data was analysed using IMB SPSS 22.0
Results
In total, 33 patients answered the criteria of our research; 60.6% of them (n=20) were males
and 39.4% (n=13) females. The mean age of patients was 67.9±9.9 years, median age – 69.0. The
mean duration of CHD was 49.7 months (range 5-262), median - 30 months. The most common
reason of CHD starting was chronic interstitial nephritis (n=11), diabetic nephropathy (n=7) and
hypertensive nephropathy (n=5). Comorbidities were noted in 72% (n=24) of patients.
According to SGA score results, 24 patients (72.7%) had normal nutritional status, 7 (21.2%)
were mild-to-moderate malnourished, and 2 patients were severely malnourished (6.0%).
Significant correlation between malnutrition (according to SGA score) and anthropometric
measurements such as weight, BMI, BSF, TSF and MUAC was found. The 1 table shows data
about correlation between nutritional status and anthropometric measurements.
Table 1. Anthropometric measurement in patients with normal nutritional
status and malnutrition
Anthropometric measurements Normal nutritional status Malnutrition
(mild-to-moderate and severe) p-value
Weight (kg) 81±11 66.6±18.2 0.007 BMI (kg/m2) 27.7±4.2 23.9±6.1 0.023 BSF (cm) 7.6±2.3 5.3±2.1 0.009 TSF (cm) 14±5.3 10,2±6.6 0.024 MUAC (cm) 30.8±3.1 25.7±5.6 0.007
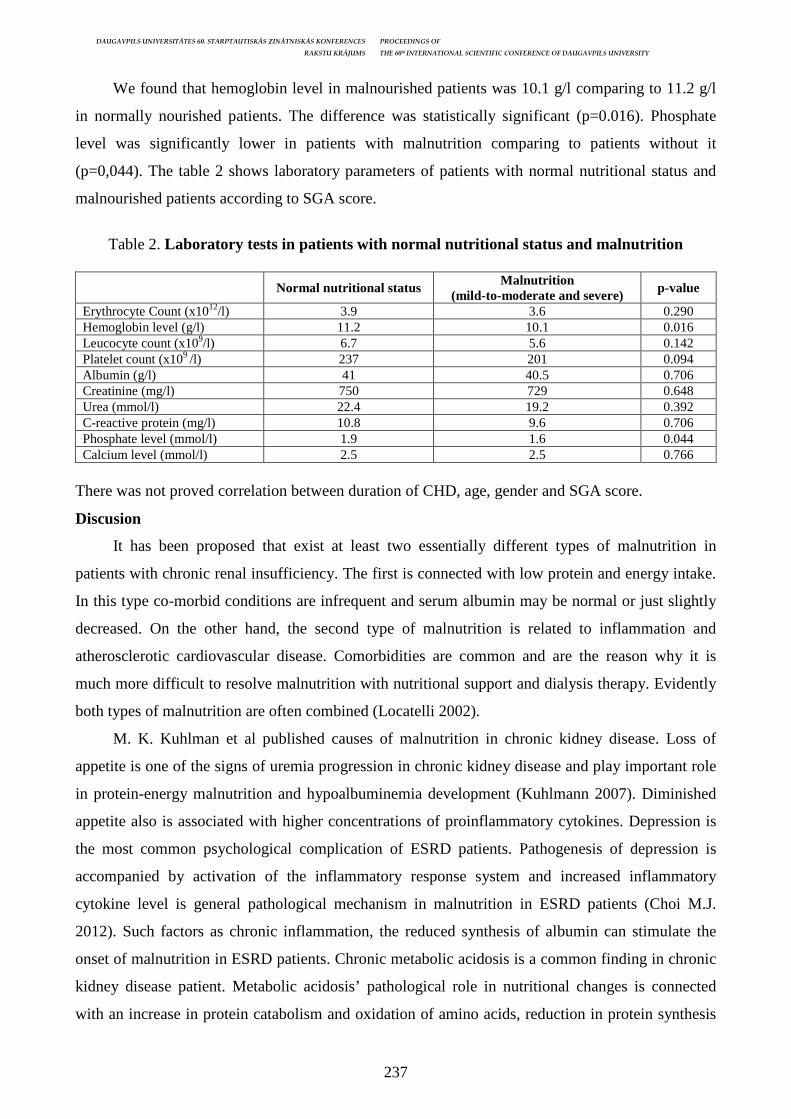
DAUGAVPILS UNIVERSITĀTES 60. STARPTAUTISKĀS ZINĀTNISKĀS KONFERENCES PROCEEDINGS OF
RAKSTU KRĀJUMS THE 60th INTERNATIONAL SCIENTIFIC CONFERENCE OF DAUGAVPILS UNIVERSITY
237
We found that hemoglobin level in malnourished patients was 10.1 g/l comparing to 11.2 g/l
in normally nourished patients. The difference was statistically significant (p=0.016). Phosphate
level was significantly lower in patients with malnutrition comparing to patients without it
(p=0,044). The table 2 shows laboratory parameters of patients with normal nutritional status and
malnourished patients according to SGA score.
Table 2. Laboratory tests in patients with normal nutritional status and malnutrition
Normal nutritional status Malnutrition
(mild-to-moderate and severe) p-value
Erythrocyte Count (x1012/l) 3.9 3.6 0.290 Hemoglobin level (g/l) 11.2 10.1 0.016 Leucocyte count (x109/l) 6.7 5.6 0.142 Platelet count (x109 /l) 237 201 0.094 Albumin (g/l) 41 40.5 0.706 Creatinine (mg/l) 750 729 0.648 Urea (mmol/l) 22.4 19.2 0.392 C-reactive protein (mg/l) 10.8 9.6 0.706 Phosphate level (mmol/l) 1.9 1.6 0.044 Calcium level (mmol/l) 2.5 2.5 0.766
There was not proved correlation between duration of CHD, age, gender and SGA score.
Discusion
It has been proposed that exist at least two essentially different types of malnutrition in
patients with chronic renal insufficiency. The first is connected with low protein and energy intake.
In this type co-morbid conditions are infrequent and serum albumin may be normal or just slightly
decreased. On the other hand, the second type of malnutrition is related to inflammation and
atherosclerotic cardiovascular disease. Comorbidities are common and are the reason why it is
much more difficult to resolve malnutrition with nutritional support and dialysis therapy. Evidently
both types of malnutrition are often combined (Locatelli 2002).
M. K. Kuhlman et al published causes of malnutrition in chronic kidney disease. Loss of
appetite is one of the signs of uremia progression in chronic kidney disease and play important role
in protein-energy malnutrition and hypoalbuminemia development (Kuhlmann 2007). Diminished
appetite also is associated with higher concentrations of proinflammatory cytokines. Depression is
the most common psychological complication of ESRD patients. Pathogenesis of depression is
accompanied by activation of the inflammatory response system and increased inflammatory
cytokine level is general pathological mechanism in malnutrition in ESRD patients (Choi M.J.
2012). Such factors as chronic inflammation, the reduced synthesis of albumin can stimulate the
onset of malnutrition in ESRD patients. Chronic metabolic acidosis is a common finding in chronic
kidney disease patient. Metabolic acidosis’ pathological role in nutritional changes is connected
with an increase in protein catabolism and oxidation of amino acids, reduction in protein synthesis

DAUGAVPILS UNIVERSITĀTES 60. STARPTAUTISKĀS ZINĀTNISKĀS KONFERENCES PROCEEDINGS OF
RAKSTU KRĀJUMS THE 60th INTERNATIONAL SCIENTIFIC CONFERENCE OF DAUGAVPILS UNIVERSITY
238
and reduction of leptin concertation (de Oliveira 2015). Other metabolic derangements which are
connected with malnutrition in ESRD patients are hyperparathyroidism, hypogonadism, growth
hormone resistance (Iyasere 2014). Renal replacement therapies methods by itself may induce
nutritional changes. It is suggested that hemodialysis as renal replacement therapy method could
cause protein catabolism, eliminate nutrients and has a proinflammatory effect. Also, peritoneal
dialysis due to peritoneal membrane may cause protein leakage (Klarić D. 2016). Nevertheless
inadequate dose of dialysis promote to malnutrition by arising proinflammatory and toxic effects of
uremic metabolites (Klarić D. 2016). Other important dialysis related risk factor is delayed gastric
emptying during peritoneal dialysis (Iyasere 2014).
Prevalence of malnutrition in Daugavpils Hemodialysis center is similar to previously
published data from the trials. It is a single-center research limited by small number of participants.
Our study could be considered as a pilot-study for national research to assess nutritional status in
Latvian hemodialysis population.
Conclusions
Malnutrition is widely spread among patients who undergo CHD. More than a quarter of all
Daugavpils CHD patient were moderately to severely malnourished. Malnourishment could be
predicted by patients’ anthropometric measurements and laboratory changes. Moreover, regular
assessment of nutritional status is recommended. Timely prediction of malnutrition might be used
in adjustment of patients’ diet and substitution therapy that could improve life quality and reduce
the development of complications.
References Bansal S., Cho M.E. 2018 Assessment of nutritional status in hemodialysis patients. [15.05.2018.] Accessed: https://www.uptodate.com/contents/assessment-of-nutritional-status-in-hemodialysis-patients?csi=f34aadc6-b405-4f5d-b310-5d101ebe30e9&source=contentShare Choi M.J., Seo J.W., Yoon J.W., Lee S.K., Kim S.J., Lee Y.K., Noh J.W., Koo J.R. 2012. The Malnutrition-Inflammation-Depression-Arteriosclerosis Complex Is Associated with an Increased Risk of Cardiovascular Disease and All-Cause Death in Chronic Hemodialysis Patients. In: Nephron Clin Pract. Vol. 122, pp. 44–52. De Oliveira C.M., Vidal C.L., Cristino E.F., Pinheiro FM Jr., Kubrusly M. 2015. Metabolic acidosis and its association with nutritional status in hemodialysis. In: J Bras Nefrol. Vol. 37(4), pp. 458–66. Detsky A.S., McLaughlin J.R., Baker J.P., et al. 1987. What is subjective global assessment of nutritional status? In: JPEN J Parenter Enteral Nutr; Vol. 11, p. 8. Heimbürger O, Qureshi AR, Blanner B, Berglund L, Stenvinkel P. 2000. Hand‐grip muscle strength, lean body mass and plasma proteins as markers of nutritional status in patients with advanced renal failure. In: Am J Kidney Dis. Vol. 36, pp. 1213–1225. Iyasere O., Brown E.A. 2014. Determinants of quality of life in advanced kidney disease: time to screen? In: Postgrad Med J. Vol. 90(1064), pp. 340–7. Kalantar-Zadeh K, Kilpatrick R.D, Kuwae N, et al. 2005. Revisiting mortality predictability of serum albumin in the dialysis population: time dependency, longitudinal changes and population-attributable fraction. In: Nephrol Dial Transplant Vol. 20, pp. 1880.
DAUGAVPILS UNIVERSITĀTES 60. STARPTAUTISKĀS ZINĀTNISKĀS KONFERENCES PROCEEDINGS OF
RAKSTU KRĀJUMS THE 60th INTERNATIONAL SCIENTIFIC CONFERENCE OF DAUGAVPILS UNIVERSITY
239
Kalantar-Zadeh K., Block G., McAllister C.J., Humphreys M.H., Kopple J.D. 2004. Appetite and inflammation, nutrition, anemia, and clinical outcome in hemodialysis patients. In: The American Journal of Clinical Nutrition, Vol. 80 (2), pp. 299–307. Klarić D., Žepina M., Klarić V., 2016. Malnutrition in patients on dialysis treatment. In: Acta Med Croatica, Vol. 70(2), pp. 55–58. Kuhlmann M.K., Kribben A., Wittwer M., Horl W.H. 2007. OPTA – malnutrition in chronic renal failure. In: Nephrology Dialysis Transplantation. Vol. 22, pp. iii13–iii19. Laws R.A., Tapsell L.C., Kelly J. 2000. Nutritional status and its relationship to quality of life in a sample of chronic hemodialysis patients. In: J Ren Nutr. Vol. 10(3), pp. 139-47. Locatelli F., Fouque D., Heimburger O., Tilman B. Drueke, Cannata-Andia J.B., Horl W.H., Ritz E. 2002. Nutritional status in dialysis patients: a European consensus. In: Nephrol Dial Transplant. Vol. 17, pp. 563–572. McCusker FX, Teehan BP, Thorpe KE, Keshaviah PR, Churchill DN, for the Canada–USA (CANUSA) peritoneal dialysis study group. 2000. How much peritoneal dialysis is required for the maintenance of a good nutritional state? In: Nephrol Dial Transplant. Vol. 15, pp. 953–960. Stenvinkel P., Heimbürger O., Lindholm B., Kaysen G.A., Bergström J. 1996. Are there two types of malnutrition in chronic renal failure? In: Kidney Int. Vol. 50(56), pp. S56–S61.

DAUGAVPILS UNIVERSITĀTES 60. STARPTAUTISKĀS ZINĀTNISKĀS KONFERENCES PROCEEDINGS OF
RAKSTU KRĀJUMS THE 60th INTERNATIONAL SCIENTIFIC CONFERENCE OF DAUGAVPILS UNIVERSITY
240
VISUAL ACUITY AND INTRAOCULAR PRESSURE CHANGES AFTER CONVENTIONAL AND FEMTOSECOND
LASER-ASSISTED CATARACT SURGERY
Dārta Nīmane1, Laura Grava1 Supervisor: Asoc. Prof. Dr. med. Igors Solomatins1, 2 1 University of Latvia, Faculty of Medicine, Riga, Latvia 2 The Dr. Solomatin eye rehabilitation and vision correction centre, Riga, Latvia Abstract
Visual acuity and interocular pressure changes after conventional and femtosecond laser-assisted cataract surgery
Key Words: visual acuity, intraocular pressure, phacoemulsification, femtosecond laser–assisted surgery, cataract Cataract surgery is the most commonly performed surgical procedure in the world. Methods of cataract surgery are continuously improved. Our aim was to examine and compare the effectiveness of cataract therapy, comparing visual acuity and intraocular pressure after phacoemulsification and femtosecond laser–assisted cataract surgery. The study was conducted at the Dr. Solomatin eye rehabilitation and vision correction center. The study included 140 patients. Visual acuity and intraocular pressure was measured in three phases - first day, two weeks and one month after the surgery. Comparing visual acuity changes after phacoemulsification cataract surgery first day average visual acuity was 0,3, but after FLACS – 0,5. Similarly after two weeks of surgery visual acuity respectively was 0,5 and 0,6. One month after surgery average visual acuity using phacoemulsification method was 0,5, but using FLACS-0,7. There was statistically significant difference between these two groups (p<0.001). Comparing intraocular pressure changes after phacoemulsification cataract surgery on a first day average intraocular pressure was 22,9 mmHg (CI 95%, but after FLACS – 17,4 mmHg. Two weeks after surgery intraocular pressure respectively was 17,49 mmHg and 16,06 mmHg. One month after surgery average intraocular pressure after both methods were equal – 15 mmHg. Comparing intraocular pressure statistically significant difference between these two groups was found only first day after surgery (p<0,001). More randomized, blinded studies with long-term visual outcomes need to be performed to properly evaluate the efficacy of femtosecond laser cataract surgery compared to the traditional phacoemulsification. Kopsavilkums Atslēgvārdi: redzes asums, intraokulārasi spiediens, fakoemulsifikācija, femtosekunžu lāzera asistētās operācijas, katarakta Kataraktas operācija ir biežāk veiktā operācija visā pasaulē. Šīs operācijas metodes nepārtraukti mainās un tiek uzlabotas. Pētījuma mērķis bija izvērtēt 2 kataraktas operācijas metožu fakoemulsifikācijas metodes un femtosekunžu lāzera asistētās kataraktas operācijas efektivitāti, salīdzinot redzes asuma un intraokulārā spiediena (IOP) izmaiņas pēc šīm operācijām. Petījums tika veikts dr. Solomatina acu rehabilitācijas un redzes korekcijas centrā. Pētījumā tikaiekļauti 140 pacienti. Redzes asums un intraokulārais spiediens tika noteikts trīs etapos – 1. dienā, 2 nedēļas un 4 nedeļas pēc operācijas. Satistiski ticama redzes asuma atšķirība starp abām metodēm bija visos trīs etapos. Pirmajā dienā pacienti pēc femtosekunžu lāzera asistētās kataraktas operācijas spēja nosaukt vidēji par divām (Snellena tabulas) rindiņām vairāk, pēc divām nedēļām par vienu rindiņu un pēc mēneša par divām rindiņām vairāk nekā pacienti pēc fakoemulsifikācijas metodes. Ja salīdzinām IOP atšķirības, tad statistiski ticama tā bija tikai pirmajā dienā pēc operācijas, kad pēc femtosekunžu lāzera asistētās metodes vidēji IOP bija par 3,2mmHg zemāks. Mēnesi pēc operācijas abām metodēm vidējais IOP bija absolīti vienāds 15mmHg. Nepieciešami papildus, randomizēti pētījumi, lai precīzāk izvērtētu femtosekunžu lāzera asistētās kataraktas operācijas efektivitāti un drošumu, salīdzinot ar standarta kataraktas operāciju.
Introduction
Cataract surgery is the most commonly performed surgical procedure in the world. Methods
of cataract surgery are continuously improved (Abell 2014). Phacoemulsification is the traditional
surgical procedure for cataract in the developed countries. In last years, femtosecond laser–assisted
cataract surgery (FLACS) has been introduced into phacoemulsification cataract surgery to perform
corneal incisions, capsulorhexis, and nuclear fragmentation (Conrad-Hengerer 2013). Femtosecond
laser technology, introduced clinically for ophthalmic surgery in 2001 as a new technique for

DAUGAVPILS UNIVERSITĀTES 60. STARPTAUTISKĀS ZINĀTNISKĀS KONFERENCES PROCEEDINGS OF
RAKSTU KRĀJUMS THE 60th INTERNATIONAL SCIENTIFIC CONFERENCE OF DAUGAVPILS UNIVERSITY
241
creating lamellar flaps in laser in situ keratomileusis (LASIK), has recently been developed into a
tool for cataract surgery. (Kendall 2013)
Since the 1970s, clinicians and researchers have been in search of a laser to use in corneal and
cataract surgery that causes minimal thermal damage to adjacent tissues. The femtosecond laser
delivers ultrashort pulses of laser energy and thus minimizes collateral tissue damage. Since the first
report of femtosecond laser use in cataract surgery in 2009, the technique has been rapidly adopted
and implemented by cataract surgeons in the U.S., Europe, and Australia (Lin 2016).
Current femtosecond laser technology systems use neodymium: glass 1053 nm (near-infrared)
wavelength. light. This feature allows the light to be focused at a 3 mm spot size, accurate within 5
mm in the anterior segment. Femtosecond laser energy is absorbed by the tissue, resulting in plasma
formation. This plasma of free electrons and ionized molecules rapidly expands, creating cavitation
bubbles. The force of the cavitation bubble creation separates the tissue. The process of converting
laser energy into mechanical energy is known as photodisruption. The femtosecond laser
technology virtually eliminates collateral damage and can therefore be used to dissect tissue on a
microscopic scale. Femtosecond laser technology systems use photodissection to create tissue
planes and side cuts for LASIK flaps in the cornea. For this application, the parameters are typically
set so neighboring shots do not entirely overlap, leaving tissue bridges that must be bluntly
dissected. Femtosecond laser technology systems used to perform certain steps of cataract surgery
may use closer spot settings to overlap these cavitation regions, eliminating tissue bridges (ie,
during capsulorhexis creation). As with any new technology, software upgrades to the systems
improve energy delivery and stability (Kendall 2013)
The amount of energy used during phacoemulsification correlates with the loss of endothelial
cells, as well as post-operative inflammation (Hooshmand 2017). The femtosecond laser provides
an opportunity to fragmented and soften the lens by reducing the required ultrasound strength and
exposure time, thereby improving the outcome of the surgery and reducing the recovery time (Kent
2017). Femtosecond laser-assisted cataract surgery (FLACS) leads to safer and more efficient
cataract removal. It enables more precise and reproducible capsulotomies and better intraocular lens
(IOL) positioning, thereby providing better visual quality. It also results in reduced trauma to the
cornea and macula, although further studies are needed to improve the outcomes through
perioperative care. (McGrahat 2017).
With manual phacoemulsifation, corneal incisions are not optimised and can result in
astigmatism and infection. Likewise, the capsulorhexis size is variable and not centred, leading to
erratic intraocular lens position and effective lens power. Complications such as capsular tears and
posterior capsule opacification (PCO) also pose a problem with manual continuous curvilinear
capsulorhexis (CCC). Lens fragmentation is currently used with excessive ultrasound power and
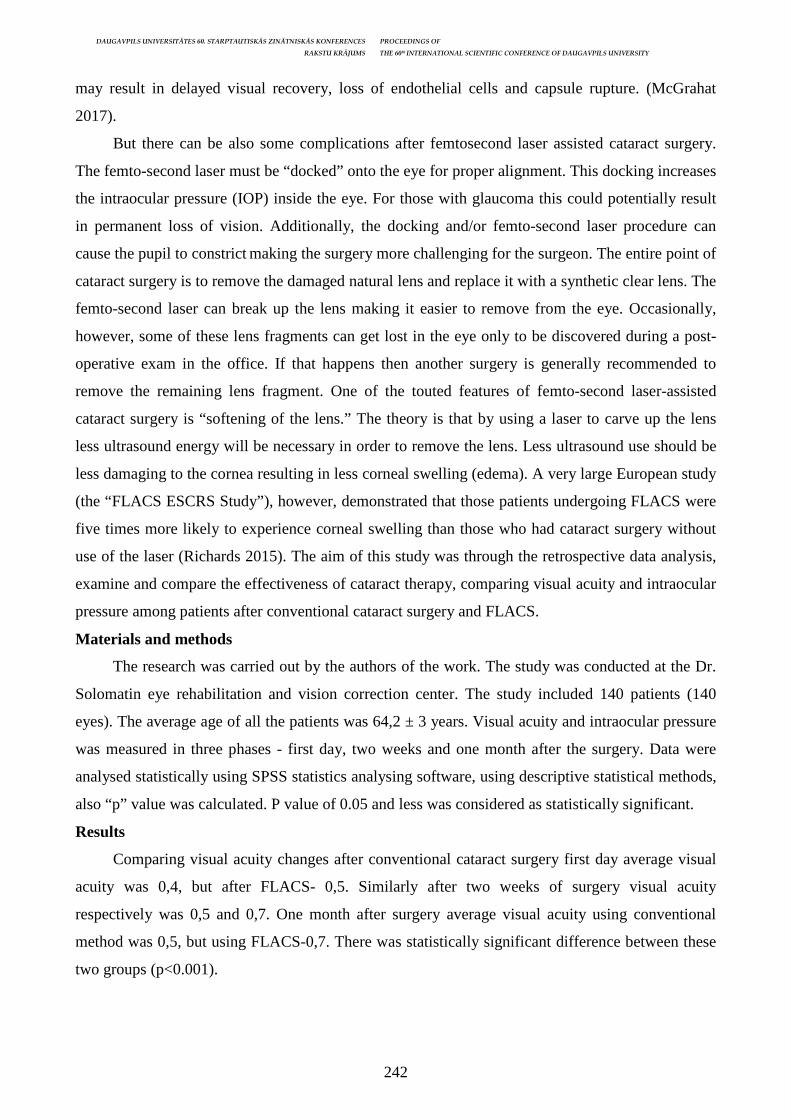
DAUGAVPILS UNIVERSITĀTES 60. STARPTAUTISKĀS ZINĀTNISKĀS KONFERENCES PROCEEDINGS OF
RAKSTU KRĀJUMS THE 60th INTERNATIONAL SCIENTIFIC CONFERENCE OF DAUGAVPILS UNIVERSITY
242
may result in delayed visual recovery, loss of endothelial cells and capsule rupture. (McGrahat
2017).
But there can be also some complications after femtosecond laser assisted cataract surgery.
The femto-second laser must be “docked” onto the eye for proper alignment. This docking increases
the intraocular pressure (IOP) inside the eye. For those with glaucoma this could potentially result
in permanent loss of vision. Additionally, the docking and/or femto-second laser procedure can
cause the pupil to constrict making the surgery more challenging for the surgeon. The entire point of
cataract surgery is to remove the damaged natural lens and replace it with a synthetic clear lens. The
femto-second laser can break up the lens making it easier to remove from the eye. Occasionally,
however, some of these lens fragments can get lost in the eye only to be discovered during a post-
operative exam in the office. If that happens then another surgery is generally recommended to
remove the remaining lens fragment. One of the touted features of femto-second laser-assisted
cataract surgery is “softening of the lens.” The theory is that by using a laser to carve up the lens
less ultrasound energy will be necessary in order to remove the lens. Less ultrasound use should be
less damaging to the cornea resulting in less corneal swelling (edema). A very large European study
(the “FLACS ESCRS Study”), however, demonstrated that those patients undergoing FLACS were
five times more likely to experience corneal swelling than those who had cataract surgery without
use of the laser (Richards 2015). The aim of this study was through the retrospective data analysis,
examine and compare the effectiveness of cataract therapy, comparing visual acuity and intraocular
pressure among patients after conventional cataract surgery and FLACS.
Materials and methods
The research was carried out by the authors of the work. The study was conducted at the Dr.
Solomatin eye rehabilitation and vision correction center. The study included 140 patients (140
eyes). The average age of all the patients was 64,2 ± 3 years. Visual acuity and intraocular pressure
was measured in three phases - first day, two weeks and one month after the surgery. Data were
analysed statistically using SPSS statistics analysing software, using descriptive statistical methods,
also “p” value was calculated. P value of 0.05 and less was considered as statistically significant.
Results
Comparing visual acuity changes after conventional cataract surgery first day average visual
acuity was 0,4, but after FLACS- 0,5. Similarly after two weeks of surgery visual acuity
respectively was 0,5 and 0,7. One month after surgery average visual acuity using conventional
method was 0,5, but using FLACS-0,7. There was statistically significant difference between these
two groups (p<0.001).
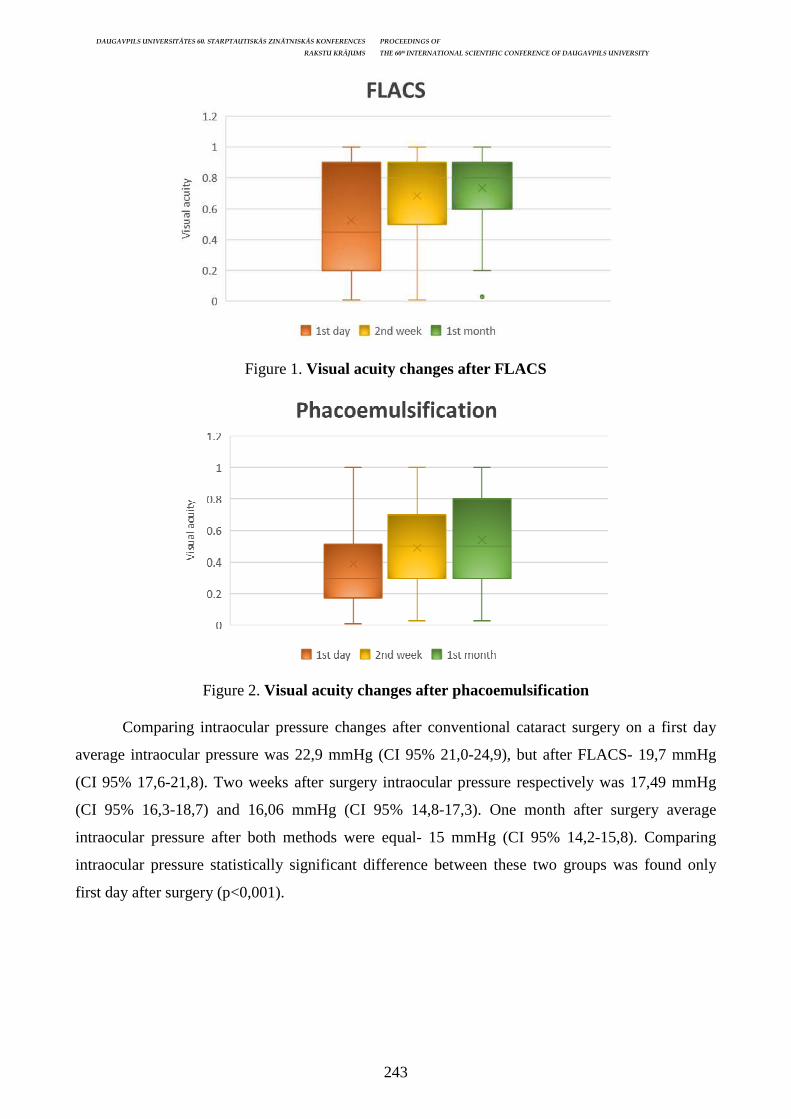
DAUGAVPILS UNIVERSITĀTES 60. STARPTAUTISKĀS ZINĀTNISKĀS KONFERENCES PROCEEDINGS OF
RAKSTU KRĀJUMS THE 60th INTERNATIONAL SCIENTIFIC CONFERENCE OF DAUGAVPILS UNIVERSITY
243
Figure 1. Visual acuity changes after FLACS
Figure 2. Visual acuity changes after phacoemulsification
Comparing intraocular pressure changes after conventional cataract surgery on a first day
average intraocular pressure was 22,9 mmHg (CI 95% 21,0-24,9), but after FLACS- 19,7 mmHg
(CI 95% 17,6-21,8). Two weeks after surgery intraocular pressure respectively was 17,49 mmHg
(CI 95% 16,3-18,7) and 16,06 mmHg (CI 95% 14,8-17,3). One month after surgery average
intraocular pressure after both methods were equal- 15 mmHg (CI 95% 14,2-15,8). Comparing
intraocular pressure statistically significant difference between these two groups was found only
first day after surgery (p<0,001).
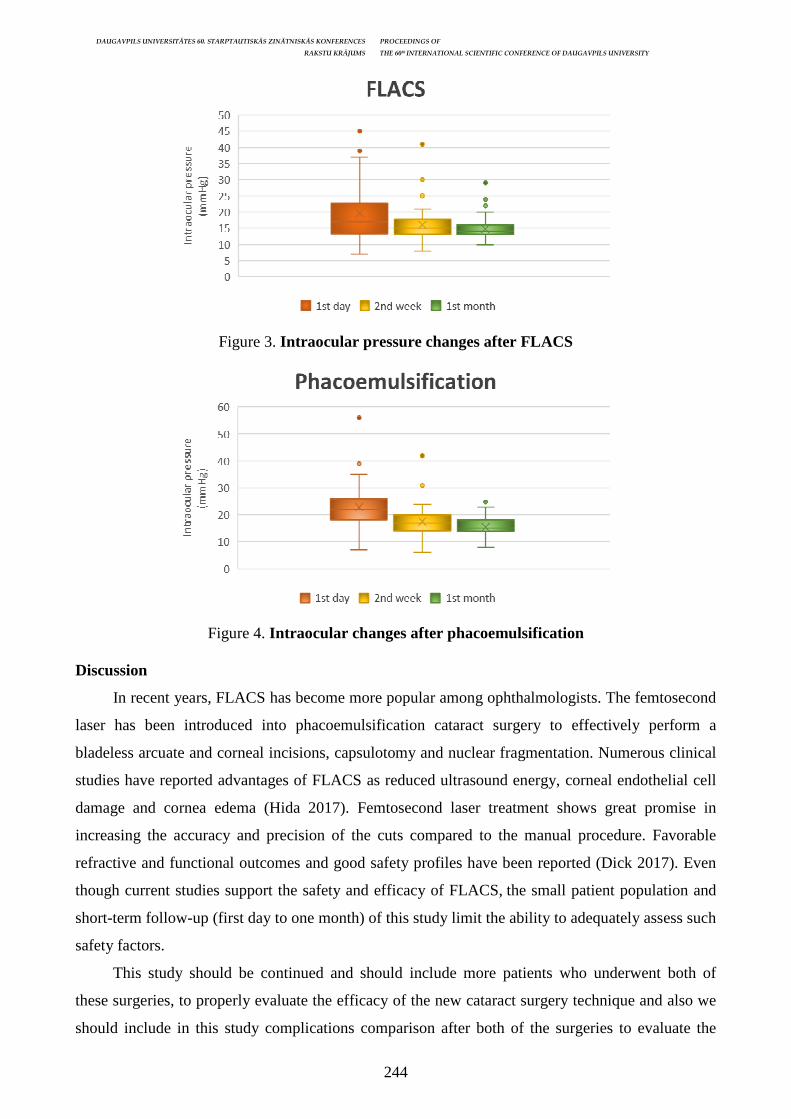
DAUGAVPILS UNIVERSITĀTES 60. STARPTAUTISKĀS ZINĀTNISKĀS KONFERENCES PROCEEDINGS OF
RAKSTU KRĀJUMS THE 60th INTERNATIONAL SCIENTIFIC CONFERENCE OF DAUGAVPILS UNIVERSITY
244
Figure 3. Intraocular pressure changes after FLACS
Figure 4. Intraocular changes after phacoemulsification
Discussion
In recent years, FLACS has become more popular among ophthalmologists. The femtosecond
laser has been introduced into phacoemulsification cataract surgery to effectively perform a
bladeless arcuate and corneal incisions, capsulotomy and nuclear fragmentation. Numerous clinical
studies have reported advantages of FLACS as reduced ultrasound energy, corneal endothelial cell
damage and cornea edema (Hida 2017). Femtosecond laser treatment shows great promise in
increasing the accuracy and precision of the cuts compared to the manual procedure. Favorable
refractive and functional outcomes and good safety profiles have been reported (Dick 2017). Even
though current studies support the safety and efficacy of FLACS, the small patient population and
short-term follow-up (first day to one month) of this study limit the ability to adequately assess such
safety factors.
This study should be continued and should include more patients who underwent both of
these surgeries, to properly evaluate the efficacy of the new cataract surgery technique and also we
should include in this study complications comparison after both of the surgeries to evaluate the
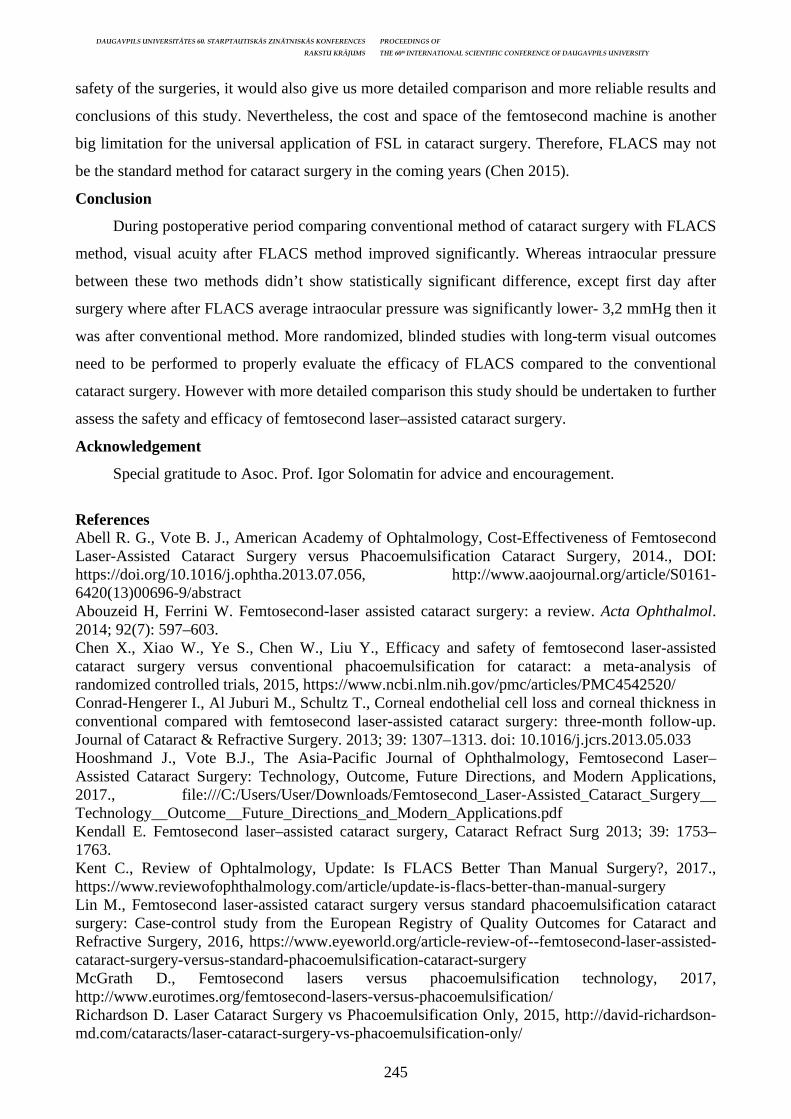
DAUGAVPILS UNIVERSITĀTES 60. STARPTAUTISKĀS ZINĀTNISKĀS KONFERENCES PROCEEDINGS OF
RAKSTU KRĀJUMS THE 60th INTERNATIONAL SCIENTIFIC CONFERENCE OF DAUGAVPILS UNIVERSITY
245
safety of the surgeries, it would also give us more detailed comparison and more reliable results and
conclusions of this study. Nevertheless, the cost and space of the femtosecond machine is another
big limitation for the universal application of FSL in cataract surgery. Therefore, FLACS may not
be the standard method for cataract surgery in the coming years (Chen 2015).
Conclusion
During postoperative period comparing conventional method of cataract surgery with FLACS
method, visual acuity after FLACS method improved significantly. Whereas intraocular pressure
between these two methods didn’t show statistically significant difference, except first day after
surgery where after FLACS average intraocular pressure was significantly lower- 3,2 mmHg then it
was after conventional method. More randomized, blinded studies with long-term visual outcomes
need to be performed to properly evaluate the efficacy of FLACS compared to the conventional
cataract surgery. However with more detailed comparison this study should be undertaken to further
assess the safety and efficacy of femtosecond laser–assisted cataract surgery.
Acknowledgement
Special gratitude to Asoc. Prof. Igor Solomatin for advice and encouragement.
References Abell R. G., Vote B. J., American Academy of Ophtalmology, Cost-Effectiveness of Femtosecond Laser-Assisted Cataract Surgery versus Phacoemulsification Cataract Surgery, 2014., DOI: https://doi.org/10.1016/j.ophtha.2013.07.056, http://www.aaojournal.org/article/S0161-6420(13)00696-9/abstract Abouzeid H, Ferrini W. Femtosecond-laser assisted cataract surgery: a review. Acta Ophthalmol. 2014; 92(7): 597–603. Chen X., Xiao W., Ye S., Chen W., Liu Y., Efficacy and safety of femtosecond laser-assisted cataract surgery versus conventional phacoemulsification for cataract: a meta-analysis of randomized controlled trials, 2015, https://www.ncbi.nlm.nih.gov/pmc/articles/PMC4542520/ Conrad-Hengerer I., Al Juburi M., Schultz T., Corneal endothelial cell loss and corneal thickness in conventional compared with femtosecond laser-assisted cataract surgery: three-month follow-up. Journal of Cataract & Refractive Surgery. 2013; 39: 1307–1313. doi: 10.1016/j.jcrs.2013.05.033 Hooshmand J., Vote B.J., The Asia-Pacific Journal of Ophthalmology, Femtosecond Laser–Assisted Cataract Surgery: Technology, Outcome, Future Directions, and Modern Applications, 2017., file:///C:/Users/User/Downloads/Femtosecond_Laser-Assisted_Cataract_Surgery__ Technology__Outcome__Future_Directions_and_Modern_Applications.pdf Kendall E. Femtosecond laser–assisted cataract surgery, Cataract Refract Surg 2013; 39: 1753–1763. Kent C., Review of Ophtalmology, Update: Is FLACS Better Than Manual Surgery?, 2017., https://www.reviewofophthalmology.com/article/update-is-flacs-better-than-manual-surgery Lin M., Femtosecond laser-assisted cataract surgery versus standard phacoemulsification cataract surgery: Case-control study from the European Registry of Quality Outcomes for Cataract and Refractive Surgery, 2016, https://www.eyeworld.org/article-review-of--femtosecond-laser-assisted-cataract-surgery-versus-standard-phacoemulsification-cataract-surgery McGrath D., Femtosecond lasers versus phacoemulsification technology, 2017, http://www.eurotimes.org/femtosecond-lasers-versus-phacoemulsification/ Richardson D. Laser Cataract Surgery vs Phacoemulsification Only, 2015, http://david-richardson-md.com/cataracts/laser-cataract-surgery-vs-phacoemulsification-only/
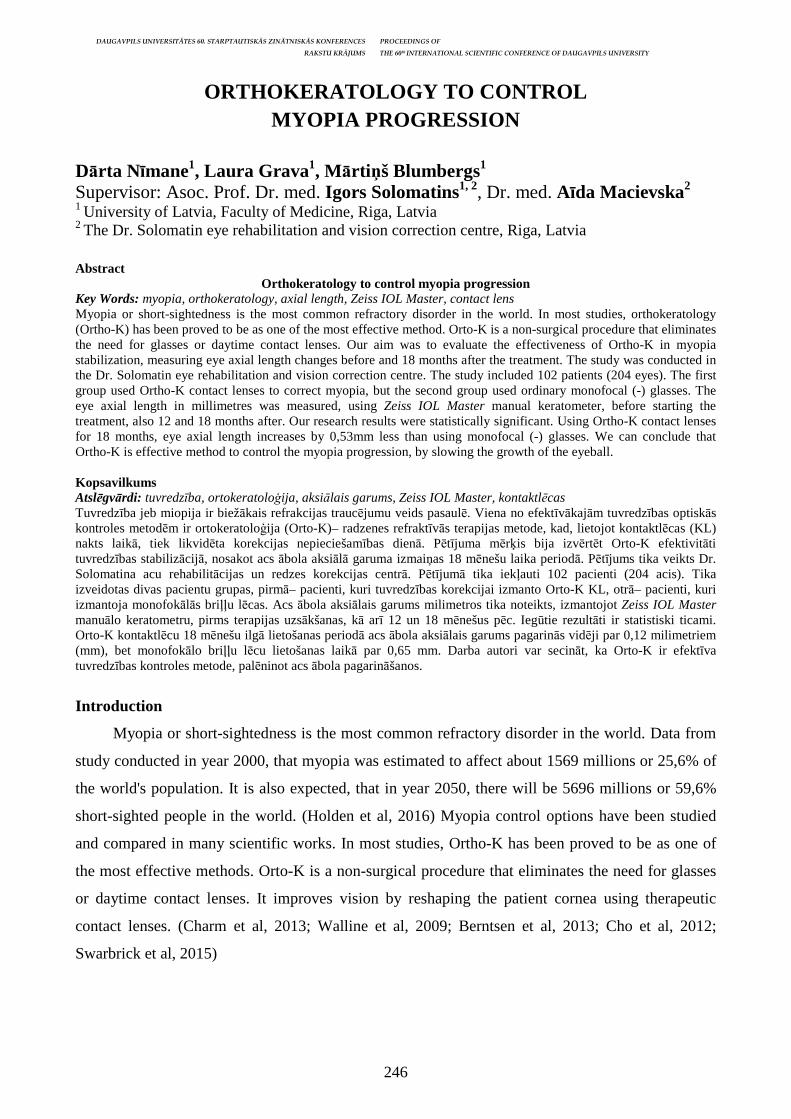
DAUGAVPILS UNIVERSITĀTES 60. STARPTAUTISKĀS ZINĀTNISKĀS KONFERENCES PROCEEDINGS OF
RAKSTU KRĀJUMS THE 60th INTERNATIONAL SCIENTIFIC CONFERENCE OF DAUGAVPILS UNIVERSITY
246
ORTHOKERATOLOGY TO CONTROL MYOPIA PROGRESSION
Dārta Nīmane1, Laura Grava1, Mārti ņš Blumbergs1 Supervisor: Asoc. Prof. Dr. med. Igors Solomatins1, 2, Dr. med. Aīda Macievska2 1 University of Latvia, Faculty of Medicine, Riga, Latvia 2 The Dr. Solomatin eye rehabilitation and vision correction centre, Riga, Latvia Abstract
Orthokeratology to control myopia progression Key Words: myopia, orthokeratology, axial length, Zeiss IOL Master, contact lens Myopia or short-sightedness is the most common refractory disorder in the world. In most studies, orthokeratology (Ortho-K) has been proved to be as one of the most effective method. Orto-K is a non-surgical procedure that eliminates the need for glasses or daytime contact lenses. Our aim was to evaluate the effectiveness of Ortho-K in myopia stabilization, measuring eye axial length changes before and 18 months after the treatment. The study was conducted in the Dr. Solomatin eye rehabilitation and vision correction centre. The study included 102 patients (204 eyes). The first group used Ortho-K contact lenses to correct myopia, but the second group used ordinary monofocal (-) glasses. The eye axial length in millimetres was measured, using Zeiss IOL Master manual keratometer, before starting the treatment, also 12 and 18 months after. Our research results were statistically significant. Using Ortho-K contact lenses for 18 months, eye axial length increases by 0,53mm less than using monofocal (-) glasses. We can conclude that Ortho-K is effective method to control the myopia progression, by slowing the growth of the eyeball. Kopsavilkums Atslēgvārdi: tuvredzība, ortokeratoloģija, aksiālais garums, Zeiss IOL Master, kontaktlēcas Tuvredzība jeb miopija ir biežākais refrakcijas traucējumu veids pasaulē. Viena no efektīvākajām tuvredzības optiskās kontroles metodēm ir ortokeratoloģija (Orto-K)– radzenes refraktīvās terapijas metode, kad, lietojot kontaktlēcas (KL) nakts laikā, tiek likvidēta korekcijas nepieciešamības dienā. Pētījuma mērķis bija izvērtēt Orto-K efektivitāti tuvredzības stabilizācijā, nosakot acs ābola aksiālā garuma izmaiņas 18 mēnešu laika periodā. Pētījums tika veikts Dr. Solomatina acu rehabilitācijas un redzes korekcijas centrā. Pētījumā tika iekļauti 102 pacienti (204 acis). Tika izveidotas divas pacientu grupas, pirmā– pacienti, kuri tuvredzības korekcijai izmanto Orto-K KL, otrā– pacienti, kuri izmantoja monofokālās briļļu lēcas. Acs ābola aksiālais garums milimetros tika noteikts, izmantojot Zeiss IOL Master manuālo keratometru, pirms terapijas uzsākšanas, kā arī 12 un 18 mēnešus pēc. Iegūtie rezultāti ir statistiski ticami. Orto-K kontaktlēcu 18 mēnešu ilgā lietošanas periodā acs ābola aksiālais garums pagarinās vidēji par 0,12 milimetriem (mm), bet monofokālo briļļu lēcu lietošanas laikā par 0,65 mm. Darba autori var secināt, ka Orto-K ir efektīva tuvredzības kontroles metode, palēninot acs ābola pagarināšanos.
Introduction
Myopia or short-sightedness is the most common refractory disorder in the world. Data from
study conducted in year 2000, that myopia was estimated to affect about 1569 millions or 25,6% of
the world's population. It is also expected, that in year 2050, there will be 5696 millions or 59,6%
short-sighted people in the world. (Holden et al, 2016) Myopia control options have been studied
and compared in many scientific works. In most studies, Ortho-K has been proved to be as one of
the most effective methods. Orto-K is a non-surgical procedure that eliminates the need for glasses
or daytime contact lenses. It improves vision by reshaping the patient cornea using therapeutic
contact lenses. (Charm et al, 2013; Walline et al, 2009; Berntsen et al, 2013; Cho et al, 2012;
Swarbrick et al, 2015)

DAUGAVPILS UNIVERSITĀTES 60. STARPTAUTISKĀS ZINĀTNISKĀS KONFERENCES PROCEEDINGS OF
RAKSTU KRĀJUMS THE 60th INTERNATIONAL SCIENTIFIC CONFERENCE OF DAUGAVPILS UNIVERSITY
247
Objective
Evaluate the effectiveness of Ortho-K in myopia stabilization, measuring eye axial length
changes before and 18 months after the treatment.
Materials and Methods
The study was conducted in the Dr. Solomatin eye rehabilitation and vision correction centre.
While carrying out the research, medical records of 102 patients were used. Two groups of patients
were formed, with the first one comprising 50 children (100 eyes) who used Ortho-K contact lenses
for the correction of short-sightedness, whereas the second consisting of 52 children (104 eyes) who
used monofocal eyeglasses. For those children who used Ortho-K contact lens for the correction of
short-sightedness the changes of the axial length of the eyeball was recorded before starting the
therapy, as well as 6, 12 and 18 months after the therapy. For children who used monofocal
eyeglasses changes of the axial length of the eyeball was recorded before the therapy, as well as 6
and 18 months after using the correction. The eye axial length in millimetres was measured, using
Zeiss IOL Master manual keratometer. The obtained data were analysed by using the statistical
software IBM SPSS Statistics 25.0.
Results
The study included 52 boys and 50 girls, the average age of all the patients was 10,3 ± 2,3
years.
Figure 1. Age of patients
In Ortho-K group the average eye axial length (milimeters) before treatment was 24,66 ±
0,77, but after 18 months - 24,78 ± 0,78. The study showed, that the eye axial length in 18 months
had grown only about 0,12 milimeters.
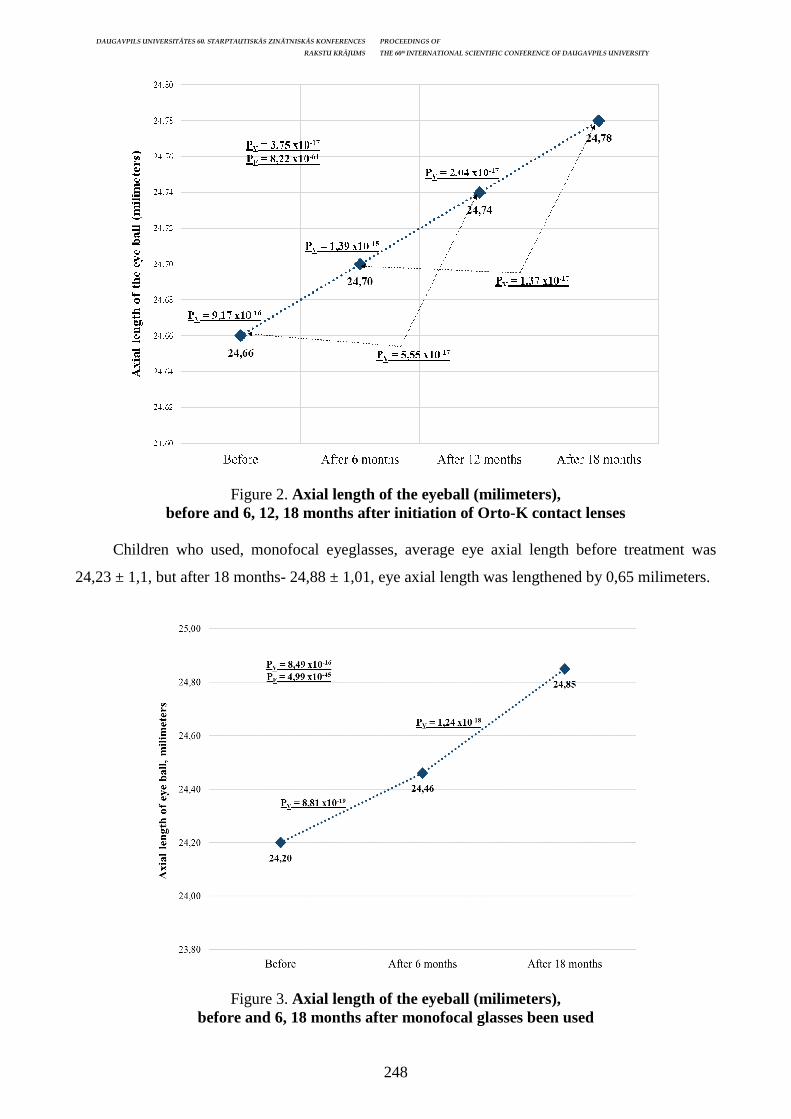
DAUGAVPILS UNIVERSITĀTES 60. STARPTAUTISKĀS ZINĀTNISKĀS KONFERENCES PROCEEDINGS OF
RAKSTU KRĀJUMS THE 60th INTERNATIONAL SCIENTIFIC CONFERENCE OF DAUGAVPILS UNIVERSITY
248
Figure 2. Axial length of the eyeball (milimeters), before and 6, 12, 18 months after initiation of Orto-K contact lenses
Children who used, monofocal eyeglasses, average eye axial length before treatment was
24,23 ± 1,1, but after 18 months- 24,88 ± 1,01, eye axial length was lengthened by 0,65 milimeters.
Figure 3. Axial length of the eyeball (milimeters), before and 6, 18 months after monofocal glasses been used

DAUGAVPILS UNIVERSITĀTES 60. STARPTAUTISKĀS ZINĀTNISKĀS KONFERENCES PROCEEDINGS OF
RAKSTU KRĀJUMS THE 60th INTERNATIONAL SCIENTIFIC CONFERENCE OF DAUGAVPILS UNIVERSITY
249
While using the Ortho-K contact lenses for a period of 18 months, AL average values of the
eyeball has extended by 0,12 milimeters, whereas while using monofocal eyeglasses by 0,65
milimeters.
Figure 4. Difference between both of the methods
The study showed that the difference between both of the methods is more than five times,
and also that the achieved differences are statistically significant (P < 0,05).
Conclusions
Our research results were statistically significant. Using Ortho-K contact lenses, for 18
months eye axial length increases by 0,53 milimeters less than using monofocal eyeglasses. We can
conclude that Ortho-K is effective method to control the myopia progression, by slowing the eye
ball growth. Using Ortho-K it is possible to improve the quality of life, relieving patients from the
need to use glasses or contact lenses during the day.
Discussion
In order to be able to more accurately determine and compare changes in the eyeball axial
length, in the next scientific work it would be necessary to create groups of patients of the same age,
for example, children aged five to seven, children aged between eight and nine, children aged 12 to
13, etc. It would also be important to carry out more frequent measurements, such as every three
months, in order to assess which treatment stage the method is more effective- at the start of therapy
or after prolonged use of contact lenses. Orto-K contact lens users need regular control visits to the
ophthalmologist, as this is the only way to ensure that the use of contact lenses is safe for eye
health. Patient compatibility is very important in the use of this method, if the safe and proper use of
DAUGAVPILS UNIVERSITĀTES 60. STARPTAUTISKĀS ZINĀTNISKĀS KONFERENCES PROCEEDINGS OF
RAKSTU KRĀJUMS THE 60th INTERNATIONAL SCIENTIFIC CONFERENCE OF DAUGAVPILS UNIVERSITY
250
contact lenses is not followed, serious health damage to the patients eyes can be adversely -
affecting the patients quality of life.
Acknowledgement
Special gratitude to Asoc. Prof. Dr. med. Igors Solomatins and Dr. med. Aīda Macievska for
advice and encouragement.
References Berntsen D. A., Barr C. D., Mutti D. O., Zadnik K., Peripheral Defocus and Myopia Progression in Myopic Children Randomly Assigned to Wear Single Vision and Progressive Addition Lenses, Investigative Ophthalmology & Visual Science, 2013., 54(8), p. 5761–5770, PMCID: PMC3755539 Charm J., Cho P., High myopia-partial reduction ortho-k: a 2-year randomized study, Investigative Ophthalmology & Visual Science, 2013., 90(6), p. 530–539, DOI: 10.1097/OPX.0b013e318293657d Cho P., Cheung S. W., Retardation of myopia in Orthokeratology (ROMIO) study: a 2-year randomized clinical trial, Investigative Ophthalmology & Visual Science, 2012., 53(11), p. 7077–7085, DOI: 10.1167/iovs.12-10565 Holden B. A., Fricke T. R., Wilson D. A., Jong M., Naidoo K. S., Sankaridurg P., Wong T. Y., Naduvilath T. J, Resnikoff S., Global Prevalence of Myopia and High Myopia and Temporal Trends from 2000 through 2050, International review of ophthalmic optics, 2016., 123(5), p. 1036–1042, PMID: 26875007 Swarbrick H. A., Alharbi A., Watt K., Lum E., Kang P., Ophthalmology, Myopia control during orthokeratology lens wear in children using a novel study design, 2015., 122(3), p. 620–630, PMID:25439432 Walline J. J., Jones L.A., Sinnott L. T., Corneal reshaping and myopia progression, British journal of ophthalmology, 2009., 93(9), p. 1181–1185, PMID: 19416935
DAUGAVPILS UNIVERSITĀTES 60. STARPTAUTISKĀS ZINĀTNISKĀS KONFERENCES PROCEEDINGS OF
RAKSTU KRĀJUMS THE 60th INTERNATIONAL SCIENTIFIC CONFERENCE OF DAUGAVPILS UNIVERSITY
251
CHANGES OF SUBJECTIVE AND OBJECTIVE VISUAL ACUITY AND SYMPTOMS AFTER CATARACT SURGERY
Rita Partojeva1, Lita Jēkabsone1, Līva Strucinska1, Viktorija Serova1, Guna Laganovska1, 2 1 Riga Stradins University, Dzirciema street 16, Riga, Latvia, [email protected] 2 Departmant of Ophthalmology, Pauls Stradins Clinical University Hospital, Pilsonu street 13, Riga, Latvia Abstract
Changes of subjective and objective visual acuity and symptoms after cataract surgery Key Words: visual acuity, cataract surgery, postoperative complaints Introduction. Cataract is the leading cause of blindness and low vision worldwide. The only currently available method of restoring vision for cataract patients is phacoemulsification. The gain from this surgery is demonstrated clinically by changes in visual acuity, but only few studies have been conducted to assess cataract surgery impact on subjective visual function and postoperative complaints. Aim. To evaluate patient's visual acuity, subjective quality of vision and complaints after cataract surgery. Materials and methods. This study was conducted at the P. Stradiņš Clinical University Hospital. 46 patients after cataract surgery were included and surveyed about their postoperative complaints and subjective visual functions. The best corrected pre- and postoperative visual acuity was obtained from medical records. Collected data was analyzed using IBM SPSS 25.0. Results. Total of 46 patients (59 eyes) were included in this study from which 39.3% (n = 18) were male and 60.87% (n = 28) were female. The mean age was 73.11 ± 2.70 years. Mean best corrected visual acuity before and after cataract surgery was 0.25 ± 0.06 and 0.70 ± 0.07, respectively. The average improvement was 0.45 ± 0.07 (p < 0.001). Mean subjective visual rating before and after the surgery was 4.65 ± 0.53 and 8.26 ± 0.39, respectively, and average improvement was 3.61 ± 0.61 (p < 0.001). In 49.15% cases there was at least one disturbing subjective symptom in operated eye. The most common symptoms after the surgery were photophobia 33.9%, foreign body sensation 18.64% and dryness 13.56%. Conclusion. Objective and subjective visual acuity improved after cataract surgery. Many patients have at least one disturbing subjective symptom in operated eye after the surgery. The most common complaints were photophobia, foreign body sensation and dryness of the eye. Kopsavilkums
Subjektīvā un objektīvā redzes asuma izmaiņas un simptomi pēc kataraktas operācijas Atslēgvārdi: redzes asums, kataraktas operācija, postoperatīvas sūdzības Ievads. Katarakta ir pasaulē vadošais iemesls aklumam un samazinātam redzes kvalitātei. Vienīgā šī brīža pieejamā ārstēšanas metode redzes atjaunošanai ir fakoemulsifikācija. Operācijas rezultātus izvērtē pēc redzes asuma izmaiņām pēc operācijas. Ir veikti tikai daži pētījumi, kas izvērtē kataraktas operācijas ietekmi uz pacientu redzes kvalitāti un pēcoperācijas redzes sūdzībām. Mērķis. Novērtēt pacientu objektīvo un subjektīvo redzes asumu un redzes kvalitāti, kā arī redzes sūdzības pēc kataraktas operācijas. Meteriāli un metodes. Pētījums tika veikts P. Stradiņa Klīniskās universitātes slimnīcā. Pētījumā tika iekļauti 46 pacienti pēc kataraktas operācijas, kuri aizpildīja anketu par savu subjektīvo redzes kvalitāti un sūdzībām pēc operācijas. Labākais koriģētais pirms un pēc operācijas redzes asums tika iegūts no pacientu medicīniskās informācijas. Iegūtie dati tika apstrādāti ar IBM SPSS 25,0. Rezultāti. Pētījumā kopā tika iekļauti 46 pacienti (59 acis), no kuriem 39,3% (n = 18) bija vīrieši un 60,87% (n = 28) sievietes. Vidējais pacientu vecums bija 73,11 ± 2,70 gadi. Vidējais labākais koriģētais redzes asums pirms operācijas bija 0,25 ± 0,06 un pēc operācijas 0,70 ± 0,07. Vidējais redzes asuma uzlabojums pēc operācijas bija 0,45 ± 0,07 (p < 0,001). Subjektīvais redzes asuma novērtējums pirms operācijas bija 4,65 ± 0,53 un pēc operācijas bija 8,26 ± 0,39. Vidējais subjektīvais uzlabojums bija 3,61 ± 0,61 (p < 0,001). 49,15% pacientiem pēc operācijas bija vismaz viena redzes sūdzība operētajā acī. Visbiežākās sūdzības pēc operācijas bija fotofobija (33,9%), svešķermeņa (18,64%) un sausuma (13,56%) sajūta operētajā acī. Secinājumi. Objektīvais un subjektīvais redzes asums uzlabojās pēc kataraktas operācijas. Pēc operācijas lielākajai daļai pacientu ir vismaz viena sūdzība operētajā acī. Visbiežākās pēcoperācijas sūdzības bija fotofobija, svešķermeņa un sausuma sajūta acī.

DAUGAVPILS UNIVERSITĀTES 60. STARPTAUTISKĀS ZINĀTNISKĀS KONFERENCES PROCEEDINGS OF
RAKSTU KRĀJUMS THE 60th INTERNATIONAL SCIENTIFIC CONFERENCE OF DAUGAVPILS UNIVERSITY
252
Introduction
A cataract is a symptomatic clouding of the lens that obstructs the passage of light and causes
a visual impairment that is often noticed by elderly patients at an early stage. Over the last 20 years
cataract surgery has undergone a revolution. Nowadays visual rehabilitation is quick and usually
patients are delighted with the result. However, as with any other invasive operations, there can
manifest postoperative complications and potential mortality. (Morris et al., 2007)
The loss of vision due to cataract is very gradual. Cataracts do not cause pain or burning.
Vision becomes increasingly blurry and dull and that is why things around appear as if seen through
a veil or fog. Contrasts and colors become faded as time goes on. Some people become very
sensitive to the light especially to the glare of the sun. Also driving car becomes very difficult
during the night. Poor vision increases the risk of getting hurt. (Allen D. et al., 2011)
It is believed that ultraviolet light and smoking increase the risk of developing cataract. Also,
female sex and diabetes mellitus is considered as a risk factor. (Allen D. et al., 2011)
The only currently available method of restoring vision for cataract patients is
phacoemulsification. This type of surgery is one of the most commonly performed surgeries in the
world. Phacoemulsification has many advantages, for example, a smaller incision size at the time of
cataract surgery and quicker visual recovery. The main technique in phacoemulsification is removal
of a cloudy lens by using ultrasonic device. The insertion of an intraocular lens is done
immediately. (Ocampo et al., 2017)
In the small number of cases serious complication can occurs. Intra-operative posterior
capsular rupture is the most common complication. This can lead to vitreous loss or a dropped
nucleus and can increase the risk of postoperative cystoid macular oedema or retinal detachment.
The most unpleasant complication is endophthalmitis, but by using intracameral antibiotics is now
significantly decreased. (Chan E. et al., 2010)
The effectiveness of cataract surgery usually is measured by visual acuity using a Snellen
chart. In the absence of any other accompanying ocular disease prior to surgery that would
significantly affect the visual outcome, a successful uncomplicated standard phacoemulsification
carries a very promising visual prognosis of gaining at least 2 lines in the Snellen distance vision
chart. Objective visual acuity measures are useful to evaluate surgeries effectiveness, but it is also
important to evaluate patient’s subjective quality of vision which may be poor despite good visual
acuity after cataract surgery. Maybe it is because patients’ expectation of visual outcome after
cataract surgery have increased. Only few studies have been conducted to assess cataract surgery
impact on subjective visual function and postoperative complaints. (Lawrence et al., 1999)
The aim of our study was to evaluate patient's visual acuity, subjective quality of vision and
complaints after cataract surgery.

DAUGAVPILS UNIVERSITĀTES 60. STARPTAUTISKĀS ZINĀTNISKĀS KONFERENCES PROCEEDINGS OF
RAKSTU KRĀJUMS THE 60th INTERNATIONAL SCIENTIFIC CONFERENCE OF DAUGAVPILS UNIVERSITY
253
Materials and methods
This mixed methods research was conducted at the Pauls Stradiņš Clinical University
Hospital Ophthalmology ward from November 2017 to March 2018. In this study, totally of 46
patients after cataract surgery, which was performed at the Pauls Stradiņš Clinical University
Hospital, were included. All participants underwent a standard eye examination and completed
survey about their postoperative complaints and subjective visual functions after surgery using. In
this survey we used Catquest-9SF questionnaire. Participants had to evaluate their vision in a ten-
point system before and after cataract surgery. Their best corrected preoperative and postoperative
visual acuity was obtained from medical records. The data was collected and statistically analyzed
using Microsoft Excel 2016 and IBM SPSS 25.00.
This study was made by respecting the provisions of the Helsinki Declaration and the Human
Right Convention. The permission of the Riga Stradins University Ethics Committee and Pauls
Stradiņš Clinical University Hospital was received.
Results
Total of 46 patients (59 eyes) were included in this study from which 39.13% (n=18) were
male and 60.87% (n=28) were female. The mean age was 73.11 ± 2.70 years, the age range is 48 -
86 years.
Mean best corrected visual acuity before and after cataract surgery was 0.25 ± 0.06 and 0.70 ±
0.07, respectively. The average improvement was 0.45 ± 0.07 (p<0.001). All patients experienced
an improvement in visual acuity, the visual acuity improvement range was from 0.04 to 1.2.
Mean subjective visual rating before and after the surgery was 4.65 ± 0.53 and 8.26 ± 0.39,
respectively, and average improvement was 3.61 ± 0.61 (p<0.001). The subjective visual rating
improvement range was from - 1 to 9. Totally 44 participants rated their vision better, 1 participant
did not feel any changes and 1 participant rated his vision worse after cataract surgery. (Figure 1.)
Fig. 1. Histogram of patients’ subjective visual rating improvement after cataract surgery in ten-point system
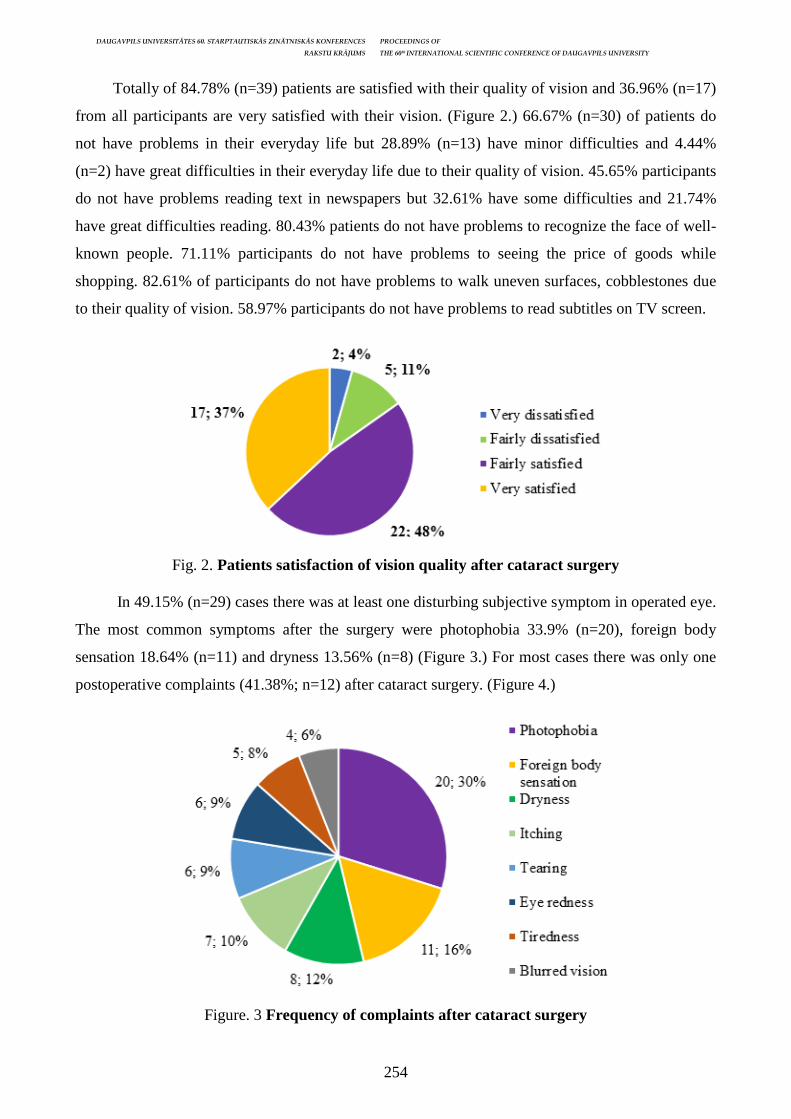
DAUGAVPILS UNIVERSITĀTES 60. STARPTAUTISKĀS ZINĀTNISKĀS KONFERENCES PROCEEDINGS OF
RAKSTU KRĀJUMS THE 60th INTERNATIONAL SCIENTIFIC CONFERENCE OF DAUGAVPILS UNIVERSITY
254
Totally of 84.78% (n=39) patients are satisfied with their quality of vision and 36.96% (n=17)
from all participants are very satisfied with their vision. (Figure 2.) 66.67% (n=30) of patients do
not have problems in their everyday life but 28.89% (n=13) have minor difficulties and 4.44%
(n=2) have great difficulties in their everyday life due to their quality of vision. 45.65% participants
do not have problems reading text in newspapers but 32.61% have some difficulties and 21.74%
have great difficulties reading. 80.43% patients do not have problems to recognize the face of well-
known people. 71.11% participants do not have problems to seeing the price of goods while
shopping. 82.61% of participants do not have problems to walk uneven surfaces, cobblestones due
to their quality of vision. 58.97% participants do not have problems to read subtitles on TV screen.
Fig. 2. Patients satisfaction of vision quality after cataract surgery
In 49.15% (n=29) cases there was at least one disturbing subjective symptom in operated eye.
The most common symptoms after the surgery were photophobia 33.9% (n=20), foreign body
sensation 18.64% (n=11) and dryness 13.56% (n=8) (Figure 3.) For most cases there was only one
postoperative complaints (41.38%; n=12) after cataract surgery. (Figure 4.)
Figure. 3 Frequency of complaints after cataract surgery
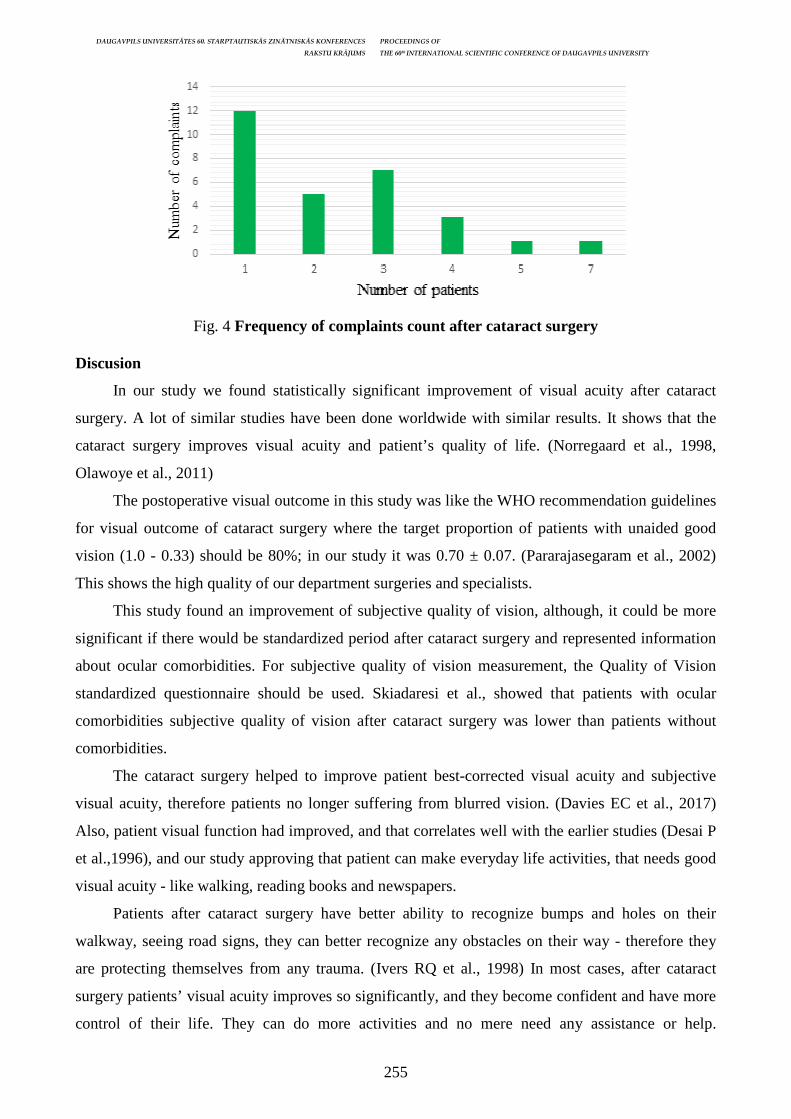
DAUGAVPILS UNIVERSITĀTES 60. STARPTAUTISKĀS ZINĀTNISKĀS KONFERENCES PROCEEDINGS OF
RAKSTU KRĀJUMS THE 60th INTERNATIONAL SCIENTIFIC CONFERENCE OF DAUGAVPILS UNIVERSITY
255
Fig. 4 Frequency of complaints count after cataract surgery
Discusion
In our study we found statistically significant improvement of visual acuity after cataract
surgery. A lot of similar studies have been done worldwide with similar results. It shows that the
cataract surgery improves visual acuity and patient’s quality of life. (Norregaard et al., 1998,
Olawoye et al., 2011)
The postoperative visual outcome in this study was like the WHO recommendation guidelines
for visual outcome of cataract surgery where the target proportion of patients with unaided good
vision (1.0 - 0.33) should be 80%; in our study it was 0.70 ± 0.07. (Pararajasegaram et al., 2002)
This shows the high quality of our department surgeries and specialists.
This study found an improvement of subjective quality of vision, although, it could be more
significant if there would be standardized period after cataract surgery and represented information
about ocular comorbidities. For subjective quality of vision measurement, the Quality of Vision
standardized questionnaire should be used. Skiadaresi et al., showed that patients with ocular
comorbidities subjective quality of vision after cataract surgery was lower than patients without
comorbidities.
The cataract surgery helped to improve patient best-corrected visual acuity and subjective
visual acuity, therefore patients no longer suffering from blurred vision. (Davies EC et al., 2017)
Also, patient visual function had improved, and that correlates well with the earlier studies (Desai P
et al.,1996), and our study approving that patient can make everyday life activities, that needs good
visual acuity - like walking, reading books and newspapers.
Patients after cataract surgery have better ability to recognize bumps and holes on their
walkway, seeing road signs, they can better recognize any obstacles on their way - therefore they
are protecting themselves from any trauma. (Ivers RQ et al., 1998) In most cases, after cataract
surgery patients’ visual acuity improves so significantly, and they become confident and have more
control of their life. They can do more activities and no mere need any assistance or help.

DAUGAVPILS UNIVERSITĀTES 60. STARPTAUTISKĀS ZINĀTNISKĀS KONFERENCES PROCEEDINGS OF
RAKSTU KRĀJUMS THE 60th INTERNATIONAL SCIENTIFIC CONFERENCE OF DAUGAVPILS UNIVERSITY
256
(Mangione CM et al., 1994) Visual acuity directly affects person's cognitive and emotional status,
therefore cataract surgery helps to improve that, in our study, patients were happier and more
satisfied with their life, than before surgery. (Gray CS et al., 2006)
Despite the mixed methods research and different postoperative period of cataract surgery we
have statistically significant results that prove the cataract surgery is the gold standard therapy for
cataract.
Conclusion
Objective and subjective visual acuity improved after cataract surgery. Many patients have at
least one disturbing subjective symptom in operated eye after the surgery. The most common
complaints were photophobia, foreign body sensation and dryness of the eye.
References Chan E, Mahroo OA, Spalton DJ. Complications of cataract surgery, Clin Exp Optom. 2010 Nov; 93(6): 379–89. Davies EC, Pineda R, Cataract surgery outcomes and complications in retinal dystrophy patients. Can J Ophthalmol. 2017, 52(6): 543–547. Desai P, Reidy A, Minassian DC, et al. Gains from cataract surgery: visual function and quality of life. Br J Ophthalmol. 1996; 80: 868–73. Gray CS, Karimova G, Hildreth AJ, et al. Recovery of visual and functional disability following cataract surgery in older people: Sunderland Cataract Study. J Cataract Refract Surg. 2006; 32: 60–66. Ivers RQ, Cumming R, Mitchell P, et al. Visual impairment and falls in older adults: The Blue Mountains Eye Study. J Am Geriatr Soc. 1998; 46: 58–64. Lawrence DJ, Brogan C, Benjamin L, et al.Measuring the effectiveness of cataract surgery: the reliability and validity of a visual function outcomes instrument. British Journal of Ophthalmology 1999; 83: 66–70. Mangione CM, Phillips RS, Lawrence MG, et al. Improved visual function and attenuation of declines in health-related quality of life after cataract extraction. Arch Ophthalmol. 1994; 112: 1419–25. Morris D, Fraser SG, Gray C. Cataract surgery and quality of life implications. Clinical Interventions in Aging. 2007; 2(1): 105–108. Norregaard JC, Hindsberger C, Alonso J, et al. Visual Outcomes of Cataract Surgery in the United States, Canada, Denmark, and Spain Report From the International Cataract Surgery Outcomes Study. Arch Ophthalmol. 1998; 116(8): 1095–1100. Ocampo VVD, Foster CS, Talavera F, Rowswy JJ, Dahl AA, Allinson RW. Senile Cataract (Age-Related Cataract) Treatment & Management. 2017. Available: https://emedicine.medscape.com/ article/1210914-treatment#d6 Olawoye OO, Ashaye AO, Bekibele CO, Ajayi BGK. Visual outcome after cataract surgery at the University College Hospital, Ibdan. Annals of Ibadan Postgraduate Medicine. 2011; 9(1): 8–13. Pararajasegaram R, ed. Importance of monitoring cataract surgical outcomes. Community Eye Health. 2002; 15(44): 49–50. Skiadaresi E, McAlinden C, Pesudovs K, Polizzi S, Khadka J, Ravalico G. Subjective Quality of Vision Before and After Cataract Surgery. Arch Ophthalmol. 2012; 130(11): 1377–1382.

DAUGAVPILS UNIVERSITĀTES 60. STARPTAUTISKĀS ZINĀTNISKĀS KONFERENCES PROCEEDINGS OF
RAKSTU KRĀJUMS THE 60th INTERNATIONAL SCIENTIFIC CONFERENCE OF DAUGAVPILS UNIVERSITY
257
THE PREVALENCE OF DEMODEX SPP. IN PATIENTS WITH BLEPHARITIS
Rita Partojeva1, Anete Kursīte1, 2, Guna Laganovska1, 2
1 Riga Stradins University, Dzirciema street 16, Riga, Latvia, [email protected] 2 Department of Ophthalmology, Pauls Stradins Clinical University Hospital, Pilsoņu street 13, Riga, Latvia Abstract
The prevalence of Demodex spp. in patients with blepharitis Key Words: blepharitis, Demodex spp., ocular demodicosis Introduction. Blepharitis is chronic inflammation of the eyelid. One of the possible cause of blepharitis is Demodex eyelash mites. The pathogenic role of Demodex mites remains unclear because they are found on the lashes of asymptomatic individuals. Aim. To evaluate the prevalence of Demodex mites infestation of eyelashes in patients with blepharitis, its effect on ocular symptoms and association with comorbidities. Materials and methods. This study was conducted at the P. Stradiņš Clinical University Hospital. 22 patients with blepharitis were included in research and surveyed about their comorbidities and ocular symptoms. All patients underwent random epilation of two non-adjacent lashes per lid for each eye. The lashes were examined for Demodex spp. under the light microscope. Collected data was analyzed using IMB SPSS 25.0. Results. A total of 22 patients were included in this study from which 18.18% (n=4) were male and 81.82% (n=18) female. The mean age was 66.91±8.00 years. The prevalence of Demodex spp. was 36.36% (n=8). The mean number of symptoms in Demodex-positive group was 6.63±1.2 and 4.64±1.2 in Demodex-negative group. The most common symptoms for Demodex-positive group were redness of the eyelid 75% (n=6), foreign body sensation 75% (n=6), itching 75% (n=6), eye redness 75% (n=6), cylindrical dandruff 62.50% (n=5) and blurred vision 62.5% (n=5). All patients with Demodex had complaints in both eyes but 2 Demodex-negative patients had symptoms only in one eye. Some comorbidities were more common for patients with Demodex: diabetes mellitus, hyperthyroidism, dry eye syndrome, dermatitis, asthma, allergies. Conclusion. Demodex spp. may be associated with more severe blepharitis. For patients with blepharitis and endocrine or allergic diseases Demodex spp. caused blepharitis could be considered. Kopsavilkums
Demodex spp. prevalence blefarīta pacientiem Atslēgvārdi: blefarīts, Demodex spp., okulāra demodikoze Ievads. Blefarīts ir plakstiņu malas iekaisums. Viens no iespējamiem blefarīta cēloņiem ir Demodex ērcīte. Demodex spp. patoģenētiskā loma blefarīta attīstība ir neskaidra, jo tās arī ir sastopamas skropstās asimptomātiskiem pacientiem. Mērķi. Noskaidrot Demodex spp. prevalenci skropstās pacientiem ar blefarītu un Demodex blefarīta gadījumā biežāk sastopamos simptomus un blakus slimības Materi āli un metodes. Pētījums tika veikts P. Stradiņa Klīniskās universitātes slimnīcā. Kopā 22 blefarīta pacienti tika iekļauti pētījumā un aptaujāti par viņu blakus slimībām un acs sūdzībām. Visiem pacientiem tika paņemti četri, blakus neaugošu skropstu paraugi no katra plakstiņa. Skropstas tika izmeklētas ar gaismas mikroskopu Demodex spp. diagnostikai. Iegūtie dati tika apstrādāti IMB SPSS 25.0. Rezultāti. Kopā 22 pacienti tika iekļauti pētījumā, no kuriem 18.18% (n=4) bija vīrieši un 81.82% (n=18) bija sievietes. Vidējais pacientu vecums bija 66.91±8.00 gadi. Demodex spp. skropstu paraugos tika konstatēts 36.36% (n=8) gadījumos. Vidējais sūdzību skaits Demodex-pozitīvā grupā bija 6.63±1.2 un Demodex-negatīvā grupā 4.64±1.2. Visbiežākās sūdzības Demodex-pozitīvā grupā bija plakstiņa apsārtums 75% (n=6), svešķermeņa sajūta acī 75% (n=6), nieze 75% (n=6), acs apsārtums 75% (n=6), aplikums ap skropstām 62.50% (n=5) un redzes miglošanās 62.50% (n=5). Demodex-pozitīvā grupā visiem pacientiem sūdzības tika novērotas abās acīs, bet 2 pacientiem Demodex-negatīvā grupā tikai vienā acī. Dažas blakus slimības biežāk tika novērotas Demodex-pozitīvā grupā: cukura diabēts, hipertiroidisms, sausās acs sindroms, dermatīts, astma un alerģijas. Secinājumi. Demodex spp. ir iespējama saistība ar klīniski smagāku blefarīta norisi. Blefarītu pacientiem, kuriem ir endokrīnas vai alerģiskas slimības, būtu nepieciešams apsvērt Demodex blefarīta diagnozi.
Introduction
Blepharitis is inflammatory of eyelid. It is very common disease in ophthalmologist and
optometrist practice with prevalence higher than 35% of all cases. It can be classified by its location
on the eyelids: blepharitis anterior, blepharitis posterior and mixed blepharitis. Anterior blepharitis
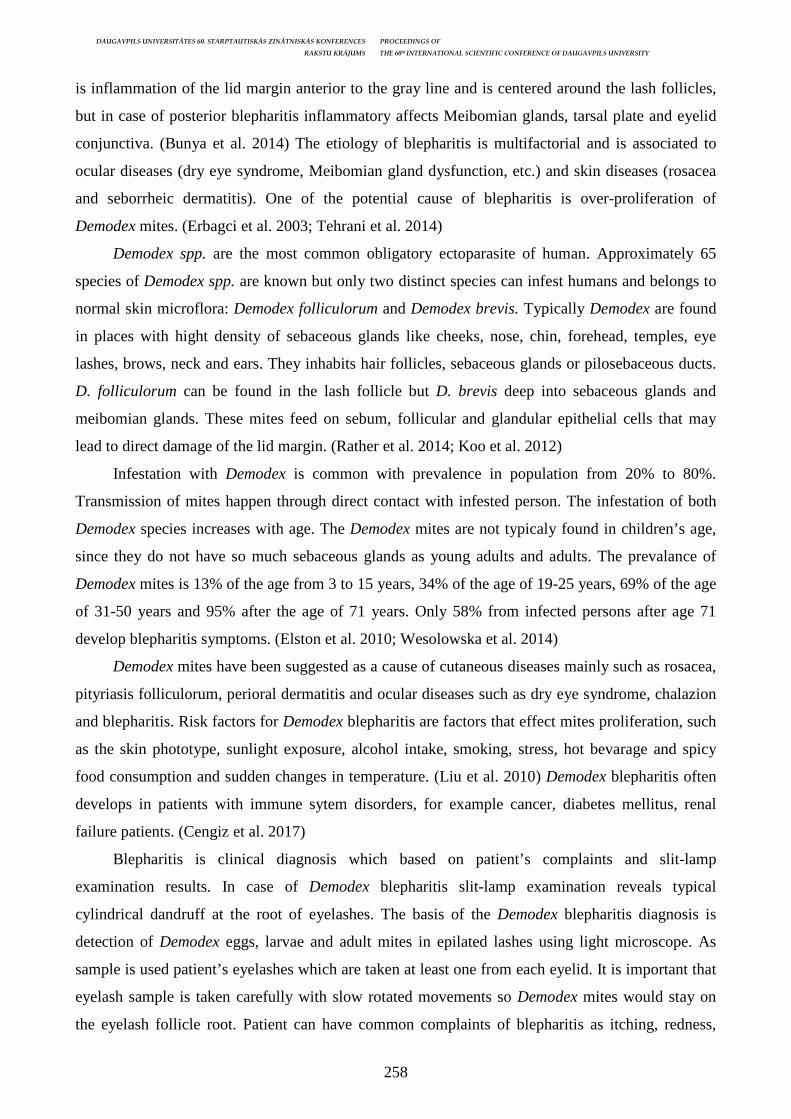
DAUGAVPILS UNIVERSITĀTES 60. STARPTAUTISKĀS ZINĀTNISKĀS KONFERENCES PROCEEDINGS OF
RAKSTU KRĀJUMS THE 60th INTERNATIONAL SCIENTIFIC CONFERENCE OF DAUGAVPILS UNIVERSITY
258
is inflammation of the lid margin anterior to the gray line and is centered around the lash follicles,
but in case of posterior blepharitis inflammatory affects Meibomian glands, tarsal plate and eyelid
conjunctiva. (Bunya et al. 2014) The etiology of blepharitis is multifactorial and is associated to
ocular diseases (dry eye syndrome, Meibomian gland dysfunction, etc.) and skin diseases (rosacea
and seborrheic dermatitis). One of the potential cause of blepharitis is over-proliferation of
Demodex mites. (Erbagci et al. 2003; Tehrani et al. 2014)
Demodex spp. are the most common obligatory ectoparasite of human. Approximately 65
species of Demodex spp. are known but only two distinct species can infest humans and belongs to
normal skin microflora: Demodex folliculorum and Demodex brevis. Typically Demodex are found
in places with hight density of sebaceous glands like cheeks, nose, chin, forehead, temples, eye
lashes, brows, neck and ears. They inhabits hair follicles, sebaceous glands or pilosebaceous ducts.
D. folliculorum can be found in the lash follicle but D. brevis deep into sebaceous glands and
meibomian glands. These mites feed on sebum, follicular and glandular epithelial cells that may
lead to direct damage of the lid margin. (Rather et al. 2014; Koo et al. 2012)
Infestation with Demodex is common with prevalence in population from 20% to 80%.
Transmission of mites happen through direct contact with infested person. The infestation of both
Demodex species increases with age. The Demodex mites are not typicaly found in children’s age,
since they do not have so much sebaceous glands as young adults and adults. The prevalance of
Demodex mites is 13% of the age from 3 to 15 years, 34% of the age of 19-25 years, 69% of the age
of 31-50 years and 95% after the age of 71 years. Only 58% from infected persons after age 71
develop blepharitis symptoms. (Elston et al. 2010; Wesolowska et al. 2014)
Demodex mites have been suggested as a cause of cutaneous diseases mainly such as rosacea,
pityriasis folliculorum, perioral dermatitis and ocular diseases such as dry eye syndrome, chalazion
and blepharitis. Risk factors for Demodex blepharitis are factors that effect mites proliferation, such
as the skin phototype, sunlight exposure, alcohol intake, smoking, stress, hot bevarage and spicy
food consumption and sudden changes in temperature. (Liu et al. 2010) Demodex blepharitis often
develops in patients with immune sytem disorders, for example cancer, diabetes mellitus, renal
failure patients. (Cengiz et al. 2017)
Blepharitis is clinical diagnosis which based on patient’s complaints and slit-lamp
examination results. In case of Demodex blepharitis slit-lamp examination reveals typical
cylindrical dandruff at the root of eyelashes. The basis of the Demodex blepharitis diagnosis is
detection of Demodex eggs, larvae and adult mites in epilated lashes using light microscope. As
sample is used patient’s eyelashes which are taken at least one from each eyelid. It is important that
eyelash sample is taken carefully with slow rotated movements so Demodex mites would stay on
the eyelash follicle root. Patient can have common complaints of blepharitis as itching, redness,
DAUGAVPILS UNIVERSITĀTES 60. STARPTAUTISKĀS ZINĀTNISKĀS KONFERENCES PROCEEDINGS OF
RAKSTU KRĀJUMS THE 60th INTERNATIONAL SCIENTIFIC CONFERENCE OF DAUGAVPILS UNIVERSITY
259
flaking, burning sensation, irritation, tearing, photophobia, blurred vision and crusting of the eyelid.
It can lead to permanent alterations to the eyelid margin, corneal neovascularization and ulceration.
(Liu et al. 2010)
The treatment option for all types of blepharitis is very similar. In all forms of blepharitis may
benefit from eyelid hygiene, which includes warm compresses, eyelid massage and eyelid scrubs.
This is thought to help melt and milk excess secretion from the Meibomian glands and to clear
away scale and debris that have accumulated on the eyelid margin. These procedures should be
performed every day even after an acute exacerbation has resolved. All forms of blepharitis also can
benefit from a treatment with topical corticosteroid eye drops to decrease inflammation, but it is
important to remember that they are not recommended for long-term use because of significant
adverse effects like increased intraocular pressure, cataract and superinfection. (Lindsley et al.
2014) It is also recommended to increase the intake of omega-3 fatty acid in dietary because of its
anti-inflammatory effect and reduction of dry eye syndrome. (Macsai et al. 2008) There is
additional therapy option treating Demodex blepharitis: eyelid hygiene should be performed using
tea tree oil shampoo or shower gel because it reduce Demodex mites count on eyelashes. (Koo et al.
2012) It is also important to prevent mating of mites and direct transmission because the life span of
Demodex mites is limited outside of body. That why it is recommended to wash bed sheets and
towels in hot water (>55oC) to elaminate Demodex mites. (Farrant 2015)
The clinical significance of Demodex spp. infestion remains debatable because it usually can
be found in asymtomatic people. That is why Demodex blepharitis is often overlooked in
differential diagnosis and therapeutic options consideration witch can be the reason for treatment
failure. (Liu et al. 2010)
The aim of this study was to determinate the incidence of Demodex mites found on the
eyelashes of patients with blepharitis, the most common ocular symptoms and comorbidities in case
of Demodex blepharitis and comorbidities related to Demodex blepharitis.
Materials and methods
This prospective study was conducted in Pauls Stradiņš Clinical University Hospital
Ophthalmology department from October 2017 till April 2018. In this study, totally 22 patients
were included who visited Ophthalmology department with blepharitis complaints and clinic in this
period.
They were surveyed about their ocular complaints and their duration, comorbidities, use of
eye decorative cosmetic and profession. All participants underwent a standard eye examination and
random epilation of four non-adjacent lashes per lid for each eye. Then the lashes were examined
for Demodex spp. based on morphology under the light microscope. The Demodex blepharitis was
diagnosed if at least one Demodex larvae and adult mite was detected in epilated lash samples using

DAUGAVPILS UNIVERSITĀTES 60. STARPTAUTISKĀS ZINĀTNISKĀS KONFERENCES PROCEEDINGS OF
RAKSTU KRĀJUMS THE 60th INTERNATIONAL SCIENTIFIC CONFERENCE OF DAUGAVPILS UNIVERSITY
260
light microscope. The data was collected and statistically analyzed using the IMB SPSS 25.0
program.
This study was made by respecting the provisions of the Helsink Declaration and the Human
Right Convention. The permission of the Riga Stradins University Ethics Committee and Paula
Stradiņš Clinical University Hospital was received.
Results
Out of 22 patients, 18.18% (n=4) were male and 81.82% (n=18) were female. The mean age
was 66.91±8.00 years, the age range is 30-85 years.
In examination of lash samples from patients showed that 36.36% (n=8) were Demodex mites
positive and 63.64% (n=14) were Demodex mites negative. (Fig. 1.) For further data analyzed
participants were divided into two groups depending on these results: Demodex-positive and
Demodex-negative group.
14; 64%
8; 36% Demodex spp. negative
Demodex spp. positive
Fig. 1. Demodex spp. prevalence in blepharitis patients
The mean age in Demodex-positive group and Demodex-negative group was 62.38±17 and
69.50±8.5 years, respectively. The age range in Demodex-positive group and Demodex-negative
group is 30-84 and 32-85 years, respectively.
The mean number of symptoms in Demodex-positive and Demodex-negative group was
6.63±1.2 and 4.64±1.2, respectively. The most common symptoms for Demodex-positive group
were redness of the eyelid 75% (n=6), eye redness 75% (n=6), foreign body sensation 75% (n=6),
itching 75% (n=6), cylindrical dandruff 62.5% (n=5) and blurred vision 62.5% (n=5). The most
common symptoms in Demodex-negative group were eye itching 62.5% (n=10), lid itching 50%
(n=8), eye dryness 50% (n=8) and eye tiredness 37.5% (n=6). (Figure 2.) All patients with Demodex
had complaints in both eyes but two Demodex-negative patients had symptoms only in one eye.
The mean complaints duration in Demodex-positive group was 3.44±1.1 years and in
Demodex-negative group 5.36±2.4 years.
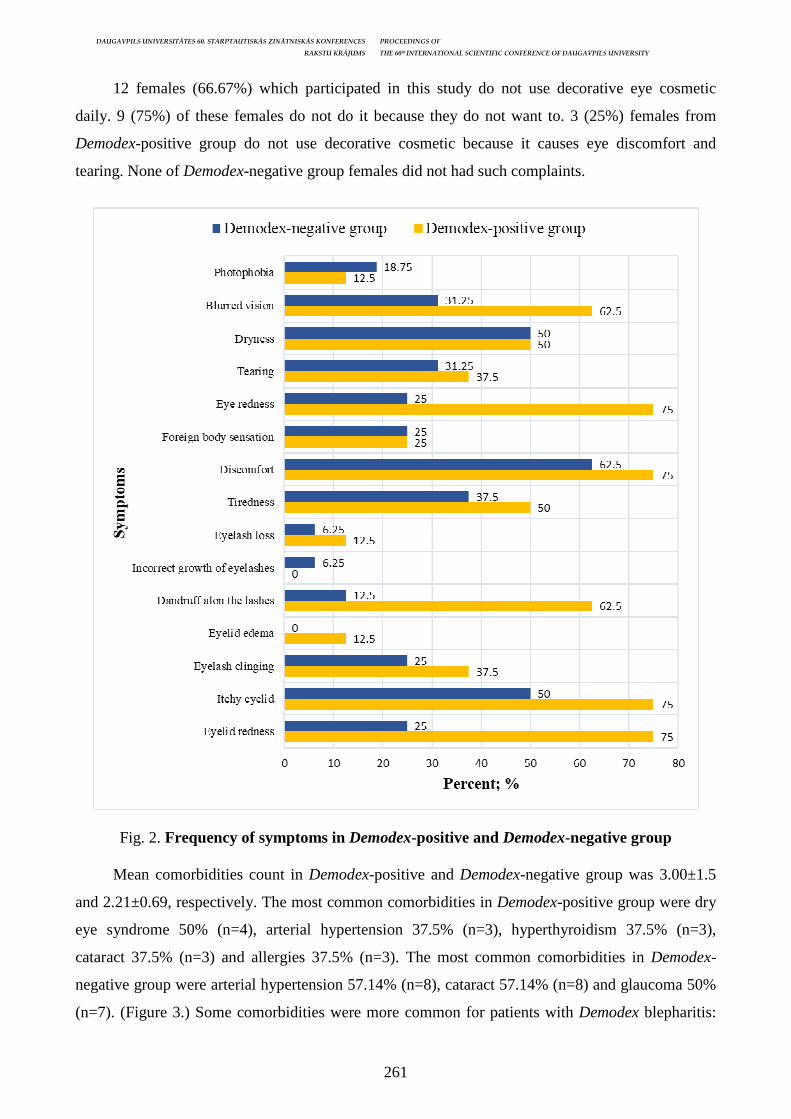
DAUGAVPILS UNIVERSITĀTES 60. STARPTAUTISKĀS ZINĀTNISKĀS KONFERENCES PROCEEDINGS OF
RAKSTU KRĀJUMS THE 60th INTERNATIONAL SCIENTIFIC CONFERENCE OF DAUGAVPILS UNIVERSITY
261
12 females (66.67%) which participated in this study do not use decorative eye cosmetic
daily. 9 (75%) of these females do not do it because they do not want to. 3 (25%) females from
Demodex-positive group do not use decorative cosmetic because it causes eye discomfort and
tearing. None of Demodex-negative group females did not had such complaints.
Fig. 2. Frequency of symptoms in Demodex-positive and Demodex-negative group
Mean comorbidities count in Demodex-positive and Demodex-negative group was 3.00±1.5
and 2.21±0.69, respectively. The most common comorbidities in Demodex-positive group were dry
eye syndrome 50% (n=4), arterial hypertension 37.5% (n=3), hyperthyroidism 37.5% (n=3),
cataract 37.5% (n=3) and allergies 37.5% (n=3). The most common comorbidities in Demodex-
negative group were arterial hypertension 57.14% (n=8), cataract 57.14% (n=8) and glaucoma 50%
(n=7). (Figure 3.) Some comorbidities were more common for patients with Demodex blepharitis:
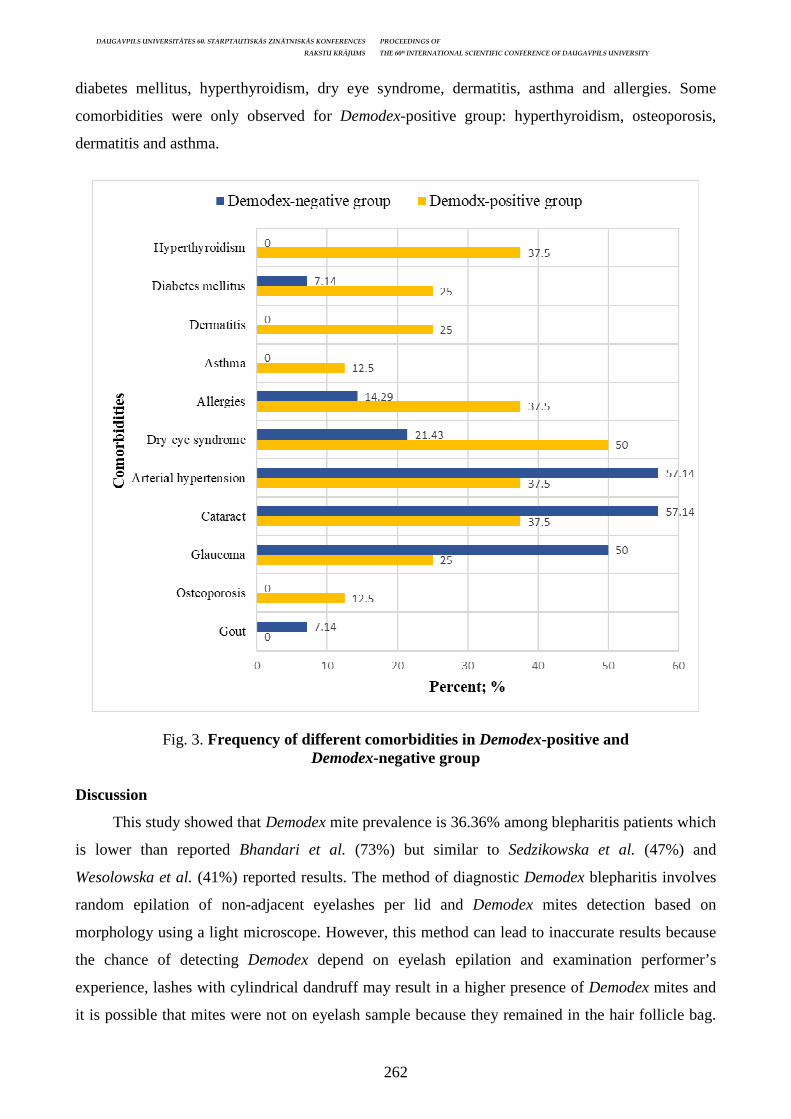
DAUGAVPILS UNIVERSITĀTES 60. STARPTAUTISKĀS ZINĀTNISKĀS KONFERENCES PROCEEDINGS OF
RAKSTU KRĀJUMS THE 60th INTERNATIONAL SCIENTIFIC CONFERENCE OF DAUGAVPILS UNIVERSITY
262
diabetes mellitus, hyperthyroidism, dry eye syndrome, dermatitis, asthma and allergies. Some
comorbidities were only observed for Demodex-positive group: hyperthyroidism, osteoporosis,
dermatitis and asthma.
Fig. 3. Frequency of different comorbidities in Demodex-positive and Demodex-negative group
Discussion
This study showed that Demodex mite prevalence is 36.36% among blepharitis patients which
is lower than reported Bhandari et al. (73%) but similar to Sedzikowska et al. (47%) and
Wesolowska et al. (41%) reported results. The method of diagnostic Demodex blepharitis involves
random epilation of non-adjacent eyelashes per lid and Demodex mites detection based on
morphology using a light microscope. However, this method can lead to inaccurate results because
the chance of detecting Demodex depend on eyelash epilation and examination performer’s
experience, lashes with cylindrical dandruff may result in a higher presence of Demodex mites and
it is possible that mites were not on eyelash sample because they remained in the hair follicle bag.

DAUGAVPILS UNIVERSITĀTES 60. STARPTAUTISKĀS ZINĀTNISKĀS KONFERENCES PROCEEDINGS OF
RAKSTU KRĀJUMS THE 60th INTERNATIONAL SCIENTIFIC CONFERENCE OF DAUGAVPILS UNIVERSITY
263
These potential errors and small number of patients may explain why Demodex prevalence in cases
of blepharitis differs from literature and other studies.
The most common symptoms of Demodex blepharitis in our study were itching, foreign body
sensation, redness of the eyelid and eye, cylindrical dandruff and blurred vision. These information
is compatible with the literature data and other studies. In Venecia et al. research the most common
symptoms were itchiness, foreign body sensation and tearing. Symptoms that may help to
distinguish Demodex blepharitis from other causes could be bilateral redness of the eyelid and eye,
cylindrical dandruff and blurred vision. Also, in this study the mean symptom count was higher in
case of Demodex blepharitis that why it is possible that it is associated with more sever blepharitis
than other etiology blepharitis.
The mean count of comorbidities was higher in case of Demodex blepharitis. There were
some comorbidities that were more common for patients with Demodex blepharitis such as diabetes
mellitus, hyperthyroidism, dry eye syndrome, dermatitis, asthma and allergies. In Yamashita et al.
and Tehrani et al. study diabetes mellitus and seborrheic dermatitis showed to be a risk factor for
Demodex infestation of the eyelid. The reason for that may be than in case of these diseases
develops immune system imbalance and altered immune system eventually causes a skin disorders
and changes of Demodex proliferation that further leads to demodicosis.
The clinical significance of Demodex infestion was debatable because it usually can be found
in asymtomatic people however several authors have concluded that Demodex infestation is related
to blepharitis even the exact pathogenic potential of Demodex remains unclear.
Conclusions
Demodex spp. is a common ectoparasite found in human eyelash follicle. Demodex spp.
infestation usually is asymptomatic but it may be associated with more severe blepharitis especially
in patients with immune system imbalance. Demodex spp. may be associated with more severe
blepharitis. For patients with blepharitis and endocrine or allergic diseases or recurrent blepharitis,
which does not respond to treatment, Demodex spp. caused blepharitis should be considered.
References Bhandari, V., Reddy, J.K. Blepharitis: Always remember demodex, Middle East African Journal of Opfthalmology, 2014; 21(4): 317–320. Bunya, V. Y., Braindard, D. H., Daniel, E. et al. Assessment of Signs of Anterior Blepharitis Using Standardized Color Photographs, HHS Public Access, 2013; 32(11): 1475–1482. Cengiz, Z.T., Ozkol, H.U., Beyhan, Y.E., Ozturk, M., Yilmaz, H. Evaluation of some chronical diseases in etiopathogenesis of demodicosis, Dermatologica Sinica, 2017; 35(4): 173–176. Elston, C.A., Elston, D.M., MD. Demodex mites, Clinics in Dermatology, 2014; 32(6): 739– 743. Erbagci, Z., Erbagci, I., Erkilic, S. Hight incidence of demodicidosis in eyelid basal cell carcinomas, International Journal of Dermatology, 2003; 42(7): 567–571.
DAUGAVPILS UNIVERSITĀTES 60. STARPTAUTISKĀS ZINĀTNISKĀS KONFERENCES PROCEEDINGS OF
RAKSTU KRĀJUMS THE 60th INTERNATIONAL SCIENTIFIC CONFERENCE OF DAUGAVPILS UNIVERSITY
264
Farrant, S. Managing Demodex in clinical practice, Contact Lens Update, 2015. Koo, H., Kim, T. H., Kim, K. W., Wee, S. W., Chun, Y. S., Kim, J. C. Ocular Surface Discomfort and Demodex: Effect of Tea Tree Oil Eyelid Scrub in Demodex Blepharitis, Journal of Korean Medical Science, 2012; 21(12): 1574–1579. Lindsley, K., Matsumura, S., Hatef, E., Akpek, E. K. Interventions for chronic blepharitis, Cochrane Database of Systematic Reviews, 2012; http://dx.doi.org/10.1002/14651858. CD005556.pub2 Liu, J., Sheha, H., Tseng, S.C.G. Pathogenic role of Demodex mites in blepharitis, Current Opinion in Allergy and Clinical Immunology, 2010; 10(5): 505–510. Macsai, M. S., MD: The Role of Omega-3 Dietary Supplementation in Blepharitis and Meibomian Gland Dysfunction, Transactions of the American Ophthalmological Society, 2008; 106: 336–356. Rather, P. A., Hassan, I. Human Demodex Mite: The Versatile Mite of Dermatological Importance, Indian Journal of Dermatology, 2014; 59(1): 60–66. Sedzikowska A., Oseka M., Skopinski P. The impact of age, se, blepharitis, rosacea and rheumatoid arthritis on Demodex mite infection // Arch Med Sci, 2018; 14(2): 353–356. Tehrani, S., Tizmaghz, A., Shabestanipour, G. The Demodex mites and their relation with seborrheic and atopic Dermatitis, Asian Pacific Journal of Tropical Medicine, 2014; 7(1): 82–84. Venecia, A. B., Siong, R. L. Demodex sp. Infestation in anterior blepharitis, meibomiangland dysfunction, and mixed blepharitis, Philipp J Ophthalmol, 2011; 36: 15–22. Wesolowska, M., Knysz, B., Reich, A., Blazejewska, D., Czarnecki, M., Gladysz, A., Pozowski, A., Misjuk-Hojlo, M. Prevalence of Demodex spp. In eyelash follicles in different populations, Arch Med Sci, 2014; 10(2): 319-24. doi: 10.5114/aoms.2014.42585 Yamashita, L. S., Cariello, A. J., Geha, N. M., Yu, M. C., Hofling-Lima, A. L. Demodex folliculorum un the eyelash follicle of diabetic patients, Arq Bras Oftalmol, 2011; 74(6): 422–424.
DAUGAVPILS UNIVERSITĀTES 60. STARPTAUTISKĀS ZINĀTNISKĀS KONFERENCES PROCEEDINGS OF
RAKSTU KRĀJUMS THE 60th INTERNATIONAL SCIENTIFIC CONFERENCE OF DAUGAVPILS UNIVERSITY
265
INTRAVITREAL ANTI-VEGF INJECTION IMPACT ON VISUAL ACUITY IN PATIENTS WITH EXUDATIVE
AGE-RELATED MACULAR DEGENERATION
Lita J ēkabsone1, Anete Kursīte2, Guna Laganovska2
1 Riga Stradiņš University, Dzirciema Str. 16, Riga, Latvia, [email protected] 2 Department of Ophthalmology, Pauls Stradins Clinical University Hospital, Riga, Latvia, [email protected], [email protected] Abstract
Intravitreal anti-VEGF injection impact on visual a cuity in patients with exudative age-related macular degeneration
Key Words: Age-related macular degeneration, visual acuity, anti-VEGF injections Introduction. Age-related macular degeneration (AMD) is a leading cause of vision loss among older adults aged 65 and more worldwide. (Ferris, 1983) It affects the central area of retina known as the macula which is responsible for central field of vision. The reason for using intravitreal injections of anti-vascular endothelial growth factor (VEGF) is to prevent choroidal neovascularization. Although injections may improve visual acuity, there are evidence showing association of anti-VEGF injections with progression of retinal pigment epithelium (RPE) atrophy. Aim. To investigate the intravitreal anti-VEGF factor impact on visual acuity in patients with exudative AMD undergoing anti-VEGF therapy. Materials and methods. A single-centre retrospective study was done in P. Stradins Clinical University Hospital. Total 48 eyes of 36 patients with exudative AMD undergoing intravitreal anti-VEGF for 48 months were included. Best-corrected visual acuity (BCVA) measurements were taken from patient medical histories. For RPE measurements Heidelberg Spectralis Optical Coherence Tomography was used. Results. Of 48 eyes 35 (72.9%) were female and 13 (27.1%) male eyes. The mean age of the patients was 81.81 ± 6.8 years. The mean number of intravitreal anti-VEGF injections received in 48 months was 15.38 ± 5.11. Mean BCVA (decimals) at the beginning of therapy was 0.29 ± 0.23. After twelve monthly anti-VEGF injections, BCVA was significantly improved from baseline (0.36 ± 0.24, p = 0.014). However, after improvement, we observed BCVA decreasing at months 24 and 48 (0.34 ± 0.24 and 0.26 ± 0.19, p = 0.01). Conclusion. After first year of anti-VEGF therapy BCVA was statistically improved from baseline. However, despite significant improvement at first year, the further treatment contributed BCVA reduction. Kopsavilkums
Intravitre ālo anti-VEGF injekciju ietekme uz redzes asumu pacientiem ar mitrās formas vecuma mākulas deģenerāciju
Atslēgvārdi: Vecuma mākulas deģenerācija, redzes asums, anti-VEGF injekcijas Ievads. Vecuma mākulas deģenerācija (VMD) ir vadošais redzes zuduma iemesls cilvēkiem pēc 65 gadu vecuma visā pasaulē. (Ferris, 1983.) Tā skar tīklenes centrālo daļu – mākulu, kas ir atbildīga par redzes lauku centrālo daļu. Intravitreālo anti-vaskulāro endoteliālo augšanas faktoru (VEGF) injekciju mērķis ir apturēt dzīslenes neovaskularizāciju. Lai gan injekcijas var uzlabot redzes asumu, ir pierādījumi, kas parāda anti-VEGF injekciju saistību ar tīklenes pigmentepitēlija (TPE) atrofijas progresēšanu. Mērķis. Izpētīt intravitreālo anti-VEGF injekciju ietekmi uz redzes asumu pacientiem ar mitrās formas vecuma mākulas deģenerāciju. Materi āli un metodes. Retrospektīvs pētījums, kurā iekļautas 36 pacientu 48 acis ar mitrās formas VMD, kuri saņēmuši vismaz 48 mēnešu ilgu anti-VEGF terapiju. Koriģētā redzes asuma mērījumi ņemti no pacientu medicīnisko kartiņu izrakstiem. TPE mērījumiem izmantots Heidelberg Spectralis OCT. Rezultāti. 35 (72,9%) no 48 acīm bija sieviešu un 13 (27,1%) vīriešu acis. Vidējais pacientu vecums bija 81,81 ± 6,8 gadi. Vidēji 48 mēnešu laikā saņemtas 15,38 ± 5,11 anti-VEGF intravitreālās injekcijas. Koriģētais redzes asums (decimālos) uzsākot terapiju bija 0,29 ± 0,23. Pēc 12 mēnešu anti-VEGF injekciju terapijas tas ievērojami uzlabojās uz 0,36 ± 0,24, p = 0,014. Lai gan tika novērots būtisks uzlabojums, turpmākās redzes asuma izmaiņas pēc 24 un 48 mēnešu terapijas bija ar negatīvu dinamiku (0,34 ± 0,24 un 0,26 ± 0,19, p = 0,01). Secinājumi. Pēc 12 mēnešu intravitreālas anti-VEGF terapijas tika novērots statistiski ticams redzes asuma uzlabojums. Lai gan redzes asums uzlabojās, turpmākās terapijas laikā tika novērots redzes asuma pazeminājums.
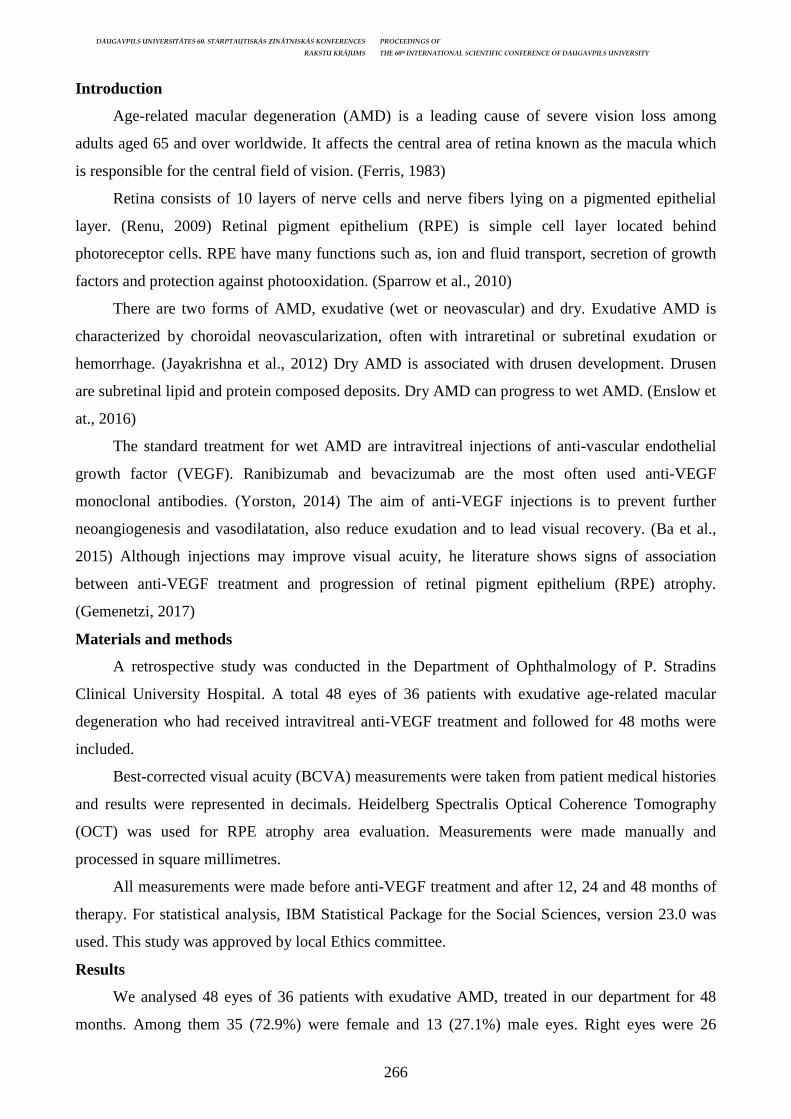
DAUGAVPILS UNIVERSITĀTES 60. STARPTAUTISKĀS ZINĀTNISKĀS KONFERENCES PROCEEDINGS OF
RAKSTU KRĀJUMS THE 60th INTERNATIONAL SCIENTIFIC CONFERENCE OF DAUGAVPILS UNIVERSITY
266
Introduction
Age-related macular degeneration (AMD) is a leading cause of severe vision loss among
adults aged 65 and over worldwide. It affects the central area of retina known as the macula which
is responsible for the central field of vision. (Ferris, 1983)
Retina consists of 10 layers of nerve cells and nerve fibers lying on a pigmented epithelial
layer. (Renu, 2009) Retinal pigment epithelium (RPE) is simple cell layer located behind
photoreceptor cells. RPE have many functions such as, ion and fluid transport, secretion of growth
factors and protection against photooxidation. (Sparrow et al., 2010)
There are two forms of AMD, exudative (wet or neovascular) and dry. Exudative AMD is
characterized by choroidal neovascularization, often with intraretinal or subretinal exudation or
hemorrhage. (Jayakrishna et al., 2012) Dry AMD is associated with drusen development. Drusen
are subretinal lipid and protein composed deposits. Dry AMD can progress to wet AMD. (Enslow et
at., 2016)
The standard treatment for wet AMD are intravitreal injections of anti-vascular endothelial
growth factor (VEGF). Ranibizumab and bevacizumab are the most often used anti-VEGF
monoclonal antibodies. (Yorston, 2014) The aim of anti-VEGF injections is to prevent further
neoangiogenesis and vasodilatation, also reduce exudation and to lead visual recovery. (Ba et al.,
2015) Although injections may improve visual acuity, he literature shows signs of association
between anti-VEGF treatment and progression of retinal pigment epithelium (RPE) atrophy.
(Gemenetzi, 2017)
Materials and methods
A retrospective study was conducted in the Department of Ophthalmology of P. Stradins
Clinical University Hospital. A total 48 eyes of 36 patients with exudative age-related macular
degeneration who had received intravitreal anti-VEGF treatment and followed for 48 moths were
included.
Best-corrected visual acuity (BCVA) measurements were taken from patient medical histories
and results were represented in decimals. Heidelberg Spectralis Optical Coherence Tomography
(OCT) was used for RPE atrophy area evaluation. Measurements were made manually and
processed in square millimetres.
All measurements were made before anti-VEGF treatment and after 12, 24 and 48 months of
therapy. For statistical analysis, IBM Statistical Package for the Social Sciences, version 23.0 was
used. This study was approved by local Ethics committee.
Results
We analysed 48 eyes of 36 patients with exudative AMD, treated in our department for 48
months. Among them 35 (72.9%) were female and 13 (27.1%) male eyes. Right eyes were 26

DAUGAVPILS UNIVERSITĀTES 60. STARPTAUTISKĀS ZINĀTNISKĀS KONFERENCES PROCEEDINGS OF
RAKSTU KRĀJUMS THE 60th INTERNATIONAL SCIENTIFIC CONFERENCE OF DAUGAVPILS UNIVERSITY
267
(54.2%) and left eyes 22 (45.8%). The mean age of patients was 81.81 ± 6.8 years. The mean
number of received intravitreal anti-VEGF injections in 48 months was 15.38 ± 5.11.
Characteristics of patients are shown in Table 1.
Table 1. Baseline characteristics of patients
Variables N = 48 eyes (36 patients)
Age 81.81 ± 6.8 Gender eyes, n (%)
Women Men
35 (72.9%) 13 (27.1%)
BCVA (decimals) 0.29 ± 0.23 Area of RPE atrophy (mm2) 1.83 ± 2.2
Mean best-corrected visual acuity (BCVA) (decimals) at the beginning of therapy was 0.29 ±
0.23. After twelve months of intravitreal anti-VEGF injection therapy, BCVA was significantly
improved from baseline (0.36 ± 0.24, p = 0.014). However, despite significant improvement at first
year, we observed remarkable BCVA decreasing at month 24 and 48 (0.34 ± 0.24 and 0.26 ± 0.19,
p = 0.01). The changes of BCVA over 48 months of anti-VEGF therapy is shown in Figure 1.
Figure 1. The changes of best-corrected visual acuity (decimals) over time after anti-vascular endothelial growth factor treatment
After first year of anti-VEGF therapy the mean RPE atrophy area was slightly increased from
baseline (from 1.83 ± 2.2 mm2 to 2.63 ± 2.1 mm2, p = 0.04). RPE atrophy enlargement was
observed also after 24 months and 48 months of intravitreal anti-VEGF therapy (3.03 ± 2.33 mm2 to
4.09 ± 2.12 mm2, p < 0.001). The changes of RPE atrophy area over 48 months of anti-VEGF
therapy is shown in Figure 2. Heidelberg Spectralis OCT scan for RPE atrophy progression is
shown in Figure 3.
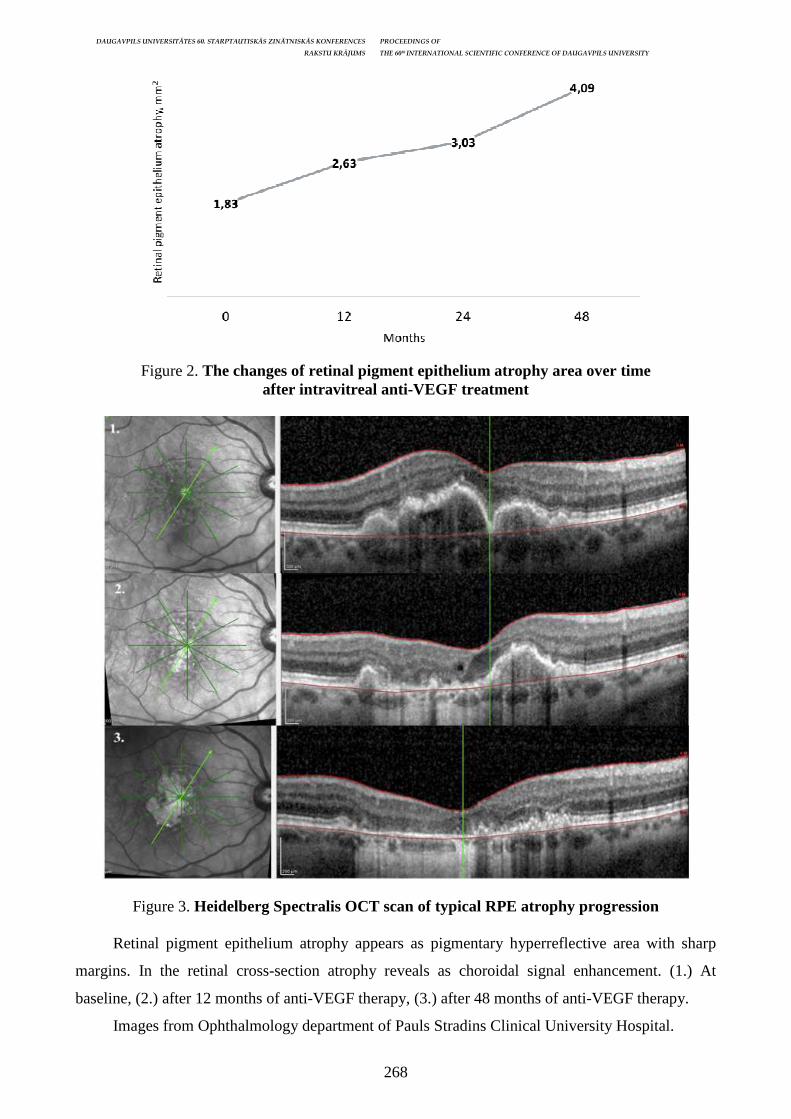
DAUGAVPILS UNIVERSITĀTES 60. STARPTAUTISKĀS ZINĀTNISKĀS KONFERENCES PROCEEDINGS OF
RAKSTU KRĀJUMS THE 60th INTERNATIONAL SCIENTIFIC CONFERENCE OF DAUGAVPILS UNIVERSITY
268
Figure 2. The changes of retinal pigment epithelium atrophy area over time after intravitreal anti-VEGF treatment
Figure 3. Heidelberg Spectralis OCT scan of typical RPE atrophy progression
Retinal pigment epithelium atrophy appears as pigmentary hyperreflective area with sharp
margins. In the retinal cross-section atrophy reveals as choroidal signal enhancement. (1.) At
baseline, (2.) after 12 months of anti-VEGF therapy, (3.) after 48 months of anti-VEGF therapy.
Images from Ophthalmology department of Pauls Stradins Clinical University Hospital.
DAUGAVPILS UNIVERSITĀTES 60. STARPTAUTISKĀS ZINĀTNISKĀS KONFERENCES PROCEEDINGS OF
RAKSTU KRĀJUMS THE 60th INTERNATIONAL SCIENTIFIC CONFERENCE OF DAUGAVPILS UNIVERSITY
269
Discussion
In our study we found statistically significant improvement of BCVA after 12 months of
intravitreal anti-VEGF therapy. However, after further anti-VEGF therapy BCVA was with
negative dynamic. The SEVEN-UP study shown that about half of patients at the end of seven-year
therapy of anti-VEGF had loss of visual acuity for about 15 letters due to retinal pigment epithelium
atrophy. (Enslow et al., 2016)
In the CATT trial which compared Bevacizumab and Ranibizumab, shown that both
medications have similar effect on retinal exudation reduce, but in the eyes that had received
monthly intravitreal injection comparison with as-needed injection, retina pigment epithelium
atrophy progressed more. (Gemenetzi et al., 2017)
Despite many studies, still is unclear whether retinal pigment epithelium atrophy develops
undergoing anti-VEGF therapy is a result from normal age-related macular degeneration
progression of anti-VEGF therapy has a toxic effect on macula causing progression of RPE atrophy
enlargement (Radhika et al., 2015)
Although the aim of intravitreal anti-VEGF therapy is to prevent neoangiogenesis and
vasodilatation, approximately 25 – 35% of patients after intensive therapy still have evidence of
active exudation and there are no significant changes in BCVA. (Broadhead et al., 2014)
Intravitreal anti-VEGF therapy is gold standard therapy for exudative AMD and still is highly
recommended, but we should discuss if it is necessary to try reduce retinal exudation if there are no
evidence of BCVA improving.
Conclusion
Our results show that after twelve months of intravitreal anti-VEGF therapy there is a
significant improvement of best-corrected visual acuity. Further anti-VEGF therapy shown visual
acuity deterioration. Retinal pigment epithelium is a frequent finding in eyes with exudative age-
related macular degeneration before and after anti-VEGF therapy.
Conflict of interest
None.
References Enslow R., Sai Bhuvanagiri, Sravanthi Vegunta, Benjamin Cutler, Michael Neff, Brian Stagg. Association of Anti-VEGF injections with progression of Geographic Atrophy. Ophthalmol Eye Dis, 2016; 8: 31–32. Ferris FL. Senile macular degeneration: review of epidemiologic features. Am J Epidemiol, 1983; 118: 132–151. Gemenetzi M, Lotery AJ, Patel P J. Risk of geographic atrophy in age-related macular degeneration patients treated with intravitreal anti-VEGF agents, 2017; 31(1): 1–19. Geoffrey K. Broadhead, Thomas Hong, Andrew A. Chang. Treating the untreatable patient: current options for the management of treatment-resistant neovascular age-related macular degeneration. Acta Ophthalmologica, 2014; 92: 8 713–723.

DAUGAVPILS UNIVERSITĀTES 60. STARPTAUTISKĀS ZINĀTNISKĀS KONFERENCES PROCEEDINGS OF
RAKSTU KRĀJUMS THE 60th INTERNATIONAL SCIENTIFIC CONFERENCE OF DAUGAVPILS UNIVERSITY
270
Jayakrishna Ambati, Benjamin J. Fowler. Mechanisms of age-related macular degeneration. Neuron, 2012; 75(1): 26–39. Jun Ba, Run-Sheng Peng, Ding Xu, Yan-Hong Li, Hui Shi, Qianyi Wang, Jing Yu. Intravitreal anti-VEGF injections for treating wet age-related macular degeneration: a systematic review and meta-analysis. Drug Des Devel Ther, 2015; 9: 5397–5405. Radhika E., Ramenaden, Philip J. Rosenfeld. Can Anti-VEGF Cause GA in Wet AMD? Available: http://www.retina-specialist.com/article/can-antivegf-cause-ga-in-wet-amd Renu Jogi. Basic Ophthalmology, 4th Edition. New Delhi: Jaypee Brothers Medical Publishers (P); 2009; 1–9. Sparrow JR, Hicks D, Hamel CP. The retinal pigment epithelium in health and disease, 2010; 10(9): 802–23. Xu Y, Tan CS. Safety and complications of intravitreal injections performed in an Asian population Singapore, 2017; 37(2): 325–332.
DAUGAVPILS UNIVERSITĀTES 60. STARPTAUTISKĀS ZINĀTNISKĀS KONFERENCES PROCEEDINGS OF
RAKSTU KRĀJUMS THE 60th INTERNATIONAL SCIENTIFIC CONFERENCE OF DAUGAVPILS UNIVERSITY
271
INFLUENCE OF AN ENTERIC OSMOTICALLY ACTIVE AGENT ON DIFFUSION ACTIVITY WITHIN FULLY DISTENDED BOWEL WALL – COMPARISON BETWEEN MAGNETIC
RESONANCE ENTEROGRAPHY DIFFUSION SEQUENCES
Monta Baduna1, Reinis Pitura1, Ilze Apine2
1 Rīga Stradiņš University, Dzirciema street 16, Riga, Latvia, [email protected], [email protected] 2 Children’s Clinical University Hospital, Vienības gatve 45, Riga, Latvia, [email protected] Abstract
Influence of an enteric osmotically active agent on diffusion activity within fully distended bowel wall – comparison between magnetic resonance enterography diffusion sequences
Key Words: Magnetic resonance enterography, Diffusion Weighted Imaging, Diffusion Weighted Imaging with Background Body Suppresion, gadolinium contrast agent, peroral osmotically active contrast agent Introduction. Inflammatory bowel disease (IBD) is a group of disabling disorders, capable of involving gastrointestinal tract in all its length. To start timely treatment early diagnosis is significant. Magnetic resonance enterography (MRE) is widely used examination, but it requires administration of gadolinium contrast medium, associated with systemic nephrogenic fibrosis and formation of gadolinium deposits in soft tissue. Diffusion weighted imaging (DWI) and DWI with background body suppression (DWIBS) does not require use of gadolinium, but preparation with peroral osmotically active agent is requested, and it could influence apparent diffusion coefficient (ADC) value within bowel wall. Aim. To evaluate DWI and DWIBS ADC values before and after preparation with mannitol within fully distended colon walls. Methods. 75 DWI and 30 DWIBS (b=50, 600, 800 s/mm2) ADC values of fully distended bowel wall segments were measured before and after preparation with mannitol (2.5%). Data were analyzed with unpaired t-test. Results. There was significant difference between ADC values before and after preparation with mannitol. DWI b=600 (ADC 0.88±0,18×10⁻³mm2/s), DWI b=800 (ADC 0.69±0.01×10⁻³mm2/s), DWIBS b=600 (ADC 0.98±0.38×10 ̶ 3mm2/s), DWIBS b=800 (ADC 0.99±0.38×10⁻³mm2/s). P values in all tests were <0.0001. Conclusion. DWI and DWIBS ADC values are significantly higher in presence of peroral osmotically active agent. That should be taken into consideration when assessing IBD. Kopsavilkums Ievads. Iekaisīgās zarnu slimības (IZS) ir invaliditāti izraisošu patoloģiju grupa, kas var izraisīt visa kuņģa – zarnu trakta bojājumu. Laicīga diagnostika ir svarīga, lai uzsāktu efektīvu ārstēšanu. Magnētiskās rezonanses enterogrāfija (MRE) ir plaši izmantota metode, bet tai ir nepieciešama gadolīniju saturošas kontrastvielas ievade, kas asociēta ar sistēmiskas nefrogēnas fibrozes attīstību un gadolīnija depozītu veidošanos mīkstajos audos. Difūzijas uzsvērtie attēli (DWI) un DWI ar apkārtējo audu supresiju (DWIBS) tiek veikti bez gadolīniju saturošas kontrastvielas, bet ir nepieciešama perorālas osmotiski aktīvas vielas ievade, kas, iespējams, ietekmē šķietamā difūzijas koeficienta (ADC) vērtību. Mērķis. Izvērtēt MRE DWI un DWIBS pilnīgi izplestas zarnas sieniņas ADC vērtību izmaiņas pēc pacienta sagatavošanas ar mannītu. Metodes. Tika iegūtas 75 DWI un 30 DWIBS (b=50, 600, 800 s/mm2) segmentu ADC vērtības pilnīgi izplestai resnās zarnas sieniņai pirms un pēc pacienta sagatavošanas ar mannītu (2,5%). Dati tika statistiski apstrādāti ar nepāra t-testu. Rezultāti. Tika novērotas statistiski nozīmīgas ADC vērtību atšķirības pirms un pēc pacienta sagatavošanas ar mannītu: DWI b=600 (ADC 0,88±0,18×10⁻³mm2/s), DWI b=800 (ADC 0,69±0,01×10⁻³mm2/s), DWIBS b=600 (ADC 0,98±0,38×10⁻³mm2/s), DWIBS b=800 (ADC 0,99±0,38×10⁻³mm2/s). P vērtība visos testos <0,0001. Secinājumi. DWI un DWIBS ADC vērtības perorālas osmotiski aktīvas vielas klātbūtnē ir nozīmīgi augstākas, kas būtu jāņem vērā, izvērtējot IZS.
Introduction
Inflammatory bowel disease (IBD) is a group of chronic idiopathic gastrointestinal tract
disorders with three main subtypes – ulcerative colitis (UC), Crohn’s disease (CD) and
indeterminate colitis (Carvalho et al. 2006). Pathogenesis of IBD is still unclear, but one of the
explanations could be genetically predisposed immune system’s impaired reaction to the
DAUGAVPILS UNIVERSITĀTES 60. STARPTAUTISKĀS ZINĀTNISKĀS KONFERENCES PROCEEDINGS OF
RAKSTU KRĀJUMS THE 60th INTERNATIONAL SCIENTIFIC CONFERENCE OF DAUGAVPILS UNIVERSITY
272
nonpathogenic microorganisms in the bowel lumen as well as influence of external factors such as
industrialization, dietary changes, smoking and use of antibiotics (Sairenji, Collins, and Evans
2017).
The global increase in IBD incidence and prevalence has reached 0,5% of the Western world
population, with 2.5 – 3.0 million patients in Europe alone, and increased incidence in low-risk
populations, such as Middle East, South and East Asia. (Kaplan 2015) (Gurudu and Fiocchi 2017)
Even though IBD has low mortality rates, it is incurable disease and may cause significant disability
because of extraintestinal manifestations and complications with stricture, fistula, abscess
formation, that often are indications for surgical treatment. (Argyriou et al. 2017). Therefore,
significance of starting treatment on a timely basis is the reason why early diagnosis is so important.
IBD diagnosis is established by combination of clinical symptoms, laboratorial evaluation,
endoscopic, histologic and radiographic studies Even though ileocolonoscopy is considered ‘the
gold standard’ for IBD detection, it has limitations in CD diagnosis because of its ability to express
in any part of the gastrointestinal tract, including proximal part of small bowel that is
endoscopically inaccessible (Annese et al. 2013) (Kilcoyne, Kaplan, and Gee 2016). Another
disadvantage of ileocolonoscopy is its ability to visualize only superficial layer of bowel mucosa,
but CD can affect bowel wall transmurally. Therefore, there is need for radiologic imaging method
that could examine all gastrointestinal tract with ability to provide cross sectional images for bowel
wall evaluation in all its thickness.
Due to its high soft tissue resolution, magnetic resonance imaging (MRI) is widely used in
assessment of IBD, especially children, because, unlike computer tomography (CT), MRI is non-
ionizing technique and does not increase the risk of radiation-induced cancer (UNSCEAR 2006).
MR enterography (MRE) is particularly used for gastrointestinal tract evaluation and requires
patient preparation with peroral osmotically active contrast agent, and intravenous administration of
gadolinium contrast medium before last MR sequence to evaluate vascularization of bowel wall,
however, it has been confirmed that gadolinium can cause systemic nephrogenic fibrosis and
formation of gadolinium deposits in soft tissue, including central nervous system (Rogosnitzky and
Branch 2016) (Sanyal et al. 2011). As a result, non-contrast MR sequences are studied for IBD
evaluation.
Diffusion weighted imaging (DWI) and diffusion weighted imaging with background body
suppression (DWIBS) are MR sequences that does not require the use of gadolinium contrast
medium. Alternatively, T2 weighted echo plantar sequence is added by two diffusion gradients,
centered around 180o pulse. In result MR is made sensitive to diffusion of water molecules in tissue,
known as Brownian motion, to produce images with qualitative and quantitative information (Sinha
et al. 2013) (Huisman 2010).
DAUGAVPILS UNIVERSITĀTES 60. STARPTAUTISKĀS ZINĀTNISKĀS KONFERENCES PROCEEDINGS OF
RAKSTU KRĀJUMS THE 60th INTERNATIONAL SCIENTIFIC CONFERENCE OF DAUGAVPILS UNIVERSITY
273
DWI has proven to be a significant part of central nervous system imaging because of its
ability to detect ischemic injury, differentiate vasogenic from cytotoxic cerebral edema and
possibility to quantitatively evaluate brain lesions, however, in IBD evaluation it has been applied
only recent, first time documented in 2009 (Oto et al. 2009). Whereas DWIBS concept were
described for the first time in 2004. This MR regime showed better fat and background suppression
characteristics during free breathing For now, DWIBS have proven to be useful additional sequence
in oncology, and in IBD diagnostics has been studied little (Mesmann et al. 2014).
Both diffusion sequences are able to detect tissues with restricted diffusion that can be
observed in physiologically normal tissues (in abdominal region – spleen, lymph nodes,
endometrium and bowel wall) or pathological finding- oncology, abscess, fibrotic and inflammatory
processes, including IBD (Bammer 2003).
In DWI restricted diffusion visualizes as region with higher signal intensity. To quantitatively
analyze intense regions, apparent diffusion coefficient (ADC) is calculated, and for that we need at
least two b values which is determined by the amplitude and duration of the applied diffusion
gradients as well as the time between them (Dunn et al. 2015). Even though there is no definition
for normal and pathological ADC value intervals within bowel wall, V. Ninivaggi et.al. compared
ADC values of pathological and normal bowel loops, and results showed that ADC in pathological
bowel loops was significantly lower than normal bowel loops and results did not overlap (Ninivaggi
et al. 2016). That is why ADC value has a potential in IBD diagnostics, but there are still
undetermined factors that can influence ADC value. One of the recent studied factors is bowel
distension degree. Statistically significant difference were observed between collapsed and
distended bowel wall segments (Apine et al. 2016).
ECCO (European Crohn’s and Colitis Organization) guidelines demands patient’s
preparation with peroral osmotically active contrast agent before MRE to distend bowel.
Hypothetically osmotically active agent could influence apparent diffusion coefficient (ADC) value
within bowel wall. It is the reason for our study – to find out if presence of osmotically active
contrast agent could be one of ADC value affecting factors.
Materials and Methods
Patient selection
In this study 83 patients with no clinical or laboratorial evidence of IBD who had underwent
MRE examination with diffusion sequences (DWI and DWIBS) were retrospectively selected from
Children’s Clinical university hospital’s database. Exclusion criteria were following: proven UC or
CD colitis, unknown ethology colitis, patients who have oncologic bowel disorders or systemic
pathologies (cystic fibrosis, celiac disease) as well as patients that uses IBD medication (biologic
agents).
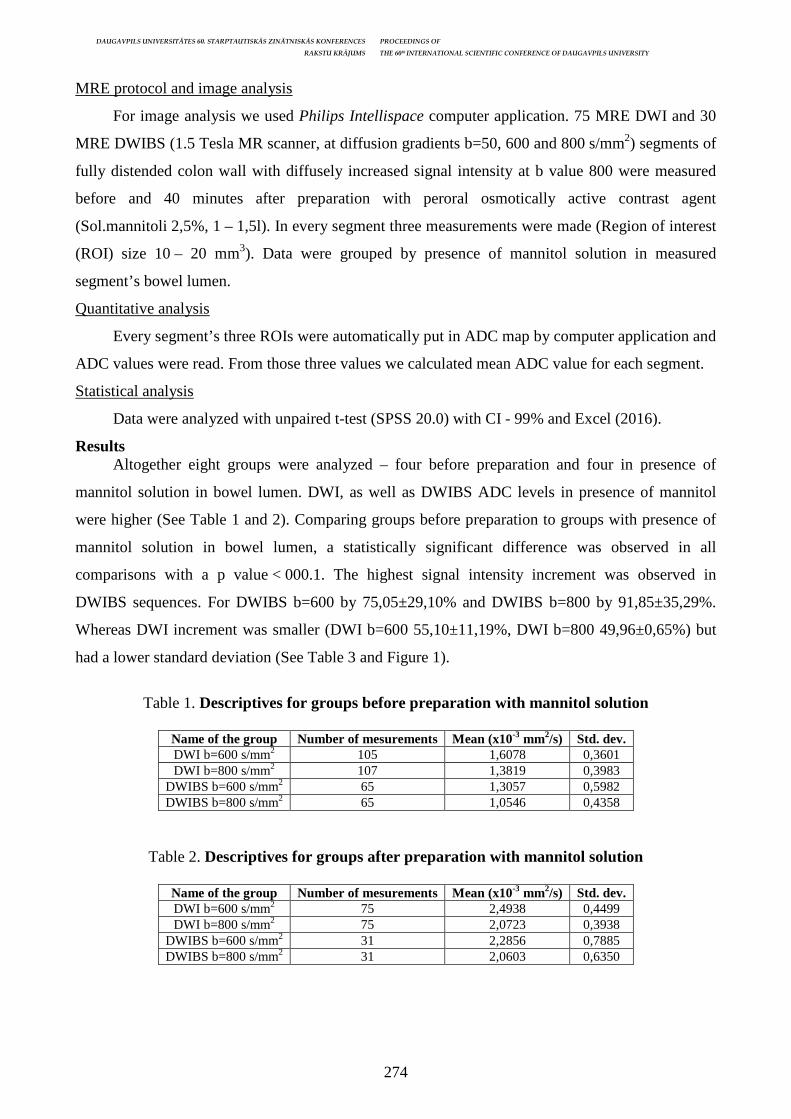
DAUGAVPILS UNIVERSITĀTES 60. STARPTAUTISKĀS ZINĀTNISKĀS KONFERENCES PROCEEDINGS OF
RAKSTU KRĀJUMS THE 60th INTERNATIONAL SCIENTIFIC CONFERENCE OF DAUGAVPILS UNIVERSITY
274
MRE protocol and image analysis
For image analysis we used Philips Intellispace computer application. 75 MRE DWI and 30
MRE DWIBS (1.5 Tesla MR scanner, at diffusion gradients b=50, 600 and 800 s/mm2) segments of
fully distended colon wall with diffusely increased signal intensity at b value 800 were measured
before and 40 minutes after preparation with peroral osmotically active contrast agent
(Sol.mannitoli 2,5%, 1 – 1,5l). In every segment three measurements were made (Region of interest
(ROI) size 10 – 20 mm3). Data were grouped by presence of mannitol solution in measured
segment’s bowel lumen.
Quantitative analysis
Every segment’s three ROIs were automatically put in ADC map by computer application and
ADC values were read. From those three values we calculated mean ADC value for each segment.
Statistical analysis
Data were analyzed with unpaired t-test (SPSS 20.0) with CI - 99% and Excel (2016).
Results Altogether eight groups were analyzed – four before preparation and four in presence of
mannitol solution in bowel lumen. DWI, as well as DWIBS ADC levels in presence of mannitol
were higher (See Table 1 and 2). Comparing groups before preparation to groups with presence of
mannitol solution in bowel lumen, a statistically significant difference was observed in all
comparisons with a p value < 000.1. The highest signal intensity increment was observed in
DWIBS sequences. For DWIBS b=600 by 75,05±29,10% and DWIBS b=800 by 91,85±35,29%.
Whereas DWI increment was smaller (DWI b=600 55,10±11,19%, DWI b=800 49,96±0,65%) but
had a lower standard deviation (See Table 3 and Figure 1).
Table 1. Descriptives for groups before preparation with mannitol solution
Name of the group Number of mesurements Mean (x10-3 mm2/s) Std. dev. DWI b=600 s/mm2 105 1,6078 0,3601 DWI b=800 s/mm2 107 1,3819 0,3983
DWIBS b=600 s/mm2 65 1,3057 0,5982 DWIBS b=800 s/mm2 65 1,0546 0,4358
Table 2. Descriptives for groups after preparation with mannitol solution
Name of the group Number of mesurements Mean (x10-3 mm2/s) Std. dev. DWI b=600 s/mm2 75 2,4938 0,4499 DWI b=800 s/mm2 75 2,0723 0,3938
DWIBS b=600 s/mm2 31 2,2856 0,7885 DWIBS b=800 s/mm2 31 2,0603 0,6350

DAUGAVPILS UNIVERSITĀTES 60. STARPTAUTISKĀS ZINĀTNISKĀS KONFERENCES PROCEEDINGS OF
RAKSTU KRĀJUMS THE 60th INTERNATIONAL SCIENTIFIC CONFERENCE OF DAUGAVPILS UNIVERSITY
275
Table 3. Comparison between groups before and after preparation with mannitol
Name of the group ADC increment
(x10-3 mm2/s) ADC increment
(%) ADC increment
Std. dev. ADC increment
Std. dev. (%) P value
DWI b=600 s/mm2 0,886 55,10 0,180 11,19 <0,0001 DWI b=800 s/mm2 0,690 49,96 0,009 0,65 <0,0001
DWIBS b=600 s/mm2 0,980 75,05 0,380 29,10 <0,0001 DWIBS b=800 s/mm2 0,986 91,85 0,379 35,29 <0,0001
Figure 1. Comparison between ADC mean value changes in presence of mannitol solution
Discussion
MR contrast sequence takes significant part in diagnosis of IBD, however, intravenous
administration of gadolinium contrast medium can result in serious complications such as systemic
nephrogenic fibrosis and gadolinium deposition in central nervous system, and other soft tissue
localizations, although, clinical significance from deposits is not cleared up yet. For this reason,
there is need for studying MR non-contrast sequences (DWI and DWIBS) in MRE bowel
examination.
Our results demonstrated that in both diffusion sequences ADC values were higher in
presence of mannitol. The explanation could be that mannitol is osmotically active solution, and,
because of this, in contact with bowel wall, osmotically active solution could cause osmosis because
of osmotic pressure that would be greater in the bowel lumen, and water molecules would be drawn
out of the bowel wall cells, resulting in greater intercellular space and less restricted diffusion. In
IBD diagnosis it could result in hypodiagnosis because ADC values are showing higher results.
Comparing both diffusion sequences, results showed that DWIBS had higher ADC value
increase in presence of mannitol. The reason for this is still unclear, but it could be associated with
1,6081,382 1,306
1,055
0,8860
0,6900 0,9800
0,9860
0,000
0,500
1,000
1,500
2,000
2,500
3,000
DWI ADC
b=600 s/mm2
DWI ADC
b=800 s/mm2
DWIBS ADC
b=600 s/mm2
DWIBS ADC
b=800 s/mm2
AD
C (
x1
0-3
mm
2/s
)
Before preparation with mannitol solution
Increment in presence of mannitol solution
DAUGAVPILS UNIVERSITĀTES 60. STARPTAUTISKĀS ZINĀTNISKĀS KONFERENCES PROCEEDINGS OF
RAKSTU KRĀJUMS THE 60th INTERNATIONAL SCIENTIFIC CONFERENCE OF DAUGAVPILS UNIVERSITY
276
DWIBS improved fat and background suppression qualities as well as it has reduced motion
artifacts.
We did not find any literature about influence of peroral osmotically active contrast agent on
bowel wall diffusion process, to our knowledge this has not been previously reported.
Our study had several limitations. First, we were able to get statistically enough
measurements only for fully distended colon wall. It was more difficult to find diffuse signal
intensity for DWIBS sequence at b value 800 than DWI since unaltered bowel walls were more
obscured in DWIBS images comparing to the DWI sequence. It is an interesting observation that
needs further studies. Second, we could not get enough measurements in all colon parts, so we
assumed that ADC value within all colon is the same. Looking from physiological perspective, in
proximal colon parts are greater absorption activity than in distal parts, and it is possible that
diffusion process differs within various colon parts.
Rationally thinking, we should take into consideration that unaffected bowel wall is only up
to 3 mm thick. That means a high possibility that ROI includes not only ADC of the bowel wall, but
ADC of the bowel lumen’s content and extraintestinal tissue too. There is need for additional
experimental study where these factors are excluded (de Souza, Costa, and Castellano 2017).
More studies with larger measurement count are needed to make further conclusions about
MR diffusion sequences independent ability to diagnose IBD. For now, DWI and DWIBS are
recommended as additional MRE sequences in establishing the diagnosis of IBD.
Conclusions
Both, DWI and DWIBS ADC values in presence of mannitol are higher, with greater
differences showing in DWIBS sequence. Consequently, diffusion within fully distended colon wall
is influenced by presence of osmotically active agent, and it should be taken into consideration
when evaluating MRE diffusion sequences ADC values in IBD.
References Annese, Vito, Marco Daperno, Matthew D. Rutter, Aurelien Amiot, Peter Bossuyt, James East, Marc Ferrante, et al. 2013. “European Evidence Based Consensus for Endoscopy in Inflammatory Bowel Disease.” Journal of Crohn’s and Colitis 7 (12): 982–1018. https://doi.org/10.1016/j. crohns.2013.09.016 Apine, Ilze, Juris Pokrotnieks, Marcis Leja, Santa Atteka, and Gaida Krumina. 2016. “MRI Apparent Diffusion Coefficient Values in Collapsed and Distended Small Bowel Loops and Their Potential Importance for Excluding Inflammatory Bowel Disease: A Study in Healthy Subjects.” Acta Chirurgica Latviensis 16 (1): 23–30. https://doi.org/10.1515/chilat-2016-0013 Argyriou, Konstantinos, Andreas Kapsoritakis, Konstantinos Oikonomou, Anastassios Manolakis, Eirini Tsakiridou, and Spyridon Potamianos. 2017. “Disability in Patients with Inflammatory Bowel Disease: Correlations with Quality of Life and Patient’s Characteristics.” Canadian Journal of Gastroenterology and Hepatology 2017: 1–11. https://doi.org/10.1155/2017/6138105 Bammer, Roland. 2003. “Basic Principles of Diffusion-Weighted Imaging.” European Journal of Radiology 45 (3): 169–84. https://doi.org/10.1016/S0720-048X(02)00303-0
DAUGAVPILS UNIVERSITĀTES 60. STARPTAUTISKĀS ZINĀTNISKĀS KONFERENCES PROCEEDINGS OF
RAKSTU KRĀJUMS THE 60th INTERNATIONAL SCIENTIFIC CONFERENCE OF DAUGAVPILS UNIVERSITY
277
Carvalho, Ryan S., Vivian Abadom, Harrison P. Dilworth, Richard Thompson, Maria Oliva-Hemker, and Carmen Cuffari. 2006. “Indeterminate Colitis: A Significant Subgroup of Pediatric IBD.” Inflammatory Bowel Diseases 12 (4): 258–62. https://doi.org/10.1097/01.MIB.0000215093. 62245.b9. Dunn, Dell P., Karen S. Lee, Martin P. Smith, and Koenraad J. Mortele. 2015. “Nononcologic Applications of Diffusion-Weighted Imaging in the Gastrointestinal System.” American Journal of Roentgenology 204 (4): 758–67. https://doi.org/10.2214/AJR.14.12729 Gurudu, Suryakanth, and Claudio Fiocchi. 2017. Inflammatory Bowel Disease. Edited by Russell D. Cohen. Vol. 16. Clinical Gastroenterology. Cham: Springer International Publishing. https://doi.org/10.1007/978-3-319-53763-4 Huisman, T. A G M. 2010. “Diffusion-Weighted and Diffusion Tensor Imaging of the Brain, Made Easy.” Cancer Imaging 10 (SPEC. ISS. A): 163–71. https://doi.org/10.1102/1470-7330.2010.9023 Kaplan, Gilaad G. 2015. “The Global Burden of IBD: From 2015 to 2025.” Nature Reviews Gastroenterology and Hepatology 12 (12). Nature Publishing Group: 720–27. https://doi.org/10.1038/nrgastro.2015.150 Kilcoyne, Aoife, Jess L. Kaplan, and Michael S. Gee. 2016. “Inflammatory Bowel Disease Imaging: Current Practice and Future Directions.” World Journal of Gastroenterology 22 (3): 917–32. https://doi.org/10.3748/wjg.v22.i3.917 Mesmann, Caroline, Monica Sigovan, Lise-Prune Berner, Adva Abergel, François Tronc, Y. Berthezène, P. Douek, and Loic Boussel. 2014. “Evaluation of Image Quality of DWIBS versus DWI Sequences in Thoracic MRI at 3T.” Magnetic Resonance Imaging 32 (10): 1237–41. https://doi.org/10.1016/j.mri.2014.08.015 Ninivaggi, V, M Missere, G Restaino, E Gangemi, M Di Matteo, A Pierro, G Sallustio, and L Bonomo. 2016. “MR-Enterography with Diffusion Weighted Imaging: ADC Values in Normal and Pathological Bowel Loops, a Possible Threshold ADC Value to Differentiate Active from Inactive Crohn’s Disease.” European Review for Medical and Pharmacological Sciences. Oto, Aytekin, Fang Zhu, Kirti Kulkarni, Gregory S. Karczmar, Jerrold R. Turner, and David Rubin. 2009. “Evaluation of Diffusion-Weighted MR Imaging for Detection of Bowel Inflammation in Patients with Crohn’s Disease.” Academic Radiology 16 (5). Elsevier Ltd: 597–603. https://doi.org/10.1016/j.acra.2008.11.009 Rogosnitzky, Moshe, and Stacy Branch. 2016. “Gadolinium-Based Contrast Agent Toxicity: A Review of Known and Proposed Mechanisms.” BioMetals. https://doi.org/10.1007/s10534-016-9931-7 Sairenji, Tomoko, Kimberly L. Collins, and David V. Evans. 2017. “An Update on Inflammatory Bowel Disease.” Primary Care – Clinics in Office Practice. https://doi.org/10.1016/j.pop. 2017.07.010 Sanyal, S., P. Marckmann, S. Scherer, and J. L. Abraham. 2011. “Multiorgan Gadolinium (Gd) Deposition and Fibrosis in a Patient with Nephrogenic Systemic Fibrosis--an Autopsy-Based Review.” Nephrology Dialysis Transplantation 26 (11): 3616–26. https://doi.org/10.1093/ ndt/gfr085 Sinha, Rakesh, Iswaran Ramachandran, Scott Sanders, Paul D. Murphy, and Prabhakar Rajiah. 2013. “Diffusion-Weighted MR Imaging of the Gastrointesti- Nal Tract: Technique, Indica- Tions, and Imaging Findings.” RadioGraphics 33 (3): 679–80. https://doi.org/10.1148/Radiographics. 33.3.333679 Souza, E.M. de, E.T. Costa, and G. Castellano. 2017. “Phantoms for Diffusion-Weighted Imaging and Diffusion Tensor Imaging Quality Control: A Review and New Perspectives.” Research on Biomedical Engineering 33 (2): 156–65. https://doi.org/10.1590/2446-4740.07816 UNSCEAR. 2006. UNSCEAR 2006 Report Volume I. Effects of Ionizing Radiation. Vol. I.
DAUGAVPILS UNIVERSITĀTES 60. STARPTAUTISKĀS ZINĀTNISKĀS KONFERENCES PROCEEDINGS OF
RAKSTU KRĀJUMS THE 60th INTERNATIONAL SCIENTIFIC CONFERENCE OF DAUGAVPILS UNIVERSITY
278
MYELOMA CELLS IN PERIPHERAL BLOOD AS A PROGNOSTIC FACTOR OF MULTIPLE MYELOMA
Olga Demida Rīga Stradiņš University, Dzirciema str. 16, Riga, Latvia, [email protected] Abstract
Myeloma cells in peripheral blood as a prognostic factor of multiple myeloma Key Words: myeloma cells, circulating plasma cells, multiple myeloma, prognostic factor Multiple myeloma prognosis is affected by several prognostic indicators determining the stage of the disease, response to therapy, relapse risk and overall survival. Over the last 10 years, myeloma cells in the peripheral blood have been increasingly studied using flow cytometry method in patients diagnosed with myeloma for the first time. The aim was find out the connection between myeloma cells in peripheral blood and myeloma stage during diagnostics and the response to the initial three-month treatment. The study was carried out at the Riga East Clinical University Hospital, Oncology Centre of Latvia, Clinic of Chemotherapy and Haematology, Laboratory of Haemopathology and Stem Cells. 52 patients diagnosed with myeloma for the first time were examined using flow cytometry method from August 2017 to February 2018. Out of the 52 patients, myeloma cells in peripheral blood were found in 11 patients (21%), no myeloma cells in peripheral blood were found in 41 patients (79%). The largest myeloma cell count in peripheral blood is 35% of the total nucleated cell population, the smallest is 1.6%. Durie-Salmon stage II A and III A are most common in the patients with positive myeloma cells in the peripheral blood, 27% (n=3) and 27% (n=3) of the patients respectively. Stages II B and III B are 18% (n=2) and 18% (n=2) of the patiens respectively. Stage I A is only found in one patient (9%), and stage I B is not found in any patient. In patients with positive myeloma cells in peripheral blood, the blood serum gradient M was reduced by 59% on average three months after the beginning of treatment. In patients with negative myeloma cells in peripheral blood, the blood serum gradient M was reduced by 85% on average three months after the beginning of treatment. According to the nonparametric Mann-Whitney test, there is a statistically significant relationship between myeloma cells in peripheral blood at the time of diagnostics and the difference in blood serum gradient M three months after the beginning of treatment (p = 0.000). P value is statistically reliable, if p < 0.05. Higher myeloma stages prevail in patients with positive myeloma cells in peripheral blood. There is a statistically significant relationship between myeloma cells in peripheral blood at the time of diagnostics and the difference in blood serum gradient M three months after the beginning of treatment, therefore the response to therapy in patients with positive myeloma cells in peripheral blood is worse than in patients with negative myeloma cells in peripheral blood. Kopsavilkums
Mielomas šūnas perifēriskaj ās asinīs kā prognostisks rādītājs mielomas slimības gadījumā Atslēgvārdi: mielomas šūnas, cirkulējošas plazmatiskās šūnas, mielomas slimība, multipla mieloma, prognostiskie rādītāji Mielomas slimības prognozi ietekmē vairāki prognostiski rādītāji, kas nosaka slimības stadiju, atbildes reakciju uz terapiju, recidīvu risku un kopējo izdzīvotību. Pēdējos 10 gados pasaulē arvien vairāk tiek pētītas mielomas šūnas perifēriskajās asinīs pacientiem ar pirmo reizi diagnosticētu mielomas slimību, izmantojot plūsmas citometrijas metodi. Darba mērķis bija noskaidrot mielomas šūnu perifēriskajās asinīs saistību ar mielomas slimības stadiju diagnostikas brīdī un atbildes reakciju uz sākuma trīs mēnešu terapiju. Pētījums tika veikts “Rīgas Austrumu klīniskā universitātes slimnīcas” stacionārā “Latvijas Onkoloģijas Centrs”, Ķīmijterapijas un hematoloģijas klīnikā, Hemapatologijas un cilmes šūnu laboratorij ā. No 2017. gada augusta līdz 2018. gada februārim ar plūsmas citometrijas metodi tika izmeklēti 52 pacienti ar pirmo reizi diagnosticēto mielomas slimību. No 52 pacientiem mielomas šūnas perifēriskajās asinīs tika atrastas 11 pacientiem (21%), 41 pacientam (79%) mielomas šūnas perifēriskajās asinīs netika atrastas. Lielākais mielomas šūnu skaits perifēriskajās asinīs ir 35% no kopējas kodolu saturošo šūnu populācijas, mazākais – 1,6%. Pacientiem ar pozitīvām mielomas šūnām perifēriskajās asinīs biežākas ir II A un III A stadijas pēc Djūrija un Selmona klasifikācijas, 27% (n=3) un 27% (n=3) pacientu attiecīgi. II B un III B stadijas ir 18% (n=2) un 18% (n=2) pacientu attiecīgi. I A stadija ir tikai vienam pacientam (9%) un I B stadijas nav nevienam pacietam. Pacientiem ar pozitīvām mielomas šūnām perifēriskajās asinīs M gradients asins serumā vidēji samazinājās par 59% pēc trim mēnešiem no terapijas sākuma. Pacientiem ar negatīvām mielomas šūnām perifēriskajās asinīs M gradients asins serumā vidēji samazinājās par 85% pēc trim mēnešiem no terapijas sākuma. Pēc neparametriskā Manna-Vitnija testa ir novērota statistiski nozīmīga saistība starp mielomas šūnām perifēriskajās asinīs diagnostikas brīdī un M gradienta starpību asins serumā pēc trim mēniešiem no terapijas sākuma (p=0.000). P vērtība statistiski ticama, ja p < 0,05. Pacientiem ar pozitīvām mielomas šūnām perifēriskajās asinīs prevalē lielākas mielomas slimības stadijas. Ir novērota statistiski nozīmīga saistība starp mielomas šūnām perifēriskajās asinīs un M gradienta starpību asins serumā pēc trim mēnešiem no terapijas sākuma, līdz ar to atbildes reakcija uz sākuma trīs mēnešu terapiju pacientiem ar pozitīvām mielomas šūnām perifēriskajās asinīs ir sliktāka, nekā pacientiem ar negatīvām mielomas šūnām perifēriskajās asinīs.

DAUGAVPILS UNIVERSITĀTES 60. STARPTAUTISKĀS ZINĀTNISKĀS KONFERENCES PROCEEDINGS OF
RAKSTU KRĀJUMS THE 60th INTERNATIONAL SCIENTIFIC CONFERENCE OF DAUGAVPILS UNIVERSITY
279
Introduction
Multiple myeloma is a B-lymphocyte malignant lymphoproliferative disease of the blood
system (Lejniece 2005; Kasper et al. 2015; Луговская и Почтарь 2016). Uncontrolled clonal
growth and proliferation of mature and immature plasma cells or myeloma cells occur in the bone
marrow in case of myeloma (Lejniece 2005; Kasper et al. 2015; Луговская и Почтарь 2016).
Myeloma cells produce abnormal protein, such as monoclonal immunoglobulin, and/or light chains,
called paraprotein or M gradient (Lejniece 2005; Kasper et al. 2015; Луговская и Почтарь 2016).
Pathological process results in bone system damage syndrome with osteoporosis, abnormal bone
fractures; neurological syndrome with spinal cord injury; anaemic syndrome due to inhibition of
normal haematopoiesis; and renal syndrome due to paraprotein-induced damage to the renal tubules
(Lejniece 2005; Kasper et al. 2015; Луговская и Почтарь 2016).
Myeloma is found in 1% of all cases of malignant tumours and in 10-13% of cases of
haematological tumours (Lejniece 2005; Kasper et al. 2015; Луговская и Почтарь 2016).
The incidence in Europe is 4.5-6.0 cases per 100,000 inhabitants annually, with an average
age at establishing diagnosis of 72 years (Moreau et al. 2017). More than 80% of patients are over
60 years (Kasper et al. 2015; Moreau et al. 2017). Only 2% of patients are under 40 years (Kasper et
al. 2015; Moreau et al. 2017).
According to the data from the Centre for Disease Prevention and Control, 91 patients with
myeloma disease were registered in Latvia in 2016, which is 4.6 cases per 100,000 inhabitants. 41
male patients and 50 female patients suffering from myeloma were registered in 2016. A total of
353 patients were registered by the end of 2016 (SPKC 2017).
Myeloma is a multifactorial pathology; its development is influenced by several risk factors
(Kasper et al. 2015; Sergentanis et al. 2015). It is believed that considerable risk factors include
genetic predisposition, various external environmental factors, lifestyle, infection, and autoimmune
diseases (Moreau et al. 2002; Kasper et al. 2015; Sergentanis et al. 2015).
Despite modern treatments, including chemotherapy, autologous or allogeneic stem cell
transplantation, myeloma is still incurable, although overall patient survival rate has increased in
recent years and their response to therapy has improved (Hanbali et al. 2017).
Multiple myeloma prognosis is affected by several prognostic indicators determining the
stage of the disease, response to therapy, relapse risk and overall survival (Lejniece 2005; Hanbali
et al. 2017; Li et al. 2017).
Over the last 10 years, myeloma cells in the peripheral blood or circulating plasma cells have
been increasingly studied using flow cytometry method in patients diagnosed with myeloma for the
first time in order to determine their association with the stage of the disease, disease progression
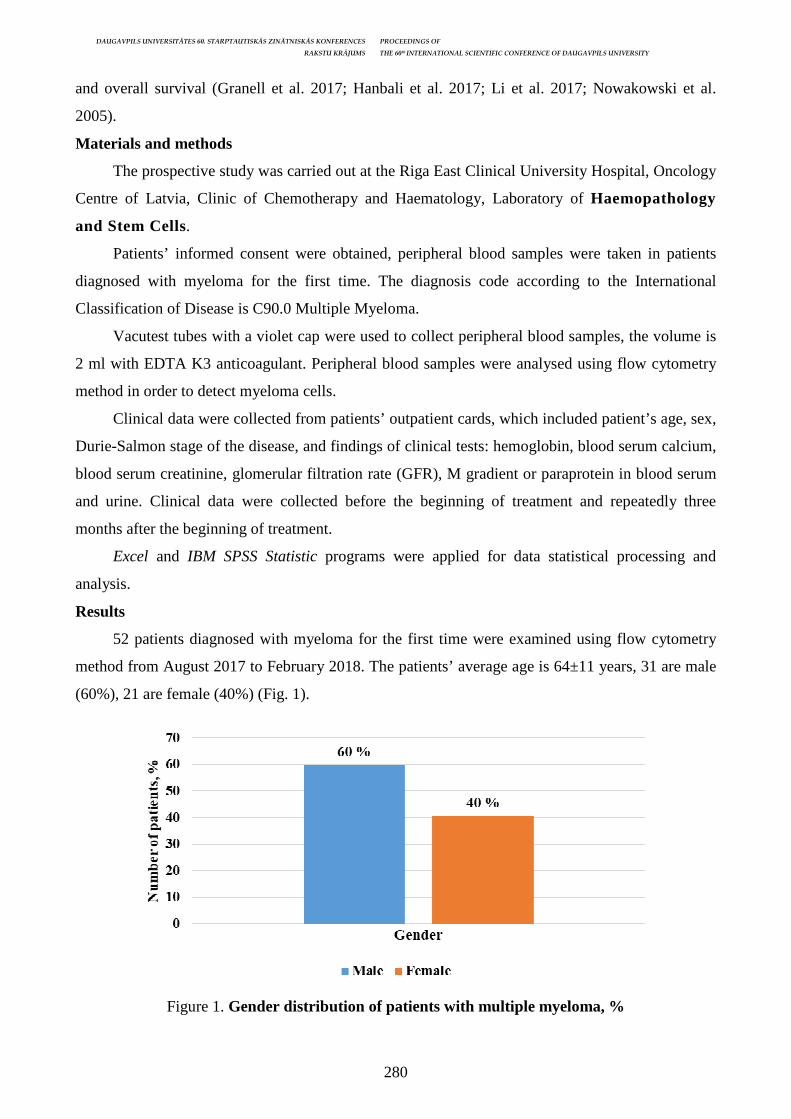
DAUGAVPILS UNIVERSITĀTES 60. STARPTAUTISKĀS ZINĀTNISKĀS KONFERENCES PROCEEDINGS OF
RAKSTU KRĀJUMS THE 60th INTERNATIONAL SCIENTIFIC CONFERENCE OF DAUGAVPILS UNIVERSITY
280
and overall survival (Granell et al. 2017; Hanbali et al. 2017; Li et al. 2017; Nowakowski et al.
2005).
Materials and methods
The prospective study was carried out at the Riga East Clinical University Hospital, Oncology
Centre of Latvia, Clinic of Chemotherapy and Haematology, Laboratory of Haemopathology
and Stem Cells.
Patients’ informed consent were obtained, peripheral blood samples were taken in patients
diagnosed with myeloma for the first time. The diagnosis code according to the International
Classification of Disease is C90.0 Multiple Myeloma.
Vacutest tubes with a violet cap were used to collect peripheral blood samples, the volume is
2 ml with EDTA K3 anticoagulant. Peripheral blood samples were analysed using flow cytometry
method in order to detect myeloma cells.
Clinical data were collected from patients’ outpatient cards, which included patient’s age, sex,
Durie-Salmon stage of the disease, and findings of clinical tests: hemoglobin, blood serum calcium,
blood serum creatinine, glomerular filtration rate (GFR), M gradient or paraprotein in blood serum
and urine. Clinical data were collected before the beginning of treatment and repeatedly three
months after the beginning of treatment.
Excel and IBM SPSS Statistic programs were applied for data statistical processing and
analysis.
Results
52 patients diagnosed with myeloma for the first time were examined using flow cytometry
method from August 2017 to February 2018. The patients’ average age is 64±11 years, 31 are male
(60%), 21 are female (40%) (Fig. 1).
Figure 1. Gender distribution of patients with multiple myeloma, %
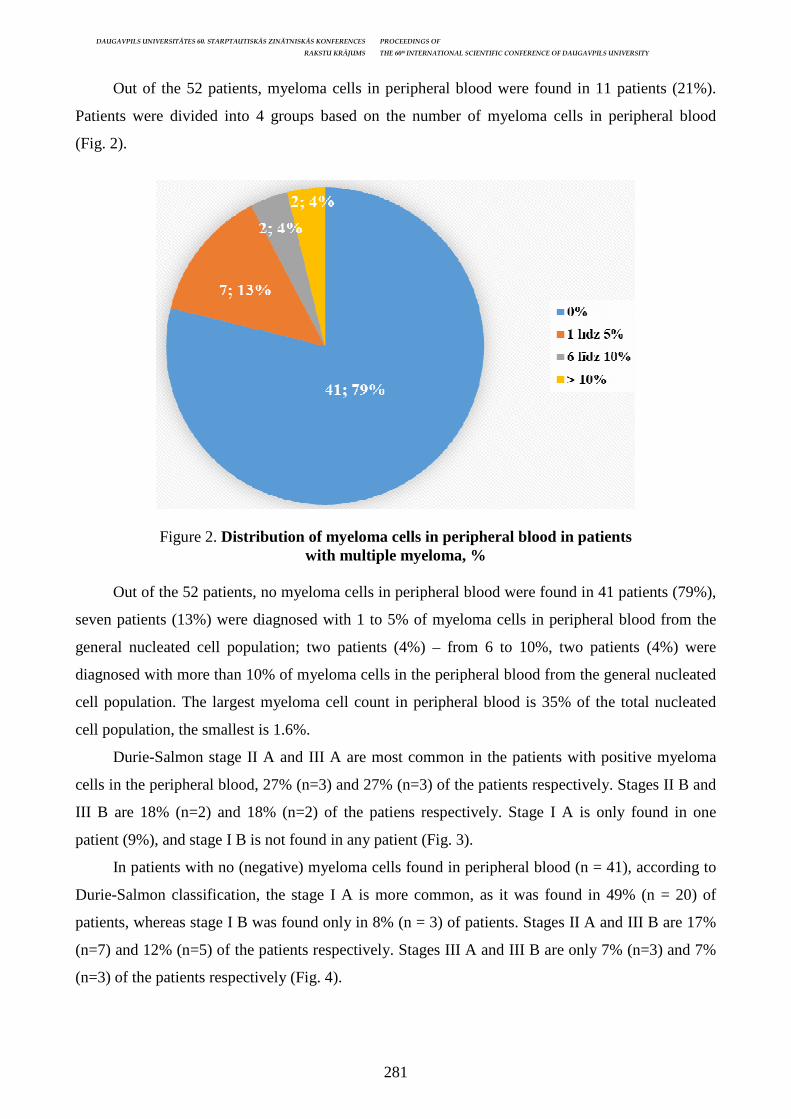
DAUGAVPILS UNIVERSITĀTES 60. STARPTAUTISKĀS ZINĀTNISKĀS KONFERENCES PROCEEDINGS OF
RAKSTU KRĀJUMS THE 60th INTERNATIONAL SCIENTIFIC CONFERENCE OF DAUGAVPILS UNIVERSITY
281
Out of the 52 patients, myeloma cells in peripheral blood were found in 11 patients (21%).
Patients were divided into 4 groups based on the number of myeloma cells in peripheral blood
(Fig. 2).
Figure 2. Distribution of myeloma cells in peripheral blood in patients with multiple myeloma, %
Out of the 52 patients, no myeloma cells in peripheral blood were found in 41 patients (79%),
seven patients (13%) were diagnosed with 1 to 5% of myeloma cells in peripheral blood from the
general nucleated cell population; two patients (4%) – from 6 to 10%, two patients (4%) were
diagnosed with more than 10% of myeloma cells in the peripheral blood from the general nucleated
cell population. The largest myeloma cell count in peripheral blood is 35% of the total nucleated
cell population, the smallest is 1.6%.
Durie-Salmon stage II A and III A are most common in the patients with positive myeloma
cells in the peripheral blood, 27% (n=3) and 27% (n=3) of the patients respectively. Stages II B and
III B are 18% (n=2) and 18% (n=2) of the patiens respectively. Stage I A is only found in one
patient (9%), and stage I B is not found in any patient (Fig. 3).
In patients with no (negative) myeloma cells found in peripheral blood (n = 41), according to
Durie-Salmon classification, the stage I A is more common, as it was found in 49% (n = 20) of
patients, whereas stage I B was found only in 8% (n = 3) of patients. Stages II A and III B are 17%
(n=7) and 12% (n=5) of the patients respectively. Stages III A and III B are only 7% (n=3) and 7%
(n=3) of the patients respectively (Fig. 4).
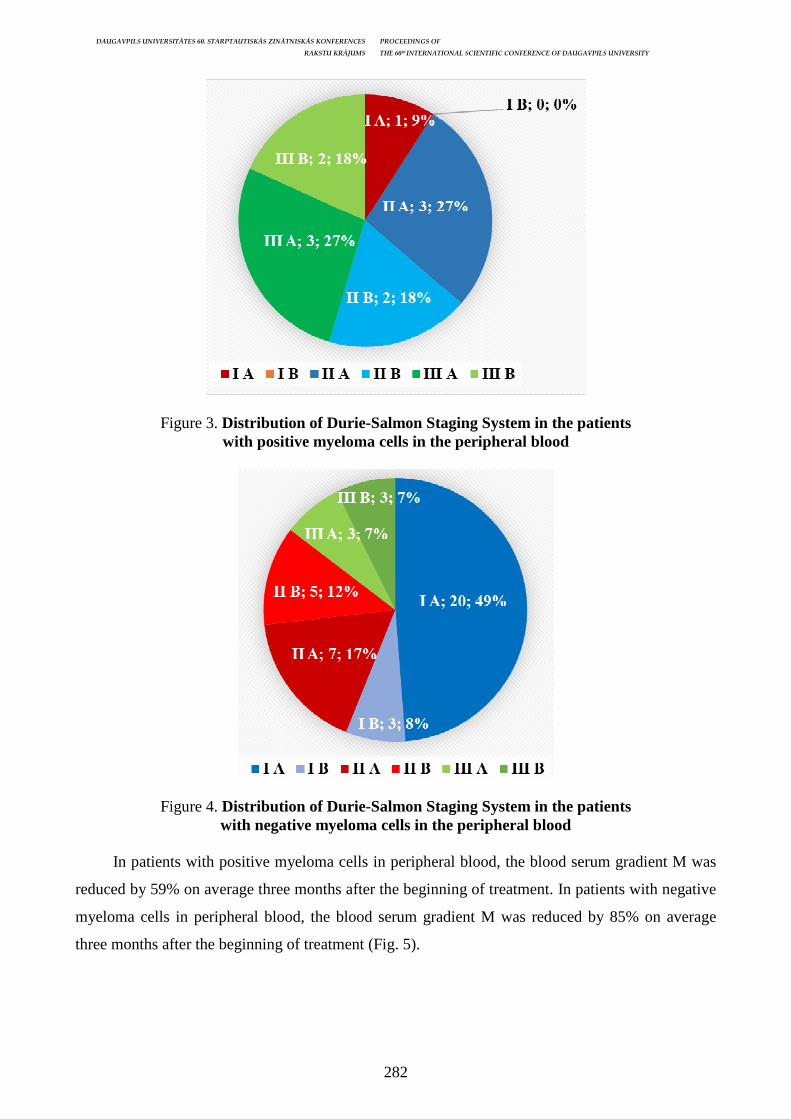
DAUGAVPILS UNIVERSITĀTES 60. STARPTAUTISKĀS ZINĀTNISKĀS KONFERENCES PROCEEDINGS OF
RAKSTU KRĀJUMS THE 60th INTERNATIONAL SCIENTIFIC CONFERENCE OF DAUGAVPILS UNIVERSITY
282
Figure 3. Distribution of Durie-Salmon Staging System in the patients with positive myeloma cells in the peripheral blood
Figure 4. Distribution of Durie-Salmon Staging System in the patients with negative myeloma cells in the peripheral blood
In patients with positive myeloma cells in peripheral blood, the blood serum gradient M was
reduced by 59% on average three months after the beginning of treatment. In patients with negative
myeloma cells in peripheral blood, the blood serum gradient M was reduced by 85% on average
three months after the beginning of treatment (Fig. 5).

DAUGAVPILS UNIVERSITĀTES 60. STARPTAUTISKĀS ZINĀTNISKĀS KONFERENCES PROCEEDINGS OF
RAKSTU KRĀJUMS THE 60th INTERNATIONAL SCIENTIFIC CONFERENCE OF DAUGAVPILS UNIVERSITY
283
Figure 5. The difference in blood serum gradient M of patients with positive and negative myeloma cells in peripheral blood, %
According to the nonparametric Mann-Whitney test, there is a statistically significant
relationship between myeloma cells in peripheral blood at the time of diagnostics and the difference
in blood serum gradient M three months after the beginning of treatment (p = 0.000). P value is
statistically significant, if p < 0.05.
Discussion
Multiple myeloma prognosis is affected by several prognostic indicators determining the
stage of the disease, response to therapy, relapse risk and overall survival (Lejniece 2005; Hanbali
et al. 2017; Li et al. 2017).
Over the last 10 years, myeloma cells in the peripheral blood or circulating plasma cells have
been increasingly studied using flow cytometry method in patients diagnosed with myeloma for the
first time in order to determine their association with the stage of the disease, disease progression
and overall survival (Nowakowski et al. 2005; Granell et al. 2017; Hanbali et al. 2017; Li et al.
2017).
Several studies concluded that plasma cells circulating in peripheral blood in patients with a
newly diagnosed myeloma suggested poor prognosis associated with more aggressive development
of the disease and reduced patient survival rate (Nowakowski et al. 2005; Granell et al. 2017;
Hanbali et al. 2017; Li et al. 2017).
The number of circulating plasma cells measured by flow cytometry in patients with newly
diagnosed multiple myeloma is an independent predictor of survival (Nowakowski et al. 2005). In
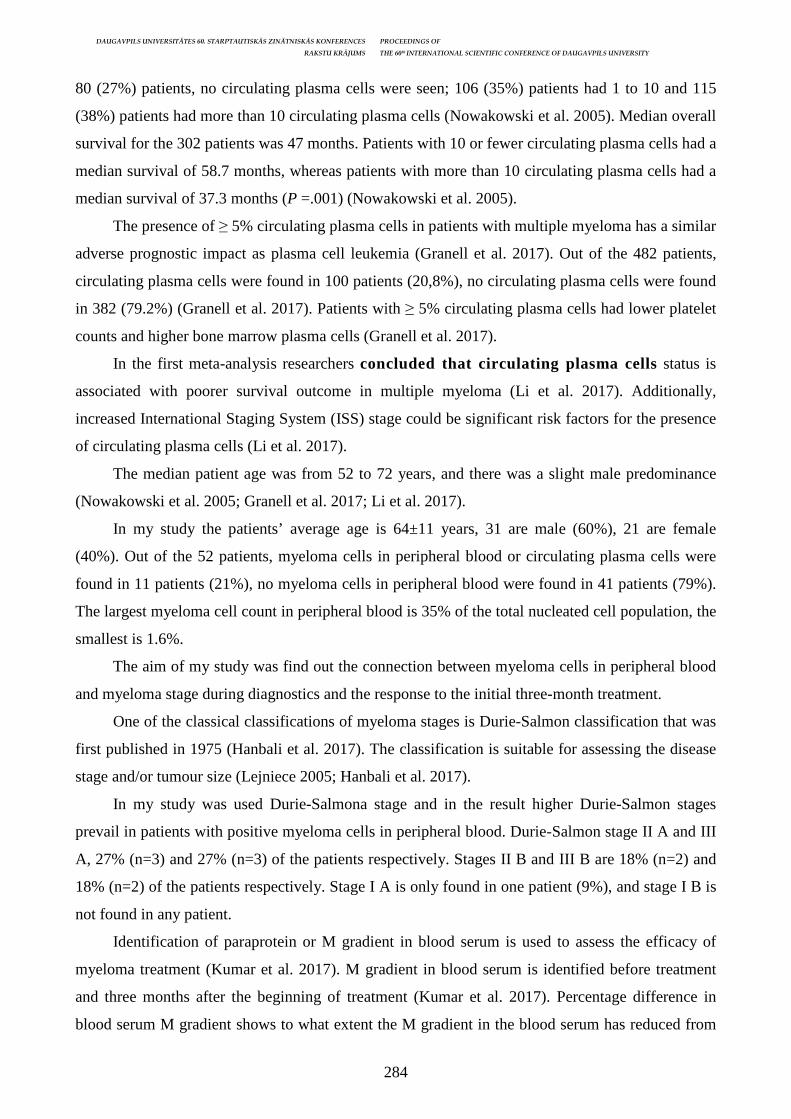
DAUGAVPILS UNIVERSITĀTES 60. STARPTAUTISKĀS ZINĀTNISKĀS KONFERENCES PROCEEDINGS OF
RAKSTU KRĀJUMS THE 60th INTERNATIONAL SCIENTIFIC CONFERENCE OF DAUGAVPILS UNIVERSITY
284
80 (27%) patients, no circulating plasma cells were seen; 106 (35%) patients had 1 to 10 and 115
(38%) patients had more than 10 circulating plasma cells (Nowakowski et al. 2005). Median overall
survival for the 302 patients was 47 months. Patients with 10 or fewer circulating plasma cells had a
median survival of 58.7 months, whereas patients with more than 10 circulating plasma cells had a
median survival of 37.3 months (P =.001) (Nowakowski et al. 2005).
The presence of ≥ 5% circulating plasma cells in patients with multiple myeloma has a similar
adverse prognostic impact as plasma cell leukemia (Granell et al. 2017). Out of the 482 patients,
circulating plasma cells were found in 100 patients (20,8%), no circulating plasma cells were found
in 382 (79.2%) (Granell et al. 2017). Patients with ≥ 5% circulating plasma cells had lower platelet
counts and higher bone marrow plasma cells (Granell et al. 2017).
In the first meta-analysis researchers concluded that circulating plasma cells status is
associated with poorer survival outcome in multiple myeloma (Li et al. 2017). Additionally,
increased International Staging System (ISS) stage could be significant risk factors for the presence
of circulating plasma cells (Li et al. 2017).
The median patient age was from 52 to 72 years, and there was a slight male predominance
(Nowakowski et al. 2005; Granell et al. 2017; Li et al. 2017).
In my study the patients’ average age is 64±11 years, 31 are male (60%), 21 are female
(40%). Out of the 52 patients, myeloma cells in peripheral blood or circulating plasma cells were
found in 11 patients (21%), no myeloma cells in peripheral blood were found in 41 patients (79%).
The largest myeloma cell count in peripheral blood is 35% of the total nucleated cell population, the
smallest is 1.6%.
The aim of my study was find out the connection between myeloma cells in peripheral blood
and myeloma stage during diagnostics and the response to the initial three-month treatment.
One of the classical classifications of myeloma stages is Durie-Salmon classification that was
first published in 1975 (Hanbali et al. 2017). The classification is suitable for assessing the disease
stage and/or tumour size (Lejniece 2005; Hanbali et al. 2017).
In my study was used Durie-Salmona stage and in the result higher Durie-Salmon stages
prevail in patients with positive myeloma cells in peripheral blood. Durie-Salmon stage II A and III
A, 27% (n=3) and 27% (n=3) of the patients respectively. Stages II B and III B are 18% (n=2) and
18% (n=2) of the patients respectively. Stage I A is only found in one patient (9%), and stage I B is
not found in any patient.
Identification of paraprotein or M gradient in blood serum is used to assess the efficacy of
myeloma treatment (Kumar et al. 2017). M gradient in blood serum is identified before treatment
and three months after the beginning of treatment (Kumar et al. 2017). Percentage difference in
blood serum M gradient shows to what extent the M gradient in the blood serum has reduced from
DAUGAVPILS UNIVERSITĀTES 60. STARPTAUTISKĀS ZINĀTNISKĀS KONFERENCES PROCEEDINGS OF
RAKSTU KRĀJUMS THE 60th INTERNATIONAL SCIENTIFIC CONFERENCE OF DAUGAVPILS UNIVERSITY
285
the beginning of myeloma treatment and the extent to the response to initial therapy (Kumar et al.
2017).
In my study in patients with positive myeloma cells in peripheral blood, the blood serum
gradient M was reduced by 59% on average three months after the beginning of treatment. In
patients with negative myeloma cells in peripheral blood, the blood serum gradient M was reduced
by 85% on average three months after the beginning of treatment. According to the nonparametric
Mann-Whitney test, there is a statistically significant relationship between myeloma cells in
peripheral blood at the time of diagnostics and the difference in blood serum gradient M three
months after the beginning of treatment (p = 0.000). P value is statistically significant, if p < 0.05.
Conclusions
1. Out of the 52 patients, myeloma cells in peripheral blood were found in 11 patients (21%).
2. Higher Durie-Salmon stages prevail in patients with positive myeloma cells in peripheral
blood.
3. There is a statistically significant relationship between myeloma cells in peripheral blood at the
time of diagnostics and the difference in blood serum gradient M three months after the
beginning of treatment, therefore the response to therapy in patients with positive myeloma
cells in peripheral blood is worse than in patients with negative myeloma cells in peripheral
blood.
References Granell M., Calvo X., Garcia-Guiсуn A., et al. 2017. Prognostic impact of circulating plasma cells in patients with multiple myeloma: implications for plasma cell leukemia definition. In: Haematologica. Vol. 102(6), pp. 1099–1104. Hanbali A., Hassanein M., Rasheed W., et al. 2017. The Evolution of Prognostic Factors in Multiple Myeloma. In: Advances in Hematology. Vol. 2017, pp. 1–11. Kasper D. L., Fauci A. S., Hauser S. L., Longo D. L., Jameson J. L., Loscalzo J. Harrison'sTM Principles of Internal Medicine, Nineteenth Edition. New York: McGraw Hill Education, 2015. Part 7, Section 2, Chapter 136. Kumar S. K., Callander N. S., Alsina M., et al. 2017. Multiple Myeloma, Version 3.2017: Clinical Practice Guidelines in Oncology. In: Journal of the National Comprehensive Cancer Network. Vol.15, pp. 230–269. Lejniece S. 2005. Klīniskā hematoloģija. Rīga: Nacionālais Medicīnas Apgāds. 181.–194. lpp. Li J., Wang N., Tesfaluul N., et al. 2017. Prognostic value of circulating plasma cells in patients with multiple myeloma: A meta-analysis. In: PLoS ONE. Vol. 12(7): e0181447. Moreau P., Facon T., Leleu X., et al. 2002. Recurrent 14q32 translocations determine the prognosis of multiple myeloma, especially in patients receiving intensive chemotherapy. In: Blood. Vol. 100(5) pp. 1579–1583. Moreau P., Miguel J. S., Sonneveld P., et al. 2017. Multiple myeloma: ESMO Clinical Practice Guidelines for diagnosis, treatment and follow-up. In: Annals of Oncology. Vol. 28(4), pp. iv52–iv61. Nowakowski G. S., Witzig T. E., Dingli D., et al. 2005. Circulating plasma cells detected by flow cytometry as a predictor of survival in 302 patients with newly diagnosed multiple myeloma. In: Blood. Vol. 106(7), pp. 2276–2279.

DAUGAVPILS UNIVERSITĀTES 60. STARPTAUTISKĀS ZINĀTNISKĀS KONFERENCES PROCEEDINGS OF
RAKSTU KRĀJUMS THE 60th INTERNATIONAL SCIENTIFIC CONFERENCE OF DAUGAVPILS UNIVERSITY
286
Sergentanis T. N., Zagouri F., Tsilimidos G., et al. 2015. Risk Factors for Multiple Myeloma: A Systematic Review of Meta-Analyses. In: Clinical Lymphoma, Myeloma & Leukemia. Vol. 15(10), pp. 563–577. Slimību profilakses un kontroles centrs. 12.06.2017. Onkoloģija. Statistikas dati par pacientu skaitu sadalījumā pa reģioniem, lokalizācijas veidiem, dzimuma un vecuma grupām no 2011. gada līdz 2016. gadam. Slimību profilakses un kontroles centrs. [skatīts 09.09.2017] Pieejams: https://www.spkc.gov.lv/lv/statistika-un-petijumi/statistika/veselibas-aprupes-statistika1/get/nid/14 Луговская С.А, Почтарь М.Е. 2016. Гематологический атлас. Москва. с. 236–241.
DAUGAVPILS UNIVERSITĀTES 60. STARPTAUTISKĀS ZINĀTNISKĀS KONFERENCES PROCEEDINGS OF
RAKSTU KRĀJUMS THE 60th INTERNATIONAL SCIENTIFIC CONFERENCE OF DAUGAVPILS UNIVERSITY
287
CONTROL AND MANAGEMENT OF GLYCEMIA IN ACUTELY HOSPITALIZED DIABETES MELLITUS
PATIENTS IN SURGERY DEPARTMENT
Olga Jermakova, Larisa Umnova Rīga Stradiņš University, Dzirciema iela 16, Rīga, [email protected], [email protected] Abstract
Control and management of glycemia in acutely hospitalized diabetes mellitus patients in surgery department Key Words: diabetes mellitus, surgery department, glycemia management Introduction. Nowadays diabetes mellitus (DM) is one of the most widespread dieses. DM patients have higher risk to develop acute surgical diseases such as purulent infections, lower limb ischemia, cholecystitis etc. Acutely hospitalized DM patients don’t receive adequate preoperative evaluation and arrangements. Furthermore, surgical procedures, anaesthesia and fasting can cause unstable glycemia levels and that is why good perioperative management of glycemia is extremely important for these patients. Aim. To investigate control and management of glycemia in acutely hospitalized diabetes mellitus patients in surgery department. Material and methods: In this retrospective research were enrolled 100 patients with DM and control group of 60 patients without DM. All patients where acutely hospitalized in Pauls Stradiņš Clinical University Hospital general surgery departments during 2014-2017. From medical histories were obtained information about their diagnoses, therapy, glycemia levels and further DM management recommendations. Results. In group of DM patients mayor part (60%) had normal glycemia levels during hospitalization, 32% had hyperglycemia above 10 mmol/l, 6% had hypoglycemia under 4 mmol/l and two patients didn’t have any data about glycemia levels. 56% of DM patients didn’t have any anti-diabetic therapy prescriptions mentioned in their medical histories, despite 14% of them were found with hyperglycemia. In surgically treated patient’s prevalence of hyperglycemia was approximately 3 times bigger than in patients who received conservative therapy (56% and 18%) and prevalence of hypoglycemia was almost 2 times bigger (7% and 4%). Prevalence of hyper and hypoglycemia was also more common in insulin dependent patients - 51% and 17% respectively, compering to insulin independent patients - 23% and 2% respectively. 54% DM patients didn’t receive any recommendations about necessary further DM management, 28% of recommendations were partly satisfying and only 18% had full recommendations which included medications with precise dosage, reminder about DM diet and regular glycemia control. In control group only 2 patients were found with hyperglycemia above 10 mmol/l and both received short term insulin therapy and 5 had hypoglycemia under 4 mmol/l. Conclusion. management of hyperglycemia in acutely hospitalized DM patients in surgery department still isn’t satisfying. However, prevalence of hypoglycemia is sufficiently low. According to acquired data special attention need patients who undergo surgical treatment and those who are insulin dependent because these two groups showed more labile blood glucose levels. Kopsavilkums Atslēgvārdi: cukura diabēts, ķirurģijas klīnika, glikēmijas uzraudzība Ievads. Mūsdienās cukura diabēts (CD) ir viena no izplatītākajām saslimšanām. CD pacientiem ir daudz lielāks risks iegūt akūtas ķirurģiskas saslimšanas tādas kā strutainas infekcijas, apakšējo ekstremitāšu išēmija, holecistīts u.c. Akūti hospitalizētiem CD pacientiem nav iespējams saņemt adekvātu preoperatīvu novērtēšanu un sagatavošanas pasākumus. Pie tam, ķirurģiskas procedūras, anastēzija un badošanās var izsaukt nestabilus glikēmijas līmeņus, kas arī nosaka kādēļ perioperatīva glikēmijas uzraudzība šiem pacientiem ir tik svarīga. Mērķis. izpētīt glikēmijas kontroli un uzraudzību ķirurģijas nodaļā akūti satcionētiem CD pacientiem. Materiāli un metodes: Šajā retrospektīvajā pētijumā tika iekļauti 100 pacienti ar CD un kontroles grupa ar 60 pacientiem bez CD. Visi pacienti bija akūti stacionēti Paula Stradiņa Klīniskās universitātes slimnīcas vispārējās ķirurģijas nodaļās laika periodā no 2014. līdz 2017. gadam. No pacientu medicīniskajām vēsturēm tika iegūta informācija par viņu diagnozēm, terapiju, glikēmijas rādītājiem un rekomendācijām par turpmāko CD kontroli. Rezultāti. CD pacientu grupā lielākai daļai pacientu (60%) stacionēšanas laikā bija normāls glikēmijas līmenis, 32% bija hiperglikēmija virs 10 mmol/l, 6% bija hipoglikēmija zem 4 mmol/l un divu pacientu medicīniskajās vēsturēs netika atrasti nekādi dati par glikēmijas līmeni. 56% gadījumu CD pacientu medicīniskajās vēsturēs nebija nekādu datu par diabēta terapiju, neskatoties uz to, ka 14% no šiem pacientiem bija atklāta hiperglikēmija.
DAUGAVPILS UNIVERSITĀTES 60. STARPTAUTISKĀS ZINĀTNISKĀS KONFERENCES PROCEEDINGS OF
RAKSTU KRĀJUMS THE 60th INTERNATIONAL SCIENTIFIC CONFERENCE OF DAUGAVPILS UNIVERSITY
288
Ķirurģiski arstētiem pacientiem hiperglikēmijas prevalence bija aptuveni trīs reizes lielāka nekā pacientiem, kuri saņēma konservatīvo terapiju (56% un 18%) un hipoglikēmija prevalence bija gandrīz divas reizes lielāka (7% un 4%). Hiper un hipoglikēmijas biežums bija lielāks arī insulīnatkarīgo CD pacientu vidū – respektītvi 51% un 17%, salīdzinot ar insulīnneatkarīgiem CD pacientiem – respektīvi 23% un 2%. 54% CD pacientu nesaņēma nekādas rekomendācijas par turpmāko nepieciešamo CD kontroli, 28% gadījumu šīs rekomendācijas bija daļēji apmierinošas un tikai 18% rekomendāciju saturēja pilnīgu informāciju par medikamentiem un to precīzu devu, atgādinājumu par CD diētu un regulāru glikēmijas kontroli. Kontroles grupā tikai 2 pacientiem tika konstatēta hiperglikēmija virs 10 mmol/l un abi saņēma īstermiņa insulīna terapiju. 5% kontroles grupā bija konstatēta hipoglikēmija zem 4 mmol/l. Secinājumi. hiperglikēmijas kontrole ķirurģijas nodaļā akūti stacionētiem CD pacientiem pagaidām nav pietiekami apmierinoša. Lai gan hipoglikēmijas prevalence ir pietiekoši zemā līmenī. Saskaņā ar iegūtiem datiem, īpaša uzraudzība nepieciešama pacientiem, kuri saņem ķirurģisko ārstēšanu un insulīnatkarīgiem pacientiem, jo šīs divas grupas uzrādīja vissvārstīgākos glikēmijas līmeņus.
Introduction
According to the literature nowadays diabetes mellitus (DM) is one of the most widespread
dieses. Its prevalence in the world rises above 400 million of people. Patients with DM very often
are hospitalized in surgery departments not only because of high frequency of diabetes but also
because they have higher risk of developing acute diseases which require surgical intervention such
as purulent infections, lower limb ischemia due to atherosclerosis, cholecystitis etc. (Clement 2004)
Majority of acutely hospitalized DM patients don’t receive satisfactory preoperative evaluation and
arrangements. Furthermore, surgical procedures, anaesthesia, preoperative and postoperative fasting
can cause unstable blood glycose levels and that is why adequate perioperative management of
glycemia is extremely important for these patients. (Elizabeth 2017)
The Aim of the Article
The aim of this study was to investigate control and management of glycemia in acutely
hospitalized diabetes mellitus patients in surgery department.
Material and methods
In this retrospective research were enrolled 100 patients with DM type 1 and type 2 aged 23 to
90 years (mean age - 71 years) and control group of 60 patients without any type of DM 25 to 93
years old (mean age – 65 years). Group of DM patients consisted of 61 women and 39 men. In torn
in control group were included 29 woman and 31 men. Patients from both groups where acutely
hospitalized in Pauls Stradiņš Clinical University Hospital general surgery departments during the
period 2014-2017. Causes of hospitalization were different: acute calculous cholecystitis, bile duct
stricture, incarcerated hernia, peripheral vascular disease, acute pancreatitis, erysipelas, acute
appendicitis, diverticulitis, purulent infections etc. From medical histories of patients were obtained
information about their surgical diagnoses, age, sex, general therapy, type of anesthesia, length of
stay in hospital, new macrovascular complications during hospitalization, blood glucose levels
during hospitalization, method used to measure blood sugar (capillary or venous samples,
laboratory or glucometer), prescribed anti-diabetic therapy (insulin or oral hypoglycemic agents)

DAUGAVPILS UNIVERSITĀTES 60. STARPTAUTISKĀS ZINĀTNISKĀS KONFERENCES PROCEEDINGS OF
RAKSTU KRĀJUMS THE 60th INTERNATIONAL SCIENTIFIC CONFERENCE OF DAUGAVPILS UNIVERSITY
289
and further DM treatment and management recommendations which patient receive after leaving
hospital.
Results
In group of DM patients only one had DM type 1. The rest 99 patients had DM type 2 and 28
of them were insulin dependent. Additionally, 4 patients were primary diagnosed with DM type 2.
Surgical treatment had 41% of patients, 44% received conservative treatment and 15% of patients
had minimally invasive procedures like endoscopic retrograde cholangiopancreatography,
percutaneous punctures, stent implantations etc.
Most part of patients - 60% had normal glycemia, 32% had hyperglycemia above 10 mmol/l,
6% were found with hypoglycemia under 4 mmol/l and 2 patients didn’t have any data about blood
glucose levels. Important is that 34% of patients with hyperglycemia didn’t have any anti-diabetic
therapy prescription mentioned in their medical cards. Furthermore, majority of patients
independently from their glycemia level (56%) didn’t have any anti-diabetic therapy prescriptions
mentioned.
In patients who were treated surgically, prevalence of hyperglycemia was approximately 3
times bigger than in patients who received conservative therapy (56% and 18%) and prevalence of
hypoglycemia was almost 2 times bigger (7% and 4%). Prevalence of hyper and hypoglyaemia was
also more common in insulin dependent patients - 51% and 17% respectively, compering to insulin
independent patients - 23% and 2% respectively.
Regarding macrovascular complications, one patient had case of pulmonary embolism on the
third day of hospitalization and other one had stroke on fourth day of hospitalization. Both patients
had glycaemia above 10 mmol/l and only patient with pulmonary embolism had anti-diabetic
therapy prescriptions mentioned in his medical history.
More than a half of patients (54%) didn’t receive any recommendations about necessary
further DM treatment and management. 28% of recommendations were partly satisfying and only
included visit of endocrinologist, diet or DM control without any details. Only 18% had full
recommendations who included medications with precise dosage, reminder about DM diet and
regular blood sugar and glycated hemoglobin control.
In control group only two patients were found with hyperglycemia above 10 mmol/l and both
received short term insulin therapy and 5 had glycaemia under 4 mmol/l. No patients from control
group were found with macrovascular complications.
Discussion
It is obvious that acute patients don’t have opportunity to receive adequate preoperative
evaluation and arrangements because of sudden onset of the problem. On the one hand, because of
stress or disease caused incapacity, they can forget to take their regular hypoglycemic pill or inject

DAUGAVPILS UNIVERSITĀTES 60. STARPTAUTISKĀS ZINĀTNISKĀS KONFERENCES PROCEEDINGS OF
RAKSTU KRĀJUMS THE 60th INTERNATIONAL SCIENTIFIC CONFERENCE OF DAUGAVPILS UNIVERSITY
290
insulin. Furthermore, surgical stress and anaesthesia make situation worth by inducing secretion of
counterregulatory hormones such as catecholamines, cortisol, glucagon, and growth hormone, alters
insulin action and leads to hyperglycemia. (Elizabeth 2017) This statement explains why in our
study prevalence of hyperglycemia is three times bigger in surgically treated patients than in
patients who received conservative therapy.
On the other hand, due to preoperative fasting, DM patients may not receive necessary
amount of carbohydrates and develop hypoglycemia, especially if previously patient had
administered insulin. All these factors lead to unstable levels of blood glucose and further
postoperative complications. (Frisch 2010)
According to literature suggestible perioperative blood glucose levels are between 8 and 11
mmol/l. (Sivakumar 2015) In our study we can see that unfortunately 32% of DM patients had
hyperglycemia above 10 mmol/l and the biggest prevalence of increased blood glucose level was
present in insulin dependent patients who didn’t receive adequate insulin therapy.
Other studies have proven that hyperglycemia causes higher risk of postoperative
complications and mortality. (Frisch 2010) (Kotagal 2015) Possible complications are infections,
renal failure, ketoacidosis, or macrovascular complications such as stroke or myocardial infarction.
However, other study has shown that adequate perioperative insulin therapy can significantly
decrease this risk. (Kwon 2013) Concerning complications of hyperglycemia in our study, only two
patients had developed macrovascular complications. One patient had case of pulmonary embolism
on the third day of hospitalization and other one had stroke on fourth day of hospitalization. Both
patients had glycaemia above 10 mmol/l, however, only patient with pulmonary embolism had anti-
diabetic therapy prescriptions mentioned in his medical history.
Adequate insulin therapy has great importance in management of DM. This therapy may be
necessary not only for insulin dependent patients but also for patients with insulin independent DM
who due to disease or surgery can’t administer food by mouth. However, are studies that show that
intensive insulin treatment may cause hypoglicemia which can lead to higher risk of mortality.
(Griesdale 2009) In our study only 6% of patient with DM were found with hypoglicemia under 4
mmol/l. And as in the case of hyperglicemia, most of them were insulin dependent, however
according to their medical histories only two of them received treatment with insulin.
The major difficulty of this research was lack of data in patient’s medical histories.
Unfortunately, the information about prescribed medications in surgery department often isn’t filled
completely, especially if these medications are not associated with treatment of surgical pathology.
Frequently, there is no data about the amount of administered medication, the time or the way of
administration. Other problem was lack of information about diet of patient. All these factors
without a doubt are very important for analysis of effectiveness of anti-diabetic therapy.
DAUGAVPILS UNIVERSITĀTES 60. STARPTAUTISKĀS ZINĀTNISKĀS KONFERENCES PROCEEDINGS OF
RAKSTU KRĀJUMS THE 60th INTERNATIONAL SCIENTIFIC CONFERENCE OF DAUGAVPILS UNIVERSITY
291
Conclusions
Management of hyperglycemia in acutely hospitalized diabetes mellitus patients in surgery
department still isn’t satisfying. However, prevalence of hypoglycemia is sufficiently low.
According to acquired data special attention need patients who undergo surgical treatment and those
who are insulin dependent because these two groups showed more labile blood glucose levels.
Acknowledgement
I would like to thank my supervisor Assist. Prof. Larisa Umnova for leading this research.
References Clement S, Braithwaite SS, Magee MF, Ahmann A, Smith EP, Schafer RG, Hirsch IB, Hirsh IB. Management of diabetes and hyperglycemia in hospitals. Diabetes Care 2004; 27: 553–591. Elizabeth W. Duggan, M. D.; Karen Carlson, M. D., M.B.A.; Guillermo E. Umpierrez, M. D., C.D.E. Anesthesiology 3 2017, Vol. 126, 547–560. doi:10.1097 Frisch A, Chandra P. Smiley D. Peng L. Rizzo M. Gatcliffe C. Hudson M. Mendoza J. Johnson R. Lin E. Umpierrez, GE. Prevalence and clinical outcome of hyperglycemia in the perioperative period in noncardiac surgery. Diabetes Care. 2010; 33: 1783–8. Griesdale DE, de Souza RJ, van Dam RM, Heyland DK, Cook DJ, Malhotra A, Dhaliwal R, Henderson WR, Chittock DR, Finfer S, Talmor D. Intensive insulin therapy and mortality among critically ill patients: A meta-analysis including NICE-SUGAR study data. CMAJ. 2009; 180: 821–7. Kotagal M, Symons RG, Hirsch IB, Umpierrez GE, Dellinger EP, Farrokhi ET, Flum DR; SCOAP-CERTAIN Collaborative. Perioperative hyperglycemia and risk of adverse events among patients with and without diabetes. Ann Surg. 2015; 261: 97–103. Kwon S, Thompson R, Dellinger P, Yanez D, Farrohki E, Flum D. Importance of perioperative glycemic control in general surgery: A report from the Surgical Care and Outcomes Assessment Program. Ann Surg. 2013; 257: 8–14. Sivakumar Sudhakaran, Salim R. Surani. Guidelines for Perioperative Management of the Diabetic Patient. Surg Res Pract. 2015; 2015: 284063.
DAUGAVPILS UNIVERSITĀTES 60. STARPTAUTISKĀS ZINĀTNISKĀS KONFERENCES PROCEEDINGS OF
RAKSTU KRĀJUMS THE 60th INTERNATIONAL SCIENTIFIC CONFERENCE OF DAUGAVPILS UNIVERSITY
292
REFRACTIVE OUTCOME AND IMPROVEMENT OF VISUAL ACUITY AFTER CATARACT SURGERY
WITH SUBLUXATED LENSES Dairis Meiers1, Juris Vanags2, Valdis Dakuļs1, Guna Laganovska2, 3 1 Riga Stradins University, Dzirciema street 16, Riga, LV-1007, [email protected] 2 Departmant of Ophthalmology, Pauls Stradins Clinical University Hospital, Riga, Latvia 3 Riga Stradins University, Dzirciema street 16, Riga Abstract
Refractive outcome and improvement of visual acuity after cataract surgery with subluxated lenses Key Words: Cataract surgery, subluxated lenses, refractive outcome Introduction. Phacoemulsification with capsular tension ring and intraocular lens implantation provide high visual acuity after procedure. There still are patients with low postoperative visual acuity, which means that there are influencing factors that should be identified, e.g., type of capsular tension ring. Aim of the study. The aim of the study was to evaluate the improvement of visual acuity and the refractive outcome three months after cataract surgery with subluxated lenses and to find out, whether the type of capsular tension ring could be considered as influencing factor of postoperative refraction and visual acuity. Material and methods. Retrospective study included 28 eyes of 28 unique patients suffering from lens subluxation and cataract who underwent phacoemulsification’s cataract surgery. All patients underwent preoperative evaluation and postoperative investigation in 3 months after surgery. In the study, as possible influencing factor of visual acuity refractive outcome was evaluated the type of capsular tension ring used in cataract surgery with subluxated lenses - unmodified capsular tension ring (CTR) and Cionni CTR. Statistical analysis was performed using IBM SPSS Statistics Version 25. Results. The postoperative UCVA for all patients was 0,54 ± 0,25. For CTR group postoperative UCVA was 0,64±0,18, but for Cionni CTR group 0,39±0,28 (p=0.041). Refractive outcome of CTR group was 0,60±0,52 D, but in Cionni CTR group refractive outcome was 0,84±0,34D (p=0.671) Conclusions. Cataract surgery with subluxated lenses outcome showed high quality of this procedure. The study revealed statistically significant difference in postoperative visual acuity between CTR and Cionni CTR group, and the better results and postoperative visual acuity were in CTR group. The type of CTR could be considered as outcome of cataract surgery influencing factor. The study did not show statistically significant correlation between refractive outcome and the type of CTR. Kopsavilkums
Refrakt īvais iznākums un redzes asuma uzlabošanās pēc kataraktas operācijas subluksētām lēcām Atslēgvārdi: Kataraktas ķirurģija, subuksētas lēcas, refraktīvais iznākums Ievads. Fakoemulsifikācijas procedūra ar kapsulas gredzena un IOL implantāciju nodrošina būtisku redzes asuma uzlabošanos. Tomēr ir arī pacienti, kam redzes asums ir relatīvi zems, tāpēc ir jāatrod ietekmējošie faktori, piemēram, kapsula gredzena veids. Mērķis. Pētījuma mērķis ir izvērtēt redzes asuma izmaiņas un refraktīvo iznākumu trīs mēnešus pēc kataraktas operācijas subluksētām lēcām un noskaidrot, vai kapsulas gredzena veidu var uzskatīt par operācijas iznākuma ietekmējošo faktoru. Materi āli un metodes. Retrospektīvajā pētījumā tika iekļauti 28 pacienti ar attiecīgi 28 kataraktas operācijām subluksētām lēcām. Pacientiem tika veikta izmeklēšana pirms operācijas un 3 mēnešus pēc operācijas. Pētījumā kā potenciāli ietekmējošais faktors redzes asumam un refrakcijai pēc operācijas tika uzskatīts kapsulas gredzena veids – nemodificēts kapsulas gredzens (CTR) vai Cionni CTR. Statistiskā analīze tika veikta ar IBM SPSS Statistics 25. Rezultāti. Vidējais redzes asums pēc operācijas bija 0,54 ± 0,25. CTR grupā redzes asums bija 0,64±0,18, bet Cionni CTR grupā - 0,39±0,28 (p=0.041). Refraktīvais iznākums CTR grupā bija 0,60±0,52 D, bet Cionni CTR grupā - 0,84±0,34D (p=0.671) Secinājumi. Kataraktas operācijas subluksētām lēcām tika veiktas augstā kvalitātē. Pētījums atklāja statistiski nozīmīgu atšķirību pēcoperācijas redzes asumā starp CTR grupu un Cionni CTR grupu. Labāks redzes asums pēc operācijas bija CTR grupā, tāpēc CTR veidu var uzskatīt par operācijas iznākumu ietekmējošu faktoru. Pētījums neuzrādīja statistiski nozīmīgu atšķirību refraktīvajā iznākumā starp abām grupām.
Introduction
Cataract surgery has a very important role in improving quality of vision and life for cataract
patients with subluxated lenses. The phacoemulsification is the leading technique in cataract
DAUGAVPILS UNIVERSITĀTES 60. STARPTAUTISKĀS ZINĀTNISKĀS KONFERENCES PROCEEDINGS OF
RAKSTU KRĀJUMS THE 60th INTERNATIONAL SCIENTIFIC CONFERENCE OF DAUGAVPILS UNIVERSITY
293
surgery. Phacoemulsification with capsular tension ring and intraocular lens implantation provide
high visual acuity after procedure, increasing quality of life and vision. The cause of lens
subluxation can be congenital (e.g., Marfan syndrome, homocystinuria) or acquired (e.g., blunt
trauma, pseudoexfoliation syndrome). Lens subluxation is characterized by a weakness or absence
of zonular support (Hoffman 2013). Various techniques and devices have been developed for
cataract surgeries involving subluxated lenses (Blecher 2008). Capsular tension rings (CTR) are
indicated for the stabilization of the capsular bag in the presence of weakened or compromised
zonules (Cionni 2003). There are two main types of CTR – classic CTR and Cionni CTR.
Difference is that Cionni CTR is specifically designed for scleral fixation with suture, but classic
CTR is not. These techniques and devices allow for the implantation of various Intra ocular lenses
(IOL) of improved material and design (Hayashi 2005).
Although cataract surgery is very effective, there still are patients with low postoperative
visual acuity, which means that there are influencing factors that should be identified, e.g., type of
capsular tension ring.
Aim of the study
The aim of the study was to evaluate the improvement of visual acuity and the refractive
outcome three months after cataract surgery with subluxated lenses in Pauls Stradins Clinical
University Hospital and to find out, whether the type of capsular tension ring could be considered as
influencing factor of postoperative refraction and visual acuity.
Material and methods
Retrospective study included 28 eyes of 28 unique patients suffering from lens subluxation
and cataract who underwent phacoemulsification’s cataract surgery with intraocular lens
implantation. Surgeries were done in Pauls Stradins Clinical University Hospital, Ophthalmology
clinic between 2011 and 2013. Data were collected at preoperative evaluation (preoperative visual
acuity) and postoperative follow-up three months after surgery (postoperative refraction and visual
acuity).
All patients underwent preoperative evaluation including biometry measurement using Carl
Zeiss IOL Master v5 optical biometer to assess axial length (AL) of an eye, anterior chamber
length, corneal power and to calculate IOL power. If the investigated lens was too cataractous, the
AL was measured via an A-scan ultrasound biometry and then manually added to the IOL Master
data sheet. The target refraction after cataract surgery was an emmetropia.
Preoperative investigation also includes the determination of uncorrected visual acuity
(UCVA) and best corrected visual acuity of each patient. Patients were asked and after that
evaluated whether they have such comorbidity as glaucoma. Three months after cataract surgery, all
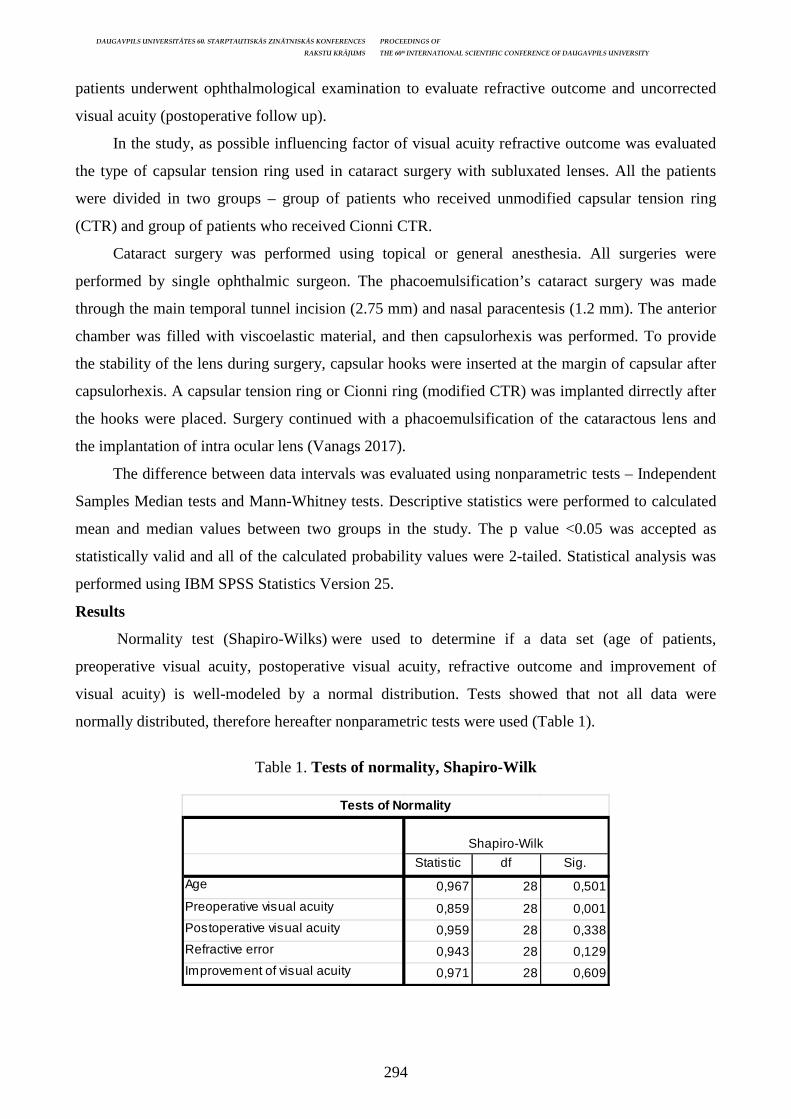
DAUGAVPILS UNIVERSITĀTES 60. STARPTAUTISKĀS ZINĀTNISKĀS KONFERENCES PROCEEDINGS OF
RAKSTU KRĀJUMS THE 60th INTERNATIONAL SCIENTIFIC CONFERENCE OF DAUGAVPILS UNIVERSITY
294
patients underwent ophthalmological examination to evaluate refractive outcome and uncorrected
visual acuity (postoperative follow up).
In the study, as possible influencing factor of visual acuity refractive outcome was evaluated
the type of capsular tension ring used in cataract surgery with subluxated lenses. All the patients
were divided in two groups – group of patients who received unmodified capsular tension ring
(CTR) and group of patients who received Cionni CTR.
Cataract surgery was performed using topical or general anesthesia. All surgeries were
performed by single ophthalmic surgeon. The phacoemulsification’s cataract surgery was made
through the main temporal tunnel incision (2.75 mm) and nasal paracentesis (1.2 mm). The anterior
chamber was filled with viscoelastic material, and then capsulorhexis was performed. To provide
the stability of the lens during surgery, capsular hooks were inserted at the margin of capsular after
capsulorhexis. A capsular tension ring or Cionni ring (modified CTR) was implanted dirrectly after
the hooks were placed. Surgery continued with a phacoemulsification of the cataractous lens and
the implantation of intra ocular lens (Vanags 2017).
The difference between data intervals was evaluated using nonparametric tests – Independent
Samples Median tests and Mann-Whitney tests. Descriptive statistics were performed to calculated
mean and median values between two groups in the study. The p value <0.05 was accepted as
statistically valid and all of the calculated probability values were 2-tailed. Statistical analysis was
performed using IBM SPSS Statistics Version 25.
Results
Normality test (Shapiro-Wilks) were used to determine if a data set (age of patients,
preoperative visual acuity, postoperative visual acuity, refractive outcome and improvement of
visual acuity) is well-modeled by a normal distribution. Tests showed that not all data were
normally distributed, therefore hereafter nonparametric tests were used (Table 1).
Table 1. Tests of normality, Shapiro-Wilk
Statistic df Sig.
Age 0,967 28 0,501
Preoperative visual acuity 0,859 28 0,001
Postoperative visual acuity 0,959 28 0,338
Refractive error 0,943 28 0,129
Improvement of visual acuity 0,971 28 0,609
Shapiro-Wilk
Tests of Normality
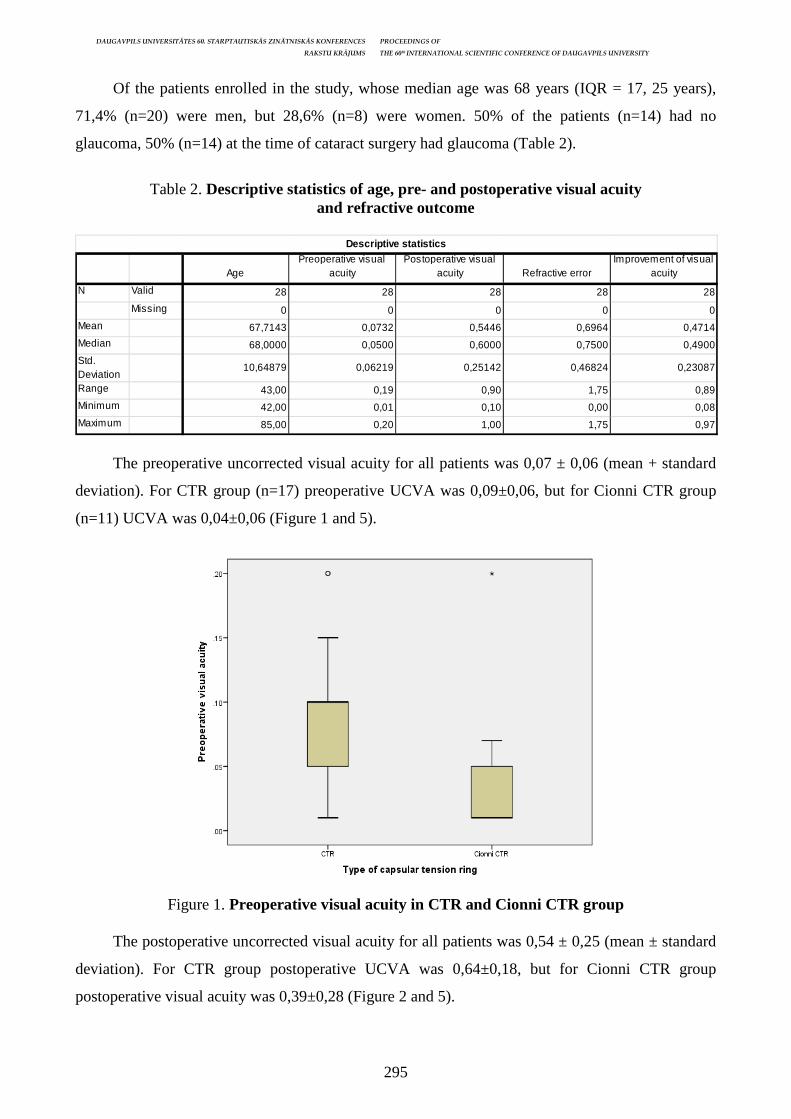
DAUGAVPILS UNIVERSITĀTES 60. STARPTAUTISKĀS ZINĀTNISKĀS KONFERENCES PROCEEDINGS OF
RAKSTU KRĀJUMS THE 60th INTERNATIONAL SCIENTIFIC CONFERENCE OF DAUGAVPILS UNIVERSITY
295
Of the patients enrolled in the study, whose median age was 68 years (IQR = 17, 25 years),
71,4% (n=20) were men, but 28,6% (n=8) were women. 50% of the patients (n=14) had no
glaucoma, 50% (n=14) at the time of cataract surgery had glaucoma (Table 2).
Table 2. Descriptive statistics of age, pre- and postoperative visual acuity
and refractive outcome
AgePreoperative visual
acuityPostoperative visual
acuity Refractive errorImprovement of visual
acuity
N Valid 28 28 28 28 28
Missing 0 0 0 0 0
Mean 67,7143 0,0732 0,5446 0,6964 0,4714
Median 68,0000 0,0500 0,6000 0,7500 0,4900
Std. Deviation
10,64879 0,06219 0,25142 0,46824 0,23087
Range 43,00 0,19 0,90 1,75 0,89
Minimum 42,00 0,01 0,10 0,00 0,08
Maximum 85,00 0,20 1,00 1,75 0,97
Descriptive statistics
The preoperative uncorrected visual acuity for all patients was 0,07 ± 0,06 (mean + standard
deviation). For CTR group (n=17) preoperative UCVA was 0,09±0,06, but for Cionni CTR group
(n=11) UCVA was 0,04±0,06 (Figure 1 and 5).
Figure 1. Preoperative visual acuity in CTR and Cionni CTR group
The postoperative uncorrected visual acuity for all patients was 0,54 ± 0,25 (mean ± standard
deviation). For CTR group postoperative UCVA was 0,64±0,18, but for Cionni CTR group
postoperative visual acuity was 0,39±0,28 (Figure 2 and 5).
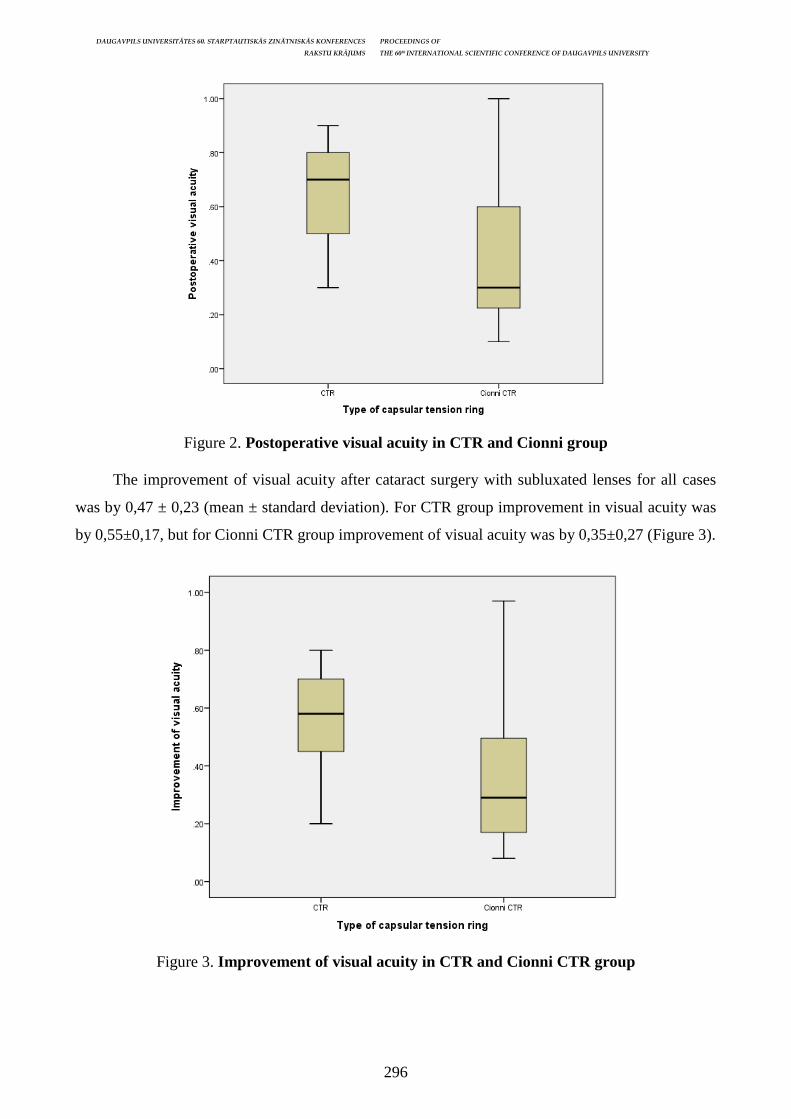
DAUGAVPILS UNIVERSITĀTES 60. STARPTAUTISKĀS ZINĀTNISKĀS KONFERENCES PROCEEDINGS OF
RAKSTU KRĀJUMS THE 60th INTERNATIONAL SCIENTIFIC CONFERENCE OF DAUGAVPILS UNIVERSITY
296
Figure 2. Postoperative visual acuity in CTR and Cionni group
The improvement of visual acuity after cataract surgery with subluxated lenses for all cases
was by 0,47 ± 0,23 (mean ± standard deviation). For CTR group improvement in visual acuity was
by 0,55±0,17, but for Cionni CTR group improvement of visual acuity was by 0,35±0,27 (Figure 3).
Figure 3. Improvement of visual acuity in CTR and Cionni CTR group
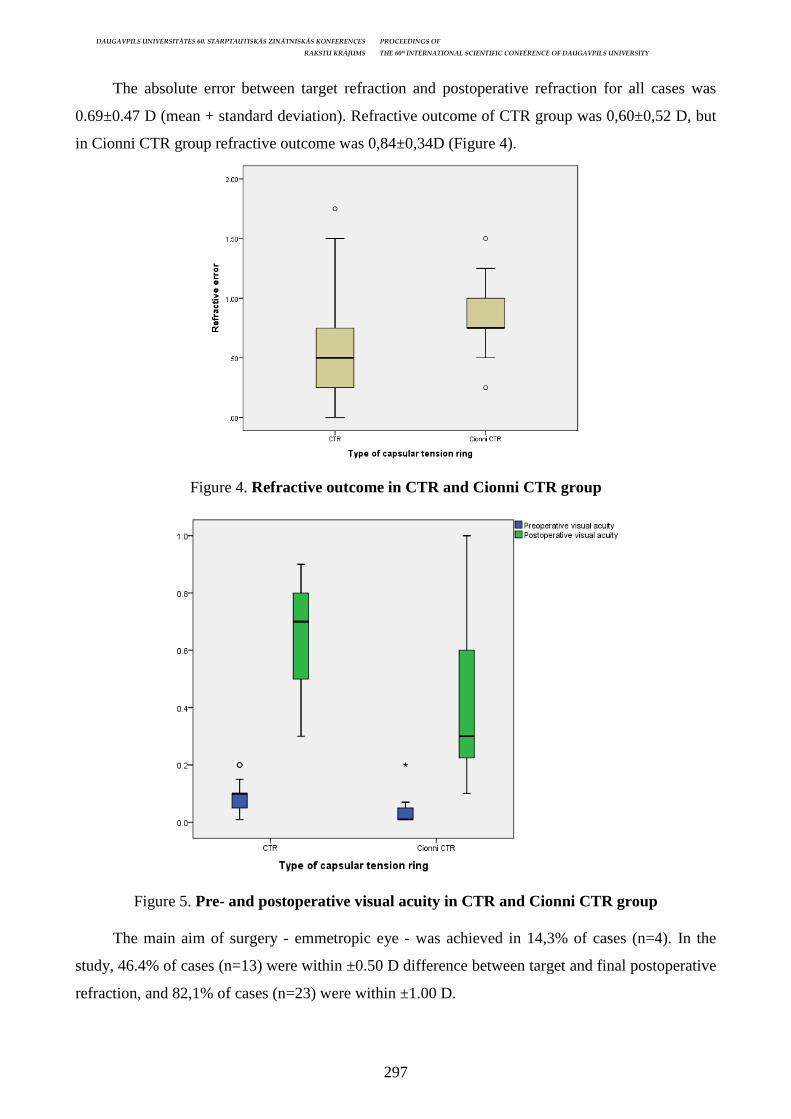
DAUGAVPILS UNIVERSITĀTES 60. STARPTAUTISKĀS ZINĀTNISKĀS KONFERENCES PROCEEDINGS OF
RAKSTU KRĀJUMS THE 60th INTERNATIONAL SCIENTIFIC CONFERENCE OF DAUGAVPILS UNIVERSITY
297
The absolute error between target refraction and postoperative refraction for all cases was
0.69±0.47 D (mean + standard deviation). Refractive outcome of CTR group was 0,60±0,52 D, but
in Cionni CTR group refractive outcome was 0,84±0,34D (Figure 4).
Figure 4. Refractive outcome in CTR and Cionni CTR group
Figure 5. Pre- and postoperative visual acuity in CTR and Cionni CTR group
The main aim of surgery - emmetropic eye - was achieved in 14,3% of cases (n=4). In the
study, 46.4% of cases (n=13) were within ±0.50 D difference between target and final postoperative
refraction, and 82,1% of cases (n=23) were within ±1.00 D.
DAUGAVPILS UNIVERSITĀTES 60. STARPTAUTISKĀS ZINĀTNISKĀS KONFERENCES PROCEEDINGS OF
RAKSTU KRĀJUMS THE 60th INTERNATIONAL SCIENTIFIC CONFERENCE OF DAUGAVPILS UNIVERSITY
298
Independent Samples Median test revealed that there is statistically significant difference
between the median value of postoperative visual acuity in both groups (p=0,041). In addition, this
test showed that there is no statistically significant difference between median values of refractive
error after cataract surgery (p=0,671) and between the median value of Improvement of visual
acuity after cataract surgery (p=0,137).
Discussion
Cataract surgery with subluxated lenses has a very important role in improving quality of
vision and life for cataract patients. Cataract surgery with capsular tension ring and IOL
implantation is very effective treatment method, because it is possible to gain emmetropia for those
patients who had only light perception (Klindzane 2008). Although a preoperative evaluation,
surgery technics and quality of IOL have been improving year from year, still part of patients have
postoperative refraction error higher than one dioptry. Therefore, it is necessary to identify
influencing factors.
There are different ways how to evaluate outcome of cataract surgery. In this study the
difference between postoperative refractive error and target refraction (refractive outcome) and
improvement of visual acuity were evaluated. The refractive outcome for all cases was 0.69 ± 0.47
D. Comparing the results with other studies, it is possible to observe high quality of cataract surgery
made in Pauls Stradins Clinical University Hospital, Ophthalmology clinic. In the study made in
Sweden in 2006 the absolute error between target refraction and postoperative refraction was 0.56 ±
0.66 D, which is about only 0,13 dioptry better outcome than in this study (Kugelberg 2008). In the
study made in Sweden all cataract cases were included, but in this study only cataract with
subluxated lenses, which surgery is more complicated because of CTR implantation.
Even though the absolute error between target refraction and postoperative refraction for CTR
group was 0,60±0,52 D, but in Cionni CTR group refractive outcome was 0,84±0,34D,
nonparametric sample test showed no statistically significant difference between these groups
(P=0,671), which means that the type of CTR could not be considered as influencing factor of
refractive outcome.
The postoperative UCVA for CTR group was 0,64±0,18, but for Cionni CTR group was
0,39±0,28 and nonparametric samples test revealed that there is statistically significant difference
between median value in these groups (P=0,041). Type of CTR could be considered as influencing
factor in cataract surgery with subluxated lenses. The improvement of visual acuity also was higher
for CTR group than Cionni CTR group, respectively, 0,55±0,17 and 0,35±0,27, but nonparametric
tests revealed no statistically significant difference (P=0,137). P value is relatively low, which
means, if there were more patients included in the study, eventually P value would be significant.
DAUGAVPILS UNIVERSITĀTES 60. STARPTAUTISKĀS ZINĀTNISKĀS KONFERENCES PROCEEDINGS OF
RAKSTU KRĀJUMS THE 60th INTERNATIONAL SCIENTIFIC CONFERENCE OF DAUGAVPILS UNIVERSITY
299
Conclusions
Cataract surgery with subluxated lenses outcome showed high quality of this procedure
because of the significant improvement of postoperative visual acuity. The study revealed
statistically significant difference in postoperative visual acuity between CTR and Cionni CTR
group, and the better results and postoperative visual acuity were in CTR group. The type of CTR
could be considered as outcome of cataract surgery influencing factor. The study did not show
statistically significant correlation between refractive outcome and the type of CTR.
References Blecher MH, Kirk MR. Surgical strategies for the management of zonular compromise. Curr Opin Ophthalmol 2008; 19(1): 31–5. Cionni RJ, Osher RH, Marques DM, Marques FF, Snyder ME, Shapiro S. Modified capsular tension ring for patients with congenital loss of zonular support. J Cataract Refract Surg 2003; 29(9): 1668–73. Hayashi K, Hayashi H. Intraocular lens factors that may affect anterior capsule contraction. Ophthalmology 2005; 112(2): 286–92. Hoffman RS, Snyder ME, Devgan U, Allen QB, Yeoh R, Braga-Mele R. Management of the subluxated crystalline lens. J Cataract Refract Surg 2013; 39: 1904–15. Klindžāne M. Katarakta. Doctus, 01.2008., Nr. 57. Kugelberg M., Lundström M. Factors related to the degree of success in achieving target refraction in cataract surgery: Swedish National Cataract Register study. J Cataract Refract Surg. 2008 Nov; 34(11). Vanags J, Erts R, Laganovska G. Anterior capsulorhexis opening reduction after cataract surgery with subluxated lenses. Medicina (Kaunas). 2017 Dec; 53(5): 310–315.

DAUGAVPILS UNIVERSITĀTES 60. STARPTAUTISKĀS ZINĀTNISKĀS KONFERENCES PROCEEDINGS OF
RAKSTU KRĀJUMS THE 60th INTERNATIONAL SCIENTIFIC CONFERENCE OF DAUGAVPILS UNIVERSITY
300
BRAIN MAGNETIC RESONANCE IMAGING, CARBOXYHEMOGLOBIN LEVEL AND NEUROLOGICAL SYMPTOM COMPARISON IN PATIENTS WITH CARBON
MONOXIDE POISONING Agate Lūse1, Laura Liepiņa2, Gaida Krūmiņa2, Roberts Stašinskis3
1 Riga Stradiņš University, Dzirciema street 16, Riga, Latvia, LV-1007, [email protected] 2 Riga East Clinical University Hospital, Department of Diagnostic Radiology, Hipokrāta street 2, LV-1038, [email protected], [email protected] 3 Riga East Clinical University Hospital, Toxicology and Sepsis Clinic, Hipokrāta street 2, LV-1038, [email protected] Abstract
Brain magnetic resonance imaging, carboxyhemoglobin level and neurological symptom comparison in patients with carbon monoxide poisoning
Key Words: carboxyhemoglobin, neurology, magnetic resonance imaging, toxicology Carbon monoxide is an odorless, colorless, tasteless and nonirritant gas, which globally remains as one of the most significant unintended non-medical toxicological cause of morbidity and mortality. Symptoms of carbon monoxide poisoning are nonspecific, and therefore diagnosis is difficult to detect. Although carboxyhemoglobin is a convenient laboratory finding, individually it is insufficient to detect severity of intoxication or prognosis of sequelae. The aim of this study was to assess relationship between neuroimaging findings in MRI, neurological symptoms and carboxyhemoglobin level in blood in patients with carbon monoxide poisoning. A cross-sectional study was done, analyzing medical history data and MRI examination findings of 19 patients, admitted to Riga East Clinical University Hospital’s Toxicology and Sepsis Clinic during the period from April 2017 till February 2018 with diagnosis of carbon monoxide poisoning. Positive, statistically significant relationship was found between group with COHb and positive neurological symptoms 23.3% (SD ±10.9) versus group without neurological symptoms 11.8% (SD ±5.6) (p=0.02). Although COHb level was higher in a group with positive findings in MRI 21.1% (SD ±11.7) versus group without any findings in MRI 14.6% (SD ±7.5) (p=0.23), there was no such a relationship found. It also applies to MRI and neurology (p=0.07), although majority of patients (n=10) had both - positive findings in MRI and neurological symptoms. Kopsavilkums
Galvas smadzeņu magnētiskās rezonanses, karboksihemoglobīna līmeņa un neiroloģiskās simptomātikas salīdzinājums pacientiem ar tvana gāzes intoksikāciju
Atslēgvārdi: karboksihemoglobīns, neiroloģija, magnētiskā rezonanse, toksikoloģija Oglekļa monoksīds ir bezkrāsaina, nekairinoša gāze, bez garšas un smaržas, kas pasaulē ieņem vienu no pirmajām vietām starp nejaušiem, ar medicīnu nesaistītiem saindēšanās gadījumiem, kas izraisījuši nāvi. Saindēšanās simptomi ir ļoti nespecifiski, kas sarežģī tās diagnostiku. COHb ir praktisks rādītājs saindēšanās noteikšanai, taču individuāli tas nav pietiekams saindēšanās smaguma un klīniskā iznākuma prognozēšanai. Pētījuma mērķis bija noteikt savstarpējo saistību atradei galvas smadzeņu magnētiskās rezonanses izmeklējumā, neiroloģiskajai simptomātikai un COHb līmenim asinīs pacientiem ar tvana gāzes intoksikāciju. Šķērsgriezuma pētījuma laikā, kas norisinājās no 2017. gada aprīļa līdz 2018. gada februārim Rīgas Austrumu Klīniskās universitātes slimnīcas Toksikoloģijas un sepses klīnikā. Tika analizētas slimības vēstures un MR izmeklējuma rezultāti 19 pacientiem, kuri stacionēti ar tvana gāzes intoksikāciju. Pozitīvu, statistiski ticamu korelāciju novēroja grupā ar vidējo COHb līmenis un pozitīvu neiroloģisko simptomātiku 23.3% (SD ±10.9) attiecībā pret grupu bez šādiem simptomiem 11.8% (SD ±5.6) (p=0.02). Lai arī augstāku COHb līmeni novēroja grupā ar pozitīvu atradi MR izmeklējumā 21.1% (SD ±11.7) attiecībā pret grupu, kurā atrades nebija 14.6% (SD ±7.5) (p=0.23), statistiski ticamu saistību starp lielumiem nenovēroja. Tāpat saistības nebija starp atradi MR un neiroloģisko simptomātiku (p=0.07), lai gan vairumam pētījuma dalībnieku (n=10) abi lielumi bija pozitīvi.
Introduction
Every year approximately 26.000 million tonnes of emissions of carbon monoxide (CO) are
estimated in the atmosphere globally, of which about 60% are from human activities, but 40% - a
result of natural processes (Nielsen u. c. 2011).
DAUGAVPILS UNIVERSITĀTES 60. STARPTAUTISKĀS ZINĀTNISKĀS KONFERENCES PROCEEDINGS OF
RAKSTU KRĀJUMS THE 60th INTERNATIONAL SCIENTIFIC CONFERENCE OF DAUGAVPILS UNIVERSITY
301
Carbon monoxide is an odorless, colorless, tasteless and nonirritant gas, which most
commonly produces as a by-product of an incomplete combustion of hydrocarbons, such as wood,
coal, petroleum or natural gas (Gözübüyük 2017). It also can be produced endogenously as a result
of human metabolism of hemoglobin, but the deadliest source of CO is exhaust gases emitted from
motor vehicles, which can reach fatal blood level of CO within 10 minutes if released in closed
environment (Gözübüyük 2017).
It remains as one of the most significant unintended non-medical toxicological cause of
morbidity and mortality (Chiew un Buckley 2014; OMS 2004; Saxena u. c. 2016). During the
period from 1996 to 2008, 758 death cases have been reported in Latvia with the mortality of 2.48
cases per 100.000 people (Braubach u. c. 2013). CO poisoning accidents most frequently happen
during winter months, half of CO incidents usually occurring between the months of November and
February, peaking in December, and 60 – 87% occurring in private residential areas (Ben 2012;
Braubach u. c. 2013).
Several pathophysiological mechanisms of carbon monoxide poisoning have been reported,
but still the most described and documented one is its ability to induce cellular damage by binding
to hemoglobin in blood. After CO has been absorbed by the lungs, in about 90% cases it binds to
hemoglobin. CO shows approximately 240-fold stronger affinity for hemoglobin compared with
oxygen as it prevents delivery of oxygen to tissues which results in tissue hypoxia (Gözübüyük
2017; Ben 2012; Sandilands un Bateman 2016). Organ systems most affected by CO induced
hypoxia are the ones that require oxygen the most - cardiovascular system and central nervous
system (Gözübüyük 2017; Prockop un Chichkova 2007).
Symptoms of CO poisoning are unspecific like nausea, fatigue, headache, dizziness,
tachypnoea, tachycardia, unconsciousness, coma and others which rarely are associated with CO
intoxication, but they are commonly mistaken with other medical conditions such as migraine,
stroke, psychiatric disorders, status epilepticus, alcohol intoxication, gastroenteritis, flu and others
(Braubach u. c. 2013; MD 2014; Kao un Nañagas 2004; Gözübüyük 2017).
According to literature, CO intoxication severity can be classified as:
1. mild intoxication: carboxyhemoglobin (COHb) level <10% without signs and symptoms;
2. moderate intoxication: COHb >10%, but <20 – 25%, with mild symptoms, such as headache,
drowsiness, fatigue;
3. severe intoxication: COHb >20 – 25%, loss of consciousness, confusion and/or myocardial
ischemia (Smollin un Olson 2010).
The diagnosis is usually based on the level in the blood. Although carboxyhemoglobin is a
convenient laboratory finding, individually it is insufficient to detect severity of intoxication or
prognosis of sequalae (Stephen u. c. 2012; Hampson u. c. 2012; Grieb u. c. 2011).
DAUGAVPILS UNIVERSITĀTES 60. STARPTAUTISKĀS ZINĀTNISKĀS KONFERENCES PROCEEDINGS OF
RAKSTU KRĀJUMS THE 60th INTERNATIONAL SCIENTIFIC CONFERENCE OF DAUGAVPILS UNIVERSITY
302
To evaluate CO effect on central nervous system and brain, magnetic resonance imaging
(MRI) can be used. Usually MRI is performed as a second step, leaving computer tomography as
the first choice, but MRI is more sensitive than CT, especially when assessing the involvement of
the white matter. Changes in the white matter are believed to closely relate with prognosis (Wilson
2017).
The timing of MRI has a major effect on the results of this method. MRI can be performed
during four phases: the ultra-acute phase – within 24 hour period, the acute phase between 24 hours
and 7 days, the subacute phase: 8 to 21 days and the chronic phase – from 22 days (Beppu 2014).
In the acute phase of CO poisoning MRI can show bilateral putamen, nucleus caudatus and
globus pallidus involvement which results hypointense in T1 and hyperintense in both T2 and
FLAIR (Fluid Attenuation Inversion Recovery) (Prockop un Chichkova 2007).
Diffusion weighted imaging (DWI) has the biggest value in early detection of pathologies
caused by carbon monoxide intoxication seen as cytotoxic edema, in the ultra-acute or acute
phase showing hyperintense areas of restricted diffusivity in the white matter of bilateral
frontal and parietal lobes, also globus pallidus (Stephen u. c. 2012; Varrassi u. c. 2017; Beppu
2014).
In a subacute phase MRI can better represent the extent of demyelinating process, revealing
bilaterally hypointense white mater areas in T1 and hyperintense in T2 and FLAIR. In this phase
DWI also shows restrictions in water diffusion as it does for cytotoxic edema and demyelination
(Varrassi u. c. 2017).
As for chronic phase, MRI reveals brain atrophy, representing areas of sulcal widening and
increased ventricle-to-brain ratio. (Varrassi u. c. 2017)
The aim of this study was to assess the relationship between neuroimaging findings in MRI,
neurological symptoms and the COHb level in blood in patients with carbon monoxide poisoning.
Materials and methods
A cross-sectional study was done, analyzing medical history data and MRI examination
findings of 19 patients who were admitted to Riga East Clinical University Hospital Toxicology and
Sepsis Clinic during period from April 2017 till February 2018 with diagnosis of carbon monoxide
poisoning. Neurological symptoms consisted of score in Glasgow Coma Scale and patient’s
symptoms on admission. Data was processed with MS Excel and IBM SPSS Statistics. Mean COHb
levels in different subgroups were analyzed using t-test. Findings in MRI in different subgroups
were analyzed using Pearson Chi-Square test. Data was statistically significant if p value was <
0.05.
DAUGAVPILS UNIVERSITĀTES 60. STARPTAUTISKĀS ZINĀTNISKĀS KONFERENCES PROCEEDINGS OF
RAKSTU KRĀJUMS THE 60th INTERNATIONAL SCIENTIFIC CONFERENCE OF DAUGAVPILS UNIVERSITY
303
Results
A total of 19 patients were included in this study of whom 52.6% (n=10) were women and
47.4% (n=9) men. Mean COHb reached 19.07% (SD ±10.76), ranging from 3.40% to 46.6%.
Glasgow Coma scale score 15 was seen in 68.4% (n=13) of cases but the lowest score - 3 was seen
in only one patient. Neurological symptoms were noted in 63.2% (n=12), but such symptoms were
not present in 36.8% (n=7) patients. Most common complaints from patients were about dizziness
30.4% (n=7), headache 21.7% (n=5), and 8.7% (n=2) for both unconsciousness and vision
impairment, but 13.0% (n=3) had no complaints at all.
The most common sources of CO were open fire 47.4% (n=9), faulty furnaces – 15.8% (n=3)
wood heating and 15.8% (n=3) gas heating. But also, in 15.8% (n=3) CO source was hydraulic oil
from military tank.
Analyzing the findings in magnetic resonance imaging, 26.3% (n=5) were without acute
pathologies in brain scan, but positive findings were found in 73.7% (n=14) cases. Findings in gray
matter were divided in two major groups: basal ganglia and cortex. Abnormalities in basal ganglia
were found in 50.0% (n=7) cases out of fourteen as hypointense areas in T1 and as hyperintense
areas in T2, FLAIR and DWI sequences, of which most commonly affected areas were nucleus
caudatus 71.4% (n=5) and globus pallidus 71.4% (n=5), but one patient had asymmetrically
involved thalamus. Cortex was involved in 78.6% (n=11) cases out of fourteen, of which
abnormalities in frontal and parietal lobes was seen the most - 81.9% (n=9) cases. In two cases
involvement was seen unilaterally, but in 81.8% (n=9) cases – bilaterally.
Microhemorrhages in basal ganglia were seen in 21.5% (n=3) cases out of fourteen. In two
cases unilaterally, but in one – bilaterally.
Abnormalities in white mater were also detected. In 42.9% (n=6) cases as hypointense areas
in T1 but hyperintense areas in T2 and FLAIR sequences, showing bilateral involvement in 66.7%
(n=4) cases, but unilateral involvement in two cases. White matter involvement in 83.3% (n=5)
cases was seen in parietal lobes.
In 21.4% (n=3) cases out of fourteen cerebral edema was documented during this study, of
which global edema with brainstem compression was found in one case.
Mean COHb level in blood was higher in all groups with positive symptoms and findings.
Mean COHb was higher in a group with positive neurological symptoms 23.3% (SD ±10.9) versus
group without complains from nervous system 11.8% (SD ±5.6), p=0.02. The same results apply to
the group with positive findings in brain MRI - mean COHb level was 21.1% (SD ±11.7) versus
group without acute abnormalities in brain 14.6% (SD ±7.5), p=0.23. Although majority of patients
did have positive findings in brain MRI and neurological symptoms (n=10), no statistically
significant correlation was found between clinical symptoms and MRI (p=0.07).
DAUGAVPILS UNIVERSITĀTES 60. STARPTAUTISKĀS ZINĀTNISKĀS KONFERENCES PROCEEDINGS OF
RAKSTU KRĀJUMS THE 60th INTERNATIONAL SCIENTIFIC CONFERENCE OF DAUGAVPILS UNIVERSITY
304
When comparing symptoms on admission with carboxyhemoglobin level classified as mild,
moderate and severe intoxication (Table 1), it showed that by increasing the COHb level, the
diversity and the number of symptoms also increased. But upon closer inspection it was found that
patients with moderate intoxication showed no symptoms at all.
When comparing radiological findings during magnetic resonance imaging and
carboxyhemoglobin level classified as mild, moderate and severe intoxication (Table 2), we found
that several brain structures can be affected during different intoxication severities, such as globus
pallidus, nucleus caudatus, and white matter pathologies, but also by increasing the COHb level,
diversity and the number of affected brain areas increased.
Discussion
This study analyzed 19 patients who were admitted to the hospital with diagnosis of carbon
monoxide intoxication. During this study we wanted to assess relationship between neuroimaging
findings in MRI, neurological symptoms and carboxyhemoglobin level in blood.
Literature data says that most commonly carbon monoxide intoxication manifests with
unspecific symptoms, involving many organ systems (Gözübüyük 2017; Grieb u. c. 2011) but in
this study we took into consideration only neurological symptoms.
During this study, two lethal cases occurred. One patient had the COHb level of 15.8% and
complaints about periodic cough on admission, but Glasgow Coma Scale score was 15. During
MRI examination pathological findings were seen bilaterally in globus pallidus. Second patient had
the COHb level of 46.6% and was intubated with Glasgow Coma Scale score 3 on admission, but
MRI examination revealed pathologies in putamen, nucleus caudatus, also substantia nigra and
cerebellar cortex, global cerebral edema with brainstem compression.
During this research work many contradictions with information in literature were found. For
example, COHb level < 10% might be normal or correspond to mild intoxication with none or
minimal symptoms, but one patient even had vision impairments, that normally are seen with
intoxication level >20% (Lange un Hillis 2015). Interesting, that no symptoms were seen with
intoxication level 10 - 20%. Importantly, according to literature, the most affected brain structure
during carbon monoxide is globus pallidus (Prockop un Chichkova 2007; Varrassi u. c. 2017),
during this study globus pallidus was also one of the most affected brain structures. It should be
noted that according to literature pathologies in white matter are commonly seen in centrum
semiovale (Lo u. c. 2007), but in this research study none of the patients had this location affected.
Hemorrhages which according to literature are a very common finding in carbon monoxide
poisoning, were found only in three patients (Lo u. c. 2007; MD 2014; Chang u. c. 2009).
Such study has never been performed in Latvia and it can be considered as the first steps of
researching carbon monoxide poisoning. This study has several flaws. Firstly, this study doesn’t
DAUGAVPILS UNIVERSITĀTES 60. STARPTAUTISKĀS ZINĀTNISKĀS KONFERENCES PROCEEDINGS OF
RAKSTU KRĀJUMS THE 60th INTERNATIONAL SCIENTIFIC CONFERENCE OF DAUGAVPILS UNIVERSITY
305
include mixing factors, such as smoking, alcohol intoxication, concomitant illnesses, that may have
affected those results. Secondly, our results may have been affected by the lack of repeated MRI
examinations during patient’s intoxications subacute or chronic phase. Thirdly, this study should be
performed with larger study groups and examination results should be compared in acute and late
intoxication phase, for example, after half a year.
Conclusion
This study shows that positive, statistically significant relationship was found only between
group with mean COHb and positive neurological symptoms 23.3% (SD ±10.9) versus group with
men COHb level, without neurological symptoms 11.8% (SD ±5.6) (p=0.02). Although COHb level
was higher in a group with positive findings in MRI 21.1% (SD ±11.7) versus group without any
findings in MRI 14.6% (SD ±7.5) (p=0.23), there was no such a relationship found. It also applies
to MRI and neurology (p=0.07), although majority of patients (n=10) had both - positive findings in
MRI and neurological symptoms.
When comparing patient’s COHb level according to classification in mild, moderate and
severe intoxication with patient symptoms on admission and neuroimaging findings in MRI, we
found that different symptoms and findings were seen in two or more intoxications severity groups,
but the number of symptoms and pathological findings in MRI increased as COHb level got higher.
Acknowledgement
We want to thank all the staff of Riga East Clinical University Hospital’s Toxicology and
Sepsis Clinic’s and Department of Diagnostic Radiology for support and patience.
References Ben, Evarts. 2012. Non-Fire Carbon Monoxide Incidents. ReVision (March): 1–12. Beppu, T. 2014. The Role of MR Imaging in Assessment of Brain Damage from Carbon Monoxide Poisoning : A Review of the Literature. Braubach, M.; A. Algoet; M. Beaton; S. Lauriou; M. E. Héroux un M. Krzyzanowski. 2013. Mortality associated with exposure to carbon monoxide in WHO European Member States. Indoor Air 23 (2): 115–125. doi: 10.1111/ina.12007 Chang, Ya-ting; Wen-neng Chang; Shu-hua Huang un Chun-chung Lui. 2009. Neuroimaging Studies in Carbon Monoxide Intoxication. 2005. Chiew, Angela L un Nicholas A Buckley. 2014. Carbon monoxide poisoning in the 21st century.: 1–8. doi: 10.1186/cc13846 Gözübüyük, Atilla Alp. 2017. Corbon monoxide intoxication epidemiology, pathophsiology, clinical evaluation and treatment during childhood, in newborn and fetus. Northern Clinics of Istanbul 4 (1): 100–107. doi: 10.14744/nci.2017.49368 Grieb, Gerrit; David Simons; Linda Schmitz; Andrzej Piatkowski; Oliver Grottke un Norbert Pallua. 2011. Glasgow Coma Scale and laboratory markers are superior to COHb in predicting CO intoxication severity. Burns 37 (4): 610–615. doi: 10.1016/j.burns.2010.03.007 Hampson, Neil B.; Claude A. Piantadosi; Stephen R. Thom un Lindell K. Weaver. 2012. Practice recommendations in the diagnosis, management, and prevention of carbon monoxide poisoning. American Journal of Respiratory and Critical Care Medicine 186 (11): 1095–1101. doi: 10.1164/rccm.201207-1284CI

DAUGAVPILS UNIVERSITĀTES 60. STARPTAUTISKĀS ZINĀTNISKĀS KONFERENCES PROCEEDINGS OF
RAKSTU KRĀJUMS THE 60th INTERNATIONAL SCIENTIFIC CONFERENCE OF DAUGAVPILS UNIVERSITY
306
Kao, Louise W. un Kristine A. Nañagas. 2004. Carbon monoxide poisoning. Emergency Medicine Clinics of North America 22 (4 SPEC. ISS.): 985–1018. doi: 10.1016/j.emc.2004.05.003 Lange, Richard A un L David Hillis. 2015. 68 – Chemical Cardiomyopathies Braunwald’s Heart Disease, 10/e. Tenth Edit. Elsevier Inc. doi: 10.1016/B978-1-4557-5134-1.00068-8 Lo, Chung-Ping; Shao-Yuan Chen; Kwo-Whei Lee; Wei-Liang Chen; Cheng-Yu Chen; Chun-Jen Hsueh un Guo-Shu Huang. 2007. Brain Injury After Acute Carbon Monoxide Poisoning: Early and Late Complications. American Journal of Roentgenology 189 (4): W205–W211. doi: 10.2214/AJR.07.2425 MD, K K Jain. 2014. Carbon monoxide poisoning: neurologic aspects.: 3. Nielsen, Vance G.; Nikhil Chawla; Dipty Mangla; Sheldon B. Gomes; Matthew R. Arkebauer; Kimberly A. Wasko; Kesavan Sadacharam un Keith Vosseller. 2011. Carbon monoxide-releasing molecule-2 enhances coagulation in rabbit plasma and decreases bleeding time in clopidogrel/ aspirin-treated rabbits. Blood Coagulation and Fibrinolysis 22 (8): 756–759. doi: 10.1097/MBC.0b013e32834c7412 OMS. 2004. Environmental health criteria 213: Carbon monoxide. Who (November): 492. doi: 10.1016/0160-4120(80)90163-4 Prockop, Leon D. un Rossitza I. Chichkova. 2007. Carbon monoxide intoxication: An updated review. Journal of the Neurological Sciences 262 (1–2): 122–130. doi: 10.1016/j.jns.2007.06.037 Sandilands, Euan A. un D. Nicholas Bateman. 2016. Carbon monoxide. Medicine (United Kingdom) 44 (3): 151–152. doi: 10.1016/j.mpmed.2015.12.024 Saxena, Ankit; Sam Khosraviani; Sanjeev Noel; Divya Mohan; Thomas Donner un Abdel Rahim A Hamad. 2016. HHS Public Access. 74 (1): 27–34. doi: 10.1016/j.cyto.2014.10.031.Interleukin-10 Smollin, Craig un Kent Olson. 2010. Carbon monoxide poisoning (acute) Search date June 2010 Carbon monoxide poisoning (acute). (June): 1–12. Stephen, Ryan A.; Sheehan W. Donal; O’Neill B. Siobhain; Clarkson R. Michael un Costello J. Daniel. 2012. Carbon monoxide poisoning: Novel magnetic resonance imaging pattern in the acute setting. International Journal of Emergency Medicine 5 (1): 1. doi: 10.1186/1865-1380-5-30 Varrassi, Marco; Alessandra Di Sibio; Camilla Gianneramo; Marco Perri; Giorgia Saltelli; Alessandra Splendiani un Carlo Masciocchi. 2017. Advanced neuroimaging of carbon monoxide poisoning. Neuroradiology Journal 30 (5): 461–469. doi: 10.1177/1971400916689342 Wilson, Kevin C. 2017. Chapter 56 – Smoke Inhalation and Carbon Monoxide Poisoning The Intensive Care Unit Manual. Second Edi. Elsevier. doi: 10.1016/B978-1-4160-2455-2.00056-6
DAUGAVPILS UNIVERSITĀTES 60. STARPTAUTISKĀS ZINĀTNISKĀS KONFERENCES PROCEEDINGS OF
RAKSTU KRĀJUMS THE 60th INTERNATIONAL SCIENTIFIC CONFERENCE OF DAUGAVPILS UNIVERSITY
307
STRESS LEVELS, MAIN CAUSES OF STRESS AND DOCTOR SUGGESTED IMPROVEMENT IN FAMILY MEDICINE
IN LATVIA
Valdis Dakuļs, Liene Rituma, Dairis Meiers Rīgas Stradiņa universitāte, Dzirciema iela 16, Rīga, [email protected] Abstract
Stress levels, main causes of stress and doctor suggested improvement in family medicine in Latvia Key Words: Stress, Stressors, family medicine, family doctors Introduction. Stress is a biological response to a stressor - some environmental condition. High long-term stress can lead to an allostatic shift in bodily functions. Doctors experience high stress levels every day. British National Health Service (NHS) revealed that their general practitioner stress levels are so high, almost 30% plan to quit in the next five years. Aim. Evaluate different stressor role in family doctor work field; ask their opinion on how to improve their work environment. Materials and methods. Surveys were sent electronically to family doctors in Latvia. The survey consisted of the personal data part, created by authors, and modified Health and Safety Executive Work-Related Stress Indicator tool that asks questions about the main causes of work-related stress. Results. Data from 183 family doctors was obtained - 25 (13,7%) men, 158 (86,3%) women. Six stressors (Control, role, relationships, demands, peer support, change) were analyzed. Men showed lower change stressor role than women (p=0,001). Longer working hours spent on bureaucracy result in higher score of demand stressor (p=0,005). Regarding suggestions of how to improve the stressful work conditions, 85 (46,4%) doctors suggested changing factors concerning health system and bureaucracy, 20 (10,9%) doctors mentioned lack of funding, 21 (11,4%) doctors mentioned media and patient support, 33 (18,0%) doctors mentioned factors involving patient treatment - more time, fewer patients, improve treatment accessibility, etc.; 20 (10,9%) suggested recreational activities. Conclusions. Changes cause more stress in women doctors compared to man, demand stressor role correlates with longer hours of bureaucracy related hours in practices. As the main improvement area for stress reduction, doctors mentioned decrease of bureaucracy. Kopsavilkums
Stresa līmeņi, galvenie stresori un ārstu rekomendācijas Latvijas primāraj ā veselības aprūpē Atslēgvārdi: Stress, stresori, ģimenes medicīna, ģimenes ārsti Ievads. Stress ir bioloģiska atbilde uz stresoru – kādu apkārtējās vides kairinātāju. Ilgstošs un augstas pakāpes stress var novest pie daudzpusīgām izmaiņām organisma funkcijās. Ārsti saskaras ar augstu stresa līmeni katru dienu. Lielbritānijas Nacionālais veselības dienests (British National Health Service (NHS)) ziņo, ka ģimenes ārstu stresa līmenis Lielbritānijā ir tik augsts, ka gandrīz 30% no ārstiem plāno pamest darbu piecu gadu laikā. Mērķis. Novērtēt dažādu stresoru ietekmi ģimenes ārsta darbā, noskaidrot ārstu viedokli par to, kā varētu uzlabot situāciju darba vidē. Materi āli un metodes. Aptaujas anketas Latvijas ģimenes ārstiem tika nosūtītas elektroniski. Anketa sastāvēja no divām daļām – personas datu daļas, kuru izveidoja paši autori, un modificētas Health and Safety Executive Work-Related Stress Indicator tool, kas jautā par galvenajiem ar darbu saistītajiem stresoriem. Rezultāti. Pētījumā piedalījās 183 ģimenes ārsti no kuriem 25 (13,7%) bija vīrieši un 158 (86,3%) sievietes. Pētījumā tika analizēti seši stresori – kontrole, loma, attiecības, pieprasījums, atbalsts, pārmaiņas. Vīrieši uzrādīja zemāku pārmaiņu stresora nozīmi kā sievietes (p=0,001). Garākas darba stundas, kas veltītas birokrātiskajam darbam rezultējas ar augstāku vērtējumu pieprasījuma stresoram (p=0,005). Ieteikumi kā samazināt stresa pilno darba vidi - 85 (46,4%) ārsti ierosina mainīt faktorus saistītus ar veselības sistēmu un birokrātiju, 20 (10,9%) ārsti minēja finansējuma trūkumu, 21 (11,4%) ārsts minēja mēdiju un pacientu atbalstu, 33 (18,0%) ārsti minēja faktorus, kas ietver pacientu ārstēšanu – lielāks konsultācijas laiks, mazāk pacienti, uzlabot ārstēšanas pieejamību u.c., 20 (10,9%) ārsti minēja atpūtu. Secinājumi. Pārmaiņas izraisa augstāku stresu sievietēm kā vīriešiem. Stundu skaits, kas pavadīts darot birokrātisko darbu praksē korelē ar pieprasījuma stresora līmeņa pieaugumu. Biežākais ieteikums, ko minēja ārsti, kas varētu mazināt stresa līmeni darbā ir birokrātiskā darba samazinājums.

DAUGAVPILS UNIVERSITĀTES 60. STARPTAUTISKĀS ZINĀTNISKĀS KONFERENCES PROCEEDINGS OF
RAKSTU KRĀJUMS THE 60th INTERNATIONAL SCIENTIFIC CONFERENCE OF DAUGAVPILS UNIVERSITY
308
Introduction
Because of the family doctor strike in summer of 2017 we can assume, that there is certain
dissatisfaction with work conditions amongst family doctors in Latvia.
This is global issue. In 2016 British NHS survey showed, that Stress levels are so acute
among British GPs that almost 30% plan to quit in the next five years. Such occurrence would make
it even harder for patients to get an appointment promptly. Six out of ten GP (59%) rated their work
as stressful, with 39% of these saying it is very stressful and 20% extremely stressful (Denis
Campbell 2016).
In Latvia one of main strike reasons was inappropriately low capitation fee. Since family
doctor practice is like a little business, in which capitation fee makes big part of practices income,
this might be considered as notable stress factor that may affect doctors work quality. Though we
cannot assume that money is the only factor that can reduce stress level.
In August and September 2017, before 8th Latvian Doctor Congress, Latvian Doctors Society
together with public opinion research center SKDS surveyed doctors and society about “Doctors
profession in nowadays Latvia”. In total 2644 respondents were reached. On question “Does
doctors encounter burning sensations?” 35% responded - often, but 55% - sometime. Therefore,
90% of doctors in Latvia has experienced burnout sensations. According to a survey, burnout is
more experienced amongst occupational medicine, family medicine and internal medicine doctors
(Pēteris Apinis 2017).
Material and Methods
We used Latvian family doctor filled surveys. They were sent them electronically via email.
Surveys consist of personal data part, created by the authors and stress evaluation part. For stress
evaluation, we used Perceived Stress Scale (1983). It is classic stress evaluation tool, that evaluates
stress level from 10 (lowest) to 50 (highest) points and divides stress levels in low (10-23 points),
average (24-36 points) and high (37-50) level. Edited Health and Safety Executive Work-Related
Stress Indicator tool survey was included as well, that evaluates main work related stressors and
scores their impact from one to five points. The data obtained were statistically processed using
IBM SPSS statistics 22.0 software using Kruskal-Wallis test and Mann-Whitney U test.
Results
Data from 183 family doctors was obtained - 25 (13,7%) men, 158 (86,3%) women. Low
stress level showed 15 doctors, average - 77, but high stress level - 23 doctors.
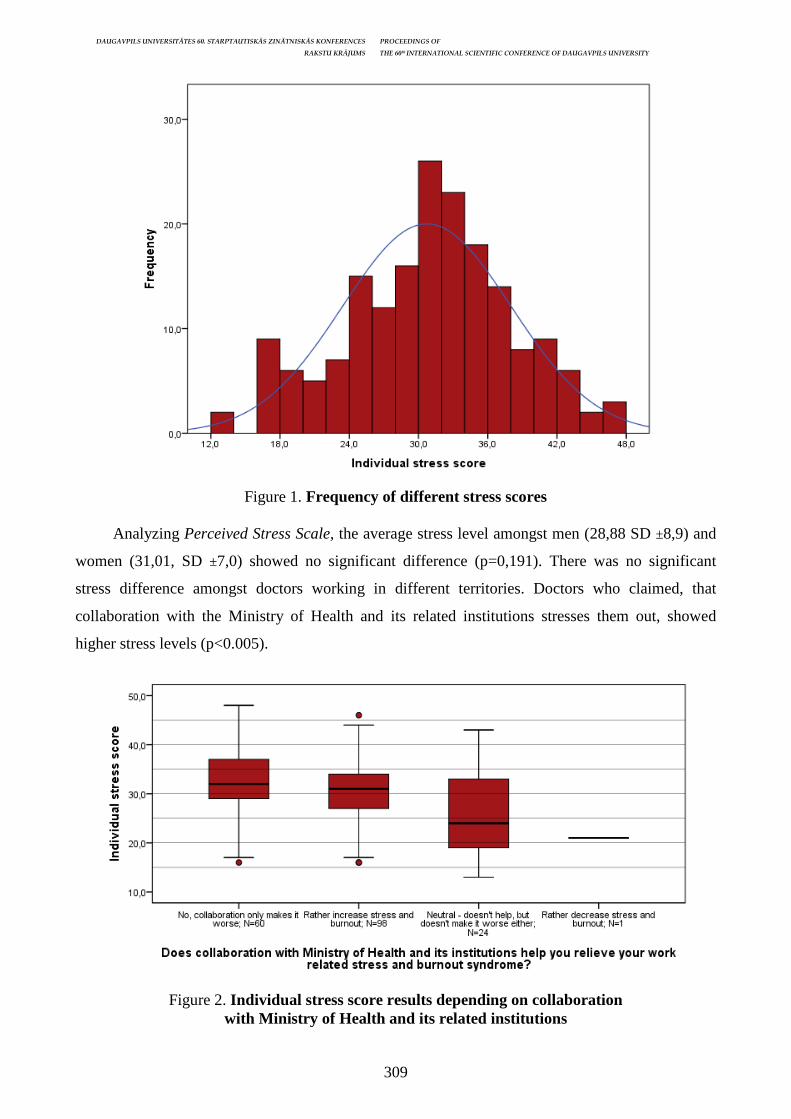
DAUGAVPILS UNIVERSITĀTES 60. STARPTAUTISKĀS ZINĀTNISKĀS KONFERENCES PROCEEDINGS OF
RAKSTU KRĀJUMS THE 60th INTERNATIONAL SCIENTIFIC CONFERENCE OF DAUGAVPILS UNIVERSITY
309
Figure 1. Frequency of different stress scores
Analyzing Perceived Stress Scale, the average stress level amongst men (28,88 SD ±8,9) and
women (31,01, SD ±7,0) showed no significant difference (p=0,191). There was no significant
stress difference amongst doctors working in different territories. Doctors who claimed, that
collaboration with the Ministry of Health and its related institutions stresses them out, showed
higher stress levels (p<0.005).
Figure 2. Individual stress score results depending on collaboration with Ministry of Health and its related institution s

DAUGAVPILS UNIVERSITĀTES 60. STARPTAUTISKĀS ZINĀTNISKĀS KONFERENCES PROCEEDINGS OF
RAKSTU KRĀJUMS THE 60th INTERNATIONAL SCIENTIFIC CONFERENCE OF DAUGAVPILS UNIVERSITY
310
78 doctors admitted frequent sensation of burnout and showed an average of 34,99 (SD ±5,76)
points; occasional burnout sensation - 97 doctors with average 28,14 (SD ±6,44) points; no
sensation - 8 doctors, and scored 20,38 (SD ±5,93) points on the stress scale (p<0,005).
Figure 3. Individual stress score results depending on burnout sensation encounters
Regarding suggestions of how to improve the stressful work conditions, 85 (46,4%) doctors
suggested changing factors concerning health system and bureaucracy, 20 (10,9%) doctors
mentioned lack of funding, 21 (11,4%) doctors mentioned media and patient support, 33 (18,0%)
doctors mentioned factors involving patient treatment - more time, less patients, improve treatment
accessibility, etc.; 20 (10,9%) suggested recreational activities.
Figure 4. Family doctor’s suggestions of how to improve the stressful work conditions
Six stressors (Control, role, relationships, demands, peer support, change) were analyzed.
Men showed lower change stressor role than women (p=0,001). Longer working hours spent on
bureaucracy result in higher score of demand stressor (p=0,005).
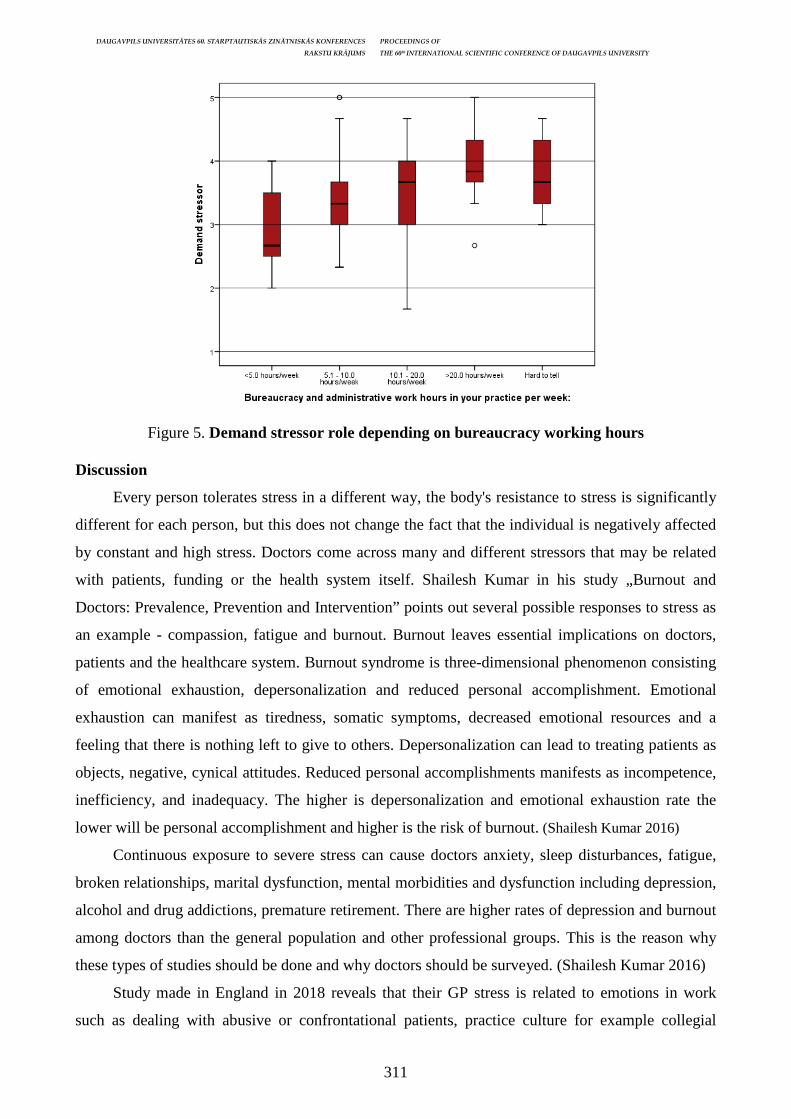
DAUGAVPILS UNIVERSITĀTES 60. STARPTAUTISKĀS ZINĀTNISKĀS KONFERENCES PROCEEDINGS OF
RAKSTU KRĀJUMS THE 60th INTERNATIONAL SCIENTIFIC CONFERENCE OF DAUGAVPILS UNIVERSITY
311
Figure 5. Demand stressor role depending on bureaucracy working hours
Discussion
Every person tolerates stress in a different way, the body's resistance to stress is significantly
different for each person, but this does not change the fact that the individual is negatively affected
by constant and high stress. Doctors come across many and different stressors that may be related
with patients, funding or the health system itself. Shailesh Kumar in his study „Burnout and
Doctors: Prevalence, Prevention and Intervention” points out several possible responses to stress as
an example - compassion, fatigue and burnout. Burnout leaves essential implications on doctors,
patients and the healthcare system. Burnout syndrome is three-dimensional phenomenon consisting
of emotional exhaustion, depersonalization and reduced personal accomplishment. Emotional
exhaustion can manifest as tiredness, somatic symptoms, decreased emotional resources and a
feeling that there is nothing left to give to others. Depersonalization can lead to treating patients as
objects, negative, cynical attitudes. Reduced personal accomplishments manifests as incompetence,
inefficiency, and inadequacy. The higher is depersonalization and emotional exhaustion rate the
lower will be personal accomplishment and higher is the risk of burnout. (Shailesh Kumar 2016)
Continuous exposure to severe stress can cause doctors anxiety, sleep disturbances, fatigue,
broken relationships, marital dysfunction, mental morbidities and dysfunction including depression,
alcohol and drug addictions, premature retirement. There are higher rates of depression and burnout
among doctors than the general population and other professional groups. This is the reason why
these types of studies should be done and why doctors should be surveyed. (Shailesh Kumar 2016)
Study made in England in 2018 reveals that their GP stress is related to emotions in work
such as dealing with abusive or confrontational patients, practice culture for example collegial
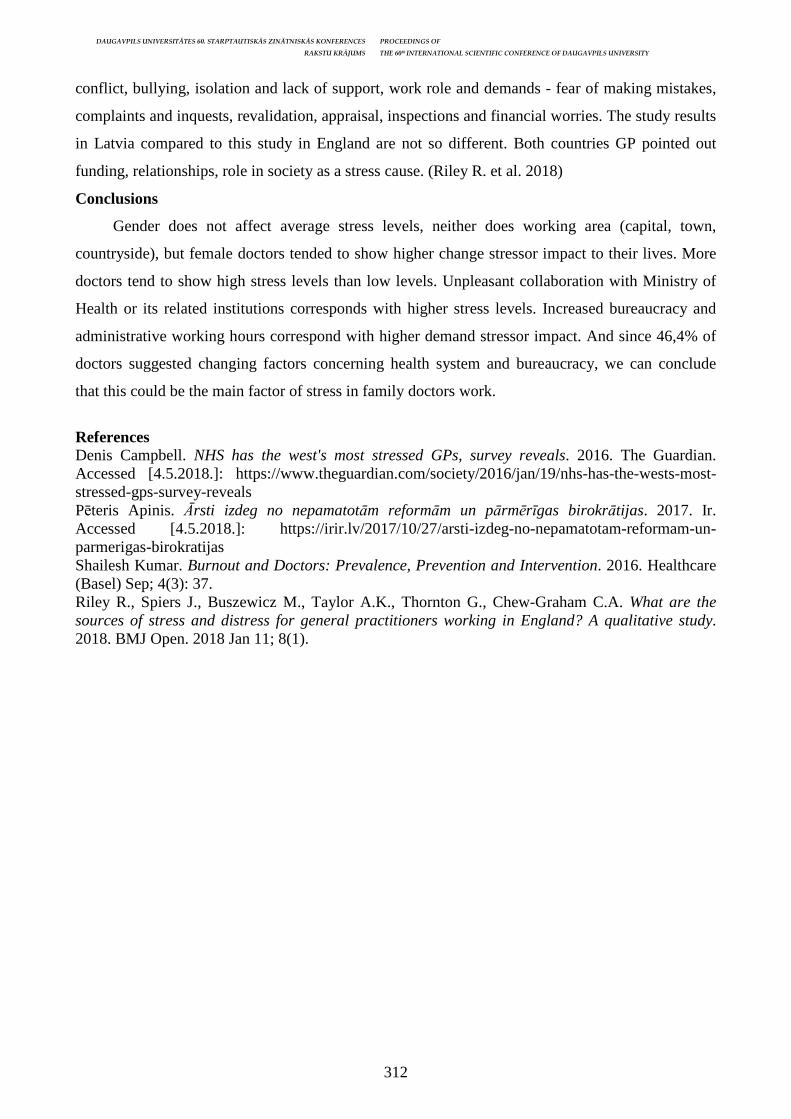
DAUGAVPILS UNIVERSITĀTES 60. STARPTAUTISKĀS ZINĀTNISKĀS KONFERENCES PROCEEDINGS OF
RAKSTU KRĀJUMS THE 60th INTERNATIONAL SCIENTIFIC CONFERENCE OF DAUGAVPILS UNIVERSITY
312
conflict, bullying, isolation and lack of support, work role and demands - fear of making mistakes,
complaints and inquests, revalidation, appraisal, inspections and financial worries. The study results
in Latvia compared to this study in England are not so different. Both countries GP pointed out
funding, relationships, role in society as a stress cause. (Riley R. et al. 2018)
Conclusions
Gender does not affect average stress levels, neither does working area (capital, town,
countryside), but female doctors tended to show higher change stressor impact to their lives. More
doctors tend to show high stress levels than low levels. Unpleasant collaboration with Ministry of
Health or its related institutions corresponds with higher stress levels. Increased bureaucracy and
administrative working hours correspond with higher demand stressor impact. And since 46,4% of
doctors suggested changing factors concerning health system and bureaucracy, we can conclude
that this could be the main factor of stress in family doctors work.
References Denis Campbell. NHS has the west's most stressed GPs, survey reveals. 2016. The Guardian. Accessed [4.5.2018.]: https://www.theguardian.com/society/2016/jan/19/nhs-has-the-wests-most-stressed-gps-survey-reveals Pēteris Apinis. Ārsti izdeg no nepamatotām reformām un pārmērīgas birokrātijas. 2017. Ir. Accessed [4.5.2018.]: https://irir.lv/2017/10/27/arsti-izdeg-no-nepamatotam-reformam-un-parmerigas-birokratijas Shailesh Kumar. Burnout and Doctors: Prevalence, Prevention and Intervention. 2016. Healthcare (Basel) Sep; 4(3): 37. Riley R., Spiers J., Buszewicz M., Taylor A.K., Thornton G., Chew-Graham C.A. What are the sources of stress and distress for general practitioners working in England? A qualitative study. 2018. BMJ Open. 2018 Jan 11; 8(1).
DAUGAVPILS UNIVERSITĀTES 60. STARPTAUTISKĀS ZINĀTNISKĀS KONFERENCES PROCEEDINGS OF
RAKSTU KRĀJUMS THE 60th INTERNATIONAL SCIENTIFIC CONFERENCE OF DAUGAVPILS UNIVERSITY
313
DILUTIONAL HYPONATREMIA CAUSED BY PSYCHOGENIC POLYDIPSIA: A CASE REPORT
Valdis Dakuļs Rīgas Stradiņa universitāte, Dzirciema iela 16, Rīga, [email protected] Abstract
Dilutional hyponatremia caused by psychogenic polydipsia: a case report Key Words: Dilutional Hyponatremia, Psychogenic Polydipsia, Excessive drinking Introduction. Primary polydipsia is caused by psychiatric disorders, and often is accompanied by sensation of dry mouth. Since primary polydipsia is a diagnosis of exclusion, other causes, like diabetes insipidus or medication induced symptom must be excluded first. Case report. 31 year old woman with paranoid schizophrenia since 2014 experiences dry mouth. Excessive water consumption caused dilutional hyponatremia. The water deprivation test excluded diabetes insipidus. In May 2016 the patient presented to the hospital with seizure. Laboratory findings showed Na+ 120.95mmol/l (N - 136-145mmol/l). After substitutional therapy, patient‘s condition improved. Patient admitted drinking around 6 liters of water per day. Patient regularly takes psychiatrist prescribed medications – Fluoxetin, Quetiapin, Olanzapine and others. In February 2017 patient admitted with fatigue, cold arms and legs. She was drinking around 25 liters of water per day. Na+ 111 mmol/l (N - 136-145mmol/l). Psychiatrist recommended limiting water consumption. Patient did that after discharge, but the next day was admitted with another seizure, since sodium rose rapidly from 111 to 134.8 mmol/l (N - 136-145mmol/l). After discharge she had several more episodes of seizures and hospital admissions. Withholding from excessive drinking allows sodium levels to rise from 128 up to 136.76mmol/l in control tests. Conclusion. Balance between antipsychotic medication for psychogenic polydipsia treatment and medication induced hyponatremia is complex. On one hand medication can reduce polydipsia, but on the other it can promote it. Hypotheses include stimulation of thirst centers by elevated dopamine levels, drinking to counteract anticholinergic side effects of psychotropic medications, and changes in feedback regulation of the hypothalamic-pituitary axis induced by chronic polydipsia. Kopsavilkums
Psihogēnas polidipsijas izraisīta dilūcijas hiponātr ēmija: gadījuma apraksts Atslēgvārdi: Dilūcijas hiponātrēmija, psihogēna polidipsija, pārmērīga dzeršana Ievads. Primāru polidipsiju izraisa psihiatriskas saslimšanas, tās bieži pavada sausas mutes sajūta. Tā kā primāra polidpsija ir izslēgšanas diagnoze, sākotnēji ir j āizslēdz citi cēloņi, piemēram, bezcukura diabēts vai medikamentozi ierosināts blakusefekts. Gadījuma apraksts. Sieviete, 31 g.v. ar paranoīdu šizofrēniju kopš 2014. gada sūdzās par sausuma sajūtu mutē. Pārmērīgs ūdens patēriņš izraisīja dilūcijas hiponātrēmiju. Ūdens nelietošanas tests izslēdza bezcukura diabētu. Paciente 2016. gada maijā tika stacionēta ar krampju lēkmi. Laboratorie izmeklējumi uzrādīja Na+ 120.95mmol/l (N - 136-145mmol/l). Pēc substitūcijas terapijas pacientes stāvoklis uzlabojās. Paciente atzīmēja dzeram vidēji 6 litri ūdens dienā. Paciente regulāri lieto psihiatra nozīmētos medikamentus - Fluoxetin, Quetiapin, Olanzapine un citus. 2017. gada februāri paciente tika stacionēta sakarā ar nespēku, aukstām rokām un kājām. Paciente atzīmēja dzeram ap 25 litri ūdens dienā, nātrija līmenis bija 111 mmol/l (N - 136-145mmol/l). Psihiatrs motivēja samazināt ūdens patēriņu. Paciente sekoja norādījumiem, bet nākamajā dienā tika atkārtoti stacionēta ar atkārtotu krampju lēkmi, sakarā ar straujo nātrija paaugstināšanos no 111 līdz 134.8 mmol/l (N - 136-145mmol/l). Pēc izrakstīšanas pacientei bija vēl dažas krampju un stacionēšanas epizodes. Atturēšanās no pērmērīgas dzeršanas ļauj uzturēt nātrija līmeni no 128 līdz 136.76mmol/l kontroles mērījumos. Secinājumi. Balanss starp antipsihotiskajiem medikamentiem psihogēnai polidipsijai un medikamentu ierosinātu hiponātrēmiju ir sarežģīts. No vienas puses medikamenti var mazināt polidipsijas izpausmi, bet no otras tā var tikt veicināta. Hipotēze iekļauj paaugstinātu dopamīna līmeņu ierosinātu slāpju centra stimulāciju, dzeršanu, lai kompensēt psihotropo medikamentu antiholīnerģiskos blakusefektus, kā arī hroniskas polidipsijas ierosinātās izmaiņas hipotalāma-hipofīzes ass atgriezeniskās saites regulācijā.
Introduction
Primary polydipsia (PP) has been defined as excessive intake of fluids. However, the
pathogenesis of PP remains unexplored. Different theories include a dysfunction in the thirst
mechanism, involvement of the hippocampus, stress-reducing behavior and lesion occurrences in
specific areas of the brain. Most studies have been performed in the psychiatric setting, indicating
that PP coincides with schizophrenia, anxiety disorder and depression. (Clara O Sailer et al. 2017)

DAUGAVPILS UNIVERSITĀTES 60. STARPTAUTISKĀS ZINĀTNISKĀS KONFERENCES PROCEEDINGS OF
RAKSTU KRĀJUMS THE 60th INTERNATIONAL SCIENTIFIC CONFERENCE OF DAUGAVPILS UNIVERSITY
314
The features of primary polydipsia include:
1) an increased desire to imbibe fluid
2) a tendency to hyponatremia and hypo-osmolality when fluid intake is excessively high
3) polyuria, with an appropriate hypo-osmolar urine
4) appropriate suppression of plasma vasopressin
5) fluid restriction restoring fluid balance
Primary polydipsia is a state of markedly increased fluid intake in the setting of a normal
vasopressin system and normal renal tubular function. In primary polydipsia, urine osmolality
increases in response to water deprivation (in some cases to >0.600 osmol/kg H2O), and there
would be no further response to injected desmopressin. (Neil Harris 2017)
Figure 1. Physiology of thirst regulation (Clara O Sailer et al. 2017)
Arginine vasopressin (AVP) secretion is suppressed by hypoosmolality caused by excess
intake of water. Suppression of AVP release obliges us to differentiate psychogenic polydipsia from
central diabetes insipidus. Osmotic stimulation tests can be carried out to determine the reserve
function of the posterior pituitary gland. Plasma AVP levels increase in response to an increase in
plasma osmolality in patients with psychogenic polydipsia but not in those with central diabetes
insipidus. (Takako Saito et al. 1999)
The case description
We describe a case of a 31 year old woman with paranoid schizophrenia that has resulted in
psychogenic polydipsia with dilutional hyponatremia. 15 years ago she had anorexia nervosa; body
weight for a long time was 30kg (BMI-12kg/m2). Progressive dysphagia with stomach pain,
constipation resulted with fear of eating.
DAUGAVPILS UNIVERSITĀTES 60. STARPTAUTISKĀS ZINĀTNISKĀS KONFERENCES PROCEEDINGS OF
RAKSTU KRĀJUMS THE 60th INTERNATIONAL SCIENTIFIC CONFERENCE OF DAUGAVPILS UNIVERSITY
315
Since 2014 patient experiences dry mouth. Excessive water consumption caused dilutional
hyponatremia. Low body weight, corresponding to phenotypic expression of anorexia nervosa also
caused dystrophic changes in organs, kidney tubulopathy, and amenorrhea. The water deprivation
test excluded diabetes insipidus - Urine specific gravity did not change significantly even after
antidiuretic hormone administration. During the test, sodium level rise from 130mmol/L to
139mmol/L in 5 hours (N - 136-145mmol/l). Her weight at that point was 35kg (BMI-16kg/m2).
Long term malnutrition caused osteoporosis. As a result, multiple traumatic fractures of pelvis
accrued in 2015.
In May 2016 patient presented to the hospital with seizure. Laboratory findings showed Na+
120.95mmol/l (N - 136-145mmol/l) suggesting initial osmotic demyelination syndrome. Serum
osmolality was 0.271 osmol/kg (N - 0.285-0.295 osmol/kg). After substitutional therapy, patient’s
condition improved. Patient admitted drinking around 6 liters of water per day. Patient regularly
takes psychiatrist prescribed medication – Fluoxetin, Quetiapin, Alpralozam, Olanzapine.
After 10 months patient admitted with fatigue, cold arms and legs. Patient’s weight was 40kg
(BMI-17.3kg/m2). She had malnutrition and was drinking around 25 liters of water per day. Na+
111 mmol/l (N - 136-145mmol/l), serum osmolality was 0.22 osmol/kg Psychiatrist recommended
limiting water consumption. Patient did that after discharge, but next day was admitted with another
seizure, since sodium rose rapidly from 111 to 134.8 mmol/l (N - 136-145mmol/l), serum
osmolality was 0.268 osmol/kg. After discharge she had several more episodes of seizures and
hospital admissions. Withholding from excessive drinking allows sodium levels to rise from 128 up
to 136.76mmol/l in control tests. Between hospitalizations patient remains work capable and works
full time job.
Discussion
Hyponatremia is defined as sodium level in serum less than 136 mmol/L. Patient had severe
hyponatremia (<120 mmol/L) with clinical signs like seizures. It was caused by excessive drinking.
Secondary causes, like diabetes insipidus, were excluded before diagnosing primary polydipsia.
Psychogenic polydipsia may be associated with several psychiatric conditions including psychotic
depression, bipolar disorder, and most commonly schizophrenia with up to 18% of patients
displaying polydipsic behavior. (Quinn CJ. 2012.)
Dry mouth and thirst is often a side effect of medications used in the treatment of some
mental disorders (antipsychotics, antidepressants, anticonvulsants, alpha agonists and
anticholinergics). (Lauren W. M. Swager 2011) Patient was using Fluoxetin, Quetiapin,
Alpralozam, Olanzapine and other drugs. Typical antipsychotics have been associated to a
worsening of polydipsic behavior, while more recently atypical antipsychotics have been reported
as being useful. However results are still mixed and controversial. (Giuseppe Bersani et al. 2007)
DAUGAVPILS UNIVERSITĀTES 60. STARPTAUTISKĀS ZINĀTNISKĀS KONFERENCES PROCEEDINGS OF
RAKSTU KRĀJUMS THE 60th INTERNATIONAL SCIENTIFIC CONFERENCE OF DAUGAVPILS UNIVERSITY
316
Table 1. Atypical antipsychotic efficacy in schizophrenic patients with polydipsia (Giuseppe Bersani et al. 2007)
Conclusions
Balance between antipsychotic medication for psychogenic polydipsia treatment and
medication induced hyponatraemia is complex. On one hand medication can reduce polydipsia, but
on the other it can promote it. Hypotheses include stimulation of thirst centers by elevated
dopamine levels, drinking to counteract anticholinergic side effects of psychotropic medications,
and changes in feedback regulation of the hypothalamic-pituitary axis induced by chronic
polydipsia.
Acknowledgement
I thank my supervisor assoc.prof. Ilze Konrāde, endocrinologist of Riga East Clinical
University hospital, for research support.
References Clara O Sailer, Bettina Winzeler, Mirjam Christ-Crain. Primary polydipsia in the medical and psychiatric patient: characteristics, complications and therapy. 01.11.2017. Swiss Med Wkly. 2017; 147:w14514. Giuseppe Bersani, Lorenzo Pesaresi, Valerio Orlandi, Simona Gherardelli and Paolo Pancheri. Atypical antipsychotics and polydipsia: a cause or a treatment?. Hum. Psychopharmacol Clin Exp 2007; 22: 103–107. Lauren W. M. Swager. Psychotropic-induced dry mouth: Don't overlook this potentially serious side effect. Current Psychiatry. 10 (12): 54–58. December 2011. Neil Harris. Psychogenic Polydipsia. 2017. LABMED. CancerTherapyAdvisor.com Accessed [4.5.2018.] https://www.cancertherapyadvisor.com/labmed/psychogenic-polydipsia/article/614698/ Quinn CJ, Iyegha UP, Beilman GJ, Cerra FB. Acute correction of hyponatremia secondary to psychogenic polydipsia. Am J Case Rep. 2012; 13(): 69–71. Takako Saito, San-e Ishikawa, Takashi Ito, Hideo Oda, Fumiko Ando, Minori Higashiyama, Shoichiro Nagasaka, Masashi Hieda, Toshikazu Saito. Urinary Excretion of Aquaporin-2 Water Channel Differentiates Psychogenic Polydipsia from Central Diabetes Insipidus. The Journal of Clinical Endocrinology & Metabolism, Volume 84, Issue 6, 1 June 1999, Pages 2235–2237.
DAUGAVPILS UNIVERSITĀTES 60. STARPTAUTISKĀS ZINĀTNISKĀS KONFERENCES PROCEEDINGS OF
RAKSTU KRĀJUMS THE 60th INTERNATIONAL SCIENTIFIC CONFERENCE OF DAUGAVPILS UNIVERSITY
317
MEAN CORPUSCULAR VOLUME AND ASPARTATE AMINOTRANSFERASE LEVEL CHANGES AS PROGNOSTIC
ETHANOL ABSTENTION DELIRIUM ASSOCIATED FACTORS FOR PATIENTS IN THE INTENSIVE CARE UNIT
Katr īna Džeriņa Rīga Stradiņš University, 16 Dzirciema Street, Rīga, LV-1007, Latvia, [email protected] Abstract
Mean corpuscular volume and aspartate aminotransferase level changes as prognostic ethanol abstention delirium associated factors for patients in the intensive care unit
Key Words: Ethanol intoxication, alcohol withdrawal syndrome, delirium tremens (DTs), mean corpuscular volume (MCV), aspartate aminotransferase (AST) Introduction. Severe ethanol intoxication is one of the most common reasons for patient admission to the intensive care unit (ICU). In many cases alcohol withdrawal syndrome develops; it can be broken down into four categories – minor and major withdrawal, withdrawal seizures and DTs with the latter being the most severe manifested by agitation, global confusion, disorientation, hallucinations, fever, hypertension, diaphoresis, and autonomic hyperactivity, which can progress to cardiovascular collapse. DTs is a medical emergency with a high mortality rate, making early recognition essential. Interview tools have been used to determine the risk of DTs but require an alert, compliant patient and a motivated physician. MCV and AST levels are parts of routine laboratory testing, influenced by excessive alcohol consumption and may serve as predictors of DTs. Aim. To evaluate a combination of MCV and AST level changes as a predictive factor for delirium tremens in alcohol intoxicated patients during a period of abstention. Materials and methods. The medical records of 269 patients diagnosed alcohol withdrawal delirium (exposed group) and 480 ethanol intoxicated patients that did not develop DTs in the period of abstention (control group) were reviewed for the period from year 2013 to 2017. Admission MCV and AST levels were assessed. Relative risk (RR), positive predictive value (PPV) and negative predictive value (NPV) were calculated afterwards. Results. Of the 269 patients diagnosed DT, both – MCV and AST levels – were changed in 122 patients (45%); no changes were found in 39 cases (14%). Of the 480 patients in the control group, both – MCV and AST levels – were changed in 98 patients (20%); no changes were found in 221 cases (46%). RR showed to be 2.46 (p < 0.0001). The PPV of the test was 55.45% and the NPV 85%, respectively. Conclusion. The combination of MCV and AST level changes may serve as prognostic factors for DTs in ethanol intoxicated patients experiencing withdrawal. Kopsavilkums
Vidējā eritrocītu tilpuma un aspartātaminotransferāzes līmeņu izmaiņas kā prognostiski etanola abstinences delīrija saistīti faktori pacientiem intensīvajā terapijā
Atslēgvārdi: Etanola intoksikācija, alkohola atcelšanas sindroms, delerium tremens (DTs), vidējais eritrocītu tilpums (MCV), apspartātaminotransferāze (ASAT) Ievads. Smaga etanola intoksikācija ir viens no biežākajiem iemesliem pacientu nosūtīšanai uz intensīvās terapijas nodaļu. Daudzos gadījumos attīstās alkohola atcelšanas sindroms; to var iedalīt četrās kategorijās – viegli un smagi noritošs atcelšanas sindroms, atcelšanas krampji un DTs, kas ir bīstamākā atcelšanas sindroma izpausme un manifestējas ar uzbudinājumu, vispārēju apjukumu, dezorientāciju, halucinācijām, drudzi, hipertenziju, diaforēzi un autonomu hiperaktivitāti, kas var progresēt līdz kardiovaskulāram kolapsam. DTs uzskatāms par neatliekamu potenciāli fatālu medicīnisku stāvokli, līdz ar to būtiski to laikus atpazīt. Izstrādāti dažādi instrumenti DTs riska noteikšanai, bet tiem nepieciešams līdzestīgs, pie samaņas esošs pacients un motivēts klīnicists. MCV un ASAT pieder rutīnā veicamajām asins analīzēm, un to izmaiņas liecina par alkoholismu, līdz ar to tie var kalpot par DTs prediktīviem faktoriem. Mērķis. Pētīt MCV un ASAT līmeņus pacientiem, kam, iestājoties stacionārā, konstatēta etanola intoksikācija, un pēcāk diagnosticēts alkohola abstinences delīrijs. Materi āli un metodes. Tika apkopoti dati par 269 pacientiem DTs grupā (eksponētajā grupā) un par 480 pacientiem kontroles grupā, kuriem iestājoties konstatēta etanola intoksikācija, bet DTs neattīstījās. Dati tika ievākti par laika periodu no 2013.līdz 2017. gadam. Tika vērtēti pacientu iestāšanās MCV un ASAT līmeņi, un pēcāk tika aprēķināts relatīvais risks (RR), testa (MCV un ASAT izmaiņu) pozitīvā prognostiskā vērtība (PPV) un negatīvā prognostiska vērtība (NPV). Rezultāti. DTs grupā no 269 pacientiem 122 (45%) gadījumos tika atklātas izmaiņas abos rādītājos, savukārt, 39 (14%) indivīdiem gan MCV, gan ASAT līmenis bija normas robežās. Kontroles grupā no 480 pacientiem paaugstināts MCV un ASAT līmenis bija atrodamas 98 (20%) indivīdiem, bet 221 (46%) pacientam ar alkohola intoksikāciju netika atrastas izmaiņas ne MCV, ne ASAT līmenī. RR = 2,46 (p < 0.0001), PPV = 55,45% un NPV = 85%.
DAUGAVPILS UNIVERSITĀTES 60. STARPTAUTISKĀS ZINĀTNISKĀS KONFERENCES PROCEEDINGS OF
RAKSTU KRĀJUMS THE 60th INTERNATIONAL SCIENTIFIC CONFERENCE OF DAUGAVPILS UNIVERSITY
318
Secinājumi. Paaugstinātu MCV un ASAT līmeņu kombinācija uzskatāma par DTs prediktīvu faktoru, ja pacientam konstatēta etanola intoksikācija, un pacients atturas no alkohola lietošanas.
Introduction
Mechanisms of macrocytosis in alcohol consumers
MCV is printed in the report generated during complete blood count. MCV is also used as an
alcohol biomarker because alcohol dependence is one of the causes of macrocytosis other than
anemia. (Dasgupta 2015)
The mechanism of increased MCV is probably related to hematotoxicity of both alcohol and
its metabolite, acetaldehyde. Alcohol can permeate the cell membrane and alter lipid structures of
the membrane. In addition, alcohol can alter erythrocyte metabolism, thus altering its stability.
Acetaldehyde, which is formed during alcohol metabolism by enzymatic reaction involving the
alcohol dehydrogenase enzyme and nicotinamide adenine dinucleotide as a cofactor, is highly
reactive and can form stable adducts with proteins and other constituents of the cell membrane. As a
result, erythrocyte membrane structure may become more susceptible to damage such as hemolysis,
thus shortening its half-life. (Dasgupta 2015)
Studies of male Japanese alcoholics showed that patients with inactive aldehyde
dehydrogenase 2 (ALDH-2) enzyme due to the presence of the ALDH2*1/2*2 genotype had higher
MCV than patients with normal ALDH-2 enzyme activity. ALDH-2 is a key enzyme involved in
the removal of the toxic acetaldehyde metabolite of alcohol. Therefore, patients with inactive
ALDH-2 enzyme may have a higher acetaldehyde concentration, thus further indicating the role of
acetaldehyde in increasing MCV. (Dasgupta 2015)
Aminotransferase level changes in alcohol consumers
AST is an enzyme found primarily in the liver and heart, but it is also found in many other
tissues including the muscle, red blood cells, pancreas, kidney, and brain. Damage to these organs
or hemolysis releases the enzyme, resulting in elevated AST levels in the serum (Devaraj 2015).
Elevated AST, indicative of hepatocyte injury and the concomitant release of intracellular hepatic
transaminases, is therefore associated with alcoholic hepatitis and alcohol dependence (Findley et
al. 2010).
Another enzyme, alanine aminotransferase or ALT, is primarily found in the liver. AST and
ALT are often measured together as part of a liver function panel to detect liver damage. Liver
diseases in which AST is higher than ALT include alcohol-induced liver damage, cirrhosis, and
liver tumors (Devaraj 2015). The AST: ALT ratio (De Ritis ratio) can be used to determine alcohol-
induced liver disease with AST: ALT ratio of greater than 2 (Opio et al. 2013).

DAUGAVPILS UNIVERSITĀTES 60. STARPTAUTISKĀS ZINĀTNISKĀS KONFERENCES PROCEEDINGS OF
RAKSTU KRĀJUMS THE 60th INTERNATIONAL SCIENTIFIC CONFERENCE OF DAUGAVPILS UNIVERSITY
319
MCV and serum AST level changes may predict the development of DTs in patients with a
positive toxicology screen for ethanol, because an increase in MCV and AST can identify those
with physical ethanol dependence.
The aim of this study is to evaluate a combination of MCV and AST level changes as a
predictive factor for DTs in alcohol intoxicated patients during a period of abstention.
The use of these tests may indicate the need for early intervention to prevent DTs, decrease
related complications, and thereby, decrease length of hospital stay (Findley et al. 2010).
Materials and methods
A retrospective cohort study was carried out at Riga East University Hospital clinical center
“Gaiļezers”, gathering data – MCV and AST – from the medical records of patients admitted to the
Toxicology center for the period from year 2013 to 2017.
The exposed group was ethanol abstention delirium or DTs group and the inclusion criteria in
this group were:
1. Individuals who had a positive toxicology screen for ethanol upon admission to the hospital and
had later developed DTs (clinical diagnosis) in the period of alcohol abstention.
2. A blood count analysis including MCV and blood biochemistry analysis including AST had
been performed.
The control group was compiled by individuals who were found to be intoxicated with
ethanol but didn’t develop DTs after refraining from alcohol consumption.
Data for 269 patients were obtained in the DTs group, and in the control group – for 480
patients.
Admission MCV and AST levels were evaluated according to the Riga East University
Hospital clinical center “Gaiļezers” laboratory standards; considering that the specified reference
interval for MCV was 80 – 97 fL and 8 – 40 U/L for AST, all values above this standard were
assumed elevated.
The obtained data were processed in Microsoft Office Excel 2010 and SPSS programs.
The relationship between MCV and AST were percentually estimated in the groups studied.
Relative risk (RR) of developing DTs was calculated in the exposed group. Test (MCV and AST
changes) positive prognostic value (PPV) and negative prognostic value (NPV) were established.
In statistics and epidemiology, relative risk is the ratio of the probability of an event occurring
in an exposed group to the probability of the event occurring in a comparison, non-exposed group.
(Sistrom, Garvan 2004)
PPV is the percentage of patients with a positive test who actually have the disease. NPV is
the percentage of patients with a negative test who do not have the disease. (Parikh et al. 2008)
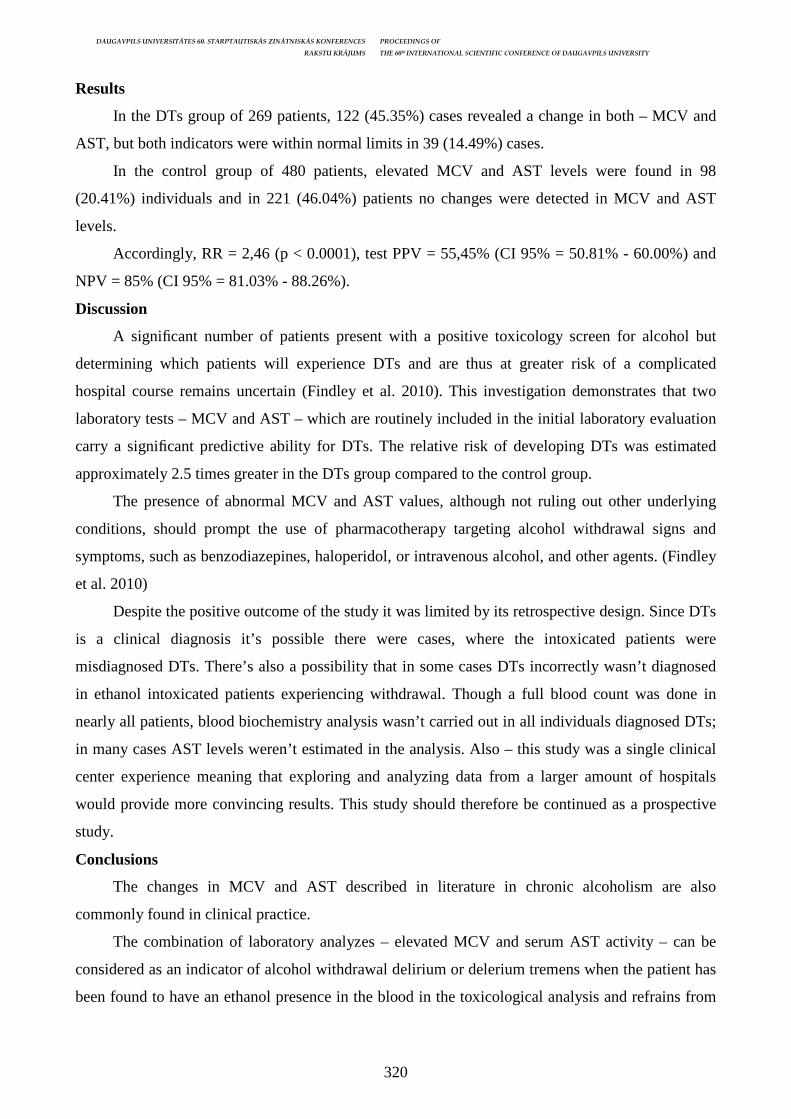
DAUGAVPILS UNIVERSITĀTES 60. STARPTAUTISKĀS ZINĀTNISKĀS KONFERENCES PROCEEDINGS OF
RAKSTU KRĀJUMS THE 60th INTERNATIONAL SCIENTIFIC CONFERENCE OF DAUGAVPILS UNIVERSITY
320
Results
In the DTs group of 269 patients, 122 (45.35%) cases revealed a change in both – MCV and
AST, but both indicators were within normal limits in 39 (14.49%) cases.
In the control group of 480 patients, elevated MCV and AST levels were found in 98
(20.41%) individuals and in 221 (46.04%) patients no changes were detected in MCV and AST
levels.
Accordingly, RR = 2,46 (p < 0.0001), test PPV = 55,45% (CI 95% = 50.81% - 60.00%) and
NPV = 85% (CI 95% = 81.03% - 88.26%).
Discussion
A significant number of patients present with a positive toxicology screen for alcohol but
determining which patients will experience DTs and are thus at greater risk of a complicated
hospital course remains uncertain (Findley et al. 2010). This investigation demonstrates that two
laboratory tests – MCV and AST – which are routinely included in the initial laboratory evaluation
carry a significant predictive ability for DTs. The relative risk of developing DTs was estimated
approximately 2.5 times greater in the DTs group compared to the control group.
The presence of abnormal MCV and AST values, although not ruling out other underlying
conditions, should prompt the use of pharmacotherapy targeting alcohol withdrawal signs and
symptoms, such as benzodiazepines, haloperidol, or intravenous alcohol, and other agents. (Findley
et al. 2010)
Despite the positive outcome of the study it was limited by its retrospective design. Since DTs
is a clinical diagnosis it’s possible there were cases, where the intoxicated patients were
misdiagnosed DTs. There’s also a possibility that in some cases DTs incorrectly wasn’t diagnosed
in ethanol intoxicated patients experiencing withdrawal. Though a full blood count was done in
nearly all patients, blood biochemistry analysis wasn’t carried out in all individuals diagnosed DTs;
in many cases AST levels weren’t estimated in the analysis. Also – this study was a single clinical
center experience meaning that exploring and analyzing data from a larger amount of hospitals
would provide more convincing results. This study should therefore be continued as a prospective
study.
Conclusions
The changes in MCV and AST described in literature in chronic alcoholism are also
commonly found in clinical practice.
The combination of laboratory analyzes – elevated MCV and serum AST activity – can be
considered as an indicator of alcohol withdrawal delirium or delerium tremens when the patient has
been found to have an ethanol presence in the blood in the toxicological analysis and refrains from
DAUGAVPILS UNIVERSITĀTES 60. STARPTAUTISKĀS ZINĀTNISKĀS KONFERENCES PROCEEDINGS OF
RAKSTU KRĀJUMS THE 60th INTERNATIONAL SCIENTIFIC CONFERENCE OF DAUGAVPILS UNIVERSITY
321
using alcohol. The risk of developing DTs was 2.5 times higher in the exposed group compared to
the control group. Test – MCV and ASAT combination – PPV was 55% and NPV 85%.
References Biomarkers Working Group. 2001. Biomarkers and surrogate endpoints: preferred definitions and conceptual framework. In: Clin Pharmacol Ther. Vol. 69, pp. 89–95. Burns J. M., Lekawa E. M., Price B. J. 2017. Delirium Tremens (DTs) Clinical Presentation. [skatīts 14.04.2018.]. Pieejams: https://emedicine.medscape.com/article/166032 Dasgupta A. 2015. Mean Corpuscular Volume and Carbohydrate-Deficient Transferrin as Alcohol Biomarkers. [skatīts 14.04.2018.]. Pieejams: http://dx.doi.org/10.1016/B978-0-12-800339-8.00006-7 Devaraj S., Chu H. V. 2015. Aspartate Aminotransferase. [skatīts 14.04.2018.]. Pieejams: https://emedicine.medscape.com/article/2087224 Findley J., Park L., Siefert C., Chiou G., Lancaster R., DeMoya M., Gervasini A., Velmahos G. 2010. Two Routine Blood Tests - Mean Corpuscular Volume and Aspartate Aminotransferase - as Predictors of Delirium Tremens in Trauma Patients. In: The Journal of Trauma. Vol. 69(1), pp. 199–201. Kattimani S., Bharadwaj B. 2013. Clinical management of alcohol withdrawal: A systematic review. In: Ind Psychiatry J. Vol. 22(2), pp. 100–108. Koob G. F. 2006. The neurobiology of addiction: A neuroadaptational view relevant for diagnosis. In: Addiction. Vol. 101 (Supp 1), pp. 23–30. Opio K. C., Seremba E., Ocama P., Lalitha R., Kagimu M., Lee M. W. 2013. Diagnosis of alcohol misuse and alcoholic liver disease among patients in the medical emergency admission service of a large urban hospital in Sub-Saharan Africa; a cross sectional study. In: Pan Afr Med J. Vol. 15, p. 23. Parikh R., Mathai A., Parikh S., Sekhar C. G., Thomas R. 2008. Understanding and using sensitivity, specificity and predictive values. In: Indian J Ophthalmol. Vol. 56(1), pp. 45–50. Peterson K. 2004/2005. Biomarkers for Alcohol Use and Abuse. A Summary. In: Alcohol Health & Research World. Vol. 28(1), pp. 30–31. Sistrom C. L., Garvan C. W. 2004. Proportions, odds, and risk. In: Radiology. Vol.230(1), pp. 12–19. Trevisan A. L., Boutros N., Petrakis L. I., Krystal H. J. 1998. Complications of alcohol withdrawal. Pathophysiological insights. In: Alcohol Health & Research World. Vol. 22(1), pp. 61–62. Waszkiewicz N., Konarzewska B., Waszkiewicz M., et al. 2010. Biomarkers of alcohol abuse. Part I. Traditional biomarkers and their interpretation. In: Psychiatr Pol. Vol. 44, pp. 127–36. Waszkiewicz N., Szajda S.D., Kępka A., et al. 2011. Glycoconjugates in the detection of alcohol abuse. In: Biochem Soc Trans. Vol. 39, pp. 365–9.
DAUGAVPILS UNIVERSITĀTES 60. STARPTAUTISKĀS ZINĀTNISKĀS KONFERENCES PROCEEDINGS OF
RAKSTU KRĀJUMS THE 60th INTERNATIONAL SCIENTIFIC CONFERENCE OF DAUGAVPILS UNIVERSITY
322
ILLICIT DRUG WITHDRAWAL DELIRIUM ASSOCIATED CHANGES IN THE LEVELS OF MEAN CORPUSCULAR
VOLUME AND ASPARTATE AMINOTRANSFERASE IN THE INTENSIVE CARE UNIT PATIENTS
Katr īna Džeriņa Rīga Stradiņš University, 16 Dzirciema Street, Rīga, LV-1007, Latvia, [email protected] Abstract
Illicit drug withdrawal delirium associated changes in the levels of mean corpuscular volume and aspartate aminotransferase in the intensive care unit patients
Key Words: Central nervous system (CNS), illicit drug abuse, withdrawal delirium, mean corpuscular volume (MCV), aspartate aminotransferase (AST) Introduction. Illicit drugs that are widely used include CNS stimulants (such as cocaine, amphetamines), CNS inhibitors (opiates and sedative-hypnotics such as benzodiazepines or barbiturates), and hallucinogens (hemp products, LSD, and phenocyclidine). Products containing solvents or propellants, the fumes of which can be inhaled, may also be considered illicit drugs. Many illicit drugs are highly addictive and pose serious risks such as intoxication and withdrawal delirium. A combination of MCV and AST level changes are seen in most patients diagnosed with delirium tremens; the goal of this study is to see if the same changes are found in patients experiencing illicit drug intoxication or withdrawal delirium. Aim. To examine a combination of MCV and AST level changes in illicit drug abusers experiencing withdrawal or intoxication delirium. Materials and methods. The medical records of 63 patients diagnosed with illicit drug intoxication or withdrawal delirium and 106 illicit drug intoxicated patients that did not develop delirium in the period of abstention (control group) were reviewed for the period from year 3013 to 2017. Admission MCV and AST levels were assessed. Relative risk (RR), test positive predictive value (PPV) and negative predictive value (NPV) were estimated. Results. Of the 63 patients diagnosed withdrawal delirium, both – MCV and AST levels – were changed in 6 cases (9%); no changes were found in 25 patients (39%). Of the 106 patients in the control group, both – MCV and AST levels – were changed in 8 patients (7%); no changes were found in 75 cases (70%). RR was estimated 2.0 (p = 0.1610). The PPV of the test was 42.86% and the NPV 75.0%, respectively. Conclusion. The combination of MCV and AST level changes are rarely observed in patients with illicit drug withdrawal delirium and shouldn’t be associated with the condition. Kopsavilkums
Narkotisko vielu abstinences delīrija asociētās izmaiņas vidējā eritrocītu tilpuma un aspartātaminotransferāzes līmeņos pacientiem intensīvajā terapijā
Atslēgvārdi: Centrālā nervu sistēma (CNS), narkotisko vielu lietošana, abstinences delīrijs, vidējais eritrocītu tilpums (MCV), aspartātaminotransferāze (ASAT) Ievads. Bieži lietotas nelikumīgās vielas ir CNS stimulanti (piemēram kokaīns un amfetamīni), CNS depresanti (opiāti, sedatīvi-hipnotiski aģenti, piemēram, benzodiazepīni un barbiturāti), un halucinogēni (kaņepju produkti, LSD, fenciklidīns). Produktus, kas satur šķīdinātājus vai propelentus, kuru izgarojumus var ieelpot, arī var uzskatīt par narkotiskajām vielām. Daudzas narkotiskas vielas spēj izraisīt spēcīgu atkarību, līdz ar to arī intoksikācijas vai atcelšanas delīriju. Izmaiņas MCV un ASAT līmeņos bieži vērojamas delerium tremens pacientiem; šī pētījuma mērķis ir noskaidrot, vai līdzīgas izmaiņas novērojamas arī pacientiem ar dažādu vielu intoksikācijas vai abstinences delīriju. Mērķis. Pētīt MCV un ASAT līmeņu izmaiņas narkotisko vielu abstinences vai intoksikācijas delīrija pacientiem. Materi āli un metodes. Tika apkopoti dati par 63 pacientiem dažādu vielu intoksikācijas vai abstinences delīrija grupā (eksponētajā grupā) un par 106 pacientiem kontroles grupā, kuriem iestājoties konstatēta vielu intoksikācija, bet delīrijs neattīstījās. Dati tika ievākti par laika periodu no 2013.līdz 2017. gadam. Tika vērtēti pacientu iestāšanās MCV un ASAT līmeņi, un pēcāk tika aprēķināts relatīvais risks (RR), testa (MCV un ASAT izmaiņu) pozitīvā prognostiskā vērtība (PPV) un negatīvā prognostiska vērtība (NPV). Rezultāti. Eksponētajā grupā no 63 pacientiem 6 (9%) gadījumos tika atklātas izmaiņas abos rādītājos, savukārt, 25 (39%) indivīdiem gan MCV, gan ASAT līmenis bija normas robežās. Kontroles grupā no 106 pacientiem paaugstināts MCV un ASAT līmenis bija atrodamas 8 (7%) indivīdiem, bet 75 (70%) pacientam ar vielu intoksikāciju netika atrastas izmaiņas ne MCV, ne ASAT līmenī. RR = 2.0 (p = 0.1610), PPV = 42.86% un NPV = 75.0%. Secinājumi. Izmaiņas MCV un ASAT līmeņos nav uzskatāmas par dažādu vielu intoksikācijas vai abstinences delīrija prognostiskiem faktoriem.
DAUGAVPILS UNIVERSITĀTES 60. STARPTAUTISKĀS ZINĀTNISKĀS KONFERENCES PROCEEDINGS OF
RAKSTU KRĀJUMS THE 60th INTERNATIONAL SCIENTIFIC CONFERENCE OF DAUGAVPILS UNIVERSITY
323
Introduction
Illicit drugs
Illicit drugs that are widely used include central nervous system (CNS) stimulants (such as
crack, cocaine, and amphetamines), CNS inhibitors (opiates, heroin and sedative-hypnotics such as
benzodiazepines or barbiturates), or hallucinogens (hemp products such as marijuana or hashish,
LSD, and phenocyclidine). Some goods employed as illicit drugs have legal uses also; examples are
home and office products containing solvents or propellants, the fumes of which can be inhaled.
Finally, so-called designer drugs are derivatives of illicit substances that technically are not illegal
but produce comparable effects. (Uutela 2001)
Many drug abusers abuse both alcohol and drugs at the same time in order to get an enhanced
buzz. However, alcohol lowers the threshold of toxic concentration of many drugs, making such
drugs more dangerous. Combining alcohol and cocaine is dangerous because in the presence of
alcohol cocaine is converted into a toxic metabolite (cocaethylene), which may cause death.
Alcohol lowers the threshold of life threatening concentrations of various benzodiazepines and
opioids. (Dasgupta 2017)
Experimentation with illicit drugs may lead through various mechanisms involving social,
psychological, and pharmacological connections to dependency and abuse (Uutela 2001). Illicit
drug use is a major public health issue globally – it has been estimated that 230 million people
worldwide (approximately 5% of world population) had abused an illicit drug at least once in their
life. The number of regular illicit drug users worldwide is approximately 27 million (roughly 0.6%
of world population). (Dasgupta 2017)
Drug induced delirium
Use and abuse of drugs, especially if inappropriate, are among the most frequent causes of
delirium (Gareri et al. 2016). While delirium is a multifactorial process, it is estimated that
medications alone may account for 12 – 39% of all cases of delirium. Drug induced delirium is
commonly seen in medical practice, especially in hospital settings. (Alagiakrishnan, Wiens 2004)
Delirium is a transient disorder of cognition with sudden onset, severe confusion and
fluctuating symptoms, attentional deficits, disorganization of speech and behavioural disorders. It is
independently associated to increased morbidity and mortality rates.
Delirium is the final common symptom of multiple neurotransmitter abnormalities and lesion
reports in prefrontal cortex, thalamus, posterior parietal cortex and basal ganglia. Acetylcholine
deficiency and dopamine excess (as well as their interaction with each other) appear to be critical in
the final common pathway of delirium. Cortisol excess, which seems to be abnormal “shut-off” of
the hypothalamic-pituitary-adrenal axis and anticholinergic activity raised levels are remarkable
too. (Gareri et al. 2016)
DAUGAVPILS UNIVERSITĀTES 60. STARPTAUTISKĀS ZINĀTNISKĀS KONFERENCES PROCEEDINGS OF
RAKSTU KRĀJUMS THE 60th INTERNATIONAL SCIENTIFIC CONFERENCE OF DAUGAVPILS UNIVERSITY
324
Mechanisms of drugs causing delirium
Many drugs have been associated with delirium, but certain classes of drugs (deliriants) are
more commonly viewed as causative agents for delirium. The most common deliriants include high
dose narcotics, benzodiazepines, and anticholinergic medications. Anticholinergic activity is also
associated with the occurrence and severity of delirium.
Neurotransmitter imbalances involving acetylcholine, dopamine, and gamma aminobutyric
acid (GABA) traversing cortical and subcortical nervous system pathways are seen in delirium. The
chemical basis of delirium remains either a diffuse excess of brain dopaminergic activity, a diffuse
deficit in brain cholinergic activity, or both. Most commonly, a relative excess of dopamine is
implicated in the aetiology of the disorder and this may explain why dopamine blockers are helpful
in providing symptomatic relief of delirium. Evidence supports a major role for cholinergic failure
in delirium. Anticholinergic intoxication causes a classical delirium syndrome that may be
reversible with cholinesterase inhibitors such as physostigmine. Drugs which can cause a
muscaranic blockade can lead to delirium. Some of the drugs causing delirium, such as digoxin,
lithium, and histamine (H2)-antagonists show measurable cholinergic receptor binding, even though
they are not traditionally classified as anticholinergic. The mechanisms of drug induced delirium are
not well defined. Some hypothesis have been supported by in vitro or animal studies. For example,
in benzodiazepine withdrawal, a rebound decline in GABAergic function may precipitate delirium.
GABA acting at GABA-A receptors inhibits the release of dopamine GABA antagonist or sudden
withdrawal from a GABA agonist may increase the risk of a hyperdopaminergic state, which in turn
facilitates the action of glutamate at N-methyl-D-aspartate (NMDA) receptors. Digoxin, in addition
to muscarinic antagonist activity, also inhibits membrane Na+K+ATPase, which can cause
profound disruption of neuronal activity. Quinolone antibiotics are NMDA receptor agonists,
GABA-A receptor antagonists, and have weak dopaminergic activity. Morphine has been shown to
increase the release of dopamine and inhibit neuronal NA+ K+ATPase. Both codeine and
diphenhydramine are muscarinic antagonists, while diphenhydramine also blocks reuptake of
dopamine. Histamine (H2)-receptor blockers such as ranitidine increase the release of dopamine in
addition to muscarinic antagonist activity. (Alagiakrishnan, Wiens 2004)
Pathogenesis of delirium is often multifactorial and may derive from the interaction of a
number of different factors, such as advanced age, hearing and vision impairments, dementia,
psychiatric disorders, brain damage and addiction to alcohol or drugs, especially psychoactive
drugs. Severe acute illnesses (urinary tract infections, pneumonia, neck femur fractures),
immobilisation, stress, major surgery and intensive care units (ICU) hospitalisations can act as
precipitating factors.
DAUGAVPILS UNIVERSITĀTES 60. STARPTAUTISKĀS ZINĀTNISKĀS KONFERENCES PROCEEDINGS OF
RAKSTU KRĀJUMS THE 60th INTERNATIONAL SCIENTIFIC CONFERENCE OF DAUGAVPILS UNIVERSITY
325
Elderly people are per se more prone to delirium onset for decreased functional reserve of the
CNS and change in neurotransmitter systems. Other possible factors are due to age-related
pharmacokinetics (liver and/or kidney functions) and pharmacodynamics, Alzheimer’s disease and
vascular dementia, which are more common in this age group and drug-drug interactions. (Gareri et
al. 2016)
Macrocytosis in drug abusers
Various drugs may cause increased MCV (Aslimia et al. 2006). Common medications that
may cause macrocytosis are antiretrovirals (zidovudine, stavudine), anticancer agents (hydroxyurea,
methotrexate, 5-fluorouracil, cyclophosphamide, azathioprine, mercaptopurine, cytosine
arabinoside), antibiotics (sulfamethoxazole and trimethoprim), anticonvulsants (phenytoin,
primidone, valproic acid), anti-inflammatory (sulfasalazine), hypoglycemic agent (metformin).
(Dasgupta 2015)
Drug-induced elevations in aminotransferases
Drugs are an important cause of liver injury. More than 900 drugs, toxins, and herbs have
been reported to cause liver injury. The manifestations of drug-induced hepatotoxicity are highly
variable, ranging from asymptomatic elevation of liver enzymes to fulminant hepatic failure.
Drug-induced liver injury is designated hepatocellular if the alanine aminotransferase (ALT)
levels are increased to more than twice the upper limit of the reference range, with alkaline
phosphatase levels that are within the reference range or are minimally elevated.
Elevation of aspartate aminotransferase (AST) greater than ALT, especially if more than 2
times greater, suggests alcoholic hepatitis. Elevation of AST less than ALT is usually observed in
persons with viral hepatitis. In viral and drug-induced hepatitis, the AST and ALT levels steadily
increase and peak in the low thousands range within 7-14 days.
Many medications can cause increases in AST, such as acetaminophen, NSAIDs, ACE
inhibitors, nicotinic acid, isoniasid, sulfonamides, erythromycin, and antifungal agents such as
griseofulvin and fluconazole. In acetaminophen overdose, transaminase levels greater than 10000
U/L are also noted. (Mehta et al. 2016)
MCV and AST, which are routinely measured laboratory values, are valuable predictors of
alcohol withdrawal delirium tremens (DTs). When both values are normal, the likelihood of
developing DT related to alcohol withdrawal is very low. (Findley et al. 2010) The aim of this study
is to see if the same changes are found in patients experiencing illicit drug withdrawal delirium.
Materials and methods
A retrospective cohort study was carried out at Riga East University Hospital clinical center
“Gaiļezers”, gathering data – MCV and AST – from the medical records of patients admitted to the
Toxicology center for the period from year 2013 to 2017.

DAUGAVPILS UNIVERSITĀTES 60. STARPTAUTISKĀS ZINĀTNISKĀS KONFERENCES PROCEEDINGS OF
RAKSTU KRĀJUMS THE 60th INTERNATIONAL SCIENTIFIC CONFERENCE OF DAUGAVPILS UNIVERSITY
326
The exposed group was various substance abstention or intoxication delirium group (delirium
group) and the inclusion criteria in this group were:
1. Individuals who had a positive toxicology screen for a substance other than ethanol upon
admission to the hospital and intoxication or abstention delirium had been diagnosed (clinical
diagnosis).
2. A blood count analysis including MCV and blood biochemistry analysis including AST had
been performed.
The control group was compiled by individuals who were found to be intoxicated with
various substances but didn’t develop delirium.
Data for 63 patients were obtained in the exposed group and in the control group – for 106
patients.
Admission MCV and AST levels were evaluated according to the Riga East University
Hospital clinical center “Gaiļezers” laboratory standards; considering that the specified reference
interval for MCV was 80 – 97 fL and 8 – 40 U/L for AST, all values above this standard were
assumed elevated.
The obtained data were processed in Microsoft Office Excel 2010 and SPSS programs.
The relationship between MCV and AST were percentually estimated in the groups studied.
Relative risk (RR) of developing DTs was calculated in the exposed group. Test (MCV and AST
changes) positive prognostic value (PPV) and negative prognostic value (NPV) were established.
In statistics and epidemiology, relative risk is the ratio of the probability of an event occurring
in an exposed group to the probability of the event occurring in a comparison, non-exposed group.
(Sistrom, Garvan 2004)
Relative Risk requires the examination of two dichotomous variables, where one variable
measures the event (occurred vs. not occurred) and the other variable measures the groups (group 1
vs. group 2). Relative Risk is calculated by dividing the probability of an event occurring for group
1 divided by the probability of an event occurrin for group 2. (Statistics Solutions 2018)
A relative risk of 1 means there is no difference in risk between the two groups. A RR of < 1
means the event is less likely to occur in the experimental group than in the control group. A RR of
> 1 says the event is more likely to happen in the experimental group than in the control group.
(Sistrom, Garvan 2004)
PPV is the percentage of patients with a positive test who actually have the disease. PPV tells
us how many of test positives are true positives; and if this number is higher (as close to 100 as
possible), then it suggests that this new test is doing as good as “gold standard”. PPV = true positive
/ (true positive + false positive). (Parikh et al. 2008)
DAUGAVPILS UNIVERSITĀTES 60. STARPTAUTISKĀS ZINĀTNISKĀS KONFERENCES PROCEEDINGS OF
RAKSTU KRĀJUMS THE 60th INTERNATIONAL SCIENTIFIC CONFERENCE OF DAUGAVPILS UNIVERSITY
327
NPV is the percentage of patients with a negative test who do not have the disease. NPV tells
us how many of test negatives are true negatives; and if this number is higher (should be close to
100), then it suggests that this new test is doing as good as “gold standard”. NPV = true negative /
(false negative + true negative). (Parikh et al. 2008)
Results
Of 63 patients in the group of delirium of various substances, a combination of elevated MCV
and AST levels was found in 6 (9.52%) patients; in 25 (39.68%) cases, both indicators were within
the normal range. In the control group of 106 patients, however, changes in both parameters were
found in 8 (7.51%) cases; in 76 (71.7%) subjects, both MCV and ASTs were within the normal
range.
In the delirium group RR = 2,03 (p = 0.1540), test PPV = 42,86% (CI 95% = 22.05% -
66.54%) and NPV = 75,25% (CI 95% = 71.63% to 78.55%).
Discussion
Narcotics, benzodiazepines, barbiturates and other substances that are characterized by
withdrawal or intoxication delirium will not in all cases have a negative effect on hepatocytes or
erythrocytes, therefore, MCV and AST may be unchanged in these cases, and therefore not
applicable to delirium prognosis.
Also – it often takes time for the biochemical reactions occurring in the body to be reflected in
the analyzes (for example – it takes months for MCV levels to rise in alcoholics). Drugs and various
substances may induce intoxication or withdrawal delirium even after a single use of the substance
when MCV and AST are still in the normal ranges.
In order to obtain more reliable results, it is advisable to continue the study in a wider range of
patients, for example, in a number of different toxicology clinics in different hospitals.
Conclusions
The changes in MCV and AST described in the literature occur in the use of various
substances, but they do not, in the light of the results of this study, lead to higher delirium
development.
Changes in MCV and AST levels are not considered as prognostic factors for intoxication or
abstention delirium in various substance abusers (such as opiates, cannabis alkaloid, sedative and
sleeping pills, cocaine and other stimulants, hallucinogens, volatile organic solvents, etc.). RR was
statistically insignificant (p = 0.1), which means that there is most likely to be no link between
changes in MCV and AST levels and delirium development.
DAUGAVPILS UNIVERSITĀTES 60. STARPTAUTISKĀS ZINĀTNISKĀS KONFERENCES PROCEEDINGS OF
RAKSTU KRĀJUMS THE 60th INTERNATIONAL SCIENTIFIC CONFERENCE OF DAUGAVPILS UNIVERSITY
328
References Alagiakrishnan K., Wiens A. C. 2004. An approach to drug induced delirium in the elderly. In: Postgrad Med J. Vol. 80, pp. 388–393. Aslimia F., Mazza J. J., Yale S. H. 2006. Megaloblastic anemia and other causes of macrocytosis. In: Clin Med Res. Vol. 4, pp. 236–41. Dasgupta A. 2015. Mean Corpuscular Volume and Carbohydrate-Deficient Transferrin as Alcohol Biomarkers. [skatīts 14.04.2018.]. Pieejams: http://dx.doi.org/10.1016/B978-0-12-800339-8.00006-7 Dasgupta A. 2017. Combined alcohol and drug abuse: A potentially deadly mix. In: Alcohol, Drugs, Genes and the Clinical Laboratory. Pp. 75–88. Findley J., Park L., Siefert C., Chiou G., Lancaster R., DeMoya M., Gervasini A., Velmahos G. 2010. Two Routine Blood Tests – Mean Corpuscular Volume and Aspartate Aminotransferase – as Predictors of Delirium Tremens in Trauma Patients. In: The Journal of Trauma. Vol. 69(1), pp. 199–201. Gareri P., Castagna A., Ruotolo G., Merante A., Russo G., Sarro D. G. 2016. Drug-induced Delirium: A Frequent and Important Matter for Geriatricians. [skatīts 15.04.2018.]. Pieejams: http://lawarencepress.com/ojs/index.php/JPBMS/article/view/49/html_15 Mehta N., Ozick L., Gbadehan E. 2016. Drug-Induced Hepatotoxicity. [skatīts 15.04.2018.]. Pieejams: https://emedicine.medscape.com/article/169814 Parikh R., Mathai A., Parikh S., Sekhar C. G., Thomas R. 2008. Understanding and using sensitivity, specificity and predictive values. In: Indian J Ophthalmol. Vol. 56(1), pp. 45–50. Sistrom C. L., Garvan C. W. 2004. Proportions, odds, and risk. In: Radiology. Vol. 230(1), pp. 12–19. Statistics Solutions 2018. [skatīts 14.04.2018.]. Pieejams: http://www.statisticssolutions.com/ relative-risk/ Uutela A. 2001. Drugs: Illicit Use and Prevention. In: International Encyclopedia of the Social & Behavioral Sciences. Pp. 3877–3881.

DAUGAVPILS UNIVERSITĀTES 60. STARPTAUTISKĀS ZINĀTNISKĀS KONFERENCES PROCEEDINGS OF
RAKSTU KRĀJUMS THE 60th INTERNATIONAL SCIENTIFIC CONFERENCE OF DAUGAVPILS UNIVERSITY
329
THE INCIDENCE OF BURNOUT SYNDROME AMONG YOUTH CENTRE STAFF
Marta G ēbele Riga Stradiņš University, Dzirciema str. 16, LV-1007, Riga, Latvia, [email protected] Abstract
The incidence of burnout syndrome among youth centre staff Key Words: burnout syndrome, youth centre staff, burnout Burnout syndrome occurs due to increased emotional burden, stress conditions in the workplace. More and more people in their daily lives tend to be exposed to the burnout syndrome, as not only employers' demands are intensified, but also the demands of society against each other. Everyone has a variety of future opportunities and it is becoming increasingly difficult to choose the right ones. Therefore, youth centre staff plays a big role in our society, which helps young people understand and assess future opportunities. According to the Ministry of Education and Science, there are 160 youth centres in Latvia. This work gives a glimpse of how topical this problem is Latvian youth centre employees, as emotional burnout is observed in more than a third of the population, and only a few of their personal achievements is assessed as being wholesome. From all this, it can be concluded that about one third of youth workers have signs of a burnout syndrome. Kopsavilkums
Izdegšanas sindroma sastopamība jauniešu centru darbinieku vidū Atslēgvārdi: izdegšanas sindroms, jauniešu centrs, darbinieki, izdegšana Izdegšanas sindroms rodas sakarā ar palielinātu emocionālo noslodzi, stresa apstākļiem darbavietā. Tādējādi izteikti samazinās darba kvalitāte un ražīgums. Arvien vairāk cilvēki savā ikdienā mēdz saskarties ar izdegšanas sindromu, jo pastiprinās ne tikai darba devēju prasības, bet arī sabiedrības prasības vienam pret otru. Katram ir pieejamas dažādas nākotnes iespējas un izvēlēties sev pareizo kļūst arvien grūtāk. Tādēļ sabiedrībā lielu lomu spēlē jaunieši centru darbinieki, kas palīdz jauniešiem izvērtēt un saprast nākotnes iespējas. Pēc Izglītības un zinātnes ministrijas datiem Latvijā ir 160 jauniešu centri. Šis darbs dod ieskatu par to cik aktuāla šī problēma ir Latvijas jauniešu centru darbinieku vidū, jo emocionāla izdegšana ir vērojama vairāk kā trešdaļai šīs populācijas, kā arī tikai retais savus personīgos sasniegumus novērtē kā pilnvērtīgus. No visa var secināt ka aptuveni trešdaļai jauniešu centros strādājošo ir izdegšanas sindroma pazīmes. Introduction
This topic becomes actual not only because of the press coverage and because of other media,
which are starting to talk about burnout syndrome, but also because research shows that a lot of
working people faced with this problem. About 27% of modern working population have some of
the burnout syndrome symptoms [Tait D. Shanafelt, MD, et al 2012]
The burnout syndrome occurs not only emotional state but also physical health. [Kenneth v.
Iserson 2018] The burnout syndrome occurs due to an increased emotional burden, stress conditions
in the workplace. Risk factors associated with burnout includes the lack of challenge on the job, low
work autonomy, role ambiguity and low professional self-esteem. [Maslach, C., Leiter, M. P. 1997]
Because of the syndrome, the quality and performance of the work are sharply reduced, the
person becomes demotivated and emotionally stunned, unable to fully perform his duties. [Chris
Loyd, Robert King & Lesley Chenoweth, 2002]
According to a research carried out in Latvia, 48% of employees are under constant stress,
while 31.2% of workers feel that their emotional state only worsens, and one of the most important
psycho-emotional risk factors is direct contact with people who are not their employees. [Prof.
M.Eglīte, Prof. I.Vanadziņš; 2017]

DAUGAVPILS UNIVERSITĀTES 60. STARPTAUTISKĀS ZINĀTNISKĀS KONFERENCES PROCEEDINGS OF
RAKSTU KRĀJUMS THE 60th INTERNATIONAL SCIENTIFIC CONFERENCE OF DAUGAVPILS UNIVERSITY
330
Young people are a large and integral part of society. They are the future of society, so
investing in reporting and promoting their initiative can only improve our future society.
The staff of youth centres plays an important role in society, because it ensures the integration
of young people into society, involving them in social activities and organizations and helps to find
solutions to the problems of young people. They are investing in our future society.
There are currently 160 youth centres in Latvia. [LR Ministry of Education and Science]
Methods and materials
To find out, the author used an anonymous Google Forms computerized questionnaire.
Questionnaire consisted of demographic questions about gender, age, education, work
experience and the Maslach Burnout Syndrome Scale. Author used Maslach Burnout Syndrome
Scale - Human severity, which consisted of 22 questions, 9 questions about emotional exhaustion, 5
about depersonalization and 8 about personal success. [Maslach C., Jackson S.E 1981] This
questionnaire was adapted in Latvian language in 2002 by S. Ašpure.
The questionnaire was sent to all youth centres’ e-mails that are available at
www.jaunatne.gov.lv
The data was compiled using statistical calculations using the following programs: Microsoft
Excel; IBM SPSS Statistics 20. The data collection period was from December 2017 until January 2018.
Results
The study was attended by 97 respondents, of which 83 women and 14 men. In data was no
normal distribution and the median age for women was 31 and 28 for men.
Respondents was included from all regions of Latvia.
Analysis of Maslach Burnout Syndrome Scale subgroups: emotional burnout,
depersonalisation, personal success. Figure 1
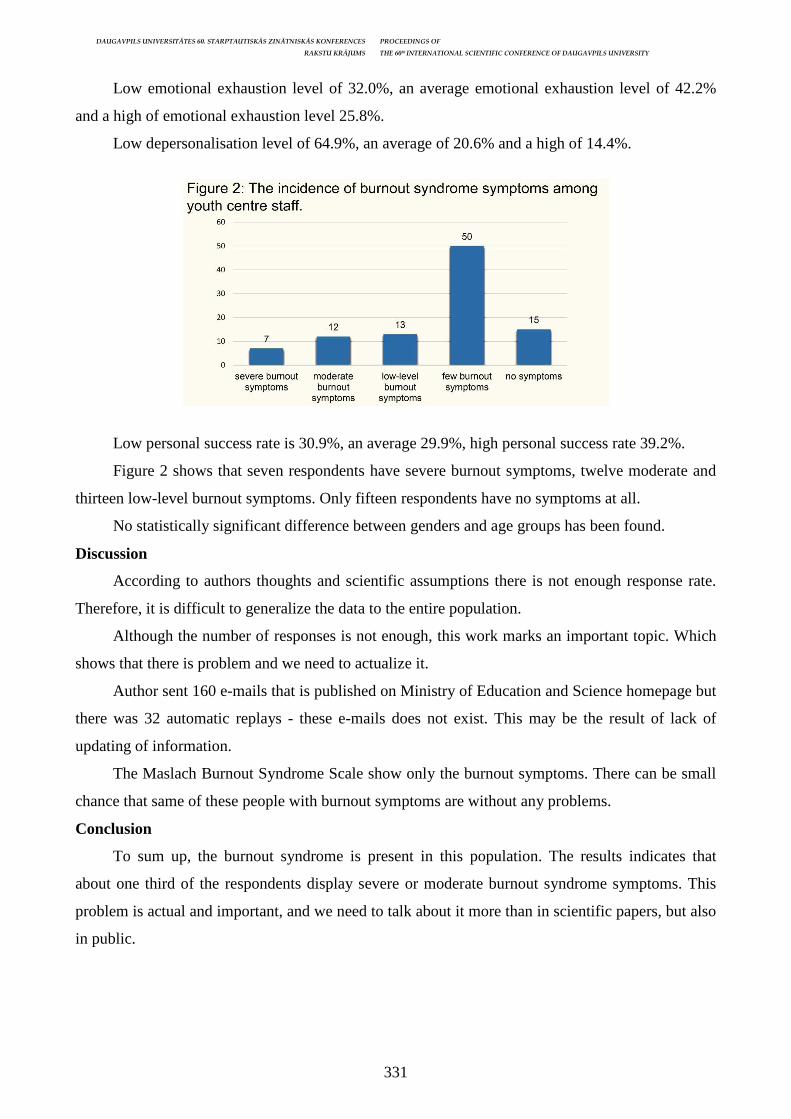
DAUGAVPILS UNIVERSITĀTES 60. STARPTAUTISKĀS ZINĀTNISKĀS KONFERENCES PROCEEDINGS OF
RAKSTU KRĀJUMS THE 60th INTERNATIONAL SCIENTIFIC CONFERENCE OF DAUGAVPILS UNIVERSITY
331
Low emotional exhaustion level of 32.0%, an average emotional exhaustion level of 42.2%
and a high of emotional exhaustion level 25.8%.
Low depersonalisation level of 64.9%, an average of 20.6% and a high of 14.4%.
Low personal success rate is 30.9%, an average 29.9%, high personal success rate 39.2%.
Figure 2 shows that seven respondents have severe burnout symptoms, twelve moderate and
thirteen low-level burnout symptoms. Only fifteen respondents have no symptoms at all.
No statistically significant difference between genders and age groups has been found.
Discussion
According to authors thoughts and scientific assumptions there is not enough response rate.
Therefore, it is difficult to generalize the data to the entire population.
Although the number of responses is not enough, this work marks an important topic. Which
shows that there is problem and we need to actualize it.
Author sent 160 e-mails that is published on Ministry of Education and Science homepage but
there was 32 automatic replays - these e-mails does not exist. This may be the result of lack of
updating of information.
The Maslach Burnout Syndrome Scale show only the burnout symptoms. There can be small
chance that same of these people with burnout symptoms are without any problems.
Conclusion
To sum up, the burnout syndrome is present in this population. The results indicates that
about one third of the respondents display severe or moderate burnout syndrome symptoms. This
problem is actual and important, and we need to talk about it more than in scientific papers, but also
in public.
DAUGAVPILS UNIVERSITĀTES 60. STARPTAUTISKĀS ZINĀTNISKĀS KONFERENCES PROCEEDINGS OF
RAKSTU KRĀJUMS THE 60th INTERNATIONAL SCIENTIFIC CONFERENCE OF DAUGAVPILS UNIVERSITY
332
References Eglīte M., Vanadziņš I. Emocionālā veselība darba vietā 2017. Kenneth V. Iserson. Burnout Syndrome: Global Medicine Volunteering as a Possible Treatment Strategy, Journal of Emergency Medicine, 2018. Loyd C., King R., Chenoweth L. Social work, stress and burnout: A review. Jornal of Mental Health (2002) 11,3, 255–265. Maslach C., Jackson S. E., The measurement of experienced burnout, Jornal of Organizational Behavior, April 1981, Volume 2, Issue 2, 99–113. Maslach, C., & Leiter, M. P. The truth about burnout: How organizations cause personal stress and what to do about it. San Francisco, CA, US: Jossey-Bass. (1997). Shanafelt TD, Boone S, Tan L, et al. Burnout and Satisfaction With Work-Life Balance Among US Physicians Relative to the General US Population. Arch Intern Med. 2012; 172(18): 1377–1385. doi: 10.1001/archinternmed.2012.3199
DAUGAVPILS UNIVERSITĀTES 60. STARPTAUTISKĀS ZINĀTNISKĀS KONFERENCES PROCEEDINGS OF
RAKSTU KRĀJUMS THE 60th INTERNATIONAL SCIENTIFIC CONFERENCE OF DAUGAVPILS UNIVERSITY
333
COMPARISON OF DEPRESSION AND ANXIETY LEVELS AND PREVALENCE AMONG RIGA STRADINS UNIVERSITY
1ST AND 6TH YEAR MEDICAL FACULTY STUDENTS
Lelde Logina1, Anete Granovska1 Scientific research supervisor: MD Art ūrs Ancāns2 1 RSU, Latvia, Riga, Dzirciema 16, [email protected], [email protected] 2 RSU Psihosomatiskās medicīnas un psihoterapijas klīnika, Latvia, Rīga, Kristapa iela 30 Abstract
Comparison of depression and anxiety levels and prevalence among Riga Stradins university 1st and 6th year medical faculty students
Key Words: Depression, anxiety Introduction. Medical students are at higher risk for depression and anxiety compared to other university students. Depression and anxiety is highly associated with burnout syndrome and suicidal tendencies in medical physicians. Aim. The aim of this study is to compare depression and anxiety prevalence and levels among RSU 1st and 6th year medical students. Materials and methods. This was a cross-sectional study of 1st and 6th year medical students. In this study Patient Health Questionnaire (PHQ-9) and Generalized Anxiety Disorder Questionnaire (GAD-7) were used. SPSS v.25 for Windows was used to perform all statistical analyses. Results. A total of 211 students (111 – 1st year, 100 – 6th year) completed the questionnaires. Overall 81,5% were female (92 – 1st year, 80 – 6th year), 18,5% were male students (19 – 1st year, 20 – 6th year).The prevalence of major depression (PHQ-9≥10) was higher in the 1st year students compared to last year students (51,3% vs. 37%). There is a statistically significant difference between 1st and 6th year student major depression levels (p=0,014). From 1st year students 14,4% had minimal, 34,2% mild, 25,2% moderate, 14,4 moderately severe and 11,7% severe major depression level. From 6th year students 30% had minimal, 34% mild, 25% moderate, 5% moderately severe and 6% severe major depression level. The prevalence of generalized anxiety (GAD-7≥10) was higher in the 1st year students compared to last year students (36% vs. 24%). There is a statistically significant difference between 1st and 6th year student generalized anxiety levels (p=0,012). From 1st year students 24,3% had minimal, 39,6% mild, 25,2% moderate and 10,8% severe generalized anxiety level. From 6th year students 44% had minimal, 32% mild, 13% moderate, 11% severe generalized anxiety level. Conclusion. A higher prevalence of anxiety and major depression was found in 1st year medical students as compared with 6th year students. Kopsavilkums
Trauksmes un depresijas līmeņa un prevalences salīdzinājums starp Rīgas Stradiņa universitātes 1. studiju gada un 6. studiju gada medicīnas fakultātes studentiem
Atslēgvārdi: Depresija, trauksme Ievads. Medicīnas studeniem ir augstāks risks dzīves laikā veidoties trauksmei un depresijai, salīdzinājumā ar vienaudžiem populācijā. Depresija un trauksme ir izteikti asociēta ar risku veidoties izdegšnas sindromam un pašnāvnieciskām domām medicīnas studentu starpā. Mērķis. Noteikt trauksmes un depresijas prevalenci un smaguma pakāpes 1. un 6. kursa medicīnas studentiem, kā arī salīdzināt abu kursu studentus savā starpā. Materi āli un metodes. Šajā šķērsgriezuma pētījumā tika analizēti 1. un 6. kursa medicīnas fakultātes studenti. Tika izmantotas sekojošas skalas: pacienta veselības aptauja – depresijas tests (PHQ-9) un ģeneralizētas trauksmes pašnovērējuma skala (GAD-7). SPSS v.25 tika izmantota statistiskai datu analīzei. Rezultāti. Pētījumā kopumā piedalījās 211 studenti (111 – 1. kursā; 100 – 6. kursā) vecumā no 18 - 34 gadiem. 81,5% bija sievietes (92 – 1.kursā; 80 – 6.kursā), 18,5% bija vīrieši (19 – 1.kursā; 20 – 6.kursā). Klīniskas depresijas prevalence (PHQ-9≥10) augstāka bija 1. kursa studentiem, salīdzinājumā ar 6. kursa studentiem (51,3% pret 37%). Tika noteikta statistiski nozīmīga atšķirība starp 1. un 6. kursa studentiem klīniskas depresijas smaguma pakāpēm (p=0,014). No 1.kursa studentiem 14,4% neuzrādīja depresiju, 34,2% tika konstatēta viegla, 25,2% mērena, bet 14,4% mēreni smaga. Savukārt 11,7% tika konstatēta smaga klīniskas depresijas pakāpe. Analizējot 6.kursa studentus 30% neuzrādīja depresiju, 34% tika konstatēta viegla, 25% mērena, bet 5% mēreni smaga. Savukārt 6% tika konstatēta smaga klīniskas depresijas pakāpe. Ģeneralizētas trauksmes prevalence (GAD7≥10) bija augstāka 1.kursa studentiem, salīdzinājumā ar 6.kursa studentiem (36% pret 24%). Tika noteikta statistiski nozīmīga atšķirība starp 1. un 6. kursa studentiem ģeneralizētas trauksmes pakāpēm (p=0,012). No 1.kursa studentiem 24,3% netika konstatēta trausme, 39,6% tika konstatēta viegla, 25,2% mērena, bet 10,8% smaga ģeneralizētas trauksmes pakāpe. No 6.kursa studentiem 44% netika konstatēta trauksme, 32% tika konstatēta viegla, 13% mērena, bet 11% smaga ģeneralizētas trauksmes pakāpe. Secinājumi. 1.kursa medicīnas studentiem bija augstāka trauksmes un depresijas prevalence nekā 6. kursa medicīnas studentiem.
DAUGAVPILS UNIVERSITĀTES 60. STARPTAUTISKĀS ZINĀTNISKĀS KONFERENCES PROCEEDINGS OF
RAKSTU KRĀJUMS THE 60th INTERNATIONAL SCIENTIFIC CONFERENCE OF DAUGAVPILS UNIVERSITY
334
Introduction
It is a well known fact that depression and anxiety is a world wide problem. There are a
number of studies that have found the prevalence of anxiety and depression to be higher among
medical students as compared to general population, with the highest study pressure in first year
students.
At the beginning of the 1st study year and coming closer to graduation, medical students have
to face a lot of difficulties. First year students are affected by lifestyle changes, they have to learn
and perceive large amount of new information, they have the pressure of being under constant
assessment as well as they have a high academic pressure from the studies that leads to sleep
deprivation. (Roh Ms et al. 2010, Ana M et al. 2014, Kunmi Sobowale et al, 2014).
6th year students are more troubled about the uncertainty of their medical future and there is a
higher competition between medical students. Students with anxiety and depression have decreased
well-being, academic performance, potential for success and are more likely to drop out of medical
school, experience burnout, suicidal thinking and other health-related issues. (Roh Ms et al. 2010,
Ana M et al. 2014, Kunmi Sobowale et al, 2014)
Unfortunately, the percentage of medical students that seek treatment is very low. More
attention should be addressed to medical students because studies also show that medical residents
have even higher prevalence of anxiety and depression. (Omar Y et al. 2016)
Aim of the article
The aim of this study is to compare depression and anxiety prevalence and levels among RSU
1st and 6th year medical students.
Matherials and methods
This was a cross-sectional study. Medical students were asked to fill two self-report
questionnaires: Patient Health Questionnaire (PHQ-9) – for the evaluation of major depressive
disorder and Generalized Anxiety Disorder Questionnaire (GAD-7) – for the evaluation of
generalized anxiety.
Microsoft Office Excel 2016 and SPSS v.25 were used to perform all statistical analyses.
With SPSS Statistics v.25.0, quantitative data was checked for compliance with the normal
distribution. Median and interquartile range were calculated. Medians were compared using the
Mann-Whitney test. The Spearman correlation test was used to determine the correlations. The Chi-
square test was used to determine the association between two variables. A statistically significant
value was taken as p <0.05.
Medical students were included in the study if the questionnaire was completely filled, the
student was 1st or 6th year Riga Stradins university medical student and the participant had agreed to
participate in the study. Although exclusion criteria were partially completed questionnaire,
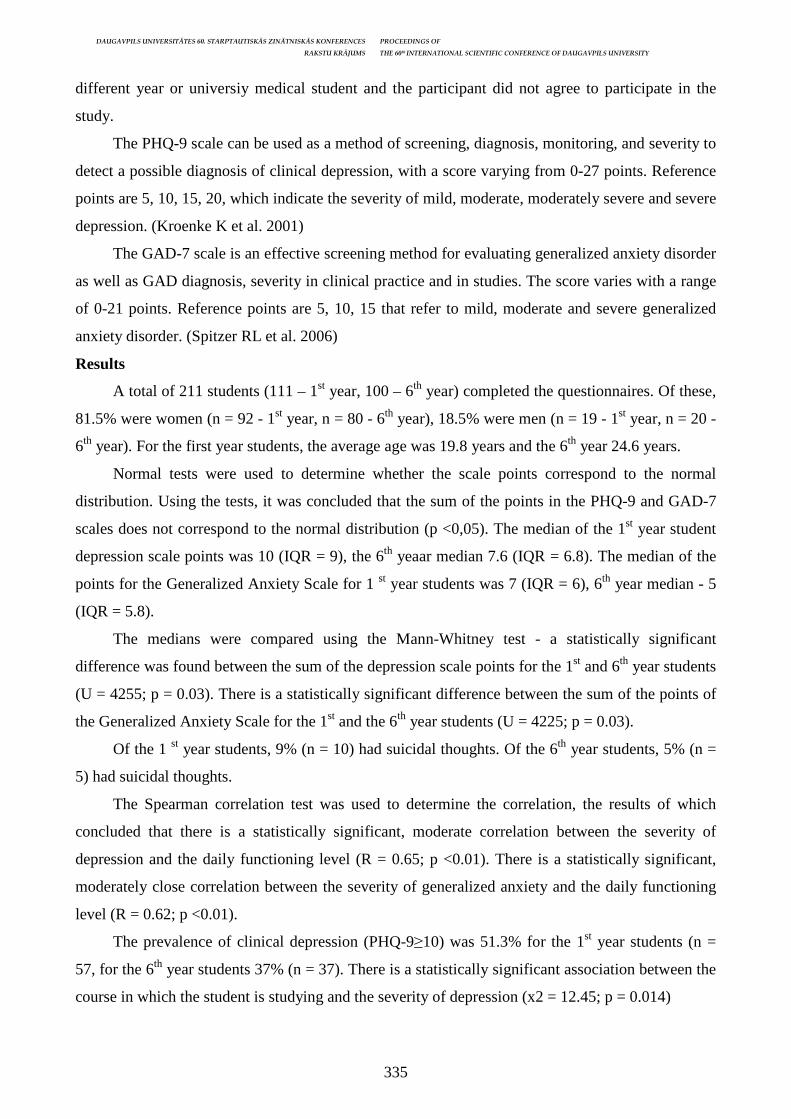
DAUGAVPILS UNIVERSITĀTES 60. STARPTAUTISKĀS ZINĀTNISKĀS KONFERENCES PROCEEDINGS OF
RAKSTU KRĀJUMS THE 60th INTERNATIONAL SCIENTIFIC CONFERENCE OF DAUGAVPILS UNIVERSITY
335
different year or universiy medical student and the participant did not agree to participate in the
study.
The PHQ-9 scale can be used as a method of screening, diagnosis, monitoring, and severity to
detect a possible diagnosis of clinical depression, with a score varying from 0-27 points. Reference
points are 5, 10, 15, 20, which indicate the severity of mild, moderate, moderately severe and severe
depression. (Kroenke K et al. 2001)
The GAD-7 scale is an effective screening method for evaluating generalized anxiety disorder
as well as GAD diagnosis, severity in clinical practice and in studies. The score varies with a range
of 0-21 points. Reference points are 5, 10, 15 that refer to mild, moderate and severe generalized
anxiety disorder. (Spitzer RL et al. 2006)
Results
A total of 211 students (111 – 1st year, 100 – 6th year) completed the questionnaires. Of these,
81.5% were women (n = 92 - 1st year, n = 80 - 6th year), 18.5% were men (n = 19 - 1st year, n = 20 -
6th year). For the first year students, the average age was 19.8 years and the 6th year 24.6 years.
Normal tests were used to determine whether the scale points correspond to the normal
distribution. Using the tests, it was concluded that the sum of the points in the PHQ-9 and GAD-7
scales does not correspond to the normal distribution (p <0,05). The median of the 1st year student
depression scale points was 10 (IQR = 9), the 6th yeaar median 7.6 (IQR = 6.8). The median of the
points for the Generalized Anxiety Scale for 1 st year students was 7 (IQR = 6), 6th year median - 5
(IQR = 5.8).
The medians were compared using the Mann-Whitney test - a statistically significant
difference was found between the sum of the depression scale points for the 1st and 6th year students
(U = 4255; p = 0.03). There is a statistically significant difference between the sum of the points of
the Generalized Anxiety Scale for the 1st and the 6th year students (U = 4225; p = 0.03).
Of the 1 st year students, 9% (n = 10) had suicidal thoughts. Of the 6th year students, 5% (n =
5) had suicidal thoughts.
The Spearman correlation test was used to determine the correlation, the results of which
concluded that there is a statistically significant, moderate correlation between the severity of
depression and the daily functioning level (R = 0.65; p <0.01). There is a statistically significant,
moderately close correlation between the severity of generalized anxiety and the daily functioning
level (R = 0.62; p <0.01).
The prevalence of clinical depression (PHQ-9≥10) was 51.3% for the 1st year students (n =
57, for the 6th year students 37% (n = 37). There is a statistically significant association between the
course in which the student is studying and the severity of depression (x2 = 12.45; p = 0.014)
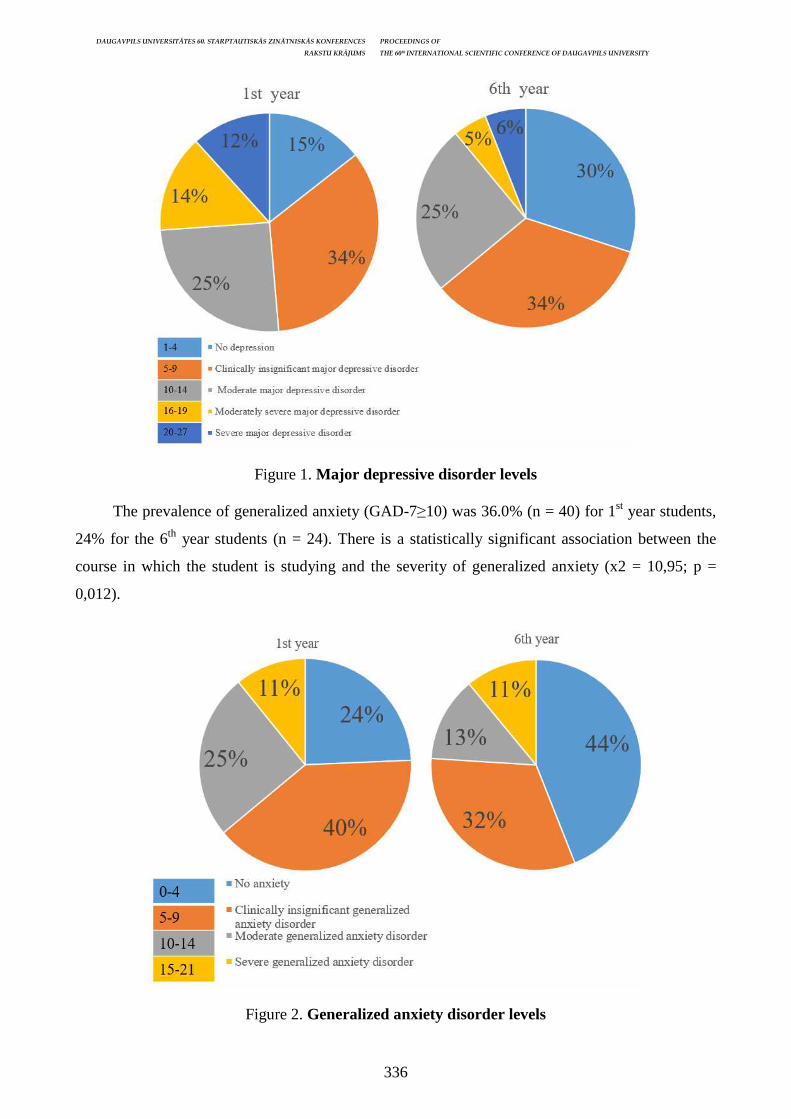
DAUGAVPILS UNIVERSITĀTES 60. STARPTAUTISKĀS ZINĀTNISKĀS KONFERENCES PROCEEDINGS OF
RAKSTU KRĀJUMS THE 60th INTERNATIONAL SCIENTIFIC CONFERENCE OF DAUGAVPILS UNIVERSITY
336
Figure 1. Major depressive disorder levels
The prevalence of generalized anxiety (GAD-7≥10) was 36.0% (n = 40) for 1st year students,
24% for the 6th year students (n = 24). There is a statistically significant association between the
course in which the student is studying and the severity of generalized anxiety (x2 = 10,95; p =
0,012).
Figure 2. Generalized anxiety disorder levels

DAUGAVPILS UNIVERSITĀTES 60. STARPTAUTISKĀS ZINĀTNISKĀS KONFERENCES PROCEEDINGS OF
RAKSTU KRĀJUMS THE 60th INTERNATIONAL SCIENTIFIC CONFERENCE OF DAUGAVPILS UNIVERSITY
337
Discussion
A large number of studies on the prevalence of depression and anxiety among medical
students have been conducted worldwide, and each study uses, at the discretion of the author, the
best depression and anxiety scoring scale. PHQ-9 and GAD-7 were selected in this study because
they are relatively newly developed, proved to be effective and are widely used in Latvia and
elsewhere in the world. They take less time, specially trained personnel are not required to complete
the questionnaire, and completion of the scales are more standardized. (Lee Baer et al. 2009)
In countless studies worldwide, medical students have a higher level of anxiety and
depression than peers in the general population. (Afzal Hakim et al. 2017, Ana M. et al. 2014,
Dyrbye LN et al. 2006, Francisco Romo Nava et al. 2013, Givens JL et al. 2002)
In a large meta-analysis type survey where 195 cross-sectional studies were used, the overall
prevalence of depression was 27.2% (9.3% -55.9%). (Lisa S. et al. 2016) A large-scale meta-
analysis study was conducted in North America to investigate the prevalence of depression, anxiety
and psychological distress in medical students. The prevalence of anxiety varied from 7.7% to
65.6% and the prevalence of depression varied from 6.9 to 66.5%. (Valerie Hope & Max Henderson
2014)
A large study was conducted in Korea, in which 7357 students participated. The prevalence of
clinical depression was assessed, that was 10.3%. (Roh MS et al. 2010) A Spanish study also found
that the prevalence of depression in younger students is higher (12%) and the rate of depression
decreases when moving to older courses. (Ana M et al. 2014) The Swedish study states that 1st year
medical students are experiencing the greatest pressure from studies. (Wallin U. et al. 2003) In a
study in Egypt (Alexandria), 43.9% of medical students were diagnosed with clinical depression
and 57.9% anxiety. (Ibrahim MB et al. 2015) In a study in India, the prevalence of depression in
medical students was 29.9% and an alarm of 41.1%. (Vaidya PM et al. 2007)
Looking at research elsewhere in the world, it can be concluded that RSU 1st and 6 th year
students of the Faculty of Medicine have a markedly high prevalence of depression and anxiety.
Therefore, in my opinion, it would be advisable to further promote various support programs for
students and create new support programs, because the persistance of depression and anxiety may
interfere with professional development, everyday life and may cause suicidal ideation.
Conclusion
RSU 1st year medical students had higher depression and anxiety prevalence and level of
severity than 6th year students. It would be recommended to make new supportive methods for
medical students. The ones that already exist should be more promoted, especially for younger
medical students.
DAUGAVPILS UNIVERSITĀTES 60. STARPTAUTISKĀS ZINĀTNISKĀS KONFERENCES PROCEEDINGS OF
RAKSTU KRĀJUMS THE 60th INTERNATIONAL SCIENTIFIC CONFERENCE OF DAUGAVPILS UNIVERSITY
338
References Afzal Hakim, Himani Tak, Savitri Nagar, Suman Bhansali. Assessment of prevalence of depression and anxiety and factors associated with them in undergraduate medical students of Dr. S. N. Medical College, Jodhpur International Journal of Community Medicine and Public Health Hakim A et al. Int J Community Med Public Health. 2017 Sep; 4(9): 3267–3272. Ana M. Bassols, Lucas S. Okabayashi, Anais B. da Silva, Bruna B. Carneiro, Fernando Feijo ́, Guilherme C. Guimara ̃es, Gabriela N. Cortes, Luis A. Rohde, Claudio L. Eizirik. First- and last-year medical students: is there a difference in the prevalence and intensity of anxiety and depressive symptoms? 2014 Associac ̧a o Brasileira de Psiquiatria Revista Brasileira de Psiquiatria. 2014; 36: 233–240. Dyrbye LN, Thomas MR, Shanafelt TD. Systematic review of depression, anxiety, and other indicators of psychological distress among U.S. and Canadian medical students. Acad Med 2006; 81(4): 354–373. Francisco Romo Nava, Silvia A. Tafoya, Gerhard Heinze. Comparative study on depression and associated factors in first year students and Interns in the Faculty of Medicine Salud Mental 2013; 36: 375–379. Givens JL, Tjia J. Depressed medical students’ use of mental health services and barriers to use. Acad Med. 2002; 77: 918–21. Ibrahim MB, Abdelreheem MH. Prevalence of anxiety and depression among medical and pharmaceutical students in Alexandria University. Alexandria J Med. 2015; 51: 167–73. Kroenke K, Spitzer RL, Williams JB. The PHQ-9: validity of a brief depression severity measure. J Gen Intern Med. 2001 Sep; 16(9): 606–13. Kunmi Sobowale, A. Ning Zhou, Jingyi Fan, Ni Liu, Renslow Sherer. Depression and suicidal ideation in medical students in China: a call for wellness curricula International Journal of Medical Education. 2014; 5: 31–36. ISSN: 2042-6372. DOI: 10.5116/ijme.52e3.a465 Lee Baer, Mark A. Blais. Handbook of Clinical Rating Scales and Assessment in Psychiatry and Mental Health Springer Science & Business Media, 2009. 7–50 p. Lisa S. Rotenstein, BA; Marco A. Ramos, MPhil; Matthew Torre, MD; J. Bradley Segal, BA, BS; Michael J. Peluso, MD, MPhil; Constance Guille, MD, MS; Srijan Sen, MD, PhD; Douglas A. Mata, MD. MPH Prevalence of Depression, Depressive Symptoms, and Suicidal Ideation Among Medical Students A Systematic Review and Meta-Analysis JAMA. 2016 Dec 6; 316(21): 2214–2236. Omar Y. Mousa, Mandip S. Dhamoon, Sarah Lander, Amit S. Dhamoon. The MD Blues: Under-Recognized Depression and Anxiety in Medical Trainees PLoS One. 2016; 11(6): e0156554. Roh MS, Jeon HJ, Kim H, Han SK et al. The prevalence and impact of depression among medical students: a nationwide cross-sectional study in South Korea. Acad Med 2010; 85(8): 1384–1390. Spitzer RL, Kroenke K, Williams JBW, Lowe B. A brief measure for assessing generalized anxiety disorder — the GAD-7. Arch Intern Med 2006; 166: 1092–7. Vaidya PM, Mulgaonkar KP. Prevalence of depression, anxiety and stress in undergraduate medical students and its correlation with their academic performance. Indian J of Occup Ther. 2007; 39: 7–10. Valerie Hope & Max Henderson Medical student depression, anxiety and distress outside North America: a systematic review Medical Education 2014; 48: 963–979. Wallin U, Runeson B. Attitudes towards suicide and suicidal patients among medical students. Eur Psychiatry 2003; 18(7): 329–33.
DAUGAVPILS UNIVERSITĀTES 60. STARPTAUTISKĀS ZINĀTNISKĀS KONFERENCES PROCEEDINGS OF
RAKSTU KRĀJUMS THE 60th INTERNATIONAL SCIENTIFIC CONFERENCE OF DAUGAVPILS UNIVERSITY
339
DIFFERENCE BETWEEN PATIENTS WITH SPECIFIC THERAPY FOR MULTIPLE SCLEROSIS AND PATIENTS WITH
NON-SPECIFIC THERAPY AND THEIR VISION FUNCTIONS
Jūlija Meščerjakova1, Zanda Arājuma1, Ņina Šakele1, Ņikita Šakels1, Santa Stūr īte1, Dmitrijs Skicko 1, Jolanta Kalniņa1, 2
1 Faculty of Medicine, University of Latvia, Riga, Latvia 2 Multiple Sclerosis Centre, Latvian Sea Medical Centre, Riga, Latvia Abstract
Difference between patients with specific therapy for multiple sclerosis and patients with non-specific therapy and their vision functions
Key Words: multiple sclerosis, optic neuritis, vision loss Vision problems is common symptom of multiple sclerosis (MS). Inflammation influences optical nerve and can cause serious vision problems. Patient can feel vision problems right away or gradually. The aim of the study was to prove that specific therapy (ST) has better influence on vision compared with non-specific therapy (NST) in MS. Results: Patients’ vision changes in both eyes before and after receiving specific and non-specific treatment for MS: mean visus before and after receiving a treatment in specific group was (1.0 (IQR 0.6-1) and 0.8 (IQR 0.5-1); P=0.001), but in group which received non-specific treatment was (0.9 (IQR 0.7-1) and 0.7 (IQR 0.5-0.8); P<0.001). 13 patients with (ST) and 10 patients with (NST) did not have retrobulbar neurites (P=0.05). In two groups statistically significant association was between nystagmus (P=0.02) and pupil symmetry (P=0.02). Conclusion: Specific therapy is better for MS patients’ eye health and there was concluded less nystagmus, retrobulbar neuritis and pupil asymmetry development in patients who received such treatment. Kopsavilkums Redzes problēmas ir bieži sastopams multiplās sklerozes (MS) simptoms. Iekaisums ietekmē optisko nervu un var izraisīt nopietnas redzes problēmas, tāpēc pacients uzreiz vai pakāpeniski var izjust redzes pasliktināšanos. Pētījuma mērķis bija pierādīt, ka specifiskai terapijai (ST) ir labāka ietekme uz redzi, nekā nespecifiskai terapijai (NST) MS gadījumā. Rezultāti: Pacientu redzes kvalitātes izmaiņas abās acīs pirms un pēc specifiskās un nespecifiskās terapijas saņemšanas MS gadījumā: mediānas vērtība visiem pacientiem pirms un pēc terapijas saņemšanas grupā, kas saņēma specifisku terapiju, bija (1,0 (IQR 0,6-1) un 0,8 (IQR 0,5-1), P = 0,001), bet grupā, kas saņēma nespecifisku ārstēšanu, bija (0,9 (IQR 0,7-1) un 0,7 (IQR 0,5-0,8), P <0,001). Retrobulbārais neirīts (P = 0,05) nebija 13 pacientiem ar (ST) un 10 pacientiem ar (NST). Starp divām pacientu grupām tika atrasta statistiski nozīmīga atšķirība starp nistagmu (P = 0,02) un zīlītes simetriju (P = 0,02). Secinājums: Specifiskā terapija ir labāka MS pacientu acu veselībai, jo pacientiem kas saņēma doto terapiju tika novērota mazāka nistagma, retrobulbara neirīta un zīlītes asimetrijas attīstība.
Introduction
Multiple sclerosis is an immune-mediated inflammatory disease that attacks myelinated axons
in the central nervous system, destroying the myelin and the axon in variable degrees and producing
significant physical disability within 20-25 years in more than 30% of patients. The hallmark of MS
is symptomatic episodes that occur months or years apart and affect different anatomic locations.
(Luzzio et al., 2018) Vision problems is a common symptom of multiple sclerosis. Inflammation
influences optical nerve in 20% of MS patients and can cause serious vision problems as optic
neuritis or retrobulbar neuritis. (Atkins, 2009)
Patient can feel vision problems right away or gradually and symptoms of optic neuritis
usually come on suddenly. Rarely symptoms are in both eyes from the very beginning and they
include: blurred vision, graying of vision. At first vision starts to get worse – blindness in one eye,
especially during an MS flare and only in about 14 weeks vision can start to improve. (Lava, 2016)
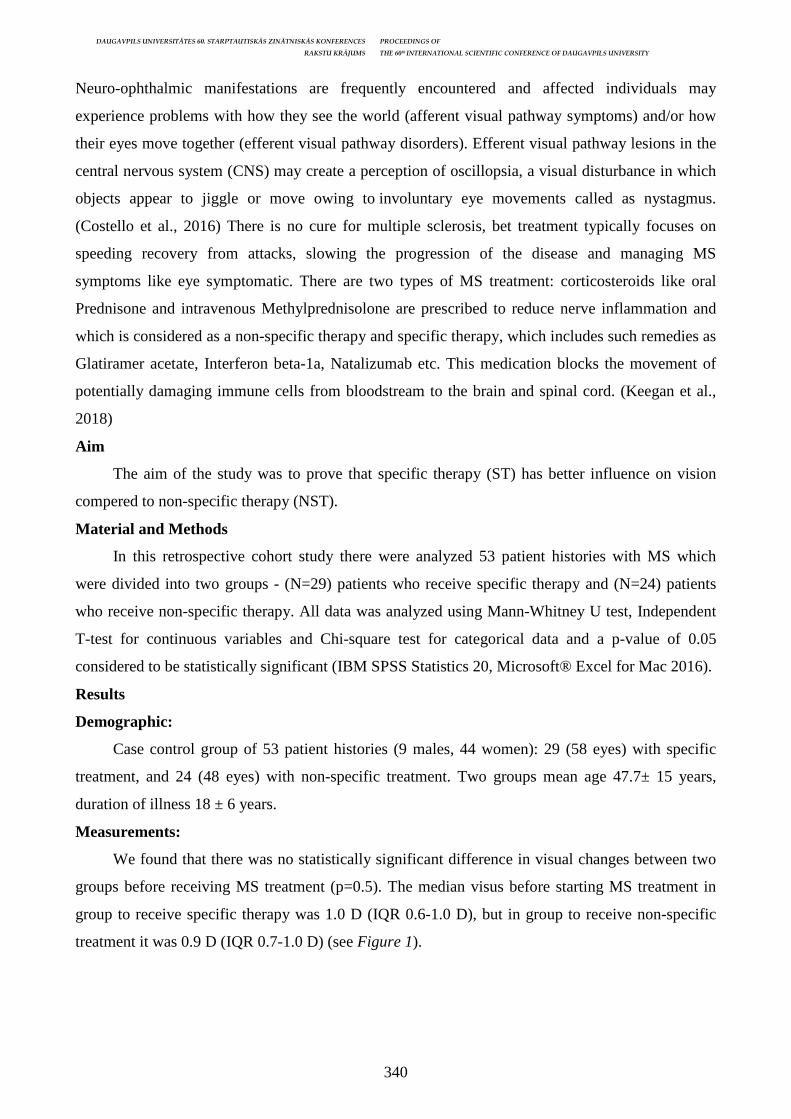
DAUGAVPILS UNIVERSITĀTES 60. STARPTAUTISKĀS ZINĀTNISKĀS KONFERENCES PROCEEDINGS OF
RAKSTU KRĀJUMS THE 60th INTERNATIONAL SCIENTIFIC CONFERENCE OF DAUGAVPILS UNIVERSITY
340
Neuro-ophthalmic manifestations are frequently encountered and affected individuals may
experience problems with how they see the world (afferent visual pathway symptoms) and/or how
their eyes move together (efferent visual pathway disorders). Efferent visual pathway lesions in the
central nervous system (CNS) may create a perception of oscillopsia, a visual disturbance in which
objects appear to jiggle or move owing to involuntary eye movements called as nystagmus.
(Costello et al., 2016) There is no cure for multiple sclerosis, bet treatment typically focuses on
speeding recovery from attacks, slowing the progression of the disease and managing MS
symptoms like eye symptomatic. There are two types of MS treatment: corticosteroids like oral
Prednisone and intravenous Methylprednisolone are prescribed to reduce nerve inflammation and
which is considered as a non-specific therapy and specific therapy, which includes such remedies as
Glatiramer acetate, Interferon beta-1a, Natalizumab etc. This medication blocks the movement of
potentially damaging immune cells from bloodstream to the brain and spinal cord. (Keegan et al.,
2018)
Aim
The aim of the study was to prove that specific therapy (ST) has better influence on vision
compered to non-specific therapy (NST).
Material and Methods
In this retrospective cohort study there were analyzed 53 patient histories with MS which
were divided into two groups - (N=29) patients who receive specific therapy and (N=24) patients
who receive non-specific therapy. All data was analyzed using Mann-Whitney U test, Independent
T-test for continuous variables and Chi-square test for categorical data and a p-value of 0.05
considered to be statistically significant (IBM SPSS Statistics 20, Microsoft® Excel for Mac 2016).
Results
Demographic:
Case control group of 53 patient histories (9 males, 44 women): 29 (58 eyes) with specific
treatment, and 24 (48 eyes) with non-specific treatment. Two groups mean age 47.7± 15 years,
duration of illness 18 ± 6 years.
Measurements:
We found that there was no statistically significant difference in visual changes between two
groups before receiving MS treatment (p=0.5). The median visus before starting MS treatment in
group to receive specific therapy was 1.0 D (IQR 0.6-1.0 D), but in group to receive non-specific
treatment it was 0.9 D (IQR 0.7-1.0 D) (see Figure 1).

DAUGAVPILS UNIVERSITĀTES 60. STARPTAUTISKĀS ZINĀTNISKĀS KONFERENCES PROCEEDINGS OF
RAKSTU KRĀJUMS THE 60th INTERNATIONAL SCIENTIFIC CONFERENCE OF DAUGAVPILS UNIVERSITY
341
Figure 1. Visus before receiving specific and non-specific treatment for MS
Visual changes after receiving MS treatment (see Figure 2) were statistically significantly
different (p=0.03) among two different patient groups who were treated with specific and non-
specific treatment. As you can see the visus median in group which was treated with non-specific
therapy was 0.7 D (IQR 0.5-0.8 D), that is less for 0.2 D than visus was before. The group which
received specific therapy visus median after treatment was 0.8 D (IQR 0.5-1.0 D), which is also less
for 0.2 D than visus before it, but better for 0.1 D comparing with non-specific treatment.
Figure 2. Visus after receiving specific and non-specific treatment for MS
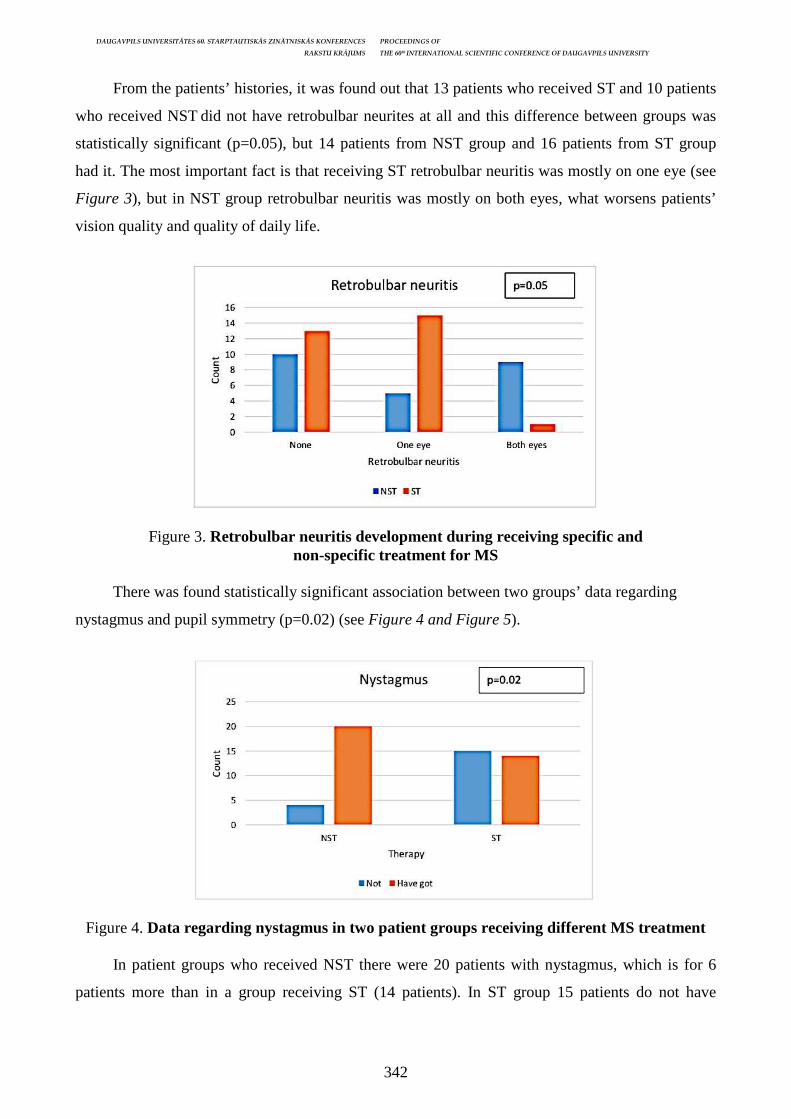
DAUGAVPILS UNIVERSITĀTES 60. STARPTAUTISKĀS ZINĀTNISKĀS KONFERENCES PROCEEDINGS OF
RAKSTU KRĀJUMS THE 60th INTERNATIONAL SCIENTIFIC CONFERENCE OF DAUGAVPILS UNIVERSITY
342
From the patients’ histories, it was found out that 13 patients who received ST and 10 patients
who received NST did not have retrobulbar neurites at all and this difference between groups was
statistically significant (p=0.05), but 14 patients from NST group and 16 patients from ST group
had it. The most important fact is that receiving ST retrobulbar neuritis was mostly on one eye (see
Figure 3), but in NST group retrobulbar neuritis was mostly on both eyes, what worsens patients’
vision quality and quality of daily life.
Figure 3. Retrobulbar neuritis development during receiving specific and non-specific treatment for MS
There was found statistically significant association between two groups’ data regarding
nystagmus and pupil symmetry (p=0.02) (see Figure 4 and Figure 5).
Figure 4. Data regarding nystagmus in two patient groups receiving different MS treatment
In patient groups who received NST there were 20 patients with nystagmus, which is for 6
patients more than in a group receiving ST (14 patients). In ST group 15 patients do not have

DAUGAVPILS UNIVERSITĀTES 60. STARPTAUTISKĀS ZINĀTNISKĀS KONFERENCES PROCEEDINGS OF
RAKSTU KRĀJUMS THE 60th INTERNATIONAL SCIENTIFIC CONFERENCE OF DAUGAVPILS UNIVERSITY
343
nystagmus at all, and, comparing with NST group, it was for 11 patients more since only 4 patients
there don’t have it.
Figure 5. Data about pupil size in two patient groups receiving different MS treatment
In patient group receiving ST there is less pupil size asymmetry (4 patients) than in NST
group (10 patients) what shows higher nerve demyelization causing poor pupil innervation and
consequently causing asymmetry.
Conclusion
Specific therapy is better for MS patients’ eye health and there was concluded less nystagmus,
retrobulbar neuritis and pupil asymmetry development in patients who received such treatment.
References Luzzio C., Dangond F. Neurology: Multiple Sclerosis. Medscape, 2018, Mar 28. Online: https://emedicine.medscape.com/article/1146199overview?pa=KPJCjGhZoCgpI6infQpEQ%2BCQWl3ueaAMIL7MFgr6xH%2Fo%2F73u0ZhnWuE4Z%2FXXgB1r56MI7dGTgNawPfsOtJla9Q%3D%3D Atkins E. J. Optic Neuritis and MS. Multiple Sclerosis Foundation, 2009, July 8. Online: https://msfocusmagazine.org/Magazine/Magazine-Items/Optic-Neuritis-and-MS.aspx Lava N. Multiple Sclerosis and Vision Problems. WebMD. Medical Reference, 2016, Dec 18. Online: https://www.webmd.com/multiple-sclerosis/multiple-sclerosis-vision-problems Costello F., Burton J.M., Lee A.G. Neuro-Ophthalmologic Manifestation of Multiple Sclerosis. Medscape, 2016, Sep 13. Online: https://emedicine.medscape.com/article/1214270-overview Keegan M. Multiple Sclerosis: Diagnosis and treatment of multiple sclerosis. Mayo Clinic Foundation for Medical Education and Research, 2018. Online: https://www.mayoclinic.org/ diseases-conditions/multiple-sclerosis/diagnosis-treatment/drc-20350274
DAUGAVPILS UNIVERSITĀTES 60. STARPTAUTISKĀS ZINĀTNISKĀS KONFERENCES PROCEEDINGS OF
RAKSTU KRĀJUMS THE 60th INTERNATIONAL SCIENTIFIC CONFERENCE OF DAUGAVPILS UNIVERSITY
344
DEPRESSION SYMPTOMS IN LATVIAN CARDIOLOGY CENTRE INPATIENTS
Art ūrs Pētersons1, Alise Visocka1, Vladimirs Voicehovskis3
1 Riga Stradins University, Dzirciema street 16, Riga, Latvia, LV-1007, [email protected], [email protected] 3 Department of Internal Diseases, RSU, Pauls Stradiņš Clinical University Hospital, Pilsoņu street 13, Riga, Latvia, LV-1002, [email protected] Abstract
Depression symptoms in Latvia Cardiology Centre impatients Key Words: Depression, Depression symptoms, Cardiac patients Introduction. Research data shows that depression (D) is common in cardiac patients and that some conditions are more associated with D than others. Assessment of D symptoms (DS) is important as failing to do so may have negative effects on the well-being and health of patients. A specific Cardiac Depression Scale (CDS-LAT) has been developed to asses DS in these patients. Aim. The aim of this study is to analyse correlations between cardiologic conditions and DS in Latvian Cardiology Centre of P.Stradins Clinical University Hospital, Riga, Latvia (LCC) inpatients. Methods. Overall 106 inpatients of the LCC having at least one of the inclusion criteria (acute coronary syndrome, arrhythmias, cardiac valve disease, cardiomyopathies, chronic heart failure, coronary artery disease, post-myocardial infarction status, post-PCI or heart surgery status, stable/unstable angina) were randomly selected. Patients completed the Latvian version of CDS-LAT. Pearson Chi-square and Odds Ratio (OR) were calculated for each diagnosis to measure its correlation with DS evaluated by CDS-LAT. Results. Out of the 106 participants, 49% (N=52) had DS (CDS-LAT score >92 points). 41.5% (N=44) of the patients had mild to moderate DS and 7.5% (N=8) had severe DS. Statistically significant positive correlation was found between DS and acute coronary syndrome χ2(1) = 18.145, p = 0.00002, OR=45.1, (95% CI: 2.61-776.34), atrial fibrillation χ2(1) = 4.190, p=0.041, OR= 2.44 (95% CI: 1.03- 5.81) Conclusions. Mild to moderate DS are common in cardiac inpatients of the LCC. Acute coronary syndrome and atrial fibrillation show a statistically significant association with increased DS compared to other cardiologic conditions in cardiac inpatients of the LCC. Kopsavilkums Atslēgvārdi: Depresija, Depresijas simptomi, Sirds slimnieki Ievads. Pētījumu rezultāti liecina ka depresija (D) ir izplatīta sirds slimnieku vidū un ka daži stāvokļi ir vairāk saistīti ar D kā citi. D simptomu (DS) noteikšana ir svarīga, jo neizdodoties noteikt DS, ir iespējamas negatīvas sekas pacientu labklājībai un veselībai. Lai noteiktu DS šajos pacientos, ir izveidota speciāla Sirds Depresijas Skala (SDS-LAT). Mērķi. Šī pētījuma mērķis ir analizēt saistības starp kardioloģiskiem stāvokļiem un DS P. Stradiņa klīniskās universitātes slimnīcas Latvijas Kardioloģijas centrā (LKC) stacionētiem pacientiem. Metodes. Kopumā tika nejauši izvēlēti 106 pacienti, kuriem bija vismaz viens iekļaušanas kritērijs (akūts koronārais sindroms, aritmijas, sirds vārstuļu slimības, kardiomiopātijas, hroniska sirds maspēja, koronārā sirds slimība, stāvoklis pēc miokarda infarkta, PKI vai sirds ķirurģijas, kā arī stabila/nestabila stenokardija). Diagnozēm tika aprēķināts Pīrsona Hī kvadrāts un izredžu attiecība (IA), lai noteiktu to saistību ar SDS-LAT noteiktiem DS. Rezultāti. No 106 pacientiem 49% (N=52) bija DS (SDS-LAT >92 punkti). 41.5% (N=44) pacientu bija viegli-mēreni DS un 7.5% (N=8) bija smagi DS. Statistiski ticama pozitīva korelācija tika atrasta starp DS un akūtu koronāro sindromu χ2(1) = 18.145, p = 0.00002, IA=45.1, (95% TI: 2.61-776.34) un priekškambaru fibrillāciju χ2(1) = 4.190, p=0.041, IA= 2.44 (95% TI: 1.03- 5.81) Secinājumi. Viegli-mēreni DS ir izplatīti LKC stacionētiem sirds slimniekiem. Akūta koronārā sindroma un ātriju fibrill ācijas pacientiem ir statistiski ticama saistība ar palielinātiem DS, salīdzinot ar citiem LKC sirds pacientiem.
Introduction
Depression is a major health burden affecting 4.4% of the global population and depressive
disorders are the single largest contributor to non-fatal health loss (WHO 2015). The prevalence of
depression in cardiac disease patients is higher than in the general population. 15–20% of
hospitalised cardiac patients meet diagnostic criteria for a major depressive disorder (MDD) and an
even higher percentage (from 25% to 65%) reported at least one depressive symptom (Ceccarini
DAUGAVPILS UNIVERSITĀTES 60. STARPTAUTISKĀS ZINĀTNISKĀS KONFERENCES PROCEEDINGS OF
RAKSTU KRĀJUMS THE 60th INTERNATIONAL SCIENTIFIC CONFERENCE OF DAUGAVPILS UNIVERSITY
345
2014). In coronary artery disease (CAD) patients the prevalence of clinically significant depression
symptoms is 31-45% and the prevalence of (MDD) ranges between 15-20% in these patients
(Huffman 2013). Some cardiac diseases are more associated with depression than others. Up to two-
thirds of patients after acute myocardial infarction have depression and the prevalence is increased
among chronic heart failure patients (Hare 2014) as well as in patients with atrial fibrillation, those
who have undergone implantable cardioverter-defibrillator (ICD) placement and those, who have
undergone coronary artery bypass graft (CABG) surgery. (Huffman 2013)
Depression has a complex relationship with cardiovascular diseases and it is associated with
adverse cardiovascular outcomes. One large study has found that the hazard ratio for cardiovascular
events in CAD patients with depression is 1.93 (Nabi 2010). Studies have indicated that depression
may lead to cardiovascular diseases through several mechanisms. Patients with DS after acute
myocardial infarction have been found to be less likely to adhere to behavior and lifestyle changes
intended to reduce the risk of subsequent cardiac events (Ziegelstein 2000). Other mechanisms
include neuro-hormonal changes associated with depression that can increase adverse outcomes in
cardiac patients, such as endothelial dysfunction, increased inflammation and decreased heart rate
variability (Pizzi 2008).
Depressive disorders in cardiac patients also come in different forms, for example, adjustment
disorder with depressed mood or MDD (Hare 2014). Nevertheless DS are increased in both of these
disorders and several self-report DS assessment scales have been developed. One such scale is
Cardiac Depression Scale (CDS), which has been designed to measure DS in cardiac disease
patients and has been validated on patients with a large spectrum of cardiac disorders (Hare 1996).
Material and Methods
The study was designed as a descriptive cross-sectional study. A total number of 106
randomly selected participants took part in our study. All participants were inpatients of Latvian
Cardiology Centre and met our inclusion criteria: age 18 or more, at least one cardiac pathology
(CAD, CHF, old myocardial infarction, acute coronary syndrome (ACS), stable or unstable angina,
status after heart surgery, status after percutaneus coronay intervention (PCI), heart valve diseases,
arrhythmias, cardiomyopathies, electrocardiostimulator (ECS) implantation), sufficient Latvian
language proficiency and absence of known psychiatric disorder (no psychiatric disorder diagnosis
found in the patients hospital chart).
The patients completed a Latvian version of CDS, which was translated to Latvian by the
authors of this study and the Latvian version of Geriatric depression scale (GDS) (Voicehovskis
2013). To determine the cut-off values for CDS we performed Receiver operating characteristics
(ROC) curve analysis between CDS and GDS. Cut-off values were found for Mild-Moderate
Depression Symptoms (>92 points on CDS predicted Mild-Moderate and Severe DS with specifity
DAUGAVPILS UNIVERSITĀTES 60. STARPTAUTISKĀS ZINĀTNISKĀS KONFERENCES PROCEEDINGS OF
RAKSTU KRĀJUMS THE 60th INTERNATIONAL SCIENTIFIC CONFERENCE OF DAUGAVPILS UNIVERSITY
346
71% and sensitivity 83%) and for severe DS (>120 points on CDS predicted severe DS with
specifity 99% and sensitivity 100%). Optimal cut-off scores were obtained by having the highest
Youden indexes (0.537 for cut off score >92 points and 0.99 for cut-off score >120 points on CDS).
Pearson Chi- square test was performed to measure whether there is statistically significant
associations found between specific conditions/patient characteristics and DS in general (Mild-
moderate and severe DS) and with severe DS. If Pearson Chi-square test showed statistically
significant associations (p value <0.05) odds ratio (OR) was calculated for these associations to
show whether a specific patient factor is associated with increased or decreased odds of having DS.
The information about the disease status of the patients and all diagnoses were obtained from the
hospital patient charts. All statistical analysis of data was performed by using IBM SPSS 23.0 (IBM
Corp., Armonk, NY, USA). The authors deny any conflict of interest.
Results
Out of the total 106 patients who took part in our study 47% (N=50) were females, 53%
(N=56) were males. Mean age of patients was 70.7 ± SD 8.1 years (range: 55-91 years). 49%
(N=52) had DS (CDS score >92 points). 41.5% (N=44) of the patients had mild to moderate DS and
7.5% (N=8) had severe DS (CDS score >120). Prevalence of DS is illustrated in Figure 1.
To measure associations found between DS in general (Mild-Moderate and Severe DS) and
patient characteristics Pearson Chi square test was performed on the following patient
characteristics: CAD, CHF (NYHA classes 1,2,3 and 4), old myocardial infarction, ACS, stable and
unstable angina, status after heart surgery, status after PCI, status after CABG, heart valve disease,
AF, other arrhythmias, cardiomyopathies, hypertensive crisis, ECS implantation, primary arterial
hypertension and patient gender. The results for each patient characteristic can be seen in Figure 2.
Figure 1. Prevalence of DS in LCC Inpatients

DAUGAVPILS UNIVERSITĀTES 60. STARPTAUTISKĀS ZINĀTNISKĀS KONFERENCES PROCEEDINGS OF
RAKSTU KRĀJUMS THE 60th INTERNATIONAL SCIENTIFIC CONFERENCE OF DAUGAVPILS UNIVERSITY
347
Patient Characteristics N (total) N with DS % with DS Chi-square p-value
CAD 93 45 48% 0.136 0.71228CHF (NYHA1) 14 4 29% 2.709 0.09981CHF (NYHA2) 32 16 50% 0.016 0.89833CHF (NYHA3) 16 9 56% 0.390 0.53220CHF (NYHA4) 2 2 100% 2.117 0.14568Old miocardial infarction 21 10 48% 0.022 0.88301ACS 15 15 100% 18.145 0.00002Stable angina 55 22 40% 3.752 0.05275Unstable angina 2 1 50% 0.001 0.97850Status after heart surgery 1 1 100% 1.048 0.30589Status after PCI 31 16 52% 0.115 0.73501Status after CABG 1 1 100% 1.048 0.30589Heart valve disease 23 14 61% 1.640 0.20030Atrial fibrillation 31 20 65% 4.190 0.04066Other arrythmias 8 5 63% 0.626 0.42892Cardiomyopathy 6 3 50% 0.002 0.96204Hypertensive crisis 5 0 0% 5.053 0.02458ECS implantation 6 2 33% 0.629 0.42767Primary arterial hypertension 67 32 48% 0.122 0.72658Gender (women) 50 25 50% 0.034 0.85434Gender (men) 56 27 48% 0.034 0.85434
Figure 2. Patient characteristics and associations with DS
Statistically significant associations were found between patient condition and DS in cases of
acute coronary syndrome χ2(1) = 18.145, p = 0.00002, OR=45.1, (95% CI: 2.61-776.34, p= 0.0087),
atrial fibrillation χ2(1) = 4.190, p=0.041, OR= 2.44 (95% CI: 1.03- 5.81, p= 0.0433). The OR>1 in
these cases show that the odds of having DS in cases of ACS and AF are higher, compared to
patients without ACS and AF. Hypertensive crisis as a factor showed association with DS in chi-
square test χ2(1) = 5.053, p=0.025, and showed an OR= 0.086 (95% CI: 0.0046 to 1.5909, p=0.0993,
indicating that the odds of having DS in cases of hypertensive crisis are decreased if compared to
patients without hypertensive crisis, but this finding is not statistically significant as the p value of
the OR is >0.05. The relationship of ACS and AF with DS can be seen in Figure 3. and Figure 4.
Figure 3. ACS patients and DS Figure 4. Atrial fibrillation patients and DS

DAUGAVPILS UNIVERSITĀTES 60. STARPTAUTISKĀS ZINĀTNISKĀS KONFERENCES PROCEEDINGS OF
RAKSTU KRĀJUMS THE 60th INTERNATIONAL SCIENTIFIC CONFERENCE OF DAUGAVPILS UNIVERSITY
348
Discussion
Our obtained prevalence of DS in hospitalized cardiac patients (49%) corresponds with
literature data of DS being present in 25% to 65% cardiac inpatients (Ceccarini 2014). According to
our study 48% of CAD patients have DS, which is slightly more than mentioned in literature (31-
45%) (Huffman 2013). The prevalence of DS for CHF patients in our study ranged from 29-100%.
The prevalence of DS increased together with the functional class of CHF, but although the
prevalence was very high in the CHF NYHA IV group (100%), we did not establish a statistically
significant association with DS in this patient group, because the number of patients with this
disorder was very small (N=2). The same principle applies to patients after heart surgery,which are
known of having a high prevalence of DS we did not establish an association between DS and
patients post-cardiosurgery, because only one such patient was included in our study. The
associations we found between ACS and DS have been established in literature (Thombs 2006) as
well as for AF and DS (Galli 2017).
We could not accurately distinguish what kind of depressive disorder the patients with
elevated DS had, as a diagnosis of MDD requires a patient to have DS for at least 2 weeks and we
did not obtain information about the duration of symptoms in our study. Stressful life events such as
acute myocardial infarction can trigger adjustment disorder with depressed mood (Hare 2014),
which could be attributed to increased DS in some patients. The construct of CDS itself is based on
symptoms of Adjustment disorder with depressed mood (Hare 1996)
Hospitalized patients have increased levels of anxiety as well (Gullich 2013), possibly
because of the hospitalization event itself. Thus, some patients in our study might have increased
DS caused by anxiety and would not demonstrate DS in other settings. We recommend further
research to be done with cardiac patients in ambulatory care to evaluate the prevalence of DS in
these cases. Further research should include patients after heart surgery and CHF NYHA class 4
patients as our research lacked sufficient amounts of these patients and DS could be prominent in
them. Next studies should include follow ups with re-evaluation of DS in the participants to analyse
the duration dynamics of DS, which would allow us to distinguish a short term adjustment disorder
from long term MDD.
Conclusions
DS are common in LCC inpatients. Mild-moderate DS are more prevalent than severe DS in
this population. Statistically significant associations have been found between increased DS in
patients with ACS and AF. DS are more prevalent in patients with these cardiac conditions
compared to patients lacking them.
DAUGAVPILS UNIVERSITĀTES 60. STARPTAUTISKĀS ZINĀTNISKĀS KONFERENCES PROCEEDINGS OF
RAKSTU KRĀJUMS THE 60th INTERNATIONAL SCIENTIFIC CONFERENCE OF DAUGAVPILS UNIVERSITY
349
Acknowledgement
The other authors would like to thank our research supervisor assist. prof. Vladimirs
Voicehovskis M.D, Ph.D for guiding and counseling us during the research process.
References Ceccarini, M., Manzoni, G. M., & Castelnuovo, G. (2014). Assessing Depression in Cardiac Patients: What Measures Should Be Considered? Depression Research and Treatment, 2014, 148256. http://doi.org/10.1155/2014/148256 Galli, F., Borghi, L., Carugo, S., Cavicchioli, M., Faioni, E. M., Negroni, M. S., & Vegni, E. (2017). Atrial fibrillation and psychological factors: a systematic review. PeerJ, 5, e3537. http://doi.org/10.7717/peerj.3537 Gullich, Inês, Ramos, Andrews Barcellos, Zan, Tiago Rafael Anschau, Scherer, Cíntia, & Mendoza-Sassi, Raúl Andrés. (2013). Prevalence of anxiety in patients admitted to a university hospital in southern Brazil and associated factors. Revista Brasileira de Epidemiologia, 16(3), 644-657. https://dx.doi.org/10.1590/S1415-790X2013000300009 Hare DL, Davis CR. (1996) Cardiac depression scale: validation of a new depression scale for cardiac patients. J Psychosom Res. 40 (Suppl 4): 379–386. David L. Hare, Samia R. Toukhsati, Peter Johansson, Tiny Jaarsma. (2014) Depression and cardiovascular disease: a clinical review, European Heart Journal, Volume 35, Issue 21, 1 June 2014. Huffman, J. C., Celano, C. M., Beach, S. R., Motiwala, S. R., & Januzzi, J. L. (2013). Depression and Cardiac Disease: Epidemiology, Mechanisms, and Diagnosis. Cardiovascular Psychiatry and Neurology, 2013, 695925. http://doi.org/10.1155/2013/695925s. Cardiovascular Psychiatry and Neurology. 2013; 2013: 695925. doi: 10.1155/2013/695925 Nabi, H., Shipley, M. J., Vahtera, J., Hall, M., Korkeila, J., Marmot, M. G., … Singh-Manoux, A. (2010). Effects of depressive symptoms and coronary heart disease and their interactive associations on mortality in middle-aged adults: the Whitehall II cohort study. Heart, 96(20), 1645–1650. http://doi.org/10.1136/hrt.2010.198507 Pizzi C, Manzoli L, Mancini S, Costa GM (2008). Analysis of potential predictors of depression among coronary heart disease risk factors including heart rate variability, markers of inflammation, and endothelial function. European Heart Journal. 2008; 29(9): 1110–1117. Thombs, B. D., Bass, E. B., Ford, D. E., Stewart, K. J., Tsilidis, K. K., Patel, U., … Ziegelstein, R. C. (2006). Prevalence of Depression in Survivors of Acute Myocardial Infarction: Review of the Evidence. Journal of General Internal Medicine, 21(1), 30–38. http://doi.org/10.1111/j.1525-1497.2005.00269.x Voicehovskis, V.V. et al. 2013. Validation of the Latvian version of the Geriatric depression scale (GDS). In: Psychother Psychosom, 82(1), pp. 122–123. World Health Organisation (2017): Depression and Other Common Mental Disorders: Global Health Estimates. Geneva; 2017. Licence: CC BY-NC-SA 3.0 IGO. Ziegelstein RC, Fauerbach JA, Stevens SS, Romanelli J, Richter DP, Bush DE (2000). Patients With Depression Are Less Likely to Follow Recommendations to Reduce Cardiac Risk During Recovery From a Myocardial Infarction. Arch Intern Med. 2000; 160(12): 1818–1823. doi: 10.1001/archinte.160.12.1818
DAUGAVPILS UNIVERSITĀTES 60. STARPTAUTISKĀS ZINĀTNISKĀS KONFERENCES PROCEEDINGS OF
RAKSTU KRĀJUMS THE 60th INTERNATIONAL SCIENTIFIC CONFERENCE OF DAUGAVPILS UNIVERSITY
350
CORRELATION BETWEEN ALEXITHYMIA AND SOMATISATION, ANXIETY, DISTRESS AND DEPRESSION
AMOUNG MEDICAL STUDENTS
Evija Tropi ņa1, Liene Sauša1, Zanda Strode 3 Scientific research supervisor: MD Art ūrs Miksons2 1 Rīga Stradiņš University, Faculty of Medicine, Latvia 2 Rīga Stradiņš University, Department of Psychosomatic Medicine and Psychotherapy, Latvia 3 SIA “Ziemeļkurzemes reģionālā slimnīca” Abstract
Correlation between alexithymia and somatization, anxiety, distress and depression amoung medical students Key Words: Alexithymia, somatization, distress, anxiety, depression Introduction. Alexithymia is an emotional deficit characterized by cognitive and affective deficits in recognition of subjective emotional states. Lately alexithymia has been brought to doctor’s attention because of its newfound association with medical conditions like cardiovascular, gastrointestinal disorders and psychiatric disorders and somatization. In this study our focus was on somatization and psychiatric disorders such as anxiety, distress, depression, because of its high prevalence the general population. All these mentioned disorders are included in Four-Dimensional-Symptom Questionnaire (4DSQ). Aim. The aim of this study is to find out if there is correlation between alexithymia and elements of Four-Dimensional-Symptom Questionnaire (4DSQ – Somatization, Distress, Anxiety and Depression) in medical students. Materials and methods. In this cross-sectional study, medical students from 1st till 6 th year were asked to fill the self-report questionnaire electronically on voluntary basis. Questionnaire consisted from internationally validated TAS 20 (Toronto Alexithymia Scale) and 4DSQ. We also included questions about current diseases and use of medication to exclude other health problems. SPSS for Windows was used to perform all statistical analyses. Results. Altogether responded 224 medical students (MS). Of all medical students 42,4% have alexithymia. Correlation coefficient (CC) between alexithymia and somatization was 0,377 (p<0,001), with depression 0,439 (p<0,001), with anxiety 0,490 (p<0,001) and with distress 0,512 (p <0,001). Conclusion. Results of this study showed that alexithymia has weak correlation with somatization, depression and anxiety and moderately strong correlation with distress. Kopsavilkums
Aleksitīmija kā trauksmi, distresu, depresiju un somatizāciju veicinošs faktors medicīnas studentu vidū Atslēgvārd: Aleksitimija, somatizācija, distress, trauksme, depresija Aleksitimija ir nespēja apzināties un izpaust savas emocijas, kas var būt par cēloni dažādu orgānu sistēmu darbības traucējumiem. Pēdējā laikā aleksitimija tiek plašāk pētīta, jo tiek uzskatīta par veicinošu faktoru kardivaskulāro, gastrointestinālo, psihiatrisko saslimšanu un somatizācijas attīstībā. Šajā pētījumā tiek apskatīta trauksmes, distresa, depresijas un somatizācijas korelācija ar aleksitīmiju. Visi iepriekš minētie psihiskie stāvokļi ir iekļauti četru dimensionālo simptomu aptaujā (4DSQ – Somatization, Distress, Anxiety and Depression). Pētījuma mērķis ir noskaidrot vai pastāv korelācija starp aleksitīmiju un somatizāciju, distresu, trauksmi, depresiju. Materi āli un metodes. Pētījumā piedalījās 1.-6.kursa medicīnas fakultātes studenti, kuri brīvprātīji aizpildīja TAS 20 (Toronto Alexithymia Scale) and 4DSQ aptaujas. Papildus tika iekļauti jautājumi par patreizējām saslimšanām, lietotajiem medikamentiem, lai izslēgtu citas saslimšanas. Iegūtie dati tika apstrādāti ar SPSS programmu. Rezultāti . Tika aptaujāti 224 medicīnas fakultātes studenti (MS). No viesiem aptaujātajiem studentiem 42,4% ir aleksitīmija. Korelācijas koeficients (CC) starp aleksitīmiju un somatizāciju ir 0,377 (p<0,001), ar depresiju 0,439 (p<0,001), ar trauksmi 0,490 (p<0,001) un ar distresu 0,512 (p <0,001). Secinājumi . Pētījumā rezultāti parādīja, ka aleksitīmijai ir vāja korelācija ar somatizāciju, depresiju un trauksmi, bet vidēji stripra korelācija pastāv starp aleksitīmiju un distresu.
Introduction
In this study our focus was on somatization and psychiatric disorders such as anxiety, distress,
depression, because of its high prevalence the general population. All these mentioned disorders are
included in Four-Dimensional-Symptom Questionnaire (4DSQ).
Alexithymia is a personality construct comprising reduced ability to identify and describe
feelings, a limited imagination and externally oriented thinking (Sifneos et al., 1973). It is
DAUGAVPILS UNIVERSITĀTES 60. STARPTAUTISKĀS ZINĀTNISKĀS KONFERENCES PROCEEDINGS OF
RAKSTU KRĀJUMS THE 60th INTERNATIONAL SCIENTIFIC CONFERENCE OF DAUGAVPILS UNIVERSITY
351
associated with a variety of mental disorders and somatic illnesses, including depression
(Honkalampi et al., 2000), substance use disorders (Loas et al., 1997), eating disorders (Taylor et
al., 1996), panic disorder (Marchesi et al., 2005), somatization (Mattila et al., 2008) and essential
hypertension (Grabe et al., 2010). In adolescents, associations have been found in terms of
depression, anxiety and eating disorder symptoms (Grabe et al., 2010).
The etiology of alexithymia remains unclear. Whilst some recent prospective studies support a
social-developmental model (Joukamaa et al., 2003; Lemche et al., 2004), according to (Tabibnia
and Zaidel 2004), at least three different neurological models have also been proposed. These
identify (1) corpus callosum deficit (Miller, 1986; Parker et al., 1999), (2) right hemispheric deficit
(Buchanan et al., 1980; Jessimer and Markham, 1997; Shipko, 1982) and (3) anterior cingulate
dysfunction (Lane et al., 1997).
Lately alexithymia has been brought to doctor’s attention because of its newfound association
with medical conditions like cardiovascular, gastrointestinal disorders and psychiatric disorders and
somatization (Grabe et al., 2010).
Somatization has been defined in diverse ways. Despite their differences, these definitions
have one element in common, namely the presence of somatic symptoms that cannot be
(adequately) explained by organic findings (Kellner R. 1990). Somatization Disorder is a
polysymptomatic disorder that begins before age 30 years, extends over a period of years, and is
characterized by a combination of pain, gastrointestinal, sexual, and pseudo neurological symptoms
(APA 1994). Epidemiological studies have demonstrated a high prevalence of such symptoms in the
general population (Kroenke K, Price RK, 1993) and in all medical settings (Fink 1992).
Psychological distress is largely defined as a state of emotional suffering characterized by
symptoms of depression (e.g., lost interest; sadness; hopelessness) and anxiety (e.g., restlessness;
feeling tense) (Mirowsky and Ross 2002). These symptoms may be tied in with somatic symptoms
(e.g., insomnia; headaches; lack of energy) that are likely to vary across cultures (Kleinman 1991,
Kirmayer 1989).
Characteristic distress symptoms are worry, irritability, tension, listlessness, poor
concentration, sleeping problems and demoralization. Mild distress states, which do not interfere
much with normal social functioning can be considered as a part of normal daily life. However,
severe distress states (as in NB) force a patient to give up and withdraw from major social roles,
especially the occupational role (Kates N et al. 1998).
When distress is separated from depression we are left with anhedonia and depressive
thoughts. These symptoms are considered to represent the core symptomatology of major
depression (Beck AT et al. 1979, Snaith RP 1987). When we separate distress from anxiety, we are
left with irrational fears, anticipation anxiety and avoidance behavior. These symptoms are
characteristic of the various anxiety disorders (APA 1994).
DAUGAVPILS UNIVERSITĀTES 60. STARPTAUTISKĀS ZINĀTNISKĀS KONFERENCES PROCEEDINGS OF
RAKSTU KRĀJUMS THE 60th INTERNATIONAL SCIENTIFIC CONFERENCE OF DAUGAVPILS UNIVERSITY
352
Whereas distress is primarily a manifestation of a stress coping problem, depression and
anxiety are triggered or aggravated by still poorly understood dysfunctions of mood and anxiety
regulation systems (Van Praag et al. 2004).
Medical students are under significant psychological distress. Students are exposed under
many stressful experiences during their training and often they must cope with this situation alone.
Studies has shoved that stress, anxiety and depression are more common in medical community
than in general population.
Our scope of interest is to find out if alexithymia could be influencing factor in high levels of
depression, anxiety, distress and somatization among medical students.
Material and Methods
In this cross-sectional study, medical students from 1st till 6th year were asked to fill the self-
report questionnaire electronically on voluntary basis. Questionnaire consisted from internationally
validated TAS 20 (Toronto Alexithymia Scale) and 4DSQ. We also included questions about
current diseases and use of medication to exclude other health problems. SPSS for Windows was
used to perform all statistical analyses.
The Four-Dimensional Symptom Questionnaire (4DSQ) is a self-report questionnaire
comprising four scales measuring distress, depression, anxiety and somatization (Terluin et al.
2006). It is intended to be used in both clinical and research settings.
The distress scale aims to measure the kind of symptoms people experience when they are
“under stress” as a result of high demands, psychosocial difficulties, daily hassles, life events, or
traumatic experiences (Ridner 2004).
The depression scale measures symptoms that are relatively specific to depressive disorder,
notably, anhedonia and negative cognitions (Beck et al. 1979,Snaith 1987).
The anxiety scale measures symptoms that are relatively specific to anxiety disorder (van
Avendok et al. 2012).
The somatization scale measures symptoms of somatic distress and somatoform disorder
(Clarke 2000, de Vreege 2015).
Results
Altogether responded 224 medical students (MS). Of all medical students 27,7% (n=62) have
mild and 14,7% (n=33) have severe alexithymia but 57,6% (n=129) have no alexithymia. Results of
distress showed that 55,8% (n=125) have mild and 20,54% (n=46) have severe distress and in
23,66% (n=53) distress is not present. Mild somatization have 49,6% (n=111) and severe 5,4%
(n=12), no somatization in 45,1% (n=101) of students. Mild depression have 26,8% (n=60) of
medical students and 21,4% (n=48) have severe depression, 51,8% (n=116) depression is not
present. Anxiety prevalence showed the lowest scores – 17% (n=38) with mild and 7,1% (n=16)
DAUGAVPILS UNIVERSITĀTES 60. STARPTAUTISKĀS ZINĀTNISKĀS KONFERENCES PROCEEDINGS OF
RAKSTU KRĀJUMS THE 60th INTERNATIONAL SCIENTIFIC CONFERENCE OF DAUGAVPILS UNIVERSITY
353
with severe anxiety and in 75,9% (n=170) anxiety was not present (see on table 1). Looking at
somatization, distress and anxiety in among medical students in different year of studies (see
diagrams 1.-4.), no significant differences where observed. Only depression was seen less among
4th year medical students.
Correlation coefficient (CC) between alexithymia and somatization was 0,377 (p<0,001), with
depression 0,439 (p<0,001), with anxiety 0,490 (p<0,001) and with distress 0,512 (p <0,001) (see
on table 2.). Of three alexithymia demotions somatization, anxiety and distress have the strongest
correlation with difficulties identifying feelings (see on table 3.). Only depression had the strongest
correlation with difficulties defining feelings (0,424, p<0,001).
Table 1. Prevalence and severity of alexithymia, somatization, depression, anxiety and distress
Disorder Severity Frequency Percent
Alexythymia Not present 129 57,6
Mild 62 27,7 Severe 33 14,7
Somatization Not present 101 45,1
Mild 111 49,6 Severe 12 5,4
Depression Not present 116 51,8
Mild 60 26,8 Severe 48 21,4
Anxiety Not present 170 75,9
Mild 38 17 Severe 16 7,1
Distress Not present 53 23,66
Mild 125 55,8 Severe 46 20,54
Table 2. Spearman’s correlation table
Somatization Alexithymia Depression Anxiety Distress
Somatization Correlation Coefficient 1 .377** .331** .503** .575**
Sig. (2-tailed) 0 0 0 0
Alexithymia Correlation Coefficient .377** 1 .439** .490** .512**
Sig. (2-tailed) 0 0 0 0 0
Depression Correlation Coefficient .331** .439** 1 .446** .725**
Sig. (2-tailed) 0 0 0 0
Anxiety Correlation Coefficient .503** .490** .446** 1 .656**
Sig. (2-tailed) 0 0 0 0
Distress Correlation Coefficient .575** .512** .725** .656** 1
Sig. (2-tailed) 0 0 0 0
**. Correlation is significant at the 0.01 level (2-tailed)
DAUGAVPILS UNIVERSITĀTES 60. STARPTAUTISKĀS ZINĀTNISKĀS KONFERENCES PROCEEDINGS OF
RAKSTU KRĀJUMS THE 60th INTERNATIONAL SCIENTIFIC CONFERENCE OF DAUGAVPILS UNIVERSITY
354
Table 3. Correlation between alexithymia dimensions and somatization, depression, anxiety, distress
DDF EOT DIF
Somatisation Correlation Coefficient .266** .218** .395**
Sig. (2-tailed) 0 0,001 0
Depression Correlation Coefficient .424** .204** .400**
Sig. (2-tailed) 0 0,002 0
Anxiety Correlation Coefficient .390** .217** .503**
Sig. (2-tailed) 0 0,001 0
Distress Correlation Coefficient .464** .195** .521**
Sig. (2-tailed) 0 0,003 0
**. Correlation is significant at the 0.01 level (2-tailed)

DAUGAVPILS UNIVERSITĀTES 60. STARPTAUTISKĀS ZINĀTNISKĀS KONFERENCES PROCEEDINGS OF
RAKSTU KRĀJUMS THE 60th INTERNATIONAL SCIENTIFIC CONFERENCE OF DAUGAVPILS UNIVERSITY
355
Conclussions
Results of this study shows weak to moderate correlation between alexithymia and
somatization, distress, anxiety and depression. The highest correlation was seen with alexithymia
and anxiety, leading us to think that alexithymia takes significant role in our coping with stressful
situations. As well alexithymia could have a role in development of somatization, distress and
depression, but more studies should be done to prove this. Results also reviled that there is different
correlation between these disorders and dimensions of alexithymia. Somatization, anxiety and
distress showed stronger correlation with difficulties identifying feelings. Regarding to similar
DAUGAVPILS UNIVERSITĀTES 60. STARPTAUTISKĀS ZINĀTNISKĀS KONFERENCES PROCEEDINGS OF
RAKSTU KRĀJUMS THE 60th INTERNATIONAL SCIENTIFIC CONFERENCE OF DAUGAVPILS UNIVERSITY
356
studies done this comes by no surprise because difficulties defining feelings has showed stronger
association between number of disorders than other dimensions of alexithymia. Only depression
showed stronger correlation with difficulties describing feelings.
Limitations to this study is that results were obtained by using questioners. This could
interfere with our results because of misinterpretation of questions. We also cannot establish
somatization diagnosis by only questionnaire because standard physical examination should be
done to exclude organic pathology.
Acknowledges
We would like to thank our scientific research supervisor MD Artūrs Miksons (Rīga Stradiņš
University, Department of Psychosomatic Medicine and Psychotherapy, Latvia). No other
acknowledges to report.
References American Psychiatric Association (APA). Diagnostic and statistical manual of mental disorders. 4th ed. Washington (DC): APA, 1994. Beck AT, Rush AJ, Shaw BF, Emery G. Cognitive therapy of depression. New York: Guilford Press, 1979. Buchanan, D. C., Waterhouse, G. J., West Jr., S. C., 1980. A proposed neuropsychological basis of alexithymia. Psychotherapy and Psychosomatics 34, 248–255. Clarke DM, Smith GC. Somatisation: what is it? Aust Fam Physician. 2000; 29: 109–13. de Vroege L, Emons WHM, Sijtsma K, Hoedeman R, van der Feltz-Cornelis CM. Validation of the 4DSQ somatization subscale in the occupational health care setting as a screener. J Occup Rehabil. 2015; 25: 105–15. Fink P. The use of hospitalizations by persistent somatizing patients. Psychol Med 1992; 22: 173–80. Grabe HJ, Schwahn C, Barnow S, et al. Alexithymia, hypertension, and subclinical atherosclerosis in the general population. J Psychosom Res 2010; 68: 139–47. Honkalampi K, Hintikka J, Tanskanen A, Lehtonen J, Viinamäki H. Depression is strongly associated with alexithymia in the general population. J Psychosom Res 2000; 48: 99–104. Jessimer, M., Markham, R., 1997. Alexithymia: a right hemisphere dysfunction specific to recognition of certain facial expressions? Brain and Cognition 34, 246–258. Joukamaa, M., Kokkonen, P., Veijola, J., Laksy, K., Karvonen, J., Jokelainen, J., Jarvelin, M., 2003. Social situation of expectant mothers and alexithymia 31 years later in their offspring: a prospective study. Psychosomatic Medicine 65, 307–312. Kates N, Craven M. Managing mental health problems. A practical guide for primary care Seattle, Hogrefe & Huber, 1998. Kellner R. Somatisation. Theories and research. J Nerv Ment Dis 1990; 178: 150–60. Kirmayer, L.J. 1989. Cultural variations in the response to psychiatric disorders and psychological distress. Social Science and Medicine no. 29: 327–339. Kleinman, A. 1991. Rethinking Psychiatry. From Cultural Category to Personal Experience. New York: The Free Press. Kroenke K, Price RK. Symptoms in the community. Prevalence, classification, and psychiatric comorbidity. Arch Intern Med 1993; 153: 2474–80. Lane, R. D., Ahern, G. L., Schwartz, G. E., Kaszniak, A. W., 1997. Is alexithymia the emotional equivalent of blindsight? Biological Psychiatry 42, 834–844.
DAUGAVPILS UNIVERSITĀTES 60. STARPTAUTISKĀS ZINĀTNISKĀS KONFERENCES PROCEEDINGS OF
RAKSTU KRĀJUMS THE 60th INTERNATIONAL SCIENTIFIC CONFERENCE OF DAUGAVPILS UNIVERSITY
357
Lemche, E., Klann-Delius, G., Koch, R., Joraschky, P., 2004. Mentalizing language development in a longitudinal attachment sample: implications for alexithymia. Psychotherapy and Psychosomatics 73, 366–374. Loas G, Fremaux D, Otmani O, Lecercle C, Delahousse J. Is alexithymia a negative factor for maintaining absistence? A follow-up study. Compr Psychiatry 1997; 38: 296–9. Marchesi C, Fontò S, Balista C, Cimmino C, Maggini C. Relationship between alexithymia and panic disorder: a longitudinal study to answer an open question. Psychother Psychosom 2005; 74: 56–60. Mattila AK, Kronholm E, Jula A, et al. Alexithymia and somatization in general population. Psychosom Med 2008; 70: 716–22. Miller, L., 1986–87. Is alexithymia a disconnection syndrome? A neuropsychological perspective. International Journal of Psychiatry in Medicine 16, 199–209. Mirowsky, J., and C.E. Ross. 2002. Selecting outcomes for the sociology of mental health: Issues of measurement and dimensionality. Journal of Health and Social Behavior no. 43: 152–170. Parker, J. D., Keightley, M. L., Smith, C. T., Taylor, G. J., 1999. Interhemispheric transfer deficit in alexithymia: an experimental study. Psychosomatic Medicine 61, 464–468. Ridner SH. Psychological distress: concept analysis. J Adv Nurs. 2004; 45: 536–45. Shipko, S., 1982. Further reflections on psychosomatic theory: alexithymia and interhemispheric specialization. Psychotherapy and Psychosomatics 37, 83–86. Sifneos P. The prevalence of “alexithymic” characteristics in psychosomatic patients. Psychother Psychosom 1973; 22: 255–62. Snaith RP. The concepts of mild depression. Br J Psychiatry. 1987; 150: 387–93. Tabibnia, G., Zaidel, E., 2004. Alexithymia, interhemispheric transfer, and right hemispheric specialization: a critical review. Psychotherapy and Psychosomatics 74, 81–92. Taylor GJ, Parker JD, Bagby RM, Bourke MP. Relationships between alexithymia and psychological characteristics associated with eating disorders. J Psychosom Res 1996; 41: 561–8. Terluin B, van Marwijk HWJ, Adèr HJ, de Vet HCW, Penninx BWJH, Hermens MLM, van Boeijen CA, van Balkom AJLM, van der Klink JJL, Stalman WAB. The Four-Dimensional Symptom Questionnaire (4DSQ): a validation study of a multidimensional self-report questionnaire to assess distress, depression, anxiety and somatization. BMC Psychiatry. 2006; 6: 34. van Avendonk MJP, Hassink-Franke LJA, Terluin B, van Marwijk HWJ, Wiersma T, Burgers JS. NHG-Standaard Angst (tweede herziening) [Summarisation of the NHG practice guideline ‘Anxiety’]. Ned Tijdschr Geneeskd. 2012; 156: A4509. Van Praag HM, De Kloet ER, Van Os J: Stress, the brain and depression Cambridge, Cambridge University Press; 2004.

DAUGAVPILS UNIVERSITĀTES 60. STARPTAUTISKĀS ZINĀTNISKĀS KONFERENCES PROCEEDINGS OF
RAKSTU KRĀJUMS THE 60th INTERNATIONAL SCIENTIFIC CONFERENCE OF DAUGAVPILS UNIVERSITY
358
EPIDEMIOLOGICAL CHARACTERISTICS AND THERAPY OF STATUS EPILEPTICUS IN PAULS STRADINS CLINICAL
UNIVERSITY HOSPITAL FROM 2012 TO 2016
Eva Vanaga Riga Stradins University, Dzirciema Street 16, Riga, Latvia, [email protected] Abstract Epidemiological characteristics and therapy of Status epilepticus in Pauls Stradiņš Clinical University Hospital
from 2012 to 2016 Key Words: status epilepticu,s epilepsy, treatment, outcome Introduction. Status epilepticus (SE) is a medical emergency and requires rapid treatment. Incidence of SE is 10-41 per 100 000 population. [1] There are no data about incidence, principles of treatment and outcome of status epilepticus in Latvia, so this study was made to collect information at Pauls Stradiņš Clinical University Hospital. Aim. To analyse clinical profile, diagnostics, therapy and outcome of status epilepticus patients stationed at Pauls Stradiņš Clinical University Hospital from 2012 to 2016. Methods. In this retrospective study all status epilepticus patients stationed in Pauls Stradiņš Clinical University Hospital from 2012 to 2016 were selected. Patient medical records were analysed and information about previous history of seizures, type of seizure, duration of hospitalization, electroencephalogram (EEG) results, therapy, complications and outcome of therapy was collected. Collected data were compared to evidence-based guidelines. Results. In the study 44 patients with status epilepticus were found. The most of the seizures were focal and only some were generalized, but in some cases medical records had no information about the seizure. The electroencephalogram was made for more than a half of the patients and served as the basis for the diagnosis of non-concurrent status epilepticus. Almost all patients received first line and second line treatment. Third line treatment was given in 73% of cases. Half of the patients developed treatment-related complications during hospitalization, the most common complication was intrahospital infection. Intrahospital mortality was 11%, all the other patients were discharged or transferred to another hospital. Kopsavilkums
Status epilepticus epidemioloģiskie rādītāji un terapija Paula Stradiņa Klīniskajā universitātes slimnīcā 2012.–2016. gadā
Atslēgvārdi: status epilepticus, epilepsija, terapija, iznākums Ievads. Status epilepticus ir neatliekama situācija medicīnā un prasa rīkoties nekavējoties. Pasaulē tā sastopamība ir 10-41 uz 100 000 iedzīvotāju. [1] Pasaules līmenī tiek veikti arvien jauni pētījumi par status epilepticus, bet par situāciju Latvijā šādu datu nav. Šis petījums tika veikts, lai ievāktu informāciju par status epilepticus Paula Stradiņa Klīniskajā unversitātes slimnīcā. Mērķis. Izpētīt status epilepticus klīnisko profilu, diagnostiku, ārstēšanu, terapijas iznākumu Paula Stradiņa Klīniskajā universitātes slimnīcā 2012.–2016. gadā Metodes. Pētījuma sākumā tika atlasīti visi pacienti, kas ir bijuši stacionēti Paula Stradiņa Klīniskajā universitātes slimnīcā 2012.–2016. gadā ar diagnozi status epilepticus. Pētījumā tika iekļauta informācija par pacientu anamnēzi pirms hospitalizācijas, lēkmes tipu un etioloģiju, elektroencefalogrammas rezultātiem, stacionēšanas ilgumu, pielietoto terapiju, tās izraisītajām komplikācijām un terapijas iznākumu. Iegūtie dati tika salīdzināti ar vadlīniju datiem. Rezultāti. Pētījumā tika iekļauti 44 status epilepticus pacienti. Biežāk status epilepticus lēkme bija parciāla, retāk – ģeneralizēta, taču daļai pacientu no medicīnas karšu datiem noteikt lēkmes tipu nebija iespējams. Vairāk kā pusei pacientu hospitalizācijas etapā tika veikta elektroencefalogramma un tā kalpoja par pamatu nekonvulsīva status epilepticus diagnostikā. Gandrīz visiem pacientiem tiek ievadīti pirmās rindas un otrās rindas medikamenti. Trešās rindas medikamenti kas pacientu ievada medicīniskajā komā tika doti 73% gadījumu. Pusei pacientu hospitalizācijas laikā attīstījās ar terapiju saistītas komplikācijas, no kurām biežākā bija intrahospitālās infekcijas pievienošanās. Stacionēšanas laikā mira 11% pacientu, pārējie tika izrakstīti vai pārvesti uz citu stacionāru.
Introduction
Status epilepticus is a medical emergency and the second most common neurological
emergency after stroke. [2] Its incidence is 10-41 per 100,000 people and mortality is 9-20% and
depends on the type of the seizure. [4] Approximetly 4-16% of people with epilepsy will have at
least one episode of status epilepticus, and approximetely half of the episodes of status epilepticus
DAUGAVPILS UNIVERSITĀTES 60. STARPTAUTISKĀS ZINĀTNISKĀS KONFERENCES PROCEEDINGS OF
RAKSTU KRĀJUMS THE 60th INTERNATIONAL SCIENTIFIC CONFERENCE OF DAUGAVPILS UNIVERSITY
359
occur in people with no prior history of epilepsy. [7] The longer the seizure continues, the less likely
it is to stop and the higher is risk of developing complications and neuronal death. [7] Data indicates
that more rapid treatment results in better prognosis and fall in mortality [7], that is why it is very
important to understand causes, potential diagnosis methods and management of status epilepticus
to be able to choose the most effective therapy method, reduce the complications and improve
prognosis.
There are many new researches and publications about status epilepticus worldwide, new
guidelines are developed, but there is no information about situation in Latvia. This research was
made to analyse clinical profile, diagnostics, therapy and outcome of status epilepticus patients
stationed at Pauls Stradiņš Clinical University Hospital and to make suggestions and improvements
in diagnostics and therapy.
Material and methods
In this study all status epilepticus patients stationed in Pauls Stradiņš Clinical University
Hospital from 2012 to 2016 were selected. Patient medical records were analysed and information
about previous history of seizures, type of seizure, duration of hospitalization,
electroencephalogram (EEG) results, therapy, complications and outcome of therapy was collected.
It was not possible to find all patients by searching them with SSK-10 code G41 (status epilepticus),
because there were many diagnosis with wrong codes, so at the beginning all patients with
diagnosed epilepsy were selected and then while studying their medical records, all the patients
with status epilepticus were found. The information from medical records was collected in pre-
prepared Microsoft Office Excel table. Data were analysed using Microsoft Office Excel and SPSS
Statistics programs.
Results
44 patients with diagnosed status epilepticus were found. 24 (55%) of them were men and 20
(45%) were women. Age was 23 – 88 years. In average it was 51 years. 23 patients (52%) were
fully independent before the episode, 7 patients (16%) presented mild dependence and 6 patients
(14%) presented total dependence. There was not information in medical records about the level of
functioning in 8 (18%) cases.
15 patients (34%) had focal SE without impairment of consciousness, 1 case (2%) was focal
SE with impaired consciousness, 5 patients (11%) had generalized convulsive SE and 6 (14%) had
nonconvulsive SE. For 17 patents (39%) the type of SE was unknown. For 2 patients (5%) cause of
SE was unknown, but for the rest of them (95%) it was known.
Electroencephalograpy was performed to 29 patients (66%). To 8 (27%) of them more than
one EEG was made during the hospitalization. In 6 (21%) cases EEG had not registered
epileptiform discharges, in 20 (69%) cases was focal activity and in 3 (10%) cases – generalized
DAUGAVPILS UNIVERSITĀTES 60. STARPTAUTISKĀS ZINĀTNISKĀS KONFERENCES PROCEEDINGS OF
RAKSTU KRĀJUMS THE 60th INTERNATIONAL SCIENTIFIC CONFERENCE OF DAUGAVPILS UNIVERSITY
360
activity. It was possible to calculate STESS for 23 patients (52%). In all other cases there was not
all the necessary information in medical record. In 5 cases (22%) the result was 0 points, in 5
(22%) – 1 point, in 4 (17%) – 2 points, in 5 (22%) – 3 points, in 3 (13%) – 4 points, in 0 – 5 points
and in 1 case (2%) the result was 6 points. From those patient who died in the hospital, STESS was
calculated to 3 of them. The results were 1 point, 3 points and 4 points.
Patients spent in hospital 1 – 33 days. In average it was 11 days. 33 patients (75%) were
stationed at an intensive care unit, 29 (66%) of them required intubation and mechanical lung
ventilation. In average patients spent 5,4 days in intensive care unit.
Almost all patients (91%) in therapy received first line therapy (Diazepam)and following
second line therapy (valproic acid). Two patients (5%) received only first line therapy (Diazepam).
Third line treatment received 33 (75%) patients. All of them received Thiopental and 3 (7%)
received additional dosage of Propofol. To 24 patients (55%) developed complications related to
treatment. Most common was intrahospital infection, it developed to 21 (48%) patients. Other
complcations were thrombocytopenia (it developed to 6 patients), leukopenia (to 2 patients),
pancytopenia (to 1 patient), hypotension (to 1 patient) and laryngospasm (to 1 patient). Other
complications related to treatment were not observed. Intrahospital mortality was 11% (5 patients).
Discussion
In this study 44 patients with diagnosed status epilepticus were selected and their medical
records were analysed. According to the data most of the patients previously were fully independent
but still some of them were mild or total dependent. This is due to the fact that for some patients
status epilepticus developed after a stroke or head injury. In almost all cases, the seizure was
symptomatic - either with a certain etiology or a background of pre-existing epilepsy. The most
commonly reported causes were alcohol intoxication and a history of cerebral stroke. According to
research data, most of the status epilepticus seizures developed without a previously diagnosed
epilepsy. To most of the patients at least one electroencephalogram during hospitalization was
performed. In general, it showed focal or generalized epileptic activity, only in 10% of EEG there
was no epileptic activity. According to the data in guidelines, loss of epileptic activity in the EEG
may be observed in the prolonged status epilepticus. [6]
It was possible to calculate status epilepticus severity score STESS for 23 patients. Other
reaserches conclude that the best cut-off value for predicting intrahospital mortality in status
epilepticus is 4 or more points (STESS≥4). [5] In this study 4 or more points got 4 patients and only
one of them died in the hospital. all the other patients were discharged or transferred to another
hospital. According to this study it is not necessary to start using it in Pauls Stradiņš Clinical
University Hospital as a tool for predicting the outcome of status epilepticus. To almost half of the
patients it was not possible to calculate STESS, because there was not all the necessary information
DAUGAVPILS UNIVERSITĀTES 60. STARPTAUTISKĀS ZINĀTNISKĀS KONFERENCES PROCEEDINGS OF
RAKSTU KRĀJUMS THE 60th INTERNATIONAL SCIENTIFIC CONFERENCE OF DAUGAVPILS UNIVERSITY
361
in the medical record. It shows that the anamnesis should be compiled more accurately and all the
necessary information should be asked.
When analyzing the treatment and comparing it with the evidence-based guidelines, it was
found that almost all patients received first-line treatment and almost all patients received second-
line treatment. Third-line treatment was given to 72.7% of patients. It shows that in most cases the
treatment was adequate and corresponded to data of guidelines
During the hospitalization treatment related complications developed to more than a half of
the patients, most of which were the intrahospital infection. An allergic reaction did not develope to
any patient. According to published data, prolonged hospitalization in the Intensive Care Unit and
the use of third line treatment increases the risk of developing an intrahospital infection. [3] Almost
all patients (except one) who had an infection were hospitalized in the Intensive Care Unit. This
shows that prolonged stay in the Intensive Care Unit significantly increases the risk of intrahospital
infection.
Conclusions
1. The most commonly used method for diagnostics in case of status epilepticus is an
electroencephalogram, althoug it is not made enough. Electroencephalography should be
performed to all patients with suspected status epilepticus and it is the most imprtant method in
the diagnosis of nonconvulsive status epilepticus due to very non-specific clinical signs.
2. In 23 cases it was possible to calculate status epilepticus severity score (STESS). Four and
more than four points got four patients and there was no correlation between the result and
intrahospital mortality.
3. In most cases the treatment was adequate and corresponded to data of evidence-based
guidelines, although the use of the third line treatment should be modified, because Propofol is
not given enough.
4. Intrahospital mortality is 11%, and it is less than results show in other researches, so the data
reliability is questioned.
References 1. Betjemann J. P., Lowenstein D. H. Status epilepticus in adults, The Lancet Neurology, Vol 14, Issue 6, June 2015, pp. 615–624. 2. Brophy G. M., Claassen R. B., Alldredge B., Bleck T. B., Glauser T., LaRoche S. M., Riviello J. J., Shutter J. L., Sperling M. R., Treiman D. M., Vespa P. M. Guidelines for the Evaluation and Management of Status Epilepticus, Neurocritical Care, August 2012. 3. Hocker S. Systemic complications of status epilepticus – An update, Epilepsy & Behavior, Vol. 49, August 2015, pp. 83–87. 4. Paris M., Reddy U. Update on the management of status epilepticus, Anaesthesia & Intensive Care Medicine, Vol. 19, Issue 3, March 2018.
DAUGAVPILS UNIVERSITĀTES 60. STARPTAUTISKĀS ZINĀTNISKĀS KONFERENCES PROCEEDINGS OF
RAKSTU KRĀJUMS THE 60th INTERNATIONAL SCIENTIFIC CONFERENCE OF DAUGAVPILS UNIVERSITY
362
5. Reindl C., Knappe R. U., Sprügel M. I., Sembill J. A., Mueller T. M., Hamer H. M., Huttner H. B., Madžar D. Comparison of scoring tools for the prediction of in-hospital mortality in status epilepticus, Seizure, Vol. 56, March 2018, pp. 92–97. 6. Trinka E., Cock H., Hesdorffer D., Rossetti A. O., Scheffer I. E., Shinnar S., Shorvon S., Lowenstein D. H. A definition and classification of status epilepticus – Report of the ILAE Task Force on Classification of Status Epilepticus, Epilepsia, 56(10): 1515–1523, October 2015, Vol. 56, Issue 10, pp. 1515–1523. 7. Walker M. C. Pathophysiology of status epilepticus, Neuroscience Letters, Vol. 667, 22 February 2018, pp. 84–91.

DAUGAVPILS UNIVERSITĀTES 60. STARPTAUTISKĀS ZINĀTNISKĀS KONFERENCES PROCEEDINGS OF
RAKSTU KRĀJUMS THE 60th INTERNATIONAL SCIENTIFIC CONFERENCE OF DAUGAVPILS UNIVERSITY
363
OBSTRUCTIVE SLEEP APNEA RISK CORRELATION WITH GLUCOSE AND HBA1C LEVEL IN TYPE 2 DIABETES
PATIENTS IN LATVIA Anete Granovska, Madara Strassere, Lelde Logina Scientific research supervisor: Dr. Ilze Skuja Riga Stradiņs University, Dzirciema street 16, Riga, LV-1007, Latvia, [email protected], [email protected] Abstract
Obstructive sleep apnea risk correlation with glucose and HBA1C level in type 2 diabetes patients in Latvia Key Words: Obstructive sleep apnea, blood glucose, HbA1c, type 2 diabetes Obstructive sleep apnea (OSA) is the most common sleeping disorder, associated with breathing. It is characterised by repetitive upper airway collapsing, blood oxygenated haemoglobin level decreasing and sympathetic nervous system activation during sleep. OSA is highly prevalent in T2D patients. OSA severity is proven to correlate with fasting blood glucose (BG) control in type 2 diabetes patients. T2D and OSA correlation studies in Latvia are lacking. In this study the risk of OSA is associated with HbA1c level that is the best laboratory marker to show the patients glucose control in last three months. Therefore, for the patients with insufficient BG control, it is advisable to perform OSA questionnaires to diagnose and treat this illness timely. Kopsavilkums Obstrukt īvas miega apnojas riska saistība ar glikozes un HbA1c līmeni 2. tipa cukura diabēta pacientiem Latvijā Atslēgvārdi: Obstruktīva miega apnoja, glikēmija, HbA1c, 2. tipa cukura diabēts Obstruktīva miega apnoja ir visbiežāk sastopamais miega traucējumu veids, kas saistīts ar elpošanu. To raksturo atkārtota augšējo elpceļu sakļaušanās, oksigenētā hemoglobīna līmeņa krišanās un simpātiskās nervu sistēmas aktivācija miega laikā. OMA ir bieži sastopama 2. tipa cukura diabēta pacientiem un ir pierādīts, ka tās smaguma pakāpe ir saistīta ar tukšas dūšas glikēmijas kontroles līmeni diabēta pacientiem. OMA un 2. tipa CD saistība Latvijā nav pietiekami pētīta. Šajā pētījumā OMA riska pakāpe ir saistīta ar HbA1c līmeni, kas ir labākais laboratoriskais marķieris, lai uzzinātu glikēmijas kontroles līmeni pēdējo trīs mēnešu laikā. Tādēļ, pacientiem ar nepietiekamu glikēmijas kontroli ir ieteicams aizpildīt OMA riska noteikšanas skalu, lai savlaicīgi diagnosticētu un ārstētu šo slimību.
Introduction
Obstructive sleep apnea (OSA) is highly prevalent in T2D patients, ranging from 58% to 88%
[16]. OSA severity is proven to correlate with fasting blood glucose (BG) control in type 2 diabetes
patients [16].
Type 2 diabetes is a very important health care problem, due to growing number of patients
and resulting increase of treatment costs. Obstructive sleep apnea and type 2 diabetes are frequent
adjuvant diseases. Because of often observed increased body mass index which is significant risk
factor for obstructive sleep apnea, in type 2 diabetes patients, they have an increased risk of OSA.
But due to OSA influence on organism, which includes decrease of insulin sensitivity and
interference in glucose metabolism, OSA increases development risk for type 2 diabetes [16].
Based on studies from 1995 to 2004 in the United States, Australia, Korea, Spain, India and
China, OSA is found in 3-7% of men and 2-5% of women in the overall population. [1]
OSA pathogenesis is multifactorial. The causes include anatomical and non-anatomical
reasons. [28] Non-anatomical reasons:
• Reduced muscle tone of the dilated throat. [2]
• Premature awakening at minor airway constriction due to low respiratory excitation threshold. [3]

DAUGAVPILS UNIVERSITĀTES 60. STARPTAUTISKĀS ZINĀTNISKĀS KONFERENCES PROCEEDINGS OF
RAKSTU KRĀJUMS THE 60th INTERNATIONAL SCIENTIFIC CONFERENCE OF DAUGAVPILS UNIVERSITY
364
• Unstable breathing control. [3]
It is essential for OSA pathogenesis to have an anatomical differences. [2]
Anatomical reasons:
• narrow upper respiratory tract [4]
• increased airway length [4]
• particular throat opening shapes [2]
The anatomical structures of the throat, which affect the airway narrowing, are dilating
thoracic muscles (m. Genioglossus), soft palate, lateral throat walls, epiglottis. Craniofacial
morphology - the size of the tongue, the position of the tongue (os hyoideum) are risk factors. Neck
circumference is clinicly used to help determine the risk of OSA [3].
Several risk factors have been identified. The most important are the first four:
Obesity - BMI 30 kg / m2 and above, but it should be taken into account that in a 2010 study
34.5% of OMA patients had BMI of 25-30 kg / m2. [2]
Neck circumference - 40 cm and more. [2]
Male sex - Two to three times greater OSA risk, than women. [5]
Age - The prevalence of OSA is increasing with age, especially in people over 65 years old,
where it is even 3 times higher than that of middle aged people. [6]
Race - Various studies show different results for the race as a risk factor [7]. Greater risk is
for Asian, African and Caucasian races. [2]
Pregnancy - 14-23% of pregnant women experience periodic snoring and / or choking
episodes during the second and third trimesters, compared with 4% who experienced it before
pregnancy. [8]
Kidney Disease: On average, OSA is found in 20% of men and 10% of female patients with
end stage kidney disease. Mild chronic kidney disease is associated with waking up at night and
with OSA. Kidney patients can accumulate fluid in the body, which, when lieing down, can migrate
to the upper respiratory tract and narrow them. The higher the HKD degree and the more
accumulated fluid, the higher the AHI. [27]
Other risk factors: polycystic ovary syndrome [1], smoking, drinking alcohol before sleep,
sedative medication, GERD, diabetes, heart failure, poorly controlled arterial hypertension,
hypothyroidism, atrial fibrillation, acromegaly, stroke. [2]
OSA has a very broad effect on the body. Micro awakening episodes and sleep fragmentation
trigger simpatic nervous system, which causes tachycardia, acute rise in blood pressure and insulin
resistance. These factors increase myocardial oxygen demand, cause endothelial dysfunction and
hypercoagulability. [9]
Type 2 diabetes mellitus epidemiology:

DAUGAVPILS UNIVERSITĀTES 60. STARPTAUTISKĀS ZINĀTNISKĀS KONFERENCES PROCEEDINGS OF
RAKSTU KRĀJUMS THE 60th INTERNATIONAL SCIENTIFIC CONFERENCE OF DAUGAVPILS UNIVERSITY
365
Diabetes mellitus is a widespread disease that affects 8.3%, or 382 million people
worldwide. [10]
According to SPKC data for the year 2014, 84 174 people in Latvia have diabetes, of which
almost 80 000 are suffering from type 2 diabetes. [13]
Referring to multiple clinic-based and community-based studies, sleep-related breathing
problems are independently linked to glucose metabolism disorders including insulin resistance,
fasting hyperglycaemia, and impaired glucose tolerance. [11]
Sleep disorders that occure in rapid eye movement sleep phase are associated with insulin
resistance disorders, but abnormal breathing in non-rapid eye movement phase, with glucose
tolerance disorders. [3]
Further studies are needed to determine precisely OSA-associated mechanisms that bind OSA
and diabetes [3], but the most important are high sympathetic nervous system activity, intermittent
hypoxia, sleep fragmentation and reduced sleep, hypothalamic and pituitary axis dislocation,
endothelial dysfunction and changes in the distribution of cytokines and adipokines. [12]
Aim, material and methods
The aim of this study is to determin the correlation of blood glucose control and OSA risk for
T2D patients. The survey is carried out in general practices in Riga. We have collected data from 72
individuals, aged 44 to 86 years old with T2D, who visited general practitioners. Along with other
measurements (systolic and diastolic blood pressure (SBP, DBP), pulse, oxygen saturation, body
mass index, neck circumference), patients underwent standardized OSA questionnaire and results
from current blood glucose (BG) level, and the last oxygenated haemoglobin (HbA1c) analysis
were collected. The study was developed from 10.08.2017. till 20.01.2018.
The STOP-BANG questionaire was used to determine OSA risk. The questionnaires were
completed by 72 patients, 68% women and 32% men.
Table 1. STOP-BANG sleep apnea questionnaire
STOP
Do you SNORE loudly (louder than talking or loud enough to be heard through closed doors)? Yes No Do you often feel TIRED, fatigued, or sleepy during daytime? Yes No Has anyone OBSERVED you stop breathing during your sleep? Yes No Do you have or are you being treated for high blood PRESSURE? Yes No BANG BMI more than 35kg/m2? Yes No AGE over 50 years old? Yes No NECK circumference > 16 inches (40cm)? Yes No GENDER: Male? Yes No Final score
Every positive ansver gives one point. 0-2 points: low risk 3-4 points: intermediate risk 5-8 points: high risk
DAUGAVPILS UNIVERSITĀTES 60. STARPTAUTISKĀS ZINĀTNISKĀS KONFERENCES PROCEEDINGS OF
RAKSTU KRĀJUMS THE 60th INTERNATIONAL SCIENTIFIC CONFERENCE OF DAUGAVPILS UNIVERSITY
366
The data was statistically processed in IBM SPSS Statistics V.22. For a statistically reliable
was accepted p value <0,05.
Glucose, HbA1c, BMI, neck circumference, glucose level self-monitoring after the STOP-
BANG scale was analyzed using the Kruskal-Wallis test.
Sleep score was also analyzed after the Pearson correlation test.
Shapiro-Wilk test of normality was used to evaluate the normal distribution of data.
MedCalc's easy-to-use statistical program was used to calculate the sensitivity and specificity
of HbA1c and BMI.
Results
33 residents (46%) were identified with high risk OSA (HR-OSA), 28 (39%) were identified
with intermediate risk OSA (IR-OSA) and 11 (15%) with low risk OSA (LR-OSA). The median
BG in patients with LR-OSA were 7,77 (+/- 1,77) mg/dL, in IR-OSA were 7,35 (+/- 2,94) mg/dL
and HR-OSA were 8,25 (+/- 3,32) mg/dL. HbA1c in LR-OSA patients was 6,16 (+/- 1,2)%, IR-
OSA patients was 6,4 (+/- 1,07)% and HR-OSA patients was 8,25 (+/- 3,32)% and HbA1c
statistically significant (p=0,017) to OSA risk grade.
The mean neck circumference was 42 ± 4.45 cm (for women 40.20 ± 3.43 cm, for men,
45.83 ± 3, 99cm). The mean glucose level was 8.55 ± 3.026 mmol / l, while the mean glycated
hemoglobin (HbA1c) level was 7.51% ± 2.07.
Fasting glucose and HbA1c levels between risk groups can be seen in table nr.2.
Table 2. Glucose control and OSA risk level
Low risk Intermediate risk High risk
Glucose level Mg/dl 7,31 8,31 9,16 St. deviation 1,77 2,94 3,32
HbA1c % 6,57 7,24 8,04 St. deviation 1,20 2,07 2,18
Together 11 28 33
Using the Kruskal-Wallis test for analysis, the level of glucose did not have a statistically
significant relationship with the OSA risk score on the STOP-BANG scale (p = 0.241). However,
there is a statistically significant difference in HbA1c levels between the risk groups (p = 0.017).
HbA1c is a better indicator of glucose control, than fasting glucose. Statistically significant
differences were observed between the low and high risk groups (p = 0.032). Using the Kruskola-
Wallis test, BMI differed significantly in the patient groups, both in low-risk (p = 0.000) and
intermediate (p = 0.021) risk groups. The minimal BMI value was 20.4 kg / m2 and the maximal
65.33 kg / m2. Only 8% (n = 6) of the respondents had normal BMI (below 25kg / m2). 68% (n =
49) were obese (BMI> 30kg / m2), with 41% (n = 20) of them having at least 2nd degree obesity
(BMI> 35kg / m2), which is 28% of the total number of respondents. The highest mean BMI was in
patients at high risk, where the median value was 34.29 kg / m2.
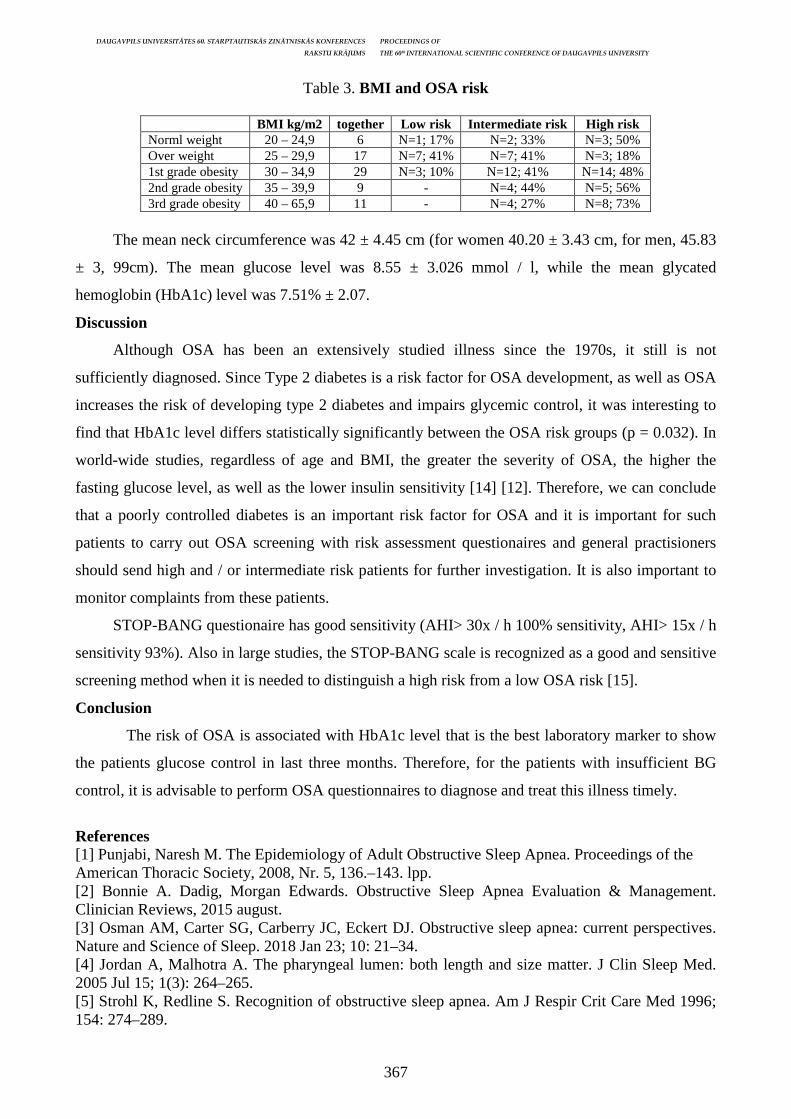
DAUGAVPILS UNIVERSITĀTES 60. STARPTAUTISKĀS ZINĀTNISKĀS KONFERENCES PROCEEDINGS OF
RAKSTU KRĀJUMS THE 60th INTERNATIONAL SCIENTIFIC CONFERENCE OF DAUGAVPILS UNIVERSITY
367
Table 3. BMI and OSA risk
BMI kg/m2 together Low risk Intermediate risk High risk Norml weight 20 – 24,9 6 N=1; 17% N=2; 33% N=3; 50% Over weight 25 – 29,9 17 N=7; 41% N=7; 41% N=3; 18% 1st grade obesity 30 – 34,9 29 N=3; 10% N=12; 41% N=14; 48% 2nd grade obesity 35 – 39,9 9 - N=4; 44% N=5; 56% 3rd grade obesity 40 – 65,9 11 - N=4; 27% N=8; 73%
The mean neck circumference was 42 ± 4.45 cm (for women 40.20 ± 3.43 cm, for men, 45.83
± 3, 99cm). The mean glucose level was 8.55 ± 3.026 mmol / l, while the mean glycated
hemoglobin (HbA1c) level was 7.51% ± 2.07.
Discussion
Although OSA has been an extensively studied illness since the 1970s, it still is not
sufficiently diagnosed. Since Type 2 diabetes is a risk factor for OSA development, as well as OSA
increases the risk of developing type 2 diabetes and impairs glycemic control, it was interesting to
find that HbA1c level differs statistically significantly between the OSA risk groups (p = 0.032). In
world-wide studies, regardless of age and BMI, the greater the severity of OSA, the higher the
fasting glucose level, as well as the lower insulin sensitivity [14] [12]. Therefore, we can conclude
that a poorly controlled diabetes is an important risk factor for OSA and it is important for such
patients to carry out OSA screening with risk assessment questionaires and general practisioners
should send high and / or intermediate risk patients for further investigation. It is also important to
monitor complaints from these patients.
STOP-BANG questionaire has good sensitivity (AHI> 30x / h 100% sensitivity, AHI> 15x / h
sensitivity 93%). Also in large studies, the STOP-BANG scale is recognized as a good and sensitive
screening method when it is needed to distinguish a high risk from a low OSA risk [15].
Conclusion
The risk of OSA is associated with HbA1c level that is the best laboratory marker to show
the patients glucose control in last three months. Therefore, for the patients with insufficient BG
control, it is advisable to perform OSA questionnaires to diagnose and treat this illness timely.
References [1] Punjabi, Naresh M. The Epidemiology of Adult Obstructive Sleep Apnea. Proceedings of the American Thoracic Society, 2008, Nr. 5, 136.–143. lpp. [2] Bonnie A. Dadig, Morgan Edwards. Obstructive Sleep Apnea Evaluation & Management. Clinician Reviews, 2015 august. [3] Osman AM, Carter SG, Carberry JC, Eckert DJ. Obstructive sleep apnea: current perspectives. Nature and Science of Sleep. 2018 Jan 23; 10: 21–34. [4] Jordan A, Malhotra A. The pharyngeal lumen: both length and size matter. J Clin Sleep Med. 2005 Jul 15; 1(3): 264–265. [5] Strohl K, Redline S. Recognition of obstructive sleep apnea. Am J Respir Crit Care Med 1996; 154: 274–289.

DAUGAVPILS UNIVERSITĀTES 60. STARPTAUTISKĀS ZINĀTNISKĀS KONFERENCES PROCEEDINGS OF
RAKSTU KRĀJUMS THE 60th INTERNATIONAL SCIENTIFIC CONFERENCE OF DAUGAVPILS UNIVERSITY
368
[6] Ancoli-Israel S, Kripke D, Klauber M, Mason W, Fell R, Kaplan O. Sleepdisordered breathing in community-dwelling elderly. Sleep 1991; 14: 486–495. [7] Young T, Peppard PE, Gottlieb DJ. Epidemiology of obstructive sleep apnea: a population health perspective. American Journal of Respiratory Critical Care, 2002, 265(9): 1217.–1239. lpp. [8] Franklin KA, Holmgren PA, Jonsson F, Poromaa N, Stenlund H, Svanborg E. Snoring, pregnancy-induced hypertension, and growth retardation of the fetus. Chest 2000; 117: 137. [9] Kasai Takatoshi, Bradley Douglas. Obstructive Sleep Apnea and Heart Failure. Pathophysio-logic and Therapeutic Implications. Journal of the American College of Cardiology, 2011, vol. 57, 2: 119–127. [10] Cornel S. Continual evolution of type 2 diabetes: an update on pathophysiology and emerging treatment options. Therapeutics and Clinical Risk Management 2015; 11: 621–632. [11] Eckert DJ, Malho [28] Osman AM, Carter SG, Carberry JC, Eckert DJ. Obstructive sleep apnea: current perspectives. Nature and Science of Sleep. 2018 Jan 23; 10: 21–34. [12] Tasali E, Mokhlesi B, Van Cauter E. Obstructive sleep apnea and type 2 diabetes: interacting epidemics. Chest. 2008 Feb; 133(2): 496–506. [13] The center of desease profilaxis and cotroll in Latvia, statistic data about type 2 diabetes in Latvian population. [Internet] – [29.03.2018.] aveilable: https://www.spkc.gov.lv/lv/statistika-un-petijumi/statistika/veselibas-aprupes-statistika1/get/nid/1 [14] Meslier N, Gagnadoux F, Giraud P, et al. Impaired glucoseinsulin metabolism in males with obstructive sleep apnoea syndrome. Eur Respir J 2003; 22: 156–160. [15] Chung F., Subramanyam R., Liao P., Sasaki E., Shapiro C., Sun Y. High STOP-Bang score indicates a high probability of obstructive sleep apnoea. British Journal of Anaesthesia, 2012, 768.–775. lpp. [16] Aronsohn Renee S., Whitmore Harry, Van Cauter Eve, Tasali Esra. Impact of Untreated Obstructive Sleep Apnea on Glucose Control in Type 2 Diabetes. American Journal of Respi-ratory Critical Care Medicine, 2010, vol. 181, 507.–513. lpp.
DAUGAVPILS UNIVERSITĀTES 60. STARPTAUTISKĀS ZINĀTNISKĀS KONFERENCES PROCEEDINGS OF
RAKSTU KRĀJUMS THE 60th INTERNATIONAL SCIENTIFIC CONFERENCE OF DAUGAVPILS UNIVERSITY
369
PREVALENCE OF NEWLY DIAGNOSED ATRIAL FIBRILLATION AMONG PATIENTS HOSPITALIZED WITH CARDIOEMBOLIC CEREBRAL INFARCTION
AT PAULS STRADINS CLINICAL UNIVERSITY HOSPITAL, RIGA, LATVIA IN 2016
Kaspars Rimicāns1, Kristaps Jurj āns2, Evija Migl āne2, Andrejs Millers 2, Zane Priede2 1 Riga Stradins University, Faculty of Medicine, Dzirciema street 16, Riga, Latvia, [email protected] 2 Riga Stradins University, Department of Neurology and Neurosurgery; Pauls Stradins Clinical University Hospital, Neurology clinic, Pilsonu street 13, Riga, Latvia Abstract
Prevalence of newly diagnosed atrial fibrillation among patients hospitalized with cardioembolic cerebral infarction at Pauls Stradins Clinical University Hospital, Riga, Latvia in 2016
Key Words: cardioembolic stroke, atrial fibrillation, oral anticoagulants, stroke prevention Introduction. A timely diagnosis and treatment of atrial fibrillation (AF) significantly reduces the risk of cardioembolic stroke but is known to be insufficient world-wide. Aim. To estimate the prevalence of a newly diagnosed AF among cardioembolic stroke patients. To assess the type of specialist involved in monitoring the patient with a previously diagnosed AF as well as medication used in the primary stroke prevention. Methods. Data on AF, medication use and monitoring specialist of patients admitted to department of Neurology in Pauls Stradins Clinical University Hospital, Riga, Latvia with cardioembolic stroke, were obtained and data analysis was carried out using SPSS. Results. 438 patients were included, 294 females (67%), mean age 76,9, 149 patients (34%) with newly diagnosed AF. Of 413 patients with pre-stroke CHA2DS2 -VASc score of ≥2 10% (n=41) received oral anticoagulants (OACs). 56% (n=23) received warfarin, 44% (n=19) received direct OACs. In case of 166 patients (63,6%) monitoring was done by general practitioner (GP), in 14 patients (5,4%) by internist and in 81 patients (31%) by cardiologist. Among 166 patients monitored by GP 90 (54,2%) received no antithrombotic medication, 59 (35,5%) received antiplatelet agents and 17 (10,3%) received OACs. Of 14 patients monitored by internist 10 (71,4%) received no antithrombotic medication, 2 (14,3%) received antiplatelet agents and 2 (14,3%) received OACs. Among 81 patients monitored by cardiologist 40 (49,4%) received no antithrombotic medication, 28 (34,5%) received antiplatelet agents and 13 (16,1%) received OACs. Conclusion. Prevalence of a newly diagnosed AF in cardioembolic stroke patients is high. The primary cardioembolic stroke prevention is insufficient. Relevance of the monitoring specialist leads to higher rates of guideline-recommended therapy. Monitoring of patients by the appropriate specialist and a timely initiation of OAC therapy for cardioembolic stroke prevention should be promoted. Kopsavilkums
Pirmreizēji diagnosticētas ātriju fibril ācija prevalence kardioemboliska cerebrāla infarkta pacientiem PS KUS 2016. gadā
Atslēgvārdi: kardioembolisks cerebrāls infarkts, ātriju fibril ācija, perorālie antikoagulanti, insulta profilakse Ievads. Kardioemboliska cerebrāla infarkta (CI) primāra profilakse ir nepietiekama visā pasaulē. Savlaicīgi diagnosticēta un ārstēta ātriju fibril ācija (ĀF) būtiski samazina CI risku. Mērķis. Izvērtēt pirmreizēji diagnosticētas ĀF prevalenci CI pacientu vidū. Izvērtēt, pie kāda speciālista novērojušies pacienti ar iepriekš zināmu ĀF, un kādi medikamenti lietoti primārajā profilaksē. Materiāli un metodes: Pētījumā iekļauti visi CI pacienti, kas stacionēti P. Stradiņa KUS Neiroloģijas klīnikā 2016. gadā, kuriem konstatēta ĀF. No pacientiem iegūta informācija par ĀF, pie kāda speciālista novērojies, un kādi medikamenti lietoti pirms insulta, un veikta datu analīze izmantojot IBM SPSS. Rezultāti. Pētījumā iekļauti 401 pacients, no kuriem 140 (34,9%) pacientu pirmreizēji diagnosticēta ĀF. Par ĀF iepriekš zinājuši 261 (65,1%) pacients. No šiem pacientiem 166 (63,6%) novērojušies pie ģimenes ārsta, 14 pie internista (5,4%), 81 (31%) pie kardiologa. No 166 pacientiem, kas novērojušies pie ģimenes ārsta 90 (54,2%) nelietoja nekādus antitrombotiskus medikamentus, 59 (35,5%) lietoja antiagregantus un 17 (10,3%) lietojuši perorālos antikoagulantus (POAKs). No 14 pacientiem, kas novērojušies pie internista 10 (71,4%) nelietoja nekādus antitrombotiskus medikamentus, 2 (14,3%) lietoja antiagregantus un 2 (14,3%) lietojuši POAKs. No 81 pacienta, kas novērojies pie kardiologa 40 (49,4%) nelietoja nekādus antitrombotiskus medikamentus, 28 (34,5%) lietoja antiagregantus un 13 (16,1%) lietojuši POAKs.
DAUGAVPILS UNIVERSITĀTES 60. STARPTAUTISKĀS ZINĀTNISKĀS KONFERENCES PROCEEDINGS OF
RAKSTU KRĀJUMS THE 60th INTERNATIONAL SCIENTIFIC CONFERENCE OF DAUGAVPILS UNIVERSITY
370
Secinājumi. Pirmreizēji diagnosticētas ĀF prevalence CI pacientu vidū ir augsta. CI primārā profilakse ir nepietiekama. Statistiski ticama sakarība starp atbilstošu medikamentu lietošanu un novērošanos pie atbilstoša speciālista. Nepieciešams veicināt pacientu novērošanos pie atbilstoša profila speciālista un savlaicīgu POAKs uzsākšanu, lai mazinātu CI risku.
Introduction
Cardioembolic stroke (CS) is the most severe subtype of ischaemic stroke characterized by a
high in-hospital mortality and increased rates of neurological impairment at discharge. (Arboix et
al. 2012) Diagnosis of CS is commonly based on TOAST classification system featuring absence of
arterial disease and identification of a potential cardiac source of embolism. (Adams et al 1993) CS
accounts for about 20% of ischaemic strokes, with a tendency to increase. (Hart et al. 2007) (Kamel
et al 2017)
Atrial fibrillation (AF) is the most significant risk factor cardioembolic stroke. (Abroix et al.
2011) As the incidence increases it is anticipated that by 2030 about 14–17 million patients within
the European Union will be diagnosed with AF. (Shahid et al. 2016) Nonvalvular AF has an
estimated fivefold increase of CS risk. (Fuster et al. 2011) The use of oral anticoagulants (OACs)
decrease the risk of CS by two-thirds and is established as the most effective preventive
intervention. (Kirchhof et al. 2016) Anticoagulation agents can be divided into vitamin K
antagonists (VKA) and direct oral anticoagulants (OAC). Direct OACs reduce stroke with
efficiency similar or higher than VKAs but have lower bleeding rates. (Ruff et al. 2014) (Salazar et
al. 2014) VKAs are currently the only treatment with established safety in AF patients with valvular
disease (Eikelboom et al. 2013) but for other groups of patients without contraindications to direct
OACs (including patients with renal disease (Sposato et al. 2015)) direct OAC therapy is
recommended. (Kirchhof et al. 2016) Currently available OACs in Latvia include VKA (warfarin)
and direct OACs (apixaban, dabigatran, rivaroxaban) (Strēlnieks et al. 2014). The use of
anticoagulants is based on CHA2DS2-VASc score, clinical prediction rules for estimating the risk of
stroke in patients first published in 2001 and later modified. (Lip et al. 2010) European Society of
Cardiology recommends the use of anticoagulats in men with CHA2DS2 -VASc score of 2 or more
and in women with a score of 3 or more. American College of Cardiology un The National Institute
for Health and Care Excellence (NICE) recommend OAC therapy for all patients with CHA2DS2 -
VASc score of 2 or more (January et al. 2014) (Cowan et al. 2014)
Because of the often paroxysmal and asymptomatic nature of AF it is likely underdiagnosed
and is the possible mechanism in a portion of strokes diagnosed as cryptogenic. (Wessler et al.
2015) In patients with diagnosed AF, however, stroke prevention is often not adequate. Data
suggest that treatment is insufficient in 20-80% of patients. (Ogilvie et al. 2010) (Sorescu et al.
2018) Sub-optimal treatment adherence has also been noted. (Borne et al. 2017) Out of 7265
DAUGAVPILS UNIVERSITĀTES 60. STARPTAUTISKĀS ZINĀTNISKĀS KONFERENCES PROCEEDINGS OF
RAKSTU KRĀJUMS THE 60th INTERNATIONAL SCIENTIFIC CONFERENCE OF DAUGAVPILS UNIVERSITY
371
primary care patients newly starting anticoagulant therapy after 360 days persistent use of OACs
was seen in only half of patients. (Beyer-Westendorf et al. 2016)
Aim of the study was to assess the prevalence of newly diagnosed AF among stroke patients
admitted to Pauls Stradins Clinical University Hospital. To estimate they type of specialist involved
in monitoring of patients with previously diagnosed AF and medication used in primary stroke
prevention.
Methods
Data on AF, medication use and type of specialist involved in monitoring the patients
admitted to Neurological clinic of Pauls Stradins Clinical University Hospital with diagnosed CS
were obtained. Data analysis was carried using SPSS Statistics. Association among the variables
was determined using Chi-square and Fisher's exact tests. P-values <0.05 were considered
statistically significant.
Results
A total of 438 patients were included, 294 females (67%), mean age 76,9, 149 (34%) with
newly diagnosed AF.
Out of 413 patients with pre-stroke CHA2DS2 -VASc score of ≥2 10% (n=41) received
OACs. 56% (n=23) received warfarin, 44% (n=19) received direct OACs.
In case of 166 patients (63,6%) monitoring was done by general practitioner (GP), in 14
patients (5,4%) by internal medicine physician and in 81 patients (31%) by cardiologist.
Out of 166 patients monitored by GP 90 (54,2%) received no antithrombotic medication, 59
(35,5%) received antiplatelet agents and 17 (10,3%) received OACs.
Out of 14 patients monitored by internal medicine physician 10 (71,4%) received no
antithrombotic medication, 2 (14,3%) received antiplatelet agents and 2 (14,3%) received OACs.
Out of 81 patients monitored by cardiologist 40 (49,4%) received no antithrombotic
medication, 28 (34,5%) received antiplatelet agents and 13 (16,1%) received OACs.
DAUGAVPILS UNIVERSITĀTES 60. STARPTAUTISKĀS ZINĀTNISKĀS KONFERENCES PROCEEDINGS OF
RAKSTU KRĀJUMS THE 60th INTERNATIONAL SCIENTIFIC CONFERENCE OF DAUGAVPILS UNIVERSITY
372
Table 1. Association between the received therapy and the monitoring specialist
GP internist cardiologist
Count 90 10 40 140
% within monitoring specialist
54.2% 71.4% 49.4% 53.6%
Count 59 2 28 89
% within v13 monitoring specialist
35.5% 14.3% 34.6% 34.1%
Count 17 2 13 32
% within v13 monitoring specialist
10.2% 14.3% 16.0% 12.3%
Count 166 14 81 261
% within monitoring specialist
100.0% 100.0% 100.0% 100.0%
specialist Monitoring specialist
Total
Primary pre- vention
none
anti-platelet agents
OAC
Total
Figure 1. Association between the received therapy and the monitoring specialist
Discussion
The percentage of patients with a newly diagnosed AF after stroke in our study (34%) was
higher the the overall AF detection rate after stroke and transient ischaemic attack of 23,7% found
in one review (Sposato et al. 2015). In less recent studies numbers reported are lower. (Liao et al.
2007) Detection rate varies depending on the method used, duration of monitoring, and time elapsed

DAUGAVPILS UNIVERSITĀTES 60. STARPTAUTISKĀS ZINĀTNISKĀS KONFERENCES PROCEEDINGS OF
RAKSTU KRĀJUMS THE 60th INTERNATIONAL SCIENTIFIC CONFERENCE OF DAUGAVPILS UNIVERSITY
373
after stroke. (Gladstone et al. 2014) (Rizos et al. 2012) For example, more than a fivefold increase
in AF detection was seen after a 30 day electrocardiography monitoring as compared to the 24-hour
intervetion. (Gladstone et al. 2014) The high incidence of a newly detected AF among stroke
patients, often paroxysmal and asymptomatic in nature, may account for a significant proportion of
otherwise cryptogenic strokes. (Elijovich et al. 2009) (Wessler et al. 2015)
Among patients with CHA2DS2-VASc score ≥2 only 10% received anticoagulation therapy.
In a rieview by Ogilvie et al the reported anticoagulation treatment levels ranged from 19% to
81.3%. In Britain in 2015 out of 2259 patients with indicated OAC therapy 39.7% were not
receiving appropriate treatment but in a 2016 study the rate was 52%. (Shantsila et al. 2015) (Turner
et al. 2016) The results of our study confirm that regardless of clear recommendations OAC
treatment in patients with AF is often insufficient. (Kirschof et al. 2016) Limited knowledge,
adherence problems and fear of hemorrhage are some of the reasons behind it. (Wessler et al. 2015)
Both patients and caregivers expressed desire to receive more information about reducing stroke
risk and to take action to reduce it. (Frankel et al. 2015) Among 1,330 patients with reported
contraindications to OAC therapy, 30.3% recieved warfarin or dabigatran and authors concluded
that contraindications are commonly reported but often subjective. (O'Brien et al. 2014) Every forth
patient newly starting warfarin for atrial fibrillation discontinued therapy in the first year, the
tendency increases with with younger age, fewer stroke risk factors, and poorer INR control. (Fang
et al. 2010) Better adherence have been shown to be exhibited by patients with higher morbidity
and risk factors, probably attributed to more regular contact with the healthcare system and in
patients recieving direct OACs rather than warfarin. (Gorst-Rasmussen et al. 2015) (Zalesak et al.
2013)
We found similar rates among patients in warfarin and direct OAC therapy (56% un 44%). In
Western Europe the portion of patients with indicated anticoagulation therapy taking vitamin K
antagonists has been shown to be 62- 86%. (Le Heuzey et al 2015) In a French study 89 patients
received warfarin but 50 patients recieved direct OACs. (Benzimra et al. 2018)
A statistically significant trend for higher appropriate therapy rates and relveant specialist was
observed. This observation has been acknowledged in other studies. According to patients reports in
the French study, cardiologist was the initial prescriber of anticoagulants in 96% of cases, and
assured follow-up in 70%, while GPs did follow-up in only 30% of cases. (Benzimra et al. 2018)
The results of previous studies are less striking and authors suspected that at least in some cases the
follow-up wight have been dual, assured by both cardiologist and GP, without patients being aware
of it as patients tend to associate their condition with the relevant specialist. (Benzimra et al. 2018)
(Liard et al. 2013) In American study of 141,642 patients warfarin use was significantly higher in
cardiology-treated pateints than in primary care only-treated patients. (Turakhia et al. 2013)
DAUGAVPILS UNIVERSITĀTES 60. STARPTAUTISKĀS ZINĀTNISKĀS KONFERENCES PROCEEDINGS OF
RAKSTU KRĀJUMS THE 60th INTERNATIONAL SCIENTIFIC CONFERENCE OF DAUGAVPILS UNIVERSITY
374
Conclusions
Prevalence of newly diagnosed AF in cardioembolic stroke patients is high.
The primary cardioembolic stroke prevention is insufficient.
Relevance of the monitoring specialist leads to higher rates of guideline-recommended
therapy.
Monitoring of patients by the appropriate specialist and a timely initiation of OAC therapy for
cardioembolic stroke prevention should be promoted.
References Adams HP Jr1, Bendixen BH, Kappelle LJ, Biller J, Love BB, Gordon DL, Marsh EE 3rd. Classification of subtype of acute ischemic stroke. Definitions for use in a multicenter clinical trial. TOAST. Trial of Org 10172 in Acute Stroke Treatment. Stroke. 1993 Jan; 24(1): 35–41. Arboix A1, Alio J. Acute cardioembolic cerebral infarction: answers to clinical questions.Curr Cardiol Rev. 2012 Feb; 8(1): 54–67. Arboix A1, Alió J. Acute cardioembolic stroke: an update. Expert Rev Cardiovasc Ther. 2011 Mar; 9(3): 367–79. Beyer-Westendorf J1, Ehlken B2, Evers T3. Real-world persistence and adherence to oral anticoagulation for stroke risk reduction in patients with atrial fibrillation. Europace. 2016 Aug; 18(8): 1150–7. Benzimra M1, Bonnamour B1, Duracinsky M2, Lalanne C2, Aubert JP2,3, Chassany O2,3, Aubin-Auger I2,3, Mahé I1,2. Real-life experience of quality of life, treatment satisfaction, and adherence in patients receiving oral anticoagulants for atrial fibrillation. Patient Prefer Adherence. 2018 Jan 4; 12: 79–87. Borne RT1, O'Donnell C2, Turakhia MP3,4, Varosy PD5,2, Jackevicius CA6, Marzec LN5, Masoudi FA5, Hess PL5,2, Maddox TM7, Ho PM5,2. Adherence and outcomes to direct oral anticoagulants among patients with atrial fibrillation: findings from the veterans health administration. BMC Cardiovasc Disord. 2017 Sep 2; 17(1): 236. Cowan et al. NICE Atrial fibrillation: management. Clinical guideline. Published: 18 June 2014. nice.org.uk/guidance/cg180 Eikelboom JW1, Connolly SJ, Brueckmann M, Granger CB, Kappetein AP, Mack MJ, Blatchford J, Devenny K, Friedman J, Guiver K, Harper R, Khder Y, Lobmeyer MT, Maas H, Voigt JU, Simoons ML, Van de Werf F; RE-ALIGN Investigators. Dabigatran versus warfarin in patients with mechanical heart valves. N Engl J Med. 2013 Sep 26; 369(13): 1206–14. Elijovich L1, Josephson SA, Fung GL, Smith WS. Intermittent atrial fibrillation may account for a large proportion of otherwise cryptogenic stroke: a study of 30-day cardiac event monitors. J Stroke Cerebrovasc Dis. 2009 May-Jun; 18(3): 185–9. Fang MC1, Go AS, Chang Y, Borowsky LH, Pomernacki NK, Udaltsova N, Singer DE. Warfarin discontinuation after starting warfarin for atrial fibrillation. Circ Cardiovasc Qual Outcomes. 2010 Nov; 3(6): 624–31. Frankel DS1, Parker SE2, Rosenfeld LE3, Gorelick PB4. HRS/NSA 2014 survey of atrial fibrillation and stroke: Gaps in knowledge and perspective, opportunities for improvement. Heart Rhythm. 2015 Aug; 12(8): e105-13. Fuster V, Rydén LE, Cannom DS, Crijns HJ, Curtis AB, Ellenbogen KA, Halperin JL, Kay GN, Le Huezey JY, Lowe JE, Olsson SB, Prystowsky EN, Tamargo JL, Wann LS, Smith SC Jr, Priori SG, Estes NA 3rd, Ezekowitz MD, Jackman WM, January CT, Lowe JE, Page RL, Slotwiner DJ, Stevenson WG, Tracy CM, Jacobs AK, Anderson JL, Albert N, Buller CE, Creager MA, Ettinger SM, Guyton RA, Halperin JL, Hochman JS, Kushner FG, Ohman EM, Stevenson WG, Tarkington LG, Yancy CW; American College of Cardiology Foundation/American Heart Association Task Force. 2011 ACCF/AHA/HRS focused updates incorporated into the ACC/AHA/ESC 2006
DAUGAVPILS UNIVERSITĀTES 60. STARPTAUTISKĀS ZINĀTNISKĀS KONFERENCES PROCEEDINGS OF
RAKSTU KRĀJUMS THE 60th INTERNATIONAL SCIENTIFIC CONFERENCE OF DAUGAVPILS UNIVERSITY
375
guidelines for the management of patients with atrial fibrillation: a report of the American College of Cardiology Foundation/American Heart Association Task Force on practice guidelines. Circulation. 2011 Mar 15; 123(10): e269-367. Gladstone DJ1, Spring M, Dorian P, Panzov V, Thorpe KE, Hall J, Vaid H, O'Donnell M, Laupacis A, Côté R, Sharma M, Blakely JA, Shuaib A, Hachinski V, Coutts SB, Sahlas DJ, Teal P, Yip S, Spence JD, Buck B, Verreault S, Casaubon LK, Penn A, Selchen D, Jin A, Howse D, Mehdiratta M, Boyle K, Aviv R, Kapral MK, Mamdani M; EMBRACE Investigators and Coordinators. Atrial fibrillation in patients with cryptogenic stroke. N Engl J Med. 2014 Jun 26; 370(26): 2467–77. Gorst-Rasmussen A1, Skjøth F, Larsen TB, Rasmussen LH, Lip GY, Lane DA. Dabigatran adherence in atrial fibrillation patients during the first year after diagnosis: a nationwide cohort study. J Thromb Haemost. 2015 Apr; 13(4): 495–504. Hart RG1, Pearce LA, Aguilar MI. Meta-analysis: antithrombotic therapy to prevent stroke in patients who have nonvalvular atrial fibrillation. Ann Intern Med. 2007 Jun 19; 146(12): 857–67. January CT, Wann LS, Alpert JS, Calkins H, Cigarroa JE, Cleveland JC Jr, et al. 2014 AHA/ACC/HRS guideline for the management of patients with atrial fibrillation: a report of the American College of Cardiology/American Heart Association Task Force on practice guidelines and the Heart Rhythm Society. Circulation. 2014 Dec 2. 130 (23): e199-267. Kamel H1, Healey JS2. Cardioembolic Stroke. Circ Res. 2017 Feb 3; 120(3): 514–526. Kirchhof P, Benussi S, Kotecha D, Ahlsson A, Atar D, Casadei B, et al. 2016 ESC Guidelines for the management of atrial fibrillation developed in collaboration with EACTS. Europace. 2016 Nov. 18 (11): 1609–1678. Le Heuzey JY1, Ammentorp B, Darius H, De Caterina R, Schilling RJ, Schmitt J, Zamorano JL, Kirchhof P. Differences among western European countries in anticoagulation management of atrial fibrillation. Data from the PREFER IN AF registry. Thromb Haemost. 2014 May 5; 111(5): 833–41. Liao J1, Khalid Z, Scallan C, Morillo C, O'Donnell M. Noninvasive cardiac monitoring for detecting paroxysmal atrial fibrillation or flutter after acute ischemic stroke: a systematic review. Stroke. 2007 Nov; 38(11): 2935–40. Liard F, Le Heuzey JY, Aliot E, Mabo P, Leenhardt A. Presse Med. 2013 Jul-Aug; 42(7-8): e259-70. Lip GY1, Nieuwlaat R, Pisters R, Lane DA, Crijns HJ.Refining clinical risk stratification for predicting stroke and thromboembolism in atrial fibrillation using a novel risk factor-based approach: the euro heart survey on atrial fibrillation. Chest. 2010 Feb; 137(2): 263–72. doi: 10.1378/chest.09-1584. O'Brien EC1, Holmes DN2, Ansell JE3, Allen LA4, Hylek E5, Kowey PR6, Gersh BJ7, Fonarow GC8, Koller CR2, Ezekowitz MD6, Mahaffey KW9, Chang P10, Peterson ED2, Piccini JP2, Singer DE11. Physician practices regarding contraindications to oral anticoagulation in atrial fibrillation: findings from the Outcomes Registry for Better Informed Treatment of Atrial Fibrillation (ORBIT-AF) registry.Am Heart J. 2014 Apr; 167(4): 601-609.e1. Ogilvie IM1, Newton N, Welner SA, Cowell W, Lip GY. Underuse of oral anticoagulants in atrial fibrillation: a systematic review. Am J Med. 2010 Jul; 123(7): 638-645.e4. Rizos T1, Güntner J, Jenetzky E, Marquardt L, Reichardt C, Becker R, Reinhardt R, Hepp T, Kirchhof P, Aleynichenko E, Ringleb P, Hacke W, Veltkamp R. Continuous stroke unit electrocardiographic monitoring versus 24-hour Holter electrocardiography for detection of paroxysmal atrial fibrillation after stroke. Stroke. 2012 Oct; 43(10): 2689–94. Ruff CT1, Giugliano RP2, Braunwald E2, Hoffman EB2, Deenadayalu N2, Ezekowitz MD3, Camm AJ4, Weitz JI5, Lewis BS6, Parkhomenko A7, Yamashita T8, Antman EM2. Comparison of the efficacy and safety of new oral anticoagulants with warfarin in patients with atrial fibrillation: a meta-analysis of randomised trials. Lancet. 2014 Mar 15; 383(9921): 955–62. doi: 10.1016/S0140-6736(13)62343-0

DAUGAVPILS UNIVERSITĀTES 60. STARPTAUTISKĀS ZINĀTNISKĀS KONFERENCES PROCEEDINGS OF
RAKSTU KRĀJUMS THE 60th INTERNATIONAL SCIENTIFIC CONFERENCE OF DAUGAVPILS UNIVERSITY
376
Salazar CA1, del Aguila D, Cordova EG. Direct thrombin inhibitors versus vitamin K antagonists for preventing cerebral or systemic embolism in people with non-valvular atrial fibrillation. Cochrane Database Syst Rev. 2014 Mar 27; (3): CD009893. Shahid F1, Shantsila E1, Lip GY2. Recent advances in the understanding and management of atrial fibrillation: a focus on stroke prevention. F1000Res. 2016 Dec 20; 5: 2887. Shantsila E1, Wolff A2, Lip GY1, Lane DA1. Optimising stroke prevention in patients with atrial fibrillation: application of the GRASP-AF audit tool in a UK general practice cohort. Br J Gen Pract. 2015 Jan; 65(630): e16-23. Sorescu AM1, Enache T1, Guberna S1,2 The prevalence of long-term oral anticoagulation therapy in a cardiology center in Bucharest, Romania. Clujul Med. 2018; 91(1): 37–41 Sposato LA1, Cipriano LE2, Saposnik G3, Ruíz Vargas E4, Riccio PM4, Hachinski V4. Diagnosis of atrial fibrillation after stroke and transient ischaemic attack: a systematic review and meta-analysis. Lancet Neurol. 2015 Apr; 14(4): 377-87. doi: 10.1016/S1474-4422(15)70027-X. Epub 2015 Mar 4. Strēlnieks A., Raibarts J., Kalējs O., Lejnieks A. Perorālo antikoagulantu pielietojuma aspekti reālajā klīniskajā praksē pacientiem ar ātriju fibril āciju 2014.gada Zinātniskās konferences tēzes (Rīga, 2014. g. 10.–11. aprīlī) / Rīgas Stradiņa universitāte. – Rīga, 2014. – 154. lpp. Turakhia MP1, Hoang DD, Xu X, Frayne S, Schmitt S, Yang F, Phibbs CS, Than CT, Wang PJ, Heidenreich PA. Differences and trends in stroke prevention anticoagulation in primary care vs cardiology specialty management of new atrial fibrillation: The Retrospective Evaluation and Assessment of Therapies in AF (TREAT-AF) study. Am Heart J. 2013 Jan; 165(1): 93-101.e1. Turner GM1, Calvert M1, Feltham MG1, Ryan R1, Fitzmaurice D1, Cheng KK1, Marshall T1. Under-prescribing of Prevention Drugs and Primary Prevention of Stroke and Transient Ischaemic Attack in UK General Practice: A Retrospective Analysis. PLoS Med. 2016 Nov 15; 13(11): e1002169. Wessler BS1, Kent DM. Controversies in cardioembolic stroke. Curr Treat Options Cardiovasc Med. 2015 Jan; 17(1): 358. Zalesak M1, Siu K, Francis K, Yu C, Alvrtsyan H, Rao Y, Walker D, Sander S, Miyasato G, Matchar D, Sanchez H. Higher persistence in newly diagnosed nonvalvular atrial fibrillation patients treated with dabigatran versus warfarin. Circ Cardiovasc Qual Outcomes. 2013 Sep 1; 6(5): 567–74.

DAUGAVPILS UNIVERSITĀTES 60. STARPTAUTISKĀS ZINĀTNISKĀS KONFERENCES PROCEEDINGS OF
RAKSTU KRĀJUMS THE 60th INTERNATIONAL SCIENTIFIC CONFERENCE OF DAUGAVPILS UNIVERSITY
377
THE PROFILE OF CHRONIC OSTEOMYELITIS CASES AFTER ACUTE HAEMATOGENOUS OSTEOMYELITIS IN CHILDREN
Elina Silina1, Arturs Viksne1, 2, Arnis Engelis1, 2, Aigars Petersons1, 2
1 Riga Stradins University, Dzirciema str. 16, Riga, Latvia, [email protected] 2 Children’s Clinical University Hospital, Vienības gatve 45, Riga, Latvia, [email protected] Abstract
The profile of chronic osteomyelitis cases after acute haematogenous osteomyelitis in children Key Words: Acute haematogenous osteomyelitis, chronic osteomyelitis, children Introduction. Acute haematogenous osteomyelitis (AHO) can transit into a chronic form, in order to avoid it, analyze of chronic cases are essential to understand the current situation. Aim. The aim was to determine the epidemiology, etiology and management of chronic osteomyelitis (CO) cases in children after AHO. Materials and Methods. A retrospective analysis of hospitalized patient medical history from 2008 to 2017, admitted to a single reference center with diagnosis of CO after AHO episode, were included in the study. Age, localization of infection, etiological agent, length of complaints and count of surgeries were studied. Data were analyzed using IBM SPSS 22 nonparametric statistics and Mann-Whitney test. Results. A total of 282 children with AHO were hospitalized during the study period. From those 25 (9%) patients developed CO. The most common age groups with CO in histogram were divided in children aged <1 years old or at 12-15 years. The most frequent localization of the disease in 28% was in femur and the same count in tibia and fibula also. The most common etiologic agent in 60% (15/25) was identified Staphylococcus aureus. The time from onset of symptoms to presentation for a medical care <24 hours was in 4% (1/25), 24-72 hours in 52% (13/25), > 72 hours in 44% (11/25). Duration of antimicrobial therapy in acute episode < 4 weeks was in 33%, but ≥ 4 weeks was in 67%. Overall were performed 66 surgeries, average count was 2,6 for 1 patient, in a range from 1 to 8. Conclusions. In a ten-year period were identified less than 10% or 25 cases of HO after AHO. CO cases are statistically more common in patients aged ≤ 1 year and at 12 to 15 years. Kopsavilkums Atslēgvārdi: Akūts hematogēns osteomielīts, hronisks osteomielīts, bērni Ievads. Akūts hematogēns osteomielīts (AHO) var pāriet hroniskā formā, lai no tā izvairītos, ir nepieciešama hronisko gadījumu situācijas analīze. Mērķis. Uzdevums bija noteikt hroniska osteomielīta (HO) gadījumus pēc pārslimota AHO, to etioloģiskos aģentus, ārstēšanas taktiku. Materi āli un metodes. Retrospektīva medicīniskās dokumentācijas analīze no 2008. līdz 2017. gadam, pacientiem, kuri stacionēti klīnikā ar diagnozi HO pēc pārslimota AHO. Tika apkopota informācija par vecumu, infekcijas lokalizācijas vietu, etioloģisko aģentu, sūdzību ilgumu un operāciju skaitu. Dati tika analizēti izmantojot IBM SPSS 22 neparametriskās statistikas metodes un Mann-Whitney testu. Rezultāti. Kopumā šajā periodā tika stacionēti 282 bērni ar AHO. No tiem 25 (9%) pacientiem attīstījās HO. Histogrammā varēja novērot, ka HO visbiežāk skar bērnus jaunākus par vienu gadu vai arī 12-15 gadu vecumā. Visbiežāk slimība lokalizējās 28% augštilbā un tik pat lielā skaitā arī apakšstilbā. Biežākais etioloģiskais aģents 60% tika identificēts Staphylococcus aureus. Sūdzību ilgums līdz stacionēšanas brīdim < 24 stundām bija tikai 4% (1/25), 24-72 stundas - 52% (13/25), > 72 stundas - 44% (11/25). Antimikrobiālās terapijas ilgums < 4 nedēļām bija 33%, bet ≥ 4 nedēļām - 67% gadījumu. Kopā tika veiktas 66 operācijas, vidēji 2,6 operācijas 1 pacientam, variējot skaitā no 1 - 8. Secinājumi. Desmit gadu periodā tika identificēti mazāk par 10% jeb 25 HO gadījumi pēc AHO. Visbiežāk HO skar bērnus ≤ 1 gada vecumā un arī 12-15 gadu vecumā.
Introduction
Chronic osteomyelitis remains a significant cause of morbidity worldwide, especially in
developing countries (Saavedra-Lozano et al. 2017). In those regions chronic osteomyelitis usually
develops from untreated acute hematogenous osteomyelitis, where medical treatment modalities are
not commonly accessible, but may also be seen primary, as a result after trauma (Spiegel et. al.
2005). Acute haematogenous osteomyelitis (AHO) is defined as a bacterial infection of a bone
when there is seeding bacteria, but absence of a necrotic tissue. However, acute form can develop
DAUGAVPILS UNIVERSITĀTES 60. STARPTAUTISKĀS ZINĀTNISKĀS KONFERENCES PROCEEDINGS OF
RAKSTU KRĀJUMS THE 60th INTERNATIONAL SCIENTIFIC CONFERENCE OF DAUGAVPILS UNIVERSITY
378
into a chronic one with presence of recurrent pain and necrotic bone, also called osteoarticular
sequela (Hatzenbuehler et al. 2011).
In children the most frequent type of osteomyelitis is acute haematogenous osteomyelitis,
with incidence 7.1 to 100,000 children/year in France (Mitha et al. 2015). Saavedra-Lozano et al.
have collected that in developed countries reports of acute osteomyelitis rates are 2 to 13 per
100,000 children/year and it is notably more common there. Accordingly, not only incidence for
acute cases, bet also chronizing and complications can be expected in higher count. There are no
systematic studies in Europe how many patients develop chronic form after acute haematogenous
osteomyelitis in children. Sukswai et al. in 2011 collected data that in Thailand osteoarticular
sequelae was diagnosed in 29% of all patients. However, it is completely diverse region with many
differences in ethnic group, climate, health care system and more, therefore not attributed to
European population.
Diagnosis is based on clinical presentation, history of predisposing factors, imaging, and
microbiologic tests (Lima et al. 2014). Children usually have affected highly vascularized long
bones, mainly tibia and femur (Spiegel et al. 2005). Wirbel et. al described the most common
etiological agent responsible for osteomyelitis was Staphylococcus aureus even to 75%. Sukswai et
al. described methicillin-sensitive Staphylococcus aureus (MSSA) in 46.6% and methicillin-
resistant Staphylococcus aureus (MRSA) in 17.5% cases.
Treatment of chronic infection involves sanation, sequestrectomy or debridement, removal of
any implants, followed by restraining of the limb and prolonged antimicrobial treatment (Lima et al.
2014). Treatment surgical options includes two types of operations. One is sanation with
debridement and the other one is radical surgery with excision of affected bone segment and
substitution with vascularized bone graft. Overall chronic forms increase necessity for repeated
surgeries, frequently causing lasting disabilities. Patients often have pathologic fractures, limb-
length discrepancies (Sukswai et al. 2011).
Accurate diagnosis and appropriate treatment are essentials to minimizing complications and
optimizing outcomes. Analyze of chronic cases are essential to understand the situation in Latvia in
order to find the best approach for children to prevent from long-term illness.
Material and Methods
A retrospective analysis of hospitalized patient medical history in a ten-year period from 2008
to 2017, admitted to a single reference center in Latvia with diagnosis of chronic osteomyelitis (CO)
after acute AHO episode. Patients aged 0-17 years with clinical symptoms of CO and radiological
signs were included in the study. Age, gender, localization of infection, etiological agent, length of
complaints before starting treatment, duration of antimicrobial therapy in acute episode and the
following count of surgeries were studied. Data were analysed using IBM SPSS 22 nonparametric
statistics and Mann-Whitney test.

DAUGAVPILS UNIVERSITĀTES 60. STARPTAUTISKĀS ZINĀTNISKĀS KONFERENCES PROCEEDINGS OF
RAKSTU KRĀJUMS THE 60th INTERNATIONAL SCIENTIFIC CONFERENCE OF DAUGAVPILS UNIVERSITY
379
Results
A total of 282 children with AHO were hospitalized during the study period. Counting on 100
000 children in Latvia per year it is 7,9 cases. From those 25 (9%) patients developed chronic
osteomyelitis.
AGE. The most common age groups of patients with chronic osteomyelitis at the time when
they had acute haematogenous osteomyelitis episode were aged ≤ 1 years old (n=7) and 12-15 years
(n=9) (Fig. 1).
Fig. 1. Age of chronic osteomyelitis patients at the time when they had acute haematogenous osteomyelitis
LOCALIZATION. A total of 282 children with AHO were hospitalized during the study
period. From those 25 (9%) patients developed chronic osteomyelitis. 40% (10/25) of children were
under the age of 5 years. Infection site in 28% was in femur, the same count in tibia and fibula also,
4% in humerus, 12% in flat bones, 8% had more than one localization, other localizations - in 16%
(Tab. 1).
Tab. 1. Localization of infection in chronic osteomyelitis patients
Localization of infection Percentage
Femur 28% Tibia and fibula 28% Humerus 4% Flat bones 12% > 1 localization 8% Other 16%
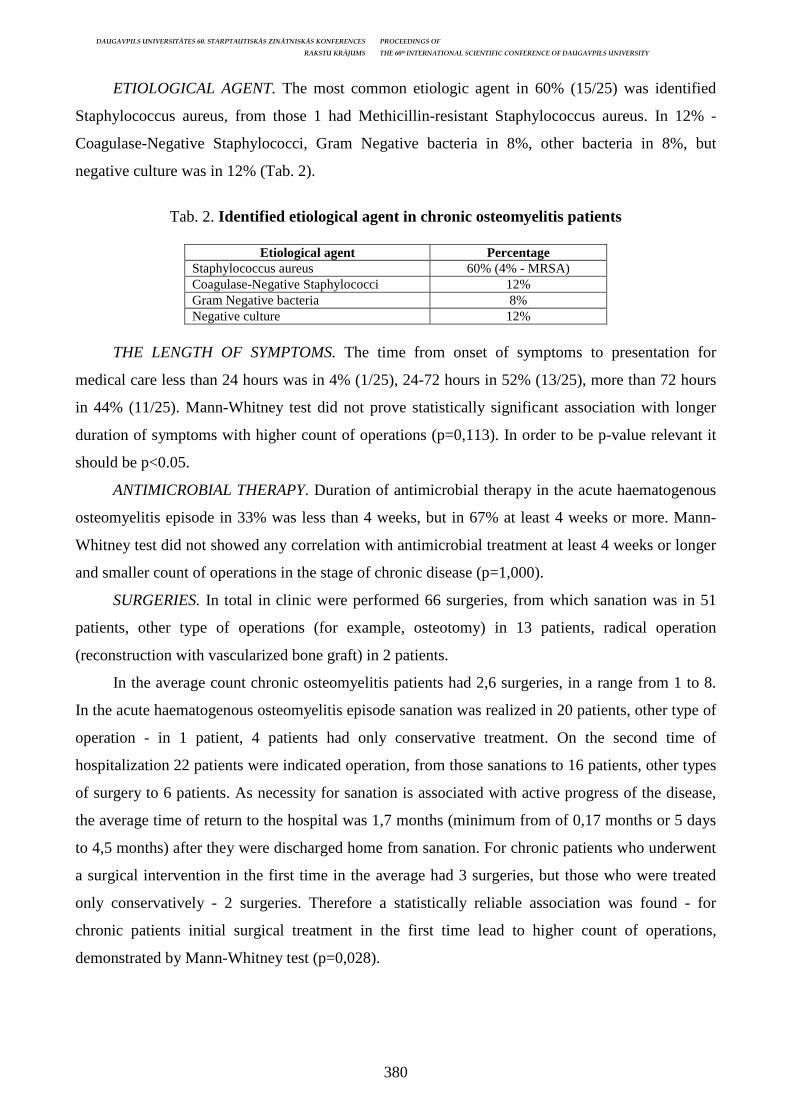
DAUGAVPILS UNIVERSITĀTES 60. STARPTAUTISKĀS ZINĀTNISKĀS KONFERENCES PROCEEDINGS OF
RAKSTU KRĀJUMS THE 60th INTERNATIONAL SCIENTIFIC CONFERENCE OF DAUGAVPILS UNIVERSITY
380
ETIOLOGICAL AGENT. The most common etiologic agent in 60% (15/25) was identified
Staphylococcus aureus, from those 1 had Methicillin-resistant Staphylococcus aureus. In 12% -
Coagulase-Negative Staphylococci, Gram Negative bacteria in 8%, other bacteria in 8%, but
negative culture was in 12% (Tab. 2).
Tab. 2. Identified etiological agent in chronic osteomyelitis patients
Etiological agent Percentage
Staphylococcus aureus 60% (4% - MRSA) Coagulase-Negative Staphylococci 12% Gram Negative bacteria 8% Negative culture 12%
THE LENGTH OF SYMPTOMS. The time from onset of symptoms to presentation for
medical care less than 24 hours was in 4% (1/25), 24-72 hours in 52% (13/25), more than 72 hours
in 44% (11/25). Mann-Whitney test did not prove statistically significant association with longer
duration of symptoms with higher count of operations (p=0,113). In order to be p-value relevant it
should be p<0.05.
ANTIMICROBIAL THERAPY. Duration of antimicrobial therapy in the acute haematogenous
osteomyelitis episode in 33% was less than 4 weeks, but in 67% at least 4 weeks or more. Mann-
Whitney test did not showed any correlation with antimicrobial treatment at least 4 weeks or longer
and smaller count of operations in the stage of chronic disease (p=1,000).
SURGERIES. In total in clinic were performed 66 surgeries, from which sanation was in 51
patients, other type of operations (for example, osteotomy) in 13 patients, radical operation
(reconstruction with vascularized bone graft) in 2 patients.
In the average count chronic osteomyelitis patients had 2,6 surgeries, in a range from 1 to 8.
In the acute haematogenous osteomyelitis episode sanation was realized in 20 patients, other type of
operation - in 1 patient, 4 patients had only conservative treatment. On the second time of
hospitalization 22 patients were indicated operation, from those sanations to 16 patients, other types
of surgery to 6 patients. As necessity for sanation is associated with active progress of the disease,
the average time of return to the hospital was 1,7 months (minimum from of 0,17 months or 5 days
to 4,5 months) after they were discharged home from sanation. For chronic patients who underwent
a surgical intervention in the first time in the average had 3 surgeries, but those who were treated
only conservatively - 2 surgeries. Therefore a statistically reliable association was found - for
chronic patients initial surgical treatment in the first time lead to higher count of operations,
demonstrated by Mann-Whitney test (p=0,028).
DAUGAVPILS UNIVERSITĀTES 60. STARPTAUTISKĀS ZINĀTNISKĀS KONFERENCES PROCEEDINGS OF
RAKSTU KRĀJUMS THE 60th INTERNATIONAL SCIENTIFIC CONFERENCE OF DAUGAVPILS UNIVERSITY
381
Discussion
Chronic osteomyelitis remains an important issue of morbidity worldwide, especially in low
income countries. Clinically CO is very often associated with exacerbations and requires prolonged
hospitalizations, antibacterial treatment, repeated surgeries. One of the most common reasons of CO
in children are AHO transition into a chronic form. There are several well-known factors which can
cause chronisation after acute episode. These factors are delayed diagnosis and delayed surgery,
insufficient sanation, too short antibacterial course and others. Nevertheless not always the reason
of AHO chronisation is obvious. Despite that there are lack of data how many children suffer from
CO after AHO episode.
Analyzing results of this study can be considered, that overall management of AHO in
Latvia's clinic is quite well. Based on this research only 9% from all AHO patients admitted to the
hospital developed CO later. It is less than reported in previous studies. According to Sukswai P. et
al. in Thailand CO rate is 29%. One of the assumptions for those number differences could be
explained by MRI scanning for early diagnosis of AHO in Latvia's clinic in indefinite situations.
Pugmire et al. recommends to use MRI scanning in all uncertain cases in order to avoid delayed
diagnosis and late complications such as CO. Therefore availability of MRI scanning is very crucial
for lowering CO rates in Latvia.
Looking closer to this CO group of patients, can be seen that higher risk have patients under 5
years of age. In this group of patients the time from onset of symptoms and initiation of treatment in
acute episode most often was more than 24 hours and sometimes the length of symptoms was even
more than 72 hours. Authors assume that in some cases this could be related to complicated
physical examination in this group of age. Also ability to localise the pain is very important for
diagnosis.
ESPID 2017 practice guidelines for Bone and Joint infections recommend antibacterial
treatment at least 4 to 6 weeks in cases of AHO. Analysing this study's CO patients can be seen that
most of them (67%) antibacterial treatment had for more than 4 weeks, however in 33% of cases
antibacterial treatment lasted less than 4 weeks. Too short length of antimicrobial treatment could
be the reason for CO. Further should be analyzed meaning for length of intravenous administration
of antimicrobial agents. In other words, when is it safe to switch for oral intake of drugs.
There are several options for surgical treatment of CO. It can vary from relatively easy
procedures, such as sequestrectomy, to wide complex interventions, such as resection of long bone
segment and substitution with bone graft. In this study average count of surgeries were 2,6 for 1
patient. In one case patient underwent 7 sanation operations before definitive radical operation. It is
believed that in CO cases aggressive debridement and resection of affected bone segment is a key to
successful treatment.
DAUGAVPILS UNIVERSITĀTES 60. STARPTAUTISKĀS ZINĀTNISKĀS KONFERENCES PROCEEDINGS OF
RAKSTU KRĀJUMS THE 60th INTERNATIONAL SCIENTIFIC CONFERENCE OF DAUGAVPILS UNIVERSITY
382
Overall for better results of CO treatment patients requires well trained team of orthopedics,
pediatrics, plastic surgeons and physiotherapists.
Conclusions
In a ten-year period were identified less than 10% or 25 cases of chronic osteomyelitis after
acute haematogenous osteomyelitis, compared to other study in Thailand percentage of chronic
patients were higher - 29% (Sukswai P. et al. 2011).
Typical site of a localization was in long bones of the lower leg (tibia, fibula) and upper leg
(femur) as mentioned in literature. Etiological agent responsible for 60% of all infections were
Staphylococcus aureus, splitting to MSSA and MRSA the resistant microorganisms were less than
in other studies. Cases of chronic osteomyelitis are statistically more common in patients aged ≤ 1
year or at 12 to 15 years.
Overall in clinic were performed 66 surgeries, from which two patients had indications for
radical surgery and they underwent vascularized bone graft operation. In the average count chronic
osteomyelitis patients had 2,6 surgeries, in a range from 1 to 8. The average time of return to the
hospital was 1,7 months.
This study confirms that cases of chronic osteomyelitis after acute haematogenous
osteomyelitis are encountered also in Latvia and more studies are needed for evidence-based
management for a patient in Europe.
References Hatzenbuehler J, Pulling TJ, 2011. Diagnosis and management of osteomyelitis. Am Fam Physician 1; 84(9): 1027–33. Lima AL, Oliveira PR, Carvalho VC, Cimerman S, Savio E, 2014. Recommendations for the treatment of osteomyelitis. Braz J Infect Dis 18(5): 526–34. Mitha A, Boutry N, Nectoux E, Petyt C, Lagrée M, Happiette L, et al. 2015. Community- acquired bone and joint infections in children: a 1-year prospective epidemiological study. Arch Dis Child 100(2): 126–9. Pugmire BS, Shailam R, Gee MS 2014. Role of MRI in the diagnosis and treatment of osteomyelitis in pediatric patients. World J Radiol. Aug 28; 6(8): 530–537. Saavedra-Lozano J, Falup-Pecurariu O, Faust SN, Girschick H, Hartwig N, Kaplan S, Lorrot M, Mantadakis E, Peltola H, Rojo P, Zaoutis T, LeMair A, 2017. Bone and Joint Infections. Pediatr Infect Dis J Aug; 36(8): 788–799. Spiegel, David A.; Penny, John Norgrove, 2005. Chronic Osteomyelitis in Children. Techniques in Orthopaedics 20(2): 142–152. Sukswai P, Kovitvanitcha D, Thumkunanon V, Chotpitayasunondh T, Sangtawesin V, Jeerathanyasakun Y. 2011. Acute hematogenous osteomyelitis and septic arthritis in children: clinical characteristics and outcomes study. J Med Assoc Thai Suppl 3: S209-16. Wirbel R, Hermans K., 2014. Surgical treatment of chronic osteomyelitis in children admitted from developing countries. Afr J Paediatr Surg 11: 297–303.
DAUGAVPILS UNIVERSITĀTES 60. STARPTAUTISKĀS ZINĀTNISKĀS KONFERENCES PROCEEDINGS OF
RAKSTU KRĀJUMS THE 60th INTERNATIONAL SCIENTIFIC CONFERENCE OF DAUGAVPILS UNIVERSITY
383
SOCIOECONOMIC STATUS, AGE, GENDER, CHILDREN NUMBER IN THE FAMILY DIFFERENCES ON THE CHILDREN’S DEPRESSION INVENTORY IN CHILDREN (7-17 YEARS OLD) WITH PSYCHIATRIC DISORDERS IN LATVIA
Aleksandra Mežecka1, Jekaterina Avdotina1, Santa Borisāne1, Nikita Bezborodovs2, Nataļja Sitņika3
1 Rīga Stradiņš University, Dzirciema street 16, Rīga, Latvia, [email protected] 2 Bērnu klīniskā slimnīca ‘Gaiļezers’, Juglas street 20, Rīga, Latvia, [email protected] 3 Rīgas speciāla internatpamatskola, Aglones iela 57, Rīga Latvija Abstract
Socioeconomic status, age, gender, children number in the family fiffesrences on the children’s depression inventory in children (7-17 years old) with psychiatric disorders in Latvia
Key Words: Children's Depression Inventory, CDI, children with psychiatric disorders Introduction. Depression causes some of the highest burdens of disease worldwide, and early detection of depression remains an important global health priority (Murray et al., 2012; Whiteford et al., 2013). Aim. The research aim was to estimate the level of depressive symptoms using the CDI (Children’s Depression Inventory) for children with psychiatric disorders from 7-17 years old, stratified by gender, age, social economic status, number of children in the family and family status. Materials un methods. A retrospective study 118 children with psychiatric disorders were identified within archives of a Riga’s special elementary school. In a cross sectional study 118 children with mental disorder was interviewed using Maria Kovacs’ 27-item self-report questionnaire (CDI). Statistical analysis was performed with SPSS 22.0 for Windows. Results. In this study, more than half children (n=74; 62,71%) had normal scores on the CDI while (n=44; 37,29%) have high-risk of depression. Girls reported higher risk of depression than boys (girls mean=61,80; median=62,00; SD=10,56; vs. boys mean=53,89; median=53,00; SD=8,63, respectively, p=0,001). Conclusion. In this study the signs of depression varied according to age and gender. Children from 7-12 years old tend to have more depressive symptoms. Significant gender differences found only for four of five factors. Girls with psychiatric disorders have higher risk of depression and tend to have more depressive symptoms. Statistically significant differences between family status, family income level and number of children in family were not recorded. This findings may help identify groups of children at very high risk of developing depression. Kopsavilkums Atslēgvārdi: bērnu depresijas skala (CDI), bērni ar psihiskām saslimšanām, depresija. Ievads. Depresija ir viena no vissmagākām saslimšanām visā pasaulē, un tas agrīna atklāšana ir viens no galvenajiem veselības aprūpes uzdevumiem (Murray et al., 2012; Whiteford et al., 2013). Mērķis. Izanalizēt depresijas simptomu prevalenci bērniem ar psihiskām saslimšanām no 7-17 gadu vecumam, salīdzināt depresijas simptomu biežumu atkarībā no dzimumiem, vecumiem, ģimenes statusiem, sociālekonomiskiem stāvokļiem un bērnu skaita ģimenē. Materi āli un metodes. Retrospektīvajā pētījumā tiks izmantotas 118 skolēnu kartes no Rīgas speciālās internātpamatskolas. Šķērsgriezuma pētījumā izmantota anketa CDI (children depression inventory). Informācija tika analizēta izmantojot SPSS 22.0 programmatūru. Rezultāti. Šajā pētījumā, vairāk nekā pusei bērnu (n=74, 62,71%) punktu skaits CDI ir normas robežas, tai pašā laikā mazāk nekā pusei bērnu (n=44; 37,29%) ir paaugstināts depresijas attīstības risks. Meitenēm ir paaugstināts depresijas risks nekā zēniem (meitenēm vidējais rezultāts=61,80; mediāna=62,00; SD=10,56; vs. zēniem vidējais rezultāts=53,89; mediāna=53,00; SD=8,63, respektīvi, p=0,001). Secinājumi. Šajā pētījumā depresijas pazīmes mainījās atkarībā no vecuma un dzimuma. Bērniem no 7 līdz 12 gadiem ir vairāk depresīvu simptomu. Dzimuma atkarīgas būtiskas atšķirības ir konstatētas tikai četriem no pieciem faktoriem. Meitenēm ar psihiatriskiem traucējumiem ir lielāks depresijas risks un tiem ir vairāk depresīvu simptomu. Statistiski nozīmīgas atšķirības starp ģimenes stāvokli, ģimenes ienākumu līmeni un bērnu skaitu ģimenē netika reģistrētas. Šie atklājumi var palīdzēt identificēt bērnu grupas, kurām ir augsts depresijas attīstības risks.
Introduction
The World Health Organization recently announced depression, particularly in adolescents
and young adults, as especially important, and selected this impairing mental disorder for their

DAUGAVPILS UNIVERSITĀTES 60. STARPTAUTISKĀS ZINĀTNISKĀS KONFERENCES PROCEEDINGS OF
RAKSTU KRĀJUMS THE 60th INTERNATIONAL SCIENTIFIC CONFERENCE OF DAUGAVPILS UNIVERSITY
384
World Health Day 2017 (The World Health Organization 2017). Depression causes some of the
highest burdens of disease worldwide, and early detection of depression remains an important
global health priority (Murray et al. 2012; Whiteford et al. 2013). Depressive disorders are
developmental disorders often manifesting early in life. Depression affects 2.5% of children and up
to 8.3% of adolescents (Preventing Depression in the WHO European Region 2016). Previous
studies with dimensional measures of broad psychopathology have found that a range of psychiatric
symptoms in childhood are associated with depressive symptoms in adulthood (Gundela et al.
2018). Two-thirds of children with depression have at least one comorbid psychiatric disorder such
an anxiety disorder, ADHD, conduct disorder, and substance use disorder. Depressed youth are also
at increased risk for educational underachievement, interpersonal problems, and suicidal behavior
(Biederman J. et al., 1995). The CDI, devised by Maria Kovacs is one of the most widely used
instruments in epidemiological studies to assess children and adolescents’ selfreport levels of
depression (Kovacs et al. 2011). There are several compelling reasons to use the CDI with an
inpatient pediatric population. First, the CDI is a quick, easy to complete measure with strong
psychometric properties. Second, scores reflect young people’s subjective degree of dysphoric
mood and pessimism. Pessimism influences the response to both psychosocial and pharmacological
interventions. The CDI also yields important information on suicidal ideation and intent (Robert D
et al. 2011).
Methods of the research
The research was carried out in Latvian special elementary school. Children with psychiatric
disorders were identified within archives of a Riga’s special elementary school. Every third child
were randomly selected for the study. The final number of subjects was 118. The children were
divided into two groups by gender (boys (n=87; 73,72%) and girls (n=31; 26,27%)), into two
groups by age (7–12 year-old (n=61; 51,69%) and 13–17 year-old (n=57; 48,31%), into four groups
by family status (single parent (n=60; 50,84%), full family (n=54; 45,76%) children from
orphanage (n=1; 0,84%), an orphan with the guardian (n=3; 2,54%), into two groups by family
income level (low income family (n=31; 26,27%) and middle income family (n=87; 73,73%), in
two groups by number of children in family (1-2 children in family (n=77; 65,25%), >3 children
(n=41; 34,75%). In the subsequent analysis of the family status, two groups were excluded: children
from an orphanage (n=1) and an orphan with a guardian (n =3), due to a small sample. The present
study used Maria Kovacs’ 27-item self-report questionnaire, which contains items regarding
cognitive, emotional and behavioural aspects of depression in children. The CDI was translated
from English to Russian and back with high coincidence. Each question is designed to assess
specific symptoms of depression and the three choices range from mild or limited symptomatology
to severe or maladaptive symptomatology. Each item is scored 0, 1 or 2, with a score of 2
DAUGAVPILS UNIVERSITĀTES 60. STARPTAUTISKĀS ZINĀTNISKĀS KONFERENCES PROCEEDINGS OF
RAKSTU KRĀJUMS THE 60th INTERNATIONAL SCIENTIFIC CONFERENCE OF DAUGAVPILS UNIVERSITY
385
representing the most severe choice. The CDI quantifies a range of symptoms of depression
including anhedonia, ineffectiveness, negative self-esteem, negative mood, interpersonal problems
(Ramli et al., 2008). A 5-factor model was chosen because it was clearly interpretable as five
distinct dimensions of depression and was best suited to describe data. Statistical analysis was
performed with SPSS 22.0 for Windows. The Shapiro-Wilk test was initially used to verify the
normality of the variables and choice of statistical tests. The Mann-Whitney test and T-test was
used for data comparison of the groups.
Research findings
Among 118 subjects 73,72% were boys and 26,27% were girls. More than half (n=74;
62,71%) had normal total scores on the CDI while (n=44; 37,29%) have high-risk of depression
(Figure 1). The mean value of the total CDI score was 55,97, which was 53,89 among boys and
61,80 among girls, with significant difference (P=0.001). There was no differences between family
status (p=0,745), age (p=0,251), family income (p=0,637) and number of children in family
(p=0,971). The girls obtained not only significantly higher total score, but also some CDI sub-
scales. The five-factor model was chosen because it was clearly interpreted as five different
dimensions of depression and is best suited for data description. Factor one: interpersonal problems.
Girls reported more symptoms of interpersonal problems (Figure 2). Analysis indicated significant
higher score of interpersonal problems factor in girls than in boys (girls mean=60,6; median=64.0;
SD=12,10; vs. boys mean=50,9; median=49,0; SD=8,34, respectively, p=0,000), but no differences
between family status (p=0,635), age (p=0,189), family income level (p=0,818) and number of
children in family (p=0,256). Factor two: negative mood. Girls reported more symptoms of negative
mood (Figure 3). Significant effects were regarding in girls (mean=55,7; median=54,0; SD=10,73;)
than in boys (mean=50,5; median=49,0; SD=9,76; respectively, p= 0,01). Analysis indicated no
differences between family status (p=0,497), age (p=0,480), family income level (p=0,352) and
number of children in family (p=0,977). Factor three: negative self-esteem. Girls and children from
7–12 years old reported more symptoms of negative self-esteem. Analysis indicated significant
effects in girls (mean=53,7; median=52,0; SD=10,62) than in boys (mean=47,7; median=46,0;
SD=7,16), (Figure 4). Significant effects regarding female gender (p=0,009). Analysis indicated
significant effects in children from 7–12 years old (mean=49,97; median=51,0; SD=7.08) than in
children from 13-17 years old (mean=48,52; median=45,0; SD=9.96) Significant effects regarding
younger children age (p=0,028). But no differences between family status (p=0,739), family income
level (p=0,897) and number of children in family (p=0,782) interaction effects were reported.
Factor four: anhedonia. Children from 7–12 year old reported more symptoms of anhedonia (Figure
5). Analysis indicated significant effects in children from 7–12 years old (mean=55,2; median=54,0;
SD=9,64) than in children from 13-17 years old (mean=49,2; median=48,0; SD=9,82) Significant

DAUGAVPILS UNIVERSITĀTES 60. STARPTAUTISKĀS ZINĀTNISKĀS KONFERENCES PROCEEDINGS OF
RAKSTU KRĀJUMS THE 60th INTERNATIONAL SCIENTIFIC CONFERENCE OF DAUGAVPILS UNIVERSITY
386
effects regarding younger children age (p=0,028). Analysis indicated no differences between family
status (p=0,820), gender (p=0,368), family income level (p=0,738) and number of children in
family (p=0,367) interaction effects were reported. Factor five: infectiveness. Analysis indicated
significant higher score of infectiveness in girls than in boys (girls mean=56,8; median=52,0;
SD=13,21; p=0,017; vs. boys mean=49,6; median=49,0; SD=8,14) (Figure 6). But no differences
between family status (p=0,275), age (p=0,469), family income level (p=0,738) and number of
children in family (p=0,367) interaction effects were reported.
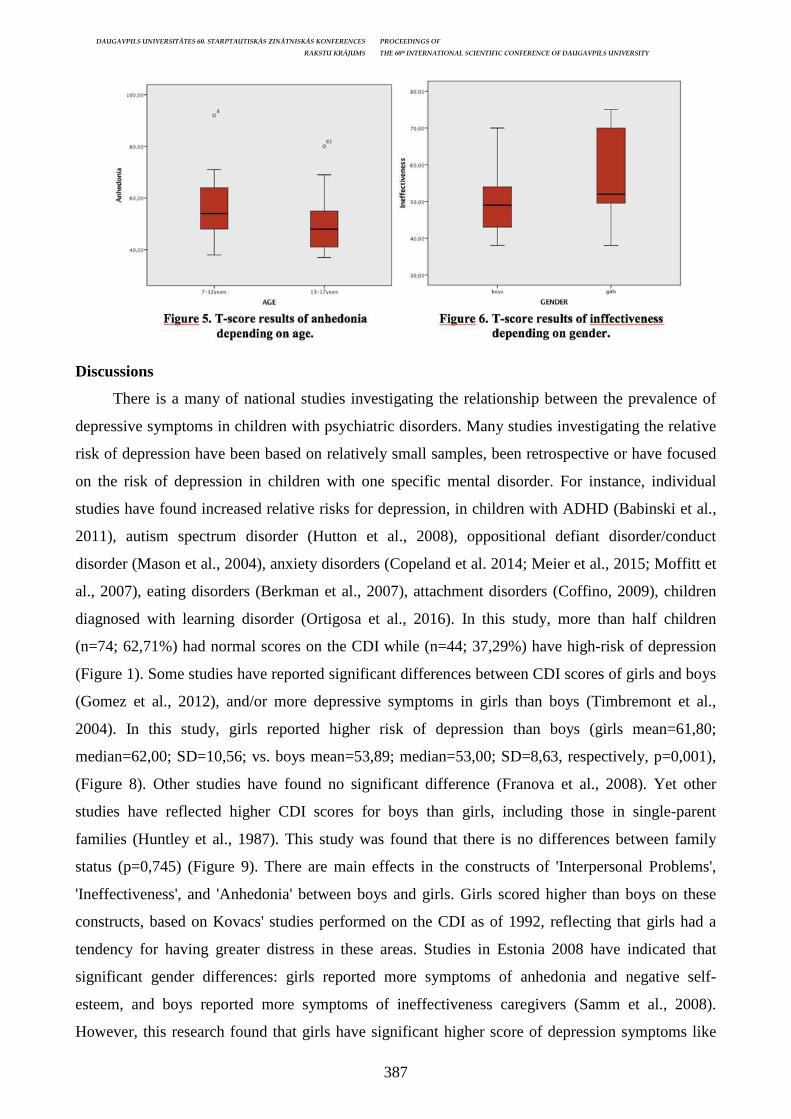
DAUGAVPILS UNIVERSITĀTES 60. STARPTAUTISKĀS ZINĀTNISKĀS KONFERENCES PROCEEDINGS OF
RAKSTU KRĀJUMS THE 60th INTERNATIONAL SCIENTIFIC CONFERENCE OF DAUGAVPILS UNIVERSITY
387
Discussions
There is a many of national studies investigating the relationship between the prevalence of
depressive symptoms in children with psychiatric disorders. Many studies investigating the relative
risk of depression have been based on relatively small samples, been retrospective or have focused
on the risk of depression in children with one specific mental disorder. For instance, individual
studies have found increased relative risks for depression, in children with ADHD (Babinski et al.,
2011), autism spectrum disorder (Hutton et al., 2008), oppositional defiant disorder/conduct
disorder (Mason et al., 2004), anxiety disorders (Copeland et al. 2014; Meier et al., 2015; Moffitt et
al., 2007), eating disorders (Berkman et al., 2007), attachment disorders (Coffino, 2009), children
diagnosed with learning disorder (Ortigosa et al., 2016). In this study, more than half children
(n=74; 62,71%) had normal scores on the CDI while (n=44; 37,29%) have high-risk of depression
(Figure 1). Some studies have reported significant differences between CDI scores of girls and boys
(Gomez et al., 2012), and/or more depressive symptoms in girls than boys (Timbremont et al.,
2004). In this study, girls reported higher risk of depression than boys (girls mean=61,80;
median=62,00; SD=10,56; vs. boys mean=53,89; median=53,00; SD=8,63, respectively, p=0,001),
(Figure 8). Other studies have found no significant difference (Franova et al., 2008). Yet other
studies have reflected higher CDI scores for boys than girls, including those in single-parent
families (Huntley et al., 1987). This study was found that there is no differences between family
status (p=0,745) (Figure 9). There are main effects in the constructs of 'Interpersonal Problems',
'Ineffectiveness', and 'Anhedonia' between boys and girls. Girls scored higher than boys on these
constructs, based on Kovacs' studies performed on the CDI as of 1992, reflecting that girls had a
tendency for having greater distress in these areas. Studies in Estonia 2008 have indicated that
significant gender differences: girls reported more symptoms of anhedonia and negative self-
esteem, and boys reported more symptoms of ineffectiveness caregivers (Samm et al., 2008).
However, this research found that girls have significant higher score of depression symptoms like
DAUGAVPILS UNIVERSITĀTES 60. STARPTAUTISKĀS ZINĀTNISKĀS KONFERENCES PROCEEDINGS OF
RAKSTU KRĀJUMS THE 60th INTERNATIONAL SCIENTIFIC CONFERENCE OF DAUGAVPILS UNIVERSITY
388
infectiveness, interpersonal problems, negative self-esteem and negative mood. Earlier studies have
reported that the majority of depressed children were left without psychiatric assessment and help
(Samm et al., 2008).
Conclusions
In this study the signs of depression varied according to age and gender. Children from 7-12
years old tend to have more depressive symptoms, especially in the symptoms of negative self-
esteem and symptoms of anhedonia. Significant gender differences found only for four of five
factors. Girls with psychiatric disorders have higher risk of depression and tend to have more
depressive symptoms, especially in the symptoms of negative mood, negative self-esteem,
interpersonal problems and symptoms of ineffectiveness. Statistically significant differences
between family status, family income level and number of children in family were not recorded.
These findings may help identify groups of children at very high risk of developing depression.
Unfortunately, depression and other mental health problems during childhood are often
unrecognized until they become severe and difficult to treat (Sun et al. 2014).
One possible solution could be to provide self-reported screening, including items about
symptoms of depression as a part of any regular check-up (or screening instrument) for
schoolchildren, which could be used as a basis for opening discussion with the children’s caregivers
(Samm et al. 2008).
References Babinski D.E., Pelham Jr., W.E., Molina B.S., Gnagy E.M., Waschbusch D.A., Yu J., Maclean M.G., Wymbs B.T., Sibley M.H., Biswas A., Robb J.A., Karch K.M. 2011. Late adolescent and young adult outcomes of girls diagnosed with ADHD in childhood: an exploratory investigation. Journal of Attention Disorders. Vol. 15, pp. 204–214. Berkman N.D., Lohr K.N., Bulik C.M., 2007. Outcomes of eating disorders: a systematic review of the literature. International Journal of Eating Disorders. Vol. 40, pp. 293–309. Biederman J, Faraone S, Mick E, Lelon E. 1995. Psychiatric comorbidity among referred juveniles with major depression: fact or artifact. Journal of the American Academy of Child and Adolescent Psychiatry. Vol. 34, pp. 579–590. Coffino, B. 2009. The role of childhood parent figure loss in the etiology of adult depression: findings from a prospective longitudinal study. Journal of Attachment and Human Development. Vol. 11, pp. 445–470. Copeland W.E., Angold A., Shanahan L., Costello E.J. 2014. Longitudinal patterns of anxiety from childhood to adulthood: the Great Smoky Mountains Study. Journal of the American Academy of Child and Adolescent Psychiatry. Vol. 53, pp. 21–33. Finch A.J., Saylor C.F., Edwards G.L. 1985. Children's depression inventory: Sex and grade norms for normal children. Journal of Consulting and Clinical Psychology, Vol. 53, (3), pp. 424–425. Franova L., Lukavsky J., Preiss M. 2008. Relationship of children’s depression inventory factor structure to school achievement. In Studia Psychologica, Vol. 50 (4), pp. 383–394. Gomez R., Vance A., Gomez A. 2012. Children’s depression inventory: Invariance across children and adolescents with and without depressive disorders. Psychological Assessment, Vol. 24 (1), 1–10. doi:10.1037/a0024966
DAUGAVPILS UNIVERSITĀTES 60. STARPTAUTISKĀS ZINĀTNISKĀS KONFERENCES PROCEEDINGS OF
RAKSTU KRĀJUMS THE 60th INTERNATIONAL SCIENTIFIC CONFERENCE OF DAUGAVPILS UNIVERSITY
389
Gundela L., Pedersena C., Munk-Olsena T., Dalsgaarda S. 2018. Longitudinal association between mental disorders in childhood and subsequent depression – A nationwide prospective cohort study. Journal of effective disorders. Vol. 227, pp. 56–64. Huntley D.K., Phelps R.E., Rehm L.P. 1987. Depression in children from single-parent families. Journal of Divorce, Vol. 10 (1–2), pp. 153–161. Hutton, J., Goode S., Murphy M., Le Couteur A., Rutter M. 2008. New-onset psychiatric disorders in individuals with autism. Autism: the international journal of research and practice. Vol. 12, pp. 373–390. Kovacs M., Obrosky D.S., Sherrill J. 2001. Developmental changes in the phenomenology of depression in girls compared to boys from childhood onward. Journal of Affective Disorders. Vol. 74, pp. 33–48. Mason W.A., Kosterman R., Hawkins J.D., Herrenkohl T.I., Lengua L.J., McCauley E., 2004. Predicting depression, social phobia, and violence in early adulthood from childhood behavior problems. Journal of the American Academy of Child and Adolescent Psychiatry. Vol. 43, pp. 307–315 Meier S.M., Petersen L., Mattheisen M., Mors O., Mortensen P.B., Laursen T.M., 2015. Secondary depression in severe anxiety disorders: a population-based cohort study in Denmark. Lancet Psychiatry. Vol. 2, pp. 515–523. Moffitt T.E., Caspi A., Harrington, H., Milne B.J., Melchior M., Goldberg D., Poulton R., 2007. Generalized anxiety disorder and depression: childhood risk factors in a birth cohort followed to age 32. Psychological Medicine Journal. Vol. 37, pp. 441–452. Murray C.J., Vos T., Lozano R., Naghavi M., Flaxman A.D., Michaud C., Ezzati M., Shibuya K., Salomon et al. 2012. Disability-adjusted life years (DALYs) for 291 diseases and injuries in 21 regions, 1990–2010: a systematic analysis for the Global Burden of Disease Study. Vol. 380, pp. 2197–2223. Ramli M., Adlina S., Suthahar A., Edariah A.B., Ariff M., Narimah A.H.H., Nuraliza A.S., Fauzi I., Karuthan C. 2008. Depression among secondary school students: a comparison between urban and rural populations in a Malaysian community. Hong Kong Journal of Psychiatry. Vol. 18, pp. 55–61. Reinemann, D.H.S., Teeter Ellison, P.A. 2004. The applicability of cognitive meditational and moderational models to explain Children’s Depression Inventory factor scores in urban youth. School Psychology Quarterly, Vol, 19 (3), pp. 231–252. Robert D. Friedberg, Steven A. 2011. Sinderman CDI Scores in Pediatric Psychiatric Inpatients: A Brief Retrospective Static Group Comparison. ABPP, State Milton Hershey Medical Center/PSU, Penn State College of Medicine. Article ID 134179, 5 pages. Ortigosa I., Rodrigues I., Freire T. 2016. Predicting signs of depression in children with specific learning disorders. Vol. 18(4), pp. 864–875. Samm A., Varnik A., Tooding L., Sisask M., Kairi Ko ̃lves,Anne-Liis von Knorring. 2008. Children’s depression inventory in Estonia. pp. 162–170. DOI: 10.1007/s00787-007-0650-z Sun S., Wang S. 2014. The children’s depression inventory in worldwide child development research: A reliability generalization study. DOI: 10.1007/s10826-014-0038-x Timbremont, B., Braet, C., Dreessen, L. 2004. Assessing depression in youth: Relation between the Children’s Depression Inventory and a structured interview. Journal of Clinical Child and Adolescent Psychology, Vol. 33 (1), pp. 149–157. Whiteford H.A., Degenhardt L., Rehm J., Baxter A.J., Ferrari A.J., Erskine H.E., Charlson F.J., Norman R.E., Flaxman A.D., Johns N., Burstein R., Murray C.J., Vos T. 2013. Global burden of disease attributable to mental and substance use disorders: findings from the global burden of disease study. pp. 1575–1586 . Preventing Depression in the WHO European Region, 2016 (Accessed): http://www.euro.who. int/en/home The World Health Organization, 2017. World Health Day − 7 April 2017 (Accessed): http://www.who.int/campaigns/world-health-day/2017/en/
DAUGAVPILS UNIVERSITĀTES 60. STARPTAUTISKĀS ZINĀTNISKĀS KONFERENCES PROCEEDINGS OF
RAKSTU KRĀJUMS THE 60th INTERNATIONAL SCIENTIFIC CONFERENCE OF DAUGAVPILS UNIVERSITY
390
VAGINAL BIRTH AFTER CESAREAN SECTION
Elīze Brokāne 1, Vija Veisa1, 2 1 Riga Stradins University, Dzirciema Street 16, Riga, Latvia, LV-1007, [email protected] 2 Rīga Maternity Hospital, Miera street 45, Riga, Latvia, LV-1013 Abstract
Vaginal birth after Cesarean section Key Words: vaginal birth, caesarean section, trial of labor Aim. The aim of this study was to evaluate the choice of delivery and the success rate of vaginal birth in patients with one previous cesarean section. Materials and methods. Retrospective study was carried out using patient data in years 2013, 2016 and 2017 from Riga Maternity Hospital. Study included pregnant women with previous one cesarean section who were admitted for trial of labour after one cesarean section. The factors and results of successful trial of labour were analysed. Data were analysed using Microsoft Excel and SPSS 21. Results. A total of 822 cesarean sections were performed in patients with a history of one previous uterine scar in 2016 and 2017, 416 and 349, respectively. In 2013 there were 458 cesarean sections in patients with one previous uterine scar. In 2016 and 2017 in 214 cases there was a trial of labour in patients with one previous cesarian section. In this study, in 157 cases had a successful vaginal birth after cesarean, and 57 cases underwent a repeat emergency cesarean section. In 2013 in 58 cases there was a trial of labour in patients with one previous cesarian section, successful vaginal delivery in 36 cases, repeat emergency cesarean section in 22 of cases. Uterine rupture is the main complication of vaginal delivery after a caesarean section: in 2013 - in 0 cases, in 2016 in 4 cases, and in 2017 - 0. Conclusion. Repeat cesarean section is the most common type of delivery for patients with a history of a single cesarean section. Patients with one previous uterine scar who try to give birth vaginally have a high success rate. Kopsavilkums Atslēgvārdi: vaginālas dzemdības pēc ķeizargrieziena Darba mērķis. Darba mērķis ir analizēt dzemdību taktikas izvēli pacientēm ar vienu dzemdes rētu anamnēzē. Materi āli un metodes. Tika veikts retrospektīvs pētījums, kurā tika iekļauti dati no Rīgas Dzemdību nama 2013., 2016. un 2017. gada. Pētījumā iekļautas pacientes ar vienu ķeizargrieziena rētu anamnēzē. Rezultātu apstrāde un statistiska izvērtēšana tika veikta SPSS 22.0 vidē un Microsoft Excel programmā. Rezultāti. 2016. un 2017. gadā kopā tika veiktas 822 ķeizargrieziena operācijas pacientēm ar vienu ķeizargrieziena rētu anamnēzē, attiecīgi 416 un 349. Vaginālas dzemdības, pacientēm ar dzemdes rētu anamnēzē 2016. un 2017. gadā tika uzsāktas 214 gadījumos, no kurām 157 bija veiksmīgs vaginālo dzemdību mēģinājums, un 57 dzemdības tika pabeigtas ar akūtu ķeizargriezienu. Vaginālas dzemdības, pacientēm ar dzemdes rētu anamnēzē 2013. gadā tika uzsāktas 58 gadījumos, no kurām veiksmīgas vaginālas dzemdības -36. Dzemdes ruptūra ir galvenā komplikācija, kas iespējama vaginālās dzemdībās pēc ķeizargrieziena: 2013.gadā – 0 gadījumu, 2016. gadā – 4, un 2017. – 0. Secinājumi. Atkārtota ķeizargrieziena operācija ir biežākais dzemdību atrisināšanas veids pacientēm ar vienu ķeizargriezienu anamnēzē. Pacientēm, mēģinot dzemdēt vagināli, ir augsts veiksmīgu vaginālu dzemdību iznākums.
Introduction
Caesarean section is a life-saving surgical procedure which is usually used due to some
complications that occur during pregnancy or during childbirth. However, it is associated with
maternal and perinatal risks and may affect future pregnancies.
One of the main goals of obstetricians and midwives is to provide safe childbirth. The goal of
the caesarean is to reduce the risk to the mother and the fetus, but, nowadays, the cesarean surgery
is done to reduce the labor pain, if woman wants it. In the society, it is believed that the cesarean
section is painless, safer and healthier than a natural childbirth which is not true and, therefore,
almost a third of all patients is happy to choose a cesarean section instead of giving birth naturally
(F. Gary Cunningham et al).
DAUGAVPILS UNIVERSITĀTES 60. STARPTAUTISKĀS ZINĀTNISKĀS KONFERENCES PROCEEDINGS OF
RAKSTU KRĀJUMS THE 60th INTERNATIONAL SCIENTIFIC CONFERENCE OF DAUGAVPILS UNIVERSITY
391
In the last decade, especially in medium and high-income countries, the frequency of cesarean
section has increased. In some regions, up to 40% of deliveries are via cesarean section. Although
the World Health Organization's guidelines suggest the optimal cesarean section rate to be 15%, this
does not affect the actual situation. (Rezeberga et al) One of the possible explanations is the
relatively low proportion of vaginal births in patients with a history of cesarean section.
With the increase in the number of primary cesareans, there are more and more women with a
history of uterine scar. These women are at high risk because there is a risk of uterine rupture. In
such cases, specialists always face a dilemma regarding the selection of the most appropriate way of
delivery. It is necessary to evaluate each case separately when making the decision.
Uterine rupture is the main complication that can occur during a vaginal childbirth if the
patient has had a cesarean section during the previous childbirth. Uterine rupture is a complete tear
of all layers of the uterus including the serous layer – it is a dangerous complication for both the
mother and the child. Uterine dehiscence is an incomplete rupture of the uterine scar, often without
any clinical manifestations. In this case, the serosa remains intact. (Rezeberga et al)
Although a cesarean section may seem more predictable and safer than natural delivery, it
involves various risks, including injuries to the baby, severe bleeding, thromboembolism,
inflammation of the uterus and abdominal wall.
A woman who has previously had caesarean section has two options for her next pregnancy:
to try to give birth vaginally or repeat the caesarean. The recommended minimum interval between
deliveries is 18 months in order not to increase the risk of uterine rupture. (Rezeberga et al)
Does Edwin Cragin’s century-old belief, "once a caesarean, always a caesarean," also works
nowadays? Although the number of vaginal births after the caesarean section is decreasing, its
success varies from 60% to 80% in various sources of literature. Therefore, the assumption "once a
caesarian, always a caesarean", which dominated during the first decades of the 20th century, has
lost its validity. Instead, there is a multifactorial approach that seeks to evaluate the success of a
vaginal birth in each case individually, taking into account the risks to both the mother and the
child.
Methods and materials
A retrospective study was carried out using patient data from the years 2013, 2016 and 2017
from Riga Maternity Hospital. The study included pregnant women who had previously had one
cesarean section and who were later admitted for trial of labor. The factors and results of successful
trial of labor were analyzed. Data was analyzed using Microsoft Excel and SPSS 21.
Results
In Latvia, out of 20 094 deliveries, there were 4304 (21%) cesarean deliveries in 2013. In
2016, there were 21646 births in total – 4663 or 21,5% were cesarean sections, 2684 were
emergency deliveries and 1979 were planned deliveries. (3.)
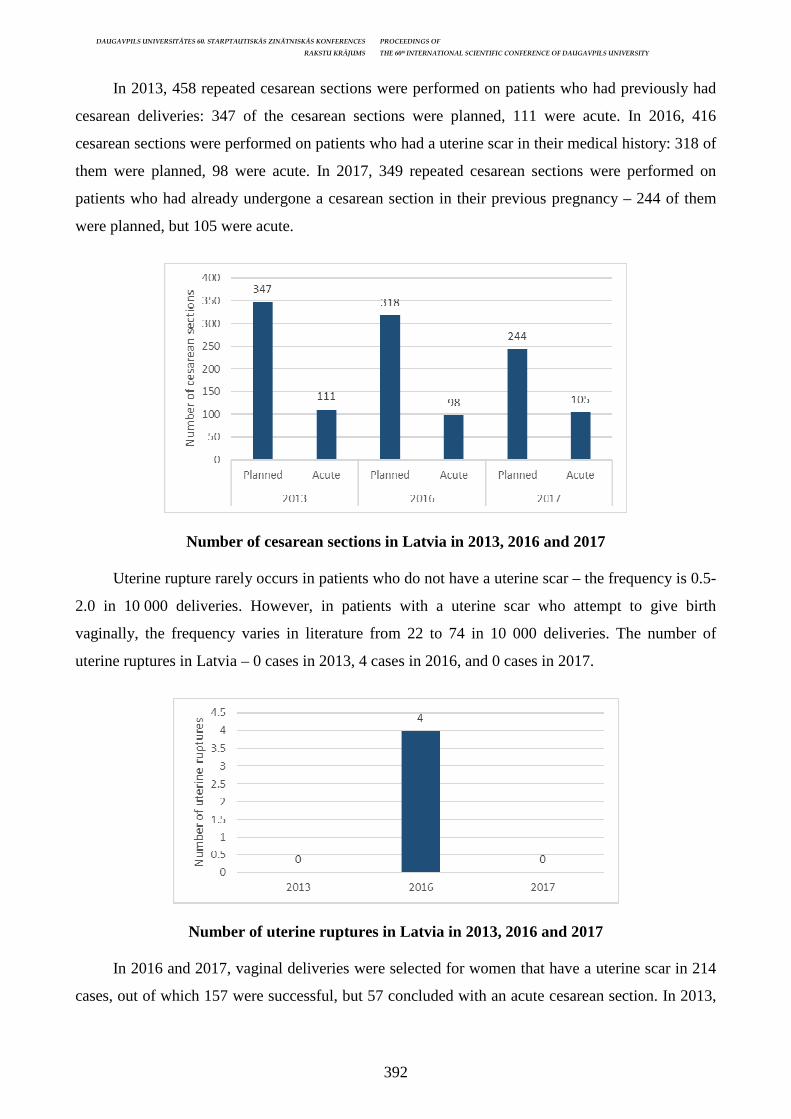
DAUGAVPILS UNIVERSITĀTES 60. STARPTAUTISKĀS ZINĀTNISKĀS KONFERENCES PROCEEDINGS OF
RAKSTU KRĀJUMS THE 60th INTERNATIONAL SCIENTIFIC CONFERENCE OF DAUGAVPILS UNIVERSITY
392
In 2013, 458 repeated cesarean sections were performed on patients who had previously had
cesarean deliveries: 347 of the cesarean sections were planned, 111 were acute. In 2016, 416
cesarean sections were performed on patients who had a uterine scar in their medical history: 318 of
them were planned, 98 were acute. In 2017, 349 repeated cesarean sections were performed on
patients who had already undergone a cesarean section in their previous pregnancy – 244 of them
were planned, but 105 were acute.
Number of cesarean sections in Latvia in 2013, 2016 and 2017
Uterine rupture rarely occurs in patients who do not have a uterine scar – the frequency is 0.5-
2.0 in 10 000 deliveries. However, in patients with a uterine scar who attempt to give birth
vaginally, the frequency varies in literature from 22 to 74 in 10 000 deliveries. The number of
uterine ruptures in Latvia – 0 cases in 2013, 4 cases in 2016, and 0 cases in 2017.
Number of uterine ruptures in Latvia in 2013, 2016 and 2017
In 2016 and 2017, vaginal deliveries were selected for women that have a uterine scar in 214
cases, out of which 157 were successful, but 57 concluded with an acute cesarean section. In 2013,
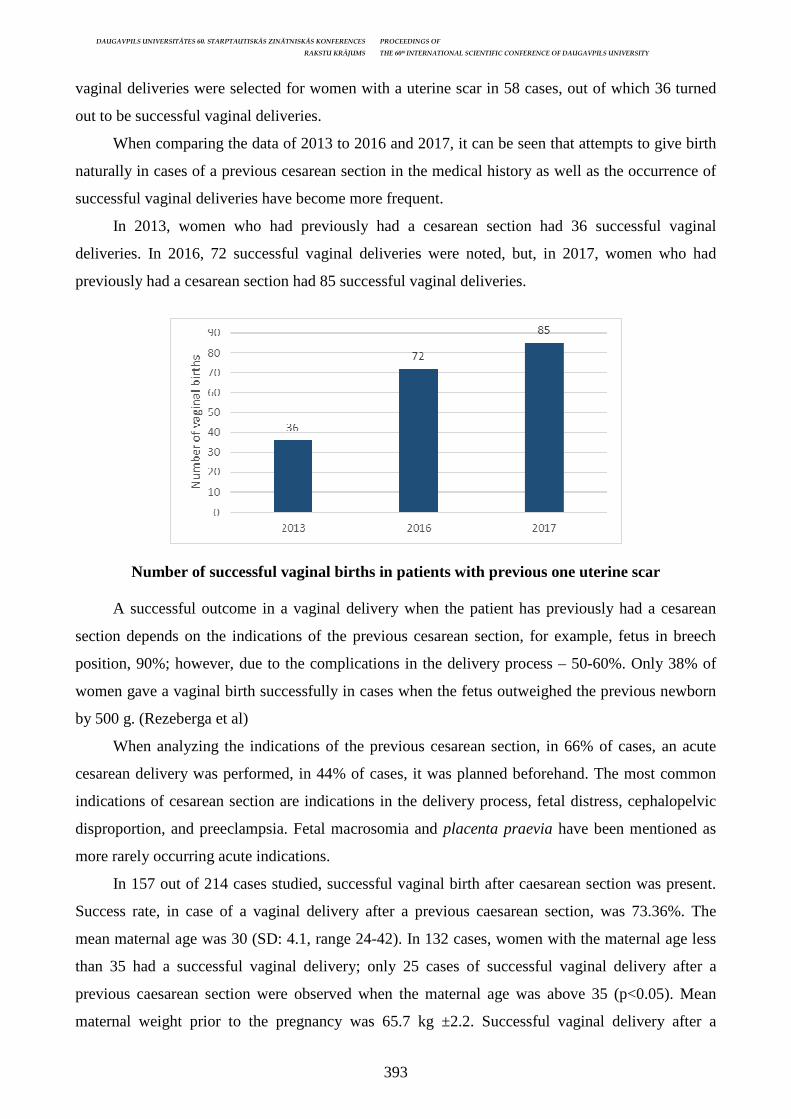
DAUGAVPILS UNIVERSITĀTES 60. STARPTAUTISKĀS ZINĀTNISKĀS KONFERENCES PROCEEDINGS OF
RAKSTU KRĀJUMS THE 60th INTERNATIONAL SCIENTIFIC CONFERENCE OF DAUGAVPILS UNIVERSITY
393
vaginal deliveries were selected for women with a uterine scar in 58 cases, out of which 36 turned
out to be successful vaginal deliveries.
When comparing the data of 2013 to 2016 and 2017, it can be seen that attempts to give birth
naturally in cases of a previous cesarean section in the medical history as well as the occurrence of
successful vaginal deliveries have become more frequent.
In 2013, women who had previously had a cesarean section had 36 successful vaginal
deliveries. In 2016, 72 successful vaginal deliveries were noted, but, in 2017, women who had
previously had a cesarean section had 85 successful vaginal deliveries.
Number of successful vaginal births in patients with previous one uterine scar
A successful outcome in a vaginal delivery when the patient has previously had a cesarean
section depends on the indications of the previous cesarean section, for example, fetus in breech
position, 90%; however, due to the complications in the delivery process – 50-60%. Only 38% of
women gave a vaginal birth successfully in cases when the fetus outweighed the previous newborn
by 500 g. (Rezeberga et al)
When analyzing the indications of the previous cesarean section, in 66% of cases, an acute
cesarean delivery was performed, in 44% of cases, it was planned beforehand. The most common
indications of cesarean section are indications in the delivery process, fetal distress, cephalopelvic
disproportion, and preeclampsia. Fetal macrosomia and placenta praevia have been mentioned as
more rarely occurring acute indications.
In 157 out of 214 cases studied, successful vaginal birth after caesarean section was present.
Success rate, in case of a vaginal delivery after a previous caesarean section, was 73.36%. The
mean maternal age was 30 (SD: 4.1, range 24-42). In 132 cases, women with the maternal age less
than 35 had a successful vaginal delivery; only 25 cases of successful vaginal delivery after a
previous caesarean section were observed when the maternal age was above 35 (p<0.05). Mean
maternal weight prior to the pregnancy was 65.7 kg ±2.2. Successful vaginal delivery after a
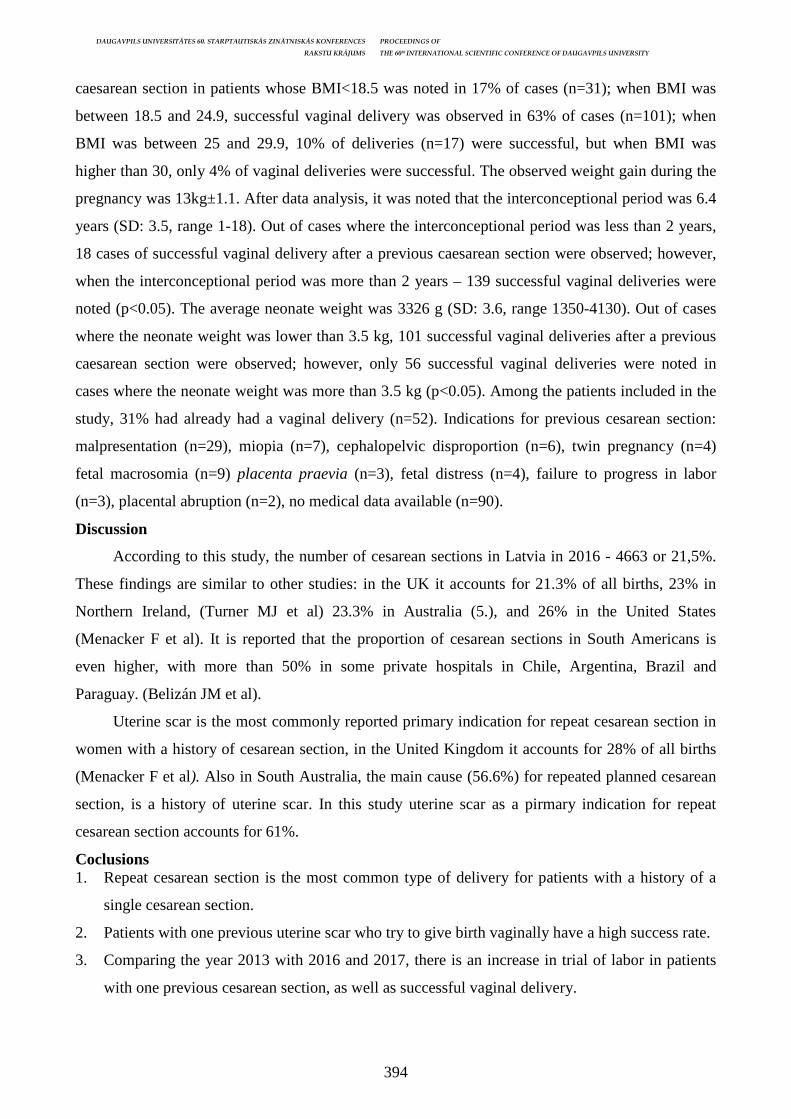
DAUGAVPILS UNIVERSITĀTES 60. STARPTAUTISKĀS ZINĀTNISKĀS KONFERENCES PROCEEDINGS OF
RAKSTU KRĀJUMS THE 60th INTERNATIONAL SCIENTIFIC CONFERENCE OF DAUGAVPILS UNIVERSITY
394
caesarean section in patients whose BMI<18.5 was noted in 17% of cases (n=31); when BMI was
between 18.5 and 24.9, successful vaginal delivery was observed in 63% of cases (n=101); when
BMI was between 25 and 29.9, 10% of deliveries (n=17) were successful, but when BMI was
higher than 30, only 4% of vaginal deliveries were successful. The observed weight gain during the
pregnancy was 13kg±1.1. After data analysis, it was noted that the interconceptional period was 6.4
years (SD: 3.5, range 1-18). Out of cases where the interconceptional period was less than 2 years,
18 cases of successful vaginal delivery after a previous caesarean section were observed; however,
when the interconceptional period was more than 2 years – 139 successful vaginal deliveries were
noted (p<0.05). The average neonate weight was 3326 g (SD: 3.6, range 1350-4130). Out of cases
where the neonate weight was lower than 3.5 kg, 101 successful vaginal deliveries after a previous
caesarean section were observed; however, only 56 successful vaginal deliveries were noted in
cases where the neonate weight was more than 3.5 kg (p<0.05). Among the patients included in the
study, 31% had already had a vaginal delivery (n=52). Indications for previous cesarean section:
malpresentation (n=29), miopia (n=7), cephalopelvic disproportion (n=6), twin pregnancy (n=4)
fetal macrosomia (n=9) placenta praevia (n=3), fetal distress (n=4), failure to progress in labor
(n=3), placental abruption (n=2), no medical data available (n=90).
Discussion
According to this study, the number of cesarean sections in Latvia in 2016 - 4663 or 21,5%.
These findings are similar to other studies: in the UK it accounts for 21.3% of all births, 23% in
Northern Ireland, (Turner MJ et al) 23.3% in Australia (5.), and 26% in the United States
(Menacker F et al). It is reported that the proportion of cesarean sections in South Americans is
even higher, with more than 50% in some private hospitals in Chile, Argentina, Brazil and
Paraguay. (Belizán JM et al).
Uterine scar is the most commonly reported primary indication for repeat cesarean section in
women with a history of cesarean section, in the United Kingdom it accounts for 28% of all births
(Menacker F et al). Also in South Australia, the main cause (56.6%) for repeated planned cesarean
section, is a history of uterine scar. In this study uterine scar as a pirmary indication for repeat
cesarean section accounts for 61%.
Coclusions 1. Repeat cesarean section is the most common type of delivery for patients with a history of a
single cesarean section.
2. Patients with one previous uterine scar who try to give birth vaginally have a high success rate.
3. Comparing the year 2013 with 2016 and 2017, there is an increase in trial of labor in patients
with one previous cesarean section, as well as successful vaginal delivery.
DAUGAVPILS UNIVERSITĀTES 60. STARPTAUTISKĀS ZINĀTNISKĀS KONFERENCES PROCEEDINGS OF
RAKSTU KRĀJUMS THE 60th INTERNATIONAL SCIENTIFIC CONFERENCE OF DAUGAVPILS UNIVERSITY
395
4. In this retrospective study, the success of VBAC was 73.36%. A trial of labor after one
cesarean section should be encouraged in most women who are willing to attempt it.
5. The success of VBAC increases significantly as the maternal age is less than 35 years,
interconceptional period >2 years, neonate weight <3.5kg. The success of VBAC decreases if
maternal BMI >30.
Acknowledgement
I would like to thank my advisor MD Vija Veisa for support and guidance.
References AIHW. Perinatal Statistics Series Number 12. Sydney, 2003. Australia's mothers and babies 2000. Dzemdniecība, prof. D. Rezebergas redakcijā, 2016 Hamilton BE, Martin JA, Sutton PD. Birth: Preliminary data for 2002. Natl Vital, Pieejams: https://www.ncbi.nlm.nih.gov/pubmed/15622995 https://www.spkc.gov.lv/ Landon MB, Hauth JC, Leveno KJ, Spong CY, Leindecker S, Varner MW, et al. Maternal and perinatal outcomes associated with a trial of labor after prior cesarean delivery, N Engl J Med. 2004. Pieejams: https://www.ncbi.nlm.nih.gov/pubmed/15598960 Rates and implications of caesarean sections in Latin America: ecological study. Belizán JM, Althabe F, Barros FC, Alexander SBMJ. 1999. Pieejams: https://www.ncbi.nlm.nih.gov/pubmed/ 10574855 RCOG. The Sentinel National Caesarean Section Audit Report- RCOG Clinical Effectiveness Support Unit. RCOG Press; 2001. Pieejams: http://orca.cf.ac.uk/93112/1/nscs_audit.pdf Trends in cesarean rates for first births and repeat cesarean rates for low-risk women: United States, 1990–2003. Menacker F, Natl Vital Stat Rep. 2005. Pieejams: https://www.ncbi.nlm.nih.gov/ pubmed/16220739 Turner MJ, Agnew G, Langan H. Uterine rupture and labour after a previous low transverse caesarean section, BJOG. 2006. Pieejams: https://www.ncbi.nlm.nih.gov/pubmed/16709218 Williams Obstetrics, 24e, F. Gary Cunningham, MD, Kenneth J. Leveno, MD, Steven L. Bloom, MD, Catherine Y. Spong, MD, Jodi S. Dashe, MD, Barbara L. Hoffman, MD, Brian M. Casey, MD, Jeanne S. Sheffield, MD
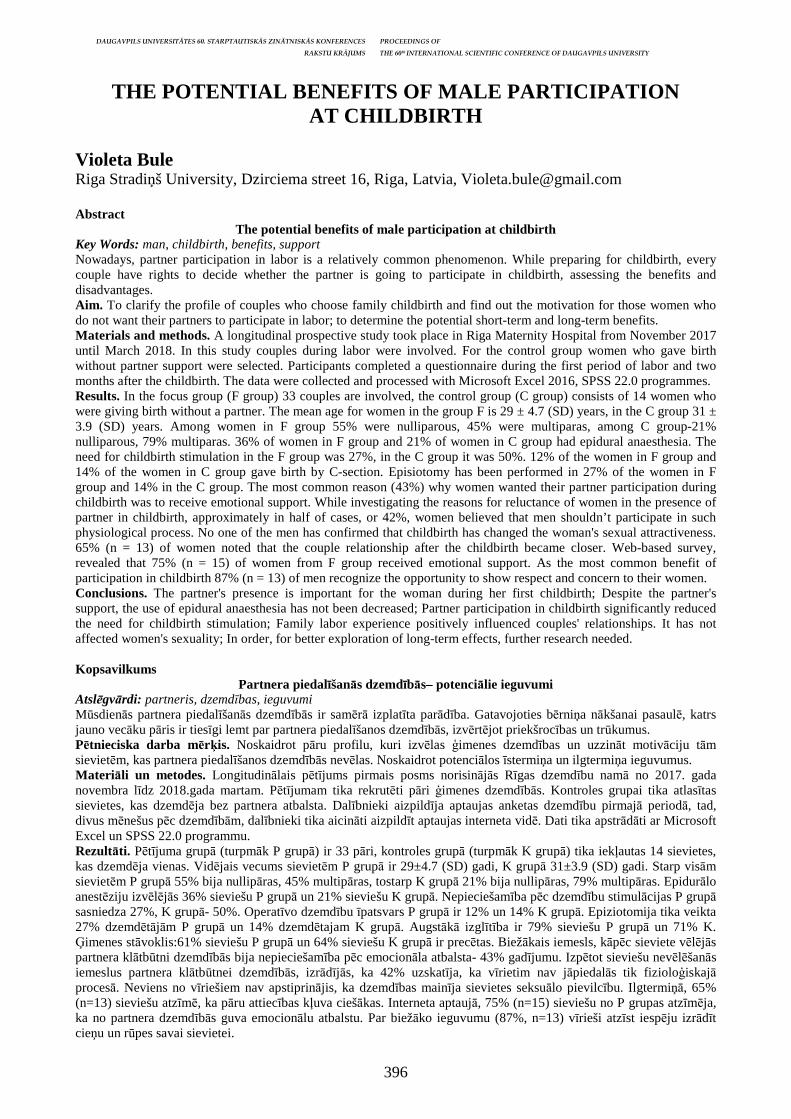
DAUGAVPILS UNIVERSITĀTES 60. STARPTAUTISKĀS ZINĀTNISKĀS KONFERENCES PROCEEDINGS OF
RAKSTU KRĀJUMS THE 60th INTERNATIONAL SCIENTIFIC CONFERENCE OF DAUGAVPILS UNIVERSITY
396
THE POTENTIAL BENEFITS OF MALE PARTICIPATION AT CHILDBIRTH
Violeta Bule Riga Stradiņš University, Dzirciema street 16, Riga, Latvia, [email protected] Abstract
The potential benefits of male participation at childbirth Key Words: man, childbirth, benefits, support Nowadays, partner participation in labor is a relatively common phenomenon. While preparing for childbirth, every couple have rights to decide whether the partner is going to participate in childbirth, assessing the benefits and disadvantages. Aim. To clarify the profile of couples who choose family childbirth and find out the motivation for those women who do not want their partners to participate in labor; to determine the potential short-term and long-term benefits. Materials and methods. A longitudinal prospective study took place in Riga Maternity Hospital from November 2017 until March 2018. In this study couples during labor were involved. For the control group women who gave birth without partner support were selected. Participants completed a questionnaire during the first period of labor and two months after the childbirth. The data were collected and processed with Microsoft Excel 2016, SPSS 22.0 programmes. Results. In the focus group (F group) 33 couples are involved, the control group (C group) consists of 14 women who were giving birth without a partner. The mean age for women in the group F is 29 ± 4.7 (SD) years, in the C group 31 ± 3.9 (SD) years. Among women in F group 55% were nulliparous, 45% were multiparas, among C group-21% nulliparous, 79% multiparas. 36% of women in F group and 21% of women in C group had epidural anaesthesia. The need for childbirth stimulation in the F group was 27%, in the C group it was 50%. 12% of the women in F group and 14% of the women in C group gave birth by C-section. Episiotomy has been performed in 27% of the women in F group and 14% in the C group. The most common reason (43%) why women wanted their partner participation during childbirth was to receive emotional support. While investigating the reasons for reluctance of women in the presence of partner in childbirth, approximately in half of cases, or 42%, women believed that men shouldn’t participate in such physiological process. No one of the men has confirmed that childbirth has changed the woman's sexual attractiveness. 65% (n = 13) of women noted that the couple relationship after the childbirth became closer. Web-based survey, revealed that 75% (n = 15) of women from F group received emotional support. As the most common benefit of participation in childbirth 87% (n = 13) of men recognize the opportunity to show respect and concern to their women. Conclusions. The partner's presence is important for the woman during her first childbirth; Despite the partner's support, the use of epidural anaesthesia has not been decreased; Partner participation in childbirth significantly reduced the need for childbirth stimulation; Family labor experience positively influenced couples' relationships. It has not affected women's sexuality; In order, for better exploration of long-term effects, further research needed. Kopsavilkums
Partnera piedalīšanās dzemdībās– potenciālie ieguvumi Atslēgvārdi: partneris, dzemdības, ieguvumi Mūsdienās partnera piedalīšanās dzemdībās ir samērā izplatīta parādība. Gatavojoties bērniņa nākšanai pasaulē, katrs jauno vecāku pāris ir tiesīgi lemt par partnera piedalīšanos dzemdībās, izvērtējot priekšrocības un trūkumus. Pētnieciska darba mērķis. Noskaidrot pāru profilu, kuri izvēlas ģimenes dzemdības un uzzināt motivāciju tām sievietēm, kas partnera piedalīšanos dzemdībās nevēlas. Noskaidrot potenciālos īstermiņa un ilgtermiņa ieguvumus. Materi āli un metodes. Longitudinālais pētījums pirmais posms norisinājās Rīgas dzemdību namā no 2017. gada novembra līdz 2018.gada martam. Pētījumam tika rekrutēti pāri ģimenes dzemdībās. Kontroles grupai tika atlasītas sievietes, kas dzemdēja bez partnera atbalsta. Dalībnieki aizpildīja aptaujas anketas dzemdību pirmajā periodā, tad, divus mēnešus pēc dzemdībām, dalībnieki tika aicināti aizpildīt aptaujas interneta vidē. Dati tika apstrādāti ar Microsoft Excel un SPSS 22.0 programmu. Rezultāti. Pētījuma grupā (turpmāk P grupā) ir 33 pāri, kontroles grupā (turpmāk K grupā) tika iekļautas 14 sievietes, kas dzemdēja vienas. Vidējais vecums sievietēm P grupā ir 29±4.7 (SD) gadi, K grupā 31±3.9 (SD) gadi. Starp visām sievietēm P grupā 55% bija nullipāras, 45% multipāras, tostarp K grupā 21% bija nullipāras, 79% multipāras. Epidurālo anestēziju izvēlējās 36% sieviešu P grupā un 21% sieviešu K grupā. Nepieciešamība pēc dzemdību stimulācijas P grupā sasniedza 27%, K grupā- 50%. Operatīvo dzemdību īpatsvars P grupā ir 12% un 14% K grupā. Epiziotomija tika veikta 27% dzemdētājām P grupā un 14% dzemdētajam K grupā. Augstākā izglītība ir 79% sieviešu P grupā un 71% K. Ģimenes stāvoklis:61% sieviešu P grupā un 64% sieviešu K grupā ir precētas. Biežākais iemesls, kāpēc sieviete vēlējās partnera klātbūtni dzemdībās bija nepieciešamība pēc emocionāla atbalsta- 43% gadījumu. Izpētot sieviešu nevēlēšanās iemeslus partnera klātbūtnei dzemdībās, izrādījās, ka 42% uzskatīja, ka vīrietim nav jāpiedalās tik fizioloģiskajā procesā. Neviens no vīriešiem nav apstiprinājis, ka dzemdības mainīja sievietes seksuālo pievilcību. Ilgtermiņā, 65% (n=13) sieviešu atzīmē, ka pāru attiecības kļuva ciešākas. Interneta aptaujā, 75% (n=15) sieviešu no P grupas atzīmēja, ka no partnera dzemdībās guva emocionālu atbalstu. Par biežāko ieguvumu (87%, n=13) vīrieši atzīst iespēju izrādīt cieņu un rūpes savai sievietei.
DAUGAVPILS UNIVERSITĀTES 60. STARPTAUTISKĀS ZINĀTNISKĀS KONFERENCES PROCEEDINGS OF
RAKSTU KRĀJUMS THE 60th INTERNATIONAL SCIENTIFIC CONFERENCE OF DAUGAVPILS UNIVERSITY
397
Secinājumi. Partnera klātbūtne ir nozīmīga sievietei viņas pirmajās dzemdībās; Neskatoties uz partnera sniegto atbalstu dzemdībās, tas nesamazināja epidurālo anestēziju izmantošanu; Partnera piedalīšanās dzemdībās ievērojami samazina vajadzību pēc dzemdību stimulācijas; Ģimenes dzemdību pieredze pozitīvi ietekmēja pāru attiecības. Tā nav ietekmējusi sieviešu seksuālo pievilcību vīriešu skatījumā. Lai rūpīgāk izpētītu ilgtermiņa ieguvumus, nepieciešama pētījuma turpināšana.
Introduction
Father’s role in labour has significantly changed since the last century. The opinion that
labour is a women’s thing that does not concern men and that the labour room is not a place for men
dominated over the world even until 1970s (Jomeen, 2017). Today, presence of men during the
labour and at the moment of birth is a quite common phenomenon in the developed countries of the
world. In the Great Britain and several other countries, the percentage of labours with the future
fathers participating constitutes at least 80% of all labours.
In Latvia, having partners at the labour is a comparatively new practice, and it has rapidly
become popular. The very first instances of such labours have been recorded in the largest maternity
institutions of our country in the late 1990s and early 2000s. By summarizing the statistical data
about the recent 9 years in the Riga Maternity Hospital, it is evident that the percentage of labours
with participation of the expected fathers or other close relatives has gradually increased since
2008, i.e., from 36% in 2008 to 62% in 2017. (Figure 1) The most frequent reason why women
chose having the husband at the labour room is their willingness to share common experience. This
experience allows improving the relationships between the future parents (Bondas-Salonen, 1998).
The fear of the pregnant mother before the labour and her need for the closet person’s support is
also an important motivation. Motivation of fathers to participate in labour tend to differ. According
to Chalmers & Meyer (Chalmers & Meyer, 1996), provision of support, curiosity and pressure are
the three main reasons for men to participate in labour.
Figure 1. Frequency of partner attendance at childbirth at Riga Maternity Hospital, year 2008-2017
DAUGAVPILS UNIVERSITĀTES 60. STARPTAUTISKĀS ZINĀTNISKĀS KONFERENCES PROCEEDINGS OF
RAKSTU KRĀJUMS THE 60th INTERNATIONAL SCIENTIFIC CONFERENCE OF DAUGAVPILS UNIVERSITY
398
Short-term benefits
Provision of support during labour may facilitate the physiological process of labour, make
the woman feel like she is having more control over the situation, and make her confident about her
strength and ability to give birth. This may reduce the need for medical intervention, thus raising the
satisfaction of women about their labour experiences. A popular systematic review was published
by Cochrane in 2017, and it included a summary of data from the 26 best available randomized
trials that involved over 15,000 women from 17 countries. Its results confirmed that continuous
support during labour may improve the results for both women and new-borns. Such practice of
labour increases the number of spontaneous vaginal labours and reduces the quantity of
instrumental assisted and operative labours. In addition, the probability of employing pain relief and
regional anaesthesia is lower for these women, also the labour duration is shorter for them. What
concerns the new-born, the low five-minute Apgar score had the lowest probability (Bohren et. al,
2017).
Long-term benefits
There is an opinion that men need to participate in labour not only for the well-being of the
mother and the child, but also to benefit in terms of their own health and to identify themselves with
the father’s role faster (WHO, 2007). By studying the long-term result of father’s participation,
Peterson and colleagues established that early creation of father-child bond may have a significant
effect on the mental health of the child (Peterson, 1979).
Another noteworthy factor is that, if the partner participates in the labour process, the couple
has a unique opportunity to share the common experience. It is considered that such choice for
labour relates to highly valuable and strong intimate relationships of the couple. Several reviews in
literature report that experiencing labour together results in improvements in relationships between
the partners and men show more respect towards the women (Dellmann, 2004; Dlugosz, 2013).
Materials and methods
A longitudinal prospective study took place in Riga Maternity Hospital from November 2017
until March 2018. In this study couples during labor were involved. For the control group women
who gave birth without partner support, whose medical records number followed the study group
were selected. In the first trial, Participants completed a questionnaire during the first period of
labor. Two months after childbirth, they were invited to undertake a web-based questionnaire. The
research design was approved by the Ethics Committee of Rīga Stradiņš University. The data from
survey and medical records were collected and processed with Microsoft Excel 2016, SPSS 22.0
programmes.
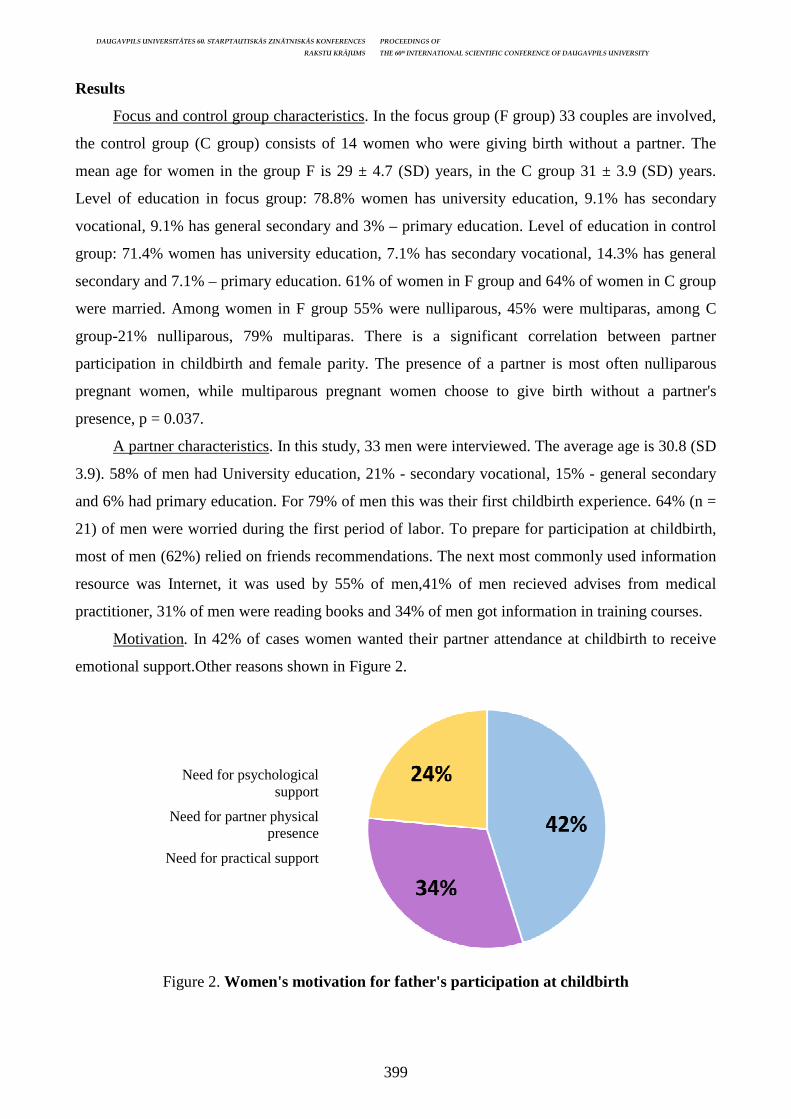
DAUGAVPILS UNIVERSITĀTES 60. STARPTAUTISKĀS ZINĀTNISKĀS KONFERENCES PROCEEDINGS OF
RAKSTU KRĀJUMS THE 60th INTERNATIONAL SCIENTIFIC CONFERENCE OF DAUGAVPILS UNIVERSITY
399
Results
Focus and control group characteristics. In the focus group (F group) 33 couples are involved,
the control group (C group) consists of 14 women who were giving birth without a partner. The
mean age for women in the group F is 29 ± 4.7 (SD) years, in the C group 31 ± 3.9 (SD) years.
Level of education in focus group: 78.8% women has university education, 9.1% has secondary
vocational, 9.1% has general secondary and 3% – primary education. Level of education in control
group: 71.4% women has university education, 7.1% has secondary vocational, 14.3% has general
secondary and 7.1% – primary education. 61% of women in F group and 64% of women in C group
were married. Among women in F group 55% were nulliparous, 45% were multiparas, among C
group-21% nulliparous, 79% multiparas. There is a significant correlation between partner
participation in childbirth and female parity. The presence of a partner is most often nulliparous
pregnant women, while multiparous pregnant women choose to give birth without a partner's
presence, p = 0.037.
A partner characteristics. In this study, 33 men were interviewed. The average age is 30.8 (SD
3.9). 58% of men had University education, 21% - secondary vocational, 15% - general secondary
and 6% had primary education. For 79% of men this was their first childbirth experience. 64% (n =
21) of men were worried during the first period of labor. To prepare for participation at childbirth,
most of men (62%) relied on friends recommendations. The next most commonly used information
resource was Internet, it was used by 55% of men,41% of men recieved advises from medical
practitioner, 31% of men were reading books and 34% of men got information in training courses.
Motivation. In 42% of cases women wanted their partner attendance at childbirth to receive
emotional support.Other reasons shown in Figure 2.
Figure 2. Women's motivation for father's participation at childbirth
Need for psychological support
Need for partner physical presence
Need for practical support
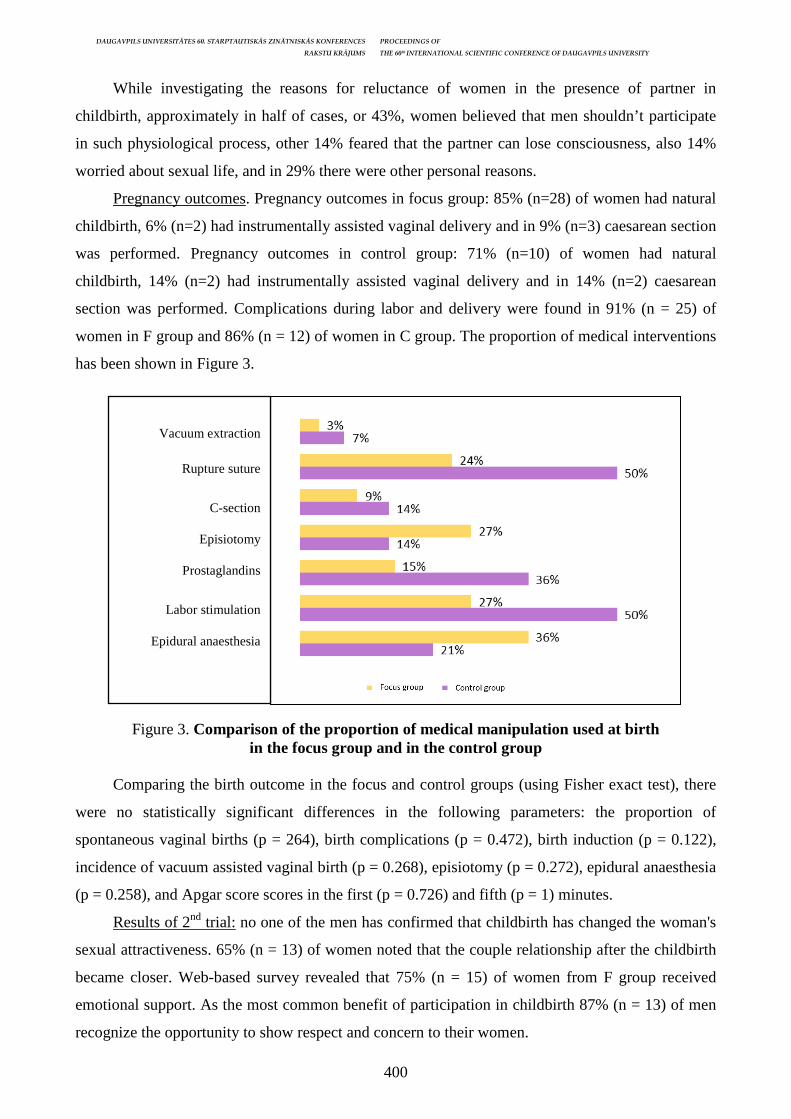
DAUGAVPILS UNIVERSITĀTES 60. STARPTAUTISKĀS ZINĀTNISKĀS KONFERENCES PROCEEDINGS OF
RAKSTU KRĀJUMS THE 60th INTERNATIONAL SCIENTIFIC CONFERENCE OF DAUGAVPILS UNIVERSITY
400
While investigating the reasons for reluctance of women in the presence of partner in
childbirth, approximately in half of cases, or 43%, women believed that men shouldn’t participate
in such physiological process, other 14% feared that the partner can lose consciousness, also 14%
worried about sexual life, and in 29% there were other personal reasons. Pregnancy outcomes. Pregnancy outcomes in focus group: 85% (n=28) of women had natural
childbirth, 6% (n=2) had instrumentally assisted vaginal delivery and in 9% (n=3) caesarean section
was performed. Pregnancy outcomes in control group: 71% (n=10) of women had natural
childbirth, 14% (n=2) had instrumentally assisted vaginal delivery and in 14% (n=2) caesarean
section was performed. Complications during labor and delivery were found in 91% (n = 25) of
women in F group and 86% (n = 12) of women in C group. The proportion of medical interventions
has been shown in Figure 3.
Figure 3. Comparison of the proportion of medical manipulation used at birth in the focus group and in the control group
Comparing the birth outcome in the focus and control groups (using Fisher exact test), there
were no statistically significant differences in the following parameters: the proportion of
spontaneous vaginal births (p = 264), birth complications (p = 0.472), birth induction (p = 0.122),
incidence of vacuum assisted vaginal birth (p = 0.268), episiotomy (p = 0.272), epidural anaesthesia
(p = 0.258), and Apgar score scores in the first (p = 0.726) and fifth (p = 1) minutes.
Results of 2nd trial: no one of the men has confirmed that childbirth has changed the woman's
sexual attractiveness. 65% (n = 13) of women noted that the couple relationship after the childbirth
became closer. Web-based survey revealed that 75% (n = 15) of women from F group received
emotional support. As the most common benefit of participation in childbirth 87% (n = 13) of men
recognize the opportunity to show respect and concern to their women.
Vacuum extraction
Rupture suture
C-section
Episiotomy
Prostaglandins
Labor stimulation
Epidural anaesthesia
DAUGAVPILS UNIVERSITĀTES 60. STARPTAUTISKĀS ZINĀTNISKĀS KONFERENCES PROCEEDINGS OF
RAKSTU KRĀJUMS THE 60th INTERNATIONAL SCIENTIFIC CONFERENCE OF DAUGAVPILS UNIVERSITY
401
Discussion
The studied subject is current, because participation of the partner in labour is a very common
phenomenon today. It is often difficult to evaluate for which couples the shared labour experience
would improve the result of labour without causing negative consequences.
Already in the end of the last century, it was reported that continuous care provided by the
partner to the woman in labour would reduce duration of labour (Berry, 1988), increases the
increases the number of spontaneous vaginal labours, reduces the use of pain relief
(Kennell J, 1991), and number of Caesarean sections.
Many studies have observed that presence of men in labour can reduce pain and alarm,
shorten the duration of labour and reduce the use of pain relief (Wilson,2016; Ye,2011). In this
study, the support of fathers would not reduce the need for using epidural anaesthesia. Similar
conclusions were drawn by the Swedish researcher Bergstrõm with colleagues, who carried out a
study in 2009 with 1087 nullipara women and their partners participating, confirmed that natural
preparation for labour would not reduce the frequency of using epidural anaesthesia during the
labours (Bergstrom et.al, 2009). However, several years earlier, a study was carried out in the Great
Britain in 1986 to assess the results of using pain relief methods learned during labour preparation
classes for partners, rarer use of epidural anaesthesia was detected (Copstick, 1986).
Generally, in this study, participation of partners had lesser effect on the labour process.
Presence of fathers made the women feel emotionally supported and safer. Of course, witnessing
the pain of their partners made a portion of men feel helpless and alarmed. However, the negative
experience or emotions caused by labour relate to the insufficient knowledge of the future fathers
about the labour process. Chapman (1991) assumed that labour preparation classes might assist men
in preparing themselves to the changes that their women would experience during labour. The
knowledge that such changes are normal would reduce anxiety, frustration and fear for men. The
ability to provide adequate physical and emotional support to a woman during labour may help the
man cope with the sense of helplessness and feel useful and appreciated by his partner (Dellmann,
2004).
Scientific literature still does not represent a unified opinion about the effect of labour with
the partner present on the sexual life of the couple and the factors that may influence a negative
result of labour. When making the decision whether the partner should participate, pregnant women
are very often worried about their sexuality and it is a common reason why women refuse from
having their husbands with them. Also, in this study, a significant percentage of women were
worried about their sexuality after labour, but no participant would indicate that shared labour
experience influenced the couple’s sexual relationships. Several of the available studies show that
the new fathers admit developing a sexual dislike after what they saw during labour. For example,
DAUGAVPILS UNIVERSITĀTES 60. STARPTAUTISKĀS ZINĀTNISKĀS KONFERENCES PROCEEDINGS OF
RAKSTU KRĀJUMS THE 60th INTERNATIONAL SCIENTIFIC CONFERENCE OF DAUGAVPILS UNIVERSITY
402
White (White, 2007) reveals that several fathers develop sexual activity problems after seeing their
partners in labour. Men recognized in his study that memories about the sights often disturb their
sexual activity even several years long. Also surveys of fathers carried out during the study
performed in Sweden in 2013 established that several men relate their psychologically sexual
problems with the woman’s suffering, blood and medical procedures sawn during labour (Binder,
2013).
It should also be remembered that libido is a complex phenomenon which can be affected by
various factors. Another identified issue is that even if both parents are satisfied with their sexual
life, they still do not reach the level of sexual relationships that they had before labour, and
exhaustion caused by care for the new-born is one of the many factors of influence (Ahlborg, 2005).
Therefore, now, the relation between the decay in sexual relationships and father’s participation in
labour is not based on sufficient evidence. Due to many controversial data and myths, more
profound studies in this subject are required.
To assess whether participation of the partner in labour would provide more pros than cons,
the couple’s relationships should be evaluated, as well as the moral readiness of men for providing
support and coping with powerful negative emotions. Assessment of the circumstances of taking the
decision and the motivation of participants are of equal importance.
Conclusions
Having the partner participating in labour is more often chosen by women who have not given
birth before and, on the contrary, a significant portion of women giving birth repeatedly, chose
labour without their partners present. No sociodemographic differences have been observed
between women choosing their partners’ support and involvement in labour and women taking the
decision to give birth and rely on the support provided by the labour care staff. For women with
their partners participating, labour was more natural and involved less medical intervention. Further
studies are necessary to determine the factors, which reduced the need for more active intervention
by the medical stall. Participation of the partner in labour had no effect on the number of Caesarean
sections. Both groups represent similar percentages of labours resolved by a Caesarean section. The
support ensured by the partner during the labour did not reduce the willingness of the woman to
receive epidural anaesthesia. Presence of the partner provided more comprehensive and continuous
support for the woman in labour both emotionally and physically. Experience of labour with the
partner present had a positive effect on the relationships of couples. From the point of view of men,
sexual attraction of women was not thereby affected.
Acknowledgement
The researcher would like to extend her thanks to the couples who gave their time and shared
their personal experiences for this study. Thanks also go to her supervisor, Dr Karlīna Elksne for
DAUGAVPILS UNIVERSITĀTES 60. STARPTAUTISKĀS ZINĀTNISKĀS KONFERENCES PROCEEDINGS OF
RAKSTU KRĀJUMS THE 60th INTERNATIONAL SCIENTIFIC CONFERENCE OF DAUGAVPILS UNIVERSITY
403
her guidance throughout this project. The researcher would also like to extend her gratitude to her
husband for his unwavering support throughout this process.
References: Ahlborg, T. Quality of intimate and sexual relationship in first-time parents six months after delivery. 2005 [tiešsaite] NCBI PubMed [atsauce 11.03.2018] https://www.ncbi.nlm.nih.gov/pubmed/16123847 Bergstrom, M., Kieler, H., Waldenström, U. Effects of natural childbirth preparation versus standard antenatal education on epidural rates, experience of childbirth and parental stress in mothers and fathers: a randomised controlled multicentre trial. 2009. [tiešsaite] NCBI PubMed [atsauce 06.02.2018] Available: https://www.ncbi.nlm.nih.gov/pubmed/19538406 Berry, L. M. Realistic expectations of the labour coach.1988. [tiešsaite] Journal of Obstetric, Gynecologic and Neonatal Nursing, 17, p. 354-355. Available: https://www-sciencedirect-com.db. rsu.lv/science/article/pii/S0884217515327581 Binder P., J. Johnsdotter, S., Essén B. More than re-establishing the partner relationship: Intimate aftercarefor Somali parents in diaspora. 2013 [tiešsaite] Midwifery Vol. 29, p. 863–870. [atsauce 18.02.2018] Available: https://www.sciencedirect.com/science/article/pii/S0266613812001672 Bohren MA, H. G.Continuous support for women during childbirth. 2017 [tiešsaite] The Cochrane Library [atsauce 13.02.2018] Available: http://www.cochrane.org/CD003766/PREG_continuous-support-women-during-childbirth Bondas-Salonen, T. How women experience the presence of their partners at the birthof their babies. 1998. [tiešsaite] SAGE JOURNALS, [atsauce 22.02.2018]. Available: http://journals. sagepub.com/doi/abs/10.1177/104973239800800605 Chalmers, B., & Meyer, D. What men say about pregnancy, birth and parenthood.1996 [tiešsaite] Journal of Psychosomatic Obstetrics and Gynecology, Vol. 17, 47–52. Available: https://www. researchgate.net/publication/14345348_What_men_say_about_pregnancy_birth_and_parenthood Chapman, L. Searching: Expectant fathers' experience during labour and birth. Journal of Perinatal and Neonatal Nursing, 1991, Vol. 4 (4), pp. 21–29. Copstick, S. M. (1986). Partner support and the use of coping techniques in labour. 1986 [tiešsaite] Journal of Psychosomatic Research Vol. 30 (4), pp. 497–503 [atsauce 18.02.2018] Available: https://www.sciencedirect.com/science/article/pii/0022399986900899 Dellmann, T. „The best moment of my life”: a literature review of Father's experience of childbirth. 2004 [tiešsaite] Australian Midwifery, 17, 20–26 [atsauce 02.03.2018] Available: https://www.sciencedirect.com/science/article/pii/S1448827204800142; https://www.researchgate. net/publication/222281770_The_best_moment_of_my_life_A_literature_review_of_fathers'_experience_of_childbirth Dlugosz, S. Fathers at birth: women's experiences of their partner's presence during childbirth. 2013 [tiešsaite] Edith Cowan University Research Online [atsauce 15.01.2018]. Available: http://ro.ecu. edu.au/cgi/viewcontent.cgi?article=1105&context=theses_hons Jomeen, J. 2017. Fathers in the birth room: choice or coercion? Help or hindrance?. [tiešsaite] Journal of Reproductive and Infant Psychology, pp. 321–323. [atsauce 01.03.2018]. Available: https://www.tandfonline.com/doi/full/10.1080/02646838.2017.1361124 Kennell J. K. M. Continuous emotional support during labour. 1991. [tiešsaite] NCBI PubMed [atsauce15.02.2018] Available: https://www.ncbi.nlm.nih.gov/pubmed/2013951 Peterson, G. H. The role of some birth-related variables in father attachment. 1979. [tiešsaite] Wiley online library [atsauce 22.02.2018]. Available: https://onlinelibrary.wiley.com/doi/pdf/10.1111/j. 1939-0025.1979.tb02614.x White, G. You cope by breaking down in private: Fathers and PTSD following childbirth. 2007. British Journal of Midwifery, 15, 39–45.

DAUGAVPILS UNIVERSITĀTES 60. STARPTAUTISKĀS ZINĀTNISKĀS KONFERENCES PROCEEDINGS OF
RAKSTU KRĀJUMS THE 60th INTERNATIONAL SCIENTIFIC CONFERENCE OF DAUGAVPILS UNIVERSITY
404
WHO: Fatherhood and health outcome in Europe, 2007. [tiešsaite] World Health Organisation [atsauce 22.02.2018]. Available: http://www.euro.who.int/__data/assets/pdf_file/0017/69011/ E91129.pdf Wilson C. L. & Simpson J. A. Childbirth pain, attachment orientations,and romantic partner support during labor and delivery. Personal Relationships, 2016, 23(4), pp. 622–644. Ye, H. J., Jiang, Y. J., Ruan, Z. F. Relationship between factors of labour pain and delivery outcomes, 2011. [tiešsaite] NCBI PUBMED [atsauce] 17.03.2018 Available: https://www.ncbi.nlm. nih.gov/pubmed/22321349
DAUGAVPILS UNIVERSITĀTES 60. STARPTAUTISKĀS ZINĀTNISKĀS KONFERENCES PROCEEDINGS OF
RAKSTU KRĀJUMS THE 60th INTERNATIONAL SCIENTIFIC CONFERENCE OF DAUGAVPILS UNIVERSITY
405
PERINATAL OUTCOMES FROM THE USE OF ANTIEPILEPTIC DRUGS DURING PREGNANCY
Anda Dubra
Riga Stradiņš University, Dzirciema ielā 16, Latvia, [email protected] Abstract
Perinatal outcomes from the use of antiepileptic drugs during pregnancy Key Words: Epilepsy, pregnancy, antiepileptic drugs, outcome, delivery Epilepsy is one of the most common neurological conditions in women of reproductive age. This was a retrospective study carried by Pauls Stradins Clinical University Hospital from January 2015 till September 2017. Out of 104 pregnant women with different neurological conditions, who were admitted to the tertiary referral perinatal care center, 40 women had epilepsy.). All patients with epilepsy (n=40) received AED before pregnancy, but only 62,5% (n=25) of women continued to use AED during first trimester, and 40% (n=16) during second and third trimester. During 1st trimester, 68% (n=17) received monotherapy, this group perinatal outcomes were 44% (n=11) spontaneous vaginal delivery and 24% (n=6)caeserian delivery. Politerapy use 32% (n=8), perinatal outcomes were 16% (n=4)spontaneous vaginal delivery, but 12% (n=3) cesarean delivery. Four patients (16%) had seizure during pregnancy period and 4% one patient had seizure during delivery. Three of those four patients, who had seizure, did not use AED in second and third trimester. Only one newborn had major malformation, whose mother did not use AED during 2nd and 3rd trimester and had a seizure during pregnancy. Kopsavilkums
Perinatālie iznākumi lietojot pretepilepsijas zāles grūtniecības laikā Atslēgvārdi: Epilepsija, grūtniecība, antikonvulsantu terapija, iznākumi, dzemdības Epilepsija ir viens no visbiežāk sastopamajiem neiroloģiskajiem stāvokļiem sievietēm reproduktīvajā vecumā. Pētījums tika izstrādāts Paula Stradiņa Klīniskās Universitātes Slimnīcā,analizējot pacientu medicīniskās kartes, kuras bija stacionētas ar dažādiem neiroloģiskiem traucējumiem grūtniecības laikā Perinatālās aprūpes centrā, laika posmā no 2015. gada janvāra līdz 2017. gada septembrim. No 104 grūtniecēm ar dažādiem neiroloģiskiem traucējumiem, 40 sievietēm bija epilepsija.Visas pacientes ar epilepsiju (n = 40) saņēma antikonvulsantu terapiju(AED) pirms grūtniecības, bet tikai 62,5% (n = 25) sieviešu turpināja lietot AED pirmajā trimestrī un 40% (n = 16) otrā un trešā trimestra laikā. Pirmā trimestra laikā 68% (n = 17) saņēma monoterapiju, šīs grupas perinatālie rezultāti bija 44% (n = 11) spontānas vaginālās dzemdības un 24% (n = 6) ķeizargriezienu operācijas. Politerapija lietoja 32% (n = 8), perinatālie rezultāti bija 16% (n = 4) spontānas vaginālās dzemdības, bet 12% (n = 3) ķeizargrieziena operācijas. Četrām pacientēm (16%) bija epilepsijas lēkmes grūtniecības laikā, bet vienai pacientei dzemdību laikā bija lēkme. Trīs no šiem četrām pacientēm, kurām bija lēkmes, AED nelietoja otrajā un trešajā trimestrī. Tikai vienam jaundzimušajam bijalielasm malformācijas, kuru māte 2. un 3. trimestrī nelietoja AED un viņas grūtniecība bija saistīta ar epileptiskām lēkmēm.
Introduction
Epilepsy is one of the most common neurological conditions in women of reproductive age.
Prescription of antiepileptic drugs(AED) to women with epilepsy and other neurological
disturbancies requires to maintain a balance between controlling maternal diseases seizures
frequency and minimizing fetal teratogenic exposure. In 15% to 30% of women, there may be
an increase in seizure frequency, most often in the first or third trimester. Antiepileptic drug (AED)
treatment is used by 0.2–0.7% of pregnant women. The risk to the developing baby from AED
taken during pregnancy congenital malformation or birth defects. In women with epilepsy the risk is
about 4% to 6%, but overall remains low.
Aim of study
To evaluate perinatal outcomes and the compliance of women with epilepsy from common
used AED during pregnancy.
DAUGAVPILS UNIVERSITĀTES 60. STARPTAUTISKĀS ZINĀTNISKĀS KONFERENCES PROCEEDINGS OF
RAKSTU KRĀJUMS THE 60th INTERNATIONAL SCIENTIFIC CONFERENCE OF DAUGAVPILS UNIVERSITY
406
Materials and methods
This was a retrospective study carried by Pauls Stradins Clinical University Hospital from
January 2015 till September 2017. Out of 104 pregnant women with different neurological
conditions, who were admitted to the tertiary referral perinatal care center, 40 women had epilepsy.
The pregnant women's medical records were analyzed. We included women in reproductive age
with epilepsy who used anticonvulsant therapy before pregnancy and during pregnancy. Data was
processed in Microsoft Excel and Microsoft Word.
Results
Average number of pregnant women were 1972 per year. Pregnant women with neurological
disturbancies were 35 (1,8%) per year. Average age of patients with epilepsy was 29,3 ±5,9 (20-41).
All patients with epilepsy (n=40) received AED before pregnancy, but only 62,5% (n=25) of
women continued to use AED during first trimester, and 40% (n=16) during second and third
trimester. During 1st trimester, 68% (n=17) received monotherapy, this group prenatal outcomes
were 27,5% (n=11) spontaneous vaginal delivery and 15% (n=6)caeserian delivery. Politerapy use
32% (n=8), perinatal outcomes were 17,5% (n=7) spontaneous vaginal delivery, but 7,5% (n=3)
cesarean delivery. Four patients (16%) had seizure during pregnancy period and 4% one patient had
seizure during delivery. Three of those four patients, who had seizure, did not use AED in second
and third trimester. Only one newborn had major malformation, whose mother did not use AED
during 2nd and 3rd trimester and had a seizure during pregnancy.
Conclusions
The study demonstrate the compliance of pregnant women is poor. The incidence of seizures
during pregnancy was relatively low. It was more common in pregnant women who did not use
anticonvulsant therapy. The incidence of congenital malformations was low 1 in 1993 in children.
In patients with controlled epilepsy, spontaneous vaginal delivery was more commonly often than
cesarean section. Therefore the education about the importance of planning pregnancy and the
effect of teratogenic AED, also about risks of seizure during pregnancy and perinatal outcomes.
References 1. Alireza Minagar, Neurological Disorders and Pregnancy, Elsevier Inc, 2011, 91.–121. lpp. 2. Clinical Governance Advice No. 1 Development of RCOG Green-top Guidelines, Epilepsy and pregnancy, UK, 2016, http://www.rcog.org.uk/green-top-development 3. Ozhan Ozdemir, Mustafa Erkan Sari, Aslihan Kurt, Vefa Selimova Sakar, Cemal Resat Atalay, Pregnancy outcome of 149 pregnancies in women with epilepsy: Experience from a tertiary care hospital, Interventional Medicine Applied Science. 2015 Sep; 7(3): 108–113. 4. Federico Barroso, Edward Araujo Junior, Cristina Aparecida Falbo Guazelli, Eduardo Felix Martins Santana, Liliam Cristine Rolo, Marılia da Gloria Martins, and Antonio Fernandes Moron, Perinatal outcomes from the use of antiepileptic drugs during pregnancy: a case-control study, 2014, Matern Fetal Neonatal Med, DOI: 10.3109/14767058.2014.955006
DAUGAVPILS UNIVERSITĀTES 60. STARPTAUTISKĀS ZINĀTNISKĀS KONFERENCES PROCEEDINGS OF
RAKSTU KRĀJUMS THE 60th INTERNATIONAL SCIENTIFIC CONFERENCE OF DAUGAVPILS UNIVERSITY
407
5. Use of antiepileptic drugs during pregnancy and risk of spontaneous abortion and stillbirth: population based cohort study, Bodil Hammer Bech, Maiken Ina Siegismund Kjaersgaard, Henrik Søndergaard Pedersen, Penelope P Howards, Merete Juul Sørensen, Jørn Olsen, Erik Thorlund Parner, Lars Henning Pedersen, Mogens Vestergaard, Jakob Christensen, BMJ, 2014. 6. Borthen, Eide MG, Veiby G, Daltveit AK, Gilhus NE, Complications during pregnancy in women with epilepsy: population-based cohort study, BJOG, 2009. 7. Hosley Catherine M., MD and Louise D. McCullough, MD, PhD, Acute Neurological Issues in Pregnancy and the Peripartum, 2011, 1(2): 104–116. 8. EURAP internim report, piejams: http://www.eurapinternational.org/pdf/private/reports/Rep_ Nov_2017.pdf
DAUGAVPILS UNIVERSITĀTES 60. STARPTAUTISKĀS ZINĀTNISKĀS KONFERENCES PROCEEDINGS OF
RAKSTU KRĀJUMS THE 60th INTERNATIONAL SCIENTIFIC CONFERENCE OF DAUGAVPILS UNIVERSITY
408
THE FREQUENCY OF DEPRESSION AND ANXIETY IN WOMEN OF REPRODUCTIVE AGE
WITH PSYCHIATRIC DISORDERS AFTER DELIVERY Linda Rubene Riga Stradins University, Dzirciema street 16, Riga, Latvia, [email protected] Abstract The frequency of depression and anxiety in women of reproductive age with psychiatric disorders after delivery
Key Words: Psychiatric diseases, pregnancy, depression, anxiety Introduction. Disturbances in mental health in the perinatal period can cause negative personal and child developmental outcomes. There are several risk factors to take in to consideration and one of the major ones is previous psychiatric disorders. Aim. To find out the frequency of patients with different psychiatric disorders in the past or at the moment of the interview at the Riga Maternity Hospital and to assess their depression and anxiety rates shortly after delivery and 6 weeks later. Materials and methods. The study was performed during the period 10 months in 2017 in Riga Maternity hospital including 235 women in the reproductive age range. Data collection was based on questionnaire form including the M.I.N.I (mini-international neuropsychiatric interview) and questionnaires to assess depression and anxiety symptoms – the Edinburgh Postnatal Depression Scale (EPDS), Patient Health Questionnaire (PHQ-9) and General Anxiety Disorder (GAD-7). After 6 weeks there was an interview with the EPDS, PHQ-9 and GAD-7 questions again. Data was processed in Microsoft Excel and IBM SPSS. Results. Altogether 75 (31,9%) of the women presented with some kind of psychiatric disorder according to M.I.N.I. 43 (18,3%) of the women presented with depression at the moment of the interview according to EPDS and 21 (8,9%) according to PHQ-9. 22 (8,9%) of the women presented with anxiety according to GAD-7. Respectively 23 (53,5%), 14 (66,6%) and 11 (50,0%) of those women also had a psychiatric disorder according to M.I.N.I. After 6 weeks only 7 (3%) women presented with depression according to EPDS and 6 (2,6%) according to PHQ-9. According to GAD-7 3 (1,3%) women had anxiety in the time of the second interview. Conclusion. This study shows that over 30% of the women who presented at the Riga Maternity hospital have had psychiatric disorders. Analyzing the depression and anxiety scales in the moment of the interview we can conclude that patients with previous psychiatric illnesses have higher rates of depression and anxiety symptoms. During the second interview there is a decline in both depression and anxiety symptoms. Kopsavilkums
Depresijas un trauksmes rādītāji sievietēm reprodukt īvajā vecumā ar psihiskām saslimšanām pēc dzemdībām Atslēgvārdi: psihiskas saslimšanas, grūtniecība, depresija, trauksme Ievads. Mentālās veselības problēmas perinatālajā period var ietekmēt gan mātes, gan bērna stāvokli. Šo traucējumu attīstībai ir vairāki riska faktori, no kuriem kā viens no svarīgākajiem jāmin iepriekšējas psihiskas saslimšanas. Mērķis. Noskaidrot psihisko saslimšanu biežumu sievietēm reproduktīvajā vecumā Rīgas Dzemdību nama pēcdzemdību nodaļā un izvērtēt viņu depresijas un trauksmes rādītājus palātā un 6 nedēļas pēc dzemdībām. Materi āli un metodes. Pētījumā tika iekļautas 235 sievietes, kas iestājās nodaļā laika posmā no 2017 gada 1. februāra līdz 31. decembrim. Datu ievākšana tika balstīta uz vispārīgās informācijas anketu, M.I.N.I (mini-international neuropsychiatric interview), EPDS (Edinburgas pēcdzemdību depresijas skalu), PHQ-9 (Patient Health Questionnaire) and GAD-7 (General Anxiety Disorder). Datu apstrāde tika veikta Microsoft Excel un IBM SPSS. Rezultāti. Kopā 75 (31,9%) sievietes uzrādīja psihisku saslimšanu intervijas brīdī vai pagātnē pēc M.I.N.I. rezultātiem. 43 (18,3%) sievietes uzrādīja paaugstinātus depresijas rādītājus pēc EPDS un 21 (8,9%) pēc PHQ-9. 22 (8,9%) sieviešu bija trauksme pēc GAD-7. Attiecīgi 23 (53,5%), 14 (66,6%) un 11 (50,0%) no šīm sievietēm bija arī psihiska saslimšana pēc M.I.N.I rezultātiem. Pēc 6 nedēļām tikai 7 (3%) sieviešu uzrādīja depresiju pēc EPDS un 6 (2,6%) pēc PHQ-9. Pēc GAD-7 3 (1,3%) sievietēm bija trauksme telefonintervijas laikā. Secinājumi. Šis pētījums parāda, ka apmēram 30% sieviešu ir sastapušās ar psihiskām saslimšanām. Analizējot depresijas un trauksmes rādītājus ir skaidrs, ka sievietēm ar psihiskām saslimšanām pagātnē ir vairāk paaugstināti depresijas un trauksmes rādītāji. Pēc 6 nedēļām sieviešu skaits ar paaugstinātiem depresijas un trauksmes rādītājiem ir krities.
Introduction Women of reproductive age frequently encounter psychiatric disorders connected with
depression and anxiety (Vesga-Lopez et al. 2008; Kessler et al. 2007). Around 18,4% of women
experience antepartum depression and around 19,2% - postpartum (Gavin et al. 2005).

DAUGAVPILS UNIVERSITĀTES 60. STARPTAUTISKĀS ZINĀTNISKĀS KONFERENCES PROCEEDINGS OF
RAKSTU KRĀJUMS THE 60th INTERNATIONAL SCIENTIFIC CONFERENCE OF DAUGAVPILS UNIVERSITY
409
Psychiatric disorders are known to be one of the major risk factors when it comes to
developing postpartum depression and other perinatal mood disorders (Falah-Hassani et al 2016). A
study shows that women who have had depressive episodes in the past are up to 20 times more
likely to develop postpartum depression (Silverman et al. 2017). Depression during pregnancy and
shortly after is a risk factor for mothers’ suicide (Lindahl et al. 2005). Disorders connected with
anxiety are also common – 21,7% of women experience them during the third trimester of
pregnancy and 11,1% 3 months after delivery (Borri et al. 2008; Reck et. al 2008).
Perinatal mood disorders affect both the mothers emotional and somatic state. They increase
the risk of different pregnancy, delivery and post-delivery complications as well as decreases
mothers overall somatic state and her ability to take care of the newborn. These disorders affect the
womans’ relationships with her partner as well as other support persons. The state of the mother
also affects the newborns biological and psychological profile and can be linked with future
development of psychiatric disorders in her offspring (Lundy et al. 1999).
To properly treat these disorders we must first assess the risk factors and gather a proper
anamnesis. These risk factors include information from both the womans’ life before conceiving
such as previous psychiatric and somatic illnesses (for example, depression, diabetes, outcomes of
previous pregnancies) as well as her state during the pregnancy – gestational diabetes, support from
her spouse and family, different complications and premature delivery and many more.
There are little studies done that focus on baby blues – a depressive state which affects
women for up to 2 weeks after pregnancy. Even less studies focus on the womans’ state while she
resides in the post-delivery ward. In this study done in the Riga Maternity Hospital post-delivery
ward shortly after delivery and an interview via phone 6 weeks after delivery the focus is on women
with previous psychiatric disorders and their depression and anxiety rates during these 2 interviews.
By looking at these rates the author hopes to see some improvements that could be made in the care
of these women.
Material and Methods
The data for this study was collected within Dr. Inta Barengos’ research ‘Saslimstība ar
grūtniecības un pēcdzemdību depresiju, tās atpazīstamība un riska faktoru profils Rīgas dzemdību
namā grūtniecības aprūpē uzņemtajām un dzemdējušajām sievietēm gada griezumā’. The data was
collected from 1st of February 2017 till 31st of December 2017 in the Riga Maternity Hospitals
post-delivery ward. All together data was collected from 235 women during the first interview.
From these 215 women responded to the second interview. The women included in the study were
older than 18, wanted to participate voluntarily and could answer the questions presented in the
interview. Data collection was based on an interview conducted in Latvian or Russian and consisted
of basic patient information, M.I.N.I version 6.0 (mini neuropsychiatric interview) – to assess previous
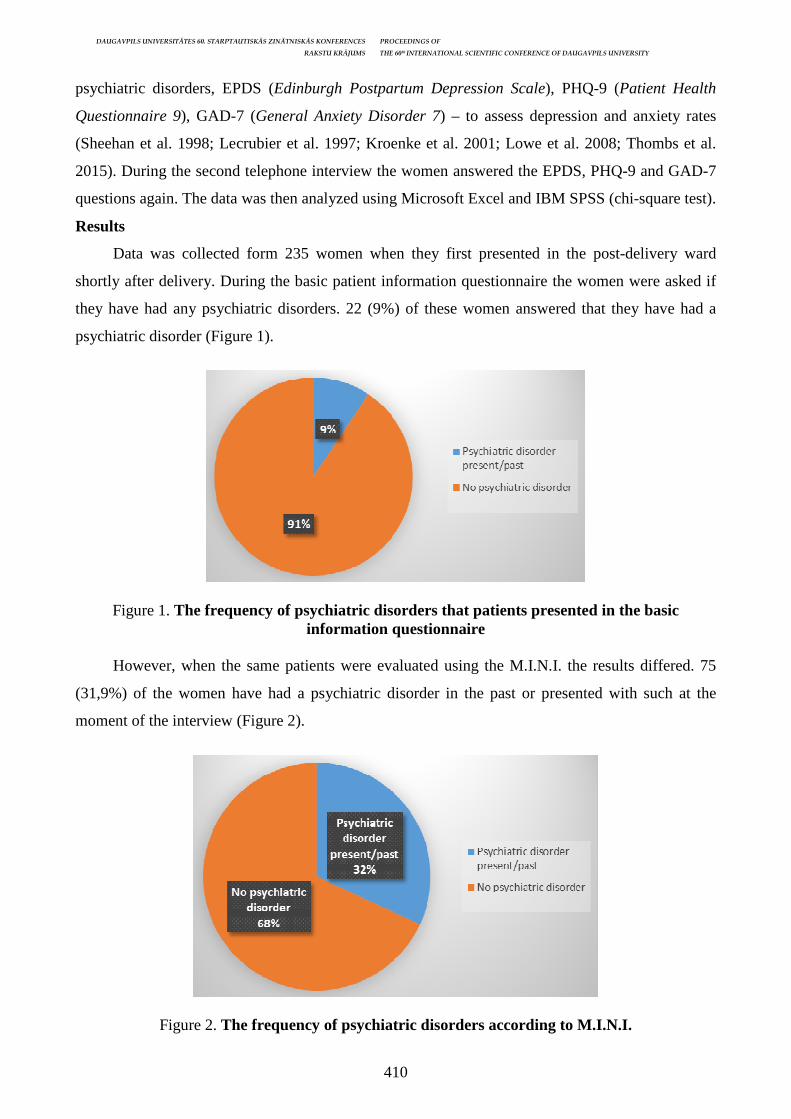
DAUGAVPILS UNIVERSITĀTES 60. STARPTAUTISKĀS ZINĀTNISKĀS KONFERENCES PROCEEDINGS OF
RAKSTU KRĀJUMS THE 60th INTERNATIONAL SCIENTIFIC CONFERENCE OF DAUGAVPILS UNIVERSITY
410
psychiatric disorders, EPDS (Edinburgh Postpartum Depression Scale), PHQ-9 (Patient Health
Questionnaire 9), GAD-7 (General Anxiety Disorder 7) – to assess depression and anxiety rates
(Sheehan et al. 1998; Lecrubier et al. 1997; Kroenke et al. 2001; Lowe et al. 2008; Thombs et al.
2015). During the second telephone interview the women answered the EPDS, PHQ-9 and GAD-7
questions again. The data was then analyzed using Microsoft Excel and IBM SPSS (chi-square test).
Results
Data was collected form 235 women when they first presented in the post-delivery ward
shortly after delivery. During the basic patient information questionnaire the women were asked if
they have had any psychiatric disorders. 22 (9%) of these women answered that they have had a
psychiatric disorder (Figure 1).
Figure 1. The frequency of psychiatric disorders that patients presented in the basic information questionnaire
However, when the same patients were evaluated using the M.I.N.I. the results differed. 75
(31,9%) of the women have had a psychiatric disorder in the past or presented with such at the
moment of the interview (Figure 2).
Figure 2. The frequency of psychiatric disorders according to M.I.N.I.

DAUGAVPILS UNIVERSITĀTES 60. STARPTAUTISKĀS ZINĀTNISKĀS KONFERENCES PROCEEDINGS OF
RAKSTU KRĀJUMS THE 60th INTERNATIONAL SCIENTIFIC CONFERENCE OF DAUGAVPILS UNIVERSITY
411
If we look at the separate data from the M.I.N.I. then 17,4% (41) of the patients have had or
had depression at the moment of the interview, 8,1% (19) obsessive compulsive disorder, 6,4% (15)
social phobia. Other disorders where less common. Only 2,6% (6) patients had generalized anxiety
disorder (Table 1). Many of the women presented with more than one psychiatric disorder,
Table 1. Psychiatric disorders according to M.I.N.I.
Responses Percent from patients who
presented with a psychiatric disorder
Patients with psychiatric disorder
Percent from all psychiatric disorders
evaluated Depression 41 32,5% 54,7% Mania 3 2,4% 4,0% Hypomania 9 7,1% 12,0% Panic disorder with agoraphobia 5 4,0% 6,7% Panic disorder without agoraphobia 1 0,8% 1,3% Agoraphobia without panic disorder 13 10,3% 17,3% Social phobia 15 11,9% 20,0% Obsessive compulsive disorder 19 15,1% 25,3% Post-traumatic stress disorder 3 2,4% 4,0% Alcoholism 1 0,8% 1,3% Psychotic disorder 5 4,0% 6,7% Mood disorders with psychotic symptoms 4 3,2% 5,3% Bulimia 1 0,8% 1,3% Generalized anxiety disorder 6 4,8% 8,0% Sum 126 100,0% 168%
As seen in the table more than half of the women (55% of all psychiatric disorders) that have
had a psychiatric disorder have had depression.
If we look at the depression and anxiety scale results (Figure 3) during the first interview we
can see:
• EPDS – 43 (18,3%) patients presented with depression, 192 (81,7%) – without,
• PHQ-9 – 21 (8,9%) with depression, 214 (91,1%) – without,
• GAD-7 – 22 (9,4%) with anxiety, 213 (90,6%) – without.
Figure 3. Results of depression and anxiety scales during the 1st interview
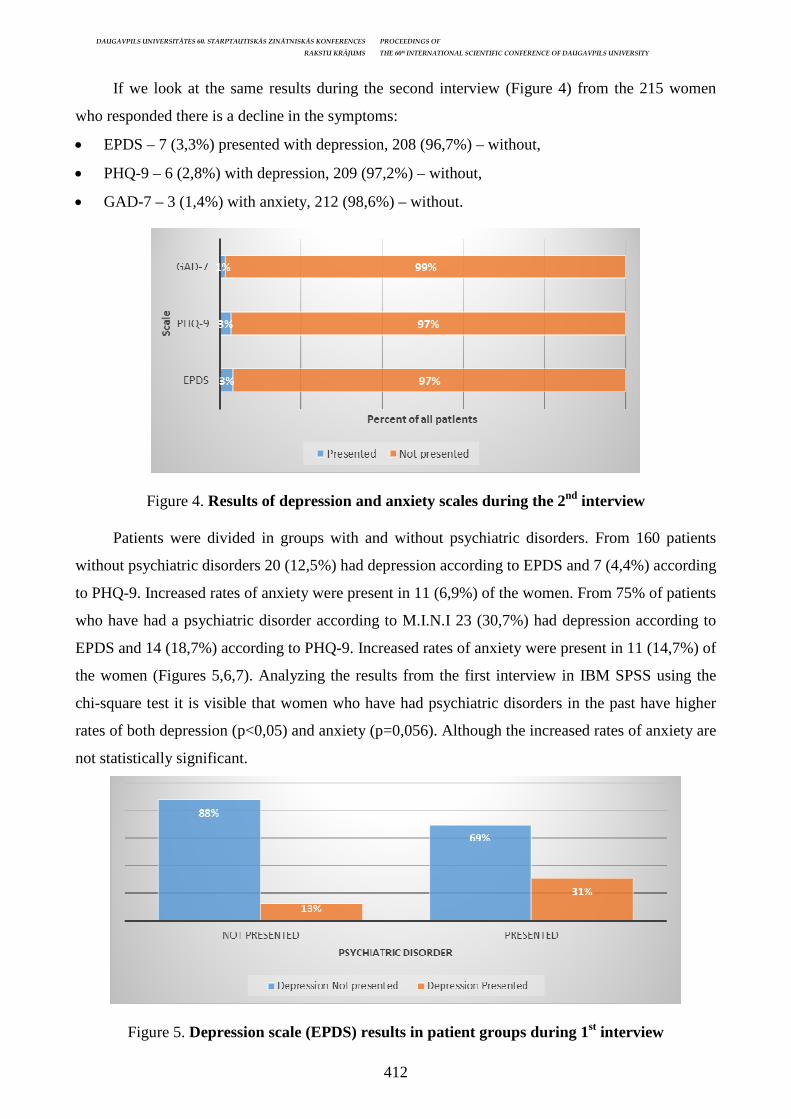
DAUGAVPILS UNIVERSITĀTES 60. STARPTAUTISKĀS ZINĀTNISKĀS KONFERENCES PROCEEDINGS OF
RAKSTU KRĀJUMS THE 60th INTERNATIONAL SCIENTIFIC CONFERENCE OF DAUGAVPILS UNIVERSITY
412
If we look at the same results during the second interview (Figure 4) from the 215 women
who responded there is a decline in the symptoms:
• EPDS – 7 (3,3%) presented with depression, 208 (96,7%) – without,
• PHQ-9 – 6 (2,8%) with depression, 209 (97,2%) – without,
• GAD-7 – 3 (1,4%) with anxiety, 212 (98,6%) – without.
Figure 4. Results of depression and anxiety scales during the 2nd interview
Patients were divided in groups with and without psychiatric disorders. From 160 patients
without psychiatric disorders 20 (12,5%) had depression according to EPDS and 7 (4,4%) according
to PHQ-9. Increased rates of anxiety were present in 11 (6,9%) of the women. From 75% of patients
who have had a psychiatric disorder according to M.I.N.I 23 (30,7%) had depression according to
EPDS and 14 (18,7%) according to PHQ-9. Increased rates of anxiety were present in 11 (14,7%) of
the women (Figures 5,6,7). Analyzing the results from the first interview in IBM SPSS using the
chi-square test it is visible that women who have had psychiatric disorders in the past have higher
rates of both depression (p<0,05) and anxiety (p=0,056). Although the increased rates of anxiety are
not statistically significant.
Figure 5. Depression scale (EPDS) results in patient groups during 1st interview
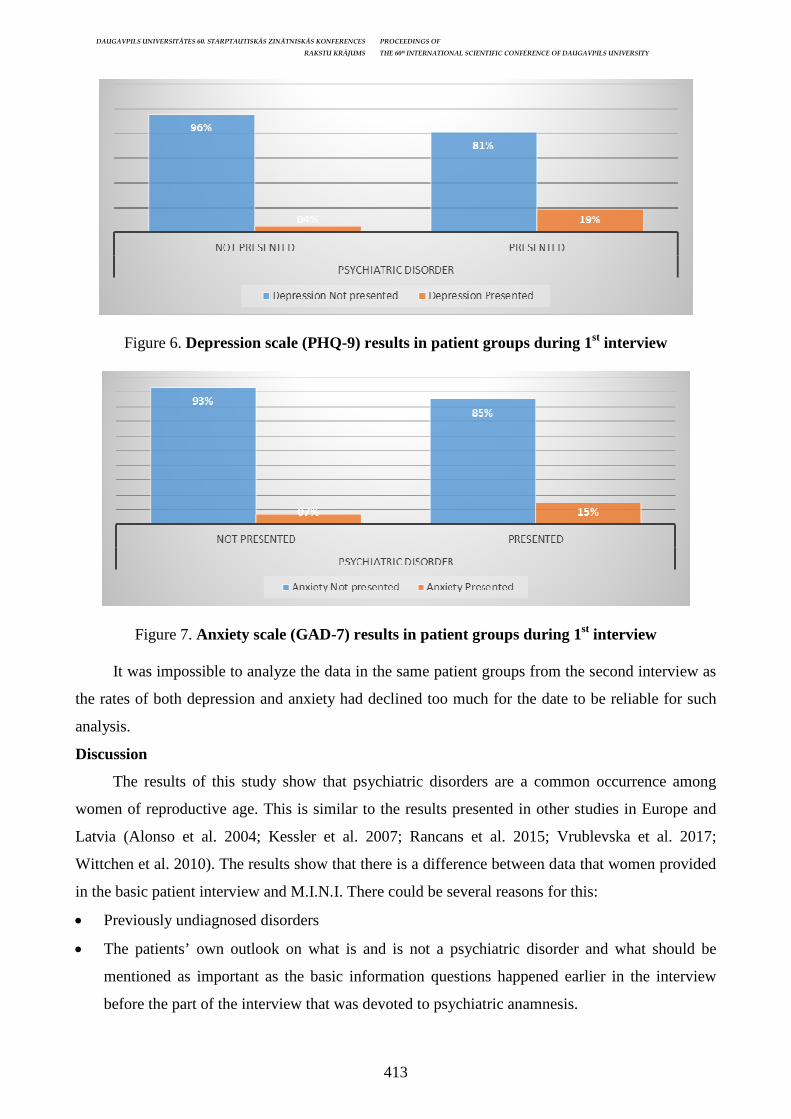
DAUGAVPILS UNIVERSITĀTES 60. STARPTAUTISKĀS ZINĀTNISKĀS KONFERENCES PROCEEDINGS OF
RAKSTU KRĀJUMS THE 60th INTERNATIONAL SCIENTIFIC CONFERENCE OF DAUGAVPILS UNIVERSITY
413
Figure 6. Depression scale (PHQ-9) results in patient groups during 1st interview
Figure 7. Anxiety scale (GAD-7) results in patient groups during 1st interview
It was impossible to analyze the data in the same patient groups from the second interview as
the rates of both depression and anxiety had declined too much for the date to be reliable for such
analysis.
Discussion
The results of this study show that psychiatric disorders are a common occurrence among
women of reproductive age. This is similar to the results presented in other studies in Europe and
Latvia (Alonso et al. 2004; Kessler et al. 2007; Rancans et al. 2015; Vrublevska et al. 2017;
Wittchen et al. 2010). The results show that there is a difference between data that women provided
in the basic patient interview and M.I.N.I. There could be several reasons for this:
• Previously undiagnosed disorders
• The patients’ own outlook on what is and is not a psychiatric disorder and what should be
mentioned as important as the basic information questions happened earlier in the interview
before the part of the interview that was devoted to psychiatric anamnesis.
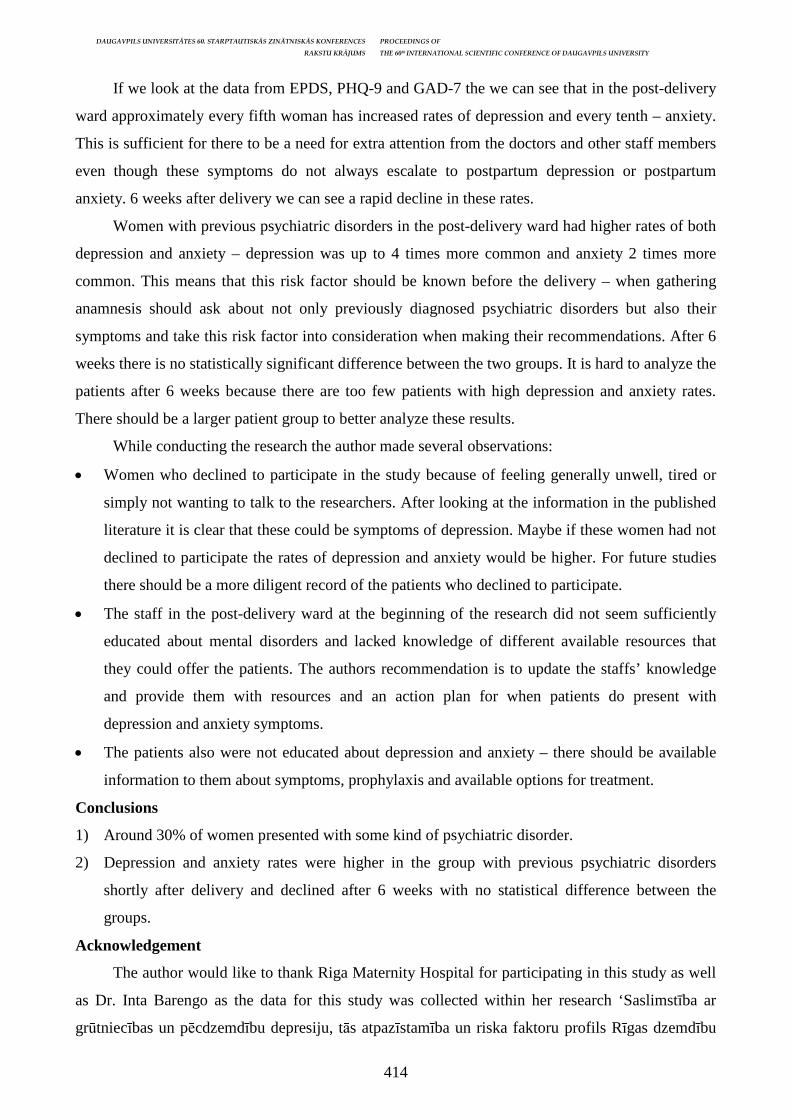
DAUGAVPILS UNIVERSITĀTES 60. STARPTAUTISKĀS ZINĀTNISKĀS KONFERENCES PROCEEDINGS OF
RAKSTU KRĀJUMS THE 60th INTERNATIONAL SCIENTIFIC CONFERENCE OF DAUGAVPILS UNIVERSITY
414
If we look at the data from EPDS, PHQ-9 and GAD-7 the we can see that in the post-delivery
ward approximately every fifth woman has increased rates of depression and every tenth – anxiety.
This is sufficient for there to be a need for extra attention from the doctors and other staff members
even though these symptoms do not always escalate to postpartum depression or postpartum
anxiety. 6 weeks after delivery we can see a rapid decline in these rates.
Women with previous psychiatric disorders in the post-delivery ward had higher rates of both
depression and anxiety – depression was up to 4 times more common and anxiety 2 times more
common. This means that this risk factor should be known before the delivery – when gathering
anamnesis should ask about not only previously diagnosed psychiatric disorders but also their
symptoms and take this risk factor into consideration when making their recommendations. After 6
weeks there is no statistically significant difference between the two groups. It is hard to analyze the
patients after 6 weeks because there are too few patients with high depression and anxiety rates.
There should be a larger patient group to better analyze these results.
While conducting the research the author made several observations:
• Women who declined to participate in the study because of feeling generally unwell, tired or
simply not wanting to talk to the researchers. After looking at the information in the published
literature it is clear that these could be symptoms of depression. Maybe if these women had not
declined to participate the rates of depression and anxiety would be higher. For future studies
there should be a more diligent record of the patients who declined to participate.
• The staff in the post-delivery ward at the beginning of the research did not seem sufficiently
educated about mental disorders and lacked knowledge of different available resources that
they could offer the patients. The authors recommendation is to update the staffs’ knowledge
and provide them with resources and an action plan for when patients do present with
depression and anxiety symptoms.
• The patients also were not educated about depression and anxiety – there should be available
information to them about symptoms, prophylaxis and available options for treatment.
Conclusions
1) Around 30% of women presented with some kind of psychiatric disorder.
2) Depression and anxiety rates were higher in the group with previous psychiatric disorders
shortly after delivery and declined after 6 weeks with no statistical difference between the
groups.
Acknowledgement
The author would like to thank Riga Maternity Hospital for participating in this study as well
as Dr. Inta Barengo as the data for this study was collected within her research ‘Saslimstība ar
grūtniecības un pēcdzemdību depresiju, tās atpazīstamība un riska faktoru profils Rīgas dzemdību
DAUGAVPILS UNIVERSITĀTES 60. STARPTAUTISKĀS ZINĀTNISKĀS KONFERENCES PROCEEDINGS OF
RAKSTU KRĀJUMS THE 60th INTERNATIONAL SCIENTIFIC CONFERENCE OF DAUGAVPILS UNIVERSITY
415
namā grūtniecības aprūpē uzņemtajām un dzemdējušajām sievietēm gada griezumā’. Prof. Elmars
Rancans was supervising the authors work for a part of this research.
There was no conflict of interest during this study.
References Alonso, J., Angermeyer, M., Bernert, S., Bruffaerts, R., Brugha, T. et. al. 2004. Prevalence of mental disorders in Europe: results from the European Study of the Epidemiology of Mental Disorders (ESEMeD) project. Acta Psychiatrica Scandinavica. Vol: 109 (s420) pp: 21–27. Available from: doi: 10.1111/j.1600-0047.2004.00327.x [viewed 23.03.2018] Borri, C., Mauri, M., Oppo, A. et al. 2008. Axis I psychopathology and functional impairment at the third month of pregnancy: Results from the Perinatal Depression-Research and Screening Unit (PND-ReScU) study. Journal of Clinical Psychiatry. Oct; 69(10): 1617–24. Available from: PMID:19192445 [viewed 23.03.2018] Falah-Hassani, K., Shiri, R., Dennis, C.L. 2016. Prevalence and risk factors for comorbid postpartum depressive symptomatology and anxiety. Journal of Affective disorders. Vol. 198. pp. 142–147. Clinical Key. Available from: https://www-clinicalkey-com.db.rsu.lv/#!/content/ journal/1-s2.0-S0165032715303839 [viewed 23.03.2018] Gavin, N. I., Gaynes, B. N., Lohr, K. N, Meltzer-Brody, S., Gartlehner, G., Swinson T. 2005. Perinatal depression: a systematic review of prevalence and incidence. Obstetrics Gynecology. Nov; 106(5 Pt 1): 1071–83. Available from: doi: 10.1097/01.AOG.0000183597.31630.db [viewed 23.03.2018] Kessler, R., Aguilar-Gaxiola, S., Alonso, J., Chatterji, S., Lee, S. et. al. 2009. The global burden of mental disorders: an update from the WHO World Mental Health (WMH) surveys. Epidemiologia e psichiatria sociale. Vol. 18 (1), pp. 23–33. Available from ISSN 1121-189X PMID 19378696 [viewed 23.03.2018] Kessler, R.C., et al. 2007. Lifetime prevalence and age-of-onset distributions of mental disorders in the World Health Organization's World Mental Health Survey Initiative. World Psychiatry. Oct; 6(3): 168–176. [viewed 23.03.2018] Lecrubier Y, Sheehan D, Weiller E, Amorim P, Bonora I. et al. 1997. The Mini International Neuropsychiatric Interview (MINI). A short diagnostic structured interview: reliability and validity according to the CIDI. European Psychiatry. Vol. 12 (5), pp. 224–231. Available from: doi: 10.1016/S0924-9338(97)83296-8 [viewed 23.03.2018] Lindahl, V., Pearson, J.L., Colpe, L. 2005. Prevalence of suicidality during pregnancy and the postpartum. Womens Mental Health. Jun; 8(2): 77–87. Available from: doi: 10.1007/s00737-005-0080-1 [viewed 23.03.2018] Löwe B, Decker O, Müller S, Brähler E, Schellberg D et al. 2008. Validation and Standardization of the Generalized Anxiety Disorder Screener (GAD-7) in the General Population. Medical Care. Vol. 46(3), pp. 266–274. Available from: doi: 10.1097/MLR.0b013e318160d093. [viewed 23.03.2018] Lundy, B., Jones, N., Field, T., Nearing, G., Davalos, M. et al. 1999. Prenatal depression effects on neonates. Infant Behavior and Development. Vol. 22 (1), 119–129. Available from: doi: 10.1016/S0163-6383(99)80009-5 [viewed 23.03.2018] Rancāns, Vrublevska, J., Kivite, A., Ivanovs, R., Logins, R., Berze, L. 2015. Prevalence of depression in primary care settings in Latvia – the results of the National Research Project BIOMEDICINE. Poster. Reck, C., Struben, K., Backenstrass, M., Stefenelli, U., Reinig, K., Fuchs, T., Sohn, C., Mundt, C. 2008. Prevalence, onset and comorbidity of postpartum anxiety and depressive disorders. Acta psychiatrica scandinavica. Dec; 118(6): 459–68. Available from: doi: 10.1111/j.1600-0447.2008.01264.x [viewed 23.03.2018] Sheehan, D. V., Lecrubier, Y., Sheehan, K. H., Amorim, P., Janavs, J., Weiller, E., Hergueta, T., Baker, R., Dunbar, G. C. 1998 The Mini-International Neuropsychiatric Interview (M.I.N.I.): the development and validation of a structured diagnostic psychiatric interview for DSM-IV and ICD-

DAUGAVPILS UNIVERSITĀTES 60. STARPTAUTISKĀS ZINĀTNISKĀS KONFERENCES PROCEEDINGS OF
RAKSTU KRĀJUMS THE 60th INTERNATIONAL SCIENTIFIC CONFERENCE OF DAUGAVPILS UNIVERSITY
416
10. Journal of Clinical Psychiatry. Suppl 20: 22–33 Available from: ISSN: 0160-6689 [viewed 23.03.2018] Silverman, M. E., Reichenberg, A., Savitz, D. A., Cnattingius, S., Lichtenstein, P., Hultman, C. M., Larsson, H., Sandin, S. 2017. The risk factors for postpartum depression: A population-based study. Depresion Anxiety. Feb; 34(2): 178–187. Available from: doi: 10.1002/da.22597. [viewed 23.03.2018] Thombs, B., Benedetti, A., Kloda, L., Levis, B., Riehm, K. et al. 2015. Diagnostic accuracy of the Edinburgh Postnatal Depression Scale (EPDS) for detecting major depression in pregnant and postnatal women: protocol for a systematic review and individual patient data meta-analyses. BMJ Open. 5(10), pp. e009742. Available from: doi: 10.1136/bmjopen-2015-009742 [viewed 23.03.2018] Vesga-López, O., Blanco C, Keyes K, Olfson M, Grant BF, Hasin DS 2008. Psychiatric disorders in pregnant and postpartum women in the United States. Arch Gen Psychiatry. Jul; 65(7): 805–15. Available from: doi: 10.1001/archpsyc.65.7.805. [viewed 23.03.2018.] Vrublevska, J., Trapencieris, M., Rancans, E. 2017. Adaptation and validation of the Patient Health Questionnaire-9 to evaluate major depression in a primary care sample in Latvia. Nordic Journal of Psychiatry Available from: doi: 10.1080/08039488.2017.1397191 [viewed 29.03.2018] Wittchen, H.U., Jacobi, F., Rehm, J., Gustavsson, A., Svensson, M., Jönsson, B., Olesen, J., Allgulander, C., Alonso, J., Faravelli C., Fratiglioni, L., Jennum, P., Lieb, R., Maercker, A., van Os, J., Preisig, M., Salvador-Carulla, L., Simon, R., Steinhausen, H. C. 2011. The size and burden of mental disorders and other disorders of the brain in Europe 2010. European Neuropsychofarmacology. 21, 655–679. Available from: doi: 10.1016/j.euroneuro.2011.07.018.
[viewed 29.03.2018]
DAUGAVPILS UNIVERSITĀTES 60. STARPTAUTISKĀS ZINĀTNISKĀS KONFERENCES PROCEEDINGS OF
RAKSTU KRĀJUMS THE 60th INTERNATIONAL SCIENTIFIC CONFERENCE OF DAUGAVPILS UNIVERSITY
417
A RARE CASE OF N. PERONEUS DAMAGE AS A COMPLICATION OF BIRTH INJURY
Liene Rucka1, Santa Smilga1, Sandija Skribāne1, Ilze Meldere2 1 Riga Stradiņš University, Dzirciema Street 16, Riga, [email protected], [email protected], [email protected] 2 Children’s Clinical University Hospital, Neonatal intensive care unit, Vienibas gatve 45, [email protected] Abstract
A rare case of n. peroneus damage as a complication of birth injury Key Words: peroneal nerve injury, birth trauma, iatrogenic, thrombosis, breech extraction Introduction. Neurological injuries during labor may occur because of traction, compression or vascular injury. Compression or traction can result in compromised perineural blood flow and resulting ischemia, which can cause focal demyelination and conduction block. N. peroneus injury due to compression during the labor is a rare complication and typically is associated with an instrument-assisted delivery or prolonged time spent in a certain position. N. peroneus injury may result in foot drop and diminished sensation on the dorsum of the foot. Most of the nerve injuries spontaneously resolve, but in more serious cases it can cause permanent impairment of nerve function. Case presentation. Male infant was born as second twin at 25th week of gestation. Internal rotation of the fetus and breech extraction was done (i.e. feet are grasped by the operator and the fetus is extracted from the uterine cavity through the vagina). Afterwards the patient had an edema and extensive subcutaneous hematomas on the right hand, corpus and legs. Cyanosis and necrosis was observed on the right foot and toes during the first day. Diagnosis of thrombosis was considered, but amputation as a treatment option was not made due to patient’s overall condition. At the age of one month a difference in length of both legs, as well as contracture of the right ankle joint and internal rotation of the right leg was seen, indicating a damaged n. peroneus. A treatment was started with cast immobilization and continued with orthosis. Conclusions. Internal rotation and extraction can be traumatic and cause n. peroneus injury during the delivery. Infants born before 37th week of gestation are in the risk group for birth injuries. Kopsavilkums
N.peroneus bojājums kā dzemdību trauma – rets klīniskais gadījums Atslēgvārdi: peroneālā nerva bojājums, dzemdību trauma, jatrogēns, tromboze, augļa ekstrakcija tūpļa guļā Ievads. Neiroloģiski bojājumi dzemdību laikā var rasties trakcijas, kompresijas un vaskulāra bojājuma dēļ. Kompresija vai trakcija var izraisīt traucētu perineirālo asins plūsmu, kā rezultātā attīstās išēmija, kas var radīt fokālu demielinizāciju un vadīšanas bloku. Kompresijas izraisīts n. peroneus bojājums ir reti sastopama dzemdību trauma un tipiski ir saistīta instrumentālām dzemdībām vai ilgstoši pavadītu laiku vienā pozīcijā. Šis bojājums var izpausties kā krītošā pēda un samazināta jušana pēdas dorsālajā daļā. Lielākā daļā gadījumu notiek spontāna izveseļošanās, bet sarežģītākos gadījumos bojājums var izraisīt paliekošus nerva funkcijas traucējumus. Kl īniskā gadījuma apraksts. Zēns – dzimis 25. gestācijas nedēļā kā otrais dvīnis. Dzemdību laikā tika veikta augļa iekšējā rotācija un ekstrakcija tūpļa guļā (t.i. dzemdību speciālists satver augli aiz kājām un izvelk no dzemdes dobuma caur dabīgiem dzemdību ceļiem). Pēc dzemdībām uz pacienta labās rokas, ķermeņa un kājām bija vērojama tūska un plašas zemādas hematomas. Pirmajā dzīves dienā novēroja labās pēdas un pirkstu cianozi un nekrozi. Tika apsvērta trombozes diagnozes varbūtība, taču tās terapija (t.i. pēdas amputācija) netika veikta pacienta vispārēji smagā veselības stāvokļa dēļ. Viena mēneša vecumā novēroja kāju garuma atšķirību, kontraktūru labās potītes rajonā, kā arī labās kājas esamību iekšējās rotācijas stāvoklī, kas apstiprināja n. peroneus bojājumu. Tika uzsākta terapija ar ģipša imobilizāciju un ortozēm. Secinājumi. Iekšēja rotācija un augļa ekstrakcija dzemdību laikā var būt traumatiska un izraisīt n. peroneus bojājumu. Jaundzimušie, kad dzimuši pirms 37. gestācijas nedēļas ir riska grupā attiecībā uz dzemdību traumām.
Introduction
The incidence of birth injuries is approximately 2% for singleton vaginal deliveries of fetuses
in a cephalic position, and approximately 1.1% for cesarean deliveries. Usually macrosomia of the
fetus is associated with several birth injuries, like brachial plexus palsy, but it mostly causes injuries
in the upper part of the body. In case of lower extremity nerve traumas – abnormal fetal
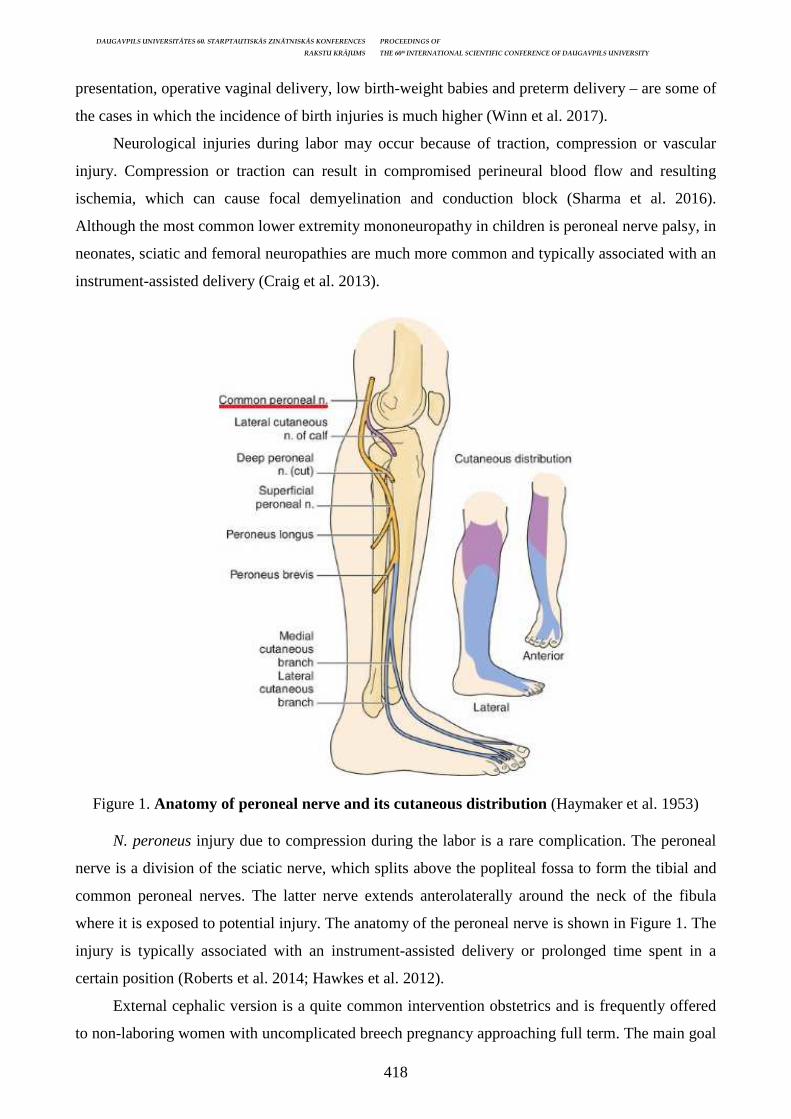
DAUGAVPILS UNIVERSITĀTES 60. STARPTAUTISKĀS ZINĀTNISKĀS KONFERENCES PROCEEDINGS OF
RAKSTU KRĀJUMS THE 60th INTERNATIONAL SCIENTIFIC CONFERENCE OF DAUGAVPILS UNIVERSITY
418
presentation, operative vaginal delivery, low birth-weight babies and preterm delivery – are some of
the cases in which the incidence of birth injuries is much higher (Winn et al. 2017).
Neurological injuries during labor may occur because of traction, compression or vascular
injury. Compression or traction can result in compromised perineural blood flow and resulting
ischemia, which can cause focal demyelination and conduction block (Sharma et al. 2016).
Although the most common lower extremity mononeuropathy in children is peroneal nerve palsy, in
neonates, sciatic and femoral neuropathies are much more common and typically associated with an
instrument-assisted delivery (Craig et al. 2013).
Figure 1. Anatomy of peroneal nerve and its cutaneous distribution (Haymaker et al. 1953)
N. peroneus injury due to compression during the labor is a rare complication. The peroneal
nerve is a division of the sciatic nerve, which splits above the popliteal fossa to form the tibial and
common peroneal nerves. The latter nerve extends anterolaterally around the neck of the fibula
where it is exposed to potential injury. The anatomy of the peroneal nerve is shown in Figure 1. The
injury is typically associated with an instrument-assisted delivery or prolonged time spent in a
certain position (Roberts et al. 2014; Hawkes et al. 2012).
External cephalic version is a quite common intervention obstetrics and is frequently offered
to non-laboring women with uncomplicated breech pregnancy approaching full term. The main goal
DAUGAVPILS UNIVERSITĀTES 60. STARPTAUTISKĀS ZINĀTNISKĀS KONFERENCES PROCEEDINGS OF
RAKSTU KRĀJUMS THE 60th INTERNATIONAL SCIENTIFIC CONFERENCE OF DAUGAVPILS UNIVERSITY
419
of this procedure is to reduce the need for caesarean section without increasing perinatal morbidity.
(Hofmeyr et al. 2000; Nassar et al. 2006). Twin pregnancy is considered as a complicated delivery
and external cephalic version is contraindicated in this case. A compulsory precondition for vaginal
delivery in twin pregnancy is the first fetus to be in cephalic presentation. Internal podalic version
with breech extraction is an obstetric procedure during labor where the fetus is turned within the
uterus such that one or both feet present through the cervix during the delivery. It is used most often
in cases where the fetus lies transversely or in breech position (Cornette et al. 2018).
It is known that trauma and compression account are the main reasons of peripheral nerve
palsies in neonates, although other significant factors should be taken in consideration. These
factors include viral infection, ischemia and demyelinating disease which can all occur in-utero with
nerve palsy being present at birth (Roberts et al. 2014).
Peroneal nerve injury may result in foot drop and diminished sensation on the dorsum of the
foot. The recovery is variable and it depends on the length of time of nerve compression which is
unpredictable. Most of the nerve injuries spontaneously resolve, but in more serious cases it can
cause permanent impairment of nerve function (Roberts et al. 2014).
Case report description
A male infant was born at 25 weeks of gestation as a second twin with a birth-weight of 720
grams. Due to the fact that the fetus was in breech position – internal rotation (i.e. internal podalic
version) of the fetus and breech extraction was done. The Apgar’s score was 2/3/4 (i.e. 1, 5 and 10
minutes after birth), therefore primary neonatal resuscitation was done. After stabilizing the
newborn and transferring him to Neonatal Intensive Care Unit (NICU) edema and extensive
subcutaneous hematomas on the right hand, corpus and legs were observed.
During the first day of life cyanosis and necrosis on the right foot and toes developed (Fig. 2).
For the following days the patient was hemodynamically instable and was under mechanical
ventilation. He was also diagnosed with metabolic disorders, persistent ductus arteriosus, he had
various seizures and apnea episodes.
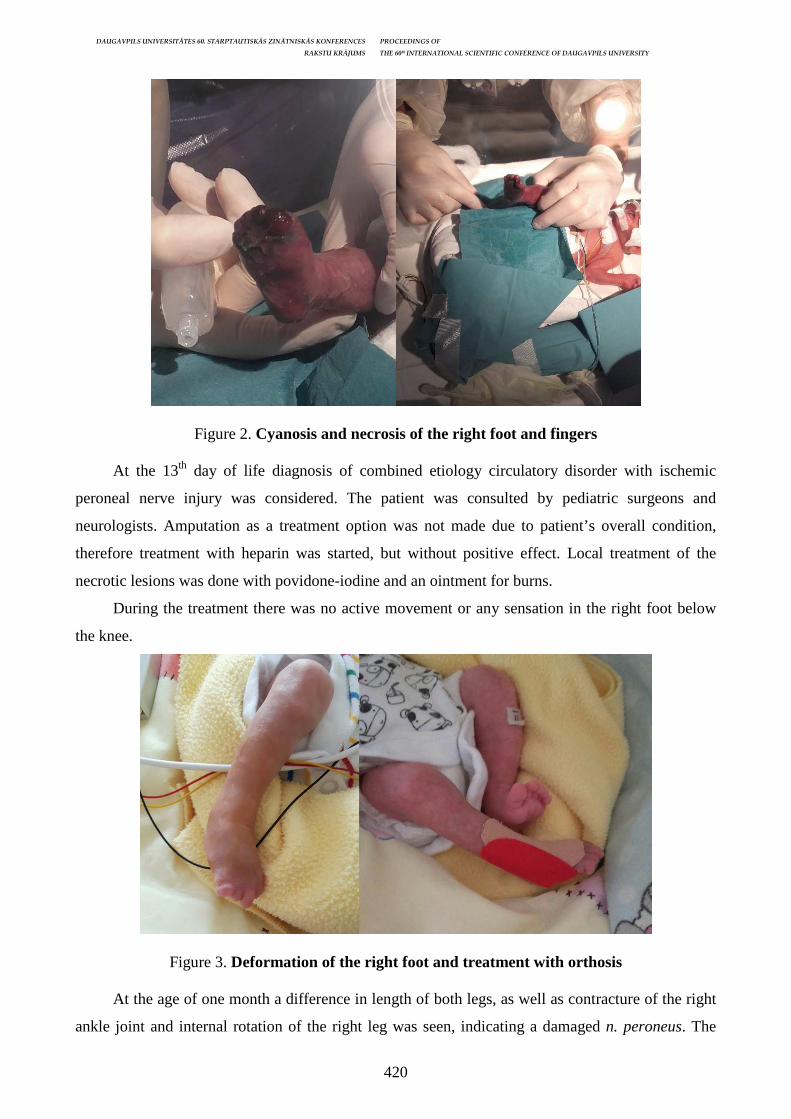
DAUGAVPILS UNIVERSITĀTES 60. STARPTAUTISKĀS ZINĀTNISKĀS KONFERENCES PROCEEDINGS OF
RAKSTU KRĀJUMS THE 60th INTERNATIONAL SCIENTIFIC CONFERENCE OF DAUGAVPILS UNIVERSITY
420
Figure 2. Cyanosis and necrosis of the right foot and fingers
At the 13th day of life diagnosis of combined etiology circulatory disorder with ischemic
peroneal nerve injury was considered. The patient was consulted by pediatric surgeons and
neurologists. Amputation as a treatment option was not made due to patient’s overall condition,
therefore treatment with heparin was started, but without positive effect. Local treatment of the
necrotic lesions was done with povidone-iodine and an ointment for burns.
During the treatment there was no active movement or any sensation in the right foot below
the knee.
Figure 3. Deformation of the right foot and treatment with orthosis
At the age of one month a difference in length of both legs, as well as contracture of the right
ankle joint and internal rotation of the right leg was seen, indicating a damaged n. peroneus. The
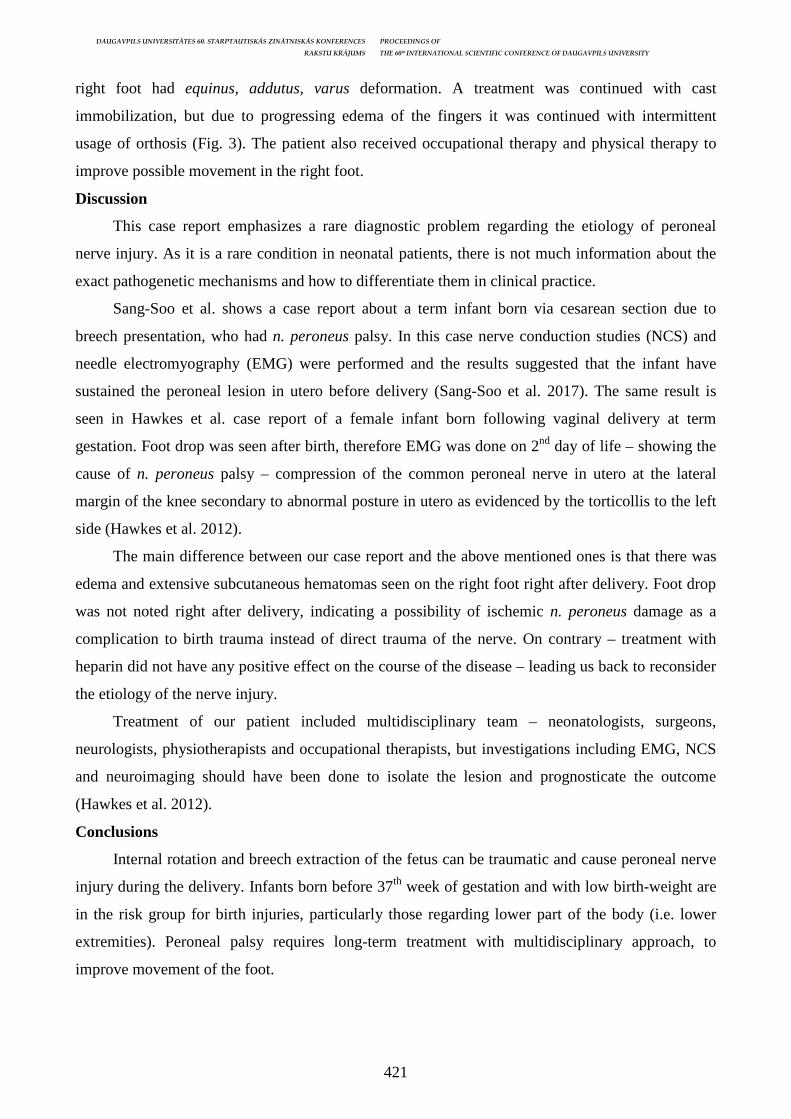
DAUGAVPILS UNIVERSITĀTES 60. STARPTAUTISKĀS ZINĀTNISKĀS KONFERENCES PROCEEDINGS OF
RAKSTU KRĀJUMS THE 60th INTERNATIONAL SCIENTIFIC CONFERENCE OF DAUGAVPILS UNIVERSITY
421
right foot had equinus, addutus, varus deformation. A treatment was continued with cast
immobilization, but due to progressing edema of the fingers it was continued with intermittent
usage of orthosis (Fig. 3). The patient also received occupational therapy and physical therapy to
improve possible movement in the right foot.
Discussion
This case report emphasizes a rare diagnostic problem regarding the etiology of peroneal
nerve injury. As it is a rare condition in neonatal patients, there is not much information about the
exact pathogenetic mechanisms and how to differentiate them in clinical practice.
Sang-Soo et al. shows a case report about a term infant born via cesarean section due to
breech presentation, who had n. peroneus palsy. In this case nerve conduction studies (NCS) and
needle electromyography (EMG) were performed and the results suggested that the infant have
sustained the peroneal lesion in utero before delivery (Sang-Soo et al. 2017). The same result is
seen in Hawkes et al. case report of a female infant born following vaginal delivery at term
gestation. Foot drop was seen after birth, therefore EMG was done on 2nd day of life – showing the
cause of n. peroneus palsy – compression of the common peroneal nerve in utero at the lateral
margin of the knee secondary to abnormal posture in utero as evidenced by the torticollis to the left
side (Hawkes et al. 2012).
The main difference between our case report and the above mentioned ones is that there was
edema and extensive subcutaneous hematomas seen on the right foot right after delivery. Foot drop
was not noted right after delivery, indicating a possibility of ischemic n. peroneus damage as a
complication to birth trauma instead of direct trauma of the nerve. On contrary – treatment with
heparin did not have any positive effect on the course of the disease – leading us back to reconsider
the etiology of the nerve injury.
Treatment of our patient included multidisciplinary team – neonatologists, surgeons,
neurologists, physiotherapists and occupational therapists, but investigations including EMG, NCS
and neuroimaging should have been done to isolate the lesion and prognosticate the outcome
(Hawkes et al. 2012).
Conclusions
Internal rotation and breech extraction of the fetus can be traumatic and cause peroneal nerve
injury during the delivery. Infants born before 37th week of gestation and with low birth-weight are
in the risk group for birth injuries, particularly those regarding lower part of the body (i.e. lower
extremities). Peroneal palsy requires long-term treatment with multidisciplinary approach, to
improve movement of the foot.
DAUGAVPILS UNIVERSITĀTES 60. STARPTAUTISKĀS ZINĀTNISKĀS KONFERENCES PROCEEDINGS OF
RAKSTU KRĀJUMS THE 60th INTERNATIONAL SCIENTIFIC CONFERENCE OF DAUGAVPILS UNIVERSITY
422
References Cornette J. M. J. Internal Podalic Version and Breech Extraction: Enhancing Realistic Sensations in a Simulation Model. Obstetrics & Gynecology: February 2018, Volume 131, Issue 2, pp. 360–363. Craig A. Entrapment neuropathies of the lower extremity. PM R. 2013; 5(5) (Suppl): S31–S40. Daren R. J., Svigos J. M. 2014. Neonatal nerve palsies: a contemporary obstetric perspective. Bali Medical Journal. 3. 10.15562/bmj.v3i2.73. Hawkes C. P., McNamara B., O’Mahony O. 2012. Your diagnosis? Congenital foot drop. Eur J Pediatr. Haymaker W., Woodhall B. 1953. Peripheral Nerve Injuries: Principles of Diagnosis. Philadelphia, WB Saunders. DOI 10.1007/s00431-012-1837-y Hofmeyr G. J., Kulier R. External cephalic version for breech presentation at term. Cochrane Database Syst Rev 2000; 2: CD000083. Kamath A. A., Mathur A., Limbrick D. 2017. Youmans and Winn Neurological Surgery. Elsevier; Ed 7. Nassar N., Roberts C. L., Barratt A. Systematic review of adverse outcomes of external cephalic version and persistent breech presentation at full term. Paediatr Perinat Epidemiol 2006; 20: 163–71. doi: 10.1111/j.1365-3016.2006.00702.x Sang-Soo L., Ji-Yun S., Mi-Jung K. A case of neonatal peroneal neuropathy with intrauterine onset. Korean J Pediatr. 2007 Jun; 50(6): 585–587. Sharma A. 2016. A Practical Guide to Third Trimester of Pregnancy & Puerperium. Nerve injuries. Jaypee Brothers Medical Pub; Ed 1, p. 214.

DAUGAVPILS UNIVERSITĀTES 60. STARPTAUTISKĀS ZINĀTNISKĀS KONFERENCES PROCEEDINGS OF
RAKSTU KRĀJUMS THE 60th INTERNATIONAL SCIENTIFIC CONFERENCE OF DAUGAVPILS UNIVERSITY
423
EVALUATION OF POSTPARTUM ENDOMETRITIS RISK FACTORS
Santa Smilga1, Liene Rucka1, Anna Miskova1, 2, Dace Rezeberga1, 2, Santa Markova2 1 Riga Stradiņš University, Dzirciema Street 16, Riga 2 Riga Maternity Hospital Abstract
Evaluation of postpartum endometritis risk factors Key Words: postpartum endometrtis, risk factors Introduction. Postpartum endometritis (PPE) is a polymicrobal infection that affects endometrium, it can also extend to myometrium and parametrium or even progress to pelvioperitonitis. Postpartum endometritis could lead to sepsis and septic shock that is the second leading cause of maternal mortality worldwide. It occurs in 1-3% of vaginal deliveries and is ten times more common after Cesarean section (CS), especially if it is emergent or ugent. The most common risk factors (RFs) of PPE include bacterial vaginosis (BV), ruptured membranes >18 hours, repetitive vaginal examinations. Aim. To evaluate occurrence and significance of different RFs in patients with PPE. Materials and methods. Retrospective case control study was performed in Riga Marnity Hospital with a permission of hospital ethics committee. Patients with PPE from year 2016 to year 2017 was included as the case group. Patients with uncomplicated postpartum period were included in control group. RFs were evaluated in both groups. The data was processed with Microsoft Excel, IBM SPSS Statistics 19.0. Results. 115 cases and 350 controls were included in the study. Statistically significant RFs were CS (p<0,001), ruptured membranes >18h (p=0,003), scalp electrod use for intrapartum surveillance (p=0,002, OR 2,7, 95% CI 1,4-5,1), chorioamnionitis (p=0,004), BV (p=0,049, OR 2,4), duration of second stage more than two hours (p<0,001). Non-statistically significant RFs were iron deficiency anaemia (p=0,18), diabetes (p=0,35), antibacterial treatment or bacterial infection during pregnancy (p=0,98), manual removal of the placenta or revision of uterine cavity after labour (p=0,28), obesity (p=0,46), group B streptococcus vaginal colonisation (p=0,084), premature labour (p=0,89). Conclusions. Not all RFs that were analysed were statistically significant. It could be due to the small count of the patients with specific RFs. Considering that 95% CI was quite wide in case of several RFs it is necessary to enlarge the case group so that the statistical data were more precise. Research should be continued. Kopsavilkums Ievads. Bakteriāls endometrīts ir polimikrobu ierosināta infekcija, kas skar endometriju, arī miometrija, parametrija slāni, bet dažkārt var izplesties ārpus dzemdes, izraisot pelvioperitonītu un sepsi. Endometrīts sastopams aptuveni 1-3% gadījumu pēc vaginālām dzemdībām, bet 10 reižu biežāk to sastop pēc ķeizargrieziena, īpaši, ja tas bijis ārkārtas. Kā svarīgākie riska faktori (RF) literatūrā minēti ķeizargrieziena operācija, bakteriālā vaginoze, ieildzis bezūdens periods, atkārtota vagināla izmeklēšana. Darba mērķi. Atlasīt literatūrā minētos endometrīta RF pacientēm un izvērtēt to saistību endometrīta attīstībā. Materi āli un metodes. Retrospektīvs gadījuma kontroles tipa pētījums. Pētījumā iekļautas pacientes, kuras bijušas stacionētas Rīgas Dzemdību namā no 2016. gada 1. janvāra līdz 2017. gada 31. decembrim. Pētījuma grupa ietver pacientes ar endometrīta diagnozi, bet kontroles grupā ir pacientes bez endometrīta. Abām grupām izvērtēti atlasītie RF. Datu apstrāde veikta ar MS Excel, IBM SPSS Statistics 19. Rezultāti. Konkrētajā laika posmā Rīgas Dzemdību namā stacionētas 115 pacientes ar pēcdzemdību endometrītu. Kontroles grupā iekļautas 350 pacientes. Novērots, ka statistiski ticami endometrīta RF ir ķeizargrieziena operācija (p<0,001), bezūdens perioda ilgums >18h (p=0,003), augļa kardiogrammas ST segmenta metodes analīze (p=0,002), horijamnionīts (p=0,004), bakteriālā vaginoze (p=0,049), ieildzis 2. dzemdību periods (p<0,001). Statistiski ticami nebija tādi riska faktori kā dzelzs deficīta anēmija (p=0,18), gestācijas/ cukura diabēts (p=0,35), antibakteriālā terapija vai pārslimota bakteriāla infekcija grūtniecības laikā (p=0,98), kā arī dzemdes dobuma revīzija vai placentas ablācija pēc dzemdību otrā perioda (p=0,28), virssvars un aptaukošanās (p=0,46), B grupas beta hemolītiskā streptokoka kolonizācija (p=0,084) un priekšlaicīgas dzemdības (p=0,89). Secinājumi. Ne visi literatūras avotos aprakstītie riska faktori ir statistiski ticami veiktajā pētījumā. Tas var būt saistīts ar mazu pacienšu skaitu, kurām ir konkrētais RF, gan pētījuma, gan kontroles grupā, piemēram. Ņemot vērā, ka 95% ticamības intervāls bija diezgan plašs atsevišķiem RF, nepieciešama lielāka pētāmā grupa, lai statistisko datu rezultāti būtu precīzāki.

DAUGAVPILS UNIVERSITĀTES 60. STARPTAUTISKĀS ZINĀTNISKĀS KONFERENCES PROCEEDINGS OF
RAKSTU KRĀJUMS THE 60th INTERNATIONAL SCIENTIFIC CONFERENCE OF DAUGAVPILS UNIVERSITY
424
Introduction
Bacterial infections account for about one-tenth of maternal deaths worldwide and contribute
to severe morbidity and long-term disability (WHO, 2015). From year 2013 to year 2015 a total of
twenty maternal deaths either during pregnancy, labour or during puerperial period occurred. None
of these deaths was attributable to postpartum endometritis or sepsis (Rezeberga D., 2015 un Centre
for disease prevention and control of the Republic of Latvia, 2017). Postpartum endometritis (PPE)
is polymicrobal infection that affects endometrium, it can extend to myometrium and parametrium
or even progress to pelvioperitonitis. Postpartum endometritis could lead to sepsis and septic shock.
The diagnosis of postpartum endometritis is based on clinical findings such as fever, chills, lower
abdominal pain, uterine tenderness and foul-smelling lochia with manifistation of systemic
inflammatory response syndrome. Postpartum endometrits occurs in one to three percent of vaginal
deliveries and is ten times more common after Cesarean section, especially if it is emergent or
urgent and is performed during second stage of labour (Tuuli, 2015). The most common risk factors
of PPE include bacterial vaginosis, prolonged rupture of membranes for more than 18 hours,
repetitive vaginal examinations, premature labour (Dalton, 2014).
Aim
To evaluate occurrence of different RFs in patients with PPE and to evaluate if they are
significant in development of PPE.
Materials and methods
A retrospective case control study was performed. Patients with PPE from year 2016 to year
2017 were included in the study as the case group. Patients with uncomplicated postpartum period
were included in research as control group. We assessed such general parameters as - age, gravidity,
parity, weeks of gestation. We analysed particular risk factors: 1) bacterial infection or antibacterial
treatment received during pregnancy, 2) B group haemolytic streptococcus vaginal colonisation,
3) prolonged second stage of the labour, i.e., more than two hours; 4) prolonged rupture of
membranes, i.e., more than 18 hours, 5) manual revision of uterine cavity or manual removal of the
placenta, 6) bacterial vaginosis, 7) anaemia, 8) either gestational or type 1 or type 2 diabetes,
9) chorioamnionitis, 10) method of delivery, 11) fetal scalp electrode use for intrapartum
surveillance. The data was processed with IBM SPSS Statistics 19.0 and Microsoft Excel program.
We calculated Pearson Chi-square test, Fischer’s Exact Test if Pearson Chi-Square test was not
applicable as well as odds ratio, 95% confidence interval and linear regression analysis. Average
count of vaginal examinations was obtained using statistical methods.
Results
115 cases and 350 controls were included in the study. The average age of patients was 30
years in both groups. It was their second pregnancy and second labour in both groups. In control
DAUGAVPILS UNIVERSITĀTES 60. STARPTAUTISKĀS ZINĀTNISKĀS KONFERENCES PROCEEDINGS OF
RAKSTU KRĀJUMS THE 60th INTERNATIONAL SCIENTIFIC CONFERENCE OF DAUGAVPILS UNIVERSITY
425
group 16% (n=56) of patients had Cesarean section but 86% (n=296) had vaginal delivery. In case
group 79% (n=91) of the patients had Cesarean section and 21% (n=24) of the patients had vaginal
delivery. From 350 controls and from 115 cases any kind of antibacterial prophylaxis was used in
59% of cases (n=205) and in 64% of controls (n=109) accordingly. Antibacterial prophylaxis was
given either to prevent early-onset neonatal sepsis or as preopertive, intraoperative, postoperative
antibacterial prophylaxis. Statistically significant risk factors were Cesarean section (p<0,001, odds
ratio (OR) 4,8, 95% confidence interval (95% CI) 3,1 - 7,5), prolonged rupture of membranes more
than 18 hours (p=0,003, OR 2,8, 95% CI 1,4 - 5,7), fetal scalp electrode use for intrapartum
surveillance (p=0,002, OR 2,7, 95% CI 1,4 - 5,1), chorioamnionitis (p=0,004 but OR and 95% CI
could not be obtained because there were no cases of chorioamnionitis in patients without
postpartum endometritis), BV (p=0,049, OR 2,4, 95% CI 1,0 - 5,8), duration of second stage more
than two hours (p<0,001, OR 12, 95% CI 3,4 - 44,7). Another risk factor such as repetitive vaginal
examinations was taken into consideration. IBM SPSS Statistics estimated count of vaginal
examinations that increased the risk of postpartum endometritis was 5 times. Vaginal examination
of 5 times had p value of 0,006, OR 1,8, 95% CI 1,2 - 2,8. Non-statistically significant RFs were
iron deficiency anaemia (p=0,18, OR 1,4, 95% CI 0,9 - 2,2), diabetes (p=0,35, OR 1,5, 95% CI 0,7 -
3,4), antibacterial treatment or bacterial infection during pregnancy (p=0,98, OR 1,01, 95% CI 0,6 -
1,9), manual removal of the placenta or revision of uterine cavity after labour (p=0,28, OR 1,7, 95%
CI 0,7 - 4,3), obesity (p=0,46, OR 1,3, 95% CI 0,6 - 2,8), group B streptococcus vaginal
colonisation (p=0,084, OR 0,5, 95% CI 0,2 - 1,1) and premature labour (p=0,89, OR 1,06, 95% CI
0,46 - 2,45). Afterwards linear regression analysis was performed to evaluate an interaction between
different risk factors and to define which of the risk factors have statistically significant interaction
to cause endometritis. After performing linear regression analysis between above mentioned
statistically significant risk factors such conditions still remained statistically significant: Cesarean
section (p<0,001), repetitive vaginal examinations (p=0,023), bacterial vaginosis (p=0,030),
chorioamnionitis (p=0,011), prolonged second stage of labour for more than two hours (p<0,001)
but as statistically insignificant risk factors were fetal scalp electrode use for intrapartum
surveillance (p=0,131) and prolonged rupture of membranes for more than 18 hours.
Discussion
Postpartum endometritis is usually associated with iatrogenic interference or so called
provider-initiated conditions during labour and childbirth such as internal fetal monitoring,
repetitive vaginal examinations, manual ablation of the placenta.
World health organisation recommends to apply routine antibacterial prophylaxis after
manual removal of placenta as it was done in our cases (World health organization, 2015). This
could be an explanation why our patients did not develop PPE. However it was demonstrated that

DAUGAVPILS UNIVERSITĀTES 60. STARPTAUTISKĀS ZINĀTNISKĀS KONFERENCES PROCEEDINGS OF
RAKSTU KRĀJUMS THE 60th INTERNATIONAL SCIENTIFIC CONFERENCE OF DAUGAVPILS UNIVERSITY
426
prophylactic antibacterial before manual removal of the placenta did not decrease the odds of
postpartum endometritis (Safrai, 2017).
WHO recommends to perform digital vaginal examinations every four hours. In the hospital
where we obtained the data routine vaginal examination is performed once in every three hours in
average. One step to decrease an incidence of postpartum endometritis could be that vaginal
examinations are performed more seldom, especially in case of labour where there are no
significant risk factors.
Postpartum endometritis is also associated with reduced ability of the macroorganism to fight
infection observed in case of anaemia and either gestational or type 1 or type 2 diabetes (Axellson,
2018). We did not find such association in our research and it could be attributable to small PPE
group and undiagnosed preexisting conditions antenatally.
Even though depending on situation preoperative, intraoperative or postoperative antibacterial
prophylaxis is used postoperative infection develops. Liu et al. associates it with pre-existing
infection, debilitating illness and prolonged rupture of membranes (Liu, 2016).
Premature labour is one of the risk factors for postpartum endometritis. It is frequently
associated with the fact that there already is an pre-existing infection which causes premature
labour. It is possible that the data that was obtained are not statistically significant due to fact that
these women usually receive antibacterial prophylaxis due to unknown status of group B
Streptococcus colonisation to prevent development of early-onset neonatal sepsis. This particular
research found no association between colonisation with B group haemolytic streptococcus and
postpartum endometritis as well. According to Martens and Dadivanyan this could not associated
with antibacterial prophylaxis against early-onset neonatal sepsis that is received during labour as
we thought (Martens, 2017).
It is also known that development of infection depends on mutual interaction between
macroorganism and microorganism so it is important to evaluate combination of risk factors.
Women with combination of different statistically risk in linear regression analysis could have
higher risk for PPE and therefore they should be monitored closely during postpartum period.
Conclusions
Not all known risk factors we analyzed were statistically significant. It could be due to the
small amount of the patients with specific risk factors. Considering that 95% CI was quite wide in
case of several risk factors it is necessary to continue the research and to enlarge the case group so
that the statistical data were more precise.
DAUGAVPILS UNIVERSITĀTES 60. STARPTAUTISKĀS ZINĀTNISKĀS KONFERENCES PROCEEDINGS OF
RAKSTU KRĀJUMS THE 60th INTERNATIONAL SCIENTIFIC CONFERENCE OF DAUGAVPILS UNIVERSITY
427
References Axelsson D, Brynhildsen J, Blomberg M. Postpartum infection in relation tomaternal characteristics, obstetric interventions and complications. J PerinatMed. 2018 Apr 25; 46(3): 271–278. Centre for disease prevention and control of the Republic of Latvia, Statistical yearbook of health care in Latvia 2016, 18th edition. Riga, 2017. Dalton E., Castillo E., Postpartum infections: A review for the non-OBGYN. Obstet Med. 2014 Sep; 7(3): 98–102. Liu R., Lin Lin, Wang D., Antimicrobial prophylaxis in caesarean section delivery. Exp Ther Med. 2016 Aug; 12(2): 961–964. Martens MG, Dadivanyan A., Group B B-Hemolytic Streptococcus Screening and Treatment in Postpartum Endomyometritis. J Gynecol Women’s Health 2017; 6(2): JGWH.MS.ID.555682 (2017). doi: 10.19080/JGWH.2017.06.555682 Rezeberga D. un citi, Mātes mirstības konfidenciālā analīze Latvijā. Ziņojums par situāciju Latvijā 2013.–2015. gadā. Safrai M, Kabiri D, Haj-Yahya R, Reuveni-Salzman A, Lipschuetz M, Ezra Y. The effect of prophylactic antibiotic treatment for manual removal of the placenta onfrequency of postpartum endometritis. Int J Gynaecol Obstet. 2017 Oct; 139(1): 45–49. Tuuli MG, Liu L., Longman RE, Odibo AO, Macones GA, Cahill AG, Infectious morbidity is higher after second-stage compared with first-stage cesareans. Am J Obstet Gynecol. 2014 Oct; 211(4): 410.e1-6. doi: 10.1016/j.ajog.2014.03.040. Epub 2015 Mar 18. WHO Recommendations for Prevention and Treatment of Maternal Peripartum Infections. Highlights and Key Messages from the World Health Organization’s 2015 Global Recommendations. September 2015.
DAUGAVPILS UNIVERSITĀTES 60. STARPTAUTISKĀS ZINĀTNISKĀS KONFERENCES PROCEEDINGS OF
RAKSTU KRĀJUMS THE 60th INTERNATIONAL SCIENTIFIC CONFERENCE OF DAUGAVPILS UNIVERSITY
428
EVALUATION OF FUNCTIONAL CAPACITY IN DIABETES MELLITUS TYPE 2 PATIENTS WITH
PRESERVED LEFT VENTRICULAR EJECTION FRACTION USING SIX MINUTE WALK TEST
Jūlija Grigorjeva, Armands K āpostiņs, Marija Ševčenko Supervisor: Dr. med. Artem Kalinin Riga Stradins University, Dzirciema street 16, Riga, [email protected] Abstract
Evaluation of functional capacity in diabetes mellitus type 2 patients with left ventricular preserved ejection fraction using six minute walk test
Key Words: 6MWT, diabetes mellitus, functional capacity, diastolic dysfunction, heart failure Introduction. The incidence of diabetes mellitus is dramatically increasing worldwide. The incidence of heart failure in diabetic patients is high even in the absence of underlying cardiovascular disease like hypertension or coronary artery disease. Heart failure manifestations can be difficult to diagnose accurately and early. Using a 6 minute walking test (6MWT), it is possible to obtain objective data on physical load tolerance. Aim. Investigate functional capacity and possible left ventricular (LV) diastolic dysfunction (DD) in diabetes mellitus type 2 (T2DM) patients using 6MWT. Methodology. A cross-sectional study. Were evaluated: standard echocardiography (LV ejection fraction, mitral valve flow- E/A ratio, mitral valve annulus velocity- E/E'; hypertrophy of LV; DD grade); 6MWT (Oxygen saturation, arterial blood pressure, heart rate, Borg modified score). Results. 22 patients participated in this study (women-12, men-10). LV DD was found in 14 patients (70%). Positive correlation (r=0.464) was found between Body mass index and LV DD grade (p=0.03). There were statistically significant differences between walked distance groups systolic (p=0.032) and diastolic (0.016) blood pressure before 6MWT and systolic blood pressure after test (p=0.043). Smoking was statistically significant factor of worse results in 6MWT (p=0.035). Conclusions. 1) This study shows high prevalence of diastolic dysfunction in asymptomatic diabetic patients. 2) It is important to investigate asymptomatic LV DD and functional capacity in T2DM patients. 3) The 6MWT is safe, non-invasive and effective method of evaluation of functional capacity and symptoms chronic heart failure. Kopsavilkums
Funkcionālās kapacitātes novērt ējums 2. tipa cukura diabēta pacientiem ar kreisā kambara saglabātu izsviedes frakciju izmantojot sešu minūšu iešanas testu
Atslēgvārdi: 6 MWT, cukura diabēts, funkcionālā kapacitāte, diastoliskā disfunkcija, sirds mazspēja Ievads. Cukura diabēta sastopamība pasaulē ievērojami pieaug. Sirds mazspējas biežums diabēta pacientiem ir augsts pat tad, ja nav pavadošo sirds un asinsvadu slimības, piemēram, hipertensijas vai koronāro artēriju slimības. Sirds mazspējas izpausmes var būt grūti diagnosticēt precīzi un agrīni. Izmantojot 6 minūšu iešanas testu (6MWT), ir iespējams iegūt objektīvus datus par fiziskās slodzes toleranci. Mērķis. Izpētīt funkcionālo kapacitāti un iespējamo kreisā kambara (LV) diastolisko disfunkciju (DD) 2. tipa cukura diabēta (T2DM) pacientiem izmantojot 6 MWT. Metodoloģija. Šķērsgriezuma pētījums. Tika izvērtēts: standarta ehokardiogrāfija (LV izsviedes frakcija, agrīnas diastoliskās pildīšanas ātruma attiecība pret vēlīnas diastoliskas pildīšanas ātrumu - E / A, agrīnas diastoliskās pildīšanas maksimālā ātruma attiecība pret fibrozā gredzena agrīnās diastliskās kustības ātrums - E / E ', LV hipertrofija, DD pakāpe); 6MWT (skābekļa piesātinājums, arteriālais asinsspiediens, sirdsdarbība, Borg modificēta skala). Rezultāti. šajā pētījumā piedalījās 22 pacienti (sievietes-12, vīrieši-10). LV DD tika konstatēts 14 pacientiem (70%). Pozitīvā korelācija (r = 0,464) tika konstatēta starp ķermeņa masas indeksu un LV DD pakāpi (p = 0,03). Pēc testa bija statistiski nozīmīgas atšķirības starp sistolisko (p = 0,032) un diastolisko (0,016) asinsspiedienu pirms 6 MWT un sistolisko asinsspiedienu pēc testa (p = 0,043). Smēķēšana bija statistiski nozīmīgs faktors, kas pasliktināja 6MWT rezultātu (p = 0,035). Secinājumi. 1) Šis pētījums parāda lielu asimptomātiskās diastoliskās disfunkciju izplatību diabēta pacientiem. 2) Ir svarīgi pētīt asimptomātisko LV DD un funkcionālo kapacitāti T2DM pacientiem. 3) 6MWT ir droša, neinvazīva un efektīva funkcionālās kapacitātes un hroniskas sirds mazspējas simptomu novērtēšanas metode.

DAUGAVPILS UNIVERSITĀTES 60. STARPTAUTISKĀS ZINĀTNISKĀS KONFERENCES PROCEEDINGS OF
RAKSTU KRĀJUMS THE 60th INTERNATIONAL SCIENTIFIC CONFERENCE OF DAUGAVPILS UNIVERSITY
429
Introduction The incidence of diabetes mellitus (DM) is dramatically and rapidly increasing worldwide
(Zhou 2016). Approximately, around 90% of diabetes patients worldwide belong to type 2 (T2DM)
(WHO 2017).
According to International Diabetes Federation (IDF) Atlas 6th Edition data, number of
people with T2DM, majority at the age 40 to 59, will increase by 55% by year 2035, from 8.3%
(382 million people) to a 10.1% (592 million people) of global prevalence (IDF 2013).
T2DM patients are at increased risk for cardiovascular diseases and cardiovascular events,
which are the leading causes of diabetes-related morbidity and mortality. According to the WHO
data cardiovascular diseases are related to around 50% of deaths in T2DM patients (WHO 2017).
T2DM is highly prevalent among patients with heart failure (HF), especially with HF with
preserved ejection fraction (EF) (MacDonald 2008). Diabetes independently from another risk
factors of heart failure (HF) promotes the development and progression of HF. T2DM patients are
at approximately 2.5 times higher risk of development of HF, relative risk of death from
cardiovascular events are higher in T2DM patients with preserved EF (MacDonald 2008).
HF leads to deterioration in the quality of life in individuals with this disease. Thus, an early
diagnosis and management may be crucial in treatment and prognosis of HF patients.
Materials and methods
This cross-sectional study was performed in the RAKUS "Gaiļezers" hospital, in Diagnostic
Cardiology department and Endocrinology department, during the time period between January and
March 2018.
In this study were involved 22 (12 female 10 male) patients with diagnosed of T2DM with
duration≥ 1 year.
Exclusion criteria
Patients were excluded from this study if one or more of the following criteria were present:
• LV EF <50%;
• Coronary artery disease (CAD), previous MI, revascularization procedure/s;
• Patients with evidence of valvular disease;
• Atrial fibrillation;
• Systolic blood pressure >180 and diastolic >100 mm Hg;
• Tachycardia> 100 beats/min;
• Any musculoskeletal disorder that may influence patient's walking.
The study protocol had been approved by Riga Stradins University Ethics committee and
afterwards was approved by RAKUS "Gaiļezers" hospital Science department. From all patients
DAUGAVPILS UNIVERSITĀTES 60. STARPTAUTISKĀS ZINĀTNISKĀS KONFERENCES PROCEEDINGS OF
RAKSTU KRĀJUMS THE 60th INTERNATIONAL SCIENTIFIC CONFERENCE OF DAUGAVPILS UNIVERSITY
430
was obtained a written informed consent (in Latvian or in Russian language) after we performed the
following procedures to them:
1) History taking (age; T2DM- duration in years, control - glycated haemoglobin; treatment;
routinely measured arterial blood pressure; history of stroke, MI; smoking- pack years; routine
drug using- angiotensin converting enzyme inhibitors, β-blockers, diuretics);
2) Clinical examination (weight, height, heart rate, blood oxygen saturation (SpO2), arterial blood
pressure);
3) Six-minute walk test (6MWT):
The test was performed in the corridor of the Endocrinology Department, according to the
international guidelines (ATS 2002). The distance of 30 meters long was measured in straight
corridor, every 5 meters was marked with colored tape on the wall, start and ending line were
marked. The 6MWT was performed for all patients at the same day time between 11 am and 13 am,
for minimizing influence of biological rhythms, temperature effects. Patients were instructed about
test. All patients had a rest on chair for at least 10 minutes before 6MWT.
Patient and examiner together were walking through the corridor for 6 minutes at the most
convenient walking pace for the patient. The additional chair was placed on the way, in case if
patient would need a rest.
Before and in the end of 6MWT were measured heart rate, oxygen saturation, arterial blood
pressure and dyspnea. Dyspnea was assessed by using modified Borg scale, 0- was no dyspnea, 10-
maximal dyspnea (Borg 1982).
Afterwards was measured the total walked distance in 6 minutes in meters and predicted
walked distance was calculated according to sex, age weight and height and this value was
expressed as a percentage (Enright 1998).
Results lower than 82% showed significant walk intolerance (Troosters 1999).
The test was immediately stopped if any of the following criteria happened during walking:
chest pain, intolerable dyspnea, leg cramps, imbalance, dizziness, sudden paleness (ATS 2002).
4) Echocardiography:
All patients underwent transthoracic echocardiography and Doppler imaging, to estimate LV
DD and hypertrophy. Standard echocardiography examination was done for all patients within 5
days of the 6MWT using VIVID E9, GE. The echocardiography examinations were performed by
one echocardiography specialist.
The following measurements were evaluated:
• LV ejection fraction-EF (two dimensional guided M-mode)
• mitral valve flow- E velocity, A velocity and E/A ratio(pulsed Doppler);
• mitral valve annulus early diastolic velocity- E'(tissue Doppler) and ratio average E/E’;
DAUGAVPILS UNIVERSITĀTES 60. STARPTAUTISKĀS ZINĀTNISKĀS KONFERENCES PROCEEDINGS OF
RAKSTU KRĀJUMS THE 60th INTERNATIONAL SCIENTIFIC CONFERENCE OF DAUGAVPILS UNIVERSITY
431
• hypertrophy of LV was defined if LV mass index (LVMI) was more than 95 g/m2 in women
and 115 g/m2 in men (Lang 2015));
• LV DD grade (normal function, I- III);
LV DD grade was assigned by combining measured parameters. The LV DD grade was
established from highest number of characteristic parameters were present (Nagueh 2016):
Normal diastolic function: E/A ≤ 0.8 + E > 50 cm/s or E/A > 0.8 - <2, average E/E’ <14.
Grade 1 DD (impaired relaxation): E/A ≤0.8 + E ≤ 50 cm/s, average E/E’<14.
Grade 2 DD (pseudonormal): E/A ≤ 0.8 + E > 50 cm/s or E/A > 0.8 - <2, average E/E’ > 14.
Grade 3 DD (restrictive): E/A ≥ 2, average E/e’ > 14.
Statistical analysis
All received data were analyzed using the SPSS for Windows package program (version
21.0).
For comparing quantitative data was analyzed by using Chi-squared test (χ2 test) or Fisher's
exact test. To carry out the correlation between studied variables, Pearson or Spearman correlation
coefficients were used. Results were considered as statistically significant when p < 0.05.Mann-
Whitney U-test was used to compare 2 groups of means, for 3 groups or more, Kruskal-Wallis H
test was used.
Results
Patients characteristics
In this study were involved 22 patients with T2DM, 12 females and 10 males. The age range
was from 38 to 72 years. Mean age of the participants was 56.8 years SD ± 8.6. All patients had
preserved LV EF, mean EF in group was 61.32% SD ± 3.24. Patient characteristics are summarized
in Table 1.
Table 1. Patient’s clinical data
Mean SD Age 56,77 8,57 Weight (kg) 95,77 26,67 Height (cm) 169,27 11,94 Body Mass index 33,19 7,18 Systolic blood pressure 137,05 12,31 Diastolic blood pressure 93,86 22,14 Duration of T2DM 10,25 6,94
Echocardiography
LV DD grade I was found in 8 patients (36.4%) and grade II was found in 6 patients (27.3%)
(Fig.1.), together LV DD grade I and II were in 14 patients (63.7%).

DAUGAVPILS UNIVERSITĀTES 60. STARPTAUTISKĀS ZINĀTNISKĀS KONFERENCES PROCEEDINGS OF
RAKSTU KRĀJUMS THE 60th INTERNATIONAL SCIENTIFIC CONFERENCE OF DAUGAVPILS UNIVERSITY
432
Fig. 1. Diastolic function
Where was no any statistically significant influence between LV DD grade and heart failure
medication use: angiotensin converting enzyme inhibitors (p=0.134), β-blockers (p=0.637),
diuretics (p=0.243). Also, no statistical significant correlation (r= -0.076) between LV DD grade
and walked distance (p=0.738) and T2DM control (p=0.200). Positive correlation (r=0.464) was
found between body mass index and LV DD grade (p=0.03).
Six minute walk tests results
Only one patient (4,5%) (Fig.2) showed clinically significant walk intolerance, patient's
walked distance was 79% from predicted, additionally this patient had LV DD grade II, primary
arterial hypertension stage I and T2DM duration was 10 years.
Fig. 2. Walk tolerance in patients
Patient's walked distance in meters has statistically significant negative correlation (r = -
0.564) with hypertrophy of LV (p=0.004).
Negative correlation (r=-0.596) was found between 6MWT walked distance and E/E' results
(p=0.003).
T2DM control did not show statistically significant correlation with walked distance
(p=0.461).
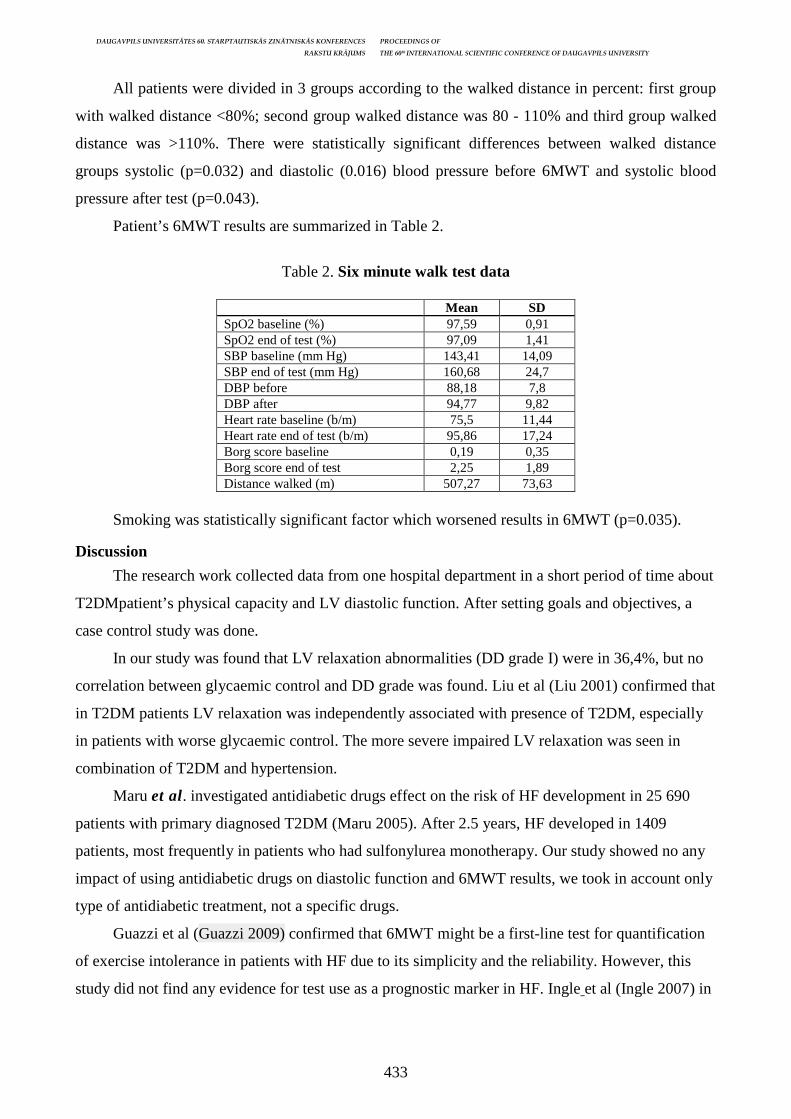
DAUGAVPILS UNIVERSITĀTES 60. STARPTAUTISKĀS ZINĀTNISKĀS KONFERENCES PROCEEDINGS OF
RAKSTU KRĀJUMS THE 60th INTERNATIONAL SCIENTIFIC CONFERENCE OF DAUGAVPILS UNIVERSITY
433
All patients were divided in 3 groups according to the walked distance in percent: first group
with walked distance <80%; second group walked distance was 80 - 110% and third group walked
distance was >110%. There were statistically significant differences between walked distance
groups systolic (p=0.032) and diastolic (0.016) blood pressure before 6MWT and systolic blood
pressure after test (p=0.043).
Patient’s 6MWT results are summarized in Table 2.
Table 2. Six minute walk test data
Mean SD
SpO2 baseline (%) 97,59 0,91 SpO2 end of test (%) 97,09 1,41 SBP baseline (mm Hg) 143,41 14,09 SBP end of test (mm Hg) 160,68 24,7 DBP before 88,18 7,8 DBP after 94,77 9,82 Heart rate baseline (b/m) 75,5 11,44 Heart rate end of test (b/m) 95,86 17,24 Borg score baseline 0,19 0,35 Borg score end of test 2,25 1,89 Distance walked (m) 507,27 73,63
Smoking was statistically significant factor which worsened results in 6MWT (p=0.035).
Discussion
The research work collected data from one hospital department in a short period of time about
T2DMpatient’s physical capacity and LV diastolic function. After setting goals and objectives, a
case control study was done.
In our study was found that LV relaxation abnormalities (DD grade I) were in 36,4%, but no
correlation between glycaemic control and DD grade was found. Liu et al (Liu 2001) confirmed that
in T2DM patients LV relaxation was independently associated with presence of T2DM, especially
in patients with worse glycaemic control. The more severe impaired LV relaxation was seen in
combination of T2DM and hypertension.
Maru et al. investigated antidiabetic drugs effect on the risk of HF development in 25 690
patients with primary diagnosed T2DM (Maru 2005). After 2.5 years, HF developed in 1409
patients, most frequently in patients who had sulfonylurea monotherapy. Our study showed no any
impact of using antidiabetic drugs on diastolic function and 6MWT results, we took in account only
type of antidiabetic treatment, not a specific drugs.
Guazzi et al (Guazzi 2009) confirmed that 6MWT might be a first-line test for quantification
of exercise intolerance in patients with HF due to its simplicity and the reliability. However, this
study did not find any evidence for test use as a prognostic marker in HF. Ingle et al (Ingle 2007) in
DAUGAVPILS UNIVERSITĀTES 60. STARPTAUTISKĀS ZINĀTNISKĀS KONFERENCES PROCEEDINGS OF
RAKSTU KRĀJUMS THE 60th INTERNATIONAL SCIENTIFIC CONFERENCE OF DAUGAVPILS UNIVERSITY
434
turn, proved that mild LV systolic dysfunction important independent predictor of mortality in HF
patients.
Enright and Sherrill (Enright 1998) reported that the significantly lower exercise capacity and
tolerance in patients with T2DM which was determined by using 6MWD may be related to the link
between T2DM and patients who is overweight. Our study showed that increased body mass index
negatively correlates with diastolic dysfunction grade but not with 6MWT results.
Our study has several limitations:
1. The study sample was small, it limits the power of statistical analyses;
2. Need of control group;
3. Disorders of pulmonary, cardiovascular or musculoskeletal systems may affect the results of
6MWT.
Conclusions
- The study showed high prevalence of asymptomatic DD in diabetic patients.
- It may be important to investigate LV DD and functional capacity in DM patients, as it might
lead to heart failure and increased mortality from cardiovascular events.
- The 6MWT is safe, non-invasive and effective method of evaluation of functional capacity and
simptoms of chronic heart failure.
References Zhou B., Lu Y., Hajifathalian K., Bentham J., Di Cesare M., et al. Worldwide trends in DM since 1980: a pooled analysis of 751 population-based studies with 4·4 million participants. Lancet. 2016; 387: 1513–30. World Health Organization. Global Report on Diabetes. Geneva, Switzerland: World Health Organization, 2017. Available: http://www.who.int/mediacentre/factsheets/fs138/en/ [accessed 25 March 2018] International Diabetes Federation. IDF Diabetes Atlas. 6th ed. Brussels, Belgium: International Diabetes Federation; 2013 MacDonald M.R., Petrie M.C., Varyani F. et al. Impact of diabetes on outcomes in patients with low and preserved ejection fraction heart failure: an analysis of the Candesartan in Heart failure: Assessment of Reduction in Mortality and morbidity (CHARM) programme. Eur Heart J. 2008; 29: 1377–85. ATS Committee on Proficiency Standards for Clinical Pulmonary Function Laboratories. ATS statement: guidelines for the six-minute walk test. Am J RespirCrit Care Med 2002; 166: 111–7. Borg G.A., Psychophysical bases of perceived exertion. MedSci Sports Exerc. 1982; 14(5): 377–81. Enright P.L., Sherrill D.L. Reference equations for the six-minute walk in healthy adults. Am J RespirCrit Care Med. 1998; 158: 1384–1387. Troosters T., Gosselink R., Decramer M. Six minute walking distance in healthy elderly subjects. EurRespir J. 1999; 14(2): 270–4. Lang R.M., Badano L.P., Mor-Avi V., Afilalo J., Armstrong A., Ernande L., et al. Recommendations for cardiac chamber quantification by echocardiography in adults: an update from the American Society of Echocardiography and the European Association of Cardiovascular Imaging. J Am SocEchocardiogr. 2015; 28: 1–39.e14. Nagueh S.F., Smiseth O.A., Appleton C.P., Byrd B.F. Recommendations for the Evaluation of Left Ventricular Diastolic Function by Echocardiography: An Update from the American Society of
DAUGAVPILS UNIVERSITĀTES 60. STARPTAUTISKĀS ZINĀTNISKĀS KONFERENCES PROCEEDINGS OF
RAKSTU KRĀJUMS THE 60th INTERNATIONAL SCIENTIFIC CONFERENCE OF DAUGAVPILS UNIVERSITY
435
Echocardiography and the European Association of Cardiovascular Imaging. J Am Soc Echocardiogr. 2016; 29(4): 277–314. Liu J.E., Palmieri V., Roman M.J., Bella J.N. The impact of diabetes on left ventricular filling pattern in normotensive and hypertensive adults: the Strong Heart Study.J Am CollCardiol. 2001; 1; 37(7): 1943–9. Maru S., Koch G.G., Stender M., et al. Antidiabetic drugs and heart failure risk in patients with type 2 diabetes in the U.K. Primary Care Setting Diabetes Care. 2005; 28: 20–6. Guazzi M., Dickstein K., Vicenzi M., Arena R.Six-Minute Walk Test and Cardiopulmonary Exercise Testing in Patients With Chronic Heart FailureCirculation: Heart Failure. 2009; 2: 549–555. Ingle L., Rigby A. S., Carroll S. et al. Prognostic value of the 6 min walk test and self-perceived symptom severity in older patients with chronic heart failure. EurHeart J. 2007; 28(5): 560–8.
DAUGAVPILS UNIVERSITĀTES 60. STARPTAUTISKĀS ZINĀTNISKĀS KONFERENCES PROCEEDINGS OF
RAKSTU KRĀJUMS THE 60th INTERNATIONAL SCIENTIFIC CONFERENCE OF DAUGAVPILS UNIVERSITY
436
GPX AND MDA STRESS MARKERS AND DEPRESSION IN CORONARY HEART DISEASE PATIENTS
Tarass Ivascenko, Vladimirs V. Voicehovskis, Julija G. Voicehovska, Andrejs Skesters, Oskars Kalejs, Ketija Apsite, Julija Grigorjeva Riga Stradins University, Dzirciema street 16, Riga, [email protected] Abstract
Gpx and mda stress markers and depression in coronary heart disease patients Key Words: oxydative stress markers, depression in CHD patients Background. Depression (D) is 3-4 times more common in patients with coronary heart disease (CHD) than the prevalence in the population. D increases the risk of cardiac mortality, and is associated with an increased risk of secondary acute ischemic events. The accumulation of free radicals in the endothelium of blood vessels leads to its damage and dysfunction, this leads to the development of inflammatory reactions and oxidative stress (OS). Active forms of oxygen initiate lipid damage, it can cause cellular necrosis or disruption of signal transmission mechanism. Reconsidering the attitude towards the use of antidepressants and antioxidants can be particularly useful in the prevention of CHD and it depends from understanding of interactions between D and CHD. Purpose. To identify and examine the relationship between the severity of symptoms of depression and indicators of OS in primary SCHD patients and in patients with recurrent SCHD. Material and Methods. A retrospective case-control study, stationary patients at the age 45-65 years: 50 patients with recurrent SCHD and 51 patients with primary SCHD. It was assessed in both target groups: manifestations of stable CHD (using structured interviews); OS parameters in the blood (MDA, GPx); quality of life level (QoL, questionnaire Q-les-Q by J.Endicott, short form, valid Latvian language version); D (long form of Geriatric Depression Scale by J.A.Yesavage and others, the valid Latvian language version GDS-LAT). Results. The data obtained from 51 patients with primary SCHD and 50 relapses of SCHD: in P with primary SCHD, D was established in 25 cases, in P with recurrent SCHD - at 30. The mean score of the QoL was 63.5% of the total possible score in the group with primary SCHD and 61.1% in the group with relapse of SCHD. GPx does not have any significant changes in both groups. Further results will be reported. Conclusions. Hypotheses of the study: 1. There is a positive correlation between the level of D and the level of OS markers in patients with SCHD; 2. In patients with recurrent SCHD and D, the level of OS markers in the blood will be higher than in patients with primary SCHD. Kopsavilkums Atslēgvārdi: oksidatīvie stresa marķieri, depresija KSS slimniekiem Ievads. Pacientiem ar koronāro sirds slimību (KSS) depresija (D) ir 3-4 reizes biežāka nekā izplatība populācijā. D palielina mirstības risku no sirds slimībām, un tas ir saistīts ar palielinātu sekundāru akūtu išēmisku notikumu risku. Brīvo radikāļu uzkrāšanās asinsvadu endotēlij ā izraisa tā bojājumus un disfunkciju, izraisa iekaisuma reakcijas un oksidatīvo stresu (OS). Aktīvās skābekļa formas veicina lipīdu bojājumus, tas var izraisīt šūnu nekrozi vai traucēt signāla pārraides mehānismu. Pārdomājot attieksmi pret antidepresantu un antioksidantu lietošanu, tas var būt īpaši noderīgs KSS profilaksei, un tas ir atkarīgs no D un KSS mijiedarbības izpratnes. Mērķis. Identificēt un pārbaudīt saikni starp depresijas simptomu smagumu un OS rādītājiem primārajos SKSS pacientiem un pacientiem ar recidivējošu SKSS. Materi āli un metodes. Retrospektīvas gadījuma kontroles pētījums stacionētiem pacientiem vecumā no 45 līdz 65 gadiem: 50 pacienti ar recidivējošu SKSS un 51 pacients ar primāro SKSS. Abās mērķgrupās tika novērtēts: stabilas KSS izpausmes (izmantojot strukturētas intervijas); OS parametri asinīs (MDA, GPx); dzīves kvalitātes novērtējums (QoL, Q-les-Q anketa J.Endicott, īsa forma, derīga latviešu valodas versija); D (gara geriatrijas depresijas skala izstādāta J.A. Yesavage un citi, derīga latviešu valodas versija GDS-LAT). Rezultāti. Dati, kas iegūti no 51 pacientiem ar primāro SKSS un 50 recidīviem SKSS: P ar primāro SKSS, D tika konstatēta 25 gadījumos, P ar recidivējošu SKSS - 30. Vidējais QoL rādītājs bija 63,5% no kopējā iespējamā punktu skaita grupā ar primāro SKSS un 61,1% grupā ar SKSS recidīvu. GPx nav būtisku izmaiņu abās grupās. Turpmāki rezultāti tiks paziņoti. Secinājumi. Pētījuma hipotēzes: 1. Pacientiem ar SKSS ir pozitīva korelācija starp D līmeni un OS marķieru līmeni; 2. Pacientiem ar recidivējošu SKSS un D, OS līmenis asinīs būs augstāks nekā pacientiem ar primāro SKSS.
Inroduction
Depression is the most common mood disorder (Adibhatla 2008). Depression is 3 to 4 times
more common in patients with coronary heart disease (CHD) if compare with the prevalence of
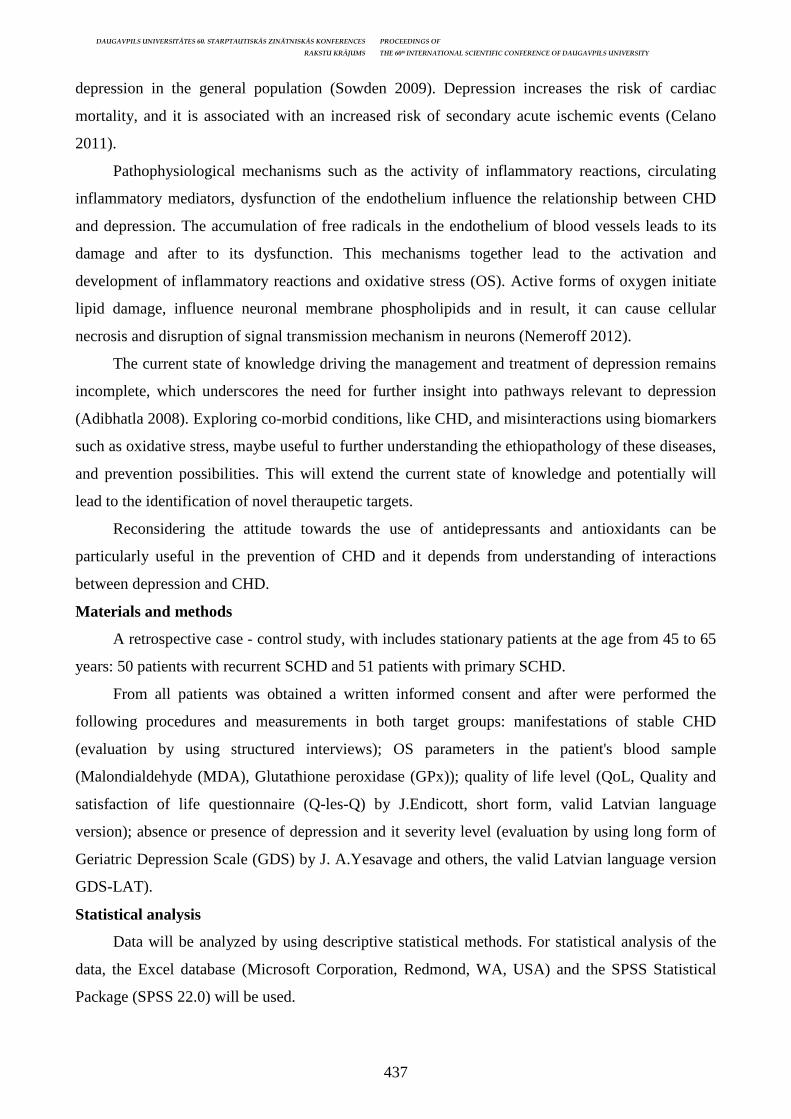
DAUGAVPILS UNIVERSITĀTES 60. STARPTAUTISKĀS ZINĀTNISKĀS KONFERENCES PROCEEDINGS OF
RAKSTU KRĀJUMS THE 60th INTERNATIONAL SCIENTIFIC CONFERENCE OF DAUGAVPILS UNIVERSITY
437
depression in the general population (Sowden 2009). Depression increases the risk of cardiac
mortality, and it is associated with an increased risk of secondary acute ischemic events (Celano
2011).
Pathophysiological mechanisms such as the activity of inflammatory reactions, circulating
inflammatory mediators, dysfunction of the endothelium influence the relationship between CHD
and depression. The accumulation of free radicals in the endothelium of blood vessels leads to its
damage and after to its dysfunction. This mechanisms together lead to the activation and
development of inflammatory reactions and oxidative stress (OS). Active forms of oxygen initiate
lipid damage, influence neuronal membrane phospholipids and in result, it can cause cellular
necrosis and disruption of signal transmission mechanism in neurons (Nemeroff 2012).
The current state of knowledge driving the management and treatment of depression remains
incomplete, which underscores the need for further insight into pathways relevant to depression
(Adibhatla 2008). Exploring co-morbid conditions, like CHD, and misinteractions using biomarkers
such as oxidative stress, maybe useful to further understanding the ethiopathology of these diseases,
and prevention possibilities. This will extend the current state of knowledge and potentially will
lead to the identification of novel theraupetic targets.
Reconsidering the attitude towards the use of antidepressants and antioxidants can be
particularly useful in the prevention of CHD and it depends from understanding of interactions
between depression and CHD.
Materials and methods
A retrospective case - control study, with includes stationary patients at the age from 45 to 65
years: 50 patients with recurrent SCHD and 51 patients with primary SCHD.
From all patients was obtained a written informed consent and after were performed the
following procedures and measurements in both target groups: manifestations of stable CHD
(evaluation by using structured interviews); OS parameters in the patient's blood sample
(Malondialdehyde (MDA), Glutathione peroxidase (GPx)); quality of life level (QoL, Quality and
satisfaction of life questionnaire (Q-les-Q) by J.Endicott, short form, valid Latvian language
version); absence or presence of depression and it severity level (evaluation by using long form of
Geriatric Depression Scale (GDS) by J. A.Yesavage and others, the valid Latvian language version
GDS-LAT).
Statistical analysis
Data will be analyzed by using descriptive statistical methods. For statistical analysis of the
data, the Excel database (Microsoft Corporation, Redmond, WA, USA) and the SPSS Statistical
Package (SPSS 22.0) will be used.
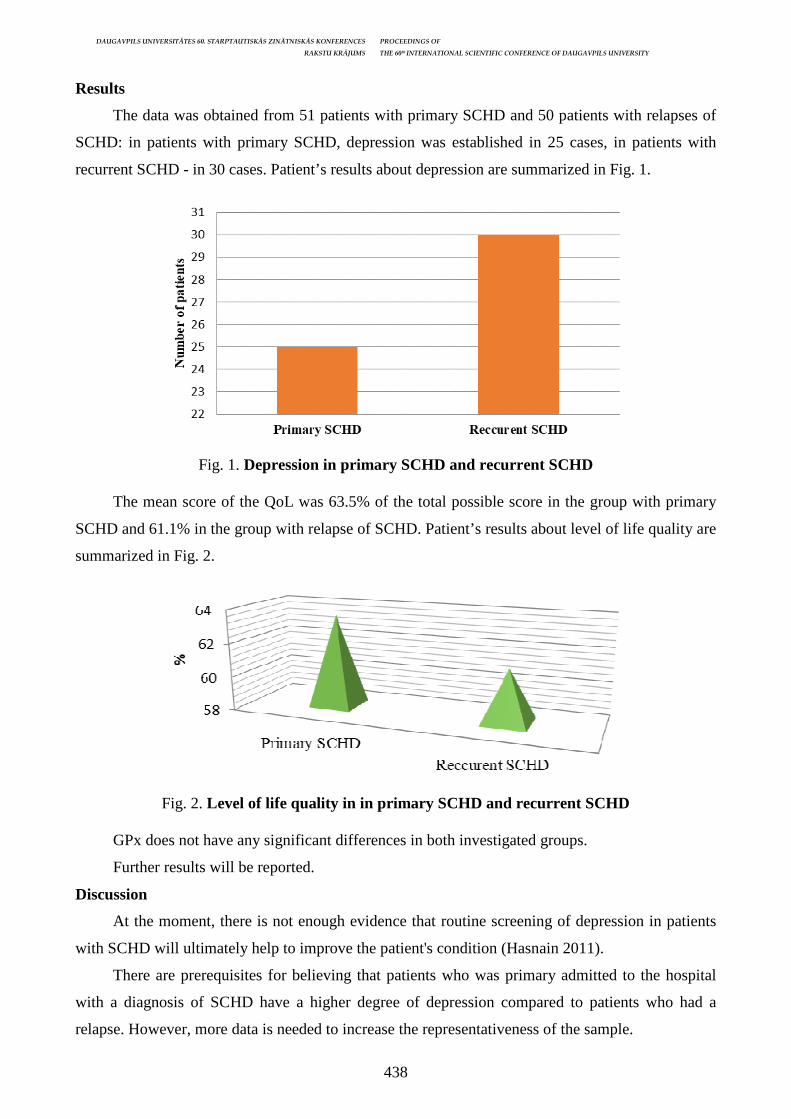
DAUGAVPILS UNIVERSITĀTES 60. STARPTAUTISKĀS ZINĀTNISKĀS KONFERENCES PROCEEDINGS OF
RAKSTU KRĀJUMS THE 60th INTERNATIONAL SCIENTIFIC CONFERENCE OF DAUGAVPILS UNIVERSITY
438
Results
The data was obtained from 51 patients with primary SCHD and 50 patients with relapses of
SCHD: in patients with primary SCHD, depression was established in 25 cases, in patients with
recurrent SCHD - in 30 cases. Patient’s results about depression are summarized in Fig. 1.
Fig. 1. Depression in primary SCHD and recurrent SCHD
The mean score of the QoL was 63.5% of the total possible score in the group with primary
SCHD and 61.1% in the group with relapse of SCHD. Patient’s results about level of life quality are
summarized in Fig. 2.
Fig. 2. Level of life quality in in primary SCHD and recurr ent SCHD
GPx does not have any significant differences in both investigated groups.
Further results will be reported.
Discussion
At the moment, there is not enough evidence that routine screening of depression in patients
with SCHD will ultimately help to improve the patient's condition (Hasnain 2011).
There are prerequisites for believing that patients who was primary admitted to the hospital
with a diagnosis of SCHD have a higher degree of depression compared to patients who had a
relapse. However, more data is needed to increase the representativeness of the sample.
DAUGAVPILS UNIVERSITĀTES 60. STARPTAUTISKĀS ZINĀTNISKĀS KONFERENCES PROCEEDINGS OF
RAKSTU KRĀJUMS THE 60th INTERNATIONAL SCIENTIFIC CONFERENCE OF DAUGAVPILS UNIVERSITY
439
Some specialists are afraid to provoke heart complications of antidepressants and do not
prescribe them. Although, there is no evidence which can support the association between
admission of antidepressants and the presence of coronary events (Huang 2013).
Patients with persistent symptoms of depression are at greatest risk of deteriorating functional
status within 30 months after coronary interventions. Proactive screening for possible depression in
this population has prognostic significance (Wilcox 2016).
Among patients with CHD, mental health treatment and cardiac rehabilitation can each,
individually, reduce depression symptoms and severity and the consequences of CHD; moreover,
cardiac rehabilitation is more important in reducing the risk of mortality. The results confirm the
subsequent importance of mental health treatment and the greater role of mental health
professionals in cardiac rehabilitation (Rutledge 2013).
Our study has several limitations at the present moment:
1. Statistical power of the reserch can be higher, if the study sample will be bigger.
2. We cannot check the honesty of patients answering the both questionnaires, as the result they
are based on subjective view of the patient, it can be influenced by patients mood, physical
health, healthcare conditions.
Conclusions
There are two working hypotheses in this study at the present moment:
1. There is a positive correlation between the level of depression and the level of OS markers in
patients with SCHD;
2. Patients with recurrent SCHD and depression will have higher level of OS markers in their
blood according to the patients with primary SCHD.
Acknowledgements/Funding
Research project was supported by RSU PhD grant.
References Adibhatla, R. M., Dempsy, R., Hatcher, J.F. Integration of cytokine biology and lipid metabolism in stroke. Front Biosci 2008, 13: 1250–1270. Celano C.M., Huffman J.C. Depression and cardiac disease: a review. Cardiol Rev 2011, 19: 130–142. Hasnain M., Vieweg W. V., Lesnefsky E. J., Pandurangi A. K. Depression screening in patients with coronary heart disease: a critical evaluation of the AHA guidelines. J. Psychosom. Res. 2011. 71: 6–12. Huang C. J., Hsieh M. H., Hou W. H., Liu J. C., Jeng C., Tsai P. S. Depression, antidepressants, and the risk of coronary heart disease: a population-based cohort study. Int. J. Cardiol. 2013; 168(5): 4711–6. Nemeroff C. B., Goldschmidt-Clermont P. J. Heartache and heartbreak – the link between depression and cardiovascular disease. Nat Rev Cardiol 2012: 526–39.
DAUGAVPILS UNIVERSITĀTES 60. STARPTAUTISKĀS ZINĀTNISKĀS KONFERENCES PROCEEDINGS OF
RAKSTU KRĀJUMS THE 60th INTERNATIONAL SCIENTIFIC CONFERENCE OF DAUGAVPILS UNIVERSITY
440
Rutledge T., Redwine L. S., Linke S. E., Mills P. J. A meta-analysis of mental health treatments and cardiac rehabilitation for improving clinical outcomes and depression among patients with coronary heart disease. Psychosom. Med. 2013; 75. 335–49. Sowden G. L., Huffman J. C. The impact of mental illness on cardiac outcomes: a review for the cardiologist. Int J Cardiol 2009, 132: 30–37. Wilcox M. E., Freiheit E. A., Faris P. et al. Depressive symptoms and functional decline following coronary interventions in older patients with coronary artery disease: a prospective cohort study. BMC Psychiatry. 2016; 16. 277.
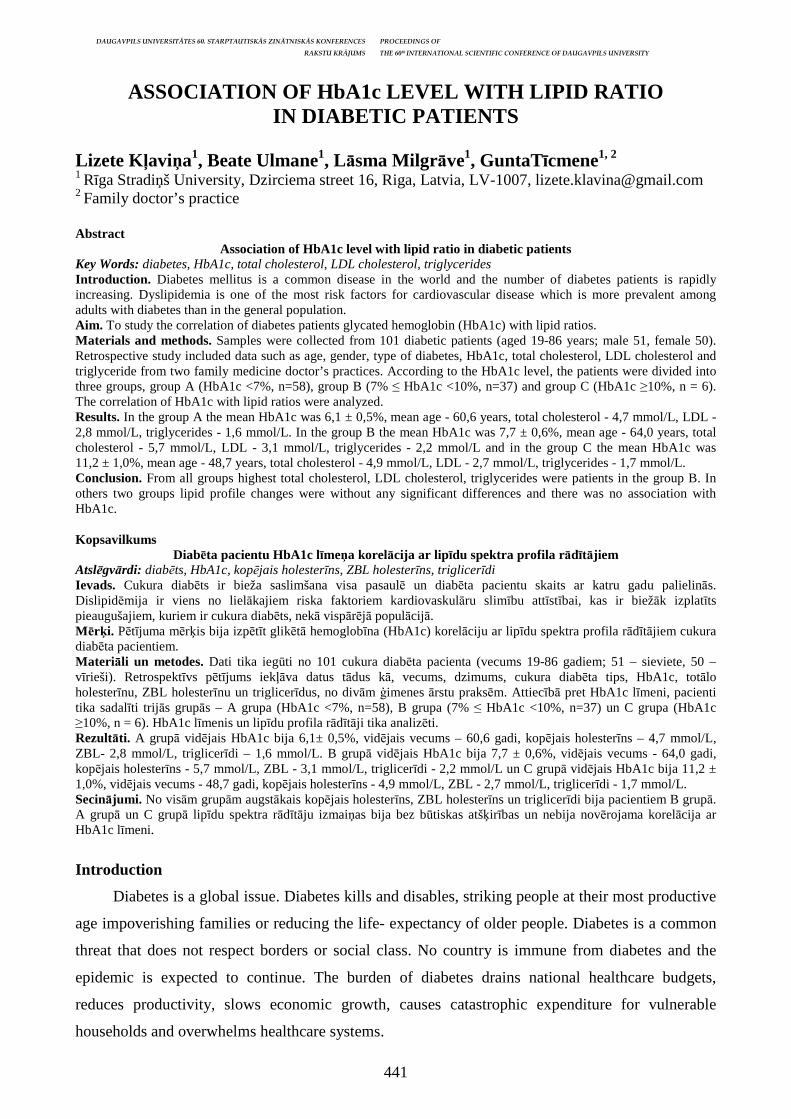
DAUGAVPILS UNIVERSITĀTES 60. STARPTAUTISKĀS ZINĀTNISKĀS KONFERENCES PROCEEDINGS OF
RAKSTU KRĀJUMS THE 60th INTERNATIONAL SCIENTIFIC CONFERENCE OF DAUGAVPILS UNIVERSITY
441
ASSOCIATION OF HbA1c LEVEL WITH LIPID RATIO IN DIABETIC PATIENTS
Lizete Kļaviņa1, Beate Ulmane1, Lāsma Milgrāve1, GuntaTīcmene1, 2
1 Rīga Stradiņš University, Dzirciema street 16, Riga, Latvia, LV-1007, [email protected] 2 Family doctor’s practice Abstract
Association of HbA1c level with lipid ratio in diabetic patients Key Words: diabetes, HbA1c, total cholesterol, LDL cholesterol, triglycerides Introduction. Diabetes mellitus is a common disease in the world and the number of diabetes patients is rapidly increasing. Dyslipidemia is one of the most risk factors for cardiovascular disease which is more prevalent among adults with diabetes than in the general population. Aim. To study the correlation of diabetes patients glycated hemoglobin (HbA1c) with lipid ratios. Materials and methods. Samples were collected from 101 diabetic patients (aged 19-86 years; male 51, female 50). Retrospective study included data such as age, gender, type of diabetes, HbA1c, total cholesterol, LDL cholesterol and triglyceride from two family medicine doctor’s practices. According to the HbA1c level, the patients were divided into three groups, group A (HbA1c <7%, n=58), group B (7% ≤ HbA1c <10%, n=37) and group C (HbA1c ≥10%, n = 6). The correlation of HbA1c with lipid ratios were analyzed. Results. In the group A the mean HbA1c was 6,1 ± 0,5%, mean age - 60,6 years, total cholesterol - 4,7 mmol/L, LDL - 2,8 mmol/L, triglycerides - 1,6 mmol/L. In the group B the mean HbA1c was 7,7 ± 0,6%, mean age - 64,0 years, total cholesterol - 5,7 mmol/L, LDL - 3,1 mmol/L, triglycerides - 2,2 mmol/L and in the group C the mean HbA1c was 11,2 ± 1,0%, mean age - 48,7 years, total cholesterol - 4,9 mmol/L, LDL - 2,7 mmol/L, triglycerides - 1,7 mmol/L. Conclusion. From all groups highest total cholesterol, LDL cholesterol, triglycerides were patients in the group B. In others two groups lipid profile changes were without any significant differences and there was no association with HbA1c. Kopsavilkums
Diabēta pacientu HbA1c līmeņa korelācija ar lip īdu spektra profila rādītājiem Atslēgvārdi: diabēts, HbA1c, kopējais holesterīns, ZBL holesterīns, triglicerīdi Ievads. Cukura diabēts ir bieža saslimšana visa pasaulē un diabēta pacientu skaits ar katru gadu palielinās. Dislipidēmija ir viens no lielākajiem riska faktoriem kardiovaskulāru slimību attīstībai, kas ir biežāk izplatīts pieaugušajiem, kuriem ir cukura diabēts, nekā vispārējā populācijā. Mērķi. Pētījuma mērķis bija izpētīt glikētā hemoglobīna (HbA1c) korelāciju ar lipīdu spektra profila rādītājiem cukura diabēta pacientiem. Materi āli un metodes. Dati tika iegūti no 101 cukura diabēta pacienta (vecums 19-86 gadiem; 51 – sieviete, 50 – vīrieši). Retrospektīvs pētījums iekļāva datus tādus kā, vecums, dzimums, cukura diabēta tips, HbA1c, totālo holesterīnu, ZBL holesterīnu un triglicerīdus, no divām ģimenes ārstu praksēm. Attiecībā pret HbA1c līmeni, pacienti tika sadalīti trij ās grupās – A grupa (HbA1c <7%, n=58), B grupa (7% ≤ HbA1c <10%, n=37) un C grupa (HbA1c ≥10%, n = 6). HbA1c līmenis un lipīdu profila rādītāji tika analizēti. Rezultāti. A grupā vidējais HbA1c bija 6,1± 0,5%, vidējais vecums – 60,6 gadi, kopējais holesterīns – 4,7 mmol/L, ZBL- 2,8 mmol/L, triglicerīdi – 1,6 mmol/L. B grupā vidējais HbA1c bija 7,7 ± 0,6%, vidējais vecums - 64,0 gadi, kopējais holesterīns - 5,7 mmol/L, ZBL - 3,1 mmol/L, triglicerīdi - 2,2 mmol/L un C grupā vidējais HbA1c bija 11,2 ± 1,0%, vidējais vecums - 48,7 gadi, kopējais holesterīns - 4,9 mmol/L, ZBL - 2,7 mmol/L, triglicerīdi - 1,7 mmol/L. Secinājumi. No visām grupām augstākais kopējais holesterīns, ZBL holesterīns un triglicerīdi bija pacientiem B grupā. A grupā un C grupā lipīdu spektra rādītāju izmaiņas bija bez būtiskas atšķirības un nebija novērojama korelācija ar HbA1c līmeni.
Introduction
Diabetes is a global issue. Diabetes kills and disables, striking people at their most productive
age impoverishing families or reducing the life- expectancy of older people. Diabetes is a common
threat that does not respect borders or social class. No country is immune from diabetes and the
epidemic is expected to continue. The burden of diabetes drains national healthcare budgets,
reduces productivity, slows economic growth, causes catastrophic expenditure for vulnerable
households and overwhelms healthcare systems.

DAUGAVPILS UNIVERSITĀTES 60. STARPTAUTISKĀS ZINĀTNISKĀS KONFERENCES PROCEEDINGS OF
RAKSTU KRĀJUMS THE 60th INTERNATIONAL SCIENTIFIC CONFERENCE OF DAUGAVPILS UNIVERSITY
442
Diabetes is one of the largest global health emergencies of the 21st century. Diabetes is
among the top 10 causes of death globally and together with the other three major
noncommunicable diseases (NCDs) (cardiovascular disease, cancer and respiratory disease) account
for over 80% of all premature NCD deaths. In 2015, 39.5 million of the 56.4 million deaths globally
were due to NCDs. (DeFronzo RA et al. 2015.). A major contributor to the challenge of diabetes is
that 30-80% of people with diabetes are undiagnosed. (Fendler W. et al. 2012)
According to the Latvian Diabetes Registry in 2016, 88,945 CD patients were registered in
Latvia. (SPKC, 2016) In Latvia, according to age-related prevalence with CD 4.9% of the
population of Latvia were affected. (IDF, 2017)
Population-wide lifestyle change, along with early detection, diagnosis and cost-effective
treatment of diabetes are required to save lives and prevent or significantly delay devastating
diabetes- related complications. Only multi-sectoral and coordinated responses with public policies
and market interventions within and beyond the health sector can address this issue.
Materials and methods
Retrospective quantitative study included data from January till December of 2017 of patients
with diabetes. During this period, 127 patients with diabetes mellitus were analyzed. Patients were
selected through a specialized informational tracking program for doctors "Medius", which selected
patients with diabetes who were prescribed prescriptions for antidiabetic medicines during the
period from January 2017 to December 2017. The study included those patients who, according to
the ICD-10 classification, were diagnosed with E10-E14 diagnostic codes.
For a further analysis of the data, a group of patients (101 patients) who had a triglyceride
assay for glycosylated hemoglobin and lipid profiles - total cholesterol, LDL (low density
cholesterol) - were isolated separately from the total number of patients (127 patients).
The following parameters were also taken into account for data analysis: patient's age, gender,
type of diabetes mellitus and prescribed antidiabetic medication.
Descriptive and analytical statistical methods were used to analyze the obtained and selected
patient data using the "IBM SPSS Statistics" version 20.0 software and the Microsoft Excel 2016
application.
Results
Average age of patients with diabetes which were included in the study were 57.3 ± 13.8
years. Patient gender distribution: 51 (50.5%) male, 50 (49.5%) women.
In the study, 97 (96%) patients with an average age of 62.5 ± 13.3 years were ill with type 2
diabetes mellitus, and 4 patients with an average age of 28 years were suffering from type 1
diabetes mellitus

DAUGAVPILS UNIVERSITĀTES 60. STARPTAUTISKĀS ZINĀTNISKĀS KONFERENCES PROCEEDINGS OF
RAKSTU KRĀJUMS THE 60th INTERNATIONAL SCIENTIFIC CONFERENCE OF DAUGAVPILS UNIVERSITY
443
The average glycated hemoglobin (HbA1c) between all patients was 7.01 ± 1.4%. Type 1
diabetes mellitus patients average HbA1c was 10.1 ± 2.2% and in patients with type 2 diabetes
mellitus. HbA1c was 6.9 ± 1.3%.
Patients were also analyzed by grouping according to HbA1c levels. 58 (57%) patients had
HbA1c <7% (group A), for 37 (37%) patients, the glycated hemoglobin was between 7 and 10%
(group B) and for 6 (6%) patients HbA1c was ≥10% (group C).
Figure 1. Proportions of patient groups according to HbA1c levels
In the group of patients with HbA1c level <7%, average glycated hemoglobin was 6.13%. In
the group where the HbA1c level was 7-10%, average HbA1c was 7.71% and in the group with the
highest HbA1c ≥10%, it was average 11.19%.
Figure 2. Average HbA1c by groups
The average age in group A was 61 ± 10,5 years. The highest age was in group B - 64 ± 14.3
years, but the youngest was group C - their average age was 49 ± 23.2 years.
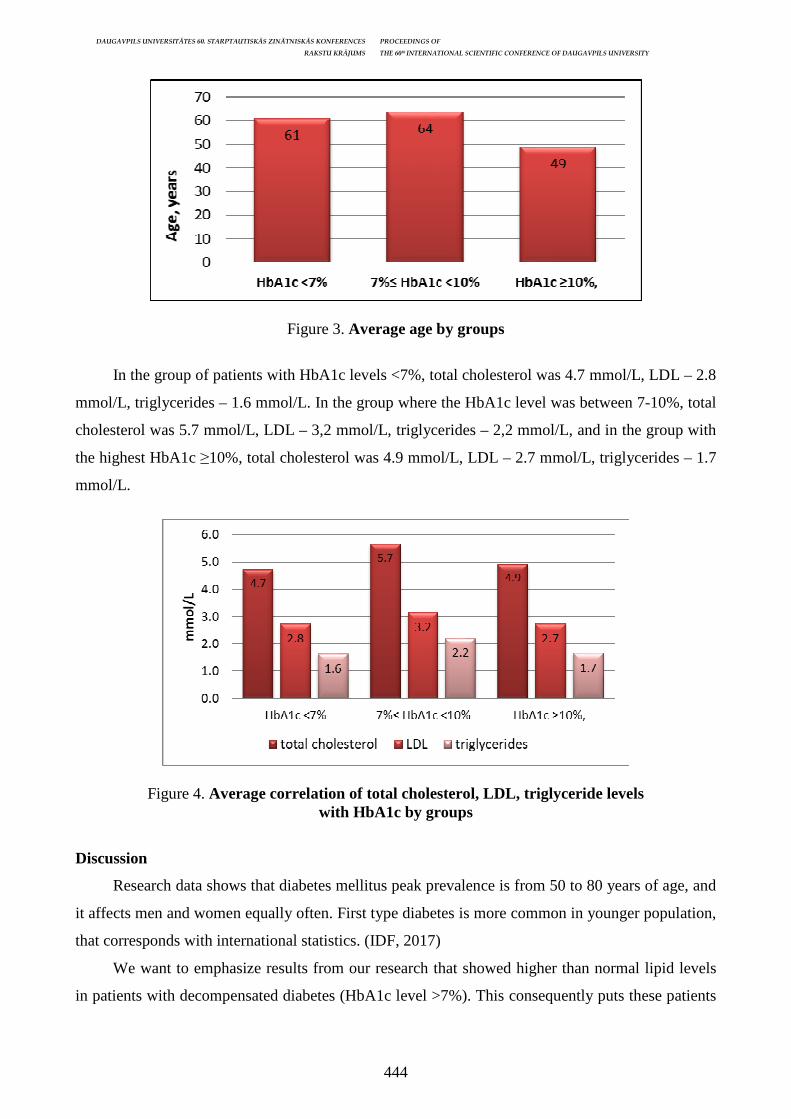
DAUGAVPILS UNIVERSITĀTES 60. STARPTAUTISKĀS ZINĀTNISKĀS KONFERENCES PROCEEDINGS OF
RAKSTU KRĀJUMS THE 60th INTERNATIONAL SCIENTIFIC CONFERENCE OF DAUGAVPILS UNIVERSITY
444
Figure 3. Average age by groups
In the group of patients with HbA1c levels <7%, total cholesterol was 4.7 mmol/L, LDL – 2.8
mmol/L, triglycerides – 1.6 mmol/L. In the group where the HbA1c level was between 7-10%, total
cholesterol was 5.7 mmol/L, LDL – 3,2 mmol/L, triglycerides – 2,2 mmol/L, and in the group with
the highest HbA1c ≥10%, total cholesterol was 4.9 mmol/L, LDL – 2.7 mmol/L, triglycerides – 1.7
mmol/L.
Figure 4. Average correlation of total cholesterol, LDL, triglyceride levels with HbA1c by groups
Discussion
Research data shows that diabetes mellitus peak prevalence is from 50 to 80 years of age, and
it affects men and women equally often. First type diabetes is more common in younger population,
that corresponds with international statistics. (IDF, 2017)
We want to emphasize results from our research that showed higher than normal lipid levels
in patients with decompensated diabetes (HbA1c level >7%). This consequently puts these patients
DAUGAVPILS UNIVERSITĀTES 60. STARPTAUTISKĀS ZINĀTNISKĀS KONFERENCES PROCEEDINGS OF
RAKSTU KRĀJUMS THE 60th INTERNATIONAL SCIENTIFIC CONFERENCE OF DAUGAVPILS UNIVERSITY
445
in higher risk for diabetes complications such as coronary heart disease, arterial hypertension,
cerebrovascular disease, peripheral atherosclerotic vascular disease, kidney damage. (ADA, 2013).
The highest lipid levels (total cholesterol, low density lipoprotein cholesterol and
triglycerides) were in group B with glycated hemoglobin 7-10%. In others two groups lipid profile
changes were without any significant differences and there was no association with HbA1c. Such
results could be explained by mean age difference: patients in group C were the youngest and their
lipid levels were not as high as expected for such high glycated hemoglobin. In comparison the age
in group B was the highest that presumably affected lipid levels.
Conclusions
1. HbA1c level, total cholesterol, LDL cholesterol and triglycerides were measured in one-year
period for most of patients (80%).
2. Most of diabetic patients were 50-80 years old in our research.
3. Diabetes mellitus affects women and men equally often.
4. Most patients had second type diabetes and their mean age was 34,5 years higher than in first
type diabetes patients.
5. Mean HbA1c level was higher for first type diabetes patients.
6. Most patients (57%) had compensated diabetes mellitus with HbA1c <7%.
7. Results show that highest lipid levels (total cholesterol, low density lipoprotein cholesterol and
triglycerides) were in the group with glycated hemoglobin 7-10%. This was also group with the
highest mean age that was 64 ± 14,3 years. Such results could indicate that lipid levels are
affected by both glycated hemoglobin level and age of patient, but research should be
continued with wider target group for statically reliable results.
8. It is important to control lipid and glycated hemoglobin levels to minimize risk for diabetes
complications and to improve quality of life.
References DeFronzo RA, Ferrannini E, Zimmet P, et al. International Textbook of Diabetes Mellitus, 2
Volume Set, 4th Edition. Wiley-Blackwell, 2015. Fendler W, Borowiec M, Baranowska-Jazwiecka A, et al. Prevalence of monogenic diabetes amongst Polish children after a nationwide genetic screening campaign. Diabetologia 2012; 55: 2631–35; DOI: http://dx.doi.org/10.1007/s00125-012-2621-2 International Diabetes Federation. IDF Diabetes Atlas, 8th edn. Brussels, Belgium: International Diabetes Federation, 2017. [15.03.2018]. Availabe: http://www.diabetesatlas.org Slimību profilakses un kontroles centrs. Statistikas dati 2016.gads, cukura diabēts [09.03.2018]. Available: https://www.spkc.gov.lv/lv/statistika-un-petijumi/statistika/veselibas-aprupes-statistika1/ get/nid/14 American Diabetes Association (ADA). Standards of medical care in diabetes -2013. Diabetes Care 2013; 36 Suppl 1: S11–S66.
DAUGAVPILS UNIVERSITĀTES 60. STARPTAUTISKĀS ZINĀTNISKĀS KONFERENCES PROCEEDINGS OF
RAKSTU KRĀJUMS THE 60th INTERNATIONAL SCIENTIFIC CONFERENCE OF DAUGAVPILS UNIVERSITY
446
THE EFFECT OF CAFFEINE ON TEAR SECRETION, STABILITY AND SYMPTOMS OF DRY EYE
Olga Muhina
Scientific research supervisor: Prof. med. Guna Laganovska Rīga Stradiņš University, Latvia, [email protected] Abstract
The effect of caffeine on tear secretion, stability and symptoms of dry eye Key Words: Dry eye syndrome, caffeine, Tear break up time, Schirmer test Introduction. Caffeine is the most widely used psychoactive substance in the world, therefore, the influence of caffeine on tear secretion is contradictory. Aim. To investigate tear production and tear film stability after oral dose of caffeine and to ascertain if symptoms of the dry eye depend on caffeine daily intake. Materials and methods. The pre-test, post-test experimental design was used in this study. 40 young participants with symptoms of dry eye filled out the questionnaire. Based on the collected data, the ocular surface disease index was calculated. Schirmer 1 and TBUT tests were measured in both eyes, before and 45 minutes after 200mg caffeine tablet intake. The results from data were collected and analyzed. Results. 40 patients (19-33y.o.) were divided in four groups depending on daily caffeine intake (<100mg; 100-200mg; 200-300mg, >300mg per day). The tear secretion and stability increase was noticed in all participants. However, the difference before and after caffeine intake was statistically significant only in 1st and 2nd group in Schirmer 1 and in 1st group in TBUT test(p<0,05). There was no interrelation found between OSDI and daily caffeine intake amount. There was a compelling correlation found between daily amount of caffeine intake and only 3 symptoms: problems with reading, driving at night and watching TV(p<0,05). Conclusion. The results demonstrated that caffeine tablet of 200mg increase tear secretion and tear stability in all participants. However, effects of caffeine were less significant for those participants, whose daily consumption of the caffeine is above the average. There was no compelling correlation found between symptoms severity of the dry eye, that showed OSDI, and daily amount of caffeine intake. Kopsavilkums
Kofeīna ietekme uz asaru sekrēciju, stabilit āti un sausās acs sindroma simptomiem Atslēgvārdi: Kofeīns, Sausās acs sindroms, Širmera tests, asaru plēvītes noturības laiks. Ievads. Kofeīns ir visplašāk lietota psihotropa ķīmiskā substance, bet tā ietekme uz asaru produkciju joprojām nav skaidri noteiktā un pētījumos pat pretrunīgā. Pētnieciskā darba mērķis. Izvērtēt kofeīna ietekmi uz asaru sekrēciju, asaru plēvītes stabilitāti un subjektīvām sajūtām, cilvēkiem ar sausās acs sindroma simptomiem. Materi āli un metodes. Pētījumā tika pielietots pirms un pēc izmeklējuma eksperimentālais dizains. 40 dalībnieki aizpildīja anketu, balstoties uz kuras tika mērīts ar acs virsmas slimības indeksu (OSDI). Tika pārbaudīts asaru plēvītes noturības laiks (TBUT) un Širmera asaru sekrēcijas tests. Abus testus veic divos etapos: pirms un 45 min pēc kofeīna (200mg) tabletes lietošanas. Dati tika statistiski apstrādāti un izanalīzēti. Rezultāti. 40 dalībnieki, vecumā no 19 līdz 33 gadiem, tika sadalīti četrās grupās atkarībā no ikdienas kofeīna patēriņa (<100; 100-200; 200-300, >300mg/dn). Visiem 40 dalībniekiem, tika novērots asaru produkcijas un asaru plēvītes stabilitātes pieaugums. Tomēr statistiski nozīmīga Širmera I testa strarpība pirms un pēc kofeīna bija tikai pirmajā un otrajā grupā; bet TBUT tikai pirmajā grupā – (p<0,05). Starp OSDI un ikdienas kofeīna lietošanas daudzumu nepastāv statistiski nozīmīgas korelācijas. Starp ikdienas kofeīna lietošanas daudzumu un tikai trim SAS simptomiem vērojama mērena korelācija: grūtības lasīt, vadīt mašīnu tumsā un grūtības skatīties TV (p<0,05) Secinājumi. Rezultāti parāda, ka 200 mg kofeīna tablete palielina asaru produkciju un asaru plēvītes stabilitāti. Tomēr dalībniekiem, kuri lieto vairāk kofeīna ikdienā, ietekme ir mazāka. Starp OSDI, simptomu smagumu un ikdienas kofeīna lietošanas daudzumu nepastāv statistiski nozīmīgas korelācijas.
Introduction
Caffeine is the most widely used psychoactive substance in the world. Global caffeine
consumption is around 120,000 tonnes per year, which corresponds to one cup of coffee per day for
every human on the planet. [8] The main sources of it are coffee, tea, soft drinks, energy drinks,
cocoa-containing products and medications.
DAUGAVPILS UNIVERSITĀTES 60. STARPTAUTISKĀS ZINĀTNISKĀS KONFERENCES PROCEEDINGS OF
RAKSTU KRĀJUMS THE 60th INTERNATIONAL SCIENTIFIC CONFERENCE OF DAUGAVPILS UNIVERSITY
447
The effect of caffeine on the human body is dose-dependent: effects at low doses can be
invisible; meanwhile, at high doses, they can be overt, and everyday users are at risk of developing
addiction. Caffeine stimulates mental activity, improves physical durability, increases blood
pressure, heart rate and diuresis, relaxes the gluteal muscle (promoting bronchodilation) and can
cause sleep disturbances. Caffeine is used as an adjuvant in several pharmaceutical medications and
has a great therapeutic role. Caffeine affects the nervous system and along with that tear production,
as the tear gland depends on the nervous system. [1]
The eyes receive both - sympathetic and parasympathetic innervation. Sympathetic system is
responsible for the production of normal tear flow, while parasympathetic is triggered by emotional
factors (e.g., when people cry laughing). [7]
Dry eye syndrome (DES) is one of the most topical pathologies in modern ophthalmology. It
is a multifactorial disorder, mainly due to insufficient tear secretion and / or poor tear formation.
The tear film consists of three layers: inner layer consists of mucus, that allows the water to spread
over the eye surface, is produced by the conjunctiva, middle or watery layer produced by lacrimal
glands, washes away foreign particles or irritants, and the oily layer produced by Meibomian
glands, which reduce evaporation of tears.
Patients with DES complain that eyes are sensitive to light, feel gritty, sore or painful, they
have blurred or poor vision, problems during reading, driving at night, working with computer,
watching TV, and feel uncomfortable in windy condition, in places with low humidity or that are air
conditioned. Untreated DES not only decrease the quality of life, but also can lead to severe
complications such as keratopathy, ulcer and other.
Therefore, the influence of caffeine on tear secretion is contradictory.
As a part of this study, I will try to find out the effect of caffeine on tear production, the
stability of tear film, the effect of daily caffeine consumption on the severity of the disease, and the
relationship between daily caffeine use and symptoms of DES.
Materials and methods
The pre-test, post-test experimental design was used in this study. All forty from 19 to 33-
years-old participants with symptoms of dry eye were informed about methodology of the research.
After consent was obtained, participants filled out the questionnaire, that included questions about
daily amount of caffeine consumption, usage of artificial tears, contact lenses, medicaments,
medical condition, risk factors and undertaken eye surgeries (if any). Based on the collected data,
the ocular surface disease index (OSDI), that shows DES severity and eye’s discomfort, was
calculated. Schirmer 1 and tear breakup time tests (TBUT) were measured in both eyes (with an
interval of 3 minutes, allowing the eyes to calm down), then each participant was given with the
DAUGAVPILS UNIVERSITĀTES 60. STARPTAUTISKĀS ZINĀTNISKĀS KONFERENCES PROCEEDINGS OF
RAKSTU KRĀJUMS THE 60th INTERNATIONAL SCIENTIFIC CONFERENCE OF DAUGAVPILS UNIVERSITY
448
200mg caffeine tablet and in 45minutes time tests were repeated. The results from data were
collected and analyzed using SPSS and Microsoft Excel programmes.
The exclusion criteria for participants were health status, factors and medications that affect
the caffeine elimination and dry eye. Pregnant women, menopausal women, smokers, users of
contraceptives, patients with chronic liver, lung, kidney, thyroid and arthritis diseases, as well as
people with diabetes, glaucoma and elderly age group were not included in the study.
All participants are caffeine users. They were divided in four groups depending on daily
caffeine intake (<100mg; 100-200mg; 200-300mg, >300mg per day). To make measurements more
accurate, participants were asked not to use caffeine 24 hours before the test. The caffeine's half-life
period is 5-6 hours, but that depends on a variety of factors. Such as age, pregnancy, smoking,
weight, medications and health status. For example, for smokers it can be 2.5-3h, meanwhile for
pregnant women it may last till 15h. [3;10]
The study includes participants with DES symptomatology. However, Shirmer's I test results
of more than 15mm and TBUT for more than 10 seconds before consuming a 200mg caffeine tablet
were excluded from the study. Those participants, whose results were below the norm in the first
phase at least in one test, were included in the second phase of the study.
Results
Schirmer tests in the right and left eye were slightly different, but the tear secretion and
stability increase was noticed in all participants (OD, 1,85 ± 0,43 mm and 0,63 ± 0,34 s, OS, 1,95 ±
0,52 mm and 0,60 ± 0,29 s). (see fig.1.) However, the difference before and after caffeine in
Schirmer 1 was statistically significant only in the first two groups of participants, according to
Wilcoxon Signed Ranks Test: in the 1st group 3,88mm and 4,75mm (OD, Z= -2,395, p=0,017; OS,
Z= -2,397, p=0,017) and in the 2nd group - 2,13mm and 2,13mm (OD, Z= -2,173, p=0,030; OS, Z= -
2,166, p=0,030). (Table 1.1.) The tendency of decreasing the growth of tear production can also be
observed in groups with higher daily caffeine consumption.
The tear film stability increase after caffeine intake was statistically significant only in 1st
group - 2 and 2,13 s (OD, Z= -2,226, p=0,026; OS, Z= -2,207, p=0,027). (Table 1.2.)
The average OSDI results of the four study groups have showed that there was an increasing
tendency of DES for people taking more caffeine every day, comparing to the first, second and third
groups. (see Fig. 2.) However, there was no statistically significant correlation found between OSDI
and daily caffeine intake amount (rs=0,231, p=0.151).
The questions included in the OSDI questionnaire were analyzed for such symptoms as eye
sensitivity to light, foreign body sensation in the eyes, painful or inflamed eyes, blurred vision, poor
eyesight, difficulty reading, driving in the dark, working on a computer, discomfort feeling in the
eyes during windy times, low humidity and in rooms with air conditioning.
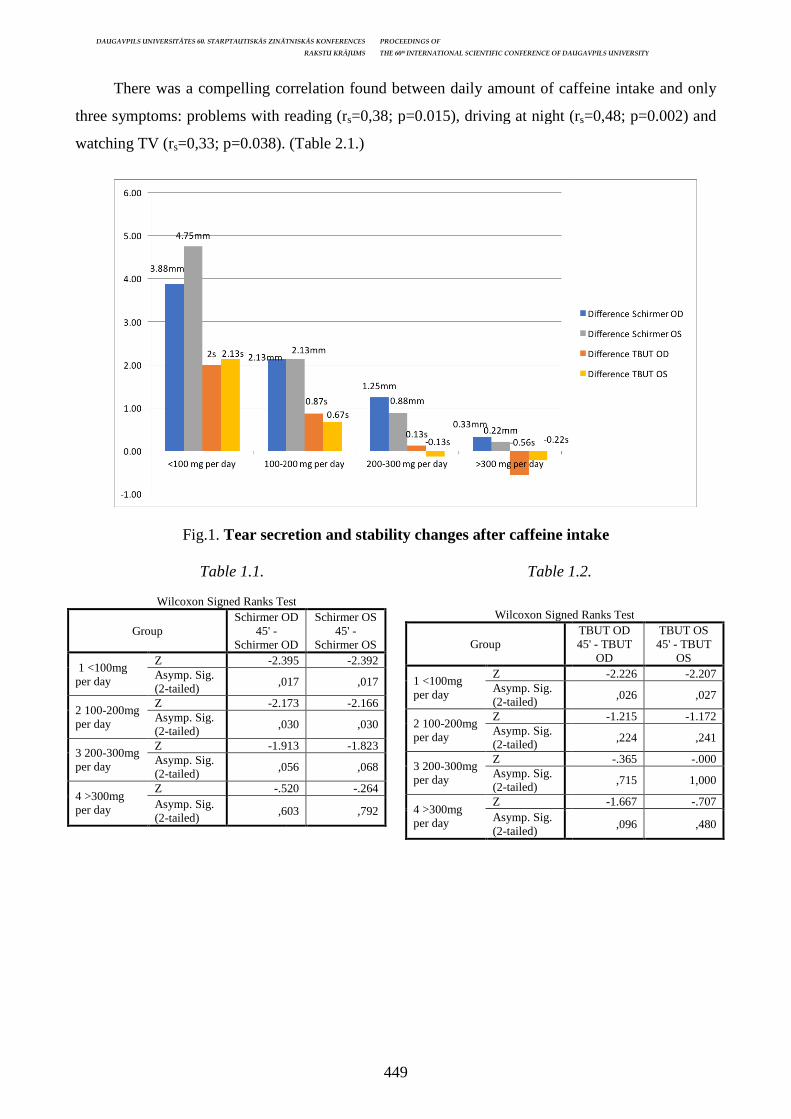
DAUGAVPILS UNIVERSITĀTES 60. STARPTAUTISKĀS ZINĀTNISKĀS KONFERENCES
There was a compelling correlation found between daily amount of caffeine intake and only
three symptoms: problems with reading (r
watching TV (rs=0,33; p=0.038). (Table 2.1.)
Fig.1. Tear secretion and stability
Table 1.1.
Wilcoxon Signed Ranks Test
Group Schirmer OD
45' - Schirmer OD
1 <100mg per day
Z -2.395Asymp. Sig. (2-tailed)
,017
2 100-200mg per day
Z -2.173Asymp. Sig. (2-tailed)
,030
3 200-300mg per day
Z -1.913Asymp. Sig. (2-tailed)
,056
4 >300mg per day
Z -.520Asymp. Sig. (2-tailed)
,603
STARPTAUTISKĀS ZINĀTNISKĀS KONFERENCES PROCEEDINGS OF
RAKSTU KRĀJUMS THE 60th INTERNATIONAL SCIENTIFIC CONFERENCE OF DAUGAVPILS UNIVERSITY
449
There was a compelling correlation found between daily amount of caffeine intake and only
with reading (rs=0,38; p=0.015), driving at night (r
=0,33; p=0.038). (Table 2.1.)
Tear secretion and stability changes after caffeine intake
Table 1.1. Table 1.2.
Wilcoxon Signed Ranks Test
Group
1 <100mg per day
Z Asymp. Sig. (2-tailed)
2 100-200mg per day
Z Asymp. Sig. (2-tailed)
3 200-300mg per day
Z Asymp. Sig. (2-tailed)
4 >300mg per day
Z Asymp. Sig. (2-tailed)
Wilcoxon Signed Ranks Test Schirmer OD
Schirmer OD
Schirmer OS 45' -
Schirmer OS 2.395 -2.392
,017 ,017
2.173 -2.166
,030 ,030
1.913 -1.823
,056 ,068
.520 -.264
,603 ,792
INTERNATIONAL SCIENTIFIC CONFERENCE OF DAUGAVPILS UNIVERSITY
There was a compelling correlation found between daily amount of caffeine intake and only
=0,38; p=0.015), driving at night (rs=0,48; p=0.002) and
after caffeine intake
Table 1.2.
Wilcoxon Signed Ranks Test TBUT OD 45' - TBUT
OD
TBUT OS 45' - TBUT
OS -2.226 -2.207
,026 ,027
-1.215 -1.172
,224 ,241
-.365 -.000
,715 1,000
-1.667 -.707
,096 ,480
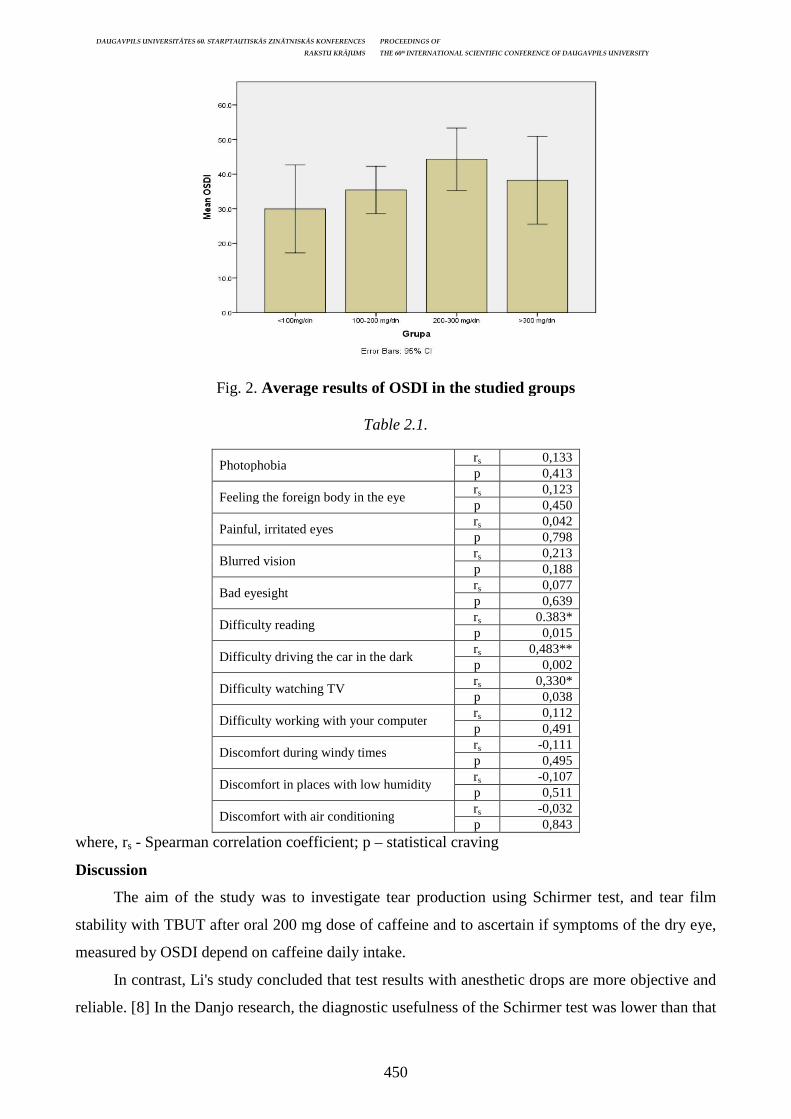
DAUGAVPILS UNIVERSITĀTES 60. STARPTAUTISKĀS ZINĀTNISKĀS KONFERENCES
Fig. 2. Average results of OSDI
Photophobia
Feeling the foreign body in the eye
Painful, irritated eyes
Blurred vision
Bad eyesight
Difficulty reading
Difficulty driving the car in the dark
Difficulty watching TV
Difficulty working with your computer
Discomfort during windy times
Discomfort in places with low humidity
Discomfort with air conditioning
where, rs - Spearman correlation coefficient; p
Discussion
The aim of the study was to investigate tear production
stability with TBUT after oral 200 mg dose of caffeine and to ascertain if symptoms of the dry eye,
measured by OSDI depend on caffeine daily intake.
In contrast, Li's study concluded that test results with anesthetic dr
reliable. [8] In the Danjo research, the diagnostic usefulness of the Schirmer test was lower than that
STARPTAUTISKĀS ZINĀTNISKĀS KONFERENCES PROCEEDINGS OF
RAKSTU KRĀJUMS THE 60th INTERNATIONAL SCIENTIFIC CONFERENCE OF DAUGAVPILS UNIVERSITY
450
Average results of OSDI in the studied groups
Table 2.1.
Photophobia rs 0,133p 0,413
Feeling the foreign body in the eye rs 0,123p 0,450
Painful, irritated eyes rs 0,042p 0,798
Blurred vision rs 0,213p 0,188
Bad eyesight rs 0,077p 0,639
Difficulty reading rs 0.383*p 0,015
Difficulty driving the car in the dark rs 0,483**p 0,002
Difficulty watching TV rs 0,330*p 0,038
Difficulty working with your computer rs 0,112p 0,491
Discomfort during windy times rs -0,111p 0,495
Discomfort in places with low humidity rs -0,107p 0,511
Discomfort with air conditioning rs -0,032p 0,843
Spearman correlation coefficient; p – statistical craving
he aim of the study was to investigate tear production using Schirmer test, and tear film
stability with TBUT after oral 200 mg dose of caffeine and to ascertain if symptoms of the dry eye,
measured by OSDI depend on caffeine daily intake.
In contrast, Li's study concluded that test results with anesthetic drops are more objective and
reliable. [8] In the Danjo research, the diagnostic usefulness of the Schirmer test was lower than that
INTERNATIONAL SCIENTIFIC CONFERENCE OF DAUGAVPILS UNIVERSITY
in the studied groups
using Schirmer test, and tear film
stability with TBUT after oral 200 mg dose of caffeine and to ascertain if symptoms of the dry eye,
ops are more objective and
reliable. [8] In the Danjo research, the diagnostic usefulness of the Schirmer test was lower than that
DAUGAVPILS UNIVERSITĀTES 60. STARPTAUTISKĀS ZINĀTNISKĀS KONFERENCES PROCEEDINGS OF
RAKSTU KRĀJUMS THE 60th INTERNATIONAL SCIENTIFIC CONFERENCE OF DAUGAVPILS UNIVERSITY
451
of TBUT, but it was concluded that in the case of DES, the performance of both tests helps to
determine the qualitative and quantitative abnormalities of tears. [4] In order to reduce the eye
surface irritation with the Schirmer test strip and increase repeatability, participants were asked to
sit with closed eyes during the test, as suggested in the Serin study. [13] In order to minimize the
probable daily changes of tear production, the examinations were carried out at the same time (at
12 - 15PM). [6]
Caffeine stimulating effects on tear production were detected in an experimental study of
Ossei as well. The study involved 41 participants aged 20 to 26 without DES, that were split into
two groups. One group received caffeine and another placebo (drinking water). Tear production was
re-measured using a Shirmer test with anesthetic drops in 45, 90, 135 and 180 minutes after caffeine
or water. The results before the caffeine consumption were 17.9 ± 4.6 mm and after caffeine 20.9 ±
5.2, 20.7 ± 5.8, 19.8 ± 5.0, and 18.1 ± 5.8 mm, respectively in 45, 90, 135 and 180 minutes. [12]
Similar results were obtained in Arita's research, although the studied parameters were
different. Researchers measured the effect of caffeine on tear volume by Tear Meniscus height
(TMH), on 78 volunteers. Participants were divided into two groups. For one group, caffeine was
given in capsules at 200 or 300 mg for six days to maintain 5-7 mg of caffeine per kg of
bodyweight. The second group received placebo (dextrose-containing capsule). It was found that
the use of caffeine increases tear volume. The TMH of members, who received caffeine, has been
increased by 0.08 mm (95% confidence interval, 0.05-0.10) compared to those receiving placebo (p
<0.0001). [3] Although the results of the TMH and Schirmer test show different parameters of tear
film dynamics one may depend on the other. (With the increase in tear production, the tear volume
in the inferior conjunctival sac increases as well. Conversely, with the decrease in tear production,
the tear volume in the inferior conjunctival sac decreases.) [30]
In contrast, a similar Amaechi study with 30 people, without DES, did not show any increase
in tear production. [1] Researchers from Nigeria used a 150-ml coffee cup (containing 250mg of
caffeine) followed by four Schirmer tests at a one-hour interval. It was found that after a cup of
coffee (Maxwell House Instant Coffee Granules) teardrop production decreased by 12.58, 38.98,
31.11 and 28.09%, and the results were statistically significant (p <0.05). In Ossei's study, the
results of such contrasts were explained by the fact that coffee contains not only caffeine, but other
physiologically active substances such as chlorogenic acid, caffeic acid, citric acid and
acetaldehyde. Although there is no evidence to show the inhibitory effect of these substances on
tear production, this fact cannot be completely excluded. [2; 12]
The results were also controversial in the Juddy's study, which involved 50 people. The
researchers used 4g Nescafe coffee granules dissolved in 150ml of boiled water (containing 60mg
of caffeine). In the Shirmer tests before the coffee and after it in 30, 45, 60, 75, 90 minutes, it was

DAUGAVPILS UNIVERSITĀTES 60. STARPTAUTISKĀS ZINĀTNISKĀS KONFERENCES PROCEEDINGS OF
RAKSTU KRĀJUMS THE 60th INTERNATIONAL SCIENTIFIC CONFERENCE OF DAUGAVPILS UNIVERSITY
452
found that the tear secretion decreased from 24.90 mm before coffee to 23.70 mm in 30 minutes;
22.50 mm in 45 minutes; 19.50 mm in 60 minutes and increased to 21.90 mm in 75 minutes and
24.50 mm in 90 minutes. [7]
The stability of the tear film also increased in this research: the right eye increased by 0.63 ±
0.34 s and the left one by 0.60 ± 0.29 s. It can be related to quantitative tear interactions. However,
this cannot be applied for each group individually. The statistically significant increase in TBUT
was only in the first group.
There was no statistically significant correlation found between OSDI, DES symptoms and
daily caffeine intake amount. However, researchers Moss and Klein discovered that the prevalence
of DES for caffeine users was 13.0%, while for those who did not use caffeine it was 16.6%. [11]
This contradicts the results of this study. However, given that the selection is small, the study
should be expanded, thus obtaining more precise data.
Conclusions
The results demonstrated that caffeine tablet of 200mg increases tear secretion and tear
stability in all participants. This will confirm the stimulatory effect of caffeine on the lacrimal
glands. However, effects of caffeine were less significant for those participants, whose daily
consumption of the caffeine is above the average. This phenomenon can be explained by the fact
that the use of caffeine in larger quantities reduces the sensitivity to it. Thus, in order to achieve
stimulating effects, a higher amount of caffeine is needed.
There was no compelling correlation found between symptoms severity of the dry eye, that
showed OSDI, and daily amount of caffeine intake. The results of this research might capture the
interest for further studies.
References Amaechi OU, Savia J. Effect of caffeine on tear formation. J Nigeria Optom Assoc 2005; 12: 14–6. Available at: http://www.ajol.info/index.php/jnoa/article/view/64451. Accessed October 2, 2013. American Academy of ophthalmology Cornea/External Disease Panel. Preferred Practice Pattern Guidelines. Dry eye syndrome. San Francisco, CA: American Academy of Ophthalmology; 2013. Available at: www.aao.org/ppp Arita R, Yanagi Y, Honda N, Maeda S, Maeda K, Kuchiba A, Yamaguchi T, Yanagihara Y, Suzuki H, Amano S. Caffeine increases tear volume depending on polymorphisms within the adenosine A2a receptor gene and cytochrome P450 1A2. Ophthalmology 2012; 119: 972–8. Bruce M, Scott N, Lader M, Marks V. The psychopharmacological and electrophysiological effects of single doses of caffeine in healthy human subjects. British Journal of Clinical Pharmacology. 1986; 22(1): 81–87. Danjo Y. Diagnostic usefulness and cutoff value of Schirmer's I test in the Japanese diagnostic criteria of dry eye. Graefes Arch Clin Exp Ophthalmol. 1997; 235(12): 761–766. Giannetto C, Piccione G, Giudice E. Daytime profile of the intraocular pressure and tear production in normal dog. Vet Ophthalmol 2009; 12: 302–5.
DAUGAVPILS UNIVERSITĀTES 60. STARPTAUTISKĀS ZINĀTNISKĀS KONFERENCES PROCEEDINGS OF
RAKSTU KRĀJUMS THE 60th INTERNATIONAL SCIENTIFIC CONFERENCE OF DAUGAVPILS UNIVERSITY
453
Juddy A. U., Esenwah, E. C., Ikoro N. C., Azuamah Y. C., George G. O., Okorie M. E., Daniel-Nwosu E. M., Nwakamma G., Effect of Caffeinated Coffee on Tear Production. International Journal of Research (IJR) Vol-1, Issue-9 October 2014 ISSN 2348-6848. Latosińska M., Latosińska J. N. Introductory Chapter: Caffeine, a Major Component of Nectar of the Gods and Favourite Beverage of Kings, Popes, Artists and Revolutionists, a Drug or a Poison? The Question of Caffeine. 2017, DOI: 10.5772/intechopen.69693. Pieejams: https://mts.intechopen. com/books/the-question-of-caffeine/introductory-chapter-caffeine-a-major-component-of-nectar-of-the-gods-and-favourite-beverage-of-king Li N, Deng X-G, He M-F. Comparison of the Schirmer I test with and without topical anesthesia for diagnosing dry eye. International Journal of Ophthalmology. 2012; 5(4): 478–481. doi: 10.3980/j.issn.2222-3959.2012.04.14 Mandal A. Caffeine pharmacology. News medical life sciences, 2014. Pieejams: https://www.news-medical.net/health/Caffeine-Pharmacology.aspx Moss SE, Klein R, Klein BE. Prevalence of and risk factors for dry eye syndrome. Arch Ophthalmol 2000; 118: 1264–8. Osei, Kwaku Antwi; Ovenseri-Ogbomo, Godwin; Kyei, Samuel; Ntodie, Michael The Effect of Caffeine on Tear Secretion Optometry and Vision Science: February 2014 - Volume 91 - Issue 2 – p. 171–177. doi: 10.1097/OPX.0000000000000129 Serin D, Karsloğlu S, Kyan A, Alagöz G. A simple approach to the repeatability of the Schirmer test without anesthesia: eyes open or closed? Cornea. 2007 Sep; 26(8): 903–6.

DAUGAVPILS UNIVERSITĀTES 60. STARPTAUTISKĀS ZINĀTNISKĀS KONFERENCES PROCEEDINGS OF
RAKSTU KRĀJUMS THE 60th INTERNATIONAL SCIENTIFIC CONFERENCE OF DAUGAVPILS UNIVERSITY
454
TREATMENT OF ATYPICAL VASOVAGAL SYNCOPE, USING DUAL CHAMBER PACEMAKER IMPLANTATION:
A CASE REPORT
Alberts Berziņs1, Mara Karakone1, Janis Pudulis2 1Riga Stradins University, Dzirciema street 16, Riga, Latvia, LV-1007, [email protected] 2 Riga East University Hospital, 2 Hipokrata street, Rīga, Latvia, LV-1038
Abstract
Treatment of atypical vasovagal syncope, using dual chamber pacemaker implantation: A case report Key Words: vasovagal syncope, tilt table test, pacemaker Introduction. Syncope is defined as a temporary loss of consciousness due to transient cerebral hypoperfusion, characterized by a rapid, short onset and spontaneous complete recovery. Vasovagal syncope (VVS) is the most common type of syncope in all ages, but is particularly common in young people. The VVS is based on two mechanisms that often work together. First is a vasodepressor a mechanism, characterized by peripheral vascular dilatation under the influence of various reflexes, and the second is a cardioinhibitory reflex, characterized by bradycardia or asystole. Case Presentation. 25-year-old caucasian male was hospitalized for a scheduled cholecystectomy due to gall bladder polyps. In the surgery room before inserting an i/v catheter for an anaesthetic patient developed a syncope, lost consciousness. During the time of admittance at Cardicac Arrhythmia department broader investigation of medical history revealed that the patient had fallen unconscious about a year ago before undergoing fibrogastroscopy. We decided to perform Tilt-Table during which developed vasovagal syncope with a cardioinhibitory mechanism. Considering the patient's symptoms - vasovagal syncope with cardioinhibitory mechanism – as well as absence of a prodromal period, it was decided to perform a dual chamber cardiac pacemaker implantation with a MRI-compatible pacemaker system. During follow up in 2015-2018 there were no abnormalities in pacemaker function, and no new onset of syncope has been reported. Conclusion. The case showed that pacemaker implantation in a patient with VSS without prodrome with a significant cardioinhibitory mechanism can be an effective method in preventing syncope in patients younger than 40 years old. Kopsavilkums
Atipiskas vazovagāla sinkopes ārstēšana, pielietojot divkameru elektrokardiostimulātora implantāciju: kl īniskais gadījums
Atslēgvārdi: Vazovagāla sinkope, slīpā galda tests, elektrokardiostimulātors(EKS) Ievads. Sinkope tiek definēta kā pārejošs samaņas zudums tranzitoras smadzeņu hipoperfūzījas dēļ, kas raksturojas ar ātru sākumu, īsu periodu un spontānu pilnīgu atgūšanos. Vazovagālās sinkopes(VVS) ir biežākais sinkopes veids visos vecumos, bet īpaši izplatīts jauniem cilvēkiem. VVS pamatā ir divi mehānismi, kuri bieži darbojas kopā. Viens ir vazodepresors mehānisms, kad dažādu refleksu ietekmē veidojas perifēro asinsvadu paplašināšanās un otrs ir kardioinhibitors reflekss, kas raksturojas ar bradikardiju vai asistoliju. Gadījuma apraksts. 25 gadus vecs vīrietis tika hospitalizēts plānveida holecistektomijai žultspūšļa polipu dēļ. Operācijas zālē pirms narkozes i/v katetra ielikšanas laikā pacientam attaisīta sinkope, zaudē samaņu. Padziļināti ievācot anamnēzi, kad pacients atradies Aritmoloģijas nodaļā, viņam bezsamaņa bijusi arī pirms gada, pirms fibrogastroskopijas. Mēs nolēmām veikt Slipā galda testu, kura laikā attīstīstijās vazovagāla sinkope ar kardioinhibitoro mehānismu. Ņemot vērā pacienta klīniku, vazovagālu sinkopi ar kardioinhibītoro mehānismu, kā arī to, ka viņam nav prodroma perioda, tika nolemts veikt divkameru ar MRI savietojuma EKS sistēmas implantāciju. Apsekošanas laikā no 2015 -2018 gadam EKS darbojās bez problēmām un jaunu ģīboņu gadījumu nav bijis. Secinājumi. Mūsu klīniskais gadījums parādīja, ka EKS implantācija pie VVS bez prodroma ar izteiktu kardioinhibitoru mehānismu var būt efektīva un var palīdzēt novērst sinkopes arī pacientiem jaunākiem par 40 gadiem. Introduction
Syncope is defined as a temporary loss of consciousness due to transient cerebral
hypoperfusion, characterized by a rapid, short onset and spontaneous complete recovery.
Syncope is fairly common in the general population. The first manifestation most frequently
occurs between the age of 10 to 30 and the prevalence rises again over the age of 65. (Ganzeboom
et al., 2003; Soteriades et al., 2002). Epidemiological data show that the average prevalence of
DAUGAVPILS UNIVERSITĀTES 60. STARPTAUTISKĀS ZINĀTNISKĀS KONFERENCES PROCEEDINGS OF
RAKSTU KRĀJUMS THE 60th INTERNATIONAL SCIENTIFIC CONFERENCE OF DAUGAVPILS UNIVERSITY
455
syncope may be between 18.1 and 39.1 cases per 1000 inhabitants. 9.3 out of 1000 people turn to
general practitioners after experiencing a syncope, and 0.7 out of 1,000 are hospitalized.
(Ganzeboom et al., 2006)
There are several causes of syncope that are divided into three major groups: reflector
(vazovagal) syncope, syncope associated with orthostatic hypotension, and cardiovascular syncope.
(Brignole et al., 2018)
Vasovagal syncope (VVS) is the most common type of syncope in all ages, but is particularly
common in young people. (Da Silva, 2014). The VVS is based on two mechanisms that can work
together. First is a vasodepressor a mechanism, characterized by peripheral vascular dilatation under
the influence of various reflexes, and the second is a cardioinhibitory reflex, characterized by
bradycardia or asystole. A combination of both mechanisms is possible as well. (Brignole et al.,
2018)
Distinguishing between the causes of syncope is crucial, as patients with vasovagal syncope
have a relatively low risk of adverse outcome, while patients with cardiovascular syncope have high
mortality rate (Brignole et al., 2018; Sheldon et al.. 2015). In order to distinguish cardiovascular
syncope from vasovagal syncope, as well as to evaluate the risk of mortality, risk scales such as
OESIL or EGSYS have been established (Colivicchi et al., 2003; Del Rosso et al., 2008)
In order to diagnose the type of syncope, a careful collection of anamnesis and physical
examination, including the use of orthostatic tests and electrocardiogram, are essential. Other tests
may be considered additionally. One of the tests that helps in diagnosing VVS is the Tilt-Table test
that is able to provoke vasovagal syncope under laboratory conditions. Reduced venous backflow
due to orthostasis as well as immobilization can provoke VVS (Moya et al., 2009). In 1986, Kenny
et al introduced the Tilt-Table test in clinical practice for diagnosing unexplained cases of syncope
Since then, several Tilt-Table test protocols have been developed with different stabilization phases,
duration, table angle as well as pharmacological provocation. The most commonly used protocols
involve using small doses of intravenous isoproterenol infusions or 300-400 µg sublingual
nitroglycerine as pharmacological provocation after 20 minutes of standing without medication.
(Morillo et al., 1995, Bartoletti et al., 2000)
Case presentation
In May 2015, a 25-year-old man was admitted to Riga Eastern Clinical University Hospital
“Gaiļezers” 10th department of surgery for a scheduled cholecystectomy due to gall bladder polyps
for oncoprophylaxis. In the surgery room before inserting an i/v catheter for an anaesthetic patient
developed a syncope, lost consciousness. The anesthetist was not able to palpate pulse during
syncope. The operation was canceled. Consulted by a cardiologist, an ECG record revealed no
significant pathology. The patient was transferred to the 10th deparment of surgery for observation.
DAUGAVPILS UNIVERSITĀTES 60. STARPTAUTISKĀS ZINĀTNISKĀS KONFERENCES PROCEEDINGS OF
RAKSTU KRĀJUMS THE 60th INTERNATIONAL SCIENTIFIC CONFERENCE OF DAUGAVPILS UNIVERSITY
456
A consultation of a therapist was conducted in the same evening. The situation was stable. In
satisfactory condition, the patient was prescribed further outpatient treatment and discharged for
subsequent re-hospitalization at the hospital’s Cardiac Arrhythmia department.
During the time of admittance at Cardicac Arrhythmia department broader investigation of
medical history revealed that the patient had fallen unconscious about a year ago before undergoing
fibrogastroscopy. There had also been periodic cases of pre-syncope state, especially during contact
with medical personnel. Other illnesses apart from gall bladder polyps were denied. Family history
was negative. Blood tests showed no abnormalities, including biochemical or hemostatic
parameters. ECG showed sinus rhythm with a frequency of 52x/min, a slight sinus bradycardia,
otherwise within the normal range. ECHO: heart cavities of normal size. The global systolic
function of both chambers and the diastolic function of the left ventricle was preserved. First grade
prolapse of the anterior mitral leaflet ~ 5mm. Grade I Mitral regurgitation and Tricuspid
regurgitation 0-I Grade was found. Other valves were not visually altered. Pericard was in the norm.
Holter monitoring found no significant arrhythmias that could explain syncope.
It was decided to perform Tilt-Table test by the Italian protocol (Bartoletti et al., 2000). The
Tilt-Table test was performed on 05/22/2015: “Into 10min of the passive phase, the patient develops
vasovagal syncope with a cardioinhibitory mechanism (asystole 18s)”
Considering the patient's symptoms - vasovagal syncope with cardioinhibitory mechanism –
as well as absence of a prodromal period, it was decided to perform a dual chamber cardiac
pacemaker implantation with a MRI-compatible pacemaker system. Thus an implantation of Etrinsa
8 DR-T (Biotronik) pacemaker was carried out. No complications occured during the postoperative
period. The control chest X-ray showed no abnormalities. There was no malfunction in the
pacemaker test, programmed in DDD mode at 60 x min, with hysteresis 40 x / min. The patient was
discharged in satisfactory condition.
2 weeks later, the patient was admitted for a scheduled onco-prophylactic laparoscopic
cholecystectomy due to gallbladder polyps. The operation was performed without complications,
with no development of syncope. The postoperative period was successful. In January 2016, during
an outpatient visit, the pacemaker showed no malfunctioning of AP 4% VP 1%, was programmed in
DDD mode at 60 x min with a hysteresis of 40x/min and the AV monitoring function turned on.
Similar results were also obtained during the February 2017 and 2018 visits.
No new onset of syncope has been reported.
Discussion
Vasovagal syncope (VVS) is characterized by vasodilation and/or bradycardia resulting from
a trigger, followed by a drop in blood pressure, resulting in reduced brain perfusion. VVS is more
DAUGAVPILS UNIVERSITĀTES 60. STARPTAUTISKĀS ZINĀTNISKĀS KONFERENCES PROCEEDINGS OF
RAKSTU KRĀJUMS THE 60th INTERNATIONAL SCIENTIFIC CONFERENCE OF DAUGAVPILS UNIVERSITY
457
likely to occur in an upright position and following a prodromal period. Although mortality has not
been established in terms of cardiovascular syncope, the quality of life is vastly affected.
Unfortunately, there are no syncope guidelines in Latvia, no syncope units and clinics, so we
used the guidelines of the European Heart Association (EHRA) and the American Heart Rhythm
Association (AHA) (Moya et al., 2009; Sheldon et al., 2015). Both guidelines for unexplained
syncope without structural changes in the heart recommend the use of a Tilt-Table test or passive
orthostatic assays, which were performed using the Italian protocol and helped us prove the
diagnosis (Bartoletti et al., 2000)
The main (class I) recommendations for treatment of VVS include patient education,
prevention of syncope-provoking factors as well as increased salt and water intake as long as it is
not contraindicated. Counter - pressure maneuvers are recommended for patients with prolonged
prodromal periods. Generally pacemaker implantation plays a very subtle role in the treatment of
typical VVS and only benefits patients with cardioinhibitory mechanism. Previous studies have
shown both positive and negative results in patients with implantable pacemakers older than 40
years of age. Pacemaker implantation is also recommended in guidelines in cases when lifestyle
alteration and medication aren’t enough. At the moment, no positive placebo-controlled study is
available in patients with VVS who are under 40 years of age. In this case pacemaker implantation
should be the last treatment option. (Sheldon 2015)
A small “single-blind” randomized study showed a significant reduction in syncope frequency
after permanent pacemaker implantation in children with frequent syncope and documented
asystole
In some patients with unexplained syncope without prodrome, sudden onset, as well as
abnormal findings in the heart and ECG, low plasma adenosine levels are described. Since syncope
of this mechanism is characterized by cardiac dysfunction, including atrioventricular blockade and
decrease in the rhythm of the sinus node, pacemaker implantation is effective in preventing syncope
(Sheldon et al., 2015)
Given that the patient had no prodrome period, the syncope could happen in horizontal state
and the Tilt-Table test showed cardioinhibitory mechanism, it was decided to implant a cardiac
pacemaker. An additional factor for the decision to perform pacemaker implantation was the
scheduled operation and possible further medical manipulations.
Looking back, we can conclude that the tactics chosen gave a positive result. The last
examination of the patient in February 2018 showed no malfunction of the pacemaker. The patient
did not report experiencing any episodes of syncope so far and overall the patient was feeling well.
It is possible that more data will be available in the future on the effectiveness of this method for

DAUGAVPILS UNIVERSITĀTES 60. STARPTAUTISKĀS ZINĀTNISKĀS KONFERENCES PROCEEDINGS OF
RAKSTU KRĀJUMS THE 60th INTERNATIONAL SCIENTIFIC CONFERENCE OF DAUGAVPILS UNIVERSITY
458
young people. At the moment, each patient should be evaluated individually aiming to improve the
patient’s quality of life.
Conclusions
The case showed that pacemaker implantation in a patient with VSS without prodrome with a
significant cardioinhibitory mechanism can be an effective method in preventing syncope in
patients younger than 40 years old.
References Bartoletti, A. Alboni, P., Ammirati, P., Del Rosso, A., Sutton, R. 2000. ‘“The Italian Protocol”: a simplified head-up tilt testing potentiated with oral nitroglycerin to assess patients with unexplained syncope’, Europace, 2(4), pp. 339–342. doi: 10.1053/eupc.2000.0125 Brignole, M., Moya, A., de Lange, F. J., Deharo, J.-C., Elliott, P. M., Lim, P. B., et al. 2018. 2018 ESC Guidelines for the diagnosis and management of syncope’, European Heart Journal, (April), pp. 1–69. doi: 10.1093/eurheartj/ehy037 Brignole, M., Moya, A., de Lange, F. J., Deharo, J.-C., Elliott, P. M., Fanciulli, A., et al. 2018. ‘Practical Instructions for the 2018 ESC Guidelines for the diagnosis and management of syncope’, European Heart Journal, (April), pp. 1–38. doi: 10.1093/eurheartj/ehy071 Colivicchi, F. et al. 2003. ‘Development and prospective validation of a risk stratification system for patients with syncope in the emergency department: the OESIL risk score’, European heart journal, 24(9), pp. 811–9. Del Rosso, A., Ungar, A., Maggi, R., Giada, F., Petix, N. 2008. ‘Clinical predictors of cardiac syncope at initial evaluation in patients referred urgently to a general hospital: the EGSYS score’, Heart, 94(12), pp. 1620–1626. doi: 10.1136/hrt.2008.143123 Ganzeboom, K. S., Colman, N., Reitsma J., Shen W., Wieling, W. 2003. ‘Prevalence and triggers of syncope in medical students’, The American journal of cardiology. Elsevier, 91(8), pp. 1006–8, A8. doi: 10.1016/S0002-9149(03)00127-9 Kanjwal, K., Masudi, S. and Grubb, B. P. 2015. ‘Syncope in Children and Adolescents’, Adolesc Med, 26, pp. 692–711. Kenny, R. A., Bayliss, J., Ingram A., Sutton R. 1986. ‘Head-up tilt: a useful test for investigating unexplained syncope.’, Lancet (London, England), 1(8494), pp. 1352–5. McLeod, K. A. et al. 1999. ‘Cardiac pacing for severe childhood neurally mediated syncope with reflex anoxic seizures.’, Heart (British Cardiac Society), 82(6), pp. 721–5. Mcleod, K. A. 2003. ‘Syncope in childhood’, Arch Dis Child, 88, pp. 350–353. Moya, A., Sutton, R., Ammirati, F., Blanc, J.-J., Brignole, M., Dahm, J. B., … Zamorano, J. L. 2009. ‘Guidelines for the diagnosis and management of syncope (version 2009): The Task Force for the Diagnosis and Management of Syncope of the European Society of Cardiology (ESC)’, European Heart Journal. Oxford University Press, 30(21), pp. 2631–2671. doi: 10.1093/eurheartj/ehp298 Sheldon, R. S., Grubb, B. P., Olshansky, B., Shen, W. K., Calkins, H., Brignole, M., … Kanjwal, K. 2015. ‘2015 Heart Rhythm Society Expert Consensus Statement on the Diagnosis and Treatment of Postural Tachycardia Syndrome, Inappropriate Sinus Tachycardia, and Vasovagal Syncope’, Heart Rhythm. Elsevier, 12(6), pp. e41–e63. doi: 10.1016/j.hrthm.2015.03.029 da Silva, Rose, M., F., L. 2014. ‘Syncope: epidemiology, etiology, and prognosis.’, Frontiers in physiology. Frontiers Media SA, 5, p. 471. doi: 10.3389/fphys.2014.00471 Soteriades, E. S., Evans, J. C., Larson, M. G., Chen, M. H., Chen, L., Benjamin, E. J., Levy, D. 2002. ‘Incidence and Prognosis of Syncope’, New England Journal of Medicine. Massachusetts Medical Society, 347(12), pp. 878–885. doi: 10.1056/NEJMoa012407