Data S1. MAT algorithm and DAVID parameters used in the ...
21
Data S1. MAT algorithm and DAVID parameters used in the performed comparisons. MAT algorithm parameters used in the following comparison: 1. FBC (17 cases) vs. MBC (7 cases) MAT algorithm parameters: P-value threshold: 0.0001, sliding window: 1400 bp, minimum number of probes in a region: 10. 2. BRCAX FBC (10 cases) vs. BRCAX MBC (6 cases) MAT algorithm parameters: P-value threshold: 0.0001, sliding window: 1400 bp, minimum number of probes in a region: 10. 3. BRCAX (16 cases) vs. BRCA1/2 (8 cases) MAT algorithm parameters: P-value threshold: 0.0001, sliding window: 1400 bp, minimum number of probes in a region: 10. 4. BRCA1 (4 cases) vs. BRCA2 (3 cases) MAT algorithm parameters: P-value threshold: 0.0001, sliding window: 600 bp, minimum number of probes in a region: 10. 5. BRCA1(4 cases) vs. BRCAX (10 cases) MAT algorithm parameters: P-value threshold: 0.0001, sliding window: 600 bp, minimum number of probes in a region: 10. 6. BRCA2 (3 cases) vs. BRCAX (10 cases) MAT algorithm parameters: P-value threshold: 0.0001, sliding window: 600 bp, minimum number of probes in a region: 10. 7. BRCA1 (4 cases) vs. BRCA2 (3 cases) and BRCAX (10 cases) MAT algorithm parameters: P-value threshold: 0.0001, sliding window: 350 bp, minimum number of probes in a region: 10. 8. BRCA2 (3 cases) vs. BRCAX (10 cases) and BRCA1 (4 cases) MAT algorithm parameters: P-value threshold: 0.0001, sliding window: 350 bp, minimum number of probes in a region: 10. 9. BRCAX (10 cases) vs. BRCA2 (3 cases) and BRCA1 (4 cases) MAT algorithm parameters: P-value threshold: 0.0001, sliding window: 350 bp, minimum number of probes in a region: 10. DAVID parameters used in the following comparison: A more stringent cut-off associated to DMR was applied to remove not relevant genes and reduced the list of DMRs and corresponding genes used for performing the functional enrichment analyses by DAVID. 1. FBC vs. MBC; cut-off: P-value<8.15x10 -5 . The list was reduced to 2846 DMRs corresponding to 2486 genes. David recognized 2395 genes. 2. BRCAX FBC vs. BRCAX MBC; cut-off: P-value<4.26x10 -5 . The list was reduced to 1242 DMRs corresponding to 1102 genes. David recognized 1050 genes. 3. BRCAX vs. BRCA1/2; cut-off not applied. David recognized 350 genes up to 357. 4. BRCA1 vs. BRCA2; cut-off: MAT score (absolute value)>3.94. The list was reduced to 802 DMRs corresponding to 755 genes. David recognized 723 genes. 5. BRCA1 vs. BRCAX; cut-off: MAT score (absolute value)>4. The list was reduced to 484 DMRs corresponding to 464 genes. David recognized 453 genes. 6. BRCA2 vs. BRCAX; cut-off: MAT score (absolute value)>4.2. The list was reduced to 673 DMRs corresponding to 629 genes. David recognized 613 genes. 7. BRCA1 vs. BRCA2 and BRCAX: P-value<6.78x10 -5 . The list was reduced to 861 DMRs corresponding to 819 genes. David recognized 797 genes. 8. BRCA2 vs. BRCA1 and BRCAX: P-value<6.78x10 -5 . The list was reduced to 1380 DMRs corresponding to 1251 genes. David recognized 1209 genes. 9. BRCAX vs. BRCA1 and BRCA2: P-value<6.78x10 -5 . The list was reduced to 962 DMRs corresponding to 914 genes. David recognized 888 genes.
-
Upload
khangminh22 -
Category
Documents
-
view
0 -
download
0
Transcript of Data S1. MAT algorithm and DAVID parameters used in the ...
Data S1. MAT algorithm and DAVID parameters used in the performed comparisons.
MAT algorithm parameters used in the following comparison:
1. FBC (17 cases) vs. MBC (7 cases) MAT algorithm parameters: P-value threshold: 0.0001,
sliding window: 1400 bp, minimum number of probes in a region: 10.
2. BRCAX FBC (10 cases) vs. BRCAX MBC (6 cases) MAT algorithm parameters: P-value threshold: 0.0001, sliding
window: 1400 bp, minimum number of probes in a region: 10.3. BRCAX (16 cases) vs. BRCA1/2 (8 cases) MAT algorithm parameters: P-value threshold: 0.0001,
sliding window: 1400 bp, minimum number of probes in a region: 10.
4. BRCA1 (4 cases) vs. BRCA2 (3 cases) MAT algorithm parameters: P-value threshold: 0.0001, sliding
window: 600 bp, minimum number of probes in a region: 10.5. BRCA1(4 cases) vs. BRCAX (10 cases) MAT algorithm parameters: P-value threshold: 0.0001,
sliding window: 600 bp, minimum number of probes in a region: 10.
6. BRCA2 (3 cases) vs. BRCAX (10 cases) MAT algorithm parameters: P-value threshold: 0.0001,
sliding window: 600 bp, minimum number of probes in a region: 10.
7. BRCA1 (4 cases) vs. BRCA2 (3 cases) and BRCAX (10 cases)
MAT algorithm parameters: P-value threshold: 0.0001, sliding window: 350 bp, minimum number of probes in a region: 10.
8. BRCA2 (3 cases) vs. BRCAX (10 cases) and BRCA1 (4 cases)
MAT algorithm parameters: P-value threshold: 0.0001, sliding window: 350 bp, minimum number of probes in a region: 10.
9. BRCAX (10 cases) vs. BRCA2 (3 cases) and BRCA1 (4 cases)
MAT algorithm parameters: P-value threshold: 0.0001, sliding window: 350 bp, minimum number of probes in a region: 10.
DAVID parameters used in the following comparison:
A more stringent cut-off associated to DMR was applied to remove not relevant genes and reduced the list of DMRs and corresponding genes used for performing the functional enrichment analyses by DAVID.1. FBC vs. MBC; cut-off: P-value<8.15x10⁻⁵. The list was reduced to 2846 DMRs corresponding to
2486 genes. David recognized 2395 genes.2. BRCAX FBC vs. BRCAX MBC; cut-off: P-value<4.26x10⁻⁵. The list was reduced to 1242 DMRs corresponding to
1102 genes. David recognized 1050 genes.3. BRCAX vs. BRCA1/2; cut-off not applied. David recognized 350 genes up to 357.4. BRCA1 vs. BRCA2; cut-off: MAT score (absolute
value)>3.94. The list was reduced to 802 DMRs corresponding to
755 genes. David recognized 723 genes.5. BRCA1 vs. BRCAX; cut-off: MAT score (absolute
value)>4. The list was reduced to 484 DMRs corresponding to
464 genes. David recognized 453 genes.6. BRCA2 vs. BRCAX; cut-off: MAT score (absolute
value)>4.2. The list was reduced to 673 DMRs corresponding
to 629 genes. David recognized 613 genes.7. BRCA1 vs. BRCA2 and BRCAX: P-value<6.78x10⁻⁵. The list was reduced to 861 DMRs corresponding to
819 genes. David recognized 797 genes.8. BRCA2 vs. BRCA1 and BRCAX: P-value<6.78x10⁻⁵. The list was reduced to 1380 DMRs corresponding
to 1251 genes. David recognized 1209 genes.9. BRCAX vs. BRCA1 and BRCA2: P-value<6.78x10⁻⁵. The list was reduced to 962 DMRs corresponding to
914 genes. David recognized 888 genes.
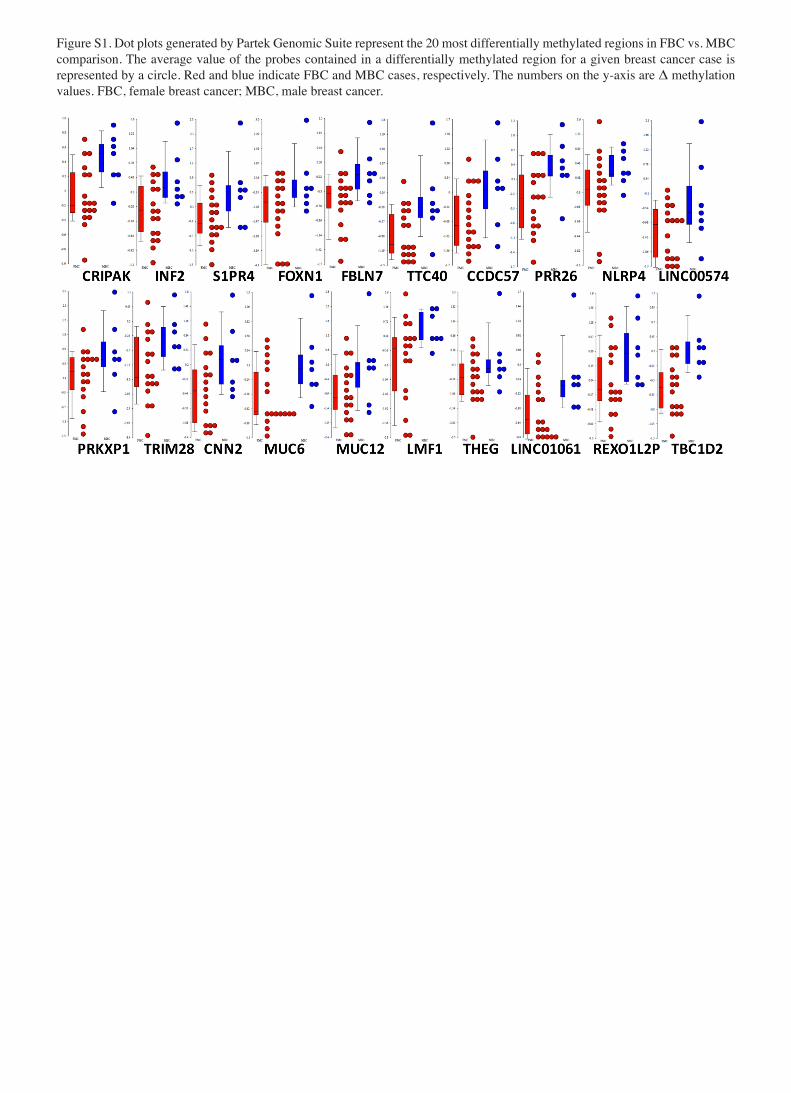
Figure S1. Dot plots generated by Partek Genomic Suite represent the 20 most differentially methylated regions in FBC vs. MBC comparison. The average value of the probes contained in a differentially methylated region for a given breast cancer case is represented by a circle. Red and blue indicate FBC and MBC cases, respectively. The numbers on the y-axis are Δ methylation values. FBC, female breast cancer; MBC, male breast cancer.
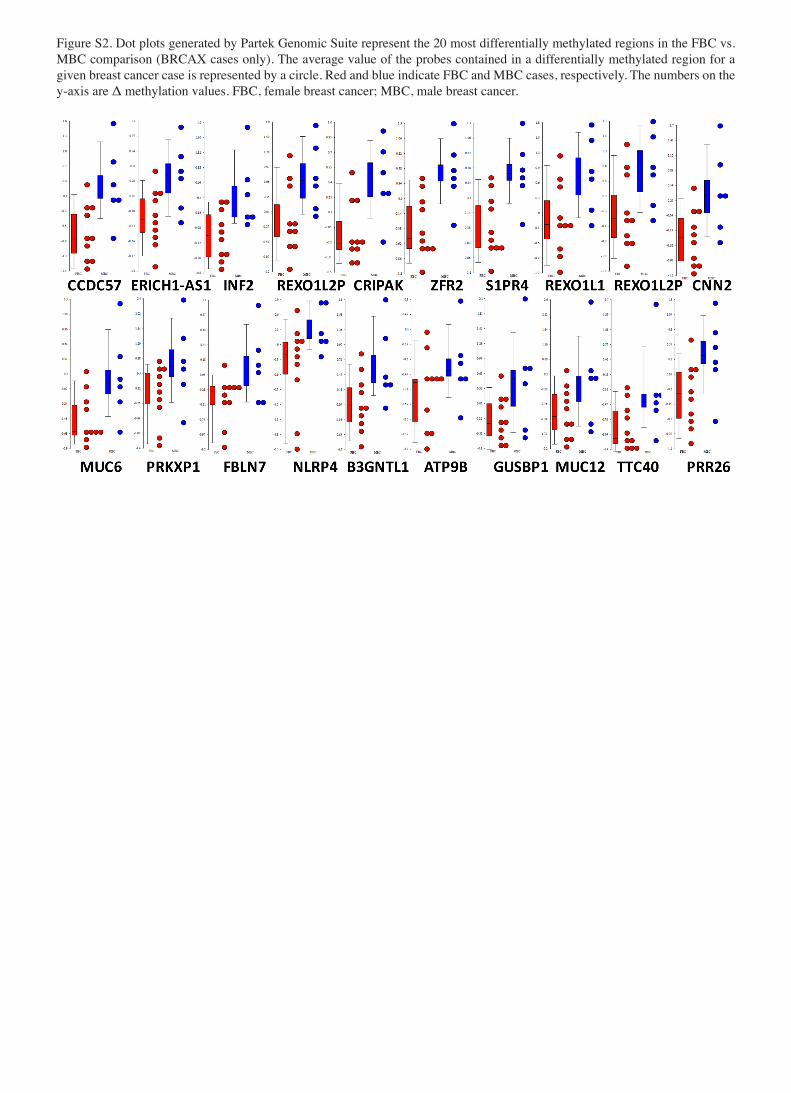
Figure S2. Dot plots generated by Partek Genomic Suite represent the 20 most differentially methylated regions in the FBC vs. MBC comparison (BRCAX cases only). The average value of the probes contained in a differentially methylated region for a given breast cancer case is represented by a circle. Red and blue indicate FBC and MBC cases, respectively. The numbers on the y-axis are Δ methylation values. FBC, female breast cancer; MBC, male breast cancer.
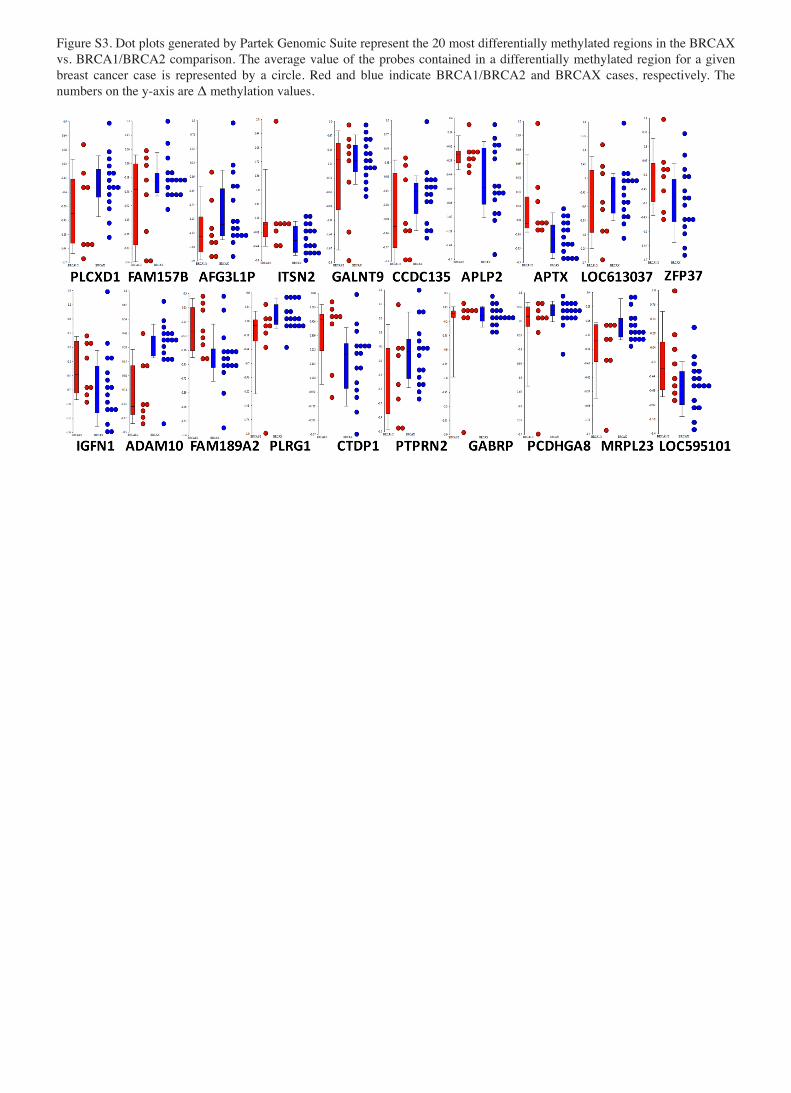
Figure S3. Dot plots generated by Partek Genomic Suite represent the 20 most differentially methylated regions in the BRCAX vs. BRCA1/BRCA2 comparison. The average value of the probes contained in a differentially methylated region for a given breast cancer case is represented by a circle. Red and blue indicate BRCA1/BRCA2 and BRCAX cases, respectively. The numbers on the y-axis are Δ methylation values.
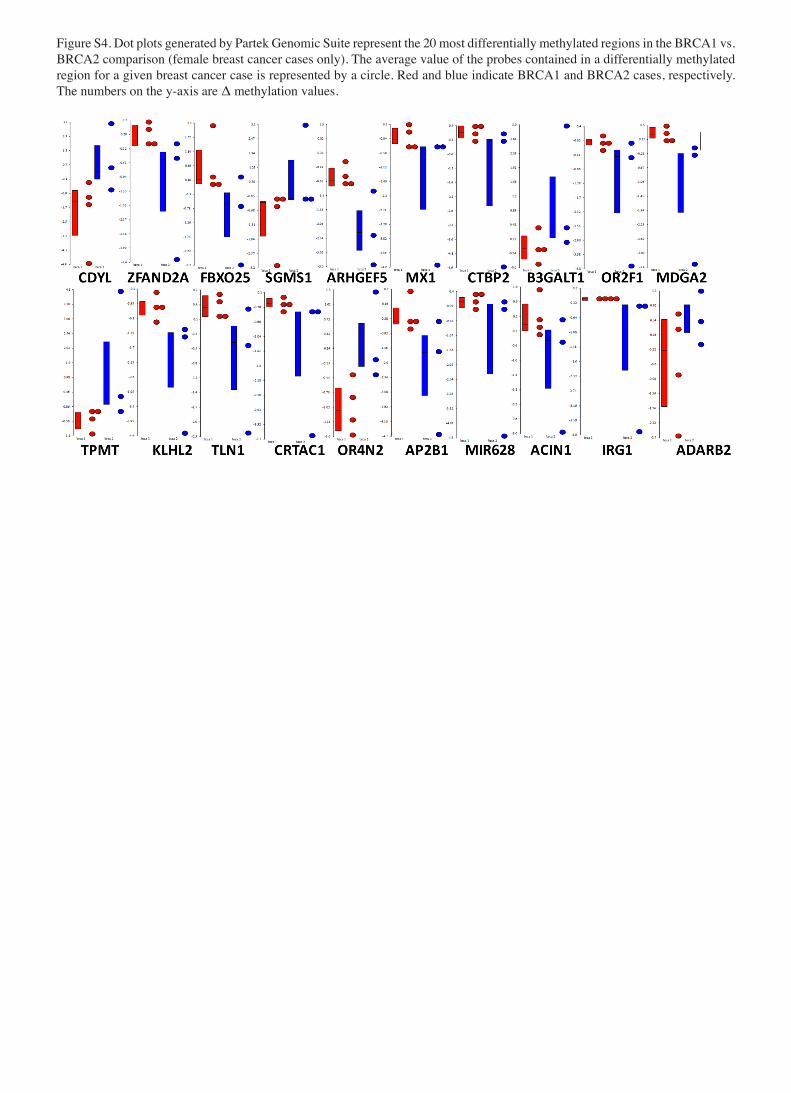
Figure S4. Dot plots generated by Partek Genomic Suite represent the 20 most differentially methylated regions in the BRCA1 vs. BRCA2 comparison (female breast cancer cases only). The average value of the probes contained in a differentially methylated region for a given breast cancer case is represented by a circle. Red and blue indicate BRCA1 and BRCA2 cases, respectively. The numbers on the y-axis are Δ methylation values.
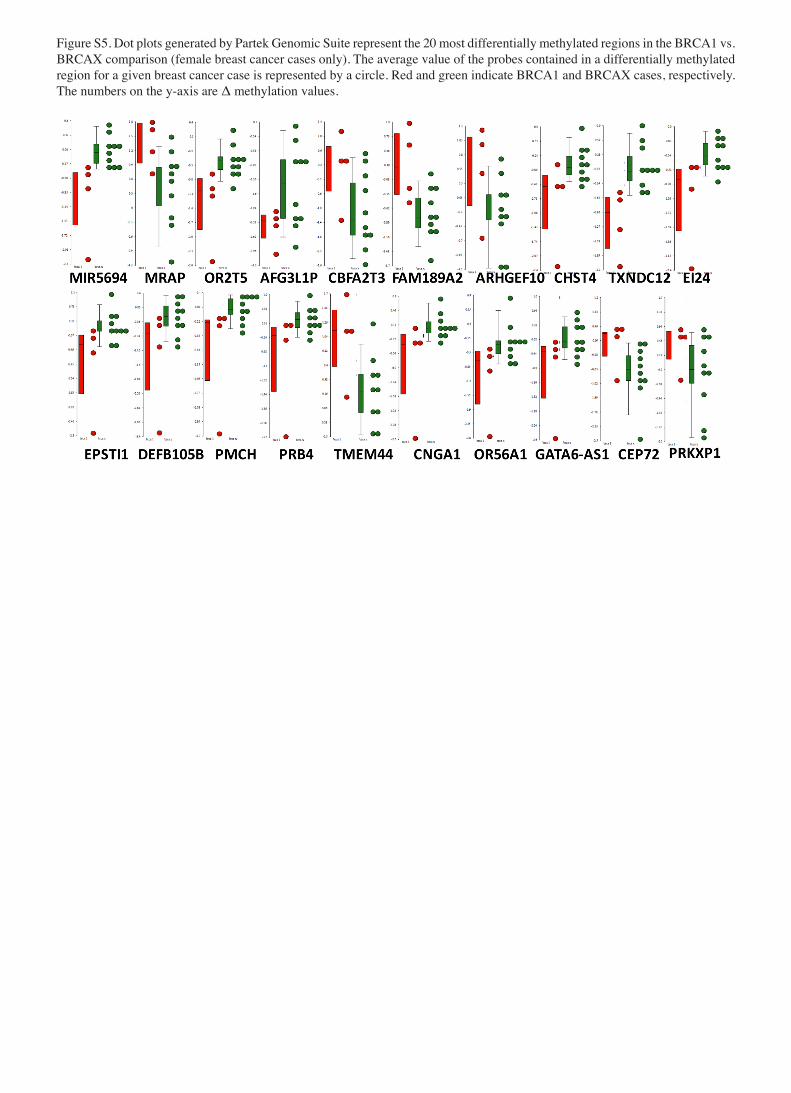
Figure S5. Dot plots generated by Partek Genomic Suite represent the 20 most differentially methylated regions in the BRCA1 vs. BRCAX comparison (female breast cancer cases only). The average value of the probes contained in a differentially methylated region for a given breast cancer case is represented by a circle. Red and green indicate BRCA1 and BRCAX cases, respectively. The numbers on the y-axis are Δ methylation values.
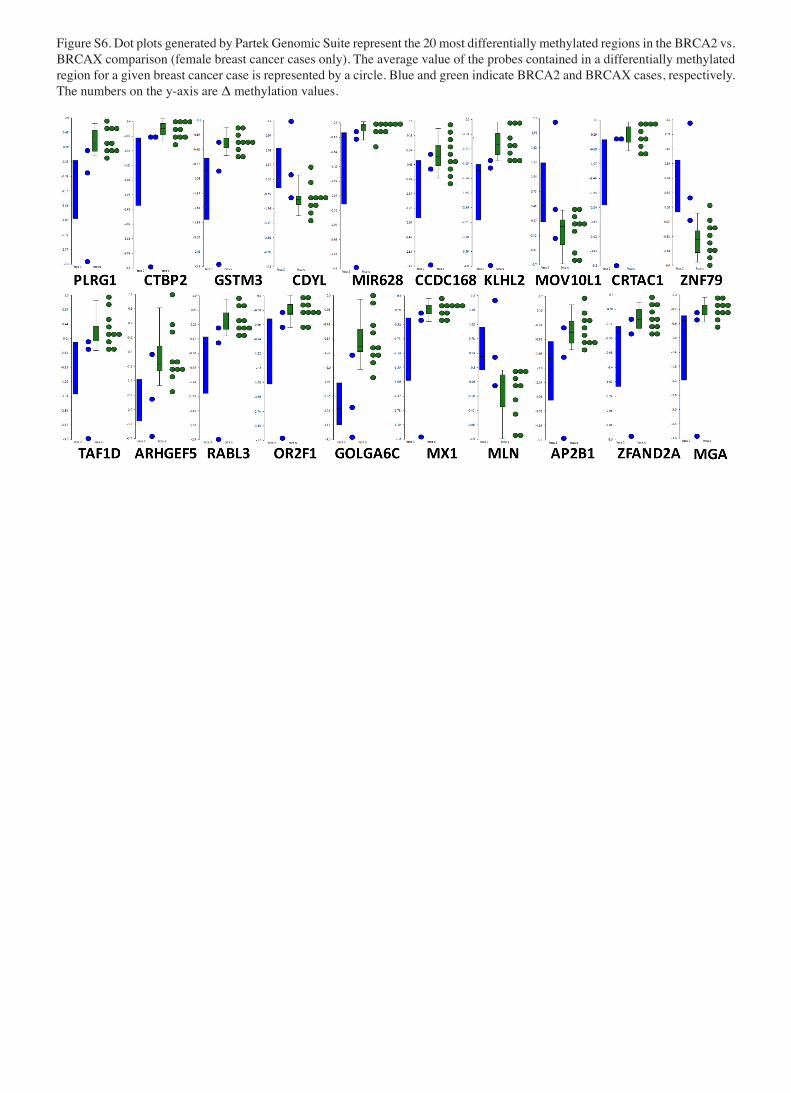
Figure S6. Dot plots generated by Partek Genomic Suite represent the 20 most differentially methylated regions in the BRCA2 vs. BRCAX comparison (female breast cancer cases only). The average value of the probes contained in a differentially methylated region for a given breast cancer case is represented by a circle. Blue and green indicate BRCA2 and BRCAX cases, respectively. The numbers on the y-axis are Δ methylation values.
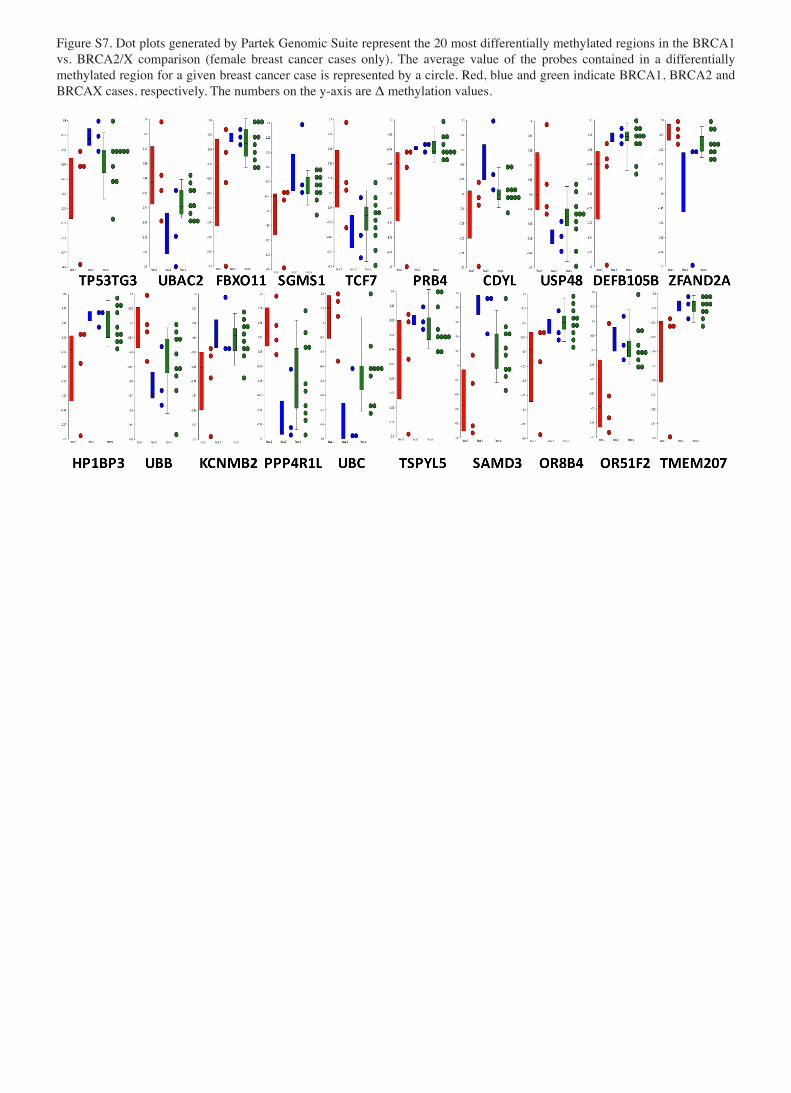
Figure S7. Dot plots generated by Partek Genomic Suite represent the 20 most differentially methylated regions in the BRCA1 vs. BRCA2/X comparison (female breast cancer cases only). The average value of the probes contained in a differentially methylated region for a given breast cancer case is represented by a circle. Red, blue and green indicate BRCA1, BRCA2 and BRCAX cases, respectively. The numbers on the y-axis are Δ methylation values.
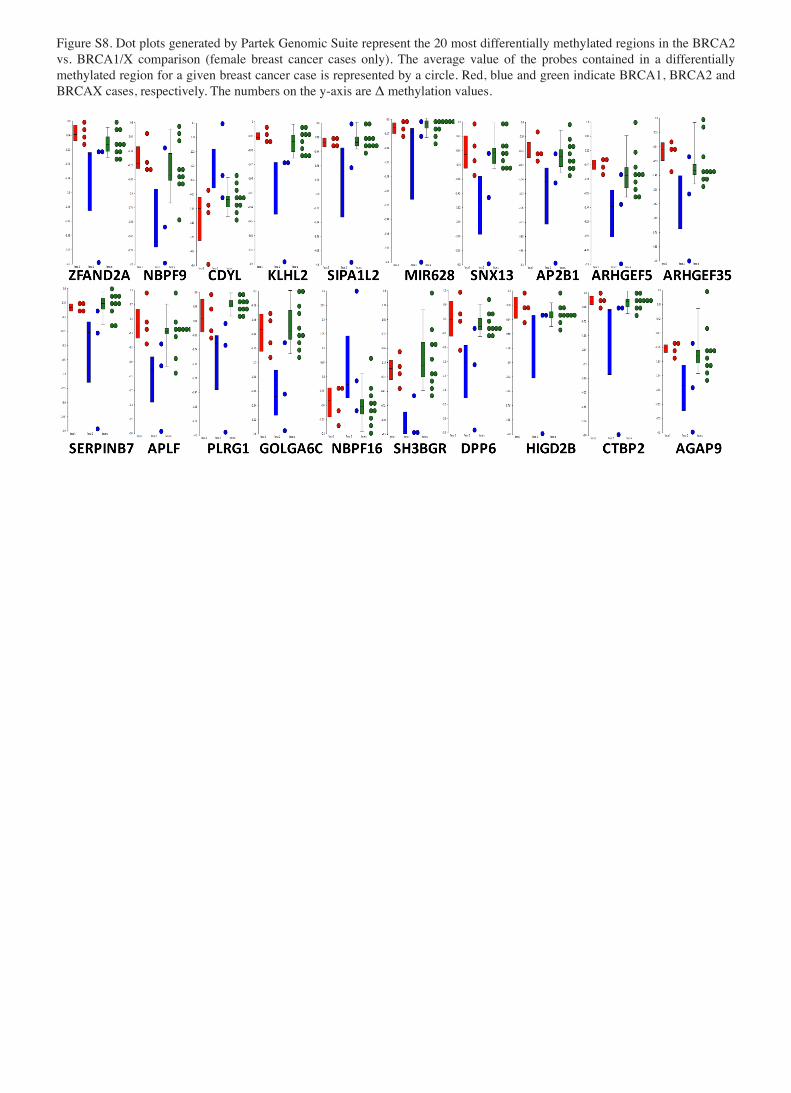
Figure S8. Dot plots generated by Partek Genomic Suite represent the 20 most differentially methylated regions in the BRCA2 vs. BRCA1/X comparison (female breast cancer cases only). The average value of the probes contained in a differentially methylated region for a given breast cancer case is represented by a circle. Red, blue and green indicate BRCA1, BRCA2 and BRCAX cases, respectively. The numbers on the y-axis are Δ methylation values.

Figure S9. Dot plots generated by Partek Genomic Suite represent the 20 most differentially methylated regions in the BRCAX vs. BRCA1/2 comparison (female breast cancer cases only). The average value of the probes contained in a differentially methyl-ated region for a given breast cancer case is represented by a circle. Red, blue and green indicate BRCA1, BRCA2 and BRCAX cases, respectively. The numbers on the y-axis are Δ methylation values.

Table SI. Genes corresponding to the 20 most differentially methylated regions.
A, Comparison N˚ 1: FBC vs. MBC (17 cases vs. 7 cases)
DMR Probes MAT Region Region length, inGene symbol P-value score Chromosome start at: end at: bp region DMR position
CRIPAK 1.42x10⁻⁵ -12.052 chr4 1378294 1383307 5014 131 PromoterINF2 1.42x10⁻⁵ -11.232 chr14 104256668 104260009 3342 74 PromoterS1PR4 1.42x10⁻⁵ -11.073 chr19 3123001 3128649 5649 135 Upstream TSSFOXN1 1.42x10⁻⁵ -10.285 chr17 23867579 23870505 2927 63 Upstream TSSFBLN7 1.42x10⁻⁵ -10.209 chr2 112612054 112614829 2776 68 PromoterTTC40 1.42x10⁻⁵ -10.075 chr10 134525715 134528706 2992 84 IntronCCDC57 1.42x10⁻⁵ -10.070 chr17 77700513 77703776 3264 90 IntronPRR26 1.42x10⁻⁵ -10.026 chr10 682104 687304 5201 144 IntronNLRP4 1.42x10⁻⁵ -9.640 chr19 61052866 61055636 2771 77 ExonLINC00574 1.42x10⁻⁵ -9.277 chr6 169945301 169948324 3024 84 Downstream CDS endPRKXP1 1.42x10⁻⁵ -9.260 chr15 98914126 98916895 2770 74 ExonTRIM28 1.42x10⁻⁵ -9.059 chr19 63741516 63747134 5619 123 Upstream TSSCNN2 1.42x10⁻⁵ -9.049 chr19 983366 988935 5570 104 ExonMUC6 1.42x10⁻⁵ -9.046 chr11 1005022 1010338 5317 145 ExonMUC12 1.42x10⁻⁵ -9.030 chr7 100419514 100436366 16853 435 ExonLMF1 1.42x10⁻⁵ -9.006 chr16 950289 952101 1813 38 IntronTHEG 1.42x10⁻⁵ -8.675 chr19 330868 334483 3616 90 Upstream TSSLINC01061 1.42x10⁻⁵ -8.510 chr4 120547714 120551328 3615 87 PromoterREXO1L2P 1.42x10⁻⁵ -8.363 chr8 86883906 86886596 2691 73 ExonTBC1D2 1.42x10⁻⁵ -8.245 chr9 100013396 100017955 4560 84 Exon
B, Comparison N˚ 2: FBC vs. MBC (10 cases vs. 6 cases; only BRCAX cases were considered)
DMR Probes MAT Region Region length, inGene symbol P-value score Chromosome start at: end at: bp region DMR position
CCDC57 1.42x10⁻⁵ -15.070 chr17 77700513 77703854 3342 92 IntronERICH1-AS1 1.42x10⁻⁵ -12.198 chr8 975683 982493 6811 171 IntronINF2 1.42x10⁻⁵ -12.105 chr14 104256668 104260009 3342 74 PromoterREXO1L2P 1.42x10⁻⁵ -12.065 chr8 86883906 86886596 2691 73 ExonCRIPAK 1.42x10⁻⁵ -12.033 chr4 1378294 1383307 5014 131 PromoterZFR2 1.42x10⁻⁵ -11.173 chr19 3787538 3790224 2687 72 IntronS1PR4 1.42x10⁻⁵ -11.164 chr19 3123001 3128649 5649 135 Upstream TSSREXO1L1 1.42x10⁻⁵ -11.155 chr8 86753702 86756668 2967 81 ExonREXO1L2P 1.42x10⁻⁵ -11.109 chr8 86760539 86763506 2968 80 ExonCNN2 1.42x10⁻⁵ -11.072 chr19 983297 989018 5722 108 ExonMUC6 1.42x10⁻⁵ -11.046 chr11 1004902 1010303 5402 147 ExonPRKXP1 1.42x10⁻⁵ -11.006 chr15 98914126 98916957 2832 76 ExonFBLN7 1.42x10⁻⁵ -10.785 chr2 112612093 112614829 2737 67 PromoterNLRP4 1.42x10⁻⁵ -10.451 chr19 61052866 61055636 2771 77 ExonB3GNTL1 1.42x10⁻⁵ -10.313 chr17 78605016 78608221 3206 78 Upstream TSSATP9B 1.42x10⁻⁵ -10.095 chr18 74925996 74929037 3042 73 Upstream TSSGUSBP1 1.42x10⁻⁵ -10.057 chr5 21516934 21520701 3768 104 IntronMUC12 1.42x10⁻⁵ -10.037 chr7 100419514 100436290 16777 433 ExonTTC40 1.42x10⁻⁵ -10.029 chr10 134525817 134528706 2890 81 IntronPRR26 1.42x10⁻⁵ -10.001 chr10 682160 687379 5220 144 Promoter
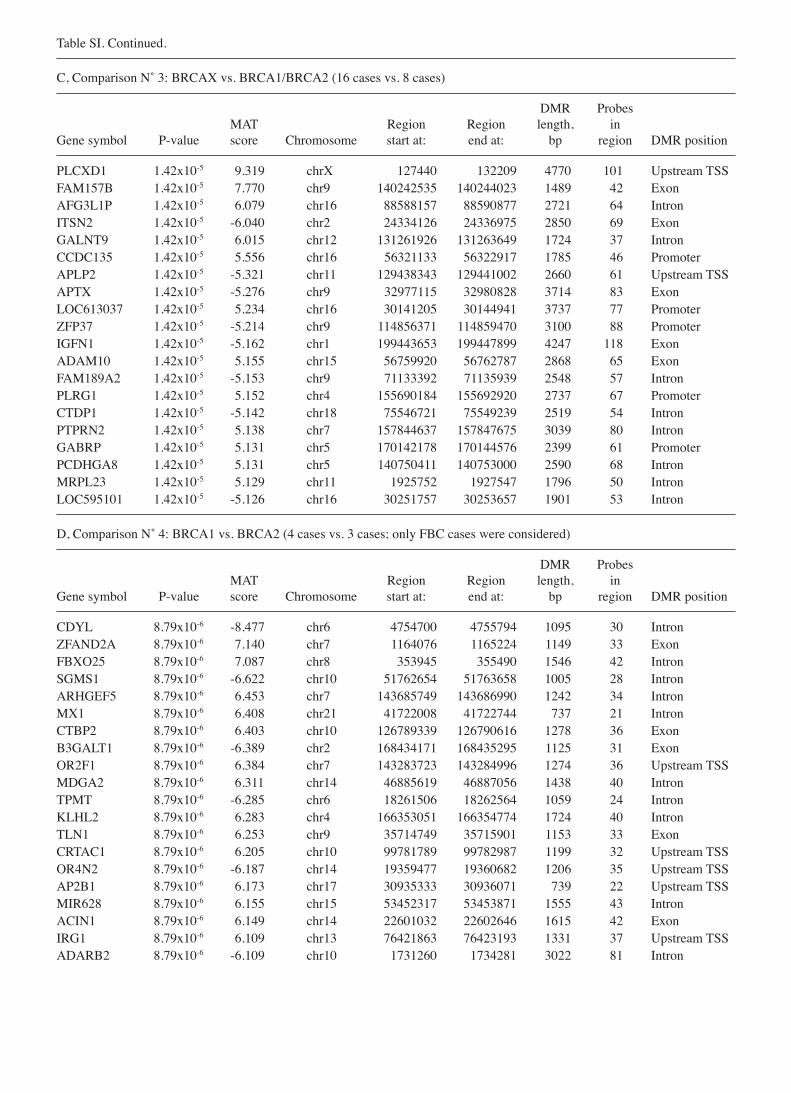
Table SI. Continued.
C, Comparison N˚ 3: BRCAX vs. BRCA1/BRCA2 (16 cases vs. 8 cases)
DMR Probes MAT Region Region length, inGene symbol P-value score Chromosome start at: end at: bp region DMR position
PLCXD1 1.42x10⁻⁵ 9.319 chrX 127440 132209 4770 101 Upstream TSSFAM157B 1.42x10⁻⁵ 7.770 chr9 140242535 140244023 1489 42 ExonAFG3L1P 1.42x10⁻⁵ 6.079 chr16 88588157 88590877 2721 64 IntronITSN2 1.42x10⁻⁵ -6.040 chr2 24334126 24336975 2850 69 ExonGALNT9 1.42x10⁻⁵ 6.015 chr12 131261926 131263649 1724 37 IntronCCDC135 1.42x10⁻⁵ 5.556 chr16 56321133 56322917 1785 46 PromoterAPLP2 1.42x10⁻⁵ -5.321 chr11 129438343 129441002 2660 61 Upstream TSSAPTX 1.42x10⁻⁵ -5.276 chr9 32977115 32980828 3714 83 ExonLOC613037 1.42x10⁻⁵ 5.234 chr16 30141205 30144941 3737 77 PromoterZFP37 1.42x10⁻⁵ -5.214 chr9 114856371 114859470 3100 88 PromoterIGFN1 1.42x10⁻⁵ -5.162 chr1 199443653 199447899 4247 118 ExonADAM10 1.42x10⁻⁵ 5.155 chr15 56759920 56762787 2868 65 ExonFAM189A2 1.42x10⁻⁵ -5.153 chr9 71133392 71135939 2548 57 IntronPLRG1 1.42x10⁻⁵ 5.152 chr4 155690184 155692920 2737 67 PromoterCTDP1 1.42x10⁻⁵ -5.142 chr18 75546721 75549239 2519 54 IntronPTPRN2 1.42x10⁻⁵ 5.138 chr7 157844637 157847675 3039 80 IntronGABRP 1.42x10⁻⁵ 5.131 chr5 170142178 170144576 2399 61 PromoterPCDHGA8 1.42x10⁻⁵ 5.131 chr5 140750411 140753000 2590 68 IntronMRPL23 1.42x10⁻⁵ 5.129 chr11 1925752 1927547 1796 50 IntronLOC595101 1.42x10⁻⁵ -5.126 chr16 30251757 30253657 1901 53 Intron
D, Comparison N˚ 4: BRCA1 vs. BRCA2 (4 cases vs. 3 cases; only FBC cases were considered)
DMR Probes MAT Region Region length, inGene symbol P-value score Chromosome start at: end at: bp region DMR position
CDYL 8.79x10⁻⁶ -8.477 chr6 4754700 4755794 1095 30 IntronZFAND2A 8.79x10⁻⁶ 7.140 chr7 1164076 1165224 1149 33 ExonFBXO25 8.79x10⁻⁶ 7.087 chr8 353945 355490 1546 42 IntronSGMS1 8.79x10⁻⁶ -6.622 chr10 51762654 51763658 1005 28 IntronARHGEF5 8.79x10⁻⁶ 6.453 chr7 143685749 143686990 1242 34 IntronMX1 8.79x10⁻⁶ 6.408 chr21 41722008 41722744 737 21 IntronCTBP2 8.79x10⁻⁶ 6.403 chr10 126789339 126790616 1278 36 ExonB3GALT1 8.79x10⁻⁶ -6.389 chr2 168434171 168435295 1125 31 ExonOR2F1 8.79x10⁻⁶ 6.384 chr7 143283723 143284996 1274 36 Upstream TSSMDGA2 8.79x10⁻⁶ 6.311 chr14 46885619 46887056 1438 40 IntronTPMT 8.79x10⁻⁶ -6.285 chr6 18261506 18262564 1059 24 IntronKLHL2 8.79x10⁻⁶ 6.283 chr4 166353051 166354774 1724 40 IntronTLN1 8.79x10⁻⁶ 6.253 chr9 35714749 35715901 1153 33 ExonCRTAC1 8.79x10⁻⁶ 6.205 chr10 99781789 99782987 1199 32 Upstream TSSOR4N2 8.79x10⁻⁶ -6.187 chr14 19359477 19360682 1206 35 Upstream TSSAP2B1 8.79x10⁻⁶ 6.173 chr17 30935333 30936071 739 22 Upstream TSSMIR628 8.79x10⁻⁶ 6.155 chr15 53452317 53453871 1555 43 IntronACIN1 8.79x10⁻⁶ 6.149 chr14 22601032 22602646 1615 42 ExonIRG1 8.79x10⁻⁶ 6.109 chr13 76421863 76423193 1331 37 Upstream TSSADARB2 8.79x10⁻⁶ -6.109 chr10 1731260 1734281 3022 81 Intron
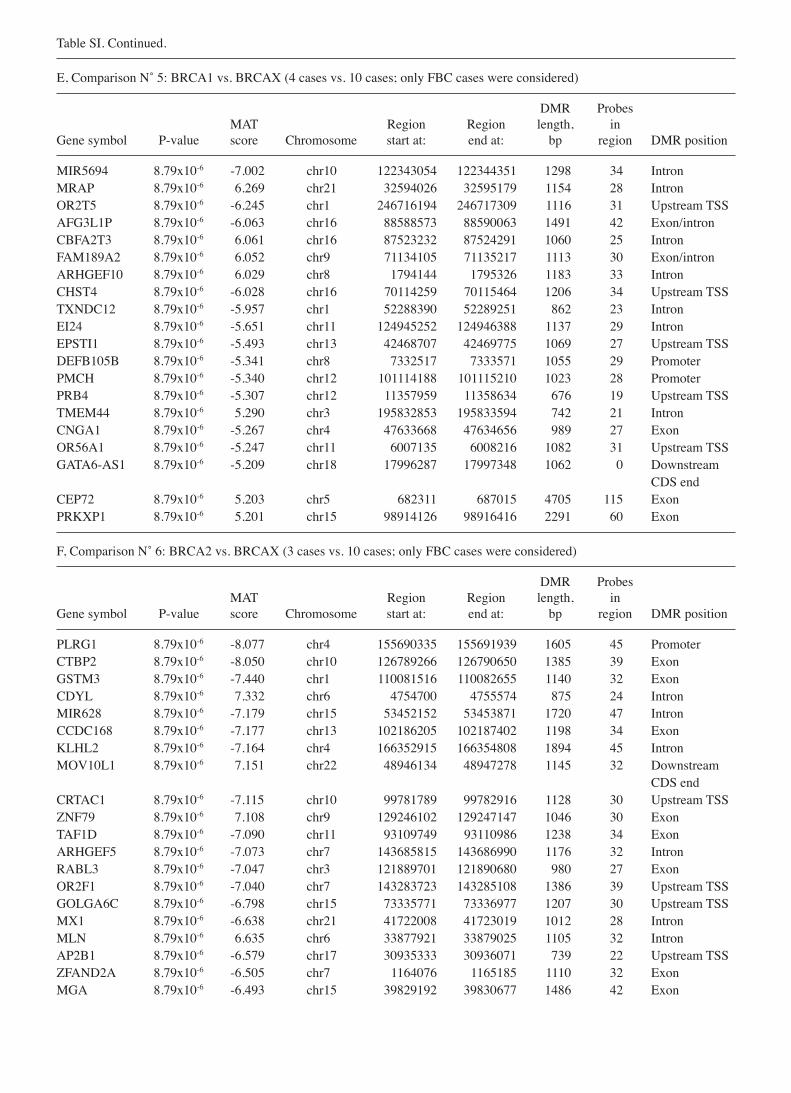
Table SI. Continued.
E, Comparison N˚ 5: BRCA1 vs. BRCAX (4 cases vs. 10 cases; only FBC cases were considered)
DMR Probes MAT Region Region length, inGene symbol P-value score Chromosome start at: end at: bp region DMR position
MIR5694 8.79x10⁻⁶ -7.002 chr10 122343054 122344351 1298 34 IntronMRAP 8.79x10⁻⁶ 6.269 chr21 32594026 32595179 1154 28 IntronOR2T5 8.79x10⁻⁶ -6.245 chr1 246716194 246717309 1116 31 Upstream TSSAFG3L1P 8.79x10⁻⁶ -6.063 chr16 88588573 88590063 1491 42 Exon/intronCBFA2T3 8.79x10⁻⁶ 6.061 chr16 87523232 87524291 1060 25 IntronFAM189A2 8.79x10⁻⁶ 6.052 chr9 71134105 71135217 1113 30 Exon/intronARHGEF10 8.79x10⁻⁶ 6.029 chr8 1794144 1795326 1183 33 IntronCHST4 8.79x10⁻⁶ -6.028 chr16 70114259 70115464 1206 34 Upstream TSSTXNDC12 8.79x10⁻⁶ -5.957 chr1 52288390 52289251 862 23 IntronEI24 8.79x10⁻⁶ -5.651 chr11 124945252 124946388 1137 29 IntronEPSTI1 8.79x10⁻⁶ -5.493 chr13 42468707 42469775 1069 27 Upstream TSSDEFB105B 8.79x10⁻⁶ -5.341 chr8 7332517 7333571 1055 29 PromoterPMCH 8.79x10⁻⁶ -5.340 chr12 101114188 101115210 1023 28 PromoterPRB4 8.79x10⁻⁶ -5.307 chr12 11357959 11358634 676 19 Upstream TSSTMEM44 8.79x10⁻⁶ 5.290 chr3 195832853 195833594 742 21 IntronCNGA1 8.79x10⁻⁶ -5.267 chr4 47633668 47634656 989 27 Exon OR56A1 8.79x10⁻⁶ -5.247 chr11 6007135 6008216 1082 31 Upstream TSSGATA6-AS1 8.79x10⁻⁶ -5.209 chr18 17996287 17997348 1062 0 Downstream CDS endCEP72 8.79x10⁻⁶ 5.203 chr5 682311 687015 4705 115 ExonPRKXP1 8.79x10⁻⁶ 5.201 chr15 98914126 98916416 2291 60 Exon
F, Comparison N˚ 6: BRCA2 vs. BRCAX (3 cases vs. 10 cases; only FBC cases were considered)
DMR Probes MAT Region Region length, inGene symbol P-value score Chromosome start at: end at: bp region DMR position
PLRG1 8.79x10⁻⁶ -8.077 chr4 155690335 155691939 1605 45 PromoterCTBP2 8.79x10⁻⁶ -8.050 chr10 126789266 126790650 1385 39 ExonGSTM3 8.79x10⁻⁶ -7.440 chr1 110081516 110082655 1140 32 ExonCDYL 8.79x10⁻⁶ 7.332 chr6 4754700 4755574 875 24 IntronMIR628 8.79x10⁻⁶ -7.179 chr15 53452152 53453871 1720 47 IntronCCDC168 8.79x10⁻⁶ -7.177 chr13 102186205 102187402 1198 34 ExonKLHL2 8.79x10⁻⁶ -7.164 chr4 166352915 166354808 1894 45 IntronMOV10L1 8.79x10⁻⁶ 7.151 chr22 48946134 48947278 1145 32 Downstream CDS endCRTAC1 8.79x10⁻⁶ -7.115 chr10 99781789 99782916 1128 30 Upstream TSSZNF79 8.79x10⁻⁶ 7.108 chr9 129246102 129247147 1046 30 ExonTAF1D 8.79x10⁻⁶ -7.090 chr11 93109749 93110986 1238 34 ExonARHGEF5 8.79x10⁻⁶ -7.073 chr7 143685815 143686990 1176 32 IntronRABL3 8.79x10⁻⁶ -7.047 chr3 121889701 121890680 980 27 ExonOR2F1 8.79x10⁻⁶ -7.040 chr7 143283723 143285108 1386 39 Upstream TSSGOLGA6C 8.79x10⁻⁶ -6.798 chr15 73335771 73336977 1207 30 Upstream TSSMX1 8.79x10⁻⁶ -6.638 chr21 41722008 41723019 1012 28 IntronMLN 8.79x10⁻⁶ 6.635 chr6 33877921 33879025 1105 32 IntronAP2B1 8.79x10⁻⁶ -6.579 chr17 30935333 30936071 739 22 Upstream TSSZFAND2A 8.79x10⁻⁶ -6.505 chr7 1164076 1165185 1110 32 ExonMGA 8.79x10⁻⁶ -6.493 chr15 39829192 39830677 1486 42 Exon
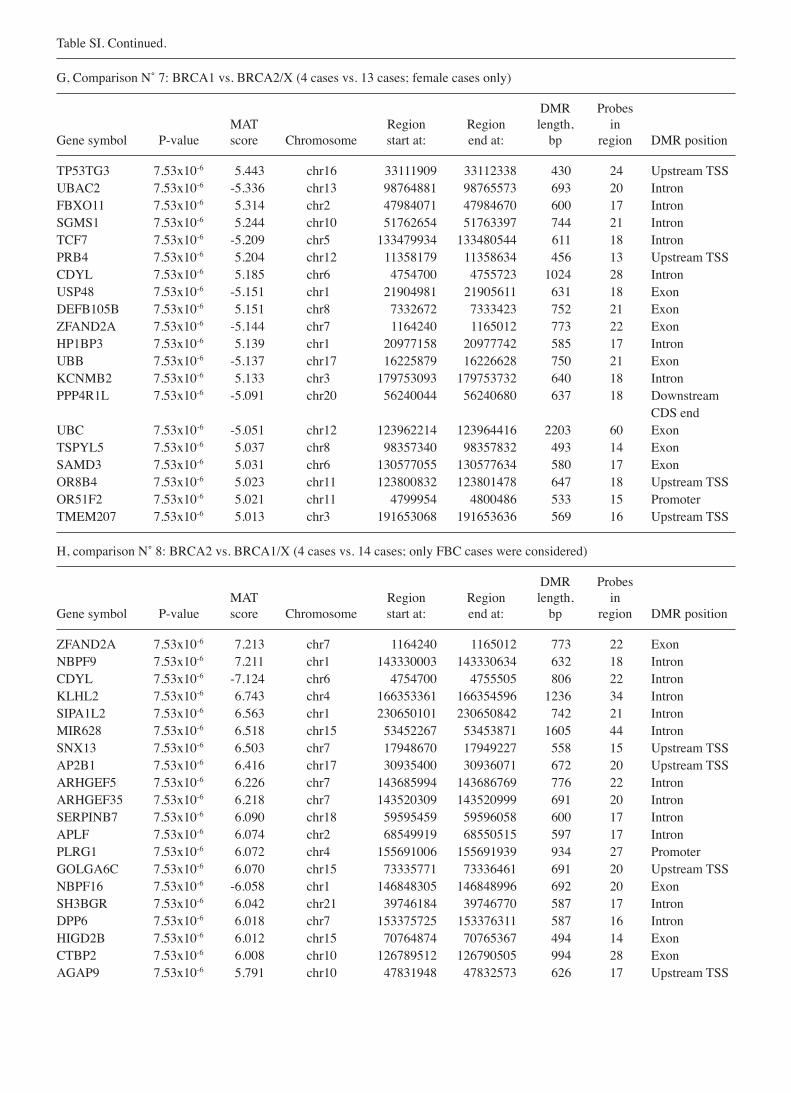
Table SI. Continued.
G, Comparison N˚ 7: BRCA1 vs. BRCA2/X (4 cases vs. 13 cases; female cases only)
DMR Probes MAT Region Region length, inGene symbol P-value score Chromosome start at: end at: bp region DMR position
TP53TG3 7.53x10⁻⁶ 5.443 chr16 33111909 33112338 430 24 Upstream TSSUBAC2 7.53x10⁻⁶ -5.336 chr13 98764881 98765573 693 20 IntronFBXO11 7.53x10⁻⁶ 5.314 chr2 47984071 47984670 600 17 IntronSGMS1 7.53x10⁻⁶ 5.244 chr10 51762654 51763397 744 21 IntronTCF7 7.53x10⁻⁶ -5.209 chr5 133479934 133480544 611 18 IntronPRB4 7.53x10⁻⁶ 5.204 chr12 11358179 11358634 456 13 Upstream TSSCDYL 7.53x10⁻⁶ 5.185 chr6 4754700 4755723 1024 28 IntronUSP48 7.53x10⁻⁶ -5.151 chr1 21904981 21905611 631 18 ExonDEFB105B 7.53x10⁻⁶ 5.151 chr8 7332672 7333423 752 21 ExonZFAND2A 7.53x10⁻⁶ -5.144 chr7 1164240 1165012 773 22 ExonHP1BP3 7.53x10⁻⁶ 5.139 chr1 20977158 20977742 585 17 IntronUBB 7.53x10⁻⁶ -5.137 chr17 16225879 16226628 750 21 ExonKCNMB2 7.53x10⁻⁶ 5.133 chr3 179753093 179753732 640 18 IntronPPP4R1L 7.53x10⁻⁶ -5.091 chr20 56240044 56240680 637 18 Downstream CDS endUBC 7.53x10⁻⁶ -5.051 chr12 123962214 123964416 2203 60 ExonTSPYL5 7.53x10⁻⁶ 5.037 chr8 98357340 98357832 493 14 ExonSAMD3 7.53x10⁻⁶ 5.031 chr6 130577055 130577634 580 17 ExonOR8B4 7.53x10⁻⁶ 5.023 chr11 123800832 123801478 647 18 Upstream TSSOR51F2 7.53x10⁻⁶ 5.021 chr11 4799954 4800486 533 15 PromoterTMEM207 7.53x10⁻⁶ 5.013 chr3 191653068 191653636 569 16 Upstream TSS
H, comparison N˚ 8: BRCA2 vs. BRCA1/X (4 cases vs. 14 cases; only FBC cases were considered)
DMR Probes MAT Region Region length, inGene symbol P-value score Chromosome start at: end at: bp region DMR position
ZFAND2A 7.53x10⁻⁶ 7.213 chr7 1164240 1165012 773 22 ExonNBPF9 7.53x10⁻⁶ 7.211 chr1 143330003 143330634 632 18 IntronCDYL 7.53x10⁻⁶ -7.124 chr6 4754700 4755505 806 22 IntronKLHL2 7.53x10⁻⁶ 6.743 chr4 166353361 166354596 1236 34 IntronSIPA1L2 7.53x10⁻⁶ 6.563 chr1 230650101 230650842 742 21 IntronMIR628 7.53x10⁻⁶ 6.518 chr15 53452267 53453871 1605 44 IntronSNX13 7.53x10⁻⁶ 6.503 chr7 17948670 17949227 558 15 Upstream TSSAP2B1 7.53x10⁻⁶ 6.416 chr17 30935400 30936071 672 20 Upstream TSSARHGEF5 7.53x10⁻⁶ 6.226 chr7 143685994 143686769 776 22 IntronARHGEF35 7.53x10⁻⁶ 6.218 chr7 143520309 143520999 691 20 IntronSERPINB7 7.53x10⁻⁶ 6.090 chr18 59595459 59596058 600 17 IntronAPLF 7.53x10⁻⁶ 6.074 chr2 68549919 68550515 597 17 IntronPLRG1 7.53x10⁻⁶ 6.072 chr4 155691006 155691939 934 27 PromoterGOLGA6C 7.53x10⁻⁶ 6.070 chr15 73335771 73336461 691 20 Upstream TSSNBPF16 7.53x10⁻⁶ -6.058 chr1 146848305 146848996 692 20 ExonSH3BGR 7.53x10⁻⁶ 6.042 chr21 39746184 39746770 587 17 IntronDPP6 7.53x10⁻⁶ 6.018 chr7 153375725 153376311 587 16 IntronHIGD2B 7.53x10⁻⁶ 6.012 chr15 70764874 70765367 494 14 ExonCTBP2 7.53x10⁻⁶ 6.008 chr10 126789512 126790505 994 28 ExonAGAP9 7.53x10⁻⁶ 5.791 chr10 47831948 47832573 626 17 Upstream TSS
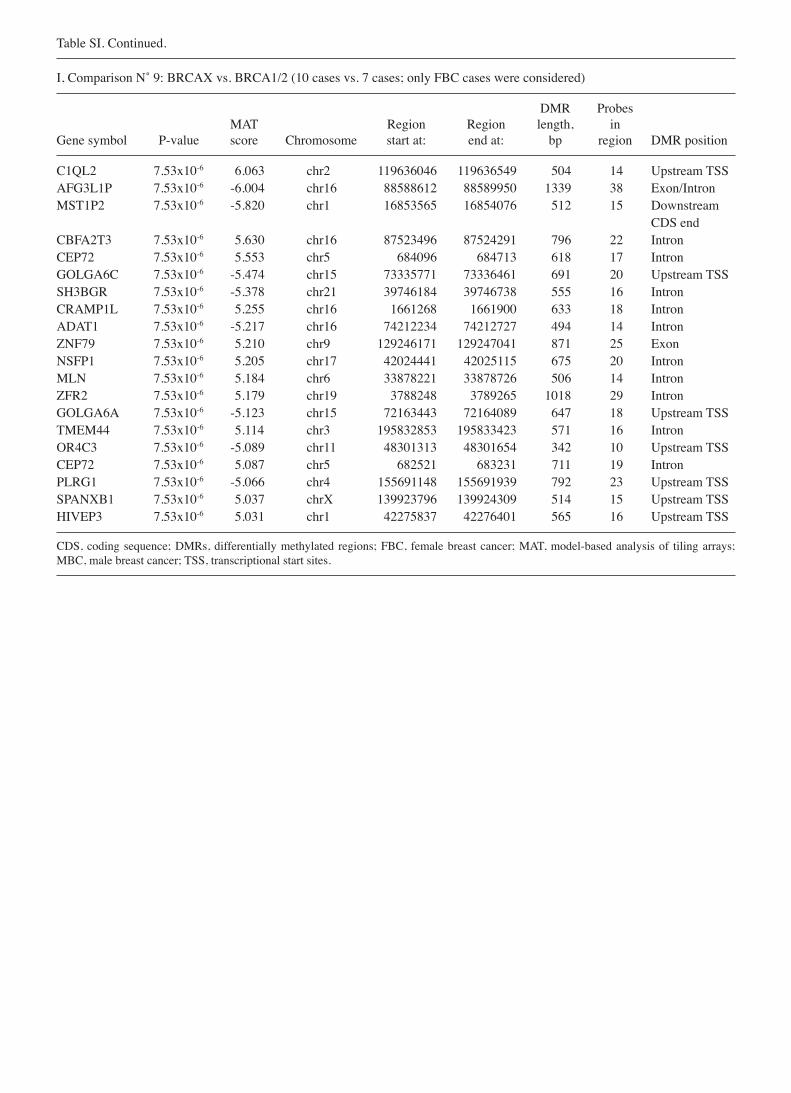
Table SI. Continued.
I, Comparison N˚ 9: BRCAX vs. BRCA1/2 (10 cases vs. 7 cases; only FBC cases were considered)
DMR Probes MAT Region Region length, inGene symbol P-value score Chromosome start at: end at: bp region DMR position
C1QL2 7.53x10⁻⁶ 6.063 chr2 119636046 119636549 504 14 Upstream TSSAFG3L1P 7.53x10⁻⁶ -6.004 chr16 88588612 88589950 1339 38 Exon/IntronMST1P2 7.53x10⁻⁶ -5.820 chr1 16853565 16854076 512 15 Downstream CDS endCBFA2T3 7.53x10⁻⁶ 5.630 chr16 87523496 87524291 796 22 IntronCEP72 7.53x10⁻⁶ 5.553 chr5 684096 684713 618 17 IntronGOLGA6C 7.53x10⁻⁶ -5.474 chr15 73335771 73336461 691 20 Upstream TSSSH3BGR 7.53x10⁻⁶ -5.378 chr21 39746184 39746738 555 16 IntronCRAMP1L 7.53x10⁻⁶ 5.255 chr16 1661268 1661900 633 18 IntronADAT1 7.53x10⁻⁶ -5.217 chr16 74212234 74212727 494 14 IntronZNF79 7.53x10⁻⁶ 5.210 chr9 129246171 129247041 871 25 ExonNSFP1 7.53x10⁻⁶ 5.205 chr17 42024441 42025115 675 20 IntronMLN 7.53x10⁻⁶ 5.184 chr6 33878221 33878726 506 14 IntronZFR2 7.53x10⁻⁶ 5.179 chr19 3788248 3789265 1018 29 IntronGOLGA6A 7.53x10⁻⁶ -5.123 chr15 72163443 72164089 647 18 Upstream TSSTMEM44 7.53x10⁻⁶ 5.114 chr3 195832853 195833423 571 16 IntronOR4C3 7.53x10⁻⁶ -5.089 chr11 48301313 48301654 342 10 Upstream TSSCEP72 7.53x10⁻⁶ 5.087 chr5 682521 683231 711 19 IntronPLRG1 7.53x10⁻⁶ -5.066 chr4 155691148 155691939 792 23 Upstream TSSSPANXB1 7.53x10⁻⁶ 5.037 chrX 139923796 139924309 514 15 Upstream TSSHIVEP3 7.53x10⁻⁶ 5.031 chr1 42275837 42276401 565 16 Upstream TSS
CDS, coding sequence; DMRs, differentially methylated regions; FBC, female breast cancer; MAT, model-based analysis of tiling arrays; MBC, male breast cancer; TSS, transcriptional start sites.
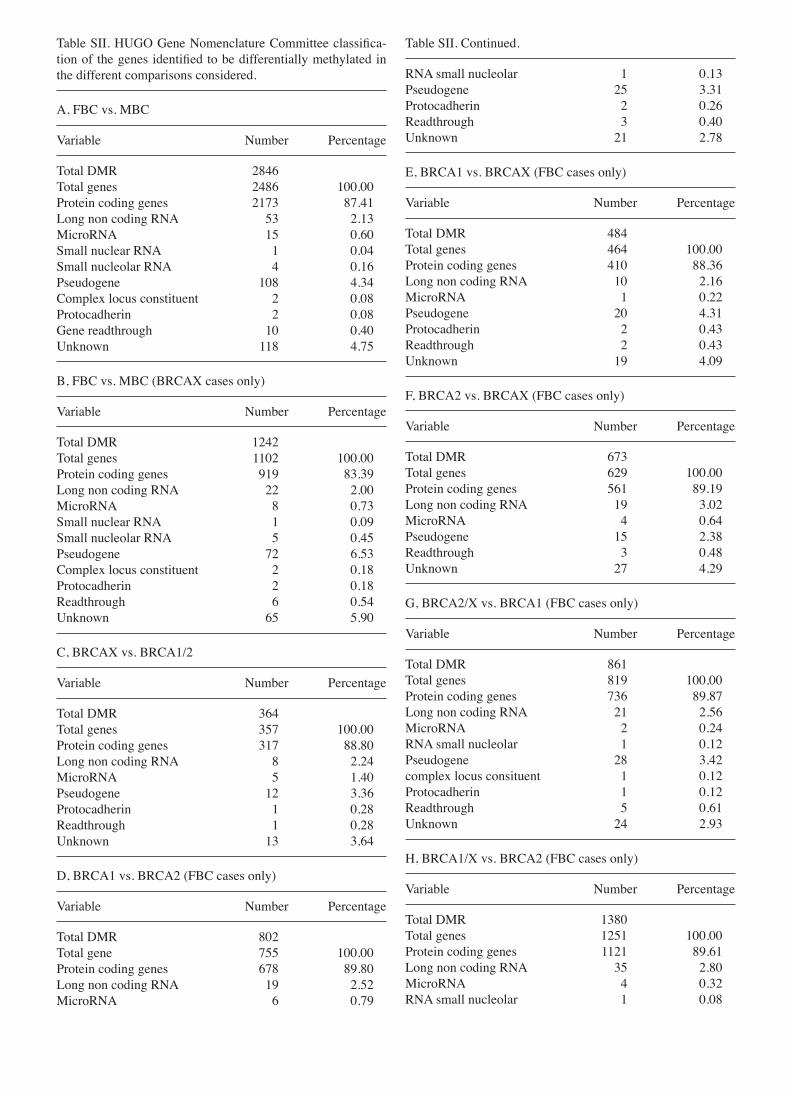
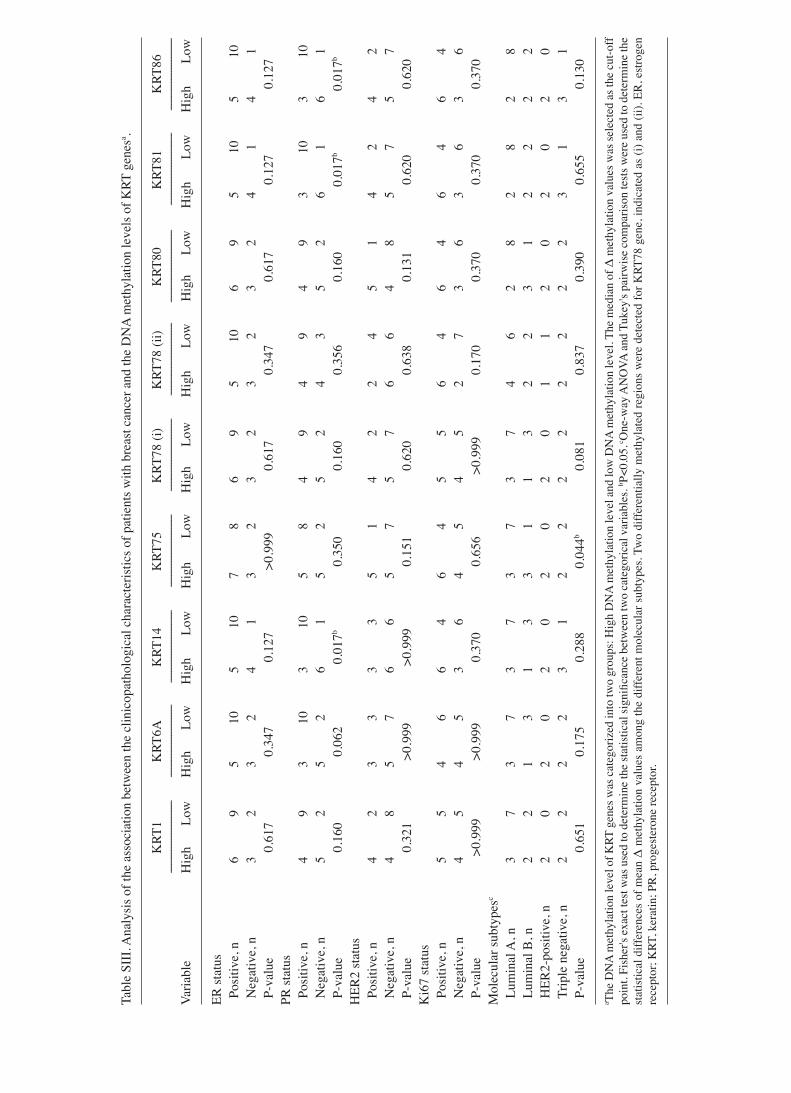
Table SII. HUGO Gene Nomenclature Committee classifica-tion of the genes identified to be differentially methylated in the different comparisons considered.
A, FBC vs. MBC
Variable Number Percentage
Total DMR 2846 Total genes 2486 100.00Protein coding genes 2173 87.41Long non coding RNA 53 2.13MicroRNA 15 0.60Small nuclear RNA 1 0.04Small nucleolar RNA 4 0.16Pseudogene 108 4.34Complex locus constituent 2 0.08Protocadherin 2 0.08Gene readthrough 10 0.40Unknown 118 4.75
B, FBC vs. MBC (BRCAX cases only)
Variable Number Percentage
Total DMR 1242 Total genes 1102 100.00Protein coding genes 919 83.39Long non coding RNA 22 2.00MicroRNA 8 0.73Small nuclear RNA 1 0.09Small nucleolar RNA 5 0.45Pseudogene 72 6.53Complex locus constituent 2 0.18Protocadherin 2 0.18Readthrough 6 0.54Unknown 65 5.90
C, BRCAX vs. BRCA1/2
Variable Number Percentage
Total DMR 364 Total genes 357 100.00Protein coding genes 317 88.80Long non coding RNA 8 2.24MicroRNA 5 1.40Pseudogene 12 3.36Protocadherin 1 0.28Readthrough 1 0.28Unknown 13 3.64
D, BRCA1 vs. BRCA2 (FBC cases only)
Variable Number Percentage
Total DMR 802 Total gene 755 100.00Protein coding genes 678 89.80Long non coding RNA 19 2.52MicroRNA 6 0.79
Table SII. Continued.
RNA small nucleolar 1 0.13Pseudogene 25 3.31Protocadherin 2 0.26Readthrough 3 0.40Unknown 21 2.78
E, BRCA1 vs. BRCAX (FBC cases only)
Variable Number Percentage
Total DMR 484 Total genes 464 100.00Protein coding genes 410 88.36Long non coding RNA 10 2.16MicroRNA 1 0.22Pseudogene 20 4.31Protocadherin 2 0.43Readthrough 2 0.43Unknown 19 4.09
F, BRCA2 vs. BRCAX (FBC cases only)
Variable Number Percentage
Total DMR 673 Total genes 629 100.00Protein coding genes 561 89.19Long non coding RNA 19 3.02MicroRNA 4 0.64Pseudogene 15 2.38Readthrough 3 0.48Unknown 27 4.29
G, BRCA2/X vs. BRCA1 (FBC cases only)
Variable Number Percentage
Total DMR 861 Total genes 819 100.00Protein coding genes 736 89.87Long non coding RNA 21 2.56MicroRNA 2 0.24RNA small nucleolar 1 0.12Pseudogene 28 3.42complex locus consituent 1 0.12Protocadherin 1 0.12Readthrough 5 0.61Unknown 24 2.93
H, BRCA1/X vs. BRCA2 (FBC cases only)
Variable Number Percentage
Total DMR 1380 Total genes 1251 100.00Protein coding genes 1121 89.61Long non coding RNA 35 2.80MicroRNA 4 0.32RNA small nucleolar 1 0.08
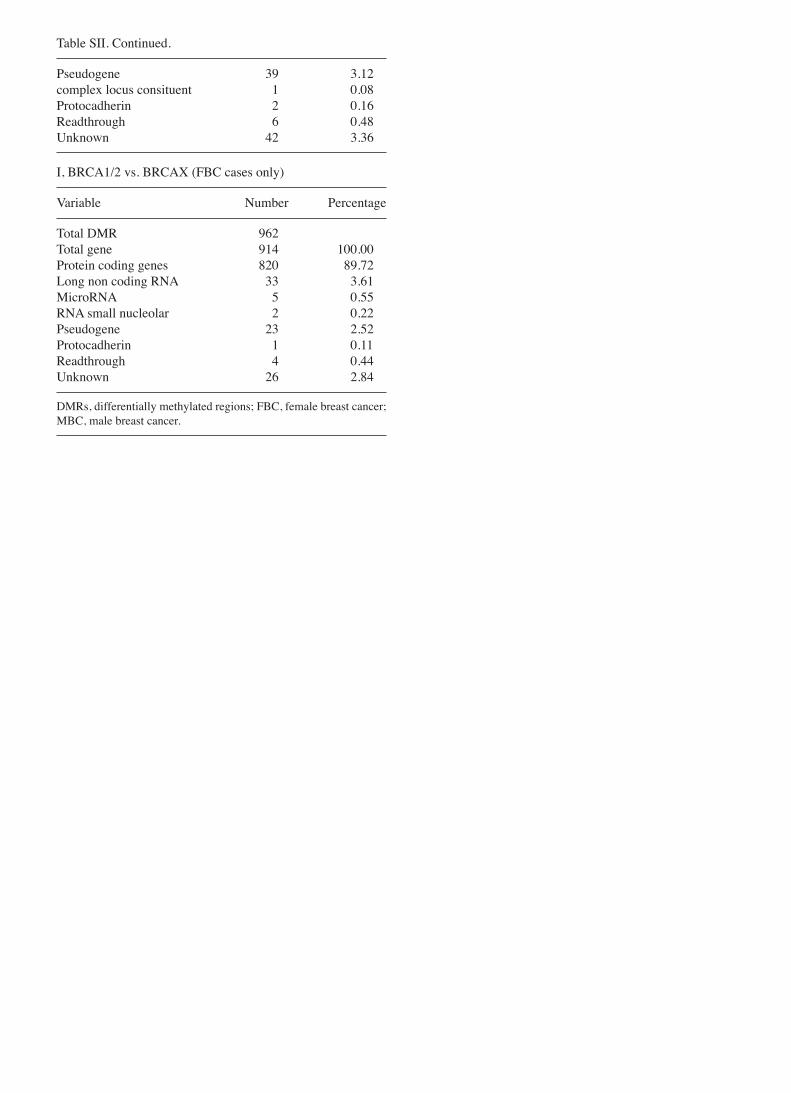
Table SII. Continued.
Pseudogene 39 3.12complex locus consituent 1 0.08Protocadherin 2 0.16Readthrough 6 0.48Unknown 42 3.36
I, BRCA1/2 vs. BRCAX (FBC cases only)
Variable Number Percentage
Total DMR 962 Total gene 914 100.00Protein coding genes 820 89.72Long non coding RNA 33 3.61MicroRNA 5 0.55RNA small nucleolar 2 0.22Pseudogene 23 2.52Protocadherin 1 0.11Readthrough 4 0.44Unknown 26 2.84
DMRs, differentially methylated regions; FBC, female breast cancer; MBC, male breast cancer.
Tabl
e SI
II. A
naly
sis o
f the
ass
ocia
tion
betw
een
the
clin
icop
atho
logi
cal c
hara
cter
istic
s of p
atie
nts w
ith b
reas
t can
cer a
nd th
e D
NA
met
hyla
tion
leve
ls o
f KRT
gen
esa .
K
RT1
KRT
6A
KRT
14
KRT
75
KRT
78 (i
) K
RT78
(ii)
KRT
80
KRT
81
KRT
86
--------
--------
--------
-- ----
--------
--------
------
--------
--------
--------
-- ----
--------
--------
------
--------
--------
--------
-- ----
--------
--------
------
--------
--------
--------
-- ----
--------
--------
------
--------
--------
--------
--Va
riabl
e H
igh
Low
H
igh
Low
H
igh
Low
H
igh
Low
H
igh
Low
H
igh
Low
H
igh
Low
H
igh
Low
H
igh
Low
ER st
atus
Pos
itive
, n
6 9
5 10
5
10
7 8
6 9
5 10
6
9 5
10
5 10
Neg
ativ
e, n
3
2 3
2 4
1 3
2 3
2 3
2 3
2 4
1 4
1 P
-val
ue
0.61
7 0.
347
0.12
7 >0
.999
0.
617
0.34
7 0.
617
0.12
7 0.
127
PR st
atus
P
ositi
ve, n
4
9 3
10
3 10
5
8 4
9 4
9 4
9 3
10
3 10
Neg
ativ
e, n
5
2 5
2 6
1 5
2 5
2 4
3 5
2 6
1 6
1 P
-val
ue
0.16
0 0.
062
0.01
7b 0.
350
0.16
0 0.
356
0.16
0 0.
017b
0.01
7b
HER
2 st
atus
P
ositi
ve, n
4
2 3
3 3
3 5
1 4
2 2
4 5
1 4
2 4
2 N
egat
ive,
n
4 8
5 7
6 6
5 7
5 7
6 6
4 8
5 7
5 7
P-v
alue
0.
321
>0.9
99
>0.9
99
0.15
1 0.
620
0.63
8 0.
131
0.62
0 0.
620
Ki6
7 st
atus
P
ositi
ve, n
5
5 4
6 6
4 6
4 5
5 6
4 6
4 6
4 6
4 N
egat
ive,
n
4 5
4 5
3 6
4 5
4 5
2 7
3 6
3 6
3 6
P-v
alue
>0
.999
>0
.999
0.
370
0.65
6 >0
.999
0.
170
0.37
0 0.
370
0.37
0 M
olec
ular
subt
ypes
c
Lum
inal
A, n
3
7 3
7 3
7 3
7 3
7 4
6 2
8 2
8 2
8 L
umin
al B
, n
2 2
1 3
1 3
3 1
1 3
2 2
3 1
2 2
2 2
HER
2-po
sitiv
e, n
2
0 2
0 2
0 2
0 2
0 1
1 2
0 2
0 2
0 T
riple
neg
ativ
e, n
2
2 2
2 3
1 2
2 2
2 2
2 2
2 3
1 3
1 P
-val
ue
0.65
1 0.
175
0.28
8 0.
044b
0.08
1 0.
837
0.39
0 0.
655
0.13
0
a The
DN
A m
ethy
latio
n le
vel o
f KRT
gen
es w
as c
ateg
oriz
ed in
to tw
o gr
oups
: Hig
h D
NA
met
hyla
tion
leve
l and
low
DN
A m
ethy
latio
n le
vel.
The
med
ian
of Δ
met
hyla
tion
valu
es w
as se
lect
ed a
s the
cut
-off
poin
t. Fi
sher
's ex
act t
est w
as u
sed
to d
eter
min
e th
e st
atis
tical
sign
ifica
nce
betw
een
two
cate
goric
al v
aria
bles
. b P<0.
05. c
One
-way
AN
OVA
and
Tuk
ey's
pairw
ise
com
paris
on te
sts w
ere
used
to d
eter
min
e th
e st
atis
tical
diff
eren
ces o
f mea
n Δ
met
hyla
tion
valu
es a
mon
g th
e di
ffere
nt m
olec
ular
subt
ypes
. Tw
o di
ffere
ntia
lly m
ethy
late
d re
gion
s wer
e de
tect
ed fo
r KRT
78 g
ene,
indi
cate
d as
(i) a
nd (i
i). E
R, e
stro
gen
rece
ptor
; KRT
, ker
atin
; PR
, pro
gest
eron
e re
cept
or.
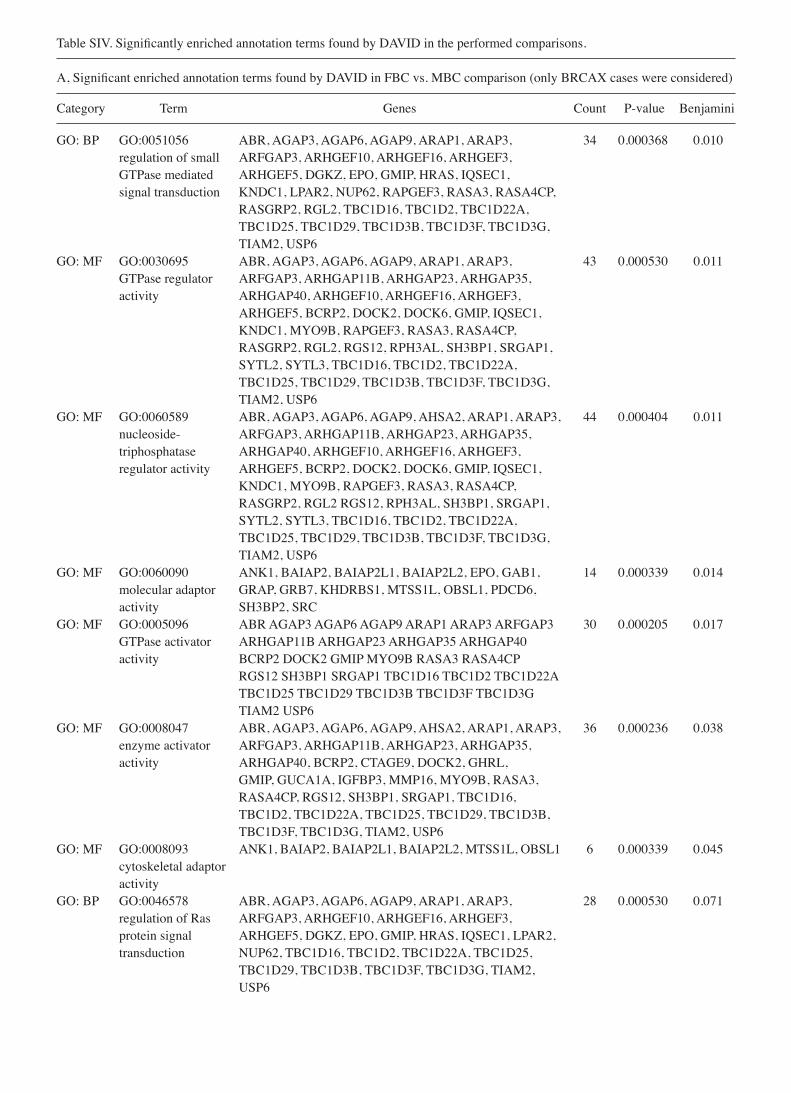
Table SIV. Significantly enriched annotation terms found by DAVID in the performed comparisons.
A, Significant enriched annotation terms found by DAVID in FBC vs. MBC comparison (only BRCAX cases were considered)
Category Term Genes Count P-value Benjamini
GO: BP GO:0051056 ABR, AGAP3, AGAP6, AGAP9, ARAP1, ARAP3, 34 0.000368 0.010 regulation of small ARFGAP3, ARHGEF10, ARHGEF16, ARHGEF3, GTPase mediated ARHGEF5, DGKZ, EPO, GMIP, HRAS, IQSEC1, signal transduction KNDC1, LPAR2, NUP62, RAPGEF3, RASA3, RASA4CP, RASGRP2, RGL2, TBC1D16, TBC1D2, TBC1D22A, TBC1D25, TBC1D29, TBC1D3B, TBC1D3F, TBC1D3G, TIAM2, USP6GO: MF GO:0030695 ABR, AGAP3, AGAP6, AGAP9, ARAP1, ARAP3, 43 0.000530 0.011 GTPase regulator ARFGAP3, ARHGAP11B, ARHGAP23, ARHGAP35, activity ARHGAP40, ARHGEF10, ARHGEF16, ARHGEF3, ARHGEF5, BCRP2, DOCK2, DOCK6, GMIP, IQSEC1, KNDC1, MYO9B, RAPGEF3, RASA3, RASA4CP, RASGRP2, RGL2, RGS12, RPH3AL, SH3BP1, SRGAP1, SYTL2, SYTL3, TBC1D16, TBC1D2, TBC1D22A, TBC1D25, TBC1D29, TBC1D3B, TBC1D3F, TBC1D3G, TIAM2, USP6GO: MF GO:0060589 ABR, AGAP3, AGAP6, AGAP9, AHSA2, ARAP1, ARAP3, 44 0.000404 0.011 nucleoside- ARFGAP3, ARHGAP11B, ARHGAP23, ARHGAP35, triphosphatase ARHGAP40, ARHGEF10, ARHGEF16, ARHGEF3, regulator activity ARHGEF5, BCRP2, DOCK2, DOCK6, GMIP, IQSEC1, KNDC1, MYO9B, RAPGEF3, RASA3, RASA4CP, RASGRP2, RGL2 RGS12, RPH3AL, SH3BP1, SRGAP1, SYTL2, SYTL3, TBC1D16, TBC1D2, TBC1D22A, TBC1D25, TBC1D29, TBC1D3B, TBC1D3F, TBC1D3G, TIAM2, USP6 GO: MF GO:0060090 ANK1, BAIAP2, BAIAP2L1, BAIAP2L2, EPO, GAB1, 14 0.000339 0.014 molecular adaptor GRAP, GRB7, KHDRBS1, MTSS1L, OBSL1, PDCD6, activity SH3BP2, SRCGO: MF GO:0005096 ABR AGAP3 AGAP6 AGAP9 ARAP1 ARAP3 ARFGAP3 30 0.000205 0.017 GTPase activator ARHGAP11B ARHGAP23 ARHGAP35 ARHGAP40 activity BCRP2 DOCK2 GMIP MYO9B RASA3 RASA4CP RGS12 SH3BP1 SRGAP1 TBC1D16 TBC1D2 TBC1D22A TBC1D25 TBC1D29 TBC1D3B TBC1D3F TBC1D3G TIAM2 USP6GO: MF GO:0008047 ABR, AGAP3, AGAP6, AGAP9, AHSA2, ARAP1, ARAP3, 36 0.000236 0.038 enzyme activator ARFGAP3, ARHGAP11B, ARHGAP23, ARHGAP35, activity ARHGAP40, BCRP2, CTAGE9, DOCK2, GHRL, GMIP, GUCA1A, IGFBP3, MMP16, MYO9B, RASA3, RASA4CP, RGS12, SH3BP1, SRGAP1, TBC1D16, TBC1D2, TBC1D22A, TBC1D25, TBC1D29, TBC1D3B, TBC1D3F, TBC1D3G, TIAM2, USP6GO: MF GO:0008093 ANK1, BAIAP2, BAIAP2L1, BAIAP2L2, MTSS1L, OBSL1 6 0.000339 0.045 cytoskeletal adaptor activity GO: BP GO:0046578 ABR, AGAP3, AGAP6, AGAP9, ARAP1, ARAP3, 28 0.000530 0.071 regulation of Ras ARFGAP3, ARHGEF10, ARHGEF16, ARHGEF3, protein signal ARHGEF5, DGKZ, EPO, GMIP, HRAS, IQSEC1, LPAR2, transduction NUP62, TBC1D16, TBC1D2, TBC1D22A, TBC1D25, TBC1D29, TBC1D3B, TBC1D3F, TBC1D3G, TIAM2, USP6
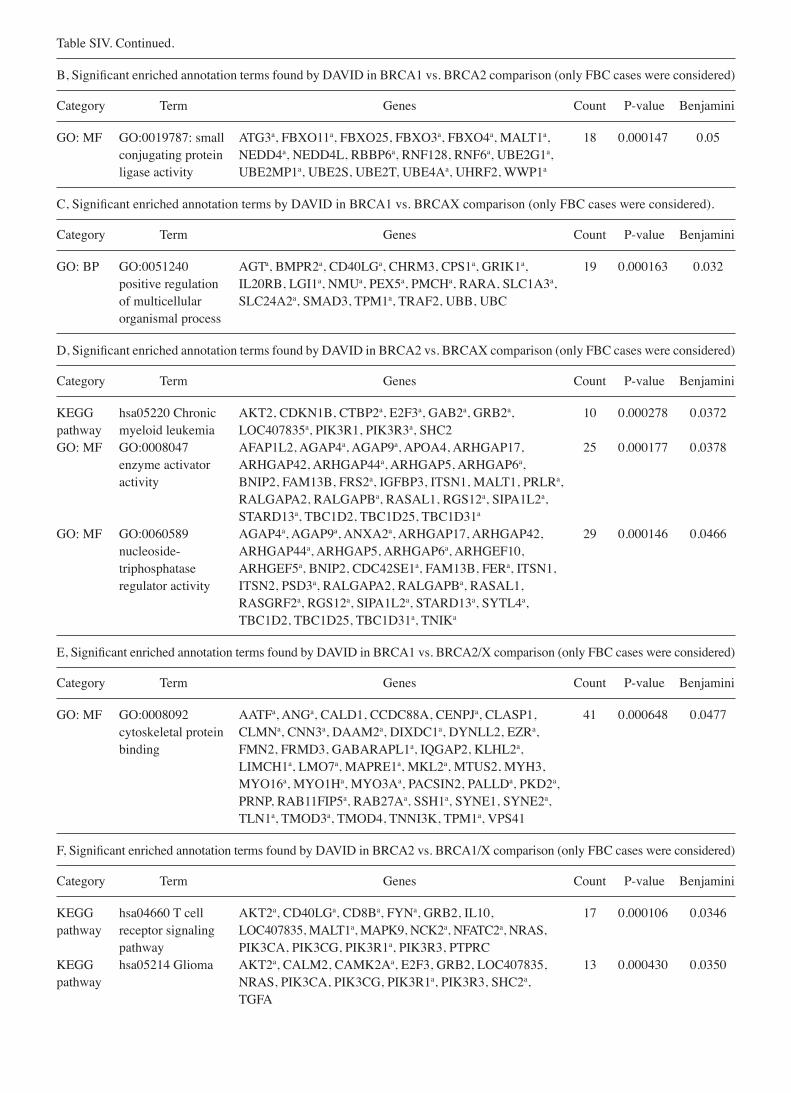
Table SIV. Continued.
B, Significant enriched annotation terms found by DAVID in BRCA1 vs. BRCA2 comparison (only FBC cases were considered)
Category Term Genes Count P-value Benjamini
GO: MF GO:0019787: small ATG3a, FBXO11a, FBXO25, FBXO3a, FBXO4a, MALT1a, 18 0.000147 0.05 conjugating protein NEDD4a, NEDD4L, RBBP6a, RNF128, RNF6a, UBE2G1a, ligase activity UBE2MP1a, UBE2S, UBE2T, UBE4Aa, UHRF2, WWP1a
C, Significant enriched annotation terms by DAVID in BRCA1 vs. BRCAX comparison (only FBC cases were considered).
Category Term Genes Count P-value Benjamini
GO: BP GO:0051240 AGTa, BMPR2a, CD40LGa, CHRM3, CPS1a, GRIK1a, 19 0.000163 0.032 positive regulation IL20RB, LGI1a, NMUa, PEX5a, PMCHa, RARA, SLC1A3a, of multicellular SLC24A2a, SMAD3, TPM1a, TRAF2, UBB, UBC organismal process
D, Significant enriched annotation terms found by DAVID in BRCA2 vs. BRCAX comparison (only FBC cases were considered)
Category Term Genes Count P-value Benjamini
KEGG hsa05220 Chronic AKT2, CDKN1B, CTBP2a, E2F3a, GAB2a, GRB2a, 10 0.000278 0.0372pathway myeloid leukemia LOC407835a, PIK3R1, PIK3R3a, SHC2GO: MF GO:0008047 AFAP1L2, AGAP4a, AGAP9a, APOA4, ARHGAP17, 25 0.000177 0.0378 enzyme activator ARHGAP42, ARHGAP44a, ARHGAP5, ARHGAP6a, activity BNIP2, FAM13B, FRS2a, IGFBP3, ITSN1, MALT1, PRLRa, RALGAPA2, RALGAPBa, RASAL1, RGS12a, SIPA1L2a, STARD13a, TBC1D2, TBC1D25, TBC1D31a
GO: MF GO:0060589 AGAP4a, AGAP9a, ANXA2a, ARHGAP17, ARHGAP42, 29 0.000146 0.0466 nucleoside- ARHGAP44a, ARHGAP5, ARHGAP6a, ARHGEF10, triphosphatase ARHGEF5a, BNIP2, CDC42SE1a, FAM13B, FERa, ITSN1, regulator activity ITSN2, PSD3a, RALGAPA2, RALGAPBa, RASAL1, RASGRF2a, RGS12a, SIPA1L2a, STARD13a, SYTL4a, TBC1D2, TBC1D25, TBC1D31a, TNIKa
E, Significant enriched annotation terms found by DAVID in BRCA1 vs. BRCA2/X comparison (only FBC cases were considered)
Category Term Genes Count P-value Benjamini
GO: MF GO:0008092 AATFa, ANGa, CALD1, CCDC88A, CENPJa, CLASP1, 41 0.000648 0.0477 cytoskeletal protein CLMNa, CNN3a, DAAM2a, DIXDC1a, DYNLL2, EZRa, binding FMN2, FRMD3, GABARAPL1a, IQGAP2, KLHL2a, LIMCH1a, LMO7a, MAPRE1a, MKL2a, MTUS2, MYH3, MYO16a, MYO1Ha, MYO3Aa, PACSIN2, PALLDa, PKD2a, PRNP, RAB11FIP5a, RAB27Aa, SSH1a, SYNE1, SYNE2a, TLN1a, TMOD3a, TMOD4, TNNI3K, TPM1a, VPS41
F, Significant enriched annotation terms found by DAVID in BRCA2 vs. BRCA1/X comparison (only FBC cases were considered)
Category Term Genes Count P-value Benjamini
KEGG hsa04660 T cell AKT2a, CD40LGa, CD8Ba, FYNa, GRB2, IL10, 17 0.000106 0.0346pathway receptor signaling LOC407835, MALT1a, MAPK9, NCK2a, NFATC2a, NRAS, pathway PIK3CA, PIK3CG, PIK3R1a, PIK3R3, PTPRCKEGG hsa05214 Glioma AKT2a, CALM2, CAMK2Aa, E2F3, GRB2, LOC407835, 13 0.000430 0.0350pathway NRAS, PIK3CA, PIK3CG, PIK3R1a, PIK3R3, SHC2a, TGFA
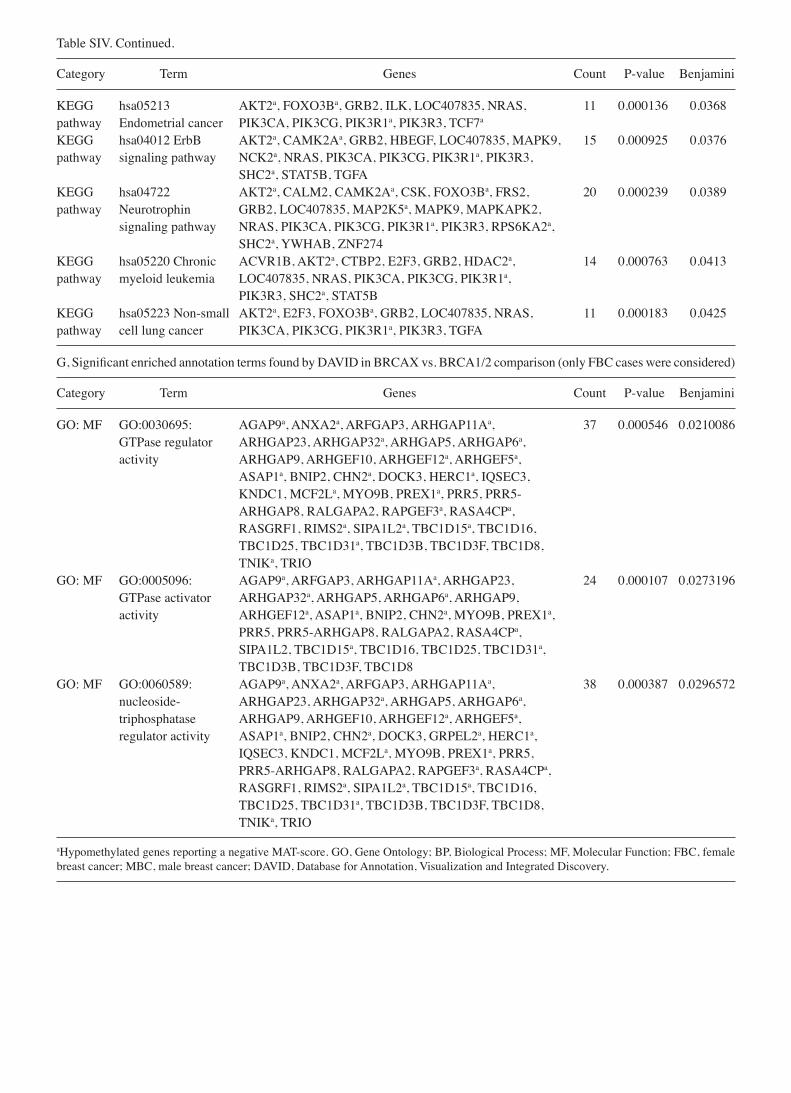
Table SIV. Continued.
Category Term Genes Count P-value Benjamini
KEGG hsa05213 AKT2a, FOXO3Ba, GRB2, ILK, LOC407835, NRAS, 11 0.000136 0.0368pathway Endometrial cancer PIK3CA, PIK3CG, PIK3R1a, PIK3R3, TCF7a
KEGG hsa04012 ErbB AKT2a, CAMK2Aa, GRB2, HBEGF, LOC407835, MAPK9, 15 0.000925 0.0376pathway signaling pathway NCK2a, NRAS, PIK3CA, PIK3CG, PIK3R1a, PIK3R3, SHC2a, STAT5B, TGFAKEGG hsa04722 AKT2a, CALM2, CAMK2Aa, CSK, FOXO3Ba, FRS2, 20 0.000239 0.0389pathway Neurotrophin GRB2, LOC407835, MAP2K5a, MAPK9, MAPKAPK2, signaling pathway NRAS, PIK3CA, PIK3CG, PIK3R1a, PIK3R3, RPS6KA2a, SHC2a, YWHAB, ZNF274KEGG hsa05220 Chronic ACVR1B, AKT2a, CTBP2, E2F3, GRB2, HDAC2a, 14 0.000763 0.0413pathway myeloid leukemia LOC407835, NRAS, PIK3CA, PIK3CG, PIK3R1a, PIK3R3, SHC2a, STAT5BKEGG hsa05223 Non-small AKT2a, E2F3, FOXO3Ba, GRB2, LOC407835, NRAS, 11 0.000183 0.0425pathway cell lung cancer PIK3CA, PIK3CG, PIK3R1a, PIK3R3, TGFA
G, Significant enriched annotation terms found by DAVID in BRCAX vs. BRCA1/2 comparison (only FBC cases were considered)
Category Term Genes Count P-value Benjamini
GO: MF GO:0030695: AGAP9a, ANXA2a, ARFGAP3, ARHGAP11Aa, 37 0.000546 0.0210086 GTPase regulator ARHGAP23, ARHGAP32a, ARHGAP5, ARHGAP6a, activity ARHGAP9, ARHGEF10, ARHGEF12a, ARHGEF5a, ASAP1a, BNIP2, CHN2a, DOCK3, HERC1a, IQSEC3, KNDC1, MCF2La, MYO9B, PREX1a, PRR5, PRR5- ARHGAP8, RALGAPA2, RAPGEF3a, RASA4CPa, RASGRF1, RIMS2a, SIPA1L2a, TBC1D15a, TBC1D16, TBC1D25, TBC1D31a, TBC1D3B, TBC1D3F, TBC1D8, TNIKa, TRIOGO: MF GO:0005096: AGAP9a, ARFGAP3, ARHGAP11Aa, ARHGAP23, 24 0.000107 0.0273196 GTPase activator ARHGAP32a, ARHGAP5, ARHGAP6a, ARHGAP9, activity ARHGEF12a, ASAP1a, BNIP2, CHN2a, MYO9B, PREX1a, PRR5, PRR5-ARHGAP8, RALGAPA2, RASA4CPa, SIPA1L2, TBC1D15a, TBC1D16, TBC1D25, TBC1D31a, TBC1D3B, TBC1D3F, TBC1D8GO: MF GO:0060589: AGAP9a, ANXA2a, ARFGAP3, ARHGAP11Aa, 38 0.000387 0.0296572 nucleoside- ARHGAP23, ARHGAP32a, ARHGAP5, ARHGAP6a, triphosphatase ARHGAP9, ARHGEF10, ARHGEF12a, ARHGEF5a, regulator activity ASAP1a, BNIP2, CHN2a, DOCK3, GRPEL2a, HERC1a, IQSEC3, KNDC1, MCF2La, MYO9B, PREX1a, PRR5, PRR5-ARHGAP8, RALGAPA2, RAPGEF3a, RASA4CPa, RASGRF1, RIMS2a, SIPA1L2a, TBC1D15a, TBC1D16, TBC1D25, TBC1D31a, TBC1D3B, TBC1D3F, TBC1D8, TNIKa, TRIO
aHypomethylated genes reporting a negative MAT-score. GO, Gene Ontology; BP, Biological Process; MF, Molecular Function; FBC, female breast cancer; MBC, male breast cancer; DAVID, Database for Annotation, Visualization and Integrated Discovery.