The Dark Side of Democracy: Explaining Ethnic Cleansing – Michael Mann Fascists – Michael Mann
Upload
khangminh22Category
view
0download
0
HAL Id: hal-01972675https://hal.archives-ouvertes.fr/hal-01972675
Submitted on 16 Jan 2019
HAL is a multi-disciplinary open accessarchive for the deposit and dissemination of sci-entific research documents, whether they are pub-lished or not. The documents may come fromteaching and research institutions in France orabroad, or from public or private research centers.
L’archive ouverte pluridisciplinaire HAL, estdestinée au dépôt et à la diffusion de documentsscientifiques de niveau recherche, publiés ou non,émanant des établissements d’enseignement et derecherche français ou étrangers, des laboratoirespublics ou privés.
Data Quality Measures and Data Cleansing for ResearchInformation Systems
Otmane Azeroual, Gunter Saake, Mohammad Abuosba
To cite this version:Otmane Azeroual, Gunter Saake, Mohammad Abuosba. Data Quality Measures and Data Cleansingfor Research Information Systems. Journal of Digital Information Management, Digital InformationResearch Foundation, 2018, 16 (1), pp.12-21. �hal-01972675�

12 Journal of Digital Information Management Volume 16 Number 1 February 2018
Journal of DigitalInformation Management
ABSTRACT: The collection, transfer and integration ofresearch information into different research informationsystems can result in different data errors that can havea variety of negative effects on data quality. In order todetect errors at an early stage and treat them efficiently,it is necessary to determine the clean-up measures andthe new techniques of data cleansing for quality improve-ment in research institutions. Thereby an adequate andreliable basis for decision-making using an RIS is pro-vided, and confidence in a given dataset increased.
In this paper, possible measures and the new techniquesof data cleansing for improving and increasing the dataquality in research information systems will be presentedand how these are to be applied to the researchinformation.
Subject Categories and Descriptors: [H. Information Sys-tems]; [H.3.5 Online Information Services]: Data sharing
General Terms: Data quality, Research Information, DataCleansing,
Keywords: Research Information Systems, CRIS, RIS, DataQuality, Research Information, Measures, Data Cleansing,Science System, Standardization
Received: 5 September 2017, Revised 20 October 2017, Ac-cepted 29 October 2017
1. Introduction
With the introduction of research information systems,
research institutions can have a current overview of theirresearch activities, record, process and manage informa-tion about their research activities, projects and publica-tions as well as integrate them into their website.
For researchers and other interest groups, they offer op-portunities to collect, categorize and use research infor-mation, be it for publication lists, preparing projects, re-ducing the burden of producing reports or outlining theirresearch output and scientific expertise.
To introduce a research information system means forresearch institutions to provide their required informationon research activities and research results in a securedquality. Because the problems of poor data quality canspread across different domains and thereby weaken en-tire research activities of an institution, the question arisesof what measures and new techniques can be taken toeliminate the sources of error, to correct the data errorsand to remedy the causes of errors in the future.
In order to improve and increase the data quality in re-search information systems, this paper aims will be topresent the possible measures and new techniques ofdata cleansing which can be applied to research informa-tion.
2. Research Information and Research InformationSystems
In addition to teaching, research is one of the core tasksof universities. Information about task fulfillment and ser-vices in this area must be available with less time and
Data Quality Measures and Data Cleansing for Research Information Sys-tems
Otmane Azeroual1, 2, 3, Gunter Saake2, Mohammad Abuosba3
1 German Center For Higher Education Research And Science Studies(Dzhw), 10117 Berlin, Germany2 Otto-Von-Guericke University Magdeburg, Department Of ComputerScience Institute For Technical And Business Information SystemsDatabase Research Group P.O. Box 4120; 39106 Magdeburg, Germany3 University Of Applied Sciences Htw Berlin Study Program ComputationalScience And Engineering Wilhelminenhofstrasse 75a, 12459 Berlin, Germany
Otmane Azeroual: [email protected] Saake: [email protected] Abuosba: [email protected]

Journal of Digital Information Management Volume 16 Number 1 February 2018 13
Figure 1. Dimensions of Research Information (RI)
As shown in the illustration 1, persons, as a scientist,are researching, doing their PhD or habilitation stand inthe centre at various research institutions. In addition toprojects, individuals can increase the scientific reputa-tion of the publications they have written, as well as ofprizes or patents received. Therefore, the relationshipbetween this information represents an N-M relationship.
Processes and systems that store and manage the re-search information correspond to Research Information
Figure 2. Integration of Research Information in the Research Information System (RIS)
more reliably. For the research area, data and informationare mainly collected to map the research activities andtheir results, and to administer the processes associatedwith the research activity. This may include informationon research projects, their duration, participating research
ers and related publications. This information is alsocalled research information or research data. The cat-egories of research information and their relationshipscan be structured and summarized using Figure 1 offive dimensions:
Systems (RIS or CRIS for Current Research InformationSystem).
A RIS is a central database that can be used to collect,manage and deliver information about research activitiesand research results.
The following figure (see Figure 2) shows an overview ofthe integration of research information from a universityinto the research information system:
14 Journal of Digital Information Management Volume 16 Number 1 February 2018
In the RIS, data from a wide variety of existing operationalsystems are integrated in a research information systemand are made by business intelligence tools in the formof reports available. Basically, all data areas of the facili-ties are mapped in the RIS; Filling takes place via classicETL (Extract, Transform, Load) processes from both SAPand non-SAP systems.
RIS provide a holistic view of research activities and re-sults at a research institution. They map the researchactivities not only institutions but also researchers cur-rent, central and clear. By the central figure in the systema working relief is possible for the researchers. Data isentered once with the RIS and can be used multiple times,e.g. on websites, for project applications or reporting pro-cesses. A double data management and with it an addi-tional work for the users should be avoided. Another ob-jective is to establish research information systems as acentral instrument for the consistent and continuous com-munication and documentation of the diverse researchactivities and results. Improved information retrieval helpsresearchers looking for collaborators, companies in theallocation of research contracts, to provide the public withtransparency and general information about their institu-tion.
3. Data Quality and its Problem in the RIS
When interpreting the data into meaningful information,data quality plays an important role. Almost all users ofthe RIS recognized the importance of data quality for elec-tronically stored data in a database and in research infor-mation systems.
The term data quality is understood to mean a “multidi-mensional measure of the suitability of data to fulfill thepurpose of its acquisition/generation. This suitability maychange over time as needs change” [21]. This underscoresthe subjective demands on data quality in each facilityand illustrates a potential dynamic data quality process.The definition makes it clear that “the quality of data de-pends on the time of consideration and the level of de-mands made on the data at that time” [1].
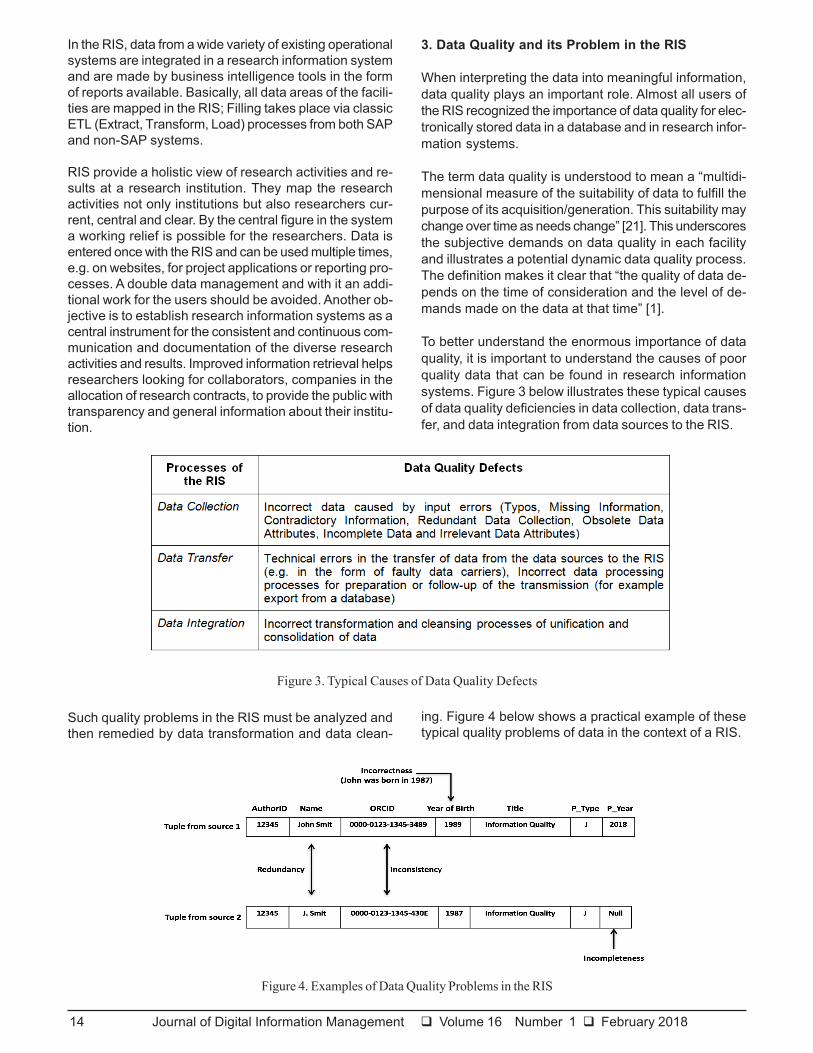
To better understand the enormous importance of dataquality, it is important to understand the causes of poorquality data that can be found in research informationsystems. Figure 3 below illustrates these typical causesof data quality deficiencies in data collection, data trans-fer, and data integration from data sources to the RIS.
Figure 3. Typical Causes of Data Quality Defects
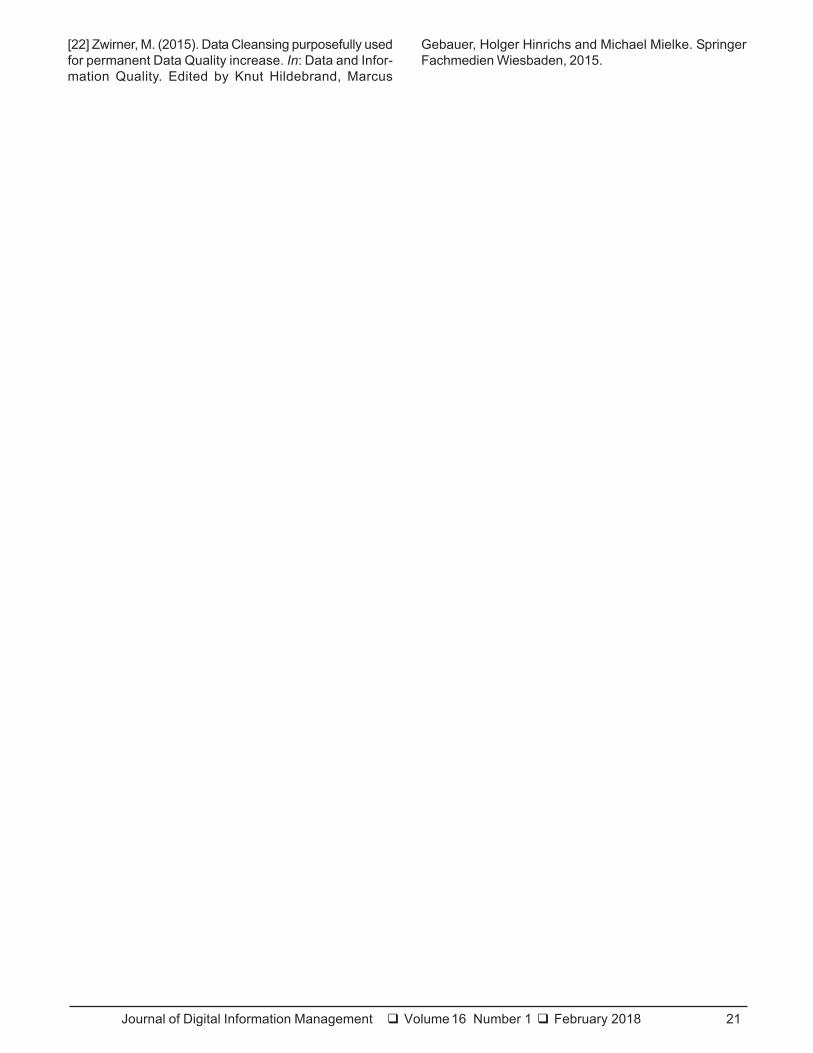
Such quality problems in the RIS must be analyzed andthen remedied by data transformation and data clean-
ing. Figure 4 below shows a practical example of thesetypical quality problems of data in the context of a RIS.
Figure 4. Examples of Data Quality Problems in the RIS

Journal of Digital Information Management Volume 16 Number 1 February 2018 15
4. Data Quality Measures
In order to enable the most efficient process for detecting,improving and increasing data quality in RIS [22]:
• To analyze specifically the resulting data errors,
• To define what action needs to be taken to eliminate thesources of error and to clean up the erroneous data and
• Prioritize the various data errors and the necessary
Figure 5. Measures Portfolio According to Different Criteria [19]
measures and transfer them to a corresponding projectplan.
Only if these steps were carried out conscientiously, afree from problems and focused data cleansing can takeplace. The procedure for securing and increasing the qual-ity of data in RIS is considered here after three measures[22] and the choice of the optimal procedure depends onthe frequency of changes of the data and their importancefor the user, as shown in Figure 5:
Laissez-FaireFor less and rarely changing data, the laissez-faire prin-ciple is appropriate. In this measure, the errors occurringwithout treatment are accepted. In other words, they aresimply ignored or, if so, only incidentally resolved so asnot to stop the business process.
Reactive ApproachFor important and only rarely changing data, the reactivemeasures are suitable. They start directly with the dataand correct quality defects, without, however, eliminatingtheir cause. This cleanup can be done manually or bymachine. Here no longer monitoring of the data qualitytakes place and the measures are always taken acutelyand selectively [22].
Proactive ApproachOn the other hand, proactive or (preventive) measures areavailable for important and frequently changing data. Here,measures are mainly taken to eliminate the sources oferror and to prevent the occurrence of the errors. Continu-ous monitoring of possible errors takes place, as well ascontinuous measures to eliminate and prevent them.
The importance of the data is determined by the specificbusiness processes of a facility. For example, this canbe quantified by the sum of costs that are caused by
possible quality deficiencies in these data. Depending ontheir nature, data errors can lead, among other things, toimage damages, additional expenditures or wrong deci-sions.
It can be deduced from the change frequency of the datahow long it takes for data to reach the lacking initial dataquality level after an initial cleanup.
Figure 5 shows that the more frequently data changes,the more rewarding a proactive approach. The accumu-lated costs for one-off adjustments increase with the fre-quency of data changes. The more frequently they haveto be applied, the lower the time saved and the cost in-volved compared to a proactive approach. According to[8], causes of poor data quality can be identified and ad-equate measures for quality improvement or increase canbe identified. The identification of the causes of poor dataquality is made possible by the “consideration of the en-tire process of data creation up to the data use with allrelated activities regarding qualitative objectives” [8].
Cleanup measures are only conditionally used to improveincomplete, missing, incorrect, or inconsistent data. Thedecision to use a particular measure must be made by adomain expert who is familiar with the business processesof his facility and can evaluate how quality deficiencieswould adversely affect them [6] [19].

16 Journal of Digital Information Management Volume 16 Number 1 February 2018
A continuous analysis of the quality requirements and aperiodical control are necessary to ensure a high dataquality in the long term. The following is the process forevaluating data quality. This requires consideration of thedefinition of data quality and the techniques presented todetect erroneous data. Therefore, the research institu-tions evaluate their data quality on the basis of differentdimen- sions (such as completeness, timeliness, correct-ness and consistency), which correspond to their furnish-ing context, their requirements or their risk level [5].
The following model in Figure 6 contains a differentiatedview and different weighting of quality dimensions andstrives for a lasting assurance of data quality. The appli-cation of such a method can form the basis for an agile,effective and sustainable data quality control in researchinformation systems.
The procedure for assessing the quality of data is de-scribed in six or seven steps [5]:
1. Identification of the data to be checked for data quality(typically research-related operational data or data in de-cision-making reports).
2. Deciding which dimensions are used and their weight-ing.
3. Work out an example of good and bad data for eachcriterion (several conditions can play a role here).
4. Apply the test criterion to the data.
5. Evaluate the test result and whether the quality is ac-ceptable or not.
6. Make corrections where necessary (for example, cleanup, improve data handling process to avoid repeated er-rors in the future).
Figure 6. Procedure Model for Data Quality Assessment [5]
7. Repeat the process periodically and observe trends indata quality.
5. Data Cleansing
The process of identifying and correcting errors and in-consistencies with the aim of increasing the quality ofgiven data sources in the RIS is referred to as “Data Clean-ing” or “Data Cleansing”.
Data Cleaning includes all the necessary activities to cleandirty data (incomplete, incorrect, not currently, inconsis-tency, redundant, etc.). The data cleansing process canbe roughly structured as follows [9]:
1. Define and determine the actual problem.
2. Find and identify faulty instances.
3. Correction of errors found.
Data Cleansing uses a variety of special methods andtechnologies within the data cleansing process. This isdivided into five areas (see Figure 7):
Figure 7. Data Cleansing Process
Parsing is the first critical component of data cleansingand helps the user understand and transform the attributes.Individual data elements are referenced according to themetadata. This process locates, identifies and isolatesindividual data elements. For this process, e.g. for names,addresses, zip code and city. The parser Profiler ana-lyzes the attributes and generates a list of tokens fromthem, and with these tokens the input data can be ana-lyzed to create application-specific rules. The biggest prob-lem here are different field formats, which must be recog-nized.
Correction & Standardization is further necessary tocheck the parsed data for correctness, then to subse-quently standardize it. Standardization is the prerequisitefor successful matching and there is no way around us-ing a second reliable data source. For address data, apostal validation is recommended.
Enhancement is the process that expands existing datawith data from other sources. Here, additional data is

Journal of Digital Information Management Volume 16 Number 1 February 2018 17
added to close existing information gaps. Typical enrich-ment values are demographic, geographic or address in-formation.
Matching There are different types of matching: for redu-plicating, matching to different datasets, consolidating orgrouping. The adaptation enables the recognition of thesame data. For example, redundancies can be detectedand condensed for further information.
Consolidation (Merge) Matching data items with con-texts are recognized by bringing them together.
All of these steps are essential for achieving and main
Data after CleanupIn this example, the missing zip code is determined basedon the addresses and added as a separate field. Enrich-ment rounds off the content by comparing the information
taining maximum data quality in research information sys-tems. Errors in the integration of multiple data sources ina RIS are eliminated by the cleanup.
The following Table 1 illustrates an example of identifyingrecords with faulty names in a publication list to showhow data cleansing processes (cleanup, standardization,enrichment, matching, and merging) can improve the qual-ity of data sources.
The cleanup process adds missing entries, and completedfields are automatically adjusted to a specific format ac-cording to set rules.
Table 1. Example of missing entries
to external content, such as demographic and geographicfactors, and dynamically expanding and optimizing it withattributes.
Data before Enrichment
Data after EnrichmentThe example shows how the reconciliation and mergeprocess runs. Merging and matching promote consistency
because related entries within a system or across sys-tems can be automatically recognized and then linked,tuned, or merged.
Original Data before cleanup

18 Journal of Digital Information Management Volume 16 Number 1 February 2018
MatchingThis example finds related entries for John Smit and LenaScott. Despite the similarities between the datasets, notall information is redundant. The adjustment functions
evaluate the data in the individual records in detail anddetermine which ones are redundant and which ones areindependent.
ConsolidationThe merge makes the reconciled data a comprehensivedata set. This example merges the duplicate entries for
John Smit into a complete record that contains all theinformation.
6. Discussion
Cleaning up of data errors in RIS is one of the possibleways to improve and enhance existing data quality. Ac-cording to the defined measures and data cleansing pro-cesses, the following developed use cases could be iden-tified in the target system and serve as a model to show
how to detect, quantify, correct, improve and increase themin case of data errors in research information systems inthe facilities and research institutions.
The following figure introduces the just mentioned usecase for improving and increasing the data quality in theRIS.

Journal of Digital Information Management Volume 16 Number 1 February 2018 19
Figure 8. Use Case for improving and increasing the Quality of Data in the RIS
The meta process flow can be viewed as shown in the following figure.
Figure 9. Main Workflow of the process
The proposed measures and the new techniques of datacleansing help institutions to overcome the identified prob-lems. With these steps every facilities and research in-stitutions can successfully enforce their data quality.
7. Conclusion and Outlook
In research, a direct positive correlation between dataquality and RIS is predominantly discussed. An improve-
ment in data quality leads to an improvement in the infor-mation basis for RIS users. In addition, this paper ad-dresses the question of which measures and new tech-niques for improving and increasing data quality can beapplied to research information. The aim was to presentpossible measures and the new techniques of data cleans-ing for improving and increasing the data quality in re-search information systems and how these should beapplied to the research information.

20 Journal of Digital Information Management Volume 16 Number 1 February 2018
After identifying an error, it is not enough to just clean itup in a mostly time-consuming process. In order to avoidreoccurrence, it should be the aim to identify the causesof these errors and to take appropriate measures and newtechniques of data cleansing. The measures must firstbe determined and evaluated. As a result, it is clearlyshown that a proactive approach is the safest method toguarantee high data quality in research information sys-tems. However, depending on the nature of the failures,satisfactory results can be achieved even with the lessexpensive and extravagantly reactive or laissez-faire prac-tices.
As a result, the new techniques of data cleansing dem-onstrate that the improvement and enhancement of dataquality can be made at different stages of the data cleans-ing process for each RIS, and that high data quality al-lows universities and research institutions e.g. to operateRIS successfully. In this respect, the review, improvementand enhancement of data quality is always purposeful.The illustrated concept can be used as a basis for theusing facilities. It offers a suitable procedure and a usecase, on the one hand to be able to better evaluate thedata quality in RIS, to prioritize problems better and toprevent them in the future as soon as they occur. On theother hand, these data errors have to be corrected, im-proved and increased with measures and data cleansing.It says, “The sooner quality problems are identified andremedied, the better.” There are many tools to help uni-versities and all research institutions perform the datacleansing process. With these tools, all facilities such ascompleteness, correctness, timeliness, and consistencyof their key data can be significantly increased and theycan successfully implement and enforce formal data qualitypolicies.
Data Cleansing tools are primarily commercial and avail-able for both small application contexts and large dataintegration application suites. In recent years, a marketfor data cleansing is also developing as a service.
References
[1] Apel, D., Behme, W., Eberlein, R., Merighi, C. (2015).Successfully Control Data Quality. Practical solutions forBusiness Intelligence projects, 3rd, Revised and ExpandedEdition, Dpunkt.verlag.
[2] Batini, C., Scannapieco, M. (2006). Data Quality -Concepts, Methods and Techniques; Springer-Verlag,Heidelberg.
[3] Batini, C., Cappiello, C., Francalanci, C., Maurino, A.(2009). Methodologies for Data Quality Assessment andImprovement. ACM Comput. Surv., 41 (3) 1-52.
[4] Bittner, S., Hornbostel, S., Scholze, F. (2012). Re-search Information in Germany: Requirements, Status andBenefits of Existing Research Information Systems, Work-shop Research Information Systems 2011, iFQ-WorkingPaper no. 10 May 2012.
[5] DAMA. (2013). The Six Primary Dimensions for DataQuality Assessment. Techn. Ber.DAMA UK WorkingGroup, Okt. 2013.
[6] English, L. (1999). Improving Data Warehouse andBusiness Information Quality, New York.
[7] English, L. (2009). Information Quality Applied: BestPractices for Improving Business Information Processes,and Systems. Wiley Hoboken NJ.
[8] Helfert, M.(2002). Planning and Measurement of DataQuality in Data Warehouse Systems, Dissertation, Uni-versity of St. Gallen, Difo-Druck, Bamberg.
[9] Helmis, M., Hollmann, R. (2009). Web-based dataintegration, approaches to measuring and securing thequality of information in heterogeneous data sets using afully web-based tool, 1. Edition © Vieweg+Teubner | GWVFachverlage GmbH, Wiesbaden.
[10] Hinrichs, H. (2002). Data Quality Management in DataWarehouse Systems. Dissertation. Oldenburg, Univ.,2002.
[11] Hildebrand, K., Gebauer, M., Hinrichs, H., Mielke,M. (2015). Data and Information Quality. On the way tothe Information Excellence, 3rd, Extended Edition,Springer Fachmedien Wiesbaden.
[12] Kimball, R., Caserta, J. (2004). The Data WarehouseETL Toolkit. Wiley Publishing, Inc.
[13] Lee, Y.W., Strong, D. M., Kahn, B.K., Wang, R.Y.(2002). AIMQ: a Methodology for Information Quality As-sessment. Information & Management, 40 (2) 133-146,December 2002.
[14] Madnick, S. E., Wang, R. Y., Lee, Y. W., Zhu, H.(2009). Overview and Framework for Data and InformationQuality Research. J. Data and Information Quality, 1 (1)1-22, June 2009.
[15] Naumann, F., Rolker, C. (2000). Assessment Meth-ods for Information Quality Criteria, 2000.
[16] Pipino, L.L., Lee, Y.W., Wang, R. Y. (2002). DataQuality Assessment. Commun. ACM, 45 (4) 211-218,2002.
[17] Rahm, R., Do, H. H. (2000). Data Cleaning: Prob-lems and Current Approaches. Data Engineering, 23 (4)3-13, December 2000.
[18] Raman, V., Hellerstein, J. M. (2001). Potter’s wheel:An Interactive Data Cleaning System, The VLDB Journal,p.381-390, 2001.
[19] Redman, T. (1997). Data Quality for the InformationAge, Norwood, 1997.
[20] Wang, R. Y., Storey, V. C., Firth, C. P. (1995). AFramework for Analysis of Data Quality Research. Knowl-edge and Data Engineering, IEEE Transactions on, 7 (4)623-640, 1995.
[21] Würthele, V. (2003). Data Quality Metric for Informa-tion Processes, Zurich: ETH Zurich, 2003.
Journal of Digital Information Management Volume 16 Number 1 February 2018 21
[22] Zwirner, M. (2015). Data Cleansing purposefully usedfor permanent Data Quality increase. In: Data and Infor-mation Quality. Edited by Knut Hildebrand, Marcus
Gebauer, Holger Hinrichs and Michael Mielke. SpringerFachmedien Wiesbaden, 2015.
Copyright © 2022 FDOKUMEN