Data mining and visualization for decision support and modeling of public health-care resources
10
Data mining and visualization for decision support and modeling of public health-care resources Nada Lavrac ˇ a,b, * , Marko Bohanec a , Aleksander Pur c , Bojan Cestnik a,d , Marko Debeljak a , Andrej Kobler e a Joz ˇef Stefan Institute, Jamova 39, SI-1000 Ljubljana, Slovenia b University of Nova Gorica, Nova Gorica, Slovenia c Ministry of Interior Affairs, S ˇ tefanova 2, Ljubljana, Slovenia d Temida, d.o.o. Ljubljana, Slovenia e Slovenian Forestry Institute, Ljubljana, Slovenia Received 1 July 2006 Available online 10 November 2006 Abstract This paper proposes an innovative use of data mining and visualization techniques for decision support in planning and regional- level management of Slovenian public health-care. Data mining and statistical techniques were used to analyze databases collected by a regional Public Heath Institute. We also studied organizational aspects of public health resources in the selected Celje region with the objective to identify the areas that are atypical in terms of availability and accessibility of public health services for the population. The most important step was the detection of outliers and the analysis of availability and accessibility deviations. The results are applicable to health-care planning and support in decision making by local and regional health-care authorities. In addition to the practical results, which are directly useful for decision making in planning of the regional health-care system, the main methodological contri- bution of the paper are the developed visualization methods that can be used to facilitate knowledge management and decision making processes. Ó 2006 Elsevier Inc. All rights reserved. Keywords: Data mining; Decision support; Knowledge discovery; Knowledge management; Visualization; Applications to health-care 1. Introduction Effective medical prevention and good access to health- care resources are important factors that affect citizens’ welfare and quality of life. As such, these are important factors in strategic planning at the national level, as well as in planning at the regional and local community levels. Large quantities of data collected by medical institutions and governmental public health institutions can serve as a valuable source of evidence that needs to be taken into account when making decisions about priorities to be included in regional strategic health-care plans. Slovenian regional public health institutes (PHIs), coor- dinated by the national Institute of Public Health (IPH), are an important part of the system of public health in Slovenia. Their functions are public health monitoring, organizing public health-related activities and proposing and implementing actions for maintaining and improving public health. PHIs themselves coordinate a regional net- work of hospitals, clinics, individual health professionals and other health-care resources involved in particular health-care activities. Data at all levels are collected, and a national-level data warehouse is maintained at the national IPH. 1532-0464/$ - see front matter Ó 2006 Elsevier Inc. All rights reserved. doi:10.1016/j.jbi.2006.10.003 * Corresponding author. Fax: +386 1 477 3315. E-mail addresses: [email protected] (N. Lavrac ˇ), marko.bohanec @ijs.si (M. Bohanec). www.elsevier.com/locate/yjbin Journal of Biomedical Informatics 40 (2007) 438–447
Transcript of Data mining and visualization for decision support and modeling of public health-care resources
www.elsevier.com/locate/yjbin
Journal of Biomedical Informatics 40 (2007) 438–447
Data mining and visualization for decision support and modelingof public health-care resources
Nada Lavrac a,b,*, Marko Bohanec a, Aleksander Pur c, Bojan Cestnik a,d,Marko Debeljak a, Andrej Kobler e
a Jozef Stefan Institute, Jamova 39, SI-1000 Ljubljana, Sloveniab University of Nova Gorica, Nova Gorica, Slovenia
c Ministry of Interior Affairs, Stefanova 2, Ljubljana, Sloveniad Temida, d.o.o. Ljubljana, Slovenia
e Slovenian Forestry Institute, Ljubljana, Slovenia
Received 1 July 2006Available online 10 November 2006
Abstract
This paper proposes an innovative use of data mining and visualization techniques for decision support in planning and regional-level management of Slovenian public health-care. Data mining and statistical techniques were used to analyze databases collected by aregional Public Heath Institute. We also studied organizational aspects of public health resources in the selected Celje region with theobjective to identify the areas that are atypical in terms of availability and accessibility of public health services for the population. Themost important step was the detection of outliers and the analysis of availability and accessibility deviations. The results are applicableto health-care planning and support in decision making by local and regional health-care authorities. In addition to the practicalresults, which are directly useful for decision making in planning of the regional health-care system, the main methodological contri-bution of the paper are the developed visualization methods that can be used to facilitate knowledge management and decision makingprocesses.� 2006 Elsevier Inc. All rights reserved.
Keywords: Data mining; Decision support; Knowledge discovery; Knowledge management; Visualization; Applications to health-care
1. Introduction
Effective medical prevention and good access to health-care resources are important factors that affect citizens’welfare and quality of life. As such, these are importantfactors in strategic planning at the national level, as wellas in planning at the regional and local community levels.Large quantities of data collected by medical institutionsand governmental public health institutions can serve asa valuable source of evidence that needs to be taken into
1532-0464/$ - see front matter � 2006 Elsevier Inc. All rights reserved.
doi:10.1016/j.jbi.2006.10.003
* Corresponding author. Fax: +386 1 477 3315.E-mail addresses: [email protected] (N. Lavrac), marko.bohanec
@ijs.si (M. Bohanec).
account when making decisions about priorities to beincluded in regional strategic health-care plans.
Slovenian regional public health institutes (PHIs), coor-dinated by the national Institute of Public Health (IPH),are an important part of the system of public health inSlovenia. Their functions are public health monitoring,organizing public health-related activities and proposingand implementing actions for maintaining and improvingpublic health. PHIs themselves coordinate a regional net-work of hospitals, clinics, individual health professionalsand other health-care resources involved in particularhealth-care activities. Data at all levels are collected, anda national-level data warehouse is maintained at thenational IPH.
N. Lavrac et al. / Journal of Biomedical Informatics 40 (2007) 438–447 439
This paper describes an application of data mining anddecision support in public health-care, carried out in Slove-nia within a project called MediMap. The goal of Medi-Map was to improve health-care knowledge managementthrough data mining and decision support integration [3].Data mining [4] is concerned with finding interesting pat-terns in data. Data mining includes predictive data miningalgorithms, which result in models that can be used for pre-diction and classification, and descriptive data mining algo-rithms for finding interesting patterns in the data, likeassociations, clusters and subgroups. Data mining is typi-cally applied to knowledge discovery in large and complexdatabases and has been extensively used in knowledgemanagement [1] and industrial and business problem solv-ing [2]. On the other hand, decision support [5,6] is con-cerned with helping decision makers solve problems andmake decisions. As indicated by the results of recentresearch [3], data mining and decision support integrationcan lead to improved solutions in practical applications.
Health-care is a knowledge-intensive domain, in whichneither data gathering nor data analysis can be successfulwithout using knowledge about both the problem domainand the data analysis process. This indicates the usefulnessof integrating data mining with decision support tech-niques [3,5] to promote the construction of effective deci-sion criteria and decision models supporting decisionmaking and planning in public health-care. The integrationof the data mining and decision support approaches, aswell as the novel visualization techniques developed forthe purpose of this health-care application, have facilitatedknowledge management and improved decision support.
In MediMap, we mainly used descriptive data miningmethods and combined them with visualization and multi-criteria decision support techniques to improve the manage-ment of data and knowledge at the Public Health Institute ofthe Celje region. The main objective of MediMap was to setup appropriate models and tools to support decisions con-cerning regional health-care, aimed to serve also as a refer-ence model for other regional PHIs. We approached thisgoal in two phases: first, we analyzed the available data withdata mining techniques, and second, we used the results ofdata mining for a more elaborate study using decision sup-port techniques. In the first phase we focused on the problemof directing the patients from primary health-care centers tospecialists. In the second phase we studied organizationalaspects of public health resources in the Celje region withthe goal to identify the areas that are atypical in terms ofavailability and accessibility of public health services.
The paper is organized as follows. Section 2 presentsdata mining and decision support used as the main technol-ogies used for knowledge management in this application.Section 3 presents the data that was used for the analysisof the Celje health-care resources. The results of applyingdata mining and decision support techniques, and the visu-alization of the results, are presented in Section 4. Section 5concludes by summarizing the main results and by present-ing plans for further work.
2. Data mining and decision support for knowledge
management
Data mining [3,4] is concerned with finding models andpatterns from the available data. Data mining includespredictive data mining algorithms, which result in modelsthat can be used for prediction and classification, anddescriptive data mining algorithms for finding interestingpatterns in the data, like associations, clusters andsubgroups.
Decision support [3,5] is concerned with helping decisionmakers solve problems and make decisions. Decision sup-port provides a variety of data analysis, preference model-ing, simulation, visualization and interactive techniques,and tools such as decision support systems, multiple-crite-ria modeling, group decision support and mediation sys-tems, expert systems, databases and data warehouses.Decision support systems incorporate both data andmodels.
Data mining and decision support can be integrated tobetter solve data analysis and decision support problems.In knowledge management [1], such integration is interest-ing for several reasons. For example, in data mining it isoften unclear which algorithm is best suited for the prob-lem. Here, we require some decision support for data min-ing. Another example is when there is a lack of data for theanalysis. To ensure that appropriate data is recorded whenthe collection process begins it is useful to first build a deci-sion model and use it as a basis for defining the attributesthat will describe the data. These two examples show thatdata mining and decision support can complement eachother, to achieve better results. Different aspects of datamining and decision support integration have been investi-gated in [3].
3. Public health data
To model the Celje regional health-care system, we firstwanted to better understand the health-care resources andtheir connections in the Celje region. The location of thisregion on the map of Slovenia is shown in Fig. 1. The Celjeregion is composed of 11 communities, further divided into34 local communities.
For the purpose of MediMap, data mining techniqueswere applied to the data of 11 community health centers(CHCs) of the Celje region. The dataset consisted of threedatabases:
• The health-care providers database,• The out-patient health-care statistics database (patients’
visits to general practitioners and specialists, diseases,human resources and availability), and
• The medical status database.
To model the processes of a particular CHC (the patientflow), we used additional data describing the directing ofpatients to other CHCs or specialists.
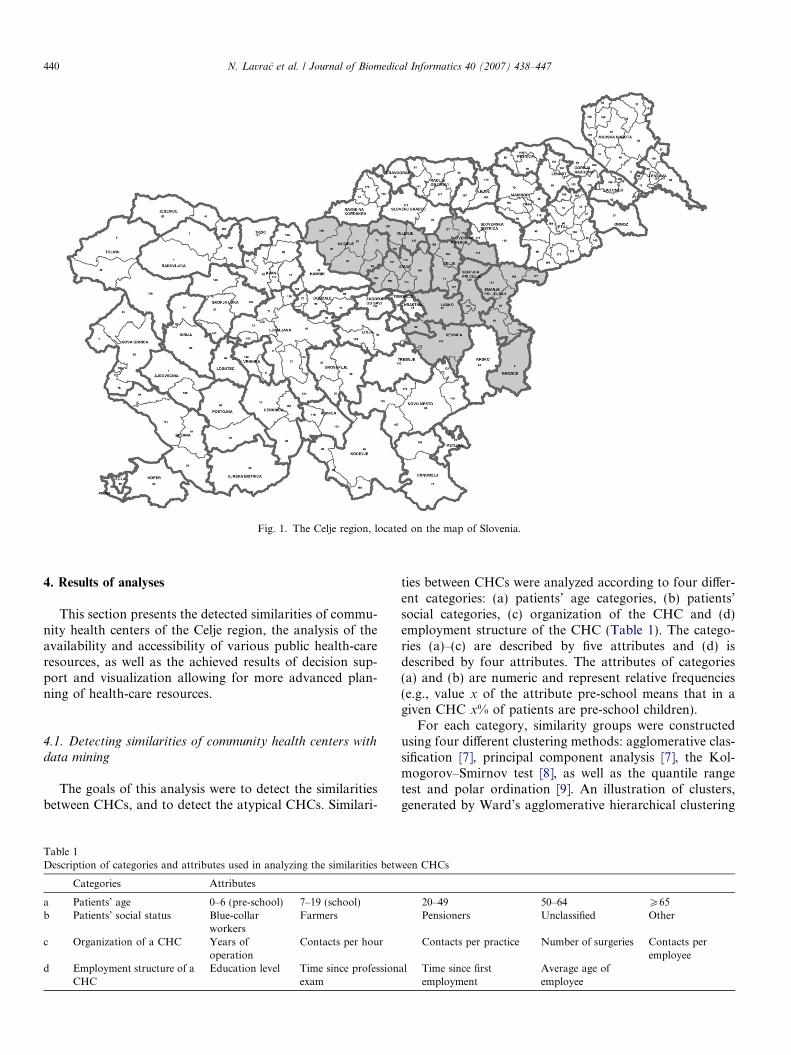
Fig. 1. The Celje region, located on the map of Slovenia.
440 N. Lavrac et al. / Journal of Biomedical Informatics 40 (2007) 438–447
4. Results of analyses
This section presents the detected similarities of commu-nity health centers of the Celje region, the analysis of theavailability and accessibility of various public health-careresources, as well as the achieved results of decision sup-port and visualization allowing for more advanced plan-ning of health-care resources.
4.1. Detecting similarities of community health centers withdata mining
The goals of this analysis were to detect the similaritiesbetween CHCs, and to detect the atypical CHCs. Similari-
Table 1Description of categories and attributes used in analyzing the similarities betw
Categories Attributes
a Patients’ age 0–6 (pre-school) 7–19 (school)b Patients’ social status Blue-collar
workersFarmers
c Organization of a CHC Years ofoperation
Contacts per hour
d Employment structure of aCHC
Education level Time since professionexam
ties between CHCs were analyzed according to four differ-ent categories: (a) patients’ age categories, (b) patients’social categories, (c) organization of the CHC and (d)employment structure of the CHC (Table 1). The catego-ries (a)–(c) are described by five attributes and (d) isdescribed by four attributes. The attributes of categories(a) and (b) are numeric and represent relative frequencies(e.g., value x of the attribute pre-school means that in agiven CHC x% of patients are pre-school children).
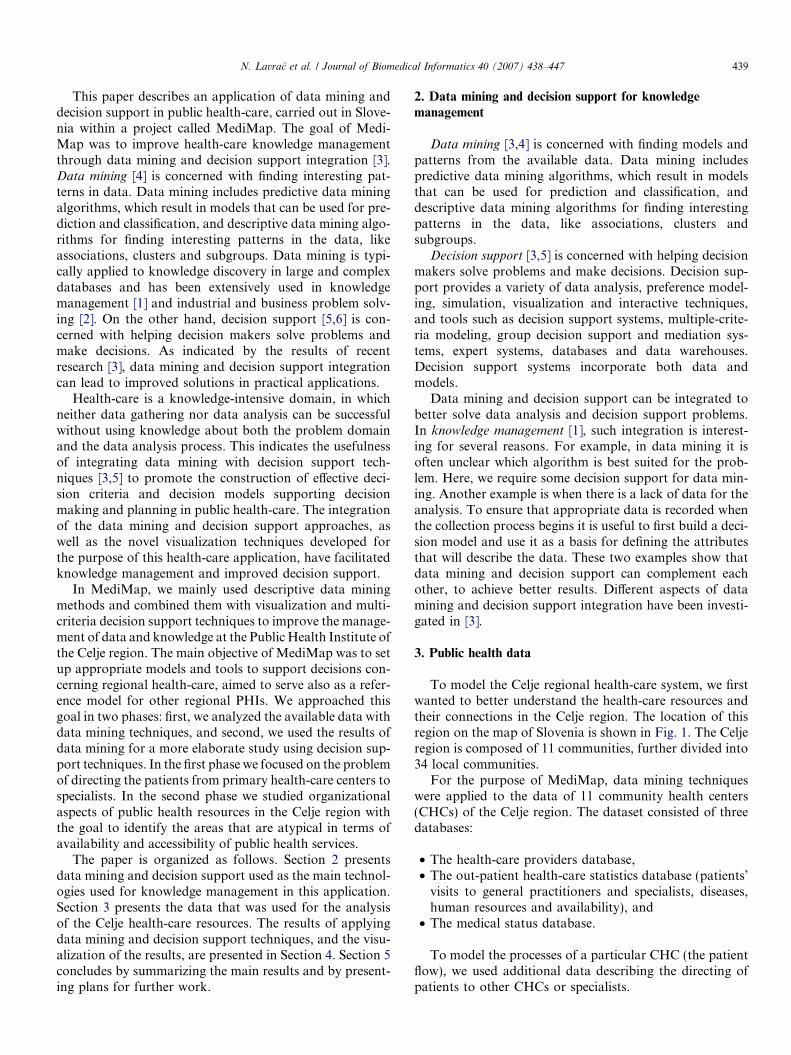
For each category, similarity groups were constructedusing four different clustering methods: agglomerative clas-sification [7], principal component analysis [7], the Kol-mogorov–Smirnov test [8], as well as the quantile rangetest and polar ordination [9]. An illustration of clusters,generated by Ward’s agglomerative hierarchical clustering
een CHCs
20–49 50–64 P65Pensioners Unclassified Other
Contacts per practice Number of surgeries Contacts peremployee
al Time since firstemployment
Average age ofemployee
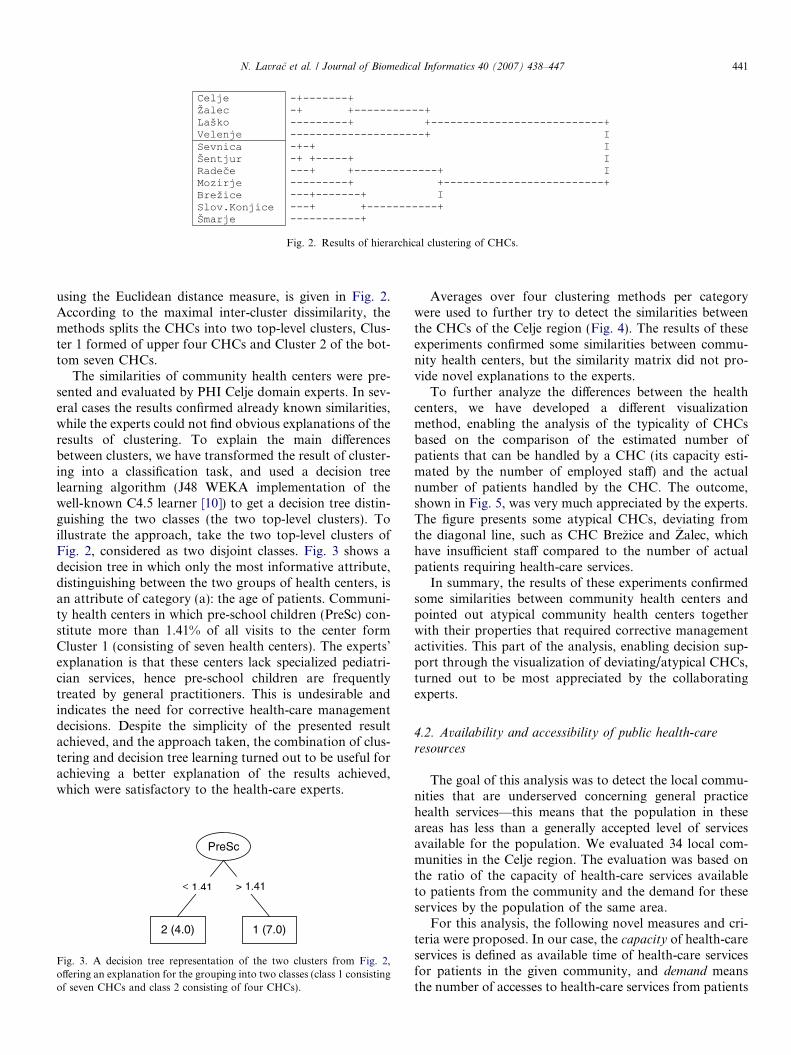
Fig. 2. Results of hierarchical clustering of CHCs.
N. Lavrac et al. / Journal of Biomedical Informatics 40 (2007) 438–447 441
using the Euclidean distance measure, is given in Fig. 2.According to the maximal inter-cluster dissimilarity, themethods splits the CHCs into two top-level clusters, Clus-ter 1 formed of upper four CHCs and Cluster 2 of the bot-tom seven CHCs.
The similarities of community health centers were pre-sented and evaluated by PHI Celje domain experts. In sev-eral cases the results confirmed already known similarities,while the experts could not find obvious explanations of theresults of clustering. To explain the main differencesbetween clusters, we have transformed the result of cluster-ing into a classification task, and used a decision treelearning algorithm (J48 WEKA implementation of thewell-known C4.5 learner [10]) to get a decision tree distin-guishing the two classes (the two top-level clusters). Toillustrate the approach, take the two top-level clusters ofFig. 2, considered as two disjoint classes. Fig. 3 shows adecision tree in which only the most informative attribute,distinguishing between the two groups of health centers, isan attribute of category (a): the age of patients. Communi-ty health centers in which pre-school children (PreSc) con-stitute more than 1.41% of all visits to the center formCluster 1 (consisting of seven health centers). The experts’explanation is that these centers lack specialized pediatri-cian services, hence pre-school children are frequentlytreated by general practitioners. This is undesirable andindicates the need for corrective health-care managementdecisions. Despite the simplicity of the presented resultachieved, and the approach taken, the combination of clus-tering and decision tree learning turned out to be useful forachieving a better explanation of the results achieved,which were satisfactory to the health-care experts.
PreSc
2 (4.0) 1 (7.0)
≤ 1.41 > 1.41
Fig. 3. A decision tree representation of the two clusters from Fig. 2,offering an explanation for the grouping into two classes (class 1 consistingof seven CHCs and class 2 consisting of four CHCs).
Averages over four clustering methods per categorywere used to further try to detect the similarities betweenthe CHCs of the Celje region (Fig. 4). The results of theseexperiments confirmed some similarities between commu-nity health centers, but the similarity matrix did not pro-vide novel explanations to the experts.
To further analyze the differences between the healthcenters, we have developed a different visualizationmethod, enabling the analysis of the typicality of CHCsbased on the comparison of the estimated number ofpatients that can be handled by a CHC (its capacity esti-mated by the number of employed staff) and the actualnumber of patients handled by the CHC. The outcome,shown in Fig. 5, was very much appreciated by the experts.The figure presents some atypical CHCs, deviating fromthe diagonal line, such as CHC Brezice and Zalec, whichhave insufficient staff compared to the number of actualpatients requiring health-care services.
In summary, the results of these experiments confirmedsome similarities between community health centers andpointed out atypical community health centers togetherwith their properties that required corrective managementactivities. This part of the analysis, enabling decision sup-port through the visualization of deviating/atypical CHCs,turned out to be most appreciated by the collaboratingexperts.
4.2. Availability and accessibility of public health-care
resources
The goal of this analysis was to detect the local commu-nities that are underserved concerning general practicehealth services—this means that the population in theseareas has less than a generally accepted level of servicesavailable for the population. We evaluated 34 local com-munities in the Celje region. The evaluation was based onthe ratio of the capacity of health-care services availableto patients from the community and the demand for theseservices by the population of the same area.
For this analysis, the following novel measures and cri-teria were proposed. In our case, the capacity of health-careservices is defined as available time of health-care servicesfor patients in the given community, and demand meansthe number of accesses to health-care services from patients
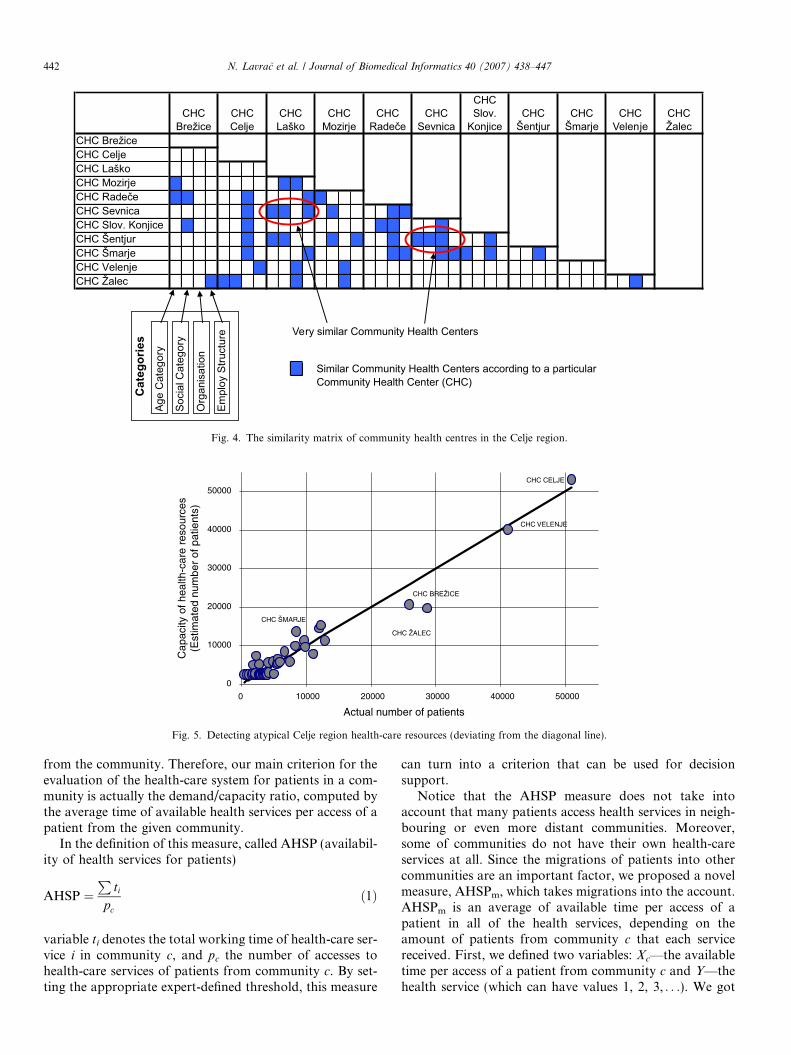
Fig. 4. The similarity matrix of community health centres in the Celje region.
0
10000
20000
30000
40000
50000
0 10000 20000 30000 40000 50000
Actual number of patients
secruoser erac-htlaeh fo yticapaC
)stneitap fo rebmun deta
mitsE(
CHC CELJE
CHC VELENJE
Fig. 5. Detecting atypical Celje region health-care resources (deviating from the diagonal line).
442 N. Lavrac et al. / Journal of Biomedical Informatics 40 (2007) 438–447
from the community. Therefore, our main criterion for theevaluation of the health-care system for patients in a com-munity is actually the demand/capacity ratio, computed bythe average time of available health services per access of apatient from the given community.
In the definition of this measure, called AHSP (availabil-ity of health services for patients)
AHSP ¼P
ti
pc
ð1Þ
variable ti denotes the total working time of health-care ser-vice i in community c, and pc the number of accesses tohealth-care services of patients from community c. By set-ting the appropriate expert-defined threshold, this measure
can turn into a criterion that can be used for decisionsupport.
Notice that the AHSP measure does not take intoaccount that many patients access health services in neigh-bouring or even more distant communities. Moreover,some of communities do not have their own health-careservices at all. Since the migrations of patients into othercommunities are an important factor, we proposed a novelmeasure, AHSPm, which takes migrations into the account.AHSPm is an average of available time per access of apatient in all of the health services, depending on theamount of patients from community c that each servicereceived. First, we defined two variables: Xc—the availabletime per access of a patient from community c and Y—thehealth service (which can have values 1, 2, 3, . . .). We got
N. Lavrac et al. / Journal of Biomedical Informatics 40 (2007) 438–447 443
the desired average with the help of the law of totalexpectation:
EðX cÞ ¼X
i
EðX cjY ¼ iÞP ðY ¼ iÞ ð2Þ
The term E(XcjY = i), which we denote by ai, is the avail-able time per access of a patient from community c athealth-care service i. It can be calculated as the ratio ofthe total working time of health-care service and the totalnumber of visits. The probability P(Y = i) that the patientvisited health-care service i can be stated as the ratio of thenumber of accesses of patients from community c to healthservice i (denoted pci), and the total number of accesses ofpatients from community c (already defined as pc). Conse-quently, we can write the new criterion as
AHSPm ¼X
i
aipci
pc
¼ 1
pc
X
i
aipci ð3Þ
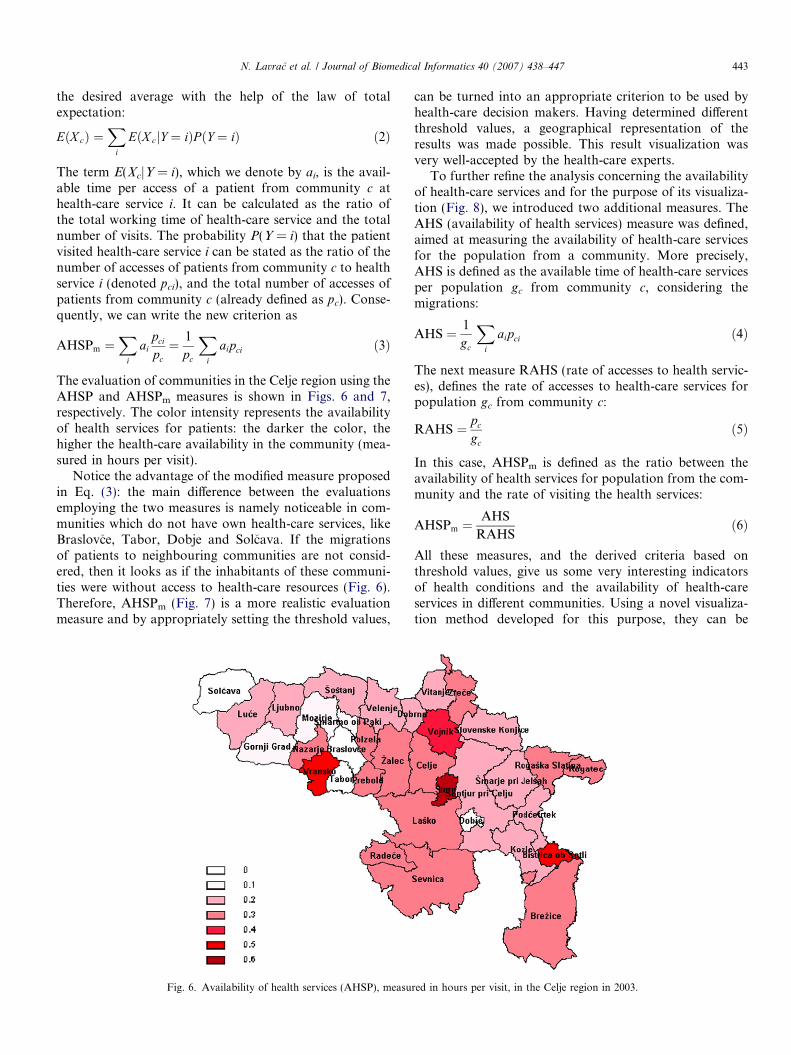
The evaluation of communities in the Celje region using theAHSP and AHSPm measures is shown in Figs. 6 and 7,respectively. The color intensity represents the availabilityof health services for patients: the darker the color, thehigher the health-care availability in the community (mea-sured in hours per visit).
Notice the advantage of the modified measure proposedin Eq. (3): the main difference between the evaluationsemploying the two measures is namely noticeable in com-munities which do not have own health-care services, likeBraslovce, Tabor, Dobje and Solcava. If the migrationsof patients to neighbouring communities are not consid-ered, then it looks as if the inhabitants of these communi-ties were without access to health-care resources (Fig. 6).Therefore, AHSPm (Fig. 7) is a more realistic evaluationmeasure and by appropriately setting the threshold values,
Fig. 6. Availability of health services (AHSP), measu
can be turned into an appropriate criterion to be used byhealth-care decision makers. Having determined differentthreshold values, a geographical representation of theresults was made possible. This result visualization wasvery well-accepted by the health-care experts.
To further refine the analysis concerning the availabilityof health-care services and for the purpose of its visualiza-tion (Fig. 8), we introduced two additional measures. TheAHS (availability of health services) measure was defined,aimed at measuring the availability of health-care servicesfor the population from a community. More precisely,AHS is defined as the available time of health-care servicesper population gc from community c, considering themigrations:
AHS ¼ 1
gc
X
i
aipci ð4Þ
The next measure RAHS (rate of accesses to health servic-es), defines the rate of accesses to health-care services forpopulation gc from community c:
RAHS ¼ pc
gcð5Þ
In this case, AHSPm is defined as the ratio between theavailability of health services for population from the com-munity and the rate of visiting the health services:
AHSPm ¼AHS
RAHSð6Þ
All these measures, and the derived criteria based onthreshold values, give us some very interesting indicatorsof health conditions and the availability of health-careservices in different communities. Using a novel visualiza-tion method developed for this purpose, they can be
red in hours per visit, in the Celje region in 2003.

Fig. 7. Availability of health services in Celje in 2003, measured in hours per visit, considering the migrations of patients to neighboring communities(AHSPm).
VranskoVojnik
Vitanje
Velenje
Tabor
Slovenske KonjiceSevnica
Rogatec
Prebold
PolzelaNazarje
Mozirje
LjubnoKozje
Gornji Grad
Dobrna
Dobje
Celje
Bistrica ob Sotli
0,25
0,5
0,75
1
1,25
2 6543
RAHS (Rate of Accesses to Health Services)
)secivreS htlae
H fo ytlibaliavA(
SH
A
Fig. 8. Available time of health-care services per population by community.
444 N. Lavrac et al. / Journal of Biomedical Informatics 40 (2007) 438–447
conveniently presented as shown in Fig. 8. Four measure-ments are actually shown in the chart: RAHS along thehorizontal axis, AHS along the vertical axis, AHSPm asdot color intensity, and population size gc as dot diameter.Communities with average values of RAHS and AHS ap-pear in the middle of the chart. The outliers representunusual communities regarding health-care. Communitiesat the left side of the chart have lower rate of accesses tohealth services and the ones at the right side have higher ac-cess rates. Communities with lower values of AHS arelocated at the bottom, and those with higher values at
the top. The dark-colored communities have higher valuesof AHSPm than the light-colored ones.
Consequently, by proposing a novel visualization of thismulti-criteria problem, Fig. 8 enables the discovery ofimplicit and interesting knowledge about health-care ser-vices in different communities. For example, the reasonfor a high value of AHSPm in communities at the left sideof the chart (e.g., Store) could be the low rate of accesses tothe nearest health services, caused by inappropriate medi-cal procedures in these services. A possible reason for thelow value of AHSPm in communities at the right side (Naz-

0-9 10-19 20-2930-39
40-4950-59
60+
Nazarje
Mozirje
Ljubno0
1
2
3
4
5
6
egareva/lautcA
sessecca
Age group
Com
mun
ities
Fig. 9. The ratio between the actual and the average accesses to health services (in year 2003).
N. Lavrac et al. / Journal of Biomedical Informatics 40 (2007) 438–447 445
arje, Mozirje, Luce in Ljubno) might be high rates of acces-ses to health services. Further expert analysis was motivat-ed based on this multi-criteria result visualization.
4.3. Decision support for planning health-care resources
Additional analysis of these rates can be provided by achart shown in Fig. 9. The chart shows the ratio of actualrates of accesses of health services and expected rates forage groups of the population in the communities. This ratiois used in order to simplify the detection of unusual rates ofaccesses to health services. The expected rate of accesses tohealth services is the average rate of population in an agegroup. For example, the access to health services of thepopulation aged between 0 and 9 years is almost five timesmore frequent than of the population aged between 20 and29 years. The age group of population from communities ismeasured along the horizontal axis. Thus, the chart showsthat in these communities the rate of accesses to health ser-vices of the population under 20 is unusually high. Thisfinding motivated further analysis, which showed that themain reason for the high value of AHSPm in these commu-
CHC Mozirje
CHC Bistrica
0
500
1000
1500
2000
2500
3000
3500
4000
4500
5000
0 5000 10000 15000
Number of accesses to
S
CH fo sruoh gnikro
W
Fig. 10. Evaluation of health services: the ratio bet
nities is the absence of paediatric services, which was laterconfirmed by the health-care experts.
A further view on the disparity of health-care in thecommunities is provided in Fig. 10. There, the evaluationof health services is based on the ratio between thehealth-care capacity and demand. In our case the demandmeans the number of accesses to health services, and ismeasured along the horizontal axis. The capacity is propor-tional to the working time of health services, and is mea-sured along the vertical axis. Some of the health servicesare denoted by an identification number and the communi-ty name. The regression line represents the expected work-ing times of health services, with respect to the number ofaccesses. The working times of the health services under theregression line, like Nazarje and Mozirje, are too short, andof those above the regression line are too long. Conse-quently, this chart can serve for supporting decisions inplanning the capacity and working times of health services.Methodologically, the aim of this chart is to highlight theCHCs that lie far away from the regression line rather thanto accurately construct the regression line. In our case, weconstructed the regression line using all the CHCs, without
CHC Nazarje
20000 25000 30000 35000
HCS (Healh Care Services)
ween the health-care capacity and the demand.

Fig. 11. CHC accessibility map for gynaecology for all the regions of Slovenia.
446 N. Lavrac et al. / Journal of Biomedical Informatics 40 (2007) 438–447
discarding any outliers as would be the case in the ordinarylinear regression.
4.4. Decision support through GIS visualizations
GIS data can be used to visualize the national road net-work, detailed by road category, and the locations of com-munity health centers of the map of Slovenia. Instead ofthe raw data visualization, presented by roads leading tothe closest CHC for a citizen at a given location, weupgraded the road visualizations by computing the CHCaccessibility through the so-called road ‘‘resistance’’ mea-sure, which is anti-proportional to the average travel speed(which is—in turn—proportional to the road category).The following road categories, allowing for different accessspeeds, were taken into the account: highways (120 km/h),main roads (80 km/h), regional roads (60 km/h) and localroads (50 km/h). This lead to the development of theCHC ‘‘access’’ map, which enables the visualization ofareas of Slovenia with low CHC access capacity. Such visu-alization enables the decision maker to see areas whichhave low accessibility to primary health services, possiblydeveloping new health-care facilities in such regions. Asample access map for gynaecology for Slovenia is shownin Fig. 11. Each dot represents a settlement (town/village)and its intensity corresponds to the accessibility of thenearest gynaecological health service: the darker the dot,the lower the access capacity.
5. Conclusions
The use of data mining and decision support methods,including novel visualization methods, can lead to betterperformance in decision making, can improve the effective-ness of developed solutions and enables tackling of newtypes of problems that have not been addressed before. Areal-life application of this approach in public health-carewas shown in this paper, following some of the guidelinesfor public health management recommended in [11,12].
In the MediMap project we have developed methodsand tools that can help regional public health institutes(PHIs) and the national Institute of Public Health (IPH)to perform their tasks more effectively. Tools and methodswere developed for the reference case of PHI Celje and test-ed on selected problems related to health-care organiza-tion, accessibility of health-care services to the citizensand the health-care providers work. The main achievementwas the creation of the model of the availability and acces-sibility of health services to the population of a given area.With the proposed model it was possible to identify theregions that differ from the average and to consequentlyexplain the causes for such situations, providing many ben-efits for health-care planning and management processes.
In addition, the national IPH has used the results of thisstudy to identify missing data that should be included inthe improved protocol of public health data gathering atthe national level, as the study indicated that addition-
N. Lavrac et al. / Journal of Biomedical Informatics 40 (2007) 438–447 447
al—more detailed, but relatively easy to obtain—data fromthe community health centres was needed. This finding wasvaluable for the IPH, as this institution is in charge ofdefining the national data model and prescribing nationaldata gathering rules and procedures.
In further work, we will extend this analysis to otherregions of Slovenia. We will focus on the development ofdecision support tools for modeling of health-care provid-ers using data mining. We wish to implement the developedmethodology so that it can be regularly used for decisionsupport in organizations responsible for the health-carenetwork: the national Ministry of Health, the nationalIPH, and the regional PHIs.
Acknowledgments
We acknowledge the financial support of the PublicHealth Institute Celje and the Slovenian Ministry of High-er Education, Science and Technology. We also express ourthanks to other members of the MediMap project teamTanja Urbancic, Mitja Jermol, Tadeja Kopac, BrankoKavsek and Primoz Luksic who also contributed to the re-sults described in this paper.
References
[1] Smith RG, Farquhar A. The road ahead for knowledge management:an AI perspective. AI Magazine 2000;21(4):17–40.
[2] Biere M. Business intelligence for the enterprise. Engelwood Cliffs,NJ: Prentice Hall PTR; 2003.
[3] Mladenic D, Lavrac N, Bohanec M, Moyle S, editors. Data miningand decision support: integration and collaboration. Dordr-echt: Kluwer; 2003.
[4] Han J, Kamber M. Data mining: concepts and techniques. 2nded. Los Altos, CA: Morgan Kaufman; 2006.
[5] Mallach EG. Decision support and data warehouse systems. NewYork: McGraw-Hill; 2000.
[6] Turban E, Aronson JE, Liang TP. Decision support systems andintelligent systems. 7th ed. Englewood Cliffs, NJ: Prentice Hall;2004.
[7] Legendre P, Legendre L. Numerical ecology. Amsterdam: Elsevier;1998. p. 317–341.
[8] Zar JH. Biostatistical analysis. Englewood Cliffs, NJ: Prentice Hall;1999. p. 478-481.
[9] Ludwig JA, Reynolds JF. Statistical ecology: a primer of methodsand computing. New York: Wiley Press; 1988. p. 337.
[10] Witten IH, Frank E. Data mining: practical machine learning toolsand techniques. 2nd ed. Los Altos, CA: Morgan Kaufmann; 2005.
[11] Niven PR. Balanced scorecard for government and nonprofitagencies. John Wiley and Sons Inc; 2003.
[12] The European Health Report, Health Systems Performance Assess-ment Methods, Annex 1, 2005. http://www.euro.who.int/document/e76907.pdf).