A personalized recommender system based on web usage mining and decision tree induction
14
A personalized recommender system based on web usage mining and decision tree induction Yoon Ho Cho a, * , Jae Kyeong Kim b,1 , Soung Hie Kim a,2 a Graduate School of Management, Korea Advanced Institute of Science and Technology, 207-43 Cheongryangri-Dong, Dongdaemun, Seoul 130-012, South Korea b School of Business Administration, KyungHee University, #1, Hoeki-Dong, Dongdaemoon, Seoul 130-701, South Korea Abstract A personalized product recommendation is an enabling mechanism to overcome information overload occurred when shopping in an Internet marketplace. Collaborative filtering has been known to be one of the most successful recommendation methods, but its application to e-commerce has exposed well-known limitations such as sparsity and scalability, which would lead to poor recommendations. This paper suggests a personalized recommendation methodology by which we are able to get further effectiveness and quality of recommendations when applied to an Internet shopping mall. The suggested methodology is based on a variety of data mining techniques such as web usage mining, decision tree induction, association rule mining and the product taxonomy. For the evaluation of the methodology, we implement a recommender system using intelligent agent and data warehousing technologies. q 2002 Elsevier Science Ltd. All rights reserved. Keywords: Product recommendation; Personalization; Web usage mining; Decision tree induction; Internet shopping mall 1. Introduction E-commerce has been growing rapidly keeping the pace with the web. Its rapid growth has made both companies and customers face a new situation. Whereas companies are harder to survive due to more and more competitions, the opportunity for customers to choose among more and more products has increased the burden of information processing before they select which products meet their needs (Kim, Kim, & Lee, 2000; Schafer, Konstan, & Riedl, 2001). As a result, the need for new marketing strategies such as one-to- one marketing and customer relationship management (CRM) has been stressed both from researches as well as from practical affairs (Berson, Smith, & Thearing, 2000; Changchien & Lu, 2001; Sarwar, Karypis, Konstan, & Riedl, 2000; Yuan & Chang, 2001). One solution to realize these strategies is personalized recommendation that helps customers find the products they would like to purchase by producing a list of recommended products for each given customer. To date, a variety of recommendation techniques (Balabanovic ´ & Shoham, 1997; Basu, Hirsh, & Cohen, 1998; Hill, Stead, Rosenstein, & Furnas, 1995; Lawrence, Almasi, Kotlyar, Viveros, & Duri, 2001; Resnick, Iacovou, Suchak, Bergstrom, & Riedl, 1994; Sarwar, Karypis, Konstan, & Riedl, 2001; Shardanand & Maes, 1995) has been developed. Collaborative filtering has been known to be the most successful recommendation technique that has been used in a number of different applications such as recommending web pages, movies, articles and products (Hill et al., 1995; Resnick et al., 1994; Shardanand & Maes, 1995). Collaborative filtering identifies customers (neigh- bors) whose interests are similar to those of a given customer and recommends products neighbors of a given customer have liked. However, despite their success, their widespread use has exposed two major limitations (Claypool et al., 1999; Sarwar et al., 2000). The first is related to sparsity. The number of ratings already obtained is very small compared to the number of ratings that need to be predicted because typical collaborative filtering requires explicit non-binary user ratings for similar products. As a result, collaborative filtering based recommendations can- not accurately compute the neighborhood and identify the products to recommend. The second is related to scalability. Algorithms to find the neighborhood usually require very long computation time that grows linearly with both the number of customers and the number of products. With millions of customers and products of real world situations, 0957-4174/02/$ - see front matter q 2002 Elsevier Science Ltd. All rights reserved. PII: S0957-4174(02)00052-0 Expert Systems with Applications 23 (2002) 329–342 www.elsevier.com/locate/eswa 1 Tel.: þ82-2-961-9355; fax: þ 82-2-967-0788. 2 Tel.: þ82-2-958-3011; fax: þ 82-2-958-3604. * Corresponding author. Tel.: þ 82-2-958-3670; fax: þ82-2-958-3604. E-mail addresses: [email protected] (Y.H. Cho), [email protected] (J.K. Kim), [email protected] (S.H. Kim).
-
Upload
independent -
Category
Documents
-
view
3 -
download
0
Transcript of A personalized recommender system based on web usage mining and decision tree induction

A personalized recommender system based on web usage mining
and decision tree induction
Yoon Ho Choa,*, Jae Kyeong Kimb,1, Soung Hie Kima,2
aGraduate School of Management, Korea Advanced Institute of Science and Technology, 207-43 Cheongryangri-Dong, Dongdaemun,
Seoul 130-012, South KoreabSchool of Business Administration, KyungHee University, #1, Hoeki-Dong, Dongdaemoon, Seoul 130-701, South Korea
Abstract
A personalized product recommendation is an enabling mechanism to overcome information overload occurred when shopping in an
Internet marketplace. Collaborative filtering has been known to be one of the most successful recommendation methods, but its application to
e-commerce has exposed well-known limitations such as sparsity and scalability, which would lead to poor recommendations. This paper
suggests a personalized recommendation methodology by which we are able to get further effectiveness and quality of recommendations
when applied to an Internet shopping mall. The suggested methodology is based on a variety of data mining techniques such as web usage
mining, decision tree induction, association rule mining and the product taxonomy. For the evaluation of the methodology, we implement a
recommender system using intelligent agent and data warehousing technologies. q 2002 Elsevier Science Ltd. All rights reserved.
Keywords: Product recommendation; Personalization; Web usage mining; Decision tree induction; Internet shopping mall
1. Introduction
E-commerce has been growing rapidly keeping the pace
with the web. Its rapid growth has made both companies and
customers face a new situation. Whereas companies are
harder to survive due to more and more competitions, the
opportunity for customers to choose among more and more
products has increased the burden of information processing
before they select which products meet their needs (Kim,
Kim, & Lee, 2000; Schafer, Konstan, & Riedl, 2001). As a
result, the need for new marketing strategies such as one-to-
one marketing and customer relationship management
(CRM) has been stressed both from researches as well as
from practical affairs (Berson, Smith, & Thearing, 2000;
Changchien & Lu, 2001; Sarwar, Karypis, Konstan, &
Riedl, 2000; Yuan & Chang, 2001). One solution to realize
these strategies is personalized recommendation that helps
customers find the products they would like to purchase by
producing a list of recommended products for each given
customer.
To date, a variety of recommendation techniques
(Balabanovic & Shoham, 1997; Basu, Hirsh, & Cohen,
1998; Hill, Stead, Rosenstein, & Furnas, 1995; Lawrence,
Almasi, Kotlyar, Viveros, & Duri, 2001; Resnick, Iacovou,
Suchak, Bergstrom, & Riedl, 1994; Sarwar, Karypis,
Konstan, & Riedl, 2001; Shardanand & Maes, 1995) has
been developed. Collaborative filtering has been known to
be the most successful recommendation technique that has
been used in a number of different applications such as
recommending web pages, movies, articles and products
(Hill et al., 1995; Resnick et al., 1994; Shardanand & Maes,
1995). Collaborative filtering identifies customers (neigh-
bors) whose interests are similar to those of a given
customer and recommends products neighbors of a given
customer have liked. However, despite their success, their
widespread use has exposed two major limitations
(Claypool et al., 1999; Sarwar et al., 2000). The first is
related to sparsity. The number of ratings already obtained is
very small compared to the number of ratings that need to be
predicted because typical collaborative filtering requires
explicit non-binary user ratings for similar products. As a
result, collaborative filtering based recommendations can-
not accurately compute the neighborhood and identify the
products to recommend. The second is related to scalability.
Algorithms to find the neighborhood usually require very
long computation time that grows linearly with both the
number of customers and the number of products. With
millions of customers and products of real world situations,
0957-4174/02/$ - see front matter q 2002 Elsevier Science Ltd. All rights reserved.
PII: S0 95 7 -4 17 4 (0 2) 00 0 52 -0
Expert Systems with Applications 23 (2002) 329–342
www.elsevier.com/locate/eswa
1 Tel.: þ82-2-961-9355; fax: þ82-2-967-0788.2 Tel.: þ82-2-958-3011; fax: þ82-2-958-3604.
* Corresponding author. Tel.: þ82-2-958-3670; fax: þ82-2-958-3604.
E-mail addresses: [email protected] (Y.H. Cho), [email protected]
(J.K. Kim), [email protected] (S.H. Kim).

existing collaborative filtering based recommendations
suffer serious scalability problems.
Recent studies have suggested web usage mining as an
enabler to overcome the problems associated with colla-
borative filtering since it will reduce the need for obtaining
subjective user ratings or registration-based personal
preferences (Mobasher, Cooley, & Srivastava, 2000a;
Mobasher, Dai, Luo, Sun, & Zhu, 2000b). E-commerce
data is rich and detailed compared to off-line commerce
data. One of them is clickstream that means visitor’s path
through a web site. Clickstream in the Internet shopping
mall provides information essential to understanding
shopping patterns or prepurchase behaviors of customers
such as what products they see, what products they add to
the shopping cart, and what products they buy. Through
analyzing such information (i.e., web usage mining), it is
possible to make a more accurate analysis of customer’s
interest or preference across all products than analyzing the
purchase records only. Furthermore, mining association
rules from clickstream provides rich and interesting
relationships or associations among products, which are
used in characterizing the appeal of individual products,
compared to the conventional mining association rules from
purchase records. Nevertheless, the existing researches
could not afford to give a formal way for capturing
individual customer’s preference or associations among
products through web usage mining. In this study, we
suggest methods to learn the customer preference and the
product association from clickstream.
The quality of the recommendations has an important
effect on the customer’s future shopping behavior. Poor
recommendations can cause two types of characteristic
errors: false negatives, which are products that are not
recommended, though the customer would like them, and
false positives, which are products that are recommended,
though the customer does not like them. In an e-commerce
environment, the most important errors to avoid are false
positives, because these errors will lead to angry customers
and thus they will be unlike to revisit the site (Sarwar et al.,
2000). If we try to find customers who are likely to buy
recommended products and recommend products to only
them, that could be a solution to avoid the false positives of
the poor recommendation.
In this paper, we propose a personalized recommen-
dation methodology based on web usage mining. Further-
more, decision tree induction is used to minimize
recommendation errors by making recommendation only
for customers who are likely to buy recommended products.
For the implementation of the proposed methodology, a
recommender system is also developed using intelligent
agent and data warehousing technology.
We begin by reviewing previous works related to our
research in Section 2. In Section 3, the suggested
recommendation methodology is explained with an illustra-
tive example case. An agent based recommender system
implemented for the evaluation is presented in Section 4.
Finally, we summarize our contributions with suggestions
for future research in Section 5.
2. Backgrounds
2.1. Web usage mining
Web usage mining is the process of applying data mining
techniques to the discovery of behavior patterns based on
web data, for various applications. In the advance of e-
commerce, the importance of web usage mining grows
larger than before. The overall process of web usage mining
is generally divided into two main tasks; data preparation
and pattern discovery. The data preparation tasks build a
server session file where each session is a sequence of
requests of different types made by single user during a
single visit to a site. Cooley, Mobasher, and Srivastava
(1999) presented a detailed description of data preparation
methods for mining web browsing patterns. The pattern
discovery tasks involve the discovery of association rules,
sequential patterns, usage clusters, page clusters, user
classifications or any other pattern discovery method
(Mobasher et al., 2000a,b). Usage pattern extracted from
web data can be applied to a wide range of applications such
as web personalization, system improvement, site modifi-
cation, business intelligence discovery, usage characteriz-
ation, and so on (Srivastava, Cooley, Deshpande, & Tan,
2000).
Our methodology recommends products based on web
usage data as well as product purchase data and customer-
related data. There have been several customer behavior
models for e-commerce, which have different analysis
purposes. Menasce, Almeida, Fonseca, and Mendes (1999)
have presented a state transition graph, called Customer
Behavior Model Graph (CBMG), that is used to describe
the behavior of groups of customers who exhibit similar
navigational patterns. VanderMeer, Dutta, and Datta
(2000) have developed a user navigation model designed
for supporting and tracking dynamic user behavior in
online personalization. The model supports the notion of a
product catalog, user navigation over this catalog and
dynamic content delivery. Lee, Podlaseck, Schonberg, and
Hoch (2001) have provided a detailed case study of the
clickstream analysis from an online retail store. Among
these models, a part of Lee et al.’s model is adopted to our
research, because they focus the online retailer who is our
consideration as well. In order to understand the effec-
tiveness of web merchandising, they have analyzed e-
shopper’s behavior according to the following four
shopping steps: product impression, clickthrough, basket
placement, and purchase. Micro-conversion rates (e.g.,
click-to-buy rate) used for measuring the effective of
efforts in merchandising are computed for each adjacent
pair of these steps. The study shows how the breakdown of
clickstreams into subsegments can highlight potential
Y.H. Cho et al. / Expert Systems with Applications 23 (2002) 329–342330

problems in merchandising. For example, a product may
have many click-throughs but a low click-to-buy rate.
Subsequent analysis may show that it has a high basket-to-
buy rate, but a low click-to-basket rate. This analysis
would allow merchandisers to begin to develop plans about
how performance might be improved.
2.2. Association rule mining and product taxonomy
Given a set of transactions where each transaction is a set
of items (itemset), an association rule implies the form
X ) Y , where X and Y are itemsets; X and Y are called the
body and the head, respectively. The support for the
association rule X ) Y is the percentage of transactions that
contain both itemset X and Y among all transactions. The
confidence for the rule X ) Y is the percentage of
transactions that contain itemset Y among transaction that
contain itemset X. The support represents the usefulness of
the discovered rule and the confidence represents certainty
of the rule.
Association rule mining is the discovery of all associ-
ation rules that are above a user-specified minimum support
and minimum confidence. Apriori algorithm is one of the
prevalent techniques used to find association rules (Agrawal,
Imielinski, & Swami, 1993; Agrawal & Srikant, 1994).
Apriori operates in two phases. In the first phase, all itemsets
with minimum support ( frequent itemsets) are generated.
This phase utilizes the downward closure property of
support. In other words, if an itemset of size k is a frequent
itemset, then all the itemsets below (k 2 1) size must also be
frequent itemsets. Using this property, candidate itemsets of
size k are generated from the set of frequent itemsets of size
(k 2 1) by imposing the constraint that all subsets of size
(k 2 1) of any candidate itemset must be present in the set
of frequent itemsets of size (k 2 1). The second phase of the
algorithm generates rules from the set of all frequent
itemsets.
Association rule mining has been widely used from
traditional business applications such as cross-marketing,
attached mailing, catalog design, loss-leader analysis, store
layout, and customer segmentation (Agrawal et al., 1993;
Srikant & Agrawal, 1995), to e-business applications such
as the renewal of web pages (Cooley et al., 1999) and web
personalization (Mobasher et al., 2000a; Mulvenna, Anand,
& Buchner, 2000).
In most Internet shopping malls, the product taxonomy is
available. A product taxonomy T is practically represented
as a tree that classifies a set of low-level products into a
higher-level of a more general product. The leaves of the
tree denote the product instances, stock keeping units
(SKUs) in retail jargon, and non-leaf nodes denote product
classes obtained by combining several lower-level nodes
into one parent node. The root node labeled by All denotes
the most general product class. Fig. 1 shows an example
product taxonomy for a fashion Internet shopping mall,
where Outerwear, Pants and Shirts are classified into
Clothes, and so on.
A number called level can be assigned to each node
in the product taxonomy. The level of the root node is
zero, and the level of any other node is one plus the
level of its parent. Please note that a higher-level
product class has a smaller level number. The product
taxonomy of Fig. 1 has four levels, referred to as levels
0 (for root), 1, 2, and 3.
Product taxonomies play an important role in the
knowledge discovery process since they represent Inter-
net shopping mall dependent knowledge and may affect
the results. In many applications, strong association rules
are more likely to exist at high levels of the product
taxonomy but may likely repeat common knowledge. For
example, the high-level association rule ‘80% of
customers who buy clothes also buy footwear’ may be
given to marketers of the fashion mall. On the other
hand, low-level rules may be more interesting, but are
difficult to find. For example, the low-level association
rule ‘40% of customers who buy shirts also buy shoes’
could be mixed with many uninteresting rules. Therefore,
it is important to mine association rules at the right level
of the product taxonomy (Berry & Linoff, 1997; Han &
Fu, 1995; Han & Kamber, 2001).
Fig. 1. Sample product taxonomy.
Y.H. Cho et al. / Expert Systems with Applications 23 (2002) 329–342 331

2.3. Decision tree induction
Classification is a data mining task which labels or
categorizes a set of cases in a database into different classes
according to a classification model. For this task, a model
set (i.e., a set of cases whose class labels are known) is first
analyzed and a classification model is constructed based on
the features available in the data of the model set. Such a
classification model is then used to categorize a score set
(i.e., a set of cases whose class labels are unknown).
The most popular classification method is the decision
tree induction which builds a decision tree and performs
classification on the given data using it (Berson et al., 2000;
Kim, Lee, Shaw, Chang, & Nelson, 2001). A decision tree is
a tree in which each non-leaf node denotes a test on an
attribute of cases, each branch corresponds to an outcome of
the test, and each leaf node denotes a class prediction (see
Fig. 2).
A case in the model set consists of multiple attributes
(independent variables) and a known class label associated
with it (dependant variables). The independent variables are
represented as an attribute-value vector x ¼ ðx1; x2;…; xiÞ:Assume that the cases can fall into j classes, that is, C ¼
ðc1; c2;…; cjÞ: Then, a model set can be denoted by M ¼
{ðxm; ymÞ} where xm [ X (all possible attribute space) and
ym [ C (all possible cases), m ¼ 1;…;M (the size of the
model set). Since all the cases in a score set have no known
class levels, on the other hand, a score set is denoted by
S ¼ {ðxs; ysÞ} where xs [ X and ys [ B, s ¼ 1;…; S (the
size of score set).
To build an effective model, the data in the model set
must mimic the time frame when the model will be applied
(Berry & Linoff, 2000). The time frame has three important
components: past, current and future. The past consists of
what has already happened and data that has already been
collected and processed. The present is the time period when
the model is being build. The future is the time period for
prediction. Since we can predict the future through the past,
the past is also divided into three time periods: the distant
past used on the input side of the data, the recent past used
to determine the output, and a period of latency used to
represent the present (see Fig. 3). Given such a model set, a
decision tree can be induced which will make it possible to
assign a class to the dependant variable of a new case in the
score set based on the values of independent variables.
The quality of a decision tree depends on both the
classification accuracy and the size of the tree. There are
well-known decision tree induction algorithms such as
CHAID (Kass, 1980), CART (Beiman, Friedman, Olshen,
& Stone, 1984), C4.5 (Quinlan, 1993) and QUEST (Loh &
Shih, 1997), etc. Applications of decision tree based
classification include target marketing, churn prediction,
medical diagnosis and so on.
3. Recommendation methodology
This paper suggests a methodology for personalized
recommendations in an e-commerce environment. The
methodology consists of five phases as shown in Fig. 4.
The recommendation problem should be defined to
clarify marketing objectives in the first phase. In phase II,
target customers are selected using predictive data mining.
We use the decision tree induction technique for this
Fig. 2. A decision tree for purchase assessment.
Fig. 3. The modeling time frame.
Fig. 4. The overall flow of recommendation.
Y.H. Cho et al. / Expert Systems with Applications 23 (2002) 329–342332

purpose. Target customer’s preferences across products are
analyzed in phase III. Tracking individual customer’s
previous shopping behavior in an e-commerce site is used
to make preference analysis. In phase IV, different
association rulesets are generated from multiple dataset,
integrated and used for discovering associations between
products. In the final phase, a personalized product
recommendation list for a given target customer is produced
by matching product associations and customer preferences
discovered in previous phases. A more detailed description
for each phase is provided in the following subsections, step
by step.
3.1. Problem definition
In most cases, recommendation problems in e-commerce
can be classified according to (1) whether customers for
whom we want recommendations (they are called target
customers in this paper) are all customers or selective
customers, (2) whether the objective of recommendation is
to predict how much a particular customer will like a
particular product ( prediction problem ), or to identify a list
of products that will be of interest to a given customer (top-
N recommendation problem ), and (3) whether the recom-
mendation is accomplished at a specific time or persistently.
For example, typical collaborative filtering based recom-
mender systems provide either predictions or top-N
recommendations to the customers whenever they visit the
site. On the other hand, most marketing campaign manage-
ment systems make top-N recommendations for particular
customers at the specified time.
This paper considers only the recommendation problem
of helping selective customers find which products they
would like to purchase by suggesting a list of top-N
recommended products for each of them at the specific time.
Thus, our methodology suggested for this problem would be
more useful in developing the campaign management
system than the collaborative recommender system. As
mentioned in Section 2.2, the product taxonomy can play an
important role in recommendation process because choos-
ing the right level of the product taxonomy may lead to
improve the results of the data mining analysis such as
association rule mining. Thus, we also consider the problem
of choosing the right level of the product taxonomy as part
of the recommendation problem.
Given the product taxonomy T, a recommendation
problem can be denoted by Recðl; n; p; tÞ where l, n, p and
t mean the recommendation based on level-l product classes
over the taxonomy T, of presenting n products to each of
target customers, for customers who have purchased p or
more level-l product classes, and conducted at the time t,
respectively.
Our methodology starts from defining the recommen-
dation problem. Setting the value of each parameter in the
problem definition depends on the purpose of recommen-
dation, the experience of the marketer, and so on.
Example 1. Given the product taxonomy in Fig. 1, let a
recommendation problem be Rec(2,2,1,2001-12-1). Then, it
represents the problem of recommending two products for
customers, who have purchased one more level-2 product
classes, on December 1, 2001. The subsequent illustrative
examples are explained based on this recommendation
problem.
3.2. Target customer selection
Making recommendation only for customers who are
likely to buy recommended products could be a solution to
avoid the false positives of the poor recommendation. This
phase performs the tasks of selecting such customers based
on the decision tree induction. The decision tree induction
uses both the model set and the score set generated from
customer records. To generate the model set and the score
set of our recommendation problem Recðl; n; p; tÞ; we also
needs two more sets: one is the model candidate set which is
a set of customers who constitute the model set and the other
is the score candidate set which is a set of customers who
form the score set.
Let msst, pd, pl and pr be the start time of the model set,
the time period for the distant past, the time period of
latency, the time period for the recent past, respectively.
Then, a model candidate set is defined as a set of customers
who have purchased p or more level-l product classes
between msst time and msst þ pd time.
Example 2. Table 1 illustrates an example of determining
the model candidate set from customer purchase records in
the case that msst ¼ kMay 1 2001l, pd ¼ kfour monthl,pl ¼ kone monthl, and pr ¼ kone monthl. Here, we obtain as
the model candidate set {101,103,104} since 101, 103 and
104 follow the definition of the model candidate set.
Table 1
Determining the model candidate set
CID May June July Aug. Sep. Oct. Model set
101 – – – Pants – T
102 – – – – Belts – F
103 Bags Wallets – – Outwear T
104 – Skincare, perfumes Socks – Socks T... ..
. ... ..
. ... ..
. ...
Y.H. Cho et al. / Expert Systems with Applications 23 (2002) 329–342 333

Now we discuss how to make a model set from the model
candidate set. The values of independent variables in the
model set are simply obtained from attributes related to
customers who belong to the model candidate set. In this
study, a dependant variable is whether or not a customer is
likely to buy new products which he/her has not yet
purchased. Since the dependant variable does not exist in the
customer records, it has to be generated using the purchase
records. Given the model candidate set size of which is M,
the model set M can be denoted as follows:
M ¼ {ðxm; ymÞ}; m ¼ 1;…;M;
where xm [ X (all possible attribute space), and
ym ¼
1 if the customer has purchased new level-l
product classes between msst þ pd þ pl
time and msst þ pd þ pl þ pr time
0 otherwise:
8>>>>><>>>>>:
ð1Þ
Example 3. Table 2 shows the model set which can be
derived from the purchase records in Table 1. Here, we can
know that the customer 103 has 1 as the value of y because
she has bought a product in October.
After the decision tree has been built from the model set,
the tree is applied to the score set in order to choose
customers who will receive recommendation. The score set
is not preclassified and also is not part of the model set. We
define the score candidate set as a set of customers who have
purchased p or more level-l product classes between
t 2 pl 2 pd time and t 2 pl time.
Example 4. Because t ¼ kDecember 1, 2001l from the
problem definition, the score candidate set consists of the
customers who have purchased one more level-2 product
classes between July and October. We can see from Table 3
that 201 and 203 satisfy the above definition and thus
become the score candidate set.
The values of independent variables of the score set are
also generated from records about customers who belong to
the model candidate set. The decision tree assigns a class (0
or 1) to the dependant variable (y ) of a new case in the score
set based on the values of independent variables. The next
recommendation phases continue to be performed only for
customers in the model candidate set who have 1 as the
value of y.
Example 5. Given that the decision tree is applied to the
score set generated in Example 4, and the decision tree
assigns 1 to the variable y of the customer 203 but 0 to the
variable y of the customer 201, only the customer 203 will
receive product recommendation.
3.3. Customer preference analysis
The methodology applies the results of analyzing
preference inclination of each customer to make recommen-
dations. For this purpose, we propose a customer preference
model represented by a matrix. The customer preference
model is constructed based on the following three general
shopping steps in online stores modified from works of Lee
et al. (2001):
1. click-through: the click on the hyperlink and the view of
the web page of the product,
2. basket placement: the placement of the product in the
shopping basket,
3. purchase: the purchase of the product—completion of a
transaction.
A basic idea of measuring the customer’s preference is
simple and straightforward. The customer’s preference is
measured by only counting the number of occurrence of
URLs mapped to the product from clickstream of the
Table 2
The model set
CID Age Gender Job Purchase amount Purchase frequency Last visit · · · Y
101 22 M Student 64 4 0827 · · · 0
103 36 F Employee 57 6 1018 · · · 1
104 23 F None 128 10 1104 · · · 1... ..
. ... ..
. ... ..
. ... ..
. ...
Table 3
Determining the score candidate set
CID July Aug. Sep. Oct. Nov. Dec. Score set
201 – – Skincare Perfumes ? T
202 – – – – ? F
203 Outwear Shirts Pants – ? T... ..
. ... ..
. ... ..
. ...
Y.H. Cho et al. / Expert Systems with Applications 23 (2002) 329–342334

customer. If we assume that all customers in an online store
buy products only in accordance with three sequential
shopping steps, we can classify all products into four product
groups such as purchased products, products placed in the
basket, products clicked through, and the other products, as
shown in Fig. 5. This classification provides an is-a relation
between different groups such that purchased products is-a
products placed in the basket, and products placed in the
basket is-a products clicked through. From this relation, it
is reasonable to obtain a preference order between products
such that {products never clicked} a {products only clicked
through} a {products only placed in the basket}a
{purchased products}. Hence, it makes sense to assign the
higher weight to occurrences of purchased products than
those of products only placed in the basket. Similarly, the
higher weight is given to products only placed in the basket
than those of products only clicked through, and so on.
Let pcij be the total number of occurrence of click-
throughs of customer i across every products in level-l
product class j. Likewise, pbij and p
pij are defined as the total
number of occurrence of basket placements and purchases
of customer i for level-l product class j, respectively. pcij; pb
ij
and ppij are calculated from the raw clickstream data as the
sum over the given time period, and so reflect individual
customer’s behaviors in the corresponding shopping process
over multiple shopping visits.
From the above discussions, we define the customer
preference matrix P ¼ ðpijÞ, i ¼ 1;…;M (total number of
customers), j ¼ 1;…;N (total number of level-l product
classes), as follows:
pij ¼
pcij 2 min
1#j#Npc
ij
� �
max1#j#N
pcij
� �2 min
1#j#Npc
ij
� � þ
pbij 2 min
1#j#Npb
ij
� �
max1#j#N
pbij
� �2 min
1#j#Npb
ij
� �
þ
ppij 2 min
1#j#Np
pij
� �
max1#j#N
ppij
� �2 min
1#j#Np
pij
� � ð2Þ
Please note that the weights for each shopping step are not
Fig. 5. Classification of products according to customer’s shopping
behavior.
Table 4
Customer preference model
CID Outerwear Pants Shirts Shoes Socks Skincare Perfumes Bags Belts Wallets
pcij: preference in click-through step
203 100 120 80 5 5 0 0 0 0 0
205 1 1 0 0 0 200 250 0 0 3
212 0 0 0 0 0 0 0 30 45 46
217 75 75 80 60 65 80 70 70 60 60
218 0 0 0 4 4 4 3 4 3 4
pbij: preference in basket placement step
203 3 3 1 0 0 0 0 0 0 0
205 0 0 0 0 0 5 4 0 0 0
212 0 0 0 0 0 0 0 1 6 6
217 0 0 0 2 2 1 0 1 1 2
218 0 0 0 2 2 2 0 2 0 2
ppij: preference in purchase step
203 1 1 1 0 0 0 0 0 0 0
205 0 0 0 0 0 2 1 0 0 0
212 0 0 0 0 0 0 0 1 0 0
217 0 0 0 0 0 0 0 0 1 0
218 0 0 0 0 2 0 0 0 0 0
pij: customer preference matrix
203 2.833 3 2 0.042 0.042 0 0 0 0 0
205 0.004 0.004 0 0 0 2.8 2.3 0 0 0.012
212 0 0 0 0 0 0 0 1.82 1.98 2
217 0.75 0.75 1 1 1.25 1.5 0.5 1 1.5 1
218 0 0 0 2 3 2 0.75 2 0.75 2
Y.H. Cho et al. / Expert Systems with Applications 23 (2002) 329–342 335

the same although they look equal as in Eq. (2). From a
casual fact that customers who purchased a specific product
had already not only clicked several web pages related to it
but placed it in the shopping basket, we can see that Eq. (2)
reflects preference order among products, and hence it is the
weighted sum of occurrence frequencies in different
shopping steps.
Example 6. Assume that the target customers have shown
their own shopping behaviors in Table 4 for the click-
through step, Table 4 for the basket placement step and
Table 4 for the purchase step, respectively. According to
Eq. (2), we obtain the customer preference matrix in
Table 4.
3.4. Product association analysis
In this phase, we first search for meaningful relationships
or associations among product classes through mining
association rules from the large transactions. As mentioned
in the problem definition, association rule mining is
performed at the level-l of the product taxonomy (but not
at leaf level). In order to capture the e-shopper’s shopping
inclination more accurately, unlike the traditional usage of
association rule mining, we look for association rules from
three different transaction sets: purchase transaction set,
basket placement transaction set and click-through trans-
action set. The steps for mining level-l association rules
from different transaction sets are as follows:
Step 1) Set the given time period as a time interval
between msst time and t 2 1 time.
For each of the purchase transaction set, basket placement
transaction set and click-through transaction set:
Step 2) Gather all the transactions made in the given time
period into a single transaction in the form of
kcustomer ID, {a set of products}l.
Step 3) Find association rules among level-l product
classes according to the following sub-steps:
Step 3.1) Set minimum support and minimum
confidence.
Step 3.2) Replace each product in transaction set
with its corresponding level-l product
class.
Step 3.3) Find all frequent itemsets of size 2 using
Apriori or its variants.
Step 3.4) Generate association rules containing a
single product class in both body and
head from the set of all frequent item-
sets of size 2.
Please note that different minimum supports and/or
minimum confidences can be specified for different
transactions in Step 3.
Next, we calculate the extent to which each product class
appeals to each customer from the discovered rules. This
work results in building a model called product association
model represented by a matrix. Given product class X and Y,
let X )p
Y , X )b
Y , and X )c
Y denote level-l association rules
in purchase transaction set, in basket placement transaction
set, and in click-through transaction set, respectively. Then,
a product association matrix A ¼ ðaijÞ; i ¼ 1;…;M (total
number of target customers), j ¼ 1;…;N (total number of
level-l product classes), is defined as follows:
aij ¼
1 if i ¼ j
1 if i)p
j
0:5 if i)b
j
0:25 if i)c
j
0 otherwise
8>>>>>>>>><>>>>>>>>>:
ð3Þ
The first condition of the Eq. (3) captures the association
among different products in a product class: a purchase of a
product in a product class implies a preference in other
Table 5
Discovered association rules
Shopping step Rule types Rule sets
Click-through X )c
Y Outwear ) Bags, Outwear ) Belts, Outwear ) Wallets
Pants ) Bags, Pants ) Wallets
Shirts ) Bags, Shirts ) Belts, Shirts ) Wallets
Bags ) Outwear, Bags ) Pants, Bags ) Shirts
Belts ) Outwear, Belts ) Shirts
Wallets ) Outwear, Wallets ) Pants, Wallets ) Shirts
Basket placement X )b
Y Outwear ) Shoes, Outwear ) Socks
Pants ) Shoes, Pants ) Socks, Pants ) Belts
Shirts ) Shoes, Shirts ) Socks
Belts ) Pants
Purchase X )p
Y Outerwear ) Shirts
Shirts ) Outerwear
Y.H. Cho et al. / Expert Systems with Applications 23 (2002) 329–342336

products in the same product class. Please note that the
matrix A is not symmetric since the rule j ) i is not
guaranteed to have minimum confidence even though the
rule i ) j satisfies both minimum support and confidence.
The multipliers for purchase associations are set higher than
those for basket placement heuristically like other
researches (Lawrence et al., 2001), because we can
normally assume that the degree of association in the
purchase is more related to the purchasing pattern of
customers than those in the basket placement. In the same
manner, the multipliers for basket placement associations
are set higher than those for click-through.
Example 7. Assume that the association rules discovered
from transactions in each shopping step are like Table 5. For
simplicity of expression, basket placement rules overlapped
with purchase rules and click-through rules overlapped with
basket placement rules are skipped in Table 5.
By applying Eq. (3) to the discovered rules, we get a
product association matrix in Table 6, each row of which
represents associations among a particular product class and
other product classes.
3.5. Recommendation generation
In the preceding phases, we have built the product
association model and the customer preference model. A
personalized recommendation list for a specific customer is
produced by scoring each candidate product for him/her and
selecting the best match. This score has to reflect the degree
of similarity between the customer preference and the
product association. Our methodology use cosine coefficient
(Lawrence et al., 2001; Mobasher et al., 2000a; Sarwar et al.,
2001) to measure the similarity. The matching score sij
between customer i and level-l product class j is computed
as follows:
sij ¼Pi·Aj
kPikkAjk¼
XN
k¼1
pikajk
ffiffiffiffiffiffiffiffiXN
k¼1
p2ik
vuutffiffiffiffiffiffiffiffiXN
k¼1
a2jk
vuut; ð4Þ
where Pi is a row vector of the M £ N customer preference
matrix P, and Aj is a row vector of the N £ N product
association matrix A. Here, M refers the total number of
customers and N refers the total number of level-l product
classes. The sij value ranges from 0 to 1, where more similar
vectors result in bigger value.
Example 8. Applying the customer preference matrix in
Table 4 and the product association matrix in Table 6 to Eq.
(4), we get the matching scores in Table 7.
All products in the same product class would have
identical matching scores for a given customer since the
scores are computed at the level of product classes but not at
the product level. From the problem definition, we have to
choose which of the products in product classes are to be
recommended to the customer. We suggest three different
strategies related with such a choice:
† Recommendation of the most frequently purchased
product. This is a strategy based on purchase history
information for choosing one product per matched
Table 6
Product association matrix
Outerwear Pants Shirts Shoes Socks Skincare Perfumes Bags Belts Wallets
Outwear 1 1 0.5 0.5 0.25 0.25 0.25
Pants 1 0.5 0.5 0.25 0.5 0.25
Shirts 1 1 0.5 0.5 0.25 0.25 0.25
Shoes 1
Socks 1
Skincare 1 0.25
Perfumes 0.25 1
Bags 0.25 0.25 0.25 1
Belts 0.25 0.5 0.25 1
Wallets 0.25 0.25 0.25 1
Table 7
Matching scores
CID Outerwear Pants Shirts Shoes Socks Skincare Perfumes Bags Belts Wallets
203 0.648 0.484 0.648 0.009 0.009 0.000 0.000 0.392 0.504 0.392
205 0.001 0.001 0.001 0.000 0.000 0.904 0.803 0.001 0.001 0.004
212 0.264 0.424 0.264 0.000 0.000 0.000 0.000 0.498 0.504 0.548
217 0.676 0.675 0.676 0.296 0.370 0.466 0.251 0.441 0.583 0.441
218 0.440 0.554 0.440 0.391 0.587 0.415 0.237 0.359 0.125 0.359
Y.H. Cho et al. / Expert Systems with Applications 23 (2002) 329–342 337

product class. This assumes that the more popular
product implies the more buyable product. This strategy
is commonly used in collaborate filtering based recom-
mender systems for online or off-line stores.
† Recommendation of product with the highest click-to-buy
rate. This is a strategy based on customer behavior
information. The click-to-buy rate measures how many
click-throughs are converted to purchases. This strategy
assumes that the more click-to-buy rate implies the
increased effectiveness of marketing.
† Recommendation of the latest product. This is a strategy
based on product data. This strategy is used under
assumption that many customers want more fashionable
products.
The decision of choosing which strategy is determined
by heuristic knowledge of marketers and domain specific
knowledge. We now propose the steps for choosing
recommended products from product classes using the
matching score.
Step 1) Select the choice strategy.
Step 2) Determine the number of recommended product
classes, nc, such that nc , n and n/nc is an integer.
For each customer:
Step 3) Select the nc highest scored product classes.
Step 4) Make a recommendation list which consists of
n/nc products per a selected product class,
according to the selected choice strategy. Here,
previously bought products are excluded from the
recommendation list.
Example 9. Assume that we select products with the
highest click-to-buy rate and the four highest click-to-buy
rates per a product class are like Table 8. If the marketer
set nc ¼ 2; the number of recommended products per
product class become 1 because n ¼ 2 from the problem
definition. Applying the above steps to Tables 7 and 8, we
finally get a recommendation list in Table 9 for each
target customer.
4. Recommender system
For the implementation of the proposed recommen-
dation methodology, a recommender system is devel-
oped using agent and data warehousing technologies.
As shown in Fig. 6, the recommender system consists
of eight agents and one data mart. The agents and
data mining algorithms have been implemented as a
Java servlet so that the system is platform independent
and transportable, and Oracle DBMS is used for the
data mart. This recommender system runs on WindowTab
le8
Cli
ck-t
o-b
uy
rate
s
Pro
du
ctcl
ass
Ou
terw
ear
Pan
tsS
hir
tsS
ho
esS
ock
sS
kin
care
Per
fum
esB
ags
Bel
tsW
alle
ts
SK
U0
2(0
.03
5)
SK
U1
3(0
.03
1)
SK
U2
5(0
.05
0)
SK
U3
0(0
.02
9)
SK
U4
8(0
.01
5)
SK
U5
5(0
.02
5)
SK
U6
3(0
.04
9)
SK
U7
2(0
.05
4)
SK
U8
0(0
.06
1)
SK
U9
9(0
.03
5)
SK
U0
4(0
.03
2)
SK
U1
5(0
.02
9)
SK
U2
0(0
.03
3)
SK
U3
2(0
.02
8)
SK
U4
3(0
.01
1)
SK
U5
1(0
.02
3)
SK
U6
5(0
.04
0)
SK
U7
1(0
.03
5)
SK
U8
1(0
.04
3)
SK
U9
3(0
.02
5)
SK
U0
3(0
.02
3)
SK
U1
9(0
.02
5)
SK
U2
4(0
.03
1)
SK
U3
1(0
.01
2)
SK
U4
2(0
.01
1)
SK
U5
2(0
.02
2)
SK
U6
2(0
.02
8)
SK
U7
7(0
.02
7)
SK
U8
7(0
.02
7)
SK
U9
4(0
.02
3)
SK
U0
1(0
.01
7)
SK
U1
8(0
.01
1)
SK
U2
2(0
.01
8)
SK
U3
9(0
.01
1)
SK
U4
4(0
.00
5)
SK
U5
3(0
.02
1)
SK
U6
9(0
.02
8)
SK
U7
4(0
.01
8)
SK
U8
5(0
.01
8)
SK
U9
5(0
.02
0)
Y.H. Cho et al. / Expert Systems with Applications 23 (2002) 329–342338

2000 server and JRUN environment. We briefly explain
the function of each agent, and their implementations.
4.1. Web log analysis agent
This agent manages web log database through periodic
collecting, parsing and analyzing web server log files such
as access logs, referrer logs, agent logs and cookie files.
Thus, the users can easily access and analyze it like other
operational databases.
4.2. Data transformation agent
This agent creates and manages the data mart that
provides data indispensable to accomplish recommendation
tasks. First, the data necessary for the recommendation are
Table 9
Recommendation lists
CID Purchased products Recommended product classes Recommended products
203 SKU00, SKU15, SKU25 Outwear, Shirts SKU02, SKU20
205 SKU51, SKU55, SKU69 Skincare, Perfumes SKU52, SKU63
212 SKU72 Wallets, Belts SKU99, SKU80
217 SKU83 Outwear, Shirts SKU02, SKU25
218 SKU44, SKU48 Socks, Pants SKU43, SKU13
Fig. 6. The architecture of recommender system.
Y.H. Cho et al. / Expert Systems with Applications 23 (2002) 329–342 339
extracted from both operational databases and web log
database and cleansed. The cleansed data are then
transformed and integrated in the form (i.e., data mart)
usable in the proposed recommendation methodology. The
data mart is a suite of fact tables together with a set of
connected dimension tables that serves recommendation
tasks. Fig. 7 shows a snowflake schema for clickstream
which is used for analysis tasks in our recommender system.
4.3. Data mining agent
This agent activates and manages data mining algorithms
such as the decision tree induction and the association rule
mining. The data mining agent carries out data mining tasks
requested from the target customer selection agent and the
association analysis agent, and generates rules or models. In
addition, the generated rules and models are managed to
perform inference or prediction tasks. The recommender
system operates the data mining agent independently so that
it preserve the stability of the whole system from the
substitution or the adjustment of data mining algorithms.
4.4. Target customer selection agent
The target customer selection agent takes responsibility
for the selecting of target customers mentioned in Section
3.2. Based on the parameters for the recommendation
specified by the user (mining expert or marketer), the target
customer selection agent takes customer data from the data
mart and creates the decision tree model from the data in
cooperation with the data mining agent. Using the model,
this agent selects target customers for whom recommen-
dation tasks will be performed.
4.5. Preference analysis agent
This agent takes charge of customer preference analysis
described in Section 3.3. For this, the agent extracts prior
Fig. 7. A clickstream snowflake schema.
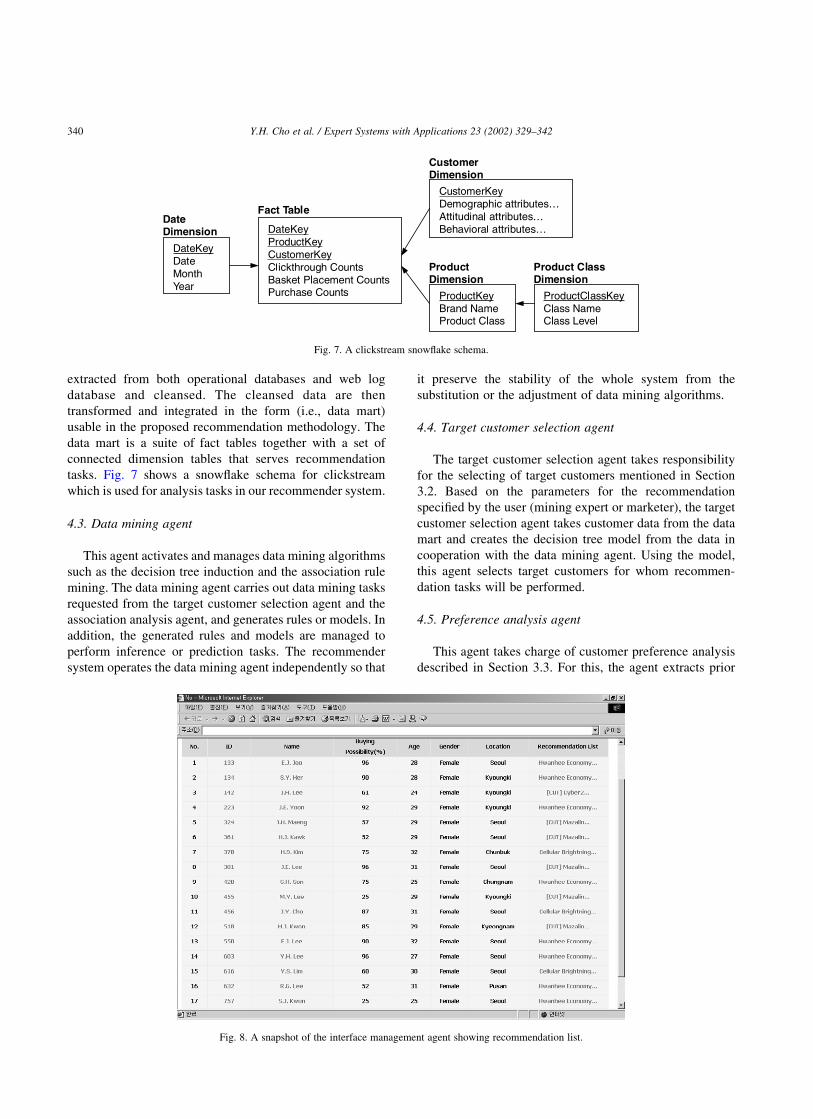
Fig. 8. A snapshot of the interface management agent showing recommendation list.
Y.H. Cho et al. / Expert Systems with Applications 23 (2002) 329–342340

shopping behavior data for target customers from the data
mart and then builds the customer preference model through
the web usage analysis for the data.
4.6. Association analysis agent
This agent has the role of analyzing associations between
product classes described in Section 3.4. For this, it first
extracts transaction data for target customers from the data
mart and then generates association rules from the data in its
interaction with the data mining agent. Finally, the agent
makes the product association model using the discovered
rules.
4.7. Recommendation generation agent
This agent makes a personalized recommendation list for
each target customer according to the steps mentioned in
Section 3.5. For each target customer, the product
recommendation agent determines recommended product
classes by integrating the product association model built by
association analysis agent and the customer preference
model built by preference analysis agent, and then selects
recommended products out of the product classes using
product attribute data extracted from the data mart.
4.8. Interface management agent
This agent provides the users with an interface whereby
they can specify recommendation task, set control para-
meters, and show results through transparent communi-
cation with agents that are needed to accomplish the given
recommendation task. Standard Java enabled browsers
provide the user interface to the recommender system in
order to minimize installation and maintenance overhead.
Fig. 8 shows a snapshot of the interface offered to a user for
the presentation of recommendation lists.
5. Conclusion
We have presented a methodology for personalized
recommendations in e-commerce and developed a recom-
mender system implementing the methodology. The
characteristics of the suggested methodology are as follows.
First, the customer preference and the product association
are automatically learned from clickstream (web usage
data), unlike other recommendation methodologies which
learn them from purchase records only. Second, in order to
avoid the poor recommendations that will lead to disappoint
customers, customers who are likely to buy recommended
products are selected using decision tree induction. Third,
the explicit participation of the marketers and the formal
usage of background knowledge such as the product
taxonomy are also introduced in the recommendation
process. Finally, we devise measures to choose highly
business-efficient products among the candidate recom-
mendable products.
As further researches, it will be interesting to compare
our suggested methodology with a standard collaborative
filtering based methodology in the aspect of recommen-
dation performance. And it will also be an interesting
research area to conduct a real marketing campaign to
customers using this methodology and to evaluate the
performance.
References
Agrawal, R., Imielinski, T., & Swami, A. (1993). Mining association
between sets of items in massive database. International Proceedings of
the ACM–SIGMOD International Conference on Management of Data
(pp. 207–216).
Agrawal, R., & Srikant, R. (1994). Fast algorithms for mining association
rules. Proceedings of the International Conference on very large Data
Bases (pp. 407–419).
Balabanovic, M., & Shoham, Y. (1997). Content-based, collaborative
recommendation. Communications of the ACM, 40(3), 66–72.
Basu, C., Hirsh, H., & Cohen, W. (1998). Recommendation as
classification: using social and content-based information in recom-
mendation. In Proceedings of the 1998 Workshop on Recommender
Systems. Menlo Park, CA: AAAI Press (pp. 11–15).
Beiman, L., Friedman, J., Olshen, R., & Stone, C. (1984). Classification and
regression trees. California: Wadsworth International Group.
Berry, J. A., & Linoff, G. (1997). Data mining techniques: For marketing,
sales, and customer support. New York: Wiley.
Berry, J. A., & Linoff, G. (2000). Mastering data mining: The art and
science of customer relationship management. New York: Wiley.
Berson, A., Smith, K., & Thearing, K. (2000). Building data mining
applications for CRM. New York: McGraw-Hill.
Changchien, S. W., & Lu, T. (2001). Mining association rules procedure to
support on-line recommendation by customers and products fragmenta-
tion. Expert Systems with Applications, 20, 325–335.
Claypool, M., Gokhale, A., Miranda, T., Murnikov, P., Netes, D., & Sartin,
M. (1999). Combining content-based and collaborative filters in an
online newspaper. ACM SIGIR ’99 Workshop on Recommender
Systems, Berkely, CA, August, 1999.
Cooley, R., Mobasher, B., & Srivastava, J. (1999). Data preparation for
mining world wide web browsing patterns. Journal of Knowledge and
Information Systems, 1.
Han, J., & Fu, Y. (1995). Discovery of multiple-level association rules from
large databases. Proceedings of the International Conference on very
large Data Bases.
Han, J., & Kamber, M. (2001). Data mining: concepts and techniques. Los
Altos, CA: Morgan Kaufmann.
Hill, W., Stead, L., Rosenstein, M., & Furnas, G. (1995). Recommending
and evaluating choices in a virtual community of use. Proceedings of
the 1995 ACM Conference on Human Factors in Computing Systems
(pp. 194–201).
Kass, G. V. (1980). An exploratory technique for investigating large
quantities of categorical data. Applied Statistics, 29, 119–127.
Kim, E., Kim, W., & Lee, Y. (2000). Purchase propensity prediction of EC
customer by combining multiple classifier based on GA. International
Conference on Electronic Commerce 2000 (pp. 274–280).
Kim, J., Lee, B., Shaw, M., Chang, H., & Nelson, M. (2001). Application of
decision-tree induction techniques to personalized advertisements on
internet storefronts. International Journal of Electronic Commerce,
5(3), 45–62.
Lawrence, R. D., Almasi, G. S., Kotlyar, V., Viveros, M. S., & Duri, S. S.
Y.H. Cho et al. / Expert Systems with Applications 23 (2002) 329–342 341

(2001). Personalization of supermarket product recommendations. Data
Mining and Knowledge Discovery, 5(1–2), 11–32.
Lee, J., Podlaseck, M., Schonberg, E., & Hoch, R. (2001). Visualization and
analysis of clickstream data of online stores for understanding web
merchandising. Data Mining and Knowledge Discovery, 5(1–2),
59–84.
Loh, W. Y., & Shih, Y. S. (1997). Split selection methods for classification
trees. Statistica Sinica, 7(8), 815–840.
Menasce, D. A., Almeida, V. A., Fonseca, R., & Mendes, M. A. (1999). A
methodology for workload characterization of e-commerce sites.
Proceedings of ACM E-Commerce 1999 (pp. 119–128).
Mobasher, B., Cooley, R., & Srivastava, J. (2000a). Automatic personaliza-
tion based on web usage mining. Communications of the ACM, 43(8),
142–151.
Mobasher, B., Dai, H., Luo, T., Sun, Y., & Zhu, J. (2000b). Integrating web
usage and content mining for more effective personalization. Proceed-
ings of the EC-Web 2000 (pp. 165–176).
Mulvenna, M. D., Anand, S. S., & Buchner, A. G. (2000). Personalization
on the net using web mining. Communications of the ACM, 43(8),
123–125.
Quinlan, J. R. (1993). C4.5: Programs for machine learning. Los Altos,
CA: Morgan Kaufmann.
Resnick, P., Iacovou, N., Suchak, M., Bergstrom, P., & Riedl, J. (1994).
Grouplens: An open architecture for collaborative filtering of netnews.
Proceedings of the ACM 1994 Conference on Computer Supported
Cooperative (pp. 175–186).
Sarwar, B., Karypis, G., Konstan, J., & Riedl, J. (2000). Analysis of
recommendation algorithms for e-commerce. Proceedings of ACM E-
Commerce 2000 Conference (pp. 158–167).
Sarwar, B., Karypis, G., Konstan, J., & Riedl, J. (2001). Item-based
collaborative filtering recommendation algorithm. Proceedings of the
Tenth International World Wide Web Conference (pp. 285–295).
Schafer, J. B., Konstan, J. A., & Riedl, J. (2001). E-commerce
recommendation applications. Data Mining and Knowledge Discovery,
5(1–2), 115–153.
Shardanand, U., & Maes, P. (1995). Social information filtering: algorithms
for automating word of mouth. Proceedings of Conference on Human
Factors in Computing Systems (CHI ’1995) (pp. 210–217).
Srikant, R., & Agrawal, R. (1995). Mining generalized association rules.
Proceedings of the International Conference on very large Data Bases.
Srivastava, J., Cooley, R., Deshpande, M., & Tan, P. (2000). Web usage
mining: Discovery and applications of usage patterns from web data.
SIGKDD Explorations, 1(2), 1–12.
VanderMeer, D., Dutta, K., & Datta, A. (2000). Enabling scalable online
personalization on the web. Proceedings of ACM E-Commerce 2000
Conference (pp. 185–196).
Yuan, S., & Chang, W. (2001). Mixed-initiative synthesized learning
approach for web-based CRM. Expert Systems with Applications, 20,
187–200.
Y.H. Cho et al. / Expert Systems with Applications 23 (2002) 329–342342