Smart Data enabling Personalized Digital Health
101
1 Smart Data enabling Personalized Digital Health: Deriving Value via harnessing Volume, Variety and Velocity Amit P. Sheth , Kno.e.sis , Wright State University
Transcript of Smart Data enabling Personalized Digital Health

1
Smart Data enabling Personalized Digital Health: Deriving Value via harnessing Volume, Variety and Velocity
Amit P. Sheth, Kno.e.sis, Wright State University

2
A Historical Perspective on Collecting Health Observations
Diseases treated onlyby external observations
First peek beyond justexternal observations
Information overload!
Doctors relied only on external
observations
Stethoscope was the first
instrument to go beyond just external
observations
Though the stethoscope has survived, it is only one among
many observations in modern medicine
http://en.wikipedia.org/wiki/Timeline_of_medicine_and_medical_technology
2600 BC ~1815 Today
Imhotep
Laennec’s stethoscope
Image Credit: British Museum

The Patient of the FutureMIT Technology Review, 2012
http://www.technologyreview.com/featuredstory/426968/the-patient-of-the-future/
3

Big Data in Medicine: Implications
“We should not make the mistake of seeing data as a technical issue. It’s a synthesis problem. That’s because information is not
the scarce resource. Attention is.”-- Conrad Wai, The data addiction | The Ideas Economy
4http://www.davidscaduto.com/post/9048831674/we-should-not-make-the-mistake-of-seeing-data-as

5
Sources of Big Data in Digital Health
Velocity Volume
Variety
Veracity
Image: http://www.dr4ward.com/dr4ward/2013/04/what-is-the-power-of-the-big-data-in-healthcare-infographic.html

6
Future Interoperability Challenges: 360 degree health

7
Big Data in Digital Health: Can alerts work?
"According to multiple recent studies, doctors ignore between 49–96% of all CDS alerts that
EMRs give them.”1
"Clinical Decision Support systems link health observations with health knowledge to influence health choices by clinicians for improved health
care".-- Robert Hayward, Centre for Health Evidence
1http://www.fastcodesign.com/1664763/badly-designed-electronic-medical-records-can-kill-you

8
Information Overload leading to Alert Fatigue
Ignoring alerts is not limited to Emergency Rooms but has also crept into EMR alerts commonly referred to as “alert fatigue”
http://health.embs.org/editorial-blog/noise-in-hospital-intensive-care-units-icus/

• What if your data volume gets so large and varied you don't know how to deal with it?
• Do you store all your data?• Do you analyze it all?• How can you find out which data points are really important?
• How can you use it to your best advantage?
9
Questions typically asked on Big Data
http://www.sas.com/big-data/

http://techcrunch.com/2012/10/27/big-data-right-now-five-trendy-open-source-technologies/
Variety of Data Analytics Enablers
10

• Current focus mainly to serve business intelligence and targeted analytics needs, not to serve complex individual and collective human needs (e.g., empower human in health, fitness and well-being; better disaster coordination, smart energy consumption) that is highly personalized/individualized/contextualized– Incorporate real-world complexity: multi-modal and multi-sensory nature
of real-world and human perception– Need deeper understanding of data and its role to information (e.g.,
skew, coverage) – Beyond correlation -> causation :: actionable info, decisions grounded
on insights
• Human involvement and guidance: Leading to actionable information, understanding and insight right in the context of human activities– Bottom-up & Top-down processing: Infusion of models and background
knowledge (data + knowledge + reasoning)
12
What is missing?

Contex
tual
InformationSmart Data
Makes SenseActionable or help decision
support/making
13

Smart Data
Smart data makes sense out of Big data
It provides value from harnessing the challenges posed by volume, velocity,
variety and veracity of big data, in-turn providing actionable information and
improve decision making.
15

“OF human, BY human and FOR human”
Smart data is focused on the actionable value achieved by human involvement in
data creation, processing and consumption phases for improving
the human experience.
Another perspective on Smart Data
16

• Focus on verticals: advertising‚ social media‚ retail‚ financial services‚ telecom‚ and healthcare– Aggregate data, focused on transactions, limited integration (limited complexity), analytics to find (simple) patterns
– Emphasis on technologies to handle volume/scale, and to lesser extent velocity: Hadoop, NoSQL,MPP warehouse ….
– Full faith in the power of data (no hypothesis), bottom up analysis
17
Current Focus on Big Data

“OF human, BY human and FOR human”
Another perspective on Smart Data
18

Petabytes of Physical(sensory)-Cyber-Social Data everyday! More on PCS Computing: http://wiki.knoesis.org/index.php/PCS 19
‘OF human’ : Relevant Real-time Data Streams for Human Experience

“OF human, BY human and FOR human”
20
Another perspective on Smart Data

Use of Prior Human-created Knowledge Models
21
‘BY human’: Involving Crowd Intelligence in data processing workflows
Crowdsourcing and Domain-expert guided Machine Learning Modeling

“OF human, BY human and FOR human”
Another perspective on Smart Data
22

Weather Application
23
‘FOR human’ : Improving Human Experience
Detection of events, such as wheezing sound, indoor temperature, humidity, dust, and CO2 level
Weather Application
Asthma Healthcare Application
Action in the Physical World
Close the window at home during day to avoid CO2 inflow, to avoid asthma
attacks at night
Public Health
Personal
Population Level

24
Why do we care about Smart Data rather than Big Data?
Smart Data enabling Personalized Digital Health: Deriving Value via harnessing Volume, Variety and Velocity
using semantics and Semantic Web
Put Knoesis Banner
Pramod Anantharam
Amit P. Sheth
Cory Henson
Dr. T.K. Prasad
Contributions by many, but Special Thanks to:
Ohio Center of Excellence in Knowledge-enabled Computing (Kno.e.sis)
Wright State University, USA
Sujan Perera
Delroy Cameron

26
April 6, 2011
http://www.nbcnews.com/id/44599555/#.UmMHMWRDszQ
Mr. Michael Yocabet suffering from type 1 diabetes is recommended a kidney transplant at the University of Pittsburgh Medical Center. The organ donor is his life partner Ms. Christina
Mecannic

27
May 6, 2011
http://www.nbcnews.com/id/44599555/#.UmMHMWRDszQ
The couple leaned about the botched kidney transplant making the situation of Mr. Yocabet much worse! The kidney he got from his wife has infected him with Hepatitis C aggravating his
health issues.

28
Life Threatening Implications!
http://www.scientificamerican.com/article.cfm?id=2003-blackout-five-years-later
Mr. Yocabet was a disabled former truck driver and he has diabetes type 1. Treatment for the liver may harm
his kidney even cause organ failure and death!
“Because he’s on anti-rejection drugs, the hepatitis C will be a lot worse in him,” -- Ms. Christina Mecannic

29
Cause of the Problem: Official Investigation
http://www.post-gazette.com/stories/local/breaking/upmc-sued-over-botched-kidney-transplant-315580/ http://www.nbcnews.com/id/44599555/#.UmMHMWRDszQ
• Jan 26: Ms. Mecannic gets her blood work positive for Hepatitis C virus.
• March 29: Second attempt to test for Hepatitis C virus in Ms. Mecannic.
• Several meetings of the transplant team -- they fail to notice the problem. (alert fatigue?)
• April 6: Transplant day!• May 6: Couple learned about botched transplant.

30
"Between 2007 and 2010, the CDC conducted 200 investigations into potential transmission of HIV and hepatitis B and C due to organ
transplants.”
Can we Prevent such life threatening incidents?
http://www.nbcnews.com/id/44599555/#.UmMHMWRDszQ
Over 28,000 organs of all types are transplanted every year in United States alone

31
How could Smart Data help?
Value: Healthcare Provider Context

32
Clinical Decision Making is Complex!
“Health professionals are required to make decisions with multiple foci (e.g. diagnosis, intervention,
interaction and evaluation), in dynamic contexts, using a diverse knowledge base (including an increasing body of evidence-based literature), with multiple variables
and individuals involved.”http://researchoutput.csu.edu.au/R/?func=dbin-jump-full&object_id=9063&local_base=GEN01-CSU01

33
Stakes are high for both doctors and patients!
http://researchoutput.csu.edu.au/R/?func=dbin-jump-full&object_id=9063&local_base=GEN01-CSU01

34
Multimodal, Multisensory, and Multi-organizational Observations
Population health record
Personal health record
Expert opinion
Clinical research
What is the overall health of the person?What are the vulnerabilities for organ
transplant?
Clinical decision support
http://www.rugeleypower.com/electricity-generation/producing-electricity.php

35
Patient Health Score (diagnostic)Semantic Perception and risk assessment algorithms can transform raw data (hard to comprehend) to abstractions (e.g., Patient Health is 3 on a
scale of 5) that is intuitively understandable and valuable for decision makers.
Having health score for various patients will allow efficient utilization of
a decision maker’s precious attention
Risk assessment model
Semantic Perception
Population health record
Personal health record
Expert opinion
Clinical research
Clinical decision support

36
Patient Vulnerability Score (prognostic)The Clinical Decision Support systems such as EMR alert system
in its current state follows the high recall philosophy by reporting every possible alert!
Doctors need actionable information and not a deluge of alerts to make timely and important decisions. Providing a vulnerability score
would facilitate right use of Doctor’s time to investigate further on vulnerabilities.
Risk assessment
modelSemantic
Perception
Population health record
Personal health record
Expert opinion
Clinical research
Clinical decision support

37
Value: Patient Context
How could Smart Data help?

38
3.4 billion people will have smartphones or tablets by 2017
-- Research2Guidance
“Intelligence at the Edges” of Digital Health
http://www.digikey.com/us/en/techzone/energy-harvesting/resources/articles/zigbees-smart-energy-20-profile.html
m-health app market is predicted to reach $26 billion in 2017 -- Research2Guidance

39
Data Overload for Patients/health aficionados
Providing actionable information in a timely manner is crucial to avoid information overload
or fatigue
Sleep dataCommunity dataPersonal
Schedule Activity dataPersonal health
records

40
Optimizing Cost, Benefit, and Preferences
Algorithms on the patient side should consider all the health signals and provide actionable and timely information for informed
decision makingWhat are the reasons for my increasing weight?
What should I consider before I get a kidney transplant?
Semantic Perception
Personalized optimization
Personalized recommendatio
n
Img: http://marloncarvallovillae.blogspot.com/2011_02_01_archive.html http://www.1800timeclocks.com/icon-time-systems/icon-time-upgrades/icon-time-advanced-pack-upgrade-sb100-pro/
Sleep data
Community data
Personal Schedule
Activity data
Personal health records

41
Annotation of sensor data
SemanticSensorWeb
SemanticPerceptio
n
Intelligence
at the Edge
Interpretation of sensor data
Efficient execution onresource-constrained devices
1 2 3
3 Primary Issues to be addressed

42
RDF OWL
How are machines supposed to integrate and interpret sensor data?
Semantic Sensor Networks (SSN)

43
W3C Semantic Sensor Network Ontology
Lefort, L., Henson, C., Taylor, K., Barnaghi, P., Compton, M., Corcho, O., Garcia-Castro, R., Graybeal, J., Herzog, A., Janowicz, K., Neuhaus, H., Nikolov, A., and Page, K.: Semantic Sensor Network XG Final Report, W3C Incubator Group Report (2011).

44
W3C Semantic Sensor Network Ontology
Lefort, L., Henson, C., Taylor, K., Barnaghi, P., Compton, M., Corcho, O., Garcia-Castro, R., Graybeal, J., Herzog, A., Janowicz, K., Neuhaus, H., Nikolov, A., and Page, K.: Semantic Sensor Network XG Final Report, W3C Incubator Group Report (2011).

45
W3C Semantic Sensor Network Ontology
Lefort, L., Henson, C., Taylor, K., Barnaghi, P., Compton, M., Corcho, O., Garcia-Castro, R., Graybeal, J., Herzog, A., Janowicz, K., Neuhaus, H., Nikolov, A., and Page, K.: Semantic Sensor Network XG Final Report, W3C Incubator Group Report (2011).

46
Semantic Annotation of SWE
Lefort, L., Henson, C., Taylor, K., Barnaghi, P., Compton, M., Corcho, O., Garcia-Castro, R., Graybeal, J., Herzog, A., Janowicz, K., Neuhaus, H., Nikolov, A., and Page, K.: Semantic Sensor Network XG Final Report, W3C Incubator Group Report (2011).

To gain new insight
in patient care &
early indications of
disease
47
Smart Data in Healthcare

… and do it efficiently and at scale
What if we could automate this sense making ability?
49

50
Making sense of sensor data with

People are good at making sense of sensory input
What can we learn from cognitive models of perception?• The key ingredient is prior knowledge
51

* based on Neisser’s cognitive model of perception
ObserveProperty
PerceiveFeature
Explanation
Discrimination
1
2
Perception Cycle*
Translating low-level signals into high-level knowledge
Focusing attention on those aspects of the environment that provide useful information
Prior Knowledge
52
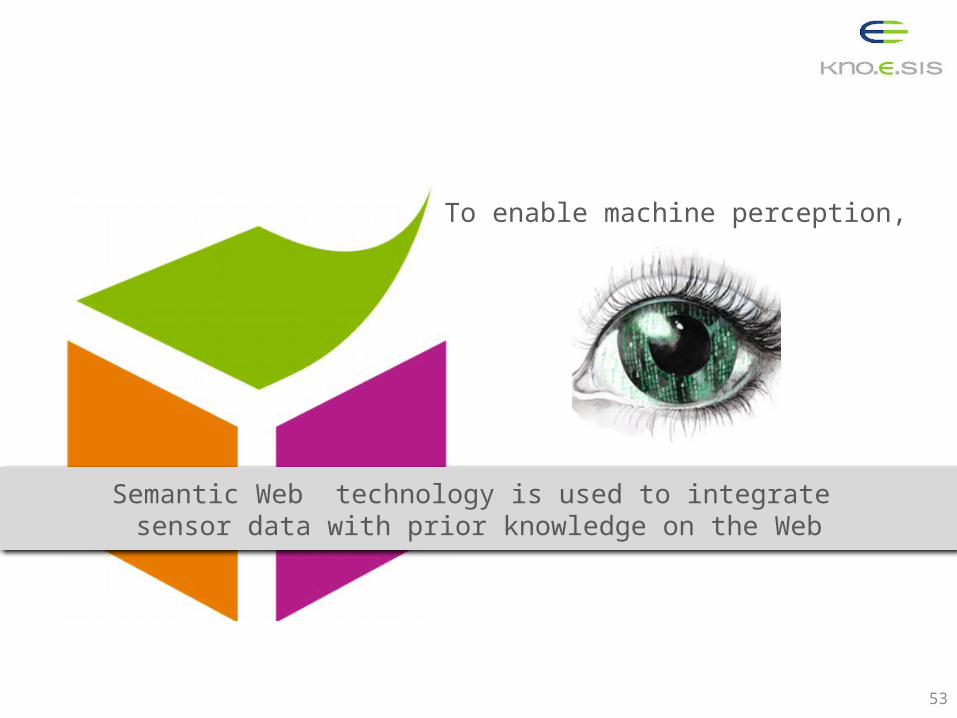
To enable machine perception,
Semantic Web technology is used to integrate sensor data with prior knowledge on the Web
53

Prior knowledge on the Web
W3C Semantic Sensor Network (SSN)
OntologyBi-partite Graph
54

Prior knowledge on the Web
W3C Semantic Sensor Network (SSN)
OntologyBi-partite Graph
55

ObserveProperty
PerceiveFeature
Explanation1
Translating low-level signals into high-level knowledge
Explanation
Explanation is the act of choosing the objects or events that best account for a set of observations; often referred to as hypothesis building
56

Explanation
Inference to the best explanation• In general, explanation is an
abductive problem; and hard to compute
Finding the sweet spot between abduction and OWL• Simulation of Parsimonious Covering
Theory in OWL-DL (using the single-feature assumption*)
* An explanation must be a single feature which accounts forall observed properties
Explanation is the act of choosing the objects or events that best account for a set of observations; often referred to as hypothesis building
57

Explanation
Explanatory Feature: a feature that explains the set of observed propertiesExplanatoryFeature ≡ ∃ssn:isPropertyOf—.{p1} ⊓ … ⊓ ∃ssn:isPropertyOf—.{pn}
elevated blood pressure
clammy skin
palpitations
Hypertension
Hyperthyroidism
Pulmonary Edema
Observed Property Explanatory Feature
58

Discrimination is the act of finding those properties that, if observed, would help distinguish between multiple explanatory features
ObserveProperty
PerceiveFeature
Explanation
Discrimination2
Focusing attention on those aspects of the environment that provide useful information
Discrimination
59

Discrimination
60
Universe of observable properties
To determine which possible observations are most informative, find those observable properties that can discriminate between the set of hypotheses.
ExpectedProperties
Not-applicableProperties
Discriminating
Properties

Discrimination
Expected Property: would be explained by every explanatory featureExpectedProperty ≡ ∃ssn:isPropertyOf.{f1} ⊓ … ⊓ ∃ssn:isPropertyOf.{fn}
elevated blood pressure
clammy skin
palpitations
Hypertension
Hyperthyroidism
Pulmonary Edema
Expected Property Explanatory Feature
61

Discrimination
Not Applicable Property: would not be explained by any explanatory featureNotApplicableProperty ≡ ¬∃ssn:isPropertyOf.{f1} ⊓ … ⊓ ¬∃ssn:isPropertyOf.{fn}
elevated blood pressure
clammy skin
palpitations
Hypertension
Hyperthyroidism
Pulmonary Edema
Not Applicable Property
Explanatory Feature
62

Discrimination
Discriminating Property: is neither expected nor not-applicableDiscriminatingProperty ≡ ¬ExpectedProperty ⊓ ¬NotApplicableProperty
elevated blood pressure
clammy skin
palpitations
Hypertension
Hyperthyroidism
Pulmonary Edema
Discriminating Property
Explanatory Feature
63

Resource savings of abstracting sensor data
64
Orders of magnitude resource savings for generating and storing relevant abstractions vs. raw observations.
Relevant abstractions
Raw observations

The Decisions are as Good as the Underlying Coded Knowledge
65
• How do we know whether we have all possible relationships?
• How do we know which relationships are missing?
• How can we efficiently fill the missing relationships?

66
Sujan Perera, Cory Henson, Krishnaprasad Thirunarayan, Amit Sheth, Suhas Nair, 'Semantics Driven Approach for Knowledge Acquisition from EMRs', Special Issue on Data Mining in Bioinformatics, Biomedicine and Healthcare Informatics, Journal of Biomedical and Health Informatics (To Appear)
Knowledge is built by abstracting real world facts, once built it should be
able to explain the real world
Semantics Driven Approach for Knowledge Acquisition from EMRs

Explanation Module
Explained?
Yes
NoHypothesis Filtering
Hypothesis Generation
Hypothesis with High Confidence
D
D D
DD
D
Patient Notes
Semantics Driven Approach for Knowledge Acquisition from EMRs
UMLS

68
1.Annotate the EMR documents with given knowledgebase
2.Find unexplained symptoms3.Generate hypothesis for unexplained symptoms1.All disorders in document becomes candidates
4.Filter out candidate disorder with high confidence1.Get disorders which has relationship with unexplained symptom in given knowledgebase
2.Collect the “neighborhood” of the disorders
3.Get the intersection of “neighborhood” and candidate disorders
The Algorithm

D1
D5
D2
D3
D4
S1
D8
D12
D6
D9 D10
D2D7
D11
D13
D5Candidate DiseaseIs symptom of
rdfs:subClassOf
Candidate Filtering Step
Intuition: “similar disorders manifest similar symptoms”

70
Evaluation
Precision = number of suggested correct relationships
Total number of suggested
= 73.09%
Recall = correct relationships found all correct relationships – known
correct relationships
= 66.67%
If we do not perform the semantic filtering step, the precision would be 30%. High precision is important since it is hard to find domain experts to validate the generated hypothesis.

Through physical monitoring and analysis, our cellphones could act as an early warning system to detect serious health conditions, and provide actionable information canary in a coal mine
kHealth
knowledge-enabled healthcare
71

72
kHealth to Manage ADHF (Acute Decompensated Heart Failure)
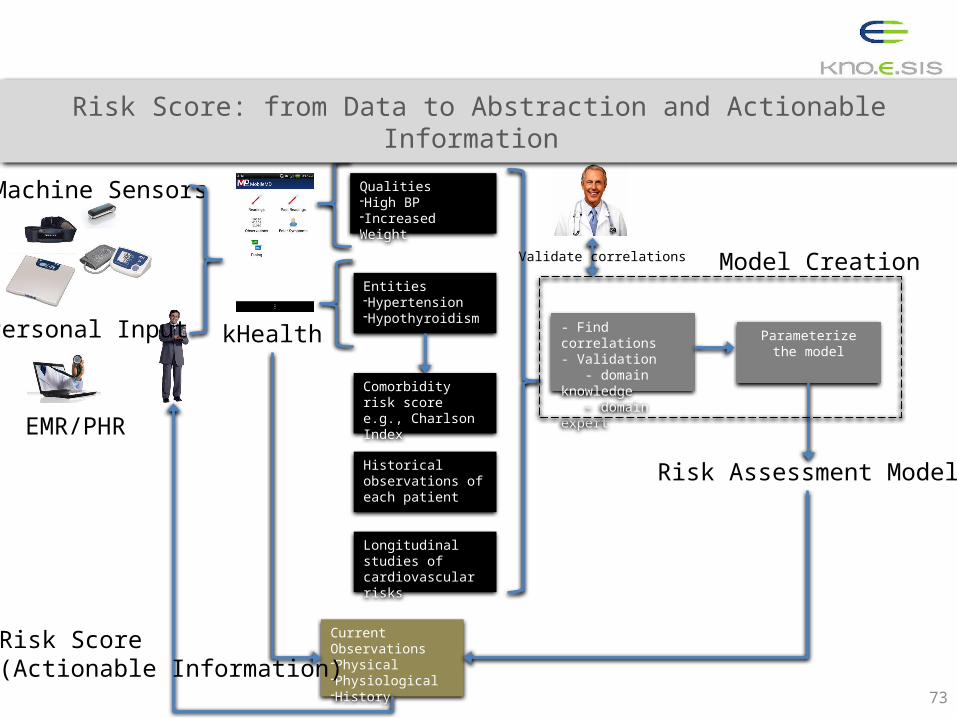
Qualities-High BP-Increased Weight
Entities-Hypertension-Hypothyroidism
kHealth
Machine Sensors
Personal Input
EMR/PHRComorbidity risk score e.g., Charlson Index
Longitudinal studies of cardiovascular risks
- Find correlations- Validation - domain knowledge - domain expert
Parameterize the model
Risk Assessment Model
Current Observations-Physical-Physiological-History
Risk Score(Actionable Information)
Model CreationValidate correlations
Historical observations of each patient
Risk Score: from Data to Abstraction and Actionable Information
73

77
1http://www.nhlbi.nih.gov/health/health-topics/topics/asthma/2http://www.lung.org/lung-disease/asthma/resources/facts-and-figures/asthma-in-adults.html 3Akinbami et al. (2009). Status of childhood asthma in the United States, 1980–2007. Pediatrics,123(Supplement 3), S131-S145.
25 millio
n
300 millio
n
$50 billio
n
155,000
593,000
People in the U.S. are diagnosed with asthma (7 million are children)1.People suffering from asthma worldwide2.
Spent on asthma alone in a year2
Hospital admissions in 20063
Emergency department visits in 20063
Asthma

Asthma is a multifactorial disease with health signals spanning personal, public health, and population levels.
78
Real-time health signals from personal level (e.g., Wheezometer, NO in breath, accelerometer, microphone), public health (e.g., CDC, Hospital EMR), and population level (e.g., pollen level, CO2) arriving continuously in fine grained samples potentially with missing information and uneven sampling frequencies.
Variety Volume
VeracityVelocity
Value
Can we detect the asthma severity level?Can we characterize asthma control level?What risk factors influence asthma control?What is the contribution of each risk factor?
semantics
Understanding relationships betweenhealth signals and asthma attacksfor providing actionable information
WHY Big Data to Smart Data: Healthcare example

79
Population Level
Personal
Public Health
Variety: Health signals span heterogeneous sourcesVolume: Health signals are fine grainedVelocity: Real-time change in situationsVeracity: Reliability of health signals may be compromised
Value: Can I reduce my asthma attacks at night?
Decision support to doctorsby providing them with
deeper insights into patientasthma care
Asthma: Demonstration of Value

80
Sensordrone – for monitoring environmental air quality
Wheezometer – for monitoringwheezing sounds
Can I reduce my asthma attacks at night?
What are the triggers?
What is the wheezing level?What is the propensity toward asthma?
What is the exposure level over a day?
What is the air quality indoors?
Commute to Work
Personal
Public Health
Population Level
Closing the window at homein the morning and taking analternate route to office may
lead to reduced asthma attacks
Actionable
Information
Asthma: Actionable Information for Asthma Patients

Personal, Public Health, and Population Level Signals for Monitoring Asthma
ICS= inhaled corticosteroid, LABA = inhaled long-acting beta2-agonist, SABA= inhaled short-acting beta2-agonist ; *consider referral to specialist
Asthma Control and Actionable Information
Sensors and their observations for understanding asthma
81

82
Personal Level
Signals
Societal Level
Signals
(Personal Level Signals)
(Personalized Societal Level Signal)
(Societal Level Signals)
Societal Level Signals
Relevant to the Personal
Level
Personal Level Sensors (kHealth**) (EventShop*)
Qualify QuantifyAction
Recommendation
What are the features influencing my asthma?What is the contribution of each of these features?
How controlled is my asthma? (risk score)What will be my action plan to manage asthma?
Storage
Societal Level Sensors
Asthma Early Warning Model (AEWM)
Query AEWM
Verify & augmentdomain knowledge
Recommended Action
Action Justification
Asthma Early Warning Model
*http://www.slideshare.net/jain49/eventshop-120721, ** http://www.youtube.com/watch?v=btnRi64hJp4

83
Population Level
Personal
Wheeze – YesDo you have tightness of chest? –Yes
Observations Physical-Cyber-Social System Health Signal ExtractionHealth Signal Understanding
<Wheezing=Yes, time, location><ChectTightness=Yes, time, location><PollenLevel=Medium, time, location>
<Pollution=Yes, time, location><Activity=High, time, location>
Wheezing
ChectTightness
PollenLevel
Pollution
Activity
Wheezing
ChectTightness
PollenLevel
Pollution
Activity
RiskCategory
<PollenLevel, ChectTightness, Pollution,Activity, Wheezing, RiskCategory><2, 1, 1,3, 1, RiskCategory><2, 1, 1,3, 1, RiskCategory><2, 1, 1,3, 1, RiskCategory><2, 1, 1,3, 1, RiskCategory>
.
.
.
Expert Knowledge
Background Knowledge
tweet reporting pollution level and asthma attacks
Acceleration readings fromon-phone sensors
Sensor and personal observations
Signals from personal, personal spaces, and community spaces
Risk Category assigned by doctors
Qualify
Quantify
Enrich
Outdoor pollen and pollution
Public Health
Health Signal Extraction to Understanding
Well Controlled - continueNot Well Controlled – contact nursePoor Controlled – contact doctor

Personal Health Score and Vulnerability Score
84
At Discharge
Health Score
Non-compliance
Poor economic status
No living assistance
Vulnerability Score
Well Controlled
Low
Well Controlled
Very low
Not Well Controlled
High
Not Well Controlled
Medium
Poor Controlled
Very High
Poor Controlled
High
Estimation of readmission vulnerability based on the personal health score

85
Health Signal Extraction Challenges
Social streams has been used to extract many near real-time events
Twitter provides access to rich signals but is noisy, informal, uncontrolled capitalization,
redundant, and lacks context
We formalize the event extraction from tweets as a sequence labeling problem
How do we know the event phrases and who creates the training set? (manual creation is
ruled out)
Now you know why you’re miserable! Very High Alert for B-ALLERGEN Ragweed I-ALLERGEN pollen. B-FACILITY Oklahoma I-FACILITY Allergy I-FACILITY Clinic says it’s an extreme exposure situation
Idea: Background knowledge used to create the training set e.g., typing information becomes the label
for a concept

86
Health Signal Understanding ChallengesFormalized as a problem of
structure extraction of a Bayesian Network
Find the structure that maximize the scoring function Where k indexes over all
possible graph structures
Ehsan Nazerfard, Bayesian Networks: Structure Learning, Topics in Machine Learning, 2011.
Where n is the number of nodesin the network
Huge exponential search space with n
Different structures may result in the same structure score (I-Map)
We use declarative knowledge to choose between Gi and Gj ,
and to guide the search
Where Xi represents eachobservation

How do we implement machine perception efficiently on aresource-constrained device?
Use of OWL reasoner is resource intensive (especially on resource-constrained devices), in terms of both memory and time
• Runs out of resources with prior knowledge >> 15 nodes
• Asymptotic complexity: O(n3)
87

intelligence at the edge
Approach 1: Send all sensor observations to the cloud for processing
Approach 2: downscale semantic processing so that each device is capable of machine perception
88Henson et al. 'An Efficient Bit Vector Approach to Semantics-based Machine Perception in Resource-Constrained Devices, ISWC 2012.

Efficient execution of machine perception
Use bit vector encodings and their operations to encode prior knowledge and execute semantic reasoning
0101100011010011110010101100011011011010110001101001111001010110001101011000110100111
89

O(n3) < x < O(n4) O(n)
Efficiency Improvement
• Problem size increased from 10’s to 1000’s of nodes• Time reduced from minutes to milliseconds• Complexity growth reduced from polynomial to linear
Evaluation on a mobile device
90

2 Prior knowledge is the key to perceptionUsing SW technologies, machine perception can be formalized and integrated with prior knowledge on the Web
3 Intelligence at the edgeBy downscaling semantic inference, machine
perception can execute efficiently on resource-constrained devices
Semantic Perception for smarter analytics: 3 ideas to takeaway
1 Translate low-level data to high-level knowledgeMachine perception can be used to convert low-level sensory signals into high-level knowledge useful for decision making
91

92
D. Cameron, G. A. Smith, R. Daniulaityte, A. P. Sheth, D. Dave, L. Chen, G. Anand, R. Carlson, K. Z. Watkins, R. Falck. PREDOSE: A Semantic Web Platform for Drug Abuse Epidemiology using Social Media. Journal of Biomedical Informatics. July 2013 (in press)
Kno.e.sis - Ohio Center of Excellence in Knowledge-enabled Computing
CITAR - Center for Interventions Treatment and Addictions Research
http://wiki.knoesis.org/index.php/PREDOSE
PREDOSE: Prescription Drug abuse Online-Surveillance and Epidemiology
Bridging the gap between researcher and policy makers
Early identification of emerging patterns and
trends in abuse

In 2008, there were 14,800 prescription painkiller deaths*
*http://www.cdc.gov/homeandrecreationalsafety/rxbrief/
PREDOSE: Prescription Drug abuse Online-Surveillance and Epidemiology
• Drug Overdose Problem in US• 100 people die everyday from drug overdoses• 36,000 drug overdose deaths in 2008• Close to half were due to prescription drugs Gil Kerlikowske
Director, ONDCP
Launched May 2011

PREDOSE: Bringing Epidemiologists and Computer Scientists together
Early Identification and Detection of
Trends
Access hard-to-reach Populations
Large Data Sample Sizes
Group Therapy: http://www.thefix.com/content/treatment-options-prison90683
Interviews
Online Surveys
Automatic Data Collection
Not Scalable
Manual Effort
Sample Biases
Epidemiologist
Qualitative Coding
Problems
Computer Scientist
Automate Information Extraction & Content
Analysis


I was sent home with 5 x 2 mg Suboxones. I also got a bunch of phenobarbital (I took all 180 mg and it didn't do shit except make me a walking zombie for 2 days). I waited 24 hours after my last 2 mg dose of Suboxone and tried injecting 4 mg of the bupe. It gave me a bad headache, for hours, and I almost vomited. I could feel the bupe working but overall the experience sucked.
Of course, junkie that I am, I decided to repeat the experiment. Today, after waiting 48 hours after my last bunk 4 mg injection, I injected 2 mg. There wasn't really any rush to speak of, but after 5 minutes I started to feel pretty damn good. So I injected another 1 mg. That was about half an hour ago. I feel great now.
Codes Triples (subject-predicate-object)
Suboxone used by injection, negative experience
Suboxone injection-causes-Cephalalgia
Suboxone used by injection, amount Suboxone injection-dosage amount-2mg
Suboxone used by injection, positive experience
Suboxone injection-has_side_effect-Euphoria
experience sucked
feel pretty damn good
didn’t do shit
feel great
Sentiment Extraction
bad headache
+ve
-ve
TriplesDOSAGE PRONOUNINTERVAL Route of
Admin.RELATIONSHIPS SENTIMENTS
DIVERSE DATA TYPESENTITIES
I was sent home with 5 x 2 mg Suboxones. I also got a bunch of phenobarbital (I took all 180 mg and it didn't do shit except make me a walking zombie for 2 days). I waited 24 hours after my last 2 mg dose of Suboxone and tried injecting 4 mg of the bupe. It gave me a bad headache, for hours, and I almost vomited. I could feel the bupe working but overall the experience sucked.
Of course, junkie that I am, I decided to repeat the experiment. Today, after waiting 48 hours after my last bunk 4 mg injection, I injected 2 mg. There wasn't really any rush to speak of, but after 5 minutes I started to feel pretty damn good. So I injected another 1 mg. That was about half an hour ago. I feel great now.
Buprenorphine
subClassOf
bupe
Entity Identification
has_slang_term
SuboxoneSubutexsubClassO
f
bupeyhas_slang_te
rm
Drug Abuse Ontology (DAO) 83 Classes
37 Properties
33:1 Buprenorphine24:1 Loperamide
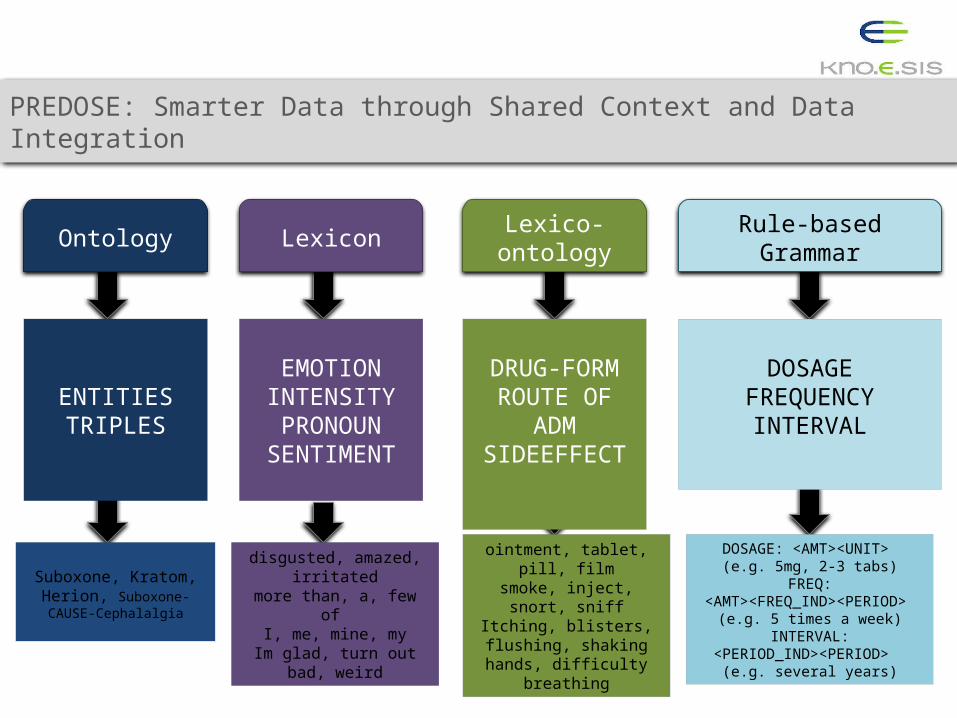
Ontology Lexicon Lexico-ontology
Rule-based Grammar
ENTITIESTRIPLES
EMOTIONINTENSITYPRONOUN
SENTIMENT
DRUG-FORMROUTE OF
ADMSIDEEFFECT
DOSAGEFREQUENCYINTERVAL
Suboxone, Kratom, Herion, Suboxone-CAUSE-Cephalalgia
disgusted, amazed, irritated
more than, a, few of
I, me, mine, myIm glad, turn out
bad, weird
ointment, tablet, pill, film
smoke, inject, snort, sniff
Itching, blisters, flushing, shaking hands, difficulty
breathing
DOSAGE: <AMT><UNIT> (e.g. 5mg, 2-3 tabs)
FREQ: <AMT><FREQ_IND><PERIOD> (e.g. 5 times a week)
INTERVAL: <PERIOD_IND><PERIOD> (e.g. several years)
PREDOSE: Smarter Data through Shared Context and Data Integration

Data Type
Semantic Web Technique
Limitations of Other Approaches
Entity Ontology-driven Identification & Normalization
ML/NLP IRRequires Labeled Data
Unpredictable term
frequencies
Triple Schema-driven
Difficult to develop language model
Requires entity
disambiguation
Sentiment
Ontology-assisted Target Entity Resolution
Inconsistent data for Parse Trees or rules
Diverse simple & complex
slang terms & phrases
PREDOSE: Role of Semantic Web & Ontologies

99
Loperamide-Withdrawal Discovery
Loperamide is used to self-medicate to from Opioid Withdrawal symptoms

100
Big Data from Healthcare Smart Data for Healthcare
Red, yellow, and green indicate high, medium, and low risk allowing
decision makers to focus on red & yellow variables
Big Data vs. Smart Data in Digital Health (Healthcare provider)
Population health record
Personal health record
Expert opinion
Clinical research
Clinical decision support
What is the overall health of the person?What are the vulnerabilities for organ
transplant?
Ms. Mecannic’s blood test not yet complete

101
Red, yellow, and green indicating high, medium,
and low risk factors
Recommendation algorithms will analyze
data deluge with domain knowledge
Big Data vs. Smart Data in Digital Health (Healthcare consumer)
Big Data from Healthcare Smart Data for Healthcare
What are the reasons for my increasing weight?What should I consider before I get a kidney
transplant?
Sleep data
Community data
Personal Schedule
Personal health records
Activity data
101http://www.airtel.in/forme/important-alerts
Ms. Mecannic: Your blood work is
incomplete. Please finish this before
organ donation!

• Real Time Feature Streams: http://www.youtube.com/watch?v=_ews4w_eCpg
• kHealth: http://www.youtube.com/watch?v=btnRi64hJp4
• PREDOSE: https://www.youtube.com/watch?v=gCFPzMgEPQM
102
Demos

Take Away
• Data processing for personalized healthcare is lot more than a Big Data processing problem
• It is all about the human – not computing, not device: help them make better decisions, give actionable information– Computing for human experience
• Whatever we do in Smart Data, focus on human-in-the-loop (empowering machine computing!):– Of Human, By Human, For Human– But in serving human needs, there is a lot more than what current big data analytics handle – variety, contextual, personalized, subjective, spanning data and knowledge across P-C-S dimensions
103

Acknowledgements• Kno.e.sis team• Funds: NSF, NIH, AFRL, Industry…
• Note:• For images and sources, if not on slides, please see
slide notes• Some images were taken from the Web Search results and
all such images belong to their respective owners, we are grateful to the owners for usefulness of these images in our context.
104

• OpenSource: http://knoesis.org/opensource
• Showcase: http://knoesis.org/showcase
• Vision: http://knoesis.org/node/266
• Publications: http://knoesis.org/library
105
References and Further Readings

Amit Sheth’s
PHD students
Ashutosh Jadhav
Hemant
Purohit
Vinh Nguyen
Lu ChenPavan
Kapanipathi
Pramod Anantharam
Sujan Perera
Alan Smith
Pramod Koneru
Maryam Panahiazar
Sarasi Lalithsena
Cory Henson
Kalpa Gunaratna
Delroy Cameron
Sanjaya Wijerat
ne
Wenbo Wang
Kno.e.sis in 2012 = ~100 researchers (15 faculty, ~50 PhD students)

107
thank you, and please visit us athttp://knoesis.orghttp://knoesis.org/projects/ssw/
http://wiki.knoesis.org/index.php/PCS
Kno.e.sis – Ohio Center of Excellence in Knowledge-enabled ComputingWright State University, Dayton, Ohio, USA
Smart Data