DATA COLLECTION SUEVEY ON WATER SUPPLY IN ...
198
DATA COLLECTION SUEVEY ON WATER SUPPLY IN TEGUCIGALPA IN THE REPUBLIC OF HONDURAS FINAL REPORT DECEMBER 2021 JAPAN INTERNATIONAL COOPERATION AGENCY (JICA) JAPAN TECHNO CO., LTD. NJS CO.,LTD. 5R JR 21-007
-
Upload
khangminh22 -
Category
Documents
-
view
1 -
download
0
Transcript of DATA COLLECTION SUEVEY ON WATER SUPPLY IN ...

DATA COLLECTION SUEVEY ON WATER SUPPLY IN TEGUCIGALPA
IN THE REPUBLIC OF HONDURAS
FINAL REPORT
DECEMBER 2021
JAPAN INTERNATIONAL COOPERATION AGENCY (JICA)
JAPAN TECHNO CO., LTD. NJS CO.,LTD.
5R
JR
21-007

SUMMARY

S-1
Summary
1.Background and Purpose of Survey
The city of Tegucigalpa is facing the problem of chronic water supply shortage, and there is an
urgent need to meet the water supply demands of the rapidly growing population. In addition, the high
non-revenue water rate (32.9%) in the distribution network is also leading to deterioration in
management. In accordance with the Framework Law on the Potable Water and Sanitation Sector
enacted in 2003, it was decided to implement the orderly transfer of potable water and sanitation
services from the Autonomous Water and Sewerage Service (SANAA) to the municipalities in charge
of the national water supply business (including Tegucigalpa City: AMDC), and the transfer is
scheduled to be completed by the end of 2021. From 2019 to 2025, the World Bank will support the
transfer and rehabilitation of water treatment plants, water source maintenance, DMA of water
distribution areas and leakage control.
This study aims to summarize the current status and issues of the water supply business in
Tegucigalpa City, and to improve the water supply service.
The purpose of this project is to clarify the direction of support for the improvement of water supply
services in Tegucigalpa City. In examining the direction of support, in addition to the above hardware
measures, we will also consider soft support through technical cooperation, and propose a
comprehensive support plan to improve the water supply service in Tegucigalpa.
2.Overview of Water Sector in Honduras
(1) National Policy
The government of Honduras enacted the Water and Sanitation Sector Framework Law (2003),
which established the National Water and Sanitation Council (CONASA). Then in 2014, the Honduras
National Vision and National Planning Act enacted the vision that "by 2038, all citizens will have
access to improved drinking water and sanitation services."
(2) Development Plan
The National Water and Sanitation Plan (PLANASA) was developed by CONASA in December
2014 and sets out plans, strategies, targets and required investments until 2022.
3. Current Status and Issues of Water and Wastewater Systems in Tegucigalpa City
(1) Outline
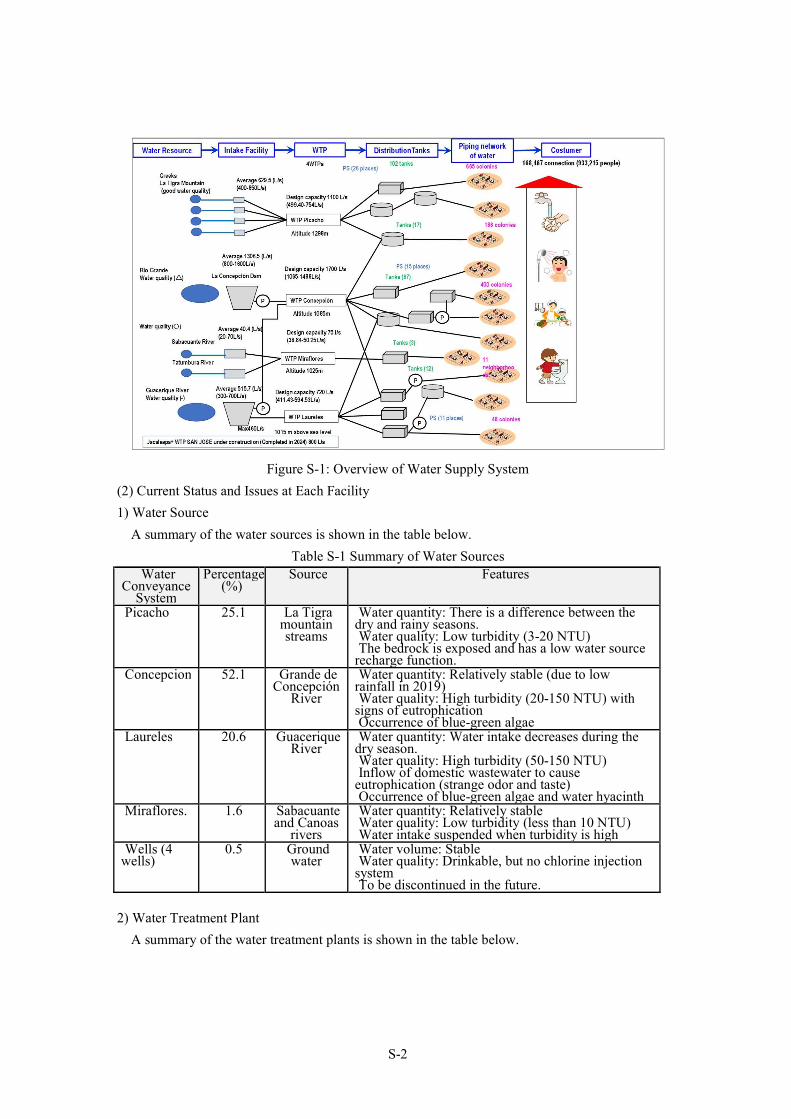
The water is taken from four sources and treated at four water treatment plants before being
supplied. The San Jose Water Treatment Plant is scheduled to be completed in 2024.
S-2
Figure S-1: Overview of Water Supply System
(2) Current Status and Issues at Each Facility
1) Water Source
A summary of the water sources is shown in the table below.
Table S-1 Summary of Water Sources Water
Conveyance System
Percentage (%)
Source Features
Picacho 25.1 La Tigra mountain streams
Water quantity: There is a difference between the dry and rainy seasons. Water quality: Low turbidity (3-20 NTU) The bedrock is exposed and has a low water source
recharge function. Concepcion 52.1 Grande de
Concepción River
Water quantity: Relatively stable (due to low rainfall in 2019) Water quality: High turbidity (20-150 NTU) with
signs of eutrophication Occurrence of blue-green algae
Laureles 20.6 Guacerique River
Water quantity: Water intake decreases during the dry season. Water quality: High turbidity (50-150 NTU) Inflow of domestic wastewater to cause
eutrophication (strange odor and taste) Occurrence of blue-green algae and water hyacinth
Miraflores. 1.6 Sabacuante and Canoas
rivers
Water quantity: Relatively stable Water quality: Low turbidity (less than 10 NTU) Water intake suspended when turbidity is high
Wells (4 wells)
0.5 Ground water
Water volume: Stable Water quality: Drinkable, but no chlorine injection
system To be discontinued in the future.
2) Water Treatment Plant
A summary of the water treatment plants is shown in the table below.

S-3
Table S-2 Summary of Water Treatment Plants Water
Treatment Plant
Flow Features
Picacho (1100L/s)
Aerator + admixture tank + floc formation tank + inclined tube sedimentation tank + gravity type rapid sand filtration tank + chlorine disinfection
Expanded in 2010 at no cost to JICA. Water quality standards for treated water:
Generally OK Aging of electrical and mechanical equipment:
needs to be renewed
Concepcion (1500L/s)
Aerator + admixture tank + high-speed coagulation sedimentation tank (inclined plate type) + gravity-type rapid sand filtration tank + chlorine disinfection
Up to 1,700 L/s can be handled operationally. Water quality standards for treated water:
Generally OK, but treatment function is limited 10 times the cost of Picacho due to high turbidity
and color Aging of electrical and mechanical equipment:
needs to be renewed
Laureles (820L/s)
Aerator + admixture tank + high-speed coagulation sedimentation tank + gravity-type rapid sand filtration tank + chlorine disinfection
Deterioration of raw water quality (powdered activated carbon, polymer) Water quality standards for treated water:
Generally OK, but treatment function is limited 10 times the cost of Picacho due to high turbidity
and color Aging of electrical and mechanical equipment:
needs to be renewed Miraflores.
(75L/s) Coagulation
sedimentation + pressure filtration system + chlorine disinfection (Unit Type)
Scheduled to stop after completion of Jacaleapa Dam + water treatment plant Water quality standards for treated water:
Generally OK, but there is an exceedance of the allowable chromaticity value during the rainy season.
Chimbo (25L/s)
Coagulation sedimentation + pressure filtration system + chlorine disinfection (Unit Type)
Current operating hours are 8 hours during the day. Water quality standards for treated water:
Generally OK Aging of electrical and mechanical equipment:
needs to be renewed
3) Water Transmission Facilities
In the water supply system, there are 26 pumping stations, and the pumps are high-head vertical-
shaft pumps. The pump is operated manually on site, and there is no flow meter, so it is not possible
to confirm the amount of water being pumped. As a result of the energy audit of the pumps, the pump
specifications do not match the required flow rate and head, and the efficiency has decreased due to
aging and low prices. In addition, the electricity consumption of the pumping station is approximately
70% of that of the waterworks system.
4) Water Distribution Facilities
The distribution tanks are made of RC, steel, and concrete block. In terms of age, 18.6% are more
than 40 years old, 47.1% are between 20 and 40 years old, and 28.4% are less than 20 years old. All
of the distribution reservoirs have flow meters that are either out of order or missing, making it
impossible to properly determine the amount of water distributed. About 5,000 leaks in distribution
pipes are repaired every year. Eighty-five percent of the leaks occur in the distribution pipe network
with a diameter of 80 mm or less. The main cause is water pressure. In the future, it is necessary to
develop an appropriate water distribution system.
5) Water Distribution Status
The water is supplied 12-15 hours once every 3-5 days. However, during the dry season from April
to June, the water is supplied once every 5 to 9 days for 12 to 15 hours. There are three water supply

S-4
stations for water trucks in the city, and water is distributed by the trucks in areas where pipes are not
installed or according to the needs of residents.
(3) Sewerage System
The sewage pipe network is about 1,500 km long. The main body of the pipes and joints are
leaking due to damage caused by age-related deterioration, and the accumulation of dirt and sediment
in the pipes causes blockages and sewage retention. The La Vega Sewage Treatment Plant located in
the city is treating only 2,000 m3/day out of the planned flow of 25,450 m3/day due to the failures of
the treatment facilities.
4.Current Status and Issues of Implementing Agencies in Tegucigalpa
(1) Business Transfer
During the study phase, the project has been transferred from SANAA to the municipality of
Tegucigalpa (AMDC) and is expected to be completed by the end of December 2021. In the future,
the Municipal Unit of Water Supply and Sanitation (UMPAS) within AMDC will maintain the water
supply and sewerage system, and the Water Supply and Sanitation Administration (UGASAM) will
be in charge of water supply and sewerage system policy. The transfer has been underway since 2003,
but the issue of retirement benefits for SANAA employees has been a hindrance to the transfer to
UMAPS.
(2) Organizational Capacity
As a result of capacity assessment (CA) using JICA's "Handbook for Capacity Assessment of
Urban Water Supply Sector and Water Utilities in Developing Countries," the average of items that
can be improved by facility investment FI was 2.3, the average of items that can be improved by
capacity development CD was 2.3, and the average of items that can be improved by program approach
was 3.5.
(3) Financial Condition
In 2020, revenue from water charges decreased due to a flat-rate system because meter reading is
not possible due to the new coronavirus pandemic, but revenue increased from the previous year due
to government subsidies from the transfer of operations. On the other hand, expenditures have been
on an upward trend due to an increase in administrative expenses from 2016 to 2018.
Operating office expenses have increased due to an increase in the payment of retirement benefits to
retired SANAA staff (administrative expenses).
5.Results of Demonstration using Japanese Equipment and Materials
(1) Background and Purpose
In this study, we conducted a demonstration test using materials and equipment procured from
Japan, keeping in mind the possibility of utilizing Japanese technology in the proposed yen loan and
technical cooperation projects.
In the demonstration, the most effective leakage countermeasure was selected. The leakage
countermeasure that can be implemented in a short period of time and the most effective measure to

S-5
improve the water supply service in Tegucigalpa was selected for demonstration.
Since the city of Tegucigalpa has an intermittent water supply of about 12 hours every 3-5 days,
we demonstrated leak detection using a tracer gas leak detector that can detect leaks even on days
when there is no water supply.
(2) Implementation Results
As a result of demonstrations in the Miraflores, Monteverde, and Buenos Aires districts from
August to October, leaks were detected even on days when there was no water supply, and C/P is eager
to continue using the provided equipment to conduct tracer gas leak detection.
(3) Japan Technology Seminar
On September 8, 2021, we introduced the products used in the demonstration and the superior
Japanese technology in supporting the improvement of water supply service in Tegucigalpa City.
Forty-nine members of the government participated in the seminar. The products explained were: (1)
Tracer gas leak detector (Goodman Co., Ltd.), (2) Surface water transfer system (Zeniya Marine
Service Co., Ltd.), and (3) Small hydroelectric power generation: Power Archimedes (Hokuriku Seiki
Co., Ltd.) and 4) Portable ultrasonic flowmeter (Tokyo Keiki Co., Ltd.)
6. Proposal for Support Measures to Improve the Water Supply Business in Tegucigalpa
After setting goals, analyzing the current situation, identifying issues, and discussing support
measures, we propose the implementation of hardware and software projects as shown in the table
below.
Table S-3 Summary of Proposals
NO. System Name
Description Beneficiary Population
Effects
Scenario 1
Concepcion Structural components PJ-1 Study on water supply
facility improvement plan for medium and long term plan in Tegucigalpa city (all subsystems) PJ-3 Installation of water quality
improvement system in dam reservoir PJ-4 Rehabilitation of existing
water treatment plant In the event that the World Bank
cannot implement it. PJ-5 Renewal of water
transmission and distribution facilities PJ-6 Improvement of water
distribution network Improvement of water
distribution network (expected in 10/114 sectors) (In PJ-1, it is necessary to
scrutinize the amount based on a highly accurate estimate.) No Structural components PJ-7 Project on non-revenue
422,403 Water
distribution pipe maintenance (37,052)
PJ-1: Develop a detailed update plan PJ-3: Reduction of
chemical costs at water treatment plants Reduction of 54-75.8
million yen/year PJ-4 Securing water
purification volume PJ-5 Improvement of
energy efficiency in water transmission and distribution PJ-6: Reduction of
water leakage Installation of long life
cycle pipes and water meters NRW will decrease
from 32.9% to 10%. 104 million yen/year
reduction PJ-7 Reduction of water
leakage Improvement of

S-6
NO. System Name
Description Beneficiary Population
Effects
reduction measures and strengthening of water transmission and distribution network management capacity (all subsystems)
financial condition Appropriate
maintenance and management
Scenario 2
Laureles Structural components PJ-1 Study on water supply
facility improvement plan for medium and long term plan in Tegucigalpa city (All subsystems) PJ-2 Construction of sewage
treatment facilities in the upper reaches of Laureles Dam PJ-3 Installation of water quality
improvement system in dam reservoir PJ-4 Rehabilitation of existing
water purification plant In the event that the World Bank
cannot implement it. PJ-5 Renewal of water
transmission and distribution facilities PJ-6 Improvement of water pipe
network Improvement of water
distribution network (all implemented) No Structural components PJ-7 Project on non-revenue
reduction measures and strengthening of water transmission and distribution network management capacity (all subsystems)
206,290 Total
PJ-1: Develop a detailed update plan PJ-2: Reduction of
chemical costs at water treatment plants 29 to 40.9 million
yen/year reduction PJ-3 Securing water
purification volume PJ-4 Improvement of
energy efficiency in water transmission and distribution PJ-5: Reduction of
water leakage Installation of long life
cycle pipes and water meters NRW will decrease
from 32.9% to 10%. Reduction of 134.8
million yen/year PJ-7 Reduction of water
leakage Improvement of
financial condition Appropriate
maintenance and management
Scenario 3
Concepcion and Laureles
Structural components PJ-1 Study on water supply
facility improvement plan for medium- and long-term planning in Tegucigalpa city (all subsystems) PJ-5 Renewal of water
transmission and distribution facilities (Laureles strain, Concepcion
strain)
628,693 (Water
distribution network maintenance: 0)
PJ-1: Formulate a detailed update plan PJ-5: Improvement of
energy efficiency in water transmission and distribution, and appropriate monitoring of water delivery volume PJ-7: Leakage
reduction,

S-7
NO. System Name
Description Beneficiary Population
Effects
No Structural components PJ-7 Project for non-revenue
reduction and capacity building of water transmission and distribution network management (All subsystems)
improvement of financial status, proper maintenance and management
CONTENTS Summary Contents Survey Area Map Photos Abbreviations
CHAPTER 1 WORK SUMMARY ............................................................................................. 1-1
BACKGROUND OF THE SURVEY .......................................................................................... 1-1 OBJECTIVES OF SURVEY ..................................................................................................... 1-2 COUNTERPART AGENCIES AND INVOLVED INSTITUTIONS .................................................. 1-2 METHODOLOGY OF SURVEY ............................................................................................... 1-3 SURVEY TEAM MEMBERS ................................................................................................... 1-3 SURVEY SCHEDULE ............................................................................................................ 1-4
CHAPTER 2 DESCRIPTION OF THE WATER SECTOR IN HONDURAS ........................... 2-1
2-1 NATIONAL POLICY .............................................................................................................. 2-1 2-2 DEVELOPMENT PLANS........................................................................................................ 2-2 2-3 RELEVANT LAWS AND REGULATIONS ................................................................................. 2-5 2-4 ORGANIZATION AND INSTITUTIONALIZATION .................................................................... 2-11 2-5 TRENDS IN ASSISTANCE FROM JAPAN AND OTHER DONORS ............................................ 2-12
CHAPTER 3 CURRENT SITUATION AND CHALLENGES OF THE POTABLE WATER
SYSTEM IN THE MUNICIPALITY OF TEGUCIGALPA ............................................................. 3-1
3-1 GENERAL SITUATION OF SURVEY AREA ............................................................................. 3-1 3-1-1 Basic Data ................................................................................................................. 3-1 3-1-2 Natural Conditions .................................................................................................... 3-2 3-1-3 Socio-economic Status .............................................................................................. 3-3 3-1-4 Socio-environmental Considerations ........................................................................ 3-5
3-2 SUMMARY OF POTABLE WATER SYSTEM............................................................................ 3-6 3-2-1 Water Demand Projection ......................................................................................... 3-6 3-2-2 Improvement Plans and Progress .............................................................................. 3-7 3-2-3 Requests from AMDC ............................................................................................. 3-18
3-3 CURRENT SITUATION OF DRINKING WATER SYSTEMS AND CHALLENGES ....................... 3-19 3-3-1 Water Sources, Catchment Works and Conduction Pipelines ................................. 3-22 3-3-2 Water Treatment Plant facilities .............................................................................. 3-36 3-3-3 Piping and Distribution Facilities ......................................................................... 3-104
3-4 CURRENT STATUS AND CHALLENGES OF SEWERAGE SYSTEM ........................................... 3-131 3-4-1 Sewage Discharge System in Municipality of Tegucigalpa ....................................... 3-131
San José de la Vega Wastewater Treatment Plant ................................................. 3-133
CHAPTER 4 CURRENT SITUATION AND CHALLENGES OF TEGUCIGALPA
EXECUTING AGENCY .................................................................................................................. 4-1
4-1 CURRENT STATUS OF EXECUTING AGENCY ........................................................................ 4-1 4-1-1 Organizational Structure and Human Resources ...................................................... 4-1 4-1-2 Transfer of SANAA services .................................................................................... 4-6 4-1-3 Institutional Capacity ................................................................................................ 4-9 4-1-4 Administrative and Financial Situation ................................................................... 4-21
4-2 CHALLENGES FOR EXECUTING AGENCY .......................................................................... 4-29
RESULTS OF DEMONSTRATION WITH EQUIPMENT AND MATERIALS
FROM JAPAN .............................................................................................................................. 5-1
BACKGROUND .................................................................................................................... 5-1 OBJECTIVES ........................................................................................................................ 5-2 BACKGROUND ON EQUIPMENT AND MATERIAL SELECTION ............................................... 5-2
5-3-1 Tracer Gas Leak Detector ............................................................................................... 5-4 5-3-2 Equipment and Materials Required for Water Leak Detection ...................................... 5-5 5-3-3 Proposals for Water Leakage Repair Materials .............................................................. 5-6 5-3-4 Equipment Used ............................................................................................................. 5-7
SELECTION OF EXECUTION AREA....................................................................................... 5-8 PERFORMANCE RESULTS .................................................................................................. 5-14
5-5-1 Pre-Training ................................................................................................................. 5-14 5-5-2 Conducting Demonstration .......................................................................................... 5-16 5-5-3 Subsequent Orientation ................................................................................................ 5-26 5-5-4 Evaluation .................................................................................................................... 5-27
HOLDING SEMINAR ON JAPANESE TECHNOLOGIES........................................................... 5-29 Background ............................................................................................................. 5-29 Dates ....................................................................................................................... 5-29 Participants .............................................................................................................. 5-29 Content of Presentation ........................................................................................... 5-31 Participants' Questions and Comments ................................................................... 5-36
CHAPTER 6 PROPOSED ASSISTANCE MEASURES TO IMPROVE POTABLE WATER
SERVICES IN TEGUCIGALPA ...................................................................................................... 6-1
6-1 CONTENT OF THE PROPOSED ASSISTANCE MEASURES ......................................................... 6-1 6-2 ANALYSIS PROCESS ................................................................................................................ 6-8
6-2-1 Goal Definition............................................................................................................... 6-9 6-2-2 Analysis of the current situation .................................................................................... 6-11 6-2-3 Identification of challenges .......................................................................................... 6-14 6-2-4 Strategy development .............................................................................................. 6-20
6-3 CONSIDERATIONS TO BE TAKEN INTO ACCOUNT FOR THE EXECUTION OF THE PROJECT ....... 6-25
Appendix 1 Japanese Technology Seminar PresentationAppendix 2 Data Collection List

List of Figures and Tables
Table 1-3-1 Counterpart Agency and Institutions Involved ..................................................................... 1-2
Table 1-5-1 Survey Team Members ......................................................................................................... 1-3
Table 1-6-1 Study Schedule and Contents ................................................................................................ 1-4
Table 1-6-2 Survey Schedule and Contents .............................................................................................. 1-5
Table 2-2-1 Potable Water and Sanitation Service Coverage Goals ......................................................... 2-3
Table 2-2-2 Master Plans for Potable Water Service in the City of Tegucigalpa ..................................... 2-4
Table 2-3-1 Laws and Regulations related to Drinking Water and Sanitation ......................................... 2-5
Table 2-3-2 Drinking Water and Sanitation Standards ............................................................................. 2-9
Table 2-4-1 Drinking Water and Sanitation Sector Agencies and Institutions .................................... 2-11
Table 2-5-1 Assistance Projects Executed in the Potable Water and Sanitation Sector in Tegucigalpa . 2-12
Table 3-1-1 Area and Population of Each Department of Honduras ........................................................ 3-1
Table 3-1-2 Main Economic Indicators .................................................................................................... 3-3
Table 3-1-3 Summary of Foreign Trade (2019 ) ...................................................................................... 3-4
Table 3-1-4 Classification of Categories and Documents to be Delivered ............................................... 3-5
Table 3-1-5 Water and Sewerage Facilities .............................................................................................. 3-5
Table 3-1-6 Sewage Facilities .................................................................................................................. 3-6
Table 3-2-1 Water Demand Projections ................................................................................................... 3-7
Table 3-2-2 Proposed AQUARUM MP Activity Plans ............................................................................ 3-8
Table 3-2-3 AQUARUM MP Proposed Source Water Development Plans ............................................. 3-9
Table 3-2-4 Source Water Development Plans ....................................................................................... 3-10
Table 3-2-5 Main Specifications of Nacaome Project ............................................................................ 3-12
Table 3-2-6 Jiniguare Project .................................................................................................................. 3-12
Table 3-2-7 Jacaleapa Project ................................................................................................................. 3-13
Table 3-2-8 Guacerique Project .............................................................................................................. 3-15
Table 3-2-9 Río del Hombre Project....................................................................................................... 3-15
Table 3-2-10 Details of Existing Water Treatment Plant Rehabilitation ................................................ 3-17
Table 3-2-11 Areas Subject to Sectorization in WB ............................................................................... 3-18
Table 3-2-12 Summary of Requests from AMDCs ................................................................................ 3-19
Table 3-3-1 Summary of Water Sources ................................................................................................ 3-22
Table 3-3-2 Summary of Conduit Pipelines ........................................................................................... 3-24
Table 3-3-3 Average Volume of Catchment of Conduit Systems .......................................................... 3-24
Table 3-3-4 Dam Specifications ............................................................................................................. 3-27
Table 3-3-5 Dam Specifications ............................................................................................................. 3-29
Table 3-3-6 Operating and Maintenance Status ...................................................................................... 3-35
Table 3-3-7 Average Annual Water Production of Water Treatment Plant (2016-2020) ....................... 3-36
Table 3-3-8 Specifications of Main Facilities of Picacho Water Treatment Plant .................................. 3-39
Table 3-3-9 Picacho Subsystem Operation and Maintenance System .................................................... 3-41
Table 3-3-10 Raw Water Volume and Production Volume of Picacho Water Treatment Plant (2016-2020)
(Unit: L/s) ...................................................................................................................................... 3-42
Table 3-3-11 Picacho Water Treatment Plant Water Quality (Monthly Average Values, 2016-2020). . 3-44
Table 3-3-12 Energy Consumption of Picacho Water Treatment Plant (2017-2020) ............................. 3-45
Table 3-3-13 Chemical Cost and Chemical Dosage Rate of Picacho Water Treatment Plant (2016-2020).
...................................................................................................................................................... 3-46
Table 3-3-14 Status of Major Facilities and Equipment of Water Treatment Plant ................................ 3-47
Table 3-3-15 Problems at the Picacho Water Treatment Plant ............................................................... 3-50
Table 3-3-16 Picacho Water Treatment Plant Improvement Plan Proposed by the World Bank ........... 3-51
Table 3-3-17 Specifications of Main Facilities of Concepción Water Treatment Plant ......................... 3-55
Table 3-3-18 Operation and Maintenance System for Concepción Subsystem ...................................... 3-58
Table 3-3-19 Raw Water Volume and Production Volume of Concepción Drinking Water Treatment
Plant (2016-2020) (Unit: L/s) ........................................................................................................ 3-59
Table 3-3-20 Water Quality at Concepción Water Treatment Plant (Monthly Average Values, 2016-
2020) ............................................................................................................................................. 3-60
Table 3-3-21 Energy Consumption of Concepción Water Treatment Plant (2017-2020) ...................... 3-62
Table 3-3-22 Chemical Cost and Chemical Dosage Rate of Concepción Water Treatment Plant (2016-
2020). ............................................................................................................................................ 3-63
Table 3-3-23 Status of Main Systems and Equipment at La Concepción Water Treatment Plant ......... 3-63
Table 3-3-24 Problems at Concepcion Water Treatment Plant .............................................................. 3-68
Table 3-3-25 Improvement Plan for La Concepción Water Treatment Plant Proposed by the World Bank
...................................................................................................................................................... 3-69
Table 3-3-26 Specifications of Main Facilities of Laureles Water Treatment Plant ............................... 3-73
Table 3-3-27 Operation and Maintenance System for Laureles subsystem ............................................ 3-76
Table 3-3-28 Raw Water Volume and Production Volume of Laureles Water Treatment Plant (2016-
2020) (Unit: L/s) ........................................................................................................................... 3-77
Table 3-3-29 Water Quality at Laureles Water Treatment Plant (Monthly Average Values, 2016-2020)
...................................................................................................................................................... 3-78
Table 3-3-30 Energy Consumption of Los Laureles Water Treatment Plant (2016-2017) ..................... 3-79
Table 3-3-31 Evolution of Chemical Cost and Chemical Dosage Rate of Los Laureles Water Treatment
Plant (2016-2020) ......................................................................................................................... 3-81
Table 3-3-32 Status of Major Facilities and Equipment at Laureles Water Treatment Plant ................. 3-81
Table 3-3-33 Los Laureles Water Treatment Plant Problems ................................................................. 3-86
Table 3-3-34 Improvement Plan for Los Laureles Water Treatment Plant Proposed by the World Bank . 3-
88
Table 3-3-35 Specifications of Main Facilities of Miraflores Water Treatment Plant ........................... 3-89
Table 3-3-36 Raw Water Volume and Production Volume of Miraflores Drinking Water Treatment Plant
(2016-2020) ................................................................................................................................... 3-91
Table 3-3-37 Water Quality of Miraflores Water Treatment Plant ......................................................... 3-92

Table 3-3-38 Evolution of Chemical Cost and Chemical Dosage Rate of Miraflores Water Treatment
Plant (2016-2020). ........................................................................................................................ 3-93
Table 3-3-39 Miraflores Water Treatment Plant Problems .................................................................... 3-94
Table 3-3-40 Specifications of Main Facilities of El Chimbo Water Treatment Plant ........................... 3-95
Table 3-3-41 Volume of Raw Water and Production Volume of Chimbo Water Treatment Plant (2018-
2020) ............................................................................................................................................. 3-98
Table 3-3-42 Water Quality of Chimbo Water Treatment Plant (Monthly Average Values, 2016-2020) ......
...................................................................................................................................................... 3-99
Table 3-3-43 Evolution of Cost of Chemicals and Chemical Dosage Rate of Chimbo Water Treatment
Plant (2018-2020). ...................................................................................................................... 3-100
Table 3-3-44 Chimbo Water Treatment Plant Problems ...................................................................... 3-101
Table 3-3-45 Total Length of Piping Systems ...................................................................................... 3-105
Table 3-3-46 Current Status of Existing Pumping Stations .................................................................. 3-112
Table 3-3-47Energy Consumption of Existing Pumping Stations (Kwh)............................................. 3-116
Table 3-3-48 Results of Energy Diagnosis of Existing Pumping Stations ........................................... 3-118
Table 3-3-49 List of Distribution Tanks ............................................................................................... 3-119
Table 3-3-50Total Length of Pipelines ................................................................................................. 3-122
Table 3-3-51 Number of Cases of Water Leaks by Type of Pipe and by Diameter ............................. 3-123
Table 3-3-3-52 Causes of Water Leaks ................................................................................................ 3-123
Table 3-3-53 Water Distribution from Distribution Tanks to Distribution Areas (Year 2020) ............ 3-125
Table 3-3-54 Water Tank Truck Supply Volume (m 3) ....................................................................... 3-126
Table 3-3-55 Water Quality Monitoring Performed ............................................................................. 3-127
Table 3-3-56 Status of Implementation of Water Leakage Prevention Measures ................................ 3-129
Table 3-4-1 Population Served by Watersheds in Southern Zone ........................................................ 3-133
Table 3-4-2 San José de la Vega Plant Major Facilities ....................................................................... 3-135
Table 3-4-3 San José de la Vega Plant Water Quality .......................................................................... 3-138
Table 3-4-4 PRRAC-ASAN Plant Main Facilities ............................................................................... 3-141
Table 3-4-5 PRRAC-ASAN Plant Operations Data (2009, taken from AMDC data) .......................... 3-143
Table 3-4-6 San José de la Vega and PRRAC-ASAN Plants Challenges ............................................ 3-144
Table 4-1-1 Division of Labor of Drinking Water System ....................................................................... 4-8
Table 4-1-2 Main Operating Indicators of Water Utility Service ............................................................. 4-9
Table 4-1-3 Data for Calculation of Operational Indicators ................................................................... 4-11
Table 4-1-4 General Situation of Drinking Water Sector ....................................................................... 4-12
Table 4-1-5 SANA Metropolitan Division Data Management ............................................................... 4-16
Table 4-1-6 Basic WSP Checklist .......................................................................................................... 4-18
Table 4-1-7 Water Tariff System ............................................................................................................ 4-22
Table 4-1-8 SANAA Metropolitan Division Profit and Loss Statement (2016-2020) ........................... 4-24
Table 4-1-9 Financial Balance of Metropolitan Division of SANAA (2016-2020) ............................ 4-26
Table 4-1-10 Financial Indicators of Metropolitan Division of SANAA (2016-2020) .......................... 4-27
Table 4-1-11 Content and Number of Claims (March 2021) .................................................................. 4-28

Table 5-1-1 Feasibility Comparison of Most Advantageous Japanese Technologies ................ 5-1
Table 5-3-1 Leak Detection Equipment and Materials Analysis Parameters ........................................... 5-2
Table 5-3-2 Proposed Leak Detection Equipment .................................................................................... 5-3
Table 5-3-3 Tracing Gas Leak Detector Features ..................................................................................... 5-4
Table 5-3-4 Equipment and Materials Used in Demonstration ................................................................ 5-7
Table 5-4-1 General Description of Colonies Subject to Demonstration ................................................. 5-8
Table 5-5-1 Classroom Training ............................................................................................................. 5-14
Table 5-5-2 Explanation Contents .......................................................................................................... 5-15
Table 5-5-3 Questions and answers ........................................................................................................ 5-15
Table 5-5-4 List of Participants .............................................................................................................. 5-16
Table 5-5-5 Schedule of Performance ............................................................................................... 5-16
Table 5-5-6 Water Leak Detection Results ............................................................................................. 5-18
Table 5-5-5-7 Results of Detected Cases by Gas Concentration ............................................................ 5-19
Table 5-5-8 Results of Detected Cases by Gas Concentration ............................................................... 5-22
Table 5-5-9 Results of Detected Cases by Gas Concentration ............................................................... 5-23
Table 5-5-10 Questions and Answers ..................................................................................................... 5-26
Table 5-5-11 Detected Gas Concentration .............................................................................................. 5-28
Table 5-6-12 Participants of Seminar on Japanese Technologies ........................................................... 5-30
Table 5-6-13 Contents of Presentation .............................................................................................. 5-31
Table 5-6-14 Answers to comments and questions are as follows. .......................................... 5-36
Table 6-1-1 Proposed Assistance Measures (Structural Components) ..................................................... 6-1
Table 6-1-2 Proposed assistance strategies (non-structural components) ................................................. 6-3
Table 6-1-3 Scenarios of future assistance measures................................................................................ 6-5
Table 6-2-4 Main operating indicators of water services according to service levels .............................. 6-9
Table 6-2-5 -Level Scale ........................................................................................................................ 6-11
Table 6-2-6 Analysis of current status of structural components ........................................................... 6-12
Table 6-2-7 Analysis of the current status of nonstructural components ................................................ 6-13
Table 6-2-8 Short-term challenges ......................................................................................................... 6-14
Table 6-2-9 Medium-term challenges ..................................................................................................... 6-16
Table 6-2-10 Long-Term Challenges ..................................................................................................... 6-19
Table 6-2-11 Content of strategies.......................................................................................................... 6-20
Figure 3-1-1 Map Locations of Departments of Honduras ....................................................................... 3-2
Figure 3-1-2Precipitation (Monthly) and Temperature ............................................................................ 3-3
Figure 3-1-3 Annual Precipitation ............................................................................................................ 3-3
Figure 3-2-1Population and Water Demand Projection ............................................................................ 3-7
Figure 3-2-2 Water Source Development Plan Location Map................................................................ 3-11
Figure 3-2-3 Overview of Jacaleapa Project ........................................................................................... 3-14
Figure 3-2-4 General Description of Rio del Hombre Facilities............................................................. 3-16
Figure 3-2-5 Areas Subject to Sectorization in WB ............................................................................... 3-18
Figure 3-3-1 Drinking Water System Schematic Diagram ..................................................................... 3-20
Figure 3-3-2Map Locations of Drinking Water System Facilities. ......................................................... 3-21
Figure 3-3-3Map Showing Locations of Water Sources and Drinking Water Treatment Plants ............ 3-23
Figure 3-3-4Annual Catchment Volume ................................................................................................ 3-25
Figure 3-3-5Monthly Variations in Catchment Volume ......................................................................... 3-26
Figure 3-3-6Total Annual Catchment Volume ....................................................................................... 3-26
Figure 3-3-7Monthly Variations in Raw Water Quality (Turbidity, Color, pH, and Alkalinity). ........... 3-26
Figure 3-3-8 Monthly Variations in Catchment Volume ........................................................................ 3-28
Figure 3-3-9Total Annual Catchment Volume ....................................................................................... 3-28
Figure 3-3-10Monthly Variations in Raw Water Quality (Turbidity, Color, pH and Alkalinity). .......... 3-28
Figure 3-3-11Monthly Variations in Catchment Volume ....................................................................... 3-30
Figure 3-3-12Total Annual Catchment Volume ..................................................................................... 3-30
Figure 3-3-13Monthly Variations in Raw Water Quality (Turbidity, Color, pH and Alkalinity). .......... 3-31
Figure 3-3-14 Outline of the sewerage improvement plan ..................................................................... 3-31
Figure 3-3-15Monthly Variations in Catchment Volume ....................................................................... 3-33
Figure 3-3-16Total Annual Catchment Volume ..................................................................................... 3-33
Figure 3-3-17Monthly Variations in Raw Water Quality (Turbidity, Color, pH, and Alkalinity). ......... 3-33
Figure 3-3-18Monthly Variations in Catchment Volume ....................................................................... 3-34
Figure 3-3-19Total Annual Catchment Volume ..................................................................................... 3-34
Figure 3-3-20Average Annual Water Production of Water Treatment Plant (2016-2020). .................... 3-37
Figure 3-3-21Picacho Water Treatment Plant Flow Diagram ................................................................ 3-38
Figure 3-3-22 General Plan of Picacho Drinking Water Treatment Plant .............................................. 3-38
Figure 3-3-23Picacho Water Treatment Plant Water Hydraulic Profile ................................................. 3-39
Figure 3-3-24Current Status of Picacho Water Treatment Plant ............................................................ 3-41
Figure 3-3-25Monthly Variations in Production Volume of Picacho Water Treatment Plant (2016-2020).
...................................................................................................................................................... 3-43
Figure 3-3-26Status of Major Facilities and Equipment of Picacho Water Treatment Plant .................. 3-50
Figure 3-3-27Flow Diagram of Concepción Water Treatment Plant ...................................................... 3-54
Figure 3-3-28General Plan of Concepción Water Treatment Plant ........................................................ 3-54
Figure 3-3-29Hydraulic Profile of Concepcion Water Treatment Plant ................................................. 3-55
Figure 3-3-30Current Status of Concepción Water Treatment Plant ...................................................... 3-57

Figure 3-3-31Monthly Variations in Production Volume of Concepcion Water Treatment Plant (2016-
2020). ............................................................................................................................................ 3-59
Figure 3-3-32Status of Major Facilities and Equipment at Concepcion Water Treatment Plant ............ 3-67
Figure 3-3-33Laureles Water Treatment Plant Flow Diagram ............................................................... 3-72
Figure 3-3-34General Plan of Laureles Water Treatment Plant ............................................................. 3-72
Figure 3-3-35Hydraulic Profile of Laureles Water Treatment Plant ...................................................... 3-73
Figure 3-3-36Current Status of Laureles Water Treatment Plant ........................................................... 3-75
Figure 3-3-37Monthly Variations in Production Volume of Laureles Water Treatment Plant (2016-2020).
...................................................................................................................................................... 3-77
Figure 3-3-38Status of Major Facilities and Equipment at Laureles Water Treatment Plant ................. 3-85
Figure 3-3-39Current Status of Miraflores Water Treatment Plant ........................................................ 3-90
Figure 3-3-40Monthly Variations in Production Volume of Miraflores Water Treatment Plant (2016-
2020). ............................................................................................................................................ 3-91
Figure 3-3-41Current Status of Chimbo Water Treatment Plant ............................................................ 3-97
Figure 3-3-42Monthly Variations in Production Volume of Chimbo Water Treatment Plant (2018-2020).
...................................................................................................................................................... 3-99
Figure 3-3-43Current Status of Central Water Quality Laboratory ...................................................... 3-103
Figure 3-3-44Piping Systems ............................................................................................................... 3-105
Figure 3-3-45 Water Level Schematic of Conduction System ............................................................. 3-107
Figure 3-3-46 Water Level Schematic of Conduction System ............................................................. 3-108
Figure 3-3-47 Air Reservoir Schematic Diagram ................................................................................. 3-109
Figure 3-3-48 Current Status of Existing SCADA System ................................................................... 3-110
Figure 3-3-49Status of Pumping Stations ............................................................................................. 3-116
Figure 3-3-50Energy Diagnosis Images ............................................................................................... 3-117
Figure 3-3-51Percentage of Pipeline Types Repaired and Percentage of Damage Causes .................. 3-124
Figure 3-3-52 Map Locations of 6 Range Sectors ................................................................................ 3-125
Figure 3-3-53Volume of Supply by Water Tank Truck (m 3) .............................................................. 3-127
Figure 3-4-1Current Sanitation Situation in Southern Zone of Municipality of Tegucigalpa .............. 3-132
Figure 3-4-2General Plan of San José de la Vega (Upper part) and PRRAC ASAN (Lower part) Plants .....
.................................................................................................................................................... 3-134
Figure 3-4-3San José de la Vega Plant Flow Diagram ......................................................................... 3-134
Figure 3-4-4 General Plan of San José de la Vega Plant ...................................................................... 3-135
Figure 3-4-5 Current Status of San José de la Vega Plant Facilities .................................................... 3-137
Figure 3-4-6 PRRAC-ASAN Plant Flow Diagram ............................................................................... 3-140
Figure 3-4-7 General Plan of PRRAC-ASAN Plant ............................................................................. 3-140
Figure 3-4-8 Current Status of PRRAC-ASAN Plant Facilities ........................................................... 3-143
Figure 4-1-1 SANAA Organizational Chart ............................................................................................. 4-2
Figure 4-1-2Organizational Chart of Metropolitan Division of SANAA ................................................. 4-2
Figure 4-1-3Organizational Chart of AMDC ........................................................................................... 4-3
Figure 4-1-4UMAPS Organizational Chart .............................................................................................. 4-5

Figure 4-1-5Organizational Chart of UGASAM ...................................................................................... 4-6
Figure 4-1-6Graph of Institutional Capacity of HPSs ............................................................................ 4-21
Figure 4-1-7Assets and Financial Indicators of Metropolitan Division of SANAA (2016-2020). ......... 4-28
Figure 5-3-1 Summary of Tracer Gas Generator and Hydrogen Gas Detector ........................................ 5-5
Figure 5-3-2 Repairing Leaks with Pressure Clamp ................................................................................. 5-6
Figure 5-3-3 Leak Repair Procedure with Rubber Waterproof Adhesive Tape........................................ 5-6
Figure 5-3-4 Demonstration Equipment and Materials Photographs ....................................................... 5-8
Figure 5-4-1 Colonies Subject to Demonstration ................................................................................ 5-10
Figure 5-4-2 Map of Colonia Miraflores ................................................................................................ 5-11
Figure 5-4-3 Map of Colonia Monteverde .............................................................................................. 5-12
Figure 5-4-4Map of Buenos Aires Zone ................................................................................................. 5-13
Figure 5-5-1 Conceptual Scheme of Water Leak Detection with Gas .................................................... 5-18
Figure 5-5-2 Water Leak Detection Results at Miraflores ...................................................................... 5-19
Figure 5-5-3 Situation of Water Leakage ............................................................................................... 5-20
Figure 5-5-4 Exploratory Excavation Survey ......................................................................................... 5-21
Figure 5-5-5 Water Leak Detection Results for Miraflores Sur ............................................................. 5-21
Figure 5-5-6 Repair Images .................................................................................................................... 5-22
Figure 5-5-7 Excavation Study ............................................................................................................... 5-23
Figure 5-5-8 Water Leak Detection Results in Jardines de Miraflores ................................................... 5-23
Figure 5-5-9Leak and Repair Images ..................................................................................................... 5-24
Figure 5-5-10Pictures of Leak and Repair .............................................................................................. 5-24
Figure 5-5-11Images of Valve and House Connection ........................................................................... 5-25
Figure 5-5-12Results of Water Leak Detection in Buenos Aires Zone and Survey Images. .................. 5-26
Figure 5-5-13Hydrogen Gas Detector Connection Hose Damage .......................................................... 5-29
Figure 6-1-1 Implementation schedule for the proposed content .............................................................. 6-7
Figure 6-2-1Assistance flow of assistance proposals ............................................................................... 6-8

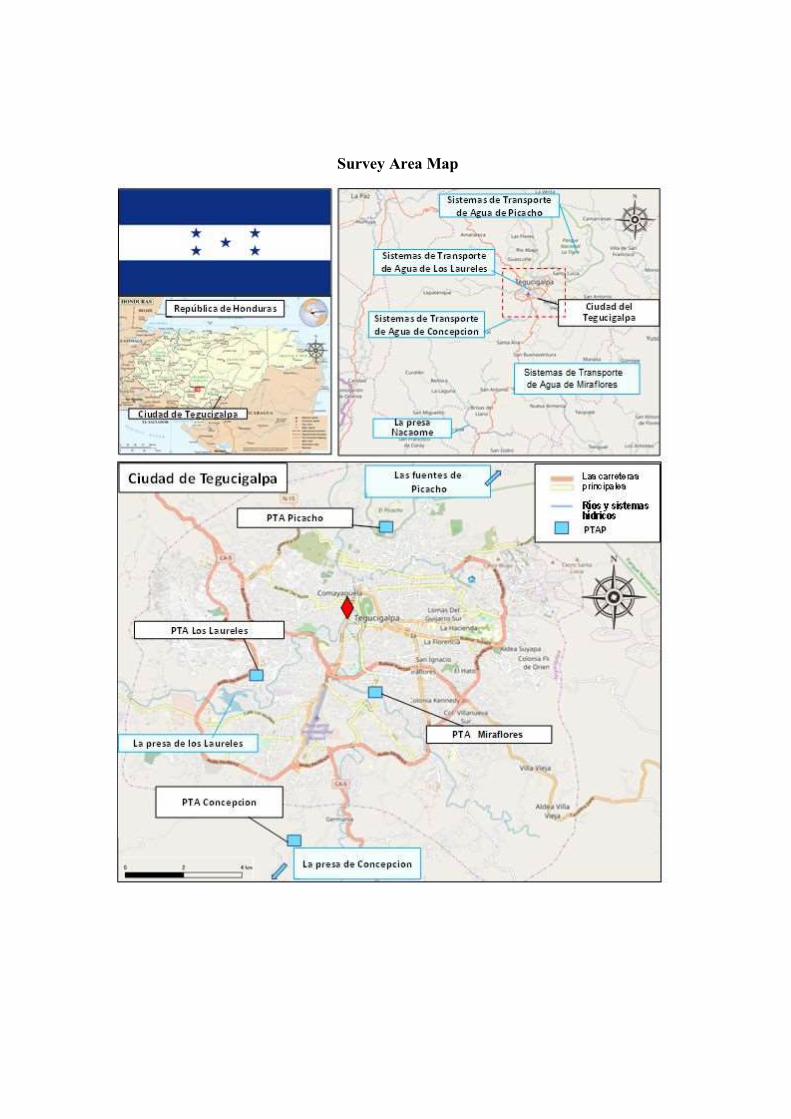
Survey Area Map

Photos
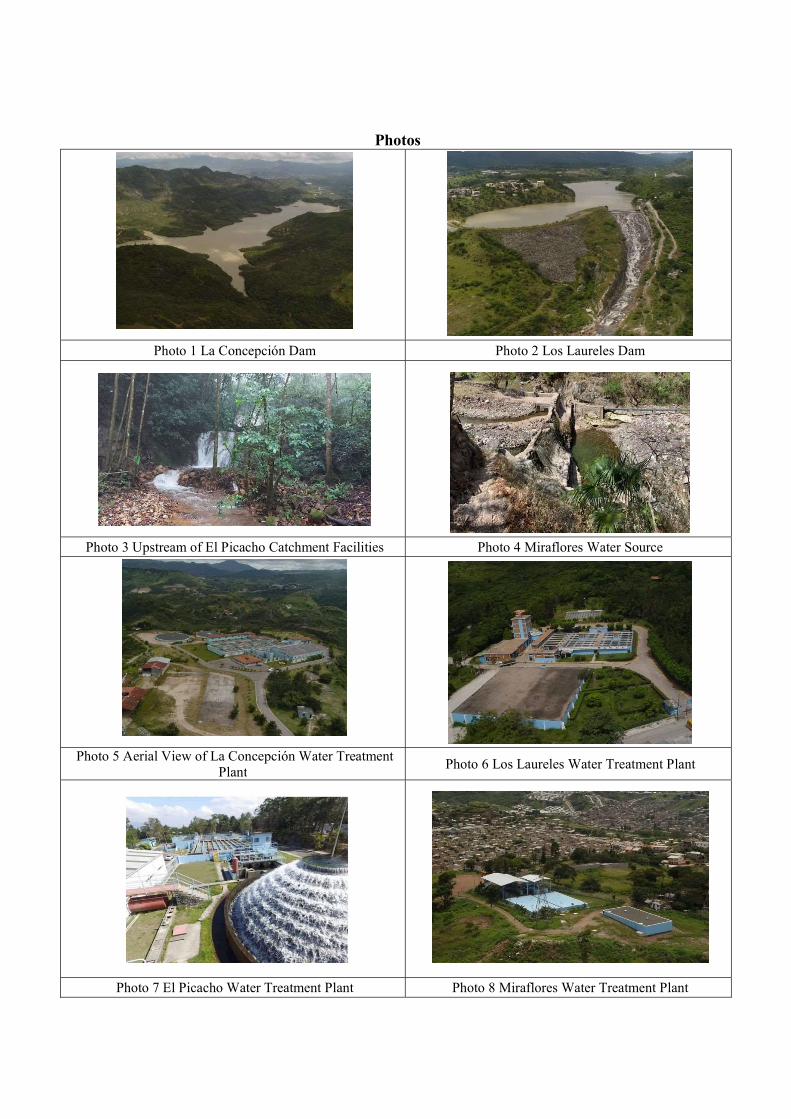
Photo 1 La Concepción Dam Photo 2 Los Laureles Dam
Photo 3 Upstream of El Picacho Catchment Facilities Photo 4 Miraflores Water Source
Photo 5 Aerial View of La Concepción Water Treatment
Plant Photo 6 Los Laureles Water Treatment Plant
Photo 7 El Picacho Water Treatment Plant Photo 8 Miraflores Water Treatment Plant

Photo 9 View of Distribution Area from PTA El Picacho Photo 10 Olimpo 1 Distribution Tank
Photo 11 Los Filtros Distribution Tank Photo 12 Olimpo 2 Distribution Tanks
Photo 13 La Leona Distribution Tank Photo 14 Canal 11Distribution Tank
Photo 15 Private Tanker Trucks (AQUABLOQ)
(AQUABLOC Filling Station)
Photo 16 SANAAA Tank Truck Filling Station

Abbreviations
ADB Asian Development Bank,
AMDC Alcaldía Municipal del Distrito Central:
BCIE Banco Centroamericano de Integracion Economica
C/A Capacity Assessment
C/P Counter Part
CONASA Consejo Nacional de Agua y Saneamiento
CORE Cofinancing for Renewable Energy and Energy Efficiency
DMA District Metered Area
ERSAPS Ente Regulador de los Servicios de Agua Potable y Saneamiento
IDB Inter-American Development Bank
IWA International Water Association
JICA Japan International Cooperation Agency
MI AMBIENET Secretaria de Recursos Naturales y Ambiente
MINSALUD Secretaria de Sallud
NRW Non-Revenue Water
PLANASA Plan Nacional de Agua Potable y Saneamiento
PROMOSAS Proyecto de Modernización del Sector Agua Potable y Saneamiento SANAA Servicio Autónomo Nacional de Acueductos y Alcantarillados
SCADA Supervisory Control And Data Acquisition
SDGs Sustainable Development Goals
SEFIN Secretaria de Finanzas
SINEIA Sistema Nacional de Evaluación de. Impacto Ambiental
STEP Special Terms for Economic Partnership
UGASAM Unidad de Gestión de Agua y Saneamiento Municipal
UMAPS Unidad Municipal de Agua Potable y Saneamiento:
VFD Variable Frequency Drives
WSP Water Service Provider

CHAPTER 1 WORK SUMMARY

1-1
Chapter 1 Work Summary
Background of the Survey
The Government of the Republic of Honduras (hereinafter, "Honduras"), among the 11 strategic
guidelines included in the 2010-2022 National Plan, emphasizes the guideline "Health as a foundation
for the improvement of living conditions" and aims to reduce by half the population without access to
safe drinking water by 2022, and to less than 10% by 2034. Under this plan, the National Drinking
Water and Sanitation Council (CONASA) elaborated in December 2014 the "National Drinking Water
and Sanitation Plan: PLANASA" and has established the strategies, detailed goals, amount of
investments needed, etc. In addition, the "Ley Marco del Sector Agua Potable y Saneamiento", put
into effect in 2003, determined to transfer the powers of the Servicio Autónomo Nacional de
Acueductos y Alcantarillados: SANAA, the entity that until then had been in charge of the country's
drinking water service, to the municipalities and to that effect they are gradually working.
In the drinking water sector of the capital Tegucigalpa, in 2015 the Municipal Unit of Drinking
Water and Sanitation: UMAPS, which would be the recipient of the powers transferred from SANAA,
and the Municipal Water and Sanitation Management Unit: UGASAM, which is the unit in charge of
policy measures, were created. However, at present the transfer of SANAA is not completed, and
therefore, the municipality of Tegucigalpa is managing the drinking water service through an
agreement with SANAA.
The population of the municipality of the Central District (Tegucigalpa) is growing year after
year and was expected to reach 1.4 million inhabitants in 2020, corresponding to 18% of the national
population, and in 2030 approximately 25% will settle in the metropolitan area. Water supply to the
metropolitan area comes from surface water sources (San Juancito-Picacho), 2 reservoirs (Los
Laureles and Concepción) and other smaller scale sources (reservoirs built on the Sabacuante and
Tatumbla rivers and wells), but the water supply capacity in 2020 was 1.47 m 3/s in the rainy season
and just 0.77 m 3/s in the dry season, much lower than the water demand of 4.05 m3 /s, which is why
the water supply schedule in the municipality is limited to every 3 to 5 days, depending on the time of
year; there are even districts that need to be supplied with tanker trucks due to the reduced hours of
water service in the dry season. Thus, Tegucigalpa faces a chronic problem of quantitative water
supply deficiency and there is an urgent need to meet the demand for water supply as a result of rapid
population growth.
In addition to the quantitative deficiency, another problem is the high rate of unbilled water due
to leaks in obsolete water pipes. It was estimated that the rate of unbilled water in Tegucigalpa is
32.9%, and in addition, a low percentage of installed meters (approx. 39%) does not allow for correct
metering, so it is assumed that the real rate of unbilled water would be higher. The high rate of non-
revenue water causes a decrease in income, thus deteriorating the administrative aspect (the
profitability obtained from the potable water service cannot cover the cost of operation and in 2020
the commercial deficit reached 80 million USD), and it is urgent to improve the efficiency of the
1-2
potable water service by proposing measures to reduce leaks and water waste, in order to counteract
the non-revenue water.
In view of this situation, with technical assistance from the World Bank, a business plan for
Tegucigalpa's potable water service for the next 10 years was prepared in 2018. The plan establishes
the guideline to improve the water supply system and the efficiency of the water service in the first 5
years and to carry out investments in infrastructure construction, such as the expansion of distribution
tanks or construction of new reservoirs in the next 5 years in coordination with other cooperating
institutions, in order to increase the total volume of water supply. In order to achieve the improvement
of the water supply system and the efficiency of the drinking water service and following this guideline,
the municipality of Tegucigalpa now sees the need to collect and analyze information to put in order
the current situation of the service and its pending problems and to clarify the priority issues to be
addressed.
Objectives of Survey
The objective of this survey is to make a diagnosis of the current situation and pending problems
of the drinking water service in the municipality of the Central District and to determine a direction
for assistance aimed at improving the water supply service. To determine the type of assistance, we
will analyze in addition to measures in structural components through the renovation of facilities,
equipment and materials related to the drinking water service, the integral support in non-structural
components through technical cooperation, and we will present proposals aimed at the improvement
of the water supply service in the municipality of the Central District.
Counterpart Agencies and Involved Institutions
Table 1-3-1 lists the counterpart agency and institutions involved. In 2015, the Municipal
Drinking Water and Sanitation Unit (UMAPS) was created, the entity to which operations will be
transferred from SANAA, and the Municipal Water and Sanitation Management Unit (UGASAM) in
charge of developing and implementing related policies. However, the transfer process has not been
completed as of the date of this survey, and UMAPS and UGASAM are hiring human resources from
SANAA and other entities.
Table 1-3-1 Counterpart Agency and Institutions Involved Institutions Acronyms
Mayor's Office of the Central District AMDC
Municipal Drinking Water and Sanitation Unit UMAPS
Municipal Water and Sanitation Management Unit UGASAM
National Autonomous Service of Aqueducts and Sewage Systems (Servicio Autónomo Nacional de Acueductos y Alcantarillados)
SANAA
1-3
Methodology of Survey
This survey consists of the first and second stages.
First Stage of the Survey (October 27, 2020 to June 30, 2021)
In the first stage of the survey, the current situation and challenges of the potable water service
in the municipality of Tegucigalpa were recognized and analyzed, and the structural and non-structural
components necessary to improve the potable water service were systematized. The survey has been
implemented remotely through videoconferences and field reconnaissance through the service of local
consultants hired for this purpose. The videoconferences were organized every Thursday, between
17:00-19:00 (Honduras time) starting December 2020. The Survey Team including the local
contracted staff conducted the interviews based on the information collected through questionnaires
to UGASAM and SANAA, and held discussions based on the results of the field reconnaissance
executed by the local contracted staff. The discussions also included requests for future cooperation
from JICA expected by the local counterpart. This report systematizes and analyzes the content
obtained through these discussions.
Second Stage of the Survey (July 13 to December 24, 2021)
In the second stage of the Survey, a demonstration of water leak detection was carried out using
the equipment and materials acquired in Japan, with the objective of exploring the possibility of
introducing Japanese technologies. Likewise, the information systematized in the first stage of the
Survey was updated through field reconnaissance and discussions. The results of the Survey will be
integrated into the Draft Final Report that will be presented to the Honduran governmental institutions,
and a basic agreement will be obtained. After integrating the comments of the related persons of the
local counterpart on the Draft Final Report, the Final Report will be elaborated and delivered to the
related institutions.
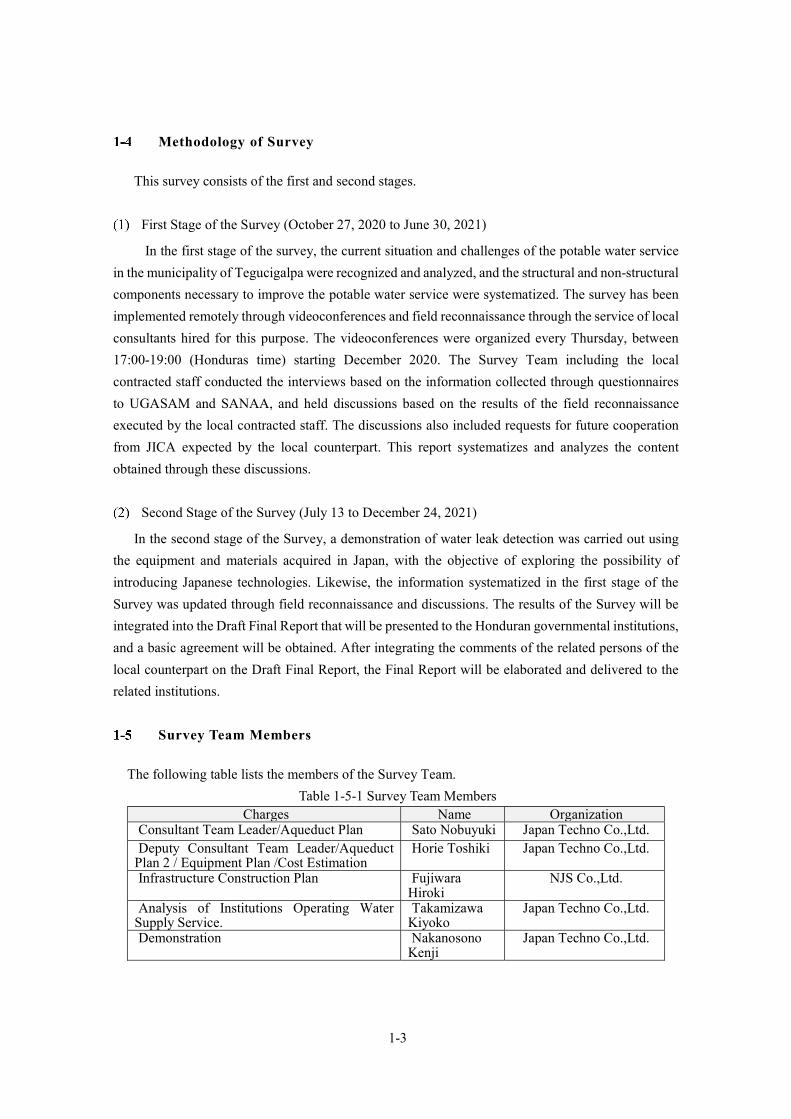
Survey Team Members
The following table lists the members of the Survey Team.
Table 1-5-1 Survey Team Members Charges Name Organization
Consultant Team Leader/Aqueduct Plan Sato Nobuyuki Japan Techno Co.,Ltd. Deputy Consultant Team Leader/Aqueduct
Plan 2 / Equipment Plan /Cost Estimation Horie Toshiki Japan Techno Co.,Ltd.
Infrastructure Construction Plan Fujiwara Hiroki
NJS Co.,Ltd.
Analysis of Institutions Operating Water Supply Service.
Takamizawa Kiyoko
Japan Techno Co.,Ltd.
Demonstration Nakanosono Kenji
Japan Techno Co.,Ltd.
1-4
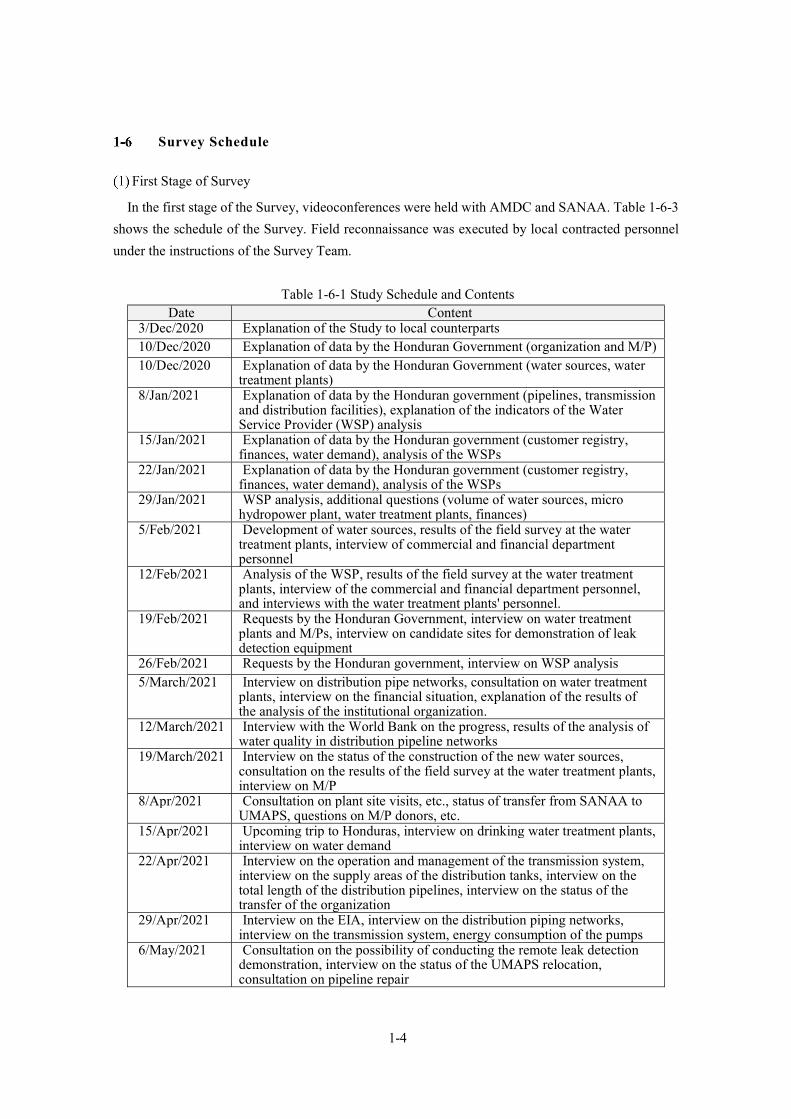
Survey Schedule
First Stage of Survey
In the first stage of the Survey, videoconferences were held with AMDC and SANAA. Table 1-6-3
shows the schedule of the Survey. Field reconnaissance was executed by local contracted personnel
under the instructions of the Survey Team.
Table 1-6-1 Study Schedule and Contents Date Content
3/Dec/2020 Explanation of the Study to local counterparts 10/Dec/2020 Explanation of data by the Honduran Government (organization and M/P) 10/Dec/2020 Explanation of data by the Honduran Government (water sources, water
treatment plants) 8/Jan/2021 Explanation of data by the Honduran government (pipelines, transmission
and distribution facilities), explanation of the indicators of the Water Service Provider (WSP) analysis
15/Jan/2021 Explanation of data by the Honduran government (customer registry, finances, water demand), analysis of the WSPs
22/Jan/2021 Explanation of data by the Honduran government (customer registry, finances, water demand), analysis of the WSPs
29/Jan/2021 WSP analysis, additional questions (volume of water sources, micro hydropower plant, water treatment plants, finances)
5/Feb/2021 Development of water sources, results of the field survey at the water treatment plants, interview of commercial and financial department personnel
12/Feb/2021 Analysis of the WSP, results of the field survey at the water treatment plants, interview of the commercial and financial department personnel, and interviews with the water treatment plants' personnel.
19/Feb/2021 Requests by the Honduran Government, interview on water treatment plants and M/Ps, interview on candidate sites for demonstration of leak detection equipment
26/Feb/2021 Requests by the Honduran government, interview on WSP analysis 5/March/2021 Interview on distribution pipe networks, consultation on water treatment
plants, interview on the financial situation, explanation of the results of the analysis of the institutional organization.
12/March/2021 Interview with the World Bank on the progress, results of the analysis of water quality in distribution pipeline networks
19/March/2021 Interview on the status of the construction of the new water sources, consultation on the results of the field survey at the water treatment plants, interview on M/P
8/Apr/2021 Consultation on plant site visits, etc., status of transfer from SANAA to UMAPS, questions on M/P donors, etc.
15/Apr/2021 Upcoming trip to Honduras, interview on drinking water treatment plants, interview on water demand
22/Apr/2021 Interview on the operation and management of the transmission system, interview on the supply areas of the distribution tanks, interview on the total length of the distribution pipelines, interview on the status of the transfer of the organization
29/Apr/2021 Interview on the EIA, interview on the distribution piping networks, interview on the transmission system, energy consumption of the pumps
6/May/2021 Consultation on the possibility of conducting the remote leak detection demonstration, interview on the status of the UMAPS relocation, consultation on pipeline repair

1-5
20/May/2021 Confirmation of AMDC applications 3/Jun/2021 Consultation on dates, visits to plant sites, tanks, etc., consultation on leak
detection demonstration. 17/Jun/2021 Consultation on suspension of trip to Honduras, consultation on leak
detection demonstration. 24/Jun/2021 Explanation of the demonstration, equipment and materials 9/Jul/2021 Explanation on the summary of the Interim Report, explanation on the
Survey Team's submission schedule 23/Jul/2021 Compilation of comments and opinions on the Interim Report
Second Stage of the Survey
Table 1-6-2 shows the schedule for Phase II of the Survey.
Table 1-6-2 Survey Schedule and Contents Name Date Content
Sato Nobuyuki 13/July - 15/Nov/2021 Consultation with the Honduran Government, internal meeting of the Study Team, confirmation and correction of the data from the consultations with the Honduran Government and JICA (in Japan), explanation to the Honduran Government on the Draft Final Report and the Final Report.
Horie Toshiki 20/Aug - 15/Nov/2021 Consultation and interview with the Honduran Government, demonstration, field reconnaissance at water sources, water treatment plants, pumping stations, distribution tanks and purification plants, technical seminar on Japanese technology, explanation to the Honduran Government on the Draft Final Report and the Final Report.
Fujiwara Hiroki 20/Aug - 23/Sep/2021 Interview on the facilities, field reconnaissance of water sources, water treatment plants, pumping stations, distribution tanks and wastewater treatment plants, technical seminar in Japan
Takamizawa Kiyoko
23/Aug - 13/Sep/2021 Interview on WSP analysis, demonstration, field survey at water treatment plants, technical seminar on Japanese technology.
Nakanosono Kenji
13/Jul - 13/Sep/2021 Interview on measures against water leaks, demonstration, field survey at water treatment plants, technical seminar on Japanese technology.


CHAPTER 2 DESCRIPTION OF THE WATER SECTOR IN HONDURAS


2-1
Chapter 2 Description of the Water Sector in Honduras
2-1 National Policy
The Government of Honduras enacted the Drinking Water and Sanitation Sector Framework Law
in 2003, creating the National Drinking Water and Sanitation Council (CONASA) as the planning
body for the drinking water and sanitation sector. The Government drafted the National Drinking
Water and Sanitation Sector Policy in 2014 under the leadership of CONASA, establishing the sector's
development policies and goals. This policy instrument also includes the main strategic elements to
comply with the policy goals, and constitutes the general conceptual and methodological guideline for
the elaboration of development programs and plans, through inter-institutional coordination.
The aforementioned policy covers the entire national territory with a broad approach and
establishes 2038 as the target year, as stipulated in the Law for the Establishment of a Country Vision
and the Adoption of a National Plan for Honduras.
This policy presents a general guideline for the development of the entire sector, involving all
municipal governments. However, due to the peculiarity and complexity of the sector in a large
metropolitan area, it establishes that it is necessary to elaborate specific and concrete development
strategies and plans for Tegucigalpa and San Pedro Sula.
Vision
In the year 2038, the Honduran population has access to improved drinking water and sanitation
services that meet service quality standards, promote the country's socio-economic development, and
are developed through actors capable of fulfilling their responsibilities efficiently and effectively,
within the framework of sustainable water resource management and risk prevention.
Policy Guidelines and Specific Objectives
1. Achieve universal access to drinking water and sanitation services with a focus on social
inclusion, taking into account the priorities and specific conditions of the different categories of
localities.
2. Improve drinking water and sanitation service levels in existing systems, according to the
conditions of the different categories of localities.
3. To achieve integral sustainability of drinking water and sanitation services.
4. To develop the provision of drinking water and sanitation services within the framework of
sustainable management of water resources.
5. Achieve sector governance through institutional strengthening and capacity building at the
municipal level.
6. Strengthen the governance of the sector at the national level through institutional strengthening.
7. To operate the sector through a transparent, adequately managed and administered financial
framework that covers all categories of costs and investments.

2-2
The strategic framework provides the basis for all actions and interventions of the sector's
stakeholders and defines how specific objectives will be achieved. The strategies are aimed at
developing the following components:
1. Strategy for infrastructure development
2. Strategy for service delivery
3. Strategy for decentralization and local development
4. Strategy for institutional development and governance of the sector
5. Strategy for capacity development and strengthening
6. Financial strategy of the sector
2-2 Development Plans
National Policies for the Water and Sanitation Sector in Honduras
The government of Honduras and CONASA has developed in December 2014 the National
Drinking Water and Sanitation Plan (PLANASA) based on the National Policies mentioned above,
which sets out the plans, strategies, goals and required investments until 2022.
PLANASA analyzes the national approach, the sector's progress and the related legal instruments,
identifying the difficulties for the proper fulfillment of the functions established by law, such as the
following:
a) Lack of an institutionalized operational body of CONASA to prepare proposals, formulate
regulations, make its resolutions and provisions viable, carry out monitoring and evaluation, and
coordinate actions with other national, regional and municipal entities, in addition to managing
and implementing financing for the benefit of the sector.
b) ERSAPS does not have sufficient resources to carry out the regulation of the sector, which
would allow it to verify compliance with the law by municipalities and water and sanitation
service providers throughout the country.
c) SANAA does not have the organization or resources to act as the Technical Secretariat of
CONASA, and as a technical assistance agency it has no formal processes for its operation.
d) In order for the Health Surveillance and Regulation System for drinking water and sanitation
services to operate efficiently, SESAL (Ministry of Health) requires trained financial and human
resources, adequate technologies and instruments for data collection, designed for this purpose,
as well as adequate mechanisms for the flow of information at the different levels.
The purpose of the Plan is to establish the sectoral framework for the development of drinking
water and sanitation services, prioritizing the areas and investments in response to the human right to
these services, promoting actions for the sustainability and governance of the services, thus
contributing to the country's economic and social growth, to the sectoral institutional framework and
to the environmental preservation of water resources.
For the formulation of the PLANASA, the guidelines of the National Plan have been considered,

2-3
which establishes national planning by hydrographic regions and, in turn, by population categories, as
follows
i) Metropolitan cities;
ii) Major cities (population over 30,000 inhabitants);
iii) Small cities (population between 5,000 and 30,000 inhabitants);
iv) Smaller urban centers (2,000 to 5,000 inhabitants);
v) Concentrated rural (250 to 2,000 inhabitants); and
vi) Dispersed rural areas with a population of less than 250 inhabitants.
PLANASA presents the following list of Strategic Guidelines, in accordance with the guidelines
of the National Policy of the Drinking Water and Sanitation Sector of Honduras.
1. Decentralization of services (decentralization and autonomy of services, municipal development plans).
2. Citizen participation and social auditing. 3. Institutional and sectoral governance (leadership, institutional consolidation and coordination,
sectoral regulations, dissemination and monitoring, knowledge management and sectoral information systems).
4. Service delivery (Sustainability, governance in service delivery) 5. Capacity building in the provision of services (Institutional strengthening of water service EPSs,
capacity building of local governments, and promotion of qualified supply). 6. Infrastructure development (principles and requirements, safe and potable water, water supply
continuity and efficiency, and universalization of services). 7. Sectoral financing (Levels of financing for the sector)
Based on these strategies, the Plan establishes the following quantitative goals of the National
Sector Plan 2014- 2022.
Table 2-2-1 Potable Water and Sanitation Service Coverage Goals
Potable Water Coverage Target (%)
Sewerage and Sanitation Target Coverage **(%)
2013* 2018 2022 2013* 2018 2022 Metropolitans 62 63 81 40 43 60 Major cities (> 30,000) 69 75 84 40 50 60 Small towns (5,000-
30,000) 80 85 91 21 43 60
Urban minor (2,000-5,000)
84 90 93 59 65 71
Concentrated and dispersed rural (<2,000)
87 89 93 68 69 74
Baseline: 2011 coverage data, **Metropolitan, major cities and small cities figures correspond to sewerage coverage, while minor urban, concentrated and dispersed rural figures correspond to sanitation coverage. Source: Prepared by the Study Team based on PLANASA.
Based on the table above, the Plan estimates the investments needed to achieve the goals for the
2014-2018 and 2018-2022 periods. The investment for the 2014-2018 period reaches US$ 503 million,
equivalent to US$ 126 million per year, which represents a sectoral challenge that requires intensifying

2-4
the management and execution capacity, while maintaining the investments required in the
decentralization axes. For the following period 2018-2022, although, with the investments of the
adjusted scenario, it is still pending to make progress in improving the continuity of the service and
the reduction of non-revenue water (unaccounted for), being possible through the execution of
sectorization actions and rehabilitation of existing systems. With this, it will have been achieved that
rural drinking water coverage will reach 93% in 2022, as well as reducing by half the gap of lack of
access to water services in urban areas. Likewise, at the urban level, sewerage coverage will have
reached 60 % (including small cities) and wastewater treatment will have reached 50 % of the total
volume collected.
Master Plan
The following table presents a summary of the master plans for potable water service in the City
of Tegucigalpa.
Table 2-2-2 Master Plans for Potable Water Service in the City of Tegucigalpa Name Year of
Production Author/ Donor
Description
P/M JICA (JICA Master
Plan)
2001 PCI/JICA It establishes as goals: (1) Achieve stable water supply service with 99% reliability against drought, which is equivalent to the driest month in 10 years; and (2) Continuous, 24-hour water supply service with adequate quantity and quality. The Plan estimated the production in 2000 and the production required for the year 2015 based on projected population and demand and performed the comparative technical and economic analysis of the following Master Plan candidate projects. The dredging project at Los Laureles Reservoir; - Los Laureles II Project (consisting of the
construction of Los Laureles II Dam and the necessary water supply facilities as well as the excavation of the existing Los Laureles reservoir).
- Quiebra Montes Project, which consists of the construction of the Quiebra Montes Dam and the necessary water supply facilities;
- Sabacuante Project, which consists of the construction of the Sabacuante Dam and the necessary facilities for water supply;
- Tatumbla Project, which consists of the construction of the Tatumbla Dam and the necessary water supply facilities; and - Tatumbla Dam, which consists of the construction of the Tatumbla Dam and the necessary water supply facilities.
- Water leakage reduction project (replacement of water pipes of a certain diameter).
The Los Laureles II Project was selected as the priority project for which the Feasibility Study was conducted.
P/M SOGREAH
2004 SOGREAH/France
Master Plan on the development of water sources. A study of the primary water supply system (water

2-5
Name Year of Production
Author/ Donor
Description
(SOGREAH Master Plan)
sources - reservoirs), population projection and water demand, and hydrological analysis, among others, was carried out, proposing four alternative sources, namely the Hombre, Guacerique, Sabacuante and Nacaome rivers, which were subjected to a comparative analysis from the technical, economic and environmental perspectives. The study analyzed the hydrological information, hydrological functions of the dams, construction of the dams, adduction lines and water treatment plants for each of the identified sources. It also included the estimation of the cost of the project and the economic analysis, leading to the selection of Guacerique II as the priority project, for which the preliminary design was carried out.
P/M AQUARUM (AQUARUM
Consolidated Master Plan)
2011 AQUARUM/Spain
It includes an extensive study and analysis of the distribution networks and proposes a master plan. The diagnosis of the existing potable water supply system included the projection of water demand, evaluation of sources and their productive capacity, distribution system, losses and current state of distribution pipes, hydrological analysis through modeling, measures against water leakage and ANF, and the study of pump energy. It proposes to improve the aqueduct system by
managing water pressure with sectorization (distribution blocks), improvement measures in low pressure areas, and improving the pressure regulation capacity of the distribution networks.
Action plan (Climate
Change Action Plan)
2018 NDF/BID This plan has been developed as a regional plan for climate change adaptation with a focus on watersheds. The plan serves as a means of multidisciplinary coordination for climate change adaptation in the central municipalities, including Tegucigalpa. The plan identifies integrated management of drinking water security and sanitation as one of the priority components.
2-3 Relevant Laws and Regulations
Laws and Regulations related to Drinking Water and Sanitation
The following table lists the legal instruments related to drinking water and sanitation.
Table 2-3-1 Laws and Regulations related to Drinking Water and Sanitation
Laws and Regulations Year Enacted Decree 1 Constitution of the Republic 2012 No. 270-2011 2 Drinking Water and Sanitation Sector
Framework Law 2003 No. 118-2003
3 Law for the Establishment of a Country Vision and the Adoption of a National Plan for Honduras
2010 No. 286-2009

2-6
4 General Environmental Law 1993 No. 104-93 5 General Regulations of the General
Environmental Law 1993 No. 109-93
6 General Water Law 2009 No. 181-2009 7 Constitutive Law of the National Autonomous
Service of Aqueducts and Sewerage (SANAA) 1961 No. 91
8 Municipalities Law 1990 No.134-90 9 Land Management Law 2003 No. 180-2003
10 Forestry, Protected Areas and Wildlife Law 2008 No.98-2007 11 National Strategy for Watershed Management in
Honduras 2011 (Ministerial
Agreement) No.014-2011
12 Health Code 1991 No.65-91 13 General Environmental Health Regulations 1998 (Agreement) No.0094
a) Amendment of Article 145 of the Constitution of the Republic of Venezuela
The Constitution of the Republic of Honduras, in its Title III "On Declarations, Rights and
Guarantees", Chapter VII "On Health", establishes the following: "The right to health protection is
recognized. It is the duty of all to participate in the promotion and preservation of personal and
community health. The State shall preserve an adequate environment to protect the health of the people.
Consequently, access to water and sanitation is declared a human right, whose development and use
shall be equitable, preferably for human consumption. Likewise, the preservation of water sources is
guaranteed so that they do not endanger life and public health. The stipulations herein are applicable
to all activities of the State, public and private. The provisions herein shall be regulated by law".
b) Framework Law for the Drinking Water and Sanitation Sector (Framework Law)
This Law establishes the norms applicable to drinking water and sanitation services in the national
territory. The provision of these services shall be governed under the principles of quality, equity,
solidarity, continuity, generality, environmental respect and citizen participation.
The objectives of the Law are:
i) Promote the expansion of service coverage; ii) ensure water quality and potability; iii) establish
the environmental management framework, both for the protection and preservation of water
sources and for sanitation and effluent discharge management; iv) establish the criteria for the
valuation of services and tariff schemes; v) strengthen service management planning and
governance; vi) establish the integration of responsibilities for environmental management and the
operation of service infrastructure; vii) establish the conditions for the regulation and technical
control of the activity of those who build and operate drinking water and sanitation systems; viii)
establish the conditions for the regulation and technical control of the activity of those who build
and operate drinking water and sanitation systems; vi) to establish the integration of responsibilities
for environmental management and operation of service infrastructure; vii) to establish the
conditions for regulation and technical control of the activity of those who build and operate
drinking water and sanitation systems; viii) to establish mechanisms for the provision of services
2-7
in rural areas that operate efficiently; ix) to promote citizen participation in the provision of
services; and x) to promote the efficient operation of drinking water and sanitation systems.
The Law created the National Council of Potable Water and Sanitation (CONASA) and the
Regulatory Entity of Potable Water and Sanitation Services (ERSAPS). It also reformed the powers
of the Servicio Autónomo Nacional de Acueductos y Alcantarillados (SANAA) transferring the
responsibilities for potable water and sanitation to the municipal governments, also transferring the
systems operated by SANAA to the municipal governments.
The Framework Law transfers the capacities for potable water and sanitation services to the
municipal governments, in accordance with the state decentralization policy, and establishes the
conditions for the creation and strengthening of service providers for both urban and rural areas. In
relation to the sustainability of services, the Law includes provisions related to environmental and
financial sustainability. On the other hand, it establishes governance conditions to achieve citizen
participation in the service provision process, transparency of EPS management, accountability of
performance.
c) Law for Establishment of a Country Vision and Adoption of a Nation Plan for Honduras
The purpose of this Law is to approve the Country Vision for the year 2038 and the National Plan
for the year 2022, with which the planning process for the economic, social and political development
of the country begins.
This law stresses the need to double the capacity of drinking water and sanitation services, which
are currently deficient in terms of scope, quality and continuity in the face of rapid urbanization.
Within this context, the Law proposes to adopt a differentiated approach prioritizing the population
living in cities with more than 5,000 inhabitants connected with paved roads and their surroundings
(in an area of influence of 10 kilometers parallel to their location). In this way, two thirds of the
national population would be covered. It also establishes the goals of universal drinking water and
sanitation coverage to be achieved by 2022 and 2034. Additionally, the Law establishes the goal to be
achieved in relation to water sources, as well as a series of considerations to be taken into account for
adaptation to climate change.
d) General Environmental Law
Article 1 of the General Environmental Law establishes that "The protection, conservation,
restoration, and sustainable management of the environment and natural resources are of public utility
and social interest. Likewise, Article 30 states that "The State and the municipalities in their respective
jurisdictions are responsible for the management, protection and conservation of watersheds and
natural water deposits, including the preservation of the natural elements involved in the hydrological
process.
The General Environmental Law includes several provisions to protect water supply sources and
manage the quality of effluents discharged into natural water bodies. In order to promote the
improvement of the quality of drinking and wastewater, it establishes some fiscal incentives to direct
natural and legal persons that use water sources or discharge effluents to an adequate treatment.

2-8
e) General Regulations of General Environmental Law
The purpose of this Regulation is to develop its precepts, which hereinafter will be identified as
the General Environmental Law. It establishes the infractions derived from acts that may damage water
sources and rivers due to illegal discharge and pollutants, as well as the sanction system.
f) General Water Law
The purpose of this law is to establish the principles and regulations applicable to the adequate
management of water resources for the protection, conservation, valorization, and use of water
resources in order to promote integrated water resource management at the national level. The Law
prioritizes the protection of water sources and declares that human consumption has a preferential and
privileged relationship over other uses, as well as establishing provisions on payment for
environmental services to raise funds to be used for the protection and conservation of water sources.
It also includes provisions on the creation and preservation of protected areas, prohibition of effluent
discharge, etc.
g) Constitutive Law of National Autonomous Service of Aqueducts and Sewerage (SANAA)
The Law creates the National Autonomous Service of Aqueducts and Sewage Systems (SANAA)
to promote the development of public drinking water supplies and sanitary and storm sewage systems
throughout the country. Considering that drinking water, sewage and storm water services cannot be
considered and resolved from a local or municipal point of view, but from a national one, the Law
establishes its objectives and powers taking into account that: 1) to achieve greater economy and
efficiency, the supply sources must be interconnected to serve two or more communities; 2) uniformity
of standards must be ensured in the application of the principles of Sanitary Engineering to achieve
economy and efficiency in the planning, design, construction and administration of the services.
It is established that SANAA will be in charge of the study, construction, operation, maintenance
and administration of all projects and works of aqueducts and sewage systems belonging to the Central
District, Municipalities, Water Boards, Development Boards or any governmental agency, and will
represent the interests of the State with respect to water supply and sewage systems in private
companies that provide public services.
h) Municipalities Law
The purpose of this Law is to develop the constitutional principles related to the Departmental and
Municipal Regime. The Law establishes the concept of the Municipality as an independent organ of
the state authority that will function to achieve the well-being of the inhabitants, promote their integral
development and the preservation of the environment.
It establishes the functions of the departmental head and the relationship with the municipalities,
as well as the terms for integrating the associations of municipalities (Council and Intermunicipal
Technical Unit). On the other hand, it establishes the functions of the constituent bodies including the
municipal mayor, vice mayor, councilors, auxiliary mayors, etc., as well as the functions of the main
resources such as the secretary, auditor, treasurer, and members of the municipal corporations, among

2-9
others. On the other hand, it establishes the integration and operation of the Municipal Development
Council and the Citizen Transparency Commission.
Its functions include the provision of drinking water and sanitation services, establishing the
powers of the municipalities to form specialized units for the provision of services.
This Law attributes to the municipalities the power to define the rates for direct and indirect
municipal services, which must be published in the planning phase. The municipalities are also
empowered to collect the contribution for improvements, until it totally or partially recovers the
investment, to issue bonds for the financing of works and services, and to enter into financing contracts
with national and foreign financial institutions.
Standards related to Drinking Water and Sanitation
The following table presents the standards related to drinking water and sanitation.
Table 2-3-2 Drinking Water and Sanitation Standards Standards Year
Established
Decree
1 National technical standard for drinking water quality 1995 No. 84-1995 2 Technical standards for wastewater discharges to receiving bodies and
sanitary sewers 1996 No. 58-1996
3 Regulation on Quality of Service of Potable Water and Sanitary Sewage Service
2005 No. 001-2006
4 Design standards for drinking water systems 2004 - ― 5 Design standards for sanitary sewerage, storm sewerage and
wastewater treatment 2004 - ―
6 Technical guidelines for the incorporation of disaster mitigation measures in the design and construction of water and sanitation systems.
2005 - ―
a) National Technical Standard for Drinking Water Quality
The purpose of this standard is to protect public health by establishing the appropriate or maximum
levels of those components or characteristics of water that may represent a risk to the health of the
community and inconvenience for the preservation of water supply systems. The Water Quality
Standard establishes the basic requirements to which the quality of water supplied for human
consumption and for all domestic use must respond, regardless of its state, origin or degree of treatment.
For all purposes of regulations on the quality of the water supplied, this Quality Standard contains the
values for physical, chemical, and organoleptic parameters, as well as the parameters of organic
substances, pesticides, disinfectants and disinfection by-products with significance for health.
b) Technical Standards for Wastewater Discharges to Receiving Bodies and Sanitary Sewers
The purpose of these standards is to regulate wastewater discharges to receiving bodies and
sanitary sewers, and to promote the creation of waste minimization programs and the installation of
wastewater treatment and disposal systems. Any natural or legal, public or private person that carries
2-10
out activities that generate discharges must comply with the provisions described in the regulations.
When the discharges do not comply with the standards, the necessary corrective measures must be
incorporated within a period of no more than 18 months from the effective date of this Agreement.
Each direct or indirect discharge to a receiving body must comply with the general physical, chemical
and bacteriological characteristics whose maximum permissible ranges and concentrations are
specified in these standards.
c) Regulation of Quality of Service of Potable Water and Sanitary Sewage Service
The "General Regulations for the Quality of Drinking Water and Sewerage Service" establishes
the control parameters and recommendations for the specific Service Quality Regulations, which
should regulate the activities of each EPS in this aspect, and the relations between the EPS, the
respective Municipal Control Committee, in relation to the Quality of Service. These Regulations
define the conditions and characteristics to which the provision of public drinking water and sanitary
sewerage services must tend, within the reasonableness and possibility based on the capacity of the
EPSs. This General Regulation defines the requirements to be met by water and sewerage service
providers, classifying operators into metropolitan, urban and rural, in order to justify the flexibility
and gradual application of the Regulation's requirements. The regulated technical aspects of service
quality of metropolitan EPSs are: quality of drinking water; water pressure; continuity of service;
absence of sanitary sewer overflows; quality of wastewater discharge; and attention to users' technical
queries and complaints.
d) Aqueduct Design Standards
These design standards establish the technical requirements that aqueduct systems must meet.
They establish the specifications and design criteria for water sources, design period, design
population served, water demand, hydrological analysis, drinking water treatment process,
disinfection, storage, distribution pipelines and pumping stations.
e) Sewage, Storm and Wastewater Treatment Design Standards
These standards establish the basic design parameters for storm sewer and wastewater treatment
facilities and works to treat wastewater and efficiently dispose of stormwater. Specifically, they
establish the standards and guidelines applicable to conventional sewer systems (design periods,
population served, area served, flow velocity, pipe diameter, slopes, etc.), sewer systems, mini sewer
systems, wastewater treatment systems, selection of wastewater treatment technology, wastewater
treatment process, sludge treatment, stormwater and wastewater disposal systems, and effluent
pumping stations.
f) Technical Guidelines for Incorporation of Disaster Mitigation Measures in the Design and
Construction of Water and Sanitation Systems.
Drinking water and sanitation systems in Honduras have been vulnerable to environmental risks
and natural disasters, with a lack of environmental and social considerations in their design,

2-11
construction, maintenance and operation. Therefore, this technical guide establishes the rules and
standards to mitigate the negative impact caused by disasters. Specifically, it presents the norms,
variables, guidelines and proposals in each phase of planning, design, construction, operation,
maintenance and monitoring, taking into account the measures against damage to drinking water and
sanitation systems at the national level.
2-4 Organization and Institutionalization
The following table presents the list of relevant agencies and institutions in the water and sanitation
sector in Honduras. These agencies and institutions exercise powers attributed by the legal framework,
establishing the respective functions and responsibilities in the area of drinking water and sanitation.
Table 2-4-1 Drinking Water and Sanitation Sector Agencies and Institutions No. Organizations and Institutions / Official Name Acronyms 1 Secretary of Health SESAL 2 Secretary of Natural Resources and Environment MIAMBIENTE 3 Secretary of Finance SEFIN 4 Secretary of State in the Offices of the Interior and Justice SGJD 5 National Water and Sanitation Council CONASA 6 Drinking Water and Sewage Services Regulatory Entity ERSAPS 7 National Autonomous Service of Aqueducts and Sewage Systems
(Servicio Autónomo Nacional de Acueductos y Alcantarillados) SANAA
8 National Institute of Forest Conservation and Development, Protected Areas and Wildlife (INCAFE)
ICF
9 Municipal Governments GM 10 Service Providers EPS 11 Water Management Boards JAA 12 Regional Development Councils CRD 13 Forest Advisory Councils CCF 14 Basin Organizations CO
Source: Luis Moncada Gross 2019 1
Of these agencies and institutions, the National Water and Sanitation Council (CONASA) is
responsible for managing, planning and financing the drinking water and sanitation sector; the
Regulatory Agency for Drinking Water and Sanitation Services (ERSAPS) is responsible for granting
permits and authorizations, regulating, managing, sanctioning, providing technical assistance, etc.; and
finally the National Autonomous Service for Aqueducts and Sewerage (SANAA) is responsible for
managing the sector, developing infrastructure and providing technical assistance at the national level.
At the regional level, local governments assume the management and coordination of the drinking
water and sanitation sector, and their functions include planning, financing, infrastructure
development, permitting and authorization, regulation, financial management, land-use planning,
environmental protection, technical assistance, etc. Under the respective municipal government, the
1 Prontuario de Disposiciones Legales Atinentes a los Servicios de Agua Potable y Saneamiento, Luis Moncada
Gross 2019
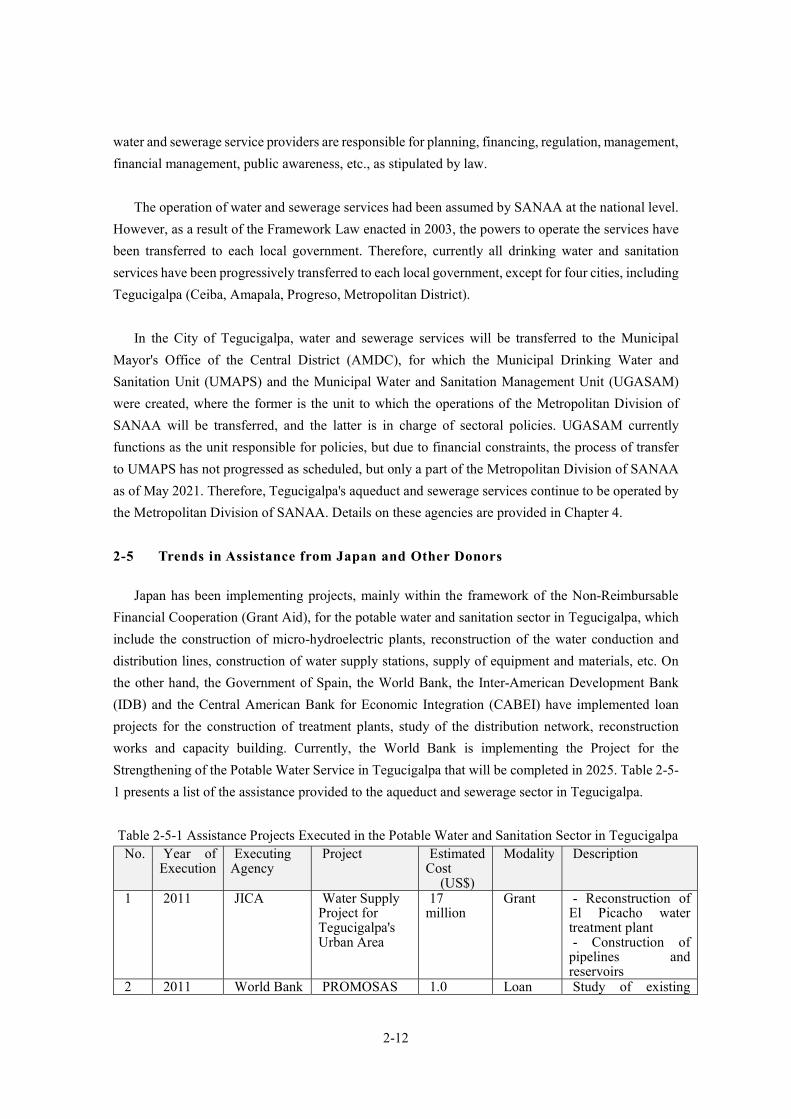
2-12
water and sewerage service providers are responsible for planning, financing, regulation, management,
financial management, public awareness, etc., as stipulated by law.
The operation of water and sewerage services had been assumed by SANAA at the national level.
However, as a result of the Framework Law enacted in 2003, the powers to operate the services have
been transferred to each local government. Therefore, currently all drinking water and sanitation
services have been progressively transferred to each local government, except for four cities, including
Tegucigalpa (Ceiba, Amapala, Progreso, Metropolitan District).
In the City of Tegucigalpa, water and sewerage services will be transferred to the Municipal
Mayor's Office of the Central District (AMDC), for which the Municipal Drinking Water and
Sanitation Unit (UMAPS) and the Municipal Water and Sanitation Management Unit (UGASAM)
were created, where the former is the unit to which the operations of the Metropolitan Division of
SANAA will be transferred, and the latter is in charge of sectoral policies. UGASAM currently
functions as the unit responsible for policies, but due to financial constraints, the process of transfer
to UMAPS has not progressed as scheduled, but only a part of the Metropolitan Division of SANAA
as of May 2021. Therefore, Tegucigalpa's aqueduct and sewerage services continue to be operated by
the Metropolitan Division of SANAA. Details on these agencies are provided in Chapter 4.
2-5 Trends in Assistance from Japan and Other Donors
Japan has been implementing projects, mainly within the framework of the Non-Reimbursable
Financial Cooperation (Grant Aid), for the potable water and sanitation sector in Tegucigalpa, which
include the construction of micro-hydroelectric plants, reconstruction of the water conduction and
distribution lines, construction of water supply stations, supply of equipment and materials, etc. On
the other hand, the Government of Spain, the World Bank, the Inter-American Development Bank
(IDB) and the Central American Bank for Economic Integration (CABEI) have implemented loan
projects for the construction of treatment plants, study of the distribution network, reconstruction
works and capacity building. Currently, the World Bank is implementing the Project for the
Strengthening of the Potable Water Service in Tegucigalpa that will be completed in 2025. Table 2-5-
1 presents a list of the assistance provided to the aqueduct and sewerage sector in Tegucigalpa.
Table 2-5-1 Assistance Projects Executed in the Potable Water and Sanitation Sector in Tegucigalpa No. Year of
Execution Executing
Agency Project Estimated
Cost (US$)
Modality Description
1 2011 JICA Water Supply Project for Tegucigalpa's Urban Area
17 million
Grant - Reconstruction of El Picacho water treatment plant - Construction of
pipelines and reservoirs
2 2011 World Bank PROMOSAS 1.0 Loan Study of existing
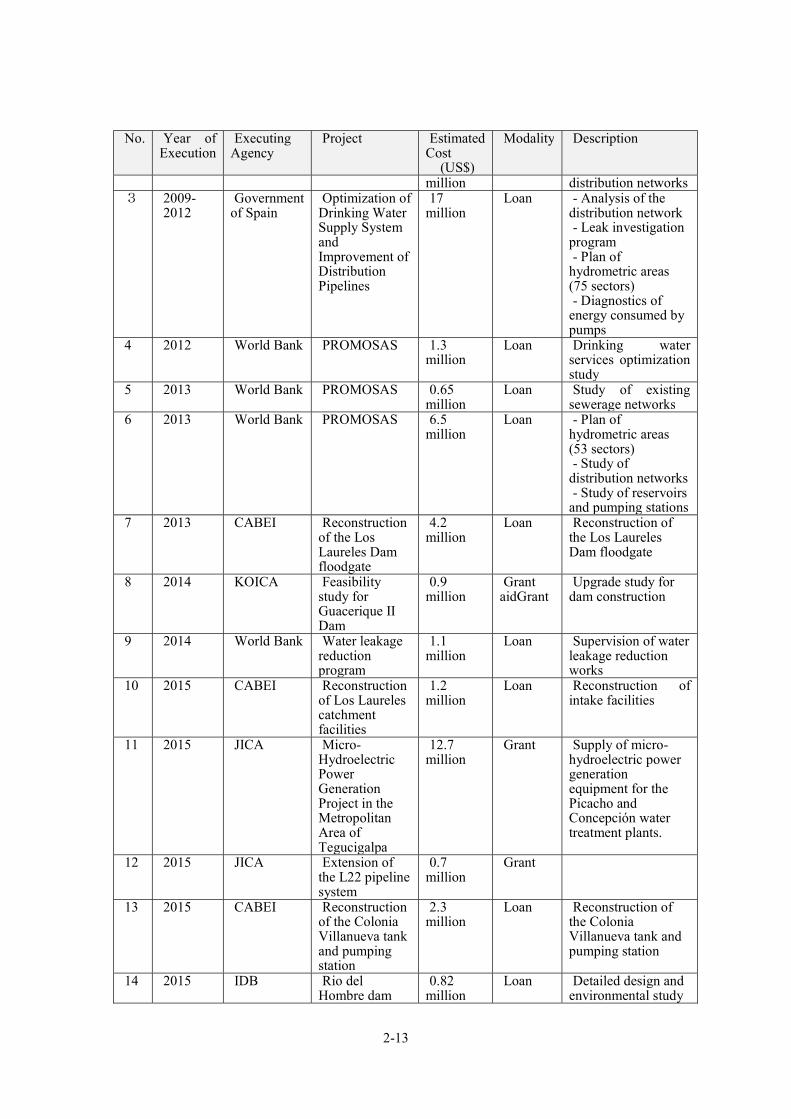
2-13
No. Year of Execution
Executing Agency
Project Estimated Cost
(US$)
Modality Description
million distribution networks 3 2009-
2012 Government
of Spain
Optimization of Drinking Water Supply System and Improvement of Distribution Pipelines
17 million
Loan - Analysis of the distribution network - Leak investigation
program - Plan of
hydrometric areas (75 sectors) - Diagnostics of
energy consumed by pumps
4 2012 World Bank PROMOSAS 1.3 million
Loan Drinking water services optimization study
5 2013 World Bank PROMOSAS 0.65 million
Loan Study of existing sewerage networks
6 2013 World Bank PROMOSAS 6.5 million
Loan - Plan of hydrometric areas (53 sectors) - Study of
distribution networks - Study of reservoirs
and pumping stations 7 2013 CABEI Reconstruction
of the Los Laureles Dam floodgate
4.2 million
Loan Reconstruction of the Los Laureles Dam floodgate
8 2014 KOICA Feasibility study for Guacerique II Dam
0.9 million
Grant aidGrant
Upgrade study for dam construction
9 2014 World Bank Water leakage reduction program
1.1 million
Loan Supervision of water leakage reduction works
10 2015 CABEI Reconstruction of Los Laureles catchment facilities
1.2 million
Loan Reconstruction of intake facilities
11 2015 JICA Micro-Hydroelectric Power Generation Project in the Metropolitan Area of Tegucigalpa
12.7 million
Grant Supply of micro-hydroelectric power generation equipment for the Picacho and Concepción water treatment plants.
12 2015 JICA Extension of the L22 pipeline system
0.7 million
Grant
13 2015 CABEI Reconstruction of the Colonia Villanueva tank and pumping station
2.3 million
Loan Reconstruction of the Colonia Villanueva tank and pumping station
14 2015 IDB Rio del Hombre dam
0.82 million
Loan Detailed design and environmental study

2-14
No. Year of Execution
Executing Agency
Project Estimated Cost
(US$)
Modality Description
feasibility study of the Rio del Hombre Dam
15 2016 CABEI Community capacity building
0.8 million
Loan Reforestation for the protection of aquifer recharge areas
16 2016 World Bank PROMOSAS 0.52 million
Loan Diagnosis for the transfer of SANAA to AMDC
17 2018 CABEI Optimization of Los Laureles drinking water treatment plant
1.4 million
Loan Reconstruction of Los Laureles drinking water treatment plant
18 2018 CABEI Reconstruction of the water treatment plant in La Concepción
1.4 million
Loan Reconstruction of the water treatment plant in La Concepción
19 2018 CABEI Reconstruction of Los Laureles drinking water treatment plant
1.5 million
Loan Reconstruction of Los Laureles drinking water treatment plant
20 2018 CABEI Project to transfer raw water from Los Laureles reservoir to the aerator of the Concepción reservoir water treatment plant.
9.7 million
Loan Detailed design and execution of raw water transfer works.
21 2019 IDB Institutional strengthening of the drinking water and sanitation sector
30 million
Loan - AMDC - Financial policy - Strengthening
operation and maintenance
22 2019-2024
World Bank Project for the Strengthening of the Potable Water Service in Tegucigalpa
50 million
Loan - Assistance in the transfer to UMAPS - Upgrading of water
treatment plants and distribution networks - Strengthening of
dam operation and maintenance capabilities - Strengthening of
operation and maintenance capabilities
Source: AMDC

CHAPTER 3 CURRENT SITUATION AND CHALLENGES OF THE POTABLE WATER SYSTEM IN THE MUNICIPALITY OF TEGUCIGALPA

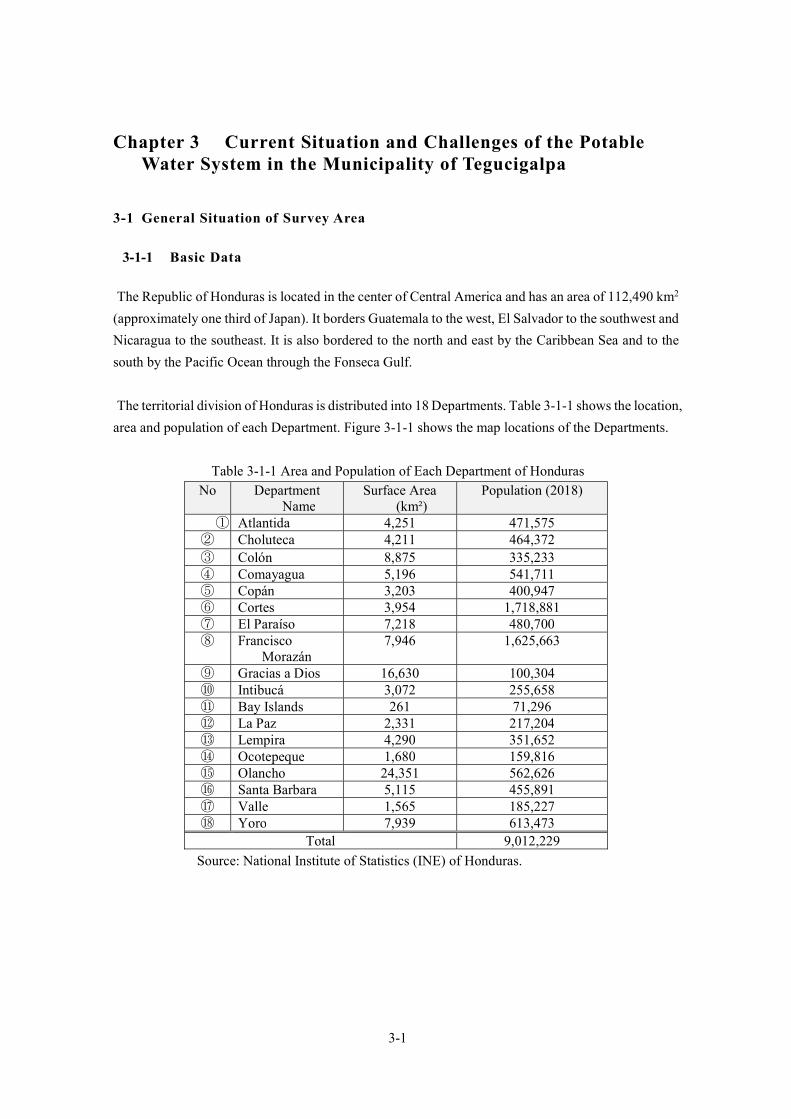
3-1
Chapter 3 Current Situation and Challenges of the Potable Water System in the Municipality of Tegucigalpa
3-1 General Situation of Survey Area
3-1-1 Basic Data
The Republic of Honduras is located in the center of Central America and has an area of 112,490 km2
(approximately one third of Japan). It borders Guatemala to the west, El Salvador to the southwest and
Nicaragua to the southeast. It is also bordered to the north and east by the Caribbean Sea and to the
south by the Pacific Ocean through the Fonseca Gulf.
The territorial division of Honduras is distributed into 18 Departments. Table 3-1-1 shows the location,
area and population of each Department. Figure 3-1-1 shows the map locations of the Departments.
Table 3-1-1 Area and Population of Each Department of Honduras No Department
Name Surface Area
(km²) Population (2018)
① Atlantida 4,251 471,575 ② Choluteca 4,211 464,372 ③ Colón 8,875 335,233 ④ Comayagua 5,196 541,711 ⑤ Copán 3,203 400,947 ⑥ Cortes 3,954 1,718,881 ⑦ El Paraíso 7,218 480,700 ⑧ Francisco
Morazán 7,946 1,625,663
⑨ Gracias a Dios 16,630 100,304 ⑩ Intibucá 3,072 255,658 ⑪ Bay Islands 261 71,296 ⑫ La Paz 2,331 217,204 ⑬ Lempira 4,290 351,652 ⑭ Ocotepeque 1,680 159,816 ⑮ Olancho 24,351 562,626 ⑯ Santa Barbara 5,115 455,891 ⑰ Valle 1,565 185,227 ⑱ Yoro 7,939 613,473
Total 9,012,229
Source: National Institute of Statistics (INE) of Honduras.
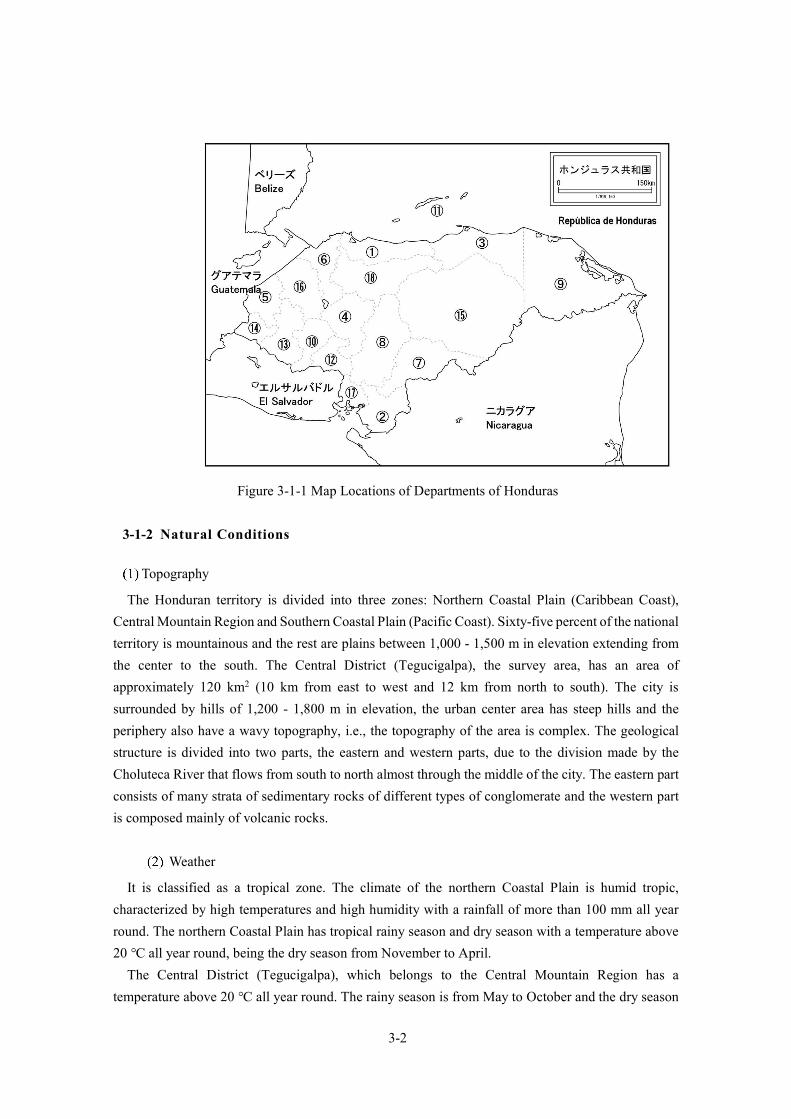
3-2
Figure 3-1-1 Map Locations of Departments of Honduras
3-1-2 Natural Conditions
Topography
The Honduran territory is divided into three zones: Northern Coastal Plain (Caribbean Coast),
Central Mountain Region and Southern Coastal Plain (Pacific Coast). Sixty-five percent of the national
territory is mountainous and the rest are plains between 1,000 - 1,500 m in elevation extending from
the center to the south. The Central District (Tegucigalpa), the survey area, has an area of
approximately 120 km2 (10 km from east to west and 12 km from north to south). The city is
surrounded by hills of 1,200 - 1,800 m in elevation, the urban center area has steep hills and the
periphery also have a wavy topography, i.e., the topography of the area is complex. The geological
structure is divided into two parts, the eastern and western parts, due to the division made by the
Choluteca River that flows from south to north almost through the middle of the city. The eastern part
consists of many strata of sedimentary rocks of different types of conglomerate and the western part
is composed mainly of volcanic rocks.
Weather
It is classified as a tropical zone. The climate of the northern Coastal Plain is humid tropic,
characterized by high temperatures and high humidity with a rainfall of more than 100 mm all year
round. The northern Coastal Plain has tropical rainy season and dry season with a temperature above
20 all year round, being the dry season from November to April.
The Central District (Tegucigalpa), which belongs to the Central Mountain Region has a
temperature above 20 all year round. The rainy season is from May to October and the dry season

3-3
is from November to April. Figure 3-1-2 shows the average temperatures from 2016 to 2020. From
September through November is the most humid season of the year due to hurricanes and other weather
systems. In 1998, Hurricane Mitch caused devastating damages. In 2020, hurricanes Eta and Iota
caused enormous damages. Flooding has occurred in the coastal regions and landslides and mudslides
have occurred in the urban area of the municipality of the Central District (Tegucigalpa). Figure 3-1-
3 shows the annual precipitation. In 2019, precipitation was lower than other years and the catchment
volume in La Concepción Reservoir and Los Laureles Dam dropped considerably. On the other hand,
in 2020 precipitation was more than double in relation to 2019 due to hurricanes. All this indicates
that Honduras is susceptible to the effects of climate change.
Figure 3-1-2Precipitation (Monthly) and Temperature Figure 3-1-3 Annual Precipitation
3-1-3 Socio-economic Status
Summary
Honduras is the third poorest country in the Latin America and Caribbean Region. In recent years,
Honduras has registered the second highest economic growth in Central America, after Panama.
Honduras' GDP growth rate has reached 4.84 % in 2017, 3.69 % in 2018 and 2.63 % in 2019, higher
than the average for Central America and well above the average for the Latin America and Caribbean
Region. However, it faces a high level of poverty and inequality. At the national level, approximately
48.3% of people are in poverty, and the percentage of people in poverty is higher in rural areas than
in urban areas. In 2020, due to the COVID-19 pandemic, there have been large drops in foreign trade,
investment and consumption, and GDP is expected to fall by 7.1 % and the unemployment rate will
rise by 9.31 %. Table 3-1-2 shows the main economic indicators.
Table 3-1-2 Main Economic Indicators Indicator 2015 2016 2017 2018 2019 2020
GDP (US$ million) 20,980 21,718 23,136 24,024 25,095 23,827
0.0
5.0
10.0
15.0
20.0
25.0
30.0
0.0
50.0
100.0
150.0
200.0
250.0
300.0
1月 2月 3月 4月 5月 6月 7月 8月 9月 10月 11月 12月
Tem
pera
tura
(℃
)
Pre
cip
itac
i n(m
m)
932.2883.4
696.5
548.8
1245.4
0.0
200.0
400.0
600.0
800.0
1000.0
1200.0
1400.0
2016 2017 2018 2019 2020
Pre
cip
itac
i n a
nual
(m
m)
Jan Feb Mar Apr May Jun July Aug Sep Oct Nov Dec

3-4
GDP per capita (US$)
2,302.2 2,342.5 2,453.7 2,505.7 2,574.9 2,405.7
Economic growth rate (%)
3.84 3.89 4.84 3.69 2.63 -8.965
Inflation (%) 3.158 2.725 3.934 4.347 4.366 3.468 Unemployment rate
(%) 6.15 6.73 5.53 5.65 5.57 9.39
Source: World Bank Open Data
General Economic Situation
The main industries are coffee, banana, palm oil and shrimp industries, and as secondary industries,
the textile and apparel industry as well as the export of electronic products for automobiles are noted.
These are produced in free trade zones (hereinafter referred to as "maquiladoras") where incentives
are granted to foreign companies to attract their investments. As a tertiary industry, tourism can be
mentioned.
Dependence on traditional industries such as coffee and bananas remains high, however, attempts
are being made to overcome this by developing new industries, among them the maquiladora
manufacturing industry (especially textiles) and tourism. On the other hand, there is a large amount of
remittances sent from Hondurans living in the U.S. (approximately one million people), and in 2019,
the amount sent was around 5,400 million USD. This amount is equivalent to approximately 20% of
GDP. Table 3-1-3-2 shows the summary of foreign trade.
Honduras is part of the HIPC (Highly Indebted Poor Countries) initiative; however, the IMF Board
of Directors in March 2005 and the World Bank Board of Directors in April of the same year decided
that the country had reached the termination point. As a result, debts owed to international
organizations (commitment amount: about US$ 300 million) and bilateral debts (expected amount:
US$ 940 million) were condoned. Japan forgave an approximate amount of 58.1 billion yen. Honduras'
official external debt in 2019 was US$ 7,699 million.
Table 3-1-3 Summary of Foreign Trade (2019 ) Item Content
Total amount of foreign trade
(1) Exports (F.O.B) 2019: US$ 8,714.9 million, 2020: US$ 7,732.9 million (2) Imports (C.I.F) 2019: US$ 11,853.9 million, 2020: US$ 9,871.1 million
Main trading partners
(1) Export 1st place USA (33.0 %); 2nd place El Salvador (9.1 %); 3rd place Germany
(8.3 %) Import
1st place USA (31.2 %); 2nd place China (19.2 %); 3rd place Guatemala (8.9 %). (31.2 %)
Source: Web page of the Ministry of Foreign Affairs, Foreign Trade Report, Central Bank of
Honduras.

3-5
3-1-4 Socio-environmental Considerations
In Honduras, the General Environmental Law (Decree 104-93) establishes that the National
Environmental Impact Assessment System (hereinafter, "SINEIA") is under the responsibility of the
Secretary of Energy, Natural Resources, Environment and Mines (hereinafter, "MiAmbiente"). Decree
189-2009 stipulates that the SINEIA is responsible for the Environmental Impact Assessment
(hereinafter, "EIA") and the management of private and public sector projects that may affect the
environment.
To obtain an environmental license in "MiAmbiente", the procedures are carried out at the General
Directorate of Environmental Evaluation and Control (DECA) and at the Environmental Units (UNA).
The DECA reviews the EIA and performs the technical supervision of the licenses. The UNAs carry
out the regulation and monitoring processes. In accordance with the Regulations of the National
Registry of Environmental Service Providers (Agreement 1205-2002), environmental consultants
registered in MiAmbiente's environmental service provider system may conduct the EIA and submit
it for review for environmental licensing.
Environmental License Application
Project executing agencies must obtain an environmental license before implementing the project.
The necessary information must be provided to the SINEA by category classification. Table 3-1-4
shows the category classification and the documents to be submitted.
Table 3-1-4 Classification of Categories and Documents to be Delivered Category Environmental
Impact Documents to be Submitted to
MiAmbiente EIA
1 Low Form F-01 Not necessary. 2 Medium Form F-02, Environmental
management plan
Not necessary.
3 High Necessary depending on
the situation.
4 Very high FormF-02, Environmental impact
study
Not necessary.
Source: MiAmbiente data edited by the Study Team.
The categories are established for each project. Also, when the project involves the construction of
reservoirs and dams, as well as the relocation of inhabitants, the EIA is required to be implemented.
The categories for water and sanitation related projects are shown below.
Table 3-1-5 Water and Sewerage Facilities Category 1 2 3 4 Surface area of the
WTP 500-1,000 m 2 1,000-5,000 m 2 5,000-10,000 m
2 More than 10,000 m 2
Source: Ministerial Agreement No. 0740-2019
3-6
Table 3-1-6 Sewage Facilities Category 1 2 3 4
Wastewater plant treatment volume
Less than 250 (m3/day)
251-400 (m3/day)
More than 401 (m3/day)
-
Source: Ministerial Agreement No. 0740-2019
Evaluation
MiAmbiente reviews the documents submitted and comments on whether or not it is necessary to
correct the environmental management plan. Once the submitted documents are approved, the
environmental license is granted.
Citizen Participation
Citizen participation is required at all stages. Especially, in case of categories 2, 3 and 4, it is necessary
to notify NGOs and local inhabitants about the implementation of the EIA. In particular, in case of
category 4, it is necessary to publish all EIA information. When MiAmbiente determines necessary,
an open discussion should be held.
3-2 Summary of Potable Water System
Section 3-2-1 describes the Water Demand Projection, 3-2-2 describes the improvement plan and
progress, and 3-2-3 describes the requests given by AMDC.
3-2-1 Water Demand Projection
Regarding population statistics in water demand forecasting, the National Census has been
conducted in 2003 and 2013. To date, the AMDC and SANAA have made the projections of water
demand through different studies by JICA, World Bank, Spain and IDB, among others. However,
there is no consistency between the reports in terms of population growth rate, unit water consumption
rate, water calculation method for industrial and commercial use, the concept of maximum daily
consumption coefficient, etc.
Table 3-2-1 and Figure 3-2-1 show the projected population growth rate and projected water
demand currently in use at AMDC and SANAA. The population growth rate ranges from 3.00 % to
4.70 % and the non-revenue water (NRW) rate ranges from 15 % to 23.57 %. On the other hand, the
NRW rate in 2020 was 32.9 % (average between 2016 and 2020) and is distant from the current
situation, so it is necessary to revise the plan. The water demand in 2030 is 6,446 L/s and the average
water production between 2016 and 2020 is around 2,500 L/s, so there will definitely be a lack of
water supply in the future.
When creating a new AMDC system in the future, new water demand projection parameters should
be established including target year, distribution areas to be expanded in the future, population growth
rate, water leakage rate forecast, calculation method, etc.
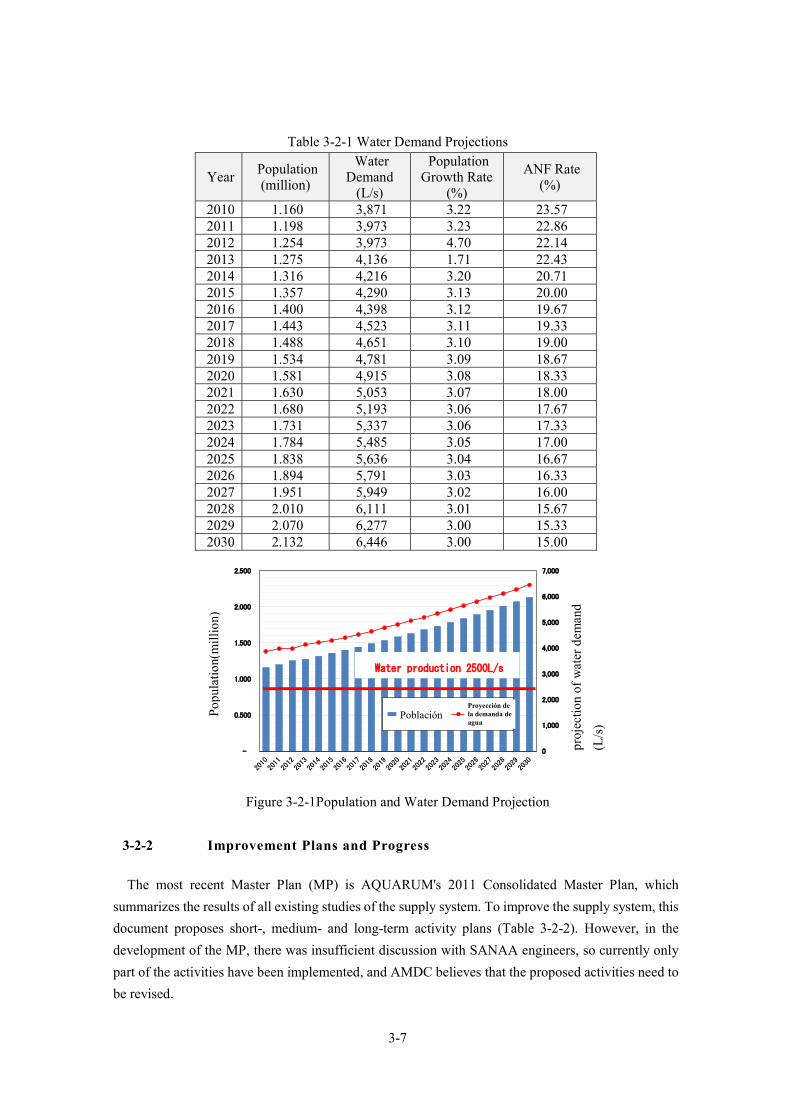
3-7
Table 3-2-1 Water Demand Projections
Year Population (million)
Water Demand
(L/s)
Population Growth Rate
(%)
ANF Rate (%)
2010 1.160 3,871 3.22 23.57 2011 1.198 3,973 3.23 22.86 2012 1.254 3,973 4.70 22.14 2013 1.275 4,136 1.71 22.43 2014 1.316 4,216 3.20 20.71 2015 1.357 4,290 3.13 20.00 2016 1.400 4,398 3.12 19.67 2017 1.443 4,523 3.11 19.33 2018 1.488 4,651 3.10 19.00 2019 1.534 4,781 3.09 18.67 2020 1.581 4,915 3.08 18.33 2021 1.630 5,053 3.07 18.00 2022 1.680 5,193 3.06 17.67 2023 1.731 5,337 3.06 17.33 2024 1.784 5,485 3.05 17.00 2025 1.838 5,636 3.04 16.67 2026 1.894 5,791 3.03 16.33 2027 1.951 5,949 3.02 16.00 2028 2.010 6,111 3.01 15.67 2029 2.070 6,277 3.00 15.33 2030 2.132 6,446 3.00 15.00
Figure 3-2-1Population and Water Demand Projection
3-2-2 Improvement Plans and Progress
The most recent Master Plan (MP) is AQUARUM's 2011 Consolidated Master Plan, which
summarizes the results of all existing studies of the supply system. To improve the supply system, this
document proposes short-, medium- and long-term activity plans (Table 3-2-2). However, in the
development of the MP, there was insufficient discussion with SANAA engineers, so currently only
part of the activities have been implemented, and AMDC believes that the proposed activities need to
be revised.
0
1,000
2,000
3,000
4,000
5,000
6,000
7,000
-
0.500
1.000
1.500
2.000
2.500水
需要
予測
(L/s)
人口
(百万
人)
人口(百万) 水需要(L/s)
Pro
yecc
ión
de la
de
man
da d
e ag
ua(L
/s)
Pob
laci
ón(M
illio
n)
PoblaciónProyección de la demanda de agua
Water production 2500L/s
Pop
ulat
ion(
mil
lion
)
proj
ecti
on o
f w
ater
dem
and
(L/s
)
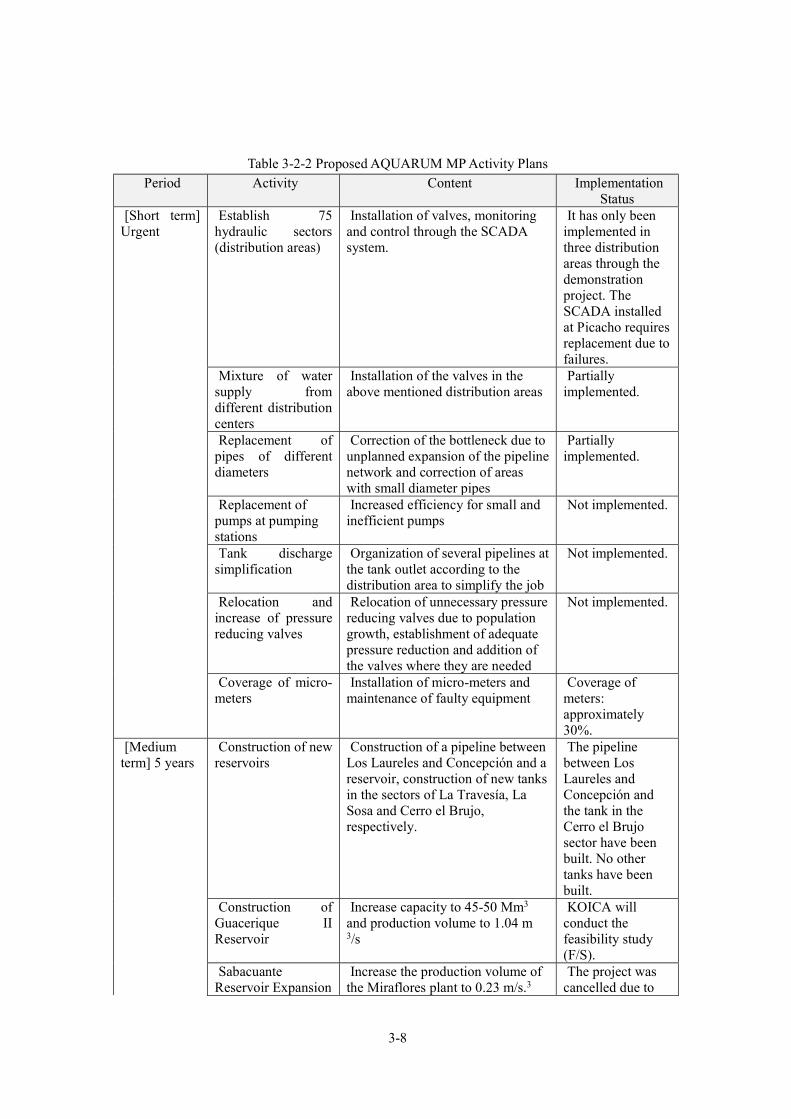
3-8
Table 3-2-2 Proposed AQUARUM MP Activity Plans Period Activity Content Implementation
Status [Short term]
Urgent Establish 75
hydraulic sectors (distribution areas)
Installation of valves, monitoring and control through the SCADA system.
It has only been implemented in three distribution areas through the demonstration project. The SCADA installed at Picacho requires replacement due to failures.
Mixture of water supply from different distribution centers
Installation of the valves in the above mentioned distribution areas
Partially implemented.
Replacement of pipes of different diameters
Correction of the bottleneck due to unplanned expansion of the pipeline network and correction of areas with small diameter pipes
Partially implemented.
Replacement of pumps at pumping stations
Increased efficiency for small and inefficient pumps
Not implemented.
Tank discharge simplification
Organization of several pipelines at the tank outlet according to the distribution area to simplify the job
Not implemented.
Relocation and increase of pressure reducing valves
Relocation of unnecessary pressure reducing valves due to population growth, establishment of adequate pressure reduction and addition of the valves where they are needed
Not implemented.
Coverage of micro-meters
Installation of micro-meters and maintenance of faulty equipment
Coverage of meters: approximately 30%.
[Medium term] 5 years
Construction of new reservoirs
Construction of a pipeline between Los Laureles and Concepción and a reservoir, construction of new tanks in the sectors of La Travesía, La Sosa and Cerro el Brujo, respectively.
The pipeline between Los Laureles and Concepción and the tank in the Cerro el Brujo sector have been built. No other tanks have been built.
Construction of Guacerique II Reservoir
Increase capacity to 45-50 Mm3 and production volume to 1.04 m 3/s
KOICA will conduct the feasibility study (F/S).
Sabacuante Reservoir Expansion
Increase the production volume of the Miraflores plant to 0.23 m/s.3
The project was cancelled due to

3-9
Period Activity Content Implementation Status
the construction of the San José Dam in the upper course.
Replacement of obsolete pipelines
Replacement of pipelines in El Bosque and Buenos Aires neighborhoods
Already implemented
[Long term] 20 years
Rehabilitation of the entire pipeline network in the water supply area.
For the neighborhoods of Los Pinos and Villanueva administered by the Water Committees and the "Barrios en Desarrollo" (SANAA unit). In these neighborhoods, the population density is high and development has been inefficient, thus affecting other neighborhoods in the same supply system. It is also necessary to change the size of the pumping stations that increase the pressure in these two neighborhoods, as well as the expansion and relocation of the tank.
Not implemented.
Construction of the Río del Hombre Dam
Increase production volume from 1.5 to 2.3 m 3/s
Not implemented.
It should be noted that AQUARUM's MP also mentions about the implementation of the financial
assessment to reduce the deficit and the scenario of increasing the production volume in the short,
medium and long term to increase the volume of water production However, these are also distant
from the current source development planning and implementation made by AMDC, i.e., it has low
effectiveness.
Table 3-2-3 AQUARUM MP Proposed Source Water Development Plans Term Activity Content Implementation
Status Short-
term Integral management of
water leaks On the condition that the supply is
guaranteed for 24 - 36 hours to be able to detect water leaks with acoustic water leak detection methods.
The Water Leakage Management Division is executing it.
Strengthening of groundwater pumping volume
According to the SANAA study, it is possible to increase to 0.38 m 3/s.
Not implemented.
Dredging of Los Laureles Dam
Increase in supply by 4,057 m 3/day The dredging system has been constructed, but its use was suspended due to algae blooms.
Ojojona Dam Increase of 0.3m 3/s, it is necessary to perform the environmental F/S.
Not implemented.
Fish Lagoon (Laguna del Pescado)
Increase of 0.08 m 3/s Not implemented.
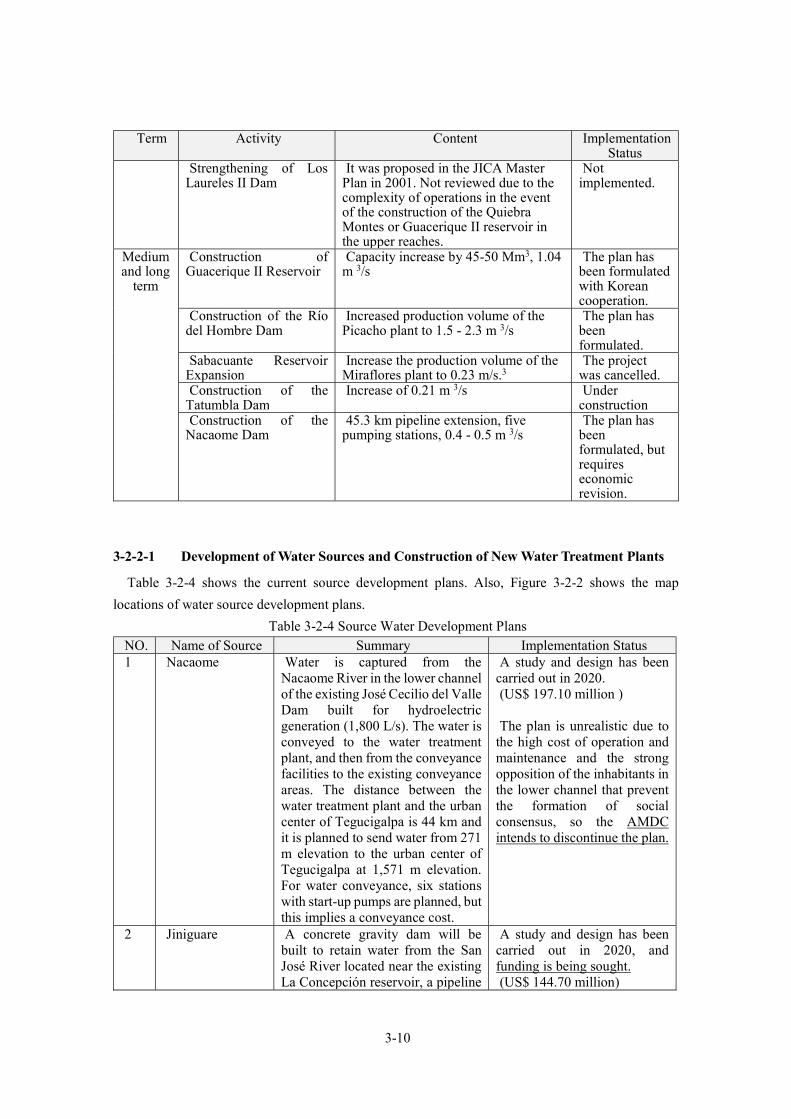
3-10
Term Activity Content Implementation Status
Strengthening of Los Laureles II Dam
It was proposed in the JICA Master Plan in 2001. Not reviewed due to the complexity of operations in the event of the construction of the Quiebra Montes or Guacerique II reservoir in the upper reaches.
Not implemented.
Medium and long
term
Construction of Guacerique II Reservoir
Capacity increase by 45-50 Mm3, 1.04 m 3/s
The plan has been formulated with Korean cooperation.
Construction of the Río del Hombre Dam
Increased production volume of the Picacho plant to 1.5 - 2.3 m 3/s
The plan has been formulated.
Sabacuante Reservoir Expansion
Increase the production volume of the Miraflores plant to 0.23 m/s.3
The project was cancelled.
Construction of the Tatumbla Dam
Increase of 0.21 m 3/s Under construction
Construction of the Nacaome Dam
45.3 km pipeline extension, five pumping stations, 0.4 - 0.5 m 3/s
The plan has been formulated, but requires economic revision.
3-2-2-1 Development of Water Sources and Construction of New Water Treatment Plants
Table 3-2-4 shows the current source development plans. Also, Figure 3-2-2 shows the map
locations of water source development plans.
Table 3-2-4 Source Water Development Plans NO. Name of Source Summary Implementation Status 1 Nacaome
Water is captured from the
Nacaome River in the lower channel of the existing José Cecilio del Valle Dam built for hydroelectric generation (1,800 L/s). The water is conveyed to the water treatment plant, and then from the conveyance facilities to the existing conveyance areas. The distance between the water treatment plant and the urban center of Tegucigalpa is 44 km and it is planned to send water from 271 m elevation to the urban center of Tegucigalpa at 1,571 m elevation. For water conveyance, six stations with start-up pumps are planned, but this implies a conveyance cost.
A study and design has been carried out in 2020. (US$ 197.10 million ) The plan is unrealistic due to
the high cost of operation and maintenance and the strong opposition of the inhabitants in the lower channel that prevent the formation of social consensus, so the AMDC intends to discontinue the plan.
2 Jiniguare A concrete gravity dam will be built to retain water from the San José River located near the existing La Concepción reservoir, a pipeline
A study and design has been carried out in 2020, and funding is being sought. (US$ 144.70 million)

3-11
NO. Name of Source Summary Implementation Status and a water treatment plant (900 L/s).
3 Jacaleapa A concrete gravity dam retaining the water from the Sabacuante River, a pipeline and a water treatment plant will be built. After completion, the use of the existing Miraflores Water Treatment Plant will be suspended.
A study and design has been carried out in 2020. The bidding process was
carried out in 2020. Work began in March 2021. Temporary suspension of
work in June 2021. Completion scheduled for
August 2024. (US$ 220 million)
4 Guacerique A dam will be built on the upper course of the existing Los Laureles Dam.
Study and design has been carried out in 2019. They are seeking financial
support. (US$ 378.9 million) Due to the generation of many
relocation cases, the AMDC intends to discontinue the plan.
5 Rio del Hombre A reservoir will be built on the Rio del Hombre to convey the water. Construction is planned after 2035.
A study and design was carried out in 2015. They are seeking financial
support. For the AMDC, it is the most
promising project.
Source: Data from AMDC
Figure 3-2-2 Water Source Development Plan Location Map

3-12
Nacaome Project
Table 3-2-5 shows the specifications for the Nacaome Project. It should be noted that the cost of
water pumping is very high, requiring US$35.9 million annually for electricity alone at six pumping
stations to send water from the water treatment plant to the urban center of Tegucigalpa.
The Nacaome Dam is for hydroelectric generation and the discharged water is used for irrigation in
the lower river basin. The Choluteca and Valle Departments located in the lower river basin are
opposing the use of the water source for drinking water for the municipality of Tegucigalpa in the
Nacaome Project. There is the possibility of a social conflict over water in the future, and this project
involves a high cost of operation and maintenance, and therefore, the AMDC intends to discontinue
the plan.
Table 3-2-5 Main Specifications of Nacaome Project Installation Specifications
Spillway Width: 115 m Height: 3.8 m
Pumping station for catchment
Receiving well: L17 m×W6 m×H7.1 m, pump: six 370 kW units.
Adduction piping 1800×255 m, DIP Purification plant Treatment volume: 1800 L/s
Treatment flow: Aeration Coagulation and sedimentation tank Rapid filtration tank.
Pumping stations Six pumping stations (1600 L/s) PS1: 11 pumps (elevation 120 m, total length 6.4 km, 4,045 kW) PS2: 16 pumps (elevation 271 m, total length 5. km, 5,885 kW) PS3: 14 pumps (elevation 767 m, total length 3.49 km, 5,148 kW) PS4: 16 pumps (elevation 1,028 m, total length 8.1 km, 5,884 kW) PS5: 17 pumps (elevation 1,313 m, total length 4.49 km, 5,884 kW)
Treatment tank Five tanks, circular (4,200 m3) Connected to the existing pipeline network (around La Concepción Water
Treatment Plant).
Source: Data from the AMDC edited by the Study Team.
Jiniguare Project
It is planned to construct a concrete gravity dam retaining water from the San Jose River about 2.0
km south of the existing La Concepcion reservoir, a 6.8 km pipeline, and a new water treatment plant
to convey water to the existing pipeline system. The following table shows the main specifications.
Table 3-2-6 Jiniguare Project Installation Specifications
Storage tank Concrete gravity type dam Length: 298 m Height: 90 m Total storage volume: 2.28 km 3 Effective storage capacity: 2.09 km 3
Catchment volume: 1,000 L/s Conduction piping 800×6800 m Steel pipe

3-13
Installation Specifications Booster pumps: Three units
Water treatment plant
Capacity: 900 L/s
Source: Data from the AMDC edited by the Study Team.
Jacaleapa Project
A dam will be built downstream of the confluence of the Sabacuante River and Canoas River. The
water will be collected, processed at the water treatment plant, and sent to the existing pipeline system.
After completion of this project, the use of the existing Miraflores Water Treatment Plant will be
suspended. On March 11, 2019, AMDC issued the call for expressions of interest for the bidding, and
in March 2021, a contractor from Ecuador won the bid and started the works. Construction of the dam
and water treatment plant is scheduled to be completed within two years. It should be noted that this
is a turnkey contract, so AMDC specified the objectives and basic conditions in the bidding documents,
after which the contractor must carry out the detailed design. Due to the design change made in June
2021, the works were temporarily suspended. In July 2021 the works were restarted, however, the
initial plan changed, and now it is planned to capture water in two dams, pump and send by gravity to
the water treatment plant. The following table and figure show the main specifications. Completion of
the works is scheduled for August 2024.
Table 3-2-7 Jacaleapa Project Installation Specifications
Storage tank Type: gravity dam Material: concrete Storage capacity : 9,200 km 3
Length : 62 m Elevation of the sill : 1,062.30mm Intake design flow : 800 L/s
Water treatment plant
Production flow : 800 L/s Type: modular plant Aerator, coagulation, rapid sedimentation, chemical injection, sand filtration, control panel, supply piping, backwashing system, water quality testing equipment, etc.
Source: Data from the AMDC edited by the Study Team.

3-14
Jacaleapa Dam and water treatment plant construction site
Spillway construction site (①). Dam construction site (②).
Water treatment plant construction site (③). Temporary office for construction
Figure 3-2-3 Overview of Jacaleapa Project
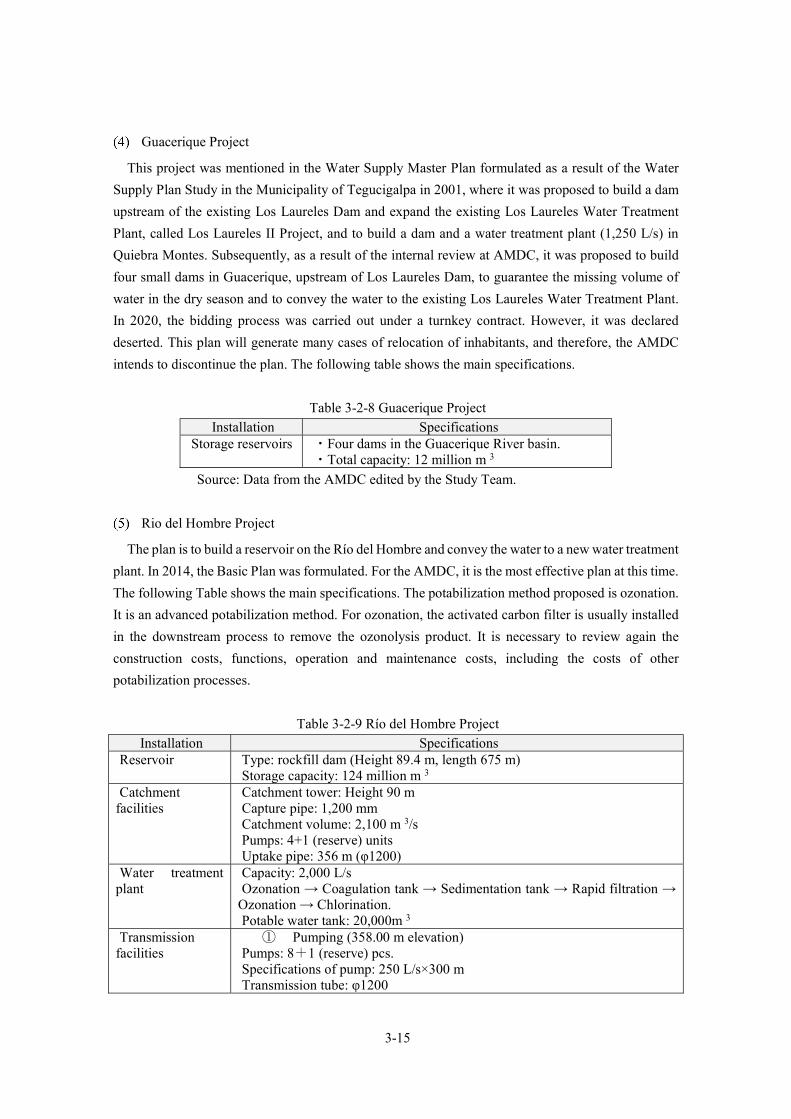
3-15
Guacerique Project
This project was mentioned in the Water Supply Master Plan formulated as a result of the Water
Supply Plan Study in the Municipality of Tegucigalpa in 2001, where it was proposed to build a dam
upstream of the existing Los Laureles Dam and expand the existing Los Laureles Water Treatment
Plant, called Los Laureles II Project, and to build a dam and a water treatment plant (1,250 L/s) in
Quiebra Montes. Subsequently, as a result of the internal review at AMDC, it was proposed to build
four small dams in Guacerique, upstream of Los Laureles Dam, to guarantee the missing volume of
water in the dry season and to convey the water to the existing Los Laureles Water Treatment Plant.
In 2020, the bidding process was carried out under a turnkey contract. However, it was declared
deserted. This plan will generate many cases of relocation of inhabitants, and therefore, the AMDC
intends to discontinue the plan. The following table shows the main specifications.
Table 3-2-8 Guacerique Project Installation Specifications
Storage reservoirs ・Four dams in the Guacerique River basin. ・Total capacity: 12 million m 3
Source: Data from the AMDC edited by the Study Team.
Rio del Hombre Project
The plan is to build a reservoir on the Río del Hombre and convey the water to a new water treatment
plant. In 2014, the Basic Plan was formulated. For the AMDC, it is the most effective plan at this time.
The following Table shows the main specifications. The potabilization method proposed is ozonation.
It is an advanced potabilization method. For ozonation, the activated carbon filter is usually installed
in the downstream process to remove the ozonolysis product. It is necessary to review again the
construction costs, functions, operation and maintenance costs, including the costs of other
potabilization processes.
Table 3-2-9 Río del Hombre Project Installation Specifications
Reservoir Type: rockfill dam (Height 89.4 m, length 675 m) Storage capacity: 124 million m 3
Catchment facilities
Catchment tower: Height 90 m Capture pipe: 1,200 mm Catchment volume: 2,100 m 3/s Pumps: 4+1 (reserve) units Uptake pipe: 356 m (φ1200)
Water treatment plant
Capacity: 2,000 L/s Ozonation Coagulation tank Sedimentation tank Rapid filtration
Ozonation Chlorination. Potable water tank: 20,000m 3
Transmission facilities
① Pumping (358.00 m elevation) Pumps: 8+1 (reserve) pcs. Specifications of pump: 250 L/s×300 m Transmission tube: φ1200

3-16
Installation Specifications Total length: 3,931 m
② Relief tank (by gravity from the relief tank to the city) Tank capacity: 4,500 m 3
Diameter of transmission tube: φ1200 Total length of transmission pipeline: 10,510 m (33,000 ft) Diameter of transmission tube: φ1200
Distribution tank Tank capacity: 30,000 m 3 (1255 m elevation)
Source: Data from the AMDC edited by the Study Team.
Project area Illustrative image of the dam
Floor plan Dam section plan
Figure 3-2-4 General Description of Rio del Hombre Facilities
3-2-2-2 Rehabilitation of Existing Potable Water Treatment Plants
The rehabilitation of the existing water treatment plants is implemented with the purpose of
improving their efficiency and increase the production volume up to 95% of the design capacity,
according to the "Project for the Strengthening of the Potable Water Service in Tegucigalpa" of the
World Bank. Although not yet started to date, it is projected to start the study from 2022 and execute
the rehabilitation works between 2023 and 2024 according to the results of the study. The following
table shows the details of the rehabilitation.
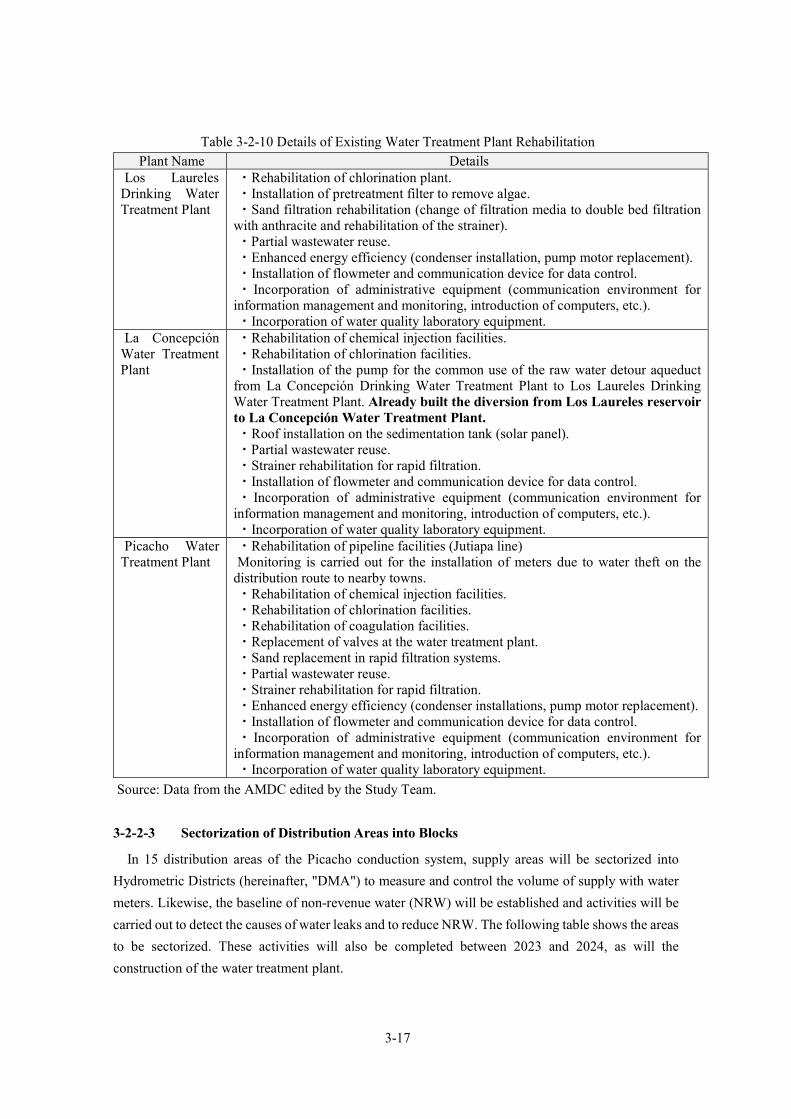
3-17
Table 3-2-10 Details of Existing Water Treatment Plant Rehabilitation Plant Name Details
Los Laureles Drinking Water Treatment Plant
・Rehabilitation of chlorination plant. ・Installation of pretreatment filter to remove algae. ・Sand filtration rehabilitation (change of filtration media to double bed filtration
with anthracite and rehabilitation of the strainer). ・Partial wastewater reuse. ・Enhanced energy efficiency (condenser installation, pump motor replacement). ・Installation of flowmeter and communication device for data control. ・ Incorporation of administrative equipment (communication environment for
information management and monitoring, introduction of computers, etc.). ・Incorporation of water quality laboratory equipment.
La Concepción Water Treatment Plant
・Rehabilitation of chemical injection facilities. ・Rehabilitation of chlorination facilities. ・Installation of the pump for the common use of the raw water detour aqueduct
from La Concepción Drinking Water Treatment Plant to Los Laureles Drinking Water Treatment Plant. Already built the diversion from Los Laureles reservoir to La Concepción Water Treatment Plant. ・Roof installation on the sedimentation tank (solar panel). ・Partial wastewater reuse. ・Strainer rehabilitation for rapid filtration. ・Installation of flowmeter and communication device for data control. ・ Incorporation of administrative equipment (communication environment for
information management and monitoring, introduction of computers, etc.). ・Incorporation of water quality laboratory equipment.
Picacho Water Treatment Plant
・Rehabilitation of pipeline facilities (Jutiapa line) Monitoring is carried out for the installation of meters due to water theft on the
distribution route to nearby towns. ・Rehabilitation of chemical injection facilities. ・Rehabilitation of chlorination facilities. ・Rehabilitation of coagulation facilities. ・Replacement of valves at the water treatment plant. ・Sand replacement in rapid filtration systems. ・Partial wastewater reuse. ・Strainer rehabilitation for rapid filtration. ・Enhanced energy efficiency (condenser installations, pump motor replacement). ・Installation of flowmeter and communication device for data control. ・ Incorporation of administrative equipment (communication environment for
information management and monitoring, introduction of computers, etc.). ・Incorporation of water quality laboratory equipment.
Source: Data from the AMDC edited by the Study Team.
3-2-2-3 Sectorization of Distribution Areas into Blocks
In 15 distribution areas of the Picacho conduction system, supply areas will be sectorized into
Hydrometric Districts (hereinafter, "DMA") to measure and control the volume of supply with water
meters. Likewise, the baseline of non-revenue water (NRW) will be established and activities will be
carried out to detect the causes of water leaks and to reduce NRW. The following table shows the areas
to be sectorized. These activities will also be completed between 2023 and 2024, as will the
construction of the water treatment plant.
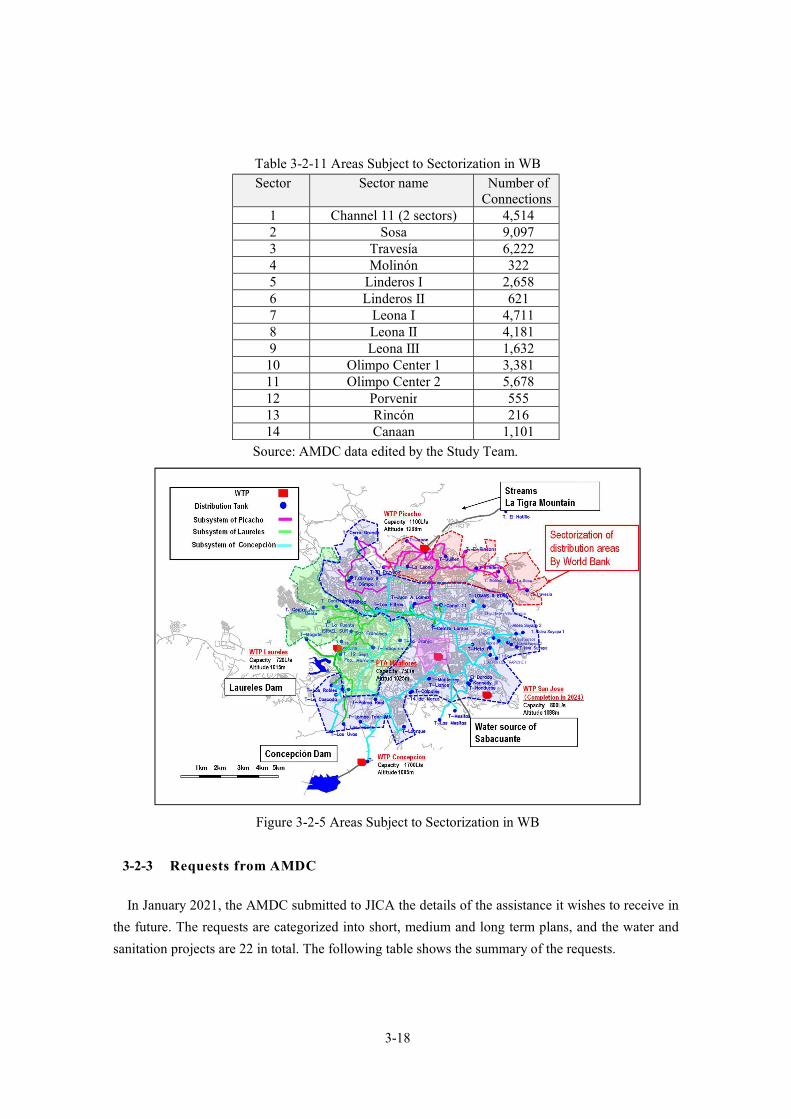
3-18
Table 3-2-11 Areas Subject to Sectorization in WB Sector Sector name Number of
Connections 1 Channel 11 (2 sectors) 4,514 2 Sosa 9,097 3 Travesía 6,222 4 Molinón 322 5 Linderos 2,658 6 Linderos 621 7 Leona 4,711 8 Leona 4,181 9 Leona 1,632
10 Olimpo Center 1 3,381 11 Olimpo Center 2 5,678 12 Porvenir 555 13 Rincón 216 14 Canaan 1,101
Source: AMDC data edited by the Study Team.
Figure 3-2-5 Areas Subject to Sectorization in WB
3-2-3 Requests from AMDC
In January 2021, the AMDC submitted to JICA the details of the assistance it wishes to receive in
the future. The requests are categorized into short, medium and long term plans, and the water and
sanitation projects are 22 in total. The following table shows the summary of the requests.

3-19
Table 3-2-12 Summary of Requests from AMDCs Urgency NO Project Details Amount
(US$ million)
Short term Phase 1
R-1 Sectorization of distribution areas in blocks (seven areas) 1.2 R-2 Rehabilitation of the Picacho conduction system (seven
areas) 1.2
R-3 Rehabilitation and new construction of reservoirs (reservoirs: four)
0.6
R-4 Increase efficiency in the operation of the pumping stations of the distribution system (10 areas)
3.0
R-5 Water meter installation (smart meter, macro meter) (one sector)
2.0
R-6 Restoration and expansion of SCADA (Picacho Drinking Water Treatment Plant)
1.0
R-7 Formulation of the Water and Sanitation Master Plan based on integrated water resources management.
4.0
R-8 Water demand management (policy planning, measures against water leakage and awareness-raising activities for water saving)
2.0
Short term Phase 2
R-9 Sectorization of distribution areas in blocks (the entire urban area)
1.4
R-10 Increase efficiency in the operation of the pumping stations of the distribution system (8 areas)
2.0
R-11 Rehabilitation and construction of new distribution tanks, Phase 2 (13 sectors)
8.4
R-12 Expansion of the pipeline system (four pipelines) 1.0 R-13 Supply piping system pipe installation (two pipelines) 0.9 R-14 SCADA reset (Picacho) 0.3 R-15 Replacement of the obsolete pipeline network of the
distribution network (8 sectors) 2.0
R-16 Water demand management, Phase 2 (policy planning, anti-leakage measures and water-saving awareness activities)
1.0
Medium term
R-17 Expansion of reservoir capacity 11.43 R-18 Replacement of obsolete pipelines (Buenos Aires, El
Bosque) 3.06
R-19 Guacerique Reservoir construction project (upstream of Los Laureles Dam)
50
R-20 Rehabilitation works at La Vega wastewater treatment plant, rehabilitation of sewage system
104.13
Long term
R-21 Replacement of distribution pipeline network (entire area) 2.2 R-22 Construction of rockfill dam and water treatment plant
(2,000 L/s) (Río del Hombre). 302.4
Source: AMDC data edited by the Study Team.
3-3 Current Situation of Drinking Water Systems and Challenges
The following is a description of the current situation of the drinking water system and the
challenges: 3-3-1 refers to the water sources, catchment facilities and pipelines, 3-3-2 refers to the
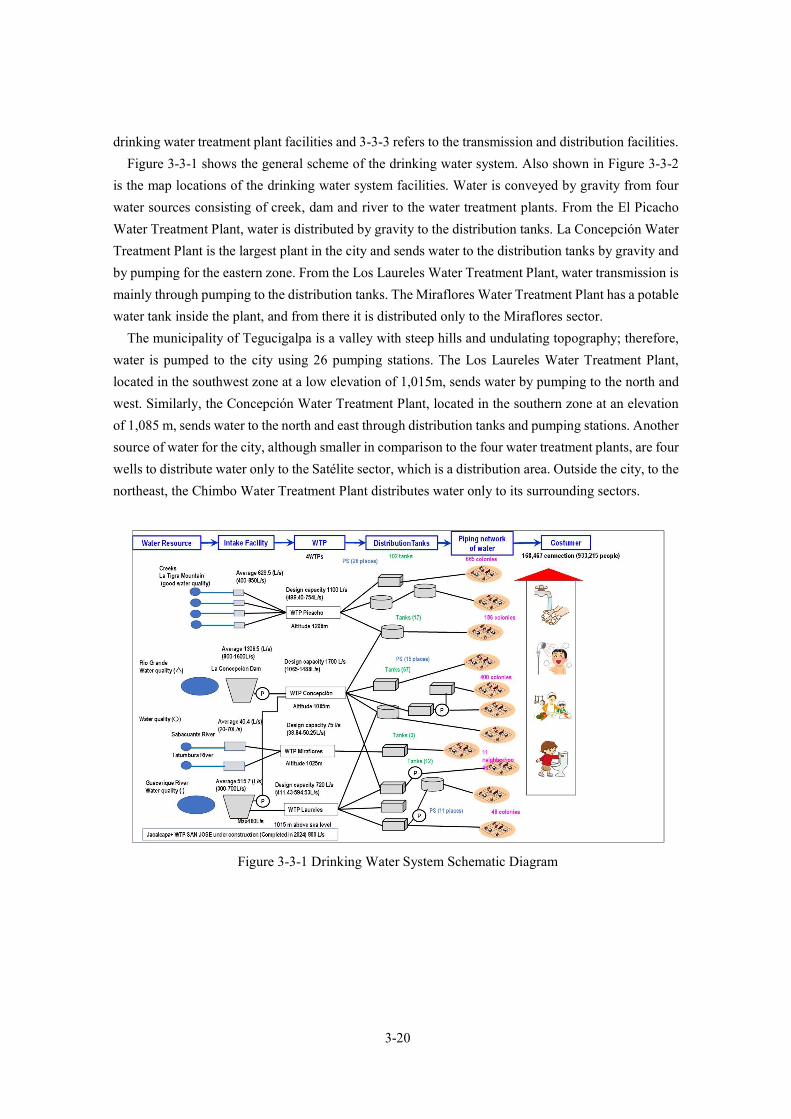
3-20
drinking water treatment plant facilities and 3-3-3 refers to the transmission and distribution facilities.
Figure 3-3-1 shows the general scheme of the drinking water system. Also shown in Figure 3-3-2
is the map locations of the drinking water system facilities. Water is conveyed by gravity from four
water sources consisting of creek, dam and river to the water treatment plants. From the El Picacho
Water Treatment Plant, water is distributed by gravity to the distribution tanks. La Concepción Water
Treatment Plant is the largest plant in the city and sends water to the distribution tanks by gravity and
by pumping for the eastern zone. From the Los Laureles Water Treatment Plant, water transmission is
mainly through pumping to the distribution tanks. The Miraflores Water Treatment Plant has a potable
water tank inside the plant, and from there it is distributed only to the Miraflores sector.
The municipality of Tegucigalpa is a valley with steep hills and undulating topography; therefore,
water is pumped to the city using 26 pumping stations. The Los Laureles Water Treatment Plant,
located in the southwest zone at a low elevation of 1,015m, sends water by pumping to the north and
west. Similarly, the Concepción Water Treatment Plant, located in the southern zone at an elevation
of 1,085 m, sends water to the north and east through distribution tanks and pumping stations. Another
source of water for the city, although smaller in comparison to the four water treatment plants, are four
wells to distribute water only to the Satélite sector, which is a distribution area. Outside the city, to the
northeast, the Chimbo Water Treatment Plant distributes water only to its surrounding sectors.
Figure 3-3-1 Drinking Water System Schematic Diagram

3-21
Figure 3-3-2Map Locations of Drinking Water System Facilities.
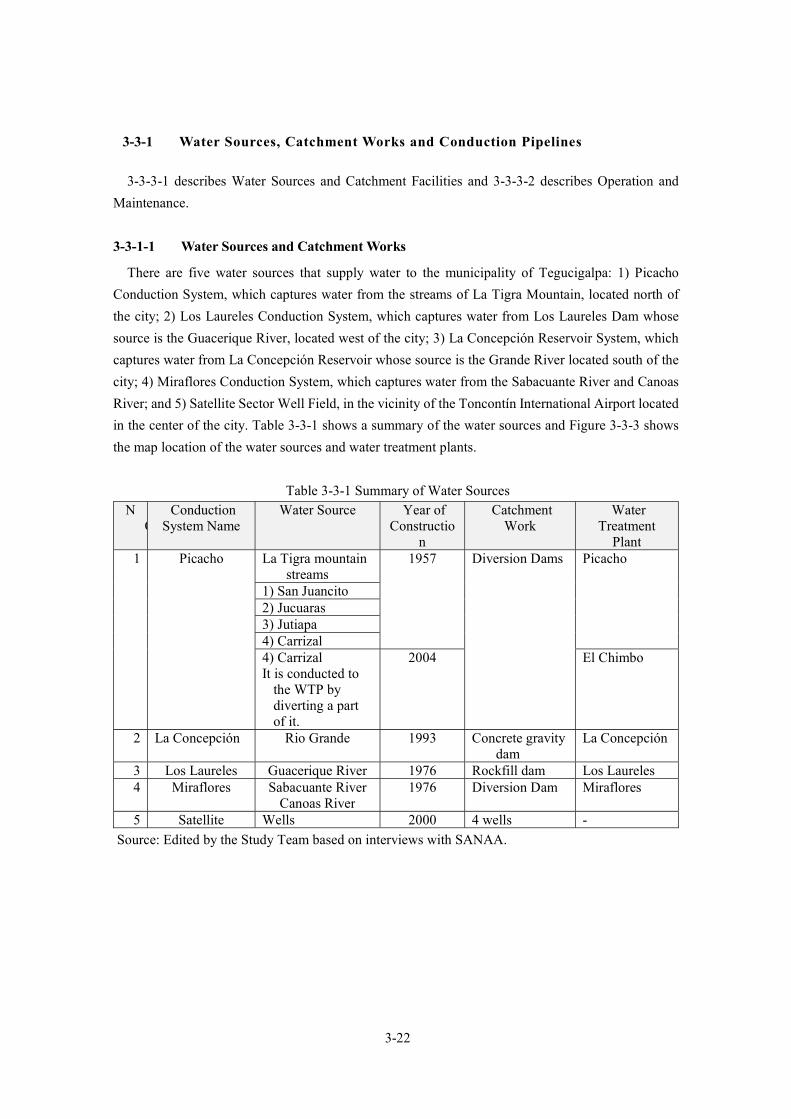
3-22
3-3-1 Water Sources, Catchment Works and Conduction Pipelines
3-3-3-1 describes Water Sources and Catchment Facilities and 3-3-3-2 describes Operation and
Maintenance.
3-3-1-1 Water Sources and Catchment Works
There are five water sources that supply water to the municipality of Tegucigalpa: 1) Picacho
Conduction System, which captures water from the streams of La Tigra Mountain, located north of
the city; 2) Los Laureles Conduction System, which captures water from Los Laureles Dam whose
source is the Guacerique River, located west of the city; 3) La Concepción Reservoir System, which
captures water from La Concepción Reservoir whose source is the Grande River located south of the
city; 4) Miraflores Conduction System, which captures water from the Sabacuante River and Canoas
River; and 5) Satellite Sector Well Field, in the vicinity of the Toncontín International Airport located
in the center of the city. Table 3-3-1 shows a summary of the water sources and Figure 3-3-3 shows
the map location of the water sources and water treatment plants.
Table 3-3-1 Summary of Water Sources N
OConduction
System Name Water Source Year of
Construction
Catchment Work
Water Treatment
Plant 1 Picacho La Tigra mountain
streams 1957 Diversion Dams Picacho
1) San Juancito 2) Jucuaras 3) Jutiapa 4) Carrizal 4) Carrizal It is conducted to
the WTP by diverting a part of it.
2004 El Chimbo
2 La Concepción Rio Grande 1993 Concrete gravity dam
La Concepción
3 Los Laureles Guacerique River 1976 Rockfill dam Los Laureles 4 Miraflores Sabacuante River
Canoas River 1976 Diversion Dam Miraflores
5 Satellite Wells 2000 4 wells -
Source: Edited by the Study Team based on interviews with SANAA.
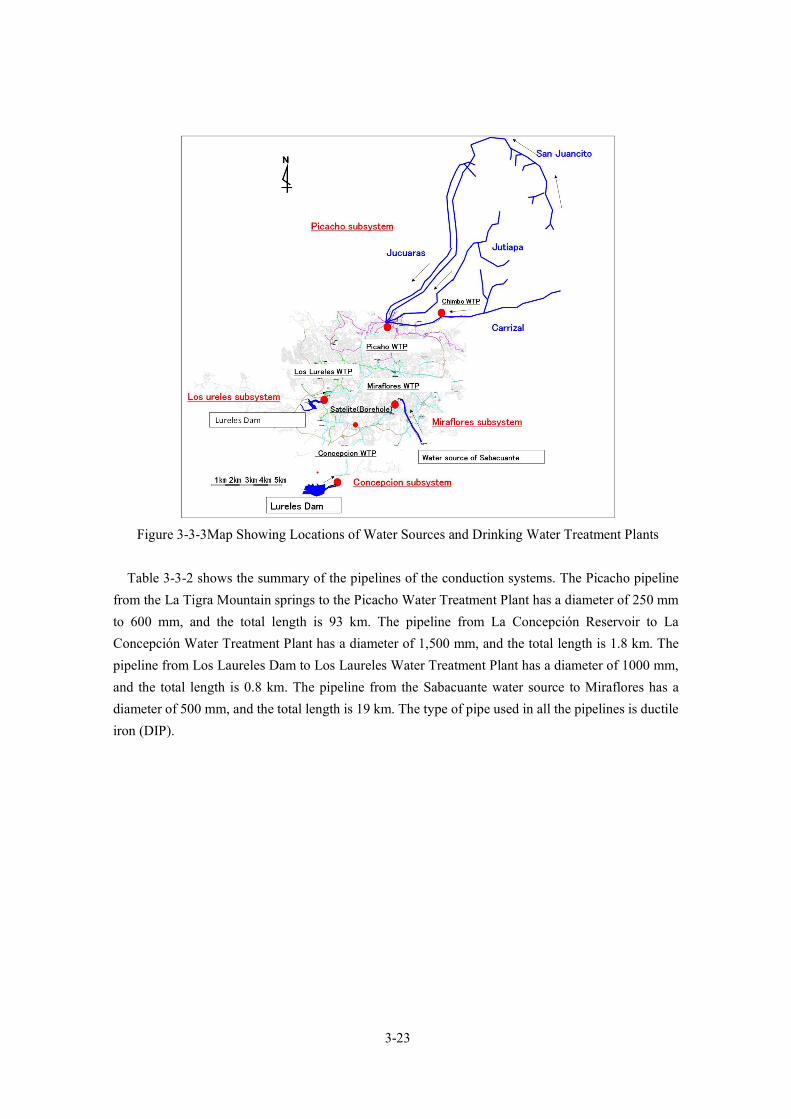
3-23
Figure 3-3-3Map Showing Locations of Water Sources and Drinking Water Treatment Plants
Table 3-3-2 shows the summary of the pipelines of the conduction systems. The Picacho pipeline
from the La Tigra Mountain springs to the Picacho Water Treatment Plant has a diameter of 250 mm
to 600 mm, and the total length is 93 km. The pipeline from La Concepción Reservoir to La
Concepción Water Treatment Plant has a diameter of 1,500 mm, and the total length is 1.8 km. The
pipeline from Los Laureles Dam to Los Laureles Water Treatment Plant has a diameter of 1000 mm,
and the total length is 0.8 km. The pipeline from the Sabacuante water source to Miraflores has a
diameter of 500 mm, and the total length is 19 km. The type of pipe used in all the pipelines is ductile
iron (DIP).
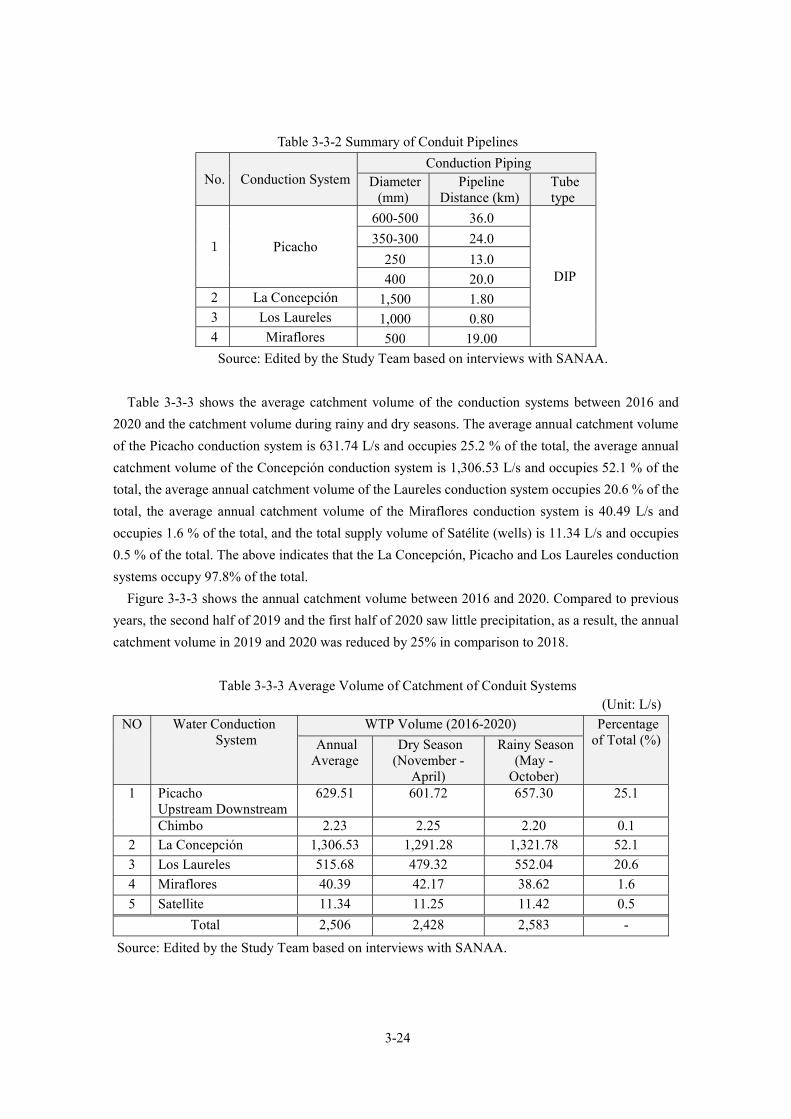
3-24
Table 3-3-2 Summary of Conduit Pipelines
No. Conduction System Conduction Piping
Diameter (mm)
Pipeline Distance (km)
Tube type
1 Picacho
600-500 36.0
DIP
350-300 24.0
250 13.0
400 20.0 2 La Concepción 1,500 1.80 3 Los Laureles 1,000 0.80 4 Miraflores 500 19.00
Source: Edited by the Study Team based on interviews with SANAA.
Table 3-3-3 shows the average catchment volume of the conduction systems between 2016 and
2020 and the catchment volume during rainy and dry seasons. The average annual catchment volume
of the Picacho conduction system is 631.74 L/s and occupies 25.2 % of the total, the average annual
catchment volume of the Concepción conduction system is 1,306.53 L/s and occupies 52.1 % of the
total, the average annual catchment volume of the Laureles conduction system occupies 20.6 % of the
total, the average annual catchment volume of the Miraflores conduction system is 40.49 L/s and
occupies 1.6 % of the total, and the total supply volume of Satélite (wells) is 11.34 L/s and occupies
0.5 % of the total. The above indicates that the La Concepción, Picacho and Los Laureles conduction
systems occupy 97.8% of the total.
Figure 3-3-3 shows the annual catchment volume between 2016 and 2020. Compared to previous
years, the second half of 2019 and the first half of 2020 saw little precipitation, as a result, the annual
catchment volume in 2019 and 2020 was reduced by 25% in comparison to 2018.
Table 3-3-3 Average Volume of Catchment of Conduit Systems (Unit: L/s)
NO Water Conduction System
WTP Volume (2016-2020) Percentage of Total (%) Annual
Average Dry Season
(November - April)
Rainy Season (May -
October) 1 Picacho
Upstream Downstream 629.51 601.72 657.30 25.1
Chimbo 2.23 2.25 2.20 0.1 2 La Concepción 1,306.53 1,291.28 1,321.78 52.1
3 Los Laureles 515.68 479.32 552.04 20.6
4 Miraflores 40.39 42.17 38.62 1.6
5 Satellite 11.34 11.25 11.42 0.5
Total 2,506 2,428 2,583 -
Source: Edited by the Study Team based on interviews with SANAA.

3-25
Figure 3-3-4Annual Catchment Volume
3-3-1-1-1 Picacho Drive System
The sources of water for this system are streams between 1,000 m - 1,200 m elevation belonging to
the La Tigra Mountain system located north of the municipality of Tegucigalpa. The water treatment
plant and pipelines are located within the ecological reserve of La Tigra National Park. Water is
collected from 23 concrete diversion works installed on more than 20 streams. The system consists of
four pipelines: San Juancito, Jucuaras, Jutiapa and Carrizal; and the water is sent by gravity to the
water treatment plant. The total length of the San Juancito line is 36 km, the total length of the Jucuaras
line is 24 km, the total length of Jutiapa is 13 km, and the total length of Carrizal is 20 km. La Tigra
Mountain has a low vegetation geology with outcropping rocks, and its geology and topography do
not allow for rainwater storage, and therefore, aquifer recharge in the water source is not favorable. In
the rainy season, the stream flows instantaneously as surface water. On the other hand, since the top
of the mountain has difficult access that makes it difficult for heavy machinery to enter, it is difficult
to develop a new water source, for example, a surface water storage dam.
Figure 3-3-5 shows the monthly variations of the catchment volume between 2016 and 2020 and
Figure 3-3-6 shows the total annual catchment volume. The catchment volume increases in the rainy
season from August to December, but in the dry season from February to April it decreases to half.
The total annual catchment volume between 2016 and 2018 was between 21-24 million m3 and in the
years 2019 and 2020 it was reduced to 15-17 million m3 due to low rainfall, registering a decrease of
20 % - 30 % compared to other years.
Figure 3-3-7 shows the monthly variations in raw water quality (turbidity, color, pH, and alkalinity)
between 2016 and 2020. The turbidity level of raw water is low, with 3 - 10 NTU or less in the dry
season and 10 - 20 NTU in the rainy season. In case of 2020, the maximum turbidity level of 99 NTU
was recorded due to hurricanes. The color level is 10 - 20 UC in dry season and 20 - 40 UC in rainy
season. In 2020, like turbidity, the maximum color level of 116 UC was recorded due to hurricanes.
The pH is about 6.2 - 6.8 leaning to mild acidity, which is assumed to be due to past mining activities.
Alkalinity tends to be low all-year round with 5 - 15 mg/L.
Vol
ume
of a
nnua
l wat
er in
take
(m
illio
n m
3 )
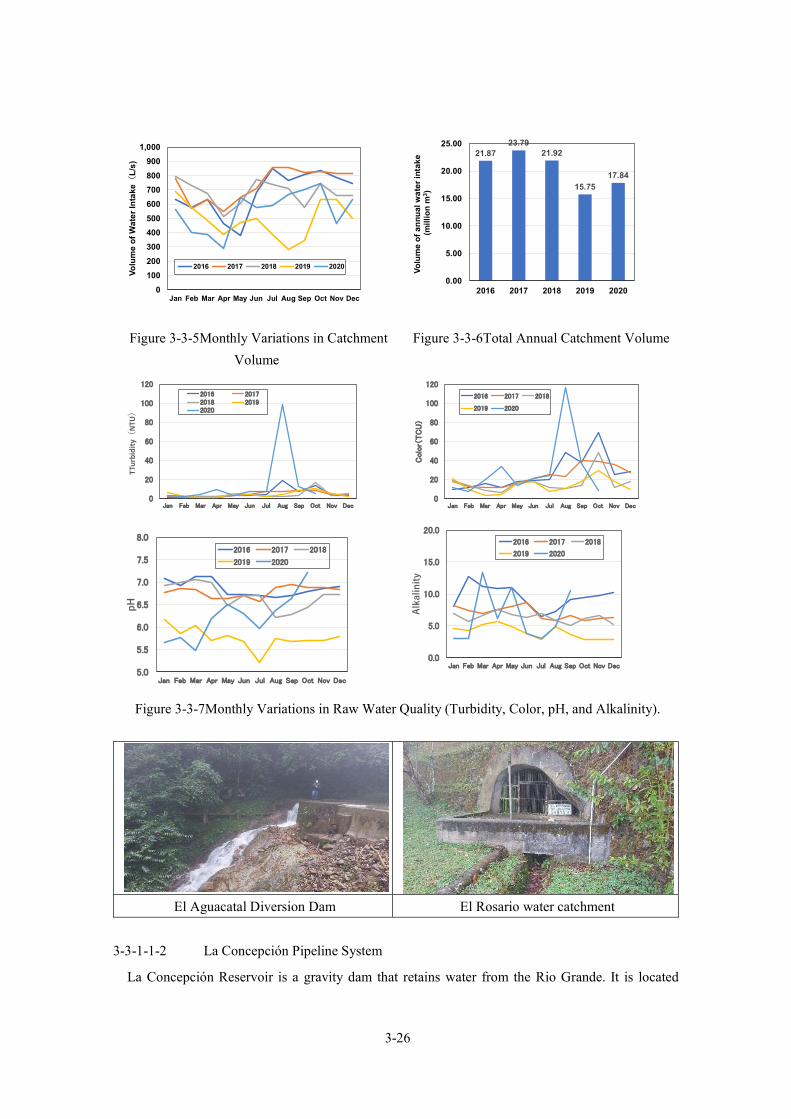
3-26
Figure 3-3-5Monthly Variations in Catchment
Volume
Figure 3-3-6Total Annual Catchment Volume
Figure 3-3-7Monthly Variations in Raw Water Quality (Turbidity, Color, pH, and Alkalinity).
El Aguacatal Diversion Dam El Rosario water catchment
3-3-1-1-2 La Concepción Pipeline System
La Concepción Reservoir is a gravity dam that retains water from the Rio Grande. It is located
0
100
200
300
400
500
600
700
800
900
1,000
Jan Feb Mar Apr May Jun Jul Aug Sep Oct Nov Dec
Vo
lum
e o
f W
ate
r In
take(
L/s
)
2016 2017 2018 2019 2020
21.8723.79
21.92
15.7517.84
0.00
5.00
10.00
15.00
20.00
25.00
2016 2017 2018 2019 2020
Vo
lum
e o
f a
nn
ual
wa
ter
inta
ke
(mill
ion
m3)
0
20
40
60
80
100
120
Jan Feb Mar Apr May Jun Jul Aug Sep Oct Nov Dec
TTur
bidi
ty(
NTU)
2016 20172018 20192020
0
20
40
60
80
100
120
Jan Feb Mar Apr May Jun Jul Aug Sep Oct Nov Dec
Colo
r(TC
U)
2016 2017 2018
2019 2020
5.0
5.5
6.0
6.5
7.0
7.5
8.0
Jan Feb Mar Apr May Jun Jul Aug Sep Oct Nov Dec
pH
2016 2017 2018
2019 2020
0.0
5.0
10.0
15.0
20.0
Jan Feb Mar Apr May Jun Jul Aug Sep Oct Nov Dec
Alkalinity
2016 2017 2018
2019 2020

3-27
southwest of the municipality of Tegucigalpa and occupies half of the water supply. It was built
between 1989 and 1992 with financing from the Italian and French governments and partially with
local funds. Table 3-3-4 shows the specifications of the reservoir.
As a result of Hurricane Mitch in 1998, the river flow was reduced and could not fill the reservoir,
so it was decided to build a diversion dam on the adjacent Ojojona River to divert the flow to The
Concepción Reservoir. Currently, the water captured in the Ojojona River is sent directly to the
pipeline coming from La Concepción Reservoir, as there is water contamination in the Ojojona River
and massive algae blooms in La Concepción Reservoir due to eutrophication. In the future, there are
plans to change the intake pipe to a larger diameter to increase the intake volume. In 2006, the reservoir
was reinforced and 3 automatic gates were installed. In 2018, a new pipeline (Trasvase) was built,
from Los Laureles Dam to La Concepción Water Treatment Plant, to convey the surplus water from
Los Laureles Dam to La Concepción Water Treatment Plant. It should be noted that in the lower
channel of La Concepción Reservoir, there are three starter pumps to convey water to the Concepción
Water Treatment Plant. During the period from January to April when the reservoir water level drops,
water is sent with three 9.46 m 3/min x 45.7m starter pumps (one is a reserve).
Table 3-3-4 Dam Specifications Parameter Specification
Height (m) 64 Crest length (m) 710 Type Concrete gravity dam Catchment area (km 2) 140 Total storage capacity (million m 3) From 36 to 40
Spillway (m 3/s) 923 Inlet flow rate (m 3/s) 1.32
Number of gates 4
Source: Edited by the Study Team based on interviews with SANAA.
Figure 3-3-8 shows the monthly variations of the catchment volume between 2016 and 2020 and
Figure 3-3-9 shows the total annual catchment volume. The average catchment volume is 1,306.53
L/s. In the rainy season, the average volume is about 1,100 - 1,400 L/s and in the dry season, between
950 - 1,300 L/s. Between August and December of 2019, in the middle of the rainy season, the
catchment volume was reduced by 40 %, registering about 800 L/s. If we compare the total annual
catchment volume, due to the low rainfall in 2019, the volume was reduced by 15% and 28% in 2019
and 2020, respectively.
The monthly variations in raw water quality (turbidity, color, pH, and alkalinity) between 2016 and
2020 are shown below in Figure 3-3-10. Both turbidity and color levels increase in the rainy season
from August to October. The maximum turbidity level is 140 NTU and color is 400 UC. On the other
hand, in the dry season, the turbidity level is 30 - 60 NTU and the color level is 100 - 150 NTU. The
pH is 6.8 - 7.8. From January to April of 2020, the pH tendency is to alkalinity. It should be noted that
in recent years the watershed has been reforested once a year for the environmental conservation of
the water source.

3-28
Figure 3-3-8 Monthly Variations in
Catchment Volume
Figure 3-3-9Total Annual Catchment Volume
Figure 3-3-10Monthly Variations in Raw Water Quality (Turbidity, Color, pH and Alkalinity).
Aerial view of the reservoir Front view of the reservoir
0
200
400
600
800
1,000
1,200
1,400
1,600
1,800
Jan Feb Mar Apr May Jun Jul Aug Sep Oct Nov Dec
Vo
lum
e o
f W
ate
r In
take(
L/s
)
2016 2017 2018 2019 2020
42.02 43.68 46.95
39.70
33.69
0.00
5.00
10.00
15.00
20.00
25.00
30.00
35.00
40.00
45.00
50.00
2016 2017 2018 2019 2020
Vo
lum
e o
f an
nu
al w
ate
r in
tak
e (m
illio
n m
3)
0
20
40
60
80
100
120
140
Jan Feb Mar Apr May Jun Jul Aug Sep Oct Nov
Turb
idity(
NTU)
2016 2017 2018 2019 20200
100
200
300
400
500
Jan Feb Mar Apr May Jun Jul Aug Sep Oct Nov Dec
Colo
r(T
CU
)
2016 2017 2018 2019 2020
5.0
5.5
6.0
6.5
7.0
7.5
8.0
Jan Feb Mar Apr May Jun Jul Aug Sep Oct Nov Dec
pH
2016 2017 2018 2019 2020
0
5
10
15
20
25
30
35
40
45
50
Jan Feb Mar Apr May Jun Jul Aug Sep Oct Nov Dec
Alkalinity
2016 2017 2018 2019 2020

3-29
Conduit (φ1100) Starter pumps
3-3-1-1-3 Los Laureles Pipeline System
Los Laureles Dam is a rockfill dam that retains water from the Guacerique River. It is located west
of the municipality of Tegucigalpa and occupies 20.6% of the water supply. It was built between 1976
and 1978 with an IDB loan as a reservoir for drinking water supply. Table 3-3-5 shows the
specifications of the dam.
Since its construction to date, the following improvements and rehabilitations have been carried out.
In 1997, a 3m inflatable dam was installed in the discharge channel with a loan from the IDB to
increase the storage volume. Also, due to the deterioration of water quality, in 2004 the catchment
method was modified, changing the facilities that capture water from the bottom to a floating type
facility that captures surface water. Subsequently, the catchment pipeline suffered a drop in yield due
to clogging of the pipeline and was damaged in 2009, and so the form of catchment was changed again
to bottom water catchment. However, the water quality at the bottom of the reservoir is poor, and the
odor and strange taste of the drinking water became problematic. For this reason, in 2015, the floating-
type catchment facilities were restored to return to surface water catchment. In the same year, a
dredging barge was installed to remove sediment in the water collection area of the dam. Around 2016,
the dredging system was damaged and has not been repaired since. It should be noted that raw water
from Los Laureles Dam is sent to La Concepción Water Treatment Plant with three 225 L/s x 100 m
x 300kW starter pumps (one is reserve) during the period from October to January mainly.
Table 3-3-5 Dam Specifications Parameter Specifcation
Height (m) 39 Crest length (m) 112 Type Rockfill dam Catchment Area (km 2) 194 Total storage capacity (million
m 3) 12 million
Overflow (m 3/s) 720 Inlet flow rate (m 3/s) 0.9
Source: Edited by the Study Team based on interviews with SANAA.
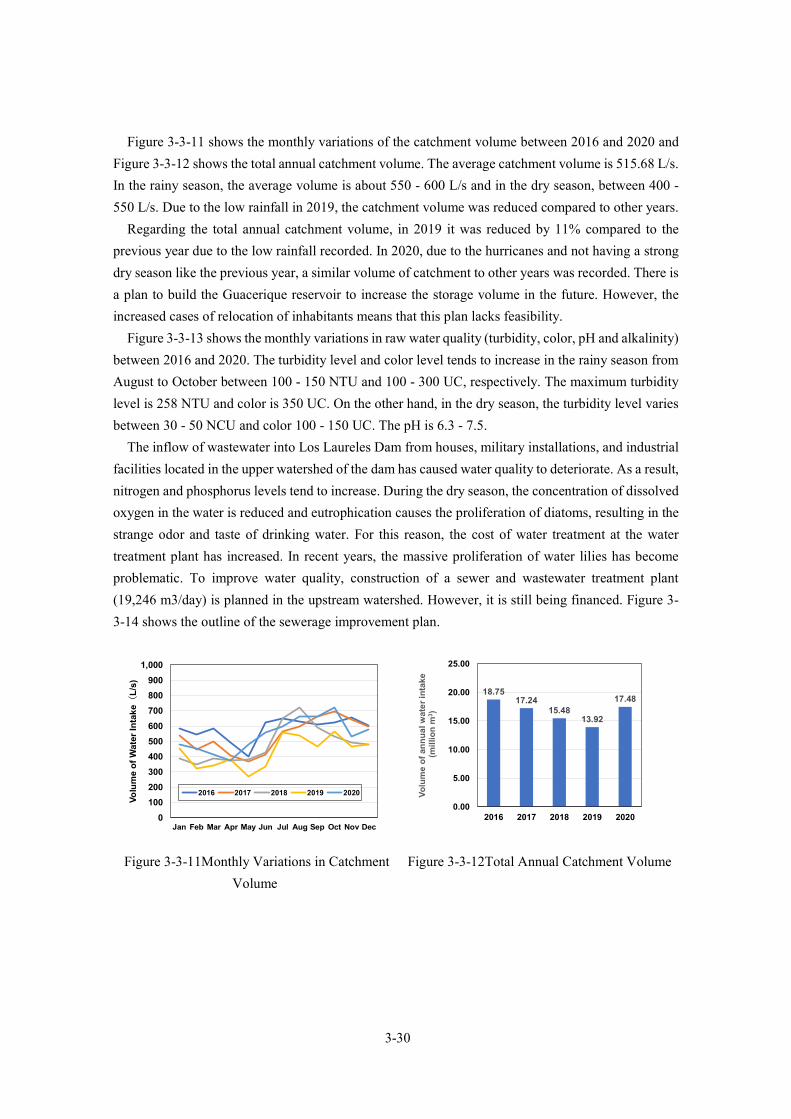
3-30
Figure 3-3-11 shows the monthly variations of the catchment volume between 2016 and 2020 and
Figure 3-3-12 shows the total annual catchment volume. The average catchment volume is 515.68 L/s.
In the rainy season, the average volume is about 550 - 600 L/s and in the dry season, between 400 -
550 L/s. Due to the low rainfall in 2019, the catchment volume was reduced compared to other years.
Regarding the total annual catchment volume, in 2019 it was reduced by 11% compared to the
previous year due to the low rainfall recorded. In 2020, due to the hurricanes and not having a strong
dry season like the previous year, a similar volume of catchment to other years was recorded. There is
a plan to build the Guacerique reservoir to increase the storage volume in the future. However, the
increased cases of relocation of inhabitants means that this plan lacks feasibility.
Figure 3-3-13 shows the monthly variations in raw water quality (turbidity, color, pH and alkalinity)
between 2016 and 2020. The turbidity level and color level tends to increase in the rainy season from
August to October between 100 - 150 NTU and 100 - 300 UC, respectively. The maximum turbidity
level is 258 NTU and color is 350 UC. On the other hand, in the dry season, the turbidity level varies
between 30 - 50 NCU and color 100 - 150 UC. The pH is 6.3 - 7.5.
The inflow of wastewater into Los Laureles Dam from houses, military installations, and industrial
facilities located in the upper watershed of the dam has caused water quality to deteriorate. As a result,
nitrogen and phosphorus levels tend to increase. During the dry season, the concentration of dissolved
oxygen in the water is reduced and eutrophication causes the proliferation of diatoms, resulting in the
strange odor and taste of drinking water. For this reason, the cost of water treatment at the water
treatment plant has increased. In recent years, the massive proliferation of water lilies has become
problematic. To improve water quality, construction of a sewer and wastewater treatment plant
(19,246 m3/day) is planned in the upstream watershed. However, it is still being financed. Figure 3-
3-14 shows the outline of the sewerage improvement plan.
Figure 3-3-11Monthly Variations in Catchment
Volume
Figure 3-3-12Total Annual Catchment Volume
0
100
200
300
400
500
600
700
800
900
1,000
Jan Feb Mar Apr May Jun Jul Aug Sep Oct Nov Dec
Vo
lum
e o
f W
ater
Inta
ke(
L/s
)
2016 2017 2018 2019 2020
18.7517.24
15.4813.92
17.48
0.00
5.00
10.00
15.00
20.00
25.00
2016 2017 2018 2019 2020
Vo
lum
e o
f an
nu
al w
ate
r in
take
(m
illio
n m
3 )

3-31
Figure 3-3-13Monthly Variations in Raw Water Quality (Turbidity, Color, pH and Alkalinity).
Figure 3-3-14 Outline of the sewerage improvement plan
Aerial view of the dam Front view of the dam
0
50
100
150
200
250
300
Jan Feb Mar Apr May Jun Jul Aug Sep Oct Nov Dec
Turb
idez(
NTU)
2016 2017 2018 2019 2020
0
50
100
150
200
250
300
350
400
Jan Feb Mar Apr May Jun Jul Aug Sep Oct Nov Dec
Colo
r(TC
U)
2016 2017 2018 2019 2020
5.0
5.5
6.0
6.5
7.0
7.5
8.0
8.5
ENE. FEB. MZO. ABR. MAYO JUN. JUL. AGO. SEPT. OCT. NOV. DIC.
pH
2016 2017 2018 2019 2020
0
10
20
30
40
50
ENE. FEB. MZO. ABR. MAYO JUN. JUL. AGO. SEPT. OCT. NOV. DIC.
Alcalinidad
2016 2017 2018 2019 2020

3-32
Inflatable dam Starter pumps
3-3-1-1-4 Miraflores Conduction System
The water sources for the Miraflores conveyance system are diversion dams installed on the
Sabacuante and Canoas rivers. They are located southeast of the municipality of Tegucigalpa and
occupy 1.6% of the water supply given. They were built in 1976. The diversion dams are of concrete
gravity type and are 8 m high and 40 m wide. The 1998 hurricane destroyed the pipeline, but it was
subsequently repaired. However, the concrete curtain was undermined by the flow of water and is in
a markedly deteriorated state due to the passage of time. During the rainy season, catchment is
suspended to clean sediment and plants accumulated in the intake.
Construction is currently underway of the San José Dam in Jacaleapa on the lower channel of the
Sabacuante River intake works (construction began in March 2021). Completion is scheduled in two
years, in March 2023. Upon completion of the San José Dam, the use of the Sabacuante intake works
will be suspended.
Figure 3-3-14 shows the monthly variations of the catchment volume between 2016 and 2020 and
Figure 3-3-15 shows the total annual catchment volume. The average catchment volume is 40.39L/s.
Throughout the year, the average volume is between 35 L/s and 50 L/s.
Regarding the total annual catchment volume, it was not greatly affected by the low rainfall in 2019,
and in 2020 it registered 1.23 million m3.
Figure 3-3-17 shows the monthly variations in raw water quality (turbidity, color, pH and alkalinity)
between 2016 and 2020. The turbidity level of the source water is very low, less than 10 NTU is
recorded all year. The maximum color level is 20 UC. However, when there is temporary high turbidity
in the rainy season, catchment is suspended. The pH varies between 6.8 - 7.5.
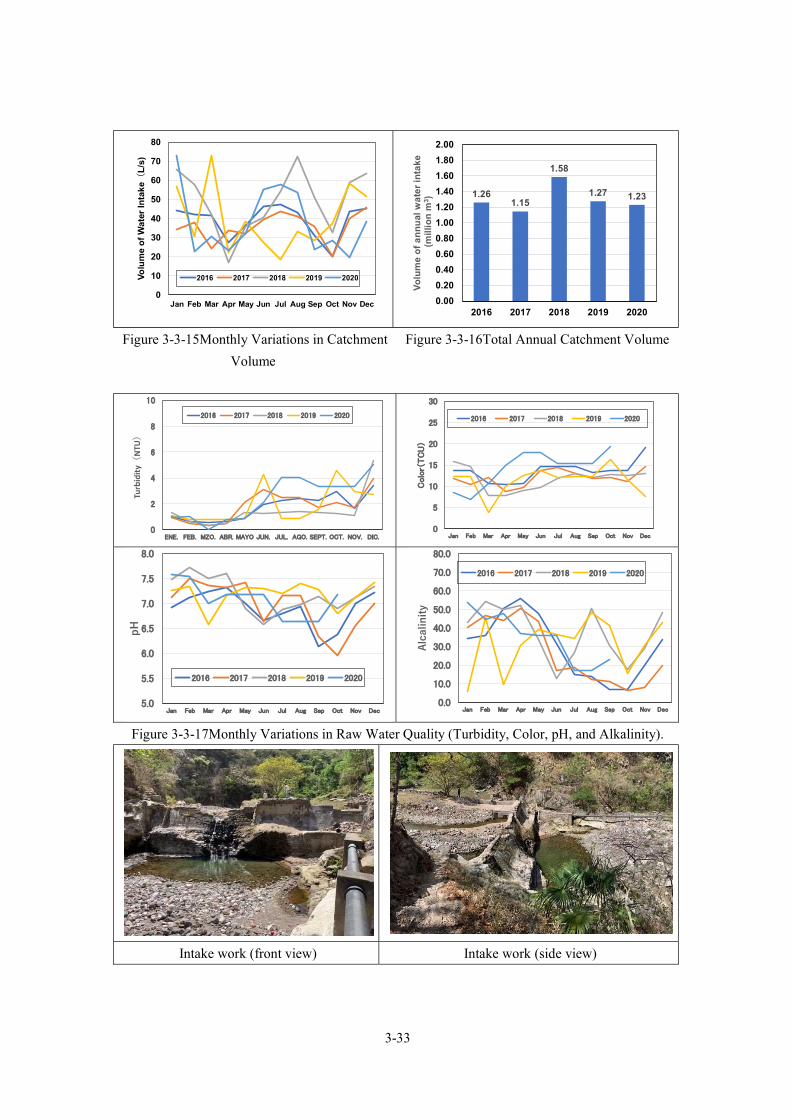
3-33
Figure 3-3-15Monthly Variations in Catchment
Volume
Figure 3-3-16Total Annual Catchment Volume
Figure 3-3-17Monthly Variations in Raw Water Quality (Turbidity, Color, pH, and Alkalinity).
Intake work (front view) Intake work (side view)
0
10
20
30
40
50
60
70
80
Jan Feb Mar Apr May Jun Jul Aug Sep Oct Nov Dec
Vo
lum
e o
f W
ater
Inta
ke(
L/s
)
2016 2017 2018 2019 2020
1.261.15
1.58
1.27 1.23
0.00
0.20
0.40
0.60
0.80
1.00
1.20
1.40
1.60
1.80
2.00
2016 2017 2018 2019 2020
Vo
lum
e o
f a
nn
ual
wa
ter
inta
ke
(mill
ion
m3 )
0
2
4
6
8
10
ENE. FEB. MZO. ABR. MAYO JUN. JUL. AGO. SEPT. OCT. NOV. DIC.
Turb
idity(
NTU)
2016 2017 2018 2019 2020
0
5
10
15
20
25
30
Jan Feb Mar Apr May Jun Jul Aug Sep Oct Nov Dec
Colo
r(TC
U)
2016 2017 2018 2019 2020
5.0
5.5
6.0
6.5
7.0
7.5
8.0
Jan Feb Mar Apr May Jun Jul Aug Sep Oct Nov Dec
pH
2016 2017 2018 2019 2020
0.0
10.0
20.0
30.0
40.0
50.0
60.0
70.0
80.0
Jan Feb Mar Apr May Jun Jul Aug Sep Oct Nov Dec
Alcalinity
2016 2017 2018 2019 2020

3-34
3-3-1-1-5 Wells
In the Satélite sector, in addition to the water supply from the Concepción Water Treatment Plant,
wells are used. The Satélite well system is located near the Toncontín International Airport to the south
of the city. It operates from 0:00 to 5:00. Currently, four wells are in operation. Each well has a
diameter of 200 mm, the casing is made of PVC and the depth of the well is 91.5 m. The well involves
a high operation and maintenance cost to work, so SANAA plans to discontinue its use in the future.
The future plan is unknown at this time, as operation and maintenance will be transferred to the
municipality of Tegucigalpa in the future.
Figure 3-3-18 shows the monthly variations of the catchment volume between 2016 and 2020 and
Figure 3-3-19 shows the total annual catchment volume. The total annual catchment volume is about
0.2 million m3 pumping from four wells as of 2019, an amount that decreased due to the failure of the
pumps that used to take water from eight wells until 2018. The catchment volume has been stable
throughout the year.
Figure 3-3-18Monthly Variations in Catchment
Volume
Figure 3-3-19Total Annual Catchment
Volume
Well (Satellite #2) Well (Satellite #4)
3-3-1-2 Operation and Maintenance
The following is a description of the operation and maintenance of the pipeline systems.
0
2
4
6
8
10
12
14
16
Jan Feb Mar Apr May Jun Jul Aug Sep Oct Nov Dec
Vo
lum
e o
f W
ate
r In
tak
e(
L/s
)
2016 2017 2018 2019 2020
0.47 0.47 0.47
0.20 0.20
0.00
0.10
0.20
0.30
0.40
0.50
0.60
0.70
0.80
0.90
1.00
2016 2017 2018 2019 2020
Vo
lum
e o
f a
nn
ual
wat
er in
take
(m
illio
n m
3 )

3-35
3-3-1-2-1 Picacho Pipeline System
The Picacho pipeline system consists of 23 intake works and an DIP pipeline with a total length of
93 km. Maintenance is ongoing, for example, when the 1998 hurricane damaged a portion of the
pipeline, a new pipeline was constructed. Table 3-3-6 shows the operation and maintenance status of
the Picacho pipeline system. The main activities are cleaning of the intake works and flow
measurement of the pipeline.
Table 3-3-6 Operating and Maintenance Status NO Installation Operation and Maintenance 1 Intake Work Once a month, SANAA cleans 23 intake works to remove leaves,
small branches and sludge accumulated in the intake. 2 Conduction
piping Measurement of flow rates in the pipeline of four systems.
Source: Edited by the Study Team based on interviews with SANAA.
3-3-1-2-2 La Concepción Pipeline System
The Concepción conveyance system consists of a gravity dam and a 1500 mm diameter DIP pipeline,
with a total length of 1.8 km. Water is discharged periodically. The concrete structures and others have
not been inspected and an operation and maintenance manual is needed.
3-3-1-2-3 Los Laureles Pipeline System
A dredging barge was introduced to dredge sediments from the dam. However, due to budgetary
reasons, the 2016 failure could not be repaired. This affects the storage volume as dredging is currently
not possible. There is a need to have an operation and maintenance manual, and to secure the budget
to replace the equipment and plan how to raise funds.
3-3-1-2-4 Miraflores Conduction System
Periodic cleaning of sand and trash at the intake is performed. The concrete structures at the intake
works have been greatly damaged due to water flow and factors. However, no repairs have been made
to date.
3-3-1-2-5 Wells (Satellite Sector)
Each time there are breakdowns, pumping from the wells is suspended due to poor operation and
maintenance of the impulsion pumps. Previously, 8 wells were being used, but currently only 4 pumps
are being operated. In the future, the guideline is to suspend the use of the wells due to high electric
power and operation and maintenance costs.

3-36
3-3-2 Water Treatment Plant facilities
In the following, 3-3-2-1 describes the Facilities and 3-3-3-2 describes the operation and
maintenance.
3-3-2-1 Facilities
Table 3-3-7 and Figure 3-3-20 show the average annual production water volume between 2016
and 2020 by the water treatment plants. The production water volume for 2019 and 2020 decreased
by approximately 20% compared to previous years. This decrease in precipitation happened due to
climate change. The total production water volume is generally around 60 - 70% of the design capacity.
In 2015, small hydropower facilities were installed in the transmission line of the Picacho Water
Treatment Plant (Line 22) and the pipeline of the Concepción Water Treatment Plant with JICA Grant
-in-aid Project.
Table 3-3-7 Average Annual Water Production of Water Treatment Plant (2016-2020) (Unit: L/sec)
Water Treatment Plant 2016 2017 2018 2019 2020 Design capacity
Concepción Water Treatment Plant
1,332.33 1,385.07 1,488.67 1,258.94 1,065.41 1,500 (Max 1,700)
Laureles Drinking Water Treatment Plant
594.53 546.66 490.80 441.53 552.82 720 + 100 (Unit type)
Picacho Water Treatment Plant
693.51 754.24 695.18 499.40 564.07 1,100
Miraflores Drinking Water Treatment Plant
39.88 36.32 50.25 40.43 38.84 75
El Chimbo Water Treatment Plant
2.31 2.35 1.89 2.34 2.45 25
Total 2,662.56 2,724.64 2,726.79 2,242.64 2,223.59 3,520
Source: SANAA statistical data

3-37
Figure 3-3-20Average Annual Water Production of Water Treatment Plant (2016-2020).
3-3-2-1-2 Picacho Water Treatment Plant
Outline
The Picacho Water Treatment Plant is located in the northern part of the city at an elevation of
about 1,300 m, the highest of 5 water treatment plants, and has a geographically advantageous
condition that allows it to send water by gravity to many areas of the city. The water sources are
streams from La Tigra Mountain system and water is captured from four pipelines. However, there
are many variations in raw water volumes between dry and rainy seasons.
The water treatment plant was built in the 1920s, with only the chlorination facility at the beginning
of construction. Subsequently, as water demand increased, water sources were developed and
purification facilities were built with IDB support in 1997 (design capacity: 900 L/s).
In addition, to improve the water supply situation in the city, between 2006 and 2010 the "Grant-in
aid, Tegucigalpa Emergency Water Supply Project " was executed, where the water treatment plant
facilities were expanded and rehabilitated (design capacity increased to 1,100 L/s.), along with
construction of distribution tanks, installation of water transmission and distribution lines, and
construction of the water supply station.
The purification process consists of aerator + mixing tank + flocculation tank + sedimentation tank
with inclined tube + gravity type rapid sand filter + chlorination. Figure 3-3-21 shows the flow diagram
of the Picacho water treatment plant, Figure 3-3-22 shows the general plan, Figure 3-3-23 shows the
hydraulic profile, Table 3-3-8 shows the specifications of the main facilities, and Figure 3-3-24 shows
the current status of the facilities.
0.00
500.00
1,000.00
1,500.00
2,000.00
2016 2017 2018 2019 2020
P R O D U C T I O N V O L U M E O F W A T E R T R E A T M E N T P L A N T S ( U N I T : L / S )
コンセプシオン浄水場 ラウレレレス浄水場
ピカチョ浄水場 ミラフローレス浄水場
チンボ浄水場
WTP concepcion WTP Laureles
WTP Picacho WTP MIraflores
WTP Chimbo

3-38
Figure 3-3-21Picacho Water Treatment Plant Flow Diagram
Figure 3-3-22 General Plan of Picacho Drinking Water Treatment Plant
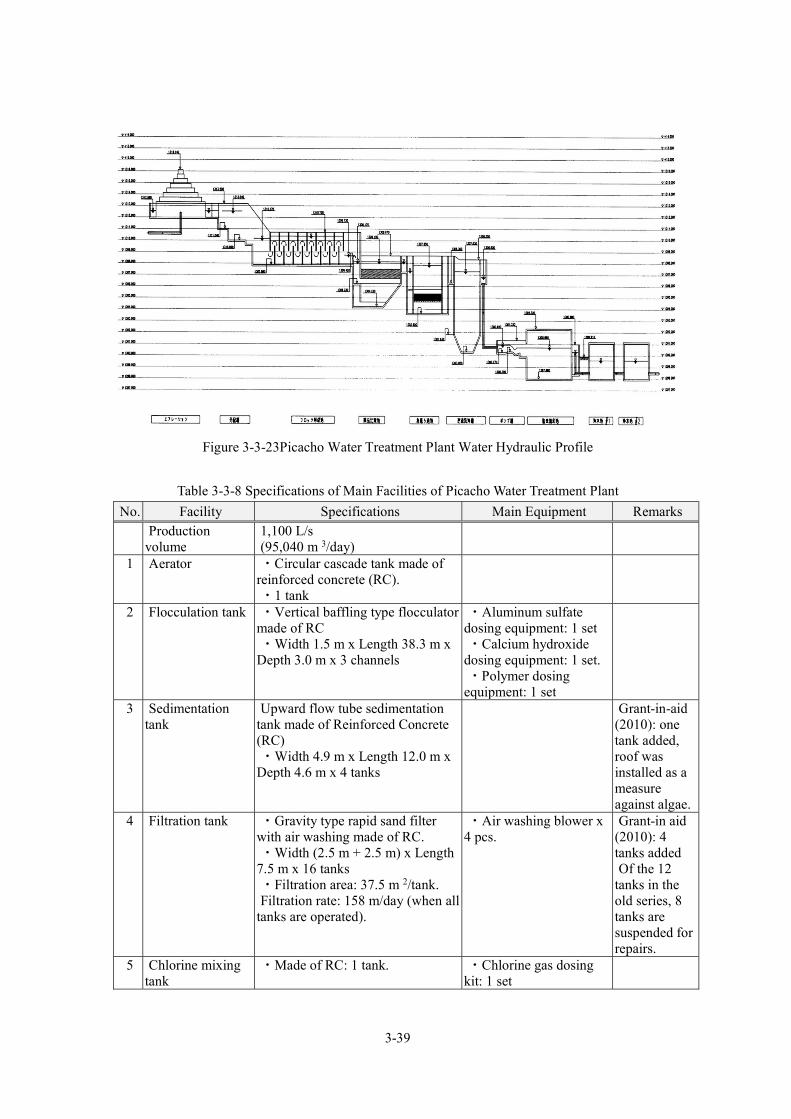
3-39
Figure 3-3-23Picacho Water Treatment Plant Water Hydraulic Profile
Table 3-3-8 Specifications of Main Facilities of Picacho Water Treatment Plant
No. Facility Specifications Main Equipment Remarks Production
volume 1,100 L/s (95,040 m 3/day)
1 Aerator ・Circular cascade tank made of reinforced concrete (RC). ・1 tank
2 Flocculation tank ・Vertical baffling type flocculator made of RC ・Width 1.5 m x Length 38.3 m x
Depth 3.0 m x 3 channels
・Aluminum sulfate dosing equipment: 1 set ・Calcium hydroxide
dosing equipment: 1 set. ・Polymer dosing
equipment: 1 set
3 Sedimentation tank
Upward flow tube sedimentation tank made of Reinforced Concrete (RC) ・Width 4.9 m x Length 12.0 m x
Depth 4.6 m x 4 tanks
Grant-in-aid (2010): one tank added, roof was installed as a measure against algae.
4 Filtration tank ・Gravity type rapid sand filter with air washing made of RC. ・Width (2.5 m + 2.5 m) x Length
7.5 m x 16 tanks ・Filtration area: 37.5 m 2/tank. Filtration rate: 158 m/day (when all
tanks are operated).
・Air washing blower x 4 pcs.
Grant-in aid (2010): 4 tanks added Of the 12
tanks in the old series, 8 tanks are suspended for repairs.
5 Chlorine mixing tank
・Made of RC: 1 tank. ・Chlorine gas dosing kit: 1 set

3-40
No. Facility Specifications Main Equipment Remarks 6 Drainage
treatment facilities ・Sludge discharge tank. ・Sludge drying bed.
・Discharge pump
7 Power receiving facilities
・Transformer: 13.8 kV x 300KVA x 1 pc.
8 Emergency power generation system
・For process: 285KVA x 1 unit ・For chlorination
equipment: 100KVA x 1 unit
The process system is faulty.
9 Monitoring and control equipment
・Control panel: 1 set (graphic panel: None)
SCADA System: None
10 Water quality laboratory
Available ・Turbidity level, residual chlorine, jar test, etc.
Source: Prepared by the Study Team based on interviews with AMDC.
Aerator and top view of flocculation tank Aerator
Coagulant dosing point Flocculation tank

3-41
Sedimentation tank Filtration tank
Filtration tank backwash drain channel Chlorination equipment
Figure 3-3-24Current Status of Picacho Water Treatment Plant
Operation and Maintenance System
The Picacho Water Treatment Plant is currently operated and maintained by the Picacho
subsystem of the AMDC Water Management Unit, and this subsystem is also responsible for the
operation and maintenance of the water source facilities related to Picacho, El Chimbo Water
Treatment Plant, and the Miraflores Water Treatment Plant. The Picacho subsystem has 35 employees
for operation and maintenance, and Table 3-3-9 shows their duties. The person in charge of water
quality testing in the Table belong to the AMDC Central Water Quality Laboratory and is stationed at
the Picacho Water Treatment Plant.
Table 3-3-9 Picacho Subsystem Operation and Maintenance System Staff Responsibilities Remarks
1 Subsystem Administrator 2 Subsystem Assistant 3 Secretary 4 Procurement warehouse keeper 5 Facility cleaning 6 Picacho Water Treatment Plant Operator 7 El Chimbo Water Treatment Plant Operator 8 Miraflores Water Treatment Plant Operator 9 Mechanical and electrical Team
10 Water source facilities inspection and management 11 Driver 12 Facilities inspection and management 13 Field Worker
Water quality test
Source: Prepared by the Study Team based on interviews with AMDC.
The water treatment plant operates in two shifts, from 8:00 a.m. to 4:00 p.m. and from 4:00 p.m.
to 8:00 a.m. Water treatment plant operators inspect the main mechanical and electrical equipment
once a week. Repairs on faulty equipment are carried out by the responsible section at AMDC
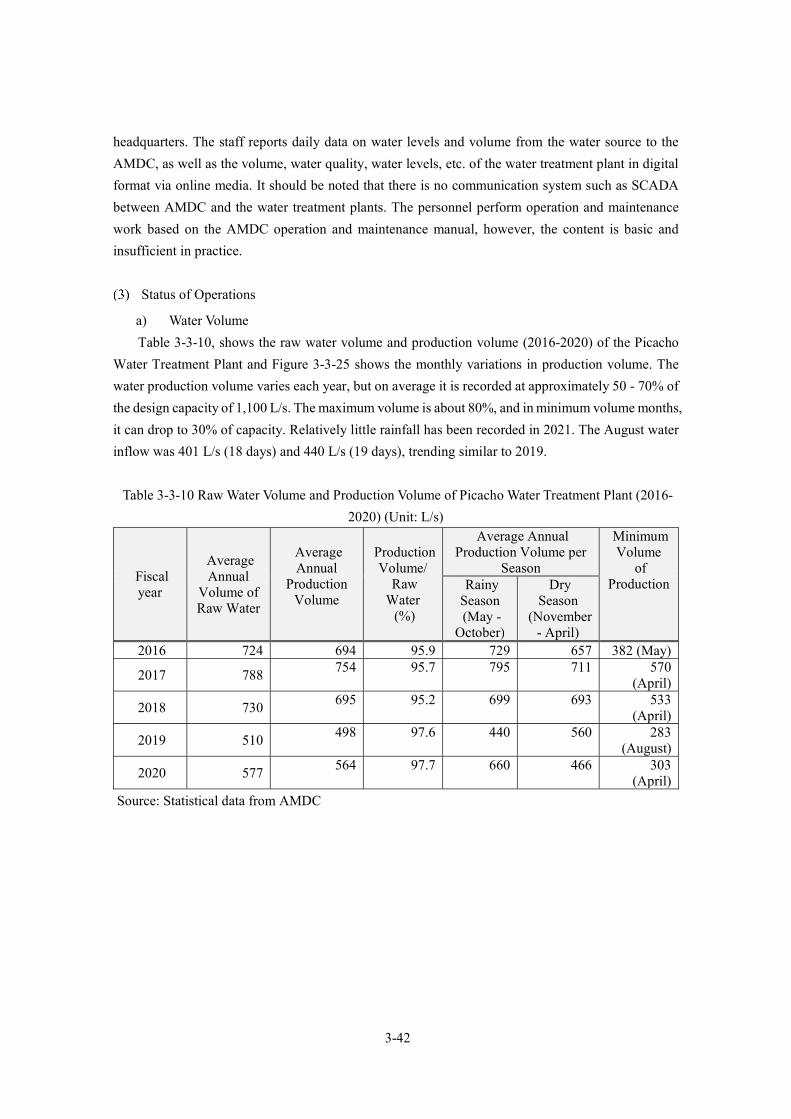
3-42
headquarters. The staff reports daily data on water levels and volume from the water source to the
AMDC, as well as the volume, water quality, water levels, etc. of the water treatment plant in digital
format via online media. It should be noted that there is no communication system such as SCADA
between AMDC and the water treatment plants. The personnel perform operation and maintenance
work based on the AMDC operation and maintenance manual, however, the content is basic and
insufficient in practice.
Status of Operations
a) Water Volume
Table 3-3-10, shows the raw water volume and production volume (2016-2020) of the Picacho
Water Treatment Plant and Figure 3-3-25 shows the monthly variations in production volume. The
water production volume varies each year, but on average it is recorded at approximately 50 - 70% of
the design capacity of 1,100 L/s. The maximum volume is about 80%, and in minimum volume months,
it can drop to 30% of capacity. Relatively little rainfall has been recorded in 2021. The August water
inflow was 401 L/s (18 days) and 440 L/s (19 days), trending similar to 2019.
Table 3-3-10 Raw Water Volume and Production Volume of Picacho Water Treatment Plant (2016-
2020) (Unit: L/s)
Fiscal year
Average Annual
Volume of Raw Water
Average Annual
Production Volume
Production Volume/
Raw Water
(%)
Average Annual Production Volume per
Season
Minimum Volume
of Production Rainy
Season (May -
October)
Dry Season
(November - April)
2016 724 694 95.9 729 657 382 (May)
2017 788 754 95.7 795 711 570
(April)
2018 730 695 95.2 699 693 533
(April)
2019 510 498 97.6 440 560 283
(August)
2020 577 564 97.7 660 466 303
(April)
Source: Statistical data from AMDC
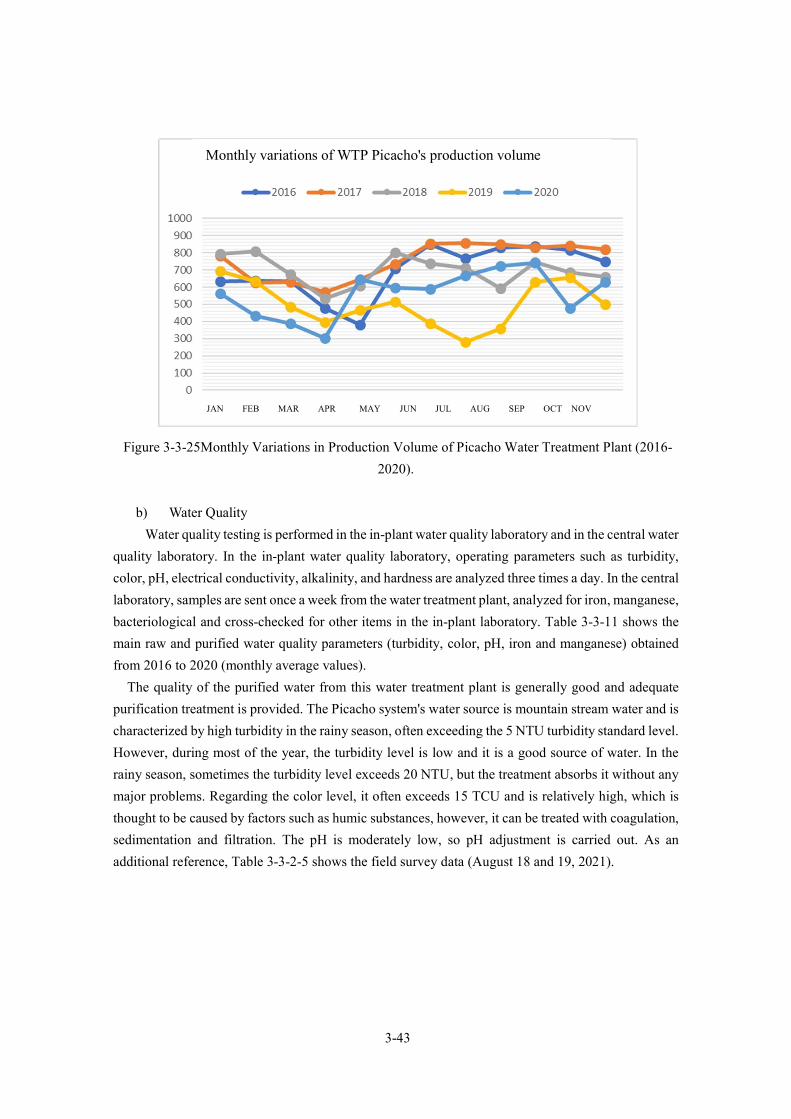
3-43
Figure 3-3-25Monthly Variations in Production Volume of Picacho Water Treatment Plant (2016-
2020).
b) Water Quality
Water quality testing is performed in the in-plant water quality laboratory and in the central water
quality laboratory. In the in-plant water quality laboratory, operating parameters such as turbidity,
color, pH, electrical conductivity, alkalinity, and hardness are analyzed three times a day. In the central
laboratory, samples are sent once a week from the water treatment plant, analyzed for iron, manganese,
bacteriological and cross-checked for other items in the in-plant laboratory. Table 3-3-11 shows the
main raw and purified water quality parameters (turbidity, color, pH, iron and manganese) obtained
from 2016 to 2020 (monthly average values).
The quality of the purified water from this water treatment plant is generally good and adequate
purification treatment is provided. The Picacho system's water source is mountain stream water and is
characterized by high turbidity in the rainy season, often exceeding the 5 NTU turbidity standard level.
However, during most of the year, the turbidity level is low and it is a good source of water. In the
rainy season, sometimes the turbidity level exceeds 20 NTU, but the treatment absorbs it without any
major problems. Regarding the color level, it often exceeds 15 TCU and is relatively high, which is
thought to be caused by factors such as humic substances, however, it can be treated with coagulation,
sedimentation and filtration. The pH is moderately low, so pH adjustment is carried out. As an
additional reference, Table 3-3-2-5 shows the field survey data (August 18 and 19, 2021).
Monthly variations of WTP Picacho's production volume
JAN FEB MAR APR MAY JUN JUL AUG SEP OCT NOV
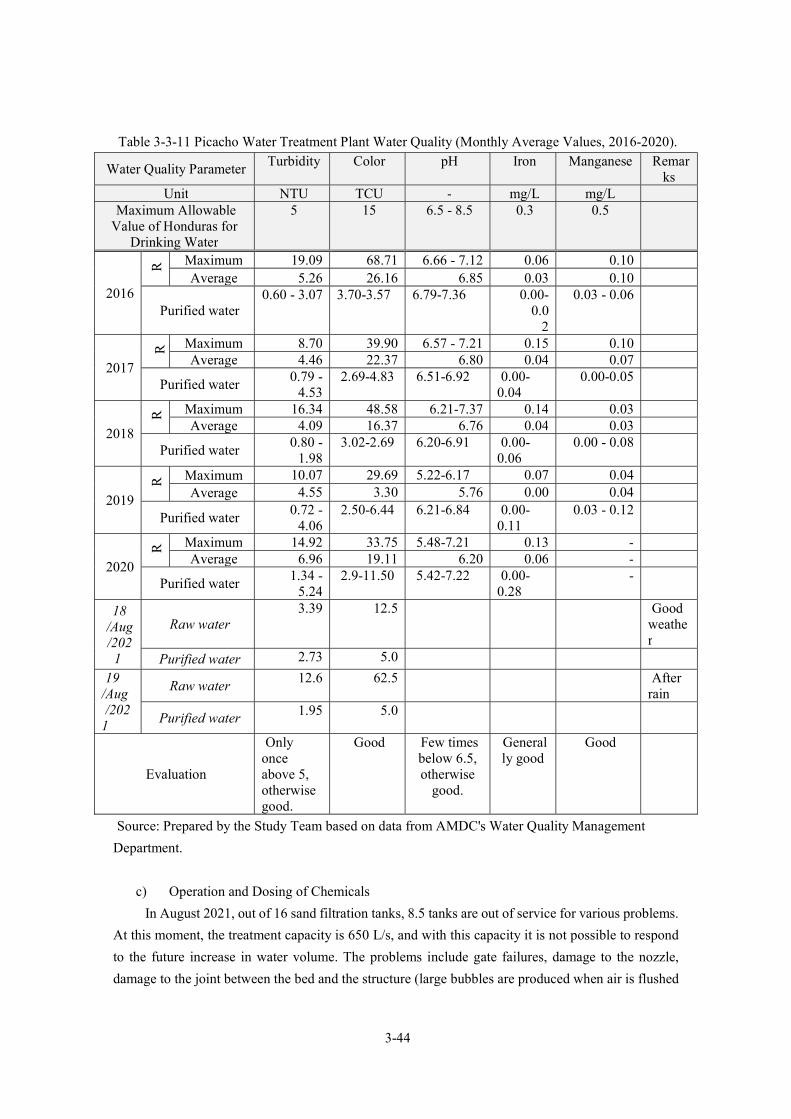
3-44
Table 3-3-11 Picacho Water Treatment Plant Water Quality (Monthly Average Values, 2016-2020).
Water Quality Parameter Turbidity Color pH Iron Manganese Remar
ks Unit NTU TCU - mg/L mg/L
Maximum Allowable Value of Honduras for
Drinking Water
5 15 6.5 - 8.5 0.3 0.5
2016
R aw Maximum 19.09 68.71 6.66 - 7.12 0.06 0.10
Average 5.26 26.16 6.85 0.03 0.10
Purified water 0.60 - 3.07 3.70-3.57 6.79-7.36 0.00-
0.02
0.03 - 0.06
2017
R Maximum 8.70 39.90 6.57 - 7.21 0.15 0.10 Average 4.46 22.37 6.80 0.04 0.07
Purified water 0.79 -
4.53 2.69-4.83 6.51-6.92 0.00-
0.04 0.00-0.05
2018
R aw Maximum 16.34 48.58 6.21-7.37 0.14 0.03
Average 4.09 16.37 6.76 0.04 0.03
Purified water 0.80 -
1.98 3.02-2.69 6.20-6.91 0.00-
0.06 0.00 - 0.08
2019
R aw Maximum 10.07 29.69 5.22-6.17 0.07 0.04
Average 4.55 3.30 5.76 0.00 0.04
Purified water 0.72 -
4.06 2.50-6.44 6.21-6.84 0.00-
0.11 0.03 - 0.12
2020
R aw Maximum 14.92 33.75 5.48-7.21 0.13 -
Average 6.96 19.11 6.20 0.06 -
Purified water 1.34 -
5.24 2.9-11.50 5.42-7.22 0.00-
0.28 -
18 /Aug /202
1
Raw water 3.39 12.5 Good
weather
Purified water 2.73 5.0
19 /Aug /202
1
Raw water 12.6 62.5 After
rain
Purified water 1.95 5.0
Evaluation
Only once above 5, otherwise good.
Good Few times below 6.5, otherwise
good.
Generally good
Good
Source: Prepared by the Study Team based on data from AMDC's Water Quality Management
Department.
c) Operation and Dosing of Chemicals
In August 2021, out of 16 sand filtration tanks, 8.5 tanks are out of service for various problems.
At this moment, the treatment capacity is 650 L/s, and with this capacity it is not possible to respond
to the future increase in water volume. The problems include gate failures, damage to the nozzle,
damage to the joint between the bed and the structure (large bubbles are produced when air is flushed
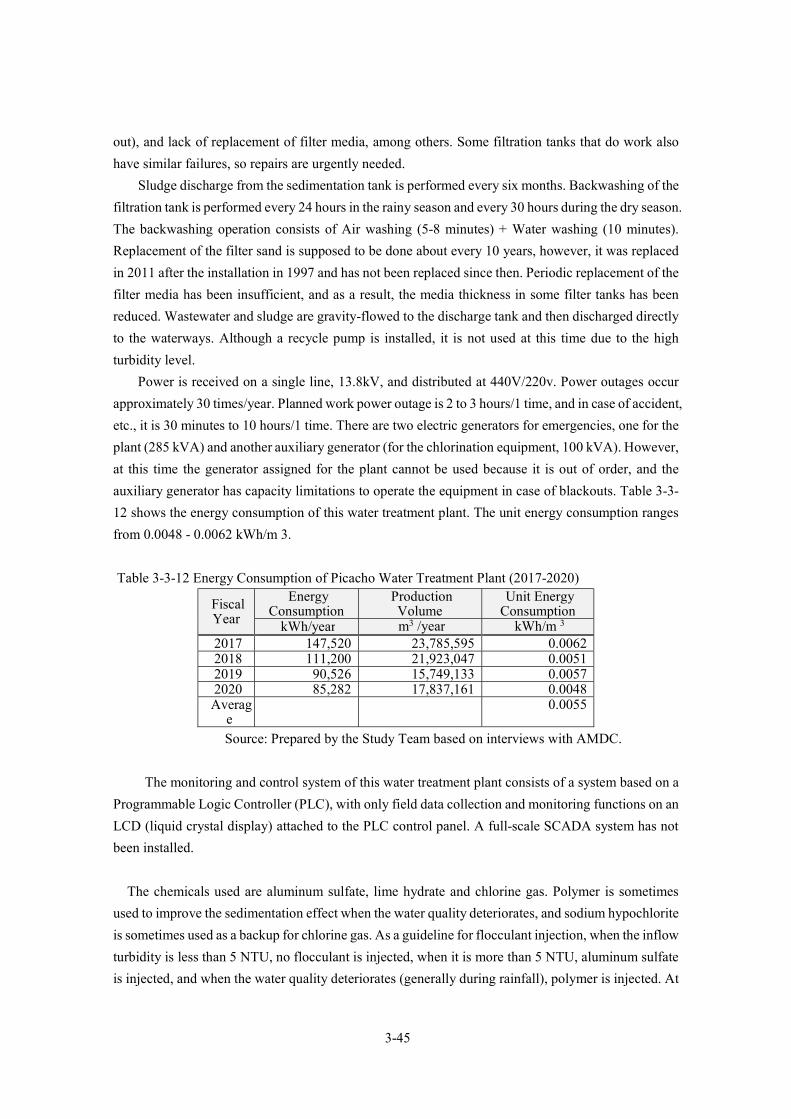
3-45
out), and lack of replacement of filter media, among others. Some filtration tanks that do work also
have similar failures, so repairs are urgently needed.
Sludge discharge from the sedimentation tank is performed every six months. Backwashing of the
filtration tank is performed every 24 hours in the rainy season and every 30 hours during the dry season.
The backwashing operation consists of Air washing (5-8 minutes) + Water washing (10 minutes).
Replacement of the filter sand is supposed to be done about every 10 years, however, it was replaced
in 2011 after the installation in 1997 and has not been replaced since then. Periodic replacement of the
filter media has been insufficient, and as a result, the media thickness in some filter tanks has been
reduced. Wastewater and sludge are gravity-flowed to the discharge tank and then discharged directly
to the waterways. Although a recycle pump is installed, it is not used at this time due to the high
turbidity level.
Power is received on a single line, 13.8kV, and distributed at 440V/220v. Power outages occur
approximately 30 times/year. Planned work power outage is 2 to 3 hours/1 time, and in case of accident,
etc., it is 30 minutes to 10 hours/1 time. There are two electric generators for emergencies, one for the
plant (285 kVA) and another auxiliary generator (for the chlorination equipment, 100 kVA). However,
at this time the generator assigned for the plant cannot be used because it is out of order, and the
auxiliary generator has capacity limitations to operate the equipment in case of blackouts. Table 3-3-
12 shows the energy consumption of this water treatment plant. The unit energy consumption ranges
from 0.0048 - 0.0062 kWh/m 3.
Table 3-3-12 Energy Consumption of Picacho Water Treatment Plant (2017-2020)
Fiscal Year
Energy Consumption
Production Volume
Unit Energy Consumption
kWh/year m3 /year kWh/m 3 2017 147,520 23,785,595 0.0062 2018 111,200 21,923,047 0.0051 2019 90,526 15,749,133 0.0057 2020 85,282 17,837,161 0.0048 Averag
e 0.0055
Source: Prepared by the Study Team based on interviews with AMDC.
The monitoring and control system of this water treatment plant consists of a system based on a
Programmable Logic Controller (PLC), with only field data collection and monitoring functions on an
LCD (liquid crystal display) attached to the PLC control panel. A full-scale SCADA system has not
been installed.
The chemicals used are aluminum sulfate, lime hydrate and chlorine gas. Polymer is sometimes
used to improve the sedimentation effect when the water quality deteriorates, and sodium hypochlorite
is sometimes used as a backup for chlorine gas. As a guideline for flocculant injection, when the inflow
turbidity is less than 5 NTU, no flocculant is injected, when it is more than 5 NTU, aluminum sulfate
is injected, and when the water quality deteriorates (generally during rainfall), polymer is injected. At

3-46
the time of the field survey (August 2021), no chemicals were injected on the 18th, and aluminum
sulfate and polymer were injected on the 19th.
Table 3-3-13 shows the cost of chemicals and the chemical dosage rate of this water treatment plant.
It should be noted that polymer and sodium hypochlorite are omitted due to low usage. The chemical
cost is 0.05 - 0.10 HNL/m3, although it depends on the quality of the raw water. When the quality of
the raw water is good, aluminum sulfate and lime hydrate are not dosed during a certain period,
generally in the dry season.
Table 3-3-13 Chemical Cost and Chemical Dosage Rate of Picacho Water Treatment Plant (2016-
2020).
Item Cost of
Chemicals Aluminum Sulfate Calcium Hydroxide Chlorine Gas
Unit HNL/m 3 mg/L mg/L mg/L
Annual
Average Monthly Average
Annual Average
Monthly Average
Annual Average
Monthly Average
2016 0.08 2.97 2.10 -
4.80 2.06 1.74 -
3.31 0.96 0.60 -
1.43
2017 0.10 2.61 1.97 -
3.40 1.45 0.00 -
2.11 1.03 0.81 -
1.35
2018 0.05 1.04 0.03 -
4.62 0.35 0.00 -
1.12 0.72 0.42 -
1.05
2019 0.05 0.90 0.00 -
2.69 0.77 0.16 -
1.49 0.63 0.42 -
1.15
2020 0.06 1.39 0.03 -
4.85 0.76 0.06 -
3.45 0.59 0.43 -
0.90
Source: Prepared by the Study Team based on interviews with SANAA.
d) Status of Major Facilities and Equipment
Table 3-3-14 and Figure 3-3-26 show the current status of the major facilities and equipment of
this water treatment plant. Some equipment has been replaced; however, most of the equipment is the
same one as at the start of the construction 25 years ago, requiring repair or replacement due to
breakdown and aging. In 2012, flow meters were installed in the raw water and
transmission/distribution systems, but many of them are not working due to malfunctions. Current
influent flows are measured at the aerator outflow channel weir. There is an urgent need to upgrade or
install chemical dosing equipment to ensure reliable treatment operation, power generator equipment
to secure power supply during power outages, and flow meters to monitor water volume. As for the
filtration tanks, eight of the 16 tanks are currently idle due to problems with the gates and water
collection equipment. It is reported that this is because the existing water collection system is not
suitable for water/air washing. Some of the filtration tanks that are still in operation are not being
cleaned effectively due to problems with the water collector (nozzle). The current inflow of water is
small compared to the design capacity, so it can be dealt with, but as the water volume will increase
in the future, it is necessary to repair it as soon as possible.
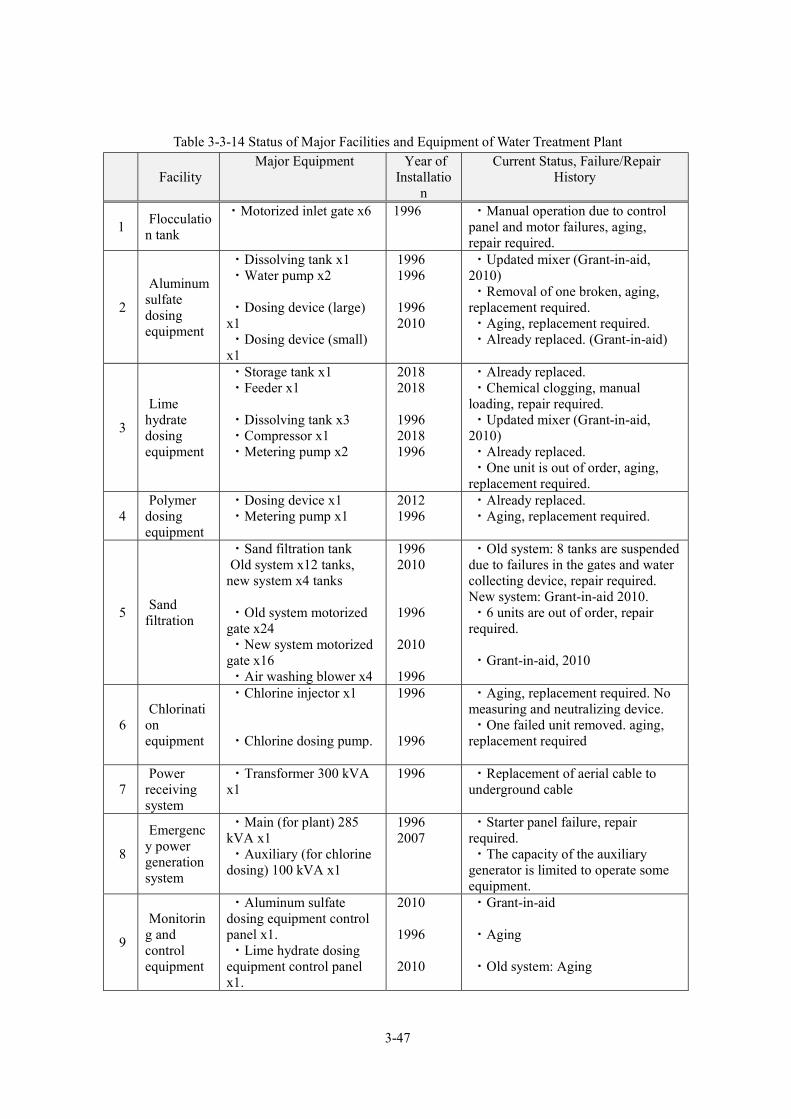
3-47
Table 3-3-14 Status of Major Facilities and Equipment of Water Treatment Plant
Facility Major Equipment Year of
Installation
Current Status, Failure/Repair History
1 Flocculatio
n tank
・Motorized inlet gate x6 1996 ・Manual operation due to control panel and motor failures, aging, repair required.
2
Aluminum sulfate dosing equipment
・Dissolving tank x1 ・Water pump x2 ・Dosing device (large)
x1 ・Dosing device (small)
x1
1996 1996 1996 2010
・Updated mixer (Grant-in-aid, 2010) ・Removal of one broken, aging,
replacement required. ・Aging, replacement required. ・Already replaced. (Grant-in-aid)
3
Lime hydrate dosing equipment
・Storage tank x1 ・Feeder x1 ・Dissolving tank x3 ・Compressor x1 ・Metering pump x2
2018 2018 1996 2018 1996
・Already replaced. ・Chemical clogging, manual
loading, repair required. ・Updated mixer (Grant-in-aid,
2010) ・Already replaced. ・One unit is out of order, aging,
replacement required.
4 Polymer
dosing equipment
・Dosing device x1 ・Metering pump x1
2012 1996
・Already replaced. ・Aging, replacement required.
5 Sand
filtration
・Sand filtration tank Old system x12 tanks,
new system x4 tanks ・Old system motorized
gate x24 ・New system motorized
gate x16 ・Air washing blower x4
1996 2010 1996 2010 1996
・Old system: 8 tanks are suspended due to failures in the gates and water collecting device, repair required. New system: Grant-in-aid 2010. ・6 units are out of order, repair
required. ・Grant-in-aid, 2010
6 Chlorinati
on equipment
・Chlorine injector x1 ・Chlorine dosing pump.
1996 1996
・Aging, replacement required. No measuring and neutralizing device. ・One failed unit removed. aging,
replacement required
7 Power
receiving system
・Transformer 300 kVA x1
1996 ・Replacement of aerial cable to underground cable
8
Emergency power generation system
・Main (for plant) 285 kVA x1 ・Auxiliary (for chlorine
dosing) 100 kVA x1
1996 2007
・Starter panel failure, repair required. ・The capacity of the auxiliary
generator is limited to operate some equipment.
9
Monitoring and control equipment
・Aluminum sulfate dosing equipment control panel x1. ・Lime hydrate dosing
equipment control panel x1.
2010 1996 2010
・Grant-in-aid ・Aging ・Old system: Aging
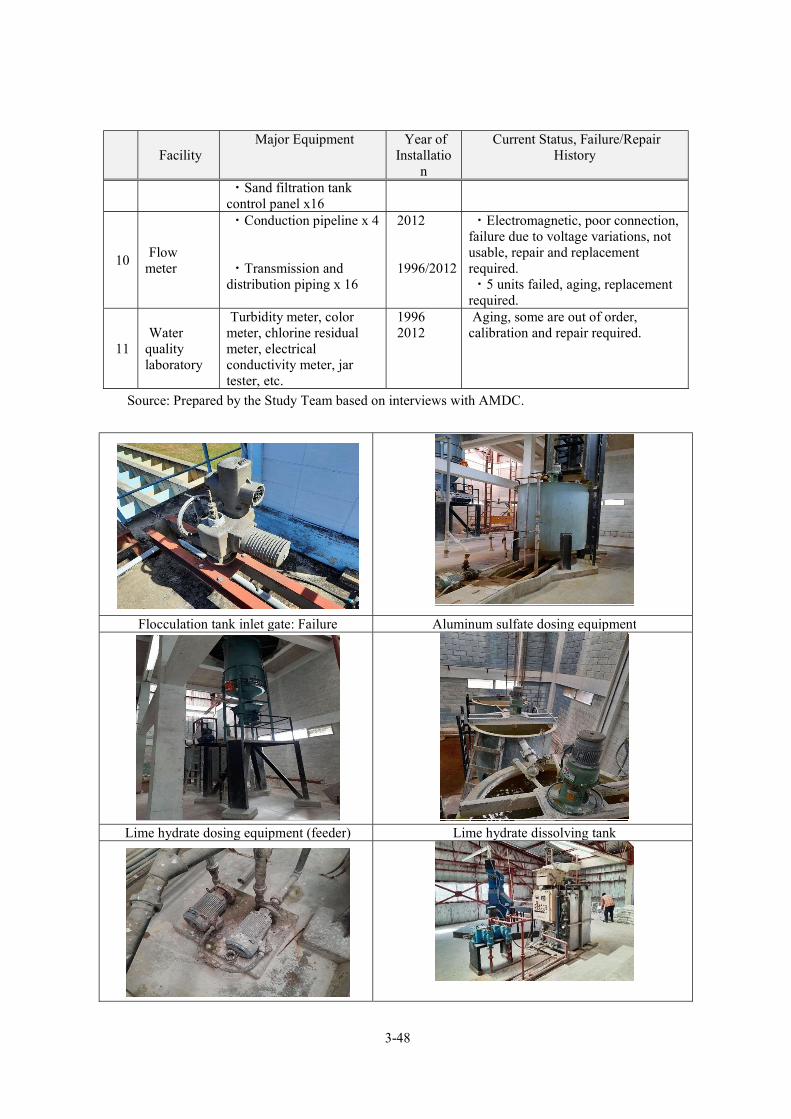
3-48
Facility Major Equipment Year of
Installation
Current Status, Failure/Repair History
・Sand filtration tank control panel x16
10 Flow
meter
・Conduction pipeline x 4 ・Transmission and
distribution piping x 16
2012 1996/2012
・Electromagnetic, poor connection, failure due to voltage variations, not usable, repair and replacement required. ・5 units failed, aging, replacement
required.
11 Water
quality laboratory
Turbidity meter, color meter, chlorine residual meter, electrical conductivity meter, jar tester, etc.
1996 2012
Aging, some are out of order, calibration and repair required.
Source: Prepared by the Study Team based on interviews with AMDC.
Flocculation tank inlet gate: Failure Aluminum sulfate dosing equipment
Lime hydrate dosing equipment (feeder) Lime hydrate dissolving tank

3-49
Lime hydrate dosing pump Polymer dosing device
Filtration tank (suspended) Filtration tank air washing blower
Chlorine dosing device : aging Transformer
Main electrical generator failure Chemical dosing equipment control panel
Sand Filtration Tank Control Panel Flowmeter (raw water, purified water and pipeline)
failure

3-50
Flow meter (distribution lines) : failure
Water quality laboratory : aging, failure
Figure 3-3-26Status of Major Facilities and Equipment of Picacho Water Treatment Plant
Problems at Picacho Water Treatment Plant and World Bank Improvement Plan
a) Problems at Picacho Water Treatment Plant
Table 3-3-15 shows the problems and possible countermeasures at this water treatment plant
identified from the results of the field survey and interviews with maintenance staff. Many of the issues
are associated with the aging and failure of the water pipes and facilities.
Table 3-3-15 Problems at the Picacho Water Treatment Plant Issue Current Problems Possible Measures Remarks
1.Water source and water quality
・Aging pipelines that are vulnerable to heavy rains and landslides.
・Reinforcement of the base structure is required to support and protect the pipeline or build a new structure.
If even one pipe fails, the raw water volume will decrease.
2. Facility scale
・The raw water volume is 50 - 70 % of the design capacity of 1,100 L/s, the available treatment volume varies due to climate change.
・Construction of new reservoirs to secure raw water supply, especially during the dry season.
3. Treatment function
・The current treatment process satisfies the drinking water standard.
4. Facilities and equipment
a. Many pieces of equipment are the same as at the beginning of construction and are 25 years old, aging, or have broken down. b. The lime hydrate feeder
device is clogged. c. Only one aluminum sulfate
and polymer metering pump is operational. d. 8 sand filtration tanks are
suspended due to failures in the drainage collection device.
a. Repair or replacement is required after detailed study. b. Addition of vibration and
heating device. c. Installation of standby
equipment to ensure operation in case of breakdowns. d. Replace the current nozzle
of the drainage collection device that is for water to the nozzle for water/air, in all tanks including those that are
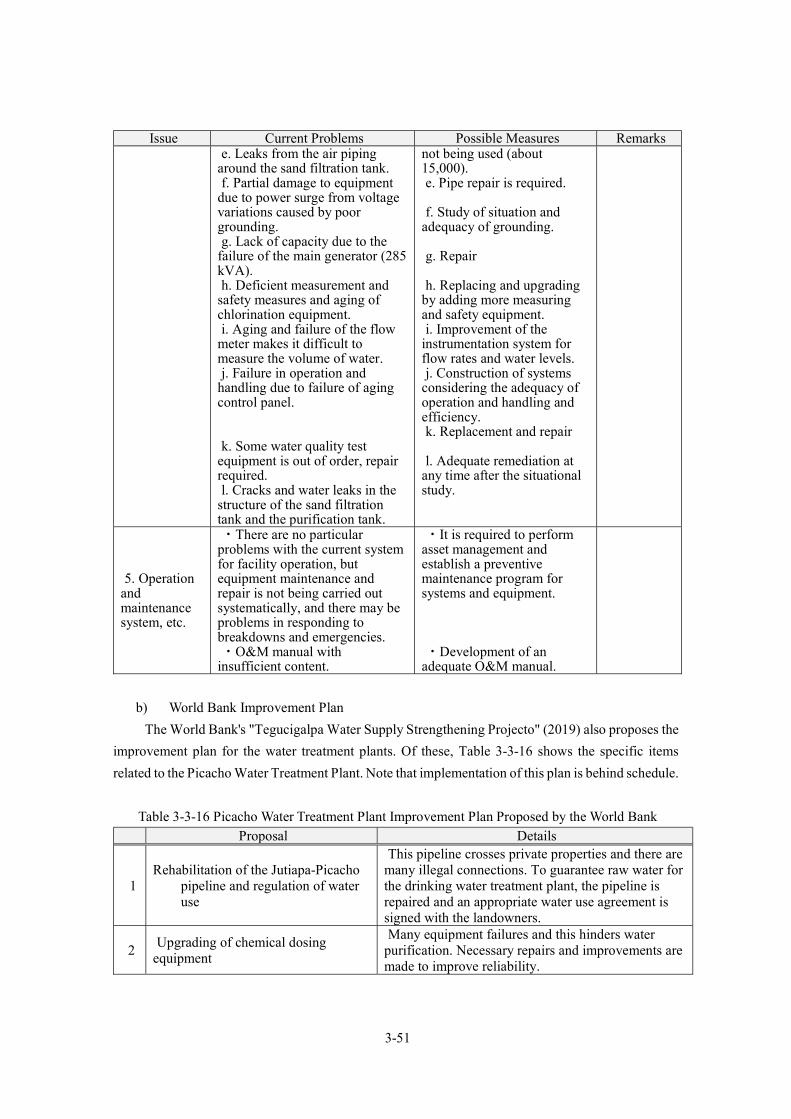
3-51
Issue Current Problems Possible Measures Remarks e. Leaks from the air piping
around the sand filtration tank. f. Partial damage to equipment
due to power surge from voltage variations caused by poor grounding. g. Lack of capacity due to the
failure of the main generator (285 kVA). h. Deficient measurement and
safety measures and aging of chlorination equipment. i. Aging and failure of the flow
meter makes it difficult to measure the volume of water. j. Failure in operation and
handling due to failure of aging control panel. k. Some water quality test
equipment is out of order, repair required. l. Cracks and water leaks in the
structure of the sand filtration tank and the purification tank.
not being used (about 15,000). e. Pipe repair is required. f. Study of situation and
adequacy of grounding. g. Repair h. Replacing and upgrading
by adding more measuring and safety equipment. i. Improvement of the
instrumentation system for flow rates and water levels. j. Construction of systems
considering the adequacy of operation and handling and efficiency. k. Replacement and repair l. Adequate remediation at
any time after the situational study.
5. Operation and maintenance system, etc.
・There are no particular problems with the current system for facility operation, but equipment maintenance and repair is not being carried out systematically, and there may be problems in responding to breakdowns and emergencies. ・O&M manual with
insufficient content.
・It is required to perform asset management and establish a preventive maintenance program for systems and equipment. ・Development of an
adequate O&M manual.
b) World Bank Improvement Plan
The World Bank's "Tegucigalpa Water Supply Strengthening Projecto" (2019) also proposes the
improvement plan for the water treatment plants. Of these, Table 3-3-16 shows the specific items
related to the Picacho Water Treatment Plant. Note that implementation of this plan is behind schedule.
Table 3-3-16 Picacho Water Treatment Plant Improvement Plan Proposed by the World Bank Proposal Details
1 Rehabilitation of the Jutiapa-Picacho
pipeline and regulation of water use
This pipeline crosses private properties and there are many illegal connections. To guarantee raw water for the drinking water treatment plant, the pipeline is repaired and an appropriate water use agreement is signed with the landowners.
2 Upgrading of chemical dosing
equipment
Many equipment failures and this hinders water purification. Necessary repairs and improvements are made to improve reliability.

3-52
Proposal Details
3 Chlorination equipment upgrade Equipment failures and lack of safety. Equipment
should be upgraded by replacing it, installing the chlorine neutralizing device, chlorine tank scale, etc.
4 Improvement of the coagulation
device Damage to the screen and short circuit affects
efficiency, this needs to be improved.
5 Replacement of motorized actuators
for valves and gates
Manual operation due to deterioration and many breakdowns. Replacement for simplified handling and greater efficiency.
6 Replacement of the filter media for
the filtration tank
The filter sand has reached its useful life, the sand needs to be replaced in all tanks. It is not necessary in case of multi-layer filtration due to the quality of the raw water.
7 Replacement of nozzles in the lower
water collection system of the filtration tank
Poor performance due to clogging or damage. All of them are renewed.
8 Sludge management and reuse of
backwash wastewater Proper sludge management and reuse of overflow
water for treatment process
9 Operations and energy efficiency
improvement
To improve system efficiency, installation of load factor reduction condenser, the pumps and blowers are replaced with high-efficiency motor, and reviewed filtration pond cleaning operations and chemical injection operations.
10 Effective measurement of water
production volume
Improvement of flow metering system and linkage with network SCADA system for water supply optimization.
11 Office equipment
Provision of equipment and software for proper information management, monitoring and surveillance of the process and improved communications.
12 Water quality testing equipment
Revision of procedures and standards in the transfer of the water quality management function, installation of new laboratory equipment to monitor treatment processes and purified water quality.
(5) Picacho Micro Hydroelectric Plant
The El Picacho micro hydroelectric plant is installed in one of the nine distribution pipelines coming
from the El Picacho Water Treatment Plant, on the L22 system line, with a diameter of 400 mm. In
August 2021, the transformer suffered a malfunction and the micro hydroelectric plant is not working.
When the survey was conducted on August 19, 2021, the flow rate was 186 L/s. This flow is within
the range of flows between 120-300 L/s that allow power generation, and therefore, if the transformer
is repaired, power can be generated. Regarding the repair, according to the interview with UMAPS, it
can be repaired at a cost of HNL 196,225.00. The electrical generator is in good condition with no
damage observed.

3-53
Transformer (damage to neutral and ground terminal)
Electric generator
3-3-2-1-3 La Concepción Water Treatment Plant
Outline
The Concepcion Water Treatment Plant is located in the downstream of Concepcion reservoir and
was built in 1991 with financing from the Italian and French governments (service began in 1993).
Initially, the design capacity was 1,200 L/s, but in 2006, with support from Italy, the treatment capacity
was increased by 300 L/s, and the current design capacity is 1,500 L/s (start of service in 2008). This
was in response to the reservoir elevation/increase in storage volume with the new construction of the
tumble gate at the reservoir overflow spillway and the plan to divert water from other water sources.
Subsequently, in order to respond to the diversion from the Laureles system, the inclined plate was
installed in the suspended solid contact type sedimentation tank in 2017 to improve efficiency and
treatment capacity. As a result, the maximum treatment capacity for the operation increased to 1,700
L/s. This water treatment plant is the largest in the municipality and water production is stable
throughout the year. Additional to this, in 2017, the booster pumping station was installed to send a
portion of treated water to the Laureles Water Treatment Plant.
The water purification process consists of aerator + mixing tank + suspended solid contact type
sedimentation tank (with inclined tube) + gravity type rapid sand filter + chlorination. Figure 3-3-27
shows the flow diagram of the Concepcion water treatment plant, Figure 3-3-28 shows the general
plan, Figure 3-3-29 shows the hydraulic profile, Table 3-3-17 shows the specifications of the main
facilities, and Figure 3-3-30 shows the current situation of the facilities.

3-54
Figure 3-3-27Flow Diagram of Concepción Water Treatment Plant
Figure 3-3-28General Plan of Concepción Water Treatment Plant

3-55
Figure 3-3-29Hydraulic Profile of Concepcion Water Treatment Plant
Table 3-3-17 Specifications of Main Facilities of Concepción Water Treatment Plant No. Facility Specifications Main Equipment Remarks
Production volume
1,500 L/s (129,600 m3/day)
Maximum for the operation, 1,700 L/s
1 Aerator ・Rectangular cascade tank, made of reinforced concrete (RC). ・1 tank
2 Suspended solid contact type sedimentation tank
・Suspended solid contact type sedimentation tank with inclined plate, made of RC (pulsation type). ・Width 17.0 m x Length 25.0 m x
Depth 3.7 m x 5 tanks ・Surface load: 36 mm/min. ・Detention time: 1.5 hours
・Aluminum sulfate dosing equipment: 1 set ・Lime hydrate dosing
equipment: 1 set. ・Polymer dosing
equipment: 1 set ・Potassium
permanganate dosing equipment is diverted for activated carbon dosing equipment: 1 set.
・Pulsator type. ・One tank added
in 2006. ・Potassium
permanganate is currently not used. ・Activated
carbon is used only for raw water coming from the Laureles system to remove odor.
3 Sand filtration tank
・Gravity type rapid sand filter with air washing made of RC ・Width (3.44 m + 3.44 m) x
Length 9.0 m x 8 tanks ・Filtration surface area:
62 m 2/tank.
・Air washing blower x 4 units.
・Aquazur type ・2 tanks added in
2006. ・Sand layer
thickness: 1.4 m

3-56
No. Facility Specifications Main Equipment Remarks Filtration rate (all tanks in
operation): 260 m/day, maximum 290 m/day.
4 Chlorine mixing tank
・Made of RC: 1 tank. ・Liquid chlorine dosing set: 1 set
5 Lime saturation tank
・Made of RC: 1 tank.
6 Backwash tank ・Made of RC: 1 tank. ・Recovery pump 7 Power receiving
system ・Transformer: 34.5 kV
x 500KVA x 1 unit
8 Emergency power generation system
・285KVA x 1 unit
9 Monitoring and control equipment
・Control panel: 1 set (graphic panel: existing)
SCADA System: None
10 Water quality laboratory
There is ・Turbidity, residual chlorine, jar test, etc.
11 Booster pumping station
Vertical pump 9.46 m3/min x 45.7 m x
94kW x 2 units (1 standby) 18.93 m3/min x 45.7 m x
188 kW x 2 units (1 standby)
It sends a portion of treated water to the Laureles Water Treatment Plant.
Source: Prepared by the Study Team based on interviews with AMDC.
Mixing tank inlet Overview of sedimentation tank and sand
filtration building

3-57
Suspended-solid contact sedimentation
tank with inclined plate
Flow diagram of sedimentation tank
Sand filtration tank Chlorination equipment
Monitoring and control room Lime saturation tank
Figure 3-3-30Current Status of Concepción Water Treatment Plant
Operation and Maintenance System
Currently, the Concepcion Water Treatment Plant is operated and maintained by the Concepción
subsystem of the AMDC Water Management Unit, and this subsystem is also responsible for the
operation and maintenance of the water source facilities related to Concepcion. The Concepción
subsystem has 29 personnel for operation and maintenance, and Table 3-3-18 shows their duties. The
water quality test personnel listed in the Table belong to the AMDC Central Water Quality Laboratory
and is stationed at the Concepcion Water Treatment Plant.

3-58
Table 3-3-18 Operation and Maintenance System for Concepción Subsystem Staff Responsibilities Remarks
1 Subsystem administrator 2 Subsystem assistant 3 Secretary 4 Procurement warehouse keeper 5 Facility cleaning 6 Water Treatment Plant operator 7 Mechanical and electrical team
8 Water source facilities inspection and
management
9 Driver 10 Facilities inspection and management 11 Field worker
Water quality test
Source: Prepared by the Study Team based on interviews with AMDC.
The water treatment plant is operated in two shifts, from 8:00 a.m. to 4:00 p.m. and from 4:00
p.m. to 8:00 a.m. of the following day. Water treatment plant operators inspect the main mechanical
and electrical equipment once a week. Repairs to faulty equipment are carried out by the responsible
section at AMDC headquarter. The staff reports daily to AMDC the data on water levels and volume
of water from the water source, as well as the volume, water quality, water levels, etc. of the water
treatment plant in digital format via online. There is no communication system such as SCADA
between AMDC and the water treatment plants. The personnel perform operation and maintenance
work based on the AMDC operation and maintenance manual.
Status of Operations
a) Water Volume
Table 3-3-19, shows the raw water volume and production volume (2016-2020) of the
Concepcion Water Treatment Plant and Figure 3-3-31 shows the monthly variations in production
volume. The water production volume varies each year, but from January to June 2018 and 2019 it
exceeded the design capacity of 1,500 L/s and approached the maximum capacity for operation (1,700
L/s). Although in the months of minimum volume this can drop to 50% of capacity, in the high water
season, the plant is generally operating at maximum capacity. Relatively little rainfall has been
recorded in 2021. The incoming volume at the time of the field survey (August 20, 2021) was 1,373
L/s, trending similar to the period between 2016 and 2018.

3-59
Table 3-3-19 Raw Water Volume and Production Volume of Concepción Drinking Water
Treatment Plant (2016-2020) (Unit: L/s)
Fiscal Year
Average Annual
Volume of Raw Water
Average Annual
Production Volume
Production Volume/
Raw water (%)
Average Annual Production Volume per
Season
Minimum Volume
of Production Rainy
Season (May -
October)
Dry Season
(November - April)
2016 1,360 1,332 97.9 1,327 1,337 1,247
(November) 2017 1,417 1,385 97.7 1,364 1,406 1,425 (October)
2018 1,519 1,489 98.0 1,495 1,482 1,464
(November)
2019 1,285 1,259 98.0 1,227 1,293 784
(November) 2020 1,089 1,065 97.8 1,196 933 706 (March)
Source: Prepared by the Study Team based on AMDC statistical data.
Figure 3-3-31Monthly Variations in Production Volume of Concepcion Water Treatment Plant
(2016-2020).
b) Water Quality
Water quality testing is performed in the in-plant water quality laboratory and in the central water
quality laboratory. In the in-plant water quality laboratory, operating parameters such as turbidity,
color, pH, electrical conductivity, alkalinity, and hardness are analyzed three times a day. In the central
laboratory, samples are sent once a week from the water treatment plant, analyzed for iron, manganese,
bacteriological and cross-checked for other items in the in-plant laboratory.
Table 3-3-20, shows the main raw and purified water quality parameters (turbidity, color, pH, iron
and manganese) obtained from 2016 to 2020 (monthly average values).
Monthly variations of WTP Concepcion's production volume
JAN FEB MAR APR MAY JUN JUL AUG SEP OCT NOV DEC

3-60
The source of water for this water treatment plant is the Concepcion reservoir. Throughout the year,
the raw water has fairly high levels of both turbidity and color, and algae is observed. In the last five
years, these values were generally maintained, and especially in the rainy season the turbidity level
rises to 100-150 NTU and the color, 300-400 UC. Likewise, the values of the analysis of nutritive salts
in the raw water in 2020 (monthly average) show the results of ammonium nitrogen between 0.51 -
2.18 mg/L (average: 1.23 mg/L), nitrate nitrogen between 0.01 - 0.08 mg/L (average: 0.05 mg/L) and
phosphoric acid between 0.05 - 0.30 mg/L (average 0.17 mg/L), indicating symptoms of water quality
contamination and eutrophication due to various wastewaters. On the other hand, the turbidity and
color level of the purified water is lower than the permitted value for drinking water and it is treated
by coagulation, sedimentation and filtration. The pH is adjusted, although sometimes the value of the
purified water is lower than the standard value. Also the iron and manganese values are lower than the
standard value.
Table 3-3-20 Water Quality at Concepción Water Treatment Plant
(Monthly Average Values, 2016-2020)
Water Quality Parameter Turbidity Color pH Iron Mangane
se Remar
ks
Unit NTU TCU - mg/L mg/L
Maximum Allowable Value of Honduras for
Drinking Water 5 15 6.5 - 8.5 0.3 0.5
2016 Raw
w
ater
Maximum 94.42 261.99 6.81-
7.09
0.35 0.44
Average 56.60 168.55 6.95 0.24 0.30
Purified water 2.50 - 3.95 6.21-
6.75
0.00-0.0
1
0.00 - 0.21
2017
Raw
w
ater
Maximum 108.00 382.40 6.55-
7.18 0.52 0.57
Average 63.26 174.68 6.98 0.27 0.13
Purified water 2.56 -
8.59 6.14-6.67
0.00 0.00 - 0.32
2018
Raw
w
ater
Maximum 78.77 276.30 6.70-
6.93 0.55 0.13
Average 52.25 158.20 6.78 0.25 0.05
Purified water 2.50 -
4.53 6.31-6.61
0.00-0.02
0.03 - 0.18
2019 Raw
w
ater
Maximum 145.27 424.38 6.62-
7.50 0.52 0.11
Average 60.85 165.12 6.89 0.34 0.06
Purified water 2.50 -
4.10 6.43-6.78
0.00-0.01
0.01 - 0.19
2020 Raw
w
ater
Maximum 125.02 361.86 6.78-
7.76 0.45 0.02
Average 70.19 182.66 7.19 0.30 0.01

3-61
Water Quality Parameter Turbidity Color pH Iron Mangane
se Remar
ks
Unit NTU TCU - mg/L mg/L
Maximum Allowable Value of Honduras for
Drinking Water 5 15 6.5 - 8.5 0.3 0.5
Purified water 2.5 - 5.51 6.29-
6.97 0.00 0.00 -
0.02
20 /Aug /202
1
Raw water 35.00 125.00
Purified water 0.72 2.50
Evaluation
Lower than allowed value
Lower than
allowed value
Sometimes it is less than
6.5
Good Good
Source: Prepared by the Study Team based on data from AMDC's Water Quality Management
Department.
c) Operation and Dosing Chemicals
The sludge unloading work of the sedimentation tank is performed every six months.
Backwashing of the filtration tank is performed every 24-28 hours, and the backwash operation
consists of 5-minute air flushing + 3-minute air and water flushing + 5-12 minute water flushing. The
filter sand has not been completely replaced since service began; however, approximately 10% is
replaced each year. Sludge is discharged directly to the nearby river. Wastewater from the wash flows
by gravity to the recovery tank and is returned to the inlet side through the recovery pump.
As an anti-algae measure, the sedimentation tank and sand filtration tank channels are washed 4-
5 times a year and pre-chlorination is performed. They are requesting the installation of a roof for both
facilities as a measure against algae. The facilities and the enclosure are well cleaned.
Power is received on a single line, 34.5 kV, and distributed at 440V/220v. Power outages occur
approximately 12 times/year. Planned work power outage is 2 to 3 hours/interruption, and in case of
accident and emergencies, it is 30 minutes to 10 hours/interruption. There is an electric generator for
emergencies with a capacity of 295 kVA. Table 3-3-21 shows the energy consumption of this water
treatment plant. Unit energy consumption ranges between 0.0088-0.0118kWh/m3.
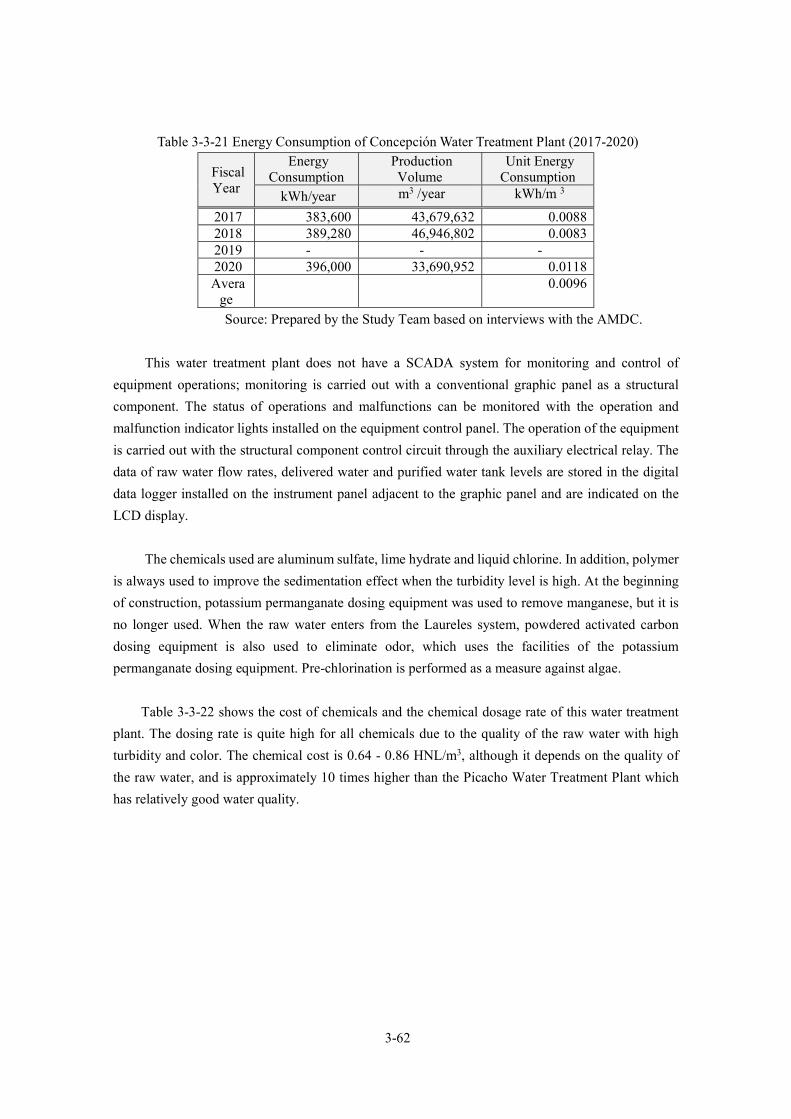
3-62
Table 3-3-21 Energy Consumption of Concepción Water Treatment Plant (2017-2020)
Fiscal Year
Energy Consumption
Production Volume
Unit Energy Consumption
kWh/year m3 /year kWh/m 3
2017 383,600 43,679,632 0.0088 2018 389,280 46,946,802 0.0083 2019 - - - 2020 396,000 33,690,952 0.0118 Avera
ge
0.0096
Source: Prepared by the Study Team based on interviews with the AMDC.
This water treatment plant does not have a SCADA system for monitoring and control of
equipment operations; monitoring is carried out with a conventional graphic panel as a structural
component. The status of operations and malfunctions can be monitored with the operation and
malfunction indicator lights installed on the equipment control panel. The operation of the equipment
is carried out with the structural component control circuit through the auxiliary electrical relay. The
data of raw water flow rates, delivered water and purified water tank levels are stored in the digital
data logger installed on the instrument panel adjacent to the graphic panel and are indicated on the
LCD display.
The chemicals used are aluminum sulfate, lime hydrate and liquid chlorine. In addition, polymer
is always used to improve the sedimentation effect when the turbidity level is high. At the beginning
of construction, potassium permanganate dosing equipment was used to remove manganese, but it is
no longer used. When the raw water enters from the Laureles system, powdered activated carbon
dosing equipment is also used to eliminate odor, which uses the facilities of the potassium
permanganate dosing equipment. Pre-chlorination is performed as a measure against algae.
Table 3-3-22 shows the cost of chemicals and the chemical dosage rate of this water treatment
plant. The dosing rate is quite high for all chemicals due to the quality of the raw water with high
turbidity and color. The chemical cost is 0.64 - 0.86 HNL/m3, although it depends on the quality of
the raw water, and is approximately 10 times higher than the Picacho Water Treatment Plant which
has relatively good water quality.
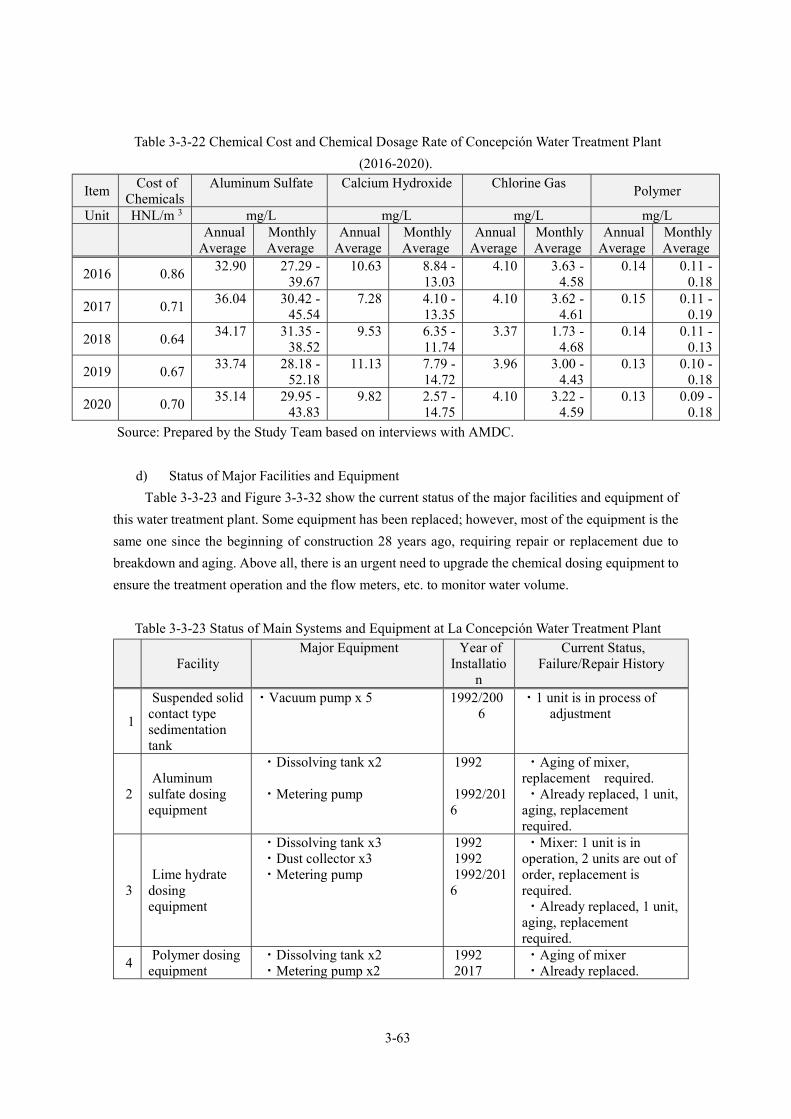
3-63
Table 3-3-22 Chemical Cost and Chemical Dosage Rate of Concepción Water Treatment Plant
(2016-2020).
Item Cost of
Chemicals Aluminum Sulfate Calcium Hydroxide Chlorine Gas
Polymer
Unit HNL/m 3 mg/L mg/L mg/L mg/L
Annual
Average Monthly Average
Annual Average
Monthly Average
Annual Average
Monthly Average
Annual Average
Monthly Average
2016 0.86 32.90 27.29 -
39.67 10.63 8.84 -
13.03 4.10 3.63 -
4.58 0.14 0.11 -
0.18
2017 0.71 36.04 30.42 -
45.54 7.28 4.10 -
13.35 4.10 3.62 -
4.61 0.15 0.11 -
0.19
2018 0.64 34.17 31.35 -
38.52 9.53 6.35 -
11.74 3.37 1.73 -
4.68 0.14 0.11 -
0.13
2019 0.67 33.74 28.18 -
52.18 11.13 7.79 -
14.72 3.96 3.00 -
4.43 0.13 0.10 -
0.18
2020 0.70 35.14 29.95 -
43.83 9.82 2.57 -
14.75 4.10 3.22 -
4.59 0.13 0.09 -
0.18
Source: Prepared by the Study Team based on interviews with AMDC.
d) Status of Major Facilities and Equipment
Table 3-3-23 and Figure 3-3-32 show the current status of the major facilities and equipment of
this water treatment plant. Some equipment has been replaced; however, most of the equipment is the
same one since the beginning of construction 28 years ago, requiring repair or replacement due to
breakdown and aging. Above all, there is an urgent need to upgrade the chemical dosing equipment to
ensure the treatment operation and the flow meters, etc. to monitor water volume.
Table 3-3-23 Status of Main Systems and Equipment at La Concepción Water Treatment Plant
Facility Major Equipment Year of
Installation
Current Status, Failure/Repair History
1
Suspended solid contact type sedimentation tank
・Vacuum pump x 5 1992/2006
・1 unit is in process of adjustment
2 Aluminum
sulfate dosing equipment
・Dissolving tank x2 ・Metering pump
1992 1992/201
6
・Aging of mixer, replacement required. ・Already replaced, 1 unit,
aging, replacement required.
3 Lime hydrate
dosing equipment
・Dissolving tank x3 ・Dust collector x3 ・Metering pump
1992 1992 1992/201
6
・Mixer: 1 unit is in operation, 2 units are out of order, replacement is required. ・Already replaced, 1 unit,
aging, replacement required.
4 Polymer dosing
equipment ・Dissolving tank x2 ・Metering pump x2
1992 2017
・Aging of mixer ・Already replaced.
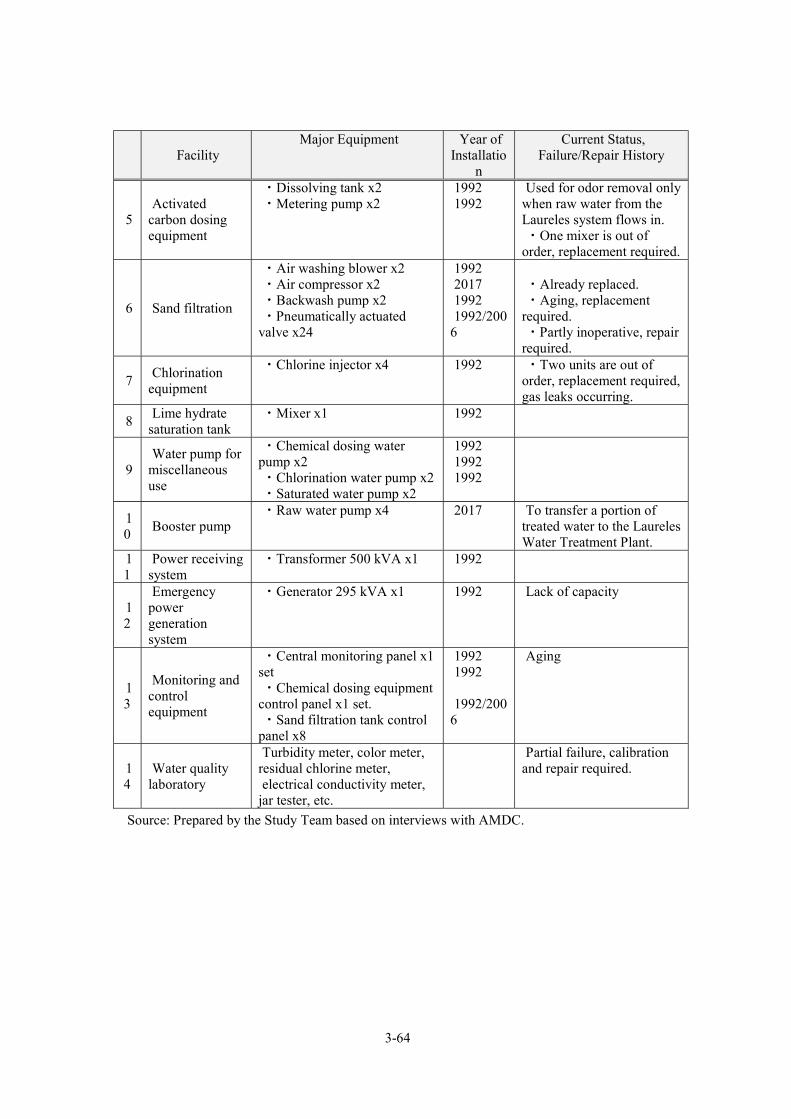
3-64
Facility Major Equipment Year of
Installation
Current Status, Failure/Repair History
5 Activated
carbon dosing equipment
・Dissolving tank x2 ・Metering pump x2
1992 1992
Used for odor removal only when raw water from the Laureles system flows in. ・One mixer is out of
order, replacement required.
6 Sand filtration
・Air washing blower x2 ・Air compressor x2 ・Backwash pump x2 ・Pneumatically actuated
valve x24
1992 2017 1992 1992/200
6
・Already replaced. ・Aging, replacement
required. ・Partly inoperative, repair
required.
7 Chlorination
equipment
・Chlorine injector x4
1992 ・Two units are out of order, replacement required, gas leaks occurring.
8 Lime hydrate
saturation tank ・Mixer x1
1992
9 Water pump for
miscellaneous use
・Chemical dosing water pump x2 ・Chlorination water pump x2 ・Saturated water pump x2
1992 1992 1992
10
Booster pump ・Raw water pump x4
2017 To transfer a portion of treated water to the Laureles Water Treatment Plant.
11
Power receiving system
・Transformer 500 kVA x1
1992
12
Emergency power generation system
・Generator 295 kVA x1
1992 Lack of capacity
13
Monitoring and control equipment
・Central monitoring panel x1 set ・Chemical dosing equipment
control panel x1 set. ・Sand filtration tank control
panel x8
1992 1992 1992/200
6
Aging
14
Water quality laboratory
Turbidity meter, color meter, residual chlorine meter, electrical conductivity meter,
jar tester, etc.
Partial failure, calibration and repair required.
Source: Prepared by the Study Team based on interviews with AMDC.

3-65
Sedimentation tank vacuum pump Aluminum sulfate dilution tank
Aluminum sulfate metering pump Lime hydrate dilution tank
Lime hydrate dosing pump Polymer dissolution tank
Polymer metering pump Activated carbon dissolution tank (for
permanganate)
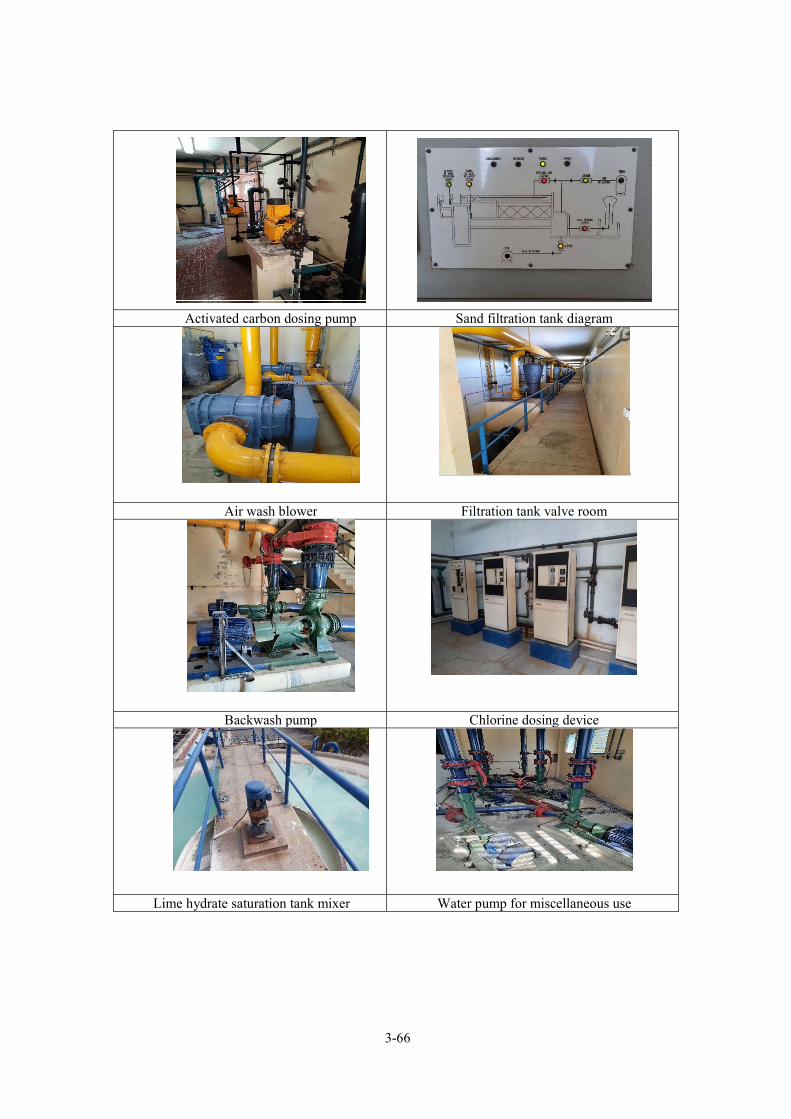
3-66
Activated carbon dosing pump Sand filtration tank diagram
Air wash blower Filtration tank valve room
Backwash pump Chlorine dosing device
Lime hydrate saturation tank mixer Water pump for miscellaneous use

3-67
Booster pump Transformer
Electric generator for emergencies Central monitoring room panel
Chemical dosing equipment control panel
Sand Filtration Tank Control Panel
Water quality laboratory Turbidity meter
Figure 3-3-32Status of Major Facilities and Equipment at Concepcion Water Treatment Plant
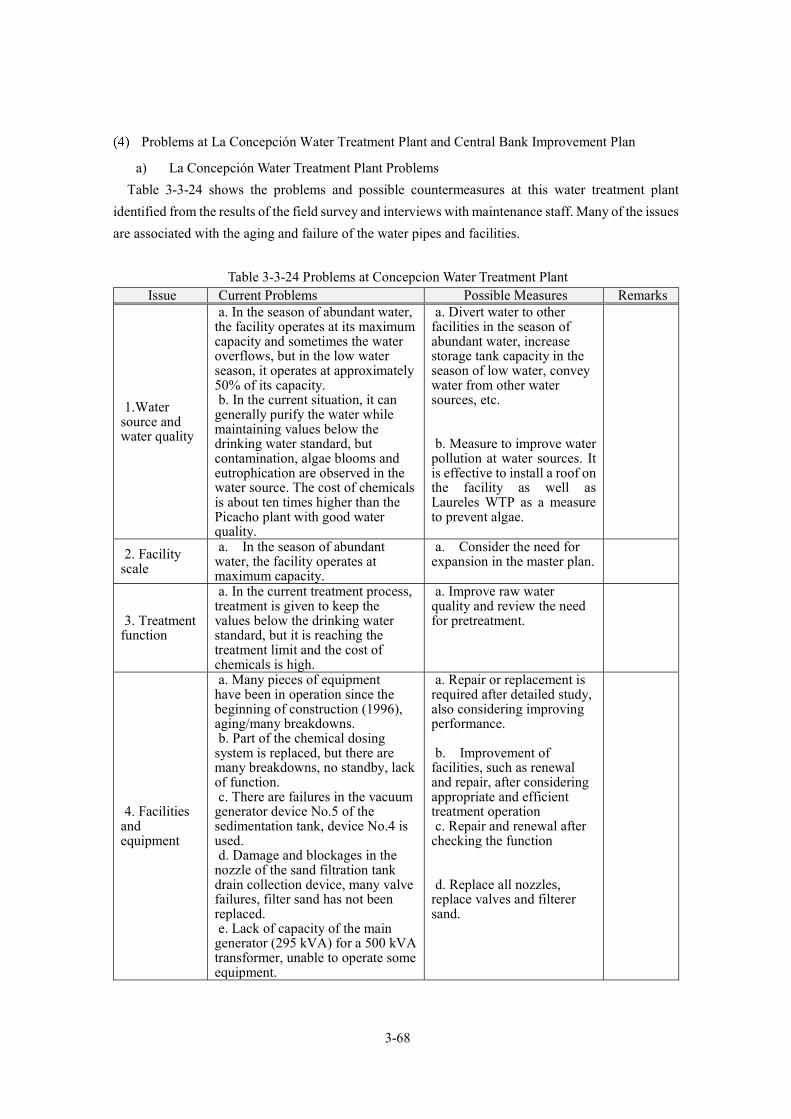
3-68
Problems at La Concepción Water Treatment Plant and Central Bank Improvement Plan
a) La Concepción Water Treatment Plant Problems
Table 3-3-24 shows the problems and possible countermeasures at this water treatment plant
identified from the results of the field survey and interviews with maintenance staff. Many of the issues
are associated with the aging and failure of the water pipes and facilities.
Table 3-3-24 Problems at Concepcion Water Treatment Plant Issue Current Problems Possible Measures Remarks
1.Water source and water quality
a. In the season of abundant water, the facility operates at its maximum capacity and sometimes the water overflows, but in the low water season, it operates at approximately 50% of its capacity. b. In the current situation, it can
generally purify the water while maintaining values below the drinking water standard, but contamination, algae blooms and eutrophication are observed in the water source. The cost of chemicals is about ten times higher than the Picacho plant with good water quality.
a. Divert water to other facilities in the season of abundant water, increase storage tank capacity in the season of low water, convey water from other water sources, etc. b. Measure to improve water
pollution at water sources. It is effective to install a roof on the facility as well as Laureles WTP as a measure to prevent algae.
2. Facility scale
a. In the season of abundant water, the facility operates at maximum capacity.
a. Consider the need for expansion in the master plan.
3. Treatment function
a. In the current treatment process, treatment is given to keep the values below the drinking water standard, but it is reaching the treatment limit and the cost of chemicals is high.
a. Improve raw water quality and review the need for pretreatment.
4. Facilities and equipment
a. Many pieces of equipment have been in operation since the beginning of construction (1996), aging/many breakdowns. b. Part of the chemical dosing
system is replaced, but there are many breakdowns, no standby, lack of function. c. There are failures in the vacuum
generator device No.5 of the sedimentation tank, device No.4 is used. d. Damage and blockages in the
nozzle of the sand filtration tank drain collection device, many valve failures, filter sand has not been replaced. e. Lack of capacity of the main
generator (295 kVA) for a 500 kVA transformer, unable to operate some equipment.
a. Repair or replacement is required after detailed study, also considering improving performance. b. Improvement of
facilities, such as renewal and repair, after considering appropriate and efficient treatment operation c. Repair and renewal after
checking the function d. Replace all nozzles,
replace valves and filterer sand.

3-69
b) World Bank Improvement Plan
The World Bank's "Project for the Strengthening of the Drinking Water Service in Tegucigalpa"
(2019) also proposes the improvement plan for the water treatment plants. Of these, Table 3-3-25
shows the specific items related to La Concepción Water Treatment Plant. It should be noted that the
implementation of this plan is behind schedule.
Table 3-3-25 Improvement Plan for La Concepción Water Treatment Plant Proposed by the World
Bank NO
Item Details
1 Upgrading of chemical dosing equipment
Many equipment failures and this hinders water purification. Necessary repairs and improvements are made to improve reliability.
2 Chlorination equipment
upgrade
Equipment failures and lack of safety. Equipment should be upgraded by replacing equipment, installing the chlorine neutralizing device, chlorine tank scale, etc.
3
Reverse delivery of raw water from the Concepcion WTP to the Laureles WTP
A water diversion facility was built from Laureles to Concepción, but the cost of pumping is high and there are few situations when water can be diverted at Laureles. On the other hand, at Concepción reservoir, water overflows due to the lack of capacity of the water treatment plant. If the reverse delivery of raw water can be accomplished using the existing pipeline, the raw water could be effectively utilized.
4 Installation of a cover on
the sedimentation tank Although pre-chlorination is performed at this water treatment
plant as a measure against algae, to alleviate this process, a cover
f. Chlorine injection facilities are outdated and inadequate for metering and safety measures. g. Obsolete and faulty flow meter
makes it difficult to measure water volume. h. Failure in operation and
handling due to failure of obsolete control panel. i. Some water quality test
equipment is out of order, repair is required.
e. Check the capacity, then replace for higher capacity or install a new one. f. Replacing and
upgrading by adding more measuring and safety equipment. g. Improvement of the
instrumentation system for flow rates and water levels. h. Construction of systems
considering the adequacy of operation, handling, and efficiency. i. Replacement and repair
5. Operation and maintenance system, etc.
・ There are no particular problems with the current system for facility operation, but equipment maintenance and repair is not being carried out systematically, and there may be problems in responding to breakdowns and emergencies. ・O&M manual with insufficient
content.
・It is required to perform asset management and establish a preventive maintenance program for systems and equipment. ・Development of an
adequate O&M manual.
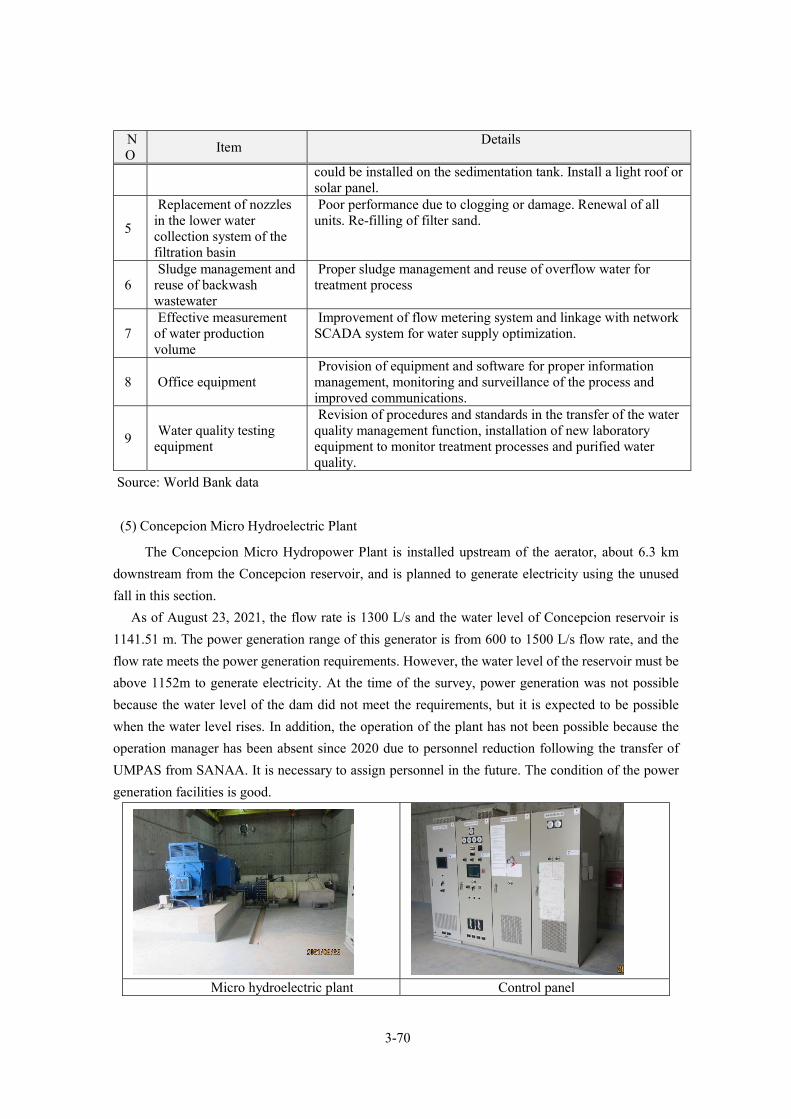
3-70
NO
Item Details
could be installed on the sedimentation tank. Install a light roof or solar panel.
5
Replacement of nozzles in the lower water collection system of the filtration basin
Poor performance due to clogging or damage. Renewal of all units. Re-filling of filter sand.
6 Sludge management and
reuse of backwash wastewater
Proper sludge management and reuse of overflow water for treatment process
7 Effective measurement
of water production volume
Improvement of flow metering system and linkage with network SCADA system for water supply optimization.
8 Office equipment Provision of equipment and software for proper information
management, monitoring and surveillance of the process and improved communications.
9 Water quality testing
equipment
Revision of procedures and standards in the transfer of the water quality management function, installation of new laboratory equipment to monitor treatment processes and purified water quality.
Source: World Bank data
(5) Concepcion Micro Hydroelectric Plant
The Concepcion Micro Hydropower Plant is installed upstream of the aerator, about 6.3 km
downstream from the Concepcion reservoir, and is planned to generate electricity using the unused
fall in this section.
As of August 23, 2021, the flow rate is 1300 L/s and the water level of Concepcion reservoir is
1141.51 m. The power generation range of this generator is from 600 to 1500 L/s flow rate, and the
flow rate meets the power generation requirements. However, the water level of the reservoir must be
above 1152m to generate electricity. At the time of the survey, power generation was not possible
because the water level of the dam did not meet the requirements, but it is expected to be possible
when the water level rises. In addition, the operation of the plant has not been possible because the
operation manager has been absent since 2020 due to personnel reduction following the transfer of
UMPAS from SANAA. It is necessary to assign personnel in the future. The condition of the power
generation facilities is good.
Micro hydroelectric plant Control panel
3-71
3-3-2-1-4 Laureles Water Treatment Plant
Outline
The Laureles Water Treatment Plant is located approximately 800 m downstream of the Los
Laureles Dam. The design capacity at the beginning of construction (1976) was 670 L/s, later in 2000,
it was increased to 720 L/s when the dam was enlarged with IDB support. In addition, in 2007, the
unit-type water purification facilities were built with the support of Spain (25 L/s x four units) to
respond to the volume of water in the rainy season, and currently the total design capacity is 820 L/s.
Subsequently in 2012, with support from Spain, the unit-type ultra-high speed coagulating
sedimentation system (75 L/s x 1 unit) was installed. The operation of these integrated type devices
has been suspended since 2013 for the former and 2017 for the latter due to various failures. In 2017,
a pumping station was built for the transmission of raw water to the Concepcion Water Treatment
Plant.
The purification process is the same as that of the Concepción Water Treatment Plant, consisting
of aerator + mixing tank + suspended solid contact type sedimentation tank + gravity-type rapid sand
filtration tank + chlorination. Initially, both the sedimentation tank and the sand filtration tank were
open, but a roof was installed to prevent algae proliferation. Figure 3-3-33 shows the flow diagram of
the water treatment plant, Figure 3-3-34 shows the general plan, Figure 3-3-35 shows the hydraulic
profile, Table 3-3-26 shows the specifications of the main facilities, and Figure 3-3-36 shows the
current status of the facilities.
The purification process in the unit-type purification plant consists of coagulation and
sedimentation + pressure type filtration system + chlorination.

3-72
Figure 3-3-33Laureles Water Treatment Plant Flow Diagram
Figure 3-3-34General Plan of Laureles Water Treatment Plant

3-73
Figure 3-3-35Hydraulic Profile of Laureles Water Treatment Plant
Table 3-3-26 Specifications of Main Facilities of Laureles Water Treatment Plant No. Facility Specifications Main Equipment Remarks
Production volume ・Main system: 720 L/s (62,208 m 3/day) ・Unit-type purification
system: 100 L/s
1 Aerator ・Rectangular cascade tank made of reinforced concrete (RC). 1 tank
2 Suspended solid contact type sedimentation tank
・Suspended solid contact type sedimentation with inclined plate, made of RC (pulsation type) ・Width 17.0 m x Length
24.7 m x Depth 4.12 m x 2 tanks
・Surface load: 50 mm/min. ・Detention time: 1.3 hours
・Aluminum sulfate dosing equipment: 1 set ・Lime hydrate
dosing equipment: 1 set. ・Polymer dosing
equipment: 1 set ・Activated carbon
dosing kit: 1 set
・Pulsator type.
3 Sand filtration tank ・ Gravity type sand filtration tank with air washing, made of RC ・6 tanks ・Filtration area: 31.5 m
2/tank.
・Air washing blower x 2 units.
・Aquazur type

3-74
No. Facility Specifications Main Equipment Remarks Filtration rate (when operating
all tanks): 260 m/day, maximum 329 m/day.
4 Chlorine mixing tank ・Made of RC: 1 tank. ・Liquid chlorine dosing set: 1 set
5 Power receiving system
・Transformer: 13.8 kV x 100 kVA x 3 units.
6 Emergency power generation system
・150 kVA x 1 unit
7 Monitoring and control equipment
・SCADA system
8 Water quality laboratory
・Turbidity, residual chlorine, jar test, etc.
9 Unit-type purification systems
・Steel plate unit ・Filtration system : 25 L/s x
4 units.
Chemical dosing + coagulation and sedimentation + pressure filtration + chlorination
Suspended operation in 2013
10 Unit-type ultra-high speed coagulating sedimentation system
・Steel plat unit ・Capacity :75 L/s
Chemical dosing + rapid agitation tank + flocculation tank + sedimentation tank
・Actiflo type Suspended
operation in 2016
11 Raw water pumping station
Vertical pump 440 L/s x 110 m x
180 kW x 3 units (1 unit as standby)
Operation from February to October
12 Transmission pumping station
Vertical pump 225 L/s x 100 m x
300 kW x 3 units (1unit as
standby)
Transmission of raw water to the Concepción Water Treatment Plant.
Source: Prepared by the Study Team based on interviews with AMDC.
Aerial view of the water treatment
plant (2018, before installing the roof).
Aerator

3-75
Sedimentation tank Sand filtration tank
Water treatment building Liquid chlorine storage room
Unit-type purification systems
(pressure filtration device) Unit-type ultra-high speed coagulating
sedimentation system
Raw water pumping station Transmission pumping station (delivery to the Concepción WTP)
Figure 3-3-36Current Status of Laureles Water Treatment Plant
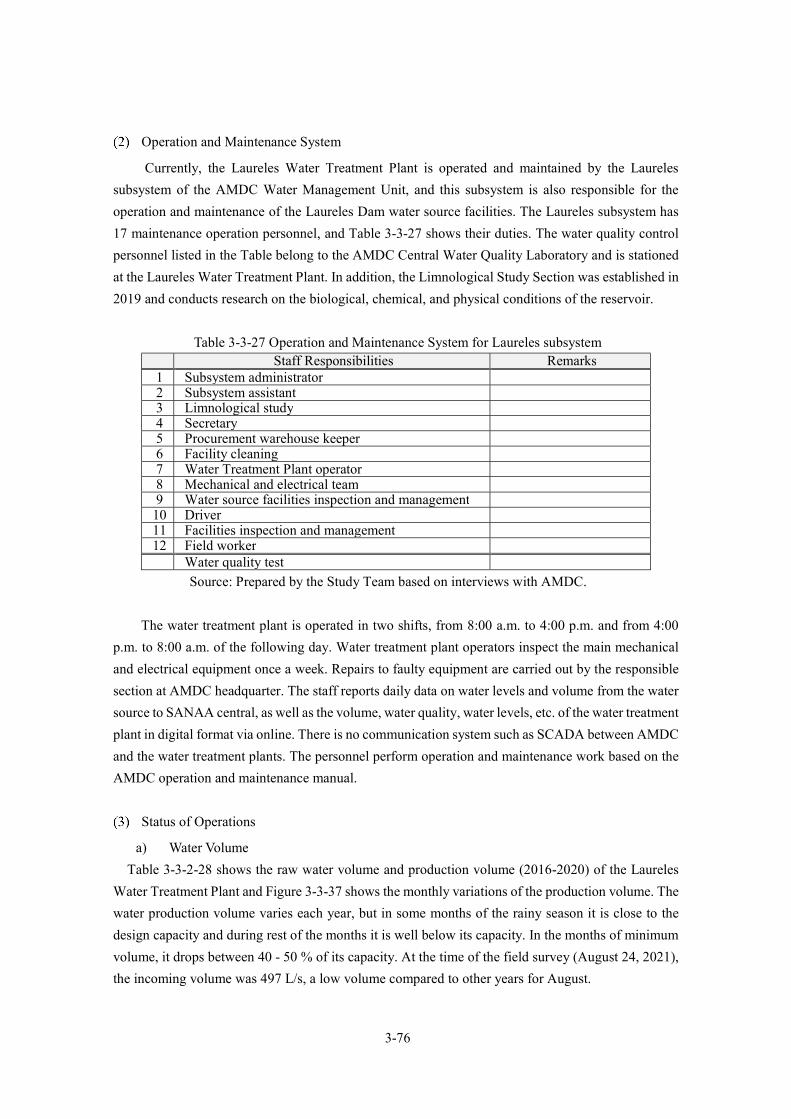
3-76
Operation and Maintenance System
Currently, the Laureles Water Treatment Plant is operated and maintained by the Laureles
subsystem of the AMDC Water Management Unit, and this subsystem is also responsible for the
operation and maintenance of the Laureles Dam water source facilities. The Laureles subsystem has
17 maintenance operation personnel, and Table 3-3-27 shows their duties. The water quality control
personnel listed in the Table belong to the AMDC Central Water Quality Laboratory and is stationed
at the Laureles Water Treatment Plant. In addition, the Limnological Study Section was established in
2019 and conducts research on the biological, chemical, and physical conditions of the reservoir.
Table 3-3-27 Operation and Maintenance System for Laureles subsystem Staff Responsibilities Remarks
1 Subsystem administrator 2 Subsystem assistant 3 Limnological study 4 Secretary 5 Procurement warehouse keeper 6 Facility cleaning 7 Water Treatment Plant operator 8 Mechanical and electrical team 9 Water source facilities inspection and management
10 Driver 11 Facilities inspection and management 12 Field worker
Water quality test
Source: Prepared by the Study Team based on interviews with AMDC.
The water treatment plant is operated in two shifts, from 8:00 a.m. to 4:00 p.m. and from 4:00
p.m. to 8:00 a.m. of the following day. Water treatment plant operators inspect the main mechanical
and electrical equipment once a week. Repairs to faulty equipment are carried out by the responsible
section at AMDC headquarter. The staff reports daily data on water levels and volume from the water
source to SANAA central, as well as the volume, water quality, water levels, etc. of the water treatment
plant in digital format via online. There is no communication system such as SCADA between AMDC
and the water treatment plants. The personnel perform operation and maintenance work based on the
AMDC operation and maintenance manual.
Status of Operations
a) Water Volume
Table 3-3-2-28 shows the raw water volume and production volume (2016-2020) of the Laureles
Water Treatment Plant and Figure 3-3-37 shows the monthly variations of the production volume. The
water production volume varies each year, but in some months of the rainy season it is close to the
design capacity and during rest of the months it is well below its capacity. In the months of minimum
volume, it drops between 40 - 50 % of its capacity. At the time of the field survey (August 24, 2021),
the incoming volume was 497 L/s, a low volume compared to other years for August.

3-77
Table 3-3-28 Raw Water Volume and Production Volume of Laureles Water Treatment Plant (2016-
2020) (Unit: L/s)
Fiscal Year
Average Annual
Volume of Raw Water
Average Annual
Production Volume
Production Volume/
Raw Water ( %)
Average Annual Production Volume per
Season Minimum Volume of Production
Rainy Season (May -
October)
Dry Season
(November - April)
2016 612 595 97.2 595 595 507 (April) 2017 569 547 96.1 556 537 365 (May)
2018 510 491 96.3 424 556 384
(February) 2019 462 440 95.2 462 419 272 (May) 2020 564 553 98.0 622 483 386 (April)
Source: Prepared by the Study Team based on AMDC statistical data.
Figure 3-3-37Monthly Variations in Production Volume of Laureles Water Treatment Plant (2016-
2020).
b) Water Quality
Water quality testing is performed in the in-plant water quality laboratory and in the central water
quality laboratory located on site. In the in-plant water quality laboratory, operating parameters such
as turbidity, color, pH, electrical conductivity, alkalinity, and hardness are analyzed three times a day.
In the central laboratory, samples are sent once a week from the water treatment plant, analyzed for
iron, manganese, bacteriological and cross-checked for other items in the in-plant laboratory
parameters.
Table 3-3-2-29, shows the main raw and purified water quality parameters (turbidity, color, pH,
iron and manganese) obtained from 2016 to 2020 (monthly average values).
0
200
400
600
800
1月 2月 3月 4月 5月 6月 7月 8月 9月 10月 11月 12月
Monthly variations in the production volume of Los Laureles
Water Treatment Plant (unit: L/s)
2016 2017 2018 2019 2020
JAN FEB MAR APR MAY JUN JUL AUG SEP OCT NOV DEC
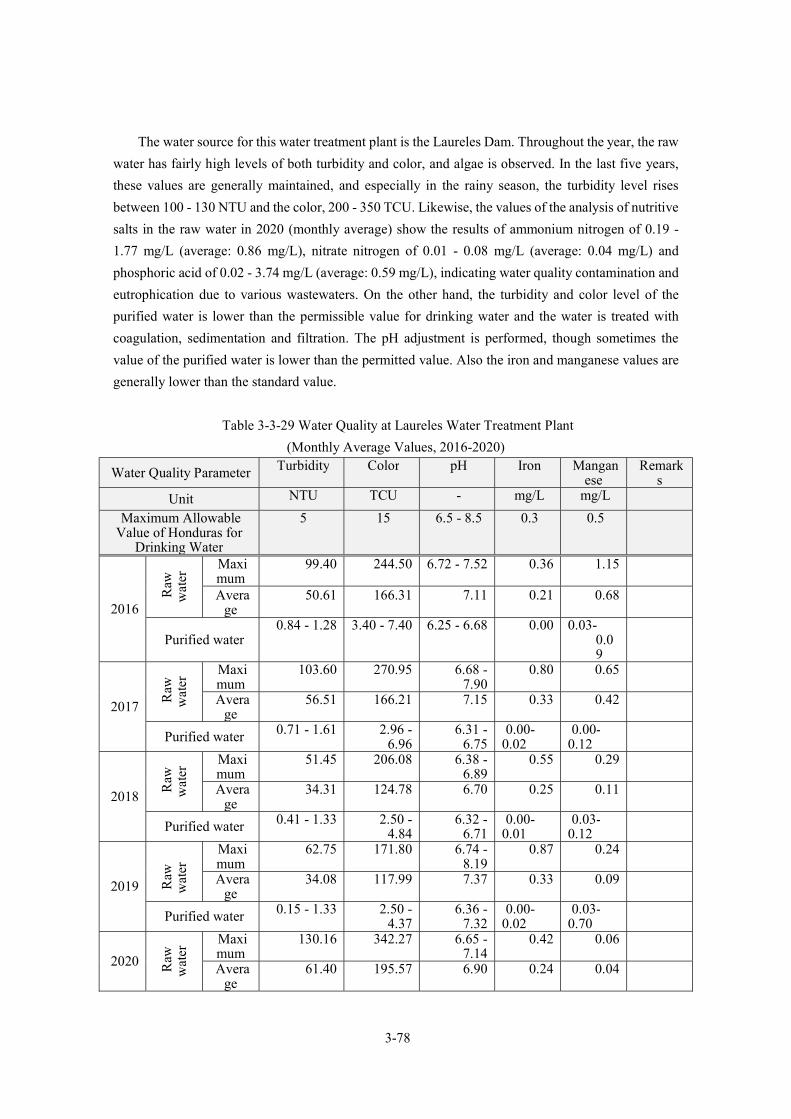
3-78
The water source for this water treatment plant is the Laureles Dam. Throughout the year, the raw
water has fairly high levels of both turbidity and color, and algae is observed. In the last five years,
these values are generally maintained, and especially in the rainy season, the turbidity level rises
between 100 - 130 NTU and the color, 200 - 350 TCU. Likewise, the values of the analysis of nutritive
salts in the raw water in 2020 (monthly average) show the results of ammonium nitrogen of 0.19 -
1.77 mg/L (average: 0.86 mg/L), nitrate nitrogen of 0.01 - 0.08 mg/L (average: 0.04 mg/L) and
phosphoric acid of 0.02 - 3.74 mg/L (average: 0.59 mg/L), indicating water quality contamination and
eutrophication due to various wastewaters. On the other hand, the turbidity and color level of the
purified water is lower than the permissible value for drinking water and the water is treated with
coagulation, sedimentation and filtration. The pH adjustment is performed, though sometimes the
value of the purified water is lower than the permitted value. Also the iron and manganese values are
generally lower than the standard value.
Table 3-3-29 Water Quality at Laureles Water Treatment Plant
(Monthly Average Values, 2016-2020)
Water Quality Parameter Turbidity Color pH Iron Manganese
Remarks
Unit NTU TCU - mg/L mg/L
Maximum Allowable Value of Honduras for
Drinking Water
5 15 6.5 - 8.5 0.3 0.5
2016
Raw
w
ater
Maximum
99.40 244.50 6.72 - 7.52 0.36 1.15
Average
50.61 166.31 7.11 0.21 0.68
Purified water 0.84 - 1.28 3.40 - 7.40 6.25 - 6.68 0.00 0.03-
0.09
2017
Raw
w
ater
Maximum
103.60 270.95 6.68 - 7.90
0.80 0.65
Average
56.51 166.21 7.15 0.33 0.42
Purified water 0.71 - 1.61 2.96 - 6.96
6.31 - 6.75
0.00-0.02
0.00-0.12
2018
Raw
w
ater
Maximum
51.45 206.08 6.38 - 6.89
0.55 0.29
Average
34.31 124.78 6.70 0.25 0.11
Purified water 0.41 - 1.33 2.50 - 4.84
6.32 - 6.71
0.00-0.01
0.03-0.12
2019 Raw
w
ater
Maximum
62.75 171.80 6.74 - 8.19
0.87 0.24
Average
34.08 117.99 7.37 0.33 0.09
Purified water 0.15 - 1.33 2.50 - 4.37
6.36 - 7.32
0.00-0.02
0.03-0.70
2020 Raw
w
ater
Maximum
130.16 342.27 6.65 - 7.14
0.42 0.06
Average
61.40 195.57 6.90 0.24 0.04
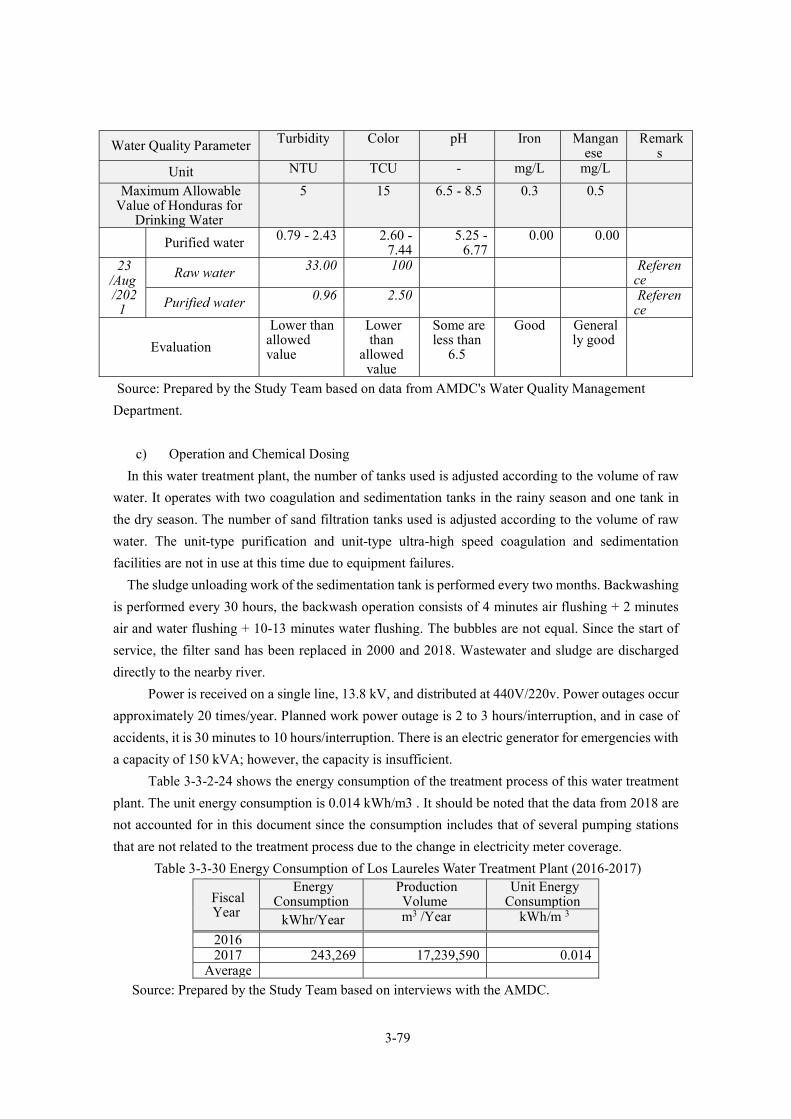
3-79
Water Quality Parameter Turbidity Color pH Iron Manganese
Remarks
Unit NTU TCU - mg/L mg/L
Maximum Allowable Value of Honduras for
Drinking Water
5 15 6.5 - 8.5 0.3 0.5
Purified water 0.79 - 2.43 2.60 - 7.44
5.25 - 6.77
0.00 0.00
23 /Aug /202
1
Raw water 33.00 100 Reference
Purified water 0.96 2.50 Reference
Evaluation
Lower than allowed value
Lower than
allowed value
Some are less than
6.5
Good Generally good
Source: Prepared by the Study Team based on data from AMDC's Water Quality Management
Department.
c) Operation and Chemical Dosing
In this water treatment plant, the number of tanks used is adjusted according to the volume of raw
water. It operates with two coagulation and sedimentation tanks in the rainy season and one tank in
the dry season. The number of sand filtration tanks used is adjusted according to the volume of raw
water. The unit-type purification and unit-type ultra-high speed coagulation and sedimentation
facilities are not in use at this time due to equipment failures.
The sludge unloading work of the sedimentation tank is performed every two months. Backwashing
is performed every 30 hours, the backwash operation consists of 4 minutes air flushing + 2 minutes
air and water flushing + 10-13 minutes water flushing. The bubbles are not equal. Since the start of
service, the filter sand has been replaced in 2000 and 2018. Wastewater and sludge are discharged
directly to the nearby river.
Power is received on a single line, 13.8 kV, and distributed at 440V/220v. Power outages occur
approximately 20 times/year. Planned work power outage is 2 to 3 hours/interruption, and in case of
accidents, it is 30 minutes to 10 hours/interruption. There is an electric generator for emergencies with
a capacity of 150 kVA; however, the capacity is insufficient.
Table 3-3-2-24 shows the energy consumption of the treatment process of this water treatment
plant. The unit energy consumption is 0.014 kWh/m3 . It should be noted that the data from 2018 are
not accounted for in this document since the consumption includes that of several pumping stations
that are not related to the treatment process due to the change in electricity meter coverage.
Table 3-3-30 Energy Consumption of Los Laureles Water Treatment Plant (2016-2017)
Fiscal Year
Energy Consumption
Production Volume
Unit Energy Consumption
kWhr/Year m3 /Year kWh/m 3
2016 2017 243,269 17,239,590 0.014
Average
Source: Prepared by the Study Team based on interviews with the AMDC.
3-80
The monitoring and control system of this water treatment plant is a SCADA system with one
PLC (Programmable Logic Controller) and one operation station as the main devices, but the
electric/pneumatic operated devices such as the high-speed coagulation sedimentation tank, the mud
drain valve, and the sand filtration tank are operated manually on site due to malfunctions. The
operator station has a monitoring function. At the operator station, the monitoring functions include
graphical display of each process facility, equipment operation status, and flow rate. LCD touch panels
as HMI (Human Machine Interface) function are also installed on the control panel of the power
receiving and transforming facilities and the water quality instrument panel, and they have the same
display function as the screen of the operator station.
The chemicals used are aluminum sulfate, lime hydrate and liquid chlorine. In addition, polymer
is always used to improve the sedimentation effect when the turbidity level is high, and mainly during
the rainy season, powdered activated carbon is used to eliminate odor. Pre-chlorination is used for
algae control.
Table 3-3-31 shows the evolution of the cost of chemicals and the chemical dosage rate of this
water treatment plant. The dosing rate is quite high for all chemicals due to the quality of the raw water
with high turbidity and color. The chemical cost is 0.69 - 0.95 HNL/m3, although it depends on the
quality of the raw water. It is approximately 10 times higher than the Picacho Water Treatment Plant
which has relatively good water quality and is similar to the Concepcion Water Treatment Plant with
symptoms of water quality contamination.

3-81
Table 3-3-31 Evolution of Chemical Cost and Chemical Dosage Rate of Los Laureles Water
Treatment Plant (2016-2020)
Item Cost of
Chemicals
Aluminum Sulfate Lime Hydrate Liquid Chlorine Polymer Activated Carbon
Unit HNL/m 3
mg/L mg/L mg/L mg/L mg/L
Annual Average
Monthly Average
Annual Average
Monthly Average
Annual Average
Monthly Average
Annual Average
Monthly Average
Annual Average
Monthly Average
2016 0.95 42.9 27.7-
50.5
4.5 0.0 - 14.
0
2.8 1.6 - 4.1 0.07 0.05-0.10
1.5 0.00-5.82
2017 0.85 46.1 37.9-52.8
7.1 0.6 - 13.2
2.5 1.8 - 3.5
0.08 0.06-0.10
0.6 0.00-4.07
2018 0.69 34.7 29.4-42.0
3.6 0.0 - 8.0
3.2 2.2 - 3.6
0.07 0.05-0.09
1.0 0.00-5.91
2019 0.69 34.7 29.4-42.0
3.6 0.0 - 8.0
3.2 2.2 - 3.6
0.07 0.05-0.09
1.0 0.00-5.91
2020 0.94 42.6 35.1-
57.8 0.5 0.0 -
3.5 3.8 2.8 -
5.8 0.08 0.06-
0.12 2.3 0.00-
6.62
Source: Prepared by the Study Team based on interviews with AMDC.
d) Status of Major Facilities and Equipment
Table 3-3-32 and Figure 3-3-38 show the current status of the major facilities and equipment of
this water treatment plant. Some equipment has been replaced; however, most of the equipment is the
same one since the beginning of construction 40 ago, requiring repair or replacement due to breakdown
and aging. Above all, there is an urgent need to upgrade the chemical dosing equipment to ensure the
treatment operation and the flow meters, etc. to monitor water volume.
The suspension of operations of the unit-type system is due to the following reasons:
・Purification system: failure of the automatic operation equipment, failure of the pressure filtration
device, difficulty in obtaining spare parts, etc.
・Ultra-high speed coagulation and sedimentation system: failure of automatic operation equipment
/SCADA system, difficulty in obtaining micro-sand and spare parts, etc.
Table 3-3-32 Status of Major Facilities and Equipment at Laureles Water Treatment Plant
System Main Equipment Year of
Installation Current Status, Failure/Repair
History
1
Suspended solid contact type sedimentation tank
・Vacuum device x2 1976 ・Aging, 1 unit failure, operated with only one unit.
2 Aluminum
sulfate dosing equipment
・Feeder x2 ・Dissolving tank x2 ・Metering pump x2
1976 2012 2012
・Aging ・1 unit failure
3 Lime hydrate
dosing equipment
・Dissolving tank x2 ・Feeder x2 ・Metering pump x5
1976 1976 2004
・Aging ・Aging
4 Polymer dosing
equipment
・Dissolving tank x2 ・Feeder x2 ・Metering pump x2
1989 1989 2012
・Aging ・Aging
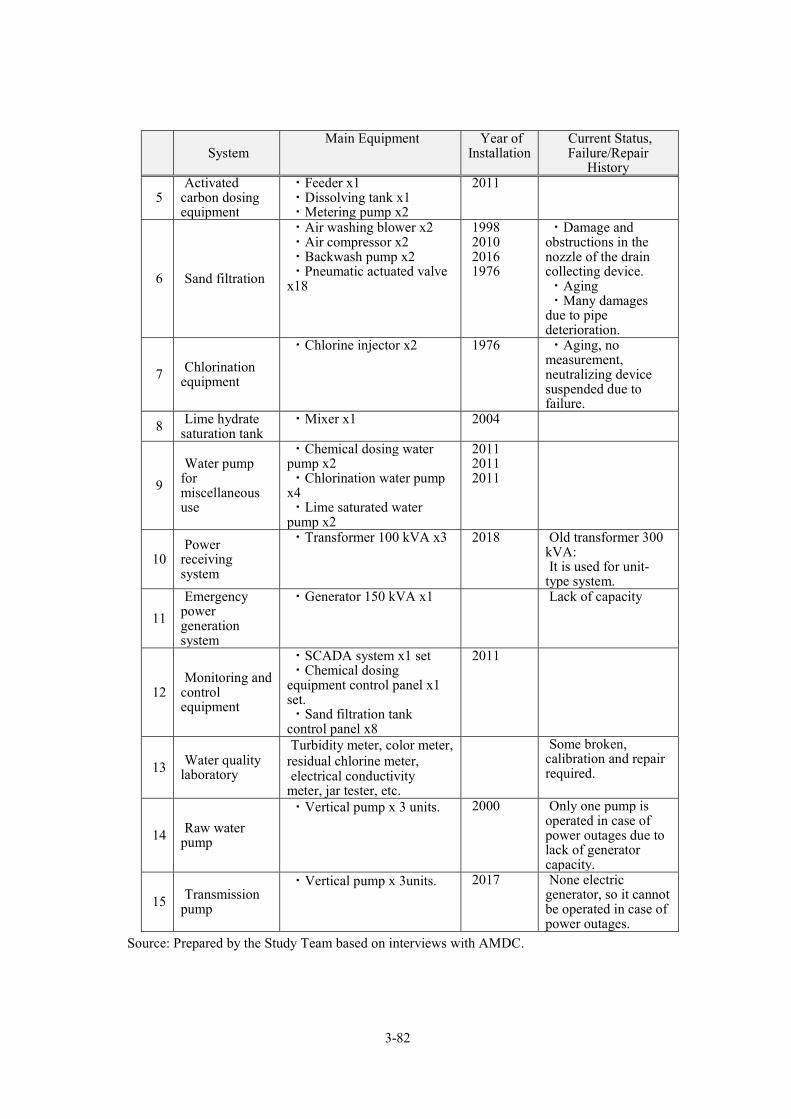
3-82
System Main Equipment Year of
Installation Current Status, Failure/Repair
History
5 Activated
carbon dosing equipment
・Feeder x1 ・Dissolving tank x1 ・Metering pump x2
2011
6 Sand filtration
・Air washing blower x2 ・Air compressor x2 ・Backwash pump x2 ・Pneumatic actuated valve
x18
1998 2010 2016 1976
・Damage and obstructions in the nozzle of the drain collecting device. ・Aging ・Many damages
due to pipe deterioration.
7 Chlorination equipment
・Chlorine injector x2 1976 ・Aging, no measurement, neutralizing device suspended due to failure.
8 Lime hydrate saturation tank
・Mixer x1 2004
9
Water pump for miscellaneous use
・Chemical dosing water pump x2 ・Chlorination water pump
x4 ・Lime saturated water
pump x2
2011 2011 2011
10 Power
receiving system
・Transformer 100 kVA x3 2018 Old transformer 300 kVA: It is used for unit-
type system.
11
Emergency power generation system
・Generator 150 kVA x1 Lack of capacity
12 Monitoring and
control equipment
・SCADA system x1 set ・Chemical dosing
equipment control panel x1 set. ・Sand filtration tank
control panel x8
2011
13 Water quality laboratory
Turbidity meter, color meter, residual chlorine meter, electrical conductivity
meter, jar tester, etc.
Some broken, calibration and repair required.
14 Raw water pump
・Vertical pump x 3 units. 2000 Only one pump is operated in case of power outages due to lack of generator capacity.
15 Transmission pump
・Vertical pump x 3units. 2017 None electric generator, so it cannot be operated in case of power outages.
Source: Prepared by the Study Team based on interviews with AMDC.

3-83
Suspended solid contact type sedimentation tank vacuum device
Dissolving tank/aluminum sulfate dosing pump
Lime hydrate feeder Lime hydrate saturation tank
Dissolving tank/polymer dosing pump Polymer Feeder/Mixer
Activated carbon dosing equipment Sand filtration flow chart

3-84
Backwash pump Air wash pump
Pneumatically actuated sand filtration valve
Chlorine dosing device
Water pump for chemical dosing Transformer
Emergency power generator SCADA System 1

3-85
SCADA System -2 SCADA System -3
Water quality laboratory-1 Water quality laboratory-2
Water quality laboratory-3 Coagulation and sedimentation tank of the unit-
type purification system (suspended)
Chemical tank of the unit-type purification system (suspended)
Unit-type ultra-high speed coagulation and sedimentation system (suspended)
Figure 3-3-38Status of Major Facilities and Equipment at Laureles Water Treatment Plant
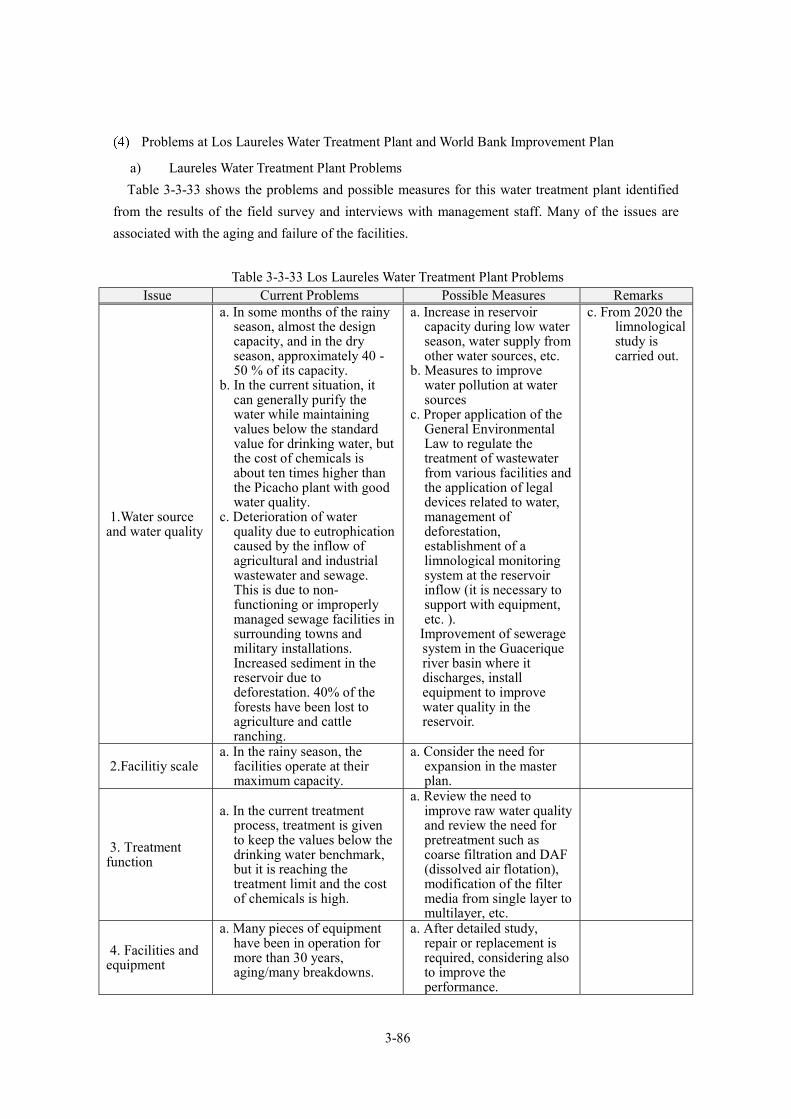
3-86
Problems at Los Laureles Water Treatment Plant and World Bank Improvement Plan
a) Laureles Water Treatment Plant Problems
Table 3-3-33 shows the problems and possible measures for this water treatment plant identified
from the results of the field survey and interviews with management staff. Many of the issues are
associated with the aging and failure of the facilities.
Table 3-3-33 Los Laureles Water Treatment Plant Problems Issue Current Problems Possible Measures Remarks
1.Water source and water quality
a. In some months of the rainy season, almost the design capacity, and in the dry season, approximately 40 - 50 % of its capacity.
b. In the current situation, it can generally purify the water while maintaining values below the standard value for drinking water, but the cost of chemicals is about ten times higher than the Picacho plant with good water quality.
c. Deterioration of water quality due to eutrophication caused by the inflow of agricultural and industrial wastewater and sewage. This is due to non-functioning or improperly managed sewage facilities in surrounding towns and military installations. Increased sediment in the reservoir due to deforestation. 40% of the forests have been lost to agriculture and cattle ranching.
a. Increase in reservoir capacity during low water season, water supply from other water sources, etc.
b. Measures to improve water pollution at water sources
c. Proper application of the General Environmental Law to regulate the treatment of wastewater from various facilities and the application of legal devices related to water, management of deforestation, establishment of a limnological monitoring system at the reservoir inflow (it is necessary to support with equipment, etc. ).
Improvement of sewerage system in the Guacerique river basin where it discharges, install equipment to improve water quality in the reservoir.
c. From 2020 the limnological study is carried out.
2.Facilitiy scale a. In the rainy season, the
facilities operate at their maximum capacity.
a. Consider the need for expansion in the master plan.
3. Treatment function
a. In the current treatment process, treatment is given to keep the values below the drinking water benchmark, but it is reaching the treatment limit and the cost of chemicals is high.
a. Review the need to improve raw water quality and review the need for pretreatment such as coarse filtration and DAF (dissolved air flotation), modification of the filter media from single layer to multilayer, etc.
4. Facilities and equipment
a. Many pieces of equipment have been in operation for more than 30 years, aging/many breakdowns.
a. After detailed study, repair or replacement is required, considering also to improve the performance.

3-87
Issue Current Problems Possible Measures Remarks b. Some of the chemical dosing
equipment is replaced, but there are many breakdowns, no standby, lack of function
c. There are failures in the sedimentation tank vacuum generating device, one unit is used for all.
d. Damage and blockages in the nozzle of the sand filtration tank drain collection device, many valve failures, filter sand has not been replaced.
e. Deficient measurement and safety measures due to chlorination equipment aging.
f. Aging and failure of the flow meter makes it difficult to measure water volume.
g. Some water quality test equipment is faulty, repair required.
h. Deterioration of structures
b. Review how to achieve a more adequate and efficient treatment operation, then upgrade and replace equipment.
c. Check the function, then
repair or replace d. Replacement of nozzles,
valves, replace single-layer filter media (sand) to multi-layer filter media (sand + anthracite).
e. Replacing and upgrading by adding more measuring and safety equipment.
f. Upgrading of instrumentation equipment such as flow meters and level meters.
g. Replacement and repair h. Implementation of the
renovation diagnosis
5. Operation and maintenance system, etc.
a. Lack of mechanical and electrical staff
b. Equipment maintenance and repair is not systematically carried out, resulting in malfunctions and emergency response problems. c. O&M Manual with
insufficient content
a. Staffing review b. It is required to perform
asset management and establish a preventive maintenance program for systems and equipment.
c. Development of an adequate O&M manual
b) World Bank Improvement Plan
The World Bank's "Tegucigalpa Water Supply Strengthening Project" (2019) also proposes the
improvement plan for the water treatment plants. Of these, Table 3-3-34 shows the specific items
related to the Laureles Water Treatment Plant. The implementation of this plan is behind schedule.

3-88
Table 3-3-34 Improvement Plan for Los Laureles Water Treatment Plant Proposed by the World
Bank Item Details
1 Chlorination equipment
upgrade
Equipment failures and lack of safety. Equipment should be upgraded by replacing equipment, installing the chlorine neutralizing device, chlorine tank scale, etc.
2 Installation of dynamic filter
(coarse filtration facility)
A coarse filtration facility is added to remove algae from the inflow. This makes it possible to reduce the amount of pre-chlorine injected, which is the current countermeasure against algae.
3
Change from single-layer filter media (sand) to multi-layer filter media (sand + anthracite)
Change from single-layer filter media (sand) to multilayer filter media (sand + anthracite) to improve the suspended particle removal effect and eliminate odor of purified water derived from organic matter.
4 Replacement of nozzles in the
lower water collection system of the filtration tank
Performance degradation due to clogging or damage, renewal of about 30%.
5 Sludge management and reuse
of backwash wastewater Proper sludge management and reuse of overflow water
for treatment process
6 Improved operations and
energy efficiency
To improve system efficiency, condenser is installed to reduce the load, the pump and blower motor is replaced with high-efficiency motor, and reviewed filtration tank washing operation and chemical dosing operation.
7 Effective measurement of
water production volume Improvement of flow metering system and linkage with
network SCADA system for water supply optimization.
8 Office equipment Provision of equipment and software for proper
information management, monitoring and surveillance of the process and improved communication.
9 Water quality testing
equipment
Review of procedures and standards associated with the transfer of the water quality management function, and installation of new laboratory equipment to monitor the treatment processes and purified water quality.
Source: World Bank data
3-3-2-1-5 Miraflores Water Treatment Plant
Outline
The Miraflores Water Treatment Plant treats water from the weir installed on the Sabacuante
River, which is one of the water sources of the Picacho subsystem. At the beginning of the construction
in 1996, the design capacity was 25 L/s, but in 2002, with the support of Spain, the unit-type
purification facilities were built, same as the facility in the Laureles Water Treatment Plant, and
currently the capacity increased to 75 L/s. The purification process of the unit-type purification facility
consists of coagulation and sedimentation + pressure filtration + chlorination.
In addition, it is under consideration whether to dispose of this water treatment plant after the
completion (2023) of the Jacaleapa (San Jose) project (including the construction of a new water
treatment plant), which is currently under construction, or to continue it as a backup.
Table 3-3-35 shows the specifications of the major facilities of the water treatment plant and
Figure 3-3-39 shows the current status of the facilities.

3-89
Table 3-3-35 Specifications of Main Facilities of Miraflores Water Treatment Plant No. Facility Specifications Main Equipment Remarks
Production volume ・Unit-type purification plant: 75 L/s (6,480 m 3/day)
2002
1 Coagulation and mixing tank
・Rectangular tank, made of steel plate. ・Width 1.6 m x Length 8.4
m x Depth 1.6 m x 2 tanks
・Aluminum sulfate dosing equipment: dissolving tank, dosing pump.
Aluminum sulfate dosing equipment: installed in 1996, aging, also mixer aging and faulty.
2 Sedimentation tank ・Rectangular sedimentation tank with inclined plate, made of steel plate. ・Width 0.62 m x Length 8.4
m x Depth 2.45 m x 1 tank
Sludge discharge valve failure
3 Sand filtration ・Pressure sand filtration, made of steel plate ・3 units/1 series x 3 series
・Air washing blower x 2units. ・Backwash pump x2
units.
Blower and pump aging, refilling of filter sand required.
4 Chlorination equipment
・Liquid chlorine dosing equipment: liquid chlorine tank. 50 kg, injector x 1 set
Aging
5 Electricity receiving system
・Transformer: 13.8kV x 100kVA x 1 unit and 75kVA x 1 unit
Installed in 1996
6 Monitoring and control equipment
・Control panel No SCADA System
7 Water quality laboratory
・Turbidity, residual chlorine, jar test, etc.
Source: Prepared by the Study Team based on interviews with AMDC.
1. Coagulation and mixing tank 2. Sedimentation tank
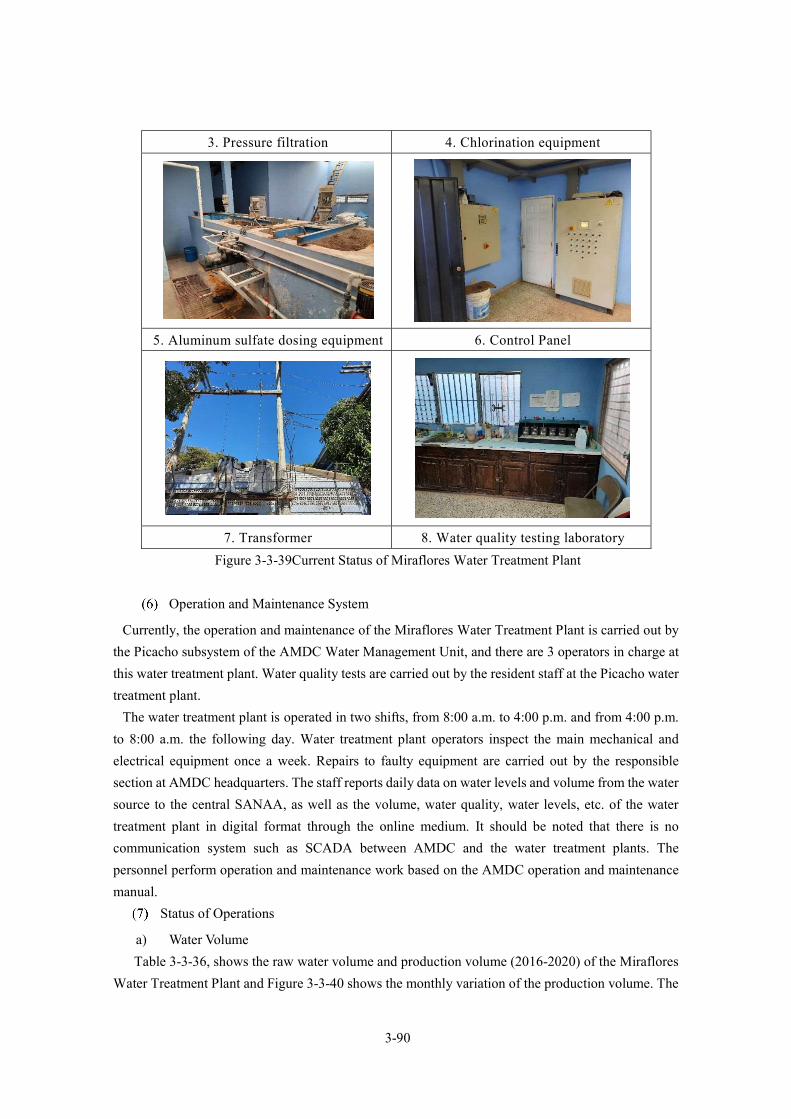
3-90
3. Pressure filtration 4. Chlorination equipment
5. Aluminum sulfate dosing equipment 6. Control Panel
7. Transformer 8. Water quality testing laboratory
Figure 3-3-39Current Status of Miraflores Water Treatment Plant
Operation and Maintenance System
Currently, the operation and maintenance of the Miraflores Water Treatment Plant is carried out by
the Picacho subsystem of the AMDC Water Management Unit, and there are 3 operators in charge at
this water treatment plant. Water quality tests are carried out by the resident staff at the Picacho water
treatment plant.
The water treatment plant is operated in two shifts, from 8:00 a.m. to 4:00 p.m. and from 4:00 p.m.
to 8:00 a.m. the following day. Water treatment plant operators inspect the main mechanical and
electrical equipment once a week. Repairs to faulty equipment are carried out by the responsible
section at AMDC headquarters. The staff reports daily data on water levels and volume from the water
source to the central SANAA, as well as the volume, water quality, water levels, etc. of the water
treatment plant in digital format through the online medium. It should be noted that there is no
communication system such as SCADA between AMDC and the water treatment plants. The
personnel perform operation and maintenance work based on the AMDC operation and maintenance
manual.
Status of Operations
a) Water Volume
Table 3-3-36, shows the raw water volume and production volume (2016-2020) of the Miraflores
Water Treatment Plant and Figure 3-3-40 shows the monthly variation of the production volume. The

3-91
water production volume varies considerably each month and each year, where in some months, it is
close to the design capacity of 75 L/s, but the rest of the year it is well below this capacity. Especially
around April and October it drops to 20 - 30%. At the time of the field study (August 25, 2021), the
incoming volume was 50 L/s.
Table 3-3-36 Raw Water Volume and Production Volume of Miraflores Drinking Water Treatment
Plant (2016-2020)
(Unit: L/s)
Fiscal Year
Average Annual
Volume of Raw
Water
Average Annual
Production Volume
Production Volume/
Raw Water
(%)
Average Annual Production Volume per
Season
Minimum Volume
of Production Rainy
Season (May -
October)
Dry Season
(November - April)
2016 40.64 39.88 98.1 37.87 41.97 20.32 October) 2017 37.09 36.32 97.9 35.75 37.03 20.08 October) 2018 52.54 50.25 95.6 48.36 52.22 17.44 (April) 2019 42.16 40.32 95.6 30.93 49.71 18.83 (July) 2020 40.02 38.84 97.1 42.28 35.09 20.00(November)
Source: Prepared by the Study Team based on AMDC statistical data.
Figure 3-3-40Monthly Variations in Production Volume of Miraflores Water Treatment Plant
(2016-2020).
b) Water Quality
Water quality testing is performed in the in-plant water quality laboratory and in the central water
quality laboratory. In the in-plant water quality laboratory, only turbidity and residual chlorine levels
of the filtered water are analyzed when the turbidity level in the raw water is low, and when the
turbidity level is high in the rainy season, operating parameters such as turbidity, color, pH, electrical
conductivity, alkalinity, and hardness are analyzed three times a day only. The central laboratory
performs cross-tests of iron, manganese, bacteriological and plant laboratory parameters.
Table 3-3-37, shows the main raw and purified water quality parameters (turbidity, color, pH, iron
0.00
20.00
40.00
60.00
80.00
1月 2月 3月 4月 5月 6月 7月 8月 9月 10月 11月 12月
ミラフローレス浄水場生産水量月別変動 (単位:L/s)
2016 2017 2018 2019 2020
WTP Miraflores' monthly production volume variations
JAN FEB MAR APR MAY JUN JUL AUG SEP OCT NOV DEC
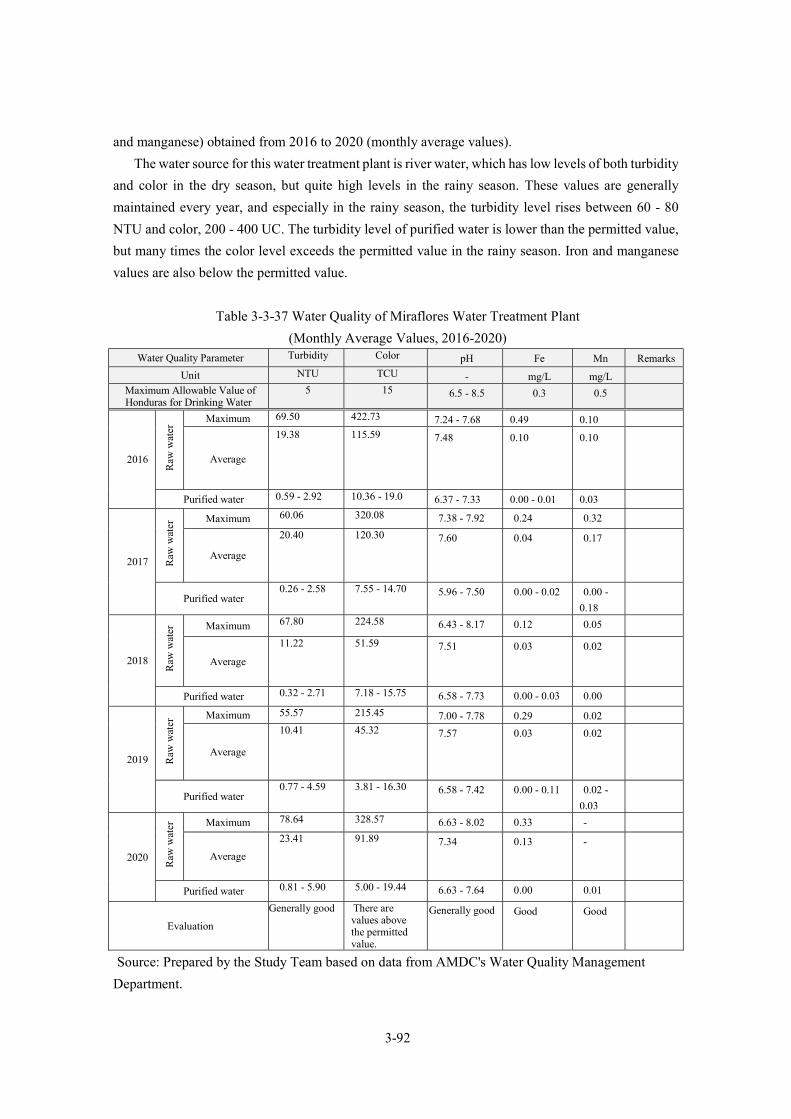
3-92
and manganese) obtained from 2016 to 2020 (monthly average values).
The water source for this water treatment plant is river water, which has low levels of both turbidity
and color in the dry season, but quite high levels in the rainy season. These values are generally
maintained every year, and especially in the rainy season, the turbidity level rises between 60 - 80
NTU and color, 200 - 400 UC. The turbidity level of purified water is lower than the permitted value,
but many times the color level exceeds the permitted value in the rainy season. Iron and manganese
values are also below the permitted value.
Table 3-3-37 Water Quality of Miraflores Water Treatment Plant
(Monthly Average Values, 2016-2020) Water Quality Parameter Turbidity Color pH Fe Mn Remarks
Unit NTU TCU - mg/L mg/L Maximum Allowable Value of Honduras for Drinking Water
5 15 6.5 - 8.5 0.3 0.5
2016
Raw
wat
er Maximum 69.50 422.73 7.24 - 7.68 0.49 0.10
Average
19.38 115.59 7.48 0.10 0.10
Purified water 0.59 - 2.92 10.36 - 19.0 6.37 - 7.33 0.00 - 0.01 0.03
2017 Raw
wat
er Maximum 60.06 320.08 7.38 - 7.92 0.24 0.32
Average
20.40 120.30 7.60 0.04 0.17
Purified water 0.26 - 2.58 7.55 - 14.70 5.96 - 7.50 0.00 - 0.02 0.00 -
0.18
2018
Raw
wat
er Maximum 67.80 224.58 6.43 - 8.17 0.12 0.05
Average
11.22 51.59 7.51 0.03 0.02
Purified water 0.32 - 2.71 7.18 - 15.75 6.58 - 7.73 0.00 - 0.03 0.00
2019 Raw
wat
er Maximum 55.57 215.45 7.00 - 7.78 0.29 0.02
Average
10.41 45.32 7.57 0.03 0.02
Purified water 0.77 - 4.59 3.81 - 16.30 6.58 - 7.42 0.00 - 0.11 0.02 -
0.03
2020
Raw
wat
er Maximum 78.64 328.57 6.63 - 8.02 0.33 -
Average
23.41 91.89 7.34 0.13 -
Purified water 0.81 - 5.90 5.00 - 19.44 6.63 - 7.64 0.00 0.01
Evaluation
Generally good
There are values above the permitted value.
Generally good
Good Good
Source: Prepared by the Study Team based on data from AMDC's Water Quality Management
Department.
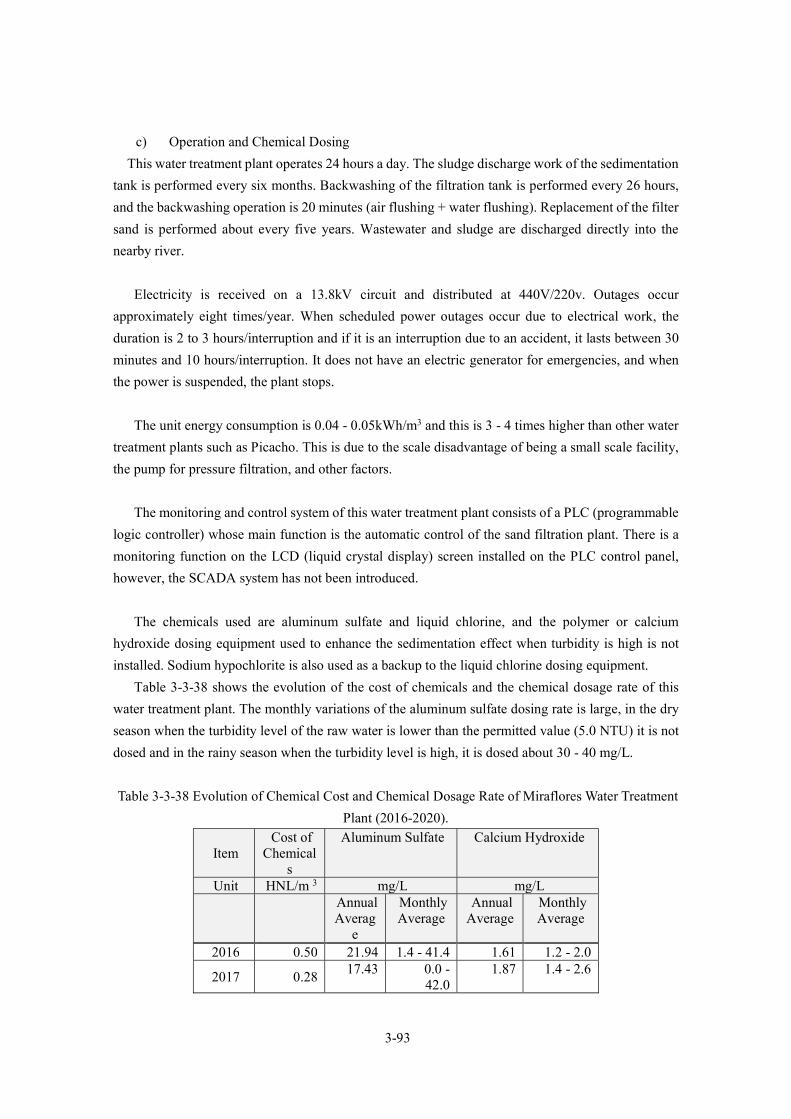
3-93
c) Operation and Chemical Dosing
This water treatment plant operates 24 hours a day. The sludge discharge work of the sedimentation
tank is performed every six months. Backwashing of the filtration tank is performed every 26 hours,
and the backwashing operation is 20 minutes (air flushing + water flushing). Replacement of the filter
sand is performed about every five years. Wastewater and sludge are discharged directly into the
nearby river.
Electricity is received on a 13.8kV circuit and distributed at 440V/220v. Outages occur
approximately eight times/year. When scheduled power outages occur due to electrical work, the
duration is 2 to 3 hours/interruption and if it is an interruption due to an accident, it lasts between 30
minutes and 10 hours/interruption. It does not have an electric generator for emergencies, and when
the power is suspended, the plant stops.
The unit energy consumption is 0.04 - 0.05kWh/m3 and this is 3 - 4 times higher than other water
treatment plants such as Picacho. This is due to the scale disadvantage of being a small scale facility,
the pump for pressure filtration, and other factors.
The monitoring and control system of this water treatment plant consists of a PLC (programmable
logic controller) whose main function is the automatic control of the sand filtration plant. There is a
monitoring function on the LCD (liquid crystal display) screen installed on the PLC control panel,
however, the SCADA system has not been introduced.
The chemicals used are aluminum sulfate and liquid chlorine, and the polymer or calcium
hydroxide dosing equipment used to enhance the sedimentation effect when turbidity is high is not
installed. Sodium hypochlorite is also used as a backup to the liquid chlorine dosing equipment.
Table 3-3-38 shows the evolution of the cost of chemicals and the chemical dosage rate of this
water treatment plant. The monthly variations of the aluminum sulfate dosing rate is large, in the dry
season when the turbidity level of the raw water is lower than the permitted value (5.0 NTU) it is not
dosed and in the rainy season when the turbidity level is high, it is dosed about 30 - 40 mg/L.
Table 3-3-38 Evolution of Chemical Cost and Chemical Dosage Rate of Miraflores Water Treatment
Plant (2016-2020).
Item Cost of
Chemicals
Aluminum Sulfate Calcium Hydroxide
Unit HNL/m 3 mg/L mg/L
Annual Averag
e
Monthly Average
Annual Average
Monthly Average
2016 0.50 21.94 1.4 - 41.4 1.61 1.2 - 2.0
2017 0.28 17.43 0.0 -
42.0 1.87 1.4 - 2.6

3-94
Item Cost of
Chemicals
Aluminum Sulfate Calcium Hydroxide
Unit HNL/m 3 mg/L mg/L
Annual Averag
e
Monthly Average
Annual Average
Monthly Average
2018 0.13 7.48 0.0 -
31.1 1.61 1.2 - 3.9
2019 0.12 3.96 0.0 -
30.86 1.67 0.6 - 2.8
2020 0.18 8.71 0.0 -
34.9 1.28 0.73 -
2.24
Source: Prepared by the Study Team based on interviews with AMDC.
d) Status of Major Facilities and Equipment
Most of the equipment at this water treatment plant is the same as that when it was constructed
back in 1996 and 2002 with some 20 years, and very little equipment has been replaced. Many require
replacement due to breakdown or aging, however, as mentioned above, this water treatment plant will
probably be out of use once the San Jose project is completed, and so what is needed is minimal repair
or replacement to continue operation until then. Above all, there is an urgent need to improve the
chemical dosing equipment to ensure the treatment operation and the flow meters, etc. to confirm the
volume of water.
Problems at Miraflores Water Treatment Plant
Table 3-3-39 shows the problems and possible measures for this water treatment plant identified
from the results of the field survey and interviews with management staff. Many of the issues are
associated with the aging and failure of facilities and equipment, inappropriate equipment
specifications, etc., but the proposed disposal of the equipment will also be considered.
Table 3-3-39 Miraflores Water Treatment Plant Problems
Issue Current Problems Actions that can be Taken Remarks
1.Water source and water quality
a. In some months, it reaches almost design capacity and in other months it works at approximately 30 - 50 % of its capacity. b. Although it is a stream water from the Picacho watershed
system, turbidity and color are
considerably high during the rainy season
a. Increase reservoir capacity in low water season, drive water from other water sources, etc. b. Water pollution survey
of water sources
2.Facility scale a. In most of the year, the
facility operates without reaching its maximum capacity.
a. Review of the method of operation
3. Treatment function
a. In the current treatment process, the turbidity level is
a. The chemical currently used for coagulation is
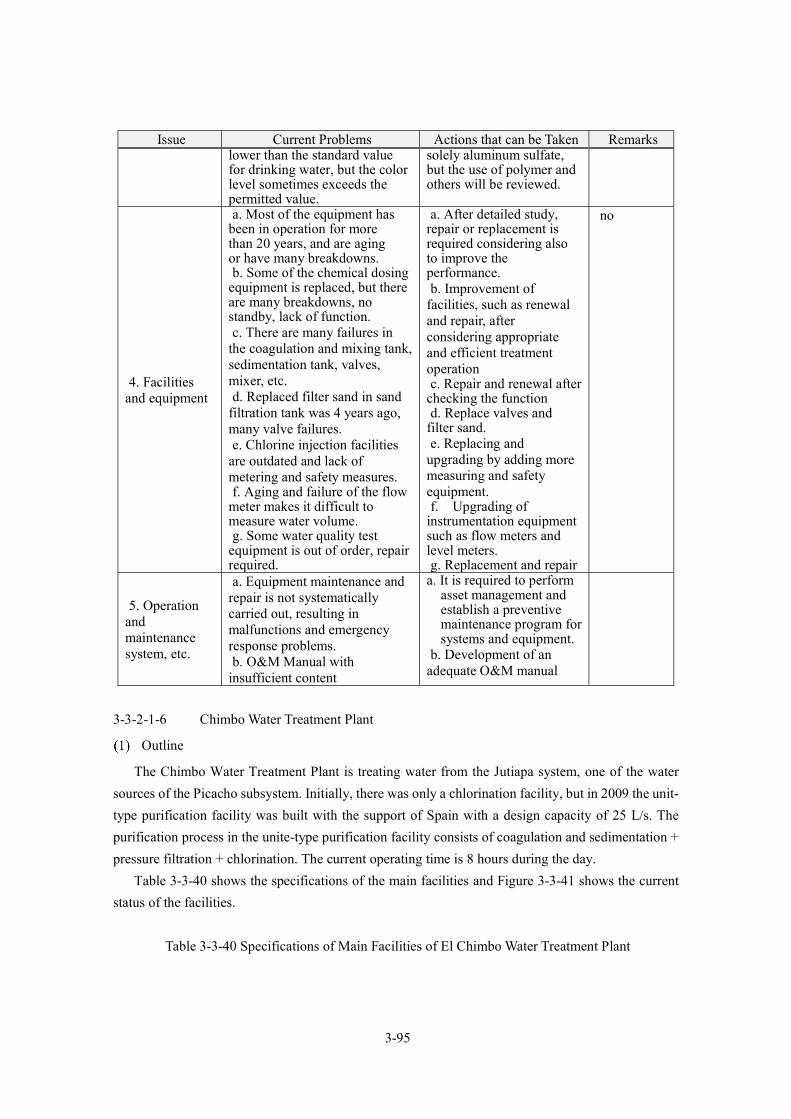
3-95
Issue Current Problems Actions that can be Taken Remarks lower than the standard value for drinking water, but the color level sometimes exceeds the permitted value.
solely aluminum sulfate, but the use of polymer and others will be reviewed.
4. Facilities and equipment
a. Most of the equipment has been in operation for more than 20 years, and are aging or have many breakdowns. b. Some of the chemical dosing
equipment is replaced, but there are many breakdowns, no standby, lack of function. c. There are many failures in
the coagulation and mixing tank, sedimentation tank, valves, mixer, etc. d. Replaced filter sand in sand
filtration tank was 4 years ago, many valve failures. e. Chlorine injection facilities
are outdated and lack of metering and safety measures. f. Aging and failure of the flow
meter makes it difficult to measure water volume. g. Some water quality test
equipment is out of order, repair required.
a. After detailed study, repair or replacement is required considering also to improve the performance. b. Improvement of
facilities, such as renewal and repair, after considering appropriate and efficient treatment operation c. Repair and renewal after
checking the function d. Replace valves and
filter sand. e. Replacing and
upgrading by adding more measuring and safety equipment. f. Upgrading of
instrumentation equipment such as flow meters and level meters. g. Replacement and repair
no
5. Operation and maintenance system, etc.
a. Equipment maintenance and repair is not systematically carried out, resulting in malfunctions and emergency response problems. b. O&M Manual with
insufficient content
a. It is required to perform asset management and establish a preventive maintenance program for systems and equipment.
b. Development of an adequate O&M manual
3-3-2-1-6 Chimbo Water Treatment Plant
Outline
The Chimbo Water Treatment Plant is treating water from the Jutiapa system, one of the water
sources of the Picacho subsystem. Initially, there was only a chlorination facility, but in 2009 the unit-
type purification facility was built with the support of Spain with a design capacity of 25 L/s. The
purification process in the unite-type purification facility consists of coagulation and sedimentation +
pressure filtration + chlorination. The current operating time is 8 hours during the day.
Table 3-3-40 shows the specifications of the main facilities and Figure 3-3-41 shows the current
status of the facilities.
Table 3-3-40 Specifications of Main Facilities of El Chimbo Water Treatment Plant
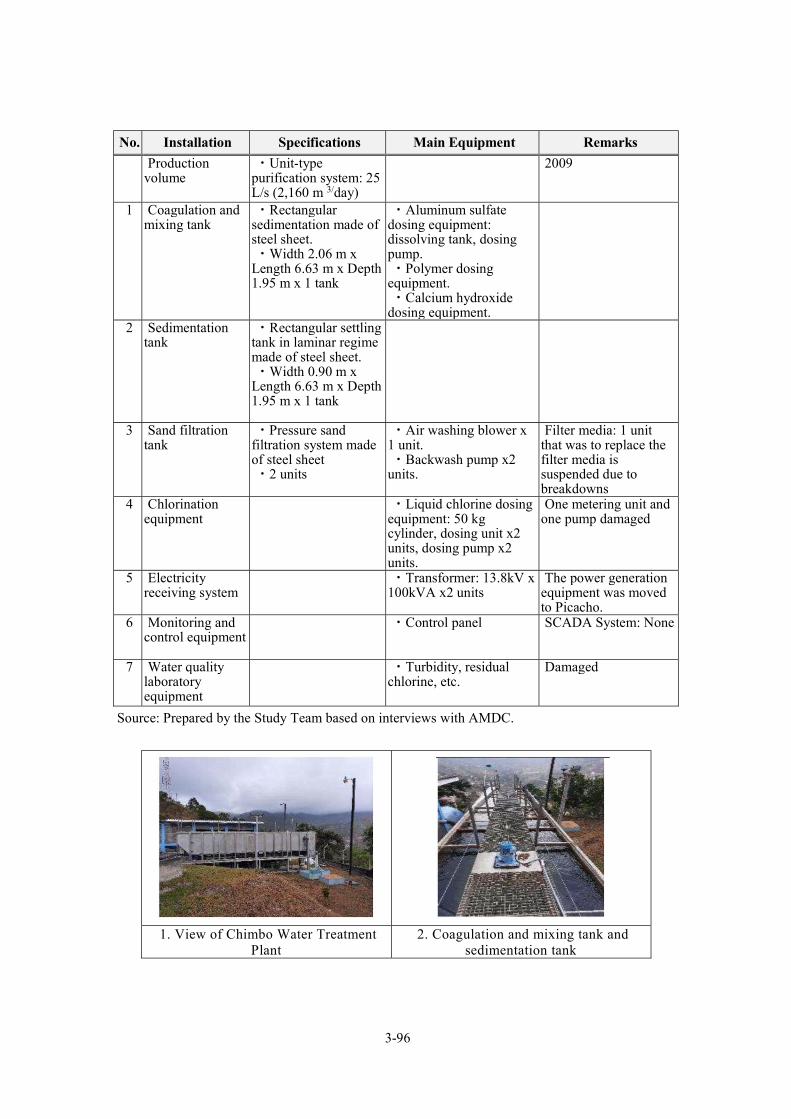
3-96
No. Installation Specifications Main Equipment Remarks
Production volume
・Unit-type purification system: 25 L/s (2,160 m 3/day)
2009
1 Coagulation and mixing tank
・Rectangular sedimentation made of steel sheet. ・Width 2.06 m x
Length 6.63 m x Depth 1.95 m x 1 tank
・Aluminum sulfate dosing equipment: dissolving tank, dosing pump. ・Polymer dosing
equipment. ・Calcium hydroxide
dosing equipment.
2 Sedimentation tank
・Rectangular settling tank in laminar regime made of steel sheet. ・Width 0.90 m x
Length 6.63 m x Depth 1.95 m x 1 tank
3 Sand filtration tank
・Pressure sand filtration system made of steel sheet ・2 units
・Air washing blower x 1 unit. ・Backwash pump x2
units.
Filter media: 1 unit that was to replace the filter media is suspended due to breakdowns
4 Chlorination equipment
・Liquid chlorine dosing equipment: 50 kg cylinder, dosing unit x2 units, dosing pump x2 units.
One metering unit and one pump damaged
5 Electricity receiving system
・Transformer: 13.8kV x 100kVA x2 units
The power generation equipment was moved to Picacho.
6 Monitoring and control equipment
・Control panel SCADA System: None
7 Water quality laboratory equipment
・Turbidity, residual chlorine, etc.
Damaged
Source: Prepared by the Study Team based on interviews with AMDC.
1. View of Chimbo Water Treatment
Plant 2. Coagulation and mixing tank and
sedimentation tank

3-97
3. Pressure filtration (one unit
suspended ) 4. Chlorination equipment
5. Chemical dosing system 6. Water feeder pump
7. Control panel 8. Graphic panel
Figure 3-3-41Current Status of Chimbo Water Treatment Plant
Operation and Maintenance System
Currently, the operation and maintenance of El Chimbo Water Treatment Plant is in charge by the
Picacho subsystem of AMDC's Water Management Unit. There are currently 4 operators in charge of
this water treatment plant. The manager who remains at the Picacho Water Treatment Plant performs
water quality testing.
The water treatment plant is operated in a single shift, from 8:00 a.m. to 4:00 p.m., with no operator
assigned during the night. Water treatment plant operators inspect the main mechanical and electrical
equipment once a week. Repairs to faulty equipment are carried out by the responsible section at
AMDC headquarters. The staff reports daily to AMDC the data on water levels and volume of water
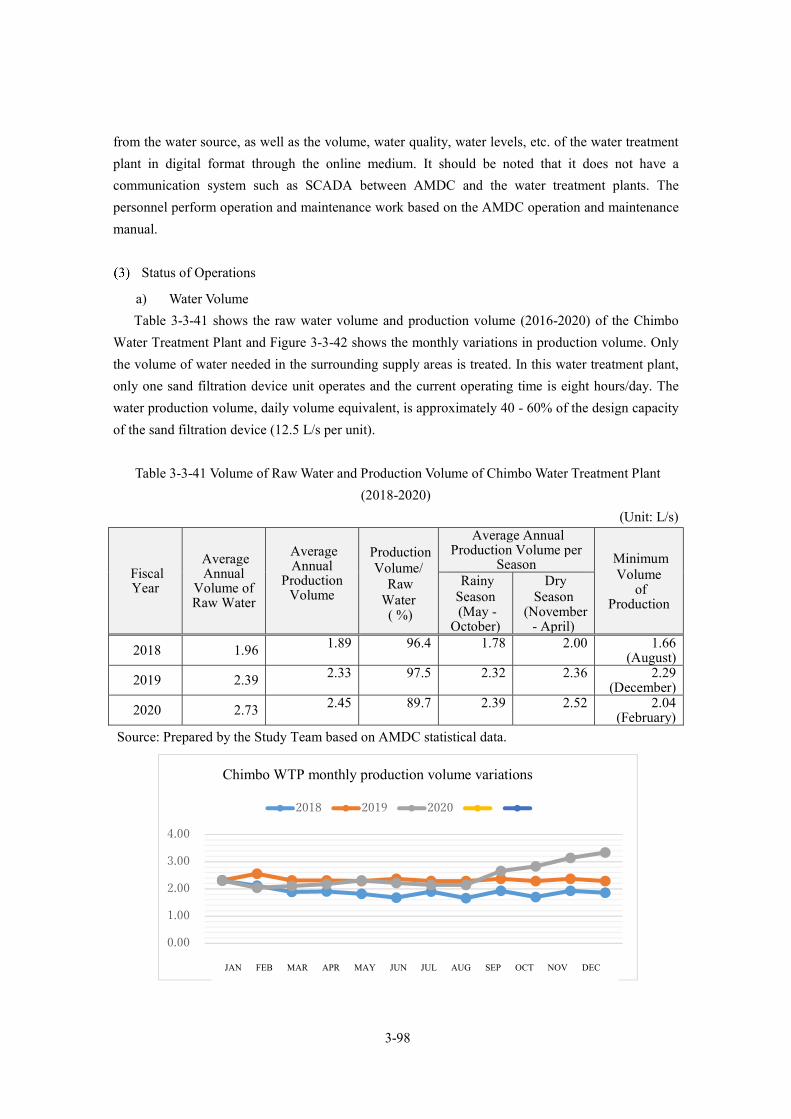
3-98
from the water source, as well as the volume, water quality, water levels, etc. of the water treatment
plant in digital format through the online medium. It should be noted that it does not have a
communication system such as SCADA between AMDC and the water treatment plants. The
personnel perform operation and maintenance work based on the AMDC operation and maintenance
manual.
Status of Operations
a) Water Volume
Table 3-3-41 shows the raw water volume and production volume (2016-2020) of the Chimbo
Water Treatment Plant and Figure 3-3-42 shows the monthly variations in production volume. Only
the volume of water needed in the surrounding supply areas is treated. In this water treatment plant,
only one sand filtration device unit operates and the current operating time is eight hours/day. The
water production volume, daily volume equivalent, is approximately 40 - 60% of the design capacity
of the sand filtration device (12.5 L/s per unit).
Table 3-3-41 Volume of Raw Water and Production Volume of Chimbo Water Treatment Plant
(2018-2020)
(Unit: L/s)
Fiscal Year
Average Annual
Volume of Raw Water
Average Annual
Production Volume
Production Volume/
Raw Water ( %)
Average Annual Production Volume per
Season Minimum Volume
of Production
Rainy Season (May -
October)
Dry Season
(November - April)
2018 1.96 1.89 96.4 1.78 2.00 1.66 (August)
2019 2.39 2.33 97.5 2.32 2.36 2.29 (December)
2020 2.73 2.45 89.7 2.39 2.52 2.04 (February)
Source: Prepared by the Study Team based on AMDC statistical data.
0.00
1.00
2.00
3.00
4.00
1月 2月 3月 4月 5月 6月 7月 8月 9月 10月 11月 12月
チンボ浄水場生産水量月別変動 (単位:L/s)
2018 2019 2020
Chimbo WTP monthly production volume variations
JAN FEB MAR APR MAY JUN JUL AUG SEP OCT NOV DEC

3-99
Figure 3-3-42Monthly Variations in Production Volume of Chimbo Water Treatment Plant (2018-
2020).
b) Water Quality
Water quality testing is performed in the central water quality laboratory once a week. Operating
parameters such as turbidity, color, pH, electrical conductivity, alkalinity, and hardness, as well as
iron, manganese, bacteria, etc., are analyzed.
Table 3-3-42, shows the main raw and purified water quality parameters (turbidity, color, pH, iron
and manganese) obtained during 2018 - 2020 (monthly average values).
The water source for this water treatment plant is the stream water from the Picacho system, and
is characterized by high turbidity in the rainy season, and many times exceeds the turbidity level of 5
NTU which is the standard value for water quality. Throughout most of the year, the turbidity level is
low and it is a good source of water. The color level exceeds 15 UC in the rainy season, but the water
can be treated with coagulation, sedimentation and filtration. Iron and manganese are not observed, or
are observed in small amounts.
Table 3-3-42 Water Quality of Chimbo Water Treatment Plant (Monthly Average Values, 2016-
2020) Water Quality
Parameter Turbidity Color pH Iron Mangane
se Remark
s Unit NTU TCU - mg/L mg/L
Maximum Allowable Value of Honduras for Drinking Water
5 15 6.5 - 8.5 0.3 0.5
2018
Raw water
0.71 - 7.27
2.50 - 20.62
6.41 - 7.79
0.00 0.00 - 0.03
Purified water
0.41 - 1.46
2.50 - 7.50
6.12 - 7.79
0.00 0.00 - 0.03
2019
Raw water
0.48 - 5.73
2.50 - 15.0
6.66 - 8.01
0.00 - 0.07
0.00
Purified water
0.32 - 2.28
2.5 - 7.50 6.72 - 7.91
0.00 - 0.02
0.00
2020
Raw water
0.50 - 7.55
2.50 - 40.00
6.25 - 7.45
0.00 -
Purified water
0.40 - 2.62
2.5 - 12.5 6.08 - 7.36
0.00 -
Evaluation
Lower than allowed value
Lower than
allowed value
Sometimes less than
6.5
Good Good
Source: Prepared by the Study Team based on data from AMDC's Water Quality Management
Department.
c) Operation and Dosing of Chemicals
The current operating time of this water treatment plant is eight hours per day. Sludge discharge
from the sedimentation tank is performed every six months. Backwashing of the filtration tank is done

3-100
every 20 hours and replacement of the filter sand is done about every five years. Wastewater and
sludge are discharged directly to the nearby river.
Electricity is received on a 13.8kV circuit and distributed at 440V/220v. Outages occur
approximately 10 times/year. When scheduled power outages occur due to electrical work, the
duration is 2 to 3 hours/interruption and if it is an interruption due to an accident, it lasts between 30
minutes and 10 hours/interruption. It does not have an electric generator for emergencies, and when
the power is suspended, the plant stops. The unit energy consumption of this water treatment plant is
quite large compared to other water treatment plants because it is an extremely small facility.
The monitoring and control system for this water treatment plant consists of a PLC (programmable
logic controller) and is fully automatic. Currently the automatic control only works on the sand
filtration facilities, and the chemical dosing equipment is operated manually. There is a monitoring
function on the LCD (liquid crystal display) screen installed on the PLC control panel, however,
SCADA has not been introduced.
The chemicals used are aluminum sulfate, lime hydrate and chlorine gas, and polymer dosing
equipment is available to enhance the settling effect when the turbidity level is high, but is not used.
Sodium hypochlorite is also available as a backup to liquid chlorine dosing equipment.
Table 3-3-43 shows the evolution of the cost of chemicals and the chemical dosage rate of this
water treatment plant. The dosing rate is quite high for all chemicals compared to the Picacho Water
Treatment Plant, despite the fact that the quality of the raw water is almost similar to that of Picacho,
and appropriate dosing control is not being performed.
Table 3-3-43 Evolution of Cost of Chemicals and Chemical Dosage Rate of Chimbo Water
Treatment Plant (2018-2020).
Item Cost of Chemicals
Aluminum Sulfate Calcium Hydroxide
Liquid Chlorine
Unit HNL/m 3 mg/L mg/L mg/L
Annual Average
Monthly Average
Annual Average
Monthly Average
Annual Average
Monthly Average
2018 0.67 22.5 19.0 - 27.9 5.5 3.3 - 7.0 6.7 3.8 - 8.9 2019 0.57 18.9 18.8 - 20.0 3.5 3.3 - 3.9 4.2 4.1 - 4.6 2020 0.48 17.6 13.3 - 22.2 1.9 0.0 - 3.7 4.2 3.0 - 7.5
Source: Prepared by the Study Team based on interviews with SANAA.
d) Status of Major Facilities and Equipment
Some equipment at this water treatment plant has been suspended due to breakdowns, but has not
been repaired. One of the two pressure filtration device units has been suspended since March 2021,
awaiting replacement of the filter media. The chlorination equipment was installed in 2003 and is
obsolete.

3-101
Problems at Chimbo Drinking Water Treatment Plant
Table 3-3-44 shows the problems of this water treatment plant and the possible measures that were
identified during the field survey and from the results of the interviews with the maintenance staff.
Many concern with aging and breakdowns of facilities and equipment, as well as inadequate
equipment specifications.
Table 3-3-44 Chimbo Water Treatment Plant Problems Issue Current Problems Possible Measures Remarks
1.Water source and water quality
a. The only water source is the Jutiapa system of the Picacho water source. b. It is stream water
from the water sources of the Picacho system, and the water quality is similar to that of Picacho.
a. If necessary, convey water from other water sources, etc.
2.Facility scale
a. Currently operating 8 hours/day, the facility does not reach its maximum capacity.
a. Consideration of operation methods and coordination with water supply areas to be served.
3. Treatment function
a. In the current treatment process, values lower than the standard value for drinking water are maintained.
4. Facilities and equipment
a. Many equipment is aging/ breakdowns, not repaired. b. No proper coagulation and mixing operation/handling. No standby. c. A sand filtration unit is suspended due to failure. d. Deficient measurement and safety measures due to aging of chlorination equipment. e. Aging and failure of the flow meter makes it difficult to measure the volume of water. f. Some water quality test equipment such as the turbidity meter is faulty, repair is required.
a. After detailed study, repair or replacement is required, considering also to improve the performance. b. Improvement of facilities such as renewal and repair, repair of the automatic operation function of the control panel, and expansion of each injection pump after considering appropriate and efficient treatment operation. c. Repair and replacement of filter sand d. Improvement by adding more measuring and safety equipment. e. Upgrading of instrumentation equipment such as flow meters and level gauges. f. Replacement and repair
b. Check the chemical dosage rate.
5. Operation and maintenance system, etc.
a. They are not performing maintenance/upgrading of equipment on a
a. A preventive maintenance program for systems and equipment needs to be established.

3-102
Issue Current Problems Possible Measures Remarks scheduled basis, so failures occur in case of breakdowns and emergencies.
3-3-2-1-7 Central Water Quality Laboratory
Outline
The central water quality laboratory is located within the Laureles Water Treatment Plant area,
but it is a separate organization from the water treatment plant. This laboratory is a supervisory body
for the water quality testing of the water treatment plants. It performs the analysis of physical, chemical
and biological parameters of drinking water, manages the laboratory equipment of the water treatment
plants and collects various data for analysis. Only this laboratory has the capacity to perform biological
and heavy metal tests. The laboratory has 2 buildings, the biological and chemical testing building
built in 2001 and the heavy metal testing building built in 2005 with Spanish cooperation. In this
laboratory, 50-60 samples from water sources and water treatment plants are analyzed weekly. The
equipment is aging and some of it is out of order, so it is necessary to replace it at the appropriate time.
Figure 3-3-43 shows the current status of the central water quality laboratory.
1. View of the central water quality
laboratory
2. Inside the laboratory
3. pH meter and color meter 4. Scales and others
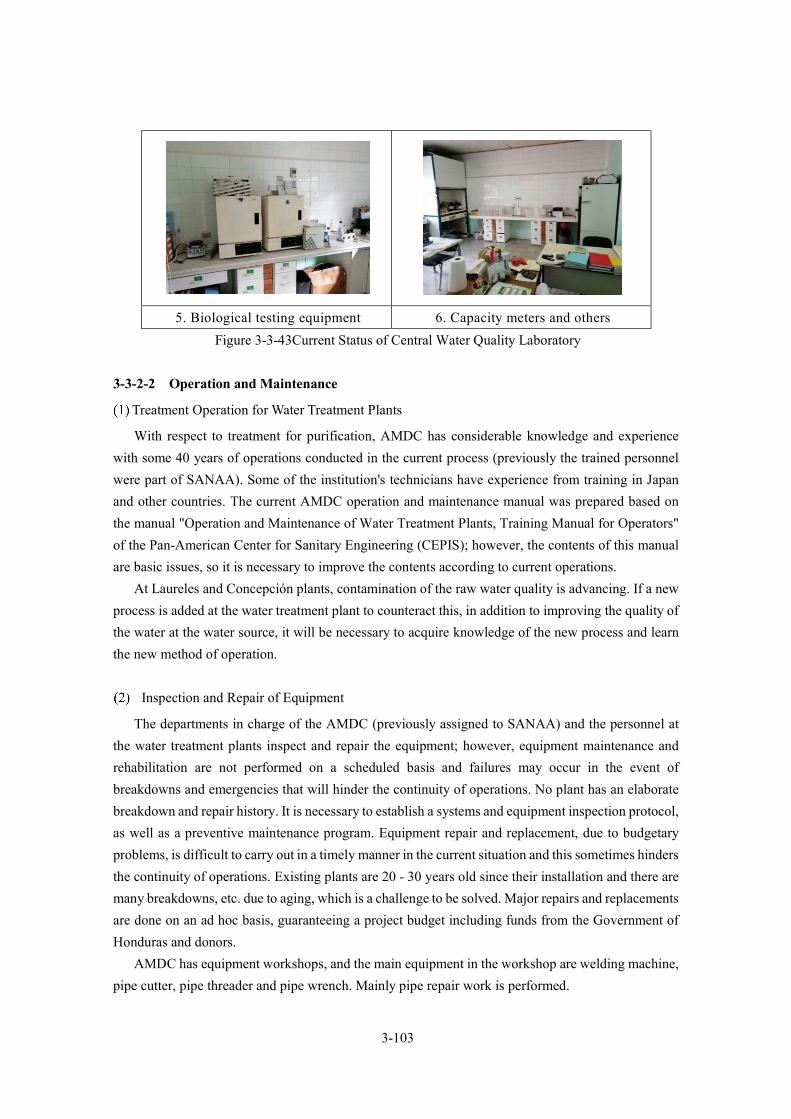
3-103
5. Biological testing equipment 6. Capacity meters and others
Figure 3-3-43Current Status of Central Water Quality Laboratory
3-3-2-2 Operation and Maintenance
Treatment Operation for Water Treatment Plants
With respect to treatment for purification, AMDC has considerable knowledge and experience
with some 40 years of operations conducted in the current process (previously the trained personnel
were part of SANAA). Some of the institution's technicians have experience from training in Japan
and other countries. The current AMDC operation and maintenance manual was prepared based on
the manual "Operation and Maintenance of Water Treatment Plants, Training Manual for Operators"
of the Pan-American Center for Sanitary Engineering (CEPIS); however, the contents of this manual
are basic issues, so it is necessary to improve the contents according to current operations.
At Laureles and Concepción plants, contamination of the raw water quality is advancing. If a new
process is added at the water treatment plant to counteract this, in addition to improving the quality of
the water at the water source, it will be necessary to acquire knowledge of the new process and learn
the new method of operation.
Inspection and Repair of Equipment
The departments in charge of the AMDC (previously assigned to SANAA) and the personnel at
the water treatment plants inspect and repair the equipment; however, equipment maintenance and
rehabilitation are not performed on a scheduled basis and failures may occur in the event of
breakdowns and emergencies that will hinder the continuity of operations. No plant has an elaborate
breakdown and repair history. It is necessary to establish a systems and equipment inspection protocol,
as well as a preventive maintenance program. Equipment repair and replacement, due to budgetary
problems, is difficult to carry out in a timely manner in the current situation and this sometimes hinders
the continuity of operations. Existing plants are 20 - 30 years old since their installation and there are
many breakdowns, etc. due to aging, which is a challenge to be solved. Major repairs and replacements
are done on an ad hoc basis, guaranteeing a project budget including funds from the Government of
Honduras and donors.
AMDC has equipment workshops, and the main equipment in the workshop are welding machine,
pipe cutter, pipe threader and pipe wrench. Mainly pipe repair work is performed.

3-104
Procurement of Equipment and Materials
AMDC has equipment and materials warehouses in two locations, one at Los Laureles Water
Treatment Plant and the other at La Vega Water Treatment Plant. They mainly store pipes, valves,
small pumps, miscellaneous accessories and consumables.
PVC and DIP pipes up to a diameter of 8" (200 mm) can be purchased locally, however, pipes and
equipment larger than 200 mm in diameter are imported, which are purchased through bidding each
time they are needed.
Chemicals are acquired through competitive bidding and are currently purchased from the
following countries: Aluminum sulfate from Finland;, Lime hydrate from Guatemala; liquid chlorine
from United States of America; polymer from United Kingdom; and powdered activated carbon from
Mexico.
3-3-3 Piping and Distribution Facilities
Piping and distribution facilities in the municipality of Tegucigalpa consist of 4 piping systems
from the water treatment plants to 102 distribution tanks, distribution pipes from the distribution tanks
to 665 distribution areas, and service pipes to households. In areas that do not have a distribution
pipeline network, water is supplied by water tank trucks.
3-3-3-1 Facilities
In the following, 3-3-3-1 describes Facilities and 3-3-3-2 describes Operation and Maintenance.
3-3-3-1-1 Pipeline Installations
The conveyance systems are shown in Figure 3-3-44. Water is sent through the Picacho
conveyance system from the Picacho Water Treatment Plant, Los Laureles conveyance system from
Los Laureles Water Treatment Plant and La Concepción conveyance system from La Concepción
Water Treatment Plant. These conduction systems have 26 pumping stations where water is sent with
increased pressure to some tanks. In the case of the Miraflores Water Treatment Plant, water is sent
from this plant to the distribution tank located inside the water treatment plant and distributed to the
surrounding areas.
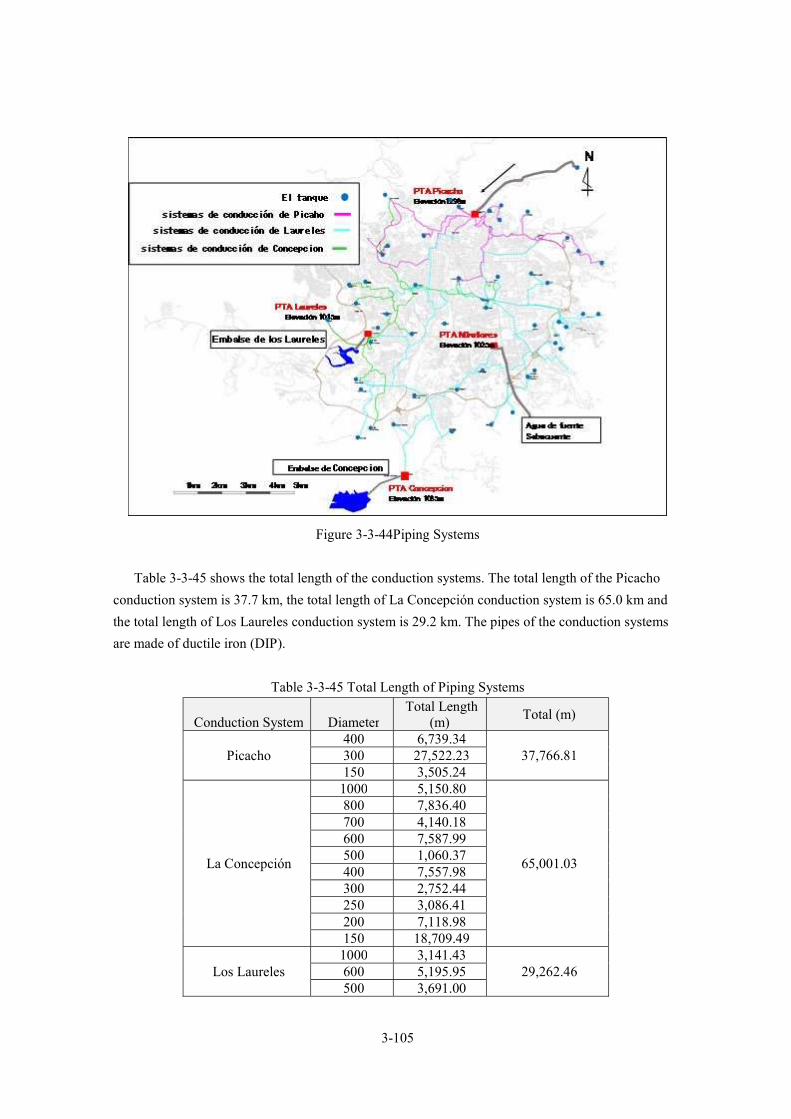
3-105
Figure 3-3-44Piping Systems
Table 3-3-45 shows the total length of the conduction systems. The total length of the Picacho
conduction system is 37.7 km, the total length of La Concepción conduction system is 65.0 km and
the total length of Los Laureles conduction system is 29.2 km. The pipes of the conduction systems
are made of ductile iron (DIP).
Table 3-3-45 Total Length of Piping Systems
Conduction System Diameter Total Length
(m) Total (m)
Picacho 400 6,739.34
37,766.81 300 27,522.23 150 3,505.24
La Concepción
1000 5,150.80
65,001.03
800 7,836.40 700 4,140.18 600 7,587.99 500 1,060.37 400 7,557.98 300 2,752.44 250 3,086.41 200 7,118.98 150 18,709.49
Los Laureles 1000 3,141.43
29,262.46 600 5,195.95 500 3,691.00

3-106
Conduction System Diameter Total Length
(m) Total (m)
400 914.01 300 4,314.99 200 5,711.36 150 6,293.72
Source: SANAA
Piping Systems
a) Picacho Conduction System
Figure 3-3-45, Figure 3-3-46 shows the conceptual scheme of the conveyance systems. The
Picacho Water Treatment Plant sends water by gravity from Picacho Hill, located to the northwest of
the city, to the distribution tanks in the sectors located to the northeast of the city, such as La Leona,
Linderos, Molinón, La Sosa and La Travesía. In the dry season, water is sent from the La Concepción
conduction system to the La Leona and Linderos distribution tanks.
In the Picacho pipeline system, the pipelines are damaged in the relatively high frequency due to
water hammer impacts. It is assumed that the cause is air deposits in the pipeline as shown in Figure
3-3-47 and when the valve is opened or closed at the start of operation, water hammer occurs inside
the pipeline. For operation, it is recommended to open and close the valve slowly with sufficient time.
In this pipeline system, there are few air valves, so it is necessary to install them properly.

3-107
Figure 3-3-45 Water Level Schematic of Conduction System
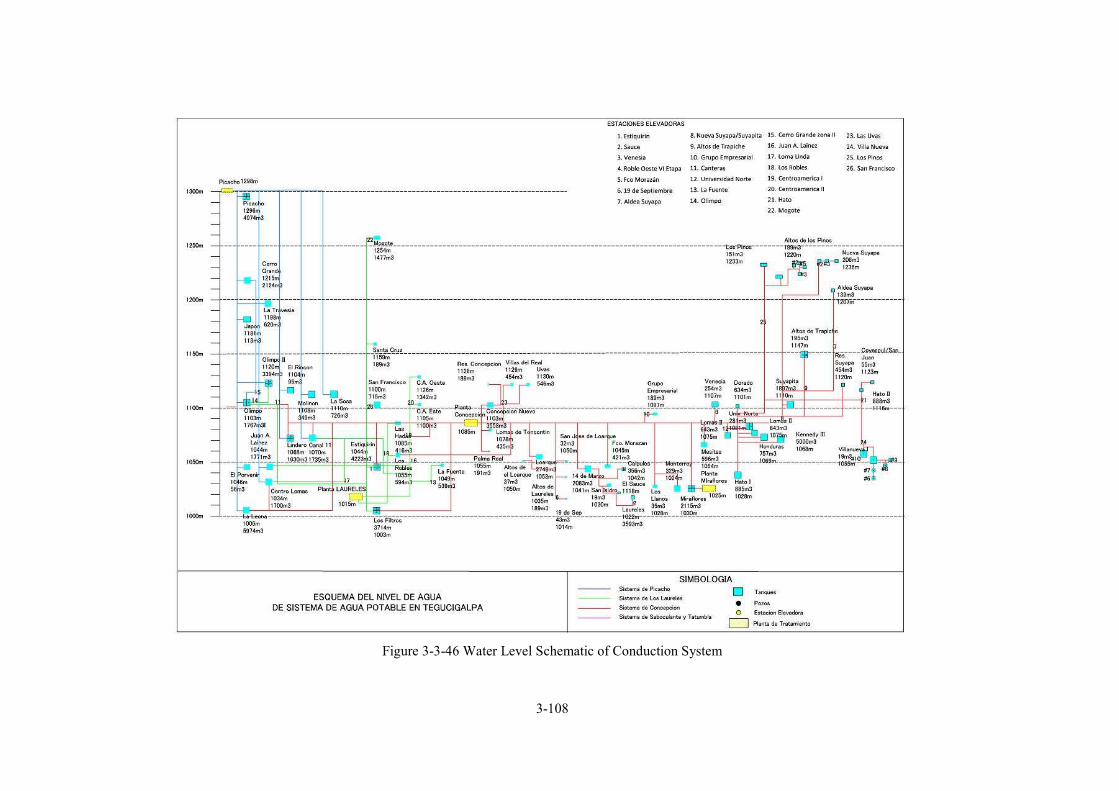
3-108
Figure 3-3-46 Water Level Schematic of Conduction System

3-109
Source: SANAA AQUARUM (Project for the Optimization of Water Supply Services in
Tegucigalpa).
Figure 3-3-47 Air Reservoir Schematic Diagram It is to be mentioned that the SCADA system was built within the Picacho Water Treatment Plant
for remote monitoring and control through the AQUARUM program in 2012. However, it is currently not operational since 2015 due to various factors, and is in the process of transition from SANAA to AMDC. The summary of the SCADA system is as follows.
The system consists of 2 operating stations, a rack-type data server and radio equipment for data communication in UHF frequencies from the signal emission points, among others.
The parameters monitored are water levels in the distribution tanks, water flow rates at the distribution points including the water treatment plant (31 points) and residual chlorine concentrations in the water treatment plants. These data are transmitted via radio on UHF frequencies to the station.
At the operator station, the LCD display is used as the HMI (Human Machine Interface) where water levels and flow trends and instantaneous values are displayed. The data stored on the server is used to produce daily, monthly and annual reports. Three persons are assigned as system operators including the person in charge. The existing system has the following challenges which require study and analysis:
1. An imperfect operation carried out by the operators due to the lack of technological transfer by the system's contractors.
2. Failures in sensors such as flow meters and application software. 3. UHF antenna connection cable not suitable for outdoor use (not weather compatible). 4. Lack of system server capacity
Figure 3-3-48 shows the current status of the existing SCADA system.
SCADA Station inside the Picacho Water Treatment Plant
Operating station
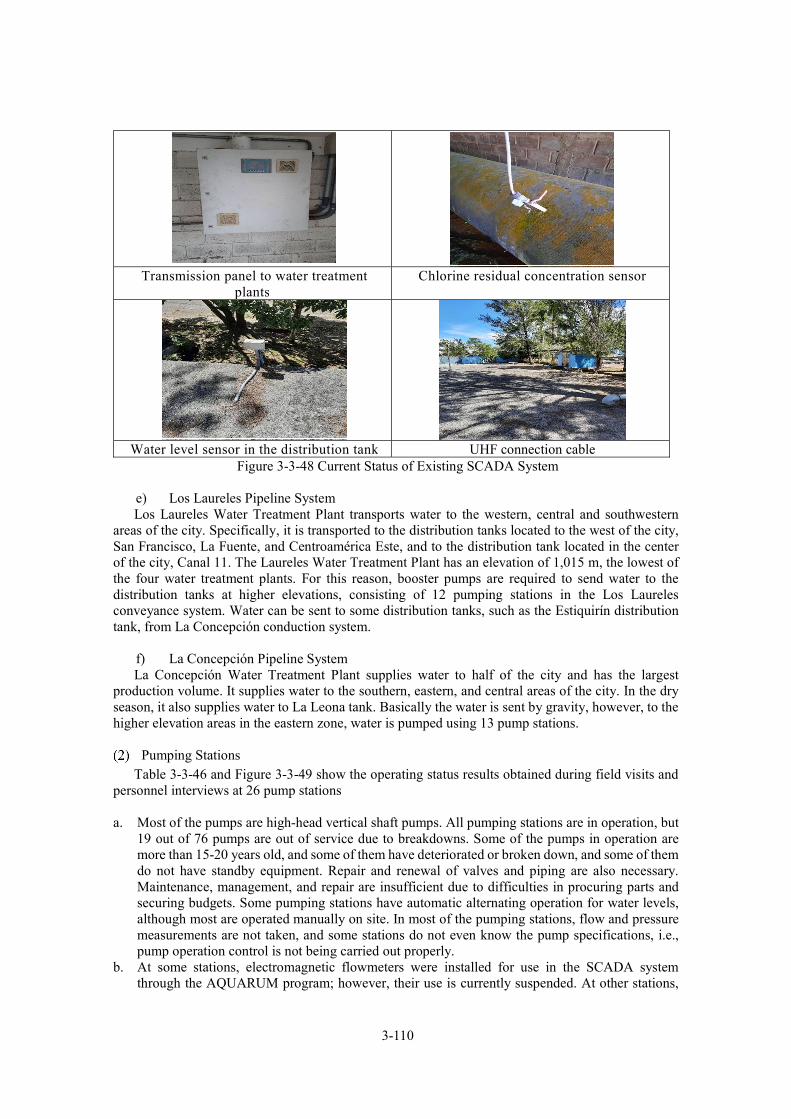
3-110
Transmission panel to water treatment
plants Chlorine residual concentration sensor
Water level sensor in the distribution tank UHF connection cable
Figure 3-3-48 Current Status of Existing SCADA System
e) Los Laureles Pipeline System Los Laureles Water Treatment Plant transports water to the western, central and southwestern
areas of the city. Specifically, it is transported to the distribution tanks located to the west of the city, San Francisco, La Fuente, and Centroamérica Este, and to the distribution tank located in the center of the city, Canal 11. The Laureles Water Treatment Plant has an elevation of 1,015 m, the lowest of the four water treatment plants. For this reason, booster pumps are required to send water to the distribution tanks at higher elevations, consisting of 12 pumping stations in the Los Laureles conveyance system. Water can be sent to some distribution tanks, such as the Estiquirín distribution tank, from La Concepción conduction system.
f) La Concepción Pipeline System La Concepción Water Treatment Plant supplies water to half of the city and has the largest
production volume. It supplies water to the southern, eastern, and central areas of the city. In the dry season, it also supplies water to La Leona tank. Basically the water is sent by gravity, however, to the higher elevation areas in the eastern zone, water is pumped using 13 pump stations.
Pumping Stations Table 3-3-46 and Figure 3-3-49 show the operating status results obtained during field visits and
personnel interviews at 26 pump stations
a. Most of the pumps are high-head vertical shaft pumps. All pumping stations are in operation, but 19 out of 76 pumps are out of service due to breakdowns. Some of the pumps in operation are more than 15-20 years old, and some of them have deteriorated or broken down, and some of them do not have standby equipment. Repair and renewal of valves and piping are also necessary. Maintenance, management, and repair are insufficient due to difficulties in procuring parts and securing budgets. Some pumping stations have automatic alternating operation for water levels, although most are operated manually on site. In most of the pumping stations, flow and pressure measurements are not taken, and some stations do not even know the pump specifications, i.e., pump operation control is not being carried out properly.
b. At some stations, electromagnetic flowmeters were installed for use in the SCADA system through the AQUARUM program; however, their use is currently suspended. At other stations,
3-111
some do not have flowmeters, or even if they have mechanical flowmeters, many are not properly working. Consequently, the exact volume of water pumped is not known.
c. With respect to the electric power situation, every month there is a scheduled suspension of electric power due to electrical work. No pumping station has an emergency generator except for No.8 pumping station, so operation is suspended when there is no power.
d. The operation time of the pumps is established according to the demand requirements of each supply area. As a general rule, AMDC manages the operation of the lift stations, however, in three stations the management is in charge of the water user communities to which AMDC provides technical assistance.
e. The issues are as follows: ・ Many equipment is more than 20 years old (working since installation) and shows
deterioration/failure. Repairs and replacements including working equipment are necessary, and in addition, it is necessary to repair/replace broken equipment to ensure backup availability.
・When replacing, it is important to properly set the specifications. ・ It is recommended to establish a preventive maintenance program including the periodic
implementation of the energy diagnosis and to conduct training to guide on how to prepare an adequate O&M program/specifications.

3-112
Table 3-3-46 Current Status of Existing Pumping Stations N
o
Name of
Pumping Station
System Name
Year of
Installation
Pump Specifications:
No. x Q (m 3/min)
x P (kW), V/H
Flow
meter
Generato
r
No. of Pumps Runnin
g
Operating Time
(Hours/day)
No. of Operator
s
Frequency of Outages
Destination
Remarks
1 Estiquirín Los Laureles 1975 2xQx112, V Exists, Aquarum
None 1 9 3 3 times/month
Estiquirín Tank 1 unit faulty, Aquarum suspended
2 El Sauce La Concepción
2x1.06x56, V Exists, mechanica
l
None 2 8 Tuesday, Friday, Sunday
3 6 times/year
El Sauce Tank Alternate operation
3 Venecia La Concepción
2006 2xQx55, V None None 2 7.5/2 days 3 2 times/month
Venecia Tank Automatic for levels and alternate operation
4 Roble Oeste VI Etapa
La Concepción
2008 2xQx30kW, V Exists, electric
None 2 9 Every 3 days
Roble Oeste VI Automatic for levels and alternate operation
5 Francisco Morazán
Los Laureles 2x0.34x15, V None None 2 21 Thursday,
Friday
3 3 times/month
Morazán tank and others
Alternate operation
6 19 de Septiembre
Los Laureles 2005 1xQx11, S None None 1 7-23 Tuesday, Friday
3 2-3 times/month
Los Laureles Tank
Administration: community
7 Aldea de Suyapa
La Concepción
1997 2x0.93x22.38, V
None None 2 20-6/7 days
2 1 time/month programme
d
Nueva Suyapa tank and others
Administration: community, alternate operation
8 Nueva Suyapa/Suyapita
La Concepción
2000 2x2.24x93.25, V 2x6.18x112,V
Exists, Aquarum
Exists, 300kVA
2 2
10 24
3 2 times/month
Suyapa/Suyapita
Alternating operation, 2 units down, Aquarum suspended
9
Altos del Trapiche
La Concepción
2002 2x3.0x44.74, V Exists, electric
2 5-17 Every 3 days
2 2 times/month programme
d
Altos de Trapiche, etc.
Alternate operation
10 Grupo La 2010 2x4.16x14.92,V Exists, None 2 4-5/3 days 2 Aguacatal Administration
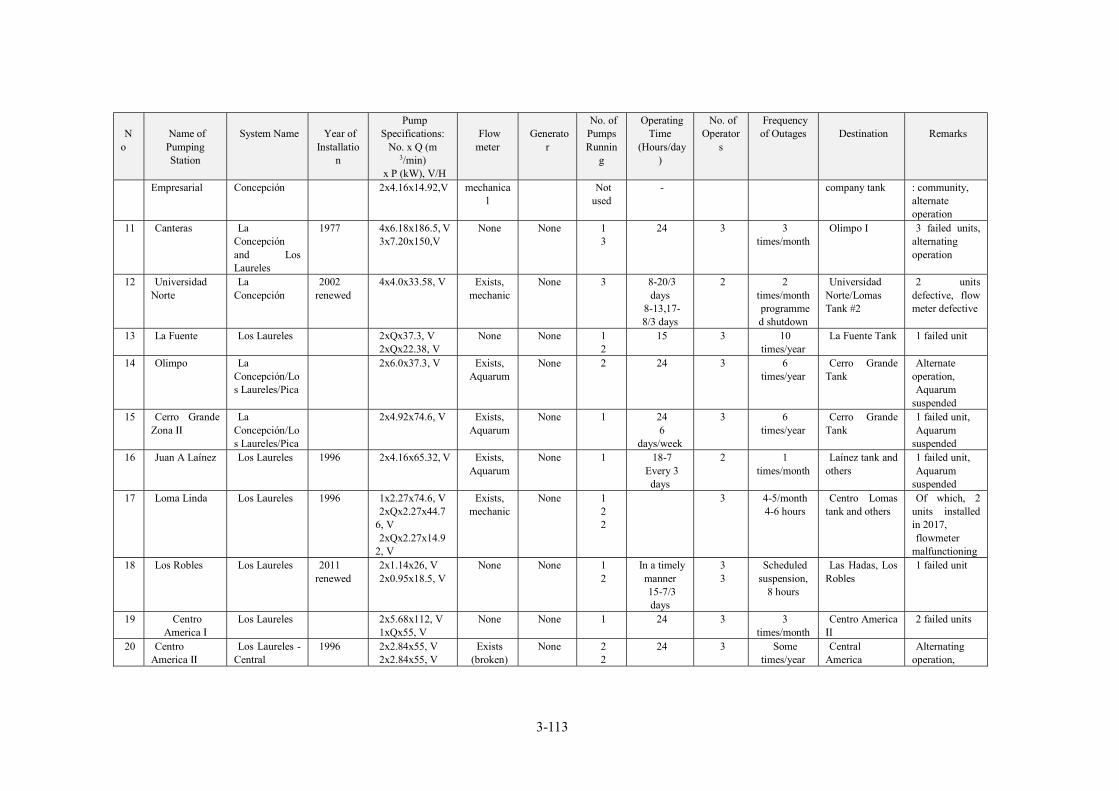
3-113
N
o
Name of
Pumping Station
System Name
Year of
Installation
Pump Specifications:
No. x Q (m 3/min)
x P (kW), V/H
Flow
meter
Generato
r
No. of Pumps Runnin
g
Operating Time
(Hours/day)
No. of Operator
s
Frequency of Outages
Destination
Remarks
Empresarial Concepción 2x4.16x14.92,V mechanical
Not used
- company tank : community, alternate operation
11 Canteras La Concepción and Los Laureles
1977 4x6.18x186.5, V 3x7.20x150,V
None None 1 3
24 3 3 times/month
Olimpo I 3 failed units, alternating operation
12 Universidad Norte
La Concepción
2002 renewed
4x4.0x33.58, V Exists, mechanic
None 3 8-20/3 days
8-13,17-8/3 days
2 2 times/month programmed shutdown
Universidad Norte/Lomas Tank #2
2 units defective, flow meter defective
13 La Fuente Los Laureles 2xQx37.3, V 2xQx22.38, V
None None 1 2
15 3 10 times/year
La Fuente Tank 1 failed unit
14 Olimpo La Concepción/Los Laureles/Pica
2x6.0x37.3, V Exists, Aquarum
None 2 24 3 6 times/year
Cerro Grande Tank
Alternate operation, Aquarum
suspended 15 Cerro Grande
Zona La
Concepción/Los Laureles/Pica
2x4.92x74.6, V Exists, Aquarum
None 1 24 6
days/week
3 6 times/year
Cerro Grande Tank
1 failed unit, Aquarum
suspended 16 Juan A Laínez Los Laureles 1996 2x4.16x65.32, V Exists,
Aquarum None 1 18-7
Every 3 days
2 1 times/month
Laínez tank and others
1 failed unit, Aquarum
suspended 17 Loma Linda Los Laureles 1996 1x2.27x74.6, V
2xQx2.27x44.76, V 2xQx2.27x14.9
2, V
Exists, mechanic
None 1 2 2
3 4-5/month 4-6 hours
Centro Lomas tank and others
Of which, 2 units installed in 2017, flowmeter
malfunctioning 18 Los Robles Los Laureles 2011
renewed 2x1.14x26, V 2x0.95x18.5, V
None None 1 2
In a timely manner 15-7/3 days
3 3
Scheduled suspension,
8 hours
Las Hadas, Los Robles
1 failed unit
19 Centro America
Los Laureles 2x5.68x112, V 1xQx55, V
None None 1 24 3 3 times/month
Centro America I
2 failed units
20 Centro America
Los Laureles - Central
1996 2x2.84x55, V 2x2.84x55, V
Exists (broken)
None 2 2
24 3 Some times/year
Central America
Alternating operation,

3-114
N
o
Name of
Pumping Station
System Name
Year of
Installation
Pump Specifications:
No. x Q (m 3/min)
x P (kW), V/H
Flow
meter
Generato
r
No. of Pumps Runnin
g
Operating Time
(Hours/day)
No. of Operator
s
Frequency of Outages
Destination
Remarks
America I East/West obsolete, there is a drop in capacity
21 Hato La Concepción
1992 2x2.0x37.3, V None None 1 8 No 2 times/month
Hato Tank II 1 faulty unit, operated by the tank manager
22 Mogote Los Laureles 1995 4x4.0x199.6, V None None 2 24 3 2-3 times /month 30 min
Mogote Tank 2 failed units
23 Las Uvas La Concepción
2x1.7x67, V None None 2 24 3 3 times/year
Las Uvas Tank Alternate operation
24 Villa Nueva La Concepción
2x3.54x74.6,V 2x4.11x112, V
None None 1 2
7-8 3 2 times/month
Villa Nueva Tank
1 faulty unit, alternating operation
25 Los Pinos La Concepción
1996 2xQx55, V Exists, mechanica
l
None 2 23 Thursday
to Saturday
3 4 times/year
Los Pinos tank and others
Alternate operation, donated by JICA
26 San Francisco Los Laureles 2x3.30x55,H Exists, Aquarum
None 2 24 3 San Francisco Alternate, obsolete operation, Aquarum
suspended
Source: Prepared by the Study Team based on interviews with SANAA Note) Pump specifications: V: vertical pump, H: horizontal pump, S: submersible pump.
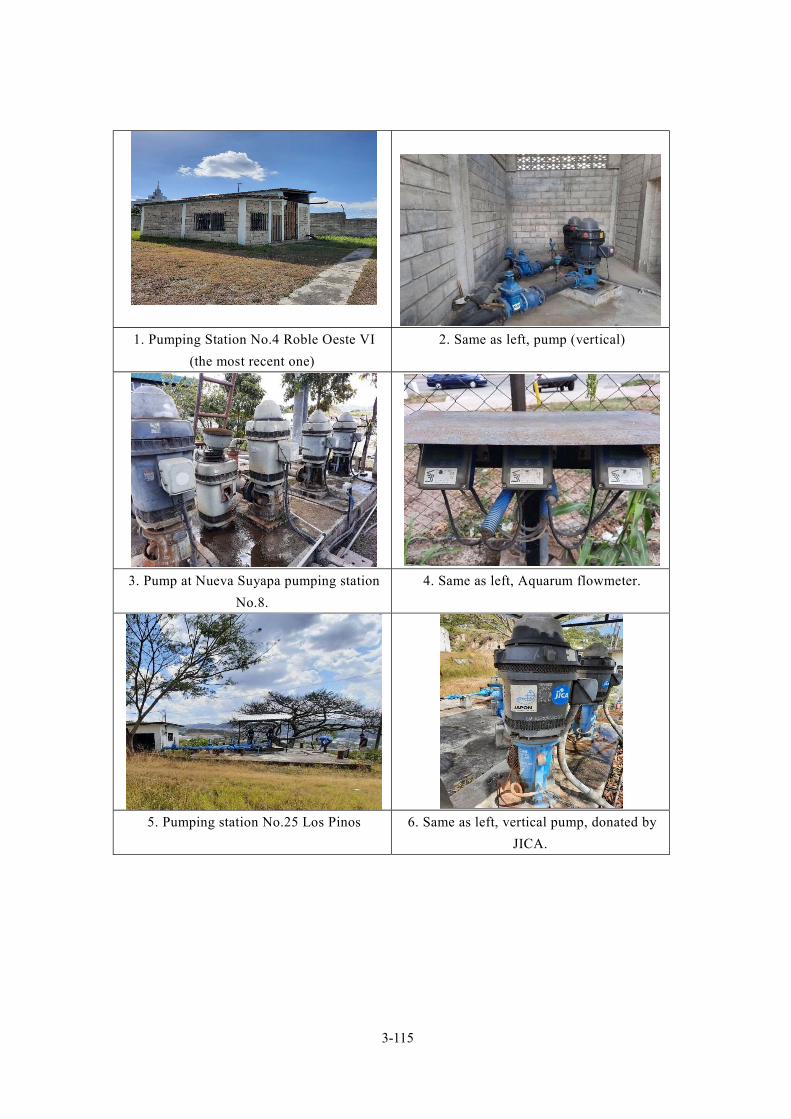
3-115
1. Pumping Station No.4 Roble Oeste VI
(the most recent one)
2. Same as left, pump (vertical)
3. Pump at Nueva Suyapa pumping station
No.8.
4. Same as left, Aquarum flowmeter.
5. Pumping station No.25 Los Pinos 6. Same as left, vertical pump, donated by
JICA.

3-116
7. San Francisco Pumping Station No. 26 8. Same as left, pump (horizontal),
obsolete.
Figure 3-3-49Status of Pumping Stations
Figure 3-3-47 shows the energy consumptions of pumping stations between 2016 and 2019. The
energy consumption of the pumping stations occupies approximately 70 % of the drinking water
system; in other words, the pumping stations occupy most of the energy consumption. This
corresponds to approximately 10% of the operation and maintenance cost of the AMDC.
Table 3-3-47Energy Consumption of Existing Pumping Stations (Kwh) NO Pumping Station 2016 2017 2018 2019 1 Estiquirín 792,360 757,080 661,800 527,640 2 El Sauce - - - - 3 Venecia - - - -
4 Roble Oeste
Etapa* - - - -
5 Francisco Morazán* - - - - 6 19 de Septiembre - - - - 7 Aldea de Suyapa* - - - -
8 Nueva
Suyapa/Suyapita 717,520 792,720 872,640 787,197
9 Altos de Trapiche 41,304 50,015 48,749 45,914 10 Grupo Empresarial* - - - - 11 Canteras 2,976,120 4,362,036 3,929,780 3,877,800 12 Universidad Norte 5,268 5,359 5,534 4,943 13 La Fuente 63,543 75,335 71,878 51,281 14 Olimpo 140,280 142,720 280,920 309,828 15 Cerro Grande Zona 364,640 375,560 437,400 384,960 16 Juan A Laínez 11,944 11,928 11,631 10,373 17 Loma Linda 556,680 503,160 370,320 383,316 18 Los Robles 135,200 128,320 141,080 135,480 19 Centro America 453,200 475,600 518,480 500,840 20 Centro America 451,960 470,560 475,720 420,320 21 Hato 174,065 171,814 158,305 184,360 22 Mogote 753,600 1,799,520 1,124,800 854,640 23 Las Uvas 190,115 204,906 203,855 202,690

3-117
NO Pumping Station 2016 2017 2018 2019 24 Villa Nueva 17,765 4 2 188,552 25 Los Pinos 194,931 204,223 203,358 43,708 26 San Francisco 424,259 437,797 3,929,780 427,556
Total 8,464,754 10,968,657 13,446,032 9,341,398
*This is due to the fact that the AMDC does not have data since it is held by the Water Administration
Boards.
Source: Prepared by the Study Team based on interviews with AMDC.
(3) Energy Diagnosis of Pumping Stations
In order to know the operation situation of existing pumping stations and energy consumption
situation, energy diagnosis was carried out. The diagnostic method is as follows: measure the inlet
voltage/current and discharge flow rate/total head to calculate the actual pump efficiency, compare it
with the standard efficiency of a similar size pump (according to JIS standards) and diagnose the
energy consumption. Diagnostics of the operations were also performed by measuring vibration and
shaft temperatures. The power analyzer was used to measure the input voltage/current, the portable
ultrasonic flowmeter was used to measure the discharge flow rate, and the pressure gauge was used to
measure the discharge pressure.
The energy diagnosis was performed in 10 pumping stations out of a total of 26 existing stations.
Out of a total of 26 pumps, 17 were operating and 9 were out of service or suspended, and metering
was possible on 14 pumps. The pumps that could not be metered had problems that did not allow
installing a pressure gauge or measuring the flow rate.
Figure 3-3-50 shows the diagnostic images and Table 3-3-48 shows the diagnostic results.
For efficiency rating, it was rated as Good if the pump had more than 50%-60% of the standard
efficiency of a similar size pump (according to JISB8313, Centrifugal pump). For vibration assessment,
the standards of JISB0906 (ISO10816-1) were used.
1. Flow measurement 2. Vibration measurement
Figure 3-3-50Energy Diagnosis Images
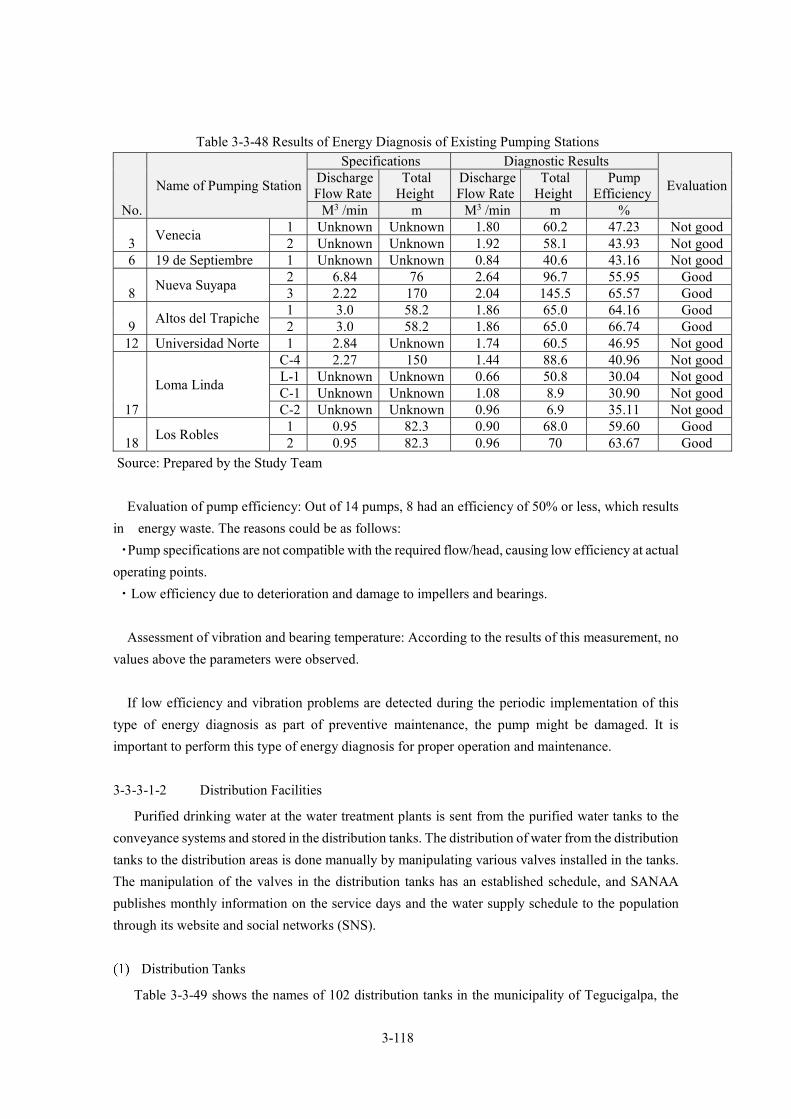
3-118
Table 3-3-48 Results of Energy Diagnosis of Existing Pumping Stations
No.
Name of Pumping Station
Specifications Diagnostic Results
Evaluation Discharge Flow Rate
Total Height
Discharge Flow Rate
Total Height
Pump Efficiency
M3 /min m M3 /min m %
3 Venecia
1 Unknown Unknown 1.80 60.2 47.23 Not good 2 Unknown Unknown 1.92 58.1 43.93 Not good
6 19 de Septiembre 1 Unknown Unknown 0.84 40.6 43.16 Not good
8 Nueva Suyapa
2 6.84 76 2.64 96.7 55.95 Good 3 2.22 170 2.04 145.5 65.57 Good
9 Altos del Trapiche
1 3.0 58.2 1.86 65.0 64.16 Good 2 3.0 58.2 1.86 65.0 66.74 Good
12 Universidad Norte 1 2.84 Unknown 1.74 60.5 46.95 Not good
17
Loma Linda
C-4 2.27 150 1.44 88.6 40.96 Not good L-1 Unknown Unknown 0.66 50.8 30.04 Not good C-1 Unknown Unknown 1.08 8.9 30.90 Not good C-2 Unknown Unknown 0.96 6.9 35.11 Not good
18 Los Robles
1 0.95 82.3 0.90 68.0 59.60 Good 2 0.95 82.3 0.96 70 63.67 Good
Source: Prepared by the Study Team
Evaluation of pump efficiency: Out of 14 pumps, 8 had an efficiency of 50% or less, which results
in energy waste. The reasons could be as follows:
・Pump specifications are not compatible with the required flow/head, causing low efficiency at actual
operating points.
・Low efficiency due to deterioration and damage to impellers and bearings.
Assessment of vibration and bearing temperature: According to the results of this measurement, no
values above the parameters were observed.
If low efficiency and vibration problems are detected during the periodic implementation of this
type of energy diagnosis as part of preventive maintenance, the pump might be damaged. It is
important to perform this type of energy diagnosis for proper operation and maintenance.
3-3-3-1-2 Distribution Facilities
Purified drinking water at the water treatment plants is sent from the purified water tanks to the
conveyance systems and stored in the distribution tanks. The distribution of water from the distribution
tanks to the distribution areas is done manually by manipulating various valves installed in the tanks.
The manipulation of the valves in the distribution tanks has an established schedule, and SANAA
publishes monthly information on the service days and the water supply schedule to the population
through its website and social networks (SNS).
Distribution Tanks
Table 3-3-49 shows the names of 102 distribution tanks in the municipality of Tegucigalpa, the
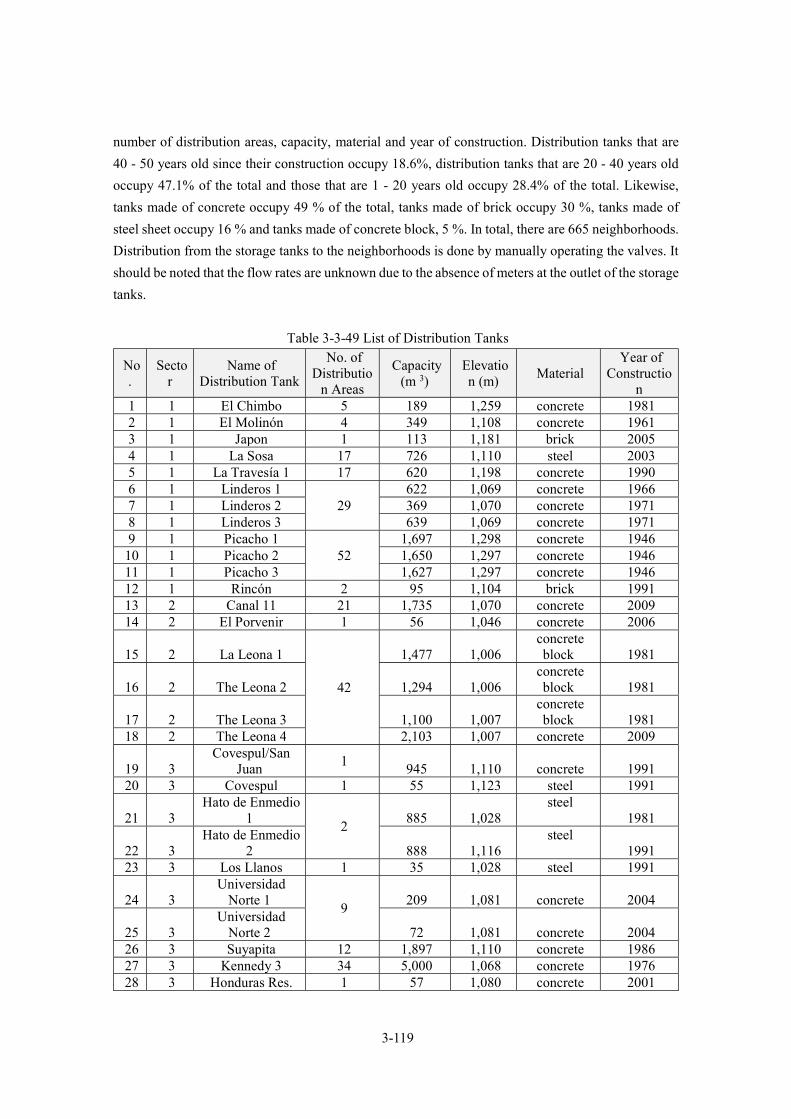
3-119
number of distribution areas, capacity, material and year of construction. Distribution tanks that are
40 - 50 years old since their construction occupy 18.6%, distribution tanks that are 20 - 40 years old
occupy 47.1% of the total and those that are 1 - 20 years old occupy 28.4% of the total. Likewise,
tanks made of concrete occupy 49 % of the total, tanks made of brick occupy 30 %, tanks made of
steel sheet occupy 16 % and tanks made of concrete block, 5 %. In total, there are 665 neighborhoods.
Distribution from the storage tanks to the neighborhoods is done by manually operating the valves. It
should be noted that the flow rates are unknown due to the absence of meters at the outlet of the storage
tanks.
Table 3-3-49 List of Distribution Tanks
No.
Sector
Name of Distribution Tank
No. of Distributio
n Areas
Capacity (m 3)
Elevation (m)
Material Year of
Construction
1 1 El Chimbo 5 189 1,259 concrete 1981 2 1 El Molinón 4 349 1,108 concrete 1961 3 1 Japon 1 113 1,181 brick 2005 4 1 La Sosa 17 726 1,110 steel 2003 5 1 La Travesía 1 17 620 1,198 concrete 1990 6 1 Linderos 1
29 622 1,069 concrete 1966
7 1 Linderos 2 369 1,070 concrete 1971 8 1 Linderos 3 639 1,069 concrete 1971 9 1 Picacho 1
52 1,697 1,298 concrete 1946
10 1 Picacho 2 1,650 1,297 concrete 1946 11 1 Picacho 3 1,627 1,297 concrete 1946 12 1 Rincón 2 95 1,104 brick 1991 13 2 Canal 11 21 1,735 1,070 concrete 2009 14 2 El Porvenir 1 56 1,046 concrete 2006
15 2 La Leona 1
42
1,477 1,006 concrete block 1981
16 2 The Leona 2 1,294 1,006 concrete block 1981
17 2 The Leona 3 1,100 1,007 concrete block 1981
18 2 The Leona 4 2,103 1,007 concrete 2009
19 3 Covespul/San
Juan 1
945 1,110 concrete 1991 20 3 Covespul 1 55 1,123 steel 1991
21 3 Hato de Enmedio
1 2
885 1,028 steel
1981
22 3 Hato de Enmedio
2 888 1,116 steel
1991 23 3 Los Llanos 1 35 1,028 steel 1991
24 3 Universidad
Norte 1 9
209 1,081 concrete 2004
25 3 Universidad
Norte 2 72 1,081 concrete 2004 26 3 Suyapita 12 1,897 1,110 concrete 1986 27 3 Kennedy 3 34 5,000 1,068 concrete 1976 28 3 Honduras Res. 1 57 1,080 concrete 2001

3-120
No.
Sector
Name of Distribution Tank
No. of Distributio
n Areas
Capacity (m 3)
Elevation (m)
Material Year of
Construction
29 3 Honduras Res. 757 1,069 brick 2001 30 3 Lomas 2da Etapa 9 643 1,075 concrete 1996 31 3 Los Pinos 1 151 1,233 brick 1996 32 3 Dorado 2 634 1,101 brick 2001 33 3 Venecia (tank) 2 254 1,107 concrete 2006
34 3 Aldea de Suyapa
(tank) 1
139 1,207 brick 1991
35 3 Nueva Suyapa
(tank) 8
206 1,236 brick 1991
36 3 Altos del
Trapiche (Tank 1) 4
195 1,147 brick 1991 37 3 Villa Nueva 1
1
19 1,055 brick 1996 38 3 Villa Nueva 2 95 1,099 brick 1996 39 3 Villa Nueva 3 95 1,179 brick 1996 40 3 Villa Nueva4 95 1,205 brick 1996 41 3 Villa Nueva 5 113 1,219 brick 1996 42 3 Villa Nueva 6 113 1,118 brick 1996
43 3 Altos de Los Pinos Tank
1 189 1,220 brick 1996
44 3 Centro Lomas
Nuevo 4 840 1,034 brick 2009 45 3 Centro Lomas 860 1,034 concrete 1991 46 3 Juan A. Laínez 1
21 1,167 1,045 concrete 1961
47 3 Juan A. Laínez 2 604 1,045 concrete 1961
48 3 Los Filtros 1 45
161 1,007 concrete block 1966
49 3 Los Filtros 2 3,497 1,003 concrete 1981
50 3 Los Filtros
Nuevo 56 1,019 concrete 2009 51 3 Miraflores 1
11 735 1,026 concrete 1981
52 3 Miraflores 2 319 1,031 concrete 1981 53 3 Miraflores New 1,061 1,030 concrete 2004 54 4 Loarque 1
12 157 1,053 concrete 1981
55 4 Loarque 2 2,591 1,057 concrete 1976 56 4 Monterrey 2 329 1,024 concrete 1991 57 4 La Cascada 1 339 1,070 concrete 1996 58 4 Concepcion
6 2,520 1,099 concrete 1994
59 4 Concepción New 3,558 1,103 concrete 2004 60 4 14 de Marzo
10 820 1,042 concrete 2004
61 4 14 de Marzo
New 2,626 1,042 concrete 2004 62 4 Calpules 1 Alto
1 95 1,047 steel 1991
63 4 Calpules 2 Bajo 261 1,042 steel 1991
64 4 Lomas Toncontín
1 8
435 1,078 brick 1991 65 4 Palma Real 1 191 1,055 steel 1986 66 4 Las Uvas 1 6 546 1,130 brick 1991 67 4 * Yaguacire 1 141 1,112 brick 1996 68 4 Mesitas 3 596 1,064 brick 2001

3-121
No.
Sector
Name of Distribution Tank
No. of Distributio
n Areas
Capacity (m 3)
Elevation (m)
Material Year of
Construction
69 4
Grupo Empresarial
(tank) 1
189 1,097 concrete 2011
70 4 Altos de Loarque
(tank) 2
37 1,051 brick 2001
71 4 San José de
Loarque 1
32 1,051 brick 2001
72 4 Res. Concepcion
1 2
189 1,128 brick 2006 73 4 Villas del Real 1 454 1,130 brick 2001 74 4 Las Hadas 1 12 416 1,085 steel 2001 75 4 Los Robles 8 594 1,056 concrete 1981
76 4 Roble Oeste VI
Etapa (tank) 1
30 1,093 concrete 2013
77 4 Estiquirin 1 88
969 1,044 concrete block 1986
78 4 Estiquirin 2 3,254 1,045 concrete 2004 79 4 Estiquirín New 3,883 1,044 concrete 2004 80 4 La Fuente 5 539 1,049 steel 1981 81 4 Los Laureles 1 1 3,593 1,022 concrete 1976 82 4 San Francisco 6 715 1,100 concrete 2004 83 4 Mogote 1
19 744 1,254 concrete 1991
84 4 Mogote 2 733 1,250 steel 1991 85 4 El Sauce (tank) 1 1,118 concrete 2015
86 4 Francisco
Morazán (tank) 1
421 1,045 brick 2006
87 4 19 de Septiembre
(tank) 1
43 -
concrete 2001
88 4 Altos de los
Laureles 4
113 1,035 concrete 2018 89 4 San Isidro 1 19 1,030 brick 2001 90 4 Santa Cruz (tank) 1 189 1,159 concrete 2016 91 5 Cerro Grande 1 11 2,124 1,215 brick 1991 92 5 Olimpo I 29 1,767 1,103 steel 2004 93 5 Olimpo 2 Old
21
851 1,121 steel 1991 94 5 Olimpo 2 (Old 2) 851 1,024 steel 1991
95 5 Olimpo 2 (New
1) 846 1,120 steel
2004
96 5 Olimpo 2 (New
2) 846 1,120 steel
2004 97 5 Canteras 10 250 991 concrete 1991 98 5 PRRAC-ASAN 1 360 1,097 concrete 2005
99 5 Centro America
Este 9
1,100 1,105 brick 1991 100 5
Centro America Oeste 1,342 1,127 brick 1991
101 6 El Hatillo
14 779 1,432 brick 1971
102 6 Miralago
1 189 1,421 concrete 2011

3-122
The administration of the operations is not the responsibility of SANAA but of the Water
Administration Boards (Juntas Administradoras de Agua).
Source: Prepared by the Study Team based on SANAA data.
Distribution Piping Network
For the distribution pipe network, mostly PVC, steel and asbestos (AC) pipes are used. The pipe
type, diameter and total length has been recorded in the "Project for the Optimization of the Supply
Services of Tegucigalpa and Renovation of the Distribution Networks of Colonias 15 de Septiembre
and 21 de Octubre of Tegucigalpa" with the assistance of Spain through the AQUARUM program in
2011. Table 3-3-50 shows the total length by pipe type. Of the total, 68 % are PVC pipes, 15 % are
galvanized steel pipes (SGPW) and 14 % are DIP. By diameter, 50 % are 50 mm diameter, 14 % are
100 mm diameter and 13 % are 80 mm diameter.
As of 2011, SANAA has not updated pipeline length data, so the current situation is unknown.
The results of interviews with SANAA are based on 2011 data, and it is currently estimated that the
total pipeline length will be about 2,000 km.
Table 3-3-50Total Length of Pipelines
Diameter (mm)
Total Length of Pipelines (Km)
Steel pipe
AC DIP HG PVC Unknown
Total Length
Percentage ( %)
15 0.20 0.20 0.02 % 20 0.38 0.321 0.70 0.05 % 25 2.45 2.613 5.06 0.37 % 40 4.25 14.85 19.10 1.40 % 50 7.53 0.74 90.01 592.82 0.402 691.51 50.52 % 65 0.01 0.18 0.19 0.01 % 80 3.74 0.45 28.60 145.24 178.03 13.01 % 90 0.11 0.11 0.01 % 100 0.004 3.17 12.73 75.04 95.16 0.014 186.12 13.60 % 150 2.82 39.71 9.22 70.27 122.02 8.91 % 200 0.002 3.17 67.38 1.40 17.42 89.37 6.53 % 250 1.362 38.75 1.21 0.55 41.88 3.06 % 300 16.37 0.54 16.92 1.24 % 350 0.536 5.64 6.18 0.45 % 400 8.11 8.11 0.59 % 450 1.71 1.72 0.13 % 500 1.10 1.11 0.08 % 600 0.47 0.48 0.03 %
Total length
0.021 22.324 193.311 212.574 940.171 0.416 1,368.817
Percentage
0.00 %
1.63 %
14.12 %
15.53 %
68.68 %
0.03 %
Source: Prepared by the Study Team based on SANAA data.
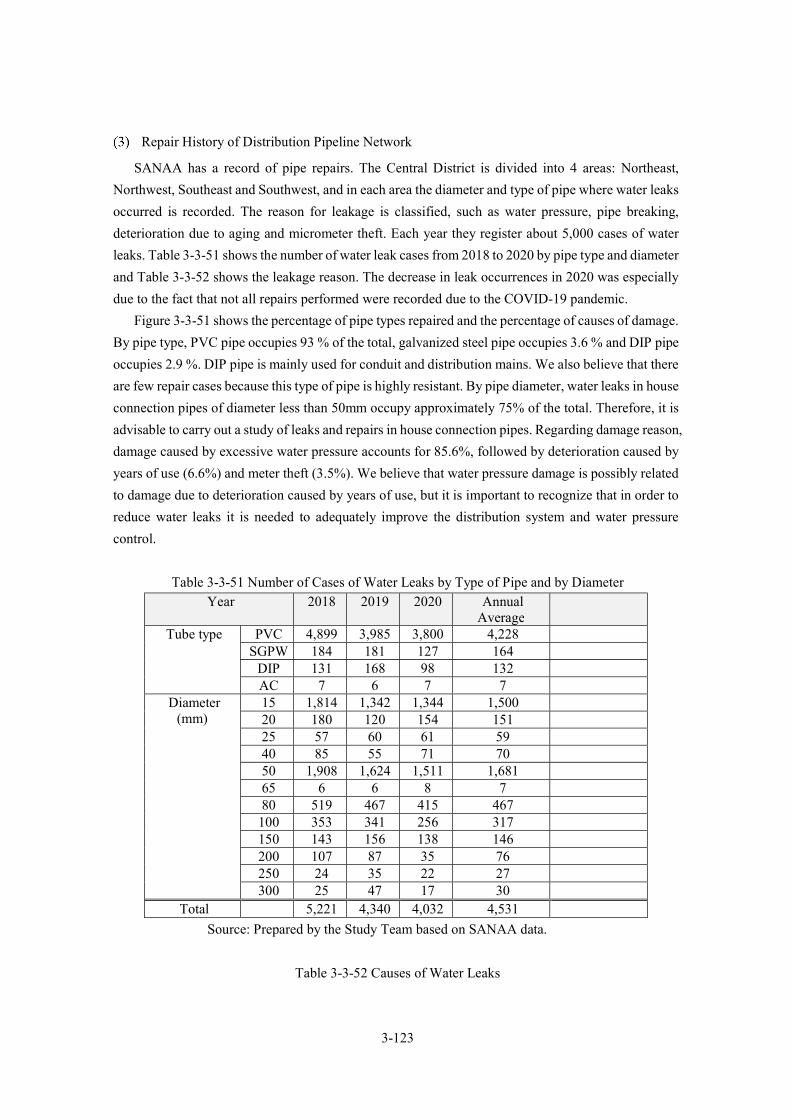
3-123
Repair History of Distribution Pipeline Network
SANAA has a record of pipe repairs. The Central District is divided into 4 areas: Northeast,
Northwest, Southeast and Southwest, and in each area the diameter and type of pipe where water leaks
occurred is recorded. The reason for leakage is classified, such as water pressure, pipe breaking,
deterioration due to aging and micrometer theft. Each year they register about 5,000 cases of water
leaks. Table 3-3-51 shows the number of water leak cases from 2018 to 2020 by pipe type and diameter
and Table 3-3-52 shows the leakage reason. The decrease in leak occurrences in 2020 was especially
due to the fact that not all repairs performed were recorded due to the COVID-19 pandemic.
Figure 3-3-51 shows the percentage of pipe types repaired and the percentage of causes of damage.
By pipe type, PVC pipe occupies 93 % of the total, galvanized steel pipe occupies 3.6 % and DIP pipe
occupies 2.9 %. DIP pipe is mainly used for conduit and distribution mains. We also believe that there
are few repair cases because this type of pipe is highly resistant. By pipe diameter, water leaks in house
connection pipes of diameter less than 50mm occupy approximately 75% of the total. Therefore, it is
advisable to carry out a study of leaks and repairs in house connection pipes. Regarding damage reason,
damage caused by excessive water pressure accounts for 85.6%, followed by deterioration caused by
years of use (6.6%) and meter theft (3.5%). We believe that water pressure damage is possibly related
to damage due to deterioration caused by years of use, but it is important to recognize that in order to
reduce water leaks it is needed to adequately improve the distribution system and water pressure
control.
Table 3-3-51 Number of Cases of Water Leaks by Type of Pipe and by Diameter Year 2018 2019 2020 Annual
Average
Tube type PVC 4,899 3,985 3,800 4,228 SGPW 184 181 127 164
DIP 131 168 98 132 AC 7 6 7 7
Diameter (mm)
15 1,814 1,342 1,344 1,500 20 180 120 154 151 25 57 60 61 59 40 85 55 71 70 50 1,908 1,624 1,511 1,681 65 6 6 8 7 80 519 467 415 467
100 353 341 256 317 150 143 156 138 146 200 107 87 35 76 250 24 35 22 27 300 25 47 17 30
Total 5,221 4,340 4,032 4,531
Source: Prepared by the Study Team based on SANAA data.
Table 3-3-52 Causes of Water Leaks

3-124
Year Water
Pressure Pipe
Rupture Deterioration Due to Years
of Use Others
Meter Theft
2018 4,355 35 305 248 278 2019 3,726 28 358 168 60 2020 3,522 5 229 137 139
Annual Average 3,868 23 297 184 159
Source: Prepared by the Study Team based on SANAA data.
Source: Prepared by the Study Team based on SANAA data.
Figure 3-3-51Percentage of Pipeline Types Repaired and Percentage of Damage Causes
Case of rupture in the pipeline due to water
pressure
Pipe damaged by break in pipeline
Water Distribution Situation
b) Water Distribution Through the Distribution Pipeline Network
The distribution areas in the municipality are divided into six large sectors. Figure 3-3-52 shows
the distribution area sectors. Table 3-3-53 shows the distribution schedule to the distribution areas
from the distribution tanks. Currently in 2021, SANAA, which manages the operations of the potable
water facilities, publishes the distribution schedule information through its website at a frequency of
once every two weeks to ensure the population is aware of the water supply schedule.
At present, in the municipality of Tegucigalpa, the supply volume is lower in relation to the water
demand, regardless of the season, whether it is rainy or dry season, and the supply is carried out in a
PVC, 93.3%
SGPW, 3.6%
DIP, 2.9% AC, 0.1%
Porcentaje de tipos de tuber as reparadas
Presi n de
agua,85.4%
Fallas de
instalaci n,0
.5%
Deterioro por
a os de uso, 6.6%
Otros, 4.1% Robo de medidor,
3.5%
Porcentaje de causas de los da os

3-125
programmed manner. From April to June, when the dry season is ending, the lowest volume of water
production is reported. Particularly in 2020, due to the drop in catchment volume, water was
distributed once every 9 - 10 days, making the situation very difficult to the population.
Source: Prepared by the Study Team based on SANAA data.
Figure 3-3-52 Map Locations of 6 Range Sectors
Table 3-3-53 Water Distribution from Distribution Tanks to Distribution Areas (Year 2020)
Sector Season
January to March, July to
December
April to June
S1 Picacho Once every 4 days (9 - 14 hours) Once every 10 days (12 - 18 hours)
S2 Leona Once every 2 days (10 - 16 hours) Once every 9 days (12 - 18 hours)
S3 Kennedy Once every 2 days (8 - 15 hours) Once every 9 days (12 - 18 hours)
S4 Estiquirín Once every 2 - 3 days (8 - 15
hours)
Once every 9 days (12 - 18 hours)
S5 Olympus Once every 3 - 4 days (8 - 12
hours)
Once every 9 days (12 - 18 hours)
S6 Hatillo Once every 6 days (9 hours) Once every 4 days (9 - 12 hours)
Source: Prepared by the Study Team based on SANAA data.
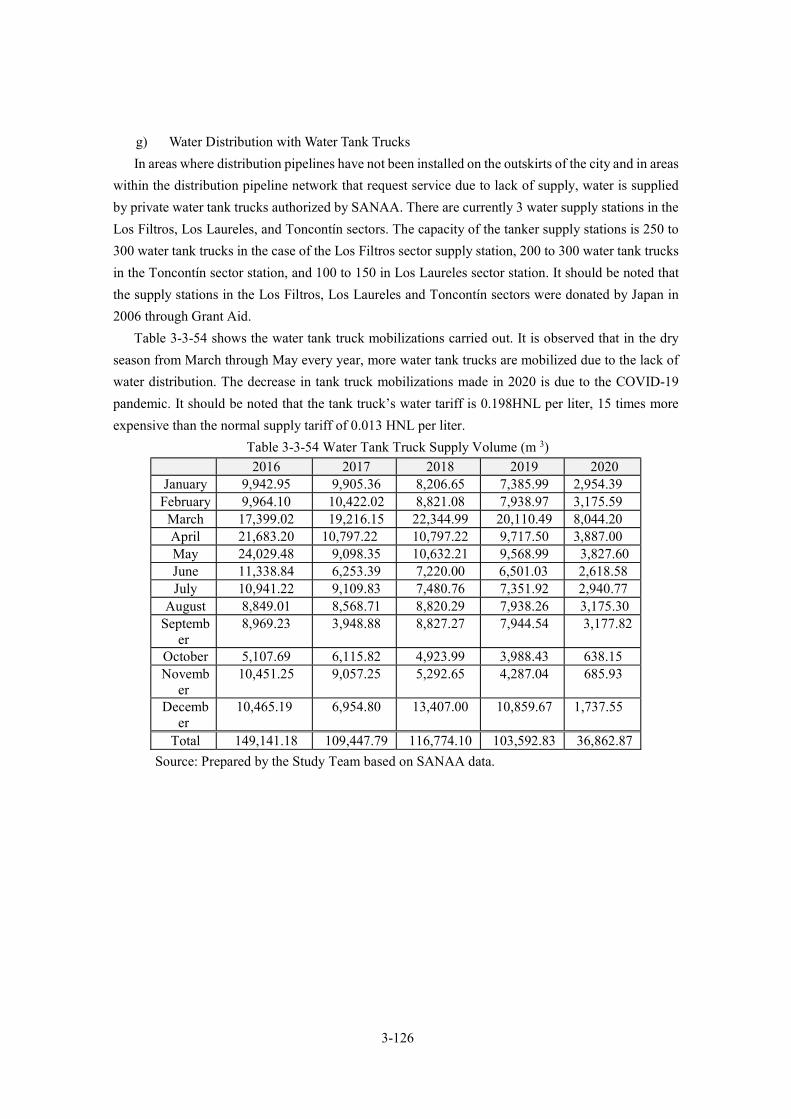
3-126
g) Water Distribution with Water Tank Trucks
In areas where distribution pipelines have not been installed on the outskirts of the city and in areas
within the distribution pipeline network that request service due to lack of supply, water is supplied
by private water tank trucks authorized by SANAA. There are currently 3 water supply stations in the
Los Filtros, Los Laureles, and Toncontín sectors. The capacity of the tanker supply stations is 250 to
300 water tank trucks in the case of the Los Filtros sector supply station, 200 to 300 water tank trucks
in the Toncontín sector station, and 100 to 150 in Los Laureles sector station. It should be noted that
the supply stations in the Los Filtros, Los Laureles and Toncontín sectors were donated by Japan in
2006 through Grant Aid.
Table 3-3-54 shows the water tank truck mobilizations carried out. It is observed that in the dry
season from March through May every year, more water tank trucks are mobilized due to the lack of
water distribution. The decrease in tank truck mobilizations made in 2020 is due to the COVID-19
pandemic. It should be noted that the tank truck’s water tariff is 0.198HNL per liter, 15 times more
expensive than the normal supply tariff of 0.013 HNL per liter.
Table 3-3-54 Water Tank Truck Supply Volume (m 3)
2016 2017 2018 2019 2020 January 9,942.95 9,905.36 8,206.65 7,385.99 2,954.39
February 9,964.10 10,422.02 8,821.08 7,938.97 3,175.59 March 17,399.02 19,216.15 22,344.99 20,110.49 8,044.20 April 21,683.20 10,797.22 10,797.22 9,717.50 3,887.00 May 24,029.48 9,098.35 10,632.21 9,568.99 3,827.60 June 11,338.84 6,253.39 7,220.00 6,501.03 2,618.58 July 10,941.22 9,109.83 7,480.76 7,351.92 2,940.77
August 8,849.01 8,568.71 8,820.29 7,938.26 3,175.30 Septemb
er 8,969.23 3,948.88 8,827.27 7,944.54 3,177.82
October 5,107.69 6,115.82 4,923.99 3,988.43 638.15 Novemb
er 10,451.25 9,057.25 5,292.65 4,287.04 685.93
December
10,465.19 6,954.80 13,407.00 10,859.67 1,737.55
Total 149,141.18 109,447.79 116,774.10 103,592.83 36,862.87
Source: Prepared by the Study Team based on SANAA data.

3-127
Source: Prepared by the Study Team based on SANAA data.
Figure 3-3-53Volume of Supply by Water Tank Truck (m 3)
Water Quality Monitoring
SANAA periodically performs water quality inspections in the distribution pipeline network and
in water tank trucks. Basically, every week it monitors 5 - 10 different distribution tanks. Table 3-3-
55 shows the number of monitoring performed in 2019 and 2020. From March to May 2020,
monitoring was temporarily suspended due to the COVID-19 pandemic. Throughout the year, water
quality monitoring is conducted at 60 - 70 locations.
Water quality parameters are turbidity levels, color, pH, residual chlorine, temperature, electrical
conductivity, alkalinity, and fecal coliform group. Water quality reference values are generally
maintained, although sometimes the turbidity level in distribution tanks exceeds 100 NTU temporarily
due to water leaks in the pipes. In addition, in many distribution tanks, residual chlorine is not detected
inside the distribution tank due to restricted drinking water service hours.
Table 3-3-55 Water Quality Monitoring Performed
Month Piping Network Tanker Truck 2020 2019 2020 2019
January 1 7 4 3 February 9 6 4 4
March 0 13 0 5 April 0 5 8 3 May 0 5 8 3 June 3 5 9 2 July 1 5 0 3
August 2 4 4 1 September 19 9 4 10
October 17 3 4 7 November 18 3 6 0 December 4 0 8 0
Total 74 65 59 41
Source: SANAA data edited by the Study Team.
-
5,000.00
10,000.00
15,000.00
20,000.00
25,000.00
30,000.00
1月 2月 3月 4月 5月 6月 7月 8月 9月 10月 11月 12月
給水
車に
よる
給水
量(m
3)
2016
2017
2018
2019
2020
Can
tidad
de
agu
a s
um
inis
trad
a po
r el
ca
mió
n c
iste
rna(
m3)
ENE FEB MAR ABR MAYO JUN JUL AGO SEP OCT NOV DIC
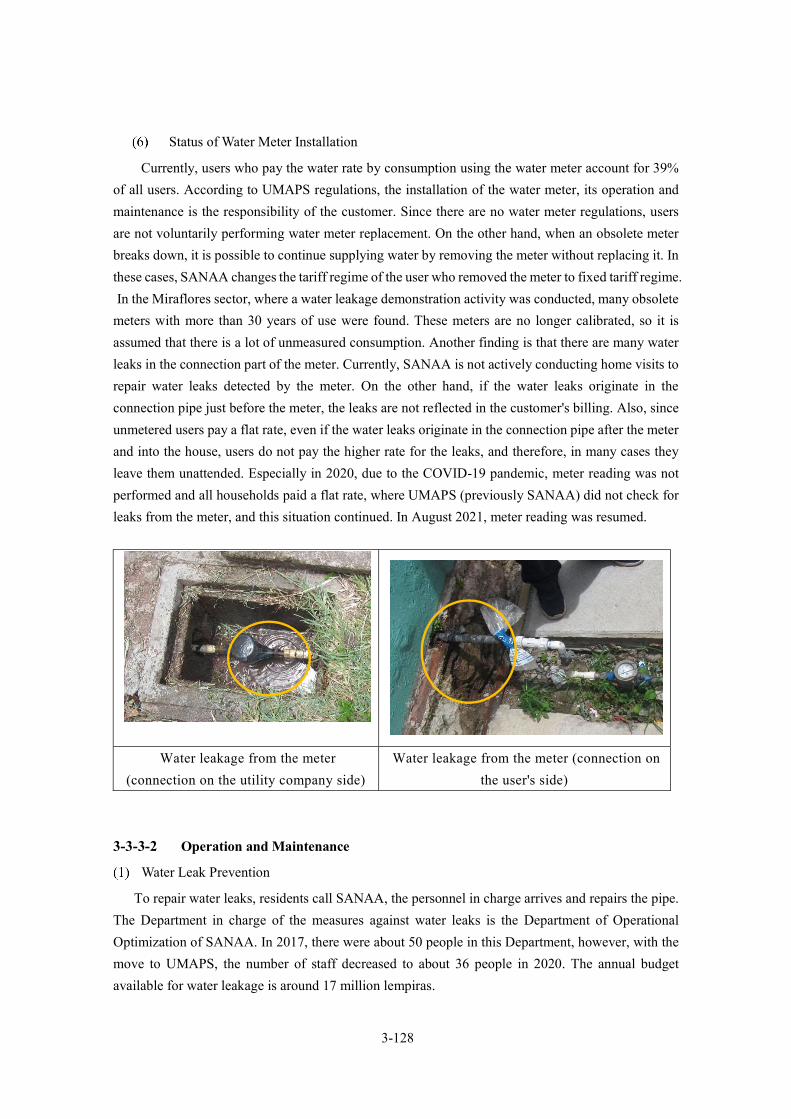
3-128
Status of Water Meter Installation
Currently, users who pay the water rate by consumption using the water meter account for 39%
of all users. According to UMAPS regulations, the installation of the water meter, its operation and
maintenance is the responsibility of the customer. Since there are no water meter regulations, users
are not voluntarily performing water meter replacement. On the other hand, when an obsolete meter
breaks down, it is possible to continue supplying water by removing the meter without replacing it. In
these cases, SANAA changes the tariff regime of the user who removed the meter to fixed tariff regime.
In the Miraflores sector, where a water leakage demonstration activity was conducted, many obsolete
meters with more than 30 years of use were found. These meters are no longer calibrated, so it is
assumed that there is a lot of unmeasured consumption. Another finding is that there are many water
leaks in the connection part of the meter. Currently, SANAA is not actively conducting home visits to
repair water leaks detected by the meter. On the other hand, if the water leaks originate in the
connection pipe just before the meter, the leaks are not reflected in the customer's billing. Also, since
unmetered users pay a flat rate, even if the water leaks originate in the connection pipe after the meter
and into the house, users do not pay the higher rate for the leaks, and therefore, in many cases they
leave them unattended. Especially in 2020, due to the COVID-19 pandemic, meter reading was not
performed and all households paid a flat rate, where UMAPS (previously SANAA) did not check for
leaks from the meter, and this situation continued. In August 2021, meter reading was resumed.
Water leakage from the meter
(connection on the utility company side)
Water leakage from the meter (connection on
the user's side)
3-3-3-2 Operation and Maintenance
Water Leak Prevention
To repair water leaks, residents call SANAA, the personnel in charge arrives and repairs the pipe.
The Department in charge of the measures against water leaks is the Department of Operational
Optimization of SANAA. In 2017, there were about 50 people in this Department, however, with the
move to UMAPS, the number of staff decreased to about 36 people in 2020. The annual budget
available for water leakage is around 17 million lempiras.

3-129
For water leak detection, SANAA has acoustic rods and equipment donated by the Spanish
Government in 2014, including 2 correlators for water leak location, acoustic leak detectors, 2 metal
pipe detectors and plastic pipe detectors. Although they have sufficient knowledge about the handling
methods of each equipment, there is no efficient water leak detection system. It should be noted that
the ultrasonic flowmeters do not have a working battery, and so measurements cannot be performed
if it is not connected to the power outlet.
Acoustic leak detector (German) Correlator for locating water leaks (German)
Buried pipe detector (German) Ultrasonic flowmeter
As prevention measures against water leakage, it is necessary to implement basic measures such as
distribution volume and water leakage volume analysis, corrective measures such as detection and
repair of exposed and buried water leaks, and preventive measures including improvement of
distribution and service pipes. The following table shows the implementation status of these measures.
Table 3-3-56 Status of Implementation of Water Leakage Prevention Measures Measures Implementation Status
Basic measurements (distribution volume analysis)
The water leakage volume is analyzed based on billing. Macrometers are not installed in the distribution tanks, and the micro-meter coverage rate for users is around 30%, resulting in an inaccurate analysis of distribution volume.
Corrective actions (detection of water leaks)
Repairs are made after receiving notice of water leaks, i.e., there is no water leak detection system. It takes an average of
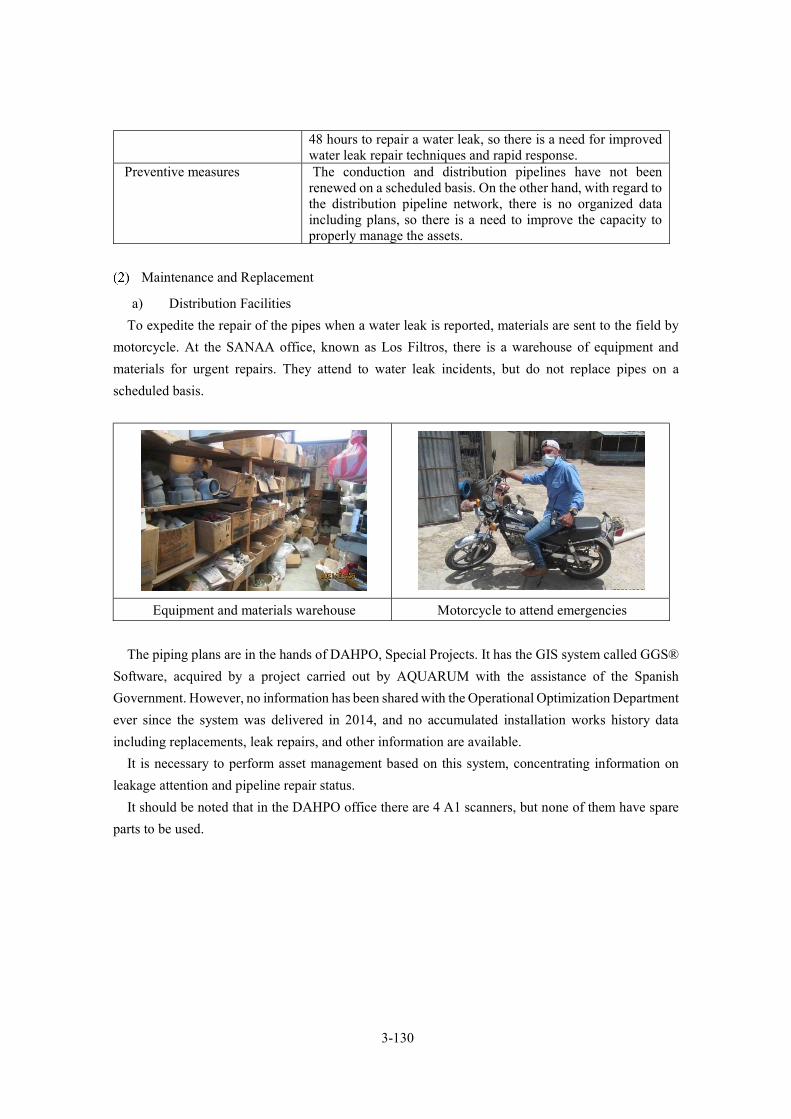
3-130
48 hours to repair a water leak, so there is a need for improved water leak repair techniques and rapid response.
Preventive measures The conduction and distribution pipelines have not been renewed on a scheduled basis. On the other hand, with regard to the distribution pipeline network, there is no organized data including plans, so there is a need to improve the capacity to properly manage the assets.
Maintenance and Replacement
a) Distribution Facilities
To expedite the repair of the pipes when a water leak is reported, materials are sent to the field by
motorcycle. At the SANAA office, known as Los Filtros, there is a warehouse of equipment and
materials for urgent repairs. They attend to water leak incidents, but do not replace pipes on a
scheduled basis.
Equipment and materials warehouse Motorcycle to attend emergencies
The piping plans are in the hands of DAHPO, Special Projects. It has the GIS system called GGS®
Software, acquired by a project carried out by AQUARUM with the assistance of the Spanish
Government. However, no information has been shared with the Operational Optimization Department
ever since the system was delivered in 2014, and no accumulated installation works history data
including replacements, leak repairs, and other information are available.
It is necessary to perform asset management based on this system, concentrating information on
leakage attention and pipeline repair status.
It should be noted that in the DAHPO office there are 4 A1 scanners, but none of them have spare
parts to be used.
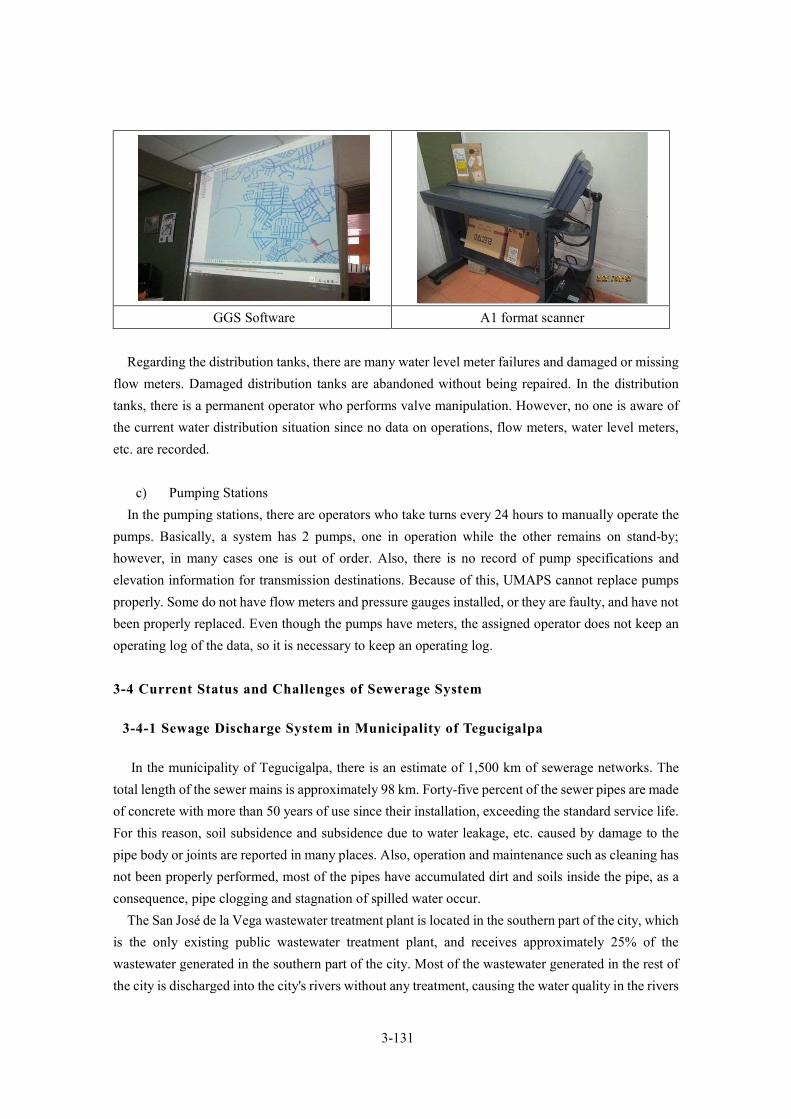
3-131
GGS Software A1 format scanner
Regarding the distribution tanks, there are many water level meter failures and damaged or missing
flow meters. Damaged distribution tanks are abandoned without being repaired. In the distribution
tanks, there is a permanent operator who performs valve manipulation. However, no one is aware of
the current water distribution situation since no data on operations, flow meters, water level meters,
etc. are recorded.
c) Pumping Stations
In the pumping stations, there are operators who take turns every 24 hours to manually operate the
pumps. Basically, a system has 2 pumps, one in operation while the other remains on stand-by;
however, in many cases one is out of order. Also, there is no record of pump specifications and
elevation information for transmission destinations. Because of this, UMAPS cannot replace pumps
properly. Some do not have flow meters and pressure gauges installed, or they are faulty, and have not
been properly replaced. Even though the pumps have meters, the assigned operator does not keep an
operating log of the data, so it is necessary to keep an operating log.
3-4 Current Status and Challenges of Sewerage System
3-4-1 Sewage Discharge System in Municipality of Tegucigalpa
In the municipality of Tegucigalpa, there is an estimate of 1,500 km of sewerage networks. The
total length of the sewer mains is approximately 98 km. Forty-five percent of the sewer pipes are made
of concrete with more than 50 years of use since their installation, exceeding the standard service life.
For this reason, soil subsidence and subsidence due to water leakage, etc. caused by damage to the
pipe body or joints are reported in many places. Also, operation and maintenance such as cleaning has
not been properly performed, most of the pipes have accumulated dirt and soils inside the pipe, as a
consequence, pipe clogging and stagnation of spilled water occur.
The San José de la Vega wastewater treatment plant is located in the southern part of the city, which
is the only existing public wastewater treatment plant, and receives approximately 25% of the
wastewater generated in the southern part of the city. Most of the wastewater generated in the rest of
the city is discharged into the city's rivers without any treatment, causing the water quality in the rivers
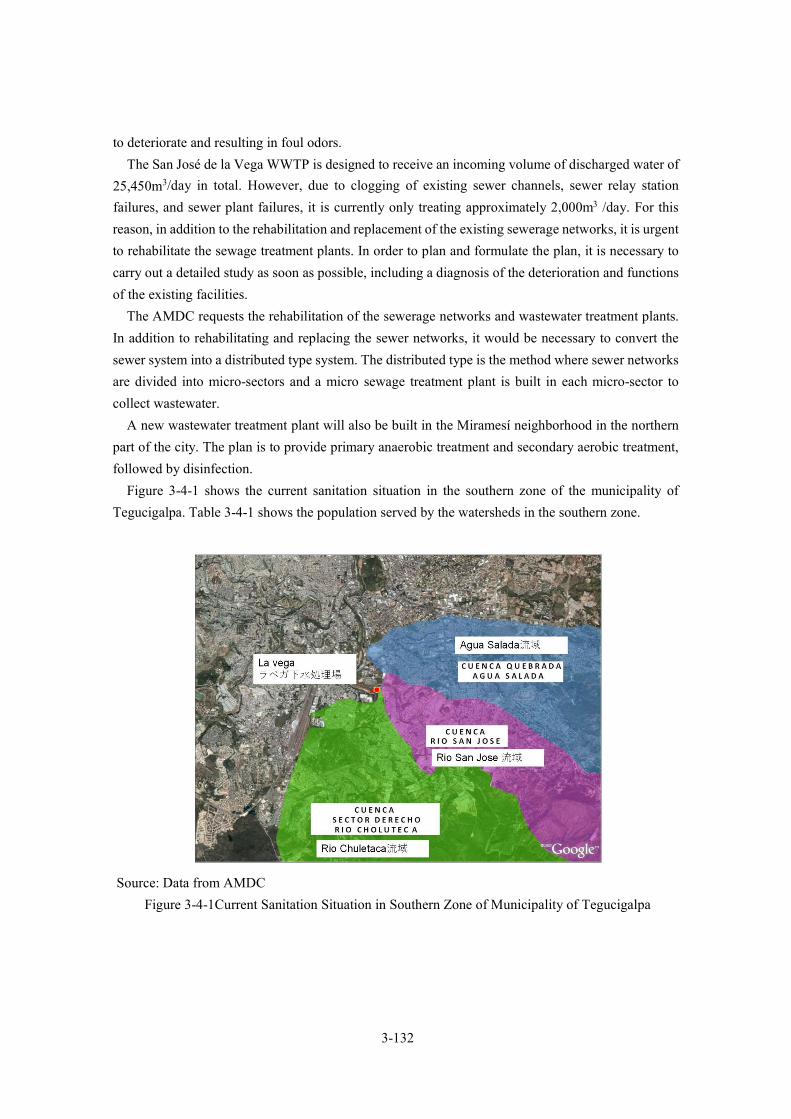
3-132
to deteriorate and resulting in foul odors.
The San José de la Vega WWTP is designed to receive an incoming volume of discharged water of
25,450m3/day in total. However, due to clogging of existing sewer channels, sewer relay station
failures, and sewer plant failures, it is currently only treating approximately 2,000m3 /day. For this
reason, in addition to the rehabilitation and replacement of the existing sewerage networks, it is urgent
to rehabilitate the sewage treatment plants. In order to plan and formulate the plan, it is necessary to
carry out a detailed study as soon as possible, including a diagnosis of the deterioration and functions
of the existing facilities.
The AMDC requests the rehabilitation of the sewerage networks and wastewater treatment plants.
In addition to rehabilitating and replacing the sewer networks, it would be necessary to convert the
sewer system into a distributed type system. The distributed type is the method where sewer networks
are divided into micro-sectors and a micro sewage treatment plant is built in each micro-sector to
collect wastewater.
A new wastewater treatment plant will also be built in the Miramesí neighborhood in the northern
part of the city. The plan is to provide primary anaerobic treatment and secondary aerobic treatment,
followed by disinfection.
Figure 3-4-1 shows the current sanitation situation in the southern zone of the municipality of
Tegucigalpa. Table 3-4-1 shows the population served by the watersheds in the southern zone.
Source: Data from AMDC
Figure 3-4-1Current Sanitation Situation in Southern Zone of Municipality of Tegucigalpa
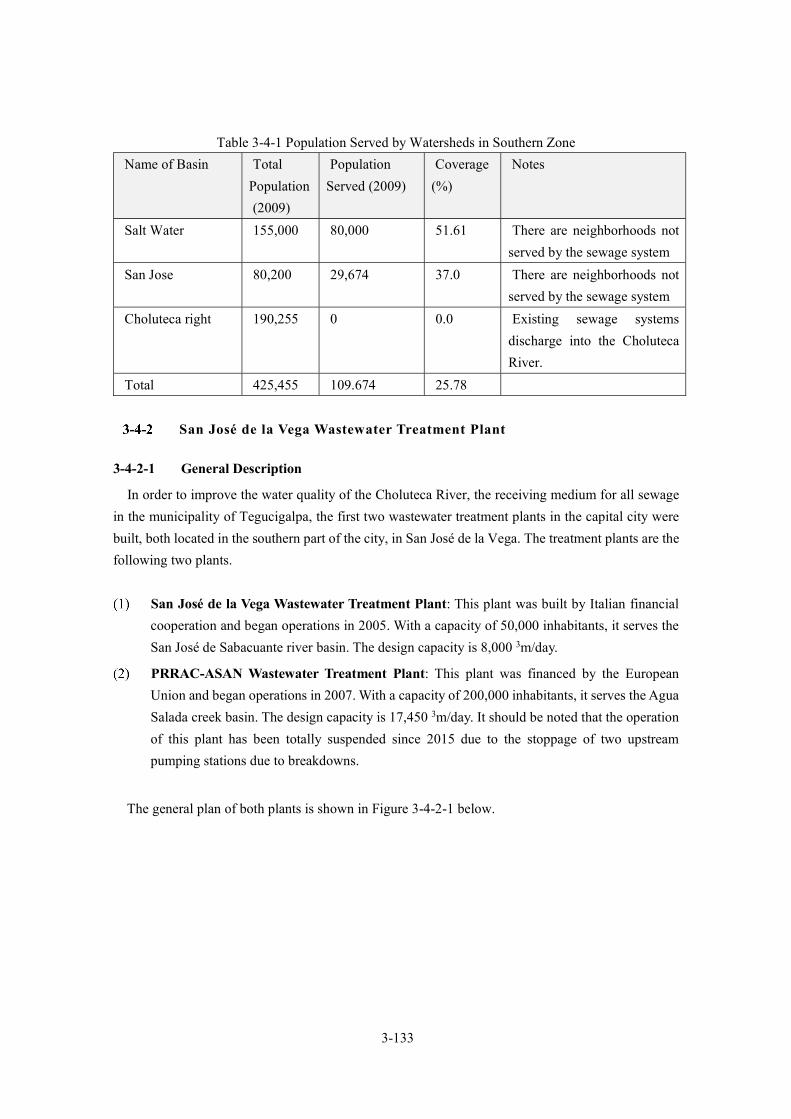
3-133
Table 3-4-1 Population Served by Watersheds in Southern Zone
Name of Basin Total
Population
(2009)
Population
Served (2009)
Coverage
(%)
Notes
Salt Water 155,000 80,000 51.61 There are neighborhoods not
served by the sewage system
San Jose 80,200 29,674 37.0 There are neighborhoods not
served by the sewage system
Choluteca right 190,255 0 0.0 Existing sewage systems
discharge into the Choluteca
River.
Total 425,455 109.674 25.78
San José de la Vega Wastewater Treatment Plant
3-4-2-1 General Description
In order to improve the water quality of the Choluteca River, the receiving medium for all sewage
in the municipality of Tegucigalpa, the first two wastewater treatment plants in the capital city were
built, both located in the southern part of the city, in San José de la Vega. The treatment plants are the
following two plants.
San José de la Vega Wastewater Treatment Plant: This plant was built by Italian financial
cooperation and began operations in 2005. With a capacity of 50,000 inhabitants, it serves the
San José de Sabacuante river basin. The design capacity is 8,000 3m/day.
PRRAC-ASAN Wastewater Treatment Plant: This plant was financed by the European
Union and began operations in 2007. With a capacity of 200,000 inhabitants, it serves the Agua
Salada creek basin. The design capacity is 17,450 3m/day. It should be noted that the operation
of this plant has been totally suspended since 2015 due to the stoppage of two upstream
pumping stations due to breakdowns.
The general plan of both plants is shown in Figure 3-4-2-1 below.

3-134
Source: Data from AMDC
Figure 3-4-2General Plan of San José de la Vega (Upper part) and PRRAC ASAN (Lower part)
Plants
3-4-2-2 San José de la Vega Wastewater Treatment Plant
(1) General Description
The process of this plant is the conventional activated sludge system. The treatment process is Pre-
treatment (Grit chamber and screen) + Primary sedimentation tank + Aeration tank + Final
sedimentation tank + Chlorination. The sludge treatment process is Aerobic digester + Filter press
dewatering. Figure 3-4-3 shows the flow diagram, Figure 3-4-4 shows the general plan, Table 3-4-2
shows the main components and Figure 3-4-5 shows the current status of the facilities.
Source: Data from AMDC
Figure 3-4-3San José de la Vega Plant Flow Diagram

3-135
Source: Data from AMDC
Figure 3-4-4 General Plan of San José de la Vega Plant
Table 3-4-2 San José de la Vega Plant Major Facilities
No. Facility Specifications Main Equipment Remarks
Design capacity
Average daily volume: 8,000 m 3/day
Design water quality
Influent mg/L
Effluent mg/L
Removal rate
COD 917 <100 >90
BOD 561 <50 >92
TKN 82 <30 >60
T-P 25 <5 >80
1 Inlet pumping station
Qmax: 200L/s, Qm: 100L/s ・Submersible pump x 3units
2 Pre-treatment ・Rectangular grit chamber made of RC (Reinforced Concrete), 1 tank.
・Mechanical screen x 1unit.・Sand removal x 1 unit.・Sand washer x 1 unit.・Deodorizer x 1 set
3 Primary sedimentation tank
・Circular sedimentation tank madeof RC.・Depth 20m, Height 3.5m, 1 tank
・Central drive sludgecollector x 1 unit.・Sludge pump
4 Aeration tank ・Rectangular tank made of RC・Length 40m, Width 15 m, Height
5 m, Volume 3,000 m 3
・MLSS: 3,500 mg/L
・Membrane air diffuser・Aeration blower

3-136
No. Facility Specifications Main Equipment Remarks 5 Final
sedimentation tank
・Circular sedimentation tank madeof RC.・Depth 25 m, Height 4.0 m, 2 tanks
・Central drive sludgecollector x 2 units.・Return and excess
pumps.6 Chlorination
tank ・Rectangular tank made of RC ・Sodium hypochlorite
dosing equipment.7 Aerobic
digester ・Rectangular tank made of RC・Length 40 m, Width 15 m, Height
5 m, Volume 3,000 m 3
・Membrane air diffuser・Aeration blower
Conversion to aeration tank when the water volume is increased in the future.
8 Sludge dehydrator
・Filter press sludgedehydrator・1.3 m3/hr, 1 pc.・Chemical dosing
equipment9 Electricity
receiving system
・Transformer
10 Emergency power generation system
・Electric generator
11 Monitoring and control equipment
・Control panel
12 Water quality laboratory
・Testing equipment
Source: Prepared by the Study Team based on AMDC data.
Inlet pumping station Grit chamber and screen
Primary sedimentation tank (suspended) Aeration tank

3-137
Final sedimentation tank Final sedimentation tank overflow trough (in bad condition)
Chlorination tank Sludge dehydrator (filter press)
Water quality sampling (influent and effluent) Water quality laboratory (common use for both plants)
Figure 3-4-5 Current Status of San José de la Vega Plant Facilities
Operation and Maintenance System
The organization for the operations control has already been transferred from SANAA to the AMDC,
to the UMAPS Sub management of Sanitary Sewage and Rainfall Drainage team. The team currently
has 9 staff who are also in charge of the PRRAC ASAN Plant.

3-138
(3) Status of Operations
a) Inlet Flow Rate
At the time of the field survey (September 2021), the incoming volume was about 2,000-3,000 m 3/day. This is considerably less than the design capacity, which is approximately 1/4-1/3. This is
reported to be due to the small amount of discharged water reaching the WWTP due to the numerous
leaks caused by damage deteriorating sewer channels in the project area (most are more than 50 years
old since installation) or due to sediment clogging. The leaked sewage overflows from the manholes,
infiltrates into the ground or flows into the rivers, becoming a cause of environmental deterioration.
b) Water Quality
Water quality tests are performed in the water quality laboratory within the plant. Operating
indicator parameters such as COD, BOD, and SS are analyzed.
Table 3-4-3, shows the results obtained from the influent and effluent data during the period from
2016 to 2019 (monthly average).
In both cases of influent and effluent, the variations are large and often exceed the design water
quality parameters. Despite proper treatment, for an efficient, effective and robust treatment operation,
it is necessary to conduct a study of the influent, a study of the functions of the sewer network and the
plant, and implement various improvement plans based on the results of these studies.
Table 3-4-3 San José de la Vega Plant Water Quality
(Monthly Average, 2016-2019)
Water Quality Parameter COD BOD SS Remarks Unit mg/L mg/L mg/L
Design Water Quality
Influent 917 561 - Effluent <100 <50 -
2016 Influent
Maximum
1,327 884 463
Average 958 655 321 Effluent 62~154 8~104 16~236
2017 Influent
Maximum
1,625 862 1,503
Average 953 546 435.9 Effluent 8~108 2~20 10~34
2018 Influent
Maximum
1,217 832 1,290
Average 930 625 381 Effluent 58~140 4~33 11~80
2019 Influent
Maximum
2,194 666 1,936
Average 1,126 507 536
Effluent 41~190 4~36 10~135
Evaluation In both
influent and In both
influent and

3-139
Water Quality Parameter COD BOD SS Remarks Unit mg/L mg/L mg/L
Design Water Quality
Influent 917 561 - Effluent <100 <50 -
effluent, many exceed design values.
effluent, many
exceed design values.
Source: Prepared by the Study Team based on data from the Plant Water Quality Control
Department.
c) Operations
The operation of the primary sedimentation tank is suspended, but it is bypassed in order to secure
the necessary load for biological treatment in the aeration tank due to the low inflow water volume.
Considering the necessary settling time, the operation in one of two final settling tanks is also
suspended.
In addition, there are other problems such as concrete corrosion and odor emanation, especially in
the pretreatment facilities. Pre-treatment facilities are equipped with a deodorizer (chemical wash
type).
The color of the liquid inside the aeration tank is the color of activated sludge, and the concentration
of MLSS (mixed liquor suspended solids) inside the tank is 3,000 mg/L, so it is presumed that the
biological treatment is adequate. In the current situation, the detention time in the tank is about 24-36
hours, and in practice, they are operating with extended aeration. In this case, there is usually the
situation where the production of bulking is promoted which is a factor of deterioration of the sludge
settling capacity in the final sedimentation tank, and this plant is not the exception. In the final
sedimentation tank, many sludge flocs overflow, causing deterioration in water quality.
The sludge dewatering operation is carried out about twice a month and the percentage of moisture
in the dewatered sludge is approximately 80%. In order to carry out a good and stable treatment
operation, it is necessary to permanently know the material balance within the system and to
adequately dewater the excess sludge and expel it out of the system. At the moment, it appears that
such operation management is not being carried out, so the operation method needs to be improved.
3-4-2-3 Treatment Plant PRRAC-ASAN
General Description
The process of this plant is of the UASB type (upflow anaerobic sludge blanket reactor). The
treatment process is Pre-treatment (Grid chamber and screen) + UASB + Aeration tank + Final
sedimentation tank + Chlorination. The sludge treatment process is Pre-thickening + Aerobic digester
+ Post-thickening + Filter press dehydrator. A gas-fired electric generator is installed that uses the
digested gas generated from the UASB reactor. Figure 3-4-6 shows the plant flow diagram, Figure 3-
4-7 shows the general plan, Table 3-4-4 shows the main components and Figure 3-4-8 shows the
current status of the facilities.

3-140
Source: Data from AMDC
Figure 3-4-6 PRRAC-ASAN Plant Flow Diagram
Source: Data from AMDC
Figure 3-4-7 General Plan of PRRAC-ASAN Plant
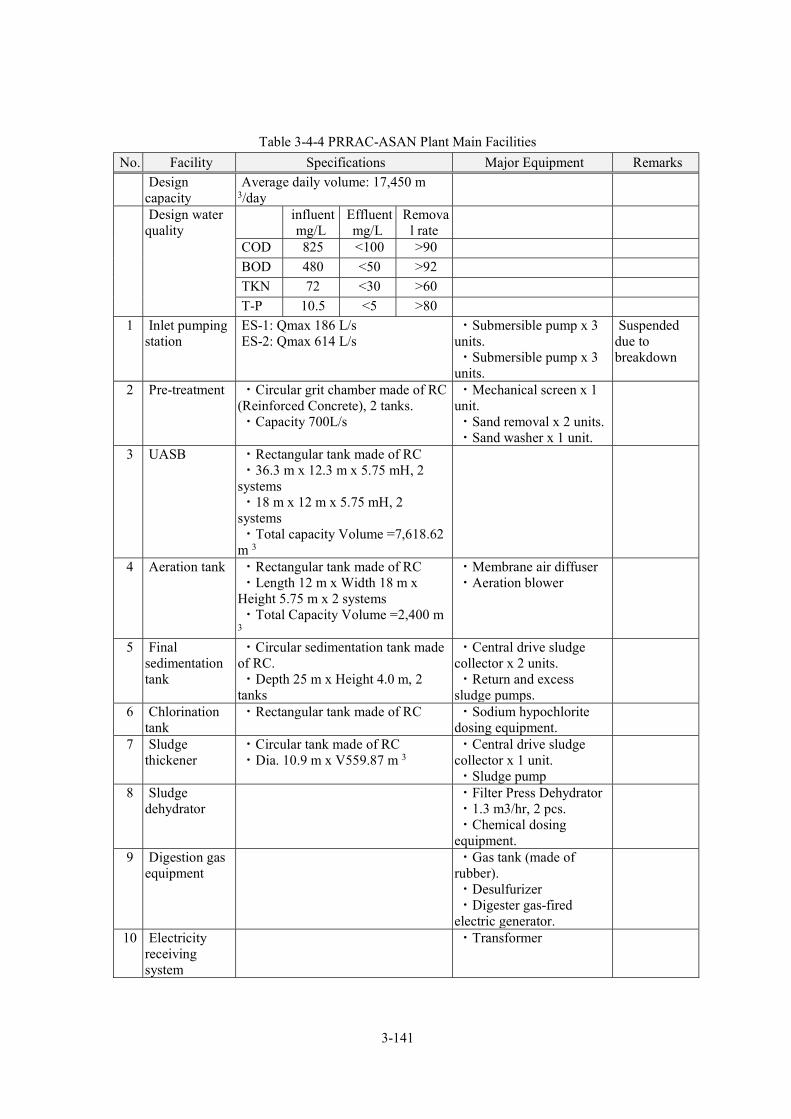
3-141
Table 3-4-4 PRRAC-ASAN Plant Main Facilities
No. Facility Specifications Major Equipment Remarks
Design capacity
Average daily volume: 17,450 m 3/day
Design water quality
influent mg/L
Effluent mg/L
Removal rate
COD 825 <100 >90
BOD 480 <50 >92
TKN 72 <30 >60
T-P 10.5 <5 >80
1 Inlet pumping station
ES-1: Qmax 186 L/s ES-2: Qmax 614 L/s
・Submersible pump x 3 units. ・Submersible pump x 3
units.
Suspended due to breakdown
2 Pre-treatment ・Circular grit chamber made of RC (Reinforced Concrete), 2 tanks. ・Capacity 700L/s
・Mechanical screen x 1 unit. ・Sand removal x 2 units. ・Sand washer x 1 unit.
3 UASB ・Rectangular tank made of RC ・36.3 m x 12.3 m x 5.75 mH, 2
systems ・18 m x 12 m x 5.75 mH, 2
systems ・Total capacity Volume =7,618.62
m 3
4 Aeration tank ・Rectangular tank made of RC ・Length 12 m x Width 18 m x
Height 5.75 m x 2 systems ・Total Capacity Volume =2,400 m
3
・Membrane air diffuser ・Aeration blower
5 Final sedimentation tank
・Circular sedimentation tank made of RC. ・Depth 25 m x Height 4.0 m, 2
tanks
・Central drive sludge collector x 2 units. ・Return and excess
sludge pumps.
6 Chlorination tank
・Rectangular tank made of RC ・Sodium hypochlorite dosing equipment.
7 Sludge thickener
・Circular tank made of RC ・Dia. 10.9 m x V559.87 m 3
・Central drive sludge collector x 1 unit. ・Sludge pump
8 Sludge dehydrator
・Filter Press Dehydrator ・1.3 m3/hr, 2 pcs. ・Chemical dosing
equipment.
9 Digestion gas equipment
・Gas tank (made of rubber). ・Desulfurizer ・Digester gas-fired
electric generator.
10 Electricity receiving system
・Transformer
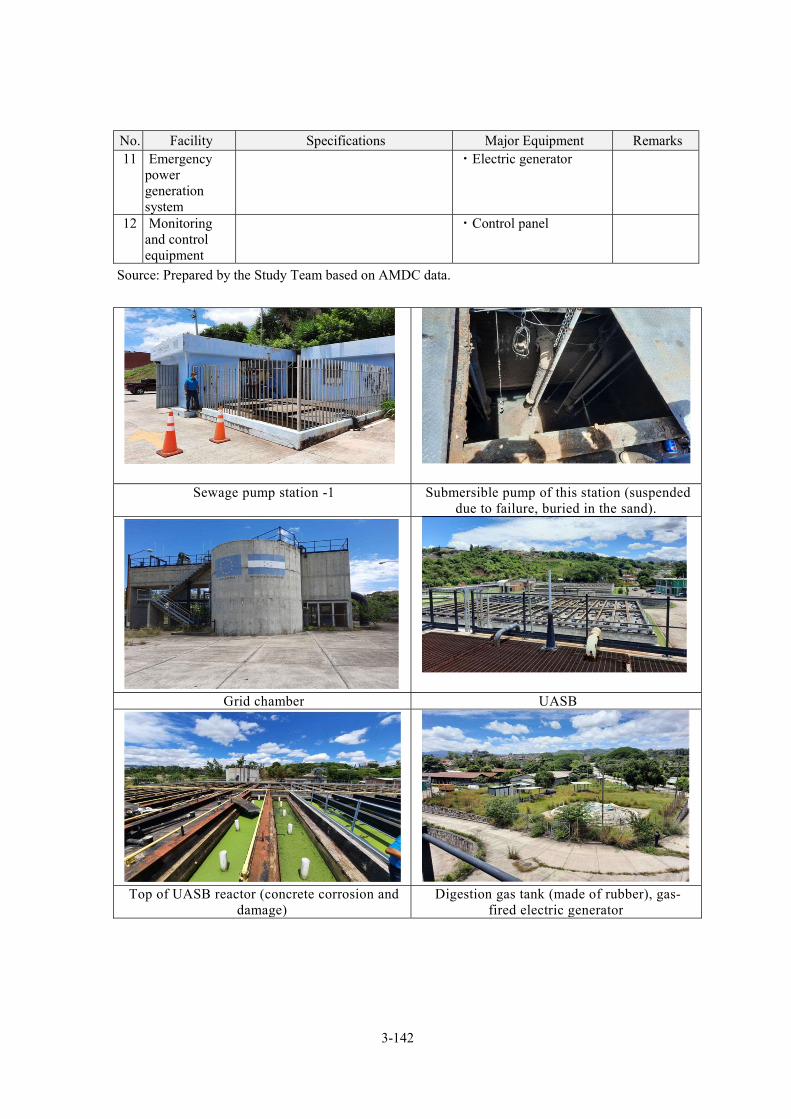
3-142
No. Facility Specifications Major Equipment Remarks 11 Emergency
power generation system
・Electric generator
12 Monitoring and control equipment
・Control panel
Source: Prepared by the Study Team based on AMDC data.
0
Sewage pump station -1 Submersible pump of this station (suspended due to failure, buried in the sand).
Grid chamber UASB
Top of UASB reactor (concrete corrosion and
damage) Digestion gas tank (made of rubber), gas-
fired electric generator

3-143
Final sedimentation tank Emergency power generator
Administration building (common use for both
floors) AMDC storage yard (adjoining this plant)
Figure 3-4-8 Current Status of PRRAC-ASAN Plant Facilities
(2) Situation
All influent from this plant passes through two upstream relay stations; however, due to the
suspension of all pumps due to failures, all stations have been suspended since 2015.
The operation and maintenance system is under the responsibility of the UMAPS Sanitary Sewer
and Rainfall Drainage Sub-Management team, as is the San José de la Vega Plant, although at this
time only maintenance of the facilities is being carried out.
Table 3-4-5 shows the 2009 influent data after the start of operations.
Table 3-4-5 PRRAC-ASAN Plant Operations Data (2009, taken from AMDC data)
Parameter Unit Design Specifications 2009 Data
Incoming volume m3 /day 17,450 9,100
BOD Mg/L 480 300
COD Mg/L 825 600
TKN Mg/L 72 45
T-P Mg/L 10.5 6.6
Sulfate (SO 4) Mg/L 35 150-250

3-144
At that time, a COD removal rate of 89 % and a high concentration of incoming sulfate were
reported, which negatively affected the operating performance of the UASB reactor. In addition, the
odor emanation problem was reported.
Due to sulfate ingress and anaerobic gas fumes, there is extensive corrosion of the concrete
structures on top of the UASB reactor and damage to the roof. These damages need to be repaired
before restarting operations.
3-4-2-4 San José de la Vega Wastewater Treatment Plant Problem
Table 3-4-6 shows the challenges of these plants identified as a result of the interviews with
management personnel and the field survey, and their possible measures.
Table 3-4-6 San José de la Vega and PRRAC-ASAN Plants Challenges Issue Current Problems Possible Measures Remarks
1.Influent and water quality
・La Vega: There is little influent due to damage from deterioration of existing canals/sediment obstruction. ・PRRAC ASAN: All
facilities are suspended due to breakdowns in upstream pumping stations resulting from foreign object clogging and sand wear. ・High concentration of
incoming sulfate adversely affects the treatment functions.
・Most of the sewerage networks in the city (total length: about 1,500 km) are more than 50 years old since their installation. According to the AMDC study, more than 70% are reported to be non-functioning. It is necessary to carry out a deterioration and a function diagnosis, as well as to clean, repair and replace them properly. ・It is necessary to install a
screen upstream of the pump and grid chamber. Also replace the pumps properly. ・It is assumed that the high
sulfate concentration is due to the anaerobic process caused by prolonged stay in the canals, so it is important that the water flows quickly.
2.Plant scale
・The total treatment capacity of the two plants is 25,450 m3/day; on the other hand, with the increase in population in the project areas, the treatment volume required also increases.
・Review the design volume, and as necessary, upgrade the treatment level and expansion.
3. Treatment functions
・The sludge bulking at La Vega and the inadequacy of PRRAC ASAN's UASB reactor to improve influent quality. It is inefficient to have two systems within the same site. ・High cost of electricity.
・To perform a diagnosis of the treatment functions including the material balance, review the treatment system to make it more effective, including the proposal to unify the two plants. ・Propose an energy saving
system.

3-145
Issue Current Problems Possible Measures Remarks
4. Facilities and equipment
・There are breakdowns/damages to some equipment such as the screen. ・Lack of maintenance work
on suspended equipment. ・The installed automatic
operation system is not working due to lack of training.
・Make repairs and replacements when necessary and timely. ・It is important to perform
periodic inspection, maintenance and repair of suspended equipment. ・Review the content of the
automatic operation system, conduct appropriate training.
5. Operation and maintenance system, etc.
・They are not performing maintenance/upgrading of equipment on a scheduled basis, so failures occur in case of breakdowns and emergencies. ・O&M manual with
insufficient content. ・Lack of water quality test
content.
・It is required to perform asset management and establish a preventive maintenance program for systems and equipment.
・Development of an appropriate O&M manual. ・Strengthening of water
quality testing equipment/system.