Arizona Well Owner's Guide to Water Supply
108
-
Upload
khangminh22 -
Category
Documents
-
view
2 -
download
0
Transcript of Arizona Well Owner's Guide to Water Supply

Arizona Water Map, 2009, Water Resources Research Center, University of Arizona
ARIZONA WELL OWNER’S
GUIDE TO WATER SUPPLY
SECOND EDITION
Janick F. Artiola, Ph.D. Department of Soil, Water and Environmental Science, University of Arizona
Kristine Uhlman, RG Retired, Water Resources Research Center, University of Arizona
Gary Hix, RG Arizona Water Well Association
AZ1485 | REVISED JUNE 2017
ACKNOWLEDGMENTS
Funding SourceThis publication was supported by Cooperative Agreement Number 5 NUE2EH001316-02-00, funded by the Centers for Disease Control and Prevention’s Environmental Health Services Support for Public Health Drinking Water Program to Reduce Drinking Water Exposures Grant. Support from the University of Arizona on this publication was established through Arizona Department of Health Services subcontract ADHS16-130922. Its contents are solely the responsibility of the authors and do not necessarily represent the official views of the Centers for Disease Control and Prevention of the U.S. Department of Health and Human Services.
Review and DevelopmentThe authors would like to thank the following groups and individuals for their assistance:
Douglas Towne, Groundwater Hydrologist Arizona Department of Environmental Quality
Dave Christiana, HydrologistArizona Department of Water Resources.
Jeff Schalau, County Director/Agent Agriculture and Natural Resources, Yavapai County Cooperative ExtensionUniversity of Arizona
Arizona Department of Health Services, Office of Environmental Health, Drinking Water Program
Kayla Iuliano, MHS, Epidemiologist
Matthew Roach, MPH, Program Manager
We gratefully acknowledge and appreciate graphics provided by the Texas A&M Agrilife Extension, “Texas Well Owner Network, Well Owner’s Guide to Water Supply”, K. Uhlman, D. Boellstorff, M.L. McFarland, D. Gholson, and J.W. Smith. 2015. Publication SC-029. 05-15.
National Ground Water Association
Lisa Angeles Watanabe for publication and graphics development
DisclaimerThe information in this publication is for educational purposes only. References to commercial products and/or trade names are made with the understanding that no discrimination is intended and no endorsement implied
CONTENTS:
S E C T I O N 1 : Introduction. . . . . . . . . . . . . . . . . . . . . . . . . . . . . . . . . . . . . . . . . . . . 8Groundwater, Wells And Aquifers . . . . . . . . . . . . . . . . . . . . . . . . . . . . . . . . . . . . . . . . . . . . . . . 9Your Well - Your Responsibility . . . . . . . . . . . . . . . . . . . . . . . . . . . . . . . . . . . . . . . . . . . . . . . . . 9Contaminants In Well Water: Your Well And Your Health . . . . . . . . . . . . . . . . . . . . . . . . . . . . . 9
Bacteria . . . . . . . . . . . . . . . . . . . . . . . . . . . . . . . . . . . . . . . . . . . . . . . . . . . . . . . . . . . . . . . . . 9Nitrates . . . . . . . . . . . . . . . . . . . . . . . . . . . . . . . . . . . . . . . . . . . . . . . . . . . . . . . . . . . . . . . . 10Arsenic . . . . . . . . . . . . . . . . . . . . . . . . . . . . . . . . . . . . . . . . . . . . . . . . . . . . . . . . . . . . . . . . . 10Fluoride . . . . . . . . . . . . . . . . . . . . . . . . . . . . . . . . . . . . . . . . . . . . . . . . . . . . . . . . . . . . . . . . 10Radon . . . . . . . . . . . . . . . . . . . . . . . . . . . . . . . . . . . . . . . . . . . . . . . . . . . . . . . . . . . . . . . . . 11Salinity . . . . . . . . . . . . . . . . . . . . . . . . . . . . . . . . . . . . . . . . . . . . . . . . . . . . . . . . . . . . . . . . 11
S E C T I O N 2 : Arizona Water Sources . . . . . . . . . . . . . . . . . . . . . . . . . . . . . . . . . . . 12Local Water Sources . . . . . . . . . . . . . . . . . . . . . . . . . . . . . . . . . . . . . . . . . . . . . . . . . . . . . . . . . 15Reclaimed Water . . . . . . . . . . . . . . . . . . . . . . . . . . . . . . . . . . . . . . . . . . . . . . . . . . . . . . . . . . . 16Outlook . . . . . . . . . . . . . . . . . . . . . . . . . . . . . . . . . . . . . . . . . . . . . . . . . . . . . . . . . . . . . . . . . . 17
S E C T I O N 3 : Arizona Geology . . . . . . . . . . . . . . . . . . . . . . . . . . . . . . . . . . . . . . . 19Physiographic Provinces . . . . . . . . . . . . . . . . . . . . . . . . . . . . . . . . . . . . . . . . . . . . . . . . . . . . . 20
Colorado Plateau Uplands . . . . . . . . . . . . . . . . . . . . . . . . . . . . . . . . . . . . . . . . . . . . . . . . . . . 20Central Highlands Region . . . . . . . . . . . . . . . . . . . . . . . . . . . . . . . . . . . . . . . . . . . . . . . . . . . 21Basin And Range . . . . . . . . . . . . . . . . . . . . . . . . . . . . . . . . . . . . . . . . . . . . . . . . . . . . . . . . . 22
Economic Geology Of Arizona . . . . . . . . . . . . . . . . . . . . . . . . . . . . . . . . . . . . . . . . . . . . . . . . 24
S E C T I O N 4 : What Is An Aquifer? . . . . . . . . . . . . . . . . . . . . . . . . . . . . . . . . . . . 25Aquifer Characteristics And Water Movement . . . . . . . . . . . . . . . . . . . . . . . . . . . . . . . . . . . . . 26Aquifer Recharge . . . . . . . . . . . . . . . . . . . . . . . . . . . . . . . . . . . . . . . . . . . . . . . . . . . . . . . . . . . 28
Soil Type . . . . . . . . . . . . . . . . . . . . . . . . . . . . . . . . . . . . . . . . . . . . . . . . . . . . . . . . . . . . . . . 29Climate . . . . . . . . . . . . . . . . . . . . . . . . . . . . . . . . . . . . . . . . . . . . . . . . . . . . . . . . . . . . . . . . 29Land Use . . . . . . . . . . . . . . . . . . . . . . . . . . . . . . . . . . . . . . . . . . . . . . . . . . . . . . . . . . . . . . . 30
S E C T I O N 5 : Well Operation And Maintenance . . . . . . . . . . . . . . . . . . . . . . . . . . 32Domestic Well Regulations . . . . . . . . . . . . . . . . . . . . . . . . . . . . . . . . . . . . . . . . . . . . . . . . . . . 32
ADWR Forms . . . . . . . . . . . . . . . . . . . . . . . . . . . . . . . . . . . . . . . . . . . . . . . . . . . . . . . . . . . . 33ADWR Records . . . . . . . . . . . . . . . . . . . . . . . . . . . . . . . . . . . . . . . . . . . . . . . . . . . . . . . . . . . 34Initial Well Disinfection . . . . . . . . . . . . . . . . . . . . . . . . . . . . . . . . . . . . . . . . . . . . . . . . . . . . 34
Well Components . . . . . . . . . . . . . . . . . . . . . . . . . . . . . . . . . . . . . . . . . . . . . . . . . . . . . . . . . . 34Well Casing . . . . . . . . . . . . . . . . . . . . . . . . . . . . . . . . . . . . . . . . . . . . . . . . . . . . . . . . . . . . . 35Sanitary Seal . . . . . . . . . . . . . . . . . . . . . . . . . . . . . . . . . . . . . . . . . . . . . . . . . . . . . . . . . . . . 36Caps . . . . . . . . . . . . . . . . . . . . . . . . . . . . . . . . . . . . . . . . . . . . . . . . . . . . . . . . . . . . . . . . . . 36Well Screens . . . . . . . . . . . . . . . . . . . . . . . . . . . . . . . . . . . . . . . . . . . . . . . . . . . . . . . . . . . . . 36Storage Tanks . . . . . . . . . . . . . . . . . . . . . . . . . . . . . . . . . . . . . . . . . . . . . . . . . . . . . . . . . . . . 37
Shared Wells . . . . . . . . . . . . . . . . . . . . . . . . . . . . . . . . . . . . . . . . . . . . . . . . . . . . . . . . . . . . . . . 38Well System Failure . . . . . . . . . . . . . . . . . . . . . . . . . . . . . . . . . . . . . . . . . . . . . . . . . . . . . . . . . 39Well Maintenance Tips . . . . . . . . . . . . . . . . . . . . . . . . . . . . . . . . . . . . . . . . . . . . . . . . . . . . . . . 39
S E C T I O N 6 : Well Yield . . . . . . . . . . . . . . . . . . . . . . . . . . . . . . . . . . . . . . . . . . . 41How To Improve Well Yield . . . . . . . . . . . . . . . . . . . . . . . . . . . . . . . . . . . . . . . . . . . . . . . . . . . 42
Redevelopment . . . . . . . . . . . . . . . . . . . . . . . . . . . . . . . . . . . . . . . . . . . . . . . . . . . . . . . . . . . 43Hydraulic Fracturing . . . . . . . . . . . . . . . . . . . . . . . . . . . . . . . . . . . . . . . . . . . . . . . . . . . . . . 43Carbon Dioxide . . . . . . . . . . . . . . . . . . . . . . . . . . . . . . . . . . . . . . . . . . . . . . . . . . . . . . . . . . 43
Drought . . . . . . . . . . . . . . . . . . . . . . . . . . . . . . . . . . . . . . . . . . . . . . . . . . . . . . . . . . . . . . . . . . 44
S E C T I O N 7 : Drinking Water Guidelines And Standards . . . . . . . . . . . . . . . . . . . . 46National Primary Drinking Water Standards . . . . . . . . . . . . . . . . . . . . . . . . . . . . . . . . . . . . . . 46National Secondary Drinking Water Standards . . . . . . . . . . . . . . . . . . . . . . . . . . . . . . . . . . . . 48Common Chemical Constituents In Groundwater . . . . . . . . . . . . . . . . . . . . . . . . . . . . . . . . . . 48
Salt – Total Dissolved Solids (TDS) . . . . . . . . . . . . . . . . . . . . . . . . . . . . . . . . . . . . . . . . . . . . 49Arsenic . . . . . . . . . . . . . . . . . . . . . . . . . . . . . . . . . . . . . . . . . . . . . . . . . . . . . . . . . . . . . . . . . 51Nitrate . . . . . . . . . . . . . . . . . . . . . . . . . . . . . . . . . . . . . . . . . . . . . . . . . . . . . . . . . . . . . . . . . 53Fluoride . . . . . . . . . . . . . . . . . . . . . . . . . . . . . . . . . . . . . . . . . . . . . . . . . . . . . . . . . . . . . . . . 54Radioactive Elements . . . . . . . . . . . . . . . . . . . . . . . . . . . . . . . . . . . . . . . . . . . . . . . . . . . . . . 54Radon . . . . . . . . . . . . . . . . . . . . . . . . . . . . . . . . . . . . . . . . . . . . . . . . . . . . . . . . . . . . . . . . . 55
Other Constituents . . . . . . . . . . . . . . . . . . . . . . . . . . . . . . . . . . . . . . . . . . . . . . . . . . . . . . . . . 56Hardness . . . . . . . . . . . . . . . . . . . . . . . . . . . . . . . . . . . . . . . . . . . . . . . . . . . . . . . . . . . . . . . 56Acidic or Alkaline Water: pH . . . . . . . . . . . . . . . . . . . . . . . . . . . . . . . . . . . . . . . . . . . . . . . . 57Taste . . . . . . . . . . . . . . . . . . . . . . . . . . . . . . . . . . . . . . . . . . . . . . . . . . . . . . . . . . . . . . . . . . 57Organic Matter . . . . . . . . . . . . . . . . . . . . . . . . . . . . . . . . . . . . . . . . . . . . . . . . . . . . . . . . . . 57Rotten Eggs (Hydrogen Sulfide Odor) . . . . . . . . . . . . . . . . . . . . . . . . . . . . . . . . . . . . . . . . . . . 57Dissolved Iron and Manganese . . . . . . . . . . . . . . . . . . . . . . . . . . . . . . . . . . . . . . . . . . . . . . . 58
Anthropogenic Contaminants . . . . . . . . . . . . . . . . . . . . . . . . . . . . . . . . . . . . . . . . . . . . . . . . . 58Pathogens . . . . . . . . . . . . . . . . . . . . . . . . . . . . . . . . . . . . . . . . . . . . . . . . . . . . . . . . . . . . . . . . . 60Emerging Contaminants . . . . . . . . . . . . . . . . . . . . . . . . . . . . . . . . . . . . . . . . . . . . . . . . . . . . . 60
S E C T I O N 8 : Testing Well Water Quality . . . . . . . . . . . . . . . . . . . . . . . . . . . . . . . . 62Sampling Your Well Water . . . . . . . . . . . . . . . . . . . . . . . . . . . . . . . . . . . . . . . . . . . . . . . . . . . . 64Water Testing Using A Certified Laboratory . . . . . . . . . . . . . . . . . . . . . . . . . . . . . . . . . . . . . . . 64Well Water Test Kits . . . . . . . . . . . . . . . . . . . . . . . . . . . . . . . . . . . . . . . . . . . . . . . . . . . . . . . . . 64Interpreting Water Test Results . . . . . . . . . . . . . . . . . . . . . . . . . . . . . . . . . . . . . . . . . . . . . . . . 65
S E C T I O N 9 : Water Treatment Options . . . . . . . . . . . . . . . . . . . . . . . . . . . . . . . . 67Indications That Your Well Water Needs Treatment . . . . . . . . . . . . . . . . . . . . . . . . . . . . . . . . . 68Treatments . . . . . . . . . . . . . . . . . . . . . . . . . . . . . . . . . . . . . . . . . . . . . . . . . . . . . . . . . . . . . . . . 68
Particle and Microfiltration . . . . . . . . . . . . . . . . . . . . . . . . . . . . . . . . . . . . . . . . . . . . . . . . . . 70Activated Carbon . . . . . . . . . . . . . . . . . . . . . . . . . . . . . . . . . . . . . . . . . . . . . . . . . . . . . . . . . 71Reverse Osmosis (RO) . . . . . . . . . . . . . . . . . . . . . . . . . . . . . . . . . . . . . . . . . . . . . . . . . . . . . . 72Nano filtration . . . . . . . . . . . . . . . . . . . . . . . . . . . . . . . . . . . . . . . . . . . . . . . . . . . . . . . . . . . 73Water Softeners . . . . . . . . . . . . . . . . . . . . . . . . . . . . . . . . . . . . . . . . . . . . . . . . . . . . . . . . . . . 73Distillation . . . . . . . . . . . . . . . . . . . . . . . . . . . . . . . . . . . . . . . . . . . . . . . . . . . . . . . . . . . . . . 74Chemical Filters . . . . . . . . . . . . . . . . . . . . . . . . . . . . . . . . . . . . . . . . . . . . . . . . . . . . . . . . . . 74Iron Filter . . . . . . . . . . . . . . . . . . . . . . . . . . . . . . . . . . . . . . . . . . . . . . . . . . . . . . . . . . . . . . 75Chlorination . . . . . . . . . . . . . . . . . . . . . . . . . . . . . . . . . . . . . . . . . . . . . . . . . . . . . . . . . . . . 75UV Radiation . . . . . . . . . . . . . . . . . . . . . . . . . . . . . . . . . . . . . . . . . . . . . . . . . . . . . . . . . . . 76
Other Disinfection Methods . . . . . . . . . . . . . . . . . . . . . . . . . . . . . . . . . . . . . . . . . . . . . . . . . . 76Alternative Sources of Potable Water . . . . . . . . . . . . . . . . . . . . . . . . . . . . . . . . . . . . . . . . . . . . 77
S E C T I O N 1 0 : Protecting Your Well Water Quality . . . . . . . . . . . . . . . . . . . . . . . . 78Well Installation and Maintenance . . . . . . . . . . . . . . . . . . . . . . . . . . . . . . . . . . . . . . . . . . . . . . 79Wellhead Protection . . . . . . . . . . . . . . . . . . . . . . . . . . . . . . . . . . . . . . . . . . . . . . . . . . . . . . . . . 80Household Wastewater Management and Onsite Septic Systems . . . . . . . . . . . . . . . . . . . . . . . 82Plugging Unused Water Wells . . . . . . . . . . . . . . . . . . . . . . . . . . . . . . . . . . . . . . . . . . . . . . . . . 83Shock Chlorination of Water Wells . . . . . . . . . . . . . . . . . . . . . . . . . . . . . . . . . . . . . . . . . . . . . 84
G L O S S A R Y O F T E R M S . . . . . . . . . . . . . . . . . . . . . . . . . . . . . . . . . . . . . . . 85
A C R O N Y M S A N D A B B R E V I A T I O N S . . . . . . . . . . . . . . . . . . . . . . . . 89
A P P E N D I X A : National Primary Drinking Water Standards . . . . . . . . . . . . . . . . 90
A P P E N D I X B : Water Problems: Symptoms, Tests, And Possible Sources . . . . . . . . . 98
A P P E N D I X C : Certified Drinking Water Laboratories in Arizona . . . . . . . . . . . 100
A P P E N D I X D : ADEQ Groundwater Quality Reports . . . . . . . . . . . . . . . . . . . . 102
Photo Credit: J. Artiola
SECTION
1 INTRODUCTION
This Well Owner’s Guide to Water Supply was written to assist you to learn more about a topic of the utmost importance—your drinking water . Gaining a better understanding about your well, its components and their maintenance, well upkeep, geology, and water quality, will ultimately empower you, the well owner, to be able to better maintain and monitor your well and your water supply .
Carefully monitoring and keeping a detailed record of any maintenance done on your well, and any water tests conducted, can help you prevent future problems from occurring and to insure safe drinking water . For example, noting a rapid turning on/off of your well pump may indicate a lowered water table . Knowing which contaminants may be present in your well water will help you choose the best water treatment .
9
S E C T I O N 1 | Introduction
1
GROUNDWATER, WELLS AND AQUIFERS
This Guide introduces the reader to the geologic conditions that form the aquifers of the state, and then clarifies the rules and regulations that guide the installation of a domestic water well . Common maintenance concerns are also identified, and recommendations are provided for the efficient operation of your well . Arizona’s geology contributes to some of the water quality concerns, such as naturally occurring elevated concentrations of arsenic, as well as other constituents . The presence of some of these constituents are geologically dependent, and this guide will help you identify if your well may be of concern .
YOUR WELL – YOUR RESPONSIBILITY
As a private well owner, you are responsible for the upkeep of your well and the quality of water it produces . While a loan provider or real estate company may require a water quality test, there are no federal or state laws that require a well owner to have their well tested . This means that while public water systems must meet certain water quality standards in order to provide safe, potable drinking water for their customers, well owners are solely responsible for testing their water, in order to protect the health of anyone who drinks it .
CONTAMINANTS IN WELL WATER: YOUR WELL AND YOUR HEALTH
Contaminants in well water may be present due to a variety of sources . Some may be present due to human sources, while others may occur naturally . Some contaminants, such as dissolved metals and nitrates, may be present due to both human and natural sources . Below you will find a subset of important well contaminants, information about their sources, and possible health effects .
It is important to remember that the presence of a contaminant in groundwater does not necessarily mean it will impact human health . The duration of exposure (i .e ., how long you have been drinking and/or cooking with the water), the concentration of the contaminant, your health, and many other “puzzle pieces” factor into whether a contaminant can make you ill . These contaminants are also discussed in later Sections of this guide, but we highlight them here to focus on their potential risk to your health .
Bacteria
Coliform bacteria can be found naturally in the environment . They can also be present in the digestive systems of animals and humans . The bacteria themselves are unlikely to cause illness; instead, they are used to indicate the presence of other bacteria, viruses, or parasites (protozoa) that could make you ill . The specific presence of E. coli in well water is usually an indicator of fecal or sewage contamination, which can make you sick . Sections 7 and 8 discuss sampling and
10
S E C T I O N 1 | Introduction
1
analyzing your well water for bacteria .
Nitrates
Nitrates can occur naturally in groundwater and are usually found at levels that do not cause health problems . However, high levels of nitrates found in well water may be present due to contamination . This contamination may be from an over-application or misuse of fertilizers, a leaking septic system (or one that is too close to the well), and animal waste .
Nitrates can interfere with the body’s ability to properly distribute oxygen . This can be particularly concerning for infants or young children . “Blue Baby Syndrome” can occur when an infant ingests high concentration of nitrates (which can then cause the skin to become discolored to a pale gray or blue color) . At high enough concentrations, nitrate can affect the nervous system or even cause death .
Arsenic
Arsenic occurs naturally in the environment, can also be present in groundwater due to human activities . Arsenic is one of the most commonly occurring contaminants in Arizona’s groundwater and long-term exposure to this element is correlated with skin problems and
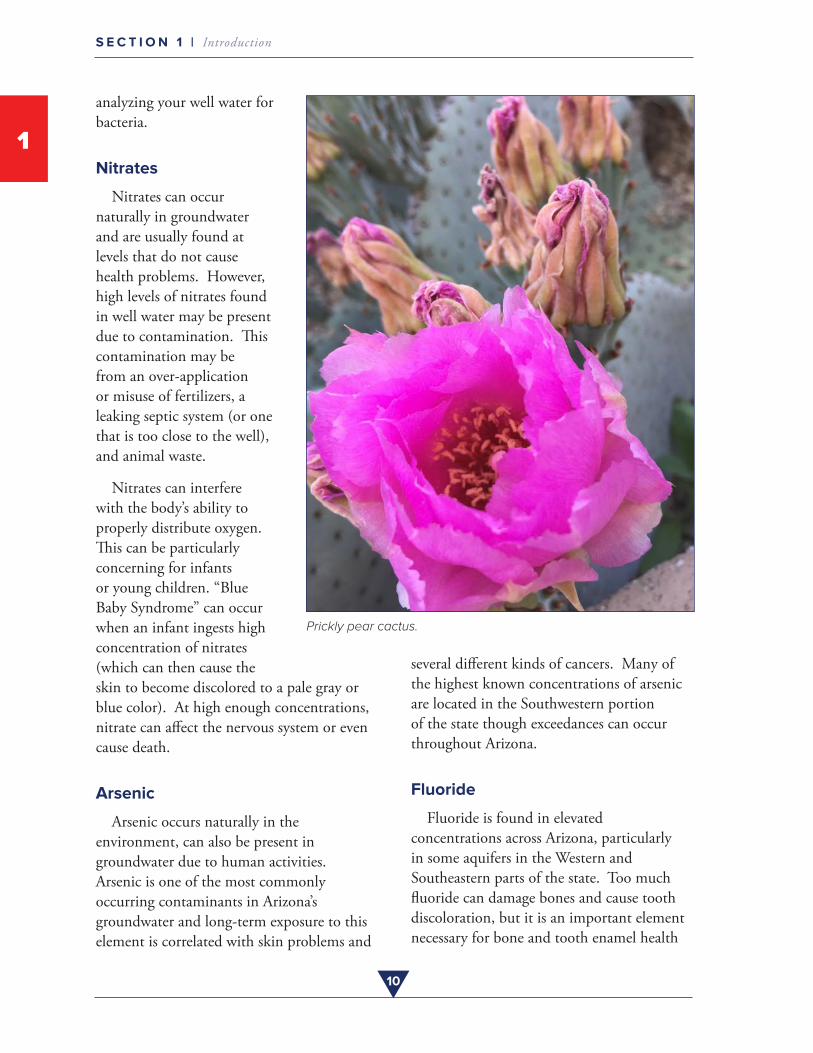
Prickly pear cactus.
several different kinds of cancers . Many of the highest known concentrations of arsenic are located in the Southwestern portion of the state though exceedances can occur throughout Arizona .
Fluoride
Fluoride is found in elevated concentrations across Arizona, particularly in some aquifers in the Western and Southeastern parts of the state . Too much fluoride can damage bones and cause tooth discoloration, but it is an important element necessary for bone and tooth enamel health

11
S E C T I O N 1 | Introduction
1
Year and location unknown, postcard of artesian well in south eastern Arizona.
in low concentrations .
Radon
Radon is an odorless, tasteless gas that cannot be seen . It forms when a radioactive metal, like radium, breaks down (decays) in rocks . The gas can dissolve into groundwater and could be present in drinking water from a private well . Radon gas can be released into the air when the water is used for domestic purposes .
When inhaled, radon can increase the risk of lung cancer, and it is the number one cause of that disease among non-smokers .
Salinity
Significant portions of Arizona’s groundwater sources have elevated levels of total dissolved solids that adversely affect household uses . However, well owners have water treatment options to improve the potability of their well water . Water treatment options, based on the types and amounts of contaminants present in water, are discussed in Section 9 .
~
The Guide addresses common well water contaminants, drinking water quality
standards, and the potential symptoms encountered from unsafe well water . Recommended water treatment options are also provided that may help you manage your well water quality .
Each Section of this Guide lists recommended further reading from the University of Arizona, Cooperative Extension’s extensive list of publications .
This work was funded by the Arizona Department of Health Services as part of a grant from the Center for Disease Control (CDC) to facilitate the education ofdomestic well owners to assure safe drinking water in Arizona . For more information about funding sources, please see the Acknowledgment Section .
SECTION
2 ARIZONA WATER SOURCES
A natural resource, such as water, qualifies as a renewable resource if it is replenished by natural processes at a rate equal to or faster than its rate of consumption . A non-renewable resource cannot be re-made, re-grown, or regenerated on a scale comparable to its consumption .
Although both surface water and groundwater are considered renewable resources in regions with plentiful rain and snow, groundwater is considered a non-renewable resource in the arid west and across Arizona . According to data compiled by the Arizona Department of Water Resources (ADWR), there is insufficient rainfall in Arizona’s dry climate to sustain river flow and reservoir storage to meet the growing population demands . Groundwater pumping exceeds the rate of aquifer recharge, causing overdraft in aquifers serving large population centers or having extensive areas of irrigated
Photo Credit: K. Uhlman
13
S E C T I O N 2 | Arizona Water Sources
2
farmland .
Perennial rivers occur where groundwater is near the land surface and discharges continually to a river bed . During precipitation events, this groundwater base flow is mixed with rainfall runoff . For example, after the summer monsoons, water flowing in the perennial Colorado River consists of a combination of groundwater base flow and recent rainfall . In contrast, the San Pedro River is only perennial in some portions . Other stretches of the river consist of dry sand and flow only after a rain .
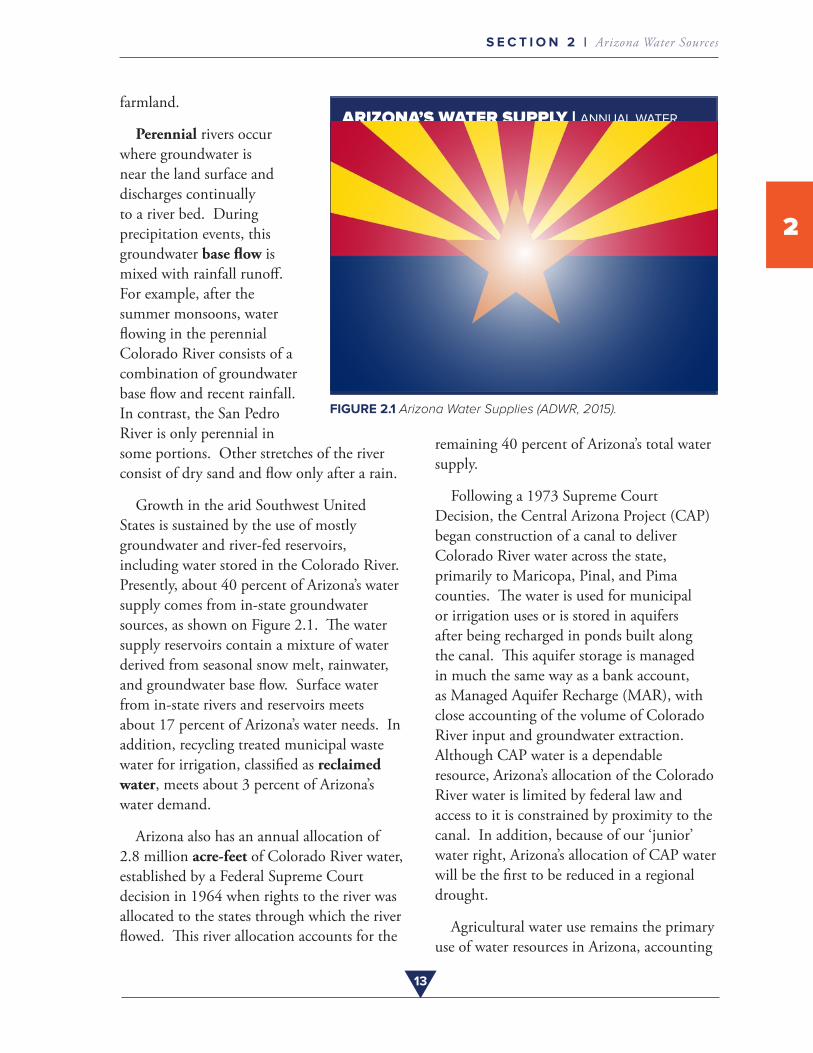
Growth in the arid Southwest United States is sustained by the use of mostly groundwater and river-fed reservoirs, including water stored in the Colorado River . Presently, about 40 percent of Arizona’s water supply comes from in-state groundwater sources, as shown on Figure 2 .1 . The water supply reservoirs contain a mixture of water derived from seasonal snow melt, rainwater, and groundwater base flow . Surface water from in-state rivers and reservoirs meets about 17 percent of Arizona’s water needs . In addition, recycling treated municipal waste water for irrigation, classified as reclaimed water, meets about 3 percent of Arizona’s water demand .
Arizona also has an annual allocation of 2 .8 million acre-feet of Colorado River water, established by a Federal Supreme Court decision in 1964 when rights to the river was allocated to the states through which the river flowed . This river allocation accounts for the
FIGURE 2.1 Arizona Water Supplies (ADWR, 2015).
ARIZONA’S WATER SUPPLY | ANNUAL WATER
BUDGET 2014
WATER SOURCE % OF TOTAL
SURFACE WATER
Colorado River 2.8 40%CAP 1.6 23%
On-River 1.2 17%*Adjusted for return flows
In-State River 1.2 17%Salt-Verde 0.7
GROUNDWATER 2.8 40%
RECLAIMED WATER 0.2 3%
TOTAL: 7.0 maf 100%
remaining 40 percent of Arizona’s total water supply .
Following a 1973 Supreme Court Decision, the Central Arizona Project (CAP) began construction of a canal to deliver Colorado River water across the state, primarily to Maricopa, Pinal, and Pima counties . The water is used for municipal or irrigation uses or is stored in aquifers after being recharged in ponds built along the canal . This aquifer storage is managed in much the same way as a bank account, as Managed Aquifer Recharge (MAR), with close accounting of the volume of Colorado River input and groundwater extraction . Although CAP water is a dependable resource, Arizona’s allocation of the Colorado River water is limited by federal law and access to it is constrained by proximity to the canal . In addition, because of our ‘junior’ water right, Arizona’s allocation of CAP water will be the first to be reduced in a regional drought .
Agricultural water use remains the primary use of water resources in Arizona, accounting
14
S E C T I O N 2 | Arizona Water Sources
2
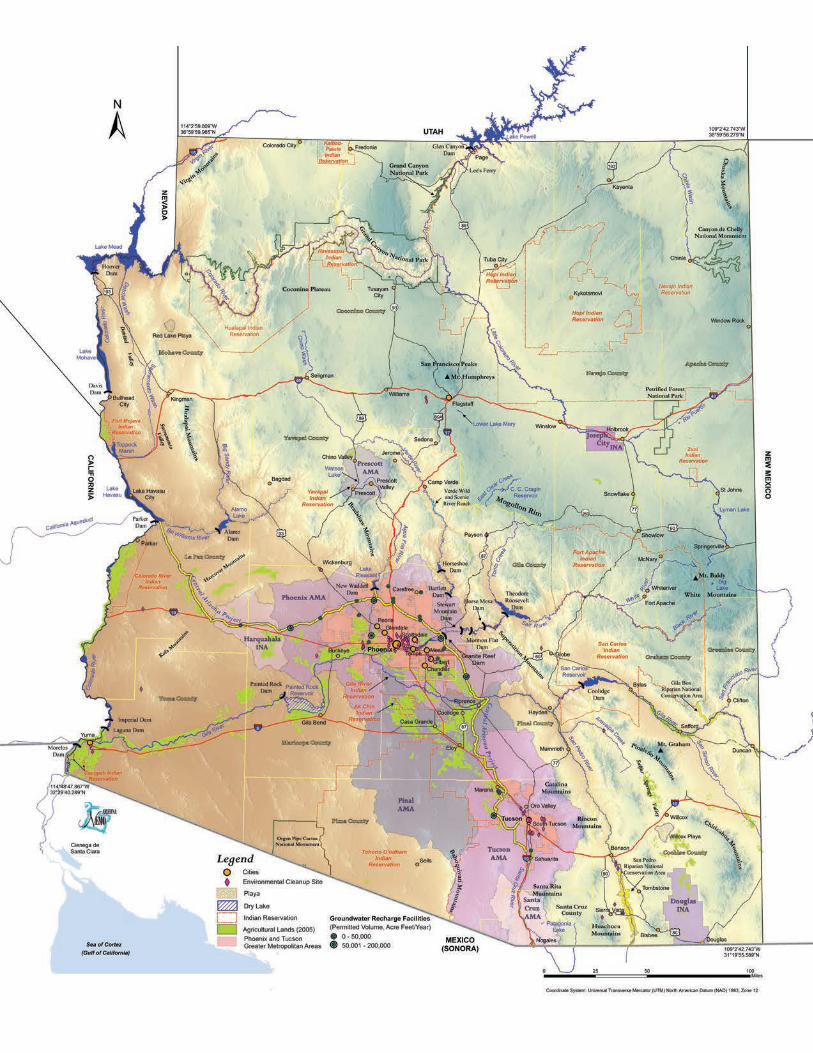
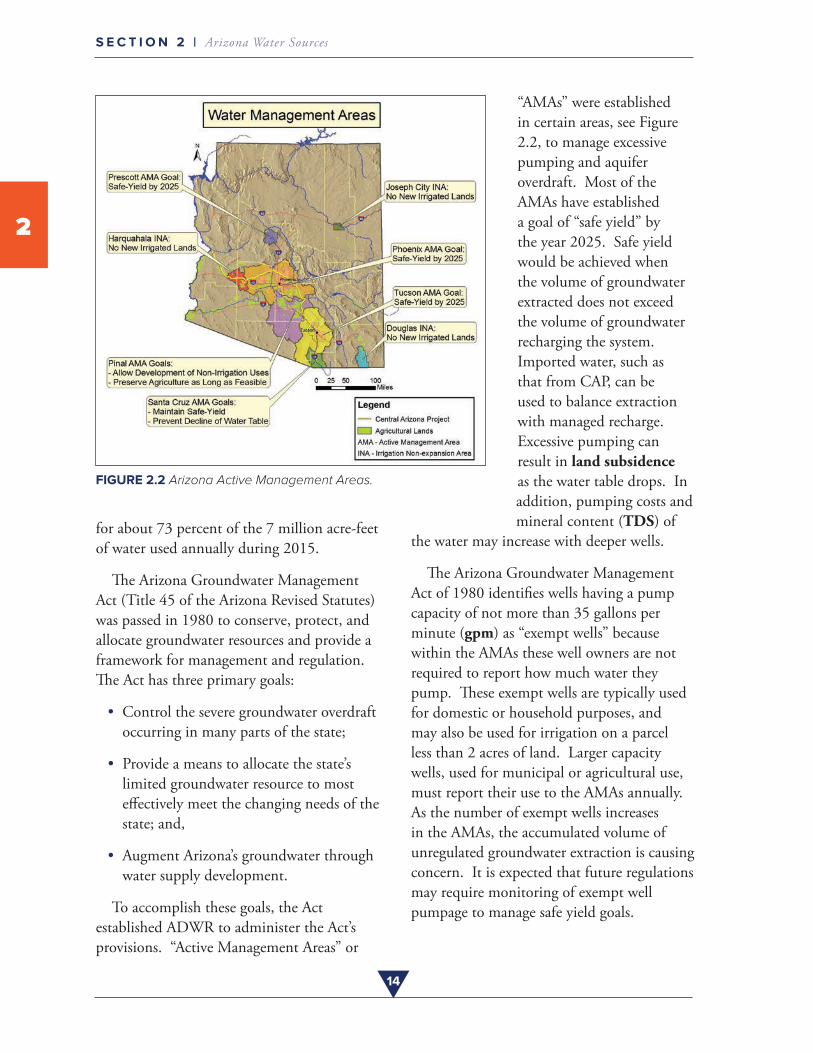
FIGURE 2.2 Arizona Active Management Areas.
for about 73 percent of the 7 million acre-feet of water used annually during 2015 .
The Arizona Groundwater Management Act (Title 45 of the Arizona Revised Statutes) was passed in 1980 to conserve, protect, and allocate groundwater resources and provide a framework for management and regulation . The Act has three primary goals:
• Control the severe groundwater overdraftoccurring in many parts of the state;
• Provide a means to allocate the state’slimited groundwater resource to mosteffectively meet the changing needs of thestate; and,
• Augment Arizona’s groundwater throughwater supply development .
To accomplish these goals, the Act established ADWR to administer the Act’s provisions . “Active Management Areas” or
“AMAs” were established in certain areas, see Figure 2 .2, to manage excessive pumping and aquifer overdraft . Most of the AMAs have established a goal of “safe yield” by the year 2025 . Safe yield would be achieved when the volume of groundwater extracted does not exceed the volume of groundwater recharging the system . Imported water, such as that from CAP, can be used to balance extraction with managed recharge . Excessive pumping can result in land subsidence as the water table drops . In addition, pumping costs and mineral content (TDS) of
the water may increase with deeper wells .
The Arizona Groundwater Management Act of 1980 identifies wells having a pump capacity of not more than 35 gallons per minute (gpm) as “exempt wells” because within the AMAs these well owners are not required to report how much water they pump . These exempt wells are typically used for domestic or household purposes, and may also be used for irrigation on a parcel less than 2 acres of land . Larger capacity wells, used for municipal or agricultural use, must report their use to the AMAs annually . As the number of exempt wells increases in the AMAs, the accumulated volume of unregulated groundwater extraction is causing concern . It is expected that future regulations may require monitoring of exempt well pumpage to manage safe yield goals .
15
S E C T I O N 2 | Arizona Water Sources
2
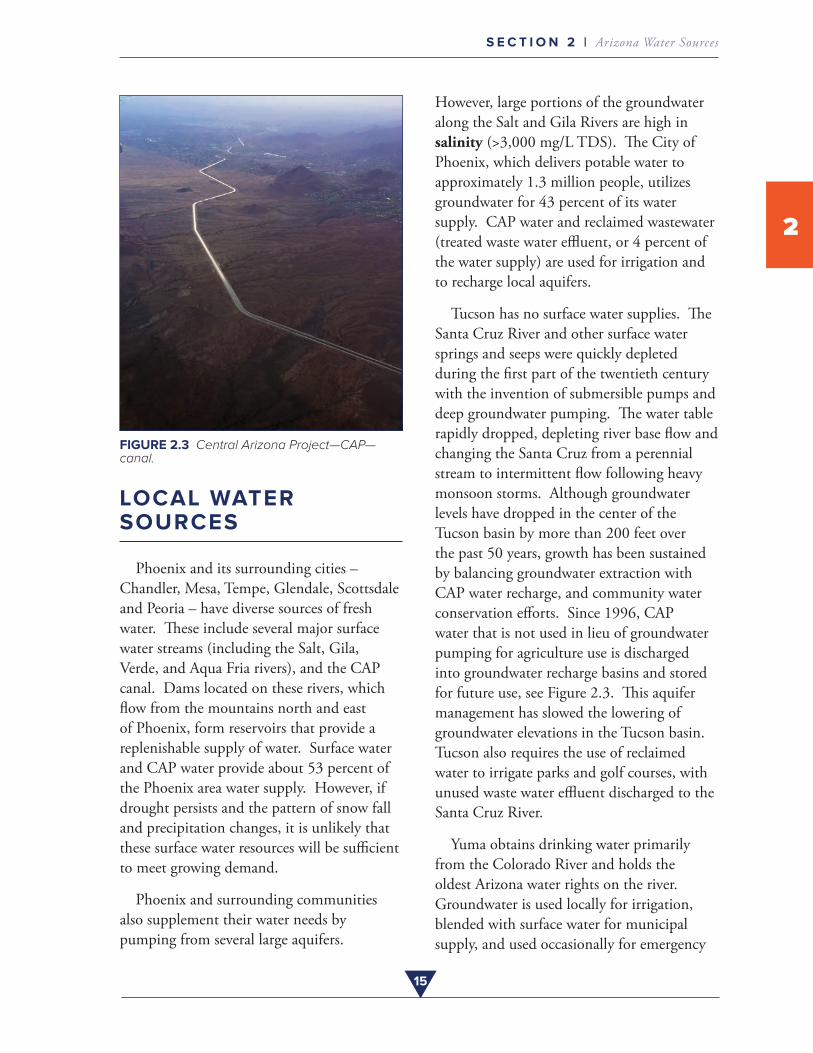
FIGURE 2.3 Central Arizona Project—CAP—canal.
LOCAL WATER SOURCES
Phoenix and its surrounding cities – Chandler, Mesa, Tempe, Glendale, Scottsdale and Peoria – have diverse sources of fresh water . These include several major surface water streams (including the Salt, Gila, Verde, and Aqua Fria rivers), and the CAP canal . Dams located on these rivers, which flow from the mountains north and east of Phoenix, form reservoirs that provide a replenishable supply of water . Surface water and CAP water provide about 53 percent of the Phoenix area water supply . However, if drought persists and the pattern of snow fall and precipitation changes, it is unlikely that these surface water resources will be sufficient to meet growing demand .
Phoenix and surrounding communities also supplement their water needs by pumping from several large aquifers .
However, large portions of the groundwater along the Salt and Gila Rivers are high in salinity (>3,000 mg/L TDS) . The City of Phoenix, which delivers potable water to approximately 1 .3 million people, utilizes groundwater for 43 percent of its water supply . CAP water and reclaimed wastewater (treated waste water effluent, or 4 percent of the water supply) are used for irrigation and to recharge local aquifers .
Tucson has no surface water supplies . The Santa Cruz River and other surface water springs and seeps were quickly depleted during the first part of the twentieth century with the invention of submersible pumps and deep groundwater pumping . The water table rapidly dropped, depleting river base flow and changing the Santa Cruz from a perennial stream to intermittent flow following heavy monsoon storms . Although groundwater levels have dropped in the center of the Tucson basin by more than 200 feet over the past 50 years, growth has been sustained by balancing groundwater extraction with CAP water recharge, and community water conservation efforts . Since 1996, CAP water that is not used in lieu of groundwater pumping for agriculture use is discharged into groundwater recharge basins and stored for future use, see Figure 2 .3 . This aquifer management has slowed the lowering of groundwater elevations in the Tucson basin . Tucson also requires the use of reclaimed water to irrigate parks and golf courses, with unused waste water effluent discharged to the Santa Cruz River .
Yuma obtains drinking water primarily from the Colorado River and holds the oldest Arizona water rights on the river . Groundwater is used locally for irrigation, blended with surface water for municipal supply, and used occasionally for emergency
16
S E C T I O N 2 | Arizona Water Sources
2
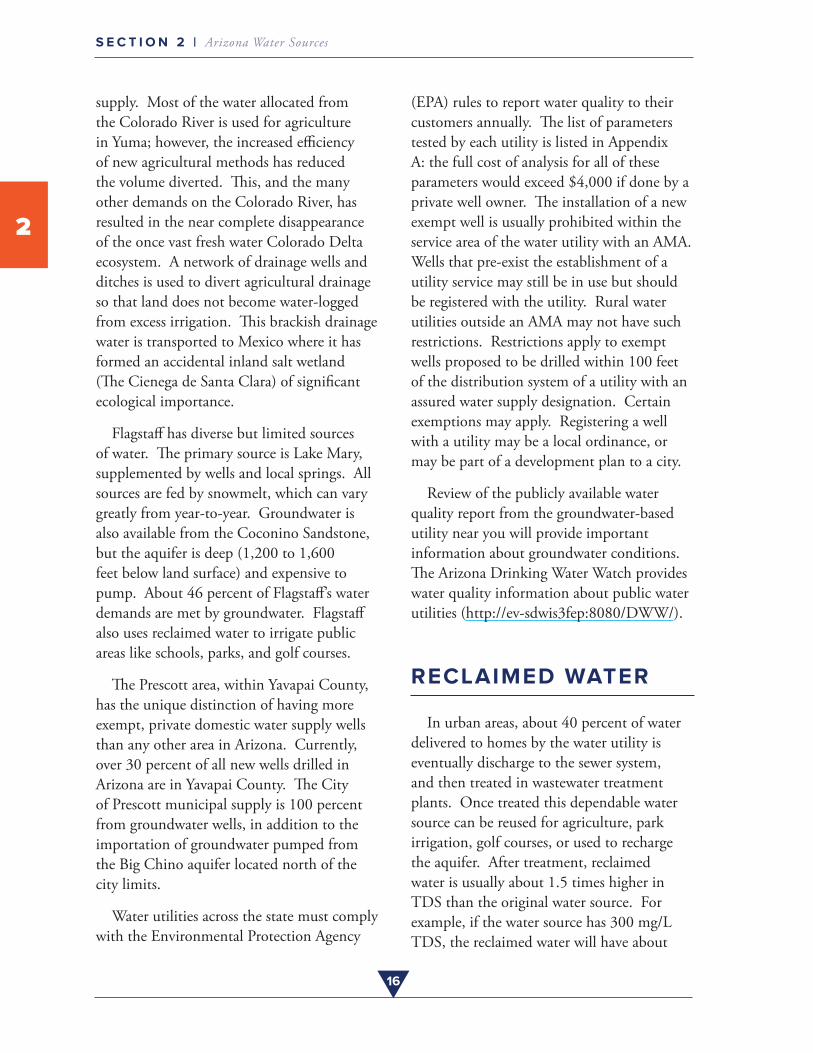
supply . Most of the water allocated from the Colorado River is used for agriculture in Yuma; however, the increased efficiency of new agricultural methods has reduced the volume diverted . This, and the many other demands on the Colorado River, has resulted in the near complete disappearance of the once vast fresh water Colorado Delta ecosystem . A network of drainage wells and ditches is used to divert agricultural drainage so that land does not become water-logged from excess irrigation . This brackish drainage water is transported to Mexico where it has formed an accidental inland salt wetland (The Cienega de Santa Clara) of significant ecological importance .
Flagstaff has diverse but limited sources of water . The primary source is Lake Mary, supplemented by wells and local springs . All sources are fed by snowmelt, which can vary greatly from year-to-year . Groundwater is also available from the Coconino Sandstone, but the aquifer is deep (1,200 to 1,600 feet below land surface) and expensive to pump . About 46 percent of Flagstaff’s water demands are met by groundwater . Flagstaff also uses reclaimed water to irrigate public areas like schools, parks, and golf courses .
The Prescott area, within Yavapai County, has the unique distinction of having more exempt, private domestic water supply wells than any other area in Arizona . Currently, over 30 percent of all new wells drilled in Arizona are in Yavapai County . The City of Prescott municipal supply is 100 percent from groundwater wells, in addition to the importation of groundwater pumped from the Big Chino aquifer located north of the city limits .
Water utilities across the state must comply with the Environmental Protection Agency
(EPA) rules to report water quality to their customers annually . The list of parameters tested by each utility is listed in Appendix A: the full cost of analysis for all of these parameters would exceed $4,000 if done by a private well owner . The installation of a new exempt well is usually prohibited within the service area of the water utility with an AMA . Wells that pre-exist the establishment of a utility service may still be in use but should be registered with the utility . Rural water utilities outside an AMA may not have such restrictions . Restrictions apply to exempt wells proposed to be drilled within 100 feet of the distribution system of a utility with an assured water supply designation . Certain exemptions may apply . Registering a well with a utility may be a local ordinance, or may be part of a development plan to a city .
Review of the publicly available water quality report from the groundwater-based utility near you will provide important information about groundwater conditions . The Arizona Drinking Water Watch provides water quality information about public water utilities (http://ev-sdwis3fep:8080/DWW/) .
RECLAIMED WATER
In urban areas, about 40 percent of water delivered to homes by the water utility is eventually discharge to the sewer system, and then treated in wastewater treatment plants . Once treated this dependable water source can be reused for agriculture, park irrigation, golf courses, or used to recharge the aquifer . After treatment, reclaimed water is usually about 1 .5 times higher in TDS than the original water source . For example, if the water source has 300 mg/L TDS, the reclaimed water will have about
17
S E C T I O N 2 | Arizona Water Sources
2
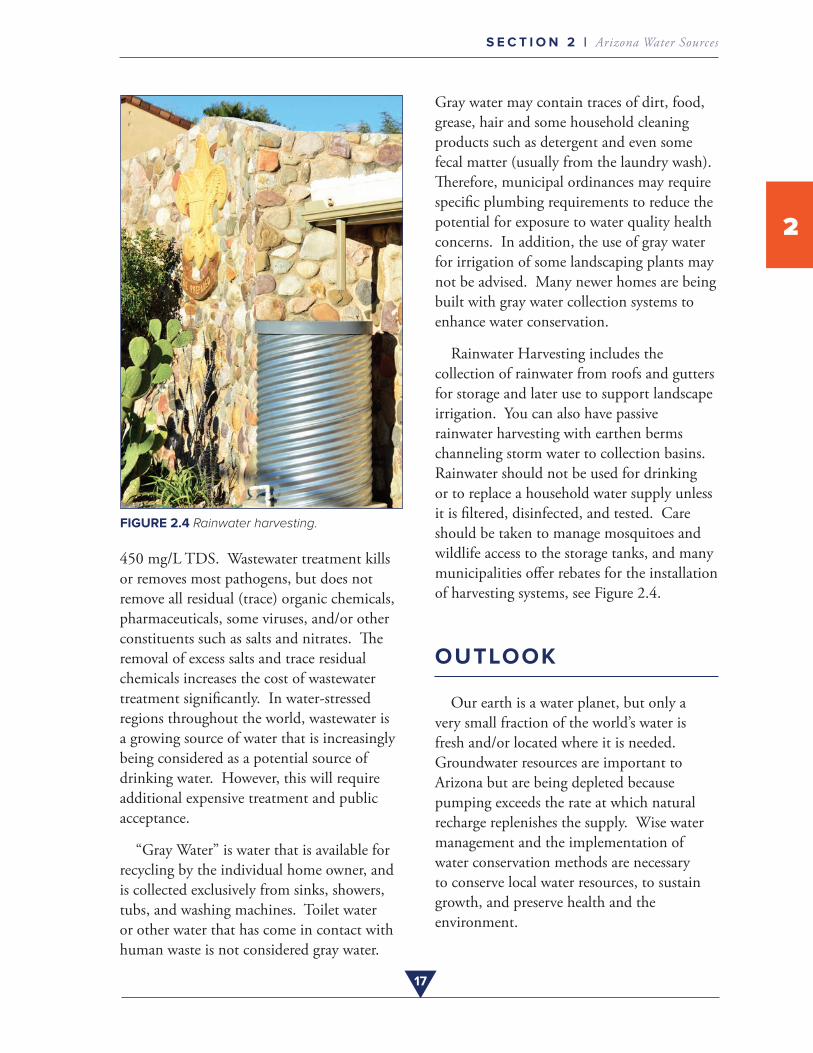
FIGURE 2.4 Rainwater harvesting.
450 mg/L TDS . Wastewater treatment kills or removes most pathogens, but does not remove all residual (trace) organic chemicals, pharmaceuticals, some viruses, and/or other constituents such as salts and nitrates . The removal of excess salts and trace residual chemicals increases the cost of wastewater treatment significantly . In water-stressed regions throughout the world, wastewater is a growing source of water that is increasingly being considered as a potential source of drinking water . However, this will require additional expensive treatment and public acceptance .
“Gray Water” is water that is available for recycling by the individual home owner, and is collected exclusively from sinks, showers, tubs, and washing machines . Toilet water or other water that has come in contact with human waste is not considered gray water .
Gray water may contain traces of dirt, food, grease, hair and some household cleaning products such as detergent and even some fecal matter (usually from the laundry wash) . Therefore, municipal ordinances may require specific plumbing requirements to reduce the potential for exposure to water quality health concerns . In addition, the use of gray water for irrigation of some landscaping plants may not be advised . Many newer homes are being built with gray water collection systems to enhance water conservation .
Rainwater Harvesting includes the collection of rainwater from roofs and gutters for storage and later use to support landscape irrigation . You can also have passive rainwater harvesting with earthen berms channeling storm water to collection basins . Rainwater should not be used for drinking or to replace a household water supply unless it is filtered, disinfected, and tested . Care should be taken to manage mosquitoes and wildlife access to the storage tanks, and many municipalities offer rebates for the installation of harvesting systems, see Figure 2 .4 .
OUTLOOK
Our earth is a water planet, but only a very small fraction of the world’s water is fresh and/or located where it is needed . Groundwater resources are important to Arizona but are being depleted because pumping exceeds the rate at which natural recharge replenishes the supply . Wise water management and the implementation of water conservation methods are necessary to conserve local water resources, to sustain growth, and preserve health and the environment .
18
S E C T I O N 2 | Arizona Water Sources
2
Photo Credit: K. Uhlman
Prickly pear cactus.
For the domestic well owner, knowledge of the vulnerability of their well, the importance of water quality monitoring, and appropriate well maintenance is necessary to assure drinking water availability and sustainable supply into the future .
R E F E R E N C E S O F I N T E R E S T
An Arizona Guide to Water Quality and Uses . 2014 . Extension Publication #AZ1610 .
Arizona Department of Water Resources, 2015 Annual Water Budget, 2014 .
Arizona Water Map Curriculum Guide . 2009 . Extension Publication #AZ1501 .
Passive Water Harvesting . 2012 . Extension Publication #AZ1564 .
Basic Components of a Rainwater Storage System . 2012 . Extension Publication #AZ1565 .
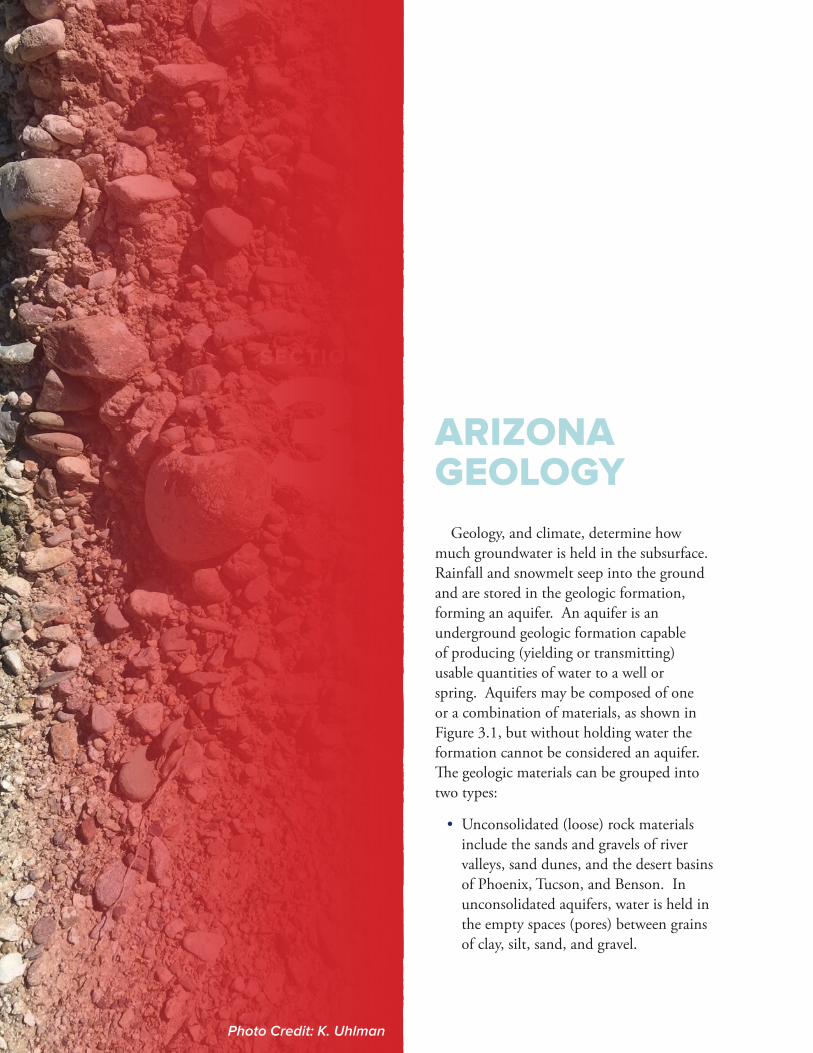
Photo Credit: J. Artiola
SECTION SECTION
3 ARIZONAGEOLOGY
Geology, and climate, determine how much groundwater is held in the subsurface . Rainfall and snowmelt seep into the ground and are stored in the geologic formation, forming an aquifer . An aquifer is an underground geologic formation capable of producing (yielding or transmitting) usable quantities of water to a well or spring . Aquifers may be composed of one or a combination of materials, as shown in Figure 3 .1, but without holding water the formation cannot be considered an aquifer . The geologic materials can be grouped into two types:
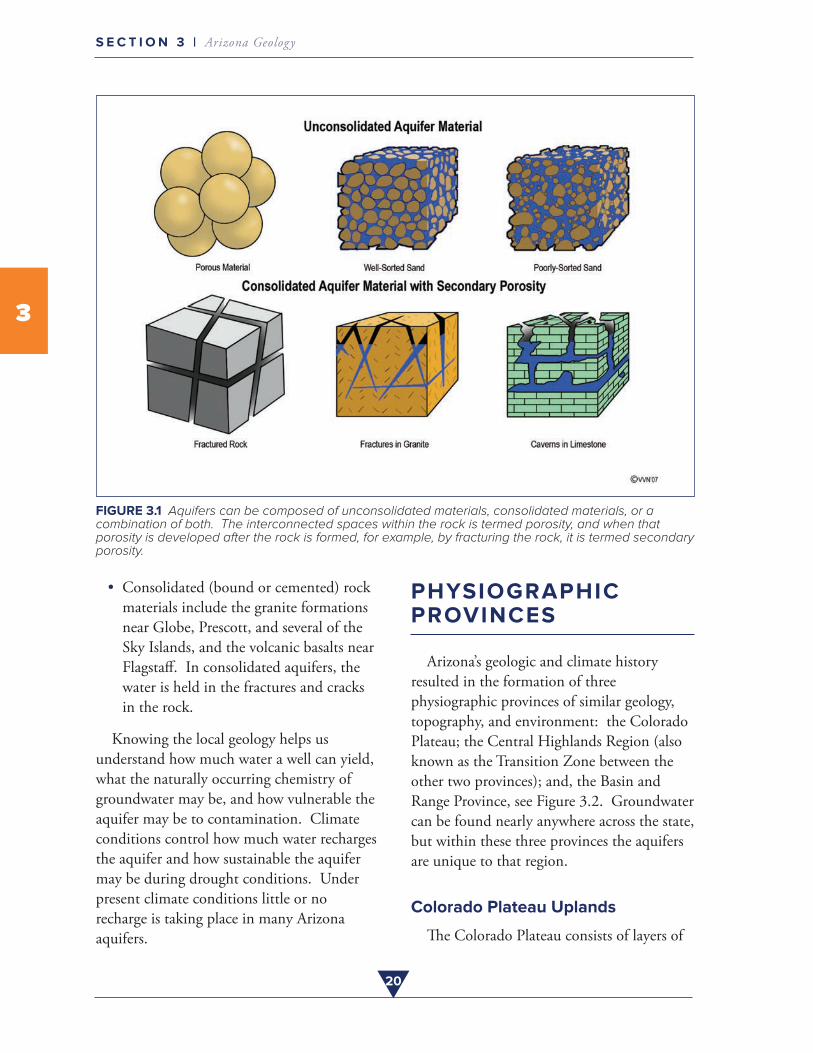
• Unconsolidated (loose) rock materialsinclude the sands and gravels of rivervalleys, sand dunes, and the desert basinsof Phoenix, Tucson, and Benson . Inunconsolidated aquifers, water is held inthe empty spaces (pores) between grainsof clay, silt, sand, and gravel .
Photo Credit: K. Uhlman
20
S E C T I O N 3 | Arizona Geology
3
FIGURE 3.1 Aquifers can be composed of unconsolidated materials, consolidated materials, or a combination of both. The interconnected spaces within the rock is termed porosity, and when that porosity is developed after the rock is formed, for example, by fracturing the rock, it is termed secondary porosity.
• Consolidated (bound or cemented) rockmaterials include the granite formationsnear Globe, Prescott, and several of theSky Islands, and the volcanic basalts nearFlagstaff . In consolidated aquifers, thewater is held in the fractures and cracksin the rock .
Knowing the local geology helps us understand how much water a well can yield, what the naturally occurring chemistry of groundwater may be, and how vulnerable the aquifer may be to contamination . Climate conditions control how much water recharges the aquifer and how sustainable the aquifer may be during drought conditions . Under present climate conditions little or no recharge is taking place in many Arizona aquifers .
PHYSIOGRAPHIC PROVINCES
Arizona’s geologic and climate history resulted in the formation of three physiographic provinces of similar geology, topography, and environment: the Colorado Plateau; the Central Highlands Region (also known as the Transition Zone between the other two provinces); and, the Basin and Range Province, see Figure 3 .2 . Groundwater can be found nearly anywhere across the state, but within these three provinces the aquifers are unique to that region .
Colorado Plateau Uplands
The Colorado Plateau consists of layers of

21
S E C T I O N 3 | Arizona Geology
3
FIGURE 3.2 Arizona Physiographic Provinces (Harshbarger et al., 1966).
consolidated sedimentary rock, which form broad plateaus and mesas, separated by deep canyons . The province covers an area of 3 .13 million square miles across northern Arizona and extends within western Colorado, northwestern New Mexico, southern and eastern Utah . About 90 percent of the area is drained by the Colorado River and its tributaries . The numerous sedimentary rock layers are visible in the walls of the Grand Canyon, and each rock layer has unique aquifer characteristics, dependent on the number of sedimentary bedding planes, fractures and cracks, and interconnected rock fractures . Some sedimentary rocks
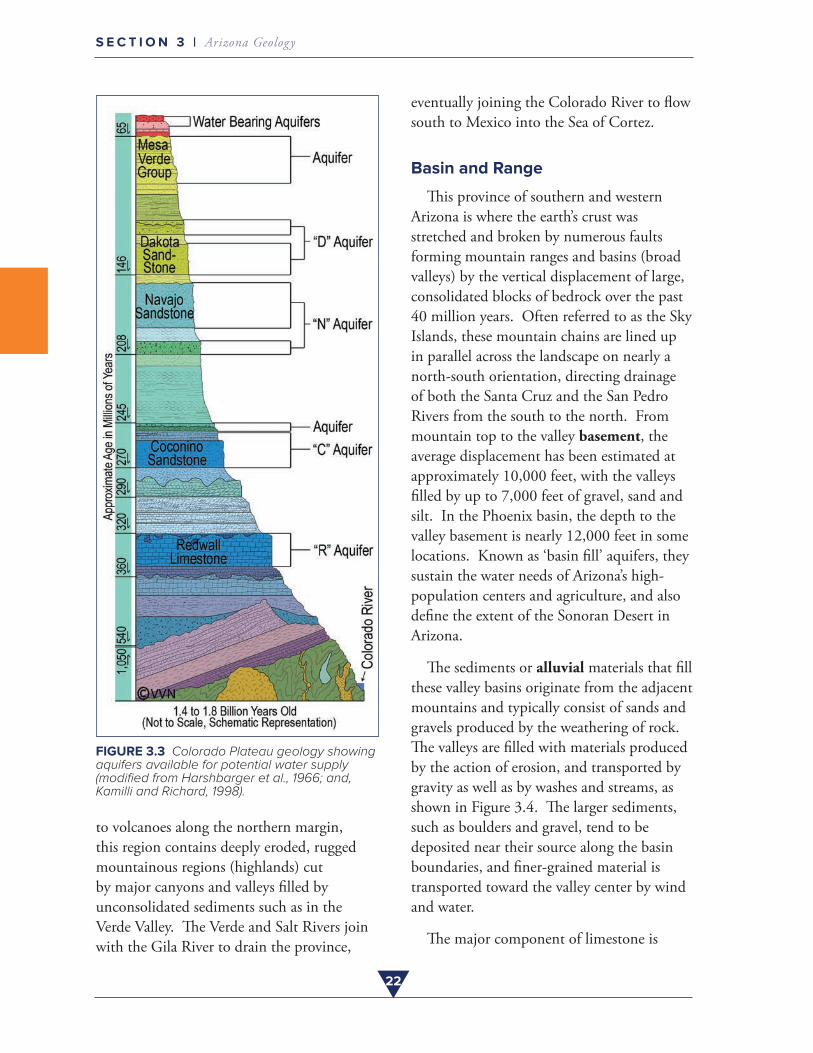
maintain their original pore space, porosity, such as the Coconino Sandstone, see Figure 3 .3, which originated from ancient white sand dunes . In some places, these layers of sedimentary rock contain caverns and caves (for example in the Redwall Limestone) . These caves were produced by large groundwater flows through rock fractures, which then dissolved the minerals in the rock, forming large caverns . Therefore, a well constructed in the consolidated sedimentary aquifers of the Colorado Plateau may yield little water if the borehole does not intercept sufficient fractures transmitting water, or in the extreme, the well may yield significant volumes of groundwater .
Central Highlands Region
The southern boundary of the Colorado Plateau is the Mogollon Rim, a steep ridge formed by erosion as the Colorado Plateau uplifted over the past 600 million years . Large volcanoes, such as the San Francisco Peaks, are present along the Rim, and the geology exposed at the land surface consists of very old igneous, metamorphic, and sedimentary rocks dating back nearly a billion years . This zone cuts across central Arizona, see Figure 3 .2, separating the Basin and Range Province from the Colorado Plateau, and exhibits geologic characteristics intermediate between the two . In addition
22
S E C T I O N 3 | Arizona Geology
FIGURE 3.3 Colorado Plateau geology showing aquifers available for potential water supply (modified from Harshbarger et al., 1966; and, Kamilli and Richard, 1998).
to volcanoes along the northern margin, this region contains deeply eroded, rugged mountainous regions (highlands) cut by major canyons and valleys filled by unconsolidated sediments such as in the Verde Valley . The Verde and Salt Rivers join with the Gila River to drain the province,
eventually joining the Colorado River to flow south to Mexico into the Sea of Cortez .
Basin and Range
This province of southern and western Arizona is where the earth’s crust was stretched and broken by numerous faults forming mountain ranges and basins (broad valleys) by the vertical displacement of large, consolidated blocks of bedrock over the past 40 million years . Often referred to as the Sky Islands, these mountain chains are lined up in parallel across the landscape on nearly a north-south orientation, directing drainage of both the Santa Cruz and the San Pedro Rivers from the south to the north . From mountain top to the valley basement, the average displacement has been estimated at approximately 10,000 feet, with the valleys filled by up to 7,000 feet of gravel, sand and silt . In the Phoenix basin, the depth to the valley basement is nearly 12,000 feet in some locations . Known as ‘basin fill’ aquifers, they sustain the water needs of Arizona’s high-population centers and agriculture, and also define the extent of the Sonoran Desert in Arizona .
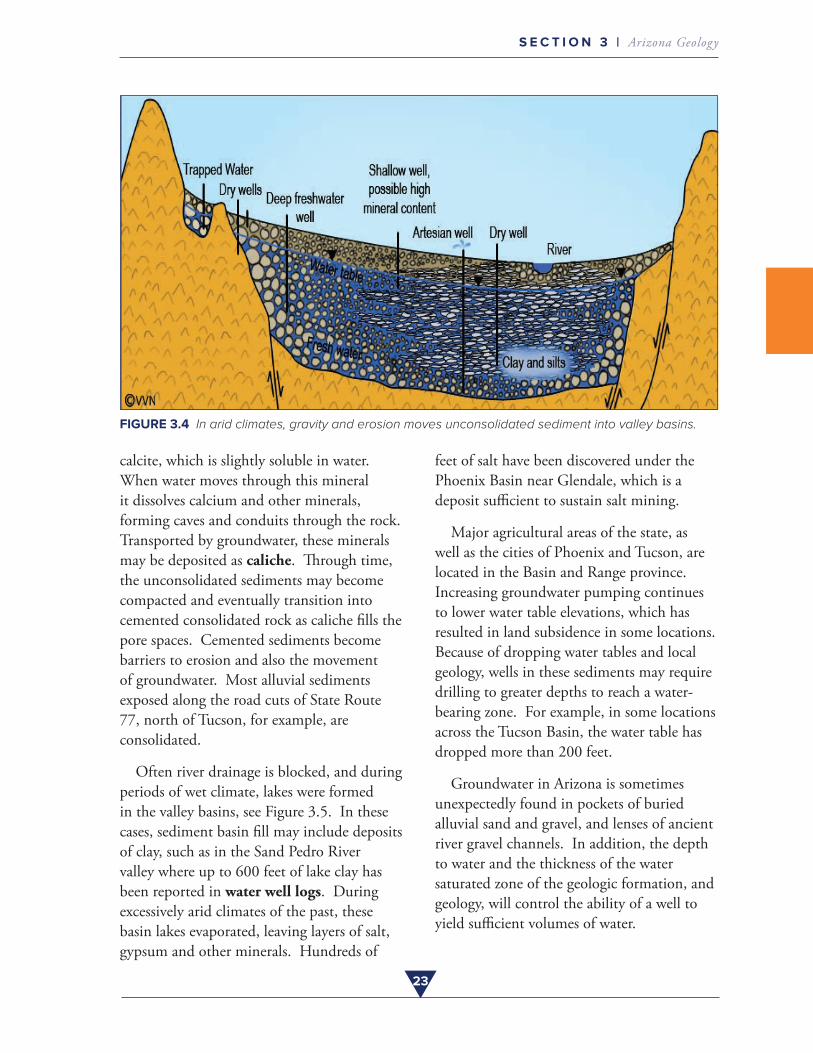
The sediments or alluvial materials that fill these valley basins originate from the adjacent mountains and typically consist of sands and gravels produced by the weathering of rock . The valleys are filled with materials produced by the action of erosion, and transported by gravity as well as by washes and streams, as shown in Figure 3 .4 . The larger sediments, such as boulders and gravel, tend to be deposited near their source along the basin boundaries, and finer-grained material is transported toward the valley center by wind and water .
The major component of limestone is
23
S E C T I O N 3 | Arizona Geology
FIGURE 3.4 In arid climates, gravity and erosion moves unconsolidated sediment into valley basins.
calcite, which is slightly soluble in water . When water moves through this mineral it dissolves calcium and other minerals, forming caves and conduits through the rock . Transported by groundwater, these minerals may be deposited as caliche . Through time, the unconsolidated sediments may become compacted and eventually transition into cemented consolidated rock as caliche fills the pore spaces . Cemented sediments become barriers to erosion and also the movement of groundwater . Most alluvial sediments exposed along the road cuts of State Route 77, north of Tucson, for example, are consolidated .
Often river drainage is blocked, and during periods of wet climate, lakes were formed in the valley basins, see Figure 3 .5 . In these cases, sediment basin fill may include deposits of clay, such as in the Sand Pedro River valley where up to 600 feet of lake clay has been reported in water well logs . During excessively arid climates of the past, these basin lakes evaporated, leaving layers of salt, gypsum and other minerals . Hundreds of
feet of salt have been discovered under the Phoenix Basin near Glendale, which is a deposit sufficient to sustain salt mining .
Major agricultural areas of the state, as well as the cities of Phoenix and Tucson, are located in the Basin and Range province . Increasing groundwater pumping continues to lower water table elevations, which has resulted in land subsidence in some locations . Because of dropping water tables and local geology, wells in these sediments may require drilling to greater depths to reach a water-bearing zone . For example, in some locations across the Tucson Basin, the water table has dropped more than 200 feet .
Groundwater in Arizona is sometimes unexpectedly found in pockets of buried alluvial sand and gravel, and lenses of ancient river gravel channels . In addition, the depth to water and the thickness of the water saturated zone of the geologic formation, and geology, will control the ability of a well to yield sufficient volumes of water .
24
S E C T I O N 3 | Arizona Geology
FIGURE 3.5 Geologic clues reveal past climates, in this case 12,000 million years or more in the past the Phoenix Basin was a lake. Used with permission from The New Yorker.
ECONOMIC GEOLOGY OF ARIZONA
Arizona is known for five C’s: cotton; citrus; cattle; climate; and, copper, all depend on water availability . Agricultural production of citrus, cotton, and other agricultural products is dependent not only on local and imported surface water but also the extraction of groundwater from the aquifers of the Basin and Range Province . Arizona produces around 65 percent of the nation’s copper, and leads the nation in non-fuel, hard rock mineral extraction . The presence of copper (and other economic minerals) is due to the injection of mineralized fluids into host rock during the intense volcanic activity of the geologic past, and is found in many locations bordering the Sky Islands of the Basin and Range as well as within the Central Highlands, as shown in Figure 3 .2 . Sand and gravel quarries, in addition to salt mining, is found in the Basin and Range, and the unique geologic setting of the Colorado Plateau Province supports uranium mining .
This geologic legacy impacts groundwater availability and quality in some of the important aquifers of the state, and will be discussed in Sections 4 and 7 .
R E F E R E N C E S O F I N T E R E S T
Arizona Salt . 2013 . Extension Publication #SWES13 .
Harshbarger, J .W ., D .D . Lewis, H .E . Skibitzke, W .L . Heckler, L .R . Kister, and H .L . Baldwin . 1966 . Arizona Water . U .S . Geological Survey Water Supply Paper 1648 . U .S . Government Printing Office, Washington D .C . 84 pages .
Kamilli, R .J ., and S .M . Richard, editors . 1998 . Geology Highway Map of Arizona, Arizona Geologica Survey, Tucson .
SECTION
1SECTION
4 WHAT IS ANAQUIFER?
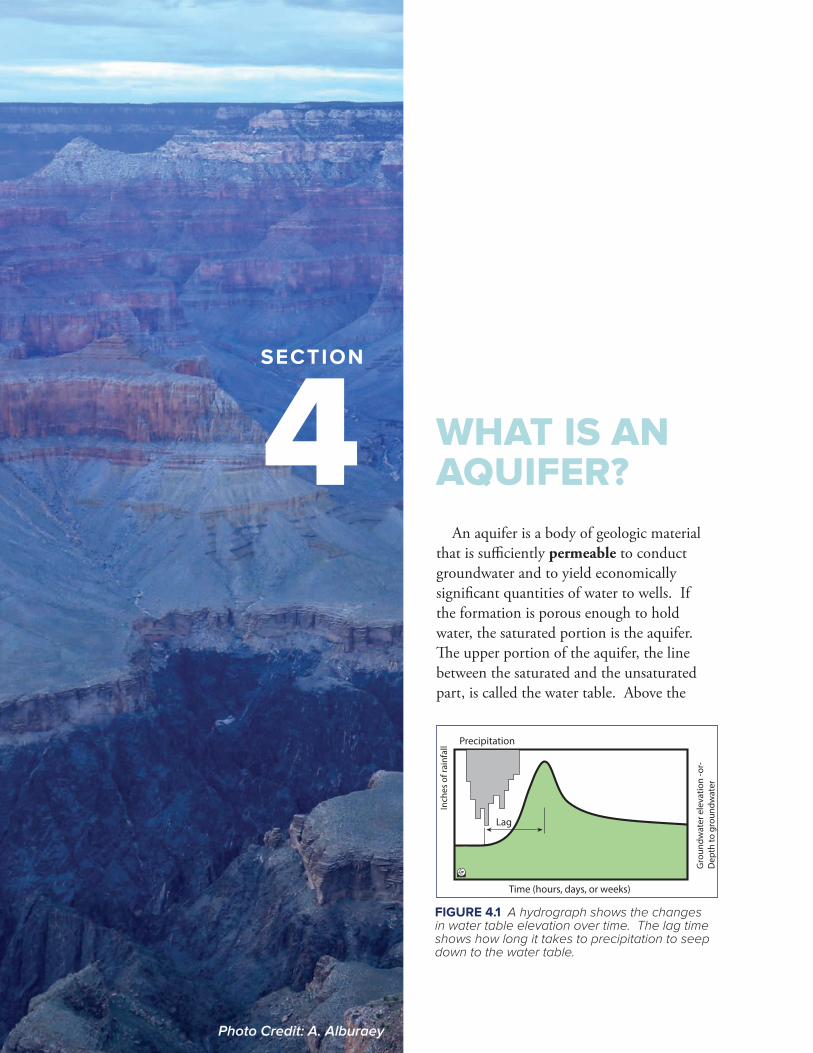
An aquifer is a body of geologic material that is sufficiently permeable to conduct groundwater and to yield economically significant quantities of water to wells . If the formation is porous enough to hold water, the saturated portion is the aquifer . The upper portion of the aquifer, the line between the saturated and the unsaturated part, is called the water table . Above the
Photo Credit: A. Alburaey
Time (hours, days, or weeks)
Precipitation
Gro
undw
ater
ele
vatio
n -o
r-D
epth
to g
roun
dwat
er
Lag
FIGURE 4.1 A hydrograph shows the changes in water table elevation over time. The lag time shows how long it takes to precipitation to seep down to the water table.
26
S E C T I O N 4 | What is an Aquifer?
4
Artesian
Make a cute cloud… Well
WatertablePotentiometric
Surface
Con�ning Layer(Aquitard)
Artesian Well
Uncon�nedAquifer
Con�nedAquifer
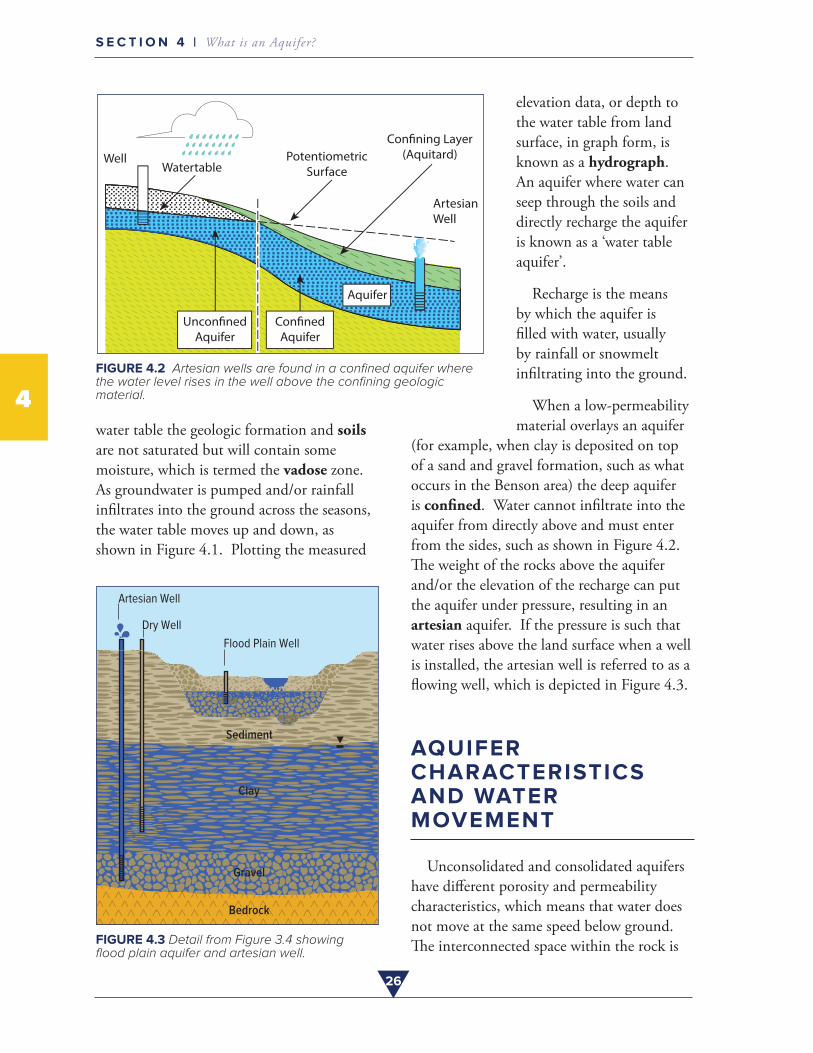
FIGURE 4.2 Artesian wells are found in a confined aquifer where the water level rises in the well above the confining geologic material.
water table the geologic formation and soils are not saturated but will contain some moisture, which is termed the vadose zone . As groundwater is pumped and/or rainfall infiltrates into the ground across the seasons, the water table moves up and down, as shown in Figure 4 .1 . Plotting the measured
Artesian Well
Dry Well
Flood Plain Well
Sediment
Clay
Gravel
Bedrock
FIGURE 4.3 Detail from Figure 3.4 showing flood plain aquifer and artesian well.
elevation data, or depth to the water table from land surface, in graph form, is known as a hydrograph . An aquifer where water can seep through the soils and directly recharge the aquifer is known as a ‘water table aquifer’ .
Recharge is the means by which the aquifer is filled with water, usually by rainfall or snowmelt infiltrating into the ground .
When a low-permeability material overlays an aquifer
(for example, when clay is deposited on top of a sand and gravel formation, such as what occurs in the Benson area) the deep aquifer is confined . Water cannot infiltrate into the aquifer from directly above and must enter from the sides, such as shown in Figure 4 .2 . The weight of the rocks above the aquifer and/or the elevation of the recharge can put the aquifer under pressure, resulting in an artesian aquifer . If the pressure is such that water rises above the land surface when a well is installed, the artesian well is referred to as a flowing well, which is depicted in Figure 4 .3 .
AQUIFER CHARACTERISTICS AND WATER MOVEMENT
Unconsolidated and consolidated aquifers have different porosity and permeability characteristics, which means that water does not move at the same speed below ground . The interconnected space within the rock is
27
S E C T I O N 4 | What is an Aquifer?
4
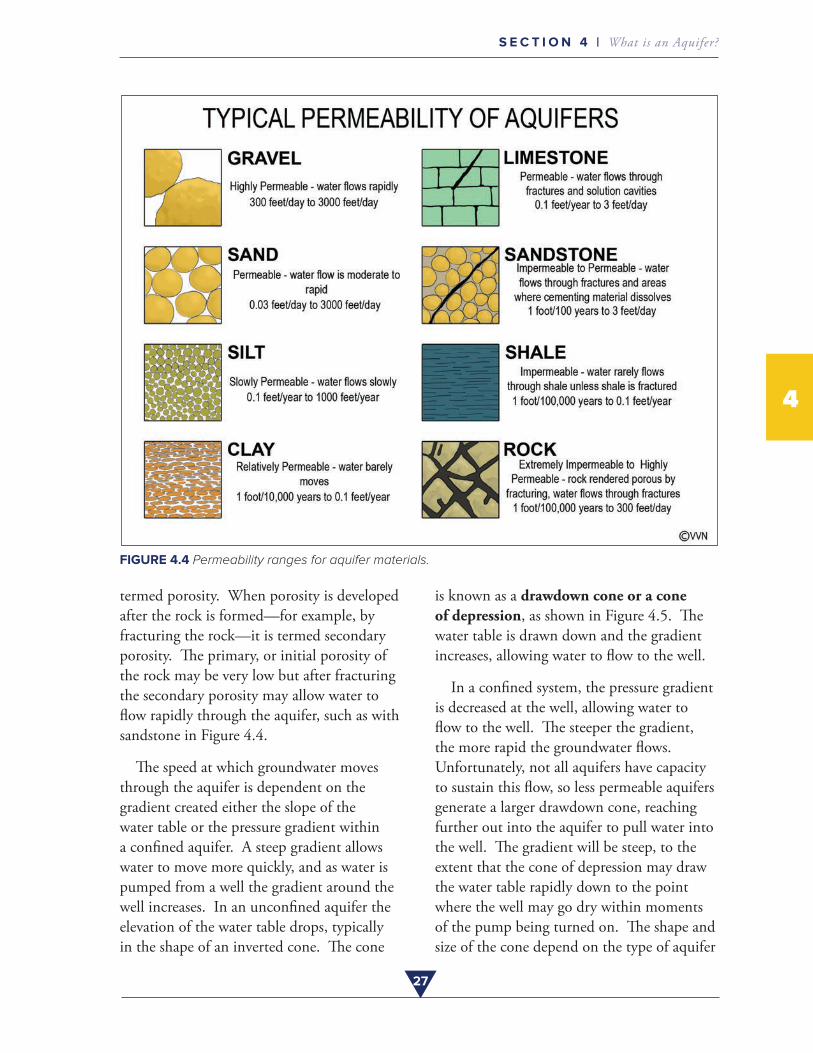
termed porosity . When porosity is developed after the rock is formed—for example, by fracturing the rock—it is termed secondary porosity . The primary, or initial porosity of the rock may be very low but after fracturing the secondary porosity may allow water to flow rapidly through the aquifer, such as with sandstone in Figure 4 .4 .
The speed at which groundwater moves through the aquifer is dependent on the gradient created either the slope of the water table or the pressure gradient within a confined aquifer . A steep gradient allows water to move more quickly, and as water is pumped from a well the gradient around the well increases . In an unconfined aquifer the elevation of the water table drops, typically in the shape of an inverted cone . The cone
FIGURE 4.4 Permeability ranges for aquifer materials.
is known as a drawdown cone or a cone of depression, as shown in Figure 4 .5 . The water table is drawn down and the gradient increases, allowing water to flow to the well .
In a confined system, the pressure gradient is decreased at the well, allowing water to flow to the well . The steeper the gradient, the more rapid the groundwater flows . Unfortunately, not all aquifers have capacity to sustain this flow, so less permeable aquifers generate a larger drawdown cone, reaching further out into the aquifer to pull water into the well . The gradient will be steep, to the extent that the cone of depression may draw the water table rapidly down to the point where the well may go dry within moments of the pump being turned on . The shape and size of the cone depend on the type of aquifer
28
S E C T I O N 4 | What is an Aquifer?
and the direction of groundwater flow:
• In an unconsolidated, porous aquifer, the cone of depression forms around the wellhead in an ever-expanding circle, or oval shape due to groundwater flow, as more water is pumped from the aquifer . The depth of the cone is dependent on the aquifer capacity to sustain the flow .
• In a consolidated, fractured-rock aquifer, the cone of depression follows the underground fracture system and may take an unpredictable shape as the cone expands outward to pull more water into the well .
• In an artesian, confined system, the cone may extend for hundreds of feet but be only a few inches deep .
Several problems can arise from cones of depression:
• Water and contaminants in the cone around the well can eventually be captured and drawn into the well and water supply system .
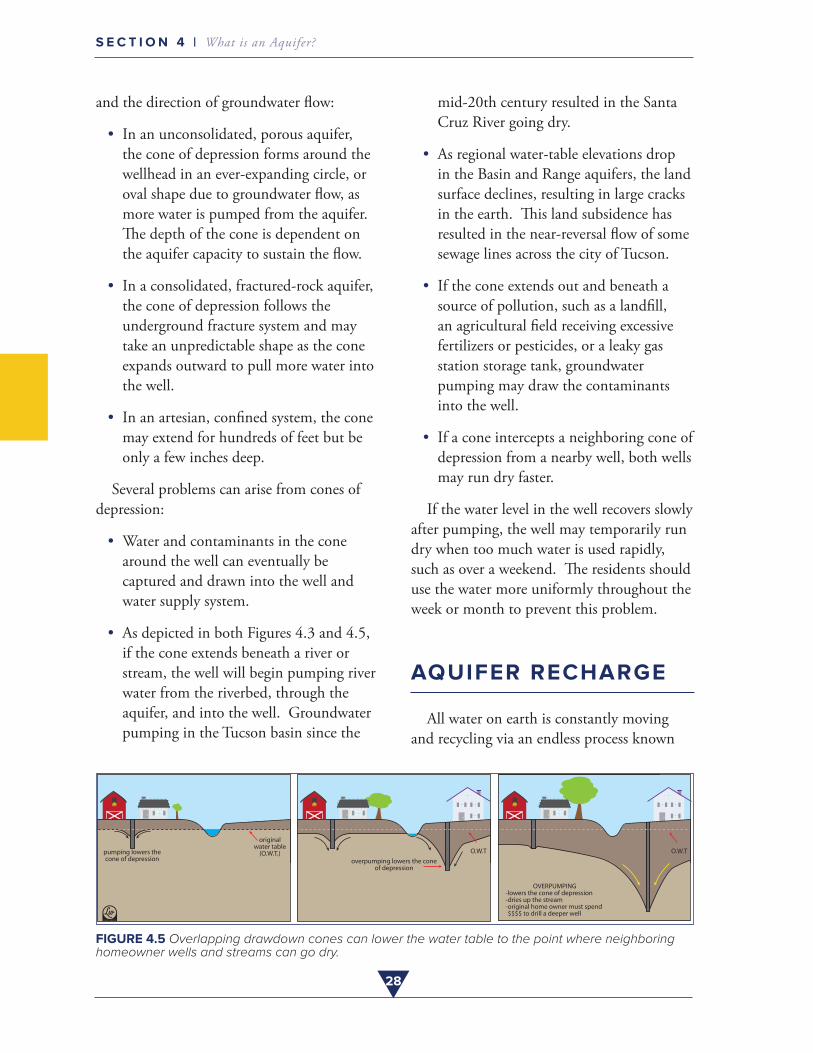
• As depicted in both Figures 4 .3 and 4 .5, if the cone extends beneath a river or stream, the well will begin pumping river water from the riverbed, through the aquifer, and into the well . Groundwater pumping in the Tucson basin since the
FIGURE 4.5 Overlapping drawdown cones can lower the water table to the point where neighboring homeowner wells and streams can go dry.
mid-20th century resulted in the Santa Cruz River going dry .
• As regional water-table elevations drop in the Basin and Range aquifers, the land surface declines, resulting in large cracks in the earth . This land subsidence has resulted in the near-reversal flow of some sewage lines across the city of Tucson .
• If the cone extends out and beneath a source of pollution, such as a landfill, an agricultural field receiving excessive fertilizers or pesticides, or a leaky gas station storage tank, groundwater pumping may draw the contaminants into the well .
• If a cone intercepts a neighboring cone of depression from a nearby well, both wells may run dry faster .
If the water level in the well recovers slowly after pumping, the well may temporarily run dry when too much water is used rapidly, such as over a weekend . The residents should use the water more uniformly throughout the week or month to prevent this problem .
AQUIFER RECHARGE
All water on earth is constantly moving and recycling via an endless process known
29
S E C T I O N 4 | What is an Aquifer?
as the water cycle or hydrologic cycle . The hydrologic (water movement) cycle is driven by the energy of the sun and the force of gravity . Water moves by evaporation, condensation, precipitation, transpiration (consumption and evaporation from plants), infiltration, and runoff to rivers and streams .
Because of Arizona’s arid and semi-arid climate, on average, recharge to groundwater is estimated to be 2 to 3 percent of the average annual rainfall . This same volume is an estimated 45 percent of the volume of groundwater used on an annual basis across the state . However, across the state this recharge is equivalent to less than half an inch of groundwater elevation rise, which is within the range of measurement error . Several factors impact infiltration and percolation through the vadose zone (unsaturated soils and rocks), including: soil type and precedent moisture; climate, land use; topography; precipitation rate and type; available pore space; and, aquifer type . Aquifers can generally be categorized into two types:
• An unconfined aquifer (otherwise knownas a water table aquifer) is rechargeddirectly after each rain or snowfall .
• A confined (or artesian) aquifer is coveredby a confining, low permeability layer of geology. The low permeability preventswater from entering the aquifer directly.
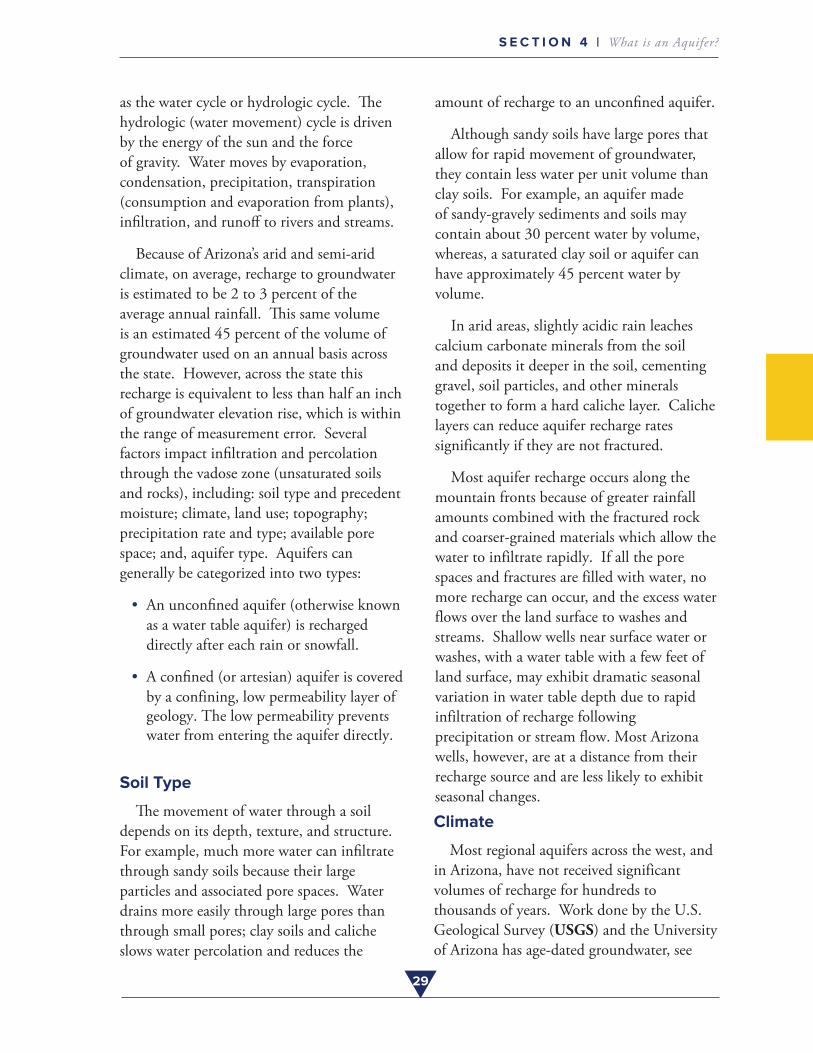
Soil Type
The movement of water through a soil depends on its depth, texture, and structure . For example, much more water can infiltrate through sandy soils because their large particles and associated pore spaces . Water drains more easily through large pores than through small pores; clay soils and caliche slows water percolation and reduces the
amount of recharge to an unconfined aquifer .
Although sandy soils have large pores that allow for rapid movement of groundwater, they contain less water per unit volume than clay soils . For example, an aquifer made of sandy-gravely sediments and soils may contain about 30 percent water by volume, whereas, a saturated clay soil or aquifer can have approximately 45 percent water by volume .
In arid areas, slightly acidic rain leaches calcium carbonate minerals from the soil and deposits it deeper in the soil, cementing gravel, soil particles, and other minerals together to form a hard caliche layer . Caliche layers can reduce aquifer recharge rates significantly if they are not fractured .
Most aquifer recharge occurs along the mountain fronts because of greater rainfall amounts combined with the fractured rock and coarser-grained materials which allow the water to infiltrate rapidly . If all the pore spaces and fractures are filled with water, no more recharge can occur, and the excess water flows over the land surface to washes and streams . Shallow wells near surface water or washes, with a water table with a few feet of land surface, may exhibit dramatic seasonal variation in water table depth due to rapid infiltration of recharge following precipitation or stream flow. Most Arizona wells, however, are at a distance from their recharge source and are less likely to exhibit seasonal changes.
Climate
Most regional aquifers across the west, and in Arizona, have not received significant volumes of recharge for hundreds to thousands of years . Work done by the U .S . Geological Survey (USGS) and the University of Arizona has age-dated groundwater, see
30
S E C T I O N 4 | What is an Aquifer?
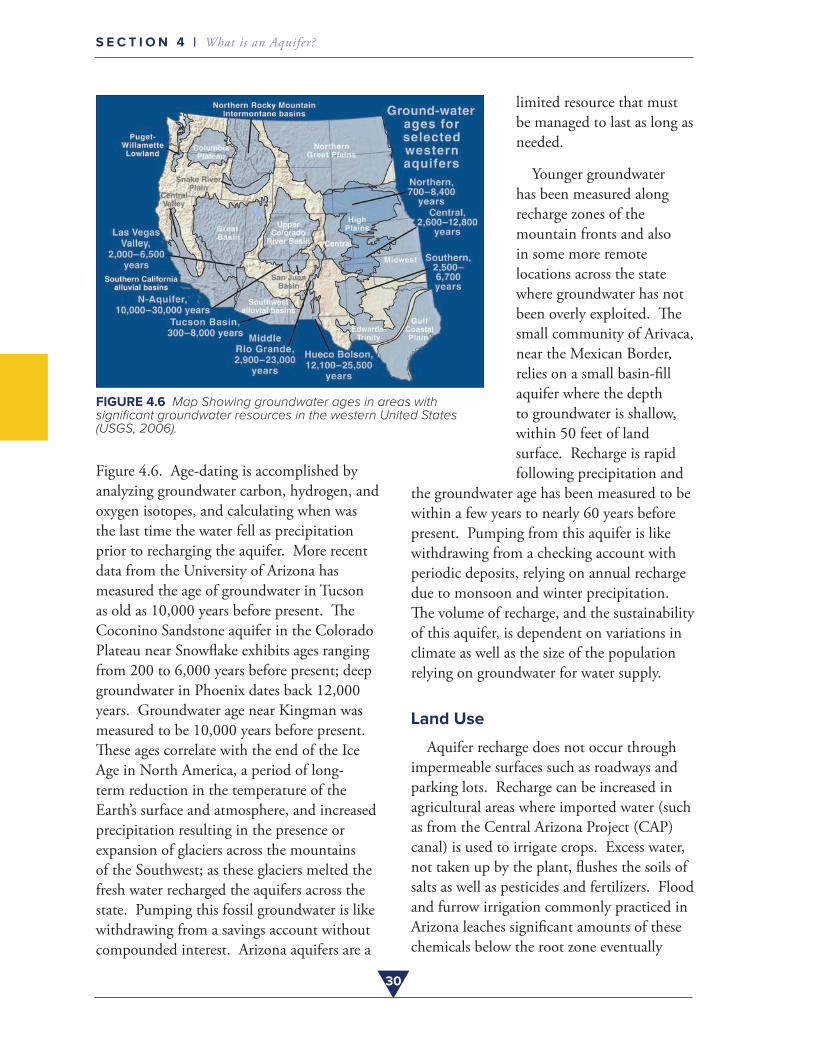
FIGURE 4.6 Map Showing groundwater ages in areas with significant groundwater resources in the western United States (USGS, 2006).
Figure 4 .6 . Age-dating is accomplished by analyzing groundwater carbon, hydrogen, and oxygen isotopes, and calculating when was the last time the water fell as precipitation prior to recharging the aquifer . More recent data from the University of Arizona has measured the age of groundwater in Tucson as old as 10,000 years before present . The Coconino Sandstone aquifer in the Colorado Plateau near Snowflake exhibits ages ranging from 200 to 6,000 years before present; deep groundwater in Phoenix dates back 12,000 years . Groundwater age near Kingman was measured to be 10,000 years before present . These ages correlate with the end of the Ice Age in North America, a period of long-term reduction in the temperature of the Earth’s surface and atmosphere, and increased precipitation resulting in the presence or expansion of glaciers across the mountains of the Southwest; as these glaciers melted the fresh water recharged the aquifers across the state . Pumping this fossil groundwater is like withdrawing from a savings account without compounded interest . Arizona aquifers are a
limited resource that must be managed to last as long as needed .
Younger groundwater has been measured along recharge zones of the mountain fronts and also in some more remote locations across the state where groundwater has not been overly exploited . The small community of Arivaca, near the Mexican Border, relies on a small basin-fill aquifer where the depth to groundwater is shallow, within 50 feet of land surface . Recharge is rapid following precipitation and
the groundwater age has been measured to be within a few years to nearly 60 years before present . Pumping from this aquifer is like withdrawing from a checking account with periodic deposits, relying on annual recharge due to monsoon and winter precipitation . The volume of recharge, and the sustainability of this aquifer, is dependent on variations in climate as well as the size of the population relying on groundwater for water supply .
Land Use
Aquifer recharge does not occur through impermeable surfaces such as roadways and parking lots . Recharge can be increased in agricultural areas where imported water (such as from the Central Arizona Project (CAP) canal) is used to irrigate crops . Excess water, not taken up by the plant, flushes the soils of salts as well as pesticides and fertilizers . Flood and furrow irrigation commonly practiced in Arizona leaches significant amounts of these chemicals below the root zone eventually
31
S E C T I O N 4 | What is an Aquifer?
reaching the groundwater . Newer irrigation methods such as drip use less water while managing soil salt accumulation damaging to crops . Nonetheless, all forms of irrigation in arid and semi-arid environments eventually impact groundwater quality .
Washes, streams and rivers drain water to areas that often provide recharge to the underlying aquifer . Recharge in areas where surface water has accumulated in ponds or lakes is called focused recharge . Retention basins (dry ponds) with accumulated stormwater runoff from urban areas can transport contaminants that can percolate to the aquifer .
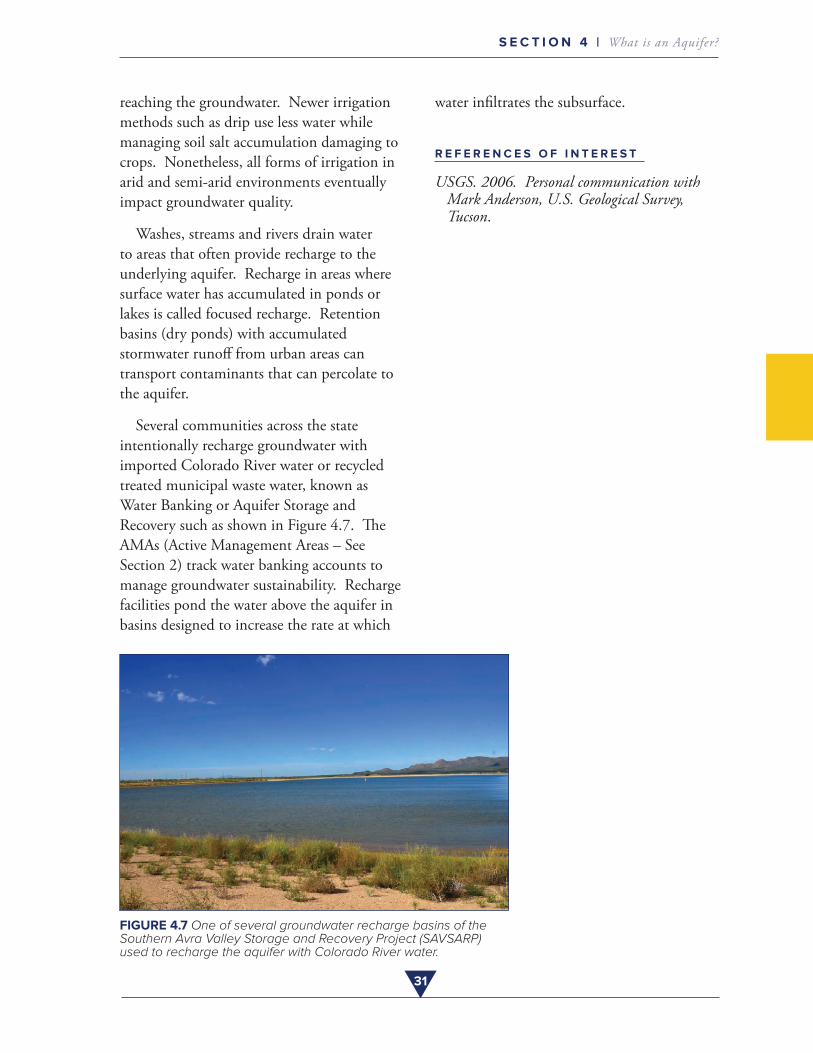
Several communities across the state intentionally recharge groundwater with imported Colorado River water or recycled treated municipal waste water, known as Water Banking or Aquifer Storage and Recovery such as shown in Figure 4 .7 . The AMAs (Active Management Areas – See Section 2) track water banking accounts to manage groundwater sustainability . Recharge facilities pond the water above the aquifer in basins designed to increase the rate at which
FIGURE 4.7 One of several groundwater recharge basins of the Southern Avra Valley Storage and Recovery Project (SAVSARP) used to recharge the aquifer with Colorado River water.
water infiltrates the subsurface .
R E F E R E N C E S O F I N T E R E S T
USGS. 2006. Personal communication with Mark Anderson, U.S. Geological Survey, Tucson .
Photo Credit: J. Artiola
SECTION
5WELL OPERATION AND MAINTENANCE
DOMESTIC WELL REGULATIONS
All domestic water wells in Arizona must be permitted by the Arizona Department of Water Resources (ADWR) and most of them are classified as “exempt” wells permitted to pump up to 35 gallons per minute (GPM) . They are exempt from having to report their pumpage to the state, hence the classification as an “exempt well .” A well that is permitted to pump more than 35 GPM is classified as a “non-exempt” well and may have other uses, such as irrigation, public water supply, or mining .
This classification, and the fact that some older well registrations don’t list the use of the well, makes it difficult to determine precisely just how many private domestic water wells are in Arizona, but as of March,
Photo Credit: J. Artiola
33
S E C T I O N 5 | Well Operation and Maintenance
5
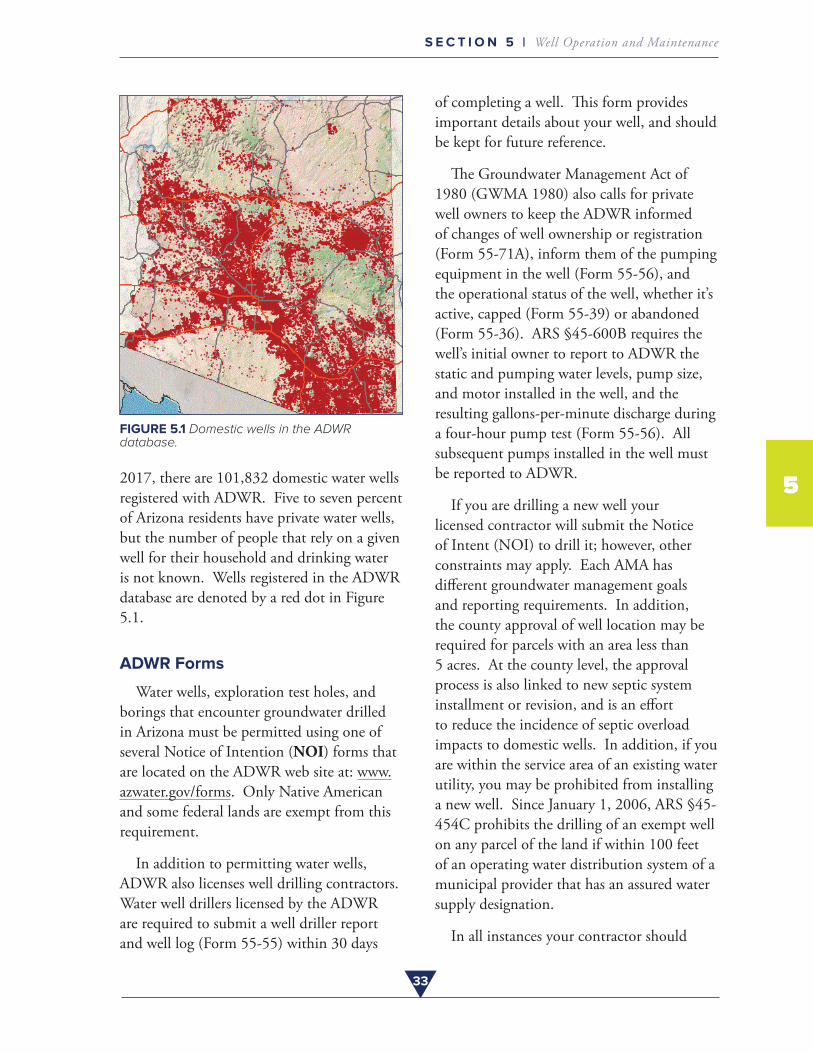
FIGURE 5.1 Domestic wells in the ADWR database.
2017, there are 101,832 domestic water wells registered with ADWR . Five to seven percent of Arizona residents have private water wells, but the number of people that rely on a given well for their household and drinking water is not known . Wells registered in the ADWR database are denoted by a red dot in Figure 5 .1 .
ADWR Forms
Water wells, exploration test holes, and borings that encounter groundwater drilled in Arizona must be permitted using one of several Notice of Intention (NOI) forms that are located on the ADWR web site at: www .azwater .gov/forms . Only Native American and some federal lands are exempt from this requirement .
In addition to permitting water wells, ADWR also licenses well drilling contractors . Water well drillers licensed by the ADWR are required to submit a well driller report and well log (Form 55-55) within 30 days
of completing a well . This form provides important details about your well, and should be kept for future reference .
The Groundwater Management Act of 1980 (GWMA 1980) also calls for private well owners to keep the ADWR informed of changes of well ownership or registration (Form 55-71A), inform them of the pumping equipment in the well (Form 55-56), and the operational status of the well, whether it’s active, capped (Form 55-39) or abandoned (Form 55-36) . ARS §45-600B requires the well’s initial owner to report to ADWR the static and pumping water levels, pump size, and motor installed in the well, and the resulting gallons-per-minute discharge during a four-hour pump test (Form 55-56) . All subsequent pumps installed in the well must be reported to ADWR .
If you are drilling a new well your licensed contractor will submit the Notice of Intent (NOI) to drill it; however, other constraints may apply . Each AMA has different groundwater management goals and reporting requirements . In addition, the county approval of well location may be required for parcels with an area less than 5 acres . At the county level, the approval process is also linked to new septic system installment or revision, and is an effort to reduce the incidence of septic overload impacts to domestic wells . In addition, if you are within the service area of an existing water utility, you may be prohibited from installing a new well . Since January 1, 2006, ARS §45-454C prohibits the drilling of an exempt well on any parcel of the land if within 100 feet of an operating water distribution system of a municipal provider that has an assured water supply designation .
In all instances your contractor should
34
S E C T I O N 5 | Well Operation and Maintenance
5
be aware of the local issues and constraints on the installation of a new domestic water supply, and your contractor will submit the documentation to the appropriate jurisdictions . However, you are responsible to assure the information he provides is correct . After well installation, an ‘as built’ description of your well is submitted to ADWR . This description includes important information such as aquifer geology, total well depth, screen length, pump setting and measured pumping capacity of the well when installed . This document (Form 55-55) should be retained for future reference .
ADWR Records
The ADWR maintains records for all water wells, exempt and non-exempt, in a database accessible by the public through their web site: www .azwater .gov . Their database contains the records for all water wells drilled since the Ground Water Management Act of 1980 was established and may include older wells . Instructions as to how to access individual well records can be found in the “An Arizona Guide to Domestic Well Registration and Record-Keeping, AZ1663 .”
Private well owners are encouraged to verify the information the ADWR has on file for their well . It is especially important that private well owners keep their own records of their well permits and logs, pump, controls, tanks, and treatment system operating manuals, and water testing results . No state agency oversees private water wells after they
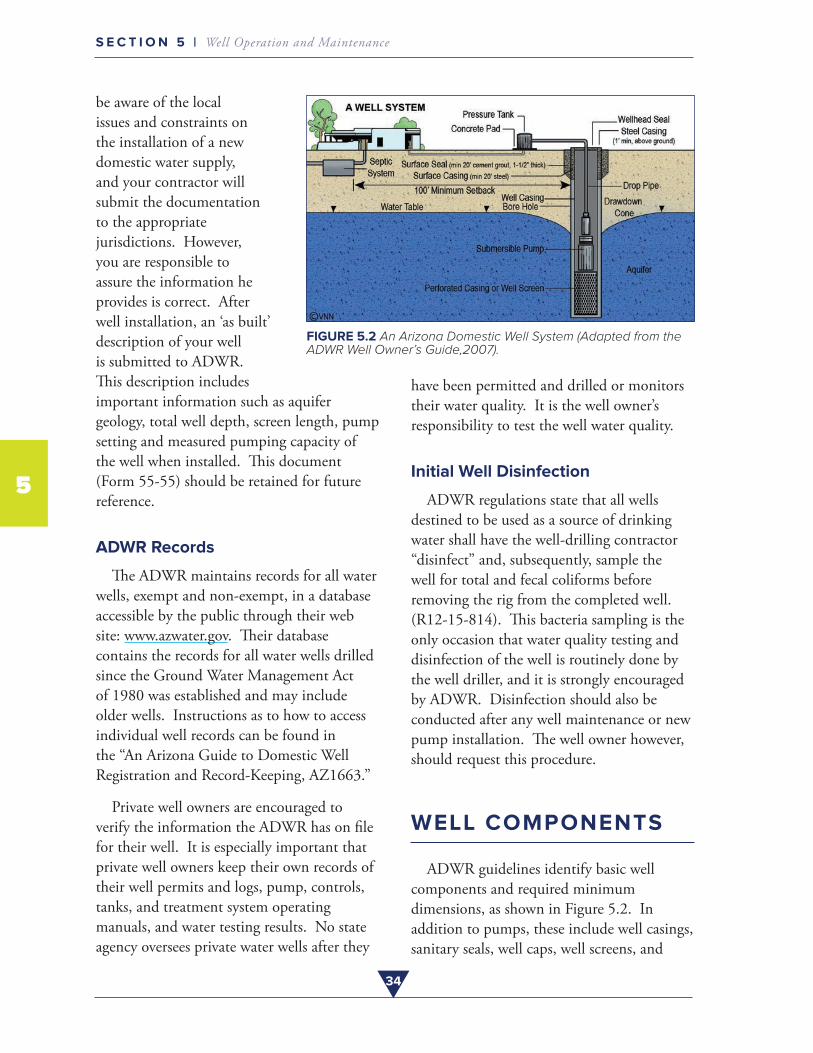
FIGURE 5.2 An Arizona Domestic Well System (Adapted from the ADWR Well Owner’s Guide,2007).
have been permitted and drilled or monitors their water quality . It is the well owner’s responsibility to test the well water quality .
Initial Well Disinfection
ADWR regulations state that all wells destined to be used as a source of drinking water shall have the well-drilling contractor “disinfect” and, subsequently, sample the well for total and fecal coliforms before removing the rig from the completed well . (R12-15-814) . This bacteria sampling is the only occasion that water quality testing and disinfection of the well is routinely done by the well driller, and it is strongly encouraged by ADWR . Disinfection should also be conducted after any well maintenance or new pump installation . The well owner however, should request this procedure .
WELL COMPONENTS
ADWR guidelines identify basic well components and required minimum dimensions, as shown in Figure 5 .2 . In addition to pumps, these include well casings, sanitary seals, well caps, well screens, and

35
S E C T I O N 5 | Well Operation and Maintenance
storage tanks .
Well Casing
The well casing is a pipe placed in the borehole . The casing keeps the well open and helps prevent the mixing of materials from different zones of the aquifer . Within the casing is the drop pipe, which carries the water to the surface, and the electrical wiring to the submersible pump .
A typical domestic water well will have two well casings – an outer or surface sanitary seal casing and an inner well casing that may be constructed of either steel or PVC . Current regulations require the outer casing constructed of steel and extend at least 1 foot minimum above land surface . This outer casing extends to a minimum depth of 20 feet below land surface, and is cemented into the borehole with a minimum of 20 feet of cement grout, at least 1-1/2 inches thick, between the casings and borehole . This serves as a sanitary seal, reducing the likelihood of ponded surface water around the well head seeping down into the aquifer . Outer well casing for domestic wells can vary from 4 to 8 inches in diameter, depending on aquifer conditions, final depth of the well, and the type of pump to be installed . The inner casing and/or the casing that extends below the 20-foot seal may be constructed of carbon steel, plastic (usually ASTM Schedule 80 PVC), or stainless steel . PVC is lightweight, resistant to corrosion, and relatively easy to install .
To minimize the risk of contaminating the well water with solvents, PVC casing sections should be joined without glues . If PVC primer and solvent cement have been used, water tests in newer wells may indicate low levels of solvents in the water . However,
over time, the solvent will flush out of the system . Many of the domestic water well drillers today are using a PVC well casing with couplings that don’t require glue . The definite advantage is that the well casing can be removed quickly and reinstalled if it doesn’t all go down the borehole on the first try .
Single casing wells, where the sanitary seal casing is built into a pitless adapter completion, are far more common in the northern portions of the state to avoid frost damage . In the southern desert portions of the state, wells are more typically completed with above ground plumbing and electrical connections . Illustrations of both styles of well completions are used as images for the back inside cover .
The pitless adapter completion has the electrical wiring and plumbing entering the well casing in the ground below the soil frost line, see Illustration 1 . The above-ground completion, see Illustration 2, has both the
FIGURE 5.3 Photo of the sanitary seal grout around the surface casing of a well in construction.
36
S E C T I O N 5 | Well Operation and Maintenance
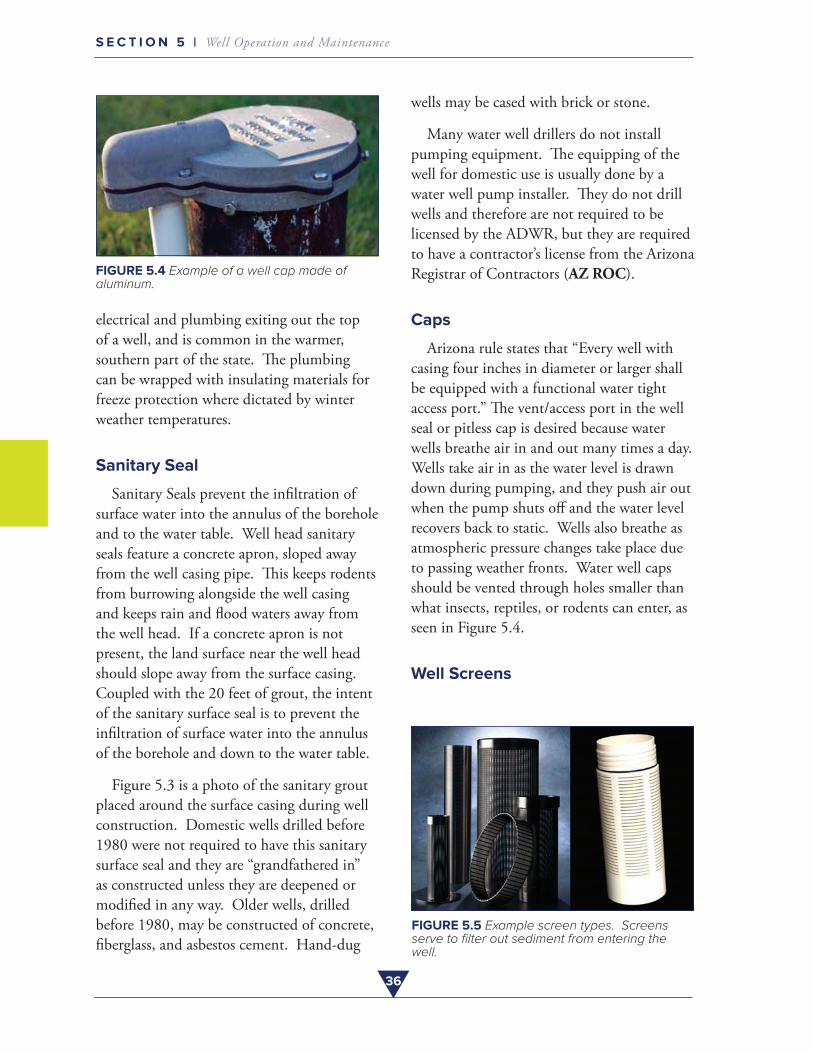
FIGURE 5.4 Example of a well cap made of aluminum.
electrical and plumbing exiting out the top of a well, and is common in the warmer, southern part of the state . The plumbing can be wrapped with insulating materials for freeze protection where dictated by winter weather temperatures .
Sanitary Seal
Sanitary Seals prevent the infiltration of surface water into the annulus of the borehole and to the water table . Well head sanitary seals feature a concrete apron, sloped away from the well casing pipe . This keeps rodents from burrowing alongside the well casing and keeps rain and flood waters away from the well head . If a concrete apron is not present, the land surface near the well head should slope away from the surface casing . Coupled with the 20 feet of grout, the intent of the sanitary surface seal is to prevent the infiltration of surface water into the annulus of the borehole and down to the water table .
Figure 5 .3 is a photo of the sanitary grout placed around the surface casing during well construction . Domestic wells drilled before 1980 were not required to have this sanitary surface seal and they are “grandfathered in” as constructed unless they are deepened or modified in any way . Older wells, drilled before 1980, may be constructed of concrete, fiberglass, and asbestos cement . Hand-dug
wells may be cased with brick or stone .
Many water well drillers do not install pumping equipment . The equipping of the well for domestic use is usually done by a water well pump installer . They do not drill wells and therefore are not required to be licensed by the ADWR, but they are required to have a contractor’s license from the Arizona Registrar of Contractors (AZ ROC) .
Caps
Arizona rule states that “Every well with casing four inches in diameter or larger shall be equipped with a functional water tight access port .” The vent/access port in the well seal or pitless cap is desired because water wells breathe air in and out many times a day . Wells take air in as the water level is drawn down during pumping, and they push air out when the pump shuts off and the water level recovers back to static . Wells also breathe as atmospheric pressure changes take place due to passing weather fronts . Water well caps should be vented through holes smaller than what insects, reptiles, or rodents can enter, as seen in Figure 5 .4 .
Well Screens
FIGURE 5.5 Example screen types. Screens serve to filter out sediment from entering the well.
37
S E C T I O N 5 | Well Operation and Maintenance
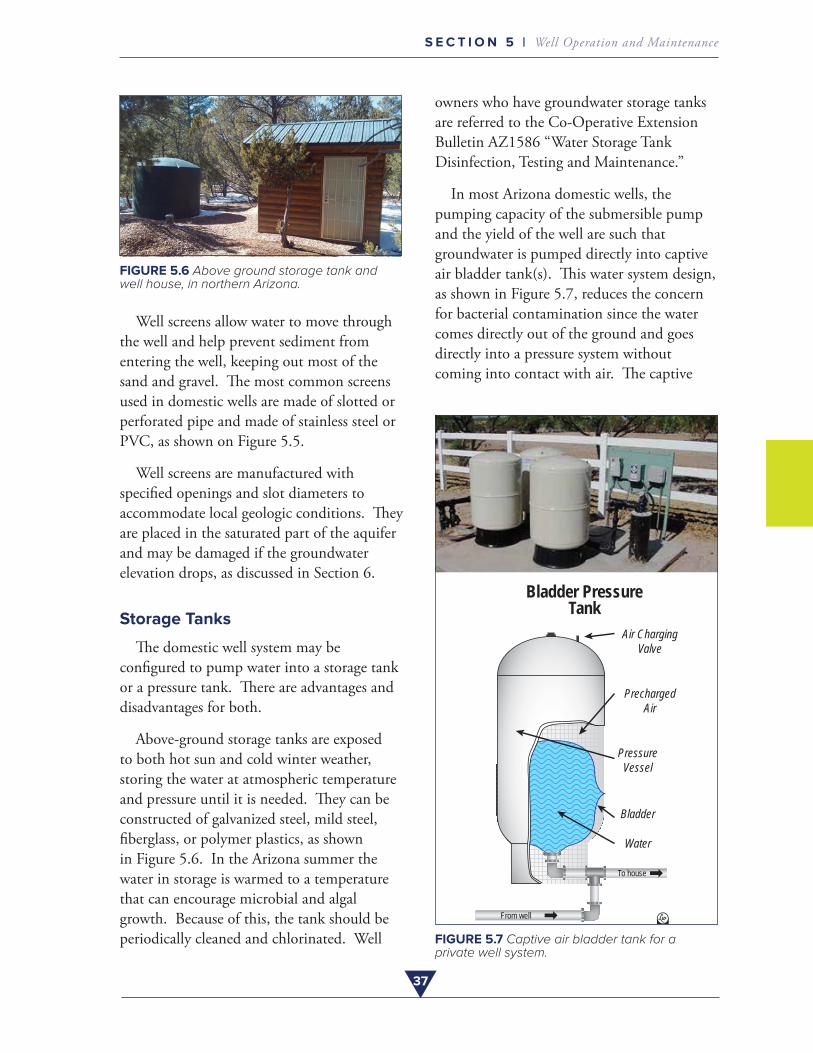
FIGURE 5.6 Above ground storage tank and well house, in northern Arizona.
Well screens allow water to move through the well and help prevent sediment from entering the well, keeping out most of the sand and gravel . The most common screens used in domestic wells are made of slotted or perforated pipe and made of stainless steel or PVC, as shown on Figure 5 .5 .
Well screens are manufactured with specified openings and slot diameters to accommodate local geologic conditions . They are placed in the saturated part of the aquifer and may be damaged if the groundwater elevation drops, as discussed in Section 6 .
Storage Tanks
The domestic well system may be configured to pump water into a storage tank or a pressure tank . There are advantages and disadvantages for both .
Above-ground storage tanks are exposed to both hot sun and cold winter weather, storing the water at atmospheric temperature and pressure until it is needed . They can be constructed of galvanized steel, mild steel, fiberglass, or polymer plastics, as shown in Figure 5 .6 . In the Arizona summer the water in storage is warmed to a temperature that can encourage microbial and algal growth . Because of this, the tank should be periodically cleaned and chlorinated . Well
owners who have groundwater storage tanks are referred to the Co-Operative Extension Bulletin AZ1586 “Water Storage Tank Disinfection, Testing and Maintenance .”
In most Arizona domestic wells, the pumping capacity of the submersible pump and the yield of the well are such that groundwater is pumped directly into captive air bladder tank(s) . This water system design, as shown in Figure 5 .7, reduces the concern for bacterial contamination since the water comes directly out of the ground and goes directly into a pressure system without coming into contact with air . The captive
Air Charging Valve
PrechargedAir
PressureVessel
Bladder
Water
Bladder PressureTank
From well
To house
private well system.FIGURE 5.7 Captive air bladder tank for a
38
S E C T I O N 5 | Well Operation and Maintenance
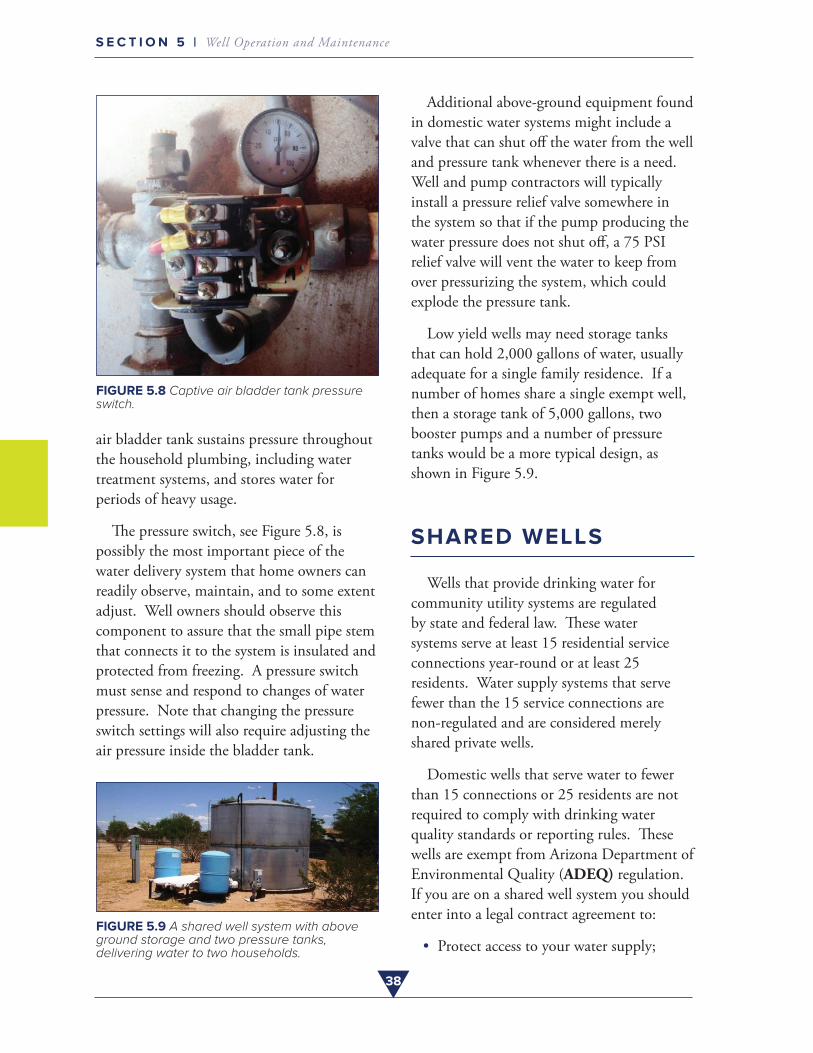
FIGURE 5.8 Captive air bladder tank pressure switch.
air bladder tank sustains pressure throughout the household plumbing, including water treatment systems, and stores water for periods of heavy usage .
The pressure switch, see Figure 5 .8, is possibly the most important piece of the water delivery system that home owners can readily observe, maintain, and to some extent adjust . Well owners should observe this component to assure that the small pipe stem that connects it to the system is insulated and protected from freezing . A pressure switch must sense and respond to changes of water pressure . Note that changing the pressure switch settings will also require adjusting the air pressure inside the bladder tank .
FIGURE 5.9 A shared well system with above ground storage and two pressure tanks, delivering water to two households.
Additional above-ground equipment found in domestic water systems might include a valve that can shut off the water from the well and pressure tank whenever there is a need . Well and pump contractors will typically install a pressure relief valve somewhere in the system so that if the pump producing the water pressure does not shut off, a 75 PSI relief valve will vent the water to keep from over pressurizing the system, which could explode the pressure tank .
Low yield wells may need storage tanks that can hold 2,000 gallons of water, usually adequate for a single family residence . If a number of homes share a single exempt well, then a storage tank of 5,000 gallons, two booster pumps and a number of pressure tanks would be a more typical design, as shown in Figure 5 .9 .
SHARED WELLS
Wells that provide drinking water for community utility systems are regulated by state and federal law . These water systems serve at least 15 residential service connections year-round or at least 25 residents . Water supply systems that serve fewer than the 15 service connections are non-regulated and are considered merely shared private wells .
Domestic wells that serve water to fewer than 15 connections or 25 residents are not required to comply with drinking water quality standards or reporting rules . These wells are exempt from Arizona Department of Environmental Quality (ADEQ) regulation . If you are on a shared well system you should enter into a legal contract agreement to:
• Protect access to your water supply;
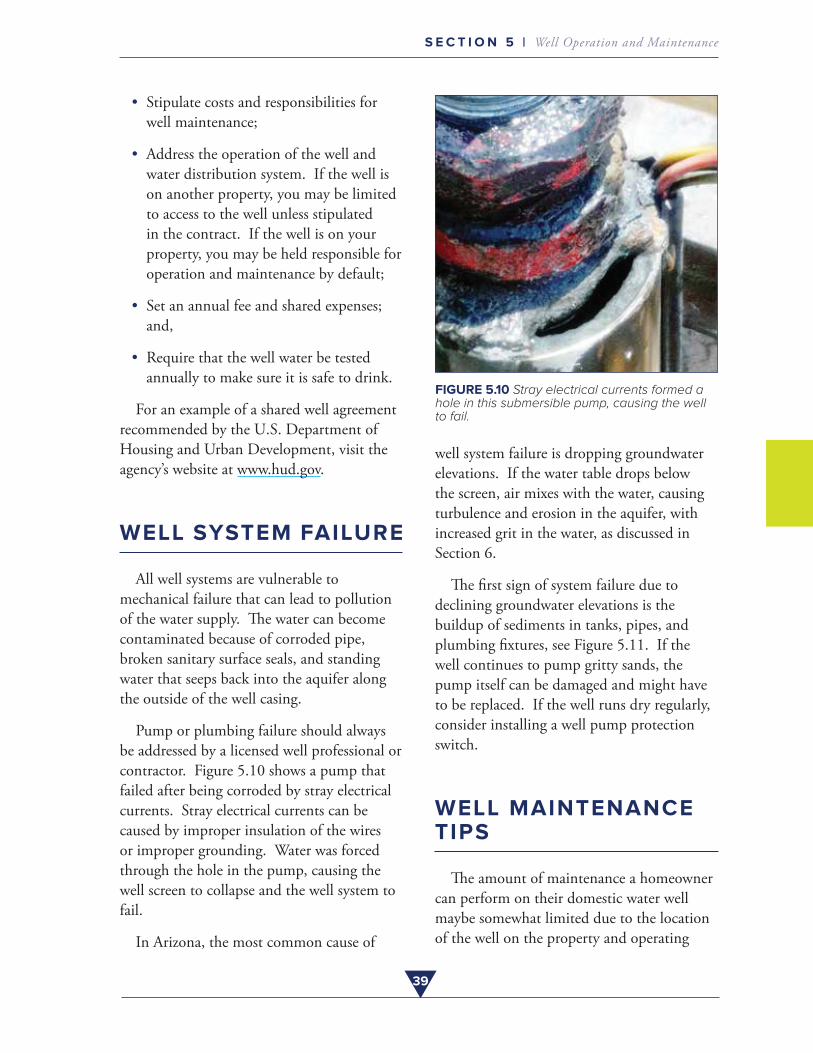
39
S E C T I O N 5 | Well Operation and Maintenance
• Stipulate costs and responsibilities forwell maintenance;
• Address the operation of the well andwater distribution system . If the well ison another property, you may be limitedto access to the well unless stipulatedin the contract . If the well is on yourproperty, you may be held responsible foroperation and maintenance by default;
• Set an annual fee and shared expenses;and,
• Require that the well water be testedannually to make sure it is safe to drink .
For an example of a shared well agreement recommended by the U .S . Department of Housing and Urban Development, visit the agency’s website at www .hud .gov .
WELL SYSTEM FAILURE
All well systems are vulnerable to mechanical failure that can lead to pollution of the water supply . The water can become contaminated because of corroded pipe, broken sanitary surface seals, and standing water that seeps back into the aquifer along the outside of the well casing .
Pump or plumbing failure should always be addressed by a licensed well professional or contractor . Figure 5 .10 shows a pump that failed after being corroded by stray electrical currents . Stray electrical currents can be caused by improper insulation of the wires or improper grounding . Water was forced through the hole in the pump, causing the well screen to collapse and the well system to fail .
In Arizona, the most common cause of
FIGURE 5.10 Stray electrical currents formed a hole in this submersible pump, causing the well to fail.
well system failure is dropping groundwater elevations . If the water table drops below the screen, air mixes with the water, causing turbulence and erosion in the aquifer, with increased grit in the water, as discussed in Section 6 .
The first sign of system failure due to declining groundwater elevations is the buildup of sediments in tanks, pipes, and plumbing fixtures, see Figure 5 .11 . If the well continues to pump gritty sands, the pump itself can be damaged and might have to be replaced . If the well runs dry regularly, consider installing a well pump protection switch .
WELL MAINTENANCE TIPS
The amount of maintenance a homeowner can perform on their domestic water well maybe somewhat limited due to the location of the well on the property and operating
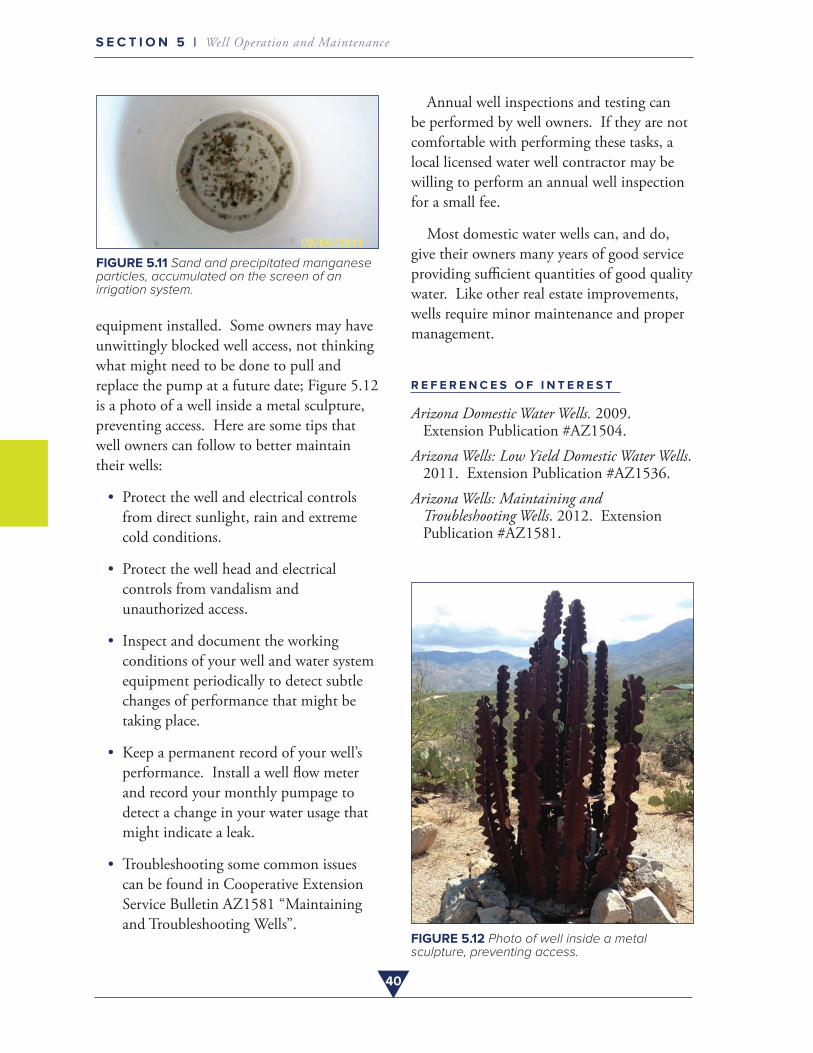
40
S E C T I O N 5 | Well Operation and Maintenance
FIGURE 5.11 Sand and precipitated manganese particles, accumulated on the screen of an irrigation system.
equipment installed . Some owners may have unwittingly blocked well access, not thinking what might need to be done to pull and replace the pump at a future date; Figure 5 .12 is a photo of a well inside a metal sculpture, preventing access . Here are some tips that well owners can follow to better maintain their wells:
• Protect the well and electrical controls from direct sunlight, rain and extreme cold conditions .
• Protect the well head and electrical controls from vandalism and unauthorized access .
• Inspect and document the working conditions of your well and water system equipment periodically to detect subtle changes of performance that might be taking place .
• Keep a permanent record of your well’s performance . Install a well flow meter and record your monthly pumpage to detect a change in your water usage that might indicate a leak .
• Troubleshooting some common issues can be found in Cooperative Extension Service Bulletin AZ1581 “Maintaining and Troubleshooting Wells” .
Annual well inspections and testing can be performed by well owners . If they are not comfortable with performing these tasks, a local licensed water well contractor may be willing to perform an annual well inspection for a small fee .
Most domestic water wells can, and do, give their owners many years of good service providing sufficient quantities of good quality water . Like other real estate improvements, wells require minor maintenance and proper management .
R E F E R E N C E S O F I N T E R E S T
Arizona Domestic Water Wells. 2009 . Extension Publication #AZ1504 .
Arizona Wells: Low Yield Domestic Water Wells . 2011 . Extension Publication #AZ1536 .
Arizona Wells: Maintaining and Troubleshooting Wells . 2012 . Extension Publication #AZ1581 .
FIGURE 5.12 Photo of well inside a metal sculpture, preventing access.
Photo Credit: J. ArtiolaPhoto Credit: J. Artiola
SECTION
6 WELL YIELD
All water wells begin a gradual decline in performance from the first day they are drilled and constructed . There are three prime factors causing this slow decline in performance: slime buildup (microbial growth) in the aquifer and well screen; scale formation (chemical precipitation) in the well screen, and sediment buildup blocking the perforations in the well screen; and, long term decline of aquifer water levels .
Microorganisms existed in the subsurface and groundwater even before the borehole was drilled and the well installed . Introduction of water from another source during drilling, plus the introduction of oxygen, iron, and other elements during the well construction, and groundwater with nutrients provide a suitable environment for bacteria to flourish and form biomass . An extreme example is shown in Figure 6 .1 .
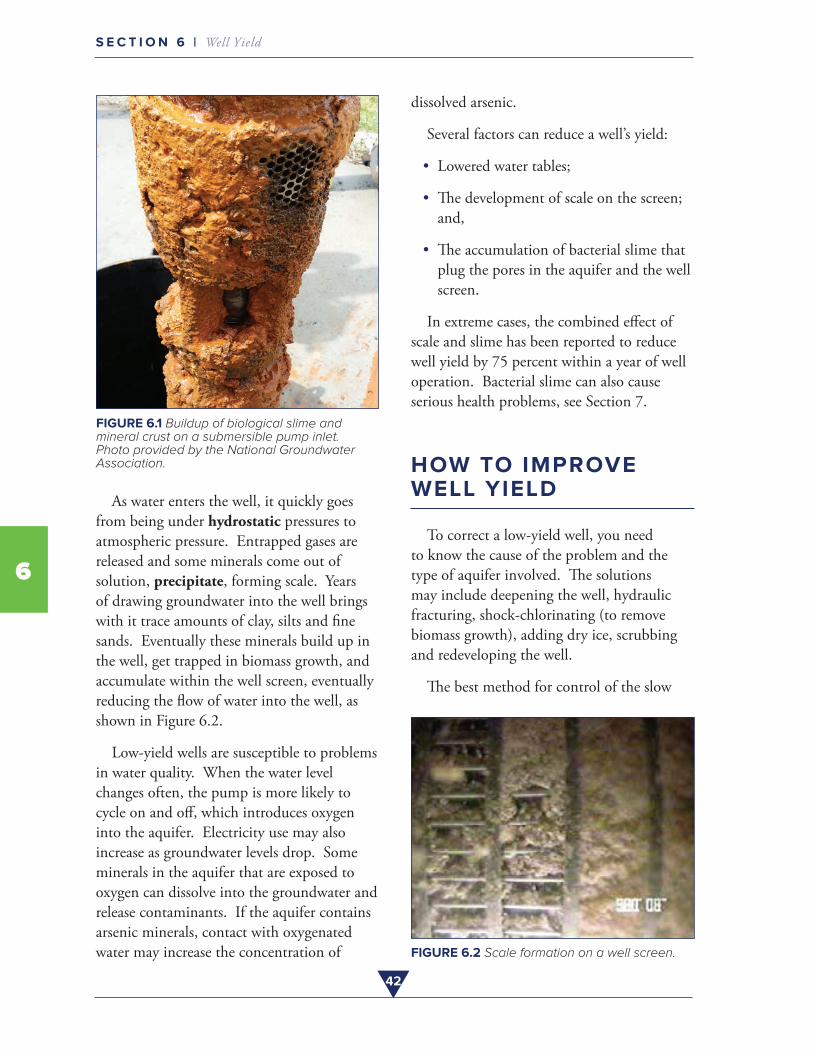
42
S E C T I O N 6 | Well Yield
6
FIGURE 6.1 Buildup of biological slime and mineral crust on a submersible pump inlet. Photo provided by the National Groundwater Association.
As water enters the well, it quickly goes from being under hydrostatic pressures to atmospheric pressure . Entrapped gases are released and some minerals come out of solution, precipitate, forming scale . Years of drawing groundwater into the well brings with it trace amounts of clay, silts and fine sands . Eventually these minerals build up in the well, get trapped in biomass growth, and accumulate within the well screen, eventually reducing the flow of water into the well, as shown in Figure 6 .2 .
Low-yield wells are susceptible to problems in water quality . When the water level changes often, the pump is more likely to cycle on and off, which introduces oxygen into the aquifer . Electricity use may also increase as groundwater levels drop . Some minerals in the aquifer that are exposed to oxygen can dissolve into the groundwater and release contaminants . If the aquifer contains arsenic minerals, contact with oxygenated water may increase the concentration of
dissolved arsenic .
Several factors can reduce a well’s yield:
• Lowered water tables;
• The development of scale on the screen; and,
• The accumulation of bacterial slime that plug the pores in the aquifer and the well screen .
In extreme cases, the combined effect of scale and slime has been reported to reduce well yield by 75 percent within a year of well operation . Bacterial slime can also cause serious health problems, see Section 7 .
HOW TO IMPROVE WELL YIELD
To correct a low-yield well, you need to know the cause of the problem and the type of aquifer involved . The solutions may include deepening the well, hydraulic fracturing, shock-chlorinating (to remove biomass growth), adding dry ice, scrubbing and redeveloping the well .
The best method for control of the slow
FIGURE 6.2 Scale formation on a well screen.
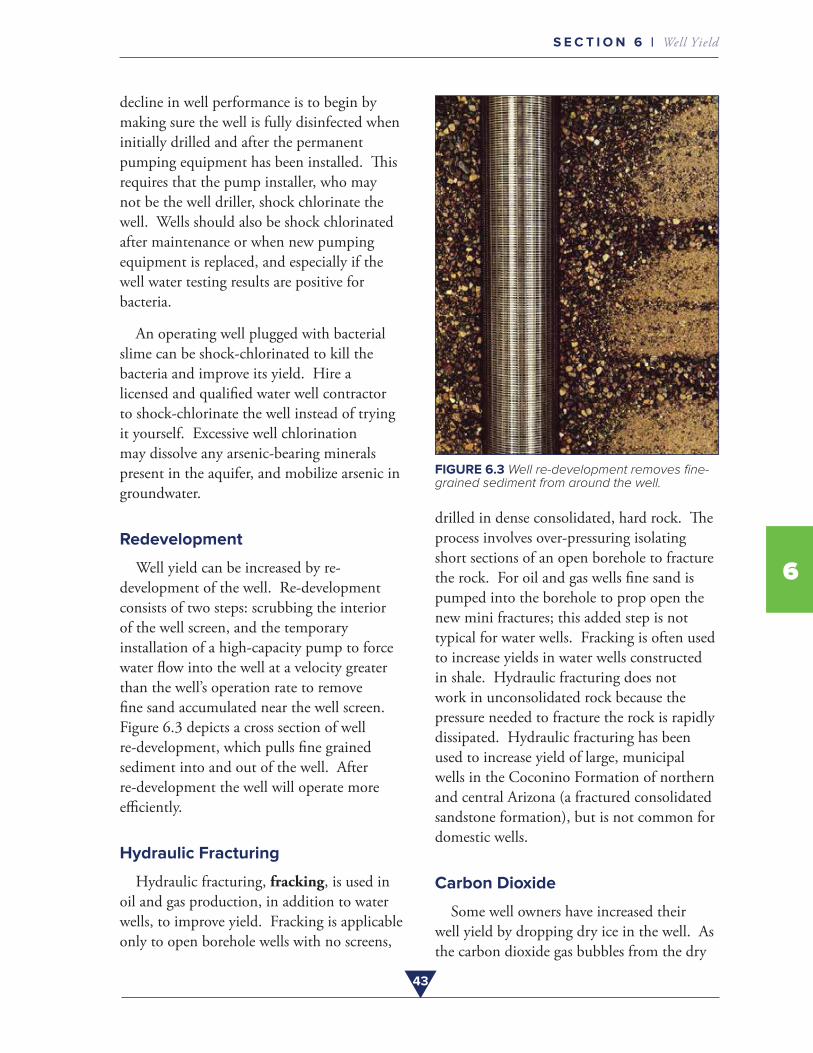
43
S E C T I O N 6 | Well Yield
6
decline in well performance is to begin by making sure the well is fully disinfected when initially drilled and after the permanent pumping equipment has been installed . This requires that the pump installer, who may not be the well driller, shock chlorinate the well . Wells should also be shock chlorinated after maintenance or when new pumping equipment is replaced, and especially if the well water testing results are positive for bacteria .
An operating well plugged with bacterial slime can be shock-chlorinated to kill the bacteria and improve its yield . Hire a licensed and qualified water well contractor to shock-chlorinate the well instead of trying it yourself . Excessive well chlorination may dissolve any arsenic-bearing minerals present in the aquifer, and mobilize arsenic in groundwater .
Redevelopment
Well yield can be increased by re-development of the well . Re-development consists of two steps: scrubbing the interior of the well screen, and the temporary installation of a high-capacity pump to force water flow into the well at a velocity greater than the well’s operation rate to remove fine sand accumulated near the well screen . Figure 6 .3 depicts a cross section of well re-development, which pulls fine grained sediment into and out of the well . After re-development the well will operate more efficiently .
Hydraulic Fracturing
Hydraulic fracturing, fracking, is used in oil and gas production, in addition to water wells, to improve yield . Fracking is applicable only to open borehole wells with no screens,
FIGURE 6.3 Well re-development removes fine-grained sediment from around the well.
drilled in dense consolidated, hard rock . The process involves over-pressuring isolating short sections of an open borehole to fracture the rock . For oil and gas wells fine sand is pumped into the borehole to prop open the new mini fractures; this added step is not typical for water wells . Fracking is often used to increase yields in water wells constructed in shale . Hydraulic fracturing does not work in unconsolidated rock because the pressure needed to fracture the rock is rapidly dissipated . Hydraulic fracturing has been used to increase yield of large, municipal wells in the Coconino Formation of northern and central Arizona (a fractured consolidated sandstone formation), but is not common for domestic wells .
Carbon Dioxide
Some well owners have increased their well yield by dropping dry ice in the well . As the carbon dioxide gas bubbles from the dry
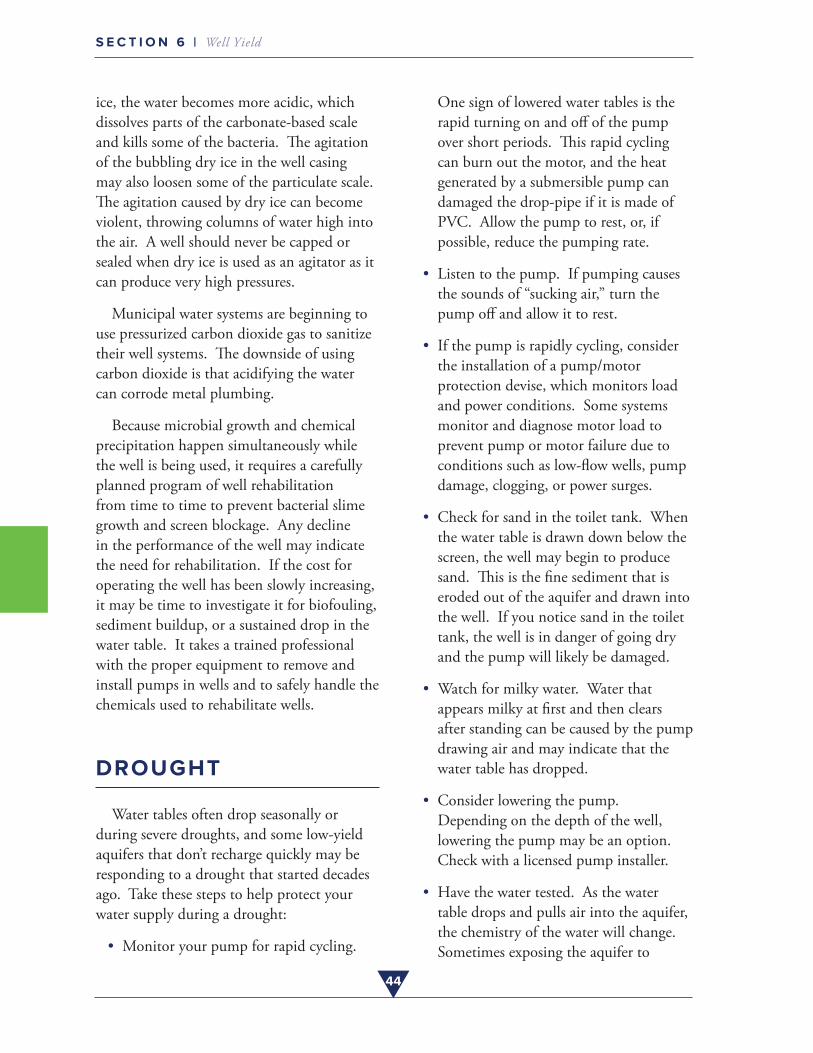
44
S E C T I O N 6 | Well Yield
ice, the water becomes more acidic, which dissolves parts of the carbonate-based scale and kills some of the bacteria . The agitation of the bubbling dry ice in the well casing may also loosen some of the particulate scale . The agitation caused by dry ice can become violent, throwing columns of water high into the air . A well should never be capped or sealed when dry ice is used as an agitator as it can produce very high pressures .
Municipal water systems are beginning to use pressurized carbon dioxide gas to sanitize their well systems . The downside of using carbon dioxide is that acidifying the water can corrode metal plumbing .
Because microbial growth and chemical precipitation happen simultaneously while the well is being used, it requires a carefully planned program of well rehabilitation from time to time to prevent bacterial slime growth and screen blockage . Any decline in the performance of the well may indicate the need for rehabilitation . If the cost for operating the well has been slowly increasing, it may be time to investigate it for biofouling, sediment buildup, or a sustained drop in the water table . It takes a trained professional with the proper equipment to remove and install pumps in wells and to safely handle the chemicals used to rehabilitate wells .
DROUGHT
Water tables often drop seasonally or during severe droughts, and some low-yield aquifers that don’t recharge quickly may be responding to a drought that started decades ago . Take these steps to help protect your water supply during a drought:
• Monitor your pump for rapid cycling .
One sign of lowered water tables is the rapid turning on and off of the pump over short periods . This rapid cycling can burn out the motor, and the heat generated by a submersible pump can damaged the drop-pipe if it is made of PVC . Allow the pump to rest, or, if possible, reduce the pumping rate .
• Listen to the pump . If pumping causes the sounds of “sucking air,” turn the pump off and allow it to rest .
• If the pump is rapidly cycling, consider the installation of a pump/motor protection devise, which monitors load and power conditions . Some systems monitor and diagnose motor load to prevent pump or motor failure due to conditions such as low-flow wells, pump damage, clogging, or power surges .
• Check for sand in the toilet tank . When the water table is drawn down below the screen, the well may begin to produce sand . This is the fine sediment that is eroded out of the aquifer and drawn into the well . If you notice sand in the toilet tank, the well is in danger of going dry and the pump will likely be damaged .
• Watch for milky water . Water that appears milky at first and then clears after standing can be caused by the pump drawing air and may indicate that the water table has dropped .
• Consider lowering the pump . Depending on the depth of the well, lowering the pump may be an option . Check with a licensed pump installer .
• Have the water tested . As the water table drops and pulls air into the aquifer, the chemistry of the water will change . Sometimes exposing the aquifer to
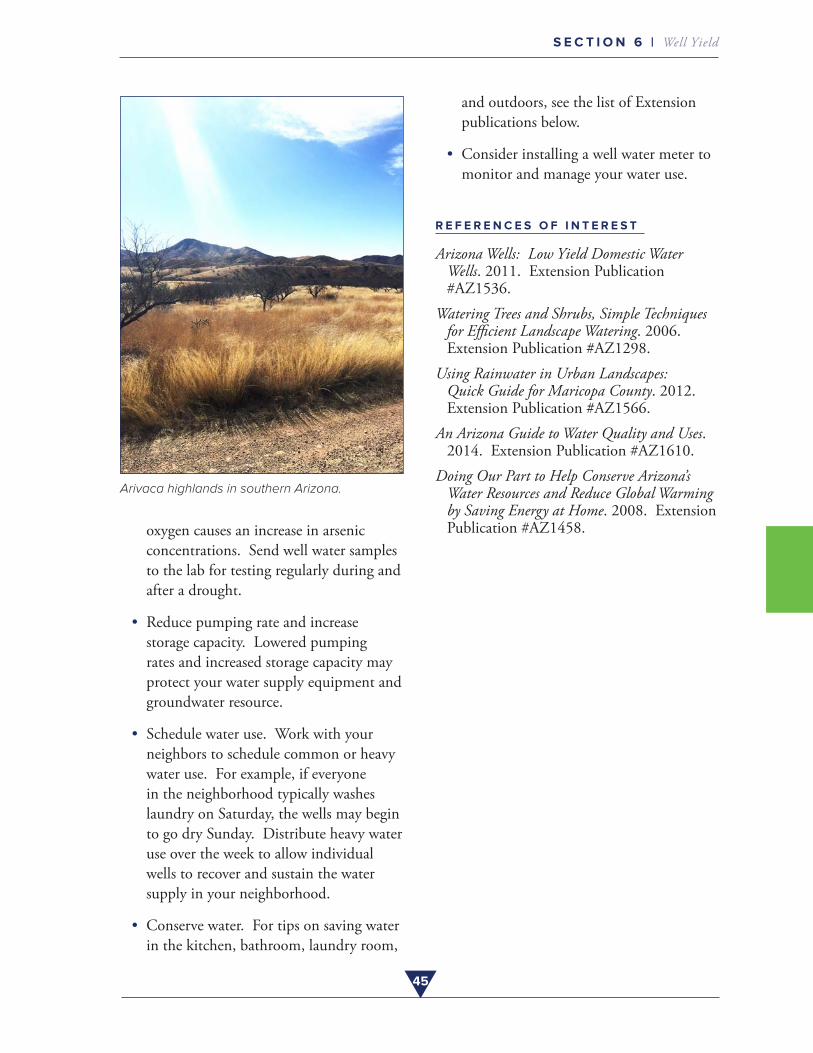
45
S E C T I O N 6 | Well Yield
Arivaca highlands in southern Arizona.
oxygen causes an increase in arsenic concentrations . Send well water samples to the lab for testing regularly during and after a drought .
• Reduce pumping rate and increase storage capacity . Lowered pumping rates and increased storage capacity may protect your water supply equipment and groundwater resource .
• Schedule water use . Work with your neighbors to schedule common or heavy water use . For example, if everyone in the neighborhood typically washes laundry on Saturday, the wells may begin to go dry Sunday . Distribute heavy water use over the week to allow individual wells to recover and sustain the water supply in your neighborhood .
• Conserve water . For tips on saving water in the kitchen, bathroom, laundry room,
and outdoors, see the list of Extension publications below .
• Consider installing a well water meter to monitor and manage your water use .
R E F E R E N C E S O F I N T E R E S T
Arizona Wells: Low Yield Domestic Water Wells . 2011 . Extension Publication #AZ1536 .
Watering Trees and Shrubs, Simple Techniques for Efficient Landscape Watering . 2006 . Extension Publication #AZ1298 .
Using Rainwater in Urban Landscapes: Quick Guide for Maricopa County . 2012 . Extension Publication #AZ1566 .
An Arizona Guide to Water Quality and Uses . 2014 . Extension Publication #AZ1610 .
Doing Our Part to Help Conserve Arizona’s Water Resources and Reduce Global Warming by Saving Energy at Home . 2008 . Extension Publication #AZ1458 .
Photo Credit: J. Artiola
SECTION
7DRINKING WATER GUIDELINES AND STANDARDS
Arizona wells registered with an “exempt” status are not subject to any federal or state monitoring, nor are they required to meet water quality standards . It is the responsibility of private domestic well owners to test their well water regularly to determine whether the water meets the drinking water standards . The next two sections are presented to familiarize private well owners with drinking water standards and to encourage well water testing . Subsequent sections will discuss well water quality and common contaminants found in Arizona groundwater .
NATIONAL PRIMARY DRINKING WATER STANDARDS
The US EPA (United States Environmental
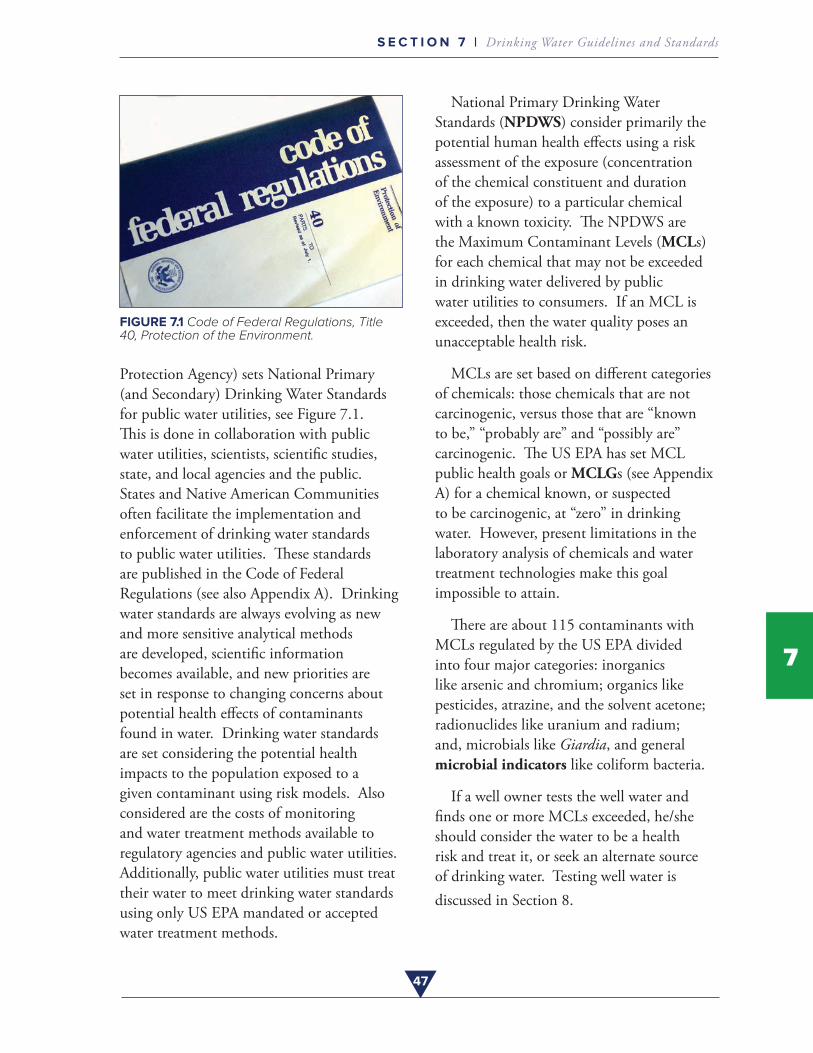
47
S E C T I O N 7 | Drinking Water Guidelines and Standards
7
FIGURE 7.1 Code of Federal Regulations, Title 40, Protection of the Environment.
Protection Agency) sets National Primary (and Secondary) Drinking Water Standards for public water utilities, see Figure 7 .1 . This is done in collaboration with public water utilities, scientists, scientific studies, state, and local agencies and the public . States and Native American Communities often facilitate the implementation and enforcement of drinking water standards to public water utilities . These standards are published in the Code of Federal Regulations (see also Appendix A) . Drinking water standards are always evolving as new and more sensitive analytical methods are developed, scientific information becomes available, and new priorities are set in response to changing concerns about potential health effects of contaminants found in water . Drinking water standards are set considering the potential health impacts to the population exposed to a given contaminant using risk models . Also considered are the costs of monitoring and water treatment methods available to regulatory agencies and public water utilities . Additionally, public water utilities must treat their water to meet drinking water standards using only US EPA mandated or accepted water treatment methods .
National Primary Drinking Water Standards (NPDWS) consider primarily the potential human health effects using a risk assessment of the exposure (concentration of the chemical constituent and duration of the exposure) to a particular chemical with a known toxicity . The NPDWS are the Maximum Contaminant Levels (MCLs) for each chemical that may not be exceeded in drinking water delivered by public water utilities to consumers . If an MCL is exceeded, then the water quality poses an unacceptable health risk .
MCLs are set based on different categories of chemicals: those chemicals that are not carcinogenic, versus those that are “known to be,” “probably are” and “possibly are” carcinogenic . The US EPA has set MCL public health goals or MCLGs (see Appendix A) for a chemical known, or suspected to be carcinogenic, at “zero” in drinking water . However, present limitations in the laboratory analysis of chemicals and water treatment technologies make this goal impossible to attain .
There are about 115 contaminants with MCLs regulated by the US EPA divided into four major categories: inorganics like arsenic and chromium; organics like pesticides, atrazine, and the solvent acetone; radionuclides like uranium and radium; and, microbials like Giardia, and general microbial indicators like coliform bacteria .
If a well owner tests the well water and finds one or more MCLs exceeded, he/she should consider the water to be a health risk and treat it, or seek an alternate source of drinking water . Testing well water is discussed in Section 8 .
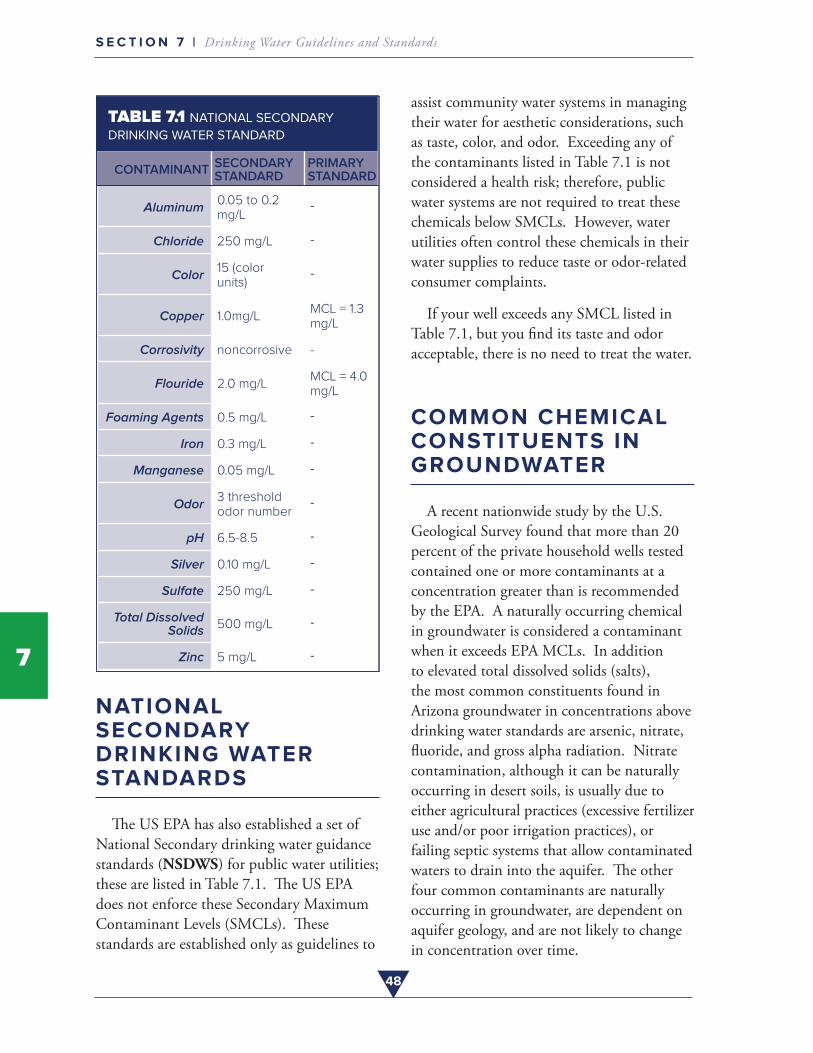
48
S E C T I O N 7 | Drinking Water Guidelines and Standards
7
TABLE 7.1 NATIONAL SECONDARY
DRINKING WATER STANDARD
CONTAMINANT SECONDARY STANDARD
PRIMARY STANDARD
Aluminum0.05 to 0.2 mg/L
Chloride 250 mg/L
Color15 (color units)
Copper 1.0mg/LMCL = 1.3 mg/L
Corrosivity noncorrosive -
Flouride 2.0 mg/LMCL = 4.0 mg/L
Foaming Agents 0.5 mg/L
Iron 0.3 mg/L
Manganese 0.05 mg/L
Odor3 threshold odor number
pH 6.5-8.5
Silver 0.10 mg/L
Sulfate 250 mg/L
Total Dissolved Solids 500 mg/L
Zinc 5 mg/L
NATIONAL SECONDARY DRINKING WATER STANDARDS
The US EPA has also established a set of National Secondary drinking water guidance standards (NSDWS) for public water utilities; these are listed in Table 7 .1 . The US EPA does not enforce these Secondary Maximum Contaminant Levels (SMCLs) . These standards are established only as guidelines to
assist community water systems in managing their water for aesthetic considerations, such as taste, color, and odor . Exceeding any of the contaminants listed in Table 7 .1 is not considered a health risk; therefore, public water systems are not required to treat these chemicals below SMCLs . However, water utilities often control these chemicals in their water supplies to reduce taste or odor-related consumer complaints .
If your well exceeds any SMCL listed in Table 7 .1, but you find its taste and odor acceptable, there is no need to treat the water .
COMMON CHEMICAL CONSTITUENTS IN GROUNDWATER
A recent nationwide study by the U .S . Geological Survey found that more than 20 percent of the private household wells tested contained one or more contaminants at a concentration greater than is recommended by the EPA . A naturally occurring chemical in groundwater is considered a contaminant when it exceeds EPA MCLs . In addition to elevated total dissolved solids (salts), the most common constituents found in Arizona groundwater in concentrations above drinking water standards are arsenic, nitrate, fluoride, and gross alpha radiation . Nitrate contamination, although it can be naturally occurring in desert soils, is usually due to either agricultural practices (excessive fertilizer use and/or poor irrigation practices), or failing septic systems that allow contaminated waters to drain into the aquifer . The other four common contaminants are naturally occurring in groundwater, are dependent on aquifer geology, and are not likely to change in concentration over time .
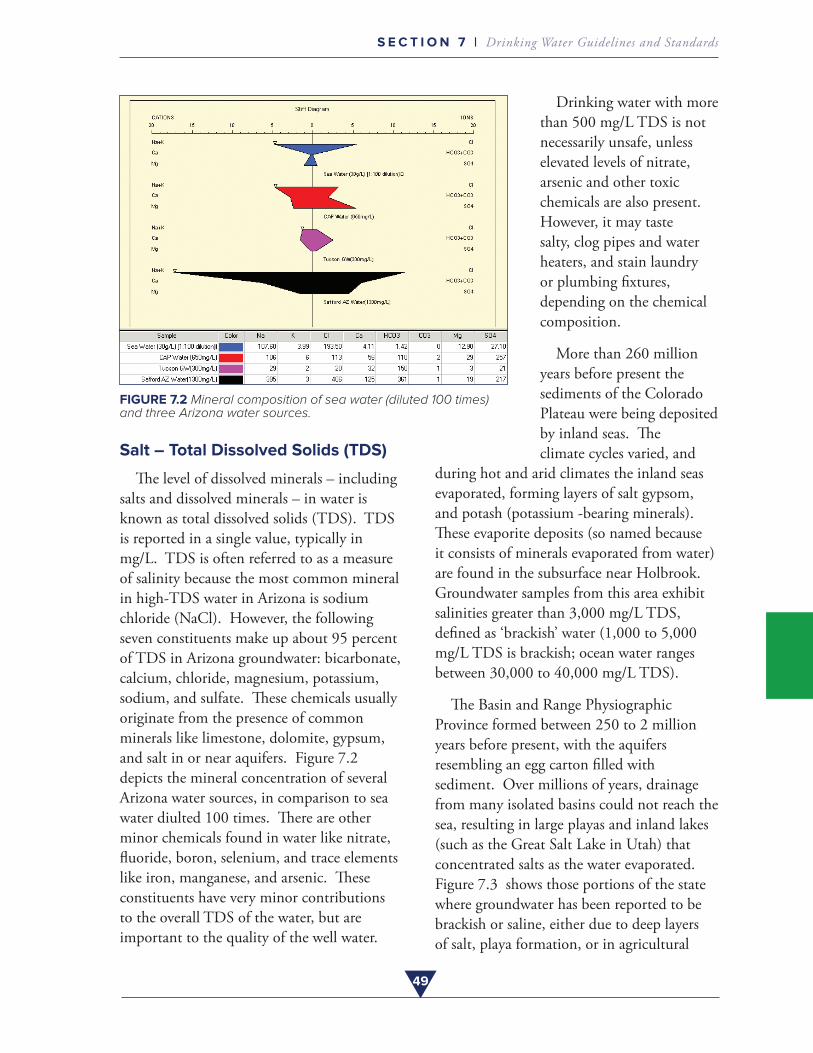
49
S E C T I O N 7 | Drinking Water Guidelines and Standards
FIGURE 7.2 Mineral composition of sea water (diluted 100 times) and three Arizona water sources.
Salt – Total Dissolved Solids (TDS)
The level of dissolved minerals – including salts and dissolved minerals – in water is known as total dissolved solids (TDS) . TDS is reported in a single value, typically in mg/L . TDS is often referred to as a measure of salinity because the most common mineral in high-TDS water in Arizona is sodium chloride (NaCl) . However, the following seven constituents make up about 95 percent of TDS in Arizona groundwater: bicarbonate, calcium, chloride, magnesium, potassium, sodium, and sulfate . These chemicals usually originate from the presence of common minerals like limestone, dolomite, gypsum, and salt in or near aquifers . Figure 7 .2 depicts the mineral concentration of several Arizona water sources, in comparison to sea water diulted 100 times . There are other minor chemicals found in water like nitrate, fluoride, boron, selenium, and trace elements like iron, manganese, and arsenic . These constituents have very minor contributions to the overall TDS of the water, but are important to the quality of the well water .
Drinking water with more than 500 mg/L TDS is not necessarily unsafe, unless elevated levels of nitrate, arsenic and other toxic chemicals are also present . However, it may taste salty, clog pipes and water heaters, and stain laundry or plumbing fixtures, depending on the chemical composition .
More than 260 million years before present the sediments of the Colorado Plateau were being deposited by inland seas . The climate cycles varied, and
during hot and arid climates the inland seas evaporated, forming layers of salt gypsom, and potash (potassium -bearing minerals) . These evaporite deposits (so named because it consists of minerals evaporated from water) are found in the subsurface near Holbrook . Groundwater samples from this area exhibit salinities greater than 3,000 mg/L TDS, defined as ‘brackish’ water (1,000 to 5,000 mg/L TDS is brackish; ocean water ranges between 30,000 to 40,000 mg/L TDS) .
The Basin and Range Physiographic Province formed between 250 to 2 million years before present, with the aquifers resembling an egg carton filled with sediment . Over millions of years, drainage from many isolated basins could not reach the sea, resulting in large playas and inland lakes (such as the Great Salt Lake in Utah) that concentrated salts as the water evaporated . Figure 7 .3 shows those portions of the state where groundwater has been reported to be brackish or saline, either due to deep layers of salt, playa formation, or in agricultural
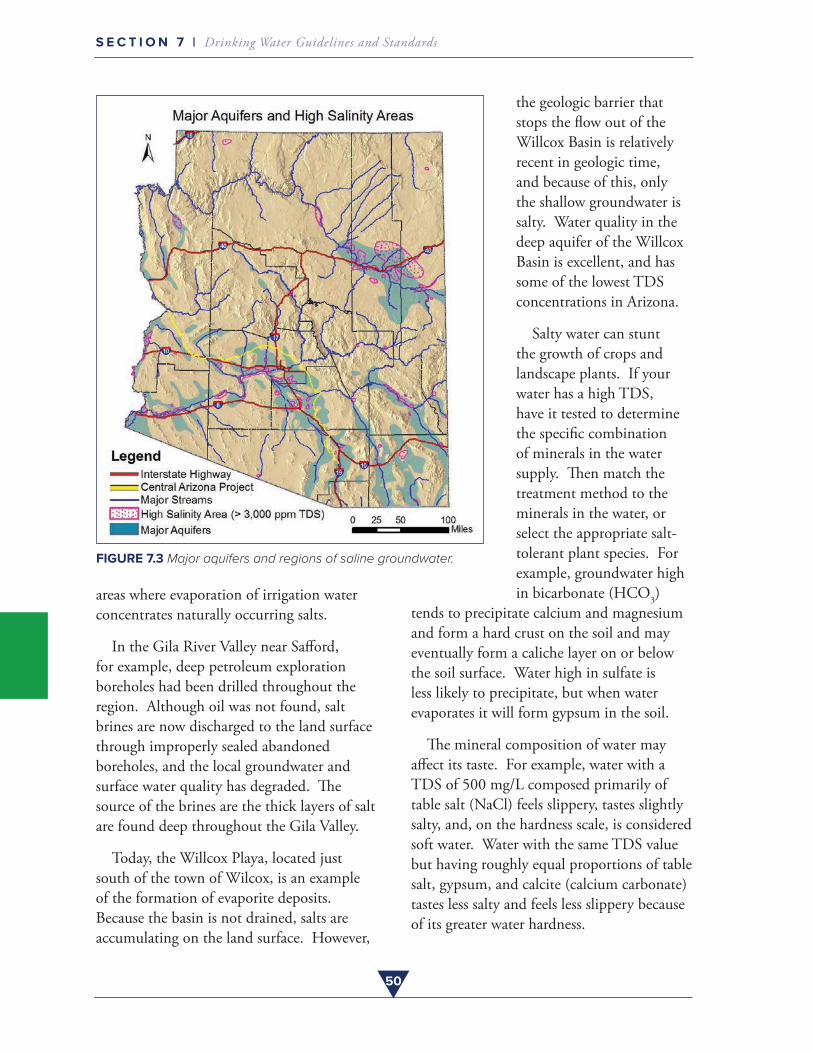
50
S E C T I O N 7 | Drinking Water Guidelines and Standards
FIGURE 7.3 Major aquifers and regions of saline groundwater.
areas where evaporation of irrigation water concentrates naturally occurring salts .
In the Gila River Valley near Safford, for example, deep petroleum exploration boreholes had been drilled throughout the region . Although oil was not found, salt brines are now discharged to the land surface through improperly sealed abandoned boreholes, and the local groundwater and surface water quality has degraded . The source of the brines are the thick layers of salt are found deep throughout the Gila Valley .
Today, the Willcox Playa, located just south of the town of Wilcox, is an example of the formation of evaporite deposits . Because the basin is not drained, salts are accumulating on the land surface . However,
the geologic barrier that stops the flow out of the Willcox Basin is relatively recent in geologic time, and because of this, only the shallow groundwater is salty . Water quality in the deep aquifer of the Willcox Basin is excellent, and has some of the lowest TDS concentrations in Arizona .
Salty water can stunt the growth of crops and landscape plants . If your water has a high TDS, have it tested to determine the specific combination of minerals in the water supply . Then match the treatment method to the minerals in the water, or select the appropriate salt-tolerant plant species . For example, groundwater high in bicarbonate (HCO3)
tends to precipitate calcium and magnesium and form a hard crust on the soil and may eventually form a caliche layer on or below the soil surface . Water high in sulfate is less likely to precipitate, but when water evaporates it will form gypsum in the soil .
The mineral composition of water may affect its taste . For example, water with a TDS of 500 mg/L composed primarily of table salt (NaCl) feels slippery, tastes slightly salty, and, on the hardness scale, is considered soft water . Water with the same TDS value but having roughly equal proportions of table salt, gypsum, and calcite (calcium carbonate) tastes less salty and feels less slippery because of its greater water hardness .
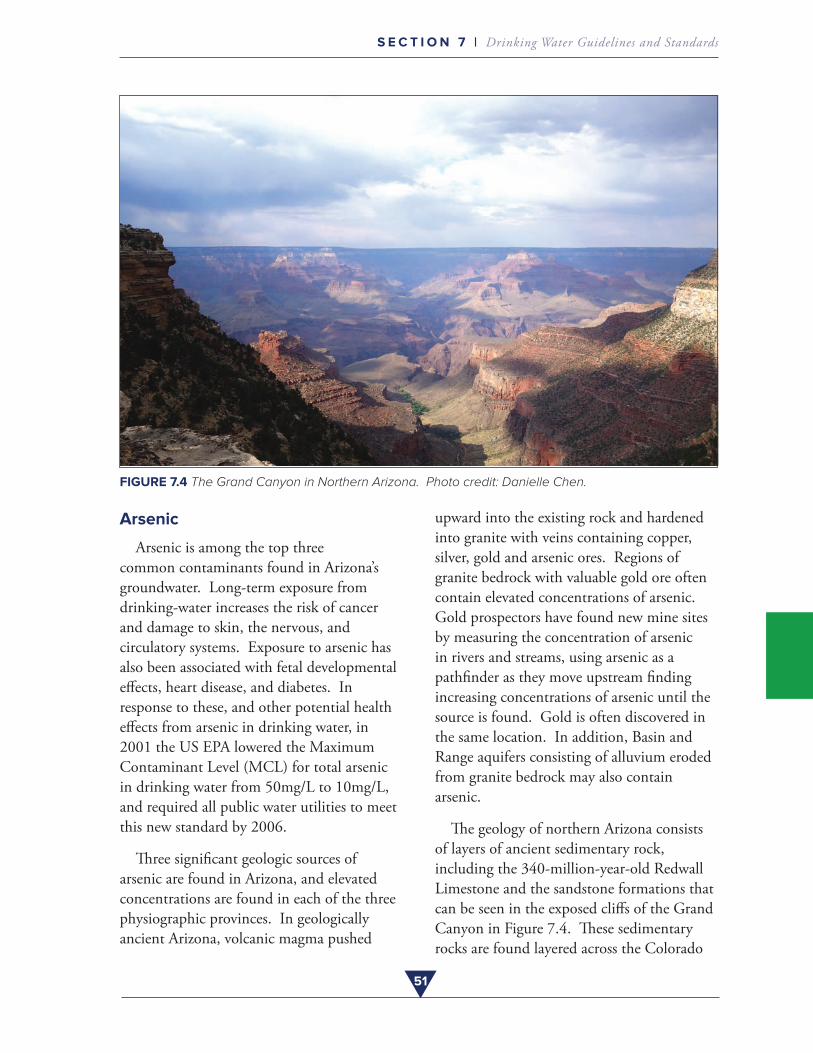
51
S E C T I O N 7 | Drinking Water Guidelines and Standards
FIGURE 7.4 The Grand Canyon in Northern Arizona. Photo credit: Danielle Chen.
Arsenic
Arsenic is among the top three common contaminants found in Arizona’s groundwater . Long-term exposure from drinking-water increases the risk of cancer and damage to skin, the nervous, and circulatory systems . Exposure to arsenic has also been associated with fetal developmental effects, heart disease, and diabetes . In response to these, and other potential health effects from arsenic in drinking water, in 2001 the US EPA lowered the Maximum Contaminant Level (MCL) for total arsenic in drinking water from 50mg/L to 10mg/L, and required all public water utilities to meet this new standard by 2006 .
Three significant geologic sources of arsenic are found in Arizona, and elevated concentrations are found in each of the three physiographic provinces . In geologically ancient Arizona, volcanic magma pushed
upward into the existing rock and hardened into granite with veins containing copper, silver, gold and arsenic ores . Regions of granite bedrock with valuable gold ore often contain elevated concentrations of arsenic . Gold prospectors have found new mine sites by measuring the concentration of arsenic in rivers and streams, using arsenic as a pathfinder as they move upstream finding increasing concentrations of arsenic until the source is found . Gold is often discovered in the same location . In addition, Basin and Range aquifers consisting of alluvium eroded from granite bedrock may also contain arsenic .
The geology of northern Arizona consists of layers of ancient sedimentary rock, including the 340-million-year-old Redwall Limestone and the sandstone formations that can be seen in the exposed cliffs of the Grand Canyon in Figure 7 .4 . These sedimentary rocks are found layered across the Colorado
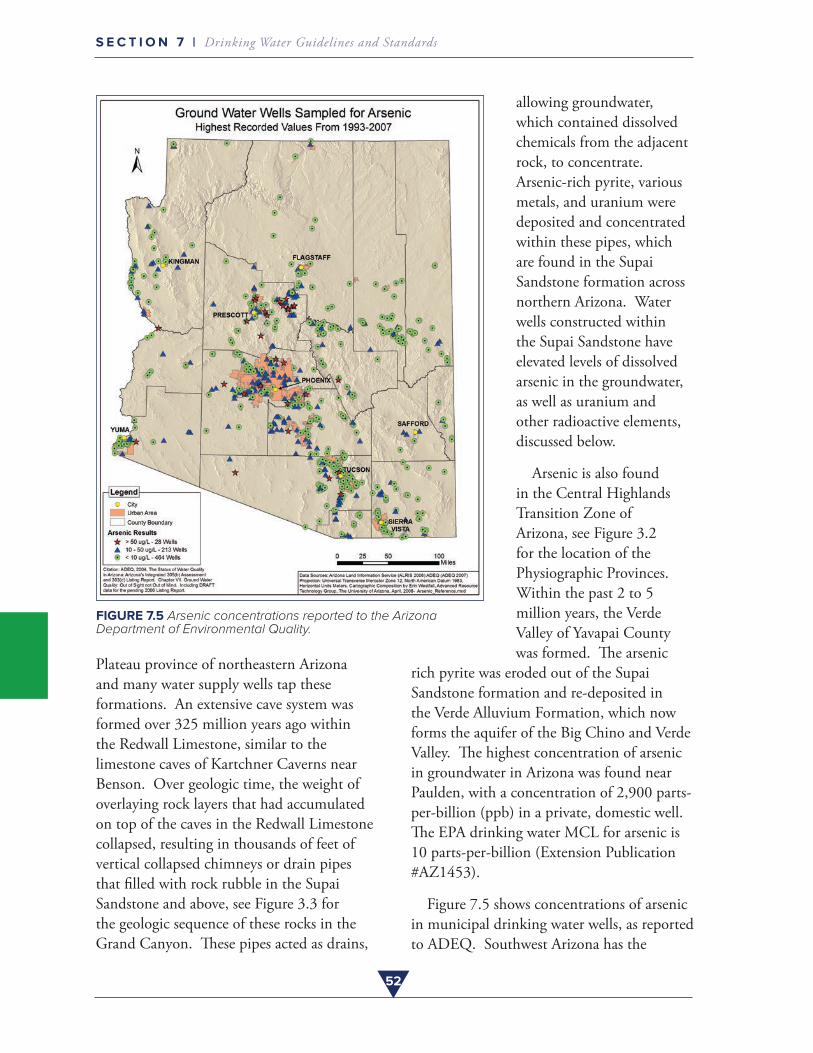
52
S E C T I O N 7 | Drinking Water Guidelines and Standards
FIGURE 7.5 Arsenic concentrations reported to the Arizona Department of Environmental Quality.
Plateau province of northeastern Arizona and many water supply wells tap these formations . An extensive cave system was formed over 325 million years ago within the Redwall Limestone, similar to the limestone caves of Kartchner Caverns near Benson . Over geologic time, the weight of overlaying rock layers that had accumulated on top of the caves in the Redwall Limestone collapsed, resulting in thousands of feet of vertical collapsed chimneys or drain pipes that filled with rock rubble in the Supai Sandstone and above, see Figure 3 .3 for the geologic sequence of these rocks in the Grand Canyon . These pipes acted as drains,
allowing groundwater, which contained dissolved chemicals from the adjacent rock, to concentrate . Arsenic-rich pyrite, various metals, and uranium were deposited and concentrated within these pipes, which are found in the Supai Sandstone formation across northern Arizona . Water wells constructed within the Supai Sandstone have elevated levels of dissolved arsenic in the groundwater, as well as uranium and other radioactive elements, discussed below .
Arsenic is also found in the Central Highlands Transition Zone of Arizona, see Figure 3 .2 for the location of the Physiographic Provinces . Within the past 2 to 5 million years, the Verde Valley of Yavapai County was formed . The arsenic
rich pyrite was eroded out of the Supai Sandstone formation and re-deposited in the Verde Alluvium Formation, which now forms the aquifer of the Big Chino and Verde Valley . The highest concentration of arsenic in groundwater in Arizona was found near Paulden, with a concentration of 2,900 parts-per-billion (ppb) in a private, domestic well . The EPA drinking water MCL for arsenic is 10 parts-per-billion (Extension Publication #AZ1453) .
Figure 7 .5 shows concentrations of arsenic in municipal drinking water wells, as reported to ADEQ . Southwest Arizona has the
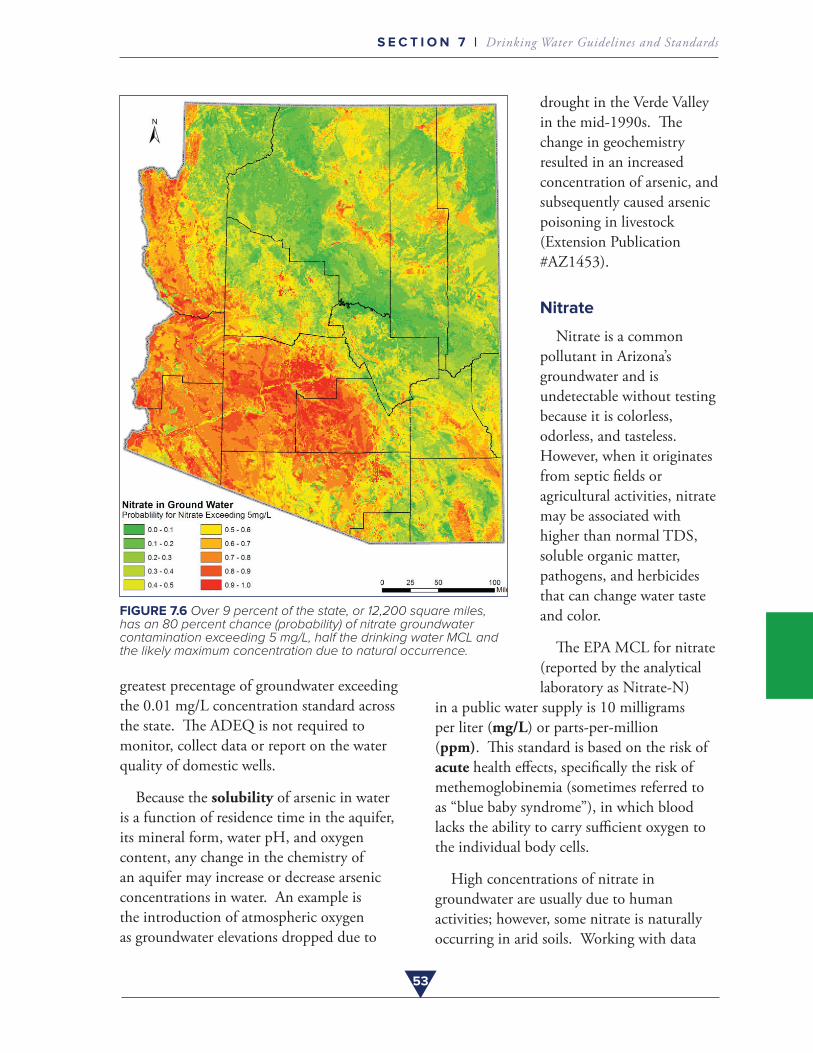
53
S E C T I O N 7 | Drinking Water Guidelines and Standards
FIGURE 7.6 Over 9 percent of the state, or 12,200 square miles, has an 80 percent chance (probability) of nitrate groundwater contamination exceeding 5 mg/L, half the drinking water MCL and the likely maximum concentration due to natural occurrence.
greatest precentage of groundwater exceeding the 0 .01 mg/L concentration standard across the state . The ADEQ is not required to monitor, collect data or report on the water quality of domestic wells .
Because the solubility of arsenic in water is a function of residence time in the aquifer, its mineral form, water pH, and oxygen content, any change in the chemistry of an aquifer may increase or decrease arsenic concentrations in water . An example is the introduction of atmospheric oxygen as groundwater elevations dropped due to
drought in the Verde Valley in the mid-1990s . The change in geochemistry resulted in an increased concentration of arsenic, and subsequently caused arsenic poisoning in livestock (Extension Publication #AZ1453) .
Nitrate
Nitrate is a common pollutant in Arizona’s groundwater and is undetectable without testing because it is colorless, odorless, and tasteless . However, when it originates from septic fields or agricultural activities, nitrate may be associated with higher than normal TDS, soluble organic matter, pathogens, and herbicides that can change water taste and color .
The EPA MCL for nitrate (reported by the analytical laboratory as Nitrate-N)
in a public water supply is 10 milligrams per liter (mg/L) or parts-per-million (ppm) . This standard is based on the risk of acute health effects, specifically the risk of methemoglobinemia (sometimes referred to as “blue baby syndrome”), in which blood lacks the ability to carry sufficient oxygen to the individual body cells .
High concentrations of nitrate in groundwater are usually due to human activities; however, some nitrate is naturally occurring in arid soils . Working with data
54
S E C T I O N 7 | Drinking Water Guidelines and Standards
from more than 6,800 municipal drinking water wells that report water chemistry to the ADEQ, a model was developed to predict nitrate concentration of nitrate (Extension Publication #AZ1536) . Where drinking water well data were unavailable, nitrate concentrations were predicted, based on soils, climate, and land use . Figure 7 .6 depicts probable locations across the state where groundwater is likely to have nitrate contamination .
Therefore, in areas with historic or current agricultural activities and/or served by individual septic systems and domestic wells, nitrate contamination may be prevalent . Large expanses of irrigated cropland are the most significant contributor to elevated nitrate concentrations . The groundwater basins in which more than 20 percent of the samples collected exceeded the MCL include Gila Bend, Harquahala, Pinal AMA, McMullen Valley, and Ranegras Plain—all regions of extensive irrigated farmland (Appendix D includes a map of these locations) . Aquifers within the Salt River Valley, as well as areas in Glendale, Mesa, Chandler and Phoenix, also contain groundwater with nitrate concentrations high enough to render the water unfit for potable use . In addition, high nitrate levels occur in Marana, St . David, Bullhead City, and other areas in Arizona . Quartzsite and Lake Havasu City have made significant efforts to address septic wastewater disposal problems that have contributed to groundwater pollution .
Fluoride
Fluoride is a common element that is concentrated in volcanic ash, soils, and sediments that contain minerals rich in fluorine like carbonates, clays, and fluorite (CaF2) . Fluoride minerals may also be
present in granite rock . Most of the elevated concentrations are associated with confined aquifers because groundwater held in confined aquifers usually has not had the opportunity to mix with recently recharged water high in dissolved oxygen . Therefore, the low oxygen environment, and long resident time, allows for fluoride naturally present in the geology to dissolve into groundwater .
Although it can be harmful at high concentrations, fluoride is essential for strong teeth and bones and is essential for the development of tooth enamel . Many municipal water supply systems add fluoride to the water to support dental health . Excessive fluoride concentrations in drinking water, however, can discolor teeth and cause skeletal fluorosis .
An extreme example of groundwater containing naturally occurring dissolved fluoride is in South Carolina, where fluoride has dissolved shark tooth enamel from fossils deposited in an unconsolidated coastal aquifer .
The maximum contaminant level for fluoride is 4 .0 mg/L, and the secondary maximum contaminant level is 2 .0 mg/L, a level at which tooth discoloration can occur . The highest reported fluoride concentrations are found in Cochise, Mohave, Graham, and Greenlee Counties, and along the lower Gila River in Yuma County .
Radioactive Elements
Radioactivity is the release of energy from within atoms in the form of atomic particles (alpha and beta) and gamma radiation . Certain atom structures are inherently unstable and spontaneously break down (decay) to form more stable atoms . For
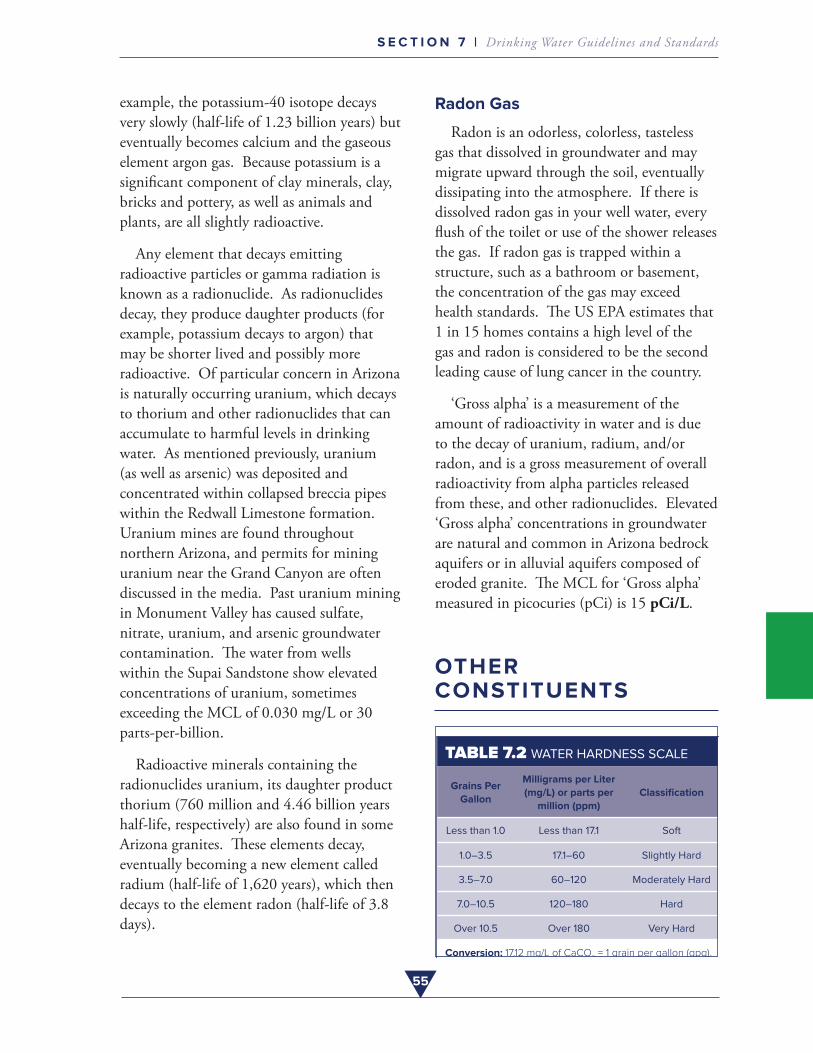
55
S E C T I O N 7 | Drinking Water Guidelines and Standards
example, the potassium-40 isotope decays very slowly (half-life of 1 .23 billion years) but eventually becomes calcium and the gaseous element argon gas . Because potassium is a significant component of clay minerals, clay, bricks and pottery, as well as animals and plants, are all slightly radioactive .
Any element that decays emitting radioactive particles or gamma radiation is known as a radionuclide . As radionuclides decay, they produce daughter products (for example, potassium decays to argon) that may be shorter lived and possibly more radioactive . Of particular concern in Arizona is naturally occurring uranium, which decays to thorium and other radionuclides that can accumulate to harmful levels in drinking water . As mentioned previously, uranium (as well as arsenic) was deposited and concentrated within collapsed breccia pipes within the Redwall Limestone formation . Uranium mines are found throughout northern Arizona, and permits for mining uranium near the Grand Canyon are often discussed in the media . Past uranium mining in Monument Valley has caused sulfate, nitrate, uranium, and arsenic groundwater contamination . The water from wells within the Supai Sandstone show elevated concentrations of uranium, sometimes exceeding the MCL of 0 .030 mg/L or 30 parts-per-billion .
Radioactive minerals containing the radionuclides uranium, its daughter product thorium (760 million and 4 .46 billion years half-life, respectively) are also found in some Arizona granites . These elements decay, eventually becoming a new element called radium (half-life of 1,620 years), which then decays to the element radon (half-life of 3 .8 days) .
Radon Gas
Radon is an odorless, colorless, tasteless gas that dissolved in groundwater and may migrate upward through the soil, eventually dissipating into the atmosphere . If there is dissolved radon gas in your well water, every flush of the toilet or use of the shower releases the gas . If radon gas is trapped within a structure, such as a bathroom or basement, the concentration of the gas may exceed health standards . The US EPA estimates that 1 in 15 homes contains a high level of the gas and radon is considered to be the second leading cause of lung cancer in the country .
‘Gross alpha’ is a measurement of the amount of radioactivity in water and is due to the decay of uranium, radium, and/or radon, and is a gross measurement of overall radioactivity from alpha particles released from these, and other radionuclides . Elevated ‘Gross alpha’ concentrations in groundwater are natural and common in Arizona bedrock aquifers or in alluvial aquifers composed of eroded granite . The MCL for ‘Gross alpha’ measured in picocuries (pCi) is 15 pCi/L .
OTHER CONSTITUENTS
TABLE 7.2 WATER HARDNESS SCALE
Grains Per Gallon
Milligrams per Liter (mg/L) or parts per
million (ppm)Classification
Less than 1.0 Less than 17.1 Soft
1.0–3.5 17.1–60 Slightly Hard
3.5–7.0 60–120 Moderately Hard
7.0–10.5 120–180 Hard
Over 10.5 Over 180 Very Hard
Conversion: 17.12 mg/L of CaCO3 = 1 grain per gallon (gpg).
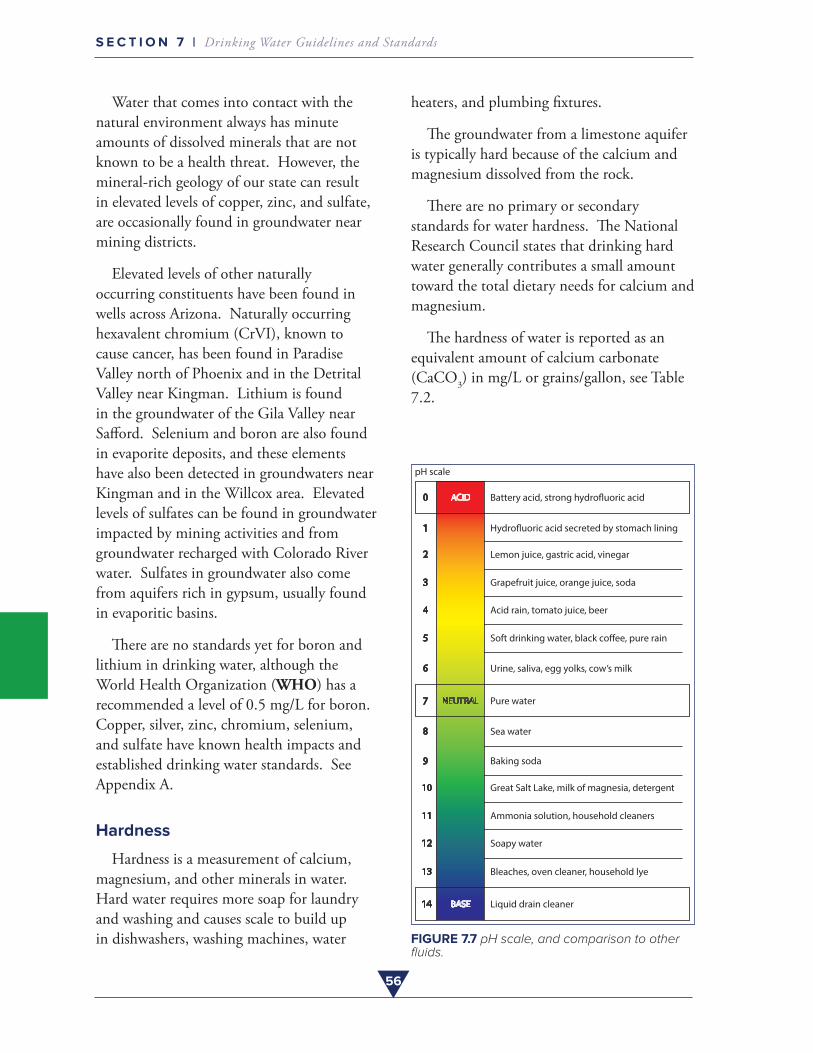
56
S E C T I O N 7 | Drinking Water Guidelines and Standards
Water that comes into contact with the natural environment always has minute amounts of dissolved minerals that are not known to be a health threat . However, the mineral-rich geology of our state can result in elevated levels of copper, zinc, and sulfate, are occasionally found in groundwater near mining districts .
Elevated levels of other naturally occurring constituents have been found in wells across Arizona . Naturally occurring hexavalent chromium (CrVI), known to cause cancer, has been found in Paradise Valley north of Phoenix and in the Detrital Valley near Kingman . Lithium is found in the groundwater of the Gila Valley near Safford . Selenium and boron are also found in evaporite deposits, and these elements have also been detected in groundwaters near Kingman and in the Willcox area . Elevated levels of sulfates can be found in groundwater impacted by mining activities and from groundwater recharged with Colorado River water . Sulfates in groundwater also come from aquifers rich in gypsum, usually found in evaporitic basins .
There are no standards yet for boron and lithium in drinking water, although the World Health Organization (WHO) has a recommended a level of 0 .5 mg/L for boron . Copper, silver, zinc, chromium, selenium, and sulfate have known health impacts and established drinking water standards . See Appendix A .
Hardness
Hardness is a measurement of calcium, magnesium, and other minerals in water . Hard water requires more soap for laundry and washing and causes scale to build up in dishwashers, washing machines, water
heaters, and plumbing fixtures .
The groundwater from a limestone aquifer is typically hard because of the calcium and magnesium dissolved from the rock .
There are no primary or secondary standards for water hardness . The National Research Council states that drinking hard water generally contributes a small amount toward the total dietary needs for calcium and magnesium .
The hardness of water is reported as an equivalent amount of calcium carbonate (CaCO3) in mg/L or grains/gallon, see Table 7 .2 .
Battery acid, strong hydro�uoric acid
Hydro�uoric acid secreted by stomach lining
Lemon juice, gastric acid, vinegar
Grapefruit juice, orange juice, soda
Acid rain, tomato juice, beer
Soft drinking water, black co�ee, pure rain
Urine, saliva, egg yolks, cow’s milk
Pure water
Sea water
Baking soda
Great Salt Lake, milk of magnesia, detergent
Ammonia solution, household cleaners
Soapy water
Bleaches, oven cleaner, household lye
Liquid drain cleaner
ACID
BASE
NEUTRAL
0
7
14
1
2
3
4
5
6
8
9
10
11
12
13
pH scale
FIGURE 7.7 pH scale, and comparison to other fluids.
57
S E C T I O N 7 | Drinking Water Guidelines and Standards
Acidic or Alkaline Water: pH
The pH of groundwater is very important as it impacts the availability of mineral constituents that may dissolve into the water . Some of these minerals, for example arsenic or fluoride, are often correlated with alkaline (pH greater than 7) water . This water quality parameter is often taken for granted and assumed to be acceptable since most groundwater sources in Arizona are alkaline (contain high levels of bicarbonates) and is hard . pH is a measure of active acidity in water and should not be confused with alkalinity . pH is important in controlling pipe corrosion and some taste problems . Metallic taste for example may be due excessive levels of metals in water (zinc and copper, for example) and this may be due to low water pH that corrodes metal pipes . The recommended pH range for drinking water is 6 .5 to 8 .5; Figure 7 .7 compares the pH of various liquids to water . Water with a pH value above 8 .5 its usually too high in TDS to be potable .
Taste
Water TDS levels and pH influence water taste, but the types and proportions of several minerals discussed in the TDS section also influence taste . For example, water with 500 mg/L of sodium salts will have a slightly salty taste and feel slippery, but water of equal TDS but composed of gypsum, calcium and bicarbonate, would taste less salty . Salty taste can be reduced by lowering the water TDS .
Organic Matter
Water color, odor, foaming, and taste are affected by the presence of natural organic matter (NOM) substances . NOM is usually found at much higher concentrations in
surface water than groundwater, but even deep, old groundwater may have measurable levels of NOM . Most NOM is derived from vegetation, such as leaves, that fall in the surface water and decay . If well water contains organic matter it is usually derived from vegetation such as leaves or roots in the well . These constituents can impart taste and color to the water, like when tea leaves are brewed . Wells with water levels that respond quickly to rain storms and floods may also have elevated levels of NOM, sediments, and other unwanted contaminants, following rapid recharge of stormwater to the aquifer .
Rotten Eggs (Hydrogen Sulfide Odor)
The decay of organic matter in the aquifer may generate hydrogen sulfide gas, which smells like rotten eggs . Although colorless, hydrogen sulfide is perceptible by the human nose at concentrations as low as 0 .47 µg/L in air . The gas may corrode pipes as well as create black stains on silverware and plumbing fixtures .
In aquifers containing pyrite (iron sulfide) mineral, or are rich in sulfate, some bacteria can produce corrosive hydrogen sulfide gas . Other bacteria may also generate slime, which promotes the growth of even more bacteria clogging wells and plumbing . Iron and sulfur-reducing bacteria can thrive in low-oxygen environments rich in organic matter such as slow-moving groundwater and in warm storage tanks, water heaters, and water softeners .
Dissolved Iron and Manganese
Iron and manganese are found in nearly all groundwater . The presence of high levels of iron, manganese, and sulfides in well water
58
S E C T I O N 7 | Drinking Water Guidelines and Standards
may be due to:
• Low oxygen content and the presence of naturally occurring iron or manganese minerals . When this groundwater water is pumped out and exposed to air it produces reddish brown (iron) or brownish black (manganese) particles, deposits, and stains and can also adversely affect the taste of water . Note that:
º When drawn from the tap, this well water may initially be clear, but soon very small particles of iron form . Called colloidal iron, these particles settle very slowly, turning the water reddish brown .
º Iron causes reddish-brown stains on concrete, glassware, laundry, porcelain, sinks, and plumbing fixtures .
º Manganese causes brownish black stains on the same materials . Detergents do not remove these stains . Chlorine bleach may even intensify the stains and produce water tinted purple .
º Manganese usually dissolves clear in water, but some colloidal manganese may tint the water black .
• When red iron or black manganese deposits have the consistency of slime, they indicate the presence of iron and manganese bacteria in the water that form biofilms on surfaces . These slimy deposits are soft and can be found in toilet tanks and can quickly clog water and well systems as they tend to grow faster than hard mineral deposits .
• Precipitated, manganese particles can
clog an and irrigation system as shown in Figure 5 .11 .
• Abnormal levels of iron, manganese can give unpleasant rust or metallic taste, odor, and color to water, but are not considered a health risk .
ANTHROPOGENIC CONTAMINANTS
Anthropogenic contaminants are found in water as a result of human activities that release industrial and agricultural chemicals into the environment, and those derived from land use activities such as oils and grease flushed off of roadways . The volumes released vary widely and their fate and transport within the environment depend on their chemical and physical properties, and how each medium responds to their presence . Some contaminants are harmless or are not known to be toxic; others degrade, decomposing into harmless chemicals . Other contaminants can accumulate in our tissue and organs, and be a potential danger to our health . Nitrate, previously discussed, is a good example of a natural and anthropogenic chemical often released into the environment at concentrations that can be harmful to human and aquatic environments . Although nitrate is released into the environment in large quantities, it is a nutrient taken up by plants and other organisms . In low-oxygen environments nitrate can also change to ammonia or nitrogen gas, dissipating into the atmosphere .
In 2003, the cause of the death of aquarium fish in a home in Tucson was traced to mercury in the water supply . The source was a broken mercury switch on a water-level
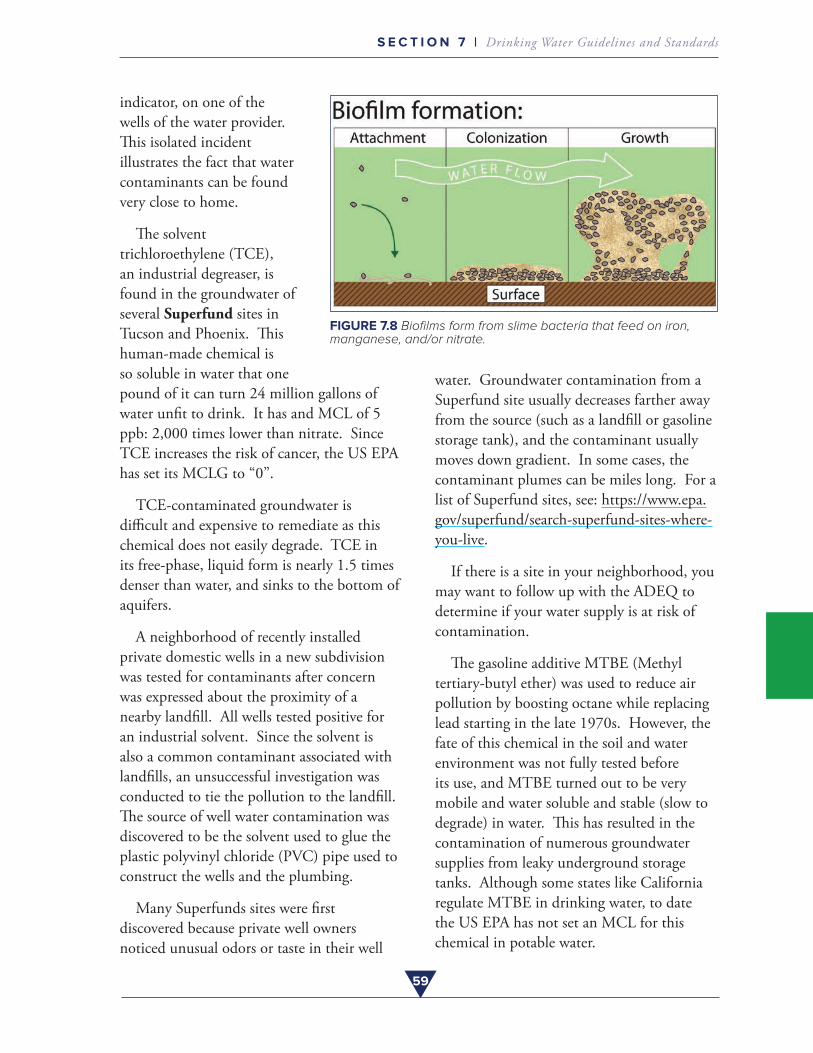
59
S E C T I O N 7 | Drinking Water Guidelines and Standards
indicator, on one of the wells of the water provider . This isolated incident illustrates the fact that water contaminants can be found very close to home .
The solvent trichloroethylene (TCE), an industrial degreaser, is found in the groundwater of several Superfund sites in Tucson and Phoenix . This human-made chemical is so soluble in water that one pound of it can turn 24 million gallons of water unfit to drink . It has and MCL of 5 ppb: 2,000 times lower than nitrate . Since TCE increases the risk of cancer, the US EPA has set its MCLG to “0” .
TCE-contaminated groundwater is difficult and expensive to remediate as this chemical does not easily degrade . TCE in its free-phase, liquid form is nearly 1 .5 times denser than water, and sinks to the bottom of aquifers .
A neighborhood of recently installed private domestic wells in a new subdivision was tested for contaminants after concern was expressed about the proximity of a nearby landfill . All wells tested positive for an industrial solvent . Since the solvent is also a common contaminant associated with landfills, an unsuccessful investigation was conducted to tie the pollution to the landfill . The source of well water contamination was discovered to be the solvent used to glue the plastic polyvinyl chloride (PVC) pipe used to construct the wells and the plumbing .
Many Superfunds sites were first discovered because private well owners noticed unusual odors or taste in their well
FIGURE 7.8 Biofilms form from slime bacteria that feed on iron,
water . Groundwater contamination from a Superfund site usually decreases farther away from the source (such as a landfill or gasoline storage tank), and the contaminant usually moves down gradient . In some cases, the contaminant plumes can be miles long . For a list of Superfund sites, see: https://www .epa .gov/superfund/search-superfund-sites-where-you-live .
If there is a site in your neighborhood, you may want to follow up with the ADEQ to determine if your water supply is at risk of contamination .
The gasoline additive MTBE (Methyl tertiary-butyl ether) was used to reduce air pollution by boosting octane while replacing lead starting in the late 1970s . However, the fate of this chemical in the soil and water environment was not fully tested before its use, and MTBE turned out to be very mobile and water soluble and stable (slow to degrade) in water . This has resulted in the contamination of numerous groundwater supplies from leaky underground storage tanks . Although some states like California regulate MTBE in drinking water, to date the US EPA has not set an MCL for this chemical in potable water .
manganese, and/or nitrate.
60
S E C T I O N 7 | Drinking Water Guidelines and Standards
It is worthwhile to note that the odor threshold (the concentration at which the human nose can detect an odor) of some natural and industrial chemicals is lower than the detection capacity of a testing laboratory . This means that sometimes we can be alerted to the presence of contaminants in water by their smell . However, one should not only rely on the sense of smell only to determine the possible presence of contaminants in well water .
PATHOGENS
Groundwater can be contaminated with organisms (such as intestinal waterborne pathogens) that can cause diseases . An enteric pathogen can impact the digestive system and cause vomiting and/or diarrhea . In rural areas, this contamination is often the result of failing septic systems and poor wellhead protection . Contaminated groundwater represents approximately half of all the waterborne disease cases documented in the US every year (CDC, 2015) .
Organisms that can contaminate groundwater include human-waste derived viruses such as adenovirus, rotavirus, hepatatis A, and norovirus; enteric bacteria such as E. coli 157:H7, Salmonella, Campylobacter, Pseudomonas, Helicobacter, Aeromonas, Vibrio cholerae, and Shigella; protozoan pathogens such as Cryptosporidium, and Giardia; and, an amoeba called Naegleria fowleri . These organisms present a human health risk when ingesting contaminated water . Typical symptoms associated with an infection include acute gastroenteritis, severe cramping, abdominal pain, dehydration, and diarrhea .
A study by the University of Arizona
detected the amoeba Naegleria fowleri in 29 of 188 water systems and private wells tested in Arizona . This organism thrives in warm water and in slow flowing or stagnant water systems such as storage tanks . This amoeba usually infects humans by traveling through the nose to the brain and spinal cord causing a painful death .
All the above-mentioned organisms are a risk to human health, but viruses are considered more of a threat to groundwater because they are much smaller than bacteria or parasites and can leach farther down the vadose zone and into aquifers . Viruses can be more persistent in the environment than many bacteria, requiring stronger disinfection methods to inactivate them .
Approximately one-third of the groundwater drinking wells used by public utilities across the US contained human intestinal viruses . However, two studies from the University of Arizona on 71 groundwater (22 from private wells) samples collected from seven counties in Arizona did not show the presence of pathogenic enteric viruses . More groundwater samples are needed to verify this trend . However, about one-half of the groundwater samples from private wells tested positive total and fecal coliforms (Extension Publication #AZ1485) .
EMERGING CONTAMINANTS
The US EPA evaluates contaminants that may need to be regulated in public water supply systems . Therefore, Escherichia coli, or E. coli, is important to test for in well water . It can be present due to leaking septic systems, septic system overflow, or
61
7
S E C T I O N 7 | Drinking Water Guidelines and Standards
agricultural runoff . This bacteria should be tested for once every year to ensure your water is safe from contamination .
Emerging contaminants include chemicals that we can detect at lower levels with new or improved analytical methods . New instruments and techniques can routinely detect concentrations or contaminants previously not expected to occur in our water supply . Very small concentrations (part-per-trillion and lower) of chemicals such as: artificial sweeteners; caffeine; fabric fire retardants; antibiotics, common medications such as ibuprofen; the mosquito repellent DEET; and, chemicals originating from products such as Teflon®, ScotchGard®, and Gore-Tex®, are found in our wastewaters and drinking water supplies .
Chemicals that can affect the human endocrine system, called endocrine disruptors, are of increasing concern and are found in pharmaceuticals and personal care products (PPCPs), steroids, and human hormones . These are passed through our bodies and end up in the environment . According to the EPA, PPCPs include therapeutic and veterinary drugs, fragrances, cosmetics, sunscreens, diagnostic agents, and vitamins .
National surveys have shown that many of these chemicals are not fully removed during treatment of municipal wastewaters . New and more aggressive wastewater treatment approaches are being developed . Thus, reclaimed wastewaters discharged into the environment are affecting the quality of other water sources . Although limited information exists about emerging contaminants in septic systems, we know that some of them have the potential to reach the groundwater when discharged through septic systems .
Drinking water standards evolve but they change slowly . An example is perchlorate, known to exist in water for many years and is naturally occurring in some groundwater . It is a water soluble, mobile, hard to degrade, a major component of rocket propellants, munitions and fireworks, and may also found in fertilizers and bleach . It has been detected in Western water supplies such as the Colorado River and found naturally in brackish groundwaters . This chemical can affect the endocrine system (thyroid function) and, according to the US EPA, is a likely human carcinogen . Some states have health based goals for drinking water public water supplies, although the US EPA has not set MCLs .
R E F E R E N C E S O F I N T E R E S T
Arsenic in Arizona Ground Water – Source and Transport Characteristics. 2008 . Extension Publication #AZ1453 .
Arizona Drinking Water Well Contaminants. 2009 . Extension Publication #AZ1536 .
Arizona Well Owner’s Guide to Water Supply, First Edition . 2009 . Extension Publication #AZ1485 .
Nitrate Contamination Potential in Arizona Groundwater: Implications for Drinking Water Wells. 2011 . Extension Publication #AZ1536 .
ADWR 2008b . Arizona Department of Water Resources . Arizona Water Atlas, Volume 2 .
CDC . 2015 . Surveillance for Waterborne Disease Outbreaks Associated with Drinking Water – United States, 2011—2012 . https://www .cdc .gov
Photo Credit: D. Towne, ADEQ Hydrologist
SECTION
8 TESTING WELL WATER QUALITY
In Arizona water testing is not required to register a pre-existing well or after drilling a new one . Some lending institutions may require some limited well water testing (bacteria contamination) before authorizing a loan . Therefore, it is the responsibility of the well owner to test the well water after completion and regularly thereafter . In deciding which parameters to test, it is helpful to gather as much information as possible about the groundwater quality from previous owners, neighbors, local water utilities, and state agencies . It is also important to be familiar with local geology and nearby past or present landuse activities, as these factors usually determine the quality of your well water and which contaminants are likely to be present, see Section 7 .
It is important to prioritize water quality information, since testing for all possible contaminants costs in excess of $4,000 per
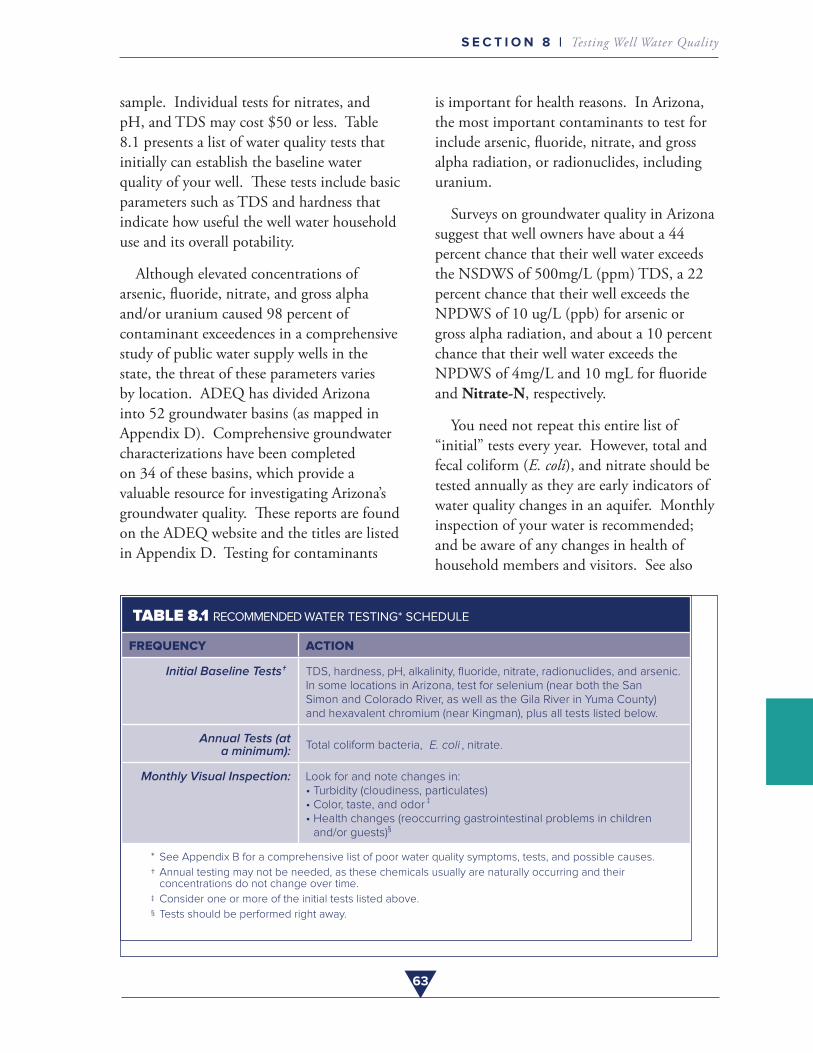
63
S E C T I O N 8 | Testing Well Water Quality
sample . Individual tests for nitrates, and pH, and TDS may cost $50 or less . Table 8 .1 presents a list of water quality tests that initially can establish the baseline water quality of your well . These tests include basic parameters such as TDS and hardness that indicate how useful the well water household use and its overall potability .
Although elevated concentrations of arsenic, fluoride, nitrate, and gross alpha and/or uranium caused 98 percent of contaminant exceedences in a comprehensive study of public water supply wells in the state, the threat of these parameters varies by location . ADEQ has divided Arizona into 52 groundwater basins (as mapped in Appendix D) . Comprehensive groundwater characterizations have been completed on 34 of these basins, which provide a valuable resource for investigating Arizona’s groundwater quality . These reports are found on the ADEQ website and the titles are listed in Appendix D . Testing for contaminants
is important for health reasons . In Arizona, the most important contaminants to test for include arsenic, fluoride, nitrate, and gross alpha radiation, or radionuclides, including uranium .
Surveys on groundwater quality in Arizona suggest that well owners have about a 44 percent chance that their well water exceeds the NSDWS of 500mg/L (ppm) TDS, a 22 percent chance that their well exceeds the NPDWS of 10 ug/L (ppb) for arsenic or gross alpha radiation, and about a 10 percent chance that their well water exceeds the NPDWS of 4mg/L and 10 mgL for fluoride and Nitrate-N, respectively .
You need not repeat this entire list of “initial” tests every year . However, total and fecal coliform (E. coli), and nitrate should be tested annually as they are early indicators of water quality changes in an aquifer . Monthly inspection of your water is recommended; and be aware of any changes in health of household members and visitors . See also
TABLE 8.1 RECOMMENDED WATER TESTING* SCHEDULE
FREQUENCY ACTION
Initial Baseline Tests† TDS, hardness, pH, alkalinity, fluoride, nitrate, radionuclides, and arsenic. In some locations in Arizona, test for selenium (near both the San Simon and Colorado River, as well as the Gila River in Yuma County) and hexavalent chromium (near Kingman), plus all tests listed below.
Annual Tests (at a minimum): Total coliform bacteria, E. coli , nitrate.
Monthly Visual Inspection: Look for and note changes in:• Turbidity (cloudiness, particulates)• Color, taste, and odor ‡
• Health changes (reoccurring gastrointestinal problems in children and/or guests)§
* See Appendix B for a comprehensive list of poor water quality symptoms, tests, and possible causes.
† Annual testing may not be needed, as these chemicals usually are naturally occurring and their concentrations do not change over time.
‡ Consider one or more of the initial tests listed above.
§ Tests should be performed right away.
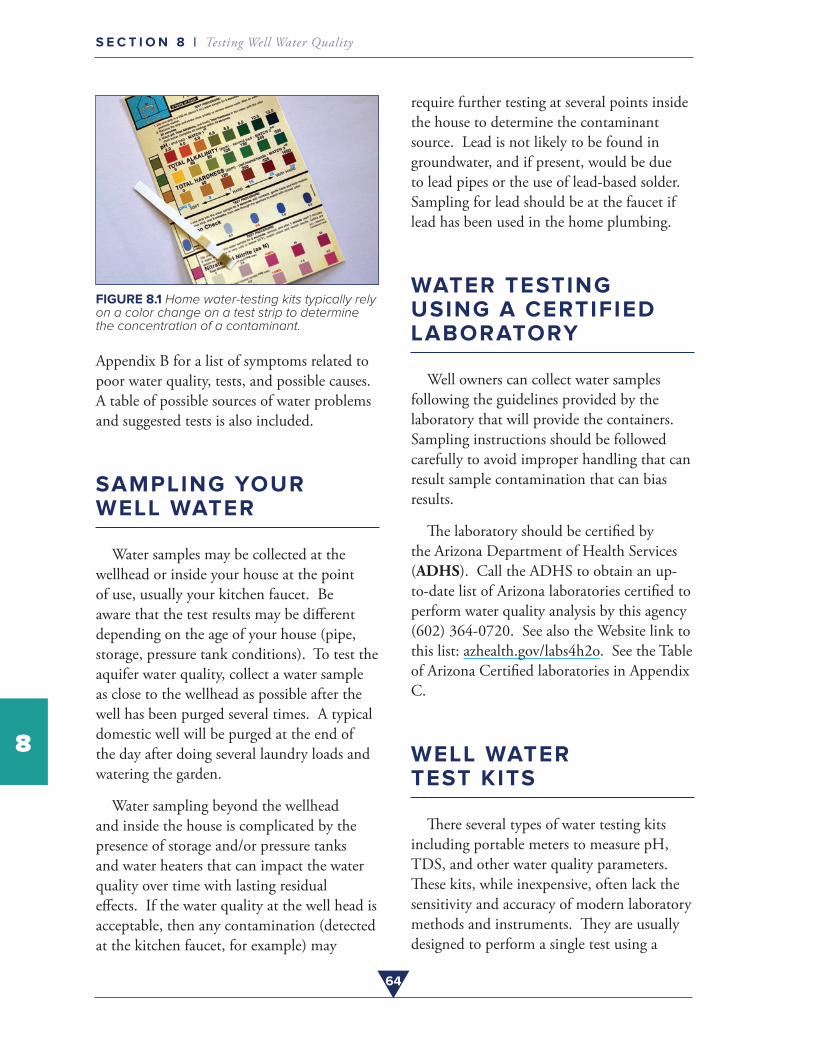
64
S E C T I O N 8 | Testing Well Water Quality
8
FIGURE 8.1 Home water-testing kits typically rely on a color change on a test strip to determine the concentration of a contaminant.
Appendix B for a list of symptoms related to poor water quality, tests, and possible causes . A table of possible sources of water problems and suggested tests is also included .
SAMPLING YOUR WELL WATER
Water samples may be collected at the wellhead or inside your house at the point of use, usually your kitchen faucet . Be aware that the test results may be different depending on the age of your house (pipe, storage, pressure tank conditions) . To test the aquifer water quality, collect a water sample as close to the wellhead as possible after the well has been purged several times . A typical domestic well will be purged at the end of the day after doing several laundry loads and watering the garden .
Water sampling beyond the wellhead and inside the house is complicated by the presence of storage and/or pressure tanks and water heaters that can impact the water quality over time with lasting residual effects . If the water quality at the well head is acceptable, then any contamination (detected at the kitchen faucet, for example) may
require further testing at several points inside the house to determine the contaminant source . Lead is not likely to be found in groundwater, and if present, would be due to lead pipes or the use of lead-based solder . Sampling for lead should be at the faucet if lead has been used in the home plumbing .
WATER TESTING USING A CERTIFIED LABORATORY
Well owners can collect water samples following the guidelines provided by the laboratory that will provide the containers . Sampling instructions should be followed carefully to avoid improper handling that can result sample contamination that can bias results .
The laboratory should be certified by the Arizona Department of Health Services (ADHS) . Call the ADHS to obtain an up-to-date list of Arizona laboratories certified to perform water quality analysis by this agency (602) 364-0720 . See also the Website link to this list: azhealth .gov/labs4h2o . See the Table of Arizona Certified laboratories in Appendix C .
WELL WATER TEST KITS
There several types of water testing kits including portable meters to measure pH, TDS, and other water quality parameters . These kits, while inexpensive, often lack the sensitivity and accuracy of modern laboratory methods and instruments . They are usually designed to perform a single test using a
65
S E C T I O N 8 | Testing Well Water Quality
8
test strip with a color scale, see Figure 8 .1 . Other tests use a combination of two or more chemicals added to the water needed obtain a color change measured against a color scale . Compared to EPA-approved methods used in laboratories testing kits have several limitations:
• Contaminant detection range is limited and can only read values at discrete intervals, lacking precision .
• Procedure or shortcuts may not be EPA-approved .
• Their accuracy is hard to measure as their calibration status is hard to check .
• Results may be influenced by the presence of other constituents or by unusual levels of some water constituents such as dissolved iron and organic matter .
• They are often less accurate when measuring contaminant levels that are at or near the drinking water standards .
On the other hand, these kits may be useful if or when:
• They can offer an early warning of the presence of high levels of a contaminant in water .
• They are used for routine verification of well water quality together with less frequent analyses performed by certified laboratories .
• They are inexpensive, easy to use . If they are from a reputable company they will be EPA certified or approved . Note: never use test strips or test kit chemicals past the expiration date posted on the box .
Water testing kits are available from
independent companies such as Hach, Lamotte, EMD Millipore, and Waterworks, and from resellers such as Ben Meadows (no endorsements implied) .
INTERPRETING WATER TEST RESULTS
Your laboratory report should include your samples results and the appropriate units:
• milligrams per liter (mg/L), or parts per million (ppm);
• micrograms per liter (µg/L) or parts per billion (ppb);
• picocuries per liter (pCi/L); and, other abbreviations or acronyms used .
The table of results must also have columns with the drinking water standards (when available), and laboratory data quality control that must include sample detection limits . Some sample values may be reported as “BDL” meaning “below detection limits” or “ND” meaning “non detect” . In either case the laboratory reported sample detection limit should be less than the drinking water MCL .
Example: your well water sample may have arsenic reported as “BDL” in the laboratory report . The report also lists the detection limit for arsenic as 1ppb . This means that your sample meets the NPDWS of 10 ppb since the arsenic concentration in your sample is “BDL” and therefore less than 1ppb .
Compare all the results to other MCL standards in Appendix A . Any water quality constituent that is above the primary MCLs may be a threat to human health or make the
66
8
S E C T I O N 8 | Testing Well Water Quality
water unfit to drink .
Contact the laboratory for clarification of special terms or abbreviations if needed . Contact ADHS if you are concerned about any health-related issues about your water quality and/or your health care provider . Seek assistance from independent water quality/treatment specialists and reputable equipment vendors before deciding on expensive water treatment options . If your well water exceeds one or more NPDWS, use an alternate source of water for drinking and cooking while exploring water treatment remedies .
Palm trees against the Arizona sky.
Photo Credit: D. Towne, ADEQ Hydrologist
SECTION
9 WATER TREATMENT OPTIONS
Domestic well owners have access to several water treatment options, but choosing which one can be difficult as the optimal system depends on the type and concentration of the contaminant . Selecting a water treatment option can also be confusing, often due to incomplete or misleading information about what treatments can do to purify water by vendors who wish to sell their product . The consumer may not realize that, besides the initial purchase price, there are additional installation, routine maintenance, and testing costs not always anticipated or explained . Some water treatment systems may be installed and maintained by well owners, but complex systems will require professional assistance .
There are several methods to treat water, starting with simple filters to remove sediment particles . More complex water treatment systems add, or remove, chemicals
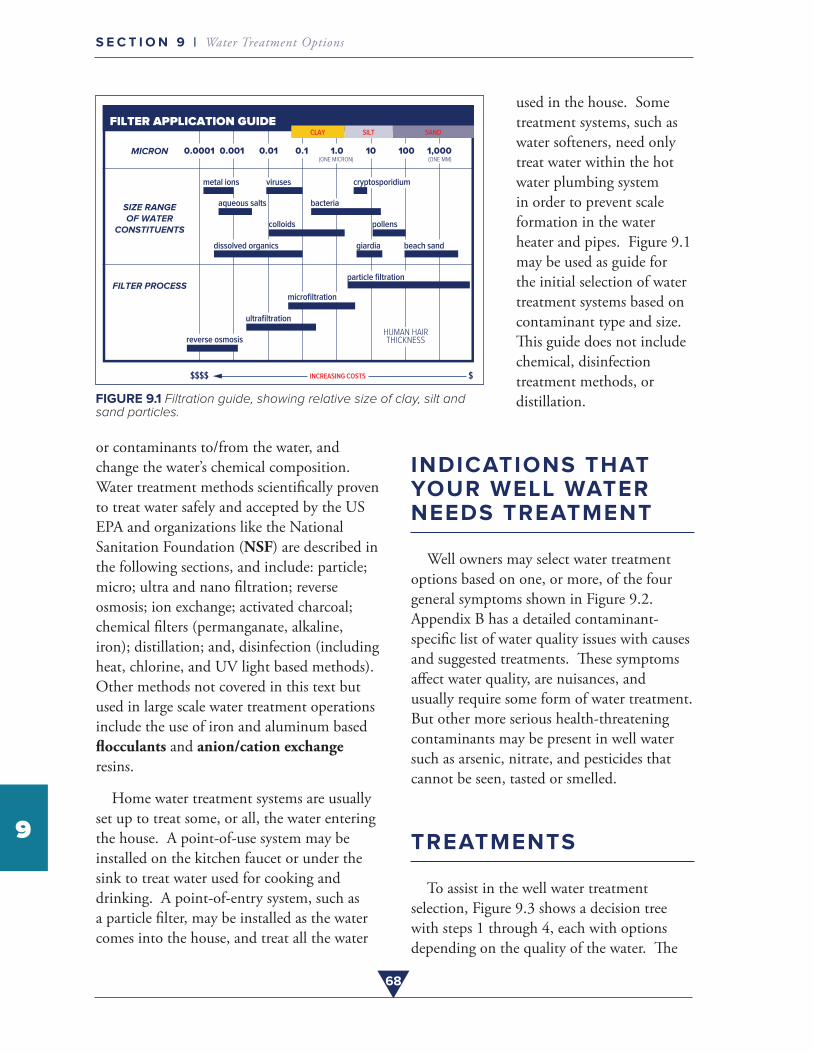
68
S E C T I O N 9 | Water Treatment Options
9
0.0001 0.001 0.01 0.1 1.0 10 100 1,000
FILTER APPLICATION GUIDE
HUMAN HAIRTHICKNESS
(ONE MICRON) (ONE MM)
FIGURE 9.1 Filtration guide, showing relative size of clay, silt and sand particles.
or contaminants to/from the water, and change the water’s chemical composition . Water treatment methods scientifically proven to treat water safely and accepted by the US EPA and organizations like the National Sanitation Foundation (NSF) are described in the following sections, and include: particle; micro; ultra and nano filtration; reverse osmosis; ion exchange; activated charcoal; chemical filters (permanganate, alkaline, iron); distillation; and, disinfection (including heat, chlorine, and UV light based methods) . Other methods not covered in this text but used in large scale water treatment operations include the use of iron and aluminum based flocculants and anion/cation exchange resins .
Home water treatment systems are usually set up to treat some, or all, the water entering the house . A point-of-use system may be installed on the kitchen faucet or under the sink to treat water used for cooking and drinking . A point-of-entry system, such as a particle filter, may be installed as the water comes into the house, and treat all the water
used in the house . Some treatment systems, such as water softeners, need only treat water within the hot water plumbing system in order to prevent scale formation in the water heater and pipes . Figure 9 .1 may be used as guide for the initial selection of water treatment systems based on contaminant type and size . This guide does not include chemical, disinfection treatment methods, or distillation .
INDICATIONS THAT YOUR WELL WATER NEEDS TREATMENT
Well owners may select water treatment options based on one, or more, of the four general symptoms shown in Figure 9 .2 . Appendix B has a detailed contaminant-specific list of water quality issues with causes and suggested treatments . These symptoms affect water quality, are nuisances, and usually require some form of water treatment . But other more serious health-threatening contaminants may be present in well water such as arsenic, nitrate, and pesticides that cannot be seen, tasted or smelled .
TREATMENTS
To assist in the well water treatment selection, Figure 9 .3 shows a decision tree with steps 1 through 4, each with options depending on the quality of the water . The
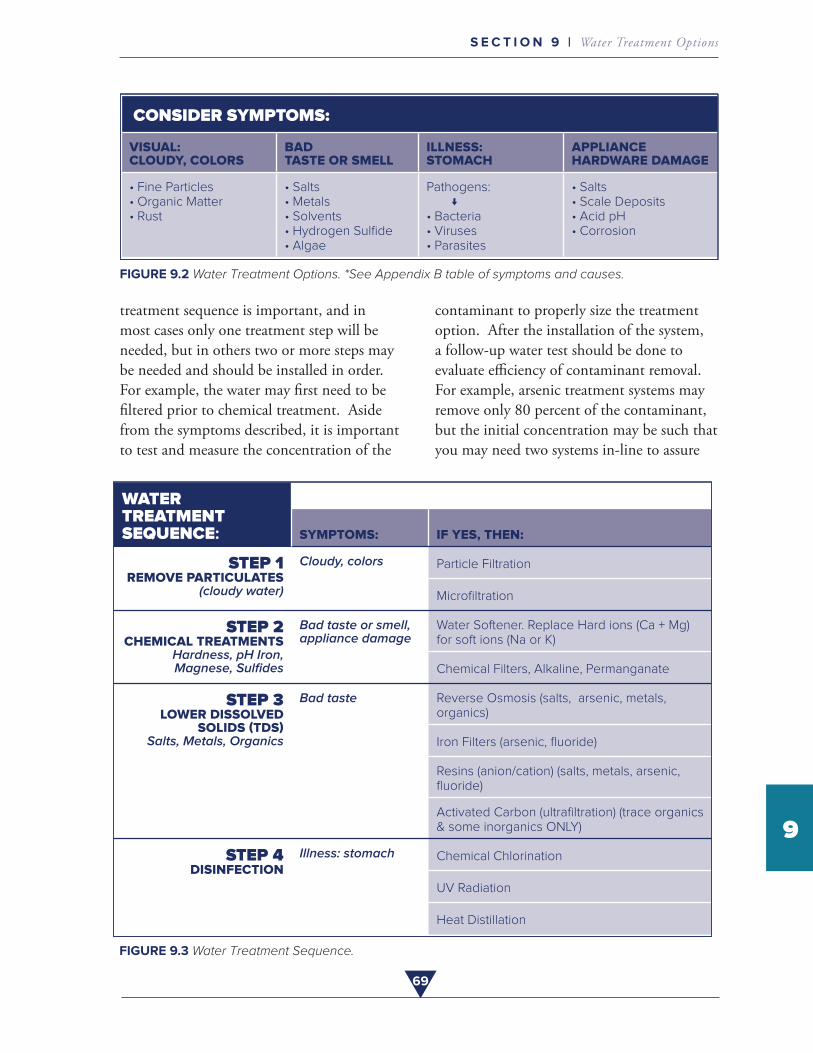
69
S E C T I O N 9 | Water Treatment Options
9
CONSIDER SYMPTOMS:
VISUAL: CLOUDY, COLORS
BAD TASTE OR SMELL
ILLNESS: STOMACH
APPLIANCE HARDWARE DAMAGE
• Fine Particles• Organic Matter• Rust
• Salts• Metals• Solvents• Hydrogen Sulfide• Algae
Pathogens: ↓• Bacteria• Viruses• Parasites
• Salts• Scale Deposits• Acid pH• Corrosion
FIGURE 9.2 Water Treatment Options. *See Appendix B table of symptoms and causes.
treatment sequence is important, and in most cases only one treatment step will be needed, but in others two or more steps may be needed and should be installed in order . For example, the water may first need to be filtered prior to chemical treatment . Aside from the symptoms described, it is important to test and measure the concentration of the
contaminant to properly size the treatment option . After the installation of the system, a follow-up water test should be done to evaluate efficiency of contaminant removal . For example, arsenic treatment systems may remove only 80 percent of the contaminant, but the initial concentration may be such that you may need two systems in-line to assure
WATER TREATMENT SEQUENCE: SYMPTOMS: IF YES, THEN:
STEP 1REMOVE PARTICULATES
(cloudy water)
Cloudy, colors Particle Filtration
Microfiltration
STEP 2CHEMICAL TREATMENTS
Hardness, pH Iron, Magnese, Sulfides
Bad taste or smell, appliance damage
Water Softener. Replace Hard ions (Ca + Mg) for soft ions (Na or K)
Chemical Filters, Alkaline, Permanganate
STEP 3LOWER DISSOLVED
Salts, Metals, Organics
Bad taste Reverse Osmosis (salts, arsenic, metals, organics)
Iron Filters (arsenic, fluoride)
Resins (anion/cation) (salts, metals, arsenic, fluoride)
Activated Carbon (ultrafiltration) (trace organics & some inorganics ONLY)
STEP 4DISINFECTION
Illness: stomach Chemical Chlorination
UV Radiation
Heat Distillation
FIGURE 9.3 Water Treatment Sequence.
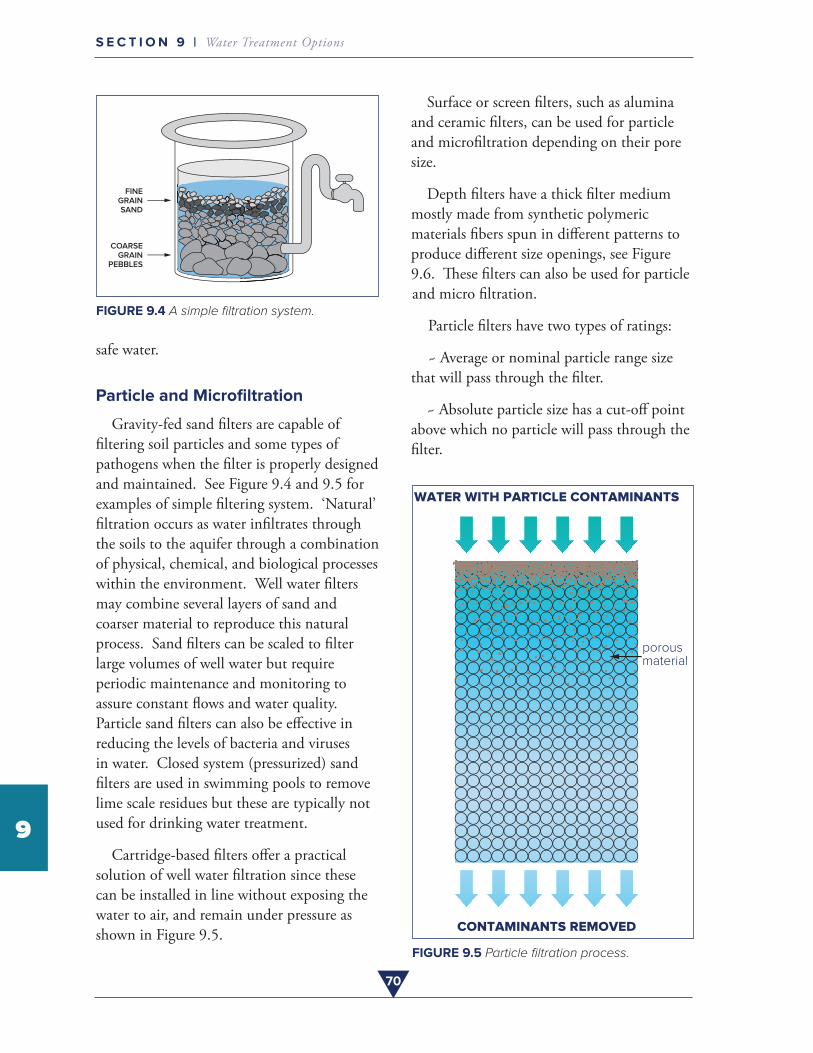
70
S E C T I O N 9 | Water Treatment Options
9
FIGURE 9.4 A simple filtration system.
safe water .
Particle and Microfiltration
Gravity-fed sand filters are capable of filtering soil particles and some types of pathogens when the filter is properly designed and maintained . See Figure 9 .4 and 9 .5 for examples of simple filtering system . ‘Natural’ filtration occurs as water infiltrates through the soils to the aquifer through a combination of physical, chemical, and biological processes within the environment . Well water filters may combine several layers of sand and coarser material to reproduce this natural process . Sand filters can be scaled to filter large volumes of well water but require periodic maintenance and monitoring to assure constant flows and water quality . Particle sand filters can also be effective in reducing the levels of bacteria and viruses in water . Closed system (pressurized) sand filters are used in swimming pools to remove lime scale residues but these are typically not used for drinking water treatment .
Cartridge-based filters offer a practical solution of well water filtration since these can be installed in line without exposing the water to air, and remain under pressure as shown in Figure 9 .5 .
Surface or screen filters, such as alumina and ceramic filters, can be used for particle and microfiltration depending on their pore size .
Depth filters have a thick filter medium mostly made from synthetic polymeric materials fibers spun in different patterns to produce different size openings, see Figure 9 .6 . These filters can also be used for particle and micro filtration .
Particle filters have two types of ratings:
~ Average or nominal particle range size that will pass through the filter .
~ Absolute particle size has a cut-off point above which no particle will pass through the filter .
WATER WITH PARTICLE CONTAMINANTS
CONTAMINANTS REMOVED
porous material
FIGURE 9.5 Particle filtration process.
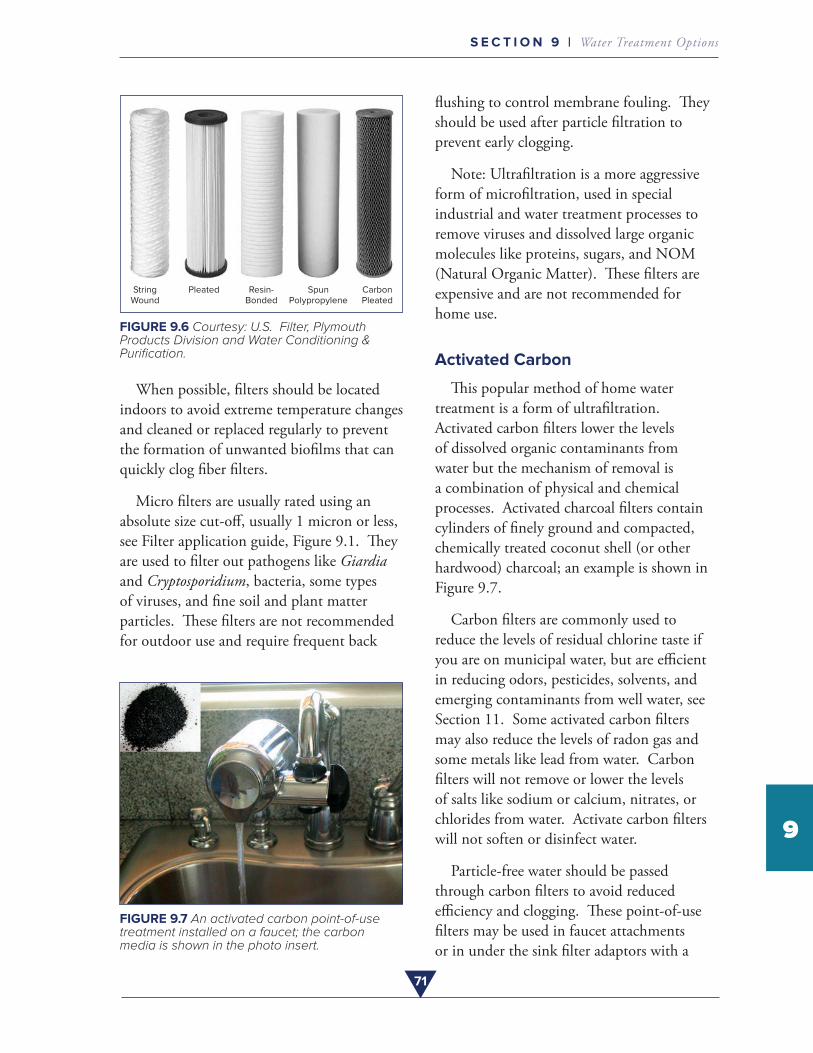
71
S E C T I O N 9 | Water Treatment Options
9
FIGURE 9.6 Courtesy: U.S. Filter, Plymouth Products Division and Water Conditioning & Purification.
When possible, filters should be located indoors to avoid extreme temperature changes and cleaned or replaced regularly to prevent the formation of unwanted biofilms that can quickly clog fiber filters .
Micro filters are usually rated using an absolute size cut-off, usually 1 micron or less, see Filter application guide, Figure 9 .1 . They are used to filter out pathogens like Giardia and Cryptosporidium, bacteria, some types of viruses, and fine soil and plant matter particles . These filters are not recommended for outdoor use and require frequent back
FIGURE 9.7 An activated carbon point-of-use treatment installed on a faucet; the carbon media is shown in the photo insert.
flushing to control membrane fouling . They should be used after particle filtration to prevent early clogging .
Note: Ultrafiltration is a more aggressive form of microfiltration, used in special industrial and water treatment processes to remove viruses and dissolved large organic molecules like proteins, sugars, and NOM (Natural Organic Matter) . These filters are expensive and are not recommended for home use .
Activated Carbon
This popular method of home water treatment is a form of ultrafiltration . Activated carbon filters lower the levels of dissolved organic contaminants from water but the mechanism of removal is a combination of physical and chemical processes . Activated charcoal filters contain cylinders of finely ground and compacted, chemically treated coconut shell (or other hardwood) charcoal; an example is shown in Figure 9 .7 .
Carbon filters are commonly used to reduce the levels of residual chlorine taste if you are on municipal water, but are efficient in reducing odors, pesticides, solvents, and emerging contaminants from well water, see Section 11 . Some activated carbon filters may also reduce the levels of radon gas and some metals like lead from water . Carbon filters will not remove or lower the levels of salts like sodium or calcium, nitrates, or chlorides from water . Activate carbon filters will not soften or disinfect water .
Particle-free water should be passed through carbon filters to avoid reduced efficiency and clogging . These point-of-use filters may be used in faucet attachments or in under the sink filter adaptors with a
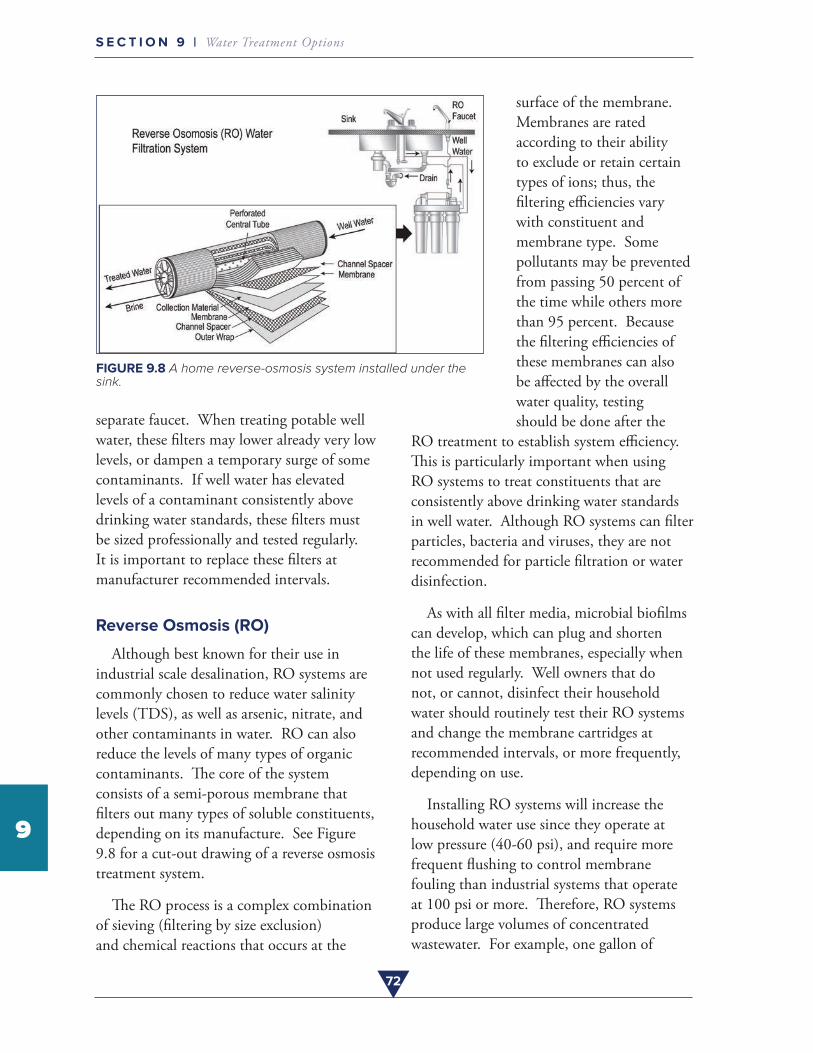
72
S E C T I O N 9 | Water Treatment Options
9
FIGURE 9.8 A home reverse-osmosis system installed under the sink.
separate faucet . When treating potable well water, these filters may lower already very low levels, or dampen a temporary surge of some contaminants . If well water has elevated levels of a contaminant consistently above drinking water standards, these filters must be sized professionally and tested regularly . It is important to replace these filters at manufacturer recommended intervals .
Reverse Osmosis (RO)
Although best known for their use in industrial scale desalination, RO systems are commonly chosen to reduce water salinity levels (TDS), as well as arsenic, nitrate, and other contaminants in water . RO can also reduce the levels of many types of organic contaminants . The core of the system consists of a semi-porous membrane that filters out many types of soluble constituents, depending on its manufacture . See Figure 9 .8 for a cut-out drawing of a reverse osmosis treatment system .
The RO process is a complex combination of sieving (filtering by size exclusion) and chemical reactions that occurs at the
surface of the membrane . Membranes are rated according to their ability to exclude or retain certain types of ions; thus, the filtering efficiencies vary with constituent and membrane type . Some pollutants may be prevented from passing 50 percent of the time while others more than 95 percent . Because the filtering efficiencies of these membranes can also be affected by the overall water quality, testing should be done after the
RO treatment to establish system efficiency . This is particularly important when using RO systems to treat constituents that are consistently above drinking water standards in well water . Although RO systems can filter particles, bacteria and viruses, they are not recommended for particle filtration or water disinfection .
As with all filter media, microbial biofilms can develop, which can plug and shorten the life of these membranes, especially when not used regularly . Well owners that do not, or cannot, disinfect their household water should routinely test their RO systems and change the membrane cartridges at recommended intervals, or more frequently, depending on use .
Installing RO systems will increase the household water use since they operate at low pressure (40-60 psi), and require more frequent flushing to control membrane fouling than industrial systems that operate at 100 psi or more . Therefore, RO systems produce large volumes of concentrated wastewater . For example, one gallon of
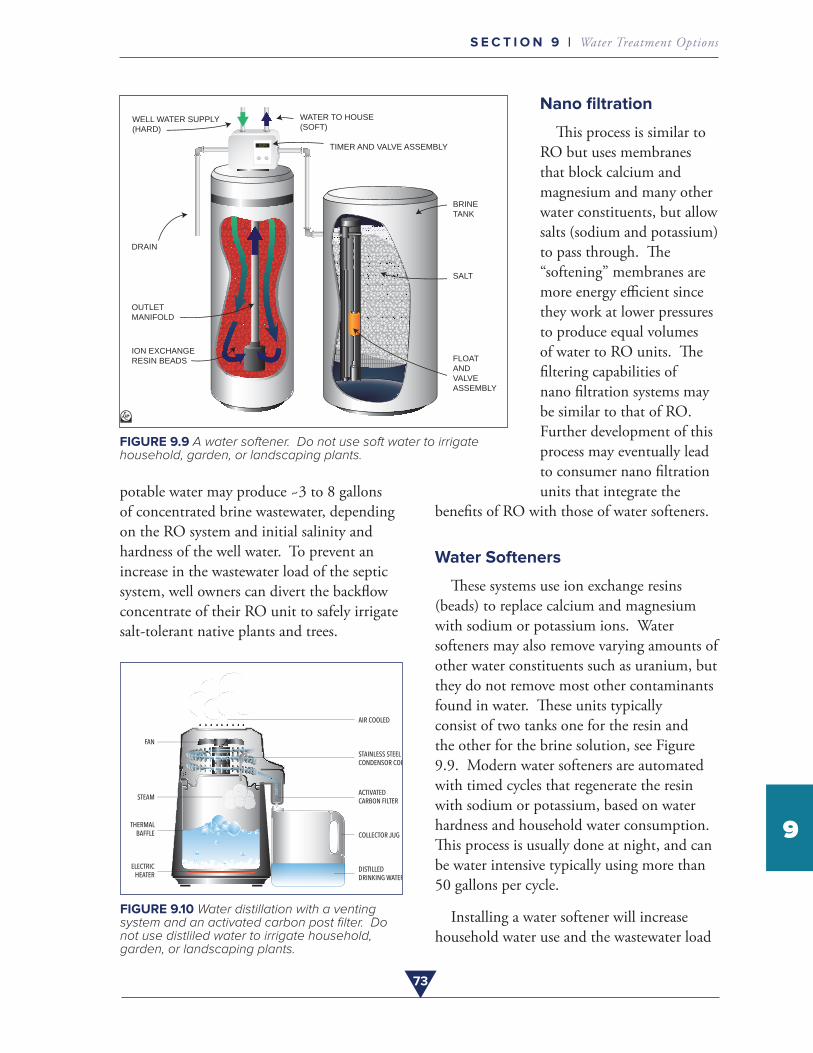
73
S E C T I O N 9 | Water Treatment Options
9
WELL WATER SUPPLY(HARD)
WATER TO HOUSE(SOFT)
TIMER AND VALVE ASSEMBLY
BRINETANK
SALT
FLOATANDVALVEASSEMBLY
DRAIN
OUTLETMANIFOLD
ION EXCHANGE RESIN BEADS
FIGURE 9.9 A water softener. Do not use soft water to irrigate household, garden, or landscaping plants.
potable water may produce ~3 to 8 gallons of concentrated brine wastewater, depending on the RO system and initial salinity and hardness of the well water . To prevent an increase in the wastewater load of the septic system, well owners can divert the backflow concentrate of their RO unit to safely irrigate salt-tolerant native plants and trees .
FIGURE 9.10 Water distillation with a venting system and an activated carbon post filter. Do not use distliled water to irrigate household, garden, or landscaping plants.
Nano filtration
This process is similar to RO but uses membranes that block calcium and magnesium and many other water constituents, but allow salts (sodium and potassium) to pass through . The “softening” membranes are more energy efficient since they work at lower pressures to produce equal volumes of water to RO units . The filtering capabilities of nano filtration systems may be similar to that of RO . Further development of this process may eventually lead to consumer nano filtration units that integrate the
benefits of RO with those of water softeners .
Water Softeners
These systems use ion exchange resins (beads) to replace calcium and magnesium with sodium or potassium ions . Water softeners may also remove varying amounts of other water constituents such as uranium, but they do not remove most other contaminants found in water . These units typically consist of two tanks one for the resin and the other for the brine solution, see Figure 9 .9 . Modern water softeners are automated with timed cycles that regenerate the resin with sodium or potassium, based on water hardness and household water consumption . This process is usually done at night, and can be water intensive typically using more than 50 gallons per cycle .
Installing a water softener will increase household water use and the wastewater load
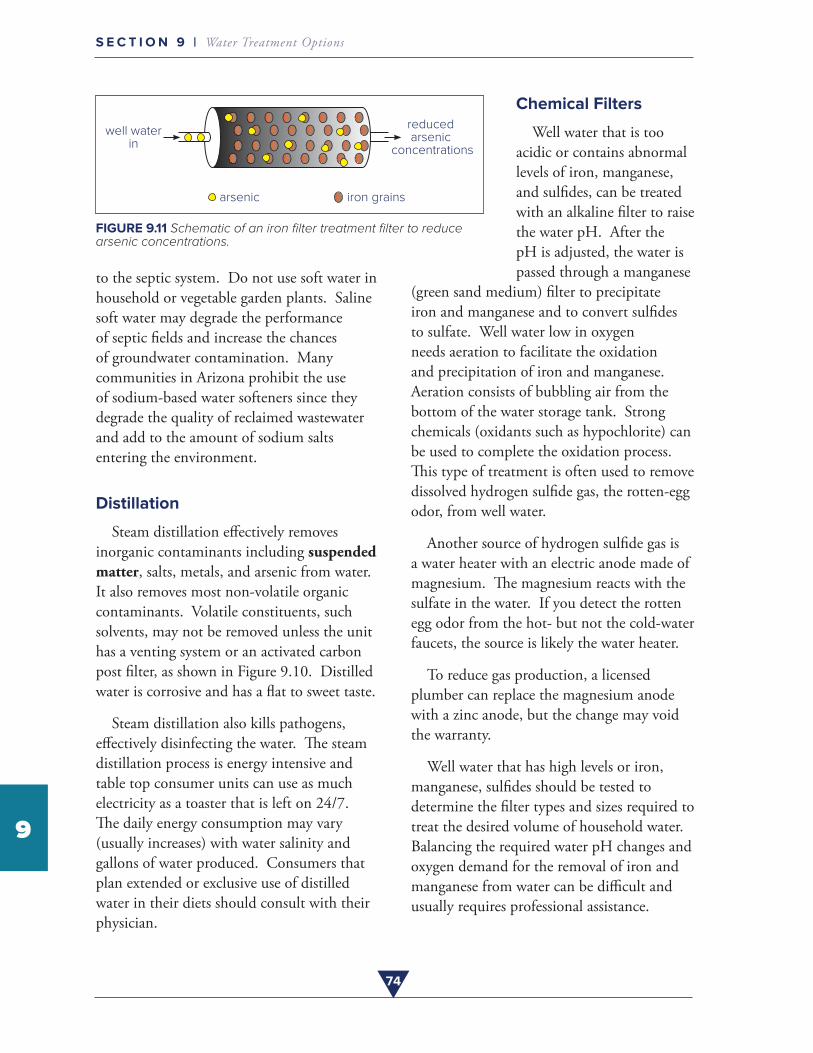
74
S E C T I O N 9 | Water Treatment Options
9
reduced arsenic
concentrations
well waterin
arsenic iron grains
FIGURE 9.11 Schematic of an iron filter treatment filter to reduce arsenic concentrations.
to the septic system . Do not use soft water in household or vegetable garden plants . Saline soft water may degrade the performance of septic fields and increase the chances of groundwater contamination . Many communities in Arizona prohibit the use of sodium-based water softeners since they degrade the quality of reclaimed wastewater and add to the amount of sodium salts entering the environment .
Distillation
Steam distillation effectively removes inorganic contaminants including suspended matter, salts, metals, and arsenic from water . It also removes most non-volatile organic contaminants . Volatile constituents, such solvents, may not be removed unless the unit has a venting system or an activated carbon post filter, as shown in Figure 9 .10 . Distilled water is corrosive and has a flat to sweet taste .
Steam distillation also kills pathogens, effectively disinfecting the water . The steam distillation process is energy intensive and table top consumer units can use as much electricity as a toaster that is left on 24/7 . The daily energy consumption may vary (usually increases) with water salinity and gallons of water produced . Consumers that plan extended or exclusive use of distilled water in their diets should consult with their physician .
Chemical Filters
Well water that is too acidic or contains abnormal levels of iron, manganese, and sulfides, can be treated with an alkaline filter to raise the water pH . After the pH is adjusted, the water is passed through a manganese
(green sand medium) filter to precipitate iron and manganese and to convert sulfides to sulfate . Well water low in oxygen needs aeration to facilitate the oxidation and precipitation of iron and manganese . Aeration consists of bubbling air from the bottom of the water storage tank . Strong chemicals (oxidants such as hypochlorite) can be used to complete the oxidation process . This type of treatment is often used to remove dissolved hydrogen sulfide gas, the rotten-egg odor, from well water .
Another source of hydrogen sulfide gas is a water heater with an electric anode made of magnesium . The magnesium reacts with the sulfate in the water . If you detect the rotten egg odor from the hot- but not the cold-water faucets, the source is likely the water heater .
To reduce gas production, a licensed plumber can replace the magnesium anode with a zinc anode, but the change may void the warranty .
Well water that has high levels or iron, manganese, sulfides should be tested to determine the filter types and sizes required to treat the desired volume of household water . Balancing the required water pH changes and oxygen demand for the removal of iron and manganese from water can be difficult and usually requires professional assistance .
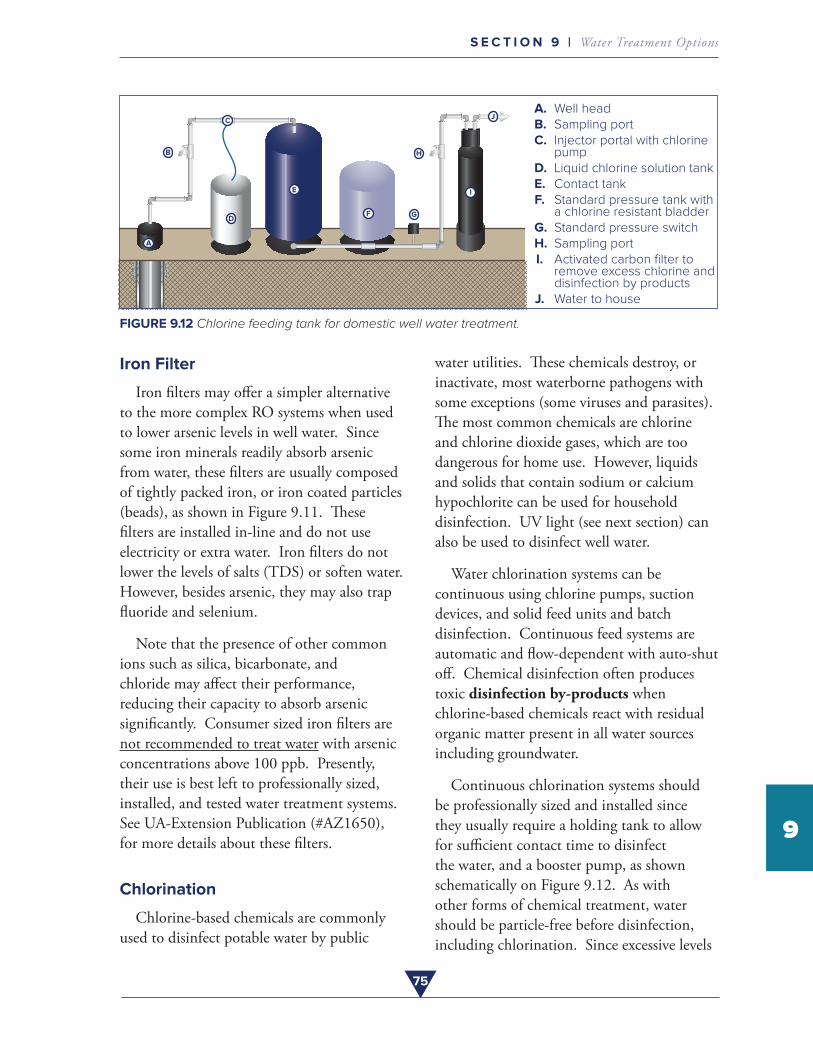
75
S E C T I O N 9 | Water Treatment Options
9
A
B
C
D
E
F G
H
I
JA. Well headB. Sampling portC. Injector portal with chlorine
pumpD. Liquid chlorine solution tankE. Contact tankF. Standard pressure tank with
a chlorine resistant bladderG. Standard pressure switchH. Sampling portI. Activated carbon filter to
remove excess chlorine and disinfection by products
J. Water to house
FIGURE 9.12 Chlorine feeding tank for domestic well water treatment.
Iron Filter
Iron filters may offer a simpler alternative to the more complex RO systems when used to lower arsenic levels in well water . Since some iron minerals readily absorb arsenic from water, these filters are usually composed of tightly packed iron, or iron coated particles (beads), as shown in Figure 9 .11 . These filters are installed in-line and do not use electricity or extra water . Iron filters do not lower the levels of salts (TDS) or soften water . However, besides arsenic, they may also trap fluoride and selenium .
Note that the presence of other common ions such as silica, bicarbonate, and chloride may affect their performance, reducing their capacity to absorb arsenic significantly . Consumer sized iron filters are not recommended to treat water with arsenic concentrations above 100 ppb . Presently, their use is best left to professionally sized, installed, and tested water treatment systems . See UA-Extension Publication (#AZ1650), for more details about these filters .
Chlorination
Chlorine-based chemicals are commonly used to disinfect potable water by public
water utilities . These chemicals destroy, or inactivate, most waterborne pathogens with some exceptions (some viruses and parasites) . The most common chemicals are chlorine and chlorine dioxide gases, which are too dangerous for home use . However, liquids and solids that contain sodium or calcium hypochlorite can be used for household disinfection . UV light (see next section) can also be used to disinfect well water .
Water chlorination systems can be continuous using chlorine pumps, suction devices, and solid feed units and batch disinfection . Continuous feed systems are automatic and flow-dependent with auto-shut off . Chemical disinfection often produces toxic disinfection by-products when chlorine-based chemicals react with residual organic matter present in all water sources including groundwater .
Continuous chlorination systems should be professionally sized and installed since they usually require a holding tank to allow for sufficient contact time to disinfect the water, and a booster pump, as shown schematically on Figure 9 .12 . As with other forms of chemical treatment, water should be particle-free before disinfection, including chlorination . Since excessive levels
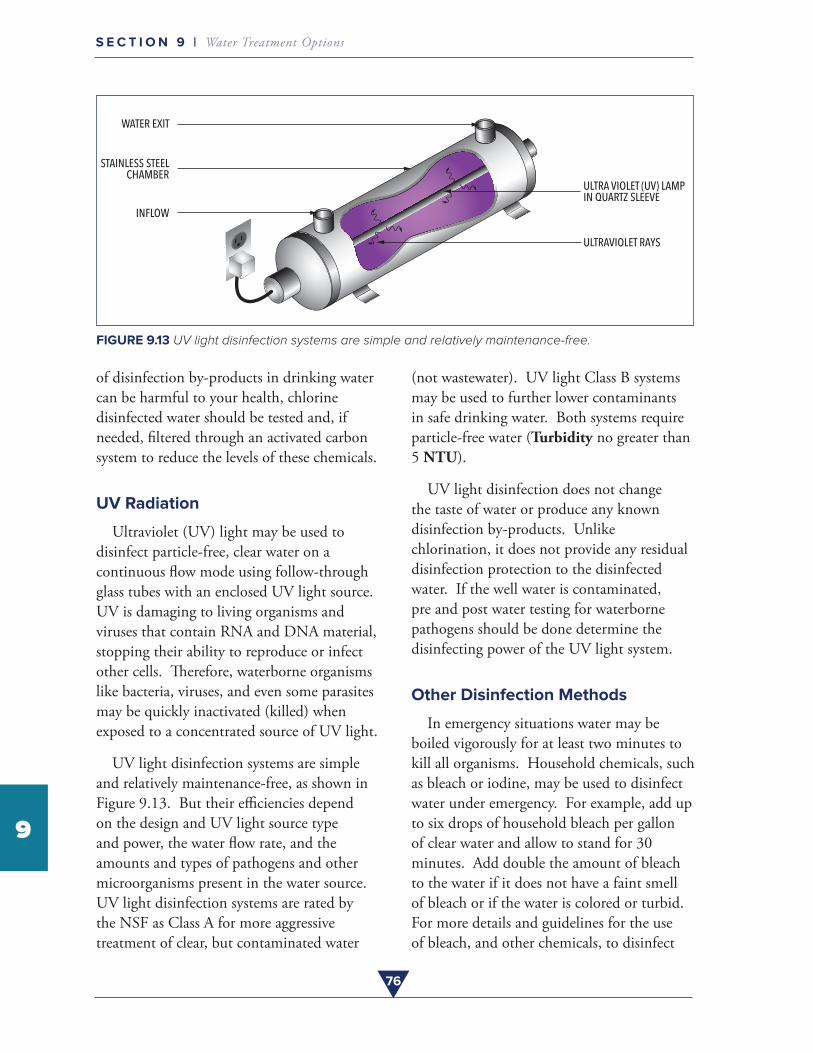
76
S E C T I O N 9 | Water Treatment Options
9
FIGURE 9.13 UV light disinfection systems are simple and relatively maintenance-free.
of disinfection by-products in drinking water can be harmful to your health, chlorine disinfected water should be tested and, if needed, filtered through an activated carbon system to reduce the levels of these chemicals .
UV Radiation
Ultraviolet (UV) light may be used to disinfect particle-free, clear water on a continuous flow mode using follow-through glass tubes with an enclosed UV light source . UV is damaging to living organisms and viruses that contain RNA and DNA material, stopping their ability to reproduce or infect other cells . Therefore, waterborne organisms like bacteria, viruses, and even some parasites may be quickly inactivated (killed) when exposed to a concentrated source of UV light .
UV light disinfection systems are simple and relatively maintenance-free, as shown in Figure 9 .13 . But their efficiencies depend on the design and UV light source type and power, the water flow rate, and the amounts and types of pathogens and other microorganisms present in the water source . UV light disinfection systems are rated by the NSF as Class A for more aggressive treatment of clear, but contaminated water
(not wastewater) . UV light Class B systems may be used to further lower contaminants in safe drinking water . Both systems require particle-free water (Turbidity no greater than 5 NTU) .
UV light disinfection does not change the taste of water or produce any known disinfection by-products . Unlike chlorination, it does not provide any residual disinfection protection to the disinfected water . If the well water is contaminated, pre and post water testing for waterborne pathogens should be done determine the disinfecting power of the UV light system .
Other Disinfection Methods
In emergency situations water may be boiled vigorously for at least two minutes to kill all organisms . Household chemicals, such as bleach or iodine, may be used to disinfect water under emergency . For example, add up to six drops of household bleach per gallon of clear water and allow to stand for 30 minutes . Add double the amount of bleach to the water if it does not have a faint smell of bleach or if the water is colored or turbid . For more details and guidelines for the use of bleach, and other chemicals, to disinfect
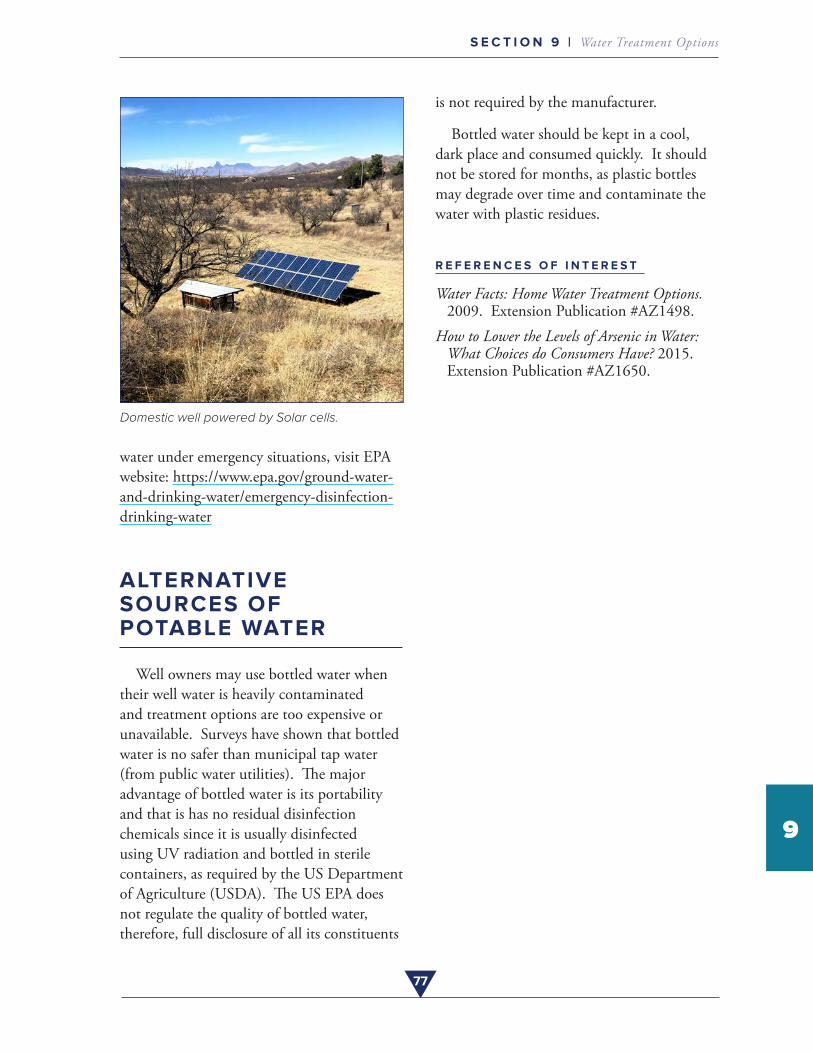
77
S E C T I O N 9 | Water Treatment Options
9
Domestic well powered by Solar cells.
water under emergency situations, visit EPA website: https://www .epa .gov/ground-water-and-drinking-water/emergency-disinfection-drinking-water
ALTERNATIVE SOURCES OF POTABLE WATER
Well owners may use bottled water when their well water is heavily contaminated and treatment options are too expensive or unavailable . Surveys have shown that bottled water is no safer than municipal tap water (from public water utilities) . The major advantage of bottled water is its portability and that is has no residual disinfection chemicals since it is usually disinfected using UV radiation and bottled in sterile containers, as required by the US Department of Agriculture (USDA) . The US EPA does not regulate the quality of bottled water, therefore, full disclosure of all its constituents
is not required by the manufacturer .
Bottled water should be kept in a cool, dark place and consumed quickly . It should not be stored for months, as plastic bottles may degrade over time and contaminate the water with plastic residues .
R E F E R E N C E S O F I N T E R E S T
Water Facts: Home Water Treatment Options. 2009 . Extension Publication #AZ1498 .
How to Lower the Levels of Arsenic in Water: What Choices do Consumers Have? 2015 . Extension Publication #AZ1650 .
Photo Credit: J. Artiola
SECTION
10PROTECTING YOUR WELL WATER QUALITY
Well water can be contaminated by manmade, rather than natural, sources as shown in Figure 10 .1 . The figure depicts the subsurface transport of common contaminants that can be found near a domestic well, several of which are discussed in Section 5 . There are five common sources of contaminants found in domestic wells:
• When the well is being installed or maintained;
• At the wellhead, where ponded surface water can seep into the well;
• From septic system leach fields or septic failure;
• By other land use activities near the well; and/or,
• By weather events such as floods or fires .
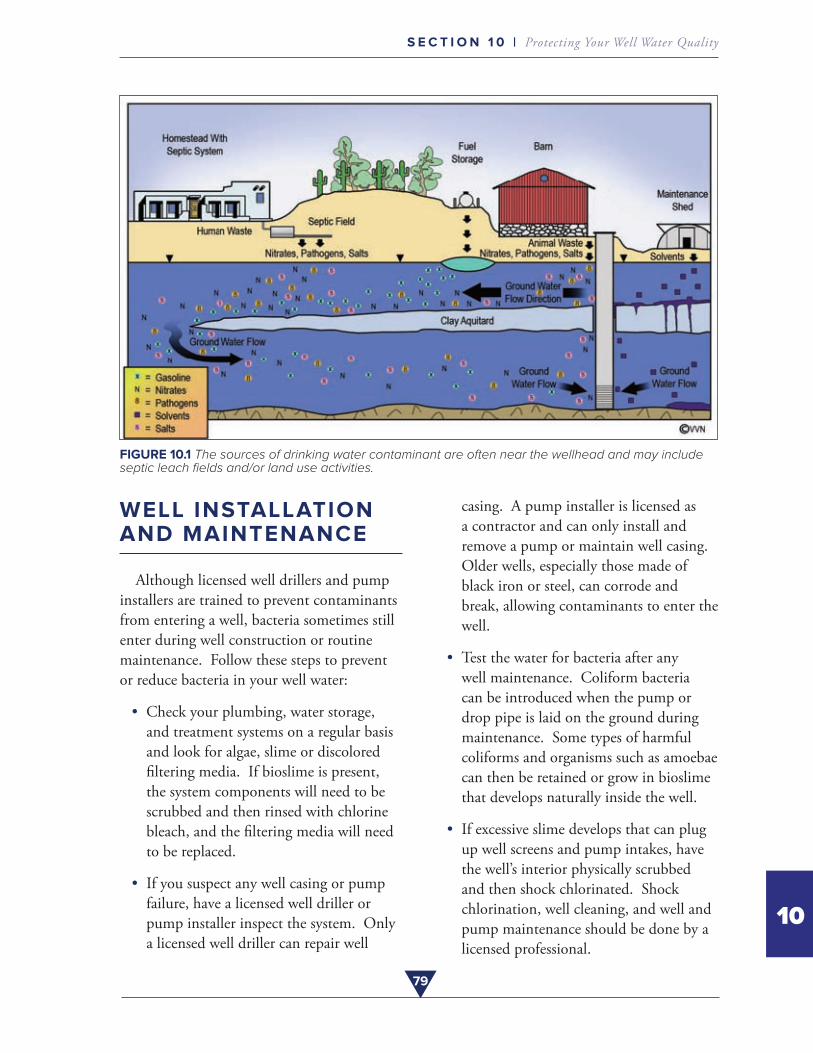
79
S E C T I O N 1 0 | Protecting Your Well Water Quality
10
FIGURE 10.1 The sources of drinking water contaminant are often near the wellhead and may include septic leach fields and/or land use activities.
WELL INSTALLATION AND MAINTENANCE
Although licensed well drillers and pump installers are trained to prevent contaminants from entering a well, bacteria sometimes still enter during well construction or routine maintenance . Follow these steps to prevent or reduce bacteria in your well water:
• Check your plumbing, water storage, and treatment systems on a regular basis and look for algae, slime or discolored filtering media . If bioslime is present, the system components will need to be scrubbed and then rinsed with chlorine bleach, and the filtering media will need to be replaced .
• If you suspect any well casing or pump failure, have a licensed well driller or pump installer inspect the system . Only a licensed well driller can repair well
casing . A pump installer is licensed as a contractor and can only install and remove a pump or maintain well casing . Older wells, especially those made of black iron or steel, can corrode and break, allowing contaminants to enter the well .
• Test the water for bacteria after any well maintenance . Coliform bacteria can be introduced when the pump or drop pipe is laid on the ground during maintenance . Some types of harmful coliforms and organisms such as amoebae can then be retained or grow in bioslime that develops naturally inside the well .
• If excessive slime develops that can plug up well screens and pump intakes, have the well’s interior physically scrubbed and then shock chlorinated . Shock chlorination, well cleaning, and well and pump maintenance should be done by a licensed professional .
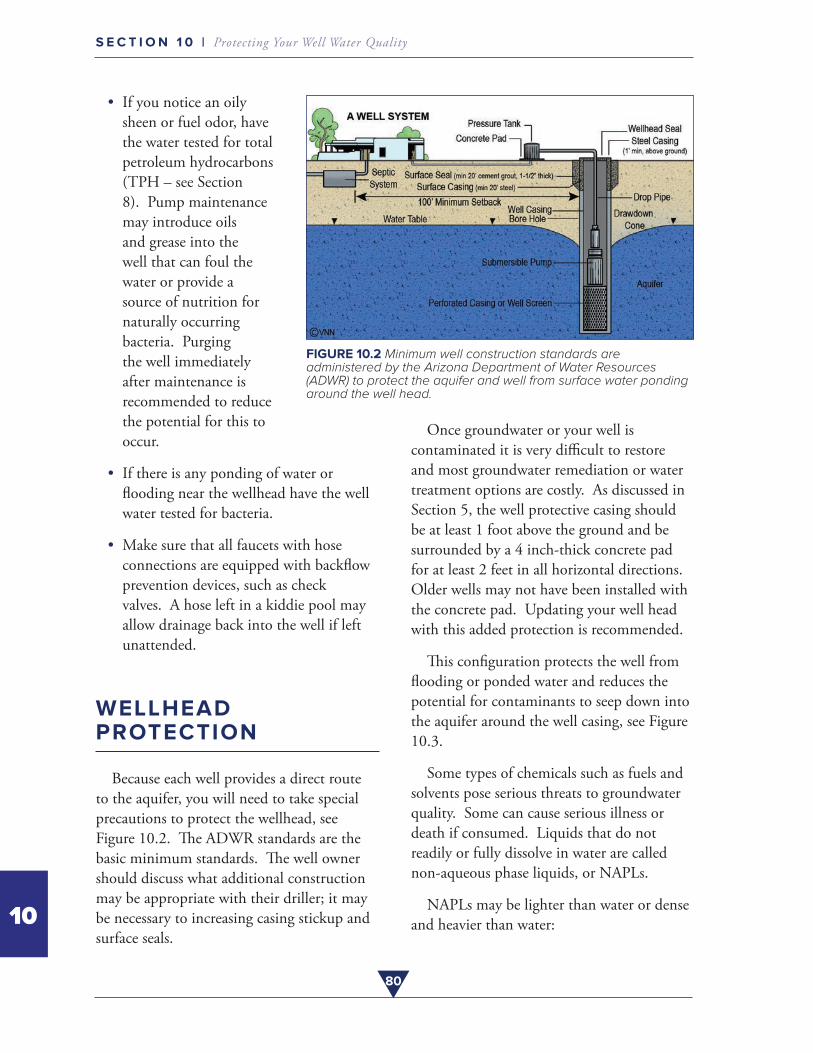
80
S E C T I O N 1 0 | Protecting Your Well Water Quality
10
• If you notice an oilysheen or fuel odor, havethe water tested for totalpetroleum hydrocarbons(TPH – see Section8) . Pump maintenancemay introduce oilsand grease into thewell that can foul thewater or provide asource of nutrition fornaturally occurringbacteria . Purgingthe well immediatelyafter maintenance isrecommended to reducethe potential for this tooccur .
• If there is any ponding of water orflooding near the wellhead have the wellwater tested for bacteria .
• Make sure that all faucets with hoseconnections are equipped with backflowprevention devices, such as checkvalves . A hose left in a kiddie pool mayallow drainage back into the well if leftunattended .
WELLHEAD PROTECTION
Because each well provides a direct route to the aquifer, you will need to take special precautions to protect the wellhead, see Figure 10 .2 . The ADWR standards are the basic minimum standards . The well owner should discuss what additional construction may be appropriate with their driller; it may be necessary to increasing casing stickup and surface seals .
FIGURE 10.2 Minimum well construction standards are administered by the Arizona Department of Water Resources (ADWR) to protect the aquifer and well from surface water ponding around the well head.
Once groundwater or your well is contaminated it is very difficult to restore and most groundwater remediation or water treatment options are costly . As discussed in Section 5, the well protective casing should be at least 1 foot above the ground and be surrounded by a 4 inch-thick concrete pad for at least 2 feet in all horizontal directions . Older wells may not have been installed with the concrete pad . Updating your well head with this added protection is recommended .
This configuration protects the well from flooding or ponded water and reduces the potential for contaminants to seep down into the aquifer around the well casing, see Figure 10 .3 .
Some types of chemicals such as fuels and solvents pose serious threats to groundwater quality . Some can cause serious illness or death if consumed . Liquids that do not readily or fully dissolve in water are called non-aqueous phase liquids, or NAPLs .
NAPLs may be lighter than water or dense and heavier than water:
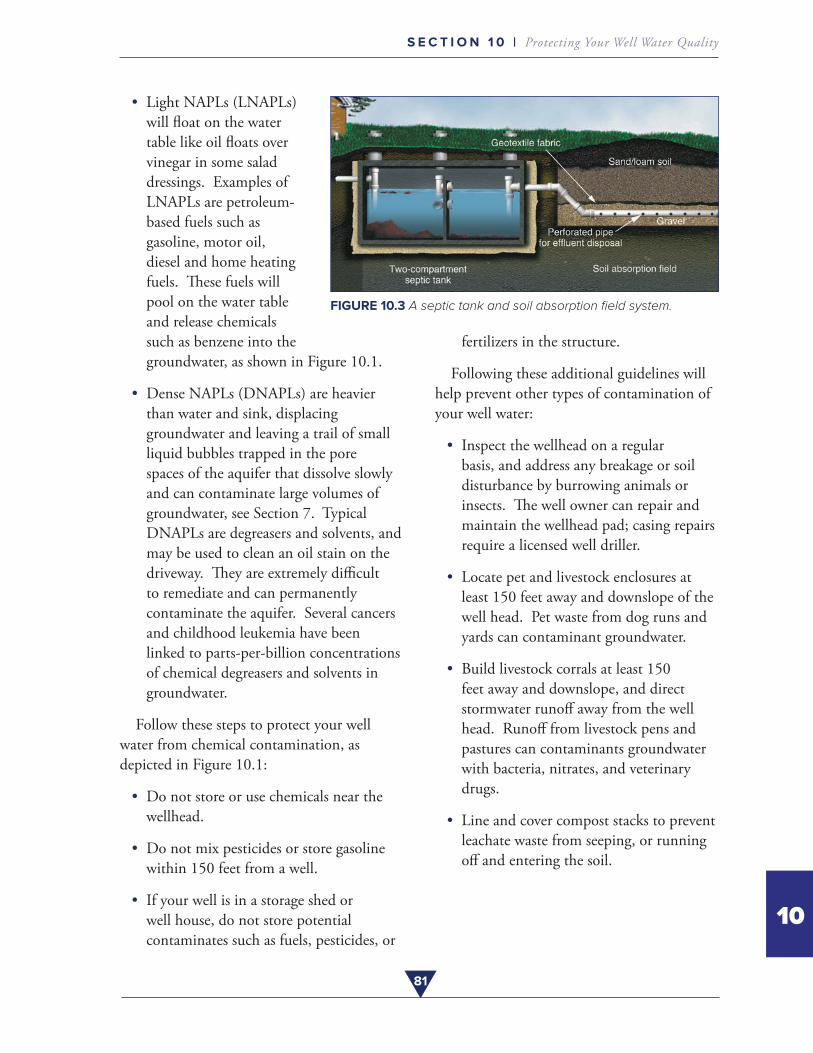
81
S E C T I O N 1 0 | Protecting Your Well Water Quality
10
• Light NAPLs (LNAPLs) will float on the water table like oil floats over vinegar in some salad dressings . Examples of LNAPLs are petroleum-based fuels such as gasoline, motor oil, diesel and home heating fuels . These fuels will pool on the water table and release chemicals such as benzene into the groundwater, as shown in Figure 10 .1 .
• Dense NAPLs (DNAPLs) are heavier than water and sink, displacing groundwater and leaving a trail of small liquid bubbles trapped in the pore spaces of the aquifer that dissolve slowly and can contaminate large volumes of groundwater, see Section 7 . Typical DNAPLs are degreasers and solvents, and may be used to clean an oil stain on the driveway . They are extremely difficult to remediate and can permanently contaminate the aquifer . Several cancers and childhood leukemia have been linked to parts-per-billion concentrations of chemical degreasers and solvents in groundwater .
Follow these steps to protect your well water from chemical contamination, as depicted in Figure 10 .1:
• Do not store or use chemicals near the wellhead .
• Do not mix pesticides or store gasoline within 150 feet from a well .
• If your well is in a storage shed or well house, do not store potential contaminates such as fuels, pesticides, or
FIGURE 10.3 A septic tank and soil absorption field system.
fertilizers in the structure .
Following these additional guidelines will help prevent other types of contamination of your well water:
• Inspect the wellhead on a regular basis, and address any breakage or soil disturbance by burrowing animals or insects . The well owner can repair and maintain the wellhead pad; casing repairs require a licensed well driller .
• Locate pet and livestock enclosures at least 150 feet away and downslope of the well head . Pet waste from dog runs and yards can contaminant groundwater .
• Build livestock corrals at least 150 feet away and downslope, and direct stormwater runoff away from the well head . Runoff from livestock pens and pastures can contaminants groundwater with bacteria, nitrates, and veterinary drugs .
• Line and cover compost stacks to prevent leachate waste from seeping, or running off and entering the soil .
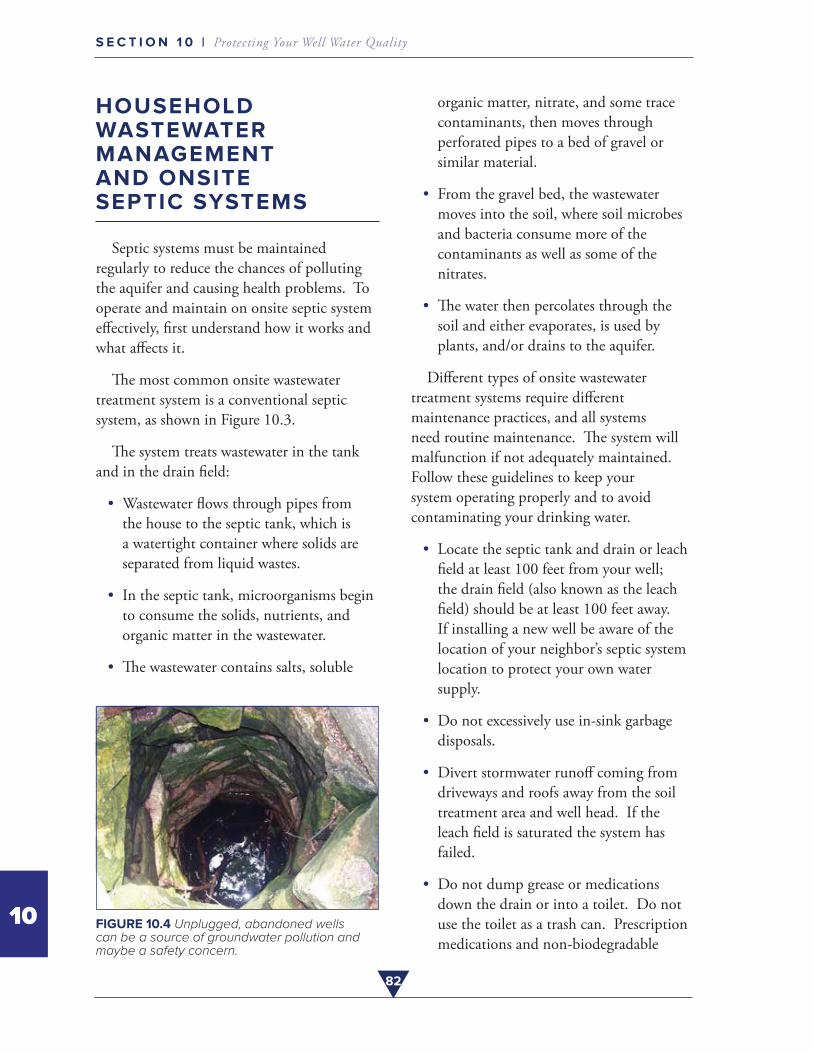
82
S E C T I O N 1 0 | Protecting Your Well Water Quality
10
HOUSEHOLD WASTEWATER MANAGEMENT AND ONSITE SEPTIC SYSTEMS
Septic systems must be maintained regularly to reduce the chances of polluting the aquifer and causing health problems . To operate and maintain on onsite septic system effectively, first understand how it works and what affects it .
The most common onsite wastewater treatment system is a conventional septic system, as shown in Figure 10 .3 .
The system treats wastewater in the tank and in the drain field:
• Wastewater flows through pipes from the house to the septic tank, which is a watertight container where solids are separated from liquid wastes .
• In the septic tank, microorganisms begin to consume the solids, nutrients, and organic matter in the wastewater .
• The wastewater contains salts, soluble
FIGURE 10.4 Unplugged, abandoned wells can be a source of groundwater pollution and maybe a safety concern.
organic matter, nitrate, and some trace contaminants, then moves through perforated pipes to a bed of gravel or similar material .
• From the gravel bed, the wastewater moves into the soil, where soil microbes and bacteria consume more of the contaminants as well as some of the nitrates .
• The water then percolates through the soil and either evaporates, is used by plants, and/or drains to the aquifer .
Different types of onsite wastewater treatment systems require different maintenance practices, and all systems need routine maintenance . The system will malfunction if not adequately maintained . Follow these guidelines to keep your system operating properly and to avoid contaminating your drinking water .
• Locate the septic tank and drain or leach field at least 100 feet from your well; the drain field (also known as the leach field) should be at least 100 feet away . If installing a new well be aware of the location of your neighbor’s septic system location to protect your own water supply .
• Do not excessively use in-sink garbage disposals .
• Divert stormwater runoff coming from driveways and roofs away from the soil treatment area and well head . If the leach field is saturated the system has failed .
• Do not dump grease or medications down the drain or into a toilet . Do not use the toilet as a trash can . Prescription medications and non-biodegradable
83
S E C T I O N 1 0 | Protecting Your Well Water Quality
10
artificial sweeteners have been found in groundwater downgradient from a failing septic system .
• If you are undergoing chemotherapy, ask your doctor about appropriate waste disposal methods to avoid discharging toxic drugs into the environment .
• Do not use chemicals to clean the septic system . They can interfere with the biological action in the tank, add toxic chemicals to groundwater, and clog the drain field by flushing sludge and scum into the field . Some septic cleaners contain solvents and degreasers and are banned in several states .
• Have the septic tank pumped every 2 to 3 years .
• Do not cover the drain field with an impervious surface such as a driveway or parking area .
• Do not drive heavy equipment over the components of a wastewater treatment system .
• Because septic systems do not remove nitrogen compounds efficiently (a common component in human waste), have the well water tested for nitrate every year . One of the most common pollutants found in domestic drinking water wells is nitrate .
• Conserve water in the home to reduce the amount of water that the wastewater treatment system must process . Excessive amounts of water can overload the system and cause it to fail .
Other problems to watch for include:
• Roots from trees and other vegetation may clog and damage the system .
• Some drinking water treatment systems, such as a reverse osmosis system and water softener systems discharge waste brine and can increase the septic field load significantly . This increased volume of water may saturate your system, leading to failure .
• Spent brine discharge from reverse osmosis and water softeners will increase the concentrations of salt in the soil, which could change the soil structure causing the system to fail . Waste brine from reverse osmosis and/or water softeners may increase the amount of salt and untreated waste entering the aquifer .
PLUGGING UNUSED WATER WELLS
An “abandoned well” is a well that has been properly plugged by a licensed well driller after a NOI to abandon a well as been filed with ADWR, and an abandonment authorization has been issued to the driller . This legal authorization from ADWR is required prior to well abandonment, and the landowner may be liable for any groundwater contamination or injury that results from lack of proper abandonment . Like all wells, an abandoned well, see Figure 10 .4, is a direct channel from the ground surface to the aquifer below . Contaminants that enter the well move directly into the aquifer and may threaten human health and the environment . It also puts other wells in the same aquifer at risk for contamination, particularly those close to the abandoned well .
A notice of intent to abandon, or NOIA, is required to be filed with the ADWR, as outlined in the “Well Abandoned Handbook”
84
S E C T I O N 1 0 | Protecting Your Well Water Quality
10
available on the ADWR web site, see also Section 5 .
ADWR’s well abandonment rule requires that well abandonment be accomplished “through filling or sealing the well so as to prevent the well, including the annular space outside the casing, from being a channel allowing the vertical movement of water” (A .A .C . R12-15-816(G)) . Specific materials and depths of fill are required based on which aquifer the well is located in, in addition to well depth . Only a licensed well driller can abandon a well . The well owner must file a NOI to abandon, which lists the licensed driller that will perform the well abandonment according to A .A .C .
SHOCK CHLORINATION OF WATER WELLS
When a water system is contaminated with bacteria the well can be disinfected by shock chlorination . This process introduces very high concentrations of liquid chlorine directly into the well and plumbing system . Chlorine is highly toxic to bacteria and animals . Bleach, commonly used to disinfect wells, can release harmful vapors and will damage skin when full-strength exposure occurs or when mixed with acids .
To reduce your risk of exposure to hazardous chemicals and to protect your pump and system components, have a licensed water well driller or pump installer conduct the procedure . See AZ1605 when considering well shock chlorination .
Downhole plumbing and pumps have been corroded with the excessive use of chlorine .
To avoid expensive repair and replacement the licensed contractor should take the responsibility of protecting your investment .
Schedule shock chlorination for when the water system will not be in use for at least 12 to 24 hours . In addition to the well, most water treatment equipment – including water heaters, softeners, filters, and pressure tanks – may need disinfection . During and immediately after the disinfection process, the water from the system will be unsuitable for consumption . You will need to flush the water system until all traces of chlorine are gone and the well water has been tested . Do not allow the water to be used for drinking until test results confirm the water is safe .
In some cases, multiple shock chlorination procedures are not enough to resolve the problem, in those situation, a licensed well driller or pump installer will need to remove the pump and plumbing from the well and scrub the interior with brushes and chemicals made for this purpose .
When chlorine chemicals are introduced into a well, some of the chemical may enter the aquifer through the well screen . When the geologic material of the aquifer is exposed to chlorine, other constituents, such as arsenic, if present, may dissolve and enter the water supply . Always test your water after shock chlorination to assure safety .
R E F E R E N C E S O F I N T E R E S T
What Well Owners Should Know About Shock Chlorination. 2013 . Extension Publication #AZ1605 .
Water Storage Tank Disinfection, Testing, and Maintenance. 2012 . Extension Publication #AZ1586 .
85
GL
OS
SA
RY
GLOSSARY
TERMS
Acre-feetA water volume unit equal to one acre with one foot of standing water; or 43,560 cubic feet; or 325,853 gallons . One acre-foot/year is approximately 893 gallons per day .
Acute
A rapid onset of an illness due to a one time or short time exposure to a chemical contaminant or waterborne pathogen . Example: gastrointestinal illness due to exposure to bacteria or water-borne toxin .
AlkalinityThe sum of all the ions that affect pH in water; these are: carbonates, bicarbonates and hydroxides . Alkalinity is usually reported as an equivalent amount CaCO3 in mg/l or grains/gallon .
AlluvialA general term that that refers to sedimentary deposits made by streams on river beds, flood plains, and alluvial fans, especially an alluvial fan deposit in an arid or semiarid region where a stream issues from a canyon onto a plain or valley floor .
Anion/Cation ExchangeThe replacement of one charged ion for another . Typical ion exchangers are ion exchange resins (porous gel polymers), zeolites, clays . Cation exchangers replace positively charged ions (cations) and anion exchangers, and replace negatively charged ions (anions) . See water softeners in Section 8 .
ArtesianTerm applied to a well with groundwater under sufficient hydrostatic pressure to rise above the confined aquifer . If the pressure in a well is sufficient to bring the water to land surface, the artesian well is termed a ‘flowing well’ .
Base FlowThe portion of stream flow that is not due to stormwater runoff . Base flow is sustained by the seepage of groundwater into the river channel slowly over time . Base flow is the primary source of running water in a stream during dry weather, and is responsible for perennial flow .
BasementThe rock surface below which no sedimentary rock or alluvium is found . In Arizona, the basement rock is usually granite or crystalline metamorphic rock like schist .
Bedding Plane(s)In sedimentary rocks, the division plane that separates each successive layer or bed from the one above or below .
CalicheA hardened natural cement of calcium carbonate and other minerals that binds other materials—such as gravel, sand, clay, and silt . Caliche is found around the world and across Arizona in arid soils .
ConfinedAn aquifer bounded above and below by impermeable sediments or rock, or by geologic
86
GL
OS
SA
RY
material of distinctly lower permeability (such as clay) than that of the aquifer itself .
Disinfection By-Products (DBPs)Result from reactions between organic matter and some ions, like bromide, found in water and chemicals used to disinfect water . Typically, gaseous chlorine (Cl2) or liquid sodium hypochlorite (bleach, NaOCl) is added to, and reacts with, water to form strong oxidizing agents, which disinfects the water . Potentially harmful compounds formed include trihalomethanes (THMs) and haloacetic acids (HAAs) .
Drawdown Cone or a Cone of Depression The lowering of the water level in a well as a result of pumping . The water level is drawn-down, or depressed, in the shape of an inverted cone .
Endocrine DisruptorsNaturally occurring or man-made substances that may mimic or interfere with the function of hormones in the body . Endocrine disruptors may turn on, shut off, or modify signals that hormones carry and thus affect the normal functions of tissues and organs . The detection of numerous pharmaceutical agents and chemicals with endocrine disrupting potential in surface and groundwaters has raised concern about drinking water as a significant route of exposure .
FlocculantsChemicals that promote suspended particles in water to aggregate, forming a floc, and are used in water treatment processes to improve the sedimentation or filterability of small particles .
FrackingThe process of injecting water with other liquids and sand at high pressure into the subsurface through boreholes to force open existing fissures
and increase the flow of water, oil, or natural gas .
Host RockA body of rock serving as a host for other rocks, or any rock in which ore mineral deposits occur . An example would be a quartz vein and gold deposit within a fault through a granitic host rock .
HydrographA graph of water level (elevation) or stream flow of water at a particular location as a function of time .
HydrostaticThe pressure exerted by liquid . Hydrostatic pressure increases with depth because of the increasing weight of fluid .
Land SubsidenceA gradual settling or sudden sinking of the Earth’s surface owing to extraction of groundwater, oil, or mining .
Microbial IndicatorsType of microbes easy to test for that indicate the likely presence or absence of pathogens that are difficult to test individually, in water . Public agencies therefore use the presence of other more abundant and more easily detected coliform bacteria as indicators of the presence of fecal and other pathogenic contamination .
MineralizedThe hydrothermal deposition of metals or minerals in the formation of ore bodies, emplacement of minerals (such as quartz) in fractures and cracks of consolidated rocks .
Natural Organic Matter, NOMFound in all surface, ground and soil waters, NOM is the result organic material dissolving
87
GL
OS
SA
RY
in water, such as tea leaves extract to make tea .
Nitrate-N Amount of nitrate in water expressed as the mass of the element nitrogen (N), excluding the mass of the three oxygens in nitrate, NO3 . The NPDWS is 10mg/L as NO3-N, but the standard is 44mg/L if written as the complete molecule NO3 . Most analytical laboratories measure nitrate in water as Nitrate-N .
Overdraft A deficit in a bank account is caused by drawing more money than the account holds . In hydrology, an overdraft is extracting more groundwater than the aquifer can sustain .
pCi/L.Picocuries per liter (pCi/L) is a unit for measuring radioactivity concentrations . The curie (Ci) unit is the activity of 1 gram of pure radium 226 . A “pico Curie” is one-trillionths of a Curie . A Curie is equivalent to 37 Billion radioactive disintegrations per second . One pico-Curie works out to 2 .2 radioactive disintegrations per minute (dpm) in a liter of air .
PerennialLasting or existing for a long or apparently infinite time; enduring or continually recurring . A perennial river flows throughout the year .
PermeableA porous material that allows liquids or gases to pass through it .
POE, POULocation where water treatment system is installed, with POE meaning “point of entry” into the home . POU indicates the system is installed at the “point of use,” such as under the sink .
PorosityPorosity is a measure of the total pore space in a material . This is measured as a volume or percent of space between the material particles . The amount of porosity in an aquifer depends on the particle size of minerals, their distribution, and the amount of sorting that occurs within the aquifer structure .
PrecipitateA precipitate is an insoluble solid that emerges from a liquid solution . The emergence of the insoluble solid from solution is called precipitation, which often forms scale .
Reclaimed WaterOr recycled water, is former wastewater (sewage) that is treated to remove solids, reduce organic matter, and disinfected enough to meet reuse standards . In Arizona parks and golf course must use reclaimed water for sustainable landscaping irrigation . It is also used to recharge groundwater aquifers; to sustain some riparian habitats; to meet commercial and industrial water needs; and, with additional treatment, for drinking .
Salinity (TDS) Is the saltiness or dissolved salt content in water, reported as Total Dissolved Solids (TDS), measured in mg/L . The salt in the ocean is mostly made up of the elements sodium (Na) and chlorine (Cl), accounting for ~ 85 .7 percent of dissolved salt, and is measured at around 34,000 to 35,000 mg/L of TDS . Groundwater is considered ‘fresh’ when the TDS is below 3,000 mg/L, although the NSDWS recommends a TDS < 500 mg/L for drinking water . Groundwater is considered brackish between 3,000 to 10,000 mg/L; saline between 10,000 to 35,000 mg/L; and, brine above 35,000 mg/L TDS .
88
GL
OS
SA
RY
SoilThe dynamic natural upper part of the earth’s surface, composed of unconsolidated minerals organic residues, air, and water that together support microbe, plant, and animal terrestrial life .
Solubility Is the property of a solid, liquid, or gaseous chemical substance to interact and mix with another solid, liquid, or a gas . By far the most common solvent is water, also called the Universal Solvent, as it reacts with and dissolves most inorganic and organic substances .
SuperfundA US federal government program designed to fund the cleanup of toxic wastes in the environment, established by the Comprehensive Environmental Response, Compensation, and Liability Act of 1980 (CERCLA) . EPA may identify parties responsible for hazardous substances releases to the environment (polluters) and either compel them to clean up the sites, or it may undertake the cleanup on its own using the Superfund (a trust fund) and costs recovered from polluters by referring to the U .S . Department of Justice . In Arizona, the Superfund program sites are listed on the Water Quality Assurance Revolving Fund (WQARF) Registry, http://legacy .azdeq .gov/environ/waste/sps/ .
Suspended Matter or Suspended SolidsRefers to small solid particles which remain in suspension in water . In groundwater, most suspended solids are made up of inorganic materials such as clays, though bacteria and algae can also contribute to the total solids concentration . Suspended solids reduce water clarity by creating an opaque, hazy or muddy appearance . Turbidity measurements are often used as an indicator of water quality and is based
on the amount of light scattered by particles in the water column . The more suspended particles that are present, the more light will be scattered .
TurbidityA measure of suspended solids in water in Nephelometric Turbidity Units (NTU) .
VadoseThe vadose zone, also termed the unsaturated zone, is the part of the aquifer between the land surface and the top of the water table . As precipitation filters through to recharge the aquifer, some moisture and many contaminants are retained within the vadose zone .
Water Well LogsAlso known as borehole logging, is the practice of making a detailed record (a well log) of the geologic formations penetrated by a borehole . Many logs will include the ‘as-built’ diagram of the well depth, screen length, and pump placement .
89
GL
OS
SA
RY
ACRONYMS AND ABBREVIATIONS
ADHS Arizona Department of Health Services
ADWR Arizona Department of Water Resources
ADEQ Arizona Department of Environmental Quality
AZ ROC Registrar of Contractors
BDL Below Detection Limit
CDC Center for Disease Control
gpg Grains per Gallon – US unit of water hardness used in salt water softeners . One gpg equals 17 .1 mg/L of hardness (as CaCO3) .
gpm Gallons per minute
MCL Maximum Contaminant Level
MCLG Maximum Contaminant Level Goal
mg/L – ppm milligrams per liter or parts per million
micrograms/L or µg/L – ppb micrograms per liter or parts per billion
ND Not Detected
Photo: Bill Radke – 2009 Water Resources Research Center photo contest
NOI Notice of Intention
NOM Natural Organic matter
NPDWS National Primary Drinking Water Standards
NSDWS National Secondary Drinking Water Standards
NSF National Sanitation Foundation
NTU Nephelometric Turbidity Unit
pCi/L picoCuries per liter
PVC Polyvinyl chloride – a type of plastic
TDS Total Dissolved Solids
US EPA United States Environmental Protection Agency
USGS United States Geological Survey
WHO World Health Organization
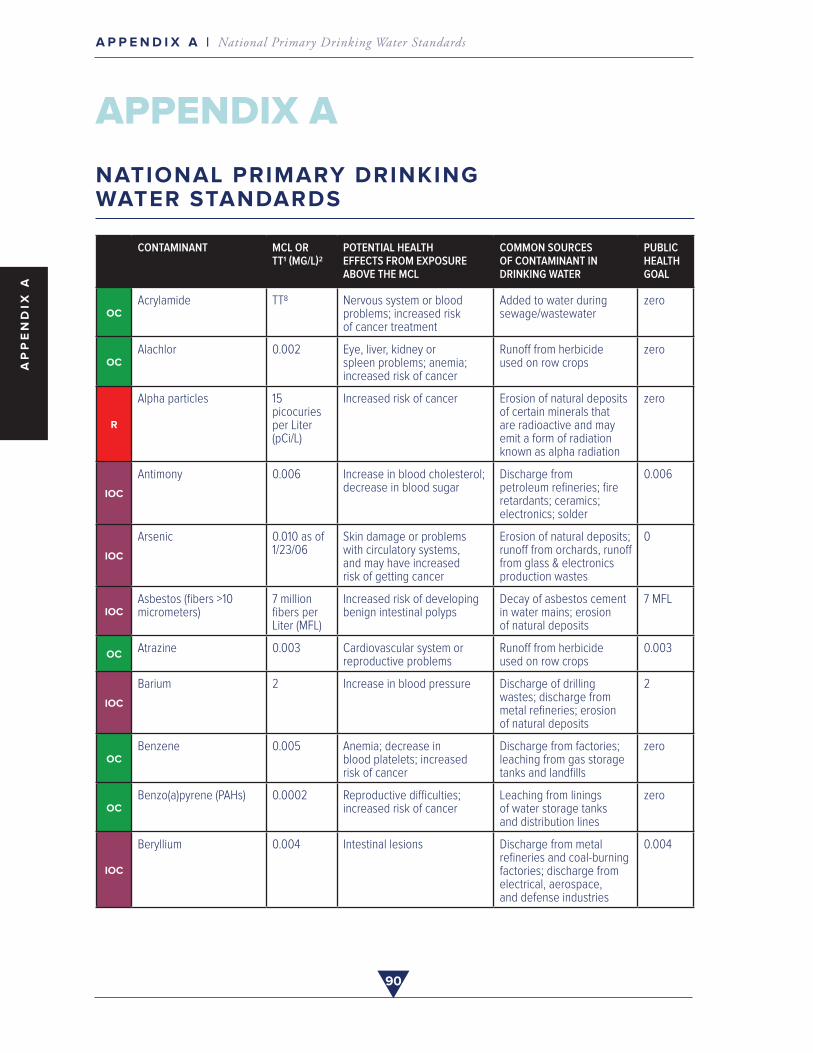
90
A P P E N D I X A | National Primary Drinking Water StandardsA
PP
EN
DIX
A
APPENDIX A
NATIONAL PRIMARY DRINKING WATER STANDARDS
CONTAMINANT MCL OR TT1 (MG/L)2
POTENTIAL HEALTH EFFECTS FROM EXPOSURE ABOVE THE MCL
COMMON SOURCES OF CONTAMINANT IN DRINKING WATER
PUBLIC HEALTH GOAL
OCAcrylamide TT8 Nervous system or blood
problems; increased risk of cancer treatment
Added to water during sewage/wastewater
zero
OCAlachlor 0.002 Eye, liver, kidney or
spleen problems; anemia; increased risk of cancer
Runoff from herbicide used on row crops
zero
R
Alpha particles 15 picocuries per Liter (pCi/L)
Increased risk of cancer Erosion of natural deposits of certain minerals that are radioactive and may emit a form of radiation known as alpha radiation
zero
IOC
Antimony 0.006 Increase in blood cholesterol; decrease in blood sugar
Discharge from petroleum refineries; fire retardants; ceramics; electronics; solder
0.006
IOC
Arsenic 0.010 as of 1/23/06
Skin damage or problems with circulatory systems, and may have increased risk of getting cancer
Erosion of natural deposits; runoff from orchards, runoff from glass & electronics production wastes
0
IOCAsbestos (fibers >10 micrometers)
7 million fibers per Liter (MFL)
Increased risk of developing benign intestinal polyps
Decay of asbestos cement in water mains; erosion of natural deposits
7 MFL
OCAtrazine 0.003 Cardiovascular system or
reproductive problemsRunoff from herbicide used on row crops
0.003
IOC
Barium 2 Increase in blood pressure Discharge of drilling wastes; discharge from metal refineries; erosion of natural deposits
2
OCBenzene 0.005 Anemia; decrease in
blood platelets; increased risk of cancer
Discharge from factories; leaching from gas storage tanks and landfills
zero
OCBenzo(a)pyrene (PAHs) 0.0002 Reproductive difficulties;
increased risk of cancerLeaching from linings of water storage tanks and distribution lines
zero
IOC
Beryllium 0.004 Intestinal lesions Discharge from metal refineries and coal-burning factories; discharge from electrical, aerospace, and defense industries
0.004
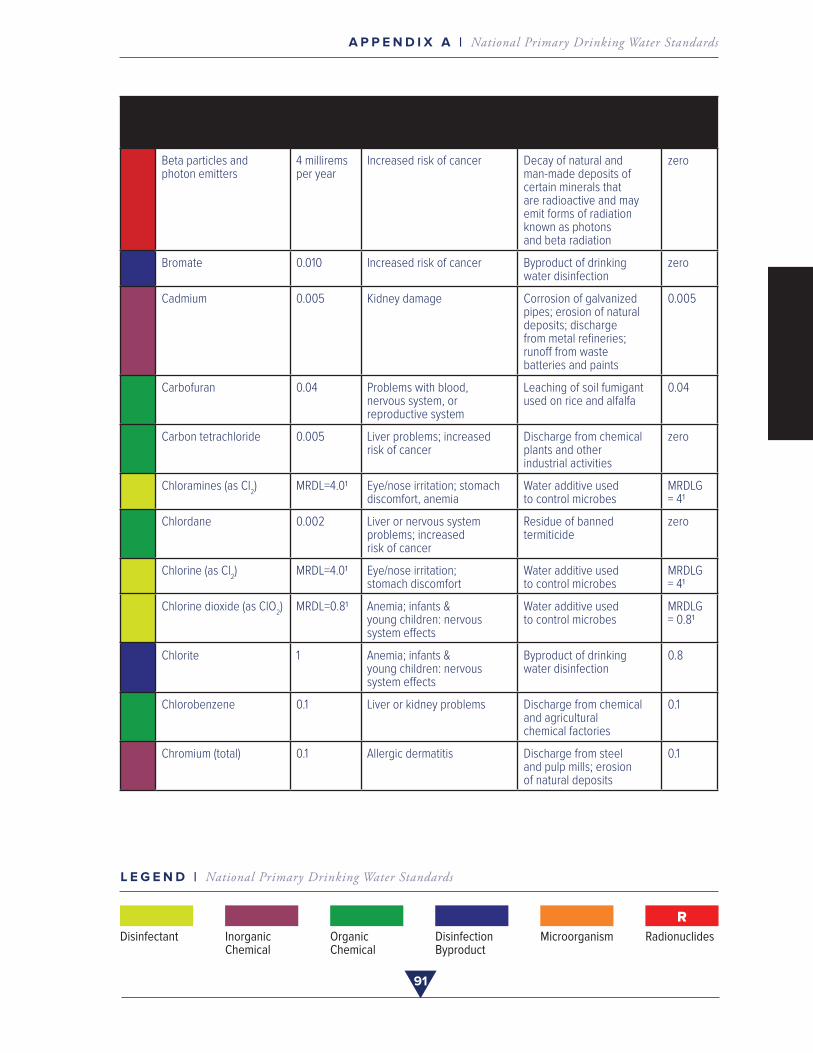
91
A P P E N D I X A | National Primary Drinking Water StandardsA
PP
EN
DIX
A
CONTAMINANT MCL OR TT1 (MG/L)2
POTENTIAL HEALTH EFFECTS FROM EXPOSURE ABOVE THE MCL
COMMON SOURCES OF CONTAMINANT IN DRINKING WATER
PUBLIC HEALTH GOAL
R
Beta particles and photon emitters
4 millirems per year
Increased risk of cancer Decay of natural and man-made deposits of certain minerals that are radioactive and may emit forms of radiation known as photons and beta radiation
zero
DBPBromate 0.010 Increased risk of cancer Byproduct of drinking
water disinfectionzero
IOC
Cadmium 0.005 Kidney damage Corrosion of galvanized pipes; erosion of natural deposits; discharge from metal refineries; runoff from waste batteries and paints
0.005
OCCarbofuran 0.04 Problems with blood,
nervous system, or reproductive system
Leaching of soil fumigant used on rice and alfalfa
0.04
OCCarbon tetrachloride 0.005 Liver problems; increased
risk of cancerDischarge from chemical plants and other industrial activities
zero
DChloramines (as Cl
2) MRDL=4.01 Eye/nose irritation; stomach
discomfort, anemiaWater additive used to control microbes
MRDLG = 41
OCChlordane 0.002 Liver or nervous system
problems; increased risk of cancer
Residue of banned termiticide
zero
DChlorine (as Cl
2) MRDL=4.01 Eye/nose irritation;
stomach discomfortWater additive used to control microbes
MRDLG = 41
DChlorine dioxide (as ClO
2) MRDL=0.81 Anemia; infants &
young children: nervous system effects
Water additive used to control microbes
MRDLG = 0.81
DBPChlorite 1 Anemia; infants &
young children: nervous system effects
Byproduct of drinking water disinfection
0.8
OCChlorobenzene 0.1 Liver or kidney problems Discharge from chemical
and agricultural chemical factories
0.1
IOCChromium (total) 0.1 Allergic dermatitis Discharge from steel
and pulp mills; erosion of natural deposits
0.1
L E G E N D | National Primary Drinking Water Standards
Disinfectant
D
Inorganic Chemical
IOC
Organic Chemical
OC
Disinfection Byproduct
DBP
Microorganism
M
Radionuclides
R
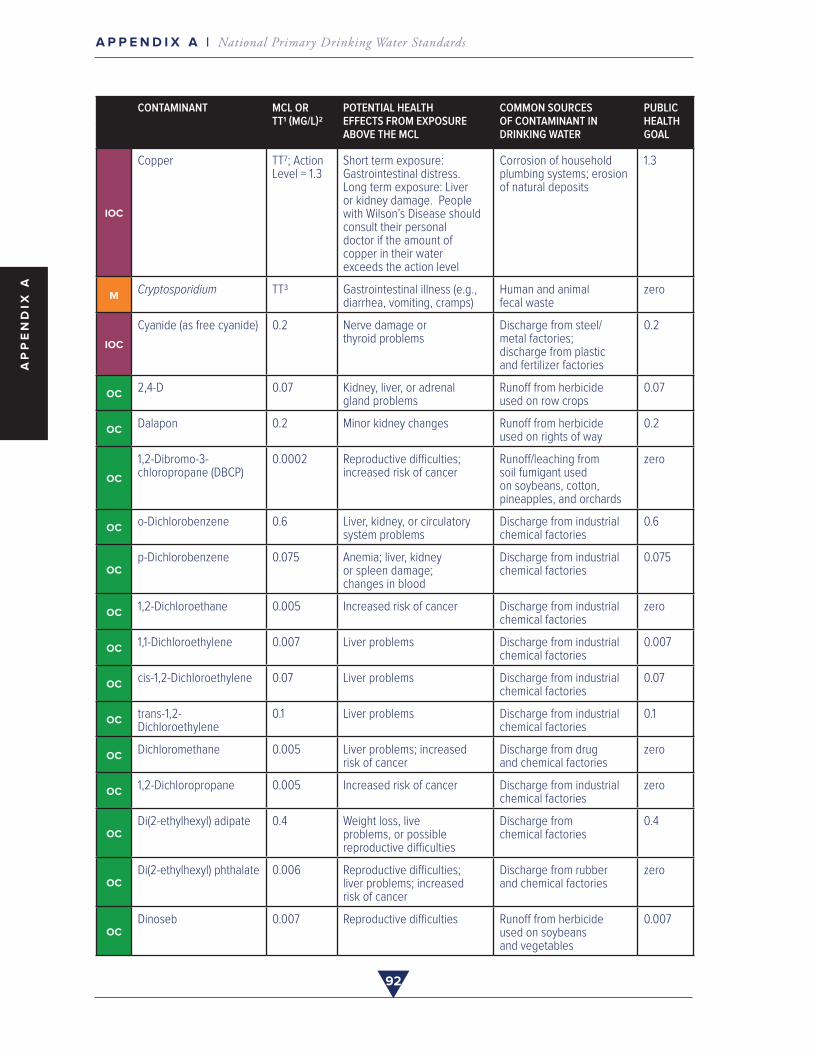
92
A P P E N D I X A | National Primary Drinking Water StandardsA
PP
EN
DIX
A
APPENDIX ACONTAMINANT MCL OR TT1 (MG/L)2
POTENTIAL HEALTH EFFECTS FROM EXPOSURE ABOVE THE MCL
COMMON SOURCES OF CONTAMINANT IN DRINKING WATER
PUBLIC HEALTH GOAL
IOC
Copper TT7; Action Level = 1.3
Short term exposure: Gastrointestinal distress. Long term exposure: Liver or kidney damage. People with Wilson’s Disease should consult their personal doctor if the amount of copper in their water exceeds the action level
Corrosion of household plumbing systems; erosion of natural deposits
1.3
MCryptosporidium TT3 Gastrointestinal illness (e.g.,
diarrhea, vomiting, cramps)Human and animal fecal waste
zero
IOC
Cyanide (as free cyanide) 0.2 Nerve damage or thyroid problems
Discharge from steel/metal factories; discharge from plastic and fertilizer factories
0.2
OC2,4-D 0.07 Kidney, liver, or adrenal
gland problemsRunoff from herbicide used on row crops
0.07
OCDalapon 0.2 Minor kidney changes Runoff from herbicide
used on rights of way0.2
OC
1,2-Dibromo-3-chloropropane (DBCP)
0.0002 Reproductive difficulties; increased risk of cancer
Runoff/leaching from soil fumigant used on soybeans, cotton, pineapples, and orchards
zero
OCo-Dichlorobenzene 0.6 Liver, kidney, or circulatory
system problemsDischarge from industrial chemical factories
0.6
OCp-Dichlorobenzene 0.075 Anemia; liver, kidney
or spleen damage; changes in blood
Discharge from industrial chemical factories
0.075
OC1,2-Dichloroethane 0.005 Increased risk of cancer Discharge from industrial
chemical factorieszero
OC1,1-Dichloroethylene 0.007 Liver problems Discharge from industrial
chemical factories0.007
OCcis-1,2-Dichloroethylene 0.07 Liver problems Discharge from industrial
chemical factories0.07
OCtrans-1,2-Dichloroethylene
0.1 Liver problems Discharge from industrial chemical factories
0.1
OCDichloromethane 0.005 Liver problems; increased
risk of cancerDischarge from drug and chemical factories
zero
OC1,2-Dichloropropane 0.005 Increased risk of cancer Discharge from industrial
chemical factorieszero
OCDi(2-ethylhexyl) adipate 0.4 Weight loss, live
problems, or possible reproductive difficulties
Discharge from chemical factories
0.4
OCDi(2-ethylhexyl) phthalate 0.006 Reproductive difficulties;
liver problems; increased risk of cancer
Discharge from rubber and chemical factories
zero
OCDinoseb 0.007 Reproductive difficulties Runoff from herbicide
used on soybeans and vegetables
0.007
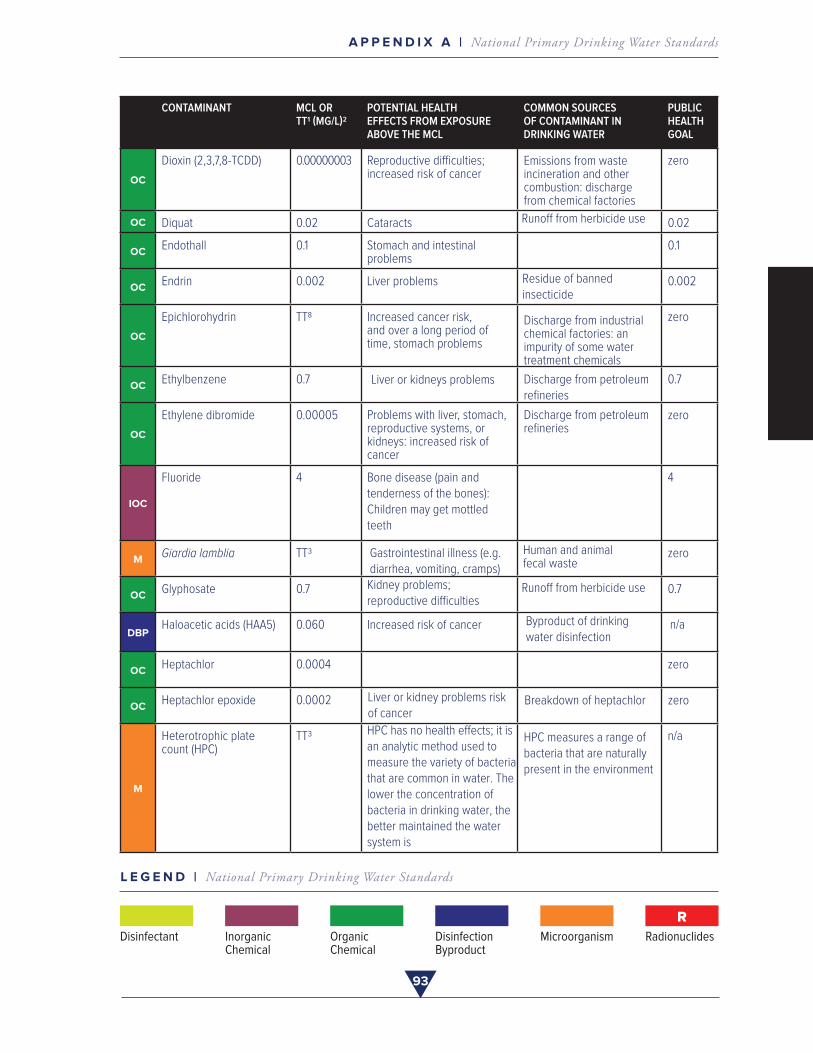
93
A P P E N D I X A | National Primary Drinking Water StandardsA
PP
EN
DIX
A
TT1 (MG/L)2ABOVE THE MCL
EFFECTS FROM EXPOSURE OF CONTAMINANT IN
DRINKING WATER
L E G E N D | National Primary Drinking Water Standards
Disinfectant
D
Inorganic Chemical
IOC
Organic Chemical
OC
Disinfection Byproduct
DBP
Microorganism
M
Radionuclides
R
CONTAMINANT MCL OR TT1 (MG/L)2
POTENTIAL HEALTH EFFECTS FROM EXPOSURE ABOVE THE MCL
COMMON SOURCES OF CONTAMINANT IN DRINKING WATER
PUBLIC HEALTH GOAL
OC
Dioxin (2,3,7,8-TCDD) 0.00000003 Reproductive difficulties; increased risk of cancer
Emissions from waste incineration and other combustion: discharge from chemical factories
zero
OC Diquat 0.02 Cataracts Runoff from herbicide use 0.02
OCEndothall 0.1 Stomach and intestinal
problems0.1
OCEndrin 0.002 Liver problems Residue of banned
insecticide0.002
OC
Epichlorohydrin TT8 Increased cancer risk, and over a long period of time, stomach problems
Discharge from industrial chemical factories: an impurity of some water treatment chemicals
zero
OCEthylbenzene 0.7 Liver or kidneys problems Discharge from petroleum
refineries0.7
OC
Ethylene dibromide 0.00005 Problems with liver, stomach, reproductive systems, or kidneys: increased risk of cancer
Discharge from petroleum refineries
zero
IOC
Fluoride 4 Bone disease (pain and tenderness of the bones): Children may get mottled teeth
4
MGiardia lamblia TT3 Gastrointestinal illness (e.g.
diarrhea, vomiting, cramps)Human and animal fecal waste
zero
OCGlyphosate 0.7 Kidney problems;
reproductive difficulties0.7
DBPHaloacetic acids (HAA5) 0.060 Increased risk of cancer
Runoff from herbicide use
n/a
OCHeptachlor 0.0004
Byproduct of drinking water disinfection
zero
OCHeptachlor epoxide 0.0002 Liver or kidney problems risk
of cancerBreakdown of heptachlor zero
M
Heterotrophic plate count (HPC)
TT3 HPC has no health effects; it is an analytic method used to measure the variety of bacteria that are common in water. The lower the concentration of bacteria in drinking water, the better maintained the water system is
HPC measures a range of bacteria that are naturally present in the environment
n/a
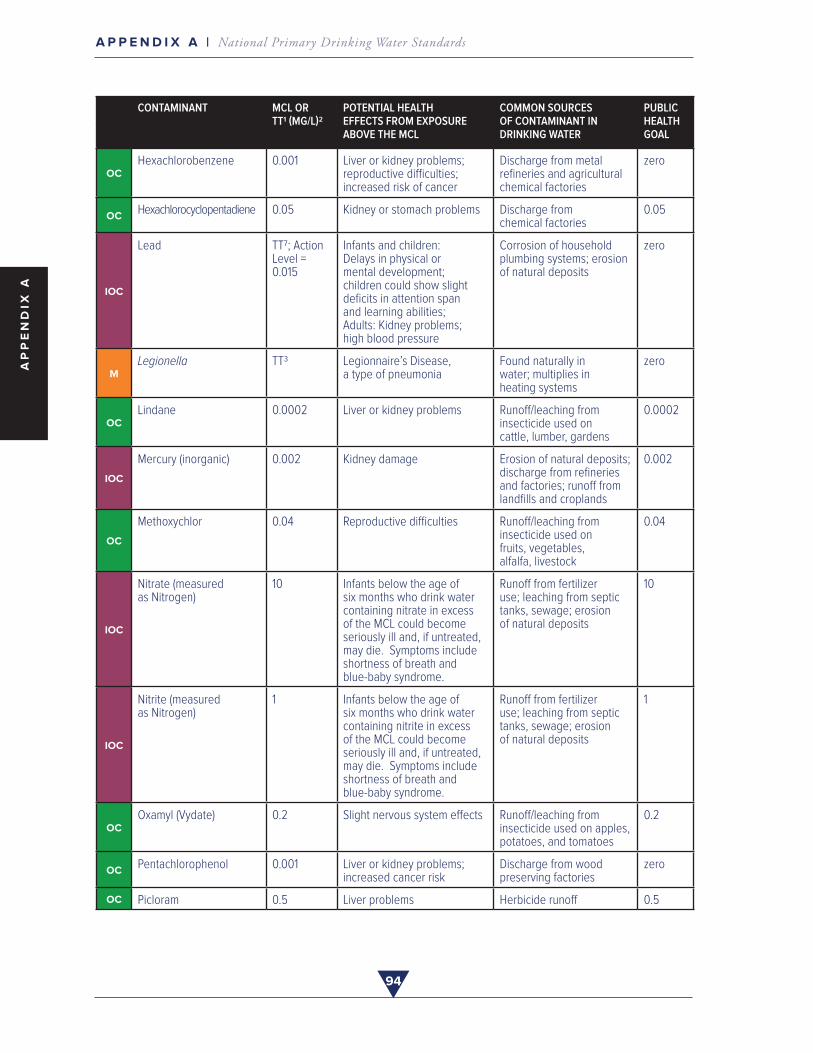
94
A P P E N D I X A | National Primary Drinking Water StandardsA
PP
EN
DIX
A
APPENDIX ACONTAMINANT MCL OR TT1 (MG/L)2
POTENTIAL HEALTH EFFECTS FROM EXPOSURE ABOVE THE MCL
COMMON SOURCES OF CONTAMINANT IN DRINKING WATER
PUBLIC HEALTH GOAL
OCHexachlorobenzene 0.001 Liver or kidney problems;
reproductive difficulties; increased risk of cancer
Discharge from metal refineries and agricultural chemical factories
zero
OCHexachlorocyclopentadiene 0.05 Kidney or stomach problems Discharge from
chemical factories0.05
IOC
Lead TT7; Action Level = 0.015
Infants and children: Delays in physical or mental development; children could show slight deficits in attention span and learning abilities; Adults: Kidney problems; high blood pressure
Corrosion of household plumbing systems; erosion of natural deposits
zero
MLegionella TT3 Legionnaire’s Disease,
a type of pneumoniaFound naturally in water; multiplies in heating systems
zero
OCLindane 0.0002 Liver or kidney problems Runoff/leaching from
insecticide used on cattle, lumber, gardens
0.0002
IOC
Mercury (inorganic) 0.002 Kidney damage Erosion of natural deposits; discharge from refineries and factories; runoff from landfills and croplands
0.002
OC
Methoxychlor 0.04 Reproductive difficulties Runoff/leaching from insecticide used on fruits, vegetables, alfalfa, livestock
0.04
IOC
Nitrate (measured as Nitrogen)
10 Infants below the age of six months who drink water containing nitrate in excess of the MCL could become seriously ill and, if untreated, may die. Symptoms include shortness of breath and blue-baby syndrome.
Runoff from fertilizer use; leaching from septic tanks, sewage; erosion of natural deposits
10
IOC
Nitrite (measured as Nitrogen)
1 Infants below the age of six months who drink water containing nitrite in excess of the MCL could become seriously ill and, if untreated, may die. Symptoms include shortness of breath and blue-baby syndrome.
Runoff from fertilizer use; leaching from septic tanks, sewage; erosion of natural deposits
1
OCOxamyl (Vydate) 0.2 Slight nervous system effects Runoff/leaching from
insecticide used on apples, potatoes, and tomatoes
0.2
OCPentachlorophenol 0.001 Liver or kidney problems;
increased cancer riskDischarge from wood preserving factories
zero
OC Picloram 0.5 Liver problems Herbicide runoff 0.5
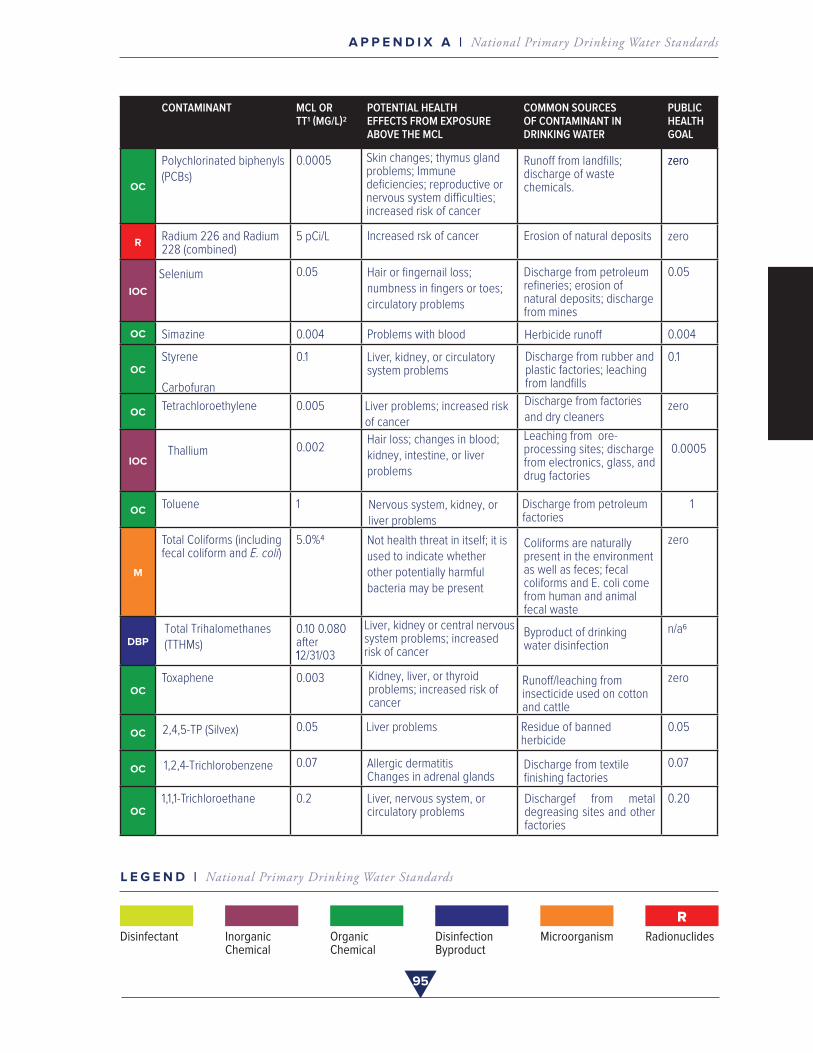
95
A P P E N D I X A | National Primary Drinking Water StandardsA
PP
EN
DIX
A
CONTAMINANT MCL OR TT1 (MG/L)2
POTENTIAL HEALTH EFFECTS FROM EXPOSURE ABOVE THE MCL
COMMON SOURCES OF CONTAMINANT IN DRINKING WATER
PUBLIC HEALTH GOAL
R
zero
DBP
IOC
OCCarbofuran
Discharge from factories and dry cleaners
OCHair loss; changes in blood; kidney, intestine, or liverproblems
Leaching from ore-processing sites; discharge from electronics, glass, and drug factories
D
OC Not health threat in itself; it is used to indicate whether other potentially harmful bacteria may be present
D
D
DBP1
Liver, kidney or central nervous system problems; increased risk of cancer
Byproduct of drinking water disinfection
OC
Kidney, liver, or thyroid problems; increased risk of cancer
IOC Discharge from textile finishing factories
Residue of banned herbicide
L E G E N D | National Primary Drinking Water Standards
Disinfectant
D
Inorganic Chemical
IOC
Organic Chemical
OC
Disinfection Byproduct
DBP
Microorganism
M
Radionuclides
R
CONTAMINANT MCL OR TT1 (MG/L)2
POTENTIAL HEALTH EFFECTS FROM EXPOSURE ABOVE THE MCL
COMMON SOURCES OF CONTAMINANT IN DRINKING WATER
PUBLIC HEALTH GOAL
OC
Polychlorinated biphenyls (PCBs)
0.0005 Skin changes; thymus gland problems; Immune deficiencies; reproductive or nervous system difficulties; increased risk of cancer
Runoff from landfills; discharge of waste chemicals.
zero
RRadium 226 and Radium 228 (combined)
5 pCi/L Increased rsk of cancer Erosion of natural deposits zero
IOC
Selenium 0.05 Hair or fingernail loss; numbness in fingers or toes; circulatory problems
Discharge from petroleum refineries; erosion of natural deposits; discharge from mines
0.05
OC Simazine 0.004 Problems with blood Herbicide runoff 0.004
OCStyrene 0.1 Liver, kidney, or circulatory
system problemsDischarge from rubber and plastic factories; leaching from landfills
0.1
OCTetrachloroethylene 0.005 Liver problems; increased risk
of cancerzero
IOCThallium 0.002 0.0005
OCToluene 1 Nervous system, kidney, or
liver problemsDischarge from petroleum factories
1
M
Total Coliforms (including fecal coliform and E. coli)
5.0%4 Coliforms are naturally present in the environment as well as feces; fecal coliforms and E. coli come from human and animal fecal waste
zero
DBPTotal Trihalomethanes(TTHMs)
0.10 0.080 after 12/31/03
n/a6
OCToxaphene 0.003 Runoff/leaching from
insecticide used on cotton and cattle
zero
OC 2,4,5-TP (Silvex) 0.05 Liver problems 0.05
OC 1,2,4-Trichlorobenzene 0.07 Allergic dermatitisChanges in adrenal glands
0.07
OC1,1,1-Trichloroethane 0.2 Liver, nervous system, or
circulatory problemsDischargef from metal degreasing sites and other factories
0.20
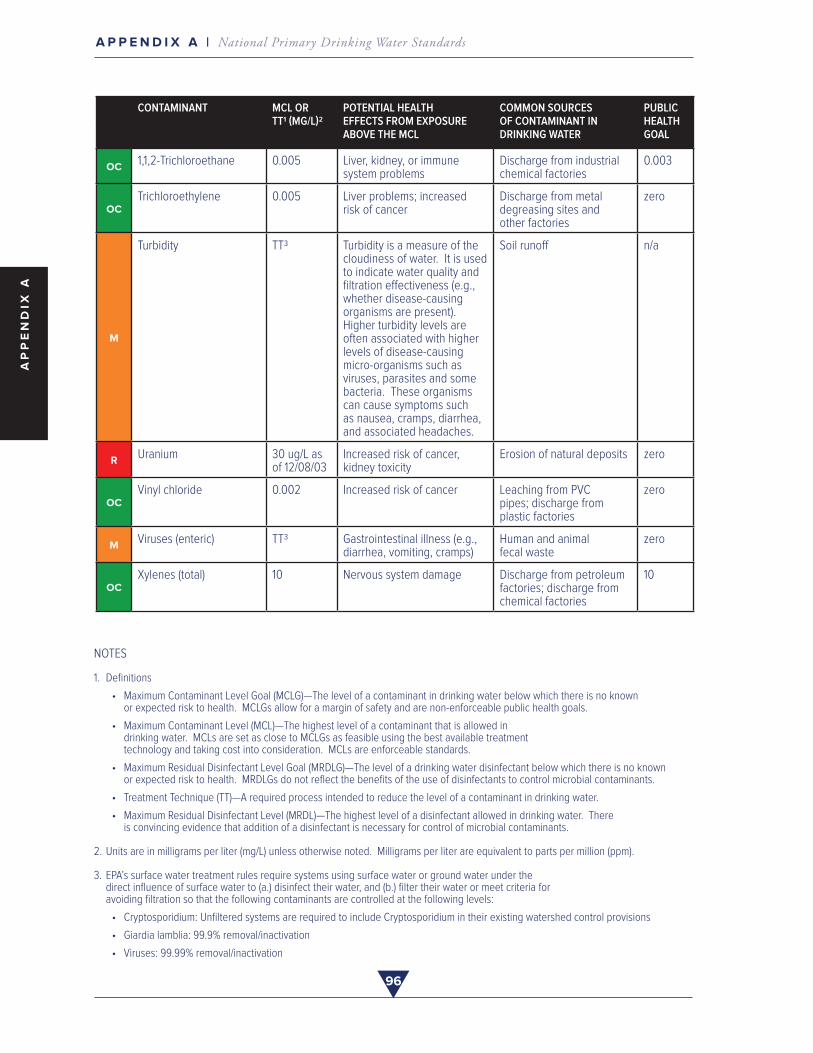
96
A P P E N D I X A | National Primary Drinking Water StandardsA
PP
EN
DIX
A
APPENDIX ACONTAMINANT MCL OR TT1 (MG/L)2
POTENTIAL HEALTH EFFECTS FROM EXPOSURE ABOVE THE MCL
COMMON SOURCES OF CONTAMINANT IN DRINKING WATER
PUBLIC HEALTH GOAL
OC1,1,2-Trichloroethane 0.005 Liver, kidney, or immune
system problemsDischarge from industrial chemical factories
0.003
OCTrichloroethylene 0.005 Liver problems; increased
risk of cancerDischarge from metal degreasing sites and other factories
zero
M
Turbidity TT3 Turbidity is a measure of the cloudiness of water. It is used to indicate water quality and filtration effectiveness (e.g., whether disease-causing organisms are present). Higher turbidity levels are often associated with higher levels of disease-causing micro-organisms such as viruses, parasites and some bacteria. These organisms can cause symptoms such as nausea, cramps, diarrhea, and associated headaches.
Soil runoff n/a
RUranium 30 ug/L as
of 12/08/03Increased risk of cancer, kidney toxicity
Erosion of natural deposits zero
OCVinyl chloride 0.002 Increased risk of cancer Leaching from PVC
pipes; discharge from plastic factories
zero
MViruses (enteric) TT3 Gastrointestinal illness (e.g.,
diarrhea, vomiting, cramps)Human and animal fecal waste
zero
OCXylenes (total) 10 Nervous system damage Discharge from petroleum
factories; discharge from chemical factories
10
NOTES
1. Definitions
• Maximum Contaminant Level Goal (MCLG)—The level of a contaminant in drinking water below which there is no known or expected risk to health. MCLGs allow for a margin of safety and are non-enforceable public health goals.
• Maximum Contaminant Level (MCL)—The highest level of a contaminant that is allowed in drinking water. MCLs are set as close to MCLGs as feasible using the best available treatment technology and taking cost into consideration. MCLs are enforceable standards.
• Maximum Residual Disinfectant Level Goal (MRDLG)—The level of a drinking water disinfectant below which there is no known or expected risk to health. MRDLGs do not reflect the benefits of the use of disinfectants to control microbial contaminants.
• Treatment Technique (TT)—A required process intended to reduce the level of a contaminant in drinking water.
• Maximum Residual Disinfectant Level (MRDL)—The highest level of a disinfectant allowed in drinking water. There is convincing evidence that addition of a disinfectant is necessary for control of microbial contaminants.
2. Units are in milligrams per liter (mg/L) unless otherwise noted. Milligrams per liter are equivalent to parts per million (ppm).
3. EPA’s surface water treatment rules require systems using surface water or ground water under the direct influence of surface water to (a.) disinfect their water, and (b.) filter their water or meet criteria for avoiding filtration so that the following contaminants are controlled at the following levels:
• Cryptosporidium: Unfiltered systems are required to include Cryptosporidium in their existing watershed control provisions
• Giardia lamblia: 99.9% removal/inactivation
• Viruses: 99.99% removal/inactivation
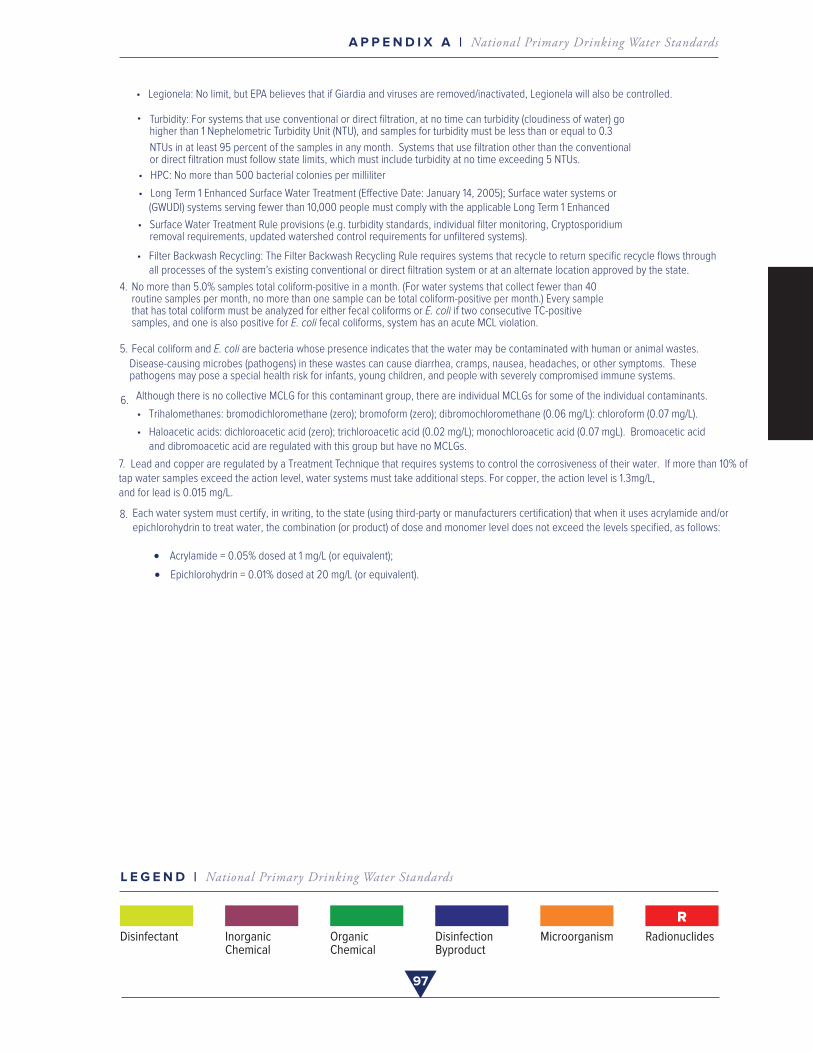
97
A P P E N D I X A | National Primary Drinking Water StandardsA
PP
EN
DIX
A
TT1 (MG/L)2ABOVE THE MCL
EFFECTS FROM EXPOSURE OF CONTAMINANT IN
DRINKING WATER
L E G E N D | National Primary Drinking Water Standards
Disinfectant
D
Inorganic Chemical
IOC
Organic Chemical
OC
Disinfection Byproduct
DBP
Microorganism
M
Radionuclides
R
• Legionela: No limit, but EPA believes that if Giardia and viruses are removed/inactivated, Legionela will also be controlled.
• Turbidity: For systems that use conventional or direct filtration, at no time can turbidity (cloudiness of water) go higher than 1 Nephelometric Turbidity Unit (NTU), and samples for turbidity must be less than or equal to 0.3
NTUs in at least 95 percent of the samples in any month. Systems that use filtration other than the conventional or direct filtration must follow state limits, which must include turbidity at no time exceeding 5 NTUs.
• HPC: No more than 500 bacterial colonies per milliliter
• Long Term 1 Enhanced Surface Water Treatment (Effective Date: January 14, 2005); Surface water systems or (GWUDI) systems serving fewer than 10,000 people must comply with the applicable Long Term 1 Enhanced
• Surface Water Treatment Rule provisions (e.g. turbidity standards, individual filter monitoring, Cryptosporidium removal requirements, updated watershed control requirements for unfiltered systems).
• Filter Backwash Recycling: The Filter Backwash Recycling Rule requires systems that recycle to return specific recycle flows through all processes of the system’s existing conventional or direct filtration system or at an alternate location approved by the state.
4. No more than 5.0% samples total coliform-positive in a month. (For water systems that collect fewer than 40 routine samples per month, no more than one sample can be total coliform-positive per month.) Every sample that has total coliform must be analyzed for either fecal coliforms or E. coli if two consecutive TC-positive samples, and one is also positive for E. coli fecal coliforms, system has an acute MCL violation.
5. Fecal coliform and E. coli are bacteria whose presence indicates that the water may be contaminated with human or animal wastes.Disease-causing microbes (pathogens) in these wastes can cause diarrhea, cramps, nausea, headaches, or other symptoms. These pathogens may pose a special health risk for infants, young children, and people with severely compromised immune systems.
6. Although there is no collective MCLG for this contaminant group, there are individual MCLGs for some of the individual contaminants.• Trihalomethanes: bromodichloromethane (zero); bromoform (zero); dibromochloromethane (0.06 mg/L): chloroform (0.07 mg/L).
• Haloacetic acids: dichloroacetic acid (zero); trichloroacetic acid (0.02 mg/L); monochloroacetic acid (0.07 mgL). Bromoacetic acid and dibromoacetic acid are regulated with this group but have no MCLGs.
7. Lead and copper are regulated by a Treatment Technique that requires systems to control the corrosiveness of their water. If more than 10% of tap water samples exceed the action level, water systems must take additional steps. For copper, the action level is 1.3mg/L, and for lead is 0.015 mg/L.
8. Each water system must certify, in writing, to the state (using third-party or manufacturers certification) that when it uses acrylamide and/or epichlorohydrin to treat water, the combination (or product) of dose and monomer level does not exceed the levels specified, as follows:
• Acrylamide = 0.05% dosed at 1 mg/L (or equivalent);
• Epichlorohydrin = 0.01% dosed at 20 mg/L (or equivalent).
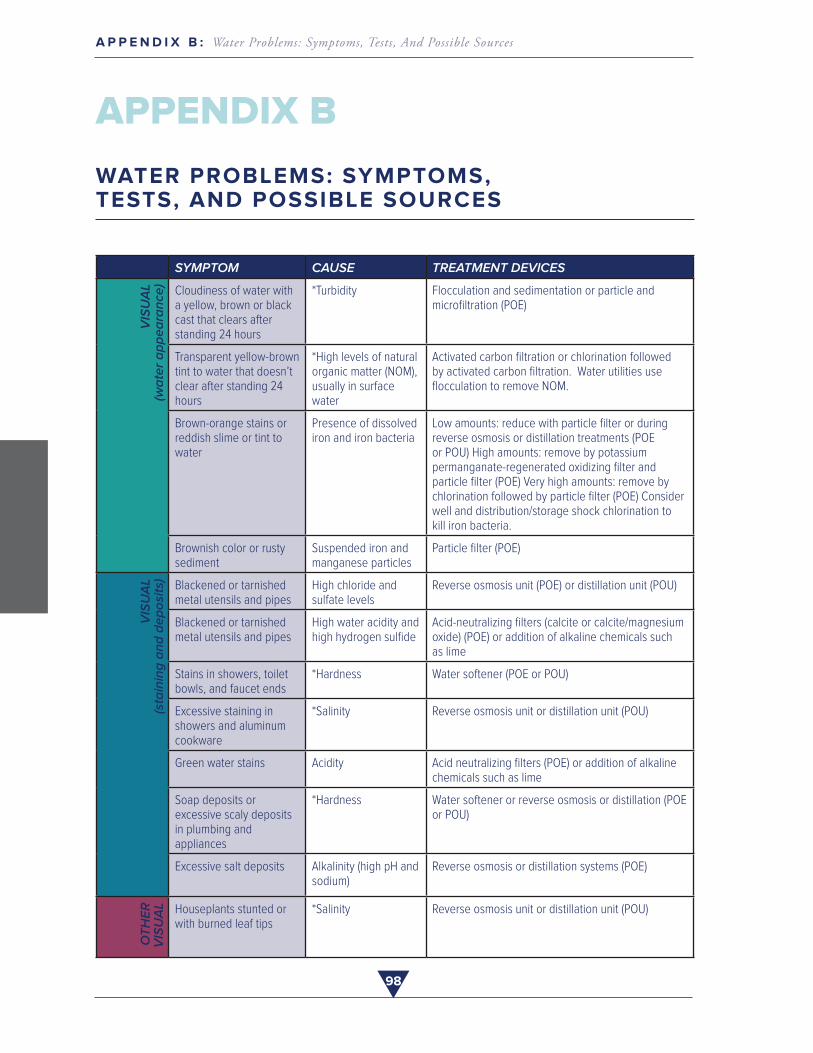
98
A P P E N D I X B : Water Problems: Symptoms, Tests, And Possible SourcesA
PP
EN
DIX
B
AP
PE
ND
IX B
APPENDIX B
WATER PROBLEMS: SYMPTOMS, TESTS, AND POSSIBLE SOURCES
SYMPTOM CAUSE TREATMENT DEVICES
VIS
UA
L(w
ate
r a
pp
ea
ran
ce)
Cloudiness of water with a yellow, brown or black cast that clears after standing 24 hours
*Turbidity Flocculation and sedimentation or particle and microfiltration (POE)
Transparent yellow-brown tint to water that doesn’t clear after standing 24 hours
*High levels of naturalorganic matter (NOM),usually in surfacewater
Activated carbon filtration or chlorination followed by activated carbon filtration. Water utilities use flocculation to remove NOM.
Brown-orange stains or reddish slime or tint to water
Presence of dissolved iron and iron bacteria
Low amounts: reduce with particle filter or during reverse osmosis or distillation treatments (POE or POU) High amounts: remove by potassium permanganate-regenerated oxidizing filter and particle filter (POE) Very high amounts: remove by chlorination followed by particle filter (POE) Consider well and distribution/storage shock chlorination to kill iron bacteria.
Brownish color or rusty sediment
Suspended iron and manganese particles
Particle filter (POE)
VIS
UA
L (
sta
inin
g a
nd
de
po
sits
)
Blackened or tarnished metal utensils and pipes
High chloride and sulfate levels
Reverse osmosis unit (POE) or distillation unit (POU)
Blackened or tarnished metal utensils and pipes
High water acidity and high hydrogen sulfide
Acid-neutralizing filters (calcite or calcite/magnesium oxide) (POE) or addition of alkaline chemicals such as lime
Stains in showers, toilet bowls, and faucet ends
*Hardness Water softener (POE or POU)
Excessive staining in showers and aluminum cookware
*Salinity Reverse osmosis unit or distillation unit (POU)
Green water stains Acidity Acid neutralizing filters (POE) or addition of alkaline chemicals such as lime
Soap deposits or excessive scaly deposits in plumbing and appliances
*Hardness Water softener or reverse osmosis or distillation (POE or POU)
Excessive salt deposits Alkalinity (high pH and sodium)
Reverse osmosis or distillation systems (POE)
OT
HE
R
VIS
UA
L Houseplants stunted or with burned leaf tips
*Salinity Reverse osmosis unit or distillation unit (POU)
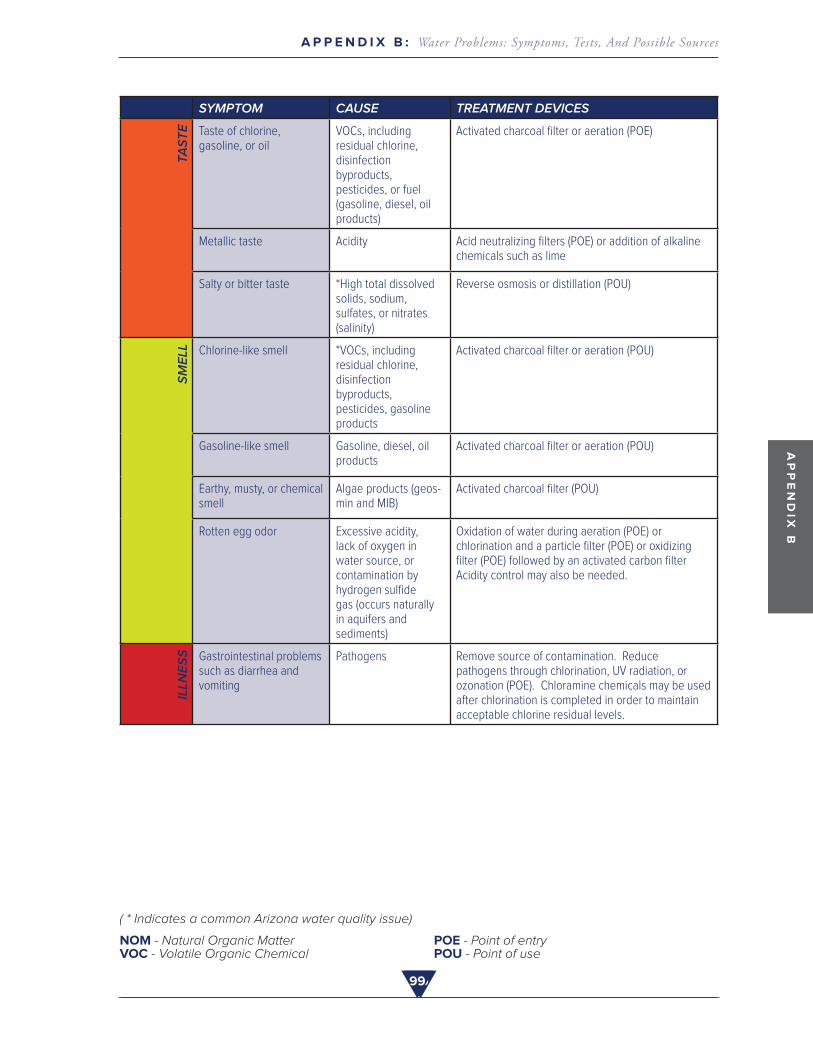
99
A P P E N D I X B : Water Problems: Symptoms, Tests, And Possible SourcesA
PP
EN
DIX
B
AP
PE
ND
IX B
99
SYMPTOM CAUSE TREATMENT DEVICES
TA
ST
E Taste of chlorine, gasoline, or oil
VOCs, including residual chlorine, disinfection byproducts, pesticides, or fuel (gasoline, diesel, oil products)
Activated charcoal filter or aeration (POE)
Metallic taste Acidity Acid neutralizing filters (POE) or addition of alkaline chemicals such as lime
Salty or bitter taste *High total dissolvedsolids, sodium,sulfates, or nitrates(salinity)
Reverse osmosis or distillation (POU)
SM
ELL Chlorine-like smell *VOCs, including
residual chlorine,disinfectionbyproducts,pesticides, gasolineproducts
Activated charcoal filter or aeration (POU)
Gasoline-like smell Gasoline, diesel, oil products
Activated charcoal filter or aeration (POU)
Earthy, musty, or chemical smell
Algae products (geos-min and MIB)
Activated charcoal filter (POU)
Rotten egg odor Excessive acidity, lack of oxygen in water source, or contamination by hydrogen sulfide gas (occurs naturally in aquifers and sediments)
Oxidation of water during aeration (POE) or chlorination and a particle filter (POE) or oxidizing filter (POE) followed by an activated carbon filter Acidity control may also be needed.
ILLN
ES
S Gastrointestinal problems such as diarrhea and vomiting
Pathogens Remove source of contamination. Reduce pathogens through chlorination, UV radiation, or ozonation (POE). Chloramine chemicals may be used after chlorination is completed in order to maintain acceptable chlorine residual levels.
( * Indicates a common Arizona water quality issue)
NOM - Natural Organic Matter VOC - Volatile Organic Chemical
POE - Point of entryPOU - Point of use
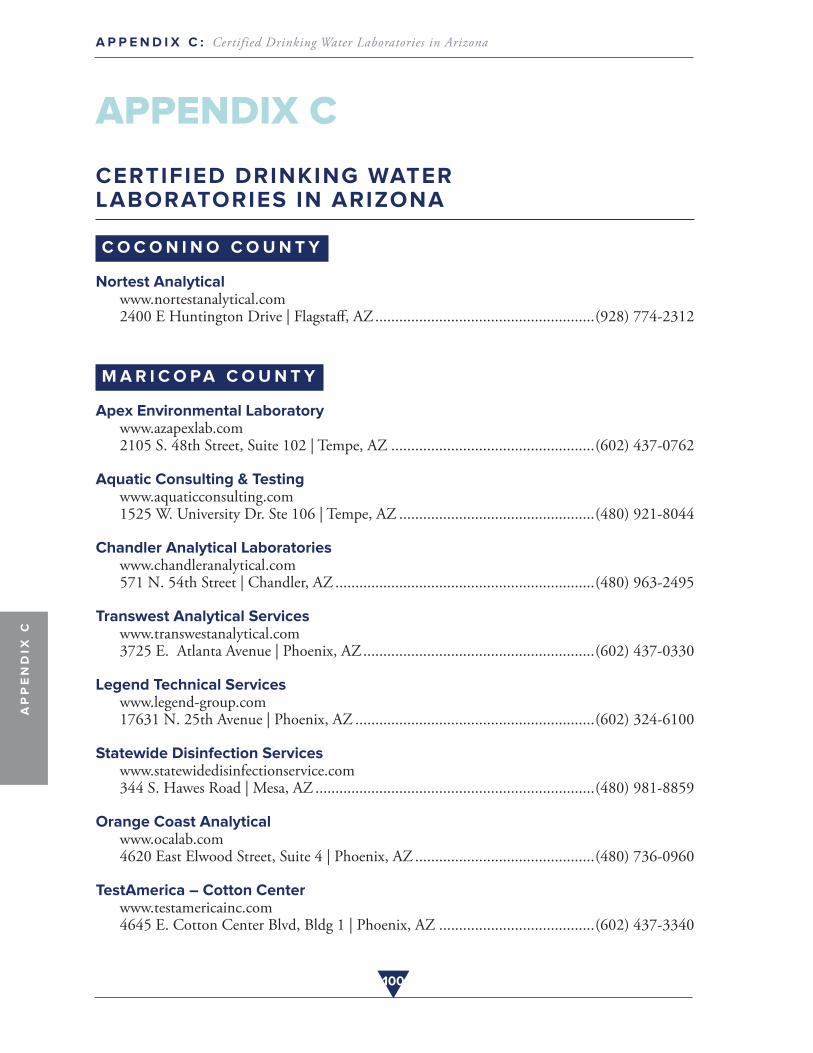
100
A P P E N D I X C : Certified Drinking Water Laboratories in Arizona
AP
PE
ND
IX C
AP
PE
ND
IX C
APPENDIX C
CERTIFIED DRINKING WATER LABORATORIES IN ARIZONA
C O C O N I N O C O U N T Y
Nortest Analytical www .nortestanalytical .com2400 E Huntington Drive | Flagstaff, AZ . . . . . . . . . . . . . . . . . . . . . . . . . . . . . . . . . . . . . . . . . . . . . . . . . . . . . . .(928) 774-2312
M A R I C O PA C O U N T Y
Apex Environmental Laboratory www .azapexlab .com 2105 S . 48th Street, Suite 102 | Tempe, AZ . . . . . . . . . . . . . . . . . . . . . . . . . . . . . . . . . . . . . . . . . . . . . . . . . . .(602) 437-0762
Aquatic Consulting & Testing www .aquaticconsulting .com 1525 W . University Dr . Ste 106 | Tempe, AZ . . . . . . . . . . . . . . . . . . . . . . . . . . . . . . . . . . . . . . . . . . . . . . . . .(480) 921-8044
Chandler Analytical Laboratories www .chandleranalytical .com 571 N . 54th Street | Chandler, AZ . . . . . . . . . . . . . . . . . . . . . . . . . . . . . . . . . . . . . . . . . . . . . . . . . . . . . . . . . . . . . . . . .(480) 963-2495
Transwest Analytical Services www .transwestanalytical .com 3725 E . Atlanta Avenue | Phoenix, AZ . . . . . . . . . . . . . . . . . . . . . . . . . . . . . . . . . . . . . . . . . . . . . . . . . . . . . . . . . .(602) 437-0330
Legend Technical Services www .legend-group .com 17631 N . 25th Avenue | Phoenix, AZ . . . . . . . . . . . . . . . . . . . . . . . . . . . . . . . . . . . . . . . . . . . . . . . . . . . . . . . . . . . .(602) 324-6100
Statewide Disinfection Services www .statewidedisinfectionservice .com 344 S . Hawes Road | Mesa, AZ . . . . . . . . . . . . . . . . . . . . . . . . . . . . . . . . . . . . . . . . . . . . . . . . . . . . . . . . . . . . . . . . . . . . . .(480) 981-8859
Orange Coast Analytical www .ocalab .com 4620 East Elwood Street, Suite 4 | Phoenix, AZ . . . . . . . . . . . . . . . . . . . . . . . . . . . . . . . . . . . . . . . . . . . . .(480) 736-0960
TestAmerica – Cotton Center www .testamericainc .com 4645 E . Cotton Center Blvd, Bldg 1 | Phoenix, AZ . . . . . . . . . . . . . . . . . . . . . . . . . . . . . . . . . . . . . . .(602) 437-3340
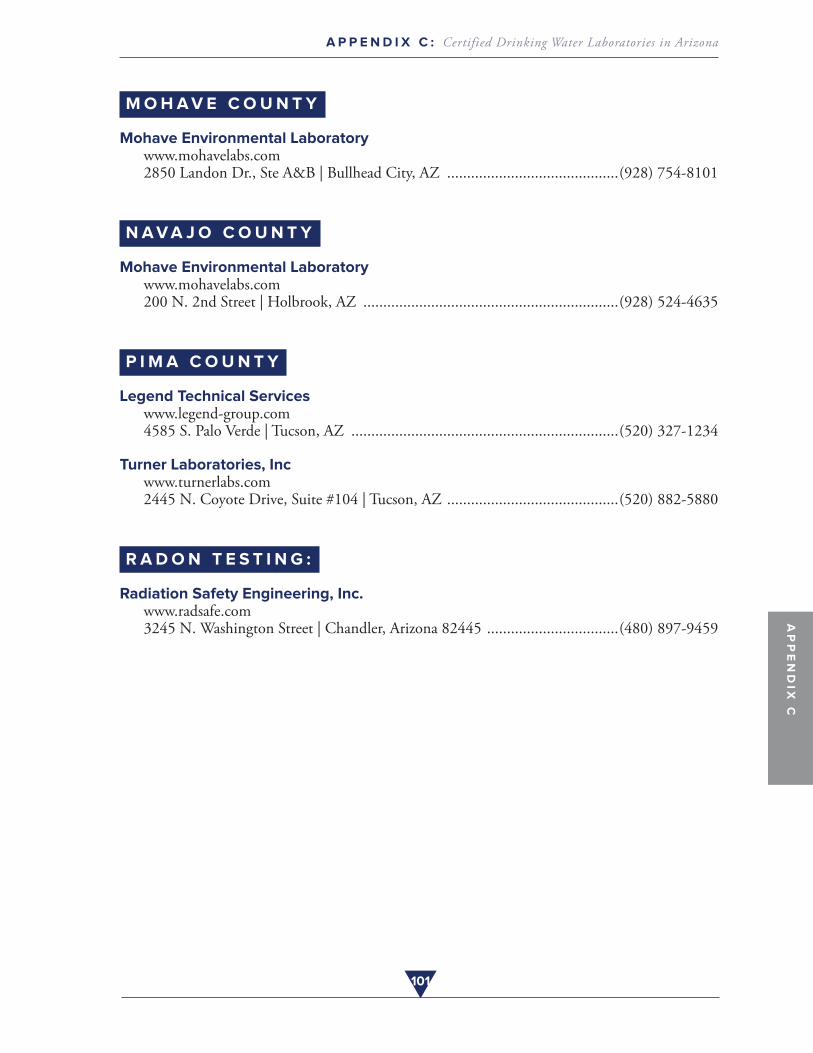
101
A P P E N D I X C : Certified Drinking Water Laboratories in ArizonaA
PP
EN
DIX
C
AP
PE
ND
IX C
M O H A V E C O U N T Y
Mohave Environmental Laboratory www .mohavelabs .com 2850 Landon Dr ., Ste A&B | Bullhead City, AZ . . . . . . . . . . . . . . . . . . . . . . . . . . . . . . . . . . . . . . . . . . .(928) 754-8101
N A V A J O C O U N T Y
Mohave Environmental Laboratory www .mohavelabs .com 200 N . 2nd Street | Holbrook, AZ . . . . . . . . . . . . . . . . . . . . . . . . . . . . . . . . . . . . . . . . . . . . . . . . . . . . . . . . . . . . . . . .(928) 524-4635
P I M A C O U N T Y
Legend Technical Services www .legend-group .com 4585 S . Palo Verde | Tucson, AZ . . . . . . . . . . . . . . . . . . . . . . . . . . . . . . . . . . . . . . . . . . . . . . . . . . . . . . . . . . . . . . . . . . .(520) 327-1234
Turner Laboratories, Inc www .turnerlabs .com 2445 N . Coyote Drive, Suite #104 | Tucson, AZ . . . . . . . . . . . . . . . . . . . . . . . . . . . . . . . . . . . . . . . . . . .(520) 882-5880
R A D O N T E S T I N G :
Radiation Safety Engineering, Inc. www .radsafe .com 3245 N . Washington Street | Chandler, Arizona 82445 . . . . . . . . . . . . . . . . . . . . . . . . . . . . . . . . .(480) 897-9459
102
A P P E N D I X D | ADEQ Groundwater Quality ReportsA
PP
EN
DIX
D
APPENDIX D
ADEQ GROUNDWATER QUALITY REPORTS
Groundwater Basin Map . The Arizona Department of Environmental Quality (ADEQ) has reported on groundwater quality for the areas noted on this map . Find the relevant report for each basin in the listing below; all reports can be found by searching on the ADEQ web site or by googling the title .
Ambient Groundwater Quality of the Western Mexican Drainage basin: A 2016-2017 Baseline Study, ADEQ Open File Report 17-forthcoming, 74 p, and ADEQ Fact Sheet 17-forthcoming, 6 p ., June 2017 .
Ambient Groundwater Quality of the Lower Gila basin: A 2013-2017 Baseline Study, ADEQ Open File Report 17-forthcoming , 84 p, and ADEQ Fact Sheet 17-forthcoming , 6 p ., June 2016 .
Groundwater Quality in Arizona: A 20-Year Overview of the ADEQ Ambient Monitoring Program (1995-2009) ADEQ Open File Report 16-02, 42 p ., August 2016 .
Ambient Groundwater Quality of the Salt River basin: A 2001-2015 Baseline Study, ADEQ Open File Report 16-01, 74 p, and ADEQ Fact Sheet 16-15, 6 p ., June 2016 .
Ambient Groundwater Quality of the Gila Bend basin: A 2012-2015 Baseline Study, ADEQ Open File Report 15-07, 77 p, and ADEQ Fact Sheet 15-05, 6 p ., June 2015 .
Ambient Groundwater Quality of the Tiger Wash basin: A 2014 Baseline Study, ADEQ Open File Report 14-07, 33 p, and ADEQ Fact Sheet 14-20, 4 p ., December 2014 .
Ambient Groundwater Quality of the Avra Valley Sub-basin of the Tucson Active Management Area: A 1998-2002 Baseline Study, ADEQ Open File Report 14-06, 62 p . and ADEQ Fact Sheet 14-11, 5 p ., September 2014 .
Ambient Groundwater Quality of the Harquahala Basin: A 2009-2014 Baseline Study, ADEQ Open File Report 14-04, 62 p . and ADEQ Fact Sheet 14-09, 5 p ., June 2014 .
Ambient Groundwater Quality of the Tonto Creek Basin: A 2002-2012 Baseline Study, ADEQ Open File Report 13-04, 52 p . and ADEQ Fact Sheet 13-18, 4 p ., November 2013 .
Ambient Groundwater Quality of the Upper Hassayampa Basin: A 2003-2009 Baseline Study, ADEQ Open File Report 13-03, 52 p . and ADEQ Fact Sheet 13-11, 3 p ., June 2013 .
Ambient Groundwater Quality of the Aravaipa Canyon Basin: A 2003 Baseline Study, ADEQ Open File Report 13-01, 46 p . and ADEQ Fact Sheet 13-04, 4 p ., April 2013 .
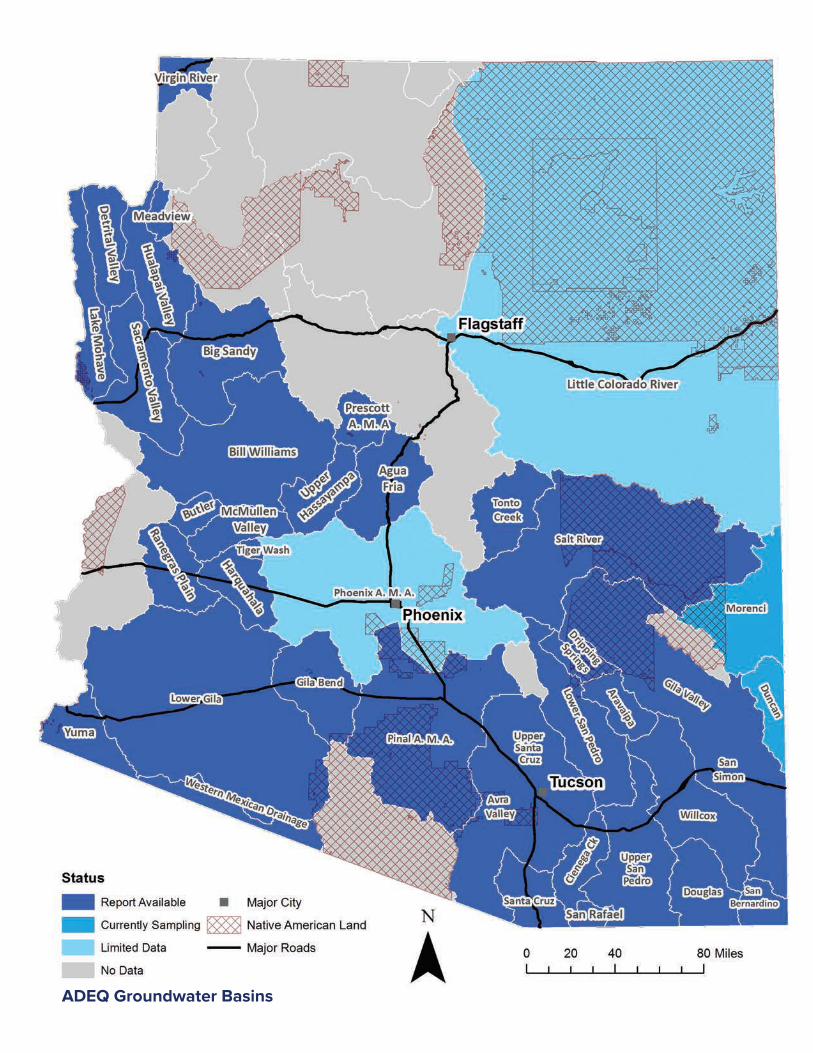
103ADEQ Groundwater Basins
104
A P P E N D I X D | ADEQ Groundwater Quality Reports
AP
PE
ND
IX D
AP
PE
ND
IX D
Ambient Groundwater Quality of the Butler Valley Basin: A 2008 – 2012 Baseline Study, ADEQ Open File Report 12-06, 45 p . and ADEQ Fact Sheet 12-10, 5 p ., November 2012
Ambient Groundwater Quality of the Cienega Creek Basin: A 2000 – 2001 Baseline Study, ADEQ Open File Report 12-05, 46 p . and ADEQ Fact Sheet 12-02, 4 p ., August 2012 .
Ambient Groundwater Quality of the Ranegras Plain Basin: A 2008-2011 Baseline Study, ADEQ Open File Report 11-07, 63 p . and ADEQ Fact Sheet 12-04, 4 p ., June 2012 .
Ambient Groundwater Quality of the Bill Williams Basin: A 2003-2009 Baseline Study, ADEQ Open File Report 11-06, 74 p . and ADEQ Fact Sheet 12-01, 4 p ., November 2011 .
Groundwater Quality in Arizona: A 15-Year Overview of the ADEQ Ambient Monitoring Program (1995-2009), ADEQ Open File Report 11-04, 25 p ., July 2011 .
Ambient Groundwater Quality of the San Bernardino Valley Basin: A 2002 Baseline Study, ADEQ Open File Report 10-03, 34 p . and ADEQ Fact Sheet 10-31, 4 p ., November 2010 .
Ambient Groundwater Quality of the Dripping Springs Wash Basin: A 2004-2005 Baseline Study, ADEQ Open File Report 10-02, 33 p . and ADEQ Fact Sheet 11-02, 4 p ., July 2010 .
Ambient Groundwater Quality of the McMullen Valley Basin: A 2008-2009 Baseline Study, ADEQ Open File Report 11-03, 94 p . and ADEQ Fact Sheet 11-03, 6 p ., May 2010 .
Ambient Groundwater Quality of the Gila Valley Sub-Basin of the Safford Basin: A 2004 Baseline Study, ADEQ Open File Report 09-12, 99 p . and ADEQ Fact Sheet 09-28, 7 p ., November 2009 .
Ambient Groundwater Quality of the Agua Fria basin: A 2004-2006 Baseline Study, ADEQ Open File Report 08-02, 59 p . and ADEQ Fact Sheet 08-15, 4 p ., July 2008 .
Ambient Groundwater Quality of the Pinal AMA: A 2005-2006 Baseline Study, ADEQ Open File Report 08-01, 97 p . and ADEQ Fact Sheet 07-27, 7 p . October 2007 .
Ambient Groundwater Quality of the Hualapai Valley Basin: A 2000 Baseline Study, ADEQ Open File Report 07-05, 53 p . and ADEQ Fact Sheet 07-10, 4 p ., March 2007 .
Ambient Groundwater Quality of the Big Sandy Basin: A 2003-2004 Baseline Study, ADEQ Open File Report 06-09, 66 p . and ADEQ Fact Sheet 06-24, 4 p ., October, 2006 .
Ambient Groundwater Quality of the Lake Mohave Basin: A 2003 Baseline Study, ADEQ Open File Report 05-08, 66 p . and ADEQ Fact Sheet 05-21, 4 p ., October, 2005 .
Ambient Groundwater Quality of the Meadview Basin: A 2000-2003 Baseline Study, ADEQ Open File Report 05-01, 32 p . and ADEQ Fact Sheet 05-01, 4 p ., January, 2005 .
105
A P P E N D I X D | ADEQ Groundwater Quality ReportsA
PP
EN
DIX
D
AP
PE
ND
IX D
Ambient Groundwater Quality of the San Simon Sub-Basin: A 2002 Baseline Study, ADEQ Open File Report 04-02, 66 p . and ADEQ Fact Sheet 04-07, 4 p ., October, 2004 .
Ambient Groundwater Quality of the Detrital Wash Basin: A 2002 Baseline Study, ADEQ Open File Report 03-03, 58 p . and ADEQ Fact Sheet 03-07, 4 p ., November 2003 .
Ambient Groundwater Quality of the San Rafael Basin: A 2002 Baseline Study, ADEQ Open File Report 03-01, 42 p . and ADEQ Fact Sheet 03-03, 4 p ., February 2003 .
Ambient Groundwater Quality of the Lower San Pedro Basin: A 2000 Baseline Study, ADEQ Open File Report 02-01, 72 p . and ADEQ Fact Sheet 02-09, 4 p ., July 2002 .
Ambient Groundwater Quality of the Willcox Basin: A 1999 Baseline Study. ADEQ Open File Report 01-09, 55 p . and ADEQ Fact Sheet 01-13, 4 p ., November 2001 .
Ambient Groundwater Quality of the Sacramento Valley Basin: A 1999 Baseline Study, ADEQ Open File Report 01-04, 77 p . and ADEQ Fact Sheet 01-10, 77 p ., June 2001 .
Ground-Water Quality in the Upper Santa Cruz Basin, Arizona, 1998, U .S . Geological Survey Water Resources Investigations Report 00-4117, 55 p ., August 2000 .
Ambient Groundwater Quality of the Prescott Active Management Area: A 1997-98 Baseline Study, ADEQ Open File Report 00-01, 75 p . and ADEQ Fact Sheet 00-13, 4 p ., May 2000 .
Ground-Water Quality in the Sierra Vista Subbasin, 1996-97, U .S . Geological Survey Water Resources Investigations Report 98-4056, 50 p, April 2000 .
Ambient Groundwater Quality of the Douglas Basin: A 1995-96 Baseline Study, ADEQ Open File Report 99-11, 155 p . and ADEQ Fact Sheet 00-08, 4 p ., June 1999 .
Ambient Groundwater Quality of the Virgin River Basin: A 1997 Baseline Study, ADEQ Open File Report 99-4, 98 p . and ADEQ Fact Sheet 01-02, 4 p ., March 1999 .
Ambient Groundwater Quality of the Yuma Basin: A 1995 Baseline Study, ADEQ Open File Report 98-7, 121 p . and ADEQ Fact Sheet 01-03, 4 p, September 1998 .
Collection and Analysis of Ground-Water Samples in the Sierra Vista Subbasin, 1996-97, Tucson: U .S . Geological Survey Fact Sheet 107-97, 2 p ., August 1997 .
The Impacts of Septic Systems on Water Quality of Shallow Perched Aquifers: A Case Study of Fort Valley, Arizona, ADEQ Open File Report 97-7, 70 p ., February 1997 .
Ambient Groundwater Quality of the Western Mexican Drainage Basin: A 2016 - 2017 Baseline Study . ADEQ Open File Report 17-02, 40 p ., May 2017 .
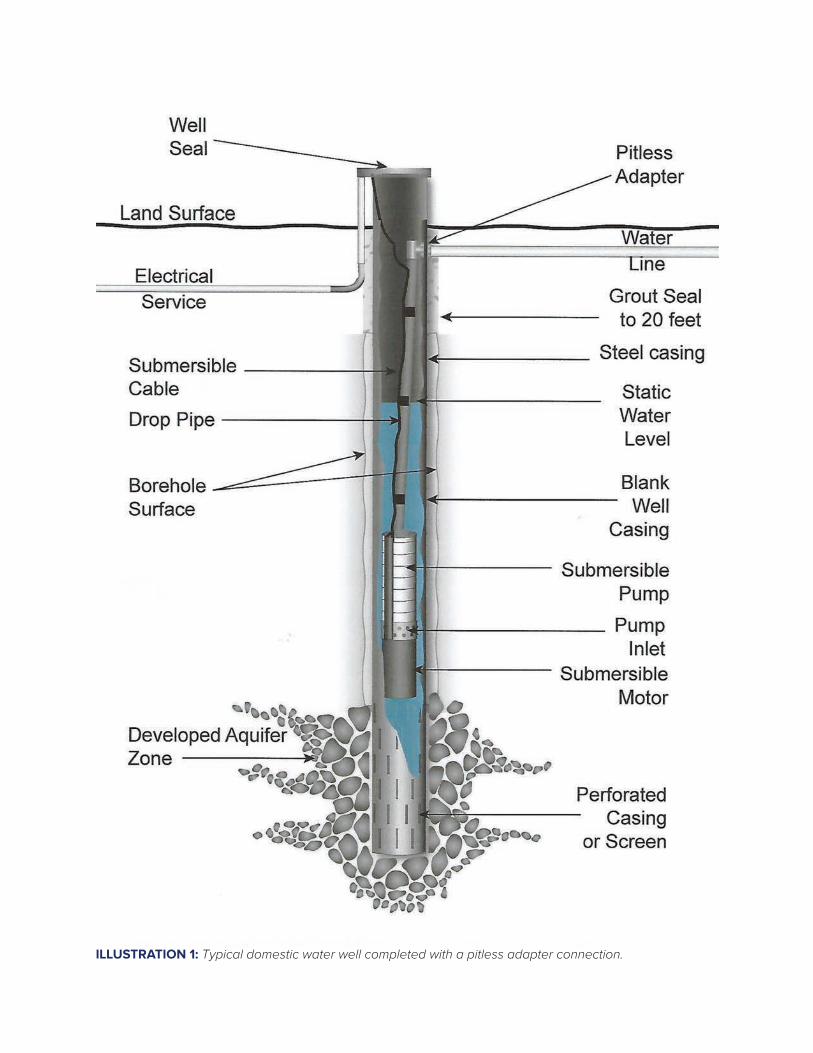
ILLUSTRATION 1: Typical domestic water well completed with a pitless adapter connection.
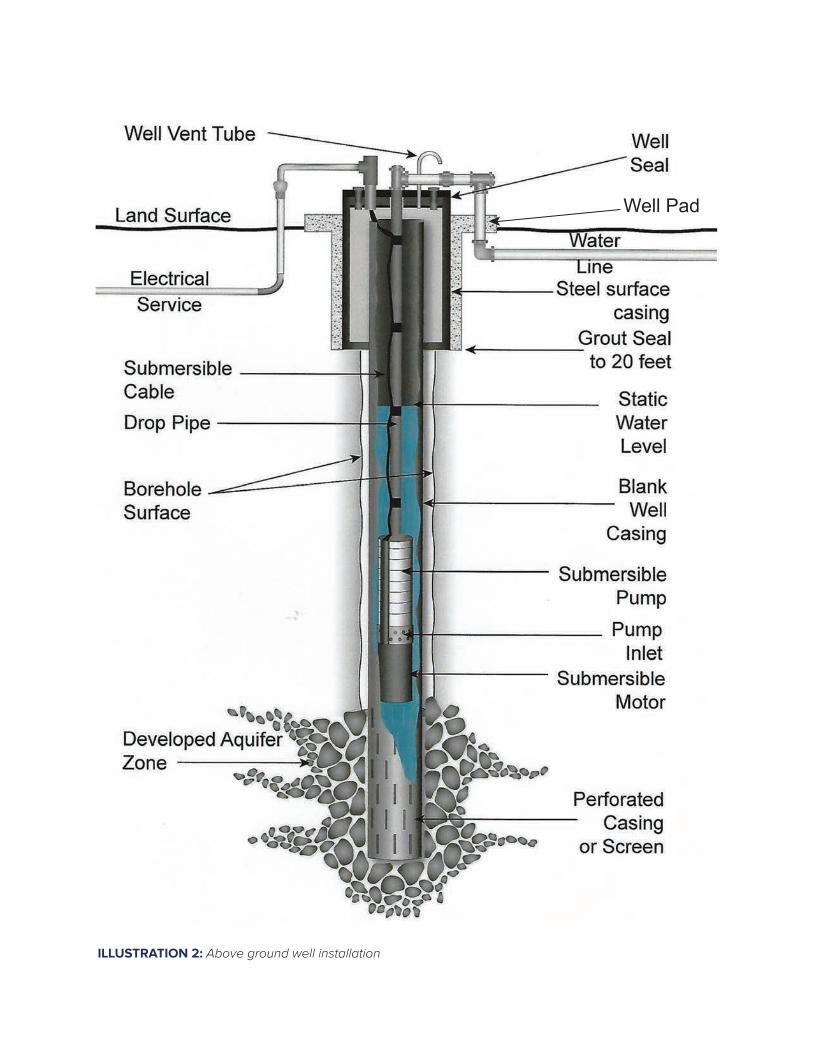
ILLUSTRATION 2: Above ground well installation