Mexican Visitors to Arizona: - Arizona Office of Tourism
97
The University of Arizona Eller College of Management Mexican Visitors to Arizona, 2007-08 Mexican Visitors to Arizona: Visitor Characteristics and Economic Impacts, 2007-08 Prepared for the: Arizona Office of Tourism Phoenix, Arizona December 2008 Prepared by: Vera Pavlakovich-Kochi, PhD and Alberta H. Charney, PhD Economic and Business Research Center
-
Upload
khangminh22 -
Category
Documents
-
view
1 -
download
0
Transcript of Mexican Visitors to Arizona: - Arizona Office of Tourism

The University of Arizona Eller College of Management
Mexican Visitors to Arizona, 2007-08
Mexican Visitors to Arizona:Visitor Characteristics and Economic Impacts, 2007-08
Prepared for the:
Arizona Office of TourismPhoenix, Arizona
December 2008
Prepared by:Vera Pavlakovich-Kochi, PhD and Alberta H. Charney, PhD
Economic and Business Research Center


The University of Arizona Eller College of Management
Mexican Visitors to Arizona, 2007-08
The University of Arizona
Eller College of ManagementPaul R. Portney, Dean and Halle Chair in Leadership
Economic and Business Research CenterMcClelland Hall 103P.O. Box 210108Tucson, AZ 85721-0108(520) 621-2155
Vera Pavlakovich-Kochi, Senior Regional Scientist, and Adjunct Associate Professor,Department of Geography and Regional [email protected]
Alberta H. Charney, Senior Research [email protected]
Marshall J. Vest, [email protected]
Arizona Office of TourismMargie A. Emmermann, Director
AnnDee Johnson, Director of Research and Strategic Planning
Melissa Elkins, Research Manager
Sponsors
Arizona Office of TourismPhoenix Sky Harbor International AirportMaricopa County DMOsTucson Convention and Visitor Bureau

The University of Arizona Eller College of Management
Mexican Visitors to Arizona, 2007-08
The University of Arizona Eller College of Management
Mexican Visitors to Arizona, 2007-08
Contents
Acknowledgements i
Executive Summary iv
List of Tables and Figures viii
I. Purpose and Research Design 1 Purpose and Objectives 1 Research Design 2 Survey instrument 3 Sampling size and interview schedule 3 Weighting procedure 4
II. Mexican Visitors to the United States 7 Economic Importance of Mexican Visitors 9 Reasons for Border Crossings 9 Factors Influencing Mexican Visitors’ Border Crossings and Spending Pattern 10 Exchange rate 10 Growth of maquiladora sector 10 NAFTA effect 11 Transformation of Mexican retail industry 11 Post 9/11 border security policies 12
III. Mexican Visitors to Arizona 13 Findings from Previous Studies 13 Border Crossing Dynamics: Empirical Evidence from Arizona’s Ports of Entry 14 Major Trends in the Arizona-Sonora Region Since 2001 15 IV. Characteristics of Mexican Visitors to Arizona 17 Visitors, Parties and Party Size 17 Length of Stay in Arizona 18 Did Mexican Visitors Travel More or Less Frequently than in Prior Year? 20 Income Categories 21 Reasons for Visiting 22 Occupations and Economic Sectors 25 Origin of Visitors 27 Characteristics of Mexican Visitors to Arizona’s Major Destinations 31
V. Travel Behavior in Major Destinations 33 Phoenix Metro Area Visitors 33 Shopping Destinations in Metro Phoenix 33 Attractions Visited in Metro Phoenix 35 Tucson Metro Area Visitors 37 Shopping Destinations in Metro Tucson 37 Attractions Visited in Metro Tucson 39 Visitors to Arizona’s Border Cities 41 Nogales Visitors 41 Douglas Visitors 42 Yuma Visitors 43 San Luis Visitors 44
Contents

The University of Arizona Eller College of Management
Mexican Visitors to Arizona, 2007-08
Lukeville Visitors 44 How Mexican Visitors Learned About Shopping Destinations and Attractions 45 Visitors to Metro Phoenix 45 Visitors to Metro Tucson 45 Visitors to Border Cities 46
VI. Expenditures by Mexican Visitors in Arizona 48 Direct Expenditures by Port of Entry 48 Average per Party Expenditures, by Port of Entry 49 Expenditure Categories 50 Expenditures by Travel Mode and Reasons for Visit 51 Expenditures by Income Group 52 Expenditures, Distances Traveled, and Length of Stay 52 Seasonality of Travel 54 Geographic Distribution of Expenditures 54 Expenditures in Major Destination Cities: Per Party Spending by Place of Origin 55 Expenditure Categories (i.e., Sales to Mexican Visitors) by Destination County 57 Expenditures per Party: Overnight and Day-Trip Visitors by Destination Area 58
VII. Total Economic Impacts of Mexican Visitors 59 Direct Sales, Jobs, and Income 59 The Multiplier Effect: Total Sales, Jobs, and Income 60 Mexican Visitor Spending as a Percent of Taxable Sales and Revenue Impacts 61
VIII. Summary and Conclusions 63 The 2007-08 Results in Comparison to 2001 Study 64 What has changed? 64 What seem to be unchanged (persistent) patterns? 67
Appendix 68 Copy of Questionnaire 68
Endnotes 79
Contents

Mexican Visitors to Arizona, 2007-08
The University of Arizona Eller College of Management i
Acknowledgements
A large number of individuals and organizations contributed their time, knowledge and resources to this project.
Our foremost appreciation goes to the Arizona Office of Tourism (AOT) and its Director, Margie A. Emmermann, for the initiation of the study and assembly of special permits from the U.S. Customs and Border Protection (CBP), which were necessary to conduct interviews at Arizona ports of entry in the post-9/11 environment.
The person we are most indebted to for the overall realization of this project is AnnDee Johnson, AOT’s Director of Research and Strategic Planning, who managed to assemble the necessary research funds from a number of sponsors; arranged site visitations and meetings with directors of Arizona border ports of entry, including Phoenix and Tucson airports; organized meetings with community leaders in border cities; served as the link between research team and other sponsors, and was always there to help resolve unexpected challenges during a year long data collection. Our special thank you also goes to Melissa Elkins, AOT’s Research Manager.
Special thanks also go to the funders who made this project possible: the Arizona Office of Tourism, Phoenix Sky Harbor International Airport, and the Metropolitan Tucson Convention and Visitors Bureau. In addition, a group of Maricopa County Destination Marketing Organizations helped fund the project through Proposition 302 tourism promotion dollars, which are derived from a car rental surcharge and a one percent tax on hotels in Maricopa County. We thank the City of Chandler, the City of Glendale, the City of Peoria, the Fountain Hills Chamber of Commerce, the Greater Phoenix Convention and Visitors Bureau, the Mesa Convention and Visitors Bureau, the Scottsdale Convention and Visitors Bureau, the Tempe Convention and Visitors Bureau, and the Wickenburg Chamber of Commerce.
Administration of interviews with the returning Mexican nationals at border crossings presented a special challenge in the post-9/11 environment because the concern with border security resulted in new procedures and a new institutional management of border crossings. First we thank former CBP Tucson Field Operations Director, Donna De La Torre for issuing the initial permit to use the eight Arizona ports of entry within the Tucson Field Office as survey sites; the permit was extended by her successor, David Higgerson, with assistance from Deborah Rodriguez, Assistant Director for Border Security. Joe Agosttini and Norma Stemple, Program Managers in the Tucson Field Office were instrumental in arranging site visitations at each of the eight ports. We also appreciate the support of Anthony van Ravenswaay, Assistant Director of Mission Support. The collaboration with border ports of entry’s directors and their personnel was especially important to ensure safe and undisturbed conditions for both the interviewer and interviewee. We thank the following officers for their understanding of the project’s special needs and their collaboration throughout the length of surveying process: Chief Peter Bachelier at Nogales Port of Entry (encompassing Mariposa, DeConcini and Morley crossings); Officer Al Acuña, representing Supervisor Robert Frias at Naco Port of Entry; Supervisor Steven Rich at Douglas Port of Entry; Officer Rosa Salas at Sasabe Port of Entry; Acting Port Director Jeff Bequette at Lukeville Port of Entry; Chief Luz Galarza at San Luis Port of Entry; Officer Rick Blankas at Tucson International Airport, and Assistant Chief Warren Eales at Phoenix Sky Harbor International Airport.
At an early stage in the project, we met with community leaders in Douglas, Nogales and Yuma to inform them about the upcoming project and year-long survey of Mexican nationals in their areas. We thank the following community representatives from both Nogales, Arizona and Nogales, Sonora, who attended meetings and provided valuable inputs about local specificities: Nils Urman and Samantha Munguria with the City of Nogales Economic Development; Marco Nunez, Jr. with the City of Nogales; Tim Mello and Olivia Ainza Kramer with the Nogales/Santa Cruz County Chamber of Commerce; Kathleen Escalada of the Pimería Alta Historical Society and Museum; Jose Ruben Grijalva, representing the City of Nogales, Sonora, and Claudio Placencia, Chair of the City of Nogales, Sonora, Tourism Committee. In Douglas we met with: Victor Gonzalez, Director of Douglas Economic Development; Curtis Shook, City Manager, and Margaret Morales, President of the Chamber of Commerce. Our hosts in Yuma were: Chris Camacho, Director of Greater Yuma Economic Development; Jeff
Acknowledgements

Mexican Visitors to Arizona, 2007-08
The University of Arizona Eller College of Management
Philpott, City of Yuma Interim Manager; Ken Rosevear of the Yuma County Chamber of Commerce; Pete Erlenbach, Manager of the City of Yuma Economic Development; Carlos Lopez, Executive Director of the San Luis Chamber of Commerce and the San Luis Economic Development Corporation, and Cliff O’Neill, Somerton City Administrator.
We also thank Beatriz López Gargallo, General Consul, and Dalya Salinas, Documentation Consul with the General Consulate of Mexico in Nogales, Arizona, for arranging a permit with the Mexican border port authorities to allow our surveyor to conduct interviews on the Mexican side of Mariposa border crossings. This was necessary because the physical configuration of border access from the Arizona side and the high speed at which vehicles approached the border crossing did not provide enough safety for interviewers or potential interviewees.
For the most crucial part of the study – collecting data through about 3,000 interviews – we thank Eric Shapiro of the Marketplacer, Inc. and his professional team of field researchers, with whom the Economic and Business Research Center (EBRC) subcontracted services for a fee. We were impressed with the quality of returned questionnaires, the timelines and general administration of the survey.
Much gratitude goes to two Eller College students, Zachary Gerin and Nguyen H. Ho, who during the academic year 2007-08 worked on entering information from individual questionnaires into a database. Many of the calculations required for the study were pre-programmed in STATA by Chung Choe, who, since working on this study, has received his Ph.D. in economics. The program saved many hours of calculating and re-calculating, each time we needed to make a change, such as correcting a data error or making small changes in methodology.
We also thank Brian D. Levin, chief CBP officer and OFO public affairs liaison in Tucson Field Office, for supplying us with data on border crossings and helping us navigate through a muddle created by institutional reorganization and the new ways border crossings are being reported.
Especially we are thankful to Alex Kovach, Director of the Air Service Department at the Tucson International Airport, who helped untangle a long-standing challenge of figuring out for how many Mexican nationals Phoenix and Tucson airports are final destinations versus those who are only passing through. These secondary data were of utmost importance for our ability to generate reasonable estimates of total economic impacts in combination with the survey data.
For advice on data and references on Mexico, as so many times in the past, we are indebted to our colleagues Pablo Wong Gonzalez and Patricia Salido, researchers at the Centro de Investigación en Alimentación y Desarrollo (CIAD) in Hermosillo, Sonora.
EBRC’s Economist Lora Mwaniki-Lyman helped in many phases of the project, be it with access to special data sources or advising on IMPLAN modeling.
And there also is Valorie Rice, EBRC’s irreplaceable Research Librarian with unmatchable knowledge of where and how to get secondary data, unearth relevant references, and keep track of daily events, all of which are instrumental for a successful and timely completion of a complex project like this.
Special thank you goes to Marshall Vest, Director of Economic and Business Research Center for his support of the project and his willingness to release substantial amounts of personnel time to complete the analysis.
We acknowledge the predecessors, Nat de Gennaro and Randall Hopkins. Nat’s first study set the standard for those of us who followed, while Randy’s study has been used as a blueprint for our last and this study. Of course, with valuable new inputs from many, we tried to improve along the way.
Finally, we are deeply indebted to the participants in this study – more than three thousand Mexican nationals returning from a visit to Arizona – who were willing to donate their time and provide information about
Acknowledgements
ii

Mexican Visitors to Arizona, 2007-08
The University of Arizona Eller College of Management
their places of origin, travel mode, Arizona’s destination and attraction places, spending pattern and other characteristics of tourism behavior relevant to those involved in Arizona’s tourism industry.
Vera Pavlakovich-Kochi and Alberta H. CharneyDecember 2008
iii
Acknowledgements

Mexican Visitors to Arizona, 2007-08
The University of Arizona Eller College of Management
MEXICAN VISITORS TO ARIZONA: VISITOR CHARACTERISTICS AND ECONOMIC
IMPACTS, 2007-08
Executive SummaryTravel and tourism continues to be among the most important export industries driving Arizona’s economy, and Mexican visitors are an important contributor to this sector. This is the fourth study conducted by The University of Arizona since the late 1970s which assesses direct spending by Mexican visitors and estimates their total economic impact on Arizona. Primary data on expenditures were collected through a year-long survey starting in July 2007 and ending in June 2008. Mexican visitors were interviewed as they were returning to Mexico through one of the six Arizona border ports of entry – Nogales, Douglas, San Luis, Lukeville, Naco and Sasabe -- and two international airports in Phoenix and Tucson. Estimates of total economic impacts, including indirect and induced sales, jobs, and income were estimated using the IMPLAN input-output models for the State, metro areas and border counties. Tax revenues were estimated by state and county tax revenue models.
MEXICAN VISITORS
As in the three previous studies (1978, 1992,and 2002), visitors in this study include both the so-called traditional tourists, who generally visit another country for leisure, historical site visits, and similar reasons and who tend to stay overnight, and day visitors or the non-traditional tourists who cross the border but return the same day. There were total of 24.04 million alien crossings from Mexico to Arizona from July 2007 through June 2008; 84.24 percent were day visits and 15.76 percent were overnight visits.
SIZE OF VISITOR PARTIES AND TRAVEL MODE
The 24.04 million Mexican visitors came to Arizona in 13.37 million parties. They came in parties of 1.8 persons that include 1.47 adults and 0.33 children. About 55 percent of all visitor parties enter by car across the U.S. Mexico border and almost 45 percent are walkers. Less than one percent of all Mexican visitor parties to Arizona fly into the state.
REASONS FOR VISITING ARIZONA
Leisure, such as shopping, vacation, visiting friends and relatives, and personal health, is the primary reason for visit for 63.94 percent of all visitor parties. Business-related reasons, such as work, business convention, professional training, and business shopping, is the primary reason for visit for 36.06 percent of all visitor parties.
LENGTH OF STAY
Close to 16 percent of all Mexican visitor parties are overnight visitors; about 2 percent spend one night; about 4 percent spend two nights; close to 5.5 percent spend 3 nights. About 4 percent spend 4 or more nights. Of those who spend one or more nights in Arizona, 60.97 percent stay in hotels and 39.02 percent spend the night with family and friends.
Executive Summary
iv

Mexican Visitors to Arizona, 2007-08
The University of Arizona Eller College of Management
ORIGIN OF MEXICAN VISITORS TO ARIZONA
Almost 99 percent of Mexican visitor parties come from the neighboring Mexican state of Sonora. Of those, 46.9 percent come from the border city of Nogales, the largest of Sonora’s border cities; 24.1 percent come from San Luis Rio Colorado, and 13.37 percent from Agua Prieta, and 1.32 percent from the capital city of Hermosillo. The remainder comes from about 20 other cities in Sonora, but also from Baja California, Sinaloa, and the Mexico City metropolitan area.
SHOPPING DESTINATIONS AND ATTRACTIONS VISITED
Three Arizona malls -- Arizona Mills Mall in Metro Phoenix and Tucson Mall and Park Place Mall in Tucson – are the most popular shopping destinations. Among the non-mall stores, Wal-Mart is the most popular in every destination city. Casinos in Tucson and Phoenix are the most popular attractions; the zoo parks are the second most visited attraction.
ECONOMIC IMPACT: JOBS, INCOME AND SALES
The results of this study, as in the past, demonstrate the economic importance of Mexican visitor spending to Arizona’s economy. Close to 23,400 wage and salary jobs in Arizona at eating and drinking establishments, retail establishments and other spending-related sectors are directly attributable to Mexican visitor spending. Through local purchases of supplies by businesses and the spending of income derived from visitor-related jobs, these visitors generated almost 7,000 additional jobs in Arizona in 2007-08. These jobs account for a total income of $837.24 million and $3.61 billion in sales.
GEOGRAPHIC DISTRIBUTION OF ECONOMIC IMPACTS
The largest economic impact of Mexican visitor spending occurred in Pima County. A county that includes Tucson and extends all the way to the U.S.-Mexico border, Pima County receives 41.21 percent of the total job impact, 37.68 percent of the total sales impact, and 39.79 percent of the total income impact. Maricopa County, containing the State’s largest metropolitan area and the capital city, Phoenix, receives the second largest share of the total impact: 28.11 percent of total jobs, 26.57 percent of total sales, and 31.69 percent of total income.
Santa Cruz County, the border county that contains Nogales, the largest port of entry into Arizona, receives 14.81 percent of the total job impact, 16.35 percent of the total sales impact, and 13.03 percent of the total income impact. Yuma County receives 8.11 percent of the total job impact, 9.16 percent of the total sales impact, and 7.56 percent of the total income impact; Cochise County receives 5.81 percent of the total job impact, 6.18 percent of the total sales impact, and 4.93 percent of the total income impact.
CONTRIBUTION TO TAXABLE SALES
Mexican visitor spending represents a staggering 48.62 percent of the total taxable sales in Santa Cruz County. Mexican visitor spending represents 6.27 percent of taxable sales in Yuma County, 5.34 percent in Cochise County, 5.20 percent in Pima County, and 0.77 percent in Maricopa County. The larger the county in terms of population and income and the further away the county is from the border, the smaller the share of total taxable sales attributable to Mexican visitor spending.
COMPARISON TO 2001 STUDY:
Visitor volume
The number of alien border crossings through six Arizona border ports of entry (BPOE) in 2007-08 was 4.92 percent above the 2001 level, reflecting an increase from 22.91 million crossings in 2001 to 24.02 million crossings in 2007-08. The number of Mexican air passengers arriving to Arizona through Phoenix and Tucson
Executive Summary
v

Mexican Visitors to Arizona, 2007-08
The University of Arizona Eller College of Management
airport was 33.5 percent higher, which reflects an increase from 15,075 Mexican air passengers in 2001 whose final destination was Arizona to 20,126 in 2007-08.
Party size
The overall average party size has decreased from 2.2 to 1.8. This smaller party size contributed significantly to the increase in the number of parties in 2007-08. While the total number of aliens crossing (through BPOE and airports together) increased 4.92 percent, the total number of parties increased 28.37 percent because of the substantial decrease in party size.
Travel mode
While motor vehicle remains the primary mode of travel, the share of Mexican visitor parties crossing the border by car decreased from 70.34 percent in 2001 to 55.02 percent of all visitor parties in 2007-08. The share of pedestrian parties increased from 29.58 percent in 2001 to 44.88 percent in 2007-08, while the share of those arriving by air increased from 0.08 percent in 2001 to 0.10 percent in 2007-08.
Share of overnight visitors
Overnight visitors’ share increased from less than 4 percent in 2001 to about 16 percent in 2007-08; this is probably the largest change since the last study. Far more Mexicans are spending the night in Arizona, particularly the visitors that come to metro Tucson. Overnight visitors to the Tucson metropolitan area (Pima County) went from approximately 15 percent to 87 percent. This huge increase for metro Tucson is the primary cause of the overall increase in the share of overnight visitors. Metro Phoenix (Maricopa County) is 3 hours from the border, so almost all visitors who choose to go to metro Phoenix, by vehicle or by air, spend the night. Visitors to the border communities of San Luis, Yuma, Nogales and Douglas are almost all day visitors because of their proximity to the border. Tucson is in that midrange of travel time (one hour from the border) that permits both day visits and overnight visits.
Share and volume of overnight visitors staying in hotels
The percentage of visitors that spend the night in hotels has dropped from 79 percent in 2001 to 61 percent in 2007-08, although the total volume of visitor parties staying in hotels increased substantially between 2001 and 2007-08. In 2001, 79 percent of those who spent the night (just 3.2 percent of all visitors) stayed in hotels, so only 2.5 percent of all 2001 visitor parties spent the night in hotels. In 2007-08, 61 percent of those spending the night (15.76 percent of all visitor parties) stayed in hotels, so 9.6 percent of all visitor parties stayed in hotels. Further, the number of visitor parties increased from 10.41 million to 13.37 million parties. Therefore, the number of Mexican visitor parties that spend the night has increased from 260,350 parties in 2001 to almost 1.29 million parties in 2007-08.
Direct expenditures
Direct expenditures in 2007-08 are 213.6 percent bigger than in 2001 (not adjusted for inflation). Even when adjusted for inflation of an average 3 percent annually, the increase is still substantial: 147.7 percent. This is likely to be a result of three main factors: the increase in the number of visitor parties; the increase in the share of visitors who chose to spend the night (coupled with a relative increase of visitor parties in higher income categories), and the strong Mexican peso during the year of this study. Therefore, this relatively high spending level found in 2007-08 may be just a one-time situation rather than a trend. The recent deterioration in the peso/dollar ratio in combination with global economic recession impacting both sides of the U.S.-Mexico border may have dramatic effects on both the number of Mexican visitors and/or spending for years to come.
Executive Summary
vi

Mexican Visitors to Arizona, 2007-08
The University of Arizona Eller College of Management vii
Geographic distribution of economic impacts
Although the three border counties (Cochise, Santa Cruz and Yuma) experienced substantial increases in Mexican visitor expenditures, their shares of total Mexican visitors’ economic impact declined from 61.87 percent in 2001 to 35.38 percent in 2007-08. The largest absolute and relative increase in direct spending occurred in Maricopa County; consequently, its share of total direct sales increased from 4.26 percent in 2001 to 25.85 percent in 2007-08. Pima County’s share of direct sales also increased from 33.76 percent to 36.32 percent.
Reasons for visiting
Shopping continues to be the main reason for visiting Arizona, with 57.44 percent of all visitor parties listing that as a reason. Visiting friends and relatives was also a very strong reason for visiting Arizona, cited by 5.81 percent of all visitor parties. These two portions are down somewhat since 2001 because the portion identified as coming for other business and/or work is higher (35.19 percent in 2007-08 vs. 14.41 percent in 2001). It is not believed that the portion of crossers who come for work has increased since 2001. Rather, a different survey question (previously in 2001, visitors were asked to list and prioritize two reasons for visiting) and a stronger focus on identifying crossers who worked, resulted in higher proportions in the business/other (including work) category than in 2001, which, in turn reduced the estimated percent that came primarily to shop and visit friends.
CONCLUSIONS
Each day, on average, more than 65,000 Mexican residents come to Arizona to work, visit friends and relatives, recreate and shop. Each day, they spend over $7,350,000 in Arizona’s stores, restaurants, hotels and other businesses, and thus contribute substantially to Arizona’s export trade with Mexico. Familial ties, long-term friendships, work opportunities, leisure activities and shopping experiences not yet available in Mexico continue to support strong cross-border interactions between Arizona and its neighbor, Sonora.
Executive Summary
Mexican Visitors to Arizona, 2007-08
The University of Arizona Eller College of Management
List of Tables and FiguresTablesResearch Design 1. Number of Days per Quarter the Interviews Were Conducted, by Port of Entry 4 2. Sample Size by Port of Entry and Travel Mode 4 3. Summary of Entrants Into Arizona from Mexico, 2007-08 by Port of Entry 5 4. Computation of Alien Parties and the Percent 6 of Parties Used to Weight Data, by Port of Entry
Mexican Visitors to Arizona 5. Alien Border Crossings at Six Arizona Border Ports of Entry, 1977-2007 14
Characteristics of Mexican Visitors 6. Party Size by Age Group, by Port of Entry 17 7. Mexican Visitor Parties, by Travel Mode, by Port of Entry 18 8. Length of Stay in Arizona, by Mode 19 9. Nights Spent in Arizona, by Port of Entry 20 10. Overnight Visitors by Type of Accommodation 20 11. Monthly Household Income Distribution, by Travel Mode 21 12. Monthly Household Income Distribution, by Port of Entry 22 13. Reasons for Visit, by Travel Mode 22 14. Reason for Visit, by Port of Entry 23 15. Reasons for Visit, by Type of Visitor 24 16. Number of Nights, by Reason for Visit, by Travel Mode 24 17. Reported Occupations of Mexican Visitors to Arizona 26 18. Economic Sectors in which Mexican Visitors are Employed 27 19. Origin of Visitors and Monthly Income, by Place of Residence 28 20. Reasons for Visit, by Destination 31 21. Party Characteristics and Length of Stay, by Destination 32
Shopping Destinations and Attractions Visited 22. Where Mexican Visitors to metro Phoenix Shopped 34 23. Metro Phoenix Attractions Attended by Mexican Visitors 35 24. Where Mexican Visitors to metro Tucson Shopped 38 25. Metro Tucson’s Attractions Attended by Mexican Visitors 39 26. Where Mexican Visitors to Nogales Shopped 41 27. Where Mexican Visitors to Douglas Shopped 42 28. Where Mexican Visitors to Yuma Shopped 43 29. Where Mexican Visitors to San Luis Shopped 44 30. Where Mexican Visitors to Lukeville Shopped 44 31. How Mexican Visitors Learned About Destinations/Attractions in Arizona 46
Expenditures by Mexican Visitors in Arizona 32. Total Direct Expenditures by Mexican Visitors to Arizona: 1977-78, 1991, 2001, 48 and 2007-08, by Port of Entry 33. Mexican Visitor Parties: 1977-78, 1991, 2001, and 2007-08, by Port of Entry 49 34. Mexican Visitor per Party Expenditures in Arizona: 1977-78, 1991, 2001, 49 and 2007-08, by Port of Entry 35. Expenditure Categories: 1991, 2001, and 2007-08 50 36. Per Party Expenditures, by Category, by Travel Mode 51 37. Per Party Expenditure, by Reason for Visit, by Travel Mode 52
List of Tables and Figures
viii

Mexican Visitors to Arizona, 2007-08
The University of Arizona Eller College of Management
38. Spending per Party, Total Spending, by Monthly Income Group 52 39. Spending per Party, Total Spending, by Distance Traveled 53 40. Spending per Party, Total Spending, Overnight vs. Day Visitors 53 41. Seasonality of Mexican Visitors’ Travel to Arizona 54 42. Expenditures by County and City, 1991, 2001, and 2007-08 55 43. Origin, per Party Expenditure, and Share of Expenditures by Destination 56 44. Percent of Expenditures, by Destination County, by Category Spending 58 45. Expenditures of Overnight vs. Day Visitors, by Destination City 58
Total Economic Impacts of Mexican Visitors 46. Direct Economic Impacts of Mexican Visitors to Arizona 2007-08, by County 59 47. Total Economic Impacts of Mexican Visitors to Arizona 2007-08, by County 60
Impact on Taxable Sales and Tax Revenues 48. Mexican Visitor Spending as a Percent of Taxable Sales 2007-08, by County 61 49. Revenue Impacts of Mexican Visitor Spending 2007-08, by Level of Government 62
FiguresResearch Design 1a. Arizona Ports of Entry 2 1b. Arizona-Sonora Border Ports of Entry 2
Mexican Visitors to the United States 2. Number of Tourists from Mexico to U.S. and from U.S. to Mexico, 1995-2006 7 3. Same-day Visitors vs. Overnight Visitors, 1995-2006 8 4. Same-day Visitor Trend, 1995-2006 8
Mexican Visitors to Arizona 5. Number of Alien Crossings from Mexico to Arizona, 1977-2007 15 6. Alien Border Crossings to Arizona 1977-2007: Annual Change (%) 15
Characteristics of Mexican Visitors 7. Origin of Mexican Visitors to Arizona, by State 27 8. Origin of All Visitors to Arizona, by City 28 9. Origin of Overnight Visitors to Arizona, by City 30
List of Tables and Figures
ix

Mexican Visitors to Arizona, 2007-08
1The University of Arizona Eller College of Management
MEXICAN VISITORS TO ARIZONA: VISITOR CHARACTERISTICS AND ECONOMIC
IMPACTS, 2007-08
I. Purpose and Research DesignTravel and tourism1 continues to be among the most important export industries driving Arizona’s economy.2 While the travel industry is not statistically identified as a single industry, it includes several economic sectors where spending by visitors generates direct sales and jobs: lodging, food services, recreation, transportation, and retail businesses. A recent report, Arizona Travel Impacts 1998-2007p, prepared by Dean Runyan Associates for the Arizona Office of Tourism, estimated that direct travel industry employment in 2007 was 171,500 with earnings of $5.1 billion. Direct tax revenue to the state and local governments was estimated at $1.5 billion. According to the same source, this represented 5.0 percent of total Arizona’s employment and 3.2 percent of total earnings in 2007.
Prior to the current study, the University of Arizona has assessed the spending by Mexican visitors to Arizona in 1977, 1991 and 2001.3 Results of each study have confirmed that Mexican visitors are an important component of Arizona’s tourism industry. 4
While some basic characteristics of Mexican visitors have persisted, the changing economic, demographic and political landscapes in the U.S.-Mexico border region are directly and indirectly affecting the volume, frequency, travel mode, and destination pattern of border crossers. Studies in other border states have reported changing patterns especially in response to new border security measures and new documentation requirements for entry into the United States. In order to better understand how these new circumstances are affecting the pattern of Mexican visitors’ travel and spending in Arizona, the Arizona Office of Tourism commissioned an update of the economic impact study.
Purpose and Objectives
The purpose of this study is to estimate the current impact of Mexican visitors on Arizona’s economy.
Specific objectives of this study are to: • ProvidemeasuresofMexicanvisitors’expendituresbycategory; • Providemeasuresofspendingbylocation(counties,majorcities); • ProvidedataonoriginofMexicanvisitors(stateofSonora,restofMexico); • UseexpendituredatatoassesstotaljobsandwagesassociatedwithMexicanvisitors’spending; • UseexpendituredataandtheeconomicimpactdatatodeterminerevenueimpactstotheState of Arizona; and • ConductastudythatiscomparableinscopetothepreviousstudiesofMexicanvisitors’impact on Arizona’s economy. In general, the findings of this study will help to better understand the economic ties between Arizona and Mexico. More specifically, the findings will assist the Arizona Office of Tourism and other hospitality-related organizations, including retail and services that depend on Mexican visitors, to reevaluate current services and marketing practices and modify them to better respond to any new trends.
I. Purpose and Research Design

Mexican Visitors to Arizona, 2007-08
2The University of Arizona Eller College of Management
Research Design
Mexican visitors were surveyed as they exited Arizona at all six border ports along the U.S.-Mexico border – Douglas, Lukeville, Naco, Nogales, San Luis and Sasabe -- and at Arizona’s two major commercial airports, Sky Harbor International Airport in Phoenix, and Tucson International Airport. Surveys were administered via interviews in Spanish by professional team of interviewers under a service subcontract with a reputable local market research firm. The interviews were conducted between July 2007 and June 2008.
Figure 1aArizona Ports of Entry
Figure 1bArizona-Sonora Border Ports of Entry
I. Purpose and Research Design

Mexican Visitors to Arizona, 2007-08
3The University of Arizona Eller College of Management
Survey instrument
The survey instrument used in this study closely resembles the one used in 2001 study. Most of the survey instrument that asks about visitor characteristics, reasons for visiting, cities visited, amount of spending per destination city, by category, is the same as in the 2001 study.
However, some modifications were made in order to obtain more detailed information about stores/malls shopped and attractions visited, while at the same time keeping the time necessary to complete each interview as short as possible. While these may be general concerns in any surveying, the fact that this survey took place at border ports of entry (including airports) in an environment of increased concerns about national border security, made this requirement especially valid.
To accomplish the above objective, ‘modules’ were introduced to gather detailed information about shopping patterns and visitor activities in the primary location visited. The primary location was defined as the Arizona destination area furthest from the border. Thus, a returning visitor who visited/shopped in both metro Phoenix and Nogales were asked questions about specific stores/malls they shopped and attractions they visited in the Phoenix area using questions in the metro Phoenix “module.” If the visitor shopped only in the border area of Nogales, they were asked questions about the border area using questions in the Nogales “module.” The use of modules minimized the completion time of each survey by asking each visitor party about shopping and visiting patterns for only one destination area. In addition, because a relatively small portion of border crossers continue beyond border communities as far as Tucson or Phoenix, administering the module for the destination area furthest from the border maximized the number of observations for those destinations.
A copy of the questionnaire is in the Appendix. Although the attached questionnaire is in English, the instrument was administered in Spanish.
Sample size and interview schedule
The sampling schedule used in this study follows the one used in 2001 studies with slight modifications (Table 1). In the 2001 study, bilingual students at the University of Arizona were used as surveyors, but at times it was difficult to maintain a regular interview schedule, particularly during mid-term and final exam weeks. Therefore, for this study, professional interviewers were used, largely because their schedules are more flexible then those of students’ resulting in a better coverage of days and weeks. In addition, a few professional interviewers conducting all the interviews is believed to provide more consistent responses across days, weeks and ports of entry than several student interviewers surveying at different times at different ports of entry.

Mexican Visitors to Arizona, 2007-08
4The University of Arizona Eller College of Management
Table 1Number of Days per Quarter the Interviews Were Conducted, by Port of Entry
The planned survey sample size was 2,664; however, 3,012 questionnaires were collected and entered into a databank for analysis. Table 2 shows the sample by port and by mode of travel.
Table 2Sample Size by Port of Entry and Travel Mode
Like in the previous study, the sample is not stratified to match actual border crossings by aliens at each port of entry. Rather, the traditional survey method is used: visitation data are analyzed by port and weighted across ports according to border crossing data obtained from secondary sources. This is comparable to conducting a stratified sample.
Weighting procedure
Determining weights was rather straightforward. Weights are based on the number of parties crossing at each port, by mode of travel (pedestrians, motor vehicles, and air). Customs and Border Protection (CBP) provided data on border crossings for both aliens and U.S. citizens, by mode of travel (pedestrians and motor vehicles) for the six southern land border ports of entry. The data on airport arrivals that was used in the past was discontinued in early 2008, so was unavailable for this study. The discontinued data series would have been difficult to use because it included both aliens and U.S. citizens, both visitors who pass through and whose final destination was Arizona, as well as international travelers from non-Mexican origins. Fortunately, good data was obtained from U.S. Department of Transportation, which detailed the numbers of persons whose trips originated in Mexico and who arrived at their final destinations in Phoenix and Tucson.
Table 3 summarizes border crossing figures for six Arizona ports of entry and air passenger arrivals from Mexico at two airports for 2007-08. The air passenger data used in 2007-08 study are considerably different from that used in the 2001 study, both in magnitude and in terms of what they measure. Data for 2001 included both final destination visitors to Arizona and visitors who arrived at Arizona airports but who boarded another plane and continued on to other destinations. Because 2001 data included both final destination visitors and visitors who were passing
Table 1Number of Days per Quarter the Interviews Were Conducted, by Port of Entry
Port of Entry Q1 Q2 Q3 Q4 TotalDouglas 4 2 4 2 12Lukeville 1 2 2 0 5Naco 2 1 2 2 7Nogales 8 7 6 7 28San Luis 4 6 3 6 19Sasabe 1 0 1 1 3Phoenix Airport 11 8 6 6 31Tucson Airport 4 3 3 3 13
Source: Marketplacer, Inc., monthly reports
Table 2Sample Size by Port of Entry and Travel Mode
Port of Entry Motor vehicle Pedestrian Air TotalDouglas 244 99 343Lukeville 103 7 110Naco 100 13 113Nogales 860 420 1,280San Luis 336 209 545Sasabe 111 0 111Phoenix Airport 390 390Tucson Airport 120 120Total 1,754 748 510 3,012
Source: Marketplacer, Inc., monthly reports
I. Purpose and Research Design

Mexican Visitors to Arizona, 2007-08
5The University of Arizona Eller College of Management
through, both types of visitors were interviewed. In 2007-08 study air passenger data include final destination visitors only, and therefore, only airport passengers who actually visited Arizona were interviewed. We believe that the 2007-08 data for Mexican visitors arriving by air are more reliable than what were used in the 2001 study. This data change between 2001 and the 2007-08 study and the corresponding change in methodology affects passenger counts at the airports, the number of parties traveling by air, and per party spending. This will be discussed in section VI. Expenditures by Mexican Visitors in Arizona, when 2001 and 2007-08 results are compared.
Table 3Summary of Entrants into Arizona from Mexico 2007-08, by Ports of Entry
Table 3Summary of Entrants into Arizona from Mexico
Border Crossing Figures for six Arizona Cities 2007-08 Total U.S.Citizens Aliens
Aliens as % of all Crossers
Aliens by port as % of Crossings
Douglas* 5,607,541 2,133,587 3,473,954 61.95 14.45 Lukeville 1,404,234 1,096,689 307,545 21.90 1.28 Naco 903,152 209,856 693,296 76.76 2.88 Nogales 16,469,067 3,496,722 12,972,345 78.77 53.96 San Luis 7,534,503 1,038,021 6,496,482 86.22 27.02 Sasabe 107,983 30,180 77,803 72.05 0.32
Air Passenger Arrivals from Mexico at Arizona Airports 2007-08 (Final Destination Passengers Only) Total U.S.Citizens Aliens
Aliens as % of all Crossers
Aliens by port as % of Crossings
Phoenix Sky Harbor Int'l Airport** 119,674 101,998 17,676 14.77 0.07 Tucson International Airport** 11,128 8,680 2,448 22.00 0.01
Total 32,157,282 8,115,733 24,041,549 74.76 100.00
*Alien crossers at Douglas figures for 3rd quarter 2007 were adjusted due to errors in the CBP data.**Airport passenger data is based on actual passengers flying to and from Mexico, whose final destination is Arizona. Determination of U.S. Citizens vs. Aliens is based on where trips originated. Passengers whose trips started and ended in a Mexico airport are assumed to be Mexican visitors; passengers whose trips started and ended in an Arizonaairport are assumed to be U.S. citizens.
Source: Data on the six southern Arizona border ports of entry was obtained from the U.S. Department of Homeland Security, Customs and Border Protection and data on the two Arizona Airports was obtained from the U.S. Department of Transportation.
I. Purpose and Research Design

Mexican Visitors to Arizona, 2007-08
6The University of Arizona Eller College of Management
Table 4 shows the computation of alien parties and the percentage of parties used to weight data by port of entry.
Table 4Computation of Alien Parties and the Percent of Parties Used to Weight Data, by Port of Entry
Final weights used in the study combine survey results on party size with the CBP data for alien crossings and the alien portion of pedestrians. This is necessary because the survey was conducted as per party interviews at ports of entry/exit. Therefore, numbers of alien border crossings had to be converted to number of parties prior to developing the weights used to convert sample results to estimates of all Mexican visitors entering Arizona.
To compute the final weights, the number of aliens obtained from CBP by port, by travel mode (pedestrians vs. passengers) were divided by the corresponding party size computed from survey results to estimates the total number of parties. The first column in Table 5 repeats the CBP data on alien border crossings, disaggregated by travel mode, and the second column reports the persons per party figures obtained from the survey. The number of alien parties is computed in the third column. The shares of total parties, across ports, by travel mode, are used to weight survey results.
In this study, Mexican visitors were interviewed as they exit the United States through Arizona ports. Some travel studies have collected data as visitors enter a region, requiring visitors to projects their travel expenditures. However, exit interviews are considered a more accurate form of data collection.
The CBP data used to calculate the weights used in this study report number of entrants to the United States (the so-called northbound crossings), rather than the number of out-bound Mexican visitors. It is conceivable that Mexican visitors enter the United States through one port and leave through a different port, particularly for visitors arriving by air. Findings from 2001 study revealed that very few (0.3 percent) reported that they entered at a different port than where they were exiting. Therefore, as in the 2001 study, in this study we use entry data to weight survey data across ports with little loss of accuracy.
Another concern was whether there were significant numbers of aliens crossing the border who were not from Mexico. All indications are that this was an inconsequential issue.
I. Purpose and Research Design
Table 4Computation of Alien Parties and the % of Parties Used to Weight Data, by Ports
Port of Entry Aliens Persons/Party Alien Parties% Parties across
PortsDouglas
Passengers 2,583,737 1.96 1,317,006 9.851Pedestrians 890,217 1.68 530,176 3.966
LukevillePassengers 249,870 1.90 131,776 0.986Pedestrians 57,675 1.43 40,369 0.302
NacoPassengers 611,465 2.05 298,870 2.236Pedestrians 81,831 1.46 55,978 0.419
NogalesPassengers 7,087,610 2.00 3,549,349 26.549Pedestrians 5,884,735 1.53 3,846,325 28.771
San LuisPassengers 4,018,570 1.99 2,024,271 15.142Pedestrians 2,477,912 1.62 1,527,049 11.422
SasabePassengers 77,803 2.25 34,629 0.259Pedestrians * * * *
Phoenix Sky Harbor Int'l Airport** 17,676 1.53 11,520 0.086
Tucson International Airport** 2,448 1.57 1,560 0.012
Totals 24,041,549 1.80 13,368,878 100.000
Source: Mexican Visitor Survey, 2007-08.*Sasabe had relatively small numbers of pedestrians. Because no pedestrians were surveyed, they were included under passengers.**Airport data are air travelers whose trips originated in Mexico and whose final destinations are Arizona.

Mexican Visitors to Arizona, 2007-08
7The University of Arizona Eller College of Management
II. Mexican Visitors to the United StatesWhile the focus of this study is on economic benefits of Mexican visitors’ spending in Arizona, it is important to place this activity in its wider economic and regional context. Mexican visitors are just one component of the two-way cross-border phenomenon known as border tourism (turismo fronterizo).5 Border tourism is one of the most important components of the services trade connection between U.S. and Mexico border states,6 encompassing both overnight visitors and same-day visitors (excursionistas).7 U.S border states serve as an important destination for Mexican visitors, and U.S. border states serve as an important source of U.S. visitors to Mexico. According to Banco de Mexico,8 more than 70 percent of all Mexican tourists to U.S. border states and of U.S. tourists to Mexican border states are from the adjacent border state.9
According to Banco de Mexico data, Mexican resident travel to U.S. outnumbers the U.S. resident travel to Mexico. Of the total number of trips (i.e., crossings) in both directions by land, about 56 percent were Mexicans visiting the U.S. and 44 percent were U.S. residents visiting Mexico10 (Figure 2). Another characteristic of border tourism is that a majority of travelers are day visitors (Figure 3); Mexican travelers to the U.S. are more likely to be day visitors – close to 90 percent of all land crossings, compared to 80 percent among U.S. visitors to Mexico.11 Figure 4 compares the 1995-2006 trend in same-day travel of Mexican residents to the U.S. and U.S. residents to Mexico. According to the same source, Mexican visitors to the U.S. spend less per person on average than U.S. visitors to Mexico, but in aggregate, they spend more due to their larger numbers.
Figure 2U.S. - Mexico Crossborder Travel, 1995-2006
Source: Banco de México. Table 9-1c.
Mexico-United States/United States-Mexico Travel by Mode of Transportation.
Retrieved April 7, 2008 at http://nats.sct.gob.mx/nats/sys/tables.jsp?i=3&id=22
The sheer numbers of travelers and their spending suggest that border tourism is an important economic activity in border states on both sides of the border.
II. Mexican Visitors to the United States
Total number of tourists (1,000)
0
20,000
40,000
60,000
80,000
100,000
120,000
140,000
1995 1996 1997 1998 1999 2000 2001 2002 2003 2004 2005 2006
MX to USUS to MX

Mexican Visitors to Arizona, 2007-08
8The University of Arizona Eller College of Management
Figure 3Same-day Travelers vs. Overnight Travelers, 1995-2006 (in 1,000)
Source: Banco de México. Table 9-1c.
Mexico-United States/United States-Mexico Travel by Mode of Transportation.
Retrieved April 7, 2008 at http://nats.sct.gob.mx/nats/sys/tables.jsp?i=3&id=22
Figure 4Same-day Visitor Trend, 1995-2006
Source: Banco de México. Table 9-1c.
Mexico-United States/United States-Mexico Travel by Mode of Transportation.
Retrieved April 7, 2008 at http://nats.sct.gob.mx/nats/sys/tables.jsp?i=3&id=22
II. Mexican Visitors to the United States
0
50,000
100,000
150,000
200,000
250,000
1995 1996 1997 1998 1999 2000 2001 2002 2003 2004 2005 2006
North- & south-bound tourists (1,000)
Overnight touristsSame-day tourists
Same-day tourists (1,000)
0
20,000
40,000
60,000
80,000
100,000
120,000
140,000
1995 1996 1997 1998 1999 2000 2001 2002 2003 2004 2005 2006
Same-day MX to USSame-day US to MX

Mexican Visitors to Arizona, 2007-08
9The University of Arizona Eller College of Management
Economic Importance of Mexican Visitors The first studies to quantify the impact of Mexican nationals on retail trade on the U.S. side of the border date back to late 1970s.12 The first study in Arizona was done in 1978. Interest in Mexican shoppers was spurred not only by their significant contribution to the retail sector in U.S. border communities, but also by increasing vulnerability of border economies to the Mexican peso devaluations. Each peso devaluation reduced the purchasing power of Mexican consumers and caused substantial losses in retail sales on the U.S. side.13
Most of the studies are region- and time specific, making comparisons across regions and over time difficult. For example, in the largest U.S. border city, San Diego, the impact of purchases by Mexican citizens in early 1990s was approximately 7.1 percent of retail sales.14 Elsewhere along the U.S. border, purchases by Mexican residents are even more noticeable. In the four largest Texas border cities –El Paso, Laredo, McAllen and Brownsville – the estimates of retail sales to residents of Mexico were estimated to range between 20 and 50 percent.15 Estimates for 2001 suggested that McAllen was the biggest net exporter of retail sales to Mexicans with almost $1 billion in sales, representing 33 percent of its total local retail trade activity. Laredo came in second with $540 million in exported retail sales or 39 percent of total retail sales. Brownsville registered $256 million (16 percent of total retail sales), while El Paso, the biggest of the four cities in terms of population, exported only $215 million (6 percent) to Mexican nationals.16
In a recent study, researchers at the University of Texas-Pan American17 attempted to synthesize the existing studies of the economic impact of Mexican visitors along the U.S.-Mexico border. They were able to estimate average expenditures per party per trip and by mode of border crossing (pedestrians, car, and bus) and then calculated total expenditures of Mexican shoppers for 2004.18 According to their estimates, Mexican shoppers spent $3.2 billion in Texas, $3.8 billion in California, and $0.86 billion in Arizona,19 or a total of close to $8 billion annually.
The above figures demonstrate that Mexican shoppers are big business for U.S. cities on or near the border. Economists with the Federal Reserve Bank of Dallas argue that stores in Laredo, El Paso, Nogales and other border towns are actually an export industry – in most years contributing to a U.S. trade surplus in cross-border shopping.20 The retail export industry provides employment for workers with low and moderate skills, and helps explain why job growth in some areas along the border has been among the fastest in the nation since the 1980s. An estimated 122,800 direct jobs were generated in 2004 through Mexican shopping in border counties of Texas, California and Arizona combined.21
Reasons for Border Crossings Survey-based studies from different locations along the U.S.-Mexican border indicate that the majority of Mexican visitors to the U.S. arrive for the purpose of shopping. On average, shopping is the primary reason to cross into the U.S. for more than two-thirds of Mexican nationals. Other reasons are social in nature, like visiting friends and relatives, or are work related.22
However, characteristics of Mexican visitors vary widely from one border community to another. They stay anywhere from a few hours to several days, they spend little or considerable amounts of money, while their visiting frequency can range from once a year up to once a day. Mode of travel – by car, airplane or on foot – is another distinguishing feature. Pedestrians generally cross more frequently than those using other modes of travel. Pedestrians, along with bus crossers, are predominantly day visitors, while those who enter in their personal vehicles tend to stay overnight. Airplane travelers also tend to stay longer.
Location is another feature that may impact crossing pattern and spending characteristics. Around half of California visitors are crossing daily or on a weekly basis compared to 16 percent for Texas visitors. About a third of visitors to Texas, on the other hand, come from cities further from the border such as Monterrey so they come less frequently and stay longer.23
II. Mexican Visitors to the United States

Mexican Visitors to Arizona, 2007-08
10The University of Arizona Eller College of Management
Factors Influencing the Mexican Visitors’ Border Crossings and Spending Pattern
The pattern of Mexican visitors’ border crossing and spending in U.S. cities has been affected by a blend of two sets of factors. On one side are factors that affect travel and spending in general, such as the availability of products and services, better quality (real or perceived), and price in location A compared to location B. On the other side are factors unique to the border setting, such as exchange rate, familial crossborder ties, a tradition of commercial ties, as well as the uneven population growth in twin border cities.
Exchange rate
Of all the factors, the impact of the exchange rate has been studied the most on the U.S. side of the border. This is understandable since there have been nine large-scale devaluations of Mexican peso in the period from 1925 to 1994, each of which reduced the purchasing power of Mexican consumers and caused substantial losses in retail sales across the border.24 As noted by Phillips and Coronado of the Federal Reserve Bank of Dallas, “border retailers know that sharp declines in the peso value result in a sharp drop in Mexican shoppers.”25
Since the last devaluation in 1994, Mexico has used a flexible exchange system, which helps to insulate the currency against sudden, deep declines in value. However, even if the last fourteen years were free of sudden changes in the value of the Mexican peso, retail sales on the U.S. side continue to be sensitive to swings in the peso’s value. The results of a recent study by researchers at the Federal Reserve Bank of Dallas have shown that changes in the real exchange rate have statistically significant impacts on total retail sales in all metropolitan areas in Texas, except El Paso. Retail trade in Laredo, McAllen and Brownsville is highly affected by changes in the value of the peso.26
Another study in California has suggested that a 10 percent decline in the value of the peso depresses total taxable sales by approximately 1 percent in San Diego County and 2.22 percent in Imperial County.27
The sensitivity to swings in the peso’s value is not uniform across the border region. It varies significantly by proximity to the border and by retailing sector, depending on type of products sold and the mix of consumers served.28
Growth of maquiladora sector
Since its inception in 1965, the maquiladora program in Mexican border cities contributed to population growth south of the border and thus increased the consumer base for retail in U.S. border cities.29 The first studies to address the issue of cross-border retail trade as part of a larger question of the maquiladora industry’s impact on the regional economies of U.S. border cities date back to the early 1970s. The more recent studies have shown that maquiladora employees became a significant component of cross-border shopping. A significant portion of maquiladora salaries has been spent on the U.S. side of the border, mainly on food and clothing.30
Estimates for Texas border cities in the early 1980s suggested that a 10 percent increase in maquiladora employment translated into a 23 percent increase in retail sales in Brownsville, a 13 percent increase in Laredo, an 11 percent increase in El Paso and a 7 percent increase in McAllen.31
The maquiladora industry experienced its largest expansion in the mid 1990s, partly as a result of the 1994 peso devaluation, partly due to the inauguration of NAFTA. The devaluation drastically reduced labor costs for foreign parent companies, but at the same time, reduced the purchasing power of maquiladora workers. Thus, the impact of a potentially larger number of cross-border consumers was diminished by the effects of devaluation.
By 2001, the border economic landscape was profoundly changed. The recession in the U.S. economy was followed by a business cycle downturn in Mexico, causing a significant contraction in the maquiladora sector
II. Mexican Visitors to the United States

Mexican Visitors to Arizona, 2007-08
11The University of Arizona Eller College of Management
employment.32 Federal Reserve Bank of Dallas’ study estimated that El Paso’s figure for retail sales in 2001 was well bellow its average exported retail sales of 11.3 percent and concluded that this was primarily due to the contracted maquiladora activity south of the border. Ciudad Juarez registered its worst maquiladora performance in 2001 and 2002, with employment declining almost 25 percent.33
Since then the maquiladora sector has recovered, although in most places along the border the employment levels are below the pre-2001 figures. Certain shifts within the sector have also occurred, which might affect the cross-border spending. There has been a shift toward a more skilled labor force, although the majority is still low skill-low wage.
NAFTA effect
Since its inauguration in 1994, NAFTA has gradually eliminated tariffs on manufacturing and agricultural products. With more U.S. products available in Mexico, the general expectation was that NAFTA would hurt U.S. retailers in the border region as a consequence of reduced demand for retail goods on the U.S. side of the border.
A recent study in Texas found a drop in retail sales of some items on the U.S. side under NAFTA, particularly groceries and furniture. However, the authors pointed to several conflicting forces at work. Because the last peso devaluation occurred as NAFTA went into effect, it was difficult to determine whether the sales decline was due to NAFTA or the devaluation of Mexican peso.34
In many places south of the border, such as in Tijuana-Rosarito Beach area, south of San Diego, a retail boom has prompted the expansion of chains such as Costco, Wal-Mart, Home Depot and Office Depot that are providing consumers with a wide variety of goods that had only been available on the U.S. side. Combined with longer waiting times at the border crossings, these are new incentives for Baja California residents who are shopping for these kinds of products to stay put. In words of the president of a market research firm in San Diego, “They (Mexican shoppers) may still be crossing, but they may only be crossing once a week now… What people are doing is choosing their purchases, and their decision to cross the border, much more judiciously.”35
Transformation of Mexican retail industry
There has been an infusion of international capital into retailing and a subsequent boom in mall construction in Mexico.36 This has been evident from the growing number of high-end stores in large Mexican cities, which gives their U.S. counterparts more competition. Experts believe that U.S. retailers still have the edge because they carry a greater variety of items, offer the latest styles, and often sell at significantly lower prices.37 They also expressed the fear that these advantages might erode as Mexico’s retail industry evolves.
A recent study focused on cross-border competition in the retail sector. The authors surveyed retailers in El Paso, and were surprised to learn that El Paso retailers didn’t pay much attention to competitors on the Mexican side of the border.38 In a follow-up survey they found that this was because they (retailers) “believed the Mexican stores cannot offer the same quality, range of merchandise, atmosphere and prices.”
While there are pronounced differences between individual pairs of border cities, a general conclusion of the panel at the San Antonio conference was that the differences in retailing between U.S. and Mexico led to billions of dollars in business in the border region. However, as Mexico becomes more sophisticated, the gap between the two economies in retailing is shrinking, and this may eventually diminish revenues on the U.S. side.
Crossing borders usually involves inconveniences, but shoppers make the trip when retailers in another country offer better prices, selection or services. To remain competitive with Mexican stores and other U.S. markets, panelists at the 2006 San Antonio conference agreed that border cities and retailers seeking cross-border shoppers must focus on customer service. For example, San Antonio and Houston are among the
II. Mexican Visitors to the United States

Mexican Visitors to Arizona, 2007-08
12The University of Arizona Eller College of Management
many U.S. cities with tourism bureaus or chambers of commerce that offer travel packages from Mexico that include airfare, hotel, shopping trips, and such extras as tourist activities and health care. “Such package deals, combined with personal customer services, will be a necessary component of marketing to the Mexican shopper in the future.”39
Post 9/11 border security policy
In the aftermath of the 9/11 terrorist attack, a series of new border security policies and procedures (screening and inspection) has been introduced. Aside from the recession, this was a major development that changed the entire border context.40
The participants at the 2006 conference41 in San Antonio, Texas argued that 9/11 had a short-lived, negative impact on cross-border shopping. Between September and November 2001, the northbound traffic by foot fell 17.9 percent and by vehicle 24.4 percent. The recently published results from the Borderplex model42 of the El Paso/Ciudad Juárez metropolitan region, suggest that despite a decline in northbound border crossings, relatively little evidence of ongoing disruptions is uncovered for retail sales in El Paso. There is a general absence of strong retail sales effects noted among most categories. This led the authors to conclude that “fewer shopping trips to El Paso are potentially being offset by greater sales volumes once the consumers from Mexico do arrive.”
On the south side of the border, retail sales in Ciudad Juárez seem to have benefited from the new administrative obstacles to crossing into El Paso. These outcomes, as suggested by the Borderplex authors, potentially reflect changes in household inventory management that takes into account the new regulatory environment affecting the border economy infrastructure.
Similarly, according to a recent article by Roberto Carreira at Cochise College in Douglas, Arizona,43 the number of crossers from Mexico has declined, although this was not reflected in retail sales tax data. The city’s retail sales tax revenue has continued to perform well, despite a decline in border crossings from Agua Prieta into Douglas at the Douglas port of entry. The city hosts a large number of day shoppers from south of the border.
However, many observers expect that the long-term impacts will come from new document requirements for entering the U.S. In particular, a potential long-term impact is expected from US-VISIT program, which checks the digital visa against a database of known criminals and suspected terrorist and increases the wait time at the border. Michael Patrick of the Texas A&M International University estimated that a 10 percent decline in northbound crossings due to US-VISIT would reduce retail sales in Texas border cities by $760 million, or 2.2 percent.44
II. Mexican Visitors to the United States

Mexican Visitors to Arizona, 2007-08
13The University of Arizona Eller College of Management
III. Mexican Visitors to Arizona
Findings from Previous Studies
The first study of economic importance of Mexican visitors to Arizona was conduced for the Arizona Office of Tourism during 1977-1978 by the University of Arizona’s Nat de Gennaro and Robert Ritchey. They concluded that the economic impact of Mexican visitors to the state of Arizona was substantial. Over a one year period these visitors spent more than $313 million for goods and services in the state. Most of the impact was realized in the border counties of Arizona with Santa Cruz receiving $137.5 million or 43.6 percent of the total direct spending, Yuma $93.5 million or 29.7 percent and Cochise $28.8 million or 9.1 percent. Pima County45 received $46.9 million or 14.9 percent and Maricopa County received $8.5 million or 2.7 percent. Survey results also showed that the state of Sonora was the overwhelming origin of Mexican visitors to Arizona, accounting for 95.9 percent of all visitors. Others came from Sinaloa, Jalisco, Baja California, and the Mexico City (DF) region.
In the 1991 update, Randall Hopkins estimated total direct expenditures of Mexican visitors in Arizona to be $688.3 million, more than twice the estimated spending in 1977-78 study. However, prices of goods and services in the U.S. also more than doubled over the same period of time. After 1991 expenditure figures were adjusted for price changes, Mexican visitors purchase just $306.2 million worth of 1991 goods at 1977 prices. Thus, Hopkins concluded, the real, inflation-adjusted expenditures decreased 2.9 percent from 1977-78 to 1991. The erosion of the peso’s value (devaluations in 1982 and 1988, in particular), combined with 14 years of inflation, had undermined considerably the purchasing power of Mexican visitors to Arizona during that period. The 1991 estimates also indicated a geographical shift in spending from border counties (Santa Cruz and Yuma) to Pima County (Tucson).46
The 2001 update by Alberta Charney and Vera Pavlakovich-Kochi estimated total direct expenditures at $857.4 million, a 28.3 percent increase from 1991 expenditures. The report did not adjust for inflation. However, when adjusted for inflation, Mexican visitors spent $677.4 million in 1991 dollars, which is a decline of 1.6 percent.47
Mexican visitors’ spending was characterized by distinctive regional patterns, both in terms of origin and place of consumption: in the 2001 study, over 99 percent of the Mexican visitors were from the neighboring state of Sonora; shopping was the primary reason for visiting (more than 70 percent), and two-thirds of all expenditures were in Arizona’s general merchandise and grocery stores. The highest portion of direct sales to Mexican visitors was in Pima County (33.76%), followed by Santa Cruz County (28.29%) and Yuma County (22.30%).48 The largest absolute job impact was in Pima County while the relative job impact (in terms of percent of total employment depending on Mexican visitor spending) was the highest in the three border counties (Santa Cruz County, Cochise and Yuma).
The percent of taxable sales related to Mexican visitors’ spending was the highest in Santa Cruz County, accounting for 47.3 percent of total sales. Visiting friends and relatives was a top trip purpose,49 which conforms to the overall notion of the importance of historical ties in the border region, which have been reinforced recently through increased migration.50
The main changes that occurred between the 1991 and the 2001 study include a general decline in per party spending except for visitors returning through Phoenix, San Luis and Sasabe. Spending for medical-related services declined as well compared to 1991 study. There was a clear shift in geographical distribution of spending from border counties to Tucson/Pima County and Phoenix/Maricopa County; the three border counties – Santa Cruz, Yuma and Cochise – lost their combined share of total expenditures by Mexican visitors from 80 percent in 1991 to 62 percent in 2001. Cochise County and Santa Cruz County also experienced a decline in direct expenditures in comparison with 1991. Santa Cruz County has lost its first place to Pima County (in terms of total expenditures), while Maricopa County experienced the largest percentage increase in Mexican visitors’ spending.
III. Mexican Visitors to Arizona

Mexican Visitors to Arizona, 2007-08
14The University of Arizona Eller College of Management
Border Crossing Dynamics: Empirical Evidence from Arizona’s Ports of Entry
Table 5 shows the number of non-U.S. citizens (“aliens” in the official statistics) crossing into Arizona from Mexico through Arizona’s six border ports of entry during last 30 years, from 1977 to 2007. Figures 5 and 6 show annual numbers and percent change from the prior year, respectively.
In 2007, a total of 22.83 million non-U.S. citizens entered Arizona from Mexico, which is about 70,000 less than in 2001, when the last study was done. While 2007 numbers are higher than in 2005 and 2006, they are still below the highest number of 25.6 million crossings recorded in 2000.
Annual percentage change figures (Figure 6) clearly indicate that despite an overall upward trend in border crossings during last 30 years, the annual numbers vary substantially as the border residents and other visitors react to changes in economic conditions (currency devaluation, economic slowdowns), catastrophic events (9/11 terrorist attack), or changes in policies (new border crossing regulations).
Table 5Alien Border Crossings at Six Arizona Border Ports of Entry, 1977-2007
III. Mexican Visitors to Arizona
Table 5Alien Border Crossings at Six Arizona Border Ports of Entry
YearAlien Border Crossings
AnnualPercentChange Year
Alien Border Crossings
AnnualPercentChange
1977 13,314,500 1993 18,845,883 5.011978 14,393,600 8.1 1994 23,198,614 23.11979 15,004,008 4.25 1995 22,347,355 -3.671980 16,229,700 8.16 1996 21,614,258 -3.281981 17,542,700 8.09 1997 23,241,839 7.531982 16,840,100 -4.01 1998 23,965,361 3.111983 14,734,500 -12.5 1999 24,318,630 1.471984 15,368,100 4.3 2000 25,651,566 5.481985 14,097,300 -8.27 2001 22,899,843 -10.731986 14,417,000 2.27 2002 25,598,819 11.791987 14,667,000 1.73 2003 23,279,290 -9.061988 17,438,900 18.9 2004 23,128,844 -0.651989 20,419,400 17.09 2005 21,047,193 -9.001990 20,821,800 1.97 2006 21,364,874 1.511991 19,648,799 -5.63 2007 22,828,527 6.851992 17,947,288 -8.66
Source: U.S. Department of Homeland Security, Customs and Border Protection.

Mexican Visitors to Arizona, 2007-08
15The University of Arizona Eller College of Management
Figure 5Number of Alien Crossings from Mexico to Arizona, 1977-2007
Source: U.S. Customs and Border Protection (CBP), and U.S. Immigration and Naturalization Services (INS)
Figure 6Alien Border Crossings to Arizona, 1977-2007: Annual Change (%)
Source: U.S. Customs and Border Protection (CBP), and U.S. Immigration and Naturalization Services (INS)
Major Trends in the Arizona-Sonora Region Since 2001 As briefly outlined in one of the preceding sections, a number of changes occurred at the national and international levels since 2001 that might have affected the volume, geography and expenditure pattern of Mexican visitors to Arizona. Among the most important is the implementation of new border security policies after 9/11/2001. It is now harder and more expensive to obtain an entry visa, while increased border security at border crossings is causing delays at the border. Both are likely to have reduced the frequency of crossings (and the total number of border crossings), but at the same time, to have increased average spending per visit. There are also region-specific responses to the national and international trends that might have affected Mexican visitors to Arizona in a more or less pronounced way than in other parts of the U.S.-Mexico border. For example, it has been documented that the maquiladora sector in Sonora – an important component
III. Mexican Visitors to Arizona
0
5,000,000
10,000,000
15,000,000
20,000,000
25,000,000
30,000,000
1977 1979 1981 1983 1985 1987 1989 1991 1993 1995 1997 1999 2001 2003 2005 2007
Number of Alien Crossings from Mexico to Arizona
Alien Border Crossings: Annual Change (%)
-15
-10
-5
0
5
10
15
20
25
197819791980198119821983198419851986198719881989199019911992199319941995199619971998199920002001200220032004200520062007

Mexican Visitors to Arizona, 2007-08
16The University of Arizona Eller College of Management
of Mexican shopping in Arizona border cities – experienced a more pronounced decline in employment between 2001 and 2003 than in other Mexican border states: about 27 percent of maquiladora employment in Sonora was lost due to economic recession in the US economy and the competition from China.51 While the maquiladora sector has revived since then, the employment levels in 2006 were still below the 2001 peak.52 However, this negative impact might have been offset to some extent by the emerging new maquiladoras with higher skill level/higher wage employees.53
Changes in Sonora’s retail sector might also have discouraged potential shoppers from crossing the border. According to a story reported by Tucson’s KOLD channel,54 the first Nogales Mall, with more than 80 retail stores, opened for business in late August 2006 in Nogales, Sonora. The mall was developed and financed by a local commercial developer and all retail stores -- from trendy clothing boutiques to jewelry and music stores – were Mexican-owned. However, the Nogales, Arizona city mayor (at that time) was not concerned about possible competition with the retail stores on his side of the border, because he did not see a direct competition with American merchandise. This was echoed by mall’s developer, who believed that only 30 percent of Nogales, Sonora residents cross the border to shop; therefore, the new mall was seen more as an alternative for people who do not cross the border. These new developments were yet another motivation for conducting the present study.
A different picture might be emerging in the case of U.S. retailers offering U.S. merchandise on the Mexican side. Since the signage of NAFTA, for example, Wal-Mart opened (or acquired through mergers) 15 stores in Sonora, three of which are located in border cities.55
At the same time, a number of new stores and shopping malls were opened up in Sierra Vista, Yuma, and Nogales, as well as on south side of Tucson with easy access from I-19. Unfortunately, besides anecdotal evidence, there are no systematic studies to show the real effect on Mexican shoppers.
The availability of shopping on the internet and through catalogs is another possible factor that might influence border shopping. For example, a 2007 survey of holiday shoppers entering the U.S. at Douglas border port of entry has shown that 2.8 percent of Mexico residents intended to conduct some holiday shopping over the internet. Most of those who planned to shop online expected to conduct about 10 percent of their shopping via the internet. About 4.5 of the interviewed indicated they intended to do some of their holiday shopping through catalogs.56
Surveys completed between July 2007 and June 2008 capture changes in the pattern of Mexican residents’ travel and spending in Arizona. However, it still represents a one-time picture rather than a continuous monitoring process. Therefore, some changes may reflect a specific mix of conditions during 2007-08 rather than being signs of any major shifts.
III. Mexican Visitors to Arizona

Mexican Visitors to Arizona, 2007-08
17The University of Arizona Eller College of Management
IV. Characteristics of Mexican Visitors to ArizonaAs shown in Table 4, more than 24 million crossings (trips) of non-U.S. citizens entering Arizona from Mexico were reported during a 12-month period from July 2007 through June 2008. The official statistics provides data on number of “crossings.” For the purpose of this study, each crosser is treated as a “visitor.”
The overwhelming majority of Mexican visitors – 99.92 percent – enter Arizona through the six Arizona-Sonora border ports of entry (BPOE). Arizona’s major international airports in Phoenix and Tucson accounted for less than one percent of the total number of trips from Mexico to Arizona.
When visitors who arrived by car or crossed the border on foot were asked if they flew to Arizona in the past, only 0.6 percent acknowledged flying before. For 71 percent of these visitors, the reason for not flying was because they needed a car, and for another 21 percent this was a short trip. The remaining 8 percent indicated that the air trip was too expensive.
Of those 99.4 percent who never traveled by air to Arizona, 68.8 percent indicated the shortness of their trip as the main reason. Another 7.8 percent needed a vehicle, while 13.7 percent thought that air travel was too expensive. About every tenth visitor party was coming from a location without an air connection.
Mexican nationals who cross the border through BPOE are predominantly day-visitors; many of them cross the border on a daily or weekly basis. In contrast, visitors arriving by air tend to come less frequently but tend to stay overnight.
This section provides basic characteristics of Mexican visitors to Arizona and explains how survey results are combined with the official count of border crossings to arrive at a profile of Mexican visitors and their spending behavior in Arizona.
Visitors, Parties and Party Size
Party size is critical for converting the total number of Mexican visitors to visitor parties. Mexican visitor parties in the current survey consist of 1.8 persons per party, including 1.47 adults and 0.33 children (Table 6). This is smaller than that of 2001, which showed an average party size of 2.20, including 1.55 adults and 0.65 children. Thus, the major source of change between the two studies has to do with the number of children identified among the parties.
Table 6Party Size, by Age Group, by Port of Entry (Averages)
There are some variations in party size and composition of parties across ports of entry. Visitors entering through Sasabe have the largest party size (2.25 persons), while visitors entering at the Phoenix Sky Harbor International Airport and Tucson International Airport have the smallest party size (1.53 and 1.57 persons). In
IV. Characteristics of Mexican Visitors to Arizona
Table 6Party Size and Percent Headed by Males, By Age Group, by Port of Entry(Averages)
Port of Entry Adults Children TotalDouglas 1.48 0.41 1.89 Lukeville 1.49 0.32 1.81 Naco 1.60 0.37 1.98 Nogales 1.50 0.28 1.79 San Luis 1.57 0.27 1.85 Sasabe 1.76 0.49 2.25 Phoenix Airport 1.41 0.12 1.53 Tucson Airport 1.48 0.09 1.57 All Ports 1.47 0.33 1.80
Source: Mexican Visitor Survey, 2007-08

Mexican Visitors to Arizona, 2007-08
18The University of Arizona Eller College of Management
comparison with 2001, party sizes have decreased at every port of entry except for Sasabe and Douglas. Using data from Table 4, the number of Mexican visitor parties arriving by each mode of travel (motor vehicle, pedestrian, and air) are summarized in Table 7. About 55 percent of all Mexican visitor parties arrive in Arizona by motor vehicle and about 45 percent walk across the border through one of the six ports of entry along the Arizona-Sonora border. Less than one percent (0.10 percent) of all parties arrives into Arizona by air. This is slightly more than in 2001, when 0.09 percent arrived by air.
Table 7Mexican Visitor Parties, by Travel, by Port of Entry
Aside from Sasabe, Naco has the lowest percentage of parties walking across the border; the majority (84.22 percent) drive across the border. The twin border communities, Sasabe/Sasabe, and Naco/Naco are the smallest in terms of population among the six Arizona ports of entry. Both lack the typical near-border shopping area that usually attracts pedestrians across the border.
On the other hand, in Nogales, Arizona, which is adjacent to the largest border city in Sonora (Nogales, Sonora), 52.01 percent of crossers are pedestrians. San Luis and Douglas, which are adjacent to large Sonoran border cities of San Luis Rio Colorado and Agua Prieta, also have high percentages of pedestrian crossers (43 and 28.7 percent, respectively).
In comparison with the 2001 study, the most striking difference is an increase in percent of pedestrian crossers; from 29.35 percent in 2001 to 44.88 in 2007-08, for all ports of entry. Except for San Luis, which already had a high percentage of pedestrian crossers in 2001, all other ports experienced a substantial increase in pedestrian crossers among all Mexican visitor parties. This increase in share of pedestrian crossers is no surprise; it is most likely a reaction to increased waiting times for motor vehicles crossing the border from Mexico, as reported in other studies in Texas and California. The new post 9/11 border crossing procedures have increased waiting times for motor vehicles and discouraged vehicle crossers.
Length of Stay in Arizona
Table 8 shows Mexican visitors by length of stay in Arizona. Day visitors (designated as spending zero nights in Arizona in Table 8) represent by far the largest group: more than 84 percent of all Mexican visitors are day visitors. In comparison with 2001 study, however, the percentage of day visitors has decreased from 96 percent in 2001 to 84.24 percent in 2007-08. Overnight visitors increased from under four percent in 2001 to 15.76 percent in the current study. This large increase in overnight visitors translates into a substantial increase in spending, as will be computed later in the report.
IV. Characteristics of Mexican Visitors to Arizona
Table 7Mexican Visitor Parties, By Travel Mode, by Port of Entry
Number of Parties, by Travel Mode Percent of Parties, by Travel ModePort of Entry Motor Vehicle Pedestrian Air Total Parties Motor Vehicle Pedestrian Air Total PartiesDouglas 1,317,006 530,176 - 1,847,182 71.30 28.70 - 100.00 Lukeville 131,776 40,369 - 172,145 76.55 23.45 - 100.00 Naco 298,870 55,978 - 354,848 84.22 15.78 - 100.00 Nogales 3,549,349 3,846,325 - 7,395,674 47.99 52.01 - 100.00 San Luis 2,024,271 1,527,049 - 3,551,320 57.00 43.00 - 100.00 Sasabe 34,629 * - 34,629 100.00 - - Phoenix Airport - - 11,520 11,520 - - 100.00 100.00 Tucson Airport - - 1,560 1,560 - - 100.00 100.00 Total 7,355,901 5,999,897 13,080 13,368,878 55.02 44.88 0.10 100.00
Source: Mexican Visitor Survey, 2007-08.

Mexican Visitors to Arizona, 2007-08
19The University of Arizona Eller College of Management
IV. Characteristics of Mexican Visitors to Arizona
Table 8Length of Stay in Arizona, by Travel Mode (Percentages)
As expected, the percentage of visitors spending one or more nights in Arizona differs according to the travel mode; 11.59 percent of pedestrian crossers spend one or more nights in Arizona, while 19.01 percent of visi-tors crossing in motor vehicles spend one or more nights in Arizona. Almost all air travelers (99.31 percent) spend at least one night in Arizona.
In interpreting Table 8, recall from Table 7 that 55.02 percent of all visitor travelers arrive by motor vehicle, 44.88 percent arrive on foot, and 0.10 percent arrives by air. Thus, approximately two-thirds of Arizona’s overnight visitors arrive by motor vehicle (19.01 percent of the 55.02 percent arriving by motor vehicle is 10.45 percent of total visitors, which is 66 percent of the 15.76 percent of all visitors spending the night).
While over 99 percent of all air travelers spend the night, air travelers represent 0.10 percent of all Mexican visitors and only 0.63 percent of all overnight travelers.
Length of stay of overnight visitors is also affected by mode of travel. Relatively few air travelers spend only one or two nights in Arizona (10.05 percent, the sum of 1.58 and 8.47 in the table). The majority of air travel-ers (about 75 percent) spend between three and six nights in Arizona.
In contrast, pedestrians who spend the night stay for relatively short periods of time, with 85.4 percent spend-ing three or fewer nights. Mexican visitors arriving by motor vehicle tend to spend more nights than pedes-trians, but fewer nights than air travelers. Almost 92 percent of motor vehicle travelers spend four or fewer nights in Arizona.
Similar results are shown in Table 9, which provides the frequency of nights spent in Arizona by port of entry. Almost all visitors traveling through the two airports spend at least one night in Arizona. The two airport entries show a majority of visitors spending 3 to 6 nights, while other ports have mostly day visitors. The exception is the Sasabe port: only 52.94 percent of its crossers are day visitors. The populations of both Sasabe, Arizona, and Sasabe, Sonora, are small, so these visitors tend to come from further south of the border, with the result that they are more likely to spend the night.
Table 8Length of Stay in Arizona, by Travel Mode(Percentages)
Percent of all VisitorsMotor Vehicle Pedestrian Air All Modes
Type of Visitor % % % %Day Visitors 80.98 88.41 0.69 84.24 Overnight Visitors 19.01 11.59 99.31 15.76 Sum 100.00 100.00 100.00 100.00
Percent of Overnight VisitorsMotor Vehicle Pedestrian Air All Modes
Nights in Arizona % % % %1 10.57 20.62 1.58 13.83 2 23.51 31.23 8.47 26.02 3 35.46 33.56 18.97 34.71 4 22.04 6.82 28.58 17.07 5 7.84 4.31 18.90 6.73 6 0.32 - 8.10 0.25 7 0.26 - 5.01 0.19 8 or more - 3.45 10.39 1.21 Total 100.00 100.00 100.00 100.00
Source: Mexican Visitor Survey, 2007-08
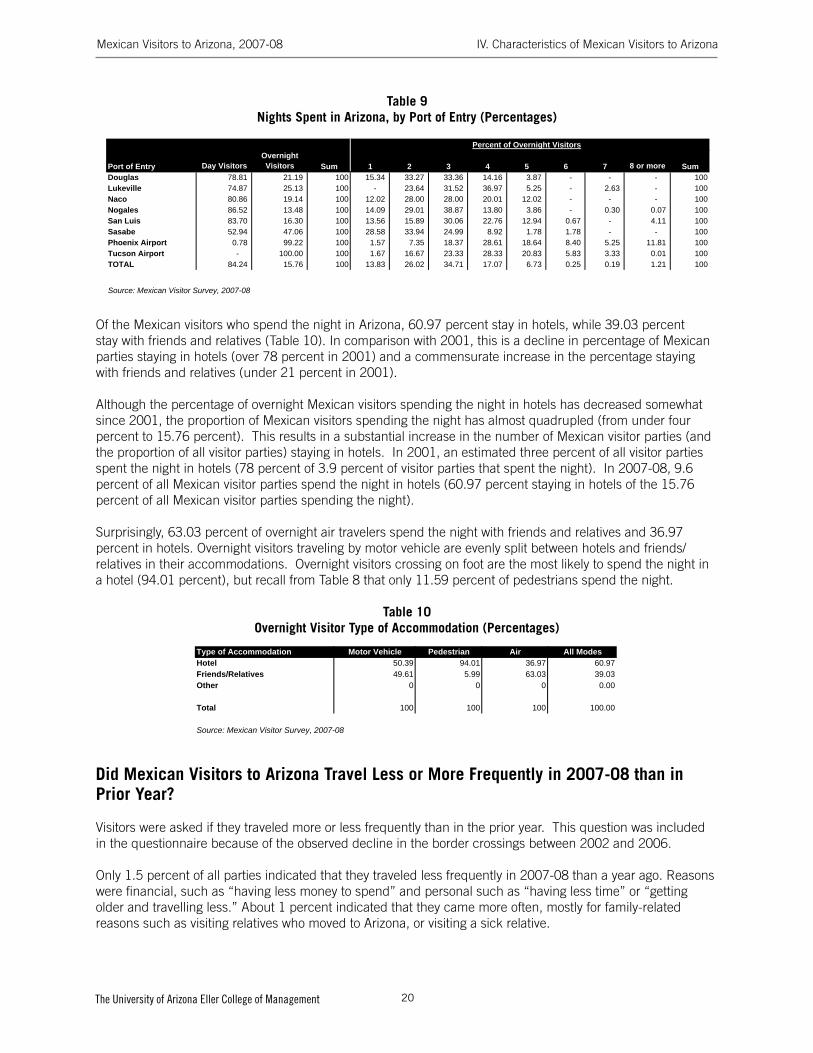
Mexican Visitors to Arizona, 2007-08
20The University of Arizona Eller College of Management
IV. Characteristics of Mexican Visitors to Arizona
Table 9Nights Spent in Arizona, by Port of Entry (Percentages)
Of the Mexican visitors who spend the night in Arizona, 60.97 percent stay in hotels, while 39.03 percent stay with friends and relatives (Table 10). In comparison with 2001, this is a decline in percentage of Mexican parties staying in hotels (over 78 percent in 2001) and a commensurate increase in the percentage staying with friends and relatives (under 21 percent in 2001).
Although the percentage of overnight Mexican visitors spending the night in hotels has decreased somewhat since 2001, the proportion of Mexican visitors spending the night has almost quadrupled (from under four percent to 15.76 percent). This results in a substantial increase in the number of Mexican visitor parties (and the proportion of all visitor parties) staying in hotels. In 2001, an estimated three percent of all visitor parties spent the night in hotels (78 percent of 3.9 percent of visitor parties that spent the night). In 2007-08, 9.6 percent of all Mexican visitor parties spend the night in hotels (60.97 percent staying in hotels of the 15.76 percent of all Mexican visitor parties spending the night).
Surprisingly, 63.03 percent of overnight air travelers spend the night with friends and relatives and 36.97 percent in hotels. Overnight visitors traveling by motor vehicle are evenly split between hotels and friends/relatives in their accommodations. Overnight visitors crossing on foot are the most likely to spend the night in a hotel (94.01 percent), but recall from Table 8 that only 11.59 percent of pedestrians spend the night.
Table 10Overnight Visitor Type of Accommodation (Percentages)
Did Mexican Visitors to Arizona Travel Less or More Frequently in 2007-08 than in Prior Year?
Visitors were asked if they traveled more or less frequently than in the prior year. This question was included in the questionnaire because of the observed decline in the border crossings between 2002 and 2006.
Only 1.5 percent of all parties indicated that they traveled less frequently in 2007-08 than a year ago. Reasons were financial, such as “having less money to spend” and personal such as “having less time” or “getting older and travelling less.” About 1 percent indicated that they came more often, mostly for family-related reasons such as visiting relatives who moved to Arizona, or visiting a sick relative.
Table 9Nights Spent in Arizona, by Port of Entry(Percentages)
Percent of Overnight Visitors
Port of Entry Day VisitorsOvernightVisitors Sum 1 2 3 4 5 6 7 8 or more Sum
Douglas 78.81 21.19 100 15.34 33.27 33.36 14.16 3.87 - - - 100Lukeville 74.87 25.13 100 - 23.64 31.52 36.97 5.25 - 2.63 - 100Naco 80.86 19.14 100 12.02 28.00 28.00 20.01 12.02 - - - 100Nogales 86.52 13.48 100 14.09 29.01 38.87 13.80 3.86 - 0.30 0.07 100San Luis 83.70 16.30 100 13.56 15.89 30.06 22.76 12.94 0.67 - 4.11 100Sasabe 52.94 47.06 100 28.58 33.94 24.99 8.92 1.78 1.78 - - 100Phoenix Airport 0.78 99.22 100 1.57 7.35 18.37 28.61 18.64 8.40 5.25 11.81 100Tucson Airport - 100.00 100 1.67 16.67 23.33 28.33 20.83 5.83 3.33 0.01 100TOTAL 84.24 15.76 100 13.83 26.02 34.71 17.07 6.73 0.25 0.19 1.21 100
Source: Mexican Visitor Survey, 2007-08
Table 10Overnight Visitor Type of Accommodation(Percentages)
Type of Accommodation Motor Vehicle Pedestrian Air All ModesHotel 50.39 94.01 36.97 60.97Friends/Relatives 49.61 5.99 63.03 39.03Other 0 0 0 0.00
Total 100 100 100 100.00
Source: Mexican Visitor Survey, 2007-08

Mexican Visitors to Arizona, 2007-08
21The University of Arizona Eller College of Management
These findings are in general agreement with the CBP data that show the number of crossings actually increased in 2007 compared to 2006.
Income Categories
Tables 11 and 12 show the income distribution of Mexican visitors, by mode and by port, respectively. The income categories for these tables were based on the average monthly household income data published by Instituto Nacional de Estadística, Geografía e Informática (INEGI), Mexico’s official data collection and publication agency.57 The 2005 data were the most recent at the time of preparation of our survey instrument.
According to INEGI data, 70 percent of all households in Mexico had average monthly income of less than 10,000 pesos. Ten percent had more than 37,600 pesos a month. Average monthly household income for Mexico as a whole was 10,244 pesos in 2005.
Because Sonora, like other Mexican border states, has higher wages than the average for Mexico as a whole, it is expected that a larger percentage of households has monthly income of more than 10,000 pesos. According to researchers at Centro de Investigación en Alimentación y Desarrollo (CIAD),58 people who can afford to cross the border (cost of the permit, transportation costs, proof of residence and other requirements) have higher incomes than the average households.
Therefore, in this study the lowest categories were aggregated as ‘under 10,000 pesos,’ while a number of categories on the high end were extended to gain a better understanding of our visitors. Visitors were asked to give monthly income in pesos, but income categories are presented throughout the report in both pesos and dollars. Income categories were converted to dollars using the average of the twelve monthly exchange rates for 2007-08.59
As shown in Table 11, 44.06 percent of all Mexican visitor parties have monthly household incomes under 10,000 pesos. The next largest group accounting for 36.32 percent of all visitors is in the category of 10,000 to 15,000 pesos a month. Thus, about 80 percent of all visitors have less than 15,000 pesos a month.60
Table 11Monthly Household Income Distribution, by Travel Mode (Percentages by row)
It is not surprising that air travelers have the highest incomes; 55.84 percent have incomes over 15,000 pesos a month. Less than 9 percent of all air travelers have incomes less than 10,000 pesos per month; close to 9 percent have incomes of more than 30,000 pesos per month. The two largest groups of air travelers earn 15,000 – 19,999 pesos per month (35.92 percent) and 20,000 – 29,999 pesos per month (28.98 percent).
Pedestrians show the lowest incomes of the three modes, as expected. The highest frequency of pedestrians’ incomes is in the under 10,000 peso category (47.2 percent). Another 33.82 percent have incomes between 10,000 and 15,000 pesos monthly. Less than 5 percent have incomes higher than 20,000 pesos.
Among Mexican visitors entering the United States in motor vehicles, the largest group (41.67 percent) has monthly income of less than 10,000 pesos. The next largest group accounting for 38.25 percent of visitors
Table 11Monthly Income Distribution, by Travel Mode(Percentages by row)
Income Categories (Pesos)Under $10,000- $15,000- $20,000- $30,000- $40,000 $50,000- $80,000
$10,000 $14,999 $19,999 $29,999 $39,999 $49,999 $79,999 or overIncome Categories (Dollars)
Under $929- $1,394- $1,860- $2,788- $3,717- $4,647- $7,435-Travel Mode $929 $1,393 $1,859 $2,787 $3,716 $4,646 $7,434 or over SumMotor Vehicle 41.67 38.25 13.27 5.48 1.07 0.22 0.05 - 100.00 Pedestrian 47.20 33.82 14.66 4.04 0.07 - 0.10 0.10 100.00 Air 8.24 35.92 28.98 18.19 4.91 2.16 0.96 0.64 100.00
All Modes 44.06 36.32 13.89 4.86 0.64 0.12 0.07 0.04 100.00
Source: Mexican Visitor Survey, 2007-08
IV. Characteristics of Mexican Visitors to Arizona

Mexican Visitors to Arizona, 2007-08
22The University of Arizona Eller College of Management
entering in motor vehicles is in the category of 10,000 to 15,000 pesos a month. Thus, close to 80 percent of all visitors entering by car have less than 15,000 pesos a month. About 13 percent have incomes of more than 15,000 but less than 20,000 pesos a month, while less than 7 percent have incomes of over 20,000 pesos.
The monthly income distribution of Mexican visitors in Table 12 shows some interesting differences across ports of entry.
Table 12Monthly Household Income Distribution, by Travel Port of Entry (Percentages by column)
The highest percent of visitors through Naco, Sasabe and Lukeville are in the lower income category of less than 10,000 pesos per month; 54.31 percent at Naco, 53.19 percent at Sasabe and 51.68 percent at Lukeville.
As expected, visitors through Phoenix and Tucson airports have higher monthly incomes; 56.05 percent of air travelers to Phoenix and 54.65 percent of air travelers to Tucson have monthly incomes of 15,000 pesos or more.
Reasons for Visiting
Among all visitor parties, 63.94 percent enter into Arizona primarily for leisure purposes (Table 13). The largest leisure segment is personal shopping (57.44 percent of all visitors). Visiting friends and relatives is the primary reason for 5.81 percent of all visiting parties.
Business reasons account for 36.06 percent of Mexican visitors. The bulk of those are workers, listed under “other” business reasons (35.19 percent). Business related reasons, such as business shopping, training, and attending convention, account for less than one percent.
Table 13Reason for Visit, by Travel Mode (Percentages)
Table 12Monthly Income Distribution, by Port of Entry(Percentages by column)
Income Categories (Pesos)Under $10,000- $15,000- $20,000- $30,000- $40,000 $50,000- $80,000
$10,000 $14,999 $19,999 $29,999 $39,999 $49,999 $79,999 or overIncome Categories (Dollars)
Under $929- $1,394- $1,860- $2,788- $3,717- $4,647- $7,435-Port of Entry $929 $1,393 $1,859 $2,787 $3,716 $4,646 $7,434 or over SumDouglas 45.71 36.24 13.02 3.27 0.89 0.30 0.29 0.29 100.00Lukeville 51.68 26.47 16.41 4.67 0.78 - - - 100.00Naco 54.31 36.20 7.04 2.46 - - - - 100.00Nogales 44.30 37.12 13.94 3.74 0.70 0.14 0.05 - 100.00San Luis 40.92 35.11 14.99 8.58 0.40 - - - 100.00Sasabe 53.19 39.36 7.45 - - - - - 100.00Phoenix Airport 8.73 35.27 30.55 17.82 4.00 1.82 1.09 0.73 100.00Tucson Airport 4.65 40.70 17.44 20.93 11.63 4.65 - - 100.00All Vistor 44.06 36.32 13.89 4.86 0.64 0.12 0.07 0.04 100.00
Source: Mexican Visitor Survey, 2007-08
Table 13Reason for Visit, by Travel Mode(Percentages)
Leisure Reason for VisitLeisure Leisure Leisure Leisure Leisure Leisure
Travel Mode Health Vacation Friends/Relatives Shopping Other AllMotor Vehicle 0.25 0.28 7.16 63.62 0.48 71.79 Pedestrian - 0.18 4.10 49.91 0.10 54.29 Air 1.02 2.40 27.59 40.75 1.25 73.01 Total 0.14 0.24 5.81 57.44 0.31 63.94
Business Reason for VisitBusiness Business Business Business Business Bus & Leisure
Travel Mode Convention Training Shopping Other All SumMotor Vehicle 0.07 0.04 1.17 26.93 28.21 100.00Pedestrian - - 0.32 45.39 45.71 100.00Air 15.75 6.25 1.15 3.85 27.00 100.00Total 0.05 0.03 0.79 35.19 36.06 100.00
Source: Mexican Visitor Survey, 2007-08
IV. Characteristics of Mexican Visitors to Arizona

Mexican Visitors to Arizona, 2007-08
23The University of Arizona Eller College of Management
As expected, there are differences when travel mode is considered. Air travelers are the most likely to cite leisure reasons for traveling (73.01 percent) and pedestrians are the least likely to cross for leisure purposes (54.29 percent). For 63.64 percent of visitor parties arriving by car, shopping is the primary reason, compared for 49.91 percent among pedestrians. Air travelers are the most likely to list visiting friends and relatives as the primary reason for visiting (27.59 percent).
Mexican visitors, in general, are less likely to list business as reason for travel. Pedestrians are the most likely to come for “other” business reasons (i.e., work, 45.39 percent) than travelers arriving by motor vehicle or air. Of motor vehicle travelers, 28.21 percent come for business reasons (mostly for work). Among air travelers, 27 percent come for business, but most of them are to attend conventions (15.75 percent) or to receive training (6.25 percent).
The reason for the visit also varies by port (Table 14). Border crossers entering through Nogales and San Luis have the highest percentages of parties entering Arizona for “other” business reasons including work (over 40 percent). Among those entering through smaller ports – Sasabe, Naco and Lukeville – shopping is the primary reason (for about 70 percent and more parties).
Table 14Reason for Visit, by Port of Entry (Percentages)
For visitors traveling by air, 39.95 percent of those using the Phoenix airport and 46.67 percent of those using the Tucson airport, shopping is the primary reason. Visiting friends and relatives is also a more important reason for visiting Arizona for those arriving through Phoenix and Tucson airports than those crossing at border ports of entry.
The Phoenix airport has the highest percent of leisure visitors coming to Arizona for medical reasons, although this percentage is only about one percent. Less than one percent among Tucson air travelers comes for medical reasons; 0.55 percent in Douglas and 0.11 percent in Nogales. Compared to the 2001 study, smaller percentages of visitors now seem to come for medical reasons.
In comparison with 2001, shopping and visiting friends and relatives have declined, but this seems to be primarily a result of an increase in the portion identified as workers in 2007-08. However, it is not believed that the portion of workers has increased since 2001; rather a more focused effort was used to identify them.
Table 14Reason for Visit, by Port of Entry(Percentages)
Leisure Reason for VisitLeisure Leisure Leisure Leisure Leisure Leisure
Port of Entry Health Vacation Friends/Relatives Shopping Other All Douglas 0.55 0.82 8.14 79.42 1.09 90.02 Lukeville - - 14.05 69.19 3.37 86.61 Naco - - 14.55 80.09 - 94.64 Nogales 0.11 0.22 4.79 53.89 0.15 59.16 San Luis - - 5.27 50.45 0.11 55.83 Sasabe - - 15.13 76.47 0.84 92.44 Phoenix Airport 1.04 2.61 27.15 39.95 1.31 72.06 Tucson Airport 0.83 0.83 30.83 46.67 0.83 79.99 Total 0.14 0.24 5.81 57.44 0.31 63.94
Business Reason for VisitBusiness Business Business Business Business Bus & Leisure
Port of Entry Convention Training Shopping Other All SumDouglas 0.27 - 2.18 7.54 9.99 100.00 Lukeville - - 1.33 12.06 13.39 100.00 Naco - - - 5.36 5.36 100.00 Nogales - 0.04 0.64 40.15 40.83 100.00 San Luis - - 0.42 43.75 44.17 100.00 Sasabe - - 0.84 6.72 7.56 100.00 Phoenix Airport 16.19 6.53 1.31 3.92 27.95 100.00 Tucson Airport 12.50 4.17 - 3.33 20.00 100.00 Total 0.05 0.03 0.79 35.19 36.06 100.00
Source: Mexican Visitor Survey, 2007-08
IV. Characteristics of Mexican Visitors to Arizona

Mexican Visitors to Arizona, 2007-08
24The University of Arizona Eller College of Management
The reason for visit determines, in part, length of stay (Table 15). Visitors who spend the night are likely to have come for leisure purposes (83.92 percent). The most likely leisure reason is shopping for overnight visitors (75.21 percent). Shopping is also the most important leisure reason for day visitors (54.11 percent), but only 60.19 percent of all day visitors come for leisure reasons.
Day visitors are more likely to come for business reasons (39.80 percent), primarily for work, than overnight visitors. Relatively few overnight visitors come for business (16.09 percent).
Table 15Reason for Visit, by Type of Visitor (Percentages)
The computed numbers of nights spent, by travel mode, by reason for visit, are presented in Table 16. The table presents the number of nights, by reason, by mode, for all visitors and for overnight visitors separately. The number of nights for all visitors averages in zero nights for day visitors so most of the entries in the upper portion of the table are much smaller than those in the lower portion. Because almost all air travelers are also overnight visitors, the two rows for air travelers are almost identical.
Table 16Number of NIghts, by Reason for Visit, by Travel Mode, for ALL Visitors and Overnight Visitors (Averages)
Pedestrians make almost all day trips, but for those who spend the night, they stay approximately two nights if the primary reason is visiting friends and relatives or shopping. Overnight Air travelers spend the most nights in Arizona if they are on vacation or visiting family (7.88 and 7.75 nights, respectively). Other leisure reasons, business shopping, medical purposes, and business convention also result in relatively long stays of air travelers (6.02, 5.6, 5.35 and 4.52 nights, respectively). Air travelers on “other” business travel spend an average of 19.27 nights in Arizona. This figure is skewed upward because a) there are very few observations in this group and b) among those were a couple who stayed for long periods of time (months).
Table 15Reason for Visit, by Length of Stay(Percentages)
Leisure Reason for VisitLeisure Leisure Leisure Leisure Leisure Leisure
Type of Visitor Health Vacation Friends/Relatives Shopping Other AllOvernight Visitors 0.01 0.78 7.90 75.21 0.02 83.92 Day Visitors 0.16 0.14 5.42 54.11 0.36 60.19 Total 0.14 0.24 5.81 57.44 0.31 63.94
Business Reason for VisitBusiness Business Business Business Business Bus & Leisure
Type of Visitor Convention Training Shopping Other All SumOvernight Visitors 0.10 0.04 0.39 15.56 16.09 100.00 Day Visitors 0.04 0.03 0.86 38.87 39.80 100.00 Total 0.05 0.03 0.79 35.19 36.06 100.00
Source: Mexican Visitor Survey, 2007-08
Table 16Number of Nights, by Reason for Visit, by Travel Mode, for All Visitors and Overnight Visitors(Averages)
All Visitors, by Travel Mode, by Reason (number of nights)
Leisure Leisure Leisure Leisure Leisure Leisure Business Business Business Business BusinessTravel Mode Health Vacation Friends/ Relatives Shopping Other All Convention Training Shopping Other All
Motor Vehicle - 1.71 0.69 0.71 0.05 0.71 - - 0.22 0.19 0.19 Pedestrian - 2.50 0.44 0.30 - 0.31 - - - 0.93 0.93 Air 5.35 7.88 7.68 3.96 6.02 5.55 4.52 3.75 5.60 19.27 5.43
All Parties 0.04 2.04 0.64 0.55 0.07 0.56 1.31 0.84 0.19 0.63 0.28
Overnight Visitors, by Travel Mode, by Reason (number of nights)
Leisure Leisure Leisure Leisure Leisure Leisure Business Business Business Business BusinessTravel Mode Health Vacation Friends/ Relatives Shopping Other All Convention Training Shopping Other All
Motor Vehicle - 3.32 3.11 2.86 6.00 2.89 - - 2.31 3.81 3.70 Pedestrian - 5.00 2.37 2.14 - 2.19 - - - 4.19 4.19 Air 5.35 7.88 7.75 3.96 6.02 5.57 4.52 4.05 5.60 19.27 5.53
All Parties 5.35 3.96 3.00 2.68 6.01 2.72 4.52 4.05 2.37 4.08 4.04
Source: Mexican Visitor Survey, 2007-08
IV. Characteristics of Mexican Visitors to Arizona

Mexican Visitors to Arizona, 2007-08
25The University of Arizona Eller College of Management
Occupations and Economic Sectors
In previous studies, the respondents were asked to state their occupation, which proved to be difficult to classify because they would give a mix of occupation and employment sector. For example, they may say ‘factory worker,’ but not say in what type of industry they worked. Similarly, a respondent may have said ‘city worker,’ but did not state his or her actual occupation.
In this study respondents were asked to provide information about both occupation and economic sector. Table 17 provides a breakdown of primary household occupations, by mode of entry.
The ten most prevalent occupations among all visitors are: agricultural worker/fisherman, business owner/self employed, waiter/waitress, factory manager/supervisor, secretary/receptionist, factory worker, construction worker/builder/contractor, cashier, cleaner, and chef/cook. Together, these reported occupations comprise 68.6 percent of all visitors. Among pedestrians, these occupations comprise 73.8 percent of all crossers.
Among visitors entering by motor vehicles the two largest groups are business owners/self-employed (14.21 percent) and agricultural workers (11.57 percent). The remaining top ten occupations include waiter/waitress, factory manager/supervisor, secretary/receptionist, construction builder/worker/contractor, cashier, cleaner, teacher, and factory worker. These ten occupations comprise 67.5 percent of car travelers.
Air travelers were most likely to be professionals, proprietors, or skilled workers. The ten most common occupations are: business owner/self employed (17.02 percent), engineer (14.18 percent), medical occupation (nurse, medical or dental assistant, doctor, dentist; 11.34 percent), and secretary/receptionist (10.79 percent). The remaining top ten cited occupations include architect, construction contractor/builder, factory manager/supervisor, lawyer and sales representative. More than 87 percent of air passengers were in one of these ten occupations.
IV. Characteristics of Mexican Visitors to Arizona

Mexican Visitors to Arizona, 2007-08
26The University of Arizona Eller College of Management
Table 17Reported Occupations of Mexican Visitors to Arizona (Percentages)
Table 17Reported Occupations of Mexican Visitors to Arizona(Percentages)
Vehicle Air AllOccupation Passengers Pedestrians Passengers ModesBusiness owner/self-employed 14.21 2.17 17.20 8.96 Accountant 0.49 0.90 1.17 0.67 Architect 1.05 0.42 6.06 0.78 Administrator/Executive 0.10 - 0.56 0.06 Administrative Assistant - 0.24 - 0.11 Agricultural worker 11.57 21.14 0.39 15.73 Bank teller/manager/emp 2.27 1.03 - 1.73 Bartender 0.43 0.79 - 0.59 Beautician/aestetician/barber 3.22 1.14 0.17 2.31 Cashier 4.23 4.07 - 4.16 Cattleman/rancher 1.22 0.97 - 1.11 Cattle/ranch worker 1.93 1.11 0.39 1.57 Chef, cook 2.50 4.39 0.39 3.32 Childcare worker 0.18 0.31 0.39 0.23 Church pastor/priest 0.10 - 0.39 0.06 Cleaner 3.83 3.50 - 3.68 Clerk in store 1.13 4.04 - 2.40 Computer programmer, tech, systems 0.46 0.52 0.39 0.49 Construction worker/builder/contractor 4.81 4.53 5.22 4.69 Doctor/Dentist 0.39 0.17 10.79 0.30 Driver, cab, bus 1.44 3.88 - 2.50 Engineer 3.42 1.90 14.18 2.77 Factory worker 3.43 6.88 - 4.93 Factory manager/supervisor 7.21 9.34 5.17 8.14 Government worker 0.63 0.72 1.56 0.67 Hotel manager 0.02 0.13 - 0.07 Hotel receptionist 0.23 - - 0.13 Lawyer 2.36 - 5.01 1.33 Legal Assistant 0.11 0.13 - 0.12 Maintenance/Repair worker 0.10 - - 0.06 Manager 0.88 0.42 3.45 0.68 Manager, Assistant 0.27 - - 0.15 Mechanic, Airplane 2.58 3.80 0.78 3.11 Miner - 0.13 - 0.06 Nurse/Med Asst/Dental Asst 2.69 1.56 11.34 2.21 Phorographer 0.16 - - 0.09 Police officer/Security 0.89 0.79 0.39 0.84 Salesperson/Sales Rep 1.16 2.54 4.00 1.76 Secretary/Receptionist 6.64 7.00 8.29 6.80 Social Worker 0.11 - - 0.06 Teacher 3.65 0.35 2.33 2.21 Waiter/Waitress 7.89 8.50 - 8.15 Welder 0.01 0.49 - 0.22
100.00 100.00 100.00 100.00
Source: Mexican Visitor Survey, 2007-08
IV. Characteristics of Mexican Visitors to Arizona

Mexican Visitors to Arizona, 2007-08
27The University of Arizona Eller College of Management
Table 18 Economic Sectors in which Mexican Visitors are Employed (Percentages)
Table 18 shows economic sectors in which Mexican visitors’ households earn their incomes. Agriculture/ranching, restaurants/bars, and manufacturing account for 57.39 percent of economic activity. As expected, visitors arriving by air are primarily associated with medical and professional services sectors.
Origin of Visitors
Table 19 and Figure 7 provide the states and cities from which Mexican visitors originate. Close to 99 percent of all Mexican visitors to Arizona are from the neighboring state of Sonora. Small percentages of visitors originate in states adjacent to Sonora: Baja California (0.89 percent), Sinaloa (0.10 percent) and 0.10 percent all other. Although small in terms of percentages (too small to be shown in the summary table), visitors to Arizona also come from Mexico City/D.F. (0.02 percent), Nuevo León (0.01 percent), and Yucatan (0.01 percent).
Figure 7 Origin of Mexican Visitors to Arizona, by State
Table 18Economic Sectors in which Mexican Visitors are Employed(Percentages)
Vehicle Air AllEconomic Sector of Employment Passengers Pedestrians Passengers ModesAgriculture/Ranching 21.06 28.90 1.98 24.78 Mining - 0.16 - 0.08 Construction 7.21 6.12 8.88 6.69 Manufacturing 12.75 18.60 6.61 15.53 Financial/Banking/Real Estate 3.36 1.26 1.89 2.36 Transportation/ Communications 2.06 5.53 3.30 3.71 Hospitality/Tourism 0.52 0.67 0.66 0.59 Retail/Wholesale 9.40 8.03 7.47 8.74 Restaurant/Bars 18.11 15.97 2.64 17.08 Medical Services 4.53 2.32 38.28 3.50 Beauty Salon/Barber Services 5.25 1.39 1.52 3.41 Personal Services except Beauty 5.35 4.65 0.66 5.01 Repair Services 4.10 4.63 2.64 4.35 Professional Services 5.85 1.77 21.48 3.92 Rental Services - - 1.32 0.00 Non-profit/Religious 0.15 - 0.66 0.08 Government/Security 0.31 - - 0.16
100.00 100.00 100.00 100.00
Source: Mexican Visitor Survey, 2007-08
Origin of Visitors to Arizona (%)
Sonora98.91%
Baja California0.89%
Other0.10%
Sinaloa0.10%
Baja California Sinaloa Sonora Other
IV. Characteristics of Mexican Visitors to Arizona

Mexican Visitors to Arizona, 2007-08
28The University of Arizona Eller College of Management
Table 19Origin of Visitors and Monthly Income, by Place of Residence (Percentages)
The three largest border cities in Sonora -- Nogales, San Luis Rio Colorado and Agua Prieta – generate the bulk of visitors to Arizona; 46.9 percent are from Nogales, 24.1 percent are from San Luis Rio Colorado and 13.37 from Agua Prieta. About 4.46 percent originate from the other three Sonoran border communities, – Naco, Sonoita and Sasabe combined, and the remaining 7.41 percent from other towns near the border such as Magdalena, Caborca, Imuris, Santa Ana, Cibuta, Cananea, and Cumpas (Figure 8).
Figure 8 Origins of All Visitors to Arizona, by City
Visitors to Arizona, by City of origin (%)
Imuris, 1.56
Magdalena, 2.45
Naco, 3.11
Nogales, 46.90
Puerto Penasco, 0.08
San Luis RC, 24.10
Mexicali, 0.61
Hermosillo, 1.32
Caborca, 0.15Sasabe, 0.17
Santa Ana, 0.76
Sonoita, 1.19Agua Prieta, 13.37
Cananea, 0.93
Cibuta, 0.62
Cumpas, 0.76
Esqueda, 0.18Guaymas, 0.30
Table 19Origin of Visitors and Monthly Income by Place of Residence(Percentages)
Income Categories (Pesos)Under $10,000- $15,000- $20,000- $30,000- $40,000 $50,000- $80,000
$10,000 $14,999 $19,999 $29,999 $39,999 $49,999 $79,999 or overIncome Categories (Dollars)
Percent of Under $929- $1,394- $1,860- $2,788- $3,717- $4,647- $7,435-Place of Residence Visitor Parties $929 $1,393 $1,859 $2,787 $3,716 $4,646 $7,434 or over SumState in MexicoBaja California 0.89 3.95 30.25 53.95 11.85 - - - - 100.00 Sinaloa 0.10 0.79 0.72 24.66 48.34 0.60 24.89 - - 100.00 Sonora 98.91 44.64 36.48 13.49 4.54 0.64 0.10 0.07 0.04 100.00 Other 0.10 5.43 17.44 61.66 10.98 2.09 1.33 0.53 0.53 100.00
100.00
City in MexicoAgua Prieta 13.37 49.51 36.82 9.92 1.72 1.03 0.34 0.33 0.33 100.00 Caborca 0.15 1.76 15.67 42.94 39.63 - - - - 100.00 Cananea 0.93 7.55 27.39 50.18 14.88 - - - - 100.00 Cibuta 0.62 63.60 36.40 - - - - - - 100.00 Cumpas 0.76 39.81 48.07 6.06 6.06 - - - - 100.00 Esqueda 0.18 25.00 25.00 25.00 25.00 - - - - 100.00 Guaymas 0.30 - 57.78 33.77 - 8.44 - - - 100.00 Hermosillo 1.32 5.72 16.11 35.09 27.40 13.70 1.96 0.02 - 100.00 Imuris 1.56 31.84 53.30 11.55 3.30 - - - - 100.00 Magdalena 2.45 7.09 47.25 35.16 8.39 2.10 - - - 100.00 Mexicali 0.61 - 27.20 55.70 17.10 - - - - 100.00 Naco 3.11 54.13 36.63 6.84 2.39 - - - - 100.00 Nogales 46.90 48.99 36.77 11.74 2.34 0.16 - - - 100.00 Puerto Penasco 0.08 - 50.00 37.50 - 12.50 - - - 100.00 San Luis RC 24.10 42.45 35.27 13.59 8.27 0.42 - - - 100.00 Santa Ana 0.76 13.21 53.10 26.95 6.74 - - - - 100.00 Sasabe 0.17 65.63 29.69 4.69 - - - - - 100.00 Sonoita 1.19 57.12 25.34 13.17 4.37 - - - - 100.00 SUM 98.56
Source: Mexican Visitor Survey, 2007-08
IV. Characteristics of Mexican Visitors to Arizona

Mexican Visitors to Arizona, 2007-08
29The University of Arizona Eller College of Management
Hermosillo, Sonora’s capital and the largest city, is the origin of 1.32 percent of all Mexican visitors to Arizona. The two other large cities located further south away from the border, Guaymas and Puerto Peñasco, contribute 0.3 and 0.08 percent of all Mexican visitors to Arizona.
Table 19 also shows visitors by origin and monthly income. Visitors from Sinaloa, have by far the highest incomes. More than 73 percent of all Sinaloa visitors have monthly incomes above 20,000 pesos.
As expected, visitors from border- and near-border localities have lower income distribution than visitors that have to travel longer distances to the border. Generally, this pattern holds. This is especially true for visitors from smaller towns, such as Altar, Cibuta, Sonoita and Sasabe, where more than 60 percent of border crossers have monthly household incomes of less than 10,000 pesos. Of all visitors from the three largest border cities -- Nogales, San Luis Rio Colorado and Agua Prieta –between 40 and 50 percent have monthly household incomes of less than 10,000. In comparison, more than 76 percent of visitors from Hermosillo have monthly incomes above 15,000 pesos.
The origin of overnight visitors is in Figure 9. As expected, the percentages of overnight visitors coming from the three major Sonoran border communities – Nogales, San Luis RC, and Agua Prieta - while still the largest are substantially smaller than the percentages of all visitors shown in Table 7. Overnight visitors tend to come from further south of the border. “Other” originating cities include: Puerto Penasco, 0.49 percent; Obregon, 0.40 percent; Sasabe, 0.39 percent; Altar, Culiacan, and Bahia de Kino, each at approximately 0.30 percent; Moctezuma, Saric and Mexico City, each at approximately 0.20 percent; Los Michis and Navajoa at approximately 0.15 percent; and Merida and Monterrey, each under 0.10 percent; and Acapulco and Guadalajara, each 0.03 percent.
IV. Characteristics of Mexican Visitors to Arizona

Mexican Visitors to Arizona, 2007-08
30The University of Arizona Eller College of Management
Figure 9 Origins of Overnight Visitors to Arizona, by City
0 2 4 6 8 10 12 14 16 18 20
Acapulco
Guadalajara
Monterrey
Merida
Navojoa
Los Mochis
MexicoCity
Saric
Moctezuma
Bahia de Kino
Culiacan
Altar
Sasabe
Obregon
Puerto Penasco
Ures
Caborca
Esqueda
Sonoita
Cibuta
Algodones
Guaymas
Naco
Santa Ana
Mexicali
Cumpas
Cananea
Imuris
Hermosillo
SanLuis
Magdalena
Agua Prieta
San Luis RC
Nogales
Percent
IV. Characteristics of Mexican Visitors to Arizona
Source: Mexican Visitor Survey, 2007-08

Mexican Visitors to Arizona, 2007-08
31The University of Arizona Eller College of Management
Characteristics of Mexican Visitors to Arizona’s Major Destinations
The previous sections presented and discussed characteristics of Mexican visitors by port of entry (i.e., by port of exit) regardless of what was their final destination in Arizona. In this section characteristics of Mexican visitors are developed for six major destinations: Nogales, Douglas, San Luis, Yuma, metro Phoenix and metro Tucson. The original questionnaire asked all respondents which Arizona cities they visited. While visitors knew the names of border communities, majority of them could not identify individual cities within the two major metropolitan areas. Even though Phoenix metropolitan visitors could name specific malls scattered throughout the area, very few visitors identified any of the more than 20 cities other than “Phoenix.”
Table 20 Reasons for Visit, by Destination (Percentages)
Reasons for visit by destination city are shown in Table 20. Leisure is the primary reason for visiting for between 45.8 percent and 98.9 percent of all visitors, depending on the destination. Almost all visitors to the metro Phoenix and Tucson areas are leisure visitors (98.9 percent and 92.6, respectively). Visiting friends and relatives is often more important reason given by Mexican visitors to the Phoenix area (11.3 percent) and Metro Tucson area (9.0 percent). Shopping is the primary reason for visit between 50.3 and 82.6 percent of Mexican visitors to all destination cities, except Yuma. For visitors to Yuma, shopping is less important, representing the primary reasons for 41 percent of those visiting the Yuma area.
Business is cited by between 1.12 percent and 54.2 percent of visitors to Arizona. Most of these visitors are workers in Nogales, San Luis and Yuma. Business shopping is the primary reason for less than 1 percent in all destination cities.
Table 21 presents the number of parties visiting each destination area, party size, and length of stay.
Table 20Reasons for Visit, by Destination(Percentages)
Leisure Reason for VisitLeisure Leisure Leisure Leisure Leisure Leisure
Destination Health Vacation Friends/Relatives Shopping Other AllDouglas 0.36 0.72 8.21 79.18 1.43 89.90 Nogales 0.13 0.17 4.23 50.32 0.17 55.02 Metro Phoenix 0.02 0.05 11.26 87.46 0.08 98.87 San Luis - - 5.28 54.51 0.23 60.02 Metro Tucson - 1.02 8.99 82.58 - 92.59 Yuma - - 4.79 41.01 - 45.80
Business Reason for VisitBusiness Business Business Business Business Bus & Leisure
Destination Convention Training Shopping Other All SumDouglas 0.36 - 0.36 9.39 10.11 100.00 Nogales - 0.04 0.64 44.31 44.99 100.00 Metro Phoenix 0.32 0.13 0.01 0.66 1.12 100.00 San Luis - - 0.20 39.78 39.98 100.00 Metro Tucson 0.02 0.01 0.67 6.71 7.41 100.00 Yuma - - 0.76 53.44 54.20 100.00
Source: Mexican Visitor Survey, 2007-08
IV. Characteristics of Mexican Visitors to Arizona

Mexican Visitors to Arizona, 2007-08
32The University of Arizona Eller College of Management
Table 21 Party Characteristics and Length of Stay, by Destination
Metro Tucson’s 1 million visitor parties and metro Phoenix 0.54 million visitor parties come in relatively large parties, with 2.68 and 2.78 persons per party, respectively. These parties are larger than those who stay in border cities. This may not be surprising; for Mexican visitors coming further north the trip may represent more of a family trip and thus is reflected in larger party sizes for non-border cities.
The longer the trip and the more expensive the trip, the longer the visitor party is expected to stay at the destination city. This is shown clearly in Table 21. Close to 99 percent of visitors to metro Phoenix and more than 87 percent of visitors in metro Tucson spend at least one night there. Average length of stay is 3.27 nights for visitors to metro Phoenix and 2.55 nights in metro Tucson. The comparison with the 2001 study suggests that overall the percentage of those visitors who spent the night has increased, and with the exception of metro Phoenix, the length of stay increased as well.
Table 21Party Characteristics and Length of Stay, by Destination Area
Average PercentNumber of Party Length of Stayed 1 or
Destination Parties Size Stay (nights) More NightsDouglas 1,422,253 1.61 0.07 3.86 Nogales 6,588,778 1.44 0.08 3.86 Metro Phoenix 537,649 2.78 3.27 98.69 San Luis 1,694,225 1.58 0.73 4.71 Metro Tucson 1,008,176 2.68 2.55 87.52 Yuma 1,492,647 1.78 0.90 12.58
Source: Mexican Visitor Survey, 2007-08
IV. Characteristics of Mexican Visitors to Arizona

Mexican Visitors to Arizona, 2007-08
33The University of Arizona Eller College of Management
V. Travel Behavior in Major DestinationsThis section provides a snapshot of Mexican visitors in major Arizona destinations and information about shopping behavior and attractions visited. In the first part of this section shopping destinations are identified for each major destination, including Phoenix and Tucson metro areas, Yuma and border communities of San Luis, Nogales, Douglas, and Lukeville. Detailed account of attractions visited is provided for Phoenix and Tucson metro areas.
The second part of this section provides insight into how Mexican visitors learn about shopping and attraction destinations. One of the major changes in comparison to previous studies is the use of new technology – Internet. However, the majority of visitors use the information obtained through friends and relatives.
Throughout the section differences between visitors arriving by air, by car or as pedestrians, are highlighted. These differences are helpful in designing appropriate marketing strategies.
Phoenix Metro Area Visitors Of the Mexican visitors who travel to metro Phoenix, 98.87 percent come for leisure reasons, primarily for shopping and visiting friends and relatives. They travel in parties of 2.78 persons and stay an average of 3.27 nights. Of all visitors to metro Phoenix, almost all (98.69) spend the night. According to survey data, 4.39 percent of parties crossing at Nogales continue to metro Phoenix, 4.08 percent of those crossing at Douglas, and 5.7 percent at San Luis. A relatively higher percentage of crossers at Lukeville (11.82 percent), Sasabe (11.71 percent) and Naco (7.96 percent) continue to metro Phoenix, but these are Arizona’s smallest border ports of entry, i.e., the absolute number of crossers is smaller.
Shopping Destinations in Metro Phoenix
As expected, there are differences in shopping destinations and attractions visited between visitors arriving by air and those arriving by car.
Table 22 presents shopping destinations of all Mexican visitors to the Phoenix metro area, as well as for those arriving by air and those arriving by car.
The most popular shopping destination among Mexican visitors arriving to Phoenix metro area by air is the Arizona Mills mall, which was visited by 87.20 percent of all visitors. Between 20 and 24 percent of Mexican visitors shop in one or all five of the following malls: Desert Sky Mall, Fiesta Mall, Arizona Center, Chandler Fashion Center, and Biltmore Fashion Park, followed by Superstition Springs Mall and Arrowhead Towne Center. At least one in ten Mexican visitors shopped in one (or all) of the following: Borgata at Scottsdale, Cabela’s, Scottsdale Fashion Square, Desert Ridge Marketplace, and IKEA. The Metrocenter Mall, and Paradise Valley Mall attracted between five and 10 percent of Mexican visitors each, followed closely by Kierland Commons. Less than one percent visited other shopping centers, while 0.53 percent indicated no shopping in any of the malls or shopping centers while visiting friends and relatives.
V. Travel Behavior in Major Destinations

Mexican Visitors to Arizona, 2007-08
34The University of Arizona Eller College of Management
Table 22 Where Mexican Visitors to Metro Phoenix Shopped (percent of parties)
Table 22Where Mexican Visitors to Metro Phoenix Shopped(% of parties)
Malls All parties Air travelers Car travelersArizona Mills 86.68 87.20 85.64Desert Sky Mall 17.94 23.47 6.91Fiesta Mall 18.12 22.40 9.57Arizona Center 15.99 20.80 6.38Chandler Fashion Center 17.05 20.27 10.64Biltmore Fashion Park 16.16 20.00 8.51Superstition Springs Mall 14.92 18.13 8.51Arrowhead Towne Center 12.61 17.07 3.72Borgata at Scottsdale 11.19 14.13 5.32Cabela's 10.12 12.27 5.85Scottsdale Fashion Square 8.17 10.67 3.19Desert Ridge Marketplace 8.17 10.40 3.72IKEA 12.61 10.13 17.55Metrocenter Mall 14.21 9.33 23.94Paradise Valley Mall 5.15 6.40 2.66Kierland Commons 3.73 4.53 2.13Other 0.36 0.53 0.00
Non-mall Stores All parties Air travelers Car travelersWal-Mart 33.04 24.53 50.00Best Buy 21.49 21.87 20.74Costo 22.38 19.47 28.19Target 18.83 14.67 27.13Circuit City 8.88 11.20 4.26Walgreens 14.03 8.80 24.47Mervyn's 12.97 8.53 21.81Ross 14.39 6.40 30.32K-Mart 5.51 5.07 6.38Marshall's 6.93 4.80 11.17Sam's Club 2.84 3.73 1.06Home Depot 3.73 2.67 5.85Lowe's 2.13 1.87 2.66Food City 1.60 1.87 1.06TJ Maxx 1.07 1.33 0.53Jared's 0.71 1.07 0.00Fry's 2.49 1.07 5.32Albertson's 0.53 0.80 0.00Rancho Market 0.36 0.53 0.00Osco 0.53 0.27 1.067 Eleven 0.18 0.27 0.00Safeway 0.18 0.27 0.00Payless 0.18 0.27 0.00Kohl's 0.18 0.27 0.00Office Depot 0.18 0.27 0.00Auto Zone 0.36 0.27 0.53Checker Auto 0.18 0.27 0.00Other 0.53 0.27 1.06
Source: Mexican Visitor Survey, 2007-08
V. Travel Behavior in Major Destinations

Mexican Visitors to Arizona, 2007-08
35The University of Arizona Eller College of Management
Among the non-mall stores, Wal-Mart is the most popular with 24.53 percent of Mexican visitors shopping there. It is followed by Best Buy where 21.87 percent of Mexican visitors shop and Costco with 19.47 percent. Between 10 and 15 percent of Mexican visitors shop at Target and/or Circuit City. Next come stores like Walgreens, Mervyn’s, Ross and K-Mart with 5 to 9 percent of all Mexican visitors shopping there. Between one and five percent of all Mexican visitors shop at stores such as Marshall’s, Sam’s Club, Home Depot, Lowe’s, Food City, TJ Maxx, Jared’s and Fry’s.
Less than one percent of Mexican visitors shop in other stores in the Phoenix metro area, among which are Albertson’s, Rancho Market, Osco, 7 Eleven, Safeway, Payless Shoes, Kohl’s, Office Depot, Auto Zone, Checker Auto, and used clothing stores.
The most popular shopping destination among Mexican visitors traveling to Phoenix metro area by car is the Arizona Mills mall, which was visited by 85.64 percent of all visitors. The Metrocenter is the second most popular shopping destination, although with 23.94 percent, it is far behind Arizona Mills. IKEA and Chandler Fashion Square attract between 10 and 20 percent of Mexican car travelers. Other shopping centers, including Fiesta Mall, Biltmore Fashion Park, Superstition Springs Mall, Desert Sky Mall, Arizona Center, Cabela’s, and Borgata at Scottsdale, each attracted between five and 10 percent Mexican visitors traveling by car. Between two and five percent shop at Arrowhead Towne Center, Desert Ridge Marketplace, Scottsdale Fashion Square, Paradise Valley Mall, and/or Kierland Commons.
Among the non-mall stores (Table 22), Wal-Mart is the most popular among car travelers with 50 percent of Mexican visitors shopping there. It is followed by Ross with 30.32 percent shopping there. Between 20 and 30 percent shop in one or all of the following stores: Costco, Target, Walgreens, Mervyn’s and Best Buy. About 10 percent shop at Marshall’s.
Between one and 10 percent shop at K-Mart, Home Depot, Fry’s, Circuit City, Lowe’s, Osco, Sam’s Club, and Food City. Less than one percent of Mexican visitors shop in other stores in the Phoenix area, such as TJ Maxx, Toys R Us, and Auto Zone.
Attractions Visited in Metro Phoenix
Table 23 presents survey results regarding which attractions in the Phoenix metro area were popular with Mexican visitors. It shows the overall popularity, as well as the differences between visitors arriving by air and those arriving by car.
Table 23Metro Phoenix Attractions Attended by Mexican Visitors (percent of parties)
Table 23Metro Phoenix Attractions Attended by Mexican Visitors(% of parties)
Attraction All parties Air travelers Car travelersCasino 22.74 25.07 18.09Zoo 13.50 12.80 14.89Museum 6.75 8.00 4.26Tempe Town Lake 2.49 3.20 1.06Downtown 2.13 2.93 0.53West World Scottsdale 2.13 2.40 1.6IMAX 1.24 1.87 0Arizona Temple 0.89 1.07 0.53Concert/Theater 1.24 1.07 1.06Events/Sports 1.07 1.07 0Science Center 0.18 0.27 0University Art Center 0.18 0.27 0South Mountain 0.36 0.27 0Water Park 0.18 0.27 0Other 0.71 0.00 0.53
Source: Mexican Visitor Survey, 2007-08
V. Travel Behavior in Major Destinations

Mexican Visitors to Arizona, 2007-08
36The University of Arizona Eller College of Management
Phoenix area casinos are the most popular attraction for air travelers, with 25.07 percent of Mexican travelers visiting at least one casino. Gila River Casinos (with several locations) are the most popular attracting 19.73 percent of Mexican visitors. Other casinos, including Fort McDowell Casino, Harrah’s Ak-Chin casino, Casino Arizona and Vee Quiva Casino attracted less than one percent each.
Zoos were visited by 12.80 percent of Mexican visitors arriving by air, which makes them the second most popular type of attraction among Mexican visitors. About 8 percent mentioned visiting a museum, although no specifics were provided.
Between two and four percent of Mexican visitors attended one (or all) of the following attractions: Tempe Town Lake, Downtown Phoenix, and West World Scottsdale. IMAX and the Arizona Temple attracted between one and two percent each, as did concert/theater and sporting events.
About one percent attended sporting events, including a baseball game and/or a soccer game. Other Phoenix area attractions, such as South Mountain and a water park were visited by 0.27 percent each; approximately the same percentage visited the Science Center and/or the University Art Center.
Casinos are the most popular attraction among visitors to Phoenix metro area traveling by car, with 18.09 percent of them visiting at least one casino. Gila River Casinos (with several locations) are the most popular, attracting 15.43 percent of Mexican visitors. Less than 3 percent visited another casino, although no specific names were provided.
Close to 15 percent of Mexican car travelers indicated visiting a zoo; more than 10 percent specifically mentioned visiting the Phoenix Zoo. About 4.26 percent mentioned visiting a museum, although no specifics were provided.
Between one and three percent of Mexican visitors traveling by car visited one (or all) of the following attractions: West World Scottsdale, concert/theater event, and Tempe Town Lake.
Downtown Phoenix, the Arizona Temple, and South Mountain attracted less than one percent each of those that traveled by car.
V. Travel Behavior in Major Destinations

Mexican Visitors to Arizona, 2007-08
37The University of Arizona Eller College of Management
Tucson Metro Area Visitors The survey results have shown that visitors to metro Tucson arrive by car through each of the six border ports of entry as well as by air via Tucson and Phoenix airports. About 6.51 percent of visitor parties interviewed at Phoenix airport reported visiting the metro Tucson area.
Tucson is about 60 miles (100 kilometers) from the Nogales border port of entry (BPOE). Survey data suggest that more than 13 percent of parties coming through Nogales visit metro Tucson. Close to 13 percent of those crossing at Douglas BPOE, also visit metro Tucson. At San Luis BPOE, which is farthest away from the Tucson metro area, 6.97 percent of all parties continue to Tucson. The percentage of crossers who continue to Tucson is larger at Lukeville (15.45 percent) and Naco (17.70 percent), but these are relatively small border crossings. At Sasabe, the smallest of the Arizona-Sonora BPOE, more than 42 percent continue to the Tucson metro area.
Mexican visitors to the Tucson metro area travel in parties of 2.68 persons, on average, and spend an average of 2.55 nights. They come primarily for leisure reasons (92.59 percent), mainly for shopping and visiting friends and relatives. Most (87.52 percent) spend the night in the area when they visit.
As expected, there are differences between air travelers and car travelers in terms of shopping destinations and attractions visited.
Shopping Destinations in Metro Tucson
Table 24 presents data on shopping destinations in the Tucson metro area as captured in 2007-08 survey. It shows results for all visitors (regardless of mode of transportation or port-of-entry), and compares them to visitors arriving by air, and those traveling by car. The results include visitors surveyed at the Tucson airport as well as all other visitors who exited Arizona by car through one of the six border crossings or via Phoenix airport. A smaller number of Mexican visitors to metro Tucson crossed the border on foot; these include shoppers who used bus or shuttle services from border towns to metro Tucson; for simplicity, in the remaining text they are included under “car travelers.”
The Tucson Mall is the most popular shopping destination, with 72.56 percent of all Mexican visitors shopping there. It is followed by the Park Place Mall, with 55.67 percent. In comparison with the 2001 survey, it is interesting that the difference between Tucson Mall and Park Place Mall has narrowed in 2007-08. In 2001 the Tucson Mall was 1.78 times more likely to be shopped at than (then) Park Mall; in 2007-08, only 1.3 times. This is most likely the positive effect of the expansion and upgrade of the Park Place Mall that occurred since the last study.
The third place Foothills Mall attracts 13.72 percent of Mexican visitors. Other malls and shopping centers, attracting less than 8 percent of Mexican visitors, include Plaza Palomino, El Con Mall, St. Phillips Plaza, La Encantada, Casas Adobes and Crossroads shopping center.
Among the non-mall stores (Table 24), Wal-Mart is the most popular with 39.96 percent of Mexican visitors shopping there. It is followed by Costco with 31.61 percent, Best Buy with 21.67 percent, Target with 21.27 percent, Ross 19.88 percent, Mervyn’s 17.69 percent, and Walgreens with 14.71 percent of Mexican visitors shopping there. Circuit City and Marshall’s attract between 8 and 9 percent; Home Depot, Fry’s, Food City, Lowe’s, Babies R Us, and Sam’ Club between 1 and 4 percent. Stores like K-Mart and TJ Maxx attract less than 1 percent.
V. Travel Behavior in Major Destinations

Mexican Visitors to Arizona, 2007-08
38The University of Arizona Eller College of Management
Table 24 Where Mexican Visitors to Metro Tucson Shopped (percent of parties)
Table 24 Where Mexican Visitors to Metro Tucson Shopped(% of parties)
Mall/Shopping Center All parties Air travelers Car travelersTucson Mall 72.56 80.00 69.55Park Place Mall 55.67 52.41 56.98Foothills Mall 13.72 29.66 7.26Plaza Palomino 7.95 22.07 2.23El Con Mall 6.96 6.21 7.26St. Phillips Plaza 5.57 15.17 1.68La Encantada 3.18 11.03 0.00Casas Adobes Plaza 2.58 7.59 0.56Crossroads 1.39 4.14 0.28
Non-mall stores All parties Air travelers Car travelersWal-Mart 39.96 15.86 49.72Costco 31.61 35.86 29.89Best Buy 21.67 19.31 22.63Target 21.27 13.10 24.58Ross 19.88 7.59 24.86Mervyn's 17.69 6.21 22.35Walgreens 14.71 8.28 17.32Circuit City 8.95 15.86 6.15Marshall's 8.55 5.52 9.78Home Depot 3.78 0.00 5.31Fry's 3.38 0.00 4.75Food City 2.98 0.00 4.19Lowe's 1.99 0.00 2.79Babies R Us 1.59 0.69 1.96Sam's Club 1.39 1.38 1.96Gas station 1.19 0.00 1.68Jared's 0.80 2.76 0.00Auto Zone 0.80 0.69 0.84K Mart 0.60 0.00 0.84TJ Maxx 0.40 1.38 0.00Office Max 0.40 0.00 0.56Family Dollar 0.40 0.00 1.96American Home 0.20 0.00 0.28Osco 0.20 0.00 0.28K B Toys 0.20 0.00 0.28Payless Shoes 0.20 0.00 0.28Thrift store 0.20 0.00 0.28Pep Boys 0.20 0.00 0.28Kohl's 0.20 0.00 0.28Office Depot 0.20 0.00 0.28Sally's Beauty 0.20 0.00 0.28
Source: Mexican Visitor Survey, 2007-08
V. Travel Behavior in Major Destinations

Mexican Visitors to Arizona, 2007-08
39The University of Arizona Eller College of Management
Tucson Mall is the favorite shopping place for both groups; it is visited by 80 percent of all air travelers and 69.55 percent of car travelers. In contrast, the second favorite shopping mall, Park Place, is more often visited by car travelers than by those arriving by air: 56.98 percent and 52.41 percent respectively.
Foothills Mall and Plaza Palomino are favorite shopping destinations of Mexican air travelers with 29.66 and 22.07 percent shopping there. In contrast, these two shopping destinations attract only 7.26 and 2.23 percent of car travelers, respectively.
Similarly, the recently opened La Encantada shopping center and St. Phillips Plaza, both housing upscale stores, are more popular among air travelers attracting between 10 and 15 percent of Mexican visitors to metro Tucson. In comparison, very few car travelers shop there.
Among the non-mall stores, Costco is the most favorite store for Mexican air travelers; 35.86 percent shops there. It is followed by Best Buy (19.31 percent), and Wal-Mart and Circuit City (each attracting 15.86 percent of air travelers).
Wal-Mart is the most favorite store for Mexican car travelers; close to 50 percent shops there. An additional five stores attract between 20 and 30 percent of Mexican car travelers: Costco (29.89 percent), Ross (24.86 percent), Target (24.58 percent), Best Buy (22.63 percent), and Mervyn’s (22.35 percent). These stores are followed by Walgreens with 17.32 percent.
Another difference between the two groups is a greater number and variety of stores visited by car travelers, which is expected. Among these are stores with home improvement materials, appliances and furnishings such as Home Deport (5.31 percent) and Lowe’s (2.79 percent); food stores such as Fry’s (4.75 percent), and Food City (4.19 percent); office supplies such as Office Max (0.56 percent) and Office Depot (0.28 percent).
It is interesting that the Costco stores are considerably more popular than Sam’s Club stores among both groups.
Attractions Visited in Metro Tucson
Table 25 presents survey results regarding which attractions were visited by Mexican visitors. The results include visitors surveyed who arrived by air (via Tucson or Phoenix airport) as well the visitors who came by car.
Table 25 Metro Tucson’s Attractions Visited by Mexican Visitors
Table 25Metro Tucson Attractions Attended by Mexican Visitors(% of parties)
Attraction All visitors Air travelers Car travelers Casino 29.82 40.00 25.70Reid Park Zoo 15.71 13.10 16.76Old Tucson Studios 9.34 13.10 7.82 Arizona-Sonora Desert Museum 6.16 10.34 4.47 Museum 3.58 6.90 2.23 Saguaro National Park 1.99 6.21 0.28 San Xavier Mission 1.59 2.07 1.40 Tucson Convention Center 1.59 4.14 0.56 Concert/Theater 0.99 2.07 0.56 Colossal Cave 0.60 1.38 0.28 University of Arizona 0.40 1.38 0.13 Downtown 0.20 0.69 0.13
Source: Mexican Visitor Survey, 2007-08
V. Travel Behavior in Major Destinations

Mexican Visitors to Arizona, 2007-08
40The University of Arizona Eller College of Management
V. Travel Behavior in Major Destinations
Tucson’s casinos are the most popular attraction; they are visited by 29.82 percent of all Mexican visitor parties. However, when individual attractions are listed, Desert Diamond Casino is the number one attraction, mentioned by 11.58 percent of visitors, while Casino Del Sol was mentioned by 8.24 percent.
The second most visited attraction is Reid Park Zoo with 15.71 percent, followed by Old Tucson Studios with 9.34 percent, Arizona-Sonora Desert Museum with 6.16 percent and other museums with 3.58 percent. Pima Air Museum was specifically mentioned by 1.19 percent.
The list of other attractions cited in the survey included Saguaro National Park, Tucson Convention Center, Concert/Theater (not specified), San Xavier Mission, Colossal Cave, University of Arizona, and the downtown district.
Comparison with the 2001 study suggests that the attraction of casinos has relatively declined; in 2001, 46 percent of Mexican visitors visited Desert Diamond Casino or/and Casino Del Sol, while in 2007-08, less than 30 percent visited one or/and another casino. The latest survey also suggests that the Desert Diamond Casino surpassed Casino Del Sol as the more popular of the two.
As shown in Table 25, casinos are the most popular attraction for Mexican air travelers to Tucson; 40 percent of all Mexican visitor parties traveling by air mentioned visiting at least one casino. Desert Diamond Casino is more popular, but the difference is relatively small; 16.44 versus 14.38 percent of Mexican air travelers.
Casinos are also the main attraction of visitors traveling by car, but relatively less popular than for air travelers; 25.7 percent of car travelers visited at least one casino. Desert Diamond casino is also more frequently visited than Casino del Sol. In addition to casinos, air travelers are also more likely to visit Old Tucson Studios (13.10 percent) and Arizona-Sonora Desert Museum (10.34 percent), than car travelers (7.82 percent and 4.47 percent respectively).
Air travelers are also more likely to visit Saguaro National Park (6.21 percent), Tucson Convention Center (4.14 percent) or a concert/theater event (2.07 percent) than car travelers (0.28, 0.56 and 0.56 percent, respectively).
Pima Air Museum is more attractive to air travelers; 4.11 percent of air travelers visited this museum compared to and 0.28 percent of car travelers.
Other attractions, such as, San Xavier Mission, University of Arizona and Colossal Cave are more often visited by air travelers than car travelers.

Mexican Visitors to Arizona, 2007-08
41The University of Arizona Eller College of Management
V. Travel Behavior in Major Destinations
Visitors to Arizona’s Border CitiesNogales Visitors
Shopping destinations for Mexican visitors in Nogales are shown in Table 26. Only 5.16 percent of visiting parties indicated shopping at the Mariposa Mall in Nogales. The majority of shoppers in Nogales went to non-mall stores. Almost 50 percent of all shoppers in Nogales shop at Wal-Mart. The Food City and Factory 2–U follow with 38.08 and 31.67 percent, respectively. Family Dollar store, Ross, and JC Penney attract between 10 and 16 percent each of Mexican shoppers.
Table 26 Where Mexican Visitors to Nogales Shopped (percent of parties)
The remainder of the list contains various discount stores, mostly apparel, shoes and children’s clothing stores. Buying gasoline is also a frequent expenditure for Mexican visitors to Arizona border cities; about every tenth visitor purchased gasoline in Nogales.
Table 26Where Mexican Visitors to Nogales Shopped(% of parties)
% ofMalls/Shopping Centers partiesMariposa Mall 5.16
% ofNon-Mall Stores partiesWal-Mart 49.11Food City 38.08Factory 2-U 31.67Family Dollar 15.12Ross 14.86JC Penney 10.59Brackers 5.60Big Lots 5.60Safeway 5.52Payless Shoes 5.25Fashion store 4.63Walgreens 4.09Bazar 3.83Home Depot 3.65Radio Shack 3.11Dollar Mart 2.67KidsSupercenter 2.49K Mart 2.22Western Warehouse 1.60Mazon 1.42Duty Free 1.33Stage 1.16Other discount store 0.53Auto Zone 0.36True Value 0.18Cindarela Shoe Store 0.18La Familia 0.18Osco 0.09Market 0.09Checkers 0.09Other 0.18
Source: Mexican Visitor Survey, 2007-08

Mexican Visitors to Arizona, 2007-08
42The University of Arizona Eller College of Management
V. Travel Behavior in Major Destinations
Douglas Visitors
Table 27 presents shopping destinations for Mexican visitors to Douglas. Like in Nogales, Wal-Mart is the most frequent shopping destination for Mexican visitors to Douglas. One Wal-Mart store is located within the city limits, and three stores are in Sierra Vista
Table 27Where Mexican Visitors to Douglas Shopped (percent of parties)
Interestingly, Safeway is the most popular among grocery stores; about every third Mexican visitor shops there. Close to 25 percent shop in Factory 2-U, while more than 18 percent shop in the Family Dollar stores, and close to 17 percent in Food City. More than every tenth visitor also shops at JC Penney’s. Close to 13 percent purchase gasoline at Douglas gas stations.
The remainder of the list includes additional discount stores, such as Dollar Tree, drug stores, and auto parts stores.
Table 27Where Mexican Visitors to Douglas Shopped(% of parties)
% ofMalls/Shopping centers/Stores partiesWal-Mart 54.27Safeway 33.17Factory 2-U 24.87Family Dollar 18.34Food City 16.83JC Penney 13.32Gas station 12.56Dollar Tree 9.30Radio Shack 4.77Payless Shoes 3.02Stage 2.76La Familia 1.76Duty Free 1.26Discount store 0.50B&D Lumber 0.25Midwest Pharmacy 0.25Rite Aid 0.25Double H 0.25Checkers 0.25
Source: Mexican Visitor Survey, 2007-08

Mexican Visitors to Arizona, 2007-08
43The University of Arizona Eller College of Management
Yuma Visitors
Table 28 shows shopping destinations for Mexican visitors to Yuma, which is located about 25 miles north of the border, and accessed primarily through San Luis border port of entry.
Table 28Where Mexican Visitors to Yuma Shopped (percent of parties)
Yuma has two main shopping malls, yet the non-mall stores are more frequent shopping destinations; about 6.1 percent of Mexican parties shop at Yuma Historical Mall and less than 1 percent at Yuma Palms.
Wal-Mart is the most frequent shopping destination, with 25.2 percent saying they shopped there. All other stores attract less than 10 percent of all Mexican visiting parties. Sam’s Club and JC Penney attract about 9 percent of visiting parties, followed by Target, Family Dollar and Factory 2-U stores (6.69, 6.10 and 5.12 percent). Safeway is the most popular among food stores, with 4.33 percent shopping there. Between 1 and 4 percent shop in one or all of the following stores: Mervyn’s, Best Buy, Big Lots and Home Depot. Less than one percent shop at Albertson’s, Lowe’s, Circuit City, Kohl’s, Rite Aid, and Western Warehouse.
V. Travel Behavior in Major Destinations
Table 28Where Mexican Visitors to Yuma Shopped(% of parties)
% ofMalls/shopping centers partiesYuma Historical Mall 6.10Yuma Palms 0.39
% ofNon-mall stores partiesWal-Mart 25.20Sams Club 9.06JC Penney 9.06Target 6.69Family Dollar 6.10Factory 2-U 5.12Safeway 4.33Mervyn's 3.35Best Buy 2.76Big Lots 2.76Home Depot 1.57Albertson's 0.59Lowes 0.39Circuit City 0.39Kohl's 0.39Rite Aid 0.39Western Warehouse 0.20
Source: Mexican Visitor Survey, 2007-08

Mexican Visitors to Arizona, 2007-08
44The University of Arizona Eller College of Management
V. Travel Behavior in Major Destinations
San Luis Visitors
Table 29 shows shopping destinations for Mexican visitors to San Luis. The largest percent of Mexican visitors shop in discount stores such as Food City (41.73 percent), Factory 2-U (24.21 percent), or Family Dollar store (17.52 percent).
Table 29Where Mexican Visitors to San Luis Shopped (percent of parties)
More than every tenth visitor also shops in one or all of the following stores: King’s Market, general discount stores, Payless Shoes, and Mercado Del Sol. The names of some stores clearly indicate catering to Mexican shoppers.
Lukeville Visitors
Table 30 shows where Mexican visitors shop in Lukeville. Being the smallest of Arizona’s border ports of entry (aside from Sasabe), Lukeville offers limited choice of retail stores. Of those who do shop in Lukeville, more than two thirds shop in the general merchandise store; close to 13 percent shop in the duty free shop. More than a third purchase gasoline at the Lukeville gas station.
Table 30Where Mexican Visitors to Lukeville Shopped (percent of parties)
Table 29Where Mexican Visitors to San Luis Shopped(% of parties)
% ofStores partiesFood City 41.73Factory 2-U 24.21Family Dollar 17.52Kings Market 12.01Discount store 11.42Payless Shoes 10.43Mercado del Sol 10.04Fashion store 7.68Gas station 7.48Zody's 5.71Rainbow Shoes 3.54La Mexicana 1.57Duty Free Shop 0.98Other 0.60
Source: Mexican Visitor Survey, 2007-08
Table 30Where Mexican Visitors to Lukeville Shopped
Number of % ofStores parties partiesGeneral store 73 77.66Gas station 33 35.11Duty free store 12 12.77
Source: Mexican Visitor Survey, 2007-08

Mexican Visitors to Arizona, 2007-08
45The University of Arizona Eller College of Management
How Mexican Visitors Learned About Shopping Destinations and AttractionsTable 31 shows where Mexican visitors learned about Arizona’s shopping destinations and attractions they visited. Data presents sources of information for different groups of visitors by mode of travel and destination city. Visitors to Metro Phoenix
About two thirds of all Mexican visitors arriving through the Phoenix airport and who responded to the question about how they learned about destinations and attractions indicated friends and relatives as the major source of information. About every fifth visitor did not know or did not remember. Less than a half percent indicated that they previously lived in Arizona.
Slightly more than 5 percent of visitors obtained the information on the internet, with Yahoo being the primary source. Television was the source of information for 2.40 percent, while periodicals and magazines were the source of information for about one percent of Mexican visitors, each. El Imparcial was mentioned as the main periodical.
Of the television channels, specifically mentioned were Discovery Channel and Channel 33.
Less than one in one hundred obtained information either from a radio announcement, Phoenix Center in Sonora, or a brochure/guidebook. The remaining sources, such as the Tucson Center in Sonora, hotel information or a coworker, each provided information for 0.26 percent of Mexican visitors.
In comparison, Mexican visitors arriving by car rely much more on information from friends and relatives than those arriving by air; 86.30 percent indicated friends and relatives as the major source of information about shopping/attraction destinations in the Phoenix area. They also seem to use the internet slightly more, but both rely heavily on Yahoo as a search engine. Metro Phoenix car/pedestrian travelers rely less on television for their information than air travelers, but slightly more on periodicals, in particular El Imparcial.
Visitors to Metro Tucson
More than half of all Mexican air passengers that visited the Tucson area and who provided information about how they learned of destinations/attractions, indicated friends and relatives as the major source of information. About 15 percent answered that they did not know or did not remember. About one percent indicated previous knowledge from living in Arizona.
The internet turned out to be the second major source of information with 6.85 percent of Tucson air passengers finding information on-line. Yahoo was listed in 80 percent of all internet sources.
V. Travel Behavior in Major Destinations

Mexican Visitors to Arizona, 2007-08
46The University of Arizona Eller College of Management
Table 31How Mexican visitors Learned About Destinations/Attractions in Arizona (Percent of Parties)
About three percent of Tucson air visitors acquired the information from periodicals, mainly El Imparcial; television and radio were a source of information for 2.05 and 0.68 percent of Mexican visitors, respectively. No specific radio stations were mentioned, while only Discovery channel was mentioned among television channels.
In comparison, car travelers to metro Tucson relay more on information from friends and relatives than those visitors arriving by air. The internet is relatively less important as a source of travel information for car travelers to the Tucson area than for air travelers or car travelers to metro Phoenix. It is, however, relatively more important than radio or television. Yahoo was listed as the main internet source.
Close to 3 percent of all car and pedestrian crossers learned about shopping destinations/attractions from the radio. The most popular radio station was 104.3; other specifically mentioned stations include 105.1 FM and 105.3 FM.
Television was the source of information for 2.37 percent of Mexican car and pedestrian crossers; Univision Mexico and Discovery Channel were the most frequently mentioned. More than half, however, did not specify the TV channel.
Visitors to Border Cities
Table 31 also shows information sources for visitors to Arizona border cities. While friends and relatives remain the major source of information, border visitors are more likely to have lived in Arizona, and therefore draw on “first-hand” experience, compared with visitors to metro Phoenix or Tucson. Also, border residents tend to cross the border more frequently and know the area simply by being there; this is why large percentage of those, particularly pedestrians, who “don’t remember or don’t know” where they obtained information.
V. Travel Behavior in Major Destinations
Table 31 How Mexican Visitors Learned About Destinations/Attractions in Arizona(Percent of Parties)
How Mexican Visitors Metro Phoenix Metro Tucson Metro Phoenix Metro Tucson Border cities Border citiesLearned about Destination air travelers air travelers by car by car by car pedestriansFriends or relatives 69.07 57.53 86.30 82.37 61.38 52.93Don't remember or don't know 21.87 15.07 10.96 12.20 27.78 40.15Internet 5.60 6.85 6.16 3.05 0.51 2.11
Yahoo 3.73 5.48 4.79 2.71 0.36 1.35 Other 1.86 1.37 1.37 0.34 0.36 0.75
Television station 2.40 2.05 0.68 2.37 1.38 0.30 Univision MX 0.00 0.00 0.00 0.34 0.44 0.00
Discovery 0.53 0.68 0.00 0.00 0.07 0.00 De Las Estrellas 0.00 0.00 0.00 0.00 0.07 0.15
Channel 40 0.00 0.00 0.00 0.34 0.00 0.00 Galavision 0.00 0.00 0.00 0.00 0.00 0.15
Channel 33 0.53 0.00 0.00 0.00 0.00 0.00 Other/not specified 1.33 1.37 0.68 1.69 0.80 0.30
Periodical 1.07 3.42 2.74 1.36 3.85 3.91 El Imparcial 0.53 2.74 2.74 0.68 2.25 3.91
AZ Daily Star 0.00 0.00 0.00 0.00 0.07 0.00 Other/not specified 0.54 0.68 0.00 0.68 1.75 0.45
Magazine 1.07 0.00 0.00 0.00 0.22 0.00Radio station announcement 0.80 0.68 0.68 2.71 7.35 1.50
105.1 FM 0.00 0.00 0.00 0.34 2.33 1.35 104.3 FM 0.00 0.00 0.00 0.68 0.51 0.00 105.3 FM 0.00 0.00 0.68 0.34 0.58 0.00 109.6FM 0.00 0.00 0.00 0.00 0.07 0.00
96.7FM 0.00 0.00 0.00 0.00 0.07 0.00 Xeni 0.00 0.00 0.00 0.00 0.07 0.15
Other/not specified 0.80 0.68 0.00 0.00 3.71 0.00Phoenix Center in Sonora 0.53 0.00 0.00 0.00 0.00 0.00Brochure/Guidebook 0.53 0.68 0.00 0.00 0.00 0.00Lived in Arizona 0.27 1.37 0.68 1.02 3.56 7.67Tucson Center in Sonora 0.27 0.68 0.00 0.34 0.07 0.30Hotel information 0.27 0.00 0.00 0.00 0.00 0.00Coworker 0.27 0.00 0.00 0.00 0.00 0.00
Source: Mexican Visitor Survey, 2007-08Note: Percentages are computed based on number of parties per destination per mode of travel.

Mexican Visitors to Arizona, 2007-08
47The University of Arizona Eller College of Management
V. Travel Behavior in Major Destinations
Interestingly, for car crossers, the radio is significantly more important than for any other group of visitors; 7.35 percent mentioned radio announcement as the source of shopping information. Among radio stations, 105.1 FM, 105.3 FM and 104.3 FM are the most often mentioned. However, almost 50 percent did not indicate a specific radio station.
Periodicals are slightly more important for visitors to border cities than for visitors to metro Phoenix or Tucson; 3.85 percent of car crossers and 3.91 percent of pedestrians mentioned a periodical, in most cases El Imparcial.
Television is slightly more important for car crossers than pedestrians; Univision Mexico, Discovery Channel, De las Estrellas, and Galavison are specifically mentioned.

Mexican Visitors to Arizona, 2007-08
48The University of Arizona Eller College of Management
VI. Expenditures by Mexican Visitors in ArizonaDirect Expenditures by Port of EntryTable 32 presents total direct expenditures of Mexican visitors to Arizona, by port of entry for 1977-78, 1991, 2001, and the current study year 2007-08.
Table 32Total Direct Expenditures of Mexican Visitors to Arizona: 1977-78, 1991, 2001,
and 2007-08, by Port of Entry (Millions of Dollars)
Total estimated direct expenditures by Mexican visitors to Arizona in 2007-08 were $2.69 billion, an increase of 213.6 percent over estimated expenditures in 2001 (in current dollars). Adjusted for inflation61 direct spending was $2.12 billion in 2001 dollars or 147.73 percent increase over spending in 2001. Direct expenditures estimated for 2001 for airport passengers were revised because of more precise data for 2001 that have recently become available. As discussed earlier in section I. Purpose and Research Design, the data used in the 2001 study included both visitors passing through Arizona as well as visitors whose final destination was Arizona. Although the methodology used in 2001 accounted for visitors passing through, the estimates are believed to be too high for that year. In order to make comparisons of expenditures, numbers of parties and expenditures per party between 2001 and 2007-08, the 2001 figures were revised to reflect the new airport data that include only final destination passengers.62
Total expenditures did not increase equally for visitors entering through all ports of entry. In particular, the highest percentage increase in direct expenditures is shown for visitors entering through Douglas and Lukeville, and the lowest relative increase for visitor parties entering through Nogales.
To better understand the source of these differing increases, expenditures are broken down into change in the number of parties and change in the expenditures per party as shown in Tables 33 and 34.
VI. Expenditures by Mexican Visitors in Arizona
Table 32Total Direct Expenditures of Mexican Visitors in Arizona1977-78 vs. 1991 vs. 2001 vs. 2007-08, by Port of Entry(Millions of Dollars)
Percent ChangePort of Entry 1977-78 1991 2001 2007-08 2001 to 2007-08Douglas 26.1 140.9 98.8 466.4 372.1Lukeville 7.3 17.7 13.8 58.0 320.3Naco 6.7 31.0 30.8 98.4 219.6Nogales 168.8 343.8 502.5 1,281.8 155.1San Luis 99 131.1 194.2 735.3 278.6Sasabe 0.8 0.5 4.7 16.1 242.5Phoenix Airport 2 0.8 11.7 29.2 149.7 *Tucson Airport 4.7 22.6 0.9 3.3 265.5 *Total 315.3 668.2 857.4 2,688.7 213.6
*Based on revised 2001 data for air passengers obtained in 2008. Revised data includes final destination travelers only.
Source: Mexican Visitor Survey, 2007-08

Mexican Visitors to Arizona, 2007-08
49The University of Arizona Eller College of Management
VI. Expenditures by Mexican Visitors in Arizona
Table 33 Mexican Visitor Parties: 1977-78, 1991, 2001, and 2007-08, by Port of Entry (Thousands of Parties)
Aside from Nogales, with a 51.5 percent increase in the number of visitor parties, Phoenix and Tucson airports have seen the highest increases in number of parties, 45.8 percent and 56 percent respectively. Overall, the number of Mexican visitor parties increased 28.4 percent since 2001, compared to 213.6 percent increase for total expenditures (Table 32). This pronounced difference in growth rates means that there had to be an overall increase in per party expenditures between 2001 and 2007-08. This finding echoes observations along the Texas-Mexico border, as mentioned earlier in one of the introductory sections. This is particularly the case with entrants through Douglas, Naco and Sasabe; in 2007-08 the number of visitor parties declined, while direct expenditures increased.
Average per Party Expenditures, by Port of Entry
Table 34 shows an increase in per party expenditures of Mexican visitors compared to 2001. The past decade shows the highest relative increase in the last 30 years. Average per party expenditures increased for all border ports of entry, but most notably for Douglas and Sasabe. Visitors entering through Sasabe are spending more per party, but very few parties pass through the Sasabe port of entry so this increase has a very little impact on total Mexican visitor spending in Arizona. Note that these spending figures are by port of entry, not destination city. Portions of the people traveling through these ports go on to Tucson or Phoenix.
Table 34Mexican Visitor per Party Expenditures in Arizona: 1977-78, 1991, 2001,
and 2007-08, by Port of Entry (Dollars)
Table 33Mexican Visitor Parties to Arizona1977-78 vs. 1991 vs. 2001 vs. 2007-08, by Port of Entry( Thousands of Parties)
Percent ChangePort of Entry 1977-78 1991 2001 2007-08 2001 to 2007-08Douglas 713.6 1,251.1 1,995.2 1,847.2 -7.4Lukeville 131.8 152.7 143.5 172.1 20.0Naco 228.9 238.0 356.6 354.8 -0.5Nogales 2,892.4 2,821.0 4,881.6 7,395.7 51.5San Luis 2,333.9 2,405.6 2,988.0 3,551.3 18.9Sasabe 25.4 6.7 40.2 34.6 -13.9Phoenix Airport 2.9 0.7 7.9 11.5 45.8 *Tucson Airport 7.3 19.9 1.0 1.6 56.0 *Total 6,336.2 6,895.7 10,414.0 13,368.9 28.4
*Based on revised 2001 data for air passengers obtained in 2008. Revised data includes final destination travelers only.
Source: Mexican Visitor Survey, 2007-08
Table 34Mexican Per Party Expenditures in Arizona1977-78 vs. 1991 vs. 2001 vs. 2007-08, by Port of Entry(Dollars)
Percent ChangePort of Entry 1977-78 1991 2001 2007-08 2001 to 2007-08Douglas 36.63 112.63 49.51 252.51 410.02Lukeville 55.57 115.80 96.39 336.95 249.57Naco 29.16 130.34 86.47 277.42 220.83Nogales 58.37 121.86 102.94 173.32 68.37San Luis 42.41 54.50 65.01 207.05 218.49Sasabe 29.73 68.05 115.97 464.88 300.86Phoenix Airport 674.04 1,164.11 1,484.80 2,535.65 70.77Tucson Airport 639.68 1,135.24 895.50 2,108.57 135.46Total 49.77 99.82 91.75 201.11 119.20
Source: Mexican Visitor Survey, 2007-08

Mexican Visitors to Arizona, 2007-08
50The University of Arizona Eller College of Management
VI. Expenditures by Mexican Visitors in Arizona
Mexican parties exiting through Phoenix and Tucson airports have always had the highest average per party expenditures and therefore the increases are relatively small in comparison to changes to other ports of entry.
The difference in per party expenditures between Phoenix and Tucson airport travelers can partly be explained by reasons for visit and place of origin of Mexican visitors. Travelers to metro Phoenix tend to come from longer distances (Mexico City, Yucatan) than those to metro Tucson; visitors to metro Phoenix also stay longer than those in Tucson; visitors who come to Phoenix and/or Tucson also demonstrate higher expenditures per party.
Expenditure Categories
Table 35 presents expenditures, by category for 1991, 2001, and 2007-08. Store purchases make up by far the largest expenditure category representing 57.5 percent of all Mexican visitor expenditures. Food purchases make up the second largest category (20.4 percent), of which more than 50 percent is comprised of grocery purchases. Transportation-related expenditures represent 7.4 percent of the total, with gasoline and automobile related expenses representing more than 80 percent of this category.
Table 35 Expenditure Categories: 1991, 2001, and 2007-08 (Thousands of Dollars)
Business-related expenditures declined from 2001 about 17.8 percent. Medical expenditures increased 95.7 percent, although their share in total expenditures remains only about 0.5 percent.
Lodging expenditures in 2007-08 show the highest percentage increase among all categories. This corresponds to the increase in the portion of Mexican visitors spending at least one night in Arizona.
As expected, both per party expenditures and expenditures by category differ substantially by mode of travel (Tables 36 and 37).
Pedestrians spend an average of $71.99 per party compared to $302.40 per party for visitors entering by motor vehicles and $2,484.71 for visitors traveling by air. Pedestrians spend more than 80 percent on purchases in department and other merchandise stores, and on food. As in the past, pedestrians spend relatively larger shares of their money on shopping in grocery stores than other two groups. On average, a pedestrian party spends $36.27 in department and other merchandise stores, $17.07 in grocery stores, and $7.52 in restaurants.
Parties traveling by motor vehicle spend most of their money in merchandise stores, and relatively less on food. Spending on food is almost equally divided between grocery stores and restaurants. On average, they
Table 35Expenditure per Category*, 1991, 2001 and 2007-08(Thousands of Dollars)
% of Column Percent ChangeExpenditure Type 1991 2001 2007-08 Total 2001 to 2007-08Lodging 12,934 9,094 182,895 6.8 1,911.2 Total Food 173,971 321,742 547,333 20.4 70.1
Restaurants 28,788 81,750 241,610 Groceries 145,183 240,065 305,723
Total Transportation 24,627 85,235 198,270 7.4 132.6 Gasoline & Auto 20,987 68,706 170,253 Air travel 2,969 4,620 5,727 Car rental 671 11,909 1,919 Bus, taxi na na 20,371
Stores 222,312 373,541 1,546,257 57.5 313.9 Total Medical 24,105 6,388 12,504 0.5 95.7
Doctors 15,745 1,837 2,086 Hospitals 5,205 3,597 2,047 Medicine 3,155 954 8,370
Entertainment na na 111,140 4.1 Total Business 148,238 45,032 37,000 1.4 (17.8) All Other 82,063 14,125 51,443 1.9 264.2 Total 688,256 857,402 2,688,670 100 213.6
Source: Mexican Visitor Survey, 2007-08

Mexican Visitors to Arizona, 2007-08
51The University of Arizona Eller College of Management
VI. Expenditures by Mexican Visitors in Arizona
spend $178.88 in merchandise stores, $27.57 in grocery stores, and $26.33 in restaurants, per party.
Table 36Per Party Expenditures, by Category, by Travel Mode (Dollars per Party)
Air travelers spend a little more than one third of all expenditures in stores and about one quarter on transportation. Lodging expenses account for larger share than food expenses. An average party spends $981.18 in stores and other merchandise stores, $666.98 on transportation, $255.59 on lodging, and $216.20 on food.
Expenditures by Travel Mode and Reason for Visit
Per party expenditures vary both by mode of travel and by reason for visit (Table 37). Per party expenditures range from $84.75 for a pedestrian traveling to visit friends and relatives to $7,022 for air passenger visiting Arizona for business-related shopping. Leisure visitor parties traveling by motor vehicle spend, on average, $409.95, pedestrian leisure visitor parties spend $122.83, and leisure visitor parties traveling by air spend $2,247.73. Business travelers (including workers) spend $29.64 if traveling by motor vehicles, $11.52 if traveling by foot, and $3,114.95 if traveling by air. Overall, Mexican visitors who come to Arizona spend the most if they are here for business shopping or for a business convention. These two categories, however, represent a small portion of overall expenditures.
Table 36Per Party Expenditures, by Category,by Travel Mode(Dollars per Party)
Categories Motor Vehicle Pedestrian Air All ModesLodging 23.16 1.32 352.84 13.68 Total Food 53.90 24.59 255.59 40.94
Restaurants 26.33 7.52 216.20 18.07 Groceries 27.57 17.07 39.39 22.87
Total Transportation 22.08 4.52 666.98 14.83 Gasoline 21.52 1.39 93.57 12.56 Auto expenses 0.32 - 2.49 0.18 Air Travel - - 437.85 0.43 Car Rental - 0.04 130.13 0.14 Buses, cabs 0.24 3.09 2.94 1.52
Stores 178.88 36.27 981.18 115.66 Total Medical 1.52 0.16 27.11 0.94
Doctors 0.28 - 4.66 0.16 Hospitals 0.19 0.09 7.21 0.15 Medicine 1.06 0.07 15.24 0.63
Entertainment 13.67 1.57 88.73 8.31 Other goods 4.53 2.73 18.87 3.73 Other services 0.18 - 3.58 0.10 Total Business 4.20 0.85 75.87 2.77 All Other - - 12.27 0.01 Total 302.40 71.99 2,484.71 201.11
Source: Mexican Visitor Survey, 2007-08

Mexican Visitors to Arizona, 2007-08
52The University of Arizona Eller College of Management
VI. Expenditures by Mexican Visitors in Arizona
Table 37 Per Party Expenditures, by Reason for Visit, by Travel Mode (Dollars)
Expenditures by Income Group
It is interesting to analyze total expenditures by income group. Table 38 shows that per party spending ranges from $79.28 for parties with household incomes of less than $10,000 pesos (per month) to $1,769.65 for parties earning between 40,000 and 49,999 pesos (per month). Parties in households earning between 40,000 and 49,999 (pesos per month) represent only 0.12 percent of total visiting parties, and little bit more than 1 percent of total spending in Arizona by Mexican visitors.
Table 38 Spending per Party, Total Spending, by Monthly Income Group (Pesos/Dollars)
Parties earning less than 10,000 pesos a month constitute 44.06 percent of visitor parties, but represent less than 17 percent of total expenditures. Parties with 15,000 pesos or more represent 13.89 percent of visitor parties, but account for 29.74 percent of total expenditures in Arizona.
Expenditures, Distances Traveled, and Length of Stay
Table 39 demonstrates that per party expenditures increase with distance traveled. Visitors traveling more than 500 miles spend $1,287 per party while those traveling less than 10 miles spend between $74 and $85 per party. This table also demonstrates that fewer parties visit Arizona the further they have to travel.
Table 37Per Party Expenditures, by Reason for Visit, by Travel Mode(Dollars)
Leisure Reason for VisitLeisure Leisure Leisure Leisure Leisure Total Leisure
Travel Mode Health Vacation Friends/Relatives Shopping Other AverageMotor Vehicle 154.99 327.18 337.05 422.23 58.66 409.95Pedestrian - 180.00 84.75 125.99 - 122.83Air 2,953.27 2,299.94 1,748.69 2,577.75 1,829.39 2,247.73
All Parties 174.91 296.58 263.60 308.37 57.47 302.45
Business Reason for VisitBusiness Business Business Business Total Business
Travel Mode Convention Training Shopping Other AverageMotor Vehicle 50.00 250.00 440.44 11.41 29.64 Pedestrian - - 250.63 9.85 11.52 Air 2,858.22 2,133.85 7,022.00 4,591.26 3,114.95
All Parties 862.69 672.49 415.39 11.00 21.59
Source: Mexican Visitor Survey, 2007-08
Table 38Spending per Party, Total Spending, by Monthly Income Group(Pesos/Dollars)
Income Categories (Pesos)Under $10,000- $15,000- $20,000- $30,000- $40,000 $50,000- $80,000
$10,000 $14,999 $19,999 $29,999 $39,999 $49,999 $79,999 or overIncome Categories (Dollars)
Under $929- $1,394- $1,860- $2,788- $3,717- $4,647- $7,435-$929 $1,393 $1,859 $2,787 $3,716 $4,646 $7,434 or over Sum
Per Party Expenditures $ 79.28 222.05 446.97 396.89 1,351.33 1,769.65 1,311.38 117.80 na
Percent of Total Parties 44.06 36.32 13.89 4.86 0.64 0.12 0.07 0.04 100(% of Row Total)
Percent of Total Expenditures 16.74 38.64 29.74 9.25 4.12 1.05 0.44 0.03 100(% of Row Total)
Source: Mexican Visitor Survey, 2007-08

Mexican Visitors to Arizona, 2007-08
53The University of Arizona Eller College of Management
VI. Expenditures by Mexican Visitors in Arizona
Table 39 Spending per Party, Total Spending, by Distance Traveled
Less than five percent of all visitors to Arizona travel more than 250 miles, but account for 24 percent of all Mexican visitors’ spending in Arizona. The majority -- an 83 percent of all parties travel less than 50 miles. They account for 32 percent of total Mexican visitors’ spending.
Since 2001, the share of visitors traveling longer distances has increased in both the total number of visitors and total spending. Residents of border cities within 10 miles of the border still comprise the core of cross-border visitors; they account for 75.98 percent of all visitor parties but 24.64 percent of all Mexican visitor spending in Arizona.
An analysis of per party expenditures, number of parties and total expenditures for day visitors also show the importance of the higher income, and longer stay in Arizona (Table 40).
Table 40 Spending per Party, Total Spending, Overnight vs. Day Visitors
Overnight visitor parties (one or more nights) spend an average of $838.62 per trip while day-visitors spend an average of $81.22 per party per trip. Thus, although overnight visitors represent 15.86 percent of all visitor parties, they account for 66.07 percent of all Mexican visitor expenditures in Arizona.
In comparison with 2001 study, the percentage of overnight visitors increased from 4 percent to almost 16 percent. The share of spending attributable to overnight visitors increased substantially, from 10.85 percent in 2001 to 66.07 percent in 2007-08. A relatively small change in the share of visitor parties that spend the night can have a substantial impact on the share of overnight visitor expenditures because they spend more than 10 times per trip than day visitors.
Table 39Spending per Party, Total Spending, by Distance Traveled
Expenditures % of Total % of TotalDistance Traveled per Party ($) Parties ExpendituresUnder 5 miles 74 64.60 20.49 Over 5 and under 10 miles 85 11.38 4.15 Over 10 and under 50 miles 228 7.50 7.36 Over 50 and under 100 miles 447 3.61 6.93 Over 100 and under 250 miles 1,010 8.66 37.61 Over 250 and under 500 miles 1,285 3.96 21.86 Over 500 miles 1,287 0.29 1.61
100.00 100.00
Source: Mexican Visitor Survey, 2007-08
Table 40Spending per Party, Total Spending, Overnight vs. Day Visitors
Overnight Visitors Day Visitors Sum
Per Party Expenditures $ 838.62 81.22 na
Percent of Total Parties 15.86 84.14 100.00(% of Row Total)
Percent of Total Expenditures 66.07 33.93 100.00(% of Row Total)
Source: Mexican Visitor Survey, 2007-08

Mexican Visitors to Arizona, 2007-08
54The University of Arizona Eller College of Management
VI. Expenditures by Mexican Visitors in Arizona
Seasonality of Travel
Table 41 shows the seasonality of Mexican visitors’ travel to Arizona. The first column shows the total number of non-U.S. citizens entering Arizona, by month, as reported by CBP. Average party size per month was com-puted from survey data and used to convert total number of non-U.S. citizens, by month, to total parties. Total expenditures and expenditures per party are also computed from survey data and presented by month.
Table 41Seasonality of Mexican Visitors’ Travel to Arizona
December shows the highest number of border crossings of non-U.S. citizens, the largest per party expenditures, and the largest expenditures. Over 1.2 million parties enter Arizona during month of December and each of these parties spends on average $461.50 per party, for a total of $562 million in expenditures.
August and September have the smallest number of parties, in part, because party sizes are the biggest. The lower number of visitor parties for these months may reflect the low season for activities associated with agricultural sector, such as agricultural production in Yuma area and warehousing and distribution of fresh produce from Mexico in Nogales.
The highest total spending is in months of November, December, March and February. These coincide with major holidays in U.S. and Mexico.
Geographic Distribution of Expenditures in Arizona
Table 42 provides information on where Mexican visitors spend their money within Arizona; the results of this study are compared to findings of 1991 and 2001 studies.
Note that this table differs from previous results presented by port. Data presented by port in previous tables summarized the characteristics and spending of persons who enter through each port, while Table 42 shows expenditures according to where expenditures were stated to have occurred.
In 1991, Santa Cruz County had the highest share of direct expenditures of Mexican visitors. By 2001, Pima County took over as the place with highest direct expenditures by Mexican visitors. Pima County’s share of total direct expenditures increased from 33.76 percent in 2001 to 36.32 percent in 2007-08. The share of Maricopa County increased from 4.26 percent in 2001 to 25.82 percent of all direct Mexican expenditures in 2007-08. On the other hand, all three border counties – Santa Cruz, Yuma and Cochise -- saw their shares of total Mexican expenditure decline from 61.87 percent in 2001 to 35.38 percent in 2007-08.64
Table 41Seasonality of Mexican Visitors' Travel to Arizona
Total Crossers Average Total Total Exp $ perMonth Non-US Citizen* % Party Size Parties % ($ 000s) % PartyJanuary 1,867,018 7.77 1.74 1,074,477 8.04 149,083 5.54 138.75February 2,143,495 8.92 1.81 1,183,952 8.86 224,834 8.36 189.90March 1,995,582 8.30 1.73 1,153,065 8.62 232,076 8.63 201.27April 1,916,423 7.97 1.57 1,224,249 9.16 218,349 8.12 178.35May 2,043,631 8.50 1.64 1,247,109 9.33 176,498 6.56 141.53June 1,822,292 7.58 1.72 1,060,686 7.93 171,560 6.38 161.74July 2,140,921 8.91 1.83 1,168,321 8.74 127,671 4.75 109.28August 1,932,870 8.04 2.04 946,099 7.08 130,838 4.87 138.29September 1,887,613 7.85 2.08 907,791 6.79 163,179 6.07 179.75October 2,030,726 8.45 1.95 1,043,033 7.80 184,883 6.88 177.25November 2,042,019 8.49 1.79 1,142,313 8.54 347,666 12.93 304.35December 2,218,959 9.23 1.82 1,217,782 9.11 562,033 20.90 461.52Total 24,041,549 100 1.80 13,368,878 100 2,688,670 100 201.11
*Source of monthly crossers: U.S. Department of Homeland Security, Customs and Border Protection.Source: Mexican Visitor Survey, 2007-08
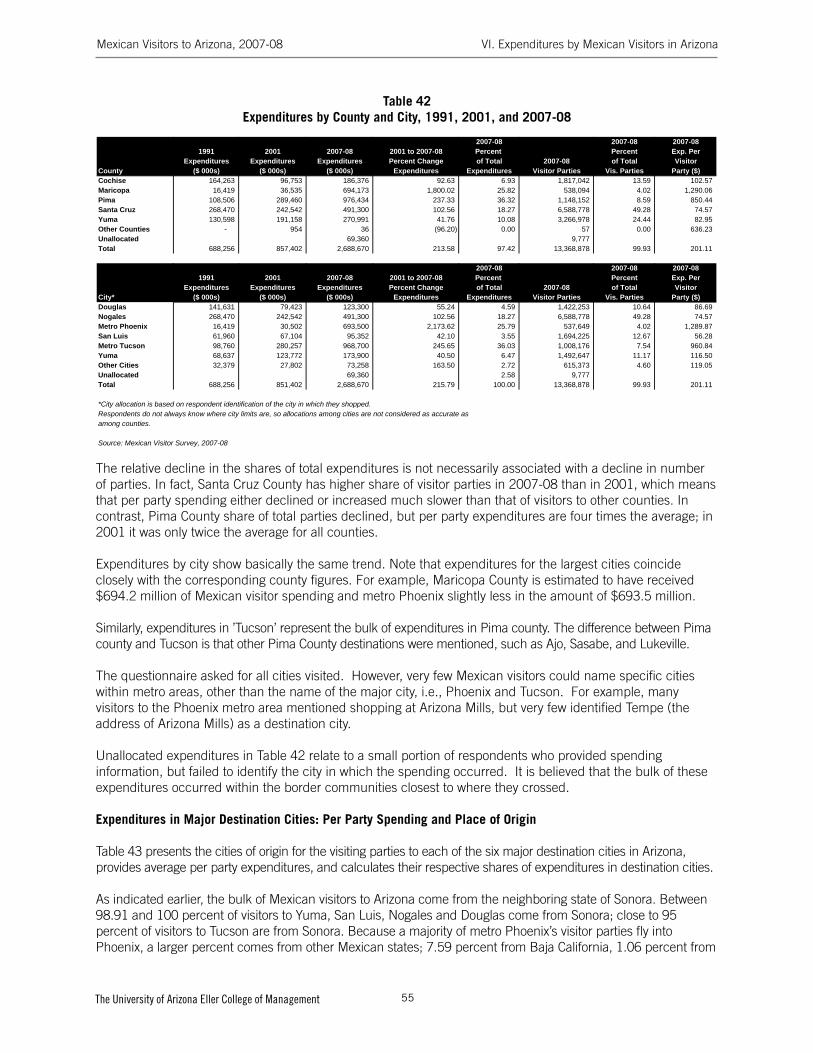
Mexican Visitors to Arizona, 2007-08
55The University of Arizona Eller College of Management
VI. Expenditures by Mexican Visitors in Arizona
Table 42Expenditures by County and City, 1991, 2001, and 2007-08
The relative decline in the shares of total expenditures is not necessarily associated with a decline in number of parties. In fact, Santa Cruz County has higher share of visitor parties in 2007-08 than in 2001, which means that per party spending either declined or increased much slower than that of visitors to other counties. In contrast, Pima County share of total parties declined, but per party expenditures are four times the average; in 2001 it was only twice the average for all counties.
Expenditures by city show basically the same trend. Note that expenditures for the largest cities coincide closely with the corresponding county figures. For example, Maricopa County is estimated to have received $694.2 million of Mexican visitor spending and metro Phoenix slightly less in the amount of $693.5 million.
Similarly, expenditures in ’Tucson’ represent the bulk of expenditures in Pima county. The difference between Pima county and Tucson is that other Pima County destinations were mentioned, such as Ajo, Sasabe, and Lukeville.
The questionnaire asked for all cities visited. However, very few Mexican visitors could name specific cities within metro areas, other than the name of the major city, i.e., Phoenix and Tucson. For example, many visitors to the Phoenix metro area mentioned shopping at Arizona Mills, but very few identified Tempe (the address of Arizona Mills) as a destination city.
Unallocated expenditures in Table 42 relate to a small portion of respondents who provided spending information, but failed to identify the city in which the spending occurred. It is believed that the bulk of these expenditures occurred within the border communities closest to where they crossed.
Expenditures in Major Destination Cities: Per Party Spending and Place of Origin
Table 43 presents the cities of origin for the visiting parties to each of the six major destination cities in Arizona, provides average per party expenditures, and calculates their respective shares of expenditures in destination cities.
As indicated earlier, the bulk of Mexican visitors to Arizona come from the neighboring state of Sonora. Between 98.91 and 100 percent of visitors to Yuma, San Luis, Nogales and Douglas come from Sonora; close to 95 percent of visitors to Tucson are from Sonora. Because a majority of metro Phoenix’s visitor parties fly into Phoenix, a larger percent comes from other Mexican states; 7.59 percent from Baja California, 1.06 percent from
Table 42Expenditures by County and City, 1991, 2001 and 2007-08
2007-08 2007-08 2007-081991 2001 2007-08 2001 to 2007-08 Percent Percent Exp. Per
Expenditures Expenditures Expenditures Percent Change of Total 2007-08 of Total VisitorCounty ($ 000s) ($ 000s) ($ 000s) Expenditures Expenditures Visitor Parties Vis. Parties Party ($)Cochise 164,263 96,753 186,376 92.63 6.93 1,817,042 13.59 102.57 Maricopa 16,419 36,535 694,173 1,800.02 25.82 538,094 4.02 1,290.06 Pima 108,506 289,460 976,434 237.33 36.32 1,148,152 8.59 850.44 Santa Cruz 268,470 242,542 491,300 102.56 18.27 6,588,778 49.28 74.57 Yuma 130,598 191,158 270,991 41.76 10.08 3,266,978 24.44 82.95 Other Counties - 954 36 (96.20) 0.00 57 0.00 636.23 Unallocated 69,360 9,777 Total 688,256 857,402 2,688,670 213.58 97.42 13,368,878 99.93 201.11
2007-08 2007-08 2007-081991 2001 2007-08 2001 to 2007-08 Percent Percent Exp. Per
Expenditures Expenditures Expenditures Percent Change of Total 2007-08 of Total VisitorCity* ($ 000s) ($ 000s) ($ 000s) Expenditures Expenditures Visitor Parties Vis. Parties Party ($)Douglas 141,631 79,423 123,300 55.24 4.59 1,422,253 10.64 86.69 Nogales 268,470 242,542 491,300 102.56 18.27 6,588,778 49.28 74.57 Metro Phoenix 16,419 30,502 693,500 2,173.62 25.79 537,649 4.02 1,289.87 San Luis 61,960 67,104 95,352 42.10 3.55 1,694,225 12.67 56.28 Metro Tucson 98,760 280,257 968,700 245.65 36.03 1,008,176 7.54 960.84 Yuma 68,637 123,772 173,900 40.50 6.47 1,492,647 11.17 116.50 Other Cities 32,379 27,802 73,258 163.50 2.72 615,373 4.60 119.05 Unallocated 69,360 2.58 9,777 Total 688,256 851,402 2,688,670 215.79 100.00 13,368,878 99.93 201.11
*City allocation is based on respondent identification of the city in which they shopped.Respondents do not always know where city limits are, so allocations among cities are not considered as accurate as among counties.
Source: Mexican Visitor Survey, 2007-08

Mexican Visitors to Arizona, 2007-08
56The University of Arizona Eller College of Management
VI. Expenditures by Mexican Visitors in Arizona
Sinaloa and 0.57 percent from Federal District (Mexico City), 0.31 from Yucatan, and 0.60 from other Mexican states.
Table 43Origin, per Party Expenditure, and Share of Expenditures by Destination
Table 43Origin, per Party Expenditures and Share of Expenditures in Destination Cities
Mexico % Parties Mexico % Parties % Exp. PerArizona State of Across City of Across Across PartyDestination Origin States Oriign Cities Cities Exp ($)
DouglasSonora 100.00 Agua Prieta 92.10 83.67 85
Naco 4.65 6.91 139 Cumpas 2.19 5.68 243 Cananea 0.70 0.41 110 Hermosillo 0.35 3.08 412 Other 0.01 0.25 2,737
NogalesSonora 99.86 Nogales 93.19 80.46 74 Sinaloa 0.14 Imuris 1.86 5.72 263 Other - Magdalena 2.11 6.42 261
Cibuta 1.01 2.31 196 Santa Ana 0.37 1.10 256 Caborca 0.14 0.29 179 Los Mochis 0.51 0.39 65 Benjamin Hill 0.14 0.44 263 Other 0.67 2.86 20
Metro PhoenixSonora 89.87 San Luis RC 18.35 21.59 1,541 Baja California 7.59 Nogales 15.54 13.85 1,168 Sinaloa 1.06 Agua Prieta 11.50 12.27 1,397 District F. 0.57 Magdalena 8.34 6.38 1,000 Yucatan 0.31 Hermosillo 7.52 7.63 1,328 Other 0.60 Mexicali 5.58 8.96 2,103
Naco 4.51 4.11 1,193 Guaymas 3.98 3.22 1,060 Cananea 3.80 3.00 1,032 Imuris 3.50 1.53 572 Sonoita (oyta) 2.89 1.94 880 Cumpas 2.75 2.18 1,039 Santa Ana 2.07 1.76 1,112 Algodones 2.01 1.77 1,149 Puerto Penasco 1.24 1.12 1,180 Cibuta 0.85 0.22 330 Other 5.57 8.48 2,005
Metro TucsonSonora 94.75 Nogales 22.40 12.67 553 Baja California 4.67 Magdalena 10.44 10.24 959 Chihuahua 0.50 Agua Prieta 9.87 9.55 946 Other 0.08 San Luis RC 8.97 15.46 1,685
Hermosillo 8.22 12.83 1,528 Cananea 7.36 5.24 696 Santa Ana 5.04 4.49 871 Naco 4.85 4.45 897 Imuris 4.74 4.59 948 Mexicali 3.22 4.72 1,433 Cumpas 2.41 1.67 676 Sonoita 1.69 1.36 788 Esqueda 1.49 1.74 1,141 Algodones 1.45 2.08 1,404 Guaymas 1.35 1.57 1,136 Ures 1.04 0.87 821 Obregon 0.84 1.75 2,045 Sasabe 0.68 0.57 810 Cibuta 0.45 0.14 300 Other 3.49 4.02 1,129
San LuisSonora 99.50 San Luis RC 99.46 95.91 69 Baja California 0.50 Mexicali 0.34 2.32 492 Other - Algodenes 0.16 1.65 725
Cumpas 0.04 0.12 220 Other - - na
YumaSonora 98.91 San Luis 98.35 95.31 146 Baja California 1.09 Mexicali 0.62 1.88 458 Other - Algodones 0.48 1.40 441
Hermosillo 0.32 1.07 500 Cumpas 0.23 0.34 220 Other - - na
Source: Mexican Visitor Survey, 2007-08

Mexican Visitors to Arizona, 2007-08
57The University of Arizona Eller College of Management
VI. Expenditures by Mexican Visitors in Arizona
In the case of the three Arizona border cities – Douglas, Nogales and San Luis – the highest percentage (92.1, 93.19 and 99.46 percent) of their visitors is from the neighboring city just south of the border: Agua Prieta, Nogales and San Luis Rio Colorado, respectively. In Yuma, about 25 miles north of the border, 98.35 percent are from San Luis Rio Colorado.
As distance increases, the percentage coming from the closest border city decreases. About 22 percent of visitors to Metro Tucson come from Nogales, Sonora. All six Sonora border cities, including Nogales, account for more than 48 percent of Mexican parties to Metro Tucson. Slightly more than 8 percent or about every 11th visitor party to Tucson comes from Hermosillo.
Slightly more than 18 percent of metro Phoenix’ visitors come from San Luis Rio Colorado; all six Sonora bor-der cities, including San Luis Rio Colorado, account for 53 percent. About 7.5 percent come from Hermosillo. Mexicali and Algodones are major origin cities in Baja California accounting together for 7.6 percent of visitor parties to metro Phoenix.
Generally, expenditures per party are related to the distance traveled. Visitors from Mexican cities located the farthest from the border tend to spend the most per party. Distance decreases the number of trips a party will make, but it tends to increase the amount spent when it makes a trip.
For example, visitors from Nogales, Sonora spend on average $74 in Nogales, Arizona, but Nogales, Sonora visitors to metro Tucson spend on average $553 per party per trip. There are exceptions to this general rule, of course, but spending per party and distances traveled are clearly related in Table 43.
Expenditure Categories (i.e., sales to Mexican Visitors) by Destination County
In Table 44, expenditures are broken down by category for Arizona’s five counties that are major destinations for Mexican visitors.
As expected, ‘stores’ (stores in malls and shopping centers, and non-mall stores) are the major beneficiaries of Mexican visitor spending; of total direct sales to Mexican visitors they account for between 50.44 percent in Yuma County to 57.95 percent in Santa Cruz County. They are followed by grocery stores and restaurants, although differences between counties are more pronounced. Of total sales to Mexican visitors in Maricopa and Pima counties, total food sales are less than 15 percent, with restaurants accounting between 10 to 11 percent and grocery stores between 2 and 3.5 percent. In contrast, in border counties – Cochise, Santa Cruz and Yuma – total food sales are over one third of all sales, with grocery stores accounting for between 24 and 30 percent of total sales, and spending at restaurants is well below ten.

Mexican Visitors to Arizona, 2007-08
58The University of Arizona Eller College of Management
VI. Expenditures by Mexican Visitors in Arizona
Table 44Percent of Expenditures by Destination County (Percentages), by Spending Category
Maricopa and Pima counties have relatively larger percentages of total sales to Mexican visitors in transportation, lodging, and entertainment sectors, while border counties have relatively larger percentages of sales in the business category.
Expenditures per Party: Overnight vs. Day Visitors by Destination Area
Table 45 shows the portion of overnight and day visitor parties and the corresponding portion of expenditures for each of the largest destination cities.
Table 45Expenditures of Overnight vs. Day Visitors by Destination City
Very few Mexican visitors spend the nights in the three border communities of San Luis, Nogales, or Douglas (less than 5 percent for each). A higher portion of visitors to Yuma spend the night (over 12 percent). Almost all visitors to metro Phoenix (98.69 percent) and the bulk of metro Tucson visitors (87.52 percent) spend at least one night.
Overnight visitors spend more than day visitors in all the destination cities, which is reflected in the percent of total expenditures made by overnight vs. day visitors. In Douglas, San Luis, and Nogales, overnight visitors represent approximately 10 percent of total expenditures; in Yuma, overnight visitors account for almost 20 percent of total expenditures. Over 96 percent of total expenditures are made by overnight visitors in both metropolitan Tucson and Phoenix.
Table 44Expenditures, by Category, for Major Destination Counties(Percentages)
Expenditures Cochise Maricopa Pima Santa Cruz YumaLodging 0.67 11.54 9.50 0.25 1.53 Total Food
Restaurants 7.34 10.54 10.08 6.66 6.61 Groceries 24.13 2.23 3.21 24.63 29.86
Total TransportationGasoline 4.47 7.37 7.72 3.03 5.30 Vehicle related 0.06 0.25 0.04 0.01 0.03 Air travel - 0.71 0.07 - - Car Rental - 0.21 0.04 0.01 - Buses, taxis 0.64 0.92 0.69 0.89 0.46
Stores 54.98 57.71 59.89 57.95 50.44 Total Medical
Doctors 0.40 0.09 0.07 - - Hospitals - 0.09 0.06 0.16 - Medicine 0.19 0.78 0.14 0.13 0.17
Entertainment 0.50 5.75 6.69 0.23 0.70 Other goods 0.55 1.59 1.37 2.83 3.38 Other Services - 0.10 0.06 0.01 - Business 6.09 0.12 0.38 3.22 1.53 Other - 0.02 - - - SUM 100.00 100.00 100.00 100.00 100.00
Source: Mexican Visitor Survey, 2007-08
Table 45Expenditures of Overnight Visitors vs. Day Visitors, by Major Destination Area
% Parties % Parties Exp/party Exp/party % Exp % ExpDestination Overnight Day Overnight Day Overnight DayCity Visitors Visitors Sum Visitors Visitors Visitors Visitors SumDouglas 3.86 96.14 100.00 257 84 10.96 89.04 100.00Nogales 3.86 96.14 100.00 180 72 9.13 90.87 100.00Metro Phoenix 98.69 1.31 100.00 1,316 823 99.18 0.82 100.00San Luis 4.71 95.29 100.00 128 58 9.73 90.27 100.00Metro Tucson 87.52 12.48 100.00 1,081 253 96.77 3.23 100.00Yuma 12.58 87.42 100.00 188 111 19.62 80.38 100.00
Source: Mexican Visitor Survey, 2007-08

Mexican Visitors to Arizona, 2007-08
59The University of Arizona Eller College of Management
VII. Total Economic Impacts of Mexican Visitors
VII. Total Economic Impacts of Mexican VisitorsTo estimate the impact of Mexican visitor spending on the economy of Arizona, a state-wide and five county-level input-output models were used. An IMPLAN input-output model65 was used that is comparable to IMPLAN version used in 2001 study; however, the latest version includes updated county data, which means that they reflect changes in economic structure such as employment by sector, wages, productivity, and the ratio of what is produced locally versus what is imported -- all of which affect the estimates of jobs, wages and output. In other words, the same type and volume of expenditures may not produce the same number of jobs, wages and output in 2001 and 2007-08.
Input output-models are used to estimate two basic things. First, using direct spending by Mexican visitors (in section VII) the model estimates number of jobs and labor income (wages and salaries) associated with direct sales. Second, the model estimates multipliers for jobs, labor income and sales, or what is better known as indirect and induced impacts.
Direct Sales, Jobs and IncomeDirect sales, income and employment generated directly by dollars spent by Mexican visitors, e.g., restaurant sales, jobs and income, are considered ‘direct impact.’ Indirect impacts are the sales, income and employment that results from other businesses in the local economy selling to the restaurants, such as food distributors. Induced impacts are the sales, income and employment generated as workers in the first two categories spend their wages and salaries locally. Total impacts are the sum of the direct, indirect, and induced impacts.
Direct economic impacts, by county are reported in Table 46. In total, direct Mexican visitor spending of $2.69 billion creates 23,385 direct jobs and pays $527.04 million in direct wages in Arizona. Total direct spending is 279% higher in 2007-08 than in the previous study for 2001.
Direct economic impacts vary across counties, from 1,498 jobs in Cochise County to 9,426 jobs in Pima County.
Table 46Direct Economic Impacts of Mexican Visitors to Arizona 2007-08, by County
Table 46Direct Economic Impacts, by County, and for Arizona
Direct Direct DirectSpending Jobs Income
County ($000s) ($000s)Cochise 186,376 1,498 28,795 Maricopa 694,173 5,800 143,409 Pima 976,434 9,426 190,228 Santa Cruz 491,300 3,762 75,210 Yuma 270,991 2,016 41,512 Other&Unallocated 69,397 883 47,889 SUM 2,688,670 23,385 527,043
Arizona 2,688,670 23,385 527,043
Percent Distribution
Direct Direct DirectSpending Jobs Income
County % % %Cochise 6.93 6.41 5.46Maricopa 25.82 24.80 27.21Pima 36.32 40.31 36.09Santa Cruz 18.27 16.09 14.27Yuma 10.08 8.62 7.88Other&Unallocated 2.58 3.78 9.09SUM 100.00 100.00 100.00
Arizona 100.00 100.00 100.00
Source: Mexican Visitor Survey, 2007-08

Mexican Visitors to Arizona, 2007-08
60The University of Arizona Eller College of Management
VII. Total Economic Impacts of Mexican Visitors
The size of the direct job impact in a county depends on the mix of expenditures in that county, and county’s average wages. For example, Cochise County’s share of direct sales to Mexican visitors is 6.93 percent, while only 5.46 percent of direct labor income generated in Arizona by Mexican visitors’ spending. Average wages in Maricopa County are above state’s average, and thus Maricopa accounts for 27.21 percent of direct labor income, while its share of direct jobs is 24.80 percent. The “Other & Unallocated” amount includes a small amount for northern Arizona (less than 1% of this category). Unallocated includes spending by visitors who did not declare where they shopped in Arizona. The bulk of this is believed to have occurred in border communities.
The Multiplier Effect: Total Sales, Jobs and IncomeThe size of a multiplier depends on two factors: the extent of inter-industry linkages within the region and the amount of leakage from the region at each round of spending. Inter-industry linkages have to do with how much businesses purchase from one another within the local economy. Generally, these linkages are much stronger for large metropolitan areas or states than they are for small counties.
Leakage refers to the portion of dollars spent by consumers that is retained in the community for the next round of spending. The smaller the county or region is, the larger the leakage, and therefore, the smaller the multiplier.
Total economic impacts are reported in Table 47. The $2.69 billion in direct Mexican visitor spending (i.e., direct sales to Mexican visitors) in Arizona ‘multiplies’ to a total sales impact of $3.61 billion, 30,354 jobs, and $837.2 million in income.66
Table 47Total Economic Impacts of Mexican Visitors to Arizona 2007-08, by CountyTable 47Total Economic Impacts 2007-08, by County, and for Arizona
Total Total TotalSales Jobs Income
County ($000s) ($000s)Cochise 211,772 1,763 36,508 Maricopa 963,236 8,066 234,895 Pima 1,291,350 12,509 294,920 Santa Cruz 560,393 4,496 96,599 Yuma 314,016 2,463 56,026 Other&Unallocated 85,930 1,058 22,209 SUM 3,426,697 30,355 741,158
Arizona* 3,613,128 30,355 837,244
Percent distribution
Total Total TotalSales Jobs Income
County % % %Cochise 6.18 5.81 4.93Maricopa 28.11 26.57 31.69Pima 37.68 41.21 39.79Santa Cruz 16.35 14.81 13.03Yuma 9.16 8.11 7.56Other&Unallocated 2.51 3.49 3.00SUM 100.00 100.00 100.00
*The sum of impacts by county is smaller than the total for Arizona; individual county I-O models do not take into account intercounty impacts (spill-overs).
Source: Mexican Visitor Survey, 2007-08

Mexican Visitors to Arizona, 2007-08
61The University of Arizona Eller College of Management
VII. Total Economic Impacts of Mexican Visitors
Again, economic impacts vary across counties. Each county has a different expenditure mix and different mul-tipliers so the impacts are not proportional to the distribution of the initial sales. For example, Maricopa County receives 25.82 percent of direct expenditures, but through a combination of the expenditure mix and multipliers, accounts for 26.67 percent of total sales impact, 26.57 percent of job impact, and 28.05 percent of income impact.
Among border counties, Santa Cruz accounts for the largest share of total sales impact (15.50 percent); Yuma County accounts for 8.69 percent, and Cochise County for 5.86 percent of total sales impact in Arizona.
Compared to 2001,67 direct spending has increased in both Maricopa and Pima counties; together these two counties received 62.14 percent of all direct spending by Mexican visitors in 2007-08 compared to 38.02 percent in 2001. In contrast, the share of border counties (Santa Cruz, Cochise and Yuma combined) has declined from 61.87 percent in 2001 to 35.28 percent in 2007-08. Larger shares of direct spending for both Pima and Maricopa Counties translate into even larger shares of total impact because of the comparatively larger multipliers in these two counties compared to the smaller border counties. These two counties together receive 62.4 percent of total sales, 67.78 percent of total jobs and 63.28 percent of total income generated in Arizona as a result of Mexican visitors’ spending.
Mexican Visitor Spending as a Percent of Taxable Sales and Revenue Impacts
Table 48 shows the percent of taxable sales in each county that is attributable to Mexican visitor spending. In this table, Mexican visitor spending, by county, is compared to Arizona Department of Revenue taxable sales figures. In order to make this comparison, several steps had to be taken to be sure the two sets of numbers are compatible.
First, gasoline sales are removed from the Mexican visitor spending. Gasoline sales are taxable under the fuel tax, but they are not taxable under ‘sales tax’ of Arizona. Second, each expenditure category was multiplied by a percentage that represents the portion that is taxable in Arizona. For example, medically-related expen-ditures (doctors, medicine and hospitals) and groceries are not taxable in Arizona, but groceries are taxed by most border communities. For comparison purposes, groceries are excluded.
Table 48Mexican Visitor Spending as a Percent of Taxable Sales 2007-08, by County (Percentages)
When all adjustments were made, the resulting ‘taxable’ Mexican visitor expenditures were compared to total taxable sales in each county, reported by the Arizona department of revenue. In Maricopa County, Mexican visitor spending represents approximately 0.77 percent of total taxable sales. This relatively low percentage is not surprising, given the extremely large size of Maricopa County economy.
In contrast, ‘taxable’ Mexican visitor spending represents 48.62 percent of the sales tax base of Santa Cruz County. Clearly, this county is very dependent on the spending of Mexican residents. Mexican visitors’ spending represents 6.27 percent of Yuma’s sales tax base, 5.34 percent of Cochise County’s sales tax base and 5.20 percent of Pima County’s sales tax base.
Table 48Mexican Visitor Spendingas a percent of Taxable Sales by County(Percentages)
Taxable Sales AttributedCounty to Mexican VisitorsCochise 5.34 Maricopa 0.77 Pima 5.20 Santa Cruz 48.62 Yuma 6.27
Source: Mexican Visitor Survey, 2007-08

Mexican Visitors to Arizona, 2007-08
62The University of Arizona Eller College of Management
VII. Total Economic Impacts of Mexican Visitors
Revenue impacts associated with Mexican visitors are computed for the State, counties and cities and summarized in Table 49. They are computed using the Arizona Tax Revenue Model.68 This model is an extensive spreadsheet that embodies: state and local tax rates; state to local revenue sharing formulas; current and recent tax collections from a variety of revenue sources for cities, counties and state; parameters delivered from economic theory and analysis; and state, county and city economic characteristics, such as population, employment, and income. By inputting Mexican visitor expenditures and total wages generated by those expenditures, the revenue model computes several categories that accrue to the State of Arizona, county and city governments. In addition, several hand calculations were made for each of the counties for taxes such as county excise taxes, local city revenues and induced county and city tax revenues.
The model computes both direct and induced revenue impacts. Direct revenue impacts are revenues paid by the Mexican visitors when they make purchase. While direct revenues are generated by the industry analyzed, induced revenues are generated when local income is spent in the county. When an industry hires workers, the payroll is spent and taxes are paid in the form of income taxes, sales taxes, property taxes, vehicle license taxes, etc. In addition, when a basic industry (such as restaurants that sell to Mexican residents) expands, the output and work force of other industries that sell to the basic industry also expand. Workers in these technically linked industries also spend their money in the community and generate revenues. These revenues associated with the total change in wages affected by tourism are ‘induced’ revenues.
Table 49Revenue Impacts of Mexican Visitor Spending 2007-08, by level of Government
As shown in Table 49, the State of Arizona receives $93.2 million directly from Mexican visitor spending. Arizona counties receive $36.1 million and cities $57.5 million. The largest direct revenue sources for all levels of government are associated with the city sales tax and the state sales tax, which is also shared with counties and cities. Smaller amounts of revenues are generated by state-shared revenues, such as state-shared sales taxes and HURF (the Highway User Revenue Fund), and county excise taxes.
Induced revenues, generated through employee spending are also presented in Table 49. The State of Arizona receives $27.8 million in induced revenues from Mexican visitor spending, while counties receive $10.1 million and cities $10.5 million.
In total, Mexican visitor spending generates $235.3 million to the State of Arizona, its counties and cities. Of this amount, the State receives 51.4 percent, counties 19.6 percent and cities 28.9 percent.
Table 49Revenue Impacts of Mexican Visitor Spending
Direct Induced TotalLevel of Revenues Revenues RevenuesGovernment ($000s) ($000s) ($000s)State of Arizona 93,200 27,836 121,035 Counties 36,129 10,126 46,254 Cities 57,504 10,503 68,006 TOTAL 186,832 48,464 235,296
Percent Distribution
Direct Induced TotalLevel of Revenues Revenues RevenuesGovernment ($000s) ($000s) ($000s)State of Arizona 49.88 57.44 51.44Counties 19.34 20.89 19.66Cities 30.78 21.67 28.90TOTAL 100.00 100.00 100.00
Source: Mexican Visitor Survey, 2007-08

Mexican Visitors to Arizona, 2007-08
63The University of Arizona Eller College of Management
VIII. Summary and Conclusions
VIII. Summary and ConclusionsTravel and tourism continues to be one of the most important export industries driving Arizona’s economy, and Mexican visitors are an important contributor to this sector. This is the forth study conducted by The University of Arizona since the late 1970s which assesses characteristics of Mexican visitors and estimates their economic impact on Arizona. Primary data on destinations, travel mode, length of stay, reasons for coming, spending and other characteristics of shopping behavior were collected through a year-long survey from July 2007 through June 2008. Mexican visitors were interviewed as they were returning to Mexico through one of the six Arizona border ports of entry – Nogales, Douglas, San Luis, Lukeville, Naco and Sasabe -- and two international airports in Phoenix and Tucson. Estimates of total economic impacts, including indirect and induced sales, jobs, and income were estimated using the IMPLAN input-output models for the State, metro areas and border counties. Tax revenues, an important component of the total economic impact, were estimated by state and county tax revenue models.
As in the three previous studies,69 visitors in this study include both the so-called traditional tourists, who generally visit other country for leisure, historical site visits, and similar reasons, and who tend to stay overnight, and day-visitors or the non-traditional tourists who cross the border but return the same day. Of a total of 24.04 million alien crossings from Mexico to Arizona reported by U.S Customs and Border Protection from July 2007 through June 2008, this study results suggest that 84.24 percent of trips are associated with day-visits and 15.76 percent with overnight visits.
The results of this study, as in the past, demonstrate the economic importance of Mexican visitor spending to Arizona’s economy. An estimated 23,385 wage and salary jobs in Arizona at eating and drinking establishments, retail establishments and other spending-related sectors are directly attributable to Mexican visitor spending. Through local purchases of supplies by businesses and the spending of income derived from visitor-related jobs, Mexican visitors generate 6,970 additional jobs in Arizona in 2007-08. These jobs account for a total income of $837 million and $3.61 billion in sales.
The largest economic impact of Mexican visitor spending occurred in Pima County. A county that includes Tucson and extends all the way to the U.S.-Mexico border, Pima County receives 41.21 percent of the total job impact, 37.68 percent of the total sales impact, and 39.79 percent of the total income impact. Maricopa County, containing the State’s largest metropolitan area and the capital city, Phoenix, receives the second largest share of the total impact: 28.11 percent of total sales, 26.57 percent of total jobs, and 31.69 percent of total income.
Santa Cruz County, the border county that contains Nogales, the largest port of entry into Arizona, receives 14.81 percent of the total job impact, 16.35 percent of the total sales impact, and 13.03 percent of the total income impact. Yuma County receives 8.11 percent of the total job impact, 9.16 percent of the total sales impact, and 7.56 percent of the total income impact; Cochise County receives 5.81 percent of the total job impact, 6.18 percent of the total sales impact, and 4.93 percent of the total income impact.
Mexican visitor spending represents a staggering 48.62 percent of the total taxable sales in Santa Cruz County. Mexican visitor spending represents 6.27 percent of taxable sales in Yuma County, 5.34 percent in Cochise County, 5.20 percent in Pima County, and 0.77 percent in Maricopa County. The larger the county in terms of population and income and the further away the county is from the border, the smaller the share of total taxable sales attributable to Mexican visitor spending.
Over 24 million Mexican visitors came to Arizona in 13.37 million parties. They came in parties of 1.8 persons that include 1.47 adults and 0.33 children. About 55 percent of all visitor parties enter by car across the U.S. Mexico border and 44.88 percent are walkers. Less than one percent of all Mexican visitor parties to Arizona fly into the state.
Day visitors comprise 84.24 percent of all Mexican visitor parties; 15.76 percent stay overnight. About 2

Mexican Visitors to Arizona, 2007-08
64The University of Arizona Eller College of Management
percent spend one night; 4.1 percent spend two nights; 5.47 percent spend 3 nights; 4.01 percent spend 4 or more nights. Of those who spend one or more nights in Arizona, 60.97 percent stay in hotels and 39.03 percent spend the night with family and friends.
The primary reason for visiting is shopping which accounts for 57.44 percent of all visitor parties. Business-related reasons, which include work (but exclude business convention, professional training, and business shopping) was cited as the primary reason for visiting by 35.19 percent of all visitor parties. Visiting friends and relatives was the primary reason, cited by 5.81 percent of all visitor parties. Other reasons, such as vacation, medical, personal, business shopping and other represented between 0.14 and 0.79 percent of the primary reasons for their visits.
Almost 99 percent of Mexican visitor parties come from the neighboring Mexican state of Sonora. Of those, 46.9 percent come from the border city of Nogales, the largest of the Sonora’s border cities; 24.1 come from San Luis Rio Colorado, and 13.37 percent from Agua Prieta, and 1.32 percent from the capital city of Hermosillo. The remainder comes from about 20 other cities in Sonora, but also from Baja California, Sinaloa, and the Mexico City metropolitan area.
Three Arizona malls -- Arizona Mills Mall in Phoenix and Tucson Mall and Park Place Mall in Tucson – are the most popular shopping destinations. Among the non-mall stores, Wal-Mart is the most popular in every destination city. Casinos in Tucson and Phoenix are the most popular attractions; the zoo parks are the second most visited attraction.
The 2007-08 Results in Comparison to 2001 Study
One of the purposes of this study was to identify if any changes have occurred in the patterns of Mexican visitors’ travel and spending in Arizona. For that reason, the methodology of data collection and estimation of economic impacts have been kept as close as possible to the methodology used in the previous studies. However, changes in the contextual situation at the border (for example, new regulations for border crossings, general concerns with border security since 9/11, and new Arizona labor laws affecting some Mexican workers), as well as increasing cost of personal interviews, dictated slight modification in the methodology applied to data collection.
Another important point is that this kind of study, only conducted every five to six years reflect primarily the situation within a given a 12-month period instead of a continuous monitoring over a longer period of time. Thus, for example, a relatively favorable peso-dollar exchange might have encouraged more spending in Arizona for certain groups of Mexican visitors; on the other hand, longer wait times at border ports of entry together with new document requirements for entering the United States might have discouraged other groups of Mexican visitors from visiting as often or visiting at all.
In interpreting the differences between 2001 and 2007-08 studies, we also consulted similar studies conducted along Texas-Mexico and California-Mexico border to see if the changes in the Arizona-Sonora region are similar to those detected in other border states.
What has changed?
Increase in the share of overnight visitors Overnight visitors’ share of total visitors increased from less than four percent in 2001 to almost 16 percent in 2007-08; this is probably the largest change since the last study. Far more Mexicans are spending the night in Arizona, particularly the visitors that come to Tucson.
Overnight visitors to the Tucson metropolitan area (Pima County) went from approximately 15 percent to 87 percent. This huge increase for Tucson is the primary cause of the overall increase in the share of overnight visitors. Phoenix (Maricopa County) is 3 hours from the border, so almost all visitors who choose to go to metro Phoenix, by vehicle or by air, spend the night. Visitors to the border communities of San Luis, Yuma, Nogales
VIII. Summary and Conclusions
Mexican Visitors to Arizona, 2007-08
65The University of Arizona Eller College of Management
and Douglas are almost all day-visitors because of their proximity to the border. Tucson is in that midrange of travel time (one hour from the border) that permits both day-visits and overnight visitors. There are several possible reasons why this big shift toward overnight visitors occurred for Tucson, but they are speculative.
First, there may be a selection bias in which Mexican visitors are crossing the border. New documentation requirements and a higher cost of getting visas may have eliminated some of those who were formerly day-visitors to Tucson. From the survey data it is clear that overnight visitors have much higher incomes than day-visitors. Well over half of day-visitors have incomes in the lowest category (less than 10,000 pesos per month), but only 7 percent of the overnight visitors are in the lowest category. It is possible that visa requirements are reducing the number of visitors in the lower income groups with the result that the remaining visitors have higher incomes and are more likely to spend the night.
The total number of parties visiting Tucson (Pima County) has dropped by approximately 22.5 percent since the 2001 study (a decrease of approximately 333,000 parties). If most or all of the reduction is due to fewer people in the lower income groups coming to Tucson because of visa requirements, this could account for a substantial part of the increase in the portion of Tucson visitors that spend the night. Consequently, to the extent that lower-income visitors are screened out, day-visitors are also likely screened out.
There is also the possibility that trip scheduling issues or increased time at the border has decreased the number of day-visitors. If Mexican visitors want to shop in Tucson and return the same day, they would want to cross the border before 9 am so they can begin shopping when stores open at 10 am. This means they are at the border during the busiest time of the day. It has been reported that lines at the border and waits are longer than they have been in the past because of added security and card scans for background/criminal checks. So either they begin their trip much earlier so they fit in a full day of shopping, or they choose to come during more convenient times at the border and spend the night or more than one night when they come. As a result of long-lines or the time-of-day problem, visitors may have been choosing to travel to Tucson less often and spend more time in Tucson when they do go.
We have also learned, anecdotally, that during the study year a number of Tucson hotels advertised aggressively in Mexico and offered some good promotional prices. This may have had some impact on overnight visitors. An ad campaign by one hotel can increase overnight visitors to other hotels and can even impact overnight visitors to friends/family.
It should also be noted that there was a substantial increase (688 percent increase, or approximately 470,000 parties) in the total number of parties traveling to Phoenix (Maricopa County) between 2001 and 2007-08. Because of the distance from the border, Mexican visitors who go to the Phoenix area almost always spend the night (except for a very few air passengers in for a day on business). A round-trip day visit from Mexico to Phoenix and back by vehicle is simply not feasible. The simple fact that more parties are choosing to go to the Phoenix area automatically increases the number of and the portion of parties who spend the night.
One possible explanation for the increase in the number of parties to metro Phoenix and a smaller, but largely offsetting, decrease in the number of parties to Tucson is that, once visitors choose to spend the night in Arizona, it matters less whether they travel to the Tucson or Phoenix area. Unless they are planning on visiting friends or family in metro Tucson, then metro Phoenix becomes a viable option for shopping once the visitor has made the decision to stay overnight.
Increase in the number of visitors staying in hotels despite decline in percentage of overnight visitors staying in hotelsThe percentage of visitors that spend the night in hotels dropped from 79 percent in 2001 to 61 percent in 2007-08 and it is not clear why. Despite the decline in the portion of visitors who spent the night in hotels (among those who spent the night), the total number of visitor parties staying in hotels increased substantially between 2001 and 2007-08. In 2001, 79 percent of those who spent the night (just 3.2 percent of all visitors) stayed in hotels, so only 2.5 percent of all 2001 visitor parties spent the night in hotels. In 2007-08, 61 percent of those spending the night (15.76 percent of all visitor parties) stayed in hotels, so 9.6 percent of all
VIII. Summary and Conclusions

Mexican Visitors to Arizona, 2007-08
66The University of Arizona Eller College of Management
visitor parties stayed in hotels. Further, the number of visitor parties increased from 10.414 million to 13.368 million parties. Therefore, the number of Mexican visitor parties that spend the night has increased from 260,350 parties in 2001 to almost 1.29 million parties in 2007-08.
Increase in volume of air passengersThe number of Mexican air passengers arriving to Arizona through Phoenix and Tucson airport was 33.5 percent higher in 2007-08 reflecting an increase from 15,075 Mexican air passengers in 2001 whose final destination was Arizona to 20,126 in 2007-08.
The highest increase in direct spending between two consecutive studiesDirect expenditures in 2007-08 are 213.6 percent bigger than in 2001 (not adjusted for inflation). Even when adjusted for inflation of an average 3 percent annually, the increase is still substantial: 147.7 percent.
We think that this is a result of three main factors. One, as discussed earlier, is the fact the number of visitor parties has increased 27 percent. Second, also discussed above, is related to the increase in the share of visitors who chose to spend the night. The increase in overnight visitors, coupled with a relative increase of visitor parties in higher income categories, has substantially increased per party spending. Third, and no doubt affecting both the increase in the number of parties and spending levels, the Mexican peso was quite strong during the year of this study. Throughout 2007-08, the peso/dollar exchange was under or close to 11 pesos per one dollar.70 Only for a short time in the fall of 2007 did the peso/dollar ratio exceed 11.
However, this relatively high spending level found in 2007-08 may be just a one-time situation rather than a trend. The recent deterioration in the peso/dollar ratio may have dramatic effects on both the number of Mexican visitors and/or spending in FY 2008-09. Recently the peso/dollar ratio has been over 13, which represents a substantial decrease in the purchasing power of all Mexicans, except those who get paid in U.S. dollars. This could have the effect of a) decreasing border crossings, b) decreasing spending per party, and/or c) reducing proportion of those who spend the night. Further, the recent deterioration of the American economy will have substantial economic impacts on both sides of the U.S.-Mexico border, affecting jobs and incomes, impacting the purchasing power of Mexican throughout the border region.
Finally, June 2009 is the deadline for compliance with new documents for border crossings,71 which also may cause a decline in border crossings, most likely of visitors in lower income categories.
Increase in direct spending in counties further away from the border (Maricopa and Pima) The largest absolute and relative increase in direct spending occurred in Maricopa County; consequently, its share of total direct sales increased from 4.26 percent in 2001 to 25.85 percent in 2007-08. Pima County’s share of direct sales also increased from 33.76 percent to 36.32 percent.
Although the three border counties (Cochise, Santa Cruz and Yuma) experienced substantial increases in Mexican visitor expenditures, their shares of total Mexican visitors’ economic impact declined. For example, Mexican visitor direct spending in Cochise County increased almost 92.63 percent, but its share decreased from 11.28 percent in 2001 to 6.93 percent of the total direct expenditures in 2007-08. Expenditures in Yuma County increased by 41.76 percent, but Yuma’s share of total Mexican visitor direct spending decreased from 22.30 percent in 2001 to 10.08 percent in 2007-08. Santa Cruz’s share of expenditures fell from 28.29 percent to 18.27 percent, despite the fact that direct spending by Mexican visitors in Santa Cruz County more than doubled (102.56 percent increase compared to 2001).
Decline in average size of visitor partiesParty size of visitors passing through all ports has declined except for visitors entering through Douglas and Sasabe. The overall average party size has decreased from 2.2 to 1.8. This smaller party size contributed significantly to the increase in the number of parties in 2007-08. The total number of aliens crossing increased by only 4.29 percent, but the total number of parties increased by 27.37 percent because of the substantial decrease in party size.
VIII. Summary and Conclusions

Mexican Visitors to Arizona, 2007-08
67The University of Arizona Eller College of Management
Decline in percentage of visitor parties arriving by carWhile motor vehicle remains the primary mode of travel, the share of Mexican visitor parties crossing the border by car decreased from 70.34 percent in 2001 to 55.02 percent of all visitor parties in 2007-08. The share of pedestrian parties increased from 29.58 percent in 2001 to 44.88 percent in 2007-08, while the share of those arriving by air increased from 0.08 percent in 2001 to 0.10 percent in 2007-08.
What seem to be unchanged (persistent) patterns?
The origin of Mexican visitors shows little changeThe neighboring state of Sonora continues to be the main origin of Mexican visitors to Arizona, with almost 99 percent of all visitors to Mexico from that state. The three largest border communities of Agua Prieta, Nogales, and San Luis RC contribute 93 percent of all Mexican visitors, a percentage almost identical to that in 2001.
The only noticeable change regarding the origin of visitors is among visitors to metro Phoenix. Because more visitors entering through the six southern BPOE are traveling to metro Phoenix, the portion of visitor parties to metro Phoenix from Sonora has increased from 52 percent in 2001 to almost 90 percent in 2007-08. Previously, in 2001, proportionately more metro Phoenix visitors came by air from other Mexican states.
Shopping is the main reason for visitingShopping is the main reason for visiting Arizona, with 57.44 percent of all visitor parties listing that as a reason. Visiting friends and relatives, listed by 5.81 percent of all visitor parties as the primary reason for visiting, was also a very strong reason for visiting Arizona. These two portions are down somewhat since 2001 because the portion identified as coming for other business and/or work is higher (35.19 percent in 2007-08 vs. 14.41 percent in 2001). It is not believed that the portion of crossers who come for work has increased since 2001. Rather, a different survey question (previously in 2001, visitors were asked to list and prioritize two reasons for visiting) and a stronger focus on identifying crossers who worked, resulted in higher proportions in the business/other (including work) category than in 2001, which, in turn reduced the estimated percent that came primarily to shop and visit friends.
For some ports, shopping was listed by a very high portion of visitors as a primary reason. In particular, shopping was identified as the primary reason by shoppers who crossed into Douglas and what we refer to as the “pass-through” ports of Naco, Lukeville and Sasabe, by 79.42, 69.19, 80.09, and 76.47 percent, respectively.
Shopping (40.75 percent), followed by visits to friends/relatives (27.59 percent), were the primary reasons for visiting by air travelers. In addition, air travelers attended conventions/conferences (15.75 percent), received business training (6.25 percent).
Overall, very few came for what they describe as a vacation (0.24 percent), personal health reasons (0.14 percent), other personal (0.31 percent), business convention (0.05 percent), business training (0.03) percent.
In conclusion, this study has attempted to quantify the economic aspects of Mexican visitors to Arizona. Each day, more than 65,000 Mexican residents came to Arizona to work, visit friends and relatives, and shop. Each day, they spend over $7,350,000 in Arizona’s stores, restaurants, hotels and other businesses, and thus contribute substantially to Arizona’s export trade with Mexico. Familial ties, long-term friendships, work opportunities and shopping experiences not yet available in Mexico continue to support strong cross-border interactions between Arizona and its neighbor, Sonora.
VIII. Summary and Conclusions
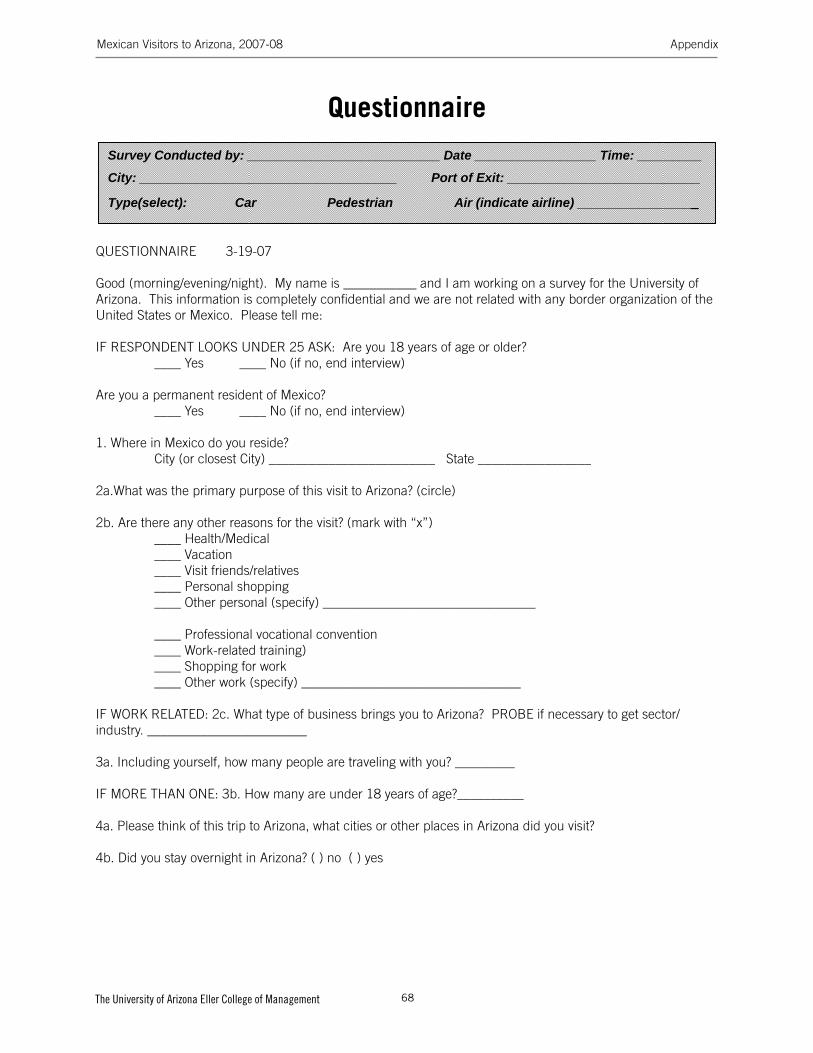
Mexican Visitors to Arizona, 2007-08
68The University of Arizona Eller College of Management
Appendix
Survey Conducted by: ___________________________ Date _________________ Time: _________
City: ____________________________________ Port of Exit: ___________________________
Type(select): Car Pedestrian Air (indicate airline) _________________
QUESTIONNAIRE 3-19-07
Good (morning/evening/night). My name is ___________ and I am working on a survey for the University of Arizona. This information is completely confidential and we are not related with any border organization of the United States or Mexico. Please tell me:
IF RESPONDENT LOOKS UNDER 25 ASK: Are you 18 years of age or older?
____ Yes ____ No (if no, end interview)
Are you a permanent resident of Mexico?
____ Yes ____ No (if no, end interview)
1. Where in Mexico do you reside?
City (or closest City) _________________________ State _________________
2a.What was the primary purpose of this visit to Arizona? (circle)
2b. Are there any other reasons for the visit? (mark with “x”) ____ Health/Medical____ Vacation ____ Visit friends/relatives ____ Personal shopping ____ Other personal (specify) ________________________________
____ Professional vocational convention ____ Work-related training) ____ Shopping for work ____ Other work (specify) _________________________________
IF WORK RELATED: 2c. What type of business brings you to Arizona? PROBE if necessary to get sector/industry. ________________________
3a. Including yourself, how many people are traveling with you? _________
IF MORE THAN ONE: 3b. How many are under 18 years of age?__________
4a. Please think of this trip to Arizona, what cities or other places in Arizona did you visit?
4b. Did you stay overnight in Arizona? ( ) no ( ) yes
IF YES: 4c. Which cities or towns did you stay overnight? PROBE: Any others?
1
QUESTIONNAIRE 3-19-07
Good (morning/evening/night). My name is ___________ and I am working on a survey for the University of Arizona. This information is completely confidential and we are not related with any border organization of the United States or Mexico. Please tell me:
IF RESPONDENT LOOKS UNDER 25 ASK: Are you 18 years of age or older? ____ Yes ____ No (if no, end interview)
Are you a permanent resident of Mexico? ____ Yes ____ No (if no, end interview)
1. Where in Mexico do you reside? City (or closest City) _________________________ State _________________
2a.What was the primary purpose of this visit to Arizona? (circle) 2b. Are there any other reasons for the visit? (mark with “x”) ____ Health/Medical ____ Vacation ____ Visit friends/relatives ____ Personal shopping ____ Other personal (specify) ________________________________
____ Professional vocational convention ____ Work-related training) ____ Shopping for work ____ Other work (specify) _________________________________
IF WORK RELATED: 2c. What type of business brings you to Arizona? PROBE if necessary to get sector/industry. ________________________
3a. Including yourself, how many people are traveling with you? _________
IF MORE THAN ONE: 3b. How many are under 18 years of age?__________
4a. Please think of this trip to Arizona, what cities or other places in Arizona did you visit?
4b. Did you stay overnight in Arizona? ( ) no ( ) yes
Questionnaire

Mexican Visitors to Arizona, 2007-08
69The University of Arizona Eller College of Management
IF YES: 4c. Which cities or towns did you stay overnight? PROBE: Any others?
Number of Nights ____ Ajo_______________________ ____ Bisbee____________________ ____ Benson____________________ ____ Chandler__________________ ____ Douglas___________________ ____ Flagstaff___________________ ____ Fountain Hills______________ ____ Glendale___________________ ____ Grand Canyon______________ ____ Lake Havasu________________ ____ Lukeville___________________ ____ Mesa______________________ ____ Naco______________________ ____ Nogales____________________ ____ Phoenix____________________ ____ Peoria______________________ ____ Pinetop_____________________ ____ Prescott____________________ ____ San Luis____________________ ____ Sasabe_____________________ ____ Scottsdale__________________ ____ Sedona ____________________ ____ Show Low___________________ ____ Sierra Vista__________________ ____ Tempe_____________________ ____ Tucson_____________________ ____ White Mountains_____________ ____ Wickenburg_________________ ____ Yuma______________________
____ Other (list)______________________________________________________________
ASK ONLY IF STAYED OVERNIGHT [check all that apply]:
4d. Where did you stay? _____ Friends/Relatives _____ Paid Hotel/Motel (indicate property name) ______________________ _____ 2nd Home/Condo in AZ _____ Other______________________________
5. How much did you spend, including all charges, in Arizona on this trip?
(in dollars) $_______________ OR (in pesos) $________________
6. During your stay in _________(name places in question 9), how much did you spend on ( )?(if the total in question 5 is in dollars indicate in dollars, if in pesos indicate in pesos)
Appendix

Mexican Visitors to Arizona, 2007-08
70The University of Arizona Eller College of Management
How much did you spend on the following items (excluding business purchases).
City Name 1. 2. 3. 4.
Lodging $ $ $ $
Food/Drink
Restaurants $ $ $ $
Groceries $ $ $ $
Transportation
Gasoline $ $ $ $
Auto Spending $ $ $ $
Flight $ $ $ $
Auto Rental $ $ $ $
Bus/Taxi $ $ $ $
Retail Stores
Amount $ $ $ $
Health and Medicine
Hospitals/Clinics $ $ $ $
Doctors/Dentists $ $ $ $
Medicines $ $ $ $
Other Spending
Entertainment $ $ $ $
Other Goods $ $ $ $
Other Services (haircuts)
7a. IF WORK RELATED TRAVELER: Did you spend any money on work related expenses in Arizona? No ( ) Yes ( ). IF YES: 7b. How much ?
7c. Where?
7d. What?
How much did you spend for your business in Arizona?
Business
Goods $ $ $ $
Services $ $ $ $
8a. Before this trip, how many trips did you take to Arizona in the last 12 months? ____ # of Trips
Appendix
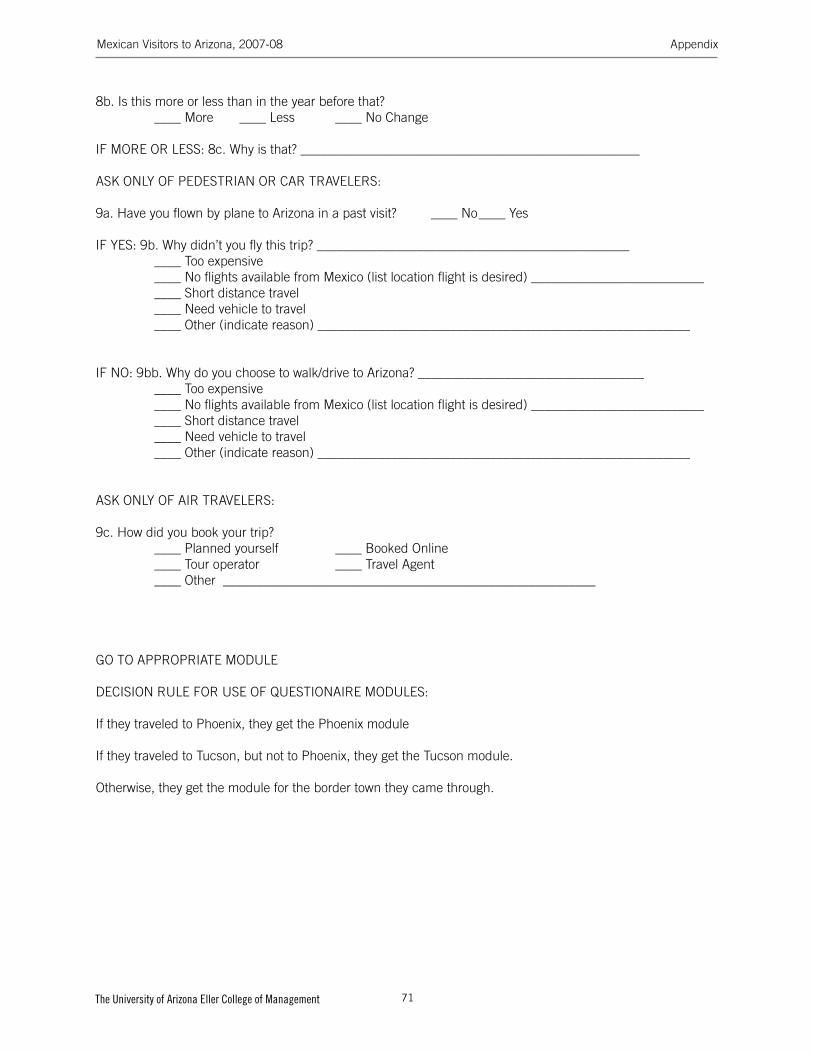
Mexican Visitors to Arizona, 2007-08
71The University of Arizona Eller College of Management
8b. Is this more or less than in the year before that? ____ More ____ Less ____ No Change
IF MORE OR LESS: 8c. Why is that? ___________________________________________________
ASK ONLY OF PEDESTRIAN OR CAR TRAVELERS:
9a. Have you flown by plane to Arizona in a past visit? ____ No ____ Yes
IF YES: 9b. Why didn’t you fly this trip? _______________________________________________ ____ Too expensive ____ No flights available from Mexico (list location flight is desired) __________________________ ____ Short distance travel ____ Need vehicle to travel ____ Other (indicate reason) ________________________________________________________
IF NO: 9bb. Why do you choose to walk/drive to Arizona? __________________________________ ____ Too expensive ____ No flights available from Mexico (list location flight is desired) __________________________ ____ Short distance travel ____ Need vehicle to travel ____ Other (indicate reason) ________________________________________________________
ASK ONLY OF AIR TRAVELERS:
9c. How did you book your trip? ____ Planned yourself ____ Booked Online ____ Tour operator ____ Travel Agent ____ Other ________________________________________________________
GO TO APPROPRIATE MODULE
DECISION RULE FOR USE OF QUESTIONAIRE MODULES:
If they traveled to Phoenix, they get the Phoenix module
If they traveled to Tucson, but not to Phoenix, they get the Tucson module.
Otherwise, they get the module for the border town they came through.
Appendix
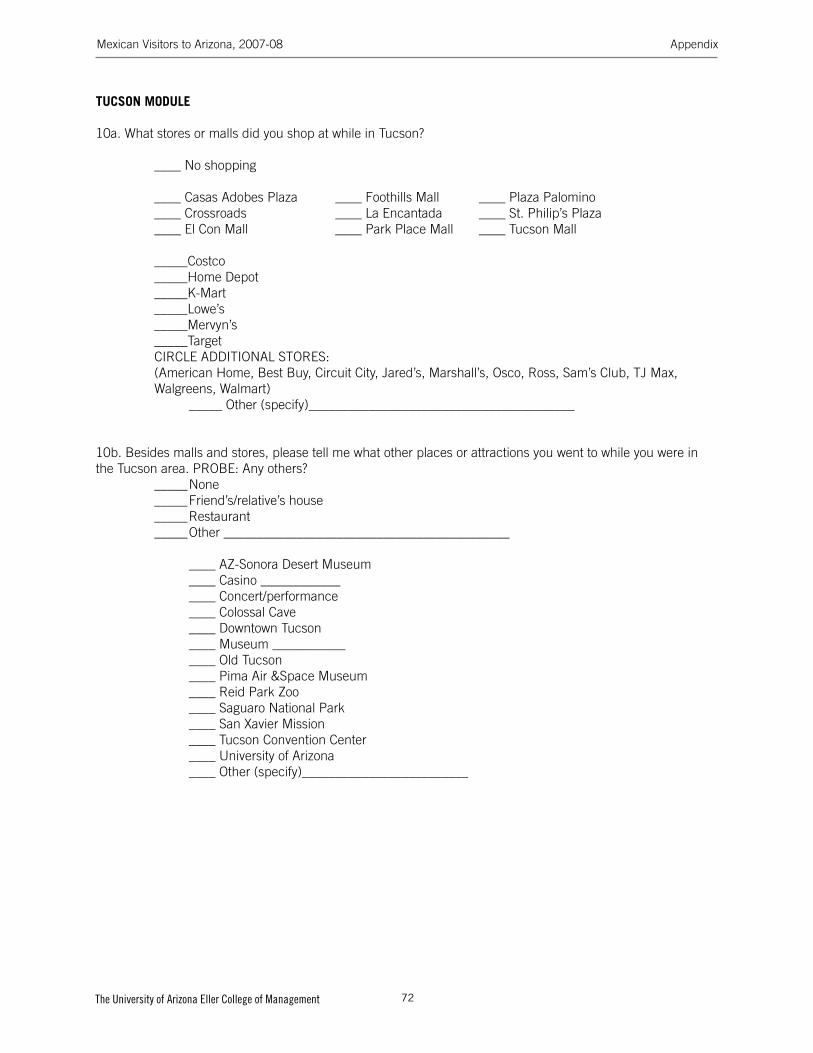
Mexican Visitors to Arizona, 2007-08
72The University of Arizona Eller College of Management
TUCSON MODULE
10a. What stores or malls did you shop at while in Tucson? ____ No shopping
____ Casas Adobes Plaza ____ Foothills Mall ____ Plaza Palomino ____ Crossroads ____ La Encantada ____ St. Philip’s Plaza ____ El Con Mall ____ Park Place Mall ____ Tucson Mall
_____Costco _____Home Depot _____K-Mart _____Lowe’s _____Mervyn’s _____Target CIRCLE ADDITIONAL STORES: (American Home, Best Buy, Circuit City, Jared’s, Marshall’s, Osco, Ross, Sam’s Club, TJ Max, Walgreens, Walmart) _____ Other (specify)________________________________________
10b. Besides malls and stores, please tell me what other places or attractions you went to while you were in the Tucson area. PROBE: Any others? _____ None _____ Friend’s/relative’s house _____ Restaurant _____ Other ___________________________________________
____ AZ-Sonora Desert Museum ____ Casino ____________ ____ Concert/performance ____ Colossal Cave ____ Downtown Tucson ____ Museum ___________ ____ Old Tucson ____ Pima Air &Space Museum ____ Reid Park Zoo ____ Saguaro National Park ____ San Xavier Mission ____ Tucson Convention Center ____ University of Arizona ____ Other (specify)_________________________
Appendix

Mexican Visitors to Arizona, 2007-08
73The University of Arizona Eller College of Management
PHOENIX MODULE
10a. What stores or malls did you shop at while in Phoenix? ____ No shopping
____ Arizona Center ____ Cabela’s ____ Kierland Commons ____ Arizona Mills ____ Chandler Fashion Center ____ Metrocenter ____ Arrowhead Towne Center ____ Desert Ridge ____ Paradise Valley Mall ____ Biltmore Fashion Park ____ Desert Sky Mall ____ Scottsdale Fashion Square ____ Borgata at Scottsdale ____ Fiesta Mall ____ Superstition Springs Mall ____ IKEA ____ Other (specify)______________
_____Costco _____Home Depot _____K-Mart _____Lowe’s _____Mervyn’s _____Target CIRCLE ADDITIONAL STORES: (American Home, Best Buy, Circuit City, Jared’s, Marshall’s, Osco, Ross, Sam’s Club, TJ Max, Walgreens, Walmart) _____Other (specify)____________________________________________________
10c. Besides malls and stores, please tell me what other places or attractions you went to while you were in the Phoenix area. PROBE: Any others? _____ None
_____ Friend’s/relative’s house _____ Restaurant _____ other? _____________________
___ Arizona Temple ___ Casino ______________ ___ Concert/performance ___ Downtown (city)___________________ ___ IMAX ___ Museum _____________ ___ Rawhide ___ South Mountain ___ Sporting event ____________________ ___ Tempe Town Lake ___ WestWorld of Scottsdale ___ Zoo _________
Appendix

Mexican Visitors to Arizona, 2007-08
74The University of Arizona Eller College of Management
NOGALES MODULE:
10a. What stores or malls did you shop at while you were here? ____ No shopping
____ Mariposa Mall ____ Sierra Vista Mall ____ Other (specify)______________ _____Brackers _____Home Depot _____ K-Mart _____ Ross _____ Walmart _____ Western Warehouse CIRCLE ADDITIONAL STORES: (AZ Sonora Supply, Bazar, Big Lots, California Furniture, Dollar mart, factory 2 U, family Dollar, JCPenney, Mission, Osco, radio Shack, Safeway, Sofa mart, Stage, True value, Walgreens) _____Other (specify)______________________________________________________
10b. Besides malls and stores, please tell me what other places or attractions you went to while you were here. PROBE: Any others? _____ None
_____ Friend’s/relative’s house _____ Restaurant
_____ other? _________________________________
Appendix

Mexican Visitors to Arizona, 2007-08
75The University of Arizona Eller College of Management
YUMA MODULE:
10a. What stores or malls did you shop at while you were here? _____ No shopping
_____Yuma Historic Mall _____ Yuma Palms _____Other (specify)_________________________________________________________
_____ Bealls _____ Home Depot _____ Lowe’s _____ Sam’s Club _____ Target _____ Walmart _____ Westwood CIRCLE ADDITIONAL STORES: (99 cent mart, Ashley Barnes & Noble, best Buy, Big Lots, Circuit City, factory 2 U, Family Dollar, Furniture Row, JCPenney, Kachina, Kirstens, Kohl’s, Merwyn’s, Oak Tree, Rite Aid, Sav-on) _____Other (specify)__________________________________
10b. Besides malls and stores, please tell me what other places or attractions you went to while you were here. PROBE: Any others?
_____ None
_____ Friend’s/relative’s house _____ Restaurant
_____ other? _________________________________
Appendix

Mexican Visitors to Arizona, 2007-08
76The University of Arizona Eller College of Management
DOUGLAS/NACO MODULE:
10a. What stores or malls did you shop at while you were here? ____ No shopping
____Sierra Vista Mall ____ Other mall (specify)______________
_____ Cato _____ Dollar Tree _____ Factory 2-U _____ JcPenney _____ Safeway _____ Stage _____ Walmart CIRCLE ADDITIONAL STORES: (B&D Lumber, Beyond Technology, Digital Odyssey, Family Dollar, La Familia, Midwest Pharmacy, radio Shack, Rite Aid, Rustic Second hand, Starlight, Thomas) _____Other store (specify)__________________________________
10b. Besides malls and stores, please tell me what other places or attractions you went to while you were here. PROBE: Any others? _____ None _____ Friend’s/relative’s house _____ Restaurant
_____ other? _________________________________
Appendix

Mexican Visitors to Arizona, 2007-08
77The University of Arizona Eller College of Management
LUKEVILLE/SASABE MODULE:
10a. What stores or malls did you shop at while you were here? ____ No shopping
_________________________________________________________________________ _________________________________________________________________________
10b. Besides [malls and] stores, please tell me what other places or attractions you went to while you were here? PROBE: Any others?_____ None
_____ Friend’s/relative’s house_____ Restaurant
_____ other? _________________________________
Appendix

Mexican Visitors to Arizona, 2007-08
78The University of Arizona Eller College of Management
ASK OF ALL:
11. How do you find out about the activities, attractions & shopping in Arizona?____ Friend or Family____ Lived in Arizona____ Descubre Phoenix Visitor Center in Sonora____ Tucson Visitor Center in Sonora____ Don’t know/remember____ Other (specify) ______________________________________________
____ Newspaper Which newspaper was that? ( )_______________ ( ) DK____ Magazine What magazine was that? ( )_______________ ( ) DK____ Radio What radio station was that? ( )_______________ ( ) DK____ Television What tv station was that? ( )_______________ ( ) DK____ Pamphlet or Guide book What was the title? ( )_______________ ( ) DK____ Internet What was the website called? ( )_______________ ( ) DK
12. What is your monthly household income? (Pesos) [Present a list on a separate sheet and ask the interviewee to indicate only the letter that best corresponds to his/her income category]
___ A. Less than $10,000 pesos ___ B. $10,000 - $14,999 pesos___ C. $15,000 - $19,999 pesos___ D. $20,000 - $29,999 pesos___ E. $30,000 - $39,999 pesos___ F. $40,000 - $49,999 pesos___ G. $50,000 - $79,999 pesos___ H. $80,000 and more pesos.
12a. Are you employed for pay or profit outside the home? ( ) no ( ) yes
IF YES: 12b. What do you do? ______________________________
Thank you for your participation!
Appendix

Mexican Visitors to Arizona, 2007-08
79The University of Arizona Eller College of Management
Endnotes
1 While tourism is not identified in the official statistical data as an industry or sector, a number of service industries, such as hotels and
restaurants, retail, entertainment and recreation, directly depend upon selling their goods and services to visitors.2 According to Cheryl Cothran’s report “The Tourism Industry in Arizona March 2002,” Arizona’s tourism industry is a major driver of the
state’s economy, based on its total annual economic impact and employment. The same report also states that the Joint Legislative Budget
Committee of the Arizona Legislature concluded (that tourism is) Arizona’s largest industry by far. Similarly, Dean Runyan Associates in
their most recent report, Arizona Travel Impacts 1998-2007p, prepared for the Arizona Office of Tourism (June 2008), argued that travel
and tourism is one of the most important “export-oriented” industries in Arizona. 3 De Gennaro, N. and R.J. Ritchey, The economic impact of Mexican visitors to Arizona, The University of Arizona College of Business
and Public Administration, Division of Economic and Business Research, prepared for Arizona Office of Tourism, 1978; Hopkins, R.G.,
The economic impact of Mexican visitors to Arizona, University of Arizona, College of Business and Public Administration, Economic
and Business Research Program, funded by the Arizona Office of Tourism through Northern Arizona University, 1992; Charney, A.H. and
V. Pavlakovich-Kochi, The economic impacts of Mexican visitors to Arizona: 2001, The University of Arizona: Economic and Business
Research Program, prepared for the City of Tucson’s Tucson-Mexico Trade Office, 2002. A copy of the 2001 study and “Revisions of
2001Study” (December 2008) are available at http://ebr.eller.arizona.edu.4 Based on the results for 2001 in combination with Dean Runyan Associates’ estimates for that same year, it was possible to estimate
the contribution of Mexican visitors to Arizona’s economy: they accounted for an estimated 7.2 percent of all visitors’ direct spending and
16.4 percent of all direct employment in Arizona’s travel industry. Compiled by authors based on Dean Runyan Associates, Arizona Travel
Impacts 1998-2007p, prepared for the Arizona Office of Tourism (June 2008).5 Bringas Rábago, N.L., “Un asercamiento al turismo fronterizo y los obstáculos para su consolidación,” paper presented at VI Congreso
nacional de Investigación Turística, organizado por el Centro de Estudios Superiores de Turismo, Secretaría de Turismo en la Ciudad de
México, del 22 al 24 de septiembre de 2004. Retrieved March 26, 2008 at http://www.colef.mx. 6 Shatz, H.J. and L.F. López-Calva, The emerging integration of California-Mexico economies. San Francisco: Public Policy Institute of
California, 2004.7 Realizing the economic importance of day-visitors, in 1994, Banco de México adjusted its definition and started to count day-visitors
in the tourism statistics. In 1994, Mexico officially brought the importance of border tourism (and the need to include day-visitors) to the
attention of the United Nations’ World Organization of Tourism (ONU-OMT 1994 in Bringas Rábago, N.L., “Un asercamiento al turismo
fronterizo y los obstáculos para su consolidación,” paper presented at VI Congreso nacional de Investigación Turística, organizado por el
Centro de Estudios Superiores de Turismo, Secretaría de Turismo en la Ciudad de México, del 22 al 24 de septiembre de 2004. Retrieved
March 26, 2008 at http://www.colef.mx. 8 Banco de Mexico is the only institution that provides data on two-way (north- and southbound) crossers by origin. 9 Bringas Rábago, N.L., N.L., “Un asercamiento al turismo fronterizo y los obstáculos para su consolidación,” paper presented at VI
Congreso nacional de Investigación Turística, organizado por el Centro de Estudios Superiores de Turismo, Secretaría de Turismo en la
Ciudad de México, del 22 al 24 de septiembre de 2004. Retrieved March 26, 2008 at http://www.colef.mx. 10 Based on a 12 year average from 1995 to 2006 calculated by authors based on Banco de Mexico data. 11 Averages calculated by author based on Banco de Mexico data from 1995 to 2006. Include only land crossers.12 San Diego Chamber of Commerce, Mexican impacts on retail sales. San Diego Economic Bulletin, vol. 27, No. 6, 1979 (cited in
Phillips, K.R. and R.Coronado, Texas border benefits from retail sales to Mexican nationals. Federal Reserve Bank of Dallas The Face of
Texas, 2005 (October): 24-26.)13 There have been nine large-scale devaluations of the peso during the past 80 years: 1925, 1934, 1940, 1948, 1954, 1976, 1982,
1986 and 1994, according to Fullerton, T.M. Jr., Borderplex 9/11 economic impacts, Technical Report TX08-1, Border Region Modeling
Project, The University of Texas at El Paso, 2008 (January).14 San Diego Dialogue,” Who crosses the border: a view of the San Diego/Tijuana metropolitan region.” Technical report, University of
California, San Diego: San Diego Dialogue, 1994 (cited in Ghaddar, S. and C.J. Brown, The economic impact of Mexican visitors along
the U.S.-Mexico border: a research synthesis, University of Texas-Pan American Center for Border Economic Studies, 2005 (December).15 Patrick, J.M. and W. Renforth, The effects of peso devaluation on cross-border retailing, Journal of Borderlands Studies, 1996, 1: 25-
41.16 Phillips, K.R. and R. Coronado, Texas border benefits from retail sales to Mexican nationals. Federal Reserve Bank of Dallas, The Face
of Texas, 2005 (October): 24-26.17 Ghaddar, S. and C.J. Brown, The economic impact of Mexican visitors along the U.S.-Mexico border: a research synthesis, University
of Texas-Pan American Center for Border Economic Studies, 2005 (December).18 To arrive at annual expenditures of Mexican shoppers, estimates per visit expenditures were projected on 2004 crossing statistics.
Endnotes

Mexican Visitors to Arizona, 2007-08
80The University of Arizona Eller College of Management
Total number of Mexican parties was estimated at 60,469 (entire border, out of which 11,522 parties crossing Arizona border). Source:
Ghaddar, S. and C.J. Brown The economic impact of Mexican visitors along the U.S.-Mexico border: a research synthesis, University of
Texas-Pan American Center for Border Economic Studies, 2005 (December).19 The estimate for Arizona included spending only in border counties; estimates are based on the study by Charney and Pavlakovich-
Kochi (2005). Arizona estimates have been revised in 2008, which is reflected in this reporting. For explanation see Revisions to 2001,
posted at http://ebr.eller.arizona.edu20 Cañas, J., R. Coronado and K. Phillips. 2006. Border benefits from Mexican shoppers. Federal Reserve Bank of Dallas Southwest
Economy (May/June):11-13.21 Ghaddar, S. and C.J. Brown, The economic impact of Mexican visitors along the U.S.-Mexico border: a research synthesis, University
of Texas-Pan American Center for Border Economic Studies, 2005 (December). Arizona estimates have been revised in 2008, which is
reflected in this reporting. For explanation see Revisions to 2001, posted at http://ebr.eller.arizona.edu22 Ghaddar, S. and C.J. Brown, The economic impact of Mexican visitors along the U.S.-Mexico border: a research synthesis, University
of Texas-Pan American Center for Border Economic Studies, 2005 (December).23 Ghaddar, S. and C.J. Brown, The economic impact of Mexican visitors along the U.S.-Mexico border: a research synthesis, University
of Texas-Pan American Center for Border Economic Studies, 2005 (December).24 Fullerton, T.M. Jr., Borderplex 9/11 economic impacts, Technical Report TX08-1, Border Region Modeling Project, The University of
Texas at El Paso, 2008 (January).25 Phillips, K.R. and R. Coronado. 2005. Texas border benefits from retail sales to Mexican nationals. Federal Reserve Bank of Dallas The
Face of Texas (October): 24-26.26 Phillips, K.R. and R. Coronado, Texas border benefits from retail sales to Mexican nationals. Federal Reserve Bank of Dallas The Face of
Texas, 2005 (October): 24-26; Cañas, J., R. Coronado and K. Phillips, Border benefits from Mexican shoppers, Federal Reserve Bank of
Dallas, Southwest Economy, 2006 (May/June):11-13.27 Phillips, K.R. and R. Coronado, Texas border benefits from retail sales to Mexican nationals, Federal Reserve Bank of Dallas The Face of
Texas, 2005 (October): 24-26.28 Patrick, J.M. and W. Renforth, The effects of peso devaluation on cross-border retailing, Journal of Borderlands Studies, 1996, 1: 25-
41.29 Phillips, K.R. and R. Coronado, Texas border benefits from retail sales to Mexican nationals, Federal Reserve Bank of Dallas, The Face
of Texas, 2005 (October): 24-26.30 Pavlakovich, K.V. and H.Kim, Outshopping by maquila employees: implications for Arizona’s border communities, Arizona Review, 1990
(Spring): 9-16; Patrick, J.M. and R.S. Arriola, “The economic impact of maquiladoras on border development: A Rio Grande Valley case
study – some preliminary findings,” paper presented at the Western Social Science Association meeting, El Paso, TX, 1987; Phillips, K.R.
and R. Coronado, Texas border benefits from retail sales to Mexican nationals, Federal Reserve Bank of Dallas, The Face of Texas, 2005
(October): 24-26. 31 Holden, R.J., Maquiladoras along the Texas-Mexico border: an econometric evaluation of employment and retail; sales effect on
four border SMSAs. Texas Department of Community Affairs, Regional Economic Development Division, 1984 (February) (cited in Phillips
and Coronado, Texas border benefits from retail sales to Mexican nationals, Federal Reserve Bank of Dallas, The Face of Texas , 2005
(October): 24-26.)32 Fullerton, T.M. Jr., Borderplex 9/11 economic impacts, Technical Report TX08-1, Border Region Modeling Project, The University of
Texas at El Paso, 2008 (January).33 Phillips, K.R. and R. Coronado, Texas border benefits from retail sales to Mexican nationals, Federal Reserve Bank of Dallas, The Face
of Texas, 2005 (October): 24-26.34 Adkisson, R.V. and L. Zimmerman, Retail trade on the U.S.-Mexico border during the NAFTA implementation era, Growth and Change,
2004, Vol. 35, No. 11: 77-89; retrieved March 20, 2008 at http://web.ebscohost.com/ehost/pdf?vid=3&hid=113&sid=cd/750e01-ff62-
4cca-a957-27eb60f71e84%40sessionmgr103. See also: Cañas, J., R. Coronado and K. Phillips, Border benefits from Mexican shoppers,
Federal Reserve Bank of Dallas, Southwest Economy, 2006 (May/June):11-13.35 Kenn Morris, president of the Crossborder Group, cited in Berenstein, Leslie. “Waits, security issues hitting tourism hard,” The San
Diego Union -Tribune, March 11, 2008. Retrieved May 2, 2008 at http://signonsandiego.printthis.clickability.com/pt/cpt?action=cpt&title=
Decline+in+border...36 Wasserman, D., The borderlands mall: form and function of an imported landscape, Journal of Borderland Studies, 1996, 11(2): 69-
88.37 Cañas, J., R. Coronado and K. Phillips, Border benefits from Mexican shoppers, Federal Reserve Bank of Dallas, Southwest Economy,
2006 (May/June):11-13.38 Hadjimarcou, J. and J.W. Barnes, Retailing for foreign nationals in the border zone: The impacts of currency devaluation and cross-
border competition, Journal of Global Marketing, 1998, 11: 85-106 (cited in Fullerton, T.M. Jr., Borderplex 9/11 economic impacts,
Endnotes

Mexican Visitors to Arizona, 2007-08
81The University of Arizona Eller College of Management
Technical Report TX08-1, Border Region Modeling Project, The University of Texas at El Paso, 2008 (January).39 Cañas, J., R. Coronado and K. Phillips, Border benefits from Mexican shoppers, Federal Reserve Bank of Dallas, Southwest Economy,
2006 (May/June):11-13.40 Fullerton, T.M. Jr., Borderplex 9/11 economic impacts, Technical Report TX08-1, Border Region Modeling Project, The University of
Texas at El Paso, 2008 (January).41 Cañas, J., R. Coronado and K. Phillips, Border benefits from Mexican shoppers, Federal Reserve Bank of Dallas, Southwest Economy,
2006 (May/June):11-13.42 Fullerton, T.M. Jr., Borderplex 9/11 economic impacts, Technical Report TX08-1, Border Region Modeling Project, The University of
Texas at El Paso, 2008 (January).43 Carreira, R., Douglas economy reviewed, The Indicator, Cochise College Center for Economic Research, 7-8, 2007 (Fall).44 Patrick, J.M, 2006 (cited in Cañas, J., R. Coronado and K. Phillips, Border benefits from Mexican shoppers, Federal Reserve Bank of
Dallas, Southwest Economy, 2006 (May/June):11-13).45 While Pima County geographically is a border county, Tucson as the largest city is 60 miles from the border and at the time of 1977-78
study was considered an interior city.46 Hopkins’ data indicate an unusual increase in the share of Cochise County. 47 Using average inflation 0.03 for 10 years (which comes to 0.30); i.e., $857.4 million in 2001 is worth $677.4 million in 1991 dollars.
This result reflects revisions of 2001 economic impacts made in 2008. For explanation Revisions to 2001, posted at http://ebr.eller.arizona.
edu48 Based on revised 2001estimates; for explanation see Revisions to 2001, posted at http://ebr.eller.arizona.edu49 Interesting comparison with findings in Cheryl Cothran’s “The Tourism Industry in Arizona March 2002:” “Visitor surveys have
established that VFR (visit friends and relatives) ranks as the single most important ‘trip purpose’ for Arizona visitors, motivating a third of
all visits and 40 percent in Maricopa County.”50 Percent of population of Hispanic origin in Pima County increased from 29 percent in 2000 to 33 percent in 2007; in the same period,
in Maricopa County from 25 percent to 30 percent, according to Pew Hispanic Center, http://pewhispanic.org/states/?countyid=4019,
November 21, 2008. 51 Vera Pavlakovich-Kochi, Arizona-Sonora Regional Indicators, public presentation, Tucson, AZ, October 2006.52 Vera Pavlakovich-Kochi, Arizona-Sonora Regional Indicators, public presentation, Tucson, AZ, October 2006.53 Wendy Vittori’s presentation at Arizona-Mexico Commission’s plenary session, in Ciudad Obregon, November 2007.54 Acosta, Suleika, New Nogales, Sonora mall makes impact on both sides of the border, KOLD News 13. Jan 21, 2007. Retrieved June 2,
2008 at http://www.kold.com/global/story.asp?s=5901885&ClientType=Printable55 Source: Walmart de México retrieved June 10, 2008 at http://www.walmartmexico.com.mx/1distrigeo.html .56 Source: “Center for Economic Research releases holiday shopping survey results,” The Daily Dispatch, http://www.douglasdispatch.
com/articles/2006/news/news4.txt accessed on 12/13/2006.57 Source: INEGI. Encuesta Nacional de Ingresos y Gastos de los Hogares 2005. Cuadro 2.1,
Hogares y su ingreso corriente total trimestral por deciles de hogares segun tamano de localidad.
htpp://inegi.gob.mx, accessed on January 16, 2007.58 Dr. Pablo Wong Gonzalez and Dr. Patricia Salido, researchers at the El Centro de Investigación en Alimentación y Desarrollo (CIAD) 59 Monthly exchange rates were retrieved from Federal Reserve website (http://www.federalreserve.gov/releases/g5/) 9/18/0860 Using the 12 month (July 07-June 08) average exchange rate, the income categories shown in Tables 11 and 12 correspond to income
categories in U.S. dollars as: (1) under 929.33; (2) 929.33 to 1,393.90; (3) 1,394.00 to 1,858.57; (4) 1,858.66 to 2,787.90; (5) 2,787.99
to 3,717.23; (6) 3,717.33 to 4,646.56; (7) 4,646.66 to 7,434.56, and (8) 7,434.65 and more. Based on Federal Reserve website http://
www.federalreserve.gov/releases/g5 on 9/18/08.61 Approximately 3 percent annually.62 For further explanation, see the report “2008 Revisions of 2001 Results” at http://ebr.eller.arizona.edu.63 The number of airport border “crossers” used in 2001 was from the Immigration and Naturalization Service (INS). The INS figures
estimated the number of international travelers from Mexico and disaggregated those figures into “Aliens” and “U.S. Citizens.” As such,
the 2001 figures included both final destination passengers and pass-through travelers. During the 2001 study, no data were available
on the portion of pass-through vs. final destination passengers, so surveyors interviewed both pass-through and final destination visitors,
as they were found and identified in the airports, as randomly as possible. In the current study, data were obtained for both airports of the
final destination traffic from Mexico to Phoenix Sky Harbor Airport and to the Tucson International Airport. This data could also identify
the portion of trips (round-trip) that originates in Mexico vs. the portion that originates in the U.S. These portions are used as proxies for
the portion of U.S. vs. Mexican travelers. It is assumed that if the trip started in Mexico and ended in Mexico, then those are Mexican
visitors to the U.S. If the trips began and ended in the U.S., it is assumed those travelers are Americans traveling to Mexico. Because
this data is for final destination travelers, only travelers who indicated they visited Phoenix/Tucson were interviewed in this study. As a
Endnotes

Mexican Visitors to Arizona, 2007-08
82The University of Arizona Eller College of Management
result, both the number of “alien crossers” report for the airports and the expenditures for party computed for the airports are conceptually
different for 2001 and 2007-08. For more explanation, see Revisions of 2001 results (December 2008) at http://ebr.eller.arizona.edu.64 Based on 2008 Revisions of 2001 results (December 2008) at http://ebr.eller.arizona.edu.65 Minnesota IMPLAN Group, Inc. IMPLAN Professional, Version 2.0. Social Accounting & Impact Analysis Software. 66 Note: “income” refers to labor income, i.e., wages and salaries, and is a part of total “sales” (or output); therefore, “income” shall not be
added to “sales.”67 2001 impacts have been revised in 2008; for explanation se Revisions 2001 (December 2008) at http://ebr.eller.arizona.edu.68 Tax revenues are a part of the total “sales” (i.e., output) impact, and they are commonly estimated by IMPLAN models. However,
Arizona revenue Model, maintained in Eller College’s Economic and Business Research Center is based on more detailed information.
Although estimated separately, the tax revenue impact reported in Table 49 shouldl not be added to the total sales impact reported in
Table 47, because, by definition, it is already a part of the total impact.69 De Gennaro, N. and R.J. Ritchey, The economic impact of Mexican visitors to Arizona, The University of Arizona College of Business
and Public Administration, Division of Economic and Business Research, prepared for Arizona Office of Tourism, 1978; Hopkins, R.G.,
The economic impact of Mexican visitors to Arizona, University of Arizona, College of Business and Public Administration, Economic
and Business Research Program, funded by the Arizona Office of Tourism through Northern Arizona University, 1992; Charney, A.H. and
V. Pavlakovich-Kochi, The economic impacts of Mexican visitors to Arizona: 2001, The University of Arizona: Economic and Business
Research Program, prepared for the City of Tucson’s Tucson-Mexico Trade Office, 2002. A copy of the “Revisions to 2001 Study”
(December 2008) is available at http://ebr.eller.arizona.edu. 70 Source: http://www.x-rates.com/d/USD/MXN/graph120.html; accessed on November 30, 2008.71 The Arizona-Mexico Commission in cooperation with the Arizona Office of Tourism was successful in obtaining an extension of
compliance with the Western Hemispheric Travel Initiative (WHTI) from January 2008 to June 2009.
Endnotes