Data-Analytics-for-Advanced-Metering-Infrastructure-A ...
124
Energy and Extractives Global Practice Group South Asia Region (SAR) Public Disclosure Authorized Public Disclosure Authorized Public Disclosure Authorized Public Disclosure Authorized
-
Upload
khangminh22 -
Category
Documents
-
view
1 -
download
0
Transcript of Data-Analytics-for-Advanced-Metering-Infrastructure-A ...

Energy and Extractives Global Practice GroupSouth Asia Region (SAR)
Pub
lic D
iscl
osur
e A
utho
rized
Pub
lic D
iscl
osur
e A
utho
rized
Pub
lic D
iscl
osur
e A
utho
rized
Pub
lic D
iscl
osur
e A
utho
rized


Data Analytics for Advanced Metering Infrastructure
A Guidance Note for South Asian Power Utilities
November 2018
Energy and Extractives Global Practice GroupSouth Asia Region (SAR)

Disclaimer
This document has been prepared for the sole purpose of sharing the results of a global AMI survey and resulting insights related to the AMI strategy for India and South Asia. This does not endorse individual vendors, products or services in any manner. Therefore, any reference herein to any vendor, product or services by trade name, trademark, manufacturer or otherwise does not constitute or imply the endorsement, recommendation or approval thereof.
Copyright © 2018The International Bank for Reconstruction and DevelopmentTHE WORLD BANK GROUP1818 H Street, N.W.Washington, D.C. 20433, U.S.A.
All rights reserved
The findings, interpretations and conclusions expressed in this paper are entirely those of the author(s) and should not be attributed in any manner to the World Bank, or its affiliated organizations, or to members of its Board of Executive Directors or the countries they represent. The World Bank does not guarantee the accuracy of the data included in this publication and accepts no responsibility whatsoever for any consequence of their use. The Boundaries, colors, denominations, other information shown on any map in this volume do not imply on the part of the World Bank Group any judgment on the legal status of any territory or the endorsement or acceptance of such boundaries.
The material in this publication is copyrighted. However, it may be reproduced in whole or in part and in any form for educational or non-profit uses, without special permission provided acknowledgment of the source is made. Requests for permission to reproduce portions for resale or commercial purposes should be sent to the Manager, Energy and Extractives Global Practice (South Asia) at [email protected]. The World Bank encourages dissemination of its work and will normally give permission promptly. The Manager would appreciate receiving a copy of or link to the publication that uses this material for its source sent in care of the address listed.
All images remain the sole property of their source and may not be used for any purpose without written permission from the source.

Table of Contents iii
Acknowledgements v
Abbreviations vi
Executive Summary ix
1. Data Analytics in Power Utilities 1
1.1 Overview of Data Analytics 2
1.2 Data Analytics: Scope and Application Points in the Electricity Utility Industry 4
1.3 Meter Data Flow in MBC Process and Analysis System 6
1.4 Core MBC Analytics 8
1.5 Advanced Revenue Cycle Management Analytics 18
1.6 Key Issues/Risks Associated with Data Analytics 22
1.7 Benefits of AMI over AMR for Improved Data Analytics 23
2. Procurement and Deployment of Analytics Systems 28
2.1 Data Analytics System Architecture 28
2.2 Approaches for Procurement and Implementation of Analytics Systems 31
2.3 Technical Specification for Analytics Systems 34
2.4 Functional Requirements of Advanced Analytics System 36
2.5 Sizing and Typical Bill of Quantity for Analytics System 38
References and Links 40
Appendices 41
Appendix A. Description of Key Technology Terms 41
Appendix B. Meter Reading Quality Checks (RQCs) – 2nd Level: Screenshots 43
Appendix C. Billing Quality Checks (BQCs) – 3rd Level: Screenshots 50
Appendix D. Meter Data Exception-Generation Checks: Screenshots 56
Appendix E. MIS Reports: Screenshots 75
Appendix F. AMR Data Analytics – Use Cases: Screenshots 89
Appendix G. Billing and Collection Data Analytics Use Cases – Screenshots 98
Appendix H. Threshold Values for Exception Generation 106
TABLE OF CONTENTS
iv Data Analytics for Advanced Metering Infrastructure: A Guidance Note for South Asian Power Utilities
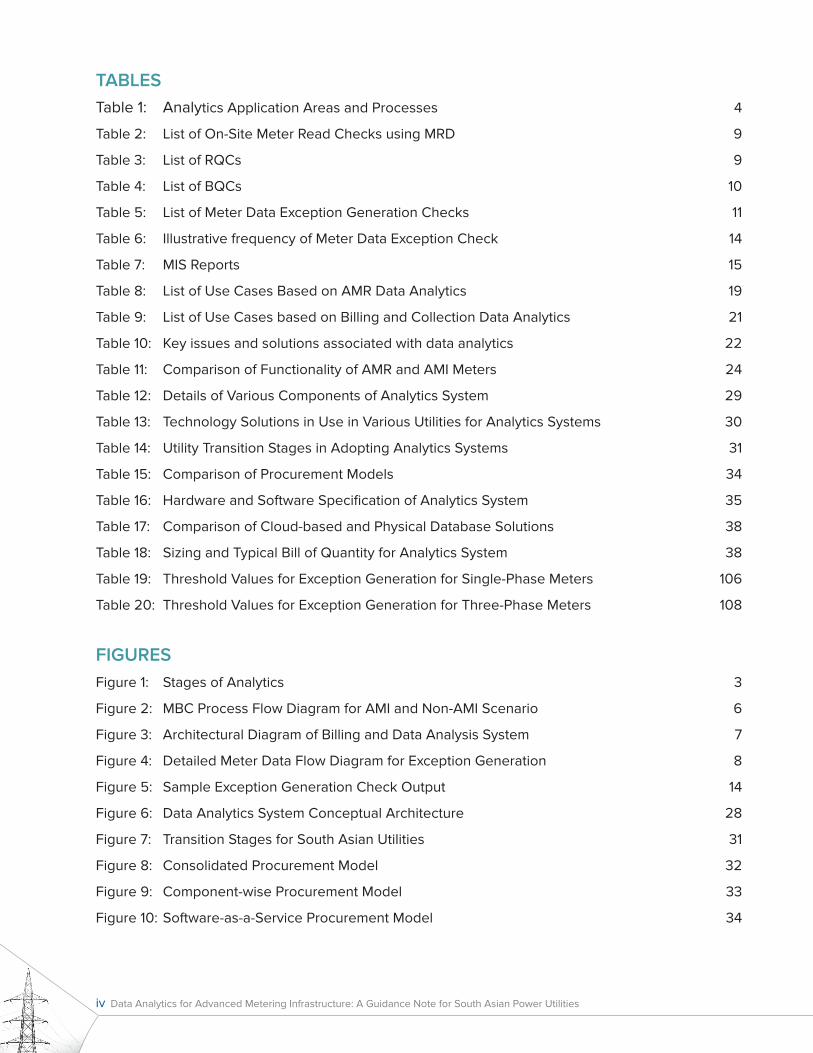
TAbLESTable 1: Analytics Application Areas and Processes 4
Table 2: List of On-Site Meter Read Checks using MRD 9
Table 3: List of RQCs 9
Table 4: List of BQCs 10
Table 5: List of Meter Data Exception Generation Checks 11
Table 6: Illustrative frequency of Meter Data Exception Check 14
Table 7: MIS Reports 15
Table 8: List of Use Cases Based on AMR Data Analytics 19
Table 9: List of Use Cases based on Billing and Collection Data Analytics 21
Table 10: Key issues and solutions associated with data analytics 22
Table 11: Comparison of Functionality of AMR and AMI Meters 24
Table 12: Details of Various Components of Analytics System 29
Table 13: Technology Solutions in Use in Various Utilities for Analytics Systems 30
Table 14: Utility Transition Stages in Adopting Analytics Systems 31
Table 15: Comparison of Procurement Models 34
Table 16: Hardware and Software Specification of Analytics System 35
Table 17: Comparison of Cloud-based and Physical Database Solutions 38
Table 18: Sizing and Typical Bill of Quantity for Analytics System 38
Table 19: Threshold Values for Exception Generation for Single-Phase Meters 106
Table 20: Threshold Values for Exception Generation for Three-Phase Meters 108
FIgURESFigure 1: Stages of Analytics 3
Figure 2: MBC Process Flow Diagram for AMI and Non-AMI Scenario 6
Figure 3: Architectural Diagram of Billing and Data Analysis System 7
Figure 4: Detailed Meter Data Flow Diagram for Exception Generation 8
Figure 5: Sample Exception Generation Check Output 14
Figure 6: Data Analytics System Conceptual Architecture 28
Figure 7: Transition Stages for South Asian Utilities 31
Figure 8: Consolidated Procurement Model 32
Figure 9: Component-wise Procurement Model 33
Figure 10: Software-as-a-Service Procurement Model 34

Acknowledgements v
This report was prepared by a World Bank team comprising Gailius J. Draugelis, Lead Energy Specialist (co-Team Lead); Rohit Mittal, Senior Energy Specialist (co-Team Lead); Amol Gupta, Energy Specialist (co-Team Lead); Phillip Matthew Hannam, Energy Economist; and Neetu Sharda, Program Assistant.
The team is grateful to World Bank Group colleagues who peer reviewed the report: Kwawu Mensan Gaba, Lead Energy Specialist/Global Lead, Power Systems, World Bank; Kelli Joseph, Senior Energy Specialist, World Bank; and Peter Mockel, Principal Industry Specialist, International Finance Corporation. The team is also most grateful to Chris Marquardt for his invaluable editing of the final report. Demetrios Papathanasiou, Practice Manager, Energy and Extractives Global Practice (South Asia unit), also provided much appreciated guidance and advice for this project.
The report is prepared based on background study undertaken by Deloitte Touche Tohmatsu India LLP team comprising James Thomson, Principal, US (Project Director), Michael Danziger, Managing Director, US (Team Leader); Anujesh Dwivedi, Partner, India (Team Leader); Ajay Madwesh, Senior Manager, US; Pankaj Kumar Goinka, Senior Manager, India; Peter Schmidt, Manager, US; Kyle Webb, Senior Manager, US; Rohit Deshpande, Specialist, US; Joel Abraham, Consultant, India; which partnered with Tata Power Delhi Distribution Limited (TPDDL) specifically on aspects of metering, billing and collections analytics use cases. TPDDL team was represented by Sandeep Dhamija, Deputy General Manager. The Bank team sincerely appreciates the hard work, dedication and collaborative spirit of the consulting team.
Company surveys that were carried out in the spring of 2018 and technical report preparation were carried out by Deloitte Touche Tohmatsu under the guidance of the World Bank team. Findings of the survey and analysis were shared at a workshop in New Delhi on June 8, 2018 with participants from Bangladesh, Bhutan, India, and Nepal. The report was also informed by an industry stakeholder consultation in Jaipur, November 2017. The Bank team is deeply thankful to all workshop and consultation participants for sharing their invaluable insights and comments.
The funding for this report was provided by United Kingdom’s Department for International Development through the World Bank-managed Trust Fund programs – the South Asia Regional Trade and Integration Program and the Program for Asia Connectivity and Trade – and the World Bank.
ACKNOWLEDGEMENTS

vi Data Analytics for Advanced Metering Infrastructure: A Guidance Note for South Asian Power Utilities
AMI Advanced Metering Infrastructure
ADMS Advanced Distribution Management System
AMR Automatic Meter Reading
API Application Programming Interface
AT&C losses Aggregate Technical and Commercial Losses
BCS Base Computer Software
BI Business Intelligence
BOM Bill of Materials
BoQ Bill of Quantity
BOOT Build, Own, Operate and Transfer
BOT Build, Own and Transfer
BQC Billing Quality Checks
CAPEX Capital Expenditure
CDW Corporate Data Warehouse
CEA Central Electricity Authority
CMMI Capability Maturity Model Integration
ComEd Commonwealth Edison
COTS Commercial Off-The-Shelf (Software)
CPU Central Processing Unit
CRM Customer Relationship Management
CT Current Transformer
DCU Data Concentrator Unit
DISCOM Distribution Company
DLMS Device Language Message Specification
DMS Distribution Management System
DTR/DT Distribution Transformer
EDA Exploratory Data Analysis
EESL Energy Efficiency Services Limited
ERP Enterprise Resource Planning
ESD Electrostatic Discharge
ETL tool Extract, Transform and Load Tool
Gbps Gigabits Per Second
GHz Gigahertz
GIS Geographic Information System
GPRS/GSM General Packet Radio Service/Global System for Mobile Communications
ABBREVIATIONS

Abbreviations vii
HBA Host Bus Adapter
HDD Hard Disk Drive
HES Head-End System
HHU Hand-Held Units
HT/LT High-Tension/Low-Tension
IBM International Business Machines Corporation
Ib Base Current
IEEE The Institute of Electrical and Electronics Engineers
IoT Internet of Things
IP Internet Protocol
IPDS Integrated Power Development Scheme
IS Indian Standard
IT Information Technology
JDBC Java Database Connectivity
kV kiloVolt
kVARh kiloVolt-Amperes Reactive hours
kWh kiloWatt-hour
lasso Least Absolute Shrinkage and Selection Operator (Regression Analysis Method)
LDAP/AD Lightweight Directory Access Protocol/Active Directory
mA milliAmpere
MAF Manufacturer’s Authorization Form
MBC Metering, Billing and Collection
MDI Maximum Demand Indicator
MDMS Meter Data Management System
MIS Management Information System
MoP Ministry of Power, Government of India
MRD Meter Reading Device
MRI Meter Reading Instrument
mT milliTesla
MTD Month to Date
NIC Network Interface Card
NLP Natural Language Processing
NMS Network Management System
NVM Nonvolatile Memory
OBIEE Oracle Business Intelligence, Enterprise Edition
OAC Office Automation Consultants
OEM Original Equipment Manufacturer
OGC Open Geospatial Consortium
OMS Order Management System
OT Operational Technology

viii Data Analytics for Advanced Metering Infrastructure: A Guidance Note for South Asian Power Utilities
PF Power Factor
PFA Predictive Failure Analysis
PoD Proof of Delivery
PPA Power Purchase Agreement
PSU Public Sector Undertaking
RAPDRP Restructured Accelerated Power Development and Reforms Program
RDBMS Relational Database Management System
RF Radio Frequency
RFP Request for Proposals
RQC Reading Quality Checks
RTC Real-Time Clock
SaaS Software as a Service
SAP BW SAP Business Warehouse (Software)
SAP HANA SAP High Performance Analytic Appliance (Software)
SAP IS-U SAP’s Industry-Specific Solution for the Utilities Industry
SAP PAL SAP Predictive Analysis Library (Part of SAP Hana)
SCADA Supervisory Control and Data Acquisition
SAIDI System Average Interruption Duration Index
SI Systems Integrator
SLA Service Level Agreement
SPSS Statistical Package for the Social Sciences
SQL Structured Query Language
SSD Solid-State Drive
SSH Secure Shell
T Tesla
TB Terabyte
ToD Time of Day
ToU Time of Use
TPDDL Tata Power Delhi Distribution Limited
UDAY Ujwal Discom Assurance Yojana
UoM Unit of Measurement
UPF Unity Power Factor
VAR Volt-Ampere Reactive
WIMS Work Information Management System
XML Extensible Markup Language
YTD Year to Date
Executive Summary ix
EXECUTIVE SUMMARY
The power industry in South Asia1 is on the cusp of a transformation driven by technological advances, decreasing energy intensity, heightened environmental awareness, and evolving customer expectations. Power distribution utilities in these countries are facing various challenges including high levels of Aggregate Technical and Commercial (AT&C) losses, increased energy theft, poor customer services and operational transparency, inefficient load management, and unreliable power supply.
Governments in most South Asian countries are helping utilities by implementing various schemes to improve their power sectors. In particular, the widespread and successful adoption of smart metering in advanced economies over the last decade has encouraged South Asian policy makers to take an increasing interest in smart metering systems in hope that they can address some of the chronic issues. Now, with high-level policies in place and utilities keen to adopt smart metering, funding requirement and implementation challenges remain the bottlenecks to mass deployment.
A recent World Bank–funded study, Advanced Metering Infrastructure and Analytics Guidance Study for South Asian Utilities, carried out in 2018, developed guidance, based on user experience, on the deployment and operation of Advanced Metering Infrastructure (AMI) and analytics systems by electricity distribution utilities in India and other South Asian countries. The guidance is intended for the ready reference of policy makers and utility managers.
The study was divided into two reports. The Survey of International Experience in Advanced Metering Infrastructure and its Implementation, published separately, covers international best practices regarding the end-to-end deployment of AMI systems, including such areas as main functions, procurement options, and the organizational or functional changes needed to implement AMI-enabled business processes.
The present report, Data Analytics for Advanced Metering Infrastructure: A Guidance Note for South Asian Power Utilities, is structured as a guidance note to assist utility managers in taking up data analytics systems to realize the full potential of AMI. The report has two main parts, as follows:
1 The World Bank’s South Asia region comprises Afghanistan, Bangladesh, Bhutan, India, Maldives, Nepal, Pakistan and Sri Lanka. See https://www.worldbank.org/en/region/sar/overview.

x Data Analytics for Advanced Metering Infrastructure: A Guidance Note for South Asian Power Utilities
Chapter 1 provides an overview of the use of data analytics by power utilities, including conceptual architecture for system deployment, meter data flow in Metering, Billing and Collection (MBC) processes, and data analytics systems. The chapter also covers in detail the core MBC analytics on data exception checks, meter reading, and billing quality checks. Further, various use cases related to advanced analytics for revenue management are also elaborated. The discussion of risks and other issues associated with data analytics systems– including the benefits of AMI over Automatic Meter Reading (AMR) for improved data analytics – will be particularly insightful to utilities that have already initiated or are considering an implementation in the near future.
Chapter 2 describes the transition phase utilities go through while adopting data analytics systems, including an explanation of procurement and implementation models for data analytics systems. With a focus on the South Asian context, the chapter outlines the basic technical and functional specifications of analytics systems, sample sizing, and typical Bill of Quantity (BoQ) for the implementation and qualification requirements of potential system integrators.
The report was prepared by AMI and utility specialists from Deloitte as well as Tata Power Delhi Distribution Limited (TPDDL), one of the first utilities in India to adopt AMR and AMI technology. Over the last 15 years, TPDDL has gained expertise in AMR technology and core data analytics, and it has recently begun implementing AMI and advanced data-analytics systems.
The World Bank conducted a South Asian stakeholder consultation on AMI implementation issues in India on November 29, 2017, during the International Symposium to Promote Innovation and Research in Energy Efficiency (INSPIRE-2017). These stakeholders provided validation and guidance on the scope of the study. The findings of the study were shared on June 8, 2018, at a regional workshop on AMI titled “International and Regional Approaches to Implementation and Data Analytics in New Delhi.” Feedback from workshop participants is reflected in the two reports.
Both reports were prepared under the guidance of a team from the World Bank’s Energy and Extractives Global Practice that was based in the World Bank’s offices in Washington, D.C., United States, and New Delhi, India.

1. Data Analytics in Power Utilities 1
1. DATA ANALYTICS IN POWER UTILITIES
Although Information Technology (IT) solutions have benefited core power utility operations for decades, most utilities in South Asian countries have remained weak in using IT to improve operational efficiency. Nevertheless, a handful of utilities in South Asia – especially the privately owned ones – have not only deployed best-in-class IT solutions in their revenue management and network operations, but have also implemented advanced solutions that leverage data to make decision making insightful, fast and more accurate.
In India, the use of operational IT by state-owned power utilities has happened on the back of two schemes promulgated by the Government of India (GoI) – the Restructured Accelerated Power Development and Reforms Program (RAPDRP) and Integrated Power Development Scheme (IPDS)– which introduced IT solutions in core utility operations throughout the country.
In November 2015, the GoI launched the Ujwal DISCOM Assurance Yojana (UDAY) program, which seeks to spur the financial turnaround and revival of power distribution companies (DISCOMs) by improving their operational and financial efficiency. As part of the program, participating DISCOMs must install smart meters for all customers consuming more than 200 kilowatt-hours (kWh) per month by December 2019.
In this context, Energy Efficiency Services Limited (EESL)2 has undertaken the procurement process for five million smart meters for the states of Haryana and Uttar Pradesh. The key feature of EESL’s procurement approach is build-own-operate-transfer (BOOT) – that is, a pay-as-you-benefit approach. This large, centralized procurement initiative has yielded aggressive pricing by bidders, thereby reducing the cost of smart meters for power utilities. This trend has encouraged several other utilities in other South Asian countries to go beyond pilots and initiate sizeable smart-meter deployment programs.
2 EESL is a “super” Energy Service Company (ESCO) that acts as the resource center for capacity building for DISCOMs, Energy Regulatory Commissions (ERCs), State Development Authorities (SDAs), financial institutions, ESCOs, and so on. Founded in 2010 by the GoI, EESL is currently implementing the largest energy efficiency portfolio in the world.

2 Data Analytics for Advanced Metering Infrastructure: A Guidance Note for South Asian Power Utilities
The implementation of smart metering technology will create a platform for end-to-end “situational awareness”– a true understanding of the full situation – in power utility operations and is considered to be a key milestone in the digital transformation of utilities.
1.1 OvERvIEw OF DATA ANALyTIcS
While most standardized utility solutions have built-in Management Information System (MIS) modules, the recent proliferation of utility operations systems involving advanced IT penetration and automation means utilities must now consider a holistic approach towards data analytics. In other words, they must now explore ways to derive maximum business advantage from aggregated and real-time data synthesis and trend visualization through advanced data analytics.
The Smart Grid concept and its constituent technologies have added new dimensions to electricity distribution systems by providing higher-resolution data for enhanced network operations. Advanced Metering Infrastructure (AMI), which includes smart metering, is considered the key to enabling active/proactive decision making in utility operations– replacing the existing, largely passive mode of operations.
By enabling automation at the last node of a utility’s network, smart meters serve as a gateway between a utility and its customers. It serves as more than just a cash box for the utility, however. In addition to helping utilities safeguard their revenue interests while helping customers optimize their consumption, smart meters provide a host of advantages in network operations by boosting utility managers’ situational awareness of conditions along the “last mile” (that is, the final leg of delivery to retail end-users, or customers).
Using the “big data” generated by smart meters and systems based on the Internet of Things (IoT), utilities will have a vast array of opportunities to improve operational and commercial efficiency using insights gained from data analytics that may not have been previously feasible.
Currently, most utilities in South Asia are focused on addressing growing consumer demand and the related issues of access, availability, quality and affordability of power supply. They are just beginning to explore data analytics solutions that will eventually generate tremendous value in terms of efficiency improvements, enhance customer services and improve financial performance.
To unlock the full value of AMI, each utility will need to implement a robust advanced analytics system capable of processing data beyond basic meter-to-cash functionality. To do this, it will first need to determine its business needs and establish a strategy. Once its strategy is aligned with its business architecture, the utility can decide on the types of analysis it intends to undertake and the benefits that can be derived.
Data analytics can be broadly grouped into four stages, as shown in Figure 1.
Descriptive analytics � helps in understanding what has happened in the past. Examples include meter ageing analysis; determining the “percentage of average billing” trend across months; trends of arrears outstanding across months, consumer categories, and so on; network optimization/load balancing; interconnected feeder analysis; predicting potential defaulting consumers; and theft analytics.

1. Data Analytics in Power Utilities 3
Figure 1: Stages of Analytics
Analytics
•
Descriptive
What is happening?
•
Diagnostic Analytics
Why did it happen?
Predictive Analytics
• What is likely to happen?
Difficulty in Implementation
Value Delivered
PrescriptiveAnalytics
• What should be done about it?
Diagnostic analytics � helps in understanding what has led to success or failure in the past. Examples include sanctioned load violation analysis, network failure analysis, and theft analytics.
Predictive analytics � helps in determining the likelihood of occurrence of an event in future based on past data patterns. Examples include footfall optimization at payment centers, energy forecasting, predictive maintenance, predictive fault analysis, and network-asset management.
Prescriptive analytics � helps in identifying steps to be taken in future to meet the desired objectives. Examples include energy optimization and Volt-Ampere Reactive (VAR) control, call center efficiency, meter reading, and billing complaints analysis.
By its very nature, development of analytics is complex since it aims at integrating structured, unstructured, and time-series data, then aligning the data with system-generated events and alarms.
Within a utility context, analytics can be defined as the process of converting data from smart grid sensors and devices by integrating it with a variety of related data sets (including data from operational, non-operational and external systems) to develop models that predict and/or prescribe the next best action – thus creating deep situational awareness.
A utility’s external data sources may be based on data that is structured (cellular network data, for example), unstructured (social media feeds and customer questions, for example), part of a time series (outside temperature, for example) or generated by an event (lightning, for example). Integrating the utility’s data and information with these external data sources leads to a deeper understanding of the causes of issues affecting operational, customer and business performance. Using AMI-type machine-to-machine communications, consumer-facing web portals, in-home devices, visualization tools, modelling software, and even spreadsheets results can then give utility managers an enhanced “situational awareness” – that is, a more thorough and precise understanding of operations.
Analytics built on data from smart meters is valuable in a variety of ways to a utility. The utility landscape surrounding, and business cases for, adopting AMI analytics vary significantly by region, as well as by utility ownership structure. This section outlines a broad set of use cases that are now possible using AMI data. This section also focuses on the “state-of-the-art” as well as the “art of the possible” to show how utilities can harness AMI data – using both predictive and prescriptive analytical models – not only to realize greater value, but also to shift to the new utility model that regulators are pushing towards.

4 Data Analytics for Advanced Metering Infrastructure: A Guidance Note for South Asian Power Utilities
1.2 DATA ANALyTIcS: ScOPE AND APPLIcATION POINTS IN ThE ELEcTRIcITy UTILITy INDUSTRy
The scope of use cases for AMI analytics is built on data and information generated from core AMI systems or AMI applications, such as an AMI Head-End3System (HES) and Meter Data Management (MDM) systems. Advanced analytics based on data from these systems are intended to boost situational awareness by using predictive and/or prescriptive models to tap into streams of business value. For example, as part of the development of optimal demand dispatch in a demand/response application, the need for accuracy has led to the development of sophisticated models for demand segmentation, demand forecasting and customer segmentation.
The specific drivers for the development of analytical models from AMI vary based on geography, regulations and underlying demographics. When compared with the cost of implementing AMI itself, the cost of implementing analytics is quite low and typically has a more immediate payback.
The successes in implementing analytics by industry leading utilities using data from AMI systems have had a cascading effect in that they have helped other utilities – especially smaller and mid-market utilities, which tend to be more risk-averse – justify their own accelerated AMI deployments. Globally, many early adopters of AMI went through multiple cycles of integrations, data management strategies, data storage, and tools due to non-standard architectures and solutions. The resulting refinement of architectures and protocols, lessons on effective use of advanced analytics, and development of successful business cases will be particularly critical in regions like Latin America and Asia, where operational savings by themselves may not justify the implementation costs of AMI.
Analytics can be useful in taking more informed decisions and actions, whether or not a human is in the loop. For example, protection and control systems that require sub-second responses will be machine-automated, whereas dashboards and reports leveraging business data may operate in a workflow that involves humans making or approving recommended decisions or actions.
Table 1 summarizes the main areas in which data analytics has been applied in the electricity utility industry.
3 A Head-End System (HES) is hardware and software that receives meter data sent to the utility. Head-end systems may perform a limited amount of data validation before either making the data available for other systems to request or pushing the data out to other systems.
Table 1: Analytics Application Areas and Processes
Application Areas Analytics Process
Net metering, sub-metering and other complex metering scenarios
Granular consumption data allows utilities to map energy flows on the laterals (i.e. local power lines) and from the laterals to the aggregation points based on their network models. This enables utilities to bill municipalities and water companies accurately for street lighting and water pump operations – operations that were previously monitored and billed separately.
Feeder capacity and performance
Consumption, voltage and power-factor data from each consumption point allows utilities to analyze key power parameters downline. In feeders with reliability issues or with high penetration of distributed energy resources, or DER (smaller sources of variable power connected to the grid but widely distributed geographically), a very granular analysis of

1. Data Analytics in Power Utilities 5
Application Areas Analytics Process
the feeder’s capacity and reliability can be performed. The ability to analyze voltage sags and swells at an individual consumption point allows a utility to address capacity or design issues. Smart meter data is immensely valuable in assessing the load on the transformer (peak and nominal), which allows the utility to plan transformer upgrades and replacement programs to minimize outages before they occur. Additionally, capacity and network constraints at the feeder and lateral levels are assessed to a highly granular degree.
Advanced outage analysis
With the smart meter “last gasp” capabilities, along with the logged events, outage analysis and prediction become significantly more accurate. (“Last gasp” refers to a short transmission a smart meter makes when it loses power, typically to signal the power loss and often to specify the time and date of the outage.) When a major weather event is expected, analyzing the potential extent of the outage, as well as possible nested outages, becomes a highly effective tool for the utility. This helps maintain a low System Average Interruption Duration Index (SAIDI) and serves customers by restoring electricity faster following an outage.
Demand segmentation Total demand calculated based on consumption can be analyzed by disaggregating the demand into multiple cross-sections or segments. The interaction of these segments at different prices, loads, temperatures, etc. over time improves the ability to predict demand.
Advanced unit commitment models
In situations where the wholesale markets allow smaller renewable and storage-based generation, and where demand aggregators bid into the Capacity and Day-Ahead markets, the ability to track the performance of these generation sources relative to demand becomes critical. For example, to address balancing and security constraints while following regulatory mandates on renewable generation, grid operators use granular demand data to predict shortfalls ahead of time and avoid buying generation through the costlier real-time and ancillary markets. To generate near-real-time and predictive demand curves, grid operators use historical and smart-meter data.
Power quality Utilities have long sought conservative voltage reduction and improved management of voltage profiles down to the level of feeder lines. With the smart meters capturing voltage profiles, voltage sags and voltage swells at the consumer level, feeder performance – including feeder quality and intermittent outages – can be captured with high fidelity. In instances where the voltages can be managed to the lower limits specified by the reliability regulator through operating the tap changers at the substation, a utility can optimize generation.
Technical and non-technical loss analysis
Distribution feeders can be sectioned to increase greater reliability and feeder reconfiguration by using AMI data to measure the technical and non-technical losses more accurately. The AMI data provides a true measure of the total losses in the distribution feeder and guidance to target diversion and energy theft. Energy theft models are then used for revenue assurance.
Advanced switching As the distribution feeders are sectioned to increase greater reliability and for feeder reconfiguration, AMI data can be used to confirm that switching operations have occurred correctly, as well to validate the network model.
Asset performance Using data from Supervisory Control and Data Acquisition (SCADA) systems, utilities can analyze the performance of network assets at the substation level, and sometimes at the feeder level. With AMI data, this analysis can be conducted along the “last mile”.
Customer preferences, customer propensity and incentives model
As customers become active participants in the energy equation, understanding precisely what drives their behavior becomes critical. AMI data facilitates this. Understanding the consumption patterns of each individual consumer and comparing them to similar consumers (within the applicable regulatory boundaries) allows for the analysis of the preferences and patterns of a class of consumers.

6 Data Analytics for Advanced Metering Infrastructure: A Guidance Note for South Asian Power Utilities
1.3 METER DATA FLOw IN Mbc PROcESS AND ANALySIS SySTEM
The initial step in the Metering, Billing and Collection (MBC) process is the planning and scheduling of the meter-reading cycle and walking sequence.
There are two scenarios. In the Advanced Metering Infrastructure (AMI) Scenario, the meter data is directly received at the HES4 if the meter is coupled with a data collector, with the remote meter data transfer taking place through wired or wireless communication.
In the Non-AMI Scenario the meter reader carries a hand-held Meter-Reading Device (MRD) in the field to record meter data and run some primary validations on the meter data based on the checks built into the device. The data is then uploaded to the server.
Figure 2 describes the process of meter reading and billing in both AMI and Non-AMI Scenarios.
In both scenarios, the following further checks are done to ensure that the bill delivered to the consumers is correct in all respects:
Meter Reading Device (MRD) on-site meter-read check: � Here a primary check is performed to ensure that the meter reader reads the correct meters and provides correct information. This check is performed only in the non-AMI scenario, where manual meter reading is done monthly.
4 The HES is sometimes also referred as the Meter Data Acquisition System (MDAS) in the case of AMR.
SAP
Bill DistributionPrinting & Invoicing
Exception handling & Troubleshooting (Follow up meter reading)
Bill Generation
SAP
BCS / HES Server
AMI Scenario
Non AMI Scenario
Base Meter Readingthrough MRD:
1st Level Check
Reading Quality Check:2nd Level Check
Billing Quality Check:3rd Level Check
Smart Meter withCommunication Module
Meter Reading Data moved to Billing Server
Data Downloading inMRD from Billing Server
Reading Data uploadedin Billing Server
Planning &Scheduling
Figure 2: MBC Process Flow Diagram for AMI and Non-AMI Scenario

1. Data Analytics in Power Utilities 7
Reading Quality Check (RQC): � This ensures that the meter data captured are accurate prior to billing in terms of consumption.
Billing Quality Check (BQC): � This ensures the quality and correctness of bills in terms of amount.
Further meter data exception-generation checks are performed on the full sets of meter data in both AMI and Non-AMI scenarios based on the frequency of meter reading and the utility’s business requirements.
A typical technical architectural diagram showing meter data flow for billing and analytics is shown in Figure 3.
The diagram depicts meter data flow from smart meters to the billing engine and the data analytics application servers. A DISCOM may have meters from different vendors deployed at the consumer premises.
The interoperability of meters from different vendors with HES system is an issue for AMI/AMR deployment. This is because each of the various vendors uses its own proprietary protocols for meter data exchange with HES system. Although the Bureau of Indian Standards has formulated the standards for smart metering (IS 16444), proprietary protocols remain in use for AMR meter data exchange from different vendors. To resolve this issue, the DISCOMs need to have HES/BCS5 software from respective meter vendors in their HES server to poll meters using proprietary Application Programming Interfaces (APIs), as shown above in Figure 3. The meter data received in different formats by the HES/BCS system will be parsed and converted to standard .xml format, which can then be directed to corresponding
5 Head-end system/base computer software.
Ven
dor
1
Ven
dor
2
Ven
dor
3
Billing Engine
Vendor 1 Meters
Vendor 2 Meters
Vendor 3 Meters
CDFAPIs
APIs
APIs
.cmd/.cdfformat
.dstformat Full / Analysis Data
.rr3/.rb3 format
Database Server
Analysis Team
Billing Data
Full / Analysis Data
MIS Reports
Data AnalyticsApplication
Application Server DatabaseComm. Modems
Comm. Modems
Comm. Modems
RS 232/Optical Port
RS 232/Optical Port
RS 232/ Optical Port
Billing Data
Vendor specific data format
Optical / Magnetic Data Storage
Devices (CD/ DVD)
Manual Process Automatic Process
Figure 3: Architectural Diagram of Billing and Data Analysis System
Note: API = application programming interface.

8 Data Analytics for Advanced Metering Infrastructure: A Guidance Note for South Asian Power Utilities
billing and analytics applications. However, this solution has a higher implementation cost. If the standardization of AMI meter data exchange can be mandated for the vendors through a policy-level decision or in the tender documents for procurement by the utility, the cost of implementation can be further reduced.
Figure 4 shows a detailed diagram of meter data flow, along with its application at different steps in MBC cycle and data analysis to “generate” (i.e., check for and list) exceptions.6
Smart meters can provide billing reads and full data (billing reads, instantaneous data, event data, load profile, and so on) separately, in line with utility requirements. Billing reads are acquired from meters each month, and analytics is done on the full data set acquired from meters at custom frequencies set by the utility for different consumer segments.
After each level of checks, the exception cases are forwarded for manual analysis, which may include on-site checks. Verified data is forwarded to a database for storage and future reference.
1.4 cORE Mbc ANALyTIcS
Data received from the smart meter must be processed (i.e. checked for exceptions) before transferring to the billing and analytics engine. There may be multiple levels of data-quality checks in a typical MBC cycle. This section describes checks occurring at four levels: on-site meter readings, comparison of those readings to existing consumer data, checks at the billing stage, and further checks using rule-based analysis.
1.4.1 First Level: On-Site Meter Reading checks Using MRDs
In the non-AMI scenario, meter readers carry a hand-held Meter Reading Device (MRD). At each site, the MRD is used to perform first-level checks (see Table 2) on the data retrieved from the meter to ensure data correctness and to reduce the number of follow-up meter readings required.
6 In programming, exceptions are anomalous or exceptional conditions requiring special processing.
Figure 4: Detailed Meter Data Flow Diagram for Exception Generation
Data Base
• Hardware Problem Rectification
• Enforcement Team
NOT OK OK
NOT OK
H
E
S
RQC
BQC
Smart Meter
General AnalysisEngine (Exception Checks)
Manual Checks
Billing Data
Analysis Data
Billing
BillingEngine
Reads
Analysis Data
NOT OK
Billing
OK
Billed Data
Invoicing
OK
Manual Process Automatic Process

1. Data Analytics in Power Utilities 9
Table 2: List of On-Site Meter Read Checks using MRD
First-level (primary) Exception Check
Function
Reading check Checks if current meter reading is less than previous reading
Zero consumption Checks if the meter consumption is absolute zero
Drop in consumption Checks if the current consumption is less than the average consumption/threshold value
High MDI*/sanctioned load Compares the current-month MDI reading against the sanctioned load and previous month’s reading
Meter-unread scenario Mandatory input in each MRD device that captures the reason the meter reading was not performed – such as a locked house or faulty meter
* MDI = Maximum Demand Indicator.
If these checks yield flags, the meter reader is directed to take a photograph of the meter or to re-read the meter at the site.
1.4.2 Second Level: Reading Quality checks (RQcs)
Reading Quality Checks (RQCs) ensure the quality of meter reading data before billing. Usually limited to the meter data used specifically for billing, RQCs ensure that supply units are measured and billed accurately. The RQCs compare each meter data set to the respective “consumer master data” and historical trends, then generate an exception list for re-reading. The utility can then cross-check the data against the consumer master data – which includes details on consumer type, tariff slab (price based on usage range), meter, and sanctioned load and maximum demand, as well as consumer address and other billing-related information.
Table 3 lists the RQCs a utility typically performs before generating bills. Sample illustrative screenshots of RQCs are provided in Appendix B.
Table 3: List of RQCs
Function What It Looks forBenefits/Use
CasesElectrical Parameters Considered
Low consumption Checks for variations in the consumption trend of a particular consumer (with reference to low value thresholds for each category).
Prevent revenue leakage
Meter data: � kWh consumptionConsumer master data: Type of �
institution and sanctioned load with previous MDIs
High Maximum Demand Indicator (MDI)
Checks for variations a consumer’s MDI trend with reference to his/her historical meter reading data and category threshold value.
Prevent revenue leakage
Meter data: � kW valueConsumer master data: Type of �
institution and sanctioned load with previous MDIs
Reading reversed/wrong reading
Checks for erroneous readings on meter energy consumption – such as very high or negative consumption.
Prevent revenue leakage; verify meter data
Meter data: � kWh and kVAhConsumer master data: � Type of institution and sanctioned load with previous MDIs
Low power factor Checks for power factor value below the threshold defined by utility.
Prevent revenue leakage
Meter data: � Power factorConsumer master data: � Type of institution and sanctioned load with previous MDIs

10 Data Analytics for Advanced Metering Infrastructure: A Guidance Note for South Asian Power Utilities
Function What It Looks forBenefits/Use
CasesElectrical Parameters Considered
Zero consumption Checks whether previous month and current month kWh readings are same, so that resultant per-month consumption is zero.
Prevent revenue leakage
Meter data: � kWh reading Consumer master data: � Type of institution and sanctioned load with previous MDIs
Contract demand Compares the demand value from meter reading data against the consumer master database. (There is a penalty for higher demand compared to contract demand.)
Prevent revenue leakage
Meter data: � MDI (kW)Consumer master data: � Type of institution and sanctioned load with previous MDIs
Non-reprogramming
Checks to see if:Tariff slab information from meter �
data does not match consumer master dataMeter reset-date info from meter �
data does not match consumer billing master dataMeter is not programmed to store �
data in Time-of-Day (ToD) slabs; HES system after receiving data identifies consumer to be billed on ToD
Prevent revenue leakage; verify data
Meter data: � kWh and kWConsumer master data: � Type of institution and sanctioned load with previous MDIs
1.4.3 Third Level: billing Quality checks (bQcs)
BQCs ensure the quality of bills generated for each consumer based on their electricity usage. BQCs are similar to RQCs, but more stringent and accurate in terms of amount billed with respect to billing parameters. They are thus a critical component of any effort by a utility to reduce its commercial losses.
Table 4 provides a typical list of BQCs a utility performs before generating bills. Sample illustrative screen shots of BQCs are shown in Appendix C.
Table 4: List of BQCs
Function What It Looks for Benefits/Use Cases Parameters Considered
Current billed demand
Generates a trend analysis of current billed �
demand along with comparison to threshold value
Billing correctness � Current month billed �
demand
Inflated bill Checks for high bill amount compared to �
threshold value for the particular categoryBilling correctness �
Consumer satisfaction �
Billed amount �
Negative amount
Checks if bill amount for the current month is �
negativeRevenue assurance � Billed amount �
High slab Slab value = number of billing days/number of �
days in a monthComparison of slab value with the threshold �
value for particular category of consumer
Consumer satisfaction �
Revenue assurance �
Billing correctness �
Number of units during �
billing periodTariff defined by the �
Regulator
Solar meter Checks the correctness of bills for consumers �
having net meteringBilling correctness � Number of units consumed �
and number of units fed back into the grid Billed amount �

1. Data Analytics in Power Utilities 11
1.4.4 Further checks Using Rule-based Analysis (further meter data exception generation checks)
In addition to the aforementioned checks, utilities can use various other exception-generation checks to identify revenue leakage, theft, and so on. This analysis can be done on a predefined frequency (i.e., at various predefined intervals) depending on the category of consumers. The raw meter data received is subjected to rule-based analysis for identifying anomalies.
These checks are oriented toward either consumers or utilities. Consumer-oriented checks generate flags when, for example, monthly bill or energy consumption exceeds the average value range; these checks can be done hourly or daily depending on the resolution of the data received. Utility-oriented checks includes checks on data for revenue assurance, system-condition monitoring, and so on.
Data analysis rules could be selectively applied to an individual metering node or groups of metering nodes or to channels common to different metering nodes. A list of exception checks that a utility could follow based on various data received from meter is provided in Table 5.
Table 5: List of Meter Data Exception Generation Checks
No.Type of
Exception Check
Function Benefits/Use CasesElectrical
Parameters Considered
Consumer Categories
1 Consumption comparison
Checks that consumption is inline with historical trend and threshold values
Identification of: Tamper condition �
Meter failure, under- �
recording
Kilowatt- �
hours (kWh)All categories
2 Voltage failure Checks that system voltage values are in line with tolerance and threshold values
System condition check �
Identification of tamper �
condition
Phase �
voltageAll categories
3 Assessed consumption
Checks whether the calculated load factor is in the predefined threshold load-factor range for the particular consumer category
Identification of:Tamper condition �
Situation where �
consumer is not running load for maximum hours, causing a loss to the utility
kWh � All categories
4 Data corruption Checks the value of maximum demand indicator (MDI)/consumption data/digits recorded against the threshold values
Identification of:Meter failure �
Data downloading �
issue
kW/kWh � All categories
5 Non-Volatile Memory7 (NVM) failure
Identifies and records meter memory failures and raises “NVM failure event” flags
Identification of:Tamper condition �
Meter failure �
Meter events �
dataAll categories
6 Power failure Checks two threshold values:Number of power failures: � The cumulative total number of power failures should be less than the threshold value defined.Time of power failure: � The cumulative power failure duration should be less than threshold value defined.
Identification of:System condition �
Tamper condition �
Phase �
voltagesAll categories
7 Non-volatile memory (NVM) is a type of computer memory that has the capability to hold saved data even if the power is turned off.

12 Data Analytics for Advanced Metering Infrastructure: A Guidance Note for South Asian Power Utilities
No.Type of
Exception Check
Function Benefits/Use CasesElectrical
Parameters Considered
Consumer Categories
7 Neutral disturbance
Checks for unbalanced neutral-current values or voltage values
Identification of:System condition �
Tamper condition �
Neutral �
current phase �
voltage
All categories – stringent for high-tension (HT) consumers depending on utility requirements
8 Current reversal Checks whether the value of the active current is negative or not
Identification of:Meter failure or meter �
connection failureTamper conditions �
Active phase �
currentAll categories
9 CT overload Checks whether the current value is above the defined threshold value
Identification of:Meter damage through �
overloadingSanctioned load violation �
Phase current � All categories
10 Current missing Checks whether the phase current is zero or less than the specified threshold value
Identification of:Meter failure: under- �
recordingTamper conditions �
Phase current � All categories
11 Power Factor (PF)
Checks whether the PF data are within the threshold range defined for Low and High PF
Proper asset/network �
managementChecks for healthiness �
of meter and meter data recording accuracy
Power factor � All categories
12 Manual reset Checks whether the meter reading reset duration is other than the historical value or predefined value (a flag event is raised whenever the meter is reset in between the billing period)
Identification of:Tamper condition �
Meter failure �
Meter events �
dataAll categories
13 Real-Time Clock (RTC) failure
Checks that the meter’s clock accuracy is in line with the HES clock time.
Identification of:Meter failure �
Meter events �
dataAll categories
14 Internal ratio Cross-verifies the CT ratio value at site with the consumer master data value
Identification of:Tamper condition �
Non-updating of data �
from site
CT Ratio � All categories
15 Magnet tamper Checks for meter tamper-event flags (the meter records a flag event whenever it senses the presence of a magnetic field; the meter starts recording high IMAX values than rated value for longer duration and this value is checked)
Identification of:Tamper condition �
Magnet Flag/ �
Magnet Tamper
All categories
16 Load unbalance Checks whether the phase current values in three phases are unequal and whether the value of each exceeds the stated tolerance range
Identification of:Tamper conditions �
Meter failure: under- �
recordingLoad unbalancing by �
consumer
Phase current � All categories (stringent for HT consumers based on utility requirement)
1. Data Analytics in Power Utilities 13
No.Type of
Exception Check
Function Benefits/Use CasesElectrical
Parameters Considered
Consumer Categories
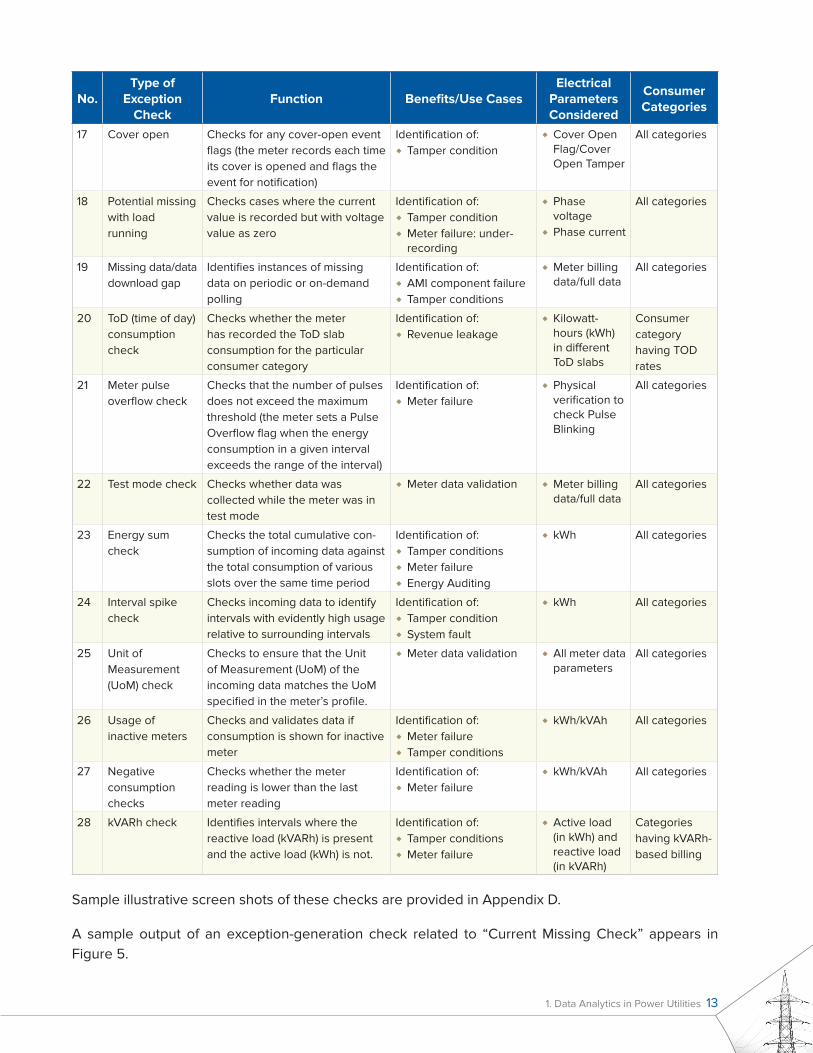
17 Cover open Checks for any cover-open event flags (the meter records each time its cover is opened and flags the event for notification)
Identification of:Tamper condition �
Cover Open �
Flag/Cover Open Tamper
All categories
18 Potential missing with load running
Checks cases where the current value is recorded but with voltage value as zero
Identification of:Tamper condition �
Meter failure: under- �
recording
Phase �
voltage Phase current �
All categories
19 Missing data/data download gap
Identifies instances of missing data on periodic or on-demand polling
Identification of:AMI component failure �
Tamper conditions �
Meter billing �
data/full dataAll categories
20 ToD (time of day) consumption check
Checks whether the meter has recorded the ToD slab consumption for the particular consumer category
Identification of:Revenue leakage �
Kilowatt- �
hours (kWh) in different ToD slabs
Consumer category having TOD rates
21 Meter pulse overflow check
Checks that the number of pulses does not exceed the maximum threshold (the meter sets a Pulse Overflow flag when the energy consumption in a given interval exceeds the range of the interval)
Identification of:Meter failure �
Physical �
verification to check Pulse Blinking
All categories
22 Test mode check Checks whether data was collected while the meter was in test mode
Meter data validation � Meter billing �
data/full dataAll categories
23 Energy sum check
Checks the total cumulative con-sumption of incoming data against the total consumption of various slots over the same time period
Identification of:Tamper conditions �
Meter failure �
Energy Auditing �
kWh � All categories
24 Interval spike check
Checks incoming data to identify intervals with evidently high usage relative to surrounding intervals
Identification of:Tamper condition �
System fault �
kWh � All categories
25 Unit of Measurement (UoM) check
Checks to ensure that the Unit of Measurement (UoM) of the incoming data matches the UoM specified in the meter’s profile.
Meter data validation � All meter data �
parametersAll categories
26 Usage of inactive meters
Checks and validates data if consumption is shown for inactive meter
Identification of:Meter failure �
Tamper conditions �
kWh/kVAh � All categories
27 Negative consumption checks
Checks whether the meter reading is lower than the last meter reading
Identification of:Meter failure �
kWh/kVAh � All categories
28 kVARh check Identifies intervals where the reactive load (kVARh) is present and the active load (kWh) is not.
Identification of:Tamper conditions �
Meter failure �
Active load �
(in kWh) and reactive load (in kVARh)
Categories having kVARh-based billing
Sample illustrative screen shots of these checks are provided in Appendix D.
A sample output of an exception-generation check related to “Current Missing Check” appears in Figure 5.

14 Data Analytics for Advanced Metering Infrastructure: A Guidance Note for South Asian Power Utilities
The aforementioned checks are the basic data-exception checks that can be performed on meter data in non-AMI and AMI scenarios for all consumer categories. However, the actual number and frequency of checks will depend on such factors as the number of parameters received, the requirements of the various consumer categories, and the utility’s business requirements and focus areas.
An illustrative example of frequency of these exception checks for various categories of consumer is provided in Table 6.
In the AMI scenario, the volume of data varies with the frequency of meter polling and number of meter parameters recorded. As a result of the high resolution of the data received from meters, the number of exception checks could be much higher in the AMI scenario than in the non-AMI scenario.
Table 6: Illustrative frequency of Meter Data Exception Check
Consumer Segment
Sanctioned Load
Reading TypeBilling Type
Full Data ReadingFrequency of
Exception check
A >299 kW AMI/Non-AMI Monthly Monthly Monthly
B 99–299 kW AMI/Non-AMI Monthly Monthly Monthly
C 10–99 kW AMI/Non-AMI Monthly Quarterly Quarterly
D 1–10 kW SMRD Monthly Quarterly/As required based on exceptions
Quarterly/as required based on exceptions
E 1 kW SMRD Monthly Quarterly/As required based on exceptions
Quarterly/as required based on exceptions
Figure 5: Sample Exception Generation Check Output
The data analytics system checks whether the phase current is zero (or less than the specified threshold value) in the meter data received under each time stamp. The following screenshot shows sample output for the system-generated exception case:
This particular check is performed to identify the following:Meter failure: Under-recording �
Tamper conditions �
Proper asset/network management �
Overall health of the meter and accuracy of meter data recording �
Current-Missing Check

1. Data Analytics in Power Utilities 15
1.4.4.1 Setting Threshold Values
Analysis of meter data is about estimating the quality of data using rule-based assessments, which trigger exceptions (or alerts) whenever the monitored metric goes above or below a user-defined threshold. The utility defines exceptions by specifying the threshold values and data to be included in the check.
The thresholds are set in the analysis software system based on factors such as the utility’s previous experiences, regulatory guidance, business requirements, power network operational requirements, and asset performance requirements. The threshold values are updated from time to time based on the maturity the utility achieves in each analysis it performs and on changes in any of the business scenarios.
While the meter has inbuilt algorithms to register events according to the thresholds defined, the utility has to further develop a list of exceptions to monitor or set an additional filtering layer to extract meaningful outputs based on its requirements.
The detailed threshold values for key exceptions as of IS 16444 standards is given in the Appendix H.
1.4.5 MIS Reports
Management Information System (MIS) reports generate a detailed information summary than can be used for decision making, coordination, control and analysis.
Table 7 shows a list of MIS reports that should be generated by a utility, along with recommended frequencies for better performance management.
Table 7: MIS Reports
No. MIS Report OutputBill Processing Step after which Report
is GeneratedFrequency Report Summary
1 Planning and Scheduling Report
Numbers Prior to meter reading each month
Once a month
Separate reports for AMI and �
non-AMI scenariosOutlines the meter reading �
sequence for a month
2 Base Meter Reading Performance Report
Numbers and percentage
Meter reading Daily Area-wise summary report after �
initial base meter reading (in the Non-AMI Scenario)Mentions the number of meters �
read and unread as well as any remarks (e.g. “gate of premises locked”)Estimates the success rate (as a �
percentage) of meter readings attempted for performance monitoring

16 Data Analytics for Advanced Metering Infrastructure: A Guidance Note for South Asian Power Utilities
No. MIS Report OutputBill Processing Step after which Report
is GeneratedFrequency Report Summary
3 Communication Success Rate Report
Numbers and percentage
Meter reading Once every 15 days
Shows the status of successful �
and unsuccessful remote meter readingsIt is generated in the AMI �
Scenario and is equivalent to a base-meter-reading performance reading in the Non-AMI Scenario
4 Follow-up Meter-Reading Report
Numbers RQC Daily Gives the meter serial number �
details of failed RQCs requiring further on-site verification for resolution
5 Monitoring Report Numbers RQC Daily Area-wise reports providing �
an overview of number of meters unread due to meter inaccessibility (premises locked, box locked, obstacles, entry not allowed, etc.), faulty meter, RQCs status, toggle cases* (ToD AMI Scenario), disconnected cases, etc.
6 Monitoring Report Numbers BQC Daily Category-wise reports �
providing status of BQCs
7 Bill Distribution Report/Disconnection Notice Report
Numbers Invoicing Once a week Reports generated area- �
wise during a billing cycle summarizing the number of bills/disconnection notices distributed with or without Proof of Delivery (PoD) and the number of undistributed bills
8 Reconciliation Report
Numbers Invoicing Once a month
Generates area-wise reports on �
the number of meters read and unread as well as consumers billed and invoiced
9 Non-Billed for Over 60/90 Days Report
Numbers Invoicing Once every 60 or 90 days
Generates area- and category- �
wise reports on the number of consumers having provisional bills** for 60/90 days
10 Current Demand and Billed Units Report
Numbers Invoicing Daily Compares and provides �
statistics on total units billed as well as the amount billed during the present month (compared to the same month in the previous year) and any deviations
11 Collection Detail Report
Numbers and percentage
Bill distribution Monthly Area- and category-wise �
reports providing data on the number of consumers paid, categorized by mode of payment used and respective amount paid

1. Data Analytics in Power Utilities 17
No. MIS Report OutputBill Processing Step after which Report
is GeneratedFrequency Report Summary
12 Due Date MIS Reports
Numbers Bill distribution Daily Area-wise due date report �
issued to various head cashiers at collection centersHelps in resource planning �
13 Demand and Collection Report
Amount and percentage variations
Completion of billing cycle
Daily Area- and category-wise �
report providing amount billed, amount collected (including subsidies, if any) and collection efficiency – both month-to-date (MTD) and year-to-date (YTD)
14 Live and Disconnected Arrears Report
Numbers Not applicable Twice a week
Area- and category-wise report �
on the number of consumers that have defaulted or disconnected, including their arrears amount and arrears ageing (or days delinquent)
15 Disconnection Orders Report
Numbers Not applicable Twice a week
Area- and category-wise report �
providing the total number of disconnection orders generated based on arrears ageing (in days) and arrear amountHelps in prioritizing �
disconnections
16 Billing Status Report
Percentage Invoicing Monthly Area- and category-wise report �
providing percentage of total billing done for various billing statuses (average/provisional/actual)
17 Amount Billed per Consumer for Various Bill Statuses Report
Numbers Invoicing Monthly Area- and category-wise report �
providing total amount billed per consumer for various billing statuses (e.g., average billing, provisional billing)
18 Sundry Adjustment Analysis Report
Numbers Invoicing Monthly/Quarterly
Category-wise report providing �
the number of consumers with sundry adjustments in terms of billing amount and units of energy consumed
19 Billing Behavior Report
Percentage Invoicing Monthly/Quarterly
Area- and category-wise report �
providing the number of times consumers have been billed using different billing methods (i.e., provisional billing, average billing compared to the total billed generated in a year)
20 Payment Behavior Report
Percentage Completion of billing cycle
Monthly/Quarterly
Area- and category-wise report �
providing the percentage of consumers paying more than four, eight, etc. times (or non-paying) in a year

18 Data Analytics for Advanced Metering Infrastructure: A Guidance Note for South Asian Power Utilities
No. MIS Report OutputBill Processing Step after which Report
is GeneratedFrequency Report Summary
21 Billing and Payment Status Report
Percentage Completion of billing cycle
Monthly Area- and category-wise report �
comparing total billing with payment received in each billing cycle
22 Pending Arrears Trend Report
Numbers Completion of billing cycle
Monthly/Quarterly
Area- and category-wise report �
providing total pending arrears at the end of the billing cycle
23 Suspected Defaulter Consumers Report
Numbers Not applicable Monthly/Quarterly/Yearly
Area- and category-wise �
report providing the number of suspected default consumers (i.e., consumers with no payment and no meter reading during the applicable time period)
24 Meter Status Report
Numbers and percentage
Meter reading Monthly Area- and category-wise report �
providing status of meter health during the latest billing cycle (e.g., okay, burned out, defective)
25 Meter Ageing Status Report
Numbers and percentage
Not applicable Monthly/Quarterly/Yearly
Area- and category-wise report �
providing meter ageing status in terms of number of years
26 Meter Data Validation Checks Consolidated Report
Failure or success status
Meter reading Monthly Consumer-wise summary report �
providing status of exception checks performed on meter data
* Toggle cases refers to selecting between ToD and non-ToD tariffs, as ToD is applicable for only a few hours.
** Provisional billing is a commonly used term among Indian distribution utilities. It refers to bills that are generated in case the meter is faulty or cannot be read for any other reason.
Sample illustrative screenshots of MIS reports appear in Appendix E.
1.5 ADvANcED REvENUE cycLE MANAgEMENT ANALyTIcS
Once the core MBC analytics has matured in a utility and the desired objective of having correct meter reading and billing is achieved, utility may leverage upon advanced revenue cycle management analytics to further its focus on revenue protection, improved energy efficiency, consumer engagement, enhanced system integrity, improved asset management etc.
1.5.1 Data Analytics
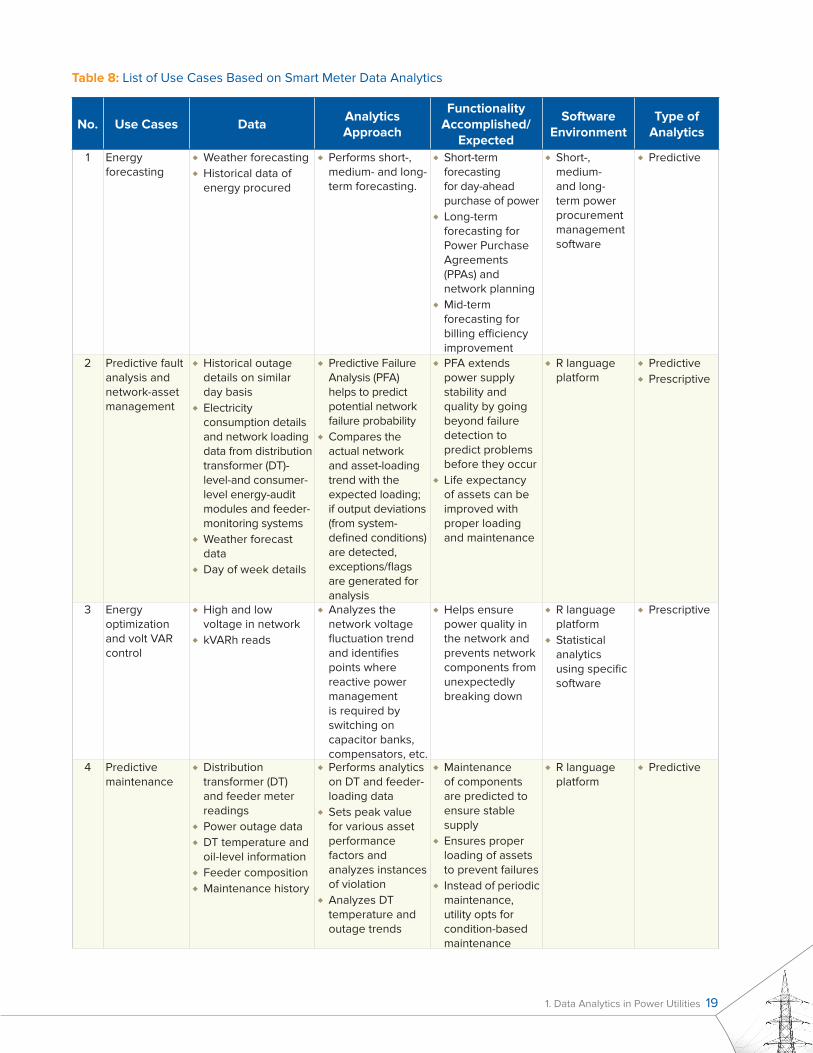
A smart meter has provisions to provide only billing data and full meter data separately depending on utility requirements. The full data includes billing reads, events data, instantaneous data etc. which can be used for enabling various use cases. A list of various use cases based on smart meter full data is provided in Table 8.
1. Data Analytics in Power Utilities 19
Table 8: List of Use Cases Based on Smart Meter Data Analytics
No. Use Cases DataAnalytics Approach
Functionality Accomplished/
Expected
Software Environment
Type of Analytics
1 Energy forecasting
Weather forecasting �
Historical data of �
energy procured
Performs short-, �
medium- and long-term forecasting.
Short-term �
forecasting for day-ahead purchase of power Long-term �
forecasting for Power Purchase Agreements (PPAs) and network planningMid-term �
forecasting for billing efficiency improvement
Short-, �
medium- and long-term power procurement management software
Predictive �
2 Predictive fault analysis and network-asset management
Historical outage �
details on similar day basisElectricity �
consumption details and network loading data from distribution transformer (DT)-level-and consumer-level energy-audit modules and feeder-monitoring systemsWeather forecast �
dataDay of week details �
Predictive Failure �
Analysis (PFA) helps to predict potential network failure probabilityCompares the �
actual network and asset-loading trend with the expected loading; if output deviations (from system-defined conditions) are detected, exceptions/flags are generated for analysis
PFA extends �
power supply stability and quality by going beyond failure detection to predict problems before they occurLife expectancy �
of assets can be improved with proper loading and maintenance
R language �
platformPredictive �
Prescriptive �
3 Energy optimization and volt VAR control
High and low �
voltage in networkkVARh reads �
Analyzes the �
network voltage fluctuation trend and identifies points where reactive power management is required by switching on capacitor banks, compensators, etc.
Helps ensure �
power quality in the network and prevents network components from unexpectedly breaking down
R language �
platformStatistical �
analytics using specific software
Prescriptive �
4 Predictive maintenance
Distribution �
transformer (DT)and feeder meter readingsPower outage data �
DT temperature and �
oil-level informationFeeder composition �
Maintenance history �
Performs analytics �
on DT and feeder-loading dataSets peak value �
for various asset performance factors and analyzes instances of violationAnalyzes DT �
temperature and outage trends
Maintenance �
of components are predicted to ensure stable supplyEnsures proper �
loading of assets to prevent failuresInstead of periodic �
maintenance, utility opts for condition-based maintenance
R language �
platformPredictive �

20 Data Analytics for Advanced Metering Infrastructure: A Guidance Note for South Asian Power Utilities
No. Use Cases DataAnalytics Approach
Functionality Accomplished/
Expected
Software Environment
Type of Analytics
5 Call center efficiency
Call center call �
frequencies, time-of-day call trends and issues reported
Uses analytics �
to increase the effectiveness of all self-service channels by analyzing customer patterns/preferences
Helps the �
utility plan and manage call center operations to accurately forecast workload and schedulesHelps the utility �
push customers to lower cost channels
R language �
platformStatistical �
analytics
Descriptive �
Diagnostic �
Predictive �
6 Network optimization/load balancing
DT or feeder �
usage data from different seasons are analyzed to understand the loading pattern
SCADA �
AMR �
GIS �
Reduction �
of capital expenditure (CAPEX) by network component swappingLoad balancing �
Balanced network �
leading to fewer maintenance outages
SAP Business �
Warehouse (BW) powered by SAP HANA SAP Business �
Objects Business Intelligence (BI) suite
Descriptive �
Diagnostic �
7 Interconnected feeder analysis
Analyzing the �
load curve on all interconnected feeders on same time stamp for better load-growth estimation
SCADA �
AMR �
GIS �
Precise load- �
growth estimationReduced CAPEX �
investment for capacity building
SAP BW on �
HANASAP Business �
Objects BI suite
Descriptive �
Predictive �
8 Energization scheme monitoring
Single dashboard �
showing status of energization scheme at various stakeholders (project monitoring)
Enterprise �
Resource Planning (ERP) system
Single point for �
scheme progress monitoringClear �
responsibility center identification
SAP BW on �
HANASAP Business �
Objects BI suite
Descriptive �
Sample illustrative screenshots of the above-mentioned use cases are provided in Appendix F.
1.5.2 billing and collection Data Analytics
Running data analytics on a consumer billing database can provide insights into such areas as consumption patterns, historical payment trends, and consumer behavior. Utilities can use these insights to plan various actions in the field that will improve their operational and commercial performance. Table 9 presents a list of various use cases based on billing and collection data.

1. Data Analytics in Power Utilities 21
Table 9: List of Use Cases based on Billing and Collection Data Analytics
No. Use Case Data Analyzed Analytics ApproachFunctionality
Accomplished/Expected
Software Environment
Type of Analytics
1 Footfall optimization at payment centers
The number of �
consumers at various centers on various days of the monthConsumer due �
dates
System studies on �
number of consumers turning up to various counters (to which area that particular consumer belongs to and where he is making payments)Gives an insight on �
workload of cashier at various counters and statistics on average footfall in various counters at same time of day/week/month.
Optimized the �
footfall leading to better consumer satisfaction and increased resource efficiency.Due date �
optimizationImproved �
Crowd Management
Statistical �
analytics performedstructured �
query language (SQL)application
Predictive �
Prescriptive �
2 Predicting defaulting consumers
Consumers’ �
previous payment defaults Consumer credit �
ratingsConsumer �
payment behavior
Performs analytics on �
assigning a probability to number of consumers expected to make defaults in next billing cycle.
Led to a �
reduction in arrears and improved consumers’ payment behavior
R language �
platformSQL �
application
Descriptive �
Predictive �
3 Consumer segmentation on default payments
Consumer default �
history Arrear amount �
Bill amount �
Segmentation of �
consumers by number of times they have previously defaulted on payments
Took action to �
improve upon the reduction of defaultsPrioritization of �
cases for action
R language �
platformDescriptive �
Prescriptive �
4 Migration to digital/online payment
Consumer mode �
of payment Payment behavior �
of consumers
Identification of target �
consumers for migrating to online payment modes
Cost �
optimizationCycle time �
reduction
Statistical �
analytics performed
Diagnostic �
Prescriptive �
5 Consumer segmentation on payment behavior
Payment behavior �
Number of times �
paidBill amount �
Performs analytics on �
various consumers and their payment behaviors.Segmented based on �
their payment behavior.
Improved �
consumer payment behavior and retention of good consumers
R language �
platformDescriptive �
Prescriptive �
6 Theft analytics
Previous �
enforcement records.Event reports and �
notification history.Load survey data. �
DT Energy audit �
data.
Performs analytics and �
identifying areas where power theft is high and assigning probability on theft occurrence.
Reduction in �
AT&C lossesR language �
platformDescriptive �
Diagnostic �
Predictive �
Prescriptive �
7 Meter reading and billing complaints analysis
Connection �
number, meter number, previous consumption pattern, complaint history, consumer category
Complaints registered �
for meter reading and billing generated monthly
Fewer defective �
bills Statistical �
analytics performed
Descriptive �
Diagnostic �
Prescriptive �

22 Data Analytics for Advanced Metering Infrastructure: A Guidance Note for South Asian Power Utilities
No. Use Case Data Analyzed Analytics ApproachFunctionality
Accomplished/Expected
Software Environment
Type of Analytics
8 Provisional billing analysis
Number of �
provisional bills (by year and similar month), repeat complaints (by segment), category of provisional billing (e.g. premises locked or entry not allowed)
Analysis of provisional �
billing (average billing) owing to inaccessibility of meters - monthly
Reduction in �
provisional billing
Statistical �
analytics performed
Descriptive �
Diagnostic �
9 Faulty-meter analysis
Number of faulty �
meters and ageing (i.e., duration) of faulty period – by year, segment, sanctioned load, meter manufacturer, and meter type
Analysis of faulty- �
meter complaints and actual meters replaced monthly
Reduction in �
provisional billingFewer meter �
replacements
Statistical �
analytics performed
Descriptive �
Diagnostic �
Sample illustrative screenshots of these use cases are provided in Appendix G.
1.6 KEy ISSUES/RISKS ASSOcIATED wITh DATA ANALyTIcS
Smart meters and other IoT-enabled systems allow utilities to use analytics to gain insights into their operations – insights that can be put to use in improving operational efficiency. However, incomplete metering or unavailability of correct data can be a bottleneck for running various analytics algorithms to derive the full potential of analytics systems and ensure a return on the investment made.
Table 10 depicts some of the issues associated with data analytics, along with possible solutions for each.
Table 10: Key issues and solutions associated with data analytics
No. Issues Impact Solutions
1 Implementation of an analytics system without proper orientation of utility requirements
Investment made will not �
yield the envisaged benefitsProper blueprinting of analytics logics �
(algorithms) before implementationRepresentatives from all functional �
departments of the utility serving on core implementation team
2 Defining inappropriate threshold values, e.g.:
Same threshold values for �
all category of consumers/geographical areasNot updating threshold �
values in line with the changing business conditions
Outputs generated will �
not be useful for proper operational decisions
Definition of threshold values in line with �
utility requirementsSelection of appropriate threshold values �
based on utility’s maturity level and requirements

1. Data Analytics in Power Utilities 23
No. Issues Impact Solutions
3 Unavailability of required skill set within the organization
Higher dependency on �
external system integrators and Original Equipment Manufacturers (OEMs)
Identification of “champion” teams with the �
organization to take up initiatives and run the project
4 Inaccuracy and inconsistency in data received
Wrong data will lead to �
wrong interpretations and less precise outputs
Establishment of a system to ensure the �
accuracy and quality of data
5 Inefficient field-level actions based on analytics results
Desired objective of �
analytics will not be achievedEstablishment of a monitoring mechanism to �
ensure there is improvement in operations over time
6 Communication failures where successful polling of meters cannot be done
Theft prediction efficiency �
will not be optimalLoad growth estimation will �
be inaccurate
Facilitate manual data downloading and �
hardware trouble shooting in the fieldStringent service-level agreement (SLA) �
conditions for timely rectification of cases
7 Mismatch of DT meter and consumer meter reading dates
It hampers proper energy �
auditing for loss-level calculation
Reading of DT meters and consumer meters �
at the same date and time, if possible
8 Consumer meter is faulty and meter cannot be read
Theft prediction efficiency �
will not be optimalEstimation of consumption based on �
previous consumption recordsEstimation of consumption by analyzing the �
feeder- or DT-level metering data along with other consumer meter points
9 Ad hoc architectures and poor integration
With ad hoc architectures �
and without proper IT infrastructure in place, inter-and intra-system integration will be unable to fully leverage the benefits of the data
Core-level standardization has to be brought �
in to successfully integrate systemsUtilities should redesign their enterprise �
architecture to allow flow of data for operational and meter-to-cash applications
10 Change management Traditional organization �
structures lead to very limited applicability of modern systems implemented
Effective use of data analytics requires �
removing traditional silos and combining historically disparate groups
11 Incomplete AMR/AMI metering Difficulty in fetching data �
remotely from non-AMR metersUnavailability of full data for �
carrying out energy auditing, load forecasting, outage management, etc.Data analytics use cases are �
limited to billing
Implement manual reading of non-AMR �
meters using Hand-Held Units (HHUs) or other conventional methods at fixed intervals for collecting full data
1.7 bENEFITS OF AMI OvER AMR FOR IMPROvED DATA ANALyTIcS
In AMI systems, the real-time meter data can be pushed or pulled to the head-end system (HES) automatically in a configurable frequency (i.e., at fixed intervals) as well as on demand. AMI systems integration pushes a huge volume of data to the utility’s servers. The number of parameters that can be captured by a smart meter (per utility requirements) will be higher than is possible using non-AMI

24 Data Analytics for Advanced Metering Infrastructure: A Guidance Note for South Asian Power Utilities
meters. This higher “resolution” and increased volume of data make it possible to run more potential use cases with advanced analytics systems – which in turn generate insights that can be used to guide efficiency-improvement initiatives in utilities.
A brief comparison of the functionality of AMR-enabled meters and AMI meters is provided in Table 11.
Table 11: Comparison of Functionality of AMR and AMI Meters
Functionality Normal Meter (AMR-Enabled) AMI Meters
Data storage Yes � Yes �
Tamper detection Yes � Yes �
Communication port Optical or RJ11 or both � Yes �
Meter reading Automated, with a defined schedule �
(meter pushing the data to HES; usually once a month)Meter can be manually polled on need �
basis (Pull mode) Optical Port is available for download of �
meter reading using CMRI
Automated, with a defined schedule (meter �
pushing the data to HES; frequency can be as low as 15 minutes)Meter can be manually polled on need basis �
(Pull mode)Optical port is available for download of meter �
reading using CMRI
Remote reading Through external/retrofit modem �
Separate power supply for modem �
Built-in or modular but integrated with meter �
housing No separate power supply for communication �
Remote communication mode
GSM, GPRS or RF Drive-By � GPRS �
Sophisticated RF with router/DCU/gateway �
capable of self-healingPlug-and-play needs no commissioning �
Data availability through remote reading
Mainly billing data � All data including load profile, events, outages �
Two-way communication No � Yes, event notification �
Configuration of parameters in meter
Limited � All allowed parameters even support remote �
firmware update
Communication protocol Proprietary � Open Standard (DLMS) �
Software support Limited �
Meter Manufacturer Dependent �
Mainly standalone desktop-based �
systemNo centralized access �
Standard; many types of Commercial �
Off-the-Shelf (COTS) software availableWeb-based applications, can be accessed �
from anywhere
Integration Meter Manufacturer Dependent � Standard, XML based or Service Oriented �
architecture
Parameter recorded Billing �
Load survey �
Events �
TOU �
Varies by utility and manufacturer �
Billing �
Load Survey �
Events �
TOU �
Power outages �
Transactions �
Standard-based �

1. Data Analytics in Power Utilities 25
Functionality Normal Meter (AMR-Enabled) AMI Meters
Data usage Limited, though data is stored in meter � All data is transferred on near real-time basis �
to central system, making it available for analytics
Communication frequency
Monthly � Configurable; can be configured for as low �
as 15 minutes (i.e., data is transmitted every 15 minutes)
Load control No � Yes �
Remote connection/disconnection
No � Yes �
Additional functionality net metering/pre-paid
No �
Separate Meters �
Yes �
Configurable �
Primary applications Monthly Billing � Utility operations �
Demand response �
Billing and customer information system �
Customer data display �
Outage management �
On-demand response None Load control �
Demand management �
Critical peak rebates �
Customer feedback Billing Billing �
Load pattern �
Website or mobile phone app �
Energy accounting Monthly billing based In real time or daily, depending on data �
communication frequency
New capabilities None Power quality �
Load balancing �
Capacitor bank switching with additional �
devicesTransformer load management �
Automated outage management �
Security Varies by meter manufacturer and also based on utility requirement mentioned in RFP (meter standards version)
Varies by meter manufacturer and also based �
on utility requirement mentioned in RFP (meter standards version)
Administration Limited to metering and billing operations and related services
AMI provides data integrations to multiple �
utility business systems in addition to metering and billing systems like OMS, DMS, NMS,* load forecasting, etc.
* A Distribution Management System (DMS) is a collection of applications designed to monitor and control a distribution network efficiently and reliably. An Outage Management System (OMS) is an electronic system developed to identify and correct the outages in the electrical network. A network management system (NMS) is a system designed for monitoring, maintaining, and optimizing a network.
Key features of smart meters include faster network restoration with outage notification from the meter, remote meter reading, remote disconnection/reconnection, and faster tamper detection. The real-time data allows utilities to improve in such areas as volt/VAR control, asset management, and network planning.

26 Data Analytics for Advanced Metering Infrastructure: A Guidance Note for South Asian Power Utilities
AMI technology facilitates two-way communication between utilities and consumers, which is not possible using AMR technology. This allows both utilities and consumers to initiate fast actions as required. Providing real-time information to consumers helps them participate in efficient and effective energy conservation efforts, while providing real-time data to utilities gives them an “as-operated” view of the network.
Running advanced data analytics on real-time meter data from AMI systems can benefit energy utilities in the following ways:
Improved customer targeting and segmentation: � There are compounding benefits for utilities to deploy consumer analytics in their operations. Detailed knowledge of consumers can increase the lifetime consumer value of residential and commercial users. In an increasingly competitive market, understanding consumer behavior and the needs of customer groups is key to successful retention of customers. Through targeting specific customers, companies are able to discern customer use patterns, which allows them to develop and deliver their message more effectively to customers.
Improved energy leakage analytics and revenue protection: � Smart meters already offer better tampering resistance, but analytics can help advance the detection of power thefts, thus preventing revenue losses. Analytics checks monthly consumption and energy bills and identifies any discrepancies that might indicate fraud.
Effectively target energy efficiency programs and demand response analytics: � A deeper understanding of how consumers use energy empowers energy utilities to develop targeted energy efficiency programs.
Improved billing and payment options: � When more information is known about users, companies are able to customize billing to user segments based on rate class, program participation, interests, efforts to conserve energy, and so on.
Reduced network maintenance and better assets management: � Metering at Distribution Transformer (DT) and feeder points provides insights into network and asset-loading conditions. This enables the utility to improve network and asset utilization while reducing the chance of network failure.
In India, AMR technology has been partially rolled out in several utilities, covering a large proportion of their high-value industrial and commercial consumers. Meanwhile, over the last few years, Ministry of Power (MoP) schemes such as IPDS and UDAY have helped accelerate the adoption of smart meters. More recently, several utilities have proposed advancing to AMI technology.
One of the key roadblocks preventing the adoption of smart metering technology has been the high cost of smart meters. With the recent EESL aggregated procurement of smart meters, however, the cost per meter has fallen by more than 50 percent.
India’s AMR metering standards support Time-of Use (ToU) pricing.8 However, various IoT-enabled services, DSM initiatives, and other initiatives requiring real - time data will require AMI implementation.
8 With time-of-use (TOU) pricing, electricity tariffs rise during peak demand periods and fall during low-demand periods.
1. Data Analytics in Power Utilities 27
While a full-scale adoption of AMI would be ideal, utilities may follow a phased approach and gradually enhance their AMI penetration. The following key technical requirements may be useful in a phased transition to AMI:
Standardization of communication technologies and data-exchange protocols. In other words, �
data-exchange protocols that support AMR should be able to support two-way communication in AMI systems.
Existing AMR head-end software solutions should be scalable so they can adopt AMI in future. �
Utilities should deploy smart meters initially, then make relevant technical upgrades where possible �
to enable two-way communication and other operational features (such as DSM initiatives, ToU tariffs, and remote disconnect/reconnect) that will allow them to adopt AMI in future.
Network Interface Cards (NICs) should be easily replaceable in the field so that without replacing �
meters, communication infrastructure can be upgraded to support future technologies, such as the migration from the third to the fourth generation of mobile broadband Internet (3G to 4G).

28 Data Analytics for Advanced Metering Infrastructure: A Guidance Note for South Asian Power Utilities
2.1 DATA ANALyTIcS SySTEM ARchITEcTURE
Data analytics systems generally follow a uniform architecture featuring the following key components:
Data sources �
Data integration �
Analytics hub �
Data sciences/analytics applications �
Data delivery points/visualization interface �
Work/case � management
However, depending on the industry and overall system architecture, the data sources, integration requirements, and dashboard components may change. Figure 6 shows an illustrative architecture of a data analytics system for a power distribution utility.
The details of the various components of an analytics system are summarized in Table 12.
2. PROCUREMENT AND DEPLOYMENT OF ANALYTICS SYSTEMS
Figure 6: Data Analytics System Conceptual Architecture
MDMS
Predictive Analytics
Data Lake
Maps/Charts
Reports and Dashboards
CRM Systems Operational Systems ERP Systems
Asset Management
SystemsCustomer
Service SystemsAccounting Systems
Work Order Management
ENTERPRISE APPLICATIONS
Data
Data
Data
Leads
Feedback
DataQuality System of
recordsAggregates
Database Statistical/ML Models
In-Memory
Business Intelligence
Streaming
DATA SOURCES DATA INTEGRATION
WORK/CASEMANAGEMENT
ANALYTICS HUB
DATA SCIENCES/ANALYTICS
APPLICATIONS
DATA VISUALIZATION
DataIngestion
DataTransformation
Master DataManagement

2. Procurement and Deployment of Analytics Systems 29
Table 12: Details of Various Components of Analytics System
Components Details
Data Sources A utility’s data sources are its operational and back-office systems. In data management terms, the overall information storage system is the “system of record” – and is sometimes referred to as “the source of truth,” meaning a trusted data source. Due to the nature of these purpose-built systems, they tend to be siloed – that is the data tend to be stored in different ways without a common organizational principle. The three main data sources are as follows:
Information Technology (IT) Systems
Operational Technology (OT) Systems
Third Party Systems
Examples �
of Input Sources
Billing engine/ �
Enterprise Resource Planning (ERP) softwareCustomer master data �
Call center �
In-house IT �
applications
SCADA (supervisory control �
and data acquisition) systemOMS (outage management �
system)GIS (geographic information �
system)AMI/MDMS (advanced �
metering infrastructure/meter data management system)ADMS (advanced distribution �
management system)
Weather forecast �
systems Social media �
Websites �
Volume Medium High Low
Data Type Structured Structured/semi-structured Unstructured
Analytics hub An analytics hub is different from a data warehouse or a simple “big data” repository. It encompasses a more modern approach in which “in-memory”* technologies are used in conjunction with “big data” hubs to address Business Intelligence (BI) and real-time analytical computing needs. This architecture scales vertically and horizontally and uses computing resources efficiently – in a cloud or a traditional data warehouse. In a real-time or a near-real-time analytics scenario, analytics are deployed on the in-memory system or database to compute new results even as new data sets become available. Models are typically developed in languages such as Python, Scala and R to execute statistical and machine-learning algorithms.
Data integration
Data integration poses several challenges that can be understood in terms of the “four V’s” of big data: variety, volume, velocity and veracity. The variety of data includes structured, unstructured, time series, events/alarms, and streaming – along with data sources external to the utility, such as weather data. The volume of data can be significant if a historical time-series data are used as data use grows exponentially. Since real-time execution of certain analytics is important, building capabilities to eliminate latency in data integration (i.e., improving velocity) is important. Lastly, knowing which data are the correct data (i.e., its veracity) is usually a big area of concern and usually requires careful analysis. Examples of software used for data integration include Informatica, Talend, Oracle Goldengate, and SAP SLT and Data Services.
Data sciences/analytics applications
Analytics-model development differs from software development in terms of its approach. It is common to have an analytics (or data science) team performing the Exploratory Data Analysis (EDA), devising models, and testing models or model “ensembles” (i.e., groups of models). These models are often tested over time to minimize false positives and negatives before they are moved into production. In addition, several vendors provide pre-built analytics models as a part of their software applications; these models have been tested at various utilities and need minimal modifications to be incorporated into production. The models – which may be descriptive, predictive or prescriptive – are built using Natural Language Processing (NLP), statistical (open-loop/closed-loop) machine-learning models, and artificial intelligence models (sometimes in an ensemble), among a variety of other approaches. Examples of software used include R, SPSS, SAS, Python, Scala, SAP Predictive Analysis Library (PAL), and Oracle R/OAC/Data Miner/OBIEE.

30 Data Analytics for Advanced Metering Infrastructure: A Guidance Note for South Asian Power Utilities
Components Details
Data visualization
Data visualization tools currently on the market can perform extensive modelling themselves, but are used mainly for data discovery and presentation of analytics results and can display insights in very crisp and clear manner. Examples of software used include the SAP Business BusinessObjects Intelligence (BI/BO) suite, Tableau, Qlikview, and Oracle Data Visualization.
Work/case management
It is important that the analytics are synthesized to drive actions. For example, if the analytics provide a prescriptive action to analyze electricity theft at a premise, there has to be a mechanism to execute the action. This can be done with existing work management systems by extending their functionality, but it is more common to manage such scenarios with a Case Management** solution.
* In computer science, in-memory processing is an emerging technology for processing data stored in database. Older systems are based on disk storage and “relational” databases maintained using a Relational Database Management System (RDBMS). Because stored data is accessed much more quickly when placed in Random-Access Memory (RAM) or flash memory, in-memory processing allows data to be analyzed in real time, enabling faster reporting and decision-making in business.** Case management refers to the process of resolving an incident or issue relating to the utility’s business, staff or customer, and being accountable for the resolution of the incident or issue.
Table 13 showcases several market-available technology solutions currently in use in various utilities for analytics systems.
Table 13: Technology Solutions in Use in Various Utilities for Analytics Systems
Components TPDDL* ComEd** PECO***
Data sources IT systems: Enterprise Resource �
Planning (ERP) systems; SAP IS-U; Metering, Billing and Collection (MBC) systemsOperational Technology (OT) �
systems: SCADA, OMS, GIS, etc.Third-party systems: weather �
data, social media, websites, etc.
IT systems: Oracle MDM, �
Accenture Customer/1 CIS, ABB Asset Suite 8OT systems: ABB DMS/OMS, �
Esri GIS, Operations Optimizer Third-party systems: weather �
data, social media, web services, etc.
IT systems: Oracle MDM, �
Accenture Customer/1 CISOT systems: Intergraph �
In-service, Esri GIS, Oracle DataRakerThird-party systems: �
weather data, social media, web services, etc.
Analytics hub Data warehouse systems: �
RDBMS, SAP BW, SAP HANA.Big-data lakes**** using Hadoop �
Data warehouse systems: �
RDBMS, custom Corporate Data WarehouseBig-data lakes using Exadata, �
Cloudera
Data warehouse systems: �
RDBMSBig-data lakes using �
Exadata, Cloudera
Data integration Informatica � Informatica �
Oracle Goldengate �
Spark �
Kafka �
Informatica �
Oracle Goldengate �
Spark �
Kafka �
Data sciences/analytics applications
Platforms based on the R �
programming language R �
Python �
Oracle R �
R �
Python �
Oracle R �
Data visualization
SAP BusinessObjects suite �
Tableau �
Qlikview �
Oracle Business Intelligence (BI) �
Qlikview �
Tableau �
Oracle BI �
Work/case management
SAP ECC � Work Information Management �
System (WIMS)Meter work management �
system
* Tata Power Delhi Distribution Limited.** Commonwealth Edison, commonly known as ComEd, is the largest electric utility in the U.S. state of Illinois.*** PECO (formerly the Philadelphia Electric Company) is an electric and natural gas utility. It is a subsidiary of Exelon Corporation, the United States’ largest regulated utility in terms of customer count and total revenue.**** A data lake is a large reservoir of enterprise data stored in a cluster of commodity servers that run software such as the open-source Hadoop platform for distributed big-data analytics.

2. Procurement and Deployment of Analytics Systems 31
2.2 APPROAchES FOR PROcUREMENT AND IMPLEMENTATION OF ANALyTIcS SySTEMS
2.2.1 Road Map
Before a utility adopts a data analytics system, it must have a clear organizational vision and mission. The TDWI Analytics Maturity Model9 showcases the journey a utility must take to maximize the end-to-end business benefits that big-data and analytics solutions can potentially offer. The journey can be divided into five stages, details of which are shown in Table 14.
While most South Asian utilities have already implemented software solutions for billing and customer-related processes, they have not yet implemented the OT systems. As a result, the utilities will have to undergo the transformation journey depicted in Figure 7 to fully leverage the benefits of data analytics.
Table 14: Utility Transition Stages in Adopting Analytics Systems
Stage Description
Nascent stageThe utility has a low awareness of analytics or its value across the value chain. It has just begin integrating OT systems into its IT framework, and has standalone reporting capabilities within each business area.
Pre-adoption stage
The utility has conducted an initial assessment of data analytics and has some form of strategic plan in place. It may have standalone dashboards and reporting capabilities and disparate analytics processes within each business area; however, difficult obstacles remain, such as data integration skill-set shortcomings with regard to tools and human resources.
Adoption stageThe utility has strategic and scalable technical capabilities to deliver enterprise-wide analytics solutions across business areas. There will be a significant shift toward data-driven business processes and a redefinition of the operating model.
Maturity stageThe utility has achieved a complete digital transformation, and all business processes and operations are now optimized using advanced analytics.
Visionary stageThe utility has generated significant business value from analytics by continuously focusing on sharpening its technological capabilities.
Source: TDWI Analytics Maturity Model.
9 See https://www.microstrategy.com/getmedia/9b914607-084f-4869-ae64-e0b3f9e003de/TDWI_Analytics-Maturity-Guide_2014-2015.pdf, p. 9.
Figure 7: Transition Stages for South Asian Utilities
Implementation and Integration of Data Sources
Adopting Core analytics related to MBC
Adopting Advanced Data Analytics Systems
1
• Implementation of IT and OT systems
• Integration of OT with IT systems
• Adoption of RQC, BQC, Exception checks
• MIS Reporting
• Leveraging high resolution “Big Data” for advanced analytics systems (data Science)
2 3
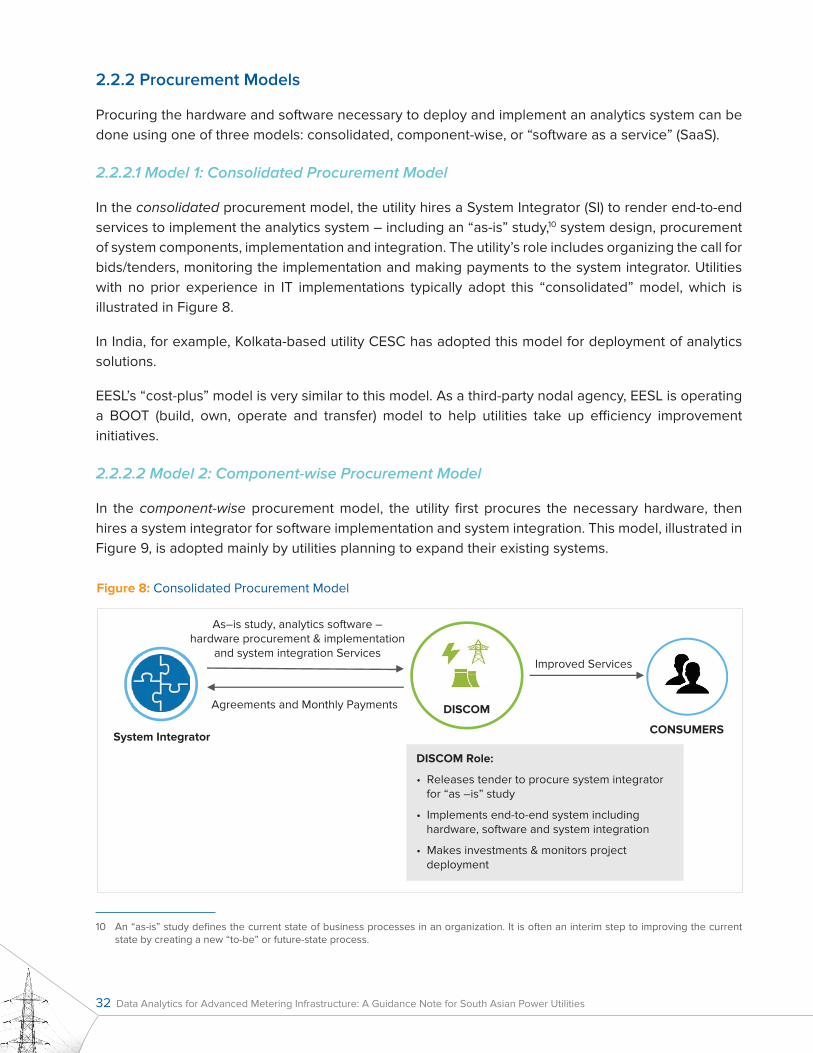
32 Data Analytics for Advanced Metering Infrastructure: A Guidance Note for South Asian Power Utilities
2.2.2 Procurement Models
Procuring the hardware and software necessary to deploy and implement an analytics system can be done using one of three models: consolidated, component-wise, or “software as a service” (SaaS).
2.2.2.1 Model 1: Consolidated Procurement Model
In the consolidated procurement model, the utility hires a System Integrator (SI) to render end-to-end services to implement the analytics system – including an “as-is” study,10 system design, procurement of system components, implementation and integration. The utility’s role includes organizing the call for bids/tenders, monitoring the implementation and making payments to the system integrator. Utilities with no prior experience in IT implementations typically adopt this “consolidated” model, which is illustrated in Figure 8.
In India, for example, Kolkata-based utility CESC has adopted this model for deployment of analytics solutions.
EESL’s “cost-plus” model is very similar to this model. As a third-party nodal agency, EESL is operating a BOOT (build, own, operate and transfer) model to help utilities take up efficiency improvement initiatives.
2.2.2.2 Model 2: Component-wise Procurement Model
In the component-wise procurement model, the utility first procures the necessary hardware, then hires a system integrator for software implementation and system integration. This model, illustrated in Figure 9, is adopted mainly by utilities planning to expand their existing systems.
10 An “as-is” study defines the current state of business processes in an organization. It is often an interim step to improving the current state by creating a new “to-be” or future-state process.
Figure 8: Consolidated Procurement Model
DISCOM
CONSUMERS
As–is study, analytics software – hardware procurement & implementation
and system integration ServicesImproved Services
Agreements and Monthly Payments
System Integrator
DISCOM Role:
• Releases tender to procure system integrator for “as –is” study
• Implements end-to-end system including hardware, software and system integration
• Makes investments & monitors project deployment

2. Procurement and Deployment of Analytics Systems 33
The key issue that might arise in this model will be related to interoperability of various system components that are procured separately. Any utility considering adopting this model should have sufficient technical expertise and an experienced IT team within the organization.
In India, Delhi-based TPDDL has adopted this model to deploy its analytics solutions.
2.2.2.3 Model 3: Software-as-a-Service Procurement Model
In the software as a service (SaaS) procurement model, the utility hires a service provider to host the systems, either on a cloud platform or physically at their host locations, and to provide other services as needed. As illustrated in Figure 10, the utility’s role is limited to managing the service provider agreements and monitoring the performance of the systems and services rendered.
In the United States, PECO and ComEd have adopted this model for deploying energy-theft and meter-operations analytics services. PECO uses Oracle DataRaker, while ComEd uses Operations Optimizer, which is made by Silver Spring Networks (recently acquired by Itron).
Figure 9: Component-wise Procurement Model
Agreements & MonthlyPayments
SystemIntegrator
Analytics software implementation& system integration services
Payments
Improvedservices
Analytics system hardwarecomponents procured
Analytics SystemHardware Vendors
DISCOM
CONSUMERS
DISCOM Role:
• Procures analytics system hardware components independently
• Release tender to procure system integrator for system implementation and integration
• Monitors project deployment

34 Data Analytics for Advanced Metering Infrastructure: A Guidance Note for South Asian Power Utilities
Figure 10: Software-as-a-Service Procurement Model
2.2.2.4 Model Comparison
The pros and cons of each procurement model are discussed in Table 15.
Table 15: Comparison of Procurement Models
Procurement Model
Pros Cons
Consolidated Traditional and mature implementation model �
High probability of success as utility draws �
on experience from previous successful programsResources: capability and capacity well �
defined and understood
Control on the outcome can only be asserted �
contractuallyMaintenance of system requires training of internal �
staffInability to deploy specific resources DISCOM �
knows and trusts
Component-wise
More control over implementation and �
executionFlexible and ability to adapt �
Change management and organizational �
knowledge
Lack of large program experience �
Depends on capacity of internal resources to scale �
DISCOM responsible for performance, reliability �
and scalabilityDISCOM accountable for delays and overruns �
Software as a Service (SaaS)
Short procurement and implementation cycle �
Vendor responsible for performance, �
reliability and scalabilityLower total cost of ownership �
Data privacy and security concerns �
Control on the outcome can only be asserted �
contractuallyStrong communications network and data �
interfaces needed
2.3 TEchNIcAL SPEcIFIcATION FOR ANALyTIcS SySTEMS
The technical specification of analytics systems varies with the number of smart meters in the utility area and the volume/variety of data captured from the meters, as explained in Table 16.
Scalable analytics software andhardware infrastructure and data
integration services
Agreements & MonthlyPayments
Increased customersatisfaction and
loyalty
DISCOM
CONSUMERS
DISCOM Role:
• Releases tender to procure software-as-a-service analytics platform to implement analytics
• Service provider ensures scalability and service level agreements are met
• DISCOM manages provider according to agreement and monitors performance
Software as aService Provider

2. Procurement and Deployment of Analytics Systems 35
Table 16: Hardware and Software Specification of Analytics System
Hardware Specifications
The solution should be sufficiently scalable to accommodate future business growth. �
The analytical system ideally should have a built-in redundancy feature with no single point of failure. �
To protect the utility’s investment, the analytical system should be able to support the coexistence of at least two �
generations of hardware in order to avoid hardware re-deployment for future upgrades or expansions. The solution should allow for data replication between two data centers in asynchronous mode. �
The power, cooling and space parameters (Rack Unit and HDD numbers)in the hardware system must be designed to �
accommodate future expansion.The operating system should be bundled with the solution including support. �
The solution should be bundled with network switch. �
The platform should be capable of the standard archiving process �
The platform should be persistent such as for long-term regulatory and analytics data, records that will be used in �
time-based analysis; need a clearly defined policy to include on-going integrity checks and other long-term reliability features, and to address the need for data-in-place upgrades.
Type Features
Analytics Solution
Data Integration and ProcessingThe Extract, Transform and Load (ETL) tool should be integrated with the most commonly used source �
systems, such as ERP systems, CRM systems, and RDBMSs. The ETL tool should allow for the aggregation of all source databases. The data will load into the data �
store, and loads can be scheduled. The solution should allow for real-time data ingestion (i.e., the process of obtaining and importing data �
for immediate use or storage in a database) and real- or near-real-time reporting capability from IoT devices, smart meters and other sources of data.The solution should have integration tools for transforming data within the analytics system. �
Data Management and AdministrationThe solution should allow the user to access and manage data through an intuitive user interface. �
Manageability and SecurityThe solution should allow full configuration of system administration, and should provide monitoring �
tools for all components.The system should ideally provide a secure authentication mechanism to prevent eavesdroppers/ �
attackers masquerading as (i.e., pretending to be) valid users; for example, the Kerberos network authentication protocol.The solution components must be integrated with the existing Lightweight Directory Access Protocol/ �
Active Directory (LDAP/AD) system. Users should only be able to log in via their corporate LDAP/AD account. However, the LDAP/AD system also can be used as a standalone.The system should ensure that data sets are secure (so that only authorized users can view particular �
data sets) and that group access is read-only.The system should be able to audit and review who is accessing what data set, to ensure that these �
policies are being followed and enforced. Also, log retention should be available.The system should have the option of partial or full encryption of the data at-rest. �
Advanced Analytics Solution
General FeaturesThe proposed advanced-analytics solution should be based on commonly used data science �
languages, such as Python or R.The solution must provide an integrated environment for running predictive and descriptive modeling, �
data mining, forecasting, optimization, simulation, experimental design and more.The platform should support multi-threaded applications for data scientists. �
Software Specifications (Analytics and Advanced Analytics)

36 Data Analytics for Advanced Metering Infrastructure: A Guidance Note for South Asian Power Utilities
2.4 FUNcTIONAL REQUIREMENTS OF ADvANcED ANALyTIcS SySTEM
The functional requirements of an advanced analytics system may be grouped into three areas: reporting, reliability, and storage.
2.4.1 Reporting
2.4.1.1 General Features
In terms of general features, the solution should:
Provide an easy-to-use visualization capability so that users can access information – including �
interactive graphs, charts, and tables – collated from the multiple operational sources, thus enhancing decision making;
Allow users (those with sufficient administrative rights) to perform ad-hoc analysis on the data and �
distribute the results on mobile devices for on-the-go analysis;
Facilitate alerts based on user defined criteria which would be dispensed in the form of emails, �
portal alerts etc.;
Be able to publish configurable alert notifications by SMS or email; �
Have parameterized calculations that enable dynamic filtering, ranking, calculations and �
display rules;
Have strong layout capabilities to provide flexibility in report layout and design; �
Allow customized interaction between sections, objects, and so on; �
Ensure that data are interactively prepared for analysis – including joining tables, defining custom �
calculated columns, and creating custom expressions; and
Be a part of an integrated solution framework, preferably from single-vendor support for better �
connectivity and seamless integration.
Type Features
Statistical Modelling FeaturesThe solution should support basic algorithms like regression, Lasso-based regression, ridge �
regression, logistic regression, decision trees, random forest, support vector machines, clustering algorithms, time series modelling, topic modelling, and term frequency matrix. The solution should be able to leverage in-memory capability to carry out statistical and forecasting �
calculations.
Data DiscoveryThe proposed tool should be a single, intuitive and visual interface that allows users to find and �
explore data, quickly transform and enrich it, and unlock it so that anyone can discover and share analytical insights.The solution should be able to upload/import data from spreadsheets (e.g. Excel) and text files (e.g. �
delimited files, such as comma-separated-values [CSV] files) into memory for analysis.The solution should have a user-friendly, drag-and-drop interface (web-based or command line) �
allowing data sampling and discovery in self-service mode.

2. Procurement and Deployment of Analytics Systems 37
2.4.1.2 Mobility Features
In terms of mobility features, the solution should provide:
Interactive reports and dashboard viewing on tablets and smartphones for iOS and Android �
without requiring any redesign;
Analysis/explorations/reports to be pushed for online or offline viewing on mobile devices; and �
Ideally, collaboration support for annotation on tablets. �
2.4.1.3 Platform Support for All Office applications
In terms of platform support for Microsoft Office applications, the solution should:
Feature seamless integration with Microsoft Office suites �
Support Outlook integration �
Support Excel integration, with the ability to leverage native Excel charts �
Allow printing to PDF as well as exporting data in Excel and comma-separated-value (CSV) formats. �
2.4.1.4 Reporting Tool Security
In terms of reporting tool security, the following is required:
The solution should define screen layouts according to allowed security permissions. �
User, group, object and folder security should be configurable. �
Security for data restrictions should be managed from within the solution. �
Security should be defined at row, column, and connection levels. �
Unsuccessful login attempts should be recorded and retrievable somewhere on the system. �
2.4.2 Reliability
High availability (HA) refers to the analytics system’s ability to service users even when confronted with component failures. The system should ideally have redundancy at both hardware and network-component levels.
Data protection capabilities let users protect data from any unauthorized access. The system should offer at-rest encryption of data to ensure data and information security.
2.4.3 Storage
The analytics system should support data storage and applications on a cloud platform or on on-site physical databases. Cloud-based storage can be a cost-effective solution compared to conventional on-site physical storage solutions; it can also accelerate technology adoption in power utilities by reducing the time required to set up data centers. Table 17 compares the various cloud-based and physical database solutions.

38 Data Analytics for Advanced Metering Infrastructure: A Guidance Note for South Asian Power Utilities
Table 17: Comparison of Cloud-based and Physical Database Solutions
Solution Physical Cloud
Servers Co-located �
Failure-dependent �
Integrated �
Fault tolerant �
Resources Partitioned �
Performance interrelated �
Unified �
Performance isolated �
Management Separate �
Manual �
Centralized full control �
Automated �
Scalability Plan ahead �
Over-provisioning �
Flexible �
Scalable �
Renting/Costing Per physical machine � Per amount of usage �
Application/Services Fixed on designated servers � Runs on all virtual machines �
Data Security High � Moderate �
Cost High � Low �
2.5 SIzINg AND TyPIcAL bILL OF QUANTITy FOR ANALyTIcS SySTEM
The component requirements, system design and system cost depend on the volume and variety of data and the processes the system must perform on the data. The utility should carry out a detailed hardware- and network-sizing exercise separately based on the business requirements. Table 18 illustrates a sample analytics system sizing and Bill of Quantity (BoQ) for 5,00,000 consumers in the AMI scenario; the configuration assumes that the necessary data center (including the required number of server racks) is already available.
Table 18: Sizing and Typical Bill of Quantity for Analytics System
Parameters Description
Number of consumers 5,00,000 �
Number of parameters 10 �
Meter polling frequency 30 minutes interval �
Total data size per year including redundancy
Data Source Size
Billing Reads 1 terabyte (TB)
AMI full data 7 TB
OT systems (SCADA, DMS, OMS, etc.) 3.5 TB
ERP and in-house IT systems 3.5 TB
Total 15 Tb
Scalable up to four times the current capacity �
Temporary/log storage should be on an SSD/Flash drive �
Memory/RAM 1 TB (scalable up to 2 TB) �
CPU* and clock speedApprox. 16 CPUs with 2.28 GHz or higher �
The number and specification of each CPU shall be as certified by the �
software provider

2. Procurement and Deployment of Analytics Systems 39
Parameters Description
Processor type OEM-certified processor �
Network interfaces 10 gigahertz (GHz), two in number �
Operating system Open source (Windows, Linux, Unix) �
HBA** connector Two in number, 16 gigabits per second (Gbps) �
Data redundancy50 percent of the main setup �
Replication support to be provided by the software vendor �
* CPU = central processing unit.** HBA = host bus adapter.

40 Data Analytics for Advanced Metering Infrastructure: A Guidance Note for South Asian Power Utilities
REFERENCES AND LINKS
TPDDL Smart Grid Lab overview:
http://www.tatapower-ddl.com/showcontent.aspx?this=151&f=ABOUT-US&s=Smart- �
Grid&t=Overview
http://www.tata.com/article/inside/tpddl-launches-state-of-the-art-smart-grid-la � b
http://www.tatapower-ddl.com/Editor_UploadedDocuments/Content/TATA-POWER-DDL%20 �
Smart-Grid-BROCHURE-Final.pdf
EESL smart-grid initiatives: http://www.eeslindia.org/content/raj/eesl/en/Programmes/Smart-Meters/about-smart-meters.html
Indian Power Sector Policies and Schemes Overview: https://powermin.nic.in/en/content/overview-4
UDAY Scheme: https://www.uday.gov.in/home.php
IEEE Smart Grids: https://smartgrid.ieee.org/
IEEE Smart Grid Standards: https://smartgrid.ieee.org/resources/standards
Yi Wang, Qixin Chen, Tao Hong, and Chongqing Kang. 2018. “Review of Smart Meter Data Analytics: Applications, Methodologies, and Challenges.” IEEE Transactions on Smart Grid. https://arxiv.org/abs/1802.04117

Appendices 41
APPENDIx A. DEScRIPTION OF KEy TEchNOLOgy TERMS
Advanced Metering Infrastructure (AMI)
AMI is an architecture for automated, two-way communication between a smart utility meter with data communication capability (via an IP address) and a utility company. The goal of AMI is to provide utility companies with real-time data about power consumption and allow customers to make informed choices about energy usage based on the price at the time of use.
Automatic Meter Reading (AMR)
AMR is a technology that automatically collects consumption, diagnostic, and status data from energy metering devices and transfers that data to a central database for billing, troubleshooting, and analyzing. AMR saves utility providers the expense of periodic trips to each physical location to read a meter.
Big Data Big data is a term that describes the large volume of data, both structured and unstructured, that may be analyzed computationally to reveal patterns, trends, and associations – providing operational benefits to respective sectors.
Big Data Analytics Big data analytics is the process of examining large and varied data sets – i.e., “big data” – to uncover hidden patterns, unknown correlations, market trends, customer preferences and other useful information that can help organizations make more-informed business decisions.
Data Lake A data lake is a large reservoir of enterprise data stored in a cluster of commodity servers that run software such as the open-source Hadoop platform for distributed big-data analytics.
DMS, OMS, NMS A Distribution Management System (DMS) is a collection of applications designed to monitor and control a distribution network efficiently and reliably. An Outage Management System (OMS) is an electronic system developed to identify and correct the outages in the electrical network. A Network Management System (NMS) is a system designed for monitoring, maintaining, and optimizing a network.
Hadoop System Apache Hadoop is “big data” management platform. It is a collection of open-source software that facilitates using a network of many computers to manage and solve problems involving massive amounts of data and computation. It provides a software framework for distributed storage and processing of big data.
Head-End System (HES)
A HES is hardware and software that receives meter data sent to the utility. HESs may perform a limited amount of data validation before either making the data available for other systems to request or pushing the data out to other systems.11
11 See https://openei.org/wiki/Definition:Head-End_System.
APPENDICES

42 Data Analytics for Advanced Metering Infrastructure: A Guidance Note for South Asian Power Utilities
In-Memory Technologies
In computer science, in-memory processing is an emerging technology for processing data stored in database. Older systems are based on disk storage and “relational” databases maintained using a Relational Database Management System (RDBMS). Because stored data is accessed much more quickly when placed in random-access memory (RAM) or flash memory, in-memory processing allows data to be analyzed in real time, enabling faster reporting and decision making.
Internet of Things (IoT)
The IoT is an interconnection of endpoints (devices and other objects) that can be uniquely identified using an Internet Protocol (IP) address. With the IoT, devices can be connected to the Internet to sense, gather, receive and send data, and communicate with each other and applications – via IP technologies, platforms and connectivity solutions.
Net Metering Also called Net Energy Metering (NEM), net metering is a billing mechanism that credits solar energy system owners for the electricity they add to the grid.12
Non-Volatile Memory
Non-Volatile Memory (NVM) is a type of computer memory that has the capability to hold saved data even if the power is turned off.
Smart Grid According to the IEEE, “The Smart Grid is defined as an integration of electricity and communication, so that the electric network will be ‘always available, live, interactive, interconnected, and tightly coupled with the communications in a complex energy and information real-time network.’”13 A smart grid is not a single technology or system, but rather a central system of systems in which various types of technology are deployed.
12 See https://www.seia.org/initiatives/net-metering and https://en.wikipedia.org/wiki/Net_metering.13 See http://docplayer.net/45366025-Co-simulation-environment-for-event-driven-distributed-controls-of-smart-grid.html.

References and Links 43
Low
Con
sum
ptio
n
AP
PEN
DIx
b. M
ETER
REA
DIN
g Q
UA
LITy
ch
EcK
S (R
Qc
S) –
2N
D L
EvEL
: Sc
REE
NSh
OTS
This
che
ck i
dent
ifies
var
iatio
ns i
n th
e co
nsum
ptio
n tr
end
of a
par
ticul
ar c
onsu
mer
, w
ith r
efer
ence
to
low
-thr
esho
ld v
alue
s fo
r ea
ch
cate
gory
.

44 Data Analytics for Advanced Metering Infrastructure: A Guidance Note for South Asian Power Utilities
Hig
h M
DI (
Max
imum
Dem
and
Indi
cato
r)
This
che
ck id
entifi
es v
aria
tions
in th
e M
DI t
rend
of a
par
ticul
ar c
onsu
mer
with
reg
ard
to h
isto
rical
met
er r
eadi
ng d
ata
and
cate
gory
-wis
e th
resh
old
valu
es.

References and Links 45
Rea
ding
Rev
erse
d/W
rong
Rea
ding
This
che
ck id
entifi
es e
rron
eous
ene
rgy
cons
umpt
ion
read
ings
, suc
h as
ver
y hi
gh o
r neg
ativ
e co
nsum
ptio
n, c
aptu
red
from
met
ers.

46 Data Analytics for Advanced Metering Infrastructure: A Guidance Note for South Asian Power Utilities
This
che
ck id
entifi
es c
ases
whe
re th
e po
wer
fact
or v
alue
is b
elow
the
thre
shol
d de
fined
by
the
utili
ty.
Low
Pow
er F
acto
r
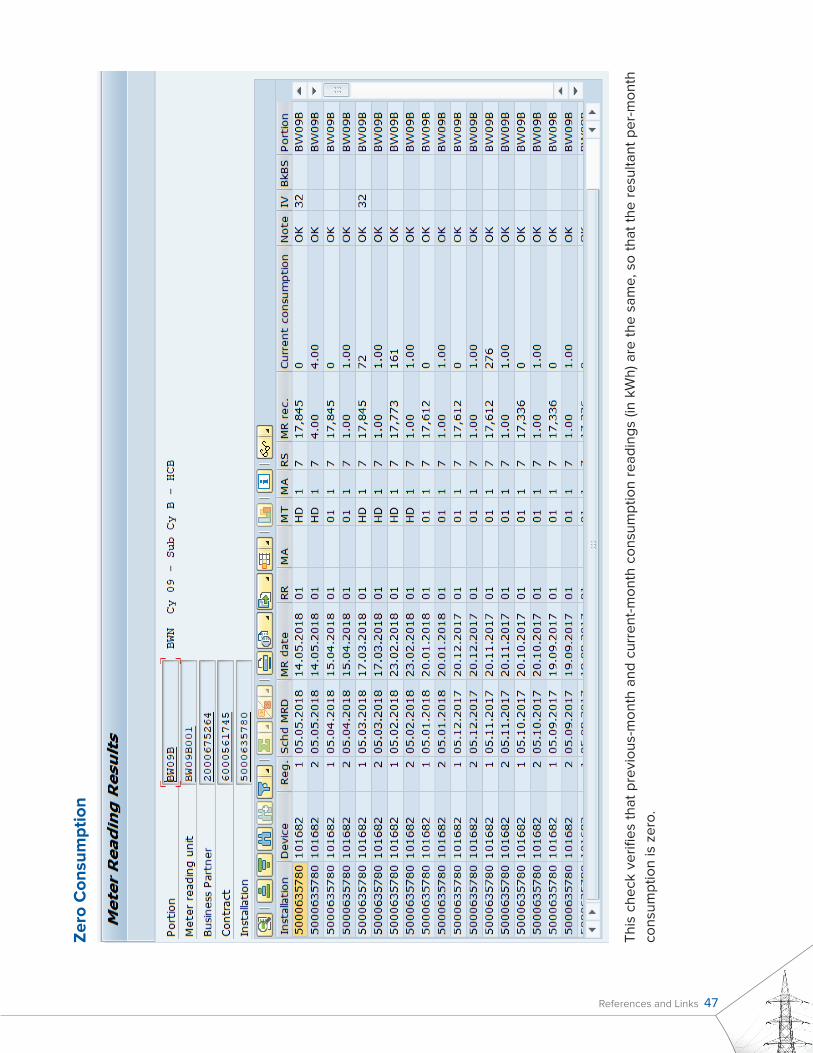
References and Links 47
This
che
ck v
erifi
es th
at p
revi
ous-
mon
th a
nd c
urre
nt-m
onth
con
sum
ptio
n re
adin
gs (i
n kW
h) a
re th
e sa
me,
so
that
the
resu
ltant
per
-mon
th
cons
umpt
ion
is z
ero.
Zero
Con
sum
ptio
n
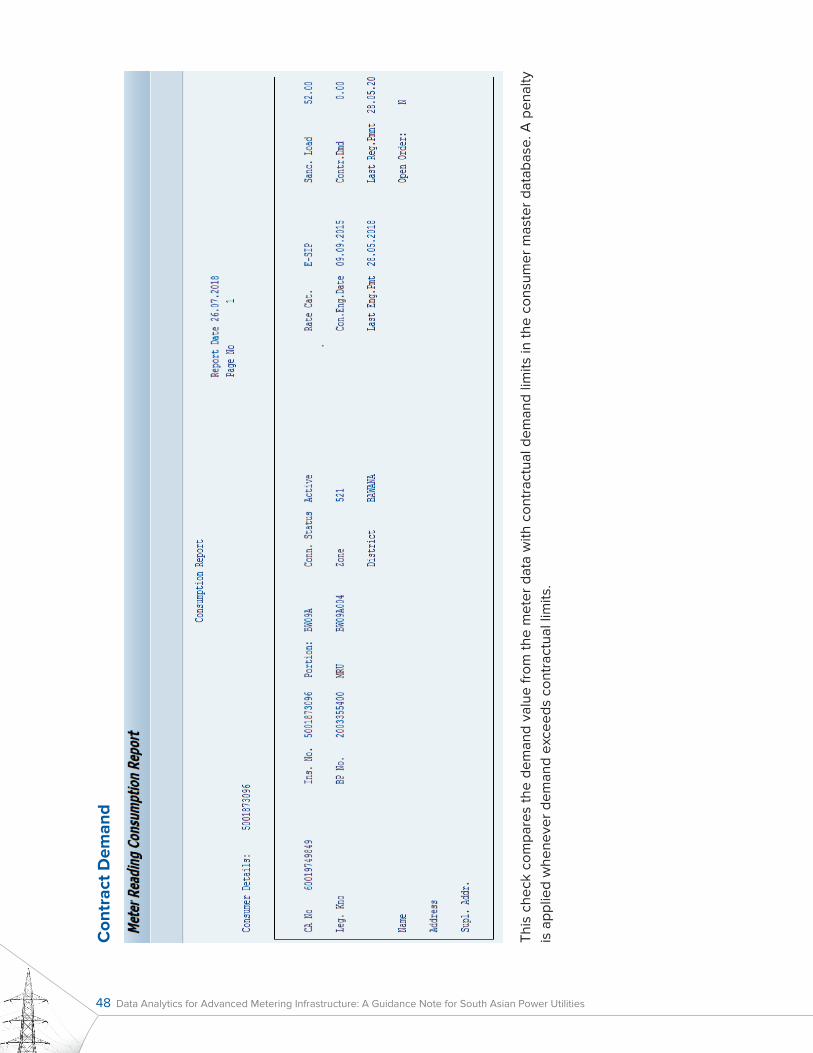
48 Data Analytics for Advanced Metering Infrastructure: A Guidance Note for South Asian Power Utilities
Con
trac
t Dem
and
This
che
ck c
ompa
res
the
dem
and
valu
e fr
om th
e m
eter
dat
a w
ith c
ontr
actu
al d
eman
d lim
its in
the
cons
umer
mas
ter
data
base
. A p
enal
ty
is a
pplie
d w
hene
ver d
eman
d ex
ceed
s co
ntra
ctua
l lim
its.

References and Links 49
Non
-Rep
rogr
amm
ing
of M
eter
s
This
che
ck v
erifi
es th
at th
e ta
riff s
lab
info
rmat
ion
and
rese
t dat
e fr
om th
e m
eter
dat
a ar
e in
line
with
the
cons
umer
mas
ter d
ata.

50 Data Analytics for Advanced Metering Infrastructure: A Guidance Note for South Asian Power Utilities
AP
PEN
DIx
c. b
ILLI
Ng
QU
ALI
Ty c
hEc
KS
(bQ
cS)
– 3
RD
LEv
EL: S
cR
EEN
ShO
TS
Cur
rent
Bill
ed D
eman
d
18
This
che
ck p
erfo
rms
a tr
end
anal
ysis
of c
urre
nt b
illed
dem
and
alon
g w
ith a
com
paris
on to
thre
shol
d va
lue.

References and Links 51
Infla
ted
Bill
19
Infla
ted
Bill
This
che
ck id
entifi
es c
ases
of h
igh
bill
amou
nt c
ompa
red
to th
e th
resh
old
valu
e fo
r the
par
ticul
ar c
ateg
ory.

52 Data Analytics for Advanced Metering Infrastructure: A Guidance Note for South Asian Power Utilities
Neg
ativ
e A
mou
nt
20
Neg
ativ
e Am
ount
This
che
ck id
entifi
es c
ases
whe
re a
cus
tom
er’s
bill
am
ount
for t
he c
urre
nt m
onth
is n
egat
ive.

References and Links 53
Hig
h S
lab
21
Hig
h Sl
ab This
che
ck c
ompa
res
the
slab
val
ue w
ith th
e th
resh
old
valu
e fo
r par
ticul
ar c
ateg
ory
of c
onsu
mer
.
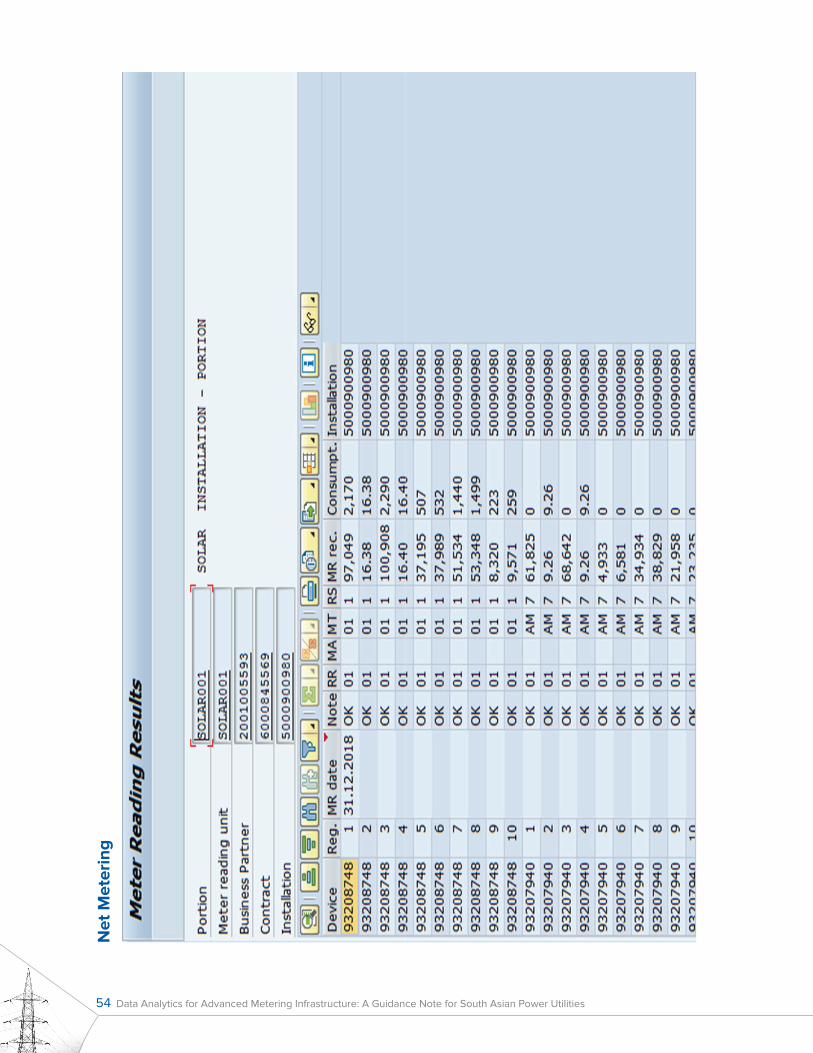
54 Data Analytics for Advanced Metering Infrastructure: A Guidance Note for South Asian Power Utilities
Net
Met
erin
g

References and Links 55
This
che
ck v
erifi
es th
e co
rrec
tnes
s of
bill
s fo
r con
sum
ers
havi
ng n
et m
eter
ing.
14
14
Net
met
erin
g (o
r net
ene
rgy
met
erin
g, N
EM) i
s a
billi
ng m
echa
nism
that
cre
dits
sol
ar e
nerg
y sy
stem
ow
ners
for t
he e
lect
ricity
they
add
to th
e gr
id.
Net
Met
erin
g B
illin
g A
nnex
ure
CA
No.
:
60
00
610
530
2B
ill N
umbe
r :
Bill
Dat
e :
14/0
1/20
19M
ultip
lyin
g Fa
ctor
:
1.00
Nam
e :
MA
NA
GER
Bill
Per
iod
: 0
1/12
/20
18 to
31/
12/2
018
NET
-Met
er N
o.
: 9
320
7940
Rem
ark
: O
KSa
nctio
ned
Load
(KW
/KV
A)
: 47
.00
/51.0
0
Sola
r Met
er
: 9
320
8748
Sola
r Met
er S
anct
ione
d Lo
ad (K
Wp)
:
Sola
r Con
sum
ptio
n :
2170
Sola
r Met
er In
stal
latio
n D
ate
: 11
/03/
2016
Rea
ding
Det
ails
Tim
e of
Day
Det
ails
Mod
erat
ion
Det
ails
Net
Met
er
Det
ails
Uni
ts
Bro
ught
Fo
rwar
d
Prev
ious
Re
adin
gD
ate
Cur
rent
Re
adin
gD
ate
Cum
ulat
ive
Con
sum
ptio
nPe
akN
orm
alO
ff Pe
akTo
tal
Uni
t-Pe
akU
nit-
Nor
mal
Uni
t-O
ff Pe
akU
nits
Car
ried
Forw
ard/
Bill
ed
Dra
w fr
om
TPD
DL
(A)
1132
95
30/1
1/18
1147
7531
/12/
2018
1479
197
65
56
27
Inje
ctio
n to
TP
DD
L (B
)37
205
3821
510
09
225
743
41
Net
(A-B
)0
470
-28
-88
586
470
-28
-88
588
470
Dis
clai
mer
:
1.
Exce
ss u
nits
if a
ny, w
ill b
e ad
just
ed a
gain
st y
our n
ext m
onth
con
sum
ptio
n an
d ex
cess
uni
ts a
t the
end
of t
he fi
nanc
ial y
ear w
ill b
e re
fund
ed th
ru C
hequ
e.2.
‘T
he a
mou
nt o
f Gov
ernm
ent S
ubsi
dy &
Ele
ctric
ity T
ax c
harg
ed in
Bill
tow
ards
Net
met
ered
con
sum
ptio
n is
sub
ject
to re
visi
on a
fter r
ecei
pt o
f cla
rifica
tion.

56 Data Analytics for Advanced Metering Infrastructure: A Guidance Note for South Asian Power Utilities
AP
PEN
DIx
D. M
ETER
DA
TA E
xc
EPTI
ON
-gEN
ERA
TIO
N c
hEc
KS:
Sc
REE
NSh
OTS
Con
sum
ptio
n C
ompa
riso
n
This
che
ck c
ompa
res
the
cons
umer
’s c
urre
nt c
onsu
mpt
ion
with
his
toric
al tr
end
and
thre
shol
d va
lues
.
His
tori
es
� A
ctiv
e (I)
Tot
al-k
Wh
(CH
1)
� A
ctiv
e (E
) Tot
al-k
Wh
(CH
2)
� R
eact
ive
(I) k
VA
rh (C
H3)
� R
eact
ive
(E) k
VA
rh (C
H4)
� A
bs A
ctiv
e - k
Wh
(CH
5)
� A
bs A
ppar
ent -
kV
Ah
(CH
6)
� D
ef. i
n A
ctiv
e (I)
- kW
h (C
H7)
� D
ef. i
n A
ppar
ent -
kV
Ah
(CH
8)
Current11 days
Consumption
History 131 days
History 230 days
History 331 days
History 428 days
History 531 days
14,0
00
13,0
00
12,0
00
11,0
00
10,0
00
9,0
00
8,0
00
7,0
00
6,0
00
5,0
00
4,0
00
3,0
00
2,0
00
1,00
013
.00
kW
h
5,3
27.
00
kW
h6,7
40.0
0 k
Wh9,
831
.00
kW
h11,3
56
.00
kW
h12,2
60.
00
kW
h
12,14
9.0
0 k
Wh 9,
124.
00
kW
h
10,6
60.
00
kW
h
9,43
6.0
0 k
Wh
0
History 631 days
History 730 days
History 831 days
History 930 days
History 1031 days
History 1131 days
8,7
81.
00
kW
h
10,5
23.
00
kW
h
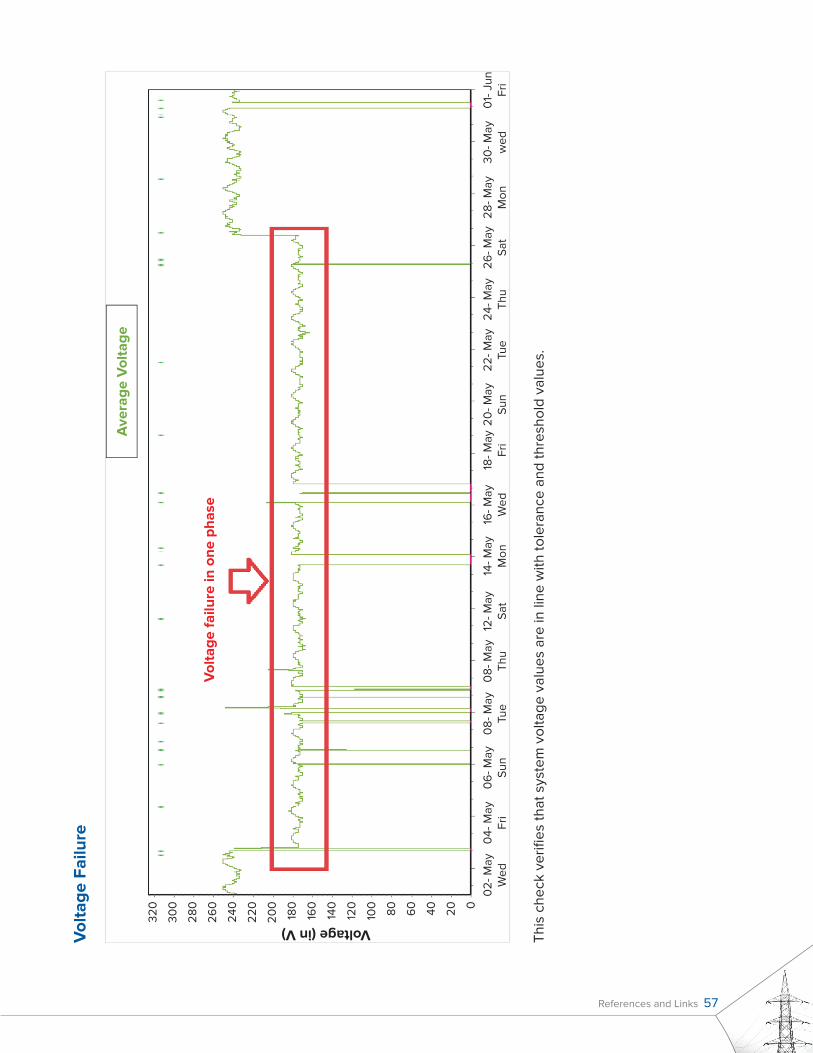
References and Links 57
Vol
tage
Fai
lure
This
che
ck v
erifi
es th
at s
yste
m v
olta
ge v
alue
s ar
e in
line
with
tole
ranc
e an
d th
resh
old
valu
es.
Voltage (in V)
Vol
tage
failu
re in
one
pha
se
Ave
rage
Vol
tage
02-
May
Wed
04-
May
Fri
06
- May
Sun
08-
May
Tue
08-
May
Thu
12- M
aySa
t14
- May
Mon
16- M
ayW
ed18
- May
Fri
20- M
aySu
n22
- May
Tue
24- M
ayTh
u26
- May
Sat
28- M
ayM
on30
- May
wed
01-
Jun
Fri
320
300
280
260
240
220
200
180
160
120
140
100 80 60 40 20 0

58 Data Analytics for Advanced Metering Infrastructure: A Guidance Note for South Asian Power Utilities
Ass
esse
d C
onsu
mpt
ion
This
che
ck v
erifi
es w
heth
er t
he c
alcu
late
d lo
ad f
acto
r is
in
the
pred
efine
d th
resh
old
load
fac
tor
rang
e fo
r th
e pa
rtic
ular
con
sum
er
cate
gory
.� A
bs A
ppar
ent-
IVA
(CH
4)�
Abs
Act
ive
Tota
l-kW
(CH
1)�
Abs
Rea
ctiv
e (L
ag)-k
VA
r (C
H2
)�
Abs
Rea
ctiv
e (L
ead)
-KV
Ar
(CH
3)
Cur
rent
His
tory
1H
isto
ry 2
His
tory
3H
isto
ry 4 H
isto
ries
His
tory
5H
isto
ry 6
His
tory
7H
isto
ry 8
His
tory
9
Maximum Demand
90 80 70 60
50 40 30 20 10 0
82
.52
kV
A8
2.3
4 kV
A
67.
54
kVA
41.8
0 k
VA
44.3
8 k
VA
HIG
H M
DI
47.3
2 k
VA
16.5
4 kV
A13
.42
kV
A
54.
12 k
VA
3.2
8 k
VA

References and Links 59
Dat
a C
orru
ptio
n
This
che
ck lo
oks
for d
ata
corr
uptio
n by
com
parin
g th
e va
lues
reco
rded
for M
DI/c
onsu
mpt
ion
data
/dig
its w
ith th
e th
resh
old
valu
es.
� A
bs A
ppar
ent -
kV
Ah
(CH
5)
� A
bs R
eact
ive
(Lag
) - k
VA
rh (C
H6
)�
Abs
Rea
ctiv
e (L
ead)
-kV
Arh
(CH
7)�
Act
ive
[Del
] - N
egC
ur-k
Wh
(CH
8)
� D
ef.in
Act
ive
(I) -
kWh
(CH
9)
� A
ctiv
e(E)
- kW
h (C
H2
)�
Act
ive(
I) - k
Wh
(CH
1)�
Act
ive(
E) T
otal
- kW
h (C
H3)
� A
bs A
ctiv
e - k
Wh
(CH
4)
Cur
rent
22 d
ays
His
tory
131
day
sH
isto
ry 2
30 d
ays
His
tory
331
day
sH
isto
ry 4
28 d
ays
His
tory
531
day
s His
tori
esHis
tory
631
day
sH
isto
ry 7
30 d
ays
His
tory
831
day
sH
isto
ry 9
30 d
ays
His
tory
10
31 d
ays
His
tory
11
31 d
ays
Consumption
6,0
0,0
00
7,0
0,0
00
8,0
0,0
00
9,0
0,0
00
10,0
0,0
00
11,0
0,0
00
5,0
0,0
00
4,0
0,0
00
3,0
0,0
00
2,0
0,0
00
1,00,
00
0 0
5,6
13.0
0 k
VA
h4,
427.
00
kV
Ah
5,4
50.
00
kV
Ah 6
,55
4.0
0 k
VA
h
6,13
0.0
0 k
VA
h7,
55
0.0
0 k
VA
h040
6.0
0 k
VA
h6
,035
.00
kV
Ah
5,18
5.0
0 k
VA
h
DA
TA C
OR
RU
PTE
D
9,71
,312
.00
kV
Ah
6,14
3.0
0 k
VA
h4,
66
6.0
0 k
VA
h

60 Data Analytics for Advanced Metering Infrastructure: A Guidance Note for South Asian Power Utilities
Nv
M (N
on-v
olat
ile M
emor
y) F
ailu
re
This
che
ck id
entifi
es c
ases
of N
VM
failu
re e
vent
flag
s.

References and Links 61
Pow
er F
ailu
re
This
che
ck id
entifi
es c
ases
of p
ower
failu
re e
vent
flag
s.
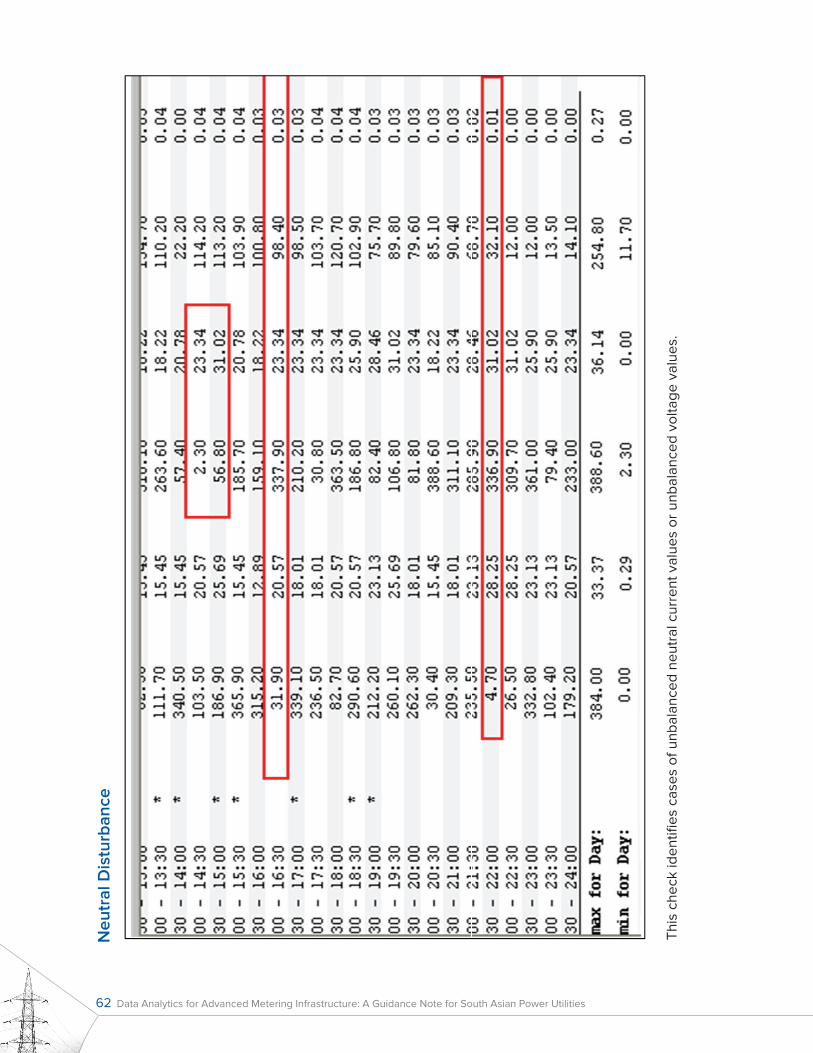
62 Data Analytics for Advanced Metering Infrastructure: A Guidance Note for South Asian Power Utilities
Neu
tral
Dis
turb
ance
This
che
ck id
entifi
es c
ases
of u
nbal
ance
d ne
utra
l cur
rent
val
ues
or u
nbal
ance
d vo
ltage
val
ues.
29
Neu
tral
Dis
turb
ance

References and Links 63
cur
rent
Rev
ersa
l
This
che
ck v
erifi
es w
heth
er th
e va
lue
of th
e ac
tive
curr
ent i
s ne
gativ
e or
not
.
30
Cur
rent
Rev
ersa
l
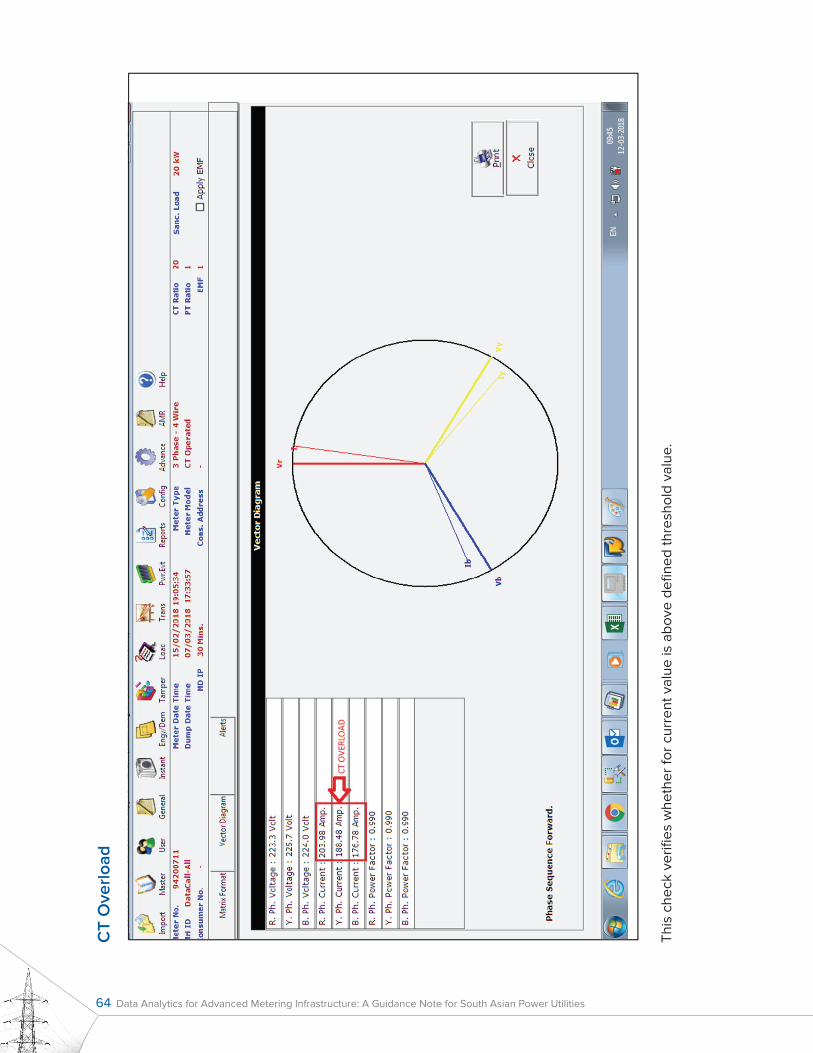
64 Data Analytics for Advanced Metering Infrastructure: A Guidance Note for South Asian Power Utilities
cT
Ove
rload
This
che
ck v
erifi
es w
heth
er fo
r cur
rent
val
ue is
abo
ve d
efine
d th
resh
old
valu
e.
31
CT
Ove
rloa
d

References and Links 65
cur
rent
Mis
sing
This
che
ck id
entifi
es c
ases
whe
re th
e ph
ase
curr
ent i
s ze
ro o
r les
s th
an s
peci
fied
thre
shol
d va
lue.
32
Cur
rent
Mis
sing
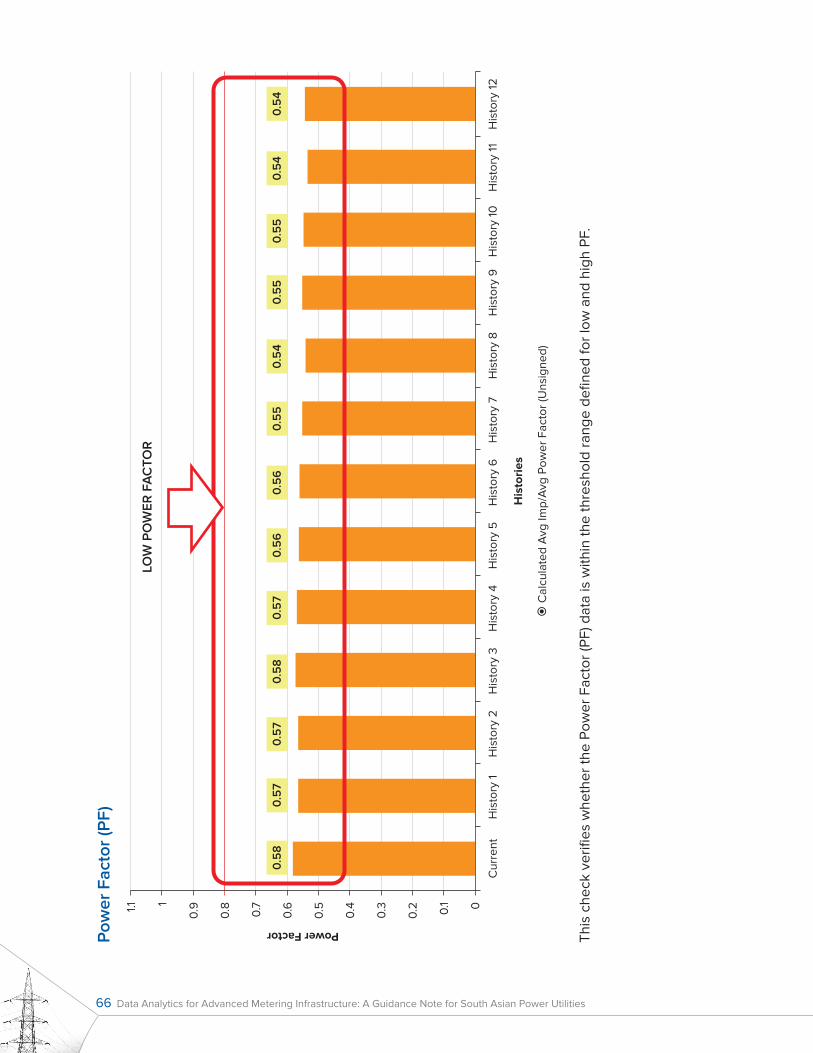
66 Data Analytics for Advanced Metering Infrastructure: A Guidance Note for South Asian Power Utilities
Pow
er F
acto
r (P
F)
This
che
ck v
erifi
es w
heth
er th
e Po
wer
Fac
tor (
PF) d
ata
is w
ithin
the
thre
shol
d ra
nge
defin
ed fo
r low
and
hig
h PF
.
His
tori
es
Power Factor
� C
alcu
late
d A
vg Im
p/A
vg P
ower
Fac
tor (
Uns
igne
d)
0.5
40.
54
0.5
50.
55
0.5
50.
54
0.5
60.
56
0.5
70.
57
0.5
70.
58
0.5
8
Cur
rent
1.1LO
W P
OW
ER F
AC
TOR
1
0.9
0.8
0.7
0.6
0.5
0.4
0.3
0.2 0.1 0
His
tory
1H
isto
ry 2
His
tory
3H
isto
ry 4
His
tory
5H
isto
ry 6
His
tory
7H
isto
ry 8
His
tory
9H
isto
ry 1
0H
isto
ry 1
1H
isto
ry 1
2

References and Links 67
Man
ual R
eset
This
che
ck v
erifi
es w
heth
er th
e m
eter
read
ing
rese
t dur
atio
n is
oth
er th
an th
e hi
stor
ical
val
ue o
r pre
defin
ed v
alue
.

68 Data Analytics for Advanced Metering Infrastructure: A Guidance Note for South Asian Power Utilities
Rea
l-Tim
e c
lock
(RTc
) Fai
lure
This
che
ck v
erifi
es th
at th
e m
eter
clo
ck a
ccur
acy
is in
line
with
the
HES
clo
ck ti
me.

References and Links 69
Inte
rnal
Rat
io
This
che
ck c
ross
-ver
ifies
that
the
on-s
ite C
T ra
tio is
con
sist
ent w
ith th
e co
nsum
er m
aste
r dat
a.

70 Data Analytics for Advanced Metering Infrastructure: A Guidance Note for South Asian Power Utilities
Mag
net T
ampe
ring
This
che
ck id
entifi
es c
ases
of m
agne
tic ta
mpe
ring
by a
naly
zing
con
sum
ptio
n pa
ttern
var
iatio
ns.
1
020406080100
120
35
79
1113
1517
1921
2325
2729
3133
3537
3941
4543
Avg
Cur
rent
-R (A
)A
vgC
urre
nt-Y
(A)
Avg
Cur
rent
-B (A
)

References and Links 71
Load
Unb
alan
ce
This
che
ck v
erifi
es w
heth
er th
e ph
ase
curr
ent v
alue
s in
thre
e ph
ases
are
une
qual
or v
ary
abov
e th
e to
lera
nce
rang
e in
eac
h ph
ase.
38
Load
Unb
alan
ce

72 Data Analytics for Advanced Metering Infrastructure: A Guidance Note for South Asian Power Utilities
cov
er O
pen
This
che
ck id
entifi
es c
ases
of a
ny “
cove
r ope
n” e
vent
flag
s.39
Cov
er O
pen

References and Links 73
Pote
ntia
l Mis
sing
with
Loa
d R
unni
ng
This
che
ck id
entit
ies
case
s w
here
the
curr
ent v
alue
is re
cord
ed b
ut w
ith v
olta
ge v
alue
as
zero
.40
Pote
ntia
l Mis
sing
with
Loa
d Run
ning

74 Data Analytics for Advanced Metering Infrastructure: A Guidance Note for South Asian Power Utilities
Other checks
Other checks include the following:
Missing Data/Data Download Gap Check Identifies instances of data missing from periodic or on-demand polling.
Time-of-Day (ToD) Consumption Check Verifies whether the ToD slab consumption has been recorded by the meter for the particular consumer category.
Meter Pulse Overflow Check Checks that the number of pulses does not exceed the maximum threshold.
Test Mode Check Checks whether the data was collected while the meter was in test mode.
Energy Sum Check Calculates the difference between the total cumulative consumption shown in the incoming data and the total consumption of various slots over the same time period.
Interval Spike Check Identifies intervals showing high usage relative to surrounding intervals.
Unit of Measurement (UoM) Check Ensures that the Unit of Measurement (UoM) of the incoming data matches the UoM specified on meter profile.
Usage of Inactive Meters Check Identifies cases of consumption shown for inactive meters.
Negative Consumption Check Verifies whether the meter reading of a consumer is lower than the previous meter reading.
Reactive Load (kVARh) Check Identifies intervals where reactive load (measured in kVARh) is present and active load (measured in kWh) is not.

References and Links 75
APPENDIx E. MIS REPORTS: ScREENShOTS
Planning and Scheduling Report
Bill MonthReading
CycleDistrict Portion TNC
Base MR Date
Actual Invoicing Date
May 16 RC–9 CL CLO9B 918 02 May 16 06 May 16
May 16 RC–9 KP KPO9B 454 02 May 16 06 May 16
May 16 RC–9 MN MNO9B 758 02 May 16 06 May 16
May 16 RC–9 PP PPO9B 668 02 May 16 06 May 16
May 16 RC–9 SN SNO9B 422 02 May 16 06 May 16
May 16 RC–9 MT MTO9B 551 02 May 16 06 May 16
May 16 RC–9 BW BWO9B 2044 02 May 16 06 May 16
May 16 RC–9 MP MPO9B 419 02 May 16 06 May 16
May 16 RC–9 NL NLO9B 3087 02 May 16 06 May 16
May 16 RC–9 RH RHO9B 666 02 May 16 06 May 16
May 16 RC–9 SB SBO9B 525 02 May 16 06 May 16
This report outlines the meter reading sequence for a month.
Base Meter Reading Performance Report
District Accepted Not Accepted Grand Total Base Performance
BD 2,529 69 2598 97.34%
BW 4,696 112 4808 97.67%
CL 2,868 77 2945 97.39%
KP 3,165 36 3201 98.88%
MN 4,144 108 4252 97.46%
MP 5,542 265 5807 95.44%
MT 3,957 142 4099 96.54%
NL 4,601 163 4764 96.58%
PP 3,673 99 3772 97.38%
RH 6,071 207 6278 96.70%
SB 8,394 279 8673 96.78%
SN 3,578 97 3675 97.36%
Grand Total 53,218 1,654 54,872 96.99%
This is a summary report that is generated after the initial base meter reading (in a non-AMI scenario) showcasing meter reading status.

76 Data Analytics for Advanced Metering Infrastructure: A Guidance Note for South Asian Power Utilities
Communication Success Rate Report
Month MODEM Installed Communicated Communication Status w.r.t. Total
Mar ’18 71,115 68,163 95.85%
April ’18 71,604 67,620 94.44%
May ’18 71,721 66,531 92.76%
June ‘18 71,726 65,705 91.61%
This report shows success rates for remote meter reading.
Follow-Up Meter Reading Report
SM
RD
_ID
_B
AS
E
MR
ID_B
AS
E
PO
RTI
ON
_B
AS
E
MR
U_B
AS
E
INST
ALL
ATI
ON
N
O_B
AS
E
DEV
ICE
NO
_B
AS
E
REA
DIN
G
REM
AR
K_B
AS
E
KW
h_B
AS
E
kVA
h_B
AS
E
kW_B
AS
E
kVA
_BA
SE
Rea
ding
Dat
e_B
AS
E
Pho
to (Y
/N)_
BA
SE
527 250 MN08B MN08B004 5000003694 51003314 TL 23 Jul 18 Y
K13 802 KP01D KP01D007 5000004203 41013941 TL 24 Jul 18 Y
S74 828 SN09C SN09C012 5000005971 40275911 ND 23 Jul 18 Y
315 189 SN05C SN05C001 5000011977 41283517 TL 24 Jul 18 Y
254 654 CLO4C CLO4C002 5000012738 40251433 ND 24 Jul 18 Y
254 654 CLO4C CLO4C002 5000012760 43034227 TL 24 Jul 18 Y
831 529 MN08C MN08C002 5000013202 41558813 TL 21 Jul 18 Y
K12 798 KP01C KP01C001 5000013221 42058397 PL 23 Jul 18 Y
738 766 BD02E BD02E004 5000014203 41084490 OB 21 Jul 18 Y
392 707 MP02D MP02D002 5000015065 41072411 TL 24 Jul 18 Y
4 139 CL04D CL04D004 5000017332 72285469 TL 23 Jul 18 Y
This report gives details (including serial numbers) of meters that have failed RQC validations and thus require follow-up on-site meter readings.

References and Links 77
Monitoring Report (Unread Meters)S
ub
Con
trac
tor
No
Bad
li
Baw
ana
Civ
il Li
nes
Kes
havp
uram
Man
golp
uri
Mod
el T
own
Mot
i Nag
ar
Nar
ela
Pita
mpu
ra
Roh
ini
Sha
kti N
agar
Sha
limar
Bag
h
Sum
:
GNI 1 1 1 3 1 1 8
HRB 89 119 58 61 138 63 92 113 51 92 61 158 1,095
KCG 4 3 1 1 4 2 2 2 1 20
PP-HCB 17 20 12 21 15 16 17 13 10 36 8 16 201
PP-NOTOD 2 1 2 1 2 8
PP-TOD 1 3 1 2 7
RC1 10 1 7 2 21 4 2 2 2 51
RC2 3 3 1 4 19 6 103 139
RC3 2 1 3 5 5 2 3 23,541 23,562
RC9 1 1,980 3 14 25 1 2,918 7 4 79 5,032
SCB 79 15 7 18 2 8,221 2,410 235 1 1 16 11,005
SHORT TE 1 1
SOLR-HCB 9 2 9 5 3 6 7 8 12 10 6 77
STLT 10 19 7 2 6 1 6 218 2 6 2 15 96
Sum: 10,436 11,335 7,060 5,789 15,768 13,088 11,505 10,858 6,380 10,471 5,532 23,943 13,2165
This report shows the number of meters unread due to meter inaccessibility.
Monitoring Report (BQC Checks)
Responsibility Center 1 day 2-5 days 6-7 days 8-15 days >15 days Grand Total
BQC Desk 35 62 5 4 106
JE Authorization Desk 1 1 1 3
Meter Reading Analysis Desk 132 113 7 2 254
Meter Reading Analysis Desk – HRB 3 36 39
RCG Coordination Desk 2 1 3
Grand Total 173 213 12 6 1 405
This report provides the status of various BQC Checks.

78 Data Analytics for Advanced Metering Infrastructure: A Guidance Note for South Asian Power Utilities
Bill Distribution Report/Disconnection Notice Report
Bill Distribution MIS
Type of Bill (Schedule/
Unscheduled)
Billing Date
Invoicing Date
Bills Receiving
Dates from Printer
Bills Receiving
Dates from MRG
Portion Total TNC of Portion
Total bills Received
Dates from Printer
Ideal Date of
Submission
Status (Completed/
Pending)
Delays in no of
days
Unscheduled 12.07.2012 09C 43 15.07.2012 Pending 2
Unscheduled 13.07.2012 09C 27 16.07.2012 Pending 1
Schedule 11.07.2012 12.07.2012 13.07.2012 14.07.2012 BD05A 1540 1380 17.07.2012 Pending
Schedule 12.07.2012 13.07.2012 14.07.2012 14.07.2012 BD05B 1498 1245 17.07.2012 Pending
Unscheduled 14.07.2012 SPL 172+140 17.07.2012 Pending
Unscheduled 14.07.2012 AMR 1184 17.07.2012 Pending
Unscheduled 14.07.2012 ADDRESS FILE (SPL)
2+1 17.07.2012 Pending
Unscheduled 14.07.2012 ADDRESS FILE (SPL)
4 17.07.2012 Pending
Schedule 13.07.2012 14.07.2012 16.07.2012 16.07.2012 BD05C 1023 722 19.07.2012 Pending
Schedule 13.07.2012 14.07.2012 16.07.2012 16.07.2012 BD06A 1256 1229 19.07.2012 Pending
Schedule 13.07.2012 14.07.2012 16.07.2012 16.07.2012 BD07C 2330 2294 19.07.2012 Pending
Schedule 13.07.2012 14.07.2012 16.07.2012 16.07.2012 BD07E 1218 1212 19.07.2012 Pending
Unscheduled 16.07.2012 SPL 227 19.07.2012 Pending
Unscheduled 16.07.2012 AMR 166 19.07.2012 Pending
Unscheduled 16.07.2012 ADDRESS FILE (SPL)
5 19.07.2012 Pending
This summary report shows the number of bills, disconnection notices distributed (with or without proof of delivery, or PoD) and undistributed bills.

References and Links 79
Reconciliation Report
Cycle
Total no. of consumers
Total Invoiced
PendingNot to
ConsiderRemaining Unbilled
Total Resolved Resolved
% ageUnbilled
% ageActive Inactive TD DT
First Bill
Active Total
Unbilled
(A) (B) (C) (D) (E) (F) (G)H=(C-(F+G))
(A-H)
RC1 180786 149518 3356 26419 1493 17 520 2819 177967 98.44 1.56
RC2 204103 172759 3315 26469 1560 7 714 2594 201509 98.73 1.27
RC3 227228 187619 3656 34056 1921 30 788 2838 224390 98.75 1.25
RC4 193881 161234 4258 26378 2011 19 698 3541 190340 98.17 1.83
RC5 185259 154329 3523 26133 1274 18 502 3003 182256 98.38 1.62
RC6 188700 158160 3310 25647 1583 24 373 2923 185787 98.46 1.54
RC7 212348 176006 4730 29879 1733 22 491 4217 201831 98.01 1.99
RC8 217974 181426 4652 30344 1552 18 629 4005 213969 98.16 1.84
RC9 41993 2131 3485 36084 293 35 245 3205 38788 92.37 7.63
SCB 170875 130116 4266 33947 2546 13 1117 3136 167739 98.16 1.84
G&I 8580 7273 543 609 155 2 46 495 8085 94.23 5.77
HRB 87665 68363 3179 15173 950 0 478 2701 84964 96.92 3.08
KCG 2453 1872 12 547 22 0 1 11 2442 99.55 0.45
Prepaid 4639 4204 202 104 129 0 22 180 4459 96.12 3.88
Streetlight 5029 4164 278 530 57 0 21 257 4772 94.89 5.11
grand Total
1931513 1559174 42768 312295 17279 205 6645 35915 1895598 98.14 1.88
This report yields statistics on meters read and unread as well as consumers billed and invoiced.
Unbilled for over 60/90 Days Report
Recent Remark
Category Grand Total
HCB SCB G&I HRB KCG Prepaid Street LightOK/MM/LR 999 114 24 27 1 1 6 1172
PL/BL/TL/SP 495 30 27 63 78 24 717
Meter Faulty 308 53 5 23 9 16 414
Open MRO 350 19 11 3 20 3 406
NM/DC 219 92 5 25 14 13 368
Plausible 123 15 28 46 116 11 339
OB/EN/NA/MH 82 97 3 35 2 39 258
BQC 119 8 15 24 15 3 184
NP/NR 64 2 1 3 3 73
Billed but not Invoiced
4 2 10 16
AR Case 11 11
grand Total 2774 432 118 247 1 268 118 3958
This report shows the number of consumers having provisional bills for 60/90 days.

80 Data Analytics for Advanced Metering Infrastructure: A Guidance Note for South Asian Power Utilities
current Demand and billed Units Report
Ow
ners
hip
Gro
up01.04.2018 to 30.04.2018 01.04.20187 to 30.04.2017 Variance Comparison
No.
of B
ills
No.
of
Pro
visi
onal
B
ills
Bill
ed U
nits
(in
MU
)
Act
ual U
nits
(in
MU
)
Cur
rent
D
eman
d (in
C
rs.)
No.
of B
ills
No.
of
Pro
visi
onal
B
ills
Bill
ed U
nits
(in
MU
)
Act
ual U
nits
(in
MU
)
Cur
rent
D
eman
d (in
C
rs.)
Bill
ed U
nits
(in
%)
Act
ual U
nits
(in
%)
Cur
rent
D
eman
d
(in %
)
HCB 815023 5321 126.79 126.2 83.14 1082017 3649 187.59 185.9 119.49 -32.41 -32.12 -30.42
HRB 70138 5 213.62 206.62 224.74 70402 11 221.22 213.12 217.62 -3.43 -3.05 3.27
EXPR 278 0 56.44 54.94 53.94 246 0 57.34 55.86 51.05 -1.57 -1.66 5.67
KCG 1661 5 45.83 44.23 47.11 1525 0 46.74 45.08 46.84 -1.94 -1.87 0.58
SCB 153423 791 14.39 14.34 7.46 187744 374 15.8 15.7 8.32 -8.96 -8.70 -10.42
Others 2 0 0.04 0.03 0.05 -100.00 -100.00 100.00
Sum: 1040523 6122 457.07 446.33 416.39 1341936 4034 528.73 515.69 443.37
This report shows the total units billed, the amount billed for the current month, and the amount billed for the same month of the previous year, and deviations.
collection Detail Report
Due Date
HRB Consumers HCB ConsumersSCG
ConsumersTotal (LT)
KCG Consumers
Grand Total
Dem
and
Pay
men
t R
ecei
ved
(W/O
S
ubsi
dy)
Dem
and
Pay
men
t R
ecei
ved
(W/O
S
ubsi
dy
Net
Dem
and
Pay
men
t R
ecei
ved
Dem
and
Pay
men
t R
ecei
ved
Dem
and
Pay
men
t R
ecei
ved
Dem
and
Pay
men
t R
ecei
ved
01 Feb 18 0.71 7.2 4.69 4.29 0.6 0.21 5.99 11.99 0.06 9.19 6.06 21.25
02 Feb 18 0.53 5.24 7.99 4.7 0.09 0.22 8.6 10.17 0.44 0.52 9.05 10.69
03 Feb 18 0.17 2.75 4.59 3.58 0.28 0.2 5.04 6.53 0.33 1.44 5.37 7.97
04 Feb 18 0 0.23 0.03 1.06 0 0.03 0.03 1.32 0 0.03 0.03 1.35
05 Feb 18 0.2 3.47 6.7 4.84 0.21 0.25 7.12 8.61 0 0.89 7.12 9.5
06 Feb 18 0.28 3.02 7.87 4.61 0.15 0.29 8.3 7.92 0 0.29 8.3 8.21
This report shows the daily amount paid by various categories of consumers.

References and Links 81
Due Date MIS Reports
Row
Lab
els
16.0
4.2
018
17.0
4.2
018
18.0
4.2
018
19.0
4.2
018
20
.04.
20
18
21.
04.
20
18
23.
04.
20
18
24.
04.
20
18
25
.04.
20
18
Badli 2366 118 42 43 791 8 12824 9 5
Bawana 4403 3063 3893 35 100 8 4118 4396 5
Civil Lines 2253 5484 141 58 2639 174 9971 3276 135
Keshavpuram 80 78 32 24 3270 5 8186 81 1
Mangolpuri 13151 16857 15578 1104 116 16 1068 7866 35
Model Town 191 114 205 23 7657 393 14754 9179 5
Moti Nagar 241 109 232 37 12610 766 24394 4063 9
Narela 4901 3914 5978 77 3135 238 10479 3866 9
Pitampura 965 119 2653 56 5282 12 11880 1495 350
Rohini 705 156 109 69 7732 27 9507 11079 5
This report is issued to head cashiers at collection centers to help them with resource planning.
Demand and collection Report
MTD – Demand vs Collection for Feb-17 Vs Feb-18 (01-Feb-18 to 28-Feb-18), Amount in Rs. crores
Ownership Group
Demand Due Date Wise MTD CollectionCollection Efficiency
(Gross of LPSC)
LPSC Income
Collection Efficiency
(Net of LPSC)
17 Feb 18 Feb Variation17 Feb 18 Feb
17 Feb 18 Feb17
Feb18
Feb17 Feb 18 Feb
Collection GS Collection GS
HRB 223.56 239.66 7% 207.72 0.24 245.33 0.25 93.02% 102.47% 0.36 0.49 92.86% 102.26%
HCB 123.44 136.59 11% 96.56 26.83 113.89 27.44 99.96% 103.47% 0.68 0.7 99.41% 102.96%
SCB 7.7 8.57 11% 5.8 2.8 6.28 3.11 111.66% 109.54% 0.16 0.13 109.64% 107.98%
Total (LT) 354,71 384.82 8% 310.09 29.87 365.5 30.81 95.84% 102.98 1.19 1.33 95.51% 102.64%
KCG 93.09 88.6 -5% 97.21 - 106.71 - 104.43% 120.4% 0 0.05 104.43% 120.38%
STL 12.17 12.15 0% 12.5 - 16.38 - 102.79% 134.78% - - 102.79% 134.78%
Total Kcg 105.25 100.75 -4% 109.71 - 123.09 - 102.24% 122.17% 0 0.05 104.29% 122.11%
Total 459.96 485.58 6% 419.81 29.87 485.59 30.81
97.76% 106.96 1.19 1.39 97.50% 106.68%Due Date Pending
- - 449.67 519.39
Total 459.96 485.58 6%Collection is net of cheque bounce. Demand & Collection extracted from BIW.
Effect of credit/debit JE’s have not been considered in this report.
This report shows the amount billed, amount collected (including subsidies, if any) and collection efficiency for various due dates.

82 Data Analytics for Advanced Metering Infrastructure: A Guidance Note for South Asian Power Utilities
Live and Disconnected Arrear Report
This report provides data on the number of consumers defaulted/disconnected, their arrears amounts, and ageing.
Disconnection Orders Report
This report shows the status of disconnection orders for various categories of consumers.
Live Arrear Comparison (For LT Segment – PRIN. + LPSC)
DW Arrear Comparison (For LT Segment – Only Principal)
74.4782.68
95.79
114.88
142.36
126.67
127.14
117.17
88.26
70.46
79.01
51.46
86.5188.8 95.71
109.28
0
20
40
60
80
100
120
140
160
Apr may Jun Jul Aug Sep Oct Nov Dec Jan Feb Mar
Arrear LT Segment FY 16–17Arrear LT Segment FY 15–16
77.2478.19
78.87
79.2381.59
87.0778.98
78.6677.979.06 79.82
75.24
72.44 74.1575.35
72.8573.48
71.7672.78 74.62
75.18 76.51
0
10
20
30
40
50
60
70
80
90
100
April May June July Aug Sep Oct Nov Dec Jan Feb Mar
FY 2015–16 FY 2016–17
DO MIS BEING SHARED WITH DISTRICTS
Segment DO Generated on 31.02.2017 and calling attempted
Resolved/held @ RRG for further working
Forwarded to dist. Grid for DO execution
Count Arrear (Lac) Count Arrear (Lac) Count Arrear (Lac)
HCB 3543 295.23 1100 84.45 2443 210.73
HRB 1035 453.18 404 168.9 631 284.28
Grand Total 4578 748.42 1504 253.35 3074 495.07
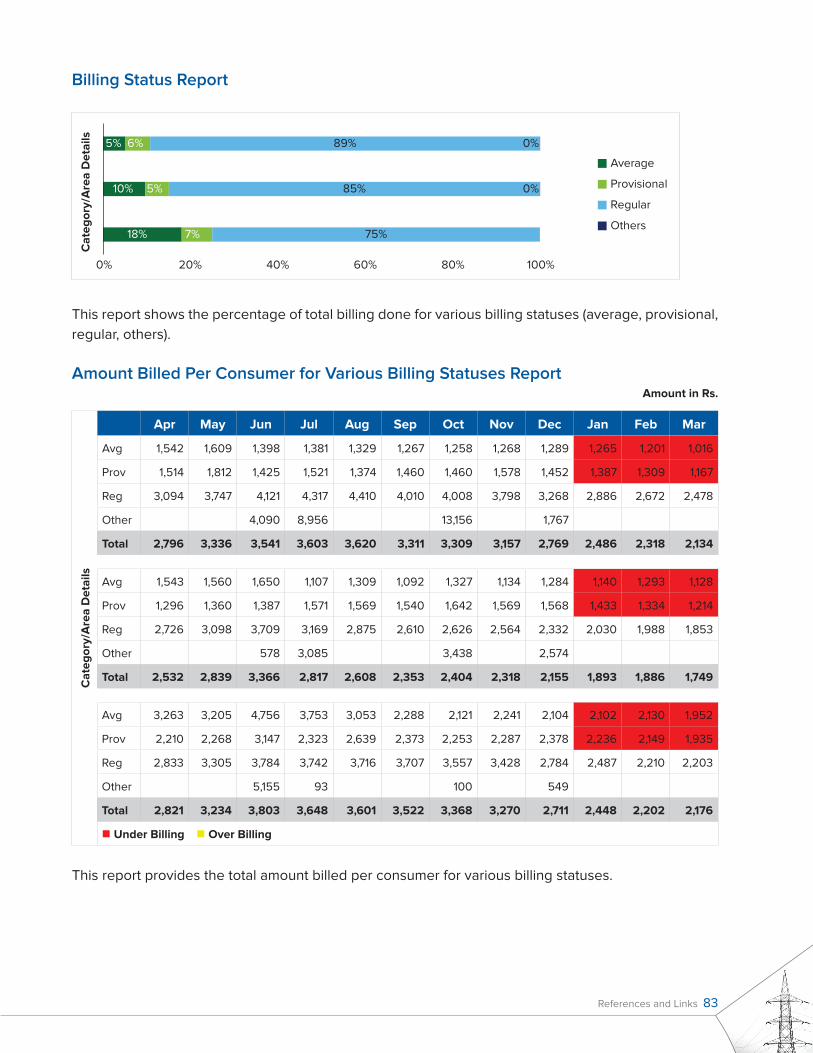
References and Links 83
billing Status Report
This report shows the percentage of total billing done for various billing statuses (average, provisional, regular, others).
Amount billed Per consumer for various billing Statuses ReportAmount in Rs.
This report provides the total amount billed per consumer for various billing statuses.
18%
10%
5%
7%
5%
6%
75%
85%
89%
0%
0%
0% 20% 40% 60% 80% 100%
Average
Provisional
Regular
Others
Cat
egor
y/A
rea
Det
ails
Cat
egor
y/A
rea
Det
ails
Apr May Jun Jul Aug Sep Oct Nov Dec Jan Feb Mar
Avg 1,542 1,609 1,398 1,381 1,329 1,267 1,258 1,268 1,289 1,265 1,201 1,016
Prov 1,514 1,812 1,425 1,521 1,374 1,460 1,460 1,578 1,452 1,387 1,309 1,167
Reg 3,094 3,747 4,121 4,317 4,410 4,010 4,008 3,798 3,268 2,886 2,672 2,478
Other 4,090 8,956 13,156 1,767
Total 2,796 3,336 3,541 3,603 3,620 3,311 3,309 3,157 2,769 2,486 2,318 2,134
Avg 1,543 1,560 1,650 1,107 1,309 1,092 1,327 1,134 1,284 1,140 1,293 1,128
Prov 1,296 1,360 1,387 1,571 1,569 1,540 1,642 1,569 1,568 1,433 1,334 1,214
Reg 2,726 3,098 3,709 3,169 2,875 2,610 2,626 2,564 2,332 2,030 1,988 1,853
Other 578 3,085 3,438 2,574
Total 2,532 2,839 3,366 2,817 2,608 2,353 2,404 2,318 2,155 1,893 1,886 1,749
Avg 3,263 3,205 4,756 3,753 3,053 2,288 2,121 2,241 2,104 2,102 2,130 1,952
Prov 2,210 2,268 3,147 2,323 2,639 2,373 2,253 2,287 2,378 2,236 2,149 1,935
Reg 2,833 3,305 3,784 3,742 3,716 3,707 3,557 3,428 2,784 2,487 2,210 2,203
Other 5,155 93 100 549
Total 2,821 3,234 3,803 3,648 3,601 3,522 3,368 3,270 2,711 2,448 2,202 2,176
Under Billing Over Billing

84 Data Analytics for Advanced Metering Infrastructure: A Guidance Note for South Asian Power Utilities
Sundry Adjustment Analysis Report
This report provides the number of consumers with sundry adjustments in terms of amount and units of energy.
billing behaviour Report
This report shows the number of times consumers of various bill statuses (provisional, average, and so on) have been billed compared to the total bills generated in a year.
178
28
159
2538 2
1774
53
1667
67
1040
26
283
11
234
10
161
6
0
500
1,000
1,500
2,000
2,500
Utility A Utility A Utility B Utility B Utility C Utility C
No of consumers with sundry adjustment
Others
Domestic
Agriculture
No of times - Average/Provisional BillingNo of consumers
No
of ti
mes
bill
ed
12 11 10 9 8 7 6 5 4 3 2 1 0
12 6% 1% 1% 1% 1% 1% 1% 2% 2% 3% 5% 10% 66% 99,097
11 12% 4% 3% 3% 3% 3% 4% 4% 5% 7% 13% 39% 2,261
10 27% 2% 3% 3% 3% 3% 3% 4% 7% 11% 32% 1,015
9 19% 3% 3% 3% 6% 5% 5% 9% 14% 33% 712
8 13% 2% 3% 3% 6% 8% 11% 14% 41% 589
7 6% 3% 2% 2% 4% 6% 13% 64% 10,445
6 9% 3% 3% 3% 4% 8% 70% 41,52,935
5 31% 9% 6% 6% 10% 38% 23,508
4 30% 8% 8% 11% 44% 10,608
3 39% 9% 11% 41% 8,147
2 38% 9% 53% 15,303
1 49% 51% 11,226
Total 43,35,846
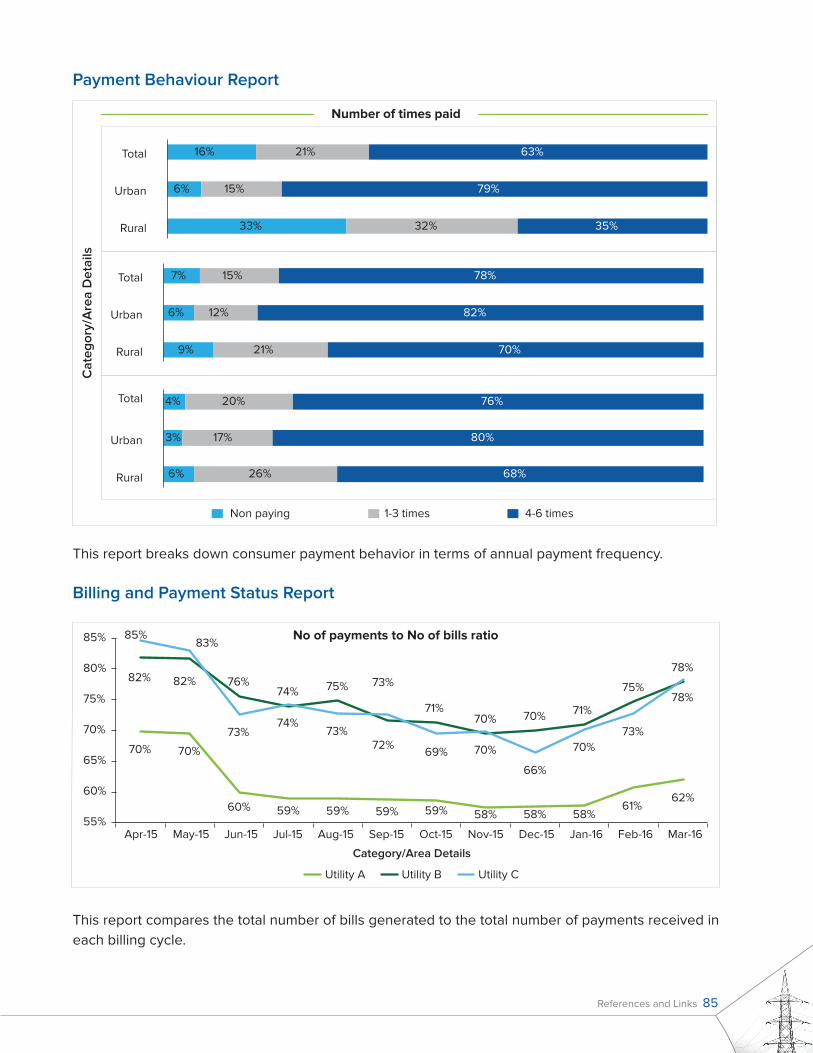
References and Links 85
Payment behaviour Report
This report breaks down consumer payment behavior in terms of annual payment frequency.
billing and Payment Status Report
This report compares the total number of bills generated to the total number of payments received in each billing cycle.
Number of times paid
33%
6%
16%
32%
15%
21%
35%
79%
63%
Rural
Urban
Total
9%
6%
7%
21%
12%
15%
70%
82%
78%
Rural
Urban
Total
6%
3%
4%
26%
17%
20%
68%
80%
76%
Rural
Urban
Total
Non paying
Cat
egor
y/A
rea
Det
ails
1-3 times 4-6 times
70% 70%
60% 59% 59% 59% 59% 58% 58% 58%61%
62%
82% 82% 76%74% 75%
72%
71%70% 70% 71%
75%
78%
85%83%
73%74%
73%
73%
69% 70%
66%
70%73%
78%
55%
60%
65%
70%
75%
80%
85% No of payments to No of bills ratio
Category/Area Details
Mar-16Feb-16Jan-16Dec-15Nov-15Oct-15Sep-15Aug-15Jul-15Jun-15May-15Apr-15
Utility A Utility B Utility C

86 Data Analytics for Advanced Metering Infrastructure: A Guidance Note for South Asian Power Utilities
Pending Arrears Trend Report
This report shows the total amount of pending arrears at the end of each billing cycle.
Suspected Defaulter consumers Report
This report breaks down the number of late-paying consumers by late-payment frequency and amount, which helps in identifying suspected default consumers.
85.5978.27
121.83 127.12136.08 136.03
147.15
74.77 73.09
103.88 101.23
123.3 118.17131.61
0
20
40
60
80
100
120
140
160
April May June July August Sept Oct
Arrears - FY 13-14 Arrears - FY 14-15
Arrear Comparison (in Crs.) Live Arrear Comparison
Note: A crore (Cr.) denotes ten million (1,00,00,000).
Average Amount
Freq
uenc
y of
Lat
e P
aym
ent NO
Amount Due
Less than or equal to
5,000
Greater than
5,000 and less than 15,000
Greater than
15,000 and less than 30,000
Greater than
30,000
Grand Total
Never late 21,907
Occasionally late 5,005 5,602 3,594 6,521 42,647
Frequent late payment 2,714 4,407 2,850 4,253
Regular late 580 1,440 1,129 2,238 19,611
Grand Total 21,907 8,299 11,467 7,573 1,3012 62,258

References and Links 87
Meter Status Report
This report shows the overall status of meter health as of the latest billing cycle.
Meter Ageing Status Report
This report provides meter ageing status in terms of number of years.
1%
1%
0%
13%
6%
3%
77%
83%
87%
9%
10%
10%
0% 20% 40% 60% 80% 100%
Burnt
Defective
OK
Others
Cat
egor
y/A
rea
Det
ails
21%
17%
15%
24%
23%
Category/Area 2
0-5 Years 6-10 Years 11-15 Years 16-20 Years >20 Years
15%
63%
11%
9%
Category/Area 3
33%
31%
11%
8%
17%
Category/Area 1
17%
68%
10%4%
1%
2%
19%
21%
20%
21%
19%25%
34%15%
9%
17%36% 62%
22%
• Outer Circle for All Meters• Inner Circle for Non-OK Meter

88 Data Analytics for Advanced Metering Infrastructure: A Guidance Note for South Asian Power Utilities
Meter Data validation checks consolidated Report
This report provides the consumer-wise status of exception checks done on meter data.M
ON
TH O
F A
NA
LYSI
SIN
STA
LLA
TIO
NM
ETER
N
UM
BER
STA
TUS
MA
GN
ET
_FLA
GPO
WER
_FA
CTO
R_
FLA
G
VO
LTA
GE_
FAIL
UR
E_FL
AG
CT_
OV
ER
LOA
D_
FLA
G
CU
RR
ENT_
R
EVER
SAL_
FLA
G
POW
ER_
FAIL
UR
E_FL
AG
NEU
TRA
L_D
ISTU
RB
AN
CE
_FLA
G
Apr
-14
50
00
7736
33N
DP0
640
4O
KO
KO
KO
KO
KO
KO
KO
K
Apr
-14
50
00
7740
405
100
2788
OK
OK
OK
OK
OK
OK
OK
OK
Apr
-14
50
00
7742
65
3114
932
OK
OK
OK
OK
OK
OK
OK
OK
Apr
-14
50
00
7743
16N
DP1
8424
OK
OK
OK
OK
OK
OK
OK
OK
Apr
-14
50
00
7744
65
540
022
23O
KO
KO
KO
KO
KO
KO
KO
K
Apr
-14
50
00
7747
09
ND
P05
940
NO
T O
KO
KO
KO
KO
KO
KO
KO
K
Apr
-14
50
00
7747
59
ND
P20
100
NO
T O
KO
KO
KO
KO
KO
KO
KO
K
Apr
-14
50
00
7749
49N
DP2
028
1N
OT
OK
OK
OK
OK
OK
OK
OK
OK
Apr
-14
50
00
776
266
700
046
62
NO
T O
KO
KO
KO
KO
KO
KO
KO
K
Apr
-14
50
00
776
306
ND
P128
95
NO
T O
KO
KO
KO
KO
KO
KO
KO
K
Apr
-14
50
00
776
375
ND
P176
19O
KO
KO
KO
KO
KO
KO
KO
K
Apr
-14
50
00
776
458
510
027
43O
KO
KO
KO
KO
KO
KO
KO
K
Apr
-14
50
00
7770
00
942
012
56
OK
OK
OK
OK
OK
OK
OK
OK
Apr
-14
50
00
7773
85N
DP1
7335
OK
OK
OK
OK
OK
OK
OK
OK
Apr
-14
50
00
7775
98
ND
P171
01
OK
OK
OK
OK
OK
OK
OK
OK
Apr
-14
50
00
7776
98
700
011
76O
KO
KO
KO
KO
KO
KO
KO
K
Apr
-14
50
00
7777
35N
DP1
69
59
NO
T O
KO
KO
KO
KO
KO
KO
KO
K
Apr
-14
50
00
7782
00
ND
P114
18O
KO
KO
KO
KO
KO
KO
KO
K
Apr
-14
50
00
7782
39N
DP1
7411
NO
T O
KO
KO
KO
KO
KO
KO
KO
K
Apr
-14
50
00
7782
46N
DP1
1419
OK
OK
OK
OK
OK
OK
OK
OK
Apr
-14
50
00
7782
74N
DP1
7842
NO
T O
KO
KO
KO
KO
KO
KO
KO
K
Apr
-14
50
00
7783
77N
DP1
517
9O
KO
KO
KO
KO
KO
KO
KO
K
Apr
-14
50
00
779
202
ND
P20
59
6O
KO
KO
KO
KO
KO
KO
KO
K
Apr
-14
50
00
780
021
ND
P19
262
OK
OK
OK
OK
OK
OK
OK
OK
Apr
-14
50
00
780
715
ND
P15
329
OK
OK
OK
OK
OK
OK
OK
OK
Apr
-14
50
00
780
90
8N
DP0
545
6N
OT
OK
OK
OK
OK
OK
OK
OK
OK
Logi
c C
heck
s
Con
sum
er
Inst
alla
tion
Num
ber
Logi
c C
heck
s
Stat
us
Con
sum
er
Met
er N
umbe
r
Dat
e

References and Links 89
APPENDIx F. AMR DATA ANALyTIcS – USE cASES: ScREENShOTS
These use cases are used to perform short-, medium- and long-term energy forecasting. The short-term forecasting takes into consideration weather-related data for day-ahead purchase of power. This section addresses the following use cases:
Predictive fault analysis and network-asset management �
Energy optimization and Volt/VAR control �
Predictive maintenance �
Network optimization/load balancing �
Interconnected feeder analysis �
Energization scheme monitoring �
Predictive Fault Analysis and Network-Asset Management
DT loading data is analyzed to ensure optimal loading of the DT to avoid failures and manage the life of the asset.
Interval Read Profile : 31 -May-18 (KT030096)
Amp-1kVAhkWh Amp-2 Amp-3 V-1 V-2 V-3
Phase-wise Capacity Limit 220 Amp
600
480
360
00
:15
00
:30
00
:45
01:
00
01:
150
1:3
00
1:4
50
2.0
00
2:1
50
2:3
00
2:4
50
3:0
00
3:1
50
3:3
00
3:4
50
4:0
0
04
:30
04
:15
04
:45
05
:00
05
:15
05
:30
05
:45
06
:00
06
:15
06
:30
06
:45
07:0
00
7:1
50
7:3
00
7:4
50
8:0
00
8:1
50
8:3
00
8:4
50
9:0
00
9:1
50
9:3
00
9:4
5
10:1
510
:00
10:3
010
:45
11:0
011
:15
11:3
011
:45
12:0
012
:15
12:3
012
:45
13:0
013
:15
13:3
013
:45
14:0
014
:15
14:3
014
:45
15:0
015
:15
15:3
015
:45
16:0
016
:15
16:3
016
:45
17:0
017
:15
17:3
017
:45
18:1
518
:00
18:3
018
:45
19:0
019
:15
19:3
02
0:0
02
0:1
52
0:3
02
0:4
52
1:0
02
1:15
21:
30
21:
45
22
:00
22
:15
22
:30
22
:45
23
:00
23
:15
23
:30
23
:45
00
:00
Line
Cur
rent
Ener
gy
Vol
tage
240
120
Predictive Fault Analysis and Network-Asset Management - DT Overload Analysis
Predictive Fault Analysis and Network-Asset Management - DT Unbalancing Analysis
Interval Read Profile : 31 -May-18 (KT030172)
Amp-1kVAhkWh Amp-2 Amp-3 V-1 V-2 V-3
Phase-wise Capacity Limit 220 Amp
320
240
160
00
:15
00
:30
00
:45
01:
00
01:
150
1:3
00
1:4
50
2:0
00
2:1
50
2:3
00
2:4
50
3:0
00
3:1
50
3:3
00
3:4
50
4:0
00
4:1
50
4:3
00
4:4
50
5:0
00
5:1
50
5:3
00
5:4
50
6:0
00
6:0
00
6:1
50
6:4
50
7:0
00
7:1
50
7:3
00
7:4
50
8:0
00
8:1
50
8:3
00
8:4
50
9:0
00
9:1
50
9:3
00
9:4
5
10:1
510
:00
10:3
010
:45
11:0
011
:15
11:3
011
:45
12:0
012
:15
12:3
012
:45
13:0
013
:15
13:3
013
:45
14:0
014
:15
14:3
014
:45
15:0
015
:15
15:3
015
:45
16:0
016
:15
16:3
016
:45
17:0
017
:15
17:3
017
:45
18:1
518
:00
18:3
018
:45
19:0
019
:15
19:3
02
0:0
02
0:1
52
0:3
02
0:4
52
1:0
02
1:15
21:
30
21:
45
22
:00
22
:15
22
:30
22
:45
23
:00
23
:15
23
:30
23
:45
00
:00
Line
Cur
rent
Ener
gy
Vol
tage
80
0
20:15Amp-1:259.98Amp-2:20.69Amp-3:87.17

90 Data Analytics for Advanced Metering Infrastructure: A Guidance Note for South Asian Power Utilities
DT current phase values are analyzed to avoid asset failures and ensure supply reliability and quality.
Outage event data is analyzed to identify outage locations easily, thereby initiating faster supply restoration. The data can also be used to identify possible cases of theft at customer locations.
Predictive Fault Analysis and Network-Asset Management- Outage Detection
SSN NIC SMART METER OUTAGE MONITOR ( LAST 24 HRS OUTAGES & 2 HRS RESTORATION )
Name Address Meter no KNO Outage from Outage to Duration
RELIANCE JIO INFOCOME KT027145 2107220198392017-08-28
18:31:40ONGOING 30
LALIT KUMAR KT027118 2107220170212017-08-28
18:31:40ONGOING 30
PRITAM PAL SINGH KT014338 2107220107382017-08-28
18:31:40ONGOING 30
LALIT KUMAR JAIN KT027279 2107220190642017-08-28
18:31:40ONGOING 30
DHEMENDRA AGARWAL KT014340 2107220136992017-08-28
18:31:40ONGOING 30
NEELAM BATALA KT027281 2107220143992017-08-28
18:31:40ONGOING 30
TAHIR HUSSAIN KT014566 210722017612 –2017-08-28
19:05:47–
TAHIR HUSSAIN KT014566 210722017612 –2017-08-28
18:56:29–
SUSHIL KUMAR PANDEY AND ROLEY PANDEY KT027185 2107220123712017-08-28
18:26:012017-08-28
18:43:55–
CHAND PRAKASH JAIN KT027098 210722012361 –2017-08-28
18:43:5418
STM USHA NARMADEV KT026839 210722012257 –2017-08-28
18:43:54–
RAMESH CHAND KT014799 2107220123632017-08-28
18:26:172017-08-28
18:43:5418
AJEET SINGH KT027199 2107220123702017-08-28
18:26:002017-08-28
18:43:5418

References and Links 91
Reliability indices values are mapped and analyzed to understand the performance of DISCOM in supplying reliable power to consumers, predict fault occurrence based on trend analysis, and also understand network overloading instances.
Energy Optimization and volt/vAR control
Predictive Fault Analysis and Network - Asset Management - Reliability Indices Analysis
Time Period:
2018-19SAIDI
34.34SAIFI
37.87Unauthorized Construction Notices Safety KPI Dashboard
4,966PADCI
5.20?
50.67
60.1953.63
28.29 27.55 31.8435.22
24.77
75
50
25
0
38.92 37.87
2014-15 2015-16
Actual Target
2016-17 2017-18 2018-19
NCC/’000 Complaints
30
22.8625.50
21.2820
10
02015-16 2016-17 2017-18
SAIFI (Nos.)
PA Compliance (%)
100
75
50
25
0 2014-15 2015-16 2016-17 2017-18 2018-19
99.29 99.30 99.61 99.60 99.64
Actual Target
60
40
20
02014-15 2015-16 2016-17 2017-18 2018-19
SAIDI (Hrs.)
27.08
46.06 46.06
26.5632.41
43.05
30.5824.80
34.34
Time Period:
2018-19SAIDI
34.34SAIFI
37.87Unauthorized Construction Notices Safety KPI Dashboard
4,966PADCI
5.20?
30
20
10
0Category I
2.77
0.41
City Circle Metro Circle Sub urban Ci...Town CircleUrban Circle Badli Rohini Shalimar Bagh
6
4
2
0
-2
6
4
21.92
0.63
4.00
4.72
3.43
6.18
414 503 505 532 Bu Shalimar...
4.07
1.070
-2
7.5
5
2.5
0
1.28
3.76
2.49
0.41
SAIDI (Hrs.)
SAIDI (Hrs.)
SAIDI (Hrs.)
SAIDI (Hrs.)
SAIDI (Hrs.)
SAIDI (Hrs.)
Reliability Intrruption Outages Month Wise Year Wise Year Wise
Category II
27.81 60
40
20
0
3
2
1
0
18.61
8.560.59 0.05
APR MAY JUN JUL AUG SEP OCT NOV DEC JAN FEB MARDistribution Inter.. Distribution Outa.. STS Interruption STS Outage

92 Data Analytics for Advanced Metering Infrastructure: A Guidance Note for South Asian Power Utilities
Under this use case, the network voltage fluctuation trend is analyzed and points are identified where reactive power management is required by switching on capacitor banks and compensators. This helps ensure power quality in the network and helps prevent unexpected breakdowns of network components.
Predictive Maintenance
Under this use case, DT and feeder loading data are analyzed to look for violations above peak value of various asset-performance factors and to assess DT temperature trends and outage trends. This ensures proper loading of assets to prevent failures. The utility opts for condition-based maintenance instead of periodic maintenance.
Call Center Efficiency
Here, insights gained from analyzing customer patterns and preferences are used to increase the effectiveness of self-service channels.
0
50
100
150
200
250
Quality Score (%) Average Handling Time (in secs) Average Hold Time (in secs)
Call Center Efficiency
Batch without hands on training Batch with hands on training

References and Links 93
Net
wor
k O
ptim
izat
ion/
Load
bal
anci
ngN
etw
ork
Opt
imiz
atio
n/Lo
ad B
alan
cing
- D
eman
d R
espo
nse
73
Net
wor
k O
ptim
izat
ion
/ Lo
ad B
alan
cing
Dem
and
resp
onse
load
pro
file
data
is a
naly
zed
to e
nsur
e th
e ne
twor
k is
opt
imal
ly lo
aded
and
bal
ance
d.

94 Data Analytics for Advanced Metering Infrastructure: A Guidance Note for South Asian Power Utilities
Net
wor
k O
ptim
izat
ion/
Load
Bal
anci
ng -
DT
Sw
appi
ng
DT
load
ing
patte
rns
are
anal
yzed
to e
nsur
e op
timal
load
ing
of n
etw
ork
asse
ts a
nd p
lan
load
shi
fting
.
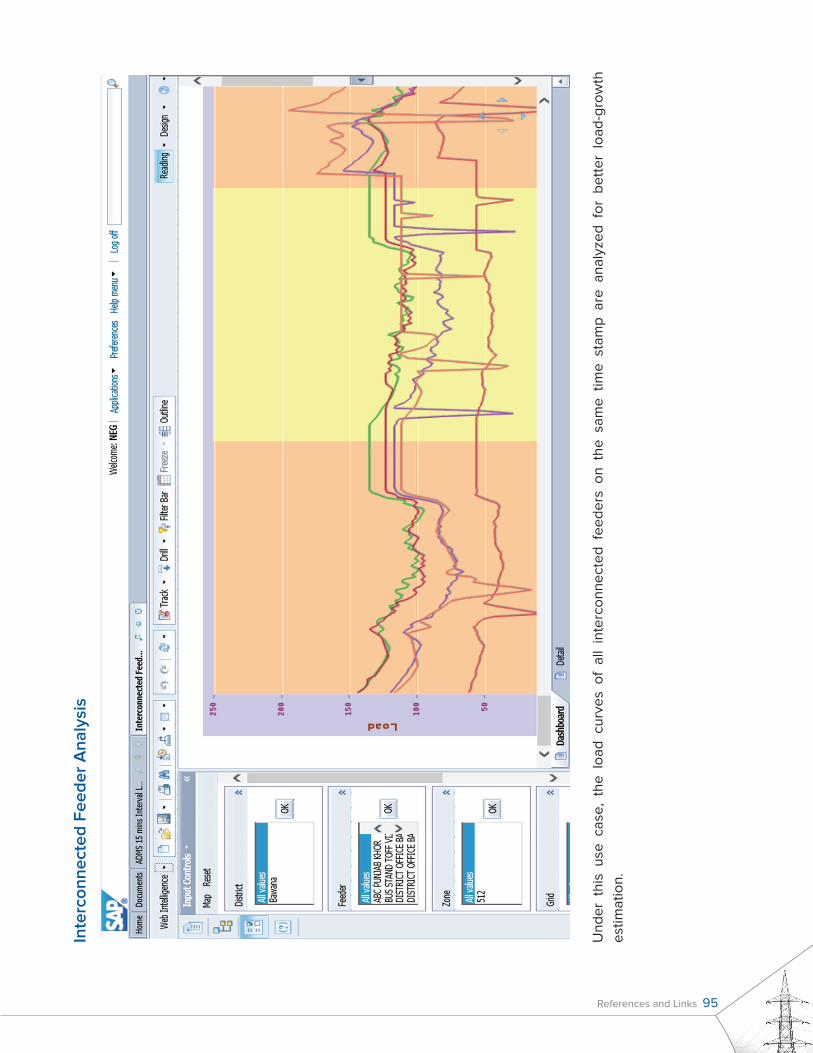
References and Links 95
Inte
rcon
nect
ed F
eede
r A
naly
sis
Und
er t
his
use
case
, th
e lo
ad c
urve
s of
all
inte
rcon
nect
ed f
eede
rs o
n th
e sa
me
time
stam
p ar
e an
alyz
ed f
or b
ette
r lo
ad-g
row
th
estim
atio
n.
75
Inte
rcon
nect
ed F
eede
r Ana
lysi
s

96 Data Analytics for Advanced Metering Infrastructure: A Guidance Note for South Asian Power Utilities
Ener
giza
tion
Sche
me
Mon
itorin
g

References and Links 97
The
ener
giza
tion
sche
me
mon
itorin
g is
kin
d of
a p
roje
ct m
onito
ring
tool
whi
ch s
how
s th
e st
atus
of
ener
giza
tion
sche
me
to v
ario
us
stak
ehol
ders
in a
sin
gle
dash
boar
d.

98 Data Analytics for Advanced Metering Infrastructure: A Guidance Note for South Asian Power Utilities
AP
PEN
DIx
g. b
ILLI
Ng
AN
D c
OLL
EcTI
ON
DA
TA A
NA
LyTI
cS
USE
cA
SES
– Sc
REE
NSh
OTS
Foot
fall
Opt
imiz
atio
n at
Pay
men
t cen
ters
Her
e, a
naly
tics
are
used
to
optim
ize
the
foot
fall
at p
aym
ent
cent
ers,
lea
ding
to
bette
r co
nsum
er s
atis
fact
ion
and
incr
ease
d re
sour
ce
effici
ency
.

References and Links 99
13,016 14,925 14,318
42,259
11,501 11,120 12,829
35,450
0
10000
20000
30000
40000
50000
Jan-Mar Apr-Jun Jul-Sep Total
Disconnection Notice Trend
2016 2017
Overallpercentagereduction in
DN–16%
63.79 62.19 70.85
196.83
48.09 46.96 58.05
153.11
0
50
100
150
200
250
Total2016 2017
Arrear – Disconnection Notice
Jan-Mar Apr-Jun Jul-Sep
Total Count 8,375
No of consumers not reaching DN-L1 – Jan to Sep
820
% Improvement 9.79%
DN Trend
Predicting Defaulting consumers
Here, analytics are used to predict defaulting consumers, leading to reductions in arrears and improved consumers payment behavior.
consumer Segmentation on Default Payments
Analytics are used here to group consumers by default history in order to improve upon the reduction of defaults.
Value Based Segment
Default History Segment Diamond Gold Silver Bronze Copper Grand Total
Star 8,109 5,703 7,916 5,150 10,032 36,910
Amateur 2,015 1,480 2,610 1,766 2,382 10,253
Crawlers 53 53 56 37 47 246
Climber 635 493 720 481 413 2,742
Cropper 1,919 1,946 4,141 3,306 4,896 16,308
Strategist 375 395 391 208 110 1,479
Stubborn 1,401 1,219 1,991 1,228 845 6,684
Exception 15 10 31 16 78 150
Grand Total 14,522 11,299 17,956 12,192 18,803 74,772
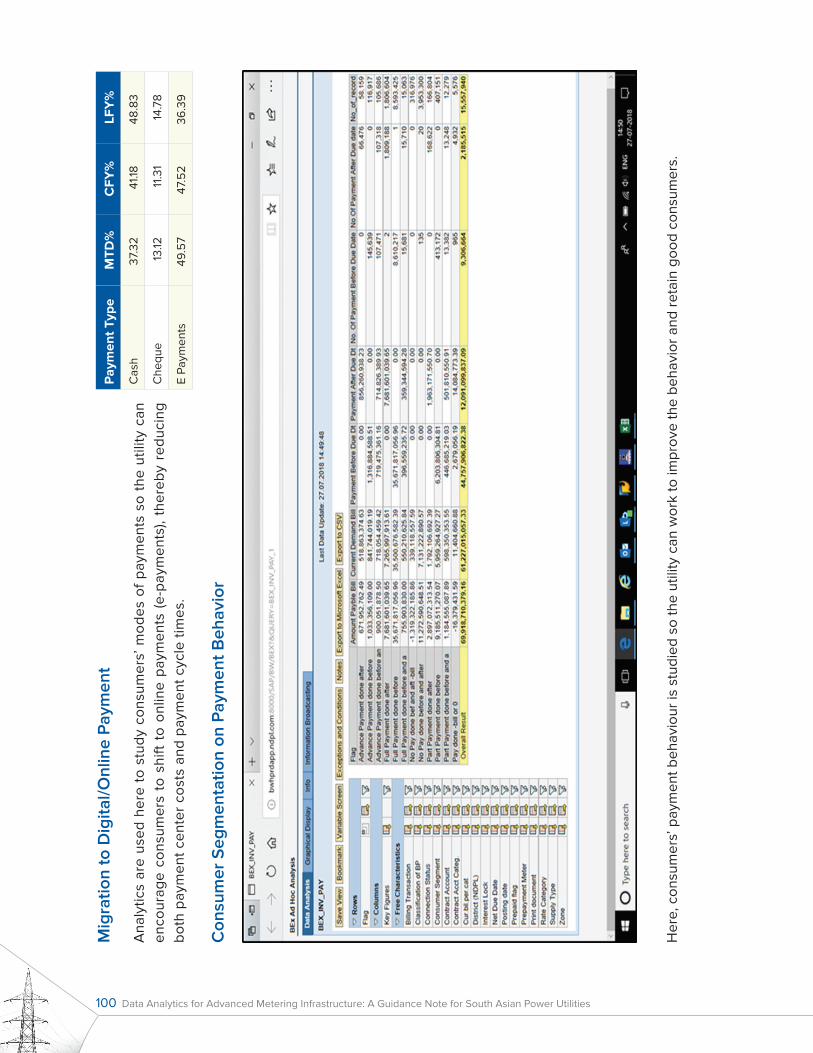
100 Data Analytics for Advanced Metering Infrastructure: A Guidance Note for South Asian Power Utilities
Mig
ratio
n to
Dig
ital/O
nlin
e Pa
ymen
t
Ana
lytic
s ar
e us
ed h
ere
to s
tudy
con
sum
ers’
mod
es o
f pa
ymen
ts s
o th
e ut
ility
can
en
cour
age
cons
umer
s to
shi
ft t
o on
line
paym
ents
(e-
paym
ents
), th
ereb
y re
duci
ng
both
pay
men
t cen
ter
cost
s an
d pa
ymen
t cyc
le ti
mes
.
con
sum
er S
egm
enta
tion
on P
aym
ent b
ehav
ior
Her
e, c
onsu
mer
s’ p
aym
ent b
ehav
iour
is s
tudi
ed s
o th
e ut
ility
can
wor
k to
impr
ove
the
beha
vior
and
reta
in g
ood
cons
umer
s.
Pay
men
t Typ
eM
TD%
CFY
%LF
Y%
Cas
h37
.32
41.18
48.8
3
Che
que
13.12
11.3
114
.78
E Pa
ymen
ts49
.57
47.5
236
.39

References and Links 101
Thef
t Ana
lytic
s - D
T En
ergy
Aud
it
Thef
t Ana
lytic
s
Her
e, D
T en
ergy
aud
it da
ta a
re a
naly
zed
to id
entif
y th
efts
bas
ed o
n lo
ad-p
rofil
e va
riatio
ns in
the
area
con
side
red.

102 Data Analytics for Advanced Metering Infrastructure: A Guidance Note for South Asian Power Utilities
Here, Aggregate Technical and Commercial (AT&C) loss data and billing and collection efficiency are analyzed to understand the DISCOM’s performance patterns, allowing the DISCOM to take actions to improve in these areas. This analysis also provides insights on theft rates.
Theft Analytics: AT&C Loss Analysis (1)
Fiscal Year:
FY 18-19AT&C Loss (with LIP) (%)
7.93Billing E�ciency (%)
92.07Collection E�ciency (%)
100.01Bill Collection (Crs) Total Billed Amount (Crs)
7,973.90Energy Input (MUs)
9,630.29 7,973.30?
AT&C Loss (with LIP) (%)
Energy Input (MUs)
9.87
8.888.59
Actual Target
Actual Target
Actual Target
8.407.93
7.67
10k
7.5k
6,429.88
6,856.97
6,937.95
7,381.18 7,973.90
512.01
5k
2.5k
0
99.6999.93
100.03 100.00
100.01100.20
99.79 99.80
10 100 100.25
100
99.75
99.5
509
2014-15
2015-162016-17
2017-18
2018-19
2019-202014-15
2015-162016-17
2017-182018-19
2019-20
8
7
Billing E�ciency (%)
Bill Collection (Crs)
Collection E�ciency (%)
Total Billed Amount (Crs)
90.4
1
8,42
3
8,61
0
90,0
40
90,4
02
90,6
30
6,45
0
6,86
2
6,93
6
7,97
3
7,39
37,
9179,
562
91.2
3
91.3
8
91.8
091
.90
92.0
792
.20
92.15
Actual Target
0
2014-15
2015-162016-17
2017-182018-19
2019-20
Actual TargetActual Target
0
5k
10k
2014-15
2015-162016-17
2017-182018-19
2019-202014-15
2015-162016-17
2017-182018-19
2019-20
2019-202018-19
2017-18
2016-172015-16
2014-15
10k
7.5k
5k
2.5k
0
Here again, AT&C loss data are analyzed to understand overall AT&C loss variation patterns, allowing the DISCOM to pursue loss-reduction measures.
Theft Analytics: AT&C Loss Analysis (2)
AT&C Losses Detail (%) for 2017-18
15
12.5
10
7.5
5
2.5
0
CityMetro Sub
TownUrban
6.71
11.52
NRL BWN
13.44
22.32
41.6646.76507.5
5
2.5
0
5.465.354.58
3.89
8.40
8.33
7.92
9.33
7.87
8.82
8.30
8.49
8.52
8.76
8.45
9.029.5
9
8.5
8
7.5
1.1725
5121301+1303
501+520522571561
APR
AUG
DEC
JUL
JUN
JAN
MAY
FEB
NOVOCT
SEP
MAR 533 517 513 5140
20.77 19.93
District Wise Detail ForMAR-2017-18/SUB
6.78
12.51
7.64
Circle Wise Detail for MAR-2017-18
6.43
15
12.5
10
7.5
5
2.5
0
513 521 533
Close
512
41.6646.76
5.6420.77
BU Wise Detail For Mar-2017-18/BWN
Bottom Five BUs/Zones forMAR-2017-18
Top Five BUs/Zones forMAR -2017-18
Month Wise Detail

References and Links 103
Meter Reading and billing complaints Analysis
Under this use case, the complaints registered for meter reading and bills generated are analyzed over various time periods.
Theft Analysis
Close
APRMAY
JUN
JUL
SEPOCT
DECJA
NMAR
3
0.861.28
2.151.52
Month Wise Detail
District Wise Detail for JAN-2018-19/METRO
0.16
0.2
0.15
0.10
0.05
0
0.020.03
KPM MGP PPR
Theft Collection Detail (Crs.) for 2018-19
1.22 1.30 1.20 1.08
1.862
1
0
6
YTD Top Five Zones
4.18
0.75
521514 417 518 522
0.60 0.54 0.12
4
2
0
NOV
1.86
Top Five Zones for JAN-2018-19
514 521518 417 522
0.060.075
0.05
0.025
0.0
0.05
0.04 0.04
0.00
Circle Wise Detail for JAN-2018-19
0.210.06
0.17
0.28 0.36
URBANTOWNSUBMETROCITY
AUG
1.75
FEB
1.06
2.75
4.134.45
5.2
4.484.24
3.05
2.28 2.21 2.291.98
1.771.52
2.08 2.162.38
1.81 1.871.6
1.21 1.1 1.2 1.13 1.09
1.021.27
1.84 1.781.52 1.48
1.11 1.03 0.94 0.88 0.80
1
2
3
4
5
6
April May June July Aug
FY 12-13 FY 13-14 FY 14-15
Sep Oct Nov Dec Jan Feb March
Complaint ‘000 Customers
Identification of theft instance and analysis on collection data for theft rate reduction and utility performance improvement.

104 Data Analytics for Advanced Metering Infrastructure: A Guidance Note for South Asian Power Utilities
150
100
50
0
92.64
APR JUNMAY OCTSEP DEC JAN FEB MAR
91.7092.20 92.3392.30 91.96 92.04 92.34 92.07
Billing Efficiency Detail for 2018-19
Billing Efficiency (%)
Circle Wise Billing Efficiency (%)for FEB-2018-19
94.03
City Metro Sub Town Urban
93.42 88.97 94.43 92.91
District Wise Billing Efficiency (%)for FEB-2018-19/Urban
Zone Wise Billing Efficiency (%)for FEB-2018-19/BDL
91.71 92.74 94.30100
150
50
0
150
100
50
0
100
50
507 516 5810
SMB BDL RHN
94.
37
88.7
5
95
.05
Close
AUG
92.06
JULY
91.98
NOV
92.39
Provisional billing Analysis
Here, analysis of circle/district/zone billing efficiency is used to reduce AT&C loss at the DISCOM.
Meter Fault Analysis
Here, meter-reading success data are analyzed to assess the performance of smart meters and the communication network. This also helps identify meter fault rates and instances of theft.
Perfect (100% Available):95.8% of population
Very Good (95-99% Available): 0.0% of population
Good (90-94% Available): 1.6% of population
Moderate (40-79% Available):0.2% of population
Poor (1-39% Available):0.1% of population
No Read: 2.2% of population
Read Success Analysis Over A Period of 7 Days Window
Perfect (100% Available) Very Good (95-99% Available) Good (80-94% Available)Moderate (40-79% Available) Poor (1-39% Available) No Read
Perfect (100% Available)
Contribution: 95.8% ofPopulation 52,614 Cases

References and Links 105
0
2000
4000
6000
8000
10000
12000
14000
16000
A1 A2 A3 A4 A5 A6 B1 B2 B3 B4 B5
Target Meters Read Success
98.063.2
Overall Read meter % Overall Nonread Meter %
Read Obtained Till Now for: 05 Jun 18
98.69% 98.96% 97.45% 94.55% 98.89% 98.16% 97.88% 94.39% 96.02% 98.6% 98.16%

106 Data Analytics for Advanced Metering Infrastructure: A Guidance Note for South Asian Power Utilities
APPENDIx h. ThREShOLD vALUES FOR ExcEPTION gENERATION
Single-Phase Meters
Table 19: Threshold Values for Exception Generation for Single-Phase Meters
ExceptionsPersistence Time for Occurrences
Persistence Time for
Restoration
Threshold Value for Occurrence of Events
Threshold Value for Restoration of Events
ESD/JAMMER Immediate (record only 1 event on first application and only 1 event for next 1 min.)
0 hr. 01 min. 0 sec. (should restore after 1 min. of last application)
Immunity up to 50 kilovolts (kV) with NIC and logging of event >50 kV
Removal of ESD/jammer signal
Magnetic Tamper 0 hr. 2 min. 0 sec. 0 hr. 2 min. 0 sec.
>0.5 tesla (T) for permanent magnet
OR
DC magnetic induction >0.2 T
OR
AC magnetic induction >10 milliTesla (mT)
<0.5 T for permanent magnet
OR
DC magnetic induction <0.2 T
OR
AC magnetic induction <10 mT
Meter Top Cover Open
Immediate Immediate If meter top cover is opened Not applicable
Neutral Missing 0 hr. 30 min. 0 sec. 0 hr. 2 min. 0 sec.
1. Battery is used for voltage reference: Under tamper condition of neutral missing, meter will perform the fraud energy registration above 500 mA assuming Vref (reference voltage from the battery) and Unity Power Factor (UPF).
OR
2. Third CT is used for voltage reference: Under tamper condition of neutral missing, meter will perform the fraud energy registration above 1 A assuming Vref (from third CT) and Unity Power Factor (UPF).
Testing: For checking the meter reliability and accuracy in lab, the meter is tested for 30 minutes with voltage sampled at intervals of 30 seconds and constant current.
Voltage >190 V

References and Links 107
ExceptionsPersistence Time for Occurrences
Persistence Time for
Restoration
Threshold Value for Occurrence of Events
Threshold Value for Restoration of Events
Neutral Disturbance
0 hr. 01 min. 0 sec. 0 hr. 02 min. 0 sec.
Voltage >145% of Vref
OR
Current >10% of base current (Ib)
OR
Frequency <47 Hz
OR
Frequency >53 Hz
OR
DC voltage/signal/pulse/chopped signal injection
Voltage <145% of Vref
OR
Current <10% of Ib
OR
Frequency >47 Hz
OR
Frequency <53 Hz
Current Mismatch
0 hr. 10 min. 0 sec. 0 hr. 02 min. 0 sec.
In-Ip ≥20% of Ib
AND
In >Ip
In –Ip <20% of Ib
Low Voltage Check
0 hr. 30 min. 0 sec. 0 hr. 02 min. 0 sec.
Voltage <70% of Vref
AND
Current >2% Ib
Voltage >70% of Vref
AND
Current <2% Ib
Outage (Power OFF/ON)
Power OFF = 0 hr. 05 min. 0 sec.
Power ON = immediate
Actual Voltage off Actual Voltage On
Overload Overload (If enabled) 0 hr. 30 min. 0 sec.
I >120% Imax I<100% Imax
Microwave Immediate (record only 1 event on first application and only one event for next 1 min.)
0 hr. 01 min. 0 sec. (should restore after 1 min. of last application)
Any higher frequency magnetic waves, micro waves >10 mT (or mutually decided)
Removal of device
Temperature Rise 0 hr. 30 min. 0 sec. 0 hr. 02 min. 0 sec.
Temperature >70˚C Temperature <60˚C
Network interface Card (NIC) removal (communication port)
Immediate Immediate On removal of card On insertion of card
EL WC (earth load – whole current)
0 hr. 30 min. 0 sec. Immediate The difference between phase and neutral currents >6.25% of Ib
The difference between phase and neutral currents <6.25% of Ib
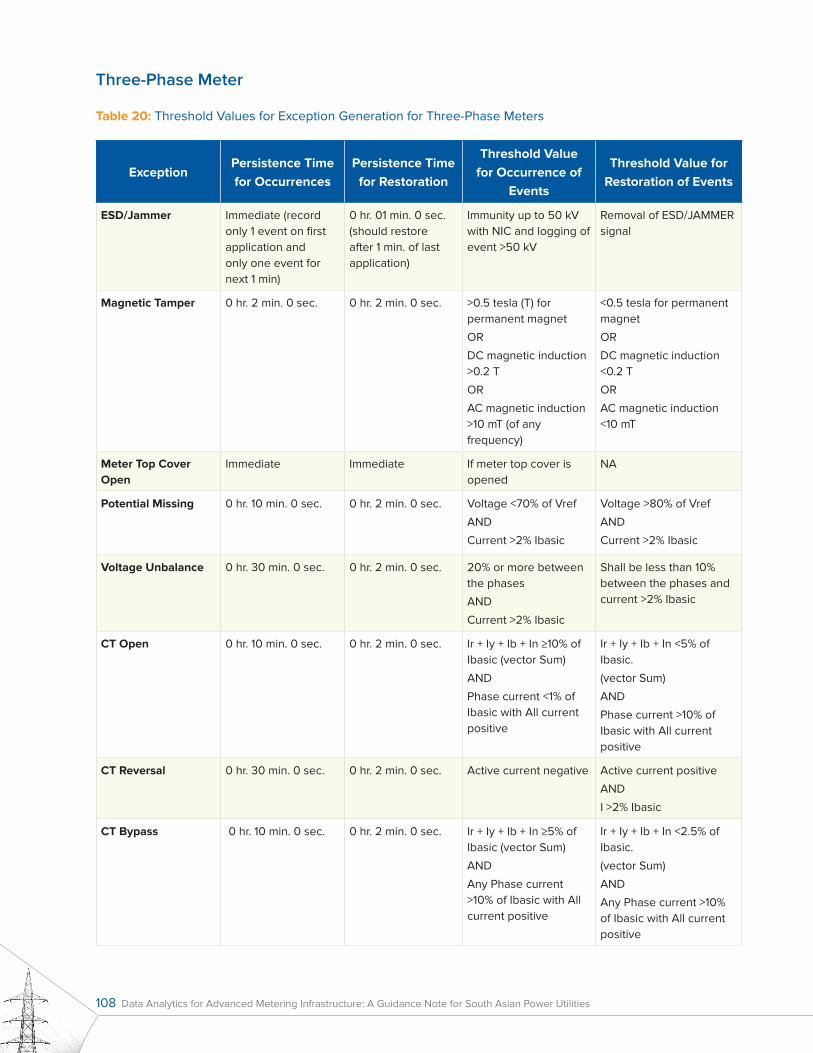
108 Data Analytics for Advanced Metering Infrastructure: A Guidance Note for South Asian Power Utilities
Three-Phase Meter
Table 20: Threshold Values for Exception Generation for Three-Phase Meters
ExceptionPersistence Time for Occurrences
Persistence Time for Restoration
Threshold Value for Occurrence of
Events
Threshold Value for Restoration of Events
ESD/Jammer Immediate (record only 1 event on first application and only one event for next 1 min)
0 hr. 01 min. 0 sec. (should restore after 1 min. of last application)
Immunity up to 50 kV with NIC and logging of event >50 kV
Removal of ESD/JAMMER signal
Magnetic Tamper 0 hr. 2 min. 0 sec. 0 hr. 2 min. 0 sec. >0.5 tesla (T) for permanent magnet
OR
DC magnetic induction >0.2 T
OR
AC magnetic induction >10 mT (of any frequency)
<0.5 tesla for permanent magnet
OR
DC magnetic induction <0.2 T
OR
AC magnetic induction <10 mT
Meter Top Cover Open
Immediate Immediate If meter top cover is opened
NA
Potential Missing 0 hr. 10 min. 0 sec. 0 hr. 2 min. 0 sec. Voltage <70% of Vref
AND
Current >2% Ibasic
Voltage >80% of Vref
AND
Current >2% Ibasic
Voltage Unbalance 0 hr. 30 min. 0 sec. 0 hr. 2 min. 0 sec. 20% or more between the phases
AND
Current >2% Ibasic
Shall be less than 10% between the phases and current >2% Ibasic
CT Open 0 hr. 10 min. 0 sec. 0 hr. 2 min. 0 sec. Ir + Iy + Ib + In ≥10% of Ibasic (vector Sum)
AND
Phase current <1% of Ibasic with All current positive
Ir + Iy + Ib + In <5% of Ibasic.
(vector Sum)
AND
Phase current >10% of Ibasic with All current positive
CT Reversal 0 hr. 30 min. 0 sec. 0 hr. 2 min. 0 sec. Active current negative Active current positive
AND
I >2% Ibasic
CT Bypass 0 hr. 10 min. 0 sec. 0 hr. 2 min. 0 sec. Ir + Iy + Ib + In ≥5% of Ibasic (vector Sum)
AND
Any Phase current >10% of Ibasic with All current positive
Ir + Iy + Ib + In <2.5% of Ibasic.
(vector Sum)
AND
Any Phase current >10% of Ibasic with All current positive

References and Links 109
ExceptionPersistence Time for Occurrences
Persistence Time for Restoration
Threshold Value for Occurrence of
Events
Threshold Value for Restoration of Events
Current Unbalance 0 hr. 30 min. 0 sec. 0 hr. 2 min. 0 sec. Current difference ≥30% between phases and I min 10% of Ibasic
Current difference <20% between the phases and I min >5% of Ib
Low Power Factor 0 hr. 30 min. 0 sec. 0 hr. 2 min. 0 sec. I >1% of Ib
AND
Power Factor ≤ 0.5 in any phase
I >1% of Ib
AND
Power Factor ≤0.7 in respective phase
Neutral Disturbance 0 hr. 01 min. 0 sec. 0 hr. 2 min. 0 sec. Voltage >145% of Vref and Current >10% Ib
OR
Frequency <47 Hz
OR
Frequency >53 Hz
OR
DC voltage/signal/pulse/chopped signal injection
Voltage <115% of Vref
AND
Current >10% Ib
AND
Frequency >47 Hz
OR
Frequency <53 Hz
Outage (Power ON/OFF)
0 hr. 02 min. 0 sec. Immediate Actual Voltage off Actual Voltage On
Over Voltage 0 hr. 30 min. 0 sec. 0 hr. 2 min. 0 sec. Voltage >130% of Vref Voltage <110% of Vref
Over Current 0hr. 30min. 0 sec. 0 hr. 2 min. 0 sec. > Preset value (default value set at 120% Ib)
I <100%Ib
Microwave Presence Immediate (record only 1 event on first application and only one event for next 1 min.)
0 hr. 01 min. 0 sec. (should restore after 1 min. of last application)
Any higher frequency magnetic waves, micro waves >10 mT (or mutually decided)
Removal of device
Temperature Rise 0 hr. 30 min. 0 sec. 0 hr. 02 min. 0 sec. Temperature >70˚C Temperature <60˚C
NIC Card Removed Immediate Immediate On removal of card On insertion of card
Phase Sequence Disturbance
Immediate Immediate Change of phase sequence
Restoration of phase sequence


Energy and Extractives Global Practice GroupSouth Asia Region (SAR)