Danske Bank Annual Report 2009 - AnnualReports.com
180
ANNUAL REPORT 2009
-
Upload
khangminh22 -
Category
Documents
-
view
0 -
download
0
Transcript of Danske Bank Annual Report 2009 - AnnualReports.com

ANNUAL rEport2009

opErAtIoNS IN 14 CoUNtrIES / 734 BrANCHES / 5.1 MILLIoN CUStoMErS / 22,093 EMpLoYEES
DANSKE BANK GROUP
danske bank skt. Petersborg
danske bank
danica Pension
realkredit danmark
nordania leasing
danske markets
danske caPital
northern bank
national irish bank
danske bank london
danske bank international
danske bank hambUrg
danske bank Poland
danske bankas
danske banka
samPo Pank
samPo Pankki
Zao danske bank, rUssia
danske bank sWeden
fokUs bank
3 DANSKE BANK ÅRSRAPPORT 2009 BANKAKTIVITETER NORDIRLAND
ANNUAL REPORT 2009
MANAGEMENT’S REPORT 4 Financial highlights
5 Overview
6 Summary 10 Financial review 22 Business units 23 Banking Activities
40 Danske Markets
42 Danske Capital
44 Danica Pension
47 Other Activities
48 Capital management
51 Investor information 53 Organisation and management 59 Corporate Responsibility
FINANCIAL STATEMENTS 63 Contents 64 Income statement
65 Statement of comprehensive income 66 Balance sheet
67 Statement of capital 70 Cash fl ow statement 71 Notes
155 Danske Bank A/S
STATEMENT AND REPORTS 173 Statement by the management 174 Auditors’ reports
MANAGEMENT AND DIRECTORSHIPS 176 Board of Directors
178 Executive Board

FINANCIAL HIGHLIGHTS DANSKE BANK ANNUAL REPORT 20094
FINANCIAL HIGHLIGHTS
INCOME STATEMENT(DKr m) 2009
2008
Index
09/08 2007
Proforma
2006 2006 2005
Net interest income 27,524 27,005 102 24,391 22,610 19,501 17,166
Net fee income 7,678 8,110 95 9,166 8,877 7,301 7,289
Net trading income 18,244 6,076 - 7,378 7,280 6,631 6,351
Other income 3,083 3,585 86 3,010 2,952 2,698 2,255
Net income from insurance business 2,810 -1,733 - 1,118 1,355 1,355 1,647
Total income 59,339 43,043 138 45,063 43,074 37,486 34,708
Expenses 28,907 28,726 101 25,070 22,640 19,485 18,198
Profit before loan impairment charges 30,432 14,317 213 19,993 20,434 18,001 16,510
Loan impairment charges 25,677 12,088 212 687 -484 -496 -1,096
Profit before tax 4,755 2,229 213 19,306 20,918 18,497 17,606
Tax 3,042 1,193 255 4,436 5,549 4,952 4,921
Net profit for the year 1,713 1,036 165 14,870 15,369 13,545 12,685
Attributable to minority interests -14 25 - 57 79 -12 4
BALANCE SHEET (AT DECEMBER 31) (DKr m)
Due from credit institutions and central
banks 202,356 215,823 94 345,959 278,817 275,268 274,918
Loans and advances 1,669,552 1,785,323 94 1,700,999 1,519,554 1,362,351 1,188,963
Repo loans 146,063 233,971 62 287,223 294,555 294,555 209,732
Trading portfolio assets 620,052 860,788 72 652,137 504,308 490,954 444,521
Investment securities 118,979 140,793 85 37,651 28,970 26,338 28,712
Assets under insurance contracts 196,944 181,259 109 190,223 194,302 194,302 188,342
Other assets 144,531 126,017 115 135,338 117,529 95,593 96,800
Total assets 3,098,477 3,543,974 87 3,349,530 2,938,035 2,739,361 2,431,988
Due to credit institutions and central banks 311,169 562,726 55 677,355 569,142 564,549 476,363
Deposits 803,932 800,297 100 798,274 693,142 598,899 533,181
Repo deposits 55,648 74,393 75 125,721 104,044 104,044 98,003
Bonds issued by Realkredit Danmark 517,055 479,534 108 518,693 484,217 484,217 438,675
Other issued bonds 514,601 526,606 98 402,391 365,761 293,736 251,099
Trading portfolio liabilities 380,567 623,290 61 331,547 240,304 236,524 212,042
Liabilities under insurance contracts 223,876 210,988 106 213,419 215,793 215,793 212,328
Other liabilities 110,968 110,033 101 118,750 114,135 97,476 92,371
Subordinated debt 80,002 57,860 138 59,025 56,325 48,951 43,837
Shareholders' equity 100,659 98,247 102 104,355 95,172 95,172 74,089
Total liabilities and equity 3,098,477 3,543,974 87 3,349,530 2,938,035 2,739,361 2,431,988
RATIOS AND KEY FIGURES
Earnings per share (DKr) 2.5 1.5 21.7 - 21.5 20.2
Diluted earnings per share (DKr) 2.5 1.5 21.6 - 21.4 20.2
Return on average shareholders' equity (%) 1.7 1.0 15.1 - 17.5 18.4
Cost/income ratio (%) 48.7 66.7 55.6 - 52 52.4
Solvency ratio (%) 17.8 13.0 9.3 - 11.4 10.3
Tier 1 capital ratio (%) 14.1 9.2 6.4 - 8.6 7.3
Share price (end of year) (DKr) 118.0 52.0 199.8 - 250 221.2
Book value per share (DKr) 145.8 142.4 152.7 - 139.1 118.2
Full-time-equivalent staff (end of year) 22,093 23,624 23,632 - 19,253 19,162
Figures for 2007 and pro forma figures for 2006 include the Sampo Bank group as of February. As of 2008, the solvency and tier 1 capital
ratios are calculated in accordance with the Capital Requirements Directive.

OVERVIEW
The year 2009
The Danske Bank Group posted a net profit of DKr1.7bn for 2009. The result, which was affected by extraordinar-ily large impairment charges, cannot be considered satisfactory, but it is acceptable given the difficult macroeco-nomic conditions and is in the aggregate slightly better than expected.
At year-end, the capital base and solvency were stronger than ever with a capital buffer of DKr64bn over the ICAAP result.
The total income was at a very satisfactory level of DKr59.3bn – 38% above 2008. The gains were generated by ex-ceptionally high net trading income, particularly in the first half-year, higher net income from insurance business and higher net interest income.
Expenses, excluding goodwill impairment charges, were as expected. Tight cost control produced noticeable results. The number of full-time employees was reduced by 6% by the end of the year. Expenses included goodwill impairment charges, mainly against Banking Activities Baltics, of DKr1.5bn and a
guarantee commission of DKr2.5bn to the Danish state for the guarantee scheme (Bank Package I).
Loan impairment charges amounted to DKr25.7bn, showing a declining trend throughout the year. The Group’s markets suffered from worse macroeconomic developments than ever before, including sharply
declining industrial output, lower asset values and rising unemployment. Charges against facilities to corporate customers amounted to DKr16.1bn (with small and medium-sized enter-
prises accounting for DKr13.3bn), charges against facilities to financial counterparties to DKr5.5bn (with Bank Package I accounting for DKr1.6bn), and charges against facilities to retail customers to DKr4.1bn.
During the year, the tier 1 capital and solvency ratios rose from 9.2% and 13.0% to 14.1% and 17.8% through the raising of DKr26bn in the form of hybrid capital from the Danish state, a strengthening of tier 1 capital from earn-ings for the year of DKr4.2bn and a reduction of total assets.
Total assets were reduced by DKr445bn, primarily through a reduction in assets held by Danske Markets. Total lending also declined in 2009. Lending as a percentage of deposits and bonds issued by Realkredit Danmark improved to 114%, against 123% at the end of 2008.
The Group accommodated its creditworthy customers throughout the year. In Denmark, new lending to corpo-rate and retail customers, including renewals, amounted to DKr45bn and DKr30bn, respectively.
The international debt markets improved significantly during the last three quarters, and the Group’s 12-month liquidity curve is now positive throughout the period. In 2009, the Group issued bonds without a guarantee from the Danish state and covered bonds with maturities of up to five and ten years, respectively.
The year 2010 is expected to be another challenging year for the financial sector. Even so, economic indicators now point to beginning stabilisation, and 2010 is likely to see modest economic growth. Unemployment will continue to rise, however. Loan impairment charges are likely to remain high, although lower than in 2009. The robust banking activities, tight cost control and a continuing, strong focus on risk, liquidity and capital manage-ment give the Group a good foundation for the future.
Fourth quarter 2009
Total income matched the level in the third quarter. A rise in net income from insurance business compensated for lower net trading income.
Expenses were 13% above the third-quarter level. This was in line with expectations and resulted primarily from the postponement of a number of projects from the third to the fourth quarter.
Loan impairment charges continued to show a declining trend.
5 DANSKE BANK ANNUAL REPORT 2009 OVERVIEW

The year 2009 was unusual and challenging for the fi nancial sector, for the Danske Bank Group and for many of its customers. The Group’s earn-ings suffered considerably from the economic downturn, since business conditions were dif-fi cult for both the Group and its customers. Many customers saw their earnings – and their credit-worthiness – deteriorate.
On the other hand, the instability in the global fi nancial markets offered Danske Markets – the Group’s trading unit – extraordinarily good trading opportunities. Danske Markets posted high net trading income and an overall record-high income. But large loan impairment charges meant that the Group’s profi t for the year ended at DKr1.7bn.
This result cannot be considered satisfactory, but it is acceptable given the diffi cult macroeconomic conditions and is in the aggregate slightly better than expected.
The economic crisisWhen 2009 began, the global economy and the fi -nancial markets were experiencing the worst crisis since the mid-1930s. The interconnectedness of the world’s economies made the crisis spread at a speed and with an impact never seen before.
At the end of 2008, the Danish economy (GDP) was set to contract by around 0.7% in 2009, but forecasts now indicate a contraction in 2009 of 4.8%. A number of the Group’s other markets saw even worse declines. The crisis hit the labour markets hard. In Denmark, for example, unemployment doubled, although from a very low level.
Throughout the second half of the year, the Dan-ish economy showed signs of beginning stabilisa-tion. But it will take time before an improvement in macroeconomic conditions translates into a general improvement in customer creditworthi-
SUMMARY DANSKE BANK ANNUAL REPORT 20096
ness. The Group’s other markets in the Nordic region are also likely to see positive, but low, growth rates in 2010.
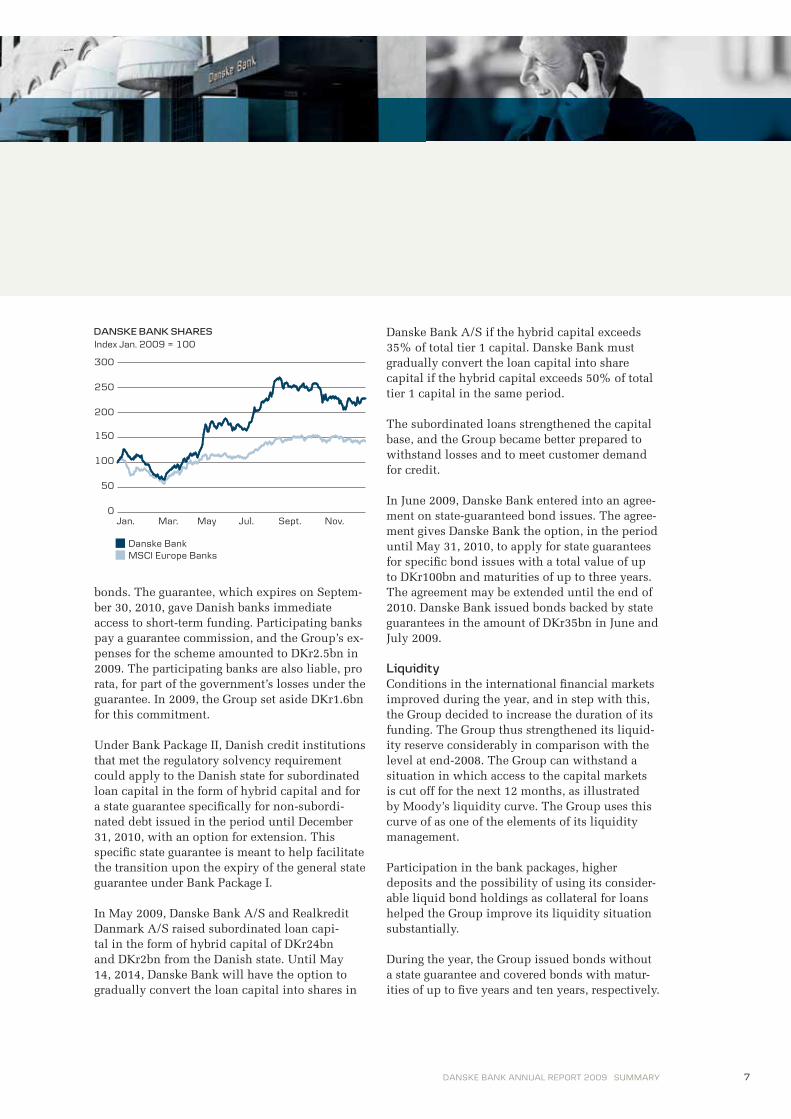
The extreme macroeconomic situation and the uncertainty in the fi nancial markets hit the price of Danske Bank shares. In March, the share price dropped to a low of DKr33.50. At that time, the Group’s market capitalisation was DKr23bn, or some 23% of the book value. From year-end 2008 to year-end 2009, the share price climbed 127%. Over the same period, the MSCI Europe Banks Index gained 42%. At the end of 2009, market capitalisation was DKr81.4bn, or 81% of the book value.
Bank packagesTo ensure fi nancial stability in Denmark and help normalise lending activities, the Danish parlia-ment passed the Bank Package I Act on October 10, 2008, and the Bank Package II Act on Feb-ruary 3, 2009. The Group participates in both packages.
Bank Package I provides an unconditional state guarantee for the obligations of the participating banks, except for subordinated debt and covered
SUMMARY
GDP DEVELOPMENT
Denmark Sweden Norway
Finland Ireland Baltics
(%)
-18
-14
-10
-6
-2
2
6
10
2010E2009E200820072006
REGNSKABSBERETNING
7 DANSKE BANK ANNUAL REPORT 2009 SUMMARY
bonds. The guarantee, which expires on Septem-ber 30, 2010, gave Danish banks immediate access to short-term funding. Participating banks pay a guarantee commission, and the Group’s ex-penses for the scheme amounted to DKr2.5bn in 2009. The participating banks are also liable, pro rata, for part of the government’s losses under the guarantee. In 2009, the Group set aside DKr1.6bn for this commitment.
Under Bank Package II, Danish credit institutions that met the regulatory solvency requirement could apply to the Danish state for subordinated loan capital in the form of hybrid capital and for a state guarantee specifi cally for non-subordi-nated debt issued in the period until December 31, 2010, with an option for extension. This specifi c state guarantee is meant to help facilitate the transition upon the expiry of the general state guarantee under Bank Package I.
In May 2009, Danske Bank A/S and Realkredit Danmark A/S raised subordinated loan capi-tal in the form of hybrid capital of DKr24bn and DKr2bn from the Danish state. Until May 14, 2014, Danske Bank will have the option to gradually convert the loan capital into shares in
Danske Bank A/S if the hybrid capital exceeds 35% of total tier 1 capital. Danske Bank must gradually convert the loan capital into share capital if the hybrid capital exceeds 50% of total tier 1 capital in the same period.
The subordinated loans strengthened the capital base, and the Group became better prepared to withstand losses and to meet customer demand for credit.
In June 2009, Danske Bank entered into an agree-ment on state-guaranteed bond issues. The agree-ment gives Danske Bank the option, in the period until May 31, 2010, to apply for state guarantees for specifi c bond issues with a total value of up to DKr100bn and maturities of up to three years. The agreement may be extended until the end of 2010. Danske Bank issued bonds backed by state guarantees in the amount of DKr35bn in June and July 2009.
LiquidityConditions in the international fi nancial markets improved during the year, and in step with this, the Group decided to increase the duration of its funding. The Group thus strengthened its liquid-ity reserve considerably in comparison with the level at end-2008. The Group can withstand a situation in which access to the capital markets is cut off for the next 12 months, as illustrated by Moody’s liquidity curve. The Group uses this curve of as one of the elements of its liquidity management.
Participation in the bank packages, higher deposits and the possibility of using its consider-able liquid bond holdings as collateral for loans helped the Group improve its liquidity situation substantially.
During the year, the Group issued bonds without a state guarantee and covered bonds with matur-ities of up to fi ve years and ten years, respectively.
DANSKE BANK SHARESIndex Jan. 2009 = 100
Danske Bank
MSCI Europe Banks
Nov.Sept.Jul.MayMar.Jan.0
50
100
150
200
250
300

There is still much unexploited potential in loans that can serve as collateral for such bonds.
Bond issues made for financing of real property through the Danish mortgage credit system – which has 100% match funding – proved an ex-tremely well-functioning funding source.
The Group has not issued bonds with a state guarantee since July 2009. This underlines that the measures taken and the improvement in the markets make the Group well prepared for the expiry of Bank Package I at the end of September 2010. The Group can still issue bonds worth an-other DKr65bn with a state guarantee.
Future regulationRegulation and supervision of the global financial system attracted attention in 2009. At interna-tional level, a number of initiatives surfaced with the aim of raising liquidity levels and the quan-tity and quality of capital in the banking sector.
Among these were a number of specific measures proposed by the EU to tighten regulations with effect from the end of 2010. The proposals in-clude stricter rules on large exposures and higher
8
capital requirements for trading books. The Group does not expect the proposed measures to have any material effect on its future capital requirement or scope of business.
The Basel Committee on Banking Supervision has also drafted a proposal to amend rules on impairments, capital requirements for mortgage loans, the maximum leverage ratio, counter-cyclical capital buffers, minimum liquidity levels, etc. After a consultation phase, the draft is expected to lead to actual recommendations at the end of 2010 and subsequent incorporation into local law. As a result, the future regulatory framework will be very different from the current one. In general, the Group believes that while the individual measures may be well-considered, it will hardly be beneficial to implement all the proposals in the present form. The Group recom-mends making analyses of the aggregate effect on the operations and lending capacity of banks and mortgage credit institutions prior to implementa-tion to avoid unintentional consequences, which could be critical for the sector or the economies.
The remuneration structure of financial institu-tions was the subject of debate among regulators, media and the sector itself throughout 2009. As a result, new draft regulation on variable elements of pay has been drawn up nationally and interna-tionally. The Group will adjust its remuneration policy when the regulatory framework has been clarified.
In 2009, the Group decided to suspend its cash bonus programme, which previously formed part of its remuneration package. Thus, neither the Executive Board nor the Group’s customer advi-sers or other staff, except staff at Danske Markets and Danske Capital, will receive performance-based remuneration. Performance-based remu-ne ration is maintained at Danske Markets and Danske Capital because these units operate in highly competitive international markets. Vari-able pay to risk takers is based on performance
SUMMARY DANSKE BANK ANNUAL REPORT 2009
12-MONTH LIQUIDITY (DKr bn)
At December 31, 2009 At December 31, 2008
12
mth
s
9 m
ths
6 m
ths
5 m
ths
4 m
ths
3 m
ths
2 m
ths
1 m
th
3 w
eeks
2 w
eeks
1 w
eek
-100
-50
0
50
100
150
200
250
300
350
400
450
9
over a period of years, and disbursement of a portion of the amount is deferred. The Group’s share-based incentive programme has been sus-pended until September 30, 2010. The Executive Board may not, however, receive share-based payments for as long as the Danish state holds hybrid capital in Danske Bank.
ICAAP resultUnder Danish law, the Group, along with all other Danish banks and mortgage credit institu-tions, must publish its ICAAP result at December 31, 2009. The calculation of the ICAAP result is based on an internal process during which management assesses the Group’s overall risks. The ICAAP result shows the estimated capital required to cover the Group’s risks.
At the end of 2009, the Group’s ICAAP result was calculated in accordance with the Basel I rules (the transitional rules). The period during which the transitional rules apply has been extended until the end of 2011. The ICAAP result was DKr84.0bn, or 10.1% of riskweighted assets, at the end of 2009. As the actual capital base stood at DKr148.3bn and the solvency ratio at 17.8% at the end of the year, the Group had a massive capital buffer of DKr64.3bn. If the transitional rules had not still been in force, the ICAAP result would have been DKr80.6bn.
Financial performanceThe Danske Bank Group posted a net profit of DKr1.7bn for 2009. The banking activities re-corded solid and stable earnings before loan and goodwill impairment charges, and capital market activities performed very strongly.
Net interest income was up 2% over the year-earlier figure, mainly because of wider lending margins. The item was adversely affected by lower central bank rates, continued keen compe-tition for deposits and higher long-term funding costs, however.
Throughout 2009, the Group tightened cost control. The lower level of activity along with integration and rationalisation measures led to several organisational adjustments. Consequent-ly, it was necessary to reduce staff by a total of 6% during the year.
Reflecting the significant economic downturn, loan impairment charges remained extraordinar-ily high, but did decline throughout the year. Small and medium-sized businesses in Denmark, Ireland and the Baltic countries in particular suf-fered as a result of falling asset values and declin-ing sales in both export and home markets.
Focus areasIn 2009, the Group worked in several areas to become a better bank for customers, employees, shareholders and other stakeholders. It continues to focus on improving customer service and on being an efficient provider of high-quality bank-ing services.
In Denmark, the Group launched a number of in-itiatives to ensure that customers see their bank as accessible, responsible and transparent. The Group’s Corporate Responsibility policy supports this process.
Customers will continue to see improvements in the form of more flexible self-service products and will be served by highly-qualified advisers at branches and finance centres.
The enhancement of the IT platform will strengthen the range of products and services and make it easier and faster for customers to bank online. In addition, increased digitalisation will free more advisory resources for proactive cus-tomer contact. IT improvements also help lower costs – a precondition for maintaining competi-tive prices.
DANSKE BANK ANNUAL REPORT 2009 SUMMARY

INCOME STATEMENT(DKr m) 2009 2008
Index
09/08
Q4
2009
Q3
2009
Q2
2009
Q1
2009
Net interest income 27,524 27,005 102 6,765 6,625 6,907 7,227
Net fee income 7,678 8,110 95 2,077 1,918 1,920 1,763
Net trading income 18,244 6,076 - 1,961 3,886 4,918 7,479
Other income 3,083 3,585 86 872 703 861 647
Net income from insurance business 2,810 -1,733 - 1,779 470 470 91
Total income 59,339 43,043 138 13,454 13,602 15,076 17,207
Expenses 28,907 28,726 101 7,184 6,338 8,489 6,896
Profi t before loan impairment charges 30,432 14,317 213 6,270 7,264 6,587 10,311
Loan impairment charges 25,677 12,088 212 4,982 6,164 6,550 7,981
Profi t before tax 4,755 2,229 213 1,288 1,100 37 2,330
Tax 3,042 1,193 255 883 517 865 777
Net profi t for the period 1,713 1,036 165 405 583 -828 1,553
Attributable to minority interests -14 25 - - - - -14
10
FINANCIAL REVIEW
Financial results for the yearThe Danske Bank Group posted a net profi t of DKr1.7bn for 2009. This result cannot be con-sidered satisfactory, but it is acceptable given the diffi cult macroeconomic conditions and is in the aggregate slightly better than expected.
The total income of DKr59.3bn was the highest in the Group’s history. Danske Markets’ exception-ally high income was the key factor behind the result. The main source of income, the banking activities, also achieved an increase in net inter-est income.
Excluding goodwill impairments, the guarantee commission paid under Bank Package I and sev-erance payments, expenses fell. A stronger focus on cost control led to effi ciency gains and a lower headcount. Investments in product development and improvement of processes and customer-facing functionality (such as eBanking) remained high.
At DKr25.7bn, or 1.1% of total credit exposure from lending activities, loan impairment charges were higher than ever before. They related
PROFIT BEFORE LOAN IMPAIRMENT CHARGES(DKr bn)
Profit before impairment charges from Danske Markets,
Danske Capital and Danica Pension
Profit before loan and goodwill impairment charges from
Banking Activities, excl. state guarantee commission
2008 2009
-2
-1
0
1
2
3
4
5
6
7
Q4Q3Q2Q1Q4Q3Q2Q1
FINANCIAL REVIEW DANSKE BANK ANNUAL REPORT 2009

11
mainly to facilities granted to small and medi-um-sized enterprises and fi nancial counterpar-ties and the loss guarantee to the Danish state. Charges against retail facilities rose to 0.5% of retail exposure, but were still low compared with charges against corporate facilities.
IncomeThe rise in income in 2009 was very satisfactory.
Net interest income rose DKr0.5bn, or 2% above the level last year, as all banking units wid-ened lending margins to strike a better balance between margins on the one hand and the risk relating to facilities and their duration on the other. In comparison with the end-2008 fi gure, however, the item was adversely affected by lower central bank rates, continued keen compe-tition for deposits and higher long-term funding costs, including interest paid to the Danish state for hybrid capital.
Net fee income fell DKr0.4bn to DKr7.7bn, main-ly because the lower level of lending activity led to lower activity- and portfolio-based fee income.
Net trading income represented a good result, rising DKr12.2bn to DKr18.2bn. Especially in the fi rst half of 2009, Danske Markets took advantage of favourable market conditions. Although the level of activity and income fell somewhat in the last months of the year, net trading income remained high in the second half-year, still ben-efi ting from strong customer activity, particularly within interest rate and currency hedging.
The available-for-sale bond portfolio posted a gain – recognised directly in shareholders’ equity – of DKr0.7bn. The fi gure comprises a loss of DKr0.6bn in the fi rst quarter and an aggregate gain of DKr1.3bn in the second to fourth quarters, refl ecting the trend in credit spreads. In 2008, the Group recognised a capital loss of DKr1.9bn.
(bp)
Cibor Euribor
CIBOR AND EURIBOR 3-MONTH SPREAD TO OIS(OIS = Overnight Index Swaps)
2008 2009
0
50
100
150
200
250
Jun. Aug. Oct. Dec.Apr.Feb.Dec.Oct.Aug.Jun.
YIELD SPREADS TO SWAP RATE(bp)
iTraxx Main
iBoxx, European covered bonds
Danish mortgage bonds
2008 2009
-20
20
60
100
140
180
220
Dec.Oct.Aug.Jun.Apr.Feb.Dec.Oct.Aug.Jun.
DANSKE BANK ANNUAL REPORT 2009 FINANCIAL REVIEW

PROFIT BEFORE LOAN IMPAIRMENT CHARGES(DKr m) 2009 2008
Index
09/08
Q4
2009
Q3
2009
Q2
2009
Q1
2009
Total Denmark 8,812 10,527 84 2,081 2,169 2,079 2,483
Total international 6,586 6,489 101 1,382 1,709 1,728 1,767
Total banking activities 15,398 17,016 90 3,463 3,878 3,807 4,250
Danske Markets 14,352 1,233 - 1,008 3,189 3,947 6,208
Danske Capital 751 813 92 205 140 249 157
Danica Pension 2,810 -1,733 - 1,779 470 470 91
Other Activities -625 1,435 - 27 -222 -261 -169
Goodwill impairment charges 1,458 3,084 47 41 - 1,417 -
Total integration expenses 796 1,363 58 171 191 208 226
Profit before loan impairment charges 30,432 14,317 213 6,270 7,264 6,587 10,311
Other income fell DKr0.5bn from the year-earlier figure, mainly because the figure for 2008 ben-efited from proceeds relating to property sales.
Insurance business generated a profit of DKr2.8bn, against a loss of DKr1.7bn in 2008, mainly because the investment return im-proved DKr2.3bn. Thus, the technical basis for risk allowance enabled the Group to book the allowance for 2009 of DKr1.1bn in the fourth quarter. The Group also booked DKr0.6bn of the DKr1.1bn allowance postponed in 2008. The residual amount remains in the shadow account.
ExpensesExcluding goodwill impairments, expenses for Bank Package I and severance payments, ex-penses fell 2%. The fall was attributable to tighter cost control, including the cut in costs achieved through staff reductions.
In view of the poor state of the Baltic economies, the Group lowered the earnings estimates for itsactivities in Latvia and Lithuania in the secondquarter and recognised goodwill impairment charges of DKr1.4bn.
ORDINARY EXPENSES(DKr bn)
2009 2008
Expenses 28.9 28.7
Goodwill impairment charges 1.5 3.1
Commission (Bank Package I) 2.5 0.6
Severance payments 0.7 0.2
Ordinary expenses 24.2 24.8
If economic conditions get worse, further good-will impairment charges against acquired activi-ties may become necessary. Such charges will not affect the Group’s solvency or liquidity.
Profit before loan impairment chargesOverall, profit before loan impairment charges rose DKr16.1bn. Profit more than doubled in comparison with 2008, mainly because of the in-crease in the profit generated by Danske Markets and Danica Pension – the Group’s market-related business units.
The cost/income ratio improved from 66.7% in 2008 to 48.7%.
12 FINANCIAL REVIEW DANSKE BANK ANNUAL REPORT 2009

13
Loan impairment chargesLoan impairment charges amounted to DKr25.7bn, against DKr12.1bn in 2008. Charges remained high, reflecting the economic crisis, but showed a declining trend throughout the year.
Charges against facilities to corporate customers amounted to DKr16.1bn (with small and medi-um-sized enterprises accounting for DKr13.3bn), charges against facilities to financial counterpar-ties to DKr5.5bn (with Bank Package I accounting for DKr1.6bn), and charges against facilities to retail customers to DKr4.1bn.
Loan impairment charges against facilities to cus-tomers in default (rating category 11) accounted for DKr15bn, or 58%, of the charges recognised for the year. The remainder comprised charges for individual facilities to customers for whichthere is other evidence of financial difficulty and collective charges.
LOAN IMPAIRMENT CHARGES(DKr m) 2009 2008
Banking Activities Denmark 10,049 4,354
Banking Activities Finland 1,723 511
Banking Activities Sweden 509 520
Banking Activities Norway 676 489
Banking Activities
Northern Ireland 1,399 641
Banking Activities Ireland 5,238 1,700
Banking Activities Baltics 2,725 295
Other Banking Activities 167 22
Danske Markets 3,237 3,237
Danske Capital -46 319
Total 25,677 12,088
At Banking Activities Denmark, loan impairment charges totalled DKr10.0bn and related mainly to corporate customers in the property, shipping and agricultural sectors. The Group recognised a total charge of DKr1.6bn for its commitment to cover losses of distressed banks under Bank Package I. Charges relating to retail customers totalled DKr2.3bn. At year-end 2009, Realkredit Danmark had 37 foreclosures, against 23 at year-end 2008.
Banking Activities Finland recognised loan im-pairment charges of DKr1.7bn, mainly against a few large facilities to corporate customers.
Loan impairment charges at Banking Activities Northern Ireland amounted to DKr1.4bn and con-sisted of charges against facilities to corporate customers, particularly in the property sector.
At Banking Activities Ireland, loan impairment charges totalled DKr5.2bn, reflecting in particular the negative trend in the Irish property market. The Republic of Ireland established the National Asset Management Agency (NAMA) in which six
DANSKE BANK ANNUAL REPORT 2009 FINANCIAL REVIEW
LOAN IMPAIRMENT CHARGES 2009(DKr m)
0
2,000
4,000
6,000
8,000
Q4Q3Q2Q1

Irish banks participate. The purpose of NAMA is to acquire property loans from banks partici-pating in the Irish bank packages. The Group expects NAMA to help stabilise Ireland’s severely strained property market.
The Baltic economies were under severe pressure through 2009, and Latvia raised loans from the International Monetary Fund. The Group’s expo-sure to the Baltic region was relatively modest, amounting to some DKr29bn, or 1.3% of expo-sure from lending activities, and the exposure to Latvia was less than DKr2.3bn. Banking Activi-ties Baltics recognised loan impairment charges of DKr2.7bn.
Danske Markets recognised impairment charges of DKr3.2bn against facilities to international fi nancial counterparties.
Total actual losses rose and amounted to DKr5.3bn in 2009, against DKr1.5bn in 2008.
TaxTax on the profi t for the year amounted to DKr3.0bn. The tax charge is high in relation to the pretax profi t for the year because of non-deductible goodwill impairment charges of DKr1.5bn and pretax losses in countries such as Ireland. The taxable amount of losses is capi-talised if it is likely that the Group will book a future taxable income that can absorb the tax loss carryforwards.
Financial results for the fourth quarter of 2009Total income amounted to DKr13.5bn in the fourth quarter – more or less the same as in the third quarter.
Net interest income rose 2% over the third-quar-ter fi gure, mainly because of improved results for Banking Activities Denmark. Lending mar-gins remained at the third-quarter level. Deposit margins continued to be under pressure owing to keener competition.
Net trading income amounted to DKr2.0bn in the fourth quarter, and was thus considerably lower than in the third quarter. The strong volatility in the capital markets in the fi rst three quarters of the year subsided, and credit spreads narrowed. Customer-driven trading activity in instruments to hedge risks – and income – dropped somewhat during the last months of the year.
Net income from insurance business amounted to DKr1.8bn and was considerably higher than in the third quarter. The risk allowance for the full year of DKr1.1bn and DKr0.6bn of the risk allowance postponed in 2008 were booked in the fourth quarter.
Expenses were 13% above the third-quarter level because of the postponement of a number of pro-jects from the third to the fourth quarter.
Loan impairment charges continued to show a declining trend.
14 FINANCIAL REVIEW DANSKE BANK ANNUAL REPORT 2009

LENDING (END OF PERIOD)(DKr m) 2009 2008
Index
09/08
Q4
2009
Q3
2009
Q2
2009
Q1
2009
Banking Activities Denmark 1,005,751 1,043,312 96 1,005,751 1,012,763 1,023,290 1,034,386
Other, Denmark 46,420 70,686 66 46,420 44,219 56,756 67,546
Total Denmark 1,052,171 1,113,998 94 1,052,171 1,056,982 1,080,046 1,101,932
Banking Activities Finland 157,810 172,617 91 157,810 162,066 166,158 169,178
Banking Activities Sweden 167,461 173,732 96 167,461 174,389 171,656 174,973
Banking Activities Norway 150,702 141,446 107 150,702 152,603 148,773 154,541
Banking Activities Northern Ireland 51,510 53,376 97 51,510 53,214 56,600 49,694
Banking Activities Ireland 76,601 79,352 97 76,601 77,866 78,831 80,035
Banking Activities Baltics 26,816 30,426 88 26,816 27,841 28,676 29,852
Other, international 20,790 35,501 59 20,790 24,351 28,483 32,644
Total international 651,690 686,450 95 651,690 672,330 679,177 690,917
Allowance account 34,309 15,125 227 34,309 31,062 28,146 22,364
Total lending 1,669,552 1,785,323 94 1,669,552 1,698,250 1,731,077 1,770,485
DEPOSITS AND BONDS ISSUED BY REALKREDIT DANMARK (END OF PERIOD)(DKr m)
Banking Activities Denmark 317,080 305,373 104 317,080 315,376 313,547 315,274
Other, Denmark 150,036 206,416 73 150,036 169,758 152,089 179,982
Total Denmark 467,116 511,789 91 467,116 485,134 465,636 495,256
Banking Activities Finland 96,005 90,358 106 96,005 93,040 98,655 95,801
Banking Activities Sweden 74,263 56,187 132 74,263 65,716 59,692 59,294
Banking Activities Norway 62,709 47,426 132 62,709 57,250 54,422 51,514
Banking Activities Northern Ireland 45,914 44,459 103 45,914 45,959 49,240 42,807
Banking Activities Ireland 30,805 24,556 125 30,805 32,367 30,312 26,738
Banking Activities Baltics 17,073 14,962 114 17,073 14,889 15,529 15,442
Other, international 10,047 10,560 95 10,047 8,722 8,974 9,597
Total international 336,816 288,508 117 336,816 317,943 316,824 301,193
Total deposits 803,932 800,297 100 803,932 803,077 782,460 796,449
Bonds issued by Realkredit Danmark 517,055 479,534 108 517,055 536,442 521,981 511,118
Own holdings of Realkredit Danmark bonds 143,630 168,197 85 143,630 126,657 127,500 132,031
Total Realkredit Danmark bonds 660,685 647,731 102 660,685 663,099 649,481 643,149
Deposits and bonds issued by Realkredit Danmark 1,464,617 1,448,028 101 1,464,617 1,466,176 1,431,941 1,439,598
Lending as % of deposits and bonds issued by
Realkredit Danmark 114.0 123.3 114.0 115.8 120.9 123.0
BALANCE SHEET
15 DANSKE BANK ANNUAL REPORT 2009 FINANCIAL REVIEW

Credit exposureAt the end of 2009, total credit exposure was DKr3,042bn. Some DKr2,301bn derived from do-mestic and international lending activities, and DKr741bn from trading and investment activities.
Total credit exposure from lending activities also included amounts due from credit institutions and central banks, guarantees and irrevocable loan commitments. The expo-sure is calculated as the carrying amounts, including repo loans, and is adjusted for impairment charges.
Credit exposure from lending activities to retail customers ac-counted for 37% of total exposure, exposure to corporate customers for 39% and exposure to finan-cial counterparties for 18%. The remaining 6% related to central banks and governments.
Loan portfolioCredit exposure from lending activities fell DKr218bn during 2009. The reduction was primarily within expo-sure to financial counterparties, where, among others, unutilised commitments were lowered. The economic downturn caused a decline in cor-porate customer demand for credit, especially in the first half of the year. Credit exposure to retail customers recorded an increase, and demand for home finance rose in the second half of the year.
Most of the Group’s credit exposure consists of loans secured on real property. At the end of 2009, these loans accounted for 87% of retail exposure and 46% of corporate exposure.
Excluding financial counterparties, Danish customers accounted for 59% of credit exposure. Lending to customers in the Nordic region ac-counted for 89% of credit exposure from lending activities. Lending as a percentage of deposits and bonds issued by Realkredit Danmark was 114.0%, against 123.3% at the end of 2008.
Throughout the year, the Group accommodated both existing and new creditworthy customers.
In Denmark, new lending amounted to DKr75bn, of which DKr30bn was for the retail segment and DKr45bn for the corporate segment. New mort-gage lending accounted for DKr23bn of the total amount.
Large exposures are defined as exposures amounting to at least 10% of the capital base calculated in accordance with the rules of the Danish Financial Business Act. At the end of
16
CREDIT EXPOSURE FROMLENDING ACTIVITIES(DKr m)
Dec. 31,
2009
Share of
total (%)
Dec. 31,
2008
Share of
total (%)
Banking Activities
Denmark 1,109,062 48 1,130,067 45
Banking Activities Finland 193,155 9 207,243 8
Banking Activities Sweden 210,138 9 219,689 9
Banking Activities Norway 186,538 8 175,408 7
Banking Activities
Northern Ireland 50,843 2 54,746 2
Banking Activities Ireland 72,942 3 81,057 3
Banking Activities Baltics 29,149 1 32,130 1
Other Banking Activities 50,391 2 61,967 2
Danske Markets 386,587 17 534,102 21
Danske Capital 12,615 1 23,461 1
Total 2,301,420 100 2,519,870 100
FINANCIAL REVIEW DANSKE BANK ANNUAL REPORT 2009

17
2009, the Group had two large exposures, against nine at the end of 2008. The fall was caused by reductions in lines to financial customer and a capital increase. The sum of large exposures may not exceed 800% of the capital base; at the end of 2009, the sum was 25%, against 107% a year earlier.
Retail customersCredit exposure to retail customers, particularly home finance, saw a rise. The quality of the retail loan portfolio was generally good, although af-fected by rising unemployment and declining as-set values. For the year as a whole, 92% of retail loan applications in Denmark were approved. For the fourth quarter, the figure was 93%.
Falling house prices led to higher loan-to-value (LTV) ratios in the Group’s markets, and the aver-age LTV ratio was thus 69% at the end of 2009, against 54% at the end of 2008. Despite lower interest rates, the financial situation of many households deteriorated because of rising unem-ployment and falling house prices.
Accumulated impairment charges against retail facilities amounted to 11% of total impairment charges.
Corporate customersCredit exposure to corporate customers fell 7% from the end-2008 level, mainly because many sectors saw a considerable slowdown in activity. Credit quality deteriorated as a result of the glob-al economic downturn. For the year as a whole, 87% of corporate loan applications in Denmark were approved. For the fourth quarter, the figure was 88%.
Credit exposure to commercial property totalled DKr242bn at the end of 2009, or 11% of total
credit exposure. The economic downturn had a particularly adverse effect on the property sector, especially in the markets of Banking Activities Ireland and Banking Activities Baltics, causing a significant deterioration in creditworthiness. Property developers in particular found their financial situation difficult, and exposure to this sector amounted to DKr13.6bn at end-2009, against DKr16.2bn at end-2008.
The Group has monitored the property sector intensely for some time now. When measuring lending to the sector, collateral (properties) is in-cluded at current market value less a deduction. The deduction covers conservative estimates of, for example, the costs of a forced sale – includ-ing the cost of days on the market, maintenance, amounts payable to external parties for consul-tancy services and the like – as well as the poten-tial loss of value during the sales period.
Low sales prices in the agricultural sector squeezed liquidity and earnings. Combined with a drop in land prices, this weakened the credit quality of this customer segment. Credit exposure to agricultural customers amounted to DKr71bn, with DKr45bn deriving from loans provided by Realkredit Danmark and DKr11bn from loans provided by Danske Bank Denmark. The average LTV ratio of agricultural properties mortgaged to Realkredit Danmark was 64%, against 46% a year earlier.
The global economic downturn has hurt the shipping industry severely. Weaker demand and growing excess capacity led to plunging freight rates and put pressure on small shipping compa-nies and companies that had purchased vessels at high cost in particular. The industry’s credit qual-ity deteriorated further, although freight rates im-proved a little towards the end of the year. Credit
DANSKE BANK ANNUAL REPORT 2009 FINANCIAL REVIEW

exposure to the shipping industry amounted to DKr44bn, or 2% of total credit exposure.
Because of lower consumer spending, demand for retail goods, including consumer durables and cars, fell. At the end of 2009, exposure to consumer durables amounted to DKr85bn; at end-2008, the fi gure was DKr98bn.
Financial counterpartiesIn view of the very turbulent fi nancial markets, the Group reduced exposure to fi nancial counter-parties throughout the year to DKr409bn at the end of 2009, or 18% of total credit exposure. At the end of 2008, exposure to fi nancial counter-parties stood at DKr634bn. Exposure to fi nan-cial counterparties comprises facilities to large, creditworthy fi nancial institutions – established as part of the Group’s capital markets activities – and is based extensively on facilities supported by collateral.
Credit exposure to private equity funds amount-ed to DKr25bn, or around 1% of total credit expo-sure. This exposure related to transactions in the Nordic region and was equally divided between fi nancing of acquisitions and operations. Being distributed on several different industries, the exposure was well diversifi ed.
For additional information about credit exposure, see Risk Management 2009, which is available at www.danskebank.com/ir.
Allowance accountOf total credit exposure, DKr30.6bn was in rating category 11 and DKr24.8bn in rating category 10, against DKr23.7bn and DKr8.9bn at the end of 2008.
Rating category 11 covers exposures to custom-ers which according to the Group’s defi nition are in default. These customers are subject to debt
collection, suspension of payments or bank-ruptcy, or have one or more facilities on which a payment is more than 90 days past due. If one payment is more than 90 days past due, the total credit exposure to the customer in question is downgraded. Downgrading takes place even if the customer has provided adequate collateral. Exposure net of collateral value in rating category 11, that is, exposure less impairment charges and the value of collateral received, was DKr6.8bn, of which DKr1.9bn relates to Bank Package I. The remaining amount equals the estimated amount of dividend distributable to the Group. Collateral received is measured at the current market value less deductions. At the end of 2008, exposure net of collateral value in rating category 11 was DKr7.7bn.
Rating category 10 covers exposure to customers not in default but for which other evidence of fi nancial diffi culty exists, including an estimated future need for fi nancial restructuring. Most of this exposure relates to customers duly servicing their loans.
EXPOSURE AT DEC. 31, 2009(DKr bn)
Rating category
11 10
Credit exposure before
impairment charges 49.6 38.6
Impairment charges 19.0 13.8
Credit exposure 30.6 24.8
Collateral value 23.8 17.2
Total unsecured credit
exposure 6.8 7.6
Covered by collateral (%) 86.2 80.2
18 FINANCIAL REVIEW DANSKE BANK ANNUAL REPORT 2009

19
Economic developments in 2009 hurt the credit quality of loan portfolios, especially at Banking Activities Ireland and Banking Activities Baltics. Impairment charges covered 8.8% and 9.3%, respectively, of these business units’ exposure. At Group level, the share of exposure covered by impairment charges was 1.6%, against 0.6% at the end of 2008.
ALLOWANCE ACCOUNT, TOTAL(DKr m)
Dec. 31,
2009
Dec. 31,
2008
Banking Activities Denmark 13,496 6,066
Banking Activities Finland 2,545 1,267
Banking Activities Sweden 1,182 696
Banking Activities Norway 1,404 737
Banking Activities
Northern Ireland 2,006 627
Banking Activities Ireland 7,002 1,855
Banking Activities Baltics 2,985 432
Other Banking Activities 1,261 678
Danske Markets 4,917 3,152
Danske Capital 297 348
Total 37,095 15,858
Deposits and bonds issued by Realkredit DanmarkDeposits at Banking Activities Denmark in-creased 4% in 2009. Higher deposits in high-interest accounts and ordinary retail deposits contributed to the increase. Deposits in the “Other, Denmark” category saw a fall of DKr56bn from the level at end-2008 because of a decline in short-term deposits placed with Danske Markets by institutional investors.
The market value of mortgage bonds issued to fund loans provided by Realkredit Danmark, including the Group’s own holdings, rose 2% over the level at the end of 2008 and amounted to DKr661bn.
Trading and investment activitiesCredit exposure to trading and investment activities declined from DKr1,003bn at year-end 2008 to DKr741bn at year-end 2009. The decline was due primarily to a drop in the positive fair value of conventional interest rate and currency contracts. The Group has made agreements with many of its counterparties to net positive and negative market values. Most of these net facilities are secured by collateral management agreements.
The bond portfolio amounted to DKr423bn, the same as at end-2008. The part of the port-folio classifi ed as available for sale amounted to DKr92bn, against DKr117bn a year earlier.
Most of the bond portfolio can be used as collat-eral for loans from central banks and therefore forms part of the Group’s liquidity reserve.
BOND PORTFOLIO(%) 2009 2008
Bonds guaranteed by central or
local governments 24 16
Bonds issued by quasi-govern-
ment institutions 2 2
Danish mortgage bonds 42 40
Swedish covered bonds 18 20
Other covered bonds 6 9
Short-dated bonds (CP etc.),
primarily with banks 4 7
Credit bonds 4 6
Total holdings 100 100
Available-for-sale bonds
included in preceding item 22 28
Short-dated bonds were issued primarily by banks in Scandinavia, Spain, France and Fin-land. Ninety per cent of the bonds had an exter-nal investment grade rating, and of those, 61% were rated AA- or higher.
DANSKE BANK ANNUAL REPORT 2009 FINANCIAL REVIEW
Holdings of credit bonds consisted of corporate bonds, including bonds issued by banks, and covered bonds not under public supervision. Ninety-five per cent of the bonds had an external investment grade rating, and of those, 43% were rated AA- or higher.
Throughout 2009, the bond portfolio benefited from declining short-term interest rates, although modestly higher long-term yields had a slightly contrary effect. Credit spreads narrowed in the last three quarters of the year from their peak in the first quarter, resulting in higher bond prices. No issuers of bonds in the Group’s portfolio de-faulted on their payment obligations.
At the end of 2009, the Group’s total Value at Risk (VaR), excluding insurance activities at Danica Pension, stood at DKr0.3bn, against DKr0.5bn at the end of 2008. The fall was owing to reduced risk taking, which more than compen-sated for the increase in VaR caused by a model adjustment in 2009. In the adjustment, model data representing the past year were given the greatest weighting.
Solvency and capitalIn May 2009, Danske Bank A/S and Realkredit Danmark A/S raised subordinated loan capital in the form of hybrid capital of DKr24bn and DKr2bn from the Danish state.
Until May 14, 2014, Danske Bank will have the option to gradually convert the loan capital into shares in Danske Bank A/S if the hybrid capital exceeds 35% of total tier 1 capital. Danske Bank must gradually convert the loan capital into share capital if the hybrid capital exceeds 50% of total tier 1 capital in the same period. The conversion must be made at market price. At end-2009, the
hybrid capital accounted for 32.9% of total tier 1 capital. Danske Bank does not expect to convert the loan capital into share capital.
The interest rate on the loans from the Danish state is 9.265% per annum, of which the individ-ual margin, calculated on the basis of the Group’s average external ratings, constitutes 0.375 of a percentage point. Payment for the conversion op-tion is 0.5 of a percentage point per annum. The interest rate will increase if Danske Bank pays dividends in excess of DKr3.4bn per annum.
The subordinated loans strengthened the capital base, and the Group is thus better prepared to withstand losses any further negative economic developments may cause.
At December 31, 2009, the solvency ratio was 17.8%, with 14.1 percentage points deriving from tier 1 capital. The loan capital raised from the Danish state accounted for 3.1 percentage points of the solvency and tier 1 capital ratios. Impairment charges against particularly highly weighted facilities and the reduction of total as-sets triggered a fall in risk-weighted assets from DKr960bn at end-2008 to DKr834bn. At the end of 2008, the solvency ratio was 13.0% and the tier 1 capital ratio was 9.2%.
At year-end 2009, the ICAAP result was 10.1%. The section on capital management and Risk Management 2009 provide more details about the Group’s ICAAP result.
RatingsIn the first quarter of 2009, Danske Bank was downgraded by Standard & Poor’s (from AA- to A+), Moody’s (from Aa1 to Aa3) and Fitch Rat-ings (from AA- to A+).
20 FINANCIAL REVIEW DANSKE BANK ANNUAL REPORT 2009

21
In the fourth quarter, Standard & Poor’s further downgraded Danske Bank from A+ to A (negative outlook). Bonds issued with a guarantee from the Danish state are rated AAA.
Similarly, Standard & Poor’s downgraded Danica Pension’s rating from AA- to A+ in February and lowered the rating again from A+ to A (negative outlook) in December.
All new bond issues from Realkredit Danmark carry Aaa and AAA ratings, the highest possible ratings awarded by Moody’s and Standard & Poor’s.
OutlookThe Group expects 2010 to be another challeng-ing year for the financial sector, the Danske Bank Group and its customers. Recent macroeconomic indicators do, however, lend hope that the busi-ness environment will gradually improve.
Danish GDP growth in 2010 is estimated at around 1.7%. The Group expects similar growth rates in its other markets, with the exception of Ireland, which is expected to see zero growth, and the Baltic countries, which are expected to see their GDPs contract.
Short-term interest rates are expected to rise about 0.5 of a percentage point in Denmark, and on average the same in the Group’s other mar-kets.
Unemployment rose in the Group’s principal markets in 2009, and the Group expects this trend to continue throughout 2010. This rise in unemployment combined with falling house prices has caused the financial situation of many households to deteriorate. Despite low interest
rates and tax reform, the Group thus expects the credit quality of the retail segment to deteriorate further in 2010. Corporate customers are likely to see their creditworthiness improve gradually, although a few sectors, agriculture for example, will continue to occasion rising impairment charges.
The performance of market-related activities – in Danske Markets, Danske Capital and Danica Pension – will depend greatly on trends in the financial markets, including the level of securi-ties prices at the end of the year. The extraordi-narily high level of income of 2009 is unlikely to continue into 2010.
The level of expenses is expected to be lower in 2010 than in 2009. Nonetheless, the Group will continue to focus on cost control. IT investments in product development and improvement of processes and customer-facing functionality will remain high also in 2010.
Loan impairment charges are likely to be high, although lower than in 2009.
The robust banking activities, tight cost control and continued strong focus on risk, liquidity and capital management combined with the massive capital buffer give the Group a solid foundation for its operations at the threshold of the new year.
DANSKE BANK ANNUAL REPORT 2009 FINANCIAL REVIEW
BUSINESS UNITS
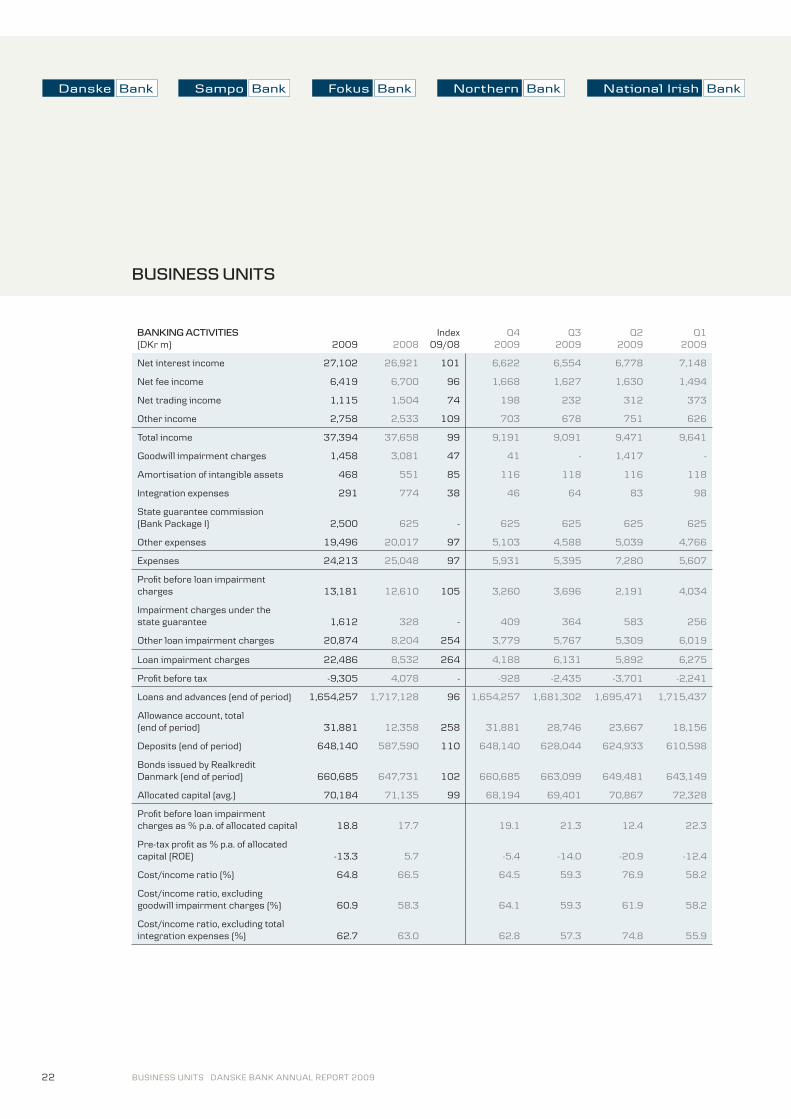
BANKING ACTIVITIES(DKr m) 2009 2008
Index
09/08
Q4
2009
Q3
2009
Q2
2009
Q1
2009
Net interest income 27,102 26,921 101 6,622 6,554 6,778 7,148
Net fee income 6,419 6,700 96 1,668 1,627 1,630 1,494
Net trading income 1,115 1,504 74 198 232 312 373
Other income 2,758 2,533 109 703 678 751 626
Total income 37,394 37,658 99 9,191 9,091 9,471 9,641
Goodwill impairment charges 1,458 3,081 47 41 - 1,417 -
Amortisation of intangible assets 468 551 85 116 118 116 118
Integration expenses 291 774 38 46 64 83 98
State guarantee commission
(Bank Package I) 2,500 625 - 625 625 625 625
Other expenses 19,496 20,017 97 5,103 4,588 5,039 4,766
Expenses 24,213 25,048 97 5,931 5,395 7,280 5,607
Profit before loan impairment
charges 13,181 12,610 105 3,260 3,696 2,191 4,034
Impairment charges under the
state guarantee 1,612 328 - 409 364 583 256
Other loan impairment charges 20,874 8,204 254 3,779 5,767 5,309 6,019
Loan impairment charges 22,486 8,532 264 4,188 6,131 5,892 6,275
Profit before tax -9,305 4,078 - -928 -2,435 -3,701 -2,241
Loans and advances (end of period) 1,654,257 1,717,128 96 1,654,257 1,681,302 1,695,471 1,715,437
Allowance account, total
(end of period) 31,881 12,358 258 31,881 28,746 23,667 18,156
Deposits (end of period) 648,140 587,590 110 648,140 628,044 624,933 610,598
Bonds issued by Realkredit
Danmark (end of period) 660,685 647,731 102 660,685 663,099 649,481 643,149
Allocated capital (avg.) 70,184 71,135 99 68,194 69,401 70,867 72,328
Profit before loan impairment
charges as % p.a. of allocated capital 18.8 17.7 19.1 21.3 12.4 22.3
Pre-tax profit as % p.a. of allocated
capital (ROE) -13.3 5.7 -5.4 -14.0 -20.9 -12.4
Cost/income ratio (%) 64.8 66.5 64.5 59.3 76.9 58.2
Cost/income ratio, excluding
goodwill impairment charges (%) 60.9 58.3 64.1 59.3 61.9 58.2
Cost/income ratio, excluding total
integration expenses (%) 62.7 63.0 62.8 57.3 74.8 55.9
22 BUSINESS UNITS DANSKE BANK ANNUAL REPORT 2009

BANKING ACTIVITIES 2009 2009 2009 2008 2009 2008 2009 2008 2009 2008
Denmark 5.5 -4.8 1,006 1,043 28 31 317 305 30 30
Finland 5.3 -7.2 158 173 13 14 96 90 12 12
Sweden 9.2 -4.4 168 174 7 74 56 5
Norway 4.8 -1.1 151 141 6 6 63 47 4 4
Northern Ireland 1.8 -4.4 52 53 - - 46 45 - -
Ireland 4.2 -7.0 77 79 5 5 31 25 3 3
Estonia* 1.3 -14.8 14 16 11 12 11 11 14 15
Latvia* 2.2 -18.3 2 3 1 1 1 1 1 1
Lithuania* 3.2 -15.5 11 12 7 7 5 4 6 5
Other - - 18 23 - - 4 4 - -
Total - - 1,657 1,717 - - 648 588 - -
Population
(millions)
GDP fore-
cast (%)
Lending
(DKr bn)
Market share
(%)
Deposits
(DKr bn)
Market share
(%)
*Together, these activities constitute Banking Activities Baltics.
Market share information is based on data reported to the local central banks.
BANKAKTIVITETERBANKAKTIVITETERBANKING ACTIVITIES
23
Market positionThe Danske Bank Group is a major financial ser-vices provider in Denmark and ranks among the largest banks in the Nordic region.
The Group’s ambition is to improve its position by increasing customer satisfaction and broaden-ing its appeal to customers in selected segments on the Scandinavian and Northern Ireland mar-kets. As for its operations in the Baltic region and Ireland, the Group focuses on restoring profit-ability.
In 2009, funding costs rose owing to the hybrid capital raised and issues of long-term bonds. Funding costs were allocated to the business units on the basis of the units’ composition of lending and deposits and trends in local inter-bank spreads. This settlement method resulted in a relatively large share of funding costs at Danske Markets and at banking units with insufficient liquidity from deposits to fund activities.
INCOME – % OF GROUP TOTAL LENDING – % OF GROUP TOTAL
Banking Activities Denmark
Banking Activities Finland
Banking Activities Sweden
Banking Activities Norway
Banking Activities Northern Ireland
Banking Activities Ireland
Banking Activities Baltics
Other Banking Activities
Danske Markets
Danske Capital
Danica Pension
Other Activities
59%9%
10%
9%
3%
4%1%
1%3%
1%
36%
8%
4%6%3%
2%1%
2%
29%
3%
5%1%
DANSKE BANK ANNUAL REPORT 2009 BUSINESS UNITS

BRANCHES
327EMPLOYEES
5,664PRE-TAX PROFIT
DKr-1,222mMARKET SHARE OF LENDING
28.2%
adjusted for the guarantee commission under Bank Package I, rose 3%
I of DKr4.1bn
downward trend
Market conditionsIn 2009, the Danish economy faced a serious economic downturn, unrivalled since the 1930s. The fi rst six months of the year in particular saw plunging output, rising unemployment and declin-ing house prices and GDP. Except for the GDP, this trend continued into the second half of the year, but was less pronounced. At the end of 2008, forecasts expected the Danish economy (GDP) to contract by around 0.7% in 2009. Forecasts now indicate a contraction in 2009 of around 4.8%.
Danske Bank is the largest bank in Denmark.
Financial summaryNet interest income was up 4% over the year-earlier fi gure, mainly because of wider lending margins. Lower central bank rates, continued keen competition for deposits and higher long-term funding costs had an adverse effect on the item.
Excluding the guarantee commission of DKr2.5bn paid to the Danish state and expenses for staff reductions, expenses fell 2% from the year-earlier level.
Total lending was down 4% from the end-2008 level. Corporate lending declined over the year, mirroring customers’ weaker investment appetite and reduced working capital requirement.
Loan impairment charges totalled DKr10.0bn, against DKr4.4bn in 2008. Some DKr5.5bn of this amount consisted of charges against facilities to corporate customers, primarily in the property, shipping and agricultural sectors. Charges against retail facilities stood at DKr2.3bn.
Total deposits rose 4%. Higher deposits in high-interest accounts and ordinary retail deposits contributed to the increase. The market value of mortgage bonds issued to fund loans provided by Realkredit Danmark rose 2% over the 2008 level.
At end-2009, Banking Activities Denmark’s market share of lending, including mortgage loans and repo loans extended by Danske Markets, was 28.2%, down from 30.5% at the end of 2008. The main reason for the decline was a reduction in repo transactions with institutional clients. The market share of deposits was 29.6%, down from the year-earlier 30.2%.
OperationsAt September 1, 2009, Realkredit Denmark’s advi-sory services for small and medium-sized enter-prises merged with Danske Bank. The integration proceeded as planned.
During the summer, Danske Bank dedicated part of its website to a dialogue with customers in Den-mark. The purpose was to determine how Danske Bank could better meet customers’ needs and de-mands. The website had more than 80,000 visitors, and 3,500 visitors blogged about their opinion of
24
INCOME – % OF GROUP TOTAL LENDING – % OF GROUP TOTAL
Banking Activities Denmark
36% 59%
BANKING ACTIVITIES DENMARK ENCOMPASSES THE BANKING ACTIVITIES OF DANSKE BANK DENMARK AS WELL AS THE
ACTIVITIES OF REALKREDIT DANMARK. DANSKE BANK DENMARK CATERS TO ALL TYPES OF RETAIL AND CORPORATE CUSTOM-
ERS. BANKING ACTIVITIES DENMARK’S FINANCE CENTRES SERVE PRIVATE BANKING AND LARGE CORPORATE CUSTOMERS. IN
ADDITION, BANKING ACTIVITIES DENMARK HAS SIX AGRICULTURAL CENTRES AND OFFERS A RANGE OF LEASING SOLUTIONS
TO THE CORPORATE SEGMENT.
BANKING ACTIVITIES DENMARK
BUSINESS UNITS DANSKE BANK ANNUAL REPORT 2009

BANKING ACTIVITIES DENMARK(DKr m) 2009 2008
Index
09/08
Q4
2009
Q3
2009
Q2
2009
Q1
2009
Net interest income 16,124 15,555 104 4,049 3,901 3,963 4,211
Net fee income 3,658 3,839 95 950 923 931 854
Net trading income 539 826 65 20 139 147 233
Other income 956 773 124 235 216 281 224
Total income 21,277 20,993 101 5,254 5,179 5,322 5,522
State guarantee commission (Bank Package I) 2,500 625 - 625 625 625 625
Other expenses 9,950 9,983 100 2,514 2,405 2,628 2,403
Expenses 12,450 10,608 117 3,139 3,030 3,253 3,028
Profi t before loan impairment charges 8,827 10,385 85 2,115 2,149 2,069 2,494
Impairment charges under the state guarantee 1,612 328 - 409 364 583 256
Other loan impairment charges 8,437 4,026 210 1,759 2,535 1,514 2,629
Loan impairment charges 10,049 4,354 231 2,168 2,899 2,097 2,885
Profi t before tax -1,222 6,031 - -53 -750 -28 -391
Loans and advances (end of period) 1,005,751 1,043,312 96 1,005,751 1,012,763 1,023,290 1,034,386
Allowance account, total (end of period) 13,496 6,066 222 13,496 11,815 9,927 8,251
Deposits (end of period) 317,080 305,373 104 317,080 315,376 313,547 315,274
Bonds issued by Realkredit Danmark (end of period) 660,685 647,731 102 660,685 663,099 649,481 643,149
Allocated capital (avg.) 38,475 38,656 100 37,350 37,896 38,687 40,002
Profi t before loan impairment charges
as % p.a. of allocated capital 22.9 26.9 22.7 22.7 21.4 24.9
Pre-tax profi t as % p.a. of allocated capital (ROE) -3.2 15.6 -0.6 -7.9 -0.3 -3.9
Cost/income ratio (%) 58.5 50.5 59.7 58.5 61.1 54.8
At April 1, 2008, the activities of Nordania Leasing within real property, construction and agricultural machinery, and capital and IT equipment
(now Danske Leasing) were transferred from Other Banking Activities to Banking Activities Denmark.
25
the economic crisis, their own fi nancial situation and their perception of Danske Bank.
In September 2009, Danske Bank launched a number of initiatives to improve customer satisfac-tion under the headings responsibility, accessibil-ity and transparency. These initiatives include more information about interest rates and fees, greater openness about complaints, an online cus-tomer board and termination of all adviser bonus programmes. The Danish www.danskebank.dk/
bedrebank site tracks the progress of the initia-tives.
Macroeconomic outlookIn 2010, Danish economic growth is likely to benefi t from an improving global economy. In re-sponse to lower interest rates on FlexLån® and tax cuts in particular, consumer spending is expected to increase, but unemployment is still expected to rise. Forecasts indicate GDP growth of about 1.7% in 2010, starting from a low point, though.
DANSKE BANK ANNUAL REPORT 2009 BUSINESS UNITS

26
55%
downward trend
Market conditionsThe Finnish economy experienced a sharp de-cline in the export of goods and services in 2009 as the manufacturing industry suffered from low global demand. A slowdown in the private sector also set back investments in construction, ma-chinery and equipment. At the end of 2008, the Finnish economy (GDP) was forecast to contract by around 0.3% in 2009. Forecasts now indicate a contraction in 2009 of around 7.2%.
Sampo Bank is the third-largest bank in the Finnish market.
Financial summaryNet interest income stood at DKr3.0bn, down 10% from the year-earlier fi gure. Lower money market rates and the costs of long-term funding contributed to the decline.
Owing primarily to a decline in integration ex-penses and to realised synergies, expenses fell 14% and were signifi cantly lower than in 2008. The synergies announced at the acquisition in 2007 have been fully realised.
Total lending was down 9% from the level at end-2008. Retail lending remained at its year-earlier level, while corporate lending dropped 18%.
Loan impairment charges totalled DKr1.7bn, against DKr0.5bn in 2008. They consisted pri-marily of a few large charges against individual corporate facilities.
Total deposits rose 6% from the level at Decem-ber 31, 2008. Retail deposits were up 5%, while corporate deposits increased 8%.
At December 31, 2009, Banking Activities Fin-land’s market share of lending was 12.6%, down from 13.8% a year earlier, while its share of deposits was 12.2%, up from 12.0%.
OperationsAfter 66 years at the same address, Sampo Bank’s head offi ce functions moved to two new address-es in Helsinki in June 2009. These functions and the Finnish units of Danske Markets and Danske Capital now share these offi ces.
The Group’s annual customer satisfaction survey, “Moment of Truth”, revealed signifi cantly im-proved satisfaction among Sampo Bank’s retail customers. Two-thirds of the customers were highly or very satisfi ed with the quality of the service rendered. Customers were particularly pleased with meetings at the bank at which committed advisers provide clear and easy-to-understand advice.
BRANCHES
121EMPLOYEES
2,169PRE-TAX PROFIT
DKr-536m
BANKING ACTIVITIES FINLAND ENCOMPASSES THE BANKING ACTIVITIES OF SAMPO BANK FINLAND AND
DANSKE BANK’S HELSINKI BRANCH. SAMPO BANK, THE THIRD-LARGEST BANK IN FINLAND, CATERS TO RETAIL
CUSTOMERS, SMALL AND MEDIUM-SIZED ENTERPRISES AND INSTITUTIONAL CLIENTS.
MARKET SHARE OF LENDING
12.6%
BANKING ACTIVITIES FINLAND
INCOME – % OF GROUP TOTAL LENDING – % OF GROUP TOTAL
Banking Activities Finland
8% 9%
BUSINESS UNITS DANSKE BANK ANNUAL REPORT 2009
27
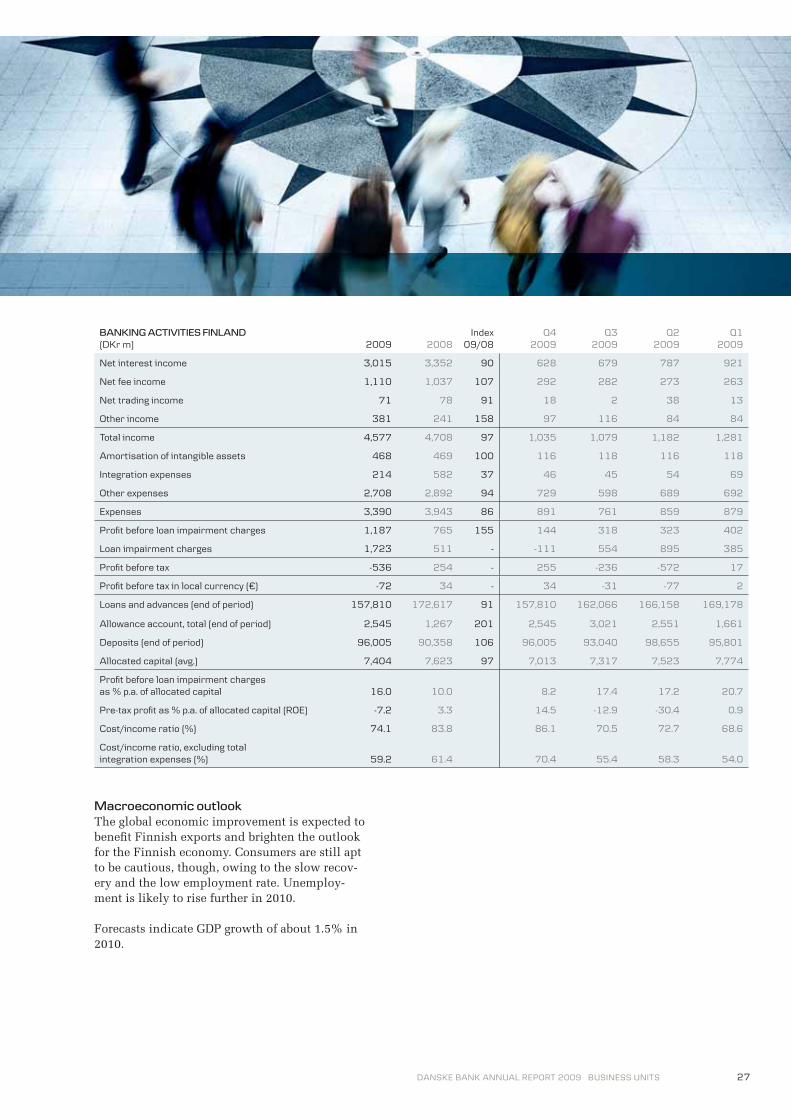
Macroeconomic outlookThe global economic improvement is expected to benefi t Finnish exports and brighten the outlook for the Finnish economy. Consumers are still apt to be cautious, though, owing to the slow recov-ery and the low employment rate. Unemploy-ment is likely to rise further in 2010.
Forecasts indicate GDP growth of about 1.5% in 2010.
BANKING ACTIVITIES FINLAND(DKr m) 2009 2008
Index
09/08
Q4
2009
Q3
2009
Q2
2009
Q1
2009
Net interest income 3,015 3,352 90 628 679 787 921
Net fee income 1,110 1,037 107 292 282 273 263
Net trading income 71 78 91 18 2 38 13
Other income 381 241 158 97 116 84 84
Total income 4,577 4,708 97 1,035 1,079 1,182 1,281
Amortisation of intangible assets 468 469 100 116 118 116 118
Integration expenses 214 582 37 46 45 54 69
Other expenses 2,708 2,892 94 729 598 689 692
Expenses 3,390 3,943 86 891 761 859 879
Profi t before loan impairment charges 1,187 765 155 144 318 323 402
Loan impairment charges 1,723 511 - -111 554 895 385
Profi t before tax -536 254 - 255 -236 -572 17
Profi t before tax in local currency (€) -72 34 - 34 -31 -77 2
Loans and advances (end of period) 157,810 172,617 91 157,810 162,066 166,158 169,178
Allowance account, total (end of period) 2,545 1,267 201 2,545 3,021 2,551 1,661
Deposits (end of period) 96,005 90,358 106 96,005 93,040 98,655 95,801
Allocated capital (avg.) 7,404 7,623 97 7,013 7,317 7,523 7,774
Profi t before loan impairment charges
as % p.a. of allocated capital 16.0 10.0 8.2 17.4 17.2 20.7
Pre-tax profi t as % p.a. of allocated capital (ROE) -7.2 3.3 14.5 -12.9 -30.4 0.9
Cost/income ratio (%) 74.1 83.8 86.1 70.5 72.7 68.6
Cost/income ratio, excluding total
integration expenses (%) 59.2 61.4 70.4 55.4 58.3 54.0
DANSKE BANK ANNUAL REPORT 2009 BUSINESS UNITS

28
down 10% in Danish kroner and 2% in local currency
2008 level, but downward trend over the year
Market conditions The economic contraction left its mark on 2009; exports and demand were down, and unemploy-ment rose. Property prices were stable throughout the period, however, and saw only modest falls. At the end of 2008, forecasts expected the Swedish economy (GDP) to contract by around 1.7% in 2009. Forecasts now indicate a contraction in 2009 of around 4.4%.
Financial summaryOn average, the Swedish krona depreciated in 2009, affecting developments in income items in Danish kroner accordingly. Total income in Danish kroner fell 6% from the level a year earlier.
Despite the narrower deposit margins occasioned by the Swedish central bank’s repeated interest rate cuts, income rose 2% in local currency owing
to wider lending margins. Net interest income suf-fered from higher funding costs.
Expenses were down 3% in Danish kroner from the year-earlier level, but increased 6% in local currency. The increase was attributable partly to the exchange rate effect of intra-group invoicing in Danish kroner.
Estimated lower growth at the Group’s Swedish real-estate agency chain led to an impairment charge of DKr16m against the goodwill of DKr39m acquired in 2005.
Total lending fell 9% in local currency from the level at end-2008, with retail lending gaining 8% and corporate lending dropping 18%.
Despite the economic contraction, loan impair-ment charges remained relatively low at DKr0.5bn, matching the 2008 level. The charges related primarily to corporate facilities. Loan impairment charges declined during the year.
Total deposits rose 24% in local currency from the level a year earlier. Retail deposits were up 3%, and corporate deposits climbed 35%.
At December 31, 2009, Banking Activities Swe-den’s market share of lending was 5.9%, down from 6.6% a year earlier, while its share of depos-its was 5.8%, up from 4.7%.
OperationsAt the end of 2009, Leif Norburg retired from the position as head of the Group’s Swedish banking activities, and Lars Mørch, former head of Group HR & Communications, took over this position. Mr Mørch remains a member of the Danske Bank Group’s Executive Committee.
BRANCHES
56EMPLOYEES
913
BANKING ACTIVITIES SWEDEN ENCOMPASSES THE BANKING ACTIVITIES OF ÖSTGÖTA ENSKILDA BANK AND
PROVINSBANKERNE IN SWEDEN, WHICH SERVE ALL TYPES OF RETAIL AND CORPORATE CUSTOMERS. REAL-ESTATE
AGENCY BUSINESS IS CARRIED OUT PRIMARILY THROUGH THE 70 OFFICES OF SKANDIA MÄKLARNA.
BANKING ACTIVITIES SWEDEN
PRE-TAX PROFIT
DKr754mMARKET SHARE OF LENDING
5.9%
INCOME – % OF GROUP TOTAL LENDING – % OF GROUP TOTAL
Banking Activities Sweden
4% 10%
BUSINESS UNITS DANSKE BANK ANNUAL REPORT 2009

29
In April, Banking Activities Sweden launched its Danske Direkt customer concept targeted at retail customers who value no-fee expert advisory serv-ices over the Internet and telephone.
Banking Activities Sweden carried out a number of organisational adjustments. To meet customers’ increased demand for round-the-clock banking, the unit intensifi ed its focus on contact centres and mobile sales teams to complement the branch network and the fi nance centres. To streamline the Swedish organisation, a number of small branches will merge.
Macroeconomic outlookThe global economy is set to improve in 2010, and most of Sweden’s export markets will benefi t. Con-sumers, however, are still likely to show caution because of the slow economic recovery and the low employment rate. Unemployment is expected to increase further in 2010. Forecasts indicate GDP growth of about 1.2% in 2010.
BANKING ACTIVITIES SWEDEN(DKr m) 2009 2008
Index
09/08
Q4
2009
Q3
2009
Q2
2009
Q1
2009
Net interest income 1,997 2,120 94 489 532 520 456
Net fee income 642 673 95 175 155 182 130
Net trading income 86 108 80 22 20 23 21
Other income 51 52 98 14 11 17 9
Total income 2,776 2,953 94 700 718 742 616
Goodwill impairment charge 16 - - 16 - - -
Other expenses 1,497 1,555 96 402 359 395 341
Expenses 1,513 1,555 97 418 359 395 341
Profi t before loan impairment charges 1,263 1,398 90 282 359 347 275
Loan impairment charges 509 520 98 -12 109 115 297
Profi t before tax 754 878 86 294 250 232 -22
Profi t before tax in local currency (SKr) 1,055 1,081 98 409 347 332 -33
Loans and advances (end of period) 167,461 173,732 96 167,461 174,389 171,656 174,973
Allowance account, total (end of period) 1,182 696 170 1,182 1,240 1,082 976
Deposits (end of period) 74,263 56,187 132 74,263 65,716 59,692 59,294
Allocated capital (avg.) 8,231 8,440 98 8,138 8,123 8,184 8,484
Profi t before loan impairment charges
as % p.a. of allocated capital 15.3 16.6 13.9 17.7 17.0 13.0
Pre-tax profi t as % p.a. of allocated capital (ROE) 9.2 10.4 14.4 12.3 11.3 -1.0
Cost/income ratio (%) 54.5 52.7 59.7 50.0 53.2 55.4
DANSKE BANK ANNUAL REPORT 2009 BUSINESS UNITS

30
72% in Danish kroner and 87% in local currency
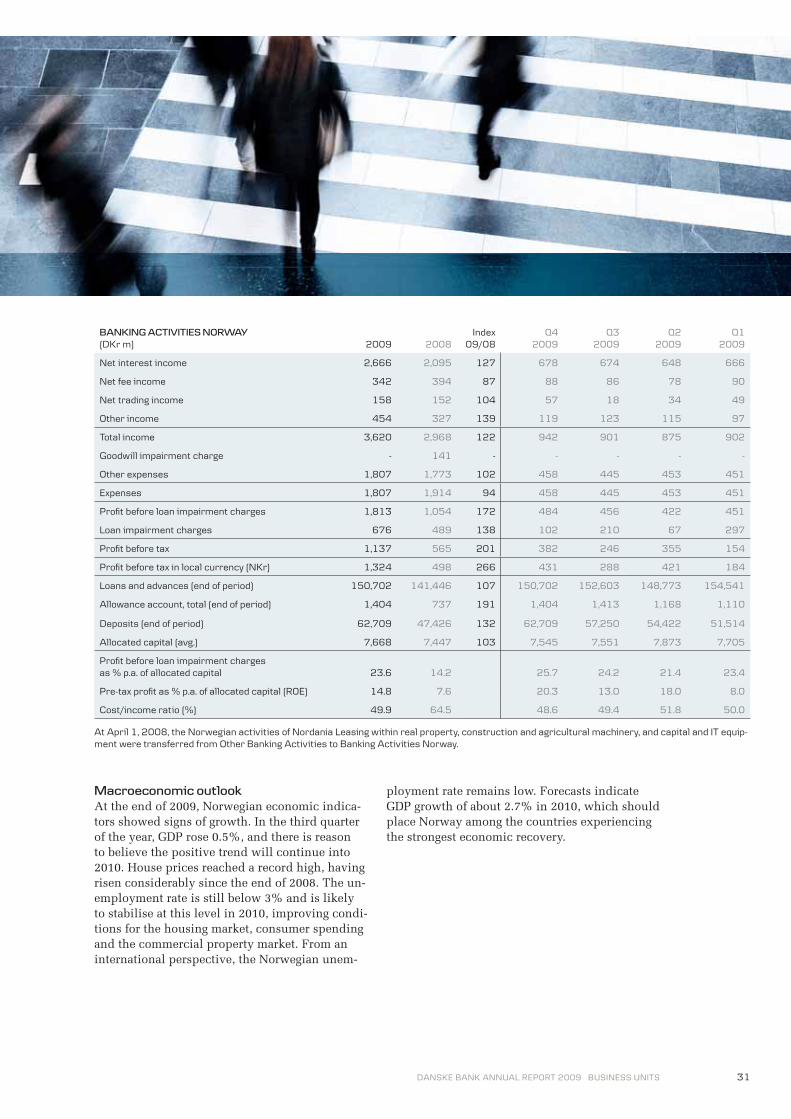
Market conditionsThe Norwegian economy continued to slow down in 2009, although low interest rates, an expansionary fi scal policy and extensive in-vestments clearly benefi ted the economy in the second half of the year, helping it outperform the other Nordic economies. At the end of 2008, fore-casts expected the Norwegian economy (GDP) to contract by around 0.5% in 2009. Forecasts now indicate a contraction in 2009 of around 1.1%.
Fokus Bank is the third-largest bank in Norway.
Financial summaryTotal income rose 22% over the level in 2008, or 26% in local currency.
Improved pricing of lending risk more than compensated for the pressure on deposit margins, and net interest income grew both in local cur-rency and in Danish kroner.
Excluding goodwill impairment charges, ex-penses rose 2% in Danish kroner and 4% in local currency. The main reason for the increase was that leasing activities were recognised for nine months of 2008 only. All underlying expenses were unchanged.
Total lending fell 10% in local currency from the level at end-2008, with retail lending gaining 6% and corporate lending dropping 18%.
Loan impairment charges came to DKr0.7bn, against DKr0.5bn in 2008. They were mainly charges against a number of corporate facilities, in particular within the property segment.
Total deposits rose 12% in local currency from the level a year earlier. Retail deposits matched the year-earlier level, and corporate deposits increased 17%.
At December 31, 2009, Banking Activities Nor-way’s market share of lending was 5.7%, down from 6.4% a year earlier, while its share of de-posits remained at 4.4%.
OperationsIn September, Trond Mellingsæter replaced Thomas F. Borgen as head of Fokus Bank and joined the Executive Committee. Mr Mellingsæter was previously in charge of Fokus Bank’s central and northern regions.
On January 1, 2010, Banking Activities Norway adjusted its geographically based organisation and regional structure to accommodate four general customer segments: Business Banking, Personal Banking, CIB and Private Banking & Asset Management.
BRANCHES
49EMPLOYEES
966
BANKING ACTIVITIES NORWAY ENCOMPASSES THE BANKING ACTIVITIES OF FOKUS BANK NORWAY, WHICH SERVES
ALL TYPES OF RETAIL AND CORPORATE CUSTOMERS. REAL-ESTATE AGENCY BUSINESS IS CARRIED OUT THROUGH THE
37 OFFICES OF FOKUS KROGSVEEN.
BANKING ACTIVITIES NORWAY
PRE-TAX PROFIT
DKr1,137mMARKETS SHARE OF LENDING
5.7%
INCOME – % OF GROUP TOTAL LENDING – % OF GROUP TOTAL
Banking Activities Norway
6% 9%
BUSINESS UNITS DANSKE BANK ANNUAL REPORT 2009
31
Macroeconomic outlookAt the end of 2009, Norwegian economic indica-tors showed signs of growth. In the third quarter of the year, GDP rose 0.5%, and there is reason to believe the positive trend will continue into 2010. House prices reached a record high, having risen considerably since the end of 2008. The un-employment rate is still below 3% and is likely to stabilise at this level in 2010, improving condi-tions for the housing market, consumer spending and the commercial property market. From an international perspective, the Norwegian unem-
ployment rate remains low. Forecasts indicate GDP growth of about 2.7% in 2010, which should place Norway among the countries experiencing the strongest economic recovery.
BANKING ACTIVITIES NORWAY(DKr m) 2009 2008
Index
09/08
Q4
2009
Q3
2009
Q2
2009
Q1
2009
Net interest income 2,666 2,095 127 678 674 648 666
Net fee income 342 394 87 88 86 78 90
Net trading income 158 152 104 57 18 34 49
Other income 454 327 139 119 123 115 97
Total income 3,620 2,968 122 942 901 875 902
Goodwill impairment charge - 141 - - - - -
Other expenses 1,807 1,773 102 458 445 453 451
Expenses 1,807 1,914 94 458 445 453 451
Profi t before loan impairment charges 1,813 1,054 172 484 456 422 451
Loan impairment charges 676 489 138 102 210 67 297
Profi t before tax 1,137 565 201 382 246 355 154
Profi t before tax in local currency (NKr) 1,324 498 266 431 288 421 184
Loans and advances (end of period) 150,702 141,446 107 150,702 152,603 148,773 154,541
Allowance account, total (end of period) 1,404 737 191 1,404 1,413 1,168 1,110
Deposits (end of period) 62,709 47,426 132 62,709 57,250 54,422 51,514
Allocated capital (avg.) 7,668 7,447 103 7,545 7,551 7,873 7,705
Profi t before loan impairment charges
as % p.a. of allocated capital 23.6 14.2 25.7 24.2 21.4 23.4
Pre-tax profi t as % p.a. of allocated capital (ROE) 14.8 7.6 20.3 13.0 18.0 8.0
Cost/income ratio (%) 49.9 64.5 48.6 49.4 51.8 50.0
At April 1, 2008, the Norwegian activities of Nordania Leasing within real property, construction and agricultural machinery, and capital and IT equip-
ment were transferred from Other Banking Activities to Banking Activities Norway.
DANSKE BANK ANNUAL REPORT 2009 BUSINESS UNITS

32
down 12% in Danish kroner, but up 3% in local currency
downward trend over the year
Market conditions Economic activity in Northern Ireland slowed considerably throughout 2009, and property prices plunged.
The Northern Ireland economy is naturally linked to that of Great Britain – a region hit hard by the global fi nancial crisis. The economic trends in Great Britain caused the pound ster-ling to depreciate signifi cantly to the benefi t of exports.
At the end of 2008, forecasts expected the economy (GDP) in Northern Ireland to contract by around 0.5% in 2009. Forecasts now indicate a contraction in 2009 of around 4.4%.
Financial summaryNet interest income fell 2% in local currency from the year-earlier level as a result of stronger competition for deposits. Central bank interest rate cuts put heavy pressure on deposit margins, but wider lending margins only partly offset this effect.
Expenses fell 10% in local currency from the 2008 level, partly because of the absence of inte-gration expenses. The unit paid DKr61m to cover expenses for the mandatory Financial Services Compensation scheme. Total lending fell 5% in local currency from the level a year earlier. Retail lending rose 3%, whereas corporate lending, excluding loans to the public sector etc., declined 8%.
Loan impairment charges came to DKr1.4bn, against DKr0.6bn in 2008. Charges against a number of corporate facilities within the property segment in particular accounted for the increase.
Deposits were up 1% in local currency from the level at end-2008; retail deposits fell 2% in local currency, whereas corporate deposits, excluding deposits from the public sector etc., were up 5%.
OperationsIn 2009, Northern Bank joined forces with North-ern Regional College (NRC) to set up College eBank. College eBank is a new initiative combin-ing on-campus banking services with personal fi nance education. Northern Bank was the fi rst bank in Northern Ireland to offer such a service to local universities.
BRANCHES
83EMPLOYEES
1,253
BANKING ACTIVITIES NORTHERN IRELAND ENCOMPASSES THE BANKING ACTIVITIES OF NORTHERN BANK,
WHICH SERVES BOTH RETAIL AND CORPORATE CUSTOMERS.
BANKING ACTIVITIES NORTHERN IRELAND
PRE-TAX PROFIT
DKr-830m
INCOME – % OF GROUP TOTAL LENDING – % OF GROUP TOTAL
Banking Activities Northern Ireland
3% 3%
BUSINESS UNITS DANSKE BANK ANNUAL REPORT 2009

33
Macroeconomic outlookThe economy is likely to grow slightly in 2010. Low interest rates have already helped stabilise the housing market and stimulate consumer spending. Exports benefi ted from the weak pound sterling, and the growth forecast for Great Britain is expected to rub off on Northern Ireland. Projected fi scal tightening will probably have a curbing effect, though.
Forecasts indicate GDP growth of around 1.2% in 2010.
BANKING ACTIVITIES NORTHERN IRELAND(DKr m) 2009 2008
Index
09/08
Q4
2009
Q3
2009
Q2
2009
Q1
2009
Net interest income 1,315 1,508 87 337 336 316 326
Net fee income 296 362 82 75 76 75 70
Net trading income 72 124 58 29 4 39 -
Other income 12 19 63 1 3 6 2
Total income 1,695 2,013 84 442 419 436 398
Expenses 1,126 1,363 83 261 267 282 316
Profi t before loan impairment charges 569 650 88 181 152 154 82
Loan impairment charges 1,399 641 218 164 371 419 445
Profi t before tax -830 9 - 17 -219 -265 -363
Profi t before tax in local currency (£) -100 -12 - 2 -27 -30 -45
Loans and advances (end of period) 51,510 53,376 97 51,510 53,214 56,600 49,694
Allowance account, total (end of period) 2,006 627 - 2,006 1,843 1,575 1,080
Deposits (end of period) 45,914 44,459 103 45,914 45,959 49,240 42,807
Allocated capital (avg.) 1,951 2,449 80 1,867 2,004 1,988 1,947
Profi t before loan impairment charges
as % p.a. of allocated capital 29.2 26.5 38.8 30.3 31.0 16.8
Pre-tax profi t as % p.a. of allocated capital (ROE) -42.5 0.4 3.6 -43.7 -53.3 -74.6
Cost/income ratio (%) 66.4 67.7 59.0 63.7 64.7 79.4
DANSKE BANK ANNUAL REPORT 2009 BUSINESS UNITS
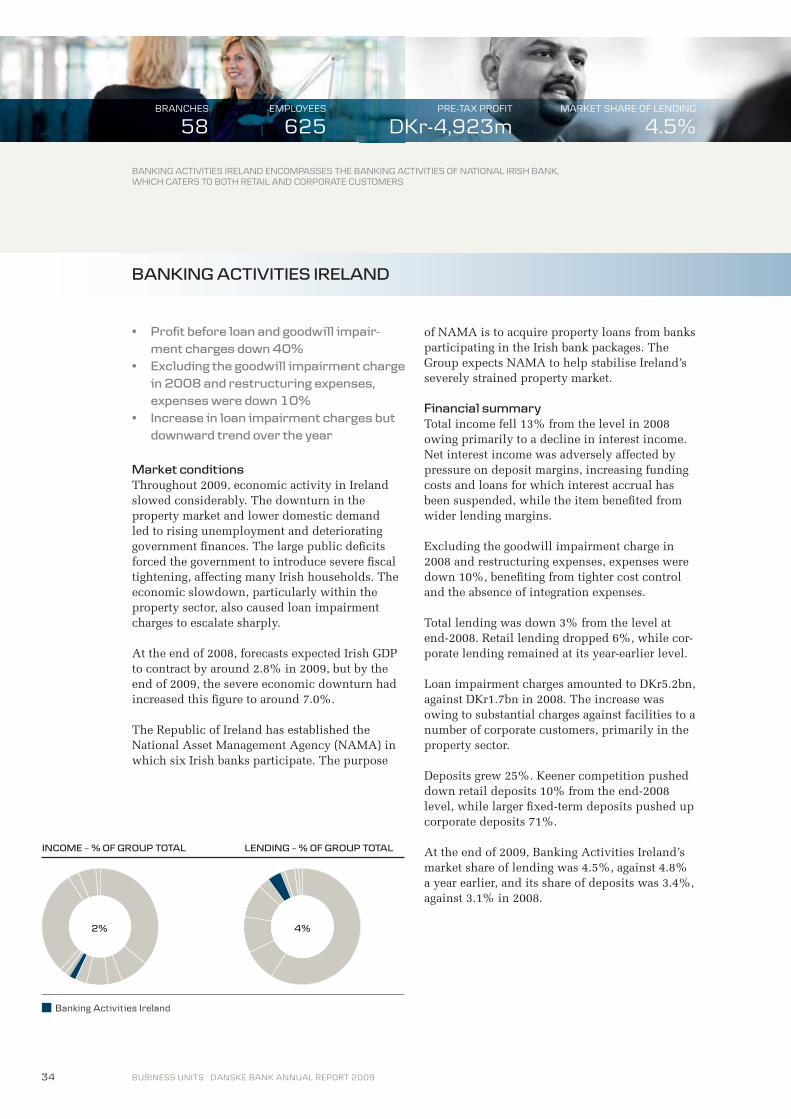
34
ment charges down 40%
in 2008 and restructuring expenses, expenses were down 10%
downward trend over the year
Market conditionsThroughout 2009, economic activity in Ireland slowed considerably. The downturn in the property market and lower domestic demand led to rising unemployment and deteriorating government fi nances. The large public defi cits forced the government to introduce severe fi scal tightening, affecting many Irish households. The economic slowdown, particularly within the property sector, also caused loan impairment charges to escalate sharply.
At the end of 2008, forecasts expected Irish GDP to contract by around 2.8% in 2009, but by the end of 2009, the severe economic downturn had increased this fi gure to around 7.0%.
The Republic of Ireland has established the National Asset Management Agency (NAMA) in which six Irish banks participate. The purpose
of NAMA is to acquire property loans from banks participating in the Irish bank packages. The Group expects NAMA to help stabilise Ireland’s severely strained property market.
Financial summaryTotal income fell 13% from the level in 2008 owing primarily to a decline in interest income. Net interest income was adversely affected by pressure on deposit margins, increasing funding costs and loans for which interest accrual has been suspended, while the item benefi ted from wider lending margins.
Excluding the goodwill impairment charge in 2008 and restructuring expenses, expenses were down 10%, benefi ting from tighter cost control and the absence of integration expenses.
Total lending was down 3% from the level at end-2008. Retail lending dropped 6%, while cor-porate lending remained at its year-earlier level.
Loan impairment charges amounted to DKr5.2bn, against DKr1.7bn in 2008. The increase was owing to substantial charges against facilities to a number of corporate customers, primarily in the property sector.
Deposits grew 25%. Keener competition pushed down retail deposits 10% from the end-2008 level, while larger fi xed-term deposits pushed up corporate deposits 71%.
At the end of 2009, Banking Activities Ireland’s market share of lending was 4.5%, against 4.8% a year earlier, and its share of deposits was 3.4%, against 3.1% in 2008.
BRANCHES
58EMPLOYEES
625
BANKING ACTIVITIES IRELAND ENCOMPASSES THE BANKING ACTIVITIES OF NATIONAL IRISH BANK,
WHICH CATERS TO BOTH RETAIL AND CORPORATE CUSTOMERS
BANKING ACTIVITIES IRELAND
PRE-TAX PROFIT
DKr-4,923mMARKET SHARE OF LENDING
4.5%
INCOME – % OF GROUP TOTAL LENDING – % OF GROUP TOTAL
Banking Activities Ireland
2% 4%
BUSINESS UNITS DANSKE BANK ANNUAL REPORT 2009
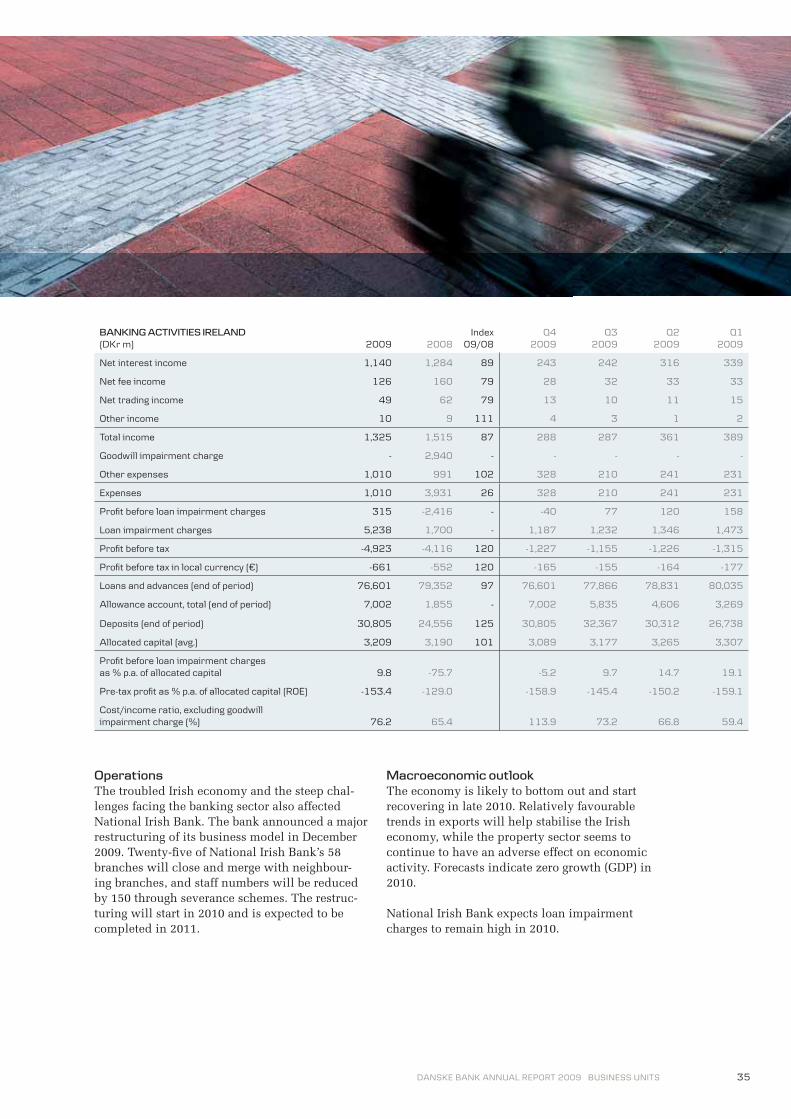
35
OperationsThe troubled Irish economy and the steep chal-lenges facing the banking sector also affected National Irish Bank. The bank announced a major restructuring of its business model in December 2009. Twenty-fi ve of National Irish Bank’s 58 branches will close and merge with neighbour-ing branches, and staff numbers will be reduced by 150 through severance schemes. The restruc-turing will start in 2010 and is expected to be completed in 2011.
Macroeconomic outlookThe economy is likely to bottom out and start recovering in late 2010. Relatively favourable trends in exports will help stabilise the Irish economy, while the property sector seems to continue to have an adverse effect on economic activity. Forecasts indicate zero growth (GDP) in 2010.
National Irish Bank expects loan impairment charges to remain high in 2010.
BANKING ACTIVITIES IRELAND(DKr m) 2009 2008
Index
09/08
Q4
2009
Q3
2009
Q2
2009
Q1
2009
Net interest income 1,140 1,284 89 243 242 316 339
Net fee income 126 160 79 28 32 33 33
Net trading income 49 62 79 13 10 11 15
Other income 10 9 111 4 3 1 2
Total income 1,325 1,515 87 288 287 361 389
Goodwill impairment charge - 2,940 - - - - -
Other expenses 1,010 991 102 328 210 241 231
Expenses 1,010 3,931 26 328 210 241 231
Profi t before loan impairment charges 315 -2,416 - -40 77 120 158
Loan impairment charges 5,238 1,700 - 1,187 1,232 1,346 1,473
Profi t before tax -4,923 -4,116 120 -1,227 -1,155 -1,226 -1,315
Profi t before tax in local currency (€) -661 -552 120 -165 -155 -164 -177
Loans and advances (end of period) 76,601 79,352 97 76,601 77,866 78,831 80,035
Allowance account, total (end of period) 7,002 1,855 - 7,002 5,835 4,606 3,269
Deposits (end of period) 30,805 24,556 125 30,805 32,367 30,312 26,738
Allocated capital (avg.) 3,209 3,190 101 3,089 3,177 3,265 3,307
Profi t before loan impairment charges
as % p.a. of allocated capital 9.8 -75.7 -5.2 9.7 14.7 19.1
Pre-tax profi t as % p.a. of allocated capital (ROE) -153.4 -129.0 -158.9 -145.4 -150.2 -159.1
Cost/income ratio, excluding goodwill
impairment charge (%) 76.2 65.4 113.9 73.2 66.8 59.4
DANSKE BANK ANNUAL REPORT 2009 BUSINESS UNITS
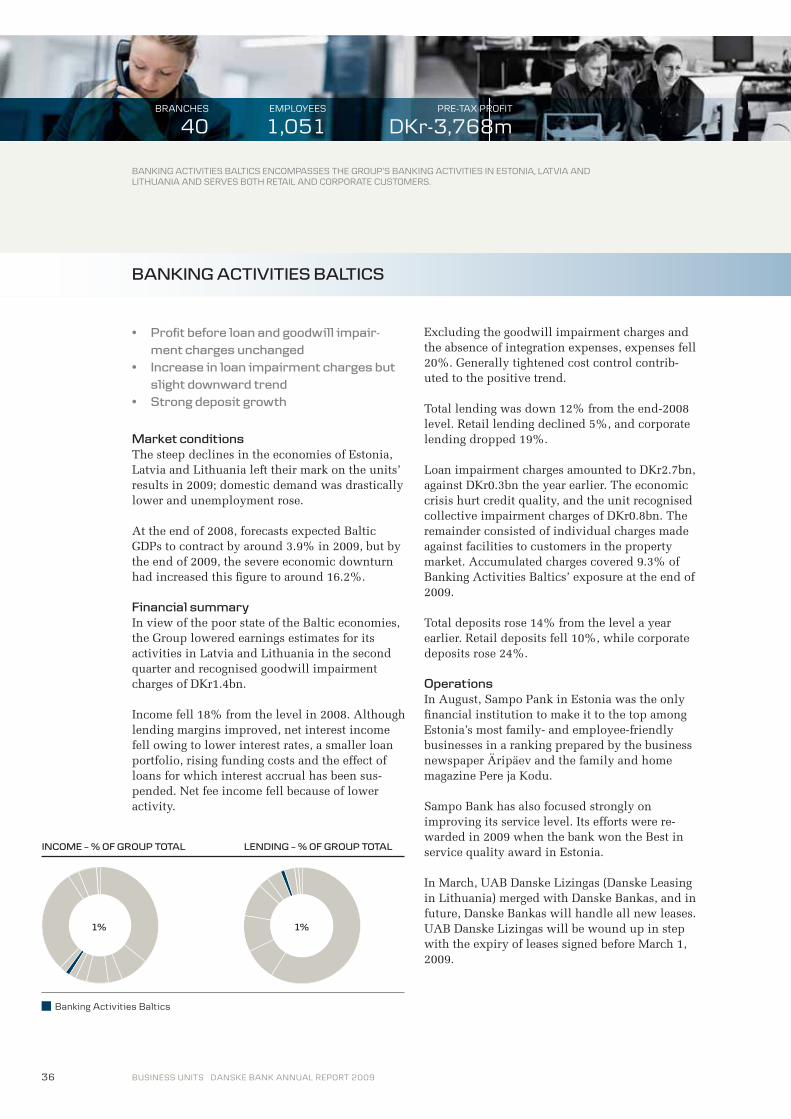
ment charges unchanged
slight downward trend
Market conditions The steep declines in the economies of Estonia, Latvia and Lithuania left their mark on the units’ results in 2009; domestic demand was drastically lower and unemployment rose.
At the end of 2008, forecasts expected Baltic GDPs to contract by around 3.9% in 2009, but by the end of 2009, the severe economic downturn had increased this fi gure to around 16.2%.
Financial summaryIn view of the poor state of the Baltic economies, the Group lowered earnings estimates for its activities in Latvia and Lithuania in the second quarter and recognised goodwill impairment charges of DKr1.4bn.
Income fell 18% from the level in 2008. Although lending margins improved, net interest income fell owing to lower interest rates, a smaller loan portfolio, rising funding costs and the effect of loans for which interest accrual has been sus-pended. Net fee income fell because of lower activity.
Excluding the goodwill impairment charges and the absence of integration expenses, expenses fell 20%. Generally tightened cost control contrib-uted to the positive trend.
Total lending was down 12% from the end-2008 level. Retail lending declined 5%, and corporate lending dropped 19%.
Loan impairment charges amounted to DKr2.7bn, against DKr0.3bn the year earlier. The economic crisis hurt credit quality, and the unit recognised collective impairment charges of DKr0.8bn. The remainder consisted of individual charges made against facilities to customers in the property market. Accumulated charges covered 9.3% of Banking Activities Baltics’ exposure at the end of 2009.
Total deposits rose 14% from the level a year earlier. Retail deposits fell 10%, while corporate deposits rose 24%.
OperationsIn August, Sampo Pank in Estonia was the only fi nancial institution to make it to the top among Estonia’s most family- and employee-friendly businesses in a ranking prepared by the business newspaper Äripäev and the family and home magazine Pere ja Kodu.
Sampo Bank has also focused strongly on improving its service level. Its efforts were re-warded in 2009 when the bank won the Best in service quality award in Estonia.
In March, UAB Danske Lizingas (Danske Leasing in Lithuania) merged with Danske Bankas, and in future, Danske Bankas will handle all new leases. UAB Danske Lizingas will be wound up in step with the expiry of leases signed before March 1, 2009.
BANKING ACTIVITIES BALTICS ENCOMPASSES THE GROUP’S BANKING ACTIVITIES IN ESTONIA, LATVIA AND
LITHUANIA AND SERVES BOTH RETAIL AND CORPORATE CUSTOMERS.
BANKING ACTIVITIES BALTICS
BRANCHES
40EMPLOYEES
1,051PRE-TAX PROFIT
DKr-3,768m
INCOME – % OF GROUP TOTAL LENDING – % OF GROUP TOTAL
Banking Activities Baltics
1% 1%
36 BUSINESS UNITS DANSKE BANK ANNUAL REPORT 2009

In October, customers of Danske Banka in Latvia were offered the opportunity to open deposit ac-counts through eBanking at an interest rate 0.1 of a percentage point above the rate offered by cus-tomer service centres. The improved electronic service proved a success with customers.
Macroeconomic outlookThe three Baltic economies are expected to stabi-lise to some extent in 2010, but will not see the high growth rates of earlier times.
Baltic GDPs are now expected to contract by a weighted average of 3.7% in 2010.
BANKING ACTIVITIES BALTICS(DKr m) 2009 2008
Index
09/08
Q4
2009
Q3
2009
Q2
2009
Q1
2009
Net interest income 488 638 76 110 105 130 143
Net fee income 136 162 84 36 32 36 32
Net trading income 116 109 106 31 33 17 35
Other income 22 20 110 9 7 3 3
Total income 762 929 82 186 177 186 213
Goodwill impairment charges 1,417 - - - - 1,417 -
Other expenses 388 525 74 101 89 100 98
Expenses 1,805 525 - 101 89 1,517 98
Profi t before loan impairment charges -1,043 404 - 85 88 -1,331 115
Loan impairment charges 2,725 295 - 613 714 839 559
Profi t before tax -3,768 109 - -528 -626 -2,170 -444
Loans and advances (end of period) 26,816 30,426 88 26,816 27,841 28,676 29,852
Allowance account, total (end of period) 2,985 432 - 2,985 2,460 1,783 966
Deposits (end of period) 17,073 14,962 114 17,073 14,889 15,529 15,442
Allocated capital (avg.) 1,362 1,493 91 1,232 1,293 1,416 1,512
Profi t before loan impairment charges
as % p.a. of allocated capital -76.6 27.1 27.6 27.2 - 30.4
Pre-tax profi t as % p.a. of allocated capital (ROE) -276.7 7.3 -171.4 -193.7 - -117.5
Cost/income ratio, excluding goodwill
impairment charges (%) 50.9 56.5 54.3 50.3 53.8 46.0
PROFIT BEFORE LOAN AND GOODWILL IMPAIRMENT CHARGES(DKr m)
Estonia 308 337 91 61 55 83 109
Latvia 45 9 - 8 23 3 11
Lithuania 21 58 36 16 10 - -5
Total Banking Activities Baltics 374 404 93 85 88 86 115
37 DANSKE BANK ANNUAL REPORT 2009 BUSINESS UNITS

down 32%
assets
against activities in Russia
Market conditions A severe economic slowdown in the markets in which Other Banking Activities operates affected results in 2009.
Germany experienced a steep economic down-turn at the end of 2008 and during the fi rst six months of 2009. Favourable developments in exports helped stabilise the economy as early as in the second quarter of 2009, however, causing growth to pick up in the last six months of the year.
Poland’s economy came to a sudden halt owing to the fi nancial unrest, with lower growth in exports and shrinking domestic demand. But economic growth was slightly positive in 2009, making Poland one of the economies suffering the least from the crisis.
Financial summaryNordania Leasing’s pretax profi t declined DKr140m. The transfer of certain activities from Nordania Leasing to Banking Activities Denmark and Banking Activities Norway at April 1, 2008, led to lower income and expenses. Total income generated by Nordania Leasing thus decreased DKr261m and expenses DKr197m. Adjusted for the transfer, profi t before loan impairment charges fell DKr38m. A combination of lower in-come from the sale of lease assets and severance payments led to the profi t decline.
At Banking Activities Germany, profi t before tax declined DKr100m owing mainly to the fact that 2008 benefi ted from the reversal of a large amount of impairment charges.
At Banking Activities Poland, profi t before tax was down DKr14m.
At Banking Activities Russia, the result before tax came to a negative DKr11m. The economic situ-ation in Russia prompted a goodwill impairment charge against ZAO Danske Bank of DKr25m, equal to the full amount of goodwill acquired with the purchase of these activities from the Sampo Bank group in 2007.
The Russian activities were transferred from Banking Activities Finland to Other Banking Activities with effect from January 1, 2009.
Altogether, expenses at Other Banking Activi-ties fell 8%, mainly because of the transfer of the leasing activities.
EMPLOYEES
310PRE-TAX PROFIT
DKr83m
OTHER BANKING ACTIVITIES ENCOMPASSES THE ACTIVITIES OF NORDANIA LEASING AND THE GROUP’S BANK-
ING ACTIVITIES IN GERMANY, POLAND AND RUSSIA. THE ACTIVITIES OF NORDANIA LEASING INCLUDE PRIMARILY
CAR AND TRUCK LEASING SOLUTIONS AND FLEET MANAGEMENT.
OTHER BANKING ACTIVITIES
INCOME – % OF GROUP TOTAL LENDING – % OF GROUP TOTAL
Other Banking Activities
2% 1%
38 BUSINESS UNITS DANSKE BANK ANNUAL REPORT 2009

Macroeconomic outlookGermany’s economy is likely to recover further in 2010. Large Asian export orders and good wage competitiveness benefi t the country. The trend in unemployment has been surprisingly favourable, and the rate is set to decline slightly. This will contribute to a moderate increase in consumer spending. Overall, the expected growth rate is 2.5-3.0%.
Forecasts indicate that Poland’s economic growth will be positive also in 2010. Consumer spend-ing in particular is likely to boost activity. The growth rate is expected to be just over 2% in 2010.
Russia’s economy (GDP) is likely to see growth in 2010.
OTHER BANKING ACTIVITIES(DKr m) 2009 2008
Index
09/08
Q4
2009
Q3
2009
Q2
2009
Q1
2009
Net interest income 357 369 97 88 85 98 86
Net fee income 109 73 149 24 41 22 22
Net trading income 24 45 53 8 6 3 7
Other income 872 1,092 80 224 199 244 205
Total income 1,362 1,579 86 344 331 367 320
Goodwill impairment charges 25 - - 25 - - -
Other expenses 1,087 1,209 90 310 234 280 263
Expenses 1,112 1,209 92 335 234 280 263
Profi t before loan impairment charges 250 370 68 9 97 87 57
Loan impairment charges 167 22 - 77 42 114 -66
Profi t before tax 83 348 24 -68 55 -27 123
Loans and advances (end of period) 17,606 22,867 77 17,606 20,560 21,487 22,778
Allowance account, total (end of period) 1,261 678 186 1,261 1,119 975 843
Deposits (end of period) 4,291 4,269 101 4,291 3,447 3,536 3,728
Allocated capital (avg.) 1,883 1,837 103 1,959 2,040 1,931 1,597
Profi t before loan impairment charges
as % p.a. of allocated capital 13.3 20.1 1.8 19.0 18.0 14.3
Pre-tax profi t as % p.a. of allocated capital (ROE) 4.4 18.9 -13.9 10.8 -5.6 30.8
Cost/income ratio (%) 81.6 76.6 97.4 70.7 76.3 82.2
PROFIT BEFORE TAX (DKr m)
Nordania Leasing -136 4 - -74 -27 -19 -16
Banking Activities Germany 163 263 62 10 59 -27 121
Banking Activities Poland 67 81 83 18 21 11 17
Banking Activities Russia -11 - - -22 2 8 1
Total Other Banking Activities 83 348 24 -68 55 -27 123
39 DANSKE BANK ANNUAL REPORT 2009 BUSINESS UNITS

Market conditionsThe global capital markets were turbulent in 2009. The equity and fi xed-income markets have calmed since the autumn of 2008, however, and at end-2009, economic indicators continued to point to further stabilisation.
The volatile markets, particularly in the fi rst halfyear, offered especially attractive business opportunities for the Group’s capital markets activities.
Financial summaryProfi t before tax rose to DKr11.1bn, up from a loss of DKr2.0bn in 2008. The main reason was extraordinarily high income from trading activi-ties, especially in the fi rst quarter of 2009.
Customer-driven trading activity in instruments to hedge interest and exchange rate risks was strong during the entire year. Global capital markets trends led to wider bid/offer spreads, although they started to narrow in the second quarter.
The unit adjusted its position-taking approach to benefi t from changes in short- and medium-term interest rates and credit spreads, increasing trading activities income by as much as DKr9.6bn over the 2008 level to DKr16.9bn.
Group Treasury posted income of DKr0.1bn, pri-marily as a result of the Group’s strategic fi xed-income portfolio. In 2008, income was negative by DKr4.0bn owing in particular to the capital loss on the Group’s holdings of mortgage bonds triggered by the signifi cant widening of credit spreads.
Danske Bank owns 26% of PBS A/S, which plans to merge with the Norwegian Nordito A/S in the fi rst quarter of 2010. PBS is consolidated as an associated undertaking into Danske Bank’s fi nancial statements with a proportionate share of its book value. Once the merger takes effect, PBS will no longer be an associated undertaking, and the shareholding in the continuing company of about 16% must be recognised at market value. The merger is expected to generate a capital gain of DKr0.7bn to be booked in the fi rst half of 2010.
The available-for-sale bond portfolio posted a gain – recognised directly in shareholders’ equity – of DKr0.7bn. In 2008, the Group recognised a capital loss of DKr1.9bn.
Loan impairment charges concerned facilities to international fi nancial counterparties: certain asset values declined, and impairment charges increased.
A 14% rise in expenses related mainly to performance-based compensation to Trading Ac-tivities staff. The Group downgraded the relative level of performance-based compensation in 2009 and adjusted its practices for the measurement and structure of such compensation in accord-ance with international recommendations.
EMPLOYEES
887PRE-TAX PROFIT
DKr11,115m
DANSKE MARKETS IS RESPONSIBLE FOR THE GROUP’S ACTIVITIES IN THE FINANCIAL MARKETS. TRADING ACTIVITIES INCLUDE TRADING
IN FIXED INCOME PRODUCTS, FOREIGN EXCHANGE, EQUITIES AND INTEREST-BEARING SECURITIES; PROVIDING THE LARGEST CORPO-
RATE CUSTOMERS AND INSTITUTIONAL CLIENTS WITH FINANCIAL PRODUCTS AND ADVISORY SERVICES ON MERGERS AND ACQUISI-
TIONS; AND ASSISTING CUSTOMERS WITH EQUITY AND DEBT ISSUES ON THE INTERNATIONAL FINANCIAL MARKETS. GROUP TREASURY
COVERS THE BANK’S STRATEGIC FIXED INCOME, FOREIGN EXCHANGE AND EQUITY PORTFOLIOS. INSTITUTIONAL BANKING INCLUDES
FACILITIES WITH INTERNATIONAL FINANCIAL INSTITUTIONS OUTSIDE THE NORDIC REGION. FACILITIES WITH NORDIC FINANCIAL INSTITU-
TIONS FORM PART OF THE GROUP’S BANKING ACTIVITIES.
TOTAL INCOME
DKr17,238m
DANSKE MARKETS
INCOME – % OF GROUP TOTAL LENDING – % OF GROUP TOTAL
Danske Markets
29% 3%
40 BUSINESS UNITS DANSKE BANK ANNUAL REPORT 2009
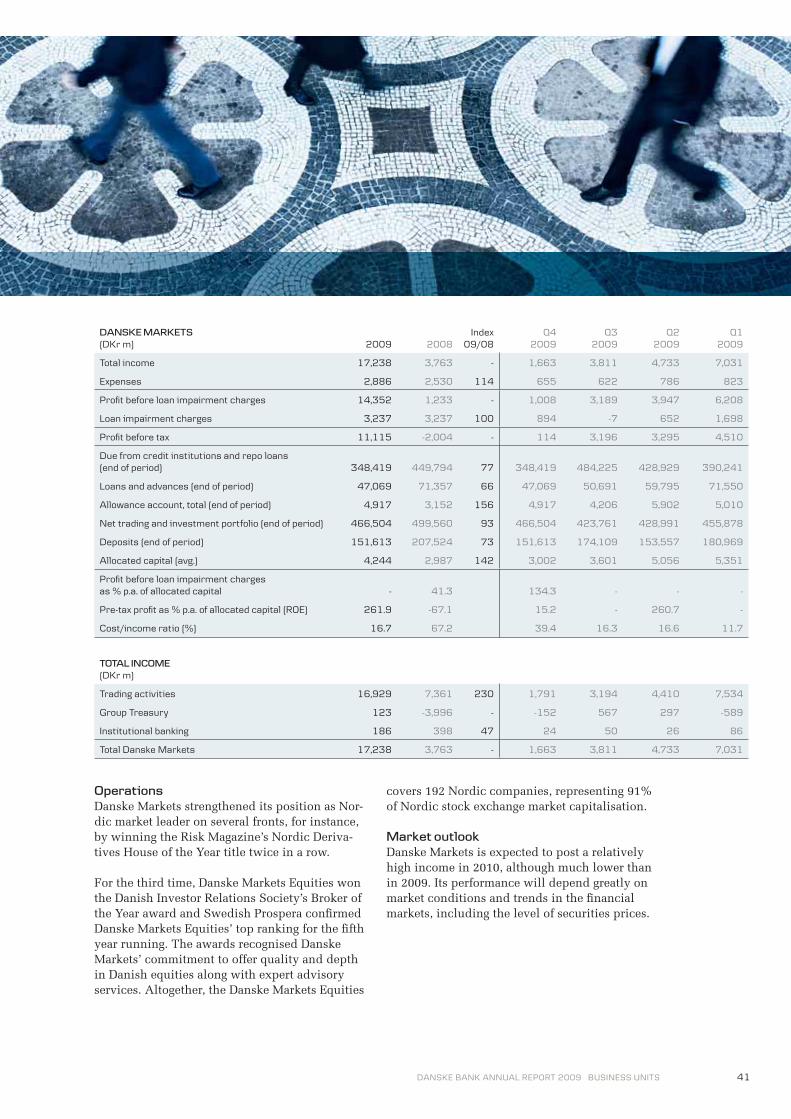
OperationsDanske Markets strengthened its position as Nor-dic market leader on several fronts, for instance, by winning the Risk Magazine’s Nordic Deriva-tives House of the Year title twice in a row.
For the third time, Danske Markets Equities won the Danish Investor Relations Society’s Broker of the Year award and Swedish Prospera confi rmed Danske Markets Equities’ top ranking for the fi fth year running. The awards recognised Danske Markets’ commitment to offer quality and depth in Danish equities along with expert advisory services. Altogether, the Danske Markets Equities
covers 192 Nordic companies, representing 91% of Nordic stock exchange market capitalisation.
Market outlookDanske Markets is expected to post a relatively high income in 2010, although much lower than in 2009. Its performance will depend greatly on market conditions and trends in the fi nancial markets, including the level of securities prices.
DANSKE MARKETS(DKr m) 2009 2008
Index
09/08
Q4
2009
Q3
2009
Q2
2009
Q1
2009
Total income 17,238 3,763 - 1,663 3,811 4,733 7,031
Expenses 2,886 2,530 114 655 622 786 823
Profi t before loan impairment charges 14,352 1,233 - 1,008 3,189 3,947 6,208
Loan impairment charges 3,237 3,237 100 894 -7 652 1,698
Profi t before tax 11,115 -2,004 - 114 3,196 3,295 4,510
Due from credit institutions and repo loans
(end of period) 348,419 449,794 77 348,419 484,225 428,929 390,241
Loans and advances (end of period) 47,069 71,357 66 47,069 50,691 59,795 71,550
Allowance account, total (end of period) 4,917 3,152 156 4,917 4,206 5,902 5,010
Net trading and investment portfolio (end of period) 466,504 499,560 93 466,504 423,761 428,991 455,878
Deposits (end of period) 151,613 207,524 73 151,613 174,109 153,557 180,969
Allocated capital (avg.) 4,244 2,987 142 3,002 3,601 5,056 5,351
Profi t before loan impairment charges
as % p.a. of allocated capital - 41.3 134.3 - - -
Pre-tax profi t as % p.a. of allocated capital (ROE) 261.9 -67.1 15.2 - 260.7 -
Cost/income ratio (%) 16.7 67.2 39.4 16.3 16.6 11.7
TOTAL INCOME(DKr m)
Trading activities 16,929 7,361 230 1,791 3,194 4,410 7,534
Group Treasury 123 -3,996 - -152 567 297 -589
Institutional banking 186 398 47 24 50 26 86
Total Danske Markets 17,238 3,763 - 1,663 3,811 4,733 7,031
41 DANSKE BANK ANNUAL REPORT 2009 BUSINESS UNITS

down 8%
tive net sales
home markets
Market conditionsThe global capital markets were turbulent for most of 2009. The benchmark equity indices bottomed out in March 2009 and then began to climb. At the end of 2009, several important indices were 50-70% higher than in March 2009. The positive equity market trends led to an in-crease in assets under management. In the Nordic region alone, unit trust business saw an increase of around DKr175bn, with sales in Sweden and Norway as the main contributors.
Danske Capital maintained its position in Nordic asset management with a total market share of 12%. The unit also made a breakthrough on sales to major institutional customers outside its home markets.
Financial summaryDanske Capital’s income rose 2% to DKr1.7bn. The rise related to performance-based fees and other one-off items of DKr288m.
Excluding these items, income fell DKr280m, mainly because the average volume of assets under management decreased and their compo-sition changed. On average, the proportion of fi xed-income and money-market mandates was higher in 2009 than in 2008.
Expenses rose DKr92m over the year-earlier fi g-ure. Of this amount, DKr26m was attributable to the consolidation of Danske Invest Management A/S, which was acquired in May 2008. Higher expenses for severance payments and other one-off items lifted the expense level by DKr60m. Excluding this amount, expenses were up 1%.
Danske Capital’s net sales totalled DKr8.7bn in 2009. Products managed by Danske Capital’s Asset Management unit accounted for DKr10.4bn, while net sales of investment products offered by external providers and structured products were negative by DKr1.7bn.
Asset Management’s net sales of DKr10.4bn consisted of net sales to institutional clients of DKr4.1bn and net sales to retail customers of DKr6.3bn. In the fourth quarter of 2009, net retail sales amounted to DKr4.4bn.
Denmark and Finland remained Danske Capital’s most important markets, with market shares in unit trust business of 28% and 17%, respectively.
In 2009, the unit trust business posted above-benchmark returns in 67% of its funds. Seventy-nine per cent of the bond-based funds and 59% of the equity-based funds delivered above-bench-mark returns.
EMPLOYEES
540PRE-TAX PROFIT
DKr760m
DANSKE CAPITAL DEVELOPS AND SELLS WEALTH MANAGEMENT PRODUCTS AND SERVICES THAT ARE OFFERED THROUGH THE
GROUP’S BRANCHES AND FINANCE CENTRES AND DIRECTLY TO BUSINESSES, INSTITUTIONAL CLIENTS AND EXTERNAL DISTRIBUTORS.
DANSKE CAPITAL SUPPORTS THE BANKING ACTIVITIES THROUGH DEVELOPMENT AND UPDATING OF THE GROUP’S OVERALL PRIVATE
BANKING AND WEALTH MANAGEMENT CONCEPT. THROUGH DANSKE BANK INTERNATIONAL IN LUXEMBOURG, DANSKE CAPITAL
PROVIDES INTERNATIONAL PRIVATE BANKING SERVICES TO CLIENTS OUTSIDE THE GROUP’S HOME MARKETS. DANSKE CAPITAL IS
REPRESENTED IN DENMARK, SWEDEN, NORWAY, FINLAND, ESTONIA, LITHUANIA AND LUXEMBOURG.
MARKET SHARE IN THE NORDIC REGION
12%
DANSKE CAPITAL
1 %
INCOME – % OF GROUP TOTAL LENDING – % OF GROUP TOTAL
Danske Capital
3% 1%
42 BUSINESS UNITS DANSKE BANK ANNUAL REPORT 2009
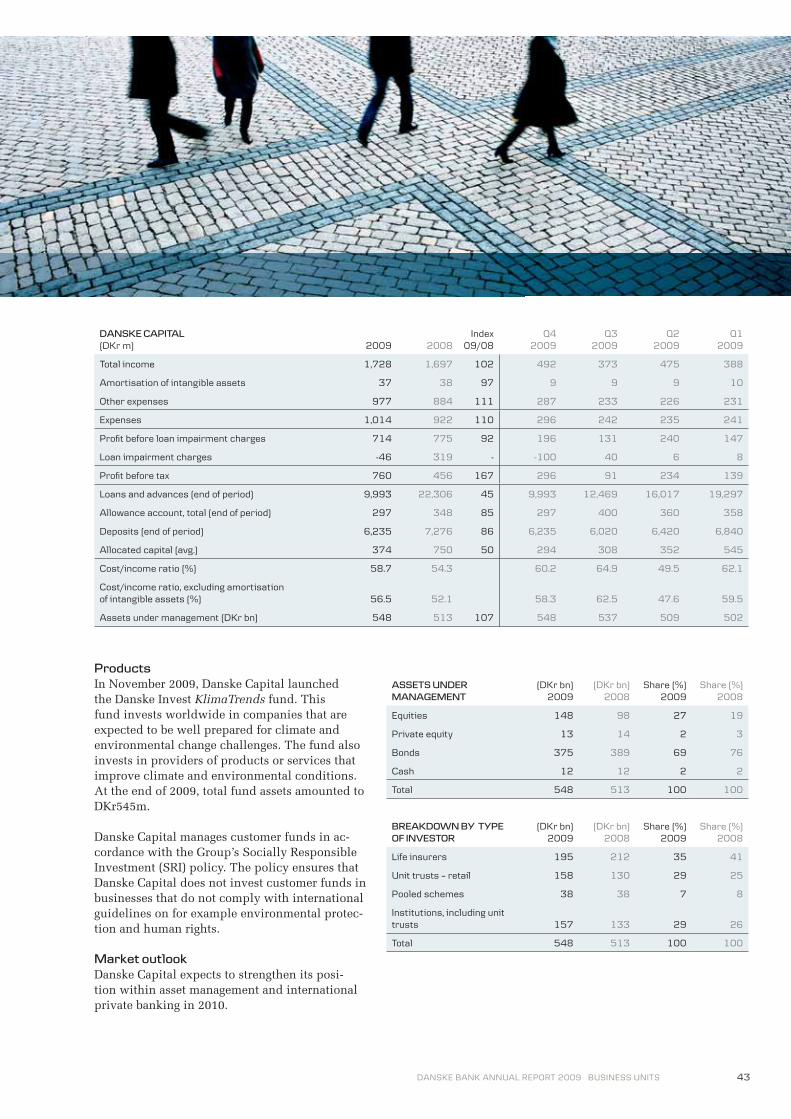
ProductsIn November 2009, Danske Capital launched the Danske Invest KlimaTrends fund. This fund invests worldwide in companies that are expected to be well prepared for climate and environmental change challenges. The fund also invests in providers of products or services that improve climate and environmental conditions. At the end of 2009, total fund assets amounted to DKr545m.
Danske Capital manages customer funds in ac-cordance with the Group’s Socially Responsible Investment (SRI) policy. The policy ensures that Danske Capital does not invest customer funds in businesses that do not comply with international guidelines on for example environmental protec-tion and human rights.
Market outlookDanske Capital expects to strengthen its posi-tion within asset management and international private banking in 2010.
BREAKDOWN BY TYPE OF INVESTOR
(DKr bn)
2009
(DKr bn)
2008
Share (%)
2009
Share (%)
2008
Life insurers 195 212 35 41
Unit trusts – retail 158 130 29 25
Pooled schemes 38 38 7 8
Institutions, including unit
trusts 157 133 29 26
Total 548 513 100 100
ASSETS UNDER MANAGEMENT
(DKr bn)
2009
(DKr bn)
2008
Share (%)
2009
Share (%)
2008
Equities 148 98 27 19
Private equity 13 14 2 3
Bonds 375 389 69 76
Cash 12 12 2 2
Total 548 513 100 100
DANSKE CAPITAL(DKr m) 2009 2008
Index
09/08
Q4
2009
Q3
2009
Q2
2009
Q1
2009
Total income 1,728 1,697 102 492 373 475 388
Amortisation of intangible assets 37 38 97 9 9 9 10
Other expenses 977 884 111 287 233 226 231
Expenses 1,014 922 110 296 242 235 241
Profi t before loan impairment charges 714 775 92 196 131 240 147
Loan impairment charges -46 319 - -100 40 6 8
Profi t before tax 760 456 167 296 91 234 139
Loans and advances (end of period) 9,993 22,306 45 9,993 12,469 16,017 19,297
Allowance account, total (end of period) 297 348 85 297 400 360 358
Deposits (end of period) 6,235 7,276 86 6,235 6,020 6,420 6,840
Allocated capital (avg.) 374 750 50 294 308 352 545
Cost/income ratio (%) 58.7 54.3 60.2 64.9 49.5 62.1
Cost/income ratio, excluding amortisation
of intangible assets (%) 56.5 52.1 58.3 62.5 47.6 59.5
Assets under management (DKr bn) 548 513 107 548 537 509 502
43 DANSKE BANK ANNUAL REPORT 2009 BUSINESS UNITS

DKr2.8bn, against a loss of DKr1.7bn in 2008
together with DKr0.6bn from the shadow account
business
Denmark of DKr3.8bn, up 29%
The economic slowdown left its mark on the pen-sions market in 2009, and the volume of premi-ums fell. Total premiums, including premiums for investment contracts, were down DKr1.4bn, or 7%, to DKr20.4bn.
In Denmark, market-based products accounted for DKr7.6bn, or around 50%, of life-insurance premiums, and regular premiums for these products rose 13%. At the end of the year, about 133,000 customers had opted for market-based products. In Sweden, total premiums were up 32% to DKr3.1bn.
The positive return on investments in the second half of 2009 lifted fi nancial reserves. Danica Pen-sion therefore decided to discontinue its tem-porary charge on transfers and surrenders with effect from October 1 and to raise the interest rate on policyholders’ savings to 2.65% before pen-sion return tax. This rate was later lifted to 3.25% with effect from January 1, 2010.
Net income totalled DKr2.8bn, up DKr4.5bn.
Market conditions in DenmarkThe diffi cult economic situation affected the Dan-ish pensions market in 2009. At the beginning of the year, investments carried negative returns, but these were more than offset by positive returns later in the year. At end-2009, the collec-
tive bonus potential stood at DKr2.8bn, against DKr1.6bn a year earlier. It was also possible to restore DKr2.8bn drawn from the bonus potential of paid-up policies at end-2008.
In 2008, the Danish Ministry of Economic and Business Affairs and the Danish Insurance Asso-ciation signed an agreement on fi nancial stabil-ity in the pension sector. In November 2009, the parties agreed to extend the agreement to include 2010. Under the agreement, pension and insur-ance companies may still temporarily adjust the discount rate (yield curve) used to calculate the value of technical provisions. This adjustment of the yield curve did not change the technical provisions at end-2009.
Danica Pension maintained its position as one of the leading life insurers and pension providers on the Danish market.
Redundancies and lower activity among corpo-rate customers had an adverse effect on premi-ums. The Danish tax reform, however, had a posi-tive effect, especially towards the end of the year, as tax benefi ts for persons paying the highest rate of tax were larger in 2009 than they will be in 2010. From 2010 onwards, fully tax deductible contributions to annuity pension schemes cannot exceed DKr100,000 annually. Excess contribu-tions will be paid into schemes with life-long pension payments.
IncomeNet income from insurance business changed from a negative DKr1.7bn in 2008 to a positive DKr2.8bn in 2009 owing partly to a positive return on equity and partly to a 7.1% return on Danica Traditionel customer funds. This made it possible to book the risk allowance and half of the shadow account balance.
The risk allowance, which is calculated as a share of technical provisions, amounted to DKr1.1bn in 2009. An amount of DKr0.6bn of the
EMPLOYEES
925INCOME
DKr2,810mTOTAL PREMIUMS
DKr20,431m
DANICA PENSION ENCOMPASSES THE DANSKE BANK GROUP’S ACTIVITIES IN THE LIFE INSURANCE AND PENSIONS MARKET.
DANICA PENSION TARGETS BOTH PERSONAL AND CORPORATE CUSTOMERS. PRODUCTS ARE MARKETED THROUGH A RANGE OF
DISTRIBUTION CHANNELS WITHIN THE DANSKE BANK GROUP, PRIMARILY BANKING ACTIVITIES’ OUTLETS AND DANICA PENSION’S
INSURANCE BROKERS AND ADVISERS. DANICA OFFERS TWO MARKET-BASED PRODUCTS, DANICA BALANCE AND DANICA LINK.
THESE PRODUCTS ALLOW CUSTOMERS TO SELECT THEIR OWN INVESTMENT PROFILE, AND THE RETURN ON SAVINGS DEPENDS ON
MARKET TRENDS. FURTHERMORE, DANICA PENSION OFFERS DANICA TRADITIONEL. THIS PRODUCT DOES NOT OFFER INDIVIDUAL
INVESTMENT PROFILES, AND DANICA PENSION SETS THE RATE OF INTEREST ON POLICYHOLDERS’ SAVINGS.
DANICA PENSION
44 BUSINESS UNITS DANSKE BANK ANNUAL REPORT 2009

postponed risk allowance for 2008 of DKr1.1bn was also booked to income. The remaining bal-ance may be booked at a later date when the in-vestment return and the fi nancial reserves permit.
Danica Pension’s net income was adversely af-fected by the DKr40m special allotment payable to certain policyholders of the former Statsanstalten for Livsforsikring. Statsanstalten for Livsfor-sikring was privatised in 1990 to form part of Danica Pension. Under the terms of the privatisa-tion, Danica Pension must meet the legitimate allotment expectations of the policyholders. This entails an obligation to make allotments to these policyholders if the percen tage by which Danica Pension’s equity exceeds its statutory solvency requirement reaches a certain limit.
The obligation to add the special allotment will exist as long as policies established with Statsan-
DANICA PENSION(DKr m) 2009 2008
Index
09/08
Q4
2009
Q3
2009
Q2
2009
Q1
2009
Share of technical provisions 1,087 1,088 100 278 271 266 272
Unit-linked business 151 -21 - 43 56 51 1
Health and accident business -97 -142 68 -41 -21 -7 -28
Return on investments 1,383 -961 - 198 485 488 212
Financing result -247 -609 41 -41 -50 -62 -94
Special allotment -40 - - -40 - - -
Change in shadow account 573 -1,088 - 1,382 -271 -266 -272
Net income from insurance business 2,810 -1,733 - 1,779 470 470 91
Premiums, insurance contracts 17,152 19,292 89 4,810 3,833 3,800 4,709
Premiums, investment contracts 3,279 2,587 127 1,297 758 734 490
Provisions, insurance contracts 222,377 204,123 109 222,377 221,287 212,927 207,220
Provisions, investment contracts 15,032 8,464 178 15,032 13,098 10,989 8,918
Customer funds, investment assets
Danica Traditionel 181,288 175,778 103 181,288 182,252 176,482 173,331
Danica Balance 13,638 7,583 180 13,638 11,991 10,052 8,216
Danica Link 32,800 20,895 157 32,800 29,786 25,803 21,602
Allocated capital (avg.) 5,731 5,245 109 5,775 5,676 5,731 5,741
Net income as % p.a. of allocated capital 49.0 -33.0 - 123.2 33.1 32.8 6.3
stalten for Livsforsikring are effective at Danica Pension. Special allotments are expensed only in years in which the excess equity limit is reached.
Unit-linked business improved signifi cantly on the 2008 result. The business volume meant that the income from existing customers exceeded current expenses, and cost reductions also con-tributed to increasing the result by DKr172m.
The health and accident result remained nega-tive, and the combined ratio was 110%. Alone, the result is not satisfactory, but it must be viewed together with the life insurance result.
The www.danskebank.com/ir site provides more details about Danica Pension’s profi t policy and consolidation in the accounts of the Danske Bank Group.
45 DANSKE BANK ANNUAL REPORT 2009 BUSINESS UNITS

Holdings and returns
Share
(%)
2009
Share
(%)
2008
Return
(%)
2009
Return
(%)
2008
Real property 10 10 4.1 7.1
Bonds etc. 80 83 6.5 6.9
Equities 10 7 22.2 -40.0
Total 100 100 7.1 -1.2
CUSTOMER FUNDS – DANICA TRADITIONEL
Activities outside DenmarkIn Sweden, Danica Pension recorded a 32% rise in premiums over the level in 2008, with the Depåförsäkring product contributing DKr2bn.
Sales in Ireland were off to a good start in 2009, adding DKr125m to total premiums.
In Norway, premiums fell 3% to DKr595m.
TOTAL PREMIUMS(DKr bn) 2009 2008
Premiums, Denmark
Danica Traditionel 9.7 11.8
Danica Balance and Danica Link 7.6 8.0
Internal transfers -0.7 -0.9
Premiums, international 3.8 3.0
Total 20.4 21.9
Investment return The return on Danica Balance and Danica Link investments in 2009 was DKr5,876m, equalling an average rate of return of 24.0%, against a nega-tive return of 24.0% in 2008. The positive return allowed many customers to recoup a large part of the loss they took in 2008.
The return on customer funds invested through Danica Traditionel was 7.1%, against a negative 1.2% in 2008. At the end of 2009, the return on customer funds, including changes in technical provisions, ended at 6.8%, and equity, credit bond and property exposures totalled 32%.
Financial strengthThe collective bonus potential stood at DKr2.8bn at end-2009, against DKr1.6bn at end-2008. A 12% fall in equity prices would reduce the collective bonus potential at the end of 2009 by DKr1.1bn, the bonus potential of paid-up policies by DKr0.6bn and shareholders’ equity by DKr0.2bn. A decline in interest rates of 70 basis points would increase the collective bonus potential by DKr0.8bn and shareholders’ equity by DKr0.3bn, while it would leave the bonus potential of paid-up policies unchanged.
The capital base of the Danica group totalled DKr22.1bn. At the end of 2009, the Danica group’s total fi nancial strength, that is, its capital base and collective bonus potential less the capital needed to meet the solvency requirement, stood at DKr17.1bn. On top of this, the bonus po-tential of paid-up policies added DKr14.2bn that may be used partly for loss compensation.
In February, Standard & Poor’s downgraded Danica Pension’s rating from AA- to A+ (nega-tive outlook). The rating was lowered again from A+ to A (negative outlook) in December. Danica Pension’s S&P rating depends highly on Danske Bank’s rating, which was also notched down.
OutlookIn 2010, the interest rate on policyholders’ sav-ings will initially be 3.25% before tax on pension returns.
The 2010 result will depend greatly on develop-ments in the fi nancial markets and the possibility of booking the risk allowance and any amounts held in the shadow account. The special allot-ment paid to certain policyholders is likely to have an adverse effect on the result for the year. The estimated expense for this item is around DKr0.5bn before tax in 2010, depending on the insurance business and investment results and the possibility of booking shadow account amounts.
46 BUSINESS UNITS DANSKE BANK ANNUAL REPORT 2009
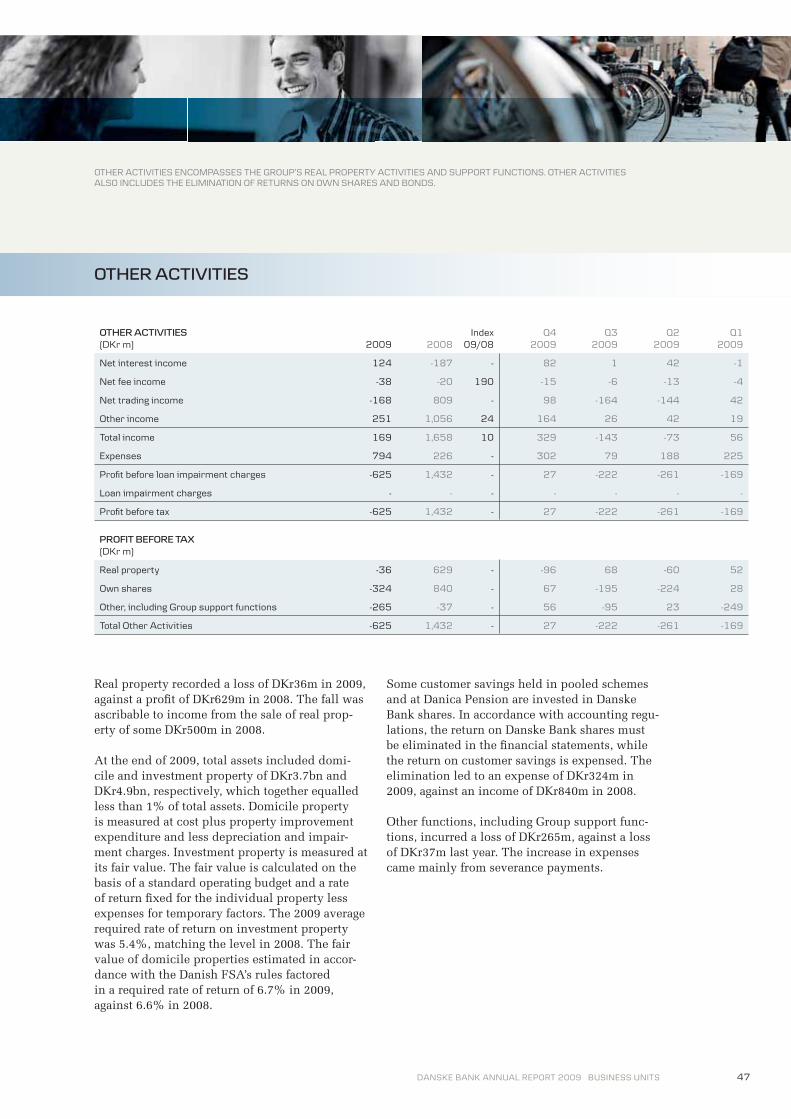
OTHER ACTIVITIES ENCOMPASSES THE GROUP’S REAL PROPERTY ACTIVITIES AND SUPPORT FUNCTIONS. OTHER ACTIVITIES
ALSO INCLUDES THE ELIMINATION OF RETURNS ON OWN SHARES AND BONDS.
OTHER ACTIVITIES
47
Real property recorded a loss of DKr36m in 2009, against a profi t of DKr629m in 2008. The fall was ascribable to income from the sale of real prop-erty of some DKr500m in 2008.
At the end of 2009, total assets included domi-cile and investment property of DKr3.7bn and DKr4.9bn, respectively, which together equalled less than 1% of total assets. Domicile property is measured at cost plus property improvement expenditure and less depreciation and impair-ment charges. Investment property is measured at its fair value. The fair value is calculated on the basis of a standard operating budget and a rate of return fi xed for the individual property less expenses for temporary factors. The 2009 average required rate of return on investment property was 5.4%, matching the level in 2008. The fair value of domicile properties estimated in accor-dance with the Danish FSA’s rules factored in a required rate of return of 6.7% in 2009, against 6.6% in 2008.
Some customer savings held in pooled schemes and at Danica Pension are invested in Danske Bank shares. In accordance with accounting regu-lations, the return on Danske Bank shares must be eliminated in the fi nancial statements, while the return on customer savings is expensed. The elimination led to an expense of DKr324m in 2009, against an income of DKr840m in 2008.
Other functions, including Group support func-tions, incurred a loss of DKr265m, against a loss of DKr37m last year. The increase in expenses came mainly from severance payments.
OTHER ACTIVITIES(DKr m) 2009 2008
Index
09/08
Q4
2009
Q3
2009
Q2
2009
Q1
2009
Net interest income 124 -187 - 82 1 42 -1
Net fee income -38 -20 190 -15 -6 -13 -4
Net trading income -168 809 - 98 -164 -144 42
Other income 251 1,056 24 164 26 42 19
Total income 169 1,658 10 329 -143 -73 56
Expenses 794 226 - 302 79 188 225
Profi t before loan impairment charges -625 1,432 - 27 -222 -261 -169
Loan impairment charges - - - - - - -
Profi t before tax -625 1,432 - 27 -222 -261 -169
PROFIT BEFORE TAX(DKr m)
Real property -36 629 - -96 68 -60 52
Own shares -324 840 - 67 -195 -224 28
Other, including Group support functions -265 -37 - 56 -95 23 -249
Total Other Activities -625 1,432 - 27 -222 -261 -169
DANSKE BANK ANNUAL REPORT 2009 BUSINESS UNITS

CAPITAL MANAGEMENT
The purpose of capital management policies and practices is to ensure that the Group has suf-ficient capital to cover the risks associated with its activities. The Group monitors developments in new regulatory proposals to be able to adjust funding to new capital requirements in good time.
In addition to common equity, the capital base consists of subordinated loan capital, including hybrid capital of DKr26bn raised under the loan agreement with the Danish state in 2009.
CAPITAL BASE(DKr bn) 2009 2008
Core tier 1 capital, excluding
hybrid capital 79 77
Hybrid capital, less statutory
deductions 39 11
Supplementary capital, less
statutory deductions 30 37
Capital base 148 125
The ICAAP result – the capital needed to cover the Group’s risks – amounted to DKr84.0bn, or 10.1% of risk-weighted assets, at the end of 2009. As the actual capital base stood at DKr148.3bn and the solvency ratio at 17.8% at the end of the year, the Group had a massive capital buffer of DKr64.3bn.
The substantial capital buffer relative to the ICAAP result and robust earnings capacity provide a solid foundation for meeting future consequences of the economic crisis.
Owing to the increased macroeconomic uncer-tainty and expectations of stricter quantitative and qualitative capital requirements, the Group has suspended its capital targets. The Group will set capital targets when conditions have been clarified.
The regulatory framework for the Group’s capital management is rooted in the Capital Require-ments Directive (CRD). The CRD consists of three pillars:
the capital requirement (8% of risk-weighted assets for credit risk, market risk and opera-tional risk based on the formulas in the Basel II guidelines).
ICAAP and the supervisory review. The ICAAP determines the capital needed (see below).
sets forth disclosure requirements for risk and capital management. The Group complies with the Pillar III disclosure requirements through its publication of Risk Management 2009, available at www.danskebank.com/ir.
Pillar IUnder Pillar I, the Group applies the following methods to calculate risk-weighted assets for the three risk types:
The Group used the IRB approach for 77% of the lending
portfolio at the end of 2009. The remaining risk was treated
according to the standardised approach.
For general market risk, the Group uses an internal Value-
at-Risk model. For specific risk, it uses the standardised
approach.
The Group uses the standardised approach for operational
risk.
Pillar IIWhile Pillar I contains uniform rules for deter-mining a credit institution’s risk-weighted assets and capital requirements for credit, market and operational risks, Pillar II contains a framework for an internal capital adequacy assessment pro-
48 CAPITAL MANAGEMENT DANSKE BANK ANNUAL REPORT 2009

49
cess (ICAAP) based on the characteristics of the individual institution. Pillar II covers all relevant risks, including risks addressed under Pillar I.
As part of the ICAAP, management assesses the Group’s risk profile on the basis of a number of criteria and estimates the capital needed to cover risks. The ICAAP also includes capital planning to ensure that the Group holds sufficient capital for the years ahead. One of the planning tools is stress testing (see below).
The ICAAP result is calculated on the basis of a number of factors, including the highest of the following measurements:
-nal economic capital model
supplement to address the risks that are not captured by Pillar I (Pillar I+)
-al rules of the CRD
The Pillar I+ requirement includes an add-on to reflect the risks not adequately covered under Pil-lar I, for example pension risk, business risk and, in the current macroeconomic situation, certain credit risks. Both the Pillar I+ requirement and the capital needed according to the internal eco-nomic capital model are supplemented by add-ons to reflect any uncertainty of the risk models, and the capital level is subject to ongoing qualita-tive adequacy assessments.
At the end of 2009, the Group’s ICAAP result was calculated according to the Basel I rules (the transitional rules). The period for which the tran-sitional rules are applicable has been extended to the end of 2011. The ICAAP result amounted to DKr84.0bn, or 10.1% of risk-weighted assets, at
the end of 2009. As the actual capital base stood at DKr148.3bn and the solvency ratio at 17.8% at the end of the year, the Group had a massive capital buffer of DKr64.3bn. If the transitional rules had not still been in force, the ICAAP result would have equalled the Pillar I+ result, which would have added DKr3bn to the buffer.
The regulatory framework provides some discre-tionary leeway for selection of ICAAP calculation method. The Group believes that it has adopted a sufficiently conservative approach:
under Pillar I to reflect risks not captured by Pillar I
of the risk models and makes qualitative ad-equacy assessments of the capital level on an ongoing basis
The calculation of the ICAAP result for the Danske Bank Group and Danske Bank A/S is described in more detail in Risk Management 2009, available at www.danskebank.com/ir.
0
20
40
60
80
100
120
140
160
Capital
base
Transitional
rules
Pillar I+Economic
capital
CAPITAL REQUIREMENTS(DKr bn)
ICAAP ratio
7.9%
10.1%9.7%
17.8%
DANSKE BANK ANNUAL REPORT 2009 CAPITAL MANAGEMENT

Severe recession Deep international recession with a
signifi cant slump in global trade, includ-
ing lower export demand. Domestic
investment and consumption decline,
and property prices fall.
Falling property prices
House prices have been signifi cantly
overvalued, and the bubble bursts.
Prices drop 40%.
Defl ation Households seek to increase savings,
and companies postpone investments
because of the fi nancial crisis and
uncertainty about the future.
Liquidity crisis A sector liquidity crisis leading to a
severe recession. The result is an
increase in funding costs equivalent
to the effect of a downgrade of Danske
Bank's rating by three notches.
Risk Management 2009, available at www.danskebank.com/ir, provides more information about stress testing.
The stress tests show that the Group holds ad-equate capital.
50
Risk Management 2009 also provides more infor-mation about the Group’s management of credit risk, market risk and liquidity risk.
Stress testingWhen calculating its ICAAP result, the Group is under a statutory obligation to use the mild recession scenario. At the moment, the economic situation is worse than a mild recession, and the Group therefore uses a number of stress test scenarios that are worse than a mild recession in its internal capital planning.
Stress tests show how various scenarios will affect the Group’s losses and earnings. If earn-ings or the capital buffer is insuffi cient to cover losses, the Group will prepare capital and risk mitigation contingency plans. The ICAAP result does not factor in the mitigating effects of such contingency plans, management intervention or risk diversifi cation.
The Group continues to develop its stress tests to be prepared for future challenges. Since 2008, the Group has added a number of new scenarios to its model framework. They include a “Credit crunch” scenario in which the current downturn worsens and continues for several years.
The Group assesses a number of scenarios, and the table shows some of them. The sce narios assume that all markets are subject to the same changes at the same time – there is thus no geographical diversifi cation. Each market is modelled separately, however, to ensure that dynamics are captured correctly.
CAPITAL MANAGEMENT DANSKE BANK ANNUAL REPORT 2009

51
The Group’s Investor Relations department is re-sponsible for providing current and adequate in-formation to investors and analysts in accordance with the Group’s overall policy of openness and transparency. Investor Relations communicates with stakeholders through regular contact and the www.danskebank.com/ir site.
To support stakeholder relations, Investor Rela-tions goes on roadshows four times a year upon the release of the Group’s fi nancial reports. In 2009, the roadshows covered the Nordic coun-tries, Europe, the US and Canada and attracted around 400 investors.
Investor Relations and senior management also build relations with analysts and existing and potential investors by presenting and discuss-ing current issues of relevance to the Danske Bank Group at seminars and conferences in and outside Denmark.
At the end of 2009, 27 equity research providers (seven in Denmark) had issued reports on Danske Bank.
Danske Bank sharesDanske Bank shares are listed on Nasdaq OMX Copenhagen and are included in a number of Danish and international equity indices, for example the OMX Copenhagen 20 Index (OMXC20). At the end of 2009, Danske Bank shares had an index weighting of about 14%.
The share price rose from DKr52.0 at December 31, 2008, to DKr118.0 at December 31, 2009, an increase of 127%. In comparison, the OMXC20 index gained 29%.
The average daily trading volume of Danske Bank shares in 2009 was DKr205m, against DKr410m in 2008. Danske Bank shares were some of the most actively traded shares in the OMXC20 index.
DANSKE BANK SHARES (DKr) 2009 2008
Share capital (million) 6,988 6,988
Share price (end of year) 118.0 52.0
Total market capitalisation
(end of year) (bn) 81 36
Earnings per share 2.5 1.5
Dividend per share - -
Book value per share 145.8 142.4
Share price/book value per share 0.8 0.4
Over the past fi ve years, Danske Bank shares have generated an average annual return of -4%, including dividends. The corresponding fi gure for the MSCI Europe Banks Index is an annual average of -7%.
Dividend policyThe overall fi nancial objective is to provide shareholders with a competitive return through share price appreciation and dividend payments.
INVESTOR INFORMATION
DANSKE BANK SHARESIndex 2005 = 100
Danske Bank shares
MSCI Europe Banks
0
50
100
150
200
2005 2006 2007 2008 2009
DANSKE BANK ANNUAL REPORT 2009 INVESTOR INFORMATION

Because of its participation in the Danish state guarantee scheme (Bank Package I), Danske Bank may not make dividend payments or buy back own shares during the two-year guarantee period from October 5, 2008, to September 30, 2010.
From October 1, 2010, and for as long as the Danish state holds hybrid capital in Danske Bank, the Bank may distribute dividends only if such dividends can be paid in full out of the profit for the year. Furthermore, the loan agree-ment stipulates an increase in the interest rate if annual dividend payments exceed DKr3.4bn.
Danske Bank will determine the level of future dividend rates when the conditions for the finan-cial sector have been clarified.
ShareholdersAt the end of 2009, Danske Bank had about 342,000 shareholders. Some 20 investors owned about 51% of the share capital.
Danske Bank estimates that shareholders outside Denmark, mainly in the UK and the US, hold more than 30% of its share capital.
According to the Danish Companies Act, share-holders in a company must notify the company if the voting rights of their shares exceed 5% of the voting rights of the company’s share capital, or if the nominal value of their shares exceeds 5% of the share capital. Shareholders must disclose changes in shareholdings if they exceed or fall below specified percentage thresholds. Two shareholder groups have notified Danske Bank that they hold more than 5% of the share capital:
Foundation and companies of the A.P. Moller – Maersk Group, Copenhagen, hold 22.76% of the share capital.
share capital.
The number of voting rights is identical to the number of shares as all shares carry the same rights.
At the end of 2009, Danske Bank itself held around 1% of the share capital. These shares are held for obligations to compensate staff in the form of conditional shares and share options is-sued under share programmes in previous years and for investments on behalf of policyholders and under pooled schemes.
52
DANSKE BANK’S SHAREHOLDERS 2009
In Denmark,
other, 33%
Realdania,
10%
A.P. Moller, 23%
Other, 9%
In Sweden, 1%
In Switzerland,
In the UK, 12%
In the US and
Canada, 11%
1%
INVESTOR INFORMATION DANSKE BANK ANNUAL REPORT 2009

53
Good corporate governance is essential in main-taining investor confidence, meeting financial objectives and ensuring proper integrity and respect in relations with stakeholders, including shareholders, employees, customers, suppliers and authorities.
The Group’s management structure reflects the statutory requirements governing Danish listed companies in general and financial services institutions in particular. In all material respects, the Group complies with the recommendations issued by the Danish Committee on Corporate Governance.
In addition to ensuring compliance with statu-tory requirements, the management structure provides maximum security of operations.
Key elements of the management structure are well-defined powers, regular reporting and con-siderable transparency in activities. Group stan-dards for risk management, financial planning and control, credit approval, HR development, compliance and the shared IT platform ensure wellstructured management of all activities.
The management’s ambition is to continually adjust its structure to make sure that the Group
maintains the highest possible management stan-dards and transparency for shareholders.
General meetingAccording to Danske Bank’s articles of associa-tion, an annual general meeting must be held every year not later than April 30. Extraordinary general meetings may be held if so decided by the general meeting or the Board of Directors or requested by one of the auditors appointed by the general meeting or shareholders together holding at least one-tenth of the shares.
Danske Bank held its annual general meeting on March 4, 2009. On May 14, 2009, an extraor-dinary general meeting adopted the resolutions to amend Danske Bank’s articles of association to allow a conversion of hybrid capital from the Danish state into share capital.
The Board of Directors calls the general meeting by announcement in the Danish Commerce and Companies Agency’s IT system, in several Danish daily papers and on Danske Bank’s website. Writ-ten notice of the general meeting must be given to all registered shareholders having made such a request. The general meeting must be called at not more than four weeks’ and not less than eight days’ notice.
ORGANISATION AND MANAGEMENT
DANSKE BANK’S MANAGEMENT STRUCTURE
INTERNAL AUDIT
BANKING
ACTIVITIES
DANSKE
MARKETS
DANICA
PENSION
BOARD OF DIRECTORS
BOARD OF DIRECTORS SECRETARIAT
EXECUTIVE BOARD
EXECUTIVE COMMITTEE
DANSKE
CAPITAL
OTHER
DANSKE BANK ANNUAL REPORT 2009 ORGANISATION AND MANAGEMENT

Shareholders are entitled to table proposals at the general meeting provided that they observe a few simple formalities. Proposals under the fi xed items on the agenda may be made at the general meeting. New items and related proposals must be submitted to the Board of Directors in writing not later than two weeks before the meeting.
Shareholders are entitled to attend and vote at the general meeting if, not later than fi ve days be-fore the meeting, they have requested an admis-sion card and ballot paper and provided proof of their shareholdings by registering their shares in Danske Bank’s share register, by holding a Danske Bank custody account or by providing other proof of their shareholdings.
There is only one class of shares and no limita-tions on holdings, voting rights or other oppor-tunities for shareholders to infl uence decisions.
The chairman of the general meeting, who is appointed by the Board of Directors, decides whether or not to make a resolution by vote. Some resolutions may be passed without a vote, while others require a ballot.
General meeting decisions are made by a simple majority of votes unless otherwise provided by law or the articles of association. In case of a par-ity of votes, decisions are made by drawing lots.
Resolutions to amend the articles of association that, pursuant to Danish law, cannot be made by the Board of Directors are passed only if adopted by at least two-thirds of the votes cast and by at least two-thirds of the share capital represented at the general meeting and entitled to vote.
A resolution to wind up Danske Bank by merger or voluntary liquidation can be passed only if adopted by at least three-quarters of the votes cast and by at least three-quarters of the share
54
capital represented at the general meeting and entitled to vote.
As a consequence of new Danish company legis-lation adopted in May 2009, the Board of Direc-tors recommends that the annual general meeting adopt a number of amendments to Danske Bank’s articles of association.
First, the Board proposes that the Group’s corporate language be both Danish and English. Second, it proposes the introduction of rules to enable Danske Bank to communicate electroni-cally with its shareholders. Third, the Board pro-poses that notices of general meetings be changed to allow future notice to be given on the Group’s website three to fi ve weeks before meetings; that the deadline for registering for attendance and for obtaining an admission card be changed from fi ve to three days; and that the role of the chairman of the general meeting be specifi ed in detail.
Finally, the Board proposes that notices of gene-ral meetings contain the full wording of propo-sals to amend the articles of association; and that proposals submitted by the shareholders to the general meeting be added to the agenda if such proposals reach the Board on the next weekday after the release of the annual report, even if the date falls on a day in the period that starts six weeks before the general meeting takes place.
Board of Directors Board candidates are nominated by shareholders or the Board of Directors and are then elected by the general meeting as the ultimate authority.
At present, the Board consists of 15 members; ten are elected by the general meeting, and fi ve are staff representatives. Under Danish law, employ-ees are entitled to elect a number of representati-ves from among themselves equal to halfof the number of members elected by the general
ORGANISATION AND MANAGEMENT DANSKE BANK ANNUAL REPORT 2009

55
meeting at the time when the staff representative election is announced.
Board members elected by the general meeting are up for election every year. Pursuant to Danish law, staff representatives serve on the Board for a four-year term and are elected separately by the Group’s employees. The current fi ve staff repre-sentatives were elected in 2006 and their term of offi ce will therefore expire in 2010.
Danske Bank has decided not to comply with the recommendations issued by the Danish Commit-tee on Corporate Governance for the maximum number of directorships. Simply counting the di-rectorships of each board member is not consid-ered a useful method because the workload varies from one company to another. Danske Bank has therefore not set an upper limit on the number of directorships that a board member may hold.
In accordance with corporate governance recom-mendations, Danske Bank classifi es its board members as either dependent or independent. All board members elected by the general meeting are considered independent members.
New Danish recommendations for corporate governance exist in draft form. They include proposals for a maximum term of offi ce for inde-pendent members. The Board fi nds such limita-tion unnecessary and inappropriate because the statutory requirements lay down that a board’s sole responsibility is to safeguard the interests of the company and because the articles of asso-ciation specify that members are up for election every year.
Under the current management structure, the Board of Directors outlines the overall principles governing the affairs of the Group, whereas the Executive Board is in charge of day-to-day man-
agement, observing the guidelines and regula-tions issued by the Board of Directors.
The rules of procedure for the Board of Directors and the Executive Board lay down the precise di-vision of duties and responsibilities. A summary of these rules is available at www.danskebank.com.
The Board of Directors meets about 12 times a year as scheduled in a meeting plan for each calendar year. Once or twice a year, it holds an extended meeting to discuss the Group’s strategic situation. The Board held 20 meetings in 2009; four were conference calls to make decisions and one was an extended strategy meeting.
The Board of Directors appoints the Executive Board, the secretary to the Board of Directors, the Group chief auditor and the deputy Group chief auditor and determines their remuneration.
During the past two years, the Board of Directors has systematically evaluated its performance on the basis of a number of criteria. In the process, the board members have looked at the Board’s overall performance and at the individual mem-bers’ contributions. The evaluation process will continue under the supervision of the chairman. The full Board has discussed the outcome of the current process, and this has had an effect on the nomination of new board members.
Board member Henning Christophersen attained the age of 70 in November 2009 and is not up for re-election as the rules of procedure lay down that board members must retire at that age. Board member Niels Chr. Nielsen (68) has decided not to offer himself for re-election.
The Board of Directors will propose to the gene-ral meeting that Michael Fairey and Ole Gjessø Andersen be elected new members of the Board.
DANSKE BANK ANNUAL REPORT 2009 ORGANISATION AND MANAGEMENT

Mr Fairey worked for, among others, Lloyds TSB Group PLC, where he was deputy CEO in the ten years until his retirement in 2008. Mr Gjessø Andersen has held management positions at EQT Partners and SEB, among others.
The election of new board members will give the Group additional expertise in the form of professional management experience from large international financial corporations and additio-nal financial expertise, including an insight into and understanding of service industries.
The Board of Directors proposes the re-election of the remaining board members elected by the general meeting.
The employees will elect their board repre-sentatives on March 12, 2010. Verner Usbeck and Solveig Ørteby have decided not to run for another term. Consequently, they will retire from the Board of Directors at Danske Bank’s annual general meeting.
Board committeesThe Board of Directors has set up four commit-tees to supervise specific areas and prepare cases for later consideration by the full Board. They are the Audit Committee, the Credit and Risk Committee, the Remuneration Committee and the Nomination Committee.
The committees base their work on clearly defined and publicly disclosed charters that set forth their purposes and duties. As stipulated by Danish law, the four committees, which report to the Board of Directors, are not authorised to make independent decisions.
The Audit Committee examines accounting, auditing and security issues. These are issues that the Board, the Audit Committee itself, the Group chief auditor or the external auditors
believe deserve examination before they are brought before the full Board. The Audit Committee held four meetings in 2009. The Credit and Risk Committee monitors signi-ficant credit exposures to prepare cases for the full Board. The committee operates as a hearing panel on major credit exposures and monitors the credit quality of the Group’s loan portfolio and reviews special renewal applications and facilities. It also monitors the Group’s overall risk profile, risk management approach and capital structure. The Credit and Risk Committee held five meetings in 2009.
The Remuneration Committee monitors trends in remuneration levels and incentive programmes to ensure continuous and longterm value creation for shareholders. The Remuneration Committee met twice in 2009.
The Nomination Committee identifies potential board candidates and recommends them to the Board of Directors for election at the general meeting. The Nomination Committee held three meetings during the year.
Executive BoardOn September 1, 2009, Thomas F. Borgen joined the Executive Board, leaving a longterm posi-tion as head of the Group’s Norwegian banking operations at Fokus Bank. The Executive Board now consists of Peter Straarup, Chairman; Tonny Thierry Andersen, Chief Financial Officer; Sven Lystbæk, head of Shared Services Centre; Per Skovhus, head of Group Credits; and Thomas F. Borgen, head of the Group’s international ban-king activities and Danske Markets.
Executive CommitteeThe Executive Committee is a co-ordinating fo-rum whose principal objective is to take an over-all view of Group activities with particular focus
56 ORGANISATION AND MANAGEMENT DANSKE BANK ANNUAL REPORT 2009

57
on the interaction between support functions, individual brands and country organisations.
Trond Mellingsætter became head of Fokus Bank on September 1, 2009, and Lars Mørch took over as head of the Group’s Swedish banking activi-ties on January 1, 2010, following Leif Norburg’s retirement. Mr Mørch was previously in charge of Group HR & Communications.
Eva Hald took up the position as head of Group Communications on January 1, 2010. She was previously responsible for Strategic Projects at Stakeholder Relations at Novozymes A/S.
From March 1, 2010, Helle Havgaard will be in charge of Group HR, leaving a position as head of Group Human Capital at ISS.
In 2009, the Group set up a Group Risk function to begin operations on January 1, 2010, and ap-pointed Peter Rostrup-Nielsen Chief Risk Officer (CRO). Reporting to the Chairman of the Execu-tive Board, the CRO is responsible for the Group’s risk policies and for assessing all risks across risk types and organisational units.
Trond Mellingsæter, Eva Hald, Helle Havgaard and Peter Rostrup-Nielsen all join the Executive Committee, bringing the number of members to 18.
Management remunerationThe principles of the Group’s remuneration policy reflect its objectives of good corporate governance and continual and long-term value creation for shareholders.
The Board of Directors adopts the remuneration policy, which was most recently approved by the general meeting in March 2008. The Board of Directors is responsible for submitting amended versions to the general meeting for approval.
Members of the Board of Directors receive a fixed fee, but are not covered by incentive programmes and do not receive performance-based compensa-tion. The remuneration of the Board of Directors is subject to the approval of the general meeting when it considers the annual report. The Board of Directors determines the Executive Board’s remuneration, which consists of fixed salaries, various types of incentive programmes and pen-sions.
As a participant in the Danish state guarantee scheme, Danske Bank may not grant share op- tions or conditional shares to the Executive Board until the expiry of the two-year guarantee period on September 30, 2010. The guarantee further prohibits share-based payment for as long as the Danish state holds hybrid capital in Danske Bank.
In 2009, Danske Bank decided to suspend its cash bonus programme, which previously formed part of its remuneration package. Therefore, neither the Executive Board nor the Group’s customer advisers will receive cash bonuses. This means that performance-based remuneration is payable to Danske Markets and Danske Capital employees only.
Note 9 of the consolidated financial statements provides individual remuneration and salary details for 2009.
WhistleblowingIn 2009, the Group set up a function to enable staff to report anonymously on irregularities that come to their attention. The Group has an interest in establishing and maintaining an en-vironment that encourages a free flow of informa-tion – and provides security and protection from reprisals for staff reporting suspicious actions.
DANSKE BANK ANNUAL REPORT 2009 ORGANISATION AND MANAGEMENT

lishing controls is to prevent, detect and cor-rect reporting errors and irregularities, but they provide no guarantee against such errors and irregularities.
The Group has set up a procedure of daily and monthly reporting, including deviation reports for the individual organisational levels. Internal management reporting is based on the same prin-ciples as external reporting, and local and central units use the same data and reporting systems. Group Finance checks the reports and uses them to prepare the consolidated fi nancial statements to be submitted to the Executive Board.
The Board of Directors has established internal audit processes to regularly review internal management reporting and external reporting (in-terim and annual reports). Furthermore, Internal Audit performs an operational audit, focusing on key areas of the Group’s risk management proce-dures, including risk reporting.
The Executive Board regularly reports to the Board of Directors and its committees on compli-ance with the risk and investment framework set out and statutory investment rules. The Board of Directors also receives accounting information on an ongoing basis. Compliance and Internal Audit regularly submit reports to the Board of Direc-tors on compliance with rules and regulations, including any violation of internal business pro-cedures and policies. Once a year, Internal Audit submits a report to the Audit Committee with information about the effectiveness of fi nancial reporting and risk management processes.
The www.danskebank.com/corporategovernance site provides more information about corporate governance at Danske Bank.
The responsibility for handling whistleblowing issues rests with the Group chief auditor and the Group general counsel, and suspicious actions must be reported to one of them.
tems in fi nancial reportingAs laid down in the Danish Financial Business Act, the Board of Directors is responsible for ensuring that the Executive Board maintains ef-fective procedures to identify, monitor and report risks and uphold adequate control procedures as well as satisfactory IT controls and security mea-sures. The division of responsibilities between the Board of Directors and the Executive Board is outlined above.
The Executive Board regularly assesses and adjusts the internal control and risk management systems used in the fi nancial reporting process to maintain a high level of reporting.
The key elements for good accounting practices are well-defi ned powers, segregation of duties, re-gular reporting and considerable transparency in activities. The shared IT platform helps provide the documentation of accounting data across the Group and reduce fi nancial reporting risks.
Group Finance regularly assesses fi nancial repor-ting risks with particular focus on items where estimates and assessments may have a material impact on the value of assets and liabilities. The note on critical accounting policies lists these items.
The Executive Board has implemented controls to eliminate identifi ed fi nancial reporting risks and regularly monitors changes in and compli-ance with relevant legislation and other fi nancial reporting regulations. The purpose of estab-
58 ORGANISATION AND MANAGEMENT DANSKE BANK ANNUAL REPORT 2009

59
Despite the challenging fi nancial climate, the Group continued its efforts to integrate corporate responsibility (CR) initiatives into its core activi-ties. Although cost reductions across the organi-sation became necessary in 2009, the Group suc-cessfully reached several important CR goals.
Carbon neutralityIn 2007, the Group set the goal of achieving carbon neutrality by the end of 2009. It reached this goal in December 2009 through a reduction of own CO2 emissions and purchases of carbon credits from environmental projects in India, Turkey and Lithuania.
For example, the more widespread use of video conferences (about 4,000 in 2009) helped reduce kilometres fl own by more than 31%. This re-duction did not only cut CO2 emissions by 871 tonnes, it also brought down air travel expenses. It was thus possible to combine energy-saving improvements with cost reductions.
Besides internal savings, the Group’s climate strategy also focuses on business opportunities. The Group participates in a project under the auspices of the Danish Ministry of Climate and Energy to develop a website that provides infor-mation about energy-saving housing improve-ments and fi nancing options.
In 2008, Nordania Leasing launched Nordania Greenfl eet, an environmental programme that ad-vises businesses how to incorporate environmen-tal considerations into their choice of company cars. Greenfl eet offers reports on SO2 and CO2 emissions from company car fl eets, guidelines for developing green company car policies and courses in safe and environmentally friendly driving. In 2009, half of all corporate customers opted for the Greenfl eet programme.
In November 2009, Danske Invest launched the KlimaTrends fund. This fund invests in com-panies that are expected to be well prepared for climate change challenges and thus offer an attractive long-term return potential. The fund also invests in companies that are likely to be capable of adapting to changes and in providers of products or services that improve climate and environmental conditions.
The www.danskebank.com/responsibility site provides more information about the Group’s CR activities. Corporate Responsibility 2009 and CR Fact Book 2009 are also available on the site.
Layoff proceduresA lower level of activity in 2009 forced the Group to reduce its headcount. Combined, natural attrition and the adjustments lowered the staff number by 6% over the year.
The Group made an effort to carry out the staff reductions in the most appropriate way, just as it reduced the number of new appointments and of-fered some employees new jobs within the Group to minimise the need for layoffs. Moreover, the Group was in close contact with Danske Kreds, the Danske Bank staff organisation, before the layoffs to ensure a proper process and a satisfac-tory agreement for the employees involved.
Socially responsible investment policyIn 2008, the Group implemented a Socially Re-sponsible Investment (SRI) policy to ensure that it does not invest customer funds in businesses that do not comply with international guidelines on human rights, the environment, labour rights, weapons and corruption.
The Group increased its focus on responsible investment by deciding to sign the Principles for
CORPORATE RESPONSIBILITY
DANSKE BANK ANNUAL REPORT 2009 CORPORATE RESPONSIBILITY

Responsible Investment (PRI) in January 2010. The decision refl ects the Group’s ambition to have environmental, social and ethical guidelines that meet international standards.
More focus on customersThe Group must conduct business in a respon-sible and trustworthy way to make customers feel secure. In 2009, Banking Activities Denmark launched 23 specifi c initiatives to increase open-ness and transparency for its customers. Formu-lated on the basis of a comprehensive dialogue with its customers in Denmark through the Sig Din Mening (Voice your opinion) campaign, the initiatives include a new online customer board, more openness about complaints and complaints handling and the termination of adviser bonus programmes.
Broader fi nancial literacy effortsTeaching basic fi nancial skills can help children achieve a greater understanding of money and personal fi nance. Therefore, the Group launched a programme for fi nancial literacy and education investment in 2008. The fi rst initiative under the programme was an entertaining and educational website for 5- to 9-year-olds. The number of unique users at Group level exceeded one million in 2009, refl ecting general interest in teaching children about money and its value and about handling money.
In 2009, the Group widened its Financial Lit-eracy and Education Investment programme by developing new initiatives for 10- to 15-year-olds, young people aged 18 to 27 and school teachers.
Banking Activities Denmark participates in an initiative introduced by the Danish Ministry of the Interior and Social Affairs to help personal customers with debt problems manage their fi -nances. A pool of funds awarded by the ministry enables a number of philanthropic organisations to establish debt advisory services in major cities across Denmark. The services are staffed by vol-unteers from the Danish banking sector.
The Group supports the initiative as a natural part of its CR work and as an extension of its ef-forts to promote fi nancial literacy. Initially, a total of 13 Danske Bank employees work voluntarily on the project, and Danske Bank compensates the employees for part of the hours spent.
CR reportingThe Group has published a CR report together with the 2009 annual report. Corporate Respon-sibility 2009 covers the Group’s CR activities in four main areas: business, staff, environment and society. Since 2007, the Group’s CR reporting has complied with the Sustainability Reporting Guidelines issued by the Global Reporting Initia-tive (GRI).
Since 2007, the Group has supported the UN Global Compact, the largest voluntary network in the world for corporate responsibility. The UN Global Compact rests on ten universally accepted principles for human rights, labour rights, the en-vironment and anti-corruption. These principles set a common framework for businesses all over the world. As a Global Compact participant, the Group undertakes to publish a Communication
60 CORPORATE RESPONSIBILITY DANSKE BANK ANNUAL REPORT 2009
61
on Progress report every year that describes how it attempts to comply with the ten principles. The Group issued its fi rst progress report in 2008.
At the end of 2008, the Danish FSA’s executive order on fi nancial reports of credit institutions etc. was amended, requiring the Group from 2009 to report on its CR work at the release of the annual report. Such reporting must include CR policies and principles, descriptions of how they are put into action and a presentation of the outcome of CR initiatives.
The Group fulfi ls its reporting obligations by referring to Communication on Progress 2009, which is available at www.unglobalcompact.org.
DANSKE BANK ANNUAL REPORT 2009 CORPORATE RESPONSIBILITY

RUBRIK

RUBRIK
64 Income statement 65 Statement of comprehensive income
66 Balance sheet 67 Statement of capital 70 Cash fl ow statement 71 Notes
71 1 Critical accounting policies
74 2 Business segmentation
78 3 Banking activities – geographical breakdown
79 4 Net interest and net trading income
80 5 Fee income and fee expenses
80 6 Other income
80 7 Net premiums
81 8 Net insurance benefi ts
81 9 Staff costs and administrative expenses
86 10 Audit fees
86 11 Amortisation, depreciation and
impairment charges
86 12 Loan impairment charges
87 13 Tax
89 14 Cash in hand etc.
89 15 Due from credit institutions
89 16 Trading portfolio
92 17 Investment securities
92 18 Loans and advances
93 19 Loans and advances at fair value etc.
93 20 Pooled schemes and unit-linked
investment contracts
94 21 Assets and liabilities under insurance
contracts
95 22 Holdings in associated undertakings
97 23 Intangible assets
100 24 Investment property
101 25 Tangible assets
102 26 Other assets
102 27 Due to credit institutions
102 28 Deposits
103 29 Deferred tax
104 30 Other liabilities
105 31 Subordinated debt
107 32 Expected due dates
108 33 Contractual due dates
109 34 Pension plans
111 35 Risk-weighted assets
112 36 Contingent liabilities
113 37 Repo and reverse transactions
113 38 Assets deposited as collateral
114 39 Leasing
115 40 Acquisition of group undertakings
116 41 Related parties
117 42 Danske Bank shares held by
the Board of Directors and
the Executive Board
118 43 Fair value information
122 44 Group holdings and undertakings
123 45 Signifi cant accounting polices
133 Defi nition of key fi nancial ratios
134 Risk management
134 Risk exposure
134 Capital base
135 Credit risk
147 Market risk
149 Liquidity risk
151 Insurance risk
153 Pension risk
154 Highlights, ratios and key fi gures
155 FINANCIAL STATEMENTS OF THE PARENT COMPANY, DANSKE BANK A/S
173 STATEMENT AND REPORTS173 Statement by the management
174 Audit reports
176 MANAGEMENT AND DIRECTORSHIPS176 Board of Directors
178 Executive Board
FINANCIAL STATEMENTS – DANSKE BANK GROUP

Income statement � Danske Bank Group
Note (DKr m) 2009 2008 4 Interest income 112,326 150,405
4 Interest expense 64,784 110,859
Net interest income 47,542 39,546
5 Fee income 10,464 11,046
5 Fee expenses 3,222 3,437
4 Net trading income 14,101 -10,694
6 Other income 3,919 4,667
7 Net premiums 17,051 19,250
8 Net insurance benefits 29,821 16,531
Income from associated undertakings 288 217
Profit on sale of associated and group undertakings 5 -
9 Staff costs and administrative expenses 24,915 23,316
11 Amortisation, depreciation and impairment charges 4,980 6,431
Profit before loan impairment charges 30,432 14,317
12 Loan impairment charges 25,677 12,088
Profit before tax 4,755 2,229
13 Tax 3,042 1,193
Net profit for the year 1,713 1,036 Portion attributable to
Shareholders of Danske Bank A/S (the Parent Company) 1,727 1,011
Minority interests -14 25
Net profit for the year 1,713 1,036
Earnings per share (DKr) 2.5 1.5
Diluted earnings per share (DKr) 2.5 1.5
Proposed dividend per share (DKr) - -
INCOME STATEMENT – DANSKE BANK GROUP
64 INCOME STATEMENT – DANSKE BANK GROUP DANSKE BANK ANNUAL REPORT 2009
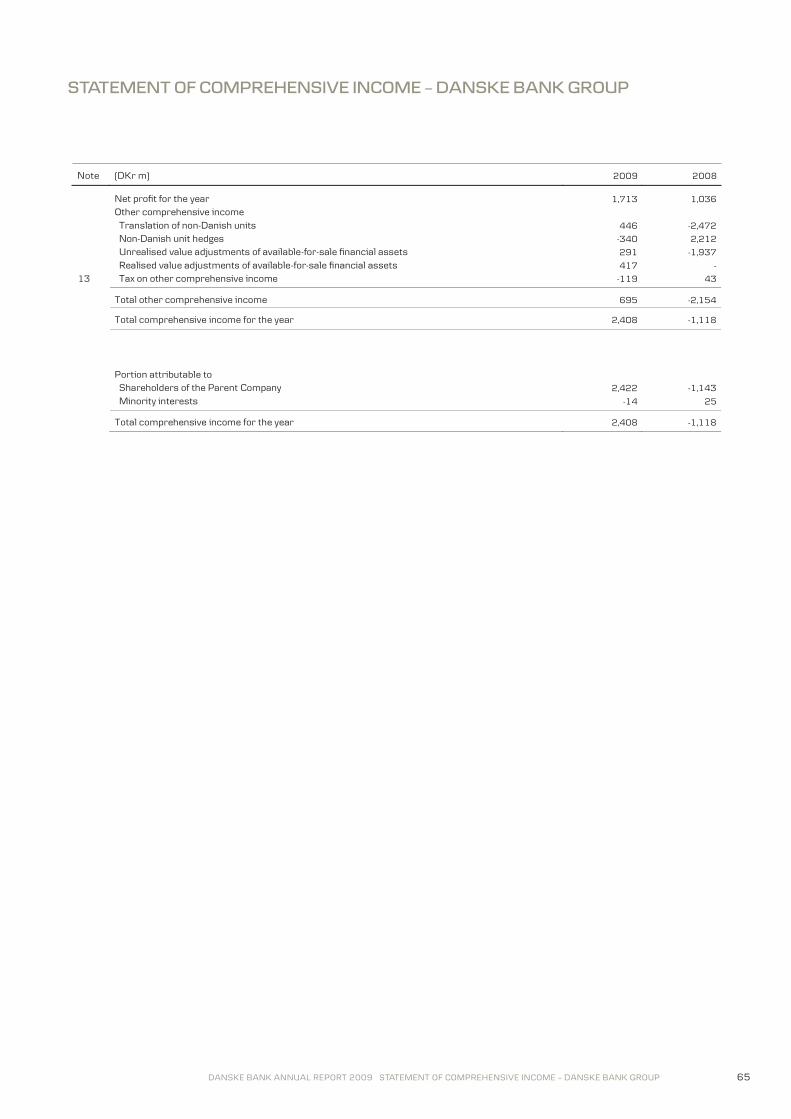
Statement of comprehensive income � Danske Bank Group
Note (DKr m) 2009 2008 Net profit for the year 1,713 1,036
Other comprehensive income
Translation of non-Danish units 446 -2,472
Non-Danish unit hedges -340 2,212
Unrealised value adjustments of available-for-sale financial assets 291 -1,937
Realised value adjustments of available-for-sale financial assets 417 -
13 Tax on other comprehensive income -119 43
Total other comprehensive income 695 -2,154
Total comprehensive income for the year 2,408 -1,118
Portion attributable to
Shareholders of the Parent Company 2,422 -1,143
Minority interests -14 25
Total comprehensive income for the year 2,408 -1,118
STATEMENT OF COMPREHENSIVE INCOME – DANSKE BANK GROUP
65DANSKE BANK ANNUAL REPORT 2009 STATEMENT OF COMPREHENSIVE INCOME – DANSKE BANK GROUP

Balance sheet � Danske Bank Group
Note (DKr m) 2009 2008 ASSETS
14 Cash in hand and demand deposits with central banks 33,714 16,379
15 Due from credit institutions and central banks 202,356 215,823
16 Trading portfolio assets 620,052 860,788
17 Investment securities 118,979 140,793
18 Loans and advances 1,127,142 1,352,113
19 Loans and advances at fair value 688,473 667,181
20 Assets under pooled schemes and unit-linked investment contracts 45,909 34,635
21 Assets under insurance contracts 196,944 181,259
22 Holdings in associated undertakings 1,086 939
23 Intangible assets 23,037 25,094
24 Investment property 4,948 4,470
25 Tangible assets 8,800 9,061
Current tax assets 2,274 2,103
29 Deferred tax assets 2,120 1,248
26 Other assets 22,643 32,088
Total assets 3,098,477 3,543,974
LIABILITIES
27 Due to credit institutions and central banks 311,169 562,726
16 Trading portfolio liabilities 380,567 623,290
28 Deposits 859,580 874,690
19 Bonds issued by Realkredit Danmark 517,055 479,534
20 Deposits under pooled schemes and unit-linked investment contracts 53,133 41,827
21 Liabilities under insurance contracts 223,876 210,988
Other issued bonds 514,601 526,606
Current tax liabilities 1,197 930
29 Deferred tax liabilities 5,391 3,082
30 Other liabilities 51,247 64,194
31 Subordinated debt 80,002 57,860
Total liabilities 2,997,818 3,445,727
SHAREHOLDERS' EQUITY
Share capital 6,988 6,988
Foreign currency translation reserve -184 -290
Reserve for available-for-sale financial assets -1,229 -1,937
Retained earnings 95,084 93,464
Proposed dividends - -
Shareholders of Danske Bank A/S (the Parent Company) 100,659 98,225
Minority interests - 22
Total shareholders' equity 100,659 98,247
Total liabilities and equity 3,098,477 3,543,974
BALANCE SHEET – DANSKE BANK GROUP
66 BALANCE SHEET – DANSKE BANK GROUP DANSKE BANK ANNUAL REPORT 2009

Statement of capital � Danske Bank Group
(DKr m) Changes in shareholders' equity Shareholders of Danske Bank A/S (the Parent Company)
Foreign currency Available- translation for-sale Retained Proposed Minority Share capital reserve assets earnings dividends Total interests Total
Shareholders' equity at January 1, 2009 6,988 -290 -1,937 93,464 - 98,225 22 98,247
Comprehensive income - 106 708 1,608 - 2,422 -14 2,408
Dividends paid - - - - - - -8 -8
Acquisition of own shares - - - -17,358 - -17,358 - -17,358
Sale of own shares - - - 17,315 - 17,315 - 17,315
Share-based payments - - - 36 - 36 - 36
Tax on entries on shareholders' equity - - - 19 - 19 - 19
Shareholders' equity at December 31, 2009 6,988 -184 -1,229 95,084 - 100,659 - 100,659 Shareholders' equity at January 1, 2008 6,988 -30 - 91,325 5,940 104,223 132 104,355
Comprehensive income - -260 -1,937 1,054 - -1,143 25 -1,118
Dividends paid - - - 109 -5,940 -5,831 -103 -5,934
Acquisition of own shares - - - -27,597 - -27,597 - -27,597
Sale of own shares - - - 28,332 - 28,332 - 28,332
Share-based payments - - - 47 - 47 - 47
Goodwill on acquisitions of minority interests - - - -55 - -55 - -55
Disposal of minority interests - - - - - - -32 -32
Tax on entries on shareholders' equity - - - 249 - 249 - 249
Shareholders' equity at December 31, 2008 6,988 -290 -1,937 93,464 - 98,225 22 98,247
Danske Bank participates in the Danish state guarantee under the Act on Financial Stability adopted by the Danish parliament on October 10, 2008. The guarantee prohibits dividend payments and share buybacks by the participating banks until the guarantee expires on September 30, 2010. From October 1, 2010, and for as long as the Danish state holds hybrid capital in Danske Bank, the Group may distribute dividends if such dividends can be paid in full out of the profit for the year. In March 2008, the Group made dividend payments of DKr8.50 per share.
STATEMENT OF CAPITAL – DANSKE BANK GROUP
67DANSKE BANK ANNUAL REPORT 2009 STATEMENT OF CAPITAL – DANSKE BANK GROUP

Statement of capital � Danske Bank Group
(DKr m) 2009 2008 Earnings per share
Net profit for the year 1,727 1,011
Average number of shares outstanding 689,697,409 686,905,802
Number of dilutive shares issued for share-based payments - 3,552
Average number of shares outstanding, including dilutive shares 689,697,409 686,909,354
Earnings per share (DKr) 2.5 1.5
Diluted earnings per share (DKr) 2.5 1.5
The share capital consists of shares of a nominal value of DKr10 each. All shares carry the same rights; there is thus only one class of shares.
Number of shares outstanding Issued shares at January 1 and December 31 698,804,276 698,804,276
Group holding of own shares 8,648,950 9,000,815
Shares outstanding at December 31 690,155,326 689,803,461
Number Number Value Value Holding of own shares 2009 2008 2009 2008
Trading portfolio 3,831,953 3,997,392 452 208
Investment on behalf of customers 4,816,997 5,003,423 568 260
Total 8,648,950 9,000,815 1,020 468
Investment Trading on behalf Total Total portfolio of customers 2009 2008
Holding at January 1 208 260 468 3,282
Acquisition of own shares 17,297 61 17,358 27,597
Sale of own shares 17,251 64 17,315 28,332
Value adjustment 198 311 509 -2,079
Holding at December 31 452 568 1,020 468
The Board of Directors is authorised to acquire own shares on behalf of Danske Bank up to ������������������������� �������������������������capital. The shares may be held for ownership or provided as collateral. If shares are acquired for ownership, the acquisition price may not deviate by more than 10% from the quoted share price at the time of acquisition.
STATEMENT OF CAPITAL – DANSKE BANK GROUP
68 STATEMENT OF CAPITAL – DANSKE BANK GROUP DANSKE BANK ANNUAL REPORT 2009

Statement of capital � Danske Bank Group
Note (DKr m) 2009 2008 Solvency Shareholders' equity 100,659 98,247
Revaluation of domicile property 1,275 1,410
Pension obligations at fair value -1,155 486
Tax effect 262 -163
Minority interests 2,984 2,979
Shareholders' equity calculated in accordance with the rules of the Danish FSA 104,025 102,959
Proposed dividends - -
Intangible assets of banking operations -23,140 -25,204
Deferred tax assets -2,223 -971
Deferred tax on intangible assets 1,229 1,433
Revaluation of real property -753 -924
Core tier 1 capital, excluding hybrid capital 79,138 77,293
Hybrid capital 41,099 13,640
Difference between expected losses and impairment charges - -
Statutory deduction for insurance subsidiaries -2,308 -2,555
Other statutory deductions - -31
Tier 1 capital 117,929 88,347
Subordinated debt, excluding hybrid capital 31,969 35,023
Hybrid capital - 1,120
Revaluation of real property 753 924
Difference between expected losses and impairment charges - 2,036
Statutory deduction for insurance subsidiaries -2,308 -2,555
Other statutory deductions - -31
Capital base 148,343 124,864
35 isk-weighted assets R 834,242 960,079
Core tier 1 capital ratio, excluding hybrid capital (%) 9.5 8.1
Tier 1 capital ratio (%) 14.1 9.2
Solvency ratio (%) 17.8 13.0
The solvency and tier 1 capital ratios are calculated in accordance with the Capital Requirements Directive. Risk-weighted assets calculated under the Basel I rules amounted to DKr1,312,565m at the end of 2009. The ICAAP result, calculated under the transi-tional requirement of 80% of the capital requirement of 8% of risk-weighted assets, was DKr84,004m. In 2008, the ICAAP result, calculated under the transitional requirement of 90% of the capital requirement, was DKr102,517m. Transitional rules used in 2009 will also apply in 2010 and 2011.
STATEMENT OF CAPITAL – DANSKE BANK GROUP
69DANSKE BANK ANNUAL REPORT 2009 STATEMENT OF CAPITAL – DANSKE BANK GROUP

Cash flow statement � Danske Bank Group
(DKr m) 2009 2008 Cash flow from operations
Profit before tax 4,755 2,229
Adjustment for non-cash operating items
Adjustment of income from associated undertakings -293 -217
Amortisation and impairment charges for intangible assets 2,517 4,105
Depreciation and impairment charges for tangible assets 1,520 1,900
Loan impairment charges 25,677 12,088
Tax paid -1,568 -3,174
Other non-cash operating items 7,651 -4,330
Total 40,259 12,601
Changes in operating capital
Cash in hand and demand deposits with central banks -232,365 -122,609
Trading portfolio -1,987 83,153
Other financial instruments at fair value -2,950 14,020
Loans and advances 199,294 -3,788
Loans and advances at fair value -21,292 -39,372
Deposits -15,110 -49,305
Bonds issued by Realkredit Danmark 37,521 -39,159
Assets/liabilities under insurance contracts -3,081 6,780
Other assets/liabilities 4,203 12,135
Cash flow from operations 4,492 -125,544
Cash flow from investing activities
Acquisition of group undertakings and other business units - -128
Sale of group undertakings and other business units 7 -
Acquisition of own shares -17,358 -27,597
Sale of own shares 17,315 28,332
Acquisition of intangible assets -332 -629
Acquisition of tangible assets -2,305 -3,599
Sale of tangible assets 82 875
Cash flow from investing activities -2,591 -2,746
Cash flow from financing activities
Increase in subordinated debt and hybrid capital 26,020 4,225
Redemption of subordinated debt and hybrid capital -4,839 -5,593
Dividends - -5,831
Increase in share capital - -
Change in minority interests -22 -110
Cash flow from financing activities 21,159 -7,309
Cash and cash equivalents at January 1 202,728 338,327
Change in cash and cash equivalents 23,060 -135,608
Acquisition/sale of businesses - 9
Cash and cash equivalents at December 31 225,788 202,728
Cash and cash equivalents at December 31
Cash in hand and demand deposits with central banks 33,714 16,379
Amounts due from credit institutions and central banks within 3 months 192,074 186,349
Total 225,788 202,728
The list of group holdings and undertakings provides information about restrictions on the use of cash flows from group undertakings.
CASH FLOW STATEMENT – DANSKE BANK GROUP
70 CASH FLOW STATEMENT – DANSKE BANK GROUP DANSKE BANK ANNUAL REPORT 2009

Notes � Danske Bank Group
Note 1 Critical accounting policies
The Danske Bank Group presents its consolidated financial statements in accordance with the International Financial Re-porting Standards (IFRSs) issued by the International Account-ing Standards Board (IASB) as adopted by the EU. Note 45 ���������������������������������������������� ��������������������� and assumptions of future events that will significantly affect the carrying amounts of assets and ��������������������������������������������������������financial statements. The estimates and assumptions that are deemed critical to the consolidated financial statements are
the fair value measurement of financial instruments the measurement of loans and advances the measurement of goodwill the measurement of liabilities under insurance con-tracts the measurement of the value of defined benefit pension plans.
The estimates and assumptions are based on premises that management finds reasonable but that are inherently uncer-tain and unpredictable. The premises may be incomplete, unex-pected future events or situations may occur, and other people may make other estimates. Fair value measurement of financial instruments Measurements of financial instruments for which prices are quoted in an active market or which are based on generally ac-cepted models employing observable market data are not sub-ject to critical estimates. Measurements of financial instruments that are only to a lim-ited extent based on observable market data, such as unlisted shares and certain bonds for which there is not an active mar-ket, are subject to estimates. The section on determination of fair value in note 45 and note 43 provide more details. At end-2009, such financial instruments accounted for around 0.5% of total assets. Measurement of loans and advances The Group makes impairment charges to account for impair-ment of loans and advances that occurs after initial recogni-tion. Impairment charges consist of individual and collective charges and rely on a number of estimates, including identifica-tion of the loans or portfolios of loans with objective evidence of impairment, expected future cash flows and expected value of collateral. The notes on risk management provide more details on impairment charges for loans and advances. At end-2009, loans and advances accounted for around 59% of total assets. Measurement of goodwill Goodwill on acquisition is tested for impairment at least once a year. Impairment testing requires that management estimate future cash flows from acquired units. A number of factors af-fect the value of such cash flows, including discount rates, changes in the real economy, customer behaviour, competition and other variables. Note 23 provides more information about impairment testing. At end-2009, goodwill accounted for less than 1% of total assets.
Liabilities under insurance contracts The calculation of liabilities under insurance contracts is based on a number of actuarial computations that rely on assump-tions about a number of variables, including mortality and dis-ability rates. These assumptions are based on the portfolios of �������������������������es. The liabilities are also af-fected by the discount rate � a zero-coupon yield curve esti-mated on the basis of euro swap market rates to which is added the spread between Danish and German government bonds. Until the end of 2010, a mortgage yield curve spread is also added. The notes on risk management contain a sensitivity analysis. At end-2009, liabilities under insurance contracts accounted for some 7% of total liabilities. Measurement of defined benefit pension plans The calculation of the net obligation for defined benefit pension plans is based on computations made by external actuaries. These computations rely on assumptions about a number of variables, including discount and mortality rates and salary in-creases. The application of the corridor method to defined benefit pension plans limits fluctuations in the figures reported, unless changes are caused by plan adjustments. Note 34 pro-vides details about the assumptions, and the section on pen-sion risk in the notes on risk management contains a sensitiv-ity analysis. At end-2009, the net pension obligation accounted for less than 0.1% of total liabilities. Financial instruments � general Financial instruments account for more than 95% of total as-sets and liabilities. Purchases and sales of financial instruments are measured at fair value at the settlement date. Classification At initial recognition, a financial asset is assigned to one of the following five categories:
trading portfolio measured at fair value loans and advances measured at amortised cost held-to-maturity investments measured at amortised cost financial assets designated at fair value through profit or loss available-for-sale financial assets measured at fair value with unrealised value adjustments recognised in other comprehensive income
At initial recognition, a financial liability is assigned to one of the following three categories:
trading portfolio measured at fair value financial liabilities designated at fair value through profit or loss other financial liabilities measured at amortised cost
����
�
���
�
�
��
�
NOTES – DANSKE BANK GROUP
71DANSKE BANK ANNUAL REPORT 2009 NOTES – DANSKE BANK GROUP

Notes � Danske Bank Group
Note 1 Financial instruments, classification and measurement
(cont'd)
2009 Fair value Amortised cost
Directly through profit or loss
Interest rate Available- Held-to- Loans
(DKr bn) Held-for-trading Designated hedge** for-sale maturity and adv. Liabilities Total
ASSETS
Cash in hand and demand de-posits with central banks - - - - - 34 - 34
Due from credit institu-tions and central banks - - - - - 202 - 202
Derivatives 304 - 9 - - - - 313
Bonds 306 16 - 92 8 - - 422
Shares 1 2 - - - - - 3
Loans and advances - - 2 - - 1,125 - 1,127
Loans and advances at fair value - 688 - - - - - 688
Assets under pooled schemes and unit-linked investment contracts - 46 - - - - - 46
Assets under insurance contracts - 172 - - - - - 172
Total financial assets 611 924 11 92 8 1,361 - 3,007
LIABILITIES
Due to credit institutions and central banks - - - - - - 311 311
Trading portfolio liabilities 377 - 3 - - - - 380
Deposits - - - - - - 859 859
Bonds issued by Realkredit Danmark - 517 - - - - - 517
Deposits under pooled schemes and unit-linked investment contracts - 53 - - - - - 53
Liabilities under insurance contracts* - 224 - - - - - 224
Other issued bonds - - 5 - - - 510 515
Subordinated debt - - 2 - - - 78 80
Total financial liabilities 377 794 10 - - - 1,758 2,939
*Obligations under insurance contracts are recognised at the present value of expected insurance benefits. **The interest rate risk on fixed-rate financial assets and liabilities is hedged by derivatives (fair value hedging). The interest rate risk on bonds available for sale is also hedged by derivatives.
Trading portfolio The trading portfolio includes financial assets acquired and li-abilities undertaken that the Group intends to sell or repur-chase in the near term. The trading portfolio also contains col-lectively managed financial assets and liabilities for which a pattern of short-term profit taking exists. Derivatives, including separated embedded derivatives, form part of the trading port-folio. Fair value option � financial assets and liabilities designated at fair value through profit or loss Loans and advances at fair value and bonds issued by Realkredit Danmark Loans and advances granted under Danish mortgage finance law are funded by issuing listed mortgage bonds with matching terms. Borrowers may repay such loans and advances by de-livering the underlying bonds. The Group buys and sells own bonds issued by Realkredit Danmark on an ongoing basis because such securities play an
important role in the Danish financial market. If these loans, advances and bonds were measured at amortised cost, the purchase and sale of own bonds would result in timing differ-ences in profit and loss recognition. Consequently, the Group recognises loans, advances and is-sued bonds at fair value in accordance with the fair value op-tion offered by IAS 39 to ensure that neither profit nor loss will occur on the purchase of own bonds. Other financial assets designated at fair value Other financial assets designated at fair value include securi-ties that are not classified as trading portfolio assets. These securities do not form part of the trading portfolio because no pattern of short-term profit taking exists, but they are still
NOTES – DANSKE BANK GROUP
72 NOTES – DANSKE BANK GROUP DANSKE BANK ANNUAL REPORT 2009

Notes � Danske Bank Group
Note 1 !����� d)
managed on a fair value basis. This category includes financial assets under insurance contracts, bonds quoted in an active market and shares that are not part of the trading portfolio. Realised and unrealised capital gains and losses and dividends are carried in the income statement under Net trading income. The financial assets are recognised on the balance sheet un-der Investment securities and Assets under insurance con-tracts. Available-for-sale financial assets Available-for-sale financial assets consist of bonds that, al-though traded in an active market at the time of acquisition, the Group intends neither to sell in the near term nor to hold to maturity. Hedge accounting The Group uses derivatives to hedge the interest rate risk on fixed-rate assets and fixed-rate liabilities measured at amor-tised cost, except for held-to-maturity investments and avail-able-for-sale financial assets. Hedged risks that meet specific criteria qualify for fair value hedge accounting and are treated accordingly. The interest rate risk on the hedged assets and li-abilities is recognised at fair value as a value adjustment of the hedged items in the income statement. At end-2009, hedging derivatives measured at fair value accounted for around 0.3% of total assets and around 0.1% of total liabilities. If the hedge criteria cease to be met, the accumulated value adjustments of the hedged items are amortised over the term to maturity. Future adjustments to the measurement of financial instru-ments In November 2009, the IASB published IFRS 9, Financial In-struments. This version of the standard is the first step to re-place the requirements of IAS 39 by the end of 2010. The first phase of IFRS 9 addresses only the classification and measure-ment of financial assets, while the next phases will include requirements for measurement and recognition of financial li-abilities, impairment methodology and guidelines for hedge ac-counting and derecognition. The EU has decided to postpone adoption of the standard until the details of the next phases are known. The standard is scheduled for implementation on January 1, 2013 at the latest. The Group does not expect IFRS 9 to mate-rially affect the measurement of its financial assets.
Note 45, Significant accounting policies, describes IFRS 9 inmore detail. Insurance activities � general
"���������������������#���������������#������������n-surance, unit-linked insurance and personal injury insurance. "���������������������������������������������#��������life insurance business ��������$�������������&+<����=��u-tive order on the contribution principle. The financial result of Danica Pension, the parent company of the life insurance group, is calculated, in accordance with the profit policy, on the basis of the return on a separate pool of assets equal to share-
����������>�?���������������$����������������?����������i-cal provisions. If the realised result of Danica Pension for a given period is insufficient to allow the booking of the risk al-lowance, the amount may be booked in later periods when a sufficient result is realised. "�������������������>���������������������>�?���������i-dated with the other assets of the Group. Life insurance policies are divided into insurance and invest-ment contracts. Insurance contracts are contracts that entail significant insurance risks or entitle policyholders to bonuses. Investment contracts are contracts that entail no significant insurance risk and comprise unit-linked contracts under which the investment risk lies with the policyholder. Insurance contracts Insurance contracts comprise both an investment element and an insurance element, which are recognised jointly. Life insurance provisions are recognised at their present value under Liabilities under insurance contracts. Assets earmarked for insurance contracts are recognised un-der Assets under insurance contracts if most of the return on the assets accrues to the policyholders. Most of these assets are measured at fair value. Insurance contract contributions are recognised under Net premiums. Net insurance benefits consists of benefits dis-bursed under insurance contracts and the annual change in in-surance obligations not deriving from additional provisions for benefit guarantees. The return on earmarked assets is allo-cated to the relevant items in the income statement. The re-turn to policyholders is recognised under Net trading income as are changes to additional provisions for benefit guarantees. Investment contracts Investment contracts are recognised as financial liabilities, and, consequently, contributions and benefits under such con-tracts are recognised directly on the balance sheet as adjust-ments of liabilities. Deposits are measured at the value of the savings under Deposits under pooled schemes and unit-linked investment contracts. Savings under unit-linked investment contracts are recognised at fair value under Assets under pooled schemes and unit-linked investment contracts. The return on the assets and the �����������������������������?�������������������������g-nised under Net trading income. Financial highlights As shown in note 2 on business segments, the financial high-lights deviate from the corresponding figures in the consoli-dated financial statements. Income of the Danske Markets segment is recognised in the consolidated income statement under Net trading income and Net interest income. Net income from insurance business is presented on a single line in the financial highlights.
NOTES – DANSKE BANK GROUP
73DANSKE BANK ANNUAL REPORT 2009 NOTES – DANSKE BANK GROUP

Notes � Danske Bank Group
Note 2 Business segmentation
The Group consists of a number of business units and re-source and support functions. The ����������#����������g-mented into business units according to legislative require-ments and product and service characteristics. Banking Activities caters to all types of retail and corporate customers. The finance centres serve large businesses and private banking customers. Mortgage finance operations in Denmark are carried out through Realkredit Danmark. Real-������������?�������������������������?�����@����WX�+��n-dia Mäklarna and Fokus Krogsveen real-estate agency chains. The figures for the Group����������?����������������������aggregated in the figures for its banking activities. At January 1, 2009, the activities of Banking Activities Russia were transferred from Banking Activities Finland to Other Banking Activities. Danske Markets is respo������������������������#������the financial markets. Trading activities include trading in fixed-income products, foreign exchange and equities. Danske Markets provides financial products, advisory services on mergers and acquisitions, and assistance with equity and debt issues in the international financial markets to large cor-porate customers and institutional clients. Group Treasury is ������������������������������������=��-income, foreign ex-change and equity portfolios and serves as the Grou�������r-����������Z�������������������������������������-length ba-sis. Surplus liquidity is settled primarily on the basis of short-term money market rates, whereas other intra-group bal-�����������������������������-length basis. Internal fees, commissi��������#������[�������������������������������-length basis or allocated to the business units at an agreed ratio. Institutional banking covers facilities with international financial institutions outside the Nordic region. Facilities with Nordic financial institutions form part of the banking activi-ties. Danske Capital develops and sells asset and wealth man-agement products and services. They are marketed through ��������������king units and directly to businesses, institu-tional clients and external distributors. Danske Capital also supports the advisory and asset management activities of the banking units. Through Danske Bank International in Luxem-bourg, it provides international private banking services to cli-��������������������������������������nske Capital is represented in Denmark, Sweden, Norway, Finland, Estonia, Lithuania and Luxembourg. Danica Pension �������������������������������#����������life insurance and pensions market. Danica Pension targets both personal and corporate customers. Its products are marketed through a range of distribution channels within the ����X�������?����������������������\���������$��n-surance brokers and advisers. Danica offers two market-based products: Danica Balance and Danica Link. These products allow customers to select their own investment pro-files, and the return on savings depends on market trends.
Furthermore, Danica Pension offers Danica Traditionel. This product does not offer individual investment profiles, and Danica Pension sets th�������������������������?�����������v-ings. Other Activities ��#�����=�����������������������������functions and real property activities, and eliminations, includ-ing the elimination of returns on own shares. Furthermore, Other Activities includes ������������������centre and specifies the difference between allocated capital �������������������>�?���
quirement.
Capital is allocated to the individual business unit at a rate of 5.5% of of its average risk-weighted assets (2008: 5.5%).Insurance companies are subject to special statutory capital ��>���������]����>����?X��������������������>�?�����������to the insurance business equals the statutory minimum require- ���������^�^����������������������$�������������>�?���������minimum re A calculated income equal to the risk-free return on its allo-cated capital is apportioned to each business unit. This in-come is calculated on the basis of the short-term money mar-ket rate and allocated from Other Activities. In the segment disclosures, interest amounts are presented on a net basis. Expenses are allocated to the business units at market price level. Other Activities supplies services to business units, and transactions are settled at unit prices ��������������-length basis, if possible, on the basis of consumption and activity. Assets and liabilities used to maintain the operating ac-tivities of a business unit are presented in the financial statements of that unit. Capitalised goodwill is allocated to the business units that recognise the income from the acquisi-tions made. The financing of goodwill is included in the ��������������������������_�����<��#���.
NOTES – DANSKE BANK GROUP
74 NOTES – DANSKE BANK GROUP DANSKE BANK ANNUAL REPORT 2009

Notes � Danske Bank Group
Note (DKr m) 2 Business segments 2009
(cont'd) Banking Danske Danske Danica Other Elimina- Reclassi- activities Markets Capital Pension activities tion Total fication Highlights
Net interest income 27,102 12,919 298 6,877 124 222 47,542 -20,018 27,524
Net fee income 6,419 120 1,297 -556 -38 - 7,242 436 7,678
Net trading income 1,115 3,854 59 9,463 154 -544 14,101 4,143 18,244
Other income 2,758 16 72 827 318 -72 3,919 -836 3,083
Net premiums - - - 17,051 - - 17,051 -17,051 -
Net insurance benefits - - - 29,821 - - 29,821 -29,821 -
Income from equity investments - 329 2 -43 7 -2 293 -293 -
Net income from insurance business - - - - - - 2,810 2,810
Total income 37,394 17,238 1,728 3,798 565 -396 60,327 -988 59,339
Expenses 24,213 2,886 1,014 988 866 -72 29,895 -988 28,907
Profit before loan impairment charges 13,181 14,352 714 2,810 -301 -324 30,432 - 30,432
Loan impairment charges 22,486 3,237 -46 - - - 25,677 - 25,677
Profit before tax -9,305 11,115 760 2,810 -301 -324 4,755 - 4,755
Loans and advances, excluding reverse transactions 1,627,698 42,158 9,725 - 17,667 -27,696 1,669,552 - 1,669,552
Other assets 446,934 4,647,071 9,303 252,674 148,836 -4,075,893 1,428,925 - 1,428,925
Total assets 2,074,632 4,689,229 19,028 252,674 166,503 -4,103,589 3,098,477 - 3,098,477
Deposits, excluding repo deposits 648,140 151,613 6,235 - 21,638 -23,694 803,932 - 803,932
Other liabilities 1,356,308 4,533,372 12,419 246,943 124,739 -4,079,895 2,193,886 - 2,193,886
Allocated capital 70,184 4,244 374 5,731 20,126 - 100,659 - 100,659
Total liabilities and equity 2,074,632 4,689,229 19,028 252,674 166,503 -4,103,589 3,098,477 - 3,098,477
Internal income 6,846 19,076 263 2,478 -28,663 - -
Amortisation and depreciation charges 2,274 3 41 19 1,022 - 3,359
Impairment charges for intangible and tan-gible assets 1,458 - - - 163 - 1,621
Reversals of impairment charges - - - - - -
Pre-tax profit as % of allocated capital (avg.) -13.3 261.9 203.2 49.0 -1.5 - 4.7
Cost/income ratio (%) 64.8 16.7 58.7 26.0 153.3 - 49.6
Full-time-equivalent staff (avg.) 13,538 887 554 951 6,864 - 22,794
In its financial highlights, the Group recognises earnings contributed by Danske Markets as net trading income and earnings contrib-uted by Danica Pension as net income from insurance business. The Reclassification column shows the adjustments made to the de-tailed figures in the calculation of the highlights. Z�������������������=������������������������������#������������������������-length basis. Until the end of 2008, liquidity was set-tled primarily on the basis of short-term money market rates. The method was changed at January 1, 2009. Liquidity expenses are now allocated on the basis of a maturity analysis of loans and deposits. Prices are based on interbank rates and funding spreads. The new set-tlement method resulted in a relatively large share of liquidity expenses at Danske Markets and at banking units with insufficient liquidity from deposits to fund activities. The staff of businesses taken over under non-performing loan agreements, an average number of around 2,000, is not included in the above staff figure.
NOTES – DANSKE BANK GROUP
75DANSKE BANK ANNUAL REPORT 2009 NOTES – DANSKE BANK GROUP

Notes � Danske Bank Group
Note (DKr m) 2 Business segments 2008
(cont'd) Banking Danske Danske Danica Other Elimina- Reclassi- activities Markets Capital Pension activities tion Total fication Highlights
Net interest income 26,921 6,366 271 6,175 -426 239 39,546 -12,541 27,005
Net fee income 6,700 150 1,430 -651 -20 - 7,609 501 8,110
Net trading income 1,504 -2,903 - -10,104 208 601 -10,694 16,770 6,076
Other income 2,533 5 2 1,130 1,045 -48 4,667 -1,082 3,585
Net premiums - - - 19,250 - - 19,250 -19,250 -
Net insurance benefits - - - 16,531 - - 16,531 -16,531 -
Income from equity investments - 145 -6 19 59 - 217 -217 -
Net income from insurance business - - - - - - - -1,733 -1,733
Total income 37,658 3,763 1,697 -712 866 792 44,064 -1,021 43,043
Expenses 25,048 2,530 922 1,021 274 -48 29,747 -1,021 28,726
Profit before loan impairment charges 12,610 1,233 775 -1,733 592 840 14,317 - 14,317
Loan impairment charges 8,532 3,237 319 - - - 12,088 - 12,088
Profit before tax 4,078 -2,004 456 -1,733 592 840 2,229 - 2,229
Loans and advances, excluding reverse transactions 1,706,198 68,204 21,985 - 1,414 -12,478 1,785,323 - 1,785,323
Other assets 370,051 4,698,756 12,526 230,230 904,084 -4,456,996 1,758,651 - 1,758,651
Total assets 2,076,249 4,766,960 34,511 230,230 905,498 -4,469,474 3,543,974 - 3,543,974
Deposits, excluding repo deposits 587,590 207,524 7,276 - 4,175 -6,268 800,297 - 800,297
Other liabilities 1,417,524 4,556,449 26,485 224,985 883,193 -4,463,206 2,645,430 - 2,645,430
Allocated capital 71,135 2,987 750 5,245 18,130 - 98,247 - 98,247
Total liabilities and equity 2,076,249 4,766,960 34,511 230,230 905,498 -4,469,474 3,543,974 - 3,543,974
Internal income 14,461 22,251 778 3,373 -40,863 - -
Amortisation and depreciation charges 2,153 6 48 4 956 - 3,167
Impairment charges for intangible and tangible assets 3,254 1 9 - 3,264
Reversals of impairment charges - - - - - - -
Pre-tax profit as % of allocated capital (avg.) 5.7 -67.1 60.8 -33.0 3.3 - 2.3
Cost/income ratio (%) 66.5 67.2 54.3 - 31.6 - 67.5
Full-time-equivalent staff (avg.) 14,345 917 574 955 6,964 - 23,755
In its financial highlights, the Group recognises earnings contributed by Danske Markets as net trading income and earnings contrib-uted by Danica Pension as net income from insurance business. The Reclassification column shows the adjustments made to the de-tailed figures in the calculation of the highlights.
NOTES – DANSKE BANK GROUP
76 NOTES – DANSKE BANK GROUP DANSKE BANK ANNUAL REPORT 2009

Notes � Danske Bank Group
Note (DKr m) 2009 2008 2 Income broken down by type of product
(cont'd) Corporate banking 13,495 12,199
Home 13,381 11,061
Trading 19,155 5,981
Day-to-day banking 4,845 8,651
Wealth management 2,660 2,598
Leasing 2,752 2,540
Insurance 3,870 -624
Other 169 1,658
Total 60,327 44,064
Corporate banking comprises interest and fee income from transactions with corporate customers. Home comprises interest and fee income from home financing and home savings products. Trading comprises income from fixed-income and foreign exchange prod-ucts, including brokerage. Day-to-day banking comprises income from personal banking products in the form of personal loans, cards and deposits. Wealth management comprises income from management of assets, including pooled assets and assets in unit trusts . Leasing encompasses income from both finance and operating leases through Danske �������������������������Z����������m-prises income from Danica Pension and services sold to customers through the Bank. In accordance with IFRSs, the Danske Bank Group is required to disclose business with a single customer that generates 10% or more of the combined revenue. The Group has no such customers.
Geographical segmentation Z������������=���������������������������$���?��������������������y of residence, whereas trading income is broken down by
the country in which activities are performed. Assets (comprising only intangible assets, investment property, tangible assets and holdings in associated undertakings) are broken down by location. Goodwill is allocated to the country in which activities are per-formed. �������������������������������������������������$��������������$���Z&{+���������������������������������������������structure. The management believes that business segmentation provides a more informative ���������������������������#����
Income External customers Assets 2009 2008 2009 2008
Denmark 36,678 17,817 16,563 15,967
Finland 5,541 3,223 15,111 16,338
Sweden 5,246 5,524 195 176
Norway 3,932 4,301 701 585
Ireland 2,099 2,192 290 556
Baltics 936 1,656 2,158 3,629
UK 4,563 5,062 2,448 2,276
Germany 306 610 1 1
Luxembourg 373 328 29 35
Poland 128 165 - -
US 47 722 374 -
Other 478 2,464 1 1
Total 60,327 44,064 37,871 39,564
NOTES – DANSKE BANK GROUP
77DANSKE BANK ANNUAL REPORT 2009 NOTES – DANSKE BANK GROUP

Notes � Danske Bank Group
Note (DKr m) 3 Banking Activities 2009, Northern geographical breakdown Denmark Finland Sweden Norway Ireland Ireland Baltics Other Total
Net interest income 16,124 3,015 1,997 2,666 1,315 1,140 488 357 27,102
Net fee income 3,658 1,110 642 342 296 126 136 109 6,419
Net trading income 539 71 86 158 72 49 116 24 1,115
Other income 956 381 51 454 12 10 22 872 2,758
Income from equity investments - - - - - - - - -
Total income 21,277 4,577 2,776 3,620 1,695 1,325 762 1,362 37,394
Goodwill impairment charges - - 16 - - - 1,417 25 1,458 Other expenses 12,450 3,390 1,497 1,807 1,126 1,010 388 1,087 22,755 Total expenses 12,450 3,390 1,513 1,807 1,126 1,010 1,805 1,112 24,213
Profit before loan impairment charges 8,827 1,187 1,263 1,813 569 315 -1,043 250 13,181
Loan impairment charges 10,049 1,723 509 676 1,399 5,238 2,725 167 22,486
Profit before tax -1,222 -536 754 1,137 -830 -4,923 -3,768 83 -9,305
Loans and advances 1,005,751 157,810 167,461 150,702 51,510 76,601 26,816 17,606 1,654,257 Credit exposure 1,109,062 193,155 210,138 186,538 50,843 72,942 29,149 50,391 1,902,218 Allowance account 13,496 2,545 1,182 1,404 2,006 7,002 2,985 1,261 31,881 Banking Activities 2008,
geographical breakdown
Net interest income 15,555 3,352 2,120 2,095 1,508 1,284 638 369 26,921 Net fee income 3,839 1,037 673 394 362 160 162 73 6,700
Net trading income 826 78 108 152 124 62 109 45 1,504
Other income 773 241 52 327 19 9 20 1,092 2,533
Income from equity investments - - - - - - - - -
Total income 20,993 4,708 2,953 2,968 2,013 1,515 929 1,579 37,658
Goodwill impairment charges - - - 141 - 2,940 - - 3,081
Other expenses 10,608 3,943 1,555 1,773 1,363 991 525 1,209 21,967
Total expenses 10,608 3,943 1,555 1,914 1,363 3,931 525 1,209 25,048
Profit before loan impairment charges 10,385 765 1,398 1,054 650 -2,416 404 370 12,610
Loan impairment charges 4,354 511 520 489 641 1,700 295 22 8,532
Profit before tax 6,031 254 878 565 9 -4,116 109 348 4,078
Loans and advances 1,043,312 172,617 173,732 141,446 53,376 79,352 30,426 22,867 1,717,128
Credit exposure 1,130,067 207,243 219,689 175,408 54,746 81,057 32,130 61,967 1,962,307
Allowance account 6,066 1,267 696 737 627 1,855 432 678 12,358
The table above breaks down the Banking Activities segment by country. At April 1, 2008, the activities of Nordania Leasing within real property, construction and agricultural machinery, and capital and IT equipment were transferred from Other Banking Activities to Banking Activities Denmark and Banking Activities Norway. This change reduced the profit before loan impairment charges of Other Banking Activities by DKr64m. At January 1, 2009, Banking Activities Russia was transferred from Banking Activities Finland to Other Banking Activities. This in-creased the profit before loan impairment charges of Banking Activities Finland by DKr11m. Comparative figures have not been re-stated.
NOTES – DANSKE BANK GROUP
78 NOTES – DANSKE BANK GROUP DANSKE BANK ANNUAL REPORT 2009

Notes � Danske Bank Group
Note (DKr m) 4 Net interest and net trading income Interest Interest Net interest Net trading 2009 income expense income income Total
Financial portfolios at amortised cost
Due from/to credit institutions and central banks 4,289 3,836 453 433 886
Repo and reverse transactions 4,403 1,350 3,053 - 3,053
Loans, advances and deposits 49,005 18,755 30,250 -476 29,774
Held-to-maturity investments 276 - 276 - 276
Other issued bonds - 11,637 -11,637 166 -11,471
Subordinated debt - 4,000 -4,000 100 -3,900
Other financial instruments 529 416 113 3 116
Total 58,502 39,994 18,508 226 18,734
Financial portfolios at fair value
Loans and advances at fair value and bonds issued by Realkredit Danmark 33,582 24,790 8,792 - 8,792
Trading portfolio and investment securities 13,024 - 13,024 24,341 37,365
Assets and deposits under pooled schemes and unit-linked investment contracts - - - -407 -407
Assets and liabilities under insurance contracts 7,218 - 7,218 -10,059 -2,841
Total 53,824 24,790 29,034 13,875 42,909
Total net interest and net trading income 112,326 64,784 47,542 14,101 61,643
2008
Financial portfolios at amortised cost
Due from/to credit institutions and central banks 9,098 25,958 -16,860 -198 -17,058
Repo and reverse transactions 20,587 11,484 9,103 - 9,103
Loans, advances and deposits 68,570 25,813 42,757 3,254 46,011
Held-to-maturity investments 250 - 250 - 250
Other issued bonds - 19,403 -19,403 -5,800 -25,203
Subordinated debt - 2,131 -2,131 -3,048 -5,179
Other financial instruments 644 1,562 -918 2 -916
Total 99,149 86,351 12,798 -5,790 7,008
Financial portfolios at fair value
Loans and advances at fair value and bonds issued by Realkredit Danmark 32,769 24,508 8,261 - 8,261
Trading portfolio and investment securities 11,327 - 11,327 3,632 14,959
Assets and deposits under pooled schemes and unit-linked investment contracts - - - 142 142
Assets and liabilities under insurance contracts 7,160 - 7,160 -8,678 -1,518
Total 51,256 24,508 26,748 -4,904 21,844
Total net interest and net trading income 150,405 110,859 39,546 -10,694 28,852
Net trading income for 2009 includes dividends from shares of DKr1,224m (2008: DKr3,363m) and exchange rate adjustments of DKr2,404m (2008: DKr1,878m). Net trading income from insurance contracts includes returns on assets of DKr-4,736m (2008: DKr-16,861m), adjustment of addi-tional provisions of DKr-1,211m (2008: DKr-4,996m), adjustment of collective bonus potential of DKr-1,286m (2008: DKr11,911m) and tax on pension returns of DKr-2,826m (2008: DKr1,268m). Interest added to financial assets subject to individual impairment amounted to DKr1,458m (2008: DKr888m).
NOTES – DANSKE BANK GROUP
79DANSKE BANK ANNUAL REPORT 2009 NOTES – DANSKE BANK GROUP

Notes � Danske Bank Group
Note (DKr m) 2009 2008 5 Fee income Financing (loans, advances and guarantees) 1,705 1,706
Investment (securities trading and advisory services) 1,989 2,175
Services (insurance and foreign exchange trading) 100 119
Fees generated by activities 3,794 4,000
Financing (guarantees) 756 702
Investment (asset management and custody services) 2,527 2,955
Services (payment services and cards) 3,387 3,389
Fees generated by portfolios 6,670 7,046
Total 10,464 11,046
Fee expenses
Financing (property valuation) 67 35
Investment (securities trading and advisory services) 871 802
Services (referrals) 16 11
Fees generated by activities 954 848
Financing (guarantees) 381 450
Investment (asset management and custody services) 465 637
Services (payment services and cards) 1,422 1,502
Fees generated by portfolios 2,268 2,589
Total 3,222 3,437
Fees generated by activities comprises fees for the execution of one-off transactions. Fees generated by portfolios comprises recur-ring fees from the product portfolio.
Fees that form an integral part of the effective rates of interest on loans, advances and deposits are carried under Interest income and Interest expense. Fees for Loans and advances at fair value are carried under Fee income. Fees for financial instruments not recognised at fair value, such as loans, advances and issued bonds, are recognised as financing fee income or expenses. Such income amounted to DKr1,891m in 2009 (2008: DKr1,719m), whereas expenses amounted to DKr381m (2008: DKr450m).
6 Other income Fair value adjustment of investment property 34 66
Fair value adjustment of investment property allocated to policyholders -288 184
Profit on sale of domicile and investment property 32 512
Income from lease assets and investment property 3,174 2,992
Reversals of impairment charges for domicile property - -
Other income 967 913
Total 3,919 4,667
7 Net premiums Regular premiums, life insurance 7,519 8,020
Single premiums, life insurance 1,102 2,803
Regular premiums, market-based products 5,279 4,696
Single premiums, market-based products 1,829 2,385
Premiums, health and accident insurance 1,423 1,388
Reinsurance premiums paid -137 -117
Change in unearned premiums provisions 36 75
Total 17,051 19,250
NOTES – DANSKE BANK GROUP
80 NOTES – DANSKE BANK GROUP DANSKE BANK ANNUAL REPORT 2009

Notes � Danske Bank Group
Note (DKr m) 2009 2008 8 Net insurance benefits Benefits paid 15,126 14,707
Reinsurers' share received -132 -126
Claims and bonuses paid 1,293 1,185
Change in outstanding claims provisions 83 244
Change in life insurance provisions -765 1,304
Change in provisions for unit-linked contracts 14,216 -783
Total 29,821 16,531
9 Staff costs and administrative expenses Staff costs 13,823 13,235
Administrative expenses 11,092 10,081
Total 24,915 23,316
Staff costs
Salaries 11,160 10,599
Share-based payment (earned in 2007 earlier) or 36 47
Pensions 1,341 1,320
Financial services employer tax 1,286 1,269
Total 13,823 13,235
Total salary costs stood at DKr12.5bn (2008: DKr12.0bn), with variable remuneration accounting for 6.7% of this amount (2008: 5.8%).
Remuneration of the Board of Directors (DKr thousands)
Alf Duch-Pedersen 1,300 1,300
Jørgen Nue Møller (until March 4, 2008) - 312
Eivind Kolding 1,250 1,250
Henning Christophersen 525 525
Peter Højland 525 525
Mats Jansson (from March 4, 2008) 492 271
Niels Chr. Nielsen 525 525
Sten Scheibye 525 525
Majken Schultz 525 525
Claus Vastrup 525 525
Birgit Aagaard-Svendsen 558 525
Helle Brøndum 325 325
Charlotte Hoffmann 325 325
Per Alling Toubro 325 325
Verner Usbeck 325 325
Solveig Ørteby 325 325
Total remuneration 8,375 8,433
Remuneration for committee work included in preceding item 2,525 2,475
Danske Bank�s directors receive a fixed fee. In addition, directors receive a fixed fee for board committee membership.
NOTES – DANSKE BANK GROUP
81DANSKE BANK ANNUAL REPORT 2009 NOTES – DANSKE BANK GROUP

Notes � Danske Bank Group
Note (DKr m) 9 Remuneration of the Executive Board (cont'd) Peter Tonny Thierry Thomas F. Sven Per 2009 Straarup Andersen Borgen Lystbæk Skovhus
Contractual remuneration 7.1 4.7 1.6 5.1 4.6 Pension 1.5 0.7 0.2 2.5 0.7 Cash bonus - - - - - Share-based payment - - - - -
Total 8.6 5.4 1.8 7.6 5.3 In 2008, Danske Bank decided to suspend its bonus programme for the Executive Board. Consequently, the contractual remuneration for 2009 was increased.
"������&���������[���������|=���#�����������+����������X�} ~������������� contractual remuneration and pension relate to the period from September 1, 2009, to December 31, 2009. Under the Danish Act on State-Funded Capital Injections into Credit In-�������X����?�^ ������������������������������=�����tible until the capital raised has been repaid. In 2009, this deduction amounted to DKr14m.
Peter Tonny Thierry Sven Per 2008 Straarup Andersen Lystbæk Skovhus
Contractual remuneration 7.1 3.3 3.9 3.2
Pension 1.5 0.6 2.5 0.6
Cash bonus - - - -
Share-based payment - - - -
Total 8.6 3.9 6.4 3.8
Z�������������$����������������������������������X�\�����+�����������#������ -?�������#�����?�������X��>�������$����������salary, and Sven Lystbæk received a 25-?�������#�����?�������X��>�����������������������?��
Pension and termination
Peter Tonny Thierry Thomas F. Sven Per
Straarup Andersen Borgen Lystbæk Skovhus
Defined contribution Defined contribution Defined contribution
Type of pension plan Defined benefit through pension fund through pension fund Defined benefit through pension fund
Age at which the board member is en-
titled to retire 60 60 60 60 60
Bank contributes Bank contributes Bank contributes
Annual benefit or contribution DKr3.1m 20% of salary 20% of salary 50% of salary 20% of salary
Notice of termination by the Bank
12 months with
life pension 12 months 12 months
12 months with
life pension 12 months
Notice of termination by the board
member 12 months 3 months 3 months 3 months 3 months
Pension obligation, end of 2009 61 - - 35 -
Pension obligation, end of 2008 45 - - 25 -
\�������������������\�����+�����������+#����?������������#������?�����@������������<�+���������������������������������ek-�����X�������������������������������W�������������Danske Bank A/S is liable for any shortfall. The obligations are determined on the basis of actuarial computations and a number of assumptions (see note 34). Therefore, changes in pension obligations cannot reasonably be added to the annual remuneration. If Mr Straarup retires at a later date than his sixtieth birthday, the pension obligation to him will be increased by the pension benefit not paid out. The obligation will be adjusted on an ongoing basis.
NOTES – DANSKE BANK GROUP
82 NOTES – DANSKE BANK GROUP DANSKE BANK ANNUAL REPORT 2009

Notes � Danske Bank Group
Note 9 Shareholdings !������� The number of Danske Bank shares, excluding options and rights to buy conditional shares, held by the Board of Directors and the Ex-
ecutive Board at the end of 2009 totalled 96,475 and 73,890, respectively (end of 2008: 93,328 and 36,784). Note 42, Danske Bank the Board of Directors and the Executive Board, contains additional details. shares held by
Share-based payment Until 2008, the Group offered senior staff and selected employees incentive programmes that consisted of share options and condi-tional shares. Incentive payments reflected individual performance and also depended on financial results and other measures of value creation. The options and shares were granted in the first quarter of the following year. The last grant was made in the first quarter of 2008.
Issued options carry a right to buy Danske Bank shares exercisable from three to seven years after they are granted provided that the employee has not resigned from the Group. The exercise price of the options is computed as the average price of Danske Bank shares for 20 stock exchange days after the release of the annual report plus 10%.
Until 2008, rights to buy Danske Bank shares under the conditional share programme were granted as a portion of the annual bonus earned. The shares vest after three years provided that the employee has not resigned from the Group.
The fair value of the share options granted for 2008 was calculated according to a dividend-adjusted Black & Scholes formula based on the following assumptions: Share price: 179.76. Dividend payout ratio: 3.9%. Rate of interest: 4.7%, equal to the swap rate. Volatil-ity: 19%. Average time of exercise: 5 years. The volatility is estimated on the basis of historical volatility.
Calculation of the fair value at the end of 2009 is based on the following assumptions: Share price: 118 (2008: 52). Dividend payout ratio: 0% (2008: 0%). Rate of interest: 1.6-2.7% (2008: 3.4-4.8%), equal to the swap rate. Volatility: 52% (2008: 25-39%). Average time of exercise: 1-3 years (2008: 1-4 years). The volatility is estimated on the basis of historical volatility.
The fair value of the conditional shares is calculated as the share price less the payment made by the employee. Intrinsic value is recognised in the year in which the share options and rights to conditional shares vest, while time value is accrued �#������������������#��������X�$����������#���������������������?������+��������������>�?�$���������������������ngly as the obligation is met by settlement in Danske Bank shares.
NOTES – DANSKE BANK GROUP
83DANSKE BANK ANNUAL REPORT 2009 NOTES – DANSKE BANK GROUP

Notes � Danske Bank Group
Note (DKr m) 9 Share-based payment (earned in 2007 or earlier)
(cont'd) Share options Number Fair value (FV)
Executive Senior Other Exercise At issue End of
year Board staff staff Total price (DKr) (DKr m) (DKr m)
Granted in 2002-07
2008, beg. 1,053,732 5,511,446 2,042,690 8,607,868 118,5-294,1 179.7 218.7
Exercised 2008 - -47,215 -41,005 -88,220 140,8-152,3
Forfeited 2008 - -246,096 -23,800 -269,896
Other changes 2008 - -663,561 701,894 38,333
2008, end 1,053,732 4,554,574 2,679,779 8,288,085 118,5-294,1 172.0 0.2
Exercised 2009 - - -10,400 -10,400 118.5
Forfeited 2009 - -70,667 -135,900 -206,567
Other changes 2009 152,641 -580,246 427,605 -
2009, end 1,206,373 3,903,661 2,961,084 8,071,118 118,5-294,1 164.8 78.8 Granted in 2008
2008 Granted 232,750 1,555,830 - 1,788,580 197.7 39.3 0.3
Forfeited 2008 - -86,290 - -86,290
Other changes 2008 - -72,300 72,300 -
2008, end 232,750 1,397,240 72,300 1,702,290 197.7 37.5 0.3
Forfeited 2009 - - - -
Other changes 2009 50,340 -105,370 55,030 -
2009, end 283,090 1,291,870 127,330 1,702,290 197.7 37.5 46.6
Holdings of the Executive Board and fair value, end of 2009 Grant year 2002-2007 2008
(DKr m) Number FV Number FV Peter Straarup 508,621 5.1 90,910 2.5
Tonny Thierry Andersen 200,855 2.0 47,280 1.3 Thomas F. Borgen 152,641 1.5 50,340 1.4 Sven Lystbæk 208,582 2.0 47,280 1.3 Per Skovhus 135,674 1.3 47,280 1.3
Holdings of the Executive Board and fair value, end of 2008 Grant year 2002-2007 2008
(DKr m) Number FV Number FV
Peter Straarup 508,621 - 90,910 -
Tonny Thierry Andersen 200,855 - 47,280 - Sven Lystbæk 208,582 - 47,280 -
Per Skovhus 135,674 - 47,280 -
Share options granted in 2008 relate to the grant in the first quarter of 2008 of options earned in 2007. "������&���������[���������|=���#�����������+����������X�} ~������������� share options were granted to him in 2008 or ear-lier. In 2009, share options were exercised at an average price of DKr139.4 (2008: DKr180.1).
NOTES – DANSKE BANK GROUP
84 NOTES – DANSKE BANK GROUP DANSKE BANK ANNUAL REPORT 2009

Notes � Danske Bank Group
Note 9 Share-based payment (earned in 2007 or earlier)
(cont'd) Conditional shares Number Fair value (FV)
Executive Senior Other Employee
payment At issue End of
year Board staff staff Total price (DKr) (DKr m) (DKr m)
Granted in 2005-07
2008, beg. 51,623 292,651 1,160,306 1,504,580 2.2-2.7 339.1 300.5
Vested 2008 -9,277 -61,767 -352,651 -423,695
Forfeited 2008 - -14,337 -55,614 -69,951
Other changes 2008 - 1,220 56,224 57,444
2008, end 42,346 217,767 808,265 1,068,378 2.2-2.7 260.5 55.6
Vested 2009 -21,294 -116,912 -445,106 -583,312 2.2-2.7
Forfeited 2009 - - -4,664 -4,664
Other changes 2009 - -3,165 3,165 -
2009, end 21,052 97,690 361,660 480,402 2.7 128.5 55.4
Granted in 2008
Granted 2008 28,779 241,236 703,391 973,406 1.8 175.0 50.6
Vested 2008 - -4,709 -2,099 -6,808
Forfeited 2008 - -11,905 -20,642 -32,547
Other changes 2008 - - 4,779 4,779
2008, end 28,779 224,622 685,429 938,830 1.8 168.8 48.8
ed 2009 Vest -14,455 -26,794 -41,249 1.8
Forfeited 2009 - - -11,357 -11,357
Other changes 2009 - -4,539 4,539 -
2009, end 28,779 205,628 651,817 886,224 1.8 159.3 103.0
Holdings of the Executive Board and fair value, end of 2009 Grant year 2007 2008 (DKr m) Number FV Number FV
Peter Straarup 8,500 1.0 11,240 1.3
Tonny Thierry Andersen 4,588 0.5 5,847 0.7
Thomas F. Borgen - - - -
Sven Lystbæk 4,724 0.5 5,845 0.7
Per Skovhus 3,240 0.4 5,847 0.7
Holdings of the Executive Board and fair value, end of 2008 Grant year 2006-2007 2008 (DKr m) Number FV Number FV
Peter Straarup 17,020 0.8 11,240 0.6
Tonny Thierry Andersen 8,846 0.4 5,847 0.3
Sven Lystbæk 10,117 0.5 5,845 0.3
Per Skovhus 6,363 0.4 5,847 0.3 Rights to conditional shares granted in 2008 relate to the grant in the first quarter of 2008 of rights earned in 2007. "������&���������[���������|=���#�����������+����������X�} ~�������������������������������$��������������������} �� or earlier. In 2009, the average price at the vesting date DKr48.2 (2008: DKr181.0). for rights to conditional shares was
NOTES – DANSKE BANK GROUP
85DANSKE BANK ANNUAL REPORT 2009 NOTES – DANSKE BANK GROUP

Notes � Danske Bank Group
Note (DKr m) 2009 2008 10 Audit fees
Total fees to the audit firms appointed by the general meeting that perform the statutory audit 25 26
Fees for non-audit services included in preceding item 7 10
11 Amortisation, depreciation and impairment charges Amortisation charges for intangible assets 1,074 1,087
Depreciation charges for tangible assets 1,727 1,606
Write-offs of residual value of lease assets sold 558 474
Impairment charges for intangible assets 1,458 3,084
Impairment charges for tangible assets 163 180
Total 4,980 6,431
Note 23 provides more information about the impairment charges for intangible assets. Impairment charges for tangible assets in 2008 include an impairment charge of DKr173m for vehicles under operating leases due to declining used-car prices.
12 Loan impairment charges Due from credit institutions and central banks 69 42
Loans and advances 22,168 10,747
Loans and advances at fair value 1,267 443
Private Contingency Association commitment 1,612 508
Guarantees and loan commitments 561 348
Total 25,677 12,088 New and increased impairment charges 29,028 13,541
Reversals of impairment charges 3,839 1,534
Write-offs charged directly to the income statement 821 523
Received on claims previously written off 471 489
Interest income, effective interest method 138 47
Total 25,677 12,088
Loan impairment charges broken down by business unit Banking Activities Denmark 10,049 4,354
Banking Activities Finland 1,723 511
Banking Activities Sweden 509 520
Banking Activities Norway 676 489
Banking Activities Northern Ireland 1,399 641
Banking Activities Ireland 5,238 1,700
Banking Activities Baltics 2,725 295
Other Banking Activities 167 22
Danske Markets 3,237 3,237
Danske Capital -46 319
Total 25,677 12,088
Loan impairment charges includes losses on businesses taken over of DKr0m (2008:DKr0m).
NOTES – DANSKE BANK GROUP
86 NOTES – DANSKE BANK GROUP DANSKE BANK ANNUAL REPORT 2009

Notes � Danske Bank Group
Note (DKr m) 13 Tax 2009 Denmark Finland Sweden Norway UK Ireland Other Total
Tax on profit for the year 2,498 122 757 487 -445 -472 95 3,042
Tax on changes in shareholders' equity -19 - - - - - - -19
Tax on profit for the year
Current tax charge 225 235 739 457 -1 10 120 1,785
Change in deferred tax 2,163 -148 5 -22 -443 -497 -29 1,029
Adjustment of prior-year tax charges 110 35 13 52 -1 15 4 228
Total 2,498 122 757 487 -445 -472 95 3,042
Effective tax rate
Tax rate 25.0 26.0 26.3 28.0 28.0 12.5 3.5 46.8
Non-taxable income and non-deductible expenses 3.9 -0.1 0.1 -0.4 0.6 -2.6 -8.8 12.4
Tax on profit for the year 28.9 25.9 26.4 27.6 28.6 9.9 -5.3 59.2
Adjustment of prior-year tax charges 1.3 10.6 0.4 3.3 0.1 -0.3 -0.2 4.8
Effective tax rate 30.2 36.5 26.8 30.9 28.7 9.6 -5.5 64.0
Tax on other comprehensive income
Non-Danish unit hedges -58 - - - - - - -58
Unrealised value adjustments of available-for-sale financial assets 73 - - - - - - 73
Realised value adjustments of available-for-sale financial assets 104 - - - - - - 104
Total 119 - - - - - - 119
NOTES – DANSKE BANK GROUP
87DANSKE BANK ANNUAL REPORT 2009 NOTES – DANSKE BANK GROUP

Notes � Danske Bank Group
Note (DKr m) 13 Tax 2008 Denmark Finland Sweden Norway UK Ireland Other Total
(cont'd) Tax on profit for the year 555 230 551 375 -536 -85 103 1,193
Tax on changes in shareholders' equity -335 - - - - - - -335
Tax on profit for the year
Current tax charge 795 366 541 381 47 25 165 2,320
Change in deferred tax -76 -136 8 1 -583 -141 -51 -978
Adjustment of prior-year tax charges -164 - 8 -7 - 31 -17 -149
Change in deferred tax charge as a result of lowered tax rate - - -6 - - - 6 -
Total 555 230 551 375 -536 -85 103 1,193
Effective tax rate
Tax rate 25.0 26.0 28.0 28.0 28.0 12.3 18.3 46.7
Non-taxable income and non-deductible expenses -1.5 - -0.7 2.4 -0.2 -9.3 1.7 13.5
Tax on profit for the year 23.5 26.0 27.3 30.4 27.8 3.0 20.0 60.2
Adjustment of prior-year tax charges -4.9 - 0.5 -0.7 - -0.8 -3.1 -6.7
Change in deferred tax charge as a result of lowered tax rate - - -0.4 - - - 1.2 -
Effective tax rate 18.6 26.0 27.4 29.7 27.8 2.2 18.1 53.5
Tax on other comprehensive income
Non-Danish unit hedges 441 - - - - - - 441
Unrealised value adjustments of
available-for-sale financial assets -484 - - - - - - -484
Total -43 - - - - - - -43
NOTES – DANSKE BANK GROUP
88 NOTES – DANSKE BANK GROUP DANSKE BANK ANNUAL REPORT 2009

Notes � Danske Bank Group
Note (DKr m) 2009 2008 14 Cash in hand and demand deposits with central banks Cash in hand 9,785 6,411
Demand deposits with central banks 23,929 9,968
Total 33,714 16,379
15 Due from credit institutions and central banks Reverse transactions 93,120 136,028
Other amounts due 109,349 79,838
Impairment charges 113 43
Total 202,356 215,823
Impairment charges
At January 1 43 1
New and increased impairment charges 70 42
Reversals of impairment charges 1 -
Foreign currency translation -1 -
Other additions and disposals 2 -
At December 31 113 43
Amounts due within three months amounted to DKr192,074m (2008: DKr186,349m). This amount is included in the cash flow statement under Cash and cash equivalents.
16 Trading portfolio assets Derivatives with positive fair value 313,387 574,456
Listed bonds 299,448 278,860
Unlisted bonds 6,288 5,951
Listed shares 589 1,397
Unlisted shares 340 124
Total 620,052 860,788 Trading portfolio liabilities
Derivatives with negative fair value 307,420 581,521
Obligations to repurchase securities 73,147 41,769
Total 380,567 623,290
Derivatives "�������������#�����������������������������������������derivatives. Derivatives are financial instruments whose value de-pends on the value of an underlying instrument or index, etc. Derivatives can be used to control market risk exposure, for example. The Group trades a considerable volume of the most commonly used interest rate, currency and equity derivatives, including
swaps forwards and futures options
Furthermore, the Group trades a limited number of swaps whose value depends on developments in specific credit or commodity risks, or inflation indices. The Group trades derivatives for three main purposes: first, customers are offered derivatives as individual transactions or as inte-gral parts of other services, such as issuance of bonds with yields that depend on developments in equity or currency indices. Second, �������������������#��#���������$�������������������"���X����#��#�����������������������������������$���=������ to ex-change rate, interest rate, equity market and credit risks. See the Risk management notes for more information about ���������������management policy. Danske Markets is responsible for managing and hedging the �������market risks.
���
NOTES – DANSKE BANK GROUP
89DANSKE BANK ANNUAL REPORT 2009 NOTES – DANSKE BANK GROUP

Notes � Danske Bank Group
Note (DKr m)
!�������
Fair value hedge accounting
���#��#������������������������������������#�����Z����������������������������������������X���#�����X��������X����� bonds, etc., is added at fixed rates. Generally, such fixed-rate items are carried at amortised cost. In accordance with general accounting standards, the fair value of the interest rate risk on fixed-rate loans, for example, is not included in the income statement as opposed to changes in the fair value of hedging derivatives. In addition, the Group classifies certain bonds as available-for-sale financial assets. ����������#������[�����������������������������������������?������������������>�?��Z�����������������������X�����Group uses fair value hedge accounting if the interest rate risk on fixed-rate financial assets and liabilities or bonds ailable for sale is hedged
by derivatives. av
The interest rate risk on fixed-rate assets and liabilities with terms longer than six months is generally hedged by derivatives. The in-terest rate risk on fixed-�����������������#�������=��������?������������������ions in Finland, Northern Ireland and Ireland is, how-ever, hedged by core free funds. Any additional interest rate risk is hedged by derivatives. For hedged assets and liabilities to which a fixed rate of interest applies for a specified period of time starting at the commencement date of the agreement, future interest payments are divided into basic interest and a profit margin and into periods of time. By enter-ing into swaps or forwards with matching payment profiles in the same currencies and for the same periods, the Group hedges the risk from the commencement date. The fair values of the hedged interest rate risk and the hedging derivatives are measured at fre-quent intervals to ensure that changes in the fair value of the hedged interest rate risk lie within a band of 80-125% of the changes in the fair value of the hedging derivatives. Portfolios of hedging derivatives are adjusted if necessary. With effective hedging, the hedged interest rate risk on hedged assets and liabilities is measured at fair value and recognised as a value adjustment of the hedged items. Value adjustments are carried in the income statement under Net trading income. Any ineffec-tive portion of a hedge which lies within the range for effective hedging is therefore also included under Net trading income.
At the end of 2009, the carrying amounts of effectively hedged fixed-rate financial assets and liabilities were DKr65,423m (2008: DKr89,994m) and DKr917,823m (2008: DKr1,122,858m), respectively. The table below shows the value adjustments of these as-sets and liabilities and the hedging derivatives. The value adjustments are recognised in the income statement as Net trading income. The Group hedges the exchange rate risk of net investments in branches and subsidiaries outside Denmark by establishing financing �������������������������������������"�����������������������������������=���������������������������������������nsac-tions. The exchange rate adjustments of the investments are recognised in other comprehensive income together with the exchange rate adjustments of the financing arrangements designated as hedging of exchange rate fluctuations. The statement of comprehen-sive income shows the translation amounts. At the end of 2009, the carrying amount of financial liabilities used to hedge net invest-ments in units outside Denmark amounted to DKr47,330m (2008: DKr44,335m).
2009 2008 Effect of interest rate hedging on profit
Effect of fixed-rate asset hedging on profit
Hedged amounts due from credit institutions 269 36
Hedged loans and advances -525 3,497
Hedged bonds available for sale -187 1,990
Hedging derivatives 418 -5,574
Total -25 -51
Effect of fixed-rate liability hedging on profit
Hedged amounts due to credit institutions 164 -234
Hedged deposits 49 -328
Hedged issued bonds 166 -5,800
Hedged subordinated debt 100 -3,048
Hedging derivatives -475 9,349
Total 4 -61
16
NOTES – DANSKE BANK GROUP
90 NOTES – DANSKE BANK GROUP DANSKE BANK ANNUAL REPORT 2009

Notes � Danske Bank Group
Note 16 Derivatives Positive fair value Negative fair value
(cont'd)
2009 Notional amount
Carrying amount
Notional amount
Carrying amount
Currency contracts
Forwards and swaps 2,453,771 81,375 2,479,437 83,655
Options 50,888 1,135 42,560 1,353
Interest rate contracts
Forwards/swaps/FRAs 10,131,683 194,033 9,937,504 196,712
Options 927,645 22,101 702,134 19,573
Equity contracts
Forwards 14,209 274 14,061 269
Options 63,775 1,372 71,484 1,350
Other contracts
Commodity contracts 3,661 955 2,569 945
Credit derivatives bought 9,143 2,878 6,377 202
Credit derivatives sold 5,479 136 4,907 127
Total derivatives held for trading purposes 304,259 304,186
Hedging derivatives
Currency contracts 179,018 995 254,525 841
Interest rate contracts 531,925 8,133 146,037 2,393
Total derivatives 313,387 307,420
Derivatives Positive fair value Negative fair value
2008 Notional amount
Carrying amount
Notional amount
Carrying amount
Currency contracts
Forwards and swaps 2,111,242 177,734 2,250,232 193,675
Options 73,301 2,790 56,109 2,873
Interest rate contracts
Forwards/swaps/FRAs 12,829,675 349,697 13,616,927 353,734
Options 955,843 21,885 771,039 19,391
Equity contracts
Forwards 4,007 919 4,830 585
Options 55,164 3,469 57,938 3,510
Other contracts
Commodity contracts 16,375 2,376 17,345 2,291
Credit derivatives bought 11,560 2,982 8,118 16
Credit derivatives sold 2,938 13 7,637 400
Total derivatives held for trading purposes 561,865 576,475
Hedging derivatives
Currency contracts 316,536 2,176 231,869 836
Interest rate contracts 622,510 10,415 173,124 4,210
Total derivatives 574,456 581,521
NOTES – DANSKE BANK GROUP
91DANSKE BANK ANNUAL REPORT 2009 NOTES – DANSKE BANK GROUP

Notes � Danske Bank Group
Note (DKr m) 2009 2008 17 Investment securities
Financial assets at fair value through profit or loss
Listed bonds 15,942 14,123
Unlisted bonds - 14
Listed shares 462 1,247
Unlisted shares 1,709 1,772
Total financial assets at fair value 18,113 17,156
Available-for-sale financial assets
Listed bonds 92,397 117,161
Total available-for-sale financial assets 92,397 117,161
Total at fair value 110,510 134,317
Held-to-maturity financial assets
Listed bonds 8,469 6,476
Total investment securities 118,979 140,793
Bonds held for trading reclassified as available-for-sale financial assets Owing to significant distortion of the pricing of bonds, in 2008, the Group reclassified bonds at a nominal value of DKr120,607m and a fair value of DKr116,722m in the held-for-trading category as available-for-sale financial assets. The portfolio comprises primarily Danish mortgage bonds and foreign covered bonds of high credit quality. At the end of 2009, the fair value of the remaining bonds was DKr92,397m (2008: DKr117,161m). In 2009, the Group recognised unrealised value adjustments of the reclassified bonds in the amount of DKr-187m in the income statement, corresponding to the part of the interest rate risk that is hedged by derivatives (2008: DKr1,990m). The Group recognised unrealised value adjustments of DKr291m (2008: DKr-1,937m) in other comprehensive income that would have been recognised in the income statement if the reclassification had not taken place. In 2009, the Group realised value adjustments of DKr417m (2008: DKr0m) that were transferred from other comprehensive income to the income statement. The Group recognised interest income of DKr4,037m (2008:1,748m for the period after the reclassification).
18 Loans and advances Reverse transactions 146,063 233,971
Other loans and advances 1,013,724 1,132,810
Impairment charges 32,645 14,668
Total 1,127,142 1,352,113
Impairment charges
At January 1 14,668 4,547
New and increased impairment charges 24,871 12,365
Reversals of impairment charges 3,169 1,226
Write-offs debited to allowance account 4,228 946
Foreign currency translation 349 -144
Other additions and disposals 154 72
At December 31 32,645 14,668
NOTES – DANSKE BANK GROUP
92 NOTES – DANSKE BANK GROUP DANSKE BANK ANNUAL REPORT 2009

Notes � Danske Bank Group
Note (DKr m) 2009 2008 19 Loans and advances at fair value and bonds issued by Realkredit Danmark Loans and advances at fair value
Nominal value 689,698 680,312
Fair value adjustment of underlying bonds 435 -12,674
Adjustment for credit risk 1,660 457
Total 688,473 667,181
Bonds issued by Realkredit Danmark
Nominal value 943,379 843,529
Fair value adjustment of funding of current loans -179 -12,981
Fair value adjustment of block issues and pre-issued bonds - -
Holding of own mortgage bonds 426,145 351,014
Total 517,055 479,534
The nominal value of bonds issued by Realkredit Danmark equals the amount repayable on maturity. Of the total adjustment for credit risk on loans and advances at fair value, changes in 2009 were recognised as an expense of DKr1,005m (2008: income of DKr394m). The yield spread between Danish mortgage bonds and Danish government bonds narrowed considerably and was around 25-35bp at the end of 2009. The narrowing caused an increase of about DKr6bn in the fair value of bonds issued by Realkredit Danmark and mortgage loans (2008: a decline of about DKr11bn owing to a spread widening). In 2009, fair value adjustments of own credit risk amounted to DKr0 (2008: DKr0) and therefore had no effect on the total fair value adjustment of issued mortgage bonds. Fair value adjustments of own credit risk are determined as the change in the benchmark yield, equalling the average yield on Danish mortgage bonds rated AAA. The accumulated effect of fair value adjustments was DKr0 for the year (2008: DKr0m).
20 Pooled schemes and unit-linked investment contracts Pooled schemes Unit-linked contracts Total
2009 2008 2009 2008 2009 2008
Assets
Bonds 19,829 20,582 - - 19,829 20,582
Shares 4,991 6,844 - - 4,991 6,844
Unit trust certificates 11,271 5,197 15,032 8,476 26,303 13,673
Cash deposits 2,010 728 - - 2,010 728
Total 38,101 33,351 15,032 8,476 53,133 41,827
including
own bonds 4,993 5,909 - - 4,993 5,909
own shares 294 141 - - 294 141
other intra-group balances 1,937 1,142 - - 1,937 1,142
Total assets 30,877 26,159 15,032 8,476 45,909 34,635
Liabilities
Deposits 38,101 33,351 15,032 8,476 53,133 41,827
NOTES – DANSKE BANK GROUP
93DANSKE BANK ANNUAL REPORT 2009 NOTES – DANSKE BANK GROUP

Notes � Danske Bank Group
Note (DKr m) 2009 2008 21 Assets under insurance contracts Due from credit institutions 1,256 1,157
Investment securities 202,991 187,897
Holdings in associated undertakings (note 22) 996 1,059
Investment property (note 24) 17,757 17,431
Tangible assets (note 25) 160 163
Reinsurers' share of provisions 1,948 1,917
Other assets 4,179 6,734
Total 229,287 216,358
including
own bonds 30,621 32,433
own shares 274 119
other intra-group balances 1,448 2,547
Total assets 196,944 181,259
Investment securities under insurance contracts Listed bonds 152,391 132,489
Listed shares 14,963 10,162
Unlisted shares 2,140 1,747
Unit trust certificates 31,406 35,830
Other securities 2,091 7,669
Total 202,991 187,897
Liabilities under insurance contracts
Life insurance provisions 178,320 177,655
Provisions for unit-linked insurance contracts 32,591 21,881
Collective bonus potential 2,846 1,553
Other technical provisions 8,621 8,574
Total provisions for insurance contracts 222,378 209,663
Other liabilities 2,494 2,979
Intra-group balances -996 -1,654
Total 223,876 210,988
Provisions for insurance contracts Balance at January 1 209,663 212,537
Premiums paid 15,730 17,904
Benefits paid -15,125 -14,707
Interest added to policyholders' savings 8,620 4,748
Fair value adjustment 5,033 2,196
Foreign currency translation 217 -338
Change in collective bonus potential 1,286 -11,911
Other changes -3,046 -766
Balance at December 31 222,378 209,663
Reinsurers' share of provisions for insurance contracts Balance at January 1 1,917 1,714
Premiums paid 137 70
Benefits paid -131 -123
Interest added to policyholders' savings 25 117
Fair value adjustment 19 134
Other changes -19 5
Balance at December 31 1,948 1,917
NOTES – DANSKE BANK GROUP
94 NOTES – DANSKE BANK GROUP DANSKE BANK ANNUAL REPORT 2009

Notes � Danske Bank Group
Note (DKr m) 2009 2008 22 Holdings in associated undertakings Cost at January 1 841 1,090
Additions 15 -
Additions on acquisitions - -
Disposals 3 249
Foreign currency translation - -
Cost at December 31 853 841
Revaluations at January 1 98 38
Share of profit 288 237
Share of other comprehensive income -10 -
Dividends 180 170
Reversals of revaluations 37 -7
Foreign currency translation - -
Revaluations at December 31 233 98
Carrying amount at December 31 1,086 939
Holdings in associated undertakings Ownership (%) Total assets Total liabilities Income Net profit
Bankpension AB, Stockholm 20 18 2 10 -4
BDB Bankernas Depå AB, Stockholm 20 1,773 1,756 35 7
DKA II A/S, Copenhagen 29 980 807 3 -91
DKA I P/S, Copenhagen 33 182 15 -25 -37
DKA I Komplementarer A/S, Copenhagen 33 1 - - -
Ejendomsaktieselskabet af 22. juni 1966, Copenhagen 50 26 6 2 2
LR Realkredit A/S, Copenhagen 31 11,699 8,474 540 -134
Danmarks Skibskredit A/S, Copenhagen 24 81,632 72,753 3,394 37
Multidata Holding A/S, Ballerup 44 661 390 811 24
PBS Holding A/S, Ballerup 26 3,178 2,226 2,472 546
E-nettet Holding A/S, Copenhagen 28 163 87 72 -15
Interessentskabet af 23. dec. 1991, Copenhagen 30 816 36 58 38
Automatia Pankkiautomaatit Oy, Helsinki 33 2,875 2,719 456 22
MB Equity Fund Ky, Helsinki 21 - - 8 6
Tapio Technologies, Helsinki 20 10 9 6 -1
Irish Clearing House Limited, Dublin 22 - - 5 -
"�������������������������=�����������������������������������������������������
NOTES – DANSKE BANK GROUP
95DANSKE BANK ANNUAL REPORT 2009 NOTES – DANSKE BANK GROUP

Notes � Danske Bank Group
Note (DKr m) 2009 2008 22 Holdings in associated undertakings under insurance contracts
(cont'd) Cost at January 1 675 618
Additions - 57
Disposals 2 -
Cost at December 31 673 675
Revaluations at January 1 384 404
Share of profit -46 -20
Dividends 15 -
Revaluations at December 31 323 384
Carrying amount at December 31 996 1,059
Ownership (%) Total assets Total liabilities Income Net profit
Ejendomsselskabet af Januar 2002 A/S, Copenhagen 50 812 313 30 -99
Dantop Ejendomme ApS, Copenhagen 50 290 6 10 -10
DNP Ejendomme Komplementarselskab ApS, Copenhagen 50 - - - -
DNP Ejendomme P/S, Copenhagen 50 1,153 26 88 66
DAN-SEB 1 A/S, Copenhagen 50 70 45 2 -1
Hovedbanegårdens Komplementarselskab ApS, Copenhagen 50 - - - -
Privathospitalet Hamlet af 1994 A/S, Frederiksberg 35 443 249 211 25 - -
"�������������������������=����������������������������������������������������� The Group has holdings in four investment companies in which Danica and the Danske Bank Group together hold more than 20% of �������������������������������������������������#���������<������������������������������"����������������������s are carried under Trading portfolio assets. Because the investment companies invest solely in securities recognised at fair value, the car-�?�����������#��������?�������?��������������#�����"�������������$����$�������������������������������������������� end of 2009.
Ownership (%) Total assets Total liabilities Income Net profit
P-N 2001 A/S, Copenhagen 27 7 1 - 2
Nordic Venture Partners K/S, Copenhagen 26 250 - -29 -21
"�������������������������=�������������������������������������������������������
NOTES – DANSKE BANK GROUP
96 NOTES – DANSKE BANK GROUP DANSKE BANK ANNUAL REPORT 2009

Notes � Danske Bank Group
Note (DKr m) 23 Intangible assets Software Customer 2009 Goodwill developed relations Other Total
Cost at January 1 19,573 2,194 4,369 1,144 27,280
Additions - 321 - 11 332
Additions on acquisitions - - - - -
Disposals 1,458 - - 9 1,467
Foreign currency translation 135 - 66 -2 199
Cost at December 31 18,250 2,515 4,435 1,144 26,344
Amortisation and impairment charges at January 1 - 963 838 385 2,186
Amortisation charges during the year - 517 436 106 1,059
Impairment charges during the year 1,458 - - - 1,458
Reversals of amortisation and impairment charges 1,458 - - 9 1,467
Foreign currency translation - - 71 - 71
Amortisation and impairment charges at December 31 - 1,480 1,345 482 3,307
Carrying amount at December 31 18,250 1,035 3,090 662 23,037
Amortisation period Annual impairment test 3 years 3-10 years
2008
Cost at January 1 23,301 1,764 5,937 1,263 32,265
Additions - 594 - 35 629
Additions on acquisitions 16 - - - 16
Disposals 3,084 164 1,254 153 4,655
Foreign currency translation -660 - -314 -1 -975
Cost at December 31 19,573 2,194 4,369 1,144 27,280
Amortisation and impairment charges at January 1 - 683 1,878 408 2,969
Amortisation charges during the year - 424 470 127 1,021
Impairment charges during the year 3,084 - - - 3,084
Reversals of amortisation and impairment charges 3,084 144 1,135 150 4,513
Foreign currency translation - - -375 - -375
Amortisation and impairment charges at December 31 - 963 838 385 2,186
Carrying amount at December 31 19,573 1,231 3,531 759 25,094
Amortisation period Annual impairment test 3 years 3-10 years
Other intangible assets were recognised at the acquisition of the Sampo Bank group and include contractual rights of DKr145m (2008: DKr215m) and rights to names of DKr463m (2008: DKr464m). Contractual rights are amortised over 1-5 years. Rights to names relate to the use of the Sampo Bank brand name. In ������������������X��������� to the use of the name has an indefinite useful life, as the name is well-established. Rights to names are therefore not amortised but subject to annual impairment testing. In 2009, the Group expensed DKr2,097m for development projects (2008: DKr1,950m).
NOTES – DANSKE BANK GROUP
97DANSKE BANK ANNUAL REPORT 2009 NOTES – DANSKE BANK GROUP

Notes � Danske Bank Group
Note (DKr m) 23 Impairment testing !������� "������������rkets suffered from unprecedented negative developments in macroeconomic conditions, including steeply declining
industrial output, declining asset values and rising unemployment. Economic indicators are pointing to a stabilisation, but a period of modest growth and rising unemployment is expected before economies will normalise.
The Baltic economies in particular gradually deteriorated in 2009 as a result of substantial imbalances, rising unemployment and
considerable fiscal tightening. Against this background, the Group made an upward revision of its end-2008 credit loss estimates for the coming years and recognised goodwill impairment charges against the banking activities in Latvia and Lithuania of a total of DKr1.4bn. Activities in Estonia are not affected to the same degree, and impairment tests did not identify any need for impairment charges against the goodwill of DKr2.1bn recognised for Banking Activities Baltics.
Developments in the Russian economy led the Group to recognise a goodwill impairment charge of DKr25m against the entire good-
will of ZAO Danske Bank, which was acquired as part of the Sampo Bank group in 2007. As a result of the low growth estimates for its Swedish real-estate agency chain, the Group recognised a goodwill impairment charge of DKr16m against the total goodwill of DKr39m acquired in 2005.
Impairment charges are recognised under Amortisation, depreciation and impairment charges in the income statement.
The impairment test of goodwill on other acquisitions did not identify any indications of impairment. The impairment test of goodwill on Banking Activities Ireland and Banking Activities Norway�� real-estate agency chain (Krogsveen)
conducted in 2008 resulted in impairment charges.
Jan. 1, 2008
Dec. 31, 2008
Dec. 31, 2009
Goodwill and rights to
names Addi-tions
Impair-ment
charges
Foreign currency
translation
Goodwill and rights to
names
Impair-ment
charges
Foreign currency
translation
Goodwill and rights to
names
Banking Activities Finland 11,753 - - -44 11,709 - -56 11,653
Banking Activities Baltics 3,479 - - -4 3,475 1,417 3 2,061
Banking Activities Northern Ireland 2,330 - - -574 1,756 - 134 1,890
Banking Activities Ireland 2,942 - 2,940 -2 - - - -
Banking Activities Norway 184 - 141 -43 - - - -
Danske Markets 1,126 - - -1 1,125 - 39 1,164
Danske Capital 1,812 - - 4 1,816 - -1 1,815
Others 140 16 3 4 157 41 14 130
Total 23,766 16 3,084 -660 20,038 1,458 133 18,713
Impairment tests compare the carrying amount and the estimated present value of expected future cash flows. The special debt structure of financial institutions requires the use of a simplified equity model to calculate the present value of future cash flows. The model is based on approved strategies and earnings estimates for cash-generating units for the next five years (the budget period). For the terminal period (> 5 years), growth estimates are determined on the basis of forecasts of real growth in GDP for the relevant markets. "��������������������$��������������������������������-adjusted required rate of return of 12% (pre-tax rate) and 9% (post-tax rate). Economic growth in the near term is expected to be low, which, combined with low money market rates and a high level of loan im-pairment charges, will reduce earnings. Earnings are expected to normalise gradually over the five-year budget period, and it is as-sumed that net interest income will increase sufficiently to cover rising credit costs. In case the economies do not normalise as ex-pected, capitalised intangible assets may be impaired. Owing to the low earnings estimates for the budget period, around 90% of the net present value of future cash flows is expected to be generated in the terminal period. Sensitivity analyses show that goodwill on Banking Activities Northern Ireland is robust against changes in impairment test assump-tions, whereas small changes in assumptions may require impairment charges against the goodwill on Banking Activities Finland and �������<��#����|�������Z����������������-adjusted required rate of return is lifted from 12% to 13%, total goodwill will be reduced around DKr2bn. If the growth estimates for the terminal period are lowered one percentage point, the total goodwill will be reduced by around DKr0.5bn. If the normalised required return for the terminal period is lowered 10%, total goodwill will be reduced by around DKr0.7bn and, similarly, if the required return is lowered 20%, total goodwill will be reduced by around DKr2.3bn. For Danske Capital, the required rate of return may be increased by up to 4.3 percentage points before impairment occurs, and the goodwill recognised is robust against changes in growth estimates for the terminal period. The goodwill on Danske Markets is robust against changes to both the required rate of return and growth estimates for the terminal period.
NOTES – DANSKE BANK GROUP
98 NOTES – DANSKE BANK GROUP DANSKE BANK ANNUAL REPORT 2009

Notes � Danske Bank Group
Note 23 Impairment test assumptions (cont'd) 2009 2008 Annual growth Required rate of Annual growth Required rate of (%) >5 yrs return before tax >5 yrs return before tax
Banking Activities Finland 2.0 12.0 2.5 12.0
Banking Activities Baltics 3.5 12.0 4.0 12.0
Banking Activities Northern Ireland 3.0 12.0 2.2 12.0
Danske Markets 1.0 12.0 1.9 12.0
Danske Capital 2.0 12.0 2.5 12.0
Banking Activities Finland In 2007, Danske Bank acquired the shares of the Sampo Bank group. The activities of the Sampo Bank group were incorporated in the business structure of the Danske Bank Group at the beginning of 2007 and are reported under Banking Activities Finland. With the acquisition, the Group strengthened its competitive position in the entire northern European market and reinforced its business plat-������Z��} �X��������<��#����&��������������������������������������
Banking Activities Baltics In 2007, Danske Bank acquired the Baltic activities of the Sampo Bank group. The activities were incorporated in the business struc-ture of the Danske Bank Group at the beginning of 2007 and are reported under Banking Activities Baltics. With the acquisition, the Group established a presence in the Baltic markets, primarily in Estonia and, to a lesser extent, in ��������"����������������������Latvia are very modest. The write-down of part of the goodwill, reflecting the growing economic crisis in the Baltic countries in 2009, means that only the goodwill on the Estonian operations is capitalised.
Banking Activities Northern Ireland (Northern Bank) In 2005, Danske Bank acquired Northern Bank, which forms part of Banking Activities Northern Ireland. The acquisition is consistent $���������������������?���������������������������#������������������������|���������������"��������������$������t pack-ages and other services supports Northern B����������������������������������������������?��������#��������������������Z�e-land. Danske Markets The trading activities of Sampo Bank were incorporated in the business structure of Danske Markets in 2007. With the acquisition, the Group strengthened its competitive position within corporate finance and institutional banking and trading activities in general. The integration process and the budgets and business plans presented confirm the financial assumptions on which the Group bas ed its acquisition. Danske Capital The wealth management activities of Sampo Bank were incorporated in the business structure of Danske Capital in 2007. In addition to the acquisition of Sampo Bank, goodwill recognised by Danske Capital is attributable to a number of minor acquisitions. With the acquisition of Sampo Bank, the Group strengthened its competitive position within asset management in Finland. The migration to the �����������form will support this position.
NOTES – DANSKE BANK GROUP
99DANSKE BANK ANNUAL REPORT 2009 NOTES – DANSKE BANK GROUP

Notes � Danske Bank Group
Note (DKr m) 2009 2008 24 Investment property Fair value at January 1 4,470 4,904
Additions 554 632
Property improvement expenditure - 4
Disposals 110 1,136
Fair value adjustment 34 66
Fair value at December 31 4,948 4,470
Required rate of return used for calculating fair value 4.8-7.5 4.0-7.5
Average required rate of return 5.4 6.7
Rental income from investment property totalled DKr332m in 2009 (2008: DKr214m). Expenses directly attributable to investment property generating rental income amounted to DKr23m (2008: DKr4m), whereas expenses directly attributable to investment prop-erty not generating rental income amounted to DKr12m (2008: DKr2m).
Investment property under insurance contracts
Fair value at January 1 17,431 17,159
Additions 285 138
Property improvement expenditure 348 996
Disposals 19 1,046
Fair value adjustment -288 184
Fair value at December 31 17,757 17,431
Required rate of return used for calculating fair value 4.5-8.0 4.5-7.8
Average required rate of return 6.2 6.3
Rental income from investment property under insurance contracts amounted to DKr1,165m in 2009 (2008: DKr1,146m). Ex-penses directly attributable to investment property generating rental income amounted to DKr224m (2008: DKr228m). The fair value of investment property is calculated on the basis of a standard operating budget and a rate of return fixed for the indi-vidual property less expenses for temporary factors. The operating budget factors in a conservative estimate of the market rent that could be earned on currently unoccupied premises and adjustments for existing leases that deviate materially from standard terms ��������������{���������������������=������������������������������������������#�����������?����������X�?��������onstruc-���X���������X������"�������������������������������������������������������?�� location, possible uses and condition as well as the term and credit quality, etc., of leases.
NOTES – DANSKE BANK GROUP
100 NOTES – DANSKE BANK GROUP DANSKE BANK ANNUAL REPORT 2009

Notes � Danske Bank Group
Note (DKr m) 25 Tangible assets Domicile Machinery, furniture 2009 property and fixtures Lease assets Total
Cost at January 1 4,697 2,451 6,417 13,565
Additions 193 248 1,595 2,036
Disposals 34 409 1,456 1,899
Transferred to lease assets held for sale - - 220 220
Transferred to real property held for sale 1 - - 1
Additions on acquisitions - - - -
Foreign currency translation 38 56 122 216
Cost at December 31 4,893 2,346 6,458 13,697
Depreciation and impairment charges at January 1 924 1,780 1,800 4,504
Depreciation charges during the year 63 291 1,003 1,357
Impairment charges during the year 163 - - 163
Transferred to lease assets held for sale - - 104 104
Transferred to real property held for sale -13 - - -13
Reversals of depreciation and impairment charges 12 375 722 1,109
Foreign currency translation 9 35 29 73
Depreciation and impairment charges at December 31 1,160 1,731 2,006 4,897
Carrying amount at December 31 3,733 615 4,452 8,800
Depreciation period 20-50 years 3-10 years 3 years
At the end of 2009, the fair value of domicile property was DKr5,234m. The required rate of return of 6.7% was determined in accordance with Danish FSA rules.
2008
Cost at January 1 5,356 2,661 5,653 13,670
Additions 102 381 2,230 2,713
Disposals 447 627 1,206 2,280
Transferred to lease assets held for sale - - 286 286
Transferred to real property held for sale 131 - - 131
Additions on acquisitions - 7 - 7
Foreign currency translation -183 29 26 -128
Cost at December 31 4,697 2,451 6,417 13,565
Depreciation and impairment charges at January 1 1,095 1,916 1,347 4,358
Depreciation charges during the year 65 342 833 1,240
Impairment charges during the year 6 - 173 179
Transferred to lease assets held for sale - - 144 144
Transferred to real property held for sale 12 - - 12
Reversals of depreciation and impairment charges 147 546 527 1,220
Foreign currency translation -83 68 118 103
Depreciation and impairment charges at December 31 924 1,780 1,800 4,504
Carrying amount at December 31 3,773 671 4,617 9,061
Depreciation period 20-50 years 3-10 years 3 years
At the end of 2008, the fair value of domicile property was DKr5,392m. The required rate of return of 6.6% was determined in accordance with Danish FSA rules. Furthermore, Assets under insurance contracts includes domicile property of DKr151m (2008: DKr154m) and machinery, furniture and fixtures of DKr9m (2008: DKr9m). At the end of 2009, the fair value of such domicile property was DKr164m (2008: DKr162m).
NOTES – DANSKE BANK GROUP
101DANSKE BANK ANNUAL REPORT 2009 NOTES – DANSKE BANK GROUP
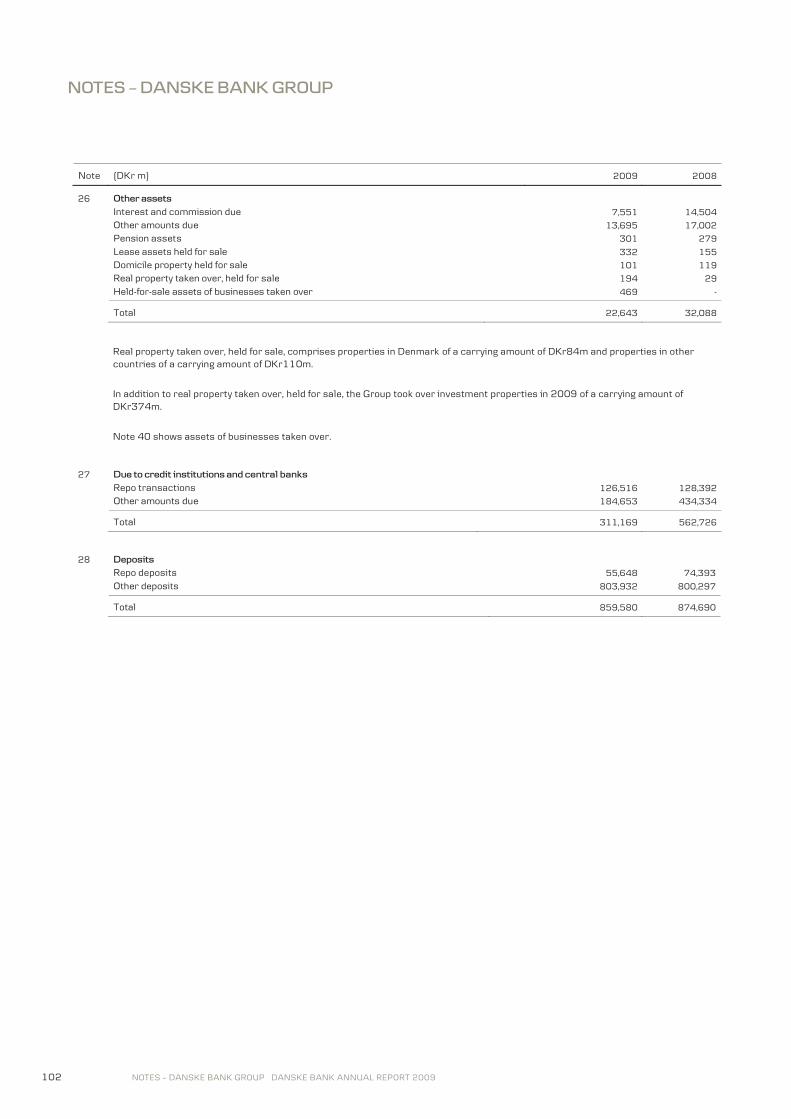
Notes � Danske Bank Group
Note (DKr m) 2009 2008 26 Other assets Interest and commission due 7,551 14,504
Other amounts due 13,695 17,002
Pension assets 301 279
Lease assets held for sale 332 155
Domicile property held for sale 101 119
Real property taken over, held for sale 194 29
Held-for-sale assets of businesses taken over 469 -
Total 22,643 32,088
Real property taken over, held for sale, comprises properties in Denmark of a carrying amount of DKr84m and properties in other countries of a carrying amount of DKr110m.
In addition to real property taken over, held for sale, the Group took over investment properties in 2009 of a carrying amount of DKr374m.
Note 40 shows assets of businesses taken over.
27 Due to credit institutions and central banks Repo transactions 126,516 128,392
Other amounts due 184,653 434,334
Total 311,169 562,726
28 Deposits Repo deposits 55,648 74,393
Other deposits 803,932 800,297
Total 859,580 874,690
NOTES – DANSKE BANK GROUP
102 NOTES – DANSKE BANK GROUP DANSKE BANK ANNUAL REPORT 2009

Notes � Danske Bank Group
Note (DKr m) 2009 2008
29 Deferred tax Deferred tax assets 2,120 1,248
Deferred tax liabilities 5,391 3,082
Deferred tax, net 3,271 1,834 Change in deferred tax Foreign Included in Included in currency profit for shareholders' 2009 At Jan. 1 translation the year equity At Dec. 31
Intangible assets 1,346 -3 -133 - 1,210
Tangible assets 1,442 1 998 - 2,441
Securities -550 -15 507 - -58
Provisions for obligations -314 -3 69 - -248
Tax loss carryforwards 72 -1 -1,598 - -1,527
Recapture of tax loss - - 2,047 - 2,047
Other -162 -54 -378 - -594
Total 1,834 -75 1,512 - 3,271
Adjustment of prior-year tax charges included in preceding item 483
2008
Intangible assets 1,529 -4 -179 - 1,346
Tangible assets 1,121 31 290 - 1,442
Securities 613 - -1,060 -103 -550
Provisions for obligations -434 73 47 - -314
Tax loss carryforwards -5 2 75 - 72
Recapture of tax loss - - - - -
Other -62 -10 -90 - -162
Total 2,762 92 -917 -103 1,834
Adjustment of prior-year tax charges included in preceding item -61
The tax base of non-capitalised tax losses was DKr0.3bn.
NOTES – DANSKE BANK GROUP
103DANSKE BANK ANNUAL REPORT 2009 NOTES – DANSKE BANK GROUP

Notes � Danske Bank Group
Note (DKr m) 2009 2008 30 Other liabilities Sundry creditors 25,935 41,015
Accrued interest and commission 17,680 18,434
Pension obligations 1,088 1,178
Other staff commitments 3,243 2,628
Irrevocable loan commitments and guarantees, etc. 2,677 621
Reserves subject to a reimbursement obligation 220 244
Liabilities of businesses taken over 247 -
Other obligations 157 74
Total 51,247 64,194
Irrevocable loan Reserves subject to a Other commitments reimbursement obligation obligations
January 1, 2009 621 244 74
New and increased obligations 2,406 - 90
Reversals of obligations 264 - 10
Spent 108 32 -3
Effect of adjustment of discount rate or term 4 8 -
Foreign currency translation 18 - -
December 31, 2009 2,677 220 157
The Group issues a number of irrevocable loan commitments and guarantees. Such facilities are valued at the higher of the received premium amortised over the life of the individual obligation and the provision made, if any. Provisions are made if it is likely that draw-ings will be made under a loan commitment or claims will be made under a guarantee and the amount payable can be reliably mea s-ured. Obligations are recognised at the fair value of expected payments. Reserves in early series subject to a reimbursement obligation relate to mortgage loan agreements under which the individual bor-��$�����������������������������#����������������������������$����������?������������������������������$��������������nd con-����������?����������������������} ��X������������obligation will gradually be reduced in step with individual borrower repayments. Factors that affect repayment patterns include changes in interest rates and cash flows. Note 40 shows liabilities of businesses taken over.
NOTES – DANSKE BANK GROUP
104 NOTES – DANSKE BANK GROUP DANSKE BANK ANNUAL REPORT 2009

Notes � Danske Bank Group
Note (DKr m) 31 Subordinated debt
Subordinated debt consists of liabilities in the form of subordinated loan capital and hybrid capital, which, in the event of Danske �������#������?������������?�$����-up, will not be repaid until the claims of ordinary creditors have been met. Hybrid capital ranks below subordinated loan capital. Early redemption of subordinated debt must be approved by the Danish FSA. Subordinated debt is included in the capital base in accordance with sections 129, 132 and 136 of the Danish Financial Business Act.
Principal Interest Redemption 2009 2008
Currency Borrower Note (millions) rate Issued Maturity price (DKr m) (DKr m)
Redeemed
loans 4,843
EUR Danske Bank A/S a 400 5.875 2002 26.03.2015 100 2,976 2,981
EUR Danske Bank A/S b 500 4.250 2003 20.06.2016 100 3,721 3,725
NOK Danske Bank A/S c 1,770 var. 2003 25.05.2014 100 1,583 1,340
GBP Danske Bank A/S d 350 5.375 2003 29.09.2021 100 2,881 2,677
NOK Danske Bank A/S e 500 var. 2003 15.02.2014 100 447 379
SEK Danske Bank A/S f 750 var. 2004 22.12.2013 100 542 510
EUR Danske Bank A/S g 700 4.100 2005 16.03.2018 100 5,209 5,216
EUR Danske Bank A/S h 500 var. 2005 09.09.2013 100 3,721 3,725
NOK Danske Bank A/S i 535 var. 2005 22.03.2014 100 478 405
EUR Danske Bank A/S j 500 6.000 2007 20.03.2016 100 3,721 3,725
EUR Danske Bank A/S k 500 5.375 2008 18.08.2014 100 3,721 3,725
DKK Danske Bank A/S l 500 5.500 2008 22.08.2014 100 500 500
EUR Danica Pension m 400 4.350 2006 Perpetual 100 2,977 2,981
EUR Sampo Bank plc n 200 var. 2004 31.05.2016 100 1,488 1,490
Subordinated debt, excluding hybrid capital 33,965 38,222
Hybrid capital
Hybrid capital included under the 15% of tier 1 capital limit (section 129(4)):
USD Danske Bank A/S o 750 5.914 2004 Perpetual 100 3,892 3,964
GBP Danske Bank A/S p 150 5.563 2005 Perpetual 100 1,234 1,147
GBP Danske Bank A/S q 500 5.684 2006 Perpetual 100 4,116 3,824
EUR Danske Bank A/S r 600 4.878 2007 Perpetual 100 4,465 4,470
SEK Danske Bank A/S s 1,350 var. 2007 Perpetual 100 976 919
SEK Danske Bank A/S t 650 5.119 2007 Perpetual 100 470 442
EUR Sampo Bank plc u 125 5.407 2004 Perpetual 100 930 931
EUR Sampo Bank plc v 125 var. 2004 Perpetual 100 930 931
EUR Sampo Bank plc w 100 var. 2004 Perpetual 100 744 745
Hybrid capital included under the 35% of tier 1 capital limit (section 129(3)):
DKK Danske Bank A/S x 23,992 9.265 2009 Perpetual 100 23,992 -
DKK Realkredit Danmark A/S y 2,034 9.265 2009 Perpetual 100 2,034 -
Total hybrid capital 43,783 17,373
Nominal subordinated debt 77,748 55,595
Hedging of interest rate risk at fair value 2,380 2,454
Holding of own bonds -126 -189
Total subordinated debt 80,002 57,860
Portion included in the capital base 73,068 49,783
NOTES – DANSKE BANK GROUP
105DANSKE BANK ANNUAL REPORT 2009 NOTES – DANSKE BANK GROUP

Notes � Danske Bank Group
Note 31 a Optional redemption date as from March 2012. If the loan is not redeemed, the annual interest rate will be 2.07 percentage !������� points above 3-month EURIBOR. b Optional redemption date as from June 2013. If the loan is not redeemed, the annual interest rate will be 2.05 percentage points above 3-month EURIBOR.
c Interest is paid at an annual rate 0.76 of a percentage point above 3-month NIBOR. Optional redemption date as from May 2011. If the loan is not redeemed, the annual interest rate will be 2.26 percentage points above 3-month NIBOR.
d Optional redemption date as from September 2018. If the loan is not redeemed, the annual interest rate will be 1.94 percent-age points above 3-month GBP LIBOR.
e Interest is paid at an annual rate 0.47 of a percentage point above 3-month NIBOR. Optional redemption date as from Febru-ary 2011. If the loan is not redeemed, the annual interest rate will be 1.97 percentage points above 3-month NIBOR.
f Interest is paid at an annual rate 0.34 of a percentage point above 3-month STIBOR. Optional redemption date as from De-cember 2010. If the loan is not redeemed, the annual interest rate will be 1.835 percentage points above 3-month STIBOR.
g Optional redemption date as from March 2015. If the loan is not redeemed, the annual interest rate will be 1.81 percentage points above 3-month EURIBOR.
h Interest is paid at an annual rate 0.20 of a percentage point above 3-month EURIBOR. Optional redemption date as from Sep-tember 2010. If the loan is not redeemed, the annual interest rate will be 1.70 percentage points above 3-month EURIBOR.
i Interest is paid at an annual rate 0.20 of a percentage point above 3-month NIBOR. Optional redemption date as from March 2011. If the loan is not redeemed, the annual interest rate will be 1.70 percentage points above 3-month NIBOR.
j Optional redemption date as from March 2013. If the loan is not redeemed, the annual interest rate will be 2.95 percentage points above 3-month EURIBOR.
k Optional redemption date as from August 2011. If the loan is not redeemed, the annual interest rate will be 3.10 percentage points above 3-month EURIBOR.
l Optional redemption date as from August 2011. If the loan is not redeemed, the annual interest rate will be 3.05 percentage points above 3-month CIBOR.
m Optional redemption date as from October 2011. If the loan is not redeemed, the annual interest rate will be 2.08 percentage points above 3-month EURIBOR.
n Interest is paid at an annual rate 0.25 of a percentage point above 3-month EURIBOR. Optional redemption date as from May 2011. If the loan is not redeemed, the annual interest rate will be 1.75 percentage points above 3-month EURIBOR.
o Optional redemption date as from June 2014. If the loan is not redeemed, the annual interest rate will be 1.66 percentage points above 3-month USD LIBOR.
p Optional redemption date as from March 2017. If the loan is not redeemed, the annual interest rate will be 1.44 percentage points above 3-month GBP LIBOR.
q Optional redemption date as from February 2017. If the loan is not redeemed, the annual interest rate will be 1.70 percent-age points above 3-month GBP LIBOR.
r Optional redemption date as from May 2017. If the loan is not redeemed, the annual interest rate will be 1.62 percentage points above 3-month EURIBOR.
s Interest is paid at an annual rate 0.65 of a percentage point above 3-month STIBOR. Optional redemption date as from Febru-ary 2017. If the loan is not redeemed, the annual interest rate will be 1.65 percentage points above 3-month STIBOR.
t Optional redemption date as from August 2017. If the loan is not redeemed, the annual interest rate will be 1.65 percentage points above 3-month STIBOR.
u Optional redemption date as from March 2014. If the loan is not redeemed, the annual interest rate will be 2.15 percentage points above 3-month EURIBOR.
v Interest is paid at an annual rate 1.6 percentage points above 3-month EURIBOR. Optional redemption date as from Decem-ber 2010.
w Interest is paid at an annual rate 0.3 of a percentage point above TEC 10. Optional redemption date as from March 2014. x Interest is paid at an annual rate of 9.625 percentage points with an annual premium of 0.5 percentage point for the conver-
sion option. If Danske Bank makes annual dividend payouts exceeding DKr3.4bn, the interest rate will increase. From April 11, 2014, to May 10, 2014, Danske Bank may redeem the loan at a price of 100 provided that the tier 1 capital ratio is at least 12% following such redemption or that the loan is replaced by other loss-absorbing tier 1 capital of at least the same or a higher quality. From May 11, 2014, to May 10, 2015, Danske Bank may redeem the loan at a price of 105, and from May 11, 2015, Danske Bank may redeem the loan at a price of 110. Redemption must be approved by the Danish FSA. Until May 14, 2014, Danske Bank will have the option to gradually convert the loan capital into shares in Danske Bank A/S if the hybrid capital exceeds 35% of total tier 1 capital. Danske Bank must, however, convert the loan capital into share capital gradually in the same period if the hybrid capital exceeds 50% of total tier 1 capital. The conversion must be made at market price. At the end of 2009, the hybrid capital accounted for 32.9% of total tier 1 capital.
y Interest is paid at an annual rate of 9.625 percentage points. If Realkredit Danmark makes annual dividend payouts exceeding DKr2.1bn, the interest rate will increase. From May 11, 2012, to May 10, 2014, Realkredit Danmark may redeem the loan at a price of 100 provided that the tier 1 capital ratio is at least 12% following such redemption or that the loan is replaced by other loss-absorbing tier 1 capital of at least the same or a higher quality. From May 11, 2014, to May 10, 2015, Realkredit Danmark may redeem the loan at a price of 105, and from May 11, 2015, Realkredit Danmark may redeem the loan at a price of 110. Redemption must be approved by the Danish FSA.
NOTES – DANSKE BANK GROUP
106 NOTES – DANSKE BANK GROUP DANSKE BANK ANNUAL REPORT 2009

Notes � Danske Bank Group
Note (DKr m)
32 Balance sheet items broken down by expected due date 2009 2008 < 1 year > 1 year < 1 year > 1 year
ASSETS
Cash in hand and demand deposits with central banks 33,714 - 16,379 -
Due from credit institutions and central banks 200,631 1,725 211,219 4,604
Trading portfolio assets 388,078 231,974 437,169 423,619
Investment securities 1,305 117,674 1,599 139,194
Loans and advances 662,289 464,853 846,040 506,073
Loans and advances at fair value 45,882 642,591 16,483 650,698
Assets under pooled schemes and unit-linked investment contracts - 45,909 - 34,635
Assets under insurance contracts 8,479 188,465 10,061 171,198
Holdings in associated undertakings - 1,086 - 939
Intangible assets - 23,037 - 25,094
Investment property - 4,948 - 4,470
Tangible assets - 8,800 - 9,061
Current tax assets 2,274 - 2,103 -
Deferred tax assets - 2,120 - 1,248
Other assets 22,342 301 31,809 279
Total 1,364,994 1,733,483 1,572,862 1,971,112
LIABILITIES
Due to credit institutions and central banks 309,102 2,067 560,194 2,532
Trading portfolio liabilities 158,381 222,186 208,840 414,450
Deposits 297,469 562,111 311,951 562,739
Bonds issued by Realkredit Danmark 181,479 335,576 129,571 349,963
Deposits under pooled schemes and unit-linked investment contracts 3,844 49,289 2,589 39,238
Liabilities under insurance contracts 18,903 204,973 14,478 196,510
Other issued bonds 266,341 248,260 297,516 229,090
Current tax liabilities 1,197 - 930 -
Deferred tax liabilities - 5,391 - 3,082
Other liabilities 49,939 1,308 62,772 1,422
Subordinated debt 4,871 75,131 3,317 54,543
Total 1,291,526 1,706,292 1,592,158 1,853,569
Deposits include fixed-term deposits and demand deposits. Fixed-term deposits are recognised at the maturity date. Demand deposits have short contractual maturities but are considered a stable financing source with expected maturities exceeding one year.
NOTES – DANSKE BANK GROUP
107DANSKE BANK ANNUAL REPORT 2009 NOTES – DANSKE BANK GROUP

Notes � Danske Bank Group
Note 33 Contractual due dates of financial liabilities 2009 0-1 month 1-3 months 3-12 months 1-5 years > 5 years
Due to credit institutions and central banks 222,413 5,437 83,211 256 1,972
Deposits 716,319 52,747 38,252 15,290 44,855
Repurchase obligation under reverse transactions 73,147 - - - -
Derivatives settled on a gross basis (cash outflows) 2,348,150 1,622,770 1,063,952 219,694 14,259
Derivatives settled on a gross basis (cash inflows) 2,348,924 1,624,523 1,062,629 219,284 14,554
Derivatives settled on a gross basis (net cash flows) 774 1,753 -1,323 -410 295
Derivatives settled on a net basis -15,571 6,331 -3,313 -3,588 -
Bonds issued by Realkredit Danmark 93,506 - 107,124 234,715 247,532
Other issued bonds 52,945 122,989 94,479 194,430 77,233
Subordinated debt - - 4,913 67,822 31,758
Other financial liabilities 81 162 820 8,242 5,727
Financial and loss guarantees 9,279 8,683 37,671 24,006 7,186
Irrevocable loan commitments shorter than 1 year 2,287 6,591 63,031 - -
Irrevocable loan commitments longer than 1 year - - - 95,188 6,771
Total 1,155,180 204,693 424,865 635,951 423,329
2008 0-1 month 1-3 months 3-12 months 1-5 years > 5 years
Due to credit institutions and central banks 472,845 76,720 30,508 1,422 2,035
Deposits 705,728 77,298 31,120 24,225 57,780
Repurchase obligation under reverse transactions 41,769 - - - -
Derivatives settled on a gross basis (cash outflows) 1,449,311 1,290,533 2,827,467 4,693,613 3,449,309
Derivatives settled on a gross basis (cash inflows) 1,584,218 1,469,108 2,781,837 4,650,373 3,441,393
Derivatives settled on a gross basis (net cash flows) 134,907 178,575 -45,630 -43,240 -7,916
Derivatives settled on a net basis 32,275 2,381 4,764 -7,855 -88
Bonds issued by Realkredit Danmark 47,630 - 99,430 257,923 284,322
Other issued bonds 43,595 147,600 81,306 231,169 38,255
Subordinated debt - 1,172 4,035 31,561 37,462
Other financial liabilities 107 213 960 5,119 2,077
Financial and loss guarantees 8,592 24,062 31,651 31,788 11,554
Irrevocable loan commitments shorter than 1 year 4,364 8,777 55,807 - -
Irrevocable loan commitments longer than 1 year - - - 81,534 17,698
Total 1,491,812 516,798 293,951 613,646 443,179
The maturity analysis is based on the earliest date on which the Group can be required to pay.
Disclosures comprise agreed payments, including principal and interest. For liabilities with variable cash flows, for example variable-rate financial liabilities, disclosure is based on the contractual conditions at the balance sheet date. Derivatives disclosures include the contractual cash flows for all derivatives, irrespective of whether the fair value at the balance sheet date is negative or positive and whether derivatives are held for trading or hedging purposes.
Amounts for other issued bonds and subordinated debt are included at the date when the Danske Bank Group has a choice of redeem-ing the debt or paying increased interest expenses.
Deposits are contractually very short-term funding, but in practice they are considered a stable funding source, as amounts disbursed largely equal deposits received. Similarly, a number of irrevocable loan commitments and guarantees are never utilised.
NOTES – DANSKE BANK GROUP
108 NOTES – DANSKE BANK GROUP DANSKE BANK ANNUAL REPORT 2009

Notes � Danske Bank Group
Note 2009 2008 34 Pension plans
Contributions to external defined contribution plans 514 683
Contributions to internal defined contribution plans 646 593
Total contributions to defined contribution plans 1,160 1,276
Contributions to defined benefit plans, standard cost 127 201
Adjustment of plans and business acquisitions - -26
Foreign currency translation 54 -131
Total 1,341 1,320
<���������������������������������������������������������������������������$�������������������������������� in-surance companies, including Danica Pension. Such payments are expensed when they are made. Defined benefit plans are typically funded by contributions made by employers and employees to separate pension funds investing the contributions on behalf of the members to fund future pension obligations. The Group also has unfunded pension plans, which are recognised directly on the balance sheet. �������������������������������Z�����������Z���������������������������������������������������������������"������� ed benefit scheme in Northern Ireland does not accept new members, while the defined benefit scheme in Ireland does. The defined benefit plans of both business units are funded through pension funds. Pensions in payment, including spouse�� and child���� benefits in Northern Ireland and Ireland, are reviewed annually by the Group and the trustee boards of the plans, and discretions are exercised as to the level of increases awarded. In Denmark, most of the employees have defined contribution plans. Defined benefit plans for employees working in Denmark are funded by contributions to pension funds, the majority of which are regulated by Danish company pension funds law. Most of th e schemes do not accept new members, and most of them are in payment. In Sweden, the defined benefit scheme accepts new members. The plans are funded through a pension fund, with an upper limit on the salary level on the basis of which pension obligations are accumulated. "����������������������������������������������������������=�������������������ulations, and actuarial gains and losses are rec-ognised using the corridor method. The actuarial calculations show an unrecognised net pension liability of DKr1,103m at December 31, 2009 (2008: an unrecognised net pension asset of DKr483m). The net pension assets and obligations of the individual pension funds are recognised under Other assets and Other liabilities, respec-tively.
Defined benefit plans Present value of unfunded pension obligations 339 296
Present value of fully or partly funded pension obligations 11,539 9,421
Fair value of plan assets 9,988 9,301
Net pension obligation at December 31 1,890 416
Actuarial gains/losses not recognised in the net pension obligation -1,103 483
Net pension obligation in accordance with IFRSs at December 31 787 899
Net pension obligation recognised on the balance sheet
Pension assets recognised under Other assets 301 279
Pension obligations recognised under Other liabilities 1,088 1,178
Total 787 899
NOTES – DANSKE BANK GROUP
109DANSKE BANK ANNUAL REPORT 2009 NOTES – DANSKE BANK GROUP
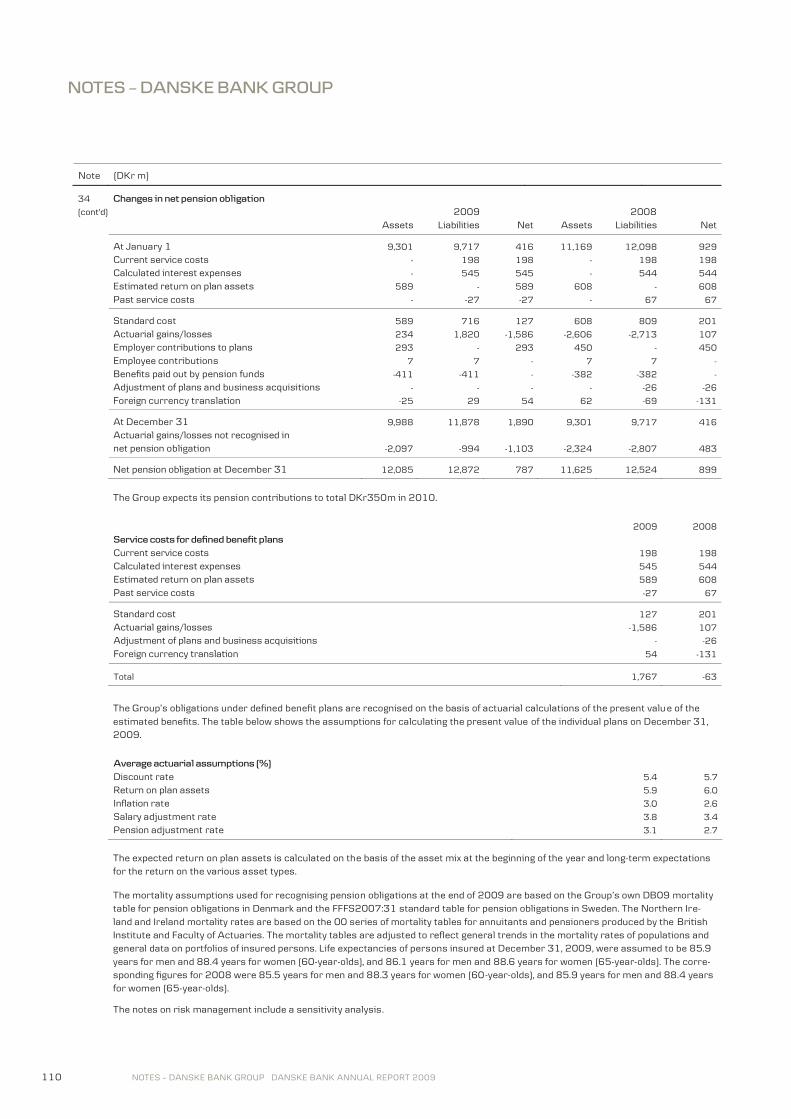
Notes � Danske Bank Group
Note (DKr m) 34 Changes in net pension obligation (cont'd) 2009 2008 Assets Liabilities Net Assets Liabilities Net
At January 1 9,301 9,717 416 11,169 12,098 929
Current service costs - 198 198 - 198 198
Calculated interest expenses - 545 545 - 544 544
Estimated return on plan assets 589 - 589 608 - 608
Past service costs - -27 -27 - 67 67
Standard cost 589 716 127 608 809 201
Actuarial gains/losses 234 1,820 -1,586 -2,606 -2,713 107
Employer contributions to plans 293 - 293 450 - 450
Employee contributions 7 7 - 7 7 - Benefits paid out by pension funds -411 -411 - -382 -382 -
Adjustment of plans and business acquisitions - - - - -26 -26
Foreign currency translation -25 29 54 62 -69 -131
At December 31 9,988 11,878 1,890 9,301 9,717 416
Actuarial gains/losses not recognised in net pension obligation -2,097 -994 -1,103 -2,324 -2,807 483
Net pension obligation at December 31 12,085 12,872 787 11,625 12,524 899
The Group expects its pension contributions to total DKr350m in 2010.
2009 2008
Service costs for defined benefit plans
Current service costs 198 198
Calculated interest expenses 545 544
Estimated return on plan assets 589 608
Past service costs -27 67
Standard cost 127 201
Actuarial gains/losses -1,586 107
Adjustment of plans and business acquisitions - -26
Foreign currency translation 54 -131
Total 1,767 -63
"������������������������������������������������������������������������������������������������������������#�� e of the estimated benefits. The table below shows the assumptions for calculating the present value of the individual plans on December 31, 2009.
Average actuarial assumptions (%)
Discount rate 5.4 5.7
Return on plan assets 5.9 6.0
Inflation rate 3.0 2.6
Salary adjustment rate 3.8 3.4
Pension adjustment rate 3.1 2.7
The expected return on plan assets is calculated on the basis of the asset mix at the beginning of the year and long-term expectations for the return on the various asset types. The mortality assumptions used for recognising pension obligations at the end of 2009 a������������������������$���� ~ mortality table for pension obligations in Denmark and the FFFS2007:31 standard table for pension obligations in Sweden. The Northern Ire-land and Ireland mortality rates are based on the 00 series of mortality tables for annuitants and pensioners produced by the British Institute and Faculty of Actuaries. The mortality tables are adjusted to reflect general trends in the mortality rates of populations and general data on portfolios of insured persons. Life expectancies of persons insured at December 31, 2009, were assumed to be 85.9 years for men and 88.4 years for women (60-year-olds), and 86.1 years for men and 88.6 years for women (65-year-olds). The corre-sponding figures for 2008 were 85.5 years for men and 88.3 years for women (60-year-olds), and 85.9 years for men and 88.4 years for women (65-year-olds). The notes on risk management include a sensitivity analysis.
NOTES – DANSKE BANK GROUP
110 NOTES – DANSKE BANK GROUP DANSKE BANK ANNUAL REPORT 2009

Notes � Danske Bank Group
Note (DKr m)
34 Pension assets 2009 2008
(cont'd) Percentage Estimated Actual Percentage Estimated Actual
(%) at Dec. 31 return at Jan. 1 return at Dec. 31 at Dec. 31 return at Jan. 1 return at Dec. 31
Shares 44 8 26 39 8 -28
Government and mortgage bonds 29 5 3 29 5 8
Index-linked bonds 6 4 7 5 5 1
Corporate bonds 12 6 13 9 6 -6
Real property 2 6 -29 2 6 -26
Cash and cash equivalents 7 3 - 16 6 1
Total 100 6 12 100 7 -15
2009 2008 2007 2006 2005 Historical trend in defined benefit plans
Present value of pension obligations 11,878 9,717 12,098 13,005 13,857
Fair value of plan assets 9,988 9,301 11,169 11,422 11,400
Actuarial gains/losses not recognised in the net pension obligation -1,103 483 376 34 -534
Experience adjustments of plan liabilities included in preceding item -38 -59 - - -
Experience adjustments of plan assets included in preceding item -217 -664 - - -
Net pension obligation at December 31 787 899 1,305 1,617 1,923
Transactions with related pension funds comprised loans and advances worth DKr8m (2008: DKr9m), deposits worth DKr125m (2008: DKr135m), issued bonds worth DKr468m (2008: DKr295m), derivatives with a positive fair value of DKr16m (2008: DKr0m), derivatives with a negative fair value of DKr549m (2008: DKr1,311m), interest expenses of DKr20m (2008: DKr19m), fee income of DKr1m (2008: DKr1m) and pension contributions of DKr293m (2008: DKr450m).
35 Risk-weighted assets 2009 2008
Credit risk (IRB approach) 470,396 551,909
Credit risk (standardised approach) 204,642 219,145
Counterparty risk 28,744 43,124
Total credit risk 703,782 814,178
Market risk 44,5 33 67,602
Operational risk 85,927 78,299
Total 834,242 960,079
NOTES – DANSKE BANK GROUP
111DANSKE BANK ANNUAL REPORT 2009 NOTES – DANSKE BANK GROUP

Notes � Danske Bank Group
Note (DKr m) 2009 2008
36 Contingent liabilities The Group uses a variety of loan-related financial instruments to meet the financial requirements of its customers. These include loan offers and other credit facilities, guarantees and instruments that are not recognised on the balance sheet.
Guarantees
Financial guarantees 9,972 10,311
Mortgage finance guarantees 2,215 3,890
Loss guarantee for the Private Contingency Association 4,727 6,339
Other guarantees 69,911 87,108
Total 86,825 107,648 Other contingent liabilities
Irrevocable loan commitments shorter than 1 year 48,289 51,874
Irrevocable loan commitments longer than 1 year 124,406 115,263
Other obligations 1,173 1,042
Total 173,868 168,179
In addition, the Group has granted credit facilities related to credit cards and overdraft facilities that can be terminated at short no-tice. At the end of 2009, such unused credit facilities amounted to DKr141,841m (2008: DKr144,616m). Owing to its business volume, the Danske Bank Group is continually a party to various lawsuits. In view of its size, the Group does not expect the outcomes of the cases pending to have any material effect on its financial position. A limited number of employees are employed under terms which grant them, if they are dismissed before reaching their normal re-tirement age, an extraordinary severance and/or pension payment in excess of their entitlement under ordinary terms of employment. Together with the majority of Danish banks, Danske Bank is participating through the Private Contingency Association in the Danish state guarantee under the Act on Financial Stability adopted by the Danish parliament on October 10, 2008. The scheme runs from October 5, 2008, to September 30, 2010, and includes an unconditional state guarantee for the obligations of Danish banks, except for subordinated debt and covered bonds. |�����������������������������������������������������������������������#��������������������������������������������� of the �����������������������������������������������#������#������?���������������������������������������������������� total amount, or an annual guarantee commission of around DKr2.5bn and a remaining commitment to cover losses of around DKr4.7bn. Of the lat-ter amount, DKr3.3�������������?��������?�����������������������������������������������=���������}^����<����� end of 2009, to-tal provisions for this commitment amounted to DKr1.9bn.
NOTES – DANSKE BANK GROUP
112 NOTES – DANSKE BANK GROUP DANSKE BANK ANNUAL REPORT 2009

Notes � Danske Bank Group
Note (DKr m)
37 Repo and reverse transactions In repo transactions, which involve selling securities to be repurchased at a later date, the securities remain on the balance sheet, and
the amounts received are recognised as deposits. Repo transaction securities are treated as assets provided as collateral for liabili-ties. At the end of 2009, the fair value of such securities totalled DKr178,578m (2008: DKr229,099m). Counterparties are entitled to sell the securities or deposit them as collateral for other loans. In reverse transactions, which involve buying securities to be resold at a later date, the Group is entitled to sell the secu rities or de-posit them as collateral for other loans. The securities are not recognised on the balance sheet and amounts paid are carried as loans. At the end of 2009, the fair value of reverse transaction securities was DKr236,601m (2008: DKr369,999m), of which securities sold totalled DKr73,147m (2008: DKr41,769m).
38 Assets deposited as collateral At the end of 2009, the Group had deposited securities worth DKr102,648m as collateral with Danish and international clearing cen-tres and other institutions (2008: DKr278,324m). At the end of 2009, the Group had delivered cash and securities worth DKr35,977m as collateral for derivatives transactions (2008: DKr66,440m). At the end of 2009, the Group had registered assets under insurance contracts worth DKr253,226m as collateral for the savings of policyholders (2008: DKr205,679m). The Group had registered loans and advances at fair value worth DKr688,473m and other assets worth DKr0m as collateral for is-sued mortgage bonds, including mortgage-covered bonds, at the end of 2009 (2008: DKr667,181m and DKr0m, respectively). At the end of 2009, the Group had registered loans and advances worth DKr123,323m and other assets worth DKr4,063m as col-lateral for covered bonds issued under Danish and Finnish law (2008: DKr78,842m and DKr3,257m, respectively).
NOTES – DANSKE BANK GROUP
113DANSKE BANK ANNUAL REPORT 2009 NOTES – DANSKE BANK GROUP

Notes � Danske Bank Group
Note (DKr m) 2009 2008 39 Leasing
The Group as lessor The Group offers fleet management, truck leasing, IT leasing, machinery leasing (such as agricultural machinery) and real pro perty leasing under both finance and operating leases. Payments due under finance leases Loans and advances includes payments due under finance leases worth DKr27,938m at the end of 2009 (2008: DKr31,786m). Finance leases
At January 1 31,786 29,431
Additions 6,016 13,505
Disposals 10,035 10,201
Foreign currency translation 171 -949
At December 31 27,938 31,786
Finance leases expiring
within 1 year 4,884 4,395
in 1-5 years 15,417 16,067
after 5 years 7,637 11,324
Total 27,938 31,786
Gross investment in finance leases expiring
within 1 year 6,439 5,255
in 1-5 years 18,476 18,923
after 5 years 9,365 15,767
Total 34,280 39,945
Unearned finance income 6,342 8,159
Unguaranteed residual value 1,671 2,645
Impairment charges for finance leases amounted to DKr1,444m at the end of 2009 (2008: DKr510m).
Payments due under operating leases The Group recognises assets leased under operating leases as tangible assets (lease assets), investment property and investment
property under insurance contracts. The table below breaks down minimum lease payments by lease term. Operating leases expiring
within 1 year 1,982 1,341
in 1-5 years 2,451 2,840
after 5 years 660 1,040
Total 5,093 5,221
The Group as lessee The Group is the lessee in a number of operating leases. Under such leases, the Group is entitled to use an asset for a speci fied period of time against lease payments, but it does not take over the major risks associated with the asset nor does it benefit from any re-turns. The leases involve mainly ����������������������?X��>�����X�������������=�������������������������������������������l-ance sheet. The table below breaks down minimum lease payments by lease term. Operating leases expiring
within 1 year 466 333
in 1-5 years 1,451 1,206
after 5 years 1,519 2,282
Total 3,436 3,821
Staff costs and administrative expenses includes lease payments in the amount of DKr926m (2008: DKr865m).
In 2009, the Group did not enter into finance leases as the lessee.
NOTES – DANSKE BANK GROUP
114 NOTES – DANSKE BANK GROUP DANSKE BANK ANNUAL REPORT 2009

Notes � Danske Bank Group
Note (DKr m) 40 Acquisition of group undertakings
Acquisitions in 2009 At the end of July, the Group acquired the Swedish facility management group Addici Holding AB. The Group is the primary banker of the Addici group, which was acquired at no cost due to its financial situation. Addici has been recognised as an asset held for sale, as the Group intends to sell the company as soon as market conditions allow. Th��������������������������� �^������������������DKr0.2bn, excluding its facilities with Danske Bank, are recognised under Other assets and Other Liabilities. Addici has about 2,000 employees, who are not included in the number of full-time equivalent staff stated in Financial highlights � Danske Bank Group on page 4. <����� earnings after the acquisition did not result in changes to the net realisable value recognised at the acquisition.
Acquisitions in 2008 Date of Fair value of Goodwill on Acquisition Total pur- Included in Danske Invest Administration A/S acquisition net assets acquisition costs chase price net profit
Danske Capital 07.05.08 64 16 6 80 -
On May 7, 2008, the Danske Bank Group acquired the shares of Danske Invest Administration A/S at a price of DKr74m, which �>�����������������������>�?��������������?���������������} ��������������������� ���������$-how. The total purchase price also includes acquisition costs of DKr6m. Danske Invest Administration A/S changed its name to Danske Invest Management A/S in November 2008. If the Group had taken over Danske Invest Management A/S on January 1, 2008, its profit would have been around DKr0.2m higher and its total income around DKr34m higher. The goodwill on acquisition totalling DKr16m represents the val�����������>����������?����=����������������?������������������-liably attributed to individually identifiable assets, including the value of staff, know-how and expected synergies from the integration into the Danske Bank Group. Costs related to the acquisition of Danske Invest Management A/S comprise fees paid to legal advisers, auditors, financial advisers and other specialists as well as other direct transaction costs.
Fair value at the date Carrying amount before Net assets acquired of acquisition acquisition
Due from credit institutions 9 9
Trading portfolio assets 61 61
Tangible assets 7 7
Other assets 3 3
Total assets 80 80
Other liabilities 16 16
Total liabilities 16 16
Net assets acquired 64 64
The figures were calculated just before the acquisition in accordance with the accounting policies of Danske Invest Management A/S.
NOTES – DANSKE BANK GROUP
115DANSKE BANK ANNUAL REPORT 2009 NOTES – DANSKE BANK GROUP

Notes � Danske Bank Group
Note (DKr m) 41 Related parties Parties with Associated Board of significant influence undertakings Directors Executive Board 2009 2008 2009 2008 2009 2008 2009 2008
Loans and irrevocable loan commitments 7,547 7,520 1,416 5,378 55 66 17 14
Securities and derivatives 1,580 1,592 10,662 9,995 - - - -
Deposits 1,474 3,255 371 411 51 38 18 12
Derivatives 86 495 2,262 2,173 - - - -
Guarantees issued 1,983 1,896 41 23 - - - -
Guarantees and collateral received 724 322 145 4,657 24 24 17 13
Interest income 76 109 455 641 2 3 1 1
Interest expense 24 115 220 63 1 1 1 1
Fee income 2 3 3 1 - - - -
Dividend income 12 16 195 170 - - - -
Other income 7 10 - - - - - -
Trade in Danske Bank shares
Acquisition of shares - 525 - - 4 5 1 -
Sale of shares - 13 - - 1 - 1 -
Related parties with significant influence include shareholders with holdings exceeding 20% of D�����������<�+���������������. A.P. Møller and Chastine Mc-Kinney Møller Foundation and companies of the A.P. Moller � Maersk Group, Copenhagen, hold 22.76% of the share capital. Note 22 lists associated undertakings. The Board of Directors and Executive Board columns list the personal facilities, deposits, etc., held by members of the Board of Directors and the Executive Board and their dependants and facilities with businesses in which these parties have a controlling or significant influence. In 2008, the average interest rates on credit facilities granted to members of the Board of Directors and the Executive Board were 3.1% (2008: 5.1%) and 4.1% (2008: 5.2%), respectively. Notes 9 and 42 specify the remuneration and shareholdings of the manage-ment. Pension funds set up for the purpose of paying out pension benefits to employees of the Danske Bank Group are also considered re-lated parties. Note 34 specifies transactions with such pension funds. Danske Bank A/S acts as the bank of a number of its related parties. Payment services, trading in securities and other instruments, in-vestment and placement of surplus liquidity, and provision of short-term and long-term financing are the primary services provided by Danske Bank A/S. Furthermore, Danica Pension manages the pension plans of a number of related parties, and Danske Capital manages the assets o f a �������������������������������� The figures above do not include debt to related parties in the form of issued notes. Such notes are bearer securities, which means that the Group does not know the identity of the holders. Danske Bank shares may be registered by name. R���������������holdings of Dan-ske Bank shares equalling 5% or more of �������������������������� are determined on the basis of the most recent reporting of holdings to the Bank. Transactions with related parties are settled on an arm�s-length basis.
NOTES – DANSKE BANK GROUP
116 NOTES – DANSKE BANK GROUP DANSKE BANK ANNUAL REPORT 2009

Notes � Danske Bank Group
Note Number 42
Directors and the Executive Board Beginning of 2009 Additions Disposals End of 2009
Board of directors Alf Duch-Pedersen 12,006 - - 12,006
Eivind Kolding 11,367 - - 11,367
Henning Christophersen 4,085 4,085 8,170 -
Peter Højland 29,000 23,000 23,000 29,000
Mats Jansson 250 - - 250
Niels Chr. Nielsen 12,258 3,000 - 15,258
Sten Scheibye 8,758 - - 8,758
Majken Schultz 917 - - 917
Claus Vastrup 975 - - 975
Birgit Aagaard-Svendsen 7,384 - - 7,384
Helle Brøndum 2,210 63 - 2,273
Charlotte Hoffmann 684 2,986 - 3,670
Per Alling Toubro 1,156 600 - 1,756
Verner Usbeck 604 127 - 731 Solveig Ørteby 1,674 456 - 2,130
Total 93,328 34,317 31,170 96,475
Executive Board
Peter Straarup 21,087 7,773 - 28,860
Tonny Thierry Andersen 4,039 4,039 - 8,078
Thomas F. Borgen - 23,900 6,937 16,963
Sven Lystbæk 7,071 5,439 - 12,510
Per Skovhus 4,587 2,892 - 7,479
Total 36,784 44,043 6,937 73,890
In accordance with the Danish Securities Trading Act, trading in Danske Bank shares by the Board of Directors and the Executive Board are reported to the Danish FSA and publicly disclosed when trans��������=������5,000 per calendar year. Danske Bank discloses all ad-ditions, disposals and total holdings of the Board of Directors and the Executive Board, including related parties, however.
Additions in respect of the holdings of Thomas F. Borgen include 6,937 shares added upon Mr Borgen�� joining the Executive Board on September 1, 2009.
Danske Bank shares held by the Board of
NOTES – DANSKE BANK GROUP
117DANSKE BANK ANNUAL REPORT 2009 NOTES – DANSKE BANK GROUP

Notes � Danske Bank Group
Note (DKr m) 43 Fair value information
Financial instruments are carried on the balance sheet at fair value or amortised cost. The Group breaks down its financial instru-ments by valuation method (note 1). Financial instruments at fair value The fair value is the amount for which a financial asset can be exchanged between knowledgeable, willing parties. If an activ e market exists, the Group uses a quoted price. If a financial instrument is quoted in a market that is not active, the Group bases its valuation on the most recent transaction price. Adjustment is made for subsequent changes in market conditions, for instance, by including trans-actions in similar financial instruments that are assumed to be motivated by normal business considerations. For a number of finan-cial assets and liabilities, no market exists. In such cases, the Group uses recent transactions in similar instruments and discounted cash flows or other generally accepted estimation and valuation techniques based on market conditions at the balance sheet date to calculate an estimated value. As was the case at the end of 2008, bond markets, except government bond markets, were highly inactive and illiquid seen in a his-torical perspective. It is therefore difficult to distinguish between sales of bonds between market makers and investors forced to
quoted prices, the valuation relies on observable market prices for instruments with similar security IDs, if available, and models based on observable input that are designed to calculate the value of financial instruments not traded in an active market. These mod-els incorporate swap rates, credit spreads and effective interest rate forecasts.
close their positions and normal transactions that are representative of a market and can be used for valuation purposes. In addition to
Generally, the Group applies valuation techniques to OTC derivatives, unlisted trading portfolio assets and liabilities, and unlisted in-vestment securities. The most frequently used valuation and estimation techniques include the pricing of transactions with future set-tlement and swap models that apply present value calculations, credit pricing models and options models, such as Black & Scho les models. In most cases, valuation is based substantially on observable input. The valuation of unlisted shares and certain derivatives is based substantially on non-observable input. The value of derivatives, primarily long-term contracts, is therefore extrapolated on the basis of observable yield curves. Also, some credit derivatives are valued on the basis of observable input as well as assumptions about the probability of default (recovery rate). The valuation of derivatives includes amortisation of the value of initial margins over the remaining term to maturity. At December 31, 2009, the value of unamortised initial margins was DKr873m (2008: DKr922m). Mortgage loans and issued mortgage bonds are recognised at the fair value of the issued mortgage bonds. The fair value of the credit risk on the mortgage loans is adjusted on the basis of impairment principles similar to those applied to loans and advances at amor-tised cost.
Investment securities (see note 17) includes unlisted shares measured at fair value in accordance with the fair value guidelines of the International Private Equity and Venture Capital Valuation Guidelines (IPEV). These guidelines calculate the estimated fair value of unlisted shares as the price at which an asset can be exchanged between knowledgeable, willing parties. Financial instruments valued on the basis of quoted prices in an active market are recognised in the Quoted prices category. Financial instruments valued substantially on the basis of other observable input are recognised in the Observable input category. The category covers derivatives valued on the basis of observable yield curves or exchange rates and illiquid mortgage bonds valued by reference to the value of similar liquid bonds. Other financial instruments are recognised in the Non-observable input category. This category covers unlisted shares and derivatives, and valuation relies on extrapolation of yield curves, correlations or other model input of material im-portance to valuation. Developments in the financial markets did not result in any reclassifications between the three categories in 2009, except for a small holding of bonds characterised by high illiquidity at the end of the year. In 2008, derivatives valued on the basis of input were recog-nised as a whole in the Observable input category.
NOTES – DANSKE BANK GROUP
118 NOTES – DANSKE BANK GROUP DANSKE BANK ANNUAL REPORT 2009
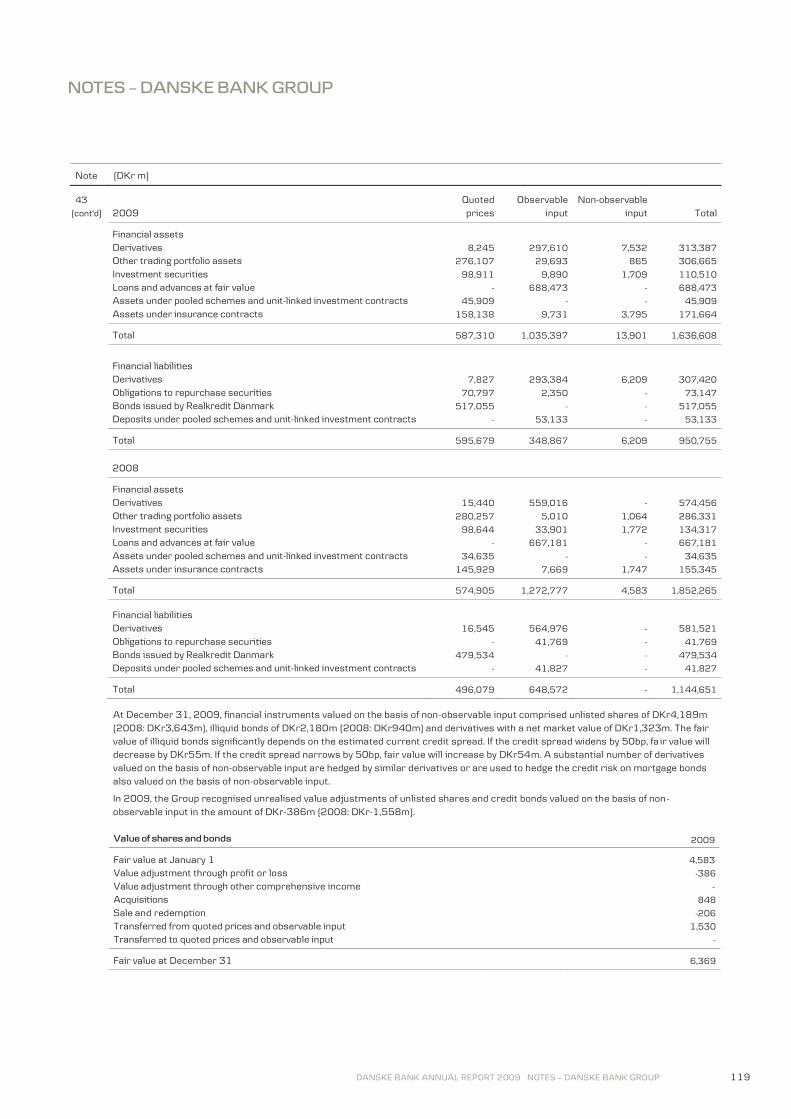
Notes � Danske Bank Group
Note (DKr m) 43 Quoted Observable Non-observable
(cont'd) 2009 prices input input Total
Financial assets
Derivatives 8,245 297,610 7,532 313,387
Other trading portfolio assets 276,107 29,693 865 306,665
Investment securities 98,911 9,890 1,709 110,510
Loans and advances at fair value - 688,473 - 688,473
Assets under pooled schemes and unit-linked investment contracts 45,909 - - 45,909
Assets under insurance contracts 158,138 9,731 3,795 171,664
Total 587,310 1,035,397 13,901 1,636,608
Financial liabilities
Derivatives 7,827 293,384 6,209 307,420
Obligations to repurchase securities 70,797 2,350 - 73,147
Bonds issued by Realkredit Danmark 517,055 - - 517,055
Deposits under pooled schemes and unit-linked investment contracts - 53,133 - 53,133
Total 595,679 348,867 6,209 950,755
2008
Financial assets
Derivatives 15,440 559,016 - 574,456
Other trading portfolio assets 280,257 5,010 1,064 286,331
Investment securities 98,644 33,901 1,772 134,317
Loans and advances at fair value - 667,181 - 667,181
Assets under pooled schemes and unit-linked investment contracts 34,635 - - 34,635
Assets under insurance contracts 145,929 7,669 1,747 155,345
Total 574,905 1,272,777 4,583 1,852,265
Financial liabilities
Derivatives 16,545 564,976 - 581,521
Obligations to repurchase securities - 41,769 - 41,769
Bonds issued by Realkredit Danmark 479,534 - - 479,534
Deposits under pooled schemes and unit-linked investment contracts - 41,827 - 41,827
Total 496,079 648,572 - 1,144,651
At December 31, 2009, financial instruments valued on the basis of non-observable input comprised unlisted shares of DKr4,189m (2008: DKr3,643m), illiquid bonds of DKr2,180m (2008: DKr940m) and derivatives with a net market value of DKr1,323m. The fair value of illiquid bonds significantly depends on the estimated current credit spread. If the credit spread widens by 50bp, fa ir value will decrease by DKr55m. If the credit spread narrows by 50bp, fair value will increase by DKr54m. A substantial number of derivatives valued on the basis of non-observable input are hedged by similar derivatives or are used to hedge the credit risk on mortgage bonds also valued on the basis of non-observable input.
In 2009, the Group recognised unrealised value adjustments of unlisted shares and credit bonds valued on the basis of non- observable input in the amount of DKr-386m (2008: DKr-1,558m). Value of shares and bonds 2009
Fair value at January 1 4,583
Value adjustment through profit or loss -386
Value adjustment through other comprehensive income -
Acquisitions 848
Sale and redemption -206
Transferred from quoted prices and observable input 1,530
Transferred to quoted prices and observable input -
Fair value at December 31 6,369
NOTES – DANSKE BANK GROUP
119DANSKE BANK ANNUAL REPORT 2009 NOTES – DANSKE BANK GROUP

Notes � Danske Bank Group
Note (DKr m)
43 Financial instruments at amortised cost !��������� The vast majority of amounts due to the Group, loans, advances, and deposits may not be assigned without the consent of customers,
and an active market does not exist for such financial instruments. Consequently, the Group bases its fair value estimates on data showing changes in market conditions after the initial recognition of the individual instrument and affecting the price that would have been fixed if the terms had been agreed at the balance sheet date. Other people may make other estimates. The Group discloses in-formation about the fair value of financial instruments at amortised cost on the basis of the following assumptions:
The Group uses quoted market prices, if available. Quoted prices exist only for a very small number of loans and advances, certain investment securities, issued bonds and subordinated debt. If quoted prices are not available, the value is approximated to reflect the price that would have been fixed if the terms had been agreed at the balance sheet date. Such adjustment is described below. &�����������������������������������������X�������������#�����X������������������������������������������#�����e rate fixed by the Group. The rate is adjusted only upon certain changes in market conditions. Such loans and advances are considered variable-rate loans as the standard variable rate fixed by the Group at any time applies to both new and existing loan arrange-ments. The interest rate risk on fixed-rate financial assets and liabilities is generally hedged by derivatives. The interest rate risk on fixed-�����������������#���������������?���������������#������&�����X����������Z�����������Z��������X�however, hedged by core free funds. Any additional interest rate risk is hedged by derivatives. The hedge is accounted for as a fair value hedge, and value ad-justments are recognised in the hedged financial instrument. Consequently, only fair value changes in fixed-rate loans in Finland, Northern Ireland and Ireland are unhedged. The recognised fair values include these unhedged changes. "�������#�������������������������������������>��?��������������?�������������X����� , is estimated on the basis of the ����������������>����������������������������������������&���������������������������������X������������������s-timate of the current return required by the market. As regards other loans and advances, impairment charges are assumed to equal the fair value of the credit risk with the following adjustments:
The calculation of impairment charges for loans and advances subject to individual impairment is based on the most likely outcome. Fair value is adjusted by weighting all possible outcomes by the probability of default. For other loans and ad-#�����X������������������������������������������������������downgraded to reflect a change in the probability of de-fault. The change in credit margins on individual risks is accounted for by adjusting fair value for the difference between the cur-rent credit premium and the credit premium for loans and advances at the balance sheet date.
The fair value of deposits does not include fair value adjustment reflecting changes in credit margins for own credit risks. For is-sued bonds and subordinated debt that are not traded in an active market, fair value includes own credit risk that is determined on the basis of observable input from own issues quoted in an active market.
�
�
�
�
�
�
�
�
NOTES – DANSKE BANK GROUP
120 NOTES – DANSKE BANK GROUP DANSKE BANK ANNUAL REPORT 2009

Notes � Danske Bank Group
Note (DKr m)
43 Fair value calculations for financial instruments recognised at amortised cost largely rely on estimates. The fair value of 97% of the !������� ����������������������������������������$������-observable input (2008: 97%). The corresponding figure for financial liabilities is
99% (2008: 99%).
Carrying amount Fair value
Carrying amount Fair value
2009 2009 2008 2008
Financial assets
Cash in hand and demand deposits with central banks 33,714 33,714 16,379 16,379
Due from credit institutions and central banks 202,356 202,364 215,823 215,823
Investment securities 8,469 8,860 6,476 6,553
Loans and advances 1,127,143 1,124,428 1,352,113 1,334,004
Assets under insurance contracts 382 382 1,059 1,059
Total 1,372,064 1,369,748 1,591,850 1,573,818
Financial liabilities
Due to credit institutions and central banks 311,169 311,169 562,726 562,777
Deposits 859,580 860,013 874,690 874,844
Other issued bonds 514,601 514,431 526,606 519,552
Subordinated debt 80,002 71,918 57,860 43,666
Irrevocable loan commitments and guarantees 2,675 1,846 621 1,593
Total 1,768,027 1,759,377 2,022,503 2,002,433
NOTES – DANSKE BANK GROUP
121DANSKE BANK ANNUAL REPORT 2009 NOTES – DANSKE BANK GROUP

Notes � Danske Bank Group
Note 44 Group holdings and undertakings
Share capital Net profit Shareholders'
equity Share
capital (thousands) (DKr m) (DKr m) (%)
Danske Bank A/S, Copenhagen 6,988,043 DKK 1,713 100,659
Credit institutions
Realkredit Danmark A/S, Kgs. Lyngby 630,000 DKK 2,593 41,162 100
Sampo Bank plc, Helsinki 106,000 EUR 86 15,274 100
Sampo Housing Loan Bank plc., Helsinki 41,050 EUR 142 950 100
Northern Bank Limited, Belfast 138,000 GBP -714 4,100 100
Danske Bank International S.A., Luxembourg 90,625 EUR 152 1,433 100
ZAO Danske Bank, St. Petersburg 1,048,000 RUB 22 215 100
Insurance operations
Forsikringsselskabet Danica, Skadeforsikringsaktieselskab af
1999, Copenhagen 1,000,000 DKK 2,321 19,215 100
Danica Pension, Livsforsikringsaktieselskab, Copenhagen 1,100,000 DKK 2,240 17,348 100
Danica Pension I, Livsforsikringsaktieselskab, Copenhagen 262,500 DKK 194 881 100
Danica Liv III, Livsforsikringsaktieselskab, Copenhagen 90,000 DKK 82 792 100
Danica Pension Försäkringsaktiebolag, Stockholm 100,000 SEK 24 110 100
Danica Pensjonsforsikring AS, Trondheim 106,344 NOK 37 205 100
Danica Life Ltd., Dublin 5,301 EUR -15 357 100
Investment and real property operations etc.
Danica Ejendomsselskab ApS, Copenhagen 2,426,100 DKK 735 17,939 100
Danske Capital AS, Tallinn 47,000 EEK 14 81 100
Danske Capital Norge AS, Trondheim 6,000 NOK - 24 100
DDB Invest AB, Linköping 100,000 SEK -4 1,188 100
Danske Corporation, Delaware 4 USD - 1 100
Danske Invest Management A/S, Copenhagen 58,000 DKK -8 69 100
Danske Leasing A/S, Birkerød 10,000 DKK 118 1,352 100
Danske Markets Inc., Delaware 2,000 USD 2 27 100
Danske Private Equity A/S, Copenhagen 5,000 DKK 34 48 100
Fokus Krogsveen AS, Trondheim 25,000 NOK 19 63 100
home a/s, Åbyhøj 15,000 DKK -9 189 100
National Irish Asset Finance Ltd., Dublin 32,384 EUR -96 172 100
UAB Danske Lizingas, Vilnius 4,000 LTL -93 -7 100
The list above includes major active subsidiary operations only. Subsidiaries held for sale are not included in the list. All credit institutions and insurance companies under supervision by national FSAs are subject to local statutory capital requirements. These requirements restrict intra-group facilities and dividend payout. Forsikringsselskabet Danica Skadeforsikringsaktieselskab af 1999 is the parent company of Danica Pension. Danica Pension is a life insurance company. Statsanstalten for Livsforsikring was privatised in 1990 to form part of Danica Pension. Under the terms of the privatisation, Danica Pension must meet the legitimate allotment expectations of the policyholders. This entails an obligation to allo-cate part of the profits to policyholders who were previously policyholders of Statsanstalten for Livsforsikring if the percentage by $����������\���������>�?��=����������������?����#���?���>����������������������������"�����������������������special al-lotment will exist as long as policies established with Statsanstalten for Livsforsikring are effective at Danica Pension. Special allot-ments are expensed only in years in which the excess equity limit is reached. In addition, it is the intention not to distribute dividends for a period of at least 25 years from 1990. Paid-up capital and interest thereon may, however, be distributed.
NOTES – DANSKE BANK GROUP
122 NOTES – DANSKE BANK GROUP DANSKE BANK ANNUAL REPORT 2009

Notes � Danske Bank Group
Note 45 Significant accounting policies
General The Danske Bank Group presents its consolidated financial statements in accordance with the International Financial Re-porting Standards (IFRSs) issued by the International Ac-counting Standards Board (IASB) as adopted by the EU and with relevant interpretations issued by the International Fi-nancial Reporting Interpretations Committee (IFRIC). Fur-thermore, the consolidated financial statements comply with the requirements for annual reports formulated by the Nasdaq OMX Copenhagen and the Danish FSA. The Group has not changed its significant accounting policies from those followed in Annual Report 2008, except in the in-stances mentioned below. The Group has implemented the amendments to IAS 1, Pres-entation of Financial Statements. This standard requires dis-closure of a statement of comprehensive income (displayed immediately after the income statement). Comprehensive in-come was previously included in the statement of changes in shareholder����>�?� "��������������?�$���Z&{+����������������>������������disclosures on the calculation of fair value and on liquidity. �������������������������������������������policies. Standards and interpretations not yet in force The IASB has issued a number of amendments to interna-tional accounting standards that have not yet come into force. Similarly, the IFRIC has issued a number of interpretations that have not yet come into force. None of these is expected �����������?������������������ future financial reporting. The paragraphs below list the standards and interpretations that ��������?��������������������������������������� Z��<����} ~X�Z<+����Z����#����������Z&{+��} ~�$���s-sued. The amendments, which will take effect on January 1, 2010, will not affect carrying amounts. In November 2009, the IASB published IFRS 9, Financial In-struments. This version of the standard is the first step to re-place the requirements of IAS 39 by the end of 2010. The first phase of IFRS 9 addresses only the classification and measurement of financial assets, while the next phases will include requirements for the measurement and recognition of financial liabilities, impairment methodology and guidelines for hedge accounting and derecognition. The EU has decided to postpone adoption of the standard until the details of the next phases are known. The standard is scheduled for implementation on January 1, 2013 at the latest. Under IFRS 9, financial assets are classified on the basis of the business model adopted for managing the assets and their contractual cash flow characteristics. Assets held with the objective of collecting contractual cash flows that are solely payments of principal and interest on the principal amount outstanding are measured at amortised cost. Other
assets are measured at fair value through profit or loss. The fair value of equities may always be adjusted through com-prehensive income, however, and, satisfying certain require-ments, a business may opt for fair value adjustment of its loans, advances, etc. The Group does not expect IFRS 9 to materially affect the measurement of its financial assets, although the standard does not allow classification of bonds as available-for-sale as-sets. Such instruments are measured at amortised cost or fair value through profit or loss. Meaningful classification and measurement of financial assets is not possible without in-formation about the future content of IFRS 9 to clarify overall accounting effects of the standard and the time of implemen-tation. Consolidation Group undertakings The consolidated financial statements cover Danske Bank A/S and group undertakings in which the Group has control over financial and operating policy decisions. Control is said to exist if Danske Bank A/S, directly or indirectly, holds more than half of the voting rights in an undertaking or otherwise has power to control management and operating policy deci-sions, provided that most of the return on the undertaking ac-crues to the Group and that the Group assumes most of the risk. Operating policy control may be exercised through �����������������������������������#�����\��������#�t-ing rights that are exercisable on the balance sheet date are included in the assessment of whether Danske Bank A/S con-trols an undertaking. The consolidated financial statements are prepared by con-solidating items of the same nature and eliminating intra-group transactions, balances and trading profits and losses. Undertakings acquired are included in the financial state-ments at the time of acquisition. The net assets of such undertakings (assets, including identi-fiable intangible assets, less liabilities and contingent liabili-ties) are included in the financial statements at fair value on the date of acquisition according to the purchase method. If the cost of acquisition, including direct transaction costs, exceeds the fair value of the net assets acquired, the excess amount is recognised as goodwill. Goodwill is recognised in the functional currency of the undertaking acquired. If the fair value of the net assets exceeds the cost of acquisition (nega-tive goodwill), the excess amount is recognised as income at the date of acquisition. The portion of the acquisition that is attributable to minority interests does not include goodwill. Divested undertakings are included in the financial state-ments until the transfer date. Held-for-sale group undertakings The assets and liabilities of undertakings that are actively marketed for sale within one year of classification are recog-nised under Other assets and Other liabilities at the lower of cost and fair value less expected costs to sell.
NOTES – DANSKE BANK GROUP
123DANSKE BANK ANNUAL REPORT 2009 NOTES – DANSKE BANK GROUP

Notes � Danske Bank Group
Note 45 Associated undertakings !������� Associated undertakings are businesses, other than group
undertakings, in which the Group has holdings and significant influence but not control. The Group generally classifies un-dertakings as associated undertakings if Danske Bank A/S, directly or indirectly, holds 20-50% of the voting rights. Holdings are recognised at cost at the date of acquisition and are subsequently measured according to the equity method. The proportionate share of the net profit or loss of the indi-vidual undertaking is included under Income from associated undertakings. The share is calculated on the basis of data from financial statements with balance sheet dates that differ no more than thre���������������������������������������date. The proportionate share of the profit and loss on transactions between associated and group undertakings is eliminated. ������������������?�����������������������������������included when determining whether a holding makes a busi-ness an associated undertaking. Segment reporting The Group consists of a number of business units and re-source and support functions. The business units are seg-mented according to legislation and product and services charact��������+������������������������$��������������significant accounting policies. Inter-�������������������������������������������-length basis. Expenses incurred centrally, including expenses in-curred by support, administrative and back-office functions, are charged to the business units according to consumption and activity at calculated unit prices or market prices, if avail-able. Segment assets and liabilities are assets and liabilities that are used to maintain the operating activities of a segment or have come into existence as a result of such activities and that are either directly attributable to or may reasonably be ������������������������<����������������������������������equity is allocated to each segment. Other assets and liabili-ties are recognised in the Other activities segment. Until the end of 2008, liquidity was settled primarily on the basis of short-term money market rates. The method was changed at January 1, 2009: Liquidity expenses are now allo-cated on the basis of a maturity analysis of loans and depos-its. Prices are based on interbank rates and funding spreads. The new settlement method resulted in a relatively large share of liquidity expenses at Danske Markets and at banking units with insufficient liquidity from deposits to fund activities.
Offsetting Assets and liabilities are netted when the Group has a legally enforceable right to set off recognised amounts and intends either to settle the balance on a net basis or to realise the as-set and settle the liability simultaneously. Translation of transactions in foreign currency The presentation currency of the consolidated financial statements is Danish kroner. The functional currency of each ������������������������������?�������������?���$��������unit is domiciled, as most income and expenses are settled in the local currency. Transactions in foreign currency are translated at the ex-���������������������������������������?��������������c-tion date. Gains and losses on exchange rate differences aris-ing between the transaction date and the settlement date are recognised in the income statement. Monetary assets and liabilities in foreign currency are trans-lated at the exchange rates at the balance sheet date. Ex-change rate adjustments of monetary assets and liabilities arising as a result of differences in the exchange rates apply-ing at the transaction date and at the balance sheet date are recognised in the income statement. Non-monetary assets and liabilities in foreign currency that are subsequently revalued at fair value are translated at the exchange rates at the date of revaluation. Exchange rate ad-justments are included in the fair value adjustment of an as-set or liability. Other non-monetary items in foreign currency are translated at the exchange rates at the date of transac-tion. Translation of units outside Denmark Assets and liabilities of units outside Denmark are translated into Danish kroner at the exchange rates at the balance sheet date. Income and expenses are translated at the exchange rates at the date of transaction. Exchange rate gains and losses arising at the translation of net investments in units outside Denmark are recognised in other comprehensive in-come. Net investments include the net assets and goodwill of the units as well as holdings in the form of subordinated loan capital. Exchange rate adjustments of financial liabilities used �������������������������#������������������������������other comprehensive income. BALANCE SHEET Due from credit institutions and central banks Amounts due from credit institutions and central banks com-prise amounts due from other credit institutions and time de-posits with central banks. Reverse transactions (purchases of securities from credit institutions and central banks that the Group agrees to resell at a later date) are recognised as amounts due from credit institutions and central banks. Amounts due from credit institutions and central banks are measured at amortised cost, as described under Loans and advances.
NOTES – DANSKE BANK GROUP
124 NOTES – DANSKE BANK GROUP DANSKE BANK ANNUAL REPORT 2009

Notes � Danske Bank Group
Note 45 Financial instruments � general (������� Purchases and sales of financial instruments are measured
at fair value at the settlement date. From the trading date to the settlement date, changes in the fair value of the unsettled financial instruments are recognised. Note 1, Critical accounting policies, explains the classification of financial assets and liabilities. Trading portfolio (assets and liabilities) Assets in the trading portfolio comprise the equities, bonds, loans and advances, and derivatives with positive fair value ������?��������������������������������������������� trading portfolio consist of derivatives with negative fair value and obligations to deliver securities. At initial recognition, the trading portfolio is measured at fair value, excluding transaction costs. Subsequently, the portfolio is measured at fair value through profit or loss. Determination of fair value The fair value of financial assets and liabilities is measured on the basis of quoted market prices of financial instruments traded in active markets. If an active market exists, fair value is based on the most recently observed market price at the balance sheet date. If a financial instrument is quoted in a market that is not ac-tive, the valuation is based on the most recent transaction price. Adjustment is made for subsequent changes in market conditions, for instance by including transactions in similar fi-nancial instruments that are assumed to be motivated by normal business considerations. If an active market does not exist, the fair value of standard and simple financial instruments, such as interest rate and currency swaps and unlisted bonds, is measured according to generally accepted valuation techniques. Market-based pa-rameters are used to measure fair value. The fair value of more complex financial instruments, such as swaptions, in-terest rate caps and floors, and other OTC products, is meas-ured on the basis of internal models, many of which are based on valuation techniques generally accepted in the industry. The results of calculations made on the basis of valuation techniques are often estimates, because exact values cannot be determined from market observations. Consequently, addi-tional parameters, such as liquidity risk and counterparty risk, are sometimes used to measure fair value. If, at the time of acquisition, a difference arises between the value of a financial instrument calculated on the basis of non-observable inputs and actual cost (day-one profit or loss) and the difference is not the result of transaction costs, the Group adjusts model parameters to actual cost.
Investment securities Investment securities consists of financial assets that, under the fair value option, the Group designates at fair value through profit or loss, available-for-sale financial assets and held-to-maturity investments. Financial assets at fair value Financial assets at fair value comprise securities managed on a fair value basis but without short-term profit taking. Real-ised and unrealised capital gains and losses and dividends are recognised in the income statement under Net trading in-come. Available-for-sale financial assets Available-for-sale financial assets consist of bonds acquired neither with the intention to sell in the near term nor with the intention to hold until maturity. At the time of acquisition, such bonds must be quoted in an active market. Bonds treated as available-for-sale financial assets are measured at fair value at initial recognition and subsequently at fair value, with unrealised gains or losses recognised in other comprehensive income. The unrealised value adjust-ments reflecting hedged interest rate risks that qualify for fair value hedge accounting are, however, recognised under Net trading income. The Group recognises interest income ac-cording to the effective interest method, amortising the dif-ference between cost and the redemption value over the term to maturity of the bonds. If objective evidence of impairment exists as described under Loans and advances, the Group recognises the impairment charge under Net trading income. The impairment charge equals the difference between the fair value at the time of cal-culation and amortised cost. If the fair value subsequently rises and the increase is attributable to one or more events that have occurred after the impairment charge was recog-nised, the Group reverses the impairment charge in the in-come statement. When bonds are sold, the Group reclassifies unrealised value adjustments recognised in other comprehensive income un-der Net trading income in the income statement. Held-to-maturity investments Held-to-maturity investments covers bonds with a quoted price in an active market that are held for the purpose of gen-erating a return until maturity. Held-to-maturity investments are measured at amortised cost.
NOTES – DANSKE BANK GROUP
125DANSKE BANK ANNUAL REPORT 2009 NOTES – DANSKE BANK GROUP

Notes � Danske Bank Group
Note 45 Loans and advances (������� Loans and advances consists of loans and advances dis-
bursed directly to borrowers and loans and advances ac-quired after disbursement. Loans and advances extended or acquired that the Group intends to resell in the near term are included in the trading portfolio. Loans and advances includes conventional bank loans; finance leases; mortgages and pledges; reverse transactions, except for transactions with credit institutions and central banks; and certain bonds not quoted in an active market at the time of acquisition. More-over, the item includes loans secured on real property, except for loans granted by Realkredit Danmark that are recognised under Loans and advances at fair value. At initial recognition, loans and advances are measured at fair value plus transaction costs less origination fees and other charges. Subsequently, they are measured at amortised cost, according to the effective interest method, less any impair-ment charges. The difference between the value at initial rec-ognition and the nominal value is amortised over the term to maturity and recognised under Interest income. If fixed-rate loans and advances and amounts due are hedged effectively by derivatives, the fair value of the hedged interest rate risk is added to the amortised cost of the assets. Impairment If objective evidence of impairment of a loan, an advance or an amount due exists, and the effect of the impairment event or events on the expected cash flow from the loan is reliably measurable, the Group determines the impairment charge in-dividually. Objective evidence of impairment of loans and advances ex-ists if at least one of the following events has occurred:
the borrower is experiencing significant financial diffi-culty ���������$�����������X����������������������>���?���interest or principal payments, lead to a breach of con-tract ��������X���������������������������������$��������n-cial difficulty, grants to the borrower a concession that the Group would not otherwise have granted it becomes probable that the borrower will enter bank-ruptcy or other financial reorganisation
All loans, advances and amounts due are tested individually for impairment at the end of each reporting period. The im-pairment charge equals the difference between the carrying amount and the present value of the most likely future cash flow from the loan. Impairment charges are assessed by credit officers. The present value of fixed-rate loans and ad-vances is calculated at the original effective interest rate, whereas the present value of loans and advances with a vari-able rate of interest is calculated at the current effective in-terest rate.
If a borrower experiences significant financial difficulty, the debt is written down to the amount that the borrower is ex-pected to be able to repay after a financial reorganisation. If
financial reorganisation is not possible, the write-down equals the estimated recoverable amount in the event of bankruptcy. All loans and advances for which objective evidence of im-pairment exists, including loans for which impairment charges have not been recognised because collateral provided is suffi-����X������������ ���������������������������?������Z�����a-���?���������������~ ���?�X���������������������������$���the Group are rated 11, and an overall impairment charge for the facilities is recognised. Loans and advances without objective evidence of impairment are included in an assessment of collective impairment at portfolio level. Collective impairment is calculated for portfo-lios of loans and advances with similar credit characteristics when impairment of expected future cash flows from the port-folio has occurred but no interest rate change has been agreed to adjust the credit margin. The collective impairment ������������������$����������������������������#�������(migration). The loans and advances are divided into portfolios based on current ratings. Calculation of charges also factors in upgrading of loan portfolios. The cash flows are specified by means of parameters used for solvency calculations and historical loss data adjusted for use in the financial statements, for example. The adjustment re-������������������������������������$���?�������������m-pirical data. This period is the period from the first appear-ance of evidence of impairment to the determination of a loss at customer level. Collective impairment is calculated as the difference between the carrying amount of the loans and advances of the portfolio and the present value of expected future cash flows.
The collective impairment charge reflecting downgrading of customer facilities is adjusted if the Group is aware of market conditions on the balance sheet date that are not fully re-�����������������������������Z������������#���������������conditions, adjustments will reduce the impairment charge, while it may increase in an economic downturn. Examples of factors that may affect the collective impairment charge are levels of unemployment, housing prices and freight rates. Impairment charges for loans and advances and guarantees are booked in an allowance account and set off against loans and advances or recognised as provisions for guarantees. Im-pairment charges for loans and advances are recorded under Loan impairment charges in the income statement. If subse-quent events show that impairment is not permanent, charges are reversed. Loans and advances that are considered uncollectible are written off. Write-offs are debited to the allowance account. Loans and advances are written off once the usual collection procedure has been completed and the loss on the individual loan or advance can be calculated. If the full loss is not ex-pected to be realised until after a number of years, for exam-ple in the event of administration of complex estates, a partial write-�������������������������������������claim less col-lateral, estimated dividend and other cash flows.
�
�
�
�
NOTES – DANSKE BANK GROUP
126 NOTES – DANSKE BANK GROUP DANSKE BANK ANNUAL REPORT 2009

Notes � Danske Bank Group
Note 45 In accordance with the effective interest method, interest is (������� recognised on the basis of the value of the loans and ad-
vances less impairment charges. Consequently, part of the al-lowance account balance is set aside for future interest in-come until the time of write-off. Loans and advances at fair value and bonds issued by Realkredit Danmark Loans and advances granted under Danish mortgage finance law are funded by issuing listed mortgage bonds with match-ing terms. Borrowers may repay such loans and advances by delivering the underlying bonds. The Group buys and sells own bonds issued by Realkredit Danmark on an ongoing basis because such securities play an important role in the Danish financial market. If these loans, advances and bonds were measured at amortised cost, the purchase and sale of own bonds would result in timing differ-ences in profit and loss recognition. The purchase price of the mortgage bond portfolio would not equal the amortised cost of the issued bonds, and elimination would result in arbitrary recognition of profit and loss. If the Group subsequently de-cided to sell its holding of own bonds, the new amortised cost �������@��$����W�$���������>����������������������������matching loans, and the difference would be amortised over the remaining term to maturity. Consequently, the Group rec-ognises loans, advances and issued bonds at fair value in ac-cordance with the fair value option offered by IAS 39 to en-sure that neither profit nor loss will occur on the purchase of own bonds. At initial recognition, loans, advances and issued bonds are measured at fair value, excluding transaction costs. Subse-quently, such assets and liabilities are measured at fair value. The fair value of the bonds issued by Realkredit Danmark is normally defined as their market value. A small part of the is-sued bonds are illiquid, however, and the fair value of these bonds is calculated on the basis of a discounted cash flow valuation technique. The fair value of the loans and advances is based on the fair value of the underlying bonds adjusted for the credit risk on borrowers in accordance with the principles described under Loans and advances. Assets and deposits under pooled schemes and unit-linked investment contracts These items include assets and deposits under pooled schemes and unit-linked contracts defined as investment contracts. Assets earmarked for customer savings are measured at fair value and recognised under Assets under pooled schemes and unit-linked investment contracts. Similarly, deposits made by customers are recognised under Deposits under pooled schemes and unit-linked investment contracts. These deposits are recognised at the value of savings. Holdings of shares and bonds issued by the Group are de-��������������������������>�?��������������]����>����?X�
the value of Deposits under pooled schemes and unit-linked investment contracts exceeds that of Assets under pooled schemes and unit-linked investment contracts. Assets and liabilities under insurance contracts Assets under insurance contracts comprises assets ear-marked for policyholders, that is, assets on which most of the return accrues to policyholders. The assets, which include fi-nancial assets, investment property, tangible assets and as-sociated undertakings, are specified in the notes. The valua-���������>��������������������������������������?�for similar assets. Note 2 shows holdings in undertakings classified as associated undertakings at group level. A few pieces of real property are jointly owned and therefore con-solidated in the financial statements on a pro rata basis.
2
Liabilities under insurance contracts consists of life insur-ance provisions, provisions for unit-linked insurance con-tracts, collective bonus potential, other technical provisions and other liabilities. Holdings of shares and bonds issued by the Group are de-��������������������������>�?��������������]����>����?X�the value of Liabilities under insurance contracts exceeds that of Assets under insurance contracts. Life insurance provisions Life insurance provisions comprises obligations towards poli-cyholders to
pay guaranteed benefits pay bonuses over time on agreed premiums not yet due pay bonuses on premiums and other payments due.
Recognition of life insurance provisions is based on actuarial computations of the present value of expected benefits for each insurance contract using the discount rate at the bal-ance sheet date. These computations rely on specific assumptions about ex-pected future mortality and disability rates based on histori-������������������������������������������$�������������� Obligations under guaranteed benefits are calculated as the present value of current guaranteed benefits plus the present value of expected future administrative expenses less future premiums. Danish rules on insurance accounting determine the discount rate: The discount rate is a zero-coupon yield curve estimated on the basis of euro swap market rates to which is added the spread between Danish and German government bonds. Until the end of 2010, a mortgage yield curve spread is also added. The change did not affect insurance liabilities at December 31, 2009, but reduced insurance liabilities at December 31, 2008, by DKr1.1bn. The effect on net profit was an increase of DKr0.4bn in 2008 and a corresponding decrease in 2009.
���
NOTES – DANSKE BANK GROUP
127DANSKE BANK ANNUAL REPORT 2009 NOTES – DANSKE BANK GROUP

Notes � Danske Bank Group
Note 45 Provisions for unit-linked insurance contracts (������� Provisions are measured at fair value on the basis of each
���������������������������������������������������������e-fits guaranteed. Collective bonus potential Provisions for collective bonus potential comprises policy-����������������������������������������������$����������entitlement not yet allocated to the individual policyholder. Other technical provisions Other technical provisions includes outstanding claims provi-sions, unearned premium provisions, and provisions for bo-nuses and premium discounts. Other liabilities Other liabilities includes the portion of Danica \��������������liabilities that rests with policyholders. Other types of liability �������������������������$�����������������������policies for such liability types. Intangible assets Goodwill Goodwill arises on the acquisition of an undertaking and is calculated as the difference between the cost of the undertak-ing and the fair value of its net assets, including contingent liabilities, at the time of acquisition. Goodwill on acquisitions ������������} }�$���$������������������������������� equity in the year of acquisition. Goodwill on associated undertakings is recognised under Holdings in associated undertakings. Goodwill is allocated to cash-generating units at the level at which the management monitors the investment. Goodwill is not amortised; instead each cash-generating unit is tested for impairment at least once a year. Goodwill is written down to its recoverable amount through the income statement if the carrying amount of the net assets of the cash-generating unit exceeds the hig�����������������������#�����������������������and their value in use, which equals the present value of the future cash flows expected from the unit. Other intangible assets Software acquired is measured at cost, including the ex-penses incurred to make each software application ready for use. Software acquired is amortised over its expected useful life, which is usually three years, according to the straight-line method. Software developed by the Group is recognised as an asset if the cost of development is reliably measurable and analyses show that the future profit from using the individual software applications exceeds cost. Cost is defined as development costs incurred to make each software application ready for use. Once the software has been developed, the cost is amor-tised over the expected useful life, which is usually three years, according to the straight-line method. Development costs consist primarily of direct remuneration and other de-velopment costs that may be attributed directly. Expenses
incurred in the planning phase are not included; such ex-penses are booked when incurred. Identifiable intangible assets taken over on the acquisition of undertakings are recognised at the time of acquisition at their fair value and amortised over their expected useful lives, which are usually three years, according to the straight-line method. The value of intangible assets with indefinite useful lives is not amortised, but the assets are tested for impair-ment at least once a year according to the principles applica-ble to goodwill. Other intangible assets to be amortised are tested for im-pairment if indications of impairment exist, and the assets are subsequently written down to their value in use. Costs attributable to the maintenance of intangible assets are expensed in the year of maintenance. Investment property Investment property is real property, including real property let under operating leases, which the Group owns for the pur-pose of receiving rent and/or obtaining capital gains. The sec-tion on domicile property below explains the distinction be-tween domicile and investment property. On acquisition, investment property is recognised at cost, in-cluding transaction costs. Subsequently, the property is measured at fair value. Fair value adjustments and rental in-come are recognised under Other income in the income statement. "�������#����������������?������������#���������������once a year. Assessments are based on the expected return ���������������������?��������������������������calculated for each property. The rate of return of a property is deter-mined on the basis of its location, type, possible uses, layout and condition as well as on the terms of lease agreements, rent adjustment and credit quality of the lessees. Tangible assets Tangible assets includes domicile property, machinery, furni-ture and fixtures. Machinery, furniture and fixtures covers equipment, vehicles, furniture, fixtures, property improvement expenditure and lease assets. Domicile property Domicile �������?���������������?���������?������������administrative departments, branches and other service units. Real property with both domicile and investment prop-erty elements is allocated proportionally to the two categories if the elements are separately sellable. If that is not the case, such real property is classified as domicile property, unless the Group occupies less than 10% of the total floorage. Domicile property is measured at cost plus property im-provement expenditure and less depreciation and impairment charges. The straight-line depreciation of the property is based on the expected scrap value and an estimated useful life of 20 to 50 years. Real property held under long-term leases is depreciated on a progressive scale.
NOTES – DANSKE BANK GROUP
128 NOTES – DANSKE BANK GROUP DANSKE BANK ANNUAL REPORT 2009

Notes � Danske Bank Group
Note 45 Investment property which becomes domicile property be- (������� cause the Group starts using it for its own activities is recog-
nised at fair value at the time of reclassification. Domicile property which becomes investment property is recognised at fair value at the time of reclassification. Any revaluation of domicile property is recognised in other comprehensive in-come. Domicile property which, according to a publicly announced plan, the Group expects to sell within 12 months is recog-nised as an asset held for sale. Real property taken over as part of the settlement of debt is recognised under Other assets. Machinery, furniture and fixtures Equipment, vehicles, furniture, fixtures and property im-provement expenditure are recognised at cost less deprecia-tion and impairment charges. Assets are depreciated over their expected useful lives, which are usually three years, ac-cording to the straight-line method. Leasehold improvements are depreciated over the term of the lease, with a maximum of 10 years. Lease assets Lease assets consists of assets, except real property, leased under operating leases with the Group as the lessor. Lease assets are measured using the same valuation technique as that applied by the Group to its other equipment, vehicles, furniture and fixtures. When, at the end of the lease period, lease assets are put up for sale, the assets are transferred to Other assets. Impairment Tangible assets are tested for impairment if indications of im-pairment exist. An impaired asset is written down to its re-coverable amount, which is the higher of its fair value less costs to sell and its value in use. Other assets Other assets includes interest and commission due, prepay-ments, lease assets put up for sale at the expiry of the lease agreement and assets held for sale. Lease assets put up for sale Lease assets put up for sale are measured at the lower of their carrying amount at the time of reclassification (expiry of the lease agreement) and their fair value less expected costs to sell. Assets held for sale Assets held for sale are tangible assets, except investment property, and assets of group undertakings actively marketed for sale within one year, for example assets or businesses taken over under non-performing loan agreements.
Tangible assets held for sale are measured at the lower of their carrying amount at the time of reclassification and their net realisable value and are no longer depreciated. Assets of group undertakings are recognised at the lower of cost and expected net realisable value. Liabilities of group undertakings
are initially measured at fair value and subsequently in accor-������$�������������������������������������� Financial guarantees issued to the Group Financial guarantees issued to the Group are contracts that require the issuer to make specified payments to reimburse the Group for a loss that it incurs because a specified debtor or a group of debtors fail to make payment when due in ac-cordance with the terms of a debt instrument. Prepaid guar-antee premiums are recognised under Other assets. Future payments that the Group is likely to receive are recognised as amounts due at present value. Amounts due to credit institutions and central banks/Deposits Amounts due to credit institutions and central banks and De-posits include amounts received under repo transactions (sales of securities which the Group agrees to repurchase at a later date). Amounts due to credit institutions and central banks and De-posits are measured at amortised cost plus the fair value of the hedged interest rate risk. Other issued bonds/Subordinated debt Other issued bonds and Subordinated debt comprise the bonds issued by the Group except bonds issued by Realkredit Danmark. Subordinated debt is liabilities in the form of subor-dinated loan capital and other capital investments which, in �������������������#������?������������?�$����-up, will not be repaid until after the claims of its ordinary creditors have been met. Other issued bonds and Subordinated debt are measured at amortised cost plus the fair value of the hedged interest rate risk. The yield on some issued bonds depends on an index that is ����������?������������������������������������������X�����example an equity or commodity index. Such embedded de-rivatives are separated and recognised at fair value in the trading portfolio. Other liabilities Other liabilities includes accrued interest, fees and commis-sions that do not form part of the amortised cost of a financial instrument. Other liabilities also includes pension obligations and provi-sions for other obligations, such as lawsuits and guarantees. If a lawsuit is likely to result in payment, a liability is recog-nised if it can be measured reliably. The liability is recognised at the present value of expected payments. Pension obligations "���������������������������������������������������n-tribution and defined benefit pension plans for its staff. Under the defined contribution pension plans, the Group pays regu-lar contributions to insurance companies and other institu-tions. Such payments are expensed as they are earned by the
NOTES – DANSKE BANK GROUP
129DANSKE BANK ANNUAL REPORT 2009 NOTES – DANSKE BANK GROUP

Notes � Danske Bank Group
Note 45 staff, and the obligations under the plans are taken over by (������� the insurance companies and other institutions.
Under the defined benefit pension plans, the Group is under an obligation to pay defined future benefits starting at the time of retirement. The amounts payable are recognised on the basis of an actuarial computation of the present value of expected benefits. The present value is calculated on the ba-sis of expected future trends in salaries and interest rates, time of retirement, mortality rates and other factors. The present value of pension benefits less the fair value of pension assets is recognised as a pension obligation for each plan under Other liabilities. If the net amount of a defined benefit pension plan is positive and may be repaid to the Group or reduce its future contributions to the plan, the net amount is recognised under Other assets. The discount rate is based on the market rate that applies to high-quality corpo-rate bonds with maturities that correspond to the maturity of the pension obligations. The difference between expected trends in pension assets and benefits and actual trends will result in actuarial gains or losses. Actuarial gains or losses that do not exceed the higher of 10% of the present value of benefits and 10% of the fair value of pension assets are not recognised in the income statement or on the balance sheet but form part of the corri-dor. If the accumulated actuarial gains or losses exceed both these threshold values, the excess amount is recognised both in the income statement and in the net pension obligation dis-tributed over the expected remaining period of service of the staff covered by the plan. Irrevocable loan commitments and guarantees At initial recognition, irrevocable loan commitments and guarantees are recognised at the amount of premiums re-ceived. Subsequently, guarantees are measured at the higher of the received premium amortised over the guarantee period and the provision made, if any. Provisions for irrevocable loan commitments and guarantees are recognised under Other li-abilities if it is likely that drawings will be made under a loan commitment or claims will be made under a guarantee and the amount payable can be reliably measured. The liability is recognised at the present value of expected payments.
revocable loan commitments are discounted in accordance with the interest terms. Ir
Deferred tax assets/Deferred tax liabilities Deferred tax on all temporary differences between the tax base of assets and liabilities and their carrying amounts is accounted for in accordance with the balance sheet liability method. Deferred tax is recognised under Deferred tax assets and Deferred tax liabilities. The Group does not recognise deferred tax on temporary dif-ferences between the tax base and the carrying amounts of goodwill not subject to amortisation for tax purposes and other items if the temporary differences arose at the time of acquisition without effect on net profit or taxable income. If the tax base may be calculated according to several sets of tax regulations, deferred tax is measured in accordance with
the regulations that apply to the use of the asset or settle-ment of the liability planned by the management. Tax assets arising from unused tax losses and unused tax credits are recognised to the extent that it is probable that the unused tax losses and unused tax credits can be used. Deferred tax is measured on the basis of the tax regulations and rates that, according to the rules in force at the balance sheet date, will apply in the relevant countries at the time the deferred tax is expected to crystallise as current tax. Changes in deferred tax as a result of changes in tax rates are recog-nised in the income statement. Current tax assets/Current tax liabilities Current tax assets and liabilities are recognised on the bal-ance sheet as the estimated tax charge on the profit for the year adjusted for prepaid tax and prior-year tax payables and receivables. Tax assets and liabilities are offset if the Group has a legally enforceable right to set off such assets and liabilities and in-tends either to settle the assets and liabilities on a net basis or to realise the assets and settle the liabilities simultane-ously. Shareholders� equity Foreign currency translation reserve The foreign currency translation reserve includes differences arisen since January 1, 2004, from the translation of the fi-nancial results of and net investments in units outside Den-mark from their functional currencies into Danish kroner. The reserve also includes exchange rate adjustments of financial liabilities used to hedge net investments in such units. If the net investment in a unit outside Denmark is fully or partly realised, translation differences are recognised in the income statement. Reserve for assets available for sale The reserve covers unrealised value adjustments of bonds treated as available-for-sale financial assets recognised in other comprehensive income. Unrealised value adjustments of hedged interest rate risks that qualify for fair value hedge accounting are recognised in the income statement and not included in the reserve. If objective evidence of impairment exists, the Group reclassi-fies accumulated unrealised capital losses from the reserve to the income statement. When bonds are sold, the Group also reclassifies unrealised value adjustments from the re-serve to the income statement. Proposed dividends "������������������������������������#��������������?����submitted to the general meeting is included as a separate �����#�������������������>�?��"����#��������������������as a liability when the general meeting has adopted the pro-posal.
NOTES – DANSKE BANK GROUP
130 NOTES – DANSKE BANK GROUP DANSKE BANK ANNUAL REPORT 2009
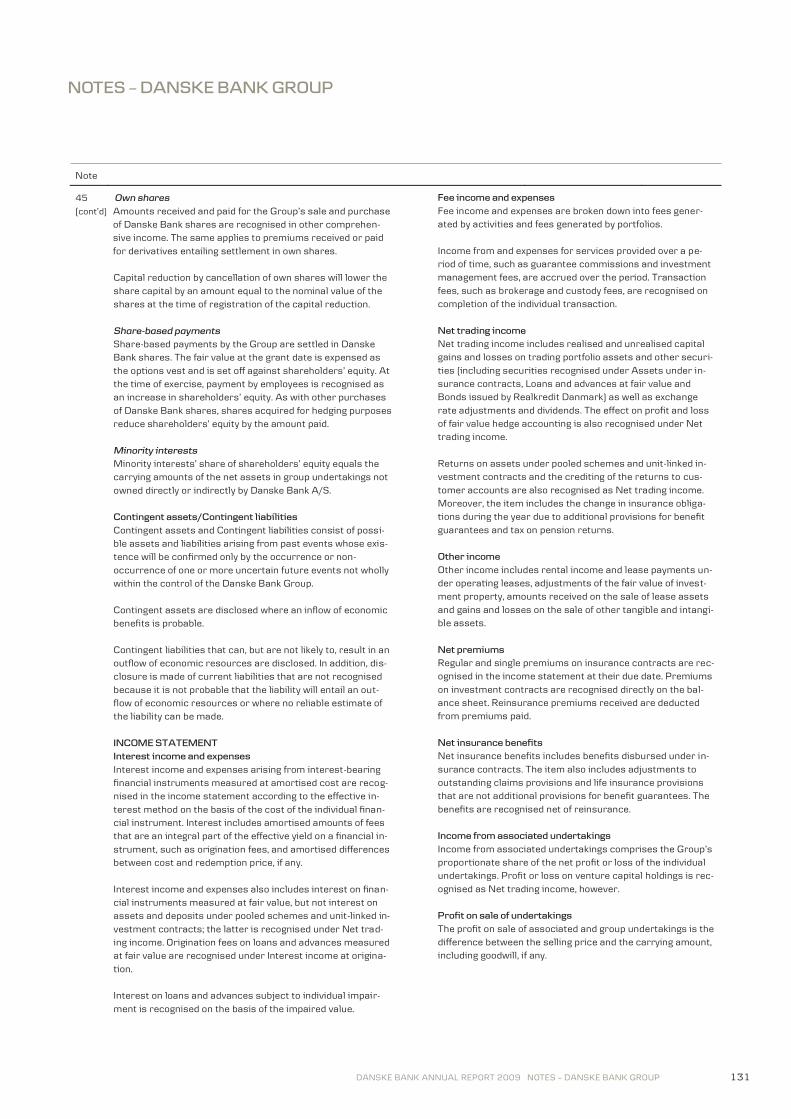
Notes � Danske Bank Group
Note 45 Own shares (������� <����������#�������������������������������������������
of Danske Bank shares are recognised in other comprehen-sive income. The same applies to premiums received or paid for derivatives entailing settlement in own shares. Capital reduction by cancellation of own shares will lower the share capital by an amount equal to the nominal value of the shares at the time of registration of the capital reduction. Share-based payments Share-based payments by the Group are settled in Danske Bank shares. The fair value at the grant date is expensed as �����������#����������������������������������������>�?��<��the time of exercise, payment by employees is recognised as an increase in shareholder����>�?��<��$������������������of Danske Bank shares, shares acquired for hedging purposes ���������������������>�?��?��������������� Minority interests �����?�����������������������������������>�?��>��������carrying amounts of the net assets in group undertakings not owned directly or indirectly by Danske Bank A/S. Contingent assets/Contingent liabilities Contingent assets and Contingent liabilities consist of possi-ble assets and liabilities arising from past events whose exis-tence will be confirmed only by the occurrence or non-occurrence of one or more uncertain future events not wholly within the control of the Danske Bank Group. Contingent assets are disclosed where an inflow of economic benefits is probable. Contingent liabilities that can, but are not likely to, result in an outflow of economic resources are disclosed. In addition, dis-closure is made of current liabilities that are not recognised because it is not probable that the liability will entail an out-flow of economic resources or where no reliable estimate of the liability can be made. INCOME STATEMENT Interest income and expenses Interest income and expenses arising from interest-bearing financial instruments measured at amortised cost are recog-nised in the income statement according to the effective in-terest method on the basis of the cost of the individual finan-cial instrument. Interest includes amortised amounts of fees that are an integral part of the effective yield on a financial in-strument, such as origination fees, and amortised differences between cost and redemption price, if any. Interest income and expenses also includes interest on finan-cial instruments measured at fair value, but not interest on assets and deposits under pooled schemes and unit-linked in-vestment contracts; the latter is recognised under Net trad-ing income. Origination fees on loans and advances measured at fair value are recognised under Interest income at origina-tion. Interest on loans and advances subject to individual impair-ment is recognised on the basis of the impaired value.
Fee income and expenses Fee income and expenses are broken down into fees gener-ated by activities and fees generated by portfolios. Income from and expenses for services provided over a pe-riod of time, such as guarantee commissions and investment management fees, are accrued over the period. Transaction fees, such as brokerage and custody fees, are recognised on completion of the individual transaction. Net trading income Net trading income includes realised and unrealised capital gains and losses on trading portfolio assets and other securi-ties (including securities recognised under Assets under in-surance contracts, Loans and advances at fair value and Bonds issued by Realkredit Danmark) as well as exchange rate adjustments and dividends. The effect on profit and loss of fair value hedge accounting is also recognised under Net trading income. Returns on assets under pooled schemes and unit-linked in-vestment contracts and the crediting of the returns to cus-tomer accounts are also recognised as Net trading income. Moreover, the item includes the change in insurance obliga-tions during the year due to additional provisions for benefit guarantees and tax on pension returns. Other income Other income includes rental income and lease payments un-der operating leases, adjustments of the fair value of invest-ment property, amounts received on the sale of lease assets and gains and losses on the sale of other tangible and intangi-ble assets. Net premiums Regular and single premiums on insurance contracts are rec-ognised in the income statement at their due date. Premiums on investment contracts are recognised directly on the bal-ance sheet. Reinsurance premiums received are deducted from premiums paid. Net insurance benefits Net insurance benefits includes benefits disbursed under in-surance contracts. The item also includes adjustments to outstanding claims provisions and life insurance provisions that are not additional provisions for benefit guarantees. The benefits are recognised net of reinsurance. Income from associated undertakings Z����������������������������������������������������proportionate share of the net profit or loss of the individual undertakings. Profit or loss on venture capital holdings is rec-ognised as Net trading income, however. Profit on sale of undertakings The profit on sale of associated and group undertakings is the difference between the selling price and the carrying amount, including goodwill, if any.
NOTES – DANSKE BANK GROUP
131DANSKE BANK ANNUAL REPORT 2009 NOTES – DANSKE BANK GROUP

Notes � Danske Bank Group
Note 45 Staff costs and administrative expenses (������� Staff costs
Salaries and other remuneration that the Group expects to pay for work carried out during the year are expensed under Staff costs and administrative expenses. This item includes salaries, bonuses, expenses for share-based payments, holi-day allowances, anniversary bonuses, pension costs and other remuneration. Bonuses and share-based payments Bonuses are expensed as they are earned. Until 2008, part of the bonuses for the year was paid in the form of equity-settled options and conditional shares. Share options may not be ex-ercised until three years after the grant date and are condi-������������������?�����������#��������������������������Conditional shares vest three years after the grant date, pro-vided that the employee has not resigned from the Group. The fair value of share-based payments at the grant date is expensed over the service period that unconditionally entitles the employee to the payment. The intrinsic value of the op-tions is expensed in the grant year, whereas the time value is accrued over the remaining service period. Expenses are set ��������������������������>�?��+���>�������������������fair value are not carried in the income statement. Pension obligations "������������������������������������������������plans are recognised in the income statement as they are earned by the employees. The Group applies the corridor method to defined benefit pension plans, and the income statement thus includes actuarial pension expenses (stan-dard cost). State guarantee scheme The guarantee commission payable for participation in the Danish state guarantee is expensed over the guarantee pe-riod according to the straight-line method and recognised un-der expenses. Amortisation, depreciation and impairment charges In addition to amortisation, depreciation and impairment charges for intangible and tangible assets, the Group ex-penses the carrying amount of assets sold at the expiry of a lease agreement. Loan impairment charges Loan impairment charges includes losses on and impairment charges for loans, advances, amounts due from credit institu-tions and guarantees, as well as fair value adjustments of the credit risk on loans and advances recognised at fair value. The item also includes impairment charges and realised gains and losses on tangible assets and businesses taken over by the Group under non-performing loan agreements if the as-sets qualify as held-for-sale assets. Similarly, subsequent value adjustments of assets that the Group has taken over and does not expect to sell within 12 months are recognised under loan impairment charges, provided that the Group has a right of recourse against the borrower.
Tax Calculated current and deferred tax on the profit for the year and adjustments of tax charges for previous years are recog-nised in the income statement. Income tax for the year is rec-ognised in accordance with the tax laws applying in the coun-tries in which the Group operates. Tax on items recognised in other comprehensive income is recognised in other compre-hensive income. Similarly, tax on items recognised in share-����������>�?������������������������������>ty. Comprehensive income Comprehensive income includes the net profit for the year and other comprehensive income from translation of units outside Denmark, non-Danish unit hedges and unrealised value adjustments of available-for-sale financial assets. Cash flow statement The Group has prepared its cash flow statement according to the indirect method. The statement is based on the pre-tax profit for the year and shows the cash flows from operating, investing and financing activities and the increase or de-crease in cash and cash equivalents during the year. Cash and cash equivalents consists of cash in hand and de-mand deposits with central banks and amounts due from credit institutions and central banks with original maturities shorter than three months. Financial highlights As shown in note 2 on business segments, the financial high-lights deviate from the corresponding figures in the consoli-dated financial statements. Income of the Danske Markets segment is recognised in the consolidated income statement under Net trading income and Net interest income. The value of each item may vary consid-erably from year to year, depending on the underlying transac-tions and changes in market conditions. The Net trading in-come item in the financial highlights shows all trading activity income, except yields on bonds classified as available-for-sale assets. Income and expenses of the Danica Pension segment are consolidated on a line-by-line basis. The return on insurance activities accruing to the Group is determined by the contri-bution principle and is calculated primarily on life insurance �����������+������������������������������#���������?�from the individual income statement items, net income from insurance business is presented on a single line in the finan-cial highlights.
NOTES – DANSKE BANK GROUP
132 NOTES – DANSKE BANK GROUP DANSKE BANK ANNUAL REPORT 2009

Notes � Danske Bank Group
Definitions of key financial ratios
Key financial ratio Definition Earnings per share (DKr) Net profit for the year divided by the average number of shares outstanding during the year. Diluted earnings per share (DKr) Net profit for the year divided by the average number of shares outstanding during the year, including
the dilutive effect of share options and conditional shares granted as share-based payments. {���������#���������������������>�?�!�� ������������������?�����#�����?��#���������������������>�?����������?���� Cost/income ratio (%) Operating expenses divided by total income. Solvency ratio Total capital base, less statutory deductions, divided by risk-weighted assets. Tier 1 capital ratio Tier 1 capital, including hybrid capital, less statutory deductions, divided by risk-weighted assets. Tier 1 capital Tier 1 capital consists primarily of paid-up share capital, plus retained earnings and less intangible
assets. Hybrid capital Hybrid capital consists of loans that form part of tier 1 capital. This means that hybrid capital is used
������#�����������������������������>�?�������� Capital base "�����������������������������������������>�?����������������?�������X������certain deductions,
such as deduction for goodwill. Supplementary capital may not account for more than half of the capi-tal base.
Supplementary capital Supplementary capital consists of subordinated loan capital subject to certain restrictions. For ex-
ample, if the Group defaults on its payment obligations, lenders cannot claim early redemption of the loan capital.
Risk-weighted assets Total risk-weighted assets and off-balance-sheet items for credit risk, market risk and operational
risk as calculated in �����������$�������������&+<���������������������>��?� Dividend per share (DKr) Proposed dividend of the net profit for the year divided by the number of issued shares at the end of
the year. Share price at December 31 Closing price of Danske Bank shares at the end of the year. Book value per share (DKr) +��������������>�?�����������������#�����?�������������������������������������������������
year. Number of full-time-equivalent staff Number of full-time-equivalent staff (part-time staff translated into full-time staff) at the end of the at December 31 year. The figure does not include the staff of businesses held for sale.
NOTES – DANSKE BANK GROUP
133DANSKE BANK ANNUAL REPORT 2009 NOTES – DANSKE BANK GROUP

Notes � Danske Bank ������ Risk Management
Risk exposure The Danske Bank Group is exposed to a number of risks, which it manages at different organisational levels. The categories of risk are as follows:
Credit risk: The risk of losses because counterparties fail to meet all or part of their payment obligations to the Group. ������������"��������������������������������#�������������������������������������#�����$����������������������nditions. Liquidity risk: The ris�����������������������������������������������������������������?X������������������#�������������������establishing new business, or lack of funding ultimately prevents the Group from meeting its obligations. Insurance risk: All types of risk in Danica Pension, including market risk, life insurance risk, business risk and operational risk. \�����������"���������������������������������������������������������������������>����������������������������butions to cover pension obligations to current and former employees.
Danica Pension is a wholly-owned subsidiary of Danske Bank. As required by Danish law and the executive order on the contribution principle, Danica Pension has notified the Danish FSA of its profit policy. The contribution principle and the profit policy imply that policyholders receive ����������������������������������������<���������������������������?��������������������������������������������������et risk and other risks on assets and liabilities allocated to policyholders are therefore not consolidated in the following tables, but are treated in the sec-tion on life insurance risk. For additional information about the Group��������������������������X���������������������������������{��������������} 9, which ���������$������������������������$���������$$$������������������ Capital base Danske Bank is a licensed financial services provider and must therefore comply with the capital requirements contained in the Danish Finan-cial Business Act. Danish capital adequacy rules are based on the EU capital requirements directives and apply to both the Parent Company, Danske Bank A/S, ��������������+�����?X����������������������������������������������������������?�$������������������>�e-ments. The capital adequacy rules call for a minimum capital level of 8% of risk-weighted assets under Pillar I (credit risk, market risk and operational risk) plus any add-on to reflect the risks not adequately covered under Pillar I, for example pension risk, business risk and certain credit ris ks. Detailed rules regulate the calculation of capital and risk-weighted assets. Capital comprises core tier 1 capital and subordinated debt. Core t������������������?������������������������?���������������������������>�?X��������$����������������������������X��tc. are not included. The solvency presentation in the statement of capital shows the difference between the ����?���������������������������>�?���� core tier ����������"����������������������������?X���[����������������������X������������������������������+��������}�X�129, 132 and 136 of the Danish Financial Business Act specify these conditions. Note 31 ���$����������������������������� Three international rating agencies � +����������\�����X�����?�������&����{������� �������?�����������������������?���������������?-ment obligations. Good ratings give the Group easier and cheaper access to capital and liquidity from the capital markets.
���
��
NOTES – DANSKE BANK GROUP’S RISK MANAGEMENT
134 NOTES – DANSKE BANK GROUP’S RISK MANAGEMENT DANSKE BANK ANNUAL REPORT 2009
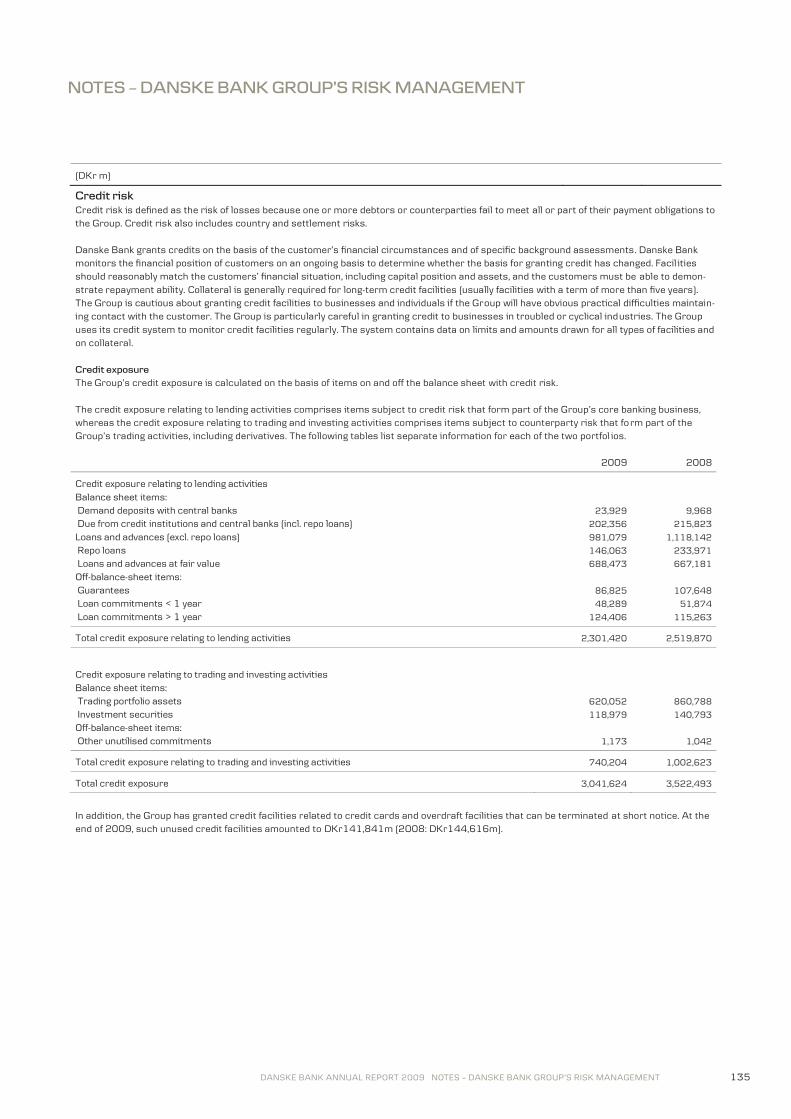
Notes � �� ����� ��������Risk Management
(DKr m) Credit risk Credit risk is defined as the risk of losses because one or more debtors or counterparties fail to meet all or part of their payment obligations to the Group. Credit risk also includes country and settlement risks. Danske Bank grants credits on the basis of ���������������������������������������������������������������������. Danske Bank monitors the financial position of customers on an ongoing basis to determine whether the basis for granting credit has changed. Facil ities ���������������?�����������������������������������X��������������������������������X�������������������������able to demon-strate repayment ability. Collateral is generally required for long-term credit facilities (usually facilities with a term of more than five years). The Group is cautious about granting credit facilities to businesses and individuals if the Group will have obvious practical difficulties maintain-ing contact with the customer. The Group is particularly careful in granting credit to businesses in troubled or cyclical industries. The Group uses its credit system to monitor credit facilities regularly. The system contains data on limits and amounts drawn for all types of facilities and on collateral. Credit exposure "�����������������=������������ulated on the basis of items on and off the balance sheet with credit risk. The credit exposure ���������������������#��������������������[����������������������������������������������������������������X�whereas the credit exposure relating to trading and investing activities comprises items subject to counterparty risk that fo rm part of the �����������������#���X�����������#��#����"��������$��������������������������������������������������$��������� ios. 2009 2008
Credit exposure relating to lending activities
Balance sheet items:
Demand deposits with central banks 23,929 9,968
Due from credit institutions and central banks (incl. repo loans) 202,356 215,823
Loans and advances (excl. repo loans) 981,079 1,118,142
Repo loans 146,063 233,971
Loans and advances at fair value 688,473 667,181
Off-balance-sheet items:
Guarantees 86,825 107,648
Loan commitments < 1 year 48,289 51,874
Loan commitments > 1 year 124,406 115,263
Total credit exposure relating to lending activities 2,301,420 2,519,870
Credit exposure relating to trading and investing activities Balance sheet items: Trading portfolio assets 620,052 860,788
Investment securities 118,979 140,793
Off-balance-sheet items:
Other unutilised commitments 1,173 1,042
Total credit exposure relating to trading and investing activities 740,204 1,002,623
Total credit exposure 3,041,624 3,522,493
In addition, the Group has granted credit facilities related to credit cards and overdraft facilities that can be terminated at short notice. At the end of 2009, such unused credit facilities amounted to DKr141,841m (2008: DKr144,616m).
NOTES – DANSKE BANK GROUP’S RISK MANAGEMENT
135DANSKE BANK ANNUAL REPORT 2009 NOTES – DANSKE BANK GROUP’S RISK MANAGEMENT

Notes � �� ����� ��������Risk Management
(DKr m) Credit exposure relating to lending activities
"���������������]������=���������������$���?������?�!�Z]+�����$�������������=�������������������������������������� by industry and customer segment. The breakdown is based on the Global Industry Classification Standard (GICS) with the following additional categories: personal customers, subsidised housing companies, and central and local governments.
Credit exposure broken down by industry (GICS) Past due Rating Personal Commercial Financial but not categories 2009 customers customers customers Governments Total impaired 10-11
Central and local governments - - - 137,238 137,238 2 - Subsidised housing companies - 117,885 - - 117,885 183 1,095 Banks - - 173,046 - 173,046 - 1,707 Diversified financials - - 180,410 - 180,410 214 6,791 Other financials - - 55,851 - 55,851 12 472 Energy and utilities - 36,827 - - 36,827 38 - Consumer discretionary and consumer staples - 212,999 - - 212,999 1,909 5,889 Commercial property - 242,092 - - 242,092 2,250 18,218 Construction, engineering and building products - 36,078 - - 36,078 272 4,322 Transportation and shipping - 68,070 - - 68,070 881 1,763 Other industrials - 86,603 - - 86,603 729 3,313 IT - 13,599 - - 13,599 46 - Materials - 48,131 - - 48,131 119 1,289 Health care - 38,372 - - 38,372 48 53 Telecommunication services - 6,789 - - 6,789 118 14 Personal customers 847,430 - - - 847,430 6,229 10,533 Total 847,430 907,445 409,307 137,238 2,301,420 13,050 55,459 2008
Central and local governments - - - 75,852 75,852 1,828 123 Subsidised housing companies - 159,571 - - 159,571 749 2,640 Banks - - 245,712 - 245,712 21 139 Diversified financials - 1,630 232,868 - 234,498 649 5,208 Other financials - 116 155,414 - 155,530 400 256 Energy and utilities - 44,318 - - 44,318 120 285 Consumer discretionary and consumer staples - 240,387 - - 240,387 3,759 3,319 Commercial property - 205,428 - - 205,428 3,323 7,408 Construction, engineering and building products - 42,057 - - 42,057 835 2,290 Transportation and shipping - 75,214 - - 75,214 515 158 Other industrials - 94,007 - - 94,007 2,066 2,872 IT - 15,739 - - 15,739 285 177 Materials - 56,090 - - 56,090 588 680 Health care - 33,026 - - 33,026 121 383 Telecommunication services - 8,694 - - 8,694 218 20 Personal customers 833,747 - - - 833,747 8,282 6,661 Total 833,747 976,277 633,994 75,852 2,519,870 23,759 32,619
Obligations towards the Private Contingency Association are included under Banks in the Financial customers segment.
NOTES – DANSKE BANK GROUP’S RISK MANAGEMENT
136 NOTES – DANSKE BANK GROUP’S RISK MANAGEMENT DANSKE BANK ANNUAL REPORT 2009

Notes � �� ����� ��������Risk Management
(DKr m) Credit exposure broken down by geographical area
Past due Rating 2009 Personal Commercial Financial but not categories Country of residence customers customers customers Governments Total impaired 10-11
Denmark 561,221 449,095 140,157 100,828 1,251,301 7,272 22,348 Finland 87,735 91,800 4,157 6,034 189,726 2,381 3,569 Sweden 65,843 132,829 32,769 5,700 237,141 220 1,944 Ireland 29,698 38,884 26,093 3,951 98,626 1,627 11,545 UK 18,517 33,430 102,275 10,520 164,742 304 6,877 Germany 635 13,158 5,800 355 19,948 53 314 Baltics 13,966 11,962 2,566 655 29,149 320 2,579 Other EU member states 2,960 9,187 47,477 760 60,384 26 452 Norway 62,470 104,850 10,455 6,998 184,773 807 3,112 Eastern Europe 152 1,270 858 26 2,306 1 49 Other European countries 1,048 2,468 4,655 8 8,179 13 324 North America 1,062 13,570 24,741 208 39,581 8 2,285 Central and South America 160 557 219 173 1,109 1 8 Africa 214 1,232 790 589 2,825 1 4 Asia 1,585 2,900 6,038 433 10,956 15 47 Oceania 164 253 257 - 674 1 2 Total 847,430 907,445 409,307 137,238 2,301,420 13,050 55,459 2008 Country of residence
Denmark 576,649 465,298 214,801 38,576 1,295,324 12,838 9,822 Finland 87,242 108,864 5,473 3,063 204,642 3,047 2,190 Sweden 51,427 149,171 47,891 23,231 271,720 720 1,727 Ireland 30,998 47,635 40,024 1,372 120,029 2,019 6,536 UK 16,963 40,043 148,136 150 205,292 800 2,733 Germany 607 16,700 14,345 155 31,807 95 680 Baltics 14,409 8,654 7,661 624 31,348 2,218 470 Other EU member states 3,041 13,106 80,272 684 97,103 2 775 Norway 48,164 102,341 11,543 7,002 169,050 1,782 1,876 Eastern Europe 95 671 1,428 - 2,194 2 1 Other European countries 963 3,315 8,545 - 12,823 - 419 North America 1,113 14,581 43,071 - 58,765 30 5,348 Central and South America 269 681 640 186 1,776 145 24 Africa 212 362 957 445 1,976 2 2 Asia 1,413 4,553 8,894 364 15,224 57 15 Oceania 182 302 313 - 797 2 1 Total 833,747 976,277 633,994 75,852 2,519,870 23,759 32,619
NOTES – DANSKE BANK GROUP’S RISK MANAGEMENT
137DANSKE BANK ANNUAL REPORT 2009 NOTES – DANSKE BANK GROUP’S RISK MANAGEMENT

Notes � �� ����� ��������Risk Management
(DKr m) Classification of customers As part of its credit risk management, the Group classifies customers according to their probability of default on obligations to the Group. The Group updates classifications regularly to identify early signs of weakness in customer earnings and liquidity. Risk classification comprises rating and credit scoring of customers. ]�������������������?����������������������������. Customer advisers provide factual data about their customers, and ratings are then assigned by credit officers independently of the individual adviser. The Group generally rates customers on an annual basis. Large corporate customers and financial counterparties are rated at least every four months, however, or when new relevant information becomes available. Examples of relevant information are financial statements, budgets or changes to ��������?�����?-to-day management or board of directors. The Group assigns credit scores to customers not rated, including personal customers. Credit scoring is a statistical model that predicts the ��������?����������������������������������������������������. The model uses account history as one of its parameters. In its credit risk management, the Group uses point-in-time probability of default (PD) estimates. These point-in-time PD estimates express a ���������������$���������in the current economic situation��"������������������������������������������������������������������$����=���\������������������������������X�������������point-in-time PD will normally increase and in turn migrate the customer to a lower rating category.
At the end of the year, the exposure-weighted average PD was 1.25%, against 0.64% in 2008.
Credit exposure broken down by rating category
2009 Personal Commercial Financial Rating category Upper PD Lower PD customers customers customers Governments Total
1 0.00 0.01 11,266 273 42,058 101,521 155,118
2 0.01 0.03 61,662 23,529 52,387 21,768 159,346
3 0.03 0.06 127,534 102,002 160,711 5,968 396,215
4 0.06 0.14 130,451 126,908 41,565 2,336 301,260
5 0.14 0.31 185,574 159,701 35,245 1,758 382,278
6 0.31 0.63 105,316 187,134 37,188 2,108 331,746
7 0.63 1.90 138,381 138,492 14,547 1,036 292,456
8 1.90 7.98 63,780 94,832 12,523 733 171,868
9 7.98 25.70 12,933 38,618 4,113 10 55,674
10 25.70 99.99 2,494 19,486 2,869 - 24,849
11 100.00 100.00 8,039 16,470 6,101 - 30,610
Total 847,430 907,445 409,307 137,238 2,301,420
2008
Rating category
1 0.00 0.01 27,529 7,782 113,765 57,202 206,278
2 0.01 0.03 98,063 46,707 138,465 14,387 297,622
3 0.03 0.06 138,873 141,887 165,110 1,248 447,118
4 0.06 0.14 152,216 200,201 60,987 601 414,005
5 0.14 0.31 152,615 214,823 59,359 1,150 427,947
6 0.31 0.63 81,685 190,206 38,531 671 311,093
7 0.63 1.90 103,120 88,558 9,373 276 201,327
8 1.90 7.98 66,892 54,566 34,049 316 155,823
9 7.98 25.70 7,282 15,064 3,691 1 26,038
10 25.70 99.99 1,010 6,434 1,472 - 8,916
11 100.00 100.00 4,462 10,049 9,192 - 23,703
Total 833,747 976,277 633,994 75,852 2,519,870
NOTES – DANSKE BANK GROUP’S RISK MANAGEMENT
138 NOTES – DANSKE BANK GROUP’S RISK MANAGEMENT DANSKE BANK ANNUAL REPORT 2009

Notes � �� ����� ��������Risk Management
(DKr m) Concentration risks As part of its credit risk management, the Group has established internal concentration limits that are monitored on a regular basis, including limits for exposures to both portfolios and single customers. Under section 145 of the Danish Financial Business Act, exposure to a single customer or a group of related customers, after deduction of particularly secure claims, may not exceed 25% of the capital base. After deduction of particularly secure claims, the sum of all exposures that exceed 10% of the capital base may not exceed 800% of the capital base. The Group submits quarterly reports to the Danish FSA on its com-pliance with these rules. In 2009, the ��������=�������did not exceed the limits established by section 145. The table below shows credit exposures to groups equalling � �������������������������������������"����������������������������-group balances. 2009 2008 Exposures calculated in Exposures calculated in accordance with section 145 accordance with section 145
Number 2 9
Exposure >20% of capital base - -
Exposure between 10% and 20% of capital base 36,952 131,478
Total 36,952 131,478
Utilisation of 800% limit (%) 24.9 107.0
Collateral Mitigating risks in the credit portfolio is a key element ��������������������������. For many loan products, collateral is required by legisla-tion, as in the mortgage finance market, or by market practice. Important means of risk mitigation are collateral and guarantees. The most important types of collateral provided are real property and finan-cial assets (shares or bonds). The Group regularly assesses the market value of collateral provided. The Group has developed models to estimate the value of the most fre-quently occurring types of collateral. For collateral for which no valuation model exists, the Group calculates the value manually. It calculates the value as the market value less a haircut. The haircut represents a conservative estimate of the costs to sell in a forced sale. Costs to sell include maintenance costs in the period over which the asset is up for sale, fees for external advisory services and any loss in value. For real property, haircuts depend on the property type, condition, location and other criteria and usually range from 20 to40% ��������������?�����r-ket value. For listed securities, haircuts are calculated with an internal model based on variables such as price volatility and marketability. For unlisted securities, the haircut is 100%. "����������������tion of collateral is generally made on behalf of the borrower. If the Group, however, submits the highest bid at a forced sale of property and acquires title, it will seek to sell the property as soon as possible. At the end of 2009, the Group had taken over properties in Denmark that are recognised at a carrying amount of DKr84m and properties in other countries that are recognised at a carrying amount of DKr110m. The properties are held for sale.
NOTES – DANSKE BANK GROUP’S RISK MANAGEMENT
139DANSKE BANK ANNUAL REPORT 2009 NOTES – DANSKE BANK GROUP’S RISK MANAGEMENT

Notes � �� ����� ��������Risk Management
(DKr m) Personal Commercial Financial 2009 customers customers customers Governments Total
Credit exposure 847,430 907,445 409,307 137,238 2,301,420
Collateral value 673,063 467,156 334,602 18,400 1,493,221
Total unsecured credit exposure 174,367 440,289 74,705 118,838 808,199
Unsecured portion of credit exposure (%) 20.6 48.5 18.3 86.6 35.1
2008
Credit exposure 833,747 976,278 633,993 75,852 2,519,870
Collateral value 684,626 502,288 424,179 10,371 1,621,464
Total unsecured credit exposure 149,121 473,990 209,814 65,481 898,406
Unsecured portion of credit exposure (%) 17.9 48.6 33.1 86.3 35.7
Personal Commercial Financial 2009 customers customers customers Governments Total
Real property 655,428 364,486 4,478 1,400 1,025,792
Personal 655,428 - - - 655,428
Commercial - 293,116 - - 293,116
Agricultural - 44,970 - - 44,970
Other - 26,400 4,478 1,400 32,278
Bank accounts 945 2,548 659 7 4,159
Custody accounts and securities 5,307 19,734 272,720 14,401 312,162
Vehicles 4,832 8,877 69 234 14,012
Equipment 245 15,668 243 27 16,183
Vessels and aircraft 153 27,198 23 1 27,375
Guarantees 5,853 11,324 10,571 1,293 29,041
Amounts due 91 5,145 388 - 5,624
Other assets 209 12,176 45,451 1,037 58,873
Total 673,063 467,156 334,602 18,400 1,493,221
2008
Real property 663,239 396,556 7,686 1,007 1,068,488
Personal 663,239 - - - 663,239
Commercial - 320,648 - - 320,648
Agricultural - 57,316 - - 57,316
Other - 18,592 7,686 1,007 27,285
Bank accounts 801 6,949 1,428 1 9,179
Custody accounts and securities 4,928 16,921 358,674 7,091 387,614
Vehicles 5,415 10,630 185 364 16,594
Equipment 92 15,073 492 50 15,707
Vessels and aircraft 113 29,031 26 1 29,171
Guarantees 8,809 16,413 22,880 1,002 49,104
Amounts due 66 4,969 226 60 5,321
Other assets 1,163 5,746 32,582 795 40,286
Total 684,626 502,287 424,179 10,371 1,621,464
Collateral
NOTES – DANSKE BANK GROUP’S RISK MANAGEMENT
140 NOTES – DANSKE BANK GROUP’S RISK MANAGEMENT DANSKE BANK ANNUAL REPORT 2009

Notes � �� ����� ��������Risk Management
(DKr m) Unsecured portion broken down by rating category 2009 Credit Unsecured portion (%) Avg. unsecured Rating category exposure Collateral 0-10 10-25 25-50 50-75 75-100 portion (%)
1 155,118 51,924 46,020 5,689 332 152 102,925 66.5
2 159,346 109,637 99,280 4,942 4,195 1,504 49,425 31.2
3 396,215 345,056 293,082 22,606 13,768 7,221 59,538 12.9
4 301,260 172,747 139,674 24,444 16,533 8,386 112,223 42.7
5 382,278 246,488 169,836 54,323 37,706 13,999 106,414 35.5
6 331,746 211,287 157,037 37,373 28,911 11,268 97,157 36.3
7 292,456 191,742 117,892 43,795 46,239 14,520 70,010 34.4
8 171,868 93,645 60,318 19,733 20,930 8,500 62,387 45.5
9 55,674 29,703 18,371 6,069 7,562 3,878 19,794 46.6
10 24,849 17,223 10,984 3,051 6,073 2,136 2,605 30.7
11 30,610 23,769 18,743 3,361 4,202 2,254 2,050 22.4
Total 2,301,420 1,493,221 1,131,237 225,386 186,451 73,818 684,528 35.1
Most of the collateral provided by customers in rating category 11 consists of real property. In its measurement of real property, the Group factors in local price and market conditions. The value of collateral is usually determined at 60-80% of the market value.
2008 Rating category
1 206,278 138,825 138,860 1,329 1,276 451 64,362 32.7
2 297,622 202,681 189,923 12,038 6,169 3,921 85,571 31.9
3 447,118 308,065 277,822 21,277 14,473 7,830 125,716 31.1
4 414,005 217,767 175,360 23,093 23,454 8,439 183,659 47.4
5 427,947 273,030 214,043 29,126 30,011 15,105 139,662 36.2
6 311,093 207,498 158,222 23,943 25,666 11,981 91,281 33.3
7 201,327 135,292 85,771 18,224 25,723 7,708 63,901 32.8
8 155,823 99,103 65,596 11,654 18,207 6,928 53,438 36.4
9 26,038 17,394 11,638 1,689 2,589 1,090 9,032 33.2
10 8,916 5,687 2,166 1,107 1,731 810 3,102 36.2
11 23,703 16,122 12,105 2,108 5,181 1,220 3,089 32.0
Total 2,519,870 1,621,464 1,331,506 145,588 154,480 65,483 822,813 35.7
NOTES – DANSKE BANK GROUP’S RISK MANAGEMENT
141DANSKE BANK ANNUAL REPORT 2009 NOTES – DANSKE BANK GROUP’S RISK MANAGEMENT

Notes � �� ����� ��������Risk Management
(DKr m) Past due amounts (no evidence of impairment) Personal Commercial Financial Due under 2009 customers customers customers Governments Total loans
1-5 days 283 247 14 1 545 3,121
6-30 days 83 86 8 - 177 2,012
31-60 days 110 984 5 - 1,099 4,802
61-90 days 17 132 7 - 156 685
> 90 days 35 64 - - 99 2,431
Total 528 1,513 34 1 2,076 13,050
The Group uses 90 past due as a definition of default (rating category 11), unless the customer�����������among the four best categories or new loan documents are under preparation. The average unsecured portion of the individual claims was 37.2% at the end of 2009 (2008: 44.4%). Real property accounted for 78% of the collateral provided (2008: 84%).
2008
1-5 days 465 245 288 4 1,002 4,147
6-30 days 81 93 73 1 248 3,870
31-60 days 238 418 407 - 1,063 7,424
61-90 days 48 64 71 - 183 1,689
> 90 days 124 356 251 4 735 6,629
Total 956 1,176 1,090 9 3,231 23,759
Impairment charges Rating categories 10 and 11 include credit facilities for which objective evidence of impairment exists and individual impairment charges are made. Credit facilities held by customers in the other rating categories are subject to collective impairment testing. The allowance account includes all impairment charges for loans and advances, loans and advances at fair value, amounts due from credit in-stitutions and central banks, and irrevocable loan commitments and guarantees. Allowance account broken down by segment and type of impairment Allowance Impairment charges Personal Commercial Financial account,
customers customers customers Governments total Individual Collective
At January 1, 2008 1,425 3,333 107 35 4,900 3,575 1,325
New impairment charges 1,291 7,740 4,509 - 13,540 9,750 3,790
Reversals of impairment charges from previous periods 366 1,092 50 26 1,534 1,122 412
Write-offs debited to allowance account 504 431 31 1 967 967 -
Foreign currency translation -40 -101 -13 - -154 -129 -25
Other items -122 13 182 - 73 83 -10
At December 31, 2008 1,684 9,462 4,704 8 15,858 11,190 4,668
New impairment charges 3,736 18,146 7,146 - 29,028 26,357 2,671
Reversals of impairment charges from previous periods 227 1,459 2,145 8 3,839 627 3,212
Write-offs debited to allowance account 1,022 1,845 1,603 - 4,470 4,470 -
Foreign currency translation 33 193 137 - 363 76 287
Other items 25 118 12 - 155 155 -
At December 31, 2009 4,229 24,615 8,251 - 37,095 32,681 4,414
NOTES – DANSKE BANK GROUP’S RISK MANAGEMENT
142 NOTES – DANSKE BANK GROUP’S RISK MANAGEMENT DANSKE BANK ANNUAL REPORT 2009

Notes � �� ����� ��������Risk Management
(DKr m) Collective impairment charges include charges made upon the up- or downgrading of customers. If all customers were downgraded one rating category with no corresponding interest rate change, collective impairment charges would increase by about DKr5.3bn. If the value of collateral provided by customers in rating categories 10 and 11 decreased 10%, individual impairment charges would increase by about DKr3bn.
Allowance account broken down by items on and off the balance sheet 2009 2008
Due from credit institutions and central banks 113 43
Loans and advances 32,645 14,668
Loans and advances at fair value 1,660 457
Other liabilities 2,677 690
Total 37,095 15,858
Allowance account and impairment charges broken down by industry Credit exposure Allowance account Loan impairment charges
2009 2008 2009 2008 2009 2008
Central and local governments 137,238 75,852 - 8 - - Subsidised housing companies 117,885 159,571 398 176 269 186 Banks 173,046 245,712 2,061 551 1,681 550 Diversified financials 180,410 234,498 6,005 4,066 3,648 3,986 Other financials 55,851 155,530 185 87 166 146 Energy and utilities 36,827 44,318 150 149 -3 105 Consumer discretionary and consumer staples 212,999 240,387 5,406 2,473 2,746 1,469 Commercial property 242,092 205,428 10,073 2,913 8,024 2,533 Construction, engineering and building products 36,078 42,057 2,921 1,009 1,563 791 Transportation and shipping 68,070 75,214 1,432 457 617 416 Other industrials 86,603 94,007 1,858 1,049 1,631 358 IT 13,599 15,739 732 637 269 454 Materials 48,131 56,090 1,475 459 1,044 181 Health care 38,372 33,026 111 123 -73 112 Telecommunication services 6,789 8,694 59 17 39 18 Personal customers 847,430 833,747 4,229 1,684 4,056 783 Total 2,301,420 2,519,870 37,095 15,858 25,677 12,088
NOTES – DANSKE BANK GROUP’S RISK MANAGEMENT
143DANSKE BANK ANNUAL REPORT 2009 NOTES – DANSKE BANK GROUP’S RISK MANAGEMENT

Notes � �� ����� ��������Risk Management
(DKr m) Loan impairment charges and allowance account broken down by geographical area
Credit exposure Allowance account Loan impairment charges
2009 2008 2009 2008 2009 2008
Denmark 1,251,301 1,295,324 14,353 6,482 8,399 6,739
Finland 189,726 204,642 2,085 1,074 1,110 390
Sweden 237,141 271,720 1,256 701 826 505
Ireland 98,626 120,029 7,010 1,849 4,980 1,645
UK 164,742 205,292 6,648 2,736 5,742 700
Germany 19,948 31,807 306 239 96 -26
Baltics 29,149 31,348 3,001 416 2,732 101
Other EU member states 60,384 97,103 261 258 63 185
Norway 184,773 169,050 1,429 741 754 472
Eastern Europe 2,306 2,194 4 1 4 -
Other European countries 8,179 12,823 189 136 49 113
North America 39,581 58,765 418 1,182 836 1,244
Central and South America 1,109 1,776 39 12 26 8
Africa 2,825 1,976 10 8 2 7
Asia 10,956 15,224 85 23 58 5
Oceania 674 797 1 - - -
Total 2,301,420 2,519,870 37,095 15,858 25,677 12,088
Allowance account for individual impairment charges broken down by evidence of impairment
2009 2008
Allowance Allowance account, account, Credit exposure individual Credit exposure individual
Rating category 10:
Financial difficulties 24,849 14,032 8,916 2,842
Rating category 11:
90 days past due 5,550 1,874 2,628 922
Restructuring of debt 8,272 5,743 6,302 1,727
Collection/suspension of payments 12,492 6,865 3,279 1,891
Bankruptcy 4,296 4,167 11,494 3,808 Total 55,459 32,681 32,619 11,190
The average unsecured portion of individually impaired claims was 26.1% at the end of 2009 (2008: 33.1%). Of total collateral received, col-lateral in the form of real property accounted for 75% (2008: 72%).
NOTES – DANSKE BANK GROUP’S RISK MANAGEMENT
144 NOTES – DANSKE BANK GROUP’S RISK MANAGEMENT DANSKE BANK ANNUAL REPORT 2009

Notes � �� ����� ��������Risk Management
(DKr m) Credit exposure relating to trading and investing activities Personal Commercial Financial 2009 customers customers customers Governments Total
Bonds - 5,219 301,694 115,632 422,545 Shares - 2,005 1,087 7 3,099 Derivatives with positive fair value 180 18,319 282,038 12,850 313,387 Other unutilised commitments - - 1,173 - 1,173 Total 180 25,543 585,992 128,489 740,204 2008
Bonds - 4,737 331,999 85,849 422,585 Shares - 3,620 865 55 4,540 Derivatives with positive fair value 719 27,090 529,138 17,509 574,456 Other unutilised commitments - - 1,042 - 1,042 Total 719 35,447 863,044 103,413 1,002,623
Other unutilised commitments comprises private equity investment commitments and other obligations. Bond portfolio broken down by geographical area Central and Quasi- Danish Swedish Other local govern- government mortgage covered covered Short-dated Credit 2009 ment bonds bonds bonds bonds bonds bonds (CP etc.) bonds Total
Denmark 34,725 - 178,674 - - 147 899 214,445
Finland 3,714 4 - - 460 1,188 524 5,890
Sweden 16,852 - - 73,956 - 3,011 1,858 95,677
Norway 2,335 - - - 1,049 6,205 3,106 12,695
Ireland 223 - - - 137 149 3,268 3,777
UK 6,781 - - - 11,792 869 551 19,993
Germany 32,422 783 - - 364 361 2,553 36,483
Spain 218 - - - 7,945 1,625 - 9,788
France 1,851 - - - 3,098 1,686 540 7,175
Italy - - - - - 218 2,826 3,044
North America 2,038 4,417 - - 376 60 1,027 7,918
Other 1,723 640 - - 1,027 1,040 1,230 5,660
Total 102,882 5,844 178,674 73,956 26,248 16,559 18,382 422,545
2008
Denmark 11,824 - 170,695 - - 108 1,008 183,635
Finland 3,561 2 - - 622 8,013 735 12,933
Sweden 7,869 - - 84,441 - 4,529 423 97,262
Norway 1,475 - - - 1,124 3,707 2,206 8,512
Ireland 229 - - - 558 843 2,705 4,335
UK 9,255 - - - 13,150 900 1,811 25,116
Germany 22,924 1,623 - - 1,726 550 2,616 29,439
Spain 1,492 - - - 14,700 4,405 172 20,769
France 3,742 - - - 4,858 3,593 366 12,559
Italy - - - - - 697 6,556 7,253
North America 146 6,004 - - 373 57 1,752 8,332
Other 4,220 688 - - 1,534 2,429 3,569 12,440
Total 66,737 8,317 170,695 84,441 38,645 29,831 23,919 422,585
NOTES – DANSKE BANK GROUP’S RISK MANAGEMENT
145DANSKE BANK ANNUAL REPORT 2009 NOTES – DANSKE BANK GROUP’S RISK MANAGEMENT

Notes � �� ����� ��������Risk Management
(DKr m) Bond portfolio broken down by rating category Central and Quasi- Danish Swedish Other local govern- government mortgage covered covered Short-dated Credit 2009 ment bonds bonds bonds bonds bonds bonds (CP etc.) bonds Total
1 98,941 5,555 - 3,891 117 3,156 2,540 114,200
2 3,905 289 36,448 35,439 12,293 7,410 6,308 102,092
3 36 - 124,316 2,897 10,602 4,057 3,911 145,819
4 - - 17,909 31,729 3,231 1,465 1,748 56,082
5 - - 1 - 5 461 3,081 3,548
6 - - - - - 10 442 452
7 - - - - - - 186 186
8 - - - - - - 166 166
9 - - - - - - - -
10 - - - - - - - -
11 - - - - - - - -
Total 102,882 5,844 178,674 73,956 26,248 16,559 18,382 422,545
2008
1 63,848 6,723 2 3,105 5,251 - 7,888 86,817
2 2,836 1,594 153,677 78,141 19,846 21,356 6,654 284,104
3 53 - 17,014 3,195 11,033 6,427 3,344 41,066
4 - - - - 2,095 1,091 1,597 4,783
5 - - - - 421 809 2,863 4,093
6 - - 2 - - 147 1,128 1,277
7 - - - - - - 176 176
8 - - - - - - 138 138
9 - - - - - - - -
10 - - - - - - - -
11 - - - - - - 131 131
Total 66,737 8,317 170,695 84,441 38,645 29,831 23,919 422,585
Derivatives with positive fair value 2009 2008
Derivatives with positive fair value 313,387 574,456
Netting benefits 248,553 453,888
Net current exposure 64,834 120,568
Derivatives with positive fair value broken down by rating category
1 19,849 29,539
2 116,485 254,087
3 141,297 211,509
4 15,928 31,763
5 9,391 13,398
6 4,209 6,216
7 3,030 27,067
8 2,524 598
9 431 279
10 181 -
11 62 -
Total 313,387 574,456
NOTES – DANSKE BANK GROUP’S RISK MANAGEMENT
146 NOTES – DANSKE BANK GROUP’S RISK MANAGEMENT DANSKE BANK ANNUAL REPORT 2009

Notes � �� ����� ��������Risk Management
(DKr m) Market risk Market risk is defined as the risk of losses because the fair value of assets and liabilities varies with changes in market conditions. The Group uses both conventional risk measures and internal mathematical and statistical models, such as Value at Risk (VaR), to manage its market risk on positions in and outside the trading portfolio on a daily basis. The Group is exposed to a variety of market risks from its activities within trading and position-taking in financial products. Most of the trading activities involve relatively simple products for which demand has increased during the financial crisis. As a result of developments on the fi-nancial markets, pricing and risk management of many relatively simple products have become far more complex, however. Models The Group measures and manages the risk on positions exposed to interest rate changes on a daily basis. Interest rate risk is calculated as the expected loss on interest rate positions in the event of a general increase in all interest rates of one percentage point . The Group also cal-culates yield curve risk, which expresses the risk of losses if interest rates for various terms change independently of one another. The Group uses a VaR model that includes all currency exposures, including options, to manage its exchange rate risk. The calculation of ex-change rate risk is based on two parameters: a confidence level of 95% and a time horizon of ten days. Equity market risk is divided into the risk associated with listed shares and that associated with unlisted shares. For listed shares, the Group calculates equity market risk as the net fair value of short-term and long-term positions in equities and equity-related instruments. For unlisted shares, the Group distinguishes between ordinary open positions, unutilised private equity commitments and bank-related investments. "���#�����������������������������������������������������$���������������market assessments of credit quality and liquidity. The risk of ������������������������������������������������������������>���?������>��?�����������������bond spread risk. The risk is calculated as the expected losses in the event of a change in the spread of one basis point. The Group breaks down its bond spread risk into mortgage, government and credit spread risks. The Group has a relatively large holding of Danish mortgage bonds as well as holdings of Danish and non-Danish covered bonds. In 2008, the Danish mortgage finance market was extremely illiquid. As a consequence, the Group decided to supplement the previous issuer lines with market risk limits for the c������������������������������������������������������������� The inflation rate risk is calculated as expected losses because of changes in traded future inflation rates of +/-1 percentage point. The com-modity risk is measured as the expected loss on positions in commodities following changes of +/-10 percentage points in individual commod-ity indices. To supplement conventional risk measures, the Group uses VaR for its internal management of interest rate, exchange rate and equity market risks. VaR is a statistical measure quantifying the maximum loss that the Group may incur on its portfolios under normal market conditions at a confidence level of 95% on the assumption that the Group keeps its positions unchanged for ten days. One of the major strengths of VaR is that it provides an aggregate measure of all risk types included in the model and factors in the correlation structure of the financial markets. The Group also uses VaR to calculate its capital requirement at a confidence level of 99%. Conventional risk measures The table below shows ����������������������at the end of 2009 and 2008 (calculations based on conventional risk measures): 2009 2008
Interest rate risk (parallel shift of the yield curve of 1 percentage point) 1,165 2,776 Exchange rate risk (VaR, confidence level of 95%, 10-day horizon) 11 76 Equity market risk, listed shares (net position) 460 558 Equity market risk, unlisted shares (net position) 3,313 3,153 Mortgage spread risk (basis point value) 74 97 Government spread risk (basis point value) 24 9 Credit spread risk on corporate bonds (basis point value) 2 4
Inflation rate risk (change in traded future inflation of 1 percentage point) 94 49 Commodity risk (10% change in commodity prices) - 7
NOTES – DANSKE BANK GROUP’S RISK MANAGEMENT
147DANSKE BANK ANNUAL REPORT 2009 NOTES – DANSKE BANK GROUP’S RISK MANAGEMENT

Notes � �� ����� ��������Risk Management
(DKr m) The breakdown of interest rate risk by due date is calculated on the basis of an interest rate rise of 1 percentage point at the end of the year. < 2 years 2-5 years 5-10 years > 10 years Total
Interest rate risk 2009 1,029 -76 391 -179 1,165
Interest rate risk 2008 1,972 541 858 -595 2,776
Value-at-Risk
The table below shows the VaR figures used for internal risk management purposes.
2009 2008 Avg. Minimum Maximum Avg. Minimum Maximum
Risk category VaR VaR VaR Dec. 31 VaR VaR VaR Dec. 31
Interest rate risk 189 46 422 140 348 149 565 389
Exchange rate risk 18 3 40 11 10 - 94 76
Equity market risk 325 249 448 282 219 135 350 277
Diversification benefit -188 -183 -214 -276
Total VaR 344 215 571 250 363 201 674 466
Back and stress testing The Group conducts back tests on a daily basis to document that its VaR model is sufficiently robust to measure market risk. At a confidence level of 99% and a time horizon of one day, back tests compare the VaR figures calculated by the model with hypothetical losses or gains as-suming a situation where the Gro�������������������������������a business day, but where market prices change. The chart below shows back test results for 2008 and 2009.
The number of exceptions in 2009 were at an acceptable level with 2. The number of exceptions in 2008 was attributable to increased volatil-ity throughout the greater part of the year. In 2008, the model captured the increased volatility only to some extent as it is based on equally weighted market data for the past two years. As a consequence of the exceptions, the Group has adjusted the model so that it sooner captures volatile market fluctuations. This adjustment increases the weighting of market data for the past 12 months as compared with the weighting of data for the preceding 12 months. The adjustment was made in early 2009. To measure the risk of losses under unusual market conditions, the Group conducts a number of stress tests and scenario analyses. Stress tests based on worst-case scenarios usually involve a combination of extreme fluctuations in interest rates, equity prices and exchange rates, whereas scenario analyses may reflect historical or expected market fluctuations. The scenarios are revised and updated regularly to �����������������������������������������������������#����� The table below shows the maximum loss following a number of extreme � but not necessarily very likely � shocks.
Risk category Change Maximum loss 2009 Maximum loss 2008
Equity market risk +20/-20% 83 114
Exchange rate risk +10/-10% 163 -
Interest rate risk +200/-200 bp 1,900 4,193
BACK TEST RESULTS, P/L EFFECT(DKr m)
-800
-600
-400
-200
0
200
400
600
Lower VaR
2008 2009
NOTES – DANSKE BANK GROUP’S RISK MANAGEMENT
148 NOTES – DANSKE BANK GROUP’S RISK MANAGEMENT DANSKE BANK ANNUAL REPORT 2009

Notes � �� ����� ���������� �����������
(DKr bn) Liquidity risk Liquidity risk is defined as the risk of losses because
����������������������������������������������? lack of funding prevents the Group from establishing new business lack of funding ultimately prevents the Group from meeting its obligations.
"�����������>��?�������������������������>��?���������{����������������������������<��{����������������X����� financing of mort-���������������������������������������$���������������������������>��?����������������������������������������ance sheet com-prises long-term contributions and assets of which a large portion is invested in liquid listed bonds and easily marketable shares. As both companies are subject to statutory limits on their exposure to Danske Bank, their liquidity is not included in liquidity management at Group level. Group-level liquidity management is based on ������������������������������������s short- and long-term liquidity risks and builds on the following four themes: operational liquidity risk, liquidity stress tests, 12-month liquidity and structural liquidity risk. Operational liquidity risk "����������������������>��?������������ent is intended mainly to ensure that the Group always has a liquidity buffer that can absorb the net effects of current transactions and changes in liquidity in the short term. The Group manages its operational liquidity risk on the basis of limits approved by the Board of Directors, including separate foreign currency �>��?��������>��?������������������������������������������$���������������������?������������������������ lready entered into as well as its holdings of liquid bonds. Operational liquidity risk factors in estimated effects on the Danish kroner liquidity of the Danish gov-������������������������?�������An effect of irrevocable loan commitments is also included to ensure that liquidity management takes ac-count of the potential risk of drawings under such commitments. "�������������������������������������������������������������������a substantial deposit surplus that is a valuable and stable source of funding. As part of managing operational liquidity risk, the Group monitors its liquidity position in the Danish market on the basis of a number of set targets. Liquidity stress tests The Group conducts stress tests that estimate liquidity risks in various scenarios in order to measure the current liquidity risk level and to be able to respond as quickly as possible to crises. Stress tests are conducted regularly and have a time horizon of up to six months. The stress tests comprise three standard scenarios: one Danske Bank-specific, a general market crisis and a combination of the two. An additional stress-to-fail test conducted in 2009 showed that the Group was within its internal stress test limits. The scenarios assume that lending activities do not decline. The degree of possible refinancing will vary, depending on the scenario in question. For example, the Group will have fewer opportunities for issuing commercial paper ������������$���������������������-term rating is down-graded than in a scenario with a mild recession. The Group constantly monitors the distribution of funding sources by product, currency, maturity and counterparty to ensure that it has a funding base that provides the best possible protection if markets come under pressure. 12-month liquidity Z�����@�����&�������+��������{������������������������?WX�����?�����������#�������������������>��������������������>��?�manage-ment. One requirement is that the 12-month liquidity curve must generally be positive. Liquidity calculations must assume, among other fac-tors, that the Group is cut off from capital markets. No access to capital prevents the Group from refinancing debt at maturity through bonds, commercial paper ���������������������_����������X�������������>��?����������������������a [positive liquidity curve for 2009].
1 week 2 weeks 3 weeks 1 month 2 months 3 months 4 months 5 months 6 months 9 months 12 months
2009 389 394 368 316 232 200 185 182 177 115 119 2008 294 288 264 200 143 46 32 16 1 -26 -49 The Group monitors its liquidity reserve to ensure that it remains robust if it is cut off from capital markets.
���
NOTES – DANSKE BANK GROUP’S RISK MANAGEMENT
149DANSKE BANK ANNUAL REPORT 2009 NOTES – DANSKE BANK GROUP’S RISK MANAGEMENT

Notes � �� ����� ���������� �����������
Structural liquidity risk
The Group manages its structural liquidity risk on the basis of its long-term liquidity mismatch. The purpose of managing structural liquidity
risk is to avoid an unnecessarily large need for funding in the future. Quantifying such risk is important when the Group plans its funding activi-
ties. Structural liquidity risk management is based on a �������$���?������?���������������������X����������������-balance-sheet items. The Group bases these calculations on the contractual due dates of individual products, but takes into account that some balance sheet items in fact have maturities that deviate materially from their contractual maturities. The maturities of such items are therefore modified to provide a more accurate view of the actual development. For example, demand deposits made by the private sector are contractually very short-term funding, but in practice they are considered a relatively stable funding source. The Group also takes into account the potential outflow of liquid-ity from unutilised credit commitments. Most ����������������������������������������������d ultra-liquid. The unencumbered part of the portfolio is included in the breakdown by maturity as immediate liquidity, because it can be provided as collateral for repo transactions with central banks. As part of managing structural liquidity risk, the Group breaks down its liquidity position by a number of variables such as currency, product, business and organisational unit. Funding sources The Group monitors its funding mix to ensure that it is well-diversified in relation to funding sources, maturities and currencies. The tables be-low break down funding sources by type of liability and currency, including funding in the form of bonds issued by Realkredit Danmark.
Funding sources by type of liability (%) 2009 2008
Central banks 6 11
Credit institutions 4 7
Repo transactions 6 6
Short-dated bonds 7 9
Long-term bonds 15 12
Danish mortgage bonds 23 19
Deposits (corporate) 19 18
Deposits (retail) 13 12
Subordinated debt 3 2
+�������������equity 4 4
Total 100 100
Funding sources by currency (%) 2009 2008
DKK 43 39
EUR 25 27
USD 13 18
SEK 7 5
GBP 4 4
CHF 2 3
NOK 4 2
Other 2 2
Total 100 100
NOTES – DANSKE BANK GROUP’S RISK MANAGEMENT
150 NOTES – DANSKE BANK GROUP’S RISK MANAGEMENT DANSKE BANK ANNUAL REPORT 2009

Notes � �� ����� ��������Risk Management
Insurance risk "�������������������������������������������������!�����������������������������������������������s assumed by Danica Pension. Financial risk concerns the performance of �����������������������������������>�?�����������������X��������#�������������������������s-tomer funds, the collective bonus potential and the bonus potential of paid-up policies are insufficient to cover guaranteed benefits to custom-ers. The most important factor as regards conventional life insurance products is the relationship between investment securities and life insur-����������������Z������?������investment returns on customer funds are insufficient to cover the guaranteed benefits to customers, the nec-essary strengthening of life insurance provisions, etc., the shortfall will be covered first by the collective bonus potentia l and then by the bonus potential of paid-up policies. If these bonus potentials are insufficient to cover the shortfal�X����������������������������������������>�?� "��������������������������������������������������������������������������������X������������������������������sk and has set targets for maximum market and interest rate risks. Stress tests are conducted regularly to ensure that Danica is able to withstand a fall in equity prices of 30% and considerable simultaneous changes in interest rates. "�����������������������$����������������������������������������������������������������rily of government and mortgage bonds with high ratings from international agencies. Individual risks are limited, and collateral has been provided for the value of derivatives hedging interest rate risk. Liquidity risk is also modest. Many of the assets consist of ultra-liquid listed bonds and easily marketable equities. To a large extent, policyholders bear the risk on investment securities under unit-linked contracts. For about half of unit-linked contracts, poli-cyholders bear the entire risk, whereas the remaining part are covered by an investment guarantee that will apply only at the time of retire-ment. Policyholders pay an annual fee for such guarantee. The risk on Danica Link guarantees is hedged by equity derivatives and by adjust-ment of investments during the last five years before disbursement. The risk on Danica Balance guarantees is managed primarily through the individual customer investment portfolios. The portion of funds invested in equities is regularly adjusted on the basis of the amount guaran-teed, the remaining life and other factors. Life insurance risks are linked to trends in mortality, disability, critical illness and other variables. For example, an increase in life expectancy affects the time during which benefits are payable under certain pension plans, whereas trends in mortality, sickness and recoveries affect life insurance and disability benefits. Life expectancy is the single most important life insurance risk. The various risk elements are subject to ongoing actuarial assessment for the purpose of calculating insurance obligations and making rele-vant business adjustments. Life insurance obligations are calculated on the basis of expected future mortality rates. Estimates are based on ����������������������$����������������urance contracts, and they are updated regularly. For health and accident policies, insurance obligations are calculated on the basis of expected future recoveries and reopenings of old claims. Estimates are based on empirical �������������������$������folio of insurance contracts, and they are updated regularly.
To mitigate insurance risk, Danica uses reinsurance to cover a small portion of the risks related to mortality and disability. Danica also rein-
sures the risk of losses due to disasters.
NOTES – DANSKE BANK GROUP’S RISK MANAGEMENT
151DANSKE BANK ANNUAL REPORT 2009 NOTES – DANSKE BANK GROUP’S RISK MANAGEMENT

Notes � �� ����� ���������� �����������
(DKr bn) Sensitivity analysis "��������#�?�������������$������������������������quity, collective bonus potential and bonus potential of paid-up policies generated by separate changes in interest rates, equity prices, real property prices and actuarial assumptions. If the bonus potential is insufficient to cover ����?����������������������������X���������������$��������#������?������������������������������������>�?�
Change in Loss absorbed by collective bonus bonus potential of Change in At December 31, 2009 potential paid-up policies equity
Interest rate increase of 0.7 of a percentage point -0.5 - -0.3
Interest rate decline of 0.7 of a percentage point 0.8 - 0.3
Decline in equity prices of 12% -1.1 -0.6 -0.2
Decline in property prices of 8% -1.0 -0.2 -0.1
Increase in credit spreads of 10 percentage points -0.8 - -
Exchange rate risk (VaR 99.5%) -0.2 - -
Loss on counterparties of 8% of RWA -1.1 -0.9 -0.1
Decrease in mortality of 10% -1.0 -0.4 -
Increase in mortality of 10% 1.3 - -
Increase in disability of 10% -0.1 - -
Change in Loss absorbed by collective bonus bonus potential of Change in At December 31, 2008 potential paid-up policies equity
Interest rate increase of 0.7 of a percentage point -0.3 -1.0 -0.4
Interest rate decline of 0.7 of a percentage point 0.4 1.0 0.1
Decline in equity prices of 12% -0.1 -0.6 -0.7
Decline in property prices of 8% -0.1 -0.5 -0.6
Increase in credit spreads of 10 percentage points -0.1 -0.3 -0.3
Exchange rate risk (VaR 99.5%) - -0.1 -
Loss on counterparties of 8% of RWA -0.1 -0.7 -0.8
Decrease in mortality of 10% -0.1 -0.7 -0.9
Increase in mortality of 10% - 1.4 -
Increase in disability of 10% - -0.2 -
NOTES – DANSKE BANK GROUP’S RISK MANAGEMENT
152 NOTES – DANSKE BANK GROUP’S RISK MANAGEMENT DANSKE BANK ANNUAL REPORT 2009

Notes � �� ����� ���������� �����������
(DKr m) Pension risk The ������������������������������������������������������������������������������������������>�������������������nal contributions to cover pension obligations to current and former employees. The use of financial derivatives to eliminate infl��������������������������������������������������������������������������?�������������proceeds from the derivatives and the associated assets with expected future pension obligations, the Group minimises its pension risk. Because of the special complexity of its pension obligations, the Group manages market risk on the basis of special follow-up and monitoring principles � so-called business objectives. Quarterly risk reports follow up on the objectives and analyse the financial status of the individual plans on the basis of sensitivity analyses and the Value at Risk (VaR) measure. The objectives include specific limits that indicate acceptable risk exposure levels. For every pension plan, the Group calculates net funding and the sensitivity of net funding to changes in interest rates, equity prices and life expectancy. Net funding expresses the difference between the market value of the assets and the present value of the pension obligations.
Sensitivity analysis Change Effect 2009 Effect 2008
Equity prices -20% -895 -734
Interest rates +1/-1% +1,066/-697 +400/+4
Life expectancy +1 year -256 -241
To supplement the sensitivity analyses, the Group calculates the risk of the individual pension funds as a VaR measure. The calculations are based on a long-term horizon with equity price volatility (20%) and correlation between interest rates and equity prices (25%) set at values re-flecting normal market data. The duration of the pension obligations is reduced by half as empirical data show that inflation risk reduces the in-terest rate risk on the obligations by approximately 50% in the long term. At the end of 2009, VaR was DKr2,425m (2008: DKr1,966m). The VaR measure is calculated at a confidence level of 99.97% and with a time horizon of one year. The calculation is adjusted for inflation risk.
Note 34 provides additiona�����������������������������������������������.
NOTES – DANSKE BANK GROUP’S RISK MANAGEMENT
153DANSKE BANK ANNUAL REPORT 2009 NOTES – DANSKE BANK GROUP’S RISK MANAGEMENT
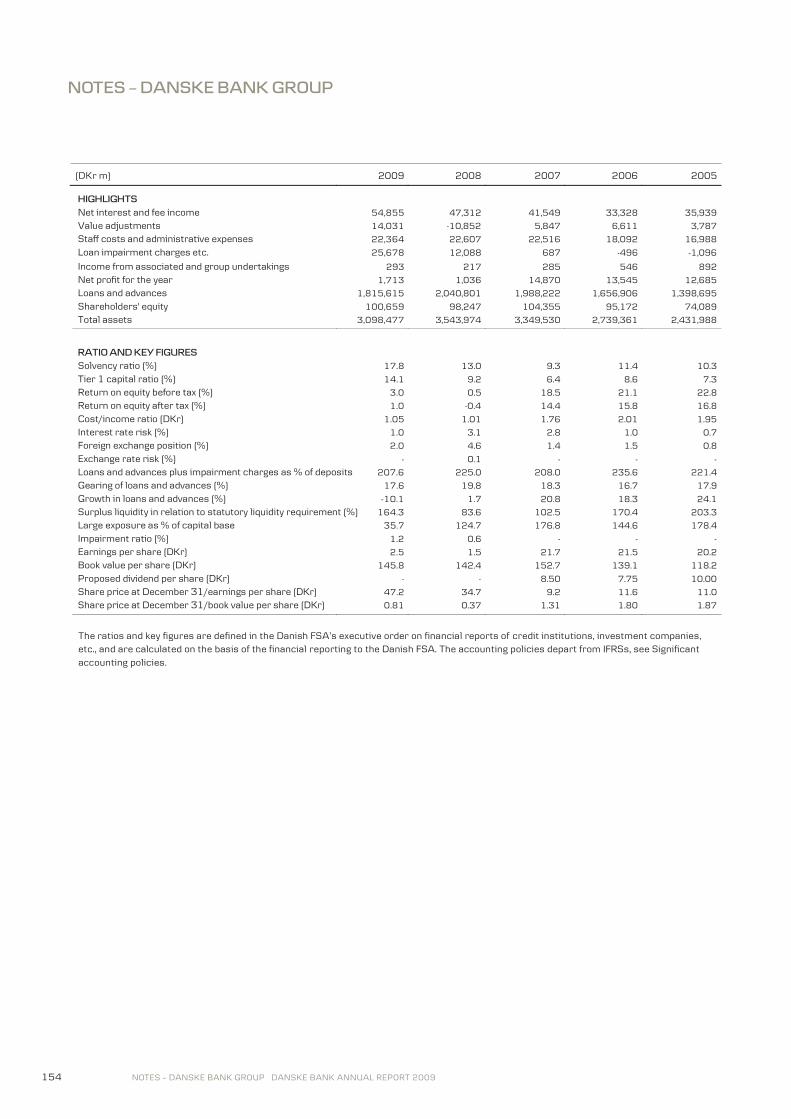
Notes � Danske Bank Group
(DKr m) 2009 2008 2007 2006 2005 HIGHLIGHTS
Net interest and fee income 54,855 47,312 41,549 33,328 35,939
Value adjustments 14,031 -10,852 5,847 6,611 3,787
Staff costs and administrative expenses 22,364 22,607 22,516 18,092 16,988
Loan impairment charges etc. 25,678 12,088 687 -496 -1,096 Income from associated and group undertakings 293 217 285 546 892
Net profit for the year 1,713 1,036 14,870 13,545 12,685
Loans and advances 1,815,615 2,040,801 1,988,222 1,656,906 1,398,695
Shareholders' equity 100,659 98,247 104,355 95,172 74,089
Total assets 3,098,477 3,543,974 3,349,530 2,739,361 2,431,988
RATIO AND KEY FIGURES
Solvency ratio (%) 17.8 13.0 9.3 11.4 10.3
Tier 1 capital ratio (%) 14.1 9.2 6.4 8.6 7.3
Return on equity before tax (%) 3.0 0.5 18.5 21.1 22.8
Return on equity after tax (%) 1.0 -0.4 14.4 15.8 16.8
Cost/income ratio (DKr) 1.05 1.01 1.76 2.01 1.95
Interest rate risk (%) 1.0 3.1 2.8 1.0 0.7
Foreign exchange position (%) 2.0 4.6 1.4 1.5 0.8
Exchange rate risk (%) - 0.1 - - -
Loans and advances plus impairment charges as % of deposits 207.6 225.0 208.0 235.6 221.4
Gearing of loans and advances (%) 17.6 19.8 18.3 16.7 17.9
Growth in loans and advances (%) -10.1 1.7 20.8 18.3 24.1
Surplus liquidity in relation to statutory liquidity requirement (%) 164.3 83.6 102.5 170.4 203.3
Large exposure as % of capital base 35.7 124.7 176.8 144.6 178.4
Impairment ratio (%) 1.2 0.6 - - -
Earnings per share (DKr) 2.5 1.5 21.7 21.5 20.2
Book value per share (DKr) 145.8 142.4 152.7 139.1 118.2
Proposed dividend per share (DKr) - - 8.50 7.75 10.00
Share price at December 31/earnings per share (DKr) 47.2 34.7 9.2 11.6 11.0
Share price at December 31/book value per share (DKr) 0.81 0.37 1.31 1.80 1.87
"���������������?������������������������������&+<����=���#������������������������������credit institutions, investment companies, etc., and are calculated on the basis of the financial reporting to the Danish FSA. The accounting policies depart from IFRSs, see Significant accounting policies.
NOTES – DANSKE BANK GROUP
154 NOTES – DANSKE BANK GROUP DANSKE BANK ANNUAL REPORT 2009

Financial statements � Danske Bank A/S
(DKr m) The financial statements of the Parent Company, Danske Bank A/S, are prepared in accordance with the Danish Financial Busines s Act and ����������&+<����=���#���������������������������of credit institutions, investment companies, �����"����������������������������������valuation principles under International Financial Reporting Standards (IFRSs) with the following exceptions:
Domicile property is measured (revalued) at its estimated fair value.
The corridor method is not applied to pension obligations.
The available-for-sale financial assets category is not used.
"����������������#���������������������?��������������������������$��������������������������&+<����=���#e order on financial re-ports of credit institutions, investment companies, etc. Available-for-sale financial assets are measured at fair value through profit or loss. Holdings in subsidiary undertakings are measured on the basis of the equity method, and tax payable by these undertakings is expensed under Income from associated and group undertakings. The format of the Parent Company financial statements is not identical to the format of the consolidated financial statements prepared in ac-cordance with IFRSs. "�������������$����$������������������������������������������������>�?����$��������Z&{+�����������������������������ts and the
with Danish FSA rules. Parent Company financial statements prepared in accordance
Shareholders' equity
Shareholders' equity
Net profit Net profit Dec. 31, Dec. 31,
2009 2008 2009 2008
Consolidated financial statements (IFRSs) 1,713 1,036 100,659 98,247
Domicile property -38 -191 1,275 1,410
Available-for-sale financial assets 708 -1,937 - -
Pension obligations -1,629 254 -1,155 486
Tax effect 247 414 262 -163
Minority interests -16 -38 2,984 2,979
Consolidated financial statements (Danish FSA rules) 985 -462 104,025 102,959
Minority interests (Danish FSA rules) -16 -14 2,985 3,001
Goodwill on acquisition of minority interests - - 54 55
Parent Company financial statements (Danish FSA rules) 1,001 -448 101,094 100,013
"����������������������������������!���� �����������������������������������������
�
�
�
44
FINANCIAL STATEMENTS – DANSKE BANK A/S
155DANSKE BANK ANNUAL REPORT 2009 FINANCIAL STATEMENTS – DANSKE BANK A/S

Income statement � Danske Bank A/S
Note (DKr m) 2009 2008 2 Interest income 69,045 103,252
3 Interest expense 39,699 81,515
Net interest income 29,346 21,737
Dividends from shares etc. 56 140
4 Fee and commission income 8,521 8,965
Fees and commissions paid 2,278 2,335
Net interest and fee income 35,645 28,507
5 Value adjustments 5,347 -3,774
Other operating income 2,009 2,189
6 Staff costs and administrative expenses 15,723 15,438
7 Amortisation, depreciation and impairment charges 4,046 5,326
Other operating expenses 2,536 674
Loan impairment charges etc. 21,118 10,265
Income from associated and group undertakings 3,211 3,889
Profit before tax 2,789 -892
9 Tax 1,788 -444
Net profit for the year 1,001 -448
Proposed profit allocation
Equity method reserve 3,012 3,864
Dividends for the year - -
Retained earnings -2,011 -4,312
Total 1,001 -448
INCOME STATEMENT – DANSKE BANK A/S
156 INCOME STATEMENT – DANSKE BANK A/S DANSKE BANK ANNUAL REPORT 2009
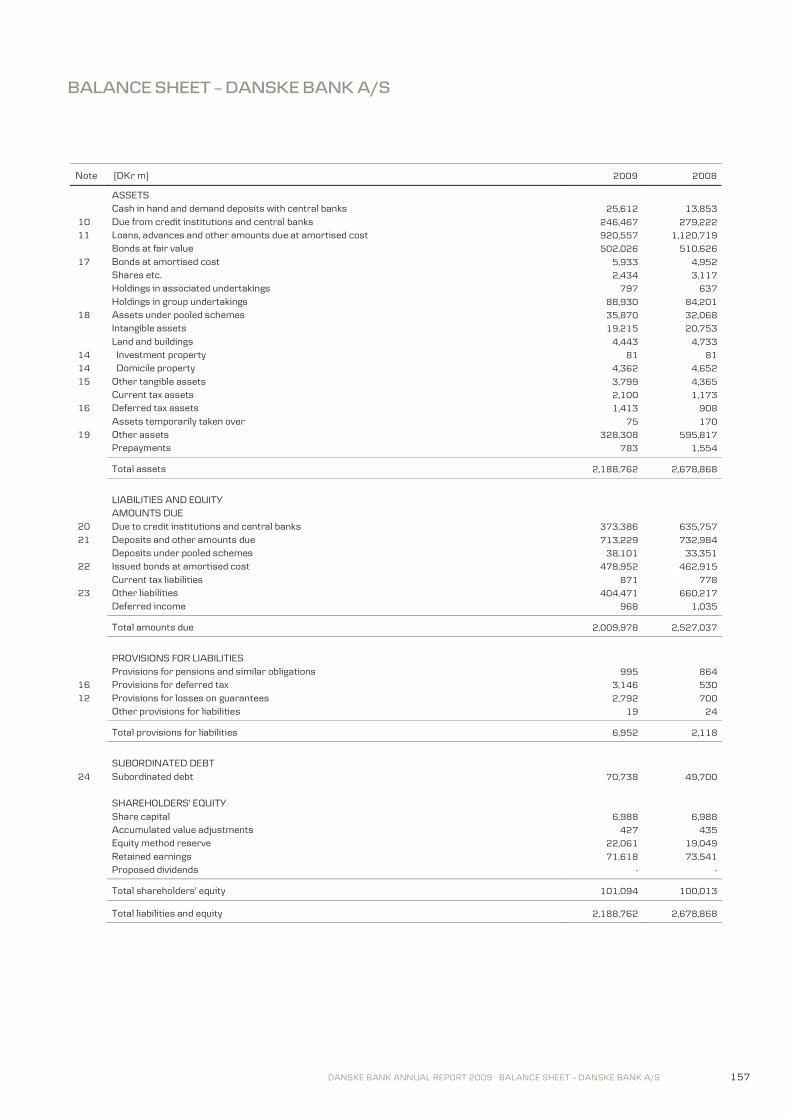
Balance sheet � Danske Bank A/S
Note (DKr m) 2009 2008 ASSETS Cash in hand and demand deposits with central banks 25,612 13,853
10 Due from credit institutions and central banks 246,467 279,222
11 Loans, advances and other amounts due at amortised cost 920,557 1,120,719
Bonds at fair value 502,026 510,626
17 Bonds at amortised cost 5,933 4,952
Shares etc. 2,434 3,117
Holdings in associated undertakings 797 637
Holdings in group undertakings 88,930 84,201
18 Assets under pooled schemes 35,870 32,068
Intangible assets 19,215 20,753
Land and buildings 4,443 4,733
14 Investment property 81 81
14 Domicile property 4,362 4,652
15 Other tangible assets 3,799 4,365
Current tax assets 2,100 1,173
16 Deferred tax assets 1,413 908
Assets temporarily taken over 75 170
19 Other assets 328,308 595,817
Prepayments 783 1,554
Total assets 2,188,762 2,678,868
LIABILITIES AND EQUITY
AMOUNTS DUE
20 Due to credit institutions and central banks 373,386 635,757
21 Deposits and other amounts due 713,229 732,984
Deposits under pooled schemes 38,101 33,351
22 Issued bonds at amortised cost 478,952 462,915
Current tax liabilities 871 778
23 Other liabilities 404,471 660,217
Deferred income 968 1,035
Total amounts due 2,009,978 2,527,037
PROVISIONS FOR LIABILITIES
Provisions for pensions and similar obligations 995 864
16 Provisions for deferred tax 3,146 530
12 Provisions for losses on guarantees 2,792 700
Other provisions for liabilities 19 24
Total provisions for liabilities 6,952 2,118
SUBORDINATED DEBT
24 Subordinated debt 70,738 49,700
SHAREHOLDERS' EQUITY
Share capital 6,988 6,988
Accumulated value adjustments 427 435
Equity method reserve 22,061 19,049
Retained earnings 71,618 73,541
Proposed dividends - -
Total shareholders' equity 101,094 100,013
Total liabilities and equity 2,188,762 2,678,868
BALANCE SHEET – DANSKE BANK A/S
157DANSKE BANK ANNUAL REPORT 2009 BALANCE SHEET – DANSKE BANK A/S

Statement of capital � Danske Bank A/S
(DKr m) Changes in shareholders' equity
Share Foreign currency Revaluation
Equity
method Retained Proposed Total Total
capital translation reserve reserve reserve earnings dividends 2009 2008
Shareholders' equity at December 31, 2008 6,988 -489 924 19,049 73,541 - 100,013 106,376
Translation of foreign units - 503 - - - - 503 -2,672
Foreign unit hedges - -340 - - - - -340 2,212
Fair value adjustment of domicile property - - -160 - - - -160 53
Sale of domicile property - - -11 - 11 - - -1
Tax on entries on shareholders' equity - - - - 84 - 84 -458
Income recognised directly equity on shareholders' - 163 -171 - 95 - 87 -866
Net profit for the year - - - 3,012 -2,011 - 1,001 -448
Total income - 163 -171 3,012 -1,916 - 1,088 -1,314
Group undertakings - - - - - - - -
Dividends paid - - - - - - - -5,831
Proposed dividends - - - - - - - -
Acquisition of own shares - - - - -17,358 - -17,358 -27,597
Sale of own shares - - - - 17,315 - 17,315 28,332
Share-based payments - - - - 36 - 36 47
Shareholders' equity at December 31 6,988 -326 753 22,061 71,618 - 101,094 100,013
At the end of 2009, the share capital consisted of 698,804,276 shares of a nominal value of DKr10 each. All shares carry the same rights; there is thus only one class of shares. Danske Bank participates in the Danish state guarantee under the Act on Financial Stability adopted by the Danish parliament on October 10, 2008. The guarantee prohibits dividend payments and share buybacks by the participating banks until the guarantee expires on September 30, 2010. From October 1, 2010, and for as long as the Danish state holds hybrid capital in Danske Bank, the Bank may distribute dividends if such dividends can be paid in full out of the profit for the year. In March 2008, the Danske Bank made dividend payments of DKr8.50 per share.
Own shares held by Danske Bank A/S Nominal Sales/purchase Number of value Percentage of price shares (DKr m) share capital (DKr m)
Holding at January 1, 2008 11,950,056 120 1.71
Acquired in 2008 200,098,659 2,001 29.00 27,500
Sold in 2008 205,335,166 2,053 29.00 28,116
Holding at December 31, 2008 6,713,549 68 1.00
Acquired in 2009 198,705,332 1,987 28.44 17,328 Sold in 2009 199,094,271 1,991 28.49 17,292
Holding at December 31, 2009 6,324,610 64 0.91
Acquisitions in 2009 and 2008 comprised trading portfolio assets and investments on behalf of customers.
Danske Bank shares held by subsidiary undertakings Nominal Sales/purchase Number of value Percentage of price shares (DKr m) share capital (DKr m)
Holding at January 1, 2008 3,250,970 32 0.47
Acquired in 2008 689,727 7 0.10 97
Sold in 2008 1,653,431 17 0.24 216
Holding at December 31, 2008 2,287,266 22 0.33
Acquired in 2009 328,167 3 0.05 30 Sold in 2009 291,093 3 0.04 333 323
Holding at December 31, 2009 2,324,340 22 0.33
Acquisitions in 2009 and 2008 comprised investments on behalf of customers.
STATEMENT OF CAPITAL – DANSKE BANK A/S
158 STATEMENT OF CAPITAL – DANSKE BANK A/S DANSKE BANK ANNUAL REPORT 2009

Statement of capital � Danske Bank A/S
(DKr m) 2009 2008 Capital base and solvency ratio Shareholders' equity 101,094 100,013
Proposed dividends - -
Intangible assets -19,427 -20,965
Deferred tax assets -1,413 -908
Deferred tax on intangible assets 266 300
Revaluation reserve -753 -924
Core tier 1 capital, excluding hybrid capital 79,767 77,516
Hybrid capital 39,066 13,679 Statutory deduction for insurance subsidiaries -2,308 -2,555
Other statutory deductions - -31
Total tier 1 capital 116,525 88,609
Subordinated debt, excluding hybrid capital 29,365 32,415
Hybrid capital - 1,081
Revaluation of real property 753 924
Difference between expected losses and impairment charges - 1,936
Statutory deduction for insurance subsidiaries -2,308 -2,555
Other statutory deductions - -31
Capital base 144,335 122,379
-weighted assets Risk 676,443 799,724
Core tier 1 capital ratio, excluding hybrid capital (%) 11.8 9.7
Tier 1 capital ratio (%) 17.2 11.1
Solvency ratio (%) 21.3 15.3
The solvency and tier 1 capital ratios are calculated in accordance with the Capital Requirements Directive. Risk-weighted assets calculated under the Basel I rules amounted to DKr987,261m at the end of 2009. The ICAAP result, calculated under the transitional requirement of 80% of the capital requirement of 8% of risk-weighted assets, was DKr63,185m. In 2008, the ICAAP result, calculated under the transitional requirement of 90% of the capital requirement, was DKr77,735m. Transitional rules used in 2009 will also apply in 2010 and 2011.
STATEMENT OF CAPITAL – DANSKE BANK A/S
159DANSKE BANK ANNUAL REPORT 2009 STATEMENT OF CAPITAL – DANSKE BANK A/S

Notes � Danske Bank A/S
Note (DKr m) 2009 2008 1 Net interest and fee income and value adjustments broken down by business segment
Banking Activities 24,885 30,344
Danske Markets 16,351 -1,742
Danske Capital 675 598
Other -919 -4,467
Total 40,992 24,733
Geographical segmentation
Denmark 26,470 13,231
Finland 316 350
Ireland 1,484 1,365
Norway 3,623 3,069
UK 2,870 1,530
Sweden 5,054 3,996
Baltics 821 825
Germany 245 244
Poland 109 123
Total 40,992 24,733
Geographical segmentation is based on the location in which the individual transaction is recorded. The figures for Denmark include financing costs related to investments in non-Danish activities.
2 Interest income
Reverse transactions with credit institutions and central banks 2,143 9,701
Other transactions with credit institutions and central banks 4,713 10,322
Reverse loans 3,232 11,509
Loans, advances and other amounts due 41,428 53,896
Bonds 16,312 19,403
Derivatives 911 -2,043
Currency contracts -2,182 -3,209
Interest rate contracts 3,093 1,166
Other interest income 306 464
Total 69,045 103,252
3 Interest expense Repo transactions with credit institutions and central banks 1,377 6,392
Other transactions with credit institutions and central banks 5,996 29,110
Repo deposits 888 5,611
Deposits and other amounts due 17,395 21,138
Issued bonds 10,159 16,344
Subordinated debt 3,708 2,115
Other interest expenses 176 805
Total 39,699 81,515
4 Fee and commission income Securities trading and custody account fees 3,460 3,889
Payment services fees 1,480 1,609
Origination fees 1,521 1,470
Guarantee commissions 897 857
Other fees and commissions 1,163 1,140
Total 8,521 8,965
NOTES – DANSKE BANK A/S
160 NOTES – DANSKE BANK A/S DANSKE BANK ANNUAL REPORT 2009

Notes � Danske Bank A/S
Note (DKr m) 2009 2008 5 Value adjustments
Loans and advances at fair value 535 2,048
Bonds 2,123 347
Shares etc. 208 -1,964
Investment property -9 157
Currency 1,718 1,622
Derivatives 1,024 961
Assets under pooled schemes 5,384 -5,492
Deposits under pooled schemes -5,570 5,873
Other assets - -
Other liabilities -66 -7,326
Total 5,347 -3,774
6 Staff costs and administrative expenses
Remuneration of the Executive Board and the Board of Directors
Executive Board 29 23
Board of Directors 8 8
Total 37 31
Under the Danish Act on State-Funded Capital Injections into Credit InstitutionsX����?�^ ������������������������������=�����tible until the capital raised has been repaid. In 2009, this deduction amounted to DKr14m. In 2008, in accordance with the Group�s general staff policies, Peter Straarup received a 40-year anniversa�?�������X��>�������$��������� salary, and Sven Lystbæk received a 25-year anni-vers��?�������X��>����������������s salary.
Staff costs
Salaries 8,576 7,813
Pensions 1,131 1,145
Financial services employer tax etc. 1,059 1,012
Total 10,766 9,970
Other administrative expenses 4,920 5,437
Total staff costs and administrative expenses 15,723 15,438
Number of full-time-equivalent staff (avg.) 16,238 16,884
Note 9 of the consolidated financial statements contains additional information about the remuneration of the Executive Board and the Board of Directors.
7 Amortisation, depreciation and impairment charges for intangible and tangible assets Includes goodwill impairment charges of DKr1.5bn, see note 23 to the consolidated financial statements.
8 Audit fees
Total fees to the audit firms appointed by the general meeting
that perform the statutory audit 15 16
Fees for non-audit services included in preceding item 6 8
NOTES – DANSKE BANK A/S
161DANSKE BANK ANNUAL REPORT 2009 NOTES – DANSKE BANK A/S

Notes � Danske Bank A/S
Note (DKr m) 2009 2008 9 Tax
Calculated tax charge for the year 495 1,006
eferred tax D 1,092 -1,379
Adjustment of prior-year tax charges 201 -66
Lowering of tax rate - -5
Total 1,788 -444 Effective tax rate % %
Danish tax rate 25.0 -25.0
Non-taxable income and non-deductible expenses -150.7 15.8
Difference between tax rates of non-Danish units and Danish tax rate -252.2 1.3
Adjustment of prior-year tax charges -47.9 -1.4
Lowering of tax rate - -0.1
Effective tax rate -425.8 -9.4
Portion included under income from associated and group undertakings 489.9 -40.4
Total 64.1 -49.8
10 Due from credit institutions and central banks
Demand deposits 5,456 17,362
Up to 3 months 216,099 215,741
From 3 months to 1 year 16,076 34,951
From 1 to 5 years 5,809 8,794
Over 5 years 3,027 2,374
Total 246,467 279,222
Due from credit institutions 183,837 248,394
Term deposits with central banks 62,630 30,828
Total 246,467 279,222
Reverse transactions included in preceding item 115,279 147,738
11 Loans, advances and other amounts due at amortised cost
Demand deposits 41,795 71,817
Up to 3 months 373,127 510,603
From 3 months to 1 year 173,368 168,771
From 1 to 5 years 101,551 123,030
Over 5 years 230,716 246,498
Total 920,557 1,120,719
Reverse transactions included in preceding item 146,063 233,971
Loans, advances and guarantees broken down by sector and industry % %
Public sector 2.4 3.2
Corporate sector
Agriculture, hunting and forestry 1.3 1.2
Fisheries 0.2 0.2
Manufacturing industries, extraction of
raw materials and utilities 9.9 9.6
Building and construction 2.4 3.5
Trade, restaurants and hotels 4.3 4.8
Transport, mail and telephone 4.6 4.4
Credit, finance and insurance 34.4 40.1
Property administration, purchase and sale, and business services 12.2 9.8
Other 0.8 0.6
Total corporate sector 70.1 74.2
Personal customers 27.5 22.6
Total 100.0 100.0
NOTES – DANSKE BANK A/S
162 NOTES – DANSKE BANK A/S DANSKE BANK ANNUAL REPORT 2009

Notes � Danske Bank A/S
Note (DKr m) 12 Impairment charges for loans, advances
and guarantees, etc.
Loans, advances Loans, advances Other Other and guarantees, and guarantees, amounts due, amounts due, individual collective individual collective impairment impairment impairment impairment Total
Impairment charges at January 1, 2009 8,891 4,240 43 - 13,174
Impairment charges during the year 21,800 2,168 64 - 24,032
Reversals of impairment charges from previous years 4,211 2,933 1 - 7,145 Other changes 147 270 1 - 418
Impairment charges at December 31, 2009 26,627 3,745 107 - 30,479
Impairment charges at January 1, 2008 2,746 1,048 1 - 3,795
Impairment charges during the year 7,537 3,437 42 - 11,016
Reversals of impairment charges from previous years 1,398 329 - - 1,727
Other changes 6 84 - - 90
Impairment charges at December 31, 2008 8,891 4,240 43 - 13,174
2009 2008 Individual Collective Individual Collective
Total loans, advances and other amounts due (including portfolios) with objective evidence of impairment before impairment charges. The amount does not include loans, advances and other amounts due recognised at nil. 26,664 88,494 16,711 218,974
Carrying amount net of impairment charges 16,880 84,749 12,626 214,750
13 Development in lending activities in Denmark in 2009
In May 2009, Danske Bank A/S raised subordinated loan capital in the form of hybrid capital of DKr24bn from the Danish state. Un-der Danish law, banks that raise state-funded capital must publish semi-annual statements on developments in their Danish lending activities. Danske Bank A/S grants loans to retail and corporate customers in a number of countries. The table below shows loans and ad-vances, irrevocable loan commitments and guarantees before impairment charges held by customers (including public sector) and re-tail customers with Danske Bank A/S. Loans etc. before impairment charges
Dec. 31, 2009 Jun. 30, 2009
Corporate
customers Retail
customers Total Share (%)
Corporate customers
Retail customers Total Share (%)
Denmark 333,822 175,387 509,209 38 367,227 163,222 530,449 36
Finland 18,596 11 18,607 1 29,640 9 29,649 2
Sweden 155,829 65,447 221,276 17 150,666 61,153 211,819 15
Ireland 56,151 29,860 86,011 6 60,096 30,998 91,094 6
UK 93,337 494 93,831 7 118,197 515 118,712 8
Germany 14,233 257 14,490 1 15,869 216 16,085 1
Baltics 15,997 14,240 30,237 2 16,253 14,676 30,929 2
Other EU member states 39,974 785 40,759 3 41,216 709 41,925 3
Norway 115,823 62,363 178,186 13 118,482 53,689 172,171 12
Eastern Europe 556 32 588 - 641 20 661 0
Other Euro-pean countries 5,220 300 5,520 - 6,350 309 6,659 0
North America 141,163 451 141,614 11 185,502 451 185,953 13
Rest of world 9,245 596 9,841 1 20,280 921 21,201 2
Total 999,946 350,223 1,350,169 100 1,130,419 326,888 1,457,307 100
NOTES – DANSKE BANK A/S
163DANSKE BANK ANNUAL REPORT 2009 NOTES – DANSKE BANK A/S

Notes � Danske Bank A/S
Note (DKr m)
!�������
13 ������������<�+����������������������������������?������#����#���������������������������������X��������������?��e-clining industrial output and consumer confidence. At the end of 2009, economic indicators pointed to a stabilisation, a lthough at a low level. The unemployment rate is expected to continue its upward trend. This has an adverse effect on customers� creditworthiness and moderates their investment appetite and thus the demand for loans. Danske Bank A/S grants credits on the �������������������������������������������������������������������������������
position of customers to determine whether the basis for granting credit has changed. Facilities should reasonably match the cus-����������������������X����uding capital position and assets, and the customers must be able to demonstrate repayment ability. Collateral is generally required for long-term credit facilities (usually facilities with a term of more than five years). Danske Bank A/S is particularly careful in granting credit to businesses in troubled or cyclical industries. "�����������������?���������������������credit facilities regularly. The system contains data on limits and amounts drawn for all types of facilities and collateral. Danske Bank A/S supported its creditworthy customers throughout the second half of 2009. Since Danske Bank A/S�� tightening of lending terms for less creditworthy corporate customers in 2008 and the first half of 2009, lending terms were not tightened further. Danske Bank has increased its focus on certain industries, including property developers and the agricultural sector, however. For retail customers, the requirements for the amount available for consumption and loan-to-value ratio for mortgage loans were un-changed from the level established in mid-2008. More information about the Group�s lending policy, rating of customers and risk management is provided in section 4 of Risk Management 2009, published on February 4, 2010. Risk Management 2009 is available at www.danskebank.com/ir.
In step with the lowering of leading interest rates by the Danish central bank, Danske Bank Denmark lowered its variable deposit and lending rates in the second half of 2009. In the first half of 2009, the lending margins were widened to mirror the deteriorating cred-itworthiness of customers. Lending margins widened at a slower pace in the second half of 2009.
TREND IN LENDING RATES, 2009(%)
0
2
4
6
8
Nov. Dec.Oct.Sep.Aug.Jul.Jun.MayApr.Mar.Feb.Jan.
All sectors
Households
Non-financials
Source: the Danish central bank
������������������������������������������X�����������terms of the loan amounts applied for, fell 13% from the level in the first half of 2009. For existing customers, the number of loan applications fell 17% in the second half of 2009. For new customers, the demand also fell in the same period. The share of approved applications from existing customers was unchanged at 89% at the end of the second half of 2009. Loan applications from new customers saw a similar trend. Loans and advances etc. before impairment charges to retail customers in Denmark rose above the level in the first half of 2009 and amounted to DKr175bn at the end of 2009. Demand for credit, primarily for mortgages on real property, rose 17% from the level in the first half of 2009. For existing customers, demand grew as the average loan amount applied for increased 25%. For new custom-ers, demand for credit rose above the level in the first half of 2009, also as a result of an increase in the average loan amount applied for. The share of approved applications was 92% in the second half of 2009, against 91% in the first half of 2009. Danske Bank A/S reduced loans and advances etc. to credit institutions, financial institutions and insurance companies by DKr21bn, and lower demand for credit from other corporate customers reduced loans etc. by DKr4bn in comparison with the level at June 30, 2009. Both figures are exclusive of impairment charges.
NOTES – DANSKE BANK A/S
164 NOTES – DANSKE BANK A/S DANSKE BANK ANNUAL REPORT 2009

Notes - Danske Bank A/S
Note (DKr m) 13 The table below shows the trend in loans and advances, irrevocable loan commitments and guarantees before impairment charges for !������� customers of Danske Bank A/S resident in Denmark.
Loans etc. before impairment charges
Dec. 31, 2009 Jun. 30, 2009
Existing customers New customers Total Total
Public sector 9,621 30 9,651 17,823
Corporate sector
Agriculture, hunting and forestry 10,733 52 10,785 10,895
Fisheries 966 15 981 1,485
Manufacturing industries, extraction of raw materials and utilities 67,468 201 67,669 65,696
Building and construction 7,815 96 7,911 9,509
Trade, restaurants and hotels 23,800 129 23,929 26,396
Transport, mail and telephone 27,954 42 27,996 31,240
Credit, finance and insurance 131,664 3,414 135,078 156,328
Property administration, purchase and sale, and business services 35,137 397 35,534 36,767
Other 14,242 46 14,288 11,088
Total corporate sector 319,779 4,392 324,171 349,404
Retail customers
Mortgages 132,396 2,638 135,034 124,243
Other 39,987 366 40,353 38,979
Total retail customers 172,383 3,004 175,387 163,222
Total 501,783 7,426 509,209 530,449
New customers are customers to whom Danske Bank has not granted loans or other credit facilities within the past 12 months.
A/S
In compliance with statutory requirements, this lending statement is available as a separate document at www.danskebank.com/ir.
14 Investment and domicile property 2009 2008 Investment Domicile Investment Domicile property property property property
Fair value/revaluation at January 1 81 4,652 85 5,159
Additions, including property improvement expenditure 3 33 4 40
Disposals - 18 2 423
Depreciation charges - 62 - 55
Value adjustment recognised directly on equity - -160 - 53
Value adjustment recognised in the income statement -3 -160 2 30
Other changes - 77 -8 -152
Fair value/revaluation at December 31 81 4,362 81 4,652
Required rate of return for calculation of fair value/revaluation (% per annum) 4.8-7.5 5.5-8.8 4.0-7.5 5.5-8.8
The value of real property is assessed by the Group's valuers.
NOTES – DANSKE BANK A/S
165DANSKE BANK ANNUAL REPORT 2009 NOTES – DANSKE BANK A/S

Notes � Danske Bank A/S
Note (DKr m) 2009 2008 15 Other tangible assets
Cost at January 1 7,491 7,349
Exchange rate adjustments 172 -28
Additions, including property improvement expenditure 1,082 2,072
Disposals 1,814 1,902
Cost at December 31 6,931 7,491
Depreciation and impairment charges at January 1 3,126 3,133
Exchange rate adjustments 65 99
Depreciation charges 1,034 1,099
Depreciation and impairment charges for assets sold 1,093 1,205
Depreciation and impairment charges at December 31 3,132 3,126
Carrying amount at December 31 3,799 4,365
16 Change in deferred tax
At Jan. 1 Other
adjustments
Recognised in profit for
the year
Recognised in shareholders'
equity At Dec. 31
2009
Intangible assets 276 - -7 - 269
Tangible assets 460 15 786 - 1,261
Securities -221 -15 107 - -129
Provisions for obligations -212 -7 -34 - -253
Tax loss carryforwards -139 - -1,120 - -1,259
Recapture of tax loss - - 2,047 - 2,047
Other -542 -48 387 - -203
Total -378 -55 2,166 - 1,733
Adj. of prior-year tax charges included in preceding item 1,074
2008
Intangible assets 299 - -23 - 276
Tangible assets 912 - -750 298 460
Securities -225 - 4 - -221
Provisions for obligations -335 -8 131 - -212
Tax loss carryforwards -6 - -133 - -139
Recapture of tax loss - - - - -
Other 26 -20 -548 - -542
Total 671 -28 -1,319 298 -378
Adj. of prior-year tax charges included in preceding item -65
Deferred tax
Deferred tax assets 1,413 908
Provisions for deferred tax 3,146 530
Deferred tax, net 1,733 -378
17 Bonds at amortised cost
Fair value of held-to-maturity assets 6,416 4,950
Carrying amount of held-to-maturity assets 5,933 4,952
NOTES – DANSKE BANK A/S
166 NOTES – DANSKE BANK A/S DANSKE BANK ANNUAL REPORT 2009

Notes � Danske Bank A/S
Note (DKr m) 2009 2008 18 Assets under pooled schemes
Bonds at fair value 19,829 20,582
Shares 4,991 6,844
Unit trust certificates 11,271 5,197
Cash deposits etc. 2,010 728
Total assets before elimination 38,101 33,351
Own shares 294 141
Other internal balances 1,937 1,142
Total 35,870 32,068
19 Other assets
Positive fair value of derivatives 309,645 568,205
Other assets 18,663 27,612
Total 328,308 595,817
20 Due to credit institutions and central banks
Amounts payable on demand 28,098 52,515
Up to 3 months 259,211 543,985
From 3 months to 1 year 82,685 35,346
From 1 to 5 years 1,486 2,267
Over 5 years 1,906 1,644
Total 373,386 635,757
Repo transactions included in preceding item 160,002 148,182
21 Deposits and other amounts due
On demand 400,414 345,778
Term deposits 1,848 10,539
Time deposits 231,509 257,035
Repo deposits 55,648 98,441
Special deposits 23,810 21,191
Total 713,229 732,984
On demand 400,414 345,778
Up to 3 months 225,571 292,352
From 3 months to 1 year 33,518 28,303
From 1 to 5 years 13,099 21,095
Over 5 years 40,627 45,456
Total 713,229 732,984
22 Issued bonds at amortised cost
On demand - - Up to 3 months 168,180 202,889
From 3 months to 1 year 81,982 59,593
From 1 to 5 years 164,764 175,641
Over 5 years 64,026 24,792
Total 478,952 462,915
23 Other liabilities
Negative fair value of derivatives 303,849 575,063
Other liabilities 100,622 85,154
Total 404,471 660,217
NOTES – DANSKE BANK A/S
167DANSKE BANK ANNUAL REPORT 2009 NOTES – DANSKE BANK A/S

Notes � Danske Bank A/S
Note (DKr m) 24 Subordinated debt
Subordinated debt consists of liabilities in the form of subordinated loan capital and hybrid capital, which, in the event of Danske �������#������?������������?�$����-up, will not be repaid until the claims of ordinary creditors have been met. Hybrid capital ranks below subordinated loan capital. Early redemption of subordinated debt must be approved by the Danish FSA. Subordinated debt is included in the capital base in accordance with sections 129, 132 and 136 of the Danish Financial Business Act.
Principal Interest Redemption 2009 2008 Currency (millions) rate Issued Maturity price (DKr m) (DKr m)
Redeemed loans 3,725 EUR 400 5.875 2002 26.03.2015 100 2,976 2,981
EUR 500 4.250 2003 20.06.2016 100 3,721 3,725
NOK 1,770 var. 2003 25.05.2014 100 1,583 1,340
GBP 350 5.375 2003 29.09.2021 100 2,881 2,677
NOK 500 var. 2003 15.02.2014 100 447 379
SEK 750 var. 2004 22.12.2013 100 542 510
EUR 700 4.100 2005 16.03.2018 100 5,209 5,216
EUR 500 var. 2005 09.09.2013 100 3,721 3,725
NOK 535 var. 2005 22.03.2014 100 478 405
EUR 500 6.000 2007 20.03.2016 100 3,721 3,725
EUR 500 5.375 2008 18.08.2014 100 3,721 3,725
DKK 500 5.500 2008 22.08.2014 100 500 500
Subordinated debt, excluding hybrid capital 29,500 32,633
Hybrid capital
Hybrid capital included under the 15% of tier 1 capital limit (section 129(4)): USD 750 5.914 2004 Perpetual 100 3,892 3,964
GBP 150 5.563 2005 Perpetual 100 1,234 1,147
GBP 500 5.684 2006 Perpetual 100 4,116 3,824
EUR 600 4.878 2007 Perpetual 100 4,465 4,470
SEK 1,350 var. 2007 Perpetual 100 976 919
SEK 650 5.119 2007 Perpetual 100 470 442
Hybrid capital included under the 35% of tier 1 capital limit (section 129(3)):
DKK 23,992 9.265 2009 Perpetual 100 23,992 -
Total hybrid capital 39,145 14,766
Nominal subordinated debt 68,645 47,399
Hedging of interest rate risk at fair value 2,219 2,490
Own holdings -126 -189
Total subordinated debt 70,738 49,700
Interest on subordinated debt and related items
Interest 3,708 2,115
Extraordinary repayments 3,725 5,220
Origination and redemption costs 47 15
Amount included in the capital base at December 31 68,431 47,175
Note 31 of the consolidated financial statements contains additional information about subordinated debt and contractual terms.
NOTES – DANSKE BANK A/S
168 NOTES – DANSKE BANK A/S DANSKE BANK ANNUAL REPORT 2009

Notes � Danske Bank A/S
Note (DKr m) 2009 2008 25 Assets deposited as collateral
At the end of 2009, Danske Bank A/S had deposited securities worth DKr98,358m as collateral with Danish and international clear-ing centres and other institutions (2008: DKr269,392m). In repo transactions, which involve selling securities to be repurchased at a later date, the securities remain on the balance sheet, and the amounts received are recognised as deposits. Repo transaction securities are treated as assets provided as collateral for liabili-ties. Counterparties are entitled to sell the securities or deposit them as collateral for other loans.
Assets sold in repo transactions
Bonds at fair value 211,844 248,700
Shares etc. 2 46
Total 211,846 248,746
Total collateral deposited for subsidiary undertakings 540 941
At the end of 2009, Danske Bank A/S had delivered cash and securities worth DKr35,124m (2008: DKr65,944m) as collateral for derivatives transactions. At the end of 2009, Danske Bank A/S had registered loans and advances worth DKr108,067m and other assets worth DKr2,947m as collateral for covered bonds (2008: DKr63,305m and DKr1,022m, respectively).
26 Contingent liabilities Danske Bank uses a variety of loan-related financial instruments to meet the financial requirements of its customers. These include loan offers and other credit facilities, guarantees and instruments that are not recognised on the balance sheet.
Guarantees and other liabilities
Guarantees etc.
Financial guarantees 6,988 9,102
Mortgage finance guarantees 46,958 47,126
Registration and remortgaging guarantees 22,674 9,978
Loss guarantee for the Private Contingency Association 4,727 6,339
Other guarantees 165,438 229,746
Total 246,785 302,291
Other liabilities
Irrevocable loan commitments shorter than 1 year 45,172 50,458
Irrevocable loan commitments longer than 1 year 108,239 99,771
Other obligations 774 907
Total 154,185 151,136
In addition, Danske Bank has granted credit facilities related to credit cards and overdraft facilities that can be terminated at short no-tice. At the end of 2009, such unused credit facilities amounted to DKr122,800m (2008: DKr125,419m). Owing to its business volume, Danske Bank A/S is continually a party to various lawsuits. In view of its size, the Bank does not expect the outcomes of the cases pending to have any material effect on its financial position. A limited number of employees are employed under terms which grant them, if they are dismissed before reaching their normal re-tirement age, an extraordinary severance and/or pension payment in excess of their entitlement under ordinary terms of employment. Danske Bank A/S manages the joint taxation scheme that covers all group companies. The Bank is liable only for tax payable by the Bank itself and for amounts received from subsidiary undertakings in payment of joint corporation tax. The Bank is registered jointly with all significant wholly-owned Danish subsidiaries for financial services employer tax and VAT, for which it is jointly and severally l i-able. Together with the majority of Danish banks, Danske Bank is participating in the Danish state guarantee under the Act on Financial Stability adopted by the Danish parliament on October 10, 2008. The scheme runs from October 5, 2008, to September 30, 2010, and includes an unconditional state guarantee for the obligations of Danish banks, except for subordinated debt and covered bonds. |�������������are of the state guarantee commission and the commitment to cover losses is calculated on the basis of the part of the �����������������������������������������������#������#������?��������������������������������������������������������al amount, or an annual guarantee commission of around DKr2.5bn and a remaining commitment to cover losses of around DKr4.7bn. Of the lat-ter amount, DKr3.3�������������?��������?�����������������������������������������������=���������}^����<�������������} ~, to-tal impairment charges for this commitment amounted to DKr1.9bn.
NOTES – DANSKE BANK A/S
169DANSKE BANK ANNUAL REPORT 2009 NOTES – DANSKE BANK A/S
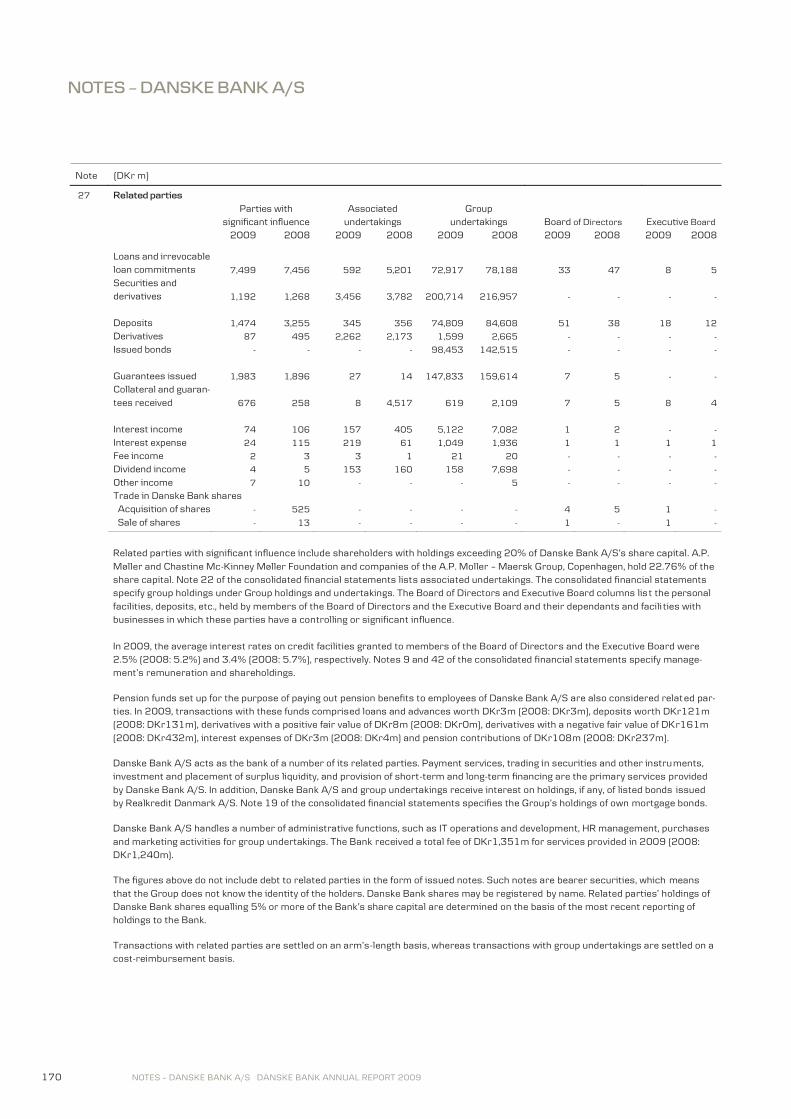
Notes � Danske Bank A/S
Note (DKr m) 27 Related parties
Parties with
significant influence Associated
undertakings Group
undertakings Board of Directors Executive Board
2009 2008 2009 2008 2009 2008 2009 2008 2009 2008
Loans and irrevocable loan commitments 7,499 7,456 592 5,201 72,917 78,188 33 47 8 5
Securities and derivatives 1,192 1,268 3,456 3,782 200,714 216,957 - - - -
Deposits 1,474 3,255 345 356 74,809 84,608 51 38 18 12
Derivatives 87 495 2,262 2,173 1,599 2,665 - - - -
Issued bonds - - - - 98,453 142,515 - - - -
Guarantees issued 1,983 1,896 27 14 147,833 159,614 7 5 - -
Collateral and guaran-tees received 676 258 8 4,517 619 2,109 7 5 8 4
Interest income 74 106 157 405 5,122 7,082 1 2 - -
Interest expense 24 115 219 61 1,049 1,936 1 1 1 1
Fee income 2 3 3 1 21 20 - - - -
Dividend income 4 5 153 160 158 7,698 - - - -
Other income 7 10 - - - 5 - - - -
Trade in Danske Bank shares
Acquisition of shares - 525 - - - - 4 5 1 -
Sale of shares - 13 - - - - 1 - 1 -
Related parties with significant influence include shareholders with holdings exceeding 20% of ������������<�+���������������. A.P. Møller and Chastine Mc-Kinney Møller Foundation and companies of the A.P. Moller � Maersk Group, Copenhagen, hold 22.76% of the share capital. Note 22 of the consolidated financial statements lists associated undertakings. The consolidated financial statements specify group holdings under Group holdings and undertakings. The Board of Directors and Executive Board columns list the personal facilities, deposits, etc., held by members of the Board of Directors and the Executive Board and their dependants and facili ties with businesses in which these parties have a controlling or significant influence. In 2009, the average interest rates on credit facilities granted to members of the Board of Directors and the Executive Board were 2.5% (2008: 5.2%) and 3.4% (2008: 5.7%), respectively. Notes 9 and 42 of the consolidated financial statements specify manage-������ remuneration and shareholdings. Pension funds set up for the purpose of paying out pension benefits to employees of Danske Bank A/S are also considered related par-ties. In 2009, transactions with these funds comprised loans and advances worth DKr3m (2008: DKr3m), deposits worth DKr121m (2008: DKr131m), derivatives with a positive fair value of DKr8m (2008: DKr0m), derivatives with a negative fair value of DKr161m (2008: DKr432m), interest expenses of DKr3m (2008: DKr4m) and pension contributions of DKr108m (2008: DKr237m). Danske Bank A/S acts as the bank of a number of its related parties. Payment services, trading in securities and other instruments, investment and placement of surplus liquidity, and provision of short-term and long-term financing are the primary services provided by Danske Bank A/S. In addition, Danske Bank A/S and group undertakings receive interest on holdings, if any, of listed bonds issued by Realkredit Danmark A/S. Note 19 ���������������������������������������������������������������������$� mortgage bonds. Danske Bank A/S handles a number of administrative functions, such as IT operations and development, HR management, purchases and marketing activities for group undertakings. The Bank received a total fee of DKr1,351m for services provided in 2009 (2008: DKr1,240m). The figures above do not include debt to related parties in the form of issued notes. Such notes are bearer securities, which means that the Group does not know the identity of the holders. Danske Bank shares may be registered by name. R���������������holdings of Danske Bank shares equalling 5% or more of the Bank�s share capital are determined on the basis of the most recent reporting of holdings to the Bank. "�����������$�����������������������������������������-length basis, whereas transactions with group undertakings are settled on a cost-reimbursement basis.
NOTES – DANSKE BANK A/S
170 NOTES – DANSKE BANK A/S DANSKE BANK ANNUAL REPORT 2009

Notes � Danske Bank A/S
Note (DKr m) 28 Hedging of risk 2009 2008 Carrying Amortised/ Carrying Amortised/ amount notional value amount notional value
Assets
Due from credit institutions 5,874 5,590 24,412 24,382
Loans and advances 51,850 50,152 55,856 53,645
Total 57,724 55,742 80,268 78,027
Financial instruments hedging interest rate risk
Derivatives -187 62,018 -1,098 67,099
Liabilities
Deposits 176,344 176,112 141,134 140,840
Due to credit institutions 143,272 143,225 380,328 380,117
Issued bonds 502,382 498,175 526,419 521,997
Subordinated debt 71,003 68,645 49,973 47,399
Total 893,001 886,157 1,097,854 1,090,353
Financial instruments hedging interest rate risk
Derivatives 7,692 923,147 9,069 1,032,048
The consolidated financial statements include additional information about hedge accounting.
29 Group holdings and undertakings T�������������������������������� are listed in the consolidated financial statements . (note 44)
NOTES – DANSKE BANK A/S
171DANSKE BANK ANNUAL REPORT 2009 NOTES – DANSKE BANK A/S

Notes � Danske Bank A/S
(DKr m) 2009 2008 2007 2006 2005 HIGHLIGHTS Net interest and fee income 35,645 28,507 22,866 18,431 20,461
Value adjustments 5,347 -3,774 2,690 4,164 165
Staff costs and administrative expenses 15,723 15,438 14,590 11,297 11,144
Loan impairment charges etc. 21,118 10,265 306 -207 -1,162
Income from associated
and group undertakings 3,211 3,889 7,054 5,571 4,908
Net profit for the year 1,001 -448 14,996 13,960 12,209
Loans and advances 920,557 1,120,719 1,120,373 818,530 641,307
Shareholders' equity 101,094 100,013 106,376 96,509 74,638
Total assets 2,188,762 2,678,868 2,412,451 1,869,507 1,638,126
RATIOS AND KEY FIGURES
Solvency ratio (%) 21.3 15.3 11.9 16.2 15.2
Tier 1 capital ratio (%) 17.2 11.1 8.3 12.2 10.7
Return on equity before tax (%) 2.8 -0.9 17.1 20.0 21.8
Return on equity after tax (%) 1.0 -0.4 14.8 16.3 17.2
Cost/income ratio (DKr) 1.06 0.97 2.03 2.35 2.35
Interest rate risk (%) 0.7 2.5 2.1 -0.4 -
Foreign exchange position (%) 2.9 3.3 2.1 0.5 1.6
Exchange rate risk (%) - 0.1 - - -
Loans and advances plus impairment charges as % of deposits 126.2 147.9 139.5 136.8 114.7
Gearing of loans and advances (%) 9.1 11.2 10.5 8.5 8.6
Growth in loans and advances (%) -17.9 - 36.9 27.6 26.0
Surplus liquidity in relation to statutory liquidity requirement (%) 138.3 66.3 88.3 137.0 160.2
Large exposures as % of capital base 22.8 98.2 151.0 151.5 173.8
Impairment ratio (%) 1.6 0.7 - - -0.1
Earnings per share (DKr) 1.5 -6.5 21.8 21.2 18.6
Book value per share (DKr) 146 145 155 140 117
Proposed dividend per share (DKr) - - 8.50 7.75 10.00
Share price at December 31/earnings per share (DKr) 81.6 -8.0 9.1 11.8 11.9
Share price at December 31/book value per share (DKr) 0.81 0.36 1.29 1.78 1.89
"��������������������������������&+<����=���#��������������������������������������������, investment companies, etc.
NOTES – DANSKE BANK A/S
172 NOTES – DANSKE BANK A/S DANSKE BANK ANNUAL REPORT 2009

RUBRIK
173 DANSKE BANK ANNUAL REPORT 2009 STATEMENT BY THE MANAGEMENT
STATEMENT BY THE MANAGEMENT
The Board of Directors and the Executive Board (the management) have today considered and approved the annual report of Danske Bank A/S for the financial year 2009.
The consolidated financial statements have been prepared in accordance with the International Financial Reporting Standards (IFRSs) as adopted by the EU, and the Parent Company’s financial statements have been prepared in accordance with the Danish Financial Business Act. Furthermore, the annual report has been prepared in accordance with additional Danish disclosure requirements for annual reports of listed financial institutions.
In our opinion, the consolidated financial statements and the Parent Company’s financial statements give a true and fair view of the Group’s and the Parent Company’s assets, liabilities, equity and financial position at December 31, 2009, and of the results of the Group’s and the Parent Company’s operations and the consoli-dated cash flows for the financial year starting on January 1 and ending on December 31, 2009. Moreover, in our opinion, the management’s report includes a fair review of developments in the Group’s and the Parent Company’s operations and financial position and describes the significant risks and uncertainty factors that may affect the Group and the Parent Company.
The management will submit the annual report to the general meeting for approval.
Copenhagen, February 4, 2010
EXECUTIVE BOARD
Peter StraarupChairman
Tonny Thierry AndersenChief Financial Officer
Thomas F. BorgenMember of the
Executive Board
Sven LystbækMember of the
Executive Board
Per SkovhusMember of the
Executive Board
BOARD OF DIRECTORS
Alf Duch-PedersenChairman
Eivind KoldingVice Chairman
Henning Christophersen
Peter Højland Mats Jansson Niels Chr. Nielsen
Sten Scheibye Majken Schultz Claus Vastrup
Birgit Aagaard-Svendsen Helle Brøndum Charlotte Hoffmann
Per Alling Toubro Verner Usbeck Solveig Ørteby

AUDITORS’ REPORTS
INTERNAL AUDIT’S REPORT
We have audited the annual report of Danske Bank A/S for the financial year 2009. The consolidated financial statements have been prepared in accordance with the International Financial Reporting Standards (IFRSs) as adopted by the EU and the Parent Company’s financial statements have been prepared in accordance with the Danish Financial Business Act. Furthermore, the annual report has been prepared in accordance with additional Danish disclosure requirements for annual reports of listed financial institutions.
Basis of opinionWe conducted our audit in accordance with the executive order of the Danish Financial Supervisory Authority on auditing financial businesses and financial groups and in accordance with Danish Standards on Auditing. These standards require that we plan and perform the audit to obtain reasonable assurance whether the annual report is free from material misstatement. The audit comprised all significant areas and risk areas and was conducted in accordance with the division of responsibilities agreed with the external auditors, enabling the external auditors to the widest possible extent to base their audit on the work performed by Internal Audit.
We planned and conducted our audit such that we have assessed the business and internal control procedures, including the risk and capital management implemented by the management, aimed at the Group’s and the Parent Company’s reporting processes and major business risks.
An audit involves performing procedures to obtain audit evidence about the amounts and disclosures in the annual report. The procedures selected depend on the auditor’s judgment, including the assessment of the risks of material misstatement of the annual report, whether due to fraud or error. In making those risk assessments, the auditor considers internal controls relevant to the preparation and fair presentation of the annual report in order to design audit procedures that are appropriate in the circumstances. An audit also includes evaluating the appropriateness of accounting policies used and the reasonableness of accounting estimates made by the management, as well as evaluating the overall presentation of the annual report.
We believe that the audit evidence we have obtained is sufficient and appropriate to provide a basis for our audit opinion.
Our audit did not result in any qualification.
OpinionIn our opinion, the business and internal control procedures, including the risk and capital management imple-mented by the management, aimed at the Group’s and the Parent Company’s reporting processes and major busi-ness risks operate effectively.
Furthermore, we believe that the annual report gives a true and fair view of the Group’s and the Parent Company’s assets, liabilities, equity and financial position at December 31, 2009, and of the results of the Group’s and the Parent Company’s operations and the consolidated cash flows for the financial year 2009 in accordance with the International Financial Reporting Standards (IFRSs) as adopted by the EU in respect of the consolidated financial statements, in accordance with the Danish Financial Business Act in respect of the Parent Company’s financial statements and in accordance with additional Danish disclosure requirements for annual reports of listed financial institutions.
Copenhagen, February 4, 2010
Jens Peter ThomassenGroup Chief Auditor
Niels Thor MikkelsenDeputy Group Chief Auditor
174 INTERNAL AUDIT’S REPORT DANSKE BANK ANNUAL REPORT 2009

RUBRIK
INDEPENDENT AUDITORS’ REPORT
To the shareholders of Danske Bank A/S
We have audited the consolidated financial statements and the Parent Company’s financial statements of Danske Bank A/S for the financial year 2009. The consolidated financial statements comprise the income statement, statement of comprehensive income, balance sheet, statement of capital, cash flow statement and notes. The Parent Company’s financial statements comprise income statement, balance sheet, statement of capital and notes. The consolidated financial statements have been prepared in accordance with the International Financial Reporting Standards (IFRSs) as adopted by the EU, and the Parent Company’s financial statements have been prepared in accordance with the Danish Financial Busi-ness Act. Furthermore, the consolidated financial statements and the Parent Company’s financial statements have been prepared in accordance with additional Danish disclosure requirements for listed financial institutions. In addition to our audit, we have read the management’s report prepared in accordance with Danish disclosure requirements for listed financial institutions and issued a statement in this regard.
Management’s responsibility Management is responsible for preparing and presenting consolidated financial statements and Parent Company financial statements that give a true and fair view in accordance with the International Financial Reporting Standards (IFRSs) as adopted by the EU in respect of the consoli-dated financial statements and in accordance with the Danish Financial Business Act in respect of the Parent Company and in accordance with additional Danish disclosure requirements for listed financial institutions. This responsibility includes: designing, implementing and main-taining internal controls relevant to the preparation and fair presentation of consolidated financial statements and Parent Company’s financial statements that are free from material misstatement, whether due to fraud or error; selecting and applying appropriate accounting policies; and making accounting estimates that are reasonable in the circumstances. Further, it is the responsibility of Management to prepare a management’s report that gives a fair review in accordance with Danish disclosure requirements for listed financial institutions.
Auditors’ responsibility and basis of opinionOur responsibility is to express an opinion on the consolidated financial statements and the Parent Company’s financial statements based on our audit. We conducted our audit in accordance with Danish Standards on Auditing. Those standards require that we comply with ethical require-ments and plan and perform the audit to obtain reasonable assurance whether the consolidated financial statements and the Parent Company’s financial statements are free from material misstatement.
An audit involves performing procedures to obtain audit evidence about the amounts and disclosures in the consolidated financial statements and the Parent Company’s financial statements. The procedures selected depend on the auditor’s judgment, including the assessment of the risks of material misstatement of the consolidated financial statements and the Parent Company’s financial statements, whether due to fraud or error. In making those risk assessments, the auditor considers internal controls relevant to the preparation and fair presentation of the consolidated fi-nancial statements and the Parent Company’s financial statements in order to design audit procedures that are appropriate in the circumstances, but not for the purpose of expressing an opinion on the effectiveness of internal controls. An audit also includes evaluating the appropriateness of accounting policies used and the reasonableness of accounting estimates made by the management, as well as evaluating the overall presenta-tion of the consolidated financial statements and the Parent Company’s financial statements.
We believe that the audit evidence we have obtained is sufficient and appropriate to provide a basis for our audit opinion.
Our audit did not result in any qualification.
OpinionIn our opinion, the consolidated financial statements give a true and fair view of the Group’s assets, liabilities, equity and financial position at December 31, 2009, and of the results of the Group’s operations and cash flows for the financial year 2009 in accordance with the International Financial Reporting Standards (IFRSs) as adopted by the EU and in accordance with additional Danish disclosure requirements for listed financial institutions. Furthermore, in our opinion, the Parent Company’s financial statements give a true and fair view of the Parent Company’s assets, liabilities and financial position at December 31, 2009, and of the results of the Parent Company’s operations for the financial year 2009 in accordance with the Danish Financial Business Act and in accordance with additional Danish disclosure requirements for listed financial institutions.
Statement on the management’s reportPursuant to the Danish Financial Business Act, we have read the management’s report. We have not performed any other procedures in addition to the audit of the consolidated financial statements and the Parent Company’s financial statements. On this basis, it is our opinion that the infor-mation given in the management’s report is consistent with the consolidated financial statements and the Parent Company’s financial statements.
Copenhagen, February 4, 2010KPMG
Statsautoriseret Revisionspartnerselskab
Copenhagen, February 4, 2010Grant Thornton
Statsautoriseret Revisionsaktieselskab
Per Gunslev Lars Rhod Søndergaard Ole Fabricius Christian F. Jakobsen
State Authorised Public Accountants State Authorised Public Accountants
175 DANSKE BANK ANNUAL REPORT 2009 INDEPENDENT AUDITORS’ REPORT

MANAGEMENT AND DIRECTORSHIPS – BOARD OF DIRECTORS
ALF DUCH-PEDERSENBorn on August 15, 1946Joined the Board on March 23, 1999
Member of the Credit and Risk Committee, the Remuneration Committee, the Nomination Committee and the Audit Committee
Directorships and other offices:The Denmark-America FoundationGroup 4 Securicor plc. (Chairman)
EIVIND KOLDINGPARTNER OF THE FIRM A.P. MØLLERBorn on November 16, 1959Joined the Board on March 27, 2001
Member of the Credit and Risk Committee, the Remuneration Committee and the Nomination Committee
Directorships and other offices:Box Club (International Council of Containership Operators) (Chairman)ELAA (The European Liner Affairs Association) (Chairman)Maersk Inc.Maersk Line Agency Holding A/S (Chairman)Safmarine Container Lines N.V. (Chairman)E. Kolding Shipping ApS (CEO)
HENNING CHRISTOPHERSENPARTNER OF KREAB GAVIN ANDERSON BRUSSELSBorn on November 8, 1939Joined the Board on March 26, 1996
Member of the Credit and Risk Committee
Directorships and other offices:European Institute of Public Administration (Chairman)Metroselskabet I/S (Chairman)Rockwool-FondenEpsilon s.p.r.l. (Managing Director)
PETER HØJLANDBorn on July 9, 1950Joined the Board on November 30, 2000
Member of the Credit and Risk Committee
Directorships and other offices:Amrop-Hever A/S (Chairman)Bikuben fondene (Chairman)Copenhagen Capacity, Fonden til Markedsføring og Erhvervsfremme i Hovedstadsregionen (Chairman)The Denmark-America FoundationFrederiksbergfondenIturi Management ApS (Chairman)Nordic Vision Clinics ASRambøll Gruppen A/S (Chairman)Siemens A/S (Chairman)
MATS JANSSONCEO OF SAS ABBorn on December 17, 1951Joined the Board on March 4, 2008
Member of the Audit Committee
Directorships and other offices:SAS Danmark A/S
NIELS CHR. NIELSENPROFESSOR OF ECONOMICS AT COPENHAGEN BUSINESS SCHOOLBorn on January 14, 1942Joined the Board on April 5, 1990
Member of the Credit and Risk Committee
Directorships and other offices:Grundfos A/SGrundfos Finance A/SGrundfos Holding A/SGrundfos Management A/SOticon Fonden, William Demants og Hustru Ida Emilies FondOtto Mønsted AktieselskabThe Poul Due Jensen Foundation
STEN SCHEIBYEBorn on October 3, 1951Joined the Board on March 31, 1998
Member of the Audit Committee
Directorships and other offices:The Danish Academy of Technical Sciences
176 MANAGEMENT AND DIRECTORSHIPS – BOARD OF DIRECTORS DANSKE BANK ANNUAL REPORT 2009

RUBRIK
MANAGEMENT AND DIRECTORSHIPS – BOARD OF DIRECTORS
177 DANSKE BANK ANNUAL REPORT 2009 MANAGEMENT AND DIRECTORSHIPS – BOARD OF DIRECTORS
DADES A/SThe Denmark-America Foundation (Chairman)The Trade Council of Denmark (Chairman)The Technical University of Denmark (Chairman)The Fulbright Commission in Denmark The Danish Industry FoundationThe Danish Committee on Corporate Governance (Chairman)Novo Nordisk A/S (Chairman)Rambøll Gruppen A/SAase og Ejnar Danielsens Fond
MAJKEN SCHULTZPROFESSOR OF ORGANIZATIONAT COPENHAGEN BUSINESS SCHOOLBorn on October 28, 1958Joined the Board on November 30, 2000
Member of the Nomination Committee
Directorships and other offices:The Academy of ManagementCOWI A/SDansk selskab for virksomhedsledelseRealdaniaReputation Institute (Executive Committee)Vci Holding ApS (CEO)
CLAUS VASTRUPPROFESSOR OF ECONOMICS AT UNIVERSITY OF AARHUSBorn on March 24, 1942Appointed by the Minister of Economic Affairs from January 1, 1995, to December 31, 2002; elected by the general meeting on March 25, 2003
Member of the Audit Committee and the Credit and Risk Committee
Directorships and other offices:Aarhus Universitets Jubilæumsfond
BIRGIT AAGAARD-SVENDSENEXECUTIVE VICE PRESIDENT AND CFO OFJ. LAURITZEN A/SBorn on February 29, 1956Joined the Board on March 28, 1995
Member of the Audit Committee
Directorships and other offices:Handyventure Singapore Pte. (Chairman)Metroselskabet I/STwelve Danish subsidiaries of J. Lauritzen A/SLandlov ApS (CEO)
HELLE BRØNDUMBANK CLERK OF DANSKE BANK A/SBorn on September 26, 1952Joined the Board on March 19, 2002 Most recently re-elected in 2006
Directorships and other offices:Danske Kreds
CHARLOTTE HOFFMANNPERSONAL CUSTOMER ADVISER OF DANSKE BANK A/SBorn on October 8, 1966Joined the Board on March 14, 2006
PER ALLING TOUBROCHAIRMAN OF DANSKE KREDS, DANSKE BANK A/S Born on June 25, 1953 Joined the Board on March 14, 2006
Directorships and other offices:Danske Kreds (Chairman)Danske Unions (Chairman)
VERNER USBECKASSISTANT VICE PRESIDENT OF DANSKE BANK A/SBorn on February 11, 1950Joined the Board on June 28, 1990Most recently re-elected in 2006
Directorships and other offices:Danske KredsDanske Funktionærers Boligselskab S.m.b.A. (Chairman)Niels Brock
SOLVEIG ØRTEBYVICE CHAIRMAN OF THE FINANCIAL SERVICES UNIONDanske Bank A/SBorn on March 28, 1965Joined the Board on November 30, 2000 Most recently re-elected in 2006
Directorships and other offices:Financial Services Union (Vice Chairman)

178 MANAGEMENT AND DIRECTORSHIPS – EXECUTIVE BOARD DANSKE BANK ANNUAL REPORT 2009
MANAGEMENT AND DIRECTORSHIPS – EXECUTIVE BOARD
PETER STRAARUPCHAIRMAN OF THE EXECUTIVE BOARDBorn on July 19, 1951Joined the Board on September 1, 1986
Directorships:DDB Invest AB (Chairman)Forsikringsselskabet Danica, Skadeforsikrings-aktieselskab af 1999 (Chairman)Danica Pension, Livsforsikringsaktieselskab (Chairman) Danica Liv III, Livsforsikringsaktieselskab (Chairman)Danica Pension I, Livsforsikringsaktieselskab (Chairman)Sampo Pankki Oyj (Chairman)
Other offices (non-exhaustive list):The Denmark-America Foundation The Private Contingency Association for the Winding up of Distressed Banks, Savings Banks and Cooperative Banks (Chairman)The Danish Bankers Association (Chairman)The International Monetary ConferenceInstitut International d’Etudes Bancaires
TONNY THIERRY ANDERSENCHIEF FINANCIAL OFFICERBorn on September 30, 1964Joined the Board on September 1, 2006
Directorships:Forsikringsselskabet Danica, Skadeforsikrings-aktieselskab af 1999 Danica Pension, Livsforsikringsaktieselskab Danica Liv III, Livsforsikringsaktieselskab Danica Pension I, Livsforsikringsaktieselskab Realkredit Danmark A/S Sampo Pankki Oyj
THOMAS F. BORGENMEMBER OF THE EXECUTIVE BOARDBorn on March 27, 1964Joined the Board on September 1, 2009
Directorships:Northern Bank Limited (Chairman)
SVEN LYSTBÆKMEMBER OF THE EXECUTIVE BOARDBorn on September 26, 1951Joined the Board on September 1, 2006 Directorships:Multidata Holding A/S (Vice Chairman)Multidata A/S (Vice Chairman)Northern Bank Limited PBS Holding A/S (Vice Chairman)PBS A/S (Vice Chairman)VP Securities A/S (Chairman)VISA Europe Limited
Danske Bank International S.A.Forsikringsselskabet Danica, Skadeforsikrings-aktieselskab af 1999 (Vice Chairman) Danica Pension, Livsforsikringsaktieselskab (Vice Chairman) Danica Liv III, Livsforsikringsaktieselskab (Vice Chairman)Danica Pension I, Livsforsikringsaktieselskab (Vice Chairman)Kreditforeningen Danmarks Pensionsafviklings-kasse (Vice Chairman)Realkredit Danmark A/S (Chairman)Sampo Pankki Oyj (Vice Chairman)
PER SKOVHUSMEMBER OF THE EXECUTIVE BOARDBorn on September 17, 1959Joined the Board on September 1, 2006
Directorships:Danmarks Skibskredit A/S (Chairman)Holdingbolag 25-6 2009 AB (Chairman)Northern Bank Limited Realkredit Danmark A/S
Other offices:ICC Danmark (Executive Committee Member)

ADDITIONAL INFORMATION ABOUT THE DANSKE BANK GROUP Other publications from the Danske Bank Group are Corporate Responsibility 2009, Risk Management 2009, Fact Book Q4 2009 and CR Fact Book 2009. These publica-tions provide detailed information about the Danske Bank Group and its business units and are available at www.danskebank.com/ir.
Annual Report 2009 is a translation of the original report in the Danish language (Årsrapport 2009). In case of discrepancies, the Danish version prevails.

DANSKE BANK A/S HOLMENS KANAL 2-12 / DK - 1092 KØBENHAVN K / TEL. +45 33 44 00 00
CVR-NR. 61 12 62 28 - KØBENHAVN / WWW.DANSKEBANK.COM