Covering theorems, inequalities on metric spaces and applications to PDE’s
Cytogenetic Characterization and AFLP-Based GeneticLinkage Mapping for the Butterfly Bicyclus anynana,Covering All 28 Karyotyped ChromosomesArjen E. Van’t Hof1¤, Frantisek Marec2, Ilik J. Saccheri3, Paul M. Brakefield1, Bas J. Zwaan1*
1 Department of Evolutionary Biology, Institute of Biology, Leiden University, Leiden, The Netherlands, 2 Faculty of Biological Sciences, University of South Bohemia, and
Biology Centre, ASCR, Institute of Entomology, Ceske Budejovice, Czech Republic, 3 School of Biological Sciences, University of Liverpool, Liverpool, United Kingdom
Abstract
Background: The chromosome characteristics of the butterfly Bicyclus anynana, have received little attention, despite thescientific importance of this species. This study presents the characterization of chromosomes in this species by means ofcytogenetic analysis and linkage mapping.
Methodology/Principal Findings: Physical genomic features in the butterfly B. anynana were examined by karyotypeanalysis and construction of a linkage map. Lepidoptera possess a female heterogametic W-Z sex chromosome system. TheWZ-bivalent in pachytene oocytes of B. anynana consists of an abnormally small, heterochromatic W-chromosome with theZ-chromosome wrapped around it. Accordingly, the W-body in interphase nuclei is much smaller than usual in Lepidoptera.This suggests an intermediate stage in the process of secondary loss of the W-chromosome to a ZZ/Z sex determinationsystem. Two nucleoli are present in the pachytene stage associated with an autosome and the WZ-bivalent respectively.Chromosome counts confirmed a haploid number of n = 28. Linkage mapping had to take account of absence of crossing-over in females, and of our use of a full-sib crossing design. We developed a new method to determine and exclude thenon-recombinant uninformative female inherited component in offspring. The linkage map was constructed using a novelapproach that uses exclusively JOINMAP-software for Lepidoptera linkage mapping. This approach simplifies the mappingprocedure, avoids over-estimation of mapping distance and increases the reliability of relative marker positions. A total of347 AFLP markers, 9 microsatellites and one single-copy nuclear gene covered all 28 chromosomes, with a mappingdistance of 1354 cM. Conserved synteny of Tpi on the Z-chromosome in Lepidoptera was confirmed for B. anynana. Theresults are discussed in relation to other mapping studies in Lepidoptera.
Conclusions/Significance: This study adds to the knowledge of chromosome structure and evolution of an intensivelystudied organism. On a broader scale it provides an insight in Lepidoptera sex chromosome evolution and it proposes asimpler and more reliable method of linkage mapping than used for Lepidoptera to date.
Citation: Van’t Hof AE, Marec F, Saccheri IJ, Brakefield PM, Zwaan BJ (2008) Cytogenetic Characterization and AFLP-Based Genetic Linkage Mapping for theButterfly Bicyclus anynana, Covering All 28 Karyotyped Chromosomes. PLoS ONE 3(12): e3882. doi:10.1371/journal.pone.0003882
Editor: William J. Murphy, Texas A&M University, United States of America
Received September 18, 2008; Accepted November 13, 2008; Published December 8, 2008
Copyright: � 2008 Van’t Hof et al. This is an open-access article distributed under the terms of the Creative Commons Attribution License, which permitsunrestricted use, distribution, and reproduction in any medium, provided the original author and source are credited.
Funding: The financing of the cytogenetic experiments was covered by grant 206/06/1860 of the Grant Agency of the Czech Republic (Prague) and from theEntomology Institute project Z50070508. The funders had no role in study design, data collection and analysis, decision to publish, or preparation of themanuscript.
Competing Interests: The authors have declared that no competing interests exist.
* E-mail: [email protected]
¤ Current address: School of Biological Sciences, University of Liverpool, The Biosciences Building, Liverpool, United Kingdom
Introduction
The butterfly Bicyclus anynana (Nymphalidae, Satyrinae) is
among the most extensively studied Lepidoptera species. It has
been established as an emerging model organism to address many
evolutionary questions with a particular focus on genetic and
environmental effects on wing pattern formation [1–3], and on life
history evolution and ageing [4–7]. Although this species has
received much scientific attention, the physical features of its
genome have yet to be described.
Lepidoptera chromosome numbers are usually between 28 to 32
pairs [8,9], but can vary widely probably as a result of their
holokinetic chromosome arrangement [10,11]. The most striking
examples at the genus level are found in Agrodiaetus, with haploid
chromosome numbers that vary between 10 and 134 [10].
However, geographical intra-specific variability is also commonly
observed in Lepidoptera [8,12]. Geographical subspecies of the
silk moth Samia cynthia show, besides different chromosome
numbers, a high polymorphism of sex chromosomes [13], which
may play a role in population and species divergence [14,15]. An
extraordinary variation in chromosome numbers, ranging from
n = 12 to n = 88, was reported between populations of a Philaethria
dido species complex, which is no longer regarded as single species,
since no evidence of hybrids between individuals of sympatric
populations with different chromosome numbers was found
[16,17]. The karyotype variation within the genus Bicyclus is less
PLoS ONE | www.plosone.org 1 December 2008 | Volume 3 | Issue 12 | e3882
spectacular (Supplement S1). With the exception of B. auricrudus
that has a reported haploid chromosome number of 14, all
karyotyped species have between 26 and 29 pairs, with n = 28 being
the predominant count [18–20]. However, geographical within-
species variation has been observed in B. funebris with n = 28 in
Uganda and n = 29 in Senegal [18,19]. A haploid chromosome
number of 28 was reported in B. anynana from Entebbe, Uganda
[18], but given the geographical variability in Lepidoptera there is
need for confirmation since the material used in the present study
originates from Nkhata Bay in Malawi, about 1300 km to the south.
Identification of individual chromosomes based on size and
banding patterns is difficult in Lepidoptera because of the large
number of small and equally sized chromosomes that are not
susceptible to banding techniques during mitosis. Much longer
meiotic chromosomes in the pachytene stage provide better
resolution, but their chromomere patterns are usually not fully
distinctive [11,21]. In addition, lepidopteran chromosomes are
holokinetic, i.e. they lack a distinct primary constriction (the
centromere) and spindle microtubules are attached to a large
kinetochore plate, which covers significant part of the chromo-
some surface [22]. Thus, the chromosomes cannot be distin-
guished or characterized by centromere position. The most useful
visual characteristics to distinguish lepidopteran chromosomes are
the presence of nucleolar organising regions (NORs) associated
with nucleoli and heterochromatin of the W chromosome in the
sex-chromosome (WZ) pachytene bivalents of females. However,
this accounts only for a small fraction of the chromosomes [23,24].
Despite the abundance of lepidopteran species and their
economical relevance, linkage maps are currently available for only
six species. One reason for this is that the generally large number of
chromosomes in this taxon requires a relatively large number of
markers to cover all chromosomes with sufficient density. Addition-
ally, a substantial part of the polymorphisms in the offspring cannot
be used for positional mapping since the maternally transmitted
markers are non-recombinant in Lepidoptera. The maternally
transmitted markers obscure a large part of the paternally
transmitted genotypes when using dominant markers, resulting in
an even greater loss of information [25,26]. The most detailed
linkage information in Lepidoptera comes from the domesticated
silkworm Bombyx mori, for which a number of linkage maps have been
constructed based on RAPD [27,28], RFLP [29], AFLP [30],
microsatellites [31], and BAC sequences [32–34]. In addition, all
genetic linkage groups (LGs) were successfully assigned to individual
chromosomes in this species [35]. The other lepidopteran linkage
maps have been constructed for Heliconius melpomene [25], H. erato
[26,36], Colias eurytheme-C. philodice hybrid [37], Ostrinia nubilalis [38]
and Plutella xylostella [39] based on RFLP, AFLP, microsatellites,
allozymes and single copy nuclear genes.
When using a cross with dominant markers such as AFLP’s, the
general approach in Lepidoptera mapping procedures is to divide
the offspring marker data into three groups based on the F1
marker genotypes. Markers that are heterozygous in both F1
parents segregate in the F2 with a 3:1 Mendelian ratio. Markers
that are recessive homozygous in the F1 male and heterozygous in
the F1 female have a 1:1 ratio in the F2 offspring. These markers
are used for LG assignment and for identification and exclusion of
the uninformative female-inherited component in the 3:1 markers.
The markers that are recessive homozygous in the F1 female and
heterozygous in the F1 male also have a 1:1 ratio in the offspring.
These markers, combined with the male-inherited component of
the 3:1 marker genotypes, are used for constructing the final
linkage map [25,26,36].
When using only the 3:1 markers, the outcome is a linkage map
with two LGs per chromosome (2n LGs). The two sets of
homologous LGs are incompatible and can only be combined with
anchoring markers. Male informative markers, allelic AFLPs and
microsatellites can act as such anchors and there are various
approaches to integrate the two sets of dominant markers. For
example, Lepidoptera specific software was designed to create a
linkage map for B. mori because it was argued that MAPMAKER
3.0 [40] is unsuitable for this purpose [29]. In other studies, the
final step is performed with MAPMAKER 3.0, allthough in some
cases the preceding steps were done in JOINMAP 3.0 [41] or
specifically designed programs [25,26,36,39]. Alternatively, the
LGs in repulsion were presented as two different sets [27,28], or
one integrated set that was based on the average distances of
anchoring markers [34].
Here we report on a novel approach for the final step in
Lepidoptera linkage maping by using the option in JOINMAP to
join maps, i.e. to present the two opposite phased homologous maps
as different mapping populations and use the software to integrate
them based on the anchoring markers. The advantages are that the
female-derived component can be removed instead of presented as
missing data, and the same software combines the two phases
automatically. To compare our mapping distance with that of other
species of butterfly, we also performed a MAPMAKER analysis
because Mapping distances generated by the two programs can
differ substantially [42,43]. In general, these differences are caused
by the different algorithms that are used. MAPMAKER determines
the mapping distance based on maximum likelihood multipoint
estimates, while JOINMAP uses linear regression of pairwise
distances. Additionally, when using dominant markers in species
with only one recombining sex, the manner in which the
uninformative part of the data are treated also has an effect on
mapping distance.
Methods
Cytogenetic proceduresSpread preparations of pachytene oocytes were obtained
following the protocol in [44] for pachytene mapping. Ovaries
of 5th instar larvae were dissected in physiological solution, then
fixed for 20 min in Carnoys fixative (6 : 3 : 1 ethanol-chloroform-
acetic acid), macerated in 60% acetic acid, spread on a slide at
45uC, dehydrated by three washes in increasing concentrations of
ethanol (70%, 80%, and 96%, 30s each), and dried at room
temperature, leaving the preparations suitable for different types of
staining. Some preparations were stained for 5 min and mounted
in 2.5% lactic acetic orcein. Others were stained with YOYO-1
fluorescent dye (Molecular Probes Inc., Eugene, OR, USA) under
the following conditions: the dry preparations were first soaked for
5 min in PBS (phosphate buffered saline), then stained with 50 ml
of 100 nM YOYO-1 in PBS for 20 min, briefly washed in tap
water, air-dried and mounted in 20 ml of antifade based on
DABCO (1,4-diazabicyclo(2.2.2)-octane; Sigma-Aldrich, St. Louis,
MO, USA) (for details, see [45]).
Male metaphase I and II chromosomes were obtained from
testes of the 5th instar larvae. The testes were dissected in
physiological solution, pretreated in hypotonic solution (0.075M
KCl) for 15 min, and then fixed in Carnoy’s fixative for
15 minutes. The testes were subsequently squashed in 20 ml of
50% acetic acid using a siliconised cover slip, followed by
dehydration in an alcohol series as described above. Staining
involved a 5 min incubation in PBS/1% Triton-X, followed by
15 min in PBS/1% Triton-X with 0.25 mg/ml DAPI (49,6-
diamino-2-phenylindole; Sigma-Aldrich). The slides were then
rinsed for 5 min in PBS/1% Triton-X with 1% Kodak PHOTO-
FLO, followed by 10s rinsing in H2O containing 1% Kodak
B. anynana Chromosomes
PLoS ONE | www.plosone.org 2 December 2008 | Volume 3 | Issue 12 | e3882
PHOTO-FLO. Finally, the preparations were mounted in 20 ml of
antifade.
To determine the sex chromatin status (see [46]), preparations
of polyploid nuclei were made from Malpighian tubules of 5th
instar larvae. The tubules were dissected in physiological solution,
fixed in Carnoy’s fixative for 2 min, and then stained with 1.5%
lactic acetic orcein for 4 min.
Linkage analysis and map constructionCross design. The linkage analysis was based on a cross
between individuals from divergent selection lines for eyespot size
on the ventral hindwing, designated High (H) and Low (L) for large
and small eyespots respectively [3,47]. An H-female was mated to
an L-male (P generation), and subsequently, 15 full-sib F1 crosses
were set up by combining random brothers and sisters to produce
segregating F2 offspring. The larvae were raised on maize plants
and the adults were fed with banana. They were reared at 23uC to
minimize the effect of temperature on eyespot size, since this
temperature is an intermediate between the temperature that
would produce small (20uC) and large (27uC) eyespots as a result of
phenotypic plasticity. The cross that produced the largest amount
of F2 adults was selected to produce the linkage map. All
procedures have been performed following our institutional
animal husbandry guidelines. From a total offspring of 71 males
and 113 females, 23 individuals from both ends of the phenotypic
extremes of the F2 generation were genotyped in each sex (i.e. 92 F2
individuals in total). DNA was extracted from half a thorax using
DNeasy tissue spin columns (Qiagen GmbH, Hilden, Germany).
AFLP. We followed a modified procedure of the AFLP
technique [48]. Digestion and ligation were performed simultane-
ously for two hours at 37uC in 25 ml 16T4 ligase buffer containing
1.2 units of both MseI and EcoRI (NEB, Ipswich, MA, USA),
0.612 mM Mse-adapter (59-GACGATGAGTCCTGAG-39+59-TA-
CTCAGGACTCAT-39), 0.068 mM Eco-adapter (59-CTCGTAG-
ACTGCGTACC-39+5-AATTGGTACGCAGTCTAC-39), 0.6
Weiss units T4 Ligase, 2.5 mg BSA and 5 ml DNA extract from
the 2nd Qiagen DNeasy tissue kit elution (corresponding to approxi-
mately 125 ng DNA).
Preamplification was performed in 15 ml 16AFLP Amplifica-
tion Core Mix Module (Applied Biosystems, Foster City, CA,
USA) supplied with 0.12 mM Eco+A primer (59-GACTGCG-
TACCAATTCA-39), 0.92 mM Mse+C primer (59-GAT-
GAGTCCTGAGTAAC-39), and 2 ml undiluted restriction-liga-
tion product as template. Preamplification PCR cycle was 120s
72uC, 120s 94uC, followed by 20 cycles of 10 s 94uC, 30 s 56uC,
120 s 72uC.
Selective amplifications with 33 different primer combinations
were processed in 10 ml 16Core Mix with 0.05 mM fluorescently
labeled Eco+ANN primer, 0.25 mM Mse+CNN primer and 1 ml
106diluted preamplified product as template. For sequence and
fluorescent labels of the primers see Table 1. Amplification was
performed with 60 s 94uC, then 9 cycles of 10 s 94uC, 30 s Ta
(annealing temperature), 120 s 72uC, with Ta decreasing 1uC per
cycle from 65uC down to 57uC. Then 25 cycles of 10 s 94uC, 30 s
56uC, 120 s 72uC, and a final extension of 30 min at 72uC. Twelve
of the combinations were genotyped on an ABI 377 automated
sequencer with 3 different dyes and ROX500 size standard, and an
additional 21 on an ABI 3100 with 4 dyes and LIZ500 size standard.
The ABI377 data output was analyzed with GENOGRAPHER
1.6.0 [49] and the ABI3100 generated data with GENOTYPER 3.6.
(Applied Biosystems). We use the term ‘‘peakpresent’’ to indicate an
AFLP amplicon that shows up as a peak on capillary fragment
analysis systems and which is either homozygous or heterozygous
and ‘‘peakabsent’’ for the recessive homozygote.
Microsatellites. The microsatellite markers available for this
species were processed under the conditions described in [50],
except in this case they were amplified with NED, PET, 6-FAM or
HEX modified fluorescent primers, run with LIZ-500 size
standard on an ABI 3700 fragment analysis instrument and
analysed with Genotyper 3.6 (primers, size standard, software and
ABI 3700 from Applied Biosystems).
Tpi genotyping. RNA was extracted from ground thorax
with TRIZOL (Invitrogen, Carlsbad, CA, USA) following the
methods suggested by the manufacturer. cDNA was synthesized
with SUPERSCRIPT III (Invitrogen) with 50 ng template and a
T17 primer under standard conditions. A section of the Tpi
(Triose-phosphate isomerase) gene was amplified with arthropod-
specific degenerate primers 197fin1F and 197fin2R [51]. PCR was
performed in 16Amplitaq PCR buffer I, 0.6 units Amplitaq Gold
polymerase (buffer and polymerase supplied by Applied
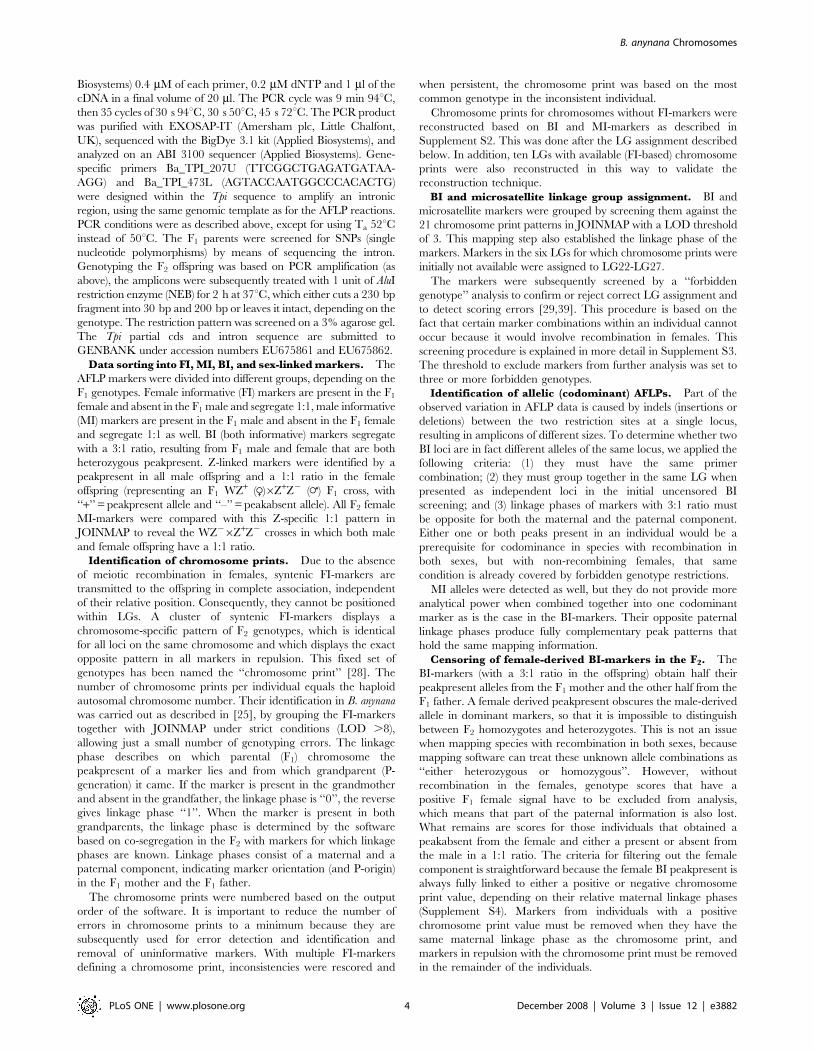
Table 1. AFLP primer combinations and fluorescent dyes.
MseI-based primer EcoRI-based primer blue EcoRI-based primer green EcoRI-based primer yellow EcoRI-based primer red Instrument
mCAA eACA 5-FAM eACC JOE eAAC NED not used ABI 377
mCAC eACA 5-FAM eACC JOE eAAC NED not used ABI 377
mCAT eACA 5-FAM eACC JOE eAAC NED not used ABI 377
mCGC eACA 5-FAM eACC JOE eAAC NED not used ABI 377
mCAG eACA 6-FAM eAAC VIC eACC NED not used ABI 3100
mCGA eACA 6-FAM eAAC VIC eACC NED not used ABI 3100
mCGG eACA 6-FAM eAAC VIC eACC NED eACG PET ABI 3100
mCGT eACA 6-FAM eAAC VIC not used eACG PET ABI 3100
mCTC eACA 6-FAM eAAC VIC eACC NED eACG PET ABI 3100
mCTG eACA 6-FAM eAAC VIC eACC NED eACG PET ABI 3100
The first column contains the different MseI-based primers used. The next four columns contain the fluorescently labeled EcoRI-based primers that were used incombination with the MseI-based primer within the same row. The primers are 19 bp in length and consist of a 16 bp core sequence and a 3 bp extension. ‘‘m’’ is shortfor a GATGAGTCCTGAGTAA core sequence and ‘‘e’’ stands for a GACTGCGTACCAATTC core sequence. ‘‘m’’ and ‘‘e’’ are followed by the three base extensions thatdifferentiate them. The colors of the fluorescent labels of the EcoRI-based primers are presented in the column headers, and the fluorescent 59 modifications in the cellsbelow them (5-FAM, 6-FAM, JOE, VIC, NED and PET). Individual AFLP markers in Fig. 2 & 3 are characterized by the eNNN-mNNN combinations shown in this table andthe PCR product size. The final column describes which fragment analysis instrument was used.doi:10.1371/journal.pone.0003882.t001
B. anynana Chromosomes
PLoS ONE | www.plosone.org 3 December 2008 | Volume 3 | Issue 12 | e3882
Biosystems) 0.4 mM of each primer, 0.2 mM dNTP and 1 ml of the
cDNA in a final volume of 20 ml. The PCR cycle was 9 min 94uC,
then 35 cycles of 30 s 94uC, 30 s 50uC, 45 s 72uC. The PCR product
was purified with EXOSAP-IT (Amersham plc, Little Chalfont,
UK), sequenced with the BigDye 3.1 kit (Applied Biosystems), and
analyzed on an ABI 3100 sequencer (Applied Biosystems). Gene-
specific primers Ba_TPI_207U (TTCGGCTGAGATGATAA-
AGG) and Ba_TPI_473L (AGTACCAATGGCCCACACTG)
were designed within the Tpi sequence to amplify an intronic
region, using the same genomic template as for the AFLP reactions.
PCR conditions were as described above, except for using Ta 52uCinstead of 50uC. The F1 parents were screened for SNPs (single
nucleotide polymorphisms) by means of sequencing the intron.
Genotyping the F2 offspring was based on PCR amplification (as
above), the amplicons were subsequently treated with 1 unit of AluI
restriction enzyme (NEB) for 2 h at 37uC, which either cuts a 230 bp
fragment into 30 bp and 200 bp or leaves it intact, depending on the
genotype. The restriction pattern was screened on a 3% agarose gel.
The Tpi partial cds and intron sequence are submitted to
GENBANK under accession numbers EU675861 and EU675862.
Data sorting into FI, MI, BI, and sex-linked markers. The
AFLP markers were divided into different groups, depending on the
F1 genotypes. Female informative (FI) markers are present in the F1
female and absent in the F1 male and segregate 1:1, male informative
(MI) markers are present in the F1 male and absent in the F1 female
and segregate 1:1 as well. BI (both informative) markers segregate
with a 3:1 ratio, resulting from F1 male and female that are both
heterozygous peakpresent. Z-linked markers were identified by a
peakpresent in all male offspring and a 1:1 ratio in the female
offspring (representing an F1 WZ+ (R)6Z+Z2 (=) F1 cross, with
‘‘+’’ = peakpresent allele and ‘‘–’’ = peakabsent allele). All F2 female
MI-markers were compared with this Z-specific 1:1 pattern in
JOINMAP to reveal the WZ26Z+Z2 crosses in which both male
and female offspring have a 1:1 ratio.
Identification of chromosome prints. Due to the absence
of meiotic recombination in females, syntenic FI-markers are
transmitted to the offspring in complete association, independent
of their relative position. Consequently, they cannot be positioned
within LGs. A cluster of syntenic FI-markers displays a
chromosome-specific pattern of F2 genotypes, which is identical
for all loci on the same chromosome and which displays the exact
opposite pattern in all markers in repulsion. This fixed set of
genotypes has been named the ‘‘chromosome print’’ [28]. The
number of chromosome prints per individual equals the haploid
autosomal chromosome number. Their identification in B. anynana
was carried out as described in [25], by grouping the FI-markers
together with JOINMAP under strict conditions (LOD .8),
allowing just a small number of genotyping errors. The linkage
phase describes on which parental (F1) chromosome the
peakpresent of a marker lies and from which grandparent (P-
generation) it came. If the marker is present in the grandmother
and absent in the grandfather, the linkage phase is ‘‘0’’, the reverse
gives linkage phase ‘‘1’’. When the marker is present in both
grandparents, the linkage phase is determined by the software
based on co-segregation in the F2 with markers for which linkage
phases are known. Linkage phases consist of a maternal and a
paternal component, indicating marker orientation (and P-origin)
in the F1 mother and the F1 father.
The chromosome prints were numbered based on the output
order of the software. It is important to reduce the number of
errors in chromosome prints to a minimum because they are
subsequently used for error detection and identification and
removal of uninformative markers. With multiple FI-markers
defining a chromosome print, inconsistencies were rescored and
when persistent, the chromosome print was based on the most
common genotype in the inconsistent individual.
Chromosome prints for chromosomes without FI-markers were
reconstructed based on BI and MI-markers as described in
Supplement S2. This was done after the LG assignment described
below. In addition, ten LGs with available (FI-based) chromosome
prints were also reconstructed in this way to validate the
reconstruction technique.
BI and microsatellite linkage group assignment. BI and
microsatellite markers were grouped by screening them against the
21 chromosome print patterns in JOINMAP with a LOD threshold
of 3. This mapping step also established the linkage phase of the
markers. Markers in the six LGs for which chromosome prints were
initially not available were assigned to LG22-LG27.
The markers were subsequently screened by a ‘‘forbidden
genotype’’ analysis to confirm or reject correct LG assignment and
to detect scoring errors [29,39]. This procedure is based on the
fact that certain marker combinations within an individual cannot
occur because it would involve recombination in females. This
screening procedure is explained in more detail in Supplement S3.
The threshold to exclude markers from further analysis was set to
three or more forbidden genotypes.
Identification of allelic (codominant) AFLPs. Part of the
observed variation in AFLP data is caused by indels (insertions or
deletions) between the two restriction sites at a single locus,
resulting in amplicons of different sizes. To determine whether two
BI loci are in fact different alleles of the same locus, we applied the
following criteria: (1) they must have the same primer
combination; (2) they must group together in the same LG when
presented as independent loci in the initial uncensored BI
screening; and (3) linkage phases of markers with 3:1 ratio must
be opposite for both the maternal and the paternal component.
Either one or both peaks present in an individual would be a
prerequisite for codominance in species with recombination in
both sexes, but with non-recombining females, that same
condition is already covered by forbidden genotype restrictions.
MI alleles were detected as well, but they do not provide more
analytical power when combined together into one codominant
marker as is the case in the BI-markers. Their opposite paternal
linkage phases produce fully complementary peak patterns that
hold the same mapping information.
Censoring of female-derived BI-markers in the F2. The
BI-markers (with a 3:1 ratio in the offspring) obtain half their
peakpresent alleles from the F1 mother and the other half from the
F1 father. A female derived peakpresent obscures the male-derived
allele in dominant markers, so that it is impossible to distinguish
between F2 homozygotes and heterozygotes. This is not an issue
when mapping species with recombination in both sexes, because
mapping software can treat these unknown allele combinations as
‘‘either heterozygous or homozygous’’. However, without
recombination in the females, genotype scores that have a
positive F1 female signal have to be excluded from analysis,
which means that part of the paternal information is also lost.
What remains are scores for those individuals that obtained a
peakabsent from the female and either a present or absent from
the male in a 1:1 ratio. The criteria for filtering out the female
component is straightforward because the female BI peakpresent is
always fully linked to either a positive or negative chromosome
print value, depending on their relative maternal linkage phases
(Supplement S4). Markers from individuals with a positive
chromosome print value must be removed when they have the
same maternal linkage phase as the chromosome print, and
markers in repulsion with the chromosome print must be removed
in the remainder of the individuals.
B. anynana Chromosomes
PLoS ONE | www.plosone.org 4 December 2008 | Volume 3 | Issue 12 | e3882

Assignment of linkage groups for MI-markers. The
censored BI genotypes are initially replaced with ‘‘missing data’’.
The BI and microsatellite markers with their LG designations are
then analyzed together with the MI and microsatellite markers in
JOINMAP to establish to which LGs they belong.
Final map construction. Microsatellites were translated to
their male informative component as described in Supplement S5,
resulting in MI-markers with a 1:1 ratio. These were then combined
with the MI- and censored BI-markers for each separate
chromosome. Each chromosome set was then divided in two
subsets, based on their chromosome print values (Supplement S4).
The BI markers in these two subsets are of opposite maternal linkage
phase as a result of the exclusion of the censored BI genotypes. All
the subsets were individually presented to JOINMAP for linkage
map construction. Subsequently, the sets of linkage maps
representing the same chromosomes with suitable anchoring
markers are combined with the ‘‘Combine groups for map
integration’’ command in JOINMAP. The remaining sets (without
anchoring markers) remain as separate LGs. The integration of the
two subsets is represented schematically in Supplement S4.
The Z chromosome markers were divided into male- and female
F2 offspring. The female F2 offspring have a 1:1 ratio for all markers,
while the F2 males have 100% peakpresent when the F1 female is
also peakpresent. These 100% male scores were excluded from
analysis and all the female markers and the remaining male markers
were separately mapped and then joined as described above.
Comparison between JOINMAP and MAPMAKER. Besides
the linkage map construction with JOINMAP, we followed the
procedures described in [26] for constructing a linkage map with
MAPMAKER 3.0.
All steps except the ‘‘Final map construction’’ were identical to the
procedures described above, since [26] used JOINMAP for that part
of the analysis. The main difference from the JOINMAP approach
in this final step is that the censored BI-markers were replaced by
‘‘missing data’’ rather than excluded, and that the markers belonging
to the same LGs were analysed together instead of in two separate
groups. For LGs without sufficient anchoring markers, the subgroups
with the largest mapping distance were compared.
Results
CytogeneticsChromosome number. The analysis of metaphase I
bivalents and male metaphase II chromosomes in male meiosis,
and pachytene bivalents in female meiotic prophase I showed a
haploid chromosome number of 28 for B. anynana in our stock
from Malawi (Fig. 1A–C). This is consistent with the findings of
[18] for B. anynana from Uganda and thus, there is no evidence for
geographical variation in chromosome numbers in this species.
Orcein staining of pachytene bivalents provided the characteristic
chromomere pattern that differentiated the chromosomes to a
certain level (Fig. 1C). However, we did not assign chromosome
numbers based on these patterns since it is not clear with which
linkage groups they correspond.
Sex chromosomes. Male pachytene spreads displayed 28
bivalents per nucleus that were aligned over their full length. Female
pachytene oocytes showed 27 fully-paired bivalents and a pair of sex
chromosomes, consisting of a small heterochromatic W chromosome
that has a circular arrangement and a Z chromosome that was
wrapped around it in the majority of nuclei (Fig 1D); in some nuclei,
the W chromosome was associated with a terminal segment of the Z
chromosome (Fig. 1C) or less often with a central part of the Z
chromosome (Fig. 1E) and formed a short thick rod or a body-like
structure. A comparison of the male and female chromosome
complements shows that B. anynana has a WZ/ZZ (female/male) sex
chromosome system, typical for the majority of advanced
Lepidoptera (reviewed in [11]).
Large, highly polyploid interphase nuclei of the Malpighian
tubules do not form lobes as is seen in some Lepidoptera (cf. [52]),
but have oval shapes. In females, each nucleus showed a small
heterochromatin W-body (i.e. sex chromatin) that was absent in
males (Fig. 1F,G). The small size of the W-body was consistent
with the tiny W chromosome observed in pachytene oocytes.
Nucleolar organising regions. Two distinct nucleoli were
regularly observed in YOYO-1-stained pachytene spreads. One was
associated with an autosome bivalent, the other with the WZ bivalent
(Fig. 1D,H,I). The association with the WZ bivalent is not apparent in
Fig. 1D and 1H since the nucleolus also borders autosomal bivalents,
but it was consistent in all examined nuclei. At the end of the
autosome bivalent, a pair of YOYO-1-positive dots was immersed
into the nucleolus mass. The dots probably composed of
heterochromatin were often separated from the main chromosome
bodies by a constriction, obviously representing the nucleolus
organizing region (NOR) (Fig 1H). In orcein-stained pachytenes,
two conspicuous chromomeres were seen at the end of this NOR-
bivalent (Fig 1I). These chromomeres most likely correspond with the
two heterochromatic dots highlighted with YOYO-1 (Fig. 1D,H).
Linkage mappingGenetic markers. A total number of 458 polymorphic
segregating markers was generated with AFLPs. The effective
number was smaller because the female informative markers do not
contribute to mapping, a small number of markers failed the
forbidden genotype screening, and 52 markers that behaved as
alleles were merged to form 26 single locus codominant markers.
This resulted in 347 AFLP loci that could be used for the
construction of the linkage map. The markers cover all
chromosomes except for the W chromosome, which cannot be
mapped even if markers were available because this chromosome
not involved in recombination. Additionally, there were seven
polymorphic microsatellites that could be positioned on the map and
another two that could only be assigned to specific LG’s by their
female informative component because they were homozygous in
the F1 male. This number is far lower than the number of
microsatellite loci available for B. anynana because many were not
informative in the P-generation to start with, and other loci inherited
an uninformative set of alleles from the P-generation to the F1 due to
the bottleneck conditions of the full-sib cross design. The AluI
digestion of the genomic Tpi amplicons gave a restriction pattern in
male F2 offspring of either a 230 bp fragment, a 200 bp (and a 30 bp)
fragment, or both of them within the same individual, thus
representing both homozygotes and the heterozygote. Female F2
offspring had either the 230 bp or the 200 bp fragment (but not both)
per individual, thereby showing a hemizygous (Z-linked) pattern.
Chromosome prints based on FI-markers were available for 21
of the 27 autosomes, another three were reconstructed from BI
and MI-markers (LGs 22, 25, 27) and the remaining three were
based on BI-markers alone (LGs 23, 24, 26), with random 1:1
designation for the unassigned values as described in Supplement
S2. The empirical verification of the BI+MI based reconstruction
for LGs with chromosome prints already available gave an exact
match between ‘‘chromosome print’’ and ‘‘reconstructed chromo-
some print’’ in eight out of 10 cases, one with a single error and
one with three, giving a total of only four inconsistent values out of
920. The verification of difference between the BI-only recon-
structed maps and the actual maps (performed on the same 10
control LGs) showed a deviation of 2 cM at most for the entire
B. anynana Chromosomes
PLoS ONE | www.plosone.org 5 December 2008 | Volume 3 | Issue 12 | e3882

mapping distance, and the markers always remained in the same
order.
The final linkage map is shown in Fig. 2 and 3. Twenty
chromosomes had sufficient anchoring markers to create integrat-
ed LGs following the procedures outlined in Supplement S4. Eight
chromosomes had either one or no anchoring markers (chromo-
somes 11, 12, 14, 17, 20, 22, 23, 24), which prevented integration.
These are represented in Fig. 2 and 3 as separate linkage groups
Figure 1. Preparations of meiotic cells and somatic interphase nuclei in Bicyclus anynana. (A) Squashed DAPI-stained male metaphase Ibivalents; (B) squashed DAPI-stained male metaphase II chromosomes; (C) spread orcein-stained female pachytene complement showingchromomere patterns; note the small heterochromatic W chromosome associated with the terminal segment of the Z chromosome (arrow); (D)spread YOYO-1-stained female postpachytene complement showing a curious WZ bivalent, in which the Z chromosome strand is wrapped aroundthe body-like W chromosome, and two nucleoli, one associated with an autosome bivalent (NA) and the other with the WZ bivalent (NWZ); note smallheterochromatin dots (arrow) highlighted with YOYO-1 at the end of each chromosome of the NOR-autosome bivalent; (E) orcein-stained femalepachytene spread, showing a WZ-bivalent where the W chromosome is associated with the central part of the Z chromosome; (F) a polyploid nucleusof the female Malpighian tubule cell showing a small sex-chromatin body (arrow), representing multiple copies of the tiny W chromosome; (G) apolyploid nucleus of the male Malpighian tubule cell without sex chromatin; (H) YOYO-1 stained female pachytene spread showing the NOR asstalked dots (arrow) in the nucleolus; (I) orcein-stained female pachytene spread with two conspicuous chromomeres (arrow) within the nucleolus.Scale bars indicate 10 mm in (A-D and H,I) and 50 mm in (F, G).doi:10.1371/journal.pone.0003882.g001
B. anynana Chromosomes
PLoS ONE | www.plosone.org 6 December 2008 | Volume 3 | Issue 12 | e3882

per chromosome with unknown position and orientation relative
to each other. These two subsets represent markers available from
the high and low eyespot selection lines respectively. The Z
chromosome contains 18 evenly dispersed markers and the Tpi
gene. The mapping lengths of the chromosomes range from 8 to
84 cM, but we assume that the smaller linkage groups have
insufficient coverage rather than representing chromosomes that
are relatively small. Therefore, the estimated map length does not
necessarily reflect the actual chromosome length.
Comparing mapping procedures; JOINMAP with
separate phase analysis vs. MAPMAKER with missing
data censoring. The mapping order in MAPMAKER was
similar to the JOINMAP output for most chromosomes. However,
in some LG’s with low proportions of anchoring markers vs. BI
markers, or unevenly distributed anchoring markers, large
rearrangements sometimes occurred. This is caused by the fact
that MAPMAKER compares small subsets of markers rather than
all representatives of an LG at the same time. MAPMAKER
initially uses a maximum of eight markers, and subsequently
positions additional markers within the initial (eight marker) map.
Finally, the mapping order is fine-tuned by using a sliding window
of five markers (ripple command). The use of a subset of markers
(i.e. eight initial markers or five ripple markers) that is made up of
BI markers of both maternal linkage phases and less than two
anchoring markers, results in an unreliable suggested marker
order. The reliability of the initial (eight marker) map can be
improved by including all available MI and codominant markers,
but with the ripple command the representative markers cannot be
hand-picked because their grouping depends on the provisional
marker order suggested by MAPMAKER. Similar to the ripple
command that is used to determine marker order, a sliding
window analysis also reveals the reliability of the marker order, by
comparing the likelihood of the most likely marker order with
alternative orders (flips test). This test is confronted with the same
bi-phasic incompatibility problems and cannot be used on a
censored data set with missing data. The consequences of
comparing only subsets of markers within a linkage group (i.e.
sliding window) are illustrated with an example based on LG21,
which is characterized by codominant anchoring markers close to
both ends and ten dominant markers of both phases in between
them (Supplement S6). JOINMAP also performs a ripple test,
which is based on a sliding window of only three markers. With
Figure 2. Linkage map of LG1-12. Vertical bars represent chromosomes and show the mapping distance in centimorgan (cM) on the left and thecorresponding markers on the right. Microsatellites are displayed in bold and start with ‘‘BA’’, the two microsatellites with only FI polymorphism areplaced underneath the LG’s they belong to. AFLPs are named according to their selective primer extension and amplicon size. The ‘‘e’’ stands for thefluorescent EcoRI-based primer and the ‘‘m’’ stands for the non-fluorescent MseI-based primer. AFLPs with two amplicon sizes per primercombination (e.g. eACCmCAA212-221 in LG03) are codominant. A vertical line indicates that markers are less than 1 cM apart (e.g. eACAmCGA119and eAACmCAT370 in LG09).doi:10.1371/journal.pone.0003882.g002
B. anynana Chromosomes
PLoS ONE | www.plosone.org 7 December 2008 | Volume 3 | Issue 12 | e3882

‘‘missing data’’ input, this results in even more problems than in
MAPMAKER because the chance that two anchoring markers are
included in a subset of just three markers is far smaller than in a
subset of five. This is presumably the reason why for the final
mapping step in some butterfly linkage maps JOINMAP has been
replaced by MAPMAKER.
The marker order suggested by JOINMAP (following the
procedures used for the present linkage map) is far more reliable
than the MAPMAKER approach because it does not attempt to
map incompatible BI markers relative to each other directly. The
ripple test, which can cause serious problems with missing data
analysis, strongly increases the reliability of the marker order when
Figure 3. Linkage map of LG13-27 and Z.doi:10.1371/journal.pone.0003882.g003
B. anynana Chromosomes
PLoS ONE | www.plosone.org 8 December 2008 | Volume 3 | Issue 12 | e3882

analyzing markers of each maternal linkage phase separately in
JOINMAP. Instead of reporting a flips test value, JOINMAP
simply excludes markers that do not meet the criteria for reliable
neighboring markers (recombination frequency smaller than 0.4
and LOD larger than 1.0). MAPMAKER on the other hand
always suggests a mapping order and will always produce a linkage
map that includes all presented markers.
The mapping distances given by MAPMAKER were larger
than those produced by JOINMAP under all circumstances. The
mapping distances decreased substantially with error detection
activated in MAPMAKER, but were on average still 38% larger
than in JOINMAP, ranging from 1.02 to 2.14 times in size for the
different LGs (Supplement S7). The total mapping distances are
1873 vs. 1354 cM for MAPMAKER and JOINMAP respectively.
The data are presented in different ways to each program, with the
censored BI-markers as missing data in MAPMAKER and
excluded in JOINMAP. Since JOINMAP has difficulties with
high proportions of non-overlapping missing data, a comparison
with identical data input was not possible for the MI-markers
combined with censored BI-markers. Therefore, the software was
also compared based only on MI-markers, thus avoiding censoring
of markers. Fourteen LGs had sufficient MI-markers to construct
linkage maps with MAPMAKER again giving higher values than
JOINMAP, but now with only 17% difference. The genome size
of B. anynana is 0.49 pg [53], which corresponds with approxi-
mately 480 Mb [54]. This means that the JOINMAP based
linkage map is 355 Kb/cM and the MAPMAKER based map 256
Mb/cM.
Discussion
CytogeneticsThe cytogenetic characteristics combined with the inheritance
patterns of genetic markers of B. anynana correspond to those
generally found in Lepidoptera. Female heterogamety is con-
firmed by the presence of a WZ bivalent in pachytene oocytes and
the presence of a heterochromatic W-body in female somatic
interphase nuclei, which are absent in males. The chromosomes
are indistinguishable in different stages of both mitotic and meiotic
divisions, except for orcein stained pachytene, where different
bivalents can be differentiated to a certain degree. We regularly
identified two distinctive bivalents that were associated with two
different nucleoli in female pachytene spreads. One of these
nucleoli is associated with the WZ bivalent and the other with an
autosome bivalent. The autosome bivalent carried a terminally
located NOR that was associated with small but clear hetero-
chromatin. The presence of heterochromatin at the NORs is
common in animals (e.g. [55,56]) but in Lepidoptera has been
reported only in the silkworm B. mori [57].
It remained unclear whether the sex-linked NOR of B. anynana
was located on the W- or on the Z chromosome or on both sex
chromosomes since we did not examine pachytene spermatocytes
for a comparison. Due to the circular form of the WZ bivalent it
was not possible to determine whether the sex-linked NOR is
terminal or interstitial. Nevertheless, we favor location of the sex-
linked NOR on the Z chromosome as the W chromosome appears
composed entirely of heterochromatin, which would inhibit a high
transcriptional activity of the active NOR.
The pachytene WZ bivalent of B. anynana is exceptional due to
the tiny W chromosome. The W chromosome of the oriental
tussock moth, Artaxa subflava is about half the size of the Z
chromosome [58] and in the other lepidopteran species examined
so far, the W chromosome was either only slightly smaller or
comparable in size to the Z chromosome (e.g. [23,59,60].
Compatible lengths in the pachytene stage of such relatively
similar sized W and Z chromosomes undoubtedly facilitate their
complete pairing. A regular synaptonemal complex can be formed
in spite of their obvious non-homology by means of twisting and
synaptic adjustment [52,61]. However, the size difference of W
and Z is too large in B. anynana to form a regular bivalent. Instead,
the much longer Z chromosome often forms a circle or horseshoe
structure with the W chromosome closed inside. This arrangement
could be considered an extreme case of synaptic adjustment as it
allows the sex chromosomes to pair along their entire length. A
similar mode of pairing was observed in mutants of the flour moth
(Ephestia kuehniella), in which the W chromosome was shortened by
irradiation [62], and also in A. subflava, in which the W
chromosome comprises about half of the Z chromosome but
shows still a conspicuous heterochromatic mass (see Fig. 3 in [58]).
On the other hand, we cannot exclude that the W and Z
chromosomes pair by means of some sequence homology, for
example, in telomeric regions or via rDNA in the case of shared
NORs. The B. anynana W chromosome is composed of constitutive
heterochromatin as in many other Lepidoptera. This observation,
combined with recent findings on the composition of W
chromosomes in B. mori, C. pomonella, and several pyralids
[57,60,63,64], suggests that the B. anynana W chromosome is
probably gene-poor and rich in interspersed repetitive sequences,
such as transposable elements, which are known to be abundant in
B. anynana in general [65]. The small size of the W chromosome is
also reflected by a small heterochromatin body in Malpighian
tubule nuclei of females. The size could indicate an intermediate
stage in the process of secondary loss of the W chromosome as is
the case in Lepidoptera that have adopted a ZZ/Z sex
determination system after loss of the W chromosome [11].
Linkage mapHow to get the most out of an F2 design. The full-sib F2
cross design was chosen for the purpose of mapping QTL for
ventral eyespot size. It generates a maximum phenotypic range in
the offspring while keeping random genetic variation to a
minimum. As a downside, this design is not ideally suited for
linkage mapping with dominant markers.
One effect of having just one set of grandparents is that BI
markers carry information in only one of both paternal linkage
phases for most LGs (Supplement S8). Another effect is that it
creates a strong bottleneck, that results in a lower proportion of FI
and MI markers relative to BI markers than in an outbred cross
(Supplement S8). This is most striking when the F1 male and
female inherit the same set of P chromosomes, where 1:1
segregating markers can only arise as a result of recombination
in the P-male. This unfavorable F1 gamete combination occurs in
25% of the chromosomes, and is reflected by the complete absence
of FI-markers in six LGs. Without recombination in the P-male for
such LGs, generating more AFLP markers will not produce FI-
markers because they do not exist for these linkage groups.
Therefore, the chromosome prints for these six FI-devoid
autosomes had to be obtained from BI and MI-markers instead.
This reconstruction is based on the forbidden genotype restric-
tions, and the assumptions that either the unassigned individuals
received a MI-marker that was fully associated with a non-
recombinant BI-marker region (BI+MI reconstruction), or that the
female BI component segregation is 1:1 (BI only reconstruction).
Empirical tests based on LGs with available chromosome prints
showed that this approach creates chromosome prints that are
identical or nearly identical to the available ones, and linkage
maps that are very similar to those based on conventionally
censored datasets. The stochastic deviations from the 1:1
B. anynana Chromosomes
PLoS ONE | www.plosone.org 9 December 2008 | Volume 3 | Issue 12 | e3882

segregation have a negligible effect on the mapping distance and
no effect on the mapping order. This validates the BI censoring
approach for LGs without FI-markers.
The selective genotyping approach was chosen to avoid
genotyping intermediate eyespot phenotypes in the offspring, since
they provide hardly any additional information in QTL mapping
compared to that of the extreme phenotypes [66]. As a result of this,
the linkage map itself is based on a non-random set of offspring. The
effect of this on the reliability of the linkage map is negligible because
it does not affect the three main characteristics in linkage mapping:
namely, marker grouping, marker order and marker distance. There
could, however be an effect of selection on the ratios of segregating
markers, since dominance promotes extreme phenotypes in recessive
homozygotes and additive alleles produce extreme phenotypes in
both types of homozygotes. Markers that are linked to genes which
are involved with eyespot formation may therefore deviate from 3:1
or 1:1 ratios due to hitch-hiking.
Effects of data censoring. Using MAPMAKER with
censored BI-markers as missing data resulted in a map that was
38% larger in size than the one produced from two subsets per
chromosome with JOINMAP. This size difference is caused by
two factors. Firstly, there is a software effect (i.e. algorithms used)
that is revealed by analyzing only the (uncensored) MI-markers,
that accounts for 17% of the difference in this study. The rest of
the difference is caused by the treatment of the incompatible bi-
phasic censored BI-markers. The main purpose of the
MAPMAKER analysis was to allow comparison of mapping
distance in B. anynana with other Lepidoptera linkage maps, since
this is the first species in this taxon for which the final mapping
step was performed in JOINMAP. This software has not been used
before for Lepidoptera linkage maps, presumably because it is less
able to deal with a substantial portion of non-overlapping
genotypes than MAPMAKER. Our approach avoided this
problem by adapting that of [34] which involves splitting up the
dataset based on chromosome print value and omitting female-
derived information rather than treating it as missing data. This
results in two linkage maps per chromosome that are then
juxtaposed and integrated based on common MI and codominant
markers and their average distances. Rather than just using the
average distance between the anchoring markers to combine the
two phases, JOINMAP also takes the number of individuals
representing both subsets into account [67].
Linkage groups and chromosome number. The number
of LGs matches the karyotype, thus markers are available for all 27
autosomes and the Z chromosome. There are no markers
available for the W chromosome, probably due to its small size.
The marker densities and distances vary substantially between the
different chromosomes, but given the uniform lengths of the
pachytene bivalents, we interpret this as incomplete marker
coverage rather than a difference in chromosome size. We aimed
to present an integrated linkage map, with relative marker
positions and distances based on both sets of incompatible BI-
markers linked together with MI, codominant AFLP and
microsatellite markers. We succeeded for 20 LGs, and mapped
the remaining eight separately because they lacked sufficient
anchoring markers. The presence of the Tpi gene of B. anynana is
consistent with all (distantly related) Lepidoptera species for which
this gene has been mapped to date (summarized in [11]). This
strengthens the hypothesis of taxon-wide conserved synteny for at
least part of the Lepidoptera Z chromosome.
Linkage and physical maps in Lepidoptera. The present
linkage map provides the basis for the assignment of the number,
position, effect and interactions of QTLs involved with the
development of wingspot size. We will further anchor the map
using SNP markers [68], with a main focus on genes that are
involved in eyespot formation in B. anynana and eyespot and wing
pattern formation in Lepidoptera in general. Additionally, physical
anchoring of linkage groups to specific chromosomes by means of
BAC-FISH, as has been performed in B. mori [35], will provide a
solid framework for future mapping studies.
The MAPMAKER mapping distance of 1873 cM in B. anynana
is within the 1430–2542 cM range reported for other butterfly
species [25,26,37]. The accuracy of these mapping distances may
however be limited, since mapping distances of both 1430 cM and
2400 cM were reported in Heliconius erato [26,36] and distances
ranging from 1305 cM to 6512 cM in Bombyx mori [30,32] when
using MAPMAKER software. One mapping software package
that does support sex-specific map construction is CRI-MAP [69],
which has been used to build many mammalian genetic maps. To
our knowledge, CRI-MAP has never been used to compute a
Lepidoptera map based on dominant markers. CRI-MAP shares
some of its origins with MAPMAKER and suffers from the same
deficiencies of MAPMAKER we have explained above. Notably,
CRI-MAP includes (1) no robust method to choose an initial order
of markers and (2) no systematic method to decide whether a
marker should be excluded from the map because it cannot be
reliably ordered. Our proposed mapping strategy avoids Lepidop-
tera specific issues that have an effect on mapping distance and
order, but it still requires a large number of analysis steps.
Therefore, we would welcome the implementation of sex-specific
recombination in the analysis parameters of JOINMAP. This
would not just be an asset to linkage mapping in Lepidoptera, but
for all organisms in which sex-specific recombination rates have
been reported.
Supporting Information
Supplement S1 Haploid chromosome numbers of different
Bicyclus species and their geographical origin.
Found at: doi:10.1371/journal.pone.0003882.s001 (0.04 MB
DOC)
Supplement S2 Reconstruction of the chromosome print
Found at: doi:10.1371/journal.pone.0003882.s002 (0.05 MB
DOC)
Supplement S3 Forbidden genotype screening
Found at: doi:10.1371/journal.pone.0003882.s003 (0.05 MB
DOC)
Supplement S4 Censoring of BI markers and map integration
with anchoring markers
Found at: doi:10.1371/journal.pone.0003882.s004 (0.12 MB
DOC)
Supplement S5 Microsatellite censoring
Found at: doi:10.1371/journal.pone.0003882.s005 (0.02 MB
DOC)
Supplement S6 Implications of sliding window analysis of a
‘‘missing data’’-censored dataset based on an example.
Found at: doi:10.1371/journal.pone.0003882.s006 (0.24 MB
DOC)
Supplement S7 Linkage group sizes of Bicyclus anynana
produced with MAPMAKER and with JOINMAP
Found at: doi:10.1371/journal.pone.0003882.s007 (0.09 MB
DOC)
Supplement S8 Implications of a full-sib design
Found at: doi:10.1371/journal.pone.0003882.s008 (0.08 MB
DOC)
B. anynana Chromosomes
PLoS ONE | www.plosone.org 10 December 2008 | Volume 3 | Issue 12 | e3882
Acknowledgments
We thank Dr Durrell Kapan and Dr. Ir. Johan W. van Ooijen for valuable
comments on linkage mapping in Lepidoptera and its implications for
JOINMAP software.
Author Contributions
Conceived and designed the experiments: AEVH FM IS PMB BJZ.
Performed the experiments: AEVH FM IS. Analyzed the data: AEVH FM
IS BJZ. Contributed reagents/materials/analysis tools: FM IS PMB BJZ.
Wrote the paper: AEVH.
References
1. Beldade P, Brakefield PM (2002) The genetics and evo-devo of butterfly wing
patterns. Nature Reviews Genetics 3: 442–452.
2. Beldade P, Brakefield PM, Long AD (2005) Generating phenotypic variation:
prospects from ‘‘evo-devo’’ research on Bicyclus anynana wing patterns. Evol Dev7: 101–107.
3. Wijngaarden PJ, Brakefield PM (2000) The genetic basis of eyespot size in the
butterfly Bicyclus anynana: an analysis of line crosses. Heredity 85: 471–479.
4. Marcus JM, Ramos DM, Monteiro A (2004) Germline transformation of the
butterfly Bicyclus anynana. Proc R Soc Lond B Biol Sci 271 Suppl 5: S263–5.
5. Fischer K, Eenhoorn E, Bot ANM, Brakefield PM, Zwaan BJ (2003) Coolerbutterflies lay larger eggs: developmental plasticity versus acclimation.
Proc R Soc B 270: 2051–2056.
6. Pijpe J, Brakefield PM, Zwaan BJ (2008) Increased life span in a polyphenic
butterfly artificially selected for starvation resistance. Am Nat 171: 81–90.
7. Zijlstra WG, Steigenga MJ, Brakefield PM, Zwaan BJ (2003) Simultaneousselection on two fitness-related traits in the butterfly Bicyclus anynana. Evolution
57: 1852–1862.
8. Robinson R (1971) Lepidoptera Genetics. Oxford, UK: Pergamon Press.
9. Suomalainen E (1969) Chromosome evolution in the Lepidoptera. Chromo-
somes Today 2: 132–138.
10. Kandul NP, Lukhtanov VA, Pierce NE (2007) Karyotypic diversity and
speciation in Agrodiaetus butterflies. Evolution 61: 546–559.
11. Traut W, Sahara K, Marec F (2008) Sex Chromosomes and Sex Determinationin Lepidoptera. Sex Dev 1: 332–346.
12. White MJD (1973) The chromosomes. London: Chapman & Hall.
13. Yoshido A, Marec F, Sahara K (2005) Resolution of sex chromosome
constitution by GISH and telomere-FISH in some species of Lepidoptera.
Chromosoma 114: 193–202.
14. Charlesworth B, Coyne JA, Barton NH (1987) The relative rates of evolution of
sex chromosomes and autosomes. Am Nat 130: 113–146.
15. Prowell DP (1998) Sex linkage and speciation in Lepidoptera. In: Howard DJ,
Berlocher SH, eds. Endless forms: species and speciation. New York: Oxford
University Press. pp 309–319.
16. Brown KS, Emmel T, Eliazar PJ, Suomalainen E (1992) Evolutionary patterns
in chromosome numbers in neotropical Lepidoptera. I. Chromosomes of the
Heliconiini (family Nymphalidae: subfamily Nymphalinae). Hereditas 117:109–125.
17. Suomalainen E, Brown KS Jr (1984) Chromosome number variation withinPhilaethria butterflies (Lepidoptera: Nymphalidae, Heliconiini). Chromosoma 90:
170–176.
18. De Lesse H (1968) Formules chromosomiques de Lepidopteres Rhopaloceresd’Uganda et du Kenya. Ann Soc Ent Fr (NS) 4: 581–599.
19. De Lesse H, Condamin M (1962) Formules chromosomiques de quelques
Lepidopteres Rhopaloceres du Senegal. Bulletin de l’IFAN 24: 464–473.
20. De Lesse H, Condamin M (1965) Formules chromosomiques de quelques
Lepidopteres Rhopaloceres du Senegal et de Cote d’Ivoire. Bulletin de l’IFAN27: 1089–1094.
21. Tanaka N, Yokoyama T, Abe H, Tsuchida K, Ninagi O, et al. (2000)
Cytogenetic analysis shows that the unusually large chromosome in the sex-limited pB silkworm (Bombyx mori) strain consists of three chromosomes.
Hereditas 133: 95–103.
22. Wolf KW (1996) The structure of condensed chromosomes in mitosis and
meiosis of insects. Int J Insect Morphol Embryol 25: 37–62.
23. Fukova I, Nguyen P, Marec F (2005) Codling moth cytogenetics: karyotype,chromosomal location of rDNA, and molecular differentiation of sex
chromosomes. Genome 48: 1083–1092.
24. Marec F, Tothova A, Sahara K, Traut W (2001) Meiotic pairing of sexchromosome, fragments and its relation to atypical transmission of a sex-linked
marker in Ephestia kuehniella (Insecta : Lepidoptera). Heredity 87: 659–671.
25. Jiggins CD, Mavarez J, Beltran M, McMillan WO, Johnston S, et al. (2005) A
genetic linkage map of the mimetic butterfly Heliconius melpomene. Genetics 171:
557–570.
26. Kapan DD, Flanagan NS, Tobler A, Papa R, Reed RD, et al. (2006)
Localization of Mullerian mimicry genes on a dense linkage map of Heliconius
erato. Genetics 173: 735–757.
27. Promboon A, Shimada T, Fujiwara H, Kobayashi M (1995) Linkage map of
Random Amplified Polymorphic DNAs (RAPDs) in the silkworm, Bombyx mori.Genet Res 66: 1–7.
28. Yasukochi Y (1998) A dense genetic map of the silkworm, Bombyx mori, covering
all chromosomes based on 1018 molecular markers. Genetics 150: 1513–1525.
29. Shi J, Heckel DG, Goldsmith MR (1995) A genetic linkage map for the
domesticated silkworm, Bombyx mori, based on restriction fragment lengthpolymorphisms. Genetical Research 66: 109–126.
30. Tan YD, Wan C, Zhu Y, Lu C, Xiang Z, et al. (2001) An amplified fragment
length polymorphism map of the silkworm. Genetics 157: 1277–1284.
31. Miao X-X, Xub S-J, Li M-H, Li M-W, Huang J-H, et al. (2005) Simple
sequence repeat-based consensus linkage map of Bombyx mori. Proc Natl Acad Sci
USA 102: 16303–16308.
32. Yamamoto K, Narukawa J, Kadono-Okuda K, Nohata J, Sasanuma M, et al.
(2006) Construction of a single nucleotide polymorphism linkage map for the
silkworm, Bombyx mori, based on bacterial artificial chromosome end sequences.
Genetics 173: 151–161.
33. Yamamoto K, Nohata J, Kadono-Okuda K, Narukawa J, Sasanuma M, et al.
(2008) A BAC-based integrated linkage map of the silkworm, Bombyx mori.
Genome Biol 9: R21.
34. Yasukochi Y, Ashakumary LA, Baba K, Yoshido A, Sahara K (2006) A second-
generation integrated map of the silkworm reveals synteny and conserved gene
order between lepidopteran insects. Genetics 173: 1319–1328.
35. Yoshido A, Bando H, Yasukochi Y, Sahara K (2005) The Bombyx mori karyotype
and the assignment of linkage groups. Genetics 170: 675–685.
36. Tobler A, Kapan D, Flanagan N, Gonzalez C, Peterson E, et al. (2005) First-
generation linkage map of the warningly colored butterfly Heliconius erato.
Heredity 94: 408–417.
37. Wang B, Porter AH (2004) An AFLP-based interspecific linkage map of
sympatric, hybridizing Colias butterflies. Genetics 168: 215–225.
38. Dopman EB, Bogdanowicz SM, Harrison RG (2004) Genetic mapping of sexual
isolation between E and Z pheromone strains of the European corn borer
(Ostrinia nubilalis). Genetics 167: 301–309.
39. Heckel DG, Gahan LJ, Liu Y-B, Tabashnik BE (1999) Genetic mapping of
resistance to Bacillus thuringiensis toxins in diamondback moth using biphasic
linkage analysis. Proc Natl Acad Sci USA 96: 8373–8377.
40. Lander ES, Green P, Abrahamson J, Barlow A, Daly MJ, et al. (1987)
MAPMAKER: an interactive computer package for constructing primary
genetic linkage maps of experimental and natural populations. Genomics 1:
174–181.
41. Van Ooijen JW, Voorrips RE (2001) JoinMap 3.0: software for the calculation of
genetic linkage maps. Wageningen: Plant Research International.
42. Gawłowska M, Swiecicki W, Wolko B (2005) Comparison of genetic maps for
two pea populations (Pisum sativum L.). Pisum Genetics 37: 19–23.
43. Sewell MM, Sherman BK, Neale DB (1999) A consensus map for loblolly pine
(Pinus taeda L.). I. Construction and integration of individual linkage maps from
two outbred three-generation pedigrees. Genetics 151: 321–330.
44. Traut W (1976) Pachytene mapping in the female silkworm, Bombyx mori L.
(Lepidoptera). Chromosoma 58: 275–284.
45. Mediouni J, Fukova I, Frydrychova R, Dhouibi MH, Marec F (2004) Karyotype,
sex chromatin and sex chromosome differentiation in the carob moth, Ectomyelois
ceratoniae (Lepidoptera: Pyralidae). Caryologia 57: 184–194.
46. Traut W, Marec F (1996) Sex chromatin in Lepidoptera. Q Rev Biol 71:
239–256.
47. Brakefield PM, Gates J, Keys D, Kesbeke F, Wijngaarden PJ, et al. (1996)
Development, plasticity and evolution of butterfly eyespot patterns. Nature 384:
236–242.
48. Vos P, Hogers R, Bleeker M, Reijans M, Lee Tvd, et al. (1995) AFLP: a new
technique for DNA fingerprinting. Nucleic Acids Research 23: 4407–4414.
49. Benham J, Jeung J-U, Jasieniuk M, Kanazin V, Blake T (1999) Genographer: A
graphical tool for automated AFLP and microsatellite analysis. J Agric Genomics
4.
50. Van’t Hof AE, Zwaan BJ, Saccheri IJ, Daly D, Bot ANM, et al. (2005)
Characterization of 28 microsatellite loci for the butterfly Bicyclus anynana. Mol
Ecol Notes 5: 169–172.
51. Regier JC (2005) Protocols, Concepts, and Reagents for preparing DNA
sequencing templates. Version 3/14/06. www.umbi.umd.edu/users/jcrlab/
PCR_primers.pdf.
52. Marec F, Traut W (1994) Sex chromosome pairing and sex chromatin bodies in
W-Z translocation strains of Ephestia kuehniella (Lepidoptera). Genome 37:426–435.
53. Gregory TR, Hebert PDN (2003) Genome size variation in lepidopteran insects.
Can J of Zool 81: 1399–1405.
54. Dolezel J, Bartos J, Voglmayr H, Greilhuber J (2003) Nuclear DNA content and
genome size of trout and human. Cytometry 51A: 127–128.
55. Hirai H, Yamamoto MT, Ogura K, Satta Y, Yamada M, et al. (1994)
Multiplication of 28S rDNA and NOR activity in chromosome evolution among
ants of the Myrmecia pilosula species complex. Chromosoma 103: 171–178.
56. King M, Contreras N, Honeycutt RL (1990) Variation within and between
nucleolar organizer regions in Australian hylid frogs (Anura) shown by 18S+28Sin-situ hybridization. Genet Res 80: 17–29.
B. anynana Chromosomes
PLoS ONE | www.plosone.org 11 December 2008 | Volume 3 | Issue 12 | e3882
57. Sahara K, Yoshido A, Kawamura N, Ohnuma A, Abe H, et al. (2003) W-
derived BAC probes as a new tool for identification of the W chromosome and
its aberrations in Bombyx mori. Chromosoma 112: 48–55.
58. Yoshido A, Yamada Y, Sahara K (2006) The W chromosome detection in
several Lepidopteran species by genomic in situ hybridization (GISH). J Insect
Biotechnol Sericol 75: 147–151.
59. Traut W, Sahara K, Otto TD, Marec F (1999) Molecular differentiation of sex
chromosomes probed by comparative genomic hybridization. Chromosoma
108: 173–180.
60. Vıtkova M, Fukova I, Kubıckova S, Marec F (2007) Molecular divergence of the
W chromosomes in pyralid moths (Lepidoptera). Chromosome Res 15:
917–930.
61. Weith A, Traut W (1986) Synaptic adjustment, non-homologous pairing, and
non-pairing of homologous segments in sex chromosome mutants of Ephestia
kuehniella (Insecta, Lepidoptera). Chromosoma 94: 125–131.
62. Traut W, Weith A, Traut G (1986) Structural mutants of the W chromosome in
Ephestia (Insecta, Lepidoptera). Genetica 70: 69–79.
63. Abe H, Mita K, Yasukochi Y, Oshiki T, Shimada T (2005) Retrotransposable
elements on the W chromosome of the silkworm, Bombyx mori. CytogenetGenome Res 110: 144–151.
64. Fukova I, Traut W, Vıtkova M, Nguyen P, Kubıckova S, et al. (2007) Probing
the W chromosome of the codling moth, Cydia pomonella, with sequences frommicrodissected sex chromatin. Chromosoma 116: 135–145.
65. Van’t Hof AE, Brakefield PM, Saccheri IJ, Zwaan BJ (2007) Evolutionarydynamics of multilocus microsatellite arrangements in the genome of the butterfly
Bicyclus anynana, with implications for other Lepidoptera. Heredity 98: 320–328.
66. Muranty H, Goffinet B, Santi F (1997) Multitrait and multipopulation QTLsearch using selective genotyping. Genet Res 70: 259–265.
67. Stam P (1993) Construction of integrated genetic linkage maps by means of anew computer package: JoinMap. Plant J 3: 739–744.
68. Beldade P, Rudd S, Gruber JD, Long AD (2006) A wing expressed sequence tagresource for Bicyclus anynana butterflies, an evo-devo model. BMC Genomics 7:
130.
69. Lander ES, Green P (1987) Construction of multilocus genetic linkage maps inhumans. Proc. Natl. Acad. Sci. USA 84: 2363–2367.
B. anynana Chromosomes
PLoS ONE | www.plosone.org 12 December 2008 | Volume 3 | Issue 12 | e3882
Copyright © 2022 FDOKUMEN