Clinical management of phenytoin-induced gingival ... - AAPD
Upload
independentCategory
view
3download
0
1
Research Article
CYP2C9*1B promoter polymorphisms, in linkage with CYP2C19*2, affect
phenytoin auto-induction of clearance and maintenance dose
Chaudhry AS1*, Urban TJ2*, Lamba JK1,3, Birnbaum AK3, Remmel RP3, Subramanian M3, Strom
S4, You JH5, Singh R6, Kasperaviciute D6, Catarino CB6, Radtke R7, Sisodiya SM6,
Goldstein DB2 and Schuetz EG1
1Department of Pharmaceutical Sciences, St. Jude Children's Research Hospital, Memphis, TN.
2Center for Human Genome Variation, Institute for Genome Sciences and Policy, Duke
University, Durham, NC.
3Departments of Experimental and Clinical Pharmacology and Medicinal Chemistry, University
of Minnesota, Minneapolis, MN.
4 Department of Pharmaceutical Sciences, School of Pharmacy, University of Pittsburgh,
Pittsburgh, PA.
5 School of Pharmacy, Faculty of Medicine, The Chinese University of Hong Kong, Hong Kong,
China.
6 Department of Clinical and Experimental Epilepsy, UCL Institute of Neurology, Queen Square,
London, WC1N 3BG UK.
7 Department of Medicine (Neurology), Duke University Medical School, Durham, NC

2
Address correspondence to: Erin G. Schuetz, Ph.D., Department of Pharmaceutical Sciences, St.
Jude Children’s Research Hospital, 262 Danny Thomas Place, Memphis, TN 38105; PH: (901)
595-2205; Fax: (901) 595-3125; Email: [email protected]
*Authorship note: Amarjit S. Chaudhry and Thomas J. Urban contributed equally to this work.

3
Abstract The commonly prescribed antiepileptic drug phenytoin has a narrow therapeutic range and wide
inter-individual variability in clearance explained partially by CYP2C9 and CYP2C19 coding
variants. After finding a paradoxically low urinary phenytoin metabolite (S)/(R) ratio in subjects
on phenytoin maintenance therapy with a CYP2C9*1/*1 & CYP2C19*1/*2 genotype, we
hypothesized that CYP2C9 regulatory polymorphisms (rPMs), G-3089A and -2663delTG, in
linkage disequilibrium with CYP2C19*2 were responsible. These rPMs explained as much as
10% of the variation in phenytoin maintenance dose in epileptic patients, but were not correlated
with other patients’ warfarin dose requirements or with phenytoin metabolite ratio in human liver
microsomes. We hypothesized the rPMs affected CYP2C9 induction by phenytoin, a PXR and
CAR activator. Transfection studies showed CYP2C9 reporters with wild-type versus variant
alleles had similar basal activity but significantly greater PHT induction by co-transfected PXR,
CAR and Nrf2 and less YY1 repression. Phenytoin induction of CYP2C9 was greater in human
hepatocytes with the CYP2C9 wild-type vs. variant haplotype. Therefore, CYP2C9 rPMs affect
phenytoin-dependent induction of CYP2C9 and phenytoin metabolism in humans, with an effect
size comparable to that for CYP2C9*2 and 2C9*3. These findings may also be relevant to the
clinical use of other PXR, CAR and Nrf2 activators.

4
Introduction
Phenytoin (PHT, 5,5-diphenylhydantoin) is among the most frequently prescribed
antiepileptic drugs. It demonstrates a large inter-individual variation in metabolism and has a
narrow therapeutic index, and hence is difficult to administer effectively. Previous studies
have consistently demonstrated reduced in vivo PHT metabolism and reduced clinical dose
requirements for PHT in patients carrying protein sequence-altering genetic variants of the
enzymes CYP2C9 and CYP2C19. These enzymes metabolize PHT to a mixture of (R) and (S)
stereoisomers of the inactive metabolite 5-(4’-hydroxyphenyl)-5-phenylhydantoin (p-HPPH).
The most commonly occurring CYP2C9 variant alleles are CYP2C9*2, a C430T leading to
Arg144Cys, and CYP2C9*3 A1075T leading to Ile359Leu (1-3). An in vitro kinetic study in
insect cells showed that recombinant CYP2C9*2 and CYP2C9*3 exhibited a 1.5-fold and 20-
fold decrease in catalytic efficiency, respectively, relative to CYP2C9*1, in formation of (S)-
pHPPH (4). The CYP2C19*2 variant allele, a G681A transition in exon 5, creates a cryptic
splice site and forms a truncated defective protein. It is the major genetic defect accounting
for 75 to 85% of CYP2C19 poor metabolizers (5).
Because of its narrow therapeutic range, genotyping of CYP2C19 in addition to
CYP2C9 could theoretically be used to optimize the dosage of phenytoin. The CYP2C9*2,
CYP2C9*3 and CYP2C19*2 alleles have all been shown to affect PHT plasma concentration
and toxicity (6-8). For example, the mean 12 h concentration of PHT in serum after a 300 mg
dose to healthy Turkish volunteers was significantly higher (26-37%) in patients with even
one CYP2C9*2 or CYP2C9*3 allele compared to WT subjects (7). In European epileptic
patients on PHT, the CYP2C9*3 allele showed a significant association with maximum PHT
dose (8).
Although PHT is metabolized to p-HPPH by both CYP2C9 (90%) and CYP2C19,
CYP2C9 demonstrates high prochiral stereoselectivity yielding an S/R ratio of 43-44. In

5
contrast, CYP2C19 that has low prochiral selectivity, yielding a S/R ratio of 1.2-1.3 (Fig 1A)
(9-11). Although it was hypothesized (12, 13) that the (S)/(R) p-HPPH ratio could be used as
a phenotypic measure of CYP2C9 activity, the results from two in vivo studies testing this
idea have been paradoxical. For example, twelve and twenty-four hour urine samples from 45
epilepsy patients taking PHT under steady-state conditions analyzed for mean urinary p-
HPPH (S)/(R) ratios in subjects homozygous for CYP2C19*1/*1 was 24.2±3.1.
Heterozygotes for the defective CYP2C9*2 and CYP2C9*3 alleles demonstrated lower values
of 11.1±3.3 and 2.7±0.6, respectively. However, unexpectedly, normal homozygotes for
CYP2C9*1/*1 but heterozygous for CYP2C19*2 had a mean (S)/(R) ratio as low as 12.9±1.7
instead of the expected range of 30-40 (13). A high (S)/(R) ratio was expected in these
subjects because CYP2C9-mediated metabolism would be expected to predominate in
CYP2C19*2 poor metabolizers. We hypothesized that some undetected CYP2C9 variation, in
LD with CYP2C19*2, was affecting PHT elimination.
Here we describe two genetic variants in the extended promoter of CYP2C9, -
3089G>A and -2663delTG, are in strong linkage disequilibrium with CYP2C19*2, and
demonstrate that these variants explain the paradoxically low (S)/(R) ratio in CYP2C19*2
carriers. We show that these polymorphisms are strongly associated with phenytoin dose
requirements in patients with epilepsy on PHT maintenance therapy, and that these variants
are causal for reduced PHT metabolism through their effects on PHT-sensitive autoinduction
of CYP2C9. These findings may have direct relevance to the clinical use of PHT and
potentially other CYP2C9 inducers.
6
Results
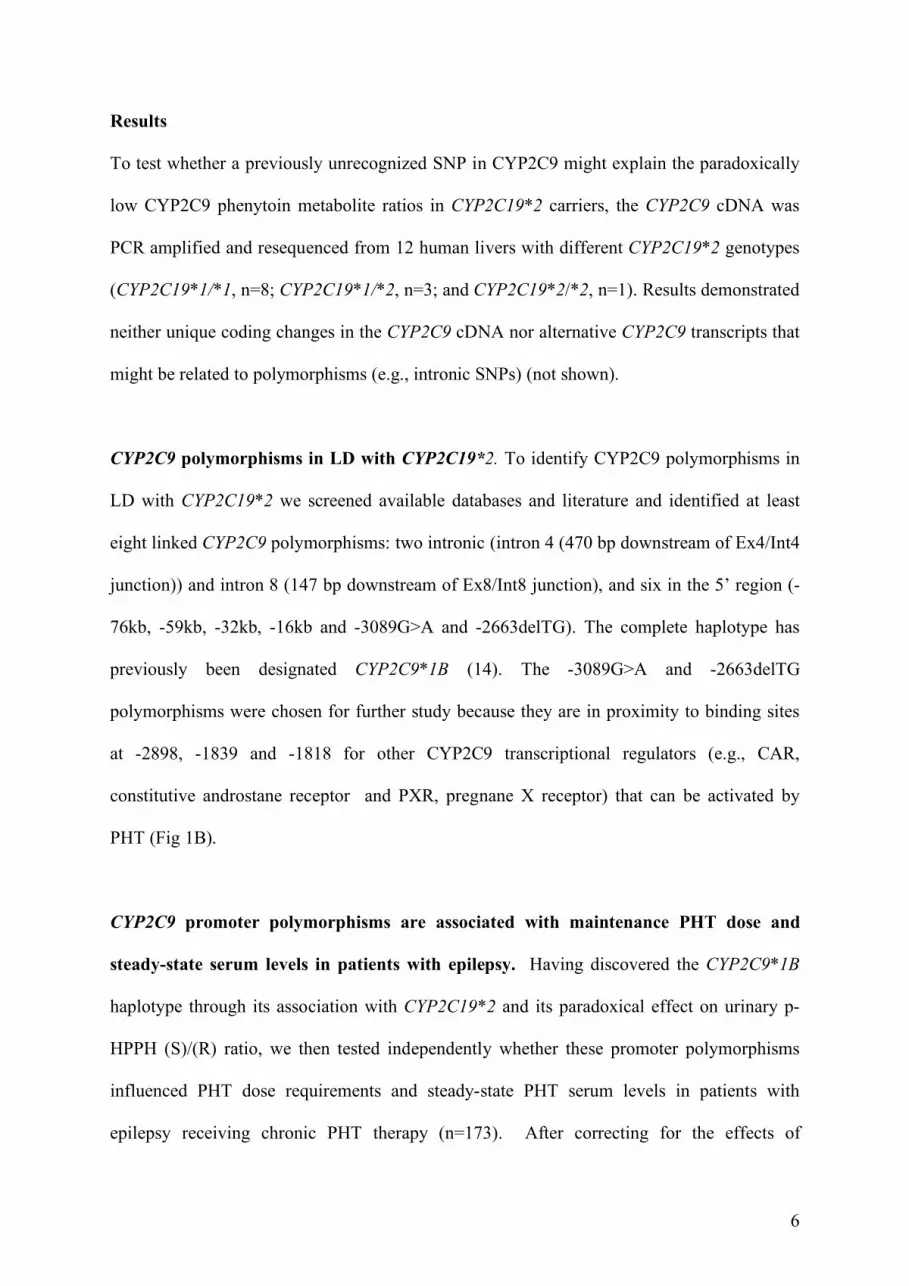
To test whether a previously unrecognized SNP in CYP2C9 might explain the paradoxically
low CYP2C9 phenytoin metabolite ratios in CYP2C19*2 carriers, the CYP2C9 cDNA was
PCR amplified and resequenced from 12 human livers with different CYP2C19*2 genotypes
(CYP2C19*1/*1, n=8; CYP2C19*1/*2, n=3; and CYP2C19*2/*2, n=1). Results demonstrated
neither unique coding changes in the CYP2C9 cDNA nor alternative CYP2C9 transcripts that
might be related to polymorphisms (e.g., intronic SNPs) (not shown).
CYP2C9 polymorphisms in LD with CYP2C19*2. To identify CYP2C9 polymorphisms in
LD with CYP2C19*2 we screened available databases and literature and identified at least
eight linked CYP2C9 polymorphisms: two intronic (intron 4 (470 bp downstream of Ex4/Int4
junction)) and intron 8 (147 bp downstream of Ex8/Int8 junction), and six in the 5’ region (-
76kb, -59kb, -32kb, -16kb and -3089G>A and -2663delTG). The complete haplotype has
previously been designated CYP2C9*1B (14). The -3089G>A and -2663delTG
polymorphisms were chosen for further study because they are in proximity to binding sites
at -2898, -1839 and -1818 for other CYP2C9 transcriptional regulators (e.g., CAR,
constitutive androstane receptor and PXR, pregnane X receptor) that can be activated by
PHT (Fig 1B).
CYP2C9 promoter polymorphisms are associated with maintenance PHT dose and
steady-state serum levels in patients with epilepsy. Having discovered the CYP2C9*1B
haplotype through its association with CYP2C19*2 and its paradoxical effect on urinary p-
HPPH (S)/(R) ratio, we then tested independently whether these promoter polymorphisms
influenced PHT dose requirements and steady-state PHT serum levels in patients with
epilepsy receiving chronic PHT therapy (n=173). After correcting for the effects of

7
CYP2C9*2 and CYP2C9*3, gender and population structure, we found that the CYP2C9*1B
haplotype was associated with a significant reduction in PHT dose requirements (Table 1).
The effect of CYP2C9*1B on phenytoin dose was independent of CYP2C9*2 and CYP2C9*3
genotype in the linear model (Table 1). The magnitude of the effect of CYP2C9*1B was
similar to that for the previously identified CYP2C9*2 and CYP2C9*3 alleles, with a beta
coefficient of -42 (i.e. 42 mg lower dose requirement per minor allele carried) and
significantly improved the overall predictive power of CYP2C9 genetic markers, from
(adjusted) r2 = 0.186 in a model containing only CYP2C9*2 and CYP2C9*3 to (adjusted) r2 =
0.23 in a model containing these markers plus CYP2C9*1B, giving an absolute difference of
4.4% of the variation in phenytoin maintenance dose explained by CYP2C9*1B. The
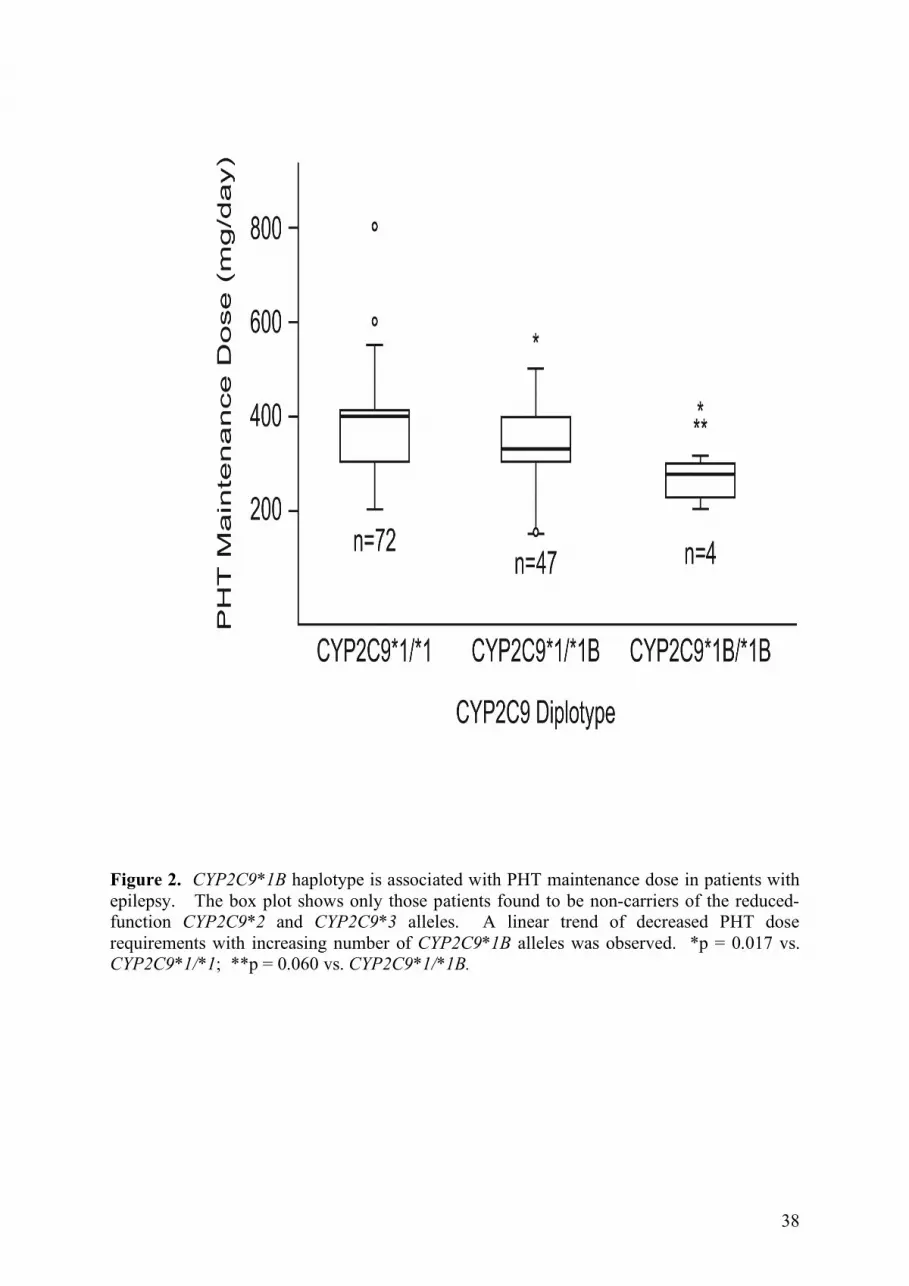
independent effect of CYP2C9*1B is shown graphically in Figure 2 in n = 123 patients who
do not carry a CYP2C9*2 or CYP2C9*3 allele.
Because body weight is also a strong independent predictor of PHT dose
requirements, we re-assessed the CYP2C9*1B effect on PHT maintenance dose in a subset of
n=70 patients for whom total body weight at the time of PHT therapy was recorded. After
correcting for total body weight, addition of CYP2C9*1B to the linear model improved the fit
from (adjusted) r2 = 0.371 to (adjusted) r2 = 0.471, with roughly 10% of the variability in
PHT dose explained by this haplotype alone (Table 1). We further inspected an overlapping
subset of n=78 patients to determine whether the effect of CYP2C9*1B was reflected in
higher PHT serum levels in these patients. As expected, there was no relationship between
the raw serum level and CYP2C9*1B haplotype, since the potential influence on serum level
had already been corrected by the reduced maintenance dose (data not shown). However, we
observed a significant effect on the ratio of serum level to maintenance dose; addition of
CYP2C9*1B to a model including CYP2C9*2, *3, gender and population structure led to

8
improved model fit (p = 0.072 without CYP2C9*1B vs. p = 0.033 in the model including
CYP2C9*1B) (Table 2).
Neither the CYP2C9 promoter polymorphisms nor the CYP2C19*2 allele were
associated with warfarin dosing requirement in vivo, nor hepatic CYP2C9 expression or
activity in vitro. We next determined the generalizability of the effect of the CYP2C19*2
genotype (and associated CYP2C9 promoter polymorphisms) on CYP2C9 mediated drug
clearance of another CYP2C9 substrate, warfarin. Because a higher percentage of Asians
carry the CYP2C19*2 allele (18-23%) compared to Whites (2-5%), we turned to a Chinese
population (n=67) with data on warfarin dose requirements necessary to achieve
anticoagulation. The patients had not previously been genotyped for CYP2C19*2 or these
CYP2C9 promoter rPMs (15). In the Hong Kong Chinese cohort, the -3089G>A and -
2663delTG polymorphisms were in complete LD. However, unlike Whites, although 89% of
the Chinese CYP2C19*2 subjects also had the CYP2C9 regulatory polymorphisms, 10.7% of
the Chinese CYP2C19*2 subjects did not. Therefore, we tested for the individual effects of
each of the aforementioned genotypes on warfarin dosing after excluding those patients
carrying the CYP2C9*2, *3 and VKORC1 variant alleles (leaving n=46 patients). Warfarin
dosing was not correlated with either the CYP2C19*2 genotype (not shown) or the CYP2C9
promoter polymorphisms (Fig 3A).
A human liver resource was used to determine the effect of the CYP2C9 promoter
genotypes on CYP2C9 mRNA expression and phenytoin hydroxylation activity in vitro.
Genotyping of 28 human livers from White donors confirmed that the CYP2C9 -3089G>A
and -2663delTG were in complete LD to CYP2C19*2 in the White population (Fig 3B).
Quantitative real-time PCR of CYP2C9 mRNA levels showed no significant effect of the
9
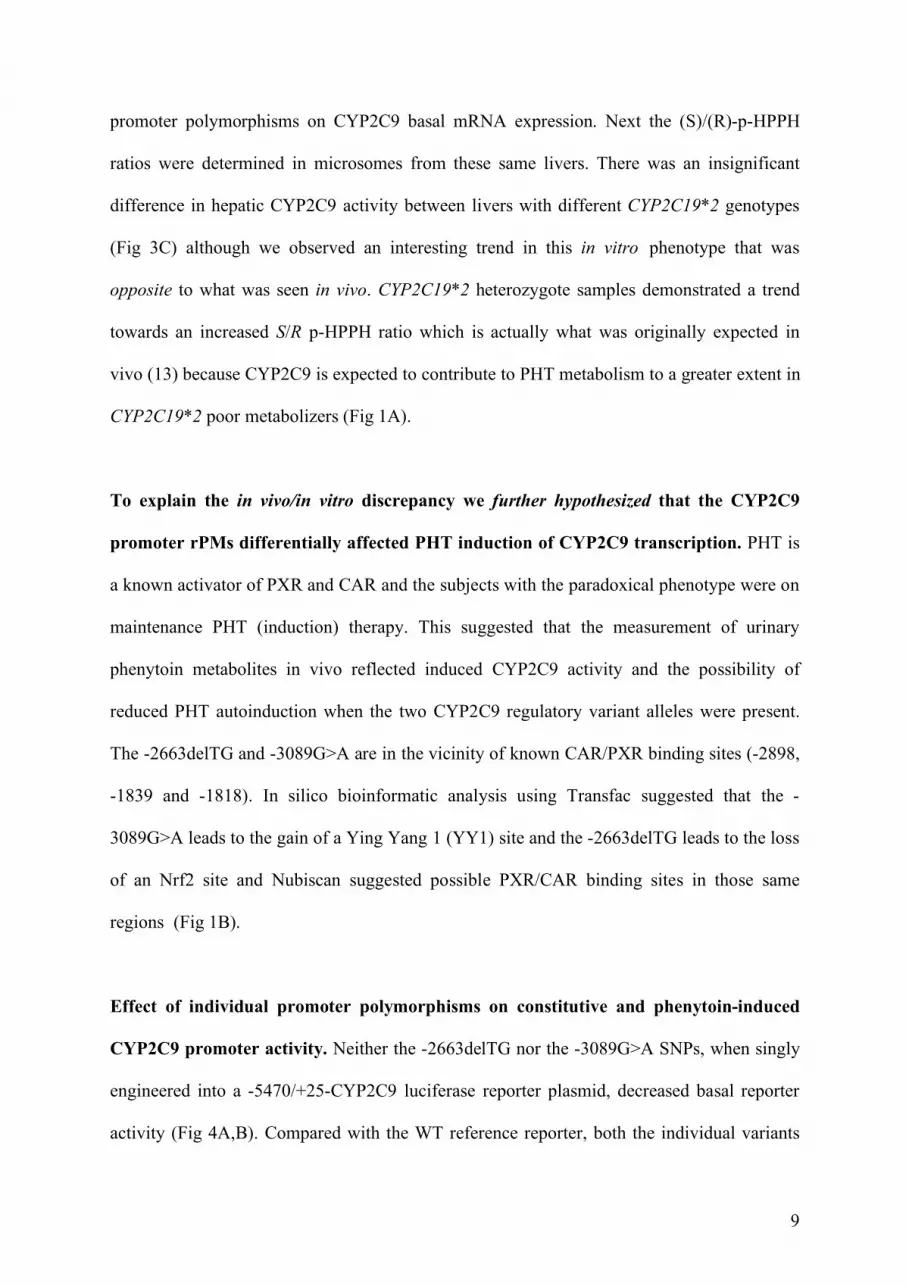
promoter polymorphisms on CYP2C9 basal mRNA expression. Next the (S)/(R)-p-HPPH
ratios were determined in microsomes from these same livers. There was an insignificant
difference in hepatic CYP2C9 activity between livers with different CYP2C19*2 genotypes
(Fig 3C) although we observed an interesting trend in this in vitro phenotype that was
opposite to what was seen in vivo. CYP2C19*2 heterozygote samples demonstrated a trend
towards an increased S/R p-HPPH ratio which is actually what was originally expected in
vivo (13) because CYP2C9 is expected to contribute to PHT metabolism to a greater extent in
CYP2C19*2 poor metabolizers (Fig 1A).
To explain the in vivo/in vitro discrepancy we further hypothesized that the CYP2C9
promoter rPMs differentially affected PHT induction of CYP2C9 transcription. PHT is
a known activator of PXR and CAR and the subjects with the paradoxical phenotype were on
maintenance PHT (induction) therapy. This suggested that the measurement of urinary
phenytoin metabolites in vivo reflected induced CYP2C9 activity and the possibility of
reduced PHT autoinduction when the two CYP2C9 regulatory variant alleles were present.
The -2663delTG and -3089G>A are in the vicinity of known CAR/PXR binding sites (-2898,
-1839 and -1818). In silico bioinformatic analysis using Transfac suggested that the -
3089G>A leads to the gain of a Ying Yang 1 (YY1) site and the -2663delTG leads to the loss
of an Nrf2 site and Nubiscan suggested possible PXR/CAR binding sites in those same
regions (Fig 1B).
Effect of individual promoter polymorphisms on constitutive and phenytoin-induced
CYP2C9 promoter activity. Neither the -2663delTG nor the -3089G>A SNPs, when singly
engineered into a -5470/+25-CYP2C9 luciferase reporter plasmid, decreased basal reporter
activity (Fig 4A,B). Compared with the WT reference reporter, both the individual variants

10
decreased CAR and CAR + PHT induced CYP2C9 promoter activity (Fig 4A,B). Since the -
3089G>A created a putative YY1 site, we compared the -3089G and -3089A reporter
plasmids in cells in which YY1 was overexpressed with an expression plasmid. YY1
overexpression decreased the -3089A variant promoter construct to a significantly greater
extent than the WT promoter construct (p=0.04) (Fig 4A). Since the -2663delTG destroyed a
putative Nrf2 site, we compared the two reporter plasmids in cells where Nrf2 (always co-
transfected with the heterodimerization partner MafK) was overexpressed. Nrf2
cotransfection significantly increased (p=0.02) the WT promoter construct’s luciferase
activity compared to the -2663delTG reporter construct, although the variant reporter was
induced by PHT/Nrf2 (Fig 4B).
Effect of promoter haplotypes on constitutive and phenytoin-induced CYP2C9
promoter activity. Luciferase activity in cells with the wild-type (WT-HAP) was induced to
a significantly greater extent (80% increase) compared to the variant haplotype (VAR-HAP)
in cells that were co-transfected with PXR and treated with 50 µM PHT (Fig 5A) (p=0.002).
In contrast, co-transfection with CAR with and without PHT induced luciferase activity from
the WT-HAP and VAR-HAP to similar extents (not shown). Conversely the VAR-HAP
luciferase activity was 20% more repressed by YY1 overexpression alone vs. the WT-HAP
cells (Fig 5B) and YY1 overexpression demonstrated a significantly greater (p=0.007)
repression of luciferase activity in the VAR-HAP cells when cotransfected with PXR and
treated with PHT.
PHT treatment of Nrf2 cotransfected cells increased luciferase promoter activity of
the WT-HAP 43% more than the VAR-HAP (p=0.02) (Fig 5B). Nrf2 and PXR cotransfection
further increased the basal (p=0.04) and PHT induced (p=0.008) promoter activity of the WT-
HAP 37% more than the VAR-HAP.

11
Next we compared the effect of co-transfection of PXR in combination with YY1 and
Nrf2. YY1 repressed activation of the WT and VAR haplotypes by either PXR or Nrf2 co-
transfected plasmids, with or without PHT, although the VAR-HAP was repressed to a
greater extent (up to 33%) compared to the WT-HAP (Fig 5C). In total, compared to the WT-
HAP, the luciferase activity in cells containing the VAR-HAP was more significantly
repressed by YY1 and less induced by PHT.
To determine the in vivo effect of the CYP2C9 regulatory polymorphisms on PHT-
mediated induction of CYP2C9, we used a novel whole animal imaging technique (16). Mice
injected by hydrodynamic infusion with the CYP2C9-WT-HAP construct had a greater
magnitude of induction upon treatment with PHT compared to mice injected with the
CYP2C9-VAR-HAP, and in fact transcriptional activity of the variant allele appeared to be
repressed by PHT treatment in vivo (Fig 5D). These results demonstrate that the CYP2C9
regulatory polymorphisms are responsible for diminished responsiveness to phenytoin-
dependent induction of CYP2C9 in vivo.
Electrophoretic mobility shift assay shows the -3089 variant allele creates a YY1
binding element. EMSAs were performed to evaluate any differential binding of YY1, Nrf2,
PXR or CAR to the WT and VAR alleles. The -3089G>A was predicted to create a YY1
binding site. Only the -3089A (VAR) oligonucleotide bound YY1 (lane 12 (VAR) vs. lane 4
(WT)) and this binding was displaced by excess cold VAR oligonucleotide (Fig 6). Neither
the -3089G nor the -3089A allele bound CAR:RXR or PXR:RXR heterodimers. YY1 binding
appeared to be somewhat diminished by co-incubation with either heterodimer. Thus, the
EMSA analysis (Fig 6A) confirmed the in silico prediction that the -3089A VAR allele
creates a YY1 binding site. In contrast, although in silico bioinformatic analysis predicted
that the -2663delTG destroyed an Nrf2 binding site, neither the -2663TG WT nor -

12
2663delTG oligonucleotides bound the Nrf2:MafK heterodimer, or CAR:RXR or PXR:RXR
heterodimers (not shown).
The variant CYP2C9 promoter haplotype alters CYP2C9 mRNA induction by
phenytoin in primary human hepatocytes. Induction of CYP2C9 mRNA was compared in
primary human hepatocytes from 12 donors (nine heterozygous for the VAR haplotype and
three with a WT haplotype) treated with phenytoin. Phenytoin treatment resulted in a 3.52-
fold induction of CYP2C9 mRNA in hepatocytes with the WT haplotype, but only a 2.07-
fold induction in hepatocytes with the VAR haplotype (a 42% decrease relative to the WT
haplotype) (Fig 7). If the single outlier in the VAR haplotype group is removed, the
difference in phenytoin induction of CYP2C9 between the two haplotypes reaches statistical
significance (p=0.02). No difference in induction of CYP3A4 or CYP2C19 mRNAs were
seen between hepatocytes with the different CYP2C9 haplotypes (Fig 7).
Phenytoin treatment does not lead to induction of unique alternative CYP2C9 mRNA
transcripts. We also considered the possibility that CYP2C9 5’ regulatory polymorphisms
could lead to genesis of PHT inducible alternative CYP2C9 mRNAs. CYP2C9 alternative
mRNAs have been described including a chimeric transcript (CYP2C18 exon 1-like_CYP2C9
chimera) that contains the CYP2C18 exon 1-like sequence spliced through a segment of the
CYP2C9 5’ UTR that is spliced to CYP2C9 exons 2-9 (Fig 7), but does not lead to an open
reading frame (17). The CYP2C18 exon 1-like sequence is located in the intergenic region
between CYP2C9 and CYP2C19 genes and one of the SNPs in LD to the CYP2C19*2 allele
was located at -32kb, 320 bp downstream of CYP2C18 like exon 1. Quantitation of this
spliced transcript by Q-realtime PCR in the phenytoin treated primary human hepatocytes
revealed no induction of the chimera in either haplotype (Fig 7). To further exclude the
13
possibility that some 5’ regulatory SNP created a unique TF binding site (e.g., CAR or PXR)
that led to use of an alternative promoter generating a unique phenytoin inducible CYP2C9
alternative mRNA, we performed 5’ RACE using cDNAs from vehicle versus phenytoin
induced primary human hepatocytes. No 5’ RACE product unique to the phenytoin treated
hepatocytes was identified. Two transcripts of equal abundance in vehicle and PHT treated
hepatocytes from both genotypes were identified by 5’-RACE. The transcripts started 25 bp
(more abundant transcript) and 62 bp upstream of the translation start site. Further, when we
used 5’ and 3’ UTR primers to amplify the full length CYP2C9 cDNA from control and PHT
treated human hepatocytes there was no evidence by sizing of PCR products on agarose gels
of any PHT inducible alternative CYP2C9 mRNAs in either genotypic group.

14
Discussion
We undertook this study to determine why patients with CYP2C9*1 genotypes, but
heterozygous for CYP2C19*2, who would be expected to produce p-HPPH(S)/(R) metabolite
ratios of 30-40:1, unexpectedly produced ratios of only 12.9 (13). We hypothesized that an
unrecognized SNP in CYP2C9, in LD with CYP2C19*2, could explain this surprising
finding. In Whites, we found CYP2C19*2 was in complete LD with CYP2C9*1B containing
the -3089G>A and -2663delTG polymorphisms. These polymorphisms decreased phenytoin-
mediated induction of CYP2C9 transcription in vitro and in mice transfected in vivo, and
resulted in a diminished capacity to induce CYP2C9 mRNA expression in primary human
hepatocytes. We propose that this mechanism explains the clinically paradoxical finding of
altered PHT clearance in CYP2C19*2 Caucasian (13) and Japanese patients (12) who were
homozygous for CYP2C9*1.
In support of this, the current study demonstrates a strong effect of the CYP2C9*1B
haplotype on PHT metabolism and dose requirements in patients with epilepsy on chronic
PHT therapy. Among patients who did not carry the CYP2C9*2 or CYP2C9*3 alleles, the
CYP2C9*1B haplotype was significantly associated with reduced PHT maintenance dose,
consistent with reduced PHT induction of CYP2C9 metabolism in CYP2C9*1B carriers.
Notably, the full effect of the CYP2C9*1B haplotype is not appreciated unless the
independent effects of CYP2C9*2 and CYP2C9*3 are taken into account (and vice versa). A
multivariate model that includes all CYP2C9 genotype information in addition to gender,
body weight, and genomic ancestry showed that nearly half of the variation in PHT
maintenance dose can be explained by these predictors (Table 1), with up to 10% of the
variation in dose attributable to CYP2C9*1B haplotype alone. The magnitude of the effect of
CYP2C9 alleles on PHT dose requirements appeared to be strongly dependent on the clinical
setting; in an additional chronic epilepsy cohort managed with a less aggressive dosing

15
strategy, no effect of any of the functional CYP2C9 alleles was observed (C. Depondt,
personal communication).
Given the magnitude of the effect of the promoter rPMs comprising the CYP2C9*1B
haplotype on PHT maintenance dose observed here, it may be surprising that this allele has
not previously been identified in candidate gene or genome-wide association studies such as
those for warfarin, another CYP2C9 substrate. However, several lines of evidence
conclusively demonstrate that the promoter rPMs affecting the PHT induction phenotype do
not decrease basal CYP2C9 expression: neither hepatic CYP2C9 mRNA expression nor
activity were affected by the CYP2C19*1B genotypes; and warfarin maintenance dose was
not significantly affected by the -3089G>A and -2663delTG polymorphisms in Chinese
patients (Fig 3A). Likewise, Veenstra et al (14) previously found no difference in warfarin
sensitivity (basal CYP2C9 activity) in White patients with the CYP2C9*1B allele.
Although we identified the -3089G>A and -2663delTG CYP2C9 promoter rPMs by
searching for SNPs in LD to CYP2C19*2, these rPMs were previously identified in the
CYP2C9*1B promoter haplotype (allele frequency 17.45% Whites of European descent).
Recently Kramer et al (18) identified common haplotypes in Hispanics and designated this
same allele CYP2C9*1D (hereafter referred to as Kramer *1D when referencing results from
that publication). Notably, in transient transfection studies the Kramer *1D haplotype,
relative to the reference haplotype, exhibited no difference in constitutive promoter activity
but showed a 50% decrease in PXR mediated promoter activity upon treatment with rifampin.
This result is similar to the effect observed here that the CYP2C9*1B promoter had
diminished activation by phenytoin. The Kramer *1D haplotype also includes a -1188T>C
SNP. Although we did not include this SNP in our CYP2C9 variant reporters, Kramer et al
(18) deduced that the -1188T>C transition was unlikely to be singly responsible for the
differences in induction profiles because it was present in numerous other haplotypes that
16
behaved no differently from the reference allele with respect to either basal or rifampin-
inducible activity. Further, a report by Sandberg et al (19) found no effect of the -1188T>C
variant on gene expression in vitro. Although we cannot exclude the possibility that the -
1188T>C might contribute to our phenotype, it would not negate the contribution of -
3089G>A or -2663delTG, it would simply imply that these polymorphisms are not the only
ones contributing to decreased phenytoin-mediated CYP2C9 induction.
Phenytoin has been shown to activate both PXR and CAR (20-22). Although
Nubiscan predicted possible PXR or CAR binding elements around -3089 and -2663 (Fig 1),
neither receptor bound to the -3089 or -2663 wild-type or variant oligonucleotides in EMSA
assays and hence cannot explain the decreased induction response. Nevertheless, the VAR-
HAP demonstrated a significantly decreased PXR mediated PHT induction of promoter
activity compared to WT-HAP (Fig 5), similar to Kramer’s *1D that demonstrated
significantly lower PXR mediated rifampin induction compared to the WT-HAP (18). It is
also possible that CAR contributes to the differential activation of the CYP2C9 WT and VAR
promoters by phenytoin because the CYP2C9 WT reporter was induced to a greater extent
than reporters with single CYP2C9 promoter variations (Fig 4). Although it is unclear why
the single variants were more induced by CAR +/- PHT while the haplotypes were more
induced by PXR +/- PHT, it does not negate the fact that the variant allele was consistently
less inducible by PHT.
There are Ying Yang (YY1) binding sites predicted in the CYP2C9 5’-flanking region
and the -3089G>A polymorphisms created an additional YY1 binding site. YY1 is a
transcription factor expressed in most tissues that plays a role in cell differentiation and can
either induce or repress expression depending upon the target gene. Our studies reveal that
YY1 is a repressor of both basal and PHT inducible CYP2C9 transcription, but the magnitude
of repression was always greater in the CYP2C9 variant reporter with the additional YY1 site.

17
Although the in vivo data suggests the CYP2C9 basal activity is not different between the
CYP2C9*1 and *1B genotypes, the experimental results suggest that YY1 could contribute to
the diminished PHT inducibility of the *1B genotype, although it is not known if or how PHT
might interact with YY1.
Our data support the idea that PHT activation of Nrf2 could participate in CYP2C9
induction. PHT-mediated activation of Nrf2-ARE signaling induces mRNA expression of
protective enzymes by binding to antioxidant response elements (ARE) in the promoter and
activating the transcription of target genes. Although Transfac predicted that the -2663delTG
abrogated a putative Nrf2 binding site, EMSA failed to demonstrate Nrf2:MafK binding to
oligonucleotides with the –2663TG or TGdeletion sequences (not shown). Nevertheless, it is
still possible that Nrf2 contributes to PHT induction of CYP2C9 because (a) mice treated
with PHT showed Keap1-Nrf2-dependent induction of genes that included Cyp2b10 and
Cyp2c29 (23, 24); (b) Transfac analysis showed 21 high scoring putative ARE binding sites
in the -5.3 kb CYP2C9 5’ flanking sequence; and (c) co-transfection with Nrf2/MafK
induced luciferase activity from the CYP2C9 reporter plasmids. If PHT generates an
antioxidant response signal it could be due to PHT metabolites activating Keap1. The PHT
dihydrodiol metabolite accounts for ~10% of the dose, strongly suggesting that an arene
oxide is formed during the initial oxidation of PHT to make either p-HPPH or PHT-diol. The
arene oxide could interact with Keap 1. A second oxidation of p-HPPH can also occur
leading to a catechol metabolite (25). The catechol could be oxidized to a quinone and then
react with Keap1 thiols as well. Alternatively, PHT’s major metabolite 4-OH-PHN can be
oxidized by peroxidases to phenoxyl free radicals which could cause oxidative stress by
redox cycling. This could also lead to oxidation of sulfhydryl groups on Keap1 thus leading
to the initiation of Keap1-Nrf2-ARE signaling pathway.

18
The low p-HPPH(S)/(R) ratio in CYP2C19*2 carriers appears to be due to the lower
induction of the linked CYP2C9*1B allele, and resulting decreased metabolism of PHT to
(S)-pHPPH, even in the face of the greatly diminished formation of (R)-p-HPPH by
CYP2C19*2. We could find no other polymorphism in the CYP2C9 cDNA of
CYP2C19*2/2C9*1B carriers, nor generation of any novel PHT induced alternative CYP2C9
transcripts in human hepatocytes with these genotypes that could explain the lower (S)-p-
HPPH or greater (R) metabolite formation. Likewise, 5’RACE of PHT-treated primary
human hepatocytes failed to identify any differentially activated promoter/CYP2C9
transcripts in CYP2C19*2 subjects. Although we considered the possibility that PHT
induction of other metabolic enzymes might contribute to the observed alteration in (S)/(R)-
p-HPPH ratios in CYP2C19*2 patients, the literature strongly supports that p-HPPH is
formed almost exclusively by either CYP2C9 or CYP2C19, with negligible activity by
expressed CYP1A2, 2A6, 2B6, 2C8, 2D6, 2E1 or 3A4 (26, 27). p-HPPH can undergo a
second hydroxylation to form a catechol metabolite (25). This can also be formed via the
diol metabolite by dihydrodiol dehydrogenase. Catechol formation from p-HPPH appears to
be mainly catalyzed by CYP2C19 with additional contribution from CYP3A4 and CYP2C9
(28). In vivo, the catechol and methylcatechol metabolites are minor accounting for <5% of
the dose in the urine. Although the amounts of these other metabolites were not measured in
our study, the differential formation of these metabolites, even if they occurred, would
appear insufficient to account for the altered p-HPPH ratios observed in CYP2C19*2 patients.
The finding that the CYP2C9*1B allele has diminished PHT inducibility is clinically
relevant because PHT has been reported to undergo auto-induction (29-31). Miller et al (29)
reported two patients who demonstrated an 11-20% increase in Vmax after 5 months-1 yr
treatment with PHT. Others have reported modest induction of PHT clearance and a decrease
in AUC after repeated doses of PHT (30, 32). Dickinson et al (31) found that eight healthy
19
individuals demonstrated a significant auto-induction of PHT metabolism and urinary
excretion of p-HPPH increased with repeated administration of PHT. While PHT auto-
induction is not as generally appreciated clinically as is the case for another antiepileptic
drug, carbamazepine, this may potentially be explained by reduced CYP2C9 inducibility in
patients carrying the CYP2C9*1B haplotype, which may obscure the PHT auto-induction in
studies that have not accounted for this genetic effect.
Phenytoin is highly prescribed, and in 2002 the generic and brand named phenytoin
(dilantin) combined sold 6.8 million units (vs. brand name lipitor which sold 53.4 million
units). Among the older antiepileptic drugs (AEDs), the prevalence of use in the United
States is: PHT>valproic acid>carbamazepine>phenobarbital (52%, 19%, 11% and 7%,
respectively). The use of phenytoin is highest among the elderly population, those most
likely to be taking other medications metabolized by CYP2C9. For example, it is estimated
that 10.5% of nursing home residents had one or more AED orders, a prevalence 10 times
greater than that found in the community (33, 34). Moreover, this at risk population will only
continue to grow, as persons over 65 years old are the fastest growing segment of the U.S.
population. Although newer AEDs that may have fewer side effects have come on the
market, PHT continues to occupy an important role in the pharmacological treatment of
epilepsy, particularly for patients on long standing PHT-containing regimens that may have
required months to years of modification of drug regimens and doses to achieve optimal
control of their disease.
Our findings, combined with those of Kramer et al (18), suggest that the CYP2C9*1B
allele will not only affect the magnitude of PHT autoinduction of clearance but also the
magnitude of other CYP2C9 drug-drug interactions resulting from PXR/CAR activation.
CYP2C9 metabolizes approximately 16% of clinically important drugs, including some with
narrow therapeutic indices: sulfonylureas such as tolbutamide, anticonvulsants such as
20
phenytoin and the anticoagulant warfarin. Other substrates include the antiotensin II blocker
losartan, the NSAIDs ibuprofen, naproxen, and flurbiprofen and drugs such as fluvastatin,
fluoxetine and rosiglitazone. Thus, it is possible that the extent of drug interactions following
co-treatment with known PXR/CAR activators and CYP2C9 inducers such as rifampin or
phenytoin or barbiturates might differ between individuals with the CYP2C9*1B vs. other
CYP2C9*1 genotypes. Although CYP2C9 is not highly induced in human hepatocytes by
phenytoin (35) and (Fig 7), hepatic CYP2C9 is also induced by rifampin, phenobarbital and
avasimibe (35, 36). Moreover, CYP2C9 is among the three most highly induced CYPs in
human duodenum in patients treated with clinical doses of oral rifampin (E. Schuetz,
unpublished observation). Our results would suggest that the magnitude of drug interactions
are likely to be different between the 17.4% of Whites and 6.6% of Hispanics (18) with the
CYP2C9*1B allele compared to those with other CYP2C9*1 alleles.

21
Methods
Materials. QuikChange II XL site-directed mutagenesis kit was obtained from Stratagene (La
Jolla, CA). TRIzol and Superscript reverse transcription-polymerase chain reaction (PCR)
system were from Invitrogen (Carlsbad, CA). The luciferase assay system, β-galactosidase
assay system, TNT quick coupled transcription/translation system, and PCR master mix were
purchased from Promega (Madison, WI). High-purity plasmid purification kits and DNeasy
tissue kit were supplied by QIAGEN (Valencia, CA). Trypsin, penicillin, streptomycin, cell
culture minimal essential media were purchased from Gibco (Carlsbad, CA). Fetal bovine
serum was purchased form HyClone (Logan, UT). DMSO and PHT were purchased from
Sigma-Aldrich (St. Louis, MO). The transfection reagent Turbofectin 8, YY1 expression and
Nrf2 expression plasmids were procured from Origene (Rockville, MD). γ-32P-ATP and 35S-
methionine were supplied by PerkinElmer (Waltham, MA). Exonuclease 1 and shrimp
alkaline phosphatase were from USB Corp. (Cleveland, OH). FirstChoice® RLM-RACE Kit
was purchased from Ambion/Applied Biosystems (Chicago, IL). Custom oligonucleotide
synthesis and DNA sequencing was done by the Hartwell Center for Bioinformatics &
Biotechnology at St. Jude Children’s Research Hospital, Memphis, TN.
In silico analysis of the CYP2C9 and CYP2C19 genes. Databases screened for potential
candidate SNPs in CYP2C9 which are in LD with CYP2C19*2: HapMap,
http://www.hapmap.org/ and Perlegen, http://genome.perlegen.com/). Web-based
bioinformatic tools Nubiscan (http://www.nubiscan.unibas.ch) and Transfac (http://hc-
transfac/cgi-bin/biobase/transfac/11.4/bin/start.cgi) were used to identify whether
polymorphisms altered transcription factor binding sites.

22
Procurement of liver tissue. Human liver studies were approved by the St Jude Children’s
Research Hospital and University of Pittsburgh Institutional Review Boards. Human liver
tissue (n=28) was processed through the St Jude Liver Resource at St. Jude Children’s
Research Hospital and was provided by the Liver Tissue Procurement and Distribution
System (NIH Contract #N01-DK-9-2310) and by the Cooperative Human Tissue Network.
RNA from donor livers was used to analyze the expression of CYP2C9 as well as to prepare
cDNA to study the polymorphic splicing events by amplifying full length cDNA. DNA from
donor livers was used to genotype for CYP2C9*2, CYP2C9*3, CYP2C9 -3089G>A,
CYP2C9-2663delTG and CYP2C19*2.
mRNA quantification. Total RNA was isolated from liver or human hepatocytes with TRIzol.
First-strand cDNA was prepared using oligo (dT) primers [Invitrogen, Superscript reverse
transcription-polymerase chain reaction (PCR) system]. Real-time PCR quantitation of
CYP2C18 like Ex1/ 2C9 Ex2 chimera, CYP2C9, CYP2C19, CYP3A4 mRNA and the
housekeeping control glyceraldehyde-3- phosphate dehydrogenase was carried out using the
QuantiTect SYBR Green PCR kit (Qiagen, Valencia, CA) according to the manufacturer’s
instructions. cDNA was analyzed in duplicate by quantitative real-time PCR on an ABI
PRISM 7900HT Sequence Detection System (PE Applied Biosystems, Foster City, CA).
Primers used for real-time quantification are provided in Supplemental Table 1. Specificity of
amplification was confirmed in each case by performing melt curve analysis and agarose gel
electrophoresis. The averaged Ct values were analyzed by the comparative Ct method to
obtain relative mRNA expression levels.
Genotyping of CYP2C9 and CYP2C19 alleles. DNA from human livers was isolated using a
DNeasy tissue kit. PCR was performed using 50 ng of genomic DNA template and 1 µM of
23
each primer in a 25 µL reaction volume using PCR master mix from Promega. Genotyping
for CYP2C9*2, CYP2C9*3, CYP2C9 -3089G>A, CYP2C9-2663delTG and CYP2C19*2 was
performed by direct DNA sequencing of the specific PCR amplified fragments. The primers
were used for PCR amplification and DNA sequencing and are listed in Supplemental Table
1.
Epilepsy Study Population. The patient population included adult individuals of primarily
European ancestry enrolled in a retrospective observational study of adult and pediatric
chronic epilepsy patients followed by epileptologists at Duke University Medical Center
(DUMC) (n=79), and the National Hospital for Neurology and Neurosurgery, University
College London Hospital (UCLH) (n = 94). Studies were performed under protocols
approved by the appropriate local Institutional Review Boards. Informed consent was either
obtained from each patient or from the patients’ parent or caregiver when it was not possible
to obtain consent from the patient directly. A DNA sample was obtained from each patient,
and medical records were reviewed retrospectively. Selected clinical data including a
comprehensive past medical history and demographic information, epilepsy diagnosis,
seizure type and frequency, drug initiation and stop dates, and adverse effects from AEDs
were recorded in a relational database (InForm). Genotyping for CYP2C9*2, CYP2C9*3 and
CYP2C9 -3089G>A was performed using Taqman MGB genotyping assays (Applied
Biosystems, Inc., Foster City, CA, USA).
Phenotyping/Phenotype Definitions. Maintenance dose was defined as any prescribed dose
that remained unchanged for two consecutive clinic visits, not including the initial (referral)
visit. If this definition was met more than once for the same drug and patient, the dose that
was maintained for the longest period of time was selected as the maintenance dose. It was
24
anticipated that the maintenance dose would tend to reflect, in a quantitative manner, the
liability toward seizure control by a given drug for a particular patient, whereas the maximum
dose will tend to limited by the tolerability of the drug, although both maintenance dose and
maximum are likely to be influenced by both efficacy and tolerability.
Chinese patients on warfarin. This study received human subject approval from the Chinese
University of Hong Kong-New Territories East Cluster Clinical Research Ethics Committee.
After informed consent was obtained, a cohort of Chinese patients who had warfarin therapy
initiated for indications of moderate intensity anticoagulation (target INR=2-3) were recruited
at the anticoagulation clinic of the Prince of Wales Hospital in Hong Kong. Exclusion criteria
included concurrent use of drugs known to interfere with warfarin metabolism, impaired
hepatic function (>1.5 times upper normal limit of serum aminotransferases) or renal function
(serum creatinine >120 µmol/L), and patients who had received warfarin for less than three
months. A 5 mL blood sample was drawn for genotyping during a regularly scheduled clinic
visit. Complete warfarin dosing information was retrieved from medical records to determine
stable warfarin dose, defined as three INR measurements within target range, at the same
mean daily dose, following consecutive clinic visits.
Human liver microsomes. Human liver microsomes were prepared from CYP2C19*2 and
CYP2C9 -3089G>A genotyped samples (n=14) and analyzed for the formation of (S) and (R)
p-HPPH. Microsomal incubations consisted of 100 µL protein (1.25 mg protein/mL), 100 µL
25 mM MgCl2, 100 µL 250 mM TRIS buffer (pH 7.4 at 37 ˚C), and 100 µL 50 µM PHT (10
µM final concentration). The above mixture was allowed to preincubate at 37 °C for 2 min at
30 rpm, and 100 µL 5 mM NADPH were added to initiate the reaction. The reaction was
stopped after 45 min by adding 100 µL 20% TCA. Production of p-HPPH under these

25
conditions was linear with respect to time and protein concentration. The samples were next
placed on ice for 30 min to complete precipitation of the protein, followed by centrifugation
at 13,000 x g for 10 min. An aliquot of the supernatant (500 µL) was then subjected to solid
phase extraction on Phenomenex Strata-X (30 mg) columns. Low speed (50 x g)
centrifugation for 30 sec was used to elute the solutions and samples through the cartridge in
a Forma Scientific (Model # 5681) swinging bucket centrifuge. The columns were activated
with 1 mL methanol, followed by conditioning with 1 mL 10 mM ammonium formate buffer
(pH 3). The sample was next added to the column and allowed to stand for 2 min prior to
centrifugation. The cartridges were then washed with 1 mL 2% methanol in buffer, followed
by two washes of 1 mL buffer solution. The cartridges were allowed to stand for 3 min before
centrifugation. Sample elution was carried out with two 1 mL washes of acetonitrile. The
final centrifugation was carried out at 75 x g for 1 min. All eluants were collected and dried
under nitrogen at 40 °C, followed by reconstitution in 100 µL 50% acetonitrile and 50%
ammonium acetate buffer (10 mM). The reconstituted samples were centrifuged at 10,000 x g
for 10 min in a Beckman microcentrifuge, and 30 µL sample was injected into the LC-MS for
analysis. Separation of R- and S-p-HPPPH was accomplished with a Nucleodex beta-OH
chiral column (200 mm x 4.6 mm) (Macherey-Nagel, Easton, PA) with 1 mL/min of 75%
ammonium formate (10 mM, pH 3) and 25% acetonitrile as mobile phase. The retention
times for the (R) and (S) p-HPPH isomers were 15 and 17 min, respectively. Peak areas were
directly measured and an S/R p-HPPH ratio was determined. Detection was by atmospheric
pressure chemical ionization-mass spectrometry (APCI-MS) in the negative ion mode at an
m/z of 266 on a Shimadzu 2010 LC-MS instrument. The APCI probe was maintained at 400
°C, the heater block at 200 °C and the desolvation line at 200 °C. The detector voltage was
1.6 kV, the microscan set to 0.3 amu, a scan time of 0.5 sec, and nitrogen gas flow rate 2.5
L/min.

26
CYP2C9 Reporter plasmids. Cloning of the -5470/+25 CYP2C9 promoter luciferase reporter
plasmid in the pGL3-basic vector (Promega, Madison, WI) has been previously described
(37). The plasmid, generously supplied by Dr. Dexi Liu, Univ. Pittsburgh, was resequenced
to genotype for the CYP2C9 -3089G>A and -2663delTG and found to be WT at these two
positions. Site-directed mutagenesis (SDM) was employed to create the VAR CYP2C9 -
3089A plasmid using primers in Supplemental Table 1. The CYP2C9 -2663delTG was
generated commercially by GenScript Corp. The CYP2C9*1B haplotype was made by a
performing SDM on the CYP2C9-2663delTG plasmid. All nucleotide variations were
confirmed by DNA sequencing.
Cell culture and transient transfection assays. HepG2 human hepatoma cells were cultured in
minimal essential media (MEM alpha) supplemented with 10% fetal bovine serum, 1%
penicillin, and 1% streptomycin, and maintained in a humidified incubator at 37 °C in an
atmosphere of 5% CO2. For transfection studies, 3 x 10⁵ cells per well were seeded into 24
well culture dishes. After 24 h cells were transfected with 400 ng CYP2C9 promoter
luciferase reporter plasmid + 40 ng of HNF-1α and HNF-4α luciferase expression plasmids
+/- 40 ng each of either pcDNA3-hPXR, pcDNA3-hCAR, pCMV6 Entry-YY1, or pCMV6
Entry-Nrf2 + pcDNA3-MafK. Each tube contained the appropriate amounts of pcDNA3
stuffer DNA to ensure equivalent amounts of total transfected plasmid and 50 ng pSV40 -
LacZ to normalize LUC activity. HNF-1α and HNF-4α were always cotransfected because
earlier observations demonstrated that these are required for optimal CYP2C9 promoter
activity (18). 24 h later, transfection medium was replaced with normal growth medium, and
cells were incubated for an additional 24 h. For induction experiments, transfection medium
was replaced with medium supplemented with 50 µM PHT or DMSO. After 24 h cell lysates

27
were prepared and luciferase assays were performed according to the manufacturer’s
instructions. Luciferase activities were normalized with respect to β-galactosidase activity to
correct for transfection efficiency and expressed as fold change with respect to vector control.
Data are reported as mean ± S.D. of three determinations and were representative of multiple
experiments. Statistical differences between groups was determined using the Student’s t-test.
Hydrodynamic Infusion of DNA and In vivo Optical Imaging. All animal studies were
approved by the St Jude Children’s Research Hospital Institutional Animal Care and Use
Committee. C57BL6J male mice (14-18 weeks) were injected by hydrodynamic infusion
(16), a rapid (5 sec) tail vein injection of 10 µgs of either the wild-type CYP2C9*1 or variant
CYP2C9*1B haplotype (plasmids in a volume of sterile saline equal to 10% of body weight).
Mice were immediately given an i.p. injection of vehicle (sterile phosphate buffered saline)
or 20 mg/kg phenytoin (PHT). Twenty four hours later, animals were anesthetized by
isoflurane and given an i.p. injection of D-firefly luciferin (30 mg/ml luciferin in sterile saline
dosed with 70 µl/10 gram of body weight) (Xenogen Corp., Alameda, CA). Optical images
were obtained with a Xenogen imaging system (http://www.xenogen.com/demo4.html).
Timed images, taken over 1 min, were quantitatively analyzed by IGOR Pro 4.0TM image
analysis software (WaveMetrics, Lake Oswego, OR). Results were graphed for each
CYP2C9 reporter as the fold change in image density in the PHT treated vs. vehicle treated
groups (each set as 1).
Electrophoretic Mobility Shift Assay (EMSA). hPXR, hCAR, hRXR, hYY1, hNrf2 and Maf K
proteins were generated by TNT in vitro transcription and translation per manufacturers
instructions. Proteins were incubated at 4°C for 1.5 h with 32P-labeled double stranded
oligonucleotides (6,00,000 cpm/reaction) in the presence or absence of 100-500 –fold excess

28
of unlabeled double-stranded oligonucleotide in a DNA binding buffer (10 mM Tris pH 8.0,
40 mM KCl, 0.05% NP40, 6% glycerol, 0.2 µg poly dI/dC, 200 µM ZnCl, 1 mM
dithiothreitol). Complexes were resolved by electrophoresis on a nondenaturing 6%
polyacrylamide gel and analyzed using a PhosphorImager Model 860 Storm (Molecular
Dynamics, Sunnyvale, CA). Specific oligonucleotides sequences used are listed in
Supplemental Table 1.
PHT treatment of primary human hepatocytes. Studies in primary hepatocytes isolated from
human liver were approved by the University of Pittsburgh Institutional Review Board.
Livers were procured from donor organs and were flushed, in situ, and maintained with
Belzar’s UW solution (Barr Laboratories, Pomona, NY). Hepatocytes were isolated as
previously described and were plated on collagen-coated six-well plates maintained in
modified Williams’ E medium for 48 h and then treated with PHT for 48 h. Media were then
aspirated and TRIzol solution (Invitrogen) was added for RNA isolation. DNA was extracted
from an aliquot of donor liver for CYP2C9 genotyping.
5’- rapid amplification of cDNA ends (RACE). 5’-RACE was carried out in control and PHT
treated human hepatocytes extracts according to the manufacturer’s protocol. The 5’RACE
and CYP2C9 gene specific primers are listed in Supplemental Table 1. RACE products were
analyzed using 1% agarose gel electrophoresis, cloned into a TOPO TA vector and sequenced
using direct DNA sequencing.
Statistical analysis. Relationship of different genotypes with CYP2C9 mRNA expression,
pHPPH (S/R) ratio, and warfarin dose requirements was analyzed using the statistical
program R: A Language and Environment for Statistical Analysis (http://www.Rproject.org).

29
Group differences were analyzed nonparametrically using the Wilcoxon rank sum test to
compare two genotype groups whereas the Kruskal-Wallis test was used to compare three
groups of genotypes with the phenotypes. Box plots indicate 2nd and 3rd quartiles, with the
bold line within the box representing the median value; the whiskers represent the range after
excluding the outliers. The outliers are defined by the R package as data points that fall
outside the 2nd and 3rd quartiles by more than 1.5 times the interquartile range, and circles
falling outside the whiskers represent outliers. Genetic association testing in the chronic
epilepsy population was performed using multiple linear regression in StataIC10 (StataCorp
LP, College Station, TX, USA).

30
Acknowledgements
We thank the Hartwell center for DNA sequencing and oligonucleotide synthesis and Dr.
Lubin Lan for performing the hydrodynamic infusion experiments. This work was supported
by NIH grants RO1 GM60346 (to E. Schuetz) and NIH/NIGMS Pharmacogenetics Research
Network under grant U01 GM61393, and NIH P30 CA21765 Cancer Center Support grant,
and by the American Lebanese Syrian Associated Charities (ALSAC), and by NIH-NINDS
P50 NS16308 (to M Subramanian) and by a Postdoctoral Research Fellowship from the
American Epilepsy Society (to T. Urban), and a grant from the Research Grants Council of
the Hong Kong Special Administrative Region, China (Project no. CUHK4519/06M), and by
grants from the UK Medical Research Council (G0400126), The Wellcome Trust (084730),
UCLH CDRC grant (F136), and the National Society for Epilepsy. This work was partly
undertaken at UCLH/UCL who received a proportion of funding from the UK Department of
Health’s NIHR Biomedical Research Centre’s funding scheme.
Footnotes
Conflict of interest: The authors have declared that no conflict of interest exists
Nonstandard abbreviations used:
PXR, pregnane X receptor; CAR, constitutive androstane receptor; YY1, Ying Yang 1
transcription factor; LD, linkage disequilibrium; PHT, phenytoin; p-HPPH, 5-(4’-
hydroxyphenyl)-5-phenylhydantoin; AED, antiepileptic drug; VAR, variant; WT, wild type;
HAP, haplotype; -2663delTG, designation used by Veenstra et al (14) but equivalent to the -
2665_-2664delTG designation used by some others; CYP2C9*1B, designation used by
Veenstra et al (14) but identical to the CYP2C9*1D haplotype described by Kramer et al (18).
31
References
1. Bhasker,C.R., Miners,J.O., Coulter,S., and Birkett,D.J. 1997. Allelic and functional
variability of cytochrome P4502C9. Pharmacogenetics 7:51-58.
2. Stubbins,M.J., Harries,L.W., Smith,G., Tarbit,M.H., and Wolf,C.R. 1996. Genetic
analysis of the human cytochrome P450 CYP2C9 locus. Pharmacogenetics 6:429-439.
3. Sullivan-Klose,T.H., Ghanayem,B.I., Bell,D.A., Zhang,Z.Y., Kaminsky,L.S.,
Shenfield,G.M., Miners,J.O., Birkett,D.J., and Goldstein,J.A. 1996. The role of the
CYP2C9-Leu359 allelic variant in the tolbutamide polymorphism. Pharmacogenetics
6:341-349.
4. Rettie,A.E., Haining,R.L., Bajpai,M., and Levy,R.H. 1999. A common genetic basis for
idiosyncratic toxicity of warfarin and phenytoin. Epilepsy Res. 35:253-255.
5. de Morais,S.M., Wilkinson,G.R., Blaisdell,J., Nakamura,K., Meyer,U.A., and
Goldstein,J.A. 1994. The major genetic defect responsible for the polymorphism of S-
mephenytoin metabolism in humans. J. Biol. Chem. 269:15419-15422.
6. Desta,Z., Zhao,X., Shin,J.G., and Flockhart,D.A. 2002. Clinical significance of the
cytochrome P450 2C19 genetic polymorphism. Clin. Pharmacokinet. 41:913-958.
7. Aynacioglu,A.S., Brockmoller,J., Bauer,S., Sachse,C., Guzelbey,P., Ongen,Z.,
Nacak,M., and Roots,I. 1999. Frequency of cytochrome P450 CYP2C9 variants in a
Turkish population and functional relevance for phenytoin. Br. J. Clin. Pharmacol.
48:409-415.
8. Tate,S.K., Depondt,C., Sisodiya,S.M., Cavalleri,G.L., Schorge,S., Soranzo,N.,
Thom,M., Sen,A., Shorvon,S.D., Sander,J.W. et al 2005. Genetic predictors of the

32
maximum doses patients receive during clinical use of the anti-epileptic drugs
carbamazepine and phenytoin. Proc. Natl. Acad. Sci. U. S. A 102:5507-5512.
9. Kupfer,A., and Preisig,R. 1984. Pharmacogenetics of mephenytoin: a new drug
hydroxylation polymorphism in man. Eur. J. Clin. Pharmacol. 26:753-759.
10. Browne, T.R., Leduc, B., 2002. Phenytoin and other hydantoins: chemistry and
biotransformation. In: Levy, R.H., Mattson, R.H., Meldrum, B.S., Perucca, E. (Eds.),
Anti-epileptic Drugs, fifth ed. Lippincott Williams and Wilkins, Philadelphia, pp. 565–
580.
11. Bajpai,M., Roskos,L.K., Shen,D.D., and Levy,R.H. 1996. Roles of cytochrome
P4502C9 and cytochrome P4502C19 in the stereoselective metabolism of phenytoin to
its major metabolite. Drug Metab Dispos. 24:1401-1403.
12. Ieiri,I., Mamiya,K., Urae,A., Wada,Y., Kimura,M., Irie,S., Amamoto,T., Kubota,T.,
Yoshioka,S., Nakamura,K. et al 1997. Stereoselective 4'-hydroxylation of phenytoin:
relationship to (S)-mephenytoin polymorphism in Japanese. Br. J. Clin. Pharmacol.
43:441-445.
13. Argikar,U.A., Cloyd,J.C., Birnbaum,A.K., Leppik,I.E., Conway,J., Kshirsagar,S.,
Oetting,W.S., Klein,E.C., and Remmel,R.P. 2006. Paradoxical urinary phenytoin
metabolite (S)/(R) ratios in CYP2C19*1/*2 patients. Epilepsy Res. 71:54-63.
14. Veenstra,D.L., Blough,D.K., Higashi,M.K., Farin,F.M., Srinouanprachan,S.,
Rieder,M.J., and Rettie,A.E. 2005. CYP2C9 haplotype structure in European American
warfarin patients and association with clinical outcomes. Clin. Pharmacol. Ther.
77:353-364.

33
15. Zhao,F., Loke,C., Rankin,S.C., Guo,J.Y., Lee,H.S., Wu,T.S., Tan,T., Liu,T.C.,
Lu,W.L., Lim,Y.T. et al 2004. Novel CYP2C9 genetic variants in Asian subjects and
their influence on maintenance warfarin dose. Clin. Pharmacol. Ther. 76:210-219.
16. Schuetz,E., Lan,L., Yasuda,K., Kim,R., Kocarek,T.A., Schuetz,J., and Strom,S. 2002.
Development of a real-time in vivo transcription assay: application reveals pregnane X
receptor-mediated induction of CYP3A4 by cancer chemotherapeutic agents. Mol.
Pharmacol. 62:439-445.
17. Warner,S.C., Finta,C., and Zaphiropoulos,P.G. 2001. Intergenic transcripts containing a
novel human cytochrome P450 2C exon 1 spliced to sequences from the CYP2C9 gene.
Mol. Biol. Evol. 18:1841-1848.
18. Kramer,M.A., Rettie,A.E., Rieder,M.J., Cabacungan,E.T., and Hines,R.N. 2008. Novel
CYP2C9 promoter variants and assessment of their impact on gene expression. Mol.
Pharmacol. 73:1751-1760.
19. Sandberg,M., Johansson,I., Christensen,M., Rane,A., and Eliasson,E. 2004. The impact
of CYP2C9 genetics and oral contraceptives on cytochrome P450 2C9 phenotype. Drug
Metab Dispos. 32:484-489.
20. Wang,H., Faucette,S., Moore,R., Sueyoshi,T., Negishi,M., and LeCluyse,E. 2004.
Human constitutive androstane receptor mediates induction of CYP2B6 gene
expression by phenytoin. J. Biol. Chem. 279:29295-29301.
21. Yueh,M.F., Kawahara,M., and Raucy,J. 2005. High volume bioassays to assess
CYP3A4-mediated drug interactions: induction and inhibition in a single cell line. Drug
Metab Dispos. 33:38-48.

34
22. Luo,G., Cunningham,M., Kim,S., Burn,T., Lin,J., Sinz,M., Hamilton,G., Rizzo,C.,
Jolley,S., Gilbert,D. et al 2002. CYP3A4 induction by drugs: correlation between a
pregnane X receptor reporter gene assay and CYP3A4 expression in human
hepatocytes. Drug Metab Dispos. 30:795-804.
23. Lu,W., Li,X., and Uetrecht,J.P. 2008. Changes in gene expression induced by
carbamazepine and phenytoin: testing the danger hypothesis. J. Immunotoxicol. 5:107-
113.
24. Lu,W., and Uetrecht,J.P. 2008. Peroxidase-mediated bioactivation of hydroxylated
metabolites of carbamazepine and phenytoin. Drug Metab Dispos. 36:1624-1636.
25. Midha,K.K., Hindmarsh,K.W., McGilveray,I.J., and Cooper,J.K. 1977. Identification of
urinary catechol and methylated catechol metabolites of phenytoin in humans,
monkeys, and dogs by GLC and GLC-mass spectrometry. J. Pharm. Sci. 66:1596-1602.
26. Giancarlo,G.M., Venkatakrishnan,K., Granda,B.W., von Moltke,L.L., and
Greenblatt,D.J. 2001. Relative contributions of CYP2C9 and 2C19 to phenytoin 4-
hydroxylation in vitro: inhibition by sulfaphenazole, omeprazole, and ticlopidine. Eur.
J. Clin. Pharmacol. 57:31-36.
27. Komatsu,T., Yamazaki,H., Asahi,S., Gillam,E.M., Guengerich,F.P., Nakajima,M., and
Yokoi,T. 2000. Formation of a dihydroxy metabolite of phenytoin in human liver
microsomes/cytosol: roles of cytochromes P450 2C9, 2C19, and 3A4. Drug Metab
Dispos. 28:1361-1368.
28. Cuttle,L., Munns,A.J., Hogg,N.A., Scott,J.R., Hooper,W.D., Dickinson,R.G., and
Gillam,E.M. 2000. Phenytoin metabolism by human cytochrome P450: involvement of

35
P450 3A and 2C forms in secondary metabolism and drug-protein adduct formation.
Drug Metab Dispos. 28:945-950.
29. Miller,R., Bill,P.L., and Du,T.J. 1989. Phenytoin auto-induction? Case reports. S. Afr.
Med. J. 75:332-333.
30. Chetty,M., Miller,R., and Seymour,M.A. 1998. Phenytoin auto-induction. Ther. Drug
Monit. 20:60-62.
31. Dickinson,R.G., Hooper,W.D., Patterson,M., Eadie,M.J., and Maguire,B. 1985. Extent
of urinary excretion of p-hydroxyphenytoin in healthy subjects given phenytoin. Ther.
Drug Monit. 7:283-289.
32. Yuen,G.J., Bell,R.D., and Ludden,T.M. 1983. Phenytoin cumulation profiles. Res.
Commun. Chem. Pathol. Pharmacol. 42:355-368.
33. Garrard,J., Harms,S.L., Eberly,L.E., and Leppik,I.E. 2007. Use of antiepileptic
medications in nursing homes. Int. Rev. Neurobiol. 81:165-182.
34. Leppik,I.E. 2007. Epilepsy in the elderly: scope of the problem. Int. Rev. Neurobiol.
81:1-14.
35. Sahi,J., Shord,S.S., Lindley,C., Ferguson,S., and LeCluyse,E.L. 2009. Regulation of
cytochrome P450 2C9 expression in primary cultures of human hepatocytes. J.
Biochem. Mol. Toxicol. 23:43-58.
36. Chen,Y., Ferguson,S.S., Negishi,M., and Goldstein,J.A. 2004. Induction of human
CYP2C9 by rifampicin, hyperforin, and phenobarbital is mediated by the pregnane X
receptor. J. Pharmacol. Exp. Ther. 308:495-501.

36
37. Al-Dosari,M.S., Knapp,J.E., and Liu,D. 2006. Activation of human CYP2C9 promoter
and regulation by CAR and PXR in mouse liver. Mol. Pharm. 3:322-328.

37
Figure 1. A) PHT is metabolized to a mixture of (S) and (R)-pHPPH by CYP2C9 and CYP2C19. CYP2C9 has a major contribution to this enantioselective metabolism and preferentially forms (S)-pHPPH with a urinary (S)/(R)-pHPPH ratio of 40:1 compared to CYP2C19 that forms both enantiomers equally and gives a ratio of 1:1. B) Putative TF and nuclear receptor binding sites in or near the -2663delTG and -3089G>A are shown. YY1 and Nrf2 binding sites are underlined and bolded. A CYP2C9 promoter map indicates the location of these polymorphisms and known CAR/PXR binding sites (-2898, -1839 and -1818) (solid triangles).
38
Figure 2. CYP2C9*1B haplotype is associated with PHT maintenance dose in patients with epilepsy. The box plot shows only those patients found to be non-carriers of the reduced-function CYP2C9*2 and CYP2C9*3 alleles. A linear trend of decreased PHT dose requirements with increasing number of CYP2C9*1B alleles was observed. *p = 0.017 vs. CYP2C9*1/*1; **p = 0.060 vs. CYP2C9*1/*1B.

39
Figure 3. A) Effect of -3089G>A on warfarin dosing in a cohort of 46 Chinese patients on warfarin therapy after excluding samples with CYP2C9*2 and *3 and VKORC1 variant alleles. B) CYP2C9 mRNA expression in 28 human livers analyzed by Q-real-time PCR. Y-axis depicts mRNA expression each liver (normalized to its GAPDH and this value depicted relative to the normalized value obtained for one liver arbitrarily set at 100%). The x-axis represents visual genotyping results for each polymorphism. Light gray squares represent homozygous major, dark gray heterozygous and black homozygous minor allele. Box plot in inset depicts the effect of -3089G>A on mRNA expression after excluding CYP2C9*2 and *3 samples. C) Effect of -3089G>A on the in vitro formation of (S) and (R)-pHPPH in fourteen human liver microsome samples after excluding samples with CYP2C9*2 and *3. Group differences were analyzed nonparametrically using the Wilcoxon rank sum test to compare two genotypes with the phenotype. Box plots indicate 2nd and 3rd quartiles. The bold line within the box represents median and whiskers represent the range after excluding the outliers.

40
Figure 4. Effect of individual CYP2C9 promoter polymorphisms on basal and PHT inducible promoter activity. A) HepG2 cells were transfected with CYP2C9 reporters (WT, -3089A and -2663delTG) +/- PXR, CAR, YY1 or NRF2 expression plasmids and luciferase expression measured after treatment with vehicle or PHT for 24 hrs. Luciferase activities were normalized to β-galactosidase. The relative luciferase normalized activity in vehicle treated cells were each set as one, and the fold change in relative luciferase activity with respect to vector (w.r.t.) was graphed relative to this baseline. Values represent the mean ± S.D. measured in triplicate. *p=0.05, **p=0.02, ***p=0.03, #p=0.007, ##p=0.0005, ###p=0.005 - wild-type vs. corresponding group for variant genotype.

41
Figure 5. The CYP2C9 variant haplotype shows diminished responsiveness to PHT induction in vitro and in vivo. A-C) HepG2 cells were transfected with CYP2C9 WT and VAR-HAP reporters +/ PXR, YY1 or Nrf2 expression plasmids singly or in combination and luciferase expression measured after treatment with vehicle or PHT for 24 hrs. Results were analyzed and graphed as in Figure 3 legend. *p=0.04, **p=0.02, #p=0.007, ##p=0.005, ###p=0.002-WT-HAP vs. corresponding group of VAR-HAP. D) Plasmids bearing the indicated CYP2C9 reporter constructs were combined with SV40-LacZ plasmid and hydrodynamically infused. and mice then treated with vehicle or PHT. After 24 hours, mice were anesthetized and injected with firefly D-luciferin and optically imaged. Emitted light is shown as a pseudocolor graphic over the black and white image of each animal. The pseudocolor indicates average luminescent signal intensity per pixel with the intensity of red>orange>yellow>green>blue. Results were graphed as fold change in activity between PHT vs. vehicle treated mice (set as one) for each haplotype.

42
Figure 6. EMSA of transcription factor binding to the wild-type and polymorphic CYP2C9 YY1 promoter elements. 32P-labeled oligonucleotides representing the -3089G and A were incubated with products from in vitro synthesis with the empty expression vector (pcDNA3), or synthesized PXR:RXR, CAR:RXR and YY1 proteins in the absence (no competitor) or presence of increasing amounts of unlabeled oligonucleotide cold competitor (CC). After electrophoresis, complex formation was assessed by a phosphoimager. Lanes 17, 18 & 19 represent binding of YY1, CAR and PXR to positive control (+ve Ctrl) oligonucleotides, respectively. Sequences for all oligonucleotides are provided in Supplemental Table 1.

43
Figure 7. Effect of CYP2C9 promoter genotypes on CYP expression in human hepatocytes treated with PHT. Primary human hepatocytes were treated with vehicle or PHT for 48 hrs, RNA extracted and analyzed by quantitative real-time PCR. CYP2C9 and CYP2C18 like Ex1/ 2C9 Ex2 chimeric transcripts were amplified from cDNA using specific primers as shown. The fold change of each mRNA after PHT treatment is depicted on the y axis and CYP2C9 -3089G>A genotypes on the x axis. Group differences were analyzed nonparametrically using the Wilcoxon rank sum test as described in Figure 3 legend.

44
Table 1. Association of CYP2C9 variants with PHT maintenance dose Model Independent
Variables
Beta Coefficient
Adjusted R2 F p-value
1 CYP2C9*2 -44.6 0.113 3.44 0.004
2 CYP2C9*3 -89.0 0.143 4.20 6.71 X 10⁻⁵
3 CYP2C9*1B -21.7 0.080 2.66 0.121
4 CYP2C9*2 +
CYP2C9*3
-45.2
-89.6
0.186 4.94 3.09 X 10⁻⁶
5 CYP2C9*2 +
CYP2C9*3 +
CYP2C9*1B
-105.4
-52.6
-42.2
0.230 5.67 1.11 X 10⁻⁷
6 TBW +
CYP2C9*2 +
CYP2C9*3 +
2.52
-47.9
-93.2
0.371 5.06 2.70 X 10⁻⁵
7 TBW +
CYP2C9*2 +
CYP2C9*3 +
CYP2C9*1B
2.29
-65.5
-121
-66.4
0.471 6.59 5.4 X 10⁻⁷
Effects of CYP2C9 alleles on PHT dose were estimated by linear regression in a
multivariate model including gender and ancestry estimated according to a principal
components method (EIGENSTRAT). The test sample included n = 173 patients with
epilepsy receiving maintenance PHT therapy, except for models 6 and 7 which included
only a subset of n = 70 patients with known body weight at the time of PHT maintenance
therapy.

45
Table 2. Association of CYP2C9 variants with PHT serum levels normalized to PHT
maintenance dose
Model Independent
Variables*
Adjusted R2 p-value
1 CYP2C9*2 0.081 0.084
2 CYP2C9*3 -0.063 0.899
3 CYP2C9*1B -0.071 0.936
4 CYP2C9*2 +
CYP2C9*3
0.092 0.072
5 CYP2C9*2 +
CYP2C9*3+
CYP2C9*1B
0.129 0.033
Copyright © 2022 FDOKUMEN