Cyclooxygenase2 functionally inactivates p53 through a physical interaction with p53
Upload
independentCategory
view
2download
0
1
Cyclooxygenase-2 inhibits TNFαααα-mediated apoptosis in renal
glomerular mesangial cells
Adiba Ishaque, Michael J. Dunn and Andrey Sorokin*
Department of Medicine and Cardiovascular Research Center, Medical College of Wisconsin,
8701 Watertown Plank Road Milwaukee WI, 53226. * Corresponding author: Tel.: 414-456-
4438; Fax: 414-456-6515; E-mail: [email protected]
Running title: Anti-apoptotic activity of COX-2 expression
Abbreviations Cyclooxygenase-2 (COX-2) Renal mesangial cells (RMC) Wild type (WT) Adenovirus (Ad) Tumour necrosis factor α (TNFα) Endothelin-1 (ET-1) Interleukin 1β (IL-1β) Prostaglandin E2 and prostaglandin I2 (PGE2 and PGI2) Annexin V (AV) Fluorescein isothiocyanate (FITC) Propidium iodide (PI) Viable (V), early membrane intact apoptotic (EA) and necrotic (N) Hanks Buffered Saline Solution (HBBS) Phosphate buffered saline (PBS) Multiplicity of infection (MOI) Green Fluorescent Protein (GFP) Acridine Orange (AO) Positive (+), negative (-) Sodium dodecyl sulfate-polyacrylamide gel electrophoresis (SDS-PAGE)
Copyright 2003 by The American Society for Biochemistry and Molecular Biology, Inc.
JBC Papers in Press. Published on January 1, 2003 as Manuscript M210559200 by guest on A
ugust 11, 2016http://w
ww
.jbc.org/D
ownloaded from

2
ABSTRACT
Renal mesangial cell apoptosis is a crucial repair mechanism in glomerular nephritis (GN).
These cells express receptors to TNFα, a cytokine with pro-apoptotic properties implicated in
the resolution of GN. Progression to proliferative GN is accompanied by cyclooxygenase-
mediated formation of prostaglandins and inefficient apoptosis of mesangial cells. The aims of
this study were to quantify TNFα mediated apoptosis in renal mesangial cells (RMC) and to
determine whether expression of the inducible form of cyclooxygenase, cylooxygenase-2
(COX-2) inhibits this apoptosis. By 24h significant levels of apoptosis were induced by TNFα
(100ng/mL) or etoposide control (100µM), as shown by phosphatidylserine externalization,
caspase-3 activation, development of a sub-G0/G1 region and distinct chromatin condensation.
Using adenoviral-mediated delivery of the COX-2 gene (AdCOX-2) apoptotic features were
prevented from appearing in AdCOX-2 cells treated with TNFα whereas etoposide treated
AdCOX-2 cells were not protected. Furthermore, COX-2 expression, induced by the
vasoconstrictor peptide ET-1 or the cytokine IL-1β also inhibited TNFα-mediated but not
etoposide-mediated apoptosis, to an extent, similar to adenoviral COX-2 infection. Selective
COX-2 inhibition by NS-398 restored TNFα-mediated apoptosis. PGE2 and PGI2 were shown
to be the major prostaglandin metabolites in AdCOX-2 cells. The addition of PGE2 and PGI2
protected against TNFα-mediated apoptosis. These results demonstrate COX-2 anti-apoptotic
activity via a death-receptor route and suggest that selective COX-2 inhibition may augment
TNFα apoptosis in chronic inflammatory conditions.
Key words: cylooxygenase-2, apoptosis, mesangial cells and flow cytometry
by guest on August 11, 2016
http://ww
w.jbc.org/
Dow
nloaded from

3
INTRODUCTION
Mesangial cells line the blood vessels of the renal glomerulus, provide structural support and
regulate glomerular ultrafiltration (1,2). Importantly mesangial cells undergo a change in
phenotype during glomerular inflammation in which they become proliferative and matrix
secreting myofibroblasts before they are eliminated by apoptosis (2,3,4). Apoptosis has been
identified as the mechanism responsible for the deletion of excess myofibroblasts on completion
of the inflammatory response in skin (5), liver (6) and renal glomerulus (7). In the glomeruli of
patients experiencing acute glomerular inflammation, referred to as glomerular nephritis (GN),
apoptotic bodies were detected as a compensatory response, instigated to counterbalance
mesangial hypercellularity thereby permitting normal structure and function to return (8).
Mesangial/myofibroblast apoptosis was also identified in the rat in-vivo model of experimental
GN, anti-Thy1.1 nephritis (7,9,10). Proliferative forms of GN are characterized by a
dysregulation of mesangial cell apoptosis allowing a chronic secretion of proinflammatory
stimuli and prostaglandins (PG), which leads to an excess deposition of extracellular matrix
proteins, post-inflammatory scarring and renal failure (7,10). Proliferative GN remains a leading
cause of end-stage renal failure (11). Consequently, to avoid progression of glomerular
inflammatory disease it is important to define the mechanisms underlying the inhibition of
mesangial cell apoptosis.
Cyclooxygenase-2 (COX-2) is an inducible form of cyclooyxgenase involved in chronic
inflammation (12,13). Several studies have highlighted an up-regulation of COX-2 expression in
proliferative GN (14,15). However the precise role of COX-2 has not been investigated. It is
plausible that COX-2 is responsible for the progression of proliferative GN by an anti-apoptotic
mechanism. A growing body of evidence that COX-2 has an anti-apoptotic role in the
pathogenesis of epithelial cell carcinomas, in particular colorectal cancer, supports this
hypothesis (16). An over-expression of COX-2 conferred a survival advantage in rat intestinal
epithelial cells by inhibiting apoptosis (17). COX-2 selective inhibitors induced apoptotic cell
by guest on August 11, 2016
http://ww
w.jbc.org/
Dow
nloaded from

4
death in HCA-7, HT-29 (18) and CaCo-2 colon cancer cell lines, which constitutively expressed
COX-2 (19).
Within the inflamed glomerulus, TNFα is produced locally by mesangial and epithelial cells as
well as by infiltrating monocytes/macrophages (20). TNFα alone may be a key component for
the resolution phase of glomerular inflammation and may enhance death receptor initiated-
apoptosis of mesangial cells by an autocrine and/or paracrine mechanism. TNFα can also
stimulate the release of other pro-inflammatory cytokines including IL-1β (21,22). Endothelins,
particularly ET-1, are mitogenic to mesangial cells in-vivo and may act in concert with other
vasoconstrictor peptides or cytokines to promote glomerular inflammation (23,24,25). Several
studies utilizing rat primary cultures of renal mesangial cells (RMC) have demonstrated
enhanced COX-2 protein levels induced by either ET-1 (26,27) or IL-1β (28,29). TNFα alone
had little effect on COX-2 but the combination of TNFα plus IL-1β dramatically increased
COX-2 expression (28). The contribution of TNFα may depend on its mediation of either one
of two conflicting pathways; cell survival via activation of NF-κB (30) or caspase-mediated
apoptosis (30,31). In previous studies of RMC apoptosis, sensitivity to TNFα could only be
achieved in the presence of cycloheximide or actinomycin D, to prevent synthesis of survival
factors (32) or by a specific inhibition of NF-κB (33, 34).
The overall objective of this study was to determine if COX-2 expression inhibits apoptosis in
RMC. Because mesangial cells express TNFα receptors and represent a potential route of
apoptosis induction in the resolution of proliferative GN, we evaluated the extent of this
apoptosis, and its inhibition by COX-2. We first established a suitable cell culture model in
which TNFα-mediated apoptosis was measured in multiple apoptosis assays. We then used two
different methods to induce COX-2 expression i.e. induction by ET-1, or IL-1β and forced
expression using adenoviral-mediated gene transfer. We also investigated the effects of PGE2
and PGI2 on TNFα mediated apoptosis, after establishing that those PGs were the major PG
metabolites generated by COX-2 over-expression. Using these multiple approaches combined
by guest on August 11, 2016
http://ww
w.jbc.org/
Dow
nloaded from

5
with several apoptosis assays, an anti-apoptotic effect of COX-2 on TNFα mediated apoptosis
was conclusively demonstrated in renal mesangial cells.
EXPERIMENTAL PROCEDURES
Materials-Recombinant IL-1β was obtained from R&D Systems (Minneapolis, MN).
Recombinant ET-1 was obtained from Calbiochem (La Jolla, CA). Annexin V and the caspase-3
apoptosis assay detection kits were purchased from Oncogene Research Products (Boston, MA)
and BD PharMingen (San Diego, CA), respectively. NS398 was obtained from Cayman
Chemical (Ann Arbor, MI). RPMI 1640 medium and fetal bovine serum were from Life
Technologies, Inc. Polyclonal goat and polyclonal rabbit anti-COX-2 (N-20) and bcl-2 (N-19)
antibodies were from Santa Cruz Biotechnology (Santa Cruz, CA). Peroxidase-conjugated
donkey anti-goat and goat anti-rabbit immunoglobulins (IgGs) were from Bio-Rad Labs
(Hercules, CA). Protein was determined by a BCA assay from Pierce (Rockford, IL). All other
reagents were obtained from Sigma Chemical (St. Louis, MO). Flow cytometry experiments
were carried out using a Becton Dickinson FACS calibur (Mountain View, CA). In all
experiments 10, 000 live cells, based on light scatter properties, were gated and analyzed using
Cell Quest Software (Becton Dickinson).
Cell culture-Primary glomerular mesangial cells from male Sprague-Dawley rats were isolated
and characterized as previously described (35,36). Rat mesangial cells (RMC) were maintained
in RPMI 1640 medium containing 17% heat inactivated fetal bovine serum, 5 µg/ml each of
insulin, transferrin and 5ng/ml sodium selenite, 100ug/ml penicillin, 100ug/ml streptomycin at
37oC in a humidified incubator (5% CO2, 95% air). All experiments were performed with cells
cultured in 60 mm dishes and used at 8-20 passages. After the cells were grown to ~60%
confluence they were starved for 24h in basal RPMI 1640 culture medium before the
experiments.
Adenovirus mediated COX-2 gene transfer-The recombinant adenoviral vectors (Ad) AdCOX-2
and AdWildType (AdWT) expressing the constitutively active and empty adenovirus vector
by guest on August 11, 2016
http://ww
w.jbc.org/
Dow
nloaded from

6
respectively, were constructed from the replication-deficient adenovirus type 5 (Ad5) as
previously described (37). RMC were incubated with AdCOX-2 or AdWT (at a multiplicity of
infection [MOI] of 200) for 1h at 37oC with periodic shaking, followed by addition of complete
medium. At 24h after infection, cells were lysed for western blot analysis. Efficiency of gene
transfer in RMC was determined by adenoviral infection of Green Fluorescent Protein (AdGFP)
at an MOI of 200 and visualized by fluorescence microscopy at 24h.
Western blot analysis- Cells were washed in ice-cold phosphate buffered saline (PBS) and then
harvested in lysis buffer as previously described (35). Cleared total cell lysates (20-40µg) were
resolved by Criterion sodium dodecyl sulfate-polyacrylamide gel electrophoresis (SDS-PAGE)
(Bio-Rad) and transferred to nitrocellulose membranes (Micron Separation Inc.). Equal protein
loading was confirmed by staining the membranes with ponceau S, which stains all the proteins
on the membrane; an intensely stained band of a distinct molecular weight sufficiently different
from the protein under investigation was selected from each membrane, to show that the amount
of protein in each lane was identical. Membranes were probed with either, COX-2 (1:1000
dilution) or bcl-2 (1:300 dilution) antibodies overnight at 4oC. Primary antibodies were detected
with goat anti-rabbit IgG-horseradish peroxidase conjugates for bcl-2 identification or anti-goat
IgG-horseradish peroxidase antibodies for COX-2 detection (1:2000 dilution), followed by
extensive washing of the membranes. The membranes were visualized by enhanced
chemiluminescence (Amersham, Piscataway, NJ).
Analysis of PG production-RMC were infected with AdCOX-2 or AdWT as described above, but
in this instance the conditioned medium was replaced with new basal medium devoid of any
previously formed PGs. After the 24h infection period, the supernatants were collected and the
cell monolayers were washed twice with a HEPES buffered medium (pH 7.4) and were
incubated in this buffer containing the calcium ionophore A3281 (1 mg/mL) for 15mins at 37oC
(38). The total cell lysates were run on a solid phase extraction device for analysis of PGE2,
PGI2 (detected as 6-keto-PGF1α, a stable product of PGI2), PGF2α, PGJ2, PGD2 prior to
measurement by liquid-chromatography mass spectrometry (LC-MS) (39). Internal standards,
1.0 ng each of [d4]- PGE2, [d4]- PGF2α, [d4] 6-keto-PGF1α, [d4]- PGD2 or [d4]-PGJ2, were added
by guest on August 11, 2016
http://ww
w.jbc.org/
Dow
nloaded from

7
to the samples followed by ethanol, to give a final concentration of 15% in the samples. Glacial
acetic acid (10 µl/mL) was then added. The samples were sonicated and vortexed three times
before centrifugation at 300 x g, at room temperature for 5 min. The supernatants were loaded
onto the solid phase extraction columns (C18Bond Elut SPE columns) that had been
preconditioned with 5ml of ethanol and 15 ml water. The columns were washed with 29ml of
water and allowed to run dry. Then the PGs were eluted from the column with 6ml of ethyl
acetate. A vacuum was applied to completely dry column. The top layer of ethyl acetate was
removed from the water layer at the bottom of the reaction tubes. The compounds of interest
were in the ethyl acetate layer. The water layer was extracted twice with 1ml of ethyl acetate.
The resulting two ethyl acetate portions were combined for each sample and dried under the
stream of nitrogen gas until completely dry. The sample was then redissolved in 20µl of
acetonitrile and transferred to an insert in the sample vial.
The derivatized extracts were subject to LC-MS using LC-ESI-MS (Agilent 1100 LC/MSD, SL
model) (39). Concentrations of the different PGs were evaluated by comparing their ratios of
peak areas to the standard curves. Results were expressed as picograms per milligram of protein
per dish.
Morphological analysis of apoptosis-RMC infected with AdWT or AdCOX-2 (MOI of 200) for
24h were incubated with TNFα (100ng/mL) or etoposide (100µM). After treatment, cells were
morphologically assessed for apoptosis by acridine orange (AO) staining using inverted
fluorescence microscopy. The cell monolayers were washed in PBS and incubated with AO in
PBS (10µg/ml) for ≈2 min. Typically 3 fields were randomly selected from each 60mm dish so
that at least 80 RMC were counted. All cells produced a green fluorescence in response to a high
affinity binding of AO to DNA. Apoptotic green cells were scored by their distinct morphology
of cellular shrinkage and chromatin condensation. Attached apoptotic cells were scored as a
percentage of the total number of cells counted for each dish.
Cell cycle analysis- RMCs (5x10⁵ cells) infected with either AdWT or AdCOX-2 were incubated
with TNFα (100ng/mL) or etoposide (100µM). At the end of the incubation time the
by guest on August 11, 2016
http://ww
w.jbc.org/
Dow
nloaded from

8
supernatants were collected. The remaining cell monolayer was washed in Hanks Buffered
Saline Solution (HBBS) without Ca2+ and Mg2+, and then incubated in a solution of trypsin–
EDTA at 37oC. The reaction was terminated by addition of basal media. The trypsinized cells
were then added to the previously collected culture supernatants. This cell suspension was
centrifuged at 179 x g, 4oC for 5mins and the resulting pellet was resuspended in PBS. The cell
suspension was centrifuged again at 179 x g, 4oC and the pellet was resuspended in 70% ice
cold-ethanol. Cells fixed in ethanol were stored at –20oC for up to 3 days. The cells were
precipitated from the ethanol by high-speed centrifugation at 358 x g, 4oC for 15mins. The pellet
was resuspended in PBS and centrifuged again at 358 x g, 4oC for 15mins. The final pellet was
resuspended in 1 mL of RNase A (prepared in PBS without Mg2+ or Ca2+ and heat-treated to
inactivate DNase) to give a final concentration of 250µg/mL. The mixture was incubated at
37oC for 30min. At the end of the incubation PI (1mg/mL ) was added to give a final
concentration of 50 ug/mL. The suspension was incubated at room temperature for 10 min in the
dark. The cells were then analysed by flow cytometry.
Annexin-V FITC and propidium iodide double staining-RMCs (5x10⁵ cells) infected with either
AdWT or AdCOX-2 were treated with TNFα (100ng/mL) or etoposide (100µM) and stained
with annexin-V (AV) labeled to FITC in combination with propidium iodide (PI), for FACS
analysis of apoptosis. FITC-AV/PI staining was optimized for attached cells according to the
instructions outlined by manufacturers of the AV assay kit (Oncogene Research Products).
Caspase-3 assay-FITC conjugated to a monoclonal rabbit antibody raised against the active
fragment of caspase-3 was also used to determine apoptosis in AdWT or AdCOX-2 cells treated
with either TNFα (100ng/mL) or etoposide (100µM), following cell permeabilization and
fixation according to the instructions outlined by manufacturers of the kit.
FITC-AV/PI and active-caspase-3-FITC staining was also carried out on cells stimulated to
express COX-2 by the addition of ET-1 (100nM) or IL-1β (2ng/mL) and on cells treated with
either PGE2 (500nM) or PGI2 (500nM) to investigate the effects of these various treatments on
TNFα (100ng/mL) or etoposide (100µM) mediated apoptosis. For PG addition, conditioned
by guest on August 11, 2016
http://ww
w.jbc.org/
Dow
nloaded from

9
media was removed and replaced with fresh basal media to ensure removal of any existing PGs.
PGs were re-administered after 6 and 12h of co-incubation with the apoptotic inducers to
replenish depleted PGs. Effect of NS398 (25µM) on ET-1 protection of apoptosis was also
assessed by these assays. Control cells received DMSO at the same concentration and time of
incubation as PGE2 (500nM) and NS398 (25µM).
RESULTS
Characterization of COX-2 over-expression by adenovirus mediated infection-Previous work
from this laboratory demonstrated a transient over-expression of COX-2 in SV40-transformed
human mesangial cells using an adenovirus mediated transfer of COX-2 cDNA (37). In this
study the AdCOX-2 construct was used to express COX-2 in rat primary renal mesangial cells
(RMC). The transgenic AdGFP construct showed ≈100% transfection efficiency in RMC at 24h
post-adenoviral infection, as visualized by fluorescence microscopy (Fig. 1B), compared to
uninfected control cells (Fig. 1A). The ability of the virus to infect the cell is governed by
specific cell receptors, and this infection process is not specific to the gene insert. Therefore
AdGFP is a suitable control that can be used for assessing the level of expression by adenovirus
mediated gene delivery (40). Western blot analysis confirmed COX-2 protein expression, which
was enhanced by a dose dependent increase in AdCOX-2 after 24h of infection (Fig. 1C).
Certain regions of the kidney contain a higher constitutive expression of COX-2 than most
tissues, however mesangial cells are normally devoid of COX-2 (41). Uninfected RMC and
RMC infected with the transgenic AdWT construct did not reveal any detectable COX-2 (Fig.
1C). In addition, we checked for anti-apoptotic bcl-2 protein in our system because an over-
expression of COX-2 in colon cancer cells was accompanied by bcl-2 protein expression (18,19).
However, we could not detect bcl-2 in RMC transfected with AdWT or AdCOX-2 (Fig. 1D).
Inhibition of TNFα mediated apoptosis in RMC by an over-expression of COX-2 as determined
by FITC-AV/PI double staining -Our first task was to develop an apoptosis model in RMC
cultures. In order to conclusively demonstrate the elicitation of apoptotic cell death by a
cytokine/receptor mediated route, the effect of TNFα was compared to a cytotoxic insult using
by guest on August 11, 2016
http://ww
w.jbc.org/
Dow
nloaded from

10
the DNA topoisomerase II inhibitor etoposide, which readily induces classic apoptotic changes
such as phosphatidylserine (PS) externalization in different cell types. We found that TNFα at a
dose of 100 ng/mL, induced a time dependent increase in apoptotic cells, which became
significant by 24h, and reached maximum effect by 40h incubation, by which time, however,
higher levels of necrotic cells were also appearing (results not shown). Lower doses of TNFα
were ineffective at inducing cell death (results not shown). Since the 24h incubation time frame
imposed the earliest, significant induction of apoptosis by TNFα, we used it to compare an
inhibition of apoptosis by COX-2 over-expression or following its up-regulation.
PS externalization is a characteristic hallmark of apoptotic cells, serving as a signal for their
phagocytic recognition and removal in-vivo (42). PS externalization was detected by FITC-AV
binding in combination with PI to distinguish between viable (V), early membrane intact
apoptotic (EA) and necrotic (N) cells. Since there is no phagocytic disposal mechanism in vitro
apoptotic cells accumulate and continue to undergo degradation and membrane lysis. It was
crucial, therefore, to include PI in the reaction, and highlight PS exposure on the surface of EA
cells, and distinguish them from N cell populations, which may or may not have transited the
process of apoptosis (43). By this analysis it was possible to both qualitatively determine viable-
V [AV (-)/PI (-)], EA [AV (+)/PI (-)] and N [AV (- and +)/PI (+)] cell fractions (Fig. 2) and
simultaneously quantify this transition (Table 1). AdWT cells incubated with either TNFα
(100ng/mL) or etoposide (100µM) produced distinct fractions of EA cells (28% and 30%,
respectively) (Table 1 and Fig. 2). However, some EA and N cell fractions were induced in
control AdWT infected cells implicating adenovirus mediated cell death as a result of the
infection procedure. Nevertheless the profile and extent of apoptosis induction by TNFα or
etoposide in AdWT infected cells was similar to uninfected cells treated with these inducers in
which cell death progressed from V to EA to N cell populations. For cells over-expressing
COX-2, the EA cell fraction induced in the AdWT cells by TNFα was significantly suppressed
(Fig. 2). The annexin V assay highlighted a reduction in the maximum fraction of EA cells
(from 28 to 6%) in AdCOX-2 cells treated with TNFα compared to AdWT treated cells (Table 1
and Fig. 2). A substantial fraction of AdCOX-2 cells were N (~18) in response to TNFα (Table
1 and Fig. 2). The transition in cell death for AdCOX-2 cells exposed to TNFα was therefore
by guest on August 11, 2016
http://ww
w.jbc.org/
Dow
nloaded from

11
from V directly to N. AdCOX-2 cells treated with etoposide, on the other hand, gave rise to a
distinct EA cell fraction (~27%) (Table 1 and Fig. 2). It was noted, that AdCOX-2 infected cells
displayed higher levels of N cell fractions in control cultures suggesting that the procedure of
adenovirus infection was also inducing necrotic cell death as shown for AdWT infected control
cells.
Morphological analysis of apoptosis induction and its inhibition by an over-expression of COX-
2- Chromatin condensation is an early event of apoptosis that requires a supply of ATP (44) and
may be independent of internucleosomal DNA fragmentation (45). It was measured by AO
staining of AdWT and AdCOX-2 cells treated with either TNFα (100ng/mL) or etoposide
(100µM) for 24h. Nuclei of control AdWT cells were composed of diffuse chromatin as
depicted by a homogenous pattern of AO staining (Fig. 3A and Fig. 3G). In response to TNFα
substantial chromatin margination and condensation became apparent, compared to AdWT
control cultures (from ~8 to 18 %) (Fig. 3B and Fig. 3G). Etoposide also increased the
proportion of AdWT cells with apoptotic nuclear phenotype (from ~8 to 28%) (Fig. 3C and Fig.
3G). AdCOX-2 cells treated with TNFα were prevented from undergoing chromatin
condensation (Fig. 3E), and appeared morphologically identical to AdCOX-2 control cells (Fig.
3D). TNFα induced apoptosis was significantly reduced (from ~18 to 6%) in cells over-
expressing COX-2 compared to AdWT cells (Fig. 3G). By contrast etoposide treated AdCOX-2
cells were not protected from apoptosis (Fig. 3F) and high levels of apoptotic cells were still
observed (Fig. 3G).
Inhibition of caspase-3 activity by an over-expression of COX-2- Caspase-3 activation is a
specific biochemical event in apoptosis, responsible for cleaving cellular substrates that lead to
characteristic apoptotic morphology (46). It was measured by FACS analysis of FITC
conjugated to a monoclonal antibody raised against the active fragment of capase-3. A marked
increase in the fraction of active caspase-3-FITC positive AdWT cells treated with either TNFα
(100ng/mL) (from 7 to 22%) or etoposide (100µM) (from 7 to 35%) was observed by 24h (Fig
4). Caspase-3 inactive cells were the predominant cell population (> 90%) in control AdWT and
uninfected cells (Fig. 4). For cells over-expressing COX-2 the induction of the active caspase-3
by guest on August 11, 2016
http://ww
w.jbc.org/
Dow
nloaded from
12
FITC positive population remained high in response to etoposide (25%) (Fig 4). Conversely,
AdCOX-2 cells treated with TNFα were prevented from the induction of a separate population
of cells, highlighting the increase in active caspase-3-FITC fluorescence. Instead the majority of
AdCOX-2 cells displayed inactive caspase-3 (93%) with TNFα (Fig 4). Since the level of
caspase-3 activation in control AdWT or control AdCOX-2 infected cells was at a minimum
identical to uninfected control cells (Fig. 4) cell death was probably not occurring specifically as
a consequence of the adenovirus mediated infection procedure, as detected by this method.
Suppression of the Sub-G1 population by an over-expression of COX-2-Further evidence for an
apparent inhibition of TNFα (100ng/mL) induced apoptosis by COX-2 over-expression was
obtained by cell cycle analysis and the measurement of a sub-G1 region. FACS analysis of
nuclear DNA showed a profound sub-G1 peak, produced by a leakage of DNA fragments from
apoptotic cells following their fixation, in response to etoposide treatment in AdWT cells. A
smaller but well-defined sub-G1 region was also produced by TNFα in AdWT cells (Fig. 5).
The sub-G1 region was considerably smaller in AdCOX-2 cells compared to AdWT cells
following treatment with TNFα but was still visible in the presence of etoposide (Fig. 5).
Profile of prostaglandin synthesis following over-expression of COX-2-In order to assess the
impact of an over-expression of COX-2 on prostaglandin production in RMC, AdWT and
AdCOX-2 cells were stimulated with the calcium ionophore A23187 (1mM, 15min at 37oC) to
release cellular arachidonic acid from membrane phospholipids, as described elsewhere (38).
The PGs were then extracted and separated by LC-MS (39). By this analysis it was possible to
determine the conversion of arachidonic acid to a variety of COX-2-mediated PG metabolites.
AdWT cells contained low levels of PGE2 and a substantial amount of PGI2. When the cells
were over-expressed with COX-2 there was a selective enhancement of PG production.
AdCOX-2 cells showed a two-fold increase in PGE2 and PGI2 (detected as 6-keto-PGF1α). There
was no evidence of PGF2α, PGJ2, PGD2 and Thromboxane A2 (TxA2) production by AdWT or
AdCOX-2 cells. Since COX-2 was the major active isoform due to adenovirus transfection,
PGE2 and PGI2 were deemed to be the principal PG metabolites induced by COX-2 in RMC.
by guest on August 11, 2016
http://ww
w.jbc.org/
Dow
nloaded from

13
Anti-apoptotic effect of PGE2 and PGI2-Having established that PGE2 and PGI2 were generated
by an over-expression of COX-2, we attempted to mimic COX-2 activity by exogenous addition
of either PGE2 or PGI2 . PGE2 (500nM) and PGI2 (500nM) were each co-incubated with either
TNFα (100ng/mL) or etoposide (100µM) in uninfected RMC. Their effect on TNFα or
etoposide-mediated apoptosis was monitored by FACS analysis using the previously established
assays in this study. The fraction of active caspase-3-FITC cells was reduced from 16 to 1% by
PGE2 (Fig. 6) and from 16 to 3% by exogenous PGI2 (Fig. 6). Furthermore the EA cell fraction
was significantly reduced in TNFα treated cells, co-incubated with either PGE2 or PGI2 (Table
2). In each instance the fraction of EA cells was reduced from ~18.5 to 3.6%. The extent of
apoptosis inhibition by PGE2 and PGI2 was comparable to the anti-apoptotic effect of an over-
expression of COX-2 suggesting that the cytoprotective effect of COX-2 on TNFα apoptosis was
mediated by PGE2 and PGI2. Moreover, the inhibitory effect of PGE2 and PGI2 could not be
elicited in the presence of etoposide as shown by a significant induction of EA cells (~20%) and
cells with active caspase-3 (>25%) (Table 2 and Fig. 6, respectively). PGE2 or PGI2 alone had
no effect on apoptosis, as shown by the low levels of caspase-3 activation (<5%, see Fig. 6) and
EA cell induction (<10%, see Table 2).
ET-1 inhibition of TNFα mediated apoptosis–Having determined the anti-apoptotic effect of an
over-expression of COX-2 and the cytoprotection afforded by the PGs generated by this
mechanism we then wanted to examine the influence of other mediators that are responsible for
proliferative GN. ET-1 may be important in the progression of proliferative GN (23,24). Earlier
investigations demonstrated a rapid induction of COX-2 gene expression in response to ET-1 in
RMC (25,26). Here COX-2 expression was enhanced in RMC by ET-1 (100nM) alone and more
so by a combination of ET-1 (100nM) with TNFα (100ng/mL) (Fig. 7A). In contrast, COX-2
was barely detected in cells incubated with TNFα alone (Fig. 7A).
This synergistic effect of ET-1 and TNFα on COX-2 expression was then tested on the
inhibition of TNFα-mediated apoptosis. ET-1 in combination with TNFα reduced the EA cell
fraction induced by TNFα alone (from 19 to 8%) (Table 3). Fraction of TNFα treated RMC
with caspase-3 activation was also reduced (from 21 to 8%) in TNFα cells pre-exposed to ET-
by guest on August 11, 2016
http://ww
w.jbc.org/
Dow
nloaded from

14
(Fig. 7B). ET-1 did not prevent apoptosis induced by etoposide as evidenced by the substantial
number of cells with active caspase-3 (26%) (Fig. 7B). NS398 (25µM), a COX-2 selective
inhibitor, was administered in combination with ET-1 for 24h prior to incubation with TNFα for
an additional 24h. In this scenario the protective effect of ET-1 over TNFα induced apoptosis
was eliminated, presumably due to an inhibition of COX-2 enzymatic activity by NS398 (Fig.
7B). NS398 alone induced neither significant fractions of EA (<10%, Table 3) cells nor cells
with active caspase-3 (≤10%, Fig. 7B) as predicted by the lack of endogenous COX-2 in RMC,
and the reported specificity of NS398 for this isoform. ET-1 alone failed to induce EA cell
fractions or caspase-3 active populations (Table 3 and Fig. 7B).
Inhibition of TNFα mediated apoptosis by IL-1β- IL-1β in combination with TNFα was reported
to elicit an additive induction of COX-2 in RMC, with IL-1β being the more potent inducer of
COX-2 (28). With this observation in mind, RMC were treated with a combination of cytokines,
and the effects on apoptotic cell death were evaluated. RMC stimulated with IL-1β (2ng/mL)
displayed increased endogenous COX-2 protein expression compared to TNFα (100ng/mL)
treated cells (Fig. 8A). The combination of TNFα and IL-1β further enhanced COX-2 protein
levels (Fig. 8A) and mitigated apoptosis resulting from TNFα alone, due to their synergism over
COX-2 expression. As a result EA cell fractions and cells with active caspase-3 were reduced to
almost that of control levels from 19 to 6% (Table 4) and 19 to 9% (Fig. 8B), respectively, in
cells co-incubated with TNFα and IL-1β. This response further supports our hypothesis that
COX-2 has an anti-apoptotic role during cytokine-mediated proliferative GN.
DISCUSSION
Mesangial cells are myofibroblasts essential for maintaining immunological functions of renal
glomeruli (1-4, 7). The mechanisms responsible for the impairment of myofibroblast/mesangial
cell apoptosis, in severe proliferative GN remain poorly characterized. To address this issue our
primary objective was to develop a suitable cell culture model of apoptosis in RMC. We were
able to induce approximately 20 to 25% apoptotic cells in sub-confluent RMC, in response to
TNFα, highlighted by a number of apoptotic indices, without prior cellular or molecular
by guest on August 11, 2016
http://ww
w.jbc.org/
Dow
nloaded from

15
manipulations as described in other published investigations (32-34). Our findings are in
agreement with one other study whereby TNFα-mediated apoptosis was also restricted to sub-
confluent rat mesangial cells, at a level of approximately 25% by 24h incubation, in the absence
of any manipulations (47).
After establishing this primary cell culture model we were able to investigate the relationship
between COX-2 expression and TNFα-mediated apoptosis in RMC. We used recombinant
adenovirus mediated gene transfer, which is an indispensable tool for driving gene expression in
primary cell types, and by this mechanistic approach we were able to show that cells over-
expressing COX-2 were resistant to apoptosis induced by TNFα. PS exposure was reduced by
approximately 50% in AdCOX-2 cells, as were nuclear apoptotic events, such as chromatin
condensation and DNA fragmentation. Protection from TNFα-mediated apoptosis by an over-
expression of COX-2 was due to the suppression of caspase-3 activation. On the other hand,
AdCOX-2 cells could not be rescued from etoposide-mediated apoptosis, suggesting that COX-2
anti-apoptotic activity was confined to the pathways mediated by TNFα. Although there is
definitive evidence of COX-2 suppression of apoptosis in cancerous or transformed cells (16-19)
this study is one of few to demonstrate the cytoprotection of COX-2 over-expression in primary
cell types such as RMC.
We were convinced of an anti-apoptotic activity of COX-2 expression since we had utilized
more than a single viability assay. There are several points of controversy for relying
exclusively on the interpretation and specificity of a single assay. For instance the AV assay
using FITC-AV/PI staining is a sensitive FC method for detecting PS exposure, which is an early
and transient event in apoptosis that may be difficult to distinguish from the necrotic cell
fraction. Studies utilizing the AV assay without including PI in the analysis run the risk of over-
estimating the level of apoptosis and incorrectly diagnosing necrosis as apoptotic cell death (43,
48). Consequently, the level of EA cell induction by TNFα at 24h was a significant parameter
that we had consistently highlighted, and inhibited by an over-expression of COX-2. By
contrast, the caspase-3 assay can exclusively detect the level of apoptotic cell death since it
measures a specific event of apoptosis not present in necrosis. As a result few caspase-3 positive
by guest on August 11, 2016
http://ww
w.jbc.org/
Dow
nloaded from

16
cells were identified in AdWT and AdCOX-2 control cells, and as expected, the absolute
quantity of apoptosis measured by the two methods was different. Nevertheless, all of our assays
were consistent in showing the same ultimate conclusion: COX-2 inhibits TNFα mediated
apoptosis in RMC.
TNFα was investigated in this study because it plays an important role in the physiology of
RMC. Elimination of mesangial/myofribroblast cells by immune surveillance may depend on
TNFα initiated apoptosis. Consequently, many studies have emphasized the importance of
TNFα in the resolution of proliferative GN (32-34) and yet few have demonstrated the caspase-
mediated pathway of TNFα, without implementing a prior deletion of the NF-κB survival
pathway (32-34). We hypothesized that the observed cytotoxic effect of TNFα was a result of
the absence of COX-2 expression in our cells. TNFα alone, at all the doses tested (25, 50,
100ng/mL), did not induce COX-2. However, a stimulatory effect on COX-2 expression by
TNFα became synergistic with the pro-inflammatory cytokine IL-1β and the vasoconstrictor
peptide ET-1. This observation is consistent with previous work showing that IL-1β potently
induced COX-2 in RMC (28,29), and in a host of other cell types relevant to the inflammatory
process, e.g. in human gingival fibroblasts (49) and osteoblasts (50). Furthermore TNFα plus
IL-1β was shown to have an additive effect on COX-2 expression in RMC (29), and a synergistic
effect in human gingival fibroblasts (49) with IL-1β as the more potent inducer of COX-2 in
each instance (29,49). Similarly, ET-1 by itself was shown to rapidly induce COX-2 in RMC
(26,27), while its anti-apoptotic effect was demonstrated in serum deprived rat fibroblasts (51)
and endothelial cells (52).
We found that the respective combinations of TNFα with ET-1 or IL-1β ameliorated TNFα-
mediated apoptosis by >50%, as quantified by a reduction in PS exposure and caspase-3
activation. Since we also show that the cytoprotection induced by ET-1 was reversed by NS398,
highlighting specific inhibition of COX-2 anti-apoptotic catalytic activity, we suggest that renal
inflammation may be propagated by at least two pathways of COX-2 induction. TNFα may act
as a bimodal ligand, at least in mesangial cells, by promoting cell survival in a synergistic action
by guest on August 11, 2016
http://ww
w.jbc.org/
Dow
nloaded from

17
with other mediators, and cell death simultaneously, which may be circumvented by up-regulated
COX-2 expression. Hence our results implicate a novel role for ET-1 and IL-1β as potent
survival factors for renal mesangial cells against TNFα-mediated apoptosis.
Another line of investigation is to analyze both the levels and types of PGs generated by COX-2
metabolism, which can change significantly during an inflammatory reaction. Several groups
correlated a single measurement of PGE2 production with COX-2 expression in RMC
(28,29,53,54). Here, we sought to determine the profile of PG release from endogenous
arachidonic acid derived from an over-expression of COX-2. By this analysis AdCOX-2 cells
demonstrated a preferential synthesis of PGI2 and PGE2 with very little if any production of
TxA2, PGF2α, PGJ2 and PGD2. Accordingly, both PGE2 and PGI2 inhibited the apoptotic
parameters elicited by TNFα, suppressing caspase-3 activation and PS exposure, by
approximately 80%. Therefore COX-2 may prevent TNFα apoptosis in RMC, at least in part, by
generating anti-apoptotic products PGE2 and PGI2. Generally, PGE2 production has been
correlated with the inhibition of apoptosis as shown in cancerous or transformed cells such as
human colon cancer cells (19) and cholangiocarcinoma cells (55). The results from the present
study support a growing recognition of both PGI2 and PGE2 participation in the progression of
various inflammatory conditions and cancer progression (38,49).
Many studies correlate an over-expression of COX-2 and the prevention of apoptosis with an
enhanced expression of bcl-2 (16,18,19). In this investigation bcl-2 was not evident in AdCOX-
2 cells implying that an over-expression of COX-2 does not regulate bcl-2 activity in RMC, and
bcl-2 induction is dependent on the cell type and extent of expression or configuration of the
proto-oncogene. Recent work from this laboratory identified an up-regulation of anti-apoptotic
dynein light chain (DLC) in PC12 cells (37), and P-glycoprotein (P-gp) expression in RMC, in
response to an over-expression of COX-2 (40). In the former study DLC selectively prevented
nitric oxide synthase activity and caspase-3 activation, in response to a trophic NGF withdrawal
model of apoptosis, and the latter report correlated COX-2 activity with increased activity of P-
gp. Studies are underway to determine whether these mechanisms can be applicable to a COX-2
by guest on August 11, 2016
http://ww
w.jbc.org/
Dow
nloaded from

18
suppression of TNFα-mediated apoptosis in RMC, enabling further novel observations of COX-
2 anti-apoptotic activity in primary cell types.
In summary, the presented data suggest that COX-2 over-expression or induction may prevent
apoptosis in renal mesangial cells. The observations implicate COX-2 expression and catalytic
activity in proliferative GN by inhibiting TNFα dependent apoptosis perhaps via the generation
of PGE2 or PGI2. These results could be useful in elucidating the molecular mechanisms
underlying the regulation of COX-2 and may open up specific strategies for the treatment of
renal inflammatory diseases that specifically target COX-2 or COX-2’s downstream components
rather than TNFα or its receptor.
ACKNOWLEDGMENTS
We gratefully acknowledge Dr Kasem Nithipatikom and Marilyn Isbell for help and advice with
LC-MS analysis. The National Institute of Health Research Grants DK 41684 and HL 22563 (to
A.S.) supported this work. The author wishes to gratefully acknowledge Dr James Zanghi for
editorial assistance.
REFERENCES
1. Davies, M. (1994) Kidney Int. 45, 320-327
2. Pfeilschifter.J (1994) News Physiol Sci 9, 271-276,
3. Striker, G.E., Mannik, M., and Tung, M.Y. (1979) J Exp Med 149,127-136
4. Johnson, R.J., Floege, J., Yoshimura H., Ida W.G., Couser W.G., and Alpers, C.E. (1992) J AM Soc
Nephrol 2, S190-S197
5. Desmouliere, A,M., Redard, I., Darby, and Gabbiani, G. (1995) Am J Pathol 146:56-66
6. Iredal, J.P., Benyon, R.C., Benyon, J., Pickering, M., McCullen, M., Northrop, S., Pawley, C., Hovell,
and Arthur, M.J. (1998) J Clin Invest 102, 538-549
7. Baker, A.J., Mooney, A., Hughes, J., Lombardi, D., Johnson, R.J., and Savill, J. (1994) J Clin Invest
94, 2105-
8. Harrison, D.J. (1988) Histopathology 12, 679-83
by guest on August 11, 2016
http://ww
w.jbc.org/
Dow
nloaded from

19
9. Bagchus, W.M., Hoedemaeker, P.J., Rozing, J., and Bakker, W.W. (1986) Lab Invest 55, 680-687
10. Shimizu, A., Masuda, Y., Kitamura, H., Ishizaki, M., Sugisaki, Y., and Yamanaka, N. (1996) 74, 941-
951
11. Kluth, D.C., and Rees, A.J. (1999) Nephrol 12, 66-75
12. Smith, W.L., DeWitt, D.L., and Garavito, R.M. (2000) Annu. Rev. Biochem 69, 145-182.
13. Hla, T., Ristimaki, A., Appleby, S., and Barriocanal, J.G. (1993) Ann NY Acad Sci 696, 197-204
14. Dubois, R.N., Abramson, S.B., Crofford, L., Gupta, R.A., Simon, L.S., Van De Putte, L.B., and Lipsky,
P.E. (1998) FASEB J 12, 1063-1073
15. Hirose, S., Yamamoto, T., Feng, L., Yaoita, E., Kawasaki, K., Goto, S. Fujinaka, H., Wilson, C.B.,
Arakawa, M., Kihara, I. (1998) J Am Soc Nephrol 9, 408-416.
16. Cao, Y., and Prescott, S.M. (2002) J Cell Physiol 190, 279-286
17. Tsuji, M., Kawano, S.S., Tsuji, S., Sawaoka, H., Hori, M., and Dubois, R.N. (1998) Cell 93, 705-716
18. Shao, J., Sheng, H., Inove, H., Morrow, J.D., and Dubois, R.N. (2000) J Biol Chem 275, 33951-33956
19. Sheng, H., Shao, J., Morrow, J.D., Beauchamp, R.D., and Dubois, R.N. (1998) Cancer Res 58, 362-366
20. Takemura, T., Yoshioka, K., Murakami, K., Akano, N., Okada, M., Aya, N., and Maki, S. (1994)
Virchows Arch 424, 459-464
21. Vassalli, P. (1992) Annu Rev Immunol 10, 411-452
22. Sterzel, R,B., Schulze-Lohoff, E., and Marx, M. (1993) Kidney Int 43, S26-S31.
23. Simonson, M.S., and Dunn, M.J. (1993) Annu Rev Physiol. 55, 249-265.
24. Perico, N., and Remuzzi, G. (1993) Kidney Int 9, S76-80
25. Abboud, H.E. (1993) Kidney Int 43, 252-267.
26. Kester, M,, Coroneos, E., Thomas, P.J, and Dunn, M.J. (1994) J Biol Chem 269, 22574-22580
27. Hughes, A.K., Padilla, E., Kutchera, W.A., Michael, J.R., and Kohan, D.E. (1995) Kidney Int 47, 53-61
28. Coyne, D.W., Nickols, M., Beryrand, W., and Morrison, A.,R. (1992) Am J Physiol 263, F97-F102.
29. Rzymkiewicz, D., Leingang, K., Baird, N., and Morrison, AR. (1994) Am J Physiol 266, F39-45.
30. Antwerp, D.J., Martin, S.J., Kafri, T., Green, D.R., and Verma, I.M. (1996) Science 274, 787-789
31. Ashkenazi, A., and Dixit, V.M. (1998 ) Science 281, 1305-1308.
32. Guo, Y.L., Baysal, K., Kang, B., Yang, L.J., and Williamson, J.R. (1998) J Biol Chem 273, 4027-4034
33. Sugiyama, H., Savill, J.S., Kitamura, M., Zhao, L., and Stylianou, E. (1999) J. Biol. Chem. 274, 19532-
19537
34. Hirahashi, J., Takayanagi, A., Hishikawa, K., Takase, O., Chikaraishi, A., Hayashi, M., Shimizu, N.,
and Saruta, T. (2000) Kidney Internal 57, 959-968.
35. Simonson, M.S., and Dunn, M.J.(1990) Methods Enzymol 187, 544-53.
by guest on August 11, 2016
http://ww
w.jbc.org/
Dow
nloaded from

20
36. Foschi, M., Chari, S., Dunn, M.J., and Sorokin, A. (1997) EMBO J 16, 6439-51
37. Chang, Y.W., Jakobi R., McGinty A., Foschi M., Dunn M.J., Sorokin A. (2000) Mol Cell Biol 20,
8571-8579.
38. Brock, T.G., McNish, R.W., and Peters-Golden, M. (1999) J Biol Chem 23, 274 :11660-11666
39. Nithipatikom, K., Grall, A.J., Holmes, B.B., Harder, D.R., Falck, J.R., and Campbell, W.B. (2001) Anal
Biochem 298, 327-336
42. Patel, V.A., Dunn, M.J., and Sorokin, A. (2002) J Biol Chem 277, 38915-38920.
43. Harris, R.C., and Breyer, M.D. (2001) Am J Physiol Renal Physiol 281, F1-11 44. Savill, J.S., Wyllie, A.H., Henson, J.E., Walport M.J., Henson P.E., and Haslett, C. (1989) J Clin Invest
83, 865-871. 45. Ishaque, A., and Al-Rubeai. (1998) J Immunol Methods 221, 43-57
46. Kerr, J.F., Winterford, C.M., and Harmon, B.V. (1994) Cancer 73, 2013-2026
47. Cohen, G.M., Sun, X.M., Snowden, R.T., Dinsdale, D., and Skilleter, D.N. (1992). Biochem J 286, 331-
334
48. Thornberry, N.A., and Lazebnik, Y. (1998) Science 281, 1312-1316
49. Bohler, T., Waiser, J., Hepburn, H., Gaedeke, J., Lehmann, C., Hambach, P., Budde, K., and Neumayer,
H.H. (2000) Cytokine 12, 986-991
50. Darzynkiewicz, Z., Juan, G., Li, X., Gorczyca, W., Murakami, T., and Traganos, F. (1997) Cytometry
27, 1-20
51. Yucerl-Lindberg, T., Nilsson, S., and Modeer, T. (1999) J Dent Res 1, 61-68.
52. Wadleigh, D.J., and Herschman, H.R. (1999) Biochem Biophys Res Commun 264, 865-70
53. Shichiri, M., Sedivy, J.M., Marumo, F., and Hirata, Y. (1998) Mol Endocrinol 12, 172-180
54. Shichiri, M., Kato, H., Marumo, F., and Hirata, Y. (1997) Hypertension 30,1198-203.
55. Tetsuka, T., Daphna-Iken, D., Miller, B.W., Guan, Z., Baier, L.D., and Morrison, A.R. (1996) J Clin
Invest 97, 2051-2056
56. Tetsuka, T., Baier, L.D., and Morrison, A.R. (1996) J Biol Chem 271, 11689-11693
57. Nzeako, U.C., Guicciardi, M.E., Yoon, J.H., Bronk, S.F., and Gores, G,J. (2002) Hepatology 35, 552-
559
FIGURE LEGENDS
by guest on August 11, 2016
http://ww
w.jbc.org/
Dow
nloaded from

21
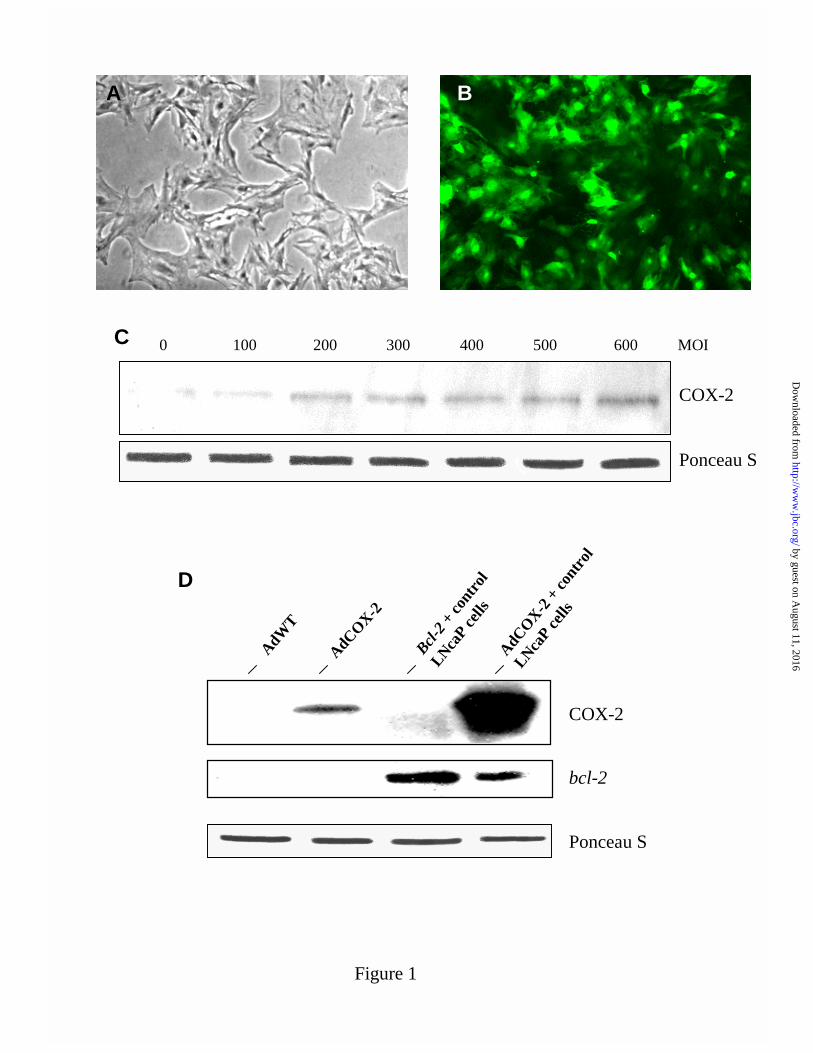
FIGURE 1: Characterization of RMC over-expressing COX-2 by adenovirus mediated
infection. Subconfluent serum starved cells untransfected (A) or infected (B) with the
adenovirus (Ad) cDNA construct for Green Fluorescent Protein (GFP) at a multiplicity of
infection (MOI) of 200 for 24h. Expression of COX-2 (C) 24h after infecting with increasing
MOI’s of AdCOX-2, and bcl-2 expression after infection with AdCOX-2 at a MOI of 200 (D)
was determined by western blot analysis with anti-COX-2 or anti-bcl-2 antibody, respectively.
Cell lysates from AdCOX-2 cells were standardized for protein and extracts from LNcaP
prostate cancer cells were used as positive (+) controls. Adenovirus Wild Type (AdWT)
construct was used as a transfection control. AdWT cells did not show endogenous COX-2 or
bcl-2 proteins (D). Ponceau S staining of the membrane bound protein confirmed equal protein
loading. ECL exposure and fluorescence micrograph are representative of 3 independent
experiments.
FIGURE 2: Illustration of the transition in cell viability by FITC-AV/PI staining following
COX-2 over-expression. Cells infected with AdWT or AdCOX-2, were incubated with TNFα
(100ng/mL) or etoposide (100µM) for 24h and subsequently stained with FITC-AV/PI to
demonstrate fractions of V, EA and N cell populations. Cells that received no adenovirus are
indicated as uninfected. Dot plot is representative of 5 independent experiments.
FIGURE 3: Apoptotic morphology as detected by fluorescence microscopy (x40). AdWT
infected (A to C) or AdCOX-2 infected (D to F) cells were stained with AO and subsequently
quantified for nuclear apoptotic morphology (G). Cells were treated with either TNFα (B and
E) or etoposide (C and F) for 24h. Control cultures (A and D) were cultured in complete
medium for 24h. Apoptotic cells were identified by ‘dots’ of chromatin condensation, which
became pronounced in the shrunken apoptotic cells (indicated by arrows). Fluorescence
micrograph is representative of 4 independent experiments. Data points (G) show the mean ± SE
of the mean of triplicate readings in a representative experiment; significant difference form
AdWT control cells (#p<0.01), and from AdWT treated cells (*p<0.001).
by guest on August 11, 2016
http://ww
w.jbc.org/
Dow
nloaded from

22
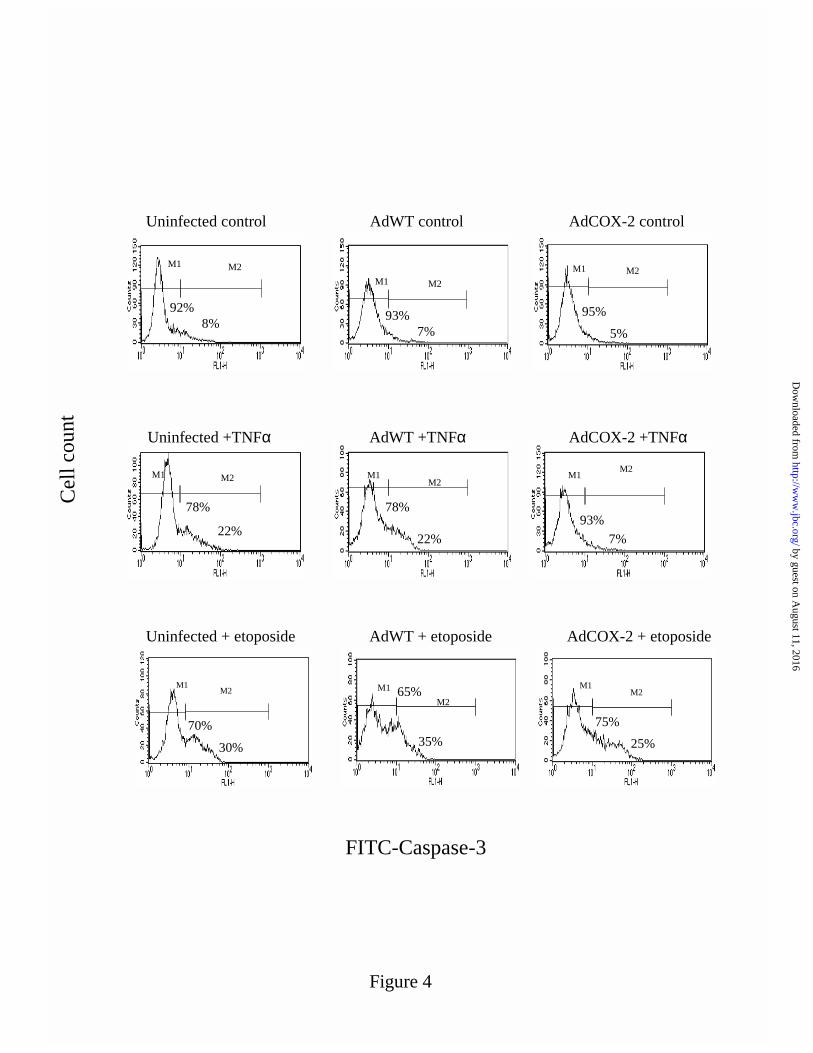
FIGURE 4: Effect of COX-2 over-expression on caspase-3 activation. AdWT or AdCOX-2
infected cells were induced to apoptosis with either TNFα (100ng/mL) or etoposide (100µM) for
24h and assayed for caspase-3 activation by flow cytometry. Histograms of cell count vs active-
caspase-3 labeled to FITC highlight M1 and M2 regions, which represent cells with inactive and
active caspase-3 respectively. Histograms are representative of 3 independent experiments.
FIGURE 5: Cell cycle analysis. Cells infected with AdWT or AdCOX-2, were analyzed for
nuclear DNA content by PI staining, as described in the experimental procedures, after treatment
with TNFα (100ng/mL) or etoposide (100µM) for 24h. Histograms are typical of 3 independent
experiments.
FIGURE 6: Effect of PGE2 and PGI2 on TNFαααα mediated apoptosis. Cells were incubated for
24h in fresh basal media in the absence (control) or presence of PGE2 or PGI2, or each PG was
co-incubated with either TNFα (100ng/mL) or etoposide (100µM). PGs were re-applied 6 and
12h during incubation to offset their metabolic degradation as described in experimental
procedures. Cells were analyzed for active-caspase-3 FITC staining. Control cultures were also
composed of an equivalent concentration of DMSO used to dissolve PGE2 (500nM). Histograms
of cell count vs caspase-3 staining are representative of 3 independent experiments.
FIGURE 7: Effect of ET-1 on TNFαααα mediated apoptosis and COX-2 expression. Cells
incubated with ET-1, TNFα (100ng/mL) or both for 24h were harvested and the whole cell
lysates were analyzed by immunoblotting with anti-COX-2 antibody. Ponceau S staining of the
membrane bound protein confirmed equal protein loading (A). Cells treated with ET-1 (100nM),
NS398 (25µM), TNFα (100ng/mL) or etoposide (100µM) alone or in several combinations as
indicated were stained with FITC-caspase-3 antibody and analysed by flow cytomtery (B).
Control cultures were also composed of an equivalent concentration of DMSO used to dissolve
NS 398 (25 µM). Histograms and western blot results are representative of at least 3
independent experiments.
by guest on August 11, 2016
http://ww
w.jbc.org/
Dow
nloaded from
23
FIGURE 8: Effect of IL-1ββββ on TNFαααα mediated apoptosis and COX-2 expression. Cells
stimulated with IL-1β or TNFα or both cytokines were harvested and whole cell lysates were
assessed for COX-2 protein by western blot analysis. Ponceau S staining of the membrane
bound protein confirmed equal protein loading (A). FITC-capase-3 staining of cells incubated in
the absence (control) or presence of IL-1β (2ng/mL) and/or TNFα (100ng/mL) was carried out
after 24h incubation (B). Histograms and western blot results are representative of at least 3
independent experiments.
by guest on August 11, 2016
http://ww
w.jbc.org/
Dow
nloaded from

24
Table 1
FITC-AV staining for uninfected, AdWT or AdCOX-2 infected cells treated with etoposide or
TNFα
Cell fraction (%) 2
Cell infection/
Inducers1
V
EA
N
Uninfected:
Control
TNFα
Etoposide
90 ± 1.8
75 ± 1.5
69 ± 1.8
4 ± 0.3
20 ± 0.6
22 ± 1.5
5 ± 1.2
5 ± 0.9
8 ± 3.3
AdWT:
Control
TNFα
Etoposide
75 ± 2
54 ± 2
43 ± 1.2
9 ± 1.7
28 ± 0.6
30 ± 0.6
12± 1
14 ± 2
25 ± 2.1
AdCOX-2:
Control
TNFα
Etoposide
78 ± 1
76 ± 1.5
54 ± 2.3
4 ± 1.4
6 ± 0.94
27 ± 1.0
16.0 ± 0.8
17.7 ± 0.7
19 .0± 1.2
1 Uninfected cells or cells infected with AdWT or AdCOX-2 for 24h were untreated (control)
or treated with either TNFα (100ng/mL) or etoposide (100µM) for an additional 24h. 2 Cell viability was quantified in terms of the fraction of V [AV (-)/ PI (-)], EA [AV (+)/ PI (-
)], or N [AV (+)/ PI (+)] cells, represented as a percentage of the total cells analysed by flow
cytometry. Note staining procedure resulted in a loss ≤ (5%) of cells. 3 Values are mean ±SE (n ≥3) 4Significantly different from treatment with TNFα alone in uninfected or AdWT infected cells
(p<0.001)
by guest on August 11, 2016
http://ww
w.jbc.org/
Dow
nloaded from

25
Table 2
FITC-AV staining for cells incubated with PGE2 or PGI2 and treated with either etoposide or
TNFα
Cell fraction (%) 2
Cell treatment 1
V
EA
N
Control
TNFα
Etoposide
90 ± 3.5
65 ± 2.9
71 ± 2.4
2.5 ± 0.3
18.5 ± 2.9
23 ± 4.0
7.5 ± 1.3
14.0 ± 3.2
5.8 ± 1.5
PGE2
PGE2 + TNFα
PGE2 + etoposide
88 ± 1.2
84 ± 2.3
70 ± 0.6
5 ± 0.6
3.6 ± 1.63
19 ± 0.8
6.8 ± 0.88
11 ± 1.2
8.0 ± 0.88
PGI2
PGI2 + TNFα
PGI2 + etoposide
87 ± 1.2
86 ± 2.3
69 ± 2.3
4 ± 0.6
3.7 ± 1.23
20 ± 0.88
8.6 ± 1.7
10 ± 1.2
11.0 ± 3.2
1 Cells in the absence of PG were treated with either TNFα (100ng/mL) or etoposide (100µM)
for 24h or were co-incubated with either PGE2 (500nM) or PGI2 (500nM) in the presence of
each inducer. Control cells consisted of DMSO at the same concentration used to dissolve
PGE2. 2 Data are mean ±SE of 2 independent experiments. 3Significantly different from TNFα alone (p<0.005)
by guest on August 11, 2016
http://ww
w.jbc.org/
Dow
nloaded from

26
Table 3
FITC-AV staining for cells pre-incubated with ET-1, TNFα, and COX-2 inhibitor NS 398
Cell fraction (%) 2
Cell treatment 1
V
EA
N
Control 90 ± 1.2 5 ± 1.2 4.0 ± 1.2
TNFα 74 ± 1.8 19 ± 1.2 6.7 ± 0.67
NS 398 89 ± 2.3 7 ± 0.7 3.4 ± 0.2
TNF + NS 398 74 ± 2.3 19 ± 2.2 5.75 ± 0.98
ET-1 85 ± 4.2 9 ± 1 3.5 ± 0.6
ET-1 + TNFα 80 ± 3.8 8 ± 1.53 9.75 ± 1.6
ET-1 + NS 398 + TNFα 70 ± 1.76 21 ± 1.8 8.0 ± 1.52
1 ET-1 (100nM) or NS 398 (25µM) treatments were for 24h prior to incubation with TNFα
(100ng/mL) for an additional 24h. Control cells were also composed of DMSO at the same
concentration as NS 398 (25µM). 2 Values are mean ±SE of 3 independent experiments. 3Significantly different from TNFα alone (p<0.005)
by guest on August 11, 2016
http://ww
w.jbc.org/
Dow
nloaded from

27
Table 4
FITC-AV staining for cells treated with IL-1β, TNFα, or TNFα plus IL-1β
Cell fraction (%) 2
Cell treatment 1
V
EA
N
Control
IL-1β
TNFα
IL-1β + TNFα
89 ± 5
85 ± 3.5
76 ± 1.2
86 ± 0.6
6 ± 1.2
7 ± 1.2
19 ± 1.7
6 ± 0.83
3 ± 0.3
3 ± 0.8
4 ± 1.0
7.6 ± 2.3
1 Cells were incubated with IL-1β (2ng/mL) or TNFα (100ng/mL) or IL-β plus TNFα for 24h. 2 Values are mean ±SE of 3 independent experiments. 3Significantly different from TNFα alone (p<0.01)
by guest on August 11, 2016
http://ww
w.jbc.org/
Dow
nloaded from
A B
C 0 100 200 300 400 500 600 MOI
COX-2
Figure 1
Ponceau S
Ponceau S
AdWT
AdCOX-2
Bcl-2 +
cont
rol
LNcaP ce
llsAdC
OX-2 + c
ontro
l
LNcaP ce
lls
COX-2
bcl-2
D
by guest on August 11, 2016
http://ww
w.jbc.org/
Dow
nloaded from

Uninfected + TNFα
Uninfected control
Uninfected + etoposide
AdWT control
AdWT + etoposide
AdWT + TNFα
AdCOX-2 control
AdCOX-2 + etoposide
AdCOX-2 + TNFα
Prop
idiu
m io
dide
FITC-Annexin V
Figure 2
VEA
NN
by guest on August 11, 2016
http://ww
w.jbc.org/
Dow
nloaded from

B
A
C
D
E
F
Figure 3
by guest on August 11, 2016
http://ww
w.jbc.org/
Dow
nloaded from

G
Figure 3
Apo
ptos
is (%
)
control TNFα etoposide
0
10
20
30
40 AdWT
AdCOX-2
∗
# by guest on August 11, 2016
http://ww
w.jbc.org/
Dow
nloaded from
M1 M2
M1M2
M1 M2
M1M2
AdWT controlUninfected control AdCOX-2 control
AdCOX-2 +TNFα
92%7%
78%
22%
95%
5%
93%7%
M1 M2
Uninfected +TNFα
78%
22%
M1 M2
92%8%
AdWT +TNFα
93%
FITC-Caspase-3
Cel
l cou
nt
M1M2M1
M2
M1M2
Uninfected + etoposide AdWT + etoposide AdCOX-2 + etoposide
70%
30%
65%
35%75%
25%
Figure 4
by guest on August 11, 2016
http://ww
w.jbc.org/
Dow
nloaded from

G1
SG2/M
AdWT control AdCOX-2 control
AdWT +TNFα
AdWT + etoposide
AdCOX-2 + TNFα
AdCOX-2 + etoposide
Propidium Iodide
Cel
l cou
nt
Sub-G1
Sub-G1Sub-G1
Figure 5
by guest on August 11, 2016
http://ww
w.jbc.org/
Dow
nloaded from

M1 M2 M1 M2 M1M2
M1 M2 M1 M2 M1M2
FITC-Caspase-3
control
TNFα
etoposide
PGE2
PGE2 + TNFα
PGE2 + etoposide
PGI2
PGI2 + TNFα
PGI2 + etoposide
M1M2
M1M2
M1M2
99%
1%
98%
2%
96%
4%
84%
16%
77%
23%
99%
1%
73%
27%
97%
3%
63%
37%
Cel
l cou
nt
Figure 6
by guest on August 11, 2016
http://ww
w.jbc.org/
Dow
nloaded from

ET-1+NS 398 + TNFα
M1 M2M1
M2
M1M2
M1M2
M1 M2
M1 M2M1
M2 M1 M2
M1 M2
FITC-Caspase-3
TNFα
etoposide
control ET-1 NS 398
ET-1 + TNFα
ET-1 + etoposide
TNFα +NS 398
99%1%
99%1%
90%
10%
79%21%
67%
33%
74%
26%
77%
23%
78%
22%
Cel
l cou
nt
92%
8%
A
B
Figure 7
control TNFα ET-1 ET-1 + TNFα
COX-2
Ponceau SPonceau S
by guest on August 11, 2016
http://ww
w.jbc.org/
Dow
nloaded from

Cel
l cou
nt
M1M2
M1M2
M1
M2
M1
M2
control
TNFα IL-1β + TNFα
IL-1β
FITC-Caspase-3
93%
7%
92%
8%
81%
19%
90%
9%
A
Figure 8
COX-2
control TNFα IL-1β + TNFαIL-1β
B
Ponceau S
by guest on August 11, 2016
http://ww
w.jbc.org/
Dow
nloaded from
Adiba Ishaque, Michael J. Dunn and Andrey Sorokincells
-mediated apoptosis in renal glomerular mesangialαCyclooxygenase-2 inhibits TNF
published online January 1, 2003J. Biol. Chem.
10.1074/jbc.M210559200Access the most updated version of this article at doi:
Alerts:
When a correction for this article is posted•
When this article is cited•
to choose from all of JBC's e-mail alertsClick here
http://www.jbc.org/content/early/2003/01/01/jbc.M210559200.citation.full.html#ref-list-1
This article cites 0 references, 0 of which can be accessed free at
by guest on August 11, 2016
http://ww
w.jbc.org/
Dow
nloaded from
Copyright © 2022 FDOKUMEN