Overproduction of phosphoprotein enriched in diabetes (PED) induces mesangial expansion and...
11
ARTICLE Overproduction of phosphoprotein enriched in diabetes (PED) induces mesangial expansion and upregulates protein kinase C-β activity and TGF-β1 expression F. Oriente & S. Iovino & A. Cassese & C. Romano & C. Miele & G. Troncone & M. Balletta & A. Perfetti & G. Santulli & G. Iaccarino & R. Valentino & F. Beguinot & P. Formisano Received: 18 May 2009 / Accepted: 5 August 2009 # Springer-Verlag 2009 Abstract Aims/hypothesis Overproduction of phosphoprotein enriched in diabetes (PED, also known as phosphoprotein enriched in astrocytes-15 [PEA-15]) is a common feature of type 2 diabetes and impairs insulin action in cultured cells and in mice. Nevertheless, the potential role of PED in diabetic complications is still unknown. Methods We studied the effect of PED overproduction and depletion on kidney function in animal and cellular models. Results Transgenic mice overexpressing PED (PEDTg) featured age-dependent increases of plasma creatinine levels and urinary volume, accompanied by expansion of the mesangial area, compared with wild-type littermates. Serum and kidney levels of TGF-β1 were also higher in 6- and 9-month-old PEDTg. Overexpression of PED in human kidney 2 cells significantly increased TGF-β1 levels, SMAD family members (SMAD)2/3 phosphorylation and fibronectin production. Opposite results were obtained following genetic silencing of PED in human kidney 2 cells by antisense oligonucleotides. Inhibition of phospho- lipase D and protein kinase C- β by 2-butanol and LY373196 respectively reduced TGF-β1, SMAD2/3 phos- phorylation and fibronectin production. Moreover, inhibi- tion of TGF-β1 receptor activity and SMAD2/3 production by SB431542 and antisense oligonucleotides respectively reduced fibronectin secretion by about 50%. TGF-β1 circulating levels were significantly reduced in Ped knock- out mice and positively correlated with PED content in peripheral blood leucocytes of type 2 diabetic patients. Conclusions/interpretation These data indicate that PED reg- ulates fibronectin production via phospholipase D/protein kinase C-β and TGF-β1/SMAD pathways in kidney cells. Raised PED levels may therefore contribute to the abnormal accumulation of extracellular matrix and renal dysfunction in diabetes. Keywords Diabetic nephropathy . PEA-15 . PED . PKC . TGF-β1 Abbreviations BIM Bisindolylmaleimide ECL Enhanced chemiluminescence ECM Extracellular matrix F. Oriente and S. Iovino contributed equally to this study. Electronic supplementary material The online version of this article (doi:10.1007/s00125-009-1528-z) contains supplementary material, which is available to authorised users. F. Oriente : S. Iovino : C. Romano : A. Perfetti : F. Beguinot : P. Formisano (*) Department of Cellular and Molecular Biology and Pathology, Federico II University of Naples, Via Pansini 5, 80131 Naples, Italy e-mail: [email protected] A. Cassese : C. Miele : R. Valentino : F. Beguinot : P. Formisano Istituto di Endocrinologia ed Oncologia Sperimentale del C.N.R., Federico II University of Naples, Naples, Italy G. Troncone Department of Biomorphological and Functional Sciences, Federico II University of Naples, Naples, Italy M. Balletta Department of Nephrology, Federico II University of Naples, Naples, Italy G. Santulli : G. Iaccarino Department of Clinical Medicine, Cardiovascular and Immunological Sciences, Federico II University of Naples, Naples, Italy Diabetologia DOI 10.1007/s00125-009-1528-z
Transcript of Overproduction of phosphoprotein enriched in diabetes (PED) induces mesangial expansion and...
ARTICLE
Overproduction of phosphoprotein enriched in diabetes(PED) induces mesangial expansion and upregulates proteinkinase C-β activity and TGF-β1 expression
F. Oriente & S. Iovino & A. Cassese & C. Romano & C. Miele & G. Troncone & M. Balletta &
A. Perfetti & G. Santulli & G. Iaccarino & R. Valentino & F. Beguinot & P. Formisano
Received: 18 May 2009 /Accepted: 5 August 2009# Springer-Verlag 2009
AbstractAims/hypothesis Overproduction of phosphoproteinenriched in diabetes (PED, also known as phosphoproteinenriched in astrocytes-15 [PEA-15]) is a common feature oftype 2 diabetes and impairs insulin action in cultured cellsand in mice. Nevertheless, the potential role of PED indiabetic complications is still unknown.
Methods We studied the effect of PED overproduction anddepletion on kidney function in animal and cellular models.Results Transgenic mice overexpressing PED (PEDTg)featured age-dependent increases of plasma creatininelevels and urinary volume, accompanied by expansion ofthe mesangial area, compared with wild-type littermates.Serum and kidney levels of TGF-β1 were also higher in 6-and 9-month-old PEDTg. Overexpression of PED in humankidney 2 cells significantly increased TGF-β1 levels,SMAD family members (SMAD)2/3 phosphorylation andfibronectin production. Opposite results were obtainedfollowing genetic silencing of PED in human kidney 2cells by antisense oligonucleotides. Inhibition of phospho-lipase D and protein kinase C-β by 2-butanol andLY373196 respectively reduced TGF-β1, SMAD2/3 phos-phorylation and fibronectin production. Moreover, inhibi-tion of TGF-β1 receptor activity and SMAD2/3 productionby SB431542 and antisense oligonucleotides respectivelyreduced fibronectin secretion by about 50%. TGF-β1circulating levels were significantly reduced in Ped knock-out mice and positively correlated with PED content inperipheral blood leucocytes of type 2 diabetic patients.Conclusions/interpretation These data indicate that PED reg-ulates fibronectin production via phospholipaseD/protein kinaseC-β and TGF-β1/SMADpathways in kidney cells. Raised PEDlevels may therefore contribute to the abnormal accumulation ofextracellular matrix and renal dysfunction in diabetes.
Keywords Diabetic nephropathy . PEA-15 . PED . PKC .
TGF-β1
AbbreviationsBIM BisindolylmaleimideECL Enhanced chemiluminescenceECM Extracellular matrix
F. Oriente and S. Iovino contributed equally to this study.
Electronic supplementary material The online version of this article(doi:10.1007/s00125-009-1528-z) contains supplementary material,which is available to authorised users.
F. Oriente : S. Iovino : C. Romano :A. Perfetti : F. Beguinot :P. Formisano (*)Department of Cellular and Molecular Biology and Pathology,Federico II University of Naples,Via Pansini 5,80131 Naples, Italye-mail: [email protected]
A. Cassese :C. Miele : R. Valentino : F. Beguinot : P. FormisanoIstituto di Endocrinologia ed Oncologia Sperimentale del C.N.R.,Federico II University of Naples,Naples, Italy
G. TronconeDepartment of Biomorphological and Functional Sciences,Federico II University of Naples,Naples, Italy
M. BallettaDepartment of Nephrology, Federico II University of Naples,Naples, Italy
G. Santulli :G. IaccarinoDepartment of Clinical Medicine,Cardiovascular and Immunological Sciences,Federico II University of Naples,Naples, Italy
DiabetologiaDOI 10.1007/s00125-009-1528-z
HK2 cells Human kidney 2 cellsPBL Peripheral blood leucocytePED Phosphoprotein enriched in diabetes/
phosphoprotein enriched in astrocytes-15Ped-KO Ped/Pea-15 knockout micePEDTg Transgenic mice overexpressing PEDPKC Protein kinase CPLD Phospholipase DSMAD SMAD family member
Introduction
Diabetic nephropathy is a frequent complication of type 1and type 2 diabetes mellitus and is currently considered theleading cause of end-stage renal disease [1]. Whilethickening of the glomerular basement membrane, glomer-ular hypertrophy and mesangial expansion are well knownfeatures of diabetic nephropathy, the pathogenesis of thesealterations is not very clear yet. The DCCT, UK ProspectiveDiabetes Study (UKPDS) and Action in Diabetes andVascular Disease: Preterax and Diamicron MR ControlledEvaluation (ADVANCE) studies have shown the role ofhyperglycaemia as a causative factor in the developmentand the progression of diabetic nephropathy [2–5]. Never-theless, hyperglycaemia alone is clearly not sufficient toaccount for the heterogeneity and variability of the clinicalappearance of the disorder. Indeed, accumulating evidencepoints to critical genetic factors predisposing only a subsetof patients with diabetes to nephropathy [6–8].
Several studies have shown an important involvement ofgrowth factors and cytokines [9, 10]. In particular, the TGF-β1 is a key factor in experimental models of diabetickidney disease as well as in patients with diabeticnephropathy [11–15]. In fact, TGF-β1 levels are increasedin diabetic patients and high glucose levels upregulateexpression and bioactivity of TGF-β1 in almost all renalcell types [11, 12, 16, 17]. Upon binding to its receptor,TGF-β1 phosphorylates the receptor-regulated SMADfamily members (SMAD)2 and 3, which form oligomericcomplexes with the common SMAD (SMAD 4). Thesecomplexes then translocate into the nucleus, therebyregulating transcription of target genes, including thoseencoding type I and type IV collagen, laminin andfibronectin [14, 16, 18, 19].
Phosphoprotein enriched in diabetes (PED, also knownas phosphoprotein enriched in astrocytes-15 [PEA-15]) is ascaffold cytosolic protein originally identified as a majorastrocyte phosphoprotein and found to be widely present indifferent tissues [20, 21]. PED plays an important role inmitogenic and metabolic signalling [21–23]. Gene profilingstudies have shown that PED (also known as PEA15) is
commonly overexpressed in individuals with type 2diabetes [21, 24]. In cultured muscle and adipose cellsand in peripheral tissues from transgenic mice, forcedproduction of PED impairs insulin-stimulated GLUT4translocation and glucose transport, suggesting that PEDmay contribute to insulin resistance in type 2 diabetes [25].Further studies have shown that PED stabilises phospholi-pase D (PLD) [26] and induces activation of classicalprotein kinase C (PKC) isoforms, including PKCα andPKCβ [23, 27]. The induction of classical PKCs, in turn,inhibits insulin signalling, at least in skeletal muscle,adipose and liver cells [28–31]. Nevertheless, the role ofPED in diabetic complications is not known.
In the present work we addressed the question ofwhether PED overproduction determines abnormalities inkidney function and whether it may represent an initialdefect in the progression toward diabetic nephropathy.
Methods
Materials Media, sera, antibiotics for cell culture and thelipofectamine reagent were from Invitrogen (Grand Island,NY, USA). The anti-PED polyclonal rabbit antibody andpcDNA3PED vector have been previously described [21].pSMAD2/3 (Ser433/435), SMAD2, PKCα, PKCβ, fibro-nectin, laminin and collagen I and IV antibodies were fromSanta Cruz Biotechnology (Santa Cruz, CA, USA).SMAD3 was purchased from Calbiochem (San Diego,CA, USA). Phosphorothioate oligonucleotides antisensesequences used were as follows: SMAD2 AS: 5′-GCACGATGGACGACAT-3′; SMAD2 S: 5′-CAATGCGAGTACGCGA-3′; SMAD3 AS: 5′-GCAGGATGGACGACAT-3′;SMAD3 S: 5′-GGAGTCAGACTGACGA-3′; PED anti-sense oligonucleotides were as previously described [25].Protein electrophoresis reagents were purchased from Bio-Rad (Richmond, VA, USA), and western blotting andenhanced chemiluminescence (ECL) reagents from Amer-sham Biosciences (Arlington Heights, IL, USA). All otherchemicals were from Sigma Aldrich (St Louis, MO, USA).
Mouse phenotyping Generation of transgenic mice over-expressing PED (PEDTg) [25] and of Ped/Pea-15 knockoutmice (Ped-KO) bearing ubiquitous ablation of the gene [32]has been previously described. Homozygous Ped-KO wereused for the study. Both PEDTg and Ped-KO mice werefertile. Body weight of PEDTg was comparable to that ofwild-type littermates, while, as previously described [32],Ped-KO displayed a slightly lower body weight. Allprocedures described below were approved by the Institu-tional Animal Care and Utilisation Committee. Animalswere kept in a 12-h dark–light cycle and had free access tostandard diet. Mice chosen for experimentation were
Diabetologia
randomly selected from each box of mice housed in groupsof three to four. Mice were habituated in individualmetabolism cages (Lenderking Caging Products, Millers-ville, MD, USA) for 24 h. Then, the following variableswere analysed: food intake (g/24 h), water intake (ml/24 h),urine volume excretion (ml/24 h), urine specific gravity,urine pH, urine glucose (mg/24 h) and albumin excretion(μg/24 h). The measurements of blood pressure and heartrate were performed partially modifying previously de-scribed methods [33]. Briefly, a 1.0-Fr polyimide pressurecatheter (SPR 1000/2; Millar Instruments, Houston, TX,USA) was inserted into the left carotid artery and advancedinto the ascending aorta of anaesthetised mice (2%isoflurane, 98% oxygen). Blood pressure and heart ratewere recorded for 15 min after suspending isofluraneadministration with an 8 channel recorder (Gould Instru-ments Systems, Cleveland, OH, USA). Data were analysedusing Powerlab and Chart 5 software (AD Instruments,Sydney, NSW, Australia).
Renal histology and morphometric analysis Kidney sec-tions were fixed by immersion in Carnoy solution followedby 4% buffered formaldehyde (vol./vol.) and embedded inparaffin. The fixed, embedded kidneys were cut into 2 μmsections and stained with periodic acid–Schiff’s reagent. Toquantify mesangial expansion, sections were coded andexamined by light microscopy by two observers unaware ofthe experimental protocol applied. According to previousreports [34, 35], measurement of the mesangial area of 30glomeruli randomly selected in each mouse by scanning ofthe outer cortex was performed with a computer-aidedmanipulator (KS-400; Carl Zeiss Vision, Munich, Germany)
Measurement of serum TGF-β1 and urine albumin Bloodsamples of mice were collected from the orbital sinus underanaesthesia. After centrifugation (800×g) of the bloodsamples, TGF-β1 levels in the supernatant fractions weremeasured using ELISA kits (R&D System, Minneapolis,MN, USA). The same kits were used to measure TGF-β1levels in the media of the cells. Samples of urine collectedthrough metabolism cages (five samples for each animal;ten animals/group) were briefly centrifuged at 500×g andthen albumin concentration was determined using ELISAkits (Bethyl Laboratories, Montgomery, TX, USA).
Tissue collection and primary mouse tubular kidney cellcultures Tissue samples (kidney) were collected rapidlyafter mice were killed by pentobarbitone overdose. Tissueswere snap-frozen in liquid nitrogen and stored at −80°C forsubsequent western blot analysis. Mouse tubular epithelialcells were isolated as previously described [36]. Cells weregrown until confluent (8 to 12 days) in RPMI 1640 mediumsupplemented with 20% fetal calf serum, 2% (wt/vol.) L-
glutamine, 20,000 units/ml penicillin, 20,000 μg/ml strep-tomycin at 37°C in 5% CO2.
Cell culture procedures and transfection Human kidney 2(HK2) proximal tubular cells were cultured in RPMI 1640medium (Invitrogen), containing 11.2 mmol/l glucose sup-plemented with 10% fetal calf serum, 2% (wt/vol.)L-glutamine, 10,000 units/ml penicillin, 10,000 μg/mlstreptomycin at 37°C in 5% (vol./vol.) CO2. Stabletransfection of PED cDNA and transient transfection ofantisense oligonucleotides [37] were performed by thelipofectamine method according to the manufacturer’s instruc-tions (Invitrogen). For these studies, 60 to 80% confluent cellswere washed twice with Optimem (Invitrogen) and incubatedfor 8 h with 5 μg of plasmid construct or antisenseoligonucleotides and 45 to 60 μl of lipofectamine reagent.The medium was then replaced with DMEM with 10% (vol./vol.) fetal calf serum and cells further incubated for 15 hbefore being assayed. Transfection efficiency for antisenseoligonucleotides was estimated as 45±10% by co-transfectionwith green fluorescent protein.
Tissue and cell lysates and immunoblotting Tissue sampleswere homogenised in a Polytron (Brinkman Instruments,Westbury, NY, USA) in 20 ml T-PER reagent (Pierce,Rockford, IL, USA) per gram of tissue according tomanufacturer’s instructions. After centrifugation at 5000×gfor 5 min, supernatant fraction was collected. Cells weresolubilised in lysis buffer (50 mmol/l HEPES, pH 7.5,150 mmol/l NaCl, 10 mmol/l EDTA, 10 mmol/l Na4P2O7,2 mmol/l Na3VO4, 100 mmol/l NaF, 10% (vol./vol.)glycerol, 1% (vol./vol.) Triton X-100, 1 mmol/l PMSF,10 mg/ml aprotinin) for 1 h at 4°C and lysates werecentrifuged at 5,000×g for 20 min. Total homogenates wereseparated by SDS-PAGE and transferred on to 0.45 μmImmobilon-P membranes as previously described [38].Upon incubation with primary and secondary antibodies,immunoreactive bands were detected by ECL according tothe manufacturer's instructions.
For peripheral blood leucocyte (PBL) separation, EDTA-treated whole-blood samples were first centrifuged for10 min at 300×g and the plasma removed. PBLs wereseparated using a 6% (vol./vol.) dextran gradient in filteredPBS, pH 7.4, as previously described [24], washed threetimes in PBS, counted and resuspended in 1 ml of PBS forsubsequent use.
Real-time RT-PCR analysis Total cellular RNA was isolat-ed from whole kidneys of wild-type and PEDTg mice usinga kit (RNeasy; Qiagen, Hilden, Germany) according tomanufacturer’s instructions. Tissue or cell RNA (1 μg) wasreverse-transcribed using Superscript II Reverse Transcrip-tase (Invitrogen). PCR reactions were analysed using
Diabetologia
SYBR Green mix (Invitrogen). Reactions were performedusing Platinum SYBR Green qPCR Super-UDG and amulticolour real-time PCR detection system (Cycler IQ;Bio-Rad). All reactions were performed in triplicate and β-actin was used as an internal standard. Primer sequencesused were as follows: TGF-β1 (forward) 5′-TGCGCTTGCAGAGATTAAAA-3′, (reverse) 5′-CTGCCGTACAACTCCAGTGA-3′; β-actin (forward) 5′-GCGTGACATCAAAGAGAAG-3, (reverse) 5′-ACTGTGTTGGCATAGAGG-3′.
PKC assay For this assay, HK2 cells were deprived ofserum and PKC activity then measured in immunoprecipi-tates with anti PKCα or PKCβ antibodies, as previouslydescribed [28].
Statistical methods Data were analysed with Statviewsoftware (Abacus Concepts, Piscataway, NJ, USA) byone-factor analysis of variance. p values of less than 0.05were considered statistically significant.
Results
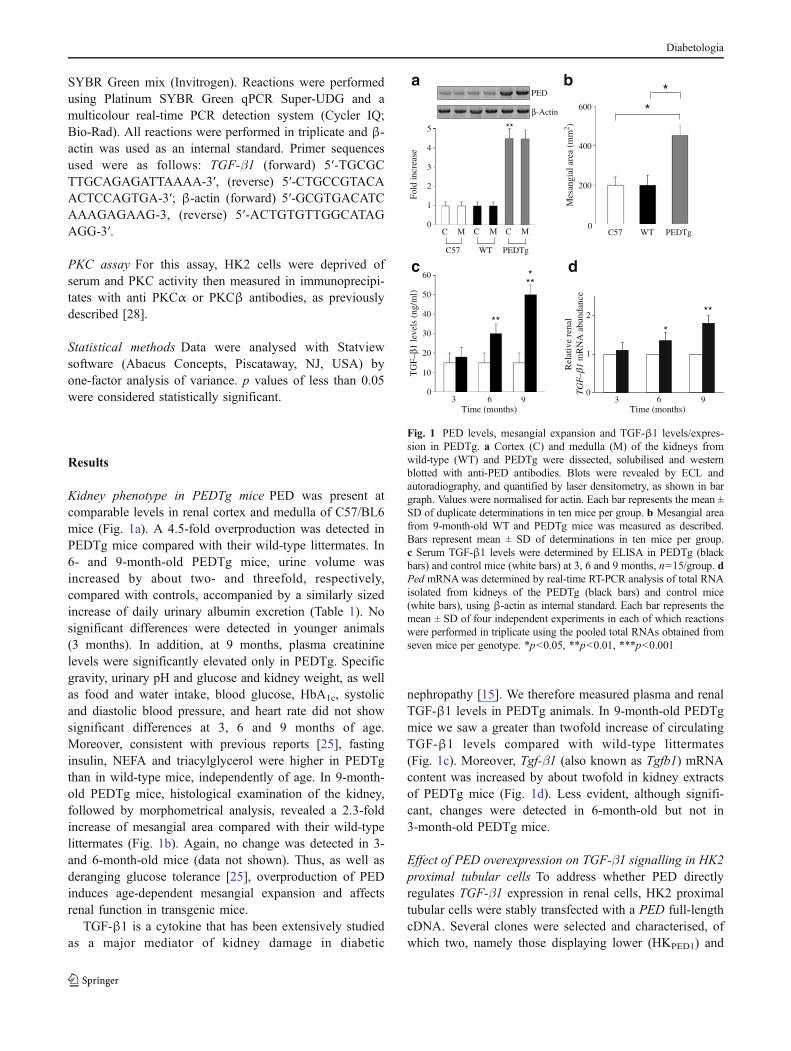
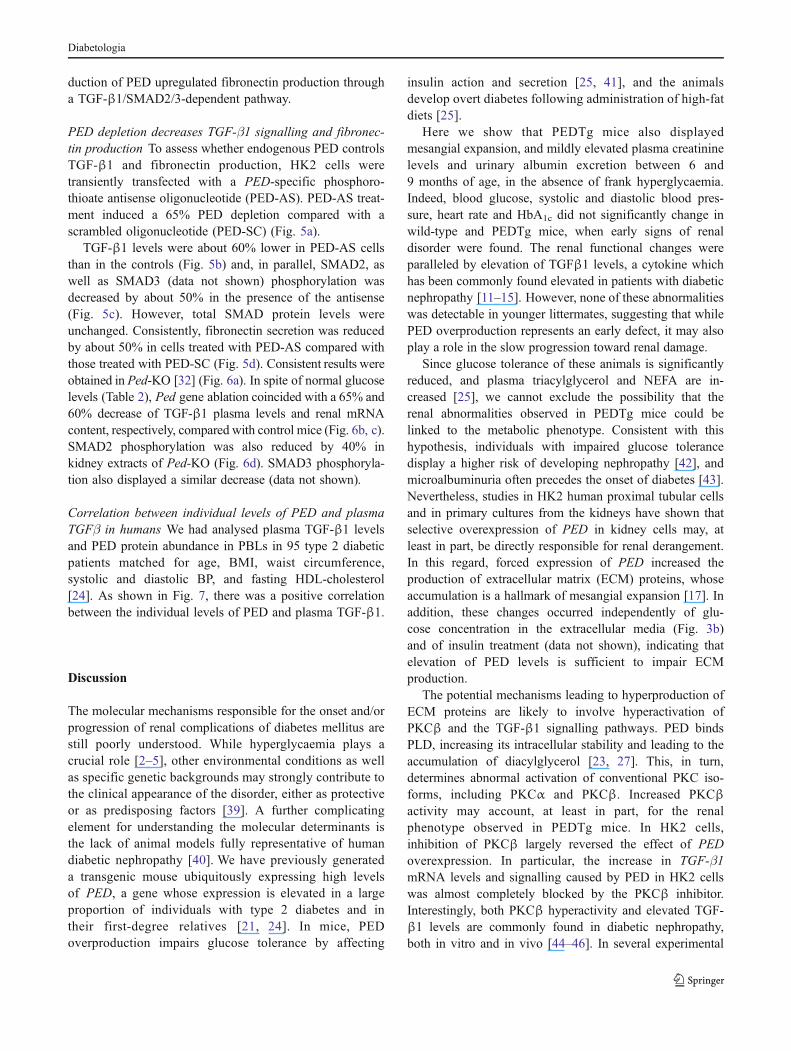
Kidney phenotype in PEDTg mice PED was present atcomparable levels in renal cortex and medulla of C57/BL6mice (Fig. 1a). A 4.5-fold overproduction was detected inPEDTg mice compared with their wild-type littermates. In6- and 9-month-old PEDTg mice, urine volume wasincreased by about two- and threefold, respectively,compared with controls, accompanied by a similarly sizedincrease of daily urinary albumin excretion (Table 1). Nosignificant differences were detected in younger animals(3 months). In addition, at 9 months, plasma creatininelevels were significantly elevated only in PEDTg. Specificgravity, urinary pH and glucose and kidney weight, as wellas food and water intake, blood glucose, HbA1c, systolicand diastolic blood pressure, and heart rate did not showsignificant differences at 3, 6 and 9 months of age.Moreover, consistent with previous reports [25], fastinginsulin, NEFA and triacylglycerol were higher in PEDTgthan in wild-type mice, independently of age. In 9-month-old PEDTg mice, histological examination of the kidney,followed by morphometrical analysis, revealed a 2.3-foldincrease of mesangial area compared with their wild-typelittermates (Fig. 1b). Again, no change was detected in 3-and 6-month-old mice (data not shown). Thus, as well asderanging glucose tolerance [25], overproduction of PEDinduces age-dependent mesangial expansion and affectsrenal function in transgenic mice.
TGF-β1 is a cytokine that has been extensively studiedas a major mediator of kidney damage in diabetic
nephropathy [15]. We therefore measured plasma and renalTGF-β1 levels in PEDTg animals. In 9-month-old PEDTgmice we saw a greater than twofold increase of circulatingTGF-β1 levels compared with wild-type littermates(Fig. 1c). Moreover, Tgf-β1 (also known as Tgfb1) mRNAcontent was increased by about twofold in kidney extractsof PEDTg mice (Fig. 1d). Less evident, although signifi-cant, changes were detected in 6-month-old but not in3-month-old PEDTg mice.
Effect of PED overexpression on TGF-β1 signalling in HK2proximal tubular cells To address whether PED directlyregulates TGF-β1 expression in renal cells, HK2 proximaltubular cells were stably transfected with a PED full-lengthcDNA. Several clones were selected and characterised, ofwhich two, namely those displaying lower (HKPED1) and
Mes
angi
al a
rea
(mm
2 )
WT PEDTg
*
C M C M
WT PEDTg
PED
β-Actin
Fold
incr
ease
**
a b
MC
C57
C57
*
TG
F–β1
leve
ls (
ng/m
l)3
c
**
***
6Time (months)
60
1
2
*
d
Time (months)
Rel
ativ
e re
nal
TG
F–β1
mR
NA
abu
ndan
ce
**
3 99
0
1
2
3
4
5
0
200
400
600
60
50
40
30
20
10
0
Fig. 1 PED levels, mesangial expansion and TGF-β1 levels/expres-sion in PEDTg. a Cortex (C) and medulla (M) of the kidneys fromwild-type (WT) and PEDTg were dissected, solubilised and westernblotted with anti-PED antibodies. Blots were revealed by ECL andautoradiography, and quantified by laser densitometry, as shown in bargraph. Values were normalised for actin. Each bar represents the mean ±SD of duplicate determinations in ten mice per group. b Mesangial areafrom 9-month-old WT and PEDTg mice was measured as described.Bars represent mean ± SD of determinations in ten mice per group.c Serum TGF-β1 levels were determined by ELISA in PEDTg (blackbars) and control mice (white bars) at 3, 6 and 9 months, n=15/group. dPed mRNAwas determined by real-time RT-PCR analysis of total RNAisolated from kidneys of the PEDTg (black bars) and control mice(white bars), using β-actin as internal standard. Each bar represents themean ± SD of four independent experiments in each of which reactionswere performed in triplicate using the pooled total RNAs obtained fromseven mice per genotype. *p<0.05, **p<0.01, ***p<0.001
Diabetologia
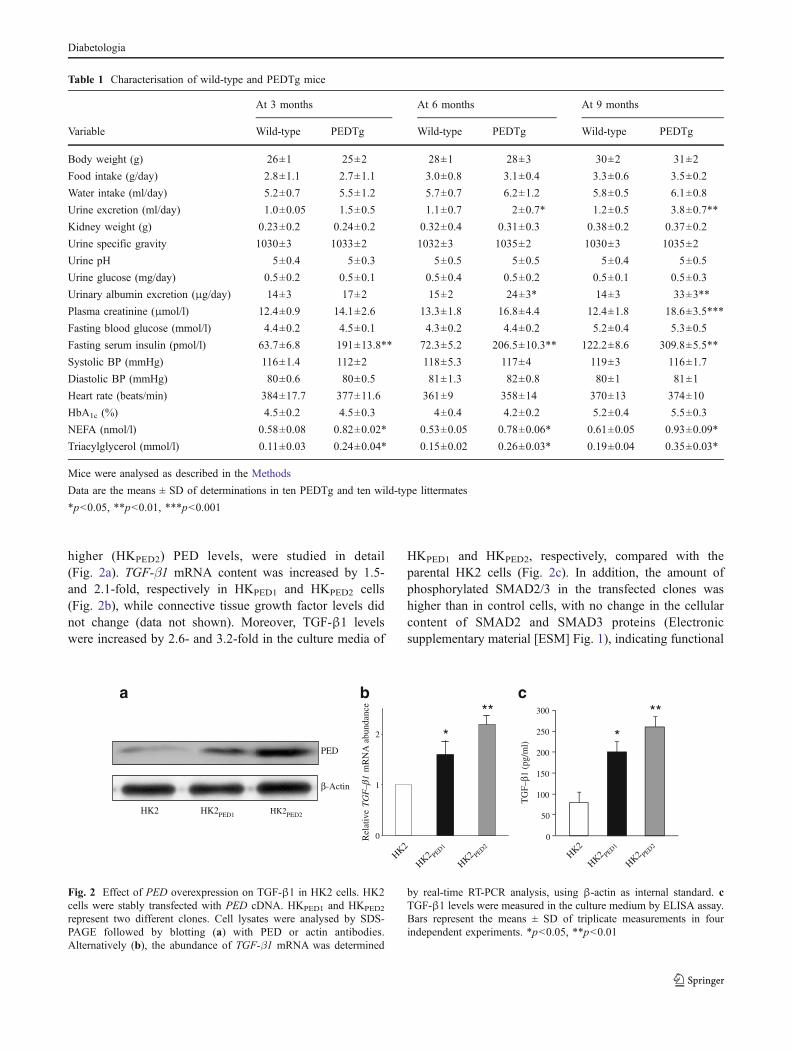
higher (HKPED2) PED levels, were studied in detail(Fig. 2a). TGF-β1 mRNA content was increased by 1.5-and 2.1-fold, respectively in HKPED1 and HKPED2 cells(Fig. 2b), while connective tissue growth factor levels didnot change (data not shown). Moreover, TGF-β1 levelswere increased by 2.6- and 3.2-fold in the culture media of
HKPED1 and HKPED2, respectively, compared with theparental HK2 cells (Fig. 2c). In addition, the amount ofphosphorylated SMAD2/3 in the transfected clones washigher than in control cells, with no change in the cellularcontent of SMAD2 and SMAD3 proteins (Electronicsupplementary material [ESM] Fig. 1), indicating functional
Table 1 Characterisation of wild-type and PEDTg mice
At 3 months At 6 months At 9 months
Variable Wild-type PEDTg Wild-type PEDTg Wild-type PEDTg
Body weight (g) 26±1 25±2 28±1 28±3 30±2 31±2
Food intake (g/day) 2.8±1.1 2.7±1.1 3.0±0.8 3.1±0.4 3.3±0.6 3.5±0.2
Water intake (ml/day) 5.2±0.7 5.5±1.2 5.7±0.7 6.2±1.2 5.8±0.5 6.1±0.8
Urine excretion (ml/day) 1.0±0.05 1.5±0.5 1.1±0.7 2±0.7* 1.2±0.5 3.8±0.7**
Kidney weight (g) 0.23±0.2 0.24±0.2 0.32±0.4 0.31±0.3 0.38±0.2 0.37±0.2
Urine specific gravity 1030±3 1033±2 1032±3 1035±2 1030±3 1035±2
Urine pH 5±0.4 5±0.3 5±0.5 5±0.5 5±0.4 5±0.5
Urine glucose (mg/day) 0.5±0.2 0.5±0.1 0.5±0.4 0.5±0.2 0.5±0.1 0.5±0.3
Urinary albumin excretion (μg/day) 14±3 17±2 15±2 24±3* 14±3 33±3**
Plasma creatinine (μmol/l) 12.4±0.9 14.1±2.6 13.3±1.8 16.8±4.4 12.4±1.8 18.6±3.5***
Fasting blood glucose (mmol/l) 4.4±0.2 4.5±0.1 4.3±0.2 4.4±0.2 5.2±0.4 5.3±0.5
Fasting serum insulin (pmol/l) 63.7±6.8 191±13.8** 72.3±5.2 206.5±10.3** 122.2±8.6 309.8±5.5**
Systolic BP (mmHg) 116±1.4 112±2 118±5.3 117±4 119±3 116±1.7
Diastolic BP (mmHg) 80±0.6 80±0.5 81±1.3 82±0.8 80±1 81±1
Heart rate (beats/min) 384±17.7 377±11.6 361±9 358±14 370±13 374±10
HbA1c (%) 4.5±0.2 4.5±0.3 4±0.4 4.2±0.2 5.2±0.4 5.5±0.3
NEFA (nmol/l) 0.58±0.08 0.82±0.02* 0.53±0.05 0.78±0.06* 0.61±0.05 0.93±0.09*
Triacylglycerol (mmol/l) 0.11±0.03 0.24±0.04* 0.15±0.02 0.26±0.03* 0.19±0.04 0.35±0.03*
Mice were analysed as described in the Methods
Data are the means ± SD of determinations in ten PEDTg and ten wild-type littermates
*p<0.05, **p<0.01, ***p<0.001
PED
a b c
0
50
100
150
200
250
300
*
β-Actin
TG
F–β1
(pg
/ml)
TG
F–β1
Rel
ativ
em
RN
A a
bund
ance **
0
1
2 *
**
HK2
HK2 PED1
HK2 PED2
HK2 HK2PED1 HK2PED2
HK2
HK2 PED1
HK2 PED2
Fig. 2 Effect of PED overexpression on TGF-β1 in HK2 cells. HK2cells were stably transfected with PED cDNA. HKPED1 and HKPED2
represent two different clones. Cell lysates were analysed by SDS-PAGE followed by blotting (a) with PED or actin antibodies.Alternatively (b), the abundance of TGF-β1 mRNA was determined
by real-time RT-PCR analysis, using β-actin as internal standard. cTGF-β1 levels were measured in the culture medium by ELISA assay.Bars represent the means ± SD of triplicate measurements in fourindependent experiments. *p<0.05, **p<0.01
Diabetologia
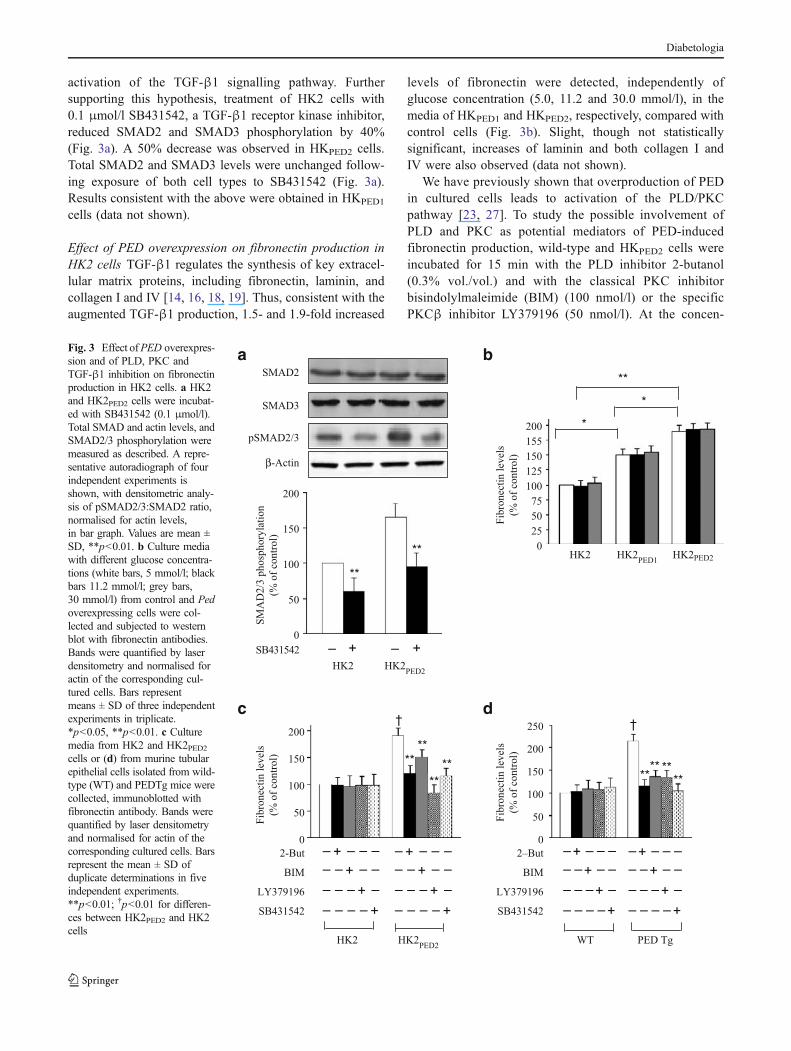
activation of the TGF-β1 signalling pathway. Furthersupporting this hypothesis, treatment of HK2 cells with0.1 μmol/l SB431542, a TGF-β1 receptor kinase inhibitor,reduced SMAD2 and SMAD3 phosphorylation by 40%(Fig. 3a). A 50% decrease was observed in HKPED2 cells.Total SMAD2 and SMAD3 levels were unchanged follow-ing exposure of both cell types to SB431542 (Fig. 3a).Results consistent with the above were obtained in HKPED1
cells (data not shown).
Effect of PED overexpression on fibronectin production inHK2 cells TGF-β1 regulates the synthesis of key extracel-lular matrix proteins, including fibronectin, laminin, andcollagen I and IV [14, 16, 18, 19]. Thus, consistent with theaugmented TGF-β1 production, 1.5- and 1.9-fold increased
levels of fibronectin were detected, independently ofglucose concentration (5.0, 11.2 and 30.0 mmol/l), in themedia of HKPED1 and HKPED2, respectively, compared withcontrol cells (Fig. 3b). Slight, though not statisticallysignificant, increases of laminin and both collagen I andIV were also observed (data not shown).
We have previously shown that overproduction of PEDin cultured cells leads to activation of the PLD/PKCpathway [23, 27]. To study the possible involvement ofPLD and PKC as potential mediators of PED-inducedfibronectin production, wild-type and HKPED2 cells wereincubated for 15 min with the PLD inhibitor 2-butanol(0.3% vol./vol.) and with the classical PKC inhibitorbisindolylmaleimide (BIM) (100 nmol/l) or the specificPKCβ inhibitor LY379196 (50 nmol/l). At the concen-
pSMAD2/3
SMAD3
SMAD2
β-Actin
**
SM
AD
2/3
ph
osp
ho
ryla
tio
n
(% o
f co
ntr
ol)
HK2 HK2PED2
SB431542 – + – +
**
Fib
ron
ecti
n l
evel
s
(% o
f co
ntr
ol)
HK2 HK2PED2
2-But
BIM
LY379196
–
–
–
–
–
–
–
+
+
–
–
– – – –
–
–
–
+SB431542
**
**
**
**
†
–
–
–
–
–
–
–
+
+
–
–
– – – –
–
–
–
+
0
50
100
150
200
0
50
100
150
200
Fib
ron
ecti
n l
evel
s
(% o
f co
ntr
ol)
*
**
HK2PED1
HK2PED2HK2
*
0
25
125
100
75
50
155
150
200
++
WT PED Tg
**** **
**
†
Fib
ron
ecti
n l
evel
s
(% o
f co
ntr
ol)
0
50
100
150
200
250
2–But
BIM
LY379196
–
–
–
–
–
–
–
+
+
–
–
– – – –
–
–
–
+SB431542
–
–
–
–
–
–
–
+
+
–
–
– – – –
–
–
–
+
++
a b
c d
Fig. 3 Effect ofPED overexpres-sion and of PLD, PKC andTGF-β1 inhibition on fibronectinproduction in HK2 cells. a HK2and HK2PED2 cells were incubat-ed with SB431542 (0.1 μmol/l).Total SMAD and actin levels, andSMAD2/3 phosphorylation weremeasured as described. A repre-sentative autoradiograph of fourindependent experiments isshown, with densitometric analy-sis of pSMAD2/3:SMAD2 ratio,normalised for actin levels,in bar graph. Values are mean ±SD, **p<0.01. b Culture mediawith different glucose concentra-tions (white bars, 5 mmol/l; blackbars 11.2 mmol/l; grey bars,30 mmol/l) from control and Pedoverexpressing cells were col-lected and subjected to westernblot with fibronectin antibodies.Bands were quantified by laserdensitometry and normalised foractin of the corresponding cul-tured cells. Bars representmeans ± SD of three independentexperiments in triplicate.*p<0.05, **p<0.01. c Culturemedia from HK2 and HK2PED2cells or (d) from murine tubularepithelial cells isolated from wild-type (WT) and PEDTg mice werecollected, immunoblotted withfibronectin antibody. Bands werequantified by laser densitometryand normalised for actin of thecorresponding cultured cells. Barsrepresent the mean ± SD ofduplicate determinations in fiveindependent experiments.**p<0.01; †p<0.01 for differen-ces between HK2PED2 and HK2cells
Diabetologia
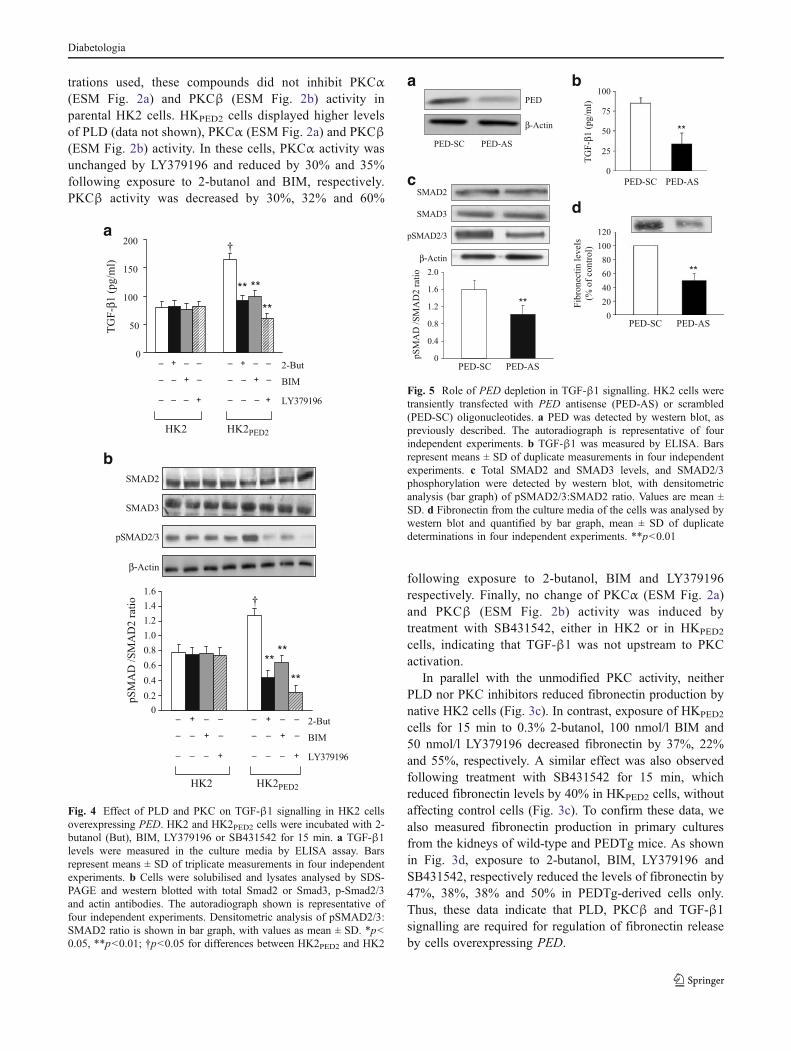
trations used, these compounds did not inhibit PKCα(ESM Fig. 2a) and PKCβ (ESM Fig. 2b) activity inparental HK2 cells. HKPED2 cells displayed higher levelsof PLD (data not shown), PKCα (ESM Fig. 2a) and PKCβ(ESM Fig. 2b) activity. In these cells, PKCα activity wasunchanged by LY379196 and reduced by 30% and 35%following exposure to 2-butanol and BIM, respectively.PKCβ activity was decreased by 30%, 32% and 60%
following exposure to 2-butanol, BIM and LY379196respectively. Finally, no change of PKCα (ESM Fig. 2a)and PKCβ (ESM Fig. 2b) activity was induced bytreatment with SB431542, either in HK2 or in HKPED2
cells, indicating that TGF-β1 was not upstream to PKCactivation.
In parallel with the unmodified PKC activity, neitherPLD nor PKC inhibitors reduced fibronectin production bynative HK2 cells (Fig. 3c). In contrast, exposure of HKPED2
cells for 15 min to 0.3% 2-butanol, 100 nmol/l BIM and50 nmol/l LY379196 decreased fibronectin by 37%, 22%and 55%, respectively. A similar effect was also observedfollowing treatment with SB431542 for 15 min, whichreduced fibronectin levels by 40% in HKPED2 cells, withoutaffecting control cells (Fig. 3c). To confirm these data, wealso measured fibronectin production in primary culturesfrom the kidneys of wild-type and PEDTg mice. As shownin Fig. 3d, exposure to 2-butanol, BIM, LY379196 andSB431542, respectively reduced the levels of fibronectin by47%, 38%, 38% and 50% in PEDTg-derived cells only.Thus, these data indicate that PLD, PKCβ and TGF-β1signalling are required for regulation of fibronectin releaseby cells overexpressing PED.
0
50
100
150
200
HK2 HK2PED2
–
–
–
–
–
–
–
+
+
–
–
2-But
BIM
LY379196
–
–
–
–
–
–
–
+
+
–
–
TG
F-β
1 (
pg/m
l)
** **
**
†
+ +
a
SMAD2
SMAD3
pSMAD2/3
β-Actin
HK2 HK2PED2
2-But
BIM
LY379196
pS
MA
D /
SM
AD
2 r
atio
****
**
†
0
0.2
0.4
0.6
0.8
1.0
1.2
1.4
1.6
–
–
–
–
–
–
–
+
+
–
–
–
–
–
–
–
–
–
+
+
–
–
+ +
b
Fig. 4 Effect of PLD and PKC on TGF-β1 signalling in HK2 cellsoverexpressing PED. HK2 and HK2PED2 cells were incubated with 2-butanol (But), BIM, LY379196 or SB431542 for 15 min. a TGF-β1levels were measured in the culture media by ELISA assay. Barsrepresent means ± SD of triplicate measurements in four independentexperiments. b Cells were solubilised and lysates analysed by SDS-PAGE and western blotted with total Smad2 or Smad3, p-Smad2/3and actin antibodies. The autoradiograph shown is representative offour independent experiments. Densitometric analysis of pSMAD2/3:SMAD2 ratio is shown in bar graph, with values as mean ± SD. *p<0.05, **p<0.01; †p<0.05 for differences between HK2PED2 and HK2
PED-SC PED-AS
pSMAD2/3
SMAD3
SMAD2
PED-SC PED-AS
Fib
ron
ecti
n l
evel
s
(% o
f co
ntr
ol)
**
β-Actin
**
TG
F-β
1 (
pg/m
l)
PED-SC PED-AS
**
pS
MA
D /
SM
AD
2 r
atio
PED-SC
PED100
75
50
25
0
0
20
40
60
80
100
120
β-Actin
0
0.4
0.8
1.2
1.6
2.0
PED-AS
a b
c
d
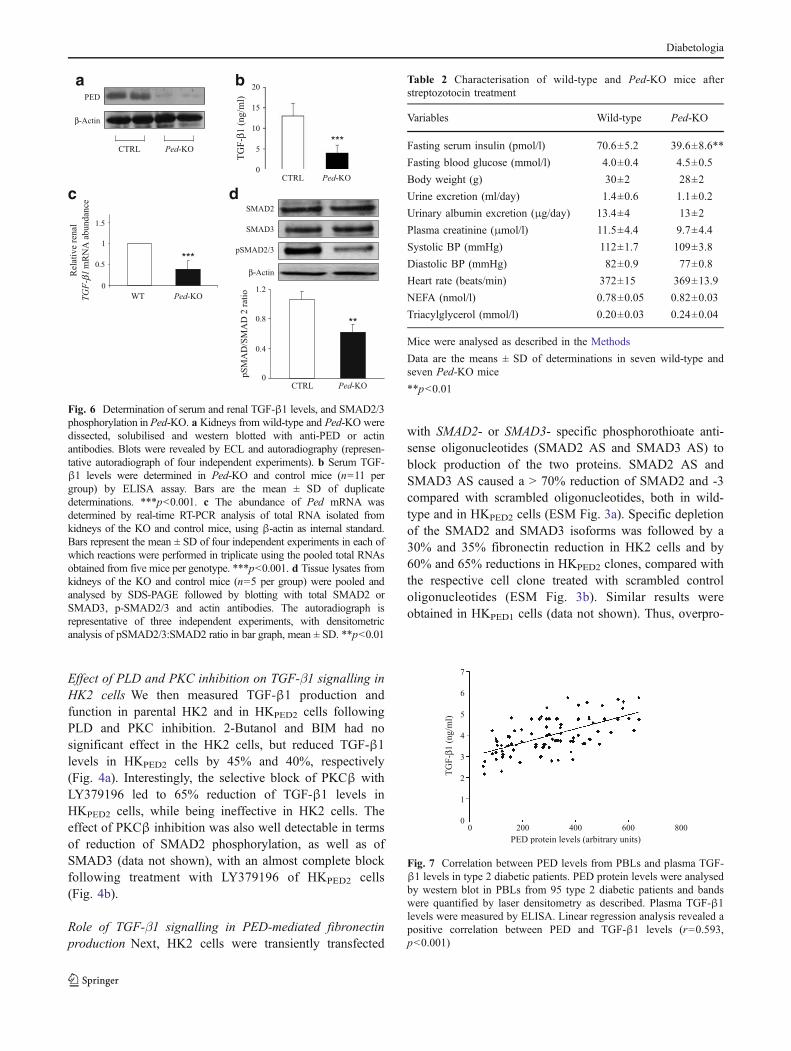
Fig. 5 Role of PED depletion in TGF-β1 signalling. HK2 cells weretransiently transfected with PED antisense (PED-AS) or scrambled(PED-SC) oligonucleotides. a PED was detected by western blot, aspreviously described. The autoradiograph is representative of fourindependent experiments. b TGF-β1 was measured by ELISA. Barsrepresent means ± SD of duplicate measurements in four independentexperiments. c Total SMAD2 and SMAD3 levels, and SMAD2/3phosphorylation were detected by western blot, with densitometricanalysis (bar graph) of pSMAD2/3:SMAD2 ratio. Values are mean ±SD. d Fibronectin from the culture media of the cells was analysed bywestern blot and quantified by bar graph, mean ± SD of duplicatedeterminations in four independent experiments. **p<0.01
Diabetologia
Effect of PLD and PKC inhibition on TGF-β1 signalling inHK2 cells We then measured TGF-β1 production andfunction in parental HK2 and in HKPED2 cells followingPLD and PKC inhibition. 2-Butanol and BIM had nosignificant effect in the HK2 cells, but reduced TGF-β1levels in HKPED2 cells by 45% and 40%, respectively(Fig. 4a). Interestingly, the selective block of PKCβ withLY379196 led to 65% reduction of TGF-β1 levels inHKPED2 cells, while being ineffective in HK2 cells. Theeffect of PKCβ inhibition was also well detectable in termsof reduction of SMAD2 phosphorylation, as well as ofSMAD3 (data not shown), with an almost complete blockfollowing treatment with LY379196 of HKPED2 cells(Fig. 4b).
Role of TGF-β1 signalling in PED-mediated fibronectinproduction Next, HK2 cells were transiently transfected
with SMAD2- or SMAD3- specific phosphorothioate anti-sense oligonucleotides (SMAD2 AS and SMAD3 AS) toblock production of the two proteins. SMAD2 AS andSMAD3 AS caused a > 70% reduction of SMAD2 and -3compared with scrambled oligonucleotides, both in wild-type and in HKPED2 cells (ESM Fig. 3a). Specific depletionof the SMAD2 and SMAD3 isoforms was followed by a30% and 35% fibronectin reduction in HK2 cells and by60% and 65% reductions in HKPED2 clones, compared withthe respective cell clone treated with scrambled controloligonucleotides (ESM Fig. 3b). Similar results wereobtained in HKPED1 cells (data not shown). Thus, overpro-
CTRL Ped-KO
PED
20
CTRL Ped-KO
TG
F-β
1 (
ng
/ml)
a b
β-Actin
d
***
c
SMAD3
SMAD2
β-Actin
pSMAD2/3
CTRL Ped-KO
**
pS
MA
D/S
MA
D 2
rat
io
0
0.4
0.8
1.2
Rel
ativ
e re
nal
0
0.5
1
1.5
WT Ped-KO
***
1m
RN
A a
bundan
ceTGF- β
15
10
5
0
Fig. 6 Determination of serum and renal TGF-β1 levels, and SMAD2/3phosphorylation in Ped-KO. a Kidneys from wild-type and Ped-KO weredissected, solubilised and western blotted with anti-PED or actinantibodies. Blots were revealed by ECL and autoradiography (represen-tative autoradiograph of four independent experiments). b Serum TGF-β1 levels were determined in Ped-KO and control mice (n=11 pergroup) by ELISA assay. Bars are the mean ± SD of duplicatedeterminations. ***p<0.001. c The abundance of Ped mRNA wasdetermined by real-time RT-PCR analysis of total RNA isolated fromkidneys of the KO and control mice, using β-actin as internal standard.Bars represent the mean ± SD of four independent experiments in each ofwhich reactions were performed in triplicate using the pooled total RNAsobtained from five mice per genotype. ***p<0.001. d Tissue lysates fromkidneys of the KO and control mice (n=5 per group) were pooled andanalysed by SDS-PAGE followed by blotting with total SMAD2 orSMAD3, p-SMAD2/3 and actin antibodies. The autoradiograph isrepresentative of three independent experiments, with densitometricanalysis of pSMAD2/3:SMAD2 ratio in bar graph, mean ± SD. **p<0.01
Table 2 Characterisation of wild-type and Ped-KO mice afterstreptozotocin treatment
Variables Wild-type Ped-KO
Fasting serum insulin (pmol/l) 70.6±5.2 39.6±8.6**
Fasting blood glucose (mmol/l) 4.0±0.4 4.5±0.5
Body weight (g) 30±2 28±2
Urine excretion (ml/day) 1.4±0.6 1.1±0.2
Urinary albumin excretion (μg/day) 13.4±4 13±2
Plasma creatinine (μmol/l) 11.5±4.4 9.7±4.4
Systolic BP (mmHg) 112±1.7 109±3.8
Diastolic BP (mmHg) 82±0.9 77±0.8
Heart rate (beats/min) 372±15 369±13.9
NEFA (nmol/l) 0.78±0.05 0.82±0.03
Triacylglycerol (mmol/l) 0.20±0.03 0.24±0.04
Mice were analysed as described in the Methods
Data are the means ± SD of determinations in seven wild-type andseven Ped-KO mice
**p<0.01
TG
F-β
1 (
ng
/ml)
PED protein levels (arbitrary units)
00
1
200 400 600 800
2
3
4
5
6
7
Fig. 7 Correlation between PED levels from PBLs and plasma TGF-β1 levels in type 2 diabetic patients. PED protein levels were analysedby western blot in PBLs from 95 type 2 diabetic patients and bandswere quantified by laser densitometry as described. Plasma TGF-β1levels were measured by ELISA. Linear regression analysis revealed apositive correlation between PED and TGF-β1 levels (r=0.593,p<0.001)
Diabetologia
duction of PED upregulated fibronectin production througha TGF-β1/SMAD2/3-dependent pathway.
PED depletion decreases TGF-β1 signalling and fibronec-tin production To assess whether endogenous PED controlsTGF-β1 and fibronectin production, HK2 cells weretransiently transfected with a PED-specific phosphoro-thioate antisense oligonucleotide (PED-AS). PED-AS treat-ment induced a 65% PED depletion compared with ascrambled oligonucleotide (PED-SC) (Fig. 5a).
TGF-β1 levels were about 60% lower in PED-AS cellsthan in the controls (Fig. 5b) and, in parallel, SMAD2, aswell as SMAD3 (data not shown) phosphorylation wasdecreased by about 50% in the presence of the antisense(Fig. 5c). However, total SMAD protein levels wereunchanged. Consistently, fibronectin secretion was reducedby about 50% in cells treated with PED-AS compared withthose treated with PED-SC (Fig. 5d). Consistent results wereobtained in Ped-KO [32] (Fig. 6a). In spite of normal glucoselevels (Table 2), Ped gene ablation coincided with a 65% and60% decrease of TGF-β1 plasma levels and renal mRNAcontent, respectively, compared with control mice (Fig. 6b, c).SMAD2 phosphorylation was also reduced by 40% inkidney extracts of Ped-KO (Fig. 6d). SMAD3 phosphoryla-tion also displayed a similar decrease (data not shown).
Correlation between individual levels of PED and plasmaTGFβ in humans We had analysed plasma TGF-β1 levelsand PED protein abundance in PBLs in 95 type 2 diabeticpatients matched for age, BMI, waist circumference,systolic and diastolic BP, and fasting HDL-cholesterol[24]. As shown in Fig. 7, there was a positive correlationbetween the individual levels of PED and plasma TGF-β1.
Discussion
The molecular mechanisms responsible for the onset and/orprogression of renal complications of diabetes mellitus arestill poorly understood. While hyperglycaemia plays acrucial role [2–5], other environmental conditions as wellas specific genetic backgrounds may strongly contribute tothe clinical appearance of the disorder, either as protectiveor as predisposing factors [39]. A further complicatingelement for understanding the molecular determinants isthe lack of animal models fully representative of humandiabetic nephropathy [40]. We have previously generateda transgenic mouse ubiquitously expressing high levelsof PED, a gene whose expression is elevated in a largeproportion of individuals with type 2 diabetes and intheir first-degree relatives [21, 24]. In mice, PEDoverproduction impairs glucose tolerance by affecting
insulin action and secretion [25, 41], and the animalsdevelop overt diabetes following administration of high-fatdiets [25].
Here we show that PEDTg mice also displayedmesangial expansion, and mildly elevated plasma creatininelevels and urinary albumin excretion between 6 and9 months of age, in the absence of frank hyperglycaemia.Indeed, blood glucose, systolic and diastolic blood pres-sure, heart rate and HbA1c did not significantly change inwild-type and PEDTg mice, when early signs of renaldisorder were found. The renal functional changes wereparalleled by elevation of TGFβ1 levels, a cytokine whichhas been commonly found elevated in patients with diabeticnephropathy [11–15]. However, none of these abnormalitieswas detectable in younger littermates, suggesting that whilePED overproduction represents an early defect, it may alsoplay a role in the slow progression toward renal damage.
Since glucose tolerance of these animals is significantlyreduced, and plasma triacylglycerol and NEFA are in-creased [25], we cannot exclude the possibility that therenal abnormalities observed in PEDTg mice could belinked to the metabolic phenotype. Consistent with thishypothesis, individuals with impaired glucose tolerancedisplay a higher risk of developing nephropathy [42], andmicroalbuminuria often precedes the onset of diabetes [43].Nevertheless, studies in HK2 human proximal tubular cellsand in primary cultures from the kidneys have shown thatselective overexpression of PED in kidney cells may, atleast in part, be directly responsible for renal derangement.In this regard, forced expression of PED increased theproduction of extracellular matrix (ECM) proteins, whoseaccumulation is a hallmark of mesangial expansion [17]. Inaddition, these changes occurred independently of glu-cose concentration in the extracellular media (Fig. 3b)and of insulin treatment (data not shown), indicating thatelevation of PED levels is sufficient to impair ECMproduction.
The potential mechanisms leading to hyperproduction ofECM proteins are likely to involve hyperactivation ofPKCβ and the TGF-β1 signalling pathways. PED bindsPLD, increasing its intracellular stability and leading to theaccumulation of diacylglycerol [23, 27]. This, in turn,determines abnormal activation of conventional PKC iso-forms, including PKCα and PKCβ. Increased PKCβactivity may account, at least in part, for the renalphenotype observed in PEDTg mice. In HK2 cells,inhibition of PKCβ largely reversed the effect of PEDoverexpression. In particular, the increase in TGF-β1mRNA levels and signalling caused by PED in HK2 cellswas almost completely blocked by the PKCβ inhibitor.Interestingly, both PKCβ hyperactivity and elevated TGF-β1 levels are commonly found in diabetic nephropathy,both in vitro and in vivo [44–46]. In several experimental
Diabetologia
and clinical studies, inhibition of PKC (LY333531) hasbeen shown to delay or halt the progression of diabeticcomplications [47]. Part of the beneficial effect of PKCinhibition is due to the consequent downregulation of TGF-β1 [48]. Consistently, higher circulating levels of TGF-β1have been detected in PEDTg mice and are paralleled byincreased Tgf-β1 mRNA content in kidney extracts.However, the question of whether other cell types contrib-ute to the increase of TGF-β1 content in the bloodstream iscurrently not resolved and under investigation in ourlaboratory.
Inhibition of PLD and PKCβ, as well as of TGF-β1receptor activity, or genetic silencing of SMAD2 andSMAD3 decreased production of fibronectin. Thus, PEDoverexpression may lead to increased PKCβ activity, whichenhances expression of TGF-β1, which in turn upregulatesfibronectin production. Further support of this hypothesiswas seen in the fact that inhibition of PED by antisenseoligonucleotides in HK2 cells was paralleled by reducedPKCβ activity and TGF-β1 expression and signalling, aswell as by decreased fibronectin production. Similarly toPED-depleted cells, kidney and total TGF-β1 levels andPKCβ activity were reduced in animals bearing thecomplete ablation of Ped gene, indicating a cause–effectrelationship.
It remains unknown whether PED overproduction isinvolved in diabetic nephropathy in humans. However, ina cohort of patients with type 2 diabetes [24], we found apositive correlation between levels of PED measured inPBLs and plasma TGFβ1 levels. It could therefore beinferred that high expression levels of PED deranges renalfunction in a subset of diabetic individuals, therebyfacilitating the onset and/or progression of diabeticnephropathy.
The mechanism leading to the increase of PED cellularlevels are only partially known and may be due to alteredtranscriptional control [49] or to post-translational modifi-cations [50]. The contribution of genetic variations andepigenetic modifications is currently under investigation inour laboratory.
Thus, high expression levels of PED determine anincrease of PKCβ activity and of TGF-β1 expression incellular and animal models, as well as in humans. Theytherefore may represent an early abnormality, contributingto the derangement of ECM deposition and to progressiontoward nephropathy.
Acknowledgements This study was supported by the EuropeanCommunity’s FP6 EUGENE2 (LSHM-CT-2004-512013) and PRE-POBEDIA (201681) projects, the European Foundation for the Studyof Diabetes and grants from the Associazione Italiana per la Ricercasul Cancro (AIRC) and the Ministero dell’Università e della RicercaScientifica (PRIN and FIRB). The financial support of Telethon–Italyis also gratefully acknowledged.
Duality of interest The authors declare that there is no duality ofinterest associated with this manuscript.
References
1. Wolf G (2004) New insights into the pathophysiology of diabeticnephropathy: from haemodynamics to molecular pathology. Eur JClin Invest 34:785–796
2. The Diabetes Control and Complications Trial Research Group(1993) The effect of intensive treatment of diabetes on thedevelopment and progression of long-term complications ininsulin-dependent diabetes mellitus. The Diabetes Control andComplications Trial Research Group. N Engl J Med 329:977–986
3. UK Prospective Diabetes Study (UKPDS) Group (1998) Intensiveblood-glucose control with sulphonylureas or insulin comparedwith conventional treatment and risk of complications in patientswith type 2 diabetes (UKPDS 33). UK Prospective Diabetes Study(UKPDS) Group. Lancet 352:837–853
4. Members of the ADVANCE collaborative group (2008) Intensiveblood glucose control and vascular outcomes in patients with type2 diabetes. N Engl J Med 358:2560–2572
5. Bilous R (2008) Microvascular disease: what does the UKPDS tellus about diabetic nephropathy? Diabet Med 25(Suppl 2):25–29
6. Fogarty DG, Hanna LS, Wantman M, Warram JH, Krolewski AS,Rich SS (2000) Segregation analysis of urinary albumin excretionin families with type 2 diabetes. Diabetes 49:1057–1063
7. Imperatore G, Knowler WC, Pettitt DJ, Kobes S, Bennett PH,Hanson RL (2000) Segregation analysis of diabetic nephropathyin Pima Indians. Diabetes 49:1049–1056
8. Boright AP, Paterson AD, Mirea L et al (2005) Genetic variationat the ACE gene is associated with persistent microalbuminuriaand severe nephropathy in type 1 diabetes: the DCCT/EDICGenetics Study. Diabetes 54:1238–1244
9. Flyvbjerg A (2000) Putative pathophysiological role of growthfactors and cytokines in experimental diabetic kidney disease.Diabetologia 43:1205–1223
10. Wolf G (2003) Growth factors and the development of diabeticnephropathy. Curr Diab Rep 3:485–490
11. Azar ST, Salti I, Zantout MS, Major S (2000) Alteration in plasmatransforming growth factor β in normoalbuminuric type 1 andtype 2 diabetic patients. J Clin Endocrinol Metab 85:4680–4682
12. Pfeiffer A, Middleberg-Bisping K, Drewes C, Schatz H (1996)Elevated plasma levels of transforming growth factor β-1 inNIDDM. Diabetes Care 18:1113–1117
13. Ziyadeh FN (2004)Mediators of diabetic renal disease the case for TGF-beta as the major mediator. J Am Soc Nephrol 15(Suppl 1):S55–S57
14. WangW, Koka V, Lan HY (2005) Transforming growth factor-betaand Smad signalling in kidney diseases. Nephrology 10:48–56
15. Sharma K, Ziyadeh FN (1995) Hyperglycemia and diabetickidney disease. The case for transforming growth factor-beta asa key mediator. Diabetes 44:1139–1146
16. Ha H, Yu MR, Lee HB (2001) High glucose-induced PKCactivation mediates TGF-beta 1 and fibronectin synthesis byperitoneal mesothelial cells. Kidney Int 59:463–470
17. Bloomgarden ZT (2005) Diabetic nephropathy. Diabetes Care28:745–751
18. Cheng J, Grande JP (2002) Transforming growth factor-betasignal transduction and progressive renal disease. Exp Biol Med227:943–956
19. Ten Dijke P, Hill CS (2004) New insights into TGF-beta-Smadsignalling. Trends Biochem Sci 29:265–273
20. Araujo H, Danziger N, Cordier J, Glowinski J, Chneiweiss H(1993) Characterization of PEA-15 a major substrate for proteinkinase C in astrocytes. J Biol Chem 268:5911–5920
Diabetologia
21. Condorelli G, Vigliotta G, Iavarone C et al (1998) PED/PEA-15gene controls glucose transport and is overexpressed in type 2diabetes mellitus. EMBO J 7:3858–3866
22. Condorelli G, Trencia A, Vigliotta G et al (2002) Multiple membersof the mitogen-activated protein kinase family are necessary for PED/PEA-15 anti-apoptotic function. J Biol Chem 277:11013–11018
23. Condorelli G, Vigliotta G, Trencia A et al (2001) Protein kinase C(PKC)- α activation inhibits PKC- ζ and mediates the action ofPED/PEA-15 on glucose transport in the L6 skeletal muscle cells.Diabetes 50:1244–1252
24. Valentino R, Lupoli G, Raciti GA et al (2006) The PEA15 gene isoverexpressed and related to insulin resistance in healthy first-degree relatives of patients with type 2 diabetes. Diabetologia49:3058–3066
25. Vigliotta G, Miele C, Santopietro S et al (2004) Overexpression ofthe ped/pea-15 gene causes diabetes by impairing glucose-stimulated insulin secretion in addition to insulin action. Mol CellBiol 24:5005–5015
26. Zhang Y, Redina O, Altshuller YM et al (2000) Regulation ofexpression of phospholipase D1 and D2 by PEA-15, a novelprotein that interacts with them. J Biol Chem 275:35224–35232
27. Viparelli F, Cassese A, Doti N et al (2008) Targeting of PED/PEA-15 molecular interaction with phospholipase D1 enhances insulinsensitivity in skeletal muscle cells. J Biol Chem 283:21769–21778
28. Caruso M, Miele C, Oriente F et al (1999) In L6 skeletal musclecells, glucose induces cytosolic translocation of protein kinase Calfa and transactivates the insulin receptor kinase. J Biol Chem274:28637–28644
29. Li Y, Soos TJ, Li X et al (2004) Protein kinase C theta inhibitsinsulin signaling by phosphorylating IRS1 at Ser(1101). J BiolChem 27:45304–45307
30. Ishizuka T, Kajita K, Natsume Y et al (2004) Protein kinase C(PKC) beta modulates serine phosphorylation of insulin receptorsubstrate-1 (IRS-1)—effect of overexpression of PKCbeta oninsulin signal transduction. Endocr Res 30:287–299
31. Nakajima K, Yamauchi K, Shigematsu S et al (2000) Selectiveattenuation of metabolic branch of insulin receptor down-signaling by high glucose in a hepatoma cell line HepG2 cells. JBiol Chem 275:20880–20886
32. Kitsberg D, Formstecher E, Fauquet M et al (1999) Knock-out ofthe neural death effector domain protein PEA-15 demonstratesthat its expression protects astrocytes from TNFalpha-inducedapoptosis. J Neurosci 19:8244–8251
33. Ciccarelli M, Santulli G, Campanile A et al (2008) Endothelialalpha1-adrenoreceptors regulate neoangiogenesis. Br J Pharmacol153:936–946
34. Kasahara M, Mukoyama M, Sugawara A et al (2000) Amelioratedglomerular injury in mice overexpressing brain natriuretic peptidewith renal ablation. J Am Soc Nephrol 11:1691–1701
35. Ziyadeh FN, Hoffman BB, Han DC et al (2000) Long-termprevention of renal insufficiency, excess matrix gene expression,and glomerular mesangial matrix expansion by treatment withmonoclonal antitransforming growth factor-beta antibody in db/dbdiabetic mice. Proc Natl Acad Sci U S A 97:8015–8020
36. Terryn S, Jouret F, Vandenabeele F et al (2007) A primary cultureof mouse proximal tubular cells, established on collagen-coatedmembranes. Am J Physiol Renal Physiol 293:F476–F485
37. Hao C, Beguinot F, Condorelli G et al (2001) Induction andintracellular regulation of tumor necrosis factor-related apoptosis-inducing ligand (TRAIL) mediated apoptosis in human malignantglioma cells. Cancer Res 61:1162–1170
38. Miele C, Caruso M, Calleja V et al (1999) Differential role ofinsulin receptor substrate (IRS)-1 and IRS-2 in L6 skeletal musclecells expressing the Arg1152 → Gln insulin receptor. J Biol Chem274:3094–3102
39. Granier C, Makni K, Molina L, Jardin-Watelet B, Ayadi H,Jarraya F (2008) Gene and protein markers of diabetic nephrop-athy. Nephrol Dial Transplant 23:792–799
40. Breyer MD, Böttinger E, Brosius FC 3rd et al (2004) AMDCC.Mouse models of diabetic nephropathy. J Am Soc Nephrol16:27–45
41. Miele C, Raciti GA, Cassese A et al (2007) PED/PEA-15 regulatesglucose-induced insulin secretion by restraining potassium channelexpression in pancreatic beta-cells. Diabetes 56:622–633
42. Singleton JR, Smith AG, Russell JW, Feldman EL (2003)Microvascular complications of impaired glucose tolerance.Diabetes 52:2867–2873
43. Mykkanen L, Haffner SM, Kuusisto J, Pyorala K, Laakso M(1994) Microalbuminuria precedes the development of NIDDM.Diabetes 43:552–557
44. Koya D, Jirousek MR, Lin YW, Ishii H, Kuboki K, King GL(1997) Characterization of protein kinase C beta isoformactivation on the gene expression of transforming growth factor-beta, extracellular matrix components, and prostanoids in theglomeruli of diabetic rats. J Clin Invest 100:115–126
45. Meier M, Park JK, Overheu D et al (2007) Deletion of proteinkinase C-beta isoform in vivo reduces renal hypertrophy but notalbuminuria in the streptozotocin-induced diabetic mouse model.Diabetes 56:346–354
46. Kelly DJ, Zhang Y, Hepper C et al (2003) Protein kinase C betainhibition attenuates the progression of experimental diabetic nephrop-athy in the presence of continued hypertension. Diabetes 52:512–518
47. Das Evcimen N, King GL (2007) The role of protein kinase Cactivation and the vascular complications of diabetes. PharmacolRes 55:498–510
48. Koya D, Haneda M, Nakagawa H et al (2000) Amelioration ofaccelerated diabetic mesangial expansion by treatment with aPKCbeta inhibitor in diabetic db/db mice, a rodent model for type2 diabetes. FASEB J 14:439–447
49. Ungaro P, Teperino R, Mirra P et al (2008) Molecular cloning andcharacterization of the human PED/PEA-15 gene promoter revealantagonistic regulation by hepatocyte nuclear factor 4alpha andchicken ovalbumin upstream promoter transcription factor II. JBiol Chem 283:30970–30979
50. Perfetti A, Oriente F, Iovino S et al (2007) Phorbol esters induceintracellular accumulation of the anti-apoptotic protein PED/PEA-15 by preventing ubiquitinylation and proteasomal degradation. JBiol Chem 282:8648–8657
Diabetologia