CY 2017 Cagayan Valley Annual Regional Development Report
111
-
Upload
khangminh22 -
Category
Documents
-
view
3 -
download
0
Transcript of CY 2017 Cagayan Valley Annual Regional Development Report


CY 2017 Cagayan ValleyAnnual Regional Development Report

FOREWORD
In 2017, the Regional Development Council 02 approved the Cagayan Valley Regional DevelopmentPlan (CVRDP) 2017-2022. The Plan shall guide our steps towards the desired development directionof Region 02 in the next six years.
The CVRDP 2017-2022 is also the first of the four RDPs geared towards realization of the long-termvision of our fellow Filipinos, a Matatag, Maginhawa at PanatagnaBuhay by 2040. Theimplementation and monitoring of this Plan is therefore crucial to keep track of our milestones andaccomplishments, the challenges that we need to address, and the strategies or actions that we need tosustain, stop or strengthen. This is made possible through the Annual Regional Development Report(ARDR), a document which provides the full picture of our performance vis-à-vis the enrolledindicators and its corresponding targets in the Plan.
The CY 2017 ARDR has more chapters than the previous annual reports to align with the RegionalDevelopment Plan and enable a better dissection of the sectors’ performance and needs for thesucceeding years of Plan implementation. Each chapter was prepared with inputs and insights fromvarious agencies. This Report was further enhanced through the review, validation and its adoption bythe sectoral committees of the Regional Development Council 02.
The gains and achievements highlighted in this Report represent the genuine commitment and hardlabor of the local government units, regional line agencies, state universities and colleges, othergovernment institutions and the private sector in order to improve the lives of more than 3.4 millionpeople in the region and provide a better and brighter future for the next generation. As a secretariatof the Regional Development Council 02, the NEDA Regional Office 02 acknowledges the continuedsupport of all stakeholders in the completion of this Report.
We hope that all of us will continue to exemplify the relentless efforts which we have shown at thestart of Plan implementation and exceed the gains of what we have started as we aim to lay down thefoundation for inclusive growth, a high trust and resilient society, and a globally competitiveknowledge economy by 2022.
DIR. DIONISIO C. LEDRES, JR.OIC-Regional DirectorNEDA Regional Office 02

Annual Regional Development Report (ARDR) I CY 2017
Page | ii
ACKNOWLEDGEMENT OF DATA SOURCESBIR Bureau of Internal RevenueBLGF Bureau of Local Government FinanceBFAR Bureau of Fisheries and Aquatic ResourcesBFP Bureau of Fire ProtectionBSP Bangko Sentral ng PilipinasCAAP Civil Aviation Authority of the PhilippinesCHED Commission on Higher EducationCHR Commission on Human RightsCSC Civil Service CommissionCEZA Cagayan Economic Zone AuthorityCOA Commission on AuditDA Department of AgricultureDAR Department of Agrarian ReformDBM Department of Budget and ManagementDENR Department of Environment and Natural ResourcesDepEd Department of EducationDILG Department of Interior and Local GovernmentDOE Department of EnergyDOH Department of HealthDOLE Department of Labor and EmploymentDOST Department of Science and TechnologyDOT Department of TourismDPWH Department of Public Works and HighwaysDSWD Department of Social Welfare and DevelopmentDTI Department of Trade and IndustryEMB Environmental Management BureauHUDCC Housing and Urban Development Coordinating CouncilMGB Mines and Geo-Sciences BureauNAPOLCOM National Police CommissionNCC National Nutrition CouncilNCCA National Commission for Culture and ArtsNCIP National Commission on Indigenous PeoplesNEA National Electrification AdministrationNIA National Irrigation AdministrationNTC National Telecommunications CommissionOCD Office of Civil DefenseOWWA Overseas Workers Welfare AdministrationPCG Philippine Coast Guard (District Northeastern Luzon)PCIC Philippine Crop Insurance CorporationPHIC Philippine Health Insurance CorporationPLGU- Batanes Provincial Local Government Unit of BatanesPLGU- Cagayan Provincial Local Government Unit of CagayanPNP Philippine National PolicePSA Philippine Statistics AuthorityTESDA Technical Education and Skills Development Authority

Annual Regional Development Report (ARDR) I CY 2017
Page | iii
EXECUTIVE SUMMARYThe Cagayan Valley Regional Development Plan (CVRDP) 2017-2022 envisions the region as the“Prime Water Resource, Agro-Industrial Hub and Emerging Tourism Destination” in the country andaims to contribute to the national vision of laying down the foundations for inclusive growth, a hightrust and resilient society, and a globally competitive knowledge economy by 2022.
To achieve this, the CVRDP 2017-2022 adopted as a framework the bedrock strategies set in thePhilippine Development Plan 2017-2022 and translated these at the regional level in consideration ofthe region’s unique characteristics. The three pillars of development, as specified in the Philippine andthe Regional Development Plan, cover various sectors from which strategies and outcomes wereidentified.
Region 02 was one of the fastest growing regions of the country in 2017. The Gross Regional DomesticProduct (GRDP) growth rate reached to 7.2 percent, higher by 3.4 percentage points than the previousyear and 1.1 percentage points higher than the upper end of the target growth for the year. Theregional economy was driven by the Services Sector with a share of 51.7 percent, followed by theAgriculture, Hunting, Forestry and Fishing (AHFF) with 33.7 percent, and Industry Sector at 15.2percent share. The following are the highlights of each sectoral performance corresponding to thedevelopment pillar that they support.
Malasakit: Enhancing the Social FabricIn 2017, most of the targets in ensuring people-centered, clean and efficient governance wereachieved. Evident were efforts to institutionalize a more efficient and transparent governance, moreresponsive public service, and more effective and efficient government budgeting and spending at theregional level. Among the achievements include the engagement of the citizenry in auditing theefficiency and effectiveness of government projects and programs, conferment of more LGUs with theSeal of Good Local Governance (SGLG), compliance of LGUs to a more seamless business transaction,and zero COA disclaimer opinions rendered to Local Government Units (LGUs) and NationalGovernment Agencies (NGAs).
Swift and fair administration of justice was likewise pursued. Targets were achieved in terms ofaddressing human rights violation cases, complaints and abuses against women and children, andadjudication of agrarian cases. Reduced incidences were also recorded on crimes committed againstwomen, children and LGBTI. However, the mere presence of such violence despite its reducedoccurrence, poses a challenge for the justice sector. There is a need to further strengthen efforts oncrime prevention, on ensuring that the rights of the population are upheld, and cases especially in therural areas are timely resolved.

Annual Regional Development Report (ARDR) I CY 2017
Page | iv
For this year, the region also promoted awareness on Philippine as well as ethnic culture and values asa means to enhance the social fabric and regain the people’s trust. One significant way to preserve theintangible cultural heritage of the Cagayan Valley was the documentation of knowledge systems,practices, languages of the different cultural communities. Utilization of information materials andvideos, and conduct of culture and arts festivals were conducted. The participation of the HigherEducation Institutions (HEIs) was also strengthened through the provision of research grants oncreative projects. Likewise, to ensure culture-sensitive governance, the Department of the Interior andLocal Government (DILG) included tourism, culture and arts as a new essential area in the 2017SGLG. This complements the efforts of local government units in promoting, protecting, andenriching their own culture and heritage. Another milestone was the creation by the RegionalDevelopment Council of the Sub-Committee on Culture under the Social Development Committee.
Pagbabago: Inequality-Reducing TransformationFor this Plan period, the Region aims to expand economic opportunities in agriculture, forestry andfisheries (AFF), as well as in industry and services (I&S) through trabaho at negosyo.
For the AFF sector, the region performed positively as most of the targets were attained during theyear. Specifically, the Gross Value Added (GVA) of the sector recovered from the contractionexperienced in the previous years with a 6.2 percent growth rate, surpassing the target of 3.6 to 4.6percent. The value of production in the agriculture posted increments particularly for crops, forestryand fisheries. Other accomplishments worth emphasizing include the 21.7 percent increase in laborproductivity, access to technologies by small farmers and fisher folks, facilitation of different financingschemes and expansion of agricultural insurance. A concern, however, that the region needs to focuson is the instability of employment in agriculture. During the year, employment levels in agriculturedeclined compared to last year, and a significant portion of those with work were underemployed.
On the performance of the I&S sector, the Industry Sector’s growth of 13.9 percent was higher than11.9 percent growth in 2016 and even beyond the upper bound of the target growth rate for the year.Although the Services Sector slowed down to 6.0 percent from the previous year’s 6.6 percent, it iswithin the target growth for 2017. Employment levels in both the industry and services sectorsincreased during the year. The tourism industry also flourished registering more visitor arrivals.Investments from Cagayan Economic Zone Authority (CEZA) and Business Name Registration(BNR) also gained positively. Consumer welfare was also ensured. On improving competitiveness ofthe local industry, particularly the micro, small and medium enterprises (MSMEs), access toproduction networks, financial institutions and other financing programs offered by various agencieswas ensured. Technical assistances were also provided to improve their productivity, efficiency andresiliency.
To accelerate human capital development, access to education in different levels was improved.Enrollment rates in elementary and Junior High School exceeded the targets for the year. More

Annual Regional Development Report (ARDR) I CY 2017
Page | v
scholarships, financial assistances and specialized training were also awarded to students under thehigher education institutions, technical and vocational education programs. As a result, there weremore graduates recorded during the year in both higher education and technical/vocational courses.
Health and nutrition was generally enhanced. The prevalence of infectious diseases like HIV,tuberculosis, and malaria decreased, the latter sustaining zero prevalence rate in all province of theregion. The nutrition of children, a primary regional concern, significantly improved. The regionregistered lesser number of stunted children, overweight and wasting among them. Neonatal andinfant deaths and under 5 mortality rate also decreased. The regional fertility rate decreased to 2.7births per woman.
Key shelter agencies have also undertaken measures to decrease number of informal settlements oraddress inadequate housing needs. The LGUs have shown full support in the preparation andenhancement of their land use plans along with their continuous capacity enhancements particularlyon Comprehensive Land Use Plan (CLUP) related trainings. Much, however, still need to be done ashousing backlog increased during the year given the increasing number of displaced houses situatedon danger zones, riverbanks, and road-right-of-way as well as those affected by natural phenomenon.
Vulnerabilities of families and individuals was reduced through the provision of social protectionprograms such as increasing coverage of health insurances, responsive programs and services tooverseas workers, and livelihood assistances to the families of child laborers and the disadvantaged.Immediate assistances were provided during natural calamities in all province region-wide. Amongthe services include provision of emergency shelter cash assistance, support through food-for-workand cash-for-work programs.
PatuloynaPag-Unlad:Increase Potential GrowthPromotion of science, technology and innovation (STI) is one of the key priorities highlighted for thisPlan period as a way to increase the potential growth of the region. Achievements were recorded interms of extending interventions that foster technology adoption and stimulate innovation in localindustries. Specifically, the Small Enterprise Technology Upgrading Program or commonly known asSET-UP, the flagship program of the DOST, has reached more beneficiaries given the extensivetechnology interventions provided and number of trainings conducted. STI promotion activities suchas S&T fairs, caravans, Centrums and technology clinics and investor’s fora were intensified as well asthe empowerment of local scientists and actors in STI ecosystem through the establishment of localchapters for open collaboration. Partnership with the State Universities and Colleges (SUCs) were alsoheightened through various projects in the field of research.

Annual Regional Development Report (ARDR) I CY 2017
Page | vi
Enabling and Supportive Economic EnvironmentThe Cagayan Valley Region displayed strong macroeconomic fundamentals during the year. The highGRDP growth attained shall set a good start for the implementation of the Plan in the succeedingyears. However, making the economic growth more inclusive so it will benefit even those in the ruralareas is another concern that the region needs to continually focus on. Specific concerns include theneed to create more jobs and the need to address underemployment especially those in agriculture andin service sectors.
Inflation rate remained within the target range while the banking system continue to exhibit strongperformances given increased savings and loan portfolios, provision of more access points to financialservices and products and strengthened financial inclusion and awareness to the regional populace.
To support the National Competition Policy at the national level and strengthen the local market’scompetitiveness, various activities and programs were undertaken. Prices were monitored in the localmarket, consumer protection was promoted and advocated, and technical assistances to local investorsand exporters were provided. This 2017, the overall competitiveness index of the provinces showed abetter standing than the previous year. The index assesses the economic dynamism, governmentefficiency, infrastructure support and resiliency of the provinces, cities and municipalities.
Foundations for Sustainable DevelopmentEnsuring peace and security is one of the priority thrusts of the Duterte Administration. As such, theregion intensified its efforts to achieve public order, security and safety in the community as well asattain just and lasting peace and safeguard territorial integrity. To enable a clear direction onaddressing peace and security concerns at the local level, all LGUs have formulated and completedtheir Peace and Order and Public Safety Plan (POPS PLAN). Most of the barangays in the region havealso organized their MamamayangAyawsaAnomalya, MamamayangAyawsaIlligalnaDroga (MASAMASID) Team in response to the tall order of the President against drug abuse. A total of 2,189barangays have also complied with the formulation of a Barangay Anti-Drug Plan of Action. In termsof crime prevention, the police and other law enforcement showed strengthened coordination andvisibility resulting to lower crime volume and increased efficiency on the arrest of perpetrators andsuspects. Fire prevention activities were also conducted, hence, the reduction of fire incidents in 2017compared to the previous year.
Ecological integrity was likewise pursued. Forestlands were rehabilitated, coastal and marineecosystems efficiently managed and mining contracts were strictly monitored. Air and water qualityconstantly monitored while waste management was effectively pursued through the participation ofthe LGUs. The adaptive capacity and resilience of ecosystems were also reinforced through theconduct of geo-hazard survey and mapping in various municipalities, and skills training program onbasic disaster risk and reduction management, incident command system, rapid and post disasterneeds assessments, emergency trainings, among others.

Annual Regional Development Report (ARDR) I CY 2017
Page | vii
The region participated in the thrust of the current administration on “Build, Build, Build” throughthe acceleration of infrastructure development in various sub-sectors. Among the key projects thatwere implemented during the year are road and bridge widening projects, flood control, farm tomarket roads, irrigation and social support infrastructures. While the performance of the region alonginfrastructure development for the year under review may be modest, prospects for a furtheracceleration of infrastructure development in the succeeding is promising. Of the 75 flagship projectsidentified under the “Build, Build, Build”, three projects are located in the region with an estimatedcost of PhP 10.7 billion. These projects shall improve the region’s connectivity to Metro Manila andRegion III, provide alternative source of power and enhance irrigation service and coverage to boostagriculture production and productivity.

Annual Regional Development Report (ARDR) I CY 2017
Page | viii
TABLE OF CONTENTSPAGE
Foreword iAcknowledgement of Data Sources iiEXECUTIVE SUMMARY iiiList of Tables xiList of Figures xiii
OVERALL FRAMEWORK xiv
I. MALASAKIT: ENHANCING THE SOCIAL FABRIC 1
PEOPLE-CENTERED, CLEAN, AND EFFICIENT GOVERNANCE 1
Accomplishments 2Efficient and Transparent Governance Increased 2Responsiveness of RLAs, SUCs, GOCCs, and LGUs Increased 3Effectiveness and Efficiency in Government Budgetingand Spending Enhanced
5
Moving Forward 6
PURSUING SWIFT AND FAIR ADMINISTRATION OF JUSTICE 7Accomplishment 8
Equitable Access to Justice Assured for All 8Moving Forward 9
PROMOTING PHILIPPINE CULTURE AND VALUES 10Accomplishments 11
Valuing our diverse cultures 11Advancing ”Pagkamalikhain” 12Inculcating values for the common good 12Strengthening culture-sensitive governance and development 13
Moving Forward 14
II. PAGBABAGO: INEQUALITY-REDUCING TRANSFORMATION 15
EXPANDING ECONOMIC OPPORTUNITIES IN AGRICULTURE,FORESTRY AND FISHERIES
15
Accomplishments 16Expanding economic opportunities in AFF 16Increasing access to economic opportunities by small farmers andfisherfolk
20
Moving Forward 24

Annual Regional Development Report (ARDR) I CY 2017
Page | ix
EXPANDING ECONOMIC OPPORTUNITIES IN INDUSTRY ANDSERVICES THROUGH TRABAHO AT NEGOSYO
25
Accomplishments 26“Trabaho”: Economic opportunities in I&S expanded 26Increase access to economic opportunities for MSMEs 31
Moving Forward 33
ACCELERATING HUMAN CAPITAL DEVELOPMENT 34Accomplishments 35
Enhancing health and nutrition for all 35Ensuring lifelong learning opportunities for all 36Increasing income-earning ability 37
Moving Forward 38
REDUCING VULNERABILITY OF INDIVIDUALS AND FAMILIES 40Accomplishment 41
Achieving Universal and Transformative Social Protection for All 41Moving Forward 42
BUILDING SAFE AND SECURE COMMUNITIES 43Accomplishment 44
Expanding access to affordable, adequate, safe and secure shelter inwell-planned communities
44
Moving Forward 45
III. PATULOY NA PAG-UNLAD: INCREASE POTENTIALGROWTH
46
REACHING FOR THE DEMOGRAPHIC DIVIDEND 46Accomplishments 47
Accelerating Demographic Transition 47Maximizing the Gains from our Demographic Dividend 47
Moving Forward 49
VIGOROUSLY ADVANCING SCIENCE, TECHNOLOGY ANDINNOVATION
50
Accomplishments 51Technology adoption promoted and accelerated 51Innovation stimulated 52
Moving Forward 55
Annual Regional Development Report (ARDR) I CY 2017
Page | x
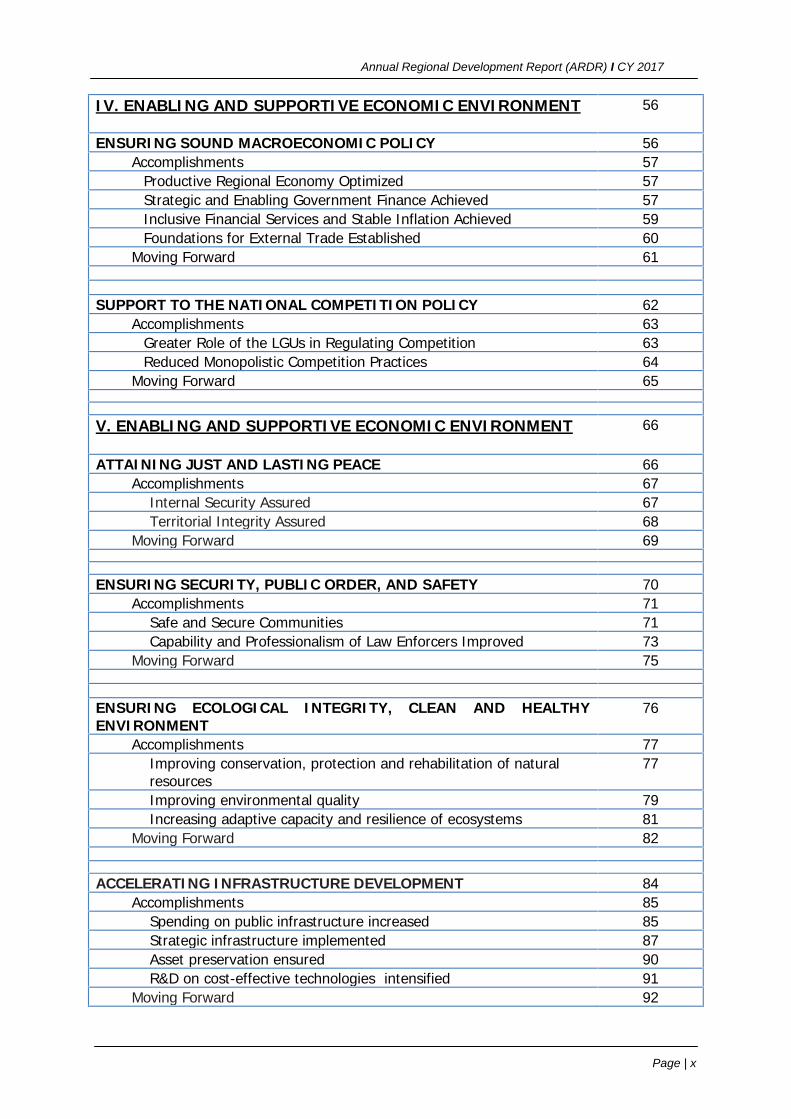
IV. ENABLING AND SUPPORTIVE ECONOMIC ENVIRONMENT 56
ENSURING SOUND MACROECONOMIC POLICY 56Accomplishments 57
Productive Regional Economy Optimized 57Strategic and Enabling Government Finance Achieved 57Inclusive Financial Services and Stable Inflation Achieved 59Foundations for External Trade Established 60
Moving Forward 61
SUPPORT TO THE NATIONAL COMPETITION POLICY 62Accomplishments 63
Greater Role of the LGUs in Regulating Competition 63Reduced Monopolistic Competition Practices 64
Moving Forward 65
V. ENABLING AND SUPPORTIVE ECONOMIC ENVIRONMENT 66
ATTAINING JUST AND LASTING PEACE 66Accomplishments 67
Internal Security Assured 67Territorial Integrity Assured 68
Moving Forward 69
ENSURING SECURITY, PUBLIC ORDER, AND SAFETY 70Accomplishments 71
Safe and Secure Communities 71Capability and Professionalism of Law Enforcers Improved 73
Moving Forward 75
ENSURING ECOLOGICAL INTEGRITY, CLEAN AND HEALTHYENVIRONMENT
76
Accomplishments 77Improving conservation, protection and rehabilitation of naturalresources
77
Improving environmental quality 79Increasing adaptive capacity and resilience of ecosystems 81
Moving Forward 82
ACCELERATING INFRASTRUCTURE DEVELOPMENT 84Accomplishments 85
Spending on public infrastructure increased 85Strategic infrastructure implemented 87Asset preservation ensured 90R&D on cost-effective technologies intensified 91
Moving Forward 92

Annual Regional Development Report (ARDR) I CY 2017
Page | xi
LIST OF TABLESNUMBER TITLE PAGE
1 Accomplishment Versus Target xvi2 Performance Indicators on Transparent Governance, Region 02,
CY 2017(CVRDP 2017-2022 Results Matrix)2
3 Performance Indicators on Responsiveness of Agencies, LocalGovernment Units and other Government Institutions, Region 02,CY 2017(CVRDP 2017-2022 Results Matrix)
4
4 Performance Indicators on Effectiveness and efficiency inGovernment Budgeting and Spending, Region 02, CY 2017(CVRDP2017-2022 Results Matrix)
5
5 Performance Indicators on Assuring Equitable Justice for All,Region 02, CY 2017(CVRDP 2017-2022 Results Matrix)
8
6 Performance Indicators on Expanding Economic Opportunities inAgriculture, Forestry and Fisheries, Region 02, CY 2017 (CVRDP2017-2022 Results Matrix)
18
7 Performance Indicators onIncreasing Access to EconomicOpportunities by Small Farmers and Fisherfolk, Region 02, CY2017 (CVRDP 2017-2022 Results Matrix)
21
8 Performance Indicators on Expanding Economic Opportunities inIndustry and Services through Trabaho at Negosyo, Region 02,CY 2017 (CVRDP 2017-2022 Results Matrix)
29
9 Performance Indicators on Increasing Access to EconomicOpportunities for MSMEs, Region 02, CY 2017 (CVRDP 2017-2022 Results Matrix)
32
10 Basic Education Net Enrolment and Completion Rate, SY 2016-2017, Region 02
36
11 Farmers and FisherfolkUnder the Registry System forBasic Sectors in Agriculture (RSBSA), Region 02, CY 2017
42
12 Socialized and Low-cost Housing Targets and Accomplishment,Region 02, 2017
44
13 Summary of Housing Need Per Province, Region 02, as ofNovember 2017
45
14 Youth Unemployment & Underemployment, Region 02, 2016 &2017
48
15 Performance Indicators on Promoting and AcceleratingTechnology Adoption, Region 02, CY 2017(CVRDP 2017-2022Results Matrix)
52
16 Performance Indicators on Stimulating Innovation, Region 2, CY2017 (CVRDP 2017-2022 Results Matrix)
54
17 Performance Indicators on Optimizing a Productive RegionalEconomy, Region 02, CY 2017 (CVRDP 2017-2022 Results Matrix)
57
18 Performance Indicators on Achieving Strategic and EnablingGovernment Finance, Region 02, CY 2017 (CVRDP 2017-2022Results Matrix)
58
19 Performance Indicators on Achieving Inclusive Financial Servicesand Stable Inflation, Region 02, CY 2017 (CVRDP 2017-2022
59

Annual Regional Development Report (ARDR) I CY 2017
Page | xii
Results Matrix)
20 Performance Indicators on Establishing Foundations for ExternalTrade, Region 02, CY 2017 (CVRDP 2017-2022 Results Matrix)
60
21 Performance Indicators on Improving the Role of LGUs inRegulating Competition, Region 02, CY 2017 (CVRDP 2017-2022Results Matrix)
63
22 Performance Indicators on Reducing Monopolistic CompetitionPractices, Region 02, CY 2017 (CVRDP 2017-2022 ResultsMatrix)
64
23 Performance Indicators on Internal Security, Region 02, CY 2017(CVRDP 2017-2022 Results Matrix)
67
24 Performance Indicators on Territorial Integrity, Region 02, CY2017(CVRDP 2017-2022 Results Matrix)
68
25 Performance Indicators on Ensuring Safe and SecureCommunities, Region 02, CY 2017 (CVRDP 2017-2022 ResultsMatrix)
72
26 Performance Indicators on Improved Capability of LawEnforcers, Region 02, CY 2017 (CVRDP 2017-2022 ResultsMatrix)
74
27 Performance Indicators on Forests, Watersheds and CoastalResources, Region 2, CY 2017 (CVRDP 2017-2022 Results Matrix)
77
28 Performance Indicators on Improving Environmental (Air)Quality, Region 02, CY 2017 (CVRDP 2017-2022 Results Matrix)
79
29 Performance Indicators on Improving Environmental Quality(Waste Management), Region 2, CY 2017(CVRDP 2017-2022 Results Matrix)
81
30 Performance Indicators on Increasing Adaptive Capacity andResilience of Ecosystem for CY 2017 (CVRDP 2017-2022Results Matrix)
82
31 ”BUILD BUILD, BUILD” Program Flagship Projects,Cagayan Valley Region
85
32 DPWH Infrastructure Programmed Amount by Region 2016 and2017
86
33 Infrastructure Spending per Capita by Region, CY 2017 87
34 Infrastructure Spending per Capita, by Region, CY 2017 88
35 National Road Density (km/sq.km.), By Regions, 2013-2017 88
2017 National Road Total (in km), Region 02, per Condition andSurface Type
89
2017 Summary of Accomplishment for Electric Cooperative inRegion 02
89
Research Areas for Infrastructure Sector, Region 02, 2017-2022 91

Annual Regional Development Report (ARDR) I CY 2017
Page | xiii
LIST OF FIGURES
NUMBER TITLE PAGE
1 Strategic Framework for CVRDP 2017-2022 xiii
2 Strategic Framework to Ensure People-Centered,Clean, Efficient and Effective Governance by 2022
1
3 Strategic Framework to Pursue Swift and FairAdministration of Justice by 2022
7
4 Strategic Framework to Promote Philippine Culture and Valuesby 2022
10
5 Strategic Framework for Expanding Economic Opportunities inAgriculture, Forestry and Fisheries by 2022
15
6 Strategic Framework for Expanding Economic Opportunities inIndustry and Services through Trabaho at Negosyo by 2022
25
7 Strategic Framework to Accelerate Human CapitalDevelopment by 2022
34
8 Strategic Framework to Reduce Vulnerability of Individuals andFamilies by 2022
40
9 Strategic Framework to Build Safe and Secure Communities by2022
43
10 Strategic Framework to Reaching for the DemographicDividend by 2022
46
11 Strategic Framework for Vigorously Advancing Science,Technology and Innovation by 2022
50
12 Strategic Framework toEnsure Sound Macroeconomic Policyby 2022
56
13 Strategic Framework to Support the National CompetitionPolicy by 2022
62
14 Strategic Framework to Attain Just and Lasting Peace by 2022 66
15 Strategic Framework to Ensure Security, Public Order andSafety by 2022
70
16 Strategic Framework to Ensure Ecological Integrity,Clean and Healthy Environment by 2022
76
17 Strategic Framework to Accelerate Infrastructure Developmentby 2022
84

Annual Regional Development Report I CY 2017
xiii
Cagayan Valley Regional DevelopmentPlan 2017-2022 Overall FrameworkThe Cagayan Valley Regional Development Plan (CVRDP) 2017-2022 supports the national frameworkof laying down the foundation for a matatag, maginhawa at panatag na buhay para sa lahat as spelledout in AmBisyonNatin 2040. It also gears the region towards realizing its vision of becoming thecountry’s “Prime Water Resource, Agro-Industrial Hub, and Emerging Tourism Destination.” Realizingthese aspirations need the concerted efforts of all stakeholders.
Figure 1.Strategic Framework for CVRDP 2017-2022

Annual Regional Development Report I CY 2017
xiv
CY 2017 reflects the region’s performance for the first year of implementing the CVRDP 2017-2022.Comparing the macro-economic achievements of the region vis a vis targets set as presented in Table 1, arobust economic growth alongside a manageable inflation was achieved, setting a good foundation for amore inclusive growth, a high trust and a globally competitive knowledge economy.
Regional gross output reached the 2017 growth target. This year’s 7.2 percent growth rate placed theCagayan Valley Region as one of the fastest growing regions in the country. This growth rate was withinthe Plan target for the year and higher than the previous year’s growth of 3.8 percent. Given the currentgrowth momentum, strategies that would sustain the gains should be implemented as guided by theregion’s development framework (Figure 1). The economic transformation currently being experiencedas indicated by the increasing share of Services to total domestic output should also be looked into,particularly its implications to agriculture where the bulk of the region’s labor force is employed.
Poverty incidence expected to continually decline. The next round of Family Income and ExpenditureSurvey (FIES) wherein poverty incidence and Gini coefficient are being determined will still beconducted in 2018. Based on the latest available data, poverty incidence among population was 15.8percent and Gini coefficient was 0.4065 in 2015. The region had a significant achievement in reducing themagnitude of the poor and the gap between the rich and the poor as compared with the 2012 levels at22.1 percent and 0.4096, respectively. This trend is expected to continue within the Plan period.
Inflation rate slightly up. One of the major factors that influenced poverty targets is the generalmovement of prices. This year, inflation rate (2012=100) registered at 2.5 percent was up by 0.8percentage points as compared to 1.7 percent in 2016. This inflation rate is still within the government’starget range of 2-4 percent. However, close monitoring should be done especially with the new tax reformand other possible market forces (i.e., increase in international fuel prices, strong US economy,weakening peso, and tight supply especially of food commodities) that may add more pressure on theprices of commodities.
Unemployment and underemployment rates slightly increased. The region registered 500 moreunemployed persons (or an unemployment rate of 3.2%) and 8,000 additional underemployed persons(or an underemployment rate of 13.6%) in 2017. This may be due to the additional 32 thousand personswho became active to search for work. As a response, the region needs to intensify efforts to create morequality jobs especially that by 2022, the region’s target for underemployment rate is within the range of 9-11 percent and underemployment rate within 1-3 percent.
Table 1 shows the summary of the accomplishment with respect to the target while Figure 1 presents theoverall development framework, with each thematic target individually discussed in the subsequentchapters.

Annual Regional Development Report I CY 2017
xv
Table 1. Macroeconomic Accomplishments Versus Targets, Region 02, CY 2017
Objectives/Results
Indicator Baseline* 2017Target
2017Actual
AccomplishmentYear Value
SocietalGoal:Foundationfor inclusivegrowth, ahigh-trustand resilientsociety and agloballycompetitiveknowledgeeconomy
Gross RegionalDomestic Productincreased (at 2000constant prices, in %)
2016 3.8 6.5-7.5 7.2 within the targetbounds
Unemployment ratedecreased (in %)
2016 3.1 1-3 3.2 not attained
Underemploymentrate decreased (in %)
2016 12.7 9-11 13.6 not attained
Poverty incidenceamong populationreduced (in %)
2015 15.8 8.2 no data n/a
Subsistence incidenceamong populationdecreased (in %)
2015 1.8 Decreasing
no data n/a
Stable headlineinflation (in %,2012=100)
2016 1.7 2-4 2.5 within the targetbounds
Reporting Entity/Data Source: PSA RO2

Annual Regional Development Report I CY 2017
1
I. “MALASAKIT”: ENHANCING THESOCIAL FABRIC
PEOPLE-CENTERED, CLEAN, ANDEFFICIENT GOVERNANCELocal governance must be further strengthened to enhance the social fabric of the country, attaininclusive growth, and build a high trust society. Indicators on good governance reflect a good start forthe Sector with most of the targets attained in 2017. By 2022, three intermediate outcomes shall beachieved namely: a) more effective and transparent local governance; b) increased responsiveness ofRLAs, SUCs, GOCCs, and LGUs, and; c) improved efficiency in government budgeting and spending.
Figure 2. Strategic Framework to Ensure People-Centered,Clean, Efficient and Effective Governance by 2022

Annual Regional Development Report I CY 2017
2
AccomplishmentsEfficient and transparent governance increasedIn 2017, local governments continuously pursued efficiency and transparency in their transactionsand local governance. The Local Government Units (LGUs) remained committed to the full disclosurepolicy (FDP) of government with only one partially compliant LGU recorded during the year. WithLGU’s compliance to FDP, the stakeholders and the general public are informed of how the LGU’sbudget is managed and used.
Likewise, the Commission on Audit (COA) has consistently performed audits to government agenciesparticularly on their transactions and fiscal operations including the posting of budgetary documentsonline, conspicuous places and bulletin boards. COA also promoted citizen participation in auditingthe efficiency and effectiveness of government projects through the conduct of the annual CitizenParticipation Audit. For this year, the audit’s goal was to determine the extent of compliance of theLGU on the minimum requirements of the Department of Health (DOH), sufficiency of funding forthe operation of the Barangay Health Stations (BHS), among others.
However, competitiveness of LGUs needs to be enhanced as four cities in the region attained lowerscorecards in terms of Government Efficiency in the Competitiveness Index of Cities andMunicipalities (CICM) Report of the National Competitiveness Council (NCC). The GovernmentEfficiency index assesses the “quality and reliability of government services and government supportfor effective and sustainable productive expansion (NCC).” Santiago City obtained 37th overallranking out of 145 cities, the highest rank among the cities in the region. On the other hand,Tumauini ranked 19th out of the 1,342 municipalities (1st – 6th class) in the country.
Table 2. Performance Indicators on Transparent Governance, Region 02, CY 2017(CVRDP 2017-2022 Results Matrix)
Indicator Baseline 2017Target
2017Actual
Accomplishment (%)Year Value
Percentage of P/C/Ms fullycompliant to the Full DisclosurePolicy (FDP) (%)
2016 98.98 100 98.98 short of 1.02percentagepoints (pp)
Number of P/C/Ms with therequired NGO representation inthe Local Development Councilincreased (cumulative)
2017 - 45 No datasubmitted
n/a

Annual Regional Development Report I CY 2017
3
Indicator Baseline 2017Target
2017Actual
Accomplishment (%)Year Value
Scorecard of cities on Government Efficiency Index Improved (CICM)Tuguegarao City 2016 14.97 increasing 10.39 Desired trend
not achievedIlagan City 2016 15.47 increasing 11.25Cauayan City 2016 13.79 increasing 10.70Santiago City 2016 14.75 increasing 11.69
Proportion of women inmanagerial positions (CESO) (%)
2016 32 increasing No data n/a
Aggregate OutputCitizen Participation in Auditingconducted
2016 1 1 1 100.00
Reporting Entity/ Data Source:DILG, NCC Website, CSC, COA
Responsiveness of RLAs, SUCs, GOCCs, and LGUsincreasedFor this year, the Anti-Red Tape Act - Report Card Survey (ARTA-RCS) was administered toagencies, service offices and LGUs concerned with facilitating the ease of doing business. Based fromthe results, 98 percent of the institutions assessed passed the ARTA-RCS, this surpassing the 80percent target.
On the other hand, 28 LGUs were conferred with the Seal of Good Local Governance (SGLG) in2017. The Provinces of Isabela and Quirino, and the cities of Cauayan, Ilagan and Santiago wereamong the awardees along with one municipality in Batanes, six municipalities in Cagayan, 12 inIsabela and two each in Nueva Vizcaya and Quirino. The SGLG is being continuously enhancedevery year by raising the overall assessment criteria. For 2018, the DILG added Peace and Order tothe original core areas on Financial Administration, Disaster Preparedness, and Social Protection,thus, the principle from “3+1” to “4+1” .
On improving competitiveness of the LGUs, 85.71 percent of the LGUs passed the SGLG essentialarea on business-friendly and competitiveness. Similarly, 55 LGUs were compliant with thestreamlining of Business Permit and Licensing System (BPLS) than the initial target of 20 LGUs. TheDepartment of Interior and Local Governance (DILG) and Department of Information andCommunication Technology (DICT) initiated a coaching and mentoring session to LGUs on theBPLS Automation or e-BPLS on November 27-30, 2017 at Baguio City.
Towards strengthening the civil service, the Civil Service Commission (CSC) monitored thecompliance of agencies and LGUs to Strategic Performance Management System (SPMS). In 2017,all agencies, GOCCs and LGUs monitored were found compliant to the requirements of the SPMS.

Annual Regional Development Report I CY 2017
4
The improvement of the government’s human resource was also assessed through theimplementation of the Program to Institutionalize Meritocracy and Excellence in Human ResourceManagement or PRIME-HRM. This integrates core areas on HRM which aims to empowergovernment agencies to develop their human resource management, competencies, systems andpractices to excellence. This 2017, three agencies assessed were found to have complied with thePRIME Maturity Levels.
Table 3. Performance Indicators on Responsiveness of Agencies, Local Government Units andOther Government Institutions, Region 02, CY 2017
(CVRDP 2017-2022 Results Matrix)
Indicator Baseline 2017Target
2017Actual
Accomplishment (%)Year Value
Proportion of agencies with apassing rate in the ARTAReport Card Survey (%)
2017 - 80 98 18 pp higher
Percentage of P/C/M LGUsconferred with the SGLGincreasing (%)
2016 22 24 28.57 Up by 4.57
Aggregate OutputsNumber of LGUs which passedthe SGLG essential area onbusiness-friendly andcompetitiveness increased(cumulative)
2016 53 55 84 152.72
Number of Cities andMunicipalities with streamlinedBusiness Permit and LicensingSystem (BPLS) (cumulative)
2017 - 20 55 275.00
Percentage of Agencies/LGUs with functional SPMS increasedRLAs 2016 100.00 increasing 100.00 100.00Provincial LGUs 2016 100.00 increasing 100.00 100.00City LGUs 2016 100.00 increasing 100.00 100.00Municipal LGUs 2016 100.00 increasing 100.00 100.00
Percentage of agencies assistedcompliant to PRIME-HRMMaturity Levels increased
2016 51 increasing 3 Desired trendnot achieved
Reporting Entity/ Data Source: DILG, CSC

Annual Regional Development Report I CY 2017
5
Effectiveness and efficiency in government budgetingand spending enhancedThe zero disallowance target was not met during the period. The COA rendered two adverseopinions to the local government sector, none were given to the National Government Sector andtwo Corporate Government Sector institutions were rendered with adverse opinion. Moreover, therewere 50 LGUs which have no independent auditor’s report due to incomplete and/or non-submission of financial reports. The results of COA audit were used by the DILG as one of thecriteria in the SGLG assessment.
Table 4. Performance Indicators on Effectiveness and Efficiency in Government Budgeting andSpending Enhanced, Region 02, CY 2017
(CVRDP 2017-2022 Results Matrix)
Indicator Baseline 2017Target
2017Actual
AccomplishmentYear Value
Aggregate OutputsNumber of LGUs with adverse/disclaimer COA findings
Adverse 2015 2 none 2 desired targetnot achieved
Disclaimer 2015 1 none 0 desired targetachieved
Reporting Entity/ Data Source: DILG, CSC

Annual Regional Development Report I CY 2017
6
Moving ForwardOverall, the region has to increase its efforts in achieving seamless service delivery, improving the localgovernment’s competitiveness, attainment of government efficiency, and ensuring clean andtransparent governance. To attain these, the following are recommended:
Strengthen LGU institutional and technical capacities. Inefficiencies and budget leakagesshould be addressed by strengthening the institutional and technical capacities of localgovernments. Upgrading of ICT infrastructure shall help ensure efficient, timely, andtransparent transactions. Continuous capacity development and technical assistance shallenhance local processes such as planning, investment programming, budgeting, procurementand program/project implementation;
Further streamlining of government transactions and processes must be prioritized byreviewing and assessing existing regulations and processes, improving new mechanisms toinclude seamless agency-to-agency transactions, and strict observance of accounting rules andregulations as well as procurement reforms by all government institutions;
Establishment of Internal Audit Service (IAS) in all LGUs and RLAs to achieve zero adverseand disclaimer COA findings. A case monitoring tool should also be developed in order forlegal officers to be guided properly in monitoring the status of the cases endorsed toconcerned agencies;
Develop participatory or feedback mechanisms not only to empower citizen participation butto ensure shared responsibility and informed decision-making between the public sector andthe citizenry; and
Intensify the full implementation of the following programs and reforms by 2019 to enhancethe local governance as pursued at the national: (a) National Identification (ID) system, (b)National Government Portal, (c) Ease of Doing Business Act and, (d) Budget Reform Act.

Annual Regional Development Report (ARDR)I CY 2017
7
Pursuing Swift and FairAdministration of JusticeThe delivery of swift and fair justice is one of the strongholds of a high-trust society. It is also anessential part of development towards the realization of a comfortable and secure life for the Filipinopeople.
To enhance the social fabric, the region ensures equitable access to justice through speedy resolutionof cases, intensifies efforts to reduce human rights violations and crimes against children and women,and improves delivery of agrarian justice to the farmers. The region showed strong performance inthis sector as most of the commitments for the year were attained.
Figure 3. Strategic Framework to Pursue Swift and FairAdministration of Justice by 2022

Annual Regional Development Report (ARDR) I CY 2017
8
AccomplishmentsEquitable access to justice assured for allEfforts to attain speedy resolution of human rights-related cases were strengthened during the period.The Commission on Human Rights (CHR) resolved all cases monitored within the prescribed period,higher than the target by 17 percentage points. Likewise, target on the percentage of resolved cases onhuman rights violation resulting in access to remedy was also met.
There was also a significant reduction in the number of complaints on women, children and lesbian,gay, bisexual, transgender, and intersex (LGBTI) investigated by the CHR. On one hand, the recordednumber of incidents from Women and Children Protection Desk (WCPD) of the PNP was lower thanthe previous year: 710 cases involved children as victims while 739 involved women. A total of 236cases were also related to children in conflict with the law. Most of the cases of WCPD were registeredin the provinces of Nueva Vizcaya at 503 cases and Cagayan at 500 cases.
Efforts to increase access to agrarian justice and uphold the legal rights of farmers were strengthenedat the start of the Plan, exhibiting notable accomplishments for the year. The target on the number ofresolved cases on agrarian law implementation (ALI) was achieved and recorded more than theexpected number of cases by 155.22 percent or a total of 3,642 cases. The remarkable performance isattributed to the 10,024 mediation activities conducted by DAR ensuring that all legal issues wereresolved before it shall be elevated to judicial or quasi-judicial proceedings. Other strategiesundertaken include in-house fast tracking of ALI case resolution, strengthening of the task forces inproblematic landholdings at the provincial offices, and conduct of regular dialogues with thestakeholders.
On the other hand, the case resolution of the DAR-Adjudication Board performed notably, surpassingthe target by more than 26.82 percent or a total of 2,180 resolved cases. Most of the cases were filedduring the second semester of the year. To respond to the influx of petitions, the DAR-AdjudicationBoard initiated the Agrarian Reform Justice on Wheels (ARJOW) in municipalities to ensure speedyresolution of cases. Technical assistance provided includes mobilization of regional adjudicators inprovincial offices to address influx of cases especially during the second semester and the inadequatemanpower at the provincial and municipal offices.
Table 5. Performance Indicators on Assuring Equitable Justice for All, Region 02, CY 2017(CVRDP 2017-2022 Results Matrix)
Indicator Baseline 2017Target
2017Actual
AccomplishmentYear Value
Percentage of cases resolved in 15working days (prescribed period)increased (%)
2016 80.00 83.00 100.00 Exceeded targetby 17 percent

Annual Regional Development Report (ARDR)I CY 2017
9
Indicator Baseline 2017Target
2017Actual
AccomplishmentYear Value
Percentage of resolvedhumanrights violation casesresulting in access to remediessustained (%)
2016 85.00 85.00 100.00 Exceeded targetby 15 percent
Aggregate OutputsNumber of complaints on Women,Children and LGBTI investigated
2016 56 60 38 63.33
Reported Cases of ViolenceAgainst Women
2016 955 decreasing 739 Desired trendachieved
Reported Crimes CommittedAgainst Children
2016 822 decreasing 710 Desired trendachieved
Number of adjudication ofagrarian cases resolved(incremental)
2016 1,365 1,719 2,180 Exceeded targetby 126.82percent
Number of Agrarian LawImplementation cases resolved(incremental)
2016 1,314 1,427 3,642 Exceeded targetby 255.22percent
Reporting Entity/ Data Source: CHR, PNP, DAR
Moving ForwardThe initiatives to deliver swift and fair justice in the region must be sustained and further enhanced toensure that human rights and agrarian justice are rightly upheld and immediately accessed by thepopulace.
Specifically, the following strategies are identified:
Crimes committed against women and children in the region are still high. There is a need tostrengthen efforts to reduce violence against women and children;
Intensify activities and initiatives of the Violence Against Women and Children (VAWC) andPAWCD;
Sustain agrarian mediation activities at the grassroots to ensure that all agrarian conflicts areimmediately responded to and resolved at the ground level. Provincial adjudicators should becontinuously capacitated to enable quality and fair delivery of justice; and
Streamline procedures and revise rules to simplify processes, guidelines and requirements tospeed up adjudication and ensure better handling of agrarian cases.

Annual Regional Development Report (ARDR) I CY 2017
10
Promoting PhilippineCulture and ValuesFollowing the PDP framework’s “Malasakit” pillar, the Regional Development Plan (CVRDP 2017-2022) promotes awareness of Philippine culture and values as it helps people distinguish the differentbeliefs and traditions based on origins, thereby building better relationships in a diverse environment.
This Chapter presents the critical role of culture in enhancing the social fabric and regaining people’strust through "Malasakit". For 2017, focus is on consolidating data and initiatives on culturedevelopment and promotion. These initial activities serve as building blocks for the implementation ofthe sector's major strategies in the succeeding years of Plan implementation.
Figure 4. Strategic Framework to Promote Philippine Culture and Values by 2022

Annual Regional Development Report (ARDR)I CY 2017
11
Accomplishments
Valuing our diverse culturesPreservation of intangible cultural heritage. As part of culture awareness at the local level, a jointcelebration to create tourism and culture awareness to both locals and visitors was conducted tostrengthen the performing arts of the Ivatans in Batanes. There was also an inter-agency choralecompetition for the singing of an Ivatan inspirational song “Laji”. Ivatan artistry was also showcased bythe “Yaru nu Artes” through the painting of the “234th Batanes Day” letterings that were displayed at theBasco Oval.
The province of Cagayan, on the other hand, has established a Cagayan Registry of Cultural Propertieswhereby all municipalities with trained cultural mappers are required to submit to the ProvincialCagayan Museum all their respective mapped cultural properties.
Also for 2017, the Santiago Living Traditions Foundation, Inc. implemented “Tilamsikan 2017: TheNorthern Luzon Culture and Arts Festival” in Santiago City. This was done in collaboration with theNational Commission for Culture and Arts (NCCA) through the National Endowment Fund forCulture and the Arts (NEFCA). This is a culture and arts festival for practitioners from 5 municipalitiesof the Provinces of Quirino and Isabela. Activities include Ybanag epic dance drama called Moro-Morode Nabuan, woodcarving and crafts, painting, folk dances, folk music and performance art. Severalartists with ethno-linguistic roots such as Bugkalot, Gaddang, Ibanag, Yogad and Ilocano participated inthe event. Another activity implemented was the conduct of a cultural show featuring the La JotaIsabela, an Ilocano Dance originating in Cauayan, Isabela. This was undertaken by the Department ofEducation of Santiago City
Also, the NCCA has approved for implementation the “TAOID Kabataan: Summer Youth HeritageCamp” of the Philippine Information Agency (PIA-RO2). The project is a four-day camp for the youthin Luzon on how to come up with programs in their localities for the preservation of tangible andintangible cultural treasures, with scheduled tour to the heritage sites in the area.
Improving public access to cultural resources. To further improve access to the region's culturalresources, public museums were improved through their modernization, expansion of facilities andupgrading of collections. Entrance fees were likewise waived which encouraged more visitors, thus,broadening the public's awareness on the region's rich cultural heritage. The move to make museumsmore visible and accessible to the public was highlighted by the re-launching of the Provincial Museumas cultural hub in the province of Cagayan and the North Luzon Indigenous and Cultural Hub in theprovince of Isabela.

Annual Regional Development Report (ARDR) I CY 2017
12
Advancing ”Pagkamalikhain”
Documentation and promotion of indigenous creativity.Documentation of cultural heritage is beingundertaken to preserve important information and materials for the benefit of present and futuregenerations. The effort includes documentation of knowledge systems and practices as well as languagerevitalization of different cultural communities in Cagayan Valley. This includes a video documentaryof the history of Diocesan Shrine of Our Lady of the Miraculous Medal in Itbud, highlighting the Ivatanintangible heritage of the province of Batanes.For the province of Cagayan, it has documented in photoand video the Pasion in Ybanag during Holy week; Traditional shell Gathering; and the Banda Dulo(Bamboo Saxophone) making and playing.
Competitions in arts such as poster making, slogan-making, poetry writing and reading, and creation ofmurals have been conducted for pupils and students. Introduction of Film Development in Educationin cooperation with the Film Development Council of the Philippines has also been conducted.
Higher Education Institutions (HEIs) in the region promoted awareness of local culture and valuesthrough the seven approved grants awarded to HEIs under the SALIKHA CHED-NCCA Grants forCreative Projects of the CHED K-to-12 Transition Program. These approved research grants include:(1) Documentation of Built Heritage in Cagayan Valley (CSU-Carig); (2) Traditional HouseConstruction Methods, Practices, and Beliefs of the Indigenous People (IPs) of Cagayan (CSU-Carig);(3) KatuYaw: Digitization of Philippine Ethnic Dance Utilizing Human Kinematics of IndigenousPeople (ISU-Cabagan); (4) Danum Water Dance Festival: Celebration of Water through Movement andConnectivity Advocating Environmental Awareness in the Grassroots (SMU-Bayombong); (5)Knowledge by Systems and Practices of Agta Communities in Cagayan Valley Region towards theEstablishment of Agta Community Heritage Center (USL-Tuguegarao); (6) Preservation andPromotion of Ybanag Cultural Resources through Cultural Mapping (USL-Tugegarao); and (7) TheMalaueg Language Corpus and Folk Literature of Rizal, Cagayan (USL-Tuguegarao). These sevenresearch grants implemented exceeded the target of two for 2017.
Inculcating values for the common good
Restoration of cultural values. The Civil Service Commission launched the implementation of ValuesRestoration Program (VRP) through Announcement No. 40, s. 2017. The VRP aims to transform theFilipino public servant and the government leadership to subscribe to the code of ethics and values thatshall provide the country with righteous, incorruptible, and sincere service towards a graft-free society.Personnel trained on VRP started conducting regular orientations in their respective offices based onthe training modules provided.

Annual Regional Development Report (ARDR)I CY 2017
13
Cagayan has also encouraged and supported the establishment of the Cagayan Heritage ConservationSociety, a private-led organization which aims to spread awareness about Cagayan’s historical andcultural treasures, and ensures its proper documentation and preservation.
Strengthening culture-sensitive governance anddevelopment
Several measures were undertaken to institutionalize culture-sensitive governance. “Tourism,Culture and the Arts” was included as a new essential area in the 2017 Guidelines for the Seal of GoodLocal Governance of the Department of the Interior and Local Government (DILG). This complementsthe capacity-building efforts of LGUs to promote, protect, and enrich culture and heritage. Theproposed legislation for the creation of the Department of Culture at both Houses of Congress and alsowithin the Executive Branch shall strengthen the public's level of understanding and respect of ourcultural diversity.
In adhering to the call to strengthen culture and values in the region, the Social DevelopmentCommittee of the RDC 2 endorsed the creation of a Sub-committee on Culture during the year. TheSDC Sub-Committee on Culture shall serve as a mechanism to oversee the implementation of theRegional Development Plan (CVRDP 2017-2022) strategies on the promotion of Philippine culture andvalues. The Department of Education (DepEd) shall serve as Chair, Department of Tourism (DOT) asCo-chair, and DILG as Vice-Chair. The Sub-Committee is composed of the DepEd, CHED, DILG, PIA,NCIP, NCCA, Department of Tourism (DOT), Department of Trade and Industry (DTI), NationalEconomic and Development Authority (NEDA), thefive provinces, five State Universities and Colleges(SUCs), five private HEIs, and two civil society organizations.
As a result of the DILG Memorandum Circular (MC) 2017-133 on the creation of Culture and ArtsCouncil, the Sangguniang Panlalawigan of the provinces of Cagayan and Quirino enacted an ordinancecreating their respective Provincial Council for Culture and the Arts. The creation aims to ensure theprotection, enrichment, and promotion of culture and the arts to advocate national legacy and pride. Itshall conduct periodic consultations to identify grassroot-based cultural concerns, issues and agendaand coordinate with existing local councils concerning culture and arts. With the DILG MC, the DILGshall provide technical assistance to LGUs which have not created yet their Council on Culture andArts. For other LGUs, culture and arts was lodged with the tourism office of the local governments.

Annual Regional Development Report (ARDR) I CY 2017
14
Moving ForwardThe sub-sector still has a long way to go in pursuing an inclusive development inclined towards thedynamics of culture and values. In the coming years, a stronger partnership and coordinatingmechanism between and among cultural agencies, other concerned agencies, civil society organizationsand the private sector is necessary, particularly in the realization of the following recommendedinterventions:
Support to national initiatives, legislations and policies promoting Philippine culture and valuessuch as: The creation of a Department of Culture. The creation of the Department ensures
implementation and monitoring of culture and arts programs at the local level as it will providefor the institutionalization of NCCA regional offices and culture offices at the local governmentunits.
The Development of the Philippine Dimensional Model for Culture. The goal of this project isto address an issue identified in the PDP 2017-2022, i.e., the need for inculcating values for thecommon good among Filipinos.
The implementation of Philippine Cultural Education Program per DepEd Memo No. 16, seriesof 2018. The NCCA, in partnership with the DepEd will be implementing several programssuch as Graduate Diploma in Cultural Education and Teaching Arts; IEC for Teachers;International Research Conference on Culture-Based Education; and Advocacy on PhilippineCulture and Arts Resources. For Region 2, the Isabela State University (ISU) is one among theHigher Education Institutions that will be offering the said graduate programs.
Creation of Culture and Art Council at the provincial level pursuant to DILG MemorandumCircular (MC) 2017-133. This shall strengthen the local governments as cultural institutions andwill pave the way for the inclusion of cultural agenda in development planning;
Operationalization of the RDC2 SDC Sub-Committee on Culture;
Establishment of a database to store information on cultural statistics and comprehensive data onlocal cultural heritage including cultural documentation, promotion and protection;
Development and promotion of culture of eco-tourism in the region should be both a conservationstrategy for the environment and promotion of local culture and values; and
Establishment offices for culture and arts in LGUs, with a mandate to protect and promote localcultural heritage and arts.

Annual Regional Development Report (ARDR) I CY 2017
15
II. “PAGBABAGO”: INEQUALITY-REDUCING TRANSFORMATIONExpanding Economic Opportunities inAgriculture, Forestry and Fisheries
The region’s agriculture sector gross output contribution has contracted over the recent years (i.e., in2013-2017, average sector share was at 36%). The sector also posted negative growth rates in the pasttwo years due to damages caused by strong typhoons (i.e.,-0.4% in 2015and - 3.0% in 2016). Ithowever recovered in 2017, posting a growth rate of 6.2 percent. In terms of employment generation,the sector has been consistently absorbing the bulk of the region’s labor force.
Expected to contribute to the Pagbabago pillar or reducing inequality, economic opportunities withinthe sector need to be expanded and its access by small farmers and fisherfolk need to be increased aswell. The desired development for the sector is presented in Figure 5.
Figure 5. Strategic Framework for Expanding Economic Opportunities inAgriculture, Forestry and Fisheries by 2022

Annual Regional Development Report (ARDR) I CY 2017
16
AccomplishmentsExpanding economic opportunities in AFF
The economy of the region was driven by the AFF sector’s performance as depicted by the generallypositive accomplishments in the sectoral outcome targets presented in Table 6. Support servicesprovided by government to the different subsectors contributed to this positive performance.
Gross Value Added in AFF recovered. The agricultures sector’s Gross Value Added growth rate of6.2 percent in 2017 outpaced the 3.6-4.6 percent target for the year. This year’s performance was arecovery from the contraction in 2016 and 2015 at -3.0 percent and -0.4 percent, respectively.However, with the economic structural transformation continuously occurring where Serviceindustries are becoming more dominant, the share of AFF sector to total domestic output was down to33.7 percent. The recorded growth rate of value of production in agriculture (at constant prices) wasat 6.12 percent in 2017, an improvement from its performance of negative 3.35 percent the previousyear. Cagayan Valley contributed 6.97 percent to the national value of production, the seventh (7th)highest among the regions of the country.
Value of production in crops improved. Among subsectors, only the crops subsector had acceleratedgrowth from last year’s value of production. Crops accounted for about 77 percent of the total value ofproduction in agriculture. It grew by 8.65 percent as compared to its negative 4.93 percent theprevious year. The region contributed 10.34 percent of the national value of production in crops nextto Northern Mindanao.
Most of the crops enrolled in the sector’s Results Matrix reached their target yields and productionvolumes. The recorded increase in the volume of palay and corn production in 2017 as compared tothe previous year (for palay, from -6.31% to 13.9% and for corn, from -6.79% to 9.45%) translated tothe improved growths of value of production in palay and corn at 13.9 percent (from -6.31%) and 9.45percent (from -6.79%), respectively. Harvest area for these crops generally increased and respectivetargets for the year were 100 percent met. Minimal gains were recorded for pineapple, coffee, andcassava while production declines were recorded in other major crops like coconut, sugarcane, bananaand mango. Besides weather condition, the regular support services of the DA RFO 02 and otheragencies contributed to the improved performance of the subsector.
Livestock subsector grew at a slower pace while poultry subsector posted production decline. Thelivestock subsector achieved its target for the year of increasing the value production. It slightly grewby 0.3 percent in 2017 from 4.5 percent growth in 2016. This was solely contributed to by the increasein the volume of hog production, which constitutes more than 70 percent of the total livestockproduction. In terms of large (i.e., cattle) and small ruminants (i.e., goat and sheep), production

Annual Regional Development Report (ARDR) I CY 2017
17
targets were not met for cattle and goat in 2017. The number of heads of said livestock was also lowercompared to the previous year.
On the other hand, value of production in the poultry subsector decreased by 1.54 percent,contributed mainly by the 3.0 percent decrease in chicken production. The chicken industrycontributed about 80 percent share to total poultry production.
Fisheries continuously suffer from diminishing production. The fisheries subsector continued toexperience downtrend in both value and volume of production with a negative 4.57 percent growth in2017. Commercial and municipal fisheries posted negative production growths at 18.19 percent and2.27 percent, respectively. In contrast, aquaculture grew at 1.82 percent in the same year. Thedeclining contribution of the fisheries to the performance of the agriculture sector as a whole has beendue to weather disturbances, high cost of fuel, and lack of fishing facilities and infrastructures.
As shown in Table 6, white shrimp and seaweeds have not met targets for the year. For white shrimps,the decline in production was noted due to less natural entry during the second half of 2017. Also,production of white shrimps went down in Cagayan because of abrupt changes in water temperatureduring the second half of 2017 that resulted to smaller sizes of species harvested. For seaweeds, thesudden change in temperature resulted to reduced area harvested and lesser harvests.
Forest production increased but contribution to total sector output is minimal. Total area of treeplantation and non-timber forest products within the production forest increased as compared to thebaseline values in 2016. Targets set for the year were likewise met. Target for the total area of non-timber products (i.e., bamboo, rattan, fruit trees, coffee, cacao, mangrove, and fuelwood) were 100percent met at 8,445 hectares or more than quadrupled the 2016 level. Similarly, tree plantationincreased by 65 percent from its level in 2016 and the target set for 2017 was also attained. Continuousefforts by the Department of the Environment and Natural Resources Regional Office 2 (DENR RO 2)in cooperation with the People’s Organizations (PO) and local government units (LGU) to maintainand protect the established plantations contributed to the positive results achieved for the year.
The AFF sector remains to be the region’s major source of employment. Forty-five (45%) of thetotal employed persons in the region in 2017 depend on agriculture as source of income. About 74percent of these employed are males. This huge number of people that depend on agriculture calls foran immediate action to implement interventions that will improve labor productivity of farmers andfisherfolk in the region.

Annual Regional Development Report (ARDR) I CY 2017
18
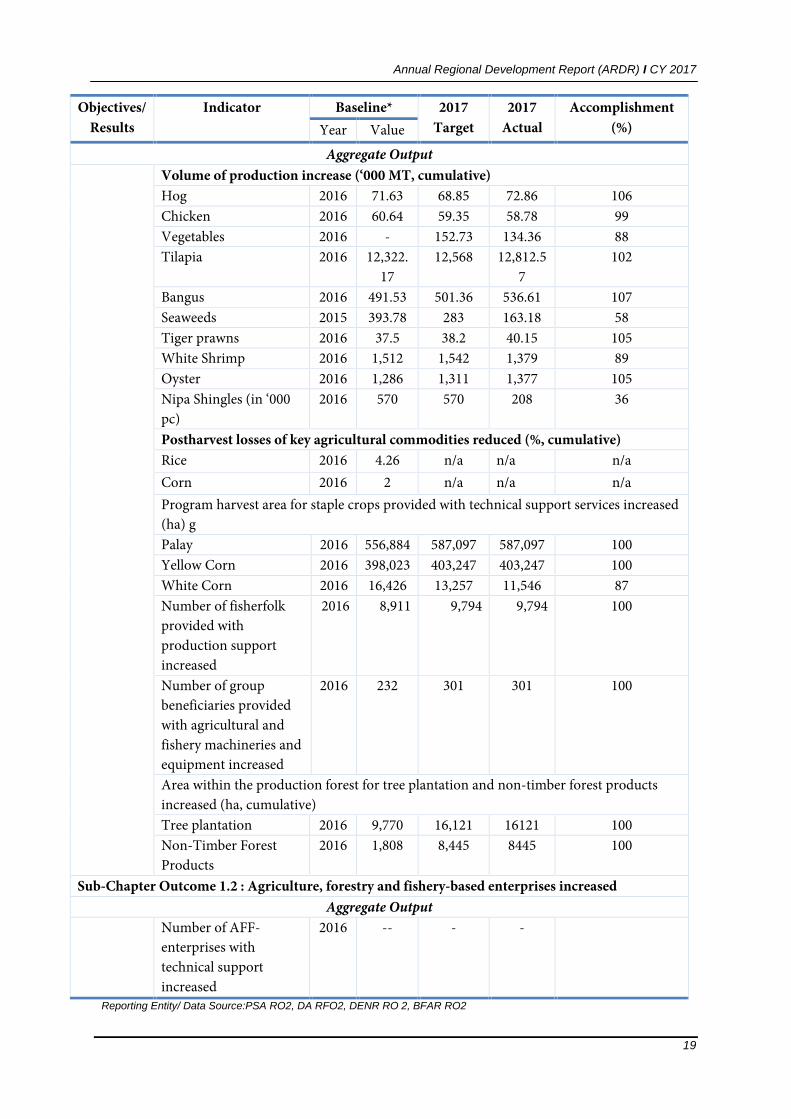
Table 6. Performance Indicators on Expanding Economic Opportunities in Agriculture, Forestryand Fisheries, Region 02, CY 2017
(CVRDP 2017-2022 Results Matrix)
Objectives/Results
Indicator Baseline* 2017Target
2017Actual
Accomplishment(%)Year Value
Economicopportunities in AFFexpanded
Gross Value Added in Agriculture, Hunting, Forestry and Fishing·Level (PhP million at2000 constant prices)
2016 47,472 Incr. 50,415 6.2% increase frombaseline
·Growth Rate (%) -0.4 3.6-4.6 6.2 1.6 pp higher thanthe upper bound ofthe target growthrate
Gross Value ofProduction in AFFincreased (%, in realterms)
2016 -3.35 Incr. 6.12 9.47 pp increasefrom baseline
·Crops 2016 -4.93 Incr. 8.65 13.58 pp increasefrom baseline
·Livestock 4.5 Incr. 0.3 4.2 pp decreasefrom baseline
·Poultry 1.9 Incr. -1.54 3.44 pp decreasefrom baseline
·Fisheries -5.15 Incr. -4.23 0.92 pp increasefrom baseline
Employment generatedby the agricultureincreased (‘000s)
2016 759 Incr. 657.7 13% increase frombaseline
Sub-Chapter Outcome 1.1: AFF productivity within ecological limit improvedYield of Major commodities increased / sustained (Mt / ha.)Palay 2016 4.19 4.25 4.52 106Corn 2016 4.05 4.48 4.42 99White 2016 2.32 2.42 2.85 118Yellow 2016 4.12 4.50 4.47 99Banana 2016 13.63 14.00 12.08 86Pineapple 2016 25.46 25.00 25.43 102Mango 2016 5.84 5.00 4.74 95Sugarcane 2016 35.85 37.07 33.94 92Cassava 2016 16.36 19.00 14.74 78Coffee 2016 0.22 0.29 0.42 145Cacao 2016 0.22 0.18 0.11 61Volume of production increase (in heads, cumulative)Cattle 2016 184,173 185,831 181,435 98Goat 2016 155,533 116,573 108,511 93Sheep 2016 9,864 12,134 11,640 96
Annual Regional Development Report (ARDR) I CY 2017
19
Objectives/Results
Indicator Baseline* 2017Target
2017Actual
Accomplishment(%)Year Value
Aggregate OutputVolume of production increase (‘000 MT, cumulative)Hog 2016 71.63 68.85 72.86 106Chicken 2016 60.64 59.35 58.78 99Vegetables 2016 - 152.73 134.36 88Tilapia 2016 12,322.
1712,568 12,812.5
7102
Bangus 2016 491.53 501.36 536.61 107Seaweeds 2015 393.78 283 163.18 58Tiger prawns 2016 37.5 38.2 40.15 105White Shrimp 2016 1,512 1,542 1,379 89Oyster 2016 1,286 1,311 1,377 105Nipa Shingles (in ‘000pc)
2016 570 570 208 36
Postharvest losses of key agricultural commodities reduced (%, cumulative)Rice 2016 4.26 n/a n/a n/aCorn 2016 2 n/a n/a n/aProgram harvest area for staple crops provided with technical support services increased(ha) gPalay 2016 556,884 587,097 587,097 100Yellow Corn 2016 398,023 403,247 403,247 100White Corn 2016 16,426 13,257 11,546 87Number of fisherfolkprovided withproduction supportincreased
2016 8,911 9,794 9,794 100
Number of groupbeneficiaries providedwith agricultural andfishery machineries andequipment increased
2016 232 301 301 100
Area within the production forest for tree plantation and non-timber forest productsincreased (ha, cumulative)Tree plantation 2016 9,770 16,121 16121 100Non-Timber ForestProducts
2016 1,808 8,445 8445 100
Sub-Chapter Outcome 1.2 : Agriculture, forestry and fishery-based enterprises increasedAggregate Output
Number of AFF-enterprises withtechnical supportincreased
2016 -- - -
Reporting Entity/ Data Source:PSA RO2, DA RFO2, DENR RO 2, BFAR RO2

Annual Regional Development Report (ARDR) I CY 2017
20
Increasing access to economic opportunities by small farmersand fisherfolk
In CY 2017, the region continuously implemented programs that sought to reduce inequality ineconomic opportunities by increasing access of the small farmers and fisherfolk along the differentstages of the value-chain to new technology, financing, and resources (i.e., land and water).Thus,targets set as presented in Table 6 were generally attained.
Labor productivity in AFF grew by 21.7 percent. From a one (1) percent growth rate in laborproductivity last year, this grew by 21.7 percent in 2017. While an increase in labor productivitysignifies a strong performance of the sector, the decline in employment within the sector during theneeds further study as it may be an indication of limited economic opportunities for farmers andfisherfolk.
Several efforts to increase access to technology were implemented. To increase access to technologyby small farmers and fisherfolk, several efforts presented as aggregate output indicators achievedpositive results. All targets set for the year in terms of the AFF researches conducted (83), newtechnologies developed (10) and technology forum conducted (5) were 100 percent attained.
Conducive financing facilitated performance in AFF. The number of small farmers and fisher folkprovided with agricultural insurance increased by about 25 percent from its level in 2016. About166,664 insured enrollees were recorded for the year reaching a total amount of Php6.184 million.Most of the insured farmers and fisher folk were recipients of subsidized insurance programsincluding Registry System for Basic Sectors in Agriculture (RSBSA), a program that provides fullpremium subsidy for subsistence farmers and fisherfolk. The LGUs were important partners of thePhilippine Crop Insurance Corporation Regional Office 02 (PCIC RO2) in their expanding theirinsurance coverage. This year, 104 LGUs or 100 percent of the target were involved in theimplementation of agricultural insurance.
This performance is attributed to the efforts of PCIC RO2 in marketing insurance programs and thecontinued allocation of social insurance funds in a number of government programs.
Redistribution of land continued to face several issues. One of the major factors that would broadeneconomic opportunities is through increased access of small farmers and fisherfolk to land and waterresources. Back in 1972, the Department of Agrarian Reform (DAR) started the implementation of theComprehensive Agrarian Reform Program (CARP). For the region, CARP coverage is more than 400thousand hectares of which about 88 percent or 366 thousand hectares were distributed from 1972-2016. This year, the target of 3,590 hectares for distribution was unmet registering only 25 percentaccomplishment rate. The DAR RO 2 has continuously faced several challenges such as resistance of
Annual Regional Development Report (ARDR) I CY 2017
21
the landowners, tedious activities in land surveys (i.e., difficulty in complying with the DENR’s e-survey processes) and problems in the Land Registration Authority-Registry of Deeds (LRA-RoD)system of registration of titles or the Philippine Land Registration and Information System(PHILARIS). Also, the apparent conflict of landholding categories and difficulties in validating thelandholdings and identified ARBs were experienced.
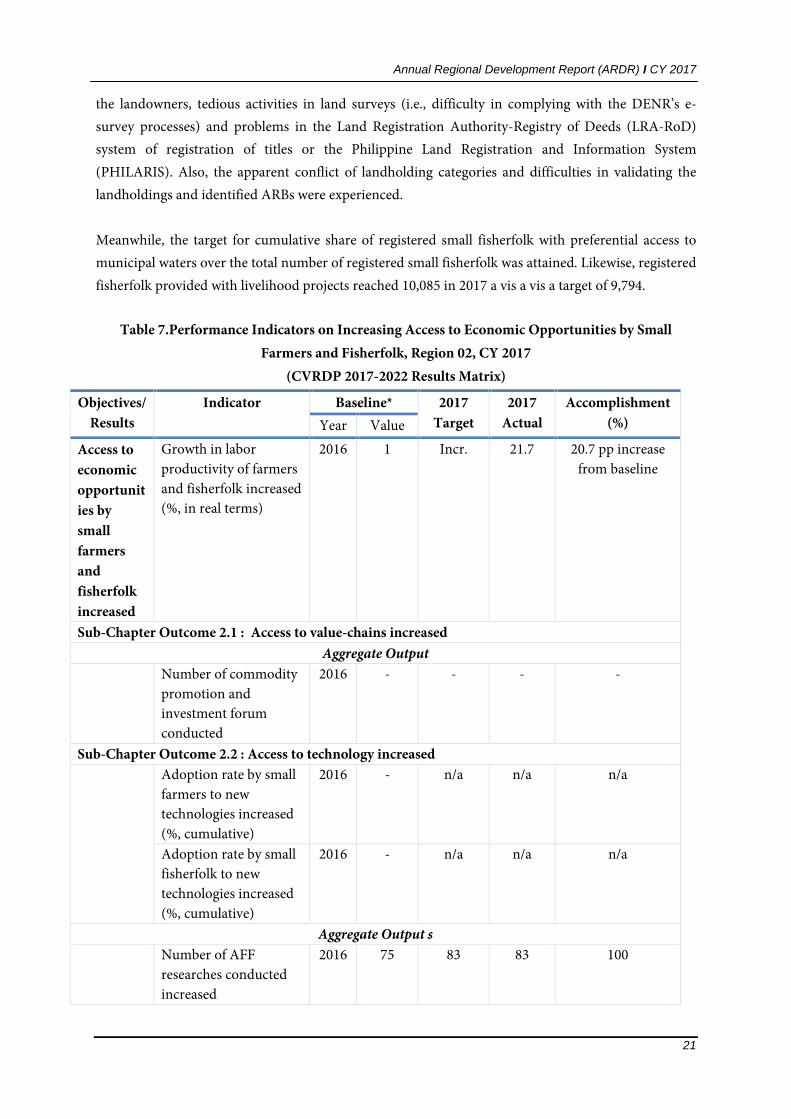
Meanwhile, the target for cumulative share of registered small fisherfolk with preferential access tomunicipal waters over the total number of registered small fisherfolk was attained. Likewise, registeredfisherfolk provided with livelihood projects reached 10,085 in 2017 a vis a vis a target of 9,794.
Table 7.Performance Indicators on Increasing Access to Economic Opportunities by SmallFarmers and Fisherfolk, Region 02, CY 2017
(CVRDP 2017-2022 Results Matrix)
Objectives/Results
Indicator Baseline* 2017Target
2017Actual
Accomplishment(%)Year Value
Access toeconomicopportunities bysmallfarmersandfisherfolkincreased
Growth in laborproductivity of farmersand fisherfolk increased(%, in real terms)
2016 1 Incr. 21.7 20.7 pp increasefrom baseline
Sub-Chapter Outcome 2.1 : Access to value-chains increasedAggregate Output
Number of commoditypromotion andinvestment forumconducted
2016 - - - -
Sub-Chapter Outcome 2.2 : Access to technology increasedAdoption rate by smallfarmers to newtechnologies increased(%, cumulative)
2016 - n/a n/a n/a
Adoption rate by smallfisherfolk to newtechnologies increased(%, cumulative)
2016 - n/a n/a n/a
Aggregate Output sNumber of AFFresearches conductedincreased
2016 75 83 83 100

Annual Regional Development Report (ARDR) I CY 2017
22
Objectives/Results
Indicator Baseline* 2017Target
2017Actual
Accomplishment(%)Year Value
Number of newtechnologies increased
2016 5 10 10 100
Number of technologyforum increased
2016 5 5 5 100
Number ofbeneficiaries providedwith extension servicesincreasedg
2016 - n/a n/a n/a
Sub-Chapter Outcome 2.3 : Access to innovative financing increasedShare of small farmersand fisherfolk withagricultural insuranceto total number offarmers and fisherfolkincreased (%,cumulative)
2016 - 10.3 - -
Aggregate OutputsAgricultural loanamount provided bygovernment banksincreased (in MillionPhP)
2016 3.5 0.89 - -
Number of LGUs withestablishedpartnerships for theimplementation ofagricultural insuranceto the total number ofLGUs increased
2016 104 104 104 100
Amount of insurancecoverage increased (inMillion Php)
2016 1,482 2079.2 2502.38 121
Number of farmers andfisherfolk insuredincreased
2016 133,442 139,833 166,664 119
Sub-Chapter Outcome 4 : Access to land and water resources increased and protectedShare of actualAgrarian ReformBeneficiaries (ARBs)with emancipationpatent (EP)/ certificateof land ownershipaward (CLOA) to total
2016 - 4.55 - -

Annual Regional Development Report (ARDR) I CY 2017
23
Objectives/Results
Indicator Baseline* 2017Target
2017Actual
Accomplishment(%)Year Value
potential ARBsincreased (%,cumulative)Share of registeredsmall fisherfolk withpreferential access tomunicipal waters overthe total number ofregistered smallfisherfolk increased (%,cumulative)
2016 23.03 23 23.13 100.6
Aggregate OutputsArea distributed underCARP increased (ha,cumulative)
2016 - 3590 901 25
Number of ARBs withEP/CLOAs increased(cumulative)
2016 - 3462 555 16
Area of collectiveCLOAs subdividedincreased (ha,cumulative)
2016 - 1672 727 43
Number of ARBOsassisted increased
2016 - 238 237 100
Number of ARBsprovided with creditincreased (cumulative)
2016 - 3520 6250 178
Number of registeredfisherfolk providedwith livelihood projects
2016 8911 9794 10,085 103
Reporting Entity/ Data Source: PSA RO2, DA RFO2, DENR RO 2, BFAR RO2, PCIC RO2, DAR RO2

Annual Regional Development Report (ARDR) I CY 2017
24
Moving ForwardIn next two to three years, the government should focus its efforts in institutionalizing policy reformsand implementing programs to attain an expanded and increased access on economic opportunitiesby small farmers and fisher folk in the region, to wit:
Continue to support the passage/enactment of the legislative agenda identified in PhilippineDevelopment Plan (PDP) 2017-2022 such as but not limited to: Amendment of the Agricultural Tariffication Act of 1996 or RA8178 or decoupling the
regulatory and proprietary function of the National Food Authority (NFA) so that its rolewill now focus on rice buffer stocking for food security;
Amendment of the Revised Charter of the PCIC Act of 1995 or RA 8175 as well as otherrelevant laws to push for the reorganization of the PCIC and increase its authorized capitalstock; and
Amendment or repeal of Presidential Decree No. 4 of 1972 as well as other relevant lawswhich will replace quantitative restrictions on rice with tariffs, wherein tariff proceeds shallbe used to support the rice sector.
Intensive capacity building of farmers and fisherfolk on value-adding activities or commoditydiversification, adoption of climate-responsive technologies, innovations and standards,orientation on the credit, insurance and other financial education and business plan preparation;
Continue to campaign for the implementation of sustainable fisheries management;
Simplify processes and requirements in land acquisition and distribution to fast-track landreform as envisioned through the CARP;
Strategically provide rural infrastructures that are disaster and climate-resilient - roads, bridges,tramlines, irrigation systems/facilities and other related facilities;
Create new markets and develop new products by providing a cohesive and easier access tonecessary agricultural marketing information (e.g. price, volumes, supply, demand, buyers, etc.);
Intensify capacity building and business advisory services to agrarian reform beneficiaryorganizations (ARBOs), cooperatives, community organizations and associations that operate orintend to engage in agri-enterprises;
Strengthen linkage with agro-processing industry through contract farming, agri-tourism,andother forms of entrepreneurial activities; and
Expansion of insurance programs of PCIC in partnership with LGUs, lending institutions,cooperatives, rural banks and government agencies.

Annual Regional Development Report (ARDR) I CY 2017
25
Expanding Economic OpportunitiesinIndustry and Services throughTrabaho at Negosyo
Together, the industry and services sectors comprise 66 percent of the total economic output in thepast two years. The increasing share of these sectors is a manifestation of a gradual structuraltransformation of the region’s economy. Theoretically, overall productivity and incomes tend toexpand as labor and other resources move from agriculture into modern economic activities. Thechallenge, therefore, remains on how the region can optimize the benefits of the structuraltransformation so that it will translate to more jobs and enhancement in productivity towards aninclusive and sustainable growth.
This section discusses the performance of the industry and service sectors particularly on how thishelp achieve the desired outcome of reducing inequality through: Trabaho, that is expandingeconomic opportunities in the sector; and Negosyo or increasing access to economic opportunities bymicro, small and medium enterprises (MSMEs), cooperatives and Overseas Filipinos (OFs).
Figure 6. Strategic Framework for Expanding Economic Opportunities inIndustry and Services through Trabaho at Negosyo by 2022

Annual Regional Development Report (ARDR) I CY 2017
26
Accomplishments“Trabaho”: Expanding economic opportunities in I&S
Industry sector contributed 15.5 percent to the total economic output of the region. The industrysector shared 15.5 percent to the total Gross Regional Domestic Product (GRDP) at 2000 constantprices in 2017. This was an increase from its GRDP share in the previous year. The sector alsoconsistently grew at faster rate. In 2017, it registered a growth rate of 13.9 or about 7.4 percentagepoints higher than the upper bound of the growth target for the year.
From among the sub-industries under the Industry sector, only manufacturing slowed down from17percent growth in 2016 to 3.9 percent in 2017. Likewise, the proportion of manufacturing GVA toGRDP declined slightly from 1.6 percent to 1.5 percent. For a structural transformation to becomegrowth enhancing, manufacturing needs to further expand since it can be the main engine foraccelerating regional economic growth. However, the region has more work to do in order improve itsranking in terms of its share to the national manufacturing GVA. The region has consistently ranked2nd lowest next to ARMM with a share of 0.11 percent.
Other sub-industries such as mining and quarrying, construction, and electricity, gas and water supplyposted accelerated growth in 2017 at 14.0 percent, 10.7 percent and 29.5 percent, respectively. Thesethree sectors contribute 90 percent of the total Industry GVA.
In terms of employment, the Industry sector generated about one-tenth of the total employed personsin the region or 179 thousand employed persons, mostly male employees (93%). This level was 20percent higher than the 149 thousand employed persons in 2016. Out of the total employed in thesector, manufacturing generated 60 thousand employed, next to construction with 112 thousandpersons. The employment level in the manufacturing industry was equivalent to 4.1 percent of thetotal employment, or 1.3 percentage points higher than its proportion in 2016 with an employmentlevel of 42 thousand persons.
While the Industry sector employment increased over the recent years, this movement of labor fromagriculture to the Industry sector was not translated to expansion in productivity. Labor productivityin 2017 further decelerated to a negative 5.2 percent growth from its 10.2 percent negative growth inthe previous year.
Among the three major productive sectors of the economy, the Industry sector has the highestproductivity value and thus, the more that government should strengthen the manufacturing industryespecially along agri-industry.
Annual Regional Development Report (ARDR) I CY 2017
27
More than half of the region’s GRDP came from the Services. For the year, the Services sectorcomprised 51 percent of the region’s GRDP. Its 6.0 percent growth was within the lower bound of the6 – 7 percent growth target for the year, and slower than the 6.6 percent growth attained in theprevious year. However, all sub-industries under the Services sector accelerated with other servicesregistering the highest growth at 7.8 percent.
About two-fifth of the total employed persons in the region or 616 thousand employees were engagedin the Services sector, 52 percent of whom were females. Employment level in the sector increased by6 percent from its level of 579 thousand employed persons in the previous year. Among the top threeindustries in terms of employment were wholesale and retail trade, repair of motor vehicles at 36percent; public administration and defense, and compulsory social security at 16 percent, andtransportation and storage at 15 percent of total employed within the sector .The number of employedpersons engaged in the Services sector increased over the recent years and was successfully translatedto expansion in Services GVA as well as labor productivity. While in 2017, labor productivity hasslightly slowed down by 0.4 percent, coming from a high growth of 5.9 percent last year, the averagegrowth rate recorded still stood at 3.2 percent from 2013 to 2017. The challenge therefore is on how totranslate the increase in labor to expansion in output of the Sector in the succeeding years.
Targets on visitor arrivals attained. The tourism industry attained its targets for the year as shown inTable 8. From the total of 2.54 million visitor arrivals in 2017, 90 percent were domestic and theremainder from foreign countries. Forty-two percent (42%) of this total were overnight tourists andthe rest were same-day visitors.
In both categories (overnight and same-day), targets set for the year were all attained. Number ofdomestic overnight tourists reached 776,369 while foreign overnight tourists at 293,775. Similarly,same-day visitors’ performance achieved 103 percent and 100 percent accomplishment rates fordomestic and foreign same-day visitors, respectively. Visitor spending is translated to receipts, thus,an increase in the number of visitor arrivals in the region translates to increased opportunities toexpand output, employment and increase in income. Development and promotion of tourismdestinations should however consider the carrying capacity of the potential tourism sites.
Investments in the economic zones revealed modest gains. Indicators of increased investments inthe region are the Cagayan Economic Zone Authority (CEZA) capital investments including numberof locators; and, DTI RO 2’s programs such as the Business Name (BN) Registration and assistance toMSMEs, exporters and investors in the region.
For CEZA’s capital investments and number of locators, accomplishment rates achieved were 125percent (Php 8.75 Billion) and 148 percent (92 locators), respectively. Despite the positiveperformance vis a vis targets, these figures were actually declines from their actual accomplishmentsin 2016 – lower by 37.6 percent in terms of capital investments and lower by 55.6 percent considering

Annual Regional Development Report (ARDR) I CY 2017
28
the number of locators. Main reason for the decreased accomplishment for the year and rescaledtargets by CEZA was Executive Order 13 which transferred online gaming industry under thejurisdiction of the Philippine Amusement and Gaming Corporation.
For local investors, Business Name (BN) Registration achieved its set target with an estimated totalinvestment of Php4.64 Billion. The number of MSMEs assisted in the priority industries was also met,registering an accomplishment rate of 122 percent or about 1,680 MSMEs assisted. The number ofexporters assisted for the year stood at 42, registering an accomplishment rate of 105 percent.
In CY 2017, activities like the orientation on the enhanced business permits and licensing system(BPLS) standards and the 1st Regional Meeting of the Business Permits and Licensing Officers(BPLOs) were conducted. The 1stRural Impact Sourcing (RIS) Forum was also held which aimed topromote various digital opportunities. These helped in facilitating the generation and establishmentof new investments regionwide.
Competitiveness of all provinces in the region improved. The Cities and MunicipalitiesCompetitiveness Index (CMCI) is an annual ranking of Philippine cities and municipalities developedby the National Competitiveness Council. In 2017, scores of all provinces increased, though in termsof standing, Isabela moved down from its rank in the previous year (from 22nd to 30th). Ranking ofPLGUs was based on population and weighted income average of the overall scores of cities andmunicipalities under a province. Batanes achieved the biggest improvement in terms of score whileQuirino had the biggest leap in terms of its ranking from 54th in 2016 to 16th rank this year.
Among the aggregate outputs contributing to the region’s competitiveness, innovativeness andresiliency, targets on the provision of assistance to MSMEs were met particularly on the number ofMSMEs assisted; number of mentees capacitated; number of MSMEs doing e-commerce; number ofaccreditation applications acted upon; and number of products developed and product partnersengaged (Table 8).
Consumer access to safe and quality goods and services ensured. In 2017, targets for theintermediate outcome indicators enrolled to measure access of consumers to safe and quality goodsand services were met. These include targets on percentage of violating firms penalized andpercentage of compliant firms which were exceeded by111 percent and 118 percent, respectively.
Targets for aggregate output indicators were also met such as number of firms monitored (pricetrending) and number of processed applications for permits, accreditations, licenses, or authorities.Activities such as the conduct of business education and advocacy, sustained enforcement of fair tradelaws and on the spot inspection of products and services by the DTI R02 facilitated the attainment ofthe set performance indicators.
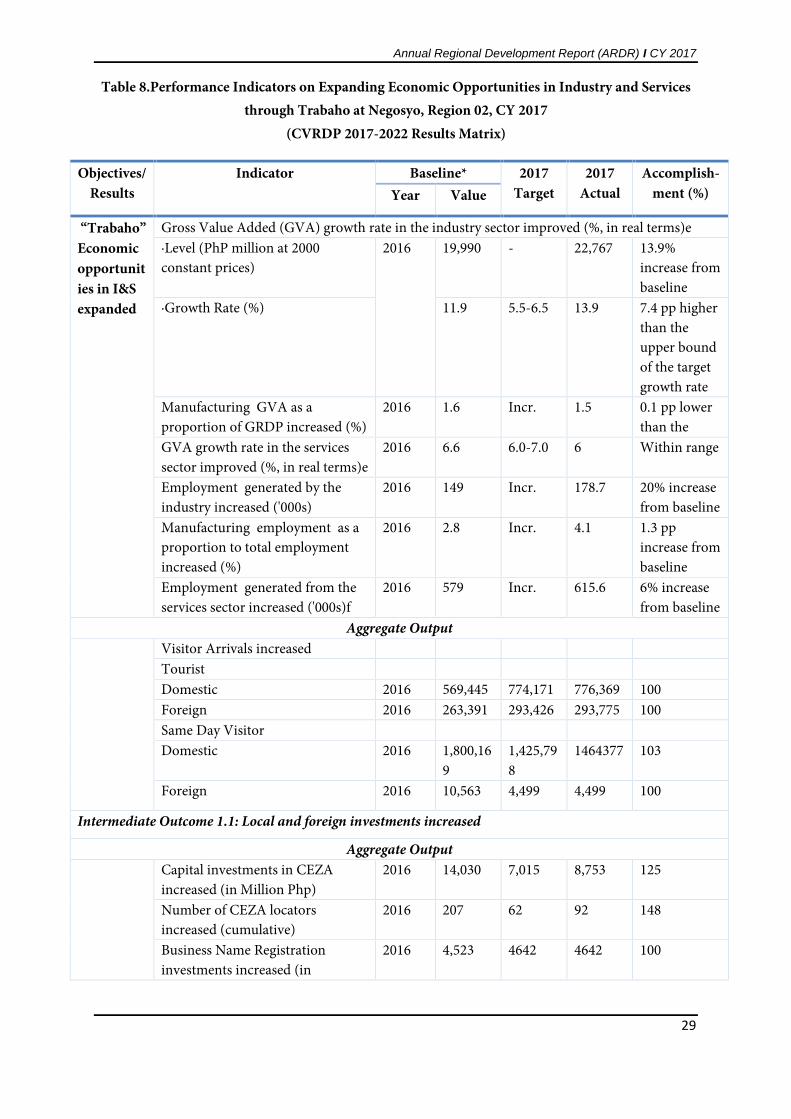
Annual Regional Development Report (ARDR) I CY 2017
29
Table 8.Performance Indicators on Expanding Economic Opportunities in Industry and Servicesthrough Trabaho at Negosyo, Region 02, CY 2017
(CVRDP 2017-2022 Results Matrix)
Objectives/Results
Indicator Baseline* 2017Target
2017Actual
Accomplish-ment (%)Year Value
“Trabaho”Economicopportunities in I&Sexpanded
Gross Value Added (GVA) growth rate in the industry sector improved (%, in real terms)e·Level (PhP million at 2000constant prices)
2016 19,990 - 22,767 13.9%increase frombaseline
·Growth Rate (%) 11.9 5.5-6.5 13.9 7.4 pp higherthan theupper boundof the targetgrowth rate
Manufacturing GVA as aproportion of GRDP increased (%)
2016 1.6 Incr. 1.5 0.1 pp lowerthan the
GVA growth rate in the servicessector improved (%, in real terms)e
2016 6.6 6.0-7.0 6 Within range
Employment generated by theindustry increased ('000s)
2016 149 Incr. 178.7 20% increasefrom baseline
Manufacturing employment as aproportion to total employmentincreased (%)
2016 2.8 Incr. 4.1 1.3 ppincrease frombaseline
Employment generated from theservices sector increased ('000s)f
2016 579 Incr. 615.6 6% increasefrom baseline
Aggregate OutputVisitor Arrivals increasedTouristDomestic 2016 569,445 774,171 776,369 100Foreign 2016 263,391 293,426 293,775 100Same Day VisitorDomestic 2016 1,800,16
91,425,798
1464377 103
Foreign 2016 10,563 4,499 4,499 100
Intermediate Outcome 1.1: Local and foreign investments increased
Aggregate OutputCapital investments in CEZAincreased (in Million Php)
2016 14,030 7,015 8,753 125
Number of CEZA locatorsincreased (cumulative)
2016 207 62 92 148
Business Name Registrationinvestments increased (in
2016 4,523 4642 4642 100

Annual Regional Development Report (ARDR) I CY 2017
30
Objectives/Results
Indicator Baseline* 2017Target
2017Actual
Accomplish-ment (%)Year Value
MillionPhp)Number of MSMEs assisted in thepriority industries increased(cumulative)
2016 - 1,380 1,680 122
Number of investors assistedincreased (cumulative)
2016 1,065 955 90 9
Number of exporters assistedincreased (cumulative)
2016 38 40 42 105
Intermediate Outcome 1.2:Competitiveness, innovativeness and resilience increased
Score of provinces in Region 02 out of the total number of participating provinces improvedBatanes 2016 15.55
(72)Incr. 27.1
(68)174% higherthan in 2016
Cagayan 2016 23.08(46)
Incr. 33.79(33)
146% higherthan in 2016
Isabela 2016 25.9(22)
Incr. 33.92(30)
131% higherthan in 2016
Nueva Vizcaya 2016 19.84(65)
Incr. 33.31(38)
168% higherthan in 2016
Quirino 2016 22.02(54)
Incr. 35.56(16)
161% higherthan in 2016
Aggregate OutputNumber of MSMEs assistedincreased (cumulative)
2016 10,486 10,450 11,356 109
Number of mentees capacitatedincreased (cumulative)
2016 - 200 200 100
Number of MSMEs doing e-commerce increased (cumulative)
2016 - 25 37 148
Number of technical assistanceprovided to stakeholders/LGUs ontourism industry developmentincreased (cumulative)
2016 5 5 37 740
Number of inspection on tourismenterprises conducted increased(cumulative)
2016 300 463 362 78
Number of accreditationapplications acted upon increased(cumulative)
2016 300 463 362 78
Number of products developedand product partners engagedincreased (incremental)
2016 5 5 8 160

Annual Regional Development Report (ARDR) I CY 2017
31
Objectives/Results
Indicator Baseline* 2017Target
2017Actual
Accomplish-ment (%)Year Value
Intermediate Outcome 1.3: Market access improved (see Section on Support to National Policy, Sub-sectorOutcome on "Strategic external trade policy regime achieved" )Intermediate Outcome 1.4: Consumer access to safe and quality goods and services ensured
Percentage of violatingfirmspenalized and compliantincreased (%)
2016 90 90 100 111
Consumer complaints resolutionrate increased (%)
2016 85 85 100 118
Aggregate OutputNumber of firms monitored (PriceTrending) increased
2016 120 120 120 100
Number of processed applicationsfor permits, accreditations,licenses, or authorities increased
2016 90 90 100 111
Reporting Entity/ Data Source: PSA RO2, DTI RO 2, CEZA, DOT RO 2
“Negosyo”: Increasing access to economic opportunities forMSMEs
MSMEs access to production networks improved. Programs to improve access of MSMEs toproduction networks were sustained as evidenced by the 156 percent accomplishment rate in terms ofthe number of the trade fairs (total firms) conducted/participated and a 100 percent accomplishmentin the number of established Go Negosyo centers. Promotional activities of the DTI R02 includingOTOP (One-Town, One Product) shows, Go Lokal! retail store concept in major malls, and theinternationally-recognized FAME exhibits helped linked MSMEs to big companies or to governmentso that these institutions are supplied with MSME products on a continued basis. In MODELS OFNEGOSYO, DTI gave different business ideas to help MSMEs get into business, from traditionalenterprises to direct selling and franchising.
Access to finance by MSMEs made easy. The DTI RO2 during the year also conducted financingforum cum matching to create awareness on the different financing windows offered by governmentfinancing institutions and the private sector. Facilitation of MSME loan applications was alsoprovided. Series of orientation was also conducted on the financing program of the DuterteAdministration – the PondoparasaPagbabago at Pag-asenso or P3. The P3 program is a microfinanceprogram in cooperation with Small Business Corporation. It supports micro entrepreneurs for themto expand and/or purchase additional supplies for their businesses.

Annual Regional Development Report (ARDR) I CY 2017
32
Productivity, efficiency, and resilience improved. Targets for the aggregate output indicators tomeasure productivity, efficiency and reliance of MSMEs were impressive during the year. The targetof 90 shared service facilities in operation was attained and the number of prototypes developedreached up to 134 as compared to its target of only five (See Section on Vigorously AdvancingScience, Technology and Innovation for other indicators).
Table 9.Performance Indicators on Increasing Access to Economic Opportunities for MSMEs,Region 02, CY 2017 (CVRDP 2017-2022 Results Matrix)
Objectives/Results
Indicator Baseline* 2017Target
2017Actual
Accomplish-ment (%)Year Value
Increased access to economic opportunities in I&S for micro, small and medium enterprises (MSMEs),cooperatives and Overseas FilipinosIntermediate Outcome 2.1: Access to production networks improved
Aggregate OutputNumber of trade fairs (total firms)conducted/participated increased(cumulative)
2016 25 25 35 140
Number of Go Negosyo centers 2016 40 56 56 100Established 2016 - 8 8 100Maintained 2016 - 48 48 100Number of trade development/trade support activities conducted/participated increased
2016 - 35 41 117
Intermediate Outcome 2.2: Access to finance improvedPrescribed percent of allocation formicro and small enterprises to totalbank loan portfolio attained (%)
2016 - - - -
Prescribed percent of allocation formedium enterprises attained (%)
2016 - - - -
Intermediate Outcome 2.3: Productivity, efficiency and resilience improvedMSMEs sales increased (MillionPhP
2016 - - - -
Aggregate OutputNumber of shared service facilitiesin operation increased
2016 90 90 90 100
Number of prototypes developedIncreased (cumulative)
2016 - 5 134 2680
Number of Small EnterpriseTechnology Upgrading Programbeneficiaries increased
2016 - - - -
Number testing and calibrationservices rendered increased
2016 3,394 - - -
Reporting Entity/ Data Source: PSA RO2, DTI RO 2, CEZA, DOT RO 2

Annual Regional Development Report (ARDR) I CY 2017
33
Moving ForwardIn the next two to three years, the region should focus its efforts on implementing programs to attainan expanded and increased access to economic opportunities by MSMEs, cooperatives and overseasFilipinos through the following:
Focused implementation of the DTI’s 7Ms (mindset change, mastery, mentoring, money,machine, market access, models of negosyo) in industries where the region has a comparativeadvantage. The 7Ms is a strategy to help promote inclusive growth and addressing incomeinequality in the sector. It seeks to help MSMEs set up their own business and become smarterentrepreneurs;
Continuous conduct of activities that would address the problems identified in each segmentof the value chain especially of those commodities/industries that have already welldocumented value chain studies;
Accelerate provision and improvement of infrastructure support system including soft andhard infrastructure (transport, power, logistics, ICT) to ease cost in business operations aswell as to attract more investors;
Continuous social preparation activities to LGUs with potential ecotourism sites to be able toeffectively develop and manage tourism products within their ecological limits;
Encourage application of permits and licensing of businesses through streamlined andharmonized procedures in business registration and licensing, entry and exit, payment oftaxes, access to finance and issuance of building permits; and
Encourage farmers and fisherfolk to enroll in TESDA courses that would open non-farmincome opportunities (i.e., carpentry) especially during lean months in agriculture.

Annual Regional Development Report (ARDR) I CY 2017
34
Accelerating Human CapitalDevelopmentA well-educated, healthy and highly skilled labor force is important to support the desired developmentdirection of Cagayan Valley region from being a purely agriculture-based economy to an agro-industrialhub and major tourism destination of the country. This section will discuss how far the region’sinvestments in human capital development has improved the education and skills level of its people,their health and nutrition as well as their productivity and earning ability.
Figure 7. Strategic Framework to Accelerate Human Capital Development by 2022

Annual Regional Development Report (ARDR)I CY 2017
35
AccomplishmentsEnhancing health and nutrition for all
Life expectancy at birth increased. Projected life expectancy at birth is 74.46 years for females and69.51 years for males for 2015-2020 1. Based on the 2010-2015 Census of Population, Region 2 posted alife expectancy of 73.3 and 68.3 years for females and males respectively, an increase from that recordedduring the 2005-2010 Census 2. The actual and latest life expectancy data is also within the projectedfigures for the region until the year 2020.
Fertility rate slightly decreased. There has been a slight decline in fertility rates in the region from 3births per woman in the 2013 to 2.7 births per woman in 2017. Much is yet to be done to reach thedesired level of 2 births per woman at the end of the Plan period.
Maternal mortality remained high but within the target. Maternal mortality, though within thetarget, was still high at 50.56 deaths per 100,000 live births in 2017. A review of maternal deathsconducted at the provincial level revealed that most deaths were due to lack of information andawareness on the standard health services for pregnant women. This lack of information is greatlyinfluenced by cultural beliefs and negative attitude towards maternal health care. Other factors leadingto maternal deaths include poor referral system and lack or non-adherence of health workers in primaryhealth facilities and referral hospitals to clinical practice guidelines. Maternal deaths directly related topregnancy and childbirth was at a relatively higher rate in the provinces of Cagayan and Quirino and inSantiago City.
Child mortality slightly decreased. Child mortality though short on target have slightly decreased.Neonatal deaths were recorded at 5 per 10,000 live births while infant deaths at 46 deaths per 1,000 livebirths. Under-5 mortality rate was lower at 6.07 in 2017 compared to the baseline value of 6.78 percentin 2016.
Nutrition among children significantly improved. Stunted children significantly decreased to 6.5percent from 29 percent in the previous year. Wasting among children and those that are overweightalso decreased in their percentage levels compared to the previous year. This notable performance wasmade possible through the conduct of “Breastfriends”, Family Planning Summits, Nutrition Caravans,provision of training support to infirmary health facilities and orientation for heads of governmentagencies on the importance of breastfeeding for working breastfeeding mothers. Intensive monitoringof overweight, wasted and stunted children was also undertaken through the Regional Health SectorPerformance Monitoring Unit.
Epidemics of HIV, malaria and tuberculosis decreased. Malaria mortality and the prevalence ofmalaria in the region were sustained at zero level. Tuberculosis (TB) incidence decreased to 310 cases
12017 Regional Social and Economic Trends, Region 222000 Census-Based National and Regional Population Projections, Volume II

Annual Regional Development Report (ARDR) I CY 2017
36
per 100,000 population from the previous year’s 322 TB cases per 100,000 population. The prevalence ofHIV decreased at less than one percent compared to the 2.5 percent prevalence rate in CY 2016.However, the number of newly diagnosed cases increased in CY 2017 for both the national and regionallevel. There were 11,103 new HIV antibody seropositive individuals reported to the HIV/AIDS & ARTRegistry of the Philippine of which 1 percent or about 1,000 individuals came from Region 2.3
Functional service delivery networks ensured. About 97 percent of births in CY 2017 were attended byskilled health personnel compared to 96 percent in CY 2016. Health personnel include doctors, nursesor midwives. There was also a decline in unmet need for modern Family Planning, from 15.6 percent in2013 to 14.4 percent in 2017. Region 02 had the highest contraceptive prevalence rate among all regionsduring the year. Of all age groups, the women of younger reproductive age (ages 15-19) have the highestvalue of unmet need with 28 percent compared to around 13-18 percent for other age groups.
Ensuring lifelong learning opportunities for all
Access to basic education improved but quality needs to be enhanced. Enrolment in the Elementaryand Junior High School exceeded the CY 2017 target rates by three percent and 11 percent respectively.However, kindergarten enrolment fell short by 21 percent of the target enrolment rate for the year. Thedecrease in enrolment in the Kindergarten was due to the implementation of DepEd Department Order47 series of 2016, which prescribed that only learners that meet the age requirement of 5 years old willbe allowed to register. In terms of completion rate, target for the elementary level was achieved but thatof Junior High School was not attained
The mean percentage score of the National Achievement Test for Grade 6 was 39.98percent and 42.96percent for Grade 10. The results were below the region’s target for both grade levels and were alsolower from their CY 2016 results.
Mean years of schooling or the average years of prior education received by adults ages 25 and older washighest in the province of Batanes followed by the province of Nueva Vizcaya. Based on latest availabledata4, the average years of schooling in both provinces is 10.1 and 9.3, respectively. The region’sfunctional literacy rate increased to 97.2 percent compared to 86.1 percent in 2008. The female grouphad a higher rate at 98 percent than that of the males with 96.4percent5.
Table 10. Basic Education Net Enrolment and Completion Rate, SY 2016-2017, Region 02Indicator Baseline 2017
Target2017
ActualAccomplishment (%)
Year Value
Net enrolment rateKinder 2016 85.8 86.46 68.64 79Elementary 2016 96.31 96.97 100.26 103
3https://www.doh.gov.ph/sites/default/files/statistics/EB_HIV_December_AIDSreg2017.pdf4https://psa.gov.ph/sites/default/files/HDI%20Tables%2C%20final%2015jan16_0_0.pdf5PSA: 2013 Functional Literacy, Education and Mass Media Survey

Annual Regional Development Report (ARDR)I CY 2017
37
Indicator Baseline 2017Target
2017Actual
Accomplishment (%)Year Value
Junior HS 2016 70.21 70.87 78.97 111Completion rateElementary 2016 88.31 91.29 95.01 104Junior HS 2016 81.99 82.53 81.46 98.7
Source: DepEd RO2
Investments in research barely moved. Government expenditure for higher education research,development and innovation for HEIs in the region amounted to Php31 Million, lower than the 61.7Million in CY 2016. The grants include four projects under the Institutional Development andInnovation Grant and one form the 2nd cycle of DARE TO6 Research Grant.
Increasing income-earning ability
Youths placed in education increased. The 2018 Gender Statistics on Labor and Employmentregistered a total of 23,000 unemployed youths ages 15-24 in CY 2017 for Region 2. Thirty-six thousandchildren ages 5-14 years old are not currently attending school, of which around 4,000 are alreadyworking. There are 35,000 youth ages 15-17 years old who are not currently attending school and 18,000of which are already working.
To assist those who are interested and deserving of a higher level of education, a total of 20,043 studentswere awarded scholarships and other financial assistance by the Commission on Higher Education(CHED) compared to only 5,355 students in CY 2016. The Private Education Student FinancialAssistance (PESFA) Program and Training for Work Scholarship Program (TWSP) of the TechnicalEducation and Skills Development Authority (TESDA) supported a total of 481 students pursue highereducation and another 4,582 students undertook specialized training. In SY 2017-2018, the ExpandedStudents’ Grant-in-Aid Program for Poverty Alleviation (ESGPPA) increased its beneficiaries to 1,247from 1,229 the previous year. The PAMANA was reduced to only 2 from last year’s 4 grantees since theother 4 already graduated and no new slots were allotted. Under the sugar industry worker grants,additional 2 slots were granted during the year.
Tertiary graduates in science, engineering, manufacturing and construction comprised 30.2 percent ofthe total level graduates from 30.68 percent in CY 2016. Graduates under the Expanded TertiaryEducation Equivalency and Accreditation Program decreased to 205 graduates from 231 in CY 2016.Post baccalaureate graduates engaged in original research of creative work increased to 910 from lastyear’s 320 graduates. Seventy-three percent were females while twenty-seven percent or 245 were males.The overwhelming increase was due to the required master’s degree teaching qualification in highereducation and the graduate program scholarship opportunity given to faculty members of HEIs under
6DARE TO (Discovery-Applied Research and Extension for Trans/Inter-disciplinary Opportunities) Research Grant is acompetitive enabler seed grant amounting to a maximum of Php15M for 2 years per project. It aims to stimulate strongcollaborative research and innovation ventures and sustainable partnerships for extension activities during the K to 12 transition.

Annual Regional Development Report (ARDR) I CY 2017
38
the K-to-12 Transition Program of CHED. Certification rate of Technical and Vocational Educationand Training (TVET) graduates increased to 92 percent in CY 2017 from the previous year’s 85 percent.The increase was brought about by the heightened information and advocacy on the Competencyassessment and certification.
The DSWD’s targeted participants for the Employment Facilitation (EF) track of its SustainableLivelihood Project were from the LISTAHANAN-identified poor households, particularly PantawidPamilya beneficiaries. They are not limited to the youth, but must be at least 18 years old at the start ofthe project to participate in the EF track. The actual accomplishment is 3,626 households for CY 2017.
The Department of Labor and Employment (DOLE) reported a total of 17,986 youths employed in CY2017 compared to the previous year’s 19,932 youths exposed under the Special Program forEmployment of Students, Government Internship Program and Jobstart.
Moving ForwardFor the following year until the end of the Plan period, the following are among the region’s strategicinterventions to fulfill the desired outcome of accelerating human capital development
Provision of comprehensive health care during the first 1000 days of life of newborn andchildren;
Strengthen advocacy campaigns on healthy diet and lifestyle; Provision of adolescent health services including sexual and reproductive health care; Provision of health services for older persons; Full implementation of the Reproductive Health Law particularly family planning; Prevention and treatment of non-communicable and lifestyle diseases; Setting-up and mobilization of service delivery networks for health care; Construction/Upgrading and equipping health facilities; Improve human resources for health; Full implementation of the K to 12 educational reform through timely delivery of adequate
education inputs such as school infrastructure and quality learning materials; Continuing hiringand capacity building of teachers; and effective and transparent monitoring and evaluationsystem including database to track learners among marginalized sectors;
Integrate programs to keep children in school by assessing the effectiveness of currentalternative delivery modes, designing an alternative learning system (ALS) program for seniorhigh school (SHS) dropouts and devising a certification mechanism that will allow completersto obtain a high school diploma;
Improved access of marginalized sectors to educational services; Improve access to quality, relevant and globally-competitive TVET programs;
Annual Regional Development Report (ARDR)I CY 2017
39
Expand access to higher education through the Unified Financial Assistance System for TertiaryEducation; Expanded Tertiary Education Equivalency and Accreditation Program; LadderizedEducation Program and Distance Education Program; and integration of 21 centurycompetencies in higher educational curriculum;
Improve employability of the young labor force through the provision of continuing skillsenhancement and retooling for the labor force especially among the youth who have noeducation;
Strengthen employment facilitation services by providing assistance to new entrants to the laborforce through coaching, career advocacy, and counseling;
Setting-up of online services for overseas Filipinos; strengthening the PESO program of LGUsand Setting-up of accessible public system for job search, matching, and job referral portals; and
Strengthen and expand internship, apprenticeship, and dual-training programs that facilitateschool-to-work transition.

Annual Regional Development Report (ARDR) I CY 2017
40
Reducing Vulnerability of Individualsand FamiliesThe reduction of vulnerabilities of persons and families is the primary concern of this chapter. As theregion endeavours to achieve universal coverage of social protection programs, all individuals andfamilies are expected to be able to deal and cope with hazards and risks during their life cycles.
Figure 8. Strategic Framework to Reduce Vulnerability of Individuals and Families by 2022

Annual Regional Development Report (ARDR)I CY 2017
41
AccomplishmentsAchieving universal and transformative social protection for all
Social protection increased for the vulnerable. The total population covered by Philippine healthinsurance increased by 1 percent in CY 2017 or a total of 3.2 Million of the region’s population. Thiscovers 92 percent of the total projected population of 3.5 Million. The number of senior citizens grantedwith social pension increased to 217,693 from 80,634 of the previous year. This is 23 percent more thanthe CY 2017 target of 176,346. There were 103,817 households provided with cash grants under theconditional cash transfer program or 0 .6 percent higher than the CY 2016 performance.
Overseas Workers Welfare Administration (OWWA) reported 340,440 members as of December 31,2017, of which 136,772 are new registrants and 203,668 overseas workers with renewed membership.Transportation assistance was given to 19 OFWs in distress. There were 4,015 OFWs and theirdependents provided with trainings on values formation, financial literacy and entrepreneurialdevelopment. Cash relief assistance was granted to 22,006 OFWs affected by Super Typhoon Lawin.Under the reintegration program, 374 OFW beneficiaries were provided livelihood start-up capitalwhile 33 returning OFWs affected by the financial crisis in the Kingdom of Saudi Arabia received theirrepatriation assistance to at least cushion the impact of employment and income displacement.
Livelihood assistance in the form of starter kits worth Php10,000.00 each was provided to 174 familieswith identified child laborers and children at risk to enable the parents earn income and free theirchildren from child labor.
Immediate assistance extended to victims of natural calamities. The Disaster Risk ReductionManagement Program focused on the provision of emergency shelter cash assistance to 120,238 familiesaffected by Super Typhoon Lawin. Aside from the shelter assistance, 98 percent of these families wereprovided with support services through the food-for-work and cash-for-work programs. In exchange ofthe support services granted, the typhoon victims rendered 80-hour community service for a period of10 days in their own localities
Food packs were given to 2,383 affected families during the onslaught of Typhoon Jolina, Isang, Kikoand the Northeast Monsoon. Also, DSWD provided augmentation support to the 350 families ofBaggao in their attendance to a Flood Drill. Fifty two families with damaged houses were providedEmergency Shelter Assistance chargeable against the Quick Relief Fund. These families were endorsedby LGUs whose houses were totally damaged by fire in the provinces of Cagayan and Isabela.
Assistance to farmers and fisherfolk. The government through the Department of Agriculture (DA)provided subsidy amounting to Php166.17 Million for rice farmers and Php107.03 Million for cornfarmers in 2017 under the Philippine Crop Insurance Corporation’s (PCIC) registry system for basicsector in agriculture. The insurance coverage amounted to Php1.89 Billion for rice and Php1.05 Billionfor corn which included marginal fishers and voluntary paying farmers with landholdings exceeding 3

Annual Regional Development Report (ARDR) I CY 2017
42
hectares. The provinces also augmented the program of DA and PCIC with its Bro Program orPananim. Extreme weather conditions highlighted the value of crop insurance with the spike in thenumber of farmers availing of the PCIC services.
Table 11. Farmers and Fisherfolk under the Registry System forBasic Sectors in Agriculture (RSBSA), Region 02. CY 2017
Provinces No. Farmers and Fisherfolk
Batanes 5,376
Cagayan 234,748
Isabela 311,975
Nueva Vizcaya 94,295
Quirino 45,711
Region (Total) 692,105
Source: PCIC website (original source-DBM)
Moving ForwardAfter the first year of implementation of the Cagayan Valley Regional Development Plan 2017-2022, theachievement of a universal and transformative social protection for all Filipinos should focus on aninclusive and convergent social protection programs for the vulnerable groups. The following strategiesshould be given priority:
Implement a convergence approach in the delivery of social protection programs to help thepoor and vulnerable become self-sufficient and self-reliant;
Redefine the criteria for the Social Pension for Indigent Senior Citizens to cover all poor seniorcitizens, not just indigent senior citizens;
Expand the coverage of the Conditional Cash Transfer Program to accommodate newlyidentified poor households and near-poor households based on Listahanan;
Strictly implement the No Balance Billing Policy of the Philhealth; Strategically implement health care services that minimize or eliminate high out-of-pocket
expenses and expand primary care benefit packages; and Improve social protection services for Overseas Workers particularly repatriation-related and
re-integration-related services.

Annual Regional Development Report (ARDR)I CY 2017
43
Building Safe and Secure CommunitiesGuided by the regional development framework, the region aims to build safe and secure communitiesby ensuring access to affordable, adequate, safe and secure shelter for the region’s populace. It is alsoenvisioned that the communities where people live in are well-planned and built with due considerationgiven to ease of access to livelihood opportunities, comfort, security and disaster resiliency. For theinitial year of Plan implementation, the performance targets of the sector include provision of housingassistance particularly for informal settlers and those belonging to the lower income bracket.
Figure 9. Strategic Framework to Build Safe and Secure Communities by 2022

Annual Regional Development Report (ARDR) I CY 2017
44
AccomplishmentsExpanding access to affordable, adequate, safe and secureshelter in well-planned communities
Informal settlements or inadequate housing decreased. During the Census year 2010, the CagayanValley region had a total of 713,274 occupied housing units inhabited by 727,327 households. The ratioof household population per housing unit was 5:1 in the same year. About 97 percent of the totalhouseholds lived in a single house-type structure while the remaining 3 percent lived either in duplex,multi-unit residential, commercial and other types of housing units.
The proportion of informal settlements or those with inadequate housing has decreased, from about 10percent of total housing units in 2016 to 8.39 percent in 2017. Access to affordable, safe and secureshelter is starting to be realized, particularly for those belonging to the lower income groups, eitherthrough their own efforts and initiatives or through the assistance local governments and governmenthousing agencies. Table 12 shows the number of units delivered for socialized and low-cost housing bythe Housing and Urban Development Coordinating Council (HUDCC).
Table 12. Socialized and Low-cost Housing Targets and Accomplishment, Region 02, 2017
Program Baseline(2016)
2017Target
2017Actual
Accomplishment (%)
Socialized Housing 658 839 839 100
Low-cost Housing 718 647 647 100
Source: HUDCC North Luzon
More LGUs have engaged in the formulation of their Comprehensive Land Use Plan (CLUP). Therewas an increased number of local governments that have committed to undertake the completion orupdating of their Comprehensive Land Use Plans (CLUPs). A total of 46 LGUs conducted CLUP-related trainings compared to the 12 recorded in CY 2016. These 46 LGUs were provided technicalsupport on land use planning by the Housing and Land Use Regulatory Board (HLURB) and otheragencies.
Housing backlog continually being assessed. As of November 2017, a total of 85 LGUs out of the totalof 93 cities and municipalities have been assessed of their housing needs. This is an improvement fromthe 73 LGUs covered as of 2016. From the 2017 assessment, the region had a total housing backlog of93,104 housing units of which the bulk, or about 62,644, are displaced housing units (Table 13).Displaced houses are those houses are situated in danger areas, along riverbanks and affected by road-right-of- way. The figure was generated by the HUDCC during the conduct of technical assistance toLGUs on Local Shelter Plan formulation.

Annual Regional Development Report (ARDR)I CY 2017
45
Table 13. Summary of Housing Need Per Province, Region 02, as of November 2017
No. ofCities/Municipalities
Province Housing Backlog Total HousingNeedDoubled-up
householdDisplacedhousehold
Homeless
6/6 QUIRINO 639 1,226 0 1,865
14/15 N.VIZCAYA 5,775 12,203 342 18,320
36/37 ISABELA 14,216 30,345 1,858 46,419
29/29 CAGAYAN 7,543 18,870 87 26,500
0/6 BATANES
Total(85/93) 28,173 62,644 2,287 93,104Source: HUDCC North Luzon
Moving ForwardTo address the concerns on housing and shelter, the following major strategies should be taken intoconsideration:
Encourage the support of the Local Chief Executives in the Local Shelter Plan formulation; Local Government Units should prioritize the identification of sites for socialized and low-cost
housing; Identification of resettlement areas in municipalities that are highly vulnerable to flooding and
other natural calamities should be a primary concern of the LGUs; Expedite land conversion and land titling for socialized and low-cost housing; The government should allocate adequate funds for housing and shelter; and Expedite land titling and land conversion of sites identified for resettlement areas and sites for
socialized and low-cost housing.

Annual Regional Development Report (ARDR) I CY 2017
46
III. PATULOY NA PAG-UNLAD:INCREASE POTENTIAL GROWTH
Reaching for the DemographicDividendReaching for the demographic dividend is a conscious endeavour across sectors. The region is currentlyin the demographic transition as it exerts all efforts to achieve low fertility and mortality while workingon the enhancing the skills, health and productivity of its labor force. With an employment rate that ishighest among regions at 96.8 percent and better than the country’s employment rate of 94.3 percent,the challenge is to address underemployment and youth unemployment to enable our working agegroup earn and save for their retirement years. The growing number of those entering the labor marketwill be an advantage for the region only if they are gainfully employed.
Figure 10. Strategic Framework to Reaching for the Demographic Dividend by 2022

Annual Regional Development Report (ARDR)I CY 2017
47
AccomplishmentsAccelerating demographic transition
The contribution of a population economic growth varies depending on the age bracket because peopleearn and consume at different levels over their lifetime. Hence, the age structure of the region’spopulation matters in demographic transition. The region’s population below 15 years of age accountsfor 30.68 percent of its total population based on 2015 Population Census and lower by 1.06 percentcompared to the 2010 Census of Population. Those aged 65 years and above comprise 5.18 percent ofthe total population versus 4.78 percent in the previous censal year. Dependency ratio declined by 1.62percent from 57.52 percent in 2010 to 55.9 percent in 2015. There are more young dependents than theold-aged group.
There was a slight decline in fertility rate from 3 births per woman in the 2013 NationalDemographic and Health Survey (NDHS) to 2.7 births per woman in the NDHS 2017. The region’stotal demand for family planning1 among currently married women and sexually active unmarriedwomen2 posted the highest among regions at 77 percent. About 57 percent of this demand is metthrough modern methods of family planning, 5.6 percent through natural method and with only 14.4percent still unmet. Younger women, age 15-19, have the highest percentage of unmet family planningneed of all age groups at 27.9 percent compared to other age groups which ranged from 13 to 18percent.The 2017 NDHS also reported that 5.4 percent of women age 15-19 experienced giving birthand 2.3 percent were pregnant with their first child at the time of survey. This translates to anadolescent birth rate of 7.8 percent, an increase of 2.4 percentage points compared to the 2013 NDHSresult of 5.4 percent. This will be pursued by improving the quality of human capital, both in terms ofhealth and education outcomes and reduction in youth unemployment rates.
Maximizing the gains from our demographic dividend
Maximizing the demographic dividend shall be pursued by improving the quality of human capital,both in terms of health and education outcomes and reduction in youth unemployment rates.
In terms of health outcomes, indicators which showed improvements in the overall health status of theregion’s population include reduction in child mortality rate, decrease tuberculosis incidence, betternutritional status and zero malaria mortality. The region’s maternal mortality was within the targetduring the period although it is still considered high given national standards. Improvements werelikewise noted in access to quality education with the increased participation rates in elementary andjunior high school participation rates. More scholarships, grants and trainings were likewise made
1 Total demand is the sum of unmet need and met need2 Women who have had sexual intercourse within 30 days preceding the 2017 NDHS

Annual Regional Development Report (ARDR) I CY 2017
48
available during the year under review for tertiary as well as technical and vocational education. (seeChaper 10).
However, providing adequate quality employment especially to the region’s young population remains achallenge in the succeeding years of Plan implementation. The number of unemployed persons ages 15-30 years old increased from 30,000 in CY 2016 to 34,000 in CY 2017. Unemployment among the femaleyouth is higher at 9.6 percent than in the males with 6 percent. Although there was a decrease inunderemployment rates among the youth from the previous year, the aggregate underemployment rateof 10.9 percent is still considered high. Majority of the unemployed are Junior High school graduates,and this emphasizes the importance of having a higher level of education in ensuring that the youthbecome productive members of the labor force. (Table 14).
Table 14. Youth Unemployment & Underemployment, Region 02, 2016 & 2017
Particulars 2016 2017Number
(in thousand)Rate(%)
Number(in thousand)
Rate(%)
UnemploymentTotal 30 6.0 34 6.9Male 16 4.6 20 6.0
Female 14 9.2 15 9.6Underemployment
Total 58 12.3 50 10.9Male 45 13.4 39 12.4
Female 13 9.4 11 7.7Source : 2018 Gender Statistics on Labor and Employment, PSA
Details may not add up to total due to rounding

Annual Regional Development Report (ARDR)I CY 2017
49
Moving Forward
Demographic dividend is not automatic. It can only be reached when all aspects of human capitaldevelopment is improved. In correlation with the strategies identified in chapter 10, the followingstrategies should be undertaken by all stakeholders concerned:
Lower the fertility rate to create a demographic window of opportunity with emphasis on theneed to speed up voluntary reduction in fertility rates, reduce teenage pregnancy and eliminaterepeated pregnancies among minors;
Expand PhilHealth coverage for reproductive health services;
Intensify the promotion of Contraceptive Self-Reliance among LGUs and establish amonitoring mechanism to ensure its sustainability;
Improve service delivery networks to attain the desired child and maternal mortality rates; and
Address job-skills mismatch especially among the youth by reinforcing the technical andvocational courses.
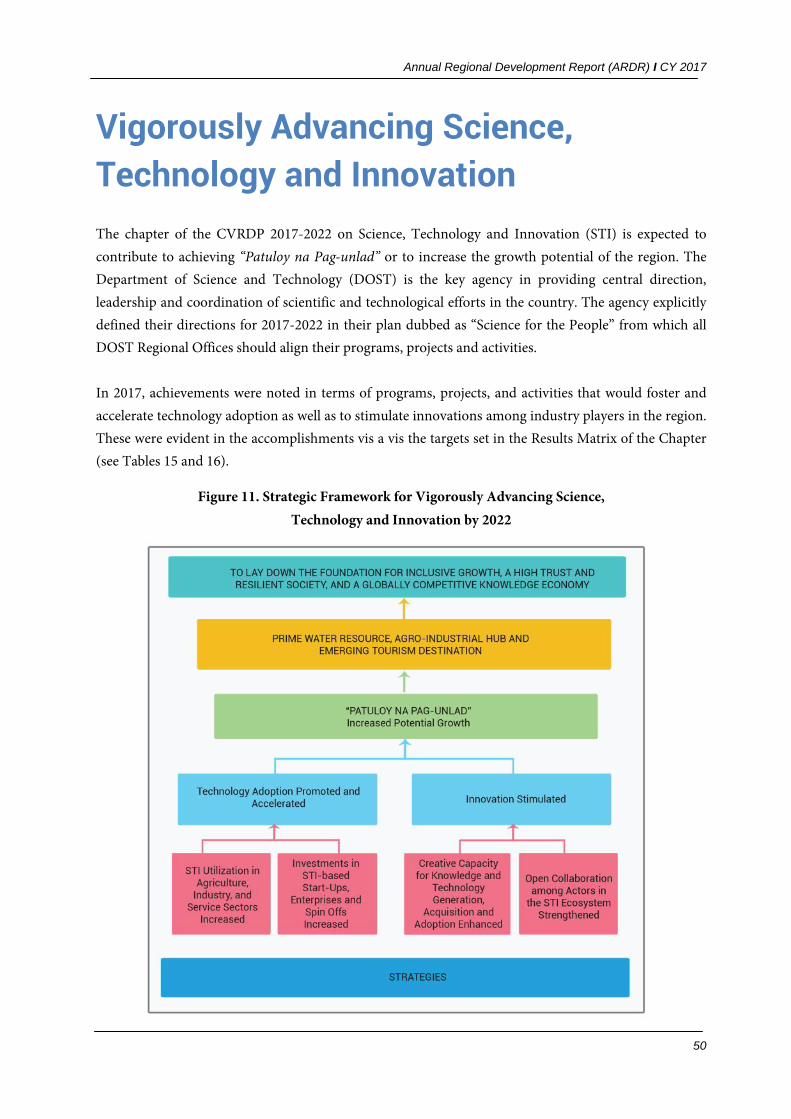
Annual Regional Development Report (ARDR) I CY 2017
50
Vigorously Advancing Science,Technology and InnovationThe chapter of the CVRDP 2017-2022 on Science, Technology and Innovation (STI) is expected tocontribute to achieving “Patuloy na Pag-unlad” or to increase the growth potential of the region. TheDepartment of Science and Technology (DOST) is the key agency in providing central direction,leadership and coordination of scientific and technological efforts in the country. The agency explicitlydefined their directions for 2017-2022 in their plan dubbed as “Science for the People” from which allDOST Regional Offices should align their programs, projects and activities.
In 2017, achievements were noted in terms of programs, projects, and activities that would foster andaccelerate technology adoption as well as to stimulate innovations among industry players in the region.These were evident in the accomplishments vis a vis the targets set in the Results Matrix of the Chapter(see Tables 15 and 16).
Figure 11. Strategic Framework for Vigorously Advancing Science,Technology and Innovation by 2022

Annual Regional Development Report (ARDR)I CY 2017
51
AccomplishmentsTechnology adoption promoted and accelerated
Technology upgrade for small enterprises accelerated. This year, the two performance indicatorsunder Small Enterprises Technology Upgrading Project (SETUP) posted remarkable achievements.Specifically, technology interventions under SETUP (395 actual, 80 target, 50 in 2016) and number oftrainings conducted for both SETUP and non-SETUP (249 actual, 100 target, 50 in 2016) weresignificantly higher compared to the levels the previous year and with respect to their targets during theyear. This achievement was contributed to by the 38 percent increase in fund allocation for the SETUPduring the year, with 81 new projects implemented amounting to about Php 84.7 Million.
STI utilization facilitated through intensified research and development. The DOST 02 alsointensified its partnership with SUCs in the region through its various projects in the field of research.In 2017, the four S&T networks in the region attained their target number of DOST funded researches.The Cagayan Valley Health Research and Development Consortium (CVHRDC) and the CagayanValley Industry, Energy and Emerging Technologies Research and Development Consortium(CVIERDEC) met their target of three (3) researches each while the Cagayan Valley Agriculture andResources Research and Development Consortium (CVARRD) and Equipment Manufacturing ClusterRegion 02 (EMC-RO2) conducted seven researches each. Likewise, a total of 20 new IntellectualProperty (IP) applications were facilitated for State Universities and Colleges (SUCs) and HigherEducation Institutions (HEIs) during the year or about 100 percent accomplishment rate.
The three existing R&D Centers continued their respective research and development undertakingsduring the year. These institutions are Metals and Engineering Innovation Center in CSU Carig, CitrusR&D Center in Quirino State University, and the Climate Change R& D Center in ISU Cauayan CityCampus.
Investments in STI-based start-ups, enterprises and spin-offs increased. During the year, the targetof 40 new MSMEs enrolled in SETUP was doubled. Similarly, the 185 number of householdsempowered thru Community Empowerment Thru S&T (CEST) was twice as much as the target for theyear.
On the one hand, the target of establishing the Food Innovation Center (FIC) in Cagayan province wasachieved. The FIC located at Cagayan State University (CSU) helps locals in the region in developingtheir processed food products. In CY 2017, it developed 50 prototypes of food products. The Center,one of the firs in the country, conducted the first ever awarding of Licensing Agreements to 12 businessfirms in the region in 2017 which generated about Php440,000 income. The Center received multiplenational awards during the Search for Most Innovative Products, making it the number one FoodInnovator in the Philippines. It is also the first FIC in the country with License to Operate (LTO)Accreditation.

Annual Regional Development Report (ARDR) I CY 2017
52
Table 15.Performance Indicators on Promoting and Accelerating Technology Adoption, Region 2, CY 2017(CVRDP 2017-2022 Results Matrix)
Objectives/Results
Indicator Baseline* 2017Target
2017Actual
Accomplishment (%)Year Value
Technology adoption promoted and acceleratedAggregate Outputs
No. of technology interventionsunder SETUP increased(cumulative)
2016 50 80 395 494
No. of trainings conducted(SETUP and Non-SETUP)increased (cumulative)
2016 50 100 249 249
Intermediate Outcome 1.1: STI (science, technology and innovation) utilization in agriculture, industryand services sectors increased
Aggregate OutputsNumber of DOST funded researches conducted by the different S&T Consortia increased(incremental)
CVHRDC 2016 2 3 3 100CVARRD 2016 2 3 7 233CVIERDC 2016 2 3 3 100EMC 2016 2 3 7 23
Number of new IntellectualProperty facilitated for SUCs andHEIs increased
2016 20 20 100
Intermediate Outcome 1.2: Investments in STI-based start-ups, enterprises and spin-offs increasedAggregate Outputs
Number of new MSMEs enrolledin SETUP increased (incremental)
2016 30 40 80 200
Number of householdsempowered thru CommunityEmpowerment Thru S&Tincreased (incremental)
2016 50 60 185 208
Number of Innovation Hubsestablished increased
2016 1(EMC -Isabela
1 (FIC-Cagayan
1 (FIC-Cagaya
n
done
Reporting Entity/ Data Source: DOST RO2
Innovation stimulated
S&T promotional activities escalated. To stimulate innovation in the region, several activities wereundertaken by the DOST RO2 with key partners like LGUs, SUCs, HEIs, and individual stakeholders.The agency surpassed its target of 100 S&T promotional activities for the year with an actualaccomplishment of 136 various activities that include S&T fairs, caravans, Centrum, technology clinics
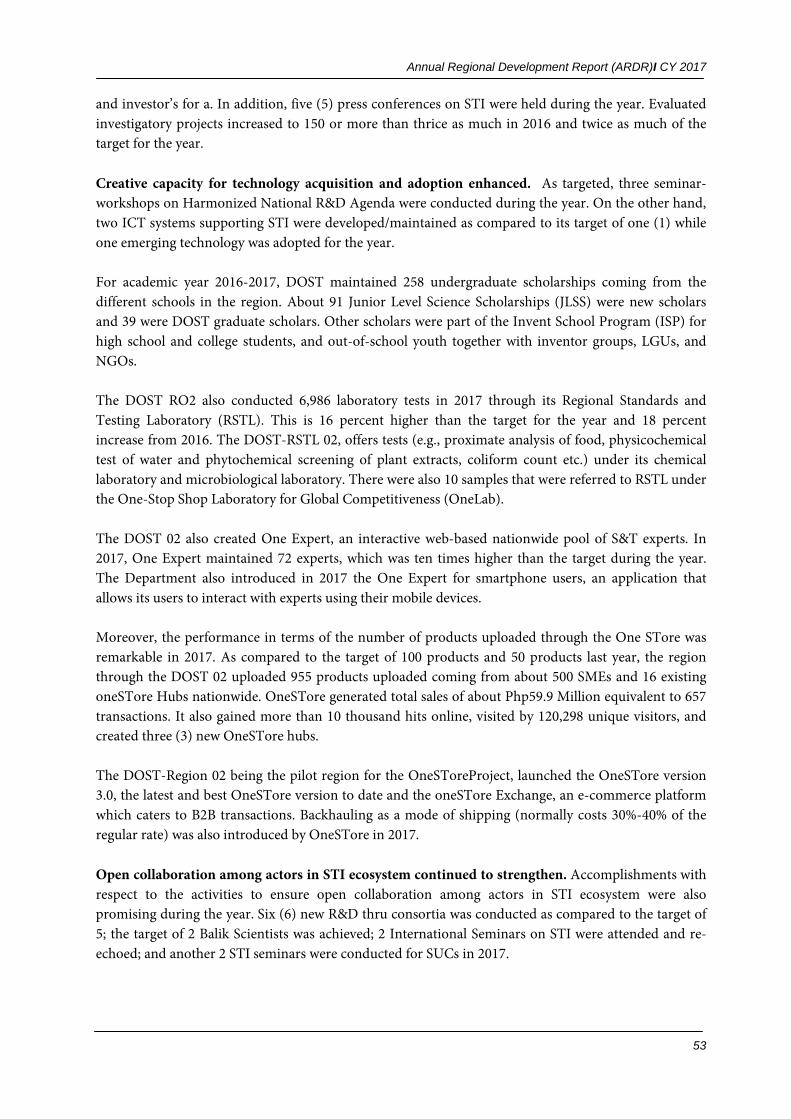
Annual Regional Development Report (ARDR)I CY 2017
53
and investor’s for a. In addition, five (5) press conferences on STI were held during the year. Evaluatedinvestigatory projects increased to 150 or more than thrice as much in 2016 and twice as much of thetarget for the year.
Creative capacity for technology acquisition and adoption enhanced. As targeted, three seminar-workshops on Harmonized National R&D Agenda were conducted during the year. On the other hand,two ICT systems supporting STI were developed/maintained as compared to its target of one (1) whileone emerging technology was adopted for the year.
For academic year 2016-2017, DOST maintained 258 undergraduate scholarships coming from thedifferent schools in the region. About 91 Junior Level Science Scholarships (JLSS) were new scholarsand 39 were DOST graduate scholars. Other scholars were part of the Invent School Program (ISP) forhigh school and college students, and out-of-school youth together with inventor groups, LGUs, andNGOs.
The DOST RO2 also conducted 6,986 laboratory tests in 2017 through its Regional Standards andTesting Laboratory (RSTL). This is 16 percent higher than the target for the year and 18 percentincrease from 2016. The DOST-RSTL 02, offers tests (e.g., proximate analysis of food, physicochemicaltest of water and phytochemical screening of plant extracts, coliform count etc.) under its chemicallaboratory and microbiological laboratory. There were also 10 samples that were referred to RSTL underthe One-Stop Shop Laboratory for Global Competitiveness (OneLab).
The DOST 02 also created One Expert, an interactive web-based nationwide pool of S&T experts. In2017, One Expert maintained 72 experts, which was ten times higher than the target during the year.The Department also introduced in 2017 the One Expert for smartphone users, an application thatallows its users to interact with experts using their mobile devices.
Moreover, the performance in terms of the number of products uploaded through the One STore wasremarkable in 2017. As compared to the target of 100 products and 50 products last year, the regionthrough the DOST 02 uploaded 955 products uploaded coming from about 500 SMEs and 16 existingoneSTore Hubs nationwide. OneSTore generated total sales of about Php59.9 Million equivalent to 657transactions. It also gained more than 10 thousand hits online, visited by 120,298 unique visitors, andcreated three (3) new OneSTore hubs.
The DOST-Region 02 being the pilot region for the OneSToreProject, launched the OneSTore version3.0, the latest and best OneSTore version to date and the oneSTore Exchange, an e-commerce platformwhich caters to B2B transactions. Backhauling as a mode of shipping (normally costs 30%-40% of theregular rate) was also introduced by OneSTore in 2017.
Open collaboration among actors in STI ecosystem continued to strengthen. Accomplishments withrespect to the activities to ensure open collaboration among actors in STI ecosystem were alsopromising during the year. Six (6) new R&D thru consortia was conducted as compared to the target of5; the target of 2 Balik Scientists was achieved; 2 International Seminars on STI were attended and re-echoed; and another 2 STI seminars were conducted for SUCs in 2017.

Annual Regional Development Report (ARDR) I CY 2017
54
DOST- RO 02 also helped empower local researchers and inventors by establishing local chapters suitedto their field of expertise (i.e., National Research Council of the Philippines (NRCP) Cagayan ValleyChapter and Filipino Inventors Society Producer Cooperative (FISPC) Regional Chapter). In 2017, theDepartment hosted the first regional celebration of the FISPC’s National Inventors Week which creatednew partnerships and opportunities with the private sectors like Air21, 2Go, ShoPinas and DOS1.
Table 16.Performance Indicators on Stimulating Innovation, Region 2, CY 2017(CVRDP 2017-2022 Results Matrix)
Objectives/Results
Indicator Baseline* 2017Target
2017Actual
Accomplishment (%)
Year ValueInnovation stimulated
Aggregate OutputsNo. S&T Promotion Activitiesconducted (S&T Fairs, Caravan,Centrum, Fora etc.) increased(incremental)
2016 50 100 136 136
No. of Investigatory Projectsevaluated increased (incremental)
2016 50 100 150 150
No. of Press Conferences on STIIncreased (incremental)
2016 5 5 100
Intermediate Outcome 2.1: Creative capacity for technology acquisition and adoption with globalstandard enhanced
Aggregate OutputsR&D expenditure as a proportionof GDP increased (in %,cumulative)f
2013 0.05 TBD - -
Number of researchers increased(cumulative)f
2013 654 TBD 20 -
No. of seminar-workshops onHarmonized National R&DAgenda increased (incremental)
2016 - 3 3 100
No. of ICT systems developedsupporting STI maintained(incremental)
2016 - 1 2 200
No. of emerging technologiesadopted (ICT, biotech, nanotechetc.) increased (incremental)
2016 - 1 1 100
No. of S&T scholarshipsmaintained (incremental)
2016 - TBD 258 -
No. of lab tests conducted 2016 5,900 6,000 6,986 116No. of samples referred (OneLab) 2016 9 10 10 100No. of S&T experts deployed thruOneExper maintained(incremental)
2016 - 10 72 720

Annual Regional Development Report (ARDR)I CY 2017
55
Objectives/Results
Indicator Baseline* 2017Target
2017Actual
Accomplishment (%)
Year ValueNo. of products uploaded thruOneSTore increased(incremental)
2016 50 100 955 955
Intermediate Outcome 2.2: Open collaboration among actors in STI ecosystem strengthenedAggregate Outputs
No. of new R&D conducted thruconsortia increased
2016 5 5 6 120
No. of new Balik Scientistsdeployed (incremental)
2016 - 2 2 100
No. of International Seminars onSTI attended (incremental)
2016 - 1 2 200
No. of International Seminars onSTI re-echoed (incremental)
2016 - 1 2 200
No. of STI seminars for SUCs(incremental)
2016 - 2 2 100
Reporting Entity/ Data Source: DOST RO2
Moving ForwardIn the next two to three years, the government should focus its efforts on the following strategies tovigorously advance science, technology and innovation in the region.
Aggressively conduct extensive promotion, marketing and commercialization of STI outputsespecially from generators in the region that feature local technologies;
Strengthen support for the start-ups and MSMEs by utilizing the existing services and programsoffered by DOST like SETUP, OneSTore, OneLab, OneExpert, laboratories, among others;
Fast-track the establishment of more innovation hubs in the region that will serve as one-stop-shop food research and development centers so that the region’s local food products can reach asizeable share of the local and national markets;
Increase investments for STI infrastructures and upgrade research facilities to accommodateR&D activities by SUCs, HEIs, government agencies, and other stakeholders; and
Expand provision of S&T scholarships to produce and develop more S&T professionals whocan take the lead in STI activities that will benefit the region and the country.

Annual Regional Development Report I CY 2017
56
IV. ENABLING AND SUPPORTIVEECONOMIC ENVIRONMENT
Ensuring Sound MacroeconomicPolicyEnsuring stable macroeconomic fundamentals is a vital responsibility of government. It is a necessarycondition for the country to attain a dynamic and sustainable economic growth and reduce poverty atthe long-term. Appropriate government policies, and administrative reforms would bring in anenabling environment for inclusive financial services, optimized economy and broad-based growth.This report shows the performance of the Region for the first year of the Plan period 2017-2022.
Figure 12. Strategic Framework toEnsure Sound Macroeconomic Policy by 2022

Annual Regional Development Report I CY 2017
57
AccomplishmentsProductive regional economy optimized
The Cagayan Valley Region surpassed its target of 5.1-6.1 percent for the Gross Regional DomesticProduct (GRDP) for the year 2017. This sets a good start in laying down the foundation for aninclusive growth and a globally competitive knowledge economy.
The GRDP growth of 7.2percent is due to the recovery of the Agriculture Sector and the continuousgrowth of the Industry Sector. On the other hand, the Services Sector recorded a slower growth for theyear from 6.6 percent to 6.0 percent.
In terms of percentage distribution, the regional economy is still driven by the Services Sector with ashare of 51.7 percent, followed by the Agriculture, Hunting, Forestry and Fishing (AHFF) with 33.7percent, and Industry Sector at 15.2 percent share.
On the creation of quality job, underemployment rate was higher compared to its level the previousyear. The total number of persons who expressed desire for more hours of work increased to 197thousand from last year's 189 thousand. Unemployment rate was 3.2 percent, slightly higher than lastyear's 3.1 percent.
Table 17. Performance Indicators on Optimizing a Productive Regional Economy,Region 02, CY 2017(CVRDP 2017-2022 Results Matrix)
Indicator Baseline 2017Target
2017Actual
Accomplishment (%)Year Value
GRDP Growth improved (atconstant prices, (%)
2016 3.3 5.1-6.1 7.2 above target1.1 pp (max)
Aggregate OutputsShare of Industry GVA to TotalGRDP increased (%)
2016 14.5 Increasing 15.2 2.0pp
Underemployment rate reduced(%)
2016 12.7 decreasing 13.6 0.9pp
Reporting Entity/ Data Source:PSA RO2
Strategic and enabling government finance achieved
Revenue collection efficiency was high as reported by the Bureau of Internal Revenue (BIR) andBureau of Local Government Finance (BLGF). The target 10 percent increase in revenue collectionswas achieved with a total collection amounting to PhP 9.96B for the year, 17.97 percent higher than in2016. The biggest source of the collection came from income taxes contributing 68.97 percent to thetotal collection with the remaining coming from value added tax and other taxes.

Annual Regional Development Report I CY 2017
58
Local revenue collection increased to PhP 3.92B, almost 10 percent higher than the previous year’sPhP 3.57B. The LGUs were also less dependent on Internal Revenue Allotment (IRA) with only theCity of Ilagan posting higher ratio for the year from 88 percent to 90 percent.
To improve government finance, DBM conducted trainings on the Government ProcurementReform Act (GPRA). A total of 17 trainings were conducted which is more than the target of 14.
Table 18. Performance Indicators on Achieving Strategic and Enabling Government Finance,Region 02, CY 2017 (CVRDP 2017-2022 Results Matrix)
Indicator Baseline 2017Target
2017Actual
Accomplishment (%)Year Value
Revenue collections by agency improved (in Million PhP )BIR 2016 8,446.52 10,438.10 9,964.95 95.47LTO 2015 12.7 No data
submittedNo data
submittedNo data
submittedLocal revenue collectionefficiency improved (regionaltotal)
2016 3,572.23 increasing 3,929.45 109.80
Aggregate OutputsIRA-Dependency Ratio of Provinces and Cities improved (%)
Batanes 2016 97 decreasing 96 Desired trendachieved
except forIlagan City
Cagayan 2016 92 decreasing 89Isabela 2016 84 decreasing 84Nueva Vizcaya 2016 80 decreasing 79Quirino 2016 78 decreasing 77Cauayan City 2016 74 decreasing 71Ilagan City 2016 88 decreasing 90Santiago City 2016 86 decreasing 82Tuguegarao City 2016 60 decreasing 59
Number of training activitiesconducted on GovernmentProcurement Reform Act (RA9184) and its revisedimplementing rules andregulations (IRR) increased
2016 13 14 17 121.42
Reporting Entity/ Data Source: BIR, LTO, BLGF

Annual Regional Development Report I CY 2017
59
Inclusive financial services and stable inflation achieved
Headline inflation rate for the year 2017 was at the high end government’s target of 2.0-4.0 percent.There was a higher inflation compared to the previous year due to price increases in several foodcommodities (e.g., rice, corn, bread and cereals, etc.), tobacco, electricity, gas and other fuels, andeducation. There was a higher rate of price increase for food items such as rice, corn, meat, fish andfruits due to the increased demand during the holiday season. The price index of tobacco also rosefrom 9.8 percent to 16.2 percent due to the implementation of additional tax for cigarettes at the startof the year. For the year 2017, the region experienced a remarkable increase on electricity, gas andother fuels from negative 4.0 percent to 7.3 percent due to the price adjustments in the world marketfor petroleum products.
On financial services, the banking industry remained strong as more savings and loans were recordedfor the year. This is attributed to the continuous campaigns conducted by the Bangko Sentral ngPilipinas (BSP) to strengthen financial inclusion and increase financial awareness to all. The BSP isalso bridging the gap on access to financial products to attain inclusivity for the agriculture sector andother underserved markets. As of 2017, there are 63 more banks established from 325 banks in 2016.There are a total of 131 universal and commercial banks, 83 thrift banks, and 174 rural andcooperative banks in the region. The increase in the latter would cater to the growing need forborrowing and savings in the countryside.
Table 19.Performance Indicators on Achieving Inclusive Financial Services and Stable Inflation,Region 02, CY 2017(CVRDP 2017-2022 Results Matrix)
Indicator Baseline 2017Target
2017Actual
Accomplishment (%)Year Value
Low and stable inflation rateachieved
2016 3.0 2.0-4.0 3.5 within target
Financial system's total savingsportfolio increased (in BillionPhP)
2016 113.99 increasing 128.29 desired trendachieved
Financial system's total loansportfolio increased (in BillionPhP)
2016 49.02 Increasing 55.65 desired trendachieved
Aggregate OutputNumber of banking institutionswithin the region increased
2016 325 increasing 388 desired trendachieved
Reporting Entity/ Data Source: PSA, BSP Website

Annual Regional Development Report I CY 2017
60
Foundations for external trade established
External trade remains one of the development strategies being pushed forward given the region’sstrategic location and resource potential. For this year, the Department of Trade and Industry (DTI)continuously assisted exporters and MSMEs in priority export industries. DTI also took advantage ofthe growing role of the digital market in increasing opportunities for the industry.
The agency conducted the first ever Rural Impact Sourcing (RIS) Forum aimed to promote variousdigital opportunities. Likewise, it also reached out to 37 MSMEs for a wider market through e-commerce (see also Section 9 on Expanding Economic Opportunities in Industry and Servicesthrough Trabaho at Negosyo).Other initiatives during the year also include the endorsement of theRegional Development Council 02 on the proposed establishment of the Philippine Corn ResearchInstitute in the Valley to take advantage of the region’s primacy in the production of crops.
Table 20. Performance Indicators on Establishing Foundations for External Trade, Region 02, CY2017 (CVRDP 2017-2022 Results Matrix)
Indicator Baseline 2017Target
2017Actual
Accomplishment (%)Year Value
Aggregate OutputsNumber of exporters assistedincreased (cumulative)
2016 38 40 42 105.00
Number of MSMEs with e-commerce increased(cumulative)
2016 - 25 37 148.00
Reporting Entity/ Data Source: DTI 02

Annual Regional Development Report I CY 2017
61
Moving Forward
For the next years, the government should focus on sustaining the positive growth trajectoryregistered during the year, on further improving generation of revenues, enhancing capability ofLGUs to generate their own local revenues and exploring mechanisms and innovative programs toestablish the export potential of the region. Specific measures that need to be pursued are as follows:
Strengthen resiliency of agricultural producers to uncertainties in the sector by developingprograms and projects that would manage risks and vulnerabilities from natural hazards.Promotion of climate-smart technologies and practices should also be intensified to ensureresiliency of crops, increased productivity and growth and sufficiency in production (see alsoSection on Expanding Economic Opportunities in Agriculture, Forestry and Fisheries). Theyounger generation should also be encouraged to engage in agriculture to address the agingpopulation of farmers and fisherfolks;
Expand revenue-generating efforts and intensify implementation of tax administrationreforms such as capacitation of LGUs to strengthen generation of local taxes, digitization andupgrading of systems for simplified and fast revenue collection and compliance monitoring;
Revisit existing LGU revenue management regulations and policies including the updating ofthe Local Revenue Code (LRC) and Local Investments and Incentives Code (LIIC) of allLGUs;
Intensify efforts to assist LGUs on the development of Local Economic Enterprises aimed tominimize dependency to IRA and attain a self-sustaining governance;
Continue advocacy on financial literacy especially in the accumulation of savings among theworking age population in order to gain the benefits of demographic dividend in the countryat the long-term (see also Section on Reaching for the Demographic Dividend); and
Explore and upgrade technologies, adapt to market trends, engage in various marketplatforms and enhance product packaging and marketing to maximize the opportunities onlocal produce or OTOP products in order to gain recognition at the local and internationalmarkets.
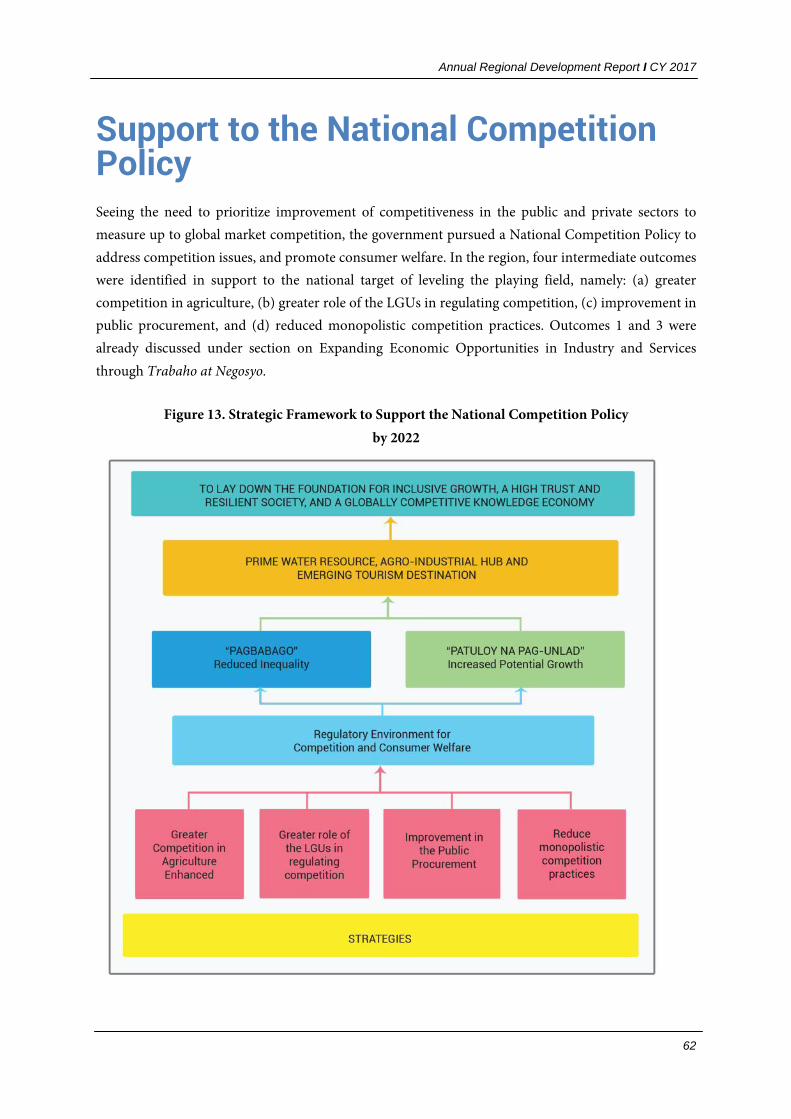
Annual Regional Development Report I CY 2017
62
Support to the National CompetitionPolicySeeing the need to prioritize improvement of competitiveness in the public and private sectors tomeasure up to global market competition, the government pursued a National Competition Policy toaddress competition issues, and promote consumer welfare. In the region, four intermediate outcomeswere identified in support to the national target of leveling the playing field, namely: (a) greatercompetition in agriculture, (b) greater role of the LGUs in regulating competition, (c) improvement inpublic procurement, and (d) reduced monopolistic competition practices. Outcomes 1 and 3 werealready discussed under section on Expanding Economic Opportunities in Industry and Servicesthrough Trabaho at Negosyo.
Figure 13. Strategic Framework to Support the National Competition Policyby 2022

Annual Regional Development Report I CY 2017
63
AccomplishmentsGreater Role of the LGUs in Regulating Competition
The Competitiveness Index of the region improved during the year with most of the provincesgarnering a higher rank in 2017 as against the previous year. The province of Quirino displayed thehighest improvement from 54thto 16th rank out of the 145 provinces assessed, earning a place in Top20 among provinces nationwide. The province of Nueva Vizcaya also displayed an impressive jumpfrom 65thto 38th rank, almost cutting its rank by half. Only the Isabela province went down in rankingfrom 22nd to 30th. On the other hand, the municipalities of Peñablanca and Nagtipunan ranked 14thand17thin the list of most improved under the category first to second class municipalities.
In terms of ranking on economic dynamism, the municipality of Bayombong in Nueva Vizcayaranked the highest in the region at 28th, followed by Solano, also in Nueva Vizcaya, at 30th rank. Thisindicator covered the municipality’s size and growth of the local economy measured through businessregistrations, capital, revenue and permits, capacity to generate employment, cost of living, cost ofdoing business, financial deepening, productivity, and presence of business and professionalorganizations.
On government efficiency which looks into the ability to protect and enforce contracts, applymoderate and reasonable taxation and regulate proactively, the City of Santiago obtained the highestrank among the cities in the region, coming out at 37thrank out of 145 cities. The municipality ofTumauini came in first from among the municipalities in the region at 19th rank for 1st to 6th classmunicipalities category (see Chapter also 5).
Table 21. Performance Indicators on Improving the Role of LGUs in Regulating Competition,Region 02, CY 2017(CVRDP 2017-2022 Results Matrix)
Indicator Baseline 2017Target
2017Actual
Accomplishment (%)Year Value
Competitiveness Ranking of Provinces improvedBatanes 2016 72 Improved
ranking68 rank improved
(up by 4)Cagayan 2016 46 33 rank improved
(up by 13)Isabela 2016 22 30 rank down by 8Nueva Vizcaya 2016 65 38 rank improved
(up by 27)Quirino 2016 54 16 rank improved
(up by 38)Reporting Entity/ Data Source:NCC Website

Annual Regional Development Report I CY 2017
64
Reduced Monopolistic Competition Practices
For this year, the Department of Trade and Industry (DTI) continued to intensify its role inmonitoring unfair practices in the local market as well as in the promoting consumer protection. Onconsumer complaints received by the agency, all cases reported were resolved exceeding the target of85 percent.
Meanwhile, on the number of Negosyo Centers established and maintained, actual accomplishmentwas short of target by 14.29 percent. Only 48 centers were recoded this year as against the target of 56Centers established and maintained.
Table 22. Performance Indicators on Reducing Monopolistic Competition Practices, Region 02,CY 2017(CVRDP 2017-2022 Results Matrix)
Indicator Baseline 2017Target
2017Actual
Accomplishment (%)Year Value
Consumer complaintsresolution rate increased (%)
2016 - 85.00 100.00 Exceededtarget by 15.0
ppAggregate Outputs
Number of Negosyo Centersestablished and maintainedincreased
2016 40 56 48 85.71
Number of advocacyactivities on ConsumerProtection Servicesconducted increased
2016 - 530 No data
Reporting Entity/ Data Source: DTI 02
The RDC 02 passed Resolution No. 02-31-2017 on September 15, 2017 supporting and endorsing theCY 2018 Convergence Program of the Department of Trade and Industry and the Department ofPublic Works and Highways. The said program is tagged as Roads Leveraging Linkages of Industryand Trade (ROLL IT). A total of 14 projects were proposed amounting to Php 511 million. TheROLL IT Program aims for a more coordinated effort between the two Departments in theidentification, prioritization and implementation of roads leading to industries and economic zones.

Annual Regional Development Report I CY 2017
65
Moving Forward
At the End-of-Plan period 2017-2022, the region aims to have contributed to the implementation ofthe National Competition Policy and in the improvement of the country’s competitiveness. Forremaining Plan period, the following strategies are recommended:
Engage more academic institutions to intensify validation, analysis and review of Cities andMunicipalities Competitiveness Index (CMCI) and other competitiveness reports and surveys
Enhance capabilities of the LGUs in terms of streamlining business processes, revenue generation,strengthening delivery of services and infrastructure facilities, and in increasing their resiliency;
LGUs to update the Comprehensive Development Plans (CDPs), Investment and IncentivesCode, and Revenue Code to attract more investors in their localities;
Sustain efforts on the resolution of cases on consumer complaints and ensure consumer welfare;and
Develop a price monitoring system for basic commodities and agricultural products that is opento the public to avoid unfair pricing especially during the occurrence of calamities where pricesskyrocket.

Annual Regional Development Report I CY 2017
66
V. ENABLING AND SUPPORTIVEECONOMIC ENVIRONMENT
Attaining Just and Lasting PeaceThe attainment of a just and lasting peace is an inherent goal of every country. Without it, socio-economic development would not progress and inequality may widen. This report shows regionalefforts to attain lasting peace and territorial integrity. At the end of the Plan period, the identifiedstrategies are expected to ensure internal security, institutionalize the Army Transformation Roadmap2028 and attain territorial integrity.
Figure 14. Strategic Framework to Attain Just and Lasting Peace by 2022

Annual Regional Development Report I CY 2017
67
AccomplishmentInternal security assured
In 2017, the Northern Luzon Command (NOLCOM) organized the Joint Task Force “TALA” with 5thInfantry Division of the Philippine Army as its core. The Brigade then formulated the IMPLAN“KAPAYAPAAN-LIBERATOR” covering the provinces of Cagayan, Isabela, Quirino and six northernmunicipalities of Nueva Vizcaya and five lower municipalities of Apayao.
On February 2017, President Duterte terminated the ceasefire with New People’s Army, which led tothe TRIAD operations of the Brigade. This resulted to nine government-initiated tactical engagementsand recovery of three high powered and seven low powered firearms. Several enemy personalities wereneutralized, nine were captured while 31 voluntarily surrendered. A total of 10 enemy encampmentswere also seized wherein various IEDs, explosives, subversive documents with high intelligence valueand communication equipment were recovered. Alongside the military operations were 4,132 civilaffairs activities conducted throughout the year through the Civil Military Operations (CMOS).
Table 23. Performance Indicators on Internal Security, Region 02, CY 2017(CVRDP 2017-2022 Results Matrix)
Indicator Baseline 2017Target
2017Actual
Accomplishment (%)Year Value
Number of barangays inGeographically Isolated andDisadvantaged areas (GIDAs)and in Conflict Affected Areas(ConAAs) provided withcommunity Service Program(CSP)
2016 - increasing No datasubmitted
c/o AFP
Percentage of LGUs with Peaceand Order and Public SafetyPlan (POPS PLAN)
2017 100 100 100
Aggregate OutputsNumber of CAA Patrol Basessupported by LGUs
2016 - increasing No datasubmitted
c/o AFP
Percentage of command andcontrol (C2) activitiessuccessfully undertaken
2016 - 90 No datasubmitted
c/o AFP
Reporting Entity/ Data Source: AFP, DILG

Annual Regional Development Report I CY 2017
68
Territorial integrity assured
To secure the region’s maritime waters, the Philippine Coastguard (PCG) conducted a total of 209seaborne patrols which is significantly higher than the previous year. There were also more coastalpatrols conducted in 2017 compared to the previous year. The continuous provision of safetyissuances to all ships (local and foreign) were also done to ensure that the vessels comply with themaritime laws and standards. However, actual accomplishment was short of the desired target interms of the issuance of Pre-Departure Inspection and Port State Control. According to PCG, this isdependent on the number of foreign vessels sailing within the area of responsibility, emergency portcalls, and the weather experienced during the period.
Table 24. Performance Indicators on Territorial Integrity, Region 02, CY 2017(CVRDP 2017-2022 Results Matrix)
Indicator Baseline 2017Target
2017Actual
Accomplishment (%)Year Value
Number of maritime security and law enforcement activities increasedSeaborne Patrol
PCG
BFAR
2016
2016
89
100
increasing
100
209
No data
Desired trendachieve
c/o BFAR
Shore/ Coastal Patrol
PCG
BFAR
2016
2016
4,672
100
increasing
100
4,969
No data
Desired trendachieve
c/o BFAR
Percentage of poaching casesresolved against cases filed (%)
2016 - - - c/o BFAR
Aggregate OutputsPre-Departure Inspection (PDI)(domestic vessel/ motor/ banca)
2016 5,315 increasing 4,471 Desired trendnot achieved
Port State Control (PSC)(foreign vessel)
2016 8 increasing 5 Desired trendnot achieved
Reporting Entity/ Data Source: BFAR, PCG Northeastern Luzon District

Annual Regional Development Report I CY 2017
69
Moving ForwardTo sustain the efforts in this Sector and as well as to address gaps on external and maritime security,the following are recommended:
Ensure implementation and monitoring of the ARMY Transformation Roadmap 2030 for thePhilippine Army continually improves its capabilities and its systems;
Strengthen efforts on improving discipline and professionalism in all levels of the PhilippineArmy, ensure strict implementation of command responsibility and accountability, andpromote culture of excellence and national pride in the performance of duties.
Enhance the capability of the coast guard and BFAR 02by increasing their manpower andmodernization of maritime patrol equipment and facilities in order to strengthencoordination and conduct of monitoring activities and rescue operations and in the sea; and
Strict enforcement of fishery laws.

Annual Regional Development Report I CY 2017
70
Ensuring Security, Public Order, andSafetyEnsuring public order, security and safety is one of the priority thrusts for this Plan period pursuant tothe 0 to 10 Socio-economic agenda of the current administration. Heightened efforts andstrengthened cooperation between and among the law enforcement agencies and other institutionswere expected as the goal for a reduced crime rate is being pursued across the country.
In the region, strategies were identified to ensure security, public order and safety of the regionalpopulace. The accomplishments and milestones achieved in 2017 and the recommended actions askey actors move forward to ensure peace and order in Cagayan Valley are presented in this chapter.
Figure 15. Strategic Framework to Ensure Security, Public Order and Safety by 2022

Annual Regional Development Report I CY 2017
71
AccomplishmentsSafe and secure communities
The region’s crime volume was 18.81 percent lower compared to its level during the previous year.Index crimes was lower by 25.16 percent due to the intensified crime prevention activities such asincreasing police visibility and strong coordination of PNP with the local government units, other lawenforcers and the general public .On the other hand, the target trend for non-index crimes was notmet. Non-index crimes include those incidences related to vehicular incidents and violation of speciallaws. On the arrest of perpetrators or suspects, both crime clearance efficiency and crime solutionefficiency significantly improved during the period. Three of the most wanted persons were alsoarrested by the PNP during the year.
In 2016, there were already 2,021 barangays with organized Mamamayang Ayaw sa Anomalya,Mamamayang Ayaw sa Illigal na Droga (MASA MASID) Team. At the end of 2017, all barangays havealready established their MASA MASID Teams and the program was fully implemented throughoutthe year. One of the major deliverables of the Program is the Community Based RehabilitationProgram (CBRP) which aims to bring new hope and opportunities to drug surrenderees. Anothermilestone for the sector is the organization of the Regional Inter-Agency Committee on Anti-IllegalDrugs (ICAD) as provided under EO No. 15, s. 2017. The following responsibilities are providedunder ICAD: PDEA shall lead the enforcement of the law, DOJ for justice, DILG on advocacyactivities, and DOH on rehabilitation of users.
The efforts of several agencies have been complemented with the participation of barangays in thecampaign against drug abuse through the formulation of their Barangay Anti-Drug Plan of Action.For this period, there are already 2,189 barangays with the said Plan of Action.
The number of fire incidents in the region decreased during the year. This is due to the heightenedadvocacy on fire prevention which led to an increased proportion of establishments complying withthe Fire Code. The BFP also responded efficiently during emergency situations. Out of the 179 fireincidents, 75.97 percent were responded within 7 minutes. More response time was needed in somecases due to factors such as terrain, road condition and distance travelled from the station. Theamount of damages amounted to PhP 100.75 million based on the submitted affidavits of losses.

Annual Regional Development Report I CY 2017
72
Table 25. Performance Indicators on Ensuring Safe and Secure Communities,Region 02, CY 2017(CVRDP 2017-2022 Results Matrix)
Indicator Baseline 2017Target
2017Actual
Accomplishment (%)Year Value
Crime SituationTotal crime volume reduced 2016 17,476 Decreasing 14,188 Desired trend
achievedCrime Clearance Efficiencyimproved
2016 74.82 76.82 81.17 Up by 4.35 pp
Crime Solution Efficiencyimproved (%)
2016 63.48 67.48 67.52 Up by 0.04 pp
Drug SituationPercentage of Watch ListedDrug Personalities (HVT andSLT) cleared
2016 1,706 139 No datasubmitted
c/o PDEA
Percentage of barangaysdeclared “drug cleared”
2016 1,075 50% No datasubmitted
c/o PDEA
Number of cases filed againstthe arrested personalitiesdecreased
2016 1,288 decreasing No datasubmitted
c/o PDEA
Public SafetyFire incidents decreased 2016 228 decreasing 179 desired trend
achievedProportion of inspectedbuildings and establishmentscomplying with the Fire Codeincreased
2016 88.30 increasing 90.76 desired trendachieved
Aggregate Outputs
Crime SituationNumber of index crimesdecreased
2016 4,308 decreasing 3,224 desired trendachieved
Number of non-index crimesdecreased
2016 13,168 increasing 10,964 desired trendnot achieved
Number of physical injuries dueto road traffic/accidentsdecreased
2016 7,311 decreasing 6,463 desired trendachieved
Most Wanted Persons Arrested(Regional, Provincial,Municipal) (incremental)
2016 2 3 3 100
Drug SituationNumber of anti-drug operationsconducted decreased
2016 834 40% No datasubmitted
c/o PDEA

Annual Regional Development Report I CY 2017
73
Number of drug personalitiesarrested decreasing
2016 1,075 40% No datasubmitted
c/o PDEA
Number of drug users decreased 2016 22,589 decreasing No datasubmitted
c/o PDEA
Number of conducted anti-drugadvocacy increased
2012 1,580 increasing No datasubmitted
c/o PDEA
Number of barangays withMASA MASID Team organized
2016 2,021 290 290 100
Public SafetyPercentage of fire callsresponded within seven (7)minutes
2016 131 increasing 136 103.82
Reporting Entity/ Data Source: PNP, PDEA, BFP, DILG
Capability and professionalism of law enforcers improved
The ratio of police to citizen improved during the period due to the continuous filling-up of vacantpositions. The police force was also continuously capacitated on human rights, gender awarenessdevelopment as well as on women and children advocacies. A total of 90percent of the police forcepassed the post training test conducted by the Commission on Human Rights (CHR).
On the other hand, firemen to population ratio was maintained at 1:2000. Various training andworkshop activities were also conducted by the BFP especially in stations with only two or threetrained safety inspectors. Campaigns on fire safety and fire drill were intensified to educate andprepare the general public in times of fire incidents in their localities.
In2017, NAPOLCOM had 39 cases for disposition, 26 of these were carry over from 2016 and 13werenew cases. On the adjudication of Summary Dismissal Cases (SDC), 29 or 74.4 percent were disposedinvolving 39 respondents. The remaining 25 cases are pending for disposition. By classification ofoffense, 85 percent were grave misconduct, followed by conduct unbecoming of a police officer at 9percent, and serious irregularities in the performance of duty at 4.69 percent. Most of the respondentswere PO III (23.44%), PO II (17.19%), PO I (14.06%), SPO I (12.5%), SPO IV (7.81%), P/Sr. InspectorII (7.81%), and P/CHIEF INSP (6.25%).
On Pre-Charge Evaluation of complaints against erring PNP members, there were 18 complaints fordisposition during the period. Seven complaints were referred for Summary Dismissal Cases (SDC),six were forwarded to the RIAS while five were dropped/ dismissed or withdrawn by thecomplainants. Out of the administrative and criminal cases involving 172 police officers, a total of15Police Commissioned Officers (PCOs) and 111 Police Non-Commissioned Officers (PNCOs) werepenalized.

Annual Regional Development Report I CY 2017
74
Table 26. Performance Indicators on Improved Capability of Law Enforcers,Region 02, CY 2017(CVRDP 2017-2022 Results Matrix)
Indicator Baseline 2017Target
2017Actual
AccomplishmentYear Value
Police to Citizen Ratio improved 2016 1:600 1:534 1:534 Ratio achieved
Firemen to Population Ratioimproved
2016 1:2000 1:2000 1:2000 Ratio achieved
Proportion of participants(AFP/PNP) who passed the posttraining tests (%)
2016 85 85 90 Up by 5 pp
Proportion of cases disposedover the total number of casesfiled (rate of disposition of cases)
2016 27 75 74.4 short of 0.6 pp
Aggregate OutputsNumber of law enforcers trainedwith Gender AwarenessDevelopment increased(cumulative)
2016 1,845 increasing 19,912 desired trendachieved
Number of law enforcers trainedof human rights increased(incremental)
2016 2,476 2,526 4,129 163.46
Number of human rightsviolation cases against lawenforcers expeditiouslyinvestigated (incremental)
2016 20 22 12 54.54
Reporting Entity/ Data Source: PNP, BFP, NAPOLCOM, CHR

Annual Regional Development Report I CY 2017
75
Moving ForwardThe following are recommended for the succeeding years in order to sustain public order, security andsafety:
Increase manpower of law enforcement agencies including the Fire Bureau in order to ensuresecurity, public order and safety within the locality;
Continuous enhancement of the Move, Shoot, Communicate and Investigate capability of thepolice;
Sustained deployment of the police force in the community for greater police visibility;
Ensure strong partnership and coordination with other law enforcement agencies inundertaking law enforcement operations;
Continue education and training programs to sustain discipline professionalism andeffectiveness among law enforcement agencies;
Strict implementation of command responsibility and accountability;
Promotion of culture of excellence in the performance of duties; and
Broaden and intensify citizen empowerment and engagement in curbing criminality andpromoting peace in their communities.

Annual Regional Development Report I CY 2017
76
Ensuring Ecological Integrity, Cleanand Healthy EnvironmentThis chapter highlights the major programs, projects and activities implemented to achieve the targetsset for 2017. Interventions focused on mainstreaming the conservation, protection and rehabilitationof natural resources along with ensuring improvements in air and water quality. These shall beattained by building the capacities of communities for them to become active stakeholders in ensuringecological integrity, clean and healthy environment.
Figure16.Strategic Framework to Ensure Ecological Integrity,Clean and Healthy Environment by 2022

Annual Regional Development Report I CY 2017
77
AccomplishmentsImproving conservation, protection and rehabilitation ofnatural resources
Forest management and rehabilitation intensified. From 2011 onwards, the National GreeningProgram (NGP) provided a significant stride in the region’s reforestation efforts. For 2017, about 16million fruit and forest trees were planted representing 95.7% accomplishment for the year. TheDENR Region 2 has already reforested about 93,047 hectares from 2011 to 2017.
Progressive rehabilitation was also done in the three Big Scale Mining sites, namely: the OceanaGoldPhilippines Inc. (OGPI), the Dinapigue Mining Corporation (formerly Geogen) and the FCF MineralsCorporation. A total of 45 hectares were rehabilitated in 2017 making the cumulative total of miningareas rehabilitated at 804 hectares.
Table 27.Performance Indicators on Forests, Watersheds and Coastal Resources, Region 2, CY 2017(CVRDP 2017-2022 Results Matrix)
Indicators 2016 BaselineValue
2017Target
2017 Actual Accomplishment (%)
Area for reforestation and rehabilitationincreased (hectare)
10,120 16,121 16,121 100
No. of seedlings planted 16,812,449 17,470,695 16,723,800 95.7Forest area maintained increased (hectares) 40,925 43,203 44,697 103Coastal Areas managed and protected(hectares)
1,650 1,619
Coral reefs 1000 627 968 154Mangroves - 785 797 101
Ecotourism Sites maintained 5 5 100Reforestation area in mining sites increased 647 804 804 100Mineral production increased
o Metallic (in MT (by wt) 86,860 86,000 67,468 78.45o Non-metallic (in cu-m (by vol) 2,067,145 2,663,167 2,663,167 100
Revenue generated on mineral productionincreased
14.0 B 15.4 B 15.7B 102
Data Source: DENR RO 2 , MGB RO 2
In securing and maintaining the existing 93,047.78 hectares of plantation, management andsupervision have been strengthened through the participation of Community-Based ForestManagement (CBFM) beneficiaries and DENR personnel; greater involvement of women; continuingsupport from mining companies; constant IEC; appointment of extension officers; procurement ofdrone for regular monitoring; conduct of regular foot patrolling and other activities related tomaintenance and protection. With the extension of the NGP per Executive Order No. 193, series of

Annual Regional Development Report I CY 2017
78
2015, other remaining unproductive and degraded areas will be reforested, thus, an increased forestcover is expected by 2028.
Coastal and marine ecosystems management improved. The Coastal and Marine EcosystemsManagement Program (CMEMP) was sustained with the continuing implementation of the BatanesProtected Landscape and Seascape, Palaui Protected Landscape and Seascape in Cagayan and theNorthern Sierra Madre Natural Park in Isabela.
The region also addressed concerns on low biodiversity and low coastal protection in Protected Areas(PAs). This was done through a more aggressive coastal resources management particularly in coralreef ecosystems through the combined initiatives of regional agencies and concerned localgovernment units.
For coral reefs, around 968 hectares in three provinces was assessed reflecting a 154 percentaccomplishment. Also, a total of 797 hectares of mangrove within the provinces of Cagayan andIsabela was assessed surpassing the 785 hectares target or 101 percent accomplishment.
Mineral resource management strengthened. The maintenance of ecological integrity andsustainable resource covers areas devoted to mineral development and management. Evaluation andmonitoring of mining rights was conducted regularly in seventeen mining right holders, namely: 8Industrial Sand and Gravel Permits (ISAGPs), 1 Mineral Processing Permits (MPP), six (6) MineralProduction Sharing Agreement (MPSAs) and 2 Financial and Technical Assistance Agreement(FTAAs).
The MGB has put premium on the monitoring of the approved mining contracts/permits as to theircompliance to the implementation of the Integrated Safety and Health, Environment and SocialDevelopment (ISHES) standards. With this, 12 Contractors and mining right holders weremonitored, of which 7 are classified as operating while 5 contractors are under exploration. Toensure compliance to safety rules, regular safety inspections were likewise conducted. Per MGBassessment, there were no safety-related incidents that occurred in the mining sites.
On Mineral Production, about 2.6 million cubic meters of non-metallic minerals was producedsurpassing the target for the year. The attainment of such is due to the increased quantity onproduction of Sand and Gravel, Pure Sand, Boulders and Mountain Soil. The region produced a totalof 67,468 MT of metallic minerals which is 22.23% lower than the target. The decline was attributed tothe copper concentrate production of OceanaGold Philippines Inc. (OGPI) with the open pit minewhich was completed and mined out in May 2017 and the transition period for the company’s shift tounderground mining method.

Annual Regional Development Report I CY 2017
79
Improving environmental quality
Air quality monitoring needs to be enhanced. The government program on air quality managementinvolves regular monitoring of ambient air quality. Two (2) Real-time monitoring stations for PM2.5concentrations had been installed within Tuguegarao City to monitor ambient air quality. However,both real-time monitoring stations were declared unserviceable since 2016 due to damages incurredfrom Typhoon Lawin. As such, there is no data recorded for PM2.5 concentrations in the region.
However, for PM10, the geometric mean of 35.51µg/Nm3 and 5.77µg/Nm3 of Tuguegarao City andSantiago City stations respectively, reveal that ambient air quality falls within “GOOD” level (0-54µg/Nm3) per the national ambient air quality guidelines. However, three samples registered “FAIR”due to activities like drying of palay and corn, continuous building construction and vehicles plyingthe area.
Table 28.Performance Indicators on Improving Environmental (Air) Quality, Region 02, CY 2017(CVRDP 2017-2022 Results Matrix)
Indicators 2016Baseline
Value
2017Targets
2017Accomp.
%accomp.
PM10 concentrations in the region and othermajor urban centers are within the AnnualPM10 Average Guideline value of 60microgram per Normal cubic meter (µg/Ncm)
15.64µg/Nc m
0-54µg/Ncm
o Tuguegarao City Station 35.51 µg/Ncm Goodo Santiago City Station 5.77 µg/Ncm Good
Monitoring of Private Emission TestingCenters (PETCs) – No. of PETCs monitored
40 40 45 113%
Data Source: EMB-RO 2
Water quality maintained. The Cagayan River and its tributaries has been the focus of regularmonitoring for its water quality. The five (5) monitoring/sampling stations located in Aparri andAlcala in Cagayan; Tumauini and Echague in Isabela; and Nagtipunan in Quirino, provides on-sitedata on water quality on a quarterly basis. The water samples collected undergo laboratory analysisfor Biochemical Oxygen Demand (BOD) and Total Suspended Solid (TSS).
Per result of analysis, the BOD stands at 1.7 mg/liter of water which means that the river is still withinthe standard of Water Classes A, B, and C. Such water classes mean that the river system can still beutilized according to its beneficial uses like source of water supply, bathing, swimming; production offish and other aquatic resources; agriculture and livestock production; and other recreation purposes.In some parts of the whole stretch, it can be a source of water supply system for the community butwith the necessary complete treatment process.

Annual Regional Development Report I CY 2017
80
Further, the water quality of the Pinacanauan de Tuguegarao has improved. There was an observedreduction in the concentration of pollutants particularly fecal coliform and Total Suspended Solids(TSS). This improvement is attributed to the interventions made through the Water QualityManagement Area (WQMA), an interagency body tasked to monitor and ensure the environmentalintegrity of the area.
With the implementation of the program involving coastal clean-up and other water qualityimprovement initiatives, the adopted esteros/waterways was gradually rehabilitated. As of 2017, atotal of 24 esteros/water bodies were adopted by 124 partner LGUs and private partner adopters.Majority of the adopted esteros are located within Tuguegarao City (6), Santiago City (5), CauayanCity (4) and Ilagan City (2), while 7 are located in Cabagan, Isabela and Solana, Penablanca, Gattaranand Alcala, Cagayan. These esteros are regularly cleaned-up by the Barangay LGU Adoptors at certainfrequencies to clear waterways.
Also, as part of the basin wide initiatives, the region initiated the institutionalization of the AddalamSub-river Basin Management Committee through a MOA under the umbrella organization of theCagayan River Basin Management Council (CRBMC) at the sub-river basin level.
Waste Management improved. The compliance of Municipal LGUs on various components ofEcological Solid Waste Management was closely monitored by the Environmental ManagementBureau (EMB RO2). Majority of the LGUs have already formulated their 10-year Solid WasteManagement Plan. A total of 57 municipalities have endorsed their SWM Plan and were subsequentlyapproved by the NSWC. It is worthy to note that there is a greater commitment among LGUs in theimplementation of their 10-year Solid Waste Management Plan in support to the Republic Act No.9003.
On Sanitary Landfill Facility (SLF), 14 LGUs have an operational SLF, to include operational ResidualContainment Areas (5 LGUs in Cagayan, 1 in Isabela, 7 in Nueva Vizcaya, and 1 in Quirino). Around26 LGUs or 32% were subjected to rehabilitation, while the rest were on the process of siteidentification or currently on-going construction of their SLF. Close monitoring of municipalitiesneeding technical assistance is needed in order to increase the number of compliant LGUs.
On Geological assessment of proposed SLF sites, five (5) sites were assessed as geologicallycompliant. The overall improvement in solid waste management was a result of sustained technicalassistance to local governments on the preparation of SWM Plans, seminars, financial assistance forsafe closure and rehabilitation of open dumpsite or controlled dump facility, and close monitoring ofcompliance of LGUs by the EMB RO2 in collaboration with concerned stakeholders.

Annual Regional Development Report I CY 2017
81
Table 29. Performance Indicators on Improving Environmental Quality(Waste Management), Region 2, CY 2017
(CVRDP 2017-2022 Results Matrix)
Indicators 2016 BaselineValue
2017Targets
2017Accomp
%accomp.
No. of LGUs (Prov, Cities, Mun) compliant with proper Ecological Solid Waste ManagementSystem (ESWM)
o No. of Solid Waste Management Plan (i.e10 year) reviewed/evaluated
11 11 12 109%
o Provision of Technical Assistance for theEstablishment of Sanitary Landfill
1 1 1 100%
o Compliance Monitoring of Toxic andHazardous Waste Management Facilities(Generators) conducted
150 150 347 231%
o Geological assessment of proposedSanitary Land fill sites
6 6 5 83%
Data Source: EMB-RO 2 and MGB RO 2
Increasing adaptive capacity and resilience of ecosystems
LGUs with institutionalized and fully operational DRRM Office. The Office of Civil Defense, incollaboration the DILG, DSWD, DOST and NEDA, and other stakeholders, continuously andvigorously carried out its mandate under RA 10121 by administering a comprehensive national civildefense and disaster risk reduction and management program.
For 2017, several activities were undertaken such as: conduct of meetings ofRegional/Municipal/Barangay Disaster Risk Reduction and Management Council Meetings; GawadKALASAG Annual Search, which aims to recognize outstanding performance of Local Disaster RiskReduction and Management Councils; promotion of DRRM programs and Projects; and strengtheningof external linkages.
On capacity building, skills training programs were organized such as Basic DRRM, Incident CommandSystem (ICS); Contingency Plan Workshop (CP); Rapid Damage Assessment and Needs Analysis(RDANA); Rapid Emergency Telecommunication Training (RETT); Post Disaster Needs Assessment(PDNA); Water Search and Rescue Training (WASAR); Mountain Search and Rescue Training(MOSAR); Community-based Disaster Risk Reduction and Management (CBDRRM) for 87 LGUs.
In connection with disaster risk reduction, geo-hazard survey and mapping were conducted in twelve(12) municipalities namely: San Pablo, Cabagan, Tumauini, Sta. Maria and Palanan in the province ofIsabela; and Mahatao, Uyugan &Uvana in Batanes province, with a map scale of 1:10,000.

Annual Regional Development Report I CY 2017
82
Table 30.Performance Indicators on Increasing Adaptive Capacity and Resilienceof Ecosystem for CY 2017 (CVRDP 2017-2022 Results Matrix)
Indicators 2016Baseline
Value
2017Targets
2017 Actual Accomplishment
No. of LGUs (Prov, Cities, Mun.barangays) trained/capacitated onDRRM/CCA increased
9 40 87 217%
Number of LGUs (Prov, Cities, Mun.,Brgys.) with functional DRRM officesand operation Centers increased
9 40 93 232%
No. of municipality with updatedGeo-hazard maps (1:10,000) used inrisk reduction planning increased
7 7 12 171%
Data Source: OCD RO2, DILG RO2 and MGB RO 2
Moving ForwardMore initiatives have to be done to further improve on outcome indicators along environment andnatural resources sector. To supplement and address the gaps on ensuring ecological integrity, clean andhealthy environment, the following strategies are recommended for implementation of the concernedagencies and LGUs:
Enactment of the National Land Use Act (NaLUA).Enactment of this law is also important toaddress deforestation activities and other ENR activities. The overlapping and conflictingnational laws on land uses (such as prime agricultural land, agrarian reform, protected areas,ancestral domain, fisheries, forestry, mining and housing) that are sector specific, results in thecompeting uses of forest resources without regulation;
Support legislative measures that would protect and develop the forestry sector particularly onsustainable forest management, tree planting, and mangrove forest protection and preservation;
Complement reforestation programs with sufficient and strict monitoring aside from adequatefinancial and manpower resources. Such strategy is imperative to assess whether the programcomponents and activities are effective or not, and if necessary, implement changes and employmeasures to sustain their effectivity;
Capacitate LGUs for long-term planning in addressing the four DRRM thematic areas;
Pursue studies on GHG reduction such as the “Greenhouse Gas (GHG) Inventory for LocalClimate Change Mitigation and Low Carbon Development in Cagayan Valley Region”.

Annual Regional Development Report I CY 2017
83
Review, codify, and streamline existing ENR policies, rules, and regulations. Existing ENR lawsand policies, including governance arrangements, should be assessed and reviewed in terms ofoverlapping and conflicting provisions to improve compliance, transparency, and accountabilityacross all levels. This should include revisiting the Local Government Code to strengthen theLGUs and its relevant ENR devolved functions. Recurrent governance issues such as lack of orlimited funding, weak coordination, and poor implementation and monitoring need to beaddressed to continuously improve the state of the ENR.
Increase utilization of the PSF. The PSF is a fund that will finance adaptation programs andprojects that are directly supportive of the objectives enumerated in the local climate changeaction plans (LCCAP) of LGUs and communities. To enhance LGUs’ access to PSF, thefollowing should be undertaken: (a) roll-out a nationwide marketing strategy to inform LGUsand key stakeholders on eligibility requirements; (b) streamline the process for projectdevelopment, appraisal, approval, negotiation, obligation/fund release, implementation, andmonitoring and evaluation; and (c) provide capacity- building activities on project proposaldevelopment for LGUs and training on review and evaluation of proposals for the PSFSecretariat.
Support the creation of plantilla position for ENR enforcers. With the continuous degradationof forest and other natural resources, the LGUs should initiate steps in partnership with DENRand other stakeholders to stop forest resources degradation and implement activities to restoreor rehabilitate degraded areas through the creation of a Municipal Environment and NaturalResources Office. Likewise, continuing assistance to LGUs on the organization ofpermanent Local Disaster Risk Reduction and Management Officers (LDRRMOs), disasteroperations centers, and emergency response teams should be undertaken.
Creation of Department of Disaster Resiliency that will consolidate several governmentfunctions and integrate new policies on disaster mitigation/prevention, preparedness, response,and rehabilitation/recovery to address existing implementing gaps and challenges.
Establishment of required number of air and water quality monitoring stations to adequatelycapture the ambient air quality of the region.
Strengthening established Water Quality Management Areas (WQMAs) and establishment ofnew WQMAs for improved water quality.

Annual Regional Development Report (ARDR) I CY 2017
84
ACCELERATING INFRASTRUCTUREDEVELOPMENTAccelerating infrastructure is one of the medium-term development foundations for the region and thecountry. It has a reciprocal relationship to macroeconomic development through the multiplier effect.Better infrastructure gives rise to economic expansion which in turn require the need to improveexisting infrastructures because of larger volume of services, goods and people that travel across theeconomy.
As stated in the CVRDP 2017-2022, access and connectivity serve as the most crucial factors indevelopment. With adequate and proper infrastructure, the region’s goal of becoming an agro-industrial hub and the next tourism destination of the country becomes more probable within the Planperiod. In this Report, the region’s accomplishment on accelerating infrastructure development ishighlighted by developments along transportation, communication, irrigation and power.
Figure 17. Strategic Framework to Accelerate Infrastructure Development by 2022

Annual Regional Development Report (ARDR)I CY 2017
85
Accomplishments
Spending in public infrastructure increased
The “Build, Build, Build” is the centerpiece program of the current administration on acceleratinginfrastructure development nationwide. It seeks to improve infrastructure support in order to developindustries in more areas of the country, attain robust growth and uplift the lives particularly those livingin poverty. Of the 75 flagship projects identified under the “Build, Build, Build”, three projects arelocated in the region with an estimated cost of PhP 10.7 billion. These projects shall improve theregion’s connectivity to Metro Manila and Region III, provide alternative source of power and enhanceirrigation service and coverage to boost agriculture production and productivity. The projects areshown in detail below:
Table 31.”BUILD BUILD, BUILD” Program Flagship ProjectsCagayan Valley Region
Project Title ImplementingAgency
Total ProjectCost (in PhP
million)
Status
1. Dalton Pass EastAlignment AlternativeRoad Project (East DaltonBypass Project)
DPWH 4,018.00 Feasibility Studyongoing
2. Chico River PumpIrrigation Project
NIA 2,696.00 NEDA Board approved.The ICC has confirmedthe proposed change infinancing of the Project
from GAA to ODA.3. Tumauini River
Multipurpose ProjectNIA 4,003.30 Updating of FS ongoing
Source: NEDA RO 2
For regular infrastructure spending, the bulk remains lodged with the Department of Public Works andHighways amounting to P14.6 Billion, a reduction by 1.7% from its 2016 level. The region is 3rd lowestin terms of infrastructure budget during the year.
The completed projects include: 278.24 kilometers of national, secondary and tertiary roads, 33 floodcontrol projects, construction of tourism roads, farm-to-market roads and bridges along local roadsfrom its regular infrastructure fund, and 574 other infrastructure projects involving school buildings,national buildings, multi-purpose buildings and water systems funded by other government agencies.Major completed projects are the PHP73.6-million Gattaran Flood Control, PHP52.2-million Sisim

Annual Regional Development Report (ARDR) I CY 2017
86
Bridge, PHP34.9-million road upgrading in Vayang Rolling Hills, and the PHP631.9-millionreplacement of Lucban Bridge.
For social infrastructure, some of the significant completed projects included 99 school buildings for atotal of 1,023 classrooms needed for the elementary, secondary, and senior high school students underthe Department of Education’s (DepEd) Basic Education Facilities Fund (BEFF) worth a total of PHP1.7billion; 61.75 kilometers of farm-to-market roads under the Department of Agriculture amounting toPHP518.5-million; and 13.21 kilometers of road leading to tourism destinations with a value ofPHP175.10 million.
Table 32. DPWH Infrastructure Programmed Amount by Region 2016 and 2017
Region2016
(in Million PhP)2017
(in Million PhP)Increase/Decrease
(in Million PhP)
PercentageChange
Davao Region 19,972 43,768 23,796 119.14SOCCSKSARGEN 13,585 18,038 4,453 32.78CARAGA 16,575 21,490 4,915 29.65Western Visayas 18,883 23,308 4,425 23.43Northern Mindanao 30,226 36,499 6,273 20.75MIMAROPA 16,753 20,135 3,382 20.18BICOL Region 21,394 24,368 2,974 13.90Eastern Visayas 20,822 23,504 2,682 12.88Central Luzon 21,262 25,094 3,832 18.02CALABARZON 23,952 27,699 3,747 15.64NCR 18,987 20,446 1,459 7.68CAR 12,625 13,518 893 7.07Ilocos Region 17,157 18,173 1,015 5.92Central Visayas 14,936 14,999 63 0.42Cagayan Valley 14,873 14,608 -266 (1.7)Zamboanga Peninsula 18,395 14,827 -3,568 (19.4)ARMM No data available No data available
Source: DPWH Website
The per capita infrastructure spending of PhP4,232.40 ranks the region at 8th compared to otherregions, higher than the PhP 3,708 national average per capita spending (See Table below).
Annual Regional Development Report (ARDR)I CY 2017
87
Table 33. Infrastructure Spending per Capita by Region, CY 2017
Region
InfrastructureProgrammed Amount
for CY 2017 (inMillion PhP)
Population(2015 Census, in
‘000)
Estimate InfraSpending per Capita
(in PhP)
Davao Region 43,768 4,893 8,944.52CARAGA 21,490 2,597 8,275.68CAR 13,518 1,722 7,850.40Northern Mindanao 36,499 4,689 7,783.55MIMAROPA 20,135 2,963 6,794.65Eastern Visayas 23,504 4,440 5,293.54Western Visayas 23,308 4,477 5,205.95Cagayan Valley 14,608 3,451 4,232.40BICOL Region 24,368 5,797 4,203.57Zamboanga Peninsula 14,827 3,630 4,084.81SOCCSKSARGEN 18,038 4,545 3,968.46Ilocos Region 18,173 5,026 3,615.66Central Visayas 14,999 6,042 2,482.43Central Luzon 25,094 11,218 2,236.88CALABARZON 27,699 14,415 1,921.58NCR 20,446 12,877 1,587.74ARMM No data available 3,781 Incomplete dateGRAND TOTAL 360,474 100,981 3,708.57
Source: DPWH Website
Strategic infrastructure implemented
Road condition improved slightly in 2017 with an average international road roughness (IRI) index of4.54 for national road network in the region, better than the 4.88 index in 2016. The region’s averageIRI is lower than the average national IRI. Other neighboring regions, except for CAR, recorded betterIRI. The national road network is still classified as “fair” per international standard.
In terms of road density, the region registered the lowest density among regions at 6.54 km/sq.km. Thisis even with an improvement of 1.71 percent from its level in 2016. The three neighboring regionsreflected higher road density levels within a range of 10 to 15 kilometers per sq.km. The region’s roaddensity is lower than the national average.

Annual Regional Development Report (ARDR) I CY 2017
88
Table 34. Infrastructure Spending per Capita, by Region, CY 2017REGION AVERAGE
CAR 5.84NCR 4.75
I 3.52II 4.54III 3.48
IV-A 3.35V 3.13VI 5.21VII 4.22VIII 4.08IX 4.39X 4.42XI 4.36XII 4.34XIII 3.73
Nationwide Average 4.12
Segments of the roads with an average IRI of 1-3 are in “good” condition, >3-5 in“fair” condition, >5-7 in “poor” condition and > 7 in “bad” condition.
Source: DPWH Website
Table 35.National Road Density (km/sq.km.), By Regions, 2013-2017
REGION 2013 2014 2015 2016 2017CAR 11.02 11.14 11.25 11.84 11.39NCR 184.15 185.16 185.63 187.08 187.50NIR 0.00 0.00 12.32 12.34 0.00
I 12.77 12.83 12.84 12.86 12.86II 6.33 6.41 6.40 6.43 6.54III 10.70 10.70 10.70 10.70 10.70
IV-A 14.85 15.13 15.13 15.19 15.34IV-B 7.72 7.76 7.76 7.76 7.76
V 12.94 12.94 12.96 13.17 13.17VI 14.39 14.46 14.97 15.10 14.58VII 14.45 14.49 16.62 16.68 14.52VIII 10.81 10.90 10.89 10.92 11.02IX 9.27 9.59 9.73 9.77 9.77X 9.28 9.40 9.58 9.59 9.58XI 8.14 8.16 8.24 8.25 8.25XII 6.68 6.76 6.76 6.79 6.79XIII 7.00 7.17 7.20 7.20 7.20
Nationwide 10.36 10.46 10.49 10.54 10.57Source: DPWH Website

Annual Regional Development Report (ARDR)I CY 2017
89
As of December 2017, the total length of classified national roads was recorded at 1,951.44kilometers,an increase of 3.04 percent based from the 2016 baseline data or an additional of 56.47 kilometers.Breakdown per condition and surface type are presented in the table below.
Table 36. 2017 National Road Total (in km), Region 02, per Condition and Surface TypeREGION/SURFACE
TYPE
CONDITION RATING GrandTotalGood Fair Poor Bad No
AssessmentRegion II 631.96 565.53 452.13 200.03 101.80 1,951.44Concrete 494.19 406.68 334.61 115.28 56.84 1,407.60Asphalt 137.77 152.31 89.86 79.27 17.08 476.31Gravel - 6.53 27.66 5.47 26.39 66.05Earth - - - - 1.48 1.48
Source: DPWH Website
For the power sector, the provision of electricity significantly improved in 2017 with all barangaysprovided with the needed services from the region’s seven electric cooperatives. System losses reflectedan average of 10.8 percent across electric cooperatives. This is an improvement from the average of 12.8percent the previous year, keeping the region on track on its target of single digit system loss by the endof the plan period (see Table below).
Table 37. 2017 Summary of Accomplishment for Electric Cooperative in Region 02BATANELCO CAGELCO1 CAGELCO 2 ISELCO 1 ISELCO 2 NUVELCO QUIRELCO
Potential Connections 6,700 151,100 138,100 215,200 168,300 110,900 54,000Served 6,153 145,255 125,319 210,546 138,478 98,066 52,034% Accomplished 92% 96% 91% 98% 82% 88% 96%Total Barangays 29 376 510 484 545 275 150Energized 29 376 510 484 545 275 150Unenergized - - - - - - -Ave. Systems Rate(Php/kWh)
10.49 11.48 10.90 9.36 10.24 5.81 9.62
Ave. Power Rate(Php/kWh)
5.93 8.02 7.77 6.64 6.81 3.80 5.56
Net Margin/(Loss) (in‘000)
(1,138 4,712 -11,315 -4,393 -30,123 12,924 -2,578
kWh Purchased (in ‘000) 1,731 - 31,846 95,936 49,531 64,606 9,586kWh Sold (in ‘000) 1,626 50,390 28,363 84,866 42,949 60,103 8,021System Loss 5.86% 12.17% 10.23% 11.35% 12.72% 6.97% 16.33%Peak Load (kw) 1,577 50,336 30,736 82,485 42,079 25,728 7,995Load Factor 50.11% 52.17% 47.31% 53.11% 53.75% 39.70% 54.75%Ave. Residential Sales inkWh
69 56 48 62 60 62 34
Source: NEA

Annual Regional Development Report (ARDR) I CY 2017
90
For power generation, the region provided hydro-electric power through Magat Dam of SN AboitizPower, Inc. with 360 MW dependable capacity, MARIS 1 Main Canal also managed by SN Aboitiz withdependable capacity of 8 MW, and NIA-Baligatan managed by NIA with 6 MW dependable capacity.For Biomass power, Green Future in San Mariano, Isabela provided a dependable capacity of 12.2 MWand IBEC in Alicia, Isabela also committed 18.3 MW. The Green Future and IBEC are independentpower producers, and one of the few bagasse-fired and rice-husked-fired cogeneration plants operatingin Luzon.
On communication, the region relies on the services provided by the PLDT for landline communicationand SMART and Globe for wireless communication. The number of cell sites remained the same butthe services for wireless communication was expanded to further cater to the improvement of datatransfer. Competition is more evident on wireless communication with the two players improving theirservices for better internet connectivity through transitioning to 4G. Nonetheless, based on theassessment of Open Signal, an independent assessor for mobile experience worldwide, download speedis still relatively low in the Philippines, much more for the region with its low coverage of cell sites. Withmore people having preference for mobile data, it necessitates the need for better communicationinfrastructure.
On social infrastructure, the DPWH built a total of 243 additional school buildings that now servethousands of students. The additional 1,164 classrooms for public schools region-wide were sourcedout of the Basic Educational Facilities Fund (BEFF) from the previous year’s General AppropriationsAct (GAA) intended to address classroom shortage and assist the implementation of Department ofEducation’s K to 12 Program.
Asset preservation ensuredThe protection of the region’s assets from natural and man-made hazards remains one of the prioritieswithin the medium term. Flood control topped the list among the critical public infrastructures that wasgiven appropriate attention. Retrofitting of national bridges and public buildings came second andthird, respectively. For private buildings, the LGUs were in the better position to coordinate, monitorand manage compliance through the strict implementation of zoning and building code. While thestandards of Building Code requires review, the LGUs through their Engineering Departments and inconsultation with appropriate agencies, may come up with location specific standards based on actualexperience or situation to improve the structural integrity of buildings within their jurisdiction.
On flood control as a preservation/intervention measure, the P2-Billion flood control project along the3.31-kilometer riverbanks of Cagayan River in Tuguegarao City and Enrile reported almost 50 percentaccomplishment by the end of 2017. Other major flood control projects that were completed during theyear include the PhP102 Million flood control in the province of Nueva Vizcaya; Barangay Lamo in themunicipality of Dupax del Norte; Barangay Gabut in the municipality of Dupax del Sur and the P73million allocated to complete the Gattaran Flood Control project.

Annual Regional Development Report (ARDR)I CY 2017
91
R&D on cost-effective technologies intensifiedLearning from the damages caused by Typhoon Lawin in 2016, the region has to intensify theassessment of structural integrity as well as revisit the design of public infrastructure. In aligning R&Defforts with the CVRDP, the Regional Research and Development Agenda (RRDA) 2017-2022 wascrafted to identify and prioritize researchable areas in the different sectors. Six research areas coveringthe infrastructure sector were identified in as shown in Table 38.
Table 38. Research Areas for Infrastructure Sector, Region 02, 2017-2022Research Area Proponent Sectoral Rank Regional Rank
Upgraded Drainage System in TuguegaraoCity
DPWH 1 4
Updated Centralized Straight Line Diagram ofthe National Road Network
DPWH 2 10
Modeling of Artificial Intelligence-Controlled Traffic Lights for Tuguegarao City
CSU 3 13
Development of Automated Control Systemfor Energy Management in School Buildings
CSU 4 17
Improvement of Infrastructure Support(Transportation, power, communication andall-weather port in Basco)
PLGUBatanes
5 21
Climate Proofing of Infrastructures forNatural Disasters (Typhoon, Flood,Landslide/ Erosion)
ISU 6 23
Source: RRDA 2017-2022
The region also participated in the crafting of two national studies, namely: the Philippine TransportMaster Plan and the Philippine Water Supply and Sanitation Master Plan. The studies assessed thetransport and water supply and sanitation situation in the region and identified areas for priorityintervention.

Annual Regional Development Report (ARDR) I CY 2017
92
Moving ForwardEfforts along infrastructure development need to be further intensified. The region’s decision-makers,program and policy advocates and implementers should be more vigilant in identifying and pushing formore project proposals given the current thrust on “Build, Build, Build”. Among the recommendationsfor the region to cope up with its infrastructure needs are the following:
Negotiate for an increase in the share of the infrastructure budget to improve on the standing ofthe region in terms of road density, irrigation coverage, among others;
Ensure the immediate restoration of government facilities damaged during calamities; Initiate gradual shift towards public transport with emphasis on mass transport to ensure
availability, affordability, convenience, and reliability of the regional transportation system; Expand the deployment of ICT infrastructure and address the gaps in digital connectivity; Improve energy efficiency through the Energy Efficiency Conservation (EEC) program; Prioritize the provision of electricity services to the remaining off-grid areas, islands and
remote communities to achieve total household electrification; Design flood control, drainage and other public infra to be more disaster-resilient; Construct or rehabilitate vital infrastructures such as roads, bridges, evacuation centers (gender
sensitive), and schools to be resistant to extreme weather conditions. Develop database and information system for proper and efficient asset management; and
Pursue completion of mitigation and preparedness plans of LGUs.