TA Oil - SEC 17-A - CY 2010 - Part 1 - Coversheet
245
0 6 9 - 0 3 9 2 7 4 S.E.C. Registration Number T R A N S - A S I A O I L A N D E N E R G Y D E V E L O P M E N T C O R P O R A T I O N (Company's Full Name) L E V E L 1 1 P H I N M A P L A Z A 3 9 P L A Z A D R I V E R O C K W E L L C E N T E R M A K A T I (Business Address: No. Street City/Town/Province) MR. RAYMUNDO A. REYES, JR. 8 7 0 - 0 1 0 0 Contact Person Company Telephone Number 1 2 3 1 1 7 - A Month Day FORM TYPE Month Day Fiscal Year Annual Meeting Secondary License Type, If Applicable Dept. Requiring this Doc. Amended Articles Number/Section Total Amount of Borrowings 3, 3 6 0 Total No. of Stockholders Domestic Foreign To be accomplished by SEC Personnel concerned File Number LCU Document I. D. Cashier STAMPS Remarks = pls. Use black ink for scanning purposes COVER SHEET
-
Upload
khangminh22 -
Category
Documents
-
view
0 -
download
0
Transcript of TA Oil - SEC 17-A - CY 2010 - Part 1 - Coversheet

0 6 9 - 0 3 9 2 7 4 S.E.C. Registration Number
T R A N S - A S I A O I L A N D E N E R G Y
D E V E L O P M E N T C O R P O R A T I O N
(Company's Full Name)
L E V E L 1 1 P H I N M A P L A Z A 3 9 P L A Z A
D R I V E R O C K W E L L C E N T E R M A K A T I
(Business Address: No. Street City/Town/Province)
MR. RAYMUNDO A. REYES, JR. 8 7 0 - 0 1 0 0Contact Person Company Telephone Number
1 2 3 1 1 7 - A Month Day FORM TYPE Month Day
Fiscal Year Annual Meeting
Secondary License Type, If Applicable
Dept. Requiring this Doc. Amended Articles Number/Section
Total Amount of Borrowings3, 3 6 0
Total No. of Stockholders Domestic Foreign
To be accomplished by SEC Personnel concerned
File Number LCU
Document I. D. Cashier
STAMPS
Remarks = pls. Use black ink for scanning purposes
COVER SHEET
1
SEC Number 39274 File Number
TRANS-ASIA OIL AND ENERGY DEVELOPMENT CORPORATION (Company’s Full Name)
11th Phinma Plaza, 39 Plaza Drive, Rockwell Center, Makati City
(Company’s Address)
870-0100 (Telephone Number)
December 31
(Fiscal Year ending) (month & day)
17-A
(Form Type)
___________________________________________________________ Amendment Designation (If Applicable)
December 2010 (Period Ended Date)
(Secondary License Type and File Number)

2
SECURITIES AND EXCHANGE COMMISSION
SEC FORM 17- A
ANNUAL REPORT PURSUANT TO SECTION 17 OF THE REVISED SECURITIES ACT AND SECTION 141 OF THE CORPORATION CODE OF THE PHILIPPINES
1. For the fiscal year ended December 31, 2010 2. SEC Identification Number 39274 3. BIR Tax Identification No. 049-000-506-020 4. Exact name of issuer as specified in its charter Trans-Asia Oil and Energy Development Corporation 5. Province, Country or other jurisdiction of Philippines incorporation or organization 6. Industry Classification Code (SEC Use Only) 7. Address of principal office 11th Floor, Phinma Plaza 39 Plaza Drive, Rockwell Center Makati City 1200 8. Issuer’s telephone number, including (632) 870-0100
area code 9. Former name, former address, and former
fiscal year, if changed since last report 10. Securities registered pursuant to Sections 8 and 12 of the SRC, or Sec. 4 and 8 of the RSA
Number of shares of common stock outstanding 1,664,625,604 shares Amount of debt outstanding None
11. Are any or all of these securities listed on a Stock Exchange?
Yes X No 12. Check whether the issuer:
(a) has filed all reports required to be filed by Section 17 of the SRC and SRC Rule 17.1 thereunder or Section 11 of the RSA and RSA Rule 11(a)-1 thereunder, and Sections 26 and 141 of The Corporation Code of the Philippines during the preceding twelve (12) months (or for such shorter period that the registrant was required to file such reports);
Yes X No
3
(b) has been subject to such filing requirements for the past ninety (90) days.
Yes X No 13. State the aggregate market value of the voting stock held by non-affiliates of the registrant. The
aggregate market value shall be computed by reference to the price at which the stock was sold, or the average bid and asked prices of such stock, as of a specified date within sixty (60) days prior to the date of filing. I a determination as to whether a particular person or entity is an affiliate cannot be made without involving unreasonable effort and expense, the aggregate market value of the common stock held by non-affiliates may be calculated on the basis of assumptions reasonable under the circumstances, provided the assumptions are set forth in this Form. (See definition of “affiliate” in “Annex B”).
NA
14. Check whether the issuer has filed all documents and reports required to be filed by Section 17 of the
Code subsequent to the distribution of securities under a plan confirmed by a court or the Commission.
NA 15. Documents incorporated by reference
a) Annual Report to security holders b) Information Statement filed pursuant to SRC Rule 20

4
TABLE OF CONTENTS
Page No. PART I BUSINESS AND GENERAL INFORMATION Item 1: Business 5 Item 2: Properties 39 Item 3: Legal Proceedings 40 Item 4: Submission of Matters to a Vote of Security Holders 40 PART II SECURITIES OF THE REGISTRANT Item 5: Market for Issuer’s Common Equity and Related Stockholders Matters 41 PART III FINANCIAL INFORMATION Item 6: Management’s Discussion and Analysis or Plan of Operation 43 Item 7: Information on Independent Accountant and other Related Matters 64 Item 8: Financial Statements 65 Item 9: Changes in and Disagreements with Accountants
on Accounting and Financial Disclosure 65
PART IV MANAGEMENT AND CERTAIN SECURITY HOLDERS Item 10: Directors and Executive Officers of the Issuer 65 Item 11: Executive Compensation 71 Item 12: Security Ownership of Certain Beneficial
Owners and Management 74
Item 13: Certain Relationships and Related Transactions 77 PART V CORPORATE GOVERNANCE Item 14: Compliance Program 77 PART VI EXHIBIT AND SCHEDULES Item 15: Exhibits and Schedules on SEC Form 17-C 79 SIGNATURES 90

5
PART I – BUSINESS Item 1. Description of Business Business Development Trans-Asia Oil and Energy Development Corporation was established by the Philippine Investment Management (PHINMA), Inc. on September 8, 1969 in line with PHINMA’s vision to create a vehicle for building the nation’s economy through self-reliance in energy. Trans-Asia Oil and Energy Development Corporation and its subsidiaries are herein collectively referred to as “TA”, “Trans-Asia” or “the Company.” TA is engaged primarily in power generation and supply, with secondary investments in petroleum and mineral exploration. The Company was originally known as Trans-Asia Oil and Mineral Development Corporation, reflecting its original purpose of engaging in petroleum and mineral exploration and production. In order to diversify its product and revenue portfolio, the Company invested in power generation and supply, which eventually became its main business and revenue source. On April 11, 1996, the Company’s name was changed to its present Trans-Asia Oil and Energy Development Corporation.
Description of Principal Business Power Generation and Supply Business The principal product of power generation and supply is the electricity produced and delivered to the end-consumer. It involves the conversion of fuel or other forms of energy to electricity; or the purchase of electricity from the WESM. In 2010, TA sold a total of 270.8 million kWh of electricity with gross proceeds of P 1.33 billion from this business, compared to 318.8 million kWh of electricity sold with gross proceeds of P1.29 billion in 2009. The Company conducts its power generation activities mainly through its subsidiaries and affiliates as follows: Location Company Size Fuel
Type TA Ownership
Customer / Projects
Bulacan Trans Asia Power Generation Corporation
52MW BFO 50% Holcim Philippines, Inc. WESM
Laguna CIP II Power Corporation 21MW BFO 100% Standby Power for CIP II Industrial Park
Guimaras Trans Asia Oil and Energy Development Corporation
3.4MW BFO 100% Peaking and Standby Power of Guimaras Island
TA Power TA owns 50% of TA Power through a joint venture with Holcim. Under the ESA with Holcim in 1998 and the memorandum of agreement among TA, TA Power and Holcim in 2007, TA Power supplies all of the electricity requirements of Holcim’s cement plant in Norzagaray, Bulacan via the former’s 52MW bunker C-fired power plant until 2013. For the year ended December 31, 2010, TA Power generated 185.4 million kWh of electricity compared to 75.4 million kWh of electricity in 2009 and 123 million kWh in 2008. CIPP CIPP is located in the Carmelray Industrial Park II in Calamba, Laguna. Originally it was the only generator allowed to supply the electricity requirements of the park through its 21MW bunker C-fired power plant. In March 2009, the Company sold CIPP’s ownership of the distribution network inside the park, effectively terminating the original Concession Agreement with the park operator Carmelray – JTCI Corporation. The Company has decided that CIPP generation assets will be transferred to Holcim’s Bacnotan La Union plant where it can provide peaking and backup power to the cement plant and sell excess power to WESM.

6
Guimaras TA has an ESA with GUIMELCO for the construction, operation and maintenance of a 3.4 MW bunker C-fired power plant by the Company in Guimaras. The power plant sells electricity primarily to GUIMELCO at the rate approved by the ERC. Installation of the power plant and construction of related facilities were completed in February 2005. Commercial operation commenced on June 26, 2005. The plant is primarily a peaking plant, and under the ESA ( as amended), the power station is required to operate to its net capacity daily from 6:00 pm to 10:00 pm, and as required by GUIMELCO during off-peak hours. In 2010 and 2009, the Guimaras plant generated a total of 4.3 million kWh and 3.8 million kWh of electricity, respectively. Revenues earned totaled P55.5 million in 2010 compared to P47.2 million in 2009. In March 2011, the Guimaras plant was registered as a WESM participant in the Visayas on a nonscheduled basis. WESM The Company’s energy trading business revolves around buying electricity from, and selling electricity to, the WESM. The Company has been trading or buying from the WESM to supply all or a portion of its customers’ electricity supply requirements. When prices are lower at the WESM than its own costs of generation, the Company purchases power from the market and sells it to its customers at an agreed price as stipulated in their bilateral contracts. On the other hand, if the WESM prices are higher than the Company’s generating prices, and the Company has excess generating capacity, the Company may sell power to the WESM. The Company’s subsidiary, TA Power, sells the excess capacity of its 52MW diesel plant to the WESM at a price not lower than the reference price. This reference price is usually pegged at the fuel cost of the plant. In times when prices at the WESM are higher than reference price, TA Power generates power and sells its excess capacity to the market. Trading of electricity has become a major business of the Company since 2008. The Company’s management believes that electricity trading will represent a major portion of the Company’s revenues for the foreseeable future. Trading opportunities should expand as the Company increases its generating capacity and expands its customer base. In the meantime, the Company has contracted the capacity of One Subic for its 105MW Bunker C-Fired power plant located at the Subic Bay Freeport, Sem-Calaca for 15MW of the generated output of SCPC’s power plant in Batangas, and NIA-Baligatan Hydro Electric Plant for up to 32GWH of generated energy. Future Projects TA is venturing into several major power generating initiatives to further diversify its revenue portfolio. The following projects are presently under development: Puting Bato 135MW Generation Project (Calaca, Batangas) Puting Bato is a 135MW ‘clean coal’ power generation project that is significantly more environment-friendly than other coal-fired generating plants. The project will be located at the Phoenix Petroterminal and Industrial Park Phase II in Barangay Puting Bato West, Calaca, Batangas. The site was assessed on factors including water availability, power export, road access for transport of fuel and heavy equipment, environment, socioeconomic factors and geotechnical factors. The plant is designed to run on sub-bituminous coal to be sourced from Semirara Mining Corporation, with option to use coal from other sources (such as Indonesia Wara coal). The proposed power plant comprises a single unit of a circulating fluidized bed boiler with auxiliaries, associated single steam turbine generator with auxiliaries, and a step-up transformer to connect to the NGCP’s Calaca 230 kV substation. Dematerialized water for the boiler will be supplied by a desalination plant. The steam will be condensed in a conventional water-

7
cooled condenser. Cooling water for the condenser will be seawater from Balayan Bay. Emissions control will be through the use of an electrostatic precipitator for particulates, and depending on the sulphur content in the coal, limestone injection for sulphur capture. Fly ash and bottom ash will be collected for safe disposal or for transport to cement plants. “Clean Coal Technology” refers to technologies that aim to minimize the environmental impact of coal electric power generation. Clean Coal Technology usually addresses atmospheric emissions from burning coal. Historically, the focus of Clean Coal Technologies has been to reduce the emissions from the smoke stack of oxides of sulfur (“SOx”) and nitrogen (“NOx”). The emissions of SOx and NOx into the atmosphere gives rise to the formation of weak sulfuric and nitric acid in the water vapor that eventually fall down as "acid rain". The technology uses a Circulating Fluidized Bed (“CFB”) boiler that reduces the emissions of SOx and NOx. Limestone injection into the boiler minimizes SOX emissions as the sulfur in the coal reacts with limestone to produce calcium sulfate, a solid material that is eventually removed from the boiler as bed ash. NOx emission is reduced because coal burning at temperatures above 1100 Celsius produces thermal NOx. CFB boilers are usually operated at between 700 to 950 C combustion temperature, thus, minimizing thermal NOx production. Construction is expected to commence on July 2011 and take 32 months. TA has signed an Engineering Procurement and Construction contract with DMCI as its EPC contractor for the project. Transferring CIPP from Calamba, Laguna to Bacnotan, La Union The Company has decided to transfer the 21-MW Bunker C-Fired Power plant currently located at Carmelray Industrial Park II in Calamba, Laguna to Bacnotan La Union. This process involves physically relocating CIPP’s 2 x 3.5MW and 2 x 7 MW Bunker C-Fired engines, a project that may take up to 12 months. The new location of the plant will serve the requirements of Holcim’s La Union plant and enable the Company to sell to the WESM during peak hours, both of which it is unable to do from its current location. Wind Energy Projects The Company aims to be a major developer of wind energy projects in various parts of the country. It has identified 33 wind sites with a total potential of 481MW to be developed in the next three (3) to seven (7) years. On October 23, 2009, the Company was awarded by the DOE with service contracts covering 10 sites with a total potential capacity of 227MW. On February 1, 2010, another 10 service contracts were awarded by the DOE to the Company, bringing the total capacity under these contracts to 367MW. Among these wind sites, the site in the Municipality of San Lorenzo in the island of Guimaras is in an advanced stage of development. The site covers 14 square kilometers of Barangays Suclaran, M. Chavez, and Cabano, all in the Municipality of San Lorenzo, Guimaras. The Company already has 43 months of uninterrupted wind resource data confirming the potential of the site for 54MW of turbine capacity. The Feasibility Study for the project has been completed and confirmed the viability of the project based on an assumed FIT rate. At present, negotiations with a selected EPC contractor are on-going. Award is expected once the much awaited Feed-In-Tarif (FIT) rate incentive which will justify the Project’s viability is in place. An ECC has been issued to the project and the Grid Impact Study for the Project has been completed. Under the RE Law, the San Lorenzo Wind Farm is required to sell its entire output to NGCP and would be given a priority dispatch. Distribution of Product Electricity sales have been sold at the prevailing Energy Regulatory Commission (ERC) approved rates. Increasingly, however, the WESM is becoming a bigger market where electricity purchases are settled based on market or spot rates. Delivery of the product is coursed through transmission lines currently owned by the National Grid Corporation of the Philippines (NGCP) and, to a certain extent, the electric cooperatives and distribution utilities like MERALCO in exchange for wheeling charges. Competition TA and TA Power compete with MERALCO and power generating companies in supplying power to the Company's customers. With the full implementation of EPIRA and its purpose of establishing a transparent and

8
efficient electricity market via more competition, the Company's customers may choose to buy power from third party suppliers. The execution of bilateral contracts protects the Company because the customers are bound by the bilateral contracts to purchase exclusively from the Company. However, if the cost of power offered by third parties is lower than what the Company’s bilateral contracts specify, this may put pressure on the Company to lower its rates in order to be competitive. The move towards a more competitive environment, as set forth by EPIRA, could result in the emergence of new and numerous competitors. Dependence on Suppliers The Company purchases bunker-C fuel from Petron Corporation, which is the biggest oil supplier in the country, for its power generation business. Disruptions to the supply of fuel could result in substantial reduction or increased power plant operating cost, and may have an adverse effect on the Company’s financial performance and financial position. Any delay in fuel deliveries or disruptions in fuel supply may result in unplanned plant shutdowns. To protect against such disruptions in fuel supply, long term contracts with the fuel supplier were executed. In case of a temporary fuel shortage along the supply chain, the oil company will give priority deliveries to the Company’s plants. In the event of force majeure situations, however, everyone, including the Company will be adversely affected. To mitigate this risk, the Company maintains long term fuel supply contracts and maintains safe and strategic inventory levels of fuel to ensure continuous electricity production. Furthermore, if any of the major suppliers fails to deliver, the Company may buy fuel from other vendors. With the established good relationships with the other fuel suppliers, TA could obtain competitive alternate sources and arrange the timely delivery of fuel. Dependence on Customer Existing off-take agreements assure a certain level of demand from the Company's customers. Under the ESA between TA and GUIMELCO, TA agreed to supply electricity generated by the power plant to GUIMELCO, and GUIMELCO agreed to take and pay for electricity delivered by TA. Holcim being 50% owner of TA Power, TA Power has some comfortable level of assurance that no other power generation company will be allowed to supply electricity to Holcim’s cement plant in Norzagaray, Bulacan. This ESA is valid up to December 26, 2013. For CIPP, it sold its distribution facilities to MERALCO and terminated its ESA with the locators in Carmelray Industrial Park II in Calamba, Laguna effective April 11, 2009 and is being relocated to La Union. Related Party Transactions During the last two (2) years, the Company was not a party in any transaction in which a Director or Executive Officer of the Company, any nominees for election as a director, any security holder owning more than 10% of the Company’s issued and outstanding shares and/or any member of his immediate family had a material interest thereon. TA is managed by PHINMA through a management contract. Under an existing management agreement, TA pays PHINMA a fixed monthly management fee plus an annual incentive based on a certain percentage of the net income. PHINMA has a general management authority with the corresponding responsibility over all operations and personnel of the Company, including planning, direction, supervision of all the operations, sales, marketing, distribution, finance, and other business activities of the Company. The management contract will expire on August 31, 2013. As of March 31, 2011, PHINMA owns 427,491,684 shares, which represent 25.68% of total outstanding shares of stock of the Company.
The Company, through its joint venture company TA Power, entered into a management contract with PHINMA on September 1, 2006 for the provision of general management services. TA also leases out to TA Power an office space for the period commencing on January 1, 2011 and expiring on December 31, 2011 for a fixed monthly rent.

9
See section on Material Contracts and Agreements for further discussion. Contracts and Agreements The Company’s power business is covered by various agreements that govern generation, off-take and distribution, as follows: ESA between TA Power and Holcim On February 25, 1998, TA Power entered into an ESA with Holcim (then, Hi-Cement Corporation) under which TA Power agreed to supply and deliver to Holcim all of the electricity requirements of Holcim’s cement plant located in Norzagaray, Bulacan. The term of the ESA is for a period of 15 years, until December 26, 2013. Under this ESA, TA Power will provide and install the necessary metering equipment, energy meters and related equipment for the measurement of electric energy generated and delivered by TA Power and accepted by Holcim, and which would determine Holcim’s payment obligations to TA Power. Under the ESA, the price of electricity generated and delivered by TA Power to Holcim is equivalent to the NPC basic charges for demand and energy adjusted for foreign exchange, fuel and purchase power cost adjustments, primary voltage discount and power factor. All monthly power billings are required to be paid not later than the last working day of the succeeding calendar month. On December 14, 2007, TA Power, Holcim and TA Oil entered into a Memorandum of Agreement where TA Power shall supply Holcim’s cement plant in Norzagaray, Bulacan and TA Oil shall supply Holcim’s cement plant in Bacnotan, La Union, at rates equal to NPC Time of Use (TOU) rates, effectively amending the ESA (see discussion below). Transmission Service Agreement with TRANSCO On July 31, 2002, TA Power entered into a TSA and an Interim Connection Agreement with TRANSCO (which were amended on September 12, 2002) covering transmission services for the transmission of power generated at the power plant of TA Power located in Norzagaray, Bulacan to the cement plants of Holcim (formerly, Union Cement Corporation) located in Bacnotan, La Union and Norzagaray, Bulacan. The TSA provides that TA Power shall pay for transmission services in accordance with the Open Access Transmission Service (“OATS”), the Open Access Transmission Tariff (“OATT”), the Tariff for Ancillary Services for Private Sector Generating Facility Customer and the Terms and Conditions for OATS (“OATS Terms”) implemented by the NPC and approved by the ERC. Under the TSA, TA Power shall supply (i) 8,000 KW of generated power to Holcim’s cement plant in Bacnotan, La Union through an ESA and (ii) 27,000 KW of generated power to Holcim’s cement plant in Norzagaray, Bulacan through also an ESA. Power delivery and ancillary service charges shall be computed based on the OATS Terms and the OATT approved by the ERC. Energy and capacity shall be transmitted by connecting the generation facility to the TRANSCO’s grid through line 1 of the Angat-San Jose 115KV transmission line and wheeling through TRANSCO’s grid from the point of receipt to a delivery point in Holcim’s plant switchyard. Memorandum of Agreement among TA, TA Power and Holcim On December 14, 2007, TA, TA Power and Holcim entered into a MOA where TA Power agreed to supply exclusively the electricity requirements of Holcim’s cement plant in Norzagaray, Bulacan through TA Power’s plant in Bulacan or through TA, acting as a RES. TA, as a RES, shall exclusively supply all of the electricity requirements of Holcim’s cement plant in Bacnotan, La Union. The 52MW diesel power plant in Bulacan shall be operated as a merchant plant which can sell its generation capacity to the Grid, which refers to a high voltage backbone system of interconnected transmission lines, substations and related facilities. Holcim guarantees a minimum off-take of 220 million kWh to be computed at the end of each calendar year. This MOA commenced in January 2008 and shall remain effective until TA Power and Holcim execute a new ESA. The electricity fees under this MOA shall be the NPC Time of Use rates, including all other charges. On January 12, 2010 the three parties entered into another Memorandum of Agreement modifying the electricity fees payable by Holcim for December 26, 2009 to December 25, 2010. Instead to NPC-TOU rates, the parties used an agreed- upon fixed time-of-use schedule.

10
On December 20, 2010, the parties entered into an Agreement on Electricity Fees for December 26, 2010 to December 25, 2013, which specifies a p/kwh TOU schedule for the first year, to be increased by twenty three centavos in the second year and by another 22 centavos for the third year. Contract for the Sale and Purchase of Industrial Lots with Bacnotan Industrial Park Corporation On January 15, 2010, Trans-Asia signed a Contract for the Sale and Purchase of Industrial Lots with BIPC where Trans-Asia is given the option to purchase 78,900 square meters of industrial land at the Phoenix Petroterminals and Industrial Park at Calaca, Batangas and 52,100 square meters of land to be acquired by BIPC, for the total purchase price of P333,825,000 payable in tranches of P15,630,000 as downpayment, P31,260,000 upon exercise of the option, P46,890,000 upon purchase of the land for BIPC acquisition, P46,890,000 upon submission of documentary deliverables, and the balance upon delivery of final deeds of absolute sale, the tax declarations and the titles to all of the properties. On November 22, 2010, Trans-Asia exercised the option to acquire the properties. Contract to Purchase Generated Energy with National Irrigation Administration On November 5, 2009, TA and National Irrigation Administration (NIA) entered into a Contract to Purchase Generated Energy where TA agreed to purchase generated energy of NIA-Baligatan Hydro Electric Plant for a period of six (6) months or upon delivery of 16GWH, whichever comes later. The Contract was extended on November 26, 2010 for an additional period of one year or delivery of 32GWH of electricity, whichever comes later. Contract to purchase Generated Electricity with Amlan Hydro Power Incorporated On July 6, 2010, Trans-Asia signed a Contract to Purchase Generated Energy with Amlan Hydro Power Incorporated (AHPI). Trans-Asia shall purchase up to 15 megawatts per hour of the generated output of AHPI’s Bakun-Benguet Hydro Plant for a period of six months. Power Administration and Management Agreement with One Subic Power Generation Corporation On November 19, 2010, Trans-Asia entered into a Power Administration and Management Agreement with One Subic , a subsidiary of Udenna Corporation, which also owns Phoenix Petroleum. The agreement is for a fixed term of five (5) years from start of commercial operations. Under the agreement, Trans-Asia has the right to sell all of the power generation output of the 116 MW Subic Diesel Power Plant, which is under lease to One Subic. Trans-Asia shall pay each month a fixed capacity and a variable electricity fee of the fuel cost in peso per liter multiplied by the kWh generated and multiplied by a fuel conversion rate. One Subic shall operate the plant and provide the fuel at its own expense. Contract to purchase Generated Electricity with Sem-Calaca Power Corporation On March 23, 2011 Trans-Asia signed a Contract to Purchase Generated Energy with Sem-Calaca Power Corporation (“SCPC”) where Trans-Asia shall purchase up to 15 megawatts per hour of the generated output of SCPC’s Calaca Power Plant, valid for three (3) years. ESA with GUIMELCO (Guimaras Power Project) The ESA with GUIMELCO was signed on November 12, 2003; valid for 10 years, term extendible by mutual agreement. Following are among the significant provisions of this ESA: Cooperation Period: 10 years, and may be extended pursuant to this ESA Electricity Fees: Electricity fees is based on a formula as set forth in this ESA and shall be
payable monthly during the Cooperation Period. Electricity Delivery Procedures: GUIMELCO must give priority to electricity generated by the Company’s
power station up to 1.8 MW, over any other power source.

11
This ESA provides for the construction, operation and maintenance of a 3.4MW bunker C-fired power plant by the Company in Guimaras. The power plant will sell electricity primarily to GUIMELCO at the rate approved by the ERC. Installation of the power plant and construction of related facilities were completed in February 2005. Commercial operation commenced on June 26, 2005. On May 4, 2006, this ESA was amended to require the power station to supply power to GUIMELCO primarily during peak demand hours. Under the amended ESA, the plant will operate up to its net capacity for four (4) continuous hours daily from 6:00 p.m. to 10:00 p.m. Furthermore, GUIMELCO may require the plant to supply power during off-peak hours or if there is no electricity from the grid by written notification. Wholesale Aggregator Certificate of Registration /RES License On November 22, 2006, the ERC granted TA a Certificate of Registration as a WA, making it the first such licensee in the country. The license authorizes TA to consolidate electric power demand of distribution utilities, pursuant to the EPIRA. The WA license is valid for a period of five (5) years, and requires the WA to comply with the EPIRA, the Grid Code, the Open Access Transmission Service Rules, the Distribution Service Open Access Rules and other ERC Rules. Under the license, TA is required to comply with Structural and Functional Unbundling of Electric Power Industry Participants as provided in Rule 10 of the implementing rules and regulations of EPIRA and to ensure that there is no cross-subsidy among its power supply business activities. TA was also granted the RES License on December 6, 2006. As a RES, the Company is allowed to supply electricity to the Contestable Market, pursuant to EPIRA. The Company also obtained membership in the WESM as a supplier on September 20, 2007. The license is valid for three (3) years. As a RES, the ERC authorizes the Company to sell, broker, market or aggregate electricity to end-users. On December 14, 2009, the ERC renewed Trans-Asia’s RES license. Joint Venture Agreement with PetroGreen Energy Corporation, and PNOC Renewables Corporation On May 19, 2010, Trans-Asia signed a joint venture agreement (JVA) with PetroGreen Energy Corporation, a wholly-owned subsidiary of publicly-listed PetroEnergy and PNOC RCPNOC RC for the development and operation of the Maibarara Geothermal Power Project (MGPP). Maibarara was awarded by the DOE to PetroEnergy in February 2010 following an open and competitive selection process for awarding of geothermal renewable energy service contract in October 2009. The parties agreed to form MGI, capitalized at P1.125 billion with the following shareholding interests: PetroGreen, 65%; Trans-Asia Oil, 25%; and PNOC RC 10%. PetroEnergy assigned the Maibarara Geothermal Service Contract to MGI in September 2010. Maibarara is an undeveloped geothermal field in Santo Tomas, Batangas and Calamba, Laguna that was discovered by Philippine Geothermal, Inc., wholly-owned subsidiary of Unocal Corporation of the United States, in the 1980s. MGI commenced workover operations on several productive wells in December 2010. Steam discharge tests will follow, most likely in the 2nd quarter of 2011. MGI hopes to commission a 20-MW geothermal power plant by the 2nd half of 2013. Construction management contract with Engineering and Development Corporation of the Philippines TA entered into a construction management contract with Engineering and Development Corporation of the Philippines (EDCOP) on September 24, 2010 for the provision by EDCOP of pre-construction and construction management services for the Puting Bato Power Plant project. Wind Energy Service Contracts TAREC, a 100% subsidiary of TA, entered into 20 Wind Energy Service Contracts with the DOE to explore and develop wind energy at specific locations and, if feasible, to produce energy from these sources over a specified period of time. These cover the following sites:
Malay, Aklan WESC-2009-10-006 Ibajay, Aklan WESC-2009-10-007 Barotac Nuevo, Iloilo WESC-2009-10-008
12
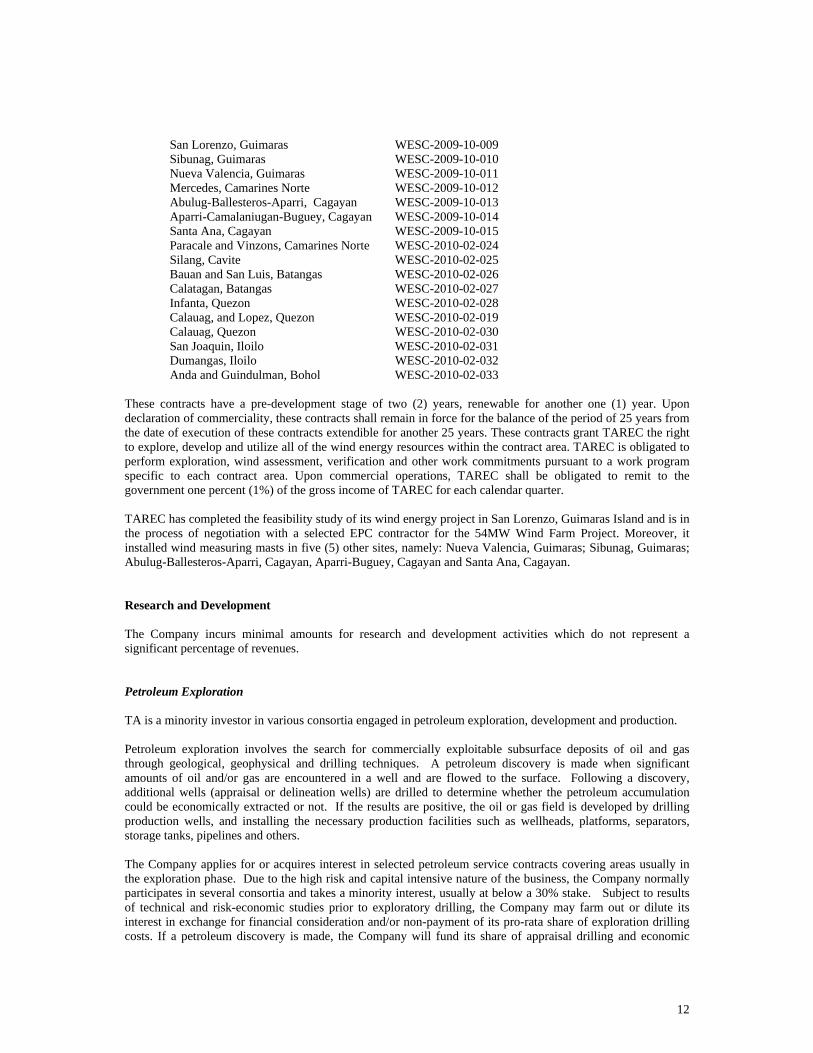
San Lorenzo, Guimaras WESC-2009-10-009 Sibunag, Guimaras WESC-2009-10-010 Nueva Valencia, Guimaras WESC-2009-10-011 Mercedes, Camarines Norte WESC-2009-10-012 Abulug-Ballesteros-Aparri, Cagayan WESC-2009-10-013 Aparri-Camalaniugan-Buguey, Cagayan WESC-2009-10-014 Santa Ana, Cagayan WESC-2009-10-015 Paracale and Vinzons, Camarines Norte WESC-2010-02-024 Silang, Cavite WESC-2010-02-025 Bauan and San Luis, Batangas WESC-2010-02-026 Calatagan, Batangas WESC-2010-02-027 Infanta, Quezon WESC-2010-02-028 Calauag, and Lopez, Quezon WESC-2010-02-019 Calauag, Quezon WESC-2010-02-030 San Joaquin, Iloilo WESC-2010-02-031 Dumangas, Iloilo WESC-2010-02-032 Anda and Guindulman, Bohol WESC-2010-02-033
These contracts have a pre-development stage of two (2) years, renewable for another one (1) year. Upon declaration of commerciality, these contracts shall remain in force for the balance of the period of 25 years from the date of execution of these contracts extendible for another 25 years. These contracts grant TAREC the right to explore, develop and utilize all of the wind energy resources within the contract area. TAREC is obligated to perform exploration, wind assessment, verification and other work commitments pursuant to a work program specific to each contract area. Upon commercial operations, TAREC shall be obligated to remit to the government one percent (1%) of the gross income of TAREC for each calendar quarter. TAREC has completed the feasibility study of its wind energy project in San Lorenzo, Guimaras Island and is in the process of negotiation with a selected EPC contractor for the 54MW Wind Farm Project. Moreover, it installed wind measuring masts in five (5) other sites, namely: Nueva Valencia, Guimaras; Sibunag, Guimaras; Abulug-Ballesteros-Aparri, Cagayan, Aparri-Buguey, Cagayan and Santa Ana, Cagayan. Research and Development The Company incurs minimal amounts for research and development activities which do not represent a significant percentage of revenues. Petroleum Exploration TA is a minority investor in various consortia engaged in petroleum exploration, development and production. Petroleum exploration involves the search for commercially exploitable subsurface deposits of oil and gas through geological, geophysical and drilling techniques. A petroleum discovery is made when significant amounts of oil and/or gas are encountered in a well and are flowed to the surface. Following a discovery, additional wells (appraisal or delineation wells) are drilled to determine whether the petroleum accumulation could be economically extracted or not. If the results are positive, the oil or gas field is developed by drilling production wells, and installing the necessary production facilities such as wellheads, platforms, separators, storage tanks, pipelines and others. The Company applies for or acquires interest in selected petroleum service contracts covering areas usually in the exploration phase. Due to the high risk and capital intensive nature of the business, the Company normally participates in several consortia and takes a minority interest, usually at below a 30% stake. Subject to results of technical and risk-economic studies prior to exploratory drilling, the Company may farm out or dilute its interest in exchange for financial consideration and/or non-payment of its pro-rata share of exploration drilling costs. If a petroleum discovery is made, the Company will fund its share of appraisal drilling and economic

13
studies. Upon delineation of a commercial discovery, financing for up to 70% of field development costs is available in the international market. As projects are mostly in the exploratory stage, the Company derives insignificant or no recurring revenues from petroleum production. In 2010, the Company assigned its royalty interest in the Cadlao Production Area, Northwest Palawan under SC No. 6 to Peak Royalties Limited (BVI) and recognized US$1.325 million income from such transaction. The Company also entered into an Option Agreement and Farm-In Option Agreement with Frontier Gasfields Pty. Ltd. Covering SC 55 and SC 69, respectively, in 2010. At this time, the Company believes it has sufficient petroleum projects on hand given its resources and risk tolerance and, therefore, has no firm plans to acquire additional petroleum interests in the next two (2) years. Product and Distribution The principal products of petroleum production are crude oil and natural gas. Crude oil is usually sold at market price in its natural state at the wellhead after removal of water and sediments, if any. Depending on the location of the oil field, the oil produced may be transported via offshore tankers and/or pipeline to the refinery. On the other hand, natural gas may be flared, reinjected to the reservoir for pressure maintenance, or sold, depending on the volume of reserves and other considerations. Natural gas is commonly transported by pipeline. However, if the deposit is very large and the market is overseas, the gas may be liquefied into liquefied natural gas and transported using specialized tankers. Competition While competition for market of petroleum does not have a significant bearing in the operations of the Company, TA’s competitors compete on two fronts, namely: (1) petroleum acreage and (2) investment capital. The DOE awards petroleum contracts to technically and financially capable companies on a competitive bidding basis. Thus, the Company competes with foreign firms and local exploration companies such as PNOC Exploration Corporation, Philodrill Corporation, Oriental Petroleum and Minerals Corporation, and PetroEnergy Resources Corporation for acquisition of prospective blocks. While there is competition in the acquisition of exploration rights, the huge financial commitments associated therewith also provide opportunities for partnership, especially between local and foreign companies. Under a service contract, a substantial financial incentive is given to consortia with at least 15% aggregate Filipino equity. Thus, many foreign firms invite local exploration companies to join their venture to take advantage of said benefit and vice versa. TA and other listed companies also compete for risk capital in the securities market. This may be in the form of initial public offerings, rights offerings, upward change in capitalization and other vehicles. These domestic companies may also seek full or partial funding of projects from foreign companies through farm-out of interest (dilution of equity in exchange for payment of certain financial obligations). TA is a recognized leader in the local petroleum industry. The Company is comparatively financially robust and has low level of debt. The technical expertise of its staff is recognized by its foreign partners and the DOE. In view of these strengths, TA remains a strong competitor in the local petroleum exploration and production industry Suppliers and Customers TA’s exploration business is not dependent on any single supplier or a limited number of suppliers, nor is it dependent on a single customer or a limited number of customers.

14
Contracts and Agreements Under a service contract, a private enterprise that seeks to develop domestic oil and gas resources is deemed a contractor that must provide all required services, technology and financing, and assume all exploration risks. In the event of commercial production, the service contractor is paid a stipulated service fee, in addition to reimbursement of validated investments. Petroleum exploration and production is a high-risk business. The worldwide commercial success rate is three percent, i.e. only one out of 30 exploratory wells results in a commercial discovery. It is also capital-intensive. Pre-drill geological and geophysical studies may run up to a few millions of dollars. The cost of a single offshore exploratory well could exceed US$30 million, whereas field development costs could reach hundreds of millions of dollars. To manage exploration risks, oil exploration firms usually form consortia or joint ventures. TA is at present a co-contractor in five service contracts with the Philippine government. A service contract grants the contractor the exclusive right to explore, develop and produce petroleum resources within the contract area. The contractor assumes all exploration risks. In the event of commercial production, the Government and the contractor normally share in the profit. Service contracts allow the contractor a certain exploration period of several years, with an option to extend for a limited number of years, and if the exploration area is deemed feasible, the service contract allows a production period of a certain number of years, with an option to extend. The Company has a share of production in one small oil field at this time. Its other petroleum operations are in the exploratory stage and other fields where it has participation are in suspension mode. The following table sets forth the Company’s existing and prospective projects as of December 31, 2010:
Contract/ Contract
Application Location Interest Issue Date Commercial
Terms Expiry Date Status SC 51 Eastern
Visayas 6.67% 8 July 2005 A July 31, 2011 Subsisting
SC 55 Offshore West Palawan
15.00% 5 August 2005 A August 5, 2011 Subsisting
SC 6 Cadlao Northwest Palawan
1.65%* 1 September 1973
A February 28, 2024 Subsisting
SC 6 Block A Northwest Palawan
7.778% A February 28, 2024 Subsisting
SC 6 Block B Northwest Palawan
14.063% A February 28, 2024 Subsisting
SC 14, Tara Northwest Palawan
22.50% 17 December 1975
A December 17, 2025 Subsisting
SC 14 B-1 North Matinloc
Northwest Palawan
6.103% A December 17, 2025 Subsisting
SC 69 Eastern Visayas
30.00% 7 May 2008 A August 7, 2012 Subsisting
MPSA No. 252-2007-V
Jose Panganiban, Camarines Norte
100.00% 28 July 2007 B July 28, 2032 Subsisting

15
Mining Lease Contracts
MRD – 491 Rizal 100.0% 24 June 1988 B June 24, 2013 Subsisting
MRD-492 Rizal 100.0% 24 June 1988 B June 24, 2013 Subsisting Exploration Permit Application
Isabela 100% Application filed with MGB in March 2007
Application still pending
Legend: A = Contractor provides all required services and technology funding. Contractor is entitled to a
service fee out of production equivalent to 40% of net proceeds. Net proceeds would refer to the balance of gross income after deducting Filipino participation incentive allowance and operating expenses. [ B = Contractor provides all required technology funding. Government share of production is excise tax on mineral products and corporate income tax. *Note: Trans-Asia entered into a Sale and Purchase Agreement with Peak Royalties Ltd. on September 21, 2010 transferring its royalty interest in SC 6 Cadlao to the latter. Said transfer of interest was subsequently approved by the DOE on December 22, 2010. The proceeds from the sale of the royalty interest were received by the Company on January 10, 2011.
Service Contract No. 6: Cadlao, Block A and B (Northwest Palawan) SC 6 grants the contractor the exclusive right to explore, develop and produce petroleum resources within the contract area. The contractor assumes all exploration risks. In the event of commercial production, the Government and the contractor share in the profit on a 60:40 basis. The exploration period is seven (7) years, extendible by three (3) years. The production period is 25 years, extendible by 15 years. SC No. 6 was awarded on September 1, 1973 and is valid until February 28, 2024 subject to certain conditions. At present, it covers three (3) contract blocks, namely: Cadlao production area (consisting of 3,400 hectares), Block A (consisting of 108,000 hectares) and Block B (consisting of 53,300 hectares), all in offshore Northwest Palawan. In 2010, the Company assigned its royalty interest in the Cadlao Production Area, Northwest Palawan under SC No. 6 to Peak Royalties Limited (BVI) and recognized US$1.325 million income from such transaction. Cadlao oil field commenced production in 1981. The field has been shut-in since 1990 when production was suspended to allow transfer of its dedicated floating production facility to another field. Consequently, the Cadlao field did not generate revenues in the last three (3) fiscal years. Block A and Block B were retained from the original contract area in 1988, subject to performance of meaningful exploration work in either of the blocks in each contract year. Block A and Block B consortia have complied with this conditionality by drilling exploratory and appraisal wells, and conducting various geological and geophysical studies. An economically marginal field discovery was made in Block A, but such field has not been developed to this date. On May 9, 1988, an Operating Agreement was entered into by and among Balabac, Oriental, TA and Philodrill in respect of SC 6 Block A where Philodrill was appointed operator. This agreement is in full force and effect during the term of SC 6. On March 7, 2007, SC 6 Block A consortium entered into a Farm-In Agreement with Vitol GPC Investments S.A. of Switzerland. Under this agreement, Vitol will undertake, at its sole cost and risk, geological, geophysical and engineering studies over a one (1) - year period. At the end of the study period, Vitol will decide whether to acquire 70% participating interest in Block A. Vitol completed the first phase of its technical due diligence over Block A and concluded that development of the Octon discovery hinges on tie-back to Galoc production facilities. Following several extensions of the Farm-in Agreement, Vitol informed the consortium in November 2010 that it is not exercising its option to acquire interest in the block.
16
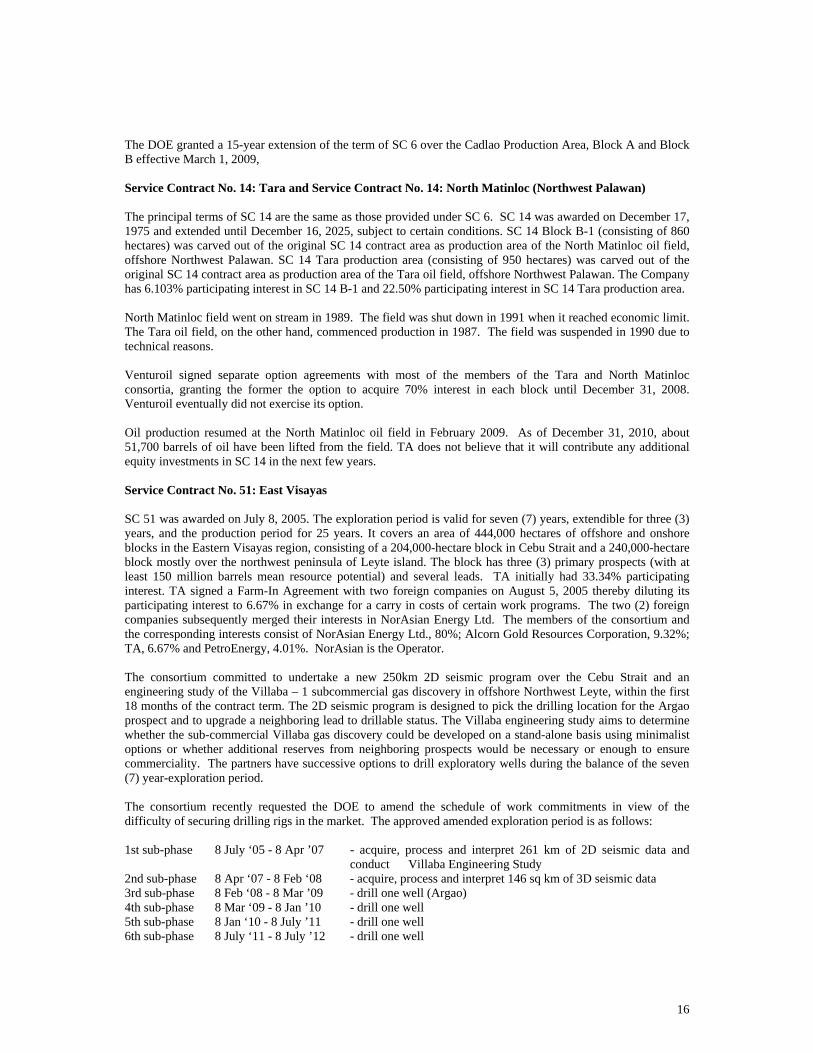
The DOE granted a 15-year extension of the term of SC 6 over the Cadlao Production Area, Block A and Block B effective March 1, 2009, Service Contract No. 14: Tara and Service Contract No. 14: North Matinloc (Northwest Palawan) The principal terms of SC 14 are the same as those provided under SC 6. SC 14 was awarded on December 17, 1975 and extended until December 16, 2025, subject to certain conditions. SC 14 Block B-1 (consisting of 860 hectares) was carved out of the original SC 14 contract area as production area of the North Matinloc oil field, offshore Northwest Palawan. SC 14 Tara production area (consisting of 950 hectares) was carved out of the original SC 14 contract area as production area of the Tara oil field, offshore Northwest Palawan. The Company has 6.103% participating interest in SC 14 B-1 and 22.50% participating interest in SC 14 Tara production area. North Matinloc field went on stream in 1989. The field was shut down in 1991 when it reached economic limit. The Tara oil field, on the other hand, commenced production in 1987. The field was suspended in 1990 due to technical reasons. Venturoil signed separate option agreements with most of the members of the Tara and North Matinloc consortia, granting the former the option to acquire 70% interest in each block until December 31, 2008. Venturoil eventually did not exercise its option. Oil production resumed at the North Matinloc oil field in February 2009. As of December 31, 2010, about 51,700 barrels of oil have been lifted from the field. TA does not believe that it will contribute any additional equity investments in SC 14 in the next few years. Service Contract No. 51: East Visayas SC 51 was awarded on July 8, 2005. The exploration period is valid for seven (7) years, extendible for three (3) years, and the production period for 25 years. It covers an area of 444,000 hectares of offshore and onshore blocks in the Eastern Visayas region, consisting of a 204,000-hectare block in Cebu Strait and a 240,000-hectare block mostly over the northwest peninsula of Leyte island. The block has three (3) primary prospects (with at least 150 million barrels mean resource potential) and several leads. TA initially had 33.34% participating interest. TA signed a Farm-In Agreement with two foreign companies on August 5, 2005 thereby diluting its participating interest to 6.67% in exchange for a carry in costs of certain work programs. The two (2) foreign companies subsequently merged their interests in NorAsian Energy Ltd. The members of the consortium and the corresponding interests consist of NorAsian Energy Ltd., 80%; Alcorn Gold Resources Corporation, 9.32%; TA, 6.67% and PetroEnergy, 4.01%. NorAsian is the Operator. The consortium committed to undertake a new 250km 2D seismic program over the Cebu Strait and an engineering study of the Villaba – 1 subcommercial gas discovery in offshore Northwest Leyte, within the first 18 months of the contract term. The 2D seismic program is designed to pick the drilling location for the Argao prospect and to upgrade a neighboring lead to drillable status. The Villaba engineering study aims to determine whether the sub-commercial Villaba gas discovery could be developed on a stand-alone basis using minimalist options or whether additional reserves from neighboring prospects would be necessary or enough to ensure commerciality. The partners have successive options to drill exploratory wells during the balance of the seven (7) year-exploration period. The consortium recently requested the DOE to amend the schedule of work commitments in view of the difficulty of securing drilling rigs in the market. The approved amended exploration period is as follows: 1st sub-phase 8 July ‘05 - 8 Apr ’07 - acquire, process and interpret 261 km of 2D seismic data and
conduct Villaba Engineering Study 2nd sub-phase 8 Apr ‘07 - 8 Feb ‘08 - acquire, process and interpret 146 sq km of 3D seismic data 3rd sub-phase 8 Feb ‘08 - 8 Mar ’09 - drill one well (Argao) 4th sub-phase 8 Mar ‘09 - 8 Jan ’10 - drill one well 5th sub-phase 8 Jan ‘10 - 8 July ’11 - drill one well 6th sub-phase 8 July ‘11 - 8 July ’12 - drill one well
17
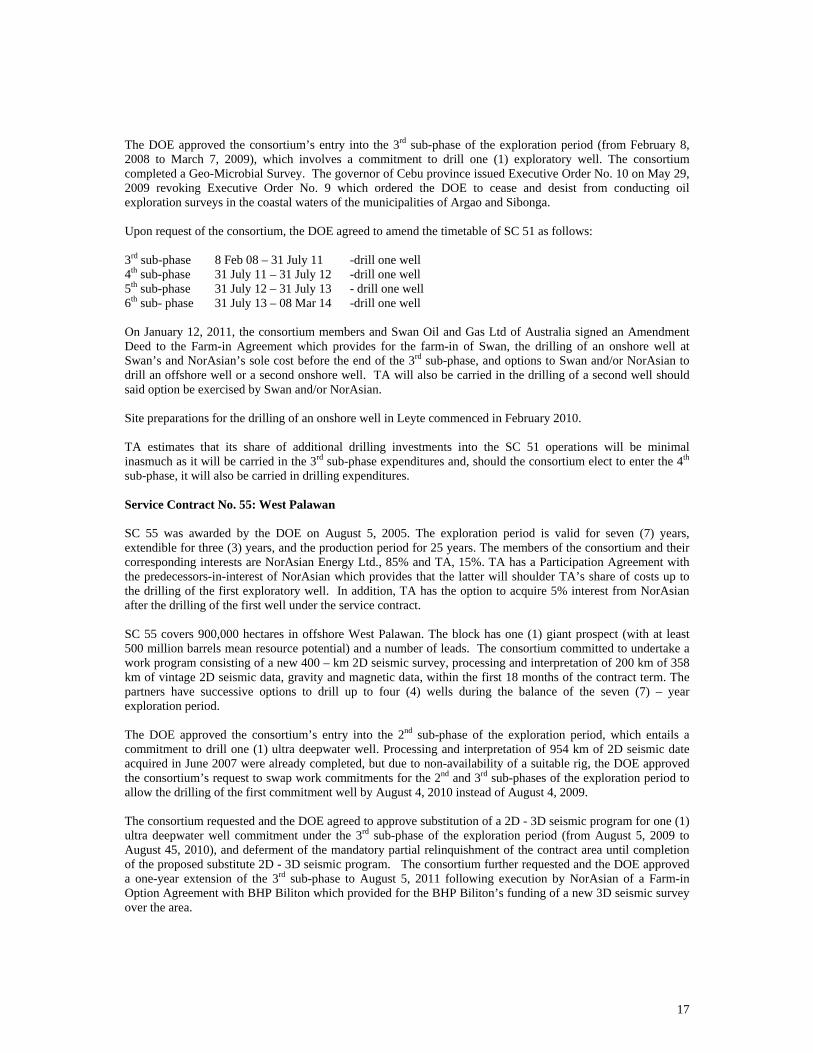
The DOE approved the consortium’s entry into the 3rd sub-phase of the exploration period (from February 8, 2008 to March 7, 2009), which involves a commitment to drill one (1) exploratory well. The consortium completed a Geo-Microbial Survey. The governor of Cebu province issued Executive Order No. 10 on May 29, 2009 revoking Executive Order No. 9 which ordered the DOE to cease and desist from conducting oil exploration surveys in the coastal waters of the municipalities of Argao and Sibonga. Upon request of the consortium, the DOE agreed to amend the timetable of SC 51 as follows: 3rd sub-phase 8 Feb 08 – 31 July 11 -drill one well 4th sub-phase 31 July 11 – 31 July 12 -drill one well 5th sub-phase 31 July 12 – 31 July 13 - drill one well 6th sub- phase 31 July 13 – 08 Mar 14 -drill one well On January 12, 2011, the consortium members and Swan Oil and Gas Ltd of Australia signed an Amendment Deed to the Farm-in Agreement which provides for the farm-in of Swan, the drilling of an onshore well at Swan’s and NorAsian’s sole cost before the end of the 3rd sub-phase, and options to Swan and/or NorAsian to drill an offshore well or a second onshore well. TA will also be carried in the drilling of a second well should said option be exercised by Swan and/or NorAsian. Site preparations for the drilling of an onshore well in Leyte commenced in February 2010. TA estimates that its share of additional drilling investments into the SC 51 operations will be minimal inasmuch as it will be carried in the 3rd sub-phase expenditures and, should the consortium elect to enter the 4th sub-phase, it will also be carried in drilling expenditures. Service Contract No. 55: West Palawan SC 55 was awarded by the DOE on August 5, 2005. The exploration period is valid for seven (7) years, extendible for three (3) years, and the production period for 25 years. The members of the consortium and their corresponding interests are NorAsian Energy Ltd., 85% and TA, 15%. TA has a Participation Agreement with the predecessors-in-interest of NorAsian which provides that the latter will shoulder TA’s share of costs up to the drilling of the first exploratory well. In addition, TA has the option to acquire 5% interest from NorAsian after the drilling of the first well under the service contract. SC 55 covers 900,000 hectares in offshore West Palawan. The block has one (1) giant prospect (with at least 500 million barrels mean resource potential) and a number of leads. The consortium committed to undertake a work program consisting of a new 400 – km 2D seismic survey, processing and interpretation of 200 km of 358 km of vintage 2D seismic data, gravity and magnetic data, within the first 18 months of the contract term. The partners have successive options to drill up to four (4) wells during the balance of the seven (7) – year exploration period. The DOE approved the consortium’s entry into the 2nd sub-phase of the exploration period, which entails a commitment to drill one (1) ultra deepwater well. Processing and interpretation of 954 km of 2D seismic date acquired in June 2007 were already completed, but due to non-availability of a suitable rig, the DOE approved the consortium’s request to swap work commitments for the 2nd and 3rd sub-phases of the exploration period to allow the drilling of the first commitment well by August 4, 2010 instead of August 4, 2009. The consortium requested and the DOE agreed to approve substitution of a 2D - 3D seismic program for one (1) ultra deepwater well commitment under the 3rd sub-phase of the exploration period (from August 5, 2009 to August 45, 2010), and deferment of the mandatory partial relinquishment of the contract area until completion of the proposed substitute 2D - 3D seismic program. The consortium further requested and the DOE approved a one-year extension of the 3rd sub-phase to August 5, 2011 following execution by NorAsian of a Farm-in Option Agreement with BHP Biliton which provided for the BHP Biliton’s funding of a new 3D seismic survey over the area.

18
On June 3, 2010, TA signed an Option Agreement with Frontier Gasfields Pty. Ltd. of Australia which granted the latte the option to acquire the 5% interest that Trans-Asia has the option to acquire from NorAsian after the drilling of the first well in the area. On February 3, 2011, TA signed an Agreement with NorAsian assigning TA’s 8.18% participating interest to the latter in exchange for a carry in the costs of a second well in the block, should NorAsian elect to participate in said well. Approval of the assignment is pending with the DOE. TA believes that its share of any additional investments in SC 55 will be minimal in 2011 to 2012. Service Contract No. 69: Camotes Sea The DOE awarded SC 69 (formerly, Area 8 of the 2006 Philippine Energy Contracting Round) on May 7, 2008 to a consortium composed of TA (with 30% interest) and NOEPI (with 70% interest). SC 69 has an exploration period of seven (7) years, divided into five (5) sub-phases and extendible for three (3) years, and a production period of 25 years. While the area is under-explored, initial indications show that it has significant petroleum potential in view of gas discoveries in onshore Northern Cebu and offshore Northwest Leyte. The consortium commenced a geological and geophysical review and reprocessing of some 3000 km of vintage 2D seismic data in fulfillment of work obligations under the 1st sub-phase of the exploration period (from May 7, 2008 to May 6, 2009). The consortium elected to enter the 2nd sub-phase of the exploration period (from May 7, 2009 to November 6, 2010), which entails a commitment to conduct either a minimum of a 50-square kilometer 3D seismic survey or a minimum of 750-line kilometer 2D seismic survey, with expected expenditures of US$2 million for the 3D seismic survey or US$1 million for the 2D seismic survey. The DOE approved extension of the 2nd sub-phase until February 7, to enable completion of interpretation of the newly acquired 900 km of 2D seismic data. On June 3, 2010, TA signed a Farm-in Option Agreement with Frontier Gasfields Pty. Ltd. of Australia which granted the latter the option to acquire 15% of TA’s interest in SC 69. Frontier exercised its option on February 3, 2011. The transfer of interest to Frontier is subject to consent of NOEPI and approval by the DOE. The consortium elected to enter the 3rd sub-phase ( February 7, 2011 to August 7, 2012) which entails a minimum commitment of either a 50 sq. km. of 3D seismic survey or one exploratory well and minimum expenditures of $2 MM or $3 MM, respectively. On February 3, 2011, TA signed an Agreement with NOEPI assigning an additional 9% of TA’s participating interest to the latter in exchange for a carry in the costs of the first well in the block, should NOEPI elect to participate in said well. Approval of said assignment is pending with the DOE. TA estimates that its share of costs in a 3D seismic program to be undertaken in the 3rd sub-phase will amount to P7 million. Mineral Exploration The Company has interests in several mine sites but, presently, it has no plans of making any further significant investments in mineral exploration. For the years 2007-2009, TA derived insignificant or no revenues from this line of business. TA’s interests in mineral exploration are limited to the following: Mineral Production Sharing Agreement 252-2007-V (Camarines Norte) The Government, through the DENR, entered into an MPSA with TA on July 28, 2007 for the exploration, development and utilization for commercial purposes of gold, silver, copper, iron and other associated mineral deposits. The contract area covers approximately 333 hectares of land situated in the municipality of Jose Panganiban, Camarines Norte. The MPSA granted to TA the right to explore, develop and operate the MPSA contract area for commercial mineral production for a period of 25 years, renewable for another 25 years, pursuant to a work program containing the required expenditures and work commitments. The exploration period is two (2) years renewable up to six (6) years for non-metallic minerals and up to eight (8) years for

19
metallic minerals. Upon commercial operation, the Government’s share in the MPSA shall be excise tax on mineral products and other duties and fees. TA is likewise obligated to pay an occupation fee over the contract area annually at the rate prescribed by existing rules and regulations. On February 14, 2008, TA signed an Operating Agreement with its subsidiary, TA Gold, granting the latter the exclusive right to explore, develop and operate the MPSA contract area for commercial mineral production. Pursuant to this Operating Agreement, TA Gold completed the drilling of three (3) exploratory diamond drill holes to probe gold, uranium and white clay occurrences. Results of the drilling operations are under evaluation. TA received on June 16, 2009 a notice issued by the DENR Secretary ordering TA to excise certain portions from the MPSA contract area that are covered by alleged mining patents of a third party. TA filed a timely motion for reconsideration of this order. TA is of the position that the alleged mining patents covering certain portions of the MPSA contract area can no longer be recognized as they are considered to have lapsed for failure to comply with the requirements of P.D. 463, which required all mining patents to be registered with the Director of Mines within two (2) years from the date of approval of the decree in 1974 and to comply with annual work obligations, submission of reports, fiscal provisions and other obligations. TA’s motion for reconsideration was denied by the DENR Secretary on November 27, 2009. The Company filed its appeal before the Office of the President on December 21, 2009. Rizal Mining Leases The Company has two (2) Mining Lease Contracts with the MGB, namely: (i) Mining Lease Contract No. MRD 491 and (ii) Mining Lease Contract No. MRD 492, which were both granted on June 24, 1988 and will expire on June 23, 2013. Mining Lease Contract No. MRD 491 covers an area of 414 hectares of land situated in the towns of Teresa, Baras and Morong, Rizal, whereas Mining Lease Contract No. MRD 492 covers an area of 248 hectares of land in Teresa and Morong, Rizal. These mining lease contracts grant the Company the exclusive right to extract and utilize all mineral deposits within the boundary lines of the mining claims, subject to payment of rentals, royalties and taxes to the Government. The Company maintains its rights to these mining lease contracts by submission of affidavits of annual work obligation to the MGB and payment of rental to the concerned municipalities, on a yearly basis. TA and Rock Energy International Corporation (“Rock Energy”) signed an Operating Agreement on March 3, 2008 granting the latter the exclusive right to extract and market tuffaceous materials within the areas covered by TA’s mining lease contracts for a period of five (5) years. Tuffaceous materials are used in the production of pozzolan cement. Rock Energy applied for and was issued an ECC for planned quarrying activities at a site in Teresa, Rizal. Related Party Transactions
TA’s mineral exploration business is not dependent on related parties, nor were there any transactions involving related parties.
20
REGULATORY FRAMEWORK PETROLEUM EXPLORATION TA’s petroleum and mineral exploration business is subject to the following laws, rules and regulations: 1. P.D. 87 or The Oil Exploration and Development Act of 1972 Petroleum exploration and production in the Philippines, where TA currently operates, is basically governed by P.D. 87 or the Oil Exploration and Development Act of 1972, as amended by P.D. 1857, and other rules and regulations promulgated by the DOE. P.D. 87, as amended, established the service contract system which declares that all petroleum within the country’s territory belongs to the state. P.D. 87 declares that the policy of the State is to hasten the discovery and production of indigenous petroleum through utilization of government and/or private resources, local and foreign, under arrangements calculated to yield maximum benefit to the Filipino people and revenues to the Philippine government and to assure just returns to participating private enterprises, particularly those that will provide services, financing, and technology and fully assume all exploration risks. The government may undertake petroleum exploration and production or may indirectly undertake the same through Service Contracts. Under a service contract, service and technology are furnished by a contractor for which it would be entitled to a service fee of up to 40% of net production proceeds while financing is provided by the Government to which all petroleum produced would belong. Where the Government is unable to finance petroleum exploration or in order to induce the contractor to exert maximum efforts to discover and produce petroleum, the service contract would stipulate that, if the contractor furnishes service, technology and financing, the proceeds of the sale of the petroleum produced under the service contract would be the source of payment of the service fee and the operating expenses due the contractor. Operating expenses are deductible up to 70% of gross production proceeds. If, in any year, the operating expenses exceed 70% of gross proceeds from production, the unrecovered expenses may be recovered from the operations of succeeding years. Intangible exploration costs may be reimbursed in full, while tangible exploration costs (such as capital expenditures and other recoverable capital assets) are to be depreciated for a period of five (5) years. Any interest or other consideration paid for any financing approved by the Government for petroleum development and production would be reimbursed to the extent of 2/3 of the amount, except interest on loans or indebtedness incurred to finance petroleum exploration. Aside from reimbursing its operating expenses, a contractor with at least 15% Filipino participation is allowed to deduct from its taxable net income a Filipino participation incentive allowance equivalent to a maximum of 7.5 % of the gross proceeds from the crude oil produced in the contract area. Incentives to service contractors include (i) exemption from all taxes except income tax and exemption from income tax obligation paid out of Government's share, (ii) exemption from all taxes and duties on importation of machinery, equipment, spare parts and materials for petroleum operations, (iii) repatriation of investments and profits and (iv) free market determination of crude oil prices. Finally, a subcontractor is subject to special income tax rate of eight percent (8%) of gross Philippine income while foreign employees of the service contractor and the subcontractor are subject to a special tax rate of 15 % on their Philippine income. A service contract has a maximum exploration period of 10 years and a maximum development and production period of 40 years. Signature bonus, discovery bonus, production bonus, development allowance and training allowance are payable to the Government. Other pertinent laws and issuances include P.D. 1857, a law amending certain sections of P.D. 87 offering improved fiscal and contractual terms to service contractors with special reference to deepwater oil exploration; DOE Circular No. 2009-04-0004, a circular that establishes the procedures for the Philippine Contracting Rounds; DOE Circular No. 2003-05-006, a circular that provides the guidelines to the financial and technical capabilities of a viable petroleum exploration and production company; Executive Order No. 66 issued in 2002 which designated the DOE as the lead government agency in developing the natural gas industry; and DOE Circular 2002-08-005, a circular setting the interim rules and regulations governing the transmission, distribution and supply of natural gas.

21
Obligation to Supply Domestic Demand Under P.D. 87, as amended, every service contractor that produces petroleum is authorized to dispose of same either domestically or internationally, subject to supplying the domestic requirements of the country on a pro-rata basis. There is a ready market for oil produced locally inasmuch as imported oil which comprised about 31% of the Philippines’ primary energy mix in year 2008. Heavy dependence on foreign oil supply is not expected to change significantly over the next 10 years. On a case to case basis, the Government has allowed the export of locally produced crude oil in the past. The domestic natural gas industry is at the nascent stage, with supply coming from a single offshore field. Domestic gas production accounted for about eight percent (8%) of the country’s primary energy mix in year 2008. The Government is actively promoting the use of natural gas for power, industry, commercial and transport applications, owing to environmental considerations and the need to diversify energy supply. 2. R.A. 8371 OR THE INDIGENOUS PEOPLES’ RIGHTS ACT OF 1997 R.A. 8371 or “The Indigenous Peoples’ Rights Act of 1997” requires the free and prior informed consent of IPs who will be affected by any mining exploration. Under the IPRA, IPs are granted certain preferential rights to their ancestral domains and all resources found therein. Ancestral domains are defined as areas generally belonging to IPs, subject to property rights within ancestral domains already existing or vested upon the effectivity of the IPRA, comprising lands, inland waters, coastal areas, and natural resources, held under a claim of ownership, occupied or possessed by IPs by themselves or through their ancestors, communally or individually, since time immemorial, continuously to the present, except when interrupted by war, force majeure or displacement by force, deceit, stealth, or as a consequence of government projects or any voluntary dealings entered into by the Government and private persons, and which are necessary to ensure their economic, social and cultural welfare. Under the IPRA, no concession, license, lease or agreement shall be issued by any government agency without the certification precondition (“CP”) from the NCIP. The CP states that the free, prior and informed consent (“FPIC”) has been obtained from the concerned IPs. For areas not occupied by IPs, a certificate of non-overlap is issued instead by the NCIP. For areas occupied by IPs, the applicant and representatives from the NCIP will conduct consultations and consensus-building to obtain the consent of IPs. The FPIC is manifested through a memorandum of agreement with IPs, traditionally represented by their elders. The CP is then issued by the NCIP stating that the FPIC has been obtained from the IPs concerned. In the course of mining exploration, the Company explores in certain areas which are covered by ancestral domains of IPs. No mining is allowed in such areas without first negotiating an agreement with IPs who will be affected by mining operations. 3. R.A. 7942 OR THE PHILIPPINE MINING ACT OF 1995 R.A. 7942 or “The Philippine Mining Act of 1995” is the governing law that regulates mineral resources development in the country. One of the primary objectives of this law is to revitalize the ailing Philippine mining industry by providing fiscal reforms and incentives and maintaining a viable inventory of mineral reserves to sustain the industry through the infusion of fresh capital through direct investments to finance mineral exploration and/or development activities. This law specifies the DENR as the primary agency responsible for the conservation, management, development, and proper use of the country’s mineral resources, and the MGB as directly in charge of the administration and disposition of mineral lands and mineral resources. The Mining Act introduced a new system of mineral resources exploration, development, utilization and conservation, with due regard to other laws (e.g., P.D. 1586 on environmental impact statement and other issues related to environmental management; R.A. 7586 or the National Integrated Protected Areas System Act of 1992; R.A. 7160 or the Local Government Code of 1991; and R.A. 7916 or the Special Economic Zone Act of 1995). The Mining Act fully recognizes the rights of IPs and respects their ancestral lands. No mineral agreements and mining permits are granted in ancestral lands/domains except with prior informed consent from IPs for areas as

22
verified by the DENR Regional Office and/ or appropriate offices as actually occupied by IPs under a claim of time immemorial possession. 4. R. A. 8749 OR THE PHILIPPINE CLEAN AIR ACT OF 1999 R.A. 8749 or the Philippine Clean Air Act of 1999 is a comprehensive air quality management program which aims to achieve and maintain healthy air for all Filipinos. Under this, the DENR is mandated to formulate a national program on how to prevent, manage, control and reverse air pollution using regulatory and market-based instruments, and set-up a mechanism for the proper identification and indemnification of victims of any damage or injury resulting from the adverse environmental impact of any project, activity or undertaking. To implement this law, the Government is promoting energy security thru a policy of energy independence, sustainability and efficiency. These involve: (1) increasing oil and gas exploration; (2) strengthening of the PNOC to spearhead the development of indigenous energy resources and building
global partnerships and collaborative undertakings; (3) pursuing the development of renewable energy such as geothermal, wind, solar, hydropower and biomass,
and the vigorous utilization of the cleaner development mechanism and the emerging carbon market; (4) expansion in the use of natural gas; and (5) adoption of energy efficiency promotion strategies. In support of this legislation, TA is participating in the oil and gas exploration and development of renewable energy sources. This is evident in the oil and gas exploration, and wind power projects of TA and its subsidiaries. 5. The Philippine Environmental Impact Statement System Projects relating to petroleum and mineral exploration and production are required to comply with the Philippine EIS System. The EIS System was established by virtue of P.D. 1586 issued by former President Ferdinand E. Marcos in 1978. The EIS System requires all government agencies, government-owned or controlled corporations and private companies to prepare an EIA for any project or activity that affects the quality of the environment. An EIA is a process that involves evaluating and predicting the likely impacts of a project (including cumulative impacts) on the environment and includes designing appropriate preventive, mitigating and enhancement measures to protect the environment and the community’s welfare. An entity that complies with the EIS System is issued an ECC, which is a document certifying that, based on the representations of the project proponent, the proposed project or undertaking will not cause significant negative environmental impacts and that the project proponent has complied with all the requirements of the EIS System.
To strengthen the implementation of the EIS System, Administrative Order No. (“AO”) 42 was issued by the Office of the President of the Philippines in 2002. It provided for the streamlining of the ECC application processing and approval procedures. Pursuant to AO 42, the DENR promulgated DENR AO 2003-30, also known as the Implementing Rules and Regulations for the Philippine EIS System (“IRR”), in 2003.
Under the IRR, in general, only projects that pose potential significant impact to the environment would be required to secure ECCs. In determining the scope of the EIS System, two factors are considered, namely: (i) the nature of the project and its potential to cause significant negative environmental impacts, and (ii) the sensitivity or vulnerability of environmental resources in the project area.
Specifically, the criteria used for determining projects to be covered by the EIS System are as follows:
a. Characteristics of the project or undertaking -
i. size of the project;
23
ii. cumulative nature of impacts vis-a-vis other projects;
iii. use of natural resources; iv. generation of wastes and environment-related nuisance; and v. environment-related hazards and risk of accidents.
b. Location of the project -
i. vulnerability of the project area to disturbances due to its ecological importance, endangered or protected status; ii. conformity of the proposed project to existing land use, based on approved zoning or on national laws and regulations; and iii. relative abundance, quality and regenerative capacity of natural resources in the area, including the impact absorptive capacity of the environment.
c. Nature of the potential impact - i. geographic extent of the impact and size of affected population;
ii. magnitude and complexity of the impact; and iii. likelihood, duration, frequency, and reversibility of the impact.
The ECC of a project not implemented within five (5) years from its date of issuance is deemed expired. The proponent must apply for a new ECC if it intends to pursue the project. The reckoning date of project implementation is the date of groundbreaking, based on the proponent's work plan as submitted to the EMB. Cost and Effects of Compliance with Environmental Laws Petroleum service contractors are mandated to comply with all environmental laws and rules and regulations in all phases of exploration and production operations. ECCs or certificates of non-coverage, if applicable, are obtained from the Environmental Management Bureau of the DENR in coordination with the DOE. The exploration, production and sale of oil and mineral deposits and power generation are subject to extensive national and local laws and regulations. The Company and its subsidiaries may incur substantial expenditures to comply with these laws and regulations, which may include permitting costs, adoption and implementation of anti-pollution equipment, methods and procedures, and payment of taxes and royalties. Under these laws, the Company could be subject to claims for personal injury or property damages, including damages to natural resources, which may result from the impact of the Company’s operations. Failure to comply with these laws may also result in the suspension or termination of the Company’s operations and subject it to administrative, civil and criminal penalties. Moreover, these laws could be modified or reinterpreted in ways that substantially increase the Company’s costs of compliance. Any such liabilities, penalties, suspensions, terminations or regulatory changes could have a material adverse effect on the Company’s financial condition and results of operations

24
POWER GENERATION Government Licenses, Intellectual Property Power generation is not considered a public utility operation under the EPIRA. Thus, a franchise is not needed to engage in the business of power generation. Nonetheless, no person or entity may engage in the generation of electricity unless such person or entity has complied with the standards, requirements and other terms and conditions set by the ERC and has received a COC from the ERC to operate the generation facilities. A COC is valid for a period of five (5) years from the date of issuance. In addition to the COC requirement, a generation company must comply with technical, financial and environmental standards. A generation company must ensure that all of its facilities connected to the Grid meet the technical design and operational criteria of the Philippine Grid Code and the Philippine Distribution Code promulgated by the ERC. The ERC has also issued the “Guidelines for the Financial Standards of Generation Companies,” which set the minimum financial capability standards for generation companies. Under the guidelines, a generation company is required to meet a minimum annual interest cover ratio or debt service coverage ratio of 1.5x throughout the period covered by its COC. For COC applications and renewals, the guidelines require the submission to the ERC of, among other things, comparative audited financial statements, a schedule of liabilities, and a five-year financial plan. For the duration of the COC, the guidelines also require a generation company to submit to the ERC audited financial statements and forecast financial statements for the next two (2) fiscal years, among other documents. The failure by a generation company to submit the requirements prescribed by the guidelines may be a ground for the imposition of fines and penalties. TA, TAPGC and CIPP are required under the EPIRA to obtain a COC from the ERC for their generation facilities. They are also required to comply with technical, financial and environmental standards provided in existing laws and regulations in their operations. TA’s power generation business is subject to the following laws, rules and regulations: 1. R.A. 9136 or The Electric Power Industry Reform Act of 2001 The power generation business of TA is governed by R.A. 9136 or the Electric Power Industry Reform Act of 2001. The enactment of the EPIRA has been a significant event in the Philippine energy industry. The EPIRA has three main objectives, namely: (i) to promote the utilization of indigenous, new and renewable energy resources in power generation, (ii) to cut the high cost of electric power in the Philippines, bring down electricity rates and improve delivery of power supply and (iii) to encourage private and foreign investment in the energy industry. The EPIRA triggered the implementation of a series of reforms in the Philippine power Industry. The two major (2) reforms are the restructuring of the electricity supply industry and the privatization of the NPC. The restructuring of the electricity industry calls for the separation of the different components of the power sector namely, generation, transmission, distribution and supply. On the other hand, the privatization of the NPC involves the sale of the state-owned power firm’s generation and transmission assets (e.g., power plants and transmission facilities) to private investors. These two (2) reforms are aimed at encouraging greater competition and at attracting more private-sector investments in the power industry. A more competitive power industry will, in turn, result in lower power rates and a more efficient delivery of electricity supply to end-users. Restructuring of the Electricity Industry One of the major reforms under the EPIRA involves the restructuring of the electricity supply industry, which calls for the separation of the different components of the electric power industry namely, generation, transmission, distribution and supply. Under the EPIRA, power generation and supply (which are not considered public utility operations) are deregulated but power distribution and transmission continue to be regulated (as common electricity carrier business) by the ERC which replaced the Energy Regulatory Board. The ERC is an independent, quasi-judicial regulatory body tasked to promote competition in the power industry, encourage market development and ensure customer choice. Compared to its predecessor, the ERC has broader powers to prevent and penalize anti-competitive practices. To promote true competition and prevent monopolistic practices, the EPIRA provides for explicit caps or limits on the volume of electricity that a distribution utility can buy from an affiliated company that is engaged in

25
power generation. Likewise, the law also provides that "no company or related group can own, operate or control more than 30% of the installed capacity of a grid and/or 25% of the national installed generating capacity". Privatization of NAPOCOR and creation of PSALM Another major reform under the EPIRA is the privatization of the NPC which involves the sale of the state-owned power firm’s generation and transmission assets (e.g., power plants and transmission facilities) to private investors. Government-owned NAPOCOR had been solely responsible for the total electrification of the country since 1936. Under the EPIRA, the NPC generation and transmission facilities, real estate properties and other disposable assets, as well as its power supply contracts with IPPs were privatized. Two weeks after the EPIRA was signed into law, the PSALM, a government-owned and –controlled corporation, was formed to help NPC sell its assets to private companies. The exact manner and mode by which these assets would be sold would be determined by the PSALM. The PSALM was tasked to manage the orderly sale, disposition and privatization of the NPC, with the objective of liquidating all of the NPC’s financial obligations and stranded contract costs in an optimal manner. Birth of the National Grid Corporation of the Philippines Another entity created by the EPIRA was the TRANSCO, which would assume all of the electricity transmission functions of the NPC. In December 2007, the TRANSCO was privatized through a management concession agreement. The management and operation of TRANSCO’s nationwide power transmission system was turned over to a consortium called NGCP composed of Monte Oro Grid Resources Corporation, Calaca High Power Corporation and the State Grid Corporation of Hong Kong Ltd. The approved franchise of NGCP was for 50 years. Thus, with the creation of the PSALM and NGCP to which the assets and debts of the NPC were transferred, the NPC was left with only the operation of Small Power Utilities Group or SPUG – a functional unit of the NPC created to pursue missionary electrification function. Open Access to Transmission and Distribution Network The EPIRA mandates the implementation of open access to transmission and distribution network/ facilities so that the benefits of competition in the generation/supply sector could really trickle down to the consumers. The implementation of the retail open access opens the supply chain. Retail open access is a condition wherein consumers (i.e., industries, commercial establishments and residential users) exercise freedom to choose their respective supplier of electricity which could offer the most reasonable cost and provide the most efficient service. The supplier of electricity could be a power generator, distribution utility or an independent aggregator (i.e., an electric industry participant that adds together individual power requirements into a size large enough that would enable them to shop for a best deal in the power market) that can directly transact business with any customer or consumer. In other words, the ultimate objective of the open access reform is to provide consumer satisfaction through customer choice and empowerment. The EPIRA prescribes certain conditions prior to the implementation of open access reforms, namely: (i) establishment of the WESM, (ii) approval of unbundled transmission and distribution wheeling charges, (iii) initial implementation of the cross subsidy removal scheme, (iv) privatization of at least 70% of the total generating assets of the NPC in Luzon and Visayas and (v) transfer of the management and control of at least 70% of the total energy output of power plants under contract with the NPC to the IPP administrators. Following is the status of the conditions to open access systems:
EPIRA Requirement Status 1 Establishment of the WESM Completed 2 Approval of unbundled transmission & distribution
wheeling charges Completed

26
3 Initial implementation of the cross subsidy removal scheme
Completed
4 Privatization of at least 70% of the total generating asset capacity of NPC in Luzon
Completed
5 Privatization of management & control of at least 70% of the total energy output of powerplant under contract with NPC to the IPPA.
In progress
With the passage of the EPIRA, there would be (i) higher levels of environmental, health and safety standards where non-complying companies would be subject to appropriate fines and penalties, (ii) there would be competition between and among generating companies where prices would be market-driven and competitive and (iii) there would be electricity tariff unbundling which includes the itemization and the segregation of various components of electricity tariffs to make the rates more transparent. Electricity Trading Market The EPIRA provided for the creation of the WESM, a trading platform where electricity made by power producers are centrally coordinated and traded like any other commodity in a market of goods. The objective is to provide a venue for free and fair trade of, and investment in, the electricity market for and by generators, distributors and suppliers. The WESM is implemented by a market operator, an autonomous group constituted by the DOE with equitable representation from electric power industry participants. The DOE formulated the WESM rules, which provide for the procedures for (i) establishing the merit order dispatch instruction for each time period, (ii) determining the market-clearing price for each time period, (iii) administering the market and (iv) prescribing guidelines for market operation in system emergencies. Distribution utilities may enter into bilateral power supply contracts, but for the first five (5) years from the establishment of the WESM, no distribution utility may source more than 90% of its total demand from bilateral power supply contracts. This is in keeping with the objective of promoting true market competition and to prevent harmful monopoly and market power abuse. The WESM provides a venue whereby generators may sell power, and at the same time suppliers and wholesale consumers can purchase electricity where no bilateral contract exists between the two (2). On November 18, 2003, the DOE established the Philippine Electricity Market Corporation as a non-stock, non-profit corporation. PEMC’s membership is comprised of an equitable representation of electricity industry participants and chaired by the DOE Secretary. Its purpose is to act as the autonomous market group operator and the governing arm of the WESM. It also undertook the preparatory work for the establishment of the WESM. The WESM started its operations on June 26, 2006 of which TA is a wholesale aggregator since November 2006, while TA Power is a wholesale generator since October 2006. Both TA and TA Power are actively trading electricity in the WESM. Currently, PEMC and the DOE are preparing for the commencement of the commercial operations of the Visayas WESM. The definite date of this operation has not been established. 2. The Renewable Energy Act of 2008 TA has substantial investments in renewable energy development. The RE Law was approved in 2008 and took effect on January 31, 2009. It aims to accelerate the development of renewable energy resources in the country such as wind, hydro and geothermal energy sources to achieve energy self-reliance and independence. In wind energy, wind is converted into useful electrical or mechanical energy through the use of wind machinery or other related equipment. Hydro power uses water-based energy systems to produce electricity by utilizing the kinetic energy of falling or running water to turn a turbine generator. Geothermal energy is produced through natural recharge where water is replenished by rainfall and heat is continuously produced inside the Earth, and through enhanced recharge where hot water used in the geothermal process is re-injected into the ground to produce steam.

27
The RE Law seeks to increase the utilization of renewable energy by institutionalizing the development of national and local capabilities in the use of renewable energy systems, and promoting its efficient and cost-effective commercial application by providing fiscal and non-fiscal incentives. The DOE is the lead government agency tasked to implement the provisions of the RE Law. The Implementing Rules and Regulations of the RE Law were released in May 2009 and presented the guidelines on the implementation of the various fiscal and non-fiscal incentives provided by the law, which include the following: a. Renewable Portfolio Standards The RPS aims to contribute to the growth of the renewable energy industry by imposing that a fraction of the electricity generated or distributed by electric power industry participants be sourced from eligible renewable energy resources. The National Renewable Energy Board, created under the RE Law to oversee its implementation shall set the minimum percentage of generation required. Upon the recommendation of the NREB, the DOE is tasked to determine the incremental increase in the electricity sold by RPS-mandated industry participant, which shall not be less than one percent (1%) of its annual energy demand over the next 10 years. The DOE shall also formulate means of compliance for the mandated RPS participants to meet the RPS requirements, including direct generation, contracting of energy or trading from eligible renewable energy resources. The DOE shall establish the renewable energy market where trading of renewable energy certificates can be made, and the renewable energy registrant which shall issue, keep and verify these renewable energy certificates. b. Feed-in-Tariff System In order to accelerate the development of emerging renewable energy resources, the RE Law sets to a guaranteed fixed price (FiT) for electricity generated from wind, solar, ocean, run-of-river hydropower and biomass. The FiT shall be set by the ERC and shall be imposed for a period of not less than 12 years. Under the FiT system, priority connection to the grid of electricity generated from emerging renewable energy resources is mandated. Priority purchase, transmission and payment for such electricity is also provided by the RE Law. Transmission and Distribution System Development The NGCP and all distribution utilities are mandated to include the required connection facilities for renewable energy-based electricity in their transmission and distribution development plans. They are also required to effect the connection of renewable energy-based power facilities with the grid, upon the approval of the DOE, at the start of their commercial operations. The ERC shall provide the mechanism for the recovery of the cost of these connection facilities. General Incentives The RE Law provides for the following fiscal-incentives: 1. Income tax holiday for a period of seven (7) years from the start of commercial operation; 2. Exemption from duties on renewable energy machinery, equipment and materials; 3. Special realty tax rates on equipment and machinery; 4. Net operating loss carry over; 5. Corporate tax rate of 10%; 6. Accelerated depreciation; 7. Zero percent value-added tax on energy sale; 8. Tax exemption of carbon credits; and 9. Tax credit on domestic capital equipment and services related to the installation of equipment and
machinery.

28
3. R.A. 7916 or The PEZA Law R.A. 7196 or “The Special Economic Zone Act of 1995” created the PEZA, the government agency mandated to implement the law which aims to encourage and promote the establishment and development of Ecozones in identified and selected areas in the country. Ecozones are areas, at least 25 hectares in extent, which have existing or even a potential factor for development as industrial, agro-industrial center, a place ideal for tourism, recreational, or commercial use, banking, investment, and financial center, or for information technology functions. Under this law, firms which are registered with the PEZA and are located within an Ecozone are entitled to fiscal and non-fiscal incentives. The following are examples of the incentives being offered to PEZA-registered companies (subject to the nature of the enterprise): 1. Tax-and duty-free importation of capital equipment, raw materials, spare parts, supplies, breeding stocks,
and genetic materials; 2. ITH of four (4) years or six (6) years for non-pioneer and pioneer enterprises, respectively; 3. A special tax rate of five percent (5%) of gross income earned in lieu of all national and local taxes after the
availment of the ITH; 4. Tax credit for import substitution; 5. Exemption from wharfage dues, export tax and import fees; 6. Tax credit on domestic capital equipment; 7. Additional deduction for incremental labor expenses and training expenses; and 8. Unrestricted use of consigned equipment. The following types of enterprises are eligible to avail of such incentives: 1. Export enterprises 2. Free trade zone enterprises 3. Service enterprises 4. Domestic market enterprises 5. Pioneer enterprises 6. Utilities enterprises 7. Facilities enterprises 8. Tourism enterprises 9. Ecozone developers/operators
CIPP, a subsidiary of TA, is a PEZA-registered company. CIPP is a utility enterprise engaged in the sole generation and distribution of electricity within the CIP II, which is one of Ecozones in Calamba, Laguna. 4. Environmental Laws TA’s power generation operations are subject to extensive, evolving and increasingly stringent safety, health and environmental laws and regulations. These laws and regulations, such as R.A. 8749 or the Clean Air Act, address, among other things, air emissions, wastewater discharges, the generation, handling, storage, transportation, treatment and disposal of toxic or hazardous chemicals, materials and waste, workplace conditions and employee exposure to hazardous substances. TA and its subsidiaries have incurred, and expect to continue to incur, operating costs to comply with such laws and regulations. In addition, TA and its subsidiaries have made and expect to make capital expenditures on an ongoing basis to comply with safety, health and environmental laws and regulations
29
RISK FACTORS Risks Relating to the Company’s Business Substantially all of the Company’s current generation revenues are attributed to two offtakers, namely Holcim and GUIMELCO. If either of these offtakers experience financial difficulties and is unable to meet its payment obligations to the Company or TA Power, the Company could be adversely affected. The Company’s two existing power generation plants provide electricity to Holcim and GUIMELCO under ESAs governing the supply, pricing and payment for such electricity. For the year ended December 31, 2010, these offtakers accounted for 67% and 6% of the total generation revenues of the Company, respectively. The failure of either of these parties to meet their payment obligations could materially and adversely affect the Company’s revenues and results of operations. To mitigate its collection risk, GUIMELCO was required to establish an escrow account where GUIMELCO shall deposit on a monthly basis an amount equivalent to Trans-Asia’s electricity bill to GUIMELCO for each billing period. Any amount not paid within 30 days from due date earns interest calculated at the average Treasury Bill rate per annum plus two percentage points. With regard to TA Power’s collection risk from Holcim, considering that Holcim is 50% owner of TA Power and has been a customer of good standing with no record of default since 1998, the Company believes that default is not likely. A major breakdown of the Company's power plant facilities may adversely affect the results of operations. The Company's power plants operate machinery with many moving parts. Wear and tear due to operations will inevitably require replacement of parts which require regular maintenance. Even though the Company strictly follows the recommended maintenance schedules for the machinery in its power plants, there may be times when unforeseen breakdowns may cause unplanned full or partial plant shutdowns that may materially affect the Company's ability to deliver the required power to its customers. To mitigate this, the Company follows the recommended maintenance schedule to minimize the possibility of major breakdown. Furthermore, the bunker C-fired power plants the Company operates has multiple engines, so that the breakdown of one engine may not necessarily affect the other units, thereby minimizing any effects that a particular problem may have on the operation of a plant as a whole. The lack of available spare parts to replace worn down portions of the Company's plant facilities may adversely affect operations. Maintenance of the Company's power plant facilities occasionally requires replacement of some of the parts of the operating machineries. Any delay in the delivery or availability of these parts may cause delays in the operations of the machinery being repaired, thereby lengthening down time and increasing opportunity losses. The Company maintains diversified sources of spare parts from all over the world. It also continuously monitors market prices from various sources other than its own regular suppliers to identify alternate sources of spare parts and materials. In instances where replacement parts have longer delivery times, the plants normally maintain inventories of its critical parts. A transmission line breakdown may prevent the Company from delivering power to its customers. Power must be wheeled from the generation source through transmission lines to reach the consumer. TA Power supplies power to Holcim's La Union cement plant via the WESM, exposing TA Power to natural or man-made risks of transmission line failures that may prevent the delivery of power. Furthermore, the power that the Company purchases from the WESM is likewise delivered via transmission lines to both the La Union and Bulacan plants of Holcim. A breakdown of the transmission line when: (a) power purchased from the WESM may be lower than the Company’s own cost of generation, and (b) WESM prices are higher and TA Power has excess capacity may prevent the Company from taking advantage of trading opportunities available in the electricity spot market. A natural mitigating measure that the Company has used is to locate its plants near its customers thereby reducing the dependence on transmission lines. TA Power is located right beside the Bulacan plant of Holcim

30
and the Guimaras Power Plant is located within the island. In the case of Holcim’s La Union cement plant, TA is currently undertaking the transfer of its CIPP II 21 MW to La Union power plant to provide peaking and backup power. Disruptions to the supply of fuel could result in substantial reduction or increased power plant operating cost, and may have an adverse effect on the Company’s financial performance and financial position. The Company purchases bunker-C fuel from Petron Corporation, which is the biggest oil supplier in the country, for its power generation business. Any delay in fuel deliveries or disruptions in fuel supply may result in unplanned plant shutdowns. To protect against such disruptions in fuel supply, long term contracts with the fuel supplier were executed. In case of temporary fuel shortage along the supply chain, the oil company will give priority deliveries to the Company’s plants. In the event of force majeure situations, however, everyone including the Company will be adversely affected. To mitigate this risk, the Company maintains long term fuel supply contracts and maintains safe and strategic inventory levels of fuel to ensure continuous electricity production. Furthermore, if any of the major suppliers fails to deliver, the Company may buy fuel from other vendors. With the established good relationships with the other fuel suppliers, TA could obtain competitive alternate sources and arrange the timely delivery of fuel. The Company’s results of operation and financial condition may be adversely affected by changes in foreign currency rates. The Company may face risks from foreign exchange rate fluctuations, especially as it affects fuel prices and cost of spare parts and equipment. Foreign currency risk is a risk of loss from carrying out operations, or holdings assets and liabilities, in a foreign currency. The size of the risk has increased in recent years because of the growth in international trade and financing and the increased magnitude of exchange rate fluctuations. Foreign currency risk is managed by holdings of cash and securities in P and foreign currencies according to an approved currency exposure allocation scheme. Foreign exchange risks are managed by constant monitoring of the political and economic environments and trading either by spot conversions and forward transactions on a deliverable or non-deliverable basis to protect values. Returns are also calibrated on a per currency basis to account for the perceived risks with higher returns expected from weaker currencies. The Company may not collect all or a portion of its receivables. The Company carries collection risk when it does not demand up-front cash payment for delivered products or rendered services. The Company must be able to collect promptly from its customers to be able to pay its obligations and finance its operations. The Company’s customers are limited only to three entities: Holcim, GUIMELCO and Philippine Electricity Market Corporation (PEMC, the operator of WESM). There have been no collection problems from these entities as far as electricity fees are concerned. To mitigate this risk, the Company continues to assess the financial capability of these entities. In case a customer encounters financial difficulty, the Company may reduce power supply, cut off credit entirely or demand payment in advance to reduce exposure to collection risk and subsequent payment defaults. WESM electricity prices may increase drastically due to various reasons such as lack of supply or transmission grid failure. Electricity trading with the customer is usually defined through a bilateral contract with a pre-defined price. The volatility of the market spot price increases the risk of having a buying price that is higher than the selling price. To mitigate this, TA has a backup power plant that can be used as bilateral supplier in the event that market prices increase beyond the price that TA can buy. Furthermore, TA has contracted the capacity of One Subic plant located in Subic to be able to sell more power during high spot market prices. This is a hedging technique wherein suppliers refrain from taking any electricity from the market whenever market price increases beyond its reference price.
31
The Company’s oil projects may not yield oil or mineral deposits in commercial quantities, thus adversely affecting the recovery of the Company’s investments. The major risk associated with the Company’s oil projects is exploration risk. There is no certainty of finding commercial petroleum below the surface of the earth. Commercial deposits of petroleum lie deep in the bowels of the earth, the exact location and depth below the surface of which is the ultimate objective of exploration work. Unfortunately, no instrument or methodology has yet been invented that would directly point to the existence of a commercial deposit. Present methods used in exploration are indirect probes where data are subject to interpretation or “best judgment”. This is where the risk emanates, but it is mitigated by careful and judicious application of scientific methods and data analysis. To manage exploration risk, TA employs various methods to identify and quantify exploration risk using geological and risk-economic yardsticks. The following approaches are used, as applicable: 1. Use of technical expertise and state-of-the-art technology. Technical expertise refers to tapping the
professional and special capabilities of experienced professionals or teams with proven success records in resource determination or delineation. State-of-the-art technology refers to “computer-based” analysis and interpretation of exploration data which enable one to reasonably visualize subsurface conditions that could host commercial volumes of oil or minerals.
2. Phased exploration programs with clear exit points. Exploration is carried out in phases or stages depending on the complexity of the problem at hand. At the end of each phase, the exploration participants are given a chance to assess the results and consequently decide whether to proceed or exit from the work program. It follows that encouraging results from a certain phase shall provide incentive to proceed to the next phase, otherwise the Company can withdraw if the chances of success are perceived to be low.
3. Determination of participation levels based on available risk capital, expenditure commitments and probability of success. The extent to which the Company participates in any given exploration program is a function of risk capital at its disposal, the expenses required to finance the exploration program and the chance of success from said exploration program. It is quite clear that, given a program with high probability of success but where the required expenditure commitment is large, participation will be constrained by disposable capital.
4. Investment in exploration projects with varying risk profiles. This approach simply dictates that low-risk projects with low potential returns should be counter balanced by risky projects that may yield high rewards.
5. Participation in exploration consortia, in the event 100% equity is not warranted by risk assessment. Where the assessment says the risk is too high for a single entity to assume, it would be prudent to spread the risk by entertaining participation by other parties.
6. Distribution of participation in many rather than one or a few contracts or tenements. The Company diversifies its project risks by participating in many projects rather than in a single project. For example, with 10 exploration projects, failure in five projects will be mitigated by success in the other five, with the expectation that the income generated by the successful projects will allow recovery of expenditures from the unsuccessful ones.
7. Use of options, whenever feasible. Some exploration projects are designed in such manner that “options” for entry and exit are provided. This is meant to cater to a wide spectrum of risk tolerance by the incoming party. Options are usually cheap or affordable at the early stages of the project. Then, they gradually increase in value as exploration progresses to such level where the risk is easily discernible and the potential rewards are more or less foreseeable. Under this scenario, the investor is given some flexibility as to when he should commit to the project.
8. Dilution of interest in phases of work which entail heavy expenditures or high risk e.g. drilling. As the exploration program advances towards its conclusion, the magnitude of expenditures increases to the point that those who were able to gain entry at the early stages might no longer afford the forward financial commitments. One way to mitigate the burden and at the same time retain the interest in the project is to

32
allow dilution or reduction in one’s participating interest. The main objective is to maintain an interest in the project until commercial operations commence.
9. Capping of annual exploration expenditures to projected Company income for the year. This approach places a self-imposed ceiling on the amount of expenditures that may be used for participation in exploration projects. This expenditure level must be affordable for the Company, i.e. in the event of failure, the Company should still be able maintain a strong financial standing.
10. Investment in less risky, non-exploration ventures or projects to balance risk exposure. This approach directs the Company to invest in low risk ventures with a more predictable revenue stream to offset the potential ill effects of risky exploration ventures.,
Changes in market interest rates may adversely affect the value of financial instruments held by the Company. TA holds financial instruments composed of cash and cash equivalents, corporate promissory notes and bonds, government bonds, listed shares of stocks, and investments in mutual and trust funds, in P and USD. These are used to finance the Company’s operations and investments. These financial instruments are primarily exposed to interest rate risk. Relative value of financial instruments may decline as a result of changes in market interest rates. The Company’s principal financial instruments are managed by PHINMA’s Treasury Department by establishing “red lines”, which are reviewed and revised as the need arises for major movements in the financial markets and are used to determine dealing parameters. Red lines are the strategic yield curves, bond prices or spreads that serve as guides whether to buy, hold or sell bonds as approved by management. Regular comparison is also done with defined benchmarks. Market and portfolio reviews are done at least once a week during the weekly Treasury Department meeting and as often as necessary should market conditions require so. Monthly reports are given to the Chief Financial Officer. Adverse business results of the issuers of securities held by the Company may negatively affect the value of TA’s investments. The Company may face credit risk as investor. Credit risk is a risk that the issuer of a security, such as a bond, may default on interest and/or principal payments or become bankrupt. If either event occurs, the Company may lose part or all of its investments. In order to mitigate the credit risk, investments are restricted only to the Company’s duly accredited domestic and foreign banks and mutual funds. Even if a maximum of 20% of the Company’s investible funds can be invested in one bank/mutual fund, PHINMA’s Treasury Department allocates funds according to its periodic assessment of the banks’/funds’ financial soundness and business performance. For unit investment trust fund (“UITF”) and mutual funds, fund placements cannot exceed 10% of the UITF’s or mutual fund’s total funds. UITF’s and mutual funds’ investment performances are reviewed weekly and monthly. Investments in non-rated securities, primarily corporate bonds, are subject to a comprehensive credit and business review in coordination with sponsoring dealers or underwriters. For rated corporate bonds and sovereign bonds, credit ratings studies/updates from the major rating agencies are used as references (such as Standard and Poor’s, and Moody’s). All major investments are discussed and approved by the Company’s Investment Committee. Exposure limits are tracked for every transaction; major transaction executions are closely supervised. Market and portfolio reviews are done at least once a week during the weekly Treasury Department meeting and as often as necessary should market conditions require so. Monthly reports are given to the Chief Financial Officer.

33
The Company’s working capital may be insufficient to meet its near term financial demands. The Company may be exposed to liquidity risk, when the Company’s working capital becomes insufficient to meet near-term financial demands. Liquidity risk must be mitigated as it tends to compound credit risk. This is managed by continuous monitoring of the weekly/monthly cash flows, as well as the longer term cashflows of the Company. Liquidity risks are managed by restricting investments principally to publicly traded securities with a history of marketability and by dealing only with large reputable domestic and international institutions. Maturities of each investment are spread out into various lengths of time as may be required by the Company’s plans and cash flow needs. The average duration adheres to the guidelines provided by the Company’s Investment Committee. The Company’s operations may cause damage to its environment and may adversely affect its financial condition and results of operations. The Company and its subsidiaries and affiliates are exposed to environmental risks. These are risks that can affect the health and viability of living things and the condition of the physical environment. It can be caused by the release of pollutants to air, land or water. Pollutants include waste, emissions (e.g. fumes, smoke, etc.) and noise. Environmental damage can also be caused by irresponsible use of energy and natural resources. Environmental issues can have a significant impact on the Company's operating and financial results. The Company abides by a number of different environmental laws, regulations, and reporting requirements while it also faces growing constraints in accessing petroleum and mineral reserves, and producing electricity, as the continued search for new sources of oil and energy conflicts with growing efforts to protect and preserve ecosystems and communities. The Company complies with all environmental regulations prescribed by the DENR. The Company regularly assesses the environmental impact of its business activities and implements control measures to minimize environmental risks. Among other items, the Company regularly incurs expenditures for: 1. prevention, control, abatement or elimination of releases into the air, land and water of pollutants,
2. training of personnel in the event accidents happen to mitigate potential damages,
3. proper disposal and handling of wastes at operating facilities, and
4. promotion of renewable energy sources. The Company’s results of operations and financial condition may be adversely affected by risks associated with its efforts in relation to corporate social responsibility. Many of the Company’s operations are located in environmentally sensitive areas and near residential communities. The Company and its subsidiaries and affiliates are at risk with regard to the ethical, social and environmental challenges posed by its operations. There is growing pressure on the Company to closely examine its impacts on, and role within, the society and the communities where it operates. It also faces complex issues as the people in these areas are often economically disadvantaged and characterized by the absence of the proper skills, inadequate governance, a weak supplier base and inadequate physical and social infrastructure. In addition, the Company must adapt to a variety of local conditions, regulations and cultural differences. In order to manage these challenging issues, the Company focuses not only on financial issues but also on non-financial issues, which have brought a range of benefits in terms of driving continuous improvement in health, safety and environmental performance and risk management, in staff recruitment, retention and motivation, and in terms of reputation enhancement. The Company works hand-in-hand with the host community, in providing medical outreach, jobs and education support. The Company also has begun to recognize that the prospects of gaining new commercial opportunities are enhanced by being the type of company that the Government,
34
partners and suppliers want to work with on non-financial as well as commercial criteria. These are embodied in the Company’s vision of aggressively seeking opportunities primarily in the services sector that will allow the organization to address the basic needs of the society, while being globally competitive and generating attractive stakeholder values. Competition in the businesses of the Company is intense. The Company and its subsidiaries and affiliates are subject to intense competition. Some competitors may have substantially greater financial and other resources, which may allow them to undertake more aggressive marketing and to react more quickly and effectively to changes in the markets and in consumer and government preferences. In addition, the entry of new competitors could reduce the Company’s sales and profit margins. Each of the Company’s businesses may be particularly affected by competition as follows: Power Generation. TA and TA Power compete with MERALCO and power generating companies in supplying power to the Company's customers. With the full implementation of EPIRA and its purpose of establishing a transparent and efficient electricity market via more competition, a substantial number of the Company's customers may choose to buy power from third party suppliers. In addition, the implementation of open access could have a material adverse impact to the Company's results of operations and financial condition. The execution of bilateral contracts protects the Company because the customers are bound by the bilateral contracts to purchase exclusively from the Company. However, if the cost of power offered by third parties is lower than what the Company’s bilateral contracts specify, this may put pressure on the Company to lower its rates in order to be competitive. The move towards a more competitive environment, as set forth by EPIRA, could result in the emergence of new and numerous competitors. There will be some competitors that may have a competitive advantage over the Company due to greater financial resources, more extensive operational experience, and thus be more successful than the Company in acquiring existing power generation facilities or in obtaining financing for the construction of new power generation facilities. TA’s existing power generation facilities and components operate on diesel fuel. While these are more reliable than hydroelectric plants, their high cost of electricity production renders them uncompetitive to baseload plants such as coal, geothermal and natural gas facilities of its competitors. To manage this risk, the Company and its power generating units constantly monitor the trends in the global oil market. It increases fuel inventory when prices are forecasted to increase to mitigate and manage cost. The Company is also developing other generating projects, primarily its 135 MW clean-coal power project, that can produce electricity at more competitive rates. Existing off-take agreements assure a certain level of demand from the Company's customers. Under the ESA between TA and GUIMELCO, TA agrees to supply electricity generated by the power plant to GUIMELCO, and GUIMELCO agrees to take and pay for electricity delivered by TA. TA Power, which is 50% owned by its off-taker Holcim, has an ESA with Holcim up to 2013 that assures TA Power that at least 50% of its output will be taken by Holcim’s plant in Bulacan. Oil exploration. TA competes with foreign and local exploration companies such as Premier Oil, Petronas Carigali Overseas, PNOC Exploration Corporation, Philodrill and PetroEnergy Resources Corporation (“PetroEnergy”) for acquisition of prospective blocks. The Company is subject to complex laws and regulations that can adversely affect the cost, manner or feasibility of doing business. Any changes to existing laws may also adversely affect the Company’s results of operations. Power generation and the exploration, production and sale of oil are subject to extensive national and local laws and regulations. The Company and its subsidiaries may incur substantial expenditures to comply with these laws and regulations, which may include permitting costs, adoption and implementation of anti-pollution equipment, methods and procedures, and payment of taxes and royalties.

35
Under these laws, the Company could be subject to claims for personal injury or property damages, including damages to natural resources, which may result from the impact of the Company’s operations. Failure to comply with these laws may also result in the suspension or termination of the Company’s operations and subject it to administrative, civil and criminal penalties. Moreover, these laws could be modified or reinterpreted in ways that substantially increase the Company’s costs of compliance. Any such liabilities, penalties, suspensions, terminations or regulatory changes could have a material adverse effect on the Company’s financial condition and results of operations. Electricity trading and generation is also subject to extensive regulation. Benchmark pricing for TA Power, for example, is the NPC rates which are set and adjusted from time to time by the ERC, sometimes with retroactive effect. Substitute pricing mechanisms have also been employed in the WESM when market prices fluctuated since 2008. Changes to, or termination of, arrangements with its partners could have an adverse impact on the Company’s business operations. To reduce exploration risks, the Company participates in joint operating or consortium agreements for exploration projects. The agreements include sharing of revenues, costs and technical expertise for the projects. Changes to, or termination of, such arrangements may impede the success of the projects. In order to mitigate the risks, TA ensures that its partners in all of its business ventures are credible, reliable and have proven track records. TA also make certain that every agreement it enters into has remedy provisions that the defaulting or terminating party shall remain liable for its proportionate share in accordance with its participating interest at the time of default of all costs, expenses and all liabilities. The Company may not be able to obtain or maintain adequate insurance for its power generation facilities which may have a material adverse effect on the Company’s business, financial condition and results of operations. The business of power generation involves significant hazards, including the risk of fires, explosions, spills, discharge, leaks, and release of hazardous materials, among others. Any of these events may cause loss of life, significant damage to the property and equipment of the Company and its neighbors, and adverse effects on the Company’s surrounding environment and may give rise to criminal and administrative offenses or revocation of governmental licenses. . These events along with other force majeure events such as earthquakes, floods and typhoons could result to significant interruptions to the Company’s operations which would adversely affect its business and financial conditions. Finally, power generation facilities, being a heavily equipment-dependent operation, are prone to mechanical and equipment breakdown. These further add to the risk of plant shutdowns which could materially and adversely affect the Company’s electricity supply to its off-takers. The Company maintains insurance coverage to protect itself against these hazards. There is no assurance however, that existing coverages will provide adequate protection against all events. In addition, the Company’s insurance policies are subject to periodic renewal, so the costs, terms and conditions of such policies may increase substantially from one period to the next, due to conditions beyond the Company’s control. Any decrease in the scope of its insurance coverage may expose the Company to material losses should any adverse events occur. At the same, time, the Company’s financial performance may be adversely affected if insurance premiums increase substantially. Risks Relating to the Company’s Growth The Company may not successfully implement its growth strategy of venturing into new power generation projects which may have different risk and return profiles. Among its new projects, the Company is expanding its power supply business through its 135MW Calaca clean coal project; the transfer of CIPP’s power plant from Calamba, Laguna to Bacnotan, La Union; and the development of the 20 MW Maibarara Geothermal Power Plant. This growth strategy will require greater allocation of management resources away from daily operations, and will require the Company to manage relationships with a greater number of customers, suppliers, contractors, service providers, lenders and other

36
third parties, which could strain the Company’s ability to complete projects at a high level of quality and on time. The Company will be required to manage its internal control and compliance functions to ensure that it will be able to comply with legal and contractual obligations and minimize operational and compliance risks. There can be no assurance that, in connection with its expansion, TA will not experience capital constraints, construction delays, operational difficulties at new operational locations or difficulties in expanding existing business and operations and training an increasing number of personnel to manage the expanded business. A failure to adapt effectively to the rapid growth, including strains on management and logistics, could result in losses or development costs that are not recovered as quickly as anticipated, if at all. Such problems could have a material adverse effect on the Company’s present and expected financial performance. To mitigate this risk, the Company goes through extensive and rigorous due diligence investigation of every new project it pursues. Programs that management deems unduly risky, regardless of its potential returns, are not pursued. The Company puts utmost importance on the risk-return assessment on any project. Failure to obtain financing or the inability to obtain financing on reasonable terms could affect the execution of the Company’s growth strategies. The Company has not engaged in any significant financing packages in the past. There is no assurance that the Company will be able to raise all of the capital requirements to carry out its growth strategies at acceptable terms. Failure to obtain these financing packages at the desired terms would adversely affect the Company’s ability to execute its growth strategies. The Company has very attractive liquidity and credit ratios which put it in a unique position to pursue its growth strategies. With a de-leveraged balance sheet, a calibrated growth strategy that would match its capacity can be pursued. Construction of the Company’s additional electricity generation facilities and equipment involves significant risks that could lead to increased expenses and lost revenues. At present, the Company is at the planning and development stage for its 135MW clean coal power plant in Calaca, Batangas; has completed its feasibility study of a 54MW wind farm in San Lorenzo, Guimaras province, and is conducting feasibility studies of various wind projects in different parts of the country. There is a possibility that any or none of these projects may prove to be feasible and even if any of these projects are shown to be feasible, there is no assurance that actual construction and operating costs will approximate those indicated in their respective feasibility studies. Any material deviation from expected project parameters, returns and costs can adversely affect the Company’s ability to grow its generating capacity and therefore its long term revenue growth prospects. The following are some risks involved in the construction of the Company’s additional electricity generation facilities: 1. breakdown of equipment used; 2. failure to obtain necessary governmental permits and approvals; 3. inability to purchase land for the generation facilities; 4. work stoppages and other employee-related actions; 5. opposition from host communities and special-interest groups; 6. political and social unrest including terrorism; 7. engineering and environmental problems; 8. delays in construction and operations; 9. unbudgeted cost overruns.
Should the Company experience any of these problems, it may not be able to deliver its power at competitive prices, thereby decreasing profitability. To manage this, the Company employs the services of contractors and suppliers through a stringent decision and awarding process. Some of the factors that influence the decisions are: reputation of the contractor/bidder, its track record in delivering similar projects, and the acceptability of its project proposal.

37
The Company’s operations will largely depend on its ability to retain the services of its senior officers. The Company’s directors and members of its senior management have been an integral part of its success. The knowledge, experience and expertise they bring have been key components of the Company’s profitability and performance. These are difficult to replace. A change in key Company management and executive personnel may adversely affect its operations and business. Having a high turnover of employees has not been a characteristic of the Company’s working environment. Dependence of the Company to its directors and senior officers. The Company’s directors and members of its senior management have been an integral part of its success. The knowledge, experience and expertise they bring have been key components of the Company’s profitability and performance. These are difficult to replace. A change in key management and executive personnel may adversely affect its operations and business. Having a high turnover of employees has not been a characteristic of the Company’s working environment. Manpower As of December 31, 2010, the Company had total employees of 72 with 52 assigned at its Makati office, 13 at its power station in Guimaras and 7 at its power station in Calamba, Laguna. Twenty one employees are managers and officers, 17 are supervisors, and 34 are non-supervisory employees. The Company has no collective bargaining agreement with its employees. Furthermore, the Company has not experienced any strikes from its employees since its incorporation. There is no reason for the Company to believe that a strike will occur. Aside from compensation, TA’s employees are given medical, hospitalization, vacation and sick leave, and personal accident insurance benefits. Also, the Company has a retirement fund which is part of the PHINMA Jumbo Retirement Plan (“Plan”). The Plan covers all full-time employees of PHINMA and its affiliates. The Plan is funded entirely by the companies under the PHINMA group which includes TA, with no employee contributions. The benefits are based on tenure and remuneration during the years of employment. Subsidiaries and Affiliates The Company’s subsidiaries and affiliates, and its percentage of ownership are as follows:
Name of Company Percentage of Ownership
Trans-Asia Renewable Energy Corporation (TAREC)
100.00%
Trans-Asia (Karang Besar) Petroleum Corporation
100.00%
CIP II Power Corporation (CIPP)
100.00%
Trans-Asia Gold and Minerals Development Corp. (TA Gold)
100.00%
Trans-Asia Power Generation Corporation (TA Power)
50.00%
38
Asia Coal Corporation (Asia Coal)
28.18%
Maibarara Geothermal, Inc. (MGI)
25.00%
Trans-Asia Renewable Energy Corporation. TAREC is a wholly-owned subsidiary of TA. TAREC was established in 2003 with the primary purpose of developing and utilizing renewable sources of energy and pursuing clean and energy efficient projects. TAREC has a portfolio of 37 prospective wind sites in Luzon and Visayas with a total estimated potential capacity of 458MW. As of the date of this Annual Report, TAREC has installed eight wind masts to measure wind resource and help determine the feasibility of establishing commercially viable wind energy projects in Ballesteros, Cagayan; Santa Ana, Cagayan; Aparri, Cagayan; Nueva Valencia, Guimaras; Sibunag, Guimaras; and San Lorenzo, Guimaras. Of these, the wind energy project in San Lorenzo, Guimaras is at the most advanced stage of development with 43 months of uninterrupted data already gathered to date. It typically takes two (2) years to determine wind viability of a wind farm and another two (2) years to construct. Trans-Asia (Karang Besar) Petroleum Corporation. Karang Besar is a wholly-owned subsidiary of TA. Incorporated on September 28, 1994, Karang Besar is engaged in oil exploration and development. Karang Besar has not started commercial operations. CIP II Power Corporation. On December 28, 2006, the Company purchased 100% of the shares of stock of CIPP, a wholly owned subsidiary of Ascendas Utilities PTE Limited, a Singaporean corporation. CIPP owns a 21MW bunker C-fired power plant in Carmelray Industrial Park II Ecozone (“CIP II Ecozone”) in Calamba City, Laguna and used to be the sole provider of power in the industrial park. It was incorporated and registered with the SEC on June 2, 1998 and with the PEZA on June 23, 1998, an Ecozone utilities enterprise, particularly to develop and operate a power supply and distribution system at CIP II Ecozone in Barangays Punta and Tulo, Calamba City, Laguna. As a PEZA registered company, CIPP is entitled to certain tax incentives which include, among others, a special five percent (5%) gross income tax rate as applicable. CIPP signed on March 26, 2009 a memorandum of agreement with CJC and MERALCO where CIPP will transfer to MERALCO its rights and obligations under the Concession Agreement dated October 3, 2000, which gave CIPP the exclusive right to sell electricity to the locators of CIP II Ecozone. CIPP also signed a memorandum of agreement with MERALCO where CIPP shall transfer ownership of the existing electric distribution system in CIP II Ecozone to MERALCO. With these agreements, CIPP has largely ceased operations as a power generator. Trans-Asia Gold and Minerals Development Corporation. TA Gold was incorporated and registered with the SEC on July 2, 2007. TA Gold is primarily engaged in the business of mining and mineral exploration within the Philippines and other countries. TA Gold was envisioned to develop the mineral projects set forth by the Company. However, due to uncertainties in the world prices of metals and minerals, TA Gold operations were suspended effective March 31, 2009. On February 16, 2009, the board of directors and stockholders of TA Gold approved the decrease of its authorized capital stock from P400 million divided into 400 million shares with a par value of P1.00 each share to P120 million divided into 120 million shares with a par value of P1.00 each share, decrease of the subscribed capital from P100 million with 100 million shares to P30 million with 30 million shares, decrease of the paid-up capital from P50 million to P30 million and the return of P20 million to its stockholder TA. Effective March 2009, TA Gold suspended its exploration activities. Trans-Asia Power Generation Corporation. TA Power is a joint venture between TA and Holcim (formerly, UCC), and was incorporated on March 14, 1996. The joint venture was TA’s first attempt to diversify from the risks associated with its then main line of business, oil exploration. TA Power is involved in the operation and maintenance of a power generation plant, including the related facilities, machinery and equipment, with a capacity of 52MW, in Norzagaray, Bulacan. The power plant has a plant capacity of 52MW and is the sole supplier of Holcim’s electricity requirements for its cement plant in Norzagaray, Bulacan based on an ESA

39
entered into by and between TA Power and Holcim. Aside from supplying electricity to Holcim, TA Power trades electricity in the WESM. The ERC granted TA Power a certificate of registration as a Wholesale Generator in October 2006 for its participation in the WESM. TA Power was registered with the Board of Investments under Executive Order No. 226, also known as the Omnibus Investments Code of 1987 (“OIC”), as an operator of a bunker-C fired power plant on a preferred status. As a registered enterprise, TA Power is entitled to certain tax and non-tax incentives under the provisions of the OIC subject to certain requirements under the terms of its registration. These incentives include, among others, income tax holiday for six (6) years which expired in February 2004. Asia Coal Corporation. Asia Coal was incorporated in the Philippines on August 7, 1991 to engage in the trading of coal. However, the stiffening market competition from the entry of new traders has caused the shareholders of Asia Coal to cease all its trading operations beginning November 1, 2000. Since then, Asia Coal’s activity has been limited to money market placements. On March 19, 2009, the directors and stockholders of Asia Coal approved the shortening of the corporate life of the company to October 31, 2009. It is now awaiting government approvals. Maibarara Geothermal, Inc. MGI was incorporated and registered with the SEC on August 11, 2010 to implement the integrated development of the Maibarara geothermal field in Calamba, Laguna and Santo Tomas, Batangas for power generation. As of December 31, 2010, MGI is in its preoperating stage. Item 2. Properties The Company owns the following fixed assets:
Properties Location Amount Land Calamba City, Laguna P=57,983,000 Building and improvements Makati City, Guimaras and
Calamba City, Laguna 173,473,350
Machinery and equipment Guimaras, Cagayan Valley and Calamba City, Laguna
497,231,531
Wells, platforms and other facilities Palawan 20,346,661 Transportation equipment Makati City, Guimaras and
Calamba City, Laguna 17,626,353
Mining and other equipment Makati City, Guimaras 25,271,178 Office furniture, equipment and others Makati City, Guimaras and
Calamba City, Laguna 29,080,392
Construction in progress Guimaras and Calaca, Batangas 9,133,537 Total P=830,146,002 Less: Accumulated depletion, depreciation and amortization
340,869,606
Net P=489,276,396 Source: Audited consolidated financial statements as of December 31, 2010
Machinery and equipment includes a 3.4 MW power station constructed by the Company in the island of Guimaras. This includes cost of construction, plant and equipment and other direct costs. The installation of the power plant and construction of related facilities were completed in February 2005. The power plant was mortgaged in favor of a bank which provided a term loan. On September 27, 2007, the bank released the chattel mortgage. Building and improvements are located in the Phinma Plaza, Rockwell Center, Makati City. They include the Company’s share in the construction cost of Phinma Plaza which was completed in October 2001 and where the Company holds its office. Included also in building and improvements are leasehold improvements located in Guimaras and Calamba City, Laguna.

40
Wells, platforms and other facilities are located in Palawan. These assets were fully depreciated. Transportation equipment covers vehicles used by officers and personnel based in Makati, Guimaras and Calamba City, Laguna. Mining equipment, office furniture, and equipment are being used in Makati, Guimaras, Calamba City, Laguna and Pangasinan. The Company has complete ownership of the above properties which have no mortgages or liens. One of its subsidiaries, Trans-Asia Renewable Energy Corporation (Renewable), has a wind monitoring tower constructed in Sual, Pangasinan. Construction of the wind tower was completed on December 21, 2005. The wind measurement in Sual, Pangasinan has not reached the required level to operate the wind tower commercially. In August 2007, the wind tower was transferred in San Lorenzo, Guimaras. Additional four (4) wind monitoring towers were constructed in Guimaras and Cagayan Valley. On the other hand, Trans-Asia (Karang Besar) Petroleum Corporation has no properties.
CIPP operates a 21 MW Bunker C-fired power plant in CIP II Special Economic Zone in Calamba City, Laguna.
For the next 12 months, the Company will acquire machinery and equipment, furniture and fixtures, office equipment and transportation equipment which will utilize company’s funds or bank loans.\ Item 3. Legal Proceedings
There are no pending legal proceedings involving claims for damages the aggregate amount of which exceeds 10% of the current assets of the registrant or any of its subsidiaries. Likewise, no legal proceedings of such nature were terminated during the fourth quarter of the calendar year covered by this report. Item 4. Submission of Matters to a Vote of Security Holders As of February 28, 2011, there were 1,664,625,604 shares of TA common stock outstanding and entitled to vote at the Annual Stockholders’ Meeting. Only holders of the Company’s stock of record at the close of business on March 5, 2011 acting in person or by proxy on the day of the meeting are entitled to notice and to vote at the Annual Stockholders’ Meeting to be held on April 4, 2011. Cumulative voting is allowed for election of the members of the Board of Directors. Each stockholder may vote the number of shares of stock outstanding in his own name as of the record date of the meeting for as many persons as there are directors to be elected or he may cumulate said shares and give one candidate as many votes as the number of directors to be elected multiplied by the number of his shares shall equal, or he may distribute them on the same principle among as many candidates as he shall see fit; provided that the total number of votes cast by him shall not exceed the number of shares owned by him as shown in the books of the corporation multiplied by the whole number of directors to be elected and provided, however, that no delinquent stock shall be voted. No meeting was held during the fourth quarter of the fiscal year that required the vote of security holders, through the solicitation of proxies or otherwise.

41
PART II – SECURITIES OF THE REGISTRANT Item 5. Market Price of and Dividend on Registrant’s Common Equity and Related Stockholder Matters Market Price TA’s common shares are listed with the Philippine Stock Exchange. Below are the high and low sales prices for January - March 2011 and for the calendar years 2010, 2009 and 2008:
Period High Low A. Calendar Year 2011
January 31 1.26 1.19 February 28 1.30 1.27 March 31 1.28 1.23
B. Calendar Year 2010
First Quarter 1.48 1.18 Second Quarter 1.40 1.14 Third Quarter 1.24 1.10 Fourth Quarter 1.18 1.06
C. Calendar Year 2009
First Quarter 0.92 0.60 Second Quarter 1.14 0.82 Third Quarter 1.36 1.12 Fourth Quarter 1.28 1.06
D. Calendar Year 2008 First Quarter 1.38 1.00 Second Quarter 1.24 0.98 Third Quarter 1.08 0.94 Fourth Quarter 1.02 0.68

42
Stockholders The Company had 3,357 registered shareholders as of February 28, 2011. The following table sets forth the top 20 shareholders of the Company, their nationality, the number of shares held, and the percentage of ownership as of February 28, 2011.
No. Name of Stockholders Citizenship No. of Shares Held % of
Ownership 1 Philippine Depository and Trust
Corporation Filipino 833,751,177 50.09%
(PCD Nominee Corp.) – Filipino 2 Phinma Corporation (formerly Bacnotan
Consolidated Industries, Inc.) Filipino 449,331,621 26.99%
3 Philippine Investment Management, Inc. Filipino 201,850,614 12.13% 4 Emar Corporation Filipino 37,283,937 2.24% 5 Philippine Depository and Trust
Corporation Foreign 15,759,051 0.95%
(PCD Nominee Corp.) – Non-Filipino 6 Wilson Chua &/or Ruby C. Chua Filipino 10,000,000 0.60% 7 Francisco L. Viray* Filipino 4,266,703 0.26% 8 Albert Mendoza &/or Jeannie Mendoza Filipino 2,987,967 0.18% 9 Albert Awad American 2,912,188 0.17%
10 Philippine Remnants Co., Inc. Filipino 2,801,218 0.17% 11 Epifania S. Godinez Filipino 1,817,825 0.11% 12 John Peter Yu &/or Juan Yu Filipino 1,580,000 0.09% 13 Teresita A. Dela Cruz Filipino 1,502,221 0.09% 14 Belek, Inc. Filipino 1,484,002 0.09% 15 Joseph D. Ong Filipino 1,397,663 0.08% 16 William How &/or Benito How Chinese 1,333,914 0.08% 17 Active Research & Management Corp. Filipino 1,333,914 0.08% 18 G & L Securities Co., Inc. Filipino 1,238,445 0.07% 19 Rizalino G. Santos Filipino 1,196,243 0.07% 20 Alexander J. Tachan &/or Dolores U.
Tanchan Filipino 1,072,867 0.06%
*The total number of shares owned by Dr. Francisco L. Viray as of February 28, 2011 is 4,448,334 shares of which 181,631 shares are lodged in AB Capital Securities, Inc. (a PCD participant) while 4,266,703 shares are certificated. Dividends
There are no limitations for the Company’s declaration of dividends to its stockholders. The Company is authorized to pay cash or stock dividends or a combination thereof, subject to
approval by the Company’s Board of Directors and Stockholders. Holders of outstanding shares on a dividend record date for such shares are entitled to the full dividend declared without regard to any subsequent transfer of shares.

43
Dividends declared and paid in 2006 up to 2010 are as follows:
Dividend Date of Declaration Type Rate Record Date Payment Date March 27, 2006 Cash P=0.04 per share April 26, 2006 May 23, 2006 April 2, 2007 Cash 0.04 per share April 19, 2007 May 23, 2007 March 25, 2008 Cash 0.04 per share April 11, 2008 May 8, 2008 March 16, 2009 Cash 0.04 per share March 30, 2009 April 27, 2009 March 24, 2010 Cash 0.04 per share May 3, 2010 May 28, 2010
No stock dividend was declared for the calendar years 2006 up to 2010.
As of December 31, 2010, TA’s retained earnings amounted to P=1.25 billion, of which P=229.45 million were equity in net earnings of investee companies that are not available for dividend declaration. On March 21, 2011, the Company’s board of directors cash dividends of P=0.04 per share payable on May 4, 2011 to all shareholders of record as of April 11, 2011. Sale of Unregistered Securities Within the Last Three (3) Years
On April 2, 2007, the Company’s Board of Directors and Stockholders approved a total of 100 million shares to be taken from the unsubscribed portion of the Company’s 2 billion authorized shares as (a) stock grants for officers and managers of the Company; and (b) stock options for directors, officers and employees of TA and its subsidiaries and affiliates under the terms and conditions as may be determined by the Executive Committee. On May 7, 2008, the Company suspended that Stock Option Plan. The Company implemented the Company’s Stock Grants Plan for its executives which resulted in the issuance of 0.3 million and 4.7 million shares in first semesters ended June 30, 2009 and June 30, 2008, respectively. The executive stock grants are given to officers and managers of the Company computed at a predetermined percentage of their variable compensation pay based on certain performance criteria. Issuance of these shares are exempt from registration under Section 10.2 of the Securities Regulation Code which states that the Commission may exempt certain transactions if it finds that the requirements for registration under the Code is not necessary in the public interest or for the protection of the investors such as by reason of the small amount involved or the limited character of the public offering. The Plan falls under Section 10.2 because the offer is limited only to qualified directors, officers and employees of TA and its subsidiaries and affiliates. On December 11, 2007, TA issued 552,528,364 shares at P=1.10 per share to its stockholders by way of a stock rights offering. The rights offering was an exempt transaction under Section 10.1 (e) of the Securities Regulation Code. TA did not engage an underwriter for the offering, but PHINMA and AB Capital Securities, Inc. (ABCSI) committed to subscribe to any shares not taken up by the stockholders. PART III – FINANCIAL INFORMATION Item 6. Management’s Discussion and Analysis of Operations To balance its involvement in the high-risk business of petroleum exploration, TA has invested in other industries in order to maintain its financial stability. At present, TA has substantial investments in power generation (TA Power, Guimaras Power Plant and CIPP) and exploration business. As a result, it has gained financial resources that strengthen it as a corporation and further support its commitment to energy development. Also, it continues to seek investments that will optimize the utilization of these financial resources while its petroleum ventures await maturation and further development. In view of the high risk and capital intensive nature of oil exploration, particularly during the drilling and development stages, the Company continues to farm-out interest in its exploration acreage. However, to enable

44
the Company survive the periods of low exploration activity resulting from the cyclical nature of exploration interest in the Philippines, the Company has as much as possible pursued the minimum program required to maintain its rights over prospective acreage while pursuing cost cutting measures. At the same time, through its membership in the Petroleum Association of the Philippines, it has worked with the Department of Energy (DOE) to encourage petroleum exploration through policies and incentive programs such as the “Window of Opportunity in the Philippine Petroleum Exploration.” Calendar Year 2010 The Company has been in business for more than 40 years, earning a solid reputation as a prudent developer and operator with a strong technical team that is highly regarded in the industry. The Company’s diversified investments have given it greater financial resources to support its commitment to energy development and capacity expansion. The Company is in a position to seek business opportunities or investments to optimize its financial resources. The Company has gained valuable experience in trading at the Wholesale Electricity Supply Market (WESM) in which it has been actively participating in the past four years. The WESM continues to present valuable business opportunities for the Company. The Company was highly exposed to volatile WESM and fuel prices in 2010. To hedge against the price fluctuations in the WESM, the Company entered into a contract with Amlan Power Holdings Incorporated in the third quarter of the year to purchase up to 15 megawatts. In November 2010, the Company was able to renew its contract to purchase the energy generated by NIA’s Baligatan Hydroelectric Power Plant. In December 2010, the Company also entered into a Power Administration and Management Agreement with One Subic Power Generation Corporation for the administration and management of the entire generation output of the 116 MW Subic Bay Diesel Power plant. This arrangement will give the Company additional capacity, take advantage of the opportunities in the WESM, and service its bilateral contracts with its customers. Commitment to Exploration Oil and gas exploration and production business remains in the list of the Company’s priorities. The Company and its partners in Service Contract No. 51 have committed to drill an onshore exploratory well in the town of San Isidro, northwest Leyte. Preparations are underway for the start of drilling operations in March 2011. The Duhat-1 well will be the first deep onshore test in Leyte since 1959. In line with efforts to harness renewable sources of energy, the Company ventured into the development of the Maibarara geothermal field in Calamba, Laguna and Sto. Tomas, Batangas for power generation by investing in 25% equity of Maibarara Geothermal, Inc. (MGI). MGI is expected to commission the first 20 MW power plant by the second half of 2013. Oil and Gas SC 6 (Offshore Northwest Palawan) Cadlao Production Area
On September 21, 2010, TA entered into a Sale and Purchase Agreement and a Deed of Assignment covering the assignment of its entire royalty interest in the Cadlao Production Area, Northwest Palawan under Service Contract No. 6 to Peak Royalties Limited (BVI). On December 22, 2010, DOE approved the Deed of Assignment and recognized the assignment by TA Oil of the 1.65% royalty interest in favor of Peak Royalties, Inc. The proceeds amounting to US$1.325 million (P=58.57 million) were recognized in the 2010 consolidated statements of income as Other Income.

45
Block A
GPC Investments S.A. (formerly known as Vitol GPC Investments S.A.) did not exercise its option to acquire interest in the block.
The consortium adopted a US$560,000 work program for year 2011 consisting mainly of reprocessing of 3D seismic data in the northern sector of the block where prospects had been identified.
Block B
On February 4, 2011, the consortium, excluding one partner, signed a Farm-in Agreement with Peak Oil and Gas Philippines, Ltd., Blade Petroleum Philippines, Ltd. and VenturOil Philippines, Inc. (“farminees”), which granted the farminees the option to acquire 70% of the participating interests of the farmors, upon farminees’ completion of a US$325,000 geological and geophysical work program at their sole cost by April 2011.
Should the farminees exercise the option, they will carry the farmors in all expenses until first oil production in the block.
The Company holds 7.78% and 14.063% participating interests in Blocks A and B, respectively.
SC 14 (Offshore Northwest Palawan)
The DOE approved the final 15-year extension of the term of SC 14 effective December 17, 2010, subject to certain terms and conditions.
Block B - 1 North Matinloc
The North Matinloc field produced 18,737 barrels of oil in year 2010.
The Company has 6.103% participating interest in Block B-1. SC 51 (Cebu Strait/Northwest Leyte)
The DOE approved a revised timeline for the remaining SC 51 work phases under which the term of the current Sub-Phase 3 was extended to July 3, 2011.
The Filipino partners, NorAsian Energy Limited (NEL), the Operator, and an Australian company finalized an Amendment Deed to the Farm-in Agreement that provides for, among others, the farm-in of said Australian company, the drilling of an onshore well in Northwest Leyte in fulfillment of the Sub-Phase 3 obligation, and options for the drilling of the Argao - 1 well in the Cebu Strait and a second onshore well.
The Company owns 6.67% participating interest in SC 51. SC 55 (Offshore West Palawan)
The consortium completed a 600 - sq. km. 3D seismic survey and a separate 1,800 sq. km. 3D seismic survey in the first quarter of year 2010.
The DOE granted a one-year extension of Sub-Phase 3 to August 5, 2011 to give the consortium sufficient time to process and interpret the new seismic data.
The Company signed an Option Agreement with Frontier Gasfields Pty. Ltd. of Australia on June 3, 2010 which grants the latter the option to acquire the 5% participating interest that Trans-Asia has from NorAsian Energy
46
Ltd. (NEL), the Operator, after the drilling of the first well under SC 55. Under the Option Agreement, the Company received a nonrefundable option fee of US$250,000.
On February 3, 2011, the Company and NEL signed an agreement providing for NEL’s acquisition of 8.18% participating interest in SC 55 from the Company. Said assignment of interest is subject to the approval of the DOE.
Interpretation of the processed seismic data was in progress as of December 31, 2010.
The Company has 15% participating interest in SC 55.
SC 69 (Camotes Sea) The partners completed a 900 - km 2D seismic survey in the second quarter of year 2010.
The DOE approved the consortium’s request for a three-month extension of the current Sub-Phase 2 until February 7, 2011 to enable completion of interpretation of the new seismic data. The Company signed a Farm-in Option Agreement with Frontier Gasfields Pty. Ltd. of Australia on June 3, 2010 which grants the latter the option to acquire 15% out of the 30% participating interest of the Company in SC 69. On February 3, 2011, Frontier notified the Company of its election to exercise its option. Such assignment of interest is subject to the consent of the Company’s partner in SC 69 and the approval of the DOE.
The Company and NorAsian Energy Philippines, Inc. (NOEPI) signed an agreement on February 3, 2011 providing for NOEPI’s acquisition of 9% participating interest in SC 69 from the Company.
The consortium elected to enter Sub-Phase 3 (February 7, 2011 to August 7, 2012) with a commitment to undertake a 150 - sq. km. 3D seismic program designed to elevate two delineated prospects to drillable status.
Minerals MPSA 252-2007-V (Camarines Norte)
The Office of the President denied the Company’s Appeal for reversal of the decision of the Department of Environment and Natural Resources excising portions of the MPSA covered by alleged mineral patents of a third party.
The Company filed a timely Motion for Reconsideration. Financial Performance Consolidated revenues declined to P=894.3 million in 2010 from P=1.1 billion in 2009. Following are the material changes in revenues in the Consolidated Statements of Income between 2010 and 2009:
• The drop in generation revenues to P=55.6 million from P=155.8 million was due to the cessation of
operations of the power generating plant of CIP II Power Corporation (CIPP) beginning April 11, 2009, when Meralco took over the concession agreement with the developer of Carmelray Industrial Park II in Calamba, Laguna. The P=55.6 million generation revenue in 2010 represents that of Guimaras power plant.
• Net trading loss of P=60.3 million was reported in 2010 as compared with P=274.5 million net trading revenues in 2009. The higher cost of power purchased per kilowatt hour in 2010 resulted in negative gross margin for the energy trading business of the Company.
• Interest and other financial income increased to P=70.1 million from P=65.6 million due to higher fair value of investments held for trading.

47
• Dividend income dropped from P=27.1 million to P=7.1 million due to lower cash dividends received from Atlas Holdings Corporation (AHC), Bacnotan Consolidated Industries, Inc. (BCII) and Phinma Properties Holdings Corporation (PPHC) in 2010. In 2009, AHC declared P21 million cash dividends and was merged with Union Galvasteel Corporation, a Phinma subsidiary, in 2010.
• Rental income improved to P=6.8 million from P=5.5 million due to additional lease contracts entered into by the Company, where the Company is the lessor.
• The increase in the Company’s share in generation revenues of a joint venture to P=754.3 million from P=563.5 million was brought by higher power rates and higher energy sales to both Holcim and WESM.
• The Company’s share in other income of a joint venture was P=381 thousand in 2010 and none in 2009.
Consolidated costs and expenses amounted to P=995.3 million in 2010 while these amounted only to P=660.3 million in 2009. Following are the material changes in costs and expenses in the Consolidated Statements of Income between 2010 and 2009:
• Cost of power generation dropped to P=44.5 million from P=129.5 million as a result of CIPP’s
cessation of operations due to Meralco’s takeover of its concession agreement on April 11, 2009. The P=44.5 million cost of power generation in 2010 represents that of Guimaras power plant.
• Cost of power plant on standby of P=29.5 million was reported in 2010 and P=26.9 million in 2009. The latter covers only expenses from April 12, 2009 to December 31, 2009. These expenses represent mainly depreciation and related maintenance cost of the power plant in Calamba, Laguna, which ceased operations in April 2009.
• General and administrative expenses decreased to P=165.5 million from P=199.8 million brought about by lower management and professional fees. Management fees are based on a certain percentage of the Company’s operating results.
• The Company’s share in cost of power generation of a joint venture rose to P=670.6 million from P=275.9 million as a result of higher energy generated and fuel cost. In 2010, 64% of the total energy sold was generated by the power plant of the joint venture and the remaining 36% was purchased from the WESM. In 2009, 29% of the total energy sold was generated by the power plant and 71% was purchased from the WESM.
• The decrease in the Company’s share in general and administrative expenses of a joint venture from P=27.7 million to P=24.9 million was brought about by lower management and professional fees. Management fees are based on a certain percentage of the joint venture’s operating results.
• The Company’s share in other expense of a joint venture of P=495.3 thousand was reported in 2009 and none in 2010.
Other income amounting to P=113.3 million was reported in 2010 while other expenses amounted to P=133.2 million was reported in 2009. Following are the material changes in other income and expenses in the Consolidated Income Statements between 2010 and 2009:
• The Company reported a net gain on its currency forward contracts of P=45.8 million in 2010 as compared with P=37.6 net gains in 2009. This was due to the appreciation of peso vis-a-vis the US dollar in 2010.
• The Company reported a P=36.9 million receipt of tax credits which represents the refunds of duties and taxes from the Bureau of Customs arising from the Company’s fuel purchases in previous years.
• The Company incurred foreign exchange loss of P=31.0 million from its foreign currency denominated financial assets in 2010 which is higher than P=13.0 million in 2009. This was brought about by the appreciation of peso in 2010.
• The Company earned P=58.6 million in 2010 from the sale of its royalty interest in the Cadlao Production Area, Northwest Palawan under Service Contract No. 6.
• Gain on sale of inventories increased from P=7.9 million to P=8.8 million. This mainly represents the sale of CIPP’s bunker fuel inventory.
• Gain on sale of available-for-sale investments increased to P=60.4 thousand from P=20.5 thousand as a result of higher market value of the said investments in 2010.
48
• Loss on sale of property, plant and equipment of P=34.3 thousand was reported in 2010 as compared with P=7.3 million gains in 2009. The disposal of the distribution asset of CIP II resulted in the gain on sale of property, plant and equipment in 2009.
• Gain on sale of investment in associates of P=24.8 million was earned from the disposal of BIPC shares in 2009.
• The Company recognized impairment loss of P=22.6 million in 2010 covering its investment in unlisted shares of stock.
• In 2010, the Company reversed a portion of the impairment provision covering the property, plant and equipment of CIPP amounting to P=20.3 million.
• Long outstanding trade receivable of CIPP amounting to P=6.7 million was provided with an allowance in 2010.
• Provisions for impairment losses on deferred exploration cost and provision for unrecoverable input tax amounting to P=11.5 million and P=0.7 million, respectively, were set-up in 2009.
• Income from option fee of P=11.5 million was recognized in 2010. This represents option fee received from a third party related to the Company’s SC 55.
• Surety bond related charges of P=8.3 million was reported on 2010 as a result of the Company’s participation in a number of biddings of power plants.
• Equity in net losses of associates amounted to P=3.4 million was reported in 2010 brought about by net losses incurred by investees, particularly from Maibarara Geothermal, Inc., a 25% associate of the Company which is in preoperating stage
• The Company had written-off P=78.5 million of intangible assets in 2009 due to expiration of contracts.
• Other income of P=3.5 million was reported in 2010 consisting of miscellaneous income and expenses, the individual components of which are not material in amount and nature.
Provision for income tax in 2010 dropped from P=60.1 million to P=3.0 million due to lower taxable income. Benefit from income tax also dropped to P=0.6 million from P=41.1 million. The latter includes the tax effect of the intangible assets written-off in 2009. Company’s share in income tax of a joint venture increased to P=4.8 million from P=3.4 million. As a consequence of the above-cited factors, a net income of P=14.7 million was reported in 2010 as compared with a net income of P=282.8 million in 2009. Total consolidated assets increased slightly to P=3.43 billion as of December 31, 2010 from P=3.38 billion as of December 31, 2009. Total consolidated liabilities increased to P=387.4 million from P=305.2 million. Equity declined from P=3.1 billion to P=3.0 billion. Following are the material changes in the accounts in the Consolidated Balance Sheets between December 31, 2010 and 2009:
• Cash and cash equivalents decreased to P=880.8 million from P=985.3 million. The Consolidated Statements of Cash Flows show details of material changes in cash and cash equivalents.
• Short-term investments of P=5 million as of December 31, 2009 have original maturities of more than three months but less than one year. These investments were converted to short-term deposits with original maturities of less than three months and formed part of cash and cash equivalents as of December 31, 2010.
• Investments held for trading increased to P=872.7 million from P=810.4 million. The Consolidated Statements of Cash Flows show the details of materials changes in investments held for trading.
• Receivables increased from P=157.5 million to P=220.0 million mainly because the 2010 receivables include P58.6 million receivable from the buyer of the Cadlao royalty interest sold in December 2010. This was subsequently collected in January 2011.
• The drop in fuel and spare parts from P=44.9 million to P=27.3 million was brought about by the disposal of fuel inventory of CIPP in 2010.
• Other current assets rose to P=79.6 million from P=16.2 million on account of the tax credits received in 2010 from the Bureau of Customs and increase in creditable withholding tax and input taxes.

49
• The Company’s share in current assets of a joint venture rose to P=295.1 million from P=198.1 million due to higher level of cash and cash equivalents and fuel and spare parts inventory.
• Property, plant and equipment increased to P=489.3 million from P=426.7 million due to reversal of a portion of the impairment provision of CIPP power plant and reclassification of certain investment property to property, plant and equipment, net of depreciation incurred in 2010.
• Investments in associates rose to P=39.8 million from P=0.6 million due to investment in Maibarara Geothermal, Inc. in 2010.
• Investment property dropped from P=92.2 million to P=23.1 million. This was mainly due to the transfer of certain investment property to property, plant and equipment account when the Company decided to occupy the property instead of leasing it out to third parties in 2010.
• The increase in deferred exploration costs from P=71.9 million to P=86.7 million was due to the Company’s payment of cash calls to the consortium of SC 69.
• Other noncurrent assets dropped from P=127.9 million to P=47.2 million brought about by the collection of long-term receivable from Phoenix Petroleum Philippines, Inc (Phoenix). in 2010. Phoenix bought the Company’s investment in Bacnotan Industrial Park Corporation (BIPC) in 2009.
• The Company’s share in noncurrent assets of a joint venture declined to P=167.2 million from P=235.7 million due to depreciation expenses and collection of long-term receivable from Phoenix in 2010. Phoenix bought the Company’s investment in BIPC in 2009.
• Accounts payable and other current liabilities increased to P=194.5 million from P=160.2 million brought about by higher trade payables in 2010.
• Due to stockholders increased from P=7.0 million to P=7.9 million brought about by unclaimed cash dividend checks from the cash dividends declared in 2010.
• Income and withholding taxes payable fell from P=39.4 million to P=4.2 million due to payment of 2009 income tax in 2010. In 2010, income tax payable was lower because of lower taxable income.
• The Company’s share in current liabilities of a joint venture rose to P=134.7 million from P=51.5 million brought about by higher level of trade and nontrade payables as of December 31, 2010.
• Pension and other post-employment benefits increased from P=6.0 million to P=10.6 million due to additional pension expense and sick and vacation leave conversion accrued in 2010.
• Deferred tax liabilities increased from P=23.4 million to P=23.8 million due to the tax effect of the reversal of impairment provision on CIPP power plant net of the recognition of deferred income tax assets related to NOLCO and MCIT.
• The decrease in other noncurrent liabilities from P=7.8 million to P=7.0 million was due to return of certain deposits.
• The Company’s share in noncurrent liabilities of a joint venture dropped from P=9.8 million to P=4.6 million because no deferred tax liability was recognized in 2010.
• The P=2.0 million increase in capital stock was brought about by additional issuance of share of stocks during the year.
• The increase in unrealized fair value gains on available-for-sale investments to P=71.8 million from P=52.2 million was due to higher market value of the said investments.
• The Company’s share in unrealized fair value gains on financial assets of a joint venture rose to P=13.2 million from P=9.0 million brought about by the higher market value of the joint venture’s financial assets.
• Retained earnings declined to P=1.2 billion from P=1.3 billion due to the lower net income earned and the declaration of cash dividends in 2010.
The top five (5) key performance indicators of Trans-Asia and its majority-owned subsidiaries, as consolidated, are the following:
1. Current Ratio = Current Assets Current Liabilities
Current ratio decreased to 6.96:1 as of December 31, 2010 from 8.59:1 as of December 31, 2009. Although the current assets as of December 31, 2010 increased to P2.4 billion from P2.2

50
billion as of December 31, 2010, such increase was only 7% from the prior year balance as compared to the corresponding 32% increase in current liabilities between 2010 and 2009.
2. Current Assets to Total Assets = Current Assets Total Assets
The ratio of current assets to total assets increased slightly to 0.69:1 as of December 31, 2010 from 0.66:1 as of December 31, 2009. There are no significant fluctuations in the balances of both the total current assets and total assets of the Company between 2010 and 2009.
3. Debt/Equity Ratio = Total Liabilities Equity
Debt/equity ratio increased slightly to 0.13:1 as of December 31, 2010 from 0.10:1 as of December 31, 2009. This is because total liabilities increased while equity account decreased between 2010 and 2009.
4. Rate of return on equity = Net Income Average Equity
The rate of return on stockholders’ equity dropped from 9.5% in 2010 as compared to 0.5% in 2009 due to lower net income earned in 2010.
5. Earnings per share = Net Income less Preferred Stock Dividend Average No. of Common Shares Outstanding
Earnings per share fell from P=0.17 to P=0.01 in 2010 brought about by the lower net income earned in 2010.
During Calendar Year 2010, other than those already disclosed and/or discussed in this report:
• There were no unusual items that affected assets, liabilities, equity, net income or cash flows. • The Company had two (2) reportable segments namely: petroleum and mining exploration and
power business. The fund placements are incidental to the Company’s petroleum and mining exploration and power generation activities arising from management of the Company’s funds. The exploration costs are shown as “deferred exploration costs” in the consolidated balance sheets.
• There were no events that had occurred subsequent to the balance sheet date that required adjustments to or disclosure in the financial statements other than those already disclosed in Note 14 to the Consolidated Financial Statements.
• The Company had not been involved in any business combinations, acquisition of subsidiaries and long-term investments, restructuring and discontinuing operations except for the 25% interest investment in Maibarara Geothermal, Inc.
• There were no contingent assets or contingent liabilities since the last annual balance sheet date. • There were no material contingencies and any other events or transactions that occurred that were
material to an understanding of the current year. • There were no operations subject to seasonality and cyclicality. • There were no material trends, demands, commitments, events or uncertainties known to the
Company that would likely affect adversely the liquidity of the Company. • There were no trends, events or uncertainties occurred that had or that were reasonably expected to
have material favorable or unfavorable impact on net revenues/income from continuing operations.

51
• There were no significant elements of income or loss that did not arise from continuing operations that had material effect on the financial condition or result of operations.
• There were no events that trigger direct or contingent financial obligation that was material to the Company.
• There were no material off-balance sheet transactions, arrangements, obligations and other relationships of the Company with unconsolidated entities or other persons created during the period.
Calendar Year 2009 Upstream Oil and Gas SC 6 (Northwest Palawan) Cadlao The Department of Energy (DOE) approved a new development plan for the Cadlao oil field subject to, among other conditions, the submission of an Extended Well Test proposal. The DOE granted earlier a 15-year extension of the term of Service Contract No. 6 covering the Cadlao Production Area effective March 1, 2009. Block A and Block B (Retention Area) The DOE granted a 15-year extension of the term of Service Contract No. 6 covering Block A and Block B effective March 1, 2009. In Block A, partners agreed to extend the term of the Farm-In Agreement with Vitol GPC Investments S.A. of Switzerland, which grants the latter the option to acquire 70% interest in the block, until 14 days after DOE approval of Galoc Phase 2 development or December 31, 2010, whichever comes first. SC 1 Block B-1 North Matinloc (Northwest Palawan) Production operations at the North Matinloc field resumed in February 2009. As of December 31, 2009, the field has produced a total of 28,315 barrels of oil. SC 51 (East Visayas) In June 2009, the DOE lifted the moratorium it imposed on exploration activities in the area following the revocation of the Cebu provincial governor’s Cease and Desist Order to the DOE. The DOE approved the extension of the current 3rd Sub-Phase of the Exploration Period until December 8, 2010.
The 3rd sub-Phase of the Exploration Period entails a commitment to drill one exploratory well. SC 55 (Offshore West Palawan) The DOE approved the consortium’s request for substitution of a 2D/3D seismic program with minimum expenditures of US $ 3 million, for one deepwater well with minimum expenditures of US $ 3 million committed under the current 3rd Sub-Phase of the Exploration Period (August 5, 2009 to August 4, 2010).

52
The consortium completed on January 1, 2010 a 600–sq.km. 3D seismic survey designed to upgrade petroleum leads to drillable prospects, in fulfillment of its work commitment. SC 69 (Camotes Sea) Partners completed reprocessing of some 2,800 kilometers of vintage 2D seismic data in fulfillment of work obligations under the 1st Sub-Phase of the Exploration Period May 7, 2008 to May 6, 2009). The consortium elected to enter the 2nd sub-Phase of the Exploration Period (May 7, 2009 to November 6, 2010) and opted to implement a minimum 750 – km 2D seismic program.
Preparations for the conduct of a 900 – km seismic survey were underway as of end 2009. Minerals MPSA 252-2007-V (Camarines Norte) TA Gold, wholly-owned subsidiary of TA and Operator of the MPSA, suspended operations in April 2009.
In June 2009, TA received notice of an Order of the Secretary of Department of Environment and Natural Resources (DENR) excising portions of the MPSA area that are covered by alleged mineral patents of a third party. TA filed a motion for Reconsideration of said Order. In December 2009, the DENR denied TA’s Motion for Reconsideration. TA filed a timely Appeal of the DENR’s ruling with the office of the President. MRD - 491 and MRD - 492 (Rizal) Rock Energy International Corporation, Operator of TA’s mining lease contracts, obtained in July 2009 an environmental Compliance Certificate for operation of a quarry to extract tuffaceous materials at a site in Teresa. Power Generation Bulacan (Trans-Asia Power Generation Corporation) TA Power registered a net income of P=69.5 million; a complete reversal of the P=158.3 million loss incurred in 2008. Total energy sold in 2009 reached 256.6 GWh. Of the total volume, 213.8 GWh was supplied to our main customer, Holcim Philippines, while 42.7 GWh was exported to the WESM. TA Power sustained the plant’s reliability and steadily assured power supply quality for Holcim to preclude opportunity losses, while complying at the same time with environmental standards and the Grid Code. Guimaras The 3.4 MW power plant in Guimaras continued to provide peaking power in the island. Total energy sales for the year amounted to 3.8 GWh resulting in total revenues of P=47.2 million and net income from operations of P=8.66 million. Aside from providing peaking power, the power plant also operated on island mode five (5) times during the year as power from the grid was not available due to transmission line problems and maintenance, thereby ensuring a reliable and continuous supply of power to the island.

53
Laguna (CIP II Power Corporation) CIP II Power Corporation (CIPP) operates in the Carmelray Industrial Park II in Calamba, Laguna. It originally was the only generator allowed to supply the electricity requirements of the park through its 21 MW Bunker C-Fired power plant. In March 2009, the company sold to Meralco CIPP’s ownership of the distribution network inside the park, effectively terminating the original Concession Agreement with the park operator Carmelray – JTCI Corporation (CJC). Prior to the turn-over of the distribution assets, CIPP sold a total of 14.9 GWh of energy resulting in Total Revenues of P=108.6 million. Electricity Trading and Marketing The electricity supply business continues to play its vital role as an active participant in the buying and selling electricity to the Philippine Wholesale Electricity Spot Market (WESM). For 2009, the total energy bought for our customers reached 268 GWh, while excess energy sold by TA Power was at 42 GWh. As the major contributor to the excellent performance of Trans-Asia in 2009, Electricity trading accounts for P=827 million of the P=1.0 billion revenues for the whole calendar year. Project Development To augment the power generation capacity of your company, plans have been drawn to build a new 1 x 135 MW coal-fired power plant. The power plant will utilize the Atmospheric Circulating Fluidized Bed (CFB) boiler technology which will be designed to minimize emissions of oxides of sulfur and nitrogen. An Electrostatic Precipitator (ESP) will be installed to remove suspended particles from the exhaust gases prior to release to the atmosphere. Liquid effluents will also be treated in a water treatment plant prior to discharge. Together, the CFB, ESP and water treatment plant will allow the power plant to surpass the environmental emissions standards set by the government. Three sites are being considered for the coal plant location feasibility studies. The first two, Norzagaray, Bulacan just adjacent to the existing Trans-Asia Power Generation Corporation, and Bacnotan, La Union, are being carefully studied to take advantage of its proximity to existing facilities and being located close to its intended main customers. The third site being considered is Calaca, Batangas, due to its ease of interconnection to the Luzon Grid via the National Grid Corporation of the Philippines. Renewable Energy Trans-Asia Renewable Energy Corporation (TAREC), your fully owned subsidiary focused on developing renewable energy (RE) projects put into motion, a “portfolio” approach in wind resource development. TAREC has identified over 30 wind sites capable of supporting over 400 MW of wind power. While waiting for the promulgation of guidelines governing the award of RE Service Contracts, which vests exclusive rights for 25 years, extendible for another 25, to particular areas, TAREC continued measuring the wind regime in its maiden wind site in San Lorenzo, Guimaras. TAREC also conducted a Public Scoping for this Guimaras pilot project at the site, where, together with the local government, the community expressed full support for this environmentally friendly project. Likewise, TAREC shortlisted potential turbine/generator suppliers and had extensive discussions with possible financial partners. These activities were undertaken with the objective of achieving a 2012 full commissioning of a 54 MW wind farm in San Lorenzo, Guimaras. TAREC also commissioned four (4) additional wind measuring devices in Ballesteros and Sta. Ana, Cagayan, as well as in Nueva Valencia and Sibunag also in Guimaras. Initial readings from these sites showed very promising results.

54
In October 2009, TAREC bagged from the Department of Energy (DOE), 10 service contracts representing a total of 227 MW of potential wind capacity making it the country’s largest wind energy resource developer. Aside from the sites mentioned above, the 10 service contracts awarded to TAREC also cover areas in Buguey/Aparri in Cagayan, Ibajay and Malay in Aklan, Mercedes in Camarines Norte as well as Barotac Nuevo in Iloilo. Financial Performance Consolidated revenues for 2009 decreased to P=1.09 billion compared with P=1.44 billion last year. Following are the material changes in revenues:
• The drop in generation revenues to P=155.8 million from P=728.3 million was due to lower energy sales of CIPP since the takeover of the concession agreement by Meralco on April 11, 2009. CIPP’s energy sales amounted to P657.5 million for the period January 1 to December 31, 2008 and P108.6 million for the period January 1 to April 11, 2009.
• Trading revenues rose to P=274.5 million from P=62.9 million on account of higher energy sales and power rates.
• Interest and other financial income increased to P=65.6 million from P=48.4 million due to higher fair value of investments held for trading.
• Dividend income improved to P=27.1 million from P=2.1 million brought about by higher cash dividends received from Atlas Holding Corporation (AHC), Bacnotan Consolidated Industries, Inc. (BCII) and Phinma Property Holdings Corporation (PPHC).
• Rental income increased to P=5.4 million from P=2.1 million with additional three (3) tenants this year following the purchase of the 3rd floor of Phinma Plaza in 2009.
• Despite the increase in energy sales, Company’s share in generation revenues of a joint venture slightly decreased to P=563.5 million from P=566.2 million because of lower power rates. Power rates are primarily influenced by fuel cost, which significantly decreased in 2009.
• In 2008, the Company’s share in other income of a joint venture of P=38.1 million represents reversal of overaccrual for energy transmission costs in prior years and proceeds from equipment insurance claim covering an engine breakdown in December 2007.
Consolidated costs and expenses for the year 2009 decreased to P=660.3 million from P=1.4 billion in previous year. Following are the material changes in costs and expenses in the Consolidated Income Statement for the year 2009:
• Cost of power generation dropped to P=129.5 million from P=742.6 million on account of lower energy
sales of CIPP due to Meralco’s takeover of its concession agreement on April 11, 2009. • The cost of power plant on standby amounting to P=26.9 million in 2009 represents the depreciation and
maintenance cost of the CIPP power plant following it cessation of operation on April 11, 2009. • General and administrative expenses increased to P=199.8 million from P=181.2 million brought about by
higher employee benefits and professional fees, a portion of which is based on the Company’s financial results. In 2009, the Company’s net income increased more than three times as compared to the previous year.
• Company’s share in cost of generation of a joint venture decreased to P=275.9 million from P=493.9 million as a result of lower fuel cost and lower volume of power generated.
• Company’s share in general and administrative expenses of a joint venture increased to P=27.7 million from P=26.4 million due to higher professional fees.
• Company’s share in other charges of a joint venture in 2009 amounted to P=495.3 thousand representing interest expense on bank borrowings.
In 2009, the Company incurred other expenses of P=133.2 million compared to 2008 other income of P=64.2 million. Below are the significant items included in the other income and expense:
55
• The Company had written-off P=78.5 million of deferred exploration costs due to expiration of petroleum service contracts and the technical evaluation that the remaining prospects in these areas are small and are likely to be uneconomic.
• With respect to the Company’s nondeliverable forward contracts covering foreign currency denominated financial assets, the Company earned a net gain on derivatives amounting to P=37.6 million in 2009 due to appreciation of peso. A net loss on derivatives of P=21.2 million was reported in the last year with the depreciation of peso.
• With respect to the Company’s foreign currency financial assets, the Company incurred a foreign exchange loss of P=12.9 million in 2009 and earned foreign exchange gain of P=69.6 million in 2008.
• Provision for impairment losses on CIPP generating assets amounting to P=106.9 million was set up in 2009 when CIPP ceased operations and Meralco took over the concession agreement in April 2009.
• Provision for impairment losses on deferred mineral exploration costs amounting to P=11.5 million was set-up in 2009 following DENR’s denial of the Company’s Motion for Reconsideration of DENR’s order excising portions of an MPSA area that are covered by alleged mineral patents of a third party.
• Gain on sale of inventories rose to P=7.9 million from P=91.7 thousand. This represents the sale of CIPP’s bunker fuel inventory.
• Gain on sale of investment in an associate of P=24.8 million was earned when the Company sold its 30% equity interest in BIPC to Phoenix Petroleum Philippines, Inc, a third party.
• Gain on sale of property and equipment of P=7.3 million was earned when CIPP sold its distribution asset to Meralco in 2009.
• Gain on sale of available-for-sale investments amounted to P=20.5 thousand from P=28.8 thousand loss in previous year as a result of the increase in market value of the said investments.
• Equity in net earnings of associates was lower at P=12.1 thousand in 2009 from P=8.6 million in 2008 this is because BIPC was sold in early 2009. Bacnotan Industrial Park Corporation (BIPC) was the only operating associate of the Company.
• Other expenses amounted to P=149 thousand was reported in 2009 while other income of P=10.6 million was reported in 2008 which represents reversal of accrued 2007 expenses in 2008.
Provision for current income tax increased to P=60.1 million in 2009 from P=5.6 million in 2008 due to higher taxable income in 2009. Benefit from deferred income tax increased to P=41.1 million from P=32.1 million due to the tax effect of the provision for impairment loss on CIPP’s power plant. The Company’s share in income tax of a joint venture declined from provision for income tax of P=6.3 million in 2008 to benefit from income tax of P=3.4 million in 2009.
As a consequence of the above-cited factors, net income increased to P=282.8 million in 2009 from P=88.5 million in 2008.
Total consolidated assets slightly increased to P=3.38 billion as of December 31, 2009 from P=3.33 billion as of December 31, 2008. Total consolidated liabilities decreased to P=313.2 million from P=476.2 million. Equity increased to P=3.07 billion from P=2.86 billion. Following are the material changes in the accounts in the Consolidated Balance Sheet as of December 31, 2009:
• Cash and cash equivalents increased to P=985 million from P=909.5 million. The Consolidated Statement of Cash Flows shows details of material changes in cash and cash equivalents.
• Short-term investments fell to P5 million from P=17.5 million in 2008 following the conversion of these investments to short-term deposits.
• Investments held for trading increased to P=810.4 million from P=544.7 million. The Consolidated Statement of Cash Flows shows the details of material changes in investment held for trading.
• Receivables dropped to P=157.5 million from P=183.9 million following collection of CIPP’s trade and non-trade receivables.
• Fuel and spare parts decreased to P=44.9 million from P=50.7 million brought about by the sale of CIPP’s bunker fuel inventory.
• Other current assets increased to P=24.3 million from P=16.4 million due to increase in input tax from the purchase of the 3rd floor and part of mezzanine of Phinma Plaza Building.

56
• Company’s share in current assets of a joint venture improved to P=198.1 million from P=162.4 million due to higher trade and other receivables from high volume of energy sold in December.
• Property, plant and equipment fell to P=426.7 million from P=620.1 million brought about by the provision for impairment loss on CIPP’s generating sets for the year 2009.
• Investments in associates fell to P=619.7 thousand from P=169.1 million brought about by the sale of BIPC shares.
• Available-for-sale investments slightly declined to P=205.1 million from P=206.4 million from the drop in market value of said investments.
• Investment property rose to P=92.2 million from P=3.3 million due to the purchase of the 3rd floor and part of mezzanine of Phinma Plaza Building.
• Intangible assets decreased to P=71.9 million from P=144.2 million due to the oil exploration costs written-off.
• Other noncurrent assets improved to P=127.9 million from P=331.7 thousand due to long term receivable from Phoenix Petroleum Philippines, Inc. in connection with the sale of BIPC shares.
• Company’s share in noncurrent assets of a joint venture declined to P=235.7 million from P=305.4 million due to depreciation expenses and lower market value of available-for-sale investments.
• Accounts payable and other current liabilities fell to P=168.2 million from P=214.5 million on account of settlement of trade payables.
• Customers’ deposits of P=27.4 million were returned to locators of CIPP in 2009. • Due to stockholders increased to P=7 million from P=6.3 million. • Income and withholding taxes payable rose to P=39.4 million from P=968.7 thousand due to higher
taxable income in 2009 than last year. • Company’s share in current liabilities of a joint venture declined to P=53.3 million from P=141.9
million on account of settlement of trade and nontrade payables. • Pension and other post-employment benefits decreased to P=6 million from P P=10.9 million brought
about by lower pension contribution in 2009 than last year. • Deferred tax liabilities decreased to P=23.4 million from P=53.5 million as a result of provision for
impairment loss on CIPP’s generating sets. • Company’s share in noncurrent liabilities of a joint venture decreased to P=8 million from P=10.7
million due to drop in deferred tax liability. • Unrealized fair value gains on available-for-sale investments declined to P=52.2 million from P=54.5
million due to lower market value of the said investments. • The Company’s share in unrealized fair value gains on financial assets of a joint venture slightly
increased to P=8.9 million from P=8.7 million brought about by the higher market value of the said financial assets.
• Retained earnings grew to P=1.29 billion from P=1.08 billion due to higher net income for the year. The top five (5) key performance indicators of Trans-Asia and its majority-owned subsidiaries, as consolidated, are the following:
1. Current Ratio = Current Assets Current Liabilities
Current ratio improved to 8.31:1 as of December 31, 2009 from 4.79:1 as of December 31, 2008 due to the increase in total current assets account and decrease in total current liabilities account between 2009 and 2008.
2. Current Assets to Total Assets = Current Assets Total Assets
The ratio of current assets to total assets increased to 66:1 as of December 31, 2009 from 56.5:1 as of December 31, 2008 due 18% increase in total current assets while total assets account increased to only 1% between 2009 and 2008.
57
3. Debt/Equity Ratio = Total Liabilities Equity
Debt/equity ratio decreased to 0.10:1 as of December 31, 2009 from 0.17:1 as of December 31, 2008 due to lower total liabilities combined with higher equity between 2009 and 2008.
4. Rate of return on stockholders’ equity = Net Income Average Equity
The rate of return on equity improved to 9.5% for the year ended December 31, 2009 as compared to 3.1% for the same period last year due to higher net income in 2009.
5. Earnings per share = Net Income less Preferred Stock Dividend Average No. of Common Shares Outstanding
Earnings per share improved to P=0.17 from P=0.05 on account of higher net income in 2009 compared to last year.
During the Calendar Year 2009, other than those already disclosed/reported in this report:
• There were no unusual items that affected assets, liabilities, equity, net income or cash flows except for the disposal of distribution asset of CIPP, provision for impairment loss on CIPP’s generating sets and write-off of intangible assets.
• The Company had two (2) reportable segments namely: petroleum and mining exploration and power business. The fund placements arising from management of the Company’s funds are incidental to the Company’s oil exploration and power generation activities. The exploration costs are shown as “Intangible assets” in the consolidated balance sheets.
• Other than the approval of the Board of Directors of the merger of the Parent Company and CIPP on February 22, 2010 and the contract entered into by the Parent Company for the sale and purchase of industrial lots with BIPC on January 15, 2010, there have been no events that had occurred subsequent to the balance sheet date that required adjustments to or disclosure in the financial statements.
• The Company had not been involved in any business combinations, acquisition of subsidiaries and long-term investments, restructuring and discontinuing operations. However, the Company sold all its shares of stocks in BIPC in March 2009.
• There were no contingent assets or contingent liabilities since the last annual balance sheet date. • There were no material contingencies and any other events or transactions that occurred that were
material to an understanding of the current period. • There were no operations subject to seasonality and cyclicality. • There were no material trends, demands, commitments, events or uncertainties known to the
Company that would likely affected adversely the liquidity of the Company. • There were no trends, events or uncertainties occurred that had or that were reasonably expected to
have material favorable or unfavorable impact on net revenues/income from continuing operations. • There were no significant elements of income or loss that did not arise from continuing operations
that had material effect on the financial condition or result of operations. • There were no events that trigger direct or contingent financial obligation that was material to the
Company. • There were no material off-balance sheet transactions, arrangements, obligations and other
relationships of the Company with unconsolidated entities or other persons created during the period.

58
Calendar Year 2008 Upstream Oil and Gas SC 6 (Northwest Palawan) Cadlao Blade Petroleum (Australia) acquired all the remaining interests held by the other equity holder in the Cadlao Production Area. It negotiated with the royalty interest holders, including Trans-Asia, for possible buyout of the latter’s interests. The Department of Energy granted a 15-year extension of the term of Service Contract No. 6 covering the Cadlao Production Area effective March 1, 2009. Block A and Block B (Retention Area) Partners requested the DOE a 15-year extension of Service Contract No. 6 for Block A and Block B. Vitol GPC Investments S. A. of Switzerland completed the first phase of its technical due diligence over Block A and concluded that development of the Octon discovery hinges on tie-back to Galoc production facilities.
In Block B, partners signed an Option Agreement with Venturoil Philippines granting the latter the option to acquire 70% interest in the area until December 31, 2008. Venturoil subsequently requested the partners to extend the ‘option period’ until September 2009. SC 14 Tara and SC 14 North Matinloc (Northwest Palawan) Venturoil Philippines signed separate Option Agreements with most of the members of the Tara and North Matinloc consortia, granting the former the option to acquire 70% interest in each block until December 31, 2008. Venturoil though sought an extension for it to exercise its acquisition rights under the Option Agreements until September 2009. SC 51 (East Visayas) The DOE approved the consortium’s entry into the 3rd Sub-Phase of its Exploration Period (February 8, 2008 to March 7, 2009) which involves a commitment to drill one exploratory well. The consortium completed a Geo-Microbial Survey over Northwest Leyte in April 2008, which the DOE accepted as a substitute for and fulfillment of the consortium’s outstanding 250-km 2D seismic program commitment under the 1st Sub-Phase of the Exploration Period. SC 55 (Offshore West Palawan) The DOE approved the consortium’s entry into the 2nd Sub-Phase of the Exploration Period (February 5, 2008 to August 4, 2009) which entails a commitment to drill one ultra deepwater well. Processing and interpretation of 954 km of 2D seismic data acquired in June 2007 were already completed. But due to non-availability of a suitable rig, the DOE approved the consortium’s request to swap work commitments for the 2nd and 3rd Sub-Phases of the Exploration Period to allow the drilling of the first commitment well by August 4, 2010, instead of August 4, 2009. The DOE credited the 954 km 2D seismic program as a fulfillment of the consortium’s work obligation for the 2nd Sub-Phase of the Exploration Period.

59
TA also accepted the offer of NorAsian Energy Ltd. (Australia) to: 1) buy the former’s option to acquire 5% participating interest from the latter after the first well is drilled, and; 2) acquire 7.5% participating interest from the former in exchange for a carry in the costs of the second well in the contract area. The Participation Agreement signed by TA with NorAsian’s predecessors on March 15, 2005 prescribes that the latter shall bear Trans-Asia’s 15% share in the cost of the drilling of the first ultra deepwater well in the block NorAsian Energy subsequently signed a Heads of Agreement with a major company in December 2008 for the farm-out of 60% out of its 85% participating interest in SC 55. SC 69 (Camotes Sea) The DOE awarded SC 69 (formerly Area 8 of the 2006 Philippine Energy Contracting Round) on May 7, 2008 to a consortium composed of Trans-Asia (30% interest) and NorAsian Energy Philippines (70% interest). SC 69 has an Exploration Period of seven years, divided into five Sub-Phases. While the area is under-explored, initial indications show that it has significant petroleum potential in view of gas discoveries in onshore Northern Cebu and offshore Northwest Leyte. The consortium commenced a geological and geophysical review and reprocessing of some 3000 km of vintage 2D seismic data in fulfillment of work obligations under the 1st Sub-Phase of the Exploration Period (May 7, 2008 to May 6, 2009). Minerals MPSA 252-2007-V (Camarines Norte) On February 14, 2008, TA signed an Operating Agreement with its subsidiary, TA Gold, granting the latter the exclusive right to explore, develop and operate the MPSA contract area for commercial mineral production. Pursuant to said Operating Agreement, TA Gold completed the drilling of three (3) exploratory diamond drill holes to probe gold, uranium and white clay occurrences. Results of the drilling operations are under evaluation. TA also filed a request with the Mines and Geosciences Bureau (MGB) for an amendment of the prevailing MPSA, primarily on the terms setting the boundary of its exploration area. The proposed revision seeks to include prospective areas that have been removed prior to the award of the MPSA, which were then attributed to land use classification and restriction issues. EPA II – 000084 (Isabela) MGB Regional Office No. 2 approved the transfer of the Exploration Permit Application (EPA) of Trans-Asia to TA Gold, allowing the latter to undertake the exploration activities upon award of the permit. The EPA covers 4,172-hectare block in the municipality of Dinapigue, which a 1987 regional study by the Japan International Cooperation Agency identified as a priority area for copper, gold and manganese exploration. Field reconnaissance also revealed large outcrops of shipping-grade manganese ore at several locations. MRD - 491 and MRD - 492 (Rizal) TA and Rock Energy International Corporation signed an Operating Agreement on March 3, 2008 granting the latter the exclusive right to extract and market tuffaceous materials within TA’s mining lease contract areas in
60
Teresa, Baras and Morong for a period of five (5) years. Tuffaceous materials are used in the production of pozzolan cement. Rock Energy applied for an Environmental Compliance Certificate for planned quarrying activities at a site in Teresa. Power Generation Bulacan (TA Power) Total energy generated and sold by TA Power in 2008 reached 116 GWh. Of the volume, more than half or 61 GWh was supplied to our main customer, cement firm Holcim Philippines, while 55 GWh was exported to WESM. TA Power sustained the plant’s reliability and steadily assured power supply quality for Holcim to preclude opportunity losses, while complying at the same time with environmental standards and the Grid Code. Guimaras The 3.4 MW power facility in Jordan, Guimaras continuously provided reliable power for the island, even at times when the submarine cable connecting it to the transmission grid in Panay mainland was severed three times last year during the months of June, July and August for a total of 51 days. As it is the sole power provider in the area, the plant has to be operated on an island-mode just to ensure continuous service to its customers. Total electricity generated and sold for the year amounted to 6.4 GWh resulting in gross revenues of P=71.07 million. Net income reached a modest P=7.5 million. Laguna (CIPP) Electricity sales of CIPP posted a flat growth of 89.9 GWh in 2008. The expected demand growth from the entry of new customers as well as the expansion programs of existing customers failed to materialize as the global economic recession started to adversely affect locators’ operations. The major rehabilitation works undertaken on the generation and distribution facilities in 2007 paid dividends in terms of equipment reliability. As a result, both the generation and distribution facilities of CIPP performed exceptionally well the whole year of 2008. There were no park-wide blackouts and the rented back-up generators were barely utilized. Electricity Trading and Marketing TA continued active participation in electricity trading at the Wholesale Electricity Spot Market (WESM) – mainly buying the electricity requirements of our customers, and selling the excess generation of affiliate TA Power. For 2008, total energy bought for our customers reached 158 GWh, while excess energy sold by TA Power was at 55 GWh. Financial Performance Consolidated revenues increased to P=1.4 billion in 2008 compared to P=1.5 billion last year. Following are the material changes in revenues in the Consolidated Income Statement in 2008:

61
• Generation revenues grew to P=728.3 million from P=624.6 million brought about by higher energy
sales and power rate. • Revenues from trading electricity which started in 2008 amounted to P=62.9 million. • Interest and other financial income improved to P=48.4 million from P=32.8 million due to higher
level of fund placements and interest rates. • Dividend income decreased to P=2.1 million from P=8.8 million as Atlas Holdings Corporation
declared a higher amount of cash dividend in the first semester of 2007. • Other income dropped to P=2.1 from P=38.9 million, the latter however was inclusive of service
income earned in 2007. • Company’s share in generation revenues of a joint venture declined to P=566.2 million from P=749.1
million due to lower energy sales and power rate. • Company’s share in other income of a joint venture rose to P=38.1 from P=5.6 million brought about
by the collection of an insurance claim. The level of consolidated costs and expenses for the year 2008 remained steady at P=1.4 billion. Following are the material changes in costs and expenses in the Consolidated Income Statement in 2008:
• Cost of power generation rose to P=742.6 million from P=556.1 million as a result of higher energy sales and higher fuel cost.
• General and administrative expense increased to P=181.2 million from P=178.9 million brought about by higher management and professional fees.
• Company’s share in cost of power generation of a joint venture declined to P=493.9 million from P=594.8 million on account of lower energy generated and repairs and maintenance expenses.
• Company’s share in general and administrative expenses of a joint venture dropped to P=26.4 million from P=49.8 million brought about by lower professional fees and salaries.
The Company generated net other income of P64.2 million in 2008 and P25.1 million in 2007. Following are details of the other income account:
• Regarding the currency forward contracts entered into by the Company, a net loss on derivatives of
P=21.2 million was reported in 2008 due to the depreciation of the peso. A net gain on derivatives of P=92.8 million was earned last year with the appreciation of peso.
• For the company’s foreign currency holdings, a foreign exchange gain of P=69.6 million was reported in 2008 following the depreciation of the peso. A foreign exchange loss of P=75.9 million was registered last year due to the appreciation of the peso.
• The Company reported a P=2.7 million receipt of tax credits which represents the refunds of duties and taxes from the Bureau of Customs arising from the Company’s fuel purchases in previous years.
• Equity in net earnings of associates increased to P=8.6 million from P=5 million brought about by higher net income of Bacnotan Industrial Park Corporation.
• Provision for unrecoverable input tax of P=6.1 million was reported in 2008. • A reversal of allowance for impairment on investment in an associate of P=3.4 million was recorded
in 2007. • Provision for impairment of available-for-sale investments of P=20 thousand was reported in 2007. • Loss on sale of property and equipment of P=35.9 thousand was reported in 2008 compared to gain
on sale of property and equipment of P=82.2 thousand last year. • Loss on sale of available-for-sale investments of P=28.8 thousand was reported in 2008 as a result
of the drop in market value of the said investments. Gain on sale of available-for-sale investments of P=1.1 million was earned last year.
• Other income of P=10.6 million was reported in 2008 brought about by the reversal of an expense accrued last year that was not utilized.
Provision for income tax increased to P=5.6 million from P=3.6 million due to higher taxable income in 2008. Benefit from deferred income tax rose to P=32.1 million from P=12.4 million brought about by the tax effect of the

62
amortization of customer contracts. Company’s share in income tax of a joint venture declined to P=6.3 million from P=35.9 million due to its lower taxable income.
As a consequence of the above-cited factors, net income increased to P=88.5 million in 2008 compared with P=78.2 million in 2007. Total consolidated assets remained steady at P=3.3 billion in 2008. Total consolidated liabilities increased to P=476.2 million from P=469.7 million. Total equity was stable at P=2.9 billion. Following are the material changes in the accounts in the Consolidated Balance Sheet as of December 31, 2008:
• Cash and cash equivalents decreased to P=909.5 million from P=1.2 billion. The Consolidated Statement of Cash Flows shows details of material changes in cash and cash equivalents.
• Short-term investments increased to P=17.5 million from P=8.6 million. The Consolidated Statement of Cash Flows shows the details of materials changes in short-term investments.
• Investments held for trading rose to P=544.7 million from P=134.1 million. The Consolidated Statement of Cash Flows shows the details of materials changes in investment held for trading.
• Receivables grew to P=183.9 million from P=118.2 million brought about by trading revenues which started in 2008 and higher generation revenues.
• Fuel and spare parts declined to P=50.7 million from P=56.1 million due to the lower volume of fuel purchased.
• Other current assets fell to P=16.4 million from P=44.7 million due to the collection of receivables from the currency forward contracts.
• Company’s share in current assets of a joint venture increased to P=162.3 million from P=144 million brought about by higher trade and other receivables.
• Property, plant and equipment declined to P=620.1 million from P=663.4 million on account of the depreciation expenses in 2008.
• Investments in associates grew to P=169.1 million from P=160.4 million due to the higher net income posted by Bacnotan Industrial Park Corporation.
• Available-for-sale investments declined to P=206.4 million from P=224.2 million brought about by the lower market value of said investments.
• Investment property decreased to P=3.3 million from P=3.6 million on account of depreciation expenses in 2008.
• Intangible assets decreased to P=144.2 million from P=185.4 million due to the full amortization of customer contracts (part of intangible assets) in 2008.
• Company’s share in noncurrent assets of a joint venture declined to P=305.4 million from P=376.9 million due to depreciation expenses and lower market value of available-for-sale investments.
• Accounts payable and other current liabilities increased to P=214.5 million from P=188.8 million on account of higher fuel cost.
• Customers’ deposits increased to P=27.4 million from P=17.5 million on account of the amortization of discount and deposits received from new locators.
• Due to stockholders increased to P=6.3 million from P=5.3 million due to reversal of stale cash dividend checks.
• Income and withholding tax payable decreased to P=968.7 thousand from P=4.1 million brought about by payment of income tax for 2007.
• Company’s share in current liabilities of a joint venture increased to P=144.4 million from P=140.9 million on account of bank loans in 2008.
• Pension and other post employment benefits increased to P=10.9 million from P=6.4 million due to the accrual of pension expense.
• Deferred tax liabilities dropped to P=53.4 million from P=85.6 million as a result of the tax effect of the amortization of intangibles.
• Other noncurrent liabilities increased to P=7.4 million from P=7.1 million due to the accretion of interest for the asset retirement obligation.
• Company’s share in noncurrent liability of a joint venture declined to P=10.7 million from P=13.8 million on account of the tax effect of the accrual of expenses.

63
• Unrealized fair value gains on available-for-sale investments fell to P=54.5 million from P=77.9 million due to lower market value of the said investments.
• The Company’s share in unrealized fair value gains on financial assets of a joint venture declined to P=8.7 million from P=16.2 million brought about by the lower market value of the said financial assets.
• Retained earnings grew to P=1.08 billion from P=1.06 billion due to higher net income in 2008. The top five (5) key performance indicators of Trans-Asia and its majority-owned subsidiaries, as consolidated, are the following:
1. Current Ratio = Current Assets Current Liabilities
Current ratio declined to 4.79:1 as of December 31, 2008 from 5.06:1 as of December 31, 2007. Although the current assets as of December 31, 2008 increased to P1.9 billion from P1.7 billion, such increase was only 10% from the prior year balance as compared to the corresponding 16% increase in current liabilities between 2008 and 2007.
2. Current Assets to Total Assets = Current Assets Total Assets
The ratio of current assets to total assets increased to 56.5% as of December 31, 2008 from 51.5% as of December 31, 2007 due to higher total current assets at 10% increase from prior year balance while total assets remain at the P3.3 billion level between 2008 and 2007.
3. Debt/Equity Ratio = Total Liabilities Equity
Debt/equity ratio increased slightly to 0.17:1 as of December 31, 2008 from 0.16:1 as of December 31, 2007. Although total liabilities increased, this was offset by the decrease in equity account between 2008 and 2007.
4. Rate of return on equity = Net Income Average Equity
The rate of return on equity decreased slightly to 3.1% for the year ended December 31, 2008 as compared to 3.2% last year when the average number of common outstanding shares was higher brought about by the stock rights offering in 2007.
5. Earnings per share = Net Income less Preferred Stock Dividend Average No. of Common Shares Outstanding
Earnings per share declined to P=0.05 from P=0.07 on account of higher average number of common outstanding shares following the stock rights offering in 2007.
During the Calendar Year 2008, other than those already disclosed and/or discussed in this report:
• There were no unusual items that affected assets, liabilities, equity, net income or cash flows. • The Company had two reportable segments namely: oil exploration and power generation. The
fund placements are incidental to the Company’s oil exploration and power generation activities
64
arising from management of the Company’s funds. The exploration costs are shown as “deferred exploration costs” in the consolidated balance sheets.
• There were no events that had occurred subsequent to the balance sheet date that required adjustments to or disclosure in the financial statements.
• The Company had not been involved in any business combinations, acquisition or disposal of subsidiaries and long-term investments, restructuring and discontinuing operations.
• There were no contingent assets or contingent liabilities since the last annual balance sheet date. • There were no material contingencies and any other events or transactions that occurred that were
material to an understanding of the current interim period. • There were no operations subject to seasonality and cyclicality. • There were no material trends, demands, commitments, events or uncertainties known to the
Company that would likely affected adversely the liquidity of the Company. • There were no trends, events or uncertainties occurred that had or that were reasonably expected to
have material favorable or unfavorable impact on net revenues/income from continuing operations. • There were no significant elements of income or loss that did not arise from continuing operations
that had material effect on the financial condition or result of operations. • There were no events that trigger direct or contingent financial obligation that was material to the
Company. • There were no material off-balance sheet transactions, arrangements, obligations and other
relationships of the Company with unconsolidated entities or other persons created during the period.
Item 7. Information on Independent Accountant and Other Related Matters The accounting firm of SyCip Gorres Velayo & Co. has been the Company’s Independent Public Accountant since 1969. The same auditing firm has been endorsed by the Audit Committee to the Board. The Board, in turn, approved the endorsement and nominated the appointment of the said auditing firm for stockholders’ approval during the Annual Meeting of Stockholders.
Audit services of SGV for the calendar year ended December 31, 2010 included the examination of the parent and consolidated financial statements of the Company, assistance in the preparation of annual income tax return and other services related to filing of reports made with the Securities and Exchange Commission. The Company has complied with SRC Rule 68, paragraph 3(b)(iv) requiring the rotation of external auditors or engagement partners who have been engaged by the company for a period of five (5) consecutive years or more as of December 31, 2002. The engagement partner who conducted the audit for Calendar Year 2010 is Ms. Catherine E. Lopez, an SEC accredited auditing partner of SGV. This is Ms. Lopez’s second year as engagement partner for the Company. The stockholders approved the engagement of the partner of SGV and the appointment of SGV as the external auditor for calendar year 2010. The members of the Audit Committee are the following:
1. Mr. Alfredo M. Velayo Chairman 2. Mr. Roberto M. Lavina Member 3. Mr. Victor J. del Rosario Member 4. Mr. Ricardo V. Camua Member 5. Mr. David L. Balangue Member
External Audit Fees and Related Services The Company paid its external auditors, SyCip Gorres Velayo & Co. (SGV) the amount of P=1,200,000 in 2010 and P=900,000 each in 2009 and 2008 for professional services rendered for the audits of the Company’s annual financial statements and services that are normally provided by the external auditors in connection with statutory and regulatory filings or engagement. The balance of audit fee for 2010 to be paid in 2011 is P=600,000.
65
Apart from the foregoing, the Company paid the amount of P=600,000 for the tax compliance review for the year ended December 31, 2008. No professional services for tax accounting compliance, advice, planning and any other form of tax services were rendered or fees billed by SGV for 2010 and 2009. TA Power paid the amount of P=301,840 and P=105,000 for tax compliance review for the years ended December 31, 2009 and 2008, respectively.
There were no other fees rendered or fees billed for products and services provided by SGV.
The Audit Committee discusses with the external auditor before the audit commences the nature and scope of the audit. It pre-approves audit fees, plans, scope and frequency one (1) month before the conduct of external audit. It evaluates and determines non-audit work by external auditor and keep under review the non-audit fees paid to external auditor both in relation to their significance to the audit and in relation to the Company’s total expenditure on consultancy. Item 8. Financial Statements The consolidated financial statements of TA and subsidiaries included in the 2010 Annual Report to Stockholders are incorporated herein for reference. The schedules listed in the accompanying Index to Financial Statements and Supplementary Schedules are filed as part of this Form 17-A. Item 9. Changes in and Disagreements with Accountants on Accounting and Financial Disclosure There was no event in the past five (5) years where SGV and the Company had any disagreement with regard to any matter relating to accounting principles or practices, financial statement disclosures or auditing scope or procedures. PART IV – MANAGEMENT AND CERTAIN SECURITY HOLDERS Item 10. Directors and Executive Officers of the Issuer Directors and Executive Officers Directors
The Company’s Board of Directors is responsible for the overall management and direction of the Company. The Board meets regularly on a monthly basis, or as often as required, to review and monitor the Company’s financial position and operations.
The directors of the Company are elected at the Annual Stockholders’ Meeting to hold office for one (1) year and until their respective successors have been elected and qualified.
The officers are likewise elected annually by the Board of Directors and serve for one (1) year and until their respective successors have been elected and qualified. None of the members of the Board of Directors directly owns more than 2% of TA shares.
Listed are the incumbent directors of the Company as of December 31, 2010 with their qualifications which include their ages, citizenship, current and past positions held and business experience for the past five years.

66
Directors Age Citizenship Position Oscar J. Hilado 73 Filipino Director and Chairman of the Board Ramon R. del Rosario, Jr. 66 Filipino Director and Vice Chairman Francisco L. Viray 62 Filipino Director, President and CEO Roberto M. Laviña 60 Filipino Director, EVP, CFO and Treasurer Antonio V. del Rosario, Sr. 78 Filipino Director Magdaleno B. Albarracin, Jr. 74 Filipino Director Alfredo M. Velayo 89 Filipino Director Raymundo O. Feliciano 85 Filipino Director Ricardo V. Camua 67 Filipino Director Victor J. del Rosario 62 Filipino Director David L. Balangue 59 Filipino Director Oscar J. Hilado was elected Chairman of the Board of the Company since April 16, 2008; He was the Chairman & CEO of Phinma Inc. (January 1994 to August 2005); and as Chairman (August 2005 to present). Chairman of Holcim Phils., Inc. Chairman of the Board & Chairman of the Executive Committee of Phinma Corp; Chairman of the Board of Phinma Property Holdings Corp., Vice Chairman of Trans Asia Power Generation Corp. (1996 to present); Director of Manila Cordage Corp. (1986 to present); Director of Seven Seas Resorts & Leisure, Inc., and First Philippine Holdings Corporation (Nov. 1996 to present); Philex Mining Corporation (December 2009 to present); Graduate of De La Salle College (Bacolod), Bachelor of Science in Commerce, (1958) Masters Degree in Business Administration, Harvard Business School, (1962). For 12 years, he was the Vice-Chairman of the Board of Directors and for 16 years, he was the Chairman of the Executive Committee of the Company. Ramon R. del Rosario, Jr. was elected as Vice Chairman of the Company on April 16, 2008. He obtained his BSC-Accounting and AB-Social Sciences degrees (Magna cum Laude) from De La Salle University and Masters in Business Administration degree from Harvard Business School. He is the President and CEO of Phinma Inc., President and Vice Chairman of Phinma Corp., Chairman of AB Capital and Investment Corporation, Chairman of Microtel Inns and Suites (Pilipinas), Inc. and Chairman of the Boards of Trustees of Araullo University, Cagayan de Oro College, University of Iloilo and University of Pangasinan. He is a director of several PHINMA-managed companies and currently serves as a member of the Boards of Directors of Ayala Corp., Roxas Holdings, Inc. and Holcim (Phils.), Inc. Mr. del Rosario served as Secretary of Finance of the Philippines in 1992-1993. He is the Chairman of the Makati Business Club, Philippine Business for Education (PBED) and De La Salle Philippines, Inc. He is the brother of Mr. Victor J. del Rosario. He has been a Director of the Company since 2002. Francisco L. Viray is President and Chief Executive Officer of the Company since April 2007. He was the Executive Vice President of the Company from April 2004 up to April 2007. He is concurrently the President and Chief Executive Officer of Trans-Asia Power Generation Corporation and CIP II Power Corporation. He is also at present a member of the Board of Directors of Araullo University, Cagayan de Oro College and University of Pangasinan of the Phinma Education Network (PEN), and Chairman, Pangasinan Medical Center, Inc. He obtained his Bachelor of Science and Masters in Electrical Engineering degrees from the University of the Philippines and his Doctorate in Engineering degree from West Virginia University. He joined the PHINMA Group in 1999, a year after he served as Secretary of the Department of Energy from 1994 to 1998. Earlier, he was President of the National Power Corporation beginning May 1993. Dr. Viray served on the Board of Directors of Meralco, Petron, Union Cement Corporation (now Holcim Philippines, Inc.) and United Pulp and Paper Company, Inc. He has been a Director of the Company since 1998. Roberto M. Laviña has a Bachelor of Arts in Economics degree from Ateneo de Manila University and a Masters in Business Management degree from Asian Institute of Management. He finished his Program for Management Development at Harvard Business School in 1988. He is the President and a Member of the Board of T-O Insurance Brokers, Inc. In 2005, he became Phinma Inc.’s Senior Executive Vice President/Chief Operating Officer (COO) and is concurrently the Chief Financial Officer of the PHINMA Group and a Member of the Board. He is also a Member of the Board and Executive Vice President/Chief Financial Officer/Treasurer

67
of Trans-Asia Renewable Energy Corporation. He is the Senior Vice President/Chief Financial Officer/Treasurer of Trans-Asia Power Generation Corporation and a member of the Board and Senior Vice President and Treasurer of PHINMA Corporation. He is also Treasurer and Board Member of Phinma Property Holdings Corporation, CIP II Power Corporation, Araullo University, Cagayan de Oro College, University of Iloilo and University of Pangasinan. He has been the Chief Financial Officer and Treasurer of the Company for 18 years. He became the Executive Vice President on April 2, 2004 and was elected as a Director of the Company on April 12, 2005.
Antonio V. del Rosario, Sr. is the Chairman of Trans-Asia Power Generation Corporation. He was the President and Chief Executive Officer of Trans-Asia Power Generation Corporation from 1996 to 2002 and has been the Chairman of its Board of Directors from 2003 up to the present. He is the past President and Chief Executive Officer of Trans-Asia Oil and Energy Development Corporation, which he served for 14 years until his retirement in April 2007. He served as officer and/or a member of the Board of Directors of a number of companies including Atlas Holdings Corporation, Asia Coal Corporation, Filmag Holdings, Inc. and Trans-Asia Gold and Minerals Development Corporation. He is an Honorary Chairman of the Global World Energy Council, which he served as Chairman from 2002 to 2004. He began his career in energy in FILOIL. Then, commencing with the Oil Crisis years of the 1970s, continued on to the Philippine National Oil Company and the Ministry of Energy where he rose to the position of Executive Vice President and Deputy Minister, respectively. Mr. del Rosario is a Life member of the Management Association of the Philippines, the Manila Polo Club, Inc. and the Alabang Country Club, Inc.
Magdaleno B. Albarracin, Jr. obtained his Bachelor of Science in Electrical Engineering degree from the University of the Philippines and Master of Science in Electrical Engineering degree from the University of Michigan. He finished his Masters in Business Administration from the University of the Philippines and Doctorate in Business Administration from Harvard University. Dr. Albarracin joined the PHINMA Group in 1971 as a consultant. He is currently the Vice-Chairman of PHINMA and Chairman of its Executive Committee. He is also Vice Chairman of Araullo University, Cagayan De Oro College, University of Iloilo and University of Pangasinan. He is the President of Holcim Philippines, Senior Executive Vice President of Phinma Corp. and Chairman of UP Engineering Research and Development Foundation. He is also a member of the Board of Directors of Trans-Asia Gold and Minerals Development Corporation, AB Capital and Investment Corporation, Phinma Foundation, Union Galvasteel Corporation, Trans-Asia Power Generation Corporation, Phinma Property Holdings Corp. and Pangasinan Medical Center, Inc. He has been a Director of the Company since 1986. Alfredo M. Velayo is a Certified Public Accountant and has a Bachelor of Science in Commerce degree from the University of Santo Tomas. He was the co-founder of SyCip Gorres & Velayo (SGV), the largest accounting firm in Asia. He retired from SGV in 1970. For the past 25 years, he has been the Treasurer and a member of the Board of Directors of Filmag Holdings, Inc. He has been the Chairman of Amvel Corporation since 1976 and KVY Realty Corporation since 1997. He is the President of William Shaw Foundation, Inc. He has been a Director of the Company since 1982 and the Chairman of the Audit Committee and Compensation Committee for the past 8 years. Raymundo O. Feliciano is a Certified Public Accountant with a Bachelor of Science in Commerce degree from Far Eastern University. He has been the Chairman and President of ROF Management and Development Corporation and the Chairman of East Asia Gas & Oil Exploration Co., Inc. and B. U. Properties Corporation. In September 2002, he was elected as director of Filmag Holdings, Inc. and remains so to date. He has been a Director of the Company since its incorporation in 1969. Ricardo V. Camua has a Bachelor of Science in Electrical Engineering degree from Mapua Institute of Technology. He was the President and Chief Executive Officer of Manila Cordage Company (2000-2009) and Manco Synthetics, Inc. (2007-2009). Mr. Camua was the Vice-President and member of the Board of Directors of Manco Insurance Agents Inc. and Tupperware Realty Corporation. In 2005, he was elected director of Filmag Holdings, Inc. and remains so to date. Since 2008, he has been the President of RVCCI. He has been a Director of the Company since 1996. Victor J. del Rosario is an Economics and Accounting graduate of De La Salle University and holds a Master of Business Administration degree from Columbia University. He was elected as Director on September 15,
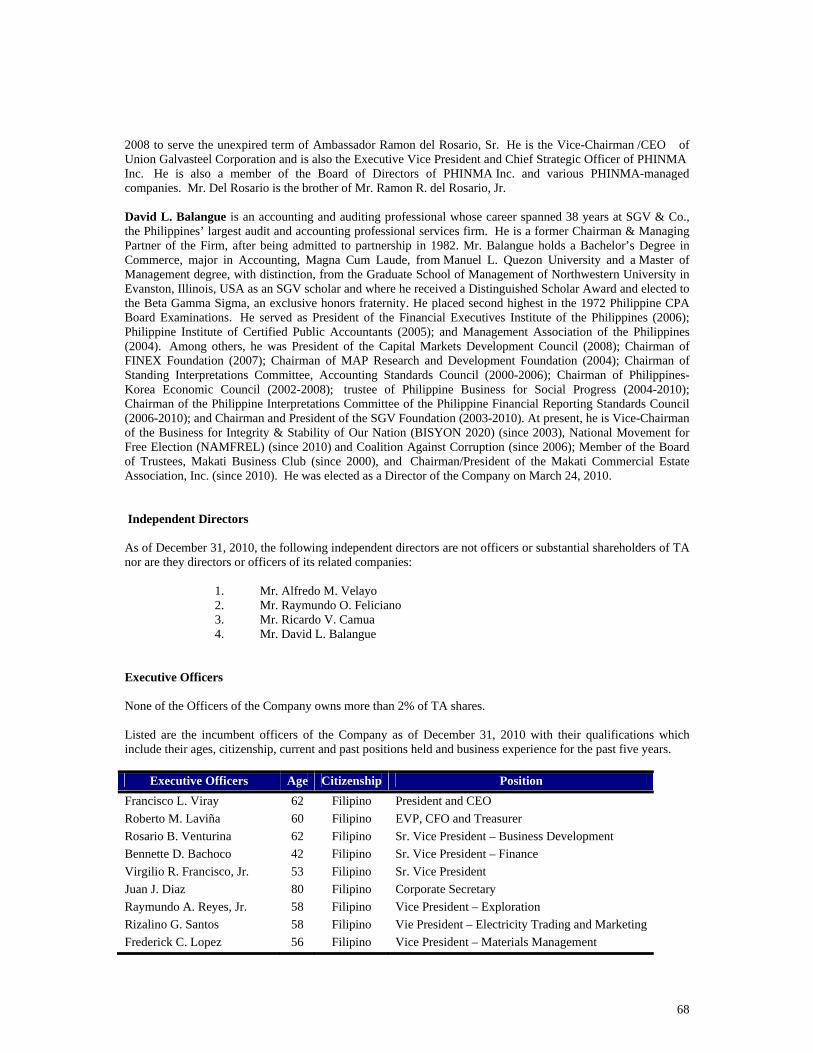
68
2008 to serve the unexpired term of Ambassador Ramon del Rosario, Sr. He is the Vice-Chairman /CEO of Union Galvasteel Corporation and is also the Executive Vice President and Chief Strategic Officer of PHINMA Inc. He is also a member of the Board of Directors of PHINMA Inc. and various PHINMA-managed companies. Mr. Del Rosario is the brother of Mr. Ramon R. del Rosario, Jr. David L. Balangue is an accounting and auditing professional whose career spanned 38 years at SGV & Co., the Philippines’ largest audit and accounting professional services firm. He is a former Chairman & Managing Partner of the Firm, after being admitted to partnership in 1982. Mr. Balangue holds a Bachelor’s Degree in Commerce, major in Accounting, Magna Cum Laude, from Manuel L. Quezon University and a Master of Management degree, with distinction, from the Graduate School of Management of Northwestern University in Evanston, Illinois, USA as an SGV scholar and where he received a Distinguished Scholar Award and elected to the Beta Gamma Sigma, an exclusive honors fraternity. He placed second highest in the 1972 Philippine CPA Board Examinations. He served as President of the Financial Executives Institute of the Philippines (2006); Philippine Institute of Certified Public Accountants (2005); and Management Association of the Philippines (2004). Among others, he was President of the Capital Markets Development Council (2008); Chairman of FINEX Foundation (2007); Chairman of MAP Research and Development Foundation (2004); Chairman of Standing Interpretations Committee, Accounting Standards Council (2000-2006); Chairman of Philippines-Korea Economic Council (2002-2008); trustee of Philippine Business for Social Progress (2004-2010); Chairman of the Philippine Interpretations Committee of the Philippine Financial Reporting Standards Council (2006-2010); and Chairman and President of the SGV Foundation (2003-2010). At present, he is Vice-Chairman of the Business for Integrity & Stability of Our Nation (BISYON 2020) (since 2003), National Movement for Free Election (NAMFREL) (since 2010) and Coalition Against Corruption (since 2006); Member of the Board of Trustees, Makati Business Club (since 2000), and Chairman/President of the Makati Commercial Estate Association, Inc. (since 2010). He was elected as a Director of the Company on March 24, 2010. Independent Directors As of December 31, 2010, the following independent directors are not officers or substantial shareholders of TA nor are they directors or officers of its related companies:
1. Mr. Alfredo M. Velayo 2. Mr. Raymundo O. Feliciano 3. Mr. Ricardo V. Camua 4. Mr. David L. Balangue
Executive Officers
None of the Officers of the Company owns more than 2% of TA shares. Listed are the incumbent officers of the Company as of December 31, 2010 with their qualifications which include their ages, citizenship, current and past positions held and business experience for the past five years.
Executive Officers Age Citizenship Position
Francisco L. Viray 62 Filipino President and CEO Roberto M. Laviña 60 Filipino EVP, CFO and Treasurer Rosario B. Venturina 62 Filipino Sr. Vice President – Business Development Bennette D. Bachoco 42 Filipino Sr. Vice President – Finance Virgilio R. Francisco, Jr. 53 Filipino Sr. Vice President Juan J. Diaz 80 Filipino Corporate Secretary Raymundo A. Reyes, Jr. 58 Filipino Vice President – Exploration Rizalino G. Santos 58 Filipino Vie President – Electricity Trading and Marketing Frederick C. Lopez 56 Filipino Vice President – Materials Management
69
Cecille B. Arenillo 53 Filipino Vice President/Compliance Officer Miguel Romualdo T. Sanidad 52 Filipino Assistant Corporate Secretary Danilo L. Panes 54 Filipino Assistant Vice President Benjamin S. Austria 65 Filipino Senior Consultant
Francisco L. Viray is President and Chief Executive Officer of the Company since April 2007. He was the Executive Vice President of the Company from April 2004 up to April 2007. He is concurrently the President and Chief Executive Officer of Trans-Asia Power Generation Corporation and CIP II Power Corporation. He is also at present a member of the Board of Directors of Araullo University, Cagayan de Oro College and University of Pangasinan of the Phinma Education Network (PEN), and Chairman, Pangasinan Medical Center, Inc. He obtained his Bachelor of Science and Masters in Electrical Engineering degrees from the University of the Philippines and his Doctorate in Engineering degree from West Virginia University. He joined the PHINMA Group in 1999, a year after he served as Secretary of the Department of Energy from 1994 to 1998. Earlier, he was President of the National Power Corporation beginning May 1993. Dr. Viray served on the Board of Directors of Meralco, Petron, Union Cement Corporation (now Holcim Philippines, Inc.) and United Pulp and Paper Company, Inc. He has been a Director of the Company since 1998. He was the Executive Vice President of the Company from April 2, 2004 up to April 2, 2007. Roberto M. Laviña has a Bachelor of Arts in Economics degree from Ateneo de Manila University and a Masters in Business Management degree from Asian Institute of Management. He finished his Program for Management Development at Harvard Business School in 1988. He is the President and a Member of the Board of T-O Insurance Brokers, Inc. In 2005, he became PHINMA’s Senior Executive Vice President/Chief Operating Officer (COO) and is concurrently the Chief Financial Officer of the PHINMA Group and a Member of the Board. He is also a Member of the Board and Executive Vice President/Chief Financial Officer/Treasurer of Trans-Asia Renewable Energy Corporation. He is the Senior Vice President/Chief Financial Officer/Treasurer of Trans-Asia Power Generation Corporation and a member of the Board and Senior Vice President and Treasurer of PHINMA Corporation. He is also Treasurer and Board Member of Phinma Property Holdings Corporation, CIP II Power Corporation, Araullo University, Cagayan de Oro College, University of Iloilo and University of Pangasinan. He has been the Chief Financial Officer and Treasurer of the Company for 18 years. He became the Executive Vice President on April 2, 2004 and was elected as a Director of the Company on April 12, 2005. Rosario B. Venturina is a Certified Public Accountant with Bachelor of Arts and Bachelor of Science in Commerce degrees from the College of the Holy Spirit. She started as Vice President of Trans-Asia Power Generation Corporation in 1996 and was promoted to Senior Vice President in 1999. In December 1, 2010, she was appointed as one of the new members of the National Renewable Energy Board (NREB) representing the Renewable Energy Development Sector. She joined Trans-Asia Oil and Energy Development Corporation in 1995. She has been the Senior Vice President for Business Development of the Company for the past 15 years. . Bennette D. Bachoco obtained her Bachelor of Science in Business Administration and Accountancy degree from the University of the Philippines. She is a Certified Public Accountant with a Masters degree in Business Administration from Asian Institute of Management. She worked with SyCip Gorres Velayo & Co. from November 1991 to May 2009. She joined the Energy Group of PHINMA in April 2010. Presently, she is the Senior Vice President for Finance for the Company and Vice President for Finance for TA Power. Virgilio R. Francisco, Jr. is a Professional Industrial Engineer. He earned his Bachelor of Science in Management and Industrial Engineering degree from the Mapua Institute of Technology (MIT). Presently, he is Senior Vice President of the Company and Senior Vice President and General Manager of CIP II Power Corporation. He was formerly the Executive Vice President and General Manager of Asia Coal Corporation from 1991 to 2000. He first joined the PHINMA Group in 1979 and held senior positions in the cement and paper manufacturing, property development companies of PHINMA and more recently in the Strategic and Corporate Planning Department of PHINMA. He underwent training on coal technology in 1993 in Sydney under the auspices of the UNDP. He was recognized by MIT in 2002 for his contribution in leading the MIT MIE-IE alumni in the field of Management. He was the recipient of the Outstanding Mapuan Award for Management and Industrial Engineering in 2003 and has been a member of the Foundation of Outstanding Mapuans, Inc. He is the Senior Vice President of the Company since April 2009.

70
Juan J. Diaz is a member of the Philippine Bar and has a Master of Laws degree from Harvard Law School. He has been Corporate Secretary of the Company for 31 years. Raymundo A. Reyes, Jr. has a Bachelor of Science in Chemistry and Master of Science in Geology degrees from the University of the Philippines. From 1976-1987, he was a Senior Geologist of PNOC. He started with the Company as Exploration Manager and was Assistant Vice President for Exploration from 1987 to 1994. He is the Vice President for Exploration of the Company since 1994. He is also the Vice President of Trans-Asia Gold and Minerals Development Corporation since its incorporation in July 2007 and the Vice President of Maibarara Geothermal, Inc., a 25%-owned subsidiary of the Company, since September 2010.
Rizalino G. Santos finished his Bachelor and Master of Science degrees in Electrical Engineering from the University of the Philippines. His relevant course/program participation includes training in energy and electricity planning by the Energy Center of Pennsylvania, Institute of International Education (IIE), and International Atomic Energy Agency (IAEA). He also attended study tours on electric utility practices, deregulation and privatization in US, UK, Germany, Japan and New Zealand. Prior to becoming an Independent Power Systems Consultant, he was the Vice-President for Market Operations of TRANSCO from March 2003 to October 2004. He was a director and Vice President of the Philippine Electricity Market Corp. (PEMC) from December 2003 to March 2004. Before the creation of TRANSCO in 2002, he had been with the National Power Corporation (NPC) for nineteen years, working mainly at the Corporate Planning Group where he was responsible for the Power Development Program (PDP). He joined Trans-Asia Oil on August 1, 2006 as Vice President for Electricity Trading and Marketing. Frederick C. Lopez has a Bachelor of Science in Industrial Engineering degree from the University of the Philippines. He obtained his Masters of Science in Management Engineering degree from the Rensselaer Polytechnic Institute at Troy, New York, in the United States. Mr. Lopez has rejoined PHINMA as Vice President for Materials Management of the Trans Asia Oil and Energy Group in August 2007. He first joined the PHINMA Group in 1980 as Manager of the Corporate Planning Department. From there, he had several assignments in the then PHINMA Cement Group as Vice President for Materials Management of Union Cement Corporation and Vice President of the PHINMA Construction Materials Group of Companies consisting of Bacnotan Consolidated Industries Inc., Bacnotan Cement Corporation, Davao Union Cement Corporation, Hi Cement Corporation, Central Cement Corporation, Bacnotan Steel Industries Inc., and Bacnotan Steel Corporation. Mr. Lopez directed and managed the procurement of materials and services of the then PHINMA Cement Group, GI Roofing Sheets and the Steel Rebars Manufacturing operations for 15 years. He is presently Vice President for Materials Management for Trans Asia Oil and Energy Development Corporation, Trans Asia Power Generation Corporation and CIP II Power Corporation. The Board of Directors of the Company approved the appointment of Mr. Lopez on August 21, 2007. Cecille B. Arenillo is a Certified Public Accountant with a Bachelor of Science in Commerce degree from the University of Santo Tomas. She is currently the Vice President-Treasury and Compliance Officer of Phinma Corp., Vice President-Compliance Officer of Phinma Property Holdings Corporation and Vice President & Phinma Group Compliance Officer of PHINMA, Inc.
Miguel Romualdo T. Sanidad has a Bachelor of Science in Business Economics and Bachelor of Laws degrees from the University of the Philippines. From 1997 up to the present, he is the Assistant Vice President – Legal Counsel of Phinma Inc. He is the Corporate Secretary of AB Capital group and other PHINMA-managed companies. He was the Assistant Corporate Secretary for 15 years and is presently the Corporate Secretary of Filmag Holdings, Inc. In 2010, he was appointed as Hearing Officer of the Public Law Enforcement Board for Quezon City. He is the Assistant Corporate Secretary since 2000. Danilo L. Panes is a licensed Mining Engineer. He obtained his Bachelor of Science in Mining Engineering degree from the Mapua Institute of Technology as a government scholar. He joined the Company in May 1996 as Project Development Manager and was promoted to Assistant Vice President in May 2006. He obtained his MBA studies at the De la Salle University and completed his Management Development Program at the Asian Institute of Management. Benjamin S. Austria has a Bachelor of Science in Geology degree from the University of the Philippines. He obtained his Masters and Doctorate in Geology degrees from Harvard University. He has been the Executive
71
Secretary of Petroleum Association of the Philippines since 1999. From 2006 to 2009, Dr Austria was Chairman of the Energy Committee of the Philippine Chamber of Commerce and Industry. He was a member of the Board of Directors of the Company for 10 years, Director Ex-Officio and Executive Vice President of the Company for 4 years. He is the Senior Adviser of the Company since April 2003. Significant Employee Other than the aforementioned Directors and Executive Officers identified in the item on Directors and Executive Officers, there are no other significant employees of the Company who may have significant influence in the Company’s major and/or strategic planning and decision-making. Family Relationships Mr. Ramon R. del Rosario, Jr. is the brother of Mr. Victor J. del Rosario. Involvement in Certain Legal Proceedings To the knowledge and/or information of the Company, the above-named nominees for election as directors of the Company, its present members of the Board of directors or its Executive Officers are not, presently or during the last five (5) years, involved or have been involved in any material legal proceeding affecting/involving themselves and/or their properties before any court of law or administrative body in the Philippines or elsewhere. To the knowledge and/or information of the Company, the said persons have not been convicted by final judgement of any offense punishable by the laws of the Republic of the Philippines or of the laws of any other nation/country. There are no material pending legal proceedings to which the Company or any of its subsidiaries is a party or of which any of the property is the subject. Item 11. Executive Compensation For the calendar years ended December 31, 2010, 2009 & 2008, the total salaries, allowances and bonuses paid to the directors and executive officers as well as estimated compensation of directors and executive officers for calendar year 2011 are as follows:
Name/Position Year Salaries Bonus Others CEO and Top 4 (Total Compensation) Francisco L. Viray, President and CEO Rosario B. Venturina, Senior Vice President – Business Development Virgilio R. Francisco, Jr., Senior Vice President Raymundo A. Reyes, Jr., Vice President – Exploration Rizalino G. Santos, Vice President – Electricity Trading and Marketing 2011 18,049,720(a) 174,000(a)
2010 16,831,048 1,234,210(b) 180,000 2009 12,463,746 3,800,040(c) 390,000 2008 10,220,493 1,142,984(d) 106,500

72
All Other Officers and Directors as a Group (Total Compensation) Unnamed 2010 8,812,190(a) 972,000(a) 2010 7,981,875 876,864(b) 3,770,500 2009 5,124,304 12,615,574(c) 2,742,750 2008 5,448,997 10,556,731(d) 862,500
(a) Estimated compensation of directors and executive officers for the ensuing year (b) Includes estimated bonus accrued in 2010 but payable in 2011.
(c) Includes bonus accrued in 2009 but paid in 2010. (d) Includes bonus accrued in 2008 but paid in 2009. Compensation of Directors The Directors receive allowances, per diem and bonus based on net income of the Company for each fiscal year.
There are no other existing arrangements/agreements to which said directors are to be compensated during the last completed fiscal year and the ensuing year. Employment Contracts and Termination of Employment and Change-in-Control Arrangements There is no existing contract between the Company and the executive officers or any significant employee. Under Article VI Section I of the Company’s By-Laws, the officers of the Corporation shall hold office for one year and until their successors are chosen and qualified in their stead. Any officer elected or appointed by the majority of the Board of Directors may be removed by the affirmative vote of the Board of Directors. Compensatory Plan or Arrangement The compensation received by officers who are not members of the Board of Directors of the Company represents salaries, bonuses and other benefits. Warrants and Options Outstanding On April 2, 2007, the Board of Directors and stockholders approved a total of 100 million shares set aside from the unsubscribed portion of the Company’s two (2) billion authorized shares for (a) stock grants for officers and managers of the Company, and (b) stock options for directors, officers and employees of the Company and its subsidiaries and affiliates for the purposes and under terms and conditions as determined by the Executive Committee of the Board of Directors. On January 8, 2008, the SEC approved the Company’s Executive Stock Grants Plan and Stock Option Plan. On January 23, 2008, the PSE approved the Company’s application to list these additional 100 million shares. Pursuant to the Company’s undertaking dated October 11, 2007, independent directors are excluded from the proposed stock options. On May 7, 2008, the Company’s Stock Option Committee decided to revisit the Company’s Stock Option Plan, and suspended its implementation until a review of the Plan is completed. The Committee also decided to go ahead with the Company’s Stock Grant for its executives. As of December 31, 2010, such stock options have not been availed of by any of the directors, officers and employees of the Company.

73
1. Options allocated to CEO & Executive Officers
Name Position Allocation of Stock Options
Ramon V. del Rosario, Sr. Chairman 3,000,000 Oscar J. Hilado Vice Chairman 2,000,000
Francisco L. Viray President & CEO 3,000,000 Roberto M. Laviña EVP/CFO & Treasurer 1,750,000 Rosario B. Venturina SVP - Business Development 1,000,000 Juan J. Diaz Corporate Secretary 500,000 Raymundo A. Reyes, Jr. VP – Exploration 750,000 Rizalino G. Santos VP - Electricity Trading and Marketing 750,000 Danilo L. Panes Assistant Vice President 500,000 Miguel Romualdo T. Sanidad Asst. Corporate Secretary 75,000 Benjamin S. Austria Senior Consultant 200,000 Total
13,525,000
2. Options allocated to all other directors and officers as a group Unnamed 11,250,000 The exercise of such grants and options are subject to the following terms and conditions: Approved Number of Shares Up to 100 million shares from the Company’s P2 billion authorized capital stock. Executive Stock Grants Plan Purpose To motivate officers to achieve the Company’s goals, to
help make their personal goals and corporate goals congruent and reward them for the resulting increase in value of TA shares
Coverage For all officers of TA and its subsidiaries and affiliates, including unclassified managers who are covered by the Company’s Variable Compensation Plan
Share Price 20% discount on weighted average closing price for 20
trading days before the date of grant but not lower than par value of P1.00 per share
Vesting Period Upon achievement of the Company’s goals and the
determination of the payout under the Variable Compensation Plan
Payout Scheme As 20% of the officer’s annual variable compensation Holding Period From Grant Date For 1st stock grants, 1/3 of shares should have a holding
period of one (1) year; 1/3 of shares should have a holding period of two (2) years and the balance should be held for three (3) years.

74
For succeeding stock grants, all shares should have a holding period of three (3) years. The holding periods shall be annotated on the stock certificates.
Stock Option Plan Coverage Directors, permanent officers and employees of TA and its
affiliates and subsidiaries Option Price At weighted average closing price for 20 trading days
prior to date of grant but should not be lower than par value of P1.00 each share
Period Of Option Valid for three (3) years from date of grant:
Up to 33% of the allocated shares can be exercised on the 1st year from date of grant; Up to 66% of the allocated shares can be exercised on the 2nd year from date of grant; and Up to 100% of the allocated shares can be exercised on the 3rd year from date of grant.
Payment Of Shares Cash payment required upon exercise of option. Right To Exercise Option Continuous employment required. In the event of
resignation, termination or retirement, the optionee shall be entitled only to the options due him/her up to the effectivity of separation. Full payment is required prior to separation date. In the event of death of optionee, his/her heirs, executors, or administrators shall have the right to exercise the balance of options granted and pay in cash.
Administration of the Plan The Company’s Stock Option Committee shall have the
power to amend or modify the terms and conditions of the Plan provided that no amendment shall, in any way, affect the rights already acquired and vested prior to the amendment thereof.
Item 12. Security Ownership of Certain Beneficial Owners and Management Security Ownership of Certain Record and Beneficial Owners The table below shows the persons or groups known to TA as of February 28, 2011 to directly or indirectly the record or beneficial owners of more than 5% of the company’s voting securities:
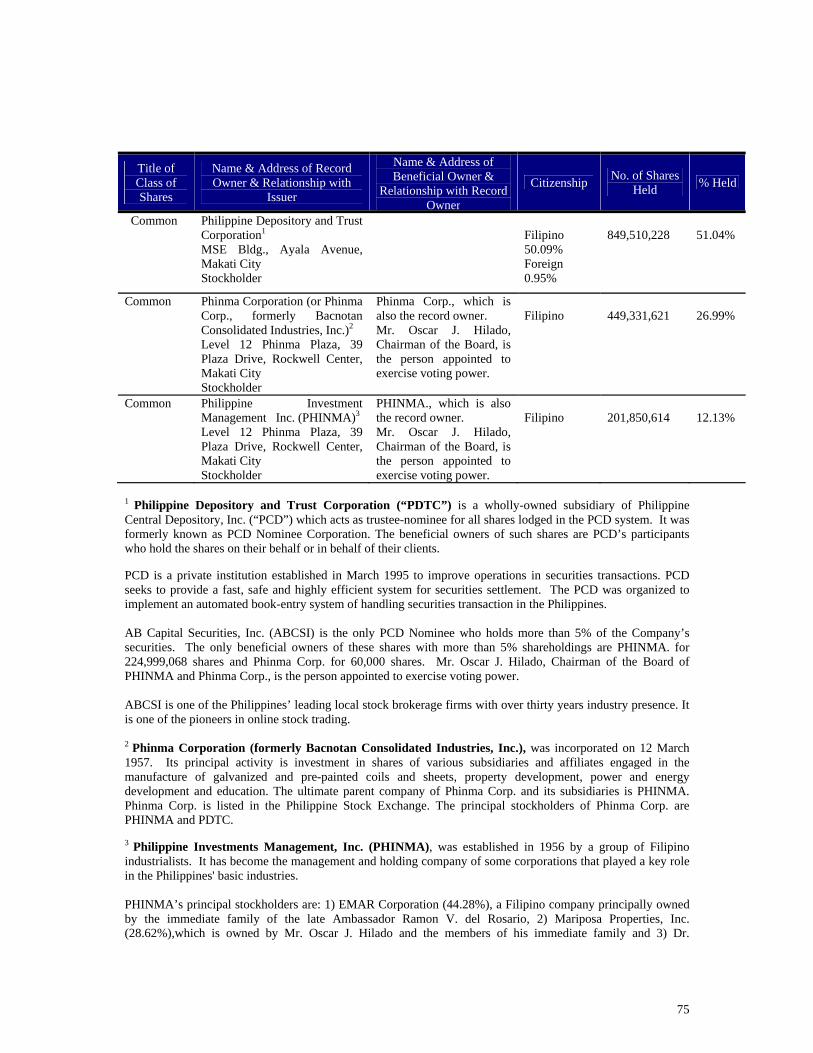
75
Title of Class of Shares
Name & Address of Record Owner & Relationship with
Issuer
Name & Address of Beneficial Owner &
Relationship with Record Owner
Citizenship No. of Shares Held % Held
Common
Philippine Depository and Trust Corporation1 MSE Bldg., Ayala Avenue, Makati City Stockholder
Filipino 50.09% Foreign 0.95%
849,510,228
51.04%
Common Phinma Corporation (or Phinma Corp., formerly Bacnotan Consolidated Industries, Inc.)2 Level 12 Phinma Plaza, 39 Plaza Drive, Rockwell Center, Makati City Stockholder
Phinma Corp., which is also the record owner. Mr. Oscar J. Hilado, Chairman of the Board, is the person appointed to exercise voting power.
Filipino
449,331,621
26.99%
Common Philippine Investment Management Inc. (PHINMA)3 Level 12 Phinma Plaza, 39 Plaza Drive, Rockwell Center, Makati City Stockholder
PHINMA., which is also the record owner. Mr. Oscar J. Hilado, Chairman of the Board, is the person appointed to exercise voting power.
Filipino
201,850,614
12.13%
1 Philippine Depository and Trust Corporation (“PDTC”) is a wholly-owned subsidiary of Philippine Central Depository, Inc. (“PCD”) which acts as trustee-nominee for all shares lodged in the PCD system. It was formerly known as PCD Nominee Corporation. The beneficial owners of such shares are PCD’s participants who hold the shares on their behalf or in behalf of their clients.
PCD is a private institution established in March 1995 to improve operations in securities transactions. PCD seeks to provide a fast, safe and highly efficient system for securities settlement. The PCD was organized to implement an automated book-entry system of handling securities transaction in the Philippines. AB Capital Securities, Inc. (ABCSI) is the only PCD Nominee who holds more than 5% of the Company’s securities. The only beneficial owners of these shares with more than 5% shareholdings are PHINMA. for 224,999,068 shares and Phinma Corp. for 60,000 shares. Mr. Oscar J. Hilado, Chairman of the Board of PHINMA and Phinma Corp., is the person appointed to exercise voting power. ABCSI is one of the Philippines’ leading local stock brokerage firms with over thirty years industry presence. It is one of the pioneers in online stock trading. 2 Phinma Corporation (formerly Bacnotan Consolidated Industries, Inc.), was incorporated on 12 March 1957. Its principal activity is investment in shares of various subsidiaries and affiliates engaged in the manufacture of galvanized and pre-painted coils and sheets, property development, power and energy development and education. The ultimate parent company of Phinma Corp. and its subsidiaries is PHINMA. Phinma Corp. is listed in the Philippine Stock Exchange. The principal stockholders of Phinma Corp. are PHINMA and PDTC.
3 Philippine Investments Management, Inc. (PHINMA), was established in 1956 by a group of Filipino industrialists. It has become the management and holding company of some corporations that played a key role in the Philippines' basic industries. PHINMA’s principal stockholders are: 1) EMAR Corporation (44.28%), a Filipino company principally owned by the immediate family of the late Ambassador Ramon V. del Rosario, 2) Mariposa Properties, Inc. (28.62%),which is owned by Mr. Oscar J. Hilado and the members of his immediate family and 3) Dr.

76
Magdaleno B. Albarracin, Jr. who owns 13.61% of PHINMA’s outstanding shares. The Del Rosario and Hilado Families are expected to direct the voting of the shares held by EMAR Corp. and Mariposa Properties, Inc. Security Ownership of Management The table below shows the securities beneficially owned by all directors’ nominees and executive officers of TA as of February 28, 2011:
Title of Class Name of Beneficial Owner Citizenship No. of
Shares Held Nature % of Class
Common Oscar J. Hilado Filipino 600,000 Direct 0.04% Common Ramon R. del Rosario, Jr. Filipino 4,722,035 Direct 0.28% 6,215,232 Indirect 0.37% Common Francisco L. Viray* Filipino 4,448,334 Direct 0.27% Common Roberto M. Laviña Filipino 437,493 Direct 0.03% Common Antonio V. del Rosario, Sr. Filipino 79,005 Direct 0.00% Common Magdaleno B. Albarracin, Jr. Filipino 1,117,891 Direct 0.07% Common Raymundo O. Feliciano Filipino 419,220 Direct 0.03% Common Ricardo V. Camua Filipino 470,841 Direct 0.03% Common Victor J. del Rosario Filipino 662,141 Direct 0.04% Common Alfredo M. Velayo Filipino 468 Direct 0.00% Common David L. Balangue Filipino 10,001 Direct 0.00% Common Rosario B. Venturina Filipino 897,792 Direct 0.05% Common Juan J. Diaz Filipino 33,657 Direct 0.00% Common Raymundo A. Reyes, Jr. Filipino 721,967 Direct 0.04% Common Rizalino G. Santos Filipino 1,196.243 Direct 0.07% Common Frederick C. Lopez Filipino 133,153 Direct 0.01% Common Danilo L. Panes Filipino 347,471 Direct 0.02% Common Benjamin S. Austria Filipino 1,315,942 Direct 0.08% Common Virgilio R. Francisco, Jr. Filipino 57,413 Direct 0.00% Bennette D. Bachoco Filipino 0 0.00% Cecille B. Arenillo Filipino 0 0.00% Miguel Romualdo T. Sanidad Filipino 0 0.00% Directors & Officers as a Group 23,886,299 1.43%
*Of the total 4,448,334 shares owned by Dr. Francisco L. Viray, 181,631 shares are lodged in AB Capital Securities, Inc. and 4,266,703 are certificated. Voting Trust Holders of 5% or more None of the directors and officers owns 5% or more of the outstanding capital stock of the Company. The Company is not also aware of any person holding 5% or more of the Company’s outstanding shares under a voting trust agreement or similar agreement. Changes in Control There are no arrangements that may result in a change in control of the registrant, nor has there been any change in control since the beginning of the last fiscal year and for the last three (3) years.

77
Item 13. Certain Relationship and Related Transactions During the last two (2) years, the Company was not a party in any transaction in which a Director or Executive Officer of the Company, any nominees for election as a director, any security holder owning more than 10% of the Company’s issued and outstanding shares and/or any member of his immediate family had a material interest thereon. The Company has a management contract with PHINMA up to August 31, 2013 renewable thereafter upon mutual agreement. Under this contract, PHINMA has a general management authority with the corresponding responsibility over all operations and personnel of the Company including planning, direction, and supervision of all the operations, sales, marketing, distribution, finance, and other business activities of the Company. As of March 31, 2011, PHINMA owns 427,491,684 shares, which represent 25.68% of total outstanding shares of stock of the Company.
PART V – CORPORATE GOVERNANCE Item 14. Compliance Program Compliance Policy In accordance with the Commission’s policy to actively promote corporate governance reforms aimed to raise investor confidence, develop capital market and help achieve high sustained growth for the corporate sector and the economy, the Board of Directors, Management, and Employees of Trans-Asia Oil and Energy Development Corporation (the “Corporation”) commit to the principles and best practices contained in the Manual on Good Corporate Governance approved by the Board on August 19, 2002 and as amended on April 2, 2004 and January 15, 2008.
To ensure adherence of the Corporation to corporate principles and test practices contained in the Manual, a Compliance Evaluation System was developed by the Corporation’s Compliance Officer and approved by the Board of directors on June 18, 2003. Compliance Evaluation System
A. Develop a Corporate Governance Evaluation Form indicating compliance risk, reference to Code of Corporate Governance and/or Manual, compliance risk owners, compliance frequency, compliance status, compliance plan and timetable.
B. Identify Compliance Risk Owners. C. Conduct an annual compliance survey by accomplishing the Corporate Governance Evaluation
Form.
D. Compliance Monitoring
1. Include compliance requirements on organizational and procedural control in internal audit plan and activities.
2. Obtain external and internal audit findings on the effectiveness of implementation and oversight of Corporation’s accounting and financial processes.
3. Obtain Agenda and Minutes of meetings of the Board, Audit Committee, Nomination Committee and Executive Compensation Committee.
4. Attend Board meetings periodically. 5. Conduct compliance checks thru direct interface with compliance risk owners and/or internal
audit and/or legal department.
E. Identify and monitor compliance violations.
78
1. Advise responsible Compliance Risk Owners of compliance violations. 2. Require plan of compliance to include a definitive timetable from the Compliance Risk
Owners. 3. Review plan of compliance and monitor implementation. 4. Identify unresolved compliance issued and agree on a revised plan and deadline for
regularization. 5. Compile unresolved compliance violations not regularized by the agreed revised deadline and
determine possible penalties.
F. Accomplish the Corporate Governance Evaluation Form at the end of the Corporation’s calendar year.
G. Report to the Chairman of the Board the extent of compliance to the Manual including
recommendation of non-compliance penalties for review and approval of the Board. H. Submit to the Securities and Exchange Commission (SEC) and Philippine Stock Exchange (PSE) a
certification on the extent of the Corporation’s compliance with the Manual for the completed year.
I. Subject Manual to periodic review and recommend appropriate changes to the Chairman for
endorsement and approval of the Board.
Compliance Certification As of December 31, 2010, the Corporation substantially complied with the principles and best practices contained in the Manual on Good Corporate Governance and as required by the SEC, the Vice President Compliance Officer, on January 27, 2011 submitted the Corporate Governance Compliance Certification (SEC Form MCG-2002) to the SEC and PSE. Since there were no major deviations from the Manual, the Corporation has not imposed any sanctions on any director, officer or employee. Corporate Governance Compliance Report As required by the Philippine Stock Exchange, the Corporation submitted last January 28, 2011, a Compliance Report on Corporate Governance for Year 2010. The Corporation is compliant with all guidelines except for those under Sections 2.8, 4.3 and 4.4. The full report is available in the Corporation’s website. Compliance Monitoring and Improving Corporate Governance The Compliance Officer and the Internal Auditor monitor the Corporation’s compliance with the Manual and the timely submission of reports and disclosures to both SEC and PSE. In addition, the SEC and PSE websites are constantly monitored or relevant circulars or memorandums affecting, improving and updating the corporate governance of the Corporation and amending the Manual, if necessary. As a result of the Compliance Program, there is effective management of the relationships between shareholders, stakeholders, directors, creditors, government and employees. Furthermore, the internal workings of the Corporation are directed and controlled leading to a corporate integrity, transparency and enhanced corporate performance, a dominant theme of Good Corporate Governance.

79
PART VI – EXHIBITS AND SCHEDULES Item 15. Exhibit and Reports on SEC Form 17-C List of Exhibits
Exhibit A - Consolidated Audited Financial Statements for the Calendar Year 2010
Exhibit B - Supplementary Schedules to the Consolidated Financial Statements Exhibit C - Parent Company Audited Financial Statements for the Calendar Year 2010 Reports on SEC Form 17-C The Company filed the following reports on SEC 17-C during the fiscal year 2010 covered by this report: Date of Filing Items Reported
January 4, 2010 Please be informed that the Office of the Secretary of the Department of Environment and Natural Resources (DENR) denied the Motion for Reconsideration of Trans-Asia Oil and Energy Development Corporation (Trans-Asia) in respect of the DENR’s Order removing certain parcels of land covered by alleged mining patents of a third party from the area covered by the Mineral Production Sharing Agreement No. 252-2007-V that was granted to Trans-Asia on 28 July 2007.
Trans-Asia filed an Appeal with the Office of the President within
the prescribed time frame.
January 4, 2010 Please be informed that the Service Contract No. 55 consortium completed a 600-sq. km. 3D seismic survey in its contract area in offshore West Palawan.
Trans-Asia has 15% participating interest in SC 55.
January 4, 2010 Certification of the Corporate Secretary with regards to the complete record of attendance of each director in Board meetings of Trans-Asia for the year 2009 as disclosed to the Securities and Exchange Commission (SEC).
January 25, 2010 Please be informed that the SC 55 consortium will acquire between
1,000 to 2,000 square kilometers of additional 3D marine seismic data over the contract area to delineate prospects.

80
The seismic survey is expected commence in early February 2010 and will take about 60 days to complete.
The forthcoming survey will extend the coverage of 600 square
kilometer 3D seismic survey that was completed on 1 January 2010.
Trans-Asia has 15% participating interest in SC 55. February 1, 2010 In compliance with Section 17.15 of the PSE Revised Disclosure
Rules, we are submitting herewith a Certification from the Department of Energy (DOE) that, as of 31 December 2009, Trans-Asia’s petroleum Service Contracts are valid and subsisting and that Trans-Asia has no pending violations with the DOE.
February 1, 2010 Please be informed that the Department of Energy awarded today
to Trans-Asia Renewable Energy Corporation, wholly-owned subsidiary of Trans-Asia Oil and Energy Development Corporation, ten (10) wind energy service contracts covering an aggregate area of 22,736 hectares.
The prospective wind sites are located in Quezon (3), Batangas (2),
Iloilo (2), Cavite (1), Camarines Norte (1) and Bohol (1).
Each service contract has a term of up to 3 years for the pre-development stage, and 25 years for the development stage, which may be extended by an additional 25 years.
February 4, 2010 This refers to PSE letter dated 4 February 2010 requesting Trans-
Asia to confirm, deny and/or clarify the news article entitled “Trans-Asia seen investing $300M in wind power projects” that was published in today’s issue of the Philippine Daily Inquirer, and which reported in part that:
“PUBLICLY-LISTED TRANS-ASIA OIL AND Energy Development Corp. plans to invest $300 million in its 10 wind power projects, which will have a combined capacity of 123 megawatts, according to its top official. Trans-Asia president Francisco L. Viray said these projects, whose service contracts were recently awarded by the Department of Energy, would complete the company’s planned 400-MW wind project portfolio….. Through subsidiary Trans-Asia Renewable Energy Corp. (Tarec), Trans-Asia Oil now holds 20 service contracts for wind power projects…….. Viray said Tarec was currently in discussions with interested local and foreign partners to realize its 400-MW wind power target. All these projects, he said, might cost as much as $1 billion….”
Please be informed that the statements in said news article specifically attributed to our President and CEO, Mr. Francisco L. Viray, Ph.D., are accurate.
81
February 11, 2010 Please be informed that the Service Contract No. 55 consortium commenced this morning a 1,800 sq. km. 3D seismic survey in its contract area in offshore West Palawan.
The seismic acquisition program is expected to be completed in sixty (60) days.
Trans-Asia has 15% participating interest in SC 55. March 18, 2010 Please be informed that the Department of Energy granted the
Service Contract No. 55 consortium’s request to annex some 88,000 hectares of open acreage adjoining the original contract area in offshore West Palawan, thus increasing the size of the contract area to 988,000 hectares, more or less.
Trans-Asia has 15% participating interest in SC 55.
March 23, 2010 Please be informed that the Service Contract 69 consortium commenced on 22 March 2010 a 900 – km 2D seismic survey in the Camotes Sea, pursuant to its work obligation under the current Exploration Sub-Phase.
The survey is designed to delineate drilling targets in the contract
area. Expected survey duration is 2 to 3 weeks. Trans-Asia has 30% participation interest in SC 69. March 24, 2010 Please be informed that the Service Contract No. 55 consortium
completed on 23 March 2010 a 1,800 – sq. km. 3D seismic survey over its contract area in offshore West Palawan.
Digital processing of the seismic data will follow.
Trans-Asia has 15% participating interest in SC 55.
March 24, 2010 Please be informed that at the annual meeting of the shareholders of Trans-Asia Oil and Energy Development Corporation held today, March 24, 2010, the following actions were taken:
1) The following directors of the corporation were elected:
Oscar J. Hilado Antonio V. del Rosario Magdaleno B. Albarracin, Jr. Ramon R. del Rosario, Jr. Francisco L. Viray Roberto M. Lavina Victor J. del Rosario David L. Balangue (Independent) Alfredo M. Velayo (Independent) Raymundo O. Feliciano (Independent) Ricardo V. Camua (Independent)
2) The auditing firm SyCip Gorres Velayo and Company
was appointed external auditors for the year 2010.

82
3) The following resolution was adopted on motion duly
seconded and unanimously carried: “RESOLVED, to approve the Plan of Merger between this Corporation and CIP II Power Corporation, with this Corporation as the surviving entity; and to authorize the President and the Corporate Secretary to sign the Articles of Merger as required by law.”
Following the annual meeting of shareholders the following officers were reelected: Oscar j. Hilado - Chairman
Ramon R. del Rosario, Jr. - Vice-Chairman Francisco L. Viray - President & CEO Roberto M. Lavina - EVP, CFO & Treasurer Juan J. Diaz - Corporate Secretary Rosario B. Venturina - SVP for Buss. Dev’t. Ponciano L. Dimayuga - VP for Exploration Carlos I. Arguelles - VP & Compliance Officer Rizalino G. Santos - VP for Electricity Trading & Marketing Frederick C. Lopez - VP – Materials Management Miguel Romualdo T. Sanidad - Asst. Corporate Secretary Danilo L. Panes - Asst. Vice President Benjamin S. Austria - Senior Consultant Francisco M. Varela - Senior Consultant Moreover, the various Committees of the Board were organized as
follows: Executive Committee/Stock Option Committee: Ramon R. del Rosario, Jr. - Chairman Oscar J. Hilado - Member Magdaleno B. Albarracin, Jr. - Member Francisco L. Viray - Member Alfredo M. Velayo - Member Audit Committee: Alfredo M. Velayo - Chairman Roberto M. Lavina - Member Ricardo V. Camua - Member Victor J. del Rosario - Member David L. Balangue - Member Nominations Committee: Ramon R. del Rosario, Jr. - Chairman Antonio V. del Rosario - Member Raymundo O. Feliciano - Member Compensation Committee: Alfredo M. Velayo - Chairman

83
Ramon R. del Rosario, Jr. - Member Oscar J. Hilado - Member March 25, 2010 Relative to our letter disclosure of 24 March 2010 on the election
of officers of Trans-Asia Oil and Energy Corporation, we would like to make the following corrections:
a) The reelection of Virgilio R. Francisco, Jr. as Senior Vice
President; and b) The reelection of Cecille B. Arenillo as Vice President
and Compliance Officer instead of Carlos I. Arguelles.
March 26. 2010 This refers to PSE letter dated March 26, 2010 requesting Trans-Asia to confirm, deny and/or clarify the news article entitled, “Trans-Asia Rights Offer” that was published in the March 26, 2010 issue of the Manila Standard Today, and which reported in part that:
….Roberto Lavina, Trans-Asia executive vice president and chief finance officer, said shareholders approved an increase in authorized capital and preemptive rights issue in November last year… “The increase in authorized capital is by P 2.2 billion or 2.2 billion shares so what we meant to do is to have to a preemptive rights issue. We’re working on that now and that’s going to be done, likely timing is about late June to early July,” he said…
Please be informed that the statement in the said news article
specifically attributed to our Executive Vice President and Chief Financial Officer, Mr. Roberto M. Lavina, is accurate. Trans-Asia is targeting the preemptive stock rights offering in late June or early July and is dependent upon the approval of the regulatory institutions and subject to the confirmation and approval of the Board of Directors. We will apprise the Exchange as soon as the approvals are obtained.
April 5, 2010 Please be informed that the Service Contract No. 69 consortium
completed on 1 April 2010 a 2D seismic survey in the Camotes Sea, pursuant to its work obligation under the current Exploration Sub-Phase.
A total of 891 km of seismic data was recorded. Digital processing
of the data will follow. Trans-Asia has 30% participating interest in Service Contract No.
69.
April 19, 2010 Please be informed that at the just-concluded regular meeting of the Board of Trans-Asia Oil and Energy Development Corporation held today, April 19, 2010, the following actions were taken:

84
1. The cash dividend of P=0.04 per share declared on March 24, 2010 was made payable on May 28, 2010 to all shareholders of record as of May 3, 2010.
2. The election of Ms. Bennette Daplas-Bachoco as Senior Vice-President/Finance vice Senior Vice-President/Finance Ponciano L. Dimayuga effective May 1, 2010.
April 20, 2010 Please be informed that the Department of Energy approved the consortium’s request for one-year extension of the term of the current exploration Sub-Phase 3 until 5 August 2011.
The extension period will allow the consortium to complete a
supplemental 1,800 sq. km. seismic program. Trans-Asia has 15% participating interest in Service Contract No.
55. May 19, 2010 Please be informed that Trans-Asia signed today a Joint Venture
Agreement with PetroGreen Energy Corporation and PNOC Renewables Corporation, for the integrated development and operation of the Maibarara Geothermal Project in Batangas and Laguna. The aforementioned companies agreed to organize Maibarara Geothermal, Inc. (MGI) capitalized at Philippine Pesos 1.125 billion with the following shareholding interests: Trans-Asia, 25%; PetroGreen, 65% and PNOC RC, 10%. The Department of Energy awarded the Maibarara geothermal service contract to PetroEnergy Resources Corporation, parent company of PetroGreen, on 1February 2010. PetroEnergy will assign said service contract to MGI, subject to DOE approval.
MGI aims to develop the Maibarara steamfield located at the
western flank of Mount Makiling and commission the first 20MW power plant by the second half of 2013. Total project cost may reach Philippine Pesos 2.8 billion.
During the first two years of the service contract, MGI will
undertake at a total estimated cost of US $ 12-18 million, information and education campaigns, environmental permitting, road rehabilitation, work-over and discharge tests of old wells, drilling of up to 2 wells (if necessary), detailed engineering studies and initial civil works for the steamfield and power plant.
May 25, 2010 This refers to your Department’s letter of 24 May 2010 requesting
additional information pertaining to Trans-Asia’s signing of a Joint Venture Agreement (“JVA”) with PetroGreen Energy Corporation (“PGEC”) and PNOC Renewables Corporation (“PRC”), which we disclosed on 19 May 2010.
Under the JVA, Trans-Asia, PGEC and PRC agreed a joint venture
company to be named Maibarara Geothermal, Inc. (“MGI”) that will have the following equity interests: Trans-Asia, 25%; PetroGreen, 65% and PNOC RC, 10%. The authorized capital stock of MGI at the time of incorporation shall be P=1.125 billion divided into 11.25 million with par value of P=100 per share. The

85
initial capital contribution of Trans-Asia, PGEC and PRC shall be P=17.58 million, P=45.70 million and P=7.03 million, respectively. Within thirty (30) days of the date of execution of the JVA, Trans-Asia, PGEC and PRC shall commence the establishment of MGI.
Following incorporation of MGI, PGEC shall cause its parent
company, PetroEnergy Resources Corporation (“PERC”) to assign to MGI the Maibarara Geothermal Renewable Energy Service Contract No. 2010-02-012 (“Service Contract”) that was awarded to PERC on 1 February 2010. PGEC is a wholly-owned subsidiary of PERC. There are no materials relationships among Trans-Asia, PGEC and PRC, their directors, officers and affiliates.
Trans-Asia’ investment in MGI will not have a significant effect on
its financial condition, considering that Trans-Asia’s investment in MGI is limited to a minimum of the P=17.58 million initial capital contribution or up to a maximum of P=70.32 million of subscribed capital in MGI.
The assignment of the Service Contract is subject to the approval of
the Department of Energy. Upon approval of said assignment, MGI shall assume all the rights, commitments and obligations of PERC under the Service Contract.
June 3, 2010 Please be informed that Trans-Asia signed today the following
agreements with Frontier Gasfields Pty. Ltd. (“Frontier”), an Australian company:
1. Option Agreement in relation to the petroleum Service
Contract dated August 5, 2005 (“SC 55”), and 2. Farm-In Option Agreement in relation to the petroleum
Service Contract dated May 7, 2008 (“SC 69”). The Option Agreement relating to SC 55 grants Frontier the option to acquire from Trans-Asia a five percent (5%) participating interest in SC 55, that may be acquired by Trans-Asia, from its current SC 55 partner by virtue of a separate agreement. Said option may be exercised by Frontier within one hundred fifty (50) days from completion of drilling operations on the first exploratory well under SC 55. The Farm-In Option Agreement relating to SC 69, on the other hand, grants Frontier the option to acquire a fifteen percent (15%) participating interest from Trans-Asia in SC 69. This option may be exercised by Frontier within one hundred and eighty two (182) days from the date of payment of the option fee, but in no case later than the expiry date of the current Sub-Phase of SC 69. Trans-Asia has fifteen percent (15%) participating interest and thirty percent (30%) participating interest in SC 55 and SC 69, respectively.
June 22, 2010 We are furnishing you herewith a copy of the letter dated June 22,
2010 of Trans-Asia Oil and Energy Development Corporation addressed to the Securities and Exchange Commission in

86
compliance to their requirement to show cause for the non submission of the Company’s Revised Manual on Corporate Governance on or before April 14, 2010 pursuant to the Revised Code of Corporate Governance. The letter read as follows:
We refer to your letter dated June 11, 2010 which we received on
June 21, 2010 calling our attention to our failure to submit the company’s Revised Manual on Corporate Governance on or before April 14, 2010 “pursuant to the Revised Code on Corporate Governance (SEC Memorandum Circular No. 6 Series of 2009).
Your records will show that our corporation had submitted its
Revised Manual on Good Corporate Governance as early as January 18, 2008.
While SEC Memorandum Circular No. 6 expressly took effect on
July 25, 2009, by express provision of Article 9 of the same Circular, and we quote:
“x x x corporations that have earlier submitted their manual may, at
their option, continue to use the said manual as long as it complies with the provisions of this Code.”
Considering (i) that SEC Memorandum Circular No. 6 prescribing
a Revised Code of Corporate Governance with effectivity on July 15, 2009 is in the nature of an administrative edict having the binding force of law upon all covered corporations who this bound to a strict compliance therewith; and (ii) that there was, and is, nothing in our existing Manual which contradicts anything in your Revised Code of Corporate Governance, our corporation did not deem itself obliged to make any further submission to the SEC pursuant to the above-quoted provision of SEC Memorandum Circular No. 6.
August 4, 2010 Please be informed that Mr. Francisco M. Varela has resigned as Senior Consultant of Trans-Asia Oil and Energy Development Corporation per resignation letter received today.
August 9, 2010 Please be informed that Trans-Asia Oil and Energy Development Corporation paid the amount of One Hundred Thousand Pesos (P=100,000.00) to the Philippine Stock Exchange, Inc. for the following delayed disclosures: (a) changes in the shareholdings of an officer and (b) Board approval of cash dividend declaration.
August 16, 2010 Please be informed that the Board of directors of Trans-Asia Oil and Energy Development Corporation (“Trans-Asia”) approved today a Contract to Purchase Generated Energy with Amlan power Holdings Incorporated (“APHI”) where Trans-Asia shall purchase up to 15 megawatts of the generated output of APHI’s Bakun hydro Plant for a period of five (5) months.
August 18, 2010 Please be informed that the Securities and Exchange Commission
(SEC) has approved the incorporation of the Maibarara

87
Geothermal, Inc. (MGI) capitalized at Philippine Pesos 1.125 billion. Trans-Asia owns 25% of the subscribed capital stock of MGI, PetroGreen Energy Resources Corporation (PetroGreen) owns 65% while the remaining 10% s owned by PNOC Renewables Corporation.
MGI aims to develop the Maibarara steamfield located at the
western flank of Mount Makiling and commission the first 30MW power plant by the second half of 2013. Total project cost may reach Philippine Pesos 2.8 billion. The Maibarara Geothermal Service Contract was awarded by the Department of Energy to PetroEnergy Resources Corporation (PetroEnergy), the parent company of PetroGreen. PetroEnergy will assign the said contract to MGI, subject to the DOE’s approval.
September 13, 2010 Please be informed that at the just-concluded joint regular meeting
of the Board of Directors and special meeting of the shareholders of Trans-Asia Renewable Energy Corporation, a wholly-owned subsidiary of Trans-Asia oil and Energy Development Corporation, held today, September 13, 2010, the following actions were taken:
The amendments in the Articles of Incorporation and By-Laws of
Trans-Asia Renewable Energy Corporation to reflect the following changes:
a. Increase of number of directors from seven (7) to
eleven (11); b. Change of par value of the shares of stock from P=0.01
to P=1.00; and c. Increase of authorized capital stock from P=100
million to P=1 billion. September 15, 2010 Please be informed that the Department of Energy approved the
Service Contract No. 69 consortium’s request for three-month extension of the current exploration sub-phase until 7 February 2011.
Trans-Asia has 30% interest in SC 69. September 16, 2010 Please be informed that at the just-concluded regular meeting of the
Board of Directors of Trans-Asia Oil and Energy Development Corporation held today, said Board authorized the Corporation sell its royalty interest in Service Contract No. 6 Cadlao Production Area to peak Royalties Limited (or its nominee) under terms and conditions as may be agreed upon, provided that all royalty interest holders sell their respective interests.
September 16, 2010 Further to our disclosure letter of 13 September 2010, please be
informed that at the just-concluded meeting of the Board of Directors of Trans-Asia Oil and Energy Development Corporation, the Board approved the subscription of a total of P=250 million in shares of stock of Trans-Asia Renewable Energy Corporation and the payment thereon of a total of P=70.25 million.

88
September 21, 2010 Please be informed that Trans-Asia entered into a Sale and
Purchase Agreement and a Deed of assignment covering the assignment of its entire royalty interest in the Cadlao Production Area, Northwest Palawan under Service contract No. 6 to Peak Royalties Limited (BVI).
Said transfer of interest is subject to the approval of the Department
of Energy. September 27, 2010 Please be informed that Maibarara Geothermal, Inc. (“MGI”)
executed a Deed of Assignment and Assumption covering the transfer of the Maibarara Geothermal Service Contract of the PetroEnergy Resources Corporation to MGI.
MGI will pursue the integrated development of the Maibarara
geothermal field in Batangas and Laguna for power generation. Said assignment is subject to the approval of the Department of
Energy. Trans-Asia owns 25% equity participation in MGI. November 17, 2010 Please be informed that the Department of Energy approved a
revised timeline for Service Contract No. 51 work phases under which the current Sub-Phase 3 was extended to 31 July 2011.
The Service Contract No. 51 consortium has committed to drill one
(1) onshore well during the first quarter of 2011. Trans-Asia owns 6.67% participating interest in Service Contract
No. 51. November 18, 2010 Please be informed that the Executive Committee of Trans-Asia Oil
and Energy Development Corporation, acting under delegated authority from the Board of Directors, approved today the Power Administration and Management Agreement with One Subic Power Generation Corporation (OSPGC) for the administration and management of the entire generation output of the 116 MW Subic Bay Diesel Power Plant currently under lease to OSPGC.
The Executive Committee, under the same delegated authority, also
approved today the exercise of the Company’s option to purchase 131,000 square meters of property located at the Phoenix Petroterminals and Industrial Park at Calaca, Batangas at the option price of P=31.26 million which shall be credited along with the initial downpayment of P=15.63 million to the total purchase price of P=333.825 million.
November 19, 2010` Please be informed that GPC Investment S>A> (formerly known as
Vitol GPC Investments S. A.) decided not to exercise its option to acquire interest in Service Contract No. 6 Block A under the

89
Amending Agreement to the Farm-In Agreement dated 30 October 2009.
Trans-Asia owns 7.78% participating interest in Service Contract
No. 6 Block A. December 14, 2010 Please be informed that the SC 69 consortium notified the
Department of Energy today of its election to enter the 3rd Sub-Phase of the Exploration Period of SC 69 (7 February 2011 – 6 August 2012).
The consortium plans to undertake a 3D seismic program and
follow on geological studies under said Sub-Phase, to elevate identified prospects in the block to drillable status.
Trans-Asia has 30% participating interest in Service Contract No.
69. December 22, 2010 Please be informed that in a letter dated today, the Department of
Energy posed no objections to and recognized the assignment by Trans-Asia of its 1.65% overriding royalty interest in SC 6 Cadlao Production Area to peak Royalties Limited.
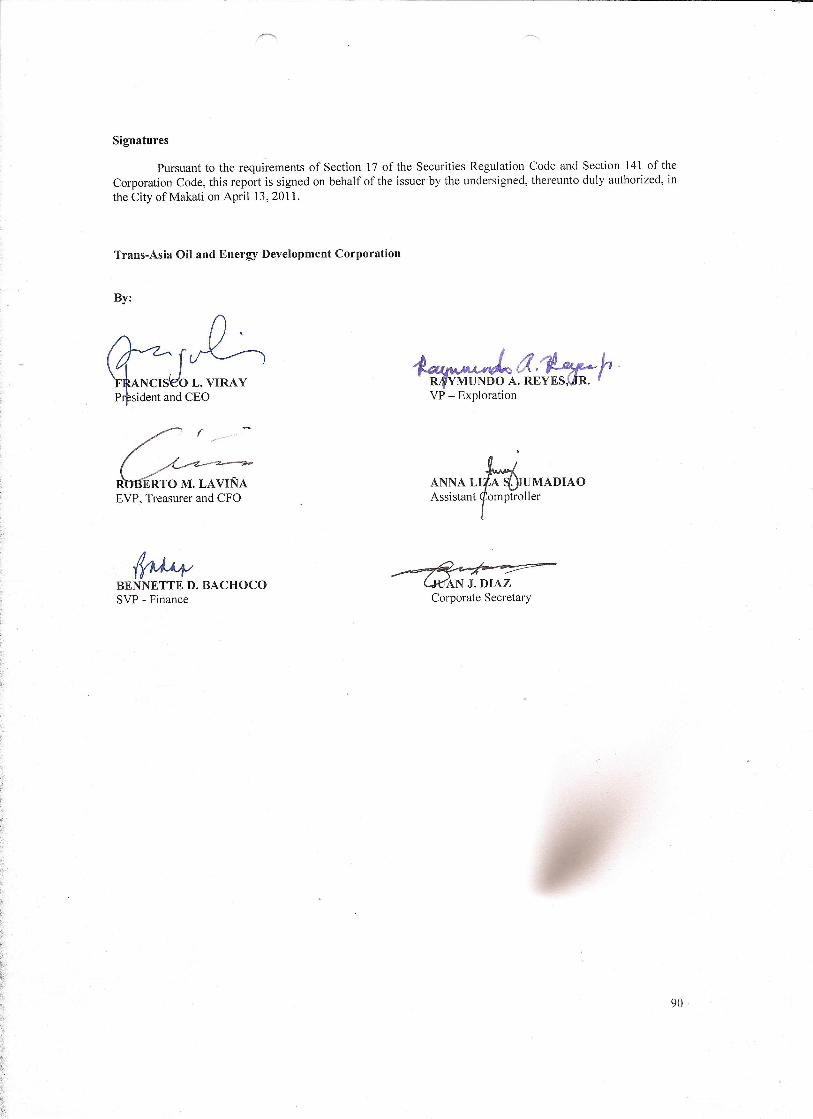


EXHIBIT A
TRANS-ASIA OIL AND ENERGY DEVELOPMENT CORPORATION AND SUBSIDIARIES
Consolidated Financial Statements December 31, 2010 and 2009
And Years Ended December 31, 2010, 2009 and 2008


*SGVMC311705*
3 9 2 7 4 SEC Registration Number
T R A N S - A S I A O I L A N D E N E R G Y
D E V E L O P M E N T C O R P O R A T I O N
A N D S U B S I D I A R I E S
(Company’s Full Name)
1 1 t h F l o o r , P H I N M A P l a z a ,
3 9 P l a z a D r i v e , R o c k w e l l C e n t e r ,
M a k a t i C i t y
(Business Address: No. Street City/Town/Province)
Yolanda Añonuevo 870-0100 (Contact Person) (Company Telephone Number)
1 2 3 1 A A C F S 0 4 0 4 Month Day (Form Type) Month Day
(Fiscal Year) (Annual Meeting)
(Secondary License Type, If Applicable)
Dept. Requiring this Doc. Amended Articles Number/Section Total Amount of Borrowings
3,360 - - Total No. of Stockholders Domestic Foreign
To be accomplished by SEC Personnel concerned
File Number LCU
Document ID Cashier
S T A M P S Remarks: Please use BLACK ink for scanning purposes.
COVER SHEET
*SGVMC311705*
INDEPENDENT AUDITORS’ REPORT The Stockholders and the Board of Directors Trans-Asia Oil and Energy Development Corporation 11th Floor, PHINMA Plaza 39 Plaza Drive, Rockwell Center Makati City We have audited the accompanying consolidated financial statements of Trans-Asia Oil and Energy Development Corporation and Subsidiaries, which comprise the consolidated balance sheets as at December 31, 2010 and 2009, the consolidated statements of income, consolidated statements of comprehensive income, consolidated statements of changes in equity and consolidated statements of cash flows for each of the three years in the period ended December 31, 2010, and a summary of significant accounting policies and other explanatory information. Management’s Responsibility for the Financial Statements
Management is responsible for the preparation and fair presentation of these financial statements in accordance with Philippine Financial Reporting Standards, and for such internal control as management determines is necessary to enable the preparation of financial statements that are free from material misstatement, whether due to fraud or error. Auditors’ Responsibility
Our responsibility is to express an opinion on these financial statements based on our audits. We conducted our audits in accordance with Philippine Standards on Auditing. Those standards require that we comply with ethical requirements and plan and perform the audit to obtain reasonable assurance about whether the financial statements are free from material misstatement. An audit involves performing procedures to obtain audit evidence about the amounts and disclosures in the financial statements. The procedures selected depend on the auditor’s judgment, including the assessment of the risks of material misstatement of the financial statements, whether due to fraud or error. In making those risk assessments, the auditor considers internal control relevant to the entity’s preparation and fair presentation of the financial statements in order to design audit procedures that are appropriate in the circumstances, but not for the purpose of expressing an opinion on the effectiveness of the entity’s internal control. An audit also includes evaluating the appropriateness of accounting policies used and the reasonableness of accounting estimates made by management, as well as evaluating the overall presentation of the financial statements.
We believe that the audit evidence we have obtained is sufficient and appropriate to provide a basis for our audit opinion.
SyCip Gorres Velayo & Co. 6760 Ayala Avenue 1226 Makati City Philippines
Phone: (632) 891 0307 Fax: (632) 819 0872 www.sgv.com.ph BOA/PRC Reg. No. 0001 SEC Accreditation No. 0012-FR-2
A member firm of Ernst & Young Global Limited

*SGVMC311705*
- 2 -
Opinion In our opinion, the consolidated financial statements present fairly, in all material respects, the financial position of Trans-Asia Oil and Energy Development Corporation and Subsidiaries as of December 31, 2010 and 2009, and their financial performance and their cash flows for each of the three years in the period ended December 31, 2010 in accordance with Philippine Financial Reporting Standards. SYCIP GORRES VELAYO & CO. Catherine E. Lopez Partner CPA Certificate No. 86447 SEC Accreditation No. 0468-AR-1 Tax Identification No. 102-085-895 PTR No. 2641533, January 3, 2011, Makati City February 21, 2011
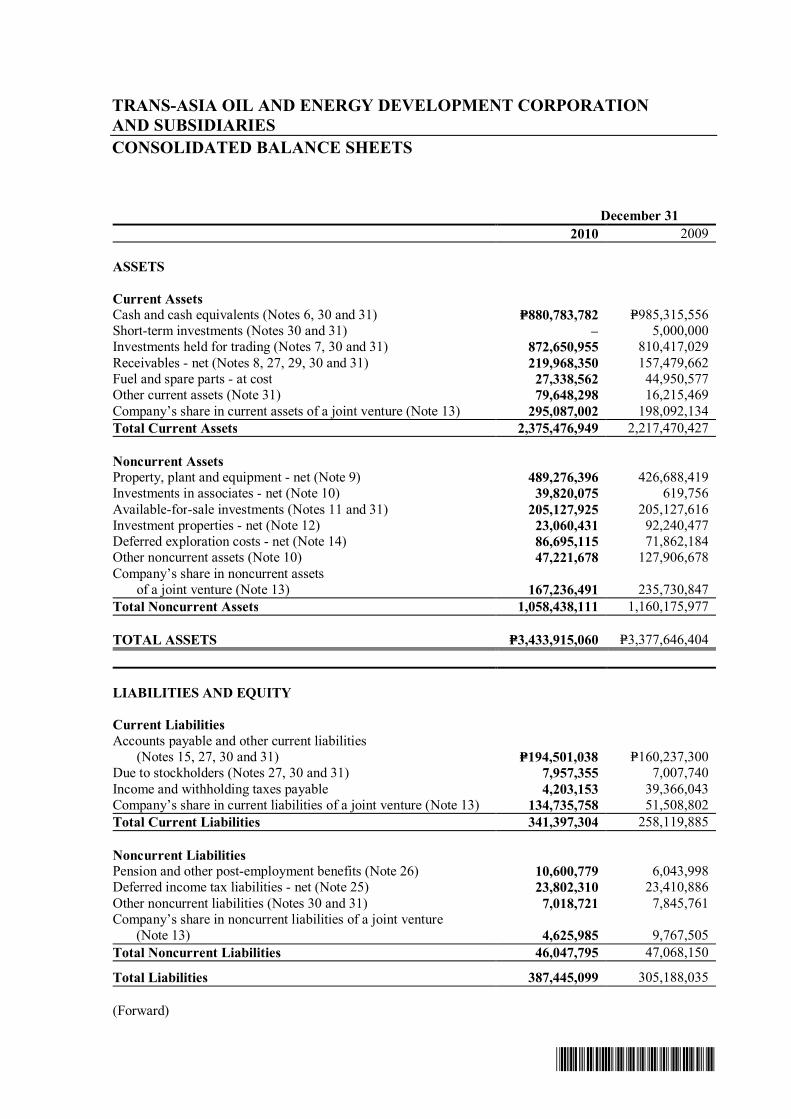
*SGVMC311705*
TRANS-ASIA OIL AND ENERGY DEVELOPMENT CORPORATION AND SUBSIDIARIES CONSOLIDATED BALANCE SHEETS December 31 2010 2009
ASSETS
Current Assets Cash and cash equivalents (Notes 6, 30 and 31) P=880,783,782 P=985,315,556 Short-term investments (Notes 30 and 31) – 5,000,000 Investments held for trading (Notes 7, 30 and 31) 872,650,955 810,417,029 Receivables - net (Notes 8, 27, 29, 30 and 31) 219,968,350 157,479,662 Fuel and spare parts - at cost 27,338,562 44,950,577 Other current assets (Note 31) 79,648,298 16,215,469 Company’s share in current assets of a joint venture (Note 13) 295,087,002 198,092,134 Total Current Assets 2,375,476,949 2,217,470,427
Noncurrent Assets Property, plant and equipment - net (Note 9) 489,276,396 426,688,419 Investments in associates - net (Note 10) 39,820,075 619,756 Available-for-sale investments (Notes 11 and 31) 205,127,925 205,127,616 Investment properties - net (Note 12) 23,060,431 92,240,477 Deferred exploration costs - net (Note 14) 86,695,115 71,862,184 Other noncurrent assets (Note 10) 47,221,678 127,906,678 Company’s share in noncurrent assets
of a joint venture (Note 13) 167,236,491 235,730,847 Total Noncurrent Assets 1,058,438,111 1,160,175,977
TOTAL ASSETS P=3,433,915,060 P=3,377,646,404
LIABILITIES AND EQUITY
Current Liabilities Accounts payable and other current liabilities
(Notes 15, 27, 30 and 31) P=194,501,038 P=160,237,300 Due to stockholders (Notes 27, 30 and 31) 7,957,355 7,007,740 Income and withholding taxes payable 4,203,153 39,366,043 Company’s share in current liabilities of a joint venture (Note 13) 134,735,758 51,508,802 Total Current Liabilities 341,397,304 258,119,885
Noncurrent Liabilities Pension and other post-employment benefits (Note 26) 10,600,779 6,043,998 Deferred income tax liabilities - net (Note 25) 23,802,310 23,410,886 Other noncurrent liabilities (Notes 30 and 31) 7,018,721 7,845,761 Company’s share in noncurrent liabilities of a joint venture
(Note 13) 4,625,985 9,767,505 Total Noncurrent Liabilities 46,047,795 47,068,150
Total Liabilities 387,445,099 305,188,035
(Forward)

*SGVMC311705*
- 2 - December 31 2010 2009
Equity Capital stock (Note 16) P=1,664,625,604 P=1,662,603,069 Additional paid-in capital (Note 16) 54,693,308 54,693,308 Unrealized fair value gains on available-for-sale investments
(Note 11) 71,834,093 52,223,943 Company’s share in unrealized fair value gains on available-for-sale
investments of a joint venture 13,185,776 8,966,770 Retained earnings (Note 16) 1,246,055,049 1,297,895,148 Parent Company shares of stock held by a joint venture (Note 13) (3,923,869) (3,923,869) Total Equity 3,046,469,961 3,072,458,369
TOTAL LIABILITIES AND EQUITY P=3,433,915,060 P=3,377,646,404 See accompanying Notes to Consolidated Financial Statements.

*SGVMC311705*
TRANS-ASIA OIL AND ENERGY DEVELOPMENT CORPORATION AND SUBSIDIARIES CONSOLIDATED STATEMENTS OF INCOME Years Ended December 31 2010 2009 2008 REVENUES Generation revenue (Note 1) P=55,588,335 P=155,843,181 P=728,339,370 Trading revenue - net (Notes 1 and 18) – 274,478,196 62,902,536 Interest and other financial income (Notes 7 and 31) 70,143,513 65,572,065 48,403,004 Dividend income 7,090,765 27,081,565 2,120,941 Rental income (Note 12) 6,831,677 5,457,295 2,113,080 Company’s share in revenue of a joint venture (Note 13): Generation 754,259,237 563,494,581 566,205,561 Other income 381,337 – 38,094,780 894,294,864 1,091,926,883 1,448,179,272
COSTS AND EXPENSES Cost of power generation (Notes 19, 22, 23 and 27) 44,472,389 129,509,836 742,645,356 Cost of power plant on standby
(Notes 1, 9, 20, 22, 23 and 24) 29,516,171 26,859,955 – Trading loss - net (Notes 1 and 18) 60,297,092 – – General and administrative expenses
(Notes 21, 22, 23, 26 and 27) 165,495,010 199,806,618 181,172,186 Company’s share in costs and expenses
of a joint venture (Note 13): Cost of power generation 670,649,773 275,907,196 493,916,963 General and administrative expenses 24,915,168 27,735,947 26,376,093 Other expense – 495,275 – 995,345,603 660,314,827 1,444,110,598
OTHER INCOME (EXPENSES) (Note 24) 113,332,315 (133,177,169) 64,208,655
INCOME BEFORE INCOME TAX 12,281,576 298,434,887 68,277,329
PROVISION FOR (BENEFIT FROM) INCOME TAX (Note 25)
Current 3,034,812 60,134,103 5,602,477 Deferred (649,944) (41,115,251) (32,129,710) Company’s share in income tax of a joint venture
(Note 13) (4,848,218) (3,393,839) 6,327,864 (2,463,350) 15,625,013 (20,199,369) NET INCOME P=14,744,926 P=282,809,874 P=88,476,698
Basic/Diluted Earnings Per Share (Note 28) P=0.01 P=0.17 P=0.05 See accompanying Notes to Consolidated Financial Statements.

*SGVMC311705*
TRANS-ASIA OIL AND ENERGY DEVELOPMENT CORPORATION AND SUBSIDIARIES CONSOLIDATED STATEMENTS OF COMPREHENSIVE INCOME Years Ended December 31 2010 2009 2008
NET INCOME FOR THE YEAR P=14,744,926 P=282,809,874 P=88,476,698
OTHER COMPREHENSIVE INCOME (LOSS) Unrealized fair value gains (losses) on available-for-sale
investments - net of deferred income tax (Note 11) 19,610,150 (2,247,007) (23,395,946) Company’s share in unrealized fair value gains (losses) on
available-for-sale investments of a joint venture - net of deferred income tax 4,219,006 207,665 (7,493,238)
Other comprehensive income (loss) 23,829,156 (2,039,342) (30,889,184)
TOTAL COMPREHENSIVE INCOME P=38,574,082 P=280,770,532 P=57,587,514 See accompanying Notes to Consolidated Financial Statements.
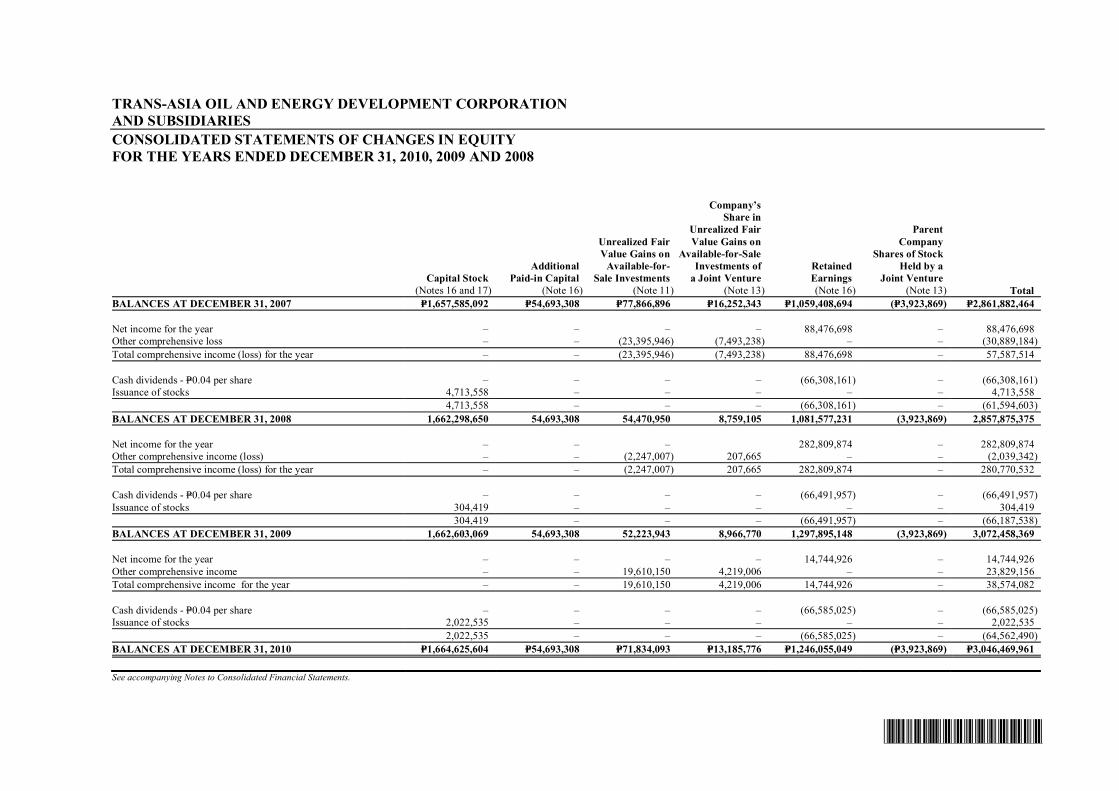
*SGVMC311705*
TRANS-ASIA OIL AND ENERGY DEVELOPMENT CORPORATION AND SUBSIDIARIES CONSOLIDATED STATEMENTS OF CHANGES IN EQUITY FOR THE YEARS ENDED DECEMBER 31, 2010, 2009 AND 2008
Capital Stock
(Notes 16 and 17)
Additional Paid-in Capital
(Note 16)
Unrealized Fair Value Gains on
Available-for- Sale Investments
(Note 11)
Company’s Share in
Unrealized Fair Value Gains on
Available-for-Sale Investments of
a Joint Venture (Note 13)
Retained Earnings (Note 16)
Parent Company
Shares of Stock Held by a
Joint Venture (Note 13) Total
BALANCES AT DECEMBER 31, 2007 P=1,657,585,092 P=54,693,308 P=77,866,896 P=16,252,343 P=1,059,408,694 (P=3,923,869) P=2,861,882,464 Net income for the year – – – – 88,476,698 – 88,476,698 Other comprehensive loss – – (23,395,946) (7,493,238) – – (30,889,184) Total comprehensive income (loss) for the year – – (23,395,946) (7,493,238) 88,476,698 – 57,587,514 Cash dividends - P=0.04 per share – – – – (66,308,161) – (66,308,161) Issuance of stocks 4,713,558 – – – – – 4,713,558 4,713,558 – – – (66,308,161) – (61,594,603) BALANCES AT DECEMBER 31, 2008 1,662,298,650 54,693,308 54,470,950 8,759,105 1,081,577,231 (3,923,869) 2,857,875,375 Net income for the year – – – 282,809,874 – 282,809,874 Other comprehensive income (loss) – – (2,247,007) 207,665 – – (2,039,342) Total comprehensive income (loss) for the year – – (2,247,007) 207,665 282,809,874 – 280,770,532 Cash dividends - P=0.04 per share – – – – (66,491,957) – (66,491,957) Issuance of stocks 304,419 – – – – – 304,419 304,419 – – – (66,491,957) – (66,187,538) BALANCES AT DECEMBER 31, 2009 1,662,603,069 54,693,308 52,223,943 8,966,770 1,297,895,148 (3,923,869) 3,072,458,369 Net income for the year – – – – 14,744,926 – 14,744,926 Other comprehensive income – – 19,610,150 4,219,006 – – 23,829,156 Total comprehensive income for the year – – 19,610,150 4,219,006 14,744,926 – 38,574,082 Cash dividends - P=0.04 per share – – – – (66,585,025) – (66,585,025) Issuance of stocks 2,022,535 – – – – – 2,022,535 2,022,535 – – – (66,585,025) – (64,562,490) BALANCES AT DECEMBER 31, 2010 P=1,664,625,604 P=54,693,308 P=71,834,093 P=13,185,776 P=1,246,055,049 (P=3,923,869) P=3,046,469,961 See accompanying Notes to Consolidated Financial Statements.

*SGVMC311705*
TRANS-ASIA OIL AND ENERGY DEVELOPMENT CORPORATION AND SUBSIDIARIES CONSOLIDATED STATEMENTS OF CASH FLOWS Years Ended December 31 2010 2009 2008
CASH FLOWS FROM OPERATING ACTIVITIES Income before income tax P=12,281,576 P=298,434,887 P=68,277,329 Adjustments for: Company’s share in loss (income) before income tax
of a joint venture (Note 13) (17,566,256) (31,001,611) 84,007,285 Interest and other financial income (Note 31) (70,143,513) (65,572,065) (48,403,004) Depreciation and amortization (Note 23) 53,210,527 56,709,449 102,234,092 Loss (gain) on derivatives - net (Note 31) (45,755,928) (37,608,112) 21,231,494 Dividend income (7,090,765) (27,081,565) (2,120,941) Unrealized foreign exchange loss (gain) 34,870,085 12,635,701 (54,846,127) Deferred exploration costs written-off – 78,517,254 – Provisions for (reversal of): Impairment loss on available-for-sale investments
(Note 11) 22,590,410 – – Impairment loss on property, plant and equipment
(Note 9) (20,320,409) 106,890,399 – Doubtful accounts (Note 8) 6,741,771 – – Impairment loss on deferred exploration costs
(Note 14) – 11,473,481 – Unrecoverable input tax – 772,415 6,162,861 Loss (gain) on sale of: Royalty interest (Note 14) (58,571,625) – – Investment in associates (Note 10) – (24,790,492) – Property and equipment (Note 29) 34,314 (7,280,152) 35,873 Available-for-sale investments (60,400) (20,462) 28,772 Equity in net losses (earnings) of associates (Note 10) 3,377,806 (12,126) (8,651,932) Operating income (loss) before working capital changes (86,402,407) 372,067,001 167,955,702 Decrease (increase) in: Receivables 7,212,335 (6,735,833) (98,837,050) Fuel and spare parts 17,633,155 7,084,270 5,339,838 Other current assets (52,105,142) (325,126) (10,455,805) Increase (decrease) in accounts payable
and other current liabilities 72,147,413 (30,080,350) 25,296,670 Net cash generated from (used in) operations (41,514,646) 342,009,962 89,299,355 Interest received 50,103,685 63,372,758 54,952,237 Income taxes paid (29,059,014) (19,527,068) (7,424,230) Company’s share in net cash flows provided
by (used in) operating activities of a joint venture 76,839,394 64,733,381 (52,329,766) Net cash flows provided by operating activities 56,369,419 450,589,033 84,497,596
CASH FLOWS FROM INVESTING ACTIVITIES Additions to: Investments held for trading (1,966,250,844) (1,245,008,119) (1,143,926,855) Investment in associates (Note 10) (42,578,125) – – Property and equipment (Note 9) (28,262,773) (19,428,624) (11,981,177) Deferred exploration costs (Note 14) (14,832,931) (17,607,890) (6,109,207) Available-for-sale investments (1,477,981) (87,021) (6,836,230) Investment properties (Note 12) – (94,362,125) – Short-term investments – – (8,871,216) (Forward)

*SGVMC311705*
- 2 -
Years Ended December 31 2010 2009 2008 Proceeds from: Sale and redemption of investments held for trading P=1,915,351,202 P=978,559,836 P=736,835,458 Settlement of currency forward contracts (Note 31) 46,418,460 22,742,850 22,199,906 Termination of short-term investments 5,000,000 12,511,120 – Sale of property and equipment (Note 9) 1,930,410 62,000,000 531,251 Sale of available-for-sale investments 254,916 240,986 1,233,190 Sale of investment in associates – 193,285,135 – Decrease (increase) in other noncurrent assets 80,685,000 (127,575,000) 1,000 Cash dividends received 7,572,394 26,571,234 2,120,941 Company’s share in net cash flows provided by (used in)
investing activities of a joint venture 2,456,000 7,876,775 (426,492) Net cash flows provided by (used in) investing activities 6,265,728 (200,280,843) (415,229,431)
CASH FLOWS FROM FINANCING ACTIVITIES Payment of cash dividends (65,635,409) (65,756,573) (65,376,071) Increase (decrease) in customers’ deposits – (27,385,096) 4,454,239 Increase (decrease) in other noncurrent liabilities 3,358,901 (2,138,281) 3,859,164 Company’s share in net cash flows provided by (used in)
financing activities of a joint venture – (36,925,000) 36,925,000 Net cash flows used in financing activities (62,276,508) (132,204,950) (20,137,668)
EFFECT OF FOREIGN EXCHANGE RATE CHANGES ON CASH AND CASH EQUIVALENTS
Effect of foreign exchange rate changes on cash and cash equivalents (26,732,147) (6,633,808) 45,662,613
NET INCREASE (DECREASE) IN CASH AND CASH EQUIVALENTS OF VENTURER AND JOINT VENTURE (26,373,508) 111,469,432 (305,206,890)
CASH AND CASH EQUIVALENTS AT BEGINNING OF YEAR (Note 6) 1,027,930,060 916,460,628 1,221,667,518
CASH AND CASH EQUIVALENTS AT END OF YEAR (Note 6) P=1,001,556,552 P=1,027,930,060 P=916,460,628
See accompanying Notes to Consolidated Financial Statements.

*SGVMC311705*
TRANS-ASIA OIL AND ENERGY DEVELOPMENT CORPORATION AND SUBSIDIARIES NOTES TO CONSOLIDATED FINANCIAL STATEMENTS 1. Corporate Information and Status of Operations
Trans-Asia Oil and Energy Development Corporation (TA Oil or “Parent Company”), incorporated on September 8, 1969, and its wholly-owned subsidiaries, Trans-Asia Renewable Energy Corporation (TAREC), Trans-Asia (Karang Besar) Petroleum Corporation, CIP II Power Corporation (CIPP) and Trans-Asia Gold and Minerals Development Corporation (TA Gold) (collectively referred to as “the Company”) are incorporated and registered with the Philippine Securities and Exchange Commission (SEC). The direct and ultimate parent company of TA Oil is Philippine Investment-Management (PHINMA), Inc., also incorporated in the Philippines. TA Oil is managed by PHINMA under an existing management agreement.
The Parent Company is involved in power generation and trading, oil and mineral exploration, exploitation and production. The Parent Company has an Electricity Supply Agreement (ESA) with Guimaras Electric Cooperative, Inc. (Guimelco), the lone electricity distributor in the province of Guimaras using its 3.4 megawatt (MW) bunker C-fired diesel generator power station in the island. The Energy Regulatory Commission (ERC) granted the Parent Company a certificate of registration as a Wholesale Aggregator in November 2006 renewable every five (5) years, and a Retail Electricity Supplier’s (RES) license in December 2006. The license authorizes the Parent Company to consolidate electricity power demand of distribution utilities, pursuant to the Electric Power Industry Reform Act of 2001 (EPIRA). As a RES, the Parent Company is allowed to supply electricity to the contestable market, pursuant to EPIRA. The other activities of the Company are investments in various operating companies and financial instruments.
The Parent Company also has a 50% interest in Trans-Asia Power Generation Corporation (TA Power), a company engaged in power generation. In October 2006, the Philippine Electricity Market Corporation (PEMC) approved TA Power’s application for registration as trading participant for both generation and customer categories in the Wholesale Electricity Spot Market (WESM). Both the Parent Company and TA Power obtained membership in the WESM which allows them to participate in electricity trading managed by PEMC, including selling of excess generation to the WESM. CIPP was registered with the Philippine Economic Zone Authority (PEZA) as an ecozone utilities enterprise, particularly, to develop and operate a power supply and distribution system at Carmelray Industrial Park II (CIP II) Special Economic Zone, in Barangay Punta and Tulo, Calamba, Laguna. In April 2009, CIPP sold its distribution assets to Manila Electric Company (MERALCO) resulting in the cessation of CIPP’s operations (see Notes 9 and 20). Substantially all of its employees were separated effective January 31, 2010. On February 22, 2010 and March 24, 2010, the Board of Directors and stockholders, respectively, of the Parent Company approved the proposed merger of the Parent Company and CIPP subject to the approval by the SEC. As of February 21, 2011, the Company has not filed its application for merger with the SEC and has deferred its plan for merger.
TA Gold was incorporated and registered with the SEC on July 2, 2007 to primarily engage in the business of mining and mineral exploration within the Philippines and other countries. On February 16, 2009, the Board of Directors approved the suspension of exploration activities of TA Gold effective March 31, 2009.

- 2 -
*SGVMC311705*
TAREC and Karang Besar have not yet started commercial operations.
The registered office address of the Parent Company is 11th Floor, PHINMA Plaza, 39 Plaza Drive, Rockwell Center, Makati City. The consolidated financial statements of the Company were authorized for issuance by the Board of Directors (BOD) on February 21, 2011.
2. Basis of Preparation
The consolidated financial statements of the Company have been prepared using the historical cost basis, except for financial assets at fair value through profit or loss (FVPL), derivative assets and available-for-sale (AFS) investments that have been measured at fair value. The consolidated financial statements are presented in Philippine peso, which is the Company’s functional currency. All values are rounded to the nearest peso, unless otherwise stated.
Statement of Compliance The consolidated financial statements have been prepared in accordance with Philippine Financial Reporting Standards (PFRS).
Basis of Consolidation The consolidated financial statements comprise the financial statements of the Parent Company and its wholly-owned subsidiaries as of December 31 of each year. The financial statements of the subsidiaries are prepared for the same reporting year as the Parent Company, using consistent accounting policies. Where the reporting date of a subsidiary or associate is different from the Parent Company, adjustments shall be made for the effects of significant transactions and events that occur between that date and the date of the Parent Company’s financial statements. The difference between the end of the reporting period of the subsidiary or associate and the Parent Company shall be no more than three months.
All intragroup balances, transactions, income and expenses and profits and losses resulting from intragroup transactions are eliminated in full.
Subsidiaries are fully consolidated from the date of acquisition, being the date on which the Company obtains control, and continue to be consolidated until the date that such control ceases.
In addition, the Company’s share of each of the assets, liabilities, income and expenses of its jointly controlled venture, TA Power, is included as a separate line item in the consolidated financial statements based on the account grouping (see Note 13).
3. Changes in Accounting Policies and Disclosures
Current Changes in Accounting Policies The accounting policies adopted are consistent with those of the previous financial year except for the adoption of the following amended and revised PFRS, Philippine Accounting Standards (PAS) and Philippine Interpretation, based on International Financial Reporting Interpretations Committee (IFRIC) interpretations, starting January 1, 2010.
- 3 -
*SGVMC311705*
Amendments to PFRS 2 - Group Cash-settled Share-based Payment Transactions The amendments to PFRS 2, Share-based Payments, clarify the scope and the accounting for group cash-settled share-based payment transactions. The adoption of these amendments did not have an impact on the consolidated financial statements. PFRS 3 - Business Combinations (Revised) and PAS 27 - Consolidated and Separate Financial Statements (Amended) PFRS 3 (Revised) introduces significant changes in the accounting for business combinations. Changes include the effect on the valuation of non-controlling interest, the accounting for transaction costs, the initial recognition and subsequent measurement of a contingent consideration and business combinations achieved in stages. These changes will impact the amount of goodwill recognized, the reported results in the period that an acquisition occurs and future results. PAS 27 (Amended) requires that a change in the ownership interest of a subsidiary (without loss of control) is accounted for as a transaction with owners in their capacity as owners. Therefore, such transactions will no longer give rise to goodwill, nor will it give rise to a gain or loss. Furthermore, losses incurred by the subsidiary will be allocated between the controlling and non-controlling interest even if the losses exceed the non-controlling equity investment in the subsidiary. The changes by PFRS 3 (Revised) and PAS 27 (Amended) will affect future acquisitions or loss of control of subsidiaries and transactions with non-controlling interests. These changes did not have a significant impact on the Company’s consolidated financial statements.
Amendment to PAS 39, Financial Instruments: Recognition and Measurement - Eligible Hedged Items The amendment to PAS 39 clarifies that an entity is permitted to designate a portion of the fair value changes or cash flow variability of a financial instrument as a hedged item. This also covers the designation of inflation as a hedged risk or portion in particular situations. The adoption of this amendment did not have an impact on the consolidated financial statements, as the Company has not entered into any such hedges.
Philippine Interpretation IFRIC 17 - Distributions of Non-Cash Assets to Owners It provides guidance on how to account for non-cash distributions to owners. The interpretation clarifies when to recognize a liability, how to measure it and the associated assets, and when to derecognize the asset and liability. The adoption of this Interpretation did not have an impact on the consolidated financial statements, as the Company has not made non-cash distributions to shareholders during the year. Improvements of PFRS adopted by the Company starting January 1, 2010 The omnibus amendments to PFRS were issued primarily with a view to remove inconsistencies and clarify wordings. The adoption of the following improvements resulted in changes in accounting policies but did not have significant impact on the consolidated financial statements of the Company.
• PFRS 2, Share-based Payment
- Clarifies that the contribution of a business on formation of a joint venture and combinations under common control are not within the scope of PFRS 2 even though they are out of scope of PFRS 3, Business Combinations (Revised).
• PFRS 5, Non-current Assets Held for Sale and Discontinued Operations
- Clarifies that the disclosures required in respect of noncurrent assets and disposal groups classified as held for sale or discontinued operations are only those set out in PFRS 5. The disclosure requirements of other PFRS only apply if specifically required for such noncurrent assets or discontinued operations.

- 4 -
*SGVMC311705*
• PFRS 8, Operating Segments - Clarifies that segment assets and liabilities need only be reported when those assets and
liabilities are included in measures that are used by the chief operating decision maker.
• PAS 1, Presentation of Financial Statements - Clarifies that the terms of a liability that could result, at anytime, in its settlement by the
issuance of equity instruments at the option of the counterparty do not affect its classification.
• PAS 7, Statement of Cash Flows
- Explicitly states that only expenditure that results in a recognized asset can be classified as a cash flow from investing activities.
• PAS 17, Leases
- Removes the specific guidance on classifying land as a lease. Prior to the amendment, leases of land were classified as operating leases. The amendment now requires that leases of land are classified as either ‘finance’ or ‘operating’ in accordance with the general principles of PAS 17.
• PAS 36, Impairment of Assets
- Clarifies that the largest unit permitted for allocating goodwill, acquired in a business combination, is the operating segment as defined in PFRS 8 before aggregation for reporting purposes.
• PAS 38, Intangible Assets
- Clarifies that if an intangible asset acquired in a business combination is identifiable only with another intangible asset, the acquirer may recognize the group of financial assets as a single asset provided the individual assets have similar useful lives. The amendment also clarifies that the valuation technique presented for determining the fair value of intangible assets acquired in a business combination that are not traded in active markets are only examples and are not restrictive on the methods that can be used.
• PAS 39, Financial Instruments: Recognition and Measurement
- Clarifies that (a) a prepayment option is considered closely related to the host contract when the exercise price of a prepayment option reimburses the lender up to the approximate present value of lost interest for the remaining term of the host contract; (b) the scope exemption for contracts between an acquirer and a vendor in a business combination to buy or sell an acquiree at a future date applies only to binding forward contracts, and not derivative contracts where further actions by either party are still to be taken; and, (c) gains or losses on cash flow hedges of a forecast transaction that subsequently results in the recognition of a financial instrument or on cash flow hedges of recognized financial instruments should be reclassified in the period that the hedged forecast cash flows affect profit or loss.
• Philippine Interpretation IFRIC-9, Reassessment of Embedded Derivatives
- Clarifies that it does not apply to possible reassessment at the date of acquisition, to embedded derivatives in contracts acquired in a business combination between entities or businesses under common control or the formation of joint venture.

- 5 -
*SGVMC311705*
• Philippine Interpretation IFRIC-16, Hedge of a Net Investment in a Foreign Operation - States that, in a hedge of a net investment in a foreign operation, qualifying hedging
instruments may be held by any entity or entities within the group, including the foreign operation itself, as long as the designation, documentation and effectiveness requirements of PAS 39 that relate to a net investment hedge are satisfied.
Amendments to Standards and Interpretations that have been issued but are not yet effective The following standards, amendments to standards and interpretation have been issued but will become effective subsequent to financial year ended December 31, 2010. The Company has not early adopted the following amendments and anticipates that these changes are either not applicable or will have no significant effect on the consolidated financial statements. Effective in 2011
PAS 24, Related Party Disclosures (Revised) The amended standard is effective for annual periods beginning on or after January 1, 2011. It addresses the concerns that the previous disclosure requirements and the definition of a ‘related party’ that were too complex and difficult to apply in practice, especially in environments where government control is pervasive. It provides partial exemption for government-related entities by providing and simplifying the definition of a related party and removing inconsistencies. Amendment to PAS 32, Classification of Rights Issues The amendment to PAS 32 is effective for annual periods beginning on or after February 1, 2010 and amended the definition of a financial liability in order to classify rights issues (and certain options or warrants) as equity instruments in cases where such rights are given pro rata to all of the existing owners of the same class of an entity’s non-derivative equity instruments, or to acquire a fixed number of the entity’s own equity instruments for a fixed amount in any currency. Amendment to Philippine Interpretation IFRIC-14, Prepayment of a Minimum Funding Requirement The amendment is effective for annual periods beginning on or after January 1, 2011. This Interpretation applies in limited circumstances when an entity is subject to minimum funding requirements and makes an early payment of contributions to cover those requirements. The amendment permits such an entity to treat the benefit of such an early payment as an asset. Philippine Interpretation IFRIC-19, Extinguishing Financial Liabilities with Equity Instruments This Interpretation which is effective for annual periods beginning on or after July 1, 2010, clarifies that equity instruments issued to a creditor to extinguish a financial liability qualify as consideration paid. The equity instruments issued are measured at their fair value. In case that this cannot be reliably measured, the instruments are measured at the fair value of the liability extinguished. Any gain or loss is recognized immediately in profit or loss. Improvements of PFRS to be adopted by the Company starting January 1, 2011 The omnibus amendments to PFRS were issued primarily with a view to remove inconsistencies and clarify wordings. The adoption of the following improvements resulted in changes in accounting policies but did not have significant impact on the consolidated financial statements of the Company. • PFRS 3, Business Combinations
- Clarifies that the amendments to PFRS 7, PAS 32, Financial Instruments: Presentation and PAS 39 that eliminate the exemption for contingent consideration, do not apply to contingent consideration that arose from business combinations whose acquisition dates precede application of PFRS 3 (as revised in 2008).

- 6 -
*SGVMC311705*
• PFRS 7, Financial Instruments: Disclosures - Emphasizes the interaction between quantitative and qualitative disclosures and the nature
and extent of risks associated with financial instruments.
• PAS 1, Presentation of Financial Statements - Clarifies that an entity will present an analysis of other comprehensive income for each
component of equity, either in the statement of changes in equity or in the notes to the financial statements.
• PAS 27, Consolidated and Separate Financial Statements
- Clarifies that the consequential amendments from PAS 27 made to PAS 21, The Effect of Changes in Foreign Exchange Rates, PAS 28, Investments in Associates and PAS 31, Interests in Joint Ventures apply prospectively for annual periods beginning on or after July 1, 2009 or earlier when PAS 27 is applied earlier.
Effective in 2012 Amendment to PAS 12, Income Taxes - Deferred Tax: Recovery of Underlying Assets The amendment to PAS 12 is effective for annual periods beginning on or after 1 January 2012. It provides a practical solution to the problem of assessing whether recovery of an asset will be through use or sale. It introduces a presumption that recovery of the carrying amount of an asset will normally be through sale. Amendment to PFRS 7 - Financial Instruments: Disclosures - Transfers of Financial Assets The amendments to PFRS 7 are effective for annual periods beginning on or after 1 July 2011. The amendments will allow users of financial statements to improve their understanding of transfer transactions of financial assets (for example, securitizations), including understanding the possible effects of any risks that may remain with the entity that transferred the assets. The amendments also require additional disclosures if a disproportionate amount of transfer transactions are undertaken around the end of a reporting period. Philippine Interpretation IFRIC 15, Agreements for the Construction of Real Estate This Interpretation, effective for annual periods beginning on or after January 1, 2012, covers accounting for revenue and associated expenses by entities that undertake the construction of real estate directly or through subcontractors. This Philippine Interpretation requires that revenue on construction of real estate be recognized only upon completion, except when such contracts qualify as construction contract under PAS 11, Construction Contracts, or involve rendering of services in which case revenue is recognized based on stage of completion. Contracts involving provision of services with the construction materials and where the risks and reward of ownership are transferred to the buyer on a continuous basis will also be accounted for based on stage of completion.
Effective in 2013 PFRS 9, Financial Instruments: Classification and Measurement PFRS 9, as issued in 2010, reflects the first phase of the work on the replacement of PAS 39 and applies to classification and measurement of financial assets and financial liabilities as defined in PAS 39. The standard is effective for annual periods beginning on or after 1 January 2013. In subsequent phases, hedge accounting and derecognition will be addressed. The completion of this project is expected in early 2011. The Company is currently assessing the impact of this standard to the consolidated financial statements.

- 7 -
*SGVMC311705*
4. Summary of Significant Accounting and Financial Reporting Policies
Cash and Cash Equivalents Cash includes cash on hand and in banks. Cash equivalents are short-term, highly liquid investments that are readily convertible to known amounts of cash with original maturities of three months or less and that are subject to an insignificant risk of change in value.
Short-term Investments Short-term investments represent investments that are readily convertible to known amounts of cash with original maturities of more than three months to one year.
Financial Assets and Financial Liabilities Financial assets and financial liabilities are recognized initially at fair value. Transaction costs are included in the initial measurement of all financial assets and liabilities, except for financial instruments measured at FVPL.
The Company recognizes a financial asset or a financial liability in the consolidated balance sheet when it becomes a party to the contractual provisions of the instruments.
All regular way purchases and sales of financial assets are recognized on the trade date, i.e., the date that the Company commits to purchase the assets. Regular way purchases or sales are purchases or sales of financial assets that require delivery of assets within the period generally established by regulation or convention in the marketplace.
The fair value of financial instruments traded in active markets at the balance sheet date is based on their quoted market price or dealer price quotations (bid price for long positions and ask price for short positions), without any deduction for transaction costs. When current bid and asking prices are not available, the price of the most recent transaction provides evidence of the current fair value as long as there has not been a significant change in economic circumstances since the time of the transaction.
For all other financial instruments not listed in an active market, the fair value is determined by using appropriate valuation techniques. Valuation techniques include net present value techniques, comparison to similar instruments for which market observable prices exist, and other relevant valuation models.
Where the transaction price in a non-active market is different from the fair value from other observable current market transactions in the same instrument or based on a valuation technique whose variables include only data from observable market, the Company recognizes the difference between the transaction price and fair value (a “Day 1” gain or loss) in the consolidated statement of income unless it qualifies for recognition as some other type of asset. In cases where the data used is not observable, the difference between the transaction price and model value is only recognized in the consolidated statement of income when the inputs become observable or when the instrument is derecognized. For each transaction, the Company determines the appropriate method of recognizing the “Day 1” gain or loss amount.
Financial instruments are classified as liabilities or equity in accordance with the substance of the contractual arrangement. Interest, dividends, gains and losses relating to a financial instrument or a component that is a financial liability, are reported as expense or income. Distributions to holders of financial instruments classified as equity are charged directly to equity, net of any related income tax benefits.

- 8 -
*SGVMC311705*
Financial assets and financial liabilities are classified as either financial asset or liability at FVPL, loans and receivables, held-to-maturity (HTM) investments, AFS investments or other financial liabilities. The Company determines the classification of its financial assets and financial liabilities at initial recognition and, where allowed and appropriate, reevaluates this designation at every reporting date.
Financial Assets and Liabilities at FVPL a. Financial Assets or Financial Liabilities Designated at FVPL
Financial assets or financial liabilities classified in this category include those that are designated by management on initial recognition as at FVPL when any of the following criteria is met: • The designation eliminates or significantly reduces the inconsistent treatment that would
otherwise arise from measuring the assets or liabilities or recognizing gains or losses on them on a different basis;
• The assets and liabilities are part of a group of financial assets, financial liabilities or both which are managed and their performance evaluated on a fair value basis, in accordance with a documented risk management or investment strategy; or
• The financial instrument contains an embedded derivative, unless the embedded derivative does not significantly modify the cash flows or it is clear, with little or no analysis, that it would not be separately recorded.
Financial assets and financial liabilities designated at FVPL are recorded in the consolidated balance sheet at fair value. Changes in fair value on financial assets and liabilities designated at FVPL are recorded in the consolidated statement of income. Interest earned or incurred is recorded in interest and other financial income or charges, respectively, while dividend income is recorded according to the terms of the contract, or when the right to receive the payment has been established. As of December 31, 2010 and 2009, the Company has no financial asset or financial liability designated on initial recognition as at FVPL.
b. Financial assets or financial liabilities held for trading
These financial instruments are recorded in the consolidated balance sheet at fair value. A financial asset or financial liability is classified under this category when any of the following criteria is met: • It is acquired or incurred principally for the purpose of selling or repurchasing it in the
near term; • On initial recognition, it is part of a portfolio of identified financial instruments that are
managed together and for which there is evidence of a recent actual pattern of short-term profit-taking; or
• It is a derivative (except for a derivative that is a financial guarantee contract or a designated and effective hedging instrument).
Changes in fair value relating to the held-for-trading positions are recognized in the consolidated statement of income as gain on investment held for trading under the “Interest and other financial income” account. Interest earned or incurred is recorded in interest and other financial income or charges, respectively, while dividend income is recorded when the right to receive payment has been established.

- 9 -
*SGVMC311705*
As of December 31, 2010 and 2009, the Company’s investments in bonds and fixed treasury notes (FXTNs) and unit investment trust funds (UITFs) are classified as financial assets held for trading (see Notes 7 and 31).
Derivatives recorded at FVPL The Company enters into short-term forward currency contracts to hedge its currency exposure. Derivative instruments are initially recognized at fair value on the date in which a derivative transaction is entered into or bifurcated, and are subsequently remeasured at fair value. Derivatives are carried as assets when the fair value is positive and as liabilities when the fair value is negative. The Company has opted not to designate its derivative transactions under hedge accounting. Consequently, gains and losses from changes in fair value of these derivatives are recognized immediately in the consolidated statement of income. The fair values of freestanding forward currency transactions are calculated by reference to current forward exchange rates for contracts with similar maturity profiles.
Embedded derivatives An embedded derivative is separated from the host contract and accounted for as a derivative, if all of the following conditions are met: (a) the economic characteristics and risks of the embedded derivative are not closely related to the economic characteristics and risks of the host contract; (b) a separate instrument with the same terms as the embedded derivative would meet the definition of a derivative; and (c) the hybrid or combined instrument is not recognized at FVPL. Embedded derivatives are measured at fair value, and are carried as assets when the fair value is positive and as liabilities when the fair value is negative. Gains and losses from changes in fair value of these derivatives are recognized immediately in the consolidated statement of income. Reassessment of embedded derivatives is only done when there are changes in the contract that significantly modifies the cash flows. As of December 31, 2010 and 2009, the Company’s derivative assets are classified as financial assets at FVPL (see Note 31).
Loans and Receivables Loans and receivables are nonderivative financial assets with fixed or determinable payments and are not quoted in an active market. Such assets are carried at amortized cost using the effective interest method. Gains and losses are recognized in the consolidated statement of income when the loans and receivables are derecognized or impaired, as well as through the amortization process. Loans and receivables are included in current assets if maturity is within 12 months from the balance sheet date. Otherwise, these are classified as noncurrent assets.
As of December 31, 2010 and 2009, the Company’s cash and cash equivalents, short-term investments and receivables are classified as loans and receivables (see Notes 6 and 31).
HTM Investments Quoted nonderivative financial assets with fixed or determinable payments and fixed maturities are classified as HTM when the Company has the positive intention and ability to hold to maturity. Such assets are carried at amortized cost using the effective interest method. Gains and losses are recognized in the consolidated statement of income when the HTM investments are derecognized or impaired, as well as through the amortization process. HTM

- 10 -
*SGVMC311705*
investments are classified as current if maturity is within 12 months from the balance sheet date. Otherwise, these are classified as noncurrent assets.
As of December 31, 2010 and 2009, the Company did not classify any financial asset under HTM investments.
AFS Investments AFS investments are nonderivative financial assets that are designated as AFS or are not classified in any of the three preceding categories. They are purchased and held indefinitely, and may be sold in response to liquidity requirements or changes in market conditions. After initial recognition, AFS investments are measured at fair value with gains or losses being recognized as a separate component of equity until the investment is derecognized or until the investment is determined to be impaired at which time the cumulative gain or loss previously reported in equity is included in the consolidated statement of income. Unlisted AFS financial assets, on the other hand, are carried at cost, net of any impairment, until the investment is derecognized. AFS investments are classified as current if they are expected to be realized within 12 months from the balance sheet date. Otherwise, these are classified as noncurrent assets.
As of December 31, 2010 and 2009, the Company’s investments in listed and unlisted equity securities and golf club shares are classified as AFS investments (see Notes 11 and 31).
Other Financial Liabilities Other financial liabilities are initially recognized at the fair value of the consideration received less directly attributable transaction costs.
After initial recognition, other financial liabilities are subsequently measured at amortized cost using the effective interest method.
Gains and losses are recognized in the consolidated statement of income when the liabilities are derecognized as well as through the amortization process.
As of December 31, 2010 and 2009, the Company’s accounts payable and other current liabilities and due to stockholders are classified as other financial liabilities (see Notes 15, 27 and 31).
Impairment of Financial Assets The Company assesses at each balance sheet date whether a financial asset or group of financial assets is impaired.
Assets carried at amortized cost If there is objective evidence (such as the probability of insolvency or significant financial difficulties of the debtor) that an impairment loss on loans and receivables carried at amortized cost has been incurred, the amount of the loss is measured as the difference between the asset’s carrying amount and the present value of estimated future cash flows (excluding future credit losses that have not been incurred) discounted at the financial asset’s original effective interest rate (i.e., the effective interest rate computed at initial recognition). The carrying amount of the asset shall be reduced through the use of an allowance account and the amount of the loss is recognized in the consolidated statement of income. Interest income continues to be accrued on the reduced carrying amount based on the original effective interest rate of the asset. Loans and receivables together with the associated allowance are written off when there is no realistic prospect of future recovery and all collateral, if any, has been realized or has been transferred to the Company. If in a subsequent year, the amount of the impairment loss increases or decreases

- 11 -
*SGVMC311705*
because of an event occurring after the impairment was recognized, the previously recognized impairment loss is increased or reduced by adjusting the allowance account, to the extent that the carrying value of the asset does not exceed its amortized cost at the reversal date. Any subsequent reversal of an impairment loss is recognized in the consolidated statement of income.
The Company first assesses whether objective evidence of impairment exists individually for financial assets that are individually significant, and individually or collectively for financial assets that are not individually significant. If it is determined that no objective evidence of impairment exists for an individually assessed financial asset, whether significant or not, the asset is included in a group of financial assets with similar credit risk characteristics and that group of financial assets is collectively assessed for impairment. Assets that are individually assessed for impairment and for which an impairment loss is or continues to be recognized are not included in a collective assessment of impairment. For the purpose of specific evaluation of impairment, the Company assesses whether financial assets are impaired through assessment of collectability of financial assets considering the creditors’ capacity to pay, history of payment, and the availability of other financial support. For the purpose of a collective evaluation of impairment, financial assets are grouped on the basis of such credit risk characteristics such as customer type, payment history, past due status and term.
Assets carried at cost If there is objective evidence that an impairment loss on an unquoted equity instrument that is not carried at fair value because its fair value cannot be reliably measured has been incurred, the amount of the loss is measured as the difference between the asset’s carrying amount and the present value of estimated future cash flows discounted at the current market rate of return for a similar financial asset.
AFS investments In the case of equity investments classified as AFS, this would include a significant or prolonged decline in the fair value of the investments below its cost. Where there is evidence of impairment, the cumulative loss, measured as the difference between the acquisition cost and the current fair value, less any impairment loss on that financial asset previously recognized in the consolidated statement of income, is removed from equity and recognized in the consolidated statement of income. Impairment losses on equity investments are not reversed through the consolidated statement of income. Increases in fair value after impairment are recognized directly in equity.
In the case of debt instruments classified as AFS, impairment is assessed based on the same criteria as financial assets carried at amortized cost. Future interest income is based on the reduced carrying amount and is accrued based on the rate of interest used to discount future cash flows for the purpose of measuring impairment loss. Any such accrual is recorded as part of “Interest and other financial income” account in the consolidated statement of income. If, in subsequent year, the fair value of a debt instrument increases and the increase can be objectively related to an event occurring after the impairment loss was recognized in the consolidated statement of income, the impairment loss is reversed through the consolidated statement of income.
Derecognition of Financial Assets and Financial Liabilities Financial assets A financial asset (or, where applicable a part of a financial asset or part of a group of similar financial assets) is derecognized when: • the rights to receive cash flows from the asset have expired or have been transferred; • the Company retains the right to receive cash flows from the asset, but has assumed an obligation
to pay them in full without material delay to a third party under a “pass-through” arrangement; or
- 12 -
*SGVMC311705*
• the Company has transferred its rights to receive cash flows from the asset and either: (a) has transferred substantially all the risks and rewards of the asset, or (b) has neither transferred nor retained substantially all the risks and rewards of the asset, but has transferred control of the asset.
Where the Company has transferred its rights to receive cash flows from an asset and has neither transferred nor retained substantially all the risks and rewards of the asset nor transferred control of the asset, the asset is recognized to the extent of the Company’s continuing involvement in the asset.
Continuing involvement that takes the form of a guarantee over the transferred asset is measured at the lower of the original carrying amount of the asset and the maximum amount of consideration that the Company could be required to repay.
Financial liabilities A financial liability is derecognized when the obligation under the liability is discharged, cancelled or has expired. Where an existing financial liability is replaced by another from the same lender on substantially different terms, or the terms of an existing liability are substantially modified, such an exchange or modification is treated as a derecognition of the original liability and the recognition of a new liability, and the difference in the respective carrying amount of a financial liability (or part of a financial liability) extinguished or transferred to another party and the consideration paid, including any non-cash assets transferred or liabilities assumed, is recognized in the consolidated statement of income. Offsetting Financial Instruments Financial assets and financial liabilities are offset and the net amount reported in the consolidated balance sheet when there is a currently legal right to set off the recognized amounts and the Company intends to either settle on a net basis, or to realize the asset and settle the liability simultaneously.
Fuel and Spare Parts Fuel and spare parts are stated at the lower of cost or net realizable value. Cost is determined using the first-in, first-out method. Net realizable value is the current replacement cost of fuel and spare parts.
Property, Plant and Equipment Property, plant and equipment, except land, are stated at cost less accumulated depletion, depreciation and amortization and impairment in value. Land is stated at cost less any impairment in value.
The initial cost of property, plant and equipment comprises its purchase price, including import duties (where applicable), borrowing costs incurred during the construction period and other costs directly attributable to bringing the asset to its working condition and location for its intended use. Expenditures incurred after the property, plant and equipment have been put into operation, such as repairs and maintenance, are charged to income in the year the costs are incurred. In situation where it can be clearly demonstrated that the expenditures have resulted in an increase in the future economic benefits expected to be obtained from the use of an item of property and equipment beyond its originally assessed standard of performance, the expenditures are capitalized as an additional cost of property and equipment.
Under the component depreciation method, plant overhaul costs are segregated into two categories, that is: (a) costs that should be depreciated over the useful life of the plant; and,

- 13 -
*SGVMC311705*
(b) parts that are replaced at periodic intervals. The cost of the initial overhaul that may be capitalized is depreciated over its estimated useful life, through the next overhaul, at which time the process is repeated. Under this method, repairs and maintenance are also expensed as incurred. Depletion of wells, platforms and other facilities are provided on a field basis under the unit-of-production method based upon estimates of proven reserves. The depletion base includes the estimated future development cost of the undeveloped reserves. Depreciation and amortization are calculated on a straight-line basis over the estimated useful lives of the assets, as follows:
Buildings and improvements 20-25 years Land improvements 10 years Machinery and equipment 9-20 years Transportation equipment 3-5 years Mining and other equipment 10 years Office furniture, equipment and others 3-10 years
The useful lives and depletion, depreciation and amortization methods are reviewed periodically to ensure that the periods and methods of depletion, depreciation and amortization are consistent with the expected pattern of economic benefits from items of property, plant and equipment.
An item of property, plant and equipment is derecognized upon disposal or when no future economic benefits are expected from its use or disposal. Any gain or loss arising on derecognition of the assets (calculated as the difference between the net disposal proceeds and the carrying amount of the asset) is included in the consolidated statement of income in the year the asset is derecognized.
Construction in-progress is stated at cost. This includes cost of construction and other direct costs. Construction in-progress is not depreciated until such time as the relevant assets are completed and put into operational use.
Investments in Associates The Parent Company’s investments in associates are accounted for under the equity method of accounting. These are entities in which the Parent Company has significant influence and which are neither subsidiaries nor joint ventures of the Parent Company. The investments in associates are carried in the consolidated balance sheet at cost plus post-acquisition changes in the Parent Company’s share of net assets of the associates, less any impairment in value. The consolidated statement of income includes the Parent Company’s share of the results of operations of the associates. Unrealized gains arising from transactions with associates are eliminated to the extent of the Parent Company’s interest in the associates. Unrealized losses are eliminated similarly but only to the extent that there is no evidence of impairment of the asset transferred.
When the Parent Company’s accumulated share in net losses of an associate equals or exceeds the carrying amount of the investment, including advances, the Company discontinues the recognition of its share in additional losses and the investment is reduced to zero. If the associate subsequently reports net income, the Parent Company will resume applying the equity method only after its share in that net income equals the share in net losses not recognized during the period the equity method was suspended.

- 14 -
*SGVMC311705*
An investment in associate is derecognized upon disposal or when no future economic benefits are expected from its use or disposal. Any gain or loss arising on derecognition of the assets (calculated as the difference between the net disposal proceeds and the net carrying amount of the investment) is included in the consolidated statement of income in the year the investment is derecognized.
Interest in a Joint Venture The Parent Company’s interest in its joint venture is proportionately consolidated to the accounts of the Parent Company. This method involves presenting the Parent Company’s share in the joint venture’s assets, liabilities, income and expenses as separate line items in the consolidated financial statements. The Parent Company’s investment in the joint venture’s shares of stock is accounted for as “Parent Company shares of stock held by a joint venture” included and shown as a reduction in the equity section of the consolidated balance sheet. Investment Properties Investment properties are carried at cost, including transaction costs, net of accumulated depreciation. The carrying amount includes the cost of replacing part of an existing investment property at the time that cost is incurred if the recognition criteria are met and excludes the costs of day-to-day servicing of an investment property.
Depreciation is calculated on a straight-line basis over the estimated useful life of 20 years.
Investment property is derecognized when either it has been disposed of or when the investment property is permanently withdrawn from use and no future economic benefit is expected from its disposal. Any gain or loss on the retirement or disposal of an investment property is recognized in the consolidated statement of income in the year of retirement or disposal.
Transfers are made to investment property when, and only when, there is a change in use, evidenced by ending of owner-occupation, commencement of an operating lease to another party or ending of construction or development. Transfers are made from investment property when, and only when, there is a change in use, evidenced by commencement of owner-occupation or commencement of development with a view to sale.
Deferred Exploration Costs The Company follows the full cost method of accounting for exploration costs determined on the basis of each service contract (SC) or geophysical survey and exploration contract (GSEC) area. Under this method, all exploration costs relating to each SC or GSEC are tentatively deferred to the extent that the capitalized costs do not exceed the value of those reserves, pending determination of whether the contract area contains oil and gas reserves in commercial quantities, net of an allowance for impairment losses.
Expenditures for mineral exploration and development work on mining properties are also deferred as incurred, net of any allowance for impairment losses. These expenditures are provided for with an allowance when there are indications that the exploration results are negative. These are written off against the allowance when the projects are abandoned or determined to be definitely unproductive. When the exploration work results are positive, the net exploration costs and subsequent development costs are capitalized and amortized from the start of commercial operations.

- 15 -
*SGVMC311705*
Deferred exploration costs are assessed for impairment when: • the period for which the Company has the right to explore in the specific area has expired
during the period or will expire in the near future, and is not expected to be renewed; • substantive expenditure on further exploration for and evaluation of mineral resources in the
specific area is neither budgeted nor planned; • exploration for and evaluation of mineral resources in the specific area have not led to the
discovery of commercially viable quantities of mineral resources and the Company has decided to discontinue such activities in the specific area; or
• sufficient data exists to indicate that, although a development in the specific area is likely to proceed, the carrying amount of the exploration and evaluation asset is unlikely to be recovered in full from successful development or by sale.
When facts and circumstances suggest that the carrying amount exceeds the recoverable amount, impairment loss is measured, presented and disclosed in accordance with PAS 36.
Business Combinations Business combinations are accounted for using the acquisition method. This involves recognizing identifiable assets (including previously unrecognized intangible assets) and liabilities (including contingent liabilities and excluding future restructuring) of the acquired business at fair value. Goodwill acquired in a business combination is initially measured at cost being the excess of the cost of the business combination over the Company’s interest in the net fair value of the identifiable assets, liabilities and contingent liabilities. Following initial recognition, goodwill is measured at cost less any accumulated impairment loss. Goodwill is reviewed for impairment, annually or more frequently if events or changes in circumstances indicate that the carrying value may be impaired. If the Company’s interest in the net fair value of the identifiable assets, liabilities and contingent liabilities exceeds the cost of the business combination, the Company reassesses the identification and measurement of the acquiree’s identifiable assets, liabilities and contingent liabilities and the measurement of the cost of the combination and recognizes immediately in the consolidated statement of income any excess remaining after that reassessment.
For the purpose of impairment testing, goodwill acquired in a business combination is, from the acquisition date, allocated to each of the Company’s cash-generating units, or groups of cash-generating units, that are expected to benefit from the synergies of the combination, irrespective of whether other assets or liabilities of the Company are assigned to those units or groups of units.
Impairment is determined by assessing the recoverable amount of the cash-generating unit (group of cash-generating units), to which the goodwill relates. Where the recoverable amount of the cash-generating unit (group of cash-generating units) is less than the carrying amount, an impairment loss is recognized. Where goodwill forms part of a cash-generating unit (group of cash-generating units) and part of the operation within that unit is disposed of, the goodwill associated with the operation disposed of is included in the carrying amount of the operation when determining the gain or loss on disposal of the operation. Goodwill disposed of in this circumstance is measured based on the relative values of the operation disposed of and the portion of the cash-generating unit retained.
Impairment of Nonfinancial Assets The Company assesses at each reporting date whether there is an indication that an asset may be impaired. If any such indication exists, or when annual impairment testing for an asset is required, the Company makes an estimate of the asset’s recoverable amount. An asset’s recoverable amount is the higher of an asset’s or cash-generating unit’s fair value less costs to sell and its value-in-use and is determined for an individual asset, unless the asset does not generate cash inflows that are largely independent of those from other assets or groups of assets. Where the
- 16 -
*SGVMC311705*
carrying amount of an asset exceeds its recoverable amount, the asset is considered impaired and is written down to its recoverable amount. In assessing value-in-use, the estimated future cash flows are discounted to their present value using a pretax discount rate that reflects current market assessment of the time value of money and the risks specific to the asset. Impairment losses of continuing operations are recognized in the consolidated statement of income in those expense categories consistent with the function of the impaired asset.
An assessment is made at each reporting date as to whether there is any indication that previously recognized impairment losses may no longer exist or may have decreased. If such indication exists, the recoverable amount is estimated. A previously recognized impairment loss is reversed only if there has been a change in the estimates used to determine the asset’s recoverable amount since the last impairment loss was recognized. If that is the case, the carrying amount of the asset is increased to its recoverable amount. That increased amount cannot exceed the carrying amount that would have been determined, net of depletion, depreciation and amortization, had no impairment loss been recognized for the asset in prior years. Such reversal is recognized in profit or loss unless the asset is carried at revalued amount, in which case, the reversal is treated as a revaluation increase. After such a reversal, the depletion, depreciation and amortization charge is adjusted in future periods to allocate the asset’s revised carrying amount, less any residual value, on a systematic basis over its remaining useful life.
Provisions Provisions are recognized when the Company has a present obligation (legal or constructive) as a result of a past event, it is probable that an outflow of resources embodying economic benefits will be required to settle the obligation and a reliable estimate can be made of the amount of the obligation. If the effect of the time value of money is material, provisions are determined by discounting the expected future cash flows at a pretax rate that reflects current market assessment of the time value of money and, where appropriate, the risks specific to the liability. Where discounting is used, the increase in the provision due to the passage of time is recognized as an interest expense.
Capital Stock Capital stock represents the portion of the paid-in capital representing the total par value of the shares issued.
Retained Earnings Retained earnings include all current and prior period results of operations as reported in the consolidated statement of income, net of any dividend declaration.
Revenue Revenue is recognized when it is probable that the economic benefits associated with the transactions will flow to the Company and the revenue can be measured reliably. The following specific recognition criteria must also be met before revenue is recognized:
Trading revenue Revenue from the sale of electricity is recognized during the period when electricity is purchased from the spot market and sold to the end consumer. Revenue is measured at the fair value of the consideration received or receivable. Trading revenue is presented gross of trading costs where the Company acts as principal and:
- has primary responsibility for providing the goods and services; - has discretion in establishing prices; and - bears the credit and inventory risks. Trading revenue is presented net of trading costs where the Company acts as agent.

- 17 -
*SGVMC311705*
Generation Revenue Revenue from the sale of electricity is recognized during the period when electricity is generated. Revenue from take-or-pay arrangement is recognized in accordance with the terms of the ESA in relation to the electricity generated.
Dividend Dividend income is recognized when the Company’s right to receive the payment is established.
Interest Income is recognized as the interest accrues, taking into account the effective yield on the asset.
Rental Income is accounted for on a straight-line basis over the lease term.
Costs and Expenses Costs and expenses are recognized when incurred.
Pensions and Other Post-Employment Benefits The Company has a defined benefit pension plan. The costs of providing benefits under the defined benefit plan are determined using the projected unit credit actuarial valuation method. The method reflects service rendered by employees to the date of valuation and incorporates assumptions concerning employees’ projected salaries. Actuarial gains and losses are recognized as income or expense when the net cumulative unrecognized actuarial gains and losses for each individual plan at the end of the previous reporting year exceed 10% of the higher of the defined benefit obligation and the fair value of plan assets at that date. These gains or losses are recognized over the expected average remaining working lives of the employees participating in the plan. Past service cost is recognized as an expense on a straight-line basis over the average period until the benefits become vested. If the benefits are already vested immediately following the introduction of, or changes to, a pension plan, past service cost is recognized immediately. The defined benefit liability is the aggregate of the present value of the defined benefit obligation and actuarial gains and losses not recognized, reduced by past service cost not yet recognized, and the fair value of plan assets out of which the obligations are to be settled directly. If such aggregate is negative, the asset is measured at the lower of such aggregate or the aggregate of cumulative unrecognized net actuarial losses and past service cost and the present value of any economic benefits available in the form of refunds from the plan or reductions in the future contributions to the plan.
If the asset is measured at the aggregate of cumulative unrecognized net actuarial losses and past service cost and the present value of any economic benefits available in the form of refunds from the plan or reductions in the future contributions to the plan, net actuarial losses of the current period and past service cost of the current period are recognized immediately to the extent that they exceed any reduction in the present value of those economic benefits. If there is no change or an increase in the present value of the economic benefits, the entire net actuarial losses of the current period and past service cost of the current period are recognized immediately. Similarly, net actuarial gains of the current period after the deduction of the past service cost of the current period exceeding any increase in the present value of the economic benefits stated in the foregoing are recognized immediately if the asset is measured at the aggregate of cumulative unrecognized net actuarial losses and past service cost and the present value of any economic benefits available in the form of refunds from the plan or reductions in the future contributions to the plan. If there is no change or a decrease in the present value of the economic benefits, the entire net actuarial gains of the current period after the deduction of past service cost of the current period are recognized immediately.

- 18 -
*SGVMC311705*
Stock Option The Company had a stock option plan offered to qualified employees, officers and directors of the Company. As allowed under PFRS 1, First Time Adoption of Philippine Financial Reporting Standards, the Company availed of the exemption from applying PFRS 2, “Share-based Payment,” to stock options granted after November 7, 2002 but were fully vested as of January 1, 2005. There were no stock options granted after November 7, 2002 which remained unvested as of January 1, 2005.
Stock option grants subsequent to January 1, 2005 are accounted for in accordance with PFRS 2, that is, the cost of stock option awards are measured by reference to the fair value at the date on which they are granted. The cost of such awards is recognized, together with a corresponding increase in equity, over the period in which the performance and/or service conditions are fulfilled, ending on the date on which the relevant employees become fully entitled to the award. The cumulative expense that is recognized at each reporting date until the vesting date reflects the extent to which the vesting period has expired and the Company’s best estimate of the number of equity instruments that will ultimately vest. The charge or credit to the statement of income for a period represents the movement in cumulative expense recognized as at the beginning and end of the period.
No expense is recognized for awards that do not ultimately vest, except for awards where vesting is conditional upon a market condition, which are treated as vesting irrespective of whether or not the market condition is satisfied, provided that all other performance conditions are satisfied.
Where the terms of the award are modified, the minimum expense recognized is the expense if the terms had not been modified. An additional expense is recognized for any modification, which increases the total fair value of the share based payment arrangement, or is otherwise beneficial to the employee as measured at the date of modification. Where the stock option is cancelled, it is treated as if it had vested on the date of the cancellation, and any expense not yet recognized for the award is recognized immediately. However, if a new award is substituted for the cancelled award, and designated as a replacement award on the date that it is granted, the cancelled and new awards are treated as if they were a modification of the original award, as described in the preceding paragraph. Leases The determination of whether the arrangement is, or contains a lease is based on the substance of the arrangement at inception date of whether the fulfillment of the arrangement depends on the use of a specific asset or assets or the arrangement conveys a right to use the asset. A reassessment is made after the inception of the lease, if any, if the following applies: a) there is a change in contractual terms, other than a renewal or extension of the arrangement; b) a renewal option is exercised or extension granted, unless the term of the renewal or extension
was initially included in the lease term; c) there is a change in the determination of whether fulfillment is dependent on a specified asset; or d) there is substantial change to the asset. Where the reassessment is made, lease accounting shall commence or cease from the date when the change in circumstances gave rise to the reassessment for scenarios a, c, or d above, and at the date of renewal or extension period for scenario b. The Company determines whether arrangements contain a lease to which lease accounting must be applied. The costs of the agreements that do not take the legal form of a lease but convey the right to use an asset are separated into lease payments if the entity has the control of the use or access to the asset, or takes essentially all of the outputs of the asset. The said lease component for these arrangements is then accounted for as finance or operating lease.

- 19 -
*SGVMC311705*
Finance leases, which transfer to the Company substantially all the risks and benefits incidental to ownership of the leased item are capitalized at the inception of the lease at the fair value of the leased property or, if lower, at the present value of the minimum lease payments. Leases where the lessor retains substantially all the risks and benefits of ownership of the asset are classified as operating leases. Operating lease income and expense is recognized in the consolidated statement of income on a straight-line basis over the lease arrangements. Borrowing Costs Borrowing costs are generally expensed as incurred. Borrowing costs including foreign exchange differences arising from foreign currency-denominated borrowings, to the extent they are regarded as an adjustment to interest costs, are capitalized if they are directly attributable to the acquisition or construction of a qualifying asset. Capitalization of borrowing costs commences when the activities to prepare the asset are in progress and expenditures and borrowing costs are being incurred. Borrowing costs are capitalized until the assets are substantially ready for their intended use. If the carrying amount of the asset exceeds its recoverable amount, an impairment loss is recorded.
Foreign Currency-denominated Transactions Transactions denominated in foreign currencies are recorded using the exchange rate at the date of the transaction. Outstanding financial assets and liabilities denominated in foreign currencies are restated using the closing rate of exchange at the balance sheet date. Exchange gains or losses arising from foreign currency-denominated transactions are credited or charged to current operations. Nonfinancial items that are measured at historical cost in a foreign currency are translated using the exchange rate at the date of the transaction. Nonfinancial items measured at fair value in a foreign currency are translated using the exchange rates at the date when the fair value is determined.
Income Tax Current tax Current income tax assets and liabilities for the current and prior periods are measured at the amount expected to be recovered from or paid to the tax authority. The tax rates and tax laws used to compute the amount are those that are enacted or substantively enacted as of the consolidated balance sheet date.
Deferred income tax Deferred income tax is provided using the balance sheet liability method on temporary differences at the consolidated balance sheet date between the tax bases of assets and liabilities and their carrying amounts for financial reporting purposes. Deferred income tax liabilities are recognized for all taxable temporary differences, except: • where the deferred income tax liability arises from the initial recognition of goodwill or of an
asset or liability in a transaction that is not a business combination and, at the time of the transaction, affects neither the accounting profit nor taxable profit or loss; and
• in respect of taxable temporary differences associated with investments in subsidiaries, associates and interests in joint ventures, where the timing of the reversal of the temporary differences can be controlled and it is probable that the temporary differences will not reverse in the foreseeable future.
Deferred income tax assets are recognized for all deductible temporary differences, carryforward benefits of unused tax credits from excess minimum corporate income tax (MCIT) and net operating loss carryover (NOLCO), to the extent that it is probable that taxable profit will be available against which the deductible temporary differences and NOLCO can be utilized.

- 20 -
*SGVMC311705*
The carrying amount of deferred income tax assets is reviewed at each balance sheet date and reduced to the extent that it is no longer probable that sufficient taxable profit will be available to allow all or part of the deferred tax asset to be utilized. Unrecognized deferred income tax assets are reassessed at each balance sheet date and are recognized to the extent that it has become probable that future taxable profit will allow the deferred income tax asset to be recovered.
Deferred income tax assets and liabilities are measured at the tax rates that are expected to apply to the year when the asset is realized or the liability is settled, based on tax rates and tax laws that have been enacted or substantively enacted at the balance sheet date.
Income tax relating to items recognized directly in equity is recognized in equity and not in the consolidated statement of income. Deferred income tax assets and deferred income tax liabilities are offset, if a legally enforceable right exists to set off current tax assets against current tax liabilities and the deferred taxes relate to the same taxable entity and the same taxation authority.
Earnings Per Share (EPS) Basic EPS is computed based on weighted average number of issued and outstanding common shares during each year after giving retroactive effect to stock dividends declared during the year. Diluted EPS is computed as if the stock options were exercised as of the beginning of the year and as if the funds obtained from exercise were used to purchase common shares at the average market price during the year. Outstanding stock options will have a dilutive effect under the treasury stock method only when the fair value of the underlying common shares during the period exceeds the exercise price of the option. Where the outstanding stock options have no dilutive effect and the Company does not have any potential common share nor other instruments that may entitle the holder to common shares, diluted EPS is the same as basic EPS.
Contingencies Contingent liabilities are not recognized in the consolidated financial statements but are disclosed unless the possibility of an outflow of resources embodying economic benefits is remote. Contingent assets are not recognized in the consolidated financial statements but disclosed when an inflow of economic benefits is probable.
Events After the Balance Sheet Date Post year-end events that provide additional information about the Company’s position at the balance sheet date (adjusting events) are reflected in the consolidated financial statements. Post year-end events that are not adjusting events are disclosed in the notes when material.
5. Significant Accounting Judgments, Estimates and Assumptions
The Company’s consolidated financial statements prepared in conformity with PFRS require management to make judgments, estimates and assumptions that affect amounts reported in the consolidated financial statements. In preparing the Company’s consolidated financial statements, management has made its best estimates and judgments of certain amounts, giving due consideration to materiality. The judgments, estimates and assumptions used in the consolidated financial statements are based upon management’s evaluation of relevant facts and circumstances as of the date of the consolidated financial statements. Actual results could differ from such estimates.
The Company believes the following represents a summary of these significant judgments and estimates and related impact and associated risks in its consolidated financial statements.

- 21 -
*SGVMC311705*
Judgments Determination of functional currency Based on the economic substance of the underlying circumstances relevant to the Company, the functional currency of the Company has been determined to be the Philippine peso. The Philippine peso is the currency of the primary economic environment in which the Company operates. It is the currency that mainly influences the sale and cost of producing electricity.
Determination of whether an arrangement contains a lease and proper classification of the lease Under TA Oil’s ESA with Guimelco and TA Power’s ESA with Holcim Philippines, Inc. (Holcim), TA Oil sells all of its output to Guimelco and TA Power sells all or substantially all of its output to Holcim (see Note 29). The Company also has various lease agreements for the lease of its investment property. The Company has evaluated the arrangements and the terms of the agreements and determined that the risks and rewards of ownership of the underlying properties are retained by the Company. Accordingly, the related assets have been recognized in the books of the Company and the fees billed to Guimelco, Holcim and the other lesees are recorded as operating revenues. Under the Power Administration and Management Agreement between TA Oil and One Subic Power Generation Corporation (One Subic Power), TA Oil will administer and manage the entire generation output of the 116 MW diesel power plant in Subic (see Note 29). The Company has evaluated that the arrangements and the terms of the agreement contain a lease and determined that the risks and rewards of ownership of the power plant are retained by the ultimate lessor. Classification of financial instruments The Company exercises judgment in classifying a financial instrument, or its component parts, on initial recognition as either a financial asset, a financial liability or an equity instrument in accordance with the substance of the contractual arrangement and the definitions of a financial asset, a financial liability or an equity instrument. The substance of a financial instrument, rather than its legal form, governs its classification in the consolidated balance sheet. The classification of the Company’s financial assets and financial liabilities are presented in Note 31.
Estimates Fair value of financial assets and financial liabilities The fair value for financial instruments traded in an active market at the balance sheet date is based on their quoted market price or dealer price quotations (bid price for long positions and ask price for short positions), without any deduction for transaction costs. Where the fair values of financial assets and financial liabilities recorded on the consolidated balance sheet cannot be derived from active markets, they are determined using a variety of valuation techniques that include the use of mathematical models. The input to these models is taken from observable markets where possible, but where this is not feasible, a degree of judgment and estimation is required in establishing fair values. Any change in value of these financial assets and financial liabilities (including derivatives) would affect the consolidated statement of comprehensive income and consolidated statement of changes in equity. The fair values of the Company’s financial assets amounted to P=2.18 billion and P=2.30 billion as of December 31, 2010 and 2009, respectively, while fair values of the Company’s financial liabilities amounted to P=203.92 million and P=146.46 million as of December 31, 2010 and 2009, respectively (see Note 31).
Estimated allowance for doubtful accounts The Company maintains allowance for doubtful accounts based on the results of the individual and collective assessment under PAS 39. Under the individual assessment, which considers the significant financial difficulties of the customer, the Company is required to obtain the present value of estimated cash flows using the receivable’s original effective interest rate. Impairment loss is determined as the difference between the receivables’ carrying balance and the computed present value. The collective assessment would require the Company to group its receivables based on the
- 22 -
*SGVMC311705*
credit risk characteristics (customer type, past-due status and terms) of the customers. Impairment loss is then determined based on historical loss experience of the receivables grouped per credit risk profile. Historical loss experience is adjusted on the basis of current observable data to reflect the effects of current conditions that did not affect the period on which the historical loss experience is based and to remove the effects of conditions in the historical period that do not exist currently. The methodology and assumptions used for the individual and collective assessments are based on management’s judgment and estimate. Therefore, the amount and timing of recorded expense for any period would differ depending on the judgments and estimates made for the year. The carrying value of receivables amounted to P=219.97 million as of December 31, 2010 and P=285.05 million (including noncurrent portion classified under noncurrent assets in the 2009 consolidated balance sheet of P=127.57 million) as of December 31, 2009 (see Notes 8 and 10).
Realizability of deferred income tax assets The carrying amount of deferred income tax assets is reviewed at each balance sheet date and reduced to the extent that it is no longer probable that sufficient taxable profit will be available to allow all or part of the deferred tax assets to be utilized. However, there is no assurance that sufficient taxable income will be generated to allow all or part of the deferred tax assets to be utilized. As of December 31, 2010 and 2009, deferred income tax assets recognized by the Company amounted to P=10.31 million and P=3.68 million, respectively. The Company’s deductible temporary differences, unused NOLCO and unused MCIT for which no deferred income tax assets were recognized in the consolidated balance sheets as of December 31, 2010 and 2009 amounted to P=164.33 million and P=100.15 million, respectively (see Note 25). Estimated useful lives of property, plant and equipment and investment properties The Company estimates the useful lives of property, plant and equipment and investment properties based on the period over which the assets are expected to be available for use. The estimated useful lives of property, plant and equipment and investment properties are reviewed periodically and are updated if expectations differ from previous estimates due to physical wear and tear, technical or commercial obsolescence and legal or other limits on the use of the assets. In addition, estimation of the useful lives of property, plant and equipment and investment properties are based on collective assessment of industry practice, internal technical evaluation and experience with similar assets. It is possible, however, that future results of operations could be materially affected by changes in estimates brought about by changes in factors mentioned above. The amounts and timing of recorded expenses for any period would be affected by changes in these factors and circumstances. The carrying value of property, plant and equipment as of December 31, 2010 and 2009 amounted to P=489.28 million and P=426.69 million, respectively (see Note 9). The carrying value of investment properties as of December 31, 2010 and 2009 amounted to P=23.06 million and P=92.24 million, respectively (see Note 12).
Impairment of deferred exploration costs The carrying value of deferred exploration costs is reviewed for impairment by management when there are indications that the carrying amount exceeds the recoverable amount. In 2009, the Company recorded a provision for impairment losses amounting to P=11.47 million representing the carrying value of deferred exploration costs where a portion of the contract area was excised and an unfavorable ruling was issued by the Department of Environment and Natural Resources (DENR). Write-off of deferred exploration costs against allowance for impairment losses amounted to P=76.62 million in 2009. In addition, deferred exploration costs amounting to P=78.52 million were directly written-off and charged in the consolidated statement of income in 2009. Among the factors considered by management in the write-off of deferred exploration costs are the expiration of the contracts and the technical evaluation that the remaining prospects in these areas are small and are likely to be uneconomic.

- 23 -
*SGVMC311705*
As of December 31, 2010 and 2009, the carrying value of deferred exploration costs amounted to P=86.70 million and P=71.86 million, respectively (see Note 14).
Impairment of property, plant and equipment and investment properties The Company performs annual impairment testing of assets which are not used in operations and those with indications of impairment. The impairment testing of assets not used in operations requires an estimation of its fair value less cost to sell. Fair value is the amount obtainable from the sale of an asset or cash-generating unit in an arm’s-length transaction between knowledgeable, willing parties, less the costs of disposal. The impairment testing of property, plant and equipment with indications of impairment requires an estimation of the value-in-use of the cash-generating units. In 2009, total impairment loss recognized in the consolidated statement of income on the property, plant and equipment of CIPP amounted to P=106.89 million. In 2010, the Company reversed a portion of the impairment provision covering the property, plant and equipment of CIPP amounting to P=20.32 million based on their fair value less costs to sell (as presented as part of “Other income (expenses)” in the consolidated statement of income). The carrying value of property, plant and equipment as of December 31, 2010 and 2009 amounted to P=489.28 million and P=426.69 million, respectively (see Note 9). The carrying value of investment properties amounted to P=23.06 million and P=92.24 million as of December 31, 2010 and 2009, respectively (see Note 12).
Impairment of investments in associates The carrying value of investments in associates is reviewed for impairment whenever events or changes in circumstances indicate the carrying value may not be recoverable. If any such indication exists and where the carrying value exceeds the estimated recoverable amount, the investment is written down to its recoverable amount. No impairment loss was deemed necessary in 2010 and 2009. Accumulated impairment loss amounted to P=1.56 million as of December 31, 2010 and 2009. The carrying value of investments in associates as of December 31, 2010 and 2009 amounted to P=39.82 million and P=0.62 million, respectively (see Note 10). Impairment of AFS investments The Company treats AFS investments as impaired when there has been a significant or prolonged decline in the fair value below its cost or where other objective evidence of impairment exists. The determination of what is “significant” or “prolonged” requires judgment. The Company treats “significant” generally as 20% or more of the original cost of investment, and “prolonged”, greater than 6 months. In addition, the Company evaluates other factors, including normal volatility in share price for quoted equities and the future cash flows and the discount factors for unquoted equities. In 2010, the Company provided for impairment loss on its investment in unlisted shares of stock amounting to P=22.59 million. The carrying value of AFS investments amounted to P=205.13 million as of December 31, 2010 and 2009 (see Note 11).
Pension and other post-employment benefits The determination of the Company’s obligation and cost for pension and other post-employment benefits is dependent on the selection of certain assumptions used by actuaries in calculating such amounts. The assumptions described in Note 26 to the consolidated financial statements include among others, discount rates, expected returns on plan assets and rates of salary increase. In accordance with PFRS, actual results that differ from the assumptions are accumulated and amortized over future periods and therefore, generally affect the recognized expense and recorded obligation in such future periods. The carrying value of pension and other post-employment benefits as of December 31, 2010 and 2009 is P=10.60 million and P=6.04 million, respectively (see Note 26).
- 24 -
*SGVMC311705*
6. Cash and Cash Equivalents
2010 2009 Cash on hand and in banks P=9,138,531 P=90,300,463 Short-term deposits 871,645,251 895,015,093 P=880,783,782 P=985,315,556
Cash in banks earn interest at the respective bank deposit rates. Short-term deposits are made for varying periods between one day and three months depending on the immediate cash requirements of the Company and earn interest at the respective short-term deposit rates.
For purposes of the consolidated statements of cash flows, cash and cash equivalents consist of the following at December 31:
2010 2009 Cash and cash equivalents of venturer P=880,783,782 P=985,315,556 Share in cash and cash equivalents
of a joint venture (Note 13) 120,772,770 42,614,504 P=1,001,556,552 P=1,027,930,060
7. Investments Held for Trading
2010 2009 Investments in bonds and FXTNs P=347,871,714 P=283,894,056 Investments in UITFs 524,779,241 526,522,973 P=872,650,955 P=810,417,029
The Company’s unrealized gain (loss) from changes in fair value of investments held for trading (included in net gains on investments held for trading under “Interest and other financial income” account in the consolidated statements of income) amounted to P=21.55 million, P=10.78 million and (P=0.18 million) in 2010, 2009 and 2008, respectively (see Note 31).
8. Receivables
2010 2009 Trade (Note 29) P=88,428,994 P=62,581,603 Due from related companies (Notes 27 and 29) 71,452,850 59,143,275 Others (Notes 10 and 14) 70,098,644 39,025,150 229,980,488 160,750,028 Less allowance for doubtful accounts 10,012,138 3,270,366 P=219,968,350 P=157,479,662
Trade receivables represent receivables from Guimelco, in accordance with the terms of the ESA between the Parent Company and Guimelco, and CIPP’s receivables from locators in CIP II. Trade receivables are noninterest-bearing and are generally on a 30-day credit term.
Other receivables include receivable from the sale of royalty interest amounting to P=58.09 million as of December 31, 2010 (see Note 14) and interest receivable of P=7.50 million and P=6.51 million as of December 31, 2010 and 2009, respectively.
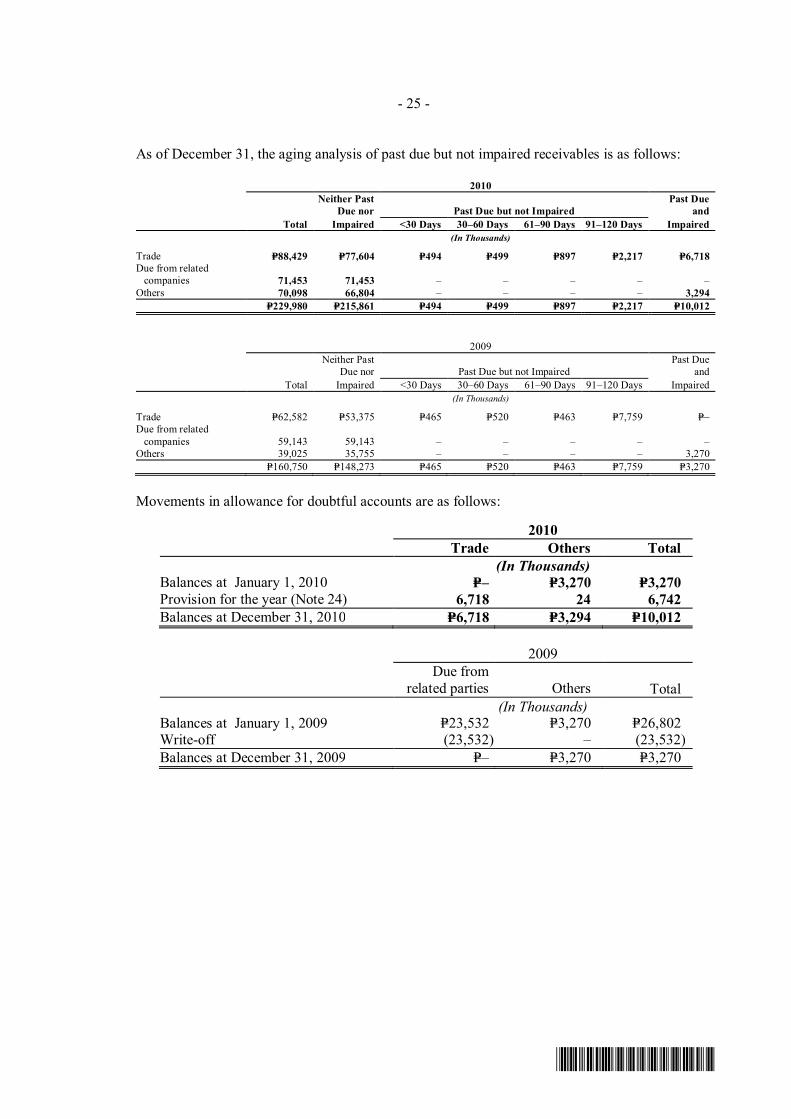
- 25 -
*SGVMC311705*
As of December 31, the aging analysis of past due but not impaired receivables is as follows: 2010
Neither Past
Due nor Past Due but not Impaired Past Due
and Total Impaired <30 Days 30–60 Days 61–90 Days 91–120 Days Impaired
(In Thousands)
Trade P=88,429 P=77,604 P=494 P=499 P=897 P=2,217 P=6,718 Due from related
companies 71,453 71,453
–
–
–
– – Others 70,098 66,804 – – – – 3,294 P=229,980 P=215,861 P=494 P=499 P=897 P=2,217 P=10,012
2009
Neither Past
Due nor Past Due but not Impaired Past Due
and Total Impaired <30 Days 30–60 Days 61–90 Days 91–120 Days Impaired
(In Thousands)
Trade P=62,582 P=53,375 P=465 P=520 P=463 P=7,759 P=– Due from related
companies 59,143 59,143 – – – – – Others 39,025 35,755 – – – – 3,270 P=160,750 P=148,273 P=465 P=520 P=463 P=7,759 P=3,270
Movements in allowance for doubtful accounts are as follows:
2010 Trade Others Total (In Thousands) Balances at January 1, 2010 P=– P=3,270 P=3,270 Provision for the year (Note 24) 6,718 24 6,742 Balances at December 31, 2010 P=6,718 P=3,294 P=10,012
2009
Due from
related parties Others Total (In Thousands) Balances at January 1, 2009 P=23,532 P=3,270 P=26,802 Write-off (23,532) – (23,532) Balances at December 31, 2009 P=– P=3,270 P=3,270

- 26 -
*SGVMC311705*
9. Property, Plant and Equipment
Land
Buildings and
Improvements
Machinery and
Equipment
Wells, Platforms and Other Facilities
Transportation Equipment
Mining and Other
Equipment
Office Furniture,
Equipment and Others
Construction In Progress Total
Cost At January 1, 2009 P=57,983,000 P=100,114,325 P=550,395,020 P=20,346,661 P=12,663,376 P=17,671,228 P=28,210,025 P=– P=787,383,635 Additions – – – – 2,948,907 15,916,604 563,113 – 19,428,624 Disposals – – (53,163,489) – – (11,366,581) – – (64,530,070) At December 31, 2009 57,983,000 100,114,325 497,231,531 20,346,661 15,612,283 22,221,251 28,773,138 – 742,282,189 Additions – 2,236,525 – – 13,430,009 3,049,927 412,775 9,133,537 28,262,773 Disposals – – – (11,415,939) – (105,521) – (11,521,460) Transfer from investment
properties (Note 12) – 71,122,500 – – – – –
– 71,122,500 At December 31, 2010 P=57,983,000 P=173,473,350 P=497,231,531 P=20,346,661 P=17,626,353 P=25,271,178 P=29,080,392 P=9,133,537 P=830,146,002
Accumulated Depreciation, Amortization, Depletion and Impairment
At January 1, 2009 P=– P=32,147,815 P=87,819,879 P=20,346,661 P=5,636,651 P=2,821,134 P=18,470,563 P=– P=167,242,703 Depreciation (Note 23) – 7,700,276 33,705,201 – 2,654,683 3,086,948 4,123,782 – 51,270,890 Impairment – – 106,890,399 – – – – – 106,890,399 Disposals – – (9,224,264) – – (585,958) – – (9,810,222) At December 31, 2009 – 39,848,091 219,191,215 20,346,661 8,291,334 5,322,124 22,594,345 – 315,593,770 Depreciation (Note 23) – 12,697,139 24,538,966 – 5,220,048 5,003,866 3,789,898 – 51,249,917 Impairment – – (20,320,409) – – – – – (20,320,409) Disposals – – – – (9,456,576) – (100,160) – (9,556,736) Transfer from investment
properties (Note 12) – 3,903,064 – – – – – – 3,903,064 At December 31, 2010 P=– P=56,448,294 P=223,409,772 P=20,346,661 P=4,054,806 P=10,325,990 P=26,284,083 P=– P=340,869,606
Net Book Value
At January 1, 2009 P=57,983,000 P=67,966,510 P=462,575,141 P=– P=7,026,725 P=14,850,094 P=9,739,462 P=– P=620,140,932 At December 31, 2009 57,983,000 60,266,234 278,040,316 – 7,320,949 16,899,127 6,178,793 – 426,688,419 At December 31, 2010 57,983,000 117,025,056 273,821,759 – 13,571,547 14,945,188 2,796,309 9,133,537 489,276,396

- 27 -
*SGVMC311705*
In the Asset Purchase Agreement entered into by CIPP and MERALCO on April 11, 2009, MERALCO acquired CIPP’s rights and interests in the existing electric distribution system on an “as is, where is” basis for a total consideration of P=62.00 million. Gain on sale recognized in the 2009 consolidated statement of income related to the said transaction amounted to P=7.28 million (see Note 24). The depreciation and related maintenance cost of the power plant of CIPP beginning April 12, 2009 are presented as part of “Cost of Power Plant on Standby” account in the consolidated statements of income for the years ended December 31, 2010 and 2009 (see Note 20).
In 2010, the Company reversed a portion of the impairment provision covering the property, plant and equipment of CIPP amounting to P=20.32 million based on their fair value less costs to sell. During the year, CIPP received offers from third parties to purchase its property, plant and equipment. In December 2010, CIPP’s board of directors approved the transfer of its 21 MW Bunker C-fired power plant from Laguna to La Union. These events triggered the review of impairment and the reversal of a portion of impairment provision. The fair value less costs to sell of the assets was determined based on the quoted price from a willing third party buyer and supplier.
10. Investments in Associates
The percentage of ownership and the carrying values of investments in associates are as follows:
Percentage
of Ownership 2010 2009 Maibarara Geothermal, Inc.(MGI) 25.00 P=39,189,046 P=– Asia Coal Corporation (Asia Coal)* 28.18 631,029 619,756 Union Aggregates Corporation (UAC)** 31.25 – – P=39,820,075 P=619,756 * Shortened corporate life to October 31, 2009 ** Ceased operations
The details and movements of investments in associates accounted for under the equity method are as follows:
2010 2009 Acquisition costs: Balance at beginning of year P=26,734,913 P=207,334,913 Addition 42,578,125 – Disposal of BIPC shares – (180,600,000) Balance at end of year 69,313,038 26,734,913 Accumulated equity in net losses: Balance at beginning of year (24,555,906) (36,673,389) Equity in net earnings (losses) for the year
(Note 24) (3,377,806) 12,126 Disposal – 12,105,357 Balance at end of year (27,933,712) (24,555,906) 41,379,326 2,179,007 Less accumulated impairment losses 1,559,251 1,559,251 P=39,820,075 P=619,756

- 28 -
*SGVMC311705*
Maibarara Geothermal, Inc. (MGI) The Company subscribed to 25% of the capital stock of MGI which was incorporated and
registered with the SEC on August 11, 2010, to implement the integration development of the Maibarara geothermal field in Calamba, Laguna and Sto. Tomas, Batangas for power generation. The details of the net assets of MGI as of December 31, 2010 are shown below:
Current assets P=99,482,069 Noncurrent assets 57,943,885 Total Assets 157,425,954 Current Liabilities 669,770 Net Assets P=156,756,184
The results of operations of MGI for the period from August 11, 2010 to December 31, 2010 are shown below:
Interest income P=494,262 General and administrative expenses (14,050,576) Net loss (P=13,556,314)
Asia Coal On March 19, 2009, the directors and stockholders of Asia Coal approved the shortening of the corporate life of the Company to October 31, 2009. The Company shall be dissolved and liquidated, the date of which is subject to the approval of the SEC. As of February 21, 2011, Asia Coal is still in the process of filing with the SEC its application for dissolution.
The net assets of Asia Coal as of October 31 are as follows:
2010 2009 Current assets P=2,358,801 P=2,358,801 Noncurrent asset 14,700 14,700 Total Assets 2,373,501 2,373,501 Current liability 133,701 133,701 Net Assets P=2,239,800 P=2,239,800
The results of operations of Asia Coal for the year ended October 31 are as follows:
2009 2008 Interest income P=194,393 P=251,348 General and administrative expenses (152,475) (264,561) Other expenses (83,377) (151,170) Benefit from income tax 4,197 22,317 Net loss (P=37,262) (P=142,066)
Other than the approval of the directors and stockholders of Asia Coal of the shortening of its corporate life, there were no significant transactions or events that need to be adjusted in Asia Coal’s financial statements.
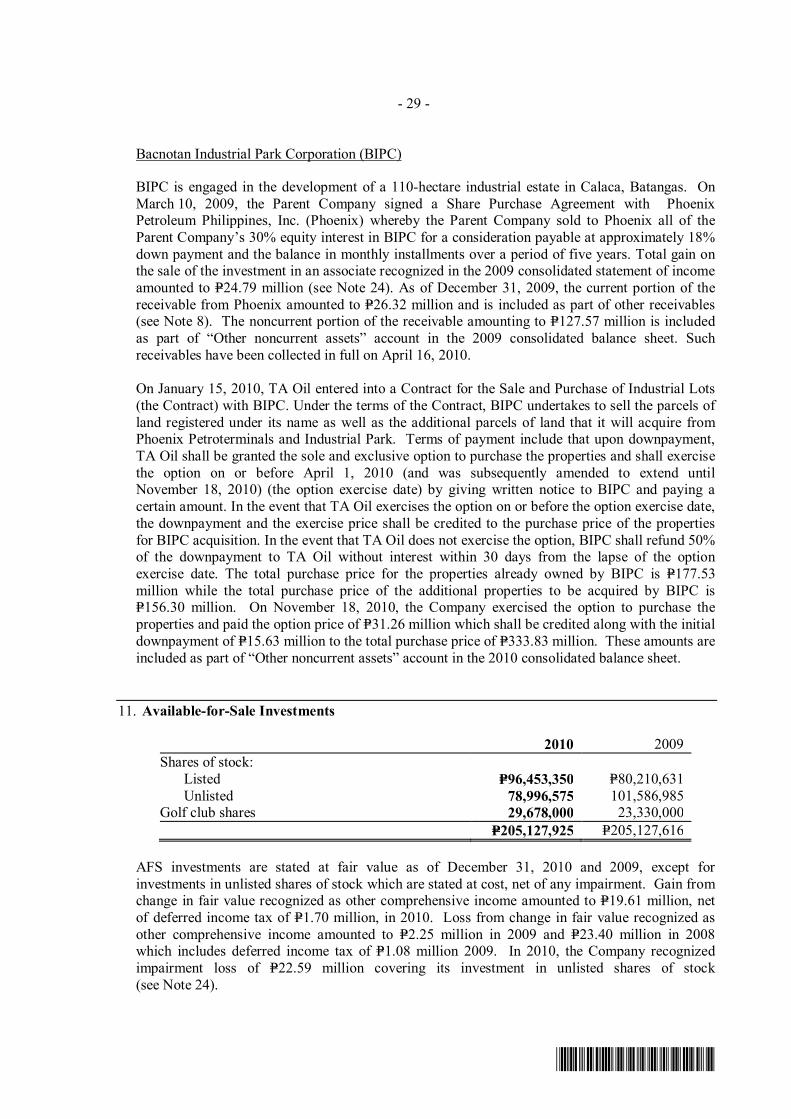
- 29 -
*SGVMC311705*
Bacnotan Industrial Park Corporation (BIPC)
BIPC is engaged in the development of a 110-hectare industrial estate in Calaca, Batangas. On March 10, 2009, the Parent Company signed a Share Purchase Agreement with Phoenix Petroleum Philippines, Inc. (Phoenix) whereby the Parent Company sold to Phoenix all of the Parent Company’s 30% equity interest in BIPC for a consideration payable at approximately 18% down payment and the balance in monthly installments over a period of five years. Total gain on the sale of the investment in an associate recognized in the 2009 consolidated statement of income amounted to P=24.79 million (see Note 24). As of December 31, 2009, the current portion of the receivable from Phoenix amounted to P=26.32 million and is included as part of other receivables (see Note 8). The noncurrent portion of the receivable amounting to P=127.57 million is included as part of “Other noncurrent assets” account in the 2009 consolidated balance sheet. Such receivables have been collected in full on April 16, 2010. On January 15, 2010, TA Oil entered into a Contract for the Sale and Purchase of Industrial Lots (the Contract) with BIPC. Under the terms of the Contract, BIPC undertakes to sell the parcels of land registered under its name as well as the additional parcels of land that it will acquire from Phoenix Petroterminals and Industrial Park. Terms of payment include that upon downpayment, TA Oil shall be granted the sole and exclusive option to purchase the properties and shall exercise the option on or before April 1, 2010 (and was subsequently amended to extend until November 18, 2010) (the option exercise date) by giving written notice to BIPC and paying a certain amount. In the event that TA Oil exercises the option on or before the option exercise date, the downpayment and the exercise price shall be credited to the purchase price of the properties for BIPC acquisition. In the event that TA Oil does not exercise the option, BIPC shall refund 50% of the downpayment to TA Oil without interest within 30 days from the lapse of the option exercise date. The total purchase price for the properties already owned by BIPC is P=177.53 million while the total purchase price of the additional properties to be acquired by BIPC is P=156.30 million. On November 18, 2010, the Company exercised the option to purchase the properties and paid the option price of P=31.26 million which shall be credited along with the initial downpayment of P=15.63 million to the total purchase price of P=333.83 million. These amounts are included as part of “Other noncurrent assets” account in the 2010 consolidated balance sheet.
11. Available-for-Sale Investments
2010 2009 Shares of stock: Listed P=96,453,350 P=80,210,631 Unlisted 78,996,575 101,586,985 Golf club shares 29,678,000 23,330,000 P=205,127,925 P=205,127,616
AFS investments are stated at fair value as of December 31, 2010 and 2009, except for investments in unlisted shares of stock which are stated at cost, net of any impairment. Gain from change in fair value recognized as other comprehensive income amounted to P=19.61 million, net of deferred income tax of P=1.70 million, in 2010. Loss from change in fair value recognized as other comprehensive income amounted to P=2.25 million in 2009 and P=23.40 million in 2008 which includes deferred income tax of P=1.08 million 2009. In 2010, the Company recognized impairment loss of P=22.59 million covering its investment in unlisted shares of stock (see Note 24).
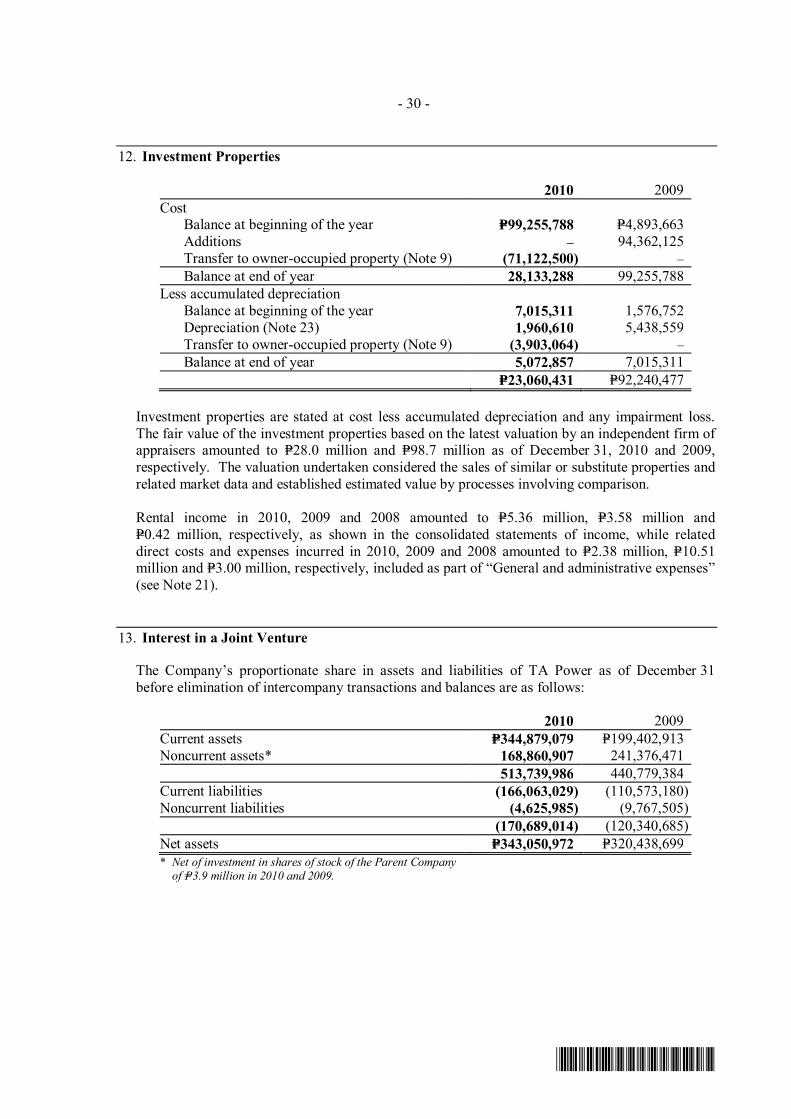
- 30 -
*SGVMC311705*
12. Investment Properties
2010 2009 Cost Balance at beginning of the year P=99,255,788 P=4,893,663 Additions – 94,362,125 Transfer to owner-occupied property (Note 9) (71,122,500) – Balance at end of year 28,133,288 99,255,788 Less accumulated depreciation Balance at beginning of the year 7,015,311 1,576,752 Depreciation (Note 23) 1,960,610 5,438,559 Transfer to owner-occupied property (Note 9) (3,903,064) – Balance at end of year 5,072,857 7,015,311 P=23,060,431 P=92,240,477
Investment properties are stated at cost less accumulated depreciation and any impairment loss. The fair value of the investment properties based on the latest valuation by an independent firm of appraisers amounted to P=28.0 million and P=98.7 million as of December 31, 2010 and 2009, respectively. The valuation undertaken considered the sales of similar or substitute properties and related market data and established estimated value by processes involving comparison.
Rental income in 2010, 2009 and 2008 amounted to P=5.36 million, P=3.58 million and P=0.42 million, respectively, as shown in the consolidated statements of income, while related direct costs and expenses incurred in 2010, 2009 and 2008 amounted to P=2.38 million, P=10.51 million and P=3.00 million, respectively, included as part of “General and administrative expenses” (see Note 21).
13. Interest in a Joint Venture
The Company’s proportionate share in assets and liabilities of TA Power as of December 31 before elimination of intercompany transactions and balances are as follows:
2010 2009 Current assets P=344,879,079 P=199,402,913 Noncurrent assets* 168,860,907 241,376,471 513,739,986 440,779,384 Current liabilities (166,063,029) (110,573,180) Noncurrent liabilities (4,625,985) (9,767,505) (170,689,014) (120,340,685) Net assets P=343,050,972 P=320,438,699 * Net of investment in shares of stock of the Parent Company
of P=3.9 million in 2010 and 2009.

- 31 -
*SGVMC311705*
The Company’s proportionate share in the revenue and expenses of TA Power for the years ended December 31, 2010, 2009 and 2008 before elimination of intercompany transactions are as follows:
2010 2009 2008 Revenue P=897,732,782 P=579,144,177 P=593,109,585 Cost of power generation (854,620,255) (530,282,115) (674,465,614) General and administrative
expenses (26,991,583) (29,712,796) (28,503,547) Other income - net 1,445,312 11,852,345 38,366,711 Income (loss) before income tax 17,566,256 31,001,611 (71,492,865) Benefit from (provision for)
income tax 4,848,218 3,393,839 (6,327,864) Net income (loss) P=22,414,474 P=34,395,450 (P=77,820,729)
Details of the Company’s share in the current and noncurrent assets and current and noncurrent liabilities of the joint venture as of December 31, 2010 and 2009, after elimination of intercompany balances, are as follows:
2010 2009 Current assets: Cash and cash equivalents P=120,772,770 P=42,614,504 Investment in trading securities 4,982,176 8,440,582 Trade and other receivables 63,971,985 85,738,184 Fuel and spares - at cost 63,391,975 35,906,315 Prepaid expenses and other current assets 41,968,096 25,392,549 P=295,087,002 P=198,092,134 Noncurrent assets: Property, plant and equipment - net P=133,879,486 P=196,923,857 Available-for-sale investments 32,219,497 23,697,283 Other noncurrent assets 1,137,508 15,109,707 P=167,236,491 P=235,730,847 Current liabilities: Trade and other payables P=134,735,758 P=48,506,839 Due to related parties – 2,929,863 Derivative liability – 72,100 P=134,735,758 P=51,508,802
Noncurrent liabilities: Deferred income tax liabilities - net (Note 25) P=– P=5,523,055 Provisions 2,500,000 2,500,000 Other noncurrent liabilities 2,125,985 1,744,450 P=4,625,985 P=9,767,505

- 32 -
*SGVMC311705*
Details of the Company’s share in the cost of power generation and general and administrative expenses of the joint venture for the years ended December 31, 2010, 2009 and 2008, after elimination of intercompany transactions, are as follows:
2010 2009 2008 Cost of power generation: Fuel P=561,966,770 P=177,323,269 P=379,308,179 Depreciation and amortization 63,825,719 63,832,927 63,441,151 Labor 11,720,899 13,998,196 14,818,399 Repairs and maintenance 16,099,595 7,509,930 21,531,011 Taxes and licenses 7,903,973 7,999,766 9,551,387 Insurance 3,933,489 3,051,387 2,617,617 Security, janitorial
and professional fees 1,228,979 1,299,554 1,168,795 Others 3,970,349 892,167 1,480,424 P=670,649,773 P=275,907,196 P=493,916,963
General and administrative expenses: Management and professional fees P=13,639,045 P=15,596,077 P=12,815,632 Salaries and directors’ fees 5,911,274 4,664,956 5,505,445 Taxes and licenses 1,329,034 1,656,024 2,760,690 Employee benefits 645,564 1,511,184 676,976 Transportation and travel 174,178 201,328 509,112 Depreciation and amortization 58,453 375,323 1,063,604 Entertainment, amusement
and recreation 20,078 10,300 38,785 Others 3,137,542 3,720,755 3,005,849 P=24,915,168 P=27,735,947 P=26,376,093
14. Deferred Exploration Costs
Oil Exploration
Costs
Mineral Exploration
Costs
Total Deferred
Exploration Costs
Cost At January 1, 2009 P=205,724,762 P=15,138,430 P=220,863,192 Additions 15,300,580 2,307,310 17,607,890 Write-off (149,163,158) (5,972,259) (155,135,417) At December 31, 2009 71,862,184 11,473,481 83,335,665 Additions 14,832,931 – 14,832,931 At December 31, 2010 86,695,115 11,473,481 98,168,596 Allowance for impairment loss and
amortization At January 1, 2009 76,618,163 – 76,618,163 Impairment (Note 24) – 11,473,481 11,473,481 Write-off (76,618,163) – (76,618,163) At December 31, 2009 – 11,473,481 11,473,481 Impairment – – – Write-off – – – At December 31, 2010 – 11,473,481 11,473,481 Net book value At January 1, 2009 P=129,106,599 P=15,138,430 P=144,245,029 At December 31, 2009 71,862,184 – 71,862,184 At December 31, 2010 86,695,115 – 86,695,115

- 33 -
*SGVMC311705*
Deferred Oil and Mineral Exploration Costs The balance of deferred oil exploration costs consists of expenditures incurred in the following production-sharing petroleum projects:
2010 2009 SC No. 51/GSEC No. 93 (East Visayas) P=32,615,780 P=32,545,030 SC No. 69 (Camotes) 29,373,778 15,179,659 SC No. 6 (Northwest Palawan) 18,992,347 18,424,285 SC No. 55 (Offshore West Palawan) 5,713,210 5,713,210 P=86,695,115 P=71,862,184
The foregoing deferred oil exploration costs represent the Company’s share in the expenditures incurred under Petroleum SCs with the Philippine Department of Energy (DOE). The contracts provide for certain minimum work and expenditure obligations and are covered by operating agreements which set forth the participating interests, rights and obligations of the contractors.
The following summarizes the status of the Company’s projects: a. SC 6 (Offshore Northwest Palawan)
Cadlao Production Area
On September 21, 2010, TA Oil entered into a Sale and Purchase Agreement and a Deed of Assignment covering the assignment of its entire royalty interest in the Cadlao Production Area, Northwest Palawan under Service Contract No. 6 to Peak Royalties Limited (BVI). On December 22, 2010, DOE approved the Deed of Assignment and recognized the assignment by TA Oil of the 1.65% royalty interest in favor of Peak Royalties, Inc. The proceeds amounting to US$1.325 million (P=58.57 million) were recognized in the 2010 consolidated statements of income as “Other Income” (see Note 24).
Block A
GPC Investments S.A. (formerly known as Vitol GPC Investments S.A.) did not exercise its option to acquire interest in the block.
The consortium adopted a US$560,000 work program for year 2011 consisting mainly of reprocessing of 3D seismic data in the northern sector of the block where prospects had been identified.
Block B
On February 4, 2011, the consortium, excluding one partner, signed a Farm-in Agreement with Peak Oil and Gas Philippines, Ltd., Blade Petroleum Philippines, Ltd. and VenturOil Philippines, Inc. (“farminees”), which granted the farminees the option to acquire 70% of the participating interests of the farmors, upon farminees’ completion of a US$325,000 geological and geophysical work program at their sole cost by April 2011. Should the farminees exercise the option, they will carry the farmors in all expenses until first oil production in the block. The Company holds 7.78% and 14.063% participating interests in Blocks A and B, respectively.
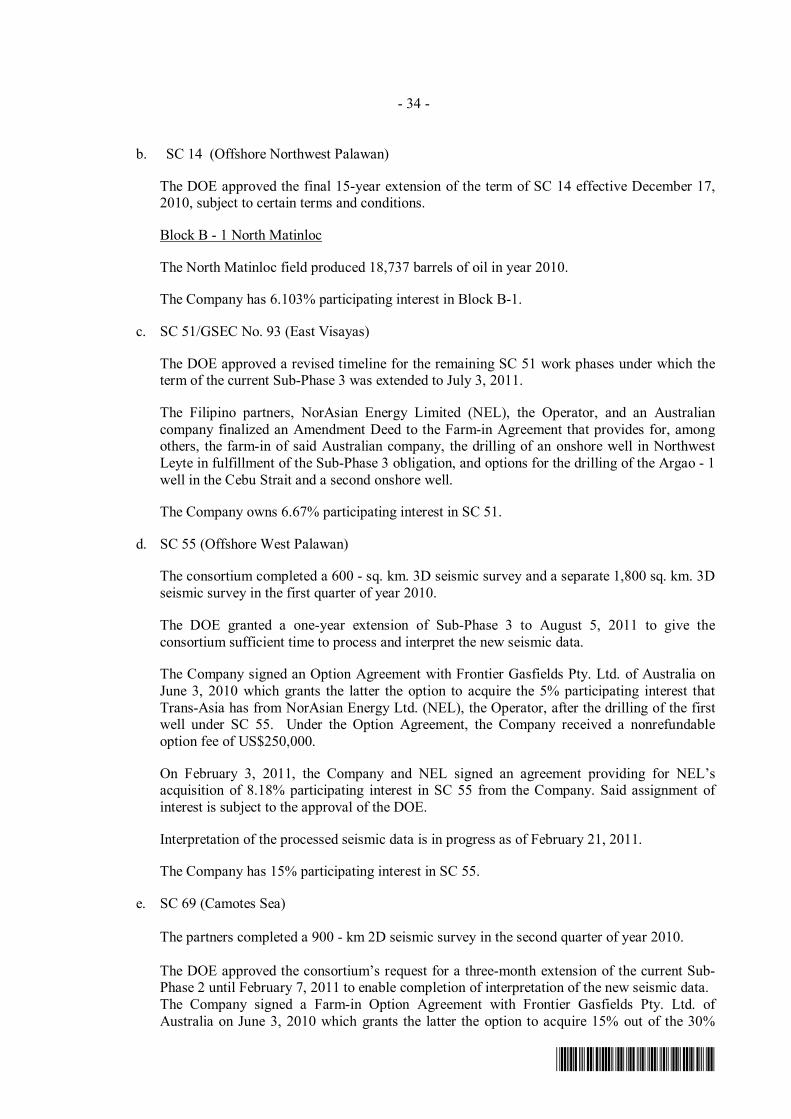
- 34 -
*SGVMC311705*
b. SC 14 (Offshore Northwest Palawan)
The DOE approved the final 15-year extension of the term of SC 14 effective December 17, 2010, subject to certain terms and conditions.
Block B - 1 North Matinloc
The North Matinloc field produced 18,737 barrels of oil in year 2010.
The Company has 6.103% participating interest in Block B-1.
c. SC 51/GSEC No. 93 (East Visayas)
The DOE approved a revised timeline for the remaining SC 51 work phases under which the term of the current Sub-Phase 3 was extended to July 3, 2011.
The Filipino partners, NorAsian Energy Limited (NEL), the Operator, and an Australian
company finalized an Amendment Deed to the Farm-in Agreement that provides for, among others, the farm-in of said Australian company, the drilling of an onshore well in Northwest Leyte in fulfillment of the Sub-Phase 3 obligation, and options for the drilling of the Argao - 1 well in the Cebu Strait and a second onshore well.
The Company owns 6.67% participating interest in SC 51. d. SC 55 (Offshore West Palawan)
The consortium completed a 600 - sq. km. 3D seismic survey and a separate 1,800 sq. km. 3D seismic survey in the first quarter of year 2010.
The DOE granted a one-year extension of Sub-Phase 3 to August 5, 2011 to give the
consortium sufficient time to process and interpret the new seismic data. The Company signed an Option Agreement with Frontier Gasfields Pty. Ltd. of Australia on
June 3, 2010 which grants the latter the option to acquire the 5% participating interest that Trans-Asia has from NorAsian Energy Ltd. (NEL), the Operator, after the drilling of the first well under SC 55. Under the Option Agreement, the Company received a nonrefundable option fee of US$250,000.
On February 3, 2011, the Company and NEL signed an agreement providing for NEL’s acquisition of 8.18% participating interest in SC 55 from the Company. Said assignment of interest is subject to the approval of the DOE.
Interpretation of the processed seismic data is in progress as of February 21, 2011. The Company has 15% participating interest in SC 55. e. SC 69 (Camotes Sea)
The partners completed a 900 - km 2D seismic survey in the second quarter of year 2010. The DOE approved the consortium’s request for a three-month extension of the current Sub-
Phase 2 until February 7, 2011 to enable completion of interpretation of the new seismic data. The Company signed a Farm-in Option Agreement with Frontier Gasfields Pty. Ltd. of
Australia on June 3, 2010 which grants the latter the option to acquire 15% out of the 30%
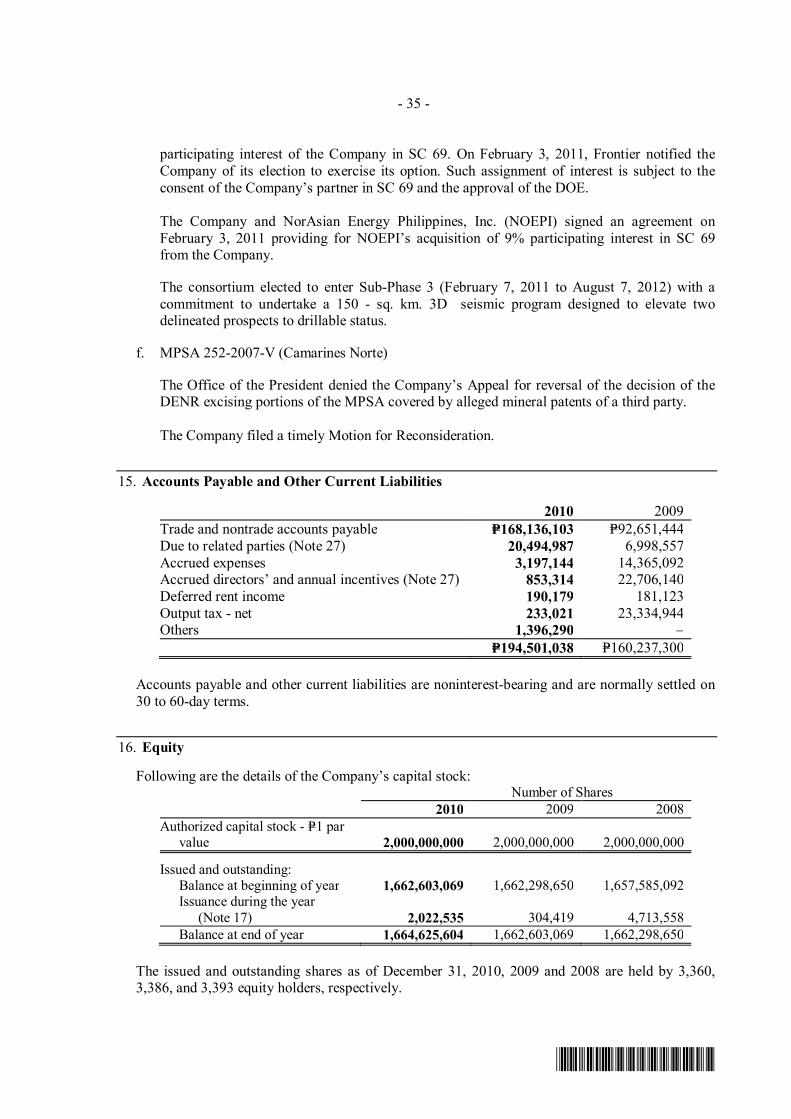
- 35 -
*SGVMC311705*
participating interest of the Company in SC 69. On February 3, 2011, Frontier notified the Company of its election to exercise its option. Such assignment of interest is subject to the consent of the Company’s partner in SC 69 and the approval of the DOE.
The Company and NorAsian Energy Philippines, Inc. (NOEPI) signed an agreement on
February 3, 2011 providing for NOEPI’s acquisition of 9% participating interest in SC 69 from the Company.
The consortium elected to enter Sub-Phase 3 (February 7, 2011 to August 7, 2012) with a
commitment to undertake a 150 - sq. km. 3D seismic program designed to elevate two delineated prospects to drillable status.
f. MPSA 252-2007-V (Camarines Norte) The Office of the President denied the Company’s Appeal for reversal of the decision of the
DENR excising portions of the MPSA covered by alleged mineral patents of a third party. The Company filed a timely Motion for Reconsideration.
15. Accounts Payable and Other Current Liabilities
2010 2009 Trade and nontrade accounts payable P=168,136,103 P=92,651,444 Due to related parties (Note 27) 20,494,987 6,998,557 Accrued expenses 3,197,144 14,365,092 Accrued directors’ and annual incentives (Note 27) 853,314 22,706,140 Deferred rent income 190,179 181,123 Output tax - net 233,021 23,334,944 Others 1,396,290 – P=194,501,038 P=160,237,300
Accounts payable and other current liabilities are noninterest-bearing and are normally settled on 30 to 60-day terms.
16. Equity
Following are the details of the Company’s capital stock: Number of Shares 2010 2009 2008 Authorized capital stock - P=1 par
value 2,000,000,000 2,000,000,000 2,000,000,000
Issued and outstanding: Balance at beginning of year 1,662,603,069 1,662,298,650 1,657,585,092 Issuance during the year
(Note 17) 2,022,535 304,419 4,713,558 Balance at end of year 1,664,625,604 1,662,603,069 1,662,298,650
The issued and outstanding shares as of December 31, 2010, 2009 and 2008 are held by 3,360, 3,386, and 3,393 equity holders, respectively.
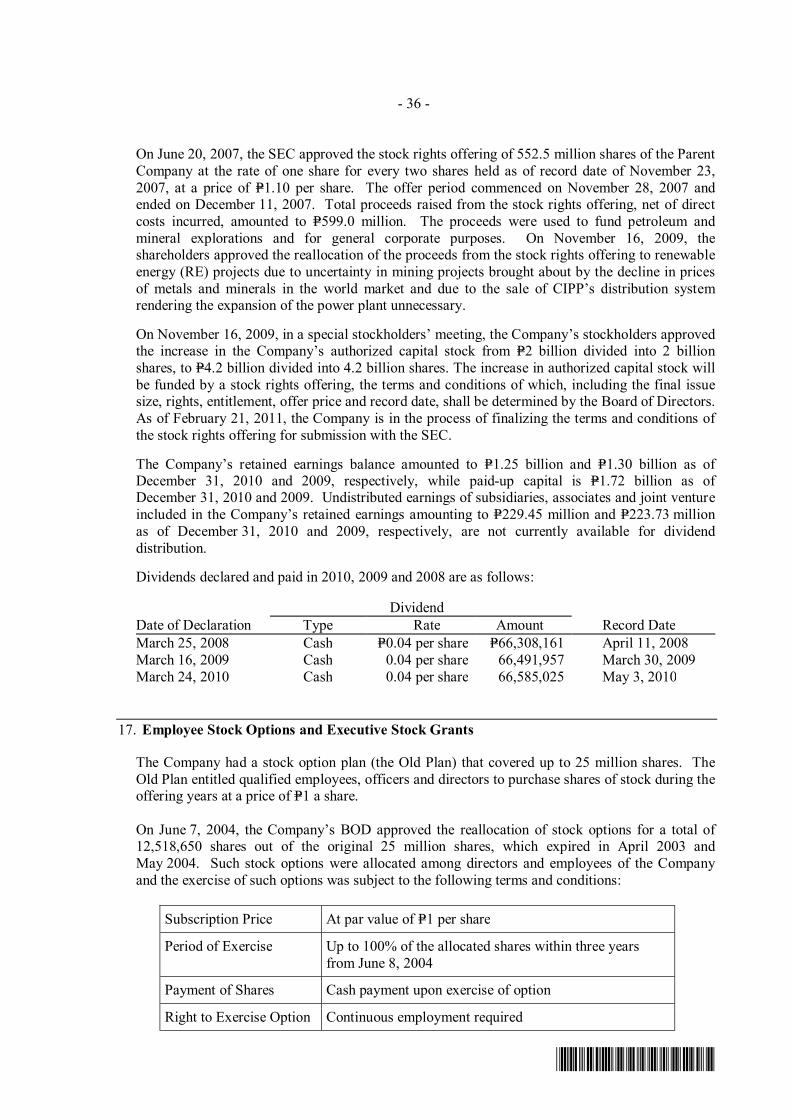
- 36 -
*SGVMC311705*
On June 20, 2007, the SEC approved the stock rights offering of 552.5 million shares of the Parent Company at the rate of one share for every two shares held as of record date of November 23, 2007, at a price of P=1.10 per share. The offer period commenced on November 28, 2007 and ended on December 11, 2007. Total proceeds raised from the stock rights offering, net of direct costs incurred, amounted to P=599.0 million. The proceeds were used to fund petroleum and mineral explorations and for general corporate purposes. On November 16, 2009, the shareholders approved the reallocation of the proceeds from the stock rights offering to renewable energy (RE) projects due to uncertainty in mining projects brought about by the decline in prices of metals and minerals in the world market and due to the sale of CIPP’s distribution system rendering the expansion of the power plant unnecessary.
On November 16, 2009, in a special stockholders’ meeting, the Company’s stockholders approved the increase in the Company’s authorized capital stock from P=2 billion divided into 2 billion shares, to P=4.2 billion divided into 4.2 billion shares. The increase in authorized capital stock will be funded by a stock rights offering, the terms and conditions of which, including the final issue size, rights, entitlement, offer price and record date, shall be determined by the Board of Directors. As of February 21, 2011, the Company is in the process of finalizing the terms and conditions of the stock rights offering for submission with the SEC.
The Company’s retained earnings balance amounted to P=1.25 billion and P=1.30 billion as of December 31, 2010 and 2009, respectively, while paid-up capital is P=1.72 billion as of December 31, 2010 and 2009. Undistributed earnings of subsidiaries, associates and joint venture included in the Company’s retained earnings amounting to P=229.45 million and P=223.73 million as of December 31, 2010 and 2009, respectively, are not currently available for dividend distribution.
Dividends declared and paid in 2010, 2009 and 2008 are as follows:
Dividend Date of Declaration Type Rate Amount Record Date March 25, 2008 Cash P=0.04 per share P=66,308,161 April 11, 2008 March 16, 2009 Cash 0.04 per share 66,491,957 March 30, 2009 March 24, 2010 Cash 0.04 per share 66,585,025 May 3, 2010
17. Employee Stock Options and Executive Stock Grants
The Company had a stock option plan (the Old Plan) that covered up to 25 million shares. The Old Plan entitled qualified employees, officers and directors to purchase shares of stock during the offering years at a price of P=1 a share. On June 7, 2004, the Company’s BOD approved the reallocation of stock options for a total of 12,518,650 shares out of the original 25 million shares, which expired in April 2003 and May 2004. Such stock options were allocated among directors and employees of the Company and the exercise of such options was subject to the following terms and conditions:
Subscription Price At par value of P=1 per share
Period of Exercise Up to 100% of the allocated shares within three years from June 8, 2004
Payment of Shares Cash payment upon exercise of option
Right to Exercise Option Continuous employment required

- 37 -
*SGVMC311705*
On April 2, 2007, the Company’s BOD and stockholders approved a total of 100 million shares to be taken from the unsubscribed portion of the Company’s 2 billion authorized shares to be awarded as follows: (a) stock grants for officers and managers of the Company; and, (b) stock options for directors, officers and employees of TA Oil and its subsidiaries and affiliates (referred to herein as the “New Plan”) under the terms and conditions as determined by the Executive Committee of the BOD.
The exercise of such grants and options are subject to the following terms and conditions:
Stock Grants The executive stock grants are given to officers and managers of the Company computed at a predetermined percentage of their variable compensation pay based on certain performance criteria.
Stock Options Following are the specific terms of the Company’s New Plan:
Coverage Directors, permanent officers and employees of TA Oil and its subsidiaries/affiliates
Exercise price At weighted average closing price for 20 trading days prior to grant date but should not be lower than par value of P=1.00 per share
Vesting period • Up to 33% of the allocated shares on the 1st year from the date of grant;
• Up to 66% of the allocated shares on the 2nd year from the date of grant; and
• Up to 100% of the allocated shares on the 3rd year from the date of grant.
Right to Exercise Option Continuous employment required. In the event of resignation, termination or retirement, the optionee shall be entitled only to the options due him/her up to the effectivity of separation. Full payment is required prior to separation date. In the event of death of optionee, his/her heirs, executors, or administrators shall have the right to exercise the balance of options granted and pay in cash.
On May 7, 2008, the Company’s Stock Option Committee suspended the implementation of the Stock Option Plan. The Committee also decided to implement the Company’s Stock Grant for its executives which resulted in the issuance of 2.02 million shares and 0.30 million shares in 2010 and 2009, respectively.
As of December 31, 2010, no stock options have been granted and awarded to any of the directors, officers and employees of the Company.
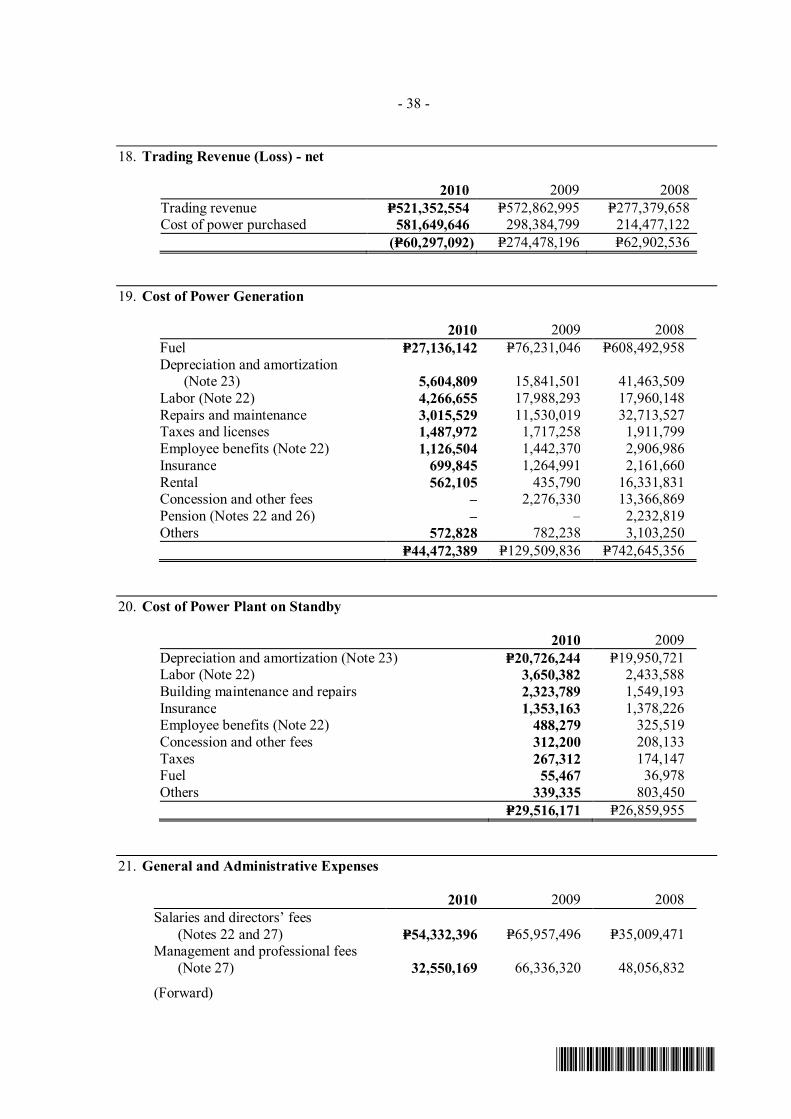
- 38 -
*SGVMC311705*
18. Trading Revenue (Loss) - net
2010 2009 2008 Trading revenue P=521,352,554 P=572,862,995 P=277,379,658 Cost of power purchased 581,649,646 298,384,799 214,477,122 (P=60,297,092) P=274,478,196 P=62,902,536
19. Cost of Power Generation
2010 2009 2008 Fuel P=27,136,142 P=76,231,046 P=608,492,958 Depreciation and amortization
(Note 23) 5,604,809 15,841,501 41,463,509 Labor (Note 22) 4,266,655 17,988,293 17,960,148 Repairs and maintenance 3,015,529 11,530,019 32,713,527 Taxes and licenses 1,487,972 1,717,258 1,911,799 Employee benefits (Note 22) 1,126,504 1,442,370 2,906,986 Insurance 699,845 1,264,991 2,161,660 Rental 562,105 435,790 16,331,831 Concession and other fees – 2,276,330 13,366,869 Pension (Notes 22 and 26) – – 2,232,819 Others 572,828 782,238 3,103,250 P=44,472,389 P=129,509,836 P=742,645,356
20. Cost of Power Plant on Standby
2010 2009 Depreciation and amortization (Note 23) P=20,726,244 P=19,950,721 Labor (Note 22) 3,650,382 2,433,588 Building maintenance and repairs 2,323,789 1,549,193 Insurance 1,353,163 1,378,226 Employee benefits (Note 22) 488,279 325,519 Concession and other fees 312,200 208,133 Taxes 267,312 174,147 Fuel 55,467 36,978 Others 339,335 803,450 P=29,516,171 P=26,859,955
21. General and Administrative Expenses
2010 2009 2008 Salaries and directors’ fees
(Notes 22 and 27) P=54,332,396 P=65,957,496 P=35,009,471 Management and professional fees
(Note 27) 32,550,169 66,336,320 48,056,832
(Forward)

- 39 -
*SGVMC311705*
2010 2009 2008 Depreciation and amortization
(Note 23) P=26,879,474 P=20,917,227 P=60,770,583 Building maintenance and repairs 10,945,442 11,922,288 9,245,427 Insurance, dues and subscriptions 7,390,535 6,728,643 3,447,953 Taxes and licenses 5,861,652 5,025,317 1,512,736 Employee benefits (Note 22) 5,232,213 3,742,979 4,903,817 Transportation and travel 4,071,035 3,543,452 2,331,980 Pension (Notes 22 and 26) 2,860,639 848,972 1,952,817 Donation and contribution 2,687,672 1,843,483 1,928,354 Rent 2,196,677 3,419,299 2,890,925 Office supplies 1,849,618 1,961,711 1,616,448 Entertainment, amusement
and recreation 316,523 308,677 215,486 General exploration – 1,465,482 2,629,431 Others 8,320,965 5,785,272 4,659,926 P=165,495,010 P=199,806,618 P=181,172,186
22. Personnel Expenses
2010 2009 2008 Salaries and directors’ fees included
under: Cost of power generation P=4,266,655 P=17,988,293 P=17,960,148 Cost of power plant on standby 3,650,382 2,433,588 – General and administrative
expenses 54,332,396 65,957,496 35,009,471 Pension (Note 26) included under: Cost of power generation – – 2,232,819
General and administrative expenses 2,860,639 848,972 1,952,817
Employee benefits included under: Cost of power generation 1,126,504 1,442,370 2,906,986 Cost of power plant on standby 488,279 325,519 – General and administrative
expenses 5,232,213 3,742,979 4,903,817 P=71,957,068 P=92,739,217 P=64,966,058
23. Depreciation and Amortization
2010 2009 2008 Depreciation expense of property,
plant and equipment and investment properties included under (Notes 9 and 12):
Cost of power generation P=5,604,809 P=15,841,501 P=41,463,509 Cost of power plant on standby 20,726,244 19,950,721 – General and administrative
expenses 26,879,474 20,917,227 13,504,451 53,210,527 56,709,449 54,967,960 (Forward)
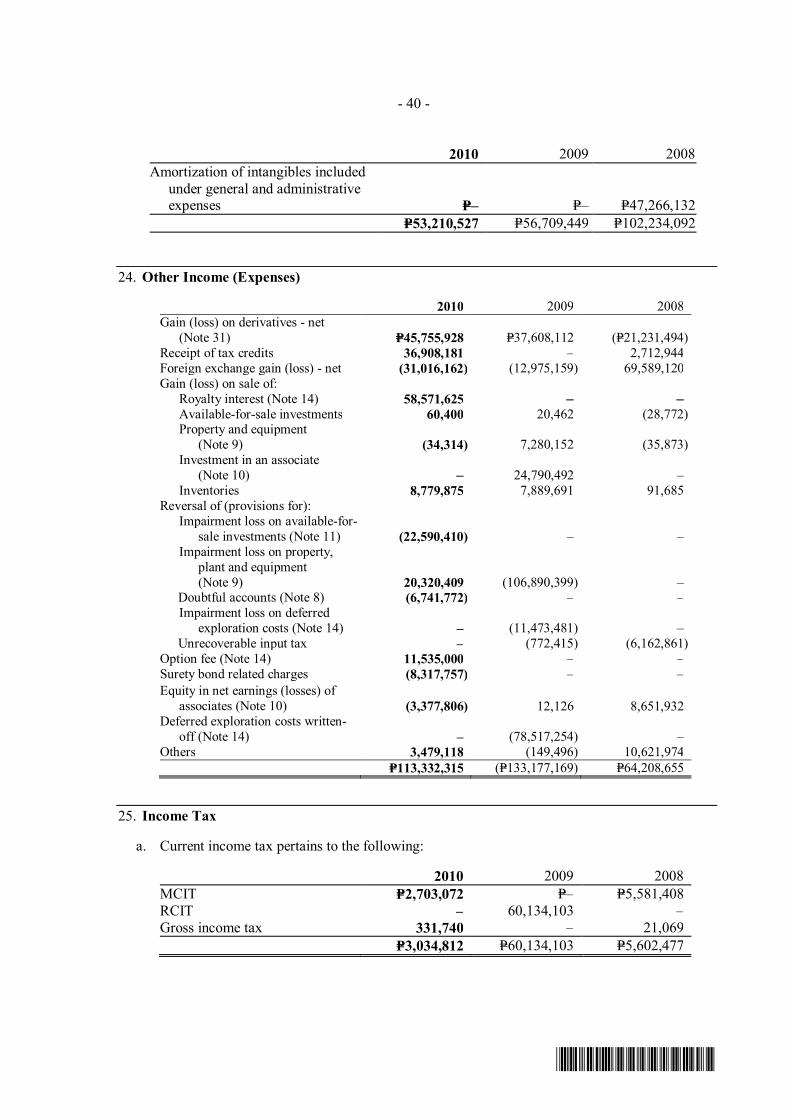
- 40 -
*SGVMC311705*
2010 2009 2008 Amortization of intangibles included
under general and administrative expenses P=– P=– P=47,266,132
P=53,210,527 P=56,709,449 P=102,234,092
24. Other Income (Expenses)
2010 2009 2008 Gain (loss) on derivatives - net
(Note 31) P=45,755,928 P=37,608,112 (P=21,231,494) Receipt of tax credits 36,908,181 – 2,712,944 Foreign exchange gain (loss) - net (31,016,162) (12,975,159) 69,589,120 Gain (loss) on sale of: Royalty interest (Note 14) 58,571,625 – – Available-for-sale investments 60,400 20,462 (28,772) Property and equipment
(Note 9) (34,314) 7,280,152 (35,873) Investment in an associate
(Note 10) – 24,790,492 – Inventories 8,779,875 7,889,691 91,685 Reversal of (provisions for): Impairment loss on available-for-
sale investments (Note 11) (22,590,410) – – Impairment loss on property,
plant and equipment (Note 9) 20,320,409 (106,890,399) –
Doubtful accounts (Note 8) (6,741,772) – – Impairment loss on deferred
exploration costs (Note 14) – (11,473,481) – Unrecoverable input tax – (772,415) (6,162,861) Option fee (Note 14) 11,535,000 – – Surety bond related charges (8,317,757) – – Equity in net earnings (losses) of
associates (Note 10) (3,377,806) 12,126 8,651,932 Deferred exploration costs written-
off (Note 14) – (78,517,254) – Others 3,479,118 (149,496) 10,621,974 P=113,332,315 (P=133,177,169) P=64,208,655
25. Income Tax
a. Current income tax pertains to the following:
2010 2009 2008 MCIT P=2,703,072 P=– P=5,581,408 RCIT – 60,134,103 – Gross income tax 331,740 – 21,069 P=3,034,812 P=60,134,103 P=5,602,477
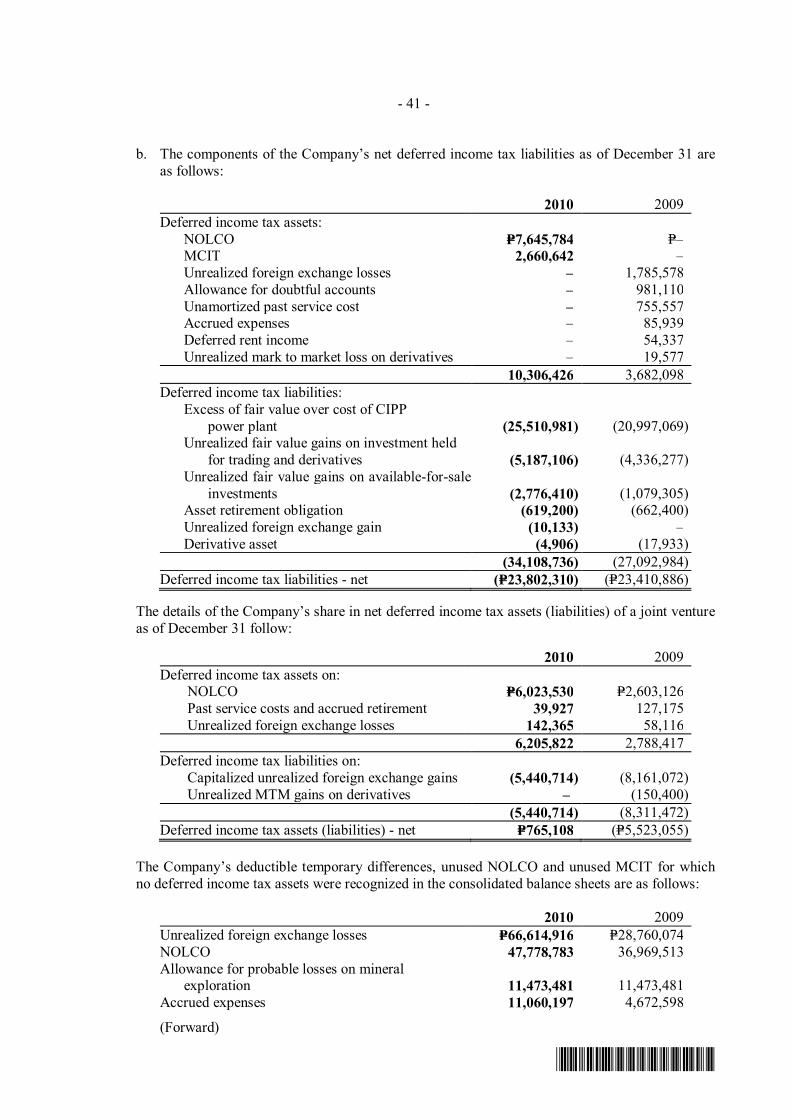
- 41 -
*SGVMC311705*
b. The components of the Company’s net deferred income tax liabilities as of December 31 are as follows:
2010 2009 Deferred income tax assets: NOLCO P=7,645,784 P=– MCIT 2,660,642 – Unrealized foreign exchange losses – 1,785,578 Allowance for doubtful accounts – 981,110 Unamortized past service cost – 755,557 Accrued expenses – 85,939 Deferred rent income – 54,337 Unrealized mark to market loss on derivatives – 19,577 10,306,426 3,682,098 Deferred income tax liabilities: Excess of fair value over cost of CIPP
power plant (25,510,981) (20,997,069) Unrealized fair value gains on investment held
for trading and derivatives (5,187,106) (4,336,277) Unrealized fair value gains on available-for-sale
investments (2,776,410) (1,079,305) Asset retirement obligation (619,200) (662,400) Unrealized foreign exchange gain (10,133) – Derivative asset (4,906) (17,933) (34,108,736) (27,092,984) Deferred income tax liabilities - net (P=23,802,310) (P=23,410,886)
The details of the Company’s share in net deferred income tax assets (liabilities) of a joint venture as of December 31 follow:
2010 2009 Deferred income tax assets on:
NOLCO P=6,023,530 P=2,603,126 Past service costs and accrued retirement 39,927 127,175 Unrealized foreign exchange losses 142,365 58,116
6,205,822 2,788,417 Deferred income tax liabilities on:
Capitalized unrealized foreign exchange gains (5,440,714) (8,161,072) Unrealized MTM gains on derivatives – (150,400)
(5,440,714) (8,311,472) Deferred income tax assets (liabilities) - net P=765,108 (P=5,523,055)
The Company’s deductible temporary differences, unused NOLCO and unused MCIT for which no deferred income tax assets were recognized in the consolidated balance sheets are as follows:
2010 2009 Unrealized foreign exchange losses P=66,614,916 P=28,760,074 NOLCO 47,778,783 36,969,513 Allowance for probable losses on mineral
exploration 11,473,481 11,473,481 Accrued expenses 11,060,197 4,672,598
(Forward)

- 42 -
*SGVMC311705*
2010 2009 Allowance for unrecoverable input tax P=6,935,276 P=6,935,276 Allowance for doubtful accounts 6,718,483 – Allowance for impairment losses 6,712,782 6,712,782 Asset retirement obligation 4,997,344 4,626,504 Unamortized past service cost 1,765,444 – Deferred rent income 190,179 – Unrealized marked to market loss 44,118 – MCIT 42,431 –
Deferred income tax assets have not been recognized with respect to the foregoing items as the Company believes it is not probable that sufficient future taxable profit will be available against which the related deferred income tax assets can be used. As of December 31, 2010, NOLCO totaling P=73.26 million can be claimed as deduction from regular taxable income and MCIT amounting to P=2.7 million can be credited against future RCIT due as follows:
Expiry Date MCIT NOLCO December 31, 2011 P=– P=12,222,794 December 31, 2012 – 17,524,263 December 31, 2013 2,703,073 43,517,673 P=2,703,073 P=73,264,730
MCIT amounting to P=0.3 million expired in 2008. NOLCO amounting to P=7.2 million, P=0.9 million and P=0.8 million expired in 2010, 2009 and 2008, respectively. NOLCO amounting to P=37.8 million and P=67.7 million were applied against taxable income in 2009 and 2008, respectively. MCIT amounting to P=10.0 million was applied against RCIT in 2009.
The reconciliation between the effective income tax rates and the statutory income tax rates follows:
2010 2009 2008 Applicable statutory income tax
rates 30.00% 30.00% 35.00% Increase (decrease) in tax rate
resulting from: Dividend income exempt
from tax (17.32) (2.72) (1.09) Equity in net losses (earnings)
of associates 8.25 – (4.44) Change in unrecognized
deferred income tax asset on allowance for probable losses on mineral exploration – (3.66) (58.60)
Gain on sale of an investment in an associate – (2.49) –
Application of NOLCO, MCIT and others (40.99) (15.90) (0.45)
Effective income tax rates (20.06%) 5.23% (29.58%)
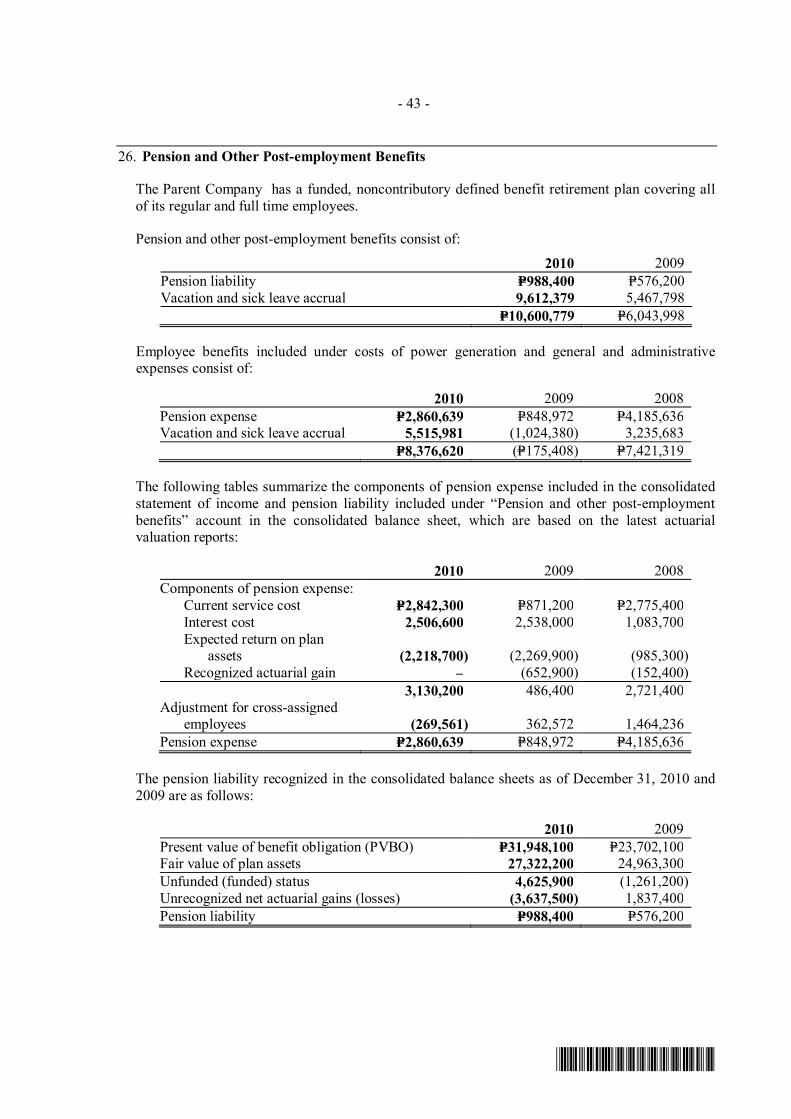
- 43 -
*SGVMC311705*
26. Pension and Other Post-employment Benefits
The Parent Company has a funded, noncontributory defined benefit retirement plan covering all of its regular and full time employees.
Pension and other post-employment benefits consist of:
2010 2009 Pension liability P=988,400 P=576,200 Vacation and sick leave accrual 9,612,379 5,467,798 P=10,600,779 P=6,043,998
Employee benefits included under costs of power generation and general and administrative expenses consist of:
2010 2009 2008 Pension expense P=2,860,639 P=848,972 P=4,185,636 Vacation and sick leave accrual 5,515,981 (1,024,380) 3,235,683 P=8,376,620 (P=175,408) P=7,421,319
The following tables summarize the components of pension expense included in the consolidated statement of income and pension liability included under “Pension and other post-employment benefits” account in the consolidated balance sheet, which are based on the latest actuarial valuation reports:
2010 2009 2008 Components of pension expense: Current service cost P=2,842,300 P=871,200 P=2,775,400 Interest cost 2,506,600 2,538,000 1,083,700 Expected return on plan
assets (2,218,700) (2,269,900) (985,300) Recognized actuarial gain – (652,900) (152,400) 3,130,200 486,400 2,721,400 Adjustment for cross-assigned
employees (269,561) 362,572 1,464,236 Pension expense P=2,860,639 P=848,972 P=4,185,636
The pension liability recognized in the consolidated balance sheets as of December 31, 2010 and 2009 are as follows:
2010 2009 Present value of benefit obligation (PVBO) P=31,948,100 P=23,702,100 Fair value of plan assets 27,322,200 24,963,300 Unfunded (funded) status 4,625,900 (1,261,200) Unrecognized net actuarial gains (losses) (3,637,500) 1,837,400 Pension liability P=988,400 P=576,200

- 44 -
*SGVMC311705*
The movements in the PVBO are as follows:
2010 2009 Balance at beginning of year P=23,702,100 P=11,169,200 Current service cost 2,842,300 871,200 Interest cost 2,506,600 2,538,000 Actual benefits paid (636,600) – Transfer in – 1,808,900 Actuarial losses 3,533,700 7,314,800 Balance at end of year P=31,948,100 P=23,702,100
The changes in the fair value of plan assets are as follows:
2010 2009 Balance at beginning of year P=24,963,300 P=20,658,800 Expected return on plan assets 2,218,700 2,269,900 Actual contribution 2,718,000 1,600,300 Actual benefits paid (636,600) – Transfer in – 1,808,900 Actuarial losses (1,941,200) (1,374,600) Balance at end of year P=27,322,200 P=24,963,300
Actual return on plan assets P=277,500 P=895,300
As of January 1, the assumptions used to determine PVBO and fair value of plan assets are as follows:
2010 2009Discount rate 10.70% 30.01%Expected rate of return on plan assets 8.60% 10.85%Rate of increase in compensation 8.00% 10.00%
As of December 31, 2010, the following are the information with respect to the above assumptions: discount rate of 8.10%, expected rate of return on plan assets of 6.40% and rate of increase in compensation of 8.00%.
The overall expected rate of return on plan assets is determined based on the prevailing return on government securities applicable to the period over which the obligation is to be settled.
The Company is expected to contribute P=4.88 million to its defined benefit pension plan in 2011.
The major categories of plan assets as a percentage of the fair value of total plan assets are as follows:
2010 2009Equities 85.8% 85.7%Mutual Funds and UITFs 1.1% 2.8%Others 13.1% 11.5%

- 45 -
*SGVMC311705*
The amounts for the current and previous four annual periods of the PVO, fair value of plan assets, deficit and any experience adjustments are as follows:
Retirement Benefits 2010 2009 2008 2007 2006 Present value of benefit
obligation P=31,948,100 P=23,702,100 P=11,169,200 P=14,719,700 P=26,964,400 Fair value of plan assets 27,322,200 24,963,300 20,658,800 15,576,500 28,114,200 Surplus (deficit) (4,625,900) 1,261,200 9,489,600 856,800 1,149,800 Experience adjustments -
gain (loss) Plan liabilities (8,255,900) 1,707,600 (519,600) (1,784,900) 651,800 Plan assets (1,941,200) (1,374,600) (1,120,200) (890,400) (542,900)
27. Related Party Transactions
PHINMA The Parent Company is controlled by PHINMA through a management agreement. Under the existing management agreement, the Parent Company pays PHINMA a fixed monthly management fee plus an annual incentive based on a certain percentage of the Parent Company’s net income. The management agreement with PHINMA was renewed for another five years starting September 1, 2008. Total management fees, including annual incentive, amounted to P=6.72 million, P=19.03 million and P=15.21 million for the years ended December 31, 2010, 2009 and 2008, respectively. Net payable to PHINMA (included under “Accounts payable and other current liabilities” account) amounted to P=1.34 million and P=10.95 million as of December 31, 2010 and 2009, respectively.
TA Power TA Power leases and occupies part of the office space owned by the Parent Company. Rental income earned from TA Power included in the consolidated statements of income amounted to P=0.92 million, P=1.10 million and P=1.16 million in 2010, 2009 and 2008, respectively, net of the Parent Company’s interest. Also, the Parent Company sold electricity to TA Power in 2010 and 2009. Net receivable from TA Power amounted to P=60.85 million and P=56.40 million as of December 31, 2010 and 2009, respectively, net of the Parent Company’s interest. PHINMA Property Holdings Corporation (PPHC) PPHC is likewise controlled by PHINMA through a management agreement. PPHC bills the Parent Company for the management of the building and other charges where the Parent Company’s office is located. Net payable to PPHC amounted to P=0.17 million as of December 31, 2010 and 2009, included in “Account payable and other current liabilities”.
Directors The Company recognized bonus to directors computed based on net income before the effect of the application of the equity method of accounting. Directors’ bonus amounted to P=0.47 million and P=15.33 million in 2010 and 2009, respectively. The related unpaid amount included under the “Accounts payable and other current liabilities” account in the consolidated balance sheets amounted to P=0.47 million and P=12.27 million as of December 31, 2010 and 2009, respectively.
Compensation of key management personnel of the Company are as follows:
2010 2009 2008 Short-term employee benefits P=26,886,937 P=36,459,235 P=24,893,755 Post-employment benefits 8,602,863 643,555 6,703,630 P=35,489,800 P=37,102,790 31,597,385

- 46 -
*SGVMC311705*
Stockholders Amounts due to stockholders for unclaimed dividends totaled P=7.96 million and P=7.01 million as of December 31, 2010 and 2009, respectively.
28. EPS Computation
2010 2009 2008 (a) Net income P=14,744,926 P=282,809,874 P=88,476,698
Common shares outstanding at beginning of year (Note 16) 1,662,603,069 1,662,298,650 1,657,585,092
Weighted average number of shares issued during the year 1,678,981 198,498 2,961,304
(b) Weighted average common shares outstanding 1,664,282,050 1,662,497,148 1,660,546,396
Basic/Diluted EPS (a/b) P=0.01 P=0.17 P=0.05
The Company’s stock option has no dilutive effect in 2010, 2009 and 2008. Also, the Company does not have any potential common share nor other instruments that may entitle the holder to common shares. Hence, diluted EPS is the same as basic EPS.
29. Commitments
Power Administration and Management Agreement On November 18, 2010, TA Oil and One Subic Power Generation Corporation (One Subic Power, a third party) entered into a Power Administration and Management Agreement (PAMA). Under the terms of the PAMA, TA Oil will administer and manage the entire generation output of the 116 MW diesel power plant in Subic, Olongapo City. TA Oil will be selling or trading the entire capacity of the power plant, while operations will be under One Subic Power for a period of five years commencing on the commercial operation date (the date when the power plant is capable of supplying power to the Grid). TA Oil will pay One Subic Power for all electricity actually delivered by the power plant based on a formula (actual fuel consumption and electricity generated) as set forth in the PAMA and shall be payable monthly. As of December 31, 2010, the power plant has not commenced commercial operations. Electricity Supply Agreement with Guimelco On November 12, 2003 and July 26, 2004, the Company signed an ESA and amendment to the ESA, respectively, with Guimelco, a nonstock, nonprofit cooperative (see Note 1). Under the ESA, the Company agreed to construct, operate and maintain a 3.4 MW bunker C-fired diesel generator power station and to supply Guimelco with electricity based on the terms and conditions set forth in the ESA. Following are the significant provisions of the ESA, among others:
Cooperation Period Ten years, and may be extended pursuant to the ESA.
Electricity Fees Electricity fees is based on a formula as set forth in the ESA and shall be payable monthly during the Cooperation Period.
Electricity Delivery Procedures Guimelco must give priority to electricity generated by the Company’s power station up to 1.8 MW, over any other power source.
The power plant commenced commercial operations on June 26, 2005.

- 47 -
*SGVMC311705*
Electricity Supply Agreements with Holcim TA Oil, TA Power and Holcim entered into a memorandum of agreement (as amended on January 12, 2010 and December 20, 2010) with the following provisions: • TA Power shall supply exclusively the electricity requirements of the Bulacan plant of Holcim
at rates equal to the agreed “Time of Use” rates schedule plus all other charges and applying such adjustments approved and in the manner prescribed by the ERC.
• TA Oil, acting as a retail electricity supplier, shall exclusively supply all the electricity
requirements of Holcim’s cement plant in La Union until 2013. TA Oil shall charge Holcim at rates equal to the agreed “Time of Use” schedule plus all other charges and applying such adjustments approved and in the manner prescribed by the ERC. Transmission charges shall be settled separately by Holcim with the National Transmission Corporation under Holcim’s Transmission Services Agreement.
• TA Oil and TA Power guarantee to cover all of Holcim’s electricity requirements for both the
La Union and Bulacan plants until 2013. Operating Lease Commitment The Company has entered into a lease contract with Guimelco for a parcel of land used only as site for electric generating plant and facilities. The term of the lease is 10 years with a renewal option included in the contract. The Company is given the first option to buy the property if the lessor decides to sell the land. The lease is at a fixed monthly rate of P=20,000 for the duration of the lease term. Starting July 2009, the fixed monthly rate was increased to P=40,000. Future minimum operating lease payables under this lease agreement as of December 31 are as follows:
2010 2009 Within one year P=480,000 P=480,000 After one year but not more than five years 1,600,000 2,080,000 P=2,080,000 P=2,560,000
Electric Power Industry Reform Act Republic Act No. 9136, the EPIRA, and the covering Implementing Rules and Regulations (IRR) provide for significant changes in the power sector which include among others: (1) The unbundling of the generation, transmission, distribution and supply, and other disposable
assets of the Company, including its contracts with independent power producers, and electricity rates;
(2) Creation of a WESM; and (3) Open and non-discriminatory access to transmission and distribution systems. The law also requires public listing of not less than 15% of common shares of generation and distribution companies within five years from the effectivity of the EPIRA. It provides cross- ownership restrictions between transmission and generation companies and between transmission and distribution companies, and a cap of 50% of its demand that a distribution utility is allowed to source from an associated company engaged in generation except for contracts entered into prior to the effectivity of the EPIRA. There are also certain sections of the EPIRA, specifically relating to generation companies, which provide for a cap on the concentration of ownership to only 30% of the installed capacity of the grid and/or 25% of the national installed generating capacity. The Company believes that it is in compliance with the applicable provisions of the EPIRA and its IRR.

- 48 -
*SGVMC311705*
Renewable Service Contracts In October 2009, TAREC was awarded 10 wind energy service contracts by the DOE, representing a total potential wind capacity of 227MW. In February 2010, another 10 service contracts representing an additional 123MW of potential wind capacity were again awarded to TAREC by the DOE thus bringing its total potential wind capacity to 350MW as of December 31, 2010.
Renewable Energy Act of 2008 On January 30, 2009, R.A. No. 9513, An Act Promoting the Development, Utilization and Commercialization of Renewable Energy Resources and for Other Purposes, which shall be known as the “Renewable Energy Act of 2008” (the Act), became effective. The Act aims to: (1) Accelerate the exploration and development of RE resources such as, but not limited to,
biomass, solar, wind, hydro, geothermal and ocean energy sources, including hybrid systems, to achieve energy self-reliance, through the adoption of sustainable energy development strategies to reduce the country’s dependence on fossil fuels and thereby minimize the country’s exposure to price fluctuations in the international markets, the effects of which spiral down to almost all sectors of the economy;
(2) Increase the utilization of RE by institutionalizing the development of national and local capabilities in the use of RE systems, and promoting its efficient and cost-effective commercial application by providing fiscal and non-fiscal incentives;
(3) Encourage the development and utilization of RE resources as tools to effectively prevent or reduce harmful emissions and thereby balance the goals of economic growth and development with the protection of health and environment; and
(4) Establish the necessary infrastructure and mechanism to carry out mandates specified in the Act and other laws.
As provided for in the Act, RE developers of RE facilities, including hybrid systems, in proportion to and to the extent of the RE component, for both power and non-power applications, as duly certified by the DOE, in consultation with the Board of Investments, shall be entitled to incentives, such as, income tax holiday, duty-free importation of RE machinery, equipment and materials, zero percent VAT rate on sale of power from RE sources, and tax exemption of carbon credits, among others. The Company expects that the Act may have significant effect on the operating results of TAREC, an RE developer. Impact on the operating results is expected to arise from the effective reduction in taxes.
30. Financial Risk Management Objectives and Policies
Objectives and Investment Policies
The PHINMA Group Treasury manages the funds of the Company and invests in short-term deposits, marketable instruments, corporate promissory notes and bonds, government bonds, listed shares of stocks, and mutual and trust funds denominated in Philippine peso, U.S. dollar and Euro. It is responsible for the sound and prudent management of the Company’s financial assets that finance the Company’s operations and investments in enterprises.
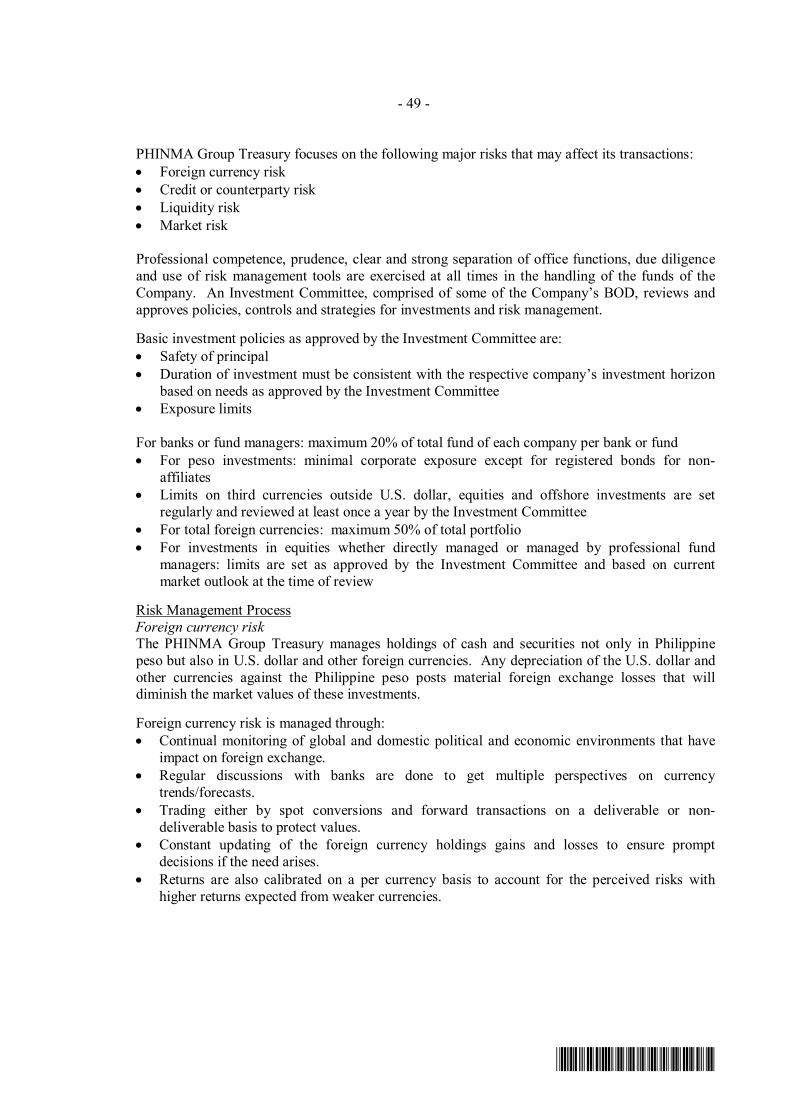
- 49 -
*SGVMC311705*
PHINMA Group Treasury focuses on the following major risks that may affect its transactions: • Foreign currency risk • Credit or counterparty risk • Liquidity risk • Market risk
Professional competence, prudence, clear and strong separation of office functions, due diligence and use of risk management tools are exercised at all times in the handling of the funds of the Company. An Investment Committee, comprised of some of the Company’s BOD, reviews and approves policies, controls and strategies for investments and risk management.
Basic investment policies as approved by the Investment Committee are: • Safety of principal • Duration of investment must be consistent with the respective company’s investment horizon
based on needs as approved by the Investment Committee • Exposure limits For banks or fund managers: maximum 20% of total fund of each company per bank or fund • For peso investments: minimal corporate exposure except for registered bonds for non-
affiliates • Limits on third currencies outside U.S. dollar, equities and offshore investments are set
regularly and reviewed at least once a year by the Investment Committee • For total foreign currencies: maximum 50% of total portfolio • For investments in equities whether directly managed or managed by professional fund
managers: limits are set as approved by the Investment Committee and based on current market outlook at the time of review
Risk Management Process Foreign currency risk The PHINMA Group Treasury manages holdings of cash and securities not only in Philippine peso but also in U.S. dollar and other foreign currencies. Any depreciation of the U.S. dollar and other currencies against the Philippine peso posts material foreign exchange losses that will diminish the market values of these investments.
Foreign currency risk is managed through: • Continual monitoring of global and domestic political and economic environments that have
impact on foreign exchange. • Regular discussions with banks are done to get multiple perspectives on currency
trends/forecasts. • Trading either by spot conversions and forward transactions on a deliverable or non-
deliverable basis to protect values. • Constant updating of the foreign currency holdings gains and losses to ensure prompt
decisions if the need arises. • Returns are also calibrated on a per currency basis to account for the perceived risks with
higher returns expected from weaker currencies.
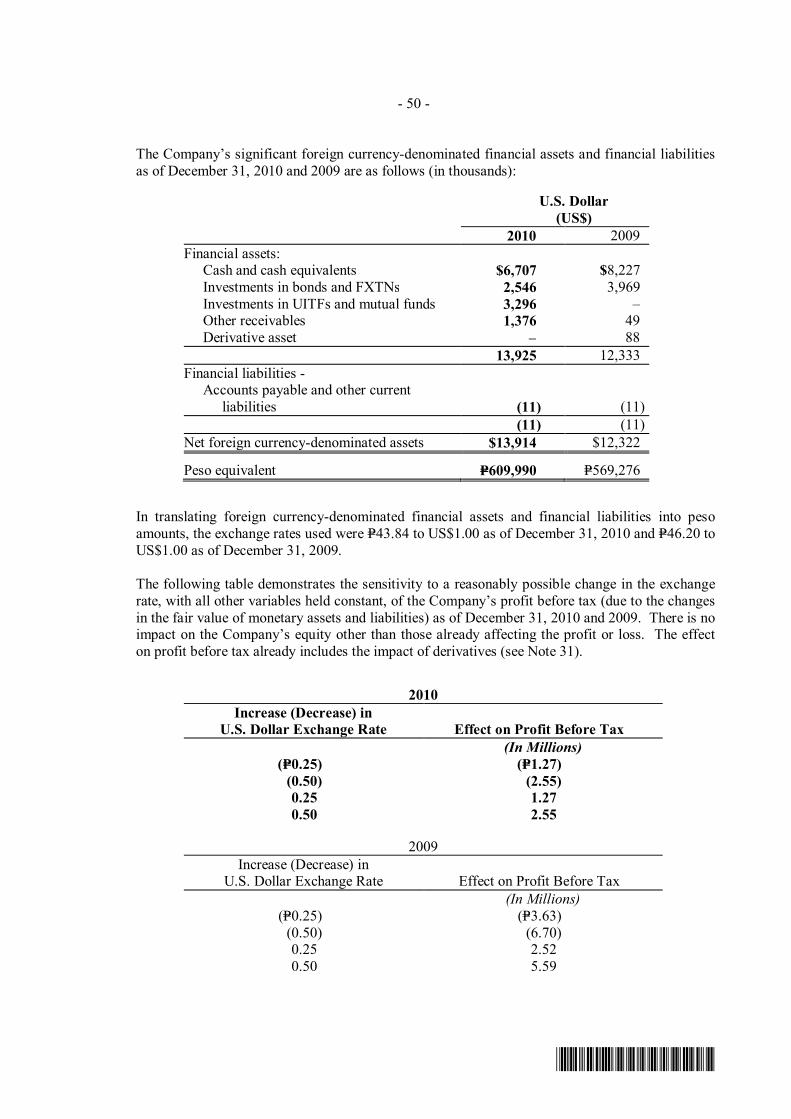
- 50 -
*SGVMC311705*
The Company’s significant foreign currency-denominated financial assets and financial liabilities as of December 31, 2010 and 2009 are as follows (in thousands):
U.S. Dollar (US$) 2010 2009 Financial assets: Cash and cash equivalents $6,707 $8,227 Investments in bonds and FXTNs 2,546 3,969 Investments in UITFs and mutual funds 3,296 – Other receivables 1,376 49 Derivative asset – 88 13,925 12,333 Financial liabilities - Accounts payable and other current
liabilities (11) (11) (11) (11) Net foreign currency-denominated assets $13,914 $12,322
Peso equivalent P=609,990 P=569,276
In translating foreign currency-denominated financial assets and financial liabilities into peso amounts, the exchange rates used were P=43.84 to US$1.00 as of December 31, 2010 and P=46.20 to US$1.00 as of December 31, 2009. The following table demonstrates the sensitivity to a reasonably possible change in the exchange rate, with all other variables held constant, of the Company’s profit before tax (due to the changes in the fair value of monetary assets and liabilities) as of December 31, 2010 and 2009. There is no impact on the Company’s equity other than those already affecting the profit or loss. The effect on profit before tax already includes the impact of derivatives (see Note 31).
2010 Increase (Decrease) in
U.S. Dollar Exchange Rate Effect on Profit Before Tax (In Millions)
(P=0.25) (P=1.27) (0.50) (2.55) 0.25 1.27 0.50 2.55
2009
Increase (Decrease) in U.S. Dollar Exchange Rate Effect on Profit Before Tax
(In Millions) (P=0.25) (P=3.63)
(0.50) (6.70) 0.25 2.52 0.50 5.59

- 51 -
*SGVMC311705*
Credit or Counterparty Risk Credit or counterparty risk is the risk due to uncertainty in counterparty’s ability to meet its obligations.
Credit or counterparty risk is managed through:
• Investments are coursed thru or transacted with duly accredited domestic and foreign banks and mutual funds up to a maximum of 20% of the Company’s investible funds. For UITF and mutual funds, fund placements cannot exceed 10% of the UITF’s or mutual funds’ total funds. Individual limits are further established for one bank or mutual fund on the basis of their valuation, financial soundness, business performance and reputation or expertise. Banks’, UITF’s and mutual funds’ performance as well as their fund level, investment mix and duration are reviewed at least once a month or as often as required.
• Investments in nonrated securities are subject to a comprehensive credit and business review in coordination with sponsoring dealers or underwriters. For rated corporate bonds and sovereign bonds, credit ratings studies and updates from the major rating agencies are used as references (S & P, Moody’s) in addition to a comprehensive credit and business review.
• For temporary investments in related parties, transactions are done on an arms-length basis taking into account the related parties’ financial standing and ability to pay. Interest rates are based on a formula that considers the average of the borrowing and lending rates of the parties and maturity dates are strictly complied with.
• Discussions are done on every major investment by Treasury en banc before it is executed subject to the Chief Financial Officer (CFO) approval. Exposure limits are tracked for every transaction and a senior Treasury Officer supervises major transaction executions.
• Market and portfolio reviews are done at least once a week and as often as necessary should market conditions require. Monthly reports are given to the CFO with updates in between these reports as needed.
• A custodian bank for peso instruments and foreign currency instruments has been appointed based on its track record on such service and the bank’s financial competence.
• Product manuals on new products are studied and reviewed to ensure that risks are identified and addressed prior to the endorsement of the new product for Investment Committee approval.
With respect to credit risk arising from the receivables of the Company, the Company’s exposures arise from default of the counterparty, with a maximum exposure equal to the carrying amount of these instruments.
2010
Neither Past Due nor Impaired Past Due
but not Past Due
Individually Class A Class B Class C Impaired Impaired Total (In Thousands) Trade and other receivables Trade receivables from
customers: Holcim P=22,979 P=– P=– P=– P=– P=22,979 Guimelco 9,961 – – 4,107 – 14,068 Locators – – – – 6,718 6,718 PEMC 44,664 – – – – 44,664 Due from related companies 71,453 – – – – 71,453 Others 66,804 – – – 3,294 70,098 P=215,861 P=– P=– P=4,107 P=10,012 P=229,980

- 52 -
*SGVMC311705*
2009
Neither Past Due nor Impaired Past Due
but not Past Due
Individually Class A Class B Class C Impaired Impaired Total (In Thousands) Trade and other receivables Trade receivables from
customers: Holcim P=36,758 P=– P=– P=– P=– P=36,758 Guimelco 11,288 – – 2,488 – 13,776 Locators – – – 6,719 – 6,719 PEMC 5,329 – – – – 5,329 Due from related companies 59,143 – – – – 59,143 Others 35,755 – – – 3,270 39,025 P=148,273 P=– P=– P=9,207 P=3,270 P=160,750
The Company uses the following criteria to rate credit risk as to class:
Class Description Class A Collateralized accounts with excellent paying habits Class B Secured accounts with good paying habits Class C Unsecured accounts
With respect to credit risk arising from the other financial assets of the Company, which comprise cash and cash equivalents, short-term investments, AFS investments, investments held for trading and derivative instruments, the Company’s exposure to credit risk arises from default of the counterparty, with a maximum exposure equal to the carrying amount of these instruments.
The Company’s assessments of the credit quality of its financial assets are as follows:
• Cash and cash equivalents, short-term investments, derivative assets and investments held for trading were assessed as high grade since these are deposited in or transacted with reputable banks, which have low probability of insolvency.
• Listed and unlisted AFS investments were assessed as high grade since these are investments in instruments that have a recognized foreign or local third party rating or instruments which carry guaranty or collateral.
There are no significant concentrations of credit risk within the Company.
Liquidity risk Liquidity risk is defined as the risk that the Company may not be able to settle or meet its obligations on time or at a reasonable price.
Liquidity risk is managed through:
• Restricting investments principally to publicly traded securities with a good track record of marketability and dealing only with large reputable domestic and international institutions.
• Continuous monitoring of the weekly and monthly cash flows as well as frequent updates of the annual plans of the Company.
• Investment maturities are spread on a weekly, monthly, and annual basis as indicated in the Company’s plans. Average duration of investments should adhere to the investment parameters approved by the Investment Committee.
• When necessary, placements are pre-terminated or securities are liquidated; but this is largely avoided.
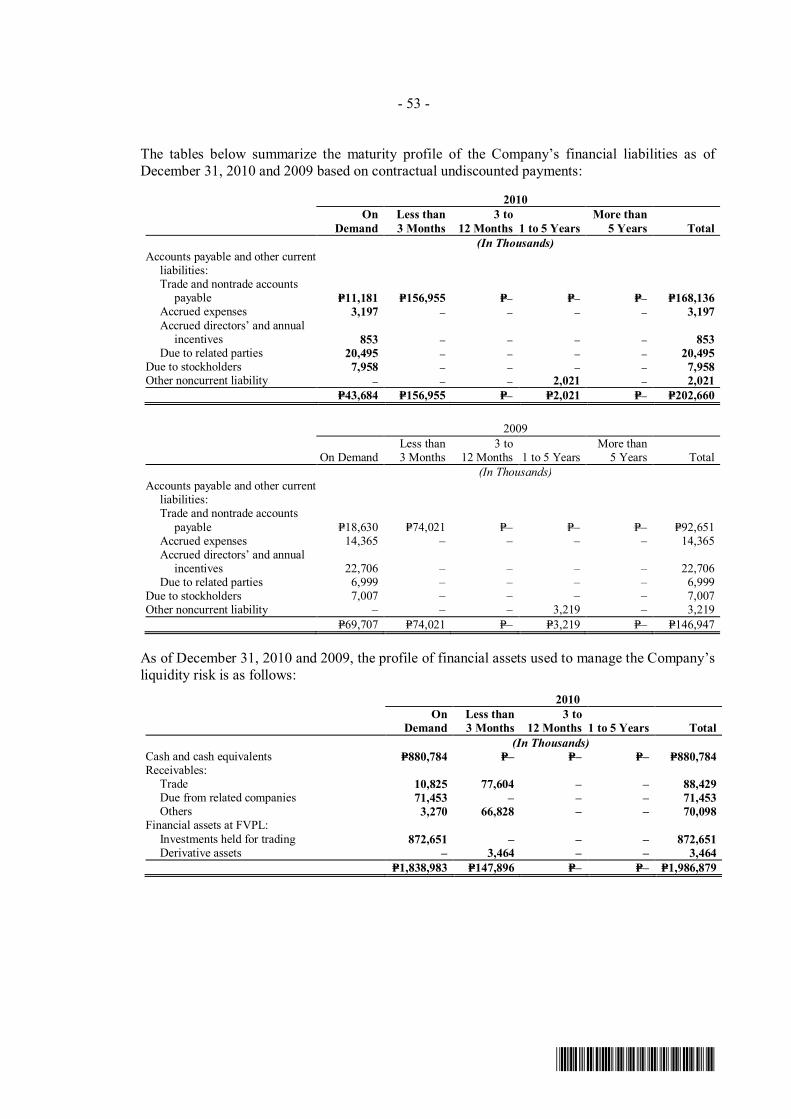
- 53 -
*SGVMC311705*
The tables below summarize the maturity profile of the Company’s financial liabilities as of December 31, 2010 and 2009 based on contractual undiscounted payments:
2010
On
Demand Less than 3 Months
3 to 12 Months 1 to 5 Years
More than 5 Years Total
(In Thousands) Accounts payable and other current
liabilities: Trade and nontrade accounts
payable P=11,181 P=156,955 P=– P=– P=– P=168,136 Accrued expenses 3,197 – – – – 3,197 Accrued directors’ and annual
incentives 853 – – – – 853 Due to related parties 20,495 – – – – 20,495 Due to stockholders 7,958 – – – – 7,958 Other noncurrent liability – – – 2,021 – 2,021 P=43,684 P=156,955 P=– P=2,021 P=– P=202,660
2009
On Demand Less than 3 Months
3 to 12 Months 1 to 5 Years
More than 5 Years Total
(In Thousands) Accounts payable and other current
liabilities: Trade and nontrade accounts
payable P=18,630 P=74,021 P=– P=– P=– P=92,651 Accrued expenses 14,365 – – – – 14,365 Accrued directors’ and annual
incentives 22,706 – – – – 22,706 Due to related parties 6,999 – – – – 6,999 Due to stockholders 7,007 – – – – 7,007 Other noncurrent liability – – – 3,219 – 3,219 P=69,707 P=74,021 P=– P=3,219 P=– P=146,947
As of December 31, 2010 and 2009, the profile of financial assets used to manage the Company’s liquidity risk is as follows: 2010
On
Demand Less than 3 Months
3 to 12 Months 1 to 5 Years Total
(In Thousands) Cash and cash equivalents P=880,784 P=– P=– P=– P=880,784 Receivables: Trade 10,825 77,604 – – 88,429 Due from related companies 71,453 – – – 71,453 Others 3,270 66,828 – – 70,098 Financial assets at FVPL: Investments held for trading 872,651 – – – 872,651 Derivative assets – 3,464 – – 3,464 P=1,838,983 P=147,896 P=– P=– P=1,986,879

- 54 -
*SGVMC311705*
2009
On Demand Less than 3 Months
3 to 12 Months 1 to 5 Years Total
(In Thousands) Cash and cash equivalents P=985,316 P=– P=– P=– P=985,316 Short-term investments – – 5,000 – 5,000 Receivables: Trade 9,207 53,375 – – 62,582 Due from related companies 59,143 – – – 59,143 Others 3,270 9,430 26,325 127,575 166,600 Financial assets at FVPL: Investments held for trading 810,417 – – – 810,417 Derivative assets – 4,148 – – 4,148 P=1,867,353 P=66,953 P=31,325 P=127,575 P=2,093,206
Market risk Market risk is the risk that the value of an investment will decrease due to drastic adverse market movements that consist of interest rate fluctuations affecting bid values or fluctuations in stock market valuation due to gyrations in offshore equity markets or business and economic changes. Interest rate, foreign exchange rates and risk appetite are factors of a market risk as the summation of the three defines the value of an instrument or a financial asset.
Market risk is managed through: • Constant review of global and domestic economic and financial environments as well as
regular discussions with banks’ economists or strategy officers are done to get multiple perspectives on interest rate trends or forecasts.
• Updates of the portfolio’s local and foreign currency bonds’ gains and losses are made as often as necessary.
• “Red Lines” are established then reviewed and revised as the need arises for major movements in the financial markets and are used to determine dealing parameters. Red lines are the strategic yield curves, bond prices or spreads that the Treasury Group uses as guides whether to buy, hold or sell bonds as approved by the Investment Committee or, in cases of high volatility, by the CFO.
• In cases of high volatility, dealers constantly give updates to approving authorities regarding changes in interest rates or prices in relation to strategies.
• Regular comparison of the portfolio’s marked-to-market values and yields with defined benchmarks.
Interest rate risk
The following table sets out the carrying amount, by maturity of the Company’s financial assets that are exposed to interest rate risk (in thousands):
Interest Rates Within 1 Year 1–2 Years 2–3 Years 3-4 Years
Beyond 4 years Total
2010 Fixed Rate Special savings account (SSA) 0.625-4.25% P=871,645 P=– P=– P=– P=– P=871,645 Investments in bonds and FXTNs 5.875-16.5% 136,645 – 3,938 59,318 147,971 347,872
2009 Fixed Rate Special savings account (SSA) 1-4.25% 895,015 – – – – 895,015 Short-term investments 4.5% 5,000 – – – – 5,000 Investments in bonds and FXTNs 6.25-17.5% 100,689 138,703 – 30,064 – 269,456
Interest on financial instruments classified as fixed rate is fixed until the maturity of the instrument. The other financial instruments of the Company that are not included in the above table are noninterest-bearing investments and are therefore not subject to interest rate volatility.

- 55 -
*SGVMC311705*
The following tables demonstrate the sensitivity to a reasonably possible change in the interest rates, with all other variables held constant, of the Company’s profit before tax as of December 31, 2010 and 2009. There is no impact on the Company’s equity other than those already affecting the profit or loss.
2010
Increase (Decrease) in Basis Points
Effect on Profit
Before Tax FXTN 25 (P=637,924) Special deposit account (SDA) 25 884,024 SSA 25 563,142 FXTN (25) 637,924 SDA (25) (884,024) SSA (25) (563,142) 2009
Increase (Decrease) in Basis Points
Effect on Profit
Before Tax FXTN 25 (P=636,238) Special deposit account (SDA) 25 243,713 SSA 25 1,058,288 FXTN (25) 636,238 SDA (25) (243,713) SSA (25) (1,058,288)
Equity price risk Equity price risk is the risk to earnings or capital arising from changes in stock exchange indices relating to its quoted equity securities. The Company’s exposure to equity price risk relates primarily to its AFS investments. The Company’s policy is to maintain the risk to an acceptable level. Movement of share price is monitored regularly to determine impact on its financial position. Based on the Company’s expectation, the Company’s assessment of reasonably possible change was determined to be an increase of 7% and 10% in 2010 and 2009, respectively, resulting to a possible effect in the equity of P=3.0 million and P=4.2 million as of December 31, 2010 and 2009, respectively.
Monitoring of Risk Management Process Risk management is regarded as a core competency, thus review of processes and approval processes including periodic audit are practiced and observed as follows: • Weekly Treasury meetings are scheduled where approved strategies, limits, mixes are
challenged and rechallenged based on current and forecasted developments on the financial and political events.
• Monthly portfolio reports are submitted to the CFO that includes an updated summary of global and domestic events of the past month and the balance of the year.
• Quarterly presentation of the investment portfolio to the Investment Committee to discuss and secure approvals on strategy changes.
• Annual teambuilding sessions are organized as a venue for the review of personal goals, corporate goals and professional development.
• One on one coaching sessions are scheduled to assist, train and advise personnel. • Periodic review of Treasury risk profile and control procedures. • Periodic specialized audit to ensure active risk oversight.
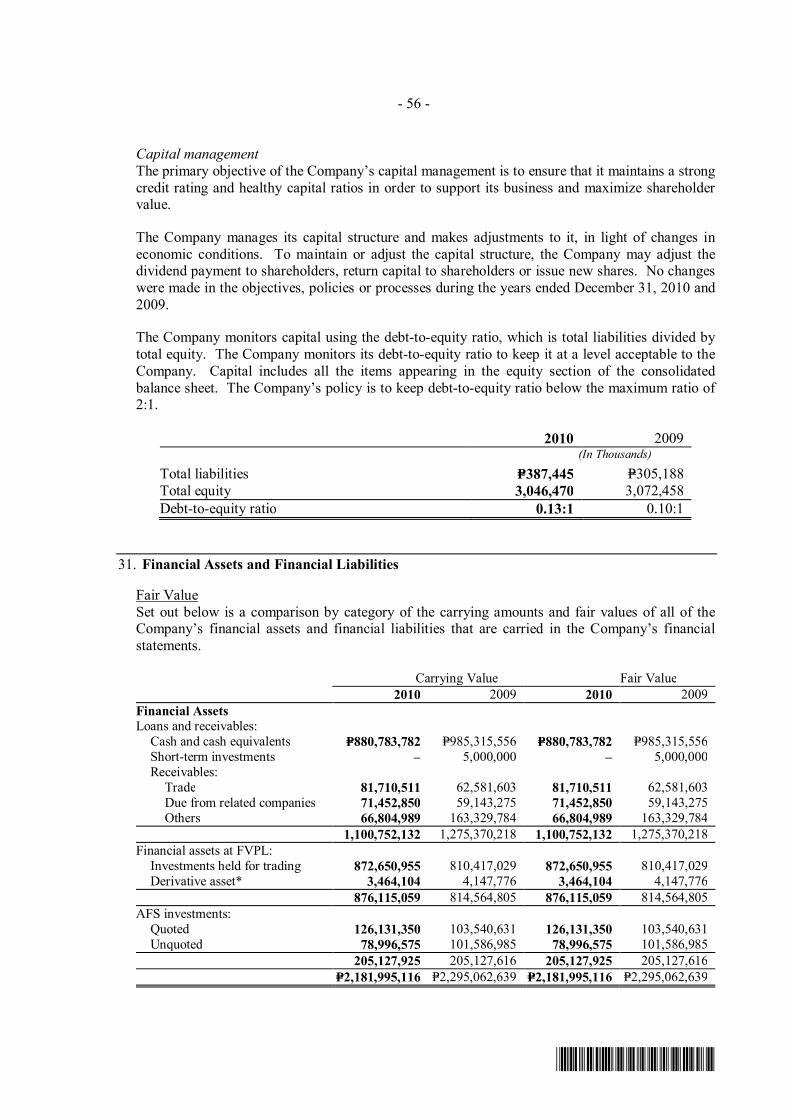
- 56 -
*SGVMC311705*
Capital management The primary objective of the Company’s capital management is to ensure that it maintains a strong credit rating and healthy capital ratios in order to support its business and maximize shareholder value.
The Company manages its capital structure and makes adjustments to it, in light of changes in economic conditions. To maintain or adjust the capital structure, the Company may adjust the dividend payment to shareholders, return capital to shareholders or issue new shares. No changes were made in the objectives, policies or processes during the years ended December 31, 2010 and 2009.
The Company monitors capital using the debt-to-equity ratio, which is total liabilities divided by total equity. The Company monitors its debt-to-equity ratio to keep it at a level acceptable to the Company. Capital includes all the items appearing in the equity section of the consolidated balance sheet. The Company’s policy is to keep debt-to-equity ratio below the maximum ratio of 2:1.
2010 2009 (In Thousands)
Total liabilities P=387,445 P=305,188 Total equity 3,046,470 3,072,458 Debt-to-equity ratio 0.13:1 0.10:1
31. Financial Assets and Financial Liabilities
Fair Value Set out below is a comparison by category of the carrying amounts and fair values of all of the Company’s financial assets and financial liabilities that are carried in the Company’s financial statements.
Carrying Value Fair Value 2010 2009 2010 2009 Financial Assets Loans and receivables: Cash and cash equivalents P=880,783,782 P=985,315,556 P=880,783,782 P=985,315,556 Short-term investments – 5,000,000 – 5,000,000 Receivables: Trade 81,710,511 62,581,603 81,710,511 62,581,603 Due from related companies 71,452,850 59,143,275 71,452,850 59,143,275 Others 66,804,989 163,329,784 66,804,989 163,329,784 1,100,752,132 1,275,370,218 1,100,752,132 1,275,370,218 Financial assets at FVPL: Investments held for trading 872,650,955 810,417,029 872,650,955 810,417,029 Derivative asset* 3,464,104 4,147,776 3,464,104 4,147,776 876,115,059 814,564,805 876,115,059 814,564,805 AFS investments: Quoted 126,131,350 103,540,631 126,131,350 103,540,631 Unquoted 78,996,575 101,586,985 78,996,575 101,586,985 205,127,925 205,127,616 205,127,925 205,127,616 P=2,181,995,116 P=2,295,062,639 P=2,181,995,116 P=2,295,062,639
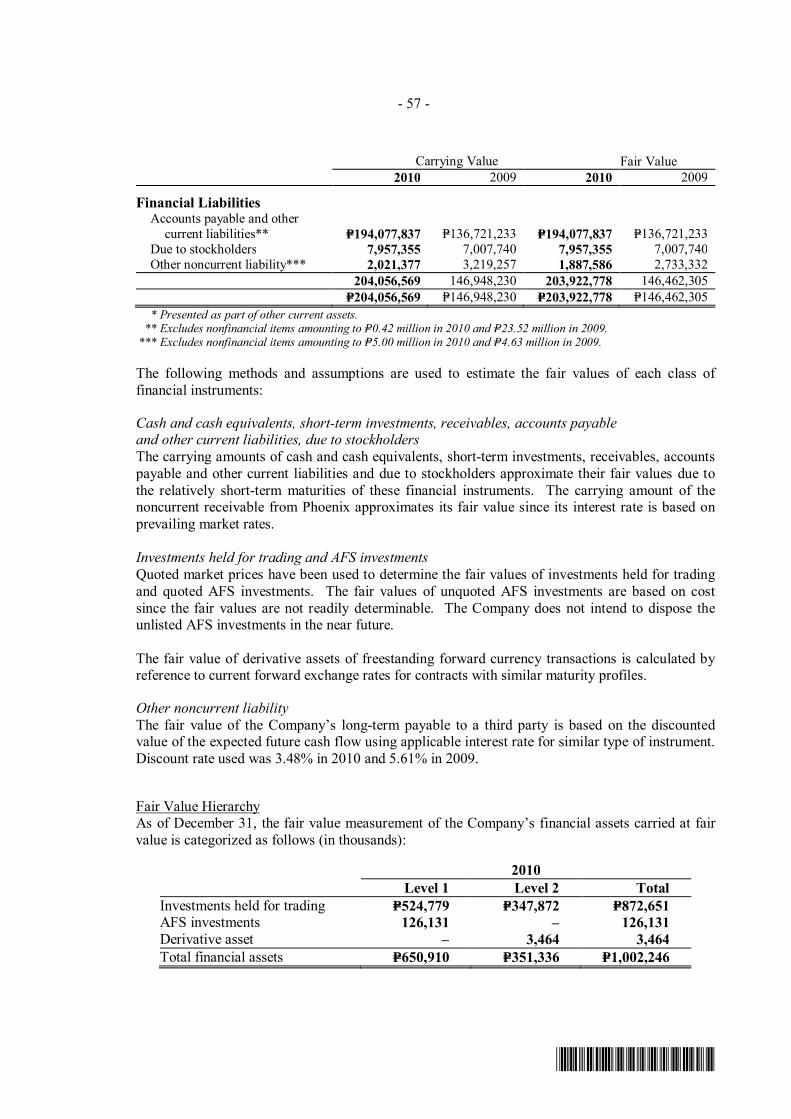
- 57 -
*SGVMC311705*
Carrying Value Fair Value 2010 2009 2010 2009
Financial Liabilities Accounts payable and other
current liabilities** P=194,077,837 P=136,721,233 P=194,077,837 P=136,721,233 Due to stockholders 7,957,355 7,007,740 7,957,355 7,007,740 Other noncurrent liability*** 2,021,377 3,219,257 1,887,586 2,733,332 204,056,569 146,948,230 203,922,778 146,462,305 P=204,056,569 P=146,948,230 P=203,922,778 P=146,462,305 * Presented as part of other current assets. ** Excludes nonfinancial items amounting to P=0.42 million in 2010 and P=23.52 million in 2009. *** Excludes nonfinancial items amounting to P=5.00 million in 2010 and P=4.63 million in 2009.
The following methods and assumptions are used to estimate the fair values of each class of financial instruments:
Cash and cash equivalents, short-term investments, receivables, accounts payable and other current liabilities, due to stockholders The carrying amounts of cash and cash equivalents, short-term investments, receivables, accounts payable and other current liabilities and due to stockholders approximate their fair values due to the relatively short-term maturities of these financial instruments. The carrying amount of the noncurrent receivable from Phoenix approximates its fair value since its interest rate is based on prevailing market rates.
Investments held for trading and AFS investments
Quoted market prices have been used to determine the fair values of investments held for trading and quoted AFS investments. The fair values of unquoted AFS investments are based on cost since the fair values are not readily determinable. The Company does not intend to dispose the unlisted AFS investments in the near future. The fair value of derivative assets of freestanding forward currency transactions is calculated by reference to current forward exchange rates for contracts with similar maturity profiles.
Other noncurrent liability The fair value of the Company’s long-term payable to a third party is based on the discounted value of the expected future cash flow using applicable interest rate for similar type of instrument. Discount rate used was 3.48% in 2010 and 5.61% in 2009.
Fair Value Hierarchy As of December 31, the fair value measurement of the Company’s financial assets carried at fair value is categorized as follows (in thousands):
2010 Level 1 Level 2 Total Investments held for trading P=524,779 P=347,872 P=872,651 AFS investments 126,131 – 126,131 Derivative asset – 3,464 3,464 Total financial assets P=650,910 P=351,336 P=1,002,246

- 58 -
*SGVMC311705*
2009 Level 1 Level 2 Total Investments held for trading P=526,523 P=283,894 P=810,417 AFS investments 103,541 – 103,541 Derivative asset – 4,148 4,148 Total financial assets P=630,064 P=288,042 P=918,106
The Company uses the following hierarchy for determining and disclosing the fair value of financial instruments by valuation technique: Level 1: quoted (unadjusted) prices in active markets for identical assets or liabilities Level 2: inputs other than quoted prices included within level 1 that are observable for the asset or
liability, either directly (i.e. as prices) or indirectly (i.e. derived from prices) Level 3: inputs for the asset or liability that are not based on observable market data
(unobservable inputs)
The Company has no financial instruments measured at fair value using the level 3 hierarchy. Also, there were no transfers between level 1 and level 2 fair value measurements.
Derivative Assets Currency forwards The Company enters into sell US$, buy peso foreign currency forward contracts to manage the foreign currency risk arising from its US$ denominated assets. These currency forwards are not accounted for as accounting hedges.
The Company has outstanding currency forward contracts with an aggregate notional amount of US$7.45 million and weighted average contracted forward rate of P=44.324 to US$1.00 as of December 31, 2010, and an aggregate notional amount of US$3.00 million and weighted average contracted forward rate of P=47.573 to US$1.00 as of December 31, 2009. The net fair value of these currency forward contracts amounted to P=3.44 million and P=4.09 million gain as of December 31, 2010 and 2009, respectively.
Embedded derivatives The Company has bifurcated embedded derivatives from its fuel purchase contracts. The purchases are denominated in U.S. dollar but the Company agreed to pay in Philippine peso using the average daily Philippine Dealing System weighted average rate of the month prior to the month of billing. Embedded derivatives are attributable to TA Oil and CIPP.
As of December 31, 2010 and 2009, TA Oil’s outstanding embedded forwards have an aggregate notional amount of US$0.05 million and US$0.06 million, respectively. The weighted average fixing rate amounted to P=43.55 to US$1.00 and P=47.01 to US$1.00 as of December 31, 2010 and 2009, respectively. The net fair value of these embedded derivatives amounted to P=0.02 million and P=0.06 million gain as of December 31, 2010 and 2009, respectively.
The net movements in fair value changes of the Company’s derivative instruments (both freestanding and embedded derivatives) are as follows:
2010 2009 Balance at beginning of year P=4,147,776 (P=9,430,049) Net changes in fair value during the year 45,755,928 37,608,112 Fair value of settled contracts (46,439,600) (24,030,287) Balance at end of year P=3,464,104 P=4,147,776

- 59 -
*SGVMC311705*
The net changes in fair value during the year are included in the “Other income (expenses)” account in the consolidated statements of income.
The fair values of the outstanding derivative assets of the Company as of December 31 are as follows:
2010 2009
Freestanding P=3,447,750 P=4,088,000 Embedded 16,354 59,776
P=3,464,104 P=4,147,776 The fair value of derivative assets are presented under “Other current assets” account in the consolidated balance sheets. The details of interest and other financial income are as follows:
Interest and Other Financial Income
2010 2009 2008 Interest income on: Cash in bank P=50,313 P=779,731 P=741,253 Short-term deposits
and investments 29,214,881 25,014,912 40,357,504 Bond 6,917,669 7,889,945 5,396,759 FXTN 10,785,313 17,489,174 7,369,636 Others 4,120,952 9,048,004 231,732 51,089,128 60,221,766 54,096,884 Net gains (losses) on investments
held for trading: Amortization of bond
premium/discount - net (8,815,020) (10,611,302) (4,983,876) Gain (loss) on redemption/sale
of investments held for trading 6,298,571 5,184,041 (526,326)
Unrealized gain (loss) from changes in fair value of investments held for trading 21,570,834 10,777,560 (183,678)
P=70,143,513 P=65,572,065 P=48,403,004 32. Operating Segments
The Company is divided into two reportable operating segments based on the nature of the
services provided - Power and Petroleum and Mining. Management monitors the operating results of its business units separately for the purpose of making decisions about resource allocation and performance assessment. Segment performance is evaluated based on operating profit or loss and is measured consistently with operating profit or loss in the consolidated financial statements. However, certain operating expenses and finance-related results are managed on a group basis and are not allocated to operating segments.

- 60 -
*SGVMC311705*
2010
Power Petroleum
and Mining Adjustments
and Eliminations Total Revenue P=810,968,202 P=279,964 P=83,046,698 P=894,294,864 Results Depreciation & amortization 33,869,458 587,788 18,753,281
53,210,527
Reversal of impairment loss on property and equipment (20,320,409) – –
(20,320,409) Provision for doubtful accounts 6,741,772 – – 6,741,772 Segment profit (P=32,085,837) P=63,780,432 (P=19,413,019) P=12,281,576
Operating assets P=1,266,189,615 P=148,378,311 P=2,019,347,134 P=3,433,915,060
Operating liabilities P=351,415,215 P=617,758 P=35,412,126 P=387,445,099
Other disclosure
Capital expenditure P=18,464,911 P=868,327 P=8,929,535 P=28,262,773
1. Revenue for each operating segment does not include interest and other financial and rental income amounting to P=75.30 million and P=7.75 million, respectively.
2. Profit for operating segment does not include general and administrative expenses, foreign
exchange loss, provision for impairment of available-for-sale investment and mark to market gain on derivatives amounting to P=102.70 million. Other income not included in the profit for operating segment amounted to P=3.65 million.
3. Segment assets do not include cash and cash equivalents, short-term investments and investments held for trading amounting to P=1.65 billion, receivables and other current assets totaling P=22.42 million and other noncurrent assets amounting to P=350.39 million as these are managed on a group basis.
4. Segment liabilities do not include accounts payable and other current liabilities of
P=27.04 million and net deferred income tax liabilities and pension and other post-employment benefits totaling P=8.37 million.
5. Capital expenditure consists of additions to property, plant and equipment.
2009
Power Petroleum
and Mining Adjustments
and Eliminations Total Revenue P=995,392,444 P=656,534 P=95,877,905 P=1,091,926,883 Results Depreciation & amortization 38,563,152 563,676 17,582,621
56,709,449
Oil and mining cost written-off – 78,517,254 –
78,517,254
Impairment losses on deferred exploration costs – 11,473,481 –
11,473,481
(Forward)
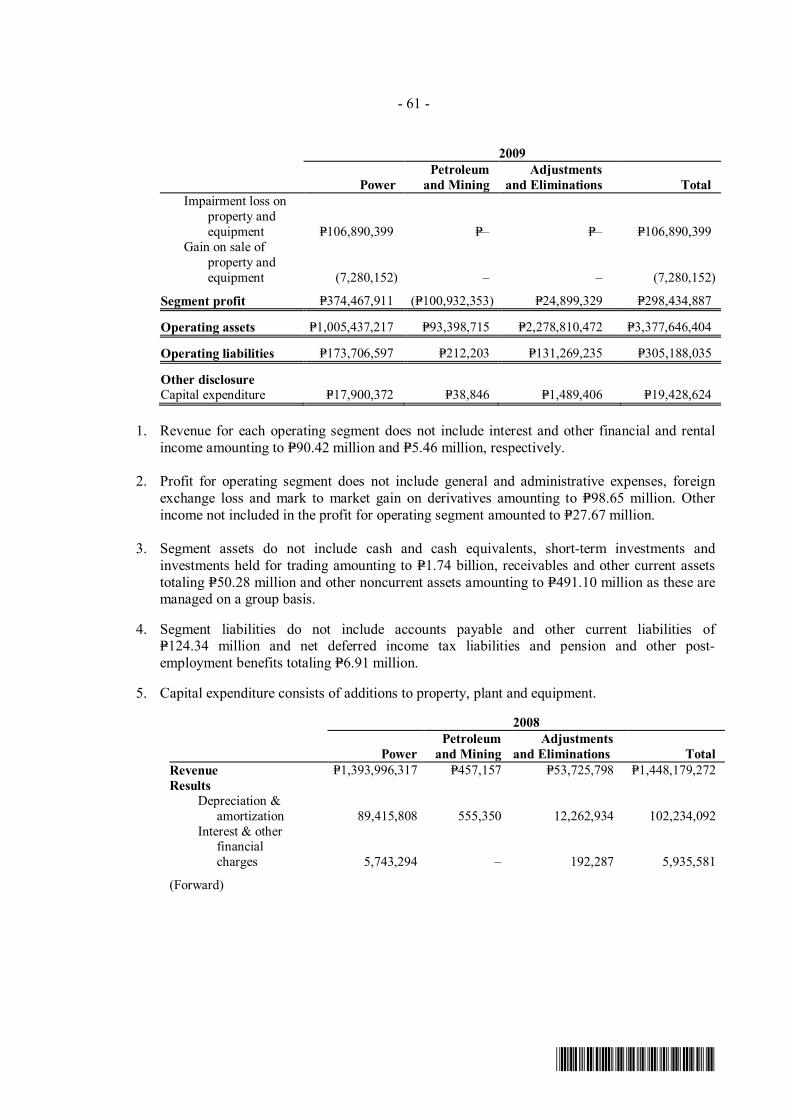
- 61 -
*SGVMC311705*
2009
Power Petroleum
and Mining Adjustments
and Eliminations Total Impairment loss on property and equipment P=106,890,399 P=– P=–
P=106,890,399 Gain on sale of property and equipment (7,280,152) – – (7,280,152)
Segment profit P=374,467,911 (P=100,932,353) P=24,899,329 P=298,434,887
Operating assets P=1,005,437,217 P=93,398,715 P=2,278,810,472 P=3,377,646,404
Operating liabilities P=173,706,597 P=212,203 P=131,269,235 P=305,188,035
Other disclosure
Capital expenditure P=17,900,372 P=38,846 P=1,489,406 P=19,428,624
1. Revenue for each operating segment does not include interest and other financial and rental income amounting to P=90.42 million and P=5.46 million, respectively.
2. Profit for operating segment does not include general and administrative expenses, foreign
exchange loss and mark to market gain on derivatives amounting to P=98.65 million. Other income not included in the profit for operating segment amounted to P=27.67 million.
3. Segment assets do not include cash and cash equivalents, short-term investments and investments held for trading amounting to P=1.74 billion, receivables and other current assets totaling P=50.28 million and other noncurrent assets amounting to P=491.10 million as these are managed on a group basis.
4. Segment liabilities do not include accounts payable and other current liabilities of
P=124.34 million and net deferred income tax liabilities and pension and other post-employment benefits totaling P=6.91 million.
5. Capital expenditure consists of additions to property, plant and equipment.
2008
Power Petroleum
and Mining Adjustments
and Eliminations Total Revenue P=1,393,996,317 P=457,157 P=53,725,798 P=1,448,179,272 Results
Depreciation & amortization 89,415,808 555,350 12,262,934
102,234,092
Interest & other financial charges 5,743,294 – 192,287
5,935,581
(Forward)

- 62 -
*SGVMC311705*
2008
Power Petroleum
and Mining Adjustments
and Eliminations Total Provision for
unrecoverable input tax P=6,162,861 P=–
P=–
P=6,162,861 Gain on sale of
property and equipment (57,143) – 93,016 35,873
Segment profit P=51,335,107 (P=13,032,332) P=29,974,554 P=68,277,329
Operating assets P=1,315,845,597 P=172,555,132 P=1,845,652,490 P=3,334,053,219
Operating liabilities P=409,677,046 P=656,163 P=65,844,635 P=476,177,844
Other disclosure Capital expenditure P=10,577,617 P=142,807 P=1,260,753
P=11,981,177
1. Revenue for each operating segment does not include interest and other financial and rental
income amounting to P=51.61 million and P=2.11 million, respectively. 2. Profit for operating segment does not include general and administrative expenses, foreign
exchange loss and mark to market gain on derivatives amounting to P=48.77 million. Other income not included in the profit for operating segment amounted to P=25.02 million.
3. Segment assets do not include cash and cash equivalents, short-term investments and
investments held for trading amounting to P=1.37 billion, receivables and other current assets totaling P=16.77 million and other noncurrent assets amounting to P=453.59 million as these are managed on a group basis.
4. Segment liabilities do not include accounts payable and other current liabilities of P=69.55
million and other current liabilities of P=46.07 million and net deferred income tax liabilities and pension and other post-employment benefits totaling P=3.70 million.
5. Capital expenditure consists of additions to property, plant and equipment.

EXHIBIT B
TRANS-ASIA OIL AND ENERGY DEVELOPMENT CORPORATION AND SUBSIDIARIES
Supplementary Schedules to the Consolidated Financial Statements


TRANS-ASIA OIL AND ENERGY DEVELOPMENT CORPORATION AND SUBSIDIARIES
INDEX TO FINANCIAL STATEMENTS AND SUPPLEMENTARY SCHEDULES
FORM 17-A, Item 7
December 31, 2008For the Year Ended December 31, 2010 Page No.
Consolidated Financial Statements
Statement of Management’s Responsibility for Financial Statements Independent Auditors' Report Consolidated Balance Sheets as of December 31, 2010 and 2009 Consolidated Statements of Income
for the years ended December 31, 2010, 2009 and 2008 Consolidated Statements of Changes in Equity
for the years ended December 31, 2010, 2009 and 2008Consolidated Statements of Cash Flows
for the years ended December 31, 2010, 2009 and 2008 Notes to Consolidated Financial Statements
Supplementary Schedules
Independent Auditors' Report on Supplementary Schedules
A. Marketable Securities - (Current Marketable Equity Securities and Other Short-term Cash Investments) 1
B. Amounts Receivable from Directors, Officers, Employees, Related Parties, and Principal Stockholders (Other than Related Parties) *
C. Non-current Marketable Equity Securities, Other Long-term Investments in Stocks and Other Investments 2
D. Indebtedness of Unconsolidated Subsidiaries and Related Parties *E. Intangible Assets 3F. Long-term Debt *G. Indebtedness to Related Parties *H. Guarantees of Securities of Other Issuers *I. Capital Stock 4J. Retained Earnings 5
These schedules, which are required by Section 17.2 of SRC Rule 68.1, have been omitted because they are either not required, not applicable or the information required to be presented is included in the Company's consolidated financial statements or the notes to consolidated financial statements.
*

1
TRANS-ASIA OIL AND ENERGY DEVELOPMENT CORPORATION AND SUBSIDIARIESSchedule A. Marketable Securities - (Current Marketable Equity Securities and Other Short-term Cash Investments)
For the Year Ended December 31, 2010
Number ofShares orPrincipal Amount Income
Name of Issuing Entity and Amount of Bonds Shown in the ReceivedAssociation of Each Issue and Notes Balance Sheet * and Accrued
Investment in Fixed Treasury Notes (FXTNs)First Metro Investment Corporation P 175,081,063 P 186,823,698 P 14,256,259 China Banking Corporation 32,500,000 35,363,885 1,286,615 International Exchange Bank 10,000,000 10,148,750 593,293 Banco De Oro 4,000,000 3,937,920 258,778
Investment in Bonds in US $ING Bank $ 1,444,035 66,880,660 4,382,328 RCBC 531,504 28,441,200 856,244 Deutsche Bank 311,199 16,275,600 532,748
Investment in Unit Investment Trust Fund and Money Market Fund ( UITF & MMF)
Banco De Oro P 171,600,500 185,032,089 - Metrobank 53,020,000 109,297,010 - ING Bank 70,497,697 75,345,935 - RCBC 10,000,000 10,614,406 -
Investment in Unit Investment Trust Fund and Money Market Fund ( UITF & MMF) in US $
Banco De Oro $ 1,700,000 75,205,847 - ING Bank 1,118,500 48,422,983 - Metrobank 475,000 20,860,972 -
P 872,650,955 P 22,166,265 * Value based on market quotations at balance sheet date.

2
TRANS-ASIA OIL AND ENERGY DEVELOPMENT CORPORATION AND SUBSIDIARIESSchedule C. Non-current Marketable Equity Securities, Other Long-term Investments in Stocks and Other Investments
For the Year Ended December 31, 2010
BEGINNING BALANCE ADDITIONS DEDUCTIONS ENDING BALANCE
Number of Number ofShares Equity in Shares
or Principal Earnings (Losses) Distribution of or PrincipalName of Issuing Entity and Amount of Amount in of Investees Earnings by Amount of Amount inDescription of Investment Investments Pesos for the Period Others Investees Others Bonds and Notes Pesos
At Equity:Maibarara Geothermal, Inc. - P - (P3,389,079) P 42,578,125 P - P - 425,781 P 39,189,046 P - Asia Coal Corporation 14,091 619,756 11,273 - - - 14,091 631,029 - Union Aggregates Corporation 156,250 1,559,251 - - - - 156,250 1,559,251 -
2,179,007 (3,377,806) 42,578,125 - - 596,122 41,379,326 - Accumulated impairment (1,559,251) - - - - - (1,559,251) -
P 619,756 (P3,377,806) P 42,578,125 P - P - P 39,820,075 P -
Available-for-sale financial assetsBacnotan Consolidated Industries, Inc. 8,043,812 P 79,633,740 P 973,423 P 14,628,639 P - P - 8,139,812 P 95,235,802 P 3,217,525 Atlas Holdings Corporation 220,000 50,169,765 - - - 22,590,410 220,000 27,579,355 1,298,000 Phinma Property Holdings Corporation 204,132,277 32,984,061 - - - - 204,132,277 32,984,061 2,041,323 Asian Plaza, Inc. 37,684 18,433,158 - - - - 37,684 18,433,158 452,208 Manila Golf & Country Club 1 share (100 units) 20,510,000 - 5,990,000 - - 1 share (100 units) 26,500,000 - Tagaytay Midlands Golf Club, Inc. 2 1,100,000 - 20,000 - - 2 1,120,000 - Alabang Country Club, Inc. 1 1,100,000 - 450,000 - - 1 1,550,000 - Manila Southwoods Golf & Country Club 1 490,000 - - - 100,000 1 390,000 - Evercrest Golf Club Resorts, Inc. 1 50,000 - - - - 1 50,000 - Puerto Azul Golf & Country Club, Inc. 1 40,000 - - - - 1 40,000 - Capitol Hills Golf & Country Club, Inc. 1 40,000 - - - 12,000 1 28,000 - Subic Bay Golf & Country Clubs 1 - - - - - 1 - - Dharmala 367,200 1,033,142 - - - - 367,200 1,033,142 - Vulcan 73,487 117,014 - - - - 73,487 117,014 - Aboitiz Equity Ventures, Inc. - - 88,138 15,742 - - 2,800 103,880 - Ayala Land 97 1,091 - 505 - - 97 1,596 1,500 Banco de Oro 500 19,500 - 9,750 - - 500 29,250 400 First Philippine Holdings Corporation 700 33,599 - 6,880 15,439 - 400 25,040 1,265 Globe Telecom, Inc. 160 146,400 98,431 - - 28,831 270 216,000 15,200 BPI 1,500 72,000 2,568 18,594 - - 1,579 93,162 1,440
DividendsReceived/
Accrued fromInvestments
Not Accountedfor by the
Equity Method

BEGINNING BALANCE ADDITIONS DEDUCTIONS ENDING BALANCE
Number of Number ofShares Equity in Shares
or Principal Earnings (Losses) Distribution of or PrincipalName of Issuing Entity and Amount of Amount in of Investees Earnings by Amount of Amount inDescription of Investment Investments Pesos for the Period Others Investees Others Bonds and Notes Pesos
DividendsReceived/
Accrued fromInvestments
Not Accountedfor by the
Equity Method
(Forward)RCBC 4,000 69,000 - 27,619 96,619 - - - 2,400 Aboitiz Power Corporation 12,000 103,200 - 183,777 13,297 - 8,800 273,680 2,100 Vista Land and Lifescape 5,000 9,400 - 6,450 - - 5,000 15,850 270 Metropolitan Bank and Trust Company 1,100 49,501 - 8,592 18,492 - 550 39,601 660 Atlas Consolidated Mining 4,000 36,400 77,979 25,137 45,124 - 5,400 94,392 - A. Soriano 179 369 - 184 - - 179 553 90 Security Bank 508 27,432 16,129 - - - 508 43,561 1,016 Philippine Long Distance Telephone Company 700 9,000 - - - - 700 9,000 550 DMCI Holdings, Inc. - - 59,866 26,534 - - 2,400 86,400 - Filinvest Land, Inc. - - 33,193 - 5,545 138 21,000 27,510 - First Generation Corp. - - 80,058 17,382 - - 8,000 97,440 - Metro Pacific Investment Corporation - - 33,138 316 - - 8,600 33,454 - RFM Corporation - - 9,711 - - 1,881 4,500 7,830 - Pepsi Cola Corporation - - 21,477 - - 2,127 7,500 19,350 -
Total 206,277,772 1,494,111 21,436,101 194,516 22,735,387 206,278,081 7,035,947
Allowance for decline in value (1,150,156) - - - - (1,150,156) -
205,127,616 1,494,111 21,436,101 194,516 22,735,387 205,127,925 7,035,947
P 205,747,372 P (1,883,695) P 64,014,226 P 194,516 P 22,735,387 P 244,948,000 P 7,035,947

3
TRANS-ASIA OIL AND ENERGY DEVELOPMENT CORPORATION AND SUBSIDIARIESSchedule E. Intangible Assets
For the Year Ended December 31, 2010
DeductionsCharged to Charged to Other Changes-
Beginning Additions Costs Other Additions EndingDescription Balance At Cost and Expenses Accounts (Deductions) Balance
Oil exploration and development costs:Service Contract (SC) No. 6 P 18,424,285 P 568,062 P - P - P - P 18,992,347 Geophysical Survey and Exploration - - - -
Contract (GSEC) No. 93 32,545,030 70,749 - - - 32,615,779 SC 55 5,713,210 - - - - 5,713,210 SC 69 15,179,659 28,139,220 - - (13,945,100) 29,373,779
Mineral exploration costs 11,473,481 - - - - 11,473,481 83,335,665 28,778,031 - - (13,945,100) 98,168,596
Allowance for probable losses (11,473,481) - - - - (11,473,481) 71,862,184 28,778,031 - - (13,945,100) 86,695,115
Customer contracts and relationships 59,082,665 - - - - 59,082,665 Amortization of intangible assets (59,082,665) - - - - (59,082,665)
P 71,862,184 P 28,778,031 P - P - (P13,945,100) P 86,695,115

4
TRANS-ASIA OIL AND ENERGY DEVELOPMENT CORPORATION AND SUBSIDIARIESSchedule I. Capital Stock
For the Year Ended December 31, 2010
Number ofShares Reserved Number of Shares Held By
Number of for Options,Number of Shares Issued Warrants, Directors,
Shares and Conversions, and Officers andTitle of Issue Authorized Outstanding Other Rights Affiliates Employees Others
Common stock 2,000,000,000 1,664,625,604 92,959,488 886,600,137 18,143,455 759,882,012

TRANS-ASIA OIL AND ENERGY DEVELOPMENT CORPORATION AND SUBSIDIARIESSchedule J. Retained Earnings
For the Year Ended December 31, 2010
Unappropriated Retained Earnings, as adjusted to available for dividend distribution, beginning P 998,320,983
Add: Net loss actually incurred/realized during the period
Net income during the period closed to Retained Eatrnings P 9,364,673 Add (deduct):Unrealized fair value gains on investment held for trading and derivative assets (20,823,717) Movement of recognized deferred tax asset (6,470,737)
Sub-total (17,929,781)
Less: Dividends declared during the year (66,585,024)
Retained Earnings Available for dividend declaration, end P 913,806,178
5

EXHIBIT C
TRANS-ASIA OIL AND ENERGY DEVELOPMENT CORPORATION
Parent Company Financial Statements December 31, 2010 and 2009
And Years Ended December 31, 2010 and 2009
Trans-Asia Oil and Energy Development Corporation
Financial Statements December 31, 2010 and 2009 and Independent Auditors’ Report SyCip Gorres Velayo & Co.
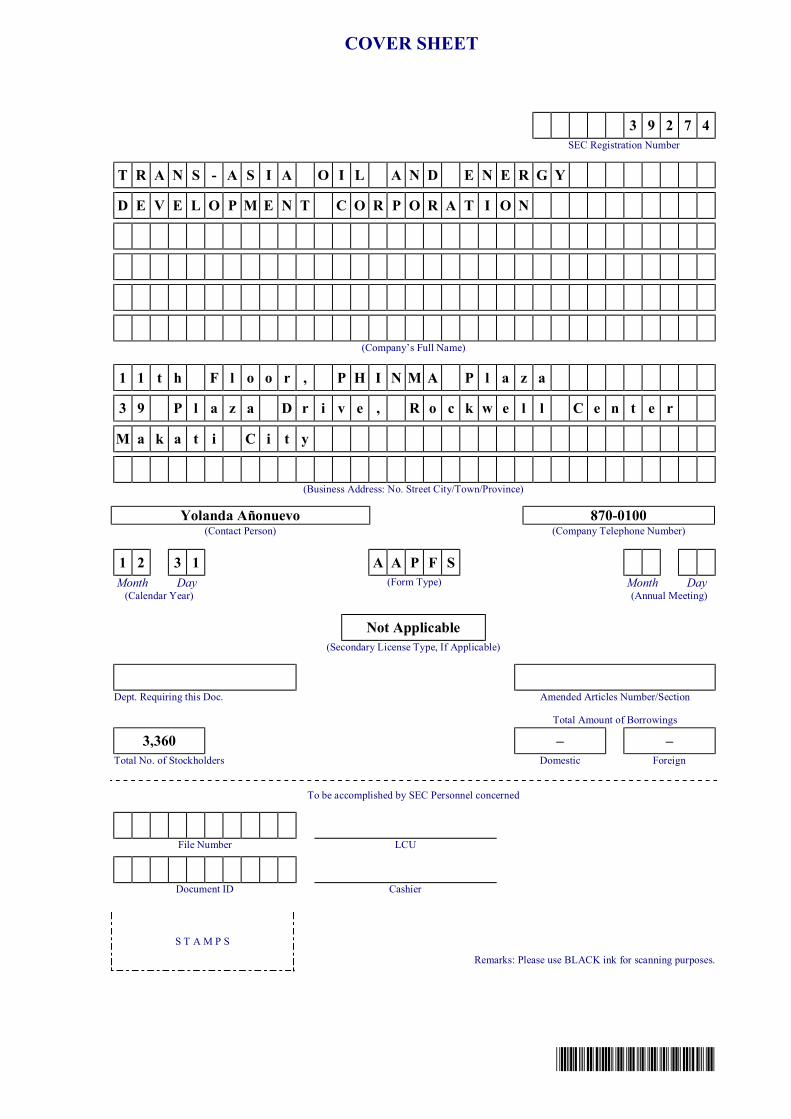
*SGVMC311706*
3 9 2 7 4
SEC Registration Number
T R A N S - A S I A O I L A N D E N E R G Y
D E V E L O P M E N T C O R P O R A T I O N
(Company’s Full Name)
1 1 t h F l o o r , P H I N M A P l a z a
3 9 P l a z a D r i v e , R o c k w e l l C e n t e r
M a k a t i C i t y
(Business Address: No. Street City/Town/Province)
Yolanda Añonuevo 870-0100 (Contact Person) (Company Telephone Number)
1 2 3 1 A A P F S Month Day (Form Type) Month Day
(Calendar Year) (Annual Meeting)
Not Applicable (Secondary License Type, If Applicable)
Dept. Requiring this Doc. Amended Articles Number/Section Total Amount of Borrowings
3,360 – – Total No. of Stockholders Domestic Foreign
To be accomplished by SEC Personnel concerned
File Number LCU
Document ID Cashier
S T A M P S Remarks: Please use BLACK ink for scanning purposes.
COVER SHEET
*SGVMC311706*
INDEPENDENT AUDITORS’ REPORT The Stockholders and the Board of Directors Trans-Asia Oil and Energy Development Corporation 11th Floor, PHINMA Plaza 39 Plaza Drive, Rockwell Center Makati City Report on the Parent Company Financial Statements We have audited the accompanying parent company financial statements of Trans-Asia Oil and Energy Development Corporation, which comprise the parent company balance sheets as at December 31, 2010 and 2009, and the parent company statements of income, statements of comprehensive income, statements of changes in equity and statements of cash flows for the years then ended, and a summary of significant accounting policies and other explanatory information. Management’s Responsibility for the Parent Company Financial Statements
Management is responsible for the preparation and fair presentation of these parent company financial statements in accordance with Philippine Financial Reporting Standards, and for such internal control as management determines is necessary to enable the preparation of parent company financial statements that are free from material misstatement, whether due to fraud or error. Auditors’ Responsibility
Our responsibility is to express an opinion on these parent company financial statements based on our audits. We conducted our audits in accordance with Philippine Standards on Auditing. Those standards require that we comply with ethical requirements and plan and perform the audit to obtain reasonable assurance about whether the parent company financial statements are free from material misstatement. An audit involves performing procedures to obtain audit evidence about the amounts and disclosures in the parent company financial statements. The procedures selected depend on the auditor’s judgment, including the assessment of the risks of material misstatement of the parent company financial statements, whether due to fraud or error. In making those risk assessments, the auditor considers internal control relevant to the entity’s preparation and fair presentation of the parent company financial statements in order to design audit procedures that are appropriate in the circumstances, but not for the purpose of expressing an opinion on the effectiveness of the entity’s internal control. An audit also includes evaluating the appropriateness of accounting policies used and the reasonableness of accounting estimates made by management, as well as evaluating the overall presentation of the parent company financial statements.
We believe that the audit evidence we have obtained is sufficient and appropriate to provide a basis for our audit opinion.
SyCip Gorres Velayo & Co. 6760 Ayala Avenue 1226 Makati City Philippines
Phone: (632) 891 0307 Fax: (632) 819 0872 www.sgv.com.ph BOA/PRC Reg. No. 0001 SEC Accreditat ion No. 0012-FR-2
A member firm of Ernst & Young Global Limited

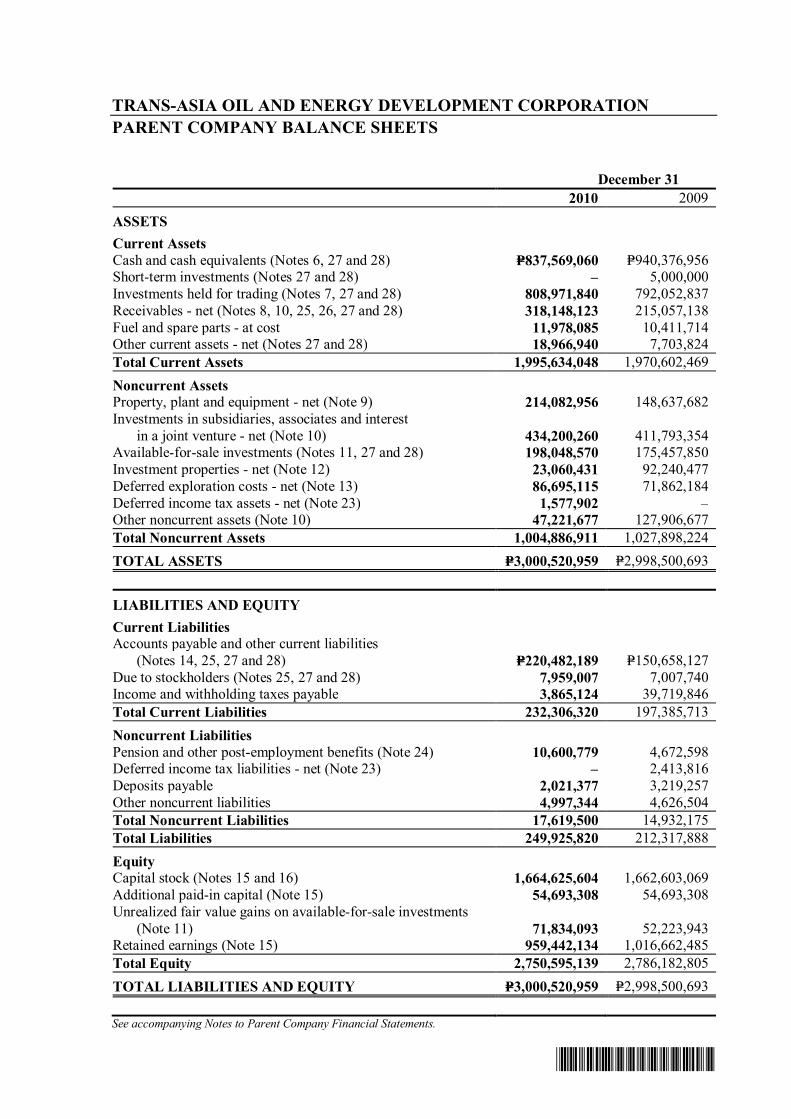
*SGVMC311706*
TRANS-ASIA OIL AND ENERGY DEVELOPMENT CORPORATION PARENT COMPANY BALANCE SHEETS December 31 2010 2009 ASSETS Current Assets Cash and cash equivalents (Notes 6, 27 and 28) P=837,569,060 P=940,376,956 Short-term investments (Notes 27 and 28) – 5,000,000 Investments held for trading (Notes 7, 27 and 28) 808,971,840 792,052,837 Receivables - net (Notes 8, 10, 25, 26, 27 and 28) 318,148,123 215,057,138 Fuel and spare parts - at cost 11,978,085 10,411,714 Other current assets - net (Notes 27 and 28) 18,966,940 7,703,824 Total Current Assets 1,995,634,048 1,970,602,469 Noncurrent Assets Property, plant and equipment - net (Note 9) 214,082,956 148,637,682 Investments in subsidiaries, associates and interest
in a joint venture - net (Note 10) 434,200,260 411,793,354 Available-for-sale investments (Notes 11, 27 and 28) 198,048,570 175,457,850 Investment properties - net (Note 12) 23,060,431 92,240,477 Deferred exploration costs - net (Note 13) 86,695,115 71,862,184 Deferred income tax assets - net (Note 23) 1,577,902 – Other noncurrent assets (Note 10) 47,221,677 127,906,677 Total Noncurrent Assets 1,004,886,911 1,027,898,224 TOTAL ASSETS P=3,000,520,959 P=2,998,500,693
LIABILITIES AND EQUITY Current Liabilities Accounts payable and other current liabilities
(Notes 14, 25, 27 and 28) P=220,482,189 P=150,658,127 Due to stockholders (Notes 25, 27 and 28) 7,959,007 7,007,740 Income and withholding taxes payable 3,865,124 39,719,846 Total Current Liabilities 232,306,320 197,385,713 Noncurrent Liabilities Pension and other post-employment benefits (Note 24) 10,600,779 4,672,598 Deferred income tax liabilities - net (Note 23) – 2,413,816 Deposits payable 2,021,377 3,219,257 Other noncurrent liabilities 4,997,344 4,626,504 Total Noncurrent Liabilities 17,619,500 14,932,175 Total Liabilities 249,925,820 212,317,888 Equity Capital stock (Notes 15 and 16) 1,664,625,604 1,662,603,069 Additional paid-in capital (Note 15) 54,693,308 54,693,308 Unrealized fair value gains on available-for-sale investments
(Note 11) 71,834,093 52,223,943 Retained earnings (Note 15) 959,442,134 1,016,662,485 Total Equity 2,750,595,139 2,786,182,805 TOTAL LIABILITIES AND EQUITY P=3,000,520,959 P=2,998,500,693 See accompanying Notes to Parent Company Financial Statements.

*SGVMC311706*
TRANS-ASIA OIL AND ENERGY DEVELOPMENT CORPORATION PARENT COMPANY STATEMENTS OF INCOME Years Ended December 31 2010 2009
REVENUE Generation revenue (Note 1) P=55,588,335 P=47,219,548 Trading revenue - net (Notes 1, 17 and 25) – 513,203,519 Interest and other financial income (Notes 7 and 28) 68,207,009 64,476,066 Rental income (Notes 12 and 25) 7,748,923 6,553,034 Dividend income 7,090,765 27,081,565 138,635,032 658,533,732
COSTS AND EXPENSES Cost of power generation (Notes 18, 20 and 21) 44,472,389 37,286,910 Trading loss - net (Note 17) 19,800,154 – General and administrative expenses
(Notes 19, 20, 21, 24 and 25) 148,608,773 189,537,353 212,881,316 226,824,263
OTHER INCOME (EXPENSES) (Note 22) 80,556,270 (64,174,998)
INCOME BEFORE INCOME TAX 6,309,986 367,534,471
PROVISION FOR (BENEFIT FROM) INCOME TAX (Note 23)
Current 2,634,136 59,108,850 Deferred (5,688,823) 2,399,072 (3,054,687) 61,507,922
NET INCOME P=9,364,673 P=306,026,549
Weighted Average Number of Shares Outstanding 1,664,282,050 1,662,497,148
Basic/Diluted Earnings Per Share P=0.01 P=0.18 See accompanying Notes to Parent Company Financial Statements.

*SGVMC311706*
TRANS-ASIA OIL AND ENERGY DEVELOPMENT CORPORATION PARENT COMPANY STATEMENTS OF COMPREHENSIVE INCOME Years Ended December 31 2010 2009
NET INCOME FOR THE YEAR P=9,364,673 P=306,026,549
OTHER COMPREHENSIVE INCOME (LOSS) Unrealized fair value gains (losses) on available-for-sale investments - net of deferred income tax (Note 11) 19,610,150 (2,247,007)
TOTAL COMPREHENSIVE INCOME P=28,974,823 P=303,779,542 See accompanying Notes to Parent Company Financial Statements.
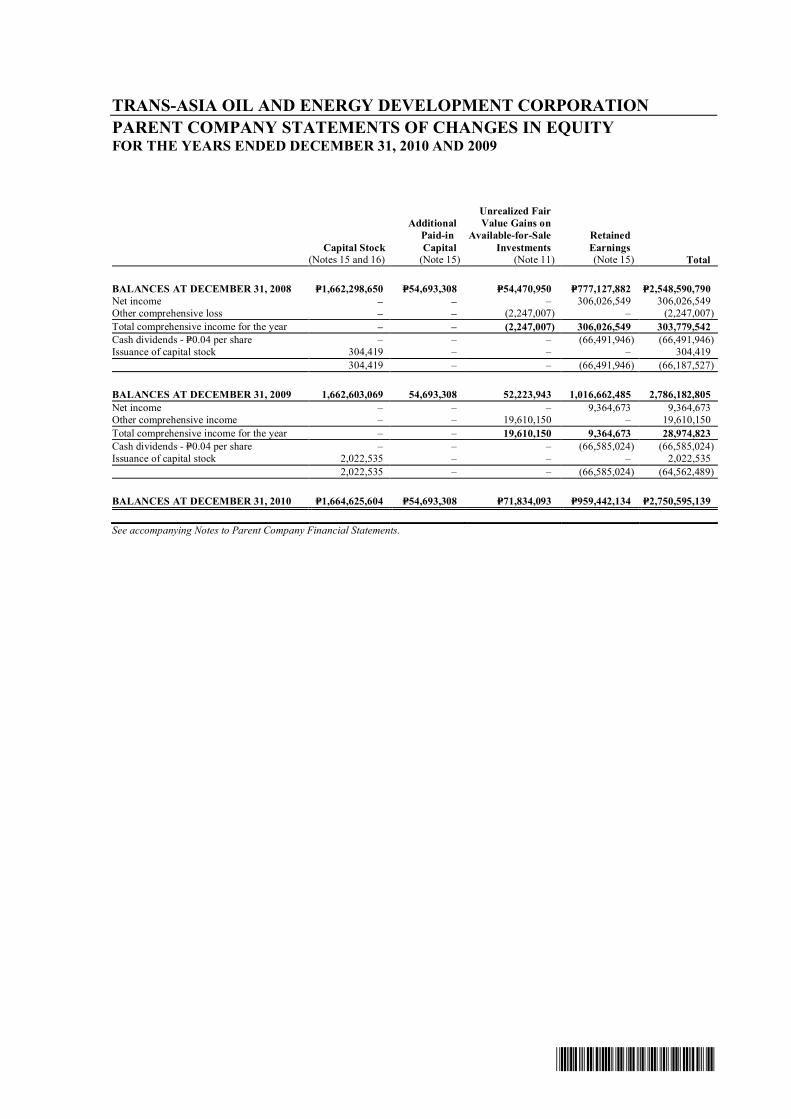
*SGVMC311706*
TRANS-ASIA OIL AND ENERGY DEVELOPMENT CORPORATION PARENT COMPANY STATEMENTS OF CHANGES IN EQUITY FOR THE YEARS ENDED DECEMBER 31, 2010 AND 2009
Capital Stock
(Notes 15 and 16)
Additional Paid-in Capital
(Note 15)
Unrealized Fair Value Gains on
Available-for-Sale Investments
(Note 11)
Retained Earnings (Note 15) Total
BALANCES AT DECEMBER 31, 2008 P=1,662,298,650 P=54,693,308 P=54,470,950 P=777,127,882 P=2,548,590,790 Net income – – – 306,026,549 306,026,549 Other comprehensive loss – – (2,247,007) – (2,247,007) Total comprehensive income for the year – – (2,247,007) 306,026,549 303,779,542 Cash dividends - P=0.04 per share – – – (66,491,946) (66,491,946) Issuance of capital stock 304,419 – – – 304,419 304,419 – – (66,491,946) (66,187,527)
BALANCES AT DECEMBER 31, 2009 1,662,603,069 54,693,308 52,223,943 1,016,662,485 2,786,182,805 Net income – – – 9,364,673 9,364,673 Other comprehensive income – – 19,610,150 – 19,610,150 Total comprehensive income for the year – – 19,610,150 9,364,673 28,974,823 Cash dividends - P=0.04 per share – – – (66,585,024) (66,585,024) Issuance of capital stock 2,022,535 – – – 2,022,535 2,022,535 – – (66,585,024) (64,562,489)
BALANCES AT DECEMBER 31, 2010 P=1,664,625,604 P=54,693,308 P=71,834,093 P=959,442,134 P=2,750,595,139 See accompanying Notes to Parent Company Financial Statements.

*SGVMC311706*
TRANS-ASIA OIL AND ENERGY DEVELOPMENT CORPORATION PARENT COMPANY STATEMENTS OF CASH FLOWS Years Ended December 31 2010 2009
CASH FLOWS FROM OPERATING ACTIVITIES Income before income tax P=6,309,986 P=367,534,471 Adjustments for: Interest and other financial income (Note 28) (68,207,009) (64,476,066) Gain on derivatives - net (45,755,928) (37,638,350) Dividend income (7,090,765) (27,081,565) Depreciation and amortization (Note 21) 28,520,905 24,283,479 Unrealized foreign exchange loss - net 34,923,077 12,743,089 Deferred exploration costs written-off – 78,517,253 Provisions for: Impairment loss on investment in a subsidiary
and associate (Note 10) 206,820 29,292,855 Unrecoverable input tax – 772,415 Loss (gain) on sale of: Royalty interest (58,571,625) – Investment in associates – (12,685,135) Available-for-sale investments (60,400) (20,462) Property and equipment 34,314 – Operating income (loss) before working capital changes (109,690,625) 371,241,984 Decrease (increase) in: Receivables (58,593,543) (19,077,017) Fuel and spare parts (1,545,231) (1,985,212) Other current assets 54,058 (3,630,515) Increase in accounts payable and other current liabilities 65,151,427 49,457,086 Net cash generated from (used in) operations (104,623,914) 396,006,326 Interest received 48,861,934 61,149,550 Income taxes paid, including creditable withholding taxes (28,785,226) (20,987,571) Net cash flows provided by (used in) operating activities (84,547,206) 436,168,305
CASH FLOWS FROM INVESTING ACTIVITIES Additions to: Investments held for trading (1,807,683,899) (1,194,659,125) Investment in an associate and a subsidiary (42,613,726) – Property and equipment (Note 9) (25,869,728) (3,622,815) Deferred exploration costs (Note 13) (14,832,931) (15,611,944) Available-for-sale investments (1,477,981) (87,021) Investment properties (Note 12) – (94,362,125) Cash dividends received 7,062,062 26,571,234
(Forward)

*SGVMC311706*
- 2 -
Years Ended December 31 2010 2009 Proceeds from: Sale/redemption of investments held for trading P=1,801,378,758 P=932,486,822 Settlement of currency forward contracts 46,418,460 22,742,850 Termination of short-term investments 5,000,000 12,511,120 Sale of property and equipment 1,049,281 – Sale of available-for-sale investments 254,916 240,986 Sale of investment in an associate – 193,285,135 Cash received from subsidiary for the return of capital 20,000,000 – Decrease (increase) in other noncurrent assets 80,685,000 (127,575,000) Cash flows provided by (used in) investing activities 69,370,212 (248,079,883)
CASH FLOWS FROM FINANCING ACTIVITIES Payments of cash dividends (65,635,410) (65,756,573) Increase (decrease) in other noncurrent liabilities 4,730,301 (2,138,279) Cash flows used in financing activities (60,905,109) (67,894,852)
EFFECT OF FOREIGN EXCHANGE RATE CHANGES ON CASH AND CASH EQUIVALENTS (26,725,793) (6,735,182)
NET INCREASE (DECREASE) IN CASH AND CASH EQUIVALENTS (102,807,896) 113,458,388
CASH AND CASH EQUIVALENTS AT BEGINNING OF YEAR 940,376,956 826,918,568
CASH AND CASH EQUIVALENTS AT END OF YEAR (Note 6) P=837,569,060 P=940,376,956
See accompanying Notes to Parent Company Financial Statements.

*SGVMC212853*
TRANS-ASIA OIL AND ENERGY DEVELOPMENT CORPORATION NOTES TO PARENT COMPANY FINANCIAL STATEMENTS 1. Corporate Information and Status of Operations
Trans-Asia Oil and Energy Development Corporation (TA Oil or “the Company”), incorporated on September 8, 1969, and its wholly-owned subsidiaries, Trans-Asia Renewable Energy Corporation (TAREC), Trans-Asia (Karang Besar) Petroleum Corporation, CIP II Power Corporation (CIPP) and Trans-Asia Gold and Minerals Development Corporation (TA Gold) were incorporated and registered with the Philippine Securities and Exchange Commission (SEC). The direct and ultimate parent company of TA Oil is Philippine Investment-Management Inc., (PHINMA), also incorporated in the Philippines. TA Oil is managed by PHINMA under an existing management agreement.
The Company is involved in power generation and trading, oil and mineral exploration, exploitation and production. The Company has an Electricity Supply Agreement (ESA) with Guimaras Electric Cooperative, Inc. (Guimelco), the lone electricity distributor in the province of Guimaras using its 3.4 megawatt (MW) bunker C-fired diesel generator power station in the island. The Energy Regulatory Commission (ERC) granted the Company a certificate of registration as a Wholesale Aggregator in November 2006 renewable every five (5) years, and a Retail Electricity Supplier’s (RES) license in December 2006. The license authorizes the Company to consolidate electricity power demand of distribution utilities, pursuant to the Electric Power Industry Reform Act of 2001 (EPIRA). As a RES, the Company is allowed to supply electricity to the contestable market, pursuant to EPIRA. The other activities of the Company are investments in various operating companies and financial instruments.
The Company also has a 50% interest in Trans-Asia Power Generation Corporation (TA Power), a company engaged in power generation. In October 2006, the Philippine Electricity Market Corporation (PEMC) approved TA Power’s application for registration as trading participant for both generation and customer categories in the Wholesale Electricity Spot Market (WESM). Both the Company and TA Power obtained membership in the WESM which allows them to participate in electricity trading managed by PEMC, including selling of excess generation to the WESM.
CIPP was registered with the Philippine Economic Zone Authority (PEZA) as an ecozone utilities enterprise, particularly, to develop and operate a power supply and distribution system at Carmelray Industrial Park II (CIP II) Special Economic Zone, in Barangay Punta and Tulo, Calamba, Laguna. In April 2009, CIPP sold its distribution assets to Manila Electric Company (MERALCO) resulting in the cessation of CIPP’s operations (see Note 10). Substantially all of its employees were separated effective January 31, 2010. On February 22, 2010 and March 24, 2010, the Board of Directors (BOD) and stockholders, respectively, of the Company approved the proposed merger of the Parent Company and CIPP subject to the approval by the SEC. As of February 21, 2011, the Company has not filed its application for merger with the SEC and has deferred its plan for merger.
TA Gold was incorporated and registered with the SEC on July 2, 2007 to primarily engage in the business of mining and mineral exploration within the Philippines and other countries. On March 16, 2009, the BOD approved the suspension of exploration activities of TA Gold effective March 31, 2009.
TAREC and Karang Besar have not yet started commercial operations.
The registered office address of the Parent Company is 11th Floor, PHINMA Plaza, 39 Plaza Drive, Rockwell Center, Makati City.

- 2 -
*SGVMC311706*
The parent company financial statements were authorized for issuance by the BOD on February 21, 2011.
2. Basis of Preparation and Statement of Compliance
The separate or parent company financial statements of the Company, which are presented for submission to the SEC and Bureau of Internal Revenue, have been prepared in compliance with Philippine Financial Reporting Standards (PFRS) using the historical cost convention, except for financial assets at fair value through profit or loss (FVPL), derivative assets and liabilities, and available-for-sale (AFS) investments which have been measured at fair value. The parent company financial statements are presented in Philippine Peso (peso), which is the Company’s functional currency. All values are rounded to the nearest peso, unless otherwise stated. The accompanying financial statements are the Company’s separate financial statements prepared in compliance with Philippine Accounting Standard (PAS) 27, Consolidated and Separate Financial Statements. The Company also prepares and issues consolidated financial statements for the same period as the separate financial statements presented in compliance with PFRS. The consolidated financial statements are filed with and may be obtained at the SEC.
3. Changes in Accounting Policies and Disclosures
Current Changes in Accounting Policies The accounting policies adopted are consistent with those of the previous financial year except for the adoption of the following amended and revised PFRS, Philippine Accounting Standards (PAS) and Philippine Interpretation, based on International Financial Reporting Interpretations Committee (IFRIC) interpretations, starting January 1, 2010. Amendments to PFRS 2 - Group Cash-settled Share-based Payment Transactions The amendments to PFRS 2, Share-based Payments, clarify the scope and the accounting for group cash-settled share-based payment transactions. The adoption of these amendments did not have an impact on the parent company financial statements. PFRS 3 - Business Combinations (Revised) and PAS 27 - Consolidated and Separate Financial Statements (Amended) PFRS 3 (Revised) introduces significant changes in the accounting for business combinations. Changes include the effect on the valuation of non-controlling interest, the accounting for transaction costs, the initial recognition and subsequent measurement of a contingent consideration and business combinations achieved in stages. These changes will impact the amount of goodwill recognized, the reported results in the period that an acquisition occurs and future results. PAS 27 (Amended) requires that a change in the ownership interest of a subsidiary (without loss of control) is accounted for as a transaction with owners in their capacity as owners. Therefore, such transactions will no longer give rise to goodwill, nor will it give rise to a gain or loss. Furthermore, losses incurred by the subsidiary will be allocated between the controlling and non-controlling interest even if the losses exceed the non-controlling equity investment in the subsidiary. The changes by PFRS 3 (Revised) and PAS 27 (Amended) will affect future acquisitions or loss of control of subsidiaries and transactions with non-controlling interests. These changes did not have a significant impact on the parent company financial statements.

- 3 -
*SGVMC311706*
Amendment to PAS 39, Financial Instruments: Recognition and Measurement - Eligible Hedged Items The amendment to PAS 39 clarifies that an entity is permitted to designate a portion of the fair value changes or cash flow variability of a financial instrument as a hedged item. This also covers the designation of inflation as a hedged risk or portion in particular situations. The adoption of this amendment did not have an impact on the parent company financial statements, as the Company has not entered into any such hedges.
Philippine Interpretation IFRIC 17 - Distributions of Non-Cash Assets to Owners It provides guidance on how to account for non-cash distributions to owners. The interpretation clarifies when to recognize a liability, how to measure it and the associated assets, and when to derecognize the asset and liability. The adoption of this Interpretation did not have an impact on the parent company financial statements, as the Company has not made non-cash distributions to shareholders during the year. Improvements of PFRS adopted by the Company starting January 1, 2010 The omnibus amendments to PFRS were issued primarily with a view to remove inconsistencies and clarify wordings. The adoption of the following improvements resulted in changes in accounting policies but did not have significant impact on the parent company financial statements of the Company.
• PFRS 2, Share-based Payment
- Clarifies that the contribution of a business on formation of a joint venture and combinations under common control are not within the scope of PFRS 2 even though they are out of scope of PFRS 3, Business Combinations (Revised).
• PFRS 5, Noncurrent Assets Held for Sale and Discontinued Operations
- Clarifies that the disclosures required in respect of noncurrent assets and disposal groups classified as held for sale or discontinued operations are only those set out in PFRS 5. The disclosure requirements of other PFRS only apply if specifically required for such noncurrent assets or discontinued operations.
• PFRS 8, Operating Segments - Clarifies that segment assets and liabilities need only be reported when those assets and
liabilities are included in measures that are used by the chief operating decision maker.
• PAS 1, Presentation of Financial Statements - Clarifies that the terms of a liability that could result, at anytime, in its settlement by the
issuance of equity instruments at the option of the counterparty do not affect its classification.
• PAS 7, Statement of Cash Flows
- Explicitly states that only expenditure that results in a recognized asset can be classified as a cash flow from investing activities.
• PAS 17, Leases
- Removes the specific guidance on classifying land as a lease. Prior to the amendment, leases of land were classified as operating leases. The amendment now requires that leases of land are classified as either ‘finance’ or ‘operating’ in accordance with the general principles of PAS 17.
• PAS 36, Impairment of Assets
- Clarifies that the largest unit permitted for allocating goodwill, acquired in a business combination, is the operating segment as defined in PFRS 8 before aggregation for reporting purposes.

- 4 -
*SGVMC311706*
• PAS 38, Intangible Assets
- Clarifies that if an intangible asset acquired in a business combination is identifiable only with another intangible asset, the acquirer may recognize the group of financial assets as a single asset provided the individual assets have similar useful lives. The amendment also clarifies that the valuation technique presented for determining the fair value of intangible assets acquired in a business combination that are not traded in active markets are only examples and are not restrictive on the methods that can be used.
• PAS 39, Financial Instruments: Recognition and Measurement
- Clarifies that (a) a prepayment option is considered closely related to the host contract when the exercise price of a prepayment option reimburses the lender up to the approximate present value of lost interest for the remaining term of the host contract; (b) the scope exemption for contracts between an acquirer and a vendor in a business combination to buy or sell an acquiree at a future date applies only to binding forward contracts, and not derivative contracts where further actions by either party are still to be taken; and, (c) gains or losses on cash flow hedges of a forecast transaction that subsequently results in the recognition of a financial instrument or on cash flow hedges of recognized financial instruments should be reclassified in the period that the hedged forecast cash flows affect profit or loss.
• Philippine Interpretation IFRIC 9, Reassessment of Embedded Derivatives
- Clarifies that it does not apply to possible reassessment at the date of acquisition, to embedded derivatives in contracts acquired in a business combination between entities or businesses under common control or the formation of joint venture.
• Philippine Interpretation IFRIC 16, Hedge of a Net Investment in a Foreign Operation
- States that, in a hedge of a net investment in a foreign operation, qualifying hedging instruments may be held by any entity or entities within the group, including the foreign operation itself, as long as the designation, documentation and effectiveness requirements of PAS 39 that relate to a net investment hedge are satisfied.
Amendments to Standards and Interpretations that have been issued but are not yet effective The following standards, amendments to standards and interpretation have been issued but will become effective subsequent to financial year ended December 31, 2010. The Company has not early adopted the following amendments and anticipates that these changes are either not applicable or will have no significant effect on the parent company financial statements. Effective in 2011
PAS 24 (Amended), Related Party Disclosures The amended standard is effective for annual periods beginning on or after January 1, 2011. It addresses the concerns that the previous disclosure requirements and the definition of a ‘related party’ that were too complex and difficult to apply in practice, especially in environments where government control is pervasive. It provides partial exemption for government-related entities by providing and simplifying the definition of a related party and removing inconsistencies. Amendment to PAS 32, Financial Instruments: Presentation - Classification of Rights Issues The amendment to PAS 32 is effective for annual periods beginning on or after February 1, 2010 and amended the definition of a financial liability in order to classify rights issues (and certain options or warrants) as equity instruments in cases where such rights are given pro rata to all of the existing owners of the same class of an entity’s non-derivative equity instruments, or to acquire a fixed number of the entity’s own equity instruments for a fixed amount in any currency.

- 5 -
*SGVMC311706*
Amendment to Philippine Interpretation IFRIC 14, Prepayment of a Minimum Funding Requirement The amendment is effective for annual periods beginning on or after January 1, 2011. This Interpretation applies in limited circumstances when an entity is subject to minimum funding requirements and makes an early payment of contributions to cover those requirements. The amendment permits such an entity to treat the benefit of such an early payment as an asset. Philippine Interpretation IFRIC 19, Extinguishing Financial Liabilities with Equity Instruments This Interpretation which is effective for annual periods beginning on or after July 1, 2010, clarifies that equity instruments issued to a creditor to extinguish a financial liability qualify as consideration paid. The equity instruments issued are measured at their fair value. In case that this cannot be reliably measured, the instruments are measured at the fair value of the liability extinguished. Any gain or loss is recognized immediately in profit or loss. Improvements of PFRS to be adopted by the Company starting January 1, 2011 The omnibus amendments to PFRS were issued primarily with a view to remove inconsistencies and clarify wordings. The adoption of the following improvements resulted in changes in accounting policies but did not have significant impact on the parent company financial statements of the Company. • PFRS 3, Business Combinations
- Clarifies that the amendments to PFRS 7, PAS 32, Financial Instruments: Presentation and PAS 39 that eliminate the exemption for contingent consideration, do not apply to contingent consideration that arose from business combinations whose acquisition dates precede application of PFRS 3 (as revised in 2008).
• PFRS 7, Financial Instruments: Disclosures
- Emphasizes the interaction between quantitative and qualitative disclosures and the nature and extent of risks associated with financial instruments.
• PAS 1, Presentation of Financial Statements - Clarifies that an entity will present an analysis of other comprehensive income for each
component of equity, either in the statement of changes in equity or in the notes to the financial statements.
• PAS 27, Consolidated and Separate Financial Statements
- Clarifies that the consequential amendments from PAS 27 made to PAS 21, The Effect of Changes in Foreign Exchange Rates, PAS 28, Investments in Associates and PAS 31, Interests in Joint Ventures apply prospectively for annual periods beginning on or after July 1, 2009 or earlier when PAS 27 is applied earlier.
Effective in 2012 Amendment to PAS 12, Income Taxes - Deferred Tax: Recovery of Underlying Assets The amendment to PAS 12 is effective for annual periods beginning on or after January 1, 2012. It provides a practical solution to the problem of assessing whether recovery of an asset will be through use or sale. It introduces a presumption that recovery of the carrying amount of an asset will normally be through sale. Amendment to PFRS 7 - Financial Instruments: Disclosures - Transfers of Financial Assets The amendments to PFRS 7 are effective for annual periods beginning on or after July 1, 2011. The amendments will allow users of financial statements to improve their understanding of transfer transactions of financial assets (for example, securitizations), including understanding the possible effects of any risks that may remain with the entity that transferred the assets. The
- 6 -
*SGVMC311706*
amendments also require additional disclosures if a disproportionate amount of transfer transactions are undertaken around the end of a reporting period. Philippine Interpretation IFRIC 15, Agreements for the Construction of Real Estate This Interpretation, effective for annual periods beginning on or after January 1, 2012, covers accounting for revenue and associated expenses by entities that undertake the construction of real estate directly or through subcontractors. This Philippine Interpretation requires that revenue on construction of real estate be recognized only upon completion, except when such contracts qualify as construction contract under PAS 11, Construction Contracts, or involve rendering of services in which case revenue is recognized based on stage of completion. Contracts involving provision of services with the construction materials and where the risks and reward of ownership are transferred to the buyer on a continuous basis will also be accounted for based on stage of completion.
Effective in 2013 PFRS 9, Financial Instruments: Classification and Measurement PFRS 9, as issued in 2010, reflects the first phase of the work on the replacement of PAS 39 and applies to classification and measurement of financial assets and financial liabilities as defined in PAS 39. The standard is effective for annual periods beginning on or after January 1, 2013. In subsequent phases, hedge accounting and derecognition will be addressed. The completion of this project is expected in early 2011. The Company is currently assessing the impact of this standard to the parent company financial statements.
4. Summary of Significant Accounting and Financial Reporting Policies
Cash and Cash Equivalents Cash includes cash on hand and in banks. Cash equivalents are short-term, highly liquid investments that are readily convertible to known amounts of cash with original maturities of three months or less and that are subject to an insignificant risk of change in value.
Short-term Investments Short-term investments represent investments that are readily convertible to known amounts of cash with original maturities of more than three months to one year.
Financial Assets and Financial Liabilities Financial assets and financial liabilities are recognized initially at fair value. Transaction costs are included in the initial measurement of all financial assets and liabilities, except for financial instruments measured at FVPL.
The Company recognizes a financial asset or a financial liability in the parent company balance sheet when it becomes a party to the contractual provisions of the instruments.
All regular way purchases and sales of financial assets are recognized on the trade date, i.e., the date that the Company commits to purchase the assets. Regular way purchases or sales are purchases or sales of financial assets that require delivery of assets within the period generally established by regulation or convention in the marketplace.
The fair value of financial instruments traded in active markets at the balance sheet date is based on their quoted market price or dealer price quotations (bid price for long positions and ask price for short positions), without any deduction for transaction costs. When current bid and asking prices are not available, the price of the most recent transaction provides evidence of the current

- 7 -
*SGVMC311706*
fair value as long as there has not been a significant change in economic circumstances since the time of the transaction. For all other financial instruments not listed in an active market, the fair value is determined by using appropriate valuation techniques. Valuation techniques include net present value techniques, comparison to similar instruments for which market observable prices exist, and other relevant valuation models. Where the transaction price in a non-active market is different from the fair value from other observable current market transactions in the same instrument or based on a valuation technique whose variables include only data from observable market, the Company recognizes the difference between the transaction price and fair value (a “Day 1” gain or loss) in the parent company statement of income unless it qualifies for recognition as some other type of asset. In cases where use is made of data which is not observable, the difference between the transaction price and model value is only recognized in the parent company statement of income when the inputs become observable or when the instrument is derecognized. For each transaction, the Company determines the appropriate method of recognizing the “Day 1” gain or loss amount. Financial instruments are classified as liabilities or equity in accordance with the substance of the contractual arrangement. Interest, dividends, gains and losses relating to a financial instrument or a component that is a financial liability, are reported as expense or income. Distributions to holders of financial instruments classified as equity are charged directly to equity, net of any related income tax benefits. Financial assets and financial liabilities are classified as either financial asset or liability at FVPL, loans and receivables, held-to-maturity (HTM) investments, AFS investments or other financial liabilities. The Company determines the classification of its financial assets and financial liabilities at initial recognition and, where allowed and appropriate, reevaluates this designation at every reporting date. Financial Assets and Financial Liabilities at FVPL a. Financial Assets or Financial Liabilities Designated at FVPL on Initial Recognition
Financial assets or financial liabilities classified in this category include those that are designated by management on initial recognition as at FVPL when any of the following criteria is met: • The designation eliminates or significantly reduces the inconsistent treatment that would
otherwise arise from measuring the assets or liabilities or recognizing gains or losses on them on a different basis;
• The assets and liabilities are part of a group of financial assets, financial liabilities or both which are managed and their performance evaluated on a fair value basis, in accordance with a documented risk management or investment strategy; or
• The financial instrument contains an embedded derivative, unless the embedded derivative does not significantly modify the cash flows or it is clear, with little or no analysis, that it would not be separately recorded.
Financial assets and financial liabilities designated at FVPL are recorded in the parent company balance sheet at fair value. Changes in fair value on financial assets and financial liabilities designated at FVPL are recorded in the parent company statement of income. Interest earned or incurred is recorded in interest and other financial income or charges, respectively, while dividend income is recorded according to the terms of the contract, or when the right to receive the payment has been established.

- 8 -
*SGVMC311706*
As of December 31, 2010 and 2009, the Company has no financial asset or financial liability designated on initial recognition as at FVPL.
b. Financial assets or financial liabilities held for trading These financial instruments are recorded in the parent company balance sheet at fair value. A financial asset or financial liability is classified under this category when any of the following criteria is met: • It is acquired or incurred principally for the purpose of selling or repurchasing it in the
near term; • On initial recognition, it is part of a portfolio of identified financial instruments that are
managed together and for which there is evidence of a recent actual pattern of short-term profit-taking; or
• It is a derivative (except for a derivative that is a financial guarantee contract or a designated and effective hedging instrument).
Changes in fair value relating to the held-for-trading positions are recognized in the parent company statement of income as gain on investment held for trading under the “Interest and other financial income” account. Interest earned or incurred is recorded in interest and other financial income or charges, respectively, while dividend income is recorded when the right to receive payment has been established. As of December 31, 2010 and 2009, the Company’s investments in bonds and fixed treasury notes (FXTNs) and unit investment trust funds (UITFs) are classified as financial assets held for trading (see Notes 7 and 28). Derivatives recorded at FVPL The Company enters into short-term forward currency contracts to hedge its currency exposure. Derivative instruments are initially recognized at fair value on the date in which a derivative transaction is entered into or bifurcated, and are subsequently remeasured at fair value. Derivatives are carried as assets when the fair value is positive and as liabilities when the fair value is negative. The Company has opted not to designate its derivative transactions under hedge accounting. Consequently, gains and losses from changes in fair value of these derivatives are recognized immediately in the parent company statement of income. The fair values of freestanding forward currency transactions are calculated by reference to current forward exchange rates for contracts with similar maturity profiles. Embedded derivatives An embedded derivative is separated from the host contract and accounted for as a derivative, if all of the following conditions are met: (a) the economic characteristics and risks of the embedded derivative are not closely related to the economic characteristics and risks of the host contract; (b) a separate instrument with the same terms as the embedded derivative would meet the definition of a derivative; and (c) the hybrid or combined instrument is not recognized at FVPL. Embedded derivatives are measured at fair value, and are carried as assets when the fair value is positive and as liabilities when the fair value is negative. Gains and losses from changes in fair value of these derivatives are recognized immediately in the parent company statement of income. Reassessment of embedded derivatives is only done when there are changes in the contract that significantly modifies the cash flows.

- 9 -
*SGVMC311706*
As of December 31, 2010 and 2009, the Company’s derivative assets are classified as financial assets at FVPL (see Note 28).
Loans and Receivables Loans and receivables are nonderivative financial assets with fixed or determinable payments and are not quoted in an active market. Such assets are carried at amortized cost using the effective interest method. Gains and losses are recognized in the parent company statement of income when the loans and receivables are derecognized or impaired, as well as through the amortization process. Loans and receivables are included in current assets if maturity is within 12 months from the balance sheet date. Otherwise, these are classified as noncurrent assets.
As of December 31, 2010 and 2009, the Company’s cash and cash equivalents, short-term investments and receivables are classified as loans and receivables (see Notes 6, 8 and 28).
HTM Investments Quoted nonderivative financial assets with fixed or determinable payments and fixed maturities are classified as HTM when the Company has the positive intention and ability to hold to maturity. Such assets are carried at amortized cost using the effective interest method. Gains and losses are recognized in the parent company statement of income when the HTM investments are derecognized or impaired, as well as through the amortization process. HTM investments are classified as current if maturity is within 12 months from the balance sheet date. Otherwise, these are classified as noncurrent assets. As of December 31, 2010 and 2009, the Company did not classify any financial asset under HTM investments.
AFS Investments AFS investments are nonderivative financial assets that are designated as AFS or are not classified in any of the three preceding categories. They are purchased and held indefinitely, and may be sold in response to liquidity requirements or changes in market conditions. After initial recognition, AFS investments are measured at fair value with gains or losses being recognized as a separate component of equity until the investment is derecognized or until the investment is determined to be impaired at which time the cumulative gain or loss previously reported in equity is included in the parent company statement of income. Unlisted AFS financial assets, on the other hand, are carried at cost, net of any impairment, until the investment is derecognized. AFS investments are classified as current if they are expected to be realized within 12 months from the balance sheet date. Otherwise, these are classified as noncurrent assets.
As of December 31, 2010 and 2009, the Company’s investments in listed and unlisted equity securities and golf club shares are classified as AFS investments (see Notes 11 and 28).
Other Financial Liabilities Other financial liabilities are initially recognized at the fair value of the consideration received less directly attributable transaction costs. After initial recognition, other financial liabilities are subsequently measured at amortized cost using the effective interest method. Gains and losses are recognized in the parent company statement of income when the liabilities are derecognized as well as through the amortization process.
- 10 -
*SGVMC311706*
As of December 31, 2010 and 2009, the Company’s accounts payable and other current liabilities, due to stockholders and deposit payable are classified as other financial liabilities (see Notes 14 and 28). Impairment of Financial Assets The Company assesses at each balance sheet date whether a financial asset or group of financial assets is impaired. Assets carried at amortized cost If there is objective evidence (such as the probability of insolvency or significant financial difficulties of the debtor) that an impairment loss on loans and receivables carried at amortized cost has been incurred, the amount of the loss is measured as the difference between the asset’s carrying amount and the present value of estimated future cash flows (excluding future credit losses that have not been incurred) discounted at the financial asset’s original effective interest rate (i.e., the effective interest rate computed at initial recognition). The carrying amount of the asset shall be reduced through the use of an allowance account and the amount of the loss is recognized in the parent company statement of income. Interest income continues to be accrued on the reduced carrying amount based on the original effective interest rate of the asset. Loans and receivables, together with the associated allowance, are written off when there is no realistic prospect of future recovery and all collateral, if any, has been realized or has been transferred to the Company. If in a subsequent year, the amount of the impairment loss increases or decreases because of an event occurring after the impairment was recognized, the previously recognized impairment loss is increased or reduced by adjusting the allowance account, to the extent that the carrying value of the asset does not exceed its amortized cost at the reversal date. Any subsequent reversal of an impairment loss is recognized in the parent company statement of income.
The Company first assesses whether objective evidence of impairment exists individually for financial assets that are individually significant, and individually or collectively for financial assets that are not individually significant. If it is determined that no objective evidence of impairment exists for an individually assessed financial asset, whether significant or not, the asset is included in a group of financial assets with similar credit risk characteristics and that group of financial assets is collectively assessed for impairment. Assets that are individually assessed for impairment and for which an impairment loss is or continues to be recognized are not included in a collective assessment of impairment. For the purpose of specific evaluation of impairment, the Company assesses whether financial assets are impaired through assessment of collectability of financial assets considering the creditors’ capacity to pay, history of payment, and the availability of other financial support. For the purpose of a collective evaluation of impairment, financial assets are grouped on the basis of such credit risk characteristics such as customer type, payment history, past due status and term. Assets carried at cost If there is objective evidence that an impairment loss on an unquoted equity instrument that is not carried at fair value because its fair value cannot be reliably measured has been incurred, the amount of the loss is measured as the difference between the asset’s carrying amount and the present value of estimated future cash flows discounted at the current market rate of return for a similar financial asset. AFS investments In the case of equity investments classified as AFS, this would include a significant or prolonged decline in the fair value of the investments below its cost. Where there is evidence of impairment, the cumulative loss, measured as the difference between the acquisition cost and the current fair value, less any impairment loss on that financial asset previously recognized in the parent company statement of income, is removed from equity and recognized in the parent company

- 11 -
*SGVMC311706*
statement of income. Impairment losses on equity investments are not reversed through the parent company statement of income. Increases in fair value after impairment are recognized directly in other comprehensive income. In the case of debt instruments classified as AFS, impairment is assessed based on the same criteria as financial assets carried at amortized cost. Future interest income is based on the reduced carrying amount and is accrued based on the rate of interest used to discount future cash flows for the purpose of measuring impairment loss. Any such accrual is recorded as part of “Interest and other financial income” account in the parent company statement of income. If, in subsequent year, the fair value of a debt instrument increases and the increase can be objectively related to an event occurring after the impairment loss was recognized in the parent company statement of income, the impairment loss is reversed through the parent company statement of income. Derecognition of Financial Assets and Financial Liabilities Financial assets A financial asset (or, where applicable a part of a financial asset or part of a group of similar financial assets) is derecognized when:
• the rights to receive cash flows from the asset have expired or have been transferred; • the Company retains the right to receive cash flows from the asset, but has assumed an
obligation to pay them in full without material delay to a third party under a “pass-through” arrangement; or
• the Company has transferred its rights to receive cash flows from the asset and either: (a) has transferred substantially all the risks and rewards of the asset, or (b) has neither transferred nor retained substantially all the risks and rewards of the asset, but has transferred control of the asset.
Where the Company has transferred its rights to receive cash flows from an asset and has neither transferred nor retained substantially all the risks and rewards of the asset nor transferred control of the asset, the asset is recognized to the extent of the Company’s continuing involvement in the asset.
Continuing involvement that takes the form of a guarantee over the transferred asset is measured at the lower of the original carrying amount of the asset and the maximum amount of consideration that the Company could be required to repay.
Financial liabilities A financial liability is derecognized when the obligation under the liability is discharged, cancelled or has expired. Where an existing financial liability is replaced by another from the same lender on substantially different terms, or the terms of an existing liability are substantially modified, such an exchange or modification is treated as a derecognition of the original liability and the recognition of a new liability, and the difference in the respective carrying amounts is recognized in the parent company statement of income.
Offsetting Financial Instruments Financial assets and financial liabilities are offset and the net amount reported in the parent company balance sheet when there is a currently legal right to set off the recognized amounts and the Company intends to either settle on a net basis, or to realize the asset and settle the liability simultaneously.
Fuel and Spare Parts Fuel and spare parts are stated at the lower of cost or net realizable value. Cost is determined using the first-in, first-out method. Net realizable value is the current replacement cost of fuel and spare parts.
- 12 -
*SGVMC311706*
Property, Plant and Equipment Property, plant and equipment, except land, are stated at cost less accumulated depletion, depreciation and amortization and impairment in value. Land is stated at cost less any impairment in value.
The initial cost of property, plant and equipment comprises its purchase price, including import duties (where applicable), borrowing costs incurred during the construction period and other costs directly attributable to bringing the asset to its working condition and location for its intended use. Expenditures incurred after the property, plant and equipment have been put into operation, such as repairs and maintenance, are charged to income in the year the costs are incurred. In situation where it can be clearly demonstrated that the expenditures have resulted in an increase in the future economic benefits expected to be obtained from the use of an item of property and equipment beyond its originally assessed standard of performance, the expenditures are capitalized as an additional cost of property and equipment. Under the component depreciation method, plant overhaul costs are segregated into two categories, that is: (a) costs that should be depreciated over the useful life of the plant; and, (b) parts that are replaced at periodic intervals. The cost of the initial overhaul that may be capitalized is depreciated over its estimated useful life, through the next overhaul, at which time the process is repeated. Under this method, repairs and maintenance are also expensed as incurred. Depletion of wells, platforms and other facilities are provided on a field basis under the unit-of-production method based upon estimates of proven reserves. The depletion base includes the estimated future development cost of the undeveloped reserves. Depreciation and amortization are calculated on a straight-line basis over the estimated useful lives of the assets, as follows:
Buildings and improvements 20-25 years Machinery and equipment 9-20 years Transportation equipment 3-5 years Mining and other equipment 10 years Office furniture, equipment and others 3-10 years
The useful lives and depletion, depreciation and amortization methods are reviewed periodically to ensure that the periods and methods of depletion, depreciation and amortization are consistent with the expected pattern of economic benefits from the items of property, plant and equipment. An item of property, plant and equipment is derecognized upon disposal or when no future economic benefits are expected from its use or disposal. Any gain or loss arising on derecognition of the assets (calculated as the difference between the net disposal proceeds and the carrying amount of the asset) is included in the parent company statement of income in the year the asset is derecognized. Construction in progress is stated at cost. This includes cost of construction and other direct costs. Construction in progress is not depreciated until such time as the relevant assets are completed and put into operational use.

- 13 -
*SGVMC311706*
Investments in Subsidiaries, Associates and Interest in a Joint Venture The Company’s investments in the following subsidiaries, associates and interest in a joint venture are carried at cost less accumulated impairment losses:
Percentage of Ownership 2010 2009 Subsidiaries: TAREC 100.00 100.00 Karang Besar 100.00 100.00 TA Gold 100.00 100.00 CIPP 100.00 100.00 Joint Venture - TA Power Associates: Union Aggregates Corporation (UAC) (a) 31.25 31.25 Asia Coal Corporation (Asia Coal) (b) 28.18 28.18 Maibarara Geothermal, Inc. (MGI) 25.00 – (a) Ceased commercial operations (b) Shortened corporate life to October 31, 2009
A subsidiary is an entity in which the Company has control. An associate is an entity in which the Company has significant influence and which is neither a subsidiary nor a joint venture of the Company. Under the cost method, the Company recognizes income from the investment only to the extent that the Company receives distributions from accumulated profits of the subsidiaries and associates. Investment Properties Investment properties are carried at cost, including transaction costs, net of accumulated depreciation. The carrying amount includes the cost of replacing part of an existing investment property at the time that cost is incurred if the recognition criteria are met and excludes the costs of day-to-day servicing of an investment property. Depreciation is calculated on a straight-line basis over the estimated useful life of 20 years. Investment property is derecognized when either it has been disposed of or when the investment property is permanently withdrawn from use and no future economic benefit is expected from its disposal. Any gain or loss on the retirement or disposal of an investment property is recognized in the parent company statement of income in the year of retirement or disposal. Transfers are made to investment property when, and only when, there is a change in use, evidenced by ending of owner-occupation, commencement of an operating lease to another party or ending of construction or development. Transfers are made from investment property when, and only when, there is a change in use, evidenced by commencement of owner-occupation or commencement of development with a view to sale. Deferred Exploration Costs The Company follows the full cost method of accounting for exploration costs determined on the basis of each service contract (SC) or geophysical survey and exploration contract (GSEC) area. Under this method, all exploration costs relating to each SC or GSEC are tentatively deferred to

- 14 -
*SGVMC311706*
the extent that the capitalized costs do not exceed the value of those reserves, pending determination of whether the contract area contains oil and gas reserves in commercial quantities, net of an allowance for impairment losses. Expenditures for mineral exploration and development work on mining properties are also deferred as incurred, net of any allowance for impairment losses. These expenditures are provided for with an allowance when there are indications that the exploration results are negative. These are written off against the allowance when the projects are abandoned or determined to be definitely unproductive. When the exploration work results are positive, the net exploration costs and subsequent development costs are capitalized and amortized from the start of commercial operations. Deferred exploration costs are assessed for impairment when:
• the period for which the Company has the right to explore in the specific area has expired during the period or will expire in the near future, and is not expected to be renewed;
• substantive expenditure on further exploration for and evaluation of mineral resources in the specific area is neither budgeted nor planned;
• exploration for and evaluation of mineral resources in the specific area have not led to the discovery of commercially viable quantities of mineral resources and the Company has decided to discontinue such activities in the specific area; or
• sufficient data exists to indicate that, although a development in the specific area is likely to proceed, the carrying amount of the exploration and evaluation asset is unlikely to be recovered in full from successful development or by sale.
When facts and circumstances suggest that the carrying amount exceeds the recoverable amount, impairment loss is measured, presented and disclosed in accordance with PAS 36. Impairment of Nonfinancial Assets The Company assesses at each reporting date whether there is an indication that an asset may be impaired. If any such indication exists, or when annual impairment testing for an asset is required, the Company makes an estimate of the asset’s recoverable amount. An asset’s recoverable amount is the higher of an asset’s or cash-generating unit’s fair value less costs to sell and its value-in-use and is determined for an individual asset, unless the asset does not generate cash inflows that are largely independent of those from other assets or groups of assets. Where the carrying amount of an asset exceeds its recoverable amount, the asset is considered impaired and is written down to its recoverable amount. In assessing value-in-use, the estimated future cash flows are discounted to their present value using a pretax discount rate that reflects current market assessment of the time value of money and the risks specific to the asset. Impairment losses of continuing operations are recognized in the parent company statement of income in those expense categories consistent with the function of the impaired asset. An assessment is made at each reporting date as to whether there is any indication that previously recognized impairment losses may no longer exist or may have decreased. If such indication exists, the recoverable amount is estimated. A previously recognized impairment loss is reversed only if there has been a change in the estimates used to determine the asset’s recoverable amount since the last impairment loss was recognized. If that is the case, the carrying amount of the asset is increased to its recoverable amount. That increased amount cannot exceed the carrying amount that would have been determined, net of depletion, depreciation and amortization, had no impairment loss been recognized for the asset in prior years. Such reversal is recognized in profit or loss unless the asset is carried at revalued amount, in which case, the reversal is treated as a
- 15 -
*SGVMC311706*
revaluation increase. After such a reversal, the depletion, depreciation and amortization charge is adjusted in future periods to allocate the asset’s revised carrying amount, less any residual value, on a systematic basis over its remaining useful life. Provisions Provisions are recognized when the Company has a present obligation (legal or constructive) as a result of a past event, it is probable that an outflow of resources embodying economic benefits will be required to settle the obligation and a reliable estimate can be made of the amount of the obligation. If the effect of the time value of money is material, provisions are determined by discounting the expected future cash flows at a pretax rate that reflects current market assessment of the time value of money and, where appropriate, the risks specific to the liability. Where discounting is used, the increase in the provision due to the passage of time is recognized as an interest expense.
Capital Stock Capital stock is the portion of the paid in capital representing the total par value of the shares issued.
Retained Earnings Retained earnings include all current and prior period results of operations as reported in the parent company statement of income, dividend distribution and other capital adjustments.
Revenue Revenue is recognized when it is probable that the economic benefits associated with the transactions will flow to the Company and the revenue can be measured reliably. The following specific recognition criteria must also be met before revenue is recognized:
Trading revenue Revenue from the sale of electricity is recognized during the period when electricity is purchased from the spot market and sold to the end consumer. Revenue is measured at the fair value of the consideration received or receivable. Trading revenue is presented gross of trading costs where the Company acts as principal and:
- has primary responsibility for providing the goods and services; - has discretion in establishing prices; and - bears the credit and inventory risks.
Trading revenue is presented net of trading costs where the Company acts as an agent.
Generation Revenue Revenue from the sale of electricity is recognized during the period when electricity is generated. Revenue from take-or-pay arrangement is recognized in accordance with the terms of the ESA in relation to the electricity generated.
Dividend Dividend income is recognized when the Company’s right to receive the payment is established.
Interest Interest income is recognized as the interest accrues, taking into account the effective yield on the asset. Rental Rental income is accounted for on a straight-line basis over the lease term.

- 16 -
*SGVMC311706*
Costs and Expenses Costs and expenses are recognized when incurred.
Pensions and Other Post-Employment Benefits The Company has a defined benefit pension plan. The costs of providing benefits under the defined benefit plan are determined using the projected unit credit actuarial valuation method. The method reflects service rendered by employees to the date of valuation and incorporates assumptions concerning employees’ projected salaries. Actuarial gains and losses are recognized as income or expense when the net cumulative unrecognized actuarial gains and losses for each individual plan at the end of the previous reporting year exceed 10% of the higher of the defined benefit obligation and the fair value of plan assets at that date. These gains or losses are recognized over the expected average remaining working lives of the employees participating in the plan. Past service cost is recognized as an expense on a straight-line basis over the average period until the benefits become vested. If the benefits are already vested immediately following the introduction of, or changes to, a pension plan, past service cost is recognized immediately. The defined benefit liability is the aggregate of the present value of the defined benefit obligation and actuarial gains and losses not recognized, reduced by past service cost not yet recognized, and the fair value of plan assets out of which the obligations are to be settled directly. If such aggregate is negative, the asset is measured at the lower of such aggregate or the aggregate of cumulative unrecognized net actuarial losses and past service cost and the present value of any economic benefits available in the form of refunds from the plan or reductions in the future contributions to the plan. If the asset is measured at the aggregate of cumulative unrecognized net actuarial losses and past service cost and the present value of any economic benefits available in the form of refunds from the plan or reductions in the future contributions to the plan, net actuarial losses of the current period and past service cost of the current period are recognized immediately to the extent that they exceed any reduction in the present value of those economic benefits. If there is no change or an increase in the present value of the economic benefits, the entire net actuarial losses of the current period and past service cost of the current period are recognized immediately. Similarly, net actuarial gains of the current period after the deduction of the past service cost of the current period exceeding any increase in the present value of the economic benefits stated in the foregoing are recognized immediately if the asset is measured at the aggregate of cumulative unrecognized net actuarial losses and past service cost and the present value of any economic benefits available in the form of refunds from the plan or reductions in the future contributions to the plan. If there is no change or a decrease in the present value of the economic benefits, the entire net actuarial gains of the current period after the deduction of past service cost of the current period are recognized immediately. Stock Option The Company had a stock option plan offered to qualified employees, officers and directors of the Company. As allowed under PFRS 1, “First Time Adoption of Philippine Financial Reporting Standards,” the Company availed of the exemption from applying PFRS 2 to stock options granted after November 7, 2002 but are fully vested as of January 1, 2005. There are no stock options granted after November 7, 2002 which remained unvested as of January 1, 2005.
- 17 -
*SGVMC311706*
Stock option grants subsequent to January 1, 2005 will be accounted for in accordance with PFRS 2, that is, the cost of stock option awards will be measured by reference to the fair value at the date on which they are granted. The cost of such awards will be recognized, together with a corresponding increase in equity, over the period in which the performance and/or service conditions are fulfilled, ending on the date on which the relevant employees become fully entitled to the award. The cumulative expense that will be recognized at each reporting date until the vesting date reflects the extent to which the vesting period has expired and the Company’s best estimate of the number of equity instruments that will ultimately vest. The income statement charge or credit for a period represents the movement in cumulative expense recognized as at the beginning and end of the period. No expense is recognized for awards that do not ultimately vest, except for awards where vesting is conditional upon a market condition, which are treated as vesting irrespective of whether or not the market condition is satisfied, provided that all other performance conditions are satisfied.
Where the terms of the award are modified, the minimum expense recognized is the expense if the terms had not been modified. An additional expense is recognized for any modification, which increases the total fair value of the share based payment arrangement, or is otherwise beneficial to the employee as measured at the date of modification. Where the stock option is cancelled, it is treated as if it had vested on the date of the cancellation, and any expense not yet recognized for the award is recognized immediately. However, if a new award is substituted for the cancelled award, and designated as a replacement award on the date that it is granted, the cancelled and new awards are treated as if they were a modification of the original award, as described in the preceding paragraph. Leases The determination of whether the arrangement is, or contains a lease is based on the substance of the arrangement at inception date of whether the fulfillment of the arrangement depends on the use of a specific asset or assets or the arrangement conveys a right to use the asset. A reassessment is made after the inception of the lease, if any, if the following applies: a) there is a change in contractual terms, other than a renewal or extension of the arrangement; b) a renewal option is exercised or extension granted, unless the term of the renewal or extension
was initially included in the lease term; c) there is a change in the determination of whether fulfillment is dependent on a specified asset; or d) there is substantial change to the asset. Where the reassessment is made, lease accounting shall commence or cease from the date when the change in circumstances gave rise to the reassessment for scenarios a, c, or d above, and at the date of renewal or extension period for scenario b. The Company determines whether arrangements contain a lease to which lease accounting must be applied. The costs of the agreements that do not take the legal form of a lease but convey the right to use an asset are separated into lease payments if the entity has the control of the use or access to the asset, or takes essentially all of the outputs of the asset. The said lease component for these arrangements is then accounted for as finance or operating lease. Finance leases, which transfer to the Company substantially all the risks and benefits incidental to ownership of the leased item are capitalized at the inception of the lease at the fair value of the leased property or, if lower, at the present value of the minimum lease payments.

- 18 -
*SGVMC311706*
Leases where the lessor retains substantially all the risks and benefits of ownership of the asset are classified as operating leases. Operating lease income and expense is recognized in the parent company statement of income on a straight-line basis over the lease arrangements. Borrowing Costs Borrowing costs are generally expensed as incurred. Borrowing costs including foreign exchange differences arising from foreign currency-denominated borrowings, to the extent they are regarded as an adjustment to interest costs, are capitalized if they are directly attributable to the acquisition or construction of a qualifying asset. Capitalization of borrowing costs commences when the activities to prepare the asset are in progress and expenditures and borrowing costs are being incurred. Borrowing costs are capitalized until the assets are substantially ready for their intended use. If the carrying amount of the asset exceeds its recoverable amount, an impairment loss is recorded. Foreign Currency-denominated Transactions Transactions denominated in foreign currencies are recorded using the exchange rate at the date of the transaction. Outstanding monetary assets and liabilities denominated in foreign currencies are restated using the closing rate of exchange at the balance sheet date. Exchange gains or losses arising from foreign currency-denominated transactions are credited or charged to current operations. Nonmonetary items that are measured at historical cost in a foreign currency are translated using the exchange rate at the date of the transaction. Nonmonetary items measured at fair value in a foreign currency are translated using the exchange rates at the date when the fair value is determined. Income Taxes Current income tax Current income tax assets and liabilities for the current and prior periods are measured at the amount expected to be recovered from or paid to the tax authority. The tax rates and tax laws used to compute the amount are those that are enacted or substantively enacted as of the balance sheet date. Deferred income tax Deferred income tax is provided using the balance sheet liability method on temporary differences at the balance sheet date between the tax bases of assets and liabilities and their carrying amounts for financial reporting purposes. Deferred income tax liabilities are recognized for all taxable temporary differences, except: • where the deferred income tax liability arises from the initial recognition of goodwill or of an
asset or liability in a transaction that is not a business combination and, at the time of the transaction, affects neither the accounting profit nor taxable profit or loss; and
• in respect of taxable temporary differences associated with investments in subsidiaries, associates and interests in joint ventures, where the timing of the reversal of the temporary differences can be controlled and it is probable that the temporary differences will not reverse in the foreseeable future.
Deferred income tax assets are recognized for all deductible temporary differences, carryforward benefits of unused tax credits from excess minimum corporate income tax (MCIT) and net operating loss carryover (NOLCO), to the extent that it is probable that taxable profit will be available against which the deductible temporary differences and the carryforward benefits of unused tax credits and unused tax losses can be utilized.

- 19 -
*SGVMC311706*
The carrying amount of deferred income tax assets is reviewed at each balance sheet date and reduced to the extent that it is no longer probable that sufficient taxable profit will be available to allow all or part of the deferred tax asset to be utilized. Unrecognized deferred income tax assets are reassessed at each balance sheet date and are recognized to the extent that it has become probable that future taxable profit will allow the deferred income tax asset to be recovered. Deferred income tax assets and liabilities are measured at the tax rates that are expected to apply to the year when the asset is realized or the liability is settled, based on tax rates and tax laws that have been enacted or substantively enacted at the balance sheet date. Income tax relating to items recognized directly in equity is recognized in equity and not in the parent company statement of income. Deferred income tax assets and deferred income tax liabilities are offset, if a legally enforceable right exists to offset current income tax assets against current income tax liabilities and the deferred income taxes relate to the same taxable entity and the same taxation authority. Earnings Per Share (EPS) Basic EPS is computed based on weighted average number of issued and outstanding common shares during each year after giving retroactive effect to stock dividends declared during the year. Diluted EPS is computed as if the stock options were exercised as of the beginning of the year and as if the funds obtained from exercise were used to purchase common shares at the average market price during the year. Outstanding stock options will have a dilutive effect under the treasury stock method only when the fair value of the underlying common shares during the period exceeds the exercise price of the option. Where the outstanding stock options have no dilutive effect and the Company does not have any potential common share nor other instruments that may entitle the holder to common shares, diluted EPS is the same as basic EPS. Contingencies Contingent liabilities are not recognized in the parent company financial statements but are disclosed unless the possibility of an outflow of resources embodying economic benefits is remote. Contingent assets are not recognized in the parent company financial statements but disclosed when an inflow of economic benefits is probable. Events After the Balance Sheet Date Post year-end events that provide additional information about the Company’s position at the balance sheet date (adjusting events) are reflected in the parent company financial statements. Post year-end events that are not adjusting events are disclosed in the notes when material.
5. Significant Accounting Judgments, Estimates and Assumptions
The parent company financial statements prepared in conformity with PFRS require management to make judgments, estimates and assumptions that affect amounts reported in the parent company financial statements and related notes. In preparing the parent company financial statements, management has made its best estimates and judgments of certain amounts, giving due consideration to materiality. The judgments, estimates and assumptions used in the parent company financial statements are based upon management’s evaluation of relevant facts and circumstances as of the date of the parent company financial statements. Actual results could differ from such estimates. The Company believes the following represent a summary of these significant judgments and estimates and related impact and associated risks in its parent company financial statements.

- 20 -
*SGVMC311706*
Judgments Determination of functional currency Based on the economic substance of the underlying circumstances relevant to the Company, the functional currency of the Company has been determined to be the Philippine peso. The Philippine peso is the currency of the primary economic environment in which the Company operates. It is the currency that mainly influences the sale and cost of producing electricity.
Determination of whether an arrangement contains a lease and proper classification of the lease Under TA Oil’s ESA with Guimelco and TA Power’s ESA with Holcim Philippines, Inc. (Holcim), TA Oil sells all of its output to Guimelco and TA Power sells all or substantially all of its output to Holcim (see Note 26). The Company also has various lease agreements for the lease of its investment properties. The Company has evaluated the arrangements and the terms of the agreements and determined that the risks and rewards of ownership of the underlying properties are retained by the Company. Accordingly, the related assets have been recognized in the books and the fees billed to Guimelco, Holcim and the other leases are recorded as operating revenues. Under the Power Administration and Management Agreement between TA Oil and One Subic Power Generation Corporation (One Subic Power), TA Oil will administer and manage the entire generation output of the 116 MW diesel power plant in Subic (see Note 26). The Company has evaluated that the arrangements and the terms of the agreement contain a lease and determined that the risks and rewards of ownership of the power plant are retained by the ultimate lessor. Classification of financial instruments The Company exercises judgment in classifying a financial instrument, or its component parts, on initial recognition as either a financial asset, a financial liability or an equity instrument in accordance with the substance of the contractual arrangement and the definitions of a financial asset, a financial liability or an equity instrument. The substance of a financial instrument, rather than its legal form, governs its classification in the parent company balance sheet. The classification of the Company’s financial assets and financial liabilities are presented in Note 28. Estimates Fair value of financial assets and financial liabilities The fair value for financial instruments traded in an active market at the balance sheet date is based on their quoted market price or dealer price quotations (bid price for long positions and ask price for short positions), without any deduction for transaction costs. Where the fair values of financial assets and financial liabilities recorded on the parent company balance sheet cannot be derived from active markets, they are determined using a variety of valuation techniques that include the use of mathematical models. The input to these models is taken from observable markets where possible, but where this is not feasible, a degree of judgment and estimation is required in establishing fair values. Any change in value of these financial assets and financial liabilities (including derivatives) would affect the parent company statement of comprehensive income and parent company statement of changes in equity. The fair values of the Company’s financial assets amounted to P=2.17 billion and P=2.26 billion as of December 31, 2010 and 2009, respectively, while fair values of Company’s financial liabilities amounted to P=230.14 million and P=140.14 million as of December 31, 2010 and 2009, respectively (see Note 28). Estimated allowance for doubtful accounts The Company maintains allowance for doubtful accounts based on the results of the individual and collective assessment under PAS 39. Under the individual assessment, which considers the significant financial difficulties of the customer, the Company is required to obtain the present value of estimated cash flows using the receivable’s original effective interest rate. Impairment loss is determined as the difference between the receivables’ carrying balance and the computed present

- 21 -
*SGVMC311706*
value. The collective assessment would require the Company to group its receivables based on the credit risk characteristics (customer type, past-due status and terms) of the customers. Impairment loss is then determined based on historical loss experience of the receivables grouped per credit risk profile. Historical loss experience is adjusted on the basis of current observable data to reflect the effects of current conditions that did not affect the period on which the historical loss experience is based and to remove the effects of conditions in the historical period that do not exist currently. The methodology and assumptions used for the individual and collective assessments are based on management’s judgment and estimate. Therefore, the amount and timing of recorded expense for any period would differ depending on the judgments and estimates made for the year. The carrying value of receivables amounted to P=318.15 million as of December 31, 2010 and P=342.63 million (including noncurrent portion classified under noncurrent assets in the 2009 balance sheet of P=127.57 million) as of December 31, 2009 (see Notes 8 and 10). Realizability of deferred income tax assets The carrying amount of deferred income tax assets is reviewed at each balance sheet date and reduced to the extent that it is no longer probable that sufficient taxable income will be available to allow all or part of the deferred income tax assets to be utilized. However, there is no assurance that sufficient taxable income will be generated to allow all or part of the deferred income tax assets to be utilized. As of December 31, 2010 and 2009, the Company recognized deferred income tax assets amounting to P=10.15 million and P=3.68 million, respectively. The Company’s deductible temporary differences and unused MCIT for which no deferred income tax assets were recognized in the parent company balance sheets as of December 31, 2010 and 2009 amounted to P=98.32 million and P=50.96 million, respectively (see Note 23). Estimated useful lives of property, plant and equipment and investment properties The Company estimates the useful lives of property, plant and equipment and investment properties based on the period over which the assets are expected to be available for use. The estimated useful lives of property, plant and equipment and investment properties are reviewed periodically and are updated if expectations differ from previous estimates due to physical wear and tear, technical or commercial obsolescence and legal or other limits on the use of the assets. In addition, estimation of the useful lives of property, plant and equipment and investment properties are based on collective assessment of industry practice, internal technical evaluation and experience with similar assets. It is possible, however, that future results of operations could be materially affected by changes in estimates brought about by changes in factors mentioned above. The amounts and timing of recorded expenses for any period would be affected by changes in these factors and circumstances. The carrying value of property, plant and equipment as of December 31, 2010 and 2009 amounted to P=214.08 million and P=148.64 million, respectively (see Note 9). The carrying value of investment properties as of December 31, 2010 and 2009 amounted to P=23.06 million and P=92.24 million, respectively (see Note 12). Impairment of deferred exploration costs The carrying value of deferred exploration costs is reviewed for impairment by management when there are indications that the carrying amount exceeds the recoverable amount. Write-off of deferred exploration costs against allowance for impairment losses amounted to P=76.62 million in 2009. In addition, deferred exploration costs amounting to P=78.52 million were directly written-off and charged in the parent company statement of income in 2009. Among the factors considered by management in the write off of deferred exploration costs are the expiration of the contracts and the technical evaluation that the remaining prospects in these areas are small and are likely to be uneconomic. As of December 31, 2010 and 2009, the carrying value of deferred exploration costs amounted to P=86.70 million and P=71.86 million, respectively (see Note 13).
- 22 -
*SGVMC311706*
Impairment of property, plant and equipment and investment properties The Company performs annual impairment testing of assets which are not used in operations and those with indications of impairment. The impairment testing of assets not used in operations requires an estimation of its fair value less cost to sell. Fair value is the amount obtainable from the sale of an asset or cash-generating unit in an arm’s-length transaction between knowledgeable, willing parties, less the costs of disposal. The impairment testing of property, plant and equipment with indications of impairment requires an estimation of the value-in-use of the cash-generating units. The carrying value of property, plant and equipment as of December 31, 2010 and 2009 amounted to P=214.08 million and P=148.64 million, respectively (see Note 9). The carrying value of investment properties amounted to P=23.06 million and P=92.24 million as of December 31, 2010 and 2009, respectively (see Note 12). Impairment of investments in subsidiaries, associates and interest in a joint venture The carrying value of these investments is reviewed for impairment whenever events or changes in circumstances indicate that the carrying value may not be recoverable. If any such indication exists and where the carrying value exceeds the estimated recoverable amount, the investment is written down to its recoverable amount. Impairment loss on investments in a subsidiary and an associate recognized in 2010 and 2009 amounted to P=0.21 million and P=29.29 million, respectively. The carrying value of investments in subsidiaries, associates, and interest in a joint venture as of December 31, 2010 and 2009 amounted to P=434.20 million and P=411.79 million, respectively (see Note 10). Impairment of AFS investments The Company treats AFS investments as impaired when there has been a significant or prolonged decline in the fair value below its cost or where other objective evidence of impairment exists. The determination of what is “significant” or “prolonged” requires judgment. The Company treats “significant” generally as 20% or more of the original cost of investment, and “prolonged”, greater than 6 months. In addition, the Company evaluates other factors, including normal volatility in share price for quoted equities and the future cash flows and the discount factors for unquoted equities. No impairment loss was deemed necessary in 2010 and 2009. The carrying value of AFS investments as of December 31, 2010 and 2009 amounted to P=198.05 million and P=175.46 million, respectively (see Note 11). Pension and other post-employment benefits The determination of the Company’s obligation and cost for pension and other post-employment benefits is dependent on the selection of certain assumptions used by actuaries in calculating such amounts. The assumptions described in Note 24 to the financial statements include among others, discount rates, expected returns on plan assets and rates of salary increase. In accordance with PFRS, actual results that differ from the assumptions are accumulated and amortized over future periods and therefore, generally affect the recognized expense and recorded obligation in such future periods. The carrying value of pension and other post-employment benefits as of December 31, 2010 and 2009 is P=10.60 million and P=4.67 million, respectively (see Note 24).
6. Cash and Cash Equivalents
2010 2009 Cash on hand and in banks P=4,575,857 P=88,638,814 Short-term deposits 832,993,203 851,738,142 P=837,569,060 P=940,376,956

- 23 -
*SGVMC311706*
Cash in banks earn interest at the respective bank deposit rates. Short-term deposits are made for varying periods between one day and three months depending on the immediate cash requirements of the Company and earn interest at the respective short-term deposit rates.
7. Investments Held for Trading
2010 2009 Investments in: Bonds and FXTNs P=347,871,714 P=282,396,862 UITFs and mutual funds 461,100,126 509,655,975 P=808,971,840 P=792,052,837
The Company’s unrealized gain from changes in fair value of investments held for trading (included in net gains on investments held for trading under “Interest and other financial income” account in the parent company statements of income) amounted to P=21.51 million and P=10.57 million as of December 31, 2010 and 2009, respectively (see Note 28).
8. Receivables
2010 2009 Trade (Note 26) P=80,683,848 P=55,863,120 Due from related companies (Notes 25 and 26) 170,810,829 123,891,193 Others (Notes 10 and 13) 69,923,812 38,573,191 321,418,489 218,327,504 Less allowance for doubtful accounts 3,270,366 3,270,366 P=318,148,123 P=215,057,138
Trade receivables include receivables from Guimelco, in accordance with the terms of the ESA between the Company and Guimelco (see Note 26). Trade receivables are noninterest-bearing and are generally on a 30-day credit term. Other receivables include receivable from the sale of royalty interest amounting to P=58.09 million as of December 31, 2010 (see Note 13) and interest receivable of P=7.45 million and P=6.43 million as of December 31, 2010 and 2009, respectively. As of December 31, the aging analysis of receivables is as follows: 2010
Neither Past
Due nor Past Due but not Impaired Past Due
and Total Impaired <30 Days 30–60 Days 61–90 Days 91–120 Days Impaired
(In Thousands)
Trade P=80,684 P=76,578 P=494 P=499 P=896 P=2,217 P=– Due from related
companies 170,811 170,811 – – – – –
Others 69,924 66,654 – – – – 3,270 P=321,419 P=314,043 P=494 P=499 P=896 P=2,217 P=3,270

- 24 -
*SGVMC311706*
2009
Neither Past
Due nor Past Due but not Impaired Past Due
and Total Impaired <30 Days 30–60 Days 61–90 Days 91–120 Days Impaired
(In Thousands)
Trade P=55,863 P=53,375 P=465 P=520 P=463 P=1,040 P=– Due from related
companies 123,891 123,891 – – – – – Others 38,573 35,303 – – – – 3,270 P=218,327 P=212,569 P=465 P=520 P=463 P=1,040 P=3,270 There were no movements in allowance for doubtful accounts in 2010.
Movements in allowance for doubtful accounts in 2009 are as follows:
Due from
related companies Others Total (In Thousands) Balances at January 1, 2009 P=23,532 P=3,270 P=26,802 Write-off (23,532) – (23,532) Balances at December 31, 2009 P=– P=3,270 P=3,270
9. Property, Plant and Equipment
Buildings and
Improvements
Machinery and
Equipment
Wells, Platforms and Other Facilities
Transportation Equipment
Mining and Other
Equipment
Office Furniture,
Equipment and Others
Construction In Progress Total
Cost At January 1, 2009 P=95,994,804 P=102,596,427 P=20,346,661 P=9,561,646 P=4,845,108 P=26,890,815 P=– P=260,235,461 Additions – – – 2,948,906 421,962 251,947 – 3,622,815 At December 31, 2009 95,994,804 102,596,427 20,346,661 12,510,552 5,267,070 27,142,762 – 263,858,276 Additions 2,236,525 – – 13,430,009 2,618,995 412,775 7,171,424 25,869,728 Disposals – – – (9,383,600) – (105,521) – (9,489,121) Transfer from investment
properties (Note 12) 71,122,500 – – – – – – 71,122,500 At December 31, 2010 169,353,829 102,596,427 20,346,661 16,556,961 7,886,065 27,450,016 7,171,424 351,361,383
Accumulated Depreciation, Amortization, Depletion and Impairment
At January 1, 2009 31,545,684 19,294,089 20,346,661 5,229,996 1,918,038 18,041,206 – 96,375,674 Depreciation (Note 21) 7,381,918 5,262,024 – 1,964,728 614,138 3,622,112 – 18,844,920 At December 31, 2009 38,927,602 24,556,113 20,346,661 7,194,724 2,532,176 21,663,318 – 115,220,594 Depreciation (Note 21) 12,380,780 5,075,311 – 4,567,803 1,183,443 3,352,958 – 26,560,295 Disposals – – – (8,305,366) – (100,160) – (8,405,526) Transfer from investment
properties (Note 12) 3,903,064 – – – – – – 3,903,064 At December 31, 2010 55,211,446 29,631,424 20,346,661 3,457,161 3,715,619 24,916,116 – 137,278,427
Net Book Value
At January 1, 2009 P=64,449,120 P=83,302,338 P=– P=4,331,650 P=2,927,070 P=8,849,609 P=– P=163,859,787 At December 31, 2009 57,067,202 78,040,314 – 5,315,828 2,734,894 5,479,444 – 148,637,682 At December 31, 2010 114,142,383 72,965,003 – 13,099,800 4,170,446 2,533,900 7,171,424 214,082,956
- 25 -
*SGVMC311706*
10. Investments in Subsidiaries, Associates and Interest in a Joint Venture
2010 2009 Joint venture - TA Power P=225,000,000 P=225,000,000 Subsidiaries: CIPP 151,234,202 151,234,202 TA Gold 30,000,000 50,000,000 TAREC 14,000,000 14,000,000 Karang Besar 3,261,206 3,225,605 198,495,408 218,459,807 Associates: MGI 42,578,125 – Asia Coal 14,515,140 14,515,140 UAC 12,219,773 12,219,773 69,313,038 26,734,913 492,808,446 470,194,720 Less accumulated impairment losses 58,608,186 58,401,366 P=434,200,260 P=411,793,354
TA Power The Company’s proportionate share in the assets and liabilities of TA Power as of December 31 and income and expenses for the years then ended are as follows:
2010 2009 Current assets P=344,879,079 P=199,402,913 Noncurrent assets 172,784,776 241,376,471 Total Assets 517,663,855 440,779,384 Current liabilities (166,063,029) (110,573,180) Noncurrent liabilities (4,625,985) (9,767,505) Total Liabilities (170,689,014) (120,340,685) Net assets P=346,974,841 P=320,438,699 2010 2009 Revenue P=897,732,782 P=579,144,177 Cost of power generation and power purchased (854,620,255) (530,282,115) General and administrative expenses (26,991,583) (29,712,796) Other income - net 1,445,312 11,852,345 Income before income tax 17,566,256 31,001,611 Benefit from income tax 4,848,218 4,163,430 Net income P=22,414,474 P=35,165,041
CIPP In April 2009, the terms of the sale of the distribution assets to Manila Electric Company (MERALCO) were finalized resulting in the cessation of CIPP’s operations starting April 2009. Also, the separation of substantially all of its employees effective January 2010 was announced. On February 22, 2010, the BOD of the Company approved the proposed merger of the Company and CIPP subject to the approval by the SEC. As of February 21, 2011, the Company has not filed its application for merger with the SEC and has deferred its plan for merger.
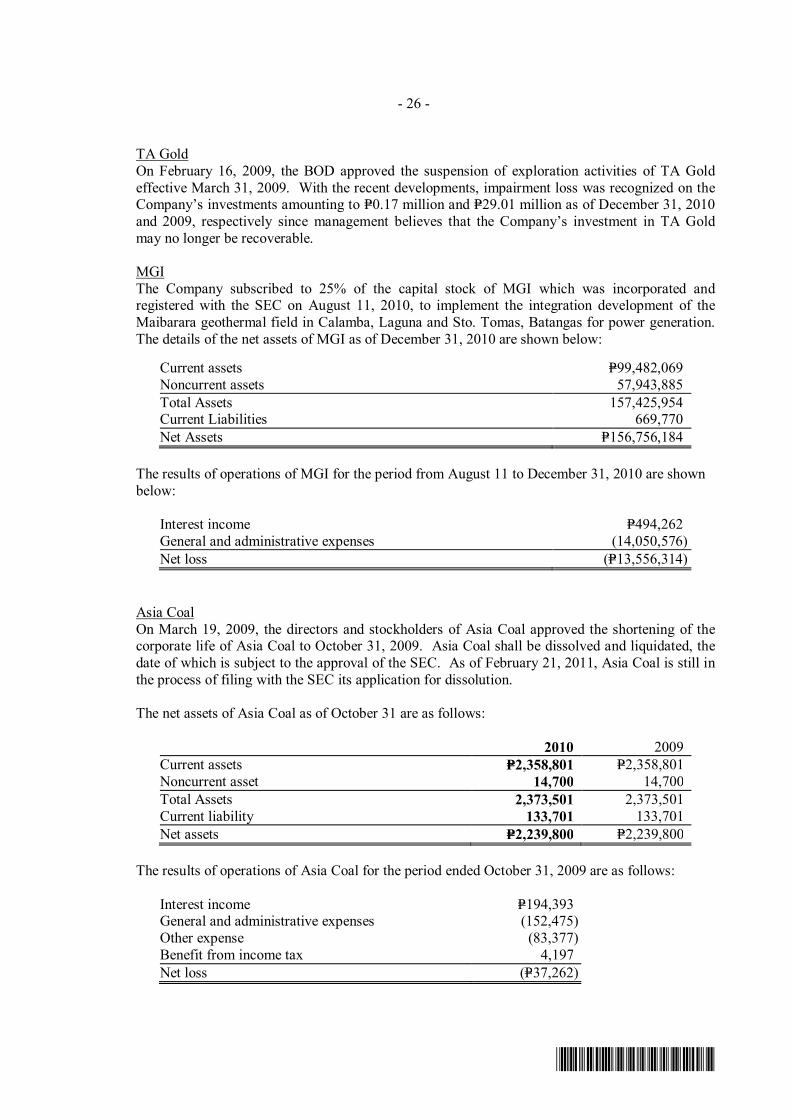
- 26 -
*SGVMC311706*
TA Gold On February 16, 2009, the BOD approved the suspension of exploration activities of TA Gold effective March 31, 2009. With the recent developments, impairment loss was recognized on the Company’s investments amounting to P=0.17 million and P=29.01 million as of December 31, 2010 and 2009, respectively since management believes that the Company’s investment in TA Gold may no longer be recoverable. MGI
The Company subscribed to 25% of the capital stock of MGI which was incorporated and registered with the SEC on August 11, 2010, to implement the integration development of the Maibarara geothermal field in Calamba, Laguna and Sto. Tomas, Batangas for power generation. The details of the net assets of MGI as of December 31, 2010 are shown below:
Current assets P=99,482,069 Noncurrent assets 57,943,885 Total Assets 157,425,954 Current Liabilities 669,770 Net Assets P=156,756,184
The results of operations of MGI for the period from August 11 to December 31, 2010 are shown below:
Interest income P=494,262 General and administrative expenses (14,050,576) Net loss (P=13,556,314)
Asia Coal On March 19, 2009, the directors and stockholders of Asia Coal approved the shortening of the corporate life of Asia Coal to October 31, 2009. Asia Coal shall be dissolved and liquidated, the date of which is subject to the approval of the SEC. As of February 21, 2011, Asia Coal is still in the process of filing with the SEC its application for dissolution.
The net assets of Asia Coal as of October 31 are as follows:
2010 2009 Current assets P=2,358,801 P=2,358,801 Noncurrent asset 14,700 14,700 Total Assets 2,373,501 2,373,501 Current liability 133,701 133,701 Net assets P=2,239,800 P=2,239,800
The results of operations of Asia Coal for the period ended October 31, 2009 are as follows:
Interest income P=194,393 General and administrative expenses (152,475) Other expense (83,377) Benefit from income tax 4,197 Net loss (P=37,262)

- 27 -
*SGVMC311706*
Other than the approval by the directors and stockholders of Asia Coal of the shortening of its corporate life, there were no significant transactions or events that need to be adjusted in Asia Coal’s financial statements. Bacnotan Industrial Park Corporation BIPC is engaged in the development of a 110-hectare industrial estate in Calaca, Batangas. On March 10, 2009, the Company signed a Share Purchase Agreement with Phoenix Petroleum Philippines, Inc. (Phoenix) whereby the Company sold to Phoenix all of the Company’s 30% equity interest in BIPC for a consideration payable at approximately 18% down payment and the balance in monthly installments over a period of five years. Total gain on the sale of the investment in an associate recognized in the 2009 parent company statement of income amounted to P=12.69 million (see Note 22). As of December 31, 2009, the current portion of the receivable from Phoenix amounted to P=26.32 million and is included as part of other receivables (see Note 8). The noncurrent portion of the receivable amounting to P=127.57 million is included as part of “Other noncurrent assets” account in the 2009 parent company balance sheet. Such receivables have been collected in full on April 16, 2010. On January 15, 2010, TA Oil entered into a Contract for the Sale and Purchase of Industrial Lots (the Contract) with BIPC. Under the terms of the Contract, BIPC undertakes to sell the parcels of land registered under its name as well as the additional parcels of land that it will acquire from Phoenix Petroterminals and Industrial Park. Terms of payment include that upon downpayment, TA Oil shall be granted the sole and exclusive option to purchase the properties and shall exercise the option on or before April 1, 2010 (and was subsequently amended to extend until November 18, 2010) (the option exercise date) by giving written notice to BIPC and paying a certain amount. In the event that TA Oil exercises the option on or before the option exercise date, the downpayment and the exercise price shall be credited to the purchase price of the properties for BIPC acquisition. In the event that TA Oil does not exercise the option, BIPC shall refund 50% of the downpayment to TA Oil without interest within 30 days from the lapse of the option exercise date. The total purchase price for the properties already owned by BIPC is P=177.53 million while the total purchase price of the additional properties to be acquired by BIPC is P=156.30 million. On November 18, 2010, the Company exercised the option to purchase the properties and paid the option price of P=31.26 million which shall be credited along with the initial downpayment of P=15.63 million to the total purchase price of P=333.83 million. These amounts are included as part of “Other noncurrent assets” account in the 2010 balance sheet.
11. Available-for-Sale Investments
2010 2009 Shares of stock: Listed P=96,453,351 P=80,210,631 Unlisted 71,917,219 71,917,219 Quoted golf club shares 29,678,000 23,330,000 P=198,048,570 P=175,457,850
AFS investments are stated at fair value as of December 31, 2010 and 2009, except for investments in unlisted shares of stock which are stated at cost, net of any impairment. Gain from change in fair value recognized as other comprehensive income amounted to P=19.61 million, net of deferred income tax of P=1.70 million in 2010. Loss from changes in fair value recognized as other comprehensive income amounted to P=2.25 million, net of deferred income tax of P=1.08 million in 2009.

- 28 -
*SGVMC311706*
12. Investment Properties
2010 2009 Cost Balance at beginning of the year P=99,255,788 P=4,893,663 Additions – 94,362,125 Transfer to owner-occupied property (Note 9) (71,122,500) – Balance at end of year 28,133,288 99,255,788 Less accumulated depreciation Balance at beginning of the year 7,015,311 1,576,752 Depreciation (Note 21) 1,960,610 5,438,559 Transfer to owner-occupied property (Note 9) (3,903,064) – Balance at end of year 5,072,857 7,015,311 P=23,060,431 P=92,240,477
Investment properties are stated at cost less accumulated depreciation and any impairment loss. The fair value of the investment properties based on the latest valuation by an independent firm of appraisers amounted to P=28.0 million and P=98.67 million as of December 31, 2010 and 2009, respectively. The valuation undertaken considered the sales of similar or substitute properties and related market data and established estimated value by processes involving comparison.
Rental income in 2010 and 2009 amounted to P=5.36 million and P=3.58 million, respectively, while related direct costs and expenses incurred in 2010 and 2009 amounted to P=2.38 million and P=10.51 million, respectively, included as part of “General and administrative expenses” (see Note 19).
13. Deferred Exploration Costs
Oil Exploration
Costs
Mineral Explorations
Costs
Total Deferred
Exploration Costs
Cost: At January 1, 2009 P=205,724,762 P=5,660,894 P=211,385,656 Additions 15,300,580 311,364 15,611,944 Write-off (149,163,158) (5,972,258) (155,135,416) At December 31, 2009 71,862,184 – 71,862,184 Additions 14,832,931 – 14,832,931 At December 31, 2010 86,695,115 – 86,695,115 Allowance for impairment loss: At January 1, 2009 76,618,163 – 76,618,163 Write-off (76,618,163) – (76,618,163) At December 31, 2009 – – – Write-off – – – At December 31, 2010 – – – Net book value: At January 1, 2009 P=129,106,599 P=5,660,894 P=134,767,493 At December 31, 2009 71,862,184 – 71,862,184 At December 31, 2010 86,695,115 – 86,695,115

- 29 -
*SGVMC311706*
The balance of the deferred oil exploration costs consists of expenditures incurred in the following production-sharing petroleum projects:
2010 2009 SC No. 51/GSEC No. 93 (East Visayas) P=32,615,780 P=32,545,030 SC No. 69 (Camotes) 29,373,778 15,179,659 SC No. 6 (Northwest Palawan) 18,992,347 18,424,285 SC No. 55 (Offshore West Palawan) 5,713,210 5,713,210 P=86,695,115 P=71,862,184
The foregoing deferred oil exploration costs represent the Company’s share in the expenditures incurred under Petroleum SCs or GSECs with the Philippine Department of Energy (DOE). The contracts provide for certain minimum work and expenditure obligations and are covered by operating agreements which set forth the participating interests, rights and obligations of the contractors.
The following summarizes the status of the Company’s projects: a. SC 6 (Offshore Northwest Palawan)
Cadlao Production Area
On September 21, 2010, TA Oil entered into a Sale and Purchase Agreement and a Deed of Assignment covering the assignment of its entire royalty interest in the Cadlao Production Area, Northwest Palawan under Service Contract No. 6 to Peak Royalties Limited (BVI). On December 22, 2010, DOE approved the Deed of Assignment and recognized the assignment by TA Oil of the 1.65% royalty interest in favor of Peak Royalties, Inc. The proceeds amounting to US$1.325 million (P=58.57 million) were recognized in the 2010 parent company statements of income as “Other Income” (see Note 22).
Block A
GPC Investments S.A. (formerly known as Vitol GPC Investments S.A.) did not exercise its option to acquire interest in the block.
The consortium adopted a US$560,000 work program for year 2011 consisting mainly of reprocessing of 3D seismic data in the northern sector of the block where prospects had been identified.
Block B
On February 4, 2011, the consortium, excluding one partner, signed a Farm-in Agreement with Peak Oil and Gas Philippines, Ltd., Blade Petroleum Philippines, Ltd. and VenturOil Philippines, Inc. (“farminees”), which granted the farminees the option to acquire 70% of the participating interests of the farmors, upon farminees’ completion of a US$325,000 geological and geophysical work program at their sole cost by April 2011. Should the farminees exercise the option, they will carry the farmors in all expenses until first oil production in the block. The Company holds 7.78% and 14.063% participating interests in Blocks A and B, respectively.

- 30 -
*SGVMC311706*
b. SC 14 (Offshore Northwest Palawan)
The DOE approved the final 15-year extension of the term of SC 14 effective December 17, 2010, subject to certain terms and conditions.
Block B - 1 North Matinloc
The North Matinloc field produced 18,737 barrels of oil in year 2010.
The Company has 6.103% participating interest in Block B-1.
c. SC 51/GSEC No. 93 (East Visayas)
The DOE approved a revised timeline for the remaining SC 51 work phases under which the term of the current Sub-Phase 3 was extended to July 3, 2011.
The Filipino partners, NorAsian Energy Limited (NEL), the Operator, and an Australian
company finalized an Amendment Deed to the Farm-in Agreement that provides for, among others, the farm-in of said Australian company, the drilling of an onshore well in Northwest Leyte in fulfillment of the Sub-Phase 3 obligation, and options for the drilling of the Argao - 1 well in the Cebu Strait and a second onshore well.
The Company owns 6.67% participating interest in SC 51. d. SC 55 (Offshore West Palawan)
The consortium completed a 600 - sq. km. 3D seismic survey and a separate 1,800 sq. km. 3D seismic survey in the first quarter of year 2010.
The DOE granted a one-year extension of Sub-Phase 3 to August 5, 2011 to give the
consortium sufficient time to process and interpret the new seismic data. The Company signed an Option Agreement with Frontier Gasfields Pty. Ltd. of Australia on
June 3, 2010 which grants the latter the option to acquire the 5% participating interest that Trans-Asia has from NorAsian Energy Ltd. (NEL), the Operator, after the drilling of the first well under SC 55. Under the Option Agreement, the Company received a nonrefundable option fee of US$250,000.
On February 3, 2011, the Company and NEL signed an agreement providing for NEL’s acquisition of 8.18% participating interest in SC 55 from the Company. Said assignment of interest is subject to the approval of the DOE.
Interpretation of the processed seismic data is in progress as of February 21, 2011. The Company has 15% participating interest in SC 55. e. SC 69 (Camotes Sea)
The partners completed a 900 - km 2D seismic survey in the second quarter of year 2010. The DOE approved the consortium’s request for a three-month extension of the current Sub-
Phase 2 until February 7, 2011 to enable completion of interpretation of the new seismic data.

- 31 -
*SGVMC311706*
The Company signed a Farm-in Option Agreement with Frontier Gasfields Pty. Ltd. of Australia on June 3, 2010 which grants the latter the option to acquire 15% out of the 30% participating interest of the Company in SC 69. On February 3, 2011, Frontier notified the Company of its election to exercise its option. Such assignment of interest is subject to the consent of the Company’s partner in SC 69 and the approval of the DOE.
The Company and NorAsian Energy Philippines, Inc. (NOEPI) signed an agreement on
February 3, 2011 providing for NOEPI’s acquisition of 9% participating interest in SC 69 from the Company.
The consortium elected to enter Sub-Phase 3 (February 7, 2011 to August 7, 2012) with a
commitment to undertake a 150 - sq. km. 3D seismic program designed to elevate two delineated prospects to drillable status.
f. MPSA 252-2007-V (Camarines Norte) The Office of the President denied the Company’s Appeal for reversal of the decision of the
DENR excising portions of the MPSA covered by alleged mineral patents of a third party. The Company filed a timely Motion for Reconsideration.
14. Accounts Payable and Other Current Liabilities
2010 2009 Trade and nontrade accounts payable P=147,024,170 P=88,555,699 Due to related parties (Note 25) 70,643,072 8,467,669 Accrued directors’ and management fees,
and annual incentives (Note 25) 842,821 22,706,140 Accrued expenses 385,657 10,672,243 Deferred rent income 190,179 181,123 Output tax - net – 20,075,253 Others 1,396,290 – P=220,482,189 P=150,658,127
Accounts payable and other current liabilities are noninterest-bearing and are normally settled on 30 to 60-day terms.
15. Equity
Number of Shares 2010 2009 Authorized capital stock - P=1 par value 2,000,000,000 2,000,000,000
Issued: Balance at beginning of year 1,662,603,069 1,662,298,650 Issuance during the year (Note 16) 2,022,535 304,419 Balance at end of year 1,664,625,604 1,662,603,069

- 32 -
*SGVMC311706*
The issued and outstanding shares as of December 31, 2010 and 2009 are held by 3,360 and 3,386 equity holders, respectively. On June 20, 2007, the SEC approved the stock rights offering of 552.53 million shares of the Company at the rate of one share for every two shares held as of record date of November 23, 2007, at a price of P=1.10 per share. The offer period commenced on November 28, 2007 and ended on December 11, 2007. Total proceeds raised from the stock rights offering, net of direct costs incurred, amounted to P=599.03 million. The proceeds were used to fund petroleum and mineral explorations and for general corporate purposes. On November 16, 2009, the shareholders approved the reallocation of the proceeds from the stock rights offering to renewable energy (RE) projects due to uncertainty in mining projects brought about by the decline in prices of metals and minerals in the world market and due to the sale of CIPP’s distribution system rendering the expansion of the power plant unnecessary.
On November 16, 2009, in a special stockholders’ meeting, the Company’s stockholders approved the increase in the Company’s authorized capital stock from P=2 billion divided into 2 billion shares, to P=4.2 billion divided into 4.2 billion shares. The increase in authorized capital stock will be funded by a stock rights offering, the terms and conditions of which, including the final issue size, rights, entitlement, offer price and record date, shall be determined by the Board of Directors. As of February 21, 2011, the Company is in the process of finalizing the terms and conditions of the stock rights offering for submission with the SEC. The Company’s retained earnings balance amounted to P=0.96 billion and P=1.02 billion as of December 31, 2010 and 2009, respectively, while paid-up capital is P=1.72 billion as of December 31, 2010 and 2009. Dividends declared and paid in 2010 and 2009 are as follows: Dividend Date of Declaration Type Rate Amount Record Date March 16, 2009 Cash P=0.04 per share P=66,491,946 March 30, 2009 March 24, 2010 Cash 0.04 per share 66,585,024 May 3, 2010
16. Employee Stock Options and Executive Stock Grants
The Company had a stock option plan (the Old Plan) that covered up to 25 million shares. The Old Plan entitled qualified employees, officers and directors to purchase shares of stock during the offering years at a price of P=1 a share. On June 7, 2004, the Company’s BOD approved the reallocation of stock options for a total of 12.52 million shares out of the original 25.00 million shares, which expired in April 2003 and May 2004. Such stock options were allocated among directors and employees of the Company and the exercise of such options was subject to the following terms and conditions:
Subscription Price At par value of P=1 per share
Period of Exercise Up to 100% of the allocated shares within three years from June 8, 2004
Payment of Shares Cash payment upon exercise of option
Right to Exercise Option Continuous employment required

- 33 -
*SGVMC311706*
On April 2, 2007, the Company’s BOD and stockholders approved a total of 100 million shares to be taken from the unsubscribed portion of the Company’s 2 billion authorized shares to be awarded as follows: (a) stock grants for officers and managers of the Company; and, (b) stock options for directors, officers and employees of the Company and its subsidiaries and affiliates (referred to herein as the “New Plan”) under the terms and conditions as determined by the Executive Committee of the BOD. The exercise of such grants and options are subject to the following terms and conditions:
Stock Grants The executive stock grants are given to officers and managers of the Company computed at a predetermined percentage of their variable compensation pay based on certain performance criteria.
Stock Options Following are the specific terms of the Company’s New Plan:
Coverage Directors, permanent officers and employees of TA Oil and its
subsidiaries/affiliates
Exercise price At weighted average closing price for 20 trading days prior to grant date but should not be lower than par value of P=1.00 per share
Vesting period • Up to 33% of the allocated shares on the 1st year from the date of grant;
• Up to 66% of the allocated shares on the 2nd year from the date of grant; and
• Up to 100% of the allocated shares on the 3rd year from the date of grant.
Right to Exercise Option Continuous employment required. In the event of resignation, termination or retirement, the optionee shall be entitled only to the options due him/her up to the effectivity of separation. Full payment is required prior to separation date. In the event of death of optionee, his/her heirs, executors, or administrators shall have the right to exercise the balance of options granted and pay in cash.
On May 7, 2008, the Company’s Stock Option Committee superseded the implementation of the Stock Option Plan. The Committee also decided to implement the Company’s Stock Grant for its executives which resulted in the issuance of 2.02 million and 0.3 million shares in 2010 and 2009, respectively.
As of December 31, 2010, such stock options have not been granted and awarded to any of the directors, officers and employees of the Company.
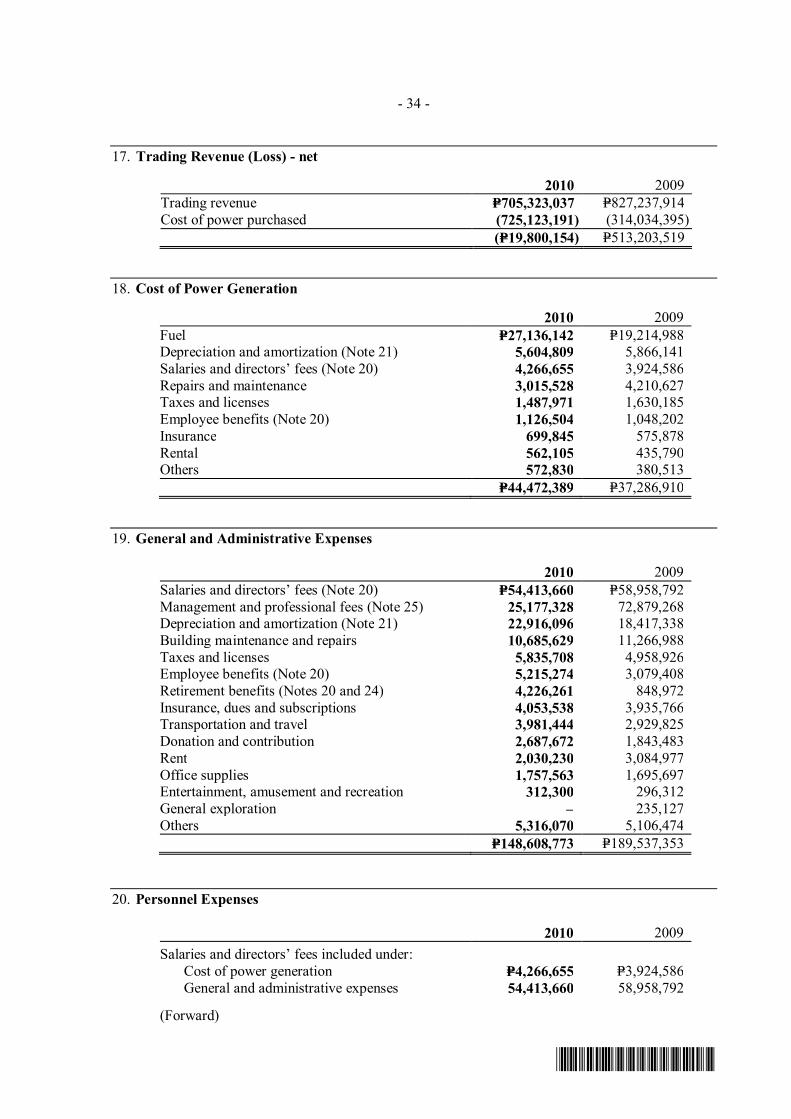
- 34 -
*SGVMC311706*
17. Trading Revenue (Loss) - net
2010 2009 Trading revenue P=705,323,037 P=827,237,914 Cost of power purchased (725,123,191) (314,034,395) (P=19,800,154) P=513,203,519
18. Cost of Power Generation
2010 2009 Fuel P=27,136,142 P=19,214,988 Depreciation and amortization (Note 21) 5,604,809 5,866,141 Salaries and directors’ fees (Note 20) 4,266,655 3,924,586 Repairs and maintenance 3,015,528 4,210,627 Taxes and licenses 1,487,971 1,630,185 Employee benefits (Note 20) 1,126,504 1,048,202 Insurance 699,845 575,878 Rental 562,105 435,790 Others 572,830 380,513 P=44,472,389 P=37,286,910
19. General and Administrative Expenses
2010 2009 Salaries and directors’ fees (Note 20) P=54,413,660 P=58,958,792 Management and professional fees (Note 25) 25,177,328 72,879,268 Depreciation and amortization (Note 21) 22,916,096 18,417,338 Building maintenance and repairs 10,685,629 11,266,988 Taxes and licenses 5,835,708 4,958,926 Employee benefits (Note 20) 5,215,274 3,079,408 Retirement benefits (Notes 20 and 24) 4,226,261 848,972 Insurance, dues and subscriptions 4,053,538 3,935,766 Transportation and travel 3,981,444 2,929,825 Donation and contribution 2,687,672 1,843,483 Rent 2,030,230 3,084,977 Office supplies 1,757,563 1,695,697 Entertainment, amusement and recreation 312,300 296,312 General exploration – 235,127 Others 5,316,070 5,106,474 P=148,608,773 P=189,537,353
20. Personnel Expenses
2010 2009 Salaries and directors’ fees included under: Cost of power generation P=4,266,655 P=3,924,586 General and administrative expenses 54,413,660 58,958,792
(Forward)
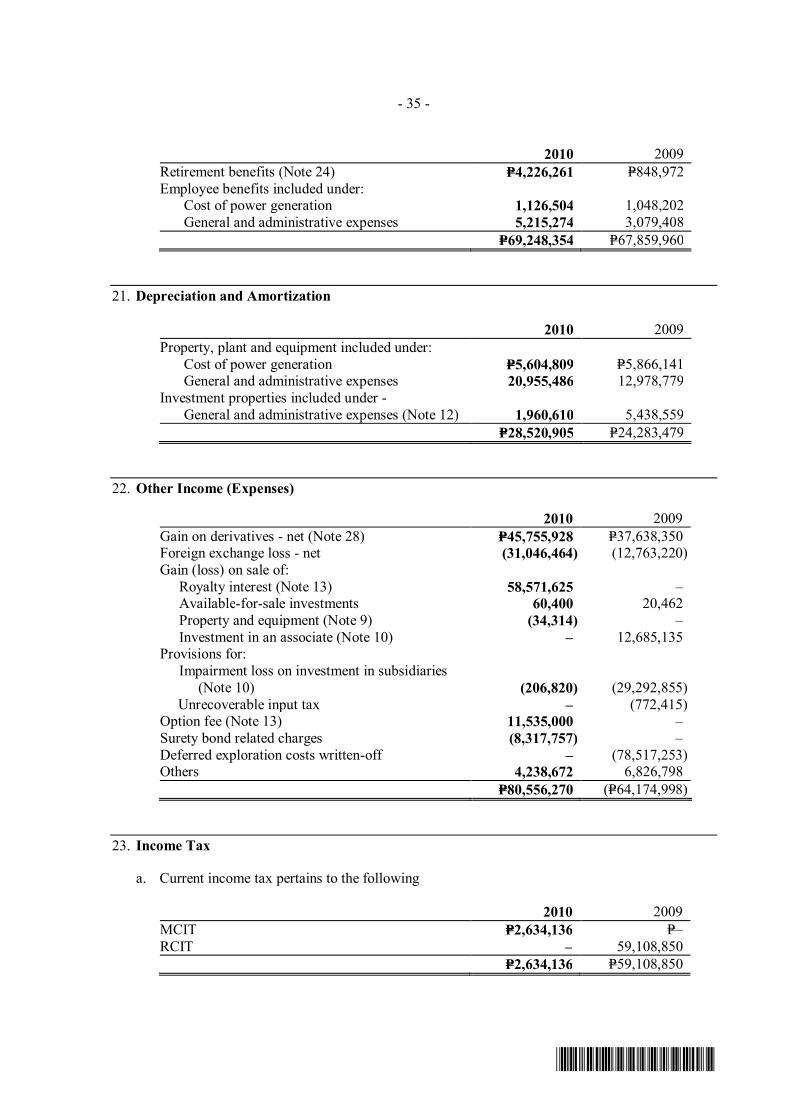
- 35 -
*SGVMC311706*
2010 2009 Retirement benefits (Note 24) P=4,226,261 P=848,972 Employee benefits included under: Cost of power generation 1,126,504 1,048,202 General and administrative expenses 5,215,274 3,079,408 P=69,248,354 P=67,859,960
21. Depreciation and Amortization
2010 2009 Property, plant and equipment included under: Cost of power generation P=5,604,809 P=5,866,141 General and administrative expenses 20,955,486 12,978,779 Investment properties included under - General and administrative expenses (Note 12) 1,960,610 5,438,559 P=28,520,905 P=24,283,479
22. Other Income (Expenses)
2010 2009 Gain on derivatives - net (Note 28) P=45,755,928 P=37,638,350 Foreign exchange loss - net (31,046,464) (12,763,220) Gain (loss) on sale of: Royalty interest (Note 13) 58,571,625 – Available-for-sale investments 60,400 20,462 Property and equipment (Note 9) (34,314) – Investment in an associate (Note 10) – 12,685,135 Provisions for: Impairment loss on investment in subsidiaries
(Note 10) (206,820) (29,292,855) Unrecoverable input tax – (772,415) Option fee (Note 13) 11,535,000 – Surety bond related charges (8,317,757) – Deferred exploration costs written-off – (78,517,253) Others 4,238,672 6,826,798 P=80,556,270 (P=64,174,998)
23. Income Tax
a. Current income tax pertains to the following 2010 2009 MCIT P=2,634,136 P=– RCIT – 59,108,850 P=2,634,136 P=59,108,850
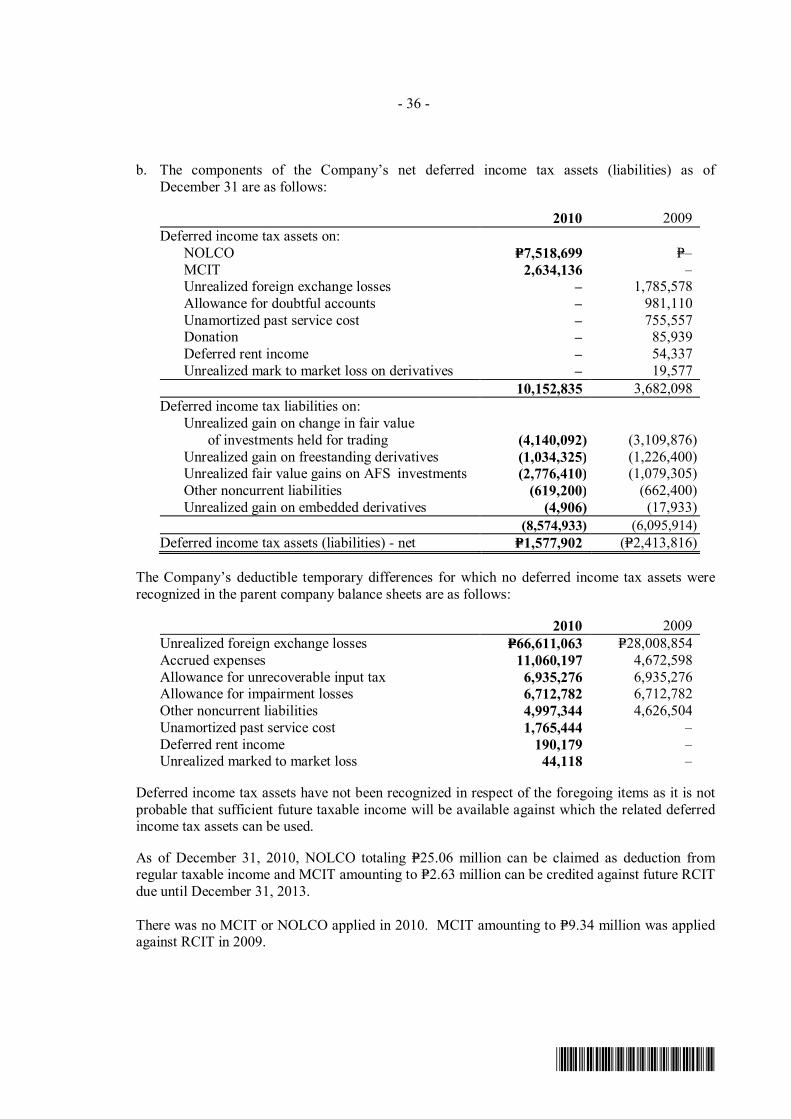
- 36 -
*SGVMC311706*
b. The components of the Company’s net deferred income tax assets (liabilities) as of December 31 are as follows:
2010 2009 Deferred income tax assets on: NOLCO P=7,518,699 P=– MCIT 2,634,136 – Unrealized foreign exchange losses – 1,785,578 Allowance for doubtful accounts – 981,110 Unamortized past service cost – 755,557 Donation – 85,939 Deferred rent income – 54,337 Unrealized mark to market loss on derivatives – 19,577 10,152,835 3,682,098 Deferred income tax liabilities on: Unrealized gain on change in fair value
of investments held for trading (4,140,092) (3,109,876) Unrealized gain on freestanding derivatives (1,034,325) (1,226,400) Unrealized fair value gains on AFS investments (2,776,410) (1,079,305) Other noncurrent liabilities (619,200) (662,400) Unrealized gain on embedded derivatives (4,906) (17,933) (8,574,933) (6,095,914) Deferred income tax assets (liabilities) - net P=1,577,902 (P=2,413,816)
The Company’s deductible temporary differences for which no deferred income tax assets were recognized in the parent company balance sheets are as follows:
2010 2009 Unrealized foreign exchange losses P=66,611,063 P=28,008,854 Accrued expenses 11,060,197 4,672,598 Allowance for unrecoverable input tax 6,935,276 6,935,276 Allowance for impairment losses 6,712,782 6,712,782 Other noncurrent liabilities 4,997,344 4,626,504 Unamortized past service cost 1,765,444 – Deferred rent income 190,179 – Unrealized marked to market loss 44,118 –
Deferred income tax assets have not been recognized in respect of the foregoing items as it is not probable that sufficient future taxable income will be available against which the related deferred income tax assets can be used.
As of December 31, 2010, NOLCO totaling P=25.06 million can be claimed as deduction from regular taxable income and MCIT amounting to P=2.63 million can be credited against future RCIT due until December 31, 2013. There was no MCIT or NOLCO applied in 2010. MCIT amounting to P=9.34 million was applied against RCIT in 2009.

- 37 -
*SGVMC311706*
The reconciliation between the effective income tax rates and the statutory income tax rate follows:
2010 2009 Applicable statutory income tax rate 30.00% 30.00% Increase (decrease) in tax rate resulting from: Changes in unrecognized deferred
income tax assets 143.10 (9.05) Interest income subjected to final tax (184.66) (3.37) Dividend income exempt from tax (33.71) (2.21) Others (3.14) 1.37 Effective income tax rates (48.41%) 16.74%
24. Pension and Other Post-employment Benefits
The Company has a funded, noncontributory defined benefit retirement plan covering all of its regular and full time employees.
Pension and other post-employment benefits consist of:
2010 2009 Pension liability P=988,400 P=576,200 Vacation and sick leave accrual 9,612,379 4,096,398 P=10,600,779 P=4,672,598
Employee benefits included under cost of power generation and general and administrative expenses consist of:
2010 2009 Net pension benefit expense P=3,130,200 P=486,400 Contributions to PHINMA and TA Power retirement
funds for common employees 1,096,061 362,572 Vacation and sick leave accrual 5,515,981 (1,024,380) P=9,742,242 (P=175,408)
The following tables summarize the components of pension expense included in the parent company statements of income and pension liability included under “Pension and other post-employment benefits” account in the parent company balance sheets, which are based on the latest actuarial valuation reports:
2010 2009 Components of provision for retirement benefits: Current service cost P=2,842,300 P=871,200 Interest cost 2,506,600 2,538,000 Expected return on plan assets (2,218,700) (2,269,900) Recognized actuarial gain – (652,900) 3,130,200 486,400 Adjustment for cross-assigned employees 1,096,061 362,572 Pension expense P=4,226,261 P=848,972
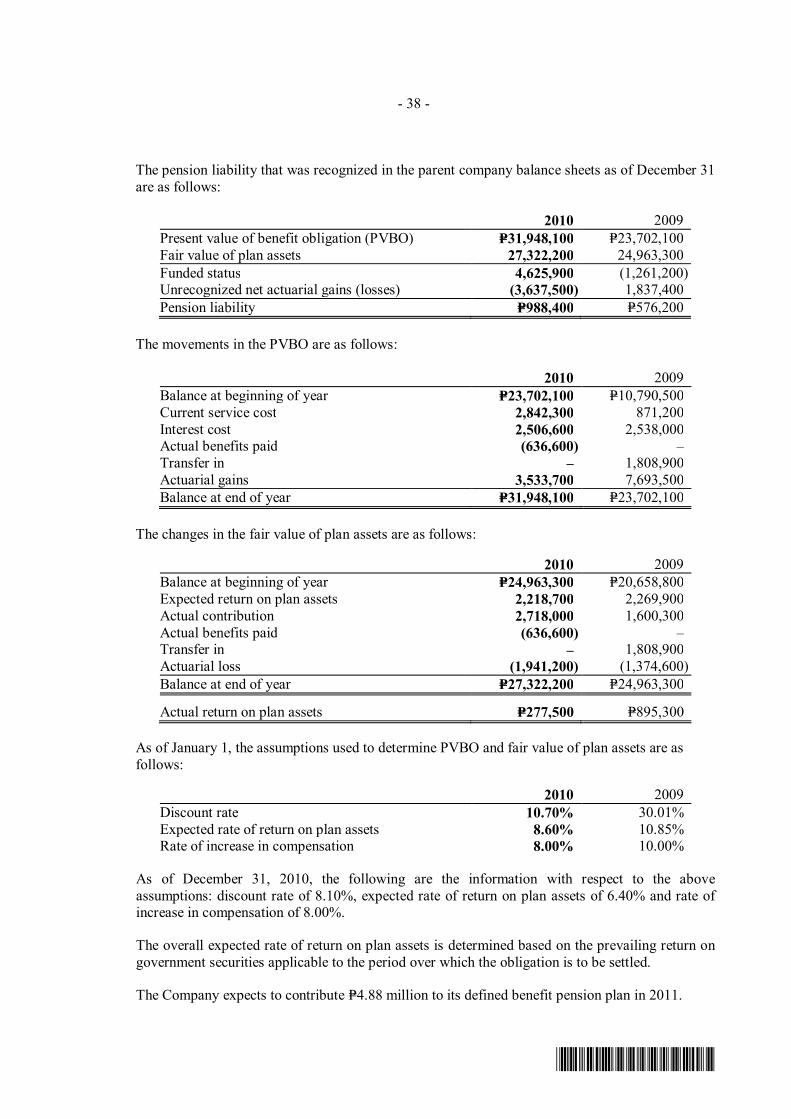
- 38 -
*SGVMC311706*
The pension liability that was recognized in the parent company balance sheets as of December 31 are as follows:
2010 2009 Present value of benefit obligation (PVBO) P=31,948,100 P=23,702,100 Fair value of plan assets 27,322,200 24,963,300 Funded status 4,625,900 (1,261,200) Unrecognized net actuarial gains (losses) (3,637,500) 1,837,400 Pension liability P=988,400 P=576,200
The movements in the PVBO are as follows:
2010 2009 Balance at beginning of year P=23,702,100 P=10,790,500 Current service cost 2,842,300 871,200 Interest cost 2,506,600 2,538,000 Actual benefits paid (636,600) – Transfer in – 1,808,900 Actuarial gains 3,533,700 7,693,500 Balance at end of year P=31,948,100 P=23,702,100
The changes in the fair value of plan assets are as follows:
2010 2009 Balance at beginning of year P=24,963,300 P=20,658,800 Expected return on plan assets 2,218,700 2,269,900 Actual contribution 2,718,000 1,600,300 Actual benefits paid (636,600) – Transfer in – 1,808,900 Actuarial loss (1,941,200) (1,374,600) Balance at end of year P=27,322,200 P=24,963,300
Actual return on plan assets P=277,500 P=895,300
As of January 1, the assumptions used to determine PVBO and fair value of plan assets are as follows:
2010 2009 Discount rate 10.70% 30.01% Expected rate of return on plan assets 8.60% 10.85% Rate of increase in compensation 8.00% 10.00%
As of December 31, 2010, the following are the information with respect to the above assumptions: discount rate of 8.10%, expected rate of return on plan assets of 6.40% and rate of increase in compensation of 8.00%.
The overall expected rate of return on plan assets is determined based on the prevailing return on government securities applicable to the period over which the obligation is to be settled.
The Company expects to contribute P=4.88 million to its defined benefit pension plan in 2011.
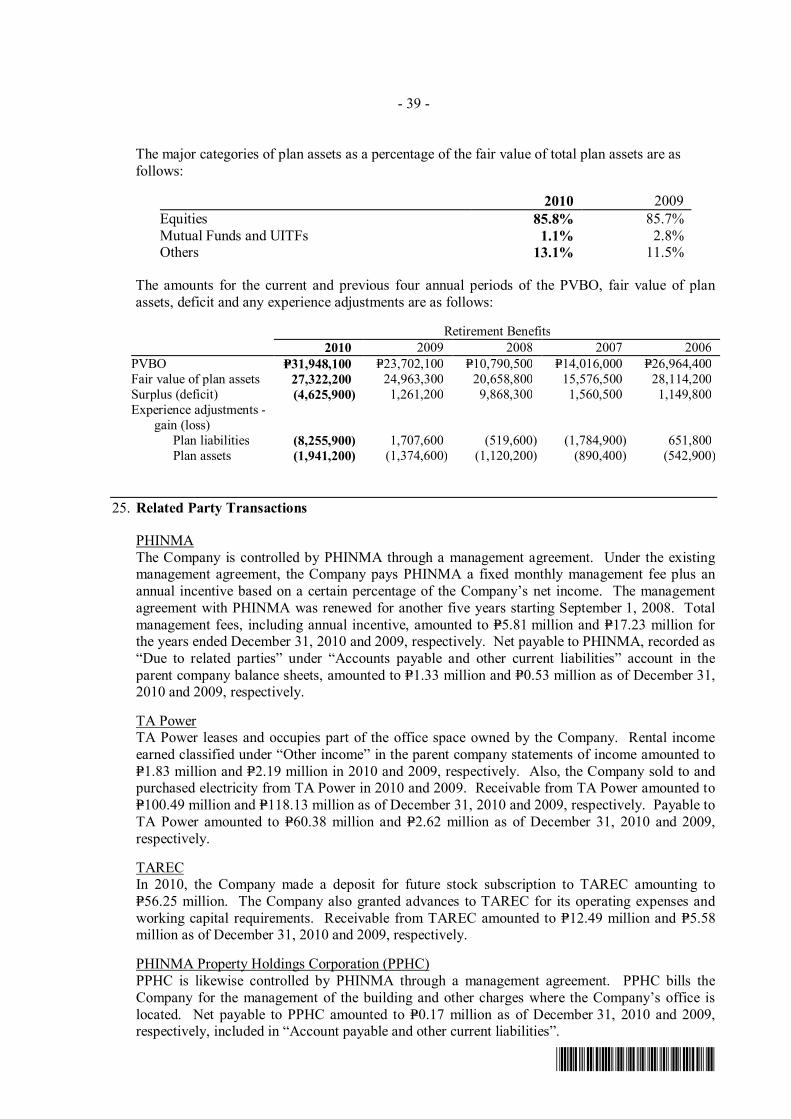
- 39 -
*SGVMC311706*
The major categories of plan assets as a percentage of the fair value of total plan assets are as follows:
2010 2009 Equities 85.8% 85.7% Mutual Funds and UITFs 1.1% 2.8% Others 13.1% 11.5%
The amounts for the current and previous four annual periods of the PVBO, fair value of plan assets, deficit and any experience adjustments are as follows:
Retirement Benefits 2010 2009 2008 2007 2006 PVBO P=31,948,100 P=23,702,100 P=10,790,500 P=14,016,000 P=26,964,400 Fair value of plan assets 27,322,200 24,963,300 20,658,800 15,576,500 28,114,200 Surplus (deficit) (4,625,900) 1,261,200 9,868,300 1,560,500 1,149,800 Experience adjustments -
gain (loss) Plan liabilities (8,255,900) 1,707,600 (519,600) (1,784,900) 651,800 Plan assets (1,941,200) (1,374,600) (1,120,200) (890,400) (542,900)
25. Related Party Transactions
PHINMA The Company is controlled by PHINMA through a management agreement. Under the existing management agreement, the Company pays PHINMA a fixed monthly management fee plus an annual incentive based on a certain percentage of the Company’s net income. The management agreement with PHINMA was renewed for another five years starting September 1, 2008. Total management fees, including annual incentive, amounted to P=5.81 million and P=17.23 million for the years ended December 31, 2010 and 2009, respectively. Net payable to PHINMA, recorded as “Due to related parties” under “Accounts payable and other current liabilities” account in the parent company balance sheets, amounted to P=1.33 million and P=0.53 million as of December 31, 2010 and 2009, respectively.
TA Power TA Power leases and occupies part of the office space owned by the Company. Rental income earned classified under “Other income” in the parent company statements of income amounted to P=1.83 million and P=2.19 million in 2010 and 2009, respectively. Also, the Company sold to and purchased electricity from TA Power in 2010 and 2009. Receivable from TA Power amounted to P=100.49 million and P=118.13 million as of December 31, 2010 and 2009, respectively. Payable to TA Power amounted to P=60.38 million and P=2.62 million as of December 31, 2010 and 2009, respectively. TAREC In 2010, the Company made a deposit for future stock subscription to TAREC amounting to P=56.25 million. The Company also granted advances to TAREC for its operating expenses and working capital requirements. Receivable from TAREC amounted to P=12.49 million and P=5.58 million as of December 31, 2010 and 2009, respectively. PHINMA Property Holdings Corporation (PPHC) PPHC is likewise controlled by PHINMA through a management agreement. PPHC bills the Company for the management of the building and other charges where the Company’s office is located. Net payable to PPHC amounted to P=0.17 million as of December 31, 2010 and 2009, respectively, included in “Account payable and other current liabilities”.
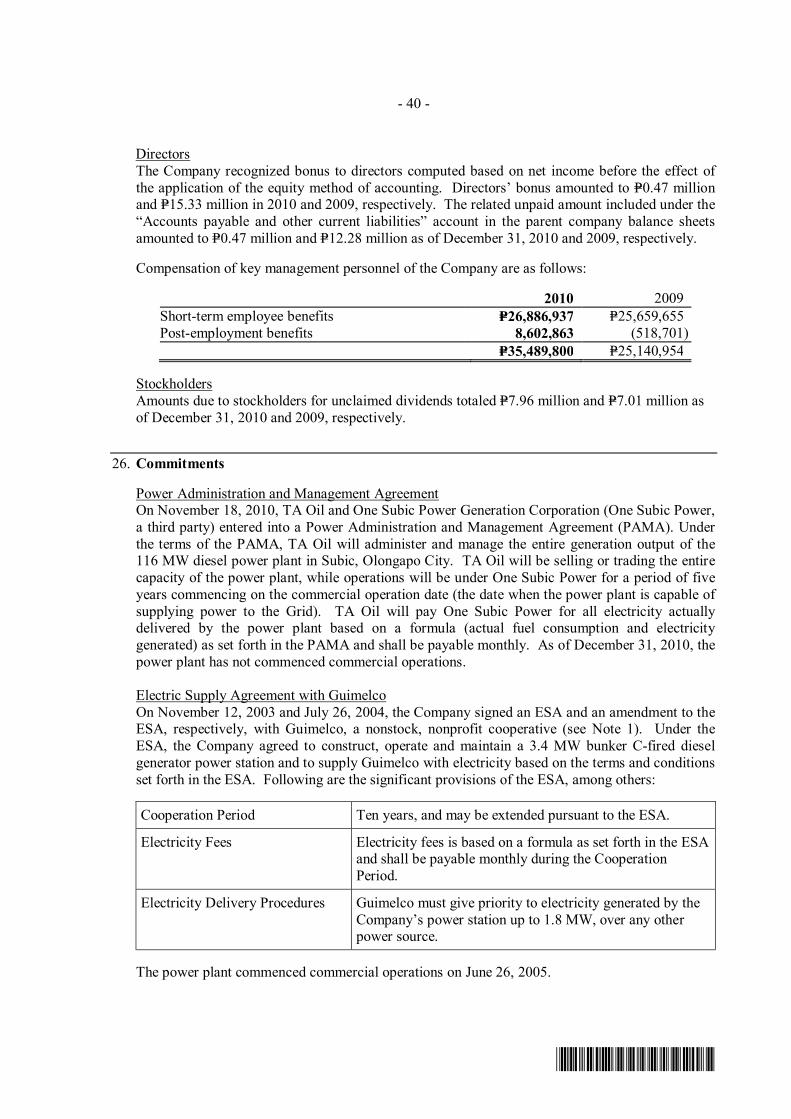
- 40 -
*SGVMC311706*
Directors The Company recognized bonus to directors computed based on net income before the effect of the application of the equity method of accounting. Directors’ bonus amounted to P=0.47 million and P=15.33 million in 2010 and 2009, respectively. The related unpaid amount included under the “Accounts payable and other current liabilities” account in the parent company balance sheets amounted to P=0.47 million and P=12.28 million as of December 31, 2010 and 2009, respectively. Compensation of key management personnel of the Company are as follows:
2010 2009 Short-term employee benefits P=26,886,937 P=25,659,655 Post-employment benefits 8,602,863 (518,701) P=35,489,800 P=25,140,954
Stockholders Amounts due to stockholders for unclaimed dividends totaled P=7.96 million and P=7.01 million as of December 31, 2010 and 2009, respectively.
26. Commitments
Power Administration and Management Agreement On November 18, 2010, TA Oil and One Subic Power Generation Corporation (One Subic Power, a third party) entered into a Power Administration and Management Agreement (PAMA). Under the terms of the PAMA, TA Oil will administer and manage the entire generation output of the 116 MW diesel power plant in Subic, Olongapo City. TA Oil will be selling or trading the entire capacity of the power plant, while operations will be under One Subic Power for a period of five years commencing on the commercial operation date (the date when the power plant is capable of supplying power to the Grid). TA Oil will pay One Subic Power for all electricity actually delivered by the power plant based on a formula (actual fuel consumption and electricity generated) as set forth in the PAMA and shall be payable monthly. As of December 31, 2010, the power plant has not commenced commercial operations. Electric Supply Agreement with Guimelco On November 12, 2003 and July 26, 2004, the Company signed an ESA and an amendment to the ESA, respectively, with Guimelco, a nonstock, nonprofit cooperative (see Note 1). Under the ESA, the Company agreed to construct, operate and maintain a 3.4 MW bunker C-fired diesel generator power station and to supply Guimelco with electricity based on the terms and conditions set forth in the ESA. Following are the significant provisions of the ESA, among others:
Cooperation Period Ten years, and may be extended pursuant to the ESA.
Electricity Fees Electricity fees is based on a formula as set forth in the ESA and shall be payable monthly during the Cooperation Period.
Electricity Delivery Procedures Guimelco must give priority to electricity generated by the Company’s power station up to 1.8 MW, over any other power source.
The power plant commenced commercial operations on June 26, 2005.

- 41 -
*SGVMC311706*
Electricity Supply Agreements with Holcim TA Oil, TA Power and Holcim entered into a memorandum of agreement (as amended on January 12, 2010 and December 20, 2010) with the following provisions: • TA Power shall supply exclusively the electricity requirements of the Bulacan plant of Holcim
at rates equal to the agreed “Time of Use” rates schedule plus all other charges and applying such adjustments approved and in the manner prescribed by the ERC.
• TA Oil, acting as a retail electricity supplier, shall exclusively supply all the electricity
requirements of Holcim’s cement plant in La Union until 2013. TA Oil shall charge Holcim at rates equal to the agreed “Time of Use” schedule plus all other charges and applying such adjustments approved and in the manner prescribed by the ERC. Transmission charges shall be settled separately by Holcim with the National Transmission Corporation under Holcim’s Transmission Services Agreement.
• TA Oil and TA Power guarantee to cover all of Holcim’s electricity requirements for both the
La Union and Bulacan plants until 2013. Operating Lease Commitment The Company has entered into a lease contract with Guimelco for a parcel of land used only as site for electric generating plant and facilities. The term of the lease is 10 years with a renewal option included in the contract. The Company is given the first option to buy the property if the lessor decides to sell the land. The lease is at a fixed monthly rate of P=20,000 for the duration of the lease term. Starting July 2009, the fixed monthly rate was increased to P=40,000. Future minimum operating lease payables under this lease agreement as of December 31 are as follows:
2010 2009 Within one year P=480,000 P=480,000 After one year but not more than five years 1,600,000 2,080,000 P=2,080,000 P=2,560,000
Electricity Power Industry Reform Act Republic Act No. 9136, the EPIRA, and the covering Implementing Rules and Regulations (IRR) provide for significant changes in the power sector, which include among others: 1) The unbundling of the generation, transmission, distribution and supply, and other disposable
assets of the Company, including its contracts with independent power producers, and electricity rates;
2) Creation of a WESM; and 3) Open and non-discriminatory access to transmission and distribution systems. The law also requires public listing of not less than 15% of common shares of generation and distribution companies within five years from the effectivity of the EPIRA. It provides cross ownership restrictions between transmission and generation companies and between transmission and distribution companies, and a cap of 50% of its demand that a distribution utility is allowed to source from an associated company engaged in generation except for contracts entered into prior to the effectivity of the EPIRA. There are also certain sections of the EPIRA, specifically relating to generation companies, which provide for a cap on the concentration of ownership to only 30% of the installed capacity of the grid and/or 25% of the national installed generating capacity.

- 42 -
*SGVMC311706*
The Company believes that it is in compliance with the applicable provisions of the EPIRA and its IRR.
Renewable Service Contracts In October 2009, TAREC was awarded 10 wind energy service contracts by the DOE, representing a total potential wind capacity of 227MW. In February 2010, another 10 service contracts representing an additional 123MW of potential wind capacity were again awarded to TAREC by the DOE thus bringing its total potential wind capacity to 350MW as of December 31, 2010.
Renewable Energy Act of 2008 On January 30, 2009, R.A. No. 9513, An Act Promoting the Development, Utilization and Commercialization of Renewable Energy Resources and for Other Purposes, which shall be known as the “Renewable Energy Act of 2008” (the Act), became effective. The Act aims to: (1) Accelerate the exploration and development of RE resources such as, but not limited to,
biomass, solar, wind, hydro, geothermal and ocean energy sources, including hybrid systems, to achieve energy self-reliance, through the adoption of sustainable energy development strategies to reduce the country’s dependence on fossil fuels and thereby minimize the country’s exposure to price fluctuations in the international markets, the effects of which spiral down to almost all sectors of the economy;
(2) Increase the utilization of RE by institutionalizing the development of national and local capabilities in the use of RE systems, and promoting its efficient and cost-effective commercial application by providing fiscal and non-fiscal incentives;
(3) Encourage the development and utilization of RE resources as tools to effectively prevent or reduce harmful emissions and thereby balance the goals of economic growth and development with the protection of health and environment; and
(4) Establish the necessary infrastructure and mechanism to carry out mandates specified in the Act and other laws.
As provided for in the Act, RE developers of RE facilities, including hybrid systems, in proportion to and to the extent of the RE component, for both power and non-power applications, as duly certified by the DOE, in consultation with the Board of Investments, shall be entitled to incentives, such as, income tax holiday, duty-free importation of RE machinery, equipment and materials, zero percent VAT rate on sale of power from RE sources, and tax exemption of carbon credits, among others. The Company expects that the Act may have significant effect on the operating results of TAREC, an RE developer. Impact on the operating results is expected to arise from the effective reduction in taxes.
27. Financial Risk Management Objectives and Policies
Objectives and Investment Policies The PHINMA Group Treasury manages the funds of the Company and invests in short-term deposits, marketable instruments, corporate promissory notes and bonds, government bonds, listed shares of stocks, and mutual and trust funds denominated in Philippine peso, U.S. dollar and Euro. It is responsible for the sound and prudent management of the Company’s financial assets that finance the Company’s operations and investments in enterprises.
- 43 -
*SGVMC311706*
PHINMA Group Treasury focuses on the following major risks that may affect its transactions: • Foreign currency risk • Credit or counterparty risk • Liquidity risk • Market risk
Professional competence, prudence, clear and strong separation of office functions, due diligence and use of risk management tools are exercised at all times in the handling of the funds of the Company. An Investment Committee, comprised of some of the Company’s BOD, reviews and approves policies, controls and strategies for investments and risk management.
Basic investment policies as approved by the Investment Committee are: • Safety of principal • Duration of investment must be consistent with the respective company’s investment horizon
based on needs as approved by the Investment Committee • Exposure limits:
• For banks or fund managers: maximum 20% of total fund of each company per bank or fund
• For peso investments: minimal corporate exposure except for registered bonds for non-affiliates
• Limits on third currencies outside U.S. dollar, equities and offshore investments are set regularly and reviewed at least once a year by the Investment Committee
• For total foreign currencies: maximum 50% of total portfolio • For investments in equities whether directly managed or managed by professional fund
managers: limits are set as approved by the Investment Committee and based on current market outlook at the time of review
Risk Management Process Foreign currency risk The PHINMA Group Treasury manages holdings of cash and securities not only in Philippine peso but also in U.S. dollar and other foreign currencies. Any depreciation of the U.S. dollar and other currencies against the Philippine peso posts material foreign exchange losses that will diminish the market values of these investments.
Foreign currency risk is managed through: • Continual monitoring of global and domestic political and economic environments that have
impact on foreign exchange. • Regular discussions with banks are done to get multiple perspectives on currency
trends/forecasts. • Trading either by spot conversions and forward transactions on a deliverable or non-
deliverable basis to protect values. • Constant updating of the foreign currency holdings gains and losses to ensure prompt
decisions if the need arises. • Returns are also calibrated on a per currency basis to account for the perceived risks with
higher returns expected from weaker currencies.
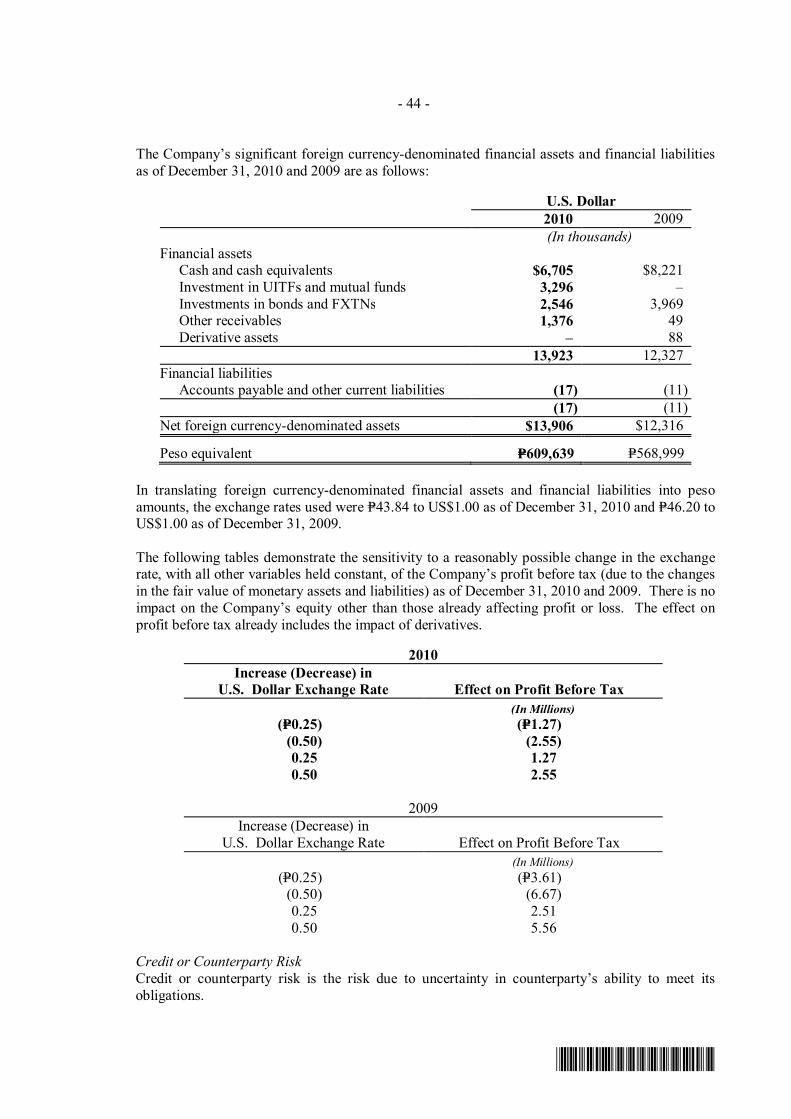
- 44 -
*SGVMC311706*
The Company’s significant foreign currency-denominated financial assets and financial liabilities as of December 31, 2010 and 2009 are as follows:
U.S. Dollar 2010 2009 (In thousands) Financial assets Cash and cash equivalents $6,705 $8,221 Investment in UITFs and mutual funds 3,296 – Investments in bonds and FXTNs 2,546 3,969 Other receivables 1,376 49 Derivative assets – 88 13,923 12,327 Financial liabilities Accounts payable and other current liabilities (17) (11) (17) (11) Net foreign currency-denominated assets $13,906 $12,316
Peso equivalent P=609,639 P=568,999 In translating foreign currency-denominated financial assets and financial liabilities into peso amounts, the exchange rates used were P=43.84 to US$1.00 as of December 31, 2010 and P=46.20 to US$1.00 as of December 31, 2009. The following tables demonstrate the sensitivity to a reasonably possible change in the exchange rate, with all other variables held constant, of the Company’s profit before tax (due to the changes in the fair value of monetary assets and liabilities) as of December 31, 2010 and 2009. There is no impact on the Company’s equity other than those already affecting profit or loss. The effect on profit before tax already includes the impact of derivatives.
2010
Increase (Decrease) in U.S. Dollar Exchange Rate Effect on Profit Before Tax
(In Millions) (P=0.25) (P=1.27)
(0.50) (2.55) 0.25 1.27 0.50 2.55
2009
Increase (Decrease) in U.S. Dollar Exchange Rate Effect on Profit Before Tax
(In Millions) (P=0.25) (P=3.61)
(0.50) (6.67) 0.25 2.51 0.50 5.56
Credit or Counterparty Risk Credit or counterparty risk is the risk due to uncertainty in counterparty’s ability to meet its obligations.

- 45 -
*SGVMC311706*
Credit or counterparty risk is managed through: • Investments are coursed thru or transacted with duly accredited domestic and foreign banks
and mutual funds up to a maximum of 20% of the Company’s investible funds. For UITF and mutual funds, fund placements cannot exceed 10% of the UITF’s or mutual funds’ total funds. Individual limits are further established for one bank or mutual fund on the basis of their valuation, financial soundness, business performance and reputation or expertise. Banks’, UITF’s and mutual funds’ performance as well as their fund level, investment mix and duration are reviewed at least once a month or as often as required.
• Investments in nonrated securities are subject to a comprehensive credit and business review in coordination with sponsoring dealers or underwriters. For rated corporate bonds and sovereign bonds, credit ratings studies and updates from the major rating agencies are used as references (S & P, Moody’s) in addition to a comprehensive credit and business review.
• For temporary investments in related parties, transactions are done on an arms-length basis taking into account the related parties’ financial standing and ability to pay. Interest rates are based on a formula that considers the average of the borrowing and lending rates of the parties and maturity dates are strictly complied with.
• Discussions are done on every major investment by Treasury en banc before it is executed subject to the Chief Financial Officer (CFO) approval. Exposure limits are tracked for every transaction and a senior Treasury Officer supervises major transaction executions.
• Market and portfolio reviews are done at least once a week and as often as necessary should market conditions require. Monthly reports are given to the CFO with updates in between these reports as needed.
• A custodian bank for peso instruments and foreign currency instruments has been appointed based on its track record on such service and the bank’s financial competence.
• Product manuals on new products are studied and reviewed to ensure that risks are identified and addressed prior to the endorsement of the new product for Investment Committee approval.
With respect to credit risk arising from the receivables of the Company, the Company’s exposures arise from default of the counterparty, with a maximum exposure equal to the carrying amount of these instruments.
2010
Neither Past Due nor Impaired Past Due
but not Past Due
Individually Class A Class B Class C Impaired Impaired Total (In Thousands) Trade and other receivables Trade receivables from customers: Holcim P=22,980 P=– P=– P=4,106 P=– P=27,086 Guimelco 9,961 – – – – 9,961 PEMC 43,637 – – – – 43,637 Due from related companies 170,811 – – – – 170,811 Others 66,654 – – – 3,270 69,924 P=314,043 P=– P=– P=4,106 P=3,270 P=321,419
2009
Neither Past Due nor Impaired Past Due
but not Past Due
Individually Class A Class B Class C Impaired Impaired Total (In Thousands) Trade and other receivables Trade receivables from customers: Holcim P=36,758 P=– P=– P=– P=– P=36,758 Guimelco 11,288 – – 2,488 – 13,776 PEMC 5,329 – – – – 5,329 Due from related companies 123,891 – – – – 123,891 Others 35,303 – – – 3,270 38,573 P=212,569 P=– P=– P=2,488 P=3,270 P=218,327
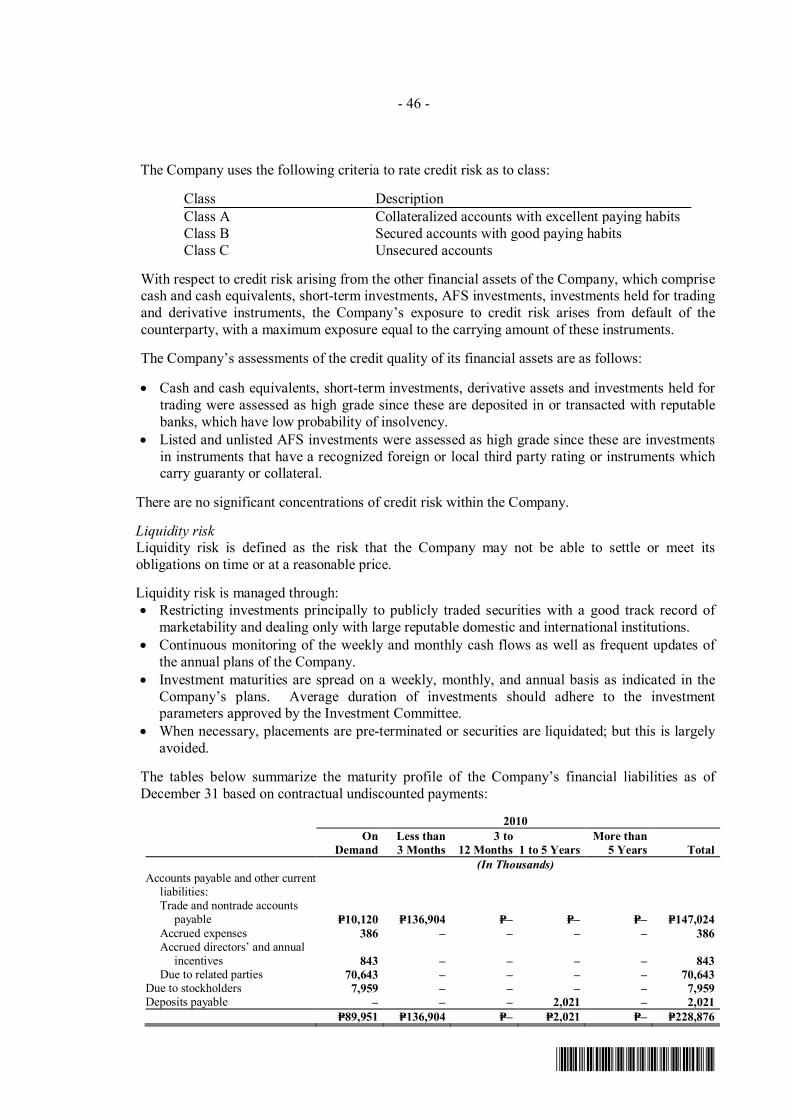
- 46 -
*SGVMC311706*
The Company uses the following criteria to rate credit risk as to class:
Class Description Class A Collateralized accounts with excellent paying habits Class B Secured accounts with good paying habits Class C Unsecured accounts
With respect to credit risk arising from the other financial assets of the Company, which comprise cash and cash equivalents, short-term investments, AFS investments, investments held for trading and derivative instruments, the Company’s exposure to credit risk arises from default of the counterparty, with a maximum exposure equal to the carrying amount of these instruments.
The Company’s assessments of the credit quality of its financial assets are as follows: • Cash and cash equivalents, short-term investments, derivative assets and investments held for
trading were assessed as high grade since these are deposited in or transacted with reputable banks, which have low probability of insolvency.
• Listed and unlisted AFS investments were assessed as high grade since these are investments in instruments that have a recognized foreign or local third party rating or instruments which carry guaranty or collateral.
There are no significant concentrations of credit risk within the Company.
Liquidity risk Liquidity risk is defined as the risk that the Company may not be able to settle or meet its obligations on time or at a reasonable price.
Liquidity risk is managed through:
• Restricting investments principally to publicly traded securities with a good track record of marketability and dealing only with large reputable domestic and international institutions.
• Continuous monitoring of the weekly and monthly cash flows as well as frequent updates of the annual plans of the Company.
• Investment maturities are spread on a weekly, monthly, and annual basis as indicated in the Company’s plans. Average duration of investments should adhere to the investment parameters approved by the Investment Committee.
• When necessary, placements are pre-terminated or securities are liquidated; but this is largely avoided.
The tables below summarize the maturity profile of the Company’s financial liabilities as of December 31 based on contractual undiscounted payments:
2010
On
Demand Less than 3 Months
3 to 12 Months 1 to 5 Years
More than 5 Years Total
(In Thousands) Accounts payable and other current
liabilities: Trade and nontrade accounts
payable P=10,120 P=136,904 P=– P=– P=– P=147,024 Accrued expenses 386 – – – – 386 Accrued directors’ and annual
incentives 843 – – – – 843 Due to related parties 70,643 – – – – 70,643 Due to stockholders 7,959 – – – – 7,959 Deposits payable – – – 2,021 – 2,021 P=89,951 P=136,904 P=– P=2,021 P=– P=228,876

- 47 -
*SGVMC311706*
2009
On Demand Less than 3 Months
3 to 12 Months 1 to 5 Years
More than 5 Years Total
(In Thousands) Accounts payable and other current
liabilities: Trade and nontrade accounts
payable P=15,623 P=72,933 P=– P=– P=– P=88,556 Accrued expenses 10,672 – – – – 10,672 Accrued directors’ and annual
incentives 22,706 – – – – 22,706 Due to related parties 8,468 – – – – 8,468 Due to stockholders 7,008 – – – – 7,008 Deposits payable – – – 3,219 – 3,219 P=64,477 P=72,933 P=– P=3,219 P=– P=140,629
As of December 31, the profile of financial assets used to manage the Company’s liquidity risk is as follows: 2010
On
Demand Less than 3 Months
3 to 12 Months 1 to 5 Years Total
(In Thousands) Cash and cash equivalents P=837,569 P=– P=– P=– P=837,569 Receivables: Trade 4,106 76,578 – – 80,684 Due from related companies 170,811 – – – 170,811 Others 3,270 66,654 – – 69,924 Financial assets at FVPL Investments held for trading 808,972 – – – 808,972 Derivative assets – 3,464 – – 3,464 P=1,824,728 P=146,696 P=– P=– P=1,971,424
2009
On Demand Less than 3 Months
3 to 12 Months 1 to 5 Years Total
(In Thousands) Cash and cash equivalents P=940,377 P=– P=– P=– P=940,377 Short-term investments – – 5,000 – 5,000 Receivables: Trade 2,488 53,375 – – 55,863 Due from related companies 123,891 – – – 123,891 Others 3,270 14,378 20,925 127,575 166,148 Financial assets at FVPL Investments held for trading 792,053 – – – 792,053 Derivative assets – 4,148 – – 4,148 P=1,862,079 P=71,901 P=25,925 P=127,575 P=2,087,480
Market risk Market risk is the risk that the value of an investment will decrease due to drastic adverse market movements that consist of interest rate fluctuations affecting bid values or fluctuations in stock market valuation due to gyrations in offshore equity markets or business and economic changes. Interest rate, foreign exchange rates and risk appetite are factors of a market risk as the summation of the three defines the value of an instrument or a financial asset.
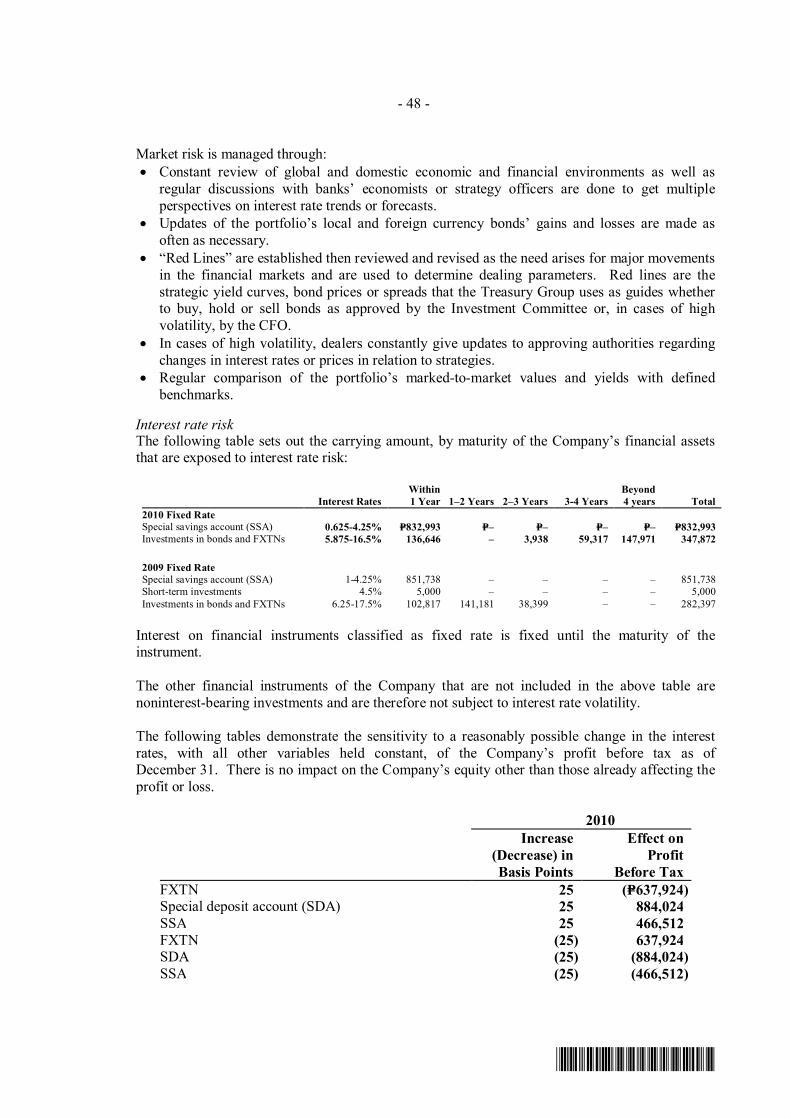
- 48 -
*SGVMC311706*
Market risk is managed through: • Constant review of global and domestic economic and financial environments as well as
regular discussions with banks’ economists or strategy officers are done to get multiple perspectives on interest rate trends or forecasts.
• Updates of the portfolio’s local and foreign currency bonds’ gains and losses are made as often as necessary.
• “Red Lines” are established then reviewed and revised as the need arises for major movements in the financial markets and are used to determine dealing parameters. Red lines are the strategic yield curves, bond prices or spreads that the Treasury Group uses as guides whether to buy, hold or sell bonds as approved by the Investment Committee or, in cases of high volatility, by the CFO.
• In cases of high volatility, dealers constantly give updates to approving authorities regarding changes in interest rates or prices in relation to strategies.
• Regular comparison of the portfolio’s marked-to-market values and yields with defined benchmarks.
Interest rate risk
The following table sets out the carrying amount, by maturity of the Company’s financial assets that are exposed to interest rate risk:
Interest Rates Within 1 Year 1–2 Years 2–3 Years 3-4 Years
Beyond 4 years Total
2010 Fixed Rate Special savings account (SSA) 0.625-4.25% P=832,993 P=– P=– P=– P=– P=832,993 Investments in bonds and FXTNs 5.875-16.5% 136,646 – 3,938 59,317 147,971 347,872
2009 Fixed Rate Special savings account (SSA) 1-4.25% 851,738 – – – – 851,738 Short-term investments 4.5% 5,000 – – – – 5,000 Investments in bonds and FXTNs 6.25-17.5% 102,817 141,181 38,399 – – 282,397
Interest on financial instruments classified as fixed rate is fixed until the maturity of the instrument. The other financial instruments of the Company that are not included in the above table are noninterest-bearing investments and are therefore not subject to interest rate volatility.
The following tables demonstrate the sensitivity to a reasonably possible change in the interest rates, with all other variables held constant, of the Company’s profit before tax as of December 31. There is no impact on the Company’s equity other than those already affecting the profit or loss.
2010
Increase (Decrease) in Basis Points
Effect on Profit
Before Tax FXTN 25 (P=637,924) Special deposit account (SDA) 25 884,024 SSA 25 466,512 FXTN (25) 637,924 SDA (25) (884,024) SSA (25) (466,512)

- 49 -
*SGVMC311706*
2009
Increase (Decrease) in Basis Points
Effect on Profit
Before Tax FXTN 25 (P=633,801) Special deposit account (SDA) 25 243,713 SSA 25 950,096 FXTN (25) 633,801 SDA (25) (243,713) SSA (25) (950,096)
Equity price risk
Equity price risk is the risk to earnings or capital arising from changes in stock exchange indices relating to its quoted equity securities. The Company’s exposure to equity price risk relates primarily to its AFS investments. The Company’s policy is to maintain the risk to an acceptable level. Movement of share price is monitored regularly to determine the impact on its financial position. Based on the Company’s expectation, the Company’s assessment of reasonably possible change was determined to be an increase of 7% and 10% in 2010 and 2009, respectively, resulting to a possible effect in the equity of P=3.00 million and P=4.15 million as of December 31, 2010 and 2009, respectively.
Monitoring of Risk Management Process Risk management is regarded as a core competency, thus review of processes and approval processes including periodic audit are practiced and observed as follows: • Weekly Treasury meetings are scheduled where approved strategies, limits, mixes are
challenged and rechallenged based on current and forecasted developments on the financial and political events.
• Monthly portfolio reports are submitted to the CFO that include an updated summary of global and domestic events of the past month and the balance of the year.
• Quarterly presentation of the investment portfolio to the Investment Committee to discuss and secure approvals on strategy changes.
• Annual team-building sessions are organized as a venue for the review of personal goals, corporate goals and professional development.
• One on one coaching sessions are scheduled to assist, train and advise personnel. • Periodic review of Treasury risk profile and control procedures. • Periodic specialized audit to ensure active risk oversight. Capital management The primary objective of the Company’s capital management is to ensure that it maintains a strong credit rating and healthy capital ratios in order to support its business and maximize shareholder value.
The Company manages its capital structure and makes adjustments to it, in light of changes in economic conditions. To maintain or adjust the capital structure, the Company may adjust the dividend payment to shareholders, return capital to shareholders or issue new shares. No changes were made in the objectives, policies or processes during the years ended December 31, 2010 and 2009.

- 50 -
*SGVMC311706*
The Company monitors capital using the debt-to-equity ratio, which is total current and noncurrent liabilities divided by total equity. The Company monitors its debt-to-equity ratio to keep it at a level acceptable to the Company. Capital includes all the items appearing in the equity section of the parent company balance sheet. The Company’s policy is to keep debt-to-equity ratio below the maximum ratio of 2:1.
2010 2009 (In Thousands)
Total liabilities P=249,926 P=212,318 Total equity 2,750,595 2,786,182 Debt-to-equity ratio 0.09:1 0.08:1
28. Financial Assets and Financial Liabilities
Fair Value Set out below is a comparison by category of carrying amounts and fair values of all of the Company’s financial assets and financial liabilities that are carried in the parent company financial statements.
Carrying Value Fair Value 2010 2009 2010 2009 Financial Assets Loans and receivables: Cash and cash equivalents P=837,569,060 P=940,376,956 P=837,569,060 P=940,376,956 Short-term investments – 5,000,000 – 5,000,000 Receivables: Trade 80,683,848 55,863,120 80,683,848 55,863,120 Due from related companies 170,810,829 123,891,193 170,810,829 123,891,193 Others 66,653,446 166,148,191 66,653,446 166,148,191 1,155,717,183 1,291,279,460 1,155,717,183 1,291,279,460 Financial assets at FVPL: Investments held for trading 808,971,840 792,052,837 808,971,840 792,052,837 Derivative assets* 3,464,104 4,147,776 3,464,104 4,147,776 812,435,944 796,200,613 812,435,944 796,200,613 AFS investments: Quoted 126,131,350 103,540,631 126,131,350 103,540,631 Unquoted 71,917,220 71,917,219 71,917,220 71,917,219 198,048,570 175,457,850 198,048,570 175,457,850 Total financial assets P=2,166,201,697 P=2,262,937,923 P=2,166,201,697 P=2,262,937,923
Financial Liabilities Accounts payable and other
current liabilities** P=220,292,010 P=130,401,751 P=220,292,010 P=130,401,751 Due to stockholders 7,959,007 7,007,740 7,959,007 7,007,740 Deposits payable 2,021,377 3,219,257 1,887,586 2,733,332 Total financial liabilities P=230,272,394 P=140,628,748 P=230,138,603 P=140,142,823 ** Presented as part of other current assets. ** Excludes nonfinancial items amounting to P=0.19 million and P=20.26 million in 2010 and 2009, respectively.

- 51 -
*SGVMC311706*
The following methods and assumptions are used to estimate the fair values of each class of financial instruments: Cash and cash equivalents, short-term investments, receivables, accounts payable and other current liabilities, due to stockholders The carrying amounts of cash and cash equivalents, short-term investments, receivables, accounts payable and other current liabilities and due to stockholders approximate their fair values due to the relatively short-term maturities of these financial instruments. The carrying amount of the noncurrent receivable from Phoenix approximates its fair value since its interest rate is based on prevailing market rates.
Investments held for trading and AFS investments
Quoted market prices have been used to determine the fair values of investments held for trading and quoted AFS investments. The fair values of unquoted AFS investments are based on cost since the fair values are not readily determinable. The Company does not intend to dispose the unlisted AFS investments in the near future. The fair value of derivative assets of freestanding forward currency transactions is calculated by reference to current forward exchange rates for contracts with similar maturity profiles. Deposits payable The fair value of the Company’s long-term payable to a third party is based on the discounted value of the expected future cash flow using applicable interest rate for similar type of instrument. Discount rate used was 3.48% in 2010 and 5.61% in 2009. Fair Value Hierarchy As of December 31, the fair value measurement of the Company’s financial assets carried at fair value are categorized as follows (in thousands):
2010 Level 1 Level 2 Total Investments held for trading P=461,100 P=347,872 P=808,972 AFS investments 126,131 – 126,131 Derivative asset – 3,464 3,464 Total financial assets P=587,231 P=351,336 P=938,567
2009 Level 1 Level 2 Total Investments held for trading P=509,656 P=282,397 P=792,053 AFS investments 103,541 – 103,541 Derivative asset – 4,148 4,148 Total financial assets P=613,197 P=286,545 P=899,742

- 52 -
*SGVMC311706*
The Company uses the following hierarchy for determining and disclosing the fair value of financial instruments by valuation technique: Level 1: quoted prices in active markets for identical assets or liabilities Level 2: inputs other than quoted prices included within level 1 that are observable for the asset or
liability, either directly (i.e., as prices) or indirectly (i.e., derived from prices) Level 3: inputs for the asset or liability that are not based on observable market data
(unobservable inputs)
The Company has no financial instruments measured at fair value using the level 3 hierarchy. Also, there were no transfers between level 1 and level 2 fair value measurements as of December 31, 2010 and 2009. Derivative Assets Currency forwards The Company enters into sell US$, buy peso foreign currency forward contracts to manage the foreign currency risk arising from its US$ denominated assets. These currency forwards are not accounted for as accounting hedges. The Company has outstanding currency forward contracts with an aggregate notional amount of US$7.45 million and weighted average contracted forward rate of P=44.324 to US$1.00 as of December 31, 2010, and an aggregate notional amount of US$3.00 million and weighted average contracted forward rate of P=47.573 to US$1.00 as of December 31, 2009. The net fair value of these currency forward contracts amounted to P=3.44 million gain and P=4.09 million gain as of December 31, 2010 and 2009, respectively. Embedded derivatives The Company has bifurcated embedded derivatives from its fuel purchase contracts. The purchases are denominated in U.S. dollar but the Company agreed to pay in Philippine peso using the average daily Philippine Dealing System weighted average rate of the month prior to the month of billing.
As of December 31, 2010 and 2009, the Company’s outstanding embedded forwards have an aggregate notional amount of US$0.05 million and US$0.06 million, respectively. The weighted average fixing rate amounted to P=45.44 to US$1.00 and P=47.01 to US$1.00 as of December 31, 2010 and 2009, respectively. The net fair value of these embedded derivatives amounted to P=0.02 million and P=0.06 million gain as of December 31, 2010 and 2009, respectively. The net movements in fair value changes of the Company’s derivative instruments (both freestanding and embedded derivatives) are as follows:
2010 2009 Balance at beginning of year P=4,147,776 (P=10,747,724) Net changes in fair value during the year 45,755,928 37,638,350 Fair value of settled contracts (46,439,600) (22,742,850) Balance at end of year P=3,464,104 P=4,147,776
The net changes in fair value during the year are included in the “Other income (expenses”) account in the parent company statements of income.
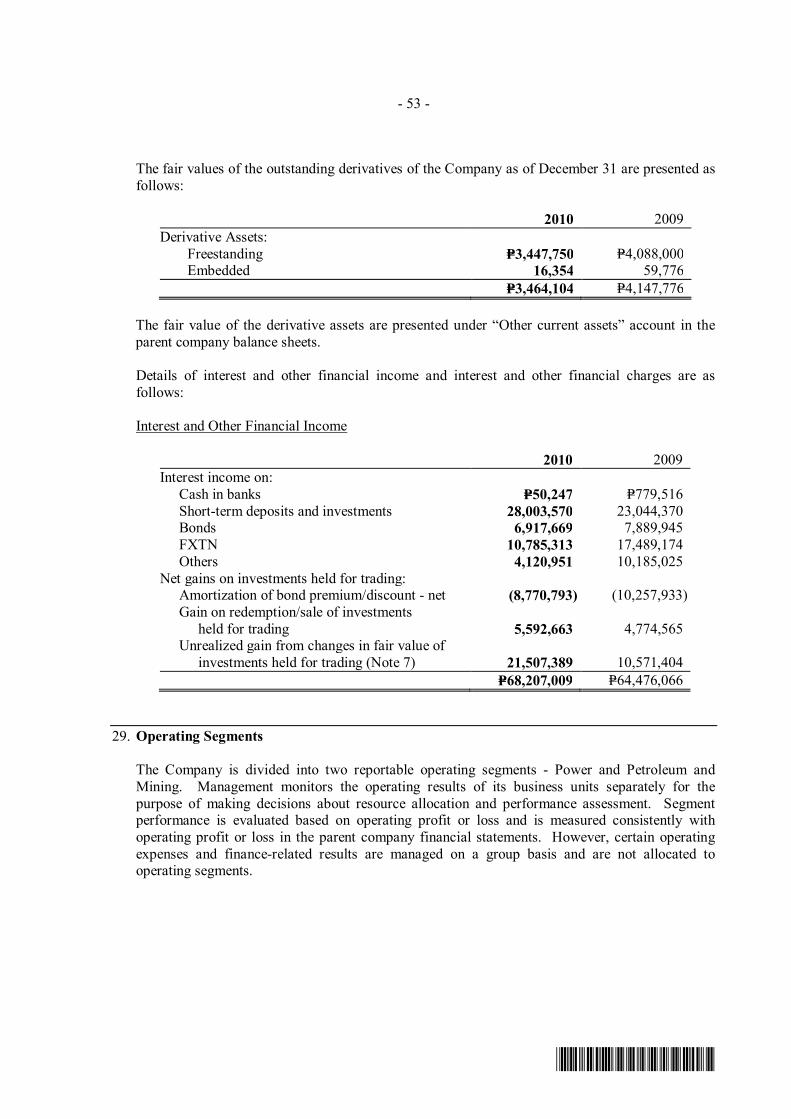
- 53 -
*SGVMC311706*
The fair values of the outstanding derivatives of the Company as of December 31 are presented as follows:
2010 2009 Derivative Assets:
Freestanding P=3,447,750 P=4,088,000 Embedded 16,354 59,776
P=3,464,104 P=4,147,776 The fair value of the derivative assets are presented under “Other current assets” account in the parent company balance sheets. Details of interest and other financial income and interest and other financial charges are as follows: Interest and Other Financial Income
2010 2009 Interest income on: Cash in banks P=50,247 P=779,516 Short-term deposits and investments 28,003,570 23,044,370 Bonds 6,917,669 7,889,945 FXTN 10,785,313 17,489,174 Others 4,120,951 10,185,025 Net gains on investments held for trading: Amortization of bond premium/discount - net (8,770,793) (10,257,933) Gain on redemption/sale of investments
held for trading 5,592,663 4,774,565 Unrealized gain from changes in fair value of
investments held for trading (Note 7) 21,507,389 10,571,404 P=68,207,009 P=64,476,066
29. Operating Segments The Company is divided into two reportable operating segments - Power and Petroleum and
Mining. Management monitors the operating results of its business units separately for the purpose of making decisions about resource allocation and performance assessment. Segment performance is evaluated based on operating profit or loss and is measured consistently with operating profit or loss in the parent company financial statements. However, certain operating expenses and finance-related results are managed on a group basis and are not allocated to operating segments.
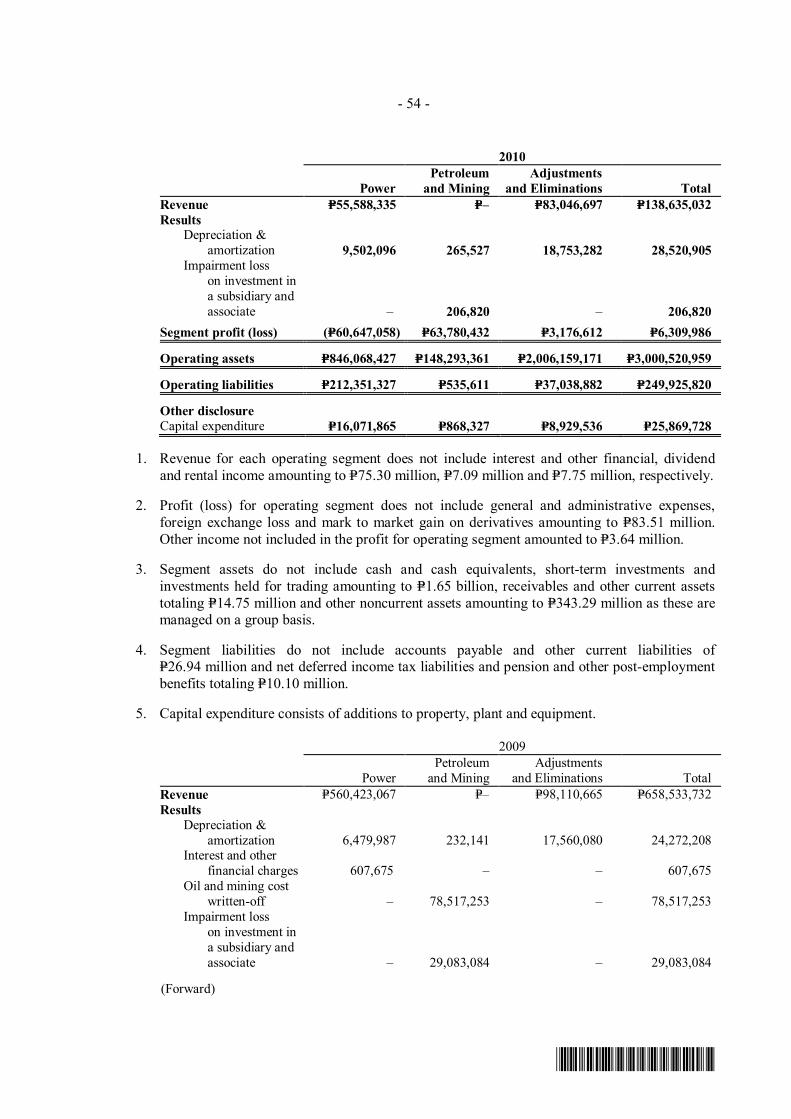
- 54 -
*SGVMC311706*
2010
Power Petroleum
and Mining Adjustments
and Eliminations Total Revenue P=55,588,335 P=– P=83,046,697 P=138,635,032 Results Depreciation & amortization 9,502,096 265,527 18,753,282
28,520,905
Impairment loss on investment in a subsidiary and associate – 206,820 –
206,820 Segment profit (loss) (P=60,647,058) P=63,780,432 P=3,176,612 P=6,309,986
Operating assets P=846,068,427 P=148,293,361 P=2,006,159,171 P=3,000,520,959
Operating liabilities P=212,351,327 P=535,611 P=37,038,882 P=249,925,820
Other disclosure
Capital expenditure P=16,071,865 P=868,327 P=8,929,536 P=25,869,728
1. Revenue for each operating segment does not include interest and other financial, dividend and rental income amounting to P=75.30 million, P=7.09 million and P=7.75 million, respectively.
2. Profit (loss) for operating segment does not include general and administrative expenses,
foreign exchange loss and mark to market gain on derivatives amounting to P=83.51 million. Other income not included in the profit for operating segment amounted to P=3.64 million.
3. Segment assets do not include cash and cash equivalents, short-term investments and investments held for trading amounting to P=1.65 billion, receivables and other current assets totaling P=14.75 million and other noncurrent assets amounting to P=343.29 million as these are managed on a group basis.
4. Segment liabilities do not include accounts payable and other current liabilities of P=26.94 million and net deferred income tax liabilities and pension and other post-employment benefits totaling P=10.10 million.
5. Capital expenditure consists of additions to property, plant and equipment. 2009
Power Petroleum
and Mining Adjustments
and Eliminations Total Revenue P=560,423,067 P=– P=98,110,665 P=658,533,732 Results Depreciation & amortization 6,479,987 232,141 17,560,080
24,272,208
Interest and other financial charges 607,675 – –
607,675
Oil and mining cost written-off – 78,517,253 –
78,517,253
Impairment loss on investment in a subsidiary and associate – 29,083,084 –
29,083,084
(Forward)

- 55 -
*SGVMC311706*
2009
Power Petroleum
and Mining Adjustments
and Eliminations Total Provision for unrecoverable input tax P=772,415 P=– P=–
P=772,415 Segment profit (loss) P=462,590,268 (P=114,356,351) P=19,300,554 P=367,534,471
Operating assets P=664,010,747 P=93,374,728 P=2,241,115,218 P=2,998,500,693
Operating liabilities P=88,230,375 P=188,216 P=123,899,297 P=212,317,888
Other disclosure
Capital expenditure P=2,133,409 P=– P=1,489,406 P=3,622,815
1. Revenue for each operating segment does not include interest and other financial, dividend and rental income amounting to P=64.48 million, P=27.08 million and P=6.55 million, respectively.
2. Profit (loss) for operating segment does not include general and administrative expenses, foreign exchange loss and mark to market gain on derivatives amounting to P=98.65 million. Other income not included in the profit for operating segment amounted to P=19.84 million.
3. Segment assets do not include cash and cash equivalents, short-term investments and investments held for trading amounting to P=1.74 billion, receivables and other current assets totaling P=42.26 million and other noncurrent assets amounting to P=461.43 million as these are managed on a group basis.
4. Segment liabilities do not include accounts payable and other current liabilities of P=116.98 million and net deferred income tax liabilities and pension and other post-employment benefits totaling P=6.91 million.
5. Capital expenditure consists of additions to property, plant and equipment. 30. Supplementary Information Required Under Revenue Regulations 15-2010
Revenue Regulations (RR) 15-2010 prescribes certain additional disclosures to be included in the financial statements. This RR mandates the inclusion in the notes to the financial statements information about the taxes, duties, and license fees paid or accrued during the taxable year, which includes the following: a. Amount of output value-added tax (VAT) declared during the year and the account title and
amounts upon which the same was based. For zero-rated sales/receipts and/or exempt sales/receipts, a statement to that effect and the legal basis therefore;
b. Amount of input VAT claimed, with beginning balance, current year purchases and payments, claims for tax credit/refund, and the balance at end of year;
c. The landed cost of imports and the amount of customs duties and tariff fees paid or accrued thereon;
d. The amount of excise taxes, classified per product category;

- 56 -
*SGVMC311706*
e. Documentary stamps tax on loan instruments, shares of stock and other transactions subject thereto;
f. All other taxes, local or national, including real estate taxes, license and permit fees lodged under the Taxes and Licenses account, both under Cost of Services and Operating Expenses;
g. Amount of withholding taxes, per category;
h. Periods covered and amount/s of deficiency tax assessments, whether protested or not; and
i. Tax cases and amounts involved, under preliminary investigation, litigation and/or prosecution in courts.
The Company also reported and/or paid the following types of taxes for the year: VAT Details of the Company’s net sales/receipts, output VAT and input VAT accounts are as follows: a. Net sales/receipts and output VAT declared in the Company’s VAT returns filed for the period
follows:
Net Sales/Receipts Output VAT Taxable sales: Sale of goods P=1,050,117 P=126,014 Sale of services 781,686,463 93,802,376 Rental income 5,306,813 636,817 788,043,393 94,565,207 Zero-rated sales 2,091,969 – Exempt sales 15,219,349 – P=805,354,711 P=94,565,207
Zero-rated sales of goods and services consist of export sales and those rendered to persons or entities whose exemptions are provided under special laws or international agreements to which the Philippines is a signatory. Zero-rated sales mainly represent rental income from a company engaged in international air transport operations.
Exempt sales represent collections allocated to franchise and benefits to host communities and sales under Presidential Decree No. 87 which are not subject to VAT.
The Company’s sale of services and rental income which are subjected to VAT are based on actual collections received, hence, may not be the same as amounts accrued in the statement of income.

- 57 -
*SGVMC311706*
b. Input VAT
Balance at January 1, 2010 Deferred on capital goods exceeding P=1 million from previous period P=9,584,970 Current year’s domestic purchases/payments for: Goods other than for resale or manufacture 302,648 Capital goods not subject to amortization 238,878 Goods lodged under Cost of Power Generation 3,875,590 Services lodged under Cost of Power Generation 204,666 Services lodged under Trading Cost 28,034,192 Services lodged under Others 6,066,467 Total available input tax 48,307,411 Less: Deferred on capital goods exceeding P=1 million for the succeeding period Claims during the year
7,285,950
40,500,961 Allocable to Exempt Sales 520,500 Balance at December 31, 2010 P=–
The Company does not have importations in 2010.
Other Taxes and Licenses
This includes all other taxes, local and national, including real estate taxes, licenses and permit fees lodged under the “Taxes and Licenses” account under the Expenses section in the Company’s statement of income. Details of other taxes and license fees consist of the following:
Business permits P=4,221,771 Real property taxes 3,022,975 Documentary stamp taxes 13,885 Other licenses 64,548 Registration fee 500 P=7,323,679
Withholding Taxes Details of withholding taxes are as follows:
Total Balance as of December 31
Withholding taxes on compensation and benefits P=13,729,079 P=1,046,242
Expanded withholding taxes 10,069,730 2,659,437 Final withholding taxes 2,690,851 – Fringe benefit 567,322 159,445 P=27,056,982 P=3,865,124
The Company has an assessment from local government of Makati City amounting to P=2,436,220 for deficiency taxes, fees and charges for the calendar years 2004 to 2007. The Company filed a judicial appeal with the Regional Trial Court of Makati.