III Semester Physical Chemistry Laboratory (CY 202) School ...
36
Course Manual M. Sc. (Integrated) - III Semester Physical Chemistry Laboratory (CY 202) School of Chemistry University of Hyderabad Preparation for the laboratory class and
-
Upload
khangminh22 -
Category
Documents
-
view
2 -
download
0
Transcript of III Semester Physical Chemistry Laboratory (CY 202) School ...

Course Manual
M. Sc. (Integrated) - III Semester
Physical Chemistry Laboratory (CY 202)
School of Chemistry
University of Hyderabad
Preparation for the laboratory class and

2
2
Laboratory practices
1. Read the instruction manual carefully; discuss with the instructors any point that
is not clear.
2. Read and understand the principles of the experiment before coming to the
laboratory class.
3. You must arrive for the laboratory on time; late entry into the laboratory is not
allowed.
4. Follow strictly, the instructions given in the laboratory by the instructors.
5. Safe practices in the laboratory are of utmost importance. Wear shoes that cover
your feet properly. Wear preferably cotton clothing; clothing made of easily
inflammable materials such as silk should be avoided.
6. Inside the laboratory, maintain absolute discipline in your behaviour and focus
full attention on the experiment you are carrying out. Do not engage in any
conversations and discussions. Do not compare your experimental observations
and results with those of others; you are supposed to report your genuine results.
7. Keep your laboratory bench clean and organized; careless and disorderly handling
of chemicals, glassware or equipment can lead to major laboratory accidents.
8. Maintain your laboratory notebooks properly. You must have two notebooks; (i)
the Observation Notebook for recording the various observations and data during
the experiment in the laboratory class and (ii) the Record Notebook for reporting
the details of the experiments, observations and conclusions in the following
laboratory class.
9. After you finish the experiment, ensure that you obtain the signature of the course
instructor on the data/observations recorded in your Observation Notebook. The
same observations along with details of the experiment, analysis, results and
conclusions must be recorded neatly in the Record Notebook and submitted
promptly at the very beginning of the following laboratory class. If this is not
followed strictly, the grade for the specific experiment will not be awarded.
10. At the end of the laboratory class, hand over to the laboratory staff, the glassware,
chemicals, equipment etc. after proper cleaning.
11. Reagent bottles and their stoppers should not be left at the work bench. They
should be returned to their proper place upon the shelves immediately after use.
If a reagent bottle is empty, bring it to the attention of laboratory staff.
12. Use the chemicals/samples provided to you very carefully, without wasting any
material; extra samples will not be given under any circumstance.

3
3
Course evaluation / grading
Step 1. Continuous assessment (60 marks): All experiments will be given equal
weightage. The grading for each experiment will be based on an assessment
(for that experiment) of: (a) your performance and experimental work in the
laboratory, (b) quality and correctness of your observations and recording of
data, (c) presentation in the Record Notebook and (d) your response to
questions during the evaluation of the Record Notebook in the following week.
Step 2. End semester practical examination (20 marks): Grading will be based on the
evaluation of one experiment you will carry out (chosen by draw) from among
the experiments carried out during the semester.
Step 3. End semester written examination (20 marks): This will be a 1 h examination
to assess your understanding of the basic theory and conceptual details of all
the experiments carried out during the semester.
Additional reading
Basic text books in Physical Chemistry: for example, P. Atkins, J. de Paula, Atkin’s
Physical Chemistry, 9th Edition, Oxford University Press, 2010

4
4
Experiments
No Title Pages
1 Molecular weight of a polymer by viscometric method 6 – 8
2 Heat of solution and lattice energy 9 – 11
3 Phase diagram and the critical solution temperature of phenol – water system 12 – 13
4 pH titration of an amino acid 14 – 16
5 Stoichiometry of ferric-salicylic acid complex by Job’s method 17 – 18
6 Conductometric titration : hydrochloric acid with sodium hydroxide 19 – 21
7 Rate constant of the acid catalysed hydrolysis of ethyl acetate 22 – 24
8 Conductometric titration : silver nitrate with potassium chloride 25 – 27
9 Solubility product of potassium hydrogen tartrate and the common ion effect 28 – 31
10 Partition coefficient of benzoic acid between water and toluene 32 – 36

5
5
Apparatus and Materials Required
No. Experiment Apparatus Materials
1 Molecular weight
by viscometry
Viscometer, Volumetric flask (4 10
mL), Beaker, Syringe, Pipette, Burette
stand, Watch (precision = 1 s)
Dry polystyrene powder,
Toluene
2 Heat of solution
Beaker, Thermal isolation chamber,
Weighing balance, Thermometer
(precision = 0.1o)
Calcium chloride, Distilled
water
3 Phase diagram :
Phenol - Water
Hard glass test tubes, Glass stirrer,
Beaker, Burette and Thermometer
(precision = 0.1o)
Phenol, Distilled water, Ice
4 pH titration
pH meter, Beaker, Burette, Pipette,
Volumetric flask, Conical flask,
Funnel
Standard buffers (pH 4, 7 and
10), glycine, 0.1 N NaOH
solution, 0.1 N standard HCl
solution, Phenolphthalein
5 Job’s method
Colorimeter, Stoppered glass tube
(test tube type)
N/500 HCl solution, Ferric
ammonium alum, Salicylic
acid
6 Conductometric
titration
Conductivity meter + Cell, Beaker,
Burette, Pipette, Volumetric flask,
Conical flask, Funnel
0.1 N oxalic acid solution, 0.5
N NaOH solution, 0.1 N HCl
solution, Phenolphthalein
7 Rate constant of
hydrolysis
Burette, Pipette, Bottle, Conical Flask,
Glass trough, Stopwatch
Ethyl acetate ester, 0.5 N HCl
solution, 0.025 N HCl
solution, 0.05 N NaOH
solution, Phenolphthalein
8 Conductometric
titration
Conductivity meter + Cell, Beaker,
Burette, Pipette, Volumetric flask,
Funnel
0.02 N AgNO3 and HCl
solutions, 0.1 N KCl solution
9 Solubility product
Stoppered bottle, Volumetric flask,
Pipette, Burette, Beaker, Conical
flask, Funnel
Potassium hydrogen tartrate,
0.03 N KCl solution, 0.1 N
oxalic acid solution, 0.05 N
NaOH solution,
Phenolphthalein
10 Partition coefficient
Stoppered bottle, Volumetric flask,
Pipette, Burette, Beaker, Conical
flask, Funnel
0.1 N oxalic acid solution, 0.1
N NaOH solution, Benzoic
acid, Toluene,
Phenolphthalein
6
6
Experiment 1
Molecular weight of a polymer by viscometric method
The viscosity average molecular weight (𝑴𝑽̅̅ ̅̅ ) of a polymer is determined by measuring
the viscosity of its solutions having a range of concentrations; polystyrene prepared by
emulsion polymerization technique is used in the experiment.
Basic concepts
Average molecular weight of polymers
The properties of polymers are dependent on their molecular weight. Unlike small
molecules, polymers do not have a unique molecular weight, as there is usually a
distribution of molecular sizes. Different kinds of average molecular weights can be
defined for polymers; number average molecular weight, 𝑀𝑁̅̅ ̅̅ , weight average molecular
weight, 𝑀𝑊̅̅ ̅̅ ̅, viscosity average molecular weight, 𝑀𝑉̅̅ ̅̅ . They are defined as follows:
𝑀𝑁̅̅ ̅̅ =∑ 𝑁𝑖𝑀𝑖∞𝑖=1
∑ 𝑁𝑖∞𝑖=1
𝑁𝑖 molecules of the polymer have molecular weight 𝑀𝑖
𝑀𝑁̅̅ ̅̅ = ∑ 𝑋𝑖𝑀𝑖∞𝑖=1 𝑋𝑖 is the number fraction of molecules with molecular weight 𝑀𝑖
𝑀𝑊̅̅ ̅̅ ̅ = ∑ 𝑤𝑖𝑀𝑖∞𝑖=1 𝑤𝑖 is the weight fraction of molecules with molecular weight 𝑀𝑖
𝑀𝑤̅̅ ̅̅̅ =∑ 𝑁𝑖𝑀𝑖
2∞𝑖=1
∑ 𝑁𝑖∞𝑖=1 𝑀𝑖
(Prove this)
𝑀𝑉̅̅ ̅̅ = (∑ 𝑁𝑖𝑀𝑖
1+𝑎∞𝑖=1
∑ 𝑁𝑖∞𝑖=1 𝑀𝑖
)
1𝑎⁄
a is a constant depending on the polymer/solvent pair used
in the viscosity experiment
Viscosity measurements
Time of flow for the solvent (t0) and polymer solution are measured in a viscometer. The
relative viscosity is determined: 𝜂𝑟𝑒𝑙 =𝑡
𝑡0
Specific viscosity is defined as : 𝜂𝑠𝑝 = 𝜂𝑟𝑒𝑙 − 1 =𝑡−𝑡0
𝑡0; the value is generally 0.2 – 0.6

7
7
Reduced viscosity is defined as : 𝜂𝑟𝑒𝑑 =𝜂𝑠𝑝
𝑐 where c is the concentration of the solution,
usually expressed as g dL-1 (then the unit of 𝜂𝑟𝑒𝑑is dL g-1.
Intrinsic viscosity is defined as : [𝜂] = (𝜂𝑠𝑝
𝑐)𝑐=0
; it is obtained by extrapolating reduced
viscosity to zero concentration, as per the following equation:
𝜂𝑟𝑒𝑑 = [𝜂] + 𝑘[𝜂]2𝑐 Huggins equation; k is known as the Huggins constant.
[𝜂] depends on the viscosity average molecular weight as :
[𝜂] = 𝐾𝑀𝑉̅̅ ̅̅𝑎 Mark-Houwink equation; K and a are constants for a polymer-solvent pair;
for polystyrene-toluene pair, K = 1.74 × 10 -4 dL g-1 and a = 0.69.
Apparatus
Viscometer, Volumetric flask (4 10 mL), Beaker, Syringe, Pipette, Burette stand,
Watch (precision required = 1 s)
Materials
Dry polystyrene powder, Toluene.
Experimental procedure
1. Clean and dry the viscometer; fix it on a burette stand securely and with the graduated
tubes vertical
2. Using a pipette, transfer 10 mL toluene into the viscometer
3. Determine the flow time of the solvent, toluene (t0). Make at least three readings; the
variation should be within 1 s. If not, repeat the measurements until such consistent
times are obtained. The mean value of the three close readings is t0.
4. Remove the viscometer from the stand, drain the solvent and allow it to dry.
5. Prepare 10 mL of 1 % (w/v) solution of polystyrene in toluene.

8
8
6. Repeat Steps 1 – 4 and determine the flow time (t) for the polymer solution.
7. Prepare at least three more solutions with different concentrations (0.5%, 0.25% and
0.12% w/v) by successive dilution from the higher concentration solution.
8. Repeat Steps 1 – 4 and determine the flow time (t) for each polymer solution.
9. Prepare a Table as shown below, entering all the data observed. Calculate the
different viscosity measures as shown in the Table, and estimate the viscosity average
molecular weight as discussed.
Data analysis
1. Note the flow time data and construct the table using the equations given earlier.
Concentration
(g dL-1)
Flow
time (s)
Mean flow
time (s) 𝜼𝒓𝒆𝒍 𝜼𝒔𝒑
𝜼𝒓𝒆𝒅
(dL g-1)
0
2. Plot 𝜂𝑟𝑒𝑑 versus concentration and measure the intercept; the intercept is [η].
3. Calculate 𝑀𝑉̅̅ ̅̅ using the Mark – Houwink equation.

9
9
Experiment 2
Heat of solution and lattice energy
Following the calorimetric measurement of the heat of solution the Born-Haber cycle
is used to determine the lattice energy of calcium chloride.
Basic concepts
Born-Haber cycle
Total enthalpy change in a process can be written as a sum of the enthalpy changes of the
constituent steps (Hess’s law). Application of this concept to an ionic solid forms the
basis of the Born-Haber cycle. The following is a representation of this concept to
calcium chloride (CaCl2); the table below gives some of the enthalpy values.
Enthalpy change for process value
∆H1 dissolving CaCl2 (s) in water heat of solution ?
∆H2 Ca2+ (aq) → Ca2+ (g) -1 heat of hydration +1579 kJ mol-1
∆H3 2Cl- (aq) → 2Cl- (g) -2 heat of hydration +715.5 kJ mol-1
∆H4 Ca2+ (g) → Ca (g) -1 ionization energy -18 eV
∆H5 2Cl- (g) → 2Cl (g) 2 electron affinity 2 × 3.64 eV
∆H6 Ca (g) → Ca (s) -1 heat of sublimation -178.2 kJ mol-1
∆H7 2Cl (g) → Cl2 (g) -1 dissociation energy -242.7 kJ mol-1
∆H8 Ca(s) + Cl2 (g) = CaCl2 (s) heat of formation ?
∆H Lattice energy ?
CaCl2 (s) Ca2+
(aq) + 2 Cl - (aq)
Ca2+
(g) + 2 Cl - (g)
Ca (g) + 2 Cl (g)Ca (s) + Cl2 (g)
H1
HH8
H6 + H7
H2 + H3
H4 + H5

10
10
The Born-Haber cycle shows that the lattice energy, ∆H = ∆H1 +∆H2 + ∆H3, can be
estimated using the measured value of the heat of solution, ∆H1 and the values of ∆H2
and ∆H3 provided in the Table. The heat of formation of CaCl2(s) can also be estimated
from the measured value of ∆H1 and the other enthalpy values provided in the Table.
Calorimetry
If a body with mass, m and specific heat, s is heated through a temperature change, T,
the heat absorbed, q = msT. The product, ms is called the water equivalent of the
body, as it represents the mass of water which absorbs the same quantity of heat when
heated through the same temperature difference.
Apparatus
Beaker, Thermal isolation chamber, Weighing balance, Thermometer (precision = 0.1o).
Materials
Calcium chloride, Distilled water.
Experimental procedure
Determination of the water equivalent of the beaker
1. Weigh a 250 mL beaker (w1). Take ~ 100 mL of distilled water in it and weigh again
(w2). Insulate the beaker from the outside environment by placing in a thermal
isolation chamber; measure the temperature of the water (T1).
2. Heat some water separately to ~ 80oC; measure the temperature (T2). Add ~ 50 mL
of this hot water to the water taken in the beaker in Step 1, kept inside the thermal
isolation chamber. Wait for the temperature to stabilize and measure it (T3).
3. Take the beaker out of the isolation chamber and let it equilibrate with the outside
environment; weight it (w3).

11
11
4. Using the various values measured above, determine the water equivalent of the
beaker, W.
Determination of the heat of solution
5. Repeat Step 1; the weight of beaker (w1), weight of beaker+water (w2) and initial
temperature (T1) are measured.
6. Take ~ 8 g CaCl2 and weigh it accurately (w); add this to the water in the beaker and
stir. Note the final temperature (T4).
7. Determine the heat of solution for the solid added.
8. Repeat Step 6 with ~ 9 g of CaCl2.
Data analysis
1. First part of the experiment
(i) Equate the heat gained by the beaker+water with the heat lost by the added hot
water. [W+(w2-w1)][T3-T1] = (w3-w2)[T2-T3]
(ii) Determine W from the above equation.
2. Second part of the experiment
(i) Heat of solution released when CaCl2 is dissolved is given by the heat gained
by the beaker+water. Q = [W+(w2-w1)][T4-T1].
(ii) Using the weight of CaCl2 added (w) and its molecular weight, determine the
molar heat of solution, ∆H1.
(iii) Repeat the analysis above, for the experiment with different weight of CaCl2.
3. Using the ∆H1, and the enthalpies values provided in the Table, determine
(i) lattice energy of CaCl2
(ii) enthalpy of formation of CaCl2.

12
12
Experiment 3
Phase diagram and the critical solution temperature of
phenol – water system
The phase diagram of a 2-component system made up of partially miscible liquids is
determined by observing the temperature at which the two become miscible
Basic concepts
For two liquids that do not react, three types of miscibility behaviour are possible:
(i) immiscible at all temperatures (eg. mercury and water)
(ii) miscible in all proportions at all temperatures (eg. ethanol and water)
(iii) partially miscible under some temperature conditions (eg. phenol and water)
In case (iii), the solubility varies with temperature and the solubility (or miscibility) curve
can be constructed. Above a certain temperature (called the critical solution temperature,
CST), the two components become completely miscible in all proportions. A 2-
component system may have an upper, lower or both upper and lower critical solution
temperatures. Phenol and water has only an upper CST; above this temperature, phenol
and water are miscible in all proportions. CST is greatly influenced by impurities.
Commercial phenol gives a higher value than a sample of purified phenol. Phenol is
corrosive; handle it carefully.
Apparatus
Hard glass test tubes, Glass stirrer, Beaker, Burette and Thermometer (precision = 0.1o).
Materials
Phenol, Distilled water, Ice.

13
13
Experimental procedure
1. Weigh accurately 2 - 3 g of phenol in a weighing bottle; transfer it to a hard glass test
tube fitted with an outer larger hard glass test tube by means of ring cork to provide
an air jacket. Add to it, 1 mL of water from a burette.
2. Clamp the test tube assembly inside a large beaker fitted with a glass stirrer. Insert a
thermometer into the test tube.
3. Heat the water of the beaker slowly and uniformly over a low flame stirring it all the
time. The mixture, which was initially turbid, suddenly becomes clear at a particular
temperature. Note the temperature. Remove the flame and allow the liquid to cool
slowly. Note the temperature at which turbidity reappears. Take the mean of both the
temperatures.
4. Go on adding 0.5 mL portions of water and repeating step 3 until 5 mL of water have
been added. Thereafter, go on adding 1 mL portions of water and repeating step 3
until 16 mL of water have been added.
5. Find the weight percentages of phenol and water.
6. Draw a smooth curve by plotting temperature against the percentage of phenol. Find
the point which just touches a horizontal line in the graph paper. The ordinate of the
point gives the critical solution temperature of the system and the abscissa gives the
composition
Data analysis
Density of water = 1 gm/ml
Weight of phenol transferred = g
No. of
observation
Volume of
water added
(mL)
Weight
percentage
of phenol
Miscibility temperature (°C) Temperature
Mean (°C) Turbidity
disappearance
Turbidity
reappearance
From the graph
Critical solution temperature = _____°C; Critical composition = ______

14
14
Experiment 4
pH titration of an amino acid
The pKa values and the isoelectric point of an amino acid (glycine) are determined
using a pH titration against acid and base.
Basic concepts
Amino acids possess at least two protolyzable functional groups, carboxylic acid and
ammonium. In addition, they may have other functional groups on the “side chain”
capable of receiving or donating a proton. Glycine, the simplest amino acid, has the
COOH and α-NH3+ groups that can donate H+.
When a water soluble amino acid is dissolved in water, it undergoes self-proteolysis,
whereby the more acidic group (COOH) transfers a proton to the more basic (NH2 group)
to yield the zwitterionic structure that has positively and negatively charged groups, but is
overall neutral. The process is shown for glycine below.
The zwitterion in its neutral form exists at the pH corresponding to the isoelectric point
(pH = pI). The following processes occur when an aqueous solution of glycine is treated
with acid or base.
COO-
CH2
NH3+
COO-
CH2
NH2
CH2
NH3+
pKa1 pKa2
COOH
CH2
NH2
CH2
NH3+
COOH COO-
CH2
NH3+
CH2
NH3+
COOHCOO-
H+
CH2
NH2
CH2
NH3+
COO-
COO-
OH-

15
15
Titration of a weak acid / base with strong base / acid leads to buffer formation and a
nearly constant pH over a range of addition of the titrant. The Henderson – Hasselbalch
equation shows that, at the midpoint of these regions where [A-] = [HA], pH = pKa.
𝐻𝐴 + 𝐻2𝑂 ⇌ 𝐻3𝑂+ + 𝐴− 𝑝𝐻 = 𝑝𝐾𝑎 + 𝑙𝑜𝑔
[𝐴−]
[𝐻𝐴]
This concept can be used to determine the pKa values of the amino acid, by titrating
against strong base and acid. Prominent increase or decrease of the pH curve gives the
equivalence points in the reaction.
Apparatus
pH meter, Beaker, Burette, Pipette, Volumetric flask, Conical flask, Funnel
Materials
Standard buffers (pH = 4, 7, 10), Glycine, 0.1 N NaOH solution, 0.1 N HCl solution
(standard), Phenolphthalein
Experimental procedure
1. Prepare ~ 250 mL ~ 0.1 N HCl solution (the concentration should be known exactly,
as this solution is used to standardise other solutions).
2. Prepare ~ 250 mL of ~ 0.1 N NaOH solution and standardise it against the HCl
solution using phenolphthalein as indicator.
3. Prepare ~ 250 mL of an ~ 0.1 M glycine solution.
4. Rinse the pH cell and the beaker with distilled water.
5. Set up and calibrate the pH meter with standard buffers ( pH = 4 and 7).
6. Pipette out 25 mL of 0.1 M glycine solution into a 250 mL beaker; measure the pH.
7. Add the standard HCl solution from a 50 mL burette in small amounts (~ 0.5 mL),
stir well and determine the pH after each addition.

16
16
8. Continue the addition of HCl and stirring and pH measurement till the pH of the
solution reaches ~ 1.4 (refill the burette if required).
9. Wash the electrodes carefully with distilled water from a wash bottle, dry with tissue
paper.
10. Calibrate the pH meter again, now at pH 7 and 10.
11. Repeat the experiment in Step 7, now by adding the NaOH solution until the pH
reaches ~ 12.
Data analysis
1. Tabulate the volumes and pH measured from the experiment.
2. Make a plot of the pH vs the volume of NaOH and HCl solution.
3. From the plot, determine the pKa1 and pKa2 for glycine.
4. Calculate the isoelectic point of glycine.
5. Using the data from the titration of glycine with base, calculate the exact
concentration of glycine in the solution prepared. Compare with the value obtained
from the titration with acid.
pH
Volume of NaOH (ml) Volume of HCl (ml)

17
17
Experiment 5
Stoichiometry of ferric-salicylic acid complex by Job’s method
Stoichiometry of Fe3+ - Salicylic acid complex is determined using colorimetry and the
Job’s method of continous variation
Basic concepts
When equimolar solutions of two reactants are mixed in varying proportions, the
maximum amount of the complex at equilibrium is formed when the proportion of the
reactants corresponds to the empirical formula of the complex. In 𝑎𝐴 + 𝑏𝐵 ⇌ 𝐴𝑎𝐵𝑏, the
maximum amount of AaBb is obtained when a parts of X molar solution of A is mixed
with b parts of X molar solution of B (Job’s method of continuous variation). If a : b = 1
: 1, the composition of the complex is AB. Several phenolic compounds (for example, 2-
hydroxybenzoic acid or salicylic acid) form colored complexes with Fe3+ salts. In
aqueous solution, the equilibrium may be written as:
[𝐹𝑒(𝐻2𝑂)6]3+ + 𝑆𝑎𝑙 ⇌ [𝐹𝑒(𝐻2𝑂)𝑥(𝑆𝑎𝑙)𝑦]
𝑛+
The stoichiometry of the complex (1 : y) can be determined by the Job’s method. The
optimum pH for the stability of the ferric-salicylic acid complex is 2.6 – 2.8.
Apparatus
Colorimeter, Stoppered glass tube (test tube type)
Materials
0.002 N HCl solution, Ferric ammonium alum, Salicylic acid
Experimental procedure
1. Prepare 0.002 N HCl.

18
18
2. Prepare 1 mM solutions of the reactants in 0.002 N HCl (providing the required pH).
3. Mix the Fe3+ and salicylic acid solutions in different proportions (see Table below) in
properly labeled stoppered glass tubes (test tube size).
4. Measure the transmission (or optical density) for a particular solution (say solution
No. 4), using different filters (ie. at different wavelengths) and thus choose the filter
corresponding to the max.
5. Using that filter, measure the transmission (or optical density) of each solution.
Data analysis
Filter (corresponding to max.) = _____________________
1. Tabulate the transmission data collected in Step 4 and plot them as follows.
Solution
No.
Volume of Fe3+
solution (mL)
Volume of Salicylic
acid solution (mL)
Transmission (%)
or Optical Density
1 1 9
2 2 8
3 3 7
: : :
9 9 1
2. Determine the stoichiometry of the complex from the peak of the curve in the plot.
Tra
nsm
issi
on
(%
)
Volume of Salicylic acid (ml)

19
19
Experiment 6
Conductometric titration : hydrochloric acid with sodium hydroxide
Conductometry is the measurement of conductivity of electrolytes or electrolytic
conductance. Conductometric titrations are used to monitor the progress of a reaction
based on the conductivities of the ions being exchanged and hence the resultant
conductivity of the reaction mixture. In this experiment, the reaction of HCl (strong
acid) with NaOH (strong base) is studied and compared with indicator based titration.
Basic concepts
When a strong acid like HCl is titrated against a strong alkali like NaOH (caustic soda),
the H+ ions are progressively replaced by the less mobile Na+ ions, with no net change in
the number of or charges of the ions, as shown in the equation:
𝐻+ + 𝐶𝑙−+𝑁𝑎𝑂𝐻 −𝐻2𝑂→ 𝑁𝑎+ + 𝐶𝑙−
and the conductance of the solution falls linearly up to the end point. Beyond the end
point it rises linearly due to the excess Na+ and OH- ions being added. The neutral point
is thus marked by a minimum in a V-shaped titration curve.
Apparatus
Conductivity meter + cell, Beaker, Burette, Pipette, Volumetric flask, Conical flask,
Funnel
Materials
0.1 N oxalic acid solution (standard), 0.5 N NaOH solution, 0.1 N HCl solution,
phenolphthalein.
Experimental procedure
1. Prepare 100 mL ~ 0.1 N oxalic acid solution (the concentration should be known
exactly, as this solution is used to standardise the other solutions).

20
20
2. Prepare about 250 mL of an ~ 0.5 N NaOH solution and standardise it against the
oxalic acid solution using phenolphthalein as the indicator.
3. Prepare about 250 mL of an ~ 0.1 N HCl solution.
4. Rinse a clean burette with the NaOH solution and then fill it with the solution. Note
the number of drops for 1 mL of NaOH falling from the burette and hence calculate
the volume of a single drop.
5. Rinse the conductivity cell and the beaker with deionised water.
6. Pipette out 25 mL of the HCl solution into the conductivity cell and add water, if
necessary, so that the electrodes are completely submerged within the solution.
Measure the conductivity.
7. Add 3 – 5 drops of the NaOH solution from the burette, mildly shaking the beaker.
Measure the conductivity. Repeat the process several times until at least five points
are observed beyond the end point (where the conductivity is the lowest).
8. Plot the conductance against the number of drops of the NaOH solution added.
9. Titrate the HCl solution against the NaOH solution using phenolphthalein indicator.
Data and analysis
Preparation of ~ 0.1 N oxalic acid solution (Step 1)
Weight of empty container = _________ g
Weight of container + oxalic acid = _________ g
Weight of oxalic acid = _________ g
Concentration of oxalic acid solution prepared = _________ N
Standardization of the NaOH solution (Step 2)
Volume of the oxalic acid solution = _________ ml
Burette readings (ml) Volume of
NaOH (ml)
Mean volume
(ml) Initial Final
Concentration of the NaOH solution = _________ N
21
21
Volume of NaOH solution drop (Step 4)
Number of
drops
Volume of
NaOH solution (ml)
Mean volume
(ml)
Conductometric titration of the HCl solution against the NaOH solution (Step 7)
Volume of the HCl solution taken = _________ ml
Number of drops of
NaOH solution added
Conductance (mho)
From the plot (Step 8):
Number of drops of the NaOH solution at end point = _________
Volume of the NaOH solution added at end point = _________ ml
Concentration of the HCl solution = _________ N
Estimation of the HCl solution concentration by titration with the NaOH solution (Step 9)
Volume of HCl solution taken = _________ ml
Burette readings (ml) Volume of
NaOH (ml)
Mean volume
(ml) Initial Final
Concentration of the HCl solution = _________ N
Comparison of the HCl solution concentration estimated using the two methods
Method Concentration of HCl (N)
Conductometric Titration
Titration using indicator

22
22
Experiment 7
Rate constant of the acid catalysed hydrolysis of ethyl acetate
Progress of a chemical reaction can be followed by monitoring the disappearance of a
reactant or the formation of a product. In the acid catalysed hydrolysis of an ester, one
of the products is an organic acid. Course of this reaction is monitored by determining
the concentration of the organic acid formed as a function of time; this kinetic study
provides the rate constant and order of the reaction.
Basic concepts
Hydrolysis of ethyl acetate, an extremely slow process in pure water, is catalyzed by H+.
𝐶𝐻3𝐶𝑂𝑂𝐶2𝐻5 + 𝐻2𝑂 ⇌ 𝐶𝐻3𝐶𝑂𝑂𝐻 + 𝐶2𝐻5𝑂𝐻
When water is present in large excess, the change in its concentration is negligible and
the backward reaction is suppressed. Progress of the reaction can be monitored by
withdrawing aliquots from the reaction mixture from time to time (t1, t2, … tn) and at the
end of the reaction, and titrating it against alkali. The amount of alkali required at any
stage is equivalent to the sum of acetic acid produced during the course of the reaction
and the acid catalyst, the latter remaining constant throughout the reaction. Let Vo and V∞
be the volumes of alkali required initially and finally respectively, and Vn be the volume
of alkali required at time tn. Since the extent of hydrolysis is directly proportional to the
amount of acetic acid formed, the initial concentration of the ester, a, is proportional to
V∞ ─ Vo and the concentration at time tn, (a ─ xn) is proportional to V∞ ─ Vn.
If the reaction follows first order kinetics, it follows the equation, 𝑘 =2.303
𝑡𝑙𝑜𝑔
𝑎
𝑎−𝑥 where
k is the rate constant. It can be written in terms of the volume of alkali as:
𝑘 =2.303
𝑡𝑛𝑙𝑜𝑔
𝑉∞ − 𝑉0𝑉∞ − 𝑉𝑛
As the hydrolysis begins as soon as the ester is mixed with water, it is difficult to
determine Vo. This problem can be eliminated using the difference equation:
∆𝑡𝑛 = 𝑡𝑛 − 𝑡1 =2.303
𝑘𝑙𝑜𝑔
𝑉∞−𝑉1
𝑉∞−𝑉𝑛 for n = 2, 3, ….
H+

23
23
It is advisable to take t1 value as soon as possible after starting the reaction. A plot of
𝑙𝑜𝑔𝑉∞−𝑉1
𝑉∞−𝑉𝑛 against ∆𝑡𝑛 for different n, provides a straight line passing through the origin;
k is determined from the slope of this line.
Apparatus
Burette, Pipette, Bottle, Conical Flask, Glass trough, Stopwatch.
Materials
Ethyl acetate, HCl solution (0.5 N and 0.25 N), 0.05 N NaOH solution, Phenolphthalein
Experimental Procedure
1. Prepare 500 mL of an ~ 0.05 N NaOH solution.
2. Prepare 100 mL of an ~ 0.5 N HCl solution; take 50 mL of the solution and dilute to
100 mL to obtain ~ 0.25 N HCl solution.
3. Rinse the burette and fill it with the NaOH solution.
4. Take 25 mL of the 0.5 N HCl solution in a 250 mL dry conical flask and cover it
with a watch glass.
5. Add 2 mL of pure (redistilled) ethyl acetate with a clean dry pipette constantly
swirling the flask during addition and starting the stopwatch when the pipette is half
empty. Shake the mixture quickly to for thorough mixing.
6. Immediately after the addition of ester, withdraw 2 mL of the reaction mixture and
pour into a conical flask containing 25 - 30 mL of chilled water to quench any further
hydrolysis of the ester, noting the time of half discharge (t1). Titrate the reaction
mixture as quickly as possible, against NaOH, using phenolphthalein as indicator;
the titre value is V1.
7. Repeat Step 6 several times, after ~ 5, 10, 15, 20, 30 and 40 min (i.e. at regular time
intervals, tn) after the initiation of the reaction, to determine the values of Vn.

24
24
8. Repeat Steps 4 – 7 with the 0.25 N HCl solution.
9. Heat both the reaction mixtures on water bath for 10 min (with watch glass cover) to
drive the reactions to completion. Draw 2 mL of the reaction mixture and titrate
against NaOH using phenolphthalein as indicator to determine the value of V∞.
10. Plot 𝑙𝑜𝑔𝑉∞−𝑉1
𝑉∞−𝑉𝑛 against ∆𝑡𝑛 for each set (with 0.5 N and 0.25 N HCl) on the same
graph; determine k1 and k2 from the slopes and find the ratio k1/k2.
Data and analysis
1. Note down the temperature of the reaction mixture before and after the experiment;
determine the mean value.
2. Analyse the kinetics of ethyl acetate hydrolysis with 0.5 N HCl (Steps 4 - 7).
V∞ = ___________ mL
3. Repeat the analysis of the kinetics with 0.25 N HCl (Step8).
4. Plot 𝑙𝑜𝑔𝑉∞−𝑉1
𝑉∞−𝑉𝑛 against ∆𝑡𝑛 for each set (with 0.5 N and 0.25 N HCl) on the same
graph. Determine the slope of each line using least square fitting.
5. Determine k1 and k2 from the slopes and find the ratio k1/k2.
Time
(min)
∆t
(s)
Volume of NaOH
(mL) V∞ ─ Vn (mL) 𝒍𝒐𝒈 (
𝑽∞ − 𝑽𝟏𝑽∞ − 𝑽𝒏
)
t2 0 V1
t2 t2 – t1 V2
t3 t3 – t1 V3
… …
tn tn – t1 Vn
25
25
Experiment 8
Conductometric titration : silver nitrate with potassium chloride
The precipitation reaction between KCl and AgNO3 is monitored by conductometric
titration.
Basic concepts
A precipitation reaction such as,
𝐾𝐶𝑙 + 𝐴𝑔𝑁𝑂3 → 𝐴𝐾𝑁𝑂3 + 𝐴𝑔𝐶𝑙 ↓
can be studied conductometrically. The net result up to the end point of this reaction is
the replacement of Ag+ by K+ ions, without change in the number of or charges on the
ions. As the mobility of K+ ions is similar to that of Ag+ ions, the conductance of the
solution remains nearly the same up to the end point. Beyond the end point however, the
conductance of the solution rises sharply due to the additional K+ and Cl- ions. The end
point can be determined as a point of intersection, by plotting the conductance against
volumes of KCl solution added.
Apparatus
Conductivity meter + cell, Beaker, Burette, Pipette, Volumetric flask, Funnel.
Materials
0.02 N AgNO3 and HCl solutions, 0.1 N KCl solution.
Experimental Procedure
1. Prepare 100 mL of 0.02 N AgNO3 solution and 100 mL of 0.1 N KCl solution (both
standard solutions).
2. Rinse the conductivity cell and the beaker with deionised water.
3. Pipette 25 mL of AgNO3 solution into the conductivity cell and add water, if
necessary, so that both the electrodes are immersed fully in the solution. Connect the
cell to the conductivity bridge and measure the conductivity.

26
26
4. Rinse a clean burette with the KCl solution and then fill it with the solution. Note
the number of drops for 1 mL of KCl falling from the burette and hence calculate the
volume of a single drop.
5. Add 3-5 drops of KCl solution into the AgNO3 solution in the conductivity cell,
while mildly shaking the beaker. Measure the conductance of the solution. Repeat
the process several times until at least five points are observed beyond the end point
(where the conductivity is the lowest).
6. Plot the conductance against the number of drops of the titrant, find the end point and
calculate the concentration of the solution.
7. Compare the concentration of AgNO3 determined above, with that obtained while
preparing the solution in Step 1.
Data and analysis
Preparation of 0.1 N KCl solution (Step 1)
Weight of KCl required to make 100 mL 0.1 N solution: _________ g
Weight of empty container = _________ g
Weight of container + KCl = _________ g
Weight of KCl = _________ g
Concentration of KCl solution prepared = _________ N
Preparation of 0.02 N AgNO3 solution (Step 1)
Weight of AgNO3 required to make 100 mL 0.02 N solution: _________ g
Weight of empty container = _________ g
Weight of container + AgNO3 = _________ g
Weight of AgNO3 = _________ g
Concentration of AgNO3 solution prepared = _________ N

27
27
Volume of KCl solution drop (Step 4)
Number of
drops
Volume of
KCl solution (ml)
Mean volume
(ml)
Conductometric titration of the AgNO3 solution against the KCl solution (Step 5)
Volume of the AgNO3 solution taken = ___25 mL
Number of drops of
KCl solution added Conductance (mho)
From the plot (Step 6):
Number of drops of the KCl solution at end point = _________
Volume of the KCl solution added at end point = _________ mL
Concentration of the AgNO3 solution = _________ N
Comparison of the AgNO3 solution concentration from the two methods (Step 7)
Method Concentration of AgNO3 (N)
Conductometric Titration
Standard solution preparation

28
28
Experiment 9
Solubility product of potassium hydrogen tartrate and
the common ion effect
Solubility product (Ksp) for potassium hydrogen tartrate in water is determined.
Basic concepts
Solubility product (Ksp) of a compound at a specified temperature is the equilibrium
constant for its dissociation in a solvent at that temperature ie. product of the dissociated
ion concentrations in the solvent, raised to the power of their stoichiometric coefficients.
For a binary ionic compound, the equilibrium and the Ksp can be written as :
𝐴𝑥𝐵𝑦(𝑠) ⇌ 𝑥𝐴𝑦+(𝑎𝑞) + 𝑦𝐵𝑥−(𝑎𝑞) 𝑲𝒔𝒑 = [𝑨]
𝒙[𝑩]𝒚
Unit of Ksp is concentration raised to the sum of the stoichiometric numbers of ions
present at solution equilibrium. Smaller the solubility product of a substance, lower its
solubility. For potassium hydrogen tartrate (KHTa) dissolved in a polar solvent like
water, the dissolution can be described as :
𝐾𝐻𝑇𝑎(𝑠𝑜𝑙𝑖𝑑) ⇌ 𝐾𝐻𝑇𝑎(𝑠𝑜𝑙𝑢𝑡𝑖𝑜𝑛) ⇌ 𝐾+(𝑎𝑞) + 𝐻𝑇𝑎−(𝑎𝑞)
HTa- is a very weak acid; its dissociation in water can be neglected. As it is a monoprotic
acid its concentration can be determined by titration with a strong alkali like NaOH.
Common ion effect
Solubility of a compound is reduced by the addition of another that has an ion common
with it. This can be understood in terms of the Le Chatelier's principle: an equilibrium is
shifted to the left by the increase in concentration of a component on the right. When the
concentration of an ion formed from dissolution of a compound A is effectively increased
by the introduction of the same ion by dissolution of a different compound B, the solution
equilibrium of A is shifted to the left and hence its solubility and Ksp reduced.
29
29
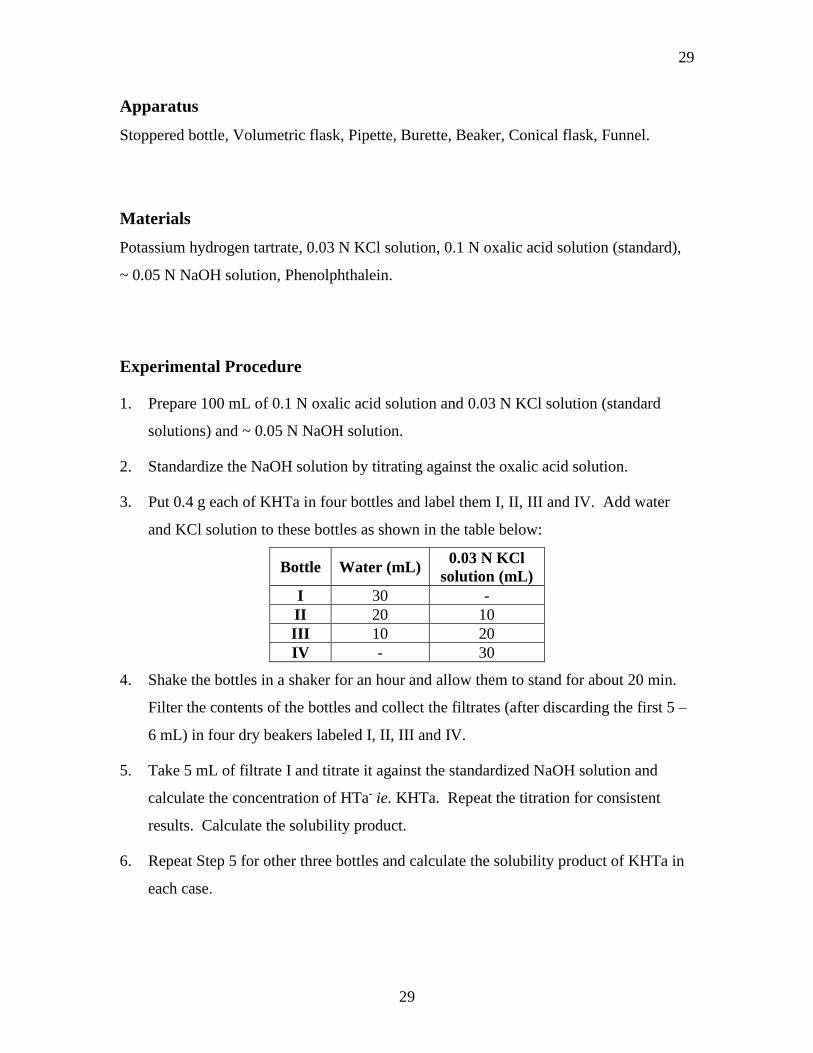
Apparatus
Stoppered bottle, Volumetric flask, Pipette, Burette, Beaker, Conical flask, Funnel.
Materials
Potassium hydrogen tartrate, 0.03 N KCl solution, 0.1 N oxalic acid solution (standard),
~ 0.05 N NaOH solution, Phenolphthalein.
Experimental Procedure
1. Prepare 100 mL of 0.1 N oxalic acid solution and 0.03 N KCl solution (standard
solutions) and ~ 0.05 N NaOH solution.
2. Standardize the NaOH solution by titrating against the oxalic acid solution.
3. Put 0.4 g each of KHTa in four bottles and label them I, II, III and IV. Add water
and KCl solution to these bottles as shown in the table below:
Bottle Water (mL) 0.03 N KCl
solution (mL)
I 30 -
II 20 10
III 10 20
IV - 30
4. Shake the bottles in a shaker for an hour and allow them to stand for about 20 min.
Filter the contents of the bottles and collect the filtrates (after discarding the first 5 –
6 mL) in four dry beakers labeled I, II, III and IV.
5. Take 5 mL of filtrate I and titrate it against the standardized NaOH solution and
calculate the concentration of HTa- ie. KHTa. Repeat the titration for consistent
results. Calculate the solubility product.
6. Repeat Step 5 for other three bottles and calculate the solubility product of KHTa in
each case.

30
30
Data and analysis
Mean of the temperatures before and after the experiment = _________oC
Preparation of 0.1 N standard oxalic acid solution (Step 1)
Weight of oxalic required to make 100 mL 0.1 N solution: _________ g
Weight of empty container = _________ g
Weight of container + oxalic acid = _________ g
Weight of oxalic acid = _________ g
Concentration of oxalic solution prepared = _________ N
Standardization of NaOH solution (Step 2)
Volume of the oxalic acid solution = _________ mL
Burette readings (ml) Volume of
NaOH (ml)
Mean volume
(ml) Initial Final
Concentration of the NaOH solution = _________ N
Preparation of 0.03 N KCl solution (Step 1)
Weight of KCl required to make 100 mL 0.03 N solution: _________ g
Weight of empty container = _________ g
Weight of container + KCl = _________ g
Weight of KCl = _________ g
Concentration of KCl solution prepared = _________ N

31
31
Determination of the concentration of KHTa in bottle I (Step 5)
Volume of the KHTa solution = _________ mL
Burette readings (ml) Volume of
NaOH (ml)
Mean volume
(ml) Initial Final
Concentration of the KHTa solution = _________ N
Repeat for bottles II - IV
Calculation of the solubility and solubility product (Step 6)
Bottle
[HTa-] = [KHTa] =
solubility of KHTa = s
(M)
[KCl] = [Cl-] = c
(M)
[K+] = (s+c)
(M)
Ksp of KHTa
= s(s+c)
(M2)
I
II
III
IV
32
32
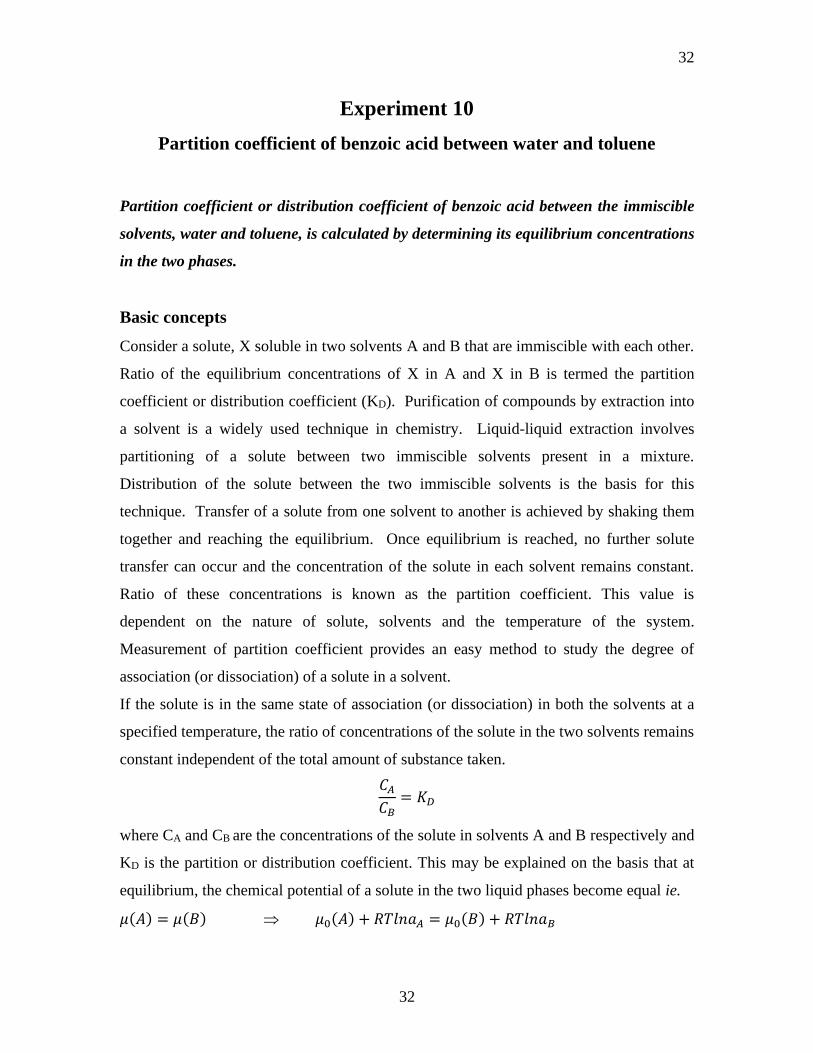
Experiment 10
Partition coefficient of benzoic acid between water and toluene
Partition coefficient or distribution coefficient of benzoic acid between the immiscible
solvents, water and toluene, is calculated by determining its equilibrium concentrations
in the two phases.
Basic concepts
Consider a solute, X soluble in two solvents A and B that are immiscible with each other.
Ratio of the equilibrium concentrations of X in A and X in B is termed the partition
coefficient or distribution coefficient (KD). Purification of compounds by extraction into
a solvent is a widely used technique in chemistry. Liquid-liquid extraction involves
partitioning of a solute between two immiscible solvents present in a mixture.
Distribution of the solute between the two immiscible solvents is the basis for this
technique. Transfer of a solute from one solvent to another is achieved by shaking them
together and reaching the equilibrium. Once equilibrium is reached, no further solute
transfer can occur and the concentration of the solute in each solvent remains constant.
Ratio of these concentrations is known as the partition coefficient. This value is
dependent on the nature of solute, solvents and the temperature of the system.
Measurement of partition coefficient provides an easy method to study the degree of
association (or dissociation) of a solute in a solvent.
If the solute is in the same state of association (or dissociation) in both the solvents at a
specified temperature, the ratio of concentrations of the solute in the two solvents remains
constant independent of the total amount of substance taken.
𝐶𝐴𝐶𝐵= 𝐾𝐷
where CA and CB are the concentrations of the solute in solvents A and B respectively and
KD is the partition or distribution coefficient. This may be explained on the basis that at
equilibrium, the chemical potential of a solute in the two liquid phases become equal ie.
𝜇(𝐴) = 𝜇(𝐵) 𝜇0(𝐴) + 𝑅𝑇𝑙𝑛𝑎𝐴 = 𝜇0(𝐵) + 𝑅𝑇𝑙𝑛𝑎𝐵

33
33
since 0(A) and 0(B) are constants, 𝑎𝐴
𝑎𝐵=𝐶𝐴
𝐶𝐵= 𝑐𝑜𝑛𝑠𝑡𝑎𝑛𝑡
{when the concentrations of the solutes in the two phases are small, the activities, a can
be replaced by the concentrations}
If a solute exists as a monomer, X in solvent A, while it associates to give the dimer, X2
or n-mer Xn such that the equilibrium, 𝑛𝑋 ⇌ 𝑋𝑛 is set up in the solvent B, then the ratio
𝐶𝐴
√(𝐶𝐵)𝑛
= 𝐾𝐷
where CB is the total concentration of X in B. Benzoic acid generally exists as a dimer in
toluene, whereas it exists as a monomer in water. The present experiment is to calculate
the partition coefficient of benzoic acid between these nonpolar and polar solvents.
Apparatus
Stoppered bottle, Volumetric flask, Pipette, Burette, Beaker, Conical flask, Funnel.
Materials
0.1 N oxalic acid solution (standard), ~ 0.1 N NaOH solution, Benzoic acid, Toluene,
Phenolphthalein.
Experimental Procedure
1. Prepare 100 mL of a saturated solution of benzoic acid: take ~ 1 g benzoic in ~ 90
mL water in a stoppered bottle, stir using a magnetic bar, filter and make up to 100
mL in a volumetric flask.
2. Take 50 mL of the saturated aqueous benzoic acid solution and 50 mL of toluene in a
250 mL bottle; mark it as I. In another 250 mL bottle (II), take 25 mL of the
saturated aqueous benzoic acid solution and add 25 mL of water and 50 mL of
toluene. Stopper the two bottles properly and shake in a mechanical shaker for half
an hour and then allow to settle.

34
34
3. Prepare 100 mL of 0.1 N oxalic acid (standard). Prepare ~ 250 mL of ~ 0.1 N NaOH
and standardize it against the oxalic acid using phenolphthalein as the indicator.
4. Take 20 mL of the aqueous layer from bottle I [Note: Close the top end of the pipette
with your finger, insert it carefully into the lower aqueous layer in the bottle, and
withdraw the solution carefully]. Titrate it against the NaOH solution using
phenolphthalein as the indicator. Repeat for consistent readings.
5. Withdraw 10 mL of the upper toluene layer from bottle I, pour it in ~ 20 mL of water
in a conical flask, shake to accelerate the passage of the benzoic acid across the
interface into the water layer; titrate with NaOH. Repeat for consistent readings.
6. Repeat Steps 4 and 5 for bottle II.
7. Calculate the molar (M) concentrations of benzoic acid in the two layers and find the
ratios 𝐶𝑊
𝐶𝑇 and
𝐶𝑊
√𝐶𝑇.
Data and analysis
Mean of the temperatures before and after the experiment = _________oC
Preparation of 0.1 N standard oxalic acid solution (Step 3)
Weight of oxalic required to make 100 mL 0.1 N solution: _________ g
Weight of empty container = _________ g
Weight of container + oxalic acid = _________ g
Weight of oxalic acid = _________ g
Concentration of oxalic solution prepared = _________ N
Standardization of NaOH solution (Step 3)
Volume of the oxalic acid solution = _________ mL
Burette readings (ml) Volume of
NaOH (ml)
Mean volume
(ml) Initial Final
Concentration of the NaOH solution = _________ N

35
35
Composition of the sets in the two bottles (Step 2)
Bottle Volume (mL)
Benzoic acid Water Toluene
I 50 0 50
II 25 25 50
Bottle I
Titration of aqueous layer (Step 4)
Volume of the aqueous solution = _________ mL
Burette readings (mL) Volume of
NaOH (mL)
Mean volume
(mL) Initial Final
Concentration of benzoic acid in the aqueous layer, CW = _________ M
Titration of toluene layer (Step 5)
Volume of the toluene layer + water = _________ mL
Burette readings (mL) Volume of
NaOH (mL)
Mean volume
(mL) Initial Final
Concentration of benzoic acid in the toluene layer, CT = _________ M
Bottle II
Titration of aqueous layer (Step 6)
Volume of the aqueous solution = _________ mL
Burette readings (mL) Volume of
NaOH (mL)
Mean volume
(mL) Initial Final
Concentration of benzoic acid in the aqueous layer, CW = _________ M
36
36
Titration of toluene layer (Step 6)
Volume of the toluene layer + water = _________ mL
Burette readings (mL) Volume of
NaOH (mL)
Mean volume
(mL) Initial Final
Concentration of benzoic acid in the toluene layer, CT = _________ M
Partition coefficient (Step 7)
Bottle CW (M) CT (M) CW / CT KD = CW / CT Mean value
of KD
I
II