Customer Churn Prediction for PC Games - Kth Diva Portal Org
Upload
khangminh22Category
view
2download
0
RESEARCH ARTICLE
Customer churn prediction for telecommunication industry: A
Malaysian Case Study [version 1; peer review: 2 approved]
Nurulhuda Mustafa1, Lew Sook Ling 2, Siti Fatimah Abdul Razak 2
1Telekom Malaysia, Faculty of Business, Ayer Keroh, Melaka, 75450, Malaysia 2Faculty of Information Science and Technology, Multimedia University, Ayer Keroh, Melaka, 75450, Malaysia
First published: 13 Dec 2021, 10:1274 https://doi.org/10.12688/f1000research.73597.1Latest published: 13 Dec 2021, 10:1274 https://doi.org/10.12688/f1000research.73597.1
v1
Abstract Background: Customer churn is a term that refers to the rate at which customers leave the business. Churn could be due to various factors, including switching to a competitor, cancelling their subscription because of poor customer service, or discontinuing all contact with a brand due to insufficient touchpoints. Long-term relationships with customers are more effective than trying to attract new customers. A rise of 5% in customer satisfaction is followed by a 95% increase in sales. By analysing past behaviour, companies can anticipate future revenue. This article will look at which variables in the Net Promoter Score (NPS) dataset influence customer churn in Malaysia's telecommunications industry. The aim of This study was to identify the factors behind customer churn and propose a churn prediction framework currently lacking in the telecommunications industry. Methods: This study applied data mining techniques to the NPS dataset from a Malaysian telecommunications company in September 2019 and September 2020, analysing 7776 records with 30 fields to determine which variables were significant for the churn prediction model. We developed a propensity for customer churn using the Logistic Regression, Linear Discriminant Analysis, K-Nearest Neighbours Classifier, Classification and Regression Trees (CART), Gaussian Naïve Bayes, and Support Vector Machine using 33 variables. Results: Customer churn is elevated for customers with a low NPS. However, an immediate helpdesk can act as a neutral party to ensure that the customer needs are met and to determine an employee's ability to obtain customer satisfaction. Conclusions: It can be concluded that CART has the most accurate churn prediction (98%). However, the research is prohibited from accessing personal customer information under Malaysia's data protection policy. Results are expected for other businesses to measure potential customer churn using NPS scores to gather customer feedback.
Open Peer Review
Approval Status
1 2
version 113 Dec 2021 view view
Catur Supriyanto , Universitas Dian
Nuswantoro, Semarang, Indonesia
1.
D. I. George Amalarethinam , Jamal
Mohamed College, Tiruchirappalli, India
2.
Any reports and responses or comments on the
article can be found at the end of the article.
Page 1 of 20
F1000Research 2021, 10:1274 Last updated: 13 JUN 2022

Corresponding author: Lew Sook Ling ([email protected])Author roles: Mustafa N: Data Curation, Investigation, Methodology, Software, Validation, Visualization, Writing – Original Draft Preparation; Sook Ling L: Conceptualization, Methodology, Project Administration, Supervision, Validation, Writing – Review & Editing; Abdul Razak SF: Conceptualization, Methodology, Software, Supervision, Validation, Writing – Review & EditingCompeting interests: No competing interests were disclosed.Grant information: The author(s) declared that no grants were involved in supporting this work.Copyright: © 2021 Mustafa N et al. This is an open access article distributed under the terms of the Creative Commons Attribution License, which permits unrestricted use, distribution, and reproduction in any medium, provided the original work is properly cited.How to cite this article: Mustafa N, Sook Ling L and Abdul Razak SF. Customer churn prediction for telecommunication industry: A Malaysian Case Study [version 1; peer review: 2 approved] F1000Research 2021, 10:1274 https://doi.org/10.12688/f1000research.73597.1First published: 13 Dec 2021, 10:1274 https://doi.org/10.12688/f1000research.73597.1
Keywords Customer Churn, Net Promoter Score (NPS), Data Mining Techniques, Classification and Regression Trees (CART)
This article is included in the Research Synergy
Foundation gateway.
Page 2 of 20
F1000Research 2021, 10:1274 Last updated: 13 JUN 2022
IntroductionCustomer retention and customer satisfaction are essential for a business to succeed.1 Customer satisfaction is improved byrepeating businesses, brand loyalty, and positiveword ofmouth.2 Consumers prefer to staywith their current providers dueto quality and price. Therefore, new anti-churn strategies must be constantly developed.3 Data processing automatesanalytical model building. Machine learning algorithms improve the dataset iteratively to find hidden patterns.4 Severalstudies show that machine learning can predict churn and severe problems in competitive service sectors. Predictingchurning customers early on can be a valuable revenue source.5 The results of the mediating effects of a customer's partialdefection on the relationship between churn determinants and total defection show that some churn determinants influencecustomer churn, either directly or indirectly through a customer's status change, or both; thus, a customer's status changeexplains the relationship between churn determinants and the probability of churn.6 This study hypothesised that changesin Net Promoter Score (NPS) can indicate whether churn determinants directly or indirectly influence churn.
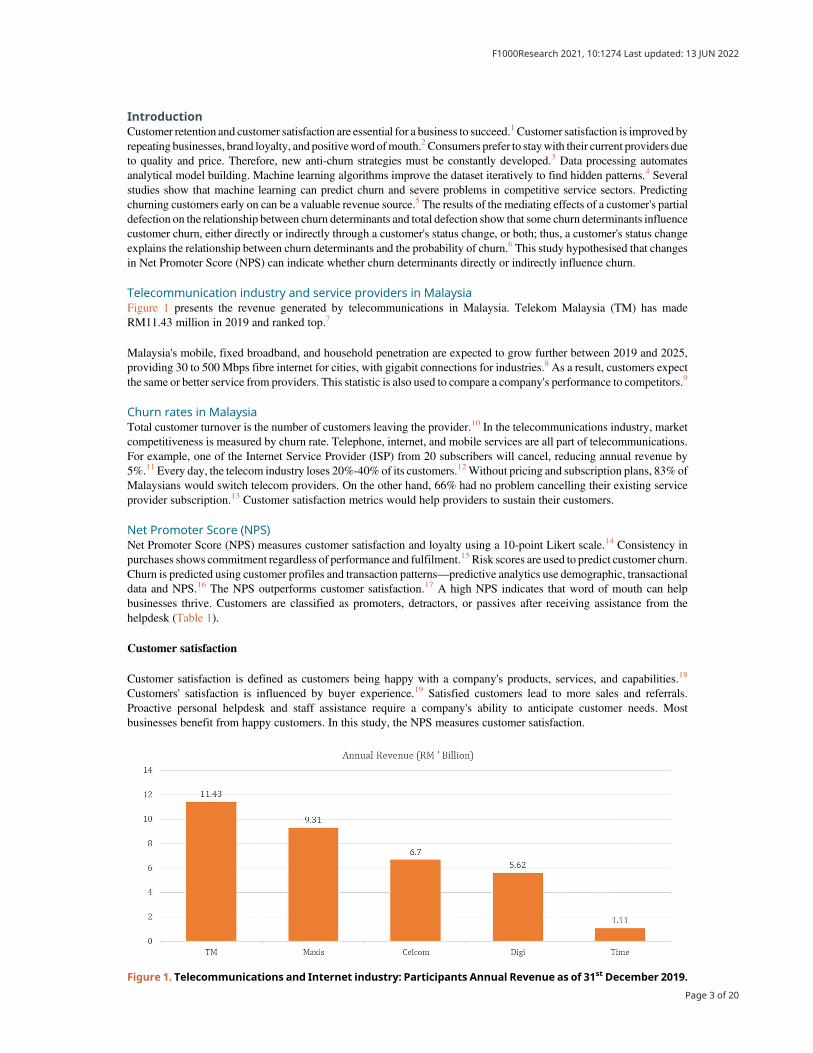
Telecommunication industry and service providers in MalaysiaFigure 1 presents the revenue generated by telecommunications in Malaysia. Telekom Malaysia (TM) has madeRM11.43 million in 2019 and ranked top.7
Malaysia's mobile, fixed broadband, and household penetration are expected to grow further between 2019 and 2025,providing 30 to 500 Mbps fibre internet for cities, with gigabit connections for industries.8 As a result, customers expectthe same or better service from providers. This statistic is also used to compare a company's performance to competitors.9
Churn rates in MalaysiaTotal customer turnover is the number of customers leaving the provider.10 In the telecommunications industry, marketcompetitiveness is measured by churn rate. Telephone, internet, and mobile services are all part of telecommunications.For example, one of the Internet Service Provider (ISP) from 20 subscribers will cancel, reducing annual revenue by5%.11 Every day, the telecom industry loses 20%-40% of its customers.12Without pricing and subscription plans, 83% ofMalaysians would switch telecom providers. On the other hand, 66% had no problem cancelling their existing serviceprovider subscription.13 Customer satisfaction metrics would help providers to sustain their customers.
Net Promoter Score (NPS)Net Promoter Score (NPS) measures customer satisfaction and loyalty using a 10-point Likert scale.14 Consistency inpurchases shows commitment regardless of performance and fulfilment.15 Risk scores are used to predict customer churn.Churn is predicted using customer profiles and transaction patterns—predictive analytics use demographic, transactionaldata and NPS.16 The NPS outperforms customer satisfaction.17 A high NPS indicates that word of mouth can helpbusinesses thrive. Customers are classified as promoters, detractors, or passives after receiving assistance from thehelpdesk (Table 1).
Customer satisfaction
Customer satisfaction is defined as customers being happy with a company's products, services, and capabilities.18
Customers' satisfaction is influenced by buyer experience.19 Satisfied customers lead to more sales and referrals.Proactive personal helpdesk and staff assistance require a company's ability to anticipate customer needs. Mostbusinesses benefit from happy customers. In this study, the NPS measures customer satisfaction.
Figure 1. Telecommunications and Internet industry: Participants Annual Revenue as of 31st December 2019.
Page 3 of 20
F1000Research 2021, 10:1274 Last updated: 13 JUN 2022
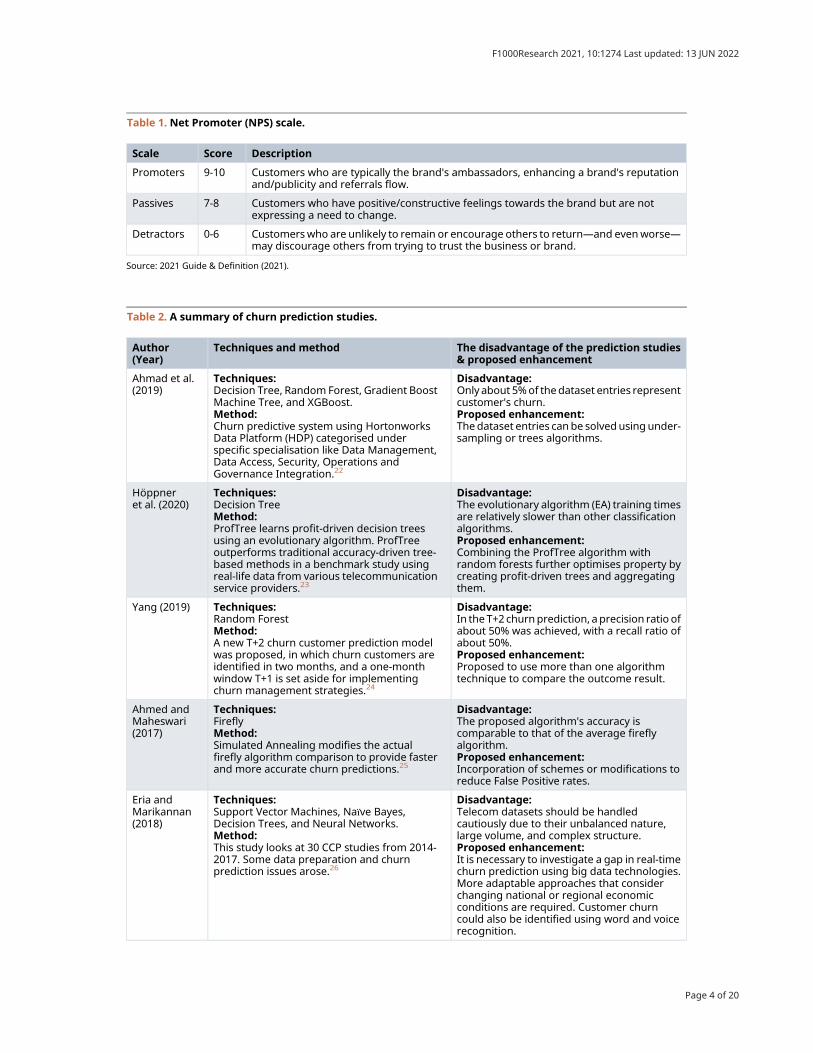
Table 1. Net Promoter (NPS) scale.
Scale Score Description
Promoters 9-10 Customers who are typically the brand's ambassadors, enhancing a brand's reputationand/publicity and referrals flow.
Passives 7-8 Customers who have positive/constructive feelings towards the brand but are notexpressing a need to change.
Detractors 0-6 Customers who are unlikely to remain or encourage others to return—and evenworse—may discourage others from trying to trust the business or brand.
Source: 2021 Guide & Definition (2021).
Table 2. A summary of churn prediction studies.
Author(Year)
Techniques and method The disadvantage of the prediction studies& proposed enhancement
Ahmad et al.(2019)
Techniques:Decision Tree, Random Forest, Gradient BoostMachine Tree, and XGBoost.Method:Churn predictive system using HortonworksData Platform (HDP) categorised underspecific specialisation like Data Management,Data Access, Security, Operations andGovernance Integration.22
Disadvantage:Only about 5%of thedataset entries representcustomer's churn.Proposed enhancement:Thedataset entries canbe solvedusing under-sampling or trees algorithms.
Höppneret al. (2020)
Techniques:Decision TreeMethod:ProfTree learns profit-driven decision treesusing an evolutionary algorithm. ProfTreeoutperforms traditional accuracy-driven tree-based methods in a benchmark study usingreal-life data from various telecommunicationservice providers.23
Disadvantage:The evolutionary algorithm (EA) training timesare relatively slower than other classificationalgorithms.Proposed enhancement:Combining the ProfTree algorithm withrandom forests further optimises property bycreating profit-driven trees and aggregatingthem.
Yang (2019) Techniques:Random ForestMethod:A new T+2 churn customer prediction modelwas proposed, in which churn customers areidentified in two months, and a one-monthwindow T+1 is set aside for implementingchurn management strategies.24
Disadvantage:In the T+2 churnprediction, a precision ratio ofabout 50% was achieved, with a recall ratio ofabout 50%.Proposed enhancement:Proposed to use more than one algorithmtechnique to compare the outcome result.
Ahmed andMaheswari(2017)
Techniques:FireflyMethod:Simulated Annealing modifies the actualfirefly algorithm comparison to provide fasterand more accurate churn predictions.25
Disadvantage:The proposed algorithm's accuracy iscomparable to that of the average fireflyalgorithm.Proposed enhancement:Incorporation of schemes or modifications toreduce False Positive rates.
Eria andMarikannan(2018)
Techniques:Support Vector Machines, Naïve Bayes,Decision Trees, and Neural Networks.Method:This study looks at 30 CCP studies from 2014-2017. Some data preparation and churnprediction issues arose.26
Disadvantage:Telecom datasets should be handledcautiously due to their unbalanced nature,large volume, and complex structure.Proposed enhancement:It is necessary to investigate a gap in real-timechurn prediction using big data technologies.More adaptable approaches that considerchanging national or regional economicconditions are required. Customer churncould also be identified using word and voicerecognition.
Page 4 of 20
F1000Research 2021, 10:1274 Last updated: 13 JUN 2022
Table
3.Asu
mmary
forch
urn
pre
dictionframew
ork
studies.
Auth
or(Yea
r)
Ahnetal.(200
6)Clemes
etal.(201
0)Gee
thaandAbithaKumari
(201
2)Kim
etal.(201
7)
Pro
pose
Des
cribes
acu
stomer'sstatustran
sitionfrom
active
tonon-use
rorsu
spen
ded
asapartial
defec
tionan
dfrom
functional
toab
solute
defec
tive
defec
tionfrom
active
toch
urn
.27
Iden
tifies
andan
alyses
factors
influen
cingban
kcu
stomers'
switch
ingbeh
aviourin
the
Chines
eretailban
kingindustry.28
Pro
vides
abrief
ove
rviewofthetren
dof
non-rev
enueea
rningcu
stomers
(NREC
s)that
trigger
reve
nuech
urn
and
arelik
elyto
churn
soon.29
Analyses
thefactors
that
areaffecting
IPTV
servicepro
viders'beh
aviour
regardingsw
itch
ingbarriers,VOCs,
andco
ntentco
nsu
mption.30
Data
setandte
chniques
Data
set:10
,000
random
samplesfrom
lead
ing
pro
vidersofm
obile
teleco
mmunicationsse
rvices
inSo
uth
Korea
Tech
nique:
Logisticregression
Data
set:
437/70
0ques
tionnaires
Tech
nique:
Logisticregression
Data
set:
37,388
datas
etsfrom
alead
ingteleco
mse
rvicePro
vider
Tech
nique:
Linea
rmodellin
g
Data
set:
5000
datas
etsfrom
IPTV
use
rsin
South
Korea/
Tech
nique:
Logisticregression
Variables
Dep
endentva
riables
Customer
churn
Indep
enden
tva
riables
Customer
Dissa
tisfac
tion
Calld
roprate
Callfailure
rate
Number
ofco
mplaints
Switch
ingco
sts
Loya
ltypoints
Mem
bersh
ipca
rdSe
rviceusa
ge
Billed
amounts
Unpaidbalan
ces
Number
ofunpaidmonthly
bills
Customer
status
Customer-related
variab
les
Depen
den
tva
riables
Switch
ingBeh
aviour
Indep
enden
tva
riables
Price
Rep
utation
ServiceQuality
EffectiveAdve
rtisingbyTh
eCompetition
Invo
luntary
Switch
ing
Distance
Switch
ingCosts
Dem
ographicCharac
teristic
Dep
enden
tva
riables
Suscep
tibility
toChurn
Indep
enden
tva
riables
Theex
tentofLo
calC
allsan
dST
DCalls
toOther
Networks
Multiple
direc
tory
numbers
Rateplan
Tariff
Admin
fee
Countofrech
arge
Sum
ofrech
arge
VASUsa
ge
Totalm
inutesofusa
geVAS
Ove
rallusa
gereve
nueper
minute
slab
Totalu
sagereve
nue
Dep
enden
tva
riables
Customer
Beh
aviours
Customer
defec
tion
Indep
enden
tva
riables
Switch
Barrier
Servicebundlin
gRem
ainingco
ntrac
tmonths
Mem
bersh
ippoints
VOC(VoiceofCustomer)
TotalV
OC
Mem
bersh
ipPeriod
Mem
bersh
ipye
ars
Deg
reeofContentUsa
ge
Chan
nel
view
sVODview
sTV
ODview
sPPV
Monthly
subscriptions
Page 5 of 20
F1000Research 2021, 10:1274 Last updated: 13 JUN 2022
Table
3.Con
tinue
d
Auth
or(Yea
r)
Ahnetal.(200
6)Clemes
etal.(201
0)Gee
thaandAbithaKumari
(201
2)Kim
etal.(201
7)
Hyp
oth
eses
H1Customer
Dissa
tisfac
tionàCustomer
churn
H2Sw
itch
ingco
stsàCustomer
churn
H3Se
rviceusa
geàCustomer
churn
H4Customer
statusàCustomer
churn
Med
iationeffects
H1'
Customer
Dissa
tisfac
tionàCustomer
Status
H2'
Switch
ingco
stsàCustomer
Status
H3'
Serviceusa
geàCustomer
Status
H1price
àcu
stomerssw
itch
ing
ban
ksH2reputationàcu
stomers
switch
ingban
ksH3se
rvicequalityàcu
stomers
switch
ingban
ksH4Effectivead
vertisingbythe
competitionàcu
stomers
switch
ingban
ksH5Invo
luntary
switch
ingà
customerssw
itch
ingban
ksH6distance
àcu
stomers
switch
ingban
ksH7sw
itch
ingco
stsàcu
stomers
switch
ingban
ksH8–H
15Dem
ographic
Charac
teristicàcu
stomers
switch
ingban
ks
H1Pro
portionofloca
lcallsto
other
networksàsu
scep
tibility
toch
urn
H2Pro
portionofST
Dca
llsto
other
networksàsu
scep
tibility
toch
urn
H3Usa
geofVASs
àsu
scep
tibility
toch
urn
H4Ove
rallusa
geRPM
àsu
scep
tibility
toch
urn
H1Se
rvicebundlin
gàDeg
reeof
contents
usa
ge
H2Rem
ainingco
ntrac
tmonthsà
Deg
reeofco
ntents
usa
ge
H3Mem
bersh
ippoints
àDeg
reeof
contents
usa
ge
H4To
talV
OCàDeg
reeofco
ntents
usa
ge
H5Mem
bersh
ipye
arsàDeg
reeof
contents
usa
ge
H6Se
rvicebundlin
gàCustomer
defec
tion
H7Rem
ainingco
ntrac
tmonthsà
Customer
defec
tion
H8Mem
bersh
ippoints
àCustomer
defec
tion
H9To
talV
OCàCustomer
defec
tion
H10
Mem
bersh
ipye
arsàCustomer
defec
tion
H11
Chan
nel
view
sàCustomer
defec
tion
H12
VODview
sàCustomer
defec
tion
H13
TVODview
sàCustomer
defec
tion
H14
PPVàCustomer
defec
tion
H15
Monthlysu
bscriptionsàCustomer
defec
tion
Resu
lts
H1a
,H1c
,H2a
,H3a
,H4,
H1c
0 ,H2a
0 andH3a
0 =Su
pported
H1b
,H2b
,H3b
,H3c
,H1a
0 ,H1b
0 ,H2b
0 ,H3b
0 and
H3c
0 =Rejec
ted
H1to
H15
=Su
pported
H1to
H4=Su
pported
H1,
H2,
H3,
H4,
H5,
H6,
H9,
H14
and
H15
=Su
pported
H7,
H8,
H10
,H11
,H12
and
H13
=Rejec
ted
Page 6 of 20
F1000Research 2021, 10:1274 Last updated: 13 JUN 2022
Excellent serviceAn excellent service exceeds consumer expectations and satisfaction by providing high-quality services. Those areability, attitude, appearance, attention, action, and accountability.20 A customer-centric approach benefits both privateand public companies. Using this mindset also helps providers win customers and save money. In addition, customerswill stay loyal regardless of market choice if companies treat them well.
Transparent subscriptions
In 2019, accountability was the key to sustaining a profitable company. Authenticity trumps traditional priorities likeprice and brand recognition.21 In addition, transparency promotes trust, peace of mind and openness. Happy customersare more pleasant than dissatisfied customers, As such, individual customers feedback counts.
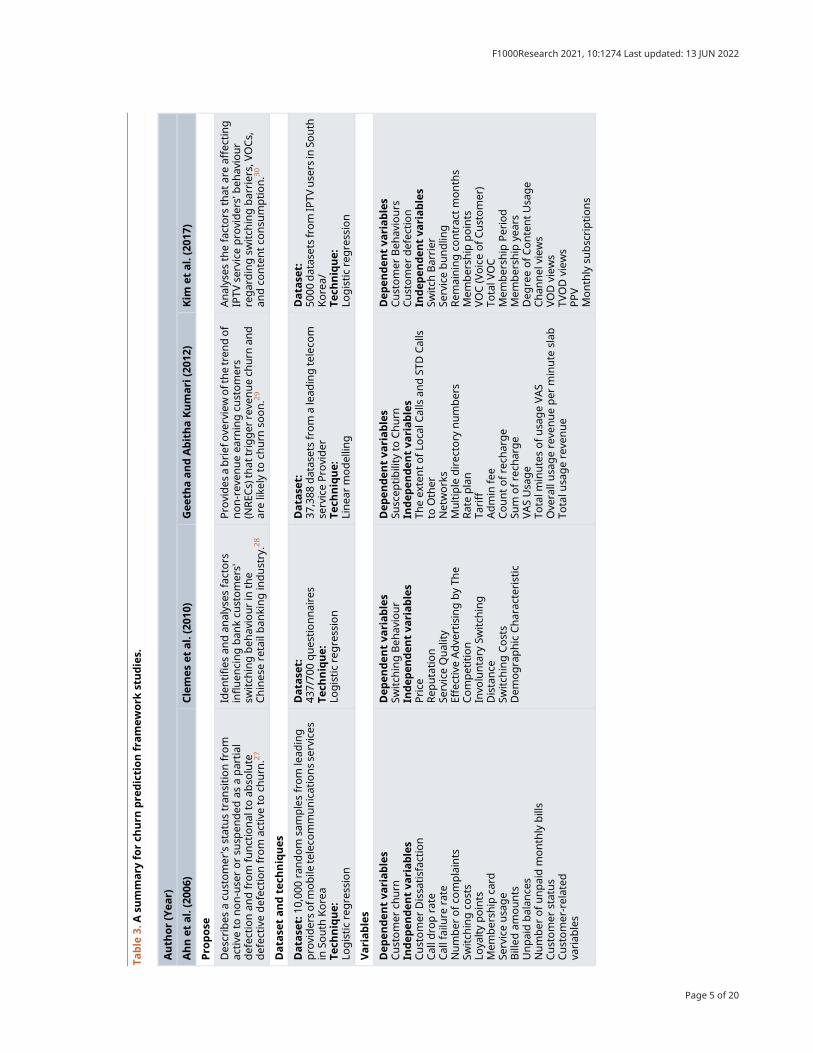
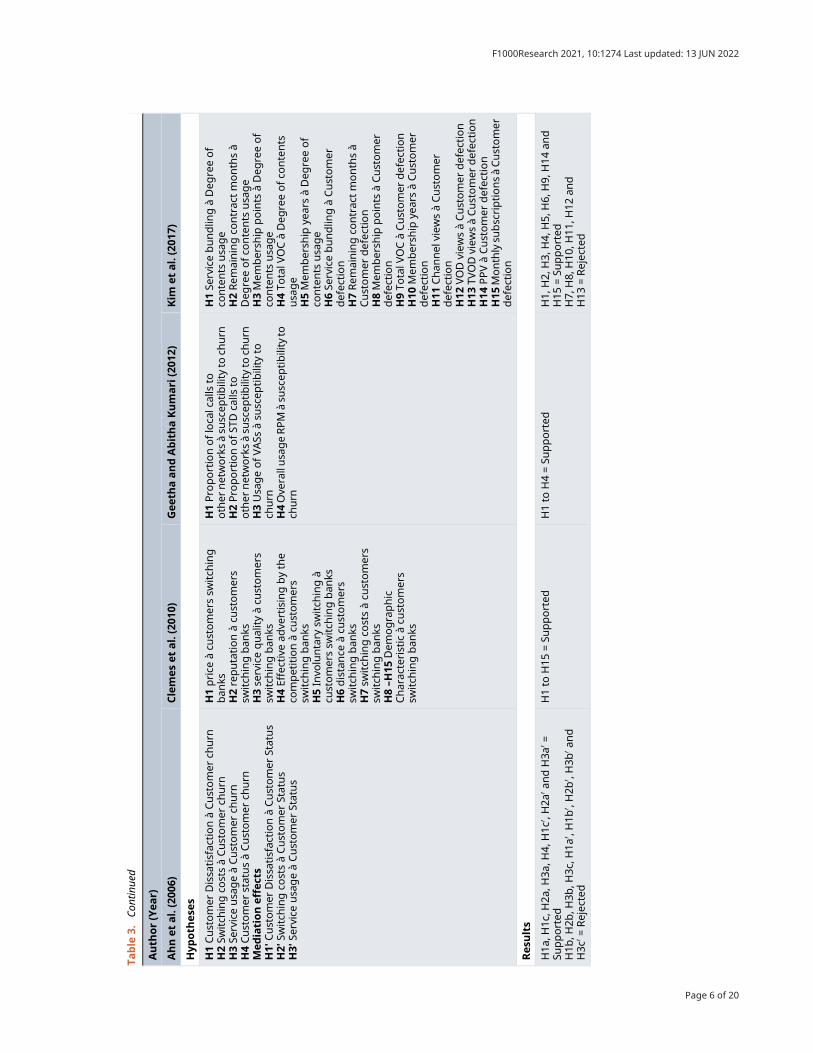
Churn prediction techniques/frameworkCompanies can classify potential customers who leave the services using advanced machine learning (ML) technology.Then, using existing data, the company can identify potential churn customers. This knowledgewould allow the companyto target those customers and recover them. Table 2 and Table 3 summarise the most recent churn prediction andframework studies.
Machine learning can predict customer churn by identifying at-risk clients, pain points and interpreting data. Table 3identifies dependent and independent variables in prior research on customer churn prediction. The cause is an
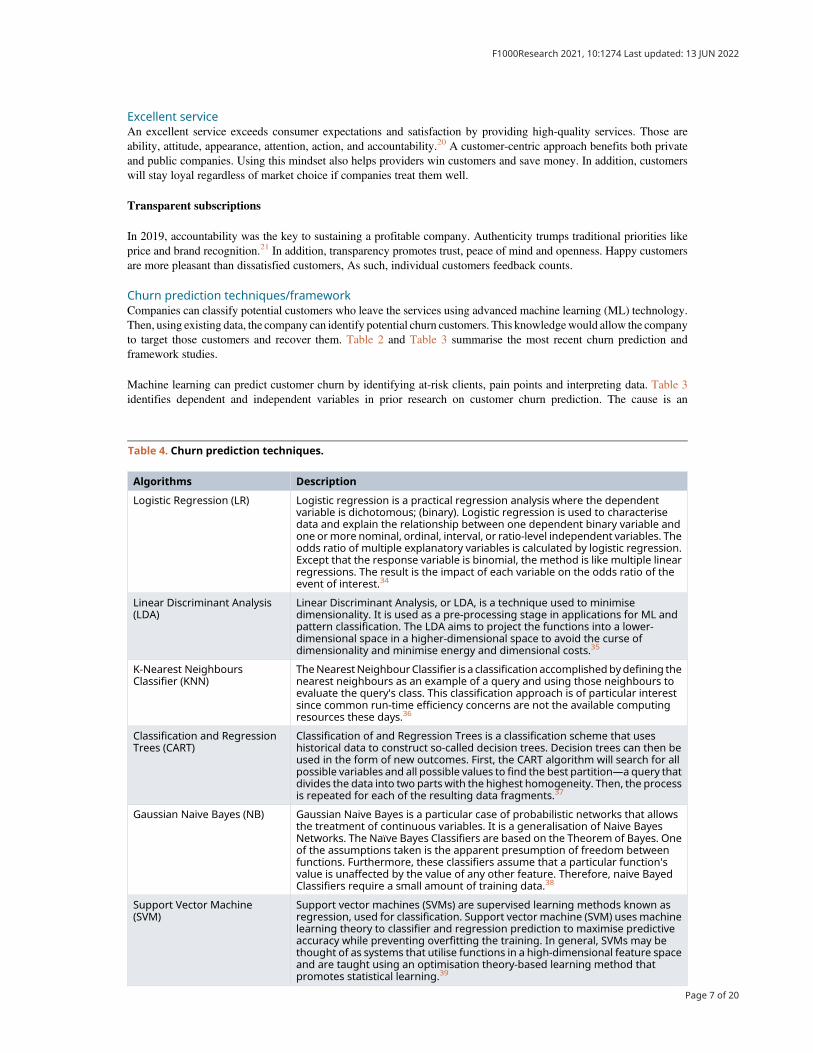
Table 4. Churn prediction techniques.
Algorithms Description
Logistic Regression (LR) Logistic regression is a practical regression analysis where the dependentvariable is dichotomous; (binary). Logistic regression is used to characterisedata and explain the relationship between one dependent binary variable andone ormore nominal, ordinal, interval, or ratio-level independent variables. Theodds ratio of multiple explanatory variables is calculated by logistic regression.Except that the response variable is binomial, the method is like multiple linearregressions. The result is the impact of each variable on the odds ratio of theevent of interest.34
Linear Discriminant Analysis(LDA)
Linear Discriminant Analysis, or LDA, is a technique used to minimisedimensionality. It is used as a pre-processing stage in applications for ML andpattern classification. The LDA aims to project the functions into a lower-dimensional space in a higher-dimensional space to avoid the curse ofdimensionality and minimise energy and dimensional costs.35
K-Nearest NeighboursClassifier (KNN)
TheNearestNeighbour Classifier is a classification accomplishedbydefining thenearest neighbours as an example of a query and using those neighbours toevaluate the query's class. This classification approach is of particular interestsince common run-time efficiency concerns are not the available computingresources these days.36
Classification and RegressionTrees (CART)
Classification of and Regression Trees is a classification scheme that useshistorical data to construct so-called decision trees. Decision trees can then beused in the form of new outcomes. First, the CART algorithm will search for allpossible variables and all possible values to find the best partition—a query thatdivides the data into two parts with the highest homogeneity. Then, the processis repeated for each of the resulting data fragments.37
Gaussian Naive Bayes (NB) Gaussian Naive Bayes is a particular case of probabilistic networks that allowsthe treatment of continuous variables. It is a generalisation of Naive BayesNetworks. The Naïve Bayes Classifiers are based on the Theorem of Bayes. Oneof the assumptions taken is the apparent presumption of freedom betweenfunctions. Furthermore, these classifiers assume that a particular function'svalue is unaffected by the value of any other feature. Therefore, naive BayedClassifiers require a small amount of training data.38
Support Vector Machine(SVM)
Support vector machines (SVMs) are supervised learning methods known asregression, used for classification. Support vector machine (SVM) uses machinelearning theory to classifier and regression prediction to maximise predictiveaccuracy while preventing overfitting the training. In general, SVMs may bethought of as systems that utilise functions in a high-dimensional feature spaceand are taught using an optimisation theory-based learning method thatpromotes statistical learning.39
Page 7 of 20
F1000Research 2021, 10:1274 Last updated: 13 JUN 2022
independent variable, and the effect is a dependent variable. As such, the factors included in this study are customer churn,defection, demographics, and the voice of the customer (NPS rating).
Traditional/statistical approachesThe traditional statistics approaches are used to solve problems involving less linear and repeatable data. They work wellin environments with stable data and relationships. This is still widely used for medium- to long-term sales forecasting,where a reasonable forecast can be made with a few hundred or even fewer data points. Machine learning and statisticsdiffer significantly. Machine learning models are created to make the most precise predictions possible. The purpose ofstatistical models is to make inferences about the relationships between variables.31 Machine Learning is a data-drivenalgorithm that does not rely on rules-based programming. Statistical modelling is the use of mathematical equations toformalise relationships between variables.32 This study appliedmachine learning and statistical approaches to analyse thepotential churn and the mediation relationship between variables.
Machine learning techniques in churn predictionMachine Learning (ML) is a branch of artificial intelligence. ML uses existing algorithms and data sets to classifypatterns.33 This study adopts six widely used churn prediction techniques. All these algorithms were evaluated based onthe performance accuracy when applied to the same data for a fair comparison. Table 4 describes the well-known churnprediction techniques.
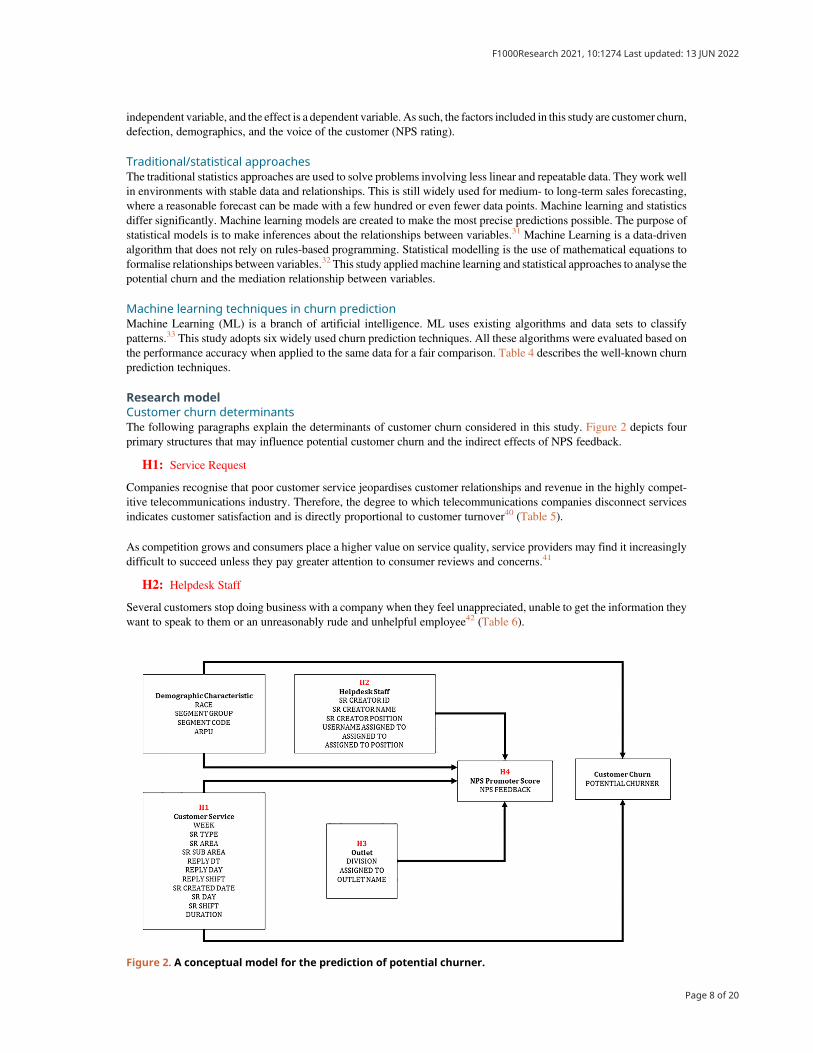
Research modelCustomer churn determinantsThe following paragraphs explain the determinants of customer churn considered in this study. Figure 2 depicts fourprimary structures that may influence potential customer churn and the indirect effects of NPS feedback.
H1: Service Request
Companies recognise that poor customer service jeopardises customer relationships and revenue in the highly compet-itive telecommunications industry. Therefore, the degree to which telecommunications companies disconnect servicesindicates customer satisfaction and is directly proportional to customer turnover40 (Table 5).
As competition grows and consumers place a higher value on service quality, service providers may find it increasinglydifficult to succeed unless they pay greater attention to consumer reviews and concerns.41
H2: Helpdesk Staff
Several customers stop doing business with a company when they feel unappreciated, unable to get the information theywant to speak to them or an unreasonably rude and unhelpful employee42 (Table 6).
Figure 2. A conceptual model for the prediction of potential churner.
Page 8 of 20
F1000Research 2021, 10:1274 Last updated: 13 JUN 2022
Poor customer service, such as rude employees, delays in service, or incorrect details, can cause customer frustration andincrease the churn rate.43
H3: Outlet
Professionalism, friendliness, knowledge, communication, and sales skills are a few examples. Additionally, providerscan reduce customer churn by adjusting service prices, policies, and branching44 (Table 7).
An important management assumption is that employee attitudes and reactions to organisational changes are related todepartment performance.45
H4: NPS score feedback
Collecting NPS surveys is a great way to get customer feedback and send them to the right team. For example, promotersshould send a customer's name to the team for testimonials and case studies or sign up for a customer loyaltyprogramme.46 The survey divided over a thousand NPS feedback types into three categories: distractor, passive, andpromoter (Table 8).
Mediation effects of NPS feedbackA mediating variable links the independent and dependent variables. Its existence explains why the other two variableshave amediator relationship.47 Some churn predictors may impact customer churn directly, indirectly, or both. This study
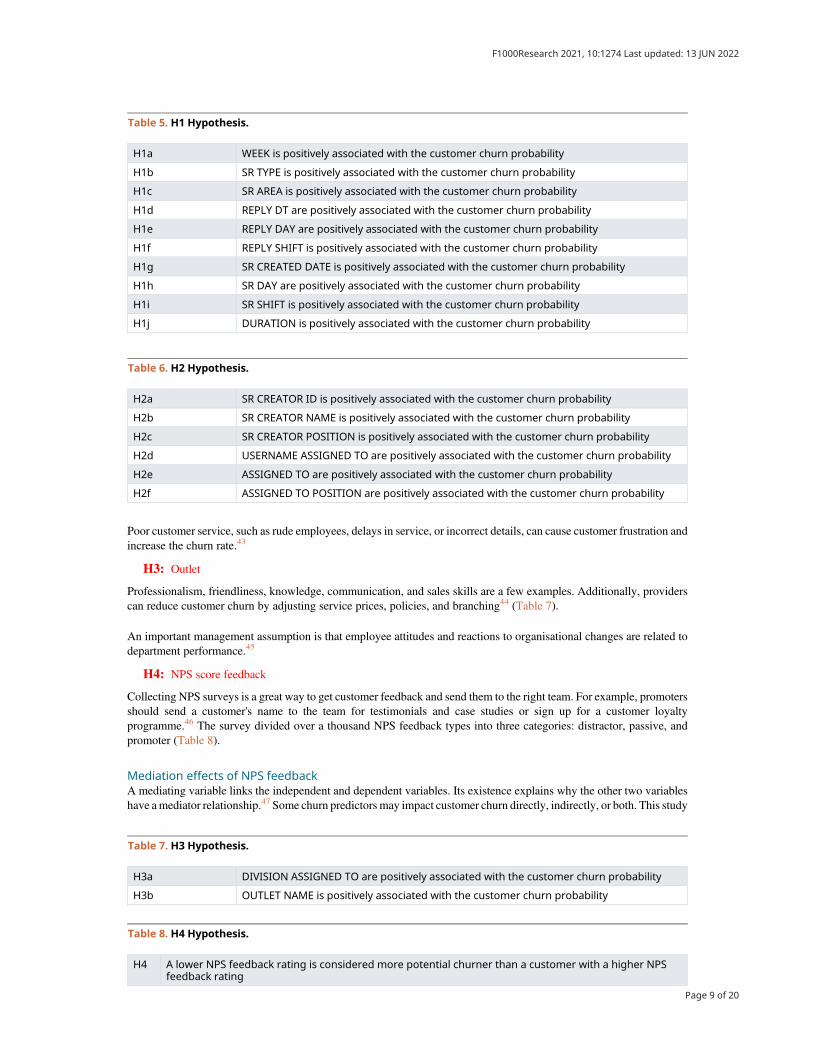
Table 5. H1 Hypothesis.
H1a WEEK is positively associated with the customer churn probability
H1b SR TYPE is positively associated with the customer churn probability
H1c SR AREA is positively associated with the customer churn probability
H1d REPLY DT are positively associated with the customer churn probability
H1e REPLY DAY are positively associated with the customer churn probability
H1f REPLY SHIFT is positively associated with the customer churn probability
H1g SR CREATED DATE is positively associated with the customer churn probability
H1h SR DAY are positively associated with the customer churn probability
H1i SR SHIFT is positively associated with the customer churn probability
H1j DURATION is positively associated with the customer churn probability
Table 6. H2 Hypothesis.
H2a SR CREATOR ID is positively associated with the customer churn probability
H2b SR CREATOR NAME is positively associated with the customer churn probability
H2c SR CREATOR POSITION is positively associated with the customer churn probability
H2d USERNAME ASSIGNED TO are positively associated with the customer churn probability
H2e ASSIGNED TO are positively associated with the customer churn probability
H2f ASSIGNED TO POSITION are positively associated with the customer churn probability
Table 7. H3 Hypothesis.
H3a DIVISION ASSIGNED TO are positively associated with the customer churn probability
H3b OUTLET NAME is positively associated with the customer churn probability
Table 8. H4 Hypothesis.
H4 A lower NPS feedback rating is considered more potential churner than a customer with a higher NPSfeedback rating
Page 9 of 20
F1000Research 2021, 10:1274 Last updated: 13 JUN 2022
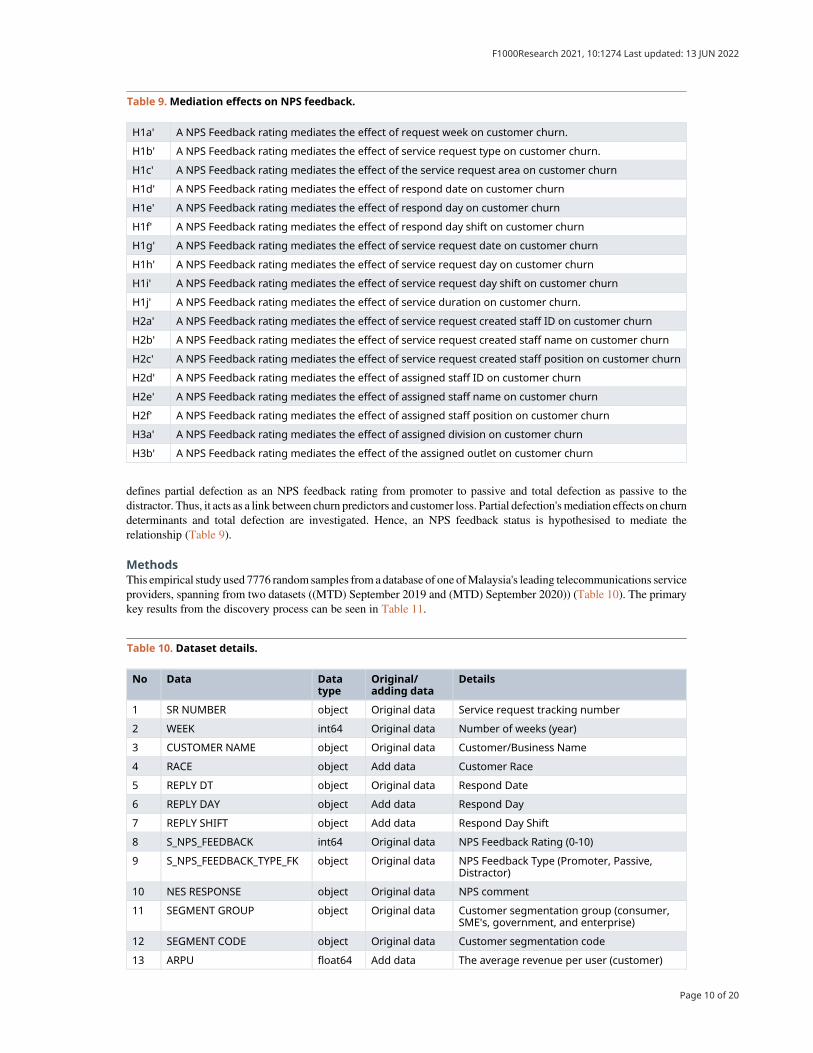
defines partial defection as an NPS feedback rating from promoter to passive and total defection as passive to thedistractor. Thus, it acts as a link between churn predictors and customer loss. Partial defection'smediation effects on churndeterminants and total defection are investigated. Hence, an NPS feedback status is hypothesised to mediate therelationship (Table 9).
MethodsThis empirical study used 7776 random samples from a database of one ofMalaysia's leading telecommunications serviceproviders, spanning from two datasets ((MTD) September 2019 and (MTD) September 2020)) (Table 10). The primarykey results from the discovery process can be seen in Table 11.
Table 9. Mediation effects on NPS feedback.
H1a' A NPS Feedback rating mediates the effect of request week on customer churn.
H1b' A NPS Feedback rating mediates the effect of service request type on customer churn.
H1c' A NPS Feedback rating mediates the effect of the service request area on customer churn
H1d' A NPS Feedback rating mediates the effect of respond date on customer churn
H1e' A NPS Feedback rating mediates the effect of respond day on customer churn
H1f' A NPS Feedback rating mediates the effect of respond day shift on customer churn
H1g' A NPS Feedback rating mediates the effect of service request date on customer churn
H1h' A NPS Feedback rating mediates the effect of service request day on customer churn
H1i' A NPS Feedback rating mediates the effect of service request day shift on customer churn
H1j' A NPS Feedback rating mediates the effect of service duration on customer churn.
H2a' A NPS Feedback rating mediates the effect of service request created staff ID on customer churn
H2b' A NPS Feedback rating mediates the effect of service request created staff name on customer churn
H2c' A NPS Feedback rating mediates the effect of service request created staff position on customer churn
H2d' A NPS Feedback rating mediates the effect of assigned staff ID on customer churn
H2e' A NPS Feedback rating mediates the effect of assigned staff name on customer churn
H2f' A NPS Feedback rating mediates the effect of assigned staff position on customer churn
H3a' A NPS Feedback rating mediates the effect of assigned division on customer churn
H3b' A NPS Feedback rating mediates the effect of the assigned outlet on customer churn
Table 10. Dataset details.
No Data Datatype
Original/adding data
Details
1 SR NUMBER object Original data Service request tracking number
2 WEEK int64 Original data Number of weeks (year)
3 CUSTOMER NAME object Original data Customer/Business Name
4 RACE object Add data Customer Race
5 REPLY DT object Original data Respond Date
6 REPLY DAY object Add data Respond Day
7 REPLY SHIFT object Add data Respond Day Shift
8 S_NPS_FEEDBACK int64 Original data NPS Feedback Rating (0-10)
9 S_NPS_FEEDBACK_TYPE_FK object Original data NPS Feedback Type (Promoter, Passive,Distractor)
10 NES RESPONSE object Original data NPS comment
11 SEGMENT GROUP object Original data Customer segmentation group (consumer,SME's, government, and enterprise)
12 SEGMENT CODE object Original data Customer segmentation code
13 ARPU float64 Add data The average revenue per user (customer)
Page 10 of 20
F1000Research 2021, 10:1274 Last updated: 13 JUN 2022
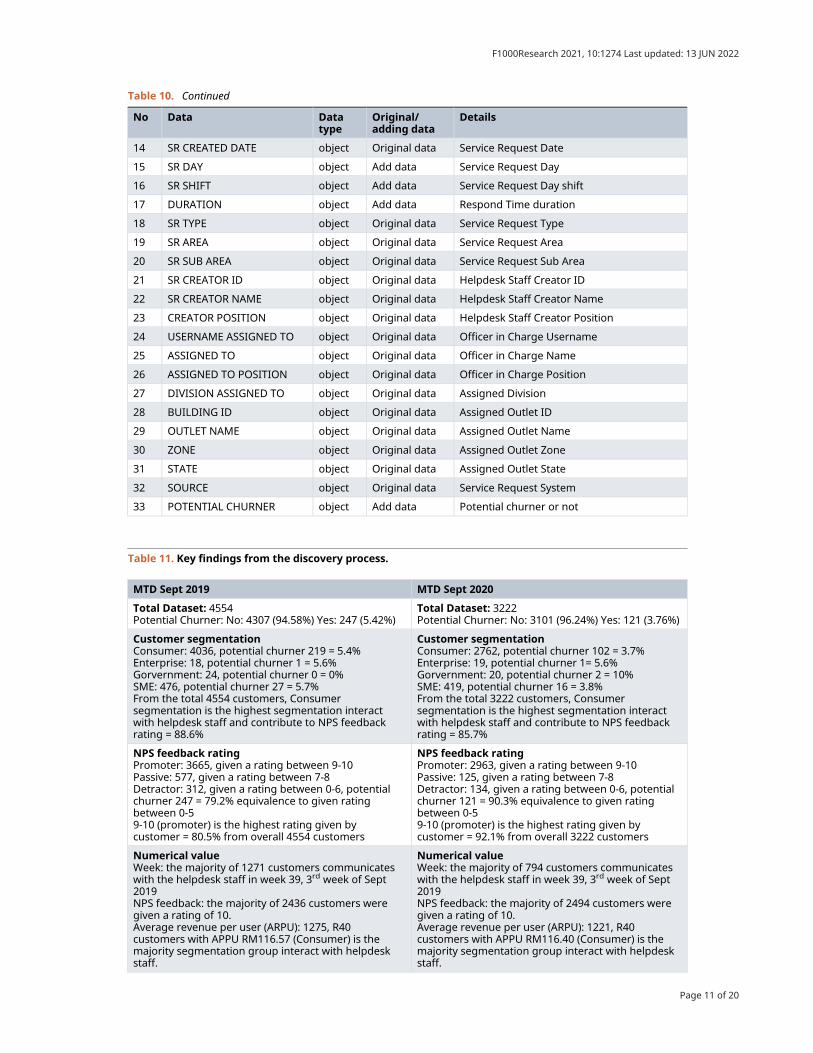
Table 10. Continued
No Data Datatype
Original/adding data
Details
14 SR CREATED DATE object Original data Service Request Date
15 SR DAY object Add data Service Request Day
16 SR SHIFT object Add data Service Request Day shift
17 DURATION object Add data Respond Time duration
18 SR TYPE object Original data Service Request Type
19 SR AREA object Original data Service Request Area
20 SR SUB AREA object Original data Service Request Sub Area
21 SR CREATOR ID object Original data Helpdesk Staff Creator ID
22 SR CREATOR NAME object Original data Helpdesk Staff Creator Name
23 CREATOR POSITION object Original data Helpdesk Staff Creator Position
24 USERNAME ASSIGNED TO object Original data Officer in Charge Username
25 ASSIGNED TO object Original data Officer in Charge Name
26 ASSIGNED TO POSITION object Original data Officer in Charge Position
27 DIVISION ASSIGNED TO object Original data Assigned Division
28 BUILDING ID object Original data Assigned Outlet ID
29 OUTLET NAME object Original data Assigned Outlet Name
30 ZONE object Original data Assigned Outlet Zone
31 STATE object Original data Assigned Outlet State
32 SOURCE object Original data Service Request System
33 POTENTIAL CHURNER object Add data Potential churner or not
Table 11. Key findings from the discovery process.
MTD Sept 2019 MTD Sept 2020
Total Dataset: 4554Potential Churner: No: 4307 (94.58%) Yes: 247 (5.42%)
Total Dataset: 3222Potential Churner: No: 3101 (96.24%) Yes: 121 (3.76%)
Customer segmentationConsumer: 4036, potential churner 219 = 5.4%Enterprise: 18, potential churner 1 = 5.6%Gorvernment: 24, potential churner 0 = 0%SME: 476, potential churner 27 = 5.7%From the total 4554 customers, Consumersegmentation is the highest segmentation interactwith helpdesk staff and contribute to NPS feedbackrating = 88.6%
Customer segmentationConsumer: 2762, potential churner 102 = 3.7%Enterprise: 19, potential churner 1= 5.6%Gorvernment: 20, potential churner 2 = 10%SME: 419, potential churner 16 = 3.8%From the total 3222 customers, Consumersegmentation is the highest segmentation interactwith helpdesk staff and contribute to NPS feedbackrating = 85.7%
NPS feedback ratingPromoter: 3665, given a rating between 9-10Passive: 577, given a rating between 7-8Detractor: 312, given a rating between 0-6, potentialchurner 247 = 79.2% equivalence to given ratingbetween 0-59-10 (promoter) is the highest rating given bycustomer = 80.5% from overall 4554 customers
NPS feedback ratingPromoter: 2963, given a rating between 9-10Passive: 125, given a rating between 7-8Detractor: 134, given a rating between 0-6, potentialchurner 121 = 90.3% equivalence to given ratingbetween 0-59-10 (promoter) is the highest rating given bycustomer = 92.1% from overall 3222 customers
Numerical valueWeek: the majority of 1271 customers communicateswith the helpdesk staff in week 39, 3rd week of Sept2019NPS feedback: the majority of 2436 customers weregiven a rating of 10.Average revenue per user (ARPU): 1275, R40customers with APPU RM116.57 (Consumer) is themajority segmentation group interact with helpdeskstaff.
Numerical valueWeek: the majority of 794 customers communicateswith the helpdesk staff in week 39, 3rd week of Sept2019NPS feedback: the majority of 2494 customers weregiven a rating of 10.Average revenue per user (ARPU): 1221, R40customers with APPU RM116.40 (Consumer) is themajority segmentation group interact with helpdeskstaff.
Page 11 of 20
F1000Research 2021, 10:1274 Last updated: 13 JUN 2022
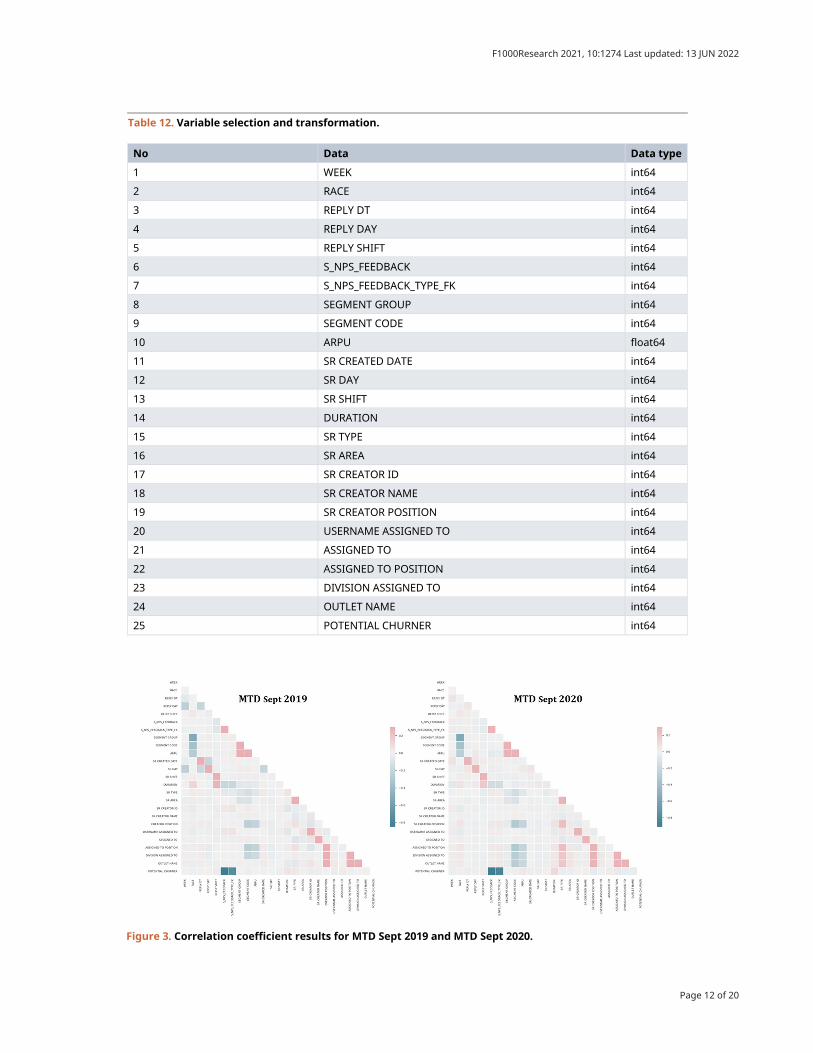
Table 12. Variable selection and transformation.
No Data Data type
1 WEEK int64
2 RACE int64
3 REPLY DT int64
4 REPLY DAY int64
5 REPLY SHIFT int64
6 S_NPS_FEEDBACK int64
7 S_NPS_FEEDBACK_TYPE_FK int64
8 SEGMENT GROUP int64
9 SEGMENT CODE int64
10 ARPU float64
11 SR CREATED DATE int64
12 SR DAY int64
13 SR SHIFT int64
14 DURATION int64
15 SR TYPE int64
16 SR AREA int64
17 SR CREATOR ID int64
18 SR CREATOR NAME int64
19 SR CREATOR POSITION int64
20 USERNAME ASSIGNED TO int64
21 ASSIGNED TO int64
22 ASSIGNED TO POSITION int64
23 DIVISION ASSIGNED TO int64
24 OUTLET NAME int64
25 POTENTIAL CHURNER int64
Figure 3. Correlation coefficient results for MTD Sept 2019 and MTD Sept 2020.
Page 12 of 20
F1000Research 2021, 10:1274 Last updated: 13 JUN 2022

Variable selection and transformationThe dependent variables for potential churner are binary, with 1 representing “yes” and 0 representing “no”. In addition, amultinomial variable for each account indicates promoter, passive, and distractor NPS feedback. Thus, a positivecorrelation coefficient implies a direct relationship between the two variables. Conversely, inverse correlation occurswhen one variable rises while the other falls.48 Finally, after data pre-processing, eight irrelevant variables were dropped,and 25 variables were selected and converted numerically to avoid unstable coefficient estimates and difficult modelinterpretation (Table 12) (Underlying data).49
The study found high correlations between variables. Figure 3 shows themost positive correlation between helpdesk staffand assigned officer in charge (r = 0.98 & 0.96) and the most negative correlation between NPS feedback and potentialchurner (r =�0.85 &�0.91). The potential churner is found to be negatively related to NPS Feedback. Customers withlower NPS ratings are more likely to churn than those with higher ratings.
ResultsMachine learning algorithmThis study tested a harness to use 10-fold cross-validation, builds multiple models to predict measurements, and selectsthe best model. As a result, CART has the highest estimated accuracy score of 0.98 or 98% (Table 13).
In Figure 4, the box and whisker plots at the top of the range, with CART, SVM, and KNN evaluations achieving 100%accuracy and NB, LDA, and LR evaluations falling into the low 41% accuracy range.
Mediation analysis resultsTable 14 shows the findings of the mediation effects, with statistical significance presented as a p-value less than 0.05.According to the results of this study, the NPS feedback rating appears to be a partial mediator between some churndeterminants and customer churn. NPS Feedback is found to be a significant mediator of several churn determinants. The
Table 13. Machine learning algorithms comparison results.
Algorithms Name MTD Sept 2019 MTD Sept 2020
Mean Std Accuracyscore
Mean Std Accuracyscore
Logistic Regression (LR) 0.42 0.01 41% 0.44 0.01 45%
Linear Discriminant Analysis (LDA) 0.41 0.02 42% 0.47 0.02 45%
K-Nearest Neighbours Classifier (KNN) 0.98 0.01 98% 0.98 0.01 97%
Classification and Regression Trees(CART)
0.98 0.01 98% 0.98 0.01 98%
Gaussian Naive Bayes (NB) 0.41 0.01 41% 0.44 0.02 44%
Support Vector Machine (SVM) 0.98 0.01 98% 0.96 0.01 98%
Figure 4. Comparing machine learning algorithms for MTD Sept 2019 and MTD Sept 2020.
Page 13 of 20
F1000Research 2021, 10:1274 Last updated: 13 JUN 2022
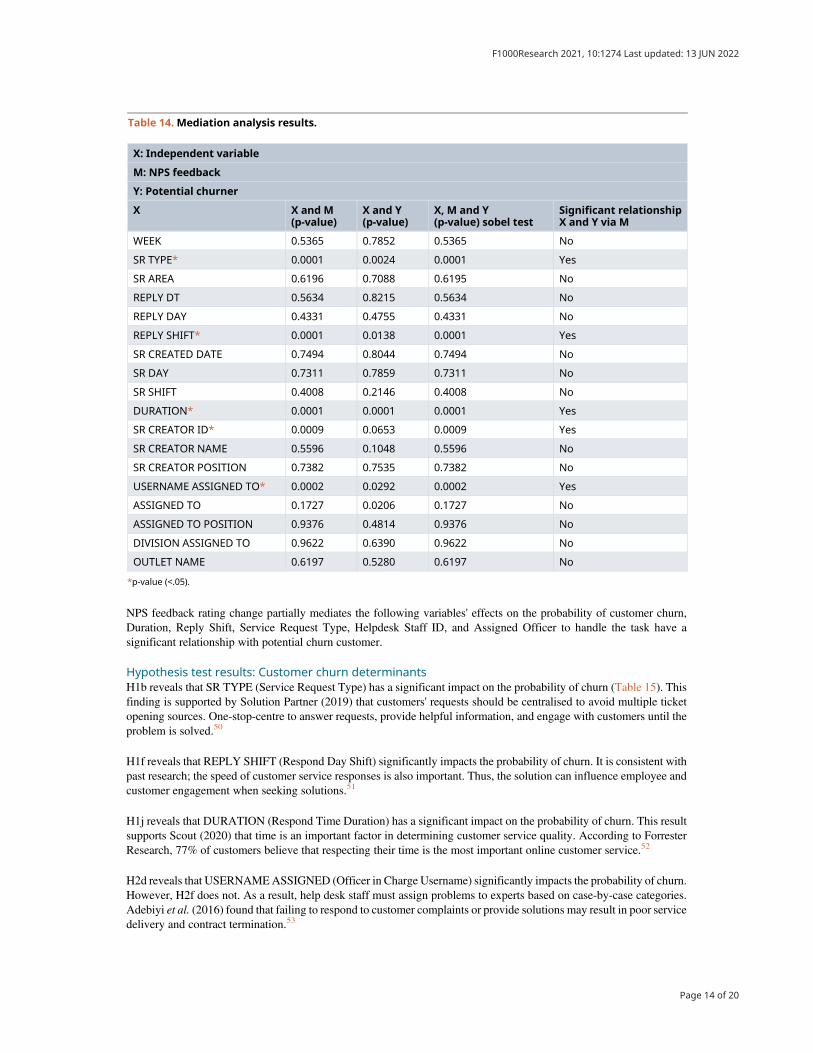
NPS feedback rating change partially mediates the following variables' effects on the probability of customer churn,Duration, Reply Shift, Service Request Type, Helpdesk Staff ID, and Assigned Officer to handle the task have asignificant relationship with potential churn customer.
Hypothesis test results: Customer churn determinantsH1b reveals that SR TYPE (Service Request Type) has a significant impact on the probability of churn (Table 15). Thisfinding is supported by Solution Partner (2019) that customers' requests should be centralised to avoid multiple ticketopening sources. One-stop-centre to answer requests, provide helpful information, and engage with customers until theproblem is solved.50
H1f reveals that REPLY SHIFT (Respond Day Shift) significantly impacts the probability of churn. It is consistent withpast research; the speed of customer service responses is also important. Thus, the solution can influence employee andcustomer engagement when seeking solutions.51
H1j reveals that DURATION (Respond Time Duration) has a significant impact on the probability of churn. This resultsupports Scout (2020) that time is an important factor in determining customer service quality. According to ForresterResearch, 77% of customers believe that respecting their time is the most important online customer service.52
H2d reveals that USERNAMEASSIGNED (Officer in Charge Username) significantly impacts the probability of churn.However, H2f does not. As a result, help desk staff must assign problems to experts based on case-by-case categories.Adebiyi et al. (2016) found that failing to respond to customer complaints or provide solutions may result in poor servicedelivery and contract termination.53
Table 14. Mediation analysis results.
X: Independent variable
M: NPS feedback
Y: Potential churner
X X and M(p-value)
X and Y(p-value)
X, M and Y(p-value) sobel test
Significant relationshipX and Y via M
WEEK 0.5365 0.7852 0.5365 No
SR TYPE* 0.0001 0.0024 0.0001 Yes
SR AREA 0.6196 0.7088 0.6195 No
REPLY DT 0.5634 0.8215 0.5634 No
REPLY DAY 0.4331 0.4755 0.4331 No
REPLY SHIFT* 0.0001 0.0138 0.0001 Yes
SR CREATED DATE 0.7494 0.8044 0.7494 No
SR DAY 0.7311 0.7859 0.7311 No
SR SHIFT 0.4008 0.2146 0.4008 No
DURATION* 0.0001 0.0001 0.0001 Yes
SR CREATOR ID* 0.0009 0.0653 0.0009 Yes
SR CREATOR NAME 0.5596 0.1048 0.5596 No
SR CREATOR POSITION 0.7382 0.7535 0.7382 No
USERNAME ASSIGNED TO* 0.0002 0.0292 0.0002 Yes
ASSIGNED TO 0.1727 0.0206 0.1727 No
ASSIGNED TO POSITION 0.9376 0.4814 0.9376 No
DIVISION ASSIGNED TO 0.9622 0.6390 0.9622 No
OUTLET NAME 0.6197 0.5280 0.6197 No
*p-value (<.05).
Page 14 of 20
F1000Research 2021, 10:1274 Last updated: 13 JUN 2022
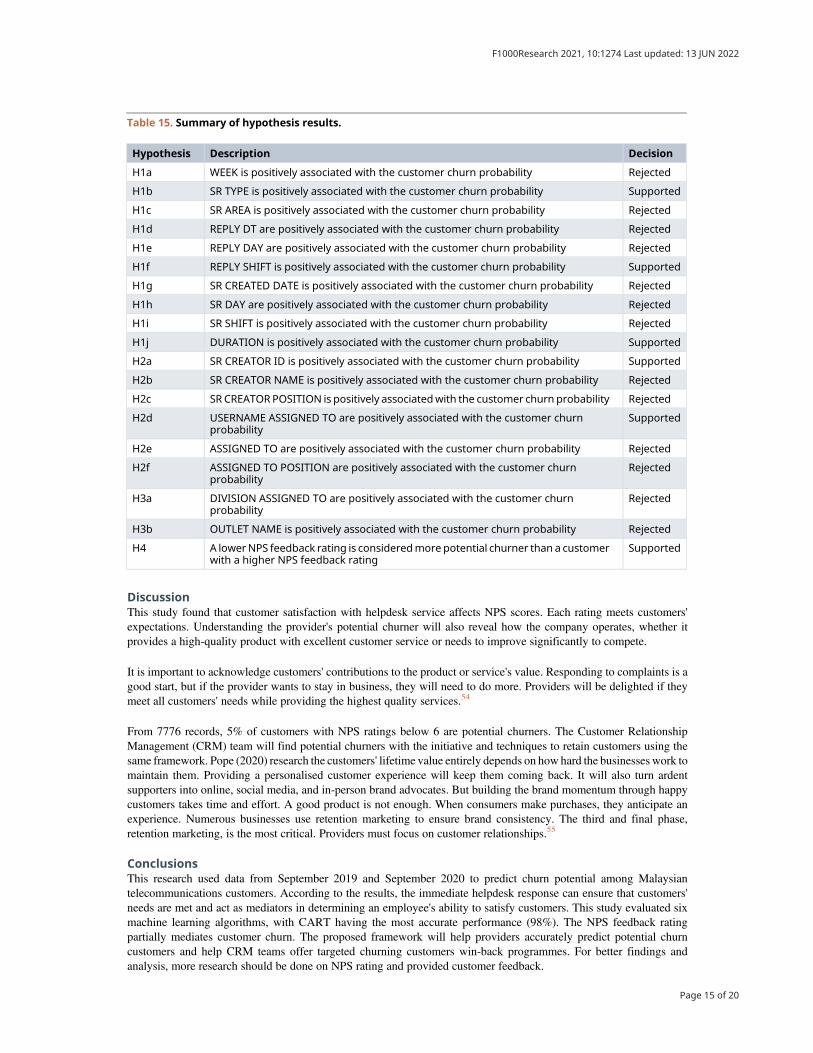
DiscussionThis study found that customer satisfaction with helpdesk service affects NPS scores. Each rating meets customers'expectations. Understanding the provider's potential churner will also reveal how the company operates, whether itprovides a high-quality product with excellent customer service or needs to improve significantly to compete.
It is important to acknowledge customers' contributions to the product or service's value. Responding to complaints is agood start, but if the provider wants to stay in business, they will need to do more. Providers will be delighted if theymeet all customers' needs while providing the highest quality services.54
From 7776 records, 5% of customers with NPS ratings below 6 are potential churners. The Customer RelationshipManagement (CRM) team will find potential churners with the initiative and techniques to retain customers using thesame framework. Pope (2020) research the customers' lifetime value entirely depends on how hard the businesses work tomaintain them. Providing a personalised customer experience will keep them coming back. It will also turn ardentsupporters into online, social media, and in-person brand advocates. But building the brand momentum through happycustomers takes time and effort. A good product is not enough. When consumers make purchases, they anticipate anexperience. Numerous businesses use retention marketing to ensure brand consistency. The third and final phase,retention marketing, is the most critical. Providers must focus on customer relationships.55
ConclusionsThis research used data from September 2019 and September 2020 to predict churn potential among Malaysiantelecommunications customers. According to the results, the immediate helpdesk response can ensure that customers'needs are met and act as mediators in determining an employee's ability to satisfy customers. This study evaluated sixmachine learning algorithms, with CART having the most accurate performance (98%). The NPS feedback ratingpartially mediates customer churn. The proposed framework will help providers accurately predict potential churncustomers and help CRM teams offer targeted churning customers win-back programmes. For better findings andanalysis, more research should be done on NPS rating and provided customer feedback.
Table 15. Summary of hypothesis results.
Hypothesis Description Decision
H1a WEEK is positively associated with the customer churn probability Rejected
H1b SR TYPE is positively associated with the customer churn probability Supported
H1c SR AREA is positively associated with the customer churn probability Rejected
H1d REPLY DT are positively associated with the customer churn probability Rejected
H1e REPLY DAY are positively associated with the customer churn probability Rejected
H1f REPLY SHIFT is positively associated with the customer churn probability Supported
H1g SR CREATED DATE is positively associated with the customer churn probability Rejected
H1h SR DAY are positively associated with the customer churn probability Rejected
H1i SR SHIFT is positively associated with the customer churn probability Rejected
H1j DURATION is positively associated with the customer churn probability Supported
H2a SR CREATOR ID is positively associated with the customer churn probability Supported
H2b SR CREATOR NAME is positively associated with the customer churn probability Rejected
H2c SR CREATORPOSITION is positively associatedwith the customer churn probability Rejected
H2d USERNAME ASSIGNED TO are positively associated with the customer churnprobability
Supported
H2e ASSIGNED TO are positively associated with the customer churn probability Rejected
H2f ASSIGNED TO POSITION are positively associated with the customer churnprobability
Rejected
H3a DIVISION ASSIGNED TO are positively associated with the customer churnprobability
Rejected
H3b OUTLET NAME is positively associated with the customer churn probability Rejected
H4 A lowerNPS feedback rating is consideredmore potential churner than a customerwith a higher NPS feedback rating
Supported
Page 15 of 20
F1000Research 2021, 10:1274 Last updated: 13 JUN 2022
Data availabilityUnderlying dataZenodo: Customer Churn Prediction for telecommunication Industry: A Malaysian Case Study.
DOI: https://doi.org/10.5281/zenodo.5758742.49
This project contains the following underlying data:
• Dataset MTD Sept 2019.csv (The file contains Net Promoter Score (NPS) in Month to Date (MTD) September2019 of a telecommunication company. 25 variables were used to determine potential churn customer).
• Dataset MTD Sept 2020.csv (The file contains Net Promoter Score (NPS) in Month to Date (MTD) September2020 of a telecommunication company. 25 variables were used to determine potential churn customer).
Data are available under the terms of the Creative Commons Attribution 4.0 International license (CC-BY 4.0).
Author contributionsNurulhuda, M., Lew, S. L., & Siti, F. A. R. comprehended the idea and contributed to the research article. All authorscontributed to the writing, editing, and consent of the final manuscript.
AcknowledgementsFirst and foremost, I must thank Multimedia University, for the sponsorship towards myMaster of Science (InformationTechnology). Lastly, special thanks to allmy familymembers and friends for their continuous support and understanding.
References
1. Tamaddoni Jahromi A, Stakhovych S, Ewing M: Managing B2Bcustomer churn, retention and profitability. Ind. Mark. Manag.2014; 43(7): 1258–1268.Publisher Full Text
2. Angelova B, Zekiri J: Measuring Customer Satisfaction withService Quality Using American Customer Satisfaction Model(ACSI Model). International Journal of Academic Research in Businessand Social Sciences. 2011; 1(3): 27.Publisher Full Text
3. Hejazinia R, Kazem M: Prioritising factors influencing customerchurn. Interdisciplinary Journal of Contemporary Research in Business.2014; 5(12): 1–10.Reference Source
4. Kumar S, Chandrakala D:A Survey on Customer Churn Predictionusing Machine Learning Techniques. Int. J. Comput. Appl. 2016;154(10): 13–16.Publisher Full Text
5. Ahmad AK, Jafar A, Aljoumaa K: Customer churn prediction intelecomusingmachine learning in big data platform. J. Big Data.2019; 6(1): 6–28.Publisher Full Text
6. Ahn J-H, Han S-P, Lee Y-S: Customer churn analysis:Churn determinants and mediation effects of partialdefection in the Korean mobile telecommunicationsservice industry. Telecommun. Policy. 2006; 30(10–11):552–568.Publisher Full Text
7. Global Legal Group: Telecoms, Media & Internet 2021|Malaysia|ICLG. International Comparative Legal Guides InternationalBusiness Reports. 2020, 11th December.Reference Source
8. Idem Est Advisory & Research: LatestMalaysia Telecoms IndustryReport – 2020-2025. Idem Est Research & Advisory. 2020,31st August.Reference Source
9. Markets RA: Malaysia Telecoms Industry Report 2020-2025 -Market Sizing, Insights, Key Telecom Trends, 5G, IoT,and More. GlobeNewswire Newsroom. 2020, 21st February.Reference Source
10. Churn Rate: Investopedia. 2021, 1st March.Reference Source
11. Reading Churn Rates: Investopedia. 2020, 25th May.Reference Source
12. The Influence of Perceived Organisational Justice onCustomer's Trust: An Overview of Public Higher EducationalStudents. Int. J. Bus. Manag. 2019; 3(3): 01–08.Publisher Full Text
13. 83% of consumers in Malaysia may switch telco provider: Frost:Digital News Asia. 2015, 7th April.Reference Source
14. What is Net Promoter Score? (Updated 2020): Qualtrics AU. 2020,12th October.Reference Source
15. Gadkari D: Factors Influencing the Net Promoter Score. UPPSALAUNIVERSITET; 2018, June.Reference Source
16. Keiningham TL, Aksoy L, Cooil B, et al. : A holistic examination ofNet Promoter. J. Database Mark. Cust. Strategy Manag. 2008; 15(2):79–90.Publisher Full Text
17. What is Net Promoter Score (NPS)? 2021 Guide & Definition:Hotjar.2021.Reference Source
18. Nunkoo R, Teeroovengadum V, Ringle CM, et al. : Service qualityand customer satisfaction: Themoderating effects of hotel starrating. Int. J. Hosp. Manag. 2020; 91: 102414.Publisher Full Text
19. Rajeev M:What is Customer Satisfaction? Freshcaller Blog. 2020,18th May.Reference Source
20. Calvert GA, Pathak A, Ching LEA, et al. : Providing ExcellentConsumer Service Is Therapeutic: Insights from anImplicit Association Neuromarketing Study. Behav. Sci. 2019;9(10): 109.PubMed Abstract|Publisher Full Text
21. Kundeliene K, Leitoniene S: Business Information Transparency:Causes and Evaluation Possibilities. Procedia. Soc. Behav. Sci. 2015;213: 340–344.Publisher Full Text
22. Ahmad AK, Jafar A, Aljoumaa K: Customer churn prediction intelecom using machine learning in big data platform. Journal of
Page 16 of 20
F1000Research 2021, 10:1274 Last updated: 13 JUN 2022
Big Data. 2019; 6(1): 1–5.Publisher Full Text
23. Höppner S, Stripling E, Baesens B, et al. : Profit-drivendecision trees for churn prediction. Eur. J. Oper. Res. 2020; 284(3):920–933.Publisher Full Text
24. Yang L: PredictionModeling and Analysis for TelecomCustomerChurn in Two Months. ArXiv.Org. 2019, 1st November.Reference Source
25. Ahmed AAQ, Maheswari D: Churn prediction on huge telecomdata using hybrid firefly-based classification. Egypt. Inform. J.2017; 18(3): 215–220.Publisher Full Text
26. Eria K, Marikannan BP: Systematic Review of Customer ChurnPrediction in the Telecom Sector. ResearchGate. 2018, September27.Reference Source
27. Ahn J-H, Han S-P, Lee Y-S: Customer churn analysis: Churndeterminants and mediation effects of partial defection in theKorean mobile telecommunications service industry.Telecommun. Policy. 2006; 30(10–11): 552–568.Publisher Full Text
28. Clemes MD, Gan C, Zhang D: Customer switching behaviour inthe Chinese retail banking industry. Int. J. Bank Mark. 2010; 28(7):519–546.Publisher Full Text
29. Geetha M, Abitha Kumari J: Analysis of churn behavior ofconsumers in Indian telecom sector. J. Indian Bus. Res. 2012; 4(1):24–35.Publisher Full Text
30. KimM-J, Kim J, Park S-Y:Understanding IPTV churning behaviors:focus onusers in South Korea. Asia Pacific Journal of Innovation andEntrepreneurship. 2017; 11(2): 190–213.Publisher Full Text
31. Stewart MPR: The Actual Difference Between Statistics andMachine Learning. Medium. 2020, July 30.Reference Source
32. Srivastava T:Machine Learning vs. Statistical Modeling. AnalyticsVidhya. 2020, June 26.Reference Source
33. Analytics P: What Is Machine Learning: Definition, Types,Applications and Examples. Potentia Analytics. 2019, December 19.Reference Source
34. Bertoncelli CM, Altamura P, Vieira ER, et al. : PredictMed:A logistic regression–based model to predict healthconditions in cerebral palsy. Health Informatics J. 2020; 26(3):2105–2118.Publisher Full Text
35. Tharwat A, Gaber T, Ibrahim A, et al.: Linear discriminant analysis:A detailed tutorial. AI Commun. 2017; 30(2): 169–190.Publisher Full Text
36. Cunningham P, Delany SJ: K-Nearest Neighbour Classifiers. 2nd ed.Machine Learning; 2020; 2: 1–15. (with Python examples).Reference Source
37. Fearn T: Classification and Regression Trees (CART). NIR News.2006; 17(6): 13–14.Publisher Full Text
38. Moraes RM, Machado LS: Gaussian Naive Bayes for OnlineTraining Assessment in Virtual Reality-Based Simulators.Mathware & Soft Computing. 2009; 16(2009): 123–132.Reference Source
39. Jakkula V: Tutorial on Support Vector Machine (SVM). School of EECS,Washington State University. 2006; 1–13.Reference Source
40. Adsit DJ, London M, Crom S, et al. : Relationships betweenemployee attitudes, customer satisfaction and departmentalperformance. J. Manag. Dev. 1996; 15(1): 62–75.Publisher Full Text
41. Kierczak L: Customer Satisfaction: Why It's Still Important in2021. Survicate. 2021, January 21.Reference Source
42. Council YE: The Customer Is Not Always Right: Here Are FiveReasons Why. Forbes. 2019, May 23.Reference Source
43. MacDonald S: Customer Complaints: Why Angry Customers AreGood for Business. SuperOffice. 2021, May 4.Reference Source
44. Hammah CA: A customer retention strategy for PhoenixInsurance Company. Ashesi Institutional Repository. 2021, July 20.Reference Source
45. Lin CY, Huang CK: Employee turnover intentions and jobperformance from a planned change: the effects of anorganisational learning culture and job satisfaction. Int.J. Manpow. 2020; 42(3): 409–423.Publisher Full Text
46. Baehre S, O'Dwyer M, O'Malley L, et al. : The use of Net PromoterScore (NPS) to predict sales growth: insights from an empiricalinvestigation. J. Acad. Market. Sci. 2021.Publisher Full Text
47. Walters GD: Why are mediation effects so small?. Int. J. Soc. Res.Methodol. 2018; 22(2): 219–232.Publisher Full Text
48. Schober P, Boer C, Schwarte LA: Correlation Coefficients. Anesth.Analg. 2018; 126(5): 1763–1768.Publisher Full Text
49. Mustafa N: Customer Churn Prediction for TelecommunicationIndustry: A Malaysian Case Study [Data set]. Zenodo. 2021;Publisher Full Text
50. Solution Partner: Best practices for Service RequestManagement. E-Core Consulting. 2019, 20th August.Reference Source
51. Tri Marwanto S, Komaladewi R: How to Restrain Customer Churnin Telecommunication Providers: Study in West Java Indonesia.Review of Integrative Business and Economics Research. 2017; 6(1):51–59.Reference Source
52. Scout H: Email Response Times: Benchmarks and Tips forSupport. HelpScout. 2020, June 9.Reference Source
53. Adebiyi SO, Oyatoye EO, Amole BB: Relevant Drivers forCustomers` Churn and Retention Decision in the NigerianMobile Telecommunication Industry. Journal of Competitiveness.2016; 6(3): 52–67.Publisher Full Text
54. Suchánek P, Králová M: Customer satisfaction, loyalty,knowledge and competitiveness in the food industry. EconomicResearch-Ekonomska Istraživanja. 2019; 32(1): 1237–1255.Publisher Full Text
55. Pope L: How to Prevent Customer Churn with RetentionMarketing. G2. 2020, 27th August.Reference Source
Page 17 of 20
F1000Research 2021, 10:1274 Last updated: 13 JUN 2022
Open Peer ReviewCurrent Peer Review Status:
Version 1
Reviewer Report 28 April 2022
https://doi.org/10.5256/f1000research.77258.r129495
© 2022 Amalarethinam D. This is an open access peer review report distributed under the terms of the Creative Commons Attribution License, which permits unrestricted use, distribution, and reproduction in any medium, provided the original work is properly cited.
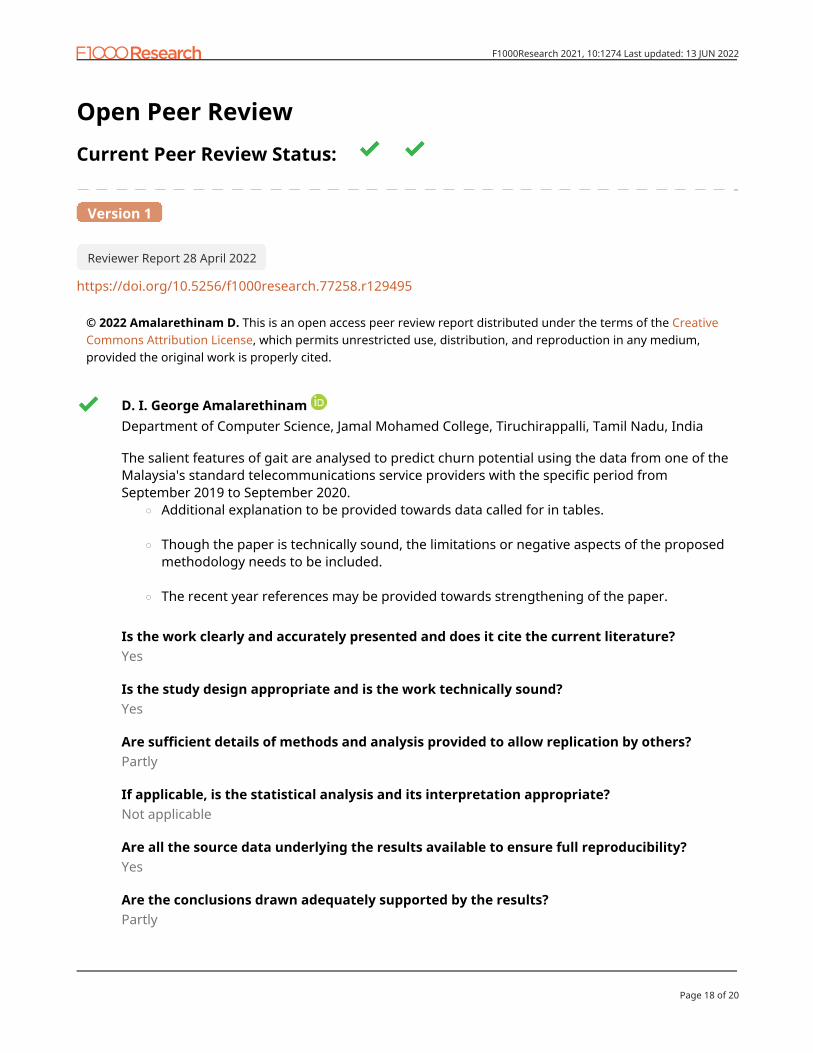
D. I. George Amalarethinam Department of Computer Science, Jamal Mohamed College, Tiruchirappalli, Tamil Nadu, India
The salient features of gait are analysed to predict churn potential using the data from one of the Malaysia's standard telecommunications service providers with the specific period from September 2019 to September 2020.
Additional explanation to be provided towards data called for in tables.
○
Though the paper is technically sound, the limitations or negative aspects of the proposed methodology needs to be included.
○
The recent year references may be provided towards strengthening of the paper.○
Is the work clearly and accurately presented and does it cite the current literature?Yes
Is the study design appropriate and is the work technically sound?Yes
Are sufficient details of methods and analysis provided to allow replication by others?Partly
If applicable, is the statistical analysis and its interpretation appropriate?Not applicable
Are all the source data underlying the results available to ensure full reproducibility?Yes
Are the conclusions drawn adequately supported by the results?Partly
Page 18 of 20
F1000Research 2021, 10:1274 Last updated: 13 JUN 2022
Competing Interests: No competing interests were disclosed.
Reviewer Expertise: Cloud Scheduling & Security, Data Mining, Network Security
I confirm that I have read this submission and believe that I have an appropriate level of expertise to confirm that it is of an acceptable scientific standard.
Reviewer Report 04 January 2022
https://doi.org/10.5256/f1000research.77258.r109266
© 2022 Supriyanto C. This is an open access peer review report distributed under the terms of the Creative Commons Attribution License, which permits unrestricted use, distribution, and reproduction in any medium, provided the original work is properly cited.
Catur Supriyanto Faculty of Computer Science, Universitas Dian Nuswantoro, Semarang, Indonesia
The research paper title on “Customer churn prediction for telecommunication industry: A Malaysian Case Study” is well organized and the originality of the paper is good. The main objective of the paper is to compare some machine learning (ML) algorithms for customer churn prediction in telecommunication industry. In experiment the authors analyzed that the data were collected from one of the Malaysia's leading telecommunications service providers. The authors hypothesized that changes in Net Promoter Score (NPS) can indicate whether churn determinants directly or indirectly influence churn. Hence, they decided to execute many algorithms such as Logistic Regression, K-Nearest Neighbor (KNN), Support Vector Machine (SVM), Linear Discriminant Analysis (LDA), Classification and Regression Trees (CART), Gaussian Naive Bayes (NB) algorithms. The authors concluded that the CART outperforms with an accuracy of 98% than other ML algorithms. The structure of the paper and result findings are good. Finally, the outcome of the paper is good and suggested to other businesses to measure potential customer churn using NPS scores to gather customer feedback in near future. Hence, I have recommended this paper to be indexed. Is the work clearly and accurately presented and does it cite the current literature?Yes
Is the study design appropriate and is the work technically sound?Yes
Are sufficient details of methods and analysis provided to allow replication by others?Yes
If applicable, is the statistical analysis and its interpretation appropriate?
Page 19 of 20
F1000Research 2021, 10:1274 Last updated: 13 JUN 2022
Yes
Are all the source data underlying the results available to ensure full reproducibility?Yes
Are the conclusions drawn adequately supported by the results?Yes
Competing Interests: No competing interests were disclosed.
Reviewer Expertise: Machine learning
I confirm that I have read this submission and believe that I have an appropriate level of expertise to confirm that it is of an acceptable scientific standard.
The benefits of publishing with F1000Research:
Your article is published within days, with no editorial bias•
You can publish traditional articles, null/negative results, case reports, data notes and more•
The peer review process is transparent and collaborative•
Your article is indexed in PubMed after passing peer review•
Dedicated customer support at every stage•
For pre-submission enquiries, contact [email protected]
Page 20 of 20
F1000Research 2021, 10:1274 Last updated: 13 JUN 2022
Copyright © 2022 FDOKUMEN