
Trends in Telecommunication Reform 2015 - ITU
244
2015 reform TRENDS IN TELECOMMUNICATION GETTING READY FOR THE DIGITAL ECONOMY
-
Upload
khangminh22 -
Category
Documents
-
view
3 -
download
0
Transcript of Trends in Telecommunication Reform 2015 - ITU

2015reformTRENDS INTELECOMMUNICATION
G E T T I N G
R E A D YFOR THE
DIGITAL ECONOMY

© ITU 2015
International Telecommunication Union Place des Nations
CH-1211 Geneva, Switzerland
All rights reserved. No par t of this publication may be reproduced, by any means whatsoever, without the prior written permission of the International Telecommunication Union.
Denominations and classifications employed in this publication do not imply any opinion on the par t of the International Telecommunication Union concerning the legal or other status of any territory or any endorsement or acceptance of any boundary.
Where the designation “country” appears in this publication, it covers countries and territories.
ISBN 978-92-6115521-6

Trends in Telecommunication Reform 2015

This report was prepared by the ITU experts Andrew J. Haire, Janet Hernandez, Javier Huerta Bravo, John Alden, Kari Ballot-Lena, Dr Martin Waldburger, Michèle Ledger, Dr René C.G. Arnold and Dr Viktor Mayer-Schonberger, and the ITU Staff Nancy Sundberg and Youlia Lozanova, under the direction of the ITU Regulatory and Market Environment Division. Chelsea Mori Clark, Elisa Bizarria and Phillippa Biggs provided valuable contributions and insights. David Wye edited the report.
We would especially like to thank the moderators of the ITU Global Symposium for Regulators (GSR14) held in Manama, Bahrain in June 2014, for their support and appreciation on the content of the various chapters expressed during the event.
These contributions, together with the support from ICT ministries and regulators, and others who have provided data and background material, are gratefully acknowledged. Without their support, a report of this nature would be impossible.
ii Trends in Telecommunication Reform 2015

iii
We are now entering a new era of communications. The future of the digital world is happening now. ITU stands fully prepared to support its membership to lead and open the door to a wealth of possibilities. I am pleased to present the 15th annual edition of Trends in Telecommunication Reform. This year’s Trends report seeks to advance the global discussion of ICTs by focusing on how the benefits of an increasingly digital world can best be made available to users around the world in a way that gives users access to the most advanced services, provides businesses with appropriate incentives for innovation and ensures that policy-makers have the right tools to evaluate how well policies fostering digital inclusion are being implemented. Thus, the theme of this year’s Trends report is: “Getting ready for the digital economy.”
But are we ready? As broadband services become more widespread around the world, and as new applications and services are developed to serve new needs and challenge existing business models, the issues confronting ICT regulators and policy-makers are becoming more complex. Today, services can be provided by a variety of competitors irrespective of location—some may be local, but others may provide services from beyond a country’s borders. As a result, new or updated regulatory approaches will be needed to ensure not only that innovation continues to flourish, but that consumers—and their data—remain protected. Although each country is unique, there are common lessons that can be learned.
To support policy-makers and regulators in getting ready for an increasingly digital society and economy, this Trends report analyses how the changes that are taking place in the digital ecosystem are impacting both individual consumers and businesses and society at large. It explores the implications of these changes for national ICT policy and legal/regulatory frameworks, and discusses how policy-makers and regulators can address the
new challenges raised by the digital economy in a smart, efficient and effective way.
The report addresses range of issues that span the full range of ICT policy-making, and delves into some important, but challenging, questions. As ICT networks and services constitute the bedrock of the digital economy, why is competition important and how can barriers to competition be reduced? How can spectrum policy be updated to balance the growing demand for broadband spectrum with increasingly crowded spectrum allocations; can changes to licensing and more spectrum sharing help? How can the power of Big Data best be harnessed, while ensuring that appropriate regulations exist to protect consumers and their data? What can policy-makers, regulators and industry do to ensure that digital consumers are protected? How can the data that the digital ecosystem now produces in vast quantities impact business models and what implications does this have for the digital economy overall? Finally, how can the implementation of broadband plans and strategies be appropriately monitored? How to gauge success and identify areas for improvement? To answer those questions, this edition draws up from discussion papers presented at the ITU Global Symposium for Regulators, held in 2014, in Bahrain.
The International Telecommunication Union is dedicated to helping regulators and policy-makers around the world navigate the
Trends in Telecommunication Reform 2015
Foreword

iv Trends in Telecommunication Reform 2015
challenges posed by an increasingly digital world. As administrations seek to develop policies and regulatory frameworks that will address these emerging issues, we hope that the research, analysis and insights contained in this edition of the Trends report will provide useful guidance as policy-makers seek to harness the benefits of a digital economy.
The world has enough resources to provide a good quality of life for everyone. We need to get better organized and move a lot faster. We are building today the smart society of tomorrow and we need to do it right. I am confident that by bringing together a diverse
group of stakeholders to share knowledge and experiences, ITU can help countries develop the most effective, informed and smart policies promoting digital inclusion and the advancement of ICTs to achieve sustainable economic and social development goals.
Brahima Sanou Director
Telecommunication Development Bureau
vTrends in Telecommunication Reform 2015
Foreword ..........................................................iii
Executive Summary ..........................................ixIntroduction ...............................................ix
1 Market and regulatory trends in the ICT sector .................................................. 11.1 ICT market trends ............................ 11.2 A world of opportunities and
challenges for consumers ............... 61.3 A New Contribution to the Debate . 81.4 Conclusions ................................... 16Methodological Annexes ......................... 17Annex 1: ICT Regulatory Tracker ............. 17Annex 2: Early Research from the
Measuring the Information Society Report 2013 ...................... 18
2 Why Competition Matters and How to Foster It in the Dynamic ICT Sector ........ 232.1 Introduction .................................. 232.2 Why Competition Matters ............. 232.3 A Changing Competitive
Landscape ...................................... 262.4 Regulatory Responses to
Changing Competitive Conditions 312.5 Conclusion ..................................... 51
3 New Frontiers in Spectrum Licensing ..... 613.1 Introduction: Regulators under
pressure ......................................... 613.2 The evolution of spectrum
licensing ......................................... 623.2.2 The “Pros” and “Cons” of
current assignment models .......... 643.3 The New Frontier: gaining more
usage from “less” spectrum ......... 673.4 International and national
developments ................................ 803.5 Conclusion .................................... 84
4 Big Data - Opportunity or Threat? ........... 894.1 The opening ................................... 894.2 Setting the stage ............................ 894.3 The opportunities .......................... 964.4 Causes for Concern .....................1014.5 The Role of (and future for)
Regulatory Authorities ................ 1054.6 Conclusion ...................................108
Annex 1: 14 of the 15 Worst Data Breaches (2000-2012)24 ............. 109
Annex 2: Forums, discussions and papers .........................................112
5 Consumer protection in the online world......................................................1195.1 Introduction .................................1195.2 Setting the scene .........................1195.3 Main online activities ..................1215.3.2 Shopping online ...........................1225.4 Cross-cutting regulatory issues
and the role of policy-makers, regulators and market operators 125
5.5 Targeted initiatives – specific market players .............................141
5.6 Conclusion ...................................144
6 The economic influence of data and their impact on business models .......... 1536.1 Introduction .................................1536.2 The evolution of the data-driven
economy ......................................1546.3 The structure of the data-driven
economy – the data value circle . 1556.4 Selected value propositions and
business models in the data-driven economy ...........................163
6.5 Potential policy and regulatory implications .................................177
7 Monitoring the Implementation of Broadband Plans and Strategies ........... 1857.1 Introduction .................................1857.2 Coordination and oversight: the
monitoring framework ................ 1877.3 Measuring and managing the
implementation of broadband plans ............................................192
7.4 Conclusions .................................210Annex: A monitoring checklist for
implementation of a broadband plan ..............................................211
8 Conclusion .............................................223
Table of Contents

List of tables and figures
TablesTable 1.1: ICT Regulatory Tracker summary structure (full set), 2007-2013 ......................................10Table 3.1: Applications of the Three Spectrum Distribution Models ..................................................64Table 5.1: Cloud Initiatives in Select Countries .................................................................................144Figure 6.8: Operating profitability for mobile device manufacturers from 2007 to Q3/13 .............166Table 7.1: Overview of key areas in a monitoring framework .........................................................188Table 7.2: A shifting balance: monitoring successive phases of a broadband plan..........................189Table 7.3: Broadband construction overview and prospects for return on investment (ROI)* .......195Checklist of optional elements to be considered in a monitoring framework for implementation of a broadband plan ..........................................................................................................................211
FiguresFigure 1.1: History of the future ............................................................................................................2Figure 1.2: Regulation matters: the link between connected ICT users and the maturity of regulation ...............................................................................................................................................4Figure 1.3: A typical day in the digital world ........................................................................................4Figure 1.4: Global smartphone data traffic forecast, exabytes per month ...........................................5Figure 1.5: Internet is the new social: active users by social platform, January 2015 .........................6Figure 1.7: Generations of regulation ...................................................................................................8Figure 1.6: So who’s in charge? .............................................................................................................8Figure 1.8: Evolution in ICT regulation, 2007-2013 ............................................................................10Figure 1.9: Better regulation is associated with faster growth in mobile broadband ........................11Figure 1.10: Every Region is different: improving regulatory patterns, 2008-2013 ...........................12Figure 1.11: Screening regulatory practices: which regulations have shaped the ICT sector? 2006-2013 ............................................................................................................................................12Figure 1.12: Winning formulas for fixed and mobile broadband ........................................................14Figure 2.1: Individuals Using the Internet ...........................................................................................23Figure 2.2: Fixed and Mobile Broadband Subscriptions (2007-2014) ................................................24Figure 2.3: Key Mobile Market Metrics for Costa Rica ........................................................................25Figure 2.4: Challenges to Traditional Service Providers ......................................................................27Figure 2.5: International Call Volumes and Growth Rates, 1993-2013 ..............................................27Figure 2.6: Companies Developing Technology Ecosystem - “Covering All the Bases”.......................29Figure 2.7: MVNO/MNO activity split ..................................................................................................35Figure 2.8. Smartphone market share worldwide (2008-2013) .........................................................51Figure 3.1: Growth in mobile broadband, 2007-2014 ........................................................................61Figure 3.2: Wi-Fi: As Channels Get Wider, DFS Becomes Unavoidable ..............................................73Figure 3.3: Example Configuration of a Hybrid Satellite/Terrestrial Network (SkyTerra)30 ................76Figure 4.1: Use of location-based information and geosocial services among smartphone owners, 2011-2013 ..............................................................................................................................90Figure 4.2: Growth of Data .................................................................................................................92Figure 4.3: The Rise of Digital Storage ..............................................................................................93Figure 4.4: Big Data Characteristics: the three Vs .............................................................................93Figure 4.5: Enterprise applications with a focus on Big Data .............................................................96Figure 4.6: U.S. baseball fans: where are they? ................................................................................98Figure 4.7: Personal Data: what is for sale? ...................................................................................101Figure 4.8: How personal data is valued ..........................................................................................102Figure 5.1: e-Commerce turnover by region .....................................................................................120Figure 5.2: Online spending per person ............................................................................................120
vi Trends in Telecommunication Reform 2015

Figure 5.3: Growth of apps available for download by platform, 2008-2012 ..................................121Figure 5.4: Worldwide market shares in 2012 .................................................................................121Figure 5.5: Share of global adspend by medium (%) ........................................................................122Figure 5.6: Percentage of the European population who ordered goods or services over the Internet .............................................................................................................................................122Figure 5.7: Online payment methods by country in 2011 ...............................................................123Figure 5.8: Percentage of applicants that have been rejected for a job because of their social media/online profile, 2013 ................................................................................................................125Figure 5.9: Google’s collection of personal data for its “street view” services ................................127Figure 5.10: Trusted Cloud Europe framework .................................................................................143Figure 6.1: Data value circle...............................................................................................................156Figure 6.2: Active mobile broadband subscriptions per 100 inhabitants, 2007-2014 .....................158Figure 6.3: Fixed (wired)-broadband subscriptions per 100 inhabitants, 2001-2014 ......................158Figure 6.4: Comparison of quarterly growth rates for data ARPU and data usage (2012 to 2014) for Bharti Airtel India .........................................................................................................................159Figure 6.5: Big Data worldwide revenue 2011-2017 by types in billion USD ...................................160Figure 6.6: Global advertising market (USD million) 2011-2017 ......................................................162Figure 6.7: Worldwide mobile device shipments and market shares for the top-4 mobile operating systems in 3Q/13 in comparison to 3Q/12 ......................................................................164Figure 6.9: The importance of video and audio in mobile data forecasted, 2013 to 2018 ..............169Figure 6.10: Market shares of online advertising and mobile advertising worldwide .....................174Figure 7.1: Performance monitoring as part of a result-based management framework .............186Figure 7.2: Categories of broadband indicators ................................................................................186Figure 7.3: Cycle of policy implementation and improvement .........................................................189Figure 7.4: Key elements of broadband plans ..................................................................................190Figure 7.5: Allocation of roles and responsibilities in implementation and monitoring of a broadband plan ..................................................................................................................................191Figure 7.6: Extract from an online status report: Digital Victoria ....................................................194Figure 7.7: ITU’s backbone transmission map – with an example of interactive regional mapping capability ............................................................................................................................................196Figure 7.8: New Zealand: Broadband deployment update as at 30 June 201332 .............................198Figure 7.9: Nationwide availability of broadband in the U.S. by number of competing providers ..200Figure 7.10: Monitoring business and household penetration and adoption in Colombia .............203Figure 7.11: Cycle of consumer adoption / product life cycle observed in Canada ........................205Figure 7.12: Broadband take-up by community anchor institutions nationwide, USA ....................206Figure 7.13: European Commission Digital Agenda ..........................................................................208
BoxesBox 1.1: GSR14 Best practice guidelines on consumer protection in a digital world ...........................7Box 1.2: Making sense of regulatory trends: the ITU Regulatory Tracker ............................................9Box 1.3: Econometric regression models for fixed broadband ...........................................................15Box 1.4: Econometric regression model for mobile cellular ...............................................................16Box 2.1: Effects of liberalization and introduction of competition: Case of mobile services in Costa Rica .............................................................................................................................................25Box 2.2: The increased relevance of CDNs for Internet traffic exchange ...........................................30Box 2.3 Canada’s ongoing reviews of mandatory unbundling for broadband access services ..........33Box 2.4: Brazil’s National Wholesale Trading System ..........................................................................34Box 2.5: Proposed Comcast/Time Warner Merger .............................................................................40Box 2.6. Recent changes in net neutrality ...........................................................................................42Box 2.7. Sponsored data program and competition in Canada ..........................................................44Box 2.8: Brazil Bans Mobile Operators from Selling Mobile Connections Due to Poor Quality of Service ..................................................................................................................................................45Box 2.9: Evolving landscape of traffic exchange between content providers, CDNs and large ISPs – the case of the United States (2011-2014) ......................................................................................46
viiTrends in Telecommunication Reform 2015
Box 2.10. Elements of open standards ................................................................................................49Box 3.1: Re-Farming Cellular Spectrum in India19 ................................................................................71Box 3.2: Efforts to Realize Cognitive Radio System Development27 ....................................................75Box 3.3: The FCC’s Broadcasting Incentive Auctions ...........................................................................78Box 3.4: Defining Licensed Shared Access...........................................................................................79Box 3.5: ITU-R Study Group 5’s Estimates of Spectrum Requirements .............................................81Box 3.6: Additional TV White Spaces Initiatives in Developing Countries .......................................82Box 5.1: Malaysia’s Response to Online Content Issues ...................................................................131Box 5.2: AGCOM’s Role in Fighting Online Piracy ..............................................................................134Box 5.3: Australian Consumer Advice on Payment Systems .............................................................138Box 5.4: Example of a widely used trustmark on UK websites .........................................................139Box 5.5: BEUC statement about enforcement ..................................................................................140Box 5.6: OECD policy guidance on mobile and online payments .....................................................141Box 7.1: United States – Eighth Broadband Progress Report, 2012 .................................................199Box 7.2: Evaluation of Canada’s Broadband for Rural and Northern Development Pilot ................202
viii Trends in Telecommunication Reform 2015

ix
Introduction
To assist policy makers and regulators in getting ready for the digital economy, this edition of Trends provides an analysis of the changing business and consumers behaviours led by technological innovation taking place in the digital ecosystem. It further provides an understanding on how these changes will affect national ICT policy and regulatory frameworks and identifies measures policy makers and regulators can take to be prepared to respond efficiently to the new challenges raised by the digital economy.
Chapter one examines key market and regulatory trends around the world and introduces a new analytical tool developed by ITU, the ICT Regulatory Tracker.
Chapter two examines ways to reduce barriers to competition and offers practical case-study examples of several approaches to devise a policy and regulatory framework to promote competition and consumer choice.
Chapter three looks at ways to accommodate broadband spectrum expansion through new modes of sharing and innovations in licensing.
Chapter four examines what Big Data is, looking at where ICT regulators, policy makers and other public authorities, have set or should set some boundaries.
Chapter five reviews a number of cross-cutting regulatory issues that policy-makers, regulators and industry should address to ensure that digital consumers are protected.
Chapter six provides an analysis of the economic influence of data and their impact on business models.
Chapter seven reviews the principles of performance monitoring, examines the increasingly broad scope of broadband plans and discusses how their implementation can be monitored.
Chapter eight draws overall conclusions.
Chapter 1: Market and regulatory trends in the ICT sector
Since the last edition of Trends, the information and communications technology (ICT) sector has continued its remarkable transformation. The growing adoption of broadband-enabled mobile devices has made access to the digital world more ubiquitous and pervasive. Technology is moving fast, transforming lifestyles and rendering old business models obsolete. The ICT industry has moved from distinct infrastructure platforms and connected devices to an ecosystem of computing – the cloud – which changes the traditional rules of the game. The cloud is enabling new innovations across the economy, at all levels, for everyone. Everything becomes a computing device, a connected device – be it a car, a fridge, or a pair of glasses. This new dimension of connectivity opens the way to massive, unlimited possibilities. Apps and m-services are empowering citizens to engage in all aspects of life irrespective of time, distance and location. However, disparities remain between those who have access to the new world of digital opportunities and those who do not, calling for continuous efforts to reduce costs and accelerate network and service deployments to achieve a truly inclusive digital society.
On the flip side, the digital economy has clearly raised many challenges that require increased attention from a regulatory perspective. Consumers are confronted with new issues brought about by the greater choice of devices, online services and applications. Identifying pro-active policy and regulatory measures in addition to co-regulatory and self-regulatory solutions and initiatives geared towards educating and empowering consumers is essential to protect the rights of all users in an open, transparent and inclusive digital world. Regulators participating in the 2014 ITU Global Symposium for Regulators (GSR-14) have identified and endorsed a set of regulatory best practice guidelines to protect consumer
Trends in Telecommunication Reform 2015
Executive Summary
interests, while also ensuring a level-playing field for traditional and new market players by fostering a light touch regulatory approach.
The interaction of the ICT sector for stimulating growth in the digital economy alongside other sectors needs to be understood and, wherever possible, managed by policy and regulatory frameworks of a new kind. To empower regulators and policy makers to do so, ITU has developed the ICT Regulatory Tracker, a new evidence-based analytical tool to help pinpoint the strengths and weaknesses of regulatory interventions. Analysis based on the Tracker clearly suggests that growth in services has happened most rapidly where regulatory enablers have been put in place to leverage latest technologies and innovations. In a nutshell, consistent, forward-looking and well-enforced, fourth-generation regulation generally provides for a vibrant market and win-win opportunities for both service providers and consumers.
The choice of regulatory intervention appears to have an equally strong impact on stirring up market growth. More precisely, the ITU Regulatory Tracker has shown that the combination of a handful of regulatory measures is closely associated with a catalytic effect on market take-up. With respect to mobile-broadband penetration, countries with a broadband plan, competition in both the mobile sector and international gateways, infrastructure sharing, mobile number portability and band migration, systematically outperform countries lacking some or all of those regulatory settings. Fixed broadband markets seem to have their “winning formula”, too. The top-five measures on record are a Broadband Plan, open competition in wireline broadband technologies, an advanced licensing framework (featuring either unified licenses or a general authorization regime) combined with an infrastructure sharing policy and provisions for fixed number portability.
New econometric research by ITU further suggests that a 10 per cent increase in the ICT Regulatory Tracker score (corresponding to an incremental enhancement of regulatory frameworks) is associated with an increase of respectively 7.7 per cent in fixed-broadband penetration and 2.3 per cent in mobile-cellular penetration over the period 2008-2013. This
evidence provides new grounds for informed policy-making and better targeted regulatory intervention.
Chapter 2: Why Competition Matters and How to Foster It in the Dynamic ICT Sector
The ICT sector has been rapidly evolving over the last few decades, creating an emerging broadband-centric environment that has presented regulators with varying and complex challenges. While traditional competition issues persist, new obstacles deriving from the entry of new entrants with new business models and alternative costs structures, coupled with the convergence of services and a rapid increase in the flow of data across the globe, have placed a tremendous burden on old revenue streams and long-standing regulatory regimes. Consequently, regulators and policymakers have been forced to adapt to reduce barriers to competition and protect consumer interests. This paper focuses on these concerns and offers practical case-study examples of several approaches regulators and policymakers have taken to devise a framework to promote competition and consumer choice.
To protect and promote competition in this new world, regulators and policymakers have adopted key reform efforts to address the various challenges. For one, liberalized licensing measures have created a more streamlined process for new competitors to enter the market. To help ease market entry, some countries have imposed access obligations requiring operators with significant marker power (SMP) to grant competitors access to their network elements at cost-based rates and on non-discriminatory terms. Other countries are creating wholesale broadband networks to supply backbone or even access services to retail service providers.
As countries seek to expand competition and extend networks to areas that are unserved, or underserved, approaches that require competing companies to share basic infrastructure are being adopted. However, regulators are finding that the benefits of faster deployment and lower costs can outweigh the risks of potential collusion or other anti-competitive concerns. Spectrum sharing goes a step further by combining
x Trends in Telecommunication Reform 2015
sharing at the access network layer with the sharing of dedicated frequencies.
As convergence has changed the way services are developed and delivered, net neutrality—the idea that all traffic on the Internet should be treated equally—has emerged as an important issue. Proponents of net neutrality are concerned that large access providers will discriminate against certain providers (i.e., those that compete with the provider’s own service), or that they will prioritize some traffic or services (their own or those willing to pay more); thus skewing competition. The access providers argue that they have to be able to manage traffic to ensure network security and avoid congestion. To address such concerns as well as other rising challenges, some countries have begun to reform their regulatory approach.
The competitive landscape has undoubtedly become more complex over the last several years. With advancing technology and changing consumer demands, competition issues have only become more important. In an effort to address these changes, policymakers and regulators are engaged in various efforts to ensure competition flourishes and consumers are protected. With data trends continuing to point to substantial increases in usage and traffic, it is critical that consumer protection and competition remain at the forefront of any future regulatory changes.
Chapter 3: New Frontiers in Spectrum Licensing New Frontiers in Spectrum Licensing
Spectrum managers in countries around the globe today face strong pressure to free up more spectrum for broadband wireless network access. Prompted by a sharp and accelerating rise in wireless broadband subscriptions in many countries, regulators are scrambling to find more spectrum for the wider channels and greater throughput available with advanced wireless technologies such as Long-Term Evolution (LTE). This chapter looks at the exploration, now under way in some countries, of ways to accommodate broadband spectrum expansion through new modes of sharing
and innovations in licensing, without compromising incumbent spectrum uses.
There are several legacy methods of spectrum sharing, which can be described along the three-dimensional axes of frequency, time and geography. A band can be divided into a new channel plan, accommodating a new use while still protecting the incumbents. Additionally, new users can transmit during time periods when the incumbent is not actively using the spectrum. In some countries, regulators now allow licence holders to subdivide and trade portions of their spectrum, most often in terms of geographic areas, but also potentially for sub-bands of spectrum. In theory, this gives operators greater flexibility to either use or trade their spectrum rights, but regulators often find trading to be difficult to implement and complex in terms of ongoing oversight and regulation.
Meanwhile, new technologies are being developed to help augment these legacy sharing methods. “Smart” antenna technologies help to focus and sharpen the directionality of transmissions, improving conditions for sharing. Small cells can be used to generate greater frequency re-use, multiplying the use of a particular spectrum band to allow greater capacity and access in congested areas. Databases have been developed to incorporate geo-location capabilities, along with more static technical data, allowing new users to share spectrum by using unoccupied channels or frequencies in geographic areas where incumbents are present.
Greater demand for sharing, coupled with these technology enablers, is breeding experimentation in new, often hybrid, ways to license shared spectrum bands. One technique for sharing is the hybrid or “heterogeneous” use of licensed operator networks, combined with unlicensed (e.g., Wi-Fi) spectrum use. Known as “operator off-loading,” this technique allows cellular network operators to direct data traffic from consumers onto small cells – even directly to the Internet via unlicensed RLANs – to avoid over-burdening their macro-cell networks in high-data-use areas.
xiTrends in Telecommunication Reform 2015
Another emerging sharing technique involves the use of databases. Such databases are empowering trials and driving the development of rules in some countries for “TV white spaces,” which allow unlicensed broadband services to operate in unoccupied spectrum in the UHF television bands (694-864 MHz). Several countries – such as Kenya and South Africa – have staged trials of TV white spaces operations, while other countries – such as the United States and United Kingdom – are developing TV white space regulations.
Cellular network operators in Europe and the United States are developing the concept of “licensed shared access” (LSA), a licensing framework that gives operators “priority access” to spectrum shared with incumbent users (perhaps government spectrum users). There would be a managed, or coordinated sharing scenario – perhaps using a database approach similar to those used for white spaces – that would provide a certain quality-of-service for the priority licensees, thus providing regulatory stability and incentives for investment that are generally not present in the licence-exempt, “swim-at-your-own-risk” model.
Chapter 4: Big Data - Opportunity or Threat?
Big Data offers a new perspective on reality, and therefore will affect and shape all sectors of our economy, especially those that play a role in the capturing and/or relaying of data and information.
Big Data obviously is closely connected to our ability to gather, analyze, and store data easily and at a relatively low cost. But Big Data’s likely impact will be felt beyond the economy; it affects how societies make sense of the world, and decide important policy challenges; and as you will read, it is having a profound impact on innovation.
The intent of this chapter is to offer a foundation; showing what Big Data is, explaining its recent history, and looking at where ICT regulators, policy makers and other authorities, such as competition authorities or data protection authorities have set or should set some boundaries. It examines the ways in which commercial entities collect, analyze and store data, that can be summarized in
eight general principles. It utilizes the diversity in the practicalities and uses of Big Data to increase awareness of the benefits and the risks; placing it in a context that allows for understanding of where the industry has been and where it could be going. For regulators, the question is: what can, or should, be done to carry out their responsibilities? Recognizing that no two countries or economies share a common or identical governance structure to oversee the technology, media or other societal sectors, this analysis treats them having a similar mandate.
The chapter is divided into four main parts: first it provides some boundaries to the subject; next, the contributions that Big Data offers to society and individuals are explained; as a balance, the attention of the reader is then drawn to some of the inherent risks of this powerful new technological tool; and finally, it concludes with the regulatory and policy considerations that should be accounted for when crafting future policy.
The concluding section sheds the light on establishing policy and the rules that will encourage the further use and benefits derived from Big Data, to set the proper frameworks to prevent societal or individual abuses.
Chapter 5: Consumer protection in the online world
One of the most important aspects of ensuring that the potential of the emerging digital world is realized is ensuring that the end users and consumers that use the Internet every day can do so safely and securely. Policy-makers and regulators have an important role to play in this regard, both in terms of setting rules that will protect consumers, as well as educating consumers on how to safely get the most out of their online experiences. In this regard, it is important to note that many of the emerging actors in the online world are either unregulated or only lightly regulated. As more and more social and economic activity is carried out online, however, this may have to change. This chapter examines the various activities that people engage in online, discusses the various regulatory issues that are involved in protecting online users and describes some of the efforts that have
xii Trends in Telecommunication Reform 2015

recently been made to address the conduct of the new market players that are gaining importance in the e-commerce ecosystem.
As policy-makers and regulators seek to drive broadband adoption, they have rightly concluded that online consumer protection will be an important part of ensuring trust and security in the online world. From this perspective, three main trends are important to keep in mind. First, and most obviously, the use of online services is growing rapidly in both developed and developing countries, although developed countries still have more users. This growth is also broad-based, as digital consumers are increasingly using online services for a variety of purposes, including simply searching for information, shopping online, downloading and streaming music and video, playing games and using other (mobile) apps, keeping up with friends on social media and often storing information in the cloud. For each of these activities, users have particular needs or concerns that policy-makers may have to address—in addition to the cross-cutting issue of how the data consumers generate will be used. Second, the online world tends to be dominated by only a handful of large players (e.g., Google, Microsoft and Facebook), each of which controls a large part of their individual markets. Finally, advertising and the collection of user data is driving many of the business models that are being developed for the online world. Each of these trends will put pressure on governments to act to protect their users.
Given these considerations, this chapter identifies a number of cross-cutting regulatory issues that policy-makers, regulators and industry should address to ensure that digital consumers are protected.
Chapter 6: The economic influence of data and their impact on business models
An increasing number of devices that collect and transmit data have been improving access to information. New data transport, storage and analysis procedures have been enabling more and more businesses to utilize data in their business models. This indicates a trend towards data collection and use becoming a new driver of economic growth. In light of this development, this chapter first
traces the evolution of business models built around data, and discusses the evidence for a sustained structural change in our markets; leading to a data-driven economy that policy-makers and regulators need to be alert to. To focus the analysis, a structural approach to analyze this emerging economy and its development is devised: the data value circle. When the data value circle is applied to analyze the market size and prospects for each of its parts, three important characteristics of the data-driven economy emerge. First and foremost, the analysis underlines the fact that data’s economic influence stretches across almost all sectors. Second, it is found that the data-driven economy is shaped by two-sided markets that seem prone to create dominant positions, and thus markets should be monitored by policy-makers and regulators, especially since; third, the analysis indicates that it is still uncertain which players will emerge as the most powerful.
This last finding merits a closer investigation of business models, strategic options and emerging challenges in the data-driven economy. Thus, this chapter analyses five key value propositions and surrounding business models: (1) mobile device ecosystems; (2) connectivity; (3) cloud services and content delivery networks; (4) targeted online advertising; and (5) video streaming. From these five models, the strategic options of market players and emerging challenges for all stakeholders are identified. Finally, the chapter sketches potential avenues for policy-makers and regulators in response to the following challenges: addressing dominance, monitoring partnerships, protecting consumers and establishing a global approach.
Chapter 7: Monitoring the Implementation of Broadband Plans and Strategies
Measurable information about the supply and use of broadband services provides a basis for judging whether broadband plans and digital strategies are achieving the objectives that have been set.
This chapter reviews the principles of performance monitoring, examines the increasingly broad scope of broadband plans and discusses how the implementation of broadband plans and strategies can be
xiiiTrends in Telecommunication Reform 2015
monitored. Within practical limits, monitoring should provide information on all aspects of the broadband market/ecosystem. The scope of many national broadband plans is already very wide, raising questions about coordination, information sharing and the role of the regulator.
This chapter reviews the issues around the monitoring of broadband plans as attention moves from initial deployment to make broadband available, through projects and programs to encourage the adoption and take-up of broadband, to integration of broadband as a core element in the digital economy. As that process of development occurs, performance monitoring helps to ensure that targets, costs, benefits and outcomes of projects are measured and programs are well managed.
In the deployment stage, there is a focus of attention on basic telecommunications/broadband indicators of availability obtained from service providers. When attention moves to indicators of adoption and use, barriers to access such as the need for improved digital literacy may need to be identified and overcome by means of projects and programs that will require monitoring and assessment of costs and benefits. Some regulators have
adopted innovative ways to expand and apply this information that are explored in the chapter.
When high-speed broadband becomes a core element of advanced services in sectors such as health and education, the savings flowing from the use of broadband-based connectivity may outweigh the costs. Within each sector, short, medium and long-term agendas need to take account of the different challenges associated with the deployment, adoption and integration stages, weighing short-term costs against long-term gains. When broadband is fully integrated in these sectors, attention turns to outcomes measured not only in terms of costs and savings, but also in terms of overall gains in capability, efficiency, productivity, innovation and public welfare. New measures may need to be developed to monitor changes in people’s behaviour and increased dependence on broadband-based services.
Chapter 8: conclusion
This chapter brings together the important issues that are addressed in this edition of Trends. Those issues will have to be addressed if the full benefits of the emerging digital world are to be realized.
xiv Trends in Telecommunication Reform 2015
1 Market and regulatory trends in the ICT sector
This chapter provides an overview of ICT market trends and starts by exploring cutting edge technologies in order to provide an overview of where the sector is headed. These trends are increasingly global and impact both developed and developing countries. The Chapter is intended to help stakeholders, and in particular ICT regulators keep abreast of the latest developments and prepare for the digital society. It explores evidence that shows how policies and regulation may impact ICT services uptake and introduces new tools developed by ITU.
1.1 ICT market trends
Since the last edition of Trends, the ICT sector has continued its remarkable transformation, and its impact on society and economic and social development has become even more obvious. The growing adoption of
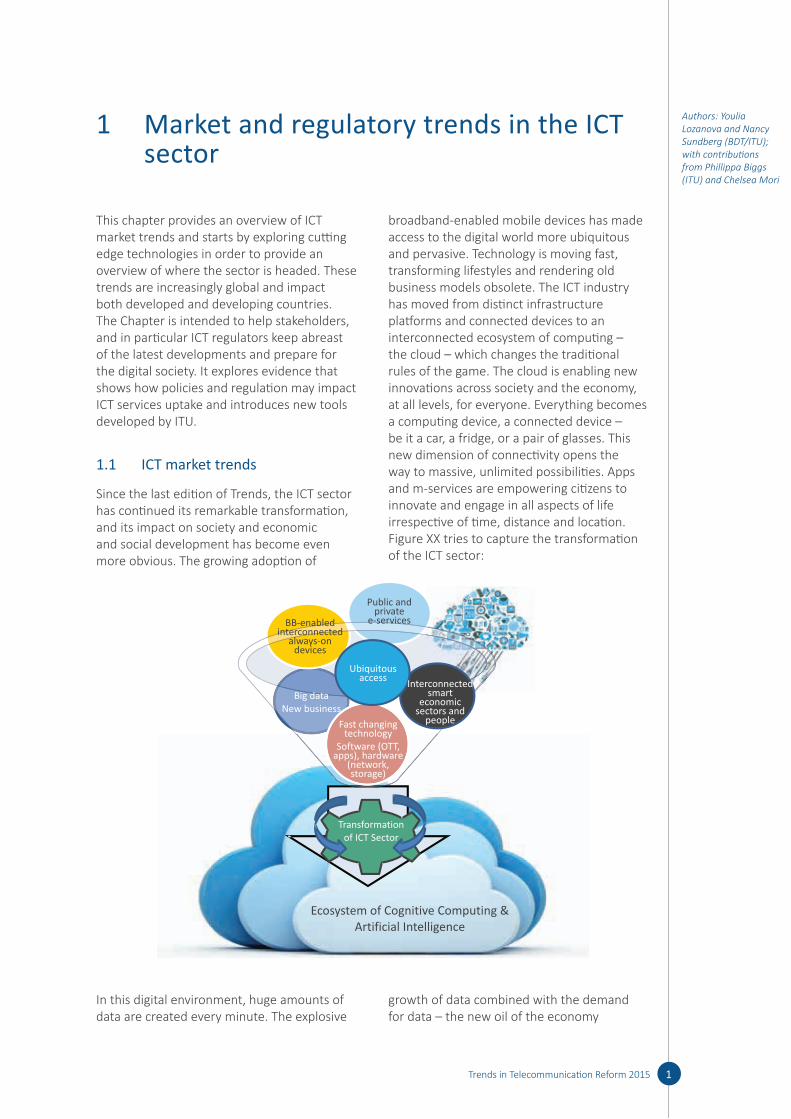
broadband-enabled mobile devices has made access to the digital world more ubiquitous and pervasive. Technology is moving fast, transforming lifestyles and rendering old business models obsolete. The ICT industry has moved from distinct infrastructure platforms and connected devices to an interconnected ecosystem of computing – the cloud – which changes the traditional rules of the game. The cloud is enabling new innovations across society and the economy, at all levels, for everyone. Everything becomes a computing device, a connected device – be it a car, a fridge, or a pair of glasses. This new dimension of connectivity opens the way to massive, unlimited possibilities. Apps and m-services are empowering citizens to innovate and engage in all aspects of life irrespective of time, distance and location. Figure XX tries to capture the transformation of the ICT sector:
BB-enabled interconnected
always-on devices
Public and private
e-services
Ubiquitous access
Big dataNew business
Interconnected smart
economic sectors and
peopleFast changing technology
Software (OTT, apps), hardware
(network, storage)
Transformation of ICT Sector
Ecosystem of Cognitive Computing & Artificial Intelligence
In this digital environment, huge amounts of data are created every minute. The explosive
growth of data combined with the demand for data – the new oil of the economy
Authors: Youlia Lozanova and Nancy Sundberg (BDT/ITU); with contributions from Phillippa Biggs (ITU) and Chelsea Mori
1Trends in Telecommunication Reform 2015

as some have called it – is reshaping the ICT industry opening up a wealth of new opportunities to innovate, do things better, faster, more widely or in a completely new way. For consumers, a new set of interactions is ruling user experiences and creating new efficiencies. New opportunities are arising for governments, business players, and consumers alike, with new challenges for ICT regulators given the additional challenges for infrastructure development. How do we unleash these opportunities? New skills, new thinking, and a different set of policy tools are part of the strategy needed to leverage the digital transformation and enable innovation and investment.
Over recent years, technological advances have democratized ICTs moving from a time where mainframes and PCs were the exclusive use of a group of qualified professionals to a society where many more people can use multiple screens and devices; where cars and objects can be connected and communicate; where cities are increasingly becoming smart; and where cognitive computing and artificial intelligence will soon be turned into full-fledged reality (see Figure 1.1). Technology has moved from being uncommon and difficult to use to being pervasive, intuitive, and more user-friendly. Digitization has accelerated
technological developments over the last two decades.
The Internet, including through the cloud, has intimately invaded all spheres of people’s lives, changing economic, social and cultural patterns, and has become a fundamental enabler of progress across the economy. What will be next? Some of the exciting future innovations such as wearables and artificial intelligence are nascent, and have yet to prove their full potential. Other, even more revolutionary innovations are probably not even on today’s radars yet. Shaping the history of the digital future needs an understanding of past and present phenomena, as past innovations are destroyed, sometimes to be reinvented in a new way to fulfil people’s continuing need to communicate, create and innovate.
However, technology cannot be examined in isolation, but needs to be considered in a broader context, where socio-economic aspects of access and affordability are brought into play.
Uptake in ICT services
Accessing the digital world is no longer the privilege of a few. But disparities remain between those who have access and those
2 Trends in Telecommunication Reform 2015
Figure 1.1: History of the future
1960 1970 1980 1990 2000 2010 2020 2030 2040 2050
Vo
lum
es, B
Internet born
www
Mobile broadband,smartphones, tablets
Mass wearables
Artificialintelligence
Social Media
Connected car
Cognitive computing
Internet of things
Mainframe (1 computer, many people)PC (1 person, 1 computer)Digital native computing (1 person, many screens)Internet of everything
One to many to any: ICTs from happy few to the masses
Source: ITU.

who do not, calling for continuous efforts to reduce costs and accelerate network and service deployments to achieve a truly inclusive digital society.
Twenty years ago, only one per cent of the global population had a mobile cellular subscription, and 11 per cent had a fixed telephone subscription. Today, mobile cellular penetration is approaching saturation with nearly seven billion subscriptions worldwide, representing a 96 per cent penetration level. Global fixed- and mobile-broadband penetration had reached 9.8 and 32 per cent, respectively, by the end of 20141. While fixed broadband showed only cautious growth between 2013 and 2014, mobile-broadband subscriptions were three times higher than wire-line broadband connections worldwide and are growing fastest in the developing regions, where growth rates are twice as high as in developed regions. Mobile broadband has helped bring high-speed data and Internet services to unconnected areas2.
But much more needs to be done to achieve universal access to Internet. In particular, the broadband divide between developed and developing countries remains large, with 82 per cent and 21 per cent penetration, respectively, for mobile broadband and 27.5 per cent and 6 per cent for fixed broadband3. ITU has estimated that there were 711 million fixed broadband subscriptions globally by the end of 20144. One industry analysis firm forecasts that global fixed broadband subscriptions will reach 920.2 million by 20195, driven by consumer demand for high-speed Internet access and the proliferation of Internet-connected devices within the home and at the workplace.
Although 3 billion people worldwide were using the Internet by the end of 2014, and users are joining at a fast pace, with nearly a billion new users added over the last four years, accessing the Internet still remains a privilege. Indeed, 4.3 billion people were not online by end of 2014, of whom 90 per cent live in the developing world. Turning to mobile coverage, 450 million people still live out of reach of a mobile signal without access to the digital world6. Many millions more of ICT users lack the necessary digital literacy to have a meaningful Internet experience or access
higher-paid, digitally literate jobs needing digital skills.
This is where ICT policies and regulations have a crucial role to play to create an enabling environment to bridge the digital divide. Regulation can enhance innovation and investment as well as infrastructure development, and can impact ICT services uptake and, in turn, affect economic growth and social development due the spillover effects of ICTs on other sectors of the economy. While there is no unique recipe for effective regulation, countries that have created an enabling policy and regulatory environment by following market developments and adapting and reforming their policy and regulatory frameworks to meet the requirements of the changing ICT environment are generally those that have shown higher levels of ICT adoption (see Figure 1.2).
Setting the conditions for ICT markets to flourish and remain vibrant, to attract investment and to foster innovation continues to be a high priority in most countries, alongside expanding universal access to the digital economy. This is why more than 140 countries have adopted national broadband-related policies, plans and digital agendas precisely recognizing the cross-sectoral and pervasive nature of ICTs on all aspects of the digital economy. More analysis of the impact of broadband policies and regulation on getting people connected is available in Sections 1.3 and 1.4.
Taking connectivity to the next level: smart devices and network growth
But it is not just the humans who are getting connected, things are also becoming smart. Sensors are deployed in a number of places to quantify (measure) almost anything from human, animals to machine activities. The Internet of Things (IoT), which connects many things to the Internet, and Machine to Machine (M2M) communications through cellular mobile networks are predicted to become the fastest-growing parts of the industry in terms of traffic. Many analysts agree that the Internet of Things (IoT) is now coming of age, and foresee strong growth in the IoT, which will also put additional pressure
3Trends in Telecommunication Reform 2015
Chapter 1
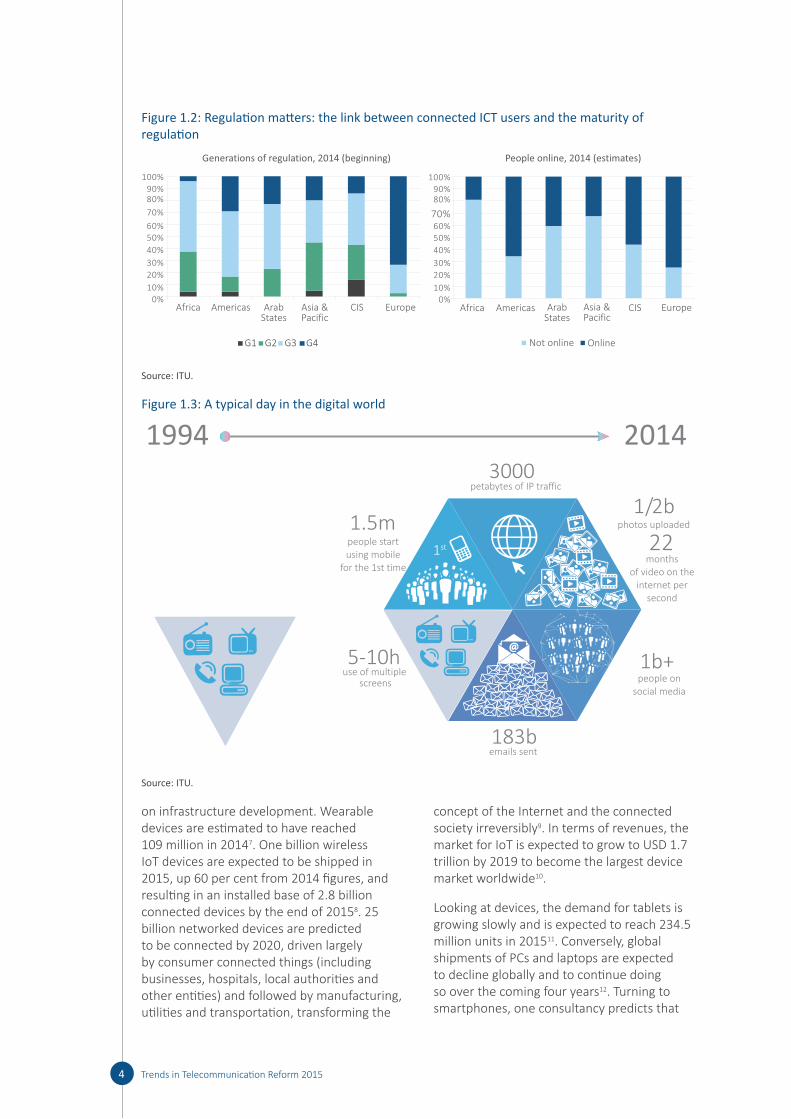
on infrastructure development. Wearable devices are estimated to have reached 109 million in 20147. One billion wireless IoT devices are expected to be shipped in 2015, up 60 per cent from 2014 figures, and resulting in an installed base of 2.8 billion connected devices by the end of 20158. 25 billion networked devices are predicted to be connected by 2020, driven largely by consumer connected things (including businesses, hospitals, local authorities and other entities) and followed by manufacturing, utilities and transportation, transforming the
concept of the Internet and the connected society irreversibly9. In terms of revenues, the market for IoT is expected to grow to USD 1.7 trillion by 2019 to become the largest device market worldwide10.
Looking at devices, the demand for tablets is growing slowly and is expected to reach 234.5 million units in 201511. Conversely, global shipments of PCs and laptops are expected to decline globally and to continue doing so over the coming four years12. Turning to smartphones, one consultancy predicts that
4 Trends in Telecommunication Reform 2015
Figure 1.2: Regulation matters: the link between connected ICT users and the maturity of regulation
G2
Generations of regulation, 2014 (beginning)
Americas Arab States
Asia & Pacific
CIS EuropeAfrica
G1 G3 G4
People online, 2014 (estimates)
Americas Arab States
Asia & Pacific
CIS EuropeAfrica
Not online Online
0%
100%
90%80%
70%
60%
50%
40%
30%
20%
10%
0%
100%
90%80%
70%60%
50%
40%
30%
20%
10%
Source: ITU.
Figure 1.3: A typical day in the digital world
20141994
1st 22
5-10h use of multiple
screens
1.5m
1b+
183b
1/2b
3000
people start using mobile
for the 1st time
petabytes of IP traffic
photos uploaded
months of video on the
internet per second
emails sent
people on social media
Source: ITU.

1.4 billion smartphones will sell worldwide in 2015, exceeding the sales of the PC, television, tablets and game console sectors combined in terms of both units and revenues. The same consultancy raised their global smartphone base forecast from 1.8 billion in 2014 to 2.2 billion in 201513. This means that, for many consumers in developing markets, their first-hand experience of the Internet will likely be via a smartphone. Added to that, with the growth of low-cost smartphones mobile and smartphone sales are expected to grow in the next five years, in particular in developing countries, where many consumers still remain unconnected14.
In mature markets, vendors rely mainly on replacement of handsets rather than sales to first-time users. With only 30 per cent or less than a third of the estimated global total of 5.2 billion unique mobile phone users owning a smartphone, there is room for growth and market opportunities. As mobile devices proliferate, other analysts15 predict a shift in focus towards serving the needs of users in diverse contexts and environments, rather than the features and functionality of devices in isolation. And going forward, phones and wearable devices will form part of an expanding computing environment (including consumer electronics and connected screens). It is therefore not surprising that global smartphone traffic is expected to increase tenfold by 2019 to reach 18.24 Exabytes per month up from 1.74, with video representing a significant part of the traffic (Figure 1.4)16.
Figure 1.4: Global smartphone data traffic forecast, exabytes per month
Global smartphone traffic to increase tenfold by 2019
2.96 EB1.74 EB 4.87 EB 7.80 EB 11.97 EB 18.24 EB
20152014 2016 2017 2018 2019
Source: Statista, based on Cisco VNI.
Nearly all the major players are now investing heavily to capitalize on recent rapid developments in broadband technology, with 4G mobile, VDSL vectoring, DOCSIS 3.0 and FTTx technologies all offering significantly higher speeds. Technologies such as Network Functions Virtualization (NFV), Software-Defined Networking (SDN) and heterogeneous networks (HetNets) are already being deployed by operators and will continue to enable the move towards the hyper-connected society, alongside imminent developments in 5G. While initial trials are underway, there is still a long way to go before 5G becomes a reality. The World Radiocommunication Conference 2015 (WRC-15) will define the technical specifications for the adoption of global standards on 5G with the International Mobile Telecommunications 2020 (IMT-2020) system. Some see 5G as having the potential to completely change the way we interact with connected devices and how everything, in turn, is linked to IoTs, while others view these technologies as the consolidation of the existing generations of mobile telephony and the next iteration of cellular networks services based on much greater coverage and always-on reliability17.
Whatever changes 5G will bring along, mobile broadband will continue to play a complementary role alongside fixed broadband in some markets, but may increasingly dominate over fixed broadband in other markets. However, it is clear that fixed technologies will still continue to play a vital role in providing backhaul networks. The integration of fixed and wireless networks is further exemplified with the increasing offload of mobile data traffic onto fixed networks, with Cisco estimating that, globally, nearly half or 46 per cent of all mobile data traffic was offloaded onto the fixed network through Wi-Fi or femto cells in 2014. Satellite communications also offer ‘universal’ broadband services rapidly to large numbers of people instantaneously, and can be deployed rapidly without large investments in terrestrial infrastructure18.
In terms of value, it is forecasted that the total value of the global fixed broadband market will grow at 3 per cent CAGR to reach USD 276 billion by 201919. Mobile operators are continuing to focus on generating a return on
5Trends in Telecommunication Reform 2015
Chapter 1
investment from their 3G and 4G networks by developing new services and pricing packages to make more efficient use of their networks. 4G is growing rapidly in many countries, with an industry association expecting 4G network infrastructure to account for much of the USD1.7 trillion which mobile operators will invest from 2015-202020. 2015 is likely to prove a ‘cusp year’, as growth in 3G starts to slow, while growth in 4G subscriptions accelerates further. Some 393 LTE networks had been commercially launched in 138 countries around the world by April 201521. Indeed, China Mobile had rolled out more than 700,000 TD-LTE base stations and signed up 106.8 million 4G subscribers by January 2015 to become the largest mobile operator in the world by subscribers (China Mobile had already overtaken U.S. provider Verizon in fall 2014 to become the largest 4G provider in the world)22.
1.2 A world of opportunities and challenges for consumers
Mobility, always-on access, and broadband-enabled devices have irreversibly changed consumers’ social and economic behaviours. The proliferation of apps developed to respond to consumers’ increasing needs to interact, communicate and share information online, are turning consumers into digital
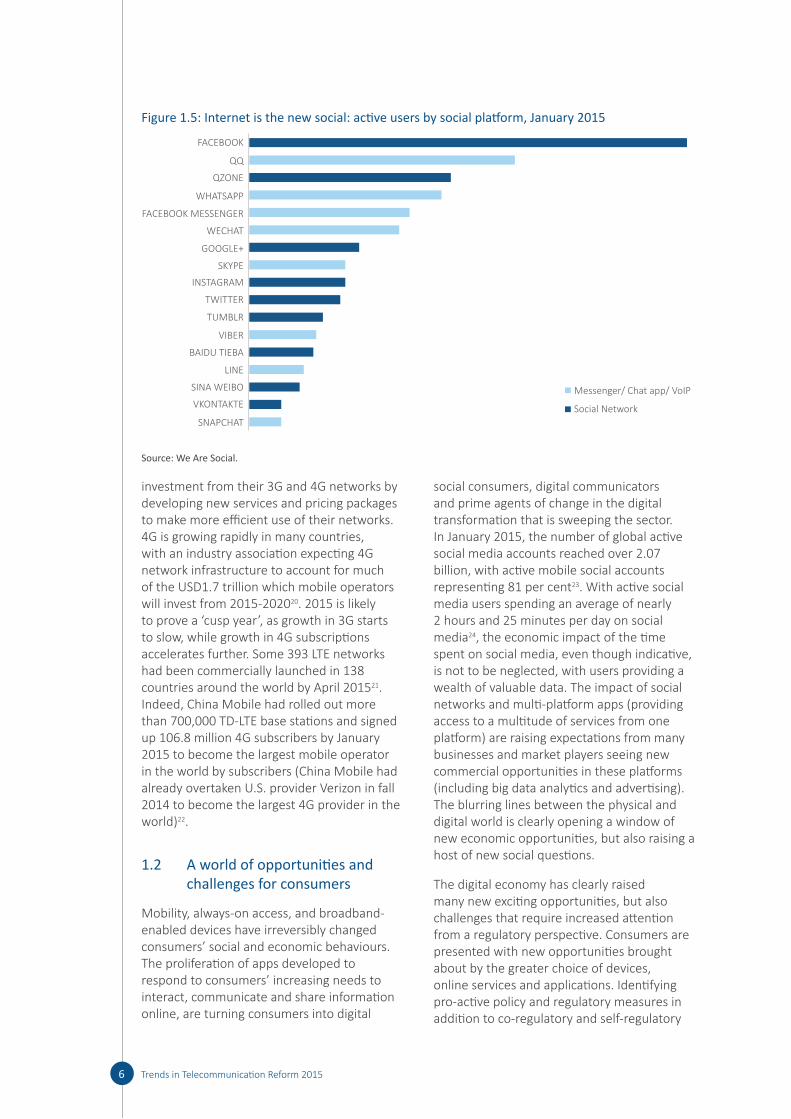
social consumers, digital communicators and prime agents of change in the digital transformation that is sweeping the sector. In January 2015, the number of global active social media accounts reached over 2.07 billion, with active mobile social accounts representing 81 per cent23. With active social media users spending an average of nearly 2 hours and 25 minutes per day on social media24, the economic impact of the time spent on social media, even though indicative, is not to be neglected, with users providing a wealth of valuable data. The impact of social networks and multi-platform apps (providing access to a multitude of services from one platform) are raising expectations from many businesses and market players seeing new commercial opportunities in these platforms (including big data analytics and advertising). The blurring lines between the physical and digital world is clearly opening a window of new economic opportunities, but also raising a host of new social questions.
The digital economy has clearly raised many new exciting opportunities, but also challenges that require increased attention from a regulatory perspective. Consumers are presented with new opportunities brought about by the greater choice of devices, online services and applications. Identifying pro-active policy and regulatory measures in addition to co-regulatory and self-regulatory
6 Trends in Telecommunication Reform 2015
Figure 1.5: Internet is the new social: active users by social platform, January 2015
QZONE
FACEBOOK MESSENGER
GOOGLE+
SKYPE
TUMBLR
VIBER
BAIDU TIEBA
LINE
SINA WEIBO
VKONTAKTE
SNAPCHAT
Messenger/ Chat app/ VoIP
Social Network
Source: We Are Social.

solutions and initiatives geared towards educating and empowering consumers is essential to provide the framework to enable investment and innovation while at the same time protect the rights of all users in
an open, transparent and inclusive digital world. Regulators participating in the 2014 ITU Global Symposium for Regulators (GSR-14) identified and endorsed a set of regulatory best practice guidelines to protect consumer
7Trends in Telecommunication Reform 2015
Chapter 1Box 1.1: GSR14 Best practice guidelines on consumer protection in a digital world
Regulators recognized that governments must continue to play a major role in facilitating the protection of citizens at all levels through the development of a wide array of relevant legislation and government policies. Furthermore:
– legal and regulatory frameworks need to be kept open, forward-looking, neutral and flexible to allow leveraging of new technologies, innovative services and new business practices (such as cloud computing, social media, mobile broadband, big data, and the Internet of Things) for users to benefit.
– Industry players have a vital role to play in ensuring transparency and accountability in their business practices, as well as willingly adopting measures geared at protecting the rights of consumers (such as protecting personal data, fighting misleading as well as unfair mass advertising, spam, the permanency of data, and child online protection).
– Regulators consider best practice to legally prohibit the use of general terms and conditions that provide to the customers’ detriment. Furthermore, unjustified and disproportionate differences between the rights and obligations arising under contracts for ICT services should be prohibited, irrespective of whether they were concluded online or otherwise.
– The role of the regulator is essential in mediating and escalating consumer complaints for redress, and sound relationships with service providers needs to be maintained to this end.
– A series of measures can be taken to ensure consumers (including people with disabilities) have easy and reliable access to ICT services as well as web content, such as: developing and regularly reviewing minimum quality of service standards and specifications of new technologies and services; monitoring network service providers; regularly assessing telecom/ICT services quality and publishing the results.
– Establishing an integrated legal system for effectively protecting personal data and information is paramount for the digital world to thrive. OTTs, and social media providers in particular, should engage in more transparent procedures for data processing, obtain the consent of their customers through opt-in before sharing their data, and provide users with the option to clearly choose the status of their communications, between private or public. Users should be able to make informed decisions about the degree to which their data can be accessed by others and the usage that third parties may make of it.
– ICT regulators should be proactive in promoting, informing, encouraging and raising awareness to stakeholders of the benefits and challenges of a connected broadband world.
– Regulators need to ensure that all service providers make available timely and accurate information about their services and products in a clear, transparent and comparable manner that is conducive to rational decision making.
– The ICT regulator should increasingly be seen as a partner to market players and an advocate for consumers’ rights.
Source: GSR14 Best practice guidelines, www. itu. int/ en/ ITU- D/ Conferences/ GSR/ Pages/ GSR2014/ GSR14- Consultation. aspx

interests, while also ensuring a level-playing field for traditional and new market players by fostering a light touch regulatory approach. Regulators recognized that the rights of all stakeholders must be balanced to ensure that both consumers and businesses benefit from digital opportunities. Moreover, stakeholder rights will increasingly be considered critical in moving to the next generation of regulation (See Box 1.1).
The disruption of the ICT sector is putting ICT regulators and policy makers under pressure to continuously review, adapt and anticipate changes to ensure that their national ICT regulatory framework remains relevant, while social development goals are met. Adopting more flexible policy and regulatory frameworks to fully embrace the potential of the digital economy remains more critical than ever. Regulators and Policy Makers further need to strengthen their enforcement powers to respond to the challenges of the dynamic digital environment. Sector reform is an ongoing process promoting social and economic development in the ICT sector and beyond through best-practice regulation. The impact of such regulation is examined in detail below.
1.3 A New Contribution to the Debate
1.3.1 Tracking the evolution of regulationIn previous editions of Trends, ITU has approached the evolution of telecommunication/ICT regulation by identifying four broad generations of regulation (see Figure 1.7). The dawn of the global digital economy has opened the way to fourth-generation regulation. In response to market and technology developments, policy-makers and regulators face ever louder calls to ensure access to digital infrastructures. Broadband networks and internet services are increasingly viewed as commodity – while access to them has even become a right in some countries – and their availability and performance impact every aspect of the development of the economy and society today.
Greater complexity and a cross-sectoral view, expanding beyond ICTs, are some of the main features of fourth-generation regulation. The interaction of the ICT sector for stimulating growth in the digital economy alongside other sectors needs to be understood and, wherever possible, managed by policy and regulatory frameworks of a new kind. To shape these, however, it is essential to have a clear
8 Trends in Telecommunication Reform 2015
Figure 1.6: So who’s in charge?
Do you control your phone, or does it control you?
More affordable
More services and content
Mobile
Higher speeds
Smarter devices
New usage patterns
Doing more online
Multiple screens
More time spent online
Direct demand for new services
Co
nsu
mer
Source: ITU.
Figure 1.7: Generations of regulation
Op
enn
ess
& F
lexi
bili
ty
Effectiveness
G1:
regulated
monopolies
G2:
Basic
reform
G3:
Enabling
environment
G4:
Integrated
regulation
G1: Regulated public monopolies – command and control approach G2: Basic reform – partial liberalization and privatization across the layers G3: Enabling investment, innovation and access – dual focus on stimulating competition in service and content delivery, and consumer protection G4: Integrated regulation – led by economic and social policy goals Source: ITU.

understanding of the complex relationships between regulatory policies and ICT growth. It is also important to quantify recent trends and learn from successful past experiences.
To do so, ITU has developed the ICT Regulatory Tracker, a new evidence-based tool to help decision-makers and regulators to make sense of the rapid evolution of the ICT sector regulation. More than a look back, the Tracker, a powerful analytical tool, helps pinpoint the strengths and weaknesses of regulatory interventions to provide a learning curve for achieving a vibrant and innovative ICT sector (see Box 1.2). Some of the benchmarking and performance tracking capabilities of the Tracker are explored below.
Fourth-generation regulation characterized by agility and flexibility has been rapidly gaining momentum over the past decade. One out of four surveyed countries now enjoys a fourth-
generation regulatory environment that allows for leveraging on the ICT sector to achieve economic growth and social development across the economy (see Figure 1.8). Not all of those countries have yet fully realized digital opportunities; however, they have opened a way to meaningful change and can expect tangible improvement of their ICT sectors as well as the entire economy over the short- to medium-term. Overall, the regulatory environment is steadily enhanced in the great majority of countries worldwide, as countries have been gradually transitioning to higher generations of regulation. The number of countries in the first- and second-generation categories of regulation has been cut by half in only 7 years, going from two-thirds to just one-third of countries. This positive outlook reflects the dynamic pace of technological and business innovation faced by telecom/ICT regulators, a reality that challenges them to adapt to the new digital world order.
9Trends in Telecommunication Reform 2015
Chapter 1Box 1.2: Making sense of regulatory trends: the ITU Regulatory Tracker
ITU has built a new tool to monitor and measure the changes taking place in the telecommunication/ICT regulatory environment. Using quantitative methods and data gathered through the annual ITU World Telecommunications/ICT Regulatory Survey, the Tracker makes both benchmarking and the identification of trends in legal and regulatory frameworks in the ICT sector possible. The countries included in the Tracker are split into score thresholds that relate to generations of regulation to help analyse the evolution of ICT regulation worldwide and its future perspectives.
The Tracker covers up to 156 countries out of the 193 ITU Member States or the period from 2003 through 2014, showcasing progress within the same country, amongst countries and regions as well as worldwide. The full set (50 indicators) is available for the period 2007-2013, and will be updated annually. It is built on self-reported data gathered yearly via ITU’s World Telecommunication Regulatory Survey and on compiled desktop research.
The Tracker was established by assessing the various dimensions of the regulatory environment: the regulatory authority itself; which segments and services that are regulated; the scope and direction of the regulations; and the enabling of a competitive environment. A variety of traditional and new regulatory matters is included, in four clusters: the regulatory authority, regulatory mandates, the regulatory regime and competition framework in the ICT sector (see Table 1.1 below).
The assessment made by the Tracker is of both qualitative and quantitative order. All indicators have been scored between 0 and 2. The reference for the scoring is what is considered the best possible scenario-based on the internationally recognized regulatory best practices adopted by the global community of regulators at the annual ITU Global Symposium for Regulators25.

But what does fourth generation of regulation stand for, in real terms? The analysis of trends in 122 countries using the ICT Regulatory Tracker shows that mobile-broadband penetration levels are higher and grow at a faster pace in countries having achieved the fourth generation of regulation (see Figure 1.9). Comparing the high and low performers – fourth-generation versus first-generation countries having implemented mobile broadband – clearly suggests that growth in services has happened most rapidly where regulatory enablers have been put in place to leverage latest technologies and innovations. In a nutshell, slow, patchy or inconsistent regulation may inhibit innovation and business incentives. Further, the time-to-market, as well as the choice of services, are limited – which is the case in countries in the first generation of regulation, which have not embarked on reforming the sector. On the
other hand, consistent, forward-looking and well-enforced, fourth-generation regulation generally provides for a vibrant market and win-win opportunities for both service providers and consumers.
The level of ICT penetration shows this. While mobile penetration in first-generation countries has gone up from close to 0 per cent to a modest 13 per cent between 2009-2013, fourth-generation countries have improved their mobile penetrations by a phenomenal 36 per cent. Today, on average, one out of two citizens in these countries has access to the unlimited opportunities of the digital world, compared with only one out of five citizens connected five years ago. And although in many respects the evolution from third- to fourth-generation of regulation can be seen as incremental, this evidence shows the massive advantage of the fourth-generation
10 Trends in Telecommunication Reform 2015
Table 1.1: ICT Regulatory Tracker summary structure (full set), 2007-2013
Cluster Name Nb indicators Max score Countries ranked if min indicators
1 Regulatory authority 10 20 3
2 Regulatory mandates 11 22 3
3 Regulatory regime 15 30 4
4 Competition framework 14 28 4
Total ICT Regulatory Tracker 50 100 14
Note: For the full list of indicators, please see the technical notes at the end of the chapter. Source: ITU.
Figure 1.8: Evolution in ICT regulation, 2007-2013
0%
20%
40%
60%
80%
100%
2007 2008 2009 2010 2011 2012 2013
G1 G2 G3 G4Co
un
trie
s in
clu
ded
in t
he
ICT
Reg
ula
tory
Tra
cker
Score Breakdown
1st Generation >=0 <40
2nd Generation >=40 <70
3rd Generation >=70 <85
4th Generation >=85
Note: Analysis based on the ICT regulatory tracker for 156 countries. Source: ITU.
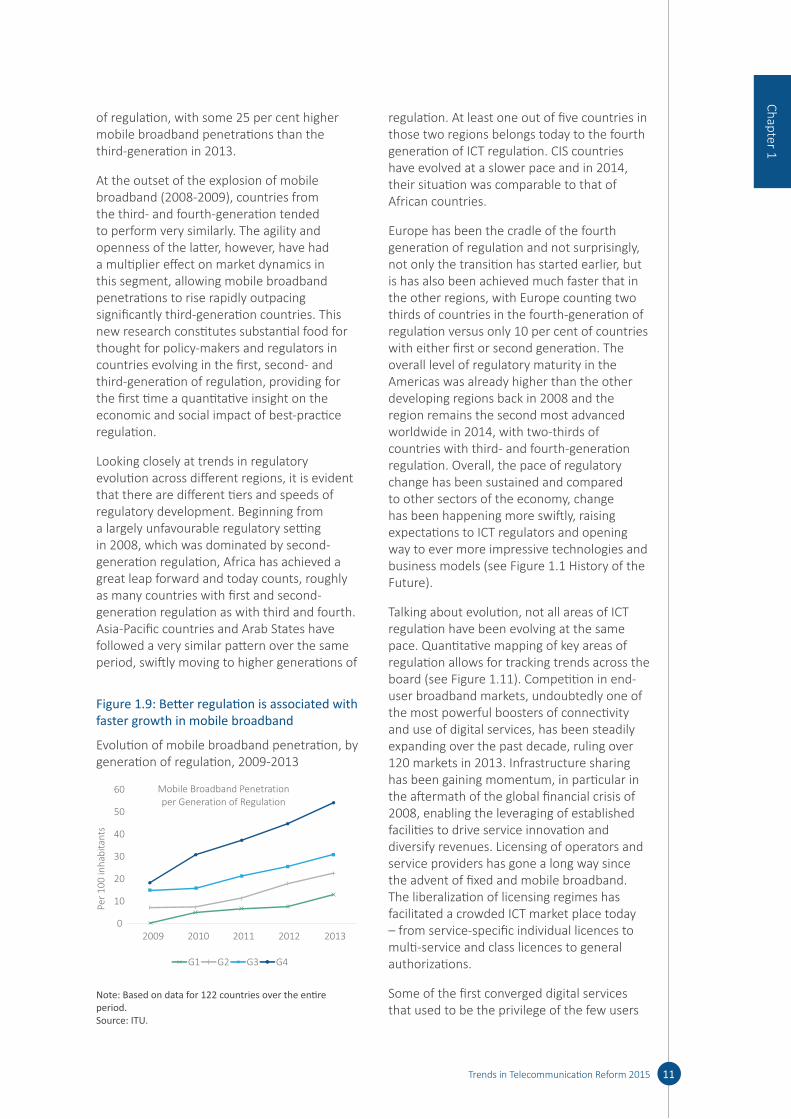
of regulation, with some 25 per cent higher mobile broadband penetrations than the third-generation in 2013.
At the outset of the explosion of mobile broadband (2008-2009), countries from the third- and fourth-generation tended to perform very similarly. The agility and openness of the latter, however, have had a multiplier effect on market dynamics in this segment, allowing mobile broadband penetrations to rise rapidly outpacing significantly third-generation countries. This new research constitutes substantial food for thought for policy-makers and regulators in countries evolving in the first, second- and third-generation of regulation, providing for the first time a quantitative insight on the economic and social impact of best-practice regulation.
Looking closely at trends in regulatory evolution across different regions, it is evident that there are different tiers and speeds of regulatory development. Beginning from a largely unfavourable regulatory setting in 2008, which was dominated by second-generation regulation, Africa has achieved a great leap forward and today counts, roughly as many countries with first and second-generation regulation as with third and fourth. Asia-Pacific countries and Arab States have followed a very similar pattern over the same period, swiftly moving to higher generations of
regulation. At least one out of five countries in those two regions belongs today to the fourth generation of ICT regulation. CIS countries have evolved at a slower pace and in 2014, their situation was comparable to that of African countries.
Europe has been the cradle of the fourth generation of regulation and not surprisingly, not only the transition has started earlier, but is has also been achieved much faster that in the other regions, with Europe counting two thirds of countries in the fourth-generation of regulation versus only 10 per cent of countries with either first or second generation. The overall level of regulatory maturity in the Americas was already higher than the other developing regions back in 2008 and the region remains the second most advanced worldwide in 2014, with two-thirds of countries with third- and fourth-generation regulation. Overall, the pace of regulatory change has been sustained and compared to other sectors of the economy, change has been happening more swiftly, raising expectations to ICT regulators and opening way to ever more impressive technologies and business models (see Figure 1.1 History of the Future).
Talking about evolution, not all areas of ICT regulation have been evolving at the same pace. Quantitative mapping of key areas of regulation allows for tracking trends across the board (see Figure 1.11). Competition in end-user broadband markets, undoubtedly one of the most powerful boosters of connectivity and use of digital services, has been steadily expanding over the past decade, ruling over 120 markets in 2013. Infrastructure sharing has been gaining momentum, in particular in the aftermath of the global financial crisis of 2008, enabling the leveraging of established facilities to drive service innovation and diversify revenues. Licensing of operators and service providers has gone a long way since the advent of fixed and mobile broadband. The liberalization of licensing regimes has facilitated a crowded ICT market place today – from service-specific individual licences to multi-service and class licences to general authorizations.
Some of the first converged digital services that used to be the privilege of the few users
11Trends in Telecommunication Reform 2015
Chapter 1
Figure 1.9: Better regulation is associated with faster growth in mobile broadband
Evolution of mobile broadband penetration, by generation of regulation, 2009-2013
0
10
20
30
40
50
60
2009 2010 2011 2012 2013
G1 G2 G3 G4
Mobile Broadband Penetration per Generation of Regulation
Per
10
0 in
hab
itan
ts
Note: Based on data for 122 countries over the entire period. Source: ITU.

with broadband connection a decade ago have been widely democratized. Voice-over-IP (VoIP) has grown into one of the most popular free services. Regulation, or more accurately, the removal of regulatory barriers, has been an important facilitator. Other regulatory practices have experienced slower adoption and remain limited to relatively fewer jurisdictions. With spectrum trading or net neutrality, however, such practices can have a significant impact on the development
of national markets. Last but not least, new policy instruments have also come of age, since new issues may need to be addressed in new ways. National broadband plans and related policies which mainly came to prominence after the 2008 global financial crisis as a means of channelling stimulus funding, have now widespread in 140 countries and are being used to reconnect economic sectors to improve efficiencies and create new business opportunities.
12 Trends in Telecommunication Reform 2015
Figure 1.10: Every Region is different: improving regulatory patterns, 2008-2013Africa Americas Arab States Asia-Pacific CIS Europe
2008
2013
G1 G2 G3 G4
Source: ITU.
Figure 1.11: Screening regulatory practices: which regulations have shaped the ICT sector? 2006-2013
Individuals allowed to use VoIP
Policy/plan that includes Broadband
Infrastructure sharing Adoption of class/general licensing
Competitive markets (DSL, Cable Modem, Fixed
Wireless BB, International Gateways)
Foreign direct investment allowed (FBO, SBO, ISPS)
150
135
120
105
90
75
60
45
30
15
0
2006 20132009
Source: ITU.

It is widely recognized that the quality of regulation is a key success factor to the development of vibrant digital economies. Based on evidence produced with the ICT Regulatory Tracker, the choice of regulatory intervention(s) appears to have an equally strong impact on stirring up market growth. More precisely, the combination of a handful of regulatory measures is closely associated with a catalytic effect on market take-up. With respect to mobile-broadband penetration, countries with a broadband plan, competition in both the mobile sector and international gateways, infrastructure sharing, mobile number portability and band migration, systematically outperform countries lacking some or all of those regulatory settings (see Figure 1.12, left chart).
As of the end of 2013, countries having applied this “winning formula” to their mobile broadband markets had an average national penetration rate of close to 60 per cent compared to a world average of 27 per cent, or more than twice lower. In the short-term, these measures seem to have had a booster effect associated with the trebling of mobile-broadband penetrations (since 2011), an effect which tends to slow down slightly over the medium-term and potentially, the long-term. In a similar way, fixed broadband markets seem to have their “winning formula”, too. The top-five measures on record are a Broadband Plan, open competition in wireline broadband technologies, an advanced licensing framework (featuring either unified licenses or a general authorization regime) combined with an infrastructure sharing policy and provisions for fixed number portability (see Figure 1.12, right chart).
Countries which have realized the potential of those regulatory pillars are associated with consistent performance above the curve, achieving, on average, fixed broadband penetrations 13 to 16 per cent higher than the global average. Within reasonable limitations, this quantitative evidence suggests that best-practice regulation does matter and both the design and the effective enforcement of regulatory frameworks are essential for broadband markets to thrive. The ICT Regulatory Tracker can serve as a sound benchmarking tool for a range of regulatory cases.
1.3.2 Quantifying the impact of regulation on ICT uptakeAs already discussed, there is by now a large body of qualitative research investigating the causality and relationship between regulation and ICT adoption. Quantitative evidence, however, is considerably less extensive. In order to fill in the gaps in this important area and provide grounds for informed policy-making, ITU has developed two econometric models based on the ICT Regulatory Tracker, for fixed broadband and for mobile cellular, which suggest that a sound regulatory environment is significantly associated with a positive impact on ICT adoption (see Annex 1).
This new ITU research suggests that a 10 per cent increase in the ICT Regulatory Tracker score (corresponding to an incremental enhancement of regulatory frameworks) is associated with an increase of 7.7 per cent in fixed-broadband penetration over the period 2008-2013 (see Box 1.3). To illustrate that, a country that has adopted some form of a broadband development strategy (a national broadband plan or digital agenda etc., that includes pro-active regulatory measures such as infrastructure sharing), countries which allow the use of VoIP services and promote a competitive environment for broadband technologies26 would have penetration levels 7.7 per cent higher on average than a country without these measures in place, other conditions being equal.
The model further suggests that a 1 per cent increase in the population living in urban areas is associated with a 7.8 per cent increase in fixed-broadband penetration, other things being equal. This high coefficient could be representative of the various characteristics urbanization is controlling for: infrastructure, commerce, investment in the Internet-intensive tertiary sector, etc.
Gross national income per capita also plays a valid role in explaining the levels of fixed-broadband penetration. A country that witnesses a 10 per cent increase in income per capita, for example from USD 10’000 to USD 11’000 is expected to have additional 9.4 fixed broadband users per every 100 people, other things being equal. This could be explained by different interpretations of the role Gross National Income (GNI) per capita plays in this
13Trends in Telecommunication Reform 2015
Chapter 1
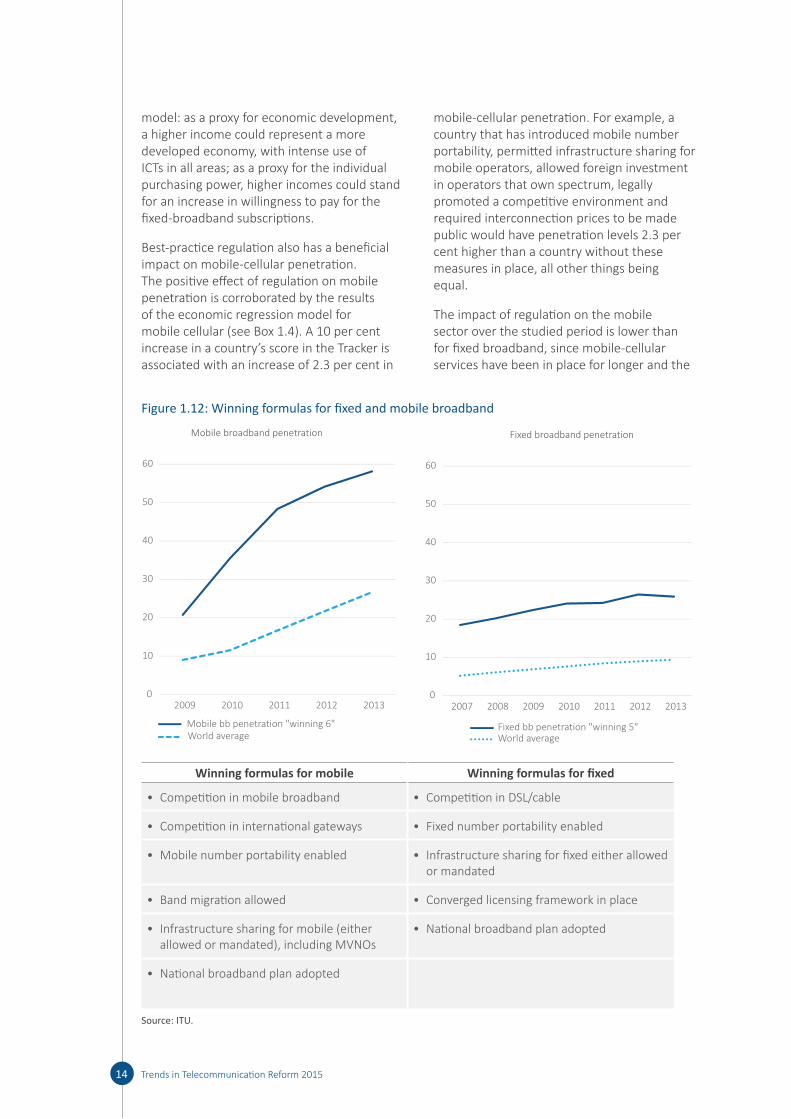
model: as a proxy for economic development, a higher income could represent a more developed economy, with intense use of ICTs in all areas; as a proxy for the individual purchasing power, higher incomes could stand for an increase in willingness to pay for the fixed-broadband subscriptions.
Best-practice regulation also has a beneficial impact on mobile-cellular penetration. The positive effect of regulation on mobile penetration is corroborated by the results of the economic regression model for mobile cellular (see Box 1.4). A 10 per cent increase in a country’s score in the Tracker is associated with an increase of 2.3 per cent in
mobile-cellular penetration. For example, a country that has introduced mobile number portability, permitted infrastructure sharing for mobile operators, allowed foreign investment in operators that own spectrum, legally promoted a competitive environment and required interconnection prices to be made public would have penetration levels 2.3 per cent higher than a country without these measures in place, all other things being equal.
The impact of regulation on the mobile sector over the studied period is lower than for fixed broadband, since mobile-cellular services have been in place for longer and the
14 Trends in Telecommunication Reform 2015
Figure 1.12: Winning formulas for fixed and mobile broadband
0
10
20
30
40
50
60
2009 2010 2011 2012 2013
Mobile bb penetration "winning 6"World average
0
10
20
30
40
50
60
2007 2008 2009 2010 2011 2012 2013
Fixed bb penetration "winning 5"World average
Mobile broadband penetration Fixed broadband penetration
Winning formulas for mobile Winning formulas for fixed
• Competition in mobile broadband • Competition in DSL/cable
• Competition in international gateways • Fixed number portability enabled
• Mobile number portability enabled • Infrastructure sharing for fixed either allowed or mandated
• Band migration allowed • Converged licensing framework in place
• Infrastructure sharing for mobile (either allowed or mandated), including MVNOs
• National broadband plan adopted
• National broadband plan adopted
Source: ITU.

effect of regulation has tended to peak few years after adoption, while fading out in the longer term. The mobile sector has also been subject to more incentive regulations rather than obligations imposed, as in the case of fixed networks. These are well-known facts remedied by regular reviews and upgrades of existing policy and regulatory settings, as well as by the adoption of new measures and policy initiatives to address the changing nature of the digital ecosystem.
Urbanization is one of the key determinants of mobile-cellular adoption; a 1 per cent increase in urbanization is associated with an increase equivalent to 4.7 per cent in mobile-cellular penetration, all other factors being equal. Evidences point to the role of network
externalities in the use of mobile phones, for instance, the high amount of mobile-cellular users motivate those who have not adhered to the service to do so28. It is worth noting, nevertheless, that the impact of urbanization on the take up of mobile-cellular services is lower than on fixed-broadband penetration levels, mobile-cellular being less infrastructure-intensive and thus deployed at a lower cost beyond urban areas.
With regards to national wealth, the results of the regression model were highly predictable and confirm general assumptions. GNI per capita has a positive impact on mobile-cellular adoption: a 10 percent increase in income, for example from USD 10’000 to USD 11’000, is expected to generate 6.5 subscriptions per
15Trends in Telecommunication Reform 2015
Chapter 1Box 1.3: Econometric regression models for fixed broadband
The panel regression model for fixed-broadband penetration reveals that all variables chosen are statistically significant, which confirms the relevance of their impact on the dissemination of this service. Moreover, all the accompanying coefficients to these variables are different from zero, as certified by the F test27 results. While the overall explanatory power of the model (r-squared) is moderate (36.1%), it nevertheless provides evidence of the importance of regulation on ICT services uptake.
Variable Coefficient Statistical Significance Interpretation
Regulatory Tracker
0.784
(4.18)*
Highly significant
(1% level)
A 10% increase in the regulatory score is linked to a 7.7% increase in fixed-broadband penetration.
Urbanization 7.636 (2.98)*
Highly significant
(1% level)
A 1% increase in urbanization is linked to a 7.8% increase in fixed-broadband penetration.
GNI p.c. 0.941 (2.21)*
Highly significant
(1% level)
A 10% increase in the per capita income is linked to a 9.4% increase in fixed-broadband penetration.
Constant –40.918
(4.40)*
Highly significant
(1% level)
Observations 749
Number of countries
135
R-squared
(within)
0.361
Absolute value of t-statistics in parentheses. *Significant at the 1% level. Estimation based on robust standard errors. Source: ITU.
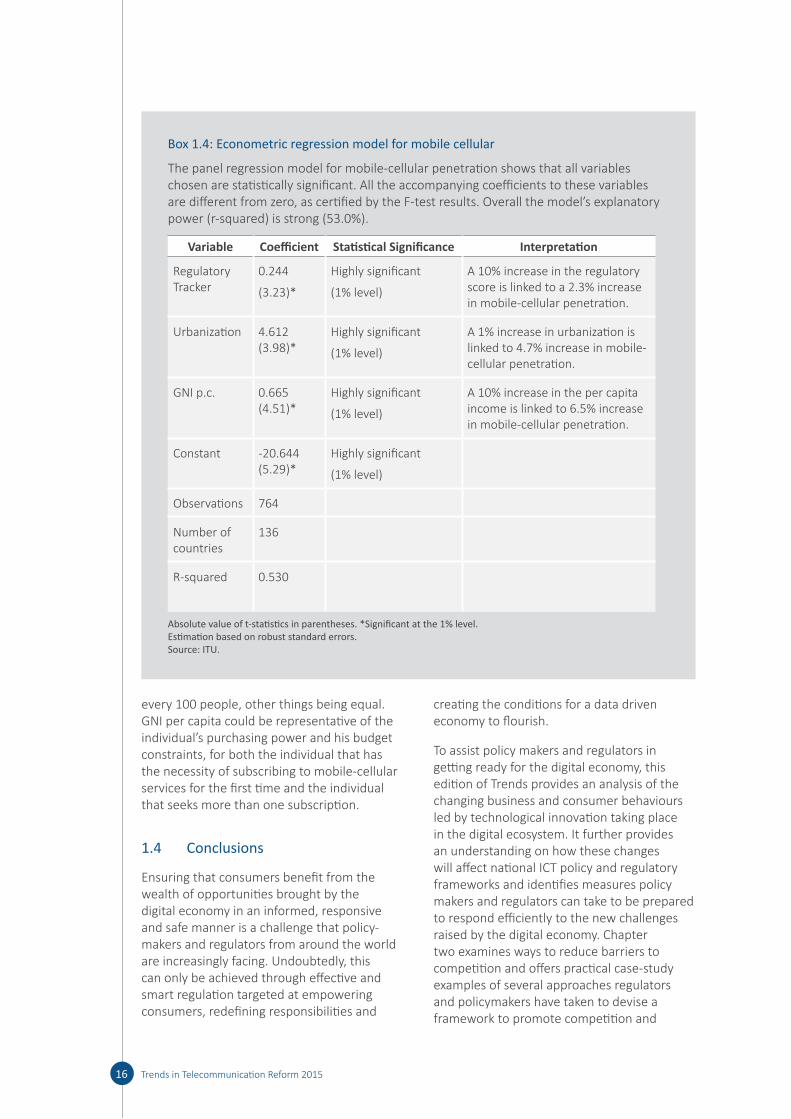
every 100 people, other things being equal. GNI per capita could be representative of the individual’s purchasing power and his budget constraints, for both the individual that has the necessity of subscribing to mobile-cellular services for the first time and the individual that seeks more than one subscription.
1.4 Conclusions
Ensuring that consumers benefit from the wealth of opportunities brought by the digital economy in an informed, responsive and safe manner is a challenge that policy-makers and regulators from around the world are increasingly facing. Undoubtedly, this can only be achieved through effective and smart regulation targeted at empowering consumers, redefining responsibilities and
creating the conditions for a data driven economy to flourish.
To assist policy makers and regulators in getting ready for the digital economy, this edition of Trends provides an analysis of the changing business and consumer behaviours led by technological innovation taking place in the digital ecosystem. It further provides an understanding on how these changes will affect national ICT policy and regulatory frameworks and identifies measures policy makers and regulators can take to be prepared to respond efficiently to the new challenges raised by the digital economy. Chapter two examines ways to reduce barriers to competition and offers practical case-study examples of several approaches regulators and policymakers have taken to devise a framework to promote competition and
16 Trends in Telecommunication Reform 2015
Box 1.4: Econometric regression model for mobile cellular
The panel regression model for mobile-cellular penetration shows that all variables chosen are statistically significant. All the accompanying coefficients to these variables are different from zero, as certified by the F-test results. Overall the model’s explanatory power (r-squared) is strong (53.0%).
Variable Coefficient Statistical Significance Interpretation
Regulatory Tracker
0.244
(3.23)*
Highly significant
(1% level)
A 10% increase in the regulatory score is linked to a 2.3% increase in mobile-cellular penetration.
Urbanization 4.612 (3.98)*
Highly significant
(1% level)
A 1% increase in urbanization is linked to 4.7% increase in mobile-cellular penetration.
GNI p.c. 0.665 (4.51)*
Highly significant
(1% level)
A 10% increase in the per capita income is linked to 6.5% increase in mobile-cellular penetration.
Constant -20.644 (5.29)*
Highly significant
(1% level)
Observations 764
Number of countries
136
R-squared 0.530
Absolute value of t-statistics in parentheses. *Significant at the 1% level. Estimation based on robust standard errors. Source: ITU.
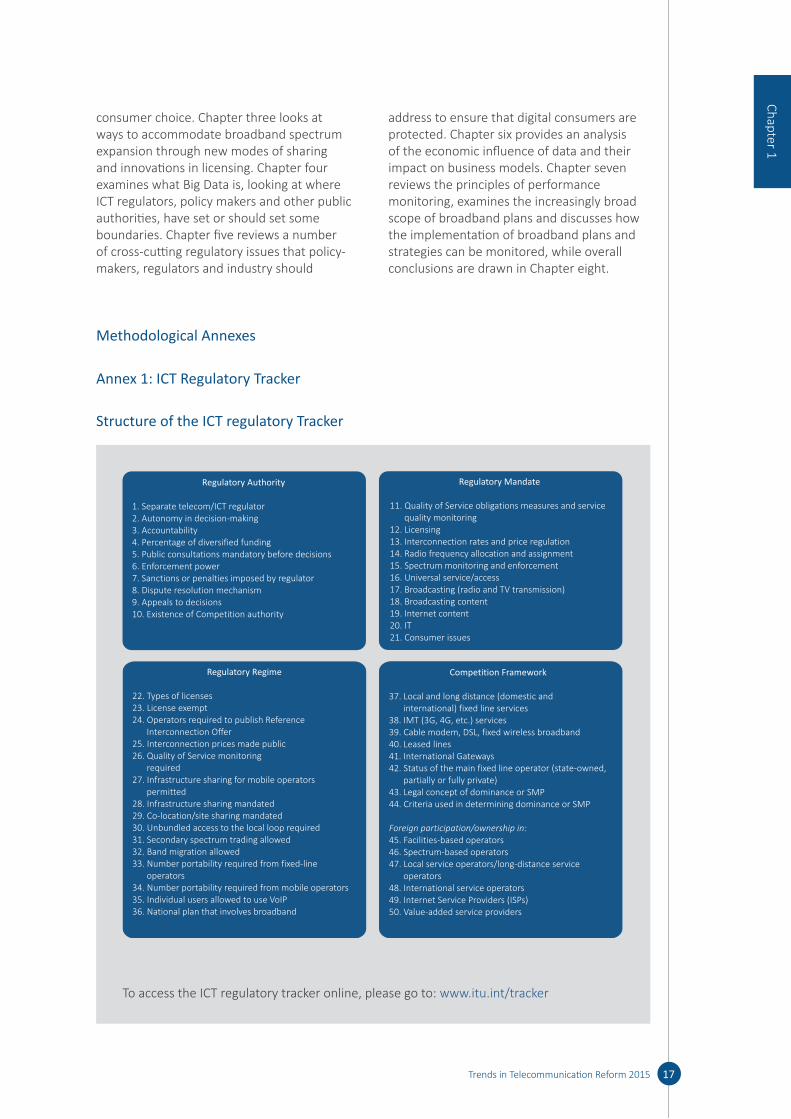
consumer choice. Chapter three looks at ways to accommodate broadband spectrum expansion through new modes of sharing and innovations in licensing. Chapter four examines what Big Data is, looking at where ICT regulators, policy makers and other public authorities, have set or should set some boundaries. Chapter five reviews a number of cross-cutting regulatory issues that policy-makers, regulators and industry should
address to ensure that digital consumers are protected. Chapter six provides an analysis of the economic influence of data and their impact on business models. Chapter seven reviews the principles of performance monitoring, examines the increasingly broad scope of broadband plans and discusses how the implementation of broadband plans and strategies can be monitored, while overall conclusions are drawn in Chapter eight.
17Trends in Telecommunication Reform 2015
Chapter 1
Regulatory Mandate
11. Quality of Service obligations measures and service quality monitoring
12. Licensing13. Interconnection rates and price regulation14. Radio frequency allocation and assignment15. Spectrum monitoring and enforcement16. Universal service/access17. Broadcasting (radio and TV transmission)18. Broadcasting content19. Internet content 20. IT21. Consumer issues
Regulatory Authority
1. Separate telecom/ICT regulator2. Autonomy in decision-making3. Accountability4. Percentage of diversified funding5. Public consultations mandatory before decisions6. Enforcement power7. Sanctions or penalties imposed by regulator8. Dispute resolution mechanism9. Appeals to decisions10. Existence of Competition authority
Regulatory Regime
22. Types of licenses23. License exempt24. Operators required to publish Reference
Interconnection Offer25. Interconnection prices made public26. Quality of Service monitoring
required27. Infrastructure sharing for mobile operators
permitted28. Infrastructure sharing mandated29. Co-location/site sharing mandated30. Unbundled access to the local loop required31. Secondary spectrum trading allowed32. Band migration allowed33. Number portability required from fixed-line
operators34. Number portability required from mobile operators35. Individual users allowed to use VoIP36. National plan that involves broadband
Competition Framework
37. Local and long distance (domestic and international) fixed line services
38. IMT (3G, 4G, etc.) services39. Cable modem, DSL, fixed wireless broadband40. Leased lines41. International Gateways42. Status of the main fixed line operator (state-owned,
partially or fully private)43. Legal concept of dominance or SMP44. Criteria used in determining dominance or SMP
Foreign participation/ownership in:45. Facilities-based operators46. Spectrum-based operators47. Local service operators/long-distance service
operators48. International service operators49. Internet Service Providers (ISPs)50. Value-added service providers
To access the ICT regulatory tracker online, please go to: www. itu. int/ tracker
Methodological Annexes
Annex 1: ICT Regulatory Tracker
Structure of the ICT regulatory Tracker
Annex 2: Early Research from the Measuring the Information Society Report 2013
Econometric regression models on the impact of regulation on ICT market uptakeThe present econometric analysis is based on panel data for 136 countries for the period between 2008 and 2013. Known as longitudinal or cross-section time series data, panel data increases the estimations precision as it provides more information about individual behaviour than in the case of a simple cross-section. Panel data is a statistical technique that also helps controlling for omitted variable bias.
National fixed broadband adoption and mobile voice services are modelled separately as they are fundamentally different and have distinct growth and development patterns. The dissemination of these services is not assumed to depend solely on regulatory measures but rather on a combination of different factors. There is not a consensus regarding all factors that influence ICT adoption; income per capita, however, is considered a crucial determinant. It has been shown that there is a close relation between the digital divide and the economic status of a country29.
The regressions were calculated using fixed effects estimation, which strips out the impact of time-invariant characteristics (such as social and cultural factors), so the effect of the independent variables can be better measured in isolation. In other words, the relationship between the predictors (in this case regulation, urbanization and gross national income per capita) and the outcome (either fixed-broadband or mobile-cellular penetration) can be estimated without a possible bias related to individual time-invariant characteristics. As it accounts for unobserved individual heterogeneity, fixed effects estimation considers that each country is a group with singularities and different realities. Unfortunately, the coefficients of the time-invariant regressors are not identified by this type of estimation, but this does not pose any major problems since the model aims at identifying the impact of time-variant
regressors, especially that of regulatory progress. The choice of fixed effects estimation was further corroborated by the Hausman test.
Two econometric models using fixed effects estimation were constructed, one for fixed-broadband adoption and one for mobile-cellular adoption. Both regressions account for 136 countries and cover the period between 2008 and 2013.
Yit= Xitβ + ci + uit
For i=1,…,n and t=1,…,T.
Yit is the dependent variable (fixed-broadband or mobile-cellular penetration) in country i and year t; Xit is the set of explanatory independent variables (regulatory environment, urbanization and gross national income per capita), β is a vector of coefficients that quantify the impact of the independent variables; ci is the individual unobserved effect that is particular to each i and is allowed to be correlated with Xit; uit is the error term representing the idiosyncratic disturbances. The dependent and independent variables are modelled using natural logarithms.
As previously stated, various other factors are considered to be relevant on the uptake of both fixed-broadband and mobile-cellular services, such as social and cultural characteristics. The price of such services is also believed to be of high relevance to their respective penetration levels. However, due to the possible endogeneity bias that could be triggered by the relationship between the competitive environment (assessed by the regulatory tracker) and the pricing changes, the price variable was not used.
Two complementary panel regression models were developed by ITU to measure the link between regulation and the prices of mobile cellular and fixed-broadband services. According to the results of the models, regulation may account for almost 10 per cent of the differences in prices of fixed broadband observed across countries. In the mobile cellular sector where competition is stronger, the different competition levels largely explain the differences in mobile-cellular prices observed across countries (an estimated 7 per cent). These models are discussed extensively
18 Trends in Telecommunication Reform 2015

in the ITU Measuring the Information Society Report 201430.
19Trends in Telecommunication Reform 2015
Chapter 1
Dependent variables:
Fixed-broadband penetration: Fixed (wired)-broadband subscriptions per 100 inhabitants. It refers to the number of subscriptions for high-speed access to the public internet (a TCP/IP connection). High-speed access is defined as downstream speeds equal to, or greater than, 256 kbit/s. Fixed-broadband includes cable modem, DSL, fibre and other fixed broadband technologies (such as Ethernet LAN and broadband-over-powerline communications). Source: ITU.
Average Standard Dev. Minimum Maximum
2008 8.164628 10.4834 0 43.70187
2013 12.0247 12.15441 0 42.98964
Mobile-cellular penetration: mobile-cellular telephone subscriptions per 100 inhabitants. It refers to the number of subscriptions to a public mobile-telephone service, which provides access to the public switched telephone network (PSTN) using cellular technology. It includes both the number of postpaid subscriptions and the number of active prepaid accounts. It includes all mobile-cellular subscriptions that offer voice communication. Source: ITU.
Average Standard Dev. Minimum Maximum
2008 80.96278 41.07941 .717919 187.1872
2013 110.4268 37.80079 12.82859 239.2249
Explanatory variables:
Regulatory Tracker: ITU ICT Regulatory Tracker. Regulatory variable resulting from the aggregated score of 50 regulatory indicators per country, per year. Source: ITU.
Average Standard Dev. Minimum Maximum
2008 59.79036 19.71692 3.5 89.33334
2013 73.87143 16.4577 23 95.33334
GNI per capita.: Gross national income in current USD per country, per year, divided by total population. Source for GNI: World Bank. Source for population: World Bank.
Average Standard Dev. Minimum Maximum
2008 14531.3 20315.62 273.4178 119125.4
2013 13329.33 19116.45 271.777 102614.8
Urbanization: Percentage of population living in urban areas. Source: World Bank.
Average Standard Dev. Minimum Maximum
2008 57.45388 22.84493 12.9152 100
2013 59.0007 22.66809 14.2468 100
Endnotes1 ITU World Telecommunication/ICT Indicators database, www. itu. int/ icteye
2 Measuring the Information Society report, 2014, www. itu. int/ en/ ITU- D/ Statistics/ Pages/ publications/ mis2014. aspx
3 ITU World Telecommunication/ICT Indicators database and Measuring the Information Society report, 2014, www. itu. int/ en/ ITU- D/ Statistics/ Pages/ publications/ mis2014. aspx
4 See ITU aggregate data for fixed broadband subscribers, available at www. itu. int/ en/ ITU- D/ Statistics/ Pages/ stat/ default. aspx
5 Ovum, “Global Fixed Voice and Broadband Outlook: 2014-2019”, available from ovum. com/ knowledge- center/
6 ITU, Idem.
7 Cisco Virtual Networking Index, February 2015.
8 Deloitte “TMT Predictions 2015”, full report available from: http:// www2. deloitte. com/ content/ dam/ Deloitte/ global/ Documents/ Technology- Media- Telecommunications/ gx- tmt- pred15- full- report. pdf Find out more about Deloitte’s TMT Predictions from www2. deloitte. com/ ca/ en/ pages/ technology- media- and- telecommunications/ articles/ tmt- predictions- 2015. html
9 www. gartner. com/ newsroom/ id/ 2905717
10 John Greenough, The ‘Internet of Things’ will be the world’s most massive device market and save companies billions of dollars, Business Insider (Feb. 18, 2015), http:// www. businessinsider. com/ the- internet- of- things- market- growth- and- trends- 2015- 2#ixzz3WBO0CLrW.
11 www. idc. com/ getdoc. jsp? containerId= prUS25480015
12 www. idc. com/ getdoc. jsp? containerId= prUS25483715
13 www2. deloitte. com/ content/ dam/ Deloitte/ global/ Documents/ Technology- Media- Telecommunications/ gx- tmt- pred15- full- report. pdf
14 www. broadbandcommission. org/ documents/ reports/ bb- annualreport2014. pdf
15 “Gartner Identifies the Top 10 Strategic Technology Trends for 2015”, available from Gartner at: www. gartner. com/ newsroom/ id/ 2867917 Information about Gartner Symposium/ITxpo in Orlando, is available at www. gartner. com/ us/ symposium. Video replays of keynotes and sessions are available on Gartner Events on Demand at www. gartnerondemand. com
16 Cisco Virtual Networking Index, February 2015.
17 GSMA Intelligence, Understanding 5G: perspectives on future technological advancements in mobile, December 2014, https:// gsmaintelligence. com/ research/? file= 141208- 5g. pdf& download
18 www. broadbandcommission. org/ documents/ reports/ bb- annualreport2014. pdf
19 Ovum, “Global Fixed Voice and Broadband Outlook: 2014-2019”, available from http:// ovum. com/ knowledge- center/
20 GSMA Intelligence, “Understanding 5G: Perspectives on future technological advancements in mobile” (December, 2014).
20 Trends in Telecommunication Reform 2015

21 www. gsacom. com/ news/ statistics
22 www. telegeography. com/ products/ commsupdate/ articles/ 2015/ 03/ 02/ miit- awards- long- awaited- fdd- licences/? utm_ source= CommsUpdate& utm_ campaign= 112ba57a5b- CommsUpdate+02+March+2015& utm_ medium= email& utm_ term= 0_ 0688983330- 112ba57a5b- 11619241
23 Source: We Are Social, based on various sources, see: http:// was- sg. wascdn. net/ wp- content/ uploads/ 2015/ 01/ Slide006. png
24 Id.
25 www. itu. int/ bestpractices
26 The Trackers includes indicators for cable modem, DSL and fixed-wireless broadband.
27 Indicates whether the causality link established between the dependent variable and the set of independent variables exists. Two hypotheses are put forward: the null hypothesis, which states that the set of variables has no effect on the dependent variable and the alternative hypothesis, which states that the set of variables has an effect on the dependent variable. The choice between both hypotheses is made based on the value of the F-statistics.
28 Vicente and Lopez, 2006.
29 Fuchs, 2009; Hargittai, 1999; Crenshaw & Robison, 2006.
30 See www. itu. int/ en/ ITU- D/ Statistics/ Documents/ publications/ mis2014/ MIS2014_ without_ Annex_ 4. pdf
21Trends in Telecommunication Reform 2015
Chapter 1


2 Why Competition Matters and How to Foster It in the Dynamic ICT Sector
2.1 Introduction
Over the last three decades, laws and regulations designed to introduce and promote competition have been a crucial catalyst in the booming global information and communications technology (ICT) sector. At the early stages of competition, government authorities are generally faced with issues related to licensing, interconnection, and access. As competition increases and markets mature, government authorities must monitor these issues, but may also face concerns related to consolidation and horizontal and vertical integration, as well as consumer issues regarding lock-in, transparency, and quality of service.
Today’s emerging broadband-centric environment is presenting lawmakers and ICT regulators with a new set of challenges. They must address traditional competition issues, but often with new twists resulting from new players, greater consolidation, and integration among telecommunication service providers, content providers, and manufacturers. The rise of Internet protocol (IP) based networks and the separation of services from the underlying physical infrastructure has unleashed a variety of innovative applications, services and new business models that challenge old revenue streams and legacy regulatory regimes. In this new environment, regulators must find ways to adapt their rules to ensure fair competition, drive investment and innovation and protect consumers.
These issues are only likely to increase over time, as more services and economic and social activity move online. This trend is illustrated in the growth of Internet users (see Figure 2.1) and data traffic over the last decade. Between 2002 and 2012, global Internet traffic increased 120 times, now amounting to 12’000 gigabytes (GB) of information being transmitted per second.1 By 2017, estimates are that global Internet traffic will reach 35’000 GB per second, nearly
a 350-fold increase from 2002, and a three-fold increase over 2012. Today, 40 per cent of the global population is using the Internet, and a fifth of Internet traffic is cross-border.2 Notably, the most significant growth is in emerging markets such as Africa and Arab States – where between the years 2005 and 2014 growth was 934 per cent and 480 per cent, respectively.
Figure 2.1: Individuals Using the Internet
2005 2010 2014
Millions
0
500
1 000
1 500
2 000
2 500
3 000
3 500
The Americas Europe CIS
Asia Pacific& Arab states Africa
Source: ITU World Telecommunication/ICT Indicators database.
This chapter examines the increasing complexity of devising an effective, yet flexible, framework to promote effective competition and consumer choice in the rapidly changing ICT sector. Section 2.2 addresses the impact of competition and the benefits that can ensue in a competitive ICT environment. Section 2.3 addresses the emerging competitive landscape; Section 2.4 identifies the key existing and emerging competition issues and how regulators are seeking to address them. Section 2.5 presents the overall conclusions of this chapter.
2.2 Why Competition Matters
Competition is a key element in realizing the benefits that advanced networks and services
Authors: Janet Hernandez and Kari Ballot-Lena, Telecommunications Management Group, Inc. (TMG)
23Trends in Telecommunication Reform 2015
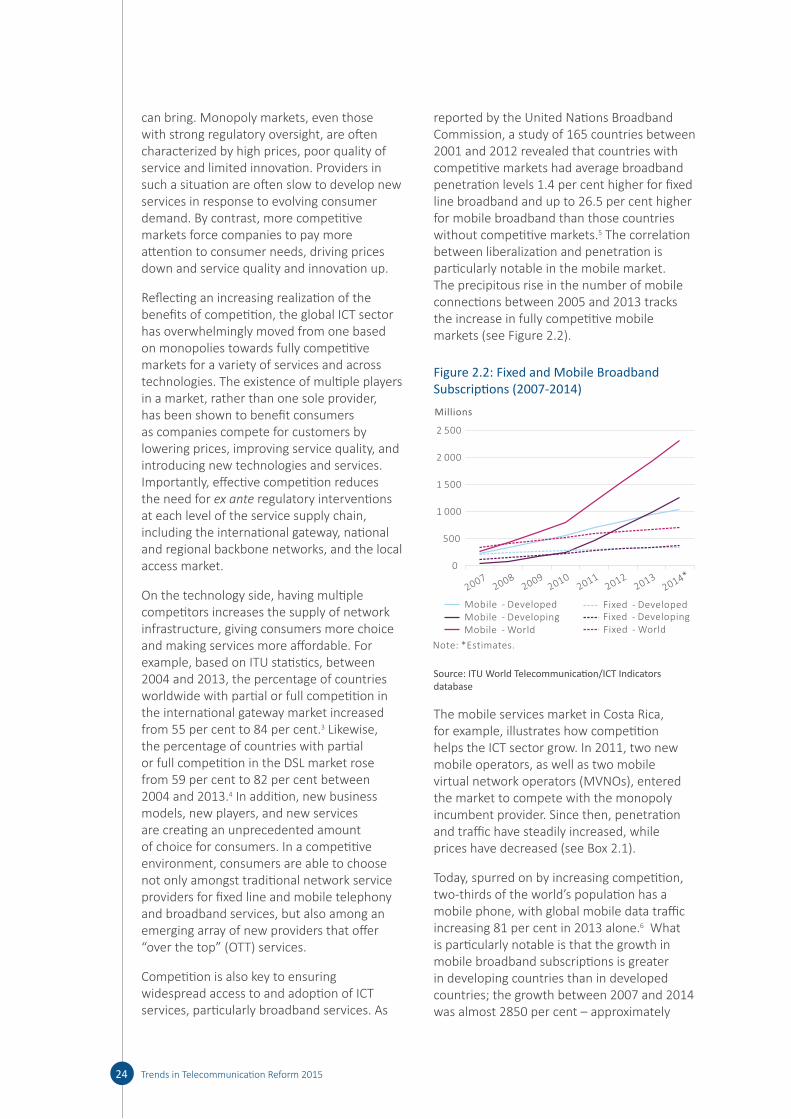
can bring. Monopoly markets, even those with strong regulatory oversight, are often characterized by high prices, poor quality of service and limited innovation. Providers in such a situation are often slow to develop new services in response to evolving consumer demand. By contrast, more competitive markets force companies to pay more attention to consumer needs, driving prices down and service quality and innovation up.
Reflecting an increasing realization of the benefits of competition, the global ICT sector has overwhelmingly moved from one based on monopolies towards fully competitive markets for a variety of services and across technologies. The existence of multiple players in a market, rather than one sole provider, has been shown to benefit consumers as companies compete for customers by lowering prices, improving service quality, and introducing new technologies and services. Importantly, effective competition reduces the need for ex ante regulatory interventions at each level of the service supply chain, including the international gateway, national and regional backbone networks, and the local access market.
On the technology side, having multiple competitors increases the supply of network infrastructure, giving consumers more choice and making services more affordable. For example, based on ITU statistics, between 2004 and 2013, the percentage of countries worldwide with partial or full competition in the international gateway market increased from 55 per cent to 84 per cent.3 Likewise, the percentage of countries with partial or full competition in the DSL market rose from 59 per cent to 82 per cent between 2004 and 2013.4 In addition, new business models, new players, and new services are creating an unprecedented amount of choice for consumers. In a competitive environment, consumers are able to choose not only amongst traditional network service providers for fixed line and mobile telephony and broadband services, but also among an emerging array of new providers that offer “over the top” (OTT) services.
Competition is also key to ensuring widespread access to and adoption of ICT services, particularly broadband services. As
reported by the United Nations Broadband Commission, a study of 165 countries between 2001 and 2012 revealed that countries with competitive markets had average broadband penetration levels 1.4 per cent higher for fixed line broadband and up to 26.5 per cent higher for mobile broadband than those countries without competitive markets.5 The correlation between liberalization and penetration is particularly notable in the mobile market. The precipitous rise in the number of mobile connections between 2005 and 2013 tracks the increase in fully competitive mobile markets (see Figure 2.2).
Figure 2.2: Fixed and Mobile Broadband Subscriptions (2007-2014)
0
500
1 000
1 500
2 000
2 500
20072008
20092010
20112012
20132014*
Millions
Mobile - DevelopedMobile - DevelopingMobile - World
Fixed - DevelopedFixed - DevelopingFixed - World
Note: *Estimates.
Source: ITU World Telecommunication/ICT Indicators database
The mobile services market in Costa Rica, for example, illustrates how competition helps the ICT sector grow. In 2011, two new mobile operators, as well as two mobile virtual network operators (MVNOs), entered the market to compete with the monopoly incumbent provider. Since then, penetration and traffic have steadily increased, while prices have decreased (see Box 2.1).
Today, spurred on by increasing competition, two-thirds of the world’s population has a mobile phone, with global mobile data traffic increasing 81 per cent in 2013 alone.6 What is particularly notable is that the growth in mobile broadband subscriptions is greater in developing countries than in developed countries; the growth between 2007 and 2014 was almost 2850 per cent – approximately
24 Trends in Telecommunication Reform 2015
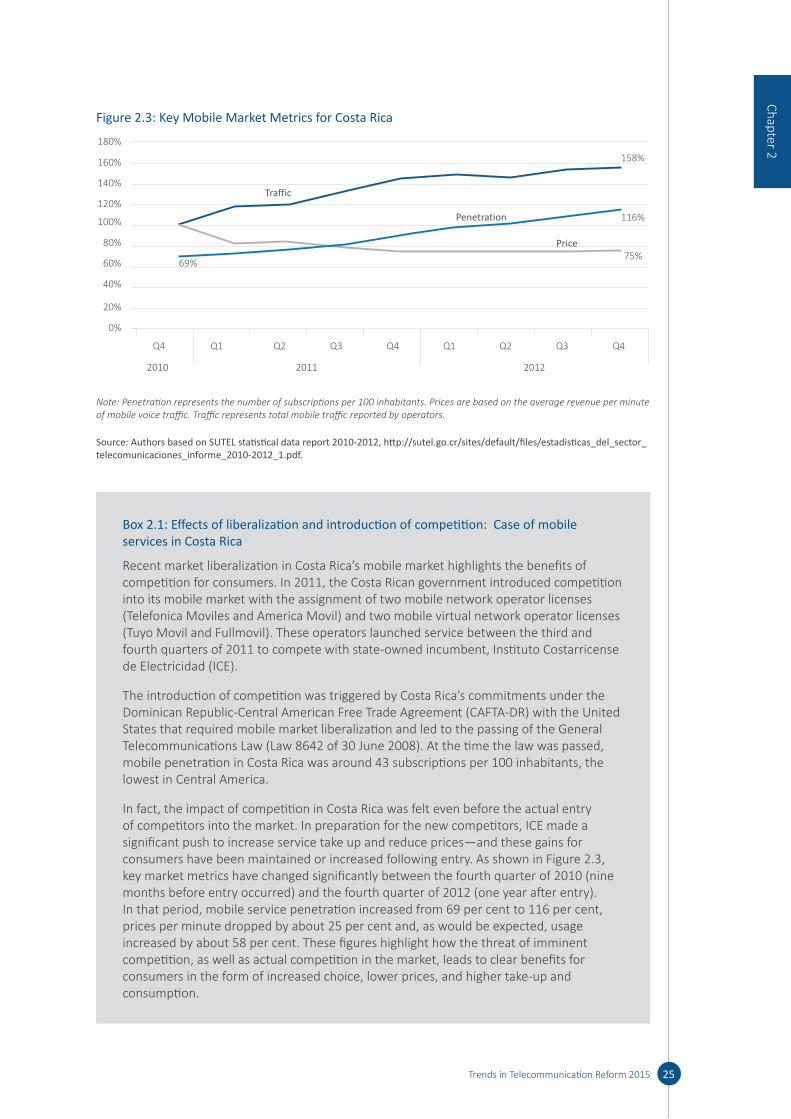
25Trends in Telecommunication Reform 2015
Chapter 2
Box 2.1: Effects of liberalization and introduction of competition: Case of mobile services in Costa Rica
Recent market liberalization in Costa Rica’s mobile market highlights the benefits of competition for consumers. In 2011, the Costa Rican government introduced competition into its mobile market with the assignment of two mobile network operator licenses (Telefonica Moviles and America Movil) and two mobile virtual network operator licenses (Tuyo Movil and Fullmovil). These operators launched service between the third and fourth quarters of 2011 to compete with state-owned incumbent, Instituto Costarricense de Electricidad (ICE).
The introduction of competition was triggered by Costa Rica’s commitments under the Dominican Republic-Central American Free Trade Agreement (CAFTA-DR) with the United States that required mobile market liberalization and led to the passing of the General Telecommunications Law (Law 8642 of 30 June 2008). At the time the law was passed, mobile penetration in Costa Rica was around 43 subscriptions per 100 inhabitants, the lowest in Central America.
In fact, the impact of competition in Costa Rica was felt even before the actual entry of competitors into the market. In preparation for the new competitors, ICE made a significant push to increase service take up and reduce prices—and these gains for consumers have been maintained or increased following entry. As shown in Figure 2.3, key market metrics have changed significantly between the fourth quarter of 2010 (nine months before entry occurred) and the fourth quarter of 2012 (one year after entry). In that period, mobile service penetration increased from 69 per cent to 116 per cent, prices per minute dropped by about 25 per cent and, as would be expected, usage increased by about 58 per cent. These figures highlight how the threat of imminent competition, as well as actual competition in the market, leads to clear benefits for consumers in the form of increased choice, lower prices, and higher take-up and consumption.
Figure 2.3: Key Mobile Market Metrics for Costa Rica
180%
Q4
2010
158%
116%
75%69%
2011 2012
Q1
Penetration
Price
Traffic
160%
140%
120%
100%
80%
60%
40%
20%
0%
Q2 Q3 Q4 Q1 Q2 Q3 Q4
Note: Penetration represents the number of subscriptions per 100 inhabitants. Prices are based on the average revenue per minute of mobile voice traffic. Traffic represents total mobile traffic reported by operators.
Source: Authors based on SUTEL statistical data report 2010-2012, http:// sutel. go. cr/ sites/ default/ files/ estadisticas_ del_ sector_ telecomunicaciones_ informe_ 2010- 2012_ 1. pdf.
eight times the average rate of growth for developed countries. The beneficiaries of this dynamic marketplace are generally the consumers who are offered better service and have more alternative providers to choose from.
2.3 A Changing Competitive Landscape
The competitive landscape in the ICT sector has changed dramatically, particularly in the last several years. New technical capabilities made possible by IP-based broadband networks have given rise to new entrants competing in traditional markets—with new business models and completely different cost structures than traditional providers. New technologies and upgraded networks have also enabled the introduction of a wide variety of new services and applications. Competition from these new entrants, models and services are forcing traditional service providers to adapt, and adapt quickly. This section discusses the changes that are taking place in the ICT sector and how these changes are impacting the competitive environment.
2.3.1 What’s happening?
Convergence creates new competitors and regulatory complexityIP-enabled broadband networks allow ubiquitous access to all types of content. Users expect to be able to access any service and application from any device and from any location—whether high-quality voice and video telephony; business projects and documents; live, streaming and downloaded video (whether a two-minute YouTube video, television programming or a feature length film); music and games; email, text messaging and social media; and a myriad of mobile-specific applications. The introduction of cloud-based services increases the importance of access as users can begin a project or program on one device and finish it on another in a different location. From the consumer’s perspective, this seamless and ubiquitous access highlights the importance of content while de-emphasizing the delivery mechanisms. Users are not necessarily
concerned about the underlying network technologies used to deliver their content, as long as their networks are secure and fast.
Although a converged broadband environment has undoubtedly expanded the user’s experience, the provider side has become more complex. For over a decade now, traditional telecommunication service providers that were previously in different markets now compete with one another. For example, bundled “triple play” packages mean that traditional telephony operators have expanded into pay TV services by offering Internet protocol television (IPTV), while cable TV operators have expanded into telephony services by offering voice over Internet protocol (VoIP) services, and both offer high-speed Internet access. Similarly, ”quadruple play” packages (fixed line telephony, pay TV and Internet, plus mobile services) offered by a single company add even greater complexity to the field of competition.
In addition to the changes taking place amongst the traditional telecommunication companies, those same companies are now facing competition from new providers in downstream, retail markets. In the past, traditional companies provided services that were intimately tied to their infrastructure—broadcasters supplied radio and television programming; telephone networks provided voice communications (and some data) and cable television provided video programming. In today’s world, with broadband rapidly becoming the norm, all voice, data and video services can be provided over a single converged network. As a result, content and applications have been separated from the underlying transmission. More importantly, this has led to a boom in new content and application providers that do not own the access networks, but that compete with operators’ traditional services, such as OTT voice (Skype) and video (Netflix) services. Network operators are also now expanding into content markets in order to generate new sources of revenue and to try to avoid becoming mere conduits (or “dumb pipes”) through which other firms’ content passes. Figure 2.4 shows how the competitive landscape is changing and becoming more international in scope.
26 Trends in Telecommunication Reform 2015
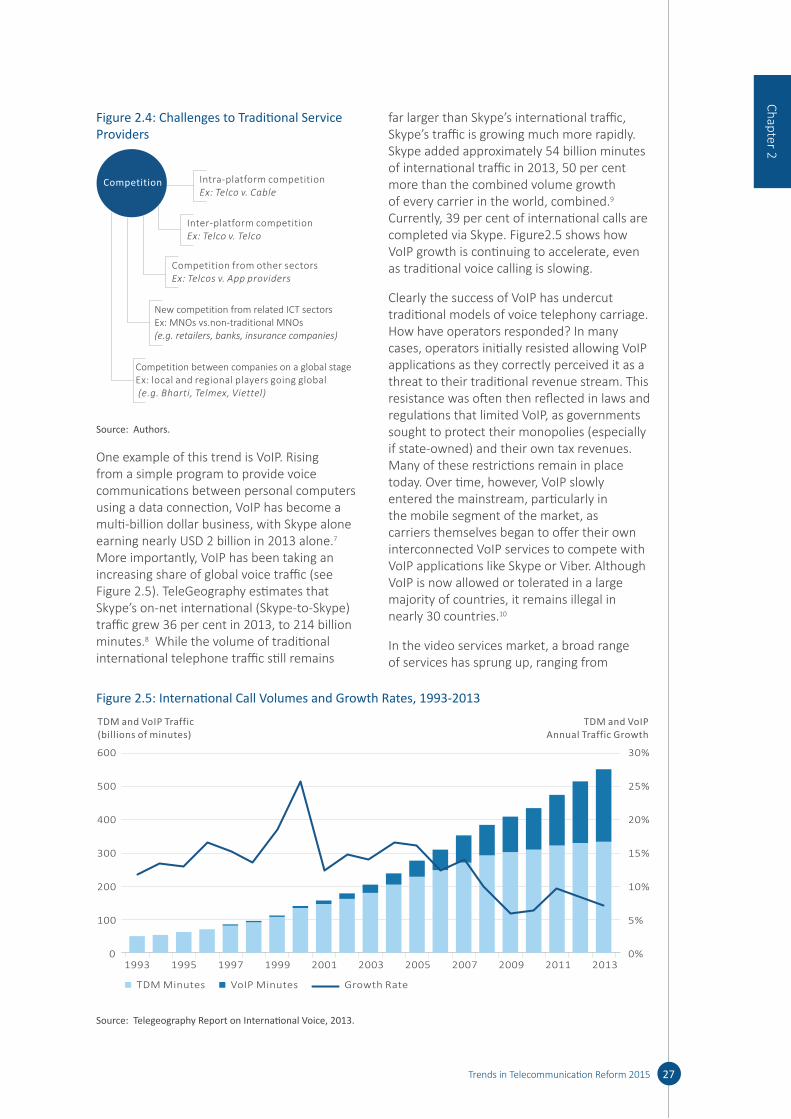
Figure 2.4: Challenges to Traditional Service Providers
Intra-platform competitionEx: Telco v. Cable
Inter-platform competitionEx: Telco v. Telco
Competition from other sectorsEx: Telcos v. App providers
New competition from related ICT sectorsEx: MNOs vs.non-traditional MNOs (e.g. retailers, banks, insurance companies)
Competition between companies on a global stageEx: local and regional players going global (e.g. Bharti, Telmex, Viettel)
Competition
Source: Authors.
One example of this trend is VoIP. Rising from a simple program to provide voice communications between personal computers using a data connection, VoIP has become a multi-billion dollar business, with Skype alone earning nearly USD 2 billion in 2013 alone.7 More importantly, VoIP has been taking an increasing share of global voice traffic (see Figure 2.5). TeleGeography estimates that Skype’s on-net international (Skype-to-Skype) traffic grew 36 per cent in 2013, to 214 billion minutes.8 While the volume of traditional international telephone traffic still remains
far larger than Skype’s international traffic, Skype’s traffic is growing much more rapidly. Skype added approximately 54 billion minutes of international traffic in 2013, 50 per cent more than the combined volume growth of every carrier in the world, combined.9 Currently, 39 per cent of international calls are completed via Skype. Figure2.5 shows how VoIP growth is continuing to accelerate, even as traditional voice calling is slowing.
Clearly the success of VoIP has undercut traditional models of voice telephony carriage. How have operators responded? In many cases, operators initially resisted allowing VoIP applications as they correctly perceived it as a threat to their traditional revenue stream. This resistance was often then reflected in laws and regulations that limited VoIP, as governments sought to protect their monopolies (especially if state-owned) and their own tax revenues. Many of these restrictions remain in place today. Over time, however, VoIP slowly entered the mainstream, particularly in the mobile segment of the market, as carriers themselves began to offer their own interconnected VoIP services to compete with VoIP applications like Skype or Viber. Although VoIP is now allowed or tolerated in a large majority of countries, it remains illegal in nearly 30 countries.10
In the video services market, a broad range of services has sprung up, ranging from
27Trends in Telecommunication Reform 2015
Chapter 2
Figure 2.5: International Call Volumes and Growth Rates, 1993-2013
TDM Minutes VoIP Minutes Growth Rate
0
100
200
300
400
500
600
0%
5%
10%
15%
20%
25%
30%
1993 1995 1997 1999 2001 2003 2005 2007 2009 2011 2013
TDM and VoIP Traffic(billions of minutes)
TDM and VoIP Annual Traffic Growth
Source: Telegeography Report on International Voice, 2013.
user-generated content sites like YouTube, to sites offering high-definition movies and television shows, like Netflix, Lovefilm in the United Kingdom (now Amazon Prime), and Hulu. The rise of Netflix has been particularly strong. Between 1999, when it began its video streaming operations, and April 2014, Netflix has acquired almost 50 million global subscribers, and a 32.3 per cent video streaming market share in the United States.11 Netflix currently operates in over 40 countries.12
Existing video content programmers or developers have responded, in many cases, by starting their own video streaming services. Hulu, for example, is owned by Comcast, Disney, and Fox, and makes content from NBC, Fox, ABC, TBS, and WWE, among others, available in the United States and Japan. In the United Kingdom, NowTV was launched by Sky in July 2012 and now offers a stand-alone streaming box or applications that enable content to be viewed on an iPad, iPhone, Android devices, personal computers, Roku, Smart TVs from LG, PS3, and Xbox 360. The rapid proliferation of these video services shows that companies see great potential in video services going forward, and competition between traditional, OTT and hybrid providers is likely to be intense.
More broadly, the last few years have also seen a rise in acquisitions and consolidation as companies expand their business lines to include network, hardware, software, services, online content (e.g., music, books, movies, etc.) apps, retail stores, etc. to create a complete ecosystem. Companies have generally done this through a hybrid approach of internally expanding their business and/or by acquiring other companies that can provide them with additional businesses and/or assets to enhance their participation in various market segments. Google, for example, has the Google Play Store, the Android operating system, Project Loon, fiber network, and Google Hangout, among others. Apple has created a similar ecosystem with devices (iPads, iPhones, computers) and software (iOS), iTunes, and FaceTime. Others have acquired their new business via acquisitions such as Microsoft’s purchase of Skype and Facebook’s purchase of WhatsApp. Likewise, many of the new players in the market are
prompting the traditional players to rethink their business strategies, and become more innovative in their plans, products, and services. As a result, more traditional players are pursuing acquisitions to horizontally or vertically integrate their business, such as Comcast’s acquisition of NBC Universal and its proposed acquisition of Time Warner, as well as AT&T’s recent announcement that it is purchasing DirecTV (see Figure 2.6).
As companies address the current landscape, where data and communications flows are experiencing tremendous growth, they are also expanding their businesses internationally. Netflix started out as a domestic business in the United States; by 2013 (only three years after starting its international expansion), almost one quarter of its streaming customers resided outside of the United States, and the company just announced plans to expand to six European countries by the end of 2014.13 Approximately 66 per cent of Apple’s revenues in the second quarter of 2014 and 40 per cent of Amazon’s revenues in the first quarter of 2014 came from sales outside the United States.14 In addition, companies that were local or regional players are expanding internationally as well. The telecommunication operations of Telmex, based in Mexico, were limited to the Americas, but the company has recently begun to make acquisitions in Europe. Similarly, Bharti of India purchased Zain’s operations in Africa and now operates in eight countries in the region. Viettel of Vietnam has expanded its operations into Africa and the Americas. H3G, a new entrant in Europe, has acquired various companies in Austria and Ireland.
Content deliveryAs the Internet has continued to evolve, the delivery of content to end users has grown more complex. The key driver behind these changes in recent years has been the growth of video traffic and, most recently, the increasing shift from recorded or on-demand video to live streaming. For example, video streaming will account for an estimated 69 per cent of all consumers Internet traffic by 2017, up from 57 per cent in 2012.15 The direct impact is a change in Internet traffic flows leading to an asymmetric in-bound to out-bound traffic mix as a consequence
28 Trends in Telecommunication Reform 2015
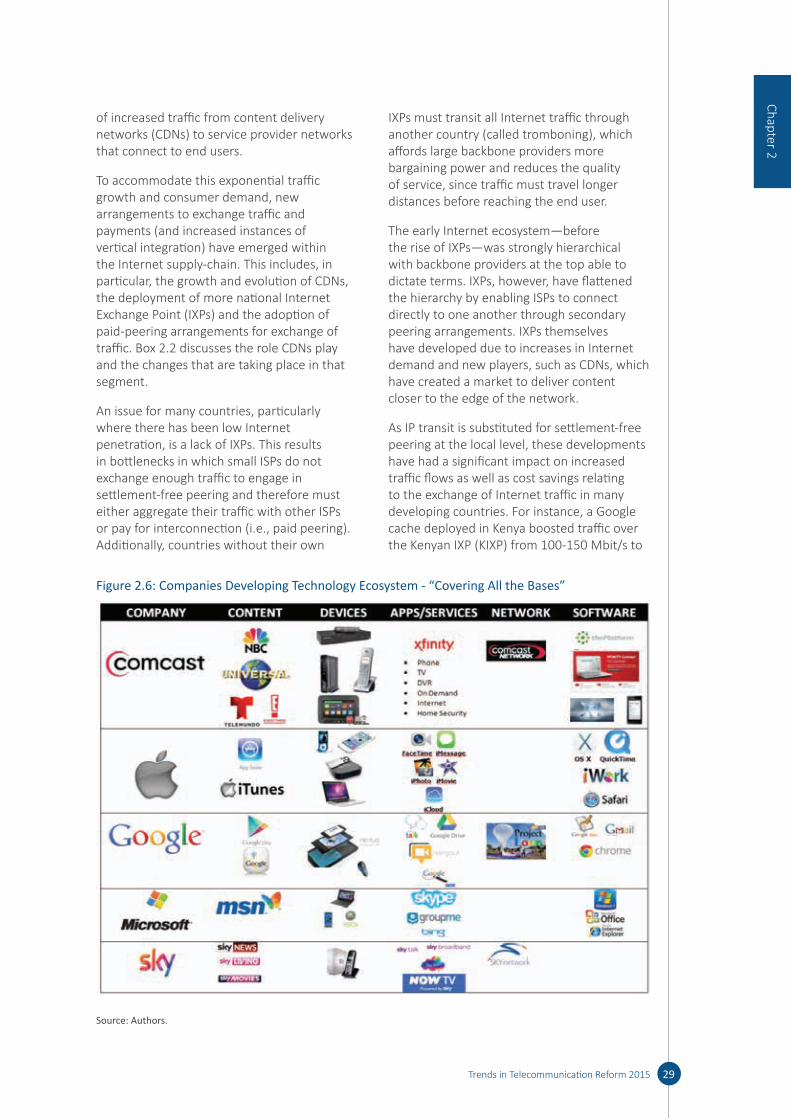
of increased traffic from content delivery networks (CDNs) to service provider networks that connect to end users.
To accommodate this exponential traffic growth and consumer demand, new arrangements to exchange traffic and payments (and increased instances of vertical integration) have emerged within the Internet supply-chain. This includes, in particular, the growth and evolution of CDNs, the deployment of more national Internet Exchange Point (IXPs) and the adoption of paid-peering arrangements for exchange of traffic. Box 2.2 discusses the role CDNs play and the changes that are taking place in that segment.
An issue for many countries, particularly where there has been low Internet penetration, is a lack of IXPs. This results in bottlenecks in which small ISPs do not exchange enough traffic to engage in settlement-free peering and therefore must either aggregate their traffic with other ISPs or pay for interconnection (i.e., paid peering). Additionally, countries without their own
IXPs must transit all Internet traffic through another country (called tromboning), which affords large backbone providers more bargaining power and reduces the quality of service, since traffic must travel longer distances before reaching the end user.
The early Internet ecosystem—before the rise of IXPs—was strongly hierarchical with backbone providers at the top able to dictate terms. IXPs, however, have flattened the hierarchy by enabling ISPs to connect directly to one another through secondary peering arrangements. IXPs themselves have developed due to increases in Internet demand and new players, such as CDNs, which have created a market to deliver content closer to the edge of the network.
As IP transit is substituted for settlement-free peering at the local level, these developments have had a significant impact on increased traffic flows as well as cost savings relating to the exchange of Internet traffic in many developing countries. For instance, a Google cache deployed in Kenya boosted traffic over the Kenyan IXP (KIXP) from 100-150 Mbit/s to
29Trends in Telecommunication Reform 2015
Chapter 2
Figure 2.6: Companies Developing Technology Ecosystem - “Covering All the Bases”
Source: Authors.

around 1 000 Mbit/s. By peering locally, the Kenyan ISPs did not have to buy transit for this traffic, which then ranged from USD 150 to USD 600 per Mbit/s/month.19 Section 2.4.60 addresses Internet interconnection issues in more detail.
2.3.2 Why are these changes important?The importance of such changes is that they are reshaping the regulatory and competitive landscape. Legacy regulations that applied just to monopoly telephony providers make little sense in an environment where companies can provide a wider range of services than before and compete with each other. So, for example, should a traditional telephone company that now provides IPTV services still be regulated as a telephony provider, a cable company,
a broadcaster, or something new entirely? Similarly, new entrants to this converged ICT market often have no physical networks and operate with business models that are nothing like traditional telecommunication companies. What regulations should apply to them? In this situation, regulators face a complex task to ensure that all competitors are treated fairly and competition can flourish, while also seeking to ensure that market-led rapid innovation continues and government regulations do not provide disincentives for new entrants or entrepreneurs.
The consequences of these changes are largely positive, but also quite disruptive. For example, this active marketplace with new business models, new players, and new services is creating an unprecedented amount of choice for consumers, who can now use
30 Trends in Telecommunication Reform 2015
Box 2.2: The increased relevance of CDNs for Internet traffic exchange
CDNs comprise a network of servers deployed across multiple networks in multiple data centers that enable fast and high-quality delivery of content to end users. Caching content close to the edge of the network via a CDN is especially attractive to OTT providers that offer video streaming as their content is latency-sensitive and uses large amounts of bandwidth. CDNs have increasingly become key players in the distribution of Internet traffic; it is estimated that 65 per cent of all Internet video traffic will cross CDNs in 2017, up from 53 per cent in 2012.16
There is already a significant number of CDNs around the world.17 Originally, pure-play CDNs, like Akamai and Limelight, invested in caching technologies to host content closer to the end users. As video began to be embedded in web sites, CDNs began to distribute pre-recorded or on-demand content and subsequently to stream live content. However, other actors within the Internet ecosystem have been vertically integrating into the CDN market. This includes Internet backbone providers, such as Level 3, content providers (CPs), such as Netflix or Google, and Internet service providers (ISPs), like Telefonica (Spain), Comcast (U.S.), Korea Telecom, Telecom Italia, and SFR (France), to name a few.
The goal of this strategy is to essentially cut out the middle man –the pure-play CDN. A pure-play CDN operator gets paid by the CP for delivering its content to the CP’s audience of end users. The CDN in turn must pay ISPs, carriers, and network operators for hosting its servers in their data centers. By vertically integrating into the CDN market, CPs are able to save the costs of paying for transit traffic over Internet backbones.
The latest step in this continual evolution is the push to create CDN federations mainly to expand the geographic footprint of its individual members. These can be characterized as a multi-tier integration between CDNs, which involves agreements similar to peering at the IP-layer, allowing interconnection and integration between CDNs and the ability to exchange traffic between them and deliver service to an end user. While still incipient, CDN federations initially covered operator-owned CDNs only, but pilots for incorporating pure-play CDNs into federations are ongoing.18
services from a variety of providers. For policymakers and regulators, however, the result of all these changes is an ICT sector that is evolving rapidly and becoming increasingly complex. This, in turn, means that competition regulation must evolve to reflect the new players and new ways of providing services; old regulatory constructs and competition policies may no longer make sense or serve the purposes for which they were originally developed.
2.4 Regulatory Responses to Changing Competitive Conditions
As policymakers and regulators confront this rapidly changing environment, a range of issues must be addressed to ensure that competition can continue to flourish in all the different segments of the ICT sector and throughout the broadband value chain. Although the benefits of competition are widely recognized, the dynamic nature of the industry itself poses several challenges related to identifying whether and what types of regulation are needed in order to effectively promote and sustain competition. First, as the various markets continue to develop and mature, the telecommunications and ICT regulatory framework must be flexible enough to accommodate the changes, and specific regulatory obligations and requirements must be updated to reflect new market conditions. Incumbents, for example, may lose their large market shares to new entrants, so there is no longer a clear dominant operator. This, in turn, can lead to removal or easing of ex ante regulation in favor of ex post competition rules. Conversely, regulations for new entrants will need to be considered in the context of what services they provide and how. For example, should VoIP providers be required to provide emergency calling services?
Second, technological and service convergence has blurred the lines between traditional products and services, making it more challenging for regulators to delineate between relevant markets. For example, in many countries regulators are debating whether fixed line broadband and mobile broadband are distinct markets or whether there is sufficient fixed line to mobile demand-
side substitution to conclude that a single broadband access market exists.
Third, as noted in Section 2.3, the emergence of new actors and business models in the broadband value chain, such as OTT (e.g., VoIP) applications, cloud computing and CDN providers, raises questions of how to apply existing competition rules in an objective, non-discriminatory way. In many jurisdictions, the services provided by these new players may not be included in market analyses and may not be subject to existing regulation, despite the fact that they provide similar services. The challenge is how to support these new players and innovation—and the positive impacts they are having on consumer choice, services and prices—as well as facilitate the roll-out of new businesses that are driving big data and the Internet of Things.
Finally, the new markets and competitors arising in a converged broadband environment also create new opportunities for operators to cut costs and improve efficiencies wherever possible through horizontal and vertical integration, a trend that can negatively impact consumers’ ability to realize the full benefits of a competitive marketplace and that may unfairly disadvantage their (new and old) competitors. In particular, policymakers and regulators are increasingly taking a closer look at vertical integration issues. In addition, market shifts in Internet interconnection are also highlighting potential new issues.
The following sections discuss some of the key ways in which policymakers and regulators seek to promote competition and market development in the context of these complex challenges.
2.4.1 Licensing reforms In the past, many countries did not have a competitive telecommunication markets; in many cases due to licensing restrictions that resulted in a single, monopoly operator. The simple solution that most countries have adopted is to liberalize their markets and open the provision of ICT services to multiple providers. Regulators have introduced various licensing-based measures to facilitate this transition. These have included eliminating exclusivity and allowing for any number of
31Trends in Telecommunication Reform 2015
Chapter 2

entrants that satisfy basic licensing criteria (with the exclusion of scarce resources, such as spectrum). In addition, the process to obtain licenses has become much more streamlined in terms of the application process (i.e., the information to be provided and the requirements that must be met), and the timeframe to obtain a license has been reduced.
Today, many jurisdictions are looking into the prospect of fostering competition and innovation by allowing the use of new services through liberalized licensing measures. These types of licenses allow a company to provide a wide range of services under a single license. In some cases, all a company needs do is simply register with the regulator and a license is essentially automatically granted; there is no laborious application process. Finally, some services and applications do not require any type of license at all. Unlicensed20 (also called license-exempt) spectrum rules have enabled the boom in Wi-Fi, Bluetooth and other devices that are now integrated into the broadband ecosystem.
One example of how licensing can influence competition is seen in the varying policy and regulatory responses to VoIP. Competition in the voice telephony market has changed dramatically over the years due to the introduction of VoIP. Policymakers and regulators, however, have sometimes struggled with how to oversee the new entrant/technology; ranging from outright bans to policies that subject VoIP providers to the same regulatory requirements imposed on traditional telephony providers. Over 80 per cent of countries responding to the 2013 ITU Regulatory Survey indicated that VoIP is legal, a percentage that has remained largely unchanged for the last several years. However, a minority of countries either prohibit or strictly regulate the provision and use of peer-to-peer (P2P) VoIP and other OTT applications—often to protect incumbent revenues.
This is particularly the case with P2P Skype, which has substantially cut into the profits of incumbent operators.21 Some countries have responded by officially banning P2P Skype, Viber (an encrypted app that allows callers to make calls and send texts to other
Viber users) and other OTT applications on the basis, at least in part, that they deprive licensed operators of their voice and text message revenues.22 Most countries that limit P2P Skype and other OTT applications, however, do so by classifying such applications as telecommunication services subject to onerous licensing obligations or limiting the number of licenses available. In these scenarios, only licensed operators (and typically just the incumbents) are permitted to offer any type of telecommunication service, including P2P Skype, which means that Skype and other OTT applications are available only if the operators permit them. This enables the incumbents to decide whether or not to allow competition from OTT applications, and inhibits consumer choice since they are unable to access certain apps and services that are available in other countries. Consumer pressure, however, can encourage regulators and operators to unblock apps. For example, Etisalat and du In the UAE blocked Skype’s website and use of the app to make P2P VoIP calls and calls that connected to the public switched telephone network (PSTN) until April 2013, when both operators lifted the ban and enabled customers to use the application.23 Although neither operator expressly stated its reasons for unblocking the app, du implied that it was due to customer pressure.
2.4.2 Access obligations Building communication networks requires significant sunk cost, especially if nationwide coverage is required as part of a company’s license terms. In an attempt to facilitate entry by new and smaller players, certain countries have imposed access obligations on dominant or SMP operators that require them to allow their competitors to use their network elements at cost-based rates and on non-discriminatory terms. While the effects of these policies are controversial, access obligations are generally intended to facilitate competition by removing the high barriers to entry associated with having to build network infrastructure. Recently, in a new approach, governments themselves are creating shared, open access networks that provide wholesale services to retail providers. Such networks are being created in response to the same cost/efficiency issues addressed above, as well
32 Trends in Telecommunication Reform 2015
as a desire to speed up the deployment of broadband services.
Opening wireline network accessWholesale obligations on wireline carriers may require incumbents to lease out just passive infrastructure, such as masts, ducts or poles, to smaller competitors, or require full unbundling of the local loop for telephony and bitstream access for broadband services. At the same time, because ex ante wholesale access obligations involve a greater degree of regulatory intervention than interconnection obligations and regulated termination rates, they potentially create even greater market distortions.24 As such, mandated unbundling obligations, if adopted, should be carefully tailored to each country’s unique situation. In addition, regulators should review wholesale access regulations on a regular basis and eliminate any ex ante obligations if they are no longer necessary to facilitate effective competition. According to the ITU’s annual telecommunication regulatory survey in 2013,
50 per cent of the 181 countries responding to the survey reported that they require full unbundling of copper local loops and 36 per cent reported wholesale bitstream access obligations are in place.25
Many regulators view these obligations as a means to enhance competition, given that fixed line broadband, in particular, requires substantial infrastructure investments, which may be economically burdensome or inefficient for new entrants to replicate, especially in rural areas. While the expectation is that regular market reviews will demonstrate at some point that competition is sufficient to no longer warrant mandated access obligations, nearly all countries that have imposed local loop unbundling (LLU) or bitstream access obligations have opted to maintain them, at least for some markets. As outlined in Box 2.3, Canada is one of the few countries currently revisiting its wholesale access regulations and considering the removal of certain obligations.
33Trends in Telecommunication Reform 2015
Chapter 2
Box 2.3 Canada’s ongoing reviews of mandatory unbundling for broadband access services
In 2008, pursuant to Telecom Decision CRTC 2008-17, the Canadian Radio-Television and Telecommunications Commission (CRTC) articulated new rules for the regulation and pricing of wholesale telecommunication services provided by incumbent carriers.26 Under these rules, large operators must unbundle their broadband network infrastructure as well as traditional network elements.
In 2010, the CRTC reiterated that large incumbent local exchange carriers (ILECs) and cable companies must make wholesale broadband available to competitors at speeds matching their own service offerings to facilitate competition in the retail Internet services market.27 However, in seeking to ensure that large operators would be incentivized to continue investing in network build-out and offering innovative services, the CRTC permitted such operators to charge competitors 10 per cent more than for unbundling of copper loops than under the previous 2008 rules. In October 2013, the CRTC initiated a consultation process to once again review its rules relating to whether mandated wholesale unbundling remains appropriate, with a particular focus on broadband.28 The CRTC noted that the broadband market had changed significantly over the last several years and the current proceeding (which was still ongoing in late 2014) is intended to provide an overall view of the wholesale broadband market. More specifically, the CRTC stated that it is considering whether changes should be made to relevant product and geographic markets, and whether new wholesale services should be included under mandatory unbundling rules and/or whether it should forebear from applying such obligations for any existing services. The consultation closed in December 2013, and the CRTC has announced plans to hold a public hearing to further discuss the matter on October 27, 2014.
Other countries are forging ahead with unbundling and other ex ante obligations as part of a long-term regulatory strategy. For example, Brazil recently established a National Wholesale Trading System, which is a virtual platform for trading regulated wholesale products between operators (see Box 2.4).
Mobile Virtual Network OperatorsA similar approach to opening access to new market entrants has also been instituted by many regulators in the wireless market. Beginning in the late 1990s, MVNOs began to enter the mobile market in countries around the world. MVNOs offer mobile services to customers by reselling wholesale capacity purchased from MNOs that own infrastructure. In this way, MVNOs avoid the costs of obtaining, owning and operating their own facilities-based mobile networks, and instead focus on providing services and marketing those services. MVNOs pay the host MNO for using its infrastructure to facilitate coverage to their customers, or in some cases are wholly owned subsidiaries of MNOs.
The entry of MVNOs into a market was seen by policymakers and regulators as a means to enhance competition with the established MNOs, providing subscribers with more – and
hopefully more innovative – options when selecting mobile carriers. There have been a wide range of MVNO strategies, informed by a combination of regulation, MVNO investment, and target markets. Depending on the applicable regulations and the agreements negotiated with MNOs, MVNOs can determine which elements of service provision they will control directly as opposed to those that will be the responsibility of the MNO, as illustrated in Figure 2.7.
MVNOs often target specific markets in an effort to succeed by catering to a niche that is perceived as underserved by existing service providers or, in some cases, to leverage brand affinity. For example, MVNOs targeting ethnic groups remain an attractive strategy for investors, though such services have enjoyed varying levels of success. Movida, a U.S. MVNO launched in 2005 to target the Hispanic market, ceased operations in 2008, while KPN-owned Ay Yildiz, which targets the Turkish community in markets including Belgium, Germany, and the Netherlands, still operates in Germany while having ceased operations in Belgium and the Netherlands. Tesco Mobile, an MVNO established by U.K. grocer/retailer Tesco in the United Kingdom in 2003 has enjoyed success and expanded to four
34 Trends in Telecommunication Reform 2015
Box 2.4: Brazil’s National Wholesale Trading System
The Brazilian National Wholesale Trading System (Sistema Nacional de Ofertas ao Atacado - SNOA) is a virtual platform for trading wholesale products between telecommunication operators.
SNOA is expected to be “a one-stop-shop” for the wholesale telecommunications market in Brazil, as it will compile all information necessary for a buyer when acquiring wholesale telecommunications products, such as towers, switching centers; Internet Exchange Points (IXP); and points of interconnection, among others. The virtual platform will also serve as a management system because it will provide performance indicators for each provider with significant market power (SMP), enabling Anatel to track the traffic transactions and requests, helping the regulator to assure that the market operates in a fair and transparent competitive fashion. Ultimately, SNOA will provide transparency regarding the treatment of wholesale transactions, reducing asymmetric information and transaction costs, and above all, reducing disputes among all players. SNOA’s system is managed by a Wholesale Board comprised of SMP and non-SMP operators. It is funded by the SMP operators and has a budget of USD 10 million for five years ending in 2019.
Sources: See Silva, Abraão, “The Brazilian National Wholesale Trading System (SNOA),” Anatel Presentation, Mar. 2014, Costa Rica, available at http:// www. itu. int/ en/ ITU- D/ Regulatory Market/Documents/CostaRica/Presentations/Session%207_Abraao_Anatel%20%282%29.pdf

additional European markets. Other niches targeted by MVNOs have included the youth market and discount/low-cost services, as well as a first wave of MVNOs focused on providing M2M services.
Although MVNOs indisputably changed the competitive landscape simply by virtue of the entrance of new services and brands into the market, their effects on prices and service adoption have been unclear, as there has been relatively little in-depth analysis on the subject. Two economic analyses found that the entry of an MVNO into a market did not, in and of itself, have a significant impact on competition, and that MNO incentives to court MVNOs would depend on the likelihood of such MVNOs competing with the host MNO, as well as the potential for revenue generation.29 These economic analyses were based on pure economic models, but noted that regulatory intervention could be employed to make market entry conditions for MVNOs more favorable. One of the reasons cited for the failure of MVNOs was over-segmentation of the market, with operators focusing too narrowly on a particular niche and being unable to build a profitable business without a broader customer base.30
In recent years, there has been something of a resurgence in MVNO interest among service providers focused on new niches, as well as new attempts to cater to previously targeted niches. While there is no single shift that is responsible for such a development, changing user needs and an overall increase in the availability of mobile data connectivity may be
the key enabling changes. In such cases, the market has identified a gap that can be filled – profitably, it is presumed – by MVNOs. In a specific case, European regulators’ focus on reducing roaming fees has created an opening for MVNO services.
In particular, the growing interest in M2M services and the “Internet of Things” (IoT), combined with expanding 3G and 4G data service offerings from MNOs have spurred new interest in MVNOs offering data connectivity for such services. For example, despite the existence of an established group of M2M-focused MVNOs – as well as increasing interest in M2M services by MNOs themselves – a new pan-European MVNO, CoSwitched, has stated its belief that the European market needs a simple, affordable, regional M2M MVNO.31
In Europe, recent changes to regulations setting upper limits on wholesale and retail data roaming services have the potential to drive the creation of MVNOs focused on providing data services to customers roaming outside their home markets. The European regulations set enough of a margin between the maximum wholesale and retail data rates that there is a legitimate opportunity for new entrants to provide such roaming services and generate a profit. Roaming-only MVNOs were allowed to enter the European market in July 2014, and MNOs and MVNOs will be required to provide their subscribers with the capacity to be served by alternative roaming providers when they travel outside their home market.
35Trends in Telecommunication Reform 2015
Chapter 2
Figure 2.7: MVNO/MNO activity split
1 2 3 4 5 6 7 8 9
Branded Reseller
Service MVNO
Full MVNO
Branding &Communication
NetworkRouting &Functionality
Apps &Services
CustomerActivation
CustomerBilling
CustomerServices
Marketing Sales &Distribution
RadioAccess
MNO Activities MVNO Activities
Source: Booz & Co.
Other new permutations of the MVNO model continue to arise. In Kenya, the regulator awarded three MVNO licenses in April 2014, two of which went to firms with a clear interest in mobile payments, which are a key driver of Kenya’s mobile market. One analyst suggested that the entry of MVNOs in the Kenyan market allows for mutually beneficial arrangements in which the MNO derives revenue from excess network capacity and the MVNO obtains the network infrastructure it needs to launch a profitable service.32 In April 2014, messaging provider WhatsApp began offering a SIM card through German operator E-plus, providing unlimited access to the WhatsApp service without counting against the subscriber’s data allowance. Facebook-owned WhatsApp refers to the partnership with E-Plus as an MVNO, although the SIM is marketed with the names of both the messaging provider and the carrier.33 In May 2014, an analyst suggested that music streaming firm Pandora consider launching an MVNO in the United States in a bid to improve its revenue stream, which is currently driven primarily by advertising.34
Wholesale, open access models In their strategies to deploy widespread, affordable access to broadband as quickly as possible, some countries are moving beyond implementing unbundling/bitstream access obligations at the wholesale level by creating a wholesale broadband access network. These wholesale, open access models seek to ensure deployment of the domestic backbone and metropolitan connections and promote retail competition at the local access level.
The plan to establish a partially or fully state-owned, wholesale-only, fiber-based broadband network operator that sells capacity to an array of retailers was initially adopted in Australia in 2011 and has gained some traction in other countries, particularly in Brazil, Kenya, Oman, and South Africa.35 Singapore and Peru have adopted similar models, but instead of a state-owned wholesale provider, the entities deploying the broadband backbone are private operators, with financing coming from a mix of private and public funds.36
The basic premise of these wholesale, open access models is that a governmental entity builds out broadband infrastructure
nationwide, then leases access to retailers on a transparent, non-discriminatory, and wholesale-only basis. In turn, retailers sell high-speed Internet access to end users. The idea behind such an approach is that the state removes bottlenecks to infrastructure deployment, while ensuring that retailers can access facilities at wholesale rates so they may deliver broadband services to consumers, businesses, and institutions.
More recently, there are also examples of the open access model being pursued for mobile services. For example, Mexico and Kenya are both pursuing an open access network for the 700 MHz band. The regulator in Mexico, the Instituto Federal de Telecomunicaciones (IFT), is examining a number of different options for the creation of an independent operator that would use the 700 MHz band to provide wholesale broadband services in the country. The new operator could offer services using 700 MHz, as well as the dark fiber belonging to state-owned power company Comision Federal de Electricidad. In Kenya, the Ministry intends to roll-out a wireless broadband network through a public-private partnership (PPP) whereby the PPP company will offer services to service providers on a wholesale-only basis and will not be permitted to offer services to end users.37 Unlike with the Mexico model, Kenya has listed a number of spectrum bands that may be included under this PPP model.
Increasing competition and universal access are the drivers behind pursuing these models, both on the fixed line and mobile sides. The government authorities view this as a mechanism to increase coverage and quality of service, as well as to allow fair competition in the provision of services and provide affordable data services to consumers. However, there are potentially large drawbacks. First, these initiatives are subject to intense political pressure and governmental budgets, making it a challenge to implement plans and maintain financing over the years it takes to fully realize the plans. For example, a change in Australia’s government last year prompted a significant scale-back of the country’s NBN project. Rather than provide fiber-to-the-premises (FTTP) directly to 93 per cent of homes, schools and businesses, the government announced in November 2013
36 Trends in Telecommunication Reform 2015
that FTTP would be provided only to about 25 per cent of buildings with the remaining getting fiber-to-the-node (FTTN) with last mile connectivity via DSL.38 Additionally, these initiatives drive out private investment and can reintroduce the same issues with liberalization and privatization as addressed over the last few decades in the traditional telephony market. Finally, these models represent a relatively novel approach for broadband, with many complex aspects and only limited case studies from the ICT sector on which to rely.
2.4.3 Network and spectrum sharing: cooperation and competition in broadbandWith the liberalization of former monopoly-based markets, significant issues have arisen over the need for new providers to build out their own physical networks. In the past, many countries, particularly those with dominant ex-monopoly providers, have turned to access obligations (see section 2.4.2) to make it easier for new players to enter a market by using the incumbents’ existing network. Today, as they seek to extend networks to areas that are unserved or underserved, policymaker and regulators are considering regulatory approaches that allow, encourage, or even require competing companies to share the basic infrastructure that provides the services, rather than forcing them to compete on a facilities basis.
In urban areas, multiple facilities-based networks may be easily supported because of the large subscriber base from which to generate revenue and recover upfront investments, but in low-density population areas, having multiple capital-intensive networks may not make economic sense, since the return on investment may not cover the cost of building and operating the network. As a result, network operators are adopting new network infrastructure and spectrum sharing models in order to share the substantial costs of network deployment and maintenance while meeting obligations to roll out broadband services. Many countries prohibited such sharing arrangements in the past due to concerns about anti-competitive behaviour, such as collusion, as well as believing that true competition required
operators to build out their own infrastructure and engage in facilities-based competition.
With respect to the competitive aspects of infrastructure and spectrum sharing, discussed in more detail in the following sections (Infrastructure and Spectrum sharing), regulators must consider whether the particular sharing being proposed would (or does) negatively impact competition in the relevant wholesale and retail markets. According to a report by the Body of European Regulators of Electronic Communications (BEREC)/Radio Spectrum Policy Group (RSPG), considerations could include whether sharing agreements are unilateral, bilateral, or multilateral; the geographic scope of the agreement; the impact on the competitive situation in the relevant market(s); who retains control of radio planning; exclusivity clauses; and whether the independence of a network operator is prejudiced.39
In general, potential sharing agreements must be considered in light of their compatibility with applicable competition or other relevant law. In Europe, for example, infrastructure sharing agreements are evaluated against their compatibility with the Treaty on the Functioning of the European Union, with a focus on the immediate effects on competition in upstream and downstream markets, as well as to the possibilities of collusion or exchange of confidential information.40 In addition, reviews of sharing arrangements must also balance anti-competitive concerns with any positive impacts on competition, such as increased incentives for network deployment, enhanced competition in services or lower cost structures and prices.
Another factor that should be considered by authorities weighing infrastructure sharing is the balance between short-term and long-term effects. For example, imposing regulatory mandates for shared access to an incumbent’s assets and facilities may increase competition in the short term, but increased obligations on operators may also decrease incentives for network deployment, thus having a negative impact on competition in the longer term. Conversely, regulations forcing a company to build its own infrastructure across an entire country may improve facilities-based competition in the short term, but if the
37Trends in Telecommunication Reform 2015
Chapter 2

network is not economically sustainable, the company could be forced out of business, thus reducing competition in the longer term.
Infrastructure sharingThere are many different forms of infrastructure sharing, with some types more likely to implicate competition issues than others. Passive infrastructure sharing, such as sharing of ducts, poles, masts, or towers, does not require operators to coordinate day-to-day operations and is generally viewed as posing little threat to competition. Since active infrastructure sharing (such as mobile roaming, spectrum sharing, backhaul sharing, or other sharing of the network) requires operators to more closely coordinate, there is greater opportunity for competition issues, such as collusion, to arise.
There are many benefits to infrastructure sharing as examined in the 2008 edition of ITU’s “Trends in Telecommunication Reform”41 and in the 2008 GSR “Best Practice Guidelines on innovative infrastructure sharing strategies to promote affordable access for all,” best practice guidelines adopted by world community of regulators focusing on innovative infrastructure sharing and open access strategies.42 A 2012 study by the GSM Association (GSMA) also found benefits for wireless operators.43 Existing operators in mature markets can use infrastructure sharing to reduce operational expenses (OPEX) and increase capacity to underserved areas while operators in nascent markets can save on capital expenditures (CAPEX) and OPEX and more easily expand coverage to previously unserved areas by sharing infrastructure. The study also found that infrastructure sharing can promote competition by lowering barriers to entry for new entrants, especially regarding mobile networks where national roaming is in place for a limited time while the entrant deploys its own network.
Since the benefits of infrastructure sharing tend to outweigh potential threats to competition in rural or underserved areas, regulators generally approve—and even encourage—infrastructure sharing agreements. For example, the ITU’s ICT Eye annual survey in 2013 reported that regulators in 106 countries require operators to engage in passive infrastructure sharing for fixed line
and mobile networks, up from 62 countries in 2008.44 Regulators have more recently begun permitting mobile operators to share both passive and active infrastructure. According to the ITU’s ICT Eye data, in 2008 124 countries reported that they permitted mobile infrastructure sharing, including active sharing through MVNOs. By 2013, 151 countries stated that such sharing is permitted.45
In the mobile market, most active infrastructure sharing takes place at the access network level, which includes sharing passive infrastructure, and increasingly active elements.46 MVNOs typically share the access network equipment and passive infrastructure. Sharing the core network is the most integrated type of sharing, which involves passive infrastructure, backhaul equipment and the core transmission ring, switching center, billing platform and value-added systems (VAS). Due to the need to coordinate closely, and the increased likelihood of collusion, sharing of the core network and spectrum resources is subject to the most regulatory scrutiny.
Although regulators have been more hesitant to allow or encourage any type of active infrastructure sharing for mobile networks, they are finding that the benefits gained from faster deployments and lower costs so far outweigh the risks of potential collusion or other anti-competitive harms. For example, the four main mobile operators in the United Kingdom—Three, Everything Everywhere (EE), O2 and Vodafone—have all entered into some type of network sharing agreement for 3G networks since 2007, including for passive and active elements. Ofcom noted in 2009 that active sharing, such as radio access network (RAN) sharing, may raise competition concerns for a number of reasons. Most notably, Ofcom expressed concern over potential collusion due to the information exchanges necessary to coordinate sharing and an overall reduction in the intensity of competition between the sharing operators.47 However, in 2011, Ofcom recognized the value of RAN sharing, noting that it reviews all sharing agreements on a case-by-case basis under EU competition law.48 The success of the agreements, through cost-savings to the operators and faster, more affordable delivery of services to end users, is demonstrated through the operators’
38 Trends in Telecommunication Reform 2015
continued use of sharing agreements. In February 2014, for example, EE and Three announced a new network sharing agreement for their LTE networks, with the operators investing a total of GBP 1 billion (USD 1.7 billion).49 In the near term, the operators plan to share just passive infrastructure, particularly masts and backhaul transmission costs, which does not require Ofcom’s approval. However, there may be active sharing in the future, which would require Ofcom approval. In 2013, the operators considered active sharing of their LTE networks in the 800 MHz band, but decided to scrap the plan in favor of their own rural deployments.50 As their LTE networks grow, they may seek to restart negotiations in order to cover remaining underserved areas and/or share operational costs.
Spectrum sharingThe skyrocketing demand for spectrum in order to keep pace with new bandwidth-hungry broadband-enabled applications and services has spurred policymakers and operators to better utilize existing spectrum allocations, as well as reallocate additional spectrum to mobile broadband use. Spectrum scarcity has driven new ideas for efficiently using existing resources, including through spectrum sharing. According to the ITU, of the 77 countries that responded to the ICT-Eye annual survey in 2013, 64 per cent replied that spectrum sharing is permitted.51
Spectrum sharing takes active infrastructure sharing a step further by combining sharing at the access network layer with the sharing of dedicated frequencies. It can be defined as the simultaneous usage of a radio frequency band in a specific geographical area by a number of independent entities, leveraged through mechanisms other than traditional multiple- and random-access techniques.52 In general, this means that end users of any participating operator can use their operator’s services across any spectrum used in the shared network. Spectrum sharing can also allow for the more efficient use of spectrum resources and possible exploitation of under-used spectrum.
There are multiple approaches to spectrum sharing, including approaches where operators could share RANs with dedicated frequencies, with physical sharing of the node (hardware)
but with the software components managed separately. Or, where multiple operators hold licenses for the same spectrum bands, RAN sharing can take place within the shared spectrum band, though this is technically and operationally more complex.
However, because spectrum sharing requires cooperation between companies that otherwise compete, some regulators have been wary of such agreements. For example, India’s Department of Telecommunications (DOT) did not permit spectrum sharing under its licensing conditions and the guidelines on infrastructure sharing issued in 2007 (which considered spectrum sharing as a type of active infrastructure) opted to prohibit spectrum sharing between competing mobile service providers.53 The Telecom Regulatory Authority of India (TRAI) sought to reverse this policy in May 2010 by issuing a series of recommendations to the DOT proposing to permit spectrum sharing in India.54 The DOT’s draft spectrum sharing guidelines circulated in late 2013, for example, indicated that such sharing could only take place in circles (geographic licensing areas) where the two operators wishing to share spectrum already hold licenses.55
In contrast, Sweden’s ICT regulator, the Post and Telecom Agency (PTS) and the Swedish Competition Authority (Konkurrensverket) have supported mobile sharing of both spectrum and infrastructure. Sweden’s ICT law specifically permits the PTS to impose spectrum sharing conditions on operators, which the regulator implemented in the 3G auction in 2000.56 In that case, spectrum sharing has been considered a success. In 2009, mobile operators Telenor and Tele2 created a joint venture, called Net4Mobility. Through Net4Mobility, the operators now share spectrum in the 800 MHz, 900 MHz, 1800 MHz, and 2600 MHz bands. The benefits of the joint venture appear so far to have outweighed competition concerns. In particular, after a 2009 review of Net4Mobility, Sweden’s competition authority determined that it did not raise competitive concerns and that the joint venture would provide for faster and less costly deployment of 4G networks in the country.57 The competition authority’s conclusions have since been confirmed—through the use of shared networks and
39Trends in Telecommunication Reform 2015
Chapter 2

spectrum, Tele2 announced in 2013 that its multi-band 4G LTE mobile broadband network covered 99 per cent of population.58
2.4.4 Potential competition concerns raised by vertical integrationAs technological and service convergence continues and OTT providers compete with traditional players, particularly in video services, access to content is an emerging competitive concern. So far, regulation in this area has been fairly limited due to the large and ever-expanding number of content providers and the relatively low barriers to entry into the content market. But, as horizontal and vertical integration increases, it may be the case that dominant network operators that are vertically integrated with large content providers engage in a refusal to deal or other anti-competitive behaviours to prevent OTT providers from accessing key
content, such as television programming or important sporting events. These are part of the concerns being expressed in relation to the Comcast and Time Warner merger currently being reviewed by government authorities in the United States (see Box 2.5). Such issues have often been addressed in a merger review context with the parties agreeing to certain concessions in order to address or alleviate competition concerns raised by the government authorities.
2.4.5 Net NeutralityThe Internet generally operates on a “best effort” basis in which all traffic is treated equally, except where data traffic is managed to ensure that congestion is minimized and all traffic reaches its final destination as quickly as possible. Consumers and entrepreneurs, however, have long been concerned that ISPs block traffic (or particular websites) or
40 Trends in Telecommunication Reform 2015
Box 2.5: Proposed Comcast/Time Warner Merger
In February 2014, Comcast Corp. and Time Warner Cable (TWC) agreed to a merger in which Comcast, a global and media technology company that is the largest U.S. video and broadband provider, would purchase TWC, the second largest cable company in the country, in a transaction valued at USD 45 billion. The resulting entity would reportedly control 30 per cent of the U.S. cable television market (including 19 of the 20 largest markets), more than 40 per cent of the broadband access market, and would hold a large portfolio of cable and broadcast television networks. In April 2014, Comcast announced a divestiture plan in conjunction with Charter Communications to transfer approximately 1.4 million current TWC subscribers to Charter, thereby reducing the combined Comcast/TWC’s managed subscriber base below 30 per cent of the nation’s total cable television subscribers. In past mergers, Comcast has kept its share of the cable market below 30 per cent in an effort to avoid regulatory opposition.
Opposition to the merger, which has come from civil society, competitors, and legislators, has centered on the significant market power that the new expanded Comcast would have over pay television and broadband service. Critics of the transaction are wary of allowing one company to control nearly a third of cable television subscriptions and more than 40 per cent of residential broadband subscriptions, as well as the reduction in the overall number of market players. Some worry that Comcast would not face sufficient competition to prevent it from taking actions viewed as unfriendly to consumers, such as drastic speed or bandwidth caps on broadband service, or higher prices or limited programming choices among pay television services. Echoing concerns that were raised in the 2009 acquisition of content provider NBC Universal by Comcast, some critics also have expressed concerns that Comcast will discriminate against other operators offering subscription TV services, such as Verizon, AT&T, and DirecTV, by withholding or charging excessive prices for NBC Universal’s programming content.
Source: FCC, Comcast - Time Warner Cable, MB Docket 14-57 (2014), http:// www. fcc. gov/ transaction/ comcast- twc.
discriminate against particular types of traffic in an effort to protect their own services (e.g., a mobile provider blocking VoIP applications to ensure that voice traffic stays on its network). As a result, there have been calls for regulators to enact regulations that would prevent such anti-competitive behaviours.
What is net neutrality?As outlined in the ITU’s Trends in Telecommunication Reform 2013, net neutrality broadly refers to the principle that all Internet traffic should be treated equally.59 Net neutrality regulation generally requires an operator, regardless of market power, to treat all Internet traffic the same, and to allow users to access and use the Internet content of their choice. This principle requires operators to not discriminate against any particular type of traffic, but also requires them to deliver service on a “best efforts” basis. Other principles of net neutrality relate to operator disclosure and transparency in implementing data caps or how they use temporary traffic management practices to relieve network congestion or protect network security.
Canada and Chile were among the first countries in the world to enact broad net neutrality legislation, in 2009 and 2010, respectively. More recently, the issue has been heating up, especially in Europe, Latin America and increasingly in the Asia-Pacific region. (See Box 6 for an overview of net neutrality rules in Europe and the Americas.) Net neutrality can be a political issue because blocking certain types of content may be viewed as implicating rights relating to freedom of expression and access to information.
In the limited countries where a full set of net neutrality laws and regulations have been proposed or enacted, the following rules tend to apply:
• No blocking or degrading traffic: As part of the non-discrimination principle, net neutrality rules prohibit operators from blocking access to certain applications and services. Most rules have an exception for reasonable network management practices whereby operators may prioritize or slow down traffic temporarily during times of network congestion or
for network security. However, some countries, such as Chile, prohibit operators from singling out any particular application to prioritize or slow down.
• No paid prioritization: Based on the idea that traffic should be treated in a non-discriminatory basis, net neutrality rules tend to prohibit paid prioritization, which allows operators to charge consumers for Internet connectivity or charge OTT providers to reach consumers. Start-up companies, consumer groups, and small businesses are concerned that allowing prioritization will create a two-tiered Internet; one tier for big companies that are willing and able to pay for better treatment and the other tier for everyone else. They fear that in such a scenario smaller businesses will be discriminated against both technically and financially by ISPs and that innovation will be stifled.
• Disclosure and transparency: The least contentious of the net neutrality rules—and the most common—relate to disclosure and transparency. Such rules require operators to clearly state what their network management practices are, and may also require identifying the actual speeds and service quality levels that subscribers can expect. A number of countries have adopted such regulations, rather than enacting more onerous net neutrality requirements. In part this is because known instances of outright blocking/degradation of services have been relatively rare, and regulators have been concerned of over-regulating a problem that might not exist and that may have unforeseen impacts on network reliability and security. Disclosure and transparency requirements are thus often seen as a first or interim step, with further regulation to be applied only if necessary.
• Tiered data plans: Net neutrality rules generally permit, and even encourage, operators to offer tiered data plans with data caps. This means that subscribers could choose in advance how much data they want to purchase, with multiple price/cap levels available. There may also be rules requiring operators to notify a subscriber who is about to reach his data limit and/or allow him to upgrade to a higher tier.
41Trends in Telecommunication Reform 2015
Chapter 2
Sponsored data plans: neutral or not?Net neutrality principles at a high level – no blocking, no discrimination and no prioritization – seem straightforward. However, the issue of net neutrality sometimes becomes less clear when looking at these principles in the context of some of the new business models that are emerging. For example, to stimulate consumer demand for their services, a relatively new commercial practice has developed in the retail mobile broadband market, called sponsored data programs (also sometimes known as zero-
rate plans). Under these programs, among other variants, content providers pay mobile operators to deliver their content or service without the use counting against the subscriber’s data plan. In some cases, the subscriber may not need a data plan at all in order to access the sponsored content. Other alternatives include operators themselves sponsoring access to third party content, or even their own content, with such usage not counting against subscribers’ data caps.
Sponsored data programs represent a new revenue source for operators and can benefit
42 Trends in Telecommunication Reform 2015
Box 2.6. Recent changes in net neutrality
Brazil
Brazil’s net neutrality bill, called Marco Civil or Internet Civil Framework, was signed into law in April 2014.60 Among other principles related to the use and provision of Internet services, the law also establishes the principle of net neutrality and requires ISPs to abide by non-discrimination principles including no blocking or degrading traffic, unless necessary for technical reasons or emergency situations. There are also disclosure and transparency obligations. The law calls for a Presidential Decree to further regulate the net neutrality principle and traffic management practices.
Canada
The CRTC issued net neutrality rules in 2009 that prohibit blocking or degrading of content except in certain circumstances, such as traffic management during congested periods.61 The rules also require disclosure of any network management practices. In January 2012, the CRTC notified fixed line operator Rogers that there was evidence of violation of the net neutrality rules through the deliberate throttling of some applications, particularly online video games. In response, Rogers stated that it would stop throttling traffic by the end of 2012. In June 2013, the CRTC accepted this response and closed the investigation.62
Europe
In April 2014, the European Parliament voted overwhelmingly in favor of stringent net neutrality regulations requiring all broadband providers (both fixed line and mobile) to treat all Internet traffic equally.63 To become EU-wide law, the Council of Ministers must vote in favor of the bill . The basic principles of Europe’s net neutrality bill are:
• No blocking or degrading traffic, even if an application competes with an operator’s services. This would ban the current practice by several mobile operators throughout Europe who currently block or charge for Skype.
• No prioritization of traffic. Thus, an OTT provider would be prohibited from paying an operator to deliver its traffic faster than other traffic.
• Tiered data plans and data caps are allowed, but must be clearly disclosed to consumers.
• Traffic management is allowed, but only on a temporary basis, such as to ease network congestion during peak-use times.
consumers as well. In April 2014, a U.S. consumer survey found that 71 per cent of men and 62 per cent of women surveyed were more willing to increase their data usage if their data plans included sponsored data programs.65 These subscribers identified several types of content that they most likely would use if offered through a sponsored data program, including mobile banking, educational videos, viewing advertisements, and holding a teleconference.
Such programs have been introduced around the world. For example, Facebook Zero, started in 2010 and available in numerous countries in Asia, the Americas, Europe, Middle East, and Africa,66 enables smartphone users to connect to a text-only version of Facebook’s mobile site without incurring data charges. In 2012, Wikipedia began sponsoring access to its site also through their Wikipedia Zero program, allowing users in India, Jordan, Malaysia, Pakistan, Saudi Arabia, Sri Lanka and Thailand to access Wikipedia’s content without it counting towards the users’ data plans.
Some argue that sponsored mobile data programs fall outside net neutrality rules because, provided the sponsored traffic is not prioritized, there is no discrimination,
blocking, or prioritization of sponsored content vis-à-vis non-sponsored content. However, some net neutrality advocates assert that such programs are within the realm of net neutrality because, under certain scenarios, content providers may be paying operators for access to customers. They claim that this practice could have a negative impact on content providers by increasing their costs overall, costs which may be passed on to consumers or may diminish investments in new content. Additionally, opponents to sponsored data programs argue that large content providers with deep pockets can pay for sponsored data and may potentially squeeze out smaller content developers and start-ups that cannot afford to sponsor their own content.
Regardless of whether net neutrality rules apply to sponsored data programs, other competition issues could arise if an operator is sponsoring its own content that is competing with similar OTT apps. One such case is pending before the CRTC (see Box 2.7). Although the CRTC’s investigation into the matter is ongoing, the case demonstrates challenges associated with balancing the benefits of new business models and consumer choice against ensuring that these
43Trends in Telecommunication Reform 2015
Chapter 2United States
In 2010, the U.S. Federal Communications Commission (FCC) adopted net neutrality regulations based on various principles of non-discrimination (i.e., no blocking or degrading) and no prioritization, except where necessary for reasonable network management, such as to resolve congestion during peak-use periods.64 However, Verizon filed a claim against the FCC on grounds that the rules were not founded on a sound legal basis. In February 2014, a U.S. court rejected the FCC’s attempt to ensure net neutrality, finding that although the FCC holds authority to impose net neutrality rules, the regulator must provide a different legal justification on which the rules would be based.
In May 2014, the FCC opened a consultation that proposes amended rules that outlines unacceptable practices for broadband providers, and provides for case-by-case enforcement when content providers or users complain of unfair discrimination. Transparency rules would require ISPs to file publicly available reports with information on the actual Internet speeds they deliver, instances of network congestion, actual instances when they block content or any paid prioritization agreements. Supporters of net neutrality are dismayed that the rules permit paid prioritization, claiming that this will create a two-tiered Internet in which large, established content companies get better access to consumers, while smaller competitors would be disadvantaged. They also claim that consumers will likely suffer due to more limited choice in services.
practices do not allow dominant operators to leverage market power and stifle competition.
Quality of service monitoringIn some cases, regulators have used quality of service regulations to address net neutrality concerns. The level of regulatory intervention with respect to quality of service is often dependent on the degree of competitiveness in the market. Regulators typically take a hands-off approach in monitoring quality of service and reporting requirements if a market is highly competitive. In markets where competition is not working well, and poor quality of service becomes an issue, regulators have intervened. Historically, quality of service requirements have been applied to voice services, but more recently regulators have been incorporating net neutrality principles into minimum quality of service requirements for data services. These requirements can vary from high-level transparency guidelines on how the information on traffic management techniques is disclosed to end-users, to requiring actual indicators for data network performance for fixed and mobile broadband providers.
In 2011, the U.K. regulator, Ofcom, issued a statement recognizing the risk of network operators using discriminatory blocking and unreasonable network management practices. Ofcom noted that if complaints were received, the regulator would consider using its authority to insure “best-effort” access to the Internet by imposing a minimum quality
of service on all providers. However, Ofcom also stated its belief that there was sufficient competition in the U.K. market to discourage discriminatory blocking and prioritization of data traffic. Nonetheless, Ofcom also noted that effective competition requires that sufficient information be available to users, and that it would be monitoring market practices in that regard.
The French regulator ARCEP also adopted network neutrality principles in 2010. Among those principles, ARCEP noted that it was necessary to promote transparency to users, monitor data traffic management practices, and conduct regular evaluations of quality of services.69 In 2012, ARCEP issued a statement to the French Parliament noting that there was a decrease in all discriminatory management practices particularly because of the increased competition in the market.70
Some countries have imposed very detailed and specific market regulations regarding quality of service, even though the market is regarded as competitive. Brazil, for example, has four major mobile operators, with each having approximately 25 per cent market share by subscribers. Nonetheless, in 2011, Brazilian regulator Anatel approved two regulations establishing targets for network management and transparency requirements for both mobile and fixed broadband providers.71 Both regulations establish minimum indicators for data network performance for mobile and fixed broadband providers, as well as minimum performance
44 Trends in Telecommunication Reform 2015
Box 2.7. Sponsored data program and competition in Canada
In November 2013, a Canadian citizen filed a complaint with the CRTC over Bell Mobility’s sponsored mobile TV service.67 For CAD 5 per month, Bell Mobility subscribers can watch 10 hours of video (equivalent to about 5 GB of data) from over 40 Bell-owned or licensed TV channels without it counting against the subscribers’ data plan.68 These same TV channels are available via other OTT applications; however, viewing video through these other applications would count against the subscribers’ monthly data caps. To get the equivalent amount of video that the Mobile TV sponsored program provides, a subscriber would need to purchase a CAD 40 per month plan for tablets or a CAD 105 per month plan for smartphones, resulting in a markup of non-sponsored content of several hundred per cent. The complaint alleges that Bell Mobility is leveraging its large market share and vertical integration in the video programming market to give itself undue preference.
Sources: CRTC and CBC News.

metrics for complaints and customer service. Some of the requirements applied to mobile data providers in Brazil include:72
• Connection attempts of data services during periods of high mobile data traffic should be connected in at least 98 per cent of cases.
• During each period of high mobile data traffic, the rate at which an operator’s data services network is down must be less than 5 per cent per month.
• During each period of high mobile data traffic, the operator must ensure that the instant transmission rate of data services, whether downloading or uploading, in 95 per cent of cases each month is 40 per cent of the maximum rate contracted by the user.
• The operator must ensure that the average transmission rate during high mobile data traffic, whether downloading or uploading, of data services must be at least 80% of the maximum transmission rate contracted by the user.
• Data services may not make voice communications unfeasible.
The Chilean Senate is currently discussing a bill that would oblige both fixed and mobile operators to assure a minimum Internet speed to users. According to the bill, ISPs must guarantee 70 per cent of advertised speed for national connections and 50 per cent in the case of international connections. In the
case of mobile connectivity, providers must guarantee 60 per cent of domestic and 40 per cent of international advertised speed.73
Regulators in other countries have also raised concerns over the quality of mobile telecommunication services provided in their respective countries. In response, policymakers are considering a variety of remedies, such as fines, the cancellation of mobile operator licenses or the suspension of new customer acquisitions unless certain quality of service standards are met (see Box 2.8).74
2.4.6 Internet InterconnectionAs noted in section 2.3.1, the Internet interconnection market is becoming increasingly complex. From a policy perspective, the key question is whether these developments may lead to market failure or the ability for certain players within the value chain to exercise market power.79 To date, Internet interconnection has remained largely unregulated, as privately negotiated agreements have resulted in efficient outcomes. The use of peering and transit arrangements has been effective in controlling any potential exercise of market power, especially considering the continued reductions in IP transit costs over the last several years.80 If a larger network refuses to peer, the argument goes, the smaller network can still reach its users via transit agreements
45Trends in Telecommunication Reform 2015
Chapter 2Box 2.8: Brazil Bans Mobile Operators from Selling Mobile Connections Due to Poor Quality of Service
Under Brazilian rules, companies that do not meet the quality of service target indicators will be subject to fines and sanctions. Based on the increasing number of user complaints about poor service quality,75 on 23 July 2012, Anatel issued a series of preliminary decisions temporarily banning thee of the four mobile operators (Tim Cellular S/A/, Group Claro, and Group Oi) from selling and activating new mobile connections in certain states.76 These operators were singled out because they had the highest index of user complaints due to poor network performance in each of the 26 states and the Federal District, from January to June 2012.77
Although operators generally resumed their operations within a month after Anatel’s sale ban, Anatel continues to monitor their quality of service indicators, and has recently noted to the press that operators have not achieved their target obligations of quality, and that the regulator is preparing a new package of quality of service obligations to apply on mobile providers, particularly with regard to data service.78

with other companies.81 However, not all Internet traffic is equal. This is especially the case for highly latency-sensitive traffic, such as video streaming. In such cases, it could be argued that despite low prices, IP transit may not be a good work around for cases where an ISP refuses to peer.
As expected, there are two sides of the issue. Very public disputes between content providers and CDNs on one side, and large ISPs on the other, have led the former to call for regulatory action in the Internet interconnection market (see Box 2.9). They argue that large ISPs have market power in terminating traffic, as their subscribers are locked-in, and are exercising that power by
demanding payments from CPs and CDNs. Large ISPs, on the other hand, argue that paid-peering arrangements with CDNs have been the norm and that just because new players, such as backbone providers and CPs, are becoming CDNs does not justify any changes in the Internet interconnection framework.82 As such, ISPs argue that they should be compensated for the use of their networks, especially considering the significant demands placed on them by the increased volume of traffic being sent to their users.83
While the issue is still unsettled, some regulatory authorities and analysts agree that greater transparency in the Internet interconnection market is needed. For
46 Trends in Telecommunication Reform 2015
Box 2.9: Evolving landscape of traffic exchange between content providers, CDNs and large ISPs – the case of the United States (2011-2014)
The Level 3-Comcast interconnection dispute that took place in the United States exemplifies the types of disputes that may arise due to shifts within the Internet ecosystem and the changing roles of existing players. As a major U.S. backbone provider, Level 3 engages in settlement-free peering with Comcast, the country’s largest ISP. In 2010, Level 3 entered into an agreement with Netflix, a subscription-based OTT content provider that allows users to stream TV shows and movies over their Internet connection.84 Netflix requires high-quality and dedicated connectivity to end users to deliver its services. To drive revenues, Level 3 agreed to deliver Netflix’s video content for a fee, thereby acting as a CDN. Since Netflix represents 30 per cent of peak U.S. broadband traffic, the deal meant that Level 3 began sending huge amounts of traffic for Comcast to terminate—much more than Comcast sent to Level 3. Comcast eventually issued an ultimatum: Level 3 had to pay Comcast to deliver Netflix’s video content like any other CDN, or else Comcast would not deliver the additional traffic. Level 3 took the issue to the FCC, but did not file a formal complaint and the parties eventually resolved the dispute in 2013 through negotiations. Although terms of the deal were not disclosed, it is understood that the parties reached an agreement to share the costs of increased traffic.
On February 24, 2014 Netflix signed a deal with Comcast which allowed Netflix’s CDN (Open Connect)85 to directly interconnect with Comcast’s servers and cache its video content closer to Comcast’s subscribers. By doing this, Netflix cut out the providers that previously transited its traffic to Comcast. Prior to reaching this agreement, Netflix had reported that delivery speed of its content to Comcast subscribers had declined by more than 25 per cent, resulting in frequent interruptions and delays of its service.86 Comcast denied that it was slowing Netflix’s traffic and instead blamed intermediate CDNs for poor traffic management.
Despite reaching agreements with Comcast, Level 3 and Netflix have claimed that Comcast and other ISPs are using their position in the Internet ecosystem to create a bottleneck and charging interconnection fees for CDNs and content providers to reach end users. In March 2014, Level 3 proposed a new rule to the FCC that would require ISPs to provide CDNs interconnect on “commercially reasonable terms, without the payment of an access charge.”

example, calls for transparency have been made recently in order to ensure that better information is available about traffic patterns, the costs of increased usage and the terms, conditions, and norms that are emerging as Internet interconnection markets continue to evolve. Increased transparency may face certain challenges, however, since the great majority of peering agreements are not written contracts.
Despite this, some regulatory authorities have begun to take steps in order to obtain information relating to Internet interconnection relationships. For example, in 2012 the French regulator, ARCEP, imposed a requirement on ISPs to provide information on a biannual basis on the technical and pricing terms governing data conveyance and interconnection.87 After a two year review, ARCEP found there was no need to impose specific ex ante regulatory obligations in the Internet interconnection market (e.g., obligation to provide interconnection, rate regulation, etc.).88 Instead, ARCEP continued its light-handed regulatory approach of collecting information from market participants which allows the regulator to monitor Internet interconnection markets more closely.
In any case, close review of traffic flows, agreement terms and conditions and commercial practices is advisable prior to any policy decision in this area. Further transparency in this market will be essential to monitor the continued development of interconnection and allow evidence-based decisions going forward in order to assess whether there is significant market failure that warrants intervention by regulatory authorities.
2.4.7 Mechanisms to enhance and protect consumer choiceA framework focused on enhancing competition is essential to the development of a thriving ICT sector. In order to take advantage of a competitive environment, however, consumers must be able to effectively choose amongst service providers. They should be able to obtain adequate information that will help ensure that they can make informed decisions and reap maximum quality for price from the variety of service
providers. Service providers have an obvious incentive to keep their customers and can use several strategies to stop them from leaving. Some of these are good for competition; lowering prices, for example or offering new attractive services. Other practices, however, may not be so good for consumers.
Companies may use several methods to effectively deny customers the ability to switch providers, essentially locking them to their existing provider in such a way that it is impossible or extremely difficult (or costly) for competitors to actually gain their business. Customer lock-in can become both a competition and a consumer protection issue. In some cases, for example, activities that prevent subscribers from switching providers may be anti-competitive, such as collusion between competitors to maintain certain market shares or carve out geographic territories in which they will not compete with each other. However, it is often the case that the same activity may be either a sign of a competitive market that benefits consumers through greater choice in service offerings or an anti-competitive practice if a provider is exploiting its market dominance to artificially limit competition and market access, raise prices or reduce output.89 In more mature competitive markets, these issues are increasingly confronting regulators seeking to maximize the benefits of competition.
Contractual obligationsIn many cases, companies use the contracts with their customers to retain those customers. For example, customer contracts often require a one or two year customer commitment, and it can be difficult for customers to break the contract without paying high early termination fees (ETFs). Notably, the 2009 amendments to the EU Universal Service Directive require EU Member States to ensure that customer contracts cannot exceed 24 months and that operators also offer contracts with a maximum duration of 12 months.90 However, the benefit to these long-term contracts is that customers often receive heavily discounted rates and/or a subsidized handset for mobile services. In such instances, customers opt to be locked into a certain provider in order to take advantage of such cost-savings. These practices also
47Trends in Telecommunication Reform 2015
Chapter 2
give operators another means by which to compete and diversify their service offerings.
Despite the benefits, regulators may occasionally become concerned with ETFs, especially if such fees are not clearly disclosed to consumers or seem excessive. In April 2012, for example, Israel’s Ministry of Communications banned all ETFs for mobile services and backdated the ban for any customer with 100 or fewer mobile subscriptions (i.e., non-enterprise customers) who signed a mobile contract after November 1, 2011.91 For customers who signed a contract before that date, an 8 per cent fee based on the customer’s monthly bill multiplied by the number of months remaining on the contract applies. The ban on ETFs does not include recovering remaining payments for subsidized handsets; mobile customers breaking their contracts can still be charged for the balance of any handset subsidy.
Number portabilityAnother measure that regulators adopt to facilitate consumer choice is number portability, which allows customers to keep the same telephone number when they switch carriers. Because people and businesses become closely associated with their phone numbers, having to change that number as a result of switching carriers is often seen as a burden that will keep subscribers from moving to a new carrier. In such cases, even if a competitor provides a better and/or less expensive service, subscribers will not switch because they will lose their long-held existing number. Such a barrier can undermine the development of a truly competitive market. Number portability rules also generally include measures to streamline the porting process, and further encourage consumers to take advantage of competition.
Although policymakers often require fixed line operators to port numbers, mobile number portability is more common, both as a regulatory obligation and consumer practice, which may be due to greater levels of competition (and therefore choice) in the mobile market generally. For example, since Mexico first introduced fixed line and mobile number portability in 2008, over 14 million numbers have been ported, nearly 90 per cent
of which was subscribers moving between mobile operators.92
According to ITU data, the implementation of mobile number portability is on the rise with a sharp uptick over the last several years.93 In 2008, 46 per cent of the countries responding to the annual Telecommunication Regulatory survey reported that mobile number portability rules had been adopted—by 2013, this figure reached more than 90 per cent of surveyed countries. For fixed line portability, the percentage has remained more or less constant since 2008, with approximately 44 per cent of countries reporting that they require fixed line number portability.
Number portability rules typically outline the steps consumers must take, the process that operators must follow, a timeframe in which operators must complete the process, and may also include limits on the amount that operators may charge consumers to port a number. Bahrain’s Telecommunications Regulatory Authority (TRA), for example, requires no customer involvement beyond the initial application for service with the new provider and it is incumbent on the two providers to port the number.94 Mexico’s IFT has also sought to simplify and bring transparency to the number portability process, including new rules issued in May 2014 requiring mobile operators to send customers a standardized text message with instructions and a code to switch. The European Union has also adopted measures, set forth in the Universal Service Directive amended in 2009, to speed up the porting process by requiring operators to port both fixed line and mobile numbers within one working day.95 However, this ambitious deadline is proving difficult to meet—only operators in Ireland port both fixed line and mobile numbers within one working day while operators in all other EU Member States take at least two working days and up to two weeks to port a number.96
InteroperabilityInteroperability in this case refers to the ability of one device to communicate and exchange information with another device, with both devices able to understand and use the information. Interoperability in a broadband environment is important for ensuring that
48 Trends in Telecommunication Reform 2015

software and equipment from different operators, manufacturers and vendors work together seamlessly to deliver broadband services and applications to consumers. A lack of interoperable products can impede the ability for customers to switch providers (particularly if the products are costly) and reduce consumer choice even if there are otherwise a variety of services and devices available in the market. To facilitate choice and ease of access, many view common, open standards as key to ensuring interoperability. However, there are benefits to proprietary standards. Manufacturers, software developers, and operators may create or license proprietary systems to maintain greater control over the quality and security of the products, which also benefits consumers, particularly if they are seeking a customized, secure product.
As defined by the ITU’s Standardization Bureau, open standards “are standards made available to the general public and are developed (or approved) and maintained via a collaborative and consensus driven process… open standards facilitate interoperability and data exchange among different products or
services and are intended for widespread adoption.”97 See Box 10 for other elements of open standards. Standard-setting organizations provide rules governing consensus-based decision-making processes and the development of open standard specifications, including the ITU, International Organization for Standardization (ISO), International Electro technical Commission (IEC), Institute of Electrical and Electronics Engineers (IEEE) and European Telecommunications Standards Institute (ETSI).98 When software, content and devices are based on open standards, any telecommunication service provider or end user can select those products that suit their needs and—importantly—use the same devices or software with a different provider without losing the functionality of their data or needing to go through lengthy processes to retrieve and move their data.99
In contrast, providers of devices and software based on proprietary systems develop their standards without outside input and often do not license or make their standards public. In addition, they typically restrict which vendors can use their standard, charge higher licensing fees than products based on open standards
49Trends in Telecommunication Reform 2015
Chapter 2
Box 2.10. Elements of open standards
• Collaborative process – voluntary and market driven development (or approval) following a transparent consensus driven process that is reasonably open to all interested parties.
• Reasonably balanced – ensures that the process is not dominated by any one interest group.
• Due process - includes consideration of and response to comments by interested parties.
• Intellectual property rights (IPRs) – IPRs essential to implement the standard to be licensed to all applicants on a worldwide, non-discriminatory basis, either (1) for free and under other reasonable terms and conditions or (2) on reasonable terms and conditions (which may include monetary compensation). Negotiations are left to the parties concerned and are performed outside the SDO.
• Quality and level of detail – sufficient to permit the development of a variety of competing implementations of interoperable products or services. Standardized interfaces are not hidden, or controlled other than by the SDO promulgating the standard.
• Publicly available – easily available for implementation and use, at a reasonable price. Publication of the text of a standard by others is permitted only with the prior approval of the SDO.
• On-going support – maintained and supported over a long period of time.
Source: ITU-T, “Definition of Open Standards,” 2005, http:// www. itu. int/ en/ ITU- T/ ipr/ Pages/ open. aspx.
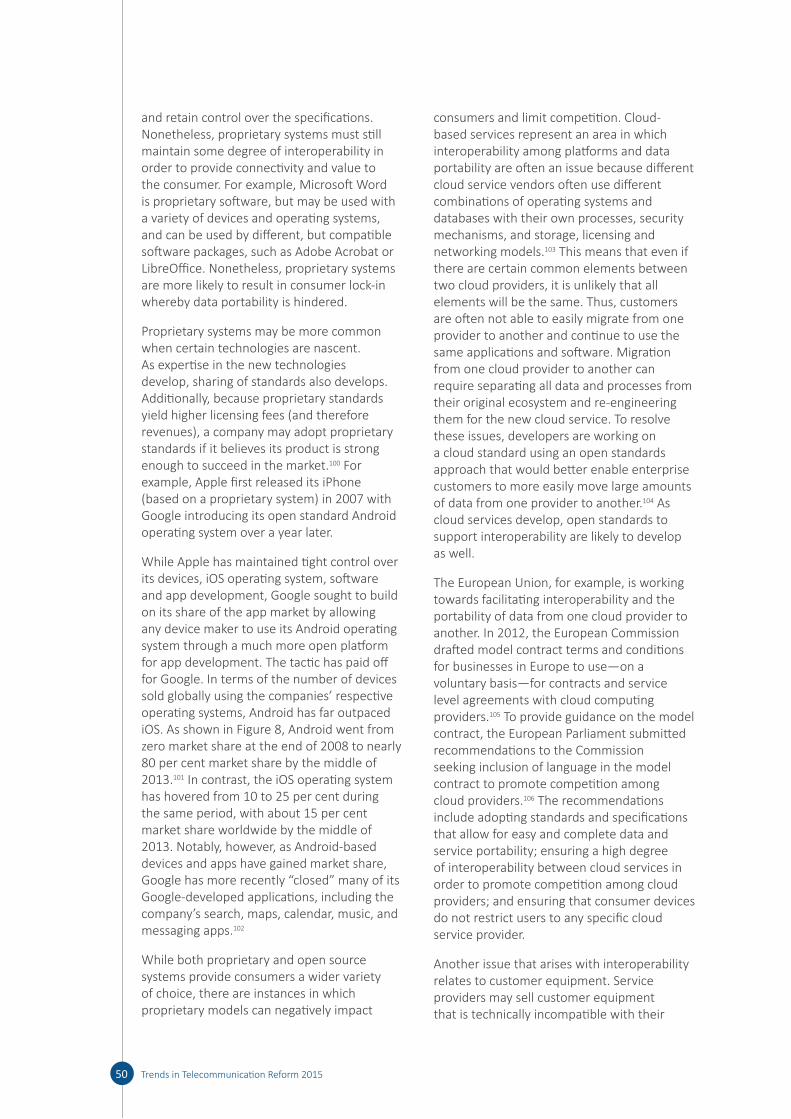
and retain control over the specifications. Nonetheless, proprietary systems must still maintain some degree of interoperability in order to provide connectivity and value to the consumer. For example, Microsoft Word is proprietary software, but may be used with a variety of devices and operating systems, and can be used by different, but compatible software packages, such as Adobe Acrobat or LibreOffice. Nonetheless, proprietary systems are more likely to result in consumer lock-in whereby data portability is hindered.
Proprietary systems may be more common when certain technologies are nascent. As expertise in the new technologies develop, sharing of standards also develops. Additionally, because proprietary standards yield higher licensing fees (and therefore revenues), a company may adopt proprietary standards if it believes its product is strong enough to succeed in the market.100 For example, Apple first released its iPhone (based on a proprietary system) in 2007 with Google introducing its open standard Android operating system over a year later.
While Apple has maintained tight control over its devices, iOS operating system, software and app development, Google sought to build on its share of the app market by allowing any device maker to use its Android operating system through a much more open platform for app development. The tactic has paid off for Google. In terms of the number of devices sold globally using the companies’ respective operating systems, Android has far outpaced iOS. As shown in Figure 8, Android went from zero market share at the end of 2008 to nearly 80 per cent market share by the middle of 2013.101 In contrast, the iOS operating system has hovered from 10 to 25 per cent during the same period, with about 15 per cent market share worldwide by the middle of 2013. Notably, however, as Android-based devices and apps have gained market share, Google has more recently “closed” many of its Google-developed applications, including the company’s search, maps, calendar, music, and messaging apps.102
While both proprietary and open source systems provide consumers a wider variety of choice, there are instances in which proprietary models can negatively impact
consumers and limit competition. Cloud-based services represent an area in which interoperability among platforms and data portability are often an issue because different cloud service vendors often use different combinations of operating systems and databases with their own processes, security mechanisms, and storage, licensing and networking models.103 This means that even if there are certain common elements between two cloud providers, it is unlikely that all elements will be the same. Thus, customers are often not able to easily migrate from one provider to another and continue to use the same applications and software. Migration from one cloud provider to another can require separating all data and processes from their original ecosystem and re-engineering them for the new cloud service. To resolve these issues, developers are working on a cloud standard using an open standards approach that would better enable enterprise customers to more easily move large amounts of data from one provider to another.104 As cloud services develop, open standards to support interoperability are likely to develop as well.
The European Union, for example, is working towards facilitating interoperability and the portability of data from one cloud provider to another. In 2012, the European Commission drafted model contract terms and conditions for businesses in Europe to use—on a voluntary basis—for contracts and service level agreements with cloud computing providers.105 To provide guidance on the model contract, the European Parliament submitted recommendations to the Commission seeking inclusion of language in the model contract to promote competition among cloud providers.106 The recommendations include adopting standards and specifications that allow for easy and complete data and service portability; ensuring a high degree of interoperability between cloud services in order to promote competition among cloud providers; and ensuring that consumer devices do not restrict users to any specific cloud service provider.
Another issue that arises with interoperability relates to customer equipment. Service providers may sell customer equipment that is technically incompatible with their
50 Trends in Telecommunication Reform 2015
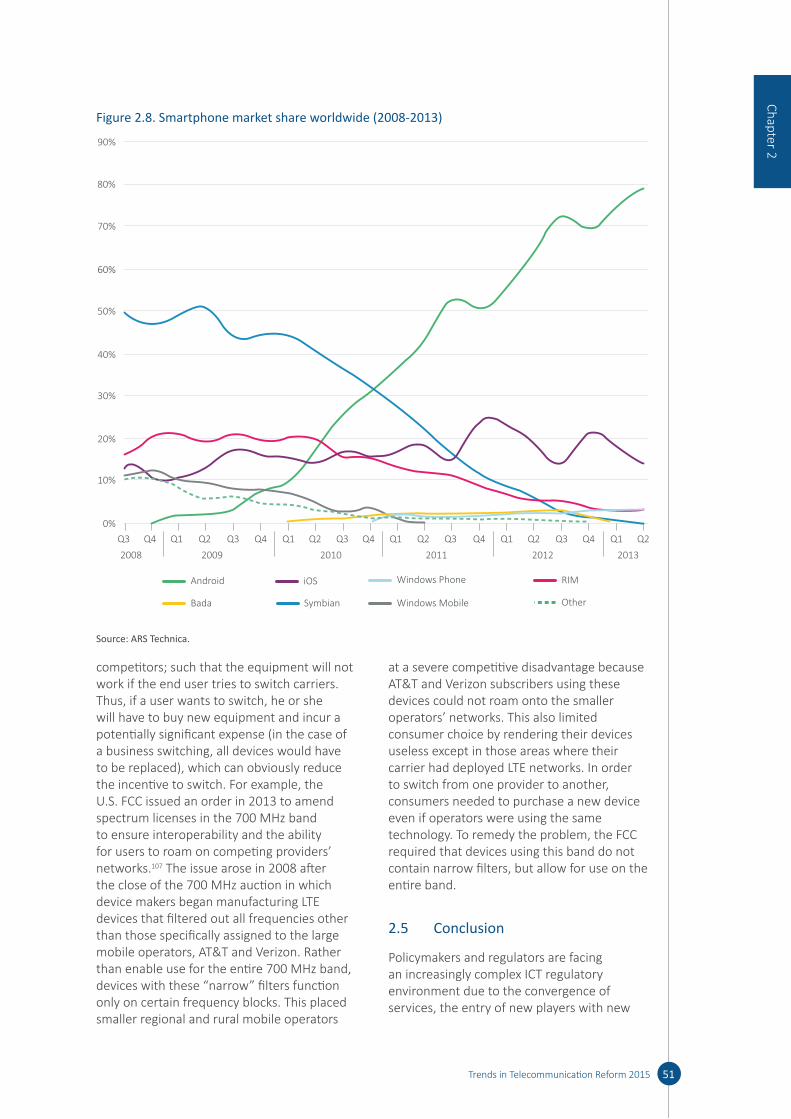
competitors; such that the equipment will not work if the end user tries to switch carriers. Thus, if a user wants to switch, he or she will have to buy new equipment and incur a potentially significant expense (in the case of a business switching, all devices would have to be replaced), which can obviously reduce the incentive to switch. For example, the U.S. FCC issued an order in 2013 to amend spectrum licenses in the 700 MHz band to ensure interoperability and the ability for users to roam on competing providers’ networks.107 The issue arose in 2008 after the close of the 700 MHz auction in which device makers began manufacturing LTE devices that filtered out all frequencies other than those specifically assigned to the large mobile operators, AT&T and Verizon. Rather than enable use for the entire 700 MHz band, devices with these “narrow” filters function only on certain frequency blocks. This placed smaller regional and rural mobile operators
at a severe competitive disadvantage because AT&T and Verizon subscribers using these devices could not roam onto the smaller operators’ networks. This also limited consumer choice by rendering their devices useless except in those areas where their carrier had deployed LTE networks. In order to switch from one provider to another, consumers needed to purchase a new device even if operators were using the same technology. To remedy the problem, the FCC required that devices using this band do not contain narrow filters, but allow for use on the entire band.
2.5 Conclusion
Policymakers and regulators are facing an increasingly complex ICT regulatory environment due to the convergence of services, the entry of new players with new
51Trends in Telecommunication Reform 2015
Chapter 2
Figure 2.8. Smartphone market share worldwide (2008-2013)
20092008
Q1 Q2Q4 Q4Q3Q3
2010
Q1 Q2 Q4Q3
2011
Q1 Q2 Q4Q3
2012
Q1 Q2
2013
Q1 Q2Q4Q3
0%
20%
10%
30%
40%
50%
60%
70%
80%
90%
OtherWindows MobileSymbianBada
RIMWindows PhoneiOSAndroid
Source: ARS Technica.
business models and cost structures, and rapidly increasing flows of data throughout the world. As a result, the competitive landscape is significantly different than it was only a few years ago, and this change seems poised to accelerate as technology advances and consumer demands change. Competition issues have become more complex as market definitions have become less distinct and companies compete in various links in the broadband value chain. New business models are being devised and discarded at an amazing speed. In an effort to address the changes in the ICT market, policymakers and regulators are engaged in a variety of efforts to ensure that competition and innovation can continue to flourish. In some cases, these
efforts are aimed at opening the market to new competition or restraining the power of a still-dominant incumbent operator (i.e., licensing reforms, access obligations, vertical integration, net neutrality, and consumer protections). In others, regulators seek to fine tune measures to promote competition to ensure that networks can be expanded and continue to grow as consumer demand and markets dictate faster, ubiquitous, more reliable and more secure services. As the markets and technologies continue to evolve, policymakers and regulators should monitor developments and carefully consider what regulatory tools will be needed to harness the benefits of competition for meeting their social and economic goals.
52 Trends in Telecommunication Reform 2015
Endnotes1 Cisco Virtual Networking Index, “The Zettabyte Era – Trends and Analysis,” (May 2013), http://
www. cisco. com/ c/ en/ us/ solutions/ collateral/ service- provider/ visual- networking- index- vni/ VNI_ Hyperconnectivity_ WP. html.
2 McKinsey Global Institute, ”Global flows in a digital age: How trade, finance, people, and data connect the world economy,” (April 2014), http:// www. mckinsey. com/ insights/ globalization/ global_ flows_ in_ a_ digital_ age.
3 ITU World Telecommunication/ICT indicators database, www. itu. int/ icteye.
4 ITU World Telecommunication/ICT indicators database, www. itu. int/ icteye.
5 UN Broadband Commission for Digital Development, “The State of Broadband 2013: Universalizing broadband,” p. 78, (September 2013), http:// www. broadbandcommission. org/ Documents/ bb- annualreport2013. pdf.
6 Cisco Visual Networking Index: Global Mobile Data Traffic Forecast Update, 2013-2018, (5 February 2014).
7 Dina Bass, “Microsoft Skype Unit Approaching $2 Billion in Annual Sales,” Bloomberg News, (19 February 2013), http:// www. bloomberg. com/ news/ 2013- 02- 19/ microsoft- s- skype- unit- approaching- 2- billion- in- annual- revenue. html.
8 Telegeography Report on International Voice, (January 2014) http:// www. telegeography. com/ page_ attachments/ products/ website/ research- services/ telegeography- report- database/ 0004/ 6341/ TG_ executive_ summary. pdf
9 Telegeography Report and Database on International Voice, (January 2014) http:// www. telegeography. com/ research- services/ telegeography- report- database/ .
10 ITU, “World Telecommunication/ICT indicators and World Telecommunication/ICT Regulatory databases,” (2013), www. itu. int/ icteye.
11 Reuters, “Netflix price hikes seen boosting global expansion,” (22 April 2014), http:// www. reuters. com/ article/ 2014/ 04/ 22/ us- netflix- results- idUSBREA3K14N20140422.
12 Netflix to launch in six more European countries this year, (21 May 2014), http:// www. reuters. com/ article/ 2014/ 05/ 21/ us- netflix- europe- idUSBREA4K03D20140521.
13 Lisa Richwine, “Netflix to launch in six more European countries this year,” Reuters (21 May 2014), http:// www. reuters. com/ article/ 2014/ 05/ 21/ us- netflix- europe- idUSBREA4K03D20140521.
14 Apple, “Apple Reports Second Quarter Results,” Press Release, (23 April 2014), https:// www. apple. com/ pr/ library/ 2014/ 04/ 23Apple- Reports- Second- Quarter- Results. html; Steve Lohr, “Amazon’s Revenue Grew 23 Percent in First Quarter, Nearing $20 Billion,” (24 April 2014), http:// www. nytimes. com/ 2014/ 04/ 25/ technology/ amazon- quarterly- earnings. html.
15 See Cisco Visual Networking Index: Forecast and Methodology, 2012–2017, http:// www. cisco. com/ c/ en/ us/ solutions/ collateral/ service- provider/ ip- ngn- ip- next- generation- network/ white_ paper_ c11- 481360. pdf.
16 Id.
17 A list of selected active CDNs can be found at www. cdn- advisor. com.
53Trends in Telecommunication Reform 2015
Chapter 2

18 See Francois Le Faucheur, CDN Federation: Lessons from Phase 3 of the CDN Federation Pilot Cisco, Content Delivery Summit, NYC, (20 May 2013), http:// conferences. infotoday. com/ documents/ 172/ 2013CDNSummit- B102C. pdf.
19 OECD Communications Outlook 2013, p. 143.
20 For which radiocommunication devices are exempted from individual licensing, as they have been already authorised in a general manner to operate under a specific regulatory framework (also named Generic Use Licensing, or similar; i.e. Wi-Fi devices).
21 McKinsey Global Institute, “Global flows in a digital age: How trade, finance, people, and data connect the world economy”.
22 MTIT, “Ministry News,” (27 June 27 2012), http:// www. mtit. gov. ps/ index. php? option= com_ content& view= article& id= 784%3 A2012- 06- 27- 09- 32- 07& catid= 1%3 A2011- 03- 30- 09- 48- 14& Itemid= 25.
23 Kyle Sinclair, “Mobile subscribers in UAE get access to Skype calls, but for how long?” The National (20 March 2013), http:// www. thenational. ae/ news/ uae- news/ mobile- subscribers- in- uae- get- access- to- skype- calls#ixzz3K18zvVMn.
24 ITU, “Telecommunications Regulation Handbook: Tenth Anniversary Edition,” (2011), http:// www. itu. int/ dms_ pub/ itu- d/ opb/ reg/ D- REG- TRH. 01- 2011- PDF- E. pdf.
25 International Telecommunication Union, “World Telecommunication/ICT indicators database,” (2013), www. itu. int/ icteye.
26 CRTC, “Revised regulatory framework for wholesale services and definition of essential service,” (2008), http:// www. crtc. gc. ca/ eng/ archive/ 2008/ dt2008- 17. htm.
27 CRTC, “Wholesale high-speed access services proceeding,” (2010), http:// crtc. gc. ca/ eng/ archive/ 2010/ 2010- 632. htm.
28 CRTC, “Review of wholesale services and associated policies,” (2013), http:// crtc. gc. ca/ eng/ archive/ 2013/ 2013- 551. htm.
29 Philip Kalmus and Lars Wiethus, “On the Competitive Effects of Mobile Virtual Network Operators (Preliminary),” (September 2006), http:// www. webmeets. com/ files/ papers/ EARIE/ 2007/ 401/ Kalmus_ Wiethaus_ 2006. pdf and Ralf Dewenter and Justus Haucap, “Incentives to license mobile virtual network operators (MVNOs),” (2006), http:// userpage. fu- berlin. de/ ~jmueller/ its/ conf/ amsterdam06/ downloads/ papers/ dewenter_ haucap_ workingpaper. pdf.
30 Philip Kalmus and Lars Wiethus, “On the Competitive Effects of Mobile Virtual Network Operators (Preliminary),” (September 2006), http:// www. webmeets. com/ files/ papers/ EARIE/ 2007/ 401/ Kalmus_ Wiethaus_ 2006. pdf.
31 European Communications, “Start-up IoT MVNO aims to disrupt M2M market with value connectivity offer,” (20 March 2014), http:// www. eurocomms. com/ industry- news/ 49- online- press/ 9708- start- up- iot- mvno- aims- to- disrupt- m2m- market- with- value- connectivity- offer.
32 HumanIPO, “Kenyan MVNOs boost competition, spectrum efficiency – analyst,” (20 May 2014), http:// www. humanipo. com/ news/ 44147/ kenyan- mvnos- boost- competition- spectrum- efficiency- analyst/ .
33 TechCrunch, “WhatsApp Becomes An MVNO, Sells €10 SIM In Germany With Free WhatsApp Use Included,” (7 April 2014), http:// techcrunch. com/ 2014/ 04/ 07/ whatsapp- launches- a- e10- sim- with- e- plus- in- germany- with- free- whatsapp- usage- included/ .
54 Trends in Telecommunication Reform 2015
34 Generator Research, “Pandora should consider becoming a virtual mobile network operator,” (21 May 2014), http:// www. generatorresearch. com/ tekcarta/ analysis- insight/ pandora- should- consider- becoming- a- virtual- mobile- network- operator/? lid= 01a259167aa210514a155837a.
35 Australia Department of Communications, “National Broadband Network,” http:// www. communications. gov. au/ broadband/ national_ broadband_ network. Note, however, that the original plan was for the government to sell down its shares in the National Broadband Network Company five years after the NBN is completed.
36 Infocomm Development Authority, “Singapore’s Next Generation Nationwide Broadband Network,” (2010), http:// www. ida. gov. sg/ ~/ media/ Files/ Infocomm%20 Landscape/ Infrastructure/ Wired/ IDA_ INFOKIT. pdf.
37 Consultation on Wireless Broadband Spectrum Policy Guidelines, Ministry of Information, Communications and Technology, Republic of Kenya, http:// www. information. go. ke/ wp- content/ uploads/ 2014/ 03/ DraftSpectructionPolicy. pdf .
38 Rodney Tucker, “he Rise and Fall of Australia’s $44 Billion Broadband Project,” IEEE, (26 November 2013), http:// spectrum. ieee. org/ telecom/ internet/ the- rise- and- fall- of- australias- 44- billion- broadband- project.
39 BEREC/RSPG, “Joint BEREC/RSPG Report on Infrastructure and spectrum sharing in mobile/wireless networks,” p. 13, (16 June 2011), http:// rspg- spectrum. eu/_ documents/ documents/ meeting/ rspg25/ rspg11- 374_ final_ joint_ rspg_ berec_ report. pdf.
40 Id, p. 14.
41 http:// www. itu. int/ pub/ D- REG- TTR. 10- 2008 .
42 GSR-08, “Best Practice Guidelines on innovative infrastructure sharing strategies to promote affordable access for all,” 2008 https:// www. itu. int/ ITU- D/ treg/ Events/ Seminars/ GSR/ GSR08/ PDF/ GSRguidelines08_ E. pdf .
43 GSMA, “Mobile Infrastructure Sharing,” Public Policy Report, (2012), http:// www. gsma. com/ publicpolicy/ wp- content/ uploads/ 2012/ 09/ Mobile- Infrastructure- sharing. pdf.
44 ITU, “ICT Eye: Infrastructure Sharing,” (2013), http:// www. itu. int/ net4/ itu- d/ icteye/ Topics. aspx? TopicID= 15.
45 Id.
46 GSMA, “Mobile Infrastructure Sharing,” Public Policy Report, (2012), http:// www. gsma. com/ publicpolicy/ wp- content/ uploads/ 2012/ 09/ Mobile- Infrastructure- sharing. pdf.
47 Ofcom, “Mobile Evolution, Ofcom’s mobile sector assessment,” Statement, (17 December 2009), § 3.15, http:// stakeholders. ofcom. org. uk/ binaries/ consultations/ msa/ statement/ MSA_ statement. pdf.
48 Ofcom, “Consultation on assessment of future mobile competition and proposals for the award of 800 MHz and 2.6 GHz spectrum and related issues, Annex 6: Competition Assessment,” (7 October 2011), § 5.45, http:// stakeholders. ofcom. org. uk/ binaries/ consultations/ combined- award/ annexes/ Annex_ 6. pdf.
49 Ken Weiland, “EE, 3 take passive route to 4G network-sharing,” Mobile World Live, (3 February 2014), http:// www. mobileworldlive. com/ ee- three- take- passive- route- 4g- network- sharing.
55Trends in Telecommunication Reform 2015
Chapter 2

50 Graeme Neill, “EE ditches Three talks over 4G spectrum, Mobile Today UK,” (14 June 2013), http:// www. mobiletoday. co. uk/ news/ industry/ 25654/ EE_ ditches_ Three_ talks_ over_ 4G_ spectrum_ share. aspx.
51 ITU, ICT-Eye, http:// www. itu. int/ net4/ itu- d/ icteye/ .
52 BEREC/RSPG, “Joint BEREC/RSPG Report on Infrastructure and spectrum sharing in mobile/wireless networks,” (16 June 2011), p. 14, http:// rspg- spectrum. eu/_ documents/ documents/ meeting/ rspg25/ rspg11- 374_ final_ joint_ rspg_ berec_ report. pdf.
53 Telecom Regulatory Authority of India, “Recommendations on Infrastructure Sharing,” (11 April 2007), http:// www. trai. gov. in/ trai/ upload/ PressReleases/ 447/ recom11apr07. pdf.
54 Telecom Regulatory Authority of India, “Recommendations on Spectrum Management and Licensing Framework,” (11 May 2010), http:// www. trai. gov. in/ WriteReadData/ Recommendation/ Documents/ FINALRECOMENDATIONS. pdf; Telecom Regulatory Authority of India, “Recommendations on Telecommunications Infrastructure Policy,” (12 April 2011), http:// www. trai. gov. in/ WriteReadData/ Recommendation/ Documents/ Rec_ Infrastructurel. pdf; Telecom Regulatory Authority of India, “Recommendations on Spectrum Management and Licensing Framework- Response of the Authority on DoT reference no. 20-281/2010-AS-I(VoL)(Pt.),” (10 October 2011), http:// www. trai. gov. in/ WriteReadData/ Recommendation/ Documents/ Final2011. pdf.
55 The Telegraph, “Spectrum sharing spoiler,” (22 December 2014), http:// www. telegraphindia. com/ 1131223/ jsp/ business/ story_ 17710584. jsp.
56 See Chapter 3, Section 11, paragraph 5 of Sweden’s Electronic Communications Act.
57 KKV, Dnr 364/2009, (9 August 2010), http:// www. kkv. se/ upload/ Filer/ Konkurrens/ 2010/ Beslut/ beslut_ 374_ 2009. pdf.
58 TeleGeography, “Tele2 Sweden reaches 99% 4G coverage?,” (19 March 2013), http:// www. telegeography. com/ products/ commsupdate/ articles/ 2013/ 03/ 19/ tele2- sweden- reaches- 99- 4g- coverage/ .
59 ITU, “Trends in Telecommunication Reform 2013,” (April 2013), http:// www. itu. int/ pub/ D- REG- TTR. 14- 2013.
60 The Internet Civil Framework is established through Law 12965 of April 23, 2014, that implements principles, guarantees, and rights on the use of Internet in Brazil. See http:// www. planalto. gov. br/ ccivil_ 03/_ ato2011- 2014/ 2014/ lei/ l12965. htm.
61 CRTC, “Review of the Internet traffic management practices of Internet service providers,” (October 2009), http:// www. crtc. gc. ca/ eng/ archive/ 2009/ 2009- 657. htm .
62 CRTC, “CRTC investigation prompts Rogers to stop slowing down Internet traffic,” Press Release, (28 June 2012), http:// www. crtc. gc. ca/ eng/ com100/ 2012/ r120628. htm
63 EU Parliament, “Report A7-0190/2014, European single market for electronic communications COM(2013)0627 – C7-0267/2013 – 2013/0309(COD),” (2014), http:// www. europarl. europa. eu/ sides/ getDoc. do? pubRef=-// EP// NONSGML+AMD+A7- 2014- 0190+237- 244+DOC+PDF+V0// EN .
64 FCC, “Open Internet Rules,” Commissioner Statement (2014), http:// www. fcc. gov/ document/ statement- fcc- chairman- tom- wheeler- fccs- open- internet- rules.
56 Trends in Telecommunication Reform 2015

65 Citrix, “Mobile Data Users Fear Exceeding Their Quota, Open to Sponsored Data Plans,” (16 April 2014), http:// www. citrix. com/ news/ announcements/ apr- 2014/ citrix-- mobile- data- users- fear- exceeding- their- quota-- open- to- sp. html .
66 The countries include Australia, Bangladesh, Cameroon, Canada, El Salvador, France, Guinea, Indonesia, Malaysia, New Zealand, Philippines, Qatar, Suriname, Trinidad and Tobago, Pakistan and the United Kingdom.
67 CRTC, “Application requesting fair treatment of Internet services by Bell Mobility,” Part 1 Proceeding, (22 November 2013), https:// services. crtc. gc. ca/ pub/ instances- proceedings/ Default- Defaut. aspx? Lang= eng& YA= 2013& S= C& PA= t& PT= pt1& PST= a.
68 Kazi Stastna, “Bell’s discounting of mobile TV against the rules, complaint claims,” CBC News, (16 December 2013), http:// www. cbc. ca/ m/ touch/ news/ story/ 1. 2445059.
69 OECD, Communications Outlook 2013, at 48.
70 Id.
71 Anatel, “Quality of Service for the Provision of Mobile Service Regulation is established through Resolution 575/2011” (Regulamento de Gestão de Qualidade de Prestação do Serviço Móvel Pessoal-RGQ-SMP), http:// legislacao. anatel. gov. br/ resolucoes/ 26- 2011/ 68- resolucao- 575 and “Quality of Service for the Provision of Multimedia Communication Services is established through Resolution 574/2011,” http:// legislacao. anatel. gov. br/ resolucoes/ 26- 2011/ 57- resolucao- 574.
72 Based on Anatel’s Resolution 575/2011 and Anatel’s Press Release announcing the ban on sale of mobile subscriptions on 23 July 2012.
73 Subsecretaria de Telecomunicaciones, “Proyecto que garantiza velocidade minima de acesso a Internet es aprobado en general en el Senado” http:// www. subtel. gob. cl/ noticias/ 138- neutralidad- red/ 5298- proyecto- que- garantiza- velocidad- minima- de- acceso- a- internet- es- aprobado- en- general- en- el- senado.
74 O Africa, “A growing number of African countries stress better mobile quality of service,” (7 October 2103), http:// www. oafrica. com/ mobile/ quality- of- service- stressed- in- a- growing- number- of- african- nations/ .
75 See Anatel’s Press Release announcing the ban on sale of mobile subscriptions on 23 July 2012.
76 See Decision No. 4783, applicable to Tim; Decision No 4787 applicable to Claro; and Decision No. 4789 applicable to Oi, that were issued 18 July 2012.
77 The index of complaints from January-June 2012 was measured with the following formula: Index of complaint = number of complaints/ total number of subscribers in the state in June-2012. Results are available here.
78 Teletime, “Anatel não está satisfeita com qalidade dos serviços movies e prepara novas exigências,” (20 May 2014), http:// www. teletime. com. br/ 20/ 05/ 2014/ anatel- nao- esta- satisfeita- com- qualidade- dos- servicos- moveis- e- prepara- novas- exigencias/ tt/ 378160/ news. aspx.
79 Some commentators argue that, considering the success of unregulated Internet interconnection arrangements to date, private agreements should continue to be applied and that “[a] very high threshold of market failure should be established to justify intervention in the Internet market.” See OECD, “Internet Traffic Exchange Market Developments and Policy Challenges,” (31 January 2013), http:// search. oecd. org/ officialdocuments/ publicdisplaydocumentpdf/? cote= DSTI/ ICCP/ CISP%282011 %292/ FINAL& docLanguage= En.
57Trends in Telecommunication Reform 2015
Chapter 2
80 See William B. Norton, “Internet Transit Pricing – Historical and Projected,” (2011), http:// drpeering. net/ white- papers/ Internet- Transit- Pricing- Historical- And- Projected. php.
81 The European Commission has supported the view that peering and transit are demand-side substitutes and should be included within the same broader relevant market. See Commission Decision of 3 March 2010 pursuant to Article 7(4) of Directive 2002/21/EC (Withdrawal of notified draft measures). Case PL/2009/1019: The wholesale national market for IP traffic exchange (IP transit). Case PL/2009/1020, at paragraph 36, http:// circa. europa. eu/ Public/ irc/ infso/ ecctf/ library? l=/ poland/ registered_ notifications/ pl20091019- 1020/ act_ part1_ v4pdf/_ EN_ 1. 0_& a= d.
82 See, for example, Jennifer Khoury, “Comcast Response to Netflix’s Opposition to Time Warner Cable Transaction,” Comcast Voices, (21 April 2014), http:// corporate. comcast. com/ comcast- voices/ comcast- response- to- netflixs- opposition- to- time- warner- cable- transaction. See also, Letter from Ian Dillner, Vice President, Federal Regulatory Affairs, Verizon, to Marlene Dortch, Secretary, FCC, Preserving the Open Internet, GN Docket No. 09-191, (13 January 2011), http:// apps. fcc. gov/ ecfs/ document/ view? id= 7021025758.
83 In 2012, the association of European Telecommunications Network Operators (ETNO) – whose members include Orange, Deutsche Telekom, Telefónica and Telecom Italia – proposed to amend Article 3 of the International Telecommunication Regulations with language that would have resulted in OTT providers paying for the termination of traffic. ETNO argued that this charging mechanism for interconnection would be consistent with the principle of “sending party network pays” used in some telecommunication services, and would ensure the sustainability of the Internet ecosystem and allow all stakeholders to invest and innovate. See OECD Communications Outlook 2013, p. 49.
84 Drew Fitzgerald, “Level 3, Comcast Reach Accord on Internet Traffic Costs,” Wall Street Journal, (16 July 2013), http:// online. wsj. com/ news/ articles/ SB10001424127887323394504578609963298727892.
85 Netflix deployed its Open Connect CDN and migrated most of its traffic to this platform. See http:// conferences. infotoday. com/ documents/ 197/ 2014CDNSummit- Netflix. pdf . See also Reed Hastings, “Internet Tolls And The Case For Strong Net Neutrality,” Netflix Blog, (20 March 2014), http:// blog. netflix. com/ 2014/ 03/ internet- tolls- and- case- for- strong- net. html.
86 Edward Wyatt and Noam Cohen, “Comcast and Netflix Reach Deal on Service,” The New York Times (23 February 2014).
87 David Clark, et al., “Interconnection in the Internet: the policy challenge,” 39th Research Conference on Communication, Information and Internet Policy, George Mason University, (9 August 2011), http:// groups. csail. mit. edu/ ana/ Publications/ Interconnection_ in_ the_ Internet_ the_ policy_ challenge_ tprc- 2011. pdf.
88 A survey of 142,000 peering agreements published in 2013 found that 99.5% of interconnection agreements are concluded without a written contract. This is, however, suggestive of generally accepted standard terms and conditions for these types of agreements. See OECD, “Internet Traffic Exchange Market Developments and Policy Challenges.”
89 Organisation for Economic Co-operation and Development, “Anticompetitive Practices,” http:// stats. oecd. org/ glossary/ detail. asp? ID= 3145.
90 European Union, “DIRECTIVE 2009/136/EC OF THE EUROPEAN PARLIAMENT AND OF THE COUNCIL of 25 November 2009 amending Directive 2002/22/EC on universal service and users’ rights relating to electronic communication networks and services, Directive 2002/58/EC concerning the processing of personal data and the protection of privacy in the electronic communications sector and Regulation (EC) No 2006/2004 on cooperation between national
58 Trends in Telecommunication Reform 2015

authorities responsible for the enforcement of consumer protection laws,” (2009), http:// eur- lex. europa. eu/ legal- content/ EN/ TXT/ HTML/? uri= CELEX: 32009L0136& from= EN.
91 Cellular News, “Israel Bans Early Termination Fees,” (3 April 2012), http:// www. cellular- news. com/ story/ Regulatory/ 53786. php.
92 TeleGeography, “Ifetel Standardises Number Portability Process,” (9 May 2014), http:// www. telegeography. com/ products/ commsupdate/ articles/ 2014/ 05/ 09/ ifetel- standardises- number- portability- process/? utm_ source= CommsUpdate& utm_ campaign= 48a3913c1f- CommsUpdate+09+May+2014& utm_ medium= email& utm_ term= 0_ 0688983330- 48a3913c1f- 8837629.
93 ITU, ICT-Eye, http:// www. itu. int/ net4/ itu- d/ icteye/ .
94 Telecom Regulatory Authority, “Important Information on Number Portability,” (19 May 2012), http:// www. tra. org. bh/ en/ press- releases/ important- information- on- number- portability. html.
95 European Union, “DIRECTIVE 2009/136/EC OF THE EUROPEAN PARLIAMENT AND OF THE COUNCIL of 25 November 2009 amending Directive 2002/22/EC on universal service and users’ rights relating to electronic communications networks and services, Directive 2002/58/EC concerning the processing of personal data and the protection of privacy in the electronic communications sector and Regulation (EC) No 2006/2004 on cooperation between national authorities responsible for the enforcement of consumer protection laws,” 2009, http:// eur- lex. europa. eu/ legal- content/ EN/ TXT/ HTML/? uri= CELEX: 32009L0136& from= EN.
96 Conference of European Postal and Telecommunications Administrations, “Number Portability Implementation in Europe,” (14 March 2014), http:// www. cept. org/ files/ 5466/ documents/ Number%20 Portability%20 Impementation%20 in%20 Europe%20 -%20 based%20 on%20 a%20 survey%20 of%20 CEPT%20 member%20 countries%20 -%20 March%202014 .pdf.
97 ITU-T, “Definition of Open Standards,” 2005, http:// www. itu. int/ en/ ITU- T/ ipr/ Pages/ open. aspx.
98 Rudi Bekkers, “The Role of Standards in a Digital Economy,” GSR-13: Discussion Paper, 2013, http:// www. itu. int/ en/ ITU- D/ Conferences/ GSR/ Documents/ Role%20 of%20 Standards%20 in%20 a%20 Digital%20 Economy. pdf.
99 ECIS, “Interoperability and Open Standards,” http:// www. ecis. eu/ open- standards/ .
100 Rudi Bekkers, “The Role of Standards in a Digital Economy,” GSR-13: Discussion Paper, (2013), http:// www. itu. int/ en/ ITU- D/ Conferences/ GSR/ Documents/ Role%20 of%20 Standards%20 in%20 a%20 Digital%20 Economy. pdf.
101 Ron Amadeo, “Google’s iron grip on Android: Controlling open source by any means necessary,” ARS Technica, (20 October 2013), http:// arstechnica. com/ gadgets/ 2013/ 10/ googles- iron- grip- on- android- controlling- open- source- by- any- means- necessary/ .
102 Id.
103 Bill Claybrook, “Cloud interoperability: Problems and best practices,” (1 June 2011), Computer World, https:// www. computerworld. com/ s/ article/ 9217158/ Cloud_ interoperability_ Problems_ and_ best_ practices.
104 Id.
105 European Commission, “European Cloud Computing Strategy,” (September 2012), http:// ec. europa. eu/ digital- agenda/ en/ european- cloud- computing- strategy.
59Trends in Telecommunication Reform 2015
Chapter 2

106 European Parliament, “European Parliament resolution of 10 December 2013 on unleashing the potential of cloud computing in Europe (2013/2063(INI)),” (10 December 2013), http:// www. europarl. europa. eu/ sides/ getDoc. do? type= TA& reference= P7- TA- 2013- 0535& format= XML& language= EN.
107 Federal Communications Commission, “In the Matter of Promoting Interoperability in the 700 MHz band,” (29 October 2013), http:// www. fcc. gov/ document/ 700- mhz- interoperability.
60 Trends in Telecommunication Reform 2015
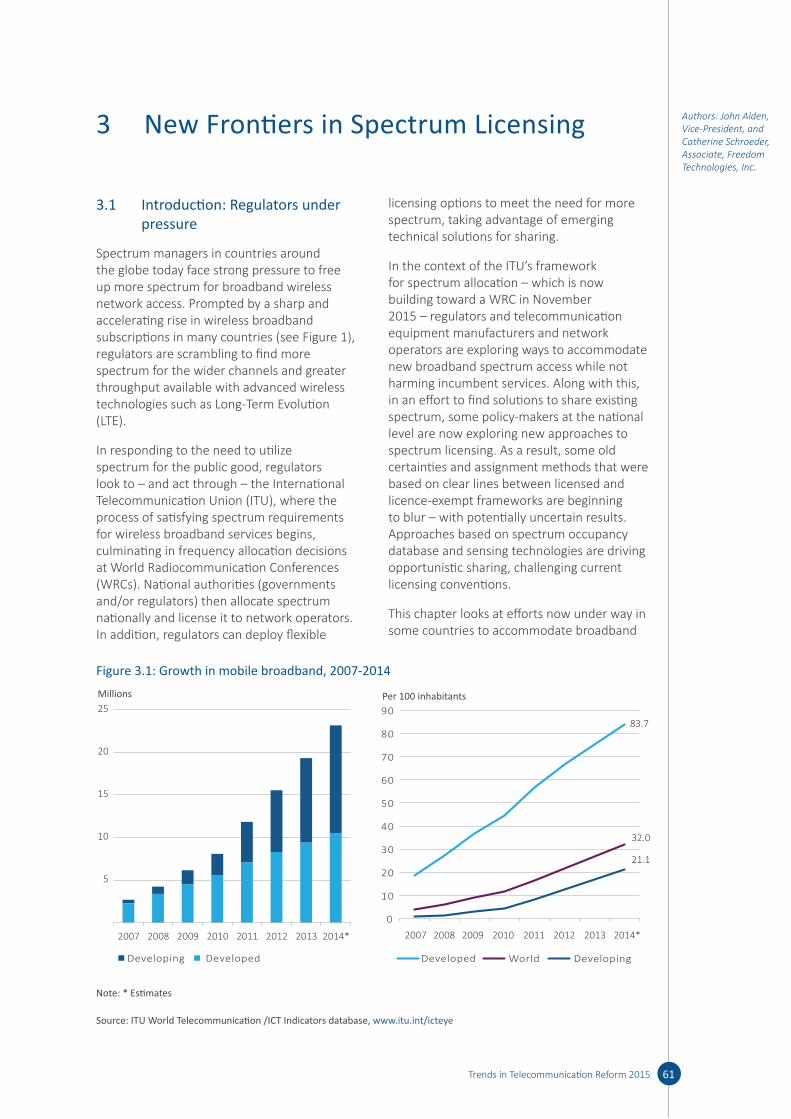
3 New Frontiers in Spectrum Licensing
3.1 Introduction: Regulators under pressure
Spectrum managers in countries around the globe today face strong pressure to free up more spectrum for broadband wireless network access. Prompted by a sharp and accelerating rise in wireless broadband subscriptions in many countries (see Figure 1), regulators are scrambling to find more spectrum for the wider channels and greater throughput available with advanced wireless technologies such as Long-Term Evolution (LTE).
In responding to the need to utilize spectrum for the public good, regulators look to – and act through – the International Telecommunication Union (ITU), where the process of satisfying spectrum requirements for wireless broadband services begins, culminating in frequency allocation decisions at World Radiocommunication Conferences (WRCs). National authorities (governments and/or regulators) then allocate spectrum nationally and license it to network operators. In addition, regulators can deploy flexible
licensing options to meet the need for more spectrum, taking advantage of emerging technical solutions for sharing.
In the context of the ITU’s framework for spectrum allocation – which is now building toward a WRC in November 2015 – regulators and telecommunication equipment manufacturers and network operators are exploring ways to accommodate new broadband spectrum access while not harming incumbent services. Along with this, in an effort to find solutions to share existing spectrum, some policy-makers at the national level are now exploring new approaches to spectrum licensing. As a result, some old certainties and assignment methods that were based on clear lines between licensed and licence-exempt frameworks are beginning to blur – with potentially uncertain results. Approaches based on spectrum occupancy database and sensing technologies are driving opportunistic sharing, challenging current licensing conventions.
This chapter looks at efforts now under way in some countries to accommodate broadband
Authors: John Alden, Vice-President, and Catherine Schroeder, Associate, Freedom Technologies, Inc.
61Trends in Telecommunication Reform 2015
Figure 3.1: Growth in mobile broadband, 2007-2014
5
10
15
20
25
2007 2008 2009 2010 2011 2012 2013 2014*
83.7
32.0
21.1
0
10
20
30
40
50
60
70
80
90
2007 2008 2009 2010 2011 2012 2013 2014*
World DevelopingDevelopedDevelopedDeveloping
Millions Per 100 inhabitants
Note: * Estimates
Source: ITU World Telecommunication /ICT Indicators database, www. itu. int/ icteye
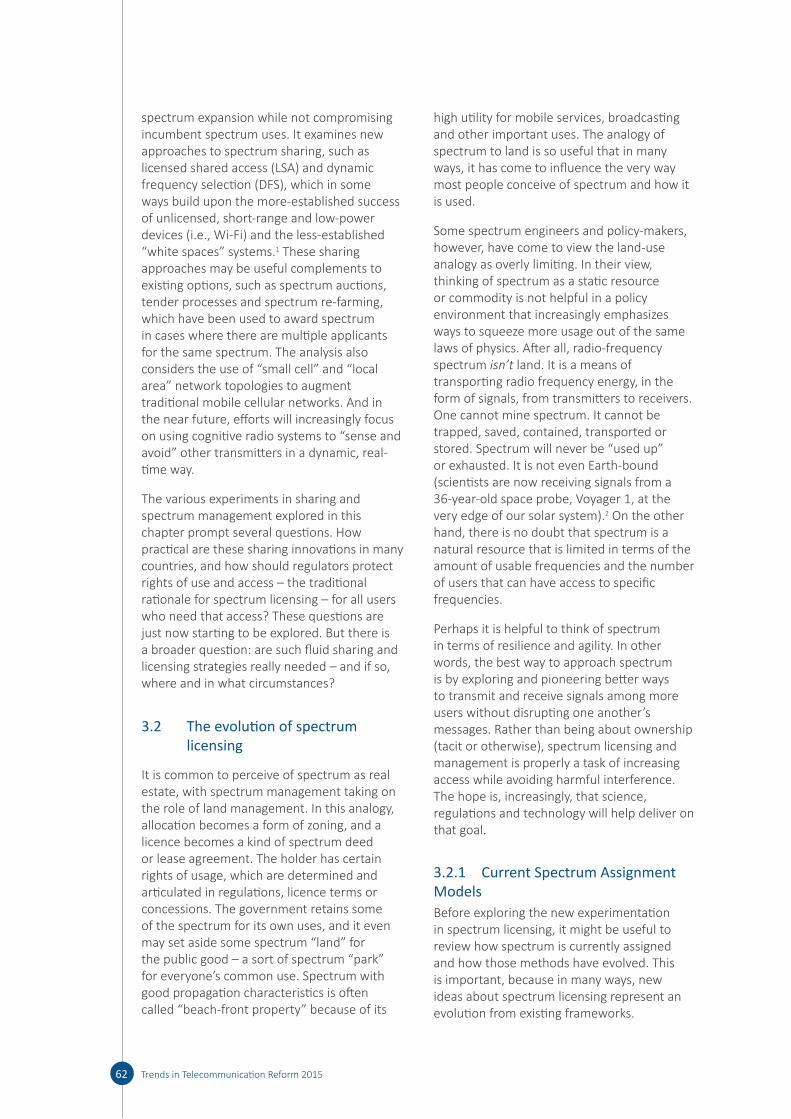
spectrum expansion while not compromising incumbent spectrum uses. It examines new approaches to spectrum sharing, such as licensed shared access (LSA) and dynamic frequency selection (DFS), which in some ways build upon the more-established success of unlicensed, short-range and low-power devices (i.e., Wi-Fi) and the less-established “white spaces” systems.1 These sharing approaches may be useful complements to existing options, such as spectrum auctions, tender processes and spectrum re-farming, which have been used to award spectrum in cases where there are multiple applicants for the same spectrum. The analysis also considers the use of “small cell” and “local area” network topologies to augment traditional mobile cellular networks. And in the near future, efforts will increasingly focus on using cognitive radio systems to “sense and avoid” other transmitters in a dynamic, real-time way.
The various experiments in sharing and spectrum management explored in this chapter prompt several questions. How practical are these sharing innovations in many countries, and how should regulators protect rights of use and access – the traditional rationale for spectrum licensing – for all users who need that access? These questions are just now starting to be explored. But there is a broader question: are such fluid sharing and licensing strategies really needed – and if so, where and in what circumstances?
3.2 The evolution of spectrum licensing
It is common to perceive of spectrum as real estate, with spectrum management taking on the role of land management. In this analogy, allocation becomes a form of zoning, and a licence becomes a kind of spectrum deed or lease agreement. The holder has certain rights of usage, which are determined and articulated in regulations, licence terms or concessions. The government retains some of the spectrum for its own uses, and it even may set aside some spectrum “land” for the public good – a sort of spectrum “park” for everyone’s common use. Spectrum with good propagation characteristics is often called “beach-front property” because of its
high utility for mobile services, broadcasting and other important uses. The analogy of spectrum to land is so useful that in many ways, it has come to influence the very way most people conceive of spectrum and how it is used.
Some spectrum engineers and policy-makers, however, have come to view the land-use analogy as overly limiting. In their view, thinking of spectrum as a static resource or commodity is not helpful in a policy environment that increasingly emphasizes ways to squeeze more usage out of the same laws of physics. After all, radio-frequency spectrum isn’t land. It is a means of transporting radio frequency energy, in the form of signals, from transmitters to receivers. One cannot mine spectrum. It cannot be trapped, saved, contained, transported or stored. Spectrum will never be “used up” or exhausted. It is not even Earth-bound (scientists are now receiving signals from a 36-year-old space probe, Voyager 1, at the very edge of our solar system).2 On the other hand, there is no doubt that spectrum is a natural resource that is limited in terms of the amount of usable frequencies and the number of users that can have access to specific frequencies.
Perhaps it is helpful to think of spectrum in terms of resilience and agility. In other words, the best way to approach spectrum is by exploring and pioneering better ways to transmit and receive signals among more users without disrupting one another’s messages. Rather than being about ownership (tacit or otherwise), spectrum licensing and management is properly a task of increasing access while avoiding harmful interference. The hope is, increasingly, that science, regulations and technology will help deliver on that goal.
3.2.1 Current Spectrum Assignment ModelsBefore exploring the new experimentation in spectrum licensing, it might be useful to review how spectrum is currently assigned and how those methods have evolved. This is important, because in many ways, new ideas about spectrum licensing represent an evolution from existing frameworks.
62 Trends in Telecommunication Reform 2015

A 2012 ITU report on spectrum value and valuation defined several broad perspectives on spectrum assignment and usage:3
• The administrative licensing model is most often employed for (but not limited to) government spectrum usage, this command-and-control approach entails determining the spectrum requirements of public-service or administrative agencies -- including law enforcement/public safety, military, science or infrastructure-related requirements – and simply making assignments in the appropriately allocated bands. This model is also used whenever the demand for spectrum can be handled on a first-come-first-served basis, as for radio relays, professional radio or satellite earth stations. In this case, annual fees may be charged to the users to cover the spectrum management costs and/or reflect the value of spectrum.
• The flexible rights-of-use model adopts an inherently economic perspective on spectrum licensing, letting the market determine the value of spectrum through auctions and (sometimes) secondary markets, offering licensees the flexibility to use the spectrum in the most economically rational way.
• The licence-exempt (or unlicensed) model takes advantage of low-power, short-range transmitters, and treats spectrum as a public “commons” that can be used and shared without requiring individual users to obtain licences. However, this model does not imply that unlicensed devices can operate in an unrestricted way; they are not “unregulated.” They must comply with a set of detailed technical and operational specifications, often listed in so-called “general licences” or “class licences,” in order to enable compatible use of a frequency band by the same or different services and devices.
While these models represent distinct philosophies about what spectrum is and how it can be used, they are not mutually exclusive. In fact, most countries’ spectrum management regimes are pragmatic combinations of all three approaches. The administrative licensing model is the baseline practice, having been used before the other two approaches were defined. It is still employed for many types
of uses, whenever the demand for spectrum can be handled on a first-come-first-served basis. In such cases, governments generally levy fees on private-sector licensees (a process known as “administrative pricing’) for the use of spectrum and/or to cover the spectrum management costs.
For commercial wireless services, however, many governments have made spectrum available through flexible rights of use (most often exclusively) for a set period of time and subject to delineated conditions. Cellular mobile network operators are, of course, the most common examples. The flexible rights-of–use approach to licensing is commonly applied whenever there are more potential users than there are channels or licences to be distributed—where many potential licensees are competing for the same frequencies in the same area. Some form of auction or tender process can then be used to determine the economically best-situated applicants for those limited licences.
Finally, governments have increasingly established modes of licence-exempt or class-licensed usage for a wide range of consumer devices, ranging from automobile key fobs up to Wi-Fi “hot spots” – and everything in between. Wireless routers, baby monitors and hotel wireless networks all function on the unlicensed/commons model, usually in discrete bands set aside for unlicensed usage (these may include bands in the 900 MHz, 2.4 GHz and 5 GHz ranges).
At a global level, there has been some exploration of how incumbent services can be protected while sharing spectrum with some of these limited-range consumer devices. At the World Radiocommunication Conference in 2003 (WRC-03), for example, the ITU opened up the possibility to use parts of the 5 GHz band for wireless local area networks (LANs), with portions of the spectrum being shared with radiolocation (radars) as the incumbent, primary service. This was the first example of a cognitive radio, established through a technology known as Dynamic Frequency Selection (DFS) (see Section 3.2.4). It also foreshadowed the concept of allowing, under controlled circumstances, dynamic spectrum access (DSA) to radio frequencies by unlicensed devices. This early experiment
63Trends in Telecommunication Reform 2015
Chapter 3

in DSA, however, yielded mixed results. Interference problems were reported as a result of unlicensed equipment operating with disabled DFS capability.
Table 3.1 below summarizes the three approaches to licensing commonly used today.
3.2.2 The “Pros” and “Cons” of current assignment models
It is worth critically examining the conventional wisdom about these three assignment approaches to see if they continue to be relevant and useful in today’s more crowded spectrum environment. Have these models, mixed and matched and applied in various combinations, led to optimal uses of spectrum? How could they be improved or even overhauled to achieve better results?
First the “Pros” As a threshold analysis, it is worth noting that the very pragmatism of most current assignment regimes may well be their greatest strength. Put simply, it seems to make sense to apply different assignment strategies to
different types of uses. For example, the operating characteristics of most equipment used on an unlicensed basis obviate the need to require a licence. These characteristics include low power, short range, and (most often) use in bands where they can only interfere with each other and are allowed to operate only on a non-protected basis. It makes little sense from a practical standpoint to license every consumer product that uses radio frequencies. Governments certainly have an interest in type-approvals and equipment certifications to ensure that these operating characteristics are met, but this is rightly opaque to the consumer, who just needs to find the correct size of batteries to become a “wireless operator” – at least of their own WiFi hotspots. Similarly, even in licensed services such as mobile, it makes no sense to require licences for individual user devices such as mobile phones or machine-to-machine devices. Rather these are licensed as part of the whole network.
By the same token, requiring large, often multinational corporations to pay a market-based price for one of their most necessary
64 Trends in Telecommunication Reform 2015
Table 3.1: Applications of the Three Spectrum Distribution Models
Model Typical Users Typical Uses
Administrative Licensing • Government agencies
• Military
• Public safety
• Resource managers
• Transport operators
• Broadcasters
• Professional users
• Earth station operators
• Fixed infrastructure operators
• Radars
• Aeronautical and maritime
• Tactical radios
• Remote sensing
• Terrestrial television broadcasting
• Professional mobile radio
• Point-to-point links
• Satellite telecommunications
Flexible Rights of Use • Commercial terrestrial wireless operators
• Satellite operators
• 2G, 3G and 4G mobile services
• Satellite broadcasting and telecommunications
• WiMax or fixed wireless
Licence-exempt • Internet hotspot providers
• Individuals
• WiFi (WLANs)
• Other low-power devices (key fobs, garage door openers)
Source: Author.

operating inputs (i.e., spectrum) also makes sense. From the government’s perspective, operators are less likely to waste or “warehouse” spectrum if it does not come cheaply or in overwhelmingly large supply. Moreover, it would be irrational from a business perspective for an operator to pay more for such an input than it could earn through providing the eventual output (the telecommunications service). So, attaching the proper economic value to spectrum allows operators to make rational decisions about how to use the resource most efficiently and effectively.4
Meanwhile, if governments expect operators of capital-intensive networks to make sufficiently large, long-term investments in spectrum and network construction, it makes sense to grant spectrum access rights on an exclusive basis – i.e., within a certain spectrum band and in a particular geographic area. Thus, the property rights model is conducive to providing large operators the kind of stability and predictability that they need to invest in market entry.
Another advantage of current licensing approaches is that they generally provide regulators with sufficient tools to make and enforce decisions on market structure and interference management. The administrative licensing model, naturally, represents the most rigid framework (in the past, it was sometimes characterized as “command-and-control” licensing) for allowing some uses and disallowing others. Most governments feel they need to maintain direct control over a certain amount of spectrum in order to facilitate some uses that would be impossible or un-economical for the market to provide, but that are necessary or important for the public good. With regard to commercial licences, regulators can use their licensing power to release an optimal amount of spectrum into the marketplace, and they can influence operators’ behavior through the ability to amend or revoke those licences or the regulations that govern them.
One of the advantages of the individual licensing model is that it provides regulators with information on the usage of specific frequency bands. This allows the establishment of national databases
containing information on the frequency assignments that have been made to operating stations. Such databases assist in interference management and in preventing unauthorized or abusive use of frequencies. They may also represent a critical element for dynamic spectrum access technologies, as this chapter will explore in Section 3.
In addition, many licensing regimes now have more flexibility, because they provide for technology neutrality, service neutrality and unified licensing. Earlier, command-and-control licences prescribed exactly what service could be offered, using exactly which technology. As part of “lighter touch” regulatory reforms, however, regulators now often refrain from such prescriptions. They may even issue licences that allow recipients an open-ended choice to provide service using a combination of wireless and wireline technologies (i.e., unified licensing). These innovations enhance the general pragmatism of many updated spectrum management and licensing regimes.
Overall, an important conclusion is that licensing regimes based on the traditional approaches to spectrum assignment continue to function well in many ways and in many countries. For regulators, these licensing regimes provide a useful tool for planning, allocation and assignment of frequencies in ways that respond to market realities.
Then the “Cons”Perhaps the biggest drawback of current spectrum licensing regimes may be that, in the face of perpetually accelerating demand for services in many economies, they may not be pragmatic or flexible enough. Critics point to spectrum in the critical bands below 6 GHz, which is highly congested in many countries and difficult to repurpose. Through administrative assignments, many bands are often used by governmental and public agencies, which may not always be the most spectrum-efficient users or have any incentive to move to other bands.
The legacy of commercial licensing, meanwhile, is a lengthy list of bands that also are tied up in existing fixed and mobile service licences, leaving little room to introduce newer generations or competitive new
65Trends in Telecommunication Reform 2015
Chapter 3

entrants. The bands reserved for unlicensed usage, meanwhile, may not be sufficient to accommodate the large number and variety of uses, even as newer generations of RLANs are poised to feature larger channelization requirements and expanded capacity.
Spectrum managers might be able to handle the growing spectrum constraints in their own, measured fashion if it were not for the crisis calls of the wireless industry for additional access to spectrum for IMT networks and RLANs.5 This is clearly being driven by recent rapid increases in mobile broadband data traffic and the perceived future market for multimedia content. No operator wants to lack sufficient spectrum or have its network perceived as being incapable of providing sufficient bandwidth or providing low quality services. Further, this market imperative is nearly always joined by government policy mandates to build out ubiquitous and affordable broadband networks. Indeed, wireless access is often a key element of both operators’ and policy-makers’ broadband strategies.
To address this so-called “spectrum crunch,” some policy-makers and companies are looking beyond the traditional spectrum planning, allocation and licensing regimes in search of new ways to make more spectrum available, more rapidly. However, the traditional licensing models have several shortcomings that can make this search difficult.
• Administrative Licensing. Whether they are government departments and/or broadcasters, current licence-holders often control large amounts of spectrum for long periods of time – and often in bands with the best propagation characteristics. Critics contend that this spectrum is often under-utilized, used inefficiently and/or held under opaque and outdated terms and conditions.6
• Flexible rights-of-use. Once licences are obtained, commercial licensees are commonly given exclusive spectrum rights for fairly long periods (10, 15 or even 20 years), with varying degrees of accountability for how they use that spectrum.
Re-purposing spectrum licensed according to these two models can be difficult, both technically and politically. The administrative licensing model, in particular, suffers from the need to find new spectrum to move the incumbents into, if their spectrum is to be re-purposed for mobile use. Identifying alternative spectrum can be difficult, and the cost of moving government/public operations can be high. In addition, timelines to accomplish such a migration are often quite long, especially if the incumbents resist the idea of moving.
For frequencies that are licensed according to a flexible rights-of-use model, incumbents may also have to be moved, or, in some cases they may be eligible to stay, as is often the case when spectrum is “re-farmed” (e.g., moving from 2G to 3G use — see section 3.1.6). In such cases, competitive concerns related to giving back licenses, bidding for one’s existing spectrum and the relative amounts of spectrum held by different operators can make the re-purposing process quite complex.
Unlicensed spectrum bands offer few statistics on numbers of users or service providers. There are increasing signs that manufacturers are eager to offer greater capacity and capability, thus putting more devices and uses into bands that are already becoming increasingly crowded. Theoretically, the ultimate result may be the “tragedy of the commons,” a situation in which an unregulated resource is subject to overuse, without any mechanism to apportion access equally. The result is constrained access and a degraded resource for all users. Thus, in the face of rising demand for spectrum for RLANs and consumer devices, manufacturers and proponents of the licence-exempt model have been advocating for more spectrum to be set aside for licence-exempt use. WRC-15, for example, is expected to consider proposals to make more spectrum in the 5 GHz band available for such use.
Finally, there have been attempts in the past to allow unlicensed device access to licensed spectrum (e.g., through the use of so-called “ultra-wideband” technologies). This combination of models has been resisted by licensed users who fear interference from
66 Trends in Telecommunication Reform 2015

the unlicensed devices operating in their spectrum.
3.3 The New Frontier: gaining more usage from “less” spectrum
Whether it is wine, olive oil or apple cider, every commodity has what can be called “second pressings.” Once the initial pressing (or stomping or threshing) has been completed, one does not simply accept that the resource is drained and then walk away. Rather, the process is repeated, often multiple times, to ensure that every last ounce or gram is gleaned from the precious resource. Often, it is the ninth or tenth pressing – even with a weaker or more diluted product than the initial, “virgin” pressing – that yields enough profit to last until next year.
Spectrum managers are looking for methodologies to generate just such “second pressings” of radio-frequency spectrum. They need to find ways to generate more usage of this scarce resource, and they are under severe pressure to do so rapidly. At the same time, however, they know that the quality and usability of such spectrum “second pressings” should not unduly degrade the quality of the “first pressings.” In essence, this is the conundrum of spectrum sharing: how to allow more access for some users without causing interference to all the others. Many regulators are justifiably cautious, therefore, in examining the options for sharing and how those approaches will affect existing rules and incumbent stakeholders.
3.3.1 Options for “Second Pressings”If one looks at an allocation table (either the ITU’s global allocation table, incorporated in the Radio Regulations, or a national table), there appears to be no such thing as unused spectrum. There is an allocation label on every band (and frequently more than one per band). Indeed, if spectrum were land, every inch already would be occupied. With spectrum, however, the analysis involves not concrete and steel but signals, which can vary in terms of strength, wave form and duration (i.e., pulses or changes defined by duty cycles). What spectrum monitoring equipment may detect is not necessarily a static edifice of
signals, but rather a complex ballet of energy, which can vary and be influenced by power limitations, directional antennas or “bursts” of data. To simplify, even when a certain frequency is allocated and assigned, it is not always in use, or “occupied” by a transmission, 100 per cent of the time, or over 100 per cent of the territory.
Again, employing a perhaps over-simplified model, spectrum usage can be envisioned in three dimensions:
(1) Frequency(2) Time(3) Physical space/geography
In other words, spectrum use can be perceived as cubic or “three-dimensional,” and the empty lapses or “white spaces” left open in these three dimensions are opportunities for sharing among different uses, whether they are completely different radiocommunication services or just different transmissions within the same service. These opportunities for sharing are briefly explored in the following sub-sections.
It is important to note, however, that the “cube” concept only goes so far in explaining the concepts behind sharing. It does not take into account the ways energy is radiated, including power levels, how receivers can vary in sensitivity, differences in wave forms, etc. These elements of physics and radio engineering are pivotal in understanding how to boost equipment performance and prevent interference. A comprehensive overview of sharing methods can be found in Report ITU-R SM.1132 “General principles and methods for sharing between radiocommunication services or between radio stations.”7
Frequency-based sharing Within any licensed block of spectrum, there are multiple frequencies that are commonly grouped together as channels, and spectrum-dependent systems commonly are designed to be tuned across multiple channels. Regulators can consolidate or “re-pack” existing channels, and such re-channelization can result in greater access to channels by new operators. Depending on factors such as the power levels employed by transmitters, the ability to boost signals by directional antennas, and other
67Trends in Telecommunication Reform 2015
Chapter 3

technical variables, even different services could share a previously monolithic spectrum block – perhaps with retention of a “guard band” to act as insulation between the two different services. Some types of services need to have separate channels for downlinks and uplinks (satellites and cellular mobile services, for example), and these channels can be alternated or “interleaved” with channels assigned to other services or operators.
Technological advances constitute a double-edged sword for frequency sharing in this manner. On the positive side, more efficient equipment, including advanced antenna systems, can achieve equal throughput using smaller channels, allowing a process known as “narrow-banding.”8 This constitutes essentially re-farming current operators on the same spectrum, but on narrower channels (e.g., downshifting from a 25 kHz channel to a 12.5 kHz channel). On the other hand, the growth of broadband mobile services is actually prompting expansion of channels to achieve greater capacity for data, with transmission standards calling for channels of 20 MHz or even wider.
Time-based sharingSimilarly, wireless transmissions occur continually – but very seldom are they continuous. The range of periods when transmissions are not taking place can range from fractions of seconds, in the case of “bursty” data or radar pulses, to long strings of hours, such as when broadcasting stations suspend programming overnight. Through pro-active coordination or regulation, technical protocols or operational agreements can allow sharing to take place through utilizing these gaps in timed transmissions or duty cycles.
Geographic-based sharingPerhaps the most common – and easily achievable – form of sharing is re-use based on geographic separation. Maritime radio systems may be able to use the same frequencies as land-based transport fleets – provided that they are de-conflicted in the port areas where they may overlap. Geographic separation can be achieved purely through such differences in usage or by creating geographic exclusion zones that preclude operation of one type of wireless system in the area reserved for another.
Geographic sharing is facilitated by limiting the power level, range and directionality of one or more types of systems, thus precluding, or at least minimizing, the potential for interference with other operators in the same bands (or in adjacent bands). Indeed, all three dimensions of sharing are made possible through a combination of regulatory requirements (often, but not always, imposed through licensing) and technological requirements. The latter are built into equipment through standards development, certification and national-level type approvals. The technological changes in recent years that have paved the way for greater sharing are explored in more detail in Section 3.3.
Several governments already have experimented with the sharing among diverse users, at least in limited ways. The most common response has been to allow unlicensed or class licence operation of low-power, short-range consumer and WiFi equipment. Such short-range devices, such as those empowered with Bluetooth or Wi-Fi capabilities, are a prime example of interference-avoidance that uses a combination of geographic separation and power levels. However, if large numbers of such devices proliferate in a given area, such as a densely populated urban zone, they can raise the overall spectrum noise floor to a level where the devices begin to cause interference (or capacity loss) to each other and to other services in the same or adjacent bands – the classic drawback to a spectrum “commons” approach.
So far, this analysis has focused on the evolution of basic sharing techniques that have become fairly common in their application across many countries. The following sections explore techniques that have been used in some countries, but that are less commonly applied. Where there are drawbacks, or where sharing results have been sub-optimal, these results are noted.
Subdividing licences – spectrum disaggregation and tradingWithin the realm of individually granted licences, there are also ways to achieve spectrum re-use. The simplest way is simply to establish smaller licensing areas rather than issuing a nationwide licence for each
68 Trends in Telecommunication Reform 2015
band. Some countries establish different-sized licensing areas for licenses intended for auction, allowing smaller market entrants an opportunity to gain spectrum access to selected urban markets or in rural areas not coveted by larger carriers. For some administrations, however, the downside to this approach may be creation of non-lucrative licence areas that go unwanted as operators “cherry-pick” the more densely populated or wealthy market areas that are most likely to produce the highest revenues.
Another way to generate re-use is to subdivide an existing licence geographically, allowing different operators to use the same spectrum in different locations. This is known as licence disaggregation, and it has been allowed in some countries, within some bands, for more than a decade.9 This can be achieved by requiring entirely new (sub)licences to be issued, or through spectrum leasing arrangements. Licensees in some countries can also subdivide their licensed frequencies and lease out a portion or specific channels of a given band. This is often referred to as spectrum partitioning. For maximum flexibility, a combination of partitioning and disaggregation may be allowed.
The “TUF” (Titulo de Usufructo de Frecuencia) pioneered in Guatemala provides an example of a tradable “property right” that allows a holder to exercise flexibility in a given band of spectrum as long as they adhere to technical criteria governing:
• Maximum transmission power;• Coverage area;• Maximum interference at border of
coverage area; and• Schedule of operation.10
Some countries have experimented with the idea of “band managers” – entities that oversee (and take responsibility for) the use of spectrum by a collection of subsidiary users. As explained in the ICT Regulation Toolkit, “[a] band manager will typically have assignment rights over, or be the licensee of, a block of spectrum, which it will then subdivide among many users. In many respects, a band manager can be thought of as a ‘wholesaler’ of spectrum, which it then ‘retails’ to individual users.”11
As these descriptions indicate, spectrum “trading” can be defined to include some very different processes. One form of such trading is the transfer of a licence from one entity to another through approval of an acquisition or merger of the licence-holder. In many countries, regulators must approve such transfers, which essentially give regulators a chance to determine whether, in fact, consolidation of two previously competitive market players would be in the public’s interest. The other processes of trading, such as tradeable rights or disaggregation/partitioning and leasing, as mentioned above, have been much more rare – and implementation has not always brought about the desired results.
Initial experimentation in spectrum trading was confined to a handful of countries: notably, Australia, New Zealand, United States, Canada, and Guatemala.12 In this decade, the Office of Communications (Ofcom) in the United Kingdom has been active in authorizing spectrum transfers and leasing.13 As a whole, the European Union has taken a cautious approach to spectrum trading, viewing both its potential benefits and possible draw-backs in terms of market failures from spectrum hoarding and lessening of competition.14 Where trading rules have been approved, initial trading levels have often been disappointing, leading to questions about the utility of the concept.
The OECD has noted concerns among some countries about the potential unforeseen effects of introducing spectrum trading (at least in terms of allowing leasing or transfer of discrete spectrum bands), including:
• low spectrum trading activity; • inefficient use of spectrum; • high transactions costs; • risk of increased interference; • impact of spectrum trading on anti-
competitive conduct; • impact on investment and innovation; • impact on international co-ordination /
harmonisation; • windfall gains; • disruptive effect on consumers; and • reduced ability to achieve public interest
objectives.15
69Trends in Telecommunication Reform 2015
Chapter 3

For most regulators, the idea of fungible licensing areas and transferring responsibility to other entities is worrisome, or even alarming. In addition to potential cherry-picking of small geographic markets, most concerning to regulators is the idea of losing direct control over licence-holders that may be able to transfer, lease out or (in practical terms) sell their licences. This loss of control may result in speculation (buying up fallow spectrum and selling it later at a profit) or commoditization of access. Leaving aside those concerns, regulators may have a simple fear of losing oversight of who ultimately controls (and is responsible for) a licence. In terms of enforcement, such a loss of control could endanger the regulator’s ability to safeguard and regulate the use of spectrum resources or resolve interference cases.
Spectrum subdivision and trading, however, can be made subject to regulatory approval. And the ability to flexibly add and subtract access to spectrum in different geographic markets is, at least in theory, economically empowering. Operators can generate capital for network expansion by leasing out unused spectrum in certain areas, or they can buy up and aggregate licences in new markets as they grow. In short, spectrum disaggregation and trading implies acceptance of a kinetic spectrum environment rather than a static one. Business plans can evolve, change and grow as operators expand or retrench, using as much spectrum or as little as they need at any given stage of market penetration.
For now, however, spectrum trading remains limited in terms of global acceptance by regulators. This is based partly on core regulatory concerns about unintended outcomes, as noted above, and partly on a limited and mixed track record for outcomes of spectrum trading – even where it has been enthusiastically embraced.16
Spectrum Re-FarmingRe-farming of spectrum is the process of re-purposing a block of frequencies from an existing use, which may no longer be optimal, to another, more productive use. (Detailed analysis of methods and challenges of spectrum re-farming can be found in Report ITU-R SM.1603 “Spectrum redeployment as a method of national spectrum management.”17)
Sometimes the term re-farming is applied as a synonym for relocation of an incumbent user out of a band to make way for re-assignment of that spectrum (see Box 1). For example, a non-commercial government or industrial band could be cleared of existing users and then licensed for a commercial service. That band could be said to have been re-farmed for a new use.
Re-farming does not necessarily involve clearing a band or switching spectrum rights from one user to another, however. Existing licence-holders may decide, or be directed to, re-farm a band from an older, less-productive technology to a newer one. This would occur, for example, when a cellular mobile operator phased out or discontinued 2G service, enabling it to use the same spectrum band to launch 3G or 4G service. In 2013, for example, T-Mobile informed its U.S. customers, via a blog post on its website, that it would be reducing the amount of spectrum dedicated to its 2G service and re-farming much of that spectrum for its newer, more advanced network services.
Approximately 90% of our network traffic is on our 3G and 4G bands (1700 MHz and 2100 MHz), which is leaving our 2G bands (850 MHz and 1900 MHz) underused,” T-Mobile explained. “To help make best use of our 2G bands, we will be re-farming the excess 1900 MHz spectrum from EDGE technology to HSPA+. This will not eliminate 2G 1900 coverage in an area, but will free up some of that spectrum for 4G services. This reallocation will result in increased 4G capacity, smoother connections, and fewer dropped calls.18
One recent example of spectrum re-farming is the re-purposing of a portion of the UHF bands in many countries to allow broadband mobile services to operate there. The transition from analog to digital television broadcasting has allowed portions of the 700 MHz and 800 MHz bands to be freed up for new uses, with that freed-up spectrum known as the “digital dividend.” Following spectrum allocation and identification decisions made at WRC-07 and WRC-12, a large and growing number of countries have opted for reallocate this frequency resource from broadcasting to mobile broadband, in
70 Trends in Telecommunication Reform 2015
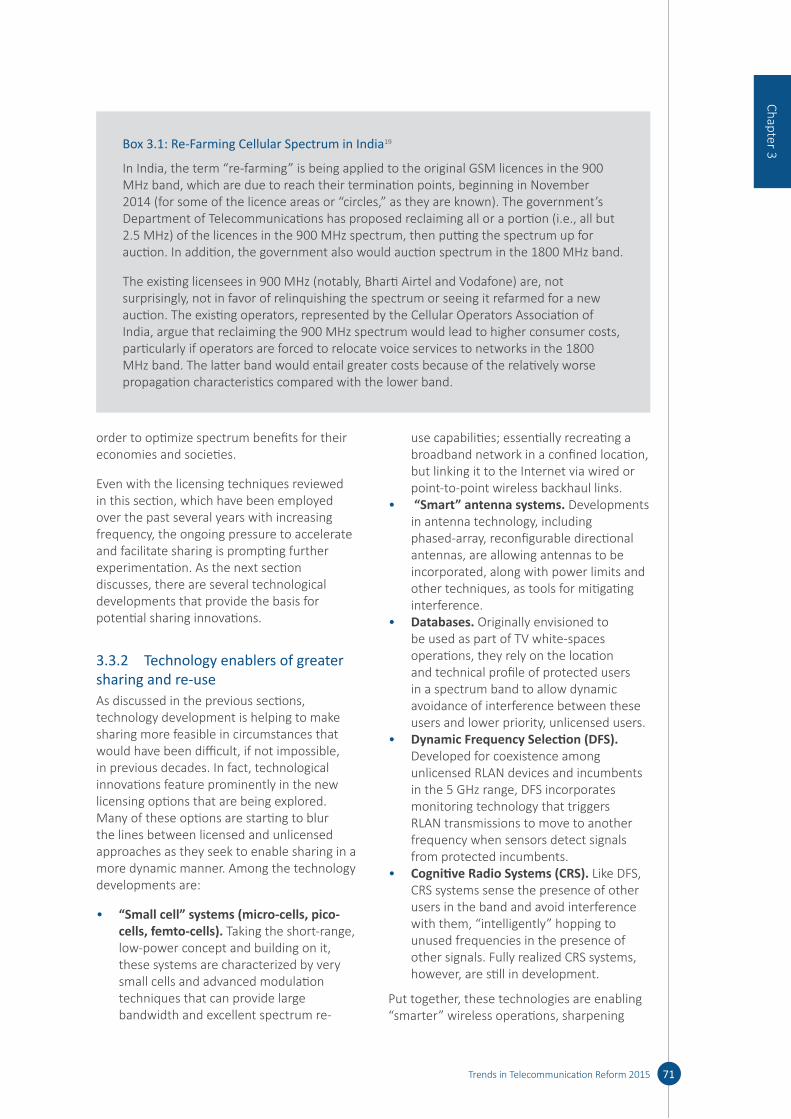
order to optimize spectrum benefits for their economies and societies.
Even with the licensing techniques reviewed in this section, which have been employed over the past several years with increasing frequency, the ongoing pressure to accelerate and facilitate sharing is prompting further experimentation. As the next section discusses, there are several technological developments that provide the basis for potential sharing innovations.
3.3.2 Technology enablers of greater sharing and re-useAs discussed in the previous sections, technology development is helping to make sharing more feasible in circumstances that would have been difficult, if not impossible, in previous decades. In fact, technological innovations feature prominently in the new licensing options that are being explored. Many of these options are starting to blur the lines between licensed and unlicensed approaches as they seek to enable sharing in a more dynamic manner. Among the technology developments are:
• “Small cell” systems (micro-cells, pico-cells, femto-cells). Taking the short-range, low-power concept and building on it, these systems are characterized by very small cells and advanced modulation techniques that can provide large bandwidth and excellent spectrum re-
use capabilities; essentially recreating a broadband network in a confined location, but linking it to the Internet via wired or point-to-point wireless backhaul links.
• “Smart” antenna systems. Developments in antenna technology, including phased-array, reconfigurable directional antennas, are allowing antennas to be incorporated, along with power limits and other techniques, as tools for mitigating interference.
• Databases. Originally envisioned to be used as part of TV white-spaces operations, they rely on the location and technical profile of protected users in a spectrum band to allow dynamic avoidance of interference between these users and lower priority, unlicensed users.
• Dynamic Frequency Selection (DFS). Developed for coexistence among unlicensed RLAN devices and incumbents in the 5 GHz range, DFS incorporates monitoring technology that triggers RLAN transmissions to move to another frequency when sensors detect signals from protected incumbents.
• Cognitive Radio Systems (CRS). Like DFS, CRS systems sense the presence of other users in the band and avoid interference with them, “intelligently” hopping to unused frequencies in the presence of other signals. Fully realized CRS systems, however, are still in development.
Put together, these technologies are enabling “smarter” wireless operations, sharpening
71Trends in Telecommunication Reform 2015
Chapter 3Box 3.1: Re-Farming Cellular Spectrum in India19
In India, the term “re-farming” is being applied to the original GSM licences in the 900 MHz band, which are due to reach their termination points, beginning in November 2014 (for some of the licence areas or “circles,” as they are known). The government’s Department of Telecommunications has proposed reclaiming all or a portion (i.e., all but 2.5 MHz) of the licences in the 900 MHz spectrum, then putting the spectrum up for auction. In addition, the government also would auction spectrum in the 1800 MHz band.
The existing licensees in 900 MHz (notably, Bharti Airtel and Vodafone) are, not surprisingly, not in favor of relinquishing the spectrum or seeing it refarmed for a new auction. The existing operators, represented by the Cellular Operators Association of India, argue that reclaiming the 900 MHz spectrum would lead to higher consumer costs, particularly if operators are forced to relocate voice services to networks in the 1800 MHz band. The latter band would entail greater costs because of the relatively worse propagation characteristics compared with the lower band.
the ability to transmit without causing interference and, ultimately, improving the chances for sharing with other users in the same or adjacent bands.
Small-cell systemsA standard or “macro” wireless cell can cover a range of tens of square kilometers and thousands of handsets. Smaller cells, known as microcells, picocells and femtocells, cover much smaller areas (as small as a 10-metre radius in the case of femtocells) and allow low-power usage.20 This also allows for increased spectrum re-use and minimizes potential interference. Small cells can improve cell-edge performance and provide increased capacity in high-traffic areas. They can be used either with or without licences they can be used to extend the networks of licensed operators within buildings or provide service in more remote areas (at less cost).
One use of small cells that is being intensively developed is for offloading data traffic from an operator’s larger macro-cells. So common is small-cell offloading in some markets that experts predict that as much as half of all data traffic in some congested areas will be offloaded in the next few years, making small cells an integral part of some 3G network topologies. 21 This is one aspect of a trend towards using different types of network technology to deploy what is known as a heterogeneous network or “het-net,” which can allow for flexible deployment of cost-effective network equipment and boost the ability of an operator to handle increased capacity demands.
“Smart” antenna systemsSmart antenna systems can include switched-beam or adaptive-array antennas, and they feature advanced signal-processing capabilities to engage in beam-forming and direction-of-arrival estimation. Such technologies improve performance and efficiency of a radio system, which pays dividends in terms of sharing or co-existence with other radios in the same or adjacent bands. One prime example of a smart antenna technology is multiple input/multiple output (MIMO) antennas, which offer increased throughput without having to increase power levels or bandwidth. Because of this capability, MIMO is an important
component of LTE and other current mobile service technologies.
DatabasesOne way to control interference is to avoid transmitting on channels being used by other systems in the vicinity. Databases can be used to store and make available information on the channels that may be used by lower-priority radio systems at a given location without causing interference to, or suffering interference from, the higher-priority systems authorized in the band. Any unlicensed device seeking to transmit in that band could perform a “look-up” in the database to obtain information on the channels available for its use. As long as the device transmits only on those channels – and as long as the database is up-to-date – the device may be able to operate without causing or receiving interference.
The use of a database is at the heart of current TV white space rules and experiments in sharing (see Section 3.3.3). White-space operations can be considered an experimental form of DSA, or as it is sometimes called, “opportunistic sharing;” the practice of using, on a non-interference and non-protection basis, the gaps in transmissions by licensed incumbents. In this case, broadcast stations are generally at fixed locations, with prescribed and well-known technical parameters for transmission. In the case of wireless microphones, these can be localized based on registration of major events (i.e., concerts or festivals) and input into the databases, as well. This provides a generally static and relatively stable spectral environment that can be documented in the database. In some limited-time events, however, programme-making and special events (PMSE) management may be required.
Dynamic Frequency Selection (DFS) Adopted for use by unlicensed devices in several sub-bands of the 5 GHz range (the 5150-5350 MHz and 5470-5725 MHz bands), DFS is designed to protect incumbents in those bands from interference. The unlicensed Wi-Fi devices operating in this band are required to be equipped with DFS capability, which can monitor and detect its local spectrum operating environment. If it detects any signals from the licensed systems
72 Trends in Telecommunication Reform 2015
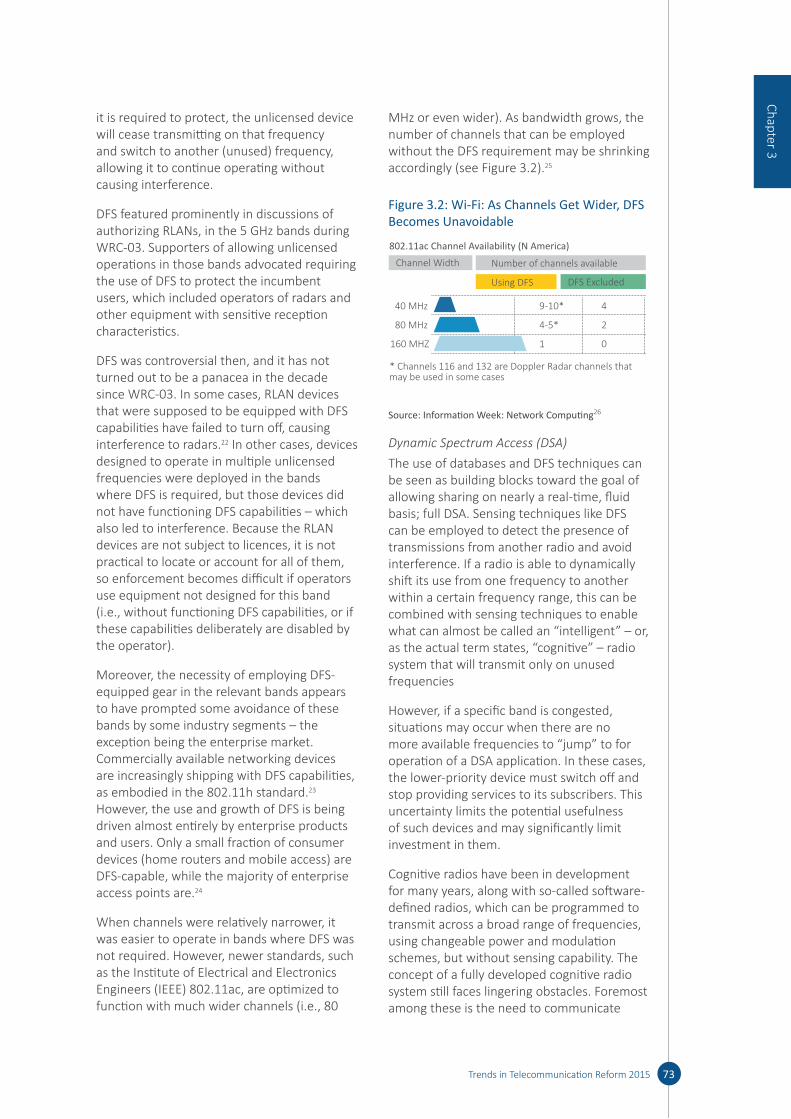
it is required to protect, the unlicensed device will cease transmitting on that frequency and switch to another (unused) frequency, allowing it to continue operating without causing interference.
DFS featured prominently in discussions of authorizing RLANs, in the 5 GHz bands during WRC-03. Supporters of allowing unlicensed operations in those bands advocated requiring the use of DFS to protect the incumbent users, which included operators of radars and other equipment with sensitive reception characteristics.
DFS was controversial then, and it has not turned out to be a panacea in the decade since WRC-03. In some cases, RLAN devices that were supposed to be equipped with DFS capabilities have failed to turn off, causing interference to radars.22 In other cases, devices designed to operate in multiple unlicensed frequencies were deployed in the bands where DFS is required, but those devices did not have functioning DFS capabilities – which also led to interference. Because the RLAN devices are not subject to licences, it is not practical to locate or account for all of them, so enforcement becomes difficult if operators use equipment not designed for this band (i.e., without functioning DFS capabilities, or if these capabilities deliberately are disabled by the operator).
Moreover, the necessity of employing DFS-equipped gear in the relevant bands appears to have prompted some avoidance of these bands by some industry segments – the exception being the enterprise market. Commercially available networking devices are increasingly shipping with DFS capabilities, as embodied in the 802.11h standard.23 However, the use and growth of DFS is being driven almost entirely by enterprise products and users. Only a small fraction of consumer devices (home routers and mobile access) are DFS-capable, while the majority of enterprise access points are.24
When channels were relatively narrower, it was easier to operate in bands where DFS was not required. However, newer standards, such as the Institute of Electrical and Electronics Engineers (IEEE) 802.11ac, are optimized to function with much wider channels (i.e., 80
MHz or even wider). As bandwidth grows, the number of channels that can be employed without the DFS requirement may be shrinking accordingly (see Figure 3.2).25
Figure 3.2: Wi-Fi: As Channels Get Wider, DFS Becomes Unavoidable
802.11ac Channel Availability (N America)
* Channels 116 and 132 are Doppler Radar channels that may be used in some cases
40 MHz
80 MHz
160 MHZ
9-10* 4
4-5* 2
1 0
Using DFS
Channel Width
DFS Excluded
Number of channels available
Source: Information Week: Network Computing26
Dynamic Spectrum Access (DSA)The use of databases and DFS techniques can be seen as building blocks toward the goal of allowing sharing on nearly a real-time, fluid basis; full DSA. Sensing techniques like DFS can be employed to detect the presence of transmissions from another radio and avoid interference. If a radio is able to dynamically shift its use from one frequency to another within a certain frequency range, this can be combined with sensing techniques to enable what can almost be called an “intelligent” – or, as the actual term states, “cognitive” – radio system that will transmit only on unused frequencies
However, if a specific band is congested, situations may occur when there are no more available frequencies to “jump” to for operation of a DSA application. In these cases, the lower-priority device must switch off and stop providing services to its subscribers. This uncertainty limits the potential usefulness of such devices and may significantly limit investment in them.
Cognitive radios have been in development for many years, along with so-called software-defined radios, which can be programmed to transmit across a broad range of frequencies, using changeable power and modulation schemes, but without sensing capability. The concept of a fully developed cognitive radio system still faces lingering obstacles. Foremost among these is the need to communicate
73Trends in Telecommunication Reform 2015
Chapter 3
within a network. It is not enough for a single radio to sense a potential interferer and hop to another frequency. It must communicate to all other receivers in its network that it is now using another frequency, and what that new frequency is. Those other receivers must notify all other devices to which they are linked, in a cascading fashion. In other words, the entire network must be cognitive, and it must allow devices to shift rapidly and efficiently from one channel to another without losing connection or dropping transmissions. This is clearly a complex engineering task -- one that industry has not yet resolved (see Box 3.2).
This complexity is further increased by a need to create reliable sensing systems for cognitive radios. For technical reasons, such as hidden obstacles and requirements for very sensitive and expensive receivers, sensing may be not fully reliable to avoid interference. Other sources of information for obtaining knowledge about electromagnetic environment (such as databases) are then necessary.
Meanwhile, regulators and policy-makers are discussing the regulatory aspects of DSA, with many implications yet unclear. Is it possible or advisable for DSA to be implemented outside bands particularly set-aside for it? How would it affect different types of radiocommunication services – particularly those with sensitive receivers? How can incumbent users be assured of their primary rights to access spectrum? What will it mean to have global allocations and national licences, if equipment can hop into and out of spectrum bands independently? When (or if) DSA becomes a reality, how can regulators ensure that it will not be abused? How would current licensing models be adapted? The next section of this chapter begins to explore these questions, starting with the last one – regarding adaptation of licensing.
3.3.3 Licensing innovations to enable greater sharingWith the goal of enabling more – and more efficient – usage of spectrum, regulators have begun to reassess their regulatory tools and embark upon new forms of licensing (including combinations of licensed and unlicensed usage). This is a complicated task,
because industry stakeholders invariably wish to preserve or enhance the approaches that work for and benefit them. For example, licensed operators are extremely reluctant to give up their rights to exclusive use of a set band in a set geographic area, because of the often high price paid to access that spectrum (based on an expectation of exclusivity) and the ensuing substantial capital outlay for network deployment. In addition, they have concerns about potentially harmful interference from new entrants in a shared environment. Meanwhile, manufacturers of unlicensed equipment seek more avenues to develop unlicensed bands that will accommodate a profusion of unlicensed uses. The following sub-sections explore the ways in which previously distinct licensing models have started to blur.
Operator offloading onto unlicensed spectrumThere are multiple approaches to small-cell data offloading. One mode involves the user deciding to initiate the offloading data onto an unlicensed (often Wi-Fi) network with their own smart phones, most of which now come equipped with WiFi capability. Another mode allows the cellular operator to detect impending network congestion and initiate the data traffic offloading, which could be to small cells (e.g., femtocells) or even directly to the Internet through WiFi. This is sometimes known as operator-managed offloading. From a licensing perspective, it is an interesting, if niche-oriented, example of the interplay between licensed and unlicensed networks. In the end, however, it may represent only a short-term solution for users and operators in highly congested areas and markets until more IMT spectrum can be mobilized.
Regulators have taken notice of the possibilities for off-loading. On the last day of March, 2014, the Federal Communications Commission (FCC) in the United States altered its domestic rules applying to RLAN use of the 5150-5250 MHz band. Among other things, the FCC reduced the previous restriction on indoor-only use of RLAN devices and increased the permissible power, while requiring manufacturers to implement more stringent protections against illegal modifications that could cause interference to other services in the band (chiefly, the Globalstar mobile satellite system). 28 One of the benefits
74 Trends in Telecommunication Reform 2015
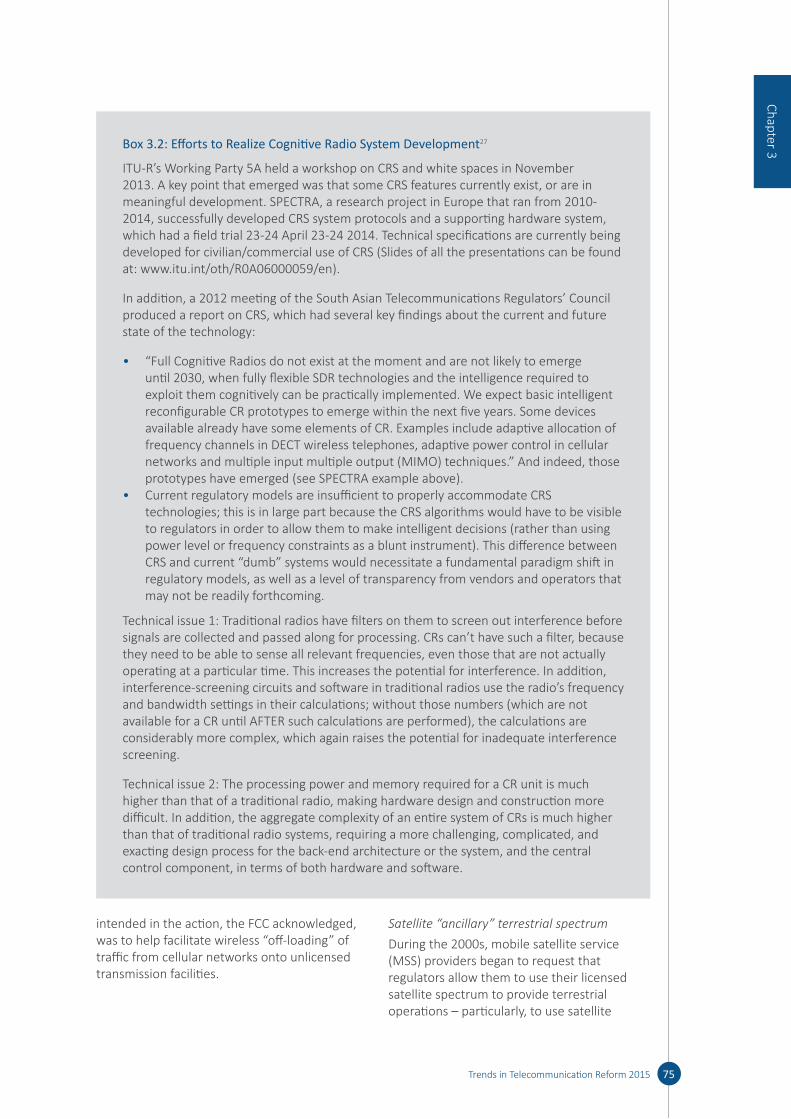
intended in the action, the FCC acknowledged, was to help facilitate wireless “off-loading” of traffic from cellular networks onto unlicensed transmission facilities.
Satellite “ancillary” terrestrial spectrumDuring the 2000s, mobile satellite service (MSS) providers began to request that regulators allow them to use their licensed satellite spectrum to provide terrestrial operations – particularly, to use satellite
75Trends in Telecommunication Reform 2015
Chapter 3Box 3.2: Efforts to Realize Cognitive Radio System Development27
ITU-R’s Working Party 5A held a workshop on CRS and white spaces in November 2013. A key point that emerged was that some CRS features currently exist, or are in meaningful development. SPECTRA, a research project in Europe that ran from 2010-2014, successfully developed CRS system protocols and a supporting hardware system, which had a field trial 23-24 April 23-24 2014. Technical specifications are currently being developed for civilian/commercial use of CRS (Slides of all the presentations can be found at: www. itu. int/ oth/ R0A06000059/ en).
In addition, a 2012 meeting of the South Asian Telecommunications Regulators’ Council produced a report on CRS, which had several key findings about the current and future state of the technology:
• “Full Cognitive Radios do not exist at the moment and are not likely to emerge until 2030, when fully flexible SDR technologies and the intelligence required to exploit them cognitively can be practically implemented. We expect basic intelligent reconfigurable CR prototypes to emerge within the next five years. Some devices available already have some elements of CR. Examples include adaptive allocation of frequency channels in DECT wireless telephones, adaptive power control in cellular networks and multiple input multiple output (MIMO) techniques.” And indeed, those prototypes have emerged (see SPECTRA example above).
• Current regulatory models are insufficient to properly accommodate CRS technologies; this is in large part because the CRS algorithms would have to be visible to regulators in order to allow them to make intelligent decisions (rather than using power level or frequency constraints as a blunt instrument). This difference between CRS and current “dumb” systems would necessitate a fundamental paradigm shift in regulatory models, as well as a level of transparency from vendors and operators that may not be readily forthcoming.
Technical issue 1: Traditional radios have filters on them to screen out interference before signals are collected and passed along for processing. CRs can’t have such a filter, because they need to be able to sense all relevant frequencies, even those that are not actually operating at a particular time. This increases the potential for interference. In addition, interference-screening circuits and software in traditional radios use the radio’s frequency and bandwidth settings in their calculations; without those numbers (which are not available for a CR until AFTER such calculations are performed), the calculations are considerably more complex, which again raises the potential for inadequate interference screening.
Technical issue 2: The processing power and memory required for a CR unit is much higher than that of a traditional radio, making hardware design and construction more difficult. In addition, the aggregate complexity of an entire system of CRs is much higher than that of traditional radio systems, requiring a more challenging, complicated, and exacting design process for the back-end architecture or the system, and the central control component, in terms of both hardware and software.
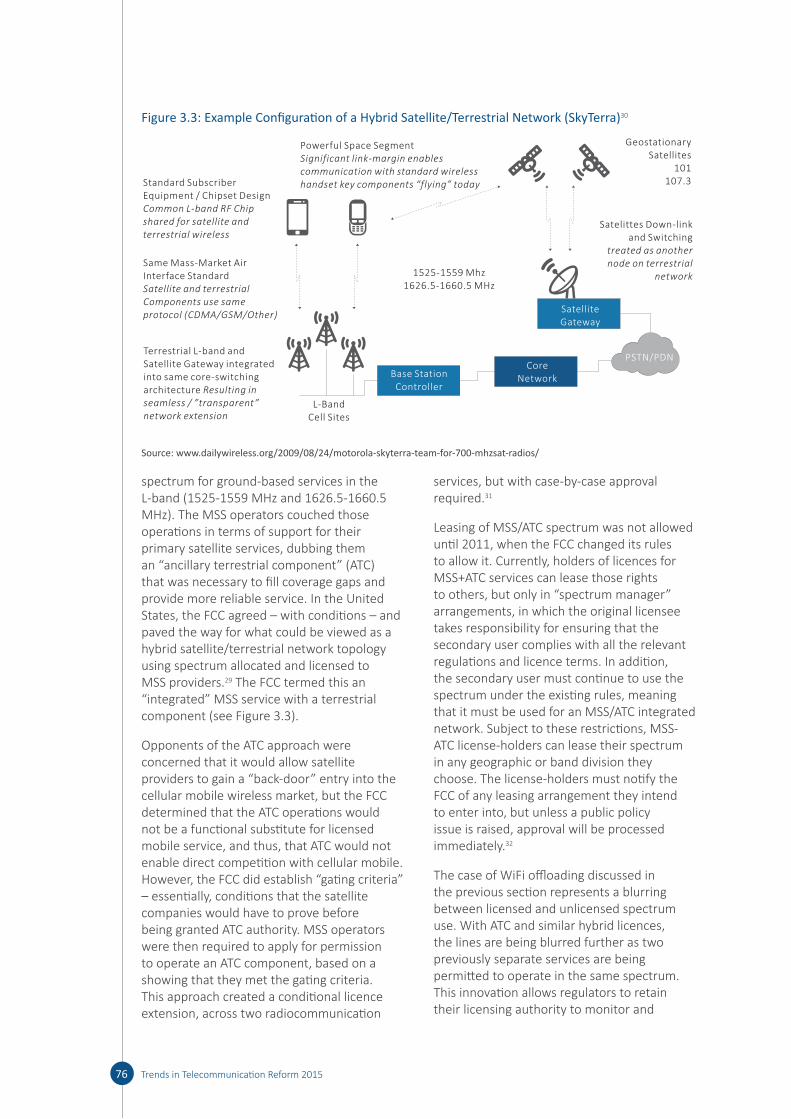
spectrum for ground-based services in the L-band (1525-1559 MHz and 1626.5-1660.5 MHz). The MSS operators couched those operations in terms of support for their primary satellite services, dubbing them an “ancillary terrestrial component” (ATC) that was necessary to fill coverage gaps and provide more reliable service. In the United States, the FCC agreed – with conditions – and paved the way for what could be viewed as a hybrid satellite/terrestrial network topology using spectrum allocated and licensed to MSS providers.29 The FCC termed this an “integrated” MSS service with a terrestrial component (see Figure 3.3).
Opponents of the ATC approach were concerned that it would allow satellite providers to gain a “back-door” entry into the cellular mobile wireless market, but the FCC determined that the ATC operations would not be a functional substitute for licensed mobile service, and thus, that ATC would not enable direct competition with cellular mobile. However, the FCC did establish “gating criteria” – essentially, conditions that the satellite companies would have to prove before being granted ATC authority. MSS operators were then required to apply for permission to operate an ATC component, based on a showing that they met the gating criteria. This approach created a conditional licence extension, across two radiocommunication
services, but with case-by-case approval required.31
Leasing of MSS/ATC spectrum was not allowed until 2011, when the FCC changed its rules to allow it. Currently, holders of licences for MSS+ATC services can lease those rights to others, but only in “spectrum manager” arrangements, in which the original licensee takes responsibility for ensuring that the secondary user complies with all the relevant regulations and licence terms. In addition, the secondary user must continue to use the spectrum under the existing rules, meaning that it must be used for an MSS/ATC integrated network. Subject to these restrictions, MSS-ATC license-holders can lease their spectrum in any geographic or band division they choose. The license-holders must notify the FCC of any leasing arrangement they intend to enter into, but unless a public policy issue is raised, approval will be processed immediately.32
The case of WiFi offloading discussed in the previous section represents a blurring between licensed and unlicensed spectrum use. With ATC and similar hybrid licences, the lines are being blurred further as two previously separate services are being permitted to operate in the same spectrum. This innovation allows regulators to retain their licensing authority to monitor and
76 Trends in Telecommunication Reform 2015
Figure 3.3: Example Configuration of a Hybrid Satellite/Terrestrial Network (SkyTerra)30
Powerful Space SegmentSignificant link-margin enables communication with standard wireless handset key components “flying” todayStandard Subscriber
Equipment / Chipset Design Common L-band RF Chip shared for satellite and terrestrial wireless
Same Mass-Market Air Interface StandardSatellite and terrestrial Components use same protocol (CDMA/GSM/Other)
Terrestrial L-band and Satellite Gateway integrated into same core-switching architecture Resulting in seamless / ”transparent” network extension
L-BandCell Sites
1525-1559 Mhz1626.5-1660.5 MHz
Satelittes Down-link and Switching
treated as another node on terrestrial
network
Geostationary Satellites
101 107.3
Base StationController
CoreNetwork
SatelliteGateway
PSTN/PDN
Source: www. dailywireless. org/ 2009/ 08/ 24/ motorola- skyterra- team- for- 700- mhzsat- radios/
enforce the operators’ behaviour, while also giving operators greater flexibility to use their spectrum to meet their broad operational requirements.
TV white spacesUse of TV white spaces (TVWS) by unlicensed devices has been authorized in the United States and is the subject of field trials in the United Kingdom and in several countries in Africa (see Section 4.2.2).33 The approach involves using databases that provide for the protection of TV services under 698 MHz, as well as other licensed services operating in these bands, such as the broadcasting auxiliary services (i.e., wireless microphones). The databases can be accessed and updated via the Internet and are maintained by multiple parties on a fee basis.
Equipment must be designed and deployed to interact with the database and adjust its transmissions as mandated by the database. With regard to building an equipment “universe” for TV white spaces, IEEE has been developing a standard for TV white spaces devices, under the rubric of 802-11af – an offshoot of the Wi-Fi suite of standards. IEEE 802.22 is another standard for Wireless Regional Area Networks (WRANs), which also uses TV white spaces.
One of the challenges related to databases, especially for countries with small territories, is coordination of TVWS devices in border areas. This may require exchange of information kept in national databases, since frequency usage, rules and available channels can be different in neighboring countries. Such exchanges may entail significant administrative difficulties. The databases then allow the TVWS devices to operate without either causing or receiving interference to/from the incumbent services.
In terms of licensing, the use of TVWS generally uses (like RLANs potentially using DFS at 5 GHz to share spectrum with radars) a combination of licensed and unlicensed strategies. The incumbent users (primarily broadcasters or wireless microphone systems) typically retain their existing licences, as well as their primary regulatory status in the band, meaning that they must be protected from harmful interference by the TVWS devices.
The TVWS devices are not required to be licensed, giving them secondary status (or no status) in the band; such devices cannot cause harmful interference to broadcasting, and they must accept interference from the broadcasting or Broadcasting Auxiliary Service (BAS) operations when that occurs.
As documented in a chapter of ITU Trends in Telecommunication Reform’s 2013/14 special edition, TVWS remain nascent in most parts of the world – and their future remains uncertain even where they are operating: in the United States, early advocacy of TVWS in television broadcasting bands has been superseded by an effort to design incentive auctions (see Box 3.3) that would provide for licences for broadband wireless (while re-farming broadcasters into a smaller spectrum range). It is not yet clear how much spectrum will remain for TVWS usage. TVWS proponents are requesting that regulations be stabilized so that providers can be certain that the spectrum they are using, on an unlicensed basis, will not be reallocated or auctioned for licensed usage, for example, by cellular mobile providers.
Licensed Shared AccessWhile the unlicensed use of TVWS amounts to “swimming at your own risk,” it can provide a means for exploiting unused spectrum that would otherwise remain fallow. It does not appeal, however, to cellular mobile operators – at least not as a spectrum strategy for their core voice networks. These operators overwhelmingly prefer to retain their licensed occupation of exclusively-assigned bands, which the operators have often “paid for” through auction or tender processes. The operators essentially have paid for the right not to endure the vagaries of database look-ups, saturation of spectrum capacity (often in vital urban areas) – in short, all the potential downsides of unlicensed use.
The problem is that, in an increasing number of countries, the availability of sufficient spectrum that can be cleared, re-farmed and made available for new licences is fast approaching nil. Meanwhile, there remain large ranges and bands of command-and-control assignments still being used by government departments and agencies, including for public safety, utility or asset
77Trends in Telecommunication Reform 2015
Chapter 3
management and military/defence. What is needed is a regulatory paradigm that could meet multiple needs for spectrum access through shared use, governed by a careful balancing-of-rights management. One proposal to achieve this is licensed shared access (LSA), see Box 3.4.
Based on these definitions, the basic components of LSA appear to include the following:
• An LSA band would allow continued use by incumbent users, including government users.
• Cellular mobile operators would be able to use the band, with licences conditioned by technical and regulatory criteria that would allow sharing with the incumbents.
• The terms and conditions for sharing should be implemented by national regulators after consultation (or
negotiation) among incumbents and new operator licensees.
• The sharing terms and conditions should allow for all parties to meet standards for quality of service (QoS) or, at a minimum, effective delivery of their services or completion of their missions.
• LSA should be employed as a complement to, not a replacement for, exclusive allocations and assignments to operators in most bands.
Some descriptions of this concept user the slightly older term, authorized shared access (ASA), and some include provisions for a sensing function, as with DFS or cognitive radio, to allow the new entrants to operate without interfering with the incumbents. As the LSA/ASA concept evolves, it already is being applied or considered in several regions where re-farming of government spectrum appears to be difficult. These bands and regions are the 2.3 GHz band in Europe and the 3.55-3.65 GHz band in the United States.
78 Trends in Telecommunication Reform 2015
Box 3.3: The FCC’s Broadcasting Incentive Auctions
The U.S. Federal Communications Commission (FCC) has designed an “incentive auction” process to provide market incentives for local television broadcasting stations to release some of their spectrum to be auctioned for broadband mobile services.
The process will involve two “separate but interdependent” proceedings:
• a “reverse auction,” in which the broadcasters “bid” the prices at which they would be willing to give up their spectrum, and
• a more familiar “forward auction,” in which the mobile providers submit bids for how much they would be willing to pay to acquire it.
The FCC will take both sets of bids, “repack” the entire spectrum range such that the broadcasters who will remain after the auction (those who chose not to participate, or whose sell prices were not met) are located together in the remaining broadcast spectrum, and issue licences for the “sold” spectrum to the mobile providers with winning bids.
In other words, the FCC is taking what would be a two-step buyback-and-resell process and making it into a simultaneous auction, in order to allow repacking, and also use information from each auction in the other auction, to allow a closer alignment of buying and selling points. All broadcasters will be affected by this auction proceeding, whether or not they choose to sell, because of the probability that their channel will be changed by the repacking.
Source: Federal Communications Commission, “The Broadcast Television Spectrum Incentive Auction,” FCC Staff Summary, http:// www. fcc. gov/ document/ broadcast- television- spectrum- incentive- auction- staff- summary.

LSA in the 2.3 GHz band in EuropeIn its opinion on LSA, issued in late 2013, the European Commission’s Radio Spectrum Policy Group (RSPG) noted a prevailing opinion in Europe that the first practical application of the concept could involve the 2.3 GHz band in 2014.34 The band (i.e., 2300-2400 MHz) was identified for IMT use at the 2007 World Radiocommunication Conference. However, the presence of incumbent users in the band delayed plans by the European Conference of Posts and Telecommunications Administrations (CEPT) to harmonise its use by IMT across Europe.35 The European Telecommunications Standards Institute (ETSI) called for compatibility studies to determine whether broadband IMT (TDD IMT/WiMAX) could co-exist with the incumbents in the band under a scenario in which there would be five 20-MHz channels.36 Those studies would include co-channel compatibility, compatibility with incumbents in adjacent bands, and cross-border compatibility.
Studies indicated a mix of compatibility and incompatibility across different countries,
ranging from no issues in countries where the band was unused, up to certain countries with government uses, where compatibility might be possible on a shared basis with provisions to protect the incumbents from interference. The CEPT Electronic Communications Committee (ECC) then sought to develop a decision on harmonized provisions, including LSA procedures, for those situations. That decision was due by mid-2014.37 In short, countries without problematic issues concerning incumbents might simply allow exclusive-use licensing; but where incumbents existed, administrations could implement the harmonized provisions that would include LSA.
LSA in the 3.55-3.65 GHz band in the United StatesIn December 2012, the FCC proposed introducing a new “Citizens Broadband Service” in the 3550-3650 MHz band, as a way to allow sharing by small-cell operators without having to re-farm or clear incumbents from the band.38 An earlier review of the band had determined that the only way to share the band otherwise would be to create large
79Trends in Telecommunication Reform 2015
Chapter 3Box 3.4: Defining Licensed Shared Access
The GSM Association (GSMA) defines LSA in the following way:
“. . .an individual-license regime of a limited number of mobile network operator (MNO) licensees in a frequency band that is identified for IMT, and which is already assigned to other incumbent users whose spectrum rights of use have not been granted through an award procedure for commercial use, for which the additional users are allowed to use the spectrum (or part of the spectrum) in accordance with sharing rules included in the rights of use of spectrum granted to the licensees.”
The European Commission’s Radio Spectrum Policy Group (RSPG) has a similar but nuanced definition, which incorporates a clause pertaining to quality of service (QoS). For RSPG, LSA is:
“A regulatory approach aiming to facilitate the introduction of radiocommunication systems operated by a limited number of licensees under an individual licensing regime in a frequency band already assigned or expected to be assigned to one or more incumbent users. Under the Licensed Shared Access (LSA) approach, the additional users are authorised to use the spectrum (or part of the spectrum) in accordance with sharing rules included in their rights of use of spectrum, thereby allowing all the authorized users, including incumbents, to provide a certain Quality of Service (QoS).
Sources: GSM Association, “Licensed Shared Access and Authorised Shared Access,” GSMA Public Policy Position Paper, February 2013, p. 4; European Commission, Directorate-General for Communications Networks, Content and Technology, Radio Spectrum Policy Group (RSPG), “RSPG Opinion on Licensed Shared Access,” (“RSPG Opinion”) RSPG13-538, 12 November 2013, p. 7.
coastal exclusion zones to protect incumbent maritime radars.39 The required size of those exclusion zones would have made it uneconomic to deploy standard, macro-cell services in the band.
In April 2014, the FCC further elaborated on its proposals, developing a three-tiered hierarchy of access to the 3550-3650 MHz band that might be described in terms of LSA.40 Existing government users and other incumbents would continue to be protected, while a “priority access licence” or PAL that would be offered based on U.S. census tracts. Where more than one applicant existed for a PAL, the licence could be auctioned. Each 10-MHz PAL would be good for only one year, although holders could aggregate extensions of up to five years through spectrum trading. Finally, a general access category would be created in a reserved portion of the band for users who could claim no interference protection. Database technology would be utilized to ensure that lower-priority users did not interfere with PAL holders or the protected incumbents.41
The so-called Citizens Broadband Service was not developed overnight, and it still faces an array of doubts: incumbent users within the Federal government have spent years studying and debating with the FCC the potential for sharing this band. Industry observers also question the PALs’ auction viability, given the licences extremely small geographic size and their short duration. The 3.5 GHz experiment will face two core questions: can it foster growth in this band for the small-cell market it hopes to address, and can it really combine auctioned licences shared with government incumbents and opportunistic users? At this juncture, it is too soon to say.
3.4 International and national developments
Given the current experimentation process with dynamic spectrum licensing and sharing trends, what avenues exist for broader implementation and adaptation? Beginning with TV white spaces, there are both international and national-level efforts to define and codify regulatory guidance and rules (respectively) for these new approaches.
It is by no means certain that dynamic sharing will work in all cases – much less become the dominant spectrum management technique that some hope it will be. It might only be applied in carefully selected parts of the spectrum.
This section looks at efforts to advance these approaches, beginning with the ITU’s Radiocommunication sector (ITU-R) developments related to these concepts, and then focusing on experiments, trials and implementations by national regulatory authorities, particularly in developing economies.
3.4.1 International developmentsWRC-12 reviewed the ITU Radio Regulations (RR) with the aim of accommodating new technologies like CRS, but it concluded that no changes to the RR were needed for this purpose. In addition, WRC-12 recognized that while CRS systems are expected to provide flexibility and improved efficiency to overall spectrum use, radio systems using CRS technology need to operate in accordance with the RR provisions. Moreover, the use of CRS does not exempt administrations from their obligations with regard to protecting the stations of other administrations that also are operating in accordance with the RR.
The work of the ITU-R on this issue has since been focused on the development of best practices. For this purpose, the relevant study groups and working parties of ITU-R are exploring technical and spectrum management issues. For example, Study Group 5’s Working Party 5A42 has developed a preliminary draft new report on cognitive radio systems, which seeks to define the technical aspects and discuss the applications in the land mobile service that will be made possible once the technology matures and becomes more widely available.43 This report, which is still pending in WP5A, follows other ITU-R reports and recommendations, including Report ITU-R M.2225, adopted in 2011, which provided an initial introduction to cognitive radio technologies (in the land mobile service).44 In addition, the same working party held a workshop in conjunction with its November 2013 meeting, bringing together
80 Trends in Telecommunication Reform 2015

experts to provide a technical update on topics related to dynamic spectrum access.45
3.4.2 National developmentsMuch of the experimentation in sharing/DSA and new licensing approaches is occurring in the more developed countries with established reputations for exploring unconventional regulatory options. However, there are some pioneering efforts taking place in developing countries, particularly in the form of TVWS trials. Some of these experiences are summarized in this section.
TVWS trial in KenyaIn December 2012, the Communications Commission of Kenya (now the Communications Authority) received an application for permission to deploy a trial TVWS network in the country. The Commission responded in August 2013, granting a one-year permit to provide TVWS services at two designated rural locations, with three conditions:
• the operators obtain a Network Facilities Providers’ Licence at least at a Tier 3 level – or partner with an existing licensee;
81Trends in Telecommunication Reform 2015
Chapter 3Box 3.5: ITU-R Study Group 5’s Estimates of Spectrum Requirements
While the working parties of SG5 explore the technical aspects of TVWS and CRS in the land mobile service, another working party, 1B, is studying new potential spectrum management principles and approaches and is developing best practices in this regard. At its recent meeting, in January 2014, WP1B agreed to establish a Correspondence Group to assist in developing a preliminary draft new Report ITU-R SM.[DYNAMIC ACCESS] on spectrum management principles and engineering techniques for dynamic access to spectrum by radio systems employing cognitive capabilities.
These studies in the ITU-R build on existing Recommendations and Reports that document technology developments, such as software-defined radios, but also well-established spectrum management principles that are recognized and implemented worldwide, and which have proven their ability to accommodate new technologies for decades. These studies, which are ongoing, benefit from the participation of all stakeholders. They particularly take into account the concerns expressed by stakeholders whose services essentially rely on international coordination and cooperation (and who provide benefits to entire international community), such as meteorological, satellite, aeronautical, radio-navigation, and Earth observation services.
Many facets of DSA remain unclear, including the following technical and operational issues:
• required protection of ubiquitously deployed satellite Earth stations that are authorized but not recorded in central databases;
• difficulty in detecting very-low-power satellite transmissions and implementing systems able to sense such satellite transmissions;
• protection of aeronautical safety services, which are critical to the safe operation of aircraft, since even minimal levels of interference can put at risk the safety of operational aircraft; and
• protection of other space services (space-to-Earth) and passive services (radio astronomy, Earth exploration-satellite service and space research service) as well as radio-determination services.
The need to protect incumbents is an issue not only for sharing in a single band or a given location, but also in adjacent bands or when the new user is far away from the incumbent’s location.
Source: ITU.
• the applicants operate in the 470-694 MHz band only on a non-interference, non-protected and non-exclusive basis; and
• all equipment had to be type-approved by the regulator before installation and deployment.
The operators were required to deliver a report to the Commission on the performance of the system and its compliance with all conditions. The Commission reviewed the report and decided not to grant, at the present time, an operational licence. This followed some mixed trial results related to the quality of service provided.46 The Commission described its approach as a cautious one, given the importance of the existing broadcasting services. Box 3.6 describes other examples of TVWS deployments.
TV White space trial in Cape TownThe Independent Communications Authority of South Africa (ICASA) supported a TVWS trial in Cape Town during six months in 2013. The trial was carried out by a consortium of partners that included Google and the
Tertiary Education and Research Network of South Africa (known as TENET), as well as the E-schools Network, the Wireless Access Providers’ Association (WAPA) and the CSIR Meraka Institute. Multiple base stations were installed at Stellenbosch University’s Faculty of Medicine and Health Sciences in Tygerberg, delivering broadband network access to ten schools within a 10-kilometer radius. Although the trial officially ended on 25 September 2013, Meraka recommended to ICASA that the service to the schools be continued.47
Testing showed that even during peak periods, average download throughput was above 2 Mbit/s, and off-peak downloads averaged in excess of 10 Mbit/s. Upload speeds during most of the trial varied within a range of just under 2.5 Mbit/s to just over 4 Mbit/s.48 Moreover, the trial system operated without causing any detected or reported interference to TV receivers in the area.
The concluding report indicated that TVWS could co-exist and share spectrum with broadcasting, and that allowing it would constitute a more efficient use of spectrum.
82 Trends in Telecommunication Reform 2015
Box 3.6: Additional TV White Spaces Initiatives in Developing Countries
Several additional trials and deployments of TVWS networks are occurring in developing countries, many of them as part of public-private partnerships or collaborations (see also Section 4.2.2). Some of these include:
• In the Philippines, a partnership involving the government, USAID and Microsoft has developed the ECOFISH project, which uses TVWS technology to deliver broadband Internet access, along with specialized government services and applications, to fishermen in several communities in the island province of Bohol. This will help attain the government’s goal to provide Internet access throughout the country by 2015.
• In May 2013, a pilot project was announced in Dar es Salaam, Tanzania. Microsoft partnered with the Tanzanian Commission for Science and Technology (COSTECH) and local Internet service provider UhuruOne, utilizing TVWS to offer affordable wireless broadband to university students and faculty. The pilot’s initial deployment will target the University of Dar es Salaam, among others.
• Singapore – the White Spaces Pilot Group (SWSPG) was established in April 2012 with support from the Infocomm Development Authority (IDA). The objective of the group is to deploy White Spaces technology pilots in Singapore, thereby accelerating the adoption of White Spaces technologies globally. SWSPG aims to attract members from the public and private sectors, local and international industry, academic and research institutes and end-user organizations that could benefit from next generation broadband wireless connectivity.
Source: Author’s research http:// www. fiercewireless. com/ tech/ press- releases/ joint- gph- us- embassy- microsoft- press- release

The report also recommended developing multiple databases and promoting competition “to drive down costs and spur innovation.”49 More broadly, the organizers advocated promoting an internationally harmonized approach to TVWS device characteristics and certification, a regional approach to spectrum management for TVWS access and the further development of TVWS equipment standards.
Cognitive radio test-bed and trial in ChinaIn China, the Beijing University of Posts and Telecommunications has explored TD-LTE technology for cognitive radio systems in two bands: (1) the UHF band (698-806 MHz, and (2) the 230 MHz band. The Chinese approach includes a combination of both database technology and sensing, as a way to build reliability and preclude missed detection of incumbents. The approach involves using a database for “global” or general location of incumbent receivers, supplemented by a “local” implementation of cognitive sensing technology.50 A test bed has been developed for this approach, and field trials are being prepared in Hebei and Zhejiang provinces for the 230 MHz band.
Based on its experience, the University has developed a list of policy and regulatory challenges associated with cognitive radio systems in their development stage:
• Policy and Regulation Challenge 1 – Frequency authorization – Possible frequency band(s) for the systems or services implementing CRS should be authorised first while accounting for existing uses in the band(s).
• Policy and Regulation Challenge 2 – Frequency allocation – It is hard to find harmonised dedicated frequency band(s) worldwide or even nationwide. When multiple cognitive cellular systems coexist in the same spectrum band, each of them should have equal right to access the spectrum.
• Policy and Regulation Challenge 3 – Cross-border coordination – Radio frequency allocation regulations are different among countries and regions. Reaching agreement on cross-border
coordination related to CRS is a big challenge.
• Interference coordination – To decrease interference risk, regulatory models with clear definitions of the rights and responsibilities of both licensed and unlicensed spectrum users are needed.
• Type approval – For reconfigurable devices, the ability to alter operational frequency and transmission modes calls for a new method for type approval.51
Additional considerationsIt should be emphasized that TVWS and CRS are still new concepts, and they remain under study in the ITU, in several countries and at a regional level as well. Some CRS trials show promise, but only with the devices operating according to certain conditions – in particular a need to use a geo-location database. Sensing techniques alone are not sufficient at this juncture.
Moreover, standards for TVWS are under development by organizations such as ETSI and IEEE. Other technical questions relate to spectrum management issues, and even those countries that have already established some national spectrum management regulations covering DSA and related approaches have indicated that these are not definitive and may evolve, taking into account new experiences.
Another area for further work is at the bilateral and multi-lateral level among countries where cross-border issues may arise. Some general principles have already been identified, but no detailed answers are yet available. Other issues, which are not related specifically to spectrum management, involve the quality of service and a comparison between TVWS and other approaches that could provide the same service to the rural areas. These issues need to be discussed at the national level, looking at medium-term and/or long-term perspectives; perhaps as part of the larger discussion on the most efficient way to bridge the digital divide. In addition, the practical aspects of the type-approval process and real-time responses to possible cases of interference (e.g. enforcement) need also to be addressed carefully.
83Trends in Telecommunication Reform 2015
Chapter 3
3.5 Conclusion
For the last ten years (since DFS was introduced), a new paradigm in spectrum management has been gaining momentum. It consists of considering spectrum access as dynamic, rather than static. Taken to its ultimate vision, this new paradigm imagines a dynamic environment in which devices and networks flexibly adapt to constraints in spectrum access with agility and mobility, much the way passengers negotiate a crowded train station or vehicles form lanes on a highway. As with those examples, there would be a set of rules and rights, often built in as software “policy” within the networks and devices themselves. Or, licensing and equipment certification would set the rules, along with coordination and negotiation among classes of users.
The traditional models of spectrum distribution are now evolving into hybrids that respond to the economic needs of telecommunication operators, equipment manufacturers and users. At the same time, these hybrids often retain the administrative and public policy hand-holds that regulators and government users need to fulfill their missions. Meanwhile, new ways of expanding spectrum access are being enabled by developing technologies or licensing approaches intended to ensure coexistence with incumbent spectrum users.
It is important not to lose sight, however, of the fact that core spectrum licensing techniques still function well in a majority of economies and spectrum bands. Regulators need not abandon proven approaches that
have worked for their stakeholders, even as they explore potential new approaches to spectrum sharing and management. Some of these new approaches may turn out to be less advantageous or necessary than first thought, and they are likely to evolve further as administrations try new rules and learn from each other.
There is also the potential for unforeseen consequences. Ten years ago, for example, the FCC’s Part 15 rules for unlicensed use of short-range devices came into conflict with a US government mandate that Federal agencies engage in narrow-banding to use spectrum more efficiently. The U.S. Department of Defense shifted some radio operations onto bands that it held as assignments (but had not previously used widely), only to find that these bands were popular with manufacturers of unlicensed wireless garage-door openers. The garage-door openers, being unlicensed, had no rights to claim protection from interference by the Defense Department – but that did not prevent the manufacturers from descending on Washington to plead for relief.52 It is a parable of how attempts to utilize new approaches to improve spectrum efficiency and sharing can, at times, collide.
For policy-makers interested in pushing ahead to pioneer options for spectrum management, the potential risks seem worth taking; they are providing options that can be applied – if and when they mature, and when and where needed. Meanwhile, it will be interesting to watch and see whether these new sharing experiments really turn out to be new frontiers in licensing, or simply the Wild West.
84 Trends in Telecommunication Reform 2015

Endnotes1 White spaces previously was known as “TV white spaces” because of the early pioneering of
this sharing technique in the UHF television broadcasting bands.
2 See Voyager Fact Sheet, NASA, http:// voyager. jpl. nasa. gov/ news/ factsheet. html.
3 See “Exploring the Value and Economic Valuation of Spectrum,” ITU-D Regulatory and Market Environment, Broadband Series, April 2012, www. itu. int/ broadband.
4 This issue is discussed in detail in ITU-R Report SM.2012 “Economic aspects of spectrum management,” which analyses financial and economic mechanisms that contribute to effective management of frequencies and spectrum efficiency.
5 Walls, John, “Wireless Spectrum Crisis,” commentary in online version of The Washington Post, (20 March 2013), http:// www. washingtonpost. com/ sf/ brand- connect/ wp/ 2013/ 03/ 20/ wireless- spectrum- crisis/ .
6 Largent, Steve, “Why Wireless Needs More Spectrum,” commentary in Politico, (6 February 2013), http:// www. politico. com/ story/ 2013/ 02/ wireless- spectrum- boost- fuels- growth- 87272. html.
7 See http:// www. itu. int/ rec/ R- REC- SM. 1132/ en
8 As an example, from the U.S. FCC: “On January 1, 2013, all public safety and business industrial land mobile radio systems operating in the 150-512 MHz radio bands must cease operating using 25 kHz efficiency technology, and begin operating using at least 12.5 kHz efficiency technology. This deadline is the result of an FCC effort that began almost two decades ago to ensure more efficient use of the spectrum and greater spectrum access for public safety and non-public safety users.” See http:// transition. fcc. gov/ pshs/ public- safety- spectrum/ narrowbanding. html .
9 The U.S. FCC, for example, decided in 2000 to allow all commercial wireless service licensees to engage in partitioning and disaggregation of licenses. It defined those terms as follows: ‘`Partitioning’ is the assignment of geographic portions of a radio license along geopolitical or other boundaries. ‘Disaggregation’ is the assignment of discrete portions or ‘‘blocks’’ of spectrum licensed to a geographic licensee or other qualifying entity.” See Federal Register/ Vol. 65, No. 114 / Tuesday, June 13, 2000 / Rules and Regulations, http:// www. gpo. gov/ fdsys/ pkg/ FR- 2000- 06- 13/ pdf/ FR- 2000- 06- 13. pdf.
10 ITU and infoDev, ICT Regulation Toolkit, https:// www. ictregulationtoolkit. org/ en/ toolkit/ docs/ Document/ 3274.
11 Ibid, Module 6, section 5.1, “What constitutes an effective regulator?”
12 OECD, “Secondary Markets for Spectrum: Policy Issues,” Working Party on Telecommunication and Information Services Policies, Directorate for Science, Technology and Industry, DSTI/ICCP/TISP(2004)11/FINAL, (20 April 2005).
13 See Ofcom “Trading Guidance Notes,” OfW513, (December 2011), http:// stakeholders. ofcom. org. uk/ binaries/ spectrum/ spectrum- policy- area/ spectrum- trading/ tradingguide. pdf.
14 Kelly, Robert B. and Ann J. LaFrance, “Spectrum Trading in the EU and the U.S. – Shifting Ends and Means,” Chapter, Squire Sanders publication,( 2012), http:// www. squiresanders. com/ files/ Publication/ 8ce3ed01- 56b5- 475a- af16- 969ee634df4f/ Presentation/ PublicationAttachment/ 9ff7086b- 589b- 4fdd- bbc6- 970717b5837b/ Tel12_ Squire%20 Sanders_ ver4. pdf.
15 OECD, Secondary Markets report, p. 5.
85Trends in Telecommunication Reform 2015
Chapter 3
16 ee for example, Ofcom UK, “Implementing Spectrum Trading,” consultation paper, (July 2002), http:// www. ofcom. org. uk/ static/ archive/ ra/ topics/ spectrum- strat/ consult/ implementingspectrumtrading. pdf.
17 ee: http:// www. itu. int/ rec/ R- REC- SM. 1603/ en
18 T-Mobile blog post, http:// support. t- mobile. com/ community/ coverage/ blog/ 2013/ 12/ 17/ network- modernization- update
19 Mitra, Sounak, “Refarming of Spectrum May Emerge as $10 Billion Business Opportunity for Equipment Makers, Business Standard, New Delhi, (4 December 2013), http:// www. business- standard. com/ article/ companies/ refarming- of- spectrum- may- emerge- as- 10- bn- business- opportunity- for- equipment- makers- 113120400893_ 1. html. Also, see “Telecom Commission for Refarming Entire Spectrum in 900 MHz Band, The Hindu, (17 October 2012), at http:// www. thehindu. com/ business/ Industry/ telecom- commission- for- refarming- entire- spectrum- in- 900- mhz- band/ article4005442. ece? css= print.
20 Fujitsu, “High-Capacity Indoor Wireless Solutions: Picocell or Nanocell,” information paper, pg. 1,http:// www. fujitsu. com/ downloads/ TEL/ fnc/ whitepapers/ High- Capacity- Indoor- Wireless. pdf. See also, Baines, Rupert, “The Crib Notes for Nanocells 101,” OSP magazine (blog), at http:// www. ospmag. com/ issue/ article/ The- Crib- Notes- for- Nanocells- 101.
21 Calabrese, Michael, “Solving the Spectrum `Crunch’: Unlicensed Spectrum on a High-Fiber Diet,” New America Foundation, (October 2013), p. 7, http:// www. twcresearchprogram. com/ pdf/ TWC_ Calabrese. pdf.
22 Tristant, Philippe, Frequency Manager of Meteo France. “RLAN 5 GHz Interference to Weather Radars in Europe,” presentation to ITU/WMO Seminar on use of radio spectrum for meteorology: Weather, Water and Climate Monitoring and Prediction,” (16-18 September 2009).
23] IEEE, available at http:// standards. ieee. org/ findstds/ standard/ 802. 11h- 2003. html.
24 Data from Wi-Fi Alliance, http:// www. wi- fi. org/ certified- products- advanced- search.”
25 See http:// chimera. labs. oreilly. com/ books/ 1234000001739/ ch05. html#additional_ planning_ considerations.
26 Jabbusch, Jennifer, “Dynamic Frequency Selection Part 3: The Channel Dilemma,” http:// www. networkcomputing. com/ wireless- infrastructure/ dynamic- frequency- selection- part- 3- the- channel- dilemma/ a/ d- id/ 1234489?.
27 SATRC Working Group on Spectrum, “Challenges of Future Technologies in Spectrum Management: Cognitive Radio,” Adopted by 13th Meeting of the South Asian Telecommunications Regulators’ Council, (18-20 April 2012), Kathmandu, Nepal.
28 Federal Communications Commission , “FCC increases Availability of Spectrum for High-Speed, High-Capacity WiFi and other Unlicensed Uses in the 5 GHz Band,” Press Release, (31 March 2014).
29 Federal Communications Commission, “Flexibility for Delivery of Communications by Mobile Satellite Service Providers in the 2 GHz Band, the L Band, and the 1.6/2.4 GHz Bands; Review of the Spectrum Sharing Plan Among Non-Geostationary Satellite OrbitMobile Satellite Service Systems in the 1.6/2.4 GHz Bands,” Report and Order and Notice of Proposed Rulemaking, IB Docket Nos. 01-185 and 02-364, FCC 03-15, 18 FCC Rcd 1962 (2003).
30 SkyTerra was acquired by LightSquared in July 2010.
86 Trends in Telecommunication Reform 2015

31 According to the U.S. Federal Register, the FCC , responding to a request by Globalstar, “proposed to modify its rules for operation of the Ancillary Terrestrial Component (ATC) of the single Mobile-Satellite Service (MSS) system operating in the 2483.5-2495 MHz band [i.e., Globalstar]. The proposed rule changes would allow the MSS operator to deploy a low-power terrestrial broadband network that would operate in both Globalstar’s licensed spectrum at 2483.5-2495 GHz, and, with the same equipment, spectrum in the adjacent 2473-2483.5 MHz band used by unlicensed devices.”
32 Federal Communications Commission, “Fixed and Mobile Services in the Mobile Satellite Service Bands at 1525-1559 MHz and 1626.5-1660.5 MHz, 1610-1626.5 MHz and 2483.5-2500 MHz, and 2000-2020 MHz and 2180-2200 MHz,” Report and Order, Docket No. 10-142, FCC 11-57, paragraphs 17-18.
33 See, with regard to Canada, http:// www. cata. ca/ Media_ and_ Events/ Press_ Releases/ cata_ pr05171302. html. For TVWS in the UK, see http:// stakeholders. ofcom. org. uk/ spectrum/ tv- white- spaces/ . And in the U.S., see http:// www. fcc. gov/ encyclopedia/ white- space- database- administration- q- page.
34 European Commission, Directorate General for Communications Networks, Content and Technology, Radio Spectrum Policy Group, “RSPG Opinion on Licensed Shared Access,” RSPG13-538, (12 November 2013, p. 22.
35 CEPT provides technical guidance, planning and coordination for its European member states, including in the area of spectrum allocation and management.
36 Espinosa, Bruno, “LSA in the 2.3-2.4 GHz Band,” presentation on behalf of the European Communications Office at the Trial LSA Workshop, Helsinki, (3 September 2013), slide 4.
37 Ibid, slide 7.
38 Federal Communications Commission, “Amendment of the Commission’s Rules with Regard to Commercial Operations in the 3550-3650 MHz Band,” Notice of Proposed Rulemaking, GN Docket No. 12-354, (2012).
39 National Telecommunications and Information Administration, “An Assessment of the Near-Term Viability of Accommodating Wireless Broadband Systems in the 1675-1710 MHz, 1755-1780 MHz, 3500-3650 MHz, and 4200-4220 MHz, 4380-4400 MHz Bands (President’s Spectrum Plan Report),” (November 2010).
40 The FCC also has proposed adding the 3650-3700 MHz band to the allocation, amounting to 150 MHz of spectrum that could be utilized, in a managed way, for broadband sharing. See FCC press release on “FCC Proposes to Make 150 MHz of Spectrum Available for Broadband” at http:// www. fcc. gov/ document/ fcc- proposes- make- 150- mhz- spectrum- available- broadband
41 Parker, Tammy, “FCC’s Latest Proposal for 3.5 GHz band Includes Auctioned Licences,” FierceWirelessTech, (23 April 2014), downloaded 25 May, at http:// www. fiercewireless. com/ tech/ story/ fccs- latest- proposal- 35- ghz- band- includes- auctioned- licenses/ 2014- 04- 23
42 SG5 is the technical group for wireless terrestrial services. Its Working Party 5A explores land mobile services other than IMT, which is under the aegis of WP5D.
43 See Annex 20 to Document 5A/421-E, Preliminary Draft New Report ITU-R M.[LMS.CRS2], “Cognitive Radio Systems [(CRS) applications] in the land mobile service,” Annex 20 to the Working Party 5A Chairman’s Report, (2 December 2013).
44 See http:// www. itu. int/ pub/ R- REP- M. 2225
45 See http:// www. itu. int/ en/ ITU- R/ seminars/ rsg/ RWP5A- 2013/ Pages/ default. aspx
87Trends in Telecommunication Reform 2015
Chapter 3
46 Haji, Mohamed A., Communications Commission of Kenya, “Licensing of TV White Space Networks in Kenya,” presentation to ITU-R WP1B workshop on Spectrum Management Issues on the Use of White Spaces by Cognitive Radio Systems, (20 January 2014).
47 See http:// www. tenet. ac. za/ tvws
48 Hart, Arno, “Cape Town TV White Space Trial,” presentation to ITU-R WP1B workshop on Spectrum Management Issues on the Use of White Spaces by Cognitive Radio Systems, (20 January 2014).
49 Ibid, slide 27.
50 Feng, Zhiyong, “Cognitive Cellular Systems in China: Challenges, Solutions and Testbed,” presentation to ITU-R WP1B workshop on Spectrum Management Issues on the Use of White Spaces by Cognitive Radio Systems, (20 January 2014).
51 Ibid, slide 14.
52 U.S. Government Accountability Office, “Potential Spectrum Interference Associated with Military Land Mobile Radios,” GAO-06-172R, (1 December 2005).
88 Trends in Telecommunication Reform 2015
4 Big Data - Opportunity or Threat?
4.1 The opening
Google can predict the spread of the seasonal flu from Internet search queries it receives. Airplane engine manufacturers can predict when an engine part will break before it actually does, allowing that part to be changed at a convenient time and place, rather than when the airplane is in mid-flight. A startup company, Inrix offers a smartphone app that helps about one hundred million users every day to drive from home to work and back; providing real time information that allows them to avoid heavy traffic. And a Dutch mobile phone operator discovered that changes in the signal strength of cell towers could be translated into local weather data, thus giving the operator a potentially lucrative and very comprehensive network of thousands of weather stations capturing real-time data.
All these are examples of Big Data; our ability to gain insights from large amounts of data that would not be attainable from much smaller amounts; and that in turn leads not only to higher efficiency, but also to innovative new products and services. Much like in other instances, an increase in quantity results in a change in quality. We have seen this in the past. If one takes a photo of a horse galloping across the field every minute, then they are just a group of still photos. But if one takes a photo every sixteenth of a second, and shows the resulting images in fast succession, the vast increase in the quantity of captured information translates into a new quality: motion,; and the film industry was born. Something similar is now happening with Big Data.
In essence, Big Data offers a new perspective on reality, and therefore will affect and shape all sectors of the economy, especially those that play a role in the capturing and/or relaying of data and information. But Big Data’s likely impact will be felt beyond the economy; it affects how societies make sense of the world, decide important policy
challenges, and as you will read, it is having a profound impact on innovation.
This chapter is divided into four main parts: the chapter will begin by defining the concept, next, the contributions that Big Data offers to society and individuals will be explained; attention will then be drawn to some of the inherent risks of this powerful new technological tool; and finally, the chapter will conclude with regulatory and policy considerations that should be accounted for when crafting future policy.
4.2 Setting the stage
Over the past few years, the world of Big Data has rapidly evolved; both in the marketplace and in the research community. What we thought we knew just a few years back is now either changed or refined. Further, as in many other areas, the rules governing Big Data have been slow to adapt. The intent of this chapter is to offer a foundation; showing what Big Data is, explaining its recent history, and looking at where ICT regulators, policy makers and other authorities, such as competition authorities or data protection authorities (collectively known as Regulatory Authorities) have set or should set some boundaries. The chapter aims to provide a stronger appreciation both nationally and globally of what the term Big Data means and the various perspectives that are shaping current discussions.
More specifically, this is a chapter about Big Data, and its characteristics, its history, its future and most importantly what Regulatory Authorities can and should do to meet the challenges it poses without dampening the opportunities and benefits it can provide. It utilizes the diversity in the practicalities and uses of Big Data to increase awareness of the benefits and the risks; placing it in a context that allows for understanding of where the industry has been and where it could be going. For regulators, the question is: what can, or should, be done to carry out their responsibilities? Recognizing that no two
Authors: Andrew J Haire, Chairman, AJH Communications & Dr. Viktor Mayer-Schönberger, Professor, Oxford Internet Institute
89Trends in Telecommunication Reform 2015
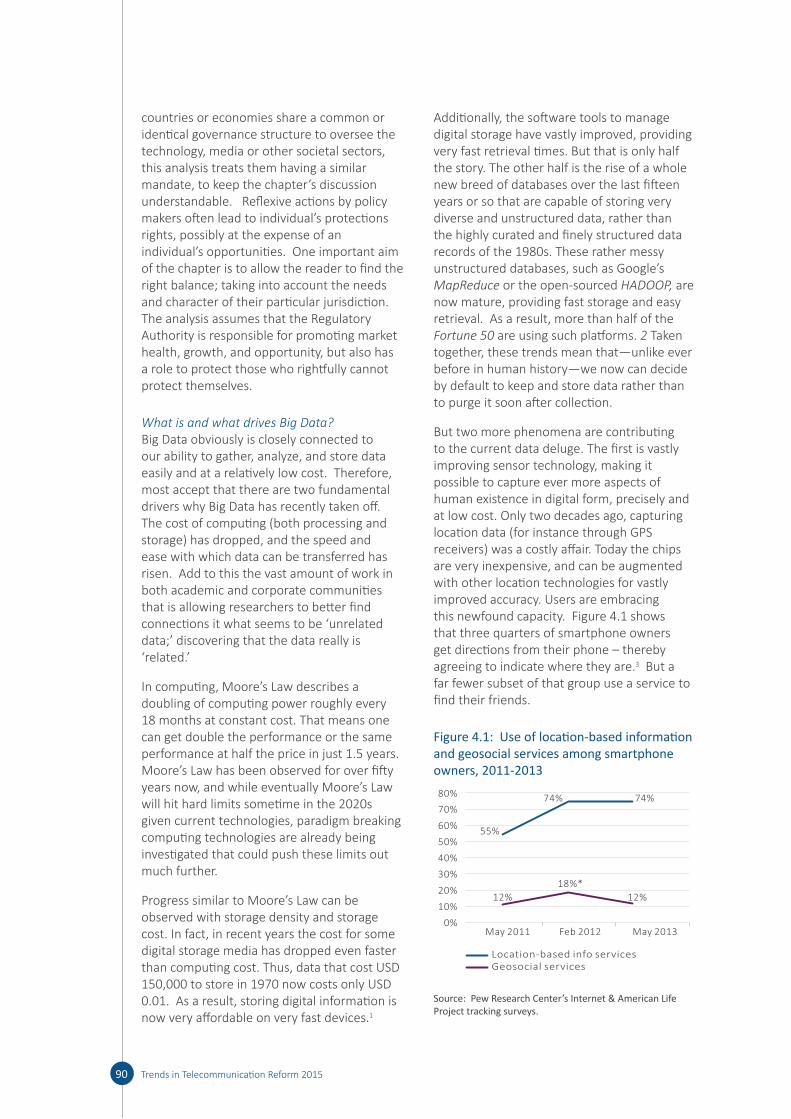
countries or economies share a common or identical governance structure to oversee the technology, media or other societal sectors, this analysis treats them having a similar mandate, to keep the chapter’s discussion understandable. Reflexive actions by policy makers often lead to individual’s protections rights, possibly at the expense of an individual’s opportunities. One important aim of the chapter is to allow the reader to find the right balance; taking into account the needs and character of their particular jurisdiction. The analysis assumes that the Regulatory Authority is responsible for promoting market health, growth, and opportunity, but also has a role to protect those who rightfully cannot protect themselves.
What is and what drives Big Data?Big Data obviously is closely connected to our ability to gather, analyze, and store data easily and at a relatively low cost. Therefore, most accept that there are two fundamental drivers why Big Data has recently taken off. The cost of computing (both processing and storage) has dropped, and the speed and ease with which data can be transferred has risen. Add to this the vast amount of work in both academic and corporate communities that is allowing researchers to better find connections it what seems to be ‘unrelated data;’ discovering that the data really is ‘related.’
In computing, Moore’s Law describes a doubling of computing power roughly every 18 months at constant cost. That means one can get double the performance or the same performance at half the price in just 1.5 years. Moore’s Law has been observed for over fifty years now, and while eventually Moore’s Law will hit hard limits sometime in the 2020s given current technologies, paradigm breaking computing technologies are already being investigated that could push these limits out much further.
Progress similar to Moore’s Law can be observed with storage density and storage cost. In fact, in recent years the cost for some digital storage media has dropped even faster than computing cost. Thus, data that cost USD 150,000 to store in 1970 now costs only USD 0.01. As a result, storing digital information is now very affordable on very fast devices.1
Additionally, the software tools to manage digital storage have vastly improved, providing very fast retrieval times. But that is only half the story. The other half is the rise of a whole new breed of databases over the last fifteen years or so that are capable of storing very diverse and unstructured data, rather than the highly curated and finely structured data records of the 1980s. These rather messy unstructured databases, such as Google’s MapReduce or the open-sourced HADOOP, are now mature, providing fast storage and easy retrieval. As a result, more than half of the Fortune 50 are using such platforms. 2 Taken together, these trends mean that—unlike ever before in human history—we now can decide by default to keep and store data rather than to purge it soon after collection.
But two more phenomena are contributing to the current data deluge. The first is vastly improving sensor technology, making it possible to capture ever more aspects of human existence in digital form, precisely and at low cost. Only two decades ago, capturing location data (for instance through GPS receivers) was a costly affair. Today the chips are very inexpensive, and can be augmented with other location technologies for vastly improved accuracy. Users are embracing this newfound capacity. Figure 4.1 shows that three quarters of smartphone owners get directions from their phone – thereby agreeing to indicate where they are.3 But a far fewer subset of that group use a service to find their friends.
Figure 4.1: Use of location-based information and geosocial services among smartphone owners, 2011-2013
70%
60%
50%
40%
30%
20%12%
55%
12%
74%74%
18%*
10%
0%May 2011 May 2013Feb 2012
Location-based info servicesGeosocial services
80%
Source: Pew Research Center’s Internet & American Life Project tracking surveys.
90 Trends in Telecommunication Reform 2015

Sensors are now available for everything from detecting movement and acceleration, to capturing environmental data (temperature, atmospheric pressure, UV exposure), to the now booming field of health monitoring (heart rate, blood oxygenation, even blood sugar levels). Other sensors capture vibration, weight, distention and many other aspects of physical properties. For example, in the mid-2000s sensors were placed on experimental basketballs to calculate spin, location and trajectory – and more importantly, to help determine if the shot would ‘go in,’ and if not, why not. Soon sensors will go even further, capturing aspects such as smell with far greater precision than today.
Of course, the most versatile sensors, so to speak, are humans themselves. Revealing data about themselves, or even more importantly about others, on social networking sites, through fitness, health and quantified-self data platforms accounts for another substantial portion of the increased data streams available.
While much of the data we create is evident and even viewable (we write an email and we see the results), we also leave behind transparent fingerprints everywhere we go. We have a phone that knows our movements, but what about the surveillance camera that image-identifies us; the airport scanner that knows what we travel with; the credit card that knows our eating habits down to the food we like? Our cars know where we drive, when we drive, and how fast; our library card knows what we read and view; our health monitor (if we choose to own one) knows where and when we walk, run, cycle – and even what our heart rate is. And all of this data can be saved, stored, communicated and under some circumstances, shared. In sum, data about where you have been, where you are, and even where you might be going, is being collected at rates faster than ever before.
In a novel experiment, and subsequent research paper4 three members of the Computer Science Department at the University of Rochester, (New York, USA) explored the relationship between people’s location, their interactions and their social ties through a social network. Amazingly, even if a person deliberately created themselves online-
self as “dark” – making them private and invisible – this analytical approach (referred in their work as ‘Flap’) would be able to predict that person’s physical location within 100 meters with an accuracy of 47 per cent.
The second phenomenon that is contributing to the increase in Big Data is networking speed and reach. Data bandwidth is continuously increasing by leaps and bounds throughout the world, both in wired and wireless networks. LTE wireless networks rolled out in many large metropolitan areas around the globe provide broadband speeds that were available only on wired networks just a few years ago. Moreover, relatively recent deployments of backbone networks and undersea cables have connected geographic areas around the world to the Internet that have long been underserved. East Africa is a particularly salient case in point here. As networks become more powerful, and reach farther, more and more data can be shared, and with more people. More importantly, however, it means that more data can be gathered, combined and analyzed together to further advance Big Data insights.
How much and how fast is the data in the world growing?The best “guestimates” of the total amount of data in the world suggest that from 1987 to 2007 the total amount of analog and digital data in the world grew from 3 billion gigabytes to 300 billion gigabytes, a 100-fold increase in just two decades.5 In research by Cisco, the computer manufacturer has added color to the profound scope of the data that exists and is being created.6 Today, 75 per cent of data is created by individuals through activities such as emails, documents, and downloading movies, to name a few. Figure 4.2 shows some of the ways in which data is growing every day.
Data growth has also been accelerating recently. More than 90 per cent of all data that exists was created in the last two years.7 IDC, a research firm, predicts that there will be 44 times more digital data by the end of 2020 than there was in 2009 - or put differently - the amount of digital data doubles every 20 months. And it is not just people that are creating data. A Boeing 777 airplane generates a terabyte of data during
91Trends in Telecommunication Reform 2015
Chapter 4

a three hour flight; and after 20 such flights it has generated more data than presently is in the world’s largest library. As technology improves, the aircraft will be capable of capturing up to 30 terabytes from its sensors.8
As a result of this growth, many (especially Internet) companies are drowning in data. Over one hundred million photos, for instance, are uploaded to Facebook every single hour, much like an hour of video on YouTube is uploaded every second. Google is said to process well over a petabyte of data every single day – which is equivalent to 100 times the entire amount of data stored in the largest library in the world, the U.S. Library of Congress.
Governments too, are considering what to do with the large amounts of data they collect. Throughout the world, a growing number of projects are under way to make the vast troves of data collected by governments publicly available so that individuals and companies can use it. Often termed “open data,” these initiatives not only aim to improve public [knowledge?], they also seek to improve accountability, stimulate democratic deliberation and increase participation through improved transparency. Governments also see “open data” as a non-monetary way to incentivize and facilitate big data entrepreneurship and innovation; it is a “data subsidy” instead of the more traditional (and much more costly) monetary subsidy, and has led to literally thousands of
applications around the globe. Additionally, the World Wide Web Foundation (www. webfoundation. org), based in Switzerland, is fostering engagements with stakeholders to further develop Open Government Data (OGD) initiatives in low- and middle-income countries. The intent of these initiatives is to improve transparency and accountability, and thus increase the efficiency and effectiveness of government.
Aside from the rapid rise in the amount of data being generated, collected and stored, there is another shift taking place. Data that was in the past stored in an analogue format and not necessarily ready for analytics, is now in digital form, and this creates huge opportunities for analysis, indexing, mining. Voice, video and other visual content can be more efficiently diagnosed and analyzed and indexed for mining and identification with the other digital indices and of kept data. Historically this analogue medium grew slowly, held a relatively short shelf life, aged quickly, and provided an infrequent means to connect with existing digital data. The common and familiar storage formats were tape cassettes, vinyl records, and celluloid film. Sound was (and to a degree still is) analogue. Today, sound and images – Skype and YouTube, to name just two - are digitized before they are transmitted. But this all is changing. In the year 2000, three quarters of data had been analog, now more than 99 percent of data in the world is digital. Figure 4. 3 illustrates the rapid rise in digital storage.
92 Trends in Telecommunication Reform 2015
Figure 4.2: Growth of Data
2005
4006008001,0001,2001,4001,6001,8002,000 BILLION GIGABYTES
DIGITAL INFORMATIONCREATED EACH YEAR, GLOBALLY
Location-tagged paymentsmade in the U.S. annually
65 BILLION
2006 2007 2008 2009 2010 2011
$
U.S. adults whose location isknown via their mobile phone
87%E-mails sentper day
Expected increase inglobal data by 2020
154 BILLION
2,000%Video and photos
stored by Facebook,per user
IIIMEGABYTES
Percentage of all digitaldata created by consumers
75%
Source: IDC, Radicati Group, Facebook, TR research, Pew Internet.

It is tempting to look at this accelerating deluge of data and think of it, and its drivers, as capturing and being the essence of Big Data. Research firms and other corporate stakeholders, such as Gartner, McKinsey and IBM, and institutions such as the ITU have put forward a plentitude of acronyms and labels to encapsulate Big Data’s qualities, such as the often-used three Vs of (high) volume, (high) velocity, and (high) variety (see Figure 4.4). Some also offer a fourth V: veracity – or simply the believability of the data itself. The ITU’s Technology Watch Report from November 2013 further addresses the meaning and uses of Big Data, but we believe that the definition here lends itself to a more qualified treatment, if for no other reason than the Big Data landscape has evolved so dramatically recently. This will be explored further below.
Figure 4.4: Big Data Characteristics: the three Vs
Volume
Velocity Variety
• Exabyte
• Records
• Sensory
• Location
• Batch
• Realtime
• Streaming
• Structured
• Semi-structured
• Unstructured
3Vs
In particular, we suggest that these characteristics fail to fully capture what Big Data is really all about. To understand Big Data, it is necessary to understand how humans have made sense of the world so far. For millennia people have done so by observing the world, and gaining insights from their observations. For hundreds of years, we have systematically captured data, and evaluated it to reveal ever more details about reality. But
93Trends in Telecommunication Reform 2015
Chapter 4
Figure 4.3: The Rise of Digital Storage
1986
1%
1993
3%
2000
25%
50%
Analog S
tora
ge
Digital Storage
Global Information Storage Capacityin optimally compressed bytes
- Portable media, flash drives: 2%- Portable hard disks: 2.4%- CDs and minidisks: 6.8% - Computer servers and mainframe hard disks : 8.9%- Digital tape: 11.8%
2007
- Paper, film, audiotape and vinyl: 6%- Analog videotapes: (Vhs, etc): 94%
Analog19 exabytes 2002
“Beginning of the Digital age”
Digital0.02 exabytes
Analog2.6 exabytes
- DVD/Bluray: 22.8%
- PC hard disks: 44.5% 123 billion gigabytes
*Others: < 1% ?...
Digital280 exabytes
94%% Digital
Dig
ital
An
alo
g
Source: Source: M. Hilbert and P. Lopez, The World Capacity to Store, Communicate and Compute Information, 2011.
capturing data has always been extraordinarily costly and difficult, and so was analyzing and storing that data.
So to save cost and time, humans have devised methods and mechanisms, institutions and processes to answer questions by collecting and analyzing as little data as was absolutely necessary to do so. Because of cost, we chose to live and think in a world of Small Data – and we understand reality based on this constraint. If the constraint of capturing, analyzing and storing data goes away, we can rethink our deeply rooted traditions of how we make sense of the world around us. This is what Big Data is all about: it is a new lens on reality, capturing not just a simplified version of it that gave us a first (but often blurry) glimpse, but a detailed version that captures and illuminates reality comprehensively and in its full complexity.
Hence, the defining qualities of Big Data are deeper and more profound than what often is suggested. The three terms that capture this are: more, messy and correlations.
• More: This means that we can now capture and analyse more data than before (when we relied on small samples and subsets of data) relative to the phenomenon we want to understand or the question we want to answer. This allows us to look into details with unprecedented clarity, and even more importantly, we can answer questions that we did not even think of when we collected the data (which is often impossible when just relying on a data sample). This is what experts mean when they say that we can now “let the data speak.” So what counts is not the absolute number of data points (the “volume”), but the relative number of data points that are captured that allows us to see reality as it is.
• Messy: In the times of Small Data, researchers spent a lot of effort ensuring that the limited number of data points that were captured and analysed were of high quality. That is understandable. If there are only 100 data points, getting 20 of them wrong will skew the result, leading to bad consequences; what is sometimes called GIGO – “garbage in, garbage out.”
But in the age of Big Data, our ability to capture many more magnitudes of data will make it more cost-effective to collect more data--even if the data is of varying quality—rather than accruing great cost at capturing little data at high quality. It is not that we give up on exactitude entirely; it is only that we give up our singular devotion to it. What we possibly lose on the micro level, we more than make up for in insight at the macro level.
• Correlations: Humans always strive to find causes for what they observe and experience. This comforts us and gives us the sense that we understand the world. But often the causes we identify are simply wrong. Statisticians have long made the point that most statistical analysis is not able to determine causalities, but only identifies correlations – seeming connections within the data. Correlations do not explain why things are happening, but they can show what is happening, and that alone can be an important insight.
Taken together, more and messy data, analyzed often first through identifying correlations gives us a very unique, very powerful, and comprehensive lens into reality, and allows us to make predictions about the present and the future. At its core, this is what Big Data is all about. For instance, large retailer Wal-Mart, through a Big Data analysis of transaction data discovered that before a hurricane, people buy batteries and flashlights, as one would expect. But they also discovered through correlational analysis that people bought Pop Tarts, a sugary snack. For Wal-Mart it does not matter why people buy Pop Tarts – but it is very valuable to know that people are buying Pop tarts before a storm. That way, Pop Tarts can be moved to a more prominent location in the store, and more of them are sold. Similarly Amazon does not know why certain people buy certain products together with others, but the simple fact that they do drives Amazon’s product recommendation engine, and is said to be responsible for about 35 percent of Amazon’s revenues.
This does not make the quest for causal linkages superfluous, but it strongly implies that rather than venturing into often incorrect assumptions and suggestions of “why,” we are
94 Trends in Telecommunication Reform 2015
better advised to use correlational analysis to first understand “what” is going on. That in itself may sometimes be good enough; full of valuable insights that can help drive innovation. But such analysis also acts as a powerful filter to highlight what specific correlations should be investigated further in an effort to understand the underlying causes. Big Data makes such explorations far more cost-effective than ever before.
Derived from these defining qualities of Big Data, and in line with the drivers of Big Data identified above, the core economic principle of Big Data comes into focus. It is not that data can provide insights – humans have known that for millennia. It is that, as we move from an age of Small Data to an age of Big Data, what we do with data and how we extract value, especially economic value from it changes. In the Small Data age, not only was relatively little data collected, but it was almost always gathered with a specific purpose in mind. Once that purpose was fulfilled, the data had realized its value, and often was put aside, forgotten, or at times even actively purged because of high storage cost. In the age of Big Data the value of data is not exhausted by only applying the data to the purpose for which the data was originally collected. Rather, the value of data today is the sum of the many uses and reuses the data can be put to that might not have been obvious at the time of collection, but that turn out to reveal valuable insights in relation to new questions.
Eight PrinciplesBig Data has important consequences for how companies operate. The ways in which commercial entities collect, analyze and store data, can be summarized in the following eight general principles:
• Data Retention. In the Big Data age, it makes sense to store data long after it has fulfilled its original purpose, because it might still hold value if it can be reused for novel purposes. For instance, Google looks at old search queries to learn what mistakes people make when typing words, and thus is able to correct these mistakes automatically, leading to what arguably is the world’s best spell checker.
• Data Collection. In the Big Data age, it may make sense for commercial entities that can collect data to capture and store that data even if it cannot be used for a particular purpose yet, as the data may hold value for purposes that have not yet been recognized. As an example, Facebook is saving years of user input because that data holds latent value even though currently Facebook may not be able to fully extract that value.
• Data Primacy. It is data that holds value, and so those that have data (or have access to it) will be able to extract that value, while those that do not have data will suffer economically. This is the real meaning of the shorthand that data is the “new gold” or “new oil.” That analogy, however, is actually insufficient, as unlike physical resources such as gold or oil, the potent value of data is that its value is not exhausted by being used once. Unlike physical resources it can be recycled many, many times over and still provide value.
• Data Expertise. The expertise to extract the hidden value in data is very important for commercial entities, and currently there is a shortage of experts in this field. These data scientists are therefore in high demand and are able to command high salaries. Eventually, however, this will change as the labour markets adjust to this demand by creating an increasing supply of data scientists, much as they did in the past with telecommunication experts, software programmers, network engineers, or web designers.
• Data Mindset. Arguably more important than the technical expertise involved in analyzing big data sets is the strategic ability to see value in specific data, and understand how to exploit it. This is one of the reasons why a small (but growing) cadre of Big Data entrepreneurs has had serial successes in Big Data start-ups; even entering relatively crowded market spaces. Professor Oren Etzioni, who founded travel price forecaster Farecast and consumer goods forecaster decide.com is an excellent example.
• Non-linear Scalability of Data. Because data’s value increases with the possible number of connections between data points, having more data will
95Trends in Telecommunication Reform 2015
Chapter 4

disproportionally increase data’s value. It is Big Data’s network effect, and it means that scale efficiencies are neither linear nor step-linear, but follow a power law. More data means much more value. This will drive many large Big Data companies to acquire even more data.
• Reduced Barriers to Entry. Entering the Big Data market does not have to be difficult. Big Data start-ups do not have to invest heavily in technical infrastructure to process and store data. Unlike in the previous generation of start-ups, such as Facebook and Google, today’s Big Data start-ups can utilize cloud storage and cloud processing capacity provided by others that provides them with flexible, commodity-priced capabilities when they need it. This greatly reduces the barriers to entry, and creates strong incentives for companies and entrepreneurs to begin utilizing Big Data. So while the big may become bigger, the small and nimble still have a good chance to succeed.
• Data’s Utility. The utility of data is not necessarily tied to the economic sector the data’s holder is operating in. So for instance, a telecommunication service provider might find that it can use its network data to offer a weather data platform/service, or a car manufacturer may turn itself into a data platform for mobility and travel. This means that companies with traditional revenue streams and in established sectors may both find themselves able to enter other
sectors and add new revenue streams based on their ability to capture and analyse data, as well as also finding themselves competing against new entrants, including those from different sectors.
4.3 The opportunities
Big Data offers a great number of opportunities, which are canvassed in this section. The most obvious, improving efficiency, is of course very important for any economic player, and particularly important for players in sectors that offer largely commoditized products, such as in telecommunications. Lowering the cost of production of a product or service is essential, as businesses in these sectors struggle to stay profitable. It is thus understandable given the powerful nature of Big Data that the initial focus of businesses and business models has been Big Data’s impact on efficiency. For instance, a quick glance of Big Data applications that a major computer company, IBM, is developing emphasizes efficiency, as shown in Figure 4.5.
An efficiency strategy alone, however, is not going to be a long-term solution, as efficiencies only give relative (and often temporary) advantages vis-à-vis the competition, but are not creating new revenue streams (and thus business value) themselves. Fortunately, the real power and role of Big Data is not limited to enhancing efficiencies. In
96 Trends in Telecommunication Reform 2015
Figure 4.5: Enterprise applications with a focus on Big Data
Source: IBM.

fact, it goes far beyond that. Big Data creates new insights that will enable new products and services. Big Data is, perhaps more than anything else, a tool for innovation. The role of data thus changes, from an auxiliary function of enabling efficient transactions to becoming valuable itself, and thus turning into a source of revenue and profit. This section explores those opportunities from the perspectives of the enterprise, the individual and society, respectively.
4.3.1 For the enterprise McKinsey & Company, a consultancy, reported9
that “Big Data” generates significant financial value across: U.S. health care; EU public sector administration; personal location data; retail productivity; and manufacturing. They also found that: data has swept into the industry landscape and has become as important as capital and labor; ways exist to have data create value (more data drives improved accuracy, gives greater segmentation; and improves decision making and product development); data will become the competitive edge – more so in some sectors than others; better data use will provide productivity and efficiency gains; there will be a shortage of the talent necessary to exploit the data. Further research by MGI and McKinsey outlined where to uncover or unlock data within an organization that could transform into value. The interactive website10 effectively shows where expertise has been ‘invested’ based on industry and role. The key point remains that the skill to leverage and then interpret this data is in short supply.
Human Resource functions Based on an article in the Society for Human Resources Management’s publication11 human resource (HR) functions—from training to integrating a newly acquired company—can see improvements from the analytics provided by Big Data. HR activity has always been data-driven but with the newly available and vast amounts of additional data arriving from social media, analytics, and smartphones, HR professionals are challenged in using this data effectively and at the same time respecting the personal and private nature – and in some cases contextual nature - of its content. Many firms now use analytics in prescreening
applicants for new positions, and the simple wording a person chooses for a CV can make the difference between ‘filed for the future’ and the next round of interviews.
Telecommunication companies not only have vast amounts of operational and customer data, but also have enormous reach insofar as their networks are local, regional and global. One firm discovered that a variation in radio frequency transmissions at mobile base stations - data already received - preceded weather changes, and became a good predictor of pending weather. Much has been made of mobile providers sharing instances of high concentrations of their users at, for example, a public sporting event, to alert transportation and public safety authorities of pending congestion, allowing them to anticipate where congestion will occur (which road, what form of public transport). Big Data allows authorities to predict with a strong degree of accuracy who will be using public transport, and also where they will be going – thus allowing for a smooth degree of capacity planning. In another example of how companies can repurpose their network data, undersea cable systems are built with extensive monitoring equipment to detect seismic activity. Given that scientists believe seismic waves are the most powerful tool to study the earth’s structure, and that 2/3 of the earth’s surface is covered by ocean, these systems are a strong tool to help researchers improve prediction of future earthquake activity.
Changes to business modelsAdvertising. Advertising, as we once knew it, is dead. The approach of repeatedly showing images and pictures to consumers to reinforce or sell a brand is gone – probably forever. In its place are highly targeted messages, friends recommendations, and search term analysis that result in a profoundly more efficient and effective way to reach the exact consumer the company wants. CEOs have complained that there was no clear connection between ad spending and the resulting sales; often thinking that the former was highly inefficient. Many believe that there are better ways to invest their precious capital. Once ‘clicks’ started replacing TV viewing surveys about two decades ago, those CEOs started to gain
97Trends in Telecommunication Reform 2015
Chapter 4

the precision they so desperately wanted. Tools like Google AdSense and other integrated advertising platforms follow users from site to site as they browsed the web – they not only know what your interests are, but can observe how long you remain engaged – thus showing desire.
Sports. Recently the New York Times reported on a Facebook experiment to answer a vexing question that has swirled around the United States for over a century: “which is your favorite baseball team”, or put differently: “where are the fans.”12 Of course the issue is not cosmic, but it showed the power and precision of Big Data. This is a classic consumer research question, but in the past a survey might have tried to gain insights from several thousand people. This particular study, however, reached many millions of followers, allowing a far more significant degree of accuracy. To the street or even the postcode, the loyalties of fans were now known, but even more valuable, the survey showed which team was 2nd, 3rd, 4th, etc. The owners of the teams now know exactly where fans are, and more importantly are not. See Figure 4.6, where the darker shading is deeper fan interest, made possible by Big Data analytics.13 More importantly, they also know gender,
age, buying habits, and viewing habits – and if these habits are changing. Owners need not waste their advertising budgets to reach possible fans who are already are your fans. The difference between the old and the new is accuracy, primarily from the size of the sample, and the ease with which someone can identify what things they like and do not like.
4.3.2 For the individual as a consumer Individuals, too, benefit from Big Data. Although they may not perform the Big Data analytics themselves, individuals benefit from the ways various institutions can improve their products and services through Big Data. The following are just a few examples of how users benefit from Big Data.
More to store and save. For instance, more efficient production of goods or services will enable companies to compete more successfully in the marketplace, including on price. This will enable individuals to get the same service at lower price, or quantitatively more at the same price (or some combination thereof). One example of this is the continuously increasing size of free email inboxes with large free email providers. Google, for instance, now offers 15 GB of free
98 Trends in Telecommunication Reform 2015
Figure 4.6: U.S. baseball fans: where are they?
Source: New York Times.
space to individuals, but started out offering just 1 GB when it began operations in 2004.
Less road traffic. One of the easiest and in some cases most powerful applications for Big Data is to have individuals become the real-time source of data; something referred to as crowd sourcing. One such company, known as Waze (www. waze. com), offers individuals an app that determines a clear and quick path to avoid heavy traffic. After informing Waze of your destination, the app routes you based on the known speed of others on the same route who are also using the app. One of the many clever side-benefits arrives when fellow users warn of heavy traffic, a disabled car, or even hidden police traps – all of which are broadcast to others using the app as they approach the area.
Increased convenience. A small example from the grocery industry: ever wonder how your supermarket offers coupons to you on items you have not bought today, but might be of interest? If you belong to the market’s loyalty club, the company knows your buying habits (history), it knows what you bought today (checkout), it may even know its overstock (inventory), and it knows your location in their store. Bring those four data points together, and in real time the company can offer you that coupon as you push your cart down the aisle past what they want you to buy.
As Big Data facilitates innovation, and thus new products and services, individuals benefit from new as well as improved products and services. In short: consumers benefit from innovation fueled by Big Data.
4.3.3 For societyThe benefits to society at large of Big Data are starting to be felt. The following are just some of the examples of how Big Data can advance societal goals and serve government policy goals.
Medicine. We have touched on the point that the value of data increases when more data is collected. This phenomenon is becoming particularly evident in the field of medical care. The tension is that personal medical information is often viewed as quite private and personal, but the societal value of sharing information collectively is
enormous in researching and preventing the spread of disease. Medical researchers are continually looking for statistical significance in their work – but are often hampered by achieving consent from the individual, so the costs of each data point remain high (often exceeding USD 200 for each point). This then increases the cost to develop medication or even medical procedures to the millions and sometimes billions of U.S. dollars.
There should be strong incentives, mostly through public awareness and direct participation, that the sharing of medical history, under controlled circumstances can yield significant public gains. In a report by the World Economic Forum it was demonstrated that by engaging individuals in a trusted way, significant improvements were achieved among the population: an 18 per cent increase in the control of diabetes; a 20 per cent increase in the control of cholesterol and a marked difference in clinical outcomes in hospital performance where data was published and shared.
From 2003, some may recall the unknown nature of both the Severe Acute Respiratory Syndrome (SARS) infection and how it spread. With this uncertainty, the public in infected areas became obsessed by avoiding contact with anyone. In addition to the tragic consequences associated with SARS, it had far-reaching economic consequences. Faced with the prospect of an early symptom, the public had little choice but to precisely retrace where they recently had been, and more importantly, who they were in contact with – no easy task if you walked on a crowded street. Quarantines were often put in place for no other reason that a suspected infected person may have visited or walked nearby. As a result, workplaces were deserted, and commerce came to a halt.
Big Data, as we are starting to know now could now play a very useful role in tracking the movements of infected persons, and permitting society at large to be far better informed, and hopefully less alarmed, than a decade ago.
Pediatric medicine is another area where medical research can be improved through Big Data.14 Presently in pediatric intensive care
99Trends in Telecommunication Reform 2015
Chapter 4

units, measurement of patients is relatively limited, both in what is recorded and how often it is recorded. Under a significant research project in Southern California in the United States, work is being done to greatly expand the data captured, by placing sensors on the children. A major part of this project is to start ‘mining’ archived pediatric data and combining it with real-time data; hopefully allowing doctors access to far better analytical research, and leading to improved predictive medicine for patients needing rapid diagnosis.
Climate Change. Today, one of the most pressing global issues (and debates) is global climate change. The data collected combines historic facts about our earth – temperatures of air and sea, currents, - with present day observations from weather stations throughout the world. While there is not agreement about the future of climate change, there is almost universal agreement that it is caused—at least in part—by mankind – which of course means changes, even small ones, can be made to people’s behaviors. The analytical models to predict change depend heavily on Big Data, and the sharing of this data. Scientists will need to ensure that this data, no matter where and how it was collected, remains available in an unrestricted form. Advancements in science depend on this sharing.
Education. Online learning has been available for quite some time. In the last five years, however, substantial research and innovation has taken this approach to a broader level. Two computer science professors from Stanford (a U.S. university), Andrew Ng and Daphne Koller founded a for-profit company that offers what is called massive open online courses – or MOOCs.15 The difference is that courses are provided at no charge, the material is of a world class nature, and the number of students that have taken courses is measured in the hundreds of thousands. The courses are offered over a 6-10 week period, but each course has been designed to insure the student interacts with the material–each course contains video lectures, exercises, and occasional quizzes. Keystroke biometrics is used to check the identities of enrolled students – and the effectiveness of the material. Peers grade homework - and statistical methods are used to complete that
student’s assessment. The most important result of this process is that it has provided a unique view into human learning—a view that cannot be ignored given that the sample size is so large, which will hopefully lead to higher quality education.
Crime Prevention. Predictive technologies associated with Big Data are starting to play a significant role in determining an individual’s propensity to commit a crime. The U.S. cities of Memphis and Los Angeles are experimenting with technologies that can determine crime ‘hot spots’ before they become hot. Richmond, Virginia, used software to analyze crime patterns; in one case analyzing sensor reporting of random gunfire a few hours before and after midnight on New Year’s Eve. The results allowed public safety officials to find and confiscate a significant number of unlicensed firearms; which in turn resulted in fewer gun-related offences, and a reduction in the number of police officers necessary.
Legal side-effects. The use of new technology, especially sensors (some undetectable, GPS trackers, CCTV image scans), will start to figure in litigation, especially as they relate to the question of the individual’s legitimate expectation of his/her privacy. This will test the boundaries of the present evidentiary process.
Better public policy decision-making. Authorities often face the dilemma of having to render important policy decisions with very limited data. The results are not just ill-fated public sector projects and initiatives, but a general distrust in government and the public sector generally. Fewer people believe government has the capacity to tackle complex policy challenges. The opportunity beckoning with Big Data is that large amounts of empirical data can be gathered, which can enable policy makers to see how society as a whole behaves in real-time; societal dynamics can be discerned as they unfold at scale.
For instance, the public sector in the United Kingdom, working with Big Data startup Inrix, is reusing navigation and traffic data gleaned from a large number of drivers to see commuter traffic patterns around London, and to retune the planned extensions of
100 Trends in Telecommunication Reform 2015
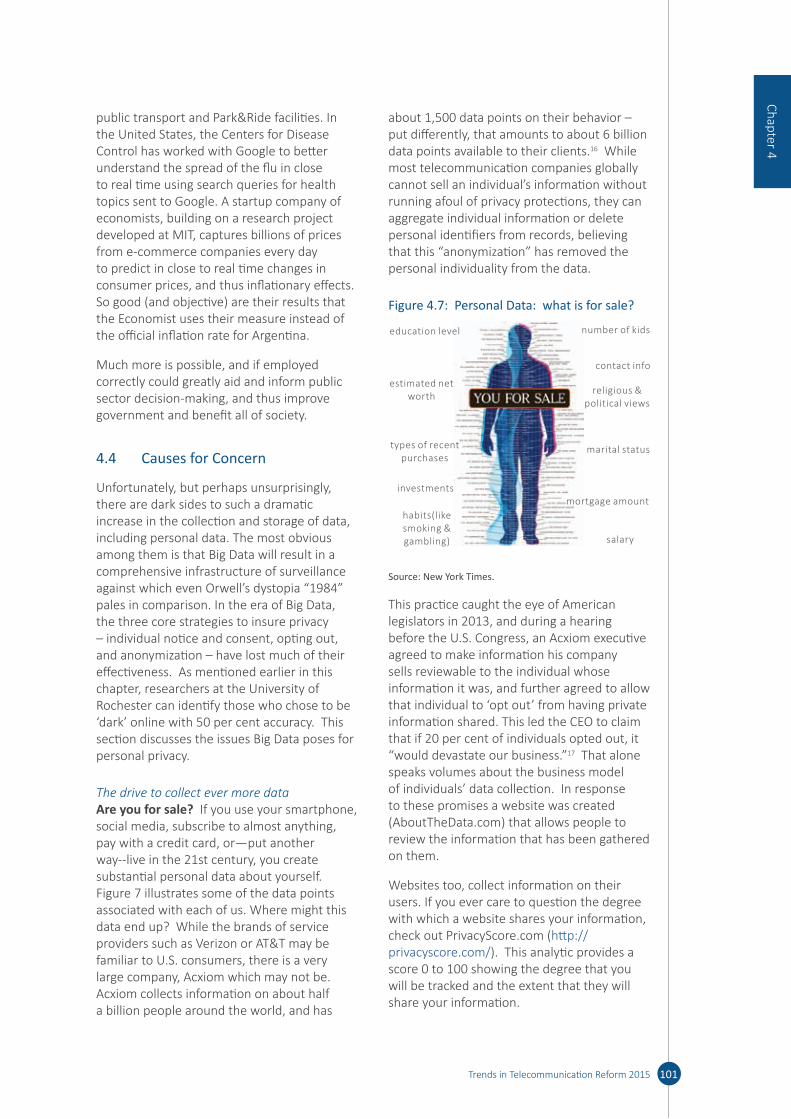
public transport and Park&Ride facilities. In the United States, the Centers for Disease Control has worked with Google to better understand the spread of the flu in close to real time using search queries for health topics sent to Google. A startup company of economists, building on a research project developed at MIT, captures billions of prices from e-commerce companies every day to predict in close to real time changes in consumer prices, and thus inflationary effects. So good (and objective) are their results that the Economist uses their measure instead of the official inflation rate for Argentina.
Much more is possible, and if employed correctly could greatly aid and inform public sector decision-making, and thus improve government and benefit all of society.
4.4 Causes for Concern
Unfortunately, but perhaps unsurprisingly, there are dark sides to such a dramatic increase in the collection and storage of data, including personal data. The most obvious among them is that Big Data will result in a comprehensive infrastructure of surveillance against which even Orwell’s dystopia “1984” pales in comparison. In the era of Big Data, the three core strategies to insure privacy – individual notice and consent, opting out, and anonymization – have lost much of their effectiveness. As mentioned earlier in this chapter, researchers at the University of Rochester can identify those who chose to be ‘dark’ online with 50 per cent accuracy. This section discusses the issues Big Data poses for personal privacy.
The drive to collect ever more dataAre you for sale? If you use your smartphone, social media, subscribe to almost anything, pay with a credit card, or—put another way--live in the 21st century, you create substantial personal data about yourself. Figure 7 illustrates some of the data points associated with each of us. Where might this data end up? While the brands of service providers such as Verizon or AT&T may be familiar to U.S. consumers, there is a very large company, Acxiom which may not be. Acxiom collects information on about half a billion people around the world, and has
about 1,500 data points on their behavior – put differently, that amounts to about 6 billion data points available to their clients.16 While most telecommunication companies globally cannot sell an individual’s information without running afoul of privacy protections, they can aggregate individual information or delete personal identifiers from records, believing that this “anonymization” has removed the personal individuality from the data.
Figure 4.7: Personal Data: what is for sale?
estimated net worth
education level
investments
types of recentpurchases
habits(like smoking & gambling)
number of kids
contact info
religious & political views
marital status
mortgage amount
salary
Source: New York Times.
This practice caught the eye of American legislators in 2013, and during a hearing before the U.S. Congress, an Acxiom executive agreed to make information his company sells reviewable to the individual whose information it was, and further agreed to allow that individual to ‘opt out’ from having private information shared. This led the CEO to claim that if 20 per cent of individuals opted out, it “would devastate our business.”17 That alone speaks volumes about the business model of individuals’ data collection. In response to these promises a website was created (AboutTheData.com) that allows people to review the information that has been gathered on them.
Websites too, collect information on their users. If you ever care to question the degree with which a website shares your information, check out PrivacyScore.com (http:// privacyscore. com/ ). This analytic provides a score 0 to 100 showing the degree that you will be tracked and the extent that they will share your information.
101Trends in Telecommunication Reform 2015
Chapter 4
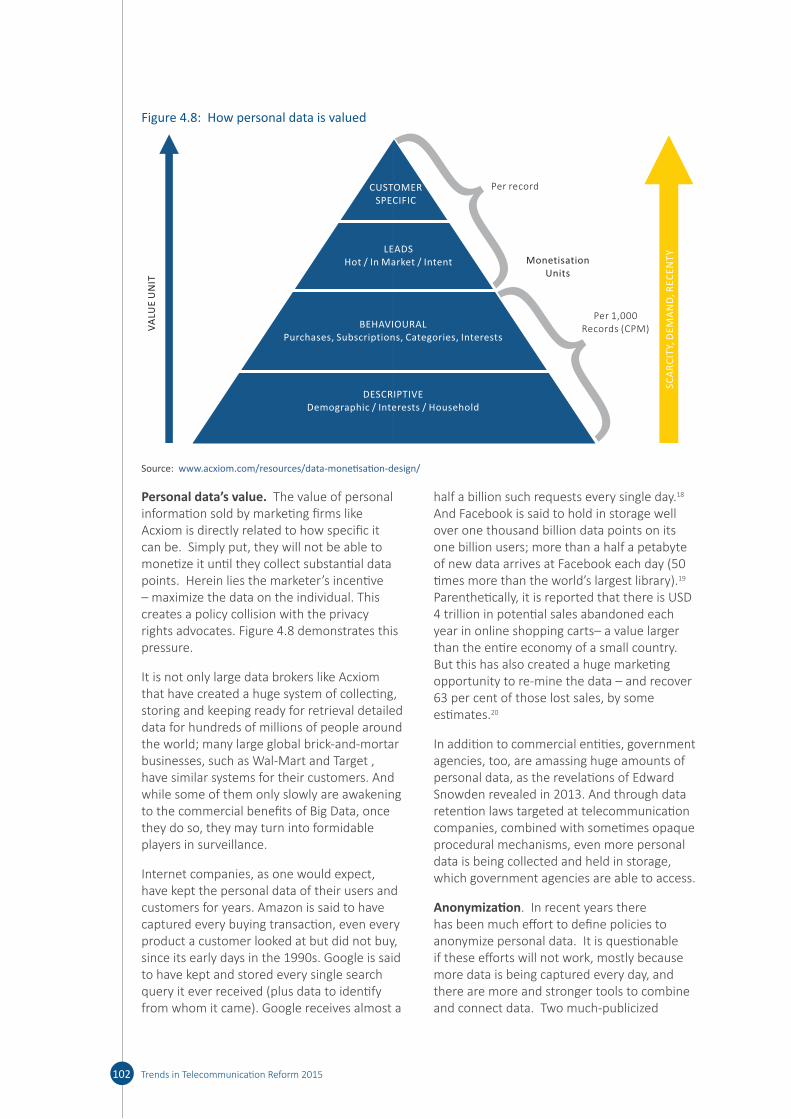
Personal data’s value. The value of personal information sold by marketing firms like Acxiom is directly related to how specific it can be. Simply put, they will not be able to monetize it until they collect substantial data points. Herein lies the marketer’s incentive – maximize the data on the individual. This creates a policy collision with the privacy rights advocates. Figure 4.8 demonstrates this pressure.
It is not only large data brokers like Acxiom that have created a huge system of collecting, storing and keeping ready for retrieval detailed data for hundreds of millions of people around the world; many large global brick-and-mortar businesses, such as Wal-Mart and Target , have similar systems for their customers. And while some of them only slowly are awakening to the commercial benefits of Big Data, once they do so, they may turn into formidable players in surveillance.
Internet companies, as one would expect, have kept the personal data of their users and customers for years. Amazon is said to have captured every buying transaction, even every product a customer looked at but did not buy, since its early days in the 1990s. Google is said to have kept and stored every single search query it ever received (plus data to identify from whom it came). Google receives almost a
half a billion such requests every single day.18 And Facebook is said to hold in storage well over one thousand billion data points on its one billion users; more than a half a petabyte of new data arrives at Facebook each day (50 times more than the world’s largest library).19 Parenthetically, it is reported that there is USD 4 trillion in potential sales abandoned each year in online shopping carts– a value larger than the entire economy of a small country. But this has also created a huge marketing opportunity to re-mine the data – and recover 63 per cent of those lost sales, by some estimates.20
In addition to commercial entities, government agencies, too, are amassing huge amounts of personal data, as the revelations of Edward Snowden revealed in 2013. And through data retention laws targeted at telecommunication companies, combined with sometimes opaque procedural mechanisms, even more personal data is being collected and held in storage, which government agencies are able to access.
Anonymization. In recent years there has been much effort to define policies to anonymize personal data. It is questionable if these efforts will not work, mostly because more data is being captured every day, and there are more and stronger tools to combine and connect data. Two much-publicized
102 Trends in Telecommunication Reform 2015
Figure 4.8: How personal data is valued
CUSTOMERSPECIFIC
LEADSHot / In Market / Intent
BEHAVIOURALPurchases, Subscriptions, Categories, Interests
DESCRIPTIVEDemographic / Interests / Household
VA
LUE
UN
IT
SC
AR
CIT
Y, D
EM
AN
D, R
EC
EN
TY
Per record
Per 1,000Records (CPM)
MonetisationUnits
Source: www. acxiom. com/ resources/ data- monetisation- design/
cases; one involving Netflix, a U.S. video rental service and the other involving AOL,21 showed that with even basic technology someone could de- anonymize data that these providers were convinced could not be made personal again. Professor Paul Ohm, of the University of Colorado Law School (in the United States) and an expert on the harm done by de-anonymization explains in an article published in the UCLA Law Review22 that no easy fix is available – and even concludes that given enough data, no anonymization is possible because any connection makes anonymity an unrealistic objective.
Given plummeting collection and storage costs, this tendency to surveil and store the captured data will likely only increase in the years to come.
A new Dark SideBut in addition to widespread surveillance and data collection, a new dark side looms, and one that so far is often overlooked. This is the tempting possibility to employ Big Data to predict the future of an individual and hold that individual accountable for that predicted behavior. This would mean that humans could be punished not for what they have done, but for what they are only predicted to do. This may sound futuristic, and indeed this is the main plot line of the 2002 movie “Minority Report.” But today, it is far more science than fiction. For instance, in more than half of U.S. states, parole boards deciding whether an incarcerated criminal should be freed on parole are utilizing Big Data analysis that claims to predict the likelihood that criminal will be involved in a homicide in the next twelve months.23 Dozens of police forces in U.S. cities and metropolitan areas use “predictive policing,” a Big Data application that forecasts when and where the next crime will be committed.
Such analysis is not limited only to government agencies; commercial entities, too, use probabilistic predictions to assign individual responsibility irrespective of actual behavior. For instance, car insurers in some countries charge drivers who had bad grades in school more than those that did well in school (their analysis says that people with bad grades are comparatively worse drivers). Similarly, some people are denied loans or credit not
for what they have done, but what a Big Data analysis predicts they will do (namely to default on their loan payments), even though they have never missed a payment in the past. Such behavior may be risk optimizing for the commercial entity employing it, but for the individuals affected, it feels like punishment for something they have not done.
While the goals of prevention may be laudable, such a use of Big Data in effect can deny individuals human volition; their ability to act freely. If society were to accept the widespread use of probabilistic predictions for the assignment of individual responsibility, it would surrender perhaps the most central individual freedom to collective fiat. It would be a different world, in which free will and individual responsibility has been marginalized (after all, if Big Data calculates who is guilty, and thus denies humans the ability to decide, we cannot hold them responsible).
It is important to keep in mind, however, that the problem here is not Big Data itself, but how probabilistic predictions from Big Data analyses are being employed. Most Big Data analyses is based on correlations; on perceiving connections in the data that tell us “what” is happening (or will happen). However, these correlations do not tell us anything about “why” these things are happening or about their causes. In a society based on justice and freedom, individual responsibility and punishment are irrevocably linked to causality. Only those that caused harm can be held responsible. Thus, it is a blatant abuse of Big Data when one uses the merely correlational analysis of likely future behavior to decide who to hold responsible, to punish, or to treat negatively.
Erosion of trust & Big Data backlashThe success of Big Data depends on the willingness of the public, of millions and millions of individuals individually and collectively to provide often personal data to Big Data analysts. They will do so if they see a value in letting others have that data, and if they see that others are not abusing the power that derives from having all that data. In short, Big Data success depends on user and societal trust in those that gather analyze and store data.
103Trends in Telecommunication Reform 2015
Chapter 4

The moment that trust is lost, users may opt for another, less data-invasive provider. We have seen this play out in the market only recently with respect to social networking platforms. Five years ago, Facebook held a commanding lead over other platforms. Then users realized that Facebook retains all of their data, and thus creates vulnerabilities – the drunken photo from the last office party, the stupid missive angrily written then posted. As a result, over the last two years, alternative social networking and sharing platforms, such as Snapchat and Frankly (and many others) have cropped up and are being embraced by dozens of millions of users. Snapchat is said to facilitate the exchange of hundreds of millions of photos among its members every week, but these photos are ephemeral – they vanish quickly and automatically. Many users have deliberately chosen Snapchat over Facebook because they trust Snapchat, but they no longer trust Facebook with their personal data. Frankly commits to total securing of a chat (text) while it is among sender and recipients (even Frankly can’t read it) and completely erasing the text when done.
If Big Data users continue to gather data and extract value without keeping user trust in mind, they will destroy trust, lose customers by the millions, and end up as business failures. But more is at stake: if people lose trust in sharing data with Big Data companies, the entire Big Data ecosystem may be in danger. Trust is something that can be destroyed quickly, but it takes a very long time to rebuild it, if that can be done at all. Look no further that what has happened to the large U.S. retailer, Target, following its data breach late last year. The effort to restore their customer’s trust has been costly and uncertain.
Aside from the loss of individual trust in specific companies, there is also a cumulative impact on public trust that is potentially important when data protection fails repeatedly. If only one or two companies have data breach or protection problems, users and consumers may be willing to attribute that to the individual companies; they just did a poor job protecting their customers’ information. However, if data breaches occur repeatedly, and across industries, people may start to
believe that companies in general cannot protect their data. Annex 1 provides a list of the 15 worst data breaches between 2001 and 2012. Headlines from 2013 and 2014 identify even more very large breaches: Target, a large U.S. retailer, allowed the personal information of somewhere between 70 and 110 million of its customers to be compromised; and at eBay, an online e-commerce site, the personal information for about 140 million of its customers was hacked.
Thus, it is in the self-interest of Big Data companies (and government agencies) to handle personal data with responsibility and care, and to maintain and enlarge the trust users have in their handling of the data. And governments and society has an interest in ensuring that the regulatory framework is in place that helps further such trust, so that Big Data can flourish without unnecessarily exposing millions to Big Data’s Dark Sides.
To this end, high-level expert groups have produced white papers and other documents, from the World Economic Forum and the European Union to the White House. We have earlier mentioned the ITU’s Tech Watch Report that was published late last year. While the ideas and suggestions in these efforts are varied and heterogeneous, a few trend lines emerge which we will discuss in the fourth and final section of this document.
But however these trends ultimately settle into concrete regulatory policies, they will likely require compliance to new and stricter regimes, and thus increase associated cost. While this is intended to maintain and improve user trust – essential for long-term success of Big Data – many businesses may perceive these additional costs as a negative aspect of Big Data.
False confidence in dataConnected to, but broader than the issues discussed above, there is another potential Dark Side that clouds the vision and understanding of those that employ Big Data. This challenge is not unique to Big Data, but Big Data is especially vulnerable to it. It is the danger that the users of Big Data will imbue results of data analysis with more meaning that it actually has, believing that they understand more parts of reality than they
104 Trends in Telecommunication Reform 2015

actually do. It leads to false decisions based on false self-confidence.
For instance, after cities introduced “predictive policing,” crime decreased. Bold officials were heard suggesting that this was caused by law enforcement’s new Big Data tool. But as is often the case, the data does not reflect causality, and thus does not prove (or even strongly suggest) that Big Data was the reason for the decline in crime. Similarly, in corporate settings, marketing and advertising managers are often attributing sales successes to certain (Big Data) campaigns they ran, but without enough conclusive data to show this.
In the Big Data age we will see the world much more through a lens of data and empirics than ever before. Hopefully that improves decision-making. But it also increases the danger of falling prey to giving data more meaning than it deserves, and thus to succumb to the Siren’s Song of the confidence over data.
The rise of the Data BaronsFinally it is also important to acknowledge a Dark Side of Big Data that is not directly linked to individuals and their rights and freedoms, but to data markets and the data economy. As noted above, collecting more and combining data increases its value not linearly but exponentially. This means that large data holders have a very strong incentive to grow even larger in order to extract more of the data’s intrinsic, but hidden value. Some experts fear that this may lead to an ever-increasing concentration of data markets, a stifling of competition and in turn reduced innovation and destruction of overall value.
For instance, Google has acquired a number of companies in recent years that add significantly to its ability to gather a wide variety of data. This includes its purchase of ITA, one of the world’s leading air travel reservation systems, and NEST, a company that has developed devices (most famously a learning thermostat) and a platform in households that works by collecting data about living habits – heating, cooling, even if you are at home. Similarly, Facebook has bought companies in the social networking sector to add even more data troves and users to its fold.
To an extent, this trend of concentration is countered by a lively ecosystem of Big Data startups, some of which succeed by positioning themselves well in the flow of information and compete effectively against the very largest of Big Data companies. Certainly the fluidity of the Big Data ecosystem, enabled by low barriers to entry, enables these startups to act as a counterforce to market concentration. Regulators, such as in the United States, have also attached restrictions to recent acquisitions of data companies to ensure competitive data markets. But overall, it is likely that the public and regulators will have to remain vigilant against the Dark Side of market concentration and data oligopolies.
In this and the previous section, we explained the upsides and the downsides of Big Data; its opportunities and its challenges. The salient question, of course, is whether the downsides and costs will exceed the benefits attained from the use of Big Data or vice versa. Which Big Data future is going to result? Are we going to forego the many benefits of Big Data in return for enhanced privacy, trust and unpredictability? Or is the pendulum swinging in the other direction, resulting in massive Big Data uses, leaving millions of people’s data exposed, deeply distrustful of the new technology, and creating a potent and dangerous ground for neo-luddites to fight not just Big Data but modern technology more generally? How can we negotiate a path that grants us the ability to utilize Big Data, while at the same time ensuring that Big Data is used responsibly and to the benefit not just of a handful of data holders but the wider market, and in fact society at large?
There is no simple answer to this question, but in the following section we aim to suggest a few proposals, especially in the field of telecommunications, that policy makers ought to consider as society approaches this Big Data world.
4.5 The Role of (and future for) Regulatory Authorities
It is clear, given the powerful qualities of Big Data and the likelihood that Big Data will shape all sectors of the economy, and
105Trends in Telecommunication Reform 2015
Chapter 4
considering its significant dark sides, that policy makers at all levels will want to play a role in influencing Big Data’s trajectory. The fundamental question thus becomes: what dimensions of Big Data policy makers should focus on in particular in their regulatory efforts? In the following analysis, we suggest four such areas of regulatory involvement.
Ensure protection for individuals’ privacyThe most obvious regulatory role for government authorities, of course, is to ensure effective protection of individuals’ privacy. As we have discussed above, current mechanisms of privacy protection will become increasingly ineffective in the context of Big Data. This is not only problematic because it potentially harms affected individuals; it is also detrimental to the acceptance and utilization of Big Data, because without sufficient societal trust in Big Data users, Big Data companies will not be able to operate. Thus, it is not just in the interest of society, but in the very interest of all responsible users of Big Data, to ensure that effective mechanisms protecting privacy are in place.
What is needed is an additional and more effective protection mechanism. Recent work undertaken by a group of privacy experts from around the world points towards a regulatory mechanism that would shift the focus of privacy protection from informed consent at the point of collecting personal data to accountable and responsible uses of personal data. The core idea is that with such a mechanism in place, users of personal data would have to evaluate the privacy harms and implications of a potential new use of such data, and what safeguards would need to be put in place to reduce the potential threats to privacy, before the proposed use could commence. And while this assumes that the Big Data users would have to evaluate their intended applications, incorrect evaluations and insufficient implementation of safeguards would not only lead to civil and criminal liability, but also regulatory enforcement. Thus, the mechanism foresees a well-resourced privacy regulator with the expertise and power to oversee such a use-based privacy protection mechanism.
The advantages of such a mechanism are clear: privacy protection would not
rely on the mystical ability of individuals to fully comprehend the complex uses of their personal data at the moment of collection, and data users could not forego the implementation of stringent privacy safeguards by pointing towards the rather formal “consent of the data subjects.” Enforcement would not depend on individuals suing data users (which we know from practice very, very rarely happens), but instead would rely on much more powerful privacy regulatory agencies with sufficient resources and stamina to regulate and enforce even against the most powerful data users. In return, data users would be permitted to reuse personal data for novel purposes (and thus unleash the power of Big Data) as long as a comprehensive privacy assessment had shown that it would produce minimal privacy risks.
Of course, such an additional mechanism would not solve all privacy challenges related to Big Data, but we suggest that a focus on responsible and accountable data use will go a long way in addressing some of the most troubling privacy challenges created by Big Data.
Protecting Human Volition / Taming Probabilistic PredictionsProbabilistic predictions, the operational outgrowth of Big Data analyses, can be tremendously useful. They reduce uncertainty and risk in the present and the future, and thus help Big Data users—and by extension society at large—to better plan and prepare for the future through better decision-making in the present. At the same time, probabilistic predictions also pose unique policy challenges, especially when they are used to decide who to punish or hold responsible based only on predictions rather than actual actions. For instance, if a government uses Big Data predictions to decide exactly which individuals to put under surveillance or police heavily; not because of the past behavior of this individual, but just because Big Data predicts he or she is a significant threat, such a policy would rightly be viewed as infringing dangerously on human rights.
Regulatory Authorities, including those intent on facilitating the use of Big Data and the growth of the data economy, are therefore well advised to put in place clear restrictions
106 Trends in Telecommunication Reform 2015

on how and for what purpose government agencies can utilize Big Data predictions. Under no circumstances can such predictions be turned into the reasons to punish people or assign individual responsibility to behavior that is only forecast. There must be in place a bright red line that interdicts such abuses of Big Data analysis.
Uses by government agencies as well as commercial entities of Big Data predictions of future behavior that result in negative treatment, quasi-punishment or the withholding of benefits granted to others (discrimination), while not prohibited per se, must be subject to strict scrutiny and rigorous justification. This includes providing transparency into the data analysis, as well as the guaranteed right afforded to affected individuals to disprove the prediction.
Facilitating publicly available Big Data expertiseTransparency and the right to disprove predictions, as just mentioned, will only be meaningful for the general public if individuals do not have to confront complex Big Data analysis themselves, but can avail themselves of specially trained Big Data experts that are established specifically to help these individuals. We envision a new cadre of such experts – the “algorithmists”. Specially trained, they would take vows of impartiality, confidentiality and professionalism, much like civic engineers, or doctors. Algorithmists would have special Big Data expertise, including statistical and technical training, but would also be well versed in the ethical considerations at play and the legal and regulatory constraints in place.
Individuals who believe they have been mistreated because of false Big Data predictions could contact algorithmists, who in turn would investigate and render a decision. They would also help individuals in disproving Big Data predictions if an individual believes such a prediction is wrong. Algorithmists could also advise data users on how to best implement transparent, disprovable predictive decision making, and how to ensure responsibility and accountability in their Big Data predictions.
Keeping data markets fluidSo far we have focused on the role of regulatory authorities to defend and enforce the rights of individuals from the dark sides of Big Data, whether it is the right to be free from undue surveillance, unlawful use of personal data, or maltreatment based on incorrect probabilistic predictions based on Big Data analyses. But there is another, equally important dimension that is not directly related to individual rights.
As some data markets are becoming more concentrated over time, and more and more data held by fewer and fewer commercial entities, ensuring competition in the data economy becomes paramount. Otherwise Big Data may face the same fate as steel manufacturing and railways in the late nineteenth century in the United States. The concentration of power of these industries in very few hands gave rise to the first effective antitrust and competition legislation in the world, and to the recognition that government must play a role in ensuring that powerful, market-stifling trusts do not form, and where they have formed they are broken up.
Ensuring competition in data markets can take a variety of forms. The most obvious is for data holders to be forced to let others access their data holdings under fair and reasonable terms. Such Fair, Reasonable and Non-Discriminatory (FRAND) licensing has been routinely utilized in certain areas of patent protection, and shown to be effective. Moreover, the U.S. federal government has in recent years and in a number of cases already used a FRAND licensing mandate to constrain data holders’ power after these data holders had acquired large data sets.
The advantage of such an approach is not only that the mechanism has already been tested and found to be effective, but that the mechanism is well known to competition authorities and thus makes it easier to employ. Moreover, such a mechanism is utilizing market competition to reduce the power of large data holders, which is much preferable than more limiting restrictions or market interventions.
Some experts have gone one step further and suggested that for data markets to truly
107Trends in Telecommunication Reform 2015
Chapter 4

function well, one needs to put in place a legal exclusion right for data, much like that which exists for intellectual property. Whether such a right is truly needed, and what its features and limitations would be, this paper cannot answer. It is important, however, to note this possibility in this context.
4.6 Conclusion
The use of Big Data is in its infancy, taking its first steps in what will be a long journey. It will be guided to an extent by decisions made by Regulatory Authorities in regions and jurisdictions throughout the world. The options are varied, complex, and often risky.
The world must not lose sight of the great potential of Big Data, benefitting the individual, organizations and society as a whole. We shared only a small handful of the benefits already being realized by the use of Big Data. We explained in this chapter the underpinnings of why the development of Big Data is at a crossroads; what factors have led us to this point in time, with all its opportunities and challenges. From this vantage point, we believe that there is no evidence the current trends will reverse anytime soon.
We also acknowledge that there are a growing number of concerns that affect our ability not only to protect the interests of the individual, but also the ability to innovate. Balancing these concerns will be the job of policy makers and regulators, but also the companies involved and the public itself. The public
will continually have to believe that there is greater benefit than cost to them, or Big Data will suffer a backlash and loss of trust. Such a loss would portend a reversal of the gains seen so far. What should the Regulatory Authorities do? We have condensed our policy recommendations to four points:
• Ensure protection not only for society itself, but for those users of Big Data. Recognize the shift in emphasis away from the point of data collection and to the point of use.
• Protect human free will. Predictive approaches that seek to determine societies’ decisions must be carefully managed to avoid holding those accountable based only on prediction.
• Grow the skills pool of people capable of managing Big Data properly. Talent will be needed to insure that we understand what we are doing, and also to give those who believe they are aggrieved by the consequences of Big Data the appropriate means for redress.
• Keep the emerging data market fluid through a number of oversight tools. Data markets must be kept robust and proper frameworks are needed to insure that small groups or individuals do not become the earlier monopoly Trusts that controlled the health and degree of innovation in a segment of the economy.
With the right level of attention today, our children and their children will find a world that has benefited from the creativity and imagination that Big Data offers.
108 Trends in Telecommunication Reform 2015

Annex 1: 14 of the 15 Worst Data Breaches (2000-2012)24
1. Heartland Payment SystemsDate: March 2008
Impact: 134 million credit cards exposed.
SQL injection was used to install spyware on Heartland’s data systems. The vulnerability to SQL injection was well understood and security analysts had warned retailers about it for several years. Yet, the continuing vulnerability of many Web-facing applications made SQL injection the most common form of attack against Web sites at the time.
2. TJX Companies Inc.Date: December 2006
Impact: 94 million credit cards exposed.
There are conflicting accounts about how this happened. One theory is that a group of hackers took advantage of a weak data encryption system and stole credit card data during a wireless transfer between two Marshall’s stores in Miami, Fla. Another holds that the hackers broke into the TJX network through in-store kiosks that allowed people to apply for jobs electronically.
3. EpsilonDate: March 2011
Impact: Exposed the names and e-mail addresses of millions of customers stored in more than 108 retail stores, as well as affecting several financial firms like CitiGroup Inc. and the non-profit educational organization, College Board. The source of the breach is still undetermined, but experts say it could lead to numerous phishing scams and countless identity theft claims. There are different views on how damaging the Epsilon breach was. Since Epsilon has a client list of more than 2,200 global brands and handles more than 40 billion e-mails annually, it could be “the biggest, if not the most expensive, security breach of all-time” According to Kevin McAleavey of the KNOS Project.25
4. RSA SecurityDate: March 2011
Impact: Possibly 40 million employee records stolen.
The impact of the cyber-attack that stole information on the company’s SecurID authentication tokens is still being debated. The company said two separate hacker groups worked in collaboration with a foreign government to launch a series of spear phishing attacks against RSA employees, posing as people the employees trusted to penetrate the company’s network. Among the lessons learned is that even good security companies like RSA are not immune to being hacked.
5. StuxnetDate: Sometime in 2010, but origins date to 2007
Impact: Meant to attack Iran’s nuclear power program, Stuxnet will also serve as a template for real-world intrusion and disruption of power grids, water supplies or public transportation systems. The immediate effects of Stuxnet were minimal -- at least in this country -- but it ranks among the top large-scale breaches because, “it was the first that bridged the virtual and real worlds. When a piece of code can have a tangible effect on a nation, city or person, then we’ve truly arrived in a strange, new world,” according to John Linkous, vice president, chief security and compliance officer of eIQnetworks, Inc.
6. U.S. Department of Veterans AffairsDate: May 2006
Impact: An unencrypted national database with names, Social Security numbers, dates of births, and some disability ratings for 26.5 million veterans, active-duty military personnel and spouses was stolen. The breach pointed once again to the human element being the weakest link in the security chain as the database was stored on a laptop and external hard drive that were both stolen from a department analyst’s home. The analyst reported the May 3, 2006 theft to the police immediately, but senior officials at the department were not told until May 16. The department estimated it would cost $100 million to $500 million to prevent and cover possible losses from the theft.
109Trends in Telecommunication Reform 2015
Chapter 4

7. Sony’s PlayStation NetworkDate: April 20, 2011
Impact: 77 million PlayStation Network accounts hacked.
This is viewed as the worst gaming community data breach of all-time. Sony is said to have lost millions of dollars while the site was down f or a month. Of more than 77 million accounts affected, 12 million had unencrypted credit card numbers. According to Sony it still has not found the source of the hack. Intruders gained access to full names, passwords, e-mails, home addresses, purchase history, credit card numbers, and PSN/Qriocity logins and passwords.
8. ESTsoftDate: July-August 2011
Impact: The personal information of 35 million South Koreans was exposed.
This case, in which hackers breached the security of a popular software provider, is called South Korea’s biggest theft of information in history, affecting a majority of the population. South Korean news outlets reported that attackers with Chinese IP addresses uploaded malware to a server used to update ESTsoft’s ALZip compression application. The attackers were then able to steal the names, user IDs, hashed passwords, birthdates, genders, telephone numbers, and street and email addresses contained in a database that was connected to the network.
9. Gawker MediaDate: December 2010
Impact: Compromised e-mail addresses and passwords of about 1.3 million commenters.
This breach involved popular blogs like Lifehacker, Gizmodo, and Jezebel, and included the theft of the source code for Gawker’s custom-built content management system. Online forums and blogs are among the most popular targets of hackers.
10. VeriSignDate: Throughout 2010
Impact: Undisclosed information stolen
Security experts are unanimous in saying that the most troubling thing about the VeriSign breach, or breaches, in which hackers gained access to privileged systems and information, is the way the company handled it -- poorly. VeriSign never announced the attacks, and the incidents only became public in 2011, as a result of a new U.S. Securities and Exchange Commission-mandated filing. VeriSign said no critical systems such as DNS servers or certificate servers were compromised, but did say that, “access was gained to information on a small portion of our computers and servers.”26
11. CardSystems Solutions Date: June 2005
Impact: 40 million credit card accounts exposed.
Hackers broke into CardSystems Solution’s database using a SQL Trojan attack, which inserted code into the database via the browser page every four days, placing data into a zip file and sending it back through FTP. Since the company never encrypted users’ personal information, hackers gained access to the names, accounts numbers, and verification codes of more than 40 million card holders. CardSystems Solutions, one of the top payment processors for Visa, MasterCard, and American Express was ultimately forced into acquisition.
12. AOLDate: August 6, 2006
Impact: Data on more than 20 million web inquiries, from more than 650,000 users, was posted publicly on a web site.
AOL Research posted a compressed text file on one of its publicly available websites containing 20 million search keywords for more than 650,000 users over a three-month period. AOL pulled the file from public access by the next day, but not before it had been mirrored and distributed on the Internet. In January 2007, Business 2.0 Magazine ranked the release of the search data among the “101 Dumbest Moments in Business.”
14. Monster.comDate: August 2007
110 Trends in Telecommunication Reform 2015

Impact: Confidential information of 1.3 million job seekers stolen and used in a phishing scam. Hackers broke into the U.S. online recruitment site’s password-protected resume library using credentials that Monster Worldwide Inc. said were stolen from its clients.
15. Fidelity National Information ServicesDate: July 2007
Impact: An employee of Fidelity subsidiary Certegy Check Services stole 3.2 million customer records including credit card, banking and personal information. Network World reported that the theft was discovered in May 2007, but was not disclosed until July. An employee allegedly sold the data for an undisclosed amount to a data broker.
111Trends in Telecommunication Reform 2015
Chapter 4

Annex 2: Forums, discussions and papers
BIG – Big Data Public Private ForumIn Europe, the Big Data Public Private Forum (BIG)27 is working towards the definition and implementation of a clear strategy that tackles research and innovation, while also it provides a major boost for technology adoption and supporting actions for the successful implementation of the Big Data economy.
In addition, each year various government and private sector entities meet to exchange their views on projects of importance in Europe. This meeting is called the European Data Forum (2014.data-forum.eu). The forum is designed to capture a larger umbrella of views by examining Open Data, Linked Data and Big Data. This year’s forum included work in: open data in the transport and communication sectors in Finland; public sector information at the European Commission; the European Single Digital Market and what is required to achieve it; and predicting parking supply to satisfy demand in a smart city, to name a few.
The World Economic ForumThe World Economic Forum (WEF), an international institution committed to improve the state of the world through public-private cooperation, acknowledges that a new approach to data collection and use is necessary to protect the rights and wellbeing of individuals.
A WEF report published in 201328 carefully lays out three strong themes:
• From Transparency to Understanding: Given the low cost of gathering and analyzing data, people need to understand how data is being collected through observations and tracking mechanisms, whether with their consent or without.
• From Passive Consent to Engaged Individuals: Too often the organizations collecting and using data see their role as a yes-no / on-off degree of consent. New ways are needed to allow individuals to exercise more choice and control over the data that affects their lives.
• From Black to White to Shades of Gray: the context within which data is collected
and used matters significantly. How is the data used? Much like money, it means little until it is used.
In order to achieve a level of trust during the flow of data, at least five issues were discovered: protection; accountability; empowerment; transparency and respect. There is a deep responsibility assumed for using personal data. Before the dawn of networked data, individual data was generally used once, and usually for a specific purpose. But the era of Big Data allows for analytics to reuse data to develop more value to others about that data.
In April of 2014, the WEF released a report titled, “Delivering Digital Infrastructure, Advancing the Internet Economy”29 that measurers the fast pace of technological change against the need to insure services and support infrastructure keep up. It recommends rethinking the regulatory scope, approach and level of engagement to ensure that appropriate infrastructure is developed and deployed. In terms of scope in this age of information and speed, it recommends thinking in far broader terms – taking into account that a decision at one level impact entire economies. By extension, it touches on an oft-repeated mantra: “move the ex-ante rules to ex-post, while moving the ex-post to forborne, and repeat the cycle.” Finally, the report brings up the idea of level of engagement, and by that it refers to harmonization of decisions that cross national borders, using radiofrequency spectrum as an example.
More recently the WEF released a report titled, “Risk and Responsibility in a Hyperconnected World”30, which focuses directly on the malicious intent to disrupt or capture information (data) in both the private and public sectors.
The International Telecommunication UnionThe Big Data work done by the ITU so far focuses on the following areas and questions.31. To address these increasingly important issues, reports, such as the current chapter addressing the regulatory issues, are being prepared as well as workshops and dedicated sessions in ITU events.
112 Trends in Telecommunication Reform 2015
Standardization32
• Which standards are required to facilitate interoperability and allow technology integration in the big data value chain?
• Which definitions, taxonomies, secure architectures and technology roadmaps need to be developed for big data analytics and technology infrastructures?
• What is the relationship between cloud computing and big data in view of security frameworks?
• Which techniques are needed for data anonymization for aggregated datasets such as mobile phone records?
• How is big data exploited in different industries; what are the specific challenges faced; and how can these challenges be addressed through international standards, including in the following sectors:– Telecommunications: A workshop on
standards for big data was held on 17 June 2014 at ITU’s TSAG meeting.33
– Healthcare: Big data is a recurring theme in ITU’s standardization activities on e-health.
– Automotive: ITU’s symposium on the Future Networked Car34 highlighted the use of data analytics to making transportation safer, more efficient and more environmentally friendly.
– Aviation: Following a call from Malaysia’s Minister of Communications and Multimedia at WTDC’14, ITU facilitated an Expert Dialogue on Real-time Monitoring of Flight Data, including the Black Box on 26-27 May in Kuala Lumpur. Experts from both, the aviation and ICT sectors debated the Need for International Standards in the Age of Cloud Computing and Big Data, adopted a communiqué highlighting challenges including those specific to aviation, and proposed concrete actions for future work and standardization, in collaboration with the International Civil Aviation Authority (ICAO).35
Regulation36
• What are the key regulatory issues at stake and how can and should big data be regulated?
• How does big data impact the regulation of privacy, copyright and Intellectual property rights (IPR), transparency and digital security issues?
• What is the link between big data and open data?
• Is there a need to regulate data management and service providers?
• How can market dominance in the area of big data be prevented and the rights of the data owners protected?
ICT data collection and analysis• How can big data complement existing ICT
statistics to better monitor information society developments?
• Which type of data from ICT companies are most useful and for which purposes?
• Which new ICT indicators could be produced from big data sources?
• What are key issues that need to be addressed, and by whom, in terms of collecting and disseminating big data in telecommunications?
• What is the role of National Statistical Offices and how can big data complement official ICT data?
UNPulseLaunched by the Executive Office of the United Nations Secretary-General to respond to the need for more timely information to track and monitor the impacts of global and local socio-economic crises, the UNPulse Initiative explores how new, digital data sources and real-time analytics technologies can help policymakers understand human well-being and emerging vulnerabilities in real-time, in order to better protect populations from various shocks.37 According to UNPulse:
The initiative was established based on a recognition that digital data offers the opportunity to gain a better understanding of changes in human well-being, and to get real-time feedback on how well policy responses are working. The overarching objective of Global Pulse is to mainstream the use of data mining and real-time data analytics into development organizations and communities of practice. To this end, Global Pulse is working to promote awareness of the opportunities Big Data presents for relief and development, forge public-private data sharing partnerships, generate high-impact analytical
113Trends in Telecommunication Reform 2015
Chapter 4
tools and approaches through its network of Pulse Labs, and drive broad adoption of useful innovations across the UN System.38
United States: White House, Big Data InitiativeTwo major initiatives to fund research on six “Big Data” initiatives were announced by President Obama two years ago 39to:
• advance state-of-the-art core technologies needed to collect, store, preserve, manage, analyze, and share huge quantities of data;
• harness these technologies to accelerate the pace of discovery in science and engineering, strengthen our national security, and transform teaching and learning; and
• expand the workforce needed to develop and use Big Data technologies.
This year, the Executive Office released two reports: The first report, Big Data: Seizing Opportunities, Preserving Values,40 is a comprehensive treatment of the subject. The report urges a focus that will move the privacy discussion forward by: preserving Privacy Values (both in the United States and through interoperable global privacy frameworks); educating Robustly and Responsibly, recognizing schools as an important sphere for using big data to enhance learning opportunities while protecting personal data usage and building digital literacy and skills; addressing Big Data and Discrimination by preventing new modes of discrimination that some uses of big data may enable; improving Law Enforcement and Security by ensuring big data’s responsible use in law enforcement,
public safety, and national security; and generally harnessing data as a public resource, using it to improve the delivery of public services, and investing in research and technology that will further power the Big Data revolution.
The second report, Big Data and Privacy: A Technology Perspective, 41examines the nature and evolution of technology and its capabilities, and analyses the challenges surrounding protecting individual privacy. What is useful to know from this work is that it concludes with the notion that technology alone cannot protect privacy; policy needs to play a strong role and needs to reflect what is technologically feasible.
This report made five policy recommendations: to focus on the use of Big Data, and less on collection; to avoid embedding technological solutions into policy, to focus on research and deployment of technologies that help to protect privacy, to encourage education and career professions and for the United States government to take the lead both internationally and at home by adopting policies that stimulate the use of practical privacy-protecting technologies that exist today.
It is worth noting that this report was subject to quick debate from privacy advocates indicating that it relies on policy aimed at the use of data, and not as much on its collection. By extension, the critics thought there would be discrimination against the poor, elderly and minorities, and even children – those not in a position to protect themselves – by placing the burden of protection on the individual.
114 Trends in Telecommunication Reform 2015

Endnotes1 Pingdom.com. “Amazing facts and figures about the evolution of hard disk drives,” February
2010, available at: http:// royal. pingdom. com/ 2010/ 02/ 18/ amazing- facts- and- figures- about- the- evolution- of- hard- disk- drives/
2 PR Newswire; “Altior’s AltraSTAR – Hadoop Storage Accelerator,” 18 December 2012, available at: http:// www. prnewswire. com/ news- releases/ altiors- altrastar--- hadoop- storage- accelerator- and- optimizer- now- certified- on- cdh4- clouderas- distribution- including- apache- hadoop- version- 4- 183906141. html
3 Pew Research Center, “Location-Based Services,” 12 September 2013, available at: http:// www. pewinternet. org/ files/ old- media/ Files/ Reports/ 2013/ PIP_ Location- based%20 services%202013 .pdf
4 Adam Sadilek, Henry Kautz and Jeffrey Bingham, “Finding Your Friends and Following Them to Where You Are”, 5th ACM Conference on Web Search and Data Mining, 2012.
5 Martin Hilbert and Priscilla López, “The World’s Technological Capacity to Store, Communicate, and Compute information,” Science 1 (April 2011), pp. 60–65.
6 Cisco, Cisco Visual Networking Index, available at: http:// www. cisco. com/ c/ en/ us/ solutions/ collateral/ service- provider/ ip- ngn- ip- next- generation- network/ white_ paper_ c11- 481360. pdf
7 SINTEF, “Big Data, for better or worse: 90% of world’s data generated over last two years,” Science Daily, 22 May 2013, available at: www. sciencedaily. com/ releases/ 2013/ 05/ 130522085217. htm
8 Rosenbush, Steve, American Airlines CIO Says Sensors Are Landing Now The Wall Street Journal, CIO Journal. 13 November 2013, http:// blogs. wsj. com/ cio/ 2013/ 11/ 13/ american- airlines- cio- says- sensors- are- landing- now/
9 McKinsey Global Institute, Big data: The next frontier for innovation, competition, and productivity, available at: http:// www. mckinsey. com/ insights/ business_ technology/ big_ data_ the_ next_ frontier_ for_ innovation p8.
10 http:// www. mckinsey. com/ tools/ Wrappers/ Wrapper. aspx? sid= {EA4CDB7F- 4500- 49DE- B5FB- CD35AA13806D}& pid= {A30FD727- 0384- 4CF1- 9364- 4C17E9ADB9F8}
11 Bill Roberts; The Benefits of Big Data, Society for Human Resource Management; Vol 58, No 10. 1 October 2013; http:// www. shrm. org/ Publications/ hrmagazine/ EditorialContent/ 2013/ 1013/ Pages/ 1013- big- data. aspx
12 New York Times, “Up Close on Baseball’s Borders,” 24 April 2014, available at: http:// www. nytimes. com/ interactive/ 2014/ 04/ 23/ upshot/ 24- upshot- baseball. html
13 New York Times. 24 April 2014. http:// www. nytimes. com/ interactive/ 2014/ 04/ 23/ upshot/ 24- upshot- baseball. html
14 Phys.org, “Using Big Data to Save Lives,” October 22, 2012, available at: http:// phys. org/ news/ 2012- 10- big. html
15 Daphne Kohler, “What we’re learning from online education,” transcript, TED, June 2012, available at: http:// www. ted. com/ talks/ daphne_ koller_ what_ we_ re_ learning_ from_ online_ education
16 Tucker, Patrick. The Naked Future. Current, 2014.
115Trends in Telecommunication Reform 2015
Chapter 4
17 Natasha Singer, “A Data Broker offers a Peek Behind the Curtain”, New York Times, 31 August 2013.
18 Craig Smith, “By the numbers: 40 amazing Google Search Statistics and Facts,” DMR, 2 February 2014.
19 Facebook, “Under the Hood,” 8 November 2012, available at: www. facebook. com/ notes/ facebook- engineering/ under- the- hood- scheduling- mapreduce- jobs- more- efficiently- with- corona/ 10151142560538920
20 Cooper Smith, “Shopping Cart Abandonment: Online Retailers’ Biggest Headache Is Actually A Huge Opportunity,” Business Insider, 18 August 2014, available at: http:// www. businessinsider. com/ heres- how- retailers- can- reduce- shopping- cart- abandonment- and- recoup- billions- of- dollars- in- lost- sales- 2014- 4
21 Mayer-Schönberger, Viktor and Cukier, Kenneth. Big Data: A Revolution That Will Transform How We Live, Work, and Think. HMH, 2013.
22 Paul Ohm, “Broken Promises of Privacy,” 57 UCLA Law Review 1701 (2010).
23 Ibid. Mayer-Schönberger, Viktor and Cukier, Kenneth p.158. Further information: Siegel, Eric. Predictive Analytics: The Power to Predict Who Will Click, Buy, Lie, or Die (Wiley 2013).
24 Taylor Armerding, CSO Online; 15Feb12, 15 Worst data breaches of the 21st Century.
25 http:// www. csoonline. com/ article/ 2130877/ data- protection/ the- 15- worst- data- security- breaches- of- the- 21st- century. html
26 www. csoonline. com/ article/ 2130877/ data- protection/ the- 15- worst- data- security- breaches- of- the- 21st- century. html
27 For more information, see: http:// big- project. eu/
28 World Economic Forum, “Unlocking the Value of Personal Data: From Collection to Usage,” available at: http:// www3. weforum. org/ docs/ WEF_ IT_ UnlockingValuePersonalData_ CollectionUsage_ Report_ 2013. pdf
29 Available at: http:// www3. weforum. org/ docs/ WEF_ TC_ DeliveringDigitalInfrastructure_ InternetEconomy_ Report_ 2014. pdf
30 Available at: http:// www3. weforum. org/ docs/ WEF_ RiskResponsibility_ HyperconnectedWorld_ Report_ 2014. pdf
31 International Telecommunication Union, Measuring the Information Society Report (2014).
32 For further information on the work on big data carried out by the ITU Telecommunication Standardization Bureau (TSB), see http:// www. itu. int/ en/ ITU- T/ techwatch/ Pages/ big- data- standards. aspx
33 See http:// www. itu. int/ en/ ITU- T/ Workshops- and- Seminars/ bigdata/ Pages/ default. aspx
34 See http:// www. itu. int/ en/ fnc/ 2014/ Pages/ default. aspx
35 See http:// www. itu. int/ en/ ITU- T/ Workshops- and- Seminars/ ccsg/ expdial/ Pages/ default. aspx
36 A background document on big data that was prepared for the GSR 2014 is available at http:// www. itu. int/ en/ ITU- D/ Conferences/ GSR/ Pages/ gsr2014/ default. aspx
37 Adapted from UNPulse (About) http:// www. unglobalpulse. org/ about- new
116 Trends in Telecommunication Reform 2015

38 Id.
39 See http:// www. whitehouse. gov/ sites/ default/ files/ microsites/ ostp/ big_ data_ press_ release_ final_ 2. pdf
40 Available at: http:// www. whitehouse. gov/ sites/ default/ files/ docs/ big_ data_ privacy_ report_ may_ 1_ 2014. pdf
41 Available at: http:// www. whitehouse. gov/ sites/ default/ files/ microsites/ ostp/ PCAST/ pcast_ big_ data_ and_ privacy_-_ may_ 2014. pdf
117Trends in Telecommunication Reform 2015
Chapter 4


5 Consumer protection in the online world
5.1 Introduction
This chapter is aimed at examining the changing usage patterns of consumers and what the local and globalised ICT consumers of digital services expect in terms of protection when they engage in various types of activities online. It examines the need for revised regulatory frameworks and explores the various options available, such as co-regulation and self-regulation, based on country experiences from around the world. It also discusses the need for greater collaboration and cooperation at the regional and international levels. This chapter complements a previous study, Regulation and Consumer Protection in a Converging Environment, which was released by ITU in 2013.1
The discussion starts by looking at consumer protection in the online world. It describes the needs and concerns of digital consumers when they engage in the most common forms of online activities: searching the Internet, shopping, making payments, consuming music and video, gaming and using apps, using social media and cloud services.
The analysis identifies a number of cross-cutting regulatory issues that need to be addressed by policy-makers, regulators2 and industry to ensure that digital consumers are effectively protected, including:
• privacy• security• fighting illegal and harmful content• copyright• net neutrality• payments• consumer rights and trust• delivery• consumer redress and education
It also highlights some of the approaches that have been taken around the world to
protect consumers, and describes some recent attempts to address specifically the conduct of new market players, such as search engine, cloud and application service providers.
5.2 Setting the scene
5.2.1 Rapid growth It is now clear that in many regions of the world, consumers have a strong online presence for many aspects of their lives (working, socialising, communicating, consuming, etc.) and this trend is set to continue. A recent OECD report3 highlights that e-commerce has been growing steadily since it first emerged in the mid-1990s with the establishment of companies like Amazon and eBay. From 2004 to 2010, e-sales grew from 9 to 14 per cent of the turnover of non-financial enterprises in the European Union, and from 10 to 16 per cent in the United States. The report also highlights, however, that growth is uneven among countries and regions of the world, and that:
• B2B sales dominate in terms of value of transactions.E-commerce is dominated by business-to-business (B2B) sales, with around 90% of the value of e-commerce transactions coming from B2B.
• B2C transactions growing faster than other segments. The remaining 10 per cent of transactions are a combination of business-to-consumer (B2C), business-to-government (B2G) and consumer-to-consumer (C2C) activities. Recently, B2C transactions have been growing faster than other segments, but from a lower base.
Figures from EMOTA, the European Distance Selling Association, show that growth is fastest in the Asia-Pacific region (with a 30 per cent increase between 2009 and 2013).4
Authors: Michèle Ledger, Javier Huerta Bravo, and James Thomson, Senior ICT Experts, Cullen International
119Trends in Telecommunication Reform 2015
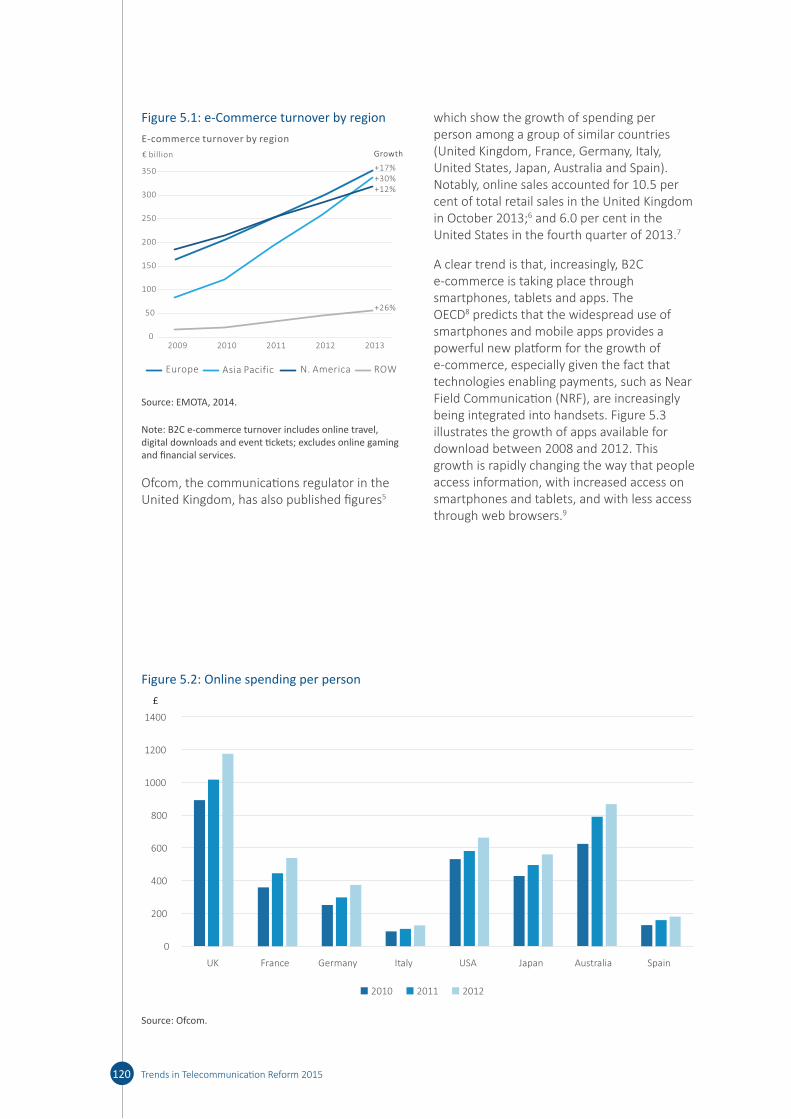
Figure 5.1: e-Commerce turnover by region
Growth
+17%+30%+12%
+26%
0
50
100
150
200
250
300
350
2009 2010 2011 2012 2013
€ billion
E-commerce turnover by region
Europe Asia Pacific N. America ROW
Source: EMOTA, 2014.
Note: B2C e-commerce turnover includes online travel, digital downloads and event tickets; excludes online gaming and financial services.
Ofcom, the communications regulator in the United Kingdom, has also published figures5
which show the growth of spending per person among a group of similar countries (United Kingdom, France, Germany, Italy, United States, Japan, Australia and Spain). Notably, online sales accounted for 10.5 per cent of total retail sales in the United Kingdom in October 2013;6 and 6.0 per cent in the United States in the fourth quarter of 2013.7
A clear trend is that, increasingly, B2C e-commerce is taking place through smartphones, tablets and apps. The OECD8 predicts that the widespread use of smartphones and mobile apps provides a powerful new platform for the growth of e-commerce, especially given the fact that technologies enabling payments, such as Near Field Communication (NRF), are increasingly being integrated into handsets. Figure 5.3 illustrates the growth of apps available for download between 2008 and 2012. This growth is rapidly changing the way that people access information, with increased access on smartphones and tablets, and with less access through web browsers.9
120 Trends in Telecommunication Reform 2015
Figure 5.2: Online spending per person£
1000
0
200
400
600
800
1200
1400
UK ItalyFrance Germany USA Japan Australia Spain
2010 2011 2012
Source: Ofcom.
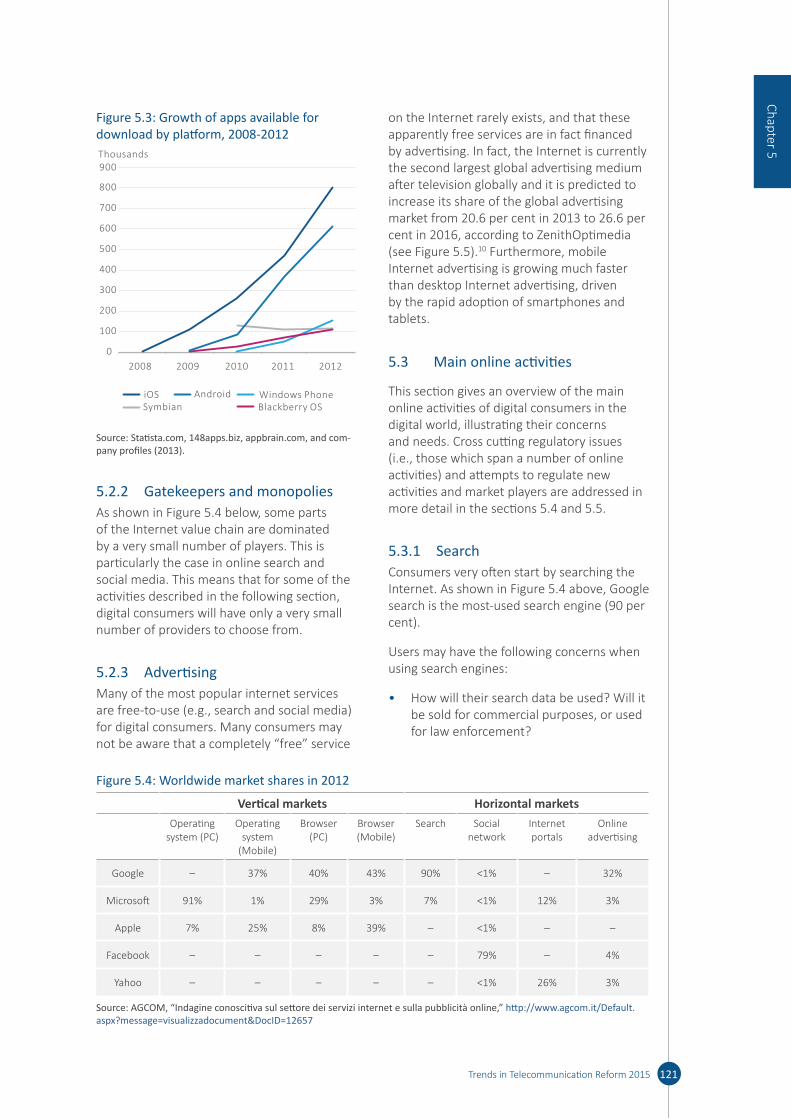
Figure 5.3: Growth of apps available for download by platform, 2008-2012
0
100
200
300
400
500
600
700
800
900
2008 2009 2010 2011 2012
iOS Android Windows PhoneSymbian Blackberry OS
Thousands
Source: Statista.com, 148apps.biz, appbrain.com, and com-pany profiles (2013).
5.2.2 Gatekeepers and monopoliesAs shown in Figure 5.4 below, some parts of the Internet value chain are dominated by a very small number of players. This is particularly the case in online search and social media. This means that for some of the activities described in the following section, digital consumers will have only a very small number of providers to choose from.
5.2.3 AdvertisingMany of the most popular internet services are free-to-use (e.g., search and social media) for digital consumers. Many consumers may not be aware that a completely “free” service
on the Internet rarely exists, and that these apparently free services are in fact financed by advertising. In fact, the Internet is currently the second largest global advertising medium after television globally and it is predicted to increase its share of the global advertising market from 20.6 per cent in 2013 to 26.6 per cent in 2016, according to ZenithOptimedia (see Figure 5.5).10 Furthermore, mobile Internet advertising is growing much faster than desktop Internet advertising, driven by the rapid adoption of smartphones and tablets.
5.3 Main online activities
This section gives an overview of the main online activities of digital consumers in the digital world, illustrating their concerns and needs. Cross cutting regulatory issues (i.e., those which span a number of online activities) and attempts to regulate new activities and market players are addressed in more detail in the sections 5.4 and 5.5.
5.3.1 SearchConsumers very often start by searching the Internet. As shown in Figure 5.4 above, Google search is the most-used search engine (90 per cent).
Users may have the following concerns when using search engines:
• How will their search data be used? Will it be sold for commercial purposes, or used for law enforcement?
121Trends in Telecommunication Reform 2015
Chapter 5
Figure 5.4: Worldwide market shares in 2012
Vertical markets Horizontal marketsOperating
system (PC)Operating
system (Mobile)
Browser (PC)
Browser (Mobile)
Search Social network
Internet portals
Online advertising
Google – 37% 40% 43% 90% <1% – 32%
Microsoft 91% 1% 29% 3% 7% <1% 12% 3%
Apple 7% 25% 8% 39% – <1% – –
Facebook – – – – – 79% – 4%
Yahoo – – – – – <1% 26% 3%
Source: AGCOM, “Indagine conoscitiva sul settore dei servizi internet e sulla pubblicità online,” http:// www. agcom. it/ Default. aspx? message= visualizzadocument& DocID= 12657
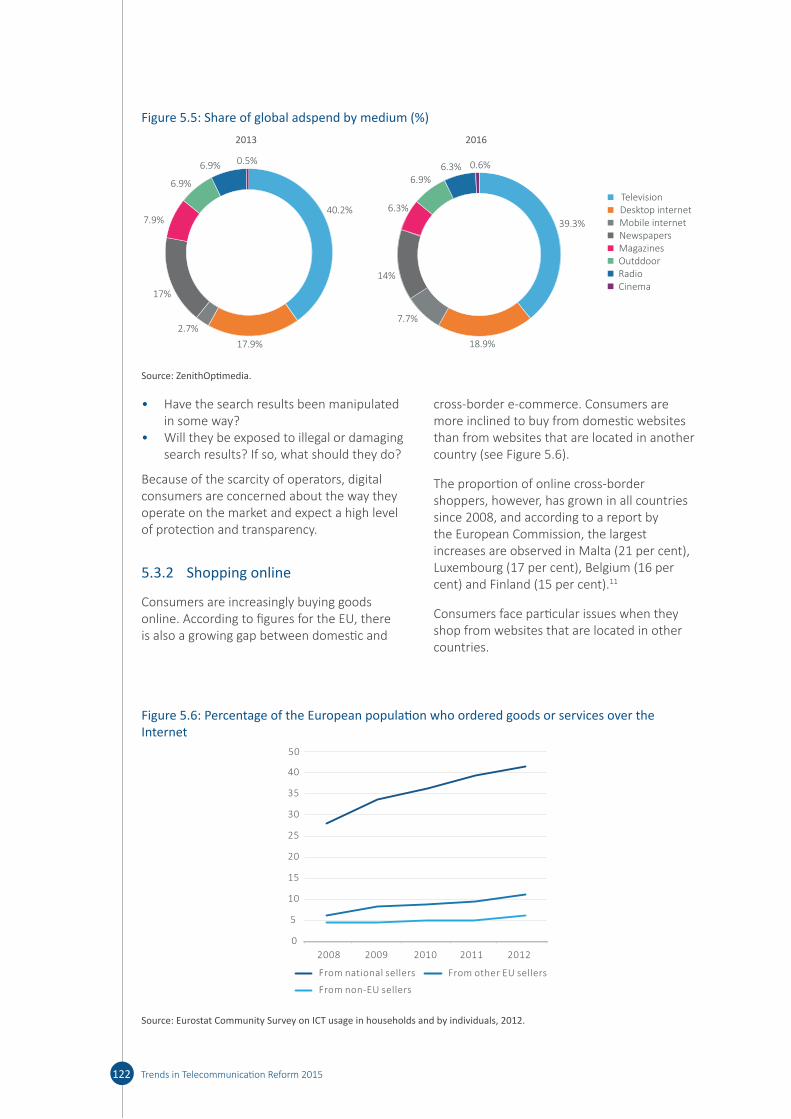
• Have the search results been manipulated in some way?
• Will they be exposed to illegal or damaging search results? If so, what should they do?
Because of the scarcity of operators, digital consumers are concerned about the way they operate on the market and expect a high level of protection and transparency.
5.3.2 Shopping online
Consumers are increasingly buying goods online. According to figures for the EU, there is also a growing gap between domestic and
cross-border e-commerce. Consumers are more inclined to buy from domestic websites than from websites that are located in another country (see Figure 5.6).
The proportion of online cross-border shoppers, however, has grown in all countries since 2008, and according to a report by the European Commission, the largest increases are observed in Malta (21 per cent), Luxembourg (17 per cent), Belgium (16 per cent) and Finland (15 per cent).11
Consumers face particular issues when they shop from websites that are located in other countries.
122 Trends in Telecommunication Reform 2015
Figure 5.5: Share of global adspend by medium (%)
Television Desktop internet Mobile internet Newspapers Magazines Outddoor RadioCinema
40.2%
17.9%
2.7%
17%
7.9%
6.9%
6.9% 0.5%
2013
39.3%
18.9%
7.7%
14%
6.3%
6.9%6.3% 0.6%
2016
Source: ZenithOptimedia.
Figure 5.6: Percentage of the European population who ordered goods or services over the Internet
0
5
10
15
20
25
30
35
40
From national sellers From other EU sellers
From non-EU sellers
2008 2009 2010 2011 2012
50
Source: Eurostat Community Survey on ICT usage in households and by individuals, 2012.
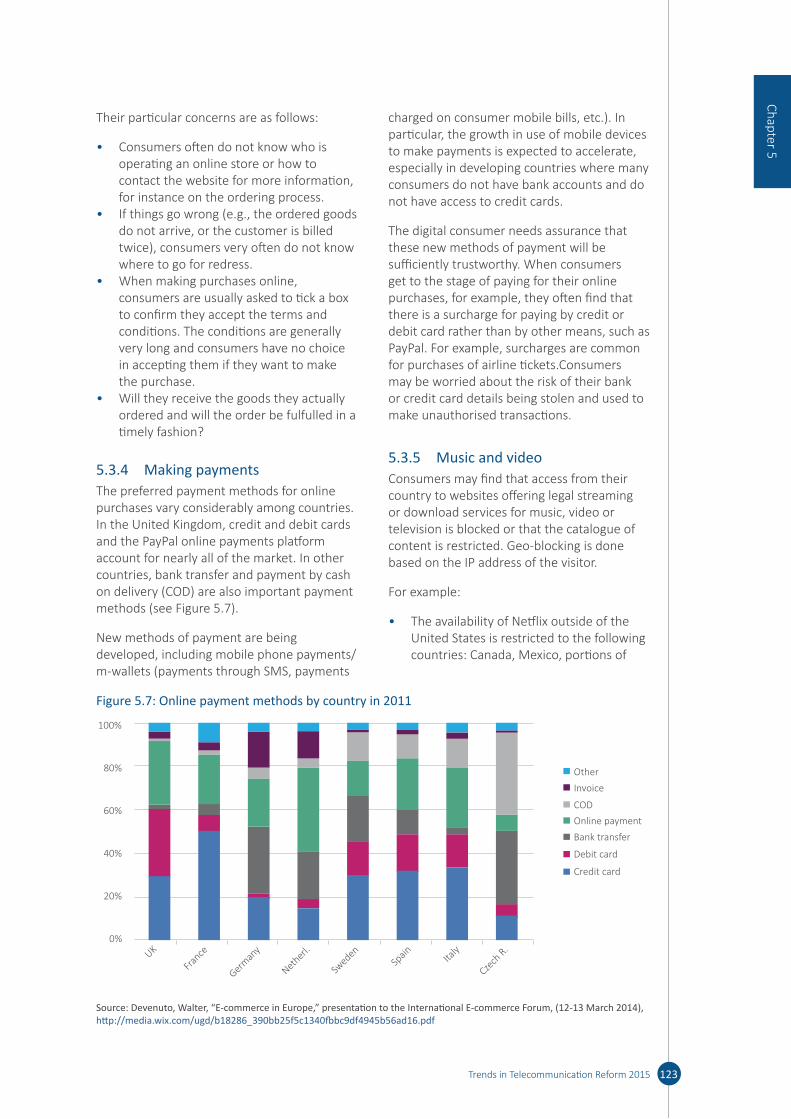
Their particular concerns are as follows:
• Consumers often do not know who is operating an online store or how to contact the website for more information, for instance on the ordering process.
• If things go wrong (e.g., the ordered goods do not arrive, or the customer is billed twice), consumers very often do not know where to go for redress.
• When making purchases online, consumers are usually asked to tick a box to confirm they accept the terms and conditions. The conditions are generally very long and consumers have no choice in accepting them if they want to make the purchase.
• Will they receive the goods they actually ordered and will the order be fulfulled in a timely fashion?
5.3.4 Making paymentsThe preferred payment methods for online purchases vary considerably among countries. In the United Kingdom, credit and debit cards and the PayPal online payments platform account for nearly all of the market. In other countries, bank transfer and payment by cash on delivery (COD) are also important payment methods (see Figure 5.7).
New methods of payment are being developed, including mobile phone payments/m-wallets (payments through SMS, payments
charged on consumer mobile bills, etc.). In particular, the growth in use of mobile devices to make payments is expected to accelerate, especially in developing countries where many consumers do not have bank accounts and do not have access to credit cards.
The digital consumer needs assurance that these new methods of payment will be sufficiently trustworthy. When consumers get to the stage of paying for their online purchases, for example, they often find that there is a surcharge for paying by credit or debit card rather than by other means, such as PayPal. For example, surcharges are common for purchases of airline tickets.Consumers may be worried about the risk of their bank or credit card details being stolen and used to make unauthorised transactions.
5.3.5 Music and videoConsumers may find that access from their country to websites offering legal streaming or download services for music, video or television is blocked or that the catalogue of content is restricted. Geo-blocking is done based on the IP address of the visitor.
For example:
• The availability of Netflix outside of the United States is restricted to the following countries: Canada, Mexico, portions of
123Trends in Telecommunication Reform 2015
Chapter 5
Figure 5.7: Online payment methods by country in 2011
Other
UK
Fran
ce
German
y
Netherl.
Sweden
Spain Ita
ly
Czech
R.
Invoice
COD
Online payment
Bank transfer
Debit card
Credit card
100%
80%
60%
40%
20%
0%
Source: Devenuto, Walter, “E-commerce in Europe,” presentation to the International E-commerce Forum, (12-13 March 2014), http:// media. wix. com/ ugd/ b18286_ 390bb25f5c1340fbbc9df4945b56ad16. pdf
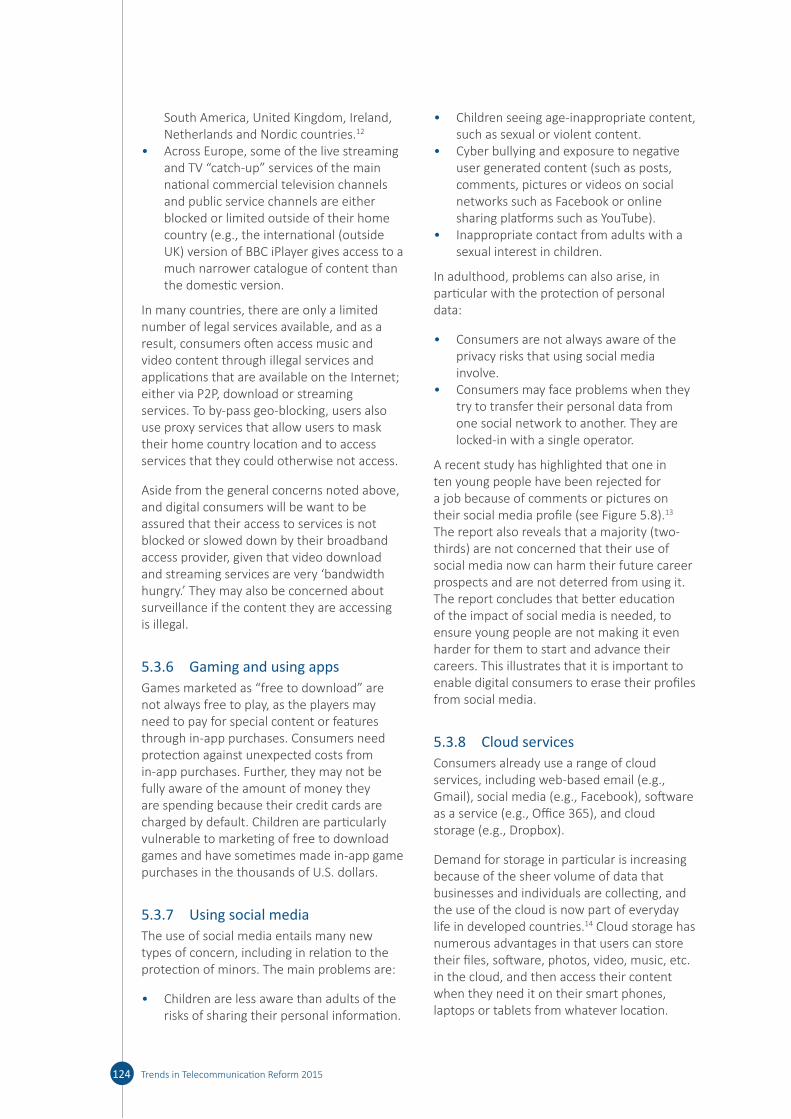
South America, United Kingdom, Ireland, Netherlands and Nordic countries.12
• Across Europe, some of the live streaming and TV “catch-up” services of the main national commercial television channels and public service channels are either blocked or limited outside of their home country (e.g., the international (outside UK) version of BBC iPlayer gives access to a much narrower catalogue of content than the domestic version.
In many countries, there are only a limited number of legal services available, and as a result, consumers often access music and video content through illegal services and applications that are available on the Internet; either via P2P, download or streaming services. To by-pass geo-blocking, users also use proxy services that allow users to mask their home country location and to access services that they could otherwise not access.
Aside from the general concerns noted above, and digital consumers will be want to be assured that their access to services is not blocked or slowed down by their broadband access provider, given that video download and streaming services are very ‘bandwidth hungry.’ They may also be concerned about surveillance if the content they are accessing is illegal.
5.3.6 Gaming and using appsGames marketed as “free to download” are not always free to play, as the players may need to pay for special content or features through in-app purchases. Consumers need protection against unexpected costs from in-app purchases. Further, they may not be fully aware of the amount of money they are spending because their credit cards are charged by default. Children are particularly vulnerable to marketing of free to download games and have sometimes made in-app game purchases in the thousands of U.S. dollars.
5.3.7 Using social mediaThe use of social media entails many new types of concern, including in relation to the protection of minors. The main problems are:
• Children are less aware than adults of the risks of sharing their personal information.
• Children seeing age-inappropriate content, such as sexual or violent content.
• Cyber bullying and exposure to negative user generated content (such as posts, comments, pictures or videos on social networks such as Facebook or online sharing platforms such as YouTube).
• Inappropriate contact from adults with a sexual interest in children.
In adulthood, problems can also arise, in particular with the protection of personal data:
• Consumers are not always aware of the privacy risks that using social media involve.
• Consumers may face problems when they try to transfer their personal data from one social network to another. They are locked-in with a single operator.
A recent study has highlighted that one in ten young people have been rejected for a job because of comments or pictures on their social media profile (see Figure 5.8).13 The report also reveals that a majority (two-thirds) are not concerned that their use of social media now can harm their future career prospects and are not deterred from using it. The report concludes that better education of the impact of social media is needed, to ensure young people are not making it even harder for them to start and advance their careers. This illustrates that it is important to enable digital consumers to erase their profiles from social media.
5.3.8 Cloud servicesConsumers already use a range of cloud services, including web-based email (e.g., Gmail), social media (e.g., Facebook), software as a service (e.g., Office 365), and cloud storage (e.g., Dropbox).
Demand for storage in particular is increasing because of the sheer volume of data that businesses and individuals are collecting, and the use of the cloud is now part of everyday life in developed countries.14 Cloud storage has numerous advantages in that users can store their files, software, photos, video, music, etc. in the cloud, and then access their content when they need it on their smart phones, laptops or tablets from whatever location.
124 Trends in Telecommunication Reform 2015

With cloud services, some of the particular concerns of digital consumers include:
• Will the data (music, video, photos) be secure?
• Will users be able to easily transfer their data from one cloud provider to another? (data portability)?
• What will happen if the service becomes unavailable?
• Is the cloud provider subject to any rules and regulations, and if so, according to what country?
5.4 Cross-cutting regulatory issues and the role of policy-makers, regulators and market operators
5.4.1 Privacy When accessing some of the online services referred to above, consumers may not feel in control of their privacy online. In particular, they may not know what personal information is being collected about them, who is collecting their personal data, who it might be passed on to, or what purpose(s) their data is being used for. Worse, consumers very often have no choice other than to accept the complex privacy terms or not to use the service at all.
The increasing monetisation of personal data has led some operators to collect massive amounts of individuals’ personal data for different purposes, such as behavioural advertising. In this regard, consumers sometimes do not understand that there is a trade-off between free-to-use services and the tracking and behavioural advertising that often finance those services. When accessing such services, consumers are often tracked without giving their consent, for the purpose of targeting personalised advertising to them. This issue has been put at the centre of the work programme of Consumers International, a global organization that advocates for consumer rights.15
Furthermore, consumers may face difficulties when they try to transfer their personal data from one operator (e.g., social network, cloud services provider) to another. Indeed, if they want to switch to another operator, they will in most cases have to re-enter all their personal data and information with the new operator. Given these difficulties, consumers may find it too burdensome to shift to another operator. This situation also prevents new operators from accessing the market, thereby impeding effective competition.
Also, in some jurisdictions, government authorities have enacted data retention laws or regulations obliging certain service
125Trends in Telecommunication Reform 2015
Chapter 5
Figure 5.8: Percentage of applicants that have been rejected for a job because of their social media/online profile, 2013
0%
2%
4%
6%
8%
10%
12%
14%
16%
18%
16-24 25-34
UK US Nigeria India Brazil China
Source: On Device Research YPCC.
Note: Based on a survey to 20’225 individuals aged 16-34 from Brazil, China, India, Nigeria, US and UK.

providers (such as ISPs) to retain certain types of personal data (in particular traffic data, such as IP addresses, email addresses of senders and recipients) for law enforcement purposes. Consumers may not know that their personal data are retained or the conditions (e.g., duration, type of retained data, location of the retained data) under which the data retention takes place. As reflected in the multistakeholder statement following NETmundial, the Snowden revelations on mass surveillance activities by intelligence agencies have put data protection at the centre of the international debate on Internet governance and have considerably increased consumers’ awareness regarding privacy issues.16
Regulatory landscape and trendsPrivacy rules vary considerably from one country to another and some countries completely lack privacy laws. The different levels of data protection throughout the world may bring some legal issues when consumers whose privacy rights have been violated seek redress in third countries, or when personal data are transferred from one jurisdiction to another. Indeed, cross-border personal data flows, which are an integral element of today’s e-commerce, are continuously increasing, thereby elevating privacy risks. In this context, international cooperation is crucial. For instance, the EU and the US, whose respective privacy policy frameworks differ enormously, have developed a Safe Harbor Framework containing a number of privacy principles17 to which U.S.-based companies may adhere. Under this voluntary scheme, Safe Harbor companies such as Google or Facebook can transfer EU citizens’ personal data to the United States. However, the revelations by Edward Snowden of alleged access to such data by U.S. intelligence agencies have put this framework under scrutiny.
In addition, privacy laws are being revised in some countries with the purpose of strengthening individuals’ privacy rights. In the European Union, whose current data protection rules date from 1995,18 a new proposal19 includes a number of measures to strengthen online privacy rights. For instance, individuals’ consent for the processing of personal data would have to be given explicitly (either by a statement or by a clear affirmative
action), rather than assumed. The new proposal also provides individuals with a right to data portability, whereby they would have the possibility to request from the operator a copy of their personal data or information20 and to transmit them directly from one operator to another. The EU’s data retention laws are particularly vulnerable at the moment. They are being challenged before constitutional courts following the decision of the Court of Justice of the European Union to strike the data retention directive as it did not respect EU citizens’ fundamental right to the protection of their personal data.21
Other countries are also updating their laws. Australia has recently adopted new data protection rules22 that will strengthen consumers’ rights by including measures aimed at improving consumers’ access to companies’ privacy policies, generally prohibiting the disclosure of individuals’ data for the purpose of direct marketing, and establishing timely and effective complaint handling mechanisms. In April 2014, Brazil, whose government is very much concerned about the issue of mass surveillance, adopted a new Internet law, known as ‘Marco Civil’.23 The law enshrines the right of Internet users to privacy of their online communications, and requires ISPs not to give third parties access to their registry of end users´ connections and applications, unless the end users have given their explicit consent, or under very specific circumstance.
The global dimension of privacy issues has also led some international organisations to take some initiatives regarding privacy. In 2013, the OECD adopted revised guidelines governing the protection of privacy and transborder flows of personal data.24 The guidelines, which aim to harmonise OECD countries’ privacy laws, include a number of principles such as purpose specification (i.e. the purposes of the data collection have to be specified), use limitation (i.e. data should not be disclosed or used for non-specified purposes without the individual’s consent or when authorised by law), and security safeguards (see next section). Similar harmonisation efforts have taken place in other international fora (e.g., the Asia-Pacific Economic Cooperation forum’s (APEC) privacy framework).25
126 Trends in Telecommunication Reform 2015

Although these agreements and soft-law approaches may help in offering solutions to consumers’ privacy concerns, more and more voices are advocating the adoption of a global instrument providing for strong privacy and data protection principles. In 2009, data protection authorities from different countries all around the world called for the establishment of a new international framework for privacy protection, with the participation of civil society.26
Role of data protection authoritiesIn an effort to address increasing data privacy concerns, from both consumers and policy-makers, data protection authorities around the world are increasing their efforts in several ways to protect consumers’ privacy rights. First, authorities have begun conducting investigations and fining major companies for not respecting privacy rules. Examples include:
• In May 2014, the Court of Justice of the European Union adopted a landmark decision obliging operators of search engines to remove from their search results links to other websites that contain personal data – at the request of the concerned individual and under certain conditions.27 The Court ruling confirmed the decision of the Spanish
data protection authority, which required Google to remove the links to websites containing an individual’s personal data. It implies that search engines are bound to implement an individual’s so-called “right to be forgotten.”
• Several regulators from different countries (e.g., Macao China, United States, Republic of Korea, and Germany) have fined Google for its collection of personal data without users’ consent for the provision of its ‘street view’ services (see Figure 5.9). According to the Korea Communications Commission, for example “the information collected included not only personal data such as online IDs, passwords and residential registration numbers but also around 600,000 Mac addresses that are highly likely to identify the user if used in combination with other information.”28
Second, governments have been issuing guidance in order to help data controllers and processors protect consumers’ personal data. Some examples:
• The Article 29 Working Party, a group that represents European data protection authorities, has recently issued recommendations on anonymization techniques.29 Anonymization techniques are gaining importance as more use
127Trends in Telecommunication Reform 2015
Chapter 5
Figure 5.9: Google’s collection of personal data for its “street view” services
Source: Korea Communications Commission.
is made of Big Data. They consist in processing personal data to prevent an individual’s identification, while still allowing operators to make information derived from the personal data they hold publicly available for different purposes (e.g., scientific research). As stated in the ITU-T Technology Watch Report, “some telecommunication operators have started exploiting aggregated customer data as a source of income by providing analytics on anonymised datasets to third parties.”30 Anonymization processes entail certain risks that personal data could be disclosed, and thus guidance can be of utmost help for operators.
• In 2014, the Article 29 Working Party and APEC data protection authorities agreed on a checklist for international businesses operating in both the EU and APEC economies, aimed at facilitating personal data transfers while respecting consumers’ privacy rights.31
Industry-driven initiativesIn addition to government regulation, standardisation and self-regulation can help in exploring the economic and social benefits of personal data, whilst respecting consumers’ privacy rights, as shown below. Regarding behavioural advertising, although some country’s laws provide that tracking can only take place with the consumer’s explicit consent, they generally do not indicate the technical means by which consent can be given. In this context, industry-led initiatives can help. Today, for example, all of the major web browsers have a “do not track” (DNT) preference setting. The purpose of the DNT standard is to determine how a website or advertiser should reply to a notification expressed by an Internet user (normally through a browser setting) that they do not wish to be tracked online. With this setting enabled, each time the browser fetches content from a website, it adds a request for the user not to be tracked – but it is up to the website and their third-party content providers (including advertisers) to honour this request. At present there is no agreed standard to implement DNT. The World Wide Web Consortium (W3C) has been working on a voluntary DNT standard since 2011, but
reaching agreement between advertisers, website owners, browser producers, and consumer privacy advocates is proving challenging.32
In the United States, under the auspices of the Department of Commerce, different stakeholders have developed a code of conduct that that would provide transparency to users and guide providers of applications for mobile devices handle personal data.33 It contains requirements for a short notice that would be presented to consumers after downloading an app. This notice would indicate what data the app collects, the means of accessing its privacy policy, and with whom it intends to share the data.34
Conclusions and RecommendationsThe processing of personal data is an intrinsic part of consumers’ day-to-day online activities. Most of consumers’ online activities involve the processing of personal data (e.g., the mere access to a website or an online payment). Adequate protection of consumers’ personal data is thus of key importance to the development of online activities.
Although some countries are strengthening their privacy laws, the coexistence of diverging legislative frameworks around the world does not help in building consumers’ trust in cross-border e-commerce. Industry initiatives are proving difficult to achieve as they require a high level of agreement among very different stakeholders. Regulators have a definite role to play to strengthen industry-led solutions such as anonymization and privacy by design.
For policy-makersStrong privacy laws and/or regulations can help to make consumers feel more confident that their personal data is protected online. Such texts should contain fundamental data protection principles (e.g., purpose limitation), and should provide individuals with clear, enforceable rights (e.g., the right to access the collected data and right to erase) and adequate safeguards. The latter are particularly relevant in the context of data retention. The global dimension of online privacy – and divergent approaches – requires concerted action in international fora and the adoption of international binding instruments.
128 Trends in Telecommunication Reform 2015
For regulatorsRegulators have an important role to play in order to ensure that the rules on data protection are respected by market players. Regulators also need to develop strong cooperation and partnerships with regulators in other countries and regions of the world, in an effort to develop common approaches. They need to provide guidance for the industry on the interpretation of the relevant legal norms and help the industry to develop best practices. Regulators can foster industry-wide codes of practice and be involved in standardisation initiatives.
For all stakeholdersSelf-regulation (e.g., codes of conduct) and standardisation initiatives require the involvement of all the parties concerned (industry, governments, civil society, consumers, etc.).
5.4.2 SecurityClosely related to privacy concerns are issues related to data security and protection. Consumers need to be assured that their data is protected from those who might unintentionally access it or intentionally steal it for financial or other motives. Digital consumers are particularly concerned about:
• What happens if my data is lost by Internet companies, online retailers or governments and re-used for fraudulent purposes?
• Who is responsible to ensure the security of data?
• Is there a competent authority to deal with these issues?
Recent cyberattacks and severe security breaches have shown that these are real questions. However, these seemingly simple questions are not easy to answer.
Regulatory landscapeMany countries have legislation in place to criminalise attacks against information systems such as the illegal interception of computer data, or the spread of malicious software into networks and computers.35 These laws are useful but do not require operators to protect their systems in the first place, and thus do
not provide particular protection for the digital consumer.
In the European Union, for example, there is currently no obligation for companies other than telecommunication operators to notify customers or national regulators of security breaches. The European Union is attempting to adopt a new directive that would oblige certain operators (‘key internet enablers’) to do so, but negotiations are difficult.36 The proposal would also oblige member states to set up national competent authorities responsible for network and information security, and would oblige certain market operators to have in place methods to address security risks.37
In relation to the role of regulators, the proposal specifies that competent authorities would have the power to require operators (and public administrations38) to:
• provide information needed to assess the security of their network and information security systems, including documented security policies; and
• undergo a security audit carried out by a qualified independent body or national authority and make the results available to the competent authority.
At the regional level, ENISA39, the European Union Agency for Network and Information Security has been set up to enhance the capability of the EU and its member states and businesses to prevent, address and respond to network and information security problems.
Industry argues that heavy-handed regulatory approaches could hinder private sector innovation and industry should be in charge of ensuring the protection of their systems. Cybersecurity standards are already being developed, and they argue that this is sufficient.40
Conclusions and RecommendationsThe digital consumer needs to be assured that his or her data will be kept secure. There are very few policy responses so far that address the concerns of digital consumers relating to the security of networks and data in a comprehensive manner.
129Trends in Telecommunication Reform 2015
Chapter 5

For policy-makersIt is difficult to conclude about specific policy responses given that comprehensive strategies have not yet been adopted to address this issue. Despite this fact, we see that consumers--as well as regulators--should at the very least be informed of data and security breaches.
For regulatorsRegulators should be established and empowered to deal with issues relating to information and network security. Their tasks can be to:
• provide information on security standards;• audit the security standards of operators;• explain to digital consumers what to do in
case of cybersecurity attacks; and• provide information on new types of
viruses, malware etc.
For the industryIndustry should continue to work on the protection of the security of their networks and information systems as a matter of priority. Even in the absence of a regulatory obligation, industry should be transparent about cyberattacks and inform affected users immediately when their data could be compromised.
5.4.3 Illegal and harmful content Digital consumers may come across illegal and harmful content on the Internet, for instance in search results or on social media. Minors need more protection than adults and parents, and care givers need to make sure that children will not be exposed to violent or other unwanted content. Many operators (ISPs, mobile operators, social networks, search engines) have committed through codes of conduct or on their own initiative to address the problem of harmful content. ISPs and mobile operators usually offer parental controls that need to be activated by subscribers (or in some cases are in operation by default). The main search engines also offer ‘safe search’ tools to prevent inappropriate content (text, images and videos) from appearing in search results.
Despite these initiatives, parents are sometimes not sufficiently digitally literate
to know how to most effectively protect their children. There is therefore a need for governments, regulatory authorities and market operators to provide information on what tools are available and how to use them. In particular, digital consumers need to know what to do when faced with illegal and harmful content.
• Who should they report the content to?• How can the content be blocked or
removed?• Where can they seek redress? • What happens if the content is on
a website that is located in another jurisdiction?
These issues illustrate that the respective roles of courts, law enforcement, service providers, and regulators need to be clearly defined to serve victims most effectively.
Almost all countries have mechanisms in place to deal with illegal content on the Internet, but this is a complex area of policy since a balance needs to be achieved between freedom of expression on the one hand, and the need to fight illegal activities on the other. Difficulties also occur because:
• What is illegal in one country may not be illegal in another country.
• ISPs, search engine providers and social networking services do not want to monitor content to detect illegal and harmful content.
• Law enforcement authorities need to be able to detect and take action against illegal content or service providers, and this very often requires the collaboration of ISPs, search engines and social networks.
Around the world, laws are being adopted to try to deal with these issues, both in general, and also through specific rules and regulations that deal with special concerns (e.g., fighting online piracy, online child pornography, illegal gambling, etc.). Self-regulatory frameworks involving notice and take-down or notice and take-action have also been developed to frame the role of internet intermediaries, and to ensure that content can easily be removed from websites when it is obviously illegal. In some areas (e.g., fighting online piracy, as explained above) regulators can be involved in
130 Trends in Telecommunication Reform 2015
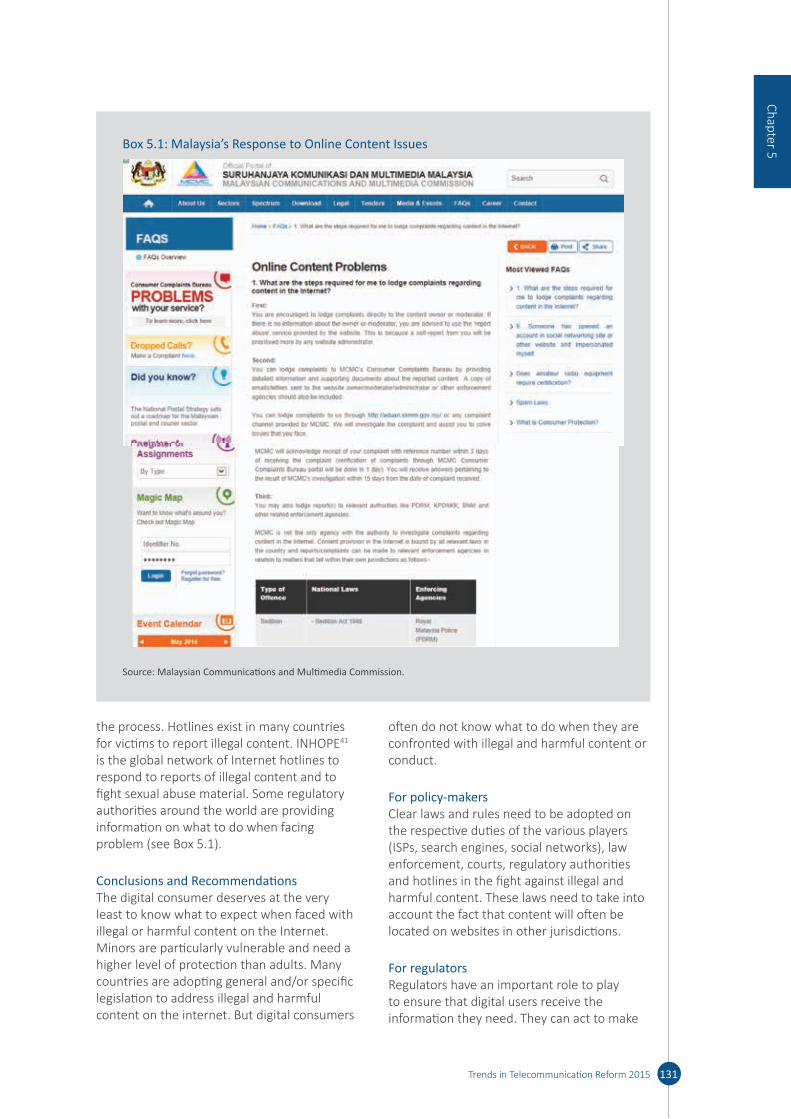
the process. Hotlines exist in many countries for victims to report illegal content. INHOPE41 is the global network of Internet hotlines to respond to reports of illegal content and to fight sexual abuse material. Some regulatory authorities around the world are providing information on what to do when facing problem (see Box 5.1).
Conclusions and RecommendationsThe digital consumer deserves at the very least to know what to expect when faced with illegal or harmful content on the Internet. Minors are particularly vulnerable and need a higher level of protection than adults. Many countries are adopting general and/or specific legislation to address illegal and harmful content on the internet. But digital consumers
often do not know what to do when they are confronted with illegal and harmful content or conduct.
For policy-makersClear laws and rules need to be adopted on the respective duties of the various players (ISPs, search engines, social networks), law enforcement, courts, regulatory authorities and hotlines in the fight against illegal and harmful content. These laws need to take into account the fact that content will often be located on websites in other jurisdictions.
For regulatorsRegulators have an important role to play to ensure that digital users receive the information they need. They can act to make
131Trends in Telecommunication Reform 2015
Chapter 5Box 5.1: Malaysia’s Response to Online Content Issues
Source: Malaysian Communications and Multimedia Commission.

sure that internet intermediaries deliver this information directly, but they can also promote this information on their websites. They can also foster industry-wide codes of practice and be involved in standardisation initiatives. Regulators need to develop strong cooperation and partnerships with regulators in other countries and regions of the world, in an effort to develop common approaches.
For the industryIndustry should provide clear information on:
• available filters or other technical means to block illegal or unwanted content;
• how to report illegal or harmful content, and explain the follow up that should be expected;
• hotlines that may be available in a particular country; and
• the possible involvement of regulators and/or the police.
5.4.4 CopyrightAs illustrated above, the main problems are the lack of creative content in some regions and an increasing amount of online piracy.
The fact that broadband subscriptions continue increasing all over the world (e.g., according to the IFPI Digital Music Report 201442, whilst mobile broadband penetration in Sub-Saharan Africa only increased 2% in 2011, it increased 11% in 2013), presents new opportunities for both businesses and consumers, but also creates “a hugely disruptive challenge to the creative industries, especially in the area of digital copyright.”43
Consumer organisations generally perceive that efforts are being made by governments and international organisations to protect the different or rightsholders (creators, music publishers, audio-visual producers) and fighting against piracy, rather than in taking the necessary steps to provide consumers with more access to creative content.
Regulatory landscape and trendsIn some cases, the reason for content restrictions is the fact that the exercise of intellectual property rights is territorial in nature. Rightsholders, who have the exclusive right to authorise or prohibit the reproduction
and communication of their works, including online, normally exercise their rights on a country by country basis. Consequently, providers of online content such as music or video need to clear rights in each country from which they allow access to their services. Currently, for example, an online provider of movies seeking to serve the U.S. market with a population of 316m would have to clear rights only once, whereas to serve the EU market as a whole with a population of 503m could involve clearing the rights 28 times. The situation becomes even more complicated as very often more than one party have rights on a single work. It goes without saying that sometimes it is not easy for Internet providers to know from whom they need to obtain rights’ clearance. For instance, an online music store that wants to offer a song will have to clear authors’ rights (via collecting societies), and the record producer’s and performers’ rights (via the record producer).
This may result in market fragmentation, and it is said to impede the emergence of new services. From the consumer perspective, this obviously leads to a lack of availability of legal content. Furthermore, the online provider’s higher licensing costs will likely be passed on to the consumer.
The territoriality principle, as well as the copyright framework, is enshrined in international treaties such as the Berne Convention and the World Trade Organisation’s Agreement on Trade-Related Aspects of Intellectual Property Rights. A reform of the copyright system is probably needed, but is proving difficult to achieve. Some also advocate a complete overhaul of the copyright system but this is unlikely to happen in the foreseeable future as it would require changes to international treaties44 on which the copyright system is based.
The World International Property Organisation (WIPO) is the main actor regarding copyright in the international sphere. However, WIPO’s on-going work (in the Standing Committee on Copyright and Related Rights, which gathers representatives from 187 countries) is limited to more concrete aspects of copyright, such as harmonizing exceptions and limitations to copyright (e.g., the treaty facilitating access to published works for the visually
132 Trends in Telecommunication Reform 2015
impaired and facilitating the cross-border exchange of accessible format copies45). Also, WIPO is witnessing a confrontation between developed countries, which rely on a strong content industry and do not want to reduce copyright protection, and developing countries, which advocate for more flexible copyright rules as a means to gain more access to creative content and knowledge.
In the European Union, several sectoral initiatives have been taken in order to overcome the rigidity of copyright rules. For instance, the region has adopted a directive that aims to facilitate the multi-territorial licensing of authors’ rights in musical works for online uses. The directive promotes the idea that national authors’ collecting societies should aggregate their repertoires. The aim is to make it easier for online music services to obtain licences for a multitude of countries and to offer a large catalogue of music to consumers.46
Role of regulatorsWhile little can be done to change the licensing of rights on a country-by-country basis, competition law authorities may have a role to play in how right holders grant licences, and their action can ultimately improve consumers’ access to online content. For instance, a system of licences for sports events that grants absolute territorial exclusivity to licensees (broadcasters in this case) has been found contrary to competition law by the Court of Justice of the European Union.47 More recently, in 2014, the European Commission launched an investigation regarding alleged restrictions between several U.S. rightsholders (film studios such as Warner Bros., Sony Pictures, Paramount Pictures) and EU users (pay-TV broadcasters such as Sky Italia (Italy) and Canal Plus (France)). Provisions included in licensing agreements between the U.S. and the EU companies would prevent the latter from offering their services across borders, “for example by refusing potential subscribers from other Member States or blocking cross-border access to their services.” 48
At the level of copyright enforcement, telecommunication operators and regulators are increasingly involved in copyright issues, mainly as regards the fight against piracy. For instance, France has set up a special
administrative authority, HADOPI49, to fight online piracy, to promote legal offers and to raise awareness about the consequences of online piracy. HADOPI has enforcement authority in relation to individual downloaders, through a so-called graduated response system.50
Another example can be found in Italy, where a special role has been given to AGCOM, the converged regulator (see Box 5.2).
Industry-driven initiativesSome industry initiatives also aim at facilitating the licensing of rights in musical works for online purposes. For example in 2000, collecting societies from all over the world signed the Santiago Agreement.51 Although the Agreement was withdrawn following the European Commission’s competition concerns,52 this agreement contained reciprocal agreements allowing a single collecting society to grant multi-territorial licences covering the repertoire of the other signatory collecting societies. Indeed, the agreement contained membership clauses, which restricted authors’ ability to affiliate to the collecting society of their choice; and exclusivity clauses, which provided each collecting society with absolute territorial protection regarding other collecting societies. These clauses obliged Internet content providers to obtain the necessary licences from the collecting society of the country where they wanted to offer their services.
Other initiatives have been started to ease licensing for a variety of media. In order to favour multi-territorial licensing solutions for online music, different rightsholders are working on a global repertoire database.53 This may help online music providers to identify who owns and controls musical works, thereby facilitating their licensing tasks. This may result in consumers having more access to more music works in more territories. In the audio-visual sector, the film producer MIRAMAX and Netflix have signed a licensing agreement covering a number of countries in Latin America that allows licensing to occur on a regional basis.54
In order to share content (e.g., videos, songs) and knowledge (e.g., academic works, e-books) whilst respecting copyright, creative
133Trends in Telecommunication Reform 2015
Chapter 5

commons licences are spreading all over the world.55 Creative commons licences are a flexible solution to conciliate rigid copyright rules in order to reach a wider audience. They normally contain a permission to publicly share and use a given work under certain conditions designed by the creator. These licences are also being increasingly used by public institutions and international organisations as a way to guide use of their materials.56
Conclusions and RecommendationsAlthough new online services continue spreading throughout the world, the online market for online content is fragmented and consumers are often limited in what they can download or use by reason of their physical location. Moving forward, the focus should be on improving licensing practices;
an increased use of multi-territorial licensing. The territoriality principle does not prevent rightsholders from granting multi-territorial licences. The challenge is to reconcile the rightsholders’ right to be properly remunerated with the consumers’ desire to enjoy--legally-- online content wherever they are. As EU Commissioner Viviane Reding said in relation to European consumers, “consumer rights online should not depend on where a company or website is based. National borders should no longer complicate (...) consumers’ lives when they go online to buy a book or download a song.”57
For policy-makersThe debate on the adequacy of the existing copyright rules in the online environment has to be brought into regional and international fora, as is happening in the EU.
134 Trends in Telecommunication Reform 2015
Box 5.2: AGCOM’s Role in Fighting Online Piracy
New rules on protecting copyright online (in force since March 31, 2014) entrust AGCOM to order selective removal (also known as “take down”)of works (or links/trackers to works) or disabling of website access by ISPs. The regulation establishes a committee composed of representatives from the different stakeholder groups (consumers, rightsholders, ISPs, public institutions) to develop and protect the legal offer of digital works and to discuss possible self-regulatory solutions with the aim of supporting the development of digital works.
The take-down procedure starts with the notification of a claim (submitted through a form on the AGCOM website) asking AGCOM for the removal of illicit content. AGCOM informs the claimant within 7 days about the start of the procedure or reasoned dismissal of the claim. The notification about the start of the procedure (sent to the claimant, service providers and website manager, and uploader, if identified) must at least contain a detailed description of the digital works involved; the indication of the copyright law provision allegedly infringed; a brief description of the facts and of the preliminary outcomes of AGCOM investigation; and notice that the receiver of the notice may remove the disputed contents on a voluntary basis. The parties may file counterclaims within five days. If the recipient takes the necessary actions to remove the illicit content, or if the claimant brings an action before a court, the procedure will be closed.
The procedure should be closed within 35 days. If AGCOM concludes that a breach has been committed, it will order the service provider to either remove the illicit content or disable access to it (i.e. web-blocking). The decision has to be proportionate to the gravity of the violation. Compliance with an AGCOM decision must take place within 3 days. The AGCOM decision can be challenged before an administrative court.
The rules are without prejudice to any self-regulatory instruments on notice and take-down procedures put in place by interested parties.
Source: Authors.

Educational campaigns should be promoted in order to educate consumers to the respect of intellectual property rights.
For regulatorsCompetition authorities can play a key role in ensuring that certain rightsholders do not put up barriers to cross-border online services. Regulators could also become more involved in copyright enforcement. They are the appropriate actors to build bridges between rightsholders, intermediaries and consumers (e.g., they can balance views from multiple stakeholders, and can develop and use fast and efficient mechanisms to take down illegal content).
For the industryRightsholders should explore new licensing solutions, especially for audio-visual content. Online service providers should not add additional barriers to e-commerce. For example, if a company acquires a multi-territorial licence, it should develop a multi-territorial online store for consumers (in the European Union, for example, a single online music store instead of 28).
5.4.5 Net neutralityNet neutrality in its simplest definition means that digital consumers should not find that their access to, and use of, specific apps, content or services is blocked or slowed down by their broadband access provider – provided that the content is legal. As Internet traffic has rapidly increased, putting a strain on service providers’ networks; and as new apps have been developed that compete with the operators’ own services, proponents of net neutrality are concerned that ISPs have an incentive to discriminate against particular forms of traffic (e.g., VoIP or messaging apps or video streaming) or competing services. Opponents of net neutrality requirements contend that some traffic management is necessary in order to prevent network congestion, ensure network security and protect consumers’ quality of service. Net neutrality is therefore an issue relevant to many of the services used by digital consumers discussed in this chapter.
Regulatory responsesIn response to calls for net neutrality policies, policy-makers and regulators have responded in a variety of ways:
• Some countries have reviewed the current market situation and their regulatory framework, and have found that there is currently no need for specific net neutrality rules. This may be based on their assessment that the market is sufficiently competitive to protect consumers, or that their existing laws/regulations are sufficient to deter companies from actions that would violate net neutrality principles.
• Many countries have imposed transparency obligations on ISPs. Traffic management or discriminatory practices may not be prohibited (i.e., to address network congestion or security issues), but broadband access providers are required to clearly disclose them, and how they might affect consumers. This approach is a common first step as policy-makers and regulators monitor the situation and consider whether additional regulations or restrictions are needed.
• A handful of countries have imposed a specific legal/regulatory requirement for net neutrality that prohibits ISPs from blocking, throttling, degrading and/or prioritizing Internet traffic. Such rules often contain exemptions for reasonable traffic management (e.g., to resolve network congestion or address security issues), and may also allow for specialized services (i.e., dedicated connection to deliver a particular type of content or service). Countries that have taken this approach have typically also included transparency obligations.
• Finally, many countries have simply not yet addressed the issue.
In the European Union, for example, broadband access providers are subject to transparency obligations and are required to explain clearly and simply on their websites and in their contracts:
• any conditions limiting access to, and use of, apps, content or services;
• the traffic management practices they apply and the impact on service quality.
135Trends in Telecommunication Reform 2015
Chapter 5
Through the “Connected Continent” legislative package,58 the EU is proposing to go beyond such transparency requirements and impose EU-wide net neutrality rules that would prohibit ISPs from blocking, degrading, slowing down, or prioritizing access to apps, content or services. . Traffic management would still be allowed for legitimate reasons, such as managing peak loads, provided it is applied in a non-discriminatory way. In addition, ISPs would be permitted to enter into agreements with content providers to offer specialized services, such as video streaming over a dedicated, enhanced connection as long as those services do not impair the quality of internet access services.59 The EU Council is currently debating the proposed net neutrality regulations. Although some expected the rules to be adopted by the end of 2014, it now appears likely that agreement will not be reached until 2015 or later.
In the meantime, two European countries – the Netherlands60 and Slovenia61 – have already enacted net neutrality laws. Other countries, have begun consideration of possible approaches to net neutrality, but appear to be awaiting the outcome of the EU-level debate before enacting their own national laws or regulations.
Net neutrality is also being actively addressed throughout the Americas. In Latin America, Chile,62 Colombia,63 and Brazil64 are among the countries that have adopted net neutrality laws. Canada has also implemented net neutrality regulations.65 In the United States, the Federal Communications Commission (FCC) issued a public consultation on 15 May 15 2014 containing proposals to replace the net neutrality rules contained in its 2010 Open Internet Order that were (partly) revoked by a court decision in January 2014.66
Although most of the debate over net neutrality has focused on blocking or slowing down traffic, recently, net neutrality advocates have begun to question whether broadband providers should be allowed to charge content companies for preferential treatment to reach customers at higher speeds or quality. This is also known as “paid prioritization,” which refers to Internet content companies paying
broadband providers to deliver their content from the ISP to the end user faster than other Internet traffic. Advocates claim that such practices can harm competition by making it more difficult for smaller content providers and new entrants to compete with the larger content providers.
In addition, proponents of net neutrality rules have recently begun focusing more on Internet interconnection issues, particularly paid peering arrangements, claiming that they create “fast lanes” for certain content providers willing to pay for direct interconnection to the ISP’s network. In February 2014 Netflix and U.S. cable operator Comcast struck a landmark deal in which Netflix would pay an undisclosed fee for direct connections to Comcast’s network. It is widely believed that this will give Netflix more reliable and faster access to Comcast’s customers.67 Very few regulators have addressed such issues.
Although the FCC declined to address paid peering issues in its proposed net neutrality rules, it did address the question of prioritization and the conditions under which it could be acceptable. The FCC has put forward a proposal to allow ISPs to charge companies to reach customers at faster speeds, but only if the agreements are “commercially reasonable.” This is a new standard that would be judged by the FCC on a case-by-case basis.
Conclusion and RecommendationsThe issues that surround net neutrality are in a great deal of flux. Governments have historically taken an incremental approach by either addressing net neutrality concerns under their existing regulatory frameworks, or by imposing transparency requirements. More recently, there has been a greater willingness to consider if specific net neutrality laws or rules are needed. Going forward, the issue for policy-makers and regulators will be to find a way to balance the concerns of net neutrality advocates about discriminatory treatment of some services/customers with the legitimate needs of access providers to manage their networks in ways that prevent congestion and keep the network secure.
136 Trends in Telecommunication Reform 2015
For policy-makersPolicy makers should define a clear set of rules on net neutrality covering basic Internet access, paid prioritization and paid-for fast lanes (Internet interconnection).
For regulatorsRegulators will need to carefully monitor the enforcement of these rules and provide guidance on their implementation. For example, regulators can define what is the minimum quality of service acceptable for basic Internet access (and for different service tiers), and what are fair and reasonable conditions for selling fast lane access.
For the industryBroadband access providers should act transparently both towards broadband users and content companies. Users should be able to easily understand the traffic management policies that apply to the broadband subscription they buy.
Fast lanes should be offered in an open and transparent way to all content companies that may be interested in using them, including at fair and non-discriminatory prices and other terms and conditions.
5.4.6 PaymentsAs discussed above, consumers need to be confident that new methods of online payment will be trustworthy.
This is an area for policy-makers and regulators, as some of these new methods of payments are not offered by the usual ‘regulated’ entities but by new entrants, which do not necessarily abide by the same set of rules and regulations. In the European Union, for example, policy-makers are seeking to make sure that the operators providing these services are supervised by national competent authorities and provide the same guarantees as payment services offered by banks and credit card companies.68
The OECD Committee on Consumer Policy very recently issued policy guidance to boost consumer protection when using mobile and on-line payment systems, and to identify ways in which policy-makers and businesses can work together to strengthen consumer
protection while also ensuring innovation in the marketplace.69 For instance, to ensure the security of payments, the OECD policy guidance specifies that:
• Payment providers should put in place appropriate safeguards to protect the security of their systems, and should encourage the adoption of such measures by all entities having access to consumer data related to payments.
• In addition to notifying consumers, payment providers should provide them with timely and effective redress mechanisms when their data is compromised and/or they suffer financial losses caused by security breaches.
• Stakeholders should work together to raise consumer awareness about payment security issues, and about the actions that consumers can take to protect themselves in such transactions.
Regarding surcharges for card payments, competition authorities around the world (including Australia, the European Union and the United States) have taken action to lower the interchange fees set by the two leading card service providers, Visa and MasterCard. The EU, for example, is adopting legislation that would cap the level of interchange fees across the 28-nation bloc, and would also prohibit retailers from applying surcharges to such card payments (because the interchange fees would have been significantly lowered by the cap).70Note also that Australia’s Department of Communications is providing information regarding the different methods of payment on its website (see Box 5.3).
5.4.7 Consumer rights and trust
The policy responsesA strong set of consumer rights can help to protect digital consumers when they buy goods and services online. These rights include:
• information on who is operating the website;
• protection against unfair commercial practices (e.g., leading consumers into purchasing a good they would not have bought without having been unlawfully led into the transaction);
137Trends in Telecommunication Reform 2015
Chapter 5
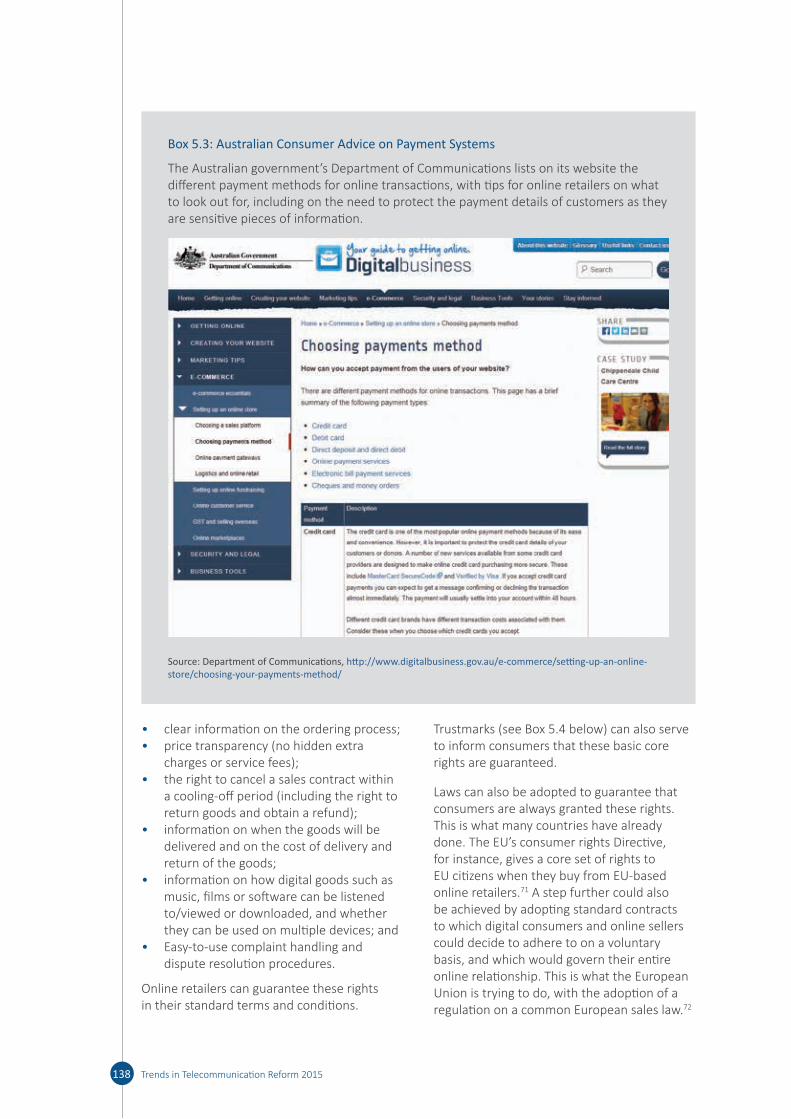
• clear information on the ordering process; • price transparency (no hidden extra
charges or service fees);• the right to cancel a sales contract within
a cooling-off period (including the right to return goods and obtain a refund);
• information on when the goods will be delivered and on the cost of delivery and return of the goods;
• information on how digital goods such as music, films or software can be listened to/viewed or downloaded, and whether they can be used on multiple devices; and
• Easy-to-use complaint handling and dispute resolution procedures.
Online retailers can guarantee these rights in their standard terms and conditions.
Trustmarks (see Box 5.4 below) can also serve to inform consumers that these basic core rights are guaranteed.
Laws can also be adopted to guarantee that consumers are always granted these rights. This is what many countries have already done. The EU’s consumer rights Directive, for instance, gives a core set of rights to EU citizens when they buy from EU-based online retailers.71 A step further could also be achieved by adopting standard contracts to which digital consumers and online sellers could decide to adhere to on a voluntary basis, and which would govern their entire online relationship. This is what the European Union is trying to do, with the adoption of a regulation on a common European sales law.72
138 Trends in Telecommunication Reform 2015
Box 5.3: Australian Consumer Advice on Payment Systems
The Australian government’s Department of Communications lists on its website the different payment methods for online transactions, with tips for online retailers on what to look out for, including on the need to protect the payment details of customers as they are sensitive pieces of information.
Source: Department of Communications, http:// www. digitalbusiness. gov. au/ e- commerce/ setting- up- an- online- store/ choosing- your- payments- method/

Negotiations on the proposed regulation, however have been long and difficult. The initiative is innovative as the parties to an online sales contract would be able to decide to be exclusively governed by the rules of the European sales law, thereby by-passing national legal regimes and the standard terms and conditions of the online retailer.
TrustmarksOne of the main concerns of digital consumers is that they must feel confident and trust the website from which they are ordering a good or a service. This is very likely to be the case, when they purchase from well-known e-commerce sites such as Amazon, but they may be less sure when making purchases from other sites, particularly if they suspect the site is in a foreign country. Trustmarks can re-assure consumers that the vendor is reliable. They show that a website complies with a set of service quality and security requirements. Trustmark schemes can be run by government bodies, non-profit organisations, industry or trade organisations, or by private businesses. Note that most trustmarks operate at a national level.73 It seems clear that regulators could have a role to play in fostering the establishment of trustmarks, as well as also
supervising or approving their operation, thereby increasing the level of trust.
However, a multitude of trustmarks have appeared, leading to a so-called “trustmark jungle” that can leave consumers confused as to which ones they can trust. The development of internationally-recognised trustmarks would help to boost the e-commerce market. The European Union, for example, is currently assessing how to establish an EU-wide trustmark scheme and cooperation platforms on the governance of trust mark systems.74
DeliveryDigital consumers need to be assured that they receive their ordered goods on time and in good order. There is usually no problem for national transactions.
The European Commission published a roadmap at the end of 201375 which highlights in particular the need for more transparency and information on the available delivery options, for more, better and more affordable delivery solutions and for enhanced complaint handling and redress mechanisms for consumers, which should be jointly ensured by
139Trends in Telecommunication Reform 2015
Chapter 5Box 5.4: Example of a widely used trustmark on UK websites
Safe BuyAccredited Retailer
Click for...Trading Standards info
SafeBuy certifies that shoppers can trust a website because the retailer adheres to the rules and regulations on distance selling but also more generally, on privacy protection, child protection and security of payment transactions.
SafeBuy certifies that shoppers can trust a website because the retailer adheres to the rules and regulations on distance selling but also more generally, on privacy protection, child protection and security of payment transactions.
Source: https:// www. safebuy. org. uk/ index. html

delivery operators, e-retailers and consumer associations.
Conclusions and recommendations• Clear rights and obligations should be
given to consumers in the laws.• Given the increasing number of cross-
border transactions, supra-national and regional laws should be adopted to give consumers the same rights when they shop from foreign websites, compared to when they shop domestically.
• Regulators should provide clear information on the rights and obligations of digital consumers
• Regulators have a role to play to foster the development of easily recognisable trustmarks in collaboration with the industry and consumer organisations
• Regulators could take a leading role in the supervision and operation of the trustmark systems
5.4.8 Consumer redress and consumer educationEven if a strong set of rights are given to consumers, a key aspect is to make sure that consumers can seek redress when things go wrong. As illustrated by the Bureau Européen des Unions de Consommateurs (BEUC), the European consumer protection authority, consumer redress remains an issue, especially in a dispute between a consumer located in
country A, and an online retailer established in country B. Box 5.5 summarizes BEUC’s views on enforcement.
The OECD adopted a recommendation on consumer dispute resolution and redress in 2007, which proposes common principles for member countries on mechanisms for consumers to resolve disputes and obtain redress for economic harm, including when they purchase goods and services across borders.76 It provides that member countries should review their existing dispute resolution and redress frameworks to ensure that they provide consumers with access to fair, easy to use, timely, and effective dispute resolution and redress processes without unnecessary cost or burden.
Member countries should encourage businesses and industry groups to provide consumers with voluntary mechanisms to informally, and at the earliest possible stages, resolve their disputes and obtain redress as appropriate.
In many countries, formal complaint processes have been established through which individuals or groups of individuals can bring problems to the attention of consumer protection authorities. The OECD’s Consumer Protection Policy Toolkit77 refers to concrete examples in Belgium, Chile, Denmark, Finland, France, Korea, Sweden, Switzerland and the United States.
140 Trends in Telecommunication Reform 2015
Box 5.5: BEUC statement about enforcement
“The lack of effective enforcement is a key problem in consumer protection. At the same time, it is a complex problem to tackle, as effective enforcement depends on multiple factors such as the enforcement structure and traditions at national level, strong public authorities; the economic climate; the strength and experience of consumer organisations; the possibility for easy redress etc.
In addition to national or cross-border instances, more and more infringements are of a genuinely European dimension, for instance when a large company targets consumers in many EU member states with the same or similar unfair practices.
We therefore need more cooperation among various enforcement bodies and organisations as well as to strengthen the powers and sanctions available to them.’”
Source: BEUC, http:// www. beuc. eu/ consumer- rights- and- enforcement/ enforcement
Consumer educationEducating consumers about their rights and how to use them is becoming a priority for many governments. The European Commission regularly publishes a scoreboard showing how the European Union, and its member states, is performing in relation to consumer issues and warning of potential problems.78 The July 2013 edition of the Consumer Conditions Scoreboard highlights that a significant number of European consumers do not know their rights and how to exercise them, noting that “[o]nly 12% of respondents were able to answer correctly four questions testing their basic consumer knowledge.’”79 This reveals the need to launch information and education campaigns, which is clearly a role for governments and regulators.
Consumers International has translated this situation into a right to consumer education; the right to acquire the knowledge and skills needed to make informed, confident choices about goods and services, while being aware of basic consumer rights and responsibilities and how to act on them.
Conclusions and recommendationsConsumers may need help in understanding their rights and responsibilities vis-à-vis online retailers under the laws and regulations of their country. Contrary to other areas, however, consumer education and redress does not demand a change of laws. Government and/or regulators can take several actions to improve the situation. For instance, they can:
• provide information to citizens on their rights and obligations through education
campaigns and by providing clear information on their websites;
• receive complaints from consumers by operating online complaint-submission mechanisms;
• provide information on the available dispute resolution mechanisms; and
• approve industry mechanisms to ensure redress.
5.5 Targeted initiatives – specific market players
In this section, we describe some recent interventions that are aimed at addressing the conduct of new market players, which have become particularly important in the e-commerce ecosystem. Some of these are regulatory interventions, while others are driven by the market players themselves or are private-public partnerships.
5.5.1 Search engines Sector-specific rules (e.g., on privacy) apply to many of the activities of search engines, but like most operators in the e-commerce ecosystem, search engines are not ‘regulated’ to the same extent as other types of operator like telecommunication operators, financial institutions or postal operators. There is no single law that covers the activity of search engines.
In the absence of specific ex ante regulation, competition law is quite often the only remedy available against search engine providers that may be abusing a dominant market position. The U.S. Federal Trade Commission (FTC) and the European Commission have recently carried out investigations relating to some
141Trends in Telecommunication Reform 2015
Chapter 5
Box 5.6: OECD policy guidance on mobile and online payments
‘Governments, payment providers, merchants and other stakeholders should develop low-cost, easy to use alternative dispute resolution and redress mechanisms which would, inter alia, facilitate resolving claims over payments involving low-value transactions. Such mechanisms could include the development of effective online dispute resolution systems. Alternative dispute resolution and redress mechanisms should not prevent parties from pursuing other forms of redress, as permitted by applicable law’
Source: OECD, http:// search. oecd. org/ officialdocuments/ displaydocumentpdf/? cote= dsti/ cp(2011)24/ final& doclanguage= en
of Google’s practices, but arrived at different conclusions. The European Commission used its competition law enforcement powers to investigate Google for an alleged abuse of a dominant position in online search and search advertising.80
One of the main concerns was that Google was discriminating in favour of its own specialised search services on its web page (e.g., specialised search services for flights or hotels). Search engines that focus on narrowly defined categories of content such as flights or hotels are referred to as “vertical” search engines as opposed to general purpose or “horizontal” search engines.
In order to avoid a potential fine of up to 10 per cent of its annual worldwide turnover, Google made commitments, including relating to the comparable display of specialised search services offered by rivals. Google has agreed to guarantee that whenever it promotes its own specialised search services on its web page, the services of three rivals, selected through an auction, will also be displayed in a way that is clearly visible to users and comparable to the way in which Google displays its own services. When finally approved, the deal will mean that people who search on Google’s local sites in Europe will see results laid out differently from those in other countries.
In the United States, a similar investigation by the FTC of Google’s vertical search business was closed in January 2013 without sanctions. The FTC concluded that Google’s actions to promote its own vertical content on the Google search results page was “a product design change with a legitimate business justification” to improve the overall quality of Google’s search product, rather than to intentionally harm competitors.81
5.5.2 Online games and in app purchasesRegarding apps, a number of interventions have taken place to frame the way in which app service providers are offering their services.
In the European Union, the network of national consumer protection enforcement
authorities (the Consumer Protection Cooperation group) has developed four principles they believe should be applied to online games and in-app purchases:82
• Games advertised as “free” should not mislead consumers about the true costs involved (e.g., free to download may not be free to play).
• Games should not contain direct exhortations to children to buy items in a game or to persuade an adult to buy items for them.
• Consumers should be adequately informed about the payment arrangements, and purchases should not be debited through default settings without the consumers’ explicit consent.
• Companies should provide an email address so that consumers can contact them in case of queries or complaints.
In the United States, the FTC has taken action against Apple for unfairly charging consumers for in-app purchases incurred by children without their parents’ consent.83 Apple failed to notify parents that entering their password would approve a purchase and then open a 15-minute window in which unlimited charges could be made without further authentication. Apple was required to change its billing practices and to pay refunds totalling USD 32.5 million. In addition, a lawsuit has been filed against Google regarding a similar 30-minute window in which in-app purchases can be made without further authentication in games apps purchased from its Play store.84
5.5.3 Children’s use of online mediaThe industry has developed self-regulation to protect children using online services. Examples of self-regulatory initiatives in Europe taken under the umbrella of the EU safer Internet programme include:85
• CEO coalition to make the Internet a better place for children;
• the safer social networking principles for the EU;86 and
• the European framework for safer mobile use by younger teenagers and children.
In particular, the safer social networking principles for the EU highlight the importance of the respective roles of parents, teachers
142 Trends in Telecommunication Reform 2015
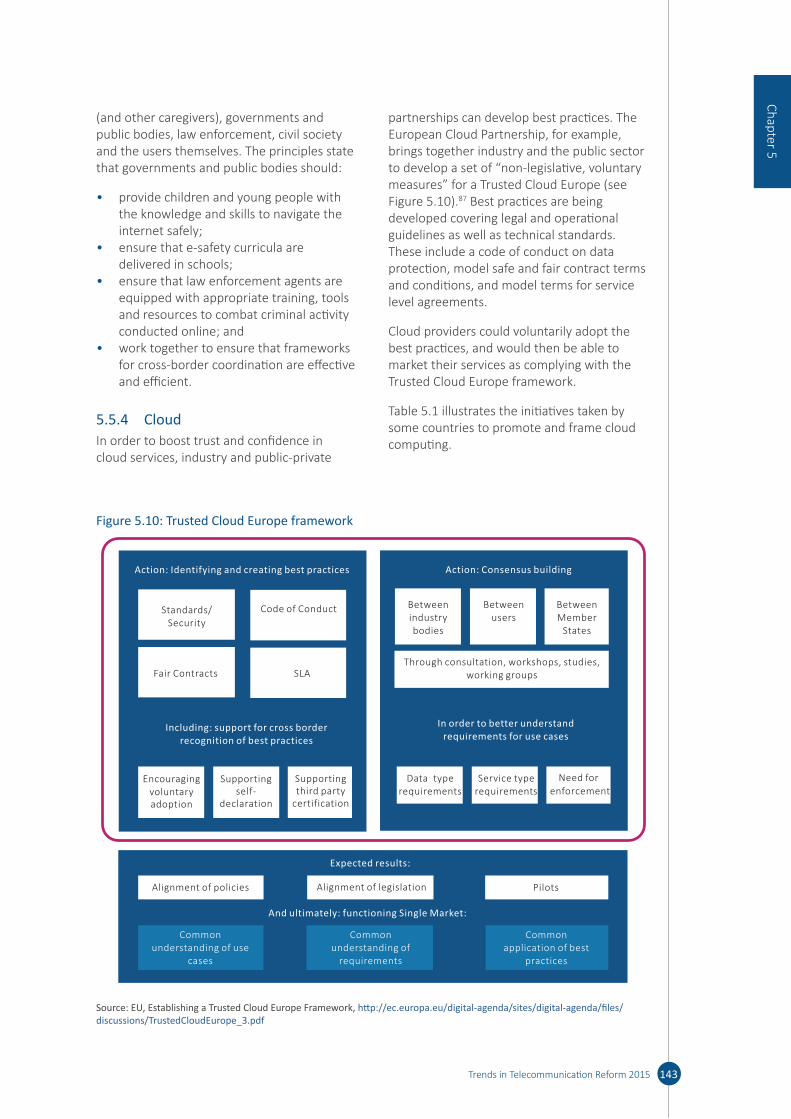
(and other caregivers), governments and public bodies, law enforcement, civil society and the users themselves. The principles state that governments and public bodies should:
• provide children and young people with the knowledge and skills to navigate the internet safely;
• ensure that e-safety curricula are delivered in schools;
• ensure that law enforcement agents are equipped with appropriate training, tools and resources to combat criminal activity conducted online; and
• work together to ensure that frameworks for cross-border coordination are effective and efficient.
5.5.4 CloudIn order to boost trust and confidence in cloud services, industry and public-private
partnerships can develop best practices. The European Cloud Partnership, for example, brings together industry and the public sector to develop a set of “non-legislative, voluntary measures” for a Trusted Cloud Europe (see Figure 5.10).87 Best practices are being developed covering legal and operational guidelines as well as technical standards. These include a code of conduct on data protection, model safe and fair contract terms and conditions, and model terms for service level agreements.
Cloud providers could voluntarily adopt the best practices, and would then be able to market their services as complying with the Trusted Cloud Europe framework.
Table 5.1 illustrates the initiatives taken by some countries to promote and frame cloud computing.
143Trends in Telecommunication Reform 2015
Chapter 5
Figure 5.10: Trusted Cloud Europe framework
Action: Identifying and creating best practices
Including: support for cross borderrecognition of best practices
Action: Consensus building
In order to better understandrequirements for use cases
StandardsSecurity
/ Code of Conduct
Fair Contracts SLA
Betweenindustrybodies
BetweenMember
States
Betweenusers
Through consultation, workshops, studies, working groups
Encouraging voluntaryadoption
Supportingself-
declaration
Supportingthird party
certification
Service typerequirements
Need for
enforcementData type
requirements
And ultimately: functioning Single Market:
Alignment of legislationAlignment of policies Pilots
Commonunderstanding of use
cases
Commonunderstanding of
requirements
Commonapplication of best
practices
Expected results:
Source: EU, Establishing a Trusted Cloud Europe Framework, http:// ec. europa. eu/ digital- agenda/ sites/ digital- agenda/ files/ discussions/ TrustedCloudEurope_ 3. pdf
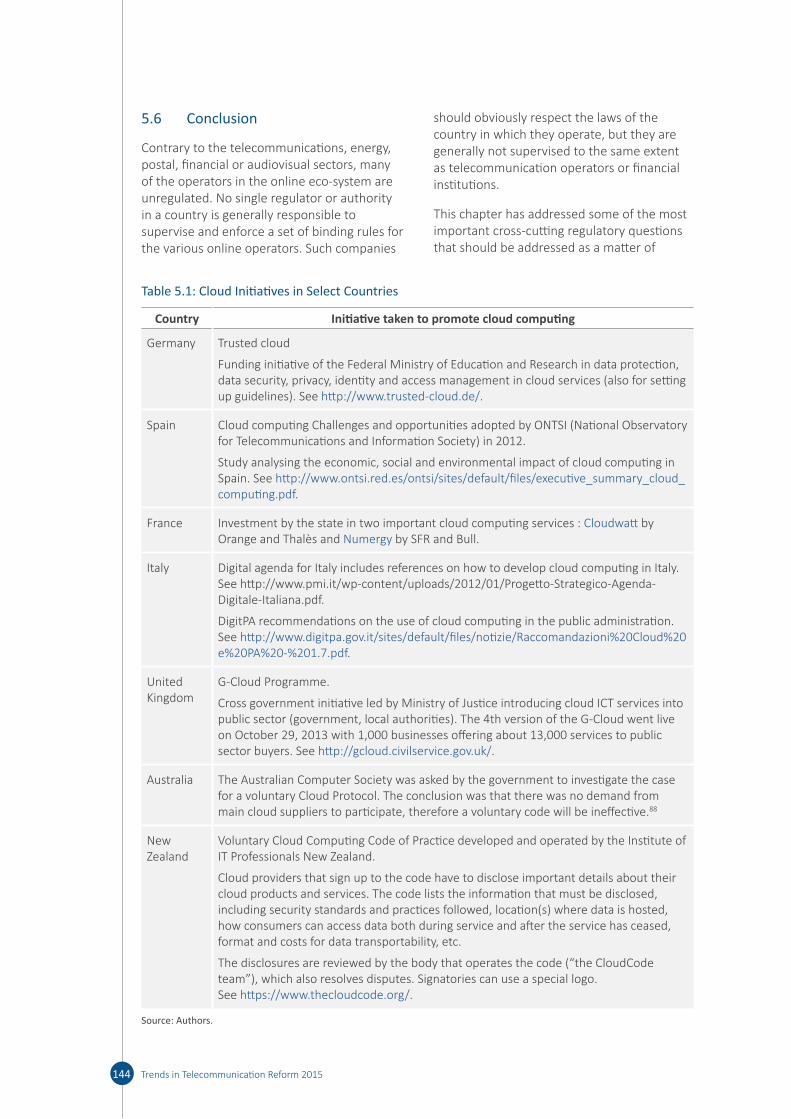
5.6 Conclusion
Contrary to the telecommunications, energy, postal, financial or audiovisual sectors, many of the operators in the online eco-system are unregulated. No single regulator or authority in a country is generally responsible to supervise and enforce a set of binding rules for the various online operators. Such companies
should obviously respect the laws of the country in which they operate, but they are generally not supervised to the same extent as telecommunication operators or financial institutions.
This chapter has addressed some of the most important cross-cutting regulatory questions that should be addressed as a matter of
144 Trends in Telecommunication Reform 2015
Table 5.1: Cloud Initiatives in Select Countries
Country Initiative taken to promote cloud computing
Germany Trusted cloud
Funding initiative of the Federal Ministry of Education and Research in data protection, data security, privacy, identity and access management in cloud services (also for setting up guidelines). See http:// www. trusted- cloud. de/ .
Spain Cloud computing Challenges and opportunities adopted by ONTSI (National Observatory for Telecommunications and Information Society) in 2012.
Study analysing the economic, social and environmental impact of cloud computing in Spain. See http:// www. ontsi. red. es/ ontsi/ sites/ default/ files/ executive_ summary_ cloud_ computing. pdf.
France Investment by the state in two important cloud computing services : Cloudwatt by Orange and Thalès and Numergy by SFR and Bull.
Italy Digital agenda for Italy includes references on how to develop cloud computing in Italy. See http:// www. pmi. it/ wp- content/ uploads/ 2012/ 01/ Progetto- Strategico- Agenda- Digitale- Italiana. pdf.
DigitPA recommendations on the use of cloud computing in the public administration. See http:// www. digitpa. gov. it/ sites/ default/ files/ notizie/ Raccomandazioni%20 Cloud%20 e%20 PA%20 -%201 .7. pdf.
United Kingdom
G-Cloud Programme.
Cross government initiative led by Ministry of Justice introducing cloud ICT services into public sector (government, local authorities). The 4th version of the G-Cloud went live on October 29, 2013 with 1,000 businesses offering about 13,000 services to public sector buyers. See http:// gcloud. civilservice. gov. uk/ .
Australia The Australian Computer Society was asked by the government to investigate the case for a voluntary Cloud Protocol. The conclusion was that there was no demand from main cloud suppliers to participate, therefore a voluntary code will be ineffective.88
New Zealand
Voluntary Cloud Computing Code of Practice developed and operated by the Institute of IT Professionals New Zealand.
Cloud providers that sign up to the code have to disclose important details about their cloud products and services. The code lists the information that must be disclosed, including security standards and practices followed, location(s) where data is hosted, how consumers can access data both during service and after the service has ceased, format and costs for data transportability, etc.
The disclosures are reviewed by the body that operates the code (“the CloudCode team”), which also resolves disputes. Signatories can use a special logo. See https:// www. thecloudcode. org/ .
Source: Authors.

priority to ensure that digital consumers are fully protect and empowered. Some of these areas may require changes to legislative frameworks, additional national regulations or increased international cooperation and
perhaps agreements. Some regulators around the world have started to become more active in addressing these issues, and are embracing their important new roles, but there is still scope for them to play an even greater role.
145Trends in Telecommunication Reform 2015
Chapter 5

Endnotes1 Available at: http:// www. itu. int/ en/ ITU- D/ Regulatory- Market/ Documents/ Regulation%20
and%20 consumer%20 protection. pdf
2 In this report, the term ‘regulator’ means a regulatory authority or body, or a public authority or agency responsible for exercising some sort of authority over an activity or category of operator: a telecom NRA, a financial authority, a media regulatory authority, a competition authority, a privacy authority etc.
3 OECD, “Electronic and Mobile Commerce”, OECD Digital Economy Papers, No. 228, (2013), http:// dx. doi. org/ 10. 1787/ 5k437p2gxw6g- en
4 EMOTA, Update on e-commerce in Europe, 2013, https:// eu- ems. com/ event_ images/ Downloads/ Presentation%20 E- Commerce%20 Conference%202013 %20- %20Walter%20 Devenuto%20 EMOTA%2015 -10- 2013. pdf
5 Ofcom, “The Communications Market Report: International,” http:// stakeholders. ofcom. org. uk/ market- data- research/ market- data/ communications- market- reports/ cmr13/ international/
6 United Kingdom Office of National Statistics, “More than 10% of retail sales made over the Internet in October 2013,” (14 November 2013), http:// www. ons. gov. uk/ ons/ rel/ rsi/ retail- sales/ october- 2013/ sty- internet- sales. html
7 U.S. Census Bureau, “Quarterly Retail E-commerce Sales, 2nd Quarter 2014,” Press Release, (15 August 2014), https:// www. census. gov/ retail/ mrts/ www/ data/ pdf/ ec_ current. pdf
8 OECD, “Electronic and Mobile Commerce”, OECD Digital Economy Papers, No. 228, (2013), http:// dx. doi. org/ 10. 1787/ 5k437p2gxw6g- en
9 OECD, “The App Economy”, OECD Digital Economy Papers, No. 230, (2013), http:// dx. doi. org/ 10. 1787/ 5k3ttftlv95k- en
10 Zenith Optimedia, “Executive Summary: Advertising Expenditure Forecasts December 2013,” http:// www. zenithoptimedia. com/ wp- content/ uploads/ 2013/ 12/ Adspend- forecasts- December- 2013- executive- summary. pdf
11 European Commission, The Consumer Conditions scoreboard – Consumers at home in the single market, sWd(2013)291, (July 2013), http:// ec. europa. eu/ consumers/ consumer_ research/ editions/ docs/ 9th_ edition_ scoreboard_ en. pdf
12 http:// ir. netflix. com/ faq. cfm
13 On Device Research, “Facebook costing 16-34s jobs in tough economic climate,” (29 May 2013), http:// ondeviceresearch. com/ blog/ facebook- costing- 16- 34s- jobs- in- tough- economic- climate#sthash. MLn5EZhF. Vp50W4rO. dpbs
14 GSR 2012 Discussion Paper, The Cloud: Data Protection and Privacy: Whose cloud is it anyway?, https:// www. itu. int/ ITU- D/ treg/ Events/ Seminars/ GSR/ GSR12/ documents. html
15 See http:// www. consumersinternational. org/ media/ 1113711/ ci%20 programme%20 of%20 work%20 on%20 privacy. pdf
16 See http:// netmundial. br/ wp- content/ uploads/ 2014/ 04/ NETmundial- Multistakeholder- Document. pdf
17 For more information on the Safe Harbor program, see http:// export. gov/ safeharbor/ eu/ eg_ main_ 018475. asp
146 Trends in Telecommunication Reform 2015
http://www.itu.int/en/ITU-D/Regulatory-Market/Documents/Regulation%20and%20consumer%20protection.pdf

18 European Commission, “Commission proposes a comprehensive reform of the data protection rules,” (25 January 2012), http:// ec. europa. eu/ justice/ newsroom/ data- protection/ news/ 120125_ en. htm
19 European Commission, “Proposal for a Regulation of the European Parliament and of the Council on the protection of individuals with regard to the processing of personal data and on the free movement of such data (General Data Protection Regulation), 2012/0011 (COD), (25 January 1012), http:// eur- lex. europa. eu/ LexUriServ/ LexUriServ. do? uri= COM: 2012: 0011: FIN: EN: PDF
20 Some operators already offer users the possibility to obtain a copy of their data. See https:// www. facebook. com/ help/ 131112897028467 and https:// support. google. com/ takeout/ answer/ 2508459? hl= en& ref_ topic= 2508503
21 Court of Justice of the European Union, “Judgment of the Court (Grand Chamber) In Joined Cases C-293/12 and C-594/12,” (8 April 2014), http:// curia. europa. eu/ juris/ document/ document. jsf? text=& docid= 150642& pageIndex= 0& doclang= EN& mode= req& dir=& occ= first& part= 1& cid= 406224
22 Office of the Australian Information Commissioner, “Privacy law reform,” http:// www. oaic. gov. au/ privacy/ privacy- act/ privacy- law- reform
23 Text available at: http:// www. senado. gov. br/ atividade/ materia/ getPDF. asp? t= 147571& tp= 1
24 Organization for Economic Co-operation and Development, “OECD Guidelines Governing the Protection of Privacy and Transborder Flows of Personal Data,” (11 July 2013), http:// www. oecd. org/ sti/ ieconomy/ 2013- oecd- privacy- guidelines. pdf
25 Asia-Pacific Economic Cooperation, “APEC Privacy Framework,” APEC#205-SO-01.2 (December 2005), http:// publications. apec. org/ publication- detail. php? pub_ id= 390
26 “The Madrid Privacy Declaration,” output from the 34th International Conference of Data Protection and Privacy Authorities, (3 November 2009), http:// privacyconference2012. org/ wps/ wcm/ connect/ 2912ce004adc64f09e809ea0fea628d8/ 2009_ M1. 2. pdf? MOD= AJPERES
27 Court of Justice of the European Union, “An internet search engine operator is responsible for the processing that it carries out of personal data which appear on web pages published by third parties,” Press Release, (13 May 2014), http:// curia. europa. eu/ jcms/ upload/ docs/ application/ pdf/ 2014- 05/ cp140070en. pdf
28 Korea Communications Commission, “News and Notice,” http:// eng. kcc. go. kr/ user. do? mode= view& page= E04010000& dc= E04010000& boardId= 1058& cp= 1& boardSeq= 37564
29 Article 29 Data Protection Working Party, “Opinion 05/2014 on Anonymisation Techniques,” 0829/14/EN, WP216, (10 April 2014), http:// ec. europa. eu/ justice/ data- protection/ article- 29/ documentation/ opinion- recommendation/ files/ 2014/ wp216_ en. pdf
30 International Telecommunication Union, “Big Data: Big Today, Normal Tomorrow,” ITU-T Technology Watch Report, (November 2013), http:// www. itu. int/ dms_ pub/ itu- t/ oth/ 23/ 01/ T23010000220001PDFE. pdf
31 Article 29 Data Protection Working Party, “Opinion 02/2014 on a referential for requirements for Binding Corporate Rules submitted to national Data Protection Authorities in the EU and Cross Border Privacy Rules submitted to APEC CBPR Accountability Agents,” 538/14/EN, WP 212, (27 February 2014), http:// ec. europa. eu/ justice/ data- protection/ article- 29/ documentation/ opinion- recommendation/ files/ 2014/ wp212_ en. pdf
32 See generally http:// www. w3. org/ TR/ tracking- dnt/
147Trends in Telecommunication Reform 2015
Chapter 5
33 National Telecommunications and Information Administration, U.S. Department of Commerce, ”Privacy Multistakeholder Process: Mobile Application Transparency,” (12 November 2013), http:// www. ntia. doc. gov/ other- publication/ 2013/ privacy- multistakeholder- process- mobile- application- transparency
34 http:// www. ntia. doc. gov/ files/ ntia/ publications/ july_ 25_ code_ draft. pdf
35 For instance, in the European Union, the relevant directive is Council Directive 2013/40/EU of 12 August 12 2013 (http:// eur- lex. europa. eu/ LexUriServ/ LexUriServ. do? uri= OJ: L: 2013: 218: 0008: 0014: EN: PDF), on attacks against information systems, and which also repealed Council Framework Decision 2005/222/JHA.
36 See generally http:// ec. europa. eu/ digital- agenda/ en/ news/ commission- proposal- directive- concerning- measures- ensure- high- common- level- network- and
37 The Commission’s initial proposal refers to market operators “which enable the provision of other information society services” (a non-exhaustive list of operators is included in an annex that lists as an example social networks and search engines), and operators of critical infrastructures that are essential for the maintenance of vital economic and societal activities in the fields of energy, transport, banking, stock exchanges and health. Software and hardware companies would be excluded.
38 The European Parliament has amended the Commission’s draft and has proposed to remove public administrations from the scope of the proposal.
39 See http:// www. enisa. europa. eu/ about- enisa/ activities for a discussion ENISA’s mission and activities
40 See in particular ISO 27001 and 27002, http:// www. 17799. com/
41 See generally http:// www. inhope. org/ Libraries/ Infographics/ INHOPE- 2013- Inforgraphic. sflb. ashx
42 http:// www. ifpi. org/ downloads/ Digital- Music- Report- 2014. pdf
43 In this regard, see Adam Denton, “Intellectual Property Rights in Today’s Digital Economy,” ITU GSR11 Discussion paper, (2011), http:// www. itu. int/ ITU- D/ treg/ Events/ Seminars/ GSR/ GSR11/ documents/ 05- Intellectual- property- E. pdf
44 See generally http:// www. wipo. int/ treaties/ en/
45 See generally http:// www. wipo. int/ treaties/ en/ text. jsp? file_ id= 301016
46 European Commission, “Commissioner Michel Barnier welcomes the European Parliament vote on the Directive on collective rights management,” Press Release, (4 February 2014), http:// europa. eu/ rapid/ press- release_ MEMO- 14- 80_ en. htm
47 Court of Justice of the European Union, “A system of licences for the broadcasting of football matches which grants broadcasters territorial exclusivity on a Member State basis and which prohibits television viewers from watching the broadcasts with a decoder card in other Member States is contraryto EU law,” Judgment in Cases C-403/08 and C-429/08, Press Release No. 102/11, (4 October 2011), http:// curia. europa. eu/ jcms/ upload/ docs/ application/ pdf/ 2011- 10/ cp110102en. pdf
48 European Commission, “Antitrust: Commission investigates restrictions affecting cross border provision of pay TV services,” Press Release, (13 January 2014), http:// europa. eu/ rapid/ press- release_ IP- 14- 15_ en. htm
148 Trends in Telecommunication Reform 2015

49 See generally http:// www. hadopi. fr/
50 Hadopi, “Graduated Response,” http:// www. hadopi. fr/ en/ new- freedoms- new- responsibilities/ graduated- response
51 European Commission, Santiago Agreement (COMP/38.126), Collective licensing of music copyrights for online use, http:// ec. europa. eu/ competition/ elojade/ isef/ case_ details. cfm? proc_ code= 1_ 38126
52 European Commission, “Commission Decision relating to a proceeding under Article 81 of the EC Treaty and Article 53 of the EEA Agreement,” (16 July 2008), http:// ec. europa. eu/ competition/ antitrust/ cases/ dec_ docs/ 38698/ 38698_ 4567_ 1. pdf
53 See generally http:// www. globalrepertoiredatabase. com/
54 Netflix, “Top Investor Questions,” http:// ir. netflix. com/ faq. cfm
55 See generally http:// creativecommons. org/ about
56 World Intellectual Property Organization, “New Online Licensing System Makes it Easier to Republish the Work of Intergovernmental Organizations,” PR/2013/750, (6 December 2013), http:// www. wipo. int/ pressroom/ en/ articles/ 2013/ article_ 0026. html
57 European Commission, “Consumer Rights: Commission wants consumers to surf the web without borders,” Press Release, (5 May 2009), http:// europa. eu/ rapid/ press- release_ IP- 09- 702_ en. htm
58 See generally http:// ec. europa. eu/ digital- agenda/ en/ connected- continent- legislative- package
59 Id.
60 Government of the Netherlands, “Dutch Telecommunications Act,”Article 7.4(a),(June 2012), http:// www. government. nl/ documents- and- publications/ notes/ 2012/ 06/ 07/ dutch- telecommunications- act. html
61 See Article 203 of the Electronic Communications Act, (2012), http:// www. scribd. com/ doc/ 144614369/ Slovenia- Net- Neutrality- law- 2012
62 Chilean National Library of Congress, “CONSAGRA EL PRINCIPIO DE NEUTRALIDAD EN LA RED PARA LOS CONSUMIDORES Y USUARIOS DE INTERNET,” Law 20453, (26 August 2012), http:// www. leychile. cl/ Navegar? idNorma= 1016570& buscar= NEUTRALIDAD+DE+RED
63 https:// www. dnp. gov. co/ LinkClick. aspx? fileticket= tYD8BLf- 2- g%3 D& tabid= 1238
64 The text of Law No. 12.965 may be found at http:// www. planalto. gov. br/ CCIVIL_ 03/_ Ato2011- 2014/ 2014/ Lei/ L12965. htm
65 Canadian Radio-television and Telecommunications Commission, “Review of the Internet traffic management practices of Internet service providers” Telecom Regulatory Policy CRTC 2009-657, (21 October 2009), http:// www. crtc. gc. ca/ eng/ archive/ 2009/ 2009- 657. htm
66 Federal Communications Commission, “FCC Launches Broad Rulemaking to Protect and Promote the Open Internet,” (15 May 2014), http:// www. fcc. gov/ document/ fcc- launches- broad- rulemaking- protect- and- promote- open- internet
67 Financial Times, “Netflix to Pay Comcast for Better Speeds,” (24 February 2014), http:// www. ft. com/ intl/ cms/ s/ 0/ 60a27b18- 9cc4- 11e3- b535- 00144feab7de. html#axzz31gCtDVc4
149Trends in Telecommunication Reform 2015
Chapter 5

68 European Commission, “Payment Services Directive and Interchange fees Regulation: frequently asked questions,” Memo, (24 July 2013), http:// europa. eu/ rapid/ press- release_ MEMO- 13- 719_ en. htm? locale= en
69 Organisation for Economic Co-operation and Development, “Consumer Policy Guidance on Mobile and Online Payments,” DSTI/CP(2011)24/FINAL, (28 March 2014), http:// www. oecd. org/ sti/ consumer/ consumerpolicyguidanceformobileandonlinepayments. htm
70 European Commission, “Payment Services Directive and Interchange fees Regulation: frequently asked questions,” Memo, (24 July 2013), http:// europa. eu/ rapid/ press- release_ MEMO- 13- 719_ en. htm
71 See generally http:// ec. europa. eu/ justice/ consumer- marketing/ rights- contracts/ directive/ index_ en. htm
72 European Commission, “Proposal for a regulation of the European Parliament and of the Council on a Common European Sales Law,” COM(2011) 635 final, 2011/0284 (COD), (11 October 2011), http:// ec. europa. eu/ justice/ contract/ files/ common_ sales_ law/ regulation_ sales_ law_ en. pdf
73 http:// www. konsumenteuropa. se/ en/ News/ Press- releases/ Press- releases- 2013/ Important- to- be- able- to- trust- a- trust- mark/
74 European Commission, “EU online Trustmarks – Building Digital Confidence in Europe (SMART 2011/0022),” http:// ec. europa. eu/ digital- agenda/ en/ news/ eu- online- trustmarks- –- building- digital- confidence- europe- smart- 20110022
75 European Commission, “Commission presents roadmap for completing the Single Market for parcel delivery,” Press Release, (16 December 2013), http:// europa. eu/ rapid/ press- release_ IP- 13- 1254_ en. htm? locale= en
76 Organisation for Economic Co-operation and Development, “OECD Recommendation on Consumer Dispute Resolution and Redress,” (2007), http:// www. oecd. org/ internet/ consumer/ 38960101. pdf
77 OECD Consumer Protection Policy Toolkit, (2010), http:// www. keepeek. com/ Digital- Asset- Management/ oecd/ governance/ consumer- policy- toolkit_ 9789264079663- en#page2
78 European Commission, The Consumer Conditions Scoreboard, 9th edition (July 2013), http:// ec. europa. eu/ consumers/ consumer_ research/ editions/ docs/ 9th_ edition_ scoreboard_ en. pdf
79 Id.
80 European Commission, ”Antitrust: Commission obtains from Google comparable display of specialised search rivals,” Press Release, (5 February 2014), http:// europa. eu/ rapid/ press- release_ IP- 14- 116_ en. htm
81 Federal Trade Commission, “Statement of the Federal Trade Commission Regarding Google’s Search Practices,” FTC File Number 111-0163, (3 January 2013), http:// www. ftc. gov/ system/ files/ documents/ public_ statements/ 295971/ 130103googlesearchstmtofcomm. pdf
82 European Commission, “Commission and Member States to raise consumer concerns with app industry,” Press Release, (27 February 2014), http:// europa. eu/ rapid/ press- release_ IP- 14- 187_ en. htm
83 Federal Trade Commission, “FTC Approves Final Order in Case About Apple Inc. Charging for Kids’ In-App Purchases Without Parental Consent,” (27 March 2014), http:// www. ftc. gov/ news-
150 Trends in Telecommunication Reform 2015

events/ press- releases/ 2014/ 03/ ftc- approves- final- order- case- about- apple- inc- charging- kids- app
84 The Guardian, “Google facing US lawsuit over $66 of in-app purchases,” (11 March 2014), http:// www. theguardian. com/ technology/ 2014/ mar/ 11/ google- us- lawsuit- in- app- purchases
85 European Commission, “Self-regulation for a Better Internet for Kids,” http:// ec. europa. eu/ digital- agenda/ en/ self- regulation- better- internet- kids
86 “Safer Social Networking Principles for the EU,” https:// ec. europa. eu/ digital- agenda/ sites/ digital- agenda/ files/ sn_ principles. pdf
87 European Commission, “’Trusted Cloud Europe’: have your say!” Press Release, (21 March 2014), http:// europa. eu/ rapid/ press- release_ IP- 14- 296_ en. htm
88 See generally http:// www. acs. org. au/ information- resources/ public- policy/ 2013- australian- cloud- protocol and http:// www. acs. org. au/__ data/ assets/ pdf_ file/ 0017/ 27800/ ACS- Cloud- Protocol- Consultation- Report. pdf
151Trends in Telecommunication Reform 2015
Chapter 5

6 The economic influence of data and their impact on business models
6.1 Introduction
With the spreading of digitization and the Internet, as well as the evolution of devices connected to it, the ability to collect, analyse and utilize data has made huge leaps recently. Numerous, often innovative business models ranging from data transport and data storage to sophisticated data analysis as well as insights creation are based on revenues essentially derived from data collection and use. This indicates a trend towards data becoming a new driver of economic growth, with a significant impact on business models. This chapter will therefore start by tracing technical innovations that have enabled better access to, as well as transport and utilization of, data. Each of these innovations has given rise to new business models that ultimately will result in a sustainable ongoing structural change in various markets, resulting in a data-driven economy that policy-makers and regulators need to be alert to.
Data have gained economic influence far beyond the ‘traditional’ ICT-actors. For instance, pharmaceutical, biological and chemical research and development has become very much data-driven. Cars feature Internet connectivity; collecting and analysing data to provide safety, maintenance and comfort functionalities. Home appliances have become ‘smart’ by being aware of their environment and reacting accordingly based on data. On the other hand, these data have to be made accessible to the end user. They have to be transported and process, otherwise, no meaningful services based on that data can be aggregated or successfully applied.
As policies and regulation have a significant impact on whether all the many value propositions can work hand-in-hand and initiate positive economic effects, policy-makers and regulators need to understand the interrelations of different actors. To this end,
this chapter develops a structural framework of the data-driven economy by defining stakeholder relationships – the data value circle - and analyses each segment of that structure. It also highlights some of the key characteristics of the data-driven economy, such as two-sided markets that already hold some policy implications. Building on this structure, it is important to recognise the economic importance and future of each sub-market and the role it plays for ongoing structural change in the economy. Besides cutting across numerous sectors, the data-driven economy shows some other rather uncommon features:
• Data, unlike most other economic factors, become more valuable with increasing availability.
• Consumers often “pay” by giving up their data not their money, but seem to be largely unaware of this.
In light of these characteristics, the chapter analyses specific value propositions within the data-driven economy, as well as the business models that surround them. The focus is on the functioning of business models, their profitability and the strategic options they enable. Emerging challenges for actors within the data-driven economy, as well as policy-makers and regulators, will be identified. In fact, various challenges may emerge from the business models that characterize the data-driven economy and the strategic behaviour of its various stakeholders:
• Strong incentives to gather more and more data about consumers have to be balanced against consumers’ interests and privacy.
• Increasing data traffic needs to be dealt with in an efficient and fair manner to all competitors.
• Consumers need transparency and empowerment as regards their own data.
• Effective solutions have to be brought forward to clarify and simplify jurisdiction
Authors: Dr René C.G. Arnold & Dr Martin Waldburger, Senior ICT Experts, WIK Consult
153Trends in Telecommunication Reform 2015
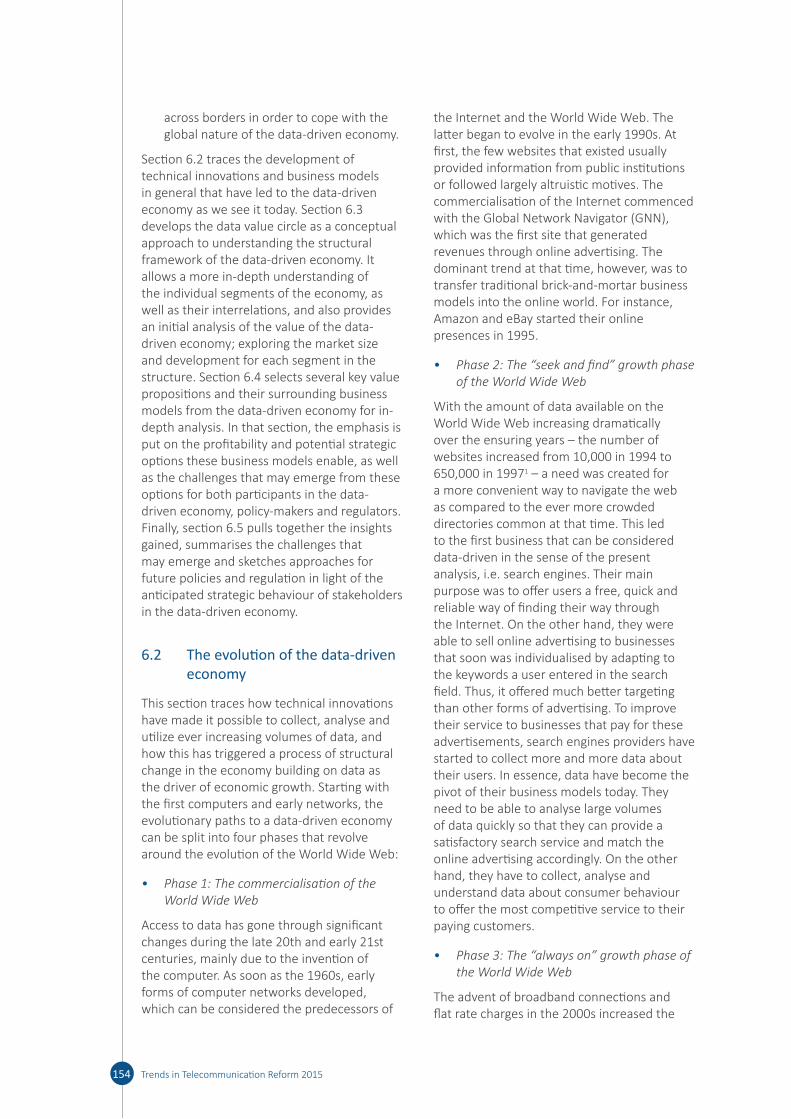
across borders in order to cope with the global nature of the data-driven economy.
Section 6.2 traces the development of technical innovations and business models in general that have led to the data-driven economy as we see it today. Section 6.3 develops the data value circle as a conceptual approach to understanding the structural framework of the data-driven economy. It allows a more in-depth understanding of the individual segments of the economy, as well as their interrelations, and also provides an initial analysis of the value of the data-driven economy; exploring the market size and development for each segment in the structure. Section 6.4 selects several key value propositions and their surrounding business models from the data-driven economy for in-depth analysis. In that section, the emphasis is put on the profitability and potential strategic options these business models enable, as well as the challenges that may emerge from these options for both participants in the data-driven economy, policy-makers and regulators. Finally, section 6.5 pulls together the insights gained, summarises the challenges that may emerge and sketches approaches for future policies and regulation in light of the anticipated strategic behaviour of stakeholders in the data-driven economy.
6.2 The evolution of the data-driven economy
This section traces how technical innovations have made it possible to collect, analyse and utilize ever increasing volumes of data, and how this has triggered a process of structural change in the economy building on data as the driver of economic growth. Starting with the first computers and early networks, the evolutionary paths to a data-driven economy can be split into four phases that revolve around the evolution of the World Wide Web:
• Phase 1: The commercialisation of the World Wide Web
Access to data has gone through significant changes during the late 20th and early 21st centuries, mainly due to the invention of the computer. As soon as the 1960s, early forms of computer networks developed, which can be considered the predecessors of
the Internet and the World Wide Web. The latter began to evolve in the early 1990s. At first, the few websites that existed usually provided information from public institutions or followed largely altruistic motives. The commercialisation of the Internet commenced with the Global Network Navigator (GNN), which was the first site that generated revenues through online advertising. The dominant trend at that time, however, was to transfer traditional brick-and-mortar business models into the online world. For instance, Amazon and eBay started their online presences in 1995.
• Phase 2: The “seek and find” growth phase of the World Wide Web
With the amount of data available on the World Wide Web increasing dramatically over the ensuring years – the number of websites increased from 10,000 in 1994 to 650,000 in 19971 – a need was created for a more convenient way to navigate the web as compared to the ever more crowded directories common at that time. This led to the first business that can be considered data-driven in the sense of the present analysis, i.e. search engines. Their main purpose was to offer users a free, quick and reliable way of finding their way through the Internet. On the other hand, they were able to sell online advertising to businesses that soon was individualised by adapting to the keywords a user entered in the search field. Thus, it offered much better targeting than other forms of advertising. To improve their service to businesses that pay for these advertisements, search engines providers have started to collect more and more data about their users. In essence, data have become the pivot of their business models today. They need to be able to analyse large volumes of data quickly so that they can provide a satisfactory search service and match the online advertising accordingly. On the other hand, they have to collect, analyse and understand data about consumer behaviour to offer the most competitive service to their paying customers.
• Phase 3: The “always on” growth phase of the World Wide Web
The advent of broadband connections and flat rate charges in the 2000s increased the
154 Trends in Telecommunication Reform 2015

importance of data, as it enabled consumers to be ‘always on’ and increased the use of data intensive services. As regards business models that profited from these developments, the most prominent examples include social networks (e.g. Facebook, MySpace), file sharing services (e.g. Napster) and messaging (e.g. ICQ) as well as video telephony (e.g. Skype). Social network sites, in particular, relied heavily on online advertising to monetise the services they offer for free to the public. Therefore, they also have been keen to collect and analyse user data. For the latter, digitised data have presented a way to enter markets (e.g., messaging) that formerly were controlled by network operators.
• Phase 4: The “on everywhere” and “seamless integration” phase of the World Wide Web
The introduction of the iPhone in 2007, the first smartphone, with its revolutionary application-based user interface (with apps available through the Apple iTunes AppStore), added ‘on everywhere’ to the already existing ‘always on’ culture. Mobile devices in particular are always in standby, always physically close to the consumer and with the app-inspired user interface, the threshold of using the device and going online has fallen dramatically. This has also increased the volume and value of data that can be collected about consumers and their behaviour. In turn, these data enable new kinds of business models that are able to offer even complex services to consumers seemingly free of charge. Whilst some of these business models are very profitable (e.g. Google and Facebook), many competitors struggle to monetise their services sustainably (e.g. Twitter, Spotify, Pandora). In addition to advertising-based business models, some subscription-based services have also become successful as they managed to adapt quickly to the multi-device environment (e.g. Netflix).
In sum, this evolutionary path reflects the growing influence that data have been having on the economy. In phase 3, new, app-based messaging and telephony services started to compete with and substitute for messaging and voice services offered by network operators. In phase 4, music and video streaming services began to enter the
business of traditional media companies. Apps have become a driver for mobile services use and consumer data have become a key resource in the fight for advertising investments. More recently, many new types of devices have begun connect to the Internet, collecting and transmitting data that supports or initiates new business models in many sectors. In essence, this appears to be leading to a structural change towards a data-driven economy that is likely to affect all economic sectors. Given these changes, interrelations between the individual groups of actors have to be clarified and the prospects for specific parts of the market should be investigated to evaluate their relative weight within the data-driven economy. The next section therefore develops a structural framework to describe the data-driven economy and enable an in-depth understanding of these issues.
6.3 The structure of the data-driven economy – the data value circle
This section develops a structured approach to defining the individual groups of actors within the data-driven economy – the data value circle. It investigates the size of the market and the prospects for each group of stakeholders in an effort to help policy-makers and regulators recognise the importance of the shift that is going on. Furthermore, for each group of stakeholders, key insights will be derived that either characterize their role in the data value circle in more detail, or highlight potential challenges that need to be addressed by policy or regulatory actions. Such measures will be described in more detail in section 6.5 based on the identified challenges. This section concludes by summarizing the general characteristics of the data value circle that will help to contextualise the challenges identified before, as well as the business model analysis in section 6.4.
6.3.1 The data value circleThe first and most obvious difference of the data-driven economy as compared to the more traditional sectors of the economy is the form of its structure. The data-driven economy is not characterized by a simple linear value chain that has a defined start and endpoint; rather, it has to be thought of as a value
155Trends in Telecommunication Reform 2015
Chapter 6
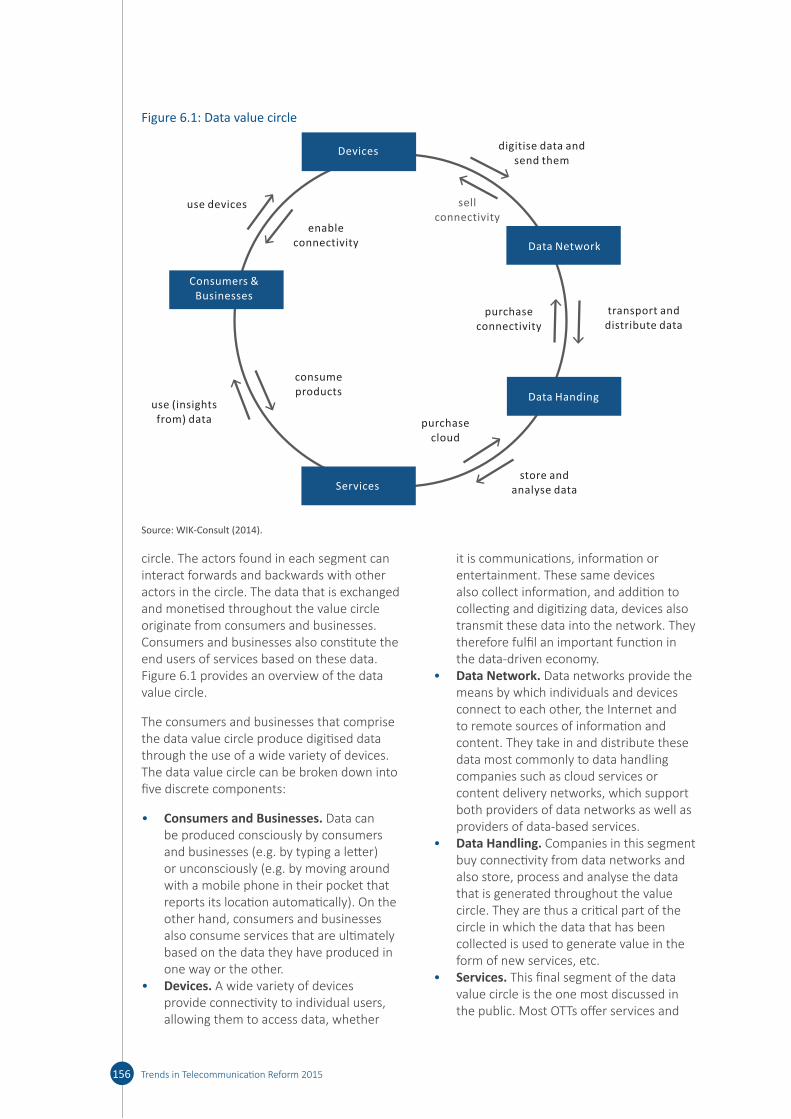
circle. The actors found in each segment can interact forwards and backwards with other actors in the circle. The data that is exchanged and monetised throughout the value circle originate from consumers and businesses. Consumers and businesses also constitute the end users of services based on these data. Figure 6.1 provides an overview of the data value circle.
The consumers and businesses that comprise the data value circle produce digitised data through the use of a wide variety of devices. The data value circle can be broken down into five discrete components:
• Consumers and Businesses. Data can be produced consciously by consumers and businesses (e.g. by typing a letter) or unconsciously (e.g. by moving around with a mobile phone in their pocket that reports its location automatically). On the other hand, consumers and businesses also consume services that are ultimately based on the data they have produced in one way or the other.
• Devices. A wide variety of devices provide connectivity to individual users, allowing them to access data, whether
it is communications, information or entertainment. These same devices also collect information, and addition to collecting and digitizing data, devices also transmit these data into the network. They therefore fulfil an important function in the data-driven economy.
• Data Network. Data networks provide the means by which individuals and devices connect to each other, the Internet and to remote sources of information and content. They take in and distribute these data most commonly to data handling companies such as cloud services or content delivery networks, which support both providers of data networks as well as providers of data-based services.
• Data Handling. Companies in this segment buy connectivity from data networks and also store, process and analyse the data that is generated throughout the value circle. They are thus a critical part of the circle in which the data that has been collected is used to generate value in the form of new services, etc.
• Services. This final segment of the data value circle is the one most discussed in the public. Most OTTs offer services and
156 Trends in Telecommunication Reform 2015
Figure 6.1: Data value circle
Consumers &Businesses
Devices
Data Network
Data Handing
Services
use devices
enableconnectivity
digitise data and send them
purchaseconnectivity
purchasecloud
transport anddistribute data
store and analyse data
consume products
use (insights from) data
sellconnectivity
Source: WIK-Consult (2014).
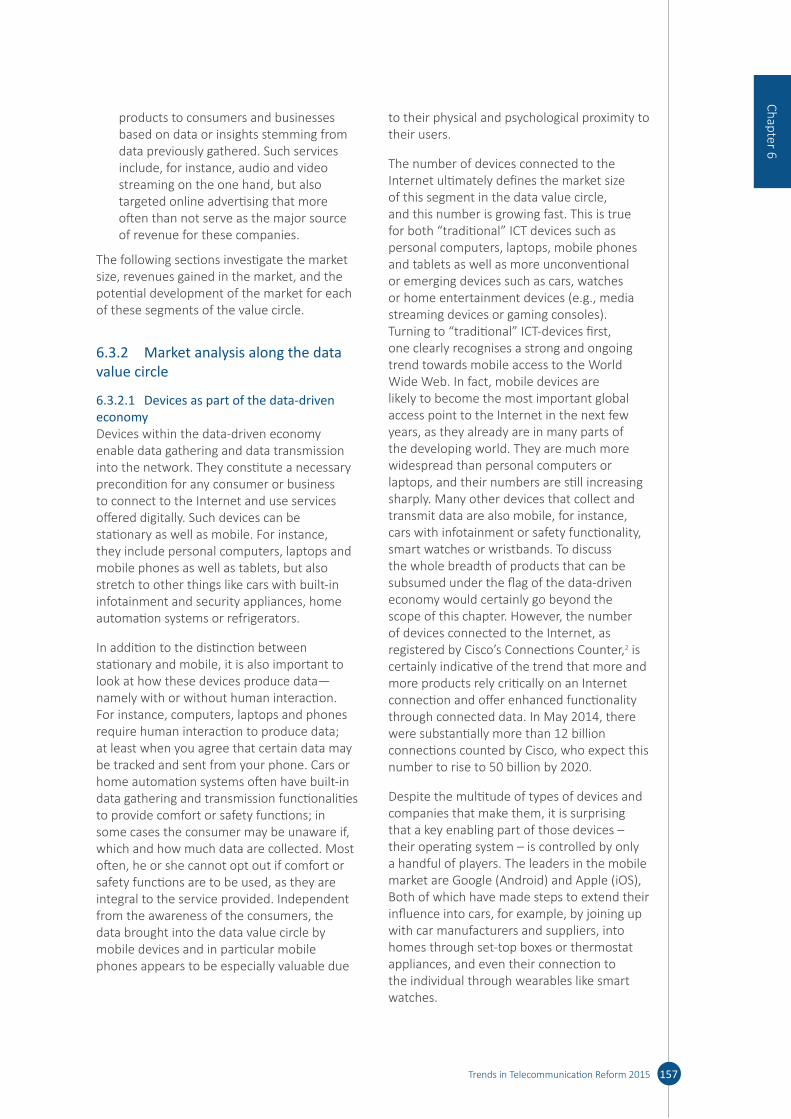
products to consumers and businesses based on data or insights stemming from data previously gathered. Such services include, for instance, audio and video streaming on the one hand, but also targeted online advertising that more often than not serve as the major source of revenue for these companies.
The following sections investigate the market size, revenues gained in the market, and the potential development of the market for each of these segments of the value circle.
6.3.2 Market analysis along the data value circle
6.3.2.1 Devices as part of the data-driven economyDevices within the data-driven economy enable data gathering and data transmission into the network. They constitute a necessary precondition for any consumer or business to connect to the Internet and use services offered digitally. Such devices can be stationary as well as mobile. For instance, they include personal computers, laptops and mobile phones as well as tablets, but also stretch to other things like cars with built-in infotainment and security appliances, home automation systems or refrigerators.
In addition to the distinction between stationary and mobile, it is also important to look at how these devices produce data—namely with or without human interaction. For instance, computers, laptops and phones require human interaction to produce data; at least when you agree that certain data may be tracked and sent from your phone. Cars or home automation systems often have built-in data gathering and transmission functionalities to provide comfort or safety functions; in some cases the consumer may be unaware if, which and how much data are collected. Most often, he or she cannot opt out if comfort or safety functions are to be used, as they are integral to the service provided. Independent from the awareness of the consumers, the data brought into the data value circle by mobile devices and in particular mobile phones appears to be especially valuable due
to their physical and psychological proximity to their users.
The number of devices connected to the Internet ultimately defines the market size of this segment in the data value circle, and this number is growing fast. This is true for both “traditional” ICT devices such as personal computers, laptops, mobile phones and tablets as well as more unconventional or emerging devices such as cars, watches or home entertainment devices (e.g., media streaming devices or gaming consoles). Turning to “traditional” ICT-devices first, one clearly recognises a strong and ongoing trend towards mobile access to the World Wide Web. In fact, mobile devices are likely to become the most important global access point to the Internet in the next few years, as they already are in many parts of the developing world. They are much more widespread than personal computers or laptops, and their numbers are still increasing sharply. Many other devices that collect and transmit data are also mobile, for instance, cars with infotainment or safety functionality, smart watches or wristbands. To discuss the whole breadth of products that can be subsumed under the flag of the data-driven economy would certainly go beyond the scope of this chapter. However, the number of devices connected to the Internet, as registered by Cisco’s Connections Counter,2 is certainly indicative of the trend that more and more products rely critically on an Internet connection and offer enhanced functionality through connected data. In May 2014, there were substantially more than 12 billion connections counted by Cisco, who expect this number to rise to 50 billion by 2020.
Despite the multitude of types of devices and companies that make them, it is surprising that a key enabling part of those devices – their operating system – is controlled by only a handful of players. The leaders in the mobile market are Google (Android) and Apple (iOS), Both of which have made steps to extend their influence into cars, for example, by joining up with car manufacturers and suppliers, into homes through set-top boxes or thermostat appliances, and even their connection to the individual through wearables like smart watches.
157Trends in Telecommunication Reform 2015
Chapter 6
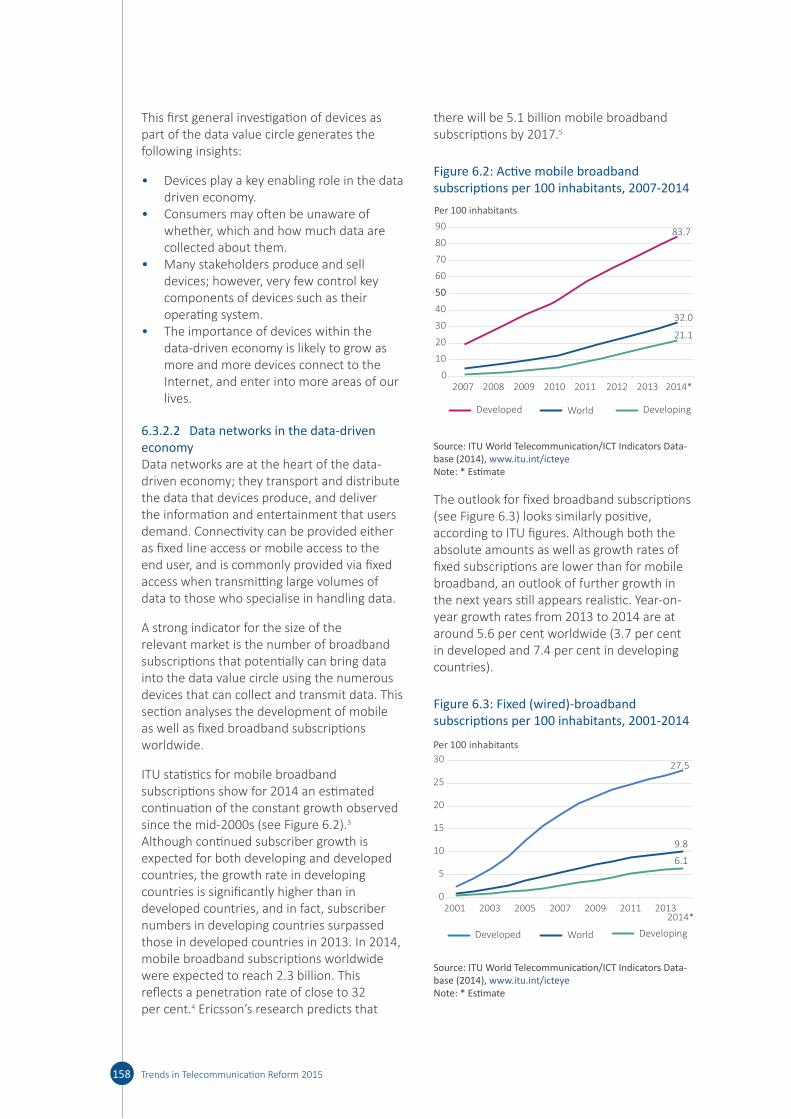
This first general investigation of devices as part of the data value circle generates the following insights:
• Devices play a key enabling role in the data driven economy.
• Consumers may often be unaware of whether, which and how much data are collected about them.
• Many stakeholders produce and sell devices; however, very few control key components of devices such as their operating system.
• The importance of devices within the data-driven economy is likely to grow as more and more devices connect to the Internet, and enter into more areas of our lives.
6.3.2.2 Data networks in the data-driven economyData networks are at the heart of the data-driven economy; they transport and distribute the data that devices produce, and deliver the information and entertainment that users demand. Connectivity can be provided either as fixed line access or mobile access to the end user, and is commonly provided via fixed access when transmitting large volumes of data to those who specialise in handling data.
A strong indicator for the size of the relevant market is the number of broadband subscriptions that potentially can bring data into the data value circle using the numerous devices that can collect and transmit data. This section analyses the development of mobile as well as fixed broadband subscriptions worldwide.
ITU statistics for mobile broadband subscriptions show for 2014 an estimated continuation of the constant growth observed since the mid-2000s (see Figure 6.2).3 Although continued subscriber growth is expected for both developing and developed countries, the growth rate in developing countries is significantly higher than in developed countries, and in fact, subscriber numbers in developing countries surpassed those in developed countries in 2013. In 2014, mobile broadband subscriptions worldwide were expected to reach 2.3 billion. This reflects a penetration rate of close to 32 per cent.4 Ericsson’s research predicts that
there will be 5.1 billion mobile broadband subscriptions by 2017.5
Figure 6.2: Active mobile broadband subscriptions per 100 inhabitants, 2007-2014
83.7
32.0
21.1
0
10
20
30
40
5050
60
70
80
90
2007 2008 2009 2010 2011 2012 2013 2014*
Per 100 inhabitants
DevelopingWorldDeveloped
Source: ITU World Telecommunication/ICT Indicators Data-base (2014), www. itu. int/ icteye Note: * Estimate
The outlook for fixed broadband subscriptions (see Figure 6.3) looks similarly positive, according to ITU figures. Although both the absolute amounts as well as growth rates of fixed subscriptions are lower than for mobile broadband, an outlook of further growth in the next years still appears realistic. Year-on-year growth rates from 2013 to 2014 are at around 5.6 per cent worldwide (3.7 per cent in developed and 7.4 per cent in developing countries).
Figure 6.3: Fixed (wired)-broadband subscriptions per 100 inhabitants, 2001-2014
27.5
9.8
6.1
0
5
10
15
20
25
30
Per 100 inhabitants
2001 2003 2005 2007 2009 2011 20132014*
DevelopingWorldDeveloped
Source: ITU World Telecommunication/ICT Indicators Data-base (2014), www. itu. int/ icteye Note: * Estimate
158 Trends in Telecommunication Reform 2015

Despite increasing market size, however, it is often asserted that network operators are having difficulties generating enough revenue to recover the costs inflicted by increasing volumes of data traffic—and the subsequent need to expand capacity—on their networks due to decreasing average revenue per user (ARPU). Obtaining revenue figures that capture the full market is not possible to the knowledge of the authors. Thus, the following analysis builds on the mobile revenues of two prominent network operators: AT&T and Bharti Airtel.
AT&T was able to keep overall ARPU almost stable from Q2/11 to Q2/13.6 Within this period, ARPU derived from data increased, whilst voice ARPU decreased. Bharti Airtel was able to double its data ARPU from Q1/12 to Q1/14,7 whilst voice APRU remained stable over this two year period. However, in the same period, data usage per customer increased also constantly – and significantly – in every quarter reported. The comparison of quarterly growth rates for data ARPU on one hand, and data usage on the other, reveals that data grew in most quarters faster than data ARPU (see Figure 6.4).
Figure 6.4: Comparison of quarterly growth rates for data ARPU and data usage (2012 to 2014) for Bharti Airtel India
Q1
-Q2
/12
Q2
-Q3
/12
Q3
-Q4
/12
Q4
/12
-Q1
/13
Q1
-Q2
/13
Q2
-Q3
/13
Q3
-Q4
/13
Q4
/13
-Q1
/14
-10.0
-5.0
0.0
5.0
10.0
15.0
20.0
25.0
Data ARPU quarter-to-quarter growth rate (%)
Data usage quarter-to-quarter growth rate (%)
Source: WIK-Consult, Data: Bharti Airtel Quarterly Reports (2012-2014)
In essence, the two considered cases of AT&T and Bharti Airtel India show that overall ARPU does not necessarily decrease – it seems at least possible to keep it at comparable levels. Data ARPU was observed to increase nearly every quarter, which indicates that data business is increasing, and will probably continue to gain even more relevance in the future. However, the faster growth of traffic volume than data ARPU may develop indeed into a significant challenge for sustainable profitability.
Network operators may be able to compensate for a part of this trend through the falling acquisition cost of IP transit traffic. TeleGeography research into monthly IP transit prices from Q2/08 to Q2/13 indicates that “10 GigE port prices have decreased at a compound annual rate of 28 and 30 percent.”8 Price levels, however, differ significantly around the world. Whilst prices in London have come down from 13 USD per Mbps on a 10 GigE port in 2008 to around 1.50 USD in 2013, prices in Sao Paolo were still around 20 USD in 2013.9 Another means to compensate for the rising costs of handling fast growing traffic volumes for a network operator is to circumvent IP transit traffic by using (typically) cost-free peering traffic whenever possible. The industry blog Dr. Peering forecasts that most network operators will be able to extend their peering traffic to a level of about 25 per cent of their total traffic in 2015.10
This analysis of data networks within the data-driven economy results in the following insights:
• Growth in mobile devices connected to the Internet is reflected by a growth in mobile subscriptions worldwide, extending the market for actors in the data networks segment of the data value circle.
• Data traffic is growing on both fixed and mobile networks around the world and is likely to drive revenue for actors in the data networks segment of the data value circle.
• The increasing level of data traffic is a driver of costs. Although there are ways to circumvent potentially shrinking profits, in the long term, the growth of data traffic may still pose a risk to actors in the data networks segment of the data value circle.
159Trends in Telecommunication Reform 2015
Chapter 6
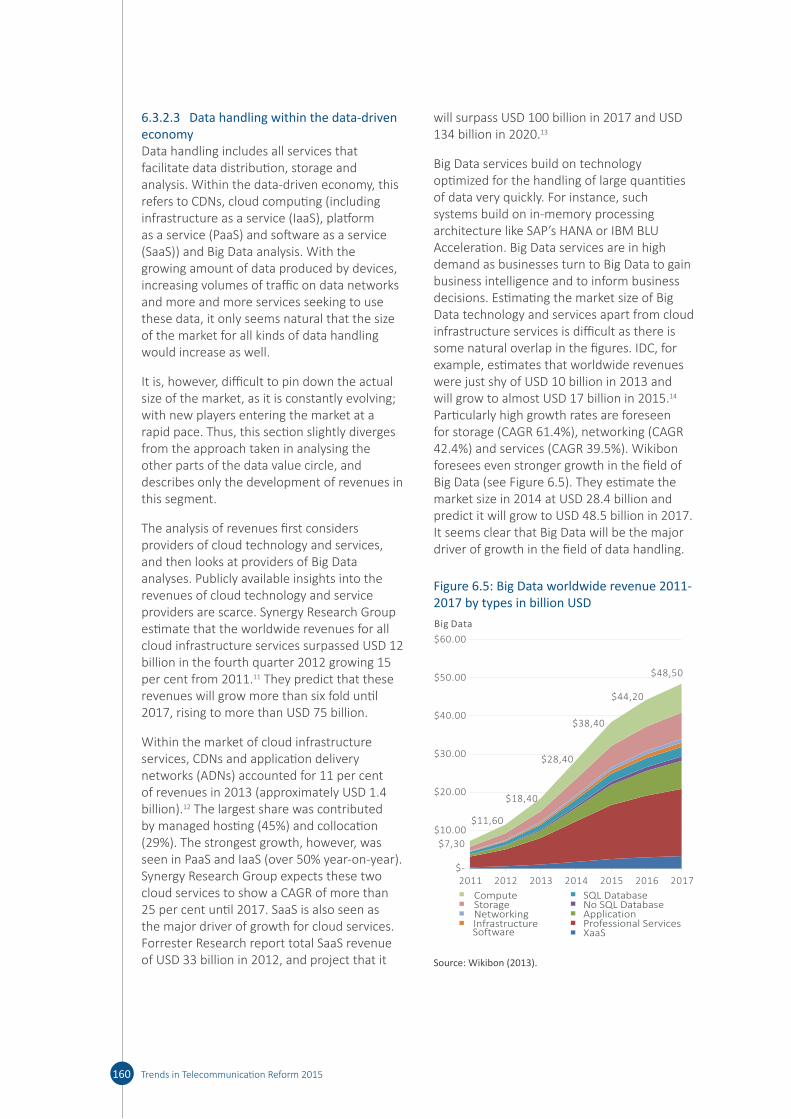
6.3.2.3 Data handling within the data-driven economyData handling includes all services that facilitate data distribution, storage and analysis. Within the data-driven economy, this refers to CDNs, cloud computing (including infrastructure as a service (IaaS), platform as a service (PaaS) and software as a service (SaaS)) and Big Data analysis. With the growing amount of data produced by devices, increasing volumes of traffic on data networks and more and more services seeking to use these data, it only seems natural that the size of the market for all kinds of data handling would increase as well.
It is, however, difficult to pin down the actual size of the market, as it is constantly evolving; with new players entering the market at a rapid pace. Thus, this section slightly diverges from the approach taken in analysing the other parts of the data value circle, and describes only the development of revenues in this segment.
The analysis of revenues first considers providers of cloud technology and services, and then looks at providers of Big Data analyses. Publicly available insights into the revenues of cloud technology and service providers are scarce. Synergy Research Group estimate that the worldwide revenues for all cloud infrastructure services surpassed USD 12 billion in the fourth quarter 2012 growing 15 per cent from 2011.11 They predict that these revenues will grow more than six fold until 2017, rising to more than USD 75 billion.
Within the market of cloud infrastructure services, CDNs and application delivery networks (ADNs) accounted for 11 per cent of revenues in 2013 (approximately USD 1.4 billion).12 The largest share was contributed by managed hosting (45%) and collocation (29%). The strongest growth, however, was seen in PaaS and IaaS (over 50% year-on-year). Synergy Research Group expects these two cloud services to show a CAGR of more than 25 per cent until 2017. SaaS is also seen as the major driver of growth for cloud services. Forrester Research report total SaaS revenue of USD 33 billion in 2012, and project that it
will surpass USD 100 billion in 2017 and USD 134 billion in 2020.13
Big Data services build on technology optimized for the handling of large quantities of data very quickly. For instance, such systems build on in-memory processing architecture like SAP’s HANA or IBM BLU Acceleration. Big Data services are in high demand as businesses turn to Big Data to gain business intelligence and to inform business decisions. Estimating the market size of Big Data technology and services apart from cloud infrastructure services is difficult as there is some natural overlap in the figures. IDC, for example, estimates that worldwide revenues were just shy of USD 10 billion in 2013 and will grow to almost USD 17 billion in 2015.14 Particularly high growth rates are foreseen for storage (CAGR 61.4%), networking (CAGR 42.4%) and services (CAGR 39.5%). Wikibon foresees even stronger growth in the field of Big Data (see Figure 6.5). They estimate the market size in 2014 at USD 28.4 billion and predict it will grow to USD 48.5 billion in 2017. It seems clear that Big Data will be the major driver of growth in the field of data handling.
Figure 6.5: Big Data worldwide revenue 2011-2017 by types in billion USD
$7,30
$11,60
$18,40
$28,40
$38,40
$44,20
$48,50
$-
$10.00
$20.00
$30.00
$40.00
$50.00
$60.00
2011 2012 2013 2014 2015 2016 2017
ComputeStorageNetworkingInfrastructureSoftware
SQL DatabaseNo SQL DatabaseApplicationProfessional ServicesXaaS
Big Data
Source: Wikibon (2013).
160 Trends in Telecommunication Reform 2015
In sum, three insights can be drawn from this general analysis of the data handling sector within the data-driven economy:
• Growing numbers of devices, growth in data traffic volumes and increasing demand for services such as Big Data analyses from providers of data-based products and services (see next section) lead to increased demand for data handling.
• Data handling constitutes a critical supply function within the data-driven economy.
• Big Data is the major driver of growth in this field.
6.3.2.4 Services within the data-driven economyServices in the data-driven economy can be understood as all services that build on digital data, either in the form of data gathered from consumers and businesses or digital content distributed to end users. Such services include those aimed at consumers like social networks, (Internet Protocol Television (IPTV), video and audio streaming and mobile-specific applications, as well as services aimed at businesses such as online advertising, business intelligence or market research. This section will examine different approaches to monetize such services, and the market size for each of these services is then analysed based on user and revenue figures.
Many services in the data-driven economy are offered for a marginal fee, or even free of charge, to the end user (usually consumers), but are monetized through offering services to other businesses, like targeted online advertising or market research insights. There are also a substantial number of services that are offered on a subscription-based revenue model. Most commonly, these are video and audio streaming services showing premium content, dating services or news-related services. Additionally, one can identify hybrid revenue-models relying on a mix of fees and secondary monetization. Consequently, it is difficult to identify a single measure that would fully capture the development of the services market in the data-driven economy. Nonetheless, some indications as regards market size and development can be drawn from the following analysis.
Indicators relating to usage of data-driven services are one way of understanding the market for such services, as well as their possible future development. In general, all data-enabled services show increasing usage, and analysts foresee further growth. Social networks, for example, have been adopted by users faster than previous innovation. The most prominent examples, Facebook, Google+ and Twitter currently feature more than 1.2 billion, over 500 million and over 230 million users respectively. Moreover, the growth of such services is certainly not limited to the developed world. For instance, Facebook has more than 50 million users in African countries.15 Chinese users are also very active on their own social networks: Renren, Tencent Weibo and Qzone, as well as Sina Weibo. E-marketer foresees the worldwide number of social networking users climbing to 2.33 billion in 2017, indicating declining growth rates over the next three years.16 Aside from social media, Digital TV Research counted 88 million IPTV subscribers globally at the end of 2013, and they predict this number to almost double by 2018.17 User numbers for video and audio streaming are difficult to identify as most of these services offer both a free and a subscription option. For video streaming, Netflix is probably the most notable example. Its user base has increased from 34.2 million in Q1/13 to 47.8 million paying subscribers in Q2/14.18 For music streaming, ABI Research estimate that worldwide subscriptions reached 29 million at the end of 2013.19 The number of consumers using the free versions of these services ranges between four- and six fold the number of subscribers depending on the service.20 Mobile apps are even more difficult to quantify, as only part of their services qualify as data-driven in the sense of the present analysis. Mobile apps are most often only another channel for (non-data) stakeholders to offer their services, such as travel services, e-commerce or infotainment. Some apps—like the mobile versions of social networks, messengers and guiding/rating apps—rely heavily on user data, whilst the online versions of video and audio streaming services draw a great load of traffic into mobile networks. The constantly increasing number of smart phones and apps will cause this market to grow over the next years.
161Trends in Telecommunication Reform 2015
Chapter 6

In this segment of the data value circle, analysing revenue figures makes relatively little sense due to the two-sided nature of many data-driven services, as described above. The other side of the services market in the data-driven economy, which mainly consists of offering targeted online advertising to other businesses, however, highlights the financial impact of the growing adoption of such services. The following analysis will therefore focus on this aspect.
A PwC report produced on behalf of the Interactive Advertising Bureau illustrates the financial impact of online advertising in the United States – probably the most important advertising market worldwide (see Figure 6.6).21 U.S. Internet advertising totalled USD 42.8 billion in 2013 (17% growth year-over year), with further growth expected. On the other hand, broadcast and cable television (TV) advertising revenues, which show similar levels (USD 40.1 billion and 34.4 billion, respectively) have been stagnant over recent years, a trend that is expected to continue. According to PwC’s Global media outlook, the worldwide situation shows a similar trend.22 Online advertising totalled USD 116.4 billion in 2013, while TV advertising had total revenue of USD 169.2 billion in the same year. The forecast until 2017, however, shows significantly higher growth rates for online advertising than for all other forms of advertising. PwC expect it to reach USD 185.4 billion in revenue by that time, equivalent to almost 90 per cent of the revenue generated by TV advertising.
In sum, the services offered to end users show a great breadth and are difficult to comprehensively analyse. Nonetheless, some key insights can be taken away from this first analysis:
• The wealth of services offered to end users based on data and the variety of revenue models they rely on indicate a great number of potentially innovative business models.
• Current numbers of users and revenues as well as their projections indicate an overall highly positive outlook for services based on data and offered to end users.
Figure 6.6: Global advertising market (USD million) 2011-2017
Out of home
Newspaper
TVInternet
0
50000
100000
150000
200000
250000
2011 2012 2013 2014 2015 2016 2017
USD Million
Source: PwC.
6.3.3 General characteristics of the data value circleThe sections above have analysed the market sizes, developments and revenues for in the different segments of the data value circle; as structured around the concepts of production (devices), transport (data networks), processing (data handling) and utilization of data (to provide services to end users). Three general characteristics can be drawn from this overarching analysis:
• Data are a significant economic factor, whose significance is likely to grow and drive structural change in all sectors of the economy.
The analysis above reinforces the results from section 6.2. Data have become a major resource for businesses worldwide triggering new business models and structural change for all economic sectors. The analysis has clearly shown that the number of devices connected to the Internet will grow dramatically within the next years, and will reach far beyond personal computers, laptops, mobile phones and tablets. This will further increase the amount of data to be transported on networks. It should be noted that unlike most other economic factors, data become more valuable with increasing availability. The more data are available for analyses, the more accurate the results can be (an important foundation for the use of Big Data). Also, the more data (in form of information or video
162 Trends in Telecommunication Reform 2015
or music) a content provider has to offer, the more valuable its service becomes. Also, more data will likely lead to more services offered to the end user. This will spur further revenue growth in the fields of data handling and data networks. In sum, the data-driven economy appears to be at the brink of a virtuous circle. Thus, policy-makers need to consider what changes this might bring to industries that are strong contributors to the economy of their respective countries. They should investigate how exactly the structural change driven by data will affect their economy, and devise effective strategies that can support businesses in adapting to and profiting from this change.
• The data-driven economy is characterized by two-sided markets.
The structure developed in section 6.3.1 indicates that actors in all fields of the data value circle are likely to have business relationships with actors situated before and behind them in the circle. The above analysis supports this assertion. For all four analysed fields, two distinct customer segments can be identified:
• Devices : (1) end user and (2) app developers.
• Data networks: (1) end users and (2) actors from data handling and data-based services.
• Data handling: (1) data network providers and (2) data-based services.
• Data-based services: (1) consumers (often served for free) and (2) businesses paying for targeted advertising.
Policy-makers should be aware of this fact and take it into account when devising policies that target specific fields within the data value circle. They have to keep in mind that the two-sided nature can be dominated by specific market actors, as is the case in operating systems for mobile devices. From the two-sided nature of many data-based services, a strong incentive emerges to collect more and more data to make the actual value proposition of their business models (i.e., targeted online advertising) more competitive. This holds strong implications as regards privacy and consumer’s ability to make (actual) informed choices about which data he or she is willing to give away in exchange
for a free service. Both aspects will be further elaborated in sections 4 and 5.
• It is unclear which players in the data-driven economy hold the most powerful position.
Building on the previous analysis, the data-driven economy has numerous points were market dominance can be achieved. Operating systems for devices, for instance, enable a significant influence on how end users interact with devices and which services may be offered on these devices. Also, it enables the providers of these operating systems direct access to most data produced by the device itself. Data network providers have significant influence on connectivity, which is the essential precondition for any data-driven business, whilst providers of data handling may hold significant power about what can actually happen with data in terms of using them for services or analysis. Their performance is also critical for the end users’ Quality of Experience (QoE). Finally, services appear to be the real driver of the data-driven economy, companies must make attractive offers to end users, whether they be consumers or businesses.
6.4 Selected value propositions and business models in the data-driven economy
The growing economic relevance of data, combined with the still unclear shape of market power and its two-sided market characteristic, make shifts in relative market power likely and places great emphasis on how individual groups of actors in the data-driven economy are positioned today, and are likely to behave strategically in the near future. Consequently, a more detailed analysis of business models and potential strategic options is needed. This section addresses this task by conducting a detailed analysis of business models and the accompanying strategic options for key value propositions within the data-driven economy; highlighting emerging challenges for market actors, policy-makers and regulators.
The selected value propositions present a representative picture of the data-driven economy, as they have been selected from all
163Trends in Telecommunication Reform 2015
Chapter 6

segments within the data value circle. For each segment, the value propositions that, based on the analysis in section 6.3, appear most influential were chosen. Each of these value propositions is likely to have sustained strong impact as the expected structural change takes place, and to pose specific challenges for other actors in the market as well as for policy-makers and regulators. The value propositions chosen for analysis are:
• mobile device ecosystems;• connectivity • cloud services and CDNs;• targeted online advertising; and• video streaming.
This section will discuss and analyse these value propositions and their associated business models in detail to derive potential strategic options for each group of actors in the data-driven economy, and identify potential challenges for market actors as well as for policy-makers and regulators.
6.4.1 Mobile device ecosystemsSection 6.3.2.1 has shown that more and more devices are connecting to the Internet, driving increasing data use. Discussing all of them would certainly go beyond the scope of this analysis. Thus, this section focuses on the value proposition of the mobile device ecosystems common in today’s mobile phones and tablets. As also noted in section 6.3.2.1, despite a growing number of types of devices and stakeholders, this area of the data value circle still appears to be controlled by just a few actors via operating systems and their accompanying mobile ecosystems. These
companies have attained powerful positions, and thus merit a more detailed analysis of their business models and strategic options. This section analyses their business models, highlighting key differences and culminating in the identification of strategic options and potential challenges for both other actors in this market, as well as policy-makers and regulators.
In the case of mobile devices, there is a de-facto duopoly of Android-based mobile devices and iOS-based mobile devices. This is evidenced in the unit shipment figures published by IDC for the third quarter of 2013 (see Figure 6.7), where the two firms are shown to hold 94 per cent of the market between them.23 Other competitors such as the Windows Phone or BlackBerry (former Research in Motion) phones have only marginal influence in the market. Thus, the following analysis of business models and strategic options will focus on these two major competitors.
Interestingly, the business models of Google and Apple in the field of devices share some major characteristics:
• They both address a two-sided market consisting of two distinct segments: (1) consumers and businesses that buy the devices and (2) develop rs that supply the apps that run on the devices.
Consequently, their value propositions are also similar. For the consumer and business segment, each competitor offers an operating system that enables a mobile ecosystem, to which the end user gains access by purchasing
164 Trends in Telecommunication Reform 2015
Figure 6.7: Worldwide mobile device shipments and market shares for the top-4 mobile operating systems in 3Q/13 in comparison to 3Q/12
33.8
9.5 4.5 1.7
139.9
26.9
3.77.7 8.4
12.90%
3.60% 1.70%0.60%
74.90%211.6 81%
14.40%
2%4.10% 4.50%
3Q13 3Q12
51.30%26.60%
156%-41.60%-80.10%
Operating SystemAndroid
iOSWindows Phone
BlackBerryOthers
Market ShareShipment Volumes Shipment Volumes Market ShareYear-Over-Year Change
Source: IDC Worldwide Mobile Phone Tracker (2013).

a device that runs that operating system. Both competitors offer their operating system free of charge to keep all users as up to date as possible, and thus establish a common standard within each ecosystem. This homogenous and widespread standard environment is the value proposition offered to the other side of the market—the app developers. The larger the number of users of these operating systems, the more attractive it is for developers to build apps for those at operating systems. Taken together, this results in a mobile ecosystem that offers a high degree of functionality and customization of devices to end users, and that, on the other hand, opens up a large market for many developers. In Europe alone, it is estimated that around 800,000 jobs have been created in the so-called app-economy.24
• For both companies, the major revenue stream stems from the apps sold in their respective app stores.
Both Google and Apple gain revenue from each app sale in their app stores (Google Play and Apple iTunes App Store). Apple reported more than USD 10 billion of revenue through their App Store in 2013,25 While Google Play registered roughly half that revenue according to App Annie.26 With the growing number of devices as well as apps, this figure is likely to grow further.
• Both business models support lock-in effects.
A third common aspect of both business models is that both are prone to lock-in effects that bind the customer to the ecosystem. This is true for both end users as well as developers. Whilst end users are likely to be unwilling to lose their investments in apps that they usually cannot take with them if they choose to switch devices, app developers often cannot afford to lose their established customer segments as their business model more often than not depends on continuous in-app purchases or advertising rather than the initial fee for downloading the app. In addition, many developers (especially small firms or individuals) may not wish to expend the resources (i.e., time and training) necessary to develop for a competing platform, especially if that platform has a smaller customer base. Finally, every new app
has to be certified for the respective platform and can be removed from these platforms by its owner, giving the two major competitors in this field a powerful position. All these factors appears to lend some long-term stability to the business models of the two main competitors in this area.
However, there is one important difference in that Apple and Google business models. Whilst Google provides the Android operating system, and therefore access to its ecosystem of applications to anyone who wants to use it,27 Apple follows its long-established policy already known from its computers and laptops of selling the device bundled together with the dedicated operating system. With the iPhone and the iPad, they follow their usual premium brand strategy.
For Apple, this strategy pays off as they are one of the few firms that actually earn profits from their devices. Figure 6.8 documents Apple’s profitability by comparing data collected on major mobile device manufacturers from 2007 to Q3/13.28 These numbers show that Apple is the only manufacturer that can claim stable and substantial profits from 2007 to 2013 for its mobile devices business. It is noteworthy that the market has changed dramatically over the same period. Nokia had roughly the same operating margins in 2007 as Samsung had in 2013. Equally, BlackBerry in 2008 had about the same operating margins as Apple had in 2013. Both Nokia and BlackBerry are currently suffering in the device market.
The fast-changing nature of the mobile device market that these numbers imply may continue as the current market leaders may be challenged. For instance, there are quite serious contenders for a potential third strong ecosystem. Microsoft’s Windows Phone is certainly a valid candidate, and Amazon launched its own mobile phone in mid-2014, extending the established ecosystem that is has built around the Kindle device.29 Others have managed to bring key partners on board that may help them to a significant position in the market. For instance, Mozilla’s Firefox OS initiative has found support among key international telecommunication providers such as America Movil, Telefonica, China Unicom, Sprint, Deutsche Telekom, and
165Trends in Telecommunication Reform 2015
Chapter 6
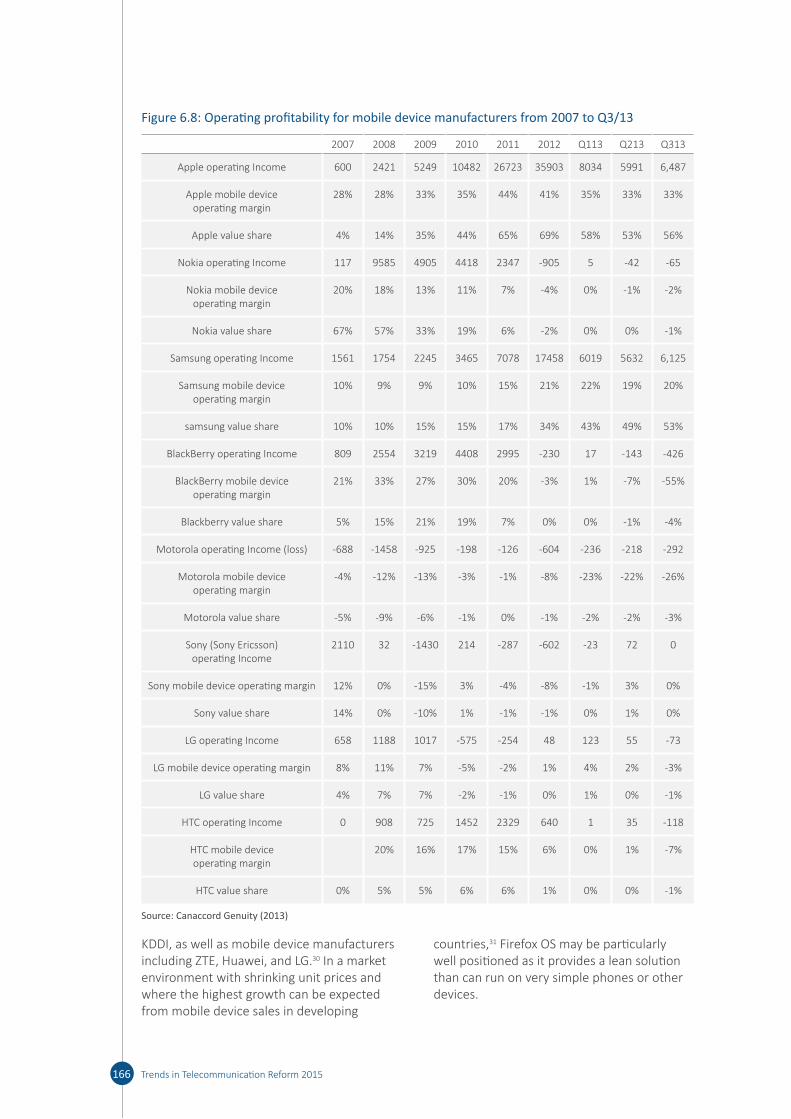
KDDI, as well as mobile device manufacturers including ZTE, Huawei, and LG.30 In a market environment with shrinking unit prices and where the highest growth can be expected from mobile device sales in developing
countries,31 Firefox OS may be particularly well positioned as it provides a lean solution than can run on very simple phones or other devices.
166 Trends in Telecommunication Reform 2015
Figure 6.8: Operating profitability for mobile device manufacturers from 2007 to Q3/13
2007 2008 2009 2010 2011 2012 Q113 Q213 Q313
Apple operating Income 600 2421 5249 10482 26723 35903 8034 5991 6,487
Apple mobile device operating margin
28% 28% 33% 35% 44% 41% 35% 33% 33%
Apple value share 4% 14% 35% 44% 65% 69% 58% 53% 56%
Nokia operating Income 117 9585 4905 4418 2347 -905 5 -42 -65
Nokia mobile device operating margin
20% 18% 13% 11% 7% -4% 0% -1% -2%
Nokia value share 67% 57% 33% 19% 6% -2% 0% 0% -1%
Samsung operating Income 1561 1754 2245 3465 7078 17458 6019 5632 6,125
Samsung mobile device operating margin
10% 9% 9% 10% 15% 21% 22% 19% 20%
samsung value share 10% 10% 15% 15% 17% 34% 43% 49% 53%
BlackBerry operating Income 809 2554 3219 4408 2995 -230 17 -143 -426
BlackBerry mobile device operating margin
21% 33% 27% 30% 20% -3% 1% -7% -55%
Blackberry value share 5% 15% 21% 19% 7% 0% 0% -1% -4%
Motorola operating Income (loss) -688 -1458 -925 -198 -126 -604 -236 -218 -292
Motorola mobile device operating margin
-4% -12% -13% -3% -1% -8% -23% -22% -26%
Motorola value share -5% -9% -6% -1% 0% -1% -2% -2% -3%
Sony (Sony Ericsson) operating Income
2110 32 -1430 214 -287 -602 -23 72 0
Sony mobile device operating margin 12% 0% -15% 3% -4% -8% -1% 3% 0%
Sony value share 14% 0% -10% 1% -1% -1% 0% 1% 0%
LG operating Income 658 1188 1017 -575 -254 48 123 55 -73
LG mobile device operating margin 8% 11% 7% -5% -2% 1% 4% 2% -3%
LG value share 4% 7% 7% -2% -1% 0% 1% 0% -1%
HTC operating Income 0 908 725 1452 2329 640 1 35 -118
HTC mobile device operating margin
20% 16% 17% 15% 6% 0% 1% -7%
HTC value share 0% 5% 5% 6% 6% 1% 0% 0% -1%
Source: Canaccord Genuity (2013)
As a result, it is not surprising that the two main competitors have devised strategies to extend their strong position in the device market. These strategies build on their key resources; their existing customer base combined with the extensive knowledge these two firms have about consumer behaviour, as well as their experience building mobile ecosystems that enable a seamless customer experience and offer added value to app developers. The main strategic direction appears to be developing additional types of devices. Google Glass, for example, is strategically interesting for Google as it will enable them to expand their revenues by selling devices themselves. More importantly, however, this device is likely to be physically even closer to its user more of the time than the mobile phone and thus will give Google access to more valuable data that can be used for their main value proposition, which remains targeted online advertising (see section 6.4.4). This strategy is also evidenced by Google’s acquisition of Nest Labs, providing an entrée into the home-automation market. Apple’s plans appear to be somewhat vague; nonetheless, it seems obvious that also they will attempt to capture additional device or devices (such as the iWatch for example) in their mobile ecosystem. The acquisition of Beats can be considered an example. Both competitors have entered associations that seek to bring their ecosystems into cars or homes.
The current position and the strategic approaches of the two major competitors in the device market as part of the data-driven economy pose challenges for actors in the market, as well as policy-makers and regulators. Actors in the market within and without the data-driven economy may see themselves faced with increasing entry barriers due to the strong customer relationships that the existing competitors have established. With the increasing number of types of devices, Apple and Google are well positioned to see these barriers grow further.
For all competitors, connectivity to the Internet will be a key bottleneck to extending their markets. This is particularly true in developing countries, where some competitors (e.g. Google, Microsoft, and Apple) have started experimenting with
their own access solutions. Given the growing number of devices and the growth of mobile traffic, spectrum may become a limiting factor to the types of services that can be transmitted to mobile devices. These challenges are certainly relevant to policy-makers and regulators, many of whom are currently working to make more spectrum available and to build out broadband networks more generally. Moreover, issues of privacy protection may become an even more pressing issue as more and more services run within the same ecosystems, potentially allowing the companies to combine data across numerous services, devices and situations. Such combinations may, for instance, enable the transformation of anonymous data into personalized data.
6.4.2 Connectivity The value proposition of connectivity is really at the heart of the data-driven economy. Without it, no one would be able to access electronic communication-based services, and no data could be transported or distributed within the data value circle. Subsumed under this value proposition are access to communication networks and transport of data and connectivity amongst data networks. It is important to note that within this value proposition, one of the unique characteristics of the data-driven economy is that two communication partners often obtain access from different network operators. Network operators, thus, need agreements and common standards for interconnection and the hand-over of traffic that either originates from , or which is intended to be transported to, another network.
In essence, the connectivity value proposition relates to two rather different customer segments:
• The access business represents the customer-provider relationship involving a network operator and either an end user or a service/content provider.
• The inter-carrier business typically represents either a customer-provider relationship among two network operators of different traffic volumes and geographical reach (called transit), or else a (typically) free-of-charge agreement
167Trends in Telecommunication Reform 2015
Chapter 6
among network operators of comparable traffic volumes (called peering).
The value propositions in those two business segments shape the business model of a network operator both on the revenue and on the cost side. In particular, it is essential to comprehend the effect of growing traffic volumes on network operator costs.
• Traffic growth implies the risk for a network operator to be forced to implement its value proposition at higher costs, without being able to scale revenues accordingly.
There are a number of factors that influence this risk. Especially in the access business, network infrastructure may become a bottleneck, meaning that access networks run at their capacity in peak hours. Network planning has always been driven by peak (not by average) traffic volumes, as there are huge traffic volume fluctuations over the course of a day. Different approaches exist to give incentive to end users to shift their usage to off-peak hours, but with the rise of flat rate-based charging in both the fixed and mobile access business, many of these incentives have become obsolete. With the rising demand for data-based services that is being seen around the world, network operators are consequently under pressure to continuously and sometimes drastically increase network capacity – which entails significant capital expenses.
Noting the considerations on data ARPU as outlined in section 6.3.2.2, data ARPU would have to rise quite substantially to compensate not just for the costs of adding capacity to accommodate increasing data traffic, but also for decreasing voice ARPU (the traditional voice-oriented telecommunications business), as well as a the potential increase in costly IP transit traffic. IP transit traffic is likely to increase as more end users have access, as more devices become connected, and as additional types of devices become connected (and create additional – novel – traffic). This is due to the fact that in the data-driven economy traffic is often transported across multiple networks as described in the inter-carrier business above. In case of a communications path involving transit, the
smaller network operator typically pays the larger one.
It needs to be emphasized that the above factors contribute only to risk. The examples given in section 6.3.2.2 for AT&T and Bharti Airtel show that it is possible to keep overall ARPU levels relatively stable – in other words, decreasing ARPU is not a given for all network operators. Higher traffic volumes do not automatically lead to higher traffic acquisition costs as unit costs are decreasing. Moreover, even in times of flat rates, there may be other instruments that give incentive to (heavy) users to limit their data usage (e.g., data caps).
Since data exchange is bi-directional, the increase of data volumes from one side of electronic communications implies a multiplication of data by the responding side. This multiplication may take extreme forms when considering products and services in the data-driven economy that are characterized by asymmetric bandwidths needed for request and response. For instance, when an end user requests a video stream, the request itself contains relatively little data, but the response (the actual video stream) is very data-intensive..
To stay with this example, the network operator that connects the respective video streaming provider to its data network will most probably be able to monetize the traffic pushed into its network. Both sides of the access business pay for connectivity – end users pay for their basic access (perhaps through tiered plans where higher speeds or larger data caps come with higher prices), while service/content providers may also have to pay the access provider directly. An emerging problem is that network operators are now having to transport the substantially larger response to the requesting party (its customer) without being able to earn from the relevant source generating most of the traffic (the content provider, which is not its customer). This situation is further intensified considering that it is exactly those services with asymmetric bandwidth requirements that are projected to be responsible for the most traffic in data networks in the future. Comcast, the largest US cable and broadband provider, and Netflix, the giant television and movie streaming service, reached a ground-
168 Trends in Telecommunication Reform 2015
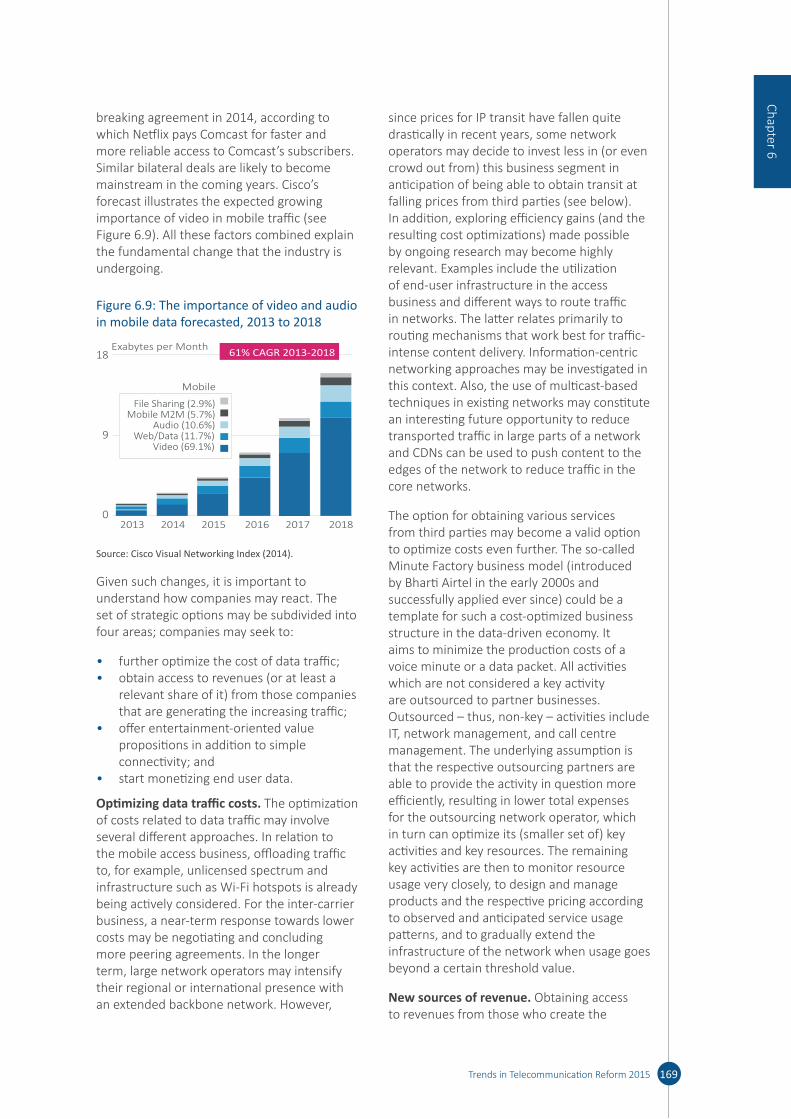
breaking agreement in 2014, according to which Netflix pays Comcast for faster and more reliable access to Comcast’s subscribers. Similar bilateral deals are likely to become mainstream in the coming years. Cisco’s forecast illustrates the expected growing importance of video in mobile traffic (see Figure 6.9). All these factors combined explain the fundamental change that the industry is undergoing.
Figure 6.9: The importance of video and audio in mobile data forecasted, 2013 to 2018
Exabytes per Month
2013 2014 2015 2016 2017 2018
18
9
0
Mobile
File Sharing (2.9%)Mobile M2M (5.7%)
Audio (10.6%)Web/Data (11.7%)
Video (69.1%)
61% CAGR 2013-2018
Source: Cisco Visual Networking Index (2014).
Given such changes, it is important to understand how companies may react. The set of strategic options may be subdivided into four areas; companies may seek to:
• further optimize the cost of data traffic;• obtain access to revenues (or at least a
relevant share of it) from those companies that are generating the increasing traffic;
• offer entertainment-oriented value propositions in addition to simple connectivity; and
• start monetizing end user data.
Optimizing data traffic costs. The optimization of costs related to data traffic may involve several different approaches. In relation to the mobile access business, offloading traffic to, for example, unlicensed spectrum and infrastructure such as Wi-Fi hotspots is already being actively considered. For the inter-carrier business, a near-term response towards lower costs may be negotiating and concluding more peering agreements. In the longer term, large network operators may intensify their regional or international presence with an extended backbone network. However,
since prices for IP transit have fallen quite drastically in recent years, some network operators may decide to invest less in (or even crowd out from) this business segment in anticipation of being able to obtain transit at falling prices from third parties (see below). In addition, exploring efficiency gains (and the resulting cost optimizations) made possible by ongoing research may become highly relevant. Examples include the utilization of end-user infrastructure in the access business and different ways to route traffic in networks. The latter relates primarily to routing mechanisms that work best for traffic-intense content delivery. Information-centric networking approaches may be investigated in this context. Also, the use of multicast-based techniques in existing networks may constitute an interesting future opportunity to reduce transported traffic in large parts of a network and CDNs can be used to push content to the edges of the network to reduce traffic in the core networks.
The option for obtaining various services from third parties may become a valid option to optimize costs even further. The so-called Minute Factory business model (introduced by Bharti Airtel in the early 2000s and successfully applied ever since) could be a template for such a cost-optimized business structure in the data-driven economy. It aims to minimize the production costs of a voice minute or a data packet. All activities which are not considered a key activity are outsourced to partner businesses. Outsourced – thus, non-key – activities include IT, network management, and call centre management. The underlying assumption is that the respective outsourcing partners are able to provide the activity in question more efficiently, resulting in lower total expenses for the outsourcing network operator, which in turn can optimize its (smaller set of) key activities and key resources. The remaining key activities are then to monitor resource usage very closely, to design and manage products and the respective pricing according to observed and anticipated service usage patterns, and to gradually extend the infrastructure of the network when usage goes beyond a certain threshold value.
New sources of revenue. Obtaining access to revenues from those who create the
169Trends in Telecommunication Reform 2015
Chapter 6
large flows of traffic has been identified as the second major strategic option. This may mean for a network operator to build CDN and data centre infrastructure in order to offer the respective cloud infrastructure and services to content and service providers. As data centres are by their very nature sources or destinations of larger traffic volumes, providing access, transport and connectivity to/from a data centre would enable a network operator to participate in the respective revenue streams. Especially when being able to optimize the storage of data in data centres and, at the same time, its delivery in a CDN, network operators would be in a unique position to combine the connectivity value proposition by means of the cloud and content delivery value propositions. However, this strategy appears to be difficult to achieve for network operators, as the market for CDNs and cloud services has entered the phase of strong price competition.
Similarly, a network operator may enter into all sorts of different partnership agreements with content/service providers. This could be an arrangement among a player like Spotify and a mobile network operator in which the technical part of the agreement would mean that Spotify’s servers are replicated within the operator’s network. Spotify traffic would ideally be limited to in-network traffic (except for the transit/peering traffic for regularly updating replica servers). In return, the network operator could offer a rebated monthly Spotify subscription. Spotify could promise its users a better quality of experience due to better response times, as well as the fact that traffic stays within the operational domain of a single operator. In addition, Spotify could benefit from much lower traffic costs – leading to a win-win situation for both the (network and service) provider as well as the user.
Similar scenarios may cover agreements that include traffic prioritization or guaranteed access for which the service/content provider would be willing to pay in order to ensure that its customers benefit from a satisfactory experience. The example of Netflix shows that there may be room for such agreements even though service/content providers will certainly try to avoid cost-sharing approaches and/or traffic prioritization or access payments.
In light of strong net neutrality arguments, it is, however, questionable whether such cost-sharing solutions are really viable in the long-term and will be accepted by all market players. Furthermore, traffic prioritization payments may become a regulatory concern in some markets.
New services. The third major strategy option identified involves a network operator extending its traditionally connectivity-focused value proposition to also include entertainment-oriented services. Many companies, for example, have begun to offer bundles combining the connectivity product (and possibly a telephony product) with IPTV, video-on-demand, music streaming, and similar managed products. In addition to developing additional sources of revenue, such bundles may also facilitate a high level of customer loyalty, and this would give the operator access to new insights on user behaviour that it may be able to monetize.
Monetizing end user data. Making better use of end user data is the fourth major strategic option available to network operators. This is not a field where operators have been active traditionally. The reasons may be regulatory or simply due to the fact that network operators had a viable and sustainable revenue model at hand—one that had worked well for decades. Nonetheless, larger network operators in recent years have shown that they understand the economic value of end user data. Examples include AT&T, Verizon, and Telefónica. The latter has founded a business unit that aims to market “footfall”32 data to local businesses. This example represents a rather simple case for monetizing user data – first of all, footfall data is aggregated data (not data on an individual level) and second it touches on a very limited set of knowledge that a network operator potentially has access to about an end user. Naturally, such a strategic move has to be accompanied by a debate and the establishment of clear guidelines with respect to what is acceptable use of end user data for a network operator.
Similarly, OTTs are keen to extend their field of operation within the data value circle. For example, they may seek to become network operators with their own infrastructure.. The Google Fiber initiative is a very prominent
170 Trends in Telecommunication Reform 2015
example of such a development. Although limited to a small number of geographically bounded U.S. markets, Google’s activities appear to have prompted a response by established network operators. AT&T, for example, has very recently announced33 that it will deploy gigabit fibre in 100 U.S. cities – which is supposedly a direct reaction to Google announcing34 two months earlier that it planned to expand its fibre activities to 34 additional cities. Facebook’s Connectivity Lab is investigating the use of drones, satellites, and laser technology to provide Internet access, especially in developing countries. Other activities may – in the long-term – threaten the exclusive reach of operators to end users: Technology is becoming available, or is under development, that has the potential to break up the termination monopoly in mobile communications. This includes a wide range of different approaches ranging from “downloading” a SIM card on the fly (e.g. Cell-Buddy35) to auction-based mobile termination (e.g. AbaCUS36).
6.4.3 Cloud services and content delivery networksThe value propositions of cloud services and CDNs as part of the data handling segment of the data value circle represent key enabling infrastructures/services for a functioning data-driven economy. Both data networks and providers of data-based services depend on data handling. Section 6.3.2.3illustrated the market size and projected increases for cloud computing infrastructure services including CDNs. This section sets out to analyse the business models of the leading providers of cloud infrastructure and software services in order to identify strategic options and potential challenges for market players as well as policy-makers and regulators.
Cloud services. According to Synergy Research, Amazon currently holds the largest share of the cloud infrastructure services market at 5.2 per cent.37 Verizon, who hold 3 per cent of this market, and is interestingly one of the main competitors to Amazon, is a network operator. This illustrates that this is the point within the data value circle where most providers of data-based services and operators of data networks may become successful due to their existing data
management infrastructure and capabilities to handle data.
In fact, Amazon’s business model as regards data handling for third parties is a perfect example of how infrastructure and know-how originally aimed at providing a specific function were turned into a business model in their own right. To run their extensive e-commerce service, Amazon had to install substantial IT infrastructure early on and learn how to effectively handle and process large data volumes. Amazon turned these resources and expertise into a separate line of business with the launch of Amazon Web Services in 2002. The fact that this service could be offered on a per-use basis made it attractive for both Amazon and their customers.38 Over time, Amazon has added various other services, all revolving around their ever growing IT infrastructure.39 Amazon Web Services experienced a big boost as apps and all kinds of OTT services required affordable and scalable back-end services to support their own offerings.40 Such services include elastic cloud storage, CDNs as well as authentication. The most important of those services are Amazon Elastic Compute Cloud and Amazon S3 (Simple Storage Service).41 Notably, Amazon handles most Netflix data on its AWS platform. This allows Netflix to focus on creating applications without the overhead of thinking about how to architect the datacenter to hold the resulting information. Economies of scale also allow negotiating a good price with Amazon.42
In principle, Verizon have followed a similar strategy to enter the area of data handling. As a provider of fixed-line and mobile Internet access, Verizon owns an extensive telecommunication network. The provided bandwidth and its competence in network management can be regarded as key enablers for providing cloud based services.43 As some Verizon subsidiaries such as Wireless have reached market saturation44, the requirement to identify new streams of revenue and new groups of customers became evident. Having acquired Terremark (a company that specialized on data centre management), Verizon became a main contender with the introduction of Verizon Cloud Compute and Verizon Cloud storage services45. Verizon also initiated partnerships with computer
171Trends in Telecommunication Reform 2015
Chapter 6
software companies like Oracle in order to enhance the flexibility and the options for customers deploying Oracle software in the cloud.46 Recently, Verizon has begun offering supplementary services to address security and operational issues, e.g. the Secure Cloud Interconnect service for business customers.
Akamai’s core market has been CDNs. The company estimates that 15-30 per cent of worldwide data traffic is transmitted via their network.47 Notable customers include Facebook, Netflix, Apple, Yahoo!, Bing and Twitter. In contrast to Amazon and Verizon, which started out in other segments of the telecommunication market, Akamai from the beginning focused on providing data handling services. Due to increasing demand and traffic volumes in video streams, social media, shopping, online games and software downloads, Akamai reported increased revenues and operating margins in the last several quarters (as documented in Akamai’s quarterly reports).48 Shopping Content and Media Content Delivery are considered the most valuable segments of its operation.49 Akamai’s pricing strategy appears to remain competitive, also in times of challenges by former customers.50 In order to respond to security concerns and extend their business, Akamai offers solutions like the Kone Site Defender for their customers. Moreover, Akamai has added more value-added services to their portfolio, like other cloud applications and the delivery of targeted advertising.51
These three examples of business models around the value proposition of cloud infrastructure services illustrate that this part of the data value circle has become very competitive as actors from both surrounding segments (i.e., data based services and data networks) have entered the business. With Google, a fourth very serious contender for the future lead in this market has already entered the scene. Similar to Amazon, they also have accumulated a significant IT infrastructure and knowledge of data handling including their own CDN. Despite these significant resources, however, they do not yet appear amongst the top three players in the IaaS/PaaS market (based on revenues according to Synergy Research52). However, due to their aggressive pricing strategy, this is
likely to change soon. In 2014 alone, they cut the price for the IaaS service Google Compute Engine by 32 per cent across all regions and company sizes.53 In addition, the price for Google Cloud Storage was decreased by 68 per cent.
Content delivery networks. CDNs represent a specific value proposition within the field of cloud infrastructure services. They are an overlay to the existing Internet infrastructure. By means of globally distributed and strategically located servers, CDNs aim to optimize the transmission of content via the Internet. The primary customers of CDN providers are content providers that transmit the large data volumes that are often needed for data-based services.
Starting over a decade ago, a wide variety of models began to emerge regarding the configuration of the CDN architecture. Similarly, in a dynamic market environment with an increasing amount of data traffic, the market players have chosen very different business models and strategies. However, several stereotypical business models can be distinguished; CDN specialists like Akamai, Edgecast and Limelight concentrate their entrepreneurial activities solely on the provision of CDN services and have shaped the CDN market since its beginning. Akamai represents the dominant company in this segment. Players that entered the market at a later point in time generally have not focused their business models solely on CDN services. Instead, CDN services were added to their existing service/product portfolio. Those providers can be divided into two groups: integrated CDN providers that own Internet access infrastructure, and CDN resellers.54 Similar to cloud services, the market for CDN services is very competitive. It may also happen that providers of data-based services with their own CDN decide to open this resource to third parties; as Amazon did with their IT infrastructure. Such a move would certainly further increase competition in this field. This very competitive market poses serious challenges to the existing market players. They will either have to significantly reduce costs to remain competitive or find other revenue streams, as Akamai have recently done.
172 Trends in Telecommunication Reform 2015

Since, due to energy costs, data centres are often situated in areas where there is naturally cold weather and services based on data usually address an international or global market, companies have to manage data handling across borders. This is becoming more difficult in light of the concerns that have emerged from revelations about the U.S. National Security Agency’s data collection activities. Policy-makers should address this issue with great care in order not to impede specific actors or undermine what is a rapidly growing sector. However, they have to strike a balance as regards valid security concerns of the businesses in their country that want to store data reliably and safely.
Finally, as cloud infrastructure services also address more and more consumers directly or indirectly through data-based services, a debate has to be started regarding what consumers understand about this issue, how important contractual provisions can be presented to them in a manner that they are likely to comprehend and if these steps would help them to make better-informed decisions. Furthermore, as data are circulated around the globe, consumers as well as businesses cannot always know what laws and jurisdiction apply. To address this problem, clear guidelines ought to be drawn up in order to support comprehension of this issue for end users of services as well as to clarify the legal frameworks for providers of services.
6.4.4 Targeted online advertisingAs described in section 6.3.2.4, many services offered to consumers free of charge rely for their revenues on the businesses that seek access to these consumers through targeted online advertising. Consequently, these services can be considered to serve a two-sided market with targeted online advertising being the most important value proposition as regards the revenue stream within the business model. The basic structure of this business model is quite similar across the numerous services that apply it. Prominent examples include Google, Facebook, Bing (Microsoft’s search engine), Yahoo and Twitter. Many smaller and less prominent actors in the area of services apply this business model, too.
The key competitive advantage that online advertising holds over other media outlets is based on the data that can be collected about the consumer who is the intended target of the advertising. These data enable a much more individualised approach that results in a significantly higher return on investment for businesses buying advertising.55 Thus, it is not surprising that the large competitors in this field have strategically constructed their business models around generating data about consumers. Google is probably the most all-embracing example, offering free services for search, navigation, mailing, calendar, office applications, image viewing and editing, social networking and so forth. Recently, the company has also entered the field of devices; selling their own mobile phones, tablets, laptops, Google Glass and home automation devices amongst other things. Thus, Google can gather large and varied amounts of user data, perhaps more than any other company.
Facebook seems similarly well-equipped, although they follow a different strategy. Their business model is constructed around their major public value proposition: their social networking service. The main Facebook site alone gives the company access to extensive data about approximately 1.2 billion active users. A significant part of Facebook’s success may be attributed to their smart strategy as regards the involvement of third parties and encouraging entry to the network. Involvement of third parties was achieved early on through the launch of the Facebook Platform in 2007. This service enables companies to access Facebook’s “Social graph” and place advertisements, but also to connect their content to Facebook via a so called “like button”. By this, Facebook is also able to collect some (rudimentary) data about their users’ behaviour outside the network. Beacon, a technology introduced not much later had the objective to learn even more about users’ behaviour outside of Facebook. This technology was, however, discontinued for legal reasons and due to widespread public concerns. Instead, Facebook has offered instant personalization for selected external sites since 2010, which allows Facebook users on third party sites to receive individualized content; for example only reviews of a particular movie written by their Facebook friends.
173Trends in Telecommunication Reform 2015
Chapter 6
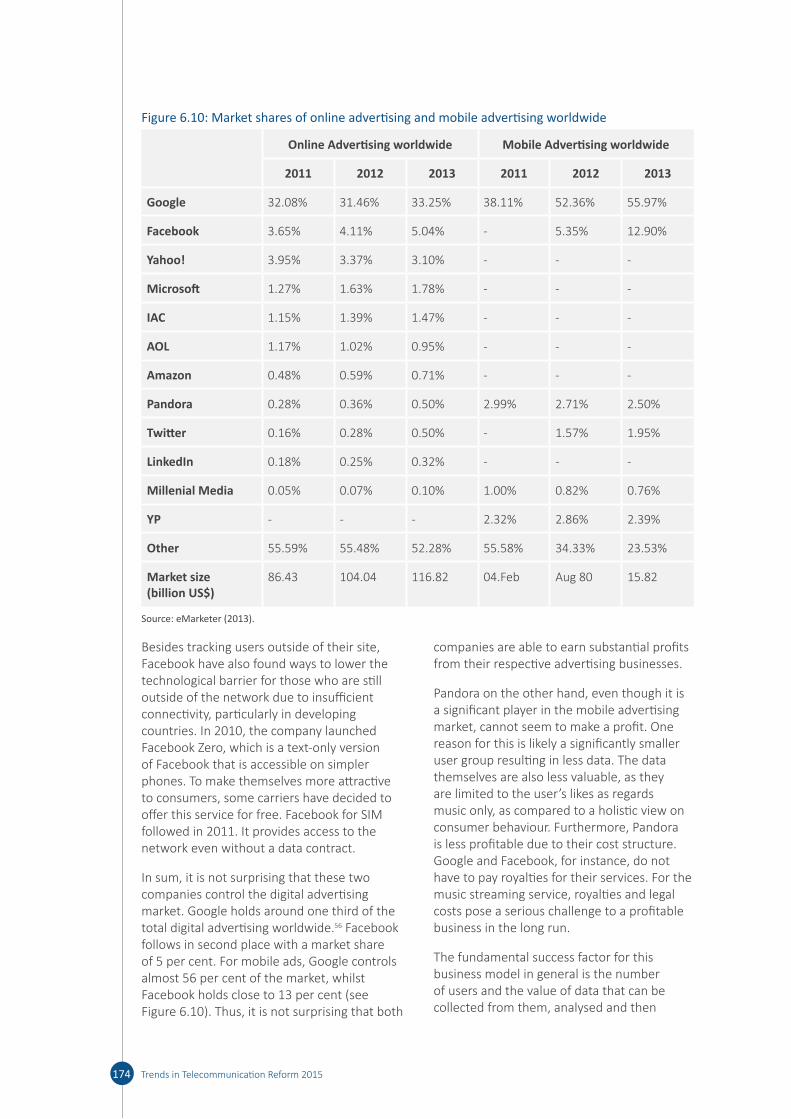
Besides tracking users outside of their site, Facebook have also found ways to lower the technological barrier for those who are still outside of the network due to insufficient connectivity, particularly in developing countries. In 2010, the company launched Facebook Zero, which is a text-only version of Facebook that is accessible on simpler phones. To make themselves more attractive to consumers, some carriers have decided to offer this service for free. Facebook for SIM followed in 2011. It provides access to the network even without a data contract.
In sum, it is not surprising that these two companies control the digital advertising market. Google holds around one third of the total digital advertising worldwide.56 Facebook follows in second place with a market share of 5 per cent. For mobile ads, Google controls almost 56 per cent of the market, whilst Facebook holds close to 13 per cent (see Figure 6.10). Thus, it is not surprising that both
companies are able to earn substantial profits from their respective advertising businesses.
Pandora on the other hand, even though it is a significant player in the mobile advertising market, cannot seem to make a profit. One reason for this is likely a significantly smaller user group resulting in less data. The data themselves are also less valuable, as they are limited to the user’s likes as regards music only, as compared to a holistic view on consumer behaviour. Furthermore, Pandora is less profitable due to their cost structure. Google and Facebook, for instance, do not have to pay royalties for their services. For the music streaming service, royalties and legal costs pose a serious challenge to a profitable business in the long run.
The fundamental success factor for this business model in general is the number of users and the value of data that can be collected from them, analysed and then
174 Trends in Telecommunication Reform 2015
Figure 6.10: Market shares of online advertising and mobile advertising worldwide
Online Advertising worldwide Mobile Advertising worldwide
2011 2012 2013 2011 2012 2013
Google 32.08% 31.46% 33.25% 38.11% 52.36% 55.97%
Facebook 3.65% 4.11% 5.04% - 5.35% 12.90%
Yahoo! 3.95% 3.37% 3.10% - - -
Microsoft 1.27% 1.63% 1.78% - - -
IAC 1.15% 1.39% 1.47% - - -
AOL 1.17% 1.02% 0.95% - - -
Amazon 0.48% 0.59% 0.71% - - -
Pandora 0.28% 0.36% 0.50% 2.99% 2.71% 2.50%
Twitter 0.16% 0.28% 0.50% - 1.57% 1.95%
LinkedIn 0.18% 0.25% 0.32% - - -
Millenial Media 0.05% 0.07% 0.10% 1.00% 0.82% 0.76%
YP - - - 2.32% 2.86% 2.39%
Other 55.59% 55.48% 52.28% 55.58% 34.33% 23.53%
Market size (billion US$)
86.43 104.04 116.82 04.Feb Aug 80 15.82
Source: eMarketer (2013).

used to target them. This implies that services offering targeted online advertising are better off optimising revenues if they have international coverage. Technically, this is easily achieved, however, legal and regulatory barriers are likely to hamper some services. This underlines the need for a more international approach to legislation and regulation, which will be pivotal to future innovative services funded by advertising.
The foreseeable strategic options of the various actors in this data-based market are circumscribed by the above analysis, and depend on the market position of the specific actor. The main competitors in the market are likely to try to extend their market position. One avenue to achieve this is to gain access to data that originally was unattainable. Google, for example, has made steps in this direction by offering more and more devices that can collect and transmit data, extending its business to data networks even up to the individual household (Google Fiber) and to data handling (e.g., cloud services). Facebook, on the other hand, seems to follow a different strategy, targeting developing countries strongly with simplified versions of their service that will also run on simple phones, as well as experimenting with their own connectivity solutions. As noted previously, smaller actors in the market tend to have problems gaining a critical mass of users and monetising their services. Therefore, their strategic options lie more with either attracting a very valuable user group or very valuable data. To achieve this, they have to be innovative.
Nevertheless, the profitability of this business model is likely to attract new stakeholders. Providers of electronic communications, for instance, potentially have access to a wealth of data about their customers. Equally, it appears sensible to transfer the principles of this business model to other industries that handle potentially valuable data, such as health, car manufacturers, manufacturers of navigation systems and so forth. Most likely the value proposition here would not be advertising, but rather consulting and market insights. This development result in data becoming a key resource for business models across numerous sectors—giving data more and more value. Eventually, this may create a market for data,
where individual companies may acquire data that they themselves may not be able to collect, but which are relevant for the service they offer to other companies. Policy-makers should consider this possibility seriously and discuss if and how they want to react to it.
The rapid growth in the collection and use of data would seem to emphasise the need for consumer education that is apparent already today. Consumers should be enabled to make informed decisions about which data are collected about them and what may happen with these data. Consumers should be made aware of the fact that their behaviour is not simply traced, but analysed and inferences are made and used by others to make a profit. Today, consumers have little opportunity to learn about this, and they often do not have a real choice when it comes to using devices like mobile phones, tablets or even cars with connected features. In addition to informing consumers (e.g., through a standardised and intuitive terminology for contracts agreements), policy-makers also have to keep in mind the more general issues associated with privacy. As more and more data are collected and potentially combined, anonymous data can—with relatively little effort—be honed down to either a small group of individuals or even the individual person him- or herself. This is even more important, as such data may result in discrimination if, for instance, such data are used to decide who is the right candidate for a specific job opening or to be admitted to a particular educational institution.
Finally, it may be relevant to consider if one is willing to trade the increasingly important objective of connecting everyone, especially in developing countries, for increased control of a few competitors in the market, who may block innovation when they become a gatekeeper of access, as well as important services and their monetisation through online advertising.
6.4.5 Video streamingVideo streaming is one of the services offered to end users within the data value circle. It comprises IPTV as well as video on demand (VoD) services, including offers by telecommunication companies (e.g. Deutsche
175Trends in Telecommunication Reform 2015
Chapter 6
Telekom), cable companies (e.g. Comcast) and OTTs (e.g. Netflix, Hulu, YouTube, Vevo). This value proposition is interesting to analyse as this service is clearly the most important source of data traffic on the Internet and therefore future developments in this area are likely to have significant impacts on the businesses of other stakeholders in the data value circle (i.e., data networks and data handling), but also policy-makers and regulators. From a business perspective, it is interesting to note that there has not yet emerged a dominant player in this market. Accordingly, there is a wide variety of business models especially as regards how revenue streams are generated. Although many of these services are not yet profitable, they have specific competitive advantages as compared to broadcast and cable TV and may alter the media landscape significantly. Consequently, this section first discusses and analyses the variety of revenue models and the corresponding profitability of the overall business models, as well as other critical success factors. Hence, this section sheds light on the specific advantages of video streaming services and how they may further impact the media landscape. Finally, the strategic options of actors in the market and potential challenges for them, as well as policy-makers and regulators, are highlighted.
Video streaming is supported by a wide variety of revenue generation concepts. These concepts stretch from fully advertising-based ones (e.g. YouTube, Vevo) to subscription-only services (e.g., Netflix). The following discussion illustrates two examples of video streaming services that earn a profit and exemplify the two main types of revenue models: YouTube and Netflix. IPTV services offered by telecommunication providers are also discussed below.
YouTube profits from Google’s proficiency and market share in targeted online advertising (see section 6.4.4) and can operate at a significant profit selling targeted online advertising. Other major success factors within YouTube’s business model are the ability to deliver a high quality of experience for the consumer based on Google’s own network infrastructure and the wide variety of largely user-generated content. YouTube shares its advertising revenues with users who have
uploaded content and allowed the placement of advertisements.
Netflix, on the other hand, does not show any advertising. Its revenue model is completely subscription-based. Since they could not rely on an already established infrastructure like YouTube, the major success factor for their business model has been key partnerships. On the one hand, this includes device manufacturers and their respective ecosystems. Netflix established partnerships with video game console manufacturers (Microsoft in 2008; Sony in 2009; Nintendo in 2010), television manufacturers (Samsung, LG and Sony in 2009; Panasonic and Google TV in 2010) and manufacturers of mobile devices (Apple in 2010; Microsoft in 2010; Android (Google) in 2011; Nook in 2011) to facilitate seamless access for the end user. Netflix, for example, came preinstalled on Nook tablets. On the other hand, Netflix had to establish key partnerships with content producers. Most notably, they recently formed a partnership with DreamWorks that will enable them to bring first rate Hollywood content to the Internet first. Just like for YouTube, QoE plays a pivotal role in Netflix’ success. Thus, they also have established partnerships with firms that offer data handling (Amazon) and Comcast as well as Verizon to guarantee quality of service for Netflix’s traffic on their networks.57 Beyond that, they produce high-quality original content only accessible through their service.
Next to OTTs, it is important to also note that many providers of telecommunication services are pushing into the media market by offering their own IPTV solutions. As regards revenue models, such services usually come in a bundle with telephony and Internet access. Providers that own an electronic communication network have a natural advantage because they can offer their IPTV service as a “managed service” (i.e., monitoring and adapting the flow of data to ensure a constant high-quality consumer experience). However, since their offers are usually confined to their own network, the number of users is naturally limited and tends to be much smaller than that of OTTs.
Independent from the platform, video on demand, and to some extent also traditional IPTV, have distinct competitive advantages
176 Trends in Telecommunication Reform 2015

as compared to traditional TV broadcast and cable services. This has to do with their revenue models. If they support their service by advertising, they can offer a much more targeted service to businesses that takes into account the actual viewing habits of the individual and is able to make further predictions about their (dis-)likes based on a large volume of other user data. Traditional media can do this only based on samples of users and cannot individualize advertising messages. Furthermore, broadcast and cable TV’s advertising revenues are growing much slower than those for online advertising worldwide, as shown in section 6.3.2.4. In some countries they even decline due to a shift towards online advertising. Still, they have to fill their broadcast every day, which makes it difficult not to compromise the quality of content. VoD platforms can produce or purchase content that fits their customer segments. There is no obligation to provide a constant stream of content. It only has to be made accessible to the user. He or she watches it whenever or wherever he or she wants. This renders the cost structure in the VoD business model more manageable. In sum, it makes VoD providers well-equipped to prosper in the long-term and change the media landscape.
Video streaming services that seek to provide premium content face particular challenges in acquiring that content. Furthermore, there are often issues regarding international licensing of premium content. International distribution is, however, a key success factor for VoD services as they rely on a sufficient number of users to make their service viable. Thus, it is likely that VoD platforms will increasingly rely on original content they produce themselves. Netflix and Amazon illustrate this emerging trend. However, IPTV services by network operators may often not have the necessary critical mass of users, nor the capabilities to produce attractive original content. Thus, if policy-makers intend to open up the media landscape to competition and foster structural change, they should take steps to facilitate international licensing of premium content, and also support network operators in their move towards IPTV and VoD services.
In addition to the trend towards producing original content, there is also a trend towards
differentiating digital video streaming in terms of quality of experience from broadcast and cable TV. It is already visible in Netflix’ recent agreement with Sony to stream 4K video to selected high-end Sony TV sets. This will add even more data traffic to existing networks. Moving to 3D television, virtual reality entertainment and other immersive media that we are likely to see in the future will aggravate this issue further. Such developments will put additional pressure on policy-makers and regulators to debate issues around cost sharing between network operators and content providers and who should pay for data network infrastructure upgrades (see section 6.4.2.2).
Finally, policy-makers should consider the long-term evolution of consumer behaviour as regards video consumption. In total viewing hours, the trend towards VoD may still be small compared to broadcast and cable TV. However, considering the video consumption behaviour of youth, it becomes obvious that this trend is inescapable. The TV set is becoming less and less important to young people as they watch an increasing amount of content on platforms such as YouTube. Often such content is produced by small or even amateur producers. In the long run, this trend may harm the business case for established studios and producers of premium content.
6.5 Potential policy and regulatory implications
This chapter set out to investigate the economic influence of data and their impact on business models. The investigation of the evolutionary path of technical innovations that allow better access, distribution and analysis of data, and the supporting innovative business models, demonstrates that a structural change towards a data-driven economy has been underway since the late 1990s. Section 6.3 supported this finding by developing the data value circle – a structural framework that helps to understand the specific characteristics of the data-driven economy. Subsequent analysis of the market size and prospects for each segment within the data value circle underline the importance of the data-driven economy and highlight the value that data have today and are likely to
177Trends in Telecommunication Reform 2015
Chapter 6
have in the future. Section 6.4 analysed the potentially most influential value propositions within each segment of the data value circle and associated business models. In this analysis, potential challenges for market players, policy-makers and regulators were identified.
Through the course of this chapter, it has become obvious that many actors within the data value circle seek to extend their businesses to other market segments in the circle. Data handling appeared to be a segment that is under a great deal of pressure. Both providers of data-driven services, as well as network operators have the relevant infrastructure and know-how that can be put to use with minimal cost to also offer cloud and/or CDN services. Google is currently undercutting prices in this area and is likely to gain market share quickly. In fact, they are currently the only firm that operates in all four relevant market segments of the data value circle, albeit with relatively small operations in data networks and data handling. Amazon is possibly the second candidate to enter all four market segments. If this happens, it might at least nationally or regionally have some effect on competition, such that small innovative service providers might have to find new ways of entering the market. This situation might be aggravated if the dominance of the existing mobile operating (eco-)systems results in a de facto duopoly in the online advertising market. This would make it potentially even more difficult for small firms to monetise their services through advertising.
Instead of entering other market segments themselves, the example of Netflix has shown that it can be profitable to work through partnerships. Such partnerships may also be attractive to other OTTs and to network operators. By means of such partnerships, OTT services may turn into managed services. For a network operator, cost reductions are not the only opportunity to benefit from such partnerships: network operators might attract more customers by offering highly popular services such as Spotify or Netflix on attractive terms and with a high quality of experience. Bundling such services with a network operator’s own IPTV, access, and telephony products may positively influence customer loyalty – suggesting that IPTV and
Netflix are possibly not competing, but instead are potentially complementary offerings. Depending on the terms and conditions of such agreements, as well as national law and regulation, such partnerships, however, may be subject to oversight or limitations.
The issue of payments (e.g., for better than best-effort transmission) between OTT content providers and network operators has been contentious, and is likely to continue to be a difficult issue for some time. The linkage between these issues and network neutrality concerns makes them particularly difficult to resolve. It should be noted that many of the commercial parties in both camps (but not all) consider commercial (QoS-aware) agreements between willing parties to be unobjectionable. An amicable solution along those lines might perhaps be possible, but it is not likely to be easy or quick. Again, this issue will not be easy to resolve.
Whether partnerships can resolve the open questions around net neutrality and the associated discussion about cost sharing of infrastructure investments between operators and OTTs is thus questionable. However, the issues highlight the idea that non-discriminatory access may not be limited to the Internet in the future, but rather the question of non-discriminatory access may extend into the field of market access in vertically related markets as well. Policy-makers and regulators may (depending on the specific situation in their country) see some need for intervention here. A second potentially important area of intervention emerges, when one considers this issue from a consumer perspective. One major feature of these ecosystems is their potential to lock in customers. Policy-makers and regulators may encourage competition amongst ecosystems by supporting migration from one system to another by common standards or similar agreements (i.e. to achieve lower switching costs). If consumers can switch easily, new entrants at various levels of the value chain may find it easier to gain traction in the market.
Another incentive to enter more and more segments of the data value circle is to gain more complete insights about consumers and thus to acquire more valuable data. For
178 Trends in Telecommunication Reform 2015
network operators, an interesting strategic avenue would be to assess which data they can gather about consumers, and whether their relationship with their customers might give them a competitive advantage over the data that OTTs can gather. From a regulatory perspective, however, it is questionable whether network operators are likely to be allowed to act just as freely as OTTs do—simply because OTTs are often not subject to the same regulation or framework that traditional providers are. Policy-makers and regulators are just now beginning to consider whether it is now time to open this competitive avenue for them and what regulatory changes might be necessary to ensure fair competition.
Generally, however, the collection and utilisation of more and more consumer data should be an area of concern for consumers, policy-makers and regulators alike, as full personal profiles and predictive analytics may have adverse effects if they are put to the wrong purposes. As consumers are often unaware that data have been collected at all, which data are collected about them, and what is done with these data, transparency and information appear to be the key means of intervention here. However, to be effective, information must be provided to consumers using terminology that is easily understood. Thus, a first step for policy-makers and regulators who wish to empower consumers and enable them to make meaningful and informed decisions about what happens to their data will be to explore how consumers conceptualise and understand the topic.
Beyond information and transparency, one might also consider steps to enable consumers to access the data that, for instance, OTTs and operators have about them. For instance, a standardised procedure could be devised to facilitate such personal data requests. In light of a recent verdict of the European Court of Justice (giving consumers the right to demand deletion of personal data from search indices; based on the argument that search engines allow the compilation of a rather fine-grained personal profile with relatively little effort),58 one might also ask whether consumers in countries outside of Europe should receive the right to ask for their data to be deleted. This trend might also extend to prohibitions on using such personal data for targeted advertising.
It is clear that the data-driven economy is very much a global economy. Many of the policy interventions that could potentially be introduced to address these emerging issues are unlikely to have much effect if they are applied only on a national level. In essence, the structural change towards a data-driven economy calls for internationally agreed responses by policy-makers and regulators. Thus, consensus needs to be reached regarding governance, implementation, enforcement, and cooperation on a wide range of policy interventions in order to ensure an overall positive economic effect of this structural change in the marketplace.
179Trends in Telecommunication Reform 2015
Chapter 6
Endnotes1 Tan Wee Hin, Leo, Handbook of Research on Literacy in Technology at the K-12 Level, Idea
Group Inc (IGI), 2005.
2 Cisco, “Connections Counter: The Internet of Everything in Motion,” (2013), http:// newsroom. cisco. com/ feature- content? type= webcontent& articleId= 1208342.
3 International Telecommunication Union, “ITU World Telecommunication/ICT indicators database,” (2014), http:// www. itu. int/ en/ ITU- D/ Statistics/ Documents/ statistics/ 2014/ ITU_ Key_ 2005- 2014_ ICT_ data. xls.
4 ITU, ICT Facts & Figures 2014, http:// www. itu. int/ en/ ITU- D/ Statistics/ Documents/ facts/ ICTFactsFigures2014- e. pdf
5 Ericsson, “Traffic and Market Report 2012,” (2012).
6 Network Strategies, “LTE vs ARPU – data takes over,” http:// www. strategies. nzl. com/ wpapers/ 2013014. htm.
7 See generally Bharti Airtel Quarterly Reports (2012-2014), http:// www. airtel. in/ about- bharti/ investor- relations/ results.
8 TeleGeography “IP Transit Port Upgrades Yield Steeper Price Declines for Buyers,” (8 October 2013), http:// www. telegeography. com/ press/ press- releases/ 2013/ 10/ 08/ ip- transit- port- upgrades- yield- steeper- price- declines- for- buyers/ index. html.
9 ITU, ICT Facts & Figures 2013, http:// www. itu. int/ en/ ITU- D/ Statistics/ Documents/ facts/ ICTFactsFigures2013- e. pdf
10 Dr. Peering, “2014 Transit Prices and Peering Projections,” (2013), http:// drpeering. net/ AskDrPeering/ blog/ articles/ Ask_ DrPeering/ Entries/ 2013/ 10/ 25_ 2014_ Transit_ Prices_ and_ Peering_ Projections. html.
11 Synergy Research Group, “Cloud Infrastructure Services: Market Primer,” (2013), http:// cncdata. com/ reports/ Synergy_ Cloud_ Infrastructure_ Services_ Market_ Primer. pdf.
12 idem.
13 Forrester Research “Sizing the Cloud – A BT Futures Report: Understanding And Quantifying The Future Of Cloud Computing,” (2011).
14 IDC, “MARKET ANALYSIS: Worldwide Big Data Technology and Services Forecast 2012-2017,” (2012).
15 SocialBakers, Facebook statistics, www. socialbakers. com.
16 eMarketer, “India Leads Worldwide Social Networking Growth, Country set to control largest Facebook population worldwide,” (19 November 2013), http:// www. emarketer. com/ Article/ India- Leads- Worldwide- Social- Networking- Growth/ 1010396.
17 Digital TV Research, “Global IPTV Forecasts,” (2013).
18 Seeking Alpha, “Netflix: A Stock With Upside Potential,” (8 May 2014), http:// seekingalpha. com/ article/ 2201453- netflix- a- stock- with- upside- potential.
19 ABIresearch, “Spotify to Hold 32% of 29-Mil. Music Streaming Subscribers Forecasted for End-2013,” (1 August 2013), https:// www. abiresearch. com/ press/ spotify- to- hold- 32- of- 29- mil- music- streaming- subsc.
180 Trends in Telecommunication Reform 2015
20 Inc., “Music Streaming Wars: Top 8 Contenders,” http:// www. inc. com/ ss/ jill- krasny/ whos- who- music- streaming- wars#3.
21 IAB “IAB Internet Advertising Revenue Report,” (2014), http:// www. iab. net/ research/ industry_ data_ and_ landscape/ adrevenuereport.
22 PwC,“Internet advertising,” http:// www. pwc. com/ gx/ en/ global- entertainment- media- outlook/ segment- insights/ internet- advertising. jhtml.
23 IDC, “Android Pushes Past 80% Market Share While Windows Phone Shipments Leap 156.0% Year Over Year in the Third Quarter, According to IDC,” (12 November 2013), http:// www. idc. com/ getdoc. jsp? containerId= prUS24442013.
24 ACT, “The European app economy. Creating jobs and driving growth,” (2013), http:// actonline. org/ appeconomy/ europe/ .
25 Apple, “App Store Sales Top $10 Billion in 2013,” Press Release, (7 January 2014), http:// www. apple. com/ pr/ library/ 2014/ 01/ 07App- Store- Sales- Top- 10- Billion- in- 2013. html? sr= hotnews. rss.
26 App Annie, “App Annie Index - Market Q1 2014: Revenue soars in the United States and China,” (15 April 2014), http:// blog. appannie. com/ app- annie- index- market- q1- 2014/ .
27 It should be noted that some fees usually apply to get a third-party certificate that allows a device manufacturer to run Google Mobile Services (GMS). See http:// www. theguardian. com/ technology/ 2014/ jan/ 23/ how- google- controls- androids- open- source
28 AppleInsider, “Apple & Samsung take massive 109% of mobile industry profits while competitors lose money,” (14 November 2013), http:// appleinsider. com/ articles/ 13/ 11/ 14/ apple- samsung- take- massive- 109- of- mobile- industry- profits- while- competitors- lose- money.
29 TechRadar, “Amazon phone release date, news and rumors,” (28 July 2014), http:// www. techradar. com/ news/ phone- and- communications/ mobile- phones/ amazon- phone- release- date- news- and- rumors- 1085821.
30 Mozilla, “Unleash the future,” http:// www. mozilla. org/ en- US/ firefox/ partners/ .
31 The Guardian “Smartphone explosion in 2014 will see ownership in India pass US, China and India will add more than 400m new smartphone users amid growth for FirefoxOS and Android, forecasts Mediacells,” (13 January 2014), http:// www. theguardian. com/ technology/ 2014/ jan/ 13/ smartphone- explosion- 2014- india- us- china- firefoxos- android.
32 Footfall relates to the number of people stepping into a geographic area, such as a street segment. Businesses with stores in that area may profit from footfall data. Footfall gives insight into when and how many people pass by in front of a store location, whether people stop at, e.g., a café nearby etc. By combining footfall data with other user profile attributes, a network operator can offer enriched information (beyond pure footfall data) that, for instance, allows a business to assess whether people passing by might fall into a targeted market segment.
33 AT&T, “AT&T Eyes 100 U.S. Cities and Municipalities for its Ultra-Fast Fiber Network,” (21 April 2014), http:// about. att. com/ story/ att_ eyes_ 100_ u_ s_ cities_ and_ municipalities_ for_ its_ ultra_ fast_ fiber_ network. html.
34 Google, “Exploring New Cities for Google Fiber,” (19 February 2014), http:// googleblog. blogspot. de/ 2014/ 02/ exploring- new- cities- for- google- fiber. html.
35 See http:// web. cell- buddy. com/ .
181Trends in Telecommunication Reform 2015
Chapter 6
http://www.apple.com/pr/library/2014/01/07App-Store-Sales-Top-10-Billion-in-2013.html?sr=hotnews.rss
36 University of Zurich, ” Auction-based Charging and User-centric System (AbaCUS),” http:// www. csg. uzh. ch/ research/ abacus. html.
37 Synergy Research Group, “Cloud Infrastructure Services: Market Primer.”
38 Isckia T., Lescop D., “Open Innovation within Business Ecosystems: A Tale from Amazon.com,” Communications & Strategies, vol. 74(2), (2009), http:// repec. idate. fr/ RePEc/ idt/ journl/ CS7402/ CS74_ ISCKIA_ LESCOP. pdf.
39 Amazon, “History & Timeline,” http:// phx. corporate- ir. net/ phoenix. zhtml? c= 176060& p= irol- corporateTimeline.
40 The Register, “Amazon to all data centers: Keep up, if you can,” (19 April 2012), http:// www. theregister. co. uk/ 2012/ 04/ 19/ amazon_ vogels_ aws_ summit/ .
41 ZDNet, “How Amazon exposed its guts: The History of AWS’s EC2,” (7 June 2012), http:// www. zdnet. com/ how- amazon- exposed- its- guts- the- history- of- awss- ec2- 3040155310/ .
42 ODBMS Industry Watch, Big Data Analytics at Netflix. Interview with Christos Kalantzis and Jason Brown, February 2013, http:// www. odbms. org/ blog/ 2013/ 02/ big- data- analytics- at- netflix- interview- with- christos- kalantzis- and- jason- brown/
43 Lens 360, “Verizon’s Cloudy Services Horizon,” (8 November 2013), http:// blog. saugatucktechnology. com/ verizon- cloud- services- horizon/ .
44 Verizon, “Industry Overview,” http:// www. verizon. com/ investor/ industryoverview. htm.
45 Datamation, “Verizon Unveils New Cloud Strategy,” (4 October 2013), http:// www. datamation. com/ cloud- computing/ verizon- unveils- new- cloud- strategy. html.
46 Ovum, “Verizon partners with Oracle to offer database services by the hour,” (2014), http:// ovum. com/
47 Akamai, “Visualizing Global Internet Performance with Akamai,” http:// www. akamai. com/ html/ technology/ visualizing_ akamai. html.
48 Acamai, Quarterly Earnings Releases, http:// www. akamai. com/ html/ investor/ quarterly_ earnings_ releases. html
49 Wall Street Journal, “Akamai Profit Rises 1.8%,” http:// online. wsj. com/
50 Wall Street Journal, .“Akamai Hints It Can Weather Competition From Customers,” (5 February 2014), http:// blogs. wsj. com/ digits/ 2014/ 02/ 05/ akamai- hints- it- can- weather- apples- diy- effort/ .
51 Forbes, “Akamai Earnings: Watching For The iOS7 Impact With An Eye On Margins,” (21 October 2013), http:// www. forbes. com/ sites/ greatspeculations/ 2013/ 10/ 21/ akamai- earnings- watching- for- the- ios7- impact- with- an- eye- on- margins/ .
52 Synergy Research, “Amazon Continues to Dominate IaaS/PaaS Despite Strong Push from Microsoft & IBM,” (3 February 2014), https:// www. srgresearch. com/ articles/ amazon- continues- to- dominate- iaaspaas- despite- strong- push- from- microsoft- ibm.
53 Google, “Google Cloud Platform Live - Blending IaaS and PaaS, Moore’s Law for the cloud,” (25 March 2014), http:// googlecloudplatform. blogspot. de/ 2014/ 03/ google- cloud- platform- live- blending- iaas- and- paas- moores- law- for- the- cloud. html.
54 Christin-Isabel Gries and Imme Philbeck, “Marktentwicklungen im Bereich Content Delivery Networks,“ (April 2013), http:// www. wik. org/ index. php? id= diskussionsbeitraegedetails& tx_
182 Trends in Telecommunication Reform 2015
ttnews[tt_ news] =1537&tx_ttnews[backPid]=93&cHash=97711fe378151af9769091acbe5d76bc.
55 Arnold and Schiffer, for example, found that the ROI for Google AdWords is on average almost 12 times the ROI to expected from other advertising formats. (Arnold, R. & Schiffer, M. (2011): Faktor Google – Wie deutsche Unternehmen Google einsetzen. IW Consult: Köln.)
56 eMarketer, “Google Takes Home Half of Worldwide Mobile Internet Ad Revenues,” (13 June 2013), http:// www. emarketer. com/ Article/ Google- Takes- Home- Half- of- Worldwide- Mobile- Internet- Ad- Revenues/ 1009966#sthash. MjU6yas0. dpuf.
57 Technically, priority is not given to Netflix traffic into Comcast, for example. Rather, the direct connection between Netflix and Comcast ensures a specific quality of service by guaranteeing a faster and more reliable connection. See http:// www. nytimes. com/ 2014/ 02/ 24/ business/ media/ comcast- and- netflix- reach- a- streaming- agreement. html.
58 Court of Justice of the European Union, “An internet search engine operator is responsible for the processing that it carries out of personal data which appear on web pages published by third parties,” Press Release, (13 May 2014), http:// curia. europa. eu/ jcms/ upload/ docs/ application/ pdf/ 2014- 05/ cp140070en. pdf.
183Trends in Telecommunication Reform 2015
Chapter 6

7 Monitoring the Implementation of Broadband Plans and Strategies
7.1 Introduction
A recent study shows that countries with a national broadband plan2 have a better track record for expanding both fixed and mobile broadband penetration compared with countries that do not have a plan.3 With all other variables held constant, countries with a plan have a 2.5 per cent higher fixed and 7.4 per cent higher mobile broadband penetration. The study also found that without a competitive market, broadband penetration is lower: 1.4 per cent lower for fixed and 26.5 per cent lower for mobile broadband access. A competitive market is thus a key engine of growth in many broadband plans.
As policy-makers seek to develop the most effective plans for driving broadband development, a key element is how to assess and analyse what approaches work and which do not. Measurable information about the supply and use of broadband provides a basis for judging whether broadband plans and digital strategies are achieving the objectives that have been set. While strong and effective national plans will reflect local circumstances and priorities, there are many elements that are common across countries to be considered. Indeed, one of the marks of an effective performance-monitoring regime is the extent to which the key performance indicators adopted allow international comparisons to be made. This chapter therefore includes a brief review of the principles of performance monitoring and looks at the increasingly broad scope of broadband plans before moving on to examine how the implementation of broadband plans and strategies can be monitored.
The main theme of the chapter is that monitoring needs to be a fully integrated part of broadband plans and strategies. Monitoring can provide an information base for the initial development of plans and strategies, allow policy-makers to check the progress of particular policies and programs, and provide
the information necessary to evaluate the effectiveness of particular strategies (or the need for changes) and reassess priorities and goals. Within practical limits, monitoring should provide information on all aspects of the broadband market/ecosystem, which can be difficult given that the scope of many national broadband plans is very wide.
This chapter reviews the issues around the monitoring of broadband plans as policy-makers’ focus moves from:
• initial deployment to make broadband networks and access available;
• through projects and programs to encourage the adoption and take-up of broadband;
• to integration of broadband as a core element in the digital economy.
As this process occurs, performance monitoring helps to ensure that targets, costs, benefits and outcomes of projects and policies are measured and programs are well managed. This chapter therefore supplements the discussion of issues connected with monitoring the implementation of national broadband plans with examples of good practices.
7.1.1 Performance monitoring - a brief primerThe overall vision for a broadband-enabled society and economy may be supported by a number of strategies to develop broadband infrastructure and to build human capacity. Common objectives are to extend networks to unserved areas, expand competition, improve the pricing and affordability of services, build capacity and improve digital literacy to support the overall adoption and use of broadband services. Each of these objectives may be pursued through a number of programs. Performance indicators will be required to measure progress against starting points, completion of key component elements and the ultimate achievement of targets and goals.
Author: Colin Oliver, Senior ICT Expert1
185Trends in Telecommunication Reform 2015
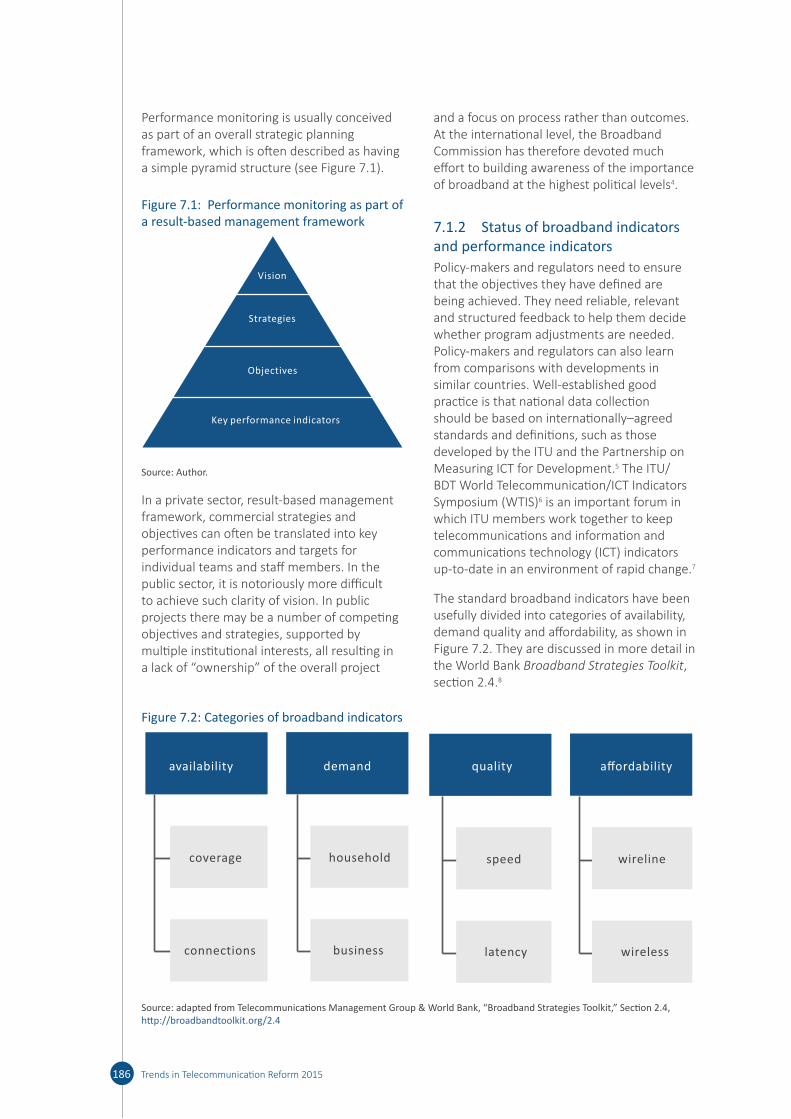
Performance monitoring is usually conceived as part of an overall strategic planning framework, which is often described as having a simple pyramid structure (see Figure 7.1).
Figure 7.1: Performance monitoring as part of a result-based management framework
Vision
Strategies
Key performance indicators
Objectives
Source: Author.
In a private sector, result-based management framework, commercial strategies and objectives can often be translated into key performance indicators and targets for individual teams and staff members. In the public sector, it is notoriously more difficult to achieve such clarity of vision. In public projects there may be a number of competing objectives and strategies, supported by multiple institutional interests, all resulting in a lack of “ownership” of the overall project
and a focus on process rather than outcomes. At the international level, the Broadband Commission has therefore devoted much effort to building awareness of the importance of broadband at the highest political levels4.
7.1.2 Status of broadband indicators and performance indicatorsPolicy-makers and regulators need to ensure that the objectives they have defined are being achieved. They need reliable, relevant and structured feedback to help them decide whether program adjustments are needed. Policy-makers and regulators can also learn from comparisons with developments in similar countries. Well-established good practice is that national data collection should be based on internationally–agreed standards and definitions, such as those developed by the ITU and the Partnership on Measuring ICT for Development.5 The ITU/BDT World Telecommunication/ICT Indicators Symposium (WTIS)6 is an important forum in which ITU members work together to keep telecommunications and information and communications technology (ICT) indicators up-to-date in an environment of rapid change.7
The standard broadband indicators have been usefully divided into categories of availability, demand quality and affordability, as shown in Figure 7.2. They are discussed in more detail in the World Bank Broadband Strategies Toolkit, section 2.4.8
186 Trends in Telecommunication Reform 2015
Figure 7.2: Categories of broadband indicators
availability
coverage
connections
demand
household
business
quality
speed
latency
a? ordability
wireline
wireless
Source: adapted from Telecommunications Management Group & World Bank, “Broadband Strategies Toolkit,” Section 2.4, http:// broadbandtoolkit. org/ 2. 4

The most useful indicators may also be converted into targets. Measureable targets focused on high-priority needs and objectives enable progress to be assessed objectively. Given the pace of change in the broadband environment, it is widely agreed that targets should look ahead approximately three to five years, and that they should be reviewed regularly to remain both ambitious and realistic. This does not exclude a longer-term vision. Egypt is an example where targets are set for availability, penetration and community access, and are expressed as both short and long-term (2015 and 2021) for both fixed and mobile services.9
There are actually many different kinds of indicators. As well as the standard telecommunications and broadband indicators, other key performance indicators (KPIs)10 can be used to monitor progress, identify problems, measure costs and benefits and facilitate decisions on any re-direction that may be required in the broadband plan.
• Quantitative indicators are presented as a number: examples being customer numbers, traffic volumes, investment totals, and average repair times.
• Qualitative indicators may not be expressed as a number, but rather as positive or negative, complete or incomplete, high or low. Examples include measures of customer satisfaction, industry competitiveness, ICT readiness, skill levels, program implementation (in some cases formulas and coding of qualitative information may be applied to express these also as numbers).
Telecommunications indicators, for example, provide well-established measures of “deployment” or “availability” of services (for coverage, connections etc.), but measures of “adoption and effective use” are still being developed. The OECD proposes to include in future work more detailed measures of the adoption and use of the Internet by households and businesses, paying more attention to the intensity of use, and exploring concepts of technology engagement and technology dependency.11 The notion of “dependency” aligns closely with the Japanese concept of “indispensability” when applied
to online services – a condition where access to the broadband Internet becomes fully integrated into people’s lives in a way that makes connectivity a necessity for social and economic life. Such measures usually rely on contracted research and surveys rather than statistical reports from operators, and often include broader considerations such as the utility of ICTs in achieving social and economic goals.
Not all indicators are equally useful, however. As policy-makers develop their overall plans, they also need to consider what information they need/want to collect in order to measure progress.
Ideally, a broadband plan or strategy should incorporate a manageable number of indicators that:
• relate to high-level goals; • are practical to collect; • are consistent across countries as far as
possible; and • reveal the extent of progress toward the
achievement of measurable targets.
7.2 Coordination and oversight: the monitoring framework
Every country with a broadband plan has its own unique set of social and economic conditions, and its own particular baseline for the development of broadband infrastructure and services. The monitoring framework must account for those conditions, while also providing timely and useful information across the various stages of broadband development. Logically, the work of monitoring broadband development begins with the initial survey of relevant conditions and priorities, considering overall national priorities, the economic and social environment, the unique geographical and other circumstances of the country, and the level of broadband awareness among key stakeholders, government agencies, business and community leaders and the public at large.
The Broadband Commission has recommended that priority be given to supporting accurate and timely statistical monitoring because reliable data and
187Trends in Telecommunication Reform 2015
Chapter 7

indicators are essential for three broad purposes:
1 Making informed policy choices. 2 Assessing the impact of broadband
policies and tracking progress toward goals and targets.
3 Monitoring development of broadband infrastructure, access, prices, affordability and usage by individuals, businesses, governments, schools and hospitals.12
The structure and approach adopted in this chapter largely mirrors these three purposes as illustrated in Table 7.1. The focus will be on strategy development, monitoring program management, tracking progress toward goals and targets, and the evaluation of outcomes.
Of course, all the information sources that are important at the strategy development stage, including broad consultation, continue to be vitally important as the plans and policies are implemented.
As Figure 7.3 indicates, monitoring should be an integral part of broadband plans from the outset in order to provide timely feedback on implementation and ultimately to support the evaluation of progress and refinement of strategies and objectives. Measurement and management go together: managers need accurate and up-to-date information to enable them to manage their programs effectively, so strategies should be framed with implementation and monitoring in mind.
188 Trends in Telecommunication Reform 2015
Table 7.1: Overview of key areas in a monitoring framework
Area Responsibility Key areas Information sources
Strategy development:
Making good policy choices.
Policy & coordinating
agencies with the regulator
Local circumstances
National priorities
State of the market –demand & supply
Business case for investment
Human capacity
Broad consultation
Industry, regulator
Economic, financial & social statistics
International experience & data
Program management:
Tracking progress of projects and
programs toward goals & targets.
Regulator & implementing
agencies
Performance Indicators
Costs & benefits
Project/program results for broadband access,
improvements in capability and efficiency
Regulator
Market players
Business users
Program participants
Community leaders
Policy Evaluation:
Monitoring development of
broadband access infrastructure, prices,
affordability and usage.
Regulator, coordinating
agencies, & national statistical offices
Outcomes
Penetration & access
Investment, competition & market effectiveness
Adoption and effective use
Innovation
Economic impacts
Regulator Statistical agencies
Industry reports
Social agencies (education, health etc.)
Source: Author, adapted from Broadband Commission, ”The State of Broadband 2013” (Sept 2013), pp. 78-84, http:// www. broadbandcommission. org/ documents/ bb- annualreport2013. pdf
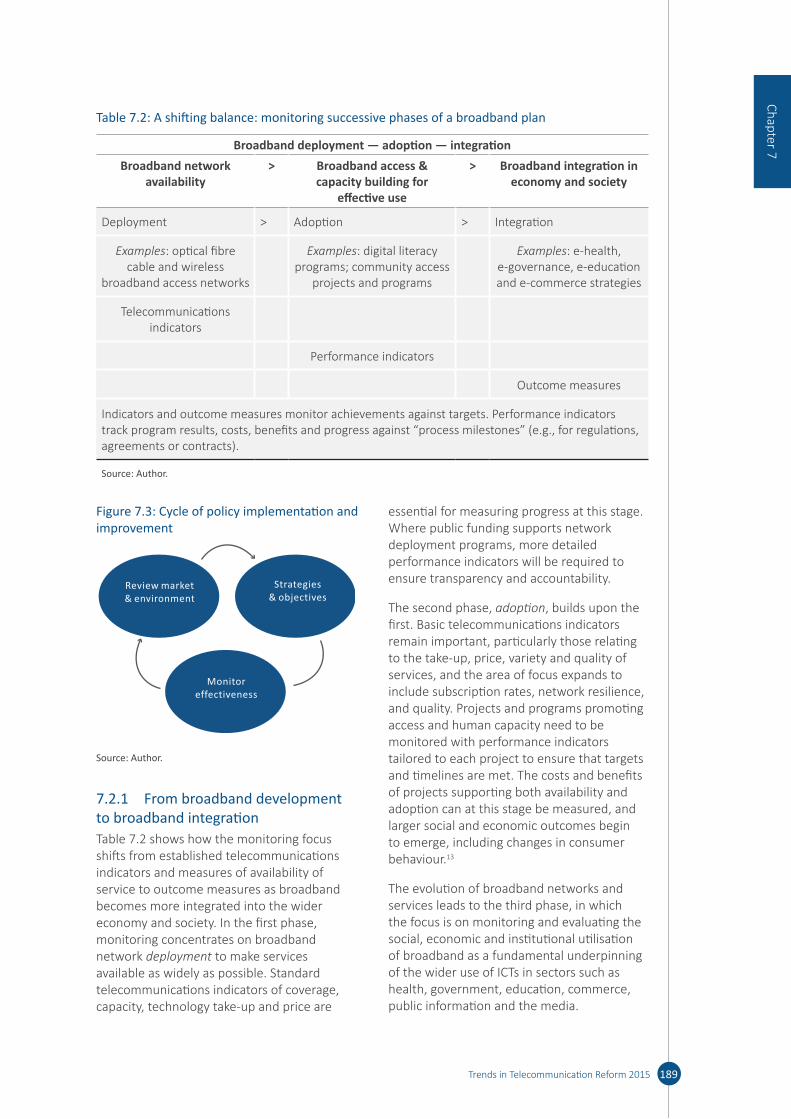
Figure 7.3: Cycle of policy implementation and improvement
Review market& environment
Strategies& objectives
Monitoreffectiveness
Source: Author.
7.2.1 From broadband development to broadband integrationTable 7.2 shows how the monitoring focus shifts from established telecommunications indicators and measures of availability of service to outcome measures as broadband becomes more integrated into the wider economy and society. In the first phase, monitoring concentrates on broadband network deployment to make services available as widely as possible. Standard telecommunications indicators of coverage, capacity, technology take-up and price are
essential for measuring progress at this stage. Where public funding supports network deployment programs, more detailed performance indicators will be required to ensure transparency and accountability.
The second phase, adoption, builds upon the first. Basic telecommunications indicators remain important, particularly those relating to the take-up, price, variety and quality of services, and the area of focus expands to include subscription rates, network resilience, and quality. Projects and programs promoting access and human capacity need to be monitored with performance indicators tailored to each project to ensure that targets and timelines are met. The costs and benefits of projects supporting both availability and adoption can at this stage be measured, and larger social and economic outcomes begin to emerge, including changes in consumer behaviour.13
The evolution of broadband networks and services leads to the third phase, in which the focus is on monitoring and evaluating the social, economic and institutional utilisation of broadband as a fundamental underpinning of the wider use of ICTs in sectors such as health, government, education, commerce, public information and the media.
189Trends in Telecommunication Reform 2015
Chapter 7
Table 7.2: A shifting balance: monitoring successive phases of a broadband plan
Broadband deployment — adoption — integrationBroadband network
availability> Broadband access &
capacity building for effective use
> Broadband integration in economy and society
Deployment > Adoption > Integration
Examples: optical fibre cable and wireless
broadband access networks
Examples: digital literacy programs; community access
projects and programs
Examples: e-health, e-governance, e-education and e-commerce strategies
Telecommunications indicators
Performance indicators
Outcome measures
Indicators and outcome measures monitor achievements against targets. Performance indicators track program results, costs, benefits and progress against “process milestones” (e.g., for regulations, agreements or contracts).
Source: Author.
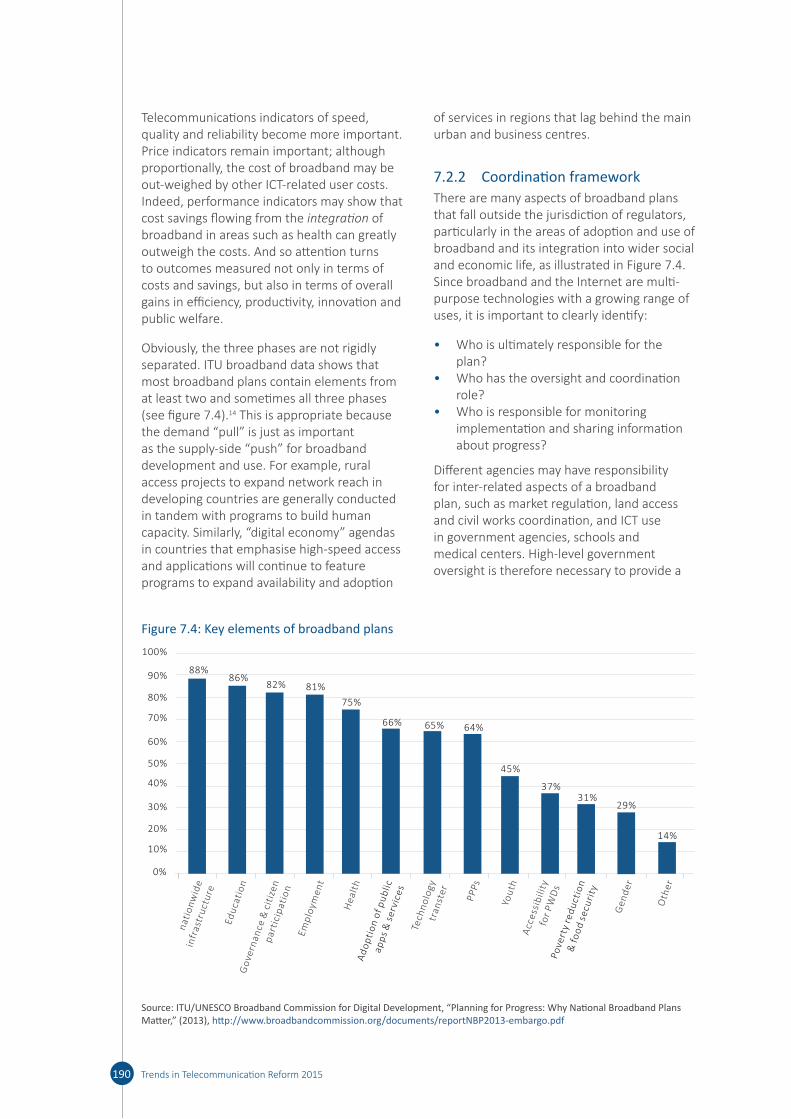
Telecommunications indicators of speed, quality and reliability become more important. Price indicators remain important; although proportionally, the cost of broadband may be out-weighed by other ICT-related user costs. Indeed, performance indicators may show that cost savings flowing from the integration of broadband in areas such as health can greatly outweigh the costs. And so attention turns to outcomes measured not only in terms of costs and savings, but also in terms of overall gains in efficiency, productivity, innovation and public welfare.
Obviously, the three phases are not rigidly separated. ITU broadband data shows that most broadband plans contain elements from at least two and sometimes all three phases (see figure 7.4).14 This is appropriate because the demand “pull” is just as important as the supply-side “push” for broadband development and use. For example, rural access projects to expand network reach in developing countries are generally conducted in tandem with programs to build human capacity. Similarly, “digital economy” agendas in countries that emphasise high-speed access and applications will continue to feature programs to expand availability and adoption
of services in regions that lag behind the main urban and business centres.
7.2.2 Coordination frameworkThere are many aspects of broadband plans that fall outside the jurisdiction of regulators, particularly in the areas of adoption and use of broadband and its integration into wider social and economic life, as illustrated in Figure 7.4. Since broadband and the Internet are multi-purpose technologies with a growing range of uses, it is important to clearly identify:
• Who is ultimately responsible for the plan?
• Who has the oversight and coordination role?
• Who is responsible for monitoring implementation and sharing information about progress?
Different agencies may have responsibility for inter-related aspects of a broadband plan, such as market regulation, land access and civil works coordination, and ICT use in government agencies, schools and medical centers. High-level government oversight is therefore necessary to provide a
190 Trends in Telecommunication Reform 2015
Figure 7.4: Key elements of broadband plans
0%
100%
90%
80%
70%
60%
50%
40%
30%
20%
10%
nat
ion
wid
e in
fras
tru
ctu
re
Edu
cati
on
Go
vern
ance
& c
itiz
en
par
tici
pat
ion
Em
plo
yme
nt
He
alth
Ad
op
tio
n o
f pu
blic
ap
ps
& s
erv
ice
s
Tech
no
logy
tr
anst
er
PP
Ps
You
thA
cce
ssib
ility
fo
r P
WD
sPo
vert
y re
du
ctio
n &
fo
od
secu
rity
Ge
nd
er
Oth
er
86%88%
82% 81%
75%
66% 65%
45%
37%31%
29%
14%
64%
Source: ITU/UNESCO Broadband Commission for Digital Development, “Planning for Progress: Why National Broadband Plans Matter,” (2013), http:// www. broadbandcommission. org/ documents/ reportNBP2013- embargo. pdf
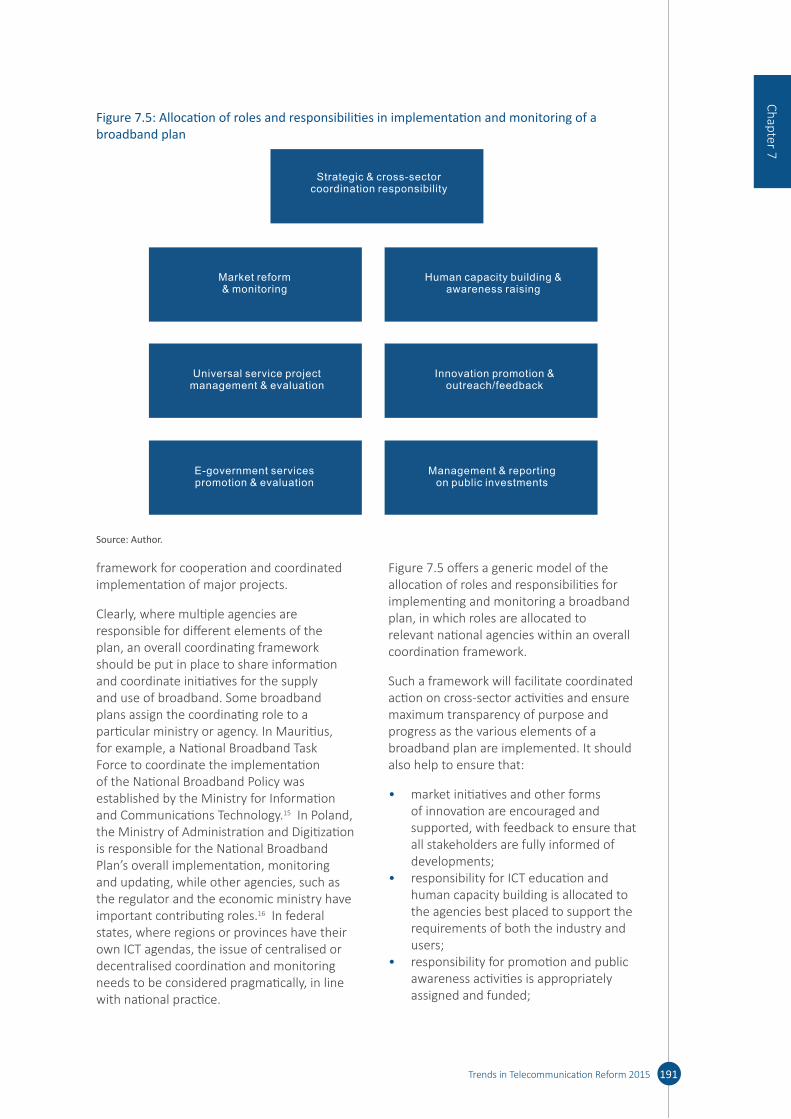
framework for cooperation and coordinated implementation of major projects.
Clearly, where multiple agencies are responsible for different elements of the plan, an overall coordinating framework should be put in place to share information and coordinate initiatives for the supply and use of broadband. Some broadband plans assign the coordinating role to a particular ministry or agency. In Mauritius, for example, a National Broadband Task Force to coordinate the implementation of the National Broadband Policy was established by the Ministry for Information and Communications Technology.15 In Poland, the Ministry of Administration and Digitization is responsible for the National Broadband Plan’s overall implementation, monitoring and updating, while other agencies, such as the regulator and the economic ministry have important contributing roles.16 In federal states, where regions or provinces have their own ICT agendas, the issue of centralised or decentralised coordination and monitoring needs to be considered pragmatically, in line with national practice.
Figure 7.5 offers a generic model of the allocation of roles and responsibilities for implementing and monitoring a broadband plan, in which roles are allocated to relevant national agencies within an overall coordination framework.
Such a framework will facilitate coordinated action on cross-sector activities and ensure maximum transparency of purpose and progress as the various elements of a broadband plan are implemented. It should also help to ensure that:
• market initiatives and other forms of innovation are encouraged and supported, with feedback to ensure that all stakeholders are fully informed of developments;
• responsibility for ICT education and human capacity building is allocated to the agencies best placed to support the requirements of both the industry and users;
• responsibility for promotion and public awareness activities is appropriately assigned and funded;
191Trends in Telecommunication Reform 2015
Chapter 7
Figure 7.5: Allocation of roles and responsibilities in implementation and monitoring of a broadband plan
Market reform & monitoring
Strategic & cross-sectorcoordination responsibility
Human capacity building & awareness raising
Innovation promotion &outreach/feedback
Universal service projectmanagement & evaluation
Management & reporting on public investments
E-government servicespromotion & evaluation
Source: Author.

• information on complementary programs is shared and published; and
• regulatory matters are handled in such a way as to support the overall broadband agenda.
7.3 Measuring and managing the implementation of broadband plans
Regulators have a central role to play in monitoring the implementation of broadband plans. Even where responsibility is shared with other agencies, the regulator may play a number of key roles as:
• the leading agency on telecommunication regulatory matters;
• the repository of industry statistics and publisher of key indicators; and
• a leading source of expert advice on technical, industry and consumer issues.
Depending on national arrangements, the regulator may also have an implementing or contributing role in areas including:
• spectrum allocation for wireless broadband services;
• administration of universal service funds; • industry promotion and development; • regulating competition and investment in
the supply and use of broadband services; • civil works coordination in support of
broadband infrastructure; and • ICT and media regulation more broadly.
While there may be differences in national arrangements, it is important that regulatory agencies play a lead role as independent providers of information about the development of the broadband environment, and the growth of broadband access and adoption. They will also likely have a lead role to play as thought leaders and broadband champions since they will generally be the best-informed agency on broadband issues.
7.3.1 Are key elements of an enabling framework in place? A checklistThe first step in developing a comprehensive broadband strategy is to ensure that an enabling environment to support broadband deployment is in place. Where the key
elements are not yet present, it may be necessary to monitor their development through to completion, so that all the essential building blocks will be in place. The Annex provides a checklist of items that may be included in such a monitoring plan. Because each country is unique, the following general discussion of the elements that should be monitored in an enabling framework may or may not be relevant to a particular country, and will depend on the extent to which a broadband plan and policies have been developed and implemented.
Regulatory scope optimizedThe development of broadband networks and services brings many challenges, including the convergence of previously separate communications services, and the regulator’s mandate may need to be adjusted or expanded to deal with issues including convergence, competition, consumer issues and spectrum reform, if it is to perform an enabling role in implementing broadband plans.
Regulatory capacity enhancedSimilarly, the regulator will need staff with the skills and knowledge to carry out its role. Ongoing staff development and enlistment of expertise will be required to deal with the challenges of implementing broadband strategies and plans. The “Connecting Africa Report 2013” reviewed connectivity, universal access policies, regulatory frameworks, ICT skills and e-applications, and found that broadband was the “single most critical element stimulating growth.”17 It found that much had been achieved in terms of connecting major cities and towns, and that village-level mobile and wireless access had improved, but that skills development remained a broad concern, and that “capacity building in key economic and technical regulatory aspects such as licensing, universal access, frequency management, numbering, interconnection, data management, digital migration and cyber-security is essential.”18
Broadband plan in placeThere remain some countries where no formal broadband plan or strategy is in place. In such cases, the progress of policy development, including consultation, information gathering
192 Trends in Telecommunication Reform 2015

and preparation of draft proposals, may need to be pushed from high levels.19
Spectrum reform for optimizing the provision of wireless broadband accessSpectrum reform and the supply of spectrum for wireless broadband access are pressing issues in many developing countries. Finding solutions to these problems are critical because wireless offers the fastest and cheapest way to provide service to remote, rural and highland areas, and it offers the benefits of strong synergies between basic voice and data-intensive broadband services.
Spectrum supply problems sometimes arise from cumbersome historic arrangements that can only be overcome by institutional reforms. Otherwise, the allocation of spectrum for wireless broadband access can be delayed.20 Access to spectrum will be a vital element in the business plans of potential broadband wireless access network operators. Investment in wireless broadband networks, therefore, needs to be supported by a clear timetable for the provision of the necessary radio frequencies, and by transparent monitoring of progress in clearing the relevant spectrum where that is required.
Simplified licensing to facilitate broadband service The rigidities that characterized most traditional licensing regimes can also hold back broadband development. For that reason, many regulatory authorities have been moving to simplifying licensing arrangements, both to unify previously separate licences and to remove unnecessary technological restrictions. Unified and technology-neutral licences give licence holders the ability to modernise and extend their services without unnecessary regulatory constraints or excessive fees. Introduction of a broadband plan can provide an opportunity to include licensing reforms in the overall implementation plan.
Telecommunications indicators systematically reportedAs discussed above, monitoring the development of broadband infrastructure development will be a critical part of any broadband plan. Basic telecommunications indicators, including the number and type
of services offered, subscriber numbers and traffic volumes by technology and service type, remain an essential tool for policy-makers, regulators and industry in developing and monitoring their broadband business plans and policies.
Civil works facilitatedA high proportion of the cost of network construction arises from civil works. To reduce costs, delays and inconvenience, major infrastructure rollouts require clear protocols to be in place with local governments and agencies responsible for roads, railways and energy supplies. This is an area in which process milestones are useful – not just achievement targets – since it involves a number of stakeholders cooperating, identification of specific obstacles, development of collaborative processes and potentially changes to regulatory arrangements to protect the interests of both network builders and property owners. Some examples will be discussed in following sections.
Infrastructure sharing promoted The high cost of civil works and passive infrastructure relative to the overall investment in broadband also means that infrastructure sharing should be promoted in order to reduce the overall deployment cost and level of investment. Barriers should not be placed in the way of commercial arrangements for infrastructure sharing, and there will be cases where regulatory action is required to ensure that competitors have access to bottleneck facilities. Infrastructure sharing may also extend beyond telecommunication networks; there can be strong synergies with energy utilities, for example, both in extending access to rural and remote areas and also reducing network rollout costs in built-up areas. The European Commission estimates that new measures to reduce the costs of deploying infrastructure (including sharing of passive infrastructure, transparency and coordination of civil works, streamlined permit granting procedures and more buildings ready for high speed network access) could reduce investment costs by 20-30 per cent.21
There may also be scope for cooperation in sharing of backbone facilities. Competing
193Trends in Telecommunication Reform 2015
Chapter 7

operators often prefer to maintain independent backbone networks, but regulatory agencies may facilitate cooperation in sharing of passive facilities and the construction of shared backbones where that is the most cost-effective way of extending the reach of broadband networks into unserved areas.
Gateway access openedInternational connectivity and gateway access is essential for broadband network operators. Regulatory agencies may need to take steps to facilitate open access arrangements on commercial terms, and, where necessary, to ensure diversity of access and protection of essential facilities.
The summary checklist in the Annex includes items that may need to be monitored in the implementation of a broadband plan. Not all the elements in this list are essential in every country, but the relevant elements should form part of the checklist of measures to be monitored for effective implementation of a broadband plan. Many of these elements can be monitored in a simple “traffic light” report, which can be maintained by the regulator or coordinating agency and published online, indicating the status of key actions and initiatives. Progress can be expressed in terms of whether consultation has begun, reports completed, regulations changed etc. Figure 7.6 provides an extract from the online report produced by the State of Victoria22 on the progress of its ICT strategy to illustrate how this can be done.
The European Commission and the Federal Communications Commission in the United States similarly maintain information about progress of their digital agendas and broadband plans on their Digital Agenda for Europe and Broadband.gov websites, with checklists marking progress in the work schedule.23
Ease of doing business promotedBroadband cannot be considered in isolation from the wider economy. Investors in broadband, as in any other sector, will be
concerned about the general conditions for doing business. The International Finance Corporation and The World Bank maintain an online database24 to monitor issues that affect the prospects for investment, reporting on a range of areas including:
• Starting a Business• Dealing with Construction Permits• Getting Electricity• Registering Property• Getting Credit• Protecting Investors• Paying Taxes• Trading Across Borders• Enforcing Contracts• Resolving Insolvency
Problems in any one of these areas can be a serious impediment to broadband investment. In some countries, the development of the telecommunications sector has required a more advanced legal and logistical framework than existed in the economy at large. For example, if construction permits are unduly difficult to obtain, the facilitation of civil works in telecommunication networks may require special arrangements to overcome those difficulties. In some countries, therefore, these essential investment conditions may also need to be referenced when monitoring the implementation of a broadband plan.
194 Trends in Telecommunication Reform 2015
Figure 7.6: Extract from an online status report: Digital Victoria
StatusBy
7. Commence implementation of an identity management capability for citizens wanting to use online channels to engage with government
Engagement Actions
8. Agencies commence transition of key service online
9. Agencies complete transition of frequent transaction services online
10. Continue to implement website management standards
March 2014
April 2014
December 2014
Ongoing
Complete
Planning underway
Commenced and ongoing
Plan Consult Identify Implement Released
Source: http:// www. digital. vic. gov. au/ status/ (as at 12 November 2013)

7.3.2 Monitoring broadband network deployment, availability and adoptionTable 7.3 outlines some of the key categories and characteristics to be considered in broadband infrastructure development for both fixed and wireless networks. It identifies some of the issues to be considered and monitored as broadband networks expand from profitable business centers and trunk routes into wider urban areas and out to rural and remote populations where the business proposition for commercial coverage may be difficult to establish and maintain. The deployment and adoption of broadband may need to be measured separately for each market segment.
Standardised broadband indicators are available for almost all countries, and regular updating and publication by the collecting authority makes it possible to track progress. The Nepal Telecommunications Authority’s regular reporting, for example, includes information on Internet access services provided by each operator, as well as providing
a breakdown of different technologies and the number of subscribers.25
The Polish regulator, the Office of Electronic Communications (UKE) annually updates its inventory of telecommunications infrastructure and public telecommunication networks that support broadband Internet access, including fibre and wireless networks as well as buildings that support collocation of facilities. The scope of data gathering, the electronic form of its submission and the map presentation format of the data are defined in an ordinance. UKE also publishes a report on coverage of the territory of Poland by telecommunications infrastructure, including cable and wireless networks and penetration of cable connections or wireless terminals in buildings.26
UKE has also collected details of the current condition of the infrastructure and information on investment projects including fibre optic network terminations, telecommunication network nodes, and access nodes. This
195Trends in Telecommunication Reform 2015
Chapter 7
Table 7.3: Broadband construction overview and prospects for return on investment (ROI)*
Fixed network Wireless network
Incumbent New entrant Incumbent New entrant
Backbone / trunk routes
Fibre network construction as part
of a capital equipment enhancement and
replacement program:
commercial ROI
New infrastructure requires access & interconnection
to achieve a commercial ROI
Re-use of existing passive
infrastructure: commercial
ROI
New infrastructure
requires access & interconnection: commercial ROI
Central business districts
Urban areas (small business & homes) – “brownfields”
Copper enhanced or replaced with fibre:
longer-term ROI
Unbundled access generally required
to achieve a commercial ROI:
new infrastructure construction
may provide a commercial ROI in
some cases
New estates – “greenfields”
New capital investment in fibre:
low maintenance cost: commercial ROI
New infrastructure: commercial ROI
Rural and remote areas
High cost and slow/negative ROI
New wireless infrastructure may be dominant over limited/declining/absent
fixed line access
New infrastructure required: possible universal service fund
(USF) support: slow ROI
Source: Author. * Note: “commercial” or “slow” ROI are relative terms. In different countries and conditions, the rate of return on investment may vary widely. In small island states, for example, the cost of international connectivity may bring additional challenges.

information is held in a dedicated database called the Information System about Broadband Infrastructure (System Informacji o Infrastrukturze Szerokopasmowej, SIIS).
Detailed information is presented in the form of tables, charts and maps at the Polish province level (with information at the commune level).27 This information makes it possible to perform a detailed assessment of the condition of broadband infrastructure and to identify specific, long-term development targets at the local level. The data is also used to estimate the level of necessary investment (a key item in the National Broadband Plan). Telecommunication companies and local government units, with the support of UKE, can use the data to help them in making effective investments in the infrastructure and in long-term planning of telecommunication infrastructure development. It particularly helps local governments and other local agencies in their decisions on investment projects financed with public assistance, and consumers can use it as a tool to help them select the most attractive telecommunications
technologies and the most competitive market offers.
Other countries that make interactive maps available to consumers include Australia, Canada, Germany, Ireland, New Zealand, the United Kingdom, and the United States, where a number of cities and states also provide broadband maps.28 At the international level, ITU is currently mapping the deployment of backbone transmission capacity (both fibre and microwave) to enable governments to track and measure progress made in achieving their broadband infrastructure development goals (see Figure 7.7). The map has capability to zoom from global to regional and local levels.29
In the United Kingdom, reports from the regulator Ofcom make comparisons with peer countries in Europe on measures of coverage, take-up, usage, price and choice.30 In the United States, the FCC is required to include information comparing the extent of broadband service capability (including
196 Trends in Telecommunication Reform 2015
Figure 7.7: ITU’s backbone transmission map – with an example of interactive regional mapping capability
Source: ITU, Telegeography, www. itu. int/ itu- d/ map- public/
NOTE: Data collection for this map is a work in progress.

data transmission speeds and the price for broadband access) with 75 communities in at least 25 countries for each of the speed benchmarks it uses to reflect different speed tiers.31 Most countries rely on ITU, OECD and other regional organisations to provide comparative information of this kind.
Monitoring the progress of a broadband plan is of most value when the information is shared. New Zealand and the United States both make a great deal of information available through the Internet, although they approach the task in different ways. New Zealand publishes regularly updated information online about the progress of its Ultra-fast Broadband Initiative, the Rural Broadband Initiative and the connection of schools and rural hospitals. The report of 30 June 2013 (see Figure 7.8) can be considered as a model of concise reporting.
The United States’ National Broadband Plan: Connecting America33 provides a framework for expanding broadband connectivity, adoption and utilisation across the nation. The Plan put forward an initial universal service goal for broadband access at 4 Mbps of actual download speed and 1 Mbps of actual upload speed by 2020, estimating that in 2009 this level of access was already available to 95% of the population, largely as a result of private sector investment. The availability gap was greatest in areas with low population density where the business case for broadband networks was unattractive.
The importance of monitoring broadband progress is underlined by the legislative requirement for the FCC to initiate an annual notice of inquiry “concerning the availability of advanced telecommunications capability to all Americans (including, in particular, elementary and secondary schools and classrooms).”34 In conducting this inquiry, the Commission must “determine whether advanced telecommunications capability is being deployed to all Americans in a reasonable and timely fashion.” It must also provide demographic information for unserved areas. If the Commission finds that broadband is not being deployed to all Americans in a reasonable and timely fashion, the Commission is required to take immediate action to accelerate broadband deployment
by removing barriers to infrastructure investment and by promoting competition in the telecommunications market.35 Box 7.1 discusses the findings from the FCC’s 2012 Broadband Progress Report.
Future Broadband Progress Reports will continue to provide updated information on these issues – both in terms of the expansion of broadband availability and adoption, and the progress of measures required to deal with the various barriers that have been identified.
It is also important to reflect that while it is true that broadband indicators of availability are well established, many countries have adopted innovative ways to expand and apply this information:
• some provide greater detail and depth of information, even down to the local community level;
• some publish this information online to assist both users and suppliers in decision-making;
• some engage in regular reviews of progress, focussing particular attention on the identification of barriers and ways to overcome them; and
• in the case of countries where wholesale access is being rolled out in a vertically separated way (see section 3.2.1), new approaches have been adopted to set requirements and hold the responsible body to account for the achievement of its targets and obligations.
Monitoring competition and wholesale access While basic enabling measures can be reduced to a checklist, and standardised telecommunications indicators will measure broadband availability, monitoring the development of a competitive broadband market is important for those countries that rely on market forces to achieve widespread and affordable broadband access. This requires information on the extent of infrastructure facilities-baseband service-level competition, and the interactive maps mentioned earlier can provide a useful input for monitoring the development of competition.
In Europe, there is reporting on service as well as infrastructure-based competition,
197Trends in Telecommunication Reform 2015
Chapter 7

198 Trends in Telecommunication Reform 2015
Figure 7.8: New Zealand: Broadband deployment update as at 30 June 201332
Source: Ministry of Business, Innovation and Employment: Broadband Deployment Update, http:// www. med. govt. nz/ sectors- industries/ technology- communication/ fast- broadband/ pdf- and- documents- library/ ultra- fast- broadband- intiative/ quarterly- report- april- june- 2013. pdf.
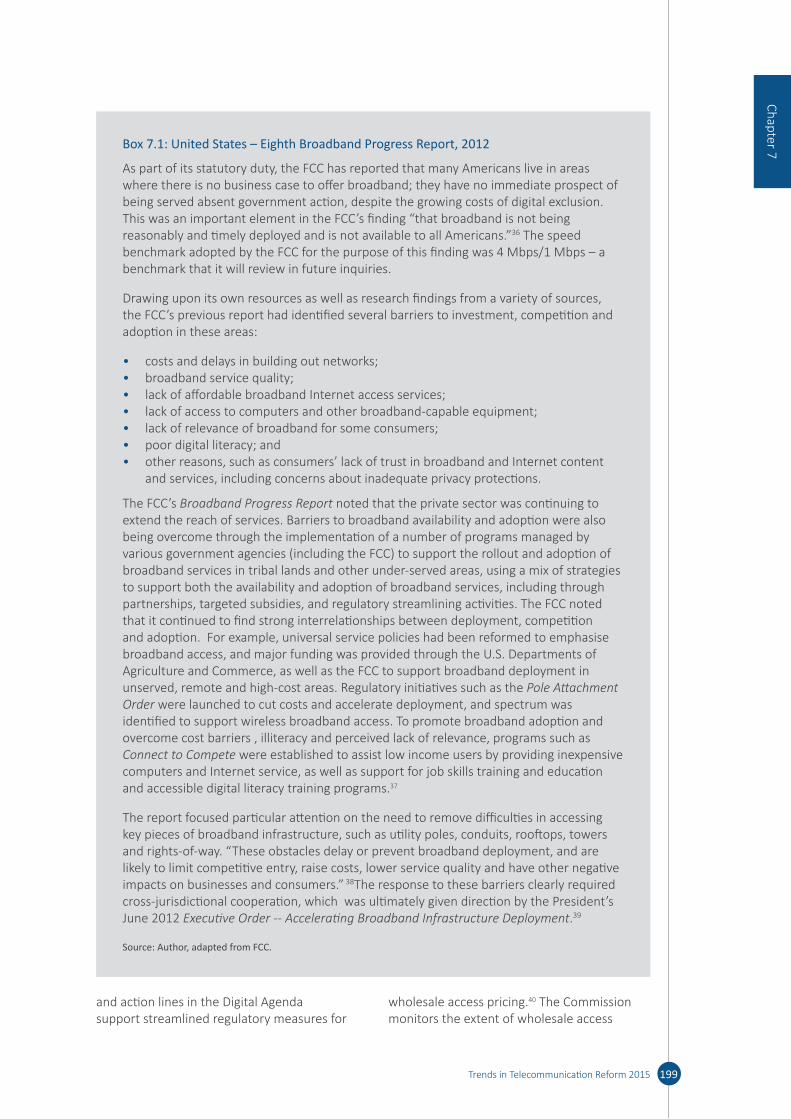
and action lines in the Digital Agenda support streamlined regulatory measures for
wholesale access pricing.40 The Commission monitors the extent of wholesale access
199Trends in Telecommunication Reform 2015
Chapter 7Box 7.1: United States – Eighth Broadband Progress Report, 2012
As part of its statutory duty, the FCC has reported that many Americans live in areas where there is no business case to offer broadband; they have no immediate prospect of being served absent government action, despite the growing costs of digital exclusion. This was an important element in the FCC’s finding “that broadband is not being reasonably and timely deployed and is not available to all Americans.”36 The speed benchmark adopted by the FCC for the purpose of this finding was 4 Mbps/1 Mbps – a benchmark that it will review in future inquiries.
Drawing upon its own resources as well as research findings from a variety of sources, the FCC’s previous report had identified several barriers to investment, competition and adoption in these areas:
• costs and delays in building out networks; • broadband service quality; • lack of affordable broadband Internet access services; • lack of access to computers and other broadband-capable equipment; • lack of relevance of broadband for some consumers; • poor digital literacy; and • other reasons, such as consumers’ lack of trust in broadband and Internet content
and services, including concerns about inadequate privacy protections.
The FCC’s Broadband Progress Report noted that the private sector was continuing to extend the reach of services. Barriers to broadband availability and adoption were also being overcome through the implementation of a number of programs managed by various government agencies (including the FCC) to support the rollout and adoption of broadband services in tribal lands and other under-served areas, using a mix of strategies to support both the availability and adoption of broadband services, including through partnerships, targeted subsidies, and regulatory streamlining activities. The FCC noted that it continued to find strong interrelationships between deployment, competition and adoption. For example, universal service policies had been reformed to emphasise broadband access, and major funding was provided through the U.S. Departments of Agriculture and Commerce, as well as the FCC to support broadband deployment in unserved, remote and high-cost areas. Regulatory initiatives such as the Pole Attachment Order were launched to cut costs and accelerate deployment, and spectrum was identified to support wireless broadband access. To promote broadband adoption and overcome cost barriers , illiteracy and perceived lack of relevance, programs such as Connect to Compete were established to assist low income users by providing inexpensive computers and Internet service, as well as support for job skills training and education and accessible digital literacy training programs.37
The report focused particular attention on the need to remove difficulties in accessing key pieces of broadband infrastructure, such as utility poles, conduits, rooftops, towers and rights-of-way. “These obstacles delay or prevent broadband deployment, and are likely to limit competitive entry, raise costs, lower service quality and have other negative impacts on businesses and consumers.” 38The response to these barriers clearly required cross-jurisdictional cooperation, which was ultimately given direction by the President’s June 2012 Executive Order -- Accelerating Broadband Infrastructure Deployment.39
Source: Author, adapted from FCC.

from incumbents in terms of activated main lines, whether shared or fully unbundled lines, bitstream access or simple resale. This information is obtained from national regulators and is published online.41
Figure 7.9 provides a breakdown of the competitive availability of broadband in the United States based upon information provided by State Broadband Initiative grantees42 and incorporated in the National Broadband Map.43 While figure 7.9 provides an indication of the extent of competition at the national level, the interactive features of the National Broadband Map enable users to obtain similar information also at state and local levels, identifying local broadband providers.
Wholesale information is also important in those cases where vertically separated models have been adopted for broadband provision. Two broad approaches to vertical separation can be distinguished:
• separation of wholesale and retail services by an existing incumbent (e.g., the United Kingdom and New Zealand creating Openreach and Chorus, respectively), and
• creation of a new entity to supply basic infrastructure on a wholesale basis (e.g., Australia and Singapore).
Although the United Kingdom and Singapore represent the first and second approaches respectively, they appear to be converging in their approach to monitoring the performance of the wholesale service provider and the achievement of rollout targets.
• In the United Kingdom, since the beginning of 2013, Openreach has committed to new contractual targets for services, leading to automatic payments to other telecommunication companies where it misses those targets. Ofcom has also proposed new performance standards for Openreach, with targets to be met in full from April 2016. Intermediate targets are also proposed to ensure progressive improvements in service. The Openreach website provides information on where and when superfast broadband is becoming available.45
• In Singapore OpenNet is the wholesale provider of Singapore’s National
Broadband Network (NBN). OpenNet’s universal service obligation (USO) requires it to provide optical fibre services to any location in Singapore at the request of a telecommunications or broadcast licensee. Operating companies and retail service providers rely on OpenNet’s NBN to deliver services to consumers and businesses and OpenNet provides information about the availability of broadband service in specific locations on its website. In December 2013, the Infocomm Development Authority of Singapore (IDA) imposed a financial penalty of SNG $750,000 on OpenNet for failing to meet its USO from January to June 2013 as well as for breaching its Quality of Service standards. The IDA notice on this matter also reported that since July 2013 OpenNet has been accepting orders for fibre services to all homes and business end-users in observation of its USO.46
Close monitoring of broadband progress is also occurring in Australia and New Zealand, which measure progress against public statements of expectations and commitments. As the wider economy becomes more dependent upon fully integrated broadband and ICT services, the performance of providers at the wholesale level may need to be more closely monitored. As the IDA noted in their decision of December 2013, a performance lapse
200 Trends in Telecommunication Reform 2015
Figure 7.9: Nationwide availability of broadband in the U.S. by number of competing providers
3.3%
Wireline broadband
None
35.6%
8.9% 20.3%32.0%
0.2%
48.3%
3.9%
35.0%28.9%
Wireless broadband
1 provider
2provider
3 providers
>3providers
None 1-2 provider
3-4provider
5-6 providers
>6providers
Source: Adapted from Steven Rosenberg, “Measuring and evaluating broadband progress,” presentation for ITU Asia Pacific Centre of Excellence Training, (October 2013), based on the National Broadband Map at June 30, 2013, http:// broadbandmap. gov/ summarize/ nationwide44

at the wholesale level affects downstream providers—such as operating companies and retail service providers—who rely on the wholesale network to deliver a wide range of services to consumers and businesses.
Expanding broadband in unserved areas – project monitoring and evaluationSo far this chapter has focused on monitoring the development of broadband in areas where a commercial return on investment is generally achievable over an acceptable period of time and broadband plans can rely largely on the market or on a mix of commercial and regulatory incentives. In the most challenging rural and remote areas, as noted above in Table 7.3, the potential return on investment may be so poor that a business case does not exist for broadband deployment without a direct injection of public funds.
Whether or not a rural broadband project is formally part of a universal access policy, it may need to be monitored and evaluated in similar ways, recognising that broadband-capable networks are now being extended to areas that have historically been restricted to basic voice services.
Canada relies on market forces for the development of broadband, but in areas where the market has failed to deliver broadband Internet services on its own, the government has used targeted funding to support services in unserved areas. The formal evaluation of Canada’s rural and northern development pilot project (see Box 7.2) illustrates the value of evaluating such projects and publishing the lessons learned.
The pilot program and its evaluation was followed up with the Broadband Canada Program, a three-year, CAN 225-million investment to bring faster Internet to an additional 218,000 Canadians in underserved areas, which ended in 2012.47 The latest program under the Economic Action Plan 2014 proposes to provide CAN 305 million over five years to extend and enhance access to high-speed broadband networks (target speed of 5 megabits per second) to an additional 280,000 Canadian households; which would represent near universal access.48
The careful evaluation of such pilot projects, whether as stand-alone broadband projects or within the framework of universal access programmes helps to ensure that future public investments are well managed and it is good practice in any subsidy scheme to make monitoring requirements an integral part of the project design and management framework. The achievement of milestones, coverage targets and service obligations all require monitoring, to ensure cost-effective use of financial resources.
Best practices for effective management of funds, including monitoring, are discussed in the OECD Broadband Strategy Toolkit.49 The ITU/InfoDev ICT Regulation Toolkit also provides detailed guidance on practical matters including the monitoring and evaluation stages of the project.50 Subsidy schemes used to support the adoption and take-up of broadband have the same need for transparency, accountability and efficiency as universal service funds, as reflected in a recent ITU study on that topic. 51
Monitoring the adoption and use of broadbandWhile indicators of adoption and use are still being developed,52 most countries have basic ICT statistics that can be used to support policy development and inform industry and users. On the demand side, many regulators already have some relevant information at hand including indicators of the number of customers; measured by subscriptions, households, businesses and/or communities.53 However, there are gaps in this information that need to be filled to provide a fuller understanding of user behaviour. For example, subscription information needs to be augmented with information about what devices are being used and actual patterns of use in order to be able to understand the real levels of access and affordability in a community, and in order to estimate likely trends in demand.
Additional information can be obtained from national statistical offices and from commissioned research, as will be seen in some of the examples to follow. National statistical offices rather than regulators may obtain general information about access to computers and the use of online services, but the ITU remains the leading international
201Trends in Telecommunication Reform 2015
Chapter 7
centre for aggregation of much of this information.
Some countries have very specific objectives in mind for the adoption and use of broadband that need to be supported by specialised
information gathering. Colombia, for example, aims to extend broadband connectivity across the country’s regions, and to stimulate adoption among young people, within the poorest social groups, and by the country’s smallest businesses. The policy is supported
202 Trends in Telecommunication Reform 2015
Box 7.2: Evaluation of Canada’s Broadband for Rural and Northern Development Pilot
This Broadband Pilot Program was a CAN 105 million initiative between 2002 and 2007 to address the broadband gap between served and unserved communities. The objectives of the program included:
• demonstrating the benefits of broadband in communities across Canada;• providing funding to unserved communities to prepare business plans for broadband
services;• providing funding to unserved communities to help them implement broadband
services that will assist in the areas of job creation, education, health, economic development, and governance;
• creating opportunities for learning by sharing best practices among communities; and• creating new business opportunities, domestically and globally, for Canadian ICT
companies.
Key findings of the evaluation included:
• CAN 4.2 million was invested in 154 projects, representing approximately 2,285 communities, to develop business plans that outlined their vision for the application of high-capacity Internet services.
• CAN 80.3 million was invested in 63 projects, representing nearly 900 communities (including 142 First Nations reserves), in the form of a one-time investment in capital infrastructure implementation of broadband business plans.
• The number of communities yet to be served by broadband was reduced from 4,000 to 2,000.
• 93 per cent of vendors and 94 per cent of project representatives indicated that without government assistance there was no business case for providing broadband services to rural and remote communities. If left to the market, only the most populated areas would be connected.
• The collaboration engendered by the project pushed up demand beyond what many providers and ISPs had expected.
• Broadband was extended to more communities than expected for two other reasons: when some communities heard that their neighbours were applying for the program they wanted to be included; and some vendors added more communities because network extension made it sensible to connect en-route communities as well as the project applicant communities.
The principal recommendation arising from the evaluation was that consideration be given to extending access to broadband services to a greater number of Canadian communities. It supported the existing “bottom up” community-based approach that appeared to have “a domino effect of increasing awareness of the benefits of broadband, which further increased the use of, and reliance on, broadband.” Other recommendations focused on administrative improvements that could be considered in future programs.
Source: Industry Canada ”Audits and Evaluations: Formative Evaluation of the Broadband for Rural & Northern Development Pilot,” http:// www. ic. gc. ca/ eic/ site/ ae- ve. nsf/ eng/ 02999. html
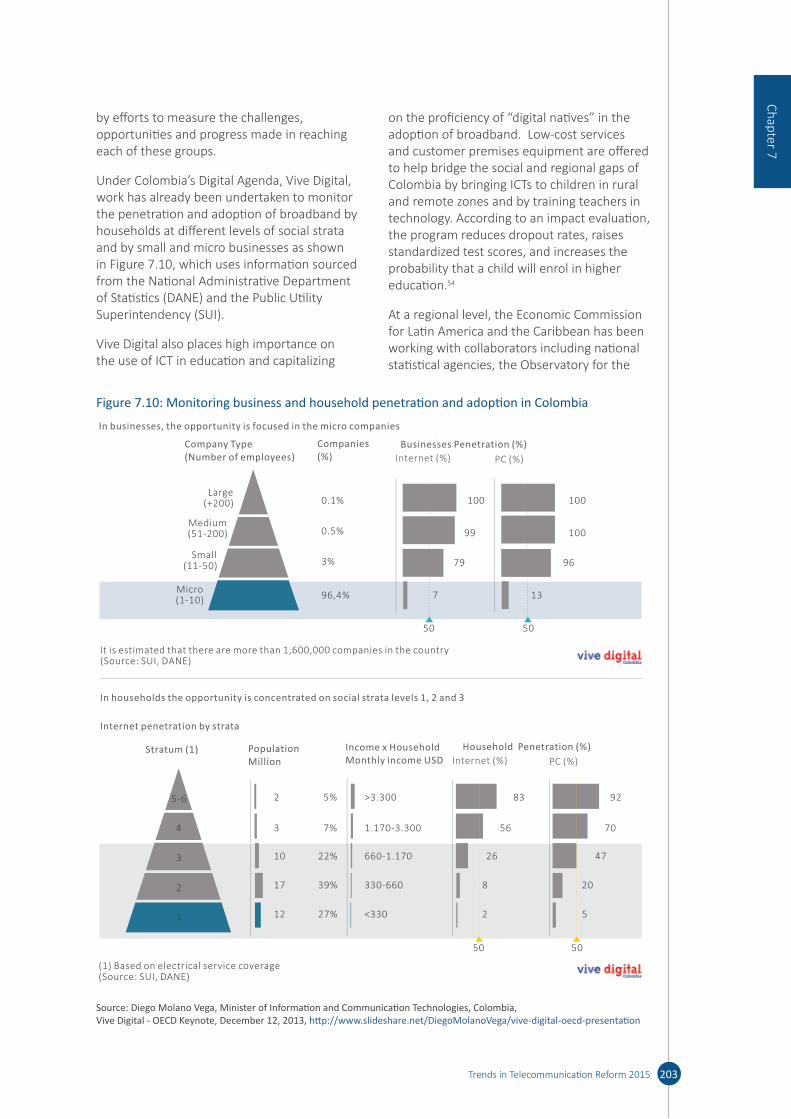
by efforts to measure the challenges, opportunities and progress made in reaching each of these groups.
Under Colombia’s Digital Agenda, Vive Digital, work has already been undertaken to monitor the penetration and adoption of broadband by households at different levels of social strata and by small and micro businesses as shown in Figure 7.10, which uses information sourced from the National Administrative Department of Statistics (DANE) and the Public Utility Superintendency (SUI).
Vive Digital also places high importance on the use of ICT in education and capitalizing
on the proficiency of “digital natives” in the adoption of broadband. Low-cost services and customer premises equipment are offered to help bridge the social and regional gaps of Colombia by bringing ICTs to children in rural and remote zones and by training teachers in technology. According to an impact evaluation, the program reduces dropout rates, raises standardized test scores, and increases the probability that a child will enrol in higher education.54
At a regional level, the Economic Commission for Latin America and the Caribbean has been working with collaborators including national statistical agencies, the Observatory for the
203Trends in Telecommunication Reform 2015
Chapter 7
Figure 7.10: Monitoring business and household penetration and adoption in Colombia
In households the opportunity is concentrated on social strata levels 1, 2 and 3
Internet penetration by strata
It is estimated that there are more than 1,600,000 companies in the country(Source: SUI, DANE)
(1) Based on electrical service coverage(Source: SUI, DANE)
Large(+200)
Medium(51-200)
Small(11-50)
Micro(1-10)
0.1% 100
50 50
99
79
7
100
100
96
13
0.5%
3%
96,4%
50 50
5-6 2 5%
7%
22%
39%
27%
3
10
17
12
>3.300 83 92
70
47
20
5
56
26
8
2
1.170-3.300
660-1.170
330-660
<330
4
3
2
1
In businesses, the opportunity is focused in the micro companies
Company Type(Number of employees)
Companies(%) Internet (%) PC (%)
Businesses Penetration (%)
Stratum (1) Income x Household Monthly income USD Internet (%)
Household Penetration (%)Population Million PC (%)
Source: Diego Molano Vega, Minister of Information and Communication Technologies, Colombia, Vive Digital - OECD Keynote, December 12, 2013, http:// www. slideshare. net/ DiegoMolanoVega/ vive- digital- oecd- presentation
Information Society in Latin America and the Caribbean (OSILAC), and the eLAC 2015 Indicators Commission to develop indicators and a statistical reference framework for assessing and monitoring the progress of the third phase of the Plan of Action on the Information and Knowledge Society for Latin America and the Caribbean (eLAC2015). This work aims to assess the region’s progress compared with the rest of the developed world, allowing governments and other stakeholders to draw their own conclusions about the effectiveness of their policies and the pace of progress in their respective countries.55
Canada provides another example of a country monitoring adoption patterns closely, with commissioned research providing feedback on the overall broadband policy agenda, including implications for the adjustment of broadband benchmarks and policy objectives. Although Canada has relied primarily on the private sector to provide broadband services, the Canadian Radio-television and Telecommunications Commission (CRTC) in 2011 decided that an unregulated, aspirational minimum threshold of 5 Mbps downstream and 1 Mbps upstream should be available to all Canadians by 2015, and stated that it would monitor progress towards this goal. At the same time, it surveyed broadband access to provide a baseline against which to measure progress. It found that the availability of 5 Mbps Internet service in small cities and towns generally kept pace with their larger counterparts, but availability declined rapidly for higher speed tiers.56
A follow-up report in 2013 found broadband availability to be 100 per cent in urban centers and 83 per cent in rural areas. 57 It also expanded the information on the adoption and use of broadband using survey-based information from the Media Technology Monitor (MTM) to monitor Canadians’ choice and use of new and existing technologies. It found a complex and evolving picture with regard to the adoption of digital technologies, noting that in the use of digital media, product life cycles and consumer adoption patterns tended to move over time through a cycle of innovation, expansion and decline, as shown in Figure 7.11.
For example, emerging trends included online-only television viewing, expanding trends included possession of a smartphone, maturing trends included having a Wi-Fi network at home, and declining trends included listening to podcasts and subscribing to analogue cable services. This type of analysis demonstrates the value of considering consumer adoption and use of broadcast and online media in a fully “converged” manner. It also shows how changing patterns of adoption and use provide a feedback loop indicating changing demand for broadband capacity and availability, whether in terms of greater download capability or greater mobility. When broadband access can be wireless or wireline-based, multi-function consumer devices open up the range of consumer choices between streamed, broadcast and interactive services, with consumers able to engage with the digital world at the time and place of their choosing.
The Commission concluded that it needed to reconsider not only the availability of broadband Internet access service, but also the capacity requirements that must be met for participating in the digital environment, in the light of changing evidence about consumer behaviour. In its 2013-2016 Three-Year Plan, the Commission indicated that it would undertake a comprehensive review to determine what services (e.g., voice, broadband) are required by all Canadians to fully participate in the digital economy.58 Thus, as in the United States, monitoring the adoption and use of broadband provides an information base to support reconsideration of the benchmark objectives for broadband access.
Having seen examples of how countries are more closely monitoring adoption patterns, the following sections review some other key issues that may be measured as part of broadband adoption.
AffordabilityConsumers are concerned about the price of broadband access more than service quality and the range of choices. Users are sensitive to price, especially for a first purchase. Entry level pricing is the most important indicator of affordability, which regulators can measure locally, and which should take account of equipment as well
204 Trends in Telecommunication Reform 2015

as service costs. International comparability can then be established, for example, to determine whether or not the Broadband Commission affordability target for basic fixed-broadband services (less than 5% of monthly gross national income per capita) has been achieved.
Business adoption and feedbackSmall business uptake of broadband is an important measure of adoption and a key building block for many e-services. Many countries already encourage and monitor adoption of broadband by micro-, small-l and medium-sized enterprises. Business users also provide a complementary source of feedback on broadband developments, because they are often early users of high-speed services and will quickly report market failings such as service gaps, regional disadvantages, reliability and quality weaknesses, inflexible regulations and barriers to innovation. Their feedback to regulators should contribute to the overall assessment of the progress of broadband implementation.
Large users can also assist in monitoring the availability of skilled staff for both the demand and supply sides of the industry. Indeed, they may compete with broadband suppliers
for talented staff and can provide important support for public-private partnerships that aim to build a specialised skills base for the broadband economy. In some cases, they may be willing participants in regional and community-based partnerships to build skills at the local level – and can provide feedback on their progress and successes. Of course, informal assessments of human capacity and skills may need to be backed up by an actual survey of local conditions and resources - as was found in the Dominican Republic.59
Anchor institutionsIn the United States, the importance of data gathering for broadband development is demonstrated by the creation of the State Broadband Initiative (SBI)60 as a competitive, merit-based matching grant program funded by the American Recovery and Reinvestment Act.61 The SBI is intended to increase broadband access and adoption through improved data collection, publicly accessible broadband maps, and statewide broadband planning. It is managed by the Department of Commerce through the National Telecommunications and Information Administration (NTIA). The National Broadband Map is one of the products of this initiative, providing a rich body of information
205Trends in Telecommunication Reform 2015
Chapter 7
Figure 7.11: Cycle of consumer adoption / product life cycle observed in Canada
Penetration
New technologiesthat are growing
Techiestry it
Innovation0-3%
Emerging4-15%
Expanding16-66%
Maturing67-100%
Decline90% 50% 0%
Visionnariesspot winners
Pragmatistssee the value
Conservativessee the writing
on the wall
New alternativestake hold
Disruptions to contentavailability or service begin
Discontinuation of newcontent and service
Old technologies thathave peaked, and are
now declining
Technology Adoption Stage / Time
*An illustration of the cycle of consumer adoption
Source: MTM 2012, from CRTC Communications Monitoring Report 2013.

not only on broadband availability, but also on take-up by community anchor institutions as illustrated in Figure 7.12.
Figure 7.12: Broadband take-up by community anchor institutions nationwide, USA
Source: National Broadband Map (http:// www. broadbandmap. gov/ summarize/ nationwide) Data provided by SBI grantees as at 30 June 2013
Digital literacy and inclusionIn 2011, the Broadband Commission noted that about 17 per cent of the world’s adults — 796 million people — still lacked basic literacy skills. Nearly two-thirds of these are women. The quality of education remains very low in many countries, and millions of children are emerging from primary school with reading, writing and numeracy skills that are far below expected levels. The state of literacy and digital literacy are fundamental issues for many countries.62 The regulator may assist in dealing with these educational issues, but may not necessarily lead.
ITU’s Connect a School, Connect a Community project63 makes advice, training materials, applications and tools available so that educational centres can also serve disadvantaged and vulnerable groups, including women and girls. It is important that school connectivity projects include methods to measure progress towards school connectivity, evaluate the impacts of Internet connectivity on basic literacy and advanced skills, and analyse the impact of broadband access on learning. Such reporting is important in order to ensure ongoing sustainability and
progress, particularly in the initial adoption stage.
In the Republic of Korea, digital literacy programs have targeted groups such as the elderly, farmers and housewives that might otherwise have been left behind. Similarly, the NTIA Broadband Adoption Toolkit shares best practices from broadband adoption and digital literacy projects in about 100 communities in the United States.64 Both of these examples highlight the value of partnering with established community organisations that people know and trust to engage hard-to-reach populations and share information about their success.
Digital inclusion plans also need to monitor gender gaps65 and access for people with disabilities – issues that appear in only a limited number of broadband plans as shown in Figure 7.4 above. School and community-based projects can be important in dealing with these issues, as well as providing information and education on cybersecurity and safety online. Programs such as these should to be monitored as important parts of the overall broadband plan.
Service quality and speedAs broadband use expands, service quality has become an increasing concern in some countries, particularly where advertised speeds greatly exceed the actual experience of users. An increasing number of regulators in places including Brazil, New Zealand, Pakistan, Poland, Singapore, Sri Lanka, the United Kingdom, the United States,66 and Europe are moving to stricter measurement and reporting of fixed broadband service quality. Initial steps may only require companies to provide consumers with information, for example, on the speeds they should expect to actually experience, but in some cases, regulators have initiated stronger measures. In Singapore, the IDA provides information to consumers on the performance of services as well as pricing in the form of interactive charts on its website.67 Mobile service quality issues are more complex, but the FCC and Ofcom have work underway to measure mobile performance.
The European Commission found major discrepancies between advertised and actual speeds on fixed networks; on average
206 Trends in Telecommunication Reform 2015

European consumers received only 74 per cent (more recently 75.6 per cent) of the advertised headline speed. Consequently, regulators in the EU will be required to monitor quality of service, and operators will be required to supply information on average speeds provided in normal and peak times as well as information on their data limits, and traffic management practices.68
In August 2013 the Australian Competition and Consumer Commission released a consultation chapter on a proposal for monitoring fixed broadband performance. It reviewed international models and invited comments on an approach that would not report the experience of individual consumers, but would show performance trends across different technologies, Internet service providers and regions.69
It seems likely that performance quality will be a prominent issue to be monitored as broadband becomes an increasingly indispensable part of social and economic development, and the focus moves increasingly to key issues to be monitored in a fully integrated broadband environment.
7.3.3 Monitoring broadband integrationIs it possible to determine when a fully integrated broadband environment has been achieved? No single indicator is sufficient, but a number of indicators considered together may show that broadband has become a pervasive and indispensable part of social and economic life. For example, a regulator might consider that integration has been achieved when there is evidence of:
• ubiquitous availability of broadband connectivity,
• high levels of digital literacy, • full coverage and utilisation of broadband
among all key community and economic institutions,
• well advanced progress with digital inclusion, and
• universally affordable access.
A further indicator to consider is whether alternatives to online communication are becoming devalued, difficult or unavailable,
increasing the costs and disadvantage of exclusion from broadband connectivity.
In the integration phase, pilot projects and community development programs give way to more mature and more fully connected eGovernment, eHealth and eEducation services. These areas, all seen as opportunities in the adoption phase, become close to essential facilities in the integration stage. A consequence for regulators is that they are obliged to give priority attention to monitoring and implementing measures to support this new level of reliance on broadband services including
• the reliability, resilience and quality or broadband services,
• remaining gaps in digital inclusion and affordability, and
• security and safety online.
Europe’s Digital Agenda forms part of the wider Europe 2020 strategy for growth in employment, productivity and social cohesion. The Digital Agenda also provides an example of the issues to be monitored in broadband plans that cover the gamut of issues from deployment of fast broadband and encouraging adoption by consumers and businesses, toward a more complete integration of broadband connectivity in social and economic life.
The Digital Agenda website maintained by the European Commission measures progress toward targets that have been set – with baseline data for each starting point shown in the Digital Agenda “dashboard” illustrated in Figure 7.13. The website contains a wealth of other information, including updates on work programs that contribute to each element of the digital agenda, the stages of work involved in the processes underway to overcome particular barriers, and information on how initiatives will work in practice.
Although the ITU has already carried out work to measure the positive impact of broadband on wider economic activity, it may be daunting to consider the expanded range of monitoring issues associated with the implementation of broadband plans when they become absorbed in wider agendas to advance national goals in areas such as improved government processes and performance, civic engagement,
207Trends in Telecommunication Reform 2015
Chapter 7
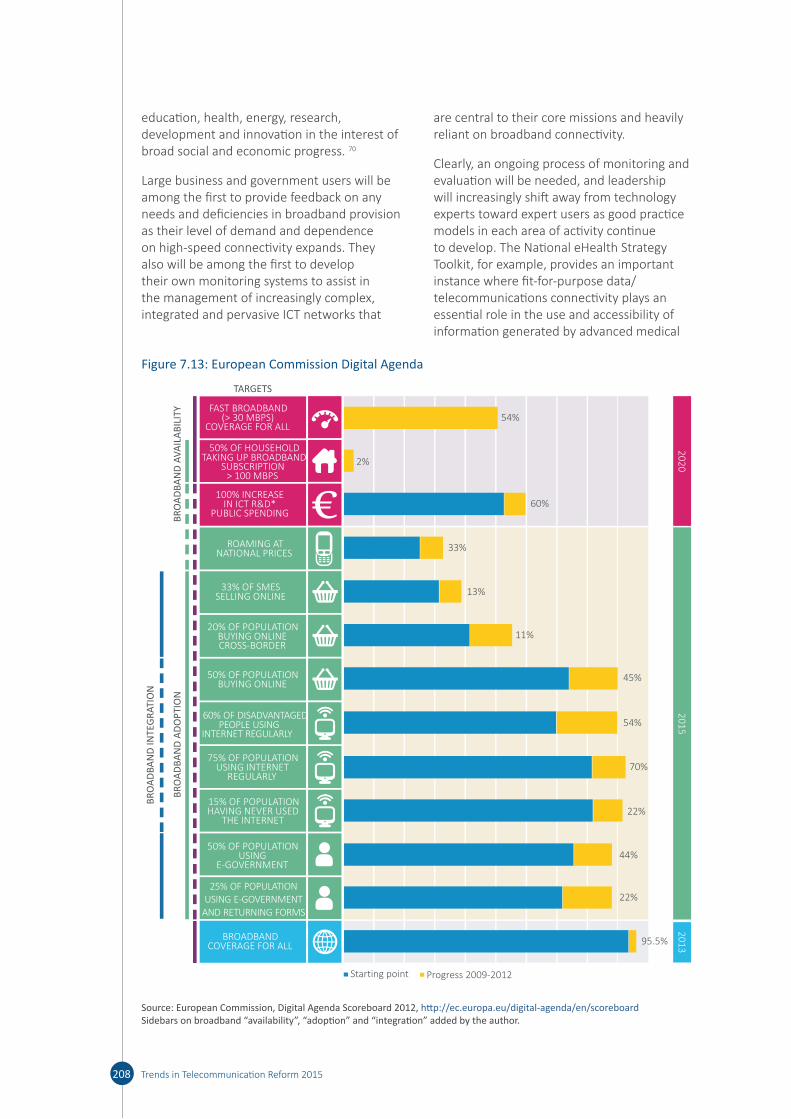
education, health, energy, research, development and innovation in the interest of broad social and economic progress. 70
Large business and government users will be among the first to provide feedback on any needs and deficiencies in broadband provision as their level of demand and dependence on high-speed connectivity expands. They also will be among the first to develop their own monitoring systems to assist in the management of increasingly complex, integrated and pervasive ICT networks that
are central to their core missions and heavily reliant on broadband connectivity.
Clearly, an ongoing process of monitoring and evaluation will be needed, and leadership will increasingly shift away from technology experts toward expert users as good practice models in each area of activity continue to develop. The National eHealth Strategy Toolkit, for example, provides an important instance where fit-for-purpose data/telecommunications connectivity plays an essential role in the use and accessibility of information generated by advanced medical
208 Trends in Telecommunication Reform 2015
Figure 7.13: European Commission Digital Agenda
FAST BROADBAND(> 30 MBPS)
COVERAGE FOR ALL
TARGETS
BR
OA
DB
AN
D A
VA
ILA
BIL
ITY
BR
OA
DB
AN
D A
DO
PTI
ON
BR
OA
DB
AN
D IN
TEG
RAT
ION
54%
33%
13%
11%
45%
54%
22%
44%
22%
95.5%
Starting point Progress 2009-2012
70%
60%
2%
100% INCREASEIN ICT R&D*
PUBLIC SPENDING
ROAMING ATNATIONAL PRICES
33% OF SMESSELLING ONLINE
20% OF POPULATIONBUYING ONLINECROSS-BORDER
60% OF DISADVANTAGEDPEOPLE USING
INTERNET REGULARLY
75% OF POPULATIONUSING INTERNET
REGULARLY
15% OF POPULATIONHAVING NEVER USED
THE INTERNET
50% OF POPULATIONUSING
E-GOVERNMENT
BROADBANDCOVERAGE FOR ALL
50% OF POPULATIONBUYING ONLINE
20
15
20
20
20
13
50% OF HOUSEHOLDTAKING UP BROADBAND
SUBSCRIPTION> 100 MBPS
€
25% OF POPULATIONUSING E-GOVERNMENT
AND RETURNING FORMS
Source: European Commission, Digital Agenda Scoreboard 2012, http:// ec. europa. eu/ digital- agenda/ en/ scoreboard Sidebars on broadband “availability”, “adoption” and “integration” added by the author.

equipment. Monitoring the contribution of broadband finds a place in the wider landscape of monitoring costs, benefits and health outcomes.71 As health administrators struggle with ever-expanding demands and costs, broadband-connected technologies offer scope for substantial savings and service improvements.
In the health sector, the “adoption” phase of broadband connectivity may appear as costly, although with long-term benefits; whereas in the “integration” phase it can become part of a larger ecosystem in which broadband enables multiple applications and uses. The eHealth Toolkit proposes a perspective for identifying short-, medium- and long-term approaches to be considered. This recognises the importance of demonstrating outcomes and benefits throughout the process of national strategy implementation, building and maintaining momentum and support for eHealth; and thereby improving the health of national populations.72
Some of the key points noted in this chapter may be helpful in the ongoing dialogue with sectoral experts as the process of integration of high-speed broadband in wider social and economic life advances. In particular, it may be useful to recognise that short-, medium- and long-term plans might need to reflect the phases of deployment, adoption and integration, with monitoring strategies tailored to each stage.
The full benefits associated with the costs of deployment may not be realised until the adoption and use of broadband is taken up and new opportunities emerge in a more integrated broadband environment. Short-term costs need to be weighed against long-term gains. Within each sector, sharing of information down to the local level, and closer attention to adoption patterns, areas of special need, and feedback loops can be helpful in developing a shared understanding of barriers, opportunities, priorities and appropriate benchmarks and objectives.
When broadband is fully integrated in society and the economy, attention will turn to outcomes measured not only in terms of costs and savings, but also in terms of spill-over effects and overall gains in capability,
efficiency, productivity, innovation and public welfare. New measures may need to be developed to monitor changes in people’s behaviour and increased dependence on broadband-based services. Communications regulators will be well placed to assist their colleagues in other sectors as they work through these issues.
However, it would be wrong to focus solely on large business and government issues. Small business, covering a much larger proportion of the work force in most countries, also has an essential role in driving the uptake and use of broadband. The Australian Communications and Media Authority (ACMA) has therefore added some complementary and exploratory studies to its annual reporting on communication developments, which will now include reports on topics such as Australian small and medium enterprises (SMEs) in the digital economy, in order to examine a range of issues, including the intensity of online activity by small and medium sized enterprises, and also their exploration of new ways of doing business with online technology.
73
ACMA has also found that Australian businesses are using mobile broadband to drive productivity, make faster decisions, improve product and service quality, and become more efficient and flexible. Its recent research report on the economic impacts of mobile broadband on the Australian economy, from 2006 to 2013 found that, in 2013, mobile broadband led to an estimated increase in Australia’s economic activity of AUD 33.8 billion. Of this, AUD 26.5 billion was attributed to time savings for businesses using mobile broadband.74
Studies such as these, and wider experience, continue to improve understanding of the way that broadband access is changing broader economic and social behaviour. The ways that people gather information, the way they work and relate to an expanding range of institutions, taking advantage of the opportunities for improved levels of capability, efficiency, participation and innovation are still being explored.75
All of this suggests that as dependence on broadband connectivity grows, it can be
209Trends in Telecommunication Reform 2015
Chapter 7

expected that regulators will continue efforts to monitor the availability, speed, affordability and reliability of broadband services and to overcome any remaining barriers to the adoption and effective use of high speed broadband connectivity.
7.4 Conclusions
A number of conclusions can be drawn from the research and analysis developed in this chapter. When broadband plans are being developed and implemented, the following are recommended for consideration by regulators and policy-makers as good practices:
• A monitoring and feedback framework should be considered to be a necessary part of any broadband plan. The Annex provides an optional list of items for consideration.
• Consider ways of making information widely available so that all stakeholders have the opportunity to make informed decisions about their own contributions to both the supply and use of broadband in an overall coordination framework.
• Consider ways to ensure that broadband indicators are in place to provide feedback on progress against targets for the expanded deployment and adoption of broadband services, and to provide a basis for international comparisons.
• Consider appropriate indicators of broadband adoption and use that are relevant to local communities, groups and regions with special needs. Consider in particular ways to recognise and highlight innovation in the use and application of
broadband and demonstrations of new capabilities enabled by broadband.
• Consider ways to ensure not only that outcomes are measured appropriately, but also that important process milestones are identified and progress reported in a transparent manner, for example, on a public website.
• Consider ways to ensure that contracts, licences, projects and programs have built-in monitoring and feedback requirements to ensure that their reach, costs, benefits and outcomes can be measured, and to assist in identifying implementation problems that may require correction.
• Consider the need to adjust measures over time as priorities shift from deployment of services, to their adoption and use, recognising that when broadband is fully integrated in social and economic life, it may shift from being seen as a cost, and instead be recognised an essential underpinning and a means of savings across wider social and economic sectors.
• Consider ways to collaborate beyond the ICT sector to measure short-, medium- and long-term outcomes in sectors such as health and education, where improvements in capability as well as reach and efficiency, may be achieved in cost-effective ways after initial hurdles associated with deployment, adoption and capacity-building have been overcome.
• Consider ways to contribute to and participate in the ongoing discussion of broadband impacts on social and economic life with a view, where necessary, to reviewing established benchmarks for broadband capacity as demand and usage continues to develop.
210 Trends in Telecommunication Reform 2015
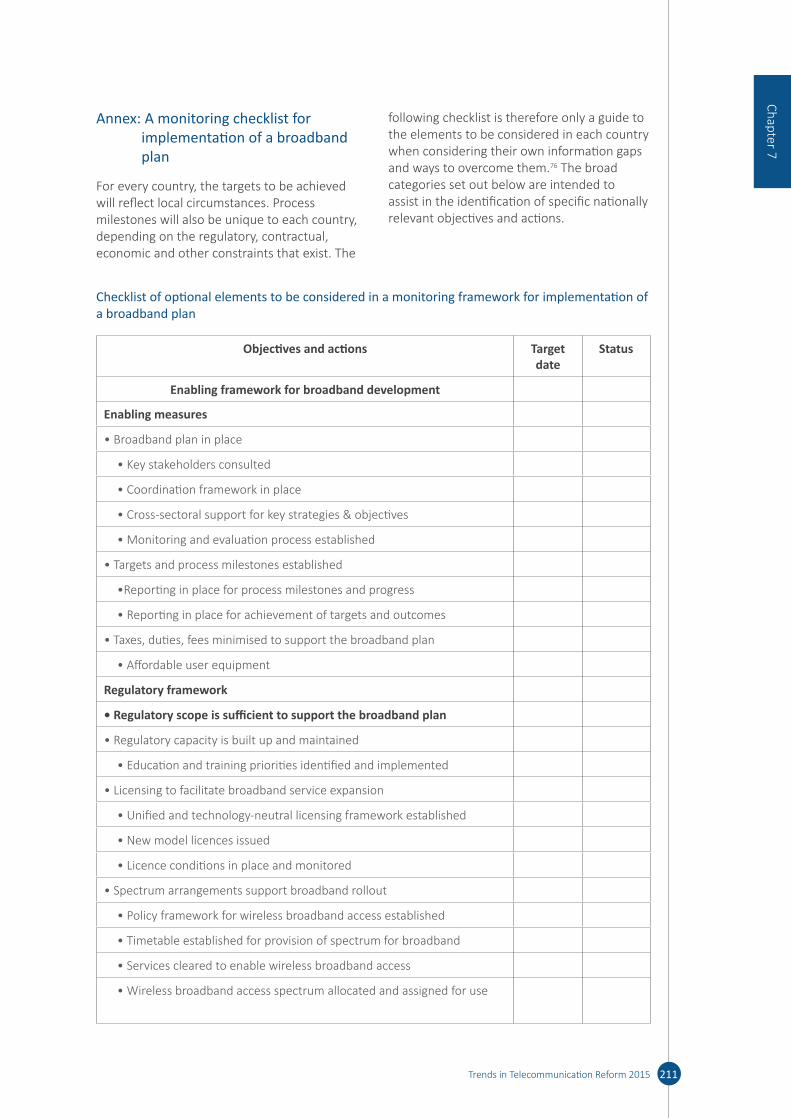
Annex: A monitoring checklist for implementation of a broadband plan
For every country, the targets to be achieved will reflect local circumstances. Process milestones will also be unique to each country, depending on the regulatory, contractual, economic and other constraints that exist. The
following checklist is therefore only a guide to the elements to be considered in each country when considering their own information gaps and ways to overcome them.76 The broad categories set out below are intended to assist in the identification of specific nationally relevant objectives and actions.
211Trends in Telecommunication Reform 2015
Chapter 7
Checklist of optional elements to be considered in a monitoring framework for implementation of a broadband plan
Objectives and actions Target date
Status
Enabling framework for broadband development
Enabling measures
• Broadband plan in place
• Key stakeholders consulted
• Coordination framework in place
• Cross-sectoral support for key strategies & objectives
• Monitoring and evaluation process established
• Targets and process milestones established
•Reporting in place for process milestones and progress
• Reporting in place for achievement of targets and outcomes
• Taxes, duties, fees minimised to support the broadband plan
• Affordable user equipment
Regulatory framework
• Regulatory scope is sufficient to support the broadband plan
• Regulatory capacity is built up and maintained
• Education and training priorities identified and implemented
• Licensing to facilitate broadband service expansion
• Unified and technology-neutral licensing framework established
• New model licences issued
• Licence conditions in place and monitored
• Spectrum arrangements support broadband rollout
• Policy framework for wireless broadband access established
• Timetable established for provision of spectrum for broadband
• Services cleared to enable wireless broadband access
• Wireless broadband access spectrum allocated and assigned for use

212 Trends in Telecommunication Reform 2015
Objectives and actions Target date
Status
Enabling framework for broadband development
• Civil works facilitation
• Multiple approvals streamlined
• Access to key requisites (poles, roofs, towers etc.,) facilitated
• Sharing and interconnection measures facilitated
• Cost-based interconnection facilitated
• Infrastructure sharing permitted/facilitated
• Gateway access facilitated
• Open access on commercial terms established
• Diversity of access established
• Backbone coordination facilitated
• Consultations with stakeholders undertaken
• Framework for cooperation agreed
Broadband deployment and availability
Broadband indicators in place
• Telecommunications/broadband indicators established
• Regulator reporting from operators in place
• Analysis capability established
• Broadband availability indicators by market segment
• Central business districts
• Urban areas
• Rural and remote areas (mapping may be required)
• Fixed and wireless technologies
• Basic and advanced speeds
• Interactive or published map of broadband availability
• Price of basic and advanced services
• Waiting times for service supply and restoration
• Technology and devices in use
• Updated to reflect changing usage and adoption patterns
• Key barriers identified
• Process to deal with identified barriers established and reported
• Process milestones identified and reported
Broadband competition monitoring
• Infrastructure and service-based competition measured
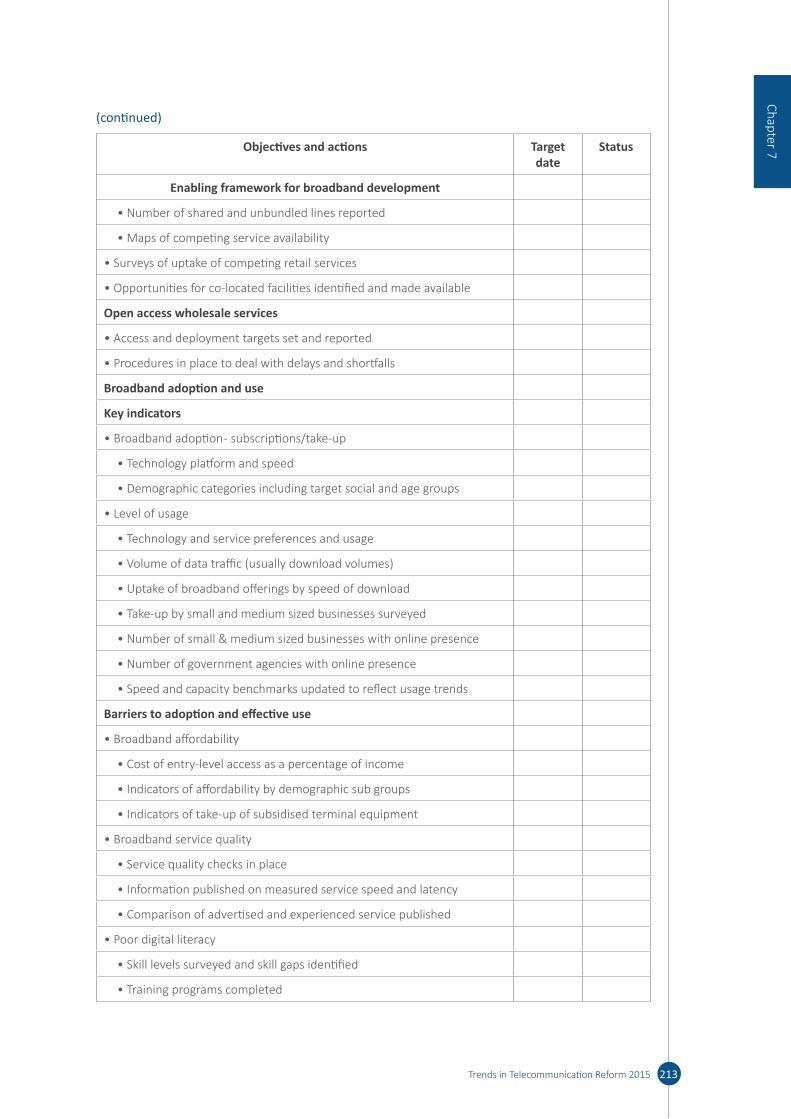
213Trends in Telecommunication Reform 2015
Chapter 7Objectives and actions Target date
Status
Enabling framework for broadband development
• Number of shared and unbundled lines reported
• Maps of competing service availability
• Surveys of uptake of competing retail services
• Opportunities for co-located facilities identified and made available
Open access wholesale services
• Access and deployment targets set and reported
• Procedures in place to deal with delays and shortfalls
Broadband adoption and use
Key indicators
• Broadband adoption - subscriptions/take-up
• Technology platform and speed
• Demographic categories including target social and age groups
• Level of usage
• Technology and service preferences and usage
• Volume of data traffic (usually download volumes)
• Uptake of broadband offerings by speed of download
• Take-up by small and medium sized businesses surveyed
• Number of small & medium sized businesses with online presence
• Number of government agencies with online presence
• Speed and capacity benchmarks updated to reflect usage trends
Barriers to adoption and effective use
• Broadband affordability
• Cost of entry-level access as a percentage of income
• Indicators of affordability by demographic sub groups
• Indicators of take-up of subsidised terminal equipment
• Broadband service quality
• Service quality checks in place
• Information published on measured service speed and latency
• Comparison of advertised and experienced service published
• Poor digital literacy
• Skill levels surveyed and skill gaps identified
• Training programs completed
(continued)
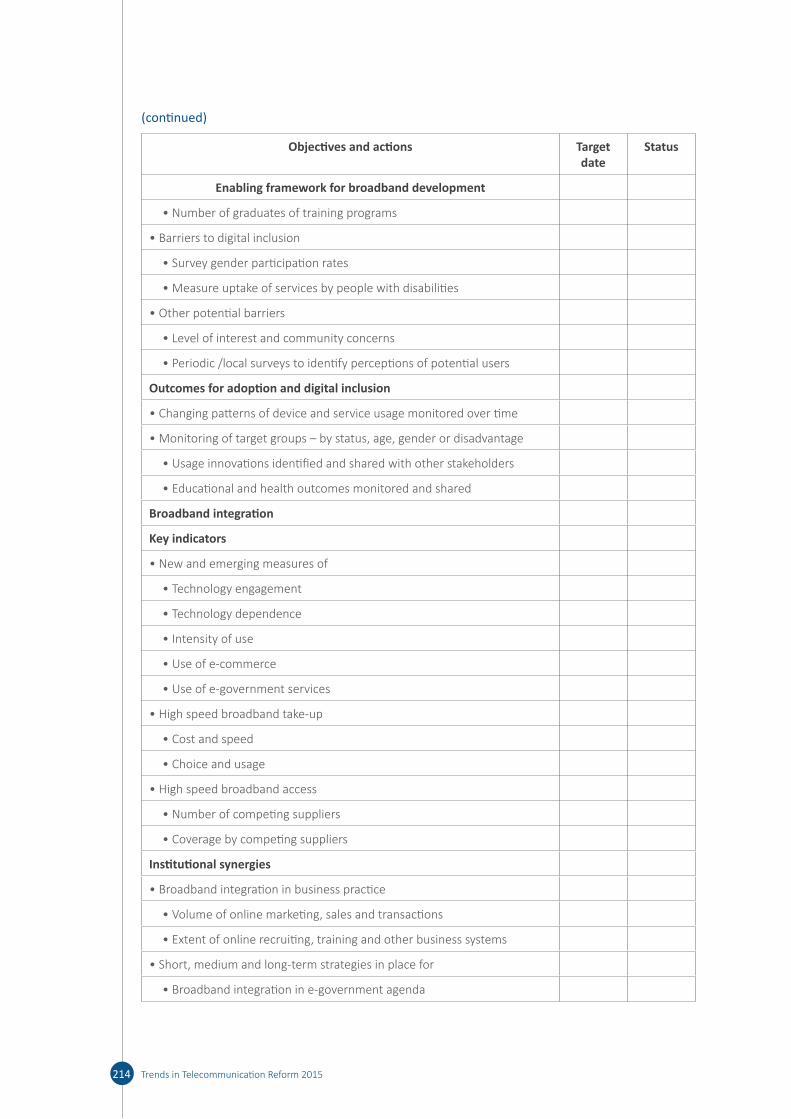
214 Trends in Telecommunication Reform 2015
Objectives and actions Target date
Status
Enabling framework for broadband development
• Number of graduates of training programs
• Barriers to digital inclusion
• Survey gender participation rates
• Measure uptake of services by people with disabilities
• Other potential barriers
• Level of interest and community concerns
• Periodic /local surveys to identify perceptions of potential users
Outcomes for adoption and digital inclusion
• Changing patterns of device and service usage monitored over time
• Monitoring of target groups – by status, age, gender or disadvantage
• Usage innovations identified and shared with other stakeholders
• Educational and health outcomes monitored and shared
Broadband integration
Key indicators
• New and emerging measures of
• Technology engagement
• Technology dependence
• Intensity of use
• Use of e-commerce
• Use of e-government services
• High speed broadband take-up
• Cost and speed
• Choice and usage
• High speed broadband access
• Number of competing suppliers
• Coverage by competing suppliers
Institutional synergies
• Broadband integration in business practice
• Volume of online marketing, sales and transactions
• Extent of online recruiting, training and other business systems
• Short, medium and long-term strategies in place for
• Broadband integration in e-government agenda
(continued)

215Trends in Telecommunication Reform 2015
Chapter 7Objectives and actions Target date
Status
Enabling framework for broadband development
• Broadband integration in health agenda
• Broadband integration in education agenda
• Broadband integration in public safety agenda
• Qualitative reports of increased capability and innovation
• Studies of changing behaviour and practices
• Consumer behaviour
• Worker participation
• Civic engagement
Project management and monitoring
Subsidised deployment projects and programs
• Transparent monitoring of tender procedures and outcomes
• Process milestones identified and reported
• Reporting responsibility clearly assigned in contracts
• Targets established with regular progress reporting requirements
• Coverage commitments mapped and progress reported
• Transparent monitoring of progress against targets
• Independent evaluation of project outcomes in place
Subsidised adoption projects and programs
• Transparent monitoring of tender procedures and outcomes
• Reporting responsibility clearly assigned in contracts
• Qualitative reporting on demand promotion projects:
• Demand aggregation
• Community anchor tenants
• Government anchor tenants
• Independent evaluation of subsidised projects and outcomes
• Cost/benefit reporting for ongoing subsidised programs
(continued)
Endnotes1 The author wishes to thank Filippo Munisteri, Steven Rosenberg, Anna Rogozińska, Joseph Di
Gregorio and the ITU RME/GSR team for their inputs and comments on this chapter.
2 In this chapter “broadband plan” is used as shorthand to include broadband policies and strategies and digital agendas, while recognizing that each country’s choice of language will reflect its own priorities.
3 International Telecommunication Union, “Planning for Progress: Why National Broadband Plans Matter,” (2013), http:// www. broadbandcommission. org/ documents/ reportNBP2013- embargo. pdf
4 See http:// www. broadbandcommission. org/ Pages/ default. aspx
5 See http:// www. itu. int/ en/ ITU- D/ Statistics/ Pages/ intlcoop/ partnership/ default. aspx
6 See http:// www. itu. int/ en/ ITU- D/ Statistics/ Pages/ events/ wtis2013/ default. aspx
7 The ITU website holds the current list of the indicators included in the World Telecommunication Indicators/ICT Indicators database (December 2013) of which 26 relate to broadband. The ITU “Handbook for the Collection of Administrative Data on Telecommunications/ICT” (2011) is a key reference document for the collection of internationally comparable indicators on telecommunications/ICT that are obtained from administrative sources (i.e. supply-side data mainly from operators). The Handbook includes definitions and methodological clarifications for 81 internationally-agreed indicators and corresponding sub-indicators, discussed by the Expert Group on Telecommunication/ICT Indicators (EGTI). The Handbook was released at the 9th ITU World Telecommunication/ICT Indicators Meeting in December 2011. The OECD’s “Communications Outlook 2013,” Chapter 4 on network dimensions and development, also discusses the widening scope of broadband indicators.
8 See http:// broadbandtoolkit. org/ 2. 4
9 eMISR, National Broadband Plan, Executive Summary, page 10, (2011), http:// www. tra. gov. eg/ emisr/ Summary_ En. pdf
10 Sometimes also called “key success indicators.”
11 Organisation for Economic Co-operation and Development, The Internet Economy on the Rise: Progress since the Seoul Declaration, (2013), pages 75-78.
12 “Policy choices must be informed by reliable data and indicators on ICT developments. Statistical indicators are also essential to assess the impact of broadband policies and to track progress towards national and international broadband goals and targets (including the targets set by the Broadband Commission). Data collected at the national level should be based on internationally agreed standards and definitions, such as those developed by ITU and the Partnership on Measuring ICT for Development. Data should be collected on a timely basis to monitor broadband infrastructure and access, prices and affordability, and broadband usage by individuals, businesses and public organizations such as Governments, schools and hospitals.” Broadband Commission, ”The State of Broadband 2013,” (Sept 2013), p 84, http:// www. broadbandcommission. org/ documents/ bb- annualreport2013. pdf
13 The challenges of assessing costs, benefits and economic impacts ex ante are discussed by Dr. Raúl L. Katz, ”Monitoring the Implementation of Broadband Plans,” ITU/BDT Regional Economic and Financial Forum of Telecommunications/ICTs for Latin America and the Caribbean, San Jose, Cost Rica, (11-12 March 2014), http:// www. itu. int/ en/ ITU- D/ Regulatory- Market/ Documents/ CostaRica/ Presentations/ Session9_ Katz- ITU%20 San%20 Jose%20 Monitoring%20
216 Trends in Telecommunication Reform 2015
Broadband%20 Plans%20 %282%29 .pdf. Dr. Katz notes that “considering the amount of investment in ICT, and their economic impact, the amount of data and analysis leading to decisions is typically sub-optimal.”
14 See ITU’s ICT Eye portal on ICT data and regulatory information: http:// www. itu. int/ icteye
15 Republic of Mauritius, ”National Broadband Policy 2012-2020,” http:// www. icta. mu/ documents/ nationalbroadbandpolicy2012. pdf
16 Ministry of Administration and Digitization, “Telecommunications,” https:// mac. gov. pl/ en/ telecommunications
17 African Development Bank, ”Connecting Africa: An Assessment of Progress Towards the Connect Africa Summit Goals,”, 2013, http:// www. transformafrica2013. org/ IMG/ pdf/ connecting_ africa- main_ report_ sept_ 2013. pdf
18 African Development Bank, ”Connecting Africa: An Assessment of Progress Towards the Connect Africa Summit Goals,” (2013), page 79, http:// www. afdb. org/ fileadmin/ uploads/ afdb/ Documents/ Project- and- Operations/ Connecting%20 Africa%20 -%20 An%20 Assessment%20 of%20 Progress%20 Towards%20 the%20 Connect%20 Africa%20 Summit%20 Goals%20 -%20 Main%20 Report. pdf
19 In the European Union, a satisfactory broadband plan is a precondition for the use of structural and cohesion funds from the European Union budget to support broadband upgrades.
20 These issues are explained in detail in ITU Guidelines for preparation of national wireless broadband masterplans for the Asia Pacific region
21 Filippo Munisteri, ”Broadband policy development and implementation in the EU,” Presentation for ITU Asia Pacific Centre of Excellence Training, (October 2013), http:// academy. itu. int/ moodle/ pluginfile. php/ 63255/ mod_ resource/ content/ 1/ FILIPPO%20 ITU%20 _Bangkok%20 _FM_ v5. pdf
22 In Australia’s federal structure, states such as Victoria have a key role to play in the development of e-government and other elements of the digital economy.
23 Federal Communications Commission, “Quarterly Broadband Action Agenda Items,” (2010) http:// www. broadband. gov/ plan/ broadband- action- agenda- items. html; European Commission, “Rules to support a competitive single market and to foster innovation and investment,” http:// ec. europa. eu/ dgs/ connect/ en/ content/ rules- support- competitive- single- market- and- foster- innovation- and- investment and “Action 45: Foster the deployment of NGA networks,” https:// ec. europa. eu/ digital- agenda/ en/ content/ action- 45- foster- deployment- nga- networks
24 The Doing Business website (http:// www. doingbusiness. org/ rankings) provides rankings and commentary on each issue.
25 Nepal Telecommunications Authority, MIS Reports, http:// www. nta. gov. np/ en/ mis- reports- en,
26 The Report of August 2013 (including investment projects implemented in 2012-2013, and buildings enabling co-location) is available in English at http:// en. uke. gov. pl/ telecommunications- infrastructure- in- poland- 12958 Rogozińska, Anna, “From National Broadband Plans towards Broadband Ubiquity – the Polish Experience,” ITU-D Regional Conference on Speeding up NGN ubiquity, (13 February 2014), http:// www. yme. gr/ pdf/ ngn_ presentations/ Rogozinska%20 Anna_ Poland. pdf, supplemented by correspondence with the author.
217Trends in Telecommunication Reform 2015
Chapter 7

27 Interactive maps presenting broadband infrastructure are available at http:// maps. polskaszerokopasmowa. pl/ maps
28 Interactive broadband maps available online include: Australia (https:// www. mybroadband. communications. gov. au), Canada (http:// www. ic. gc. ca/ app/ sitt/ bbmap/ hm. html? lng= eng), the United States (http:// www. broadbandmap. gov), Germany http:// www. zukunft- breitband. de/ Breitband/ DE/ Breitbandatlas/ breitbandatlas_ node. html, Ireland (http:// www. dcenr. gov. ie/ communications/ communications+development/ national+broadband+scheme. htm), New Zealand (http:// www. broadbandmap. govt. nz), and the United Kingdom (http:// maps. ofcom. org. uk/ broadband/ ). In June 2013, the EC commissioned a study of current broadband mapping initiatives (http:// www. broadbandmapping. eu/ ).
29 Currently, data from 113 countries have been collected. For more information on this project and to access the interactive map, see http:// www. itu. int/ itu- d/ tnd- map- public/
30 Ofcom, ”Report for Government on UK’s broadband progress,” (5 March 2013), http:// media. ofcom. org. uk/ 2013/ 03/ 05/ report- for- government- on- uk%E2%80 %99s- broadband- progress/
31 Federal Communications Commission, ”Eighth Broadband Progress Report,” (August 2012), page 52, http:// www. fcc. gov/ reports/ eighth- broadband- progress- report
32 Quarterly updates continue to be published by the Ministry of Business, Innovation, and Employment.
33 Federal Communications Commission, “National Broadband Plan: Connecting America,” (17 March 2010), http:// www. broadband. gov/ plan/
34 U.S. Code § 1302 - Advanced telecommunications incentives, http:// www. law. cornell. edu/ uscode/ text/ 47/ 1302
35 FCC, ”Eighth Broadband Progress Report,” page 8.
36 Ibid, page 9.
37 Ibid, page 62-69.
38 ibid, page 62-63.
39 The White House, ”Executive Order -- Accelerating Broadband Infrastructure Deployment,” (14 June 2012), http:// www. whitehouse. gov/ the- press- office/ 2012/ 06/ 14/ executive- order- accelerating- broadband- infrastructure- deployment
40 European Commission, “Digital Agenda for Europe, Pillar IV: Fast and ultra-fast Internet access,” actions 112-114, http:// ec. europa. eu/ digital- agenda/ en/ our- goals/ pillar- iv- fast- and- ultra- fast- internet- access
41 European Commission, ”Report: Fixed broadband wholesale lines & agreements,” (January 2013), https:// ec. europa. eu/ digital- agenda/ en/ pillar- 4- fast- and- ultra- fast- internet- access
42 The State Broadband Initiative (SBI – previously the State Broadband Data Development program) is discussed later under monitoring adoption of broadband.
43 Rosenberg, Steven, “Measuring and evaluating broadband progress,” presentation for ITU Asia Pacific Centre of Excellence Training, (October 2013)
44 In this case, the benchmark speeds used for broadband are 768 kbps down and 200 kbps up.
218 Trends in Telecommunication Reform 2015
45 Ofcom, ”New rules for faster telecoms repairs and installation,” (19 December 2013), http:// media. ofcom. org. uk/ 2013/ 12/ 19/ new- rules- for- faster- telecoms- repairs- and- installation/ ; and Openreach, ”Where and when,” http:// www. superfast- openreach. co. uk/ where- and- when/
46 OpenNet, http:// www. opennet. com. sg/ ; and IDA, ”OpenNet Failed to Meet Universal Service Obligation and Quality of Service Standards,” (20 November 2013), https:// www. ida. gov. sg/ About- Us/ Newsroom/ Media- Releases/ 2013/ OpenNet- Failed- To- Meet- Universal- Service- Obligation- and- Quality- of- Service- Standards
47 Canadian programs have generally involved matching funding from other entities. Provincial programs and their relationship with federal government programs are reviewed in Rajabiun, R., & Middleton, C.. ”Rural Broadband Development in Canada’s Provinces: An Overview of Policy Approaches.” In The Journal of Rural and Community Development, 8(2), ed. W. Ashton & A. S. Carson), [Special issue]. (2013), 7-22, http:// www. jrcd. ca/ viewarticle. php? id= 1140
48 See the Canadian budget at http:// www. budget. gc. ca/ 2014/ docs/ plan/ ch3- 4- eng. html
49 OECD Broadband Strategy Toolkit, Section 4.4.
50 ITU/infoDev, ICT Regulation Toolkit, Universal Access and Service Module 4, Section 7 “Competing for UAS subsidies,” http:// www. ictregulationtoolkit. org/ en/ Section. 3296. html
51 ITU, ”Universal service funds and digital inclusion for all,” (September 2013), http:// www. itu. int/ en/ ITU- D/ Regulatory- Market/ Documents/ USF_ final- en. pdf
52 For example, “adoption rate” can be defined as the number of people choosing to use a technology expressed as a fraction of the number to whom it is available. In this chapter, unless the context indicates otherwise, “adoption” or “take-up” simply refers to the number of people using a technology, independent of availability.
53 It should be noted that in developing countries, the number of people taking advantage of “household” access could be much larger than in developed countries. Surveys of users may be the only way to measure these differences.
54 Diego Molana Vega, Minister of Information and Communication Technologies of Colombia, “Colombia’s Digital Agenda: Successes and the Challenges Ahead.” In The Global Information Technology Report 2013, World Economic Forum,(2013), http:// www3. weforum. org/ docs/ GITR/ 2013/ GITR_ Chapter2. 1_ 2013. pdf
55 Economic Commission for Latin America and the Caribbean, ”Monitoring of the Plan of Action eLAC2010: Advances and challenges of the information society in Latin America and the Caribbean,” (November 2010), page 9, http:// www. eclac. cl/ cgi- bin/ getProd. asp? xml=/ publicaciones/ xml/ 2/ 41802/ P41802. xml& xsl=/ ddpe/ tpl- i/ p9f. xsl& base=/ elac2015/ tpl- i/ top- bottom. xsl
56 Canadian Radio-television and Telecommunications Commission, ”Broadband Report,” (November 2011), pages 1 and 13, http:// www. crtc. gc. ca/ eng/ publications/ reports/ broadband/ bbreport1111. htm
57 Canadian Radio-television and Telecommunications Commission, ”Communications Monitoring Report 2013: Broadband availability and adoption of digital technologies,” (2013), http:// www. crtc. gc. ca/ eng/ publications/ reports/ policymonitoring/ 2013/ cmr6. htm. Data related to consumer behaviour was gathered primarily from contracted research and publicly available data rather than direct data collection. One of the primary data sources was the MTM Fall 2012 survey, which examined the media habits and technology usage of 8,000 Canadians age 18 years and older.
219Trends in Telecommunication Reform 2015
Chapter 7
58 Canadian Radio-television and Telecommunications Commission , ”CRTC Three-Year Plan 2013-2016,” http:// www. crtc. gc. ca/ eng/ backgrnd/ plan2013. htm
59 San Roman, Edwin, ”Bringing Broadband Access to Rural Areas: A step-by-step approach for regulators, policy makers and universal access program administrators: The Experience of the Dominican Republic,” ITU GSR 2009,.
60 Formerly the State Broadband Data Development program.
61 See generally http:// www. recovery. gov/ arra/ Pages/ default. aspx
62 Broadband Commission, ”Broadband: A platform for progress,” (June 2011), page 78, http:// www. broadbandcommission. org/ Reports/ Report_ 2. pdf
63 ITU, http:// www. itu. int/ ITU- D/ sis/ connectaschool/
64 National Telecommunications and Information Administration, “NTIA Broadband Adoption Toolkit Shares Best Practices Across U.S.,” Press Release, (2 May 2013), http:// www. ntia. doc. gov/ press- release/ 2013/ ntia- broadband- adoption- toolkit- shares- best- practices- across- us
65 Broadband Commission Working Group on Broadband and Gender, “Doubling Digital Opportunities: Enhancing the Inclusion of Women & Girls in the Information Society,” (September 2013), http:// www. broadbandcommission. org/ Documents/ working- groups/ bb- doubling- digital- 2013. pdf
66 In the United States, the first Measuring Broadband America report identified ISPs that fell short of advertised speeds, but the second Measuring Broadband America report found substantial improvement, with consumers experiencing performance more closely aligned with what is advertised. See generally http:// www. fcc. gov/ measuring- broadband- america
67 See http:// www. ida. gov. sg/ applications/ rbs/ chart. html
68 European Commission, “Commission adopts regulatory proposals for a Connected Continent,” (11 September 2013), http:// europa. eu/ rapid/ press- release_ MEMO- 13- 779_ en. htm; and http:// ec. europa. eu/ digital- agenda/ en/ news/ quality- broadband- services- eu- samknows- study- internet- speeds
69 Australian Competition and Consumer Commission, “Broadband performance monitoring and reporting program,” http:// www. accc. gov. au/ regulated- infrastructure/ communications/ monitoring- reporting/ broadband- performance- monitoring- reporting- program
70 Economic impact studies are brought together in Dr Raul L Katz, The Impact of Broadband on the Economy: Research to Date and Policy Issues (ITU, April 2012), http:// www. itu. int/ ITU- D/ treg/ broadband/ ITU- BB- Reports_ Impact- of- Broadband- on- the- Economy. pdf
71 ITU and World Health Organization, “National eHealth Strategy Toolkit,” (2012), http:// www. itu. int/ pub/ D- STR- E_ HEALTH. 05- 2012
72 Ibid, page v.
73 Australian Communications and Media Authority, Communications report 2012–13 and Report 1 – Australian SMEs in the digital economy, (2013) http:// www. acma. gov. au/ theACMA/ Library/ Corporate- library/ Corporate- publications/ communications- report- 2012- 13. ACMA has also published a series of brief “snapshot” reports on topics such as Australians cut the cord: becoming mobile only, The connected business, and Home is where the work is: the digital worker, http:// www. acma. gov. au/ theACMA/ engage- blogs/ engage- blogs/ Research- snapshots
220 Trends in Telecommunication Reform 2015

74 Two reports were commissioned by ACMA: The Centre for International Economics reported on The economic impacts of mobile broadband on the Australian economy, from 2006 to 2013, and Woolcott Research reported on The business mobile communications usage and impact survey. Both reports are accessible from the ACMA website at http:// www. acma. gov. au/ theACMA/ engage- blogs/ engage- blogs/ Research- snapshots/ The- mobile- business
75 See also: NTIA, “NTIA report explores how and why people connect to the Internet,” Press Release, (7 June 2013), http:// www. ntia. doc. gov/ press- release/ 2013/ new- ntia- report- explores- how- and- why- people- connect- internet; and the work of the Institute for a Broadband-enabled Society at http:// www. broadband. unimelb. edu. au/
76 The form of this checklist is modelled on the example provided by the Victorian Government’s ICT Strategy Action Checklist, which is available online at http:// www. digital. vic. gov. au/ status/ . In some cases that checklist uses simple graphics as well as text to indicate progress through the stages of a project as shown in Figure 7.6.
221Trends in Telecommunication Reform 2015
Chapter 7

8 Conclusion
This fifteenth edition of Trends in Telecommunication Reform has focused on “Capitalizing on the Potential of the Digital World.” With the rise of digital content and the increasingly global nature of ubiquitous networks, there is little doubt that new technologies, services and applications are having huge impacts on both social and economic development. But with all the benefits the evolving digital world offers, it also brings challenges for policy-makers and regulators, who must seek to balance the rights of all stakeholders. Ensuring that consumers benefit from the wealth of opportunities brought by the digital economy in an informed, responsive and safe manner is a challenge that can only be achieved through effective and smart regulation targeted at empowering consumers, redefining responsibilities and creating the conditions for a data driven economy to flourish. The chapters in this report discuss some of the important issues that will have to be addressed if the full benefits of the emerging digital world are to be realized.
The first lesson to be learned, and in fact the context within which all of the issues associated with the emerging digital world must be seen, is that the amount of information and data being created and transmitted is huge and only going to continue to grow—and grow very rapidly. On the consumer side, the proliferation of smartphones and tablets will drive ever-increasing demands from users for more entertainment and more information. Social media, in particular, are expected to drive enormous amounts of data traffic. From the business/commercial side as well as for various government functions, perhaps even larger volumes of data will be produced by devices and equipment—whether it be sensors, machine-to-machine communications or wearable devices—the Internet of Things.
Administrations around the world have already started to respond to the challenges associated with these new data demands, and so analysing the impact and effectiveness
of their policy choices is thus becoming a critical part of the ongoing discussion of how to develop appropriate policies for the new digital world. To help in this regard, ITU has developed the ICT Regulatory Tracker, a new evidence-based analytical tool that can help identify the strengths and weaknesses of regulatory interventions in order to provide more complete information for all stakeholders as they develop their own responses to the evolution in technology, services and policy. One of the early findings made possible by the Tracker is that fourth generation regulation—integrated regulation led by economic and social policy goals—is much more effective at driving both fixed and mobile broadband penetration and adoption than old-style, industry-specific regulation. The lesson: smart regulation leads to more economic growth.
Mobile networks are expected to be the primary method people use to access broadband services, particularly in developing countries. Because of this, spectrum managers around the world are under strong pressure to make more spectrum available for wireless broadband use. Increasingly, as unused spectrum becomes harder to find, regulators are considering new ways to accommodate broadband spectrum expansion through innovations in sharing and licensing, without compromising incumbent spectrum uses. Such innovations include new technologies to improve legacy sharing methods, such as “smart” antennas that help to focus and sharpen the directionality of transmissions; small cells, which can be used to improve frequency re-use; spectrum occupancy databases, which allows new devices/users to share spectrum by using unoccupied channels or frequencies in geographic areas where incumbents are present or where there are no incumbents; and dynamic spectrum access (DSA) – a general term for a developing set of technologies that incorporate sensing techniques – which is being developed to allow transmitters to detect and avoid interference with incumbent uses in real
223Trends in Telecommunication Reform 2015
time. Finally, cellular network operators in Europe and the United States are developing the concept of “licensed shared access” (LSA), a framework that gives operators “priority access” to spectrum shared with incumbent users (such as government spectrum users), perhaps using a database approach similar to those used for white spaces. Exploration and experimentation is likely to continue on both national and international levels. Certainly, not all techniques are needed or appropriate for all economies and situations, but with the increasing need for broadband spectrum, these innovations should be a welcome addition for regulators’ spectrum management toolkits.
As state-owned, monopoly telecommunication service providers have faded away in the last few decades, they have been replaced by liberalized regimes that relay on competition rather than regulation to generate technical innovation and economic benefits. The transition, however, has not been easy and the emerging broadband-centric network environment presents varying and complex regulatory challenges. Most importantly, there are a host of new obstacles arising from the entry of new entrants with new (over-the-top) business models and alternative costs structures, which, when coupled with the convergence of services and a rapid increase in the flow of data across the globe, have placed a tremendous burden on old revenue streams and long-standing regulatory regimes. As a result, regulators and policy-makers have been forced to act to reduce barriers to competition and protect consumer interests. Several key reforms are being used to address the various challenges, including: liberalized licensing requirements; access obligations (physical and financial); infrastructure sharing requirements; and even the creation of wholesale networks to supply backbone or access services to retail providers.
The introduction of new services and shifting data flows have given rise to several important issues for competition policy. First, as convergence has changed the way services are developed and delivered, net neutrality has emerged as an important issue. Net neutrality in its simplest definition means that digital consumers should not find that their access to, and use of, specific apps, content
or services is blocked or slowed down by their broadband access provider – provided that the content is legal. The concern of net neutrality proponents is that Internet service providers will discriminate against services that compete with them (by blocking Voice over IP, for example) or try to charge content providers for better access to customers. Although only a few countries have so far enacted strict net neutrality requirements, more seemed poised to do so in the near future. Second, there are genuine concerns that the increasing complexity of the Internet interconnection market and lack of regulation will lead to market failure, increased disputes between access and content providers, and the ability of large players to exercise significant market power. This has led to calls to replace the current system of privately negotiated peering and transit arrangements with a more regulatory approach. So far, however, few countries have begun regulating such connections and agreements. Third, policy-makers and regulators are increasingly focusing on consumer rights and protections. Regulators, for example, are looking carefully at any barriers to customers switching carriers, such as long-term contracts with high cancellation fees, number portability, and common standards for both hardware (ensuring that devices can interoperate with many networks) and software (the ability to easily port data from one service provider to another). Taken together, all these efforts are aimed at ensuring that consumers can have easy, unfettered access to the most advanced services and applications at the lowest possible prices.
Beyond spectrum and competition issues, however, another even bigger set of policy and regulatory challenges must be confronted. Given the huge amounts of data expected to be generated and transmitted, important issues arise regarding how all the information and data that is flowing over these networks will be used. For example, Big Data, which refers to the ability to gain insights from large amounts of data that would not be attainable from much smaller data sets, leads not only to higher efficiency, but also to innovative new products and services as new perspectives on a host of socio-economic issues become better understood. However, the use of Big Data is still in its infancy, and many issues have
224 Trends in Telecommunication Reform 2015
yet to be fully considered or decided. The challenges of Big Data are varied and complex, and the legal/regulatory options often risky. In particular, administrations will need to balance protecting the interests of the individuals against the ability of public and private sectors to innovate. This will require dialogue and cooperation between policy-makers and regulators, the companies involved, and the public itself. Going forward, policy-makers will have to:
• ensure protection not only for society itself, but for the users of Big Data; recognizing the shift in emphasis away from the point of data collection and to the point of use;
• protect human free will by limiting predictive approaches that seek to determine individual and societies’ decisions; these must be carefully managed to avoid holding those accountable based only on prediction;
• increase and improve the number of people capable of managing Big Data properly to insure that we understand what we are doing, and also to give those who believe they are aggrieved by the consequences of Big Data the appropriate means for redress; and
• keep the emerging data market fluid through proper frameworks and a number of oversight tools that seek to ensure that data markets are kept robust.
The rise of Big Data and digital data generally have important implications for the economy as a whole through the impact that massive new amounts of gathered data can have on business models. The increasing number of devices (and the applications that run on them) that collect and transmit data, coupled with new data transport, storage and analysis procedures, have enabled more and more businesses to utilize data in their business models. This indicates a trend towards data collection and use becoming a new driver of economic growth—across almost all sectors—but also raises questions for consumers and regulators that may wish to limit such growth. The data value circle model helps to analyze the impacts this trend may have on the emerging global digital economy, and exposes four key challenges: (i) the rise of dominant players that can control several parts of the
data-driven economy through vertical and horizontal integration; (ii) increasing numbers of partnerships, for example between over-the-top providers (OTTs) and operators, as a way of gaining preferential treatment; (iii) ensuring adequate transparency of consumer data; (iv) and the globalization of networks and services, which means that regulatory changes may have little effect if they are only applied on a national level. To be most successful, efforts to regulate global data collection must be international in scope.
With the emergence of Big Data and the increasingly sophisticated ways in which data is being used by businesses, one of the most important issues of the emerging digital world is ensuring that the end users’ interests and data are adequately protected. Among the major consumer concerns are:
• Privacy and Security. Perhaps the most important issue for online users is the privacy and security of their data. When accessing online services, consumers may not know what personal information is being collected about them, who is collecting it, who it might be passed on to, what purpose(s) their data is being used for, or if it is adequately protected again unintentional or illegal access. Although privacy and data protection approaches and rules vary considerably, policy-makers and regulators around the world have clearly heard user concerns and are making serious efforts to protect consumers’ data and privacy. Addressing such issues will be crucial to build trust in the digital world.
• Content. Almost all countries have mechanisms in place to deal with illegal content, but this is a complex area of policy since a balance needs to be achieved between freedom of expression on one hand, and the need to fight illegal activities on the other. Such issues are complicated by the fact that content can be legal in one country but illegal in another, and Internet companies often do not want to take up a law enforcement role. Similarly, some of the content consumers access over the Internet is copyrighted. Companies seeking to license that content often have to do so on a country-by-country basis, which can
225Trends in Telecommunication Reform 2015
Chapter 8
slow availability. From the regulator’s perspective, piracy and the possible anti-competitive effects of exclusive licensing arrangements have become important issues.
• Consumer rights and education. Consumers should have clear rights and obligations in dealing with various services online. Where such rights do not exist, new laws or rules may be needed. The cross-border nature of such transactions (and the actual delivery of products and services) can pose additional challenges. But such rights can only be exercised if consumers know and understand them. To help them, government agencies and/or regulators can: provide information to citizens on their rights and obligations through education campaigns and by providing clear information on their websites; receive complaints from consumers by operating online complaint-submission mechanisms; provide information on the available dispute resolution mechanisms; and approve industry mechanisms to ensure redress.
Policy-makers and regulators have an important role to play in all these issues, both in terms of setting rules that will protect consumers, as well as educating consumers on how to safely get the most out of their online experiences. Their task is often complicated by the fact that many of the actors that have become dominant in the online world are either unregulated or only lightly regulated. As more and more social and economic activity is carried out online, however, this may have to change.
Finally, as policy-makers and regulators develop and implement new approaches and laws/regulations to deal with the new
challenges of the digital world, it will be important to also devise ways to measure how well the new policies, plans and initiatives are working. This will allow all stakeholders to fairly evaluate whether broadband plans and digital strategies are achieving the objectives that have been set, and help to indicate where improvements can or should be made. The main lesson here is that monitoring needs to be a fully integrated part of broadband plans and strategies from start to finish – providing an information base for the initial development of plans and strategies as well as for checking the progress of particular policies and programs, and for the evaluation and reassessment of priorities and strategies. In the deployment stage, for example, there is a focus of attention on basic telecommunications/broadband indicators of availability obtained from service providers. When attention moves to indicators of adoption and use, barriers to access such as the need for improved digital literacy may need to be identified and addressed. Furthermore, when broadband becomes a core element of advanced services in sectors such as health and education, the savings flowing from the use of broadband capabilities may outweigh the costs. Within each sector, short, medium and long-term agendas need to take account of the different challenges associated with the deployment, adoption and integration stages, weighing short-term costs against long-term gains. When such programs are fully integrated, it will be import to measure outcomes not only in terms of costs and savings, but also in terms of overall gains in capability, efficiency, productivity, innovation and public welfare. New measures may need to be developed to monitor changes in people’s behaviour and they ways in which they interact with, and begin to depend on broadband services.
226 Trends in Telecommunication Reform 2015
ALSO AVAILABLE FROM ITU
PUBLICATIONSTrends in Telecommunication Reform: 4th generation regulation: driving digital communications ahead (14th Edition) ...........................................Free
Trends in Telecommunication Reform: Transnational aspects of regulation in a networked society, 2013 (13th Edition)...............................185 CHF
Trends in Telecommunication Reform: Smart Regulation for a Broadband World, 2012 (12th Edition) .........................................176 CHF
Trends in Telecommunicatiosn Reform: Enabling Tomorrow’s Digital World, 2010/11 (11th Edition) ...........................................117 CHF
Trends in Telecommunication Reform: Hands-on or Hands-off? Stimulating Growth Through Effective
ICT Regulation, 2009 (10th Edition) ..............................................................................................................................................106 CHF
Trends in Telecommunication Reform: Six Degrees of Sharing, 2008 (9th Edition) .......................................................................106 CHF
Trends in Telecommunication Reform: The Road to Next-Generation Networks (NGN), 2007 (8th Edition) .................................100 CHF
Trends in Telecommunication Reform: Regulating in the Broadband World, 2006 (7th Edition) .....................................................95 CHF
Trends in Telecommunication Reform: Licensing in an Era of Convergence, 2004/05 (6th Edition) ................................................95 CHF
Trends in Telecommunication Reform: Promoting Universal Access to ICTs, 2003 (5th Edition) ....................................................90 CHF
Trends in Telecommunication Reform: Effective Regulation, 2002 (4th Edition) .............................................................................90 CHF
Trends in Telecommunication Reform: Interconnection Regulation, 2000-2001 (3rd Edition) .........................................................90 CHF
Trends in Telecommunication Reform: Convergence and Regulation, 1999 (2nd Edition) ...............................................................75 CHF
Please contact the ITU Sales Service:Tel.: +41 22 730 6141Fax: +41 22 730 5194E-mail: [email protected]: www.itu.int
Note: Discounts are available for all ITU Member States, Sector Members, Associates and Academia and Least Developed Countries.

Printed in SwitzerlandGeneva, 2015
International Telecommunication Union
Sales and Marketing Division
Place des Nations
CH-1211 Geneva 20
Switzerland
www.itu.int/publications
Photo credits: ©Shutterstock