Curvature-dependent surface visualization of vascular structures
8
Computerized Medical Imaging and Graphics 34 (2010) 651–658 Contents lists available at ScienceDirect Computerized Medical Imaging and Graphics journal homepage: www.elsevier.com/locate/compmedimag Curvature-dependent surface visualization of vascular structures Jianhuang Wu a,b,∗ , Renhui Ma a,1 , Xin Ma a,2 , Fucang Jia a,3 , Qingmao Hu a,b,4 a Shenzhen Institutes of Advanced Technology, Chinese Academy of Sciences, 1068 Xueyuan Boulevard, University Town of Shenzhen, Xili Nanshan 518055, Shenzhen, China b The Chinese University of Hong Kong, Hong Kong SAR, China article info Article history: Received 29 September 2009 Received in revised form 24 July 2010 Accepted 30 July 2010 Keywords: Vessel visualization Centerline Bidirectional sampling Curvature-dependent subdivision abstract Efficient visualization of vascular structures is essential for therapy planning and medical education. Existing techniques achieve high-quality visualization of vascular surfaces at the cost of low rendering speed and large size of resulting surface. In this paper, we present an approach for visualizing vascular structures by exploiting the local curvature information of a given surface. To handle complex topology of loop and multiple parents and/or multiple children, bidirectional adaptive sampling and modified normal calculations at joints are proposed. The proposed method has been applied to cerebral vascular trees, liver vessel trees, and aortic vessel trees. The experimental results show that it can obtain a high-quality surface visualization with fewer polygons in the approximation. © 2010 Elsevier Ltd. All rights reserved. 1. Introduction Three-dimensional (3D) visualization of vascular structures can provide straightforward information of the morphology of vessels, spatial relations among these vessels and other relevant anatomic structures, intuitive depiction of curvature, and depth relations. Thus it can help surgeons to better understand the branching pat- tern and complex topology of vascular structures for better and quick decision making during surgery and is of vital importance in therapy planning and medical education. The vascular structures can be visualized by volume rendering or surface rendering. In surface rendering, there are two kinds of methods [1]: model-based and model-free. The former assumes that the cross-section of vessels is circular, while the latter makes no shape assumption of vessel cross-section. Model-based surface visualization methods require centerline extraction and radius esti- mation from segmented vessels [2–4]. Based on the centerline tree, geometric primitives such as cylinders [5] and truncated cones [6] are used to generate vessel surface for visualization. These model- based methods suffer from the low quality of the reconstruction surface and coarse transitions at vessel branching. To overcome the drawbacks, B-Spline surfaces [7], simplex meshes [8], convolution surfaces [9,10], and subdivision surfaces [11,12] are explored. ∗ Corresponding author. Tel.: +86 755 86392115; fax: +86 755 86392194. E-mail addresses: [email protected], [email protected] (J. Wu), ma [email protected] (R. Ma), [email protected] (X. Ma), [email protected] (F. Jia), [email protected] (Q. Hu). 1 Tel.: +86 755 86392120; fax: +86 755 86392194. 2 Tel.: +86 755 86392060; fax: +86 755 86392299. 3 Tel.: +86 755 86392116; fax: +86 755 86392194. 4 Tel.: +86 755 86392117; fax: +86 755 86392194. The most common model-free technique is Marching Cubes (MC) [13]. Unfortunately, MC has two major limitations: the gen- erated surface depends highly on the chosen isovalue and a slight change in value may result in great change in geometric and even topological features of the produced surface, and the visual quality may be very low because the yielded surface may have aliasing arti- facts inappropriate for computational fluid dynamics simulations. Recently, Schumann [14,15] presented a model-free technique which can produce high-quality surface from segmented vessels. The technique, which was originally proposed to reconstruct sur- face from 3D point cloud, is based on multi-level partition unity implicits [16]. Although the above-mentioned methods like subdivision sur- face and convolution surface can generate smooth surface, the rendering speed is slow especially when the size of the recon- structed surface is large. Let us take subdivision surface based method, the most advanced technique of model-based visualiza- tion of vascular structures [17], for example. Felkel et al. [12] applied Catmull–Clark scheme to the initial mesh for the subdivi- sion surface, which is defined as the limit of a sequence of successive refinements [18]. Unfortunately, the number of polygons grows exponentially with the iteration of subdivision, e.g. an initial ves- sel surface with 7834 triangles can reach 2,005,504 triangles after only four iterations (each iteration will yield a 3 times increase in polygon). Such a huge number of polygons will not only affect the rendering speed but the post processing, e.g. collision detection as well as real-time vessel deformation simulation. To achieve a better balance among vascular structure visualiza- tion, size of the reconstructed surface, and the rendering speed, this paper presents an approach of curvature-dependent surface visu- alization of vascular structure. The goal is to obtain a high-quality topologically preserved two-manifold surface with as few polygons 0895-6111/$ – see front matter © 2010 Elsevier Ltd. All rights reserved. doi:10.1016/j.compmedimag.2010.07.006
Transcript of Curvature-dependent surface visualization of vascular structures
C
Ja
b
a
ARRA
KVCBC
1
pssTtqt
omtnvmgabsds
m(
0d
Computerized Medical Imaging and Graphics 34 (2010) 651–658
Contents lists available at ScienceDirect
Computerized Medical Imaging and Graphics
journa l homepage: www.e lsev ier .com/ locate /compmedimag
urvature-dependent surface visualization of vascular structures
ianhuang Wua,b,∗, Renhui Maa,1, Xin Maa,2, Fucang Jiaa,3, Qingmao Hua,b,4
Shenzhen Institutes of Advanced Technology, Chinese Academy of Sciences, 1068 Xueyuan Boulevard, University Town of Shenzhen, Xili Nanshan 518055, Shenzhen, ChinaThe Chinese University of Hong Kong, Hong Kong SAR, China
r t i c l e i n f o
rticle history:eceived 29 September 2009
a b s t r a c t
Efficient visualization of vascular structures is essential for therapy planning and medical education.Existing techniques achieve high-quality visualization of vascular surfaces at the cost of low rendering
eceived in revised form 24 July 2010ccepted 30 July 2010
eywords:essel visualization
speed and large size of resulting surface. In this paper, we present an approach for visualizing vascularstructures by exploiting the local curvature information of a given surface. To handle complex topology ofloop and multiple parents and/or multiple children, bidirectional adaptive sampling and modified normalcalculations at joints are proposed. The proposed method has been applied to cerebral vascular trees, livervessel trees, and aortic vessel trees. The experimental results show that it can obtain a high-quality surface
polyg
enterlineidirectional samplingurvature-dependent subdivisionvisualization with fewer
. Introduction
Three-dimensional (3D) visualization of vascular structures canrovide straightforward information of the morphology of vessels,patial relations among these vessels and other relevant anatomictructures, intuitive depiction of curvature, and depth relations.hus it can help surgeons to better understand the branching pat-ern and complex topology of vascular structures for better anduick decision making during surgery and is of vital importance inherapy planning and medical education.
The vascular structures can be visualized by volume renderingr surface rendering. In surface rendering, there are two kinds ofethods [1]: model-based and model-free. The former assumes
hat the cross-section of vessels is circular, while the latter makeso shape assumption of vessel cross-section. Model-based surfaceisualization methods require centerline extraction and radius esti-ation from segmented vessels [2–4]. Based on the centerline tree,
eometric primitives such as cylinders [5] and truncated cones [6]re used to generate vessel surface for visualization. These model-
ased methods suffer from the low quality of the reconstructionurface and coarse transitions at vessel branching. To overcome therawbacks, B-Spline surfaces [7], simplex meshes [8], convolutionurfaces [9,10], and subdivision surfaces [11,12] are explored.∗ Corresponding author. Tel.: +86 755 86392115; fax: +86 755 86392194.E-mail addresses: [email protected], [email protected] (J. Wu),
a [email protected] (R. Ma), [email protected] (X. Ma), [email protected]. Jia), [email protected] (Q. Hu).
1 Tel.: +86 755 86392120; fax: +86 755 86392194.2 Tel.: +86 755 86392060; fax: +86 755 86392299.3 Tel.: +86 755 86392116; fax: +86 755 86392194.4 Tel.: +86 755 86392117; fax: +86 755 86392194.
895-6111/$ – see front matter © 2010 Elsevier Ltd. All rights reserved.oi:10.1016/j.compmedimag.2010.07.006
ons in the approximation.© 2010 Elsevier Ltd. All rights reserved.
The most common model-free technique is Marching Cubes(MC) [13]. Unfortunately, MC has two major limitations: the gen-erated surface depends highly on the chosen isovalue and a slightchange in value may result in great change in geometric and eventopological features of the produced surface, and the visual qualitymay be very low because the yielded surface may have aliasing arti-facts inappropriate for computational fluid dynamics simulations.Recently, Schumann [14,15] presented a model-free techniquewhich can produce high-quality surface from segmented vessels.The technique, which was originally proposed to reconstruct sur-face from 3D point cloud, is based on multi-level partition unityimplicits [16].
Although the above-mentioned methods like subdivision sur-face and convolution surface can generate smooth surface, therendering speed is slow especially when the size of the recon-structed surface is large. Let us take subdivision surface basedmethod, the most advanced technique of model-based visualiza-tion of vascular structures [17], for example. Felkel et al. [12]applied Catmull–Clark scheme to the initial mesh for the subdivi-sion surface, which is defined as the limit of a sequence of successiverefinements [18]. Unfortunately, the number of polygons growsexponentially with the iteration of subdivision, e.g. an initial ves-sel surface with 7834 triangles can reach 2,005,504 triangles afteronly four iterations (each iteration will yield a 3 times increase inpolygon). Such a huge number of polygons will not only affect therendering speed but the post processing, e.g. collision detection aswell as real-time vessel deformation simulation.
To achieve a better balance among vascular structure visualiza-tion, size of the reconstructed surface, and the rendering speed, thispaper presents an approach of curvature-dependent surface visu-alization of vascular structure. The goal is to obtain a high-qualitytopologically preserved two-manifold surface with as few polygons

652 J. Wu et al. / Computerized Medical Imaging and Graphics 34 (2010) 651–658
ndent
aem
d3
2
itfidt
dpsdmu
2
ctpivssct
Fc
Fig. 1. Flow chart of curvature-depe
s possible. To handle complex topology of loop and multiple par-nts and/or multiple children, bidirectional adaptive sampling andodified normal calculations at joints are proposed.This paper is organized as follows. Details of the method are
escribed in Section 2. Results and discussion are given in Section. Finally, concluding remarks are presented in Section 4.
. Methodology
The schematic flow chart of the proposed method is illustratedn Fig. 1. The centerline tree from segmented vessels is sampled byhe proposed bidirectional sampling technique to improve the sur-ace quality at joints with branches. Then, the quadrilateral meshs tiled through a recursive branching-construction procedure asescribed in [11,19] and is converted to triangular mesh. The curva-ures of the triangular mesh are estimated for adaptive subdivision.
Though our method bears resemblance to existing methodescribed in [11,19], there are three major differences: (1) theroposed bidirectional sampling versus existing unidirectionalampling, (2) determination of up-vector and normal at joint to han-le vessels with complex topology in tiling the base quadrilateralesh, and (3) the proposed adaptive subdivision versus existing
niform subdivision.
.1. Centerline tree
The input to reconstruct adaptive subdivision surface is vesselenterline tree [11] which is obtained from segmented vessels. Theree (Fig. 2) consists of root (vessel start), joint (vessel branching),arent segment and children segments. Each vessel cross-section
s defined by a center vertex with an estimated radius. The centerertices of the cross-sections lie on the centerline and the cross-
ections are perpendicular to the centerline. In Fig. 2, the vesselegment X is the parent segment of vessel segments Y and Z. In aenterline tree, a child segment may have multiple parents whenhe vessel tree has a loop.ig. 2. Vessel centerline tree and its representation (left is the geometry of vesselross-section and right is vessel tree geometry and segments).
visualization of vascular structures.
2.2. Bidirectional sampling
To avoid generating a non-manifold initial base mesh, the cen-terline tree needs to be down-sampled. We propose bidirectionalsampling to sample the centerline. The technique samples thecenterline from both the first and last vessel cross-section simulta-neously using Eq. (1) [19] with the first and last vessel cross-sectionbeing kept:
xi+1 − xi = g(yi+1) + g(yi) i ∈ [0, N − 1] (1)
where g(yi) = ˛ri/(1 + ˇ�i), xi is the center of the cross-section, riand �i are the corresponding radius and Gaussian curvature respec-tively. Generally, ˛ is a positive scalar value, �i is obtained accordingto the way described in [20] and ˇ is a positive weight on curvatureinfluence.
Take the vessel segment illustrated in Fig. 3 for example, theproposed bidirectional sampling procedure works in this way: sup-pose that the sampling is currently from left to right and the xi
has been kept to check if xi+1 should be kept. If the Euclideandistances meet d(xi+1, xi) ≥ g(yi+1) + g(yi), vertex xi+1 is kept; oth-erwise, the smallest j with xi+j satisfying d(xi+j , xi) ≥ g(yi+j) + g(yi)(j ≥ 2) is found, and the average of xi+j and xi+j−1 will be taken asthe next new vertex. Similarly, the sampling procedure proceedssimultaneously from right to left and stops when they meet at thesame sample point. If they do not meet at the same sample point,we check the distance between them. If the distance satisfies d(xl,xr) ≤ g(yl) + g(yr), where xl (xr) is the second last sampling pointfrom left to right (right to left), the procedure ends. Otherwise, theaverage of xl and xr is taken as the last sampling point, while theprocedure ends.
2.3. Base quadrilateral mesh generation
Once the centerline has been down-sampled, a base mesh is gen-erated with quadrilateral patch along the centerline by a recursiveprocedure. For the completeness of the paper, we briefly intro-duce the main procedure. More details can be found from Refs.[11,12,21]. The procedure consists of two parts:
(1) Preprocessing steps, including computation of the directions
and normals of segments, classification of segments to forwardor backward, joining of normals at branches and determinationof up-vectors.(2) Tiling the vessel tree. This part generates the base meshrecursively according to the tree structure (i.e. branching and
Fig. 3. Bidirectional sampling example (bottom is the centerline to be sampled andtop is the sampled result).

J. Wu et al. / Computerized Medical Imaging and Graphics 34 (2010) 651–658 653
Ft
2
pilf(cpcvabTnoni
2
qiscvpartfpe
2
cft
be split into two triangles (Fig. 6 (left)). For a triangle with twoneighboring subdivided triangles, it will be split by two triangleedges (Fig. 6 (middle)). When the triangle has three neighborsto be subdivided, it will be subdivided with regular refinement(Fig. 6 (right)).
ig. 4. Definition of up-vector (�0 is in the direction of the up-vector which defineshe four quadrants in the circular cross-section).
non-branching) for a given level of the tree. For the non-branching vessel tree, the surface is tiled from the secondcross-section to the second last cross-section, based on theassumption that the first cross-section has been handled. Forthe branching part, the surface region is generated by patchingthe end cross-section and the first cross-sections of the otherbranches which share the joint.
.3.1. Determination of up-vector and normals at jointsDetermination of normals at joints and up-vectors is of
aramount importance during tiling of the base mesh, becausencorrect up-vectors will result in a twisted surface [11], particu-arly at the joint of branchings. Up-vector is defined as the first of theour vectors which equally dissect the square-shape cross-sectionFig. 4) and is propagated along the segments. When dealing withomplex topology of vascular structures (e.g. a branch has multi-le parents or multiple children), we propose a simple method toalculate the normal vector at the joint as the average of normalectors of the last cross-section of all incoming parent segments,nd the normal vectors of the last cross-sections of these parentranches are replaced by the computed normal vector at the joint.hen, the up-vector is projected to the normal plane (defined by theormal and center of the cross-section) along the trunk branch. Forther cases such as a branch with only one parent or one child, theormal vector at joint and the up-vector are handled as described
n [11].
.4. Curvature estimation
Before estimating the curvature of each vertex, the generateduadrilateral meshes are converted to triangular meshes by bisect-
ng the diagonal of every quad, because we use Loop subdivisioncheme [18] which is a face-split scheme for triangular meshes toonstruct the vessel surface. There are many references about cur-ature estimation on triangular meshes [22]. In this work, we use aolynomial fitting method which fits a 2-ring neighborhood aroundvertex, as this method has a good performance on accuracy and is
obust to noise [22]. The 2-ring neighborhood is constructed fromhe 1-ring (the star of a vertex) by adding all of the vertices of anyace containing a vertex of the 1-ring neighborhood. Generally, theolynomial is a second-order polynomial with six coefficients inach coordinate direction.
.5. Adaptive subdivision
Subdivision surfaces have been widely used in the field ofomputer graphics as it is easy to generate a smooth surfacerom arbitrary topology of complex geometric models withoutrimming/patching, and to deal with multi-resolution analysis of
Fig. 5. Color-coded visualization of Gaussian curvature (circle region with highcurvature and rectangle region with low curvature).
complex geometry [18]. Therefore, vessel surfaces reconstructed bysubdivision surface can be easily tuned to multi-scale visualizationand other applications.
In surface sampling and mesh generation, there is a principlethat highly curved regions should be densely sampled [23] or tri-angulated [24] and vice versa. Therefore, to derive a subdivisionsurface, there is no need to refine the whole model, instead, onlyareas with high curvature (e.g. blue encircled region shown in Fig. 5)need to be subdivided. In addition, refining a relatively flat surface(e.g. red rectangular region shown in Fig. 5) still generates a flatsurface without improving the surface quality. We thus proposeto subdivide the generated base mesh depending on curvature toobtain the smooth vessel surface in four steps:
(1) If the converted triangular mesh is coarse, it is subdivided byone level of uniform refinement to attain a reasonable resolu-tion in order to estimate curvature more accurately.
(2) Estimate the curvature for each vertex and the curvatures areprocessed by histogram equalization after scaling the curvatureranging between 0 and 1.
(3) For every triangle, if the curvatures of all its three vertices liebelow a user-specified threshold �, then this triangle is taggedand will not be subdivided at the next level of subdivision.
(4) Remove cracks [25]. During a subdivision process, if a triangleis to be subdivided but its neighboring triangles are not to besubdivided, a crack is generated which should be removed. Atriangle with one neighboring triangle to be subdivided will
Fig. 6. From left to right, cases of subdivided triangle (grey color) with one, two,and three subdivided neighbors and the corresponding subdivision refinement (bluecolor). (For interpretation of the references to color in this figure legend, the readeris referred to the web version of the article.)

654 J. Wu et al. / Computerized Medical Imaging and Graphics 34 (2010) 651–658
F ce usir
3
(gntudcl
ig. 7. (a) Bidirectional sampling result of a cerebral tree, (b) the generated surfaectangle region in (b).
. Results and discussion
We applied the proposed approach to visualize cerebral treeFig. 7), liver tree (Fig. 8 (left)) and aorta tree (Fig. 8 (right)). Theenerated surface offers a good balance between surface smooth-ess and surface size. A close check near branchings shows that
ransition at the branching is geometrically continuous and nat-rally smooth (Fig. 8). Fig. 7a shows a cerebral centerline tree,own-sampled by our bidirectional sampling strategy and pro-essed with one level of curvature-dependent subdivision after oneevel of uniform subdivision. As shown in Fig. 7c, the regions withFig. 8. Visualization of liver tree (left) and
ng adaptive curvature-dependent subdivision, and (c) the zoom region of the red
high curvature are approximated with more faces while those areaswith relatively low curvatures are not. With our method, the recon-structed vessel surface can have fewer polygons while keepingcomparable quality to that of the uniform subdivision.
3.1. Comparison between bidirectional sampling andunidirectional sampling
In the work of Felkel et al. [11,12], the centerline is down-sampled to a lower resolution such that the distance of the
aorta tree (right) with our method.

J. Wu et al. / Computerized Medical Imagin
Fb
ntoFocommc
Fs
ig. 9. For vessel segment with a large radius and curvature (left), or with smallranching angle and large radius (right), the generated surface can be non-manifold.
eighboring segments is comparable to the vessel diameter. Thisechnique is simple but neglects the significant change in curvaturef the centerline which can yield non-manifold base mesh (Fig. 9).urthermore, evenly sampling can not characterize the geometryf the vessel correctly. Therefore, Luboz et al. [19] used Eq. (1) to
onstruct a non-linear equation and solved the equation by meansf Broydn’s method [26] to obtain new vertices. Unfortunately, thisethod may not get correct vertices, because the Broydn’s methoday not be convergent when a vertex in the centerline has a highurvature while its two adjacent vertices have a low curvature.
ig. 10. Sampling centerline using unidirectional sampling (a), the proposed bidirectionalurface from bidirectional sampling (d).
g and Graphics 34 (2010) 651–658 655
Furthermore, solving the non-linear equation is time consumingespecially when the input dataset is large.
Both [11] and [19] adopted unidirectional sample along the cen-terline, resulting in the first two (or the last two) vertices beingtoo close (or far), as shown in Fig. 10a, and consequently the dis-tance between the two vertices cannot meet the requirement ofsampling. Therefore, the generated base mesh of this vessel seg-ment can be very thin to make the transition at vessel joints coarse(Fig. 10c).
Our bidirectional sampling method can yield a better resolution(Fig. 10b) and guarantee that the distance between the first and lasttwo segments is not too small (or large). Accordingly, the producedsurface at branching is naturally smooth (Fig. 10d) without a flattwist (Fig. 10c) to avoid misinterpretation of vessel narrowing (falsestenosis).
3.2. Determination of up-vectors
When a branch has multiple parents, Wu et al. [21] projected
all the up-vectors of the parent branches onto the plane definedby the joint location and the normal of outgoing child segment,and then took the average of these projected up-vectors as the newup-vector. The drawback of this approach is that the produced up-vector may be singular [21]. When this happened, the up-vectorsampling (b), generated surface based on unidirectional sampling (c), and generated
656 J. Wu et al. / Computerized Medical Imaging and Graphics 34 (2010) 651–658
npIinumtmpoevl
3
dpptrb�tmtss
cldfb
dcastcbs
3
c
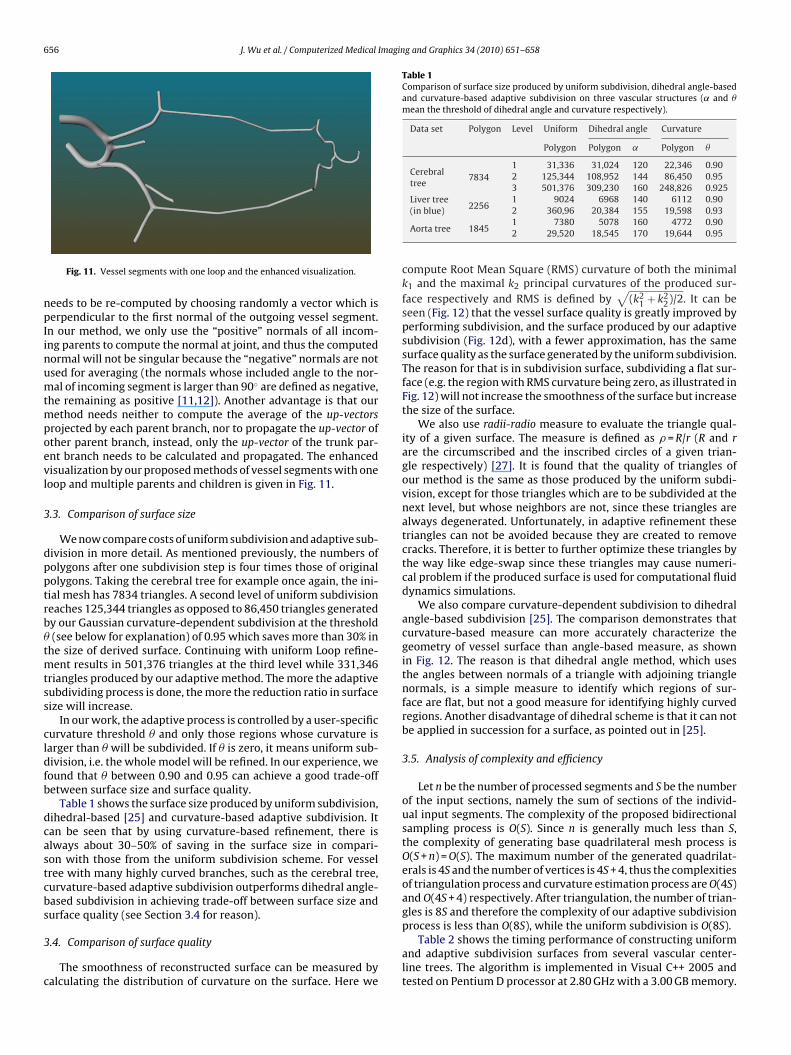
Table 1Comparison of surface size produced by uniform subdivision, dihedral angle-basedand curvature-based adaptive subdivision on three vascular structures (˛ and �mean the threshold of dihedral angle and curvature respectively).
Data set Polygon Level Uniform Dihedral angle Curvature
Polygon Polygon ˛ Polygon �
Cerebraltree
78341 31,336 31,024 120 22,346 0.902 125,344 108,952 144 86,450 0.953 501,376 309,230 160 248,826 0.925
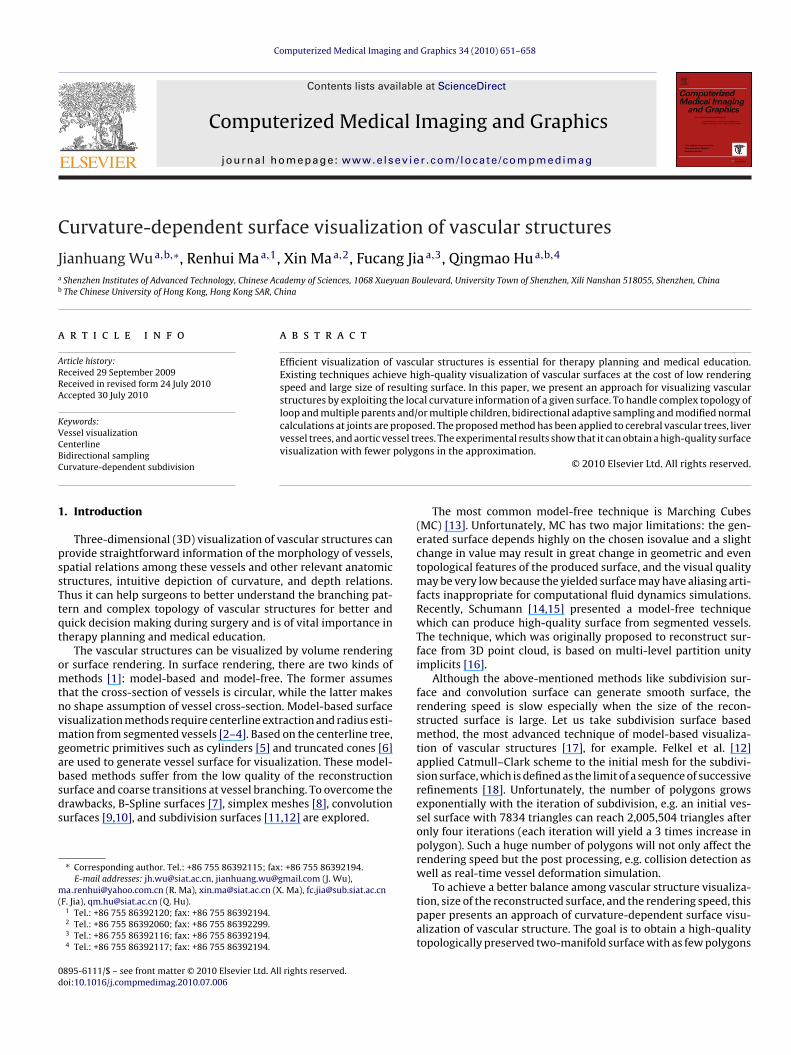
Fig. 11. Vessel segments with one loop and the enhanced visualization.
eeds to be re-computed by choosing randomly a vector which iserpendicular to the first normal of the outgoing vessel segment.
n our method, we only use the “positive” normals of all incom-ng parents to compute the normal at joint, and thus the computedormal will not be singular because the “negative” normals are notsed for averaging (the normals whose included angle to the nor-al of incoming segment is larger than 90◦ are defined as negative,
he remaining as positive [11,12]). Another advantage is that ourethod needs neither to compute the average of the up-vectors
rojected by each parent branch, nor to propagate the up-vector ofther parent branch, instead, only the up-vector of the trunk par-nt branch needs to be calculated and propagated. The enhancedisualization by our proposed methods of vessel segments with oneoop and multiple parents and children is given in Fig. 11.
.3. Comparison of surface size
We now compare costs of uniform subdivision and adaptive sub-ivision in more detail. As mentioned previously, the numbers ofolygons after one subdivision step is four times those of originalolygons. Taking the cerebral tree for example once again, the ini-ial mesh has 7834 triangles. A second level of uniform subdivisioneaches 125,344 triangles as opposed to 86,450 triangles generatedy our Gaussian curvature-dependent subdivision at the threshold(see below for explanation) of 0.95 which saves more than 30% in
he size of derived surface. Continuing with uniform Loop refine-ent results in 501,376 triangles at the third level while 331,346
riangles produced by our adaptive method. The more the adaptiveubdividing process is done, the more the reduction ratio in surfaceize will increase.
In our work, the adaptive process is controlled by a user-specificurvature threshold � and only those regions whose curvature isarger than � will be subdivided. If � is zero, it means uniform sub-ivision, i.e. the whole model will be refined. In our experience, weound that � between 0.90 and 0.95 can achieve a good trade-offetween surface size and surface quality.
Table 1 shows the surface size produced by uniform subdivision,ihedral-based [25] and curvature-based adaptive subdivision. Itan be seen that by using curvature-based refinement, there islways about 30–50% of saving in the surface size in compari-on with those from the uniform subdivision scheme. For vesselree with many highly curved branches, such as the cerebral tree,urvature-based adaptive subdivision outperforms dihedral angle-ased subdivision in achieving trade-off between surface size andurface quality (see Section 3.4 for reason).
.4. Comparison of surface quality
The smoothness of reconstructed surface can be measured byalculating the distribution of curvature on the surface. Here we
Liver tree(in blue) 2256
1 9024 6968 140 6112 0.902 360,96 20,384 155 19,598 0.93
Aorta tree 18451 7380 5078 160 4772 0.902 29,520 18,545 170 19,644 0.95
compute Root Mean Square (RMS) curvature of both the minimalk1 and the maximal k2 principal curvatures of the produced sur-face respectively and RMS is defined by
√(k2
1 + k22)/2. It can be
seen (Fig. 12) that the vessel surface quality is greatly improved byperforming subdivision, and the surface produced by our adaptivesubdivision (Fig. 12d), with a fewer approximation, has the samesurface quality as the surface generated by the uniform subdivision.The reason for that is in subdivision surface, subdividing a flat sur-face (e.g. the region with RMS curvature being zero, as illustrated inFig. 12) will not increase the smoothness of the surface but increasethe size of the surface.
We also use radii-radio measure to evaluate the triangle qual-ity of a given surface. The measure is defined as � = R/r (R and rare the circumscribed and the inscribed circles of a given trian-gle respectively) [27]. It is found that the quality of triangles ofour method is the same as those produced by the uniform subdi-vision, except for those triangles which are to be subdivided at thenext level, but whose neighbors are not, since these triangles arealways degenerated. Unfortunately, in adaptive refinement thesetriangles can not be avoided because they are created to removecracks. Therefore, it is better to further optimize these triangles bythe way like edge-swap since these triangles may cause numeri-cal problem if the produced surface is used for computational fluiddynamics simulations.
We also compare curvature-dependent subdivision to dihedralangle-based subdivision [25]. The comparison demonstrates thatcurvature-based measure can more accurately characterize thegeometry of vessel surface than angle-based measure, as shownin Fig. 12. The reason is that dihedral angle method, which usesthe angles between normals of a triangle with adjoining trianglenormals, is a simple measure to identify which regions of sur-face are flat, but not a good measure for identifying highly curvedregions. Another disadvantage of dihedral scheme is that it can notbe applied in succession for a surface, as pointed out in [25].
3.5. Analysis of complexity and efficiency
Let n be the number of processed segments and S be the numberof the input sections, namely the sum of sections of the individ-ual input segments. The complexity of the proposed bidirectionalsampling process is O(S). Since n is generally much less than S,the complexity of generating base quadrilateral mesh process isO(S + n) = O(S). The maximum number of the generated quadrilat-erals is 4S and the number of vertices is 4S + 4, thus the complexitiesof triangulation process and curvature estimation process are O(4S)and O(4S + 4) respectively. After triangulation, the number of trian-gles is 8S and therefore the complexity of our adaptive subdivision
process is less than O(8S), while the uniform subdivision is O(8S).Table 2 shows the timing performance of constructing uniformand adaptive subdivision surfaces from several vascular center-line trees. The algorithm is implemented in Visual C++ 2005 andtested on Pentium D processor at 2.80 GHz with a 3.00 GB memory.

J. Wu et al. / Computerized Medical Imaging and Graphics 34 (2010) 651–658 657
Fig. 12. Color-coded visualization of RMS curvature distribution for the vessel surface. (asurface, (c) the result of two levels of adaptive subdivision based on dihedral angle withsubdivision based on Gaussian curvature with threshold 0.95 on the initial surface.
Table 2Timing performance for each process of generating subdivision surface on threevascular trees.
Data set Data size Method Run time (s)
n S Sam MeGen TriEst Sub
Cerebraltree
61 1523Uni 0.001 4.425 – 0.397Ang 0.001 4.367 0.030 0.309Cur 0.001 4.367 0.115 0.306
Liver tree 131 3107Uni 0.003 7.875 – 1.186Ang 0.003 7.545 0.109 1.034Cur 0.003 7.545 0.324 1.029
Phantomtree
52 2832Uni 0.002 6.717 – 0.787Ang 0.002 6.538 0.093 0.640Cur 0.002 6.538 0.279 0.636
Uni: one level of uniform subdivision; Ang: one level of subdivision based on dihe-dral angle with threshold 165◦; Cur: one level of subdivision based on based onGaussian curvature with threshold 0.90; Sam: unidirectional sampling for Uni andbidirectional sampling for Ada; MeGen: base quadrilateral mesh generating process;TriEst: for Ang, TriEst means triangulation and dihedral angle estimation process; forCur, TriEst means triangulation and curvature estimation process; Sub: subdivisionprocess.
) The initial surface, (b) the result of two levels of uniform subdivision on the initialthreshold 165◦ on the initial surface, and (d) the result of two levels of adaptive
It is clearly seen that the most time-consuming process is generat-ing the base quadrilateral mesh because the process is a recursiveprocedure whose complexity depends on the input vascular treestructure. Compared to the uniform subdivision-based method[11,19], our method needs additional processes of triangulation andcurvature estimation; fortunately, these two processes need a littletime and help to achieve curvature-dependent adaptive subdivi-sion which saves a great deal of memory complexities (discussedin Section 3.3). In contrast to dihedral angle-based subdivision, ourmethod is a bit slower as the curvature estimation is a bit morecomplicated than dihedral angle computation.
4. Conclusion
In this paper, we have presented a method for visualizing vas-cular structures defined by its centerline and radius. To achieve
a smooth transition at branches, we proposed a bidirectionalsampling strategy; by means of that, the centerline can be down-sampled to generate a topologically-correct base mesh. To dealwith complex topology of vascular structures, we devised a wayto determinate normals and up-vector at joint branchings. Finally,
6 Imagin
tfsslswOalcigvwa
A
amToF
R
[
[
[
[
[
[
[
[
[
[
[
[
[
[
[
[
[[
[
[
Shenzhen Institutes of Advanced Technology, and was awarded the Hundred TalentProgram, Chinese Academy of Sciences in 2008. He has published more than 100
58 J. Wu et al. / Computerized Medical
o reach a better trade-off between the surface quality and the sur-ace size, we exploited the differential geometric property of a givenurface and used curvature-dependent subdivision to generate theurface for visualization. Experimental tests on a variety of vascu-ar structures demonstrate our method can achieve a high-qualityurface visualization with fewer polygons in the approximationhile keeping the same smoothness as the uniform subdivision.ur method can not only reduce the size of resulted surface in stor-ge space but reduce the computational load especially at higherevels of subdivision, thus the speed of rendering and interactionan be drastically improved. In the future, we will develop morenteractive facilities (e.g. annotation and angle qualification) foreometric analysis [28] of vascular structures, and for exploringasculature in our interventional neuroradiology simulator systemhich aims to provide a virtual environment for physicians to learn
nd practice without putting patients at risk [29].
cknowledgements
The authors thank all the anonymous reviewers for their valu-ble suggestions and comments, and thank Xiaohua Du for hisanual segmentation of the intrahepatic vasculature (Fig. 8 (left)).
his work was supported by National Natural Science Foundationf China under Grant No. 60803108 and China Postdoctoral Scienceoundation (Grant No. 20100470560).
eferences
[1] Oeltze S, Preim B. 3D visualization of vasculature: an overview. In: Visualizationin medicine and life sciences. Springer; 2007. p. 19–39.
[2] Volkau I, Ng TT, Marchenko Y, Nowinski WL. On geometric modeling of thehuman intracranial venous system. IEEE Trans Med Imag 2008;27(6):745–51.
[3] Bühler K, Felkel P, Cruz AL. Geometric methods for vessel visualization andquantification – a survey. In: Brunnet G, Hamann B, Müller H, editors. Geometricmodeling for scientific visualization. 2004. p. 399–420.
[4] Gülsün MA, Tek H. Geometric modeling of tubular structures. In: IEEE computersociety conference on computer vision and pattern recognition workshops(CVPRW). 2008. p. 1–8.
[5] Masutani Y, Masamune K, Dohi T. Region-growing-based feature extractionalgorithm for tree-like objects. In: Proceedings of visualization in biomedicalcomputing. 1996. p. 161–71.
[6] Hahn HK, Preim B, Selle D, Peitgen HO. Visualization and interaction techniquesfor the exploration of vascular structures. In: IEEE visualization 01. 2001. p.395–402.
[7] Höhne KH, Pflesser B, Pommert A, Riemer M, Schubert R, Schiemann T, et al. Arealistic model of the inner organs from the visible human data. In: Proceedingsof the international conference on medical image computing and computer-assisted intervention (MICCAI). 2000. p. 776–85.
[8] Bornik A, Reitinger B, Beichel R. Reconstruction and representation of tubularstructures using simplex meshes. In: Proceedings of winter school of computergraphics (WSCG). 2005. p. 61–5.
[9] Oeltze S, Preim B. Visualization of vascular structures with convolutionsurfaces. In: Proceedings of IEEE/Eurographics symposium on visualization(VisSym). 2004. p. 311–20.
10] Oeltze S, Preim B. Visualization of vascular structures with convolu-tion surfaces: method, validation and evaluation. IEEE Trans Med Imag2005;25(4):540–9.
11] Felkel P, Wegenkittl R, Bühler K. Surface models of tube trees. In: Proceedingsof the computer graphics international (CGI). 2004. p. 70–7.
12] Felkel P, Kanitsar A, Fuhrmann AL, Wegenkittl R. SMART-surface models fromby axis-and-radius-defined tubes. TR-VRVis-2002-008. Vienna, Austria: VRVisResearch Center; 2002.
13] Lorensen WE, Cline HE. Marching cubes: a high resolution 3D surface construc-tion algorithm. In: Proceedings of ACM SIGGRAPH. 1987. p. 163–9.
14] Schumann C, Neugebauer M, Bade R, Preim B, Peitgen HO. Implicit vessel surface
reconstruction for visualization and simulation. Int J CAS 2008;2(5):275–86.15] Schumann C, Oeltze S, Bade R, Preim B, Peitgen HO. Model-free surfacevisualization of vascular trees. In: Eurographics/IEEE-VGTC symposium onvisualization. 2007. p. 283–90.
16] Ohtake Y, Belyaev A, Alexa M, Turk G, Seidel HP. Multilevel partition of unityimplicits. ACM Trans Graph 2003;22:463–70.
g and Graphics 34 (2010) 651–658
17] Klein J, Bartz D, Friman O, Hadwiger M, Preim B, Ritter F, et al. Advanced algo-rithms in medical computer graphics. In: Proceedings of Eurographics 2008.2008. p. 25–44.
18] Zorin D, Schroder P. Subdivision for modeling and animation. SIGGRAPH 2000course notes; 2000. p. 13–16.
19] Luboz V, Wu X, Krissian K, Westin CF, Kikinis R, Cotin S, et al. A segmentationand reconstruction technique for 3d vascular structures. In: Proceedings of theinternational conference on medical image computing and computer-assistedintervention (MICCAI). 2005. p. 43–50.
20] Calabi E, Olver PJ, Shakiban C, Tannenbaun A, Haker S. Differential and numer-ically invariant signature curves applied to object recognition. Int J ComputVision 1998;26(2):107–35.
21] Wu X, Luboz V, Krissian K. Smooth vasculature reconstruction from patientscan. In: Proceedings of the virtual reality interactions and physical simulation,VRIPHYS poster. 2005.
22] Gatzke T, Grimm C. Improved curvature estimation on triangular meshes. In:Eurographics symposium on geometry processing. 2003. p. 57–67.
23] Li SZ. Adaptive sampling and mesh generation. Comput Aided Design1995;27(3):235–40.
24] Karkanis T, Stewar AJ. Curvature-dependent triangulation of implicit surfaces.IEEE Comput Graph 2001;21(2):60–9.
25] Amresh A, Farin G, Razdan A. Adaptive subdivision schemes for triangularmeshes. In: Farin G, Hagen H, Hamann B, editors. Hierarchical and geometricmethods in scientific visualization. Springer-Verlag; 2003. p. 319–27.
26] Numerical recipes in C. Cambridge; 1992.27] Pebay PP, Baker TJ. A comparison of triangle quality measures. In: 10th inter-
national meshing roundtable. 2001. p. 327–40.28] Piccinelli M, Veneziani A, Steinman DA, Remuzzi A, Antiga L. A framework for
geometric analysis of vascular structures: application to cerebral aneurysms.IEEE Trans Med Imag 2009;28(8):1141–55.
29] Ma X. Latest development of an interventional radiology training simulationsystem: NeuroCath. In: 12th international conference on human-computerinteraction, vol. 4561. 2007. p. 684–93.
Jianhuang Wu received his Ph.D. degree from Shenyang Institute of Automa-tion, Chinese Academy of Sciences in 2007. He is currently an assistant professorat the Center for Human-Computer Interaction, Shenzhen Institutes of AdvancedTechnology, Chinese Academy of Sciences. His research interests include medicalvisualization, virtual surgery and computer graphics. He now is a PI of researchproject funded by the National Natural Science Foundation of China.
Renhui Ma is now a M.S. student at the Center for Human-Computer Interaction,Shenzhen Institutes of Advanced Technology, Chinese Academy of Sciences. Hisresearch interests are geometric modeling and computer graphics.
Xin Ma received his M.S. degree from National University of Singapore in 2002. Heis now an associate professor at the Center for Human-Computer Interaction, Shen-zhen Institutes of Advanced Technology, Chinese Academy of Sciences. From 2000to 2007, he served as senior associate scientist in Biomedical Imaging Lab, Agency ofScience, Technology and Research of Singapore. After that he joined Shenzhen Insti-tutes of Advanced Technology. He has published more than 30 papers, filed morethan 5 international inventive patents. His research interests include virtual surgeryand computer assisted surgery.
Fucang Jia received his Ph.D. degree in Computer Application Technology from Insti-tute of Computing Technology, Chinese Academy of Sciences in 2004. He is currentlyan associate professor at the Center for Human-Computer Interaction, ShenzhenInstitutes of Advanced Technology, Chinese Academy of Sciences. From August 2004to April 2008, he engaged in R&D and management in Neurosurgery planning andnavigation, Orthopedic surgery navigation, medical image storage and transmissionsystem in Shenzhen Anke High-tech Co., Ltd. From December 2005 to August 2007,He was a postdoctoral research fellow in Zhejiang University and Anke High-techCo., Ltd. He has published more than 40 papers. Presently, he focuses his researchon surgical plan navigation and medical imaging information system.
Qingmao Hu received his Ph.D. degree from Huazhong University of Science andTechnology in 1990. He is now a professor and associate director of the Center forHuman-Computer Interaction, Shenzhen Institutes of Advanced Technology, Chi-nese Academy of Sciences. He served as lecturer, associate professor, and professorin the First Military Medical University from 1990 to 1996, and guest scientist andpost doctor in University of Bern, Switzerland from1996 to 2000. From 2000 to 2007,he served as associate member, member and senior scientist in Biomedical ImagingLab, Agency of Science, Technology and Research of Singapore. After that he joined
papers, filed more than 20 international inventive patents, and won RSNA meritawards 3 times, ASNR 1st prize 1 time. His research areas are: image analysis, medi-cal image processing, computer-aided diagnoses and therapy, computer vision, andpattern recognition.