Current Applications for an Array of Water Level Gauge Stations
29
Current Applications for an Array of Water Level Gauge Stations NEW DISCOVERIES IN THE SEICHE BAND AND THE METEOROLOGICAL-OCEANIC BAND Edwin Alfonso-Sosa, Ph. D. Ocean Physics Education, Inc. , 2014
Transcript of Current Applications for an Array of Water Level Gauge Stations
Current Applications for an Array of Water Level Gauge StationsNEW DISCOVERIES IN THE SEICHE BAND AND THE METEOROLOGICAL-OCEANIC BAND
Edwin Alfonso-Sosa, Ph. D.Ocean Physics Education, Inc. , 2014
A Tide Gauge is a Water Level Gauge (WLG)
The term “tide-gauge” is inadequate to describe or contain all the current applications of this kind of oceanographic instrument. A more proper name should be a Water Level Gauge (WLG), because it measures changes or oscillations in water levels due to a myriad of oceanographic and atmospheric phenomena. Tides are just one contributor to water level variability.

Physical Parameters Measured by WLG’sA single station can record: Water Level Height
Amplitude of the oscillation Time
Time scale of the oscillation Period or Frequency of
oscillation Arrival time of a particular
oscillation Form
Linear or nonlinear form Symmetric or asymmetric form Single or mixed form
An array of stations allow us to determine the: Coherence between
stations Age or lag time of any
event. Important for warning
systems. Spreading or Spatial
Coverage of an event Wave Speed or Celerity Pinpoint the Source
Area of a particular event
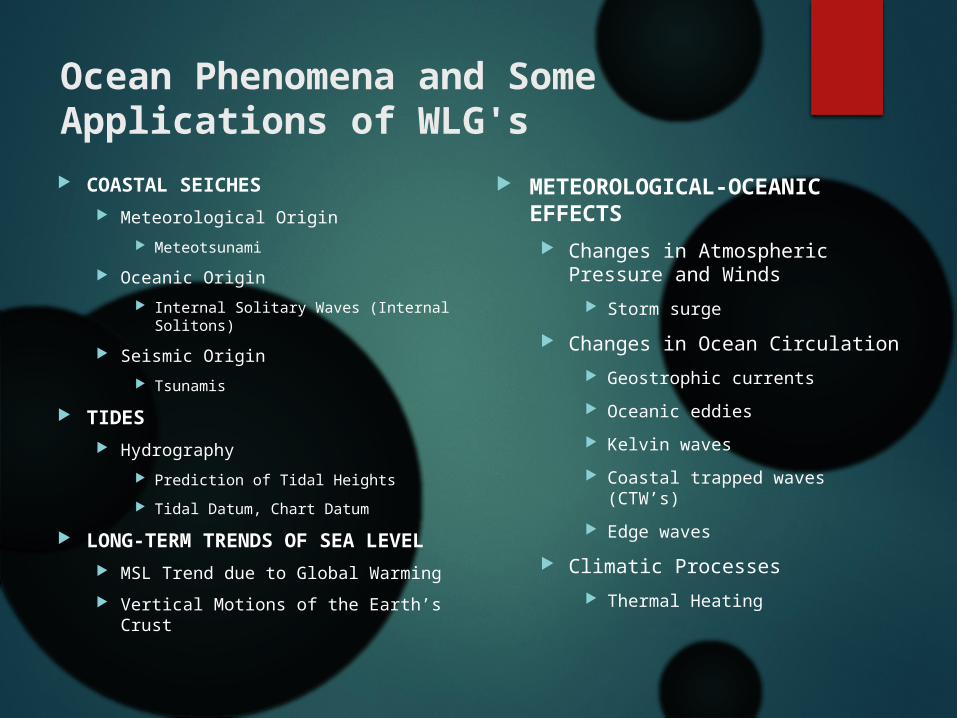
Ocean Phenomena and Some Applications of WLG's COASTAL SEICHES
Meteorological Origin Meteotsunami
Oceanic Origin Internal Solitary Waves (Internal
Solitons) Seismic Origin
Tsunamis TIDES
Hydrography Prediction of Tidal Heights Tidal Datum, Chart Datum
LONG-TERM TRENDS OF SEA LEVEL MSL Trend due to Global Warming Vertical Motions of the Earth’s
Crust
METEOROLOGICAL-OCEANIC EFFECTS Changes in Atmospheric
Pressure and Winds Storm surge
Changes in Ocean Circulation Geostrophic currents Oceanic eddies Kelvin waves Coastal trapped waves
(CTW’s) Edge waves
Climatic Processes Thermal Heating
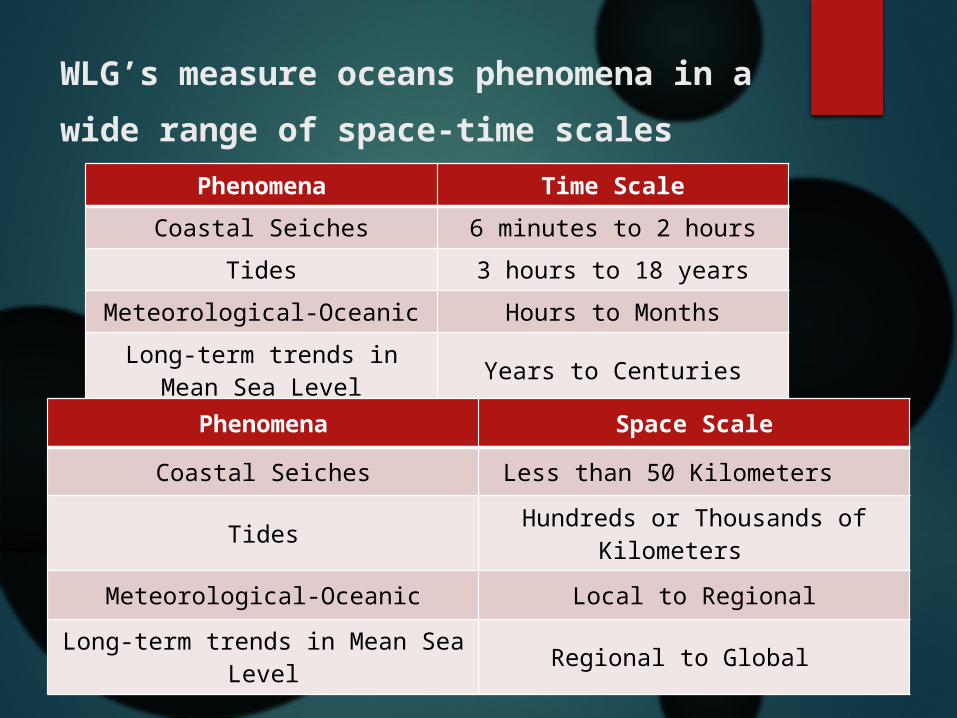
WLG’s measure oceans phenomena in a wide range of space-time scales
Phenomena Time ScaleCoastal Seiches 6 minutes to 2 hours
Tides 3 hours to 18 yearsMeteorological-Oceanic Hours to MonthsLong-term trends in
Mean Sea Level Years to Centuries
Phenomena Space Scale
Coastal Seiches Less than 50 Kilometers
Tides Hundreds or Thousands of Kilometers
Meteorological-Oceanic Local to RegionalLong-term trends in Mean Sea
Level Regional to Global
An Array of WLG’s is a Sensitive Instrument Capable of New Discoveries
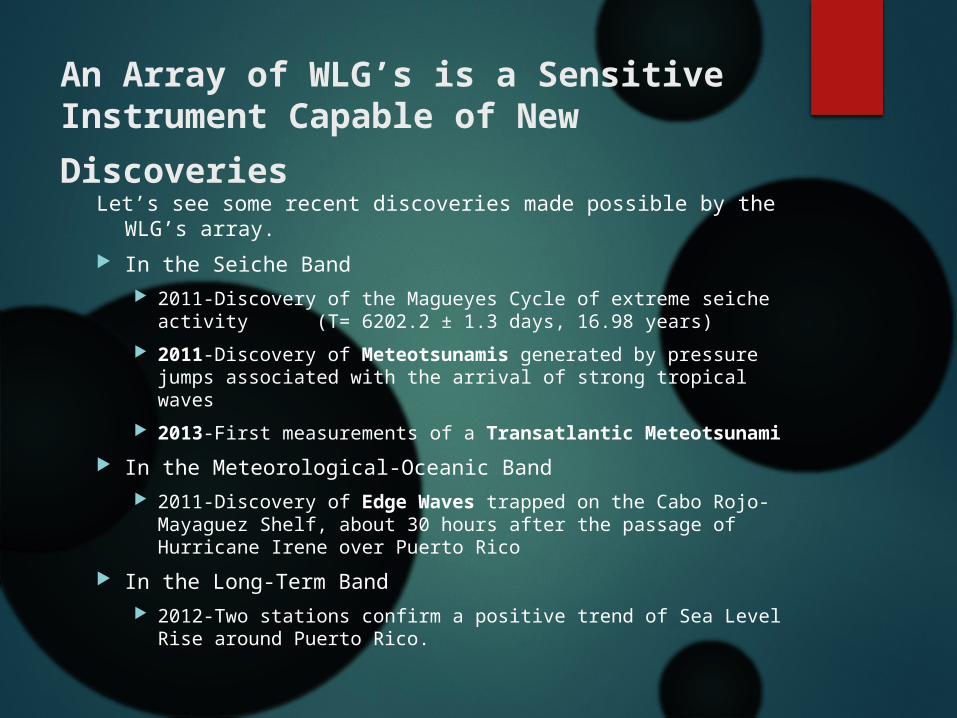
Let’s see some recent discoveries made possible by the WLG’s array.
In the Seiche Band 2011-Discovery of the Magueyes Cycle of extreme seiche
activity (T= 6202.2 ± 1.3 days, 16.98 years) 2011-Discovery of Meteotsunamis generated by pressure
jumps associated with the arrival of strong tropical waves
2013-First measurements of a Transatlantic Meteotsunami In the Meteorological-Oceanic Band
2011-Discovery of Edge Waves trapped on the Cabo Rojo-Mayaguez Shelf, about 30 hours after the passage of Hurricane Irene over Puerto Rico
In the Long-Term Band 2012-Two stations confirm a positive trend of Sea Level
Rise around Puerto Rico.
Locally Generated MeteotsunamisDISCOVERED BY MEANS OF THE WLG’S ARRAY
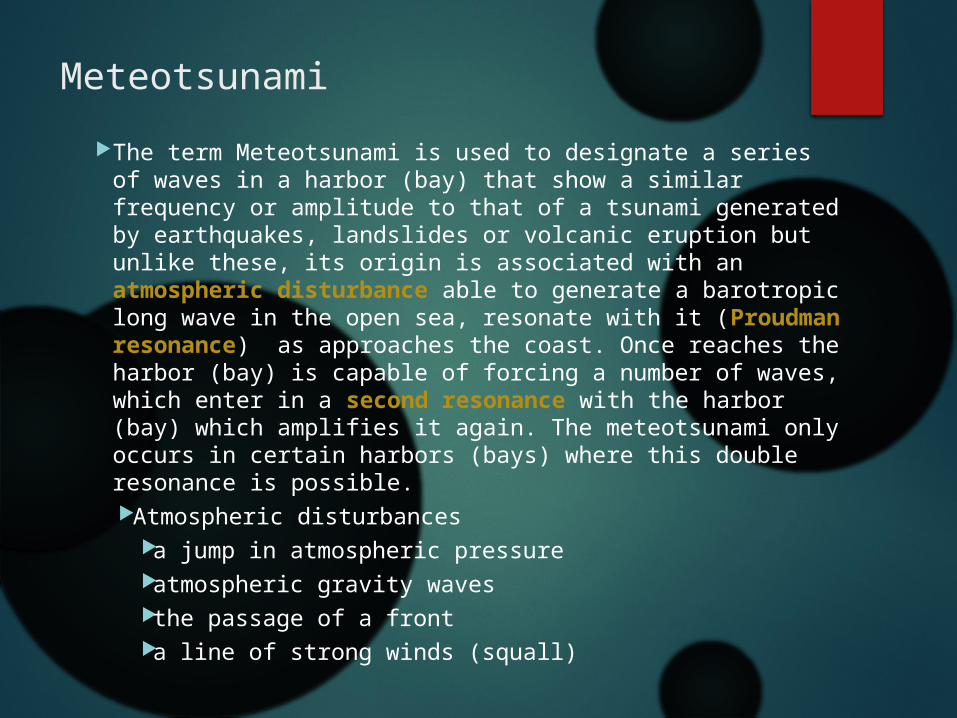
MeteotsunamiThe term Meteotsunami is used to designate a series of waves in a harbor (bay) that show a similar frequency or amplitude to that of a tsunami generated by earthquakes, landslides or volcanic eruption but unlike these, its origin is associated with an atmospheric disturbance able to generate a barotropic long wave in the open sea, resonate with it (Proudman resonance) as approaches the coast. Once reaches the harbor (bay) is capable of forcing a number of waves, which enter in a second resonance with the harbor (bay) which amplifies it again. The meteotsunami only occurs in certain harbors (bays) where this double resonance is possible.Atmospheric disturbances
a jump in atmospheric pressureatmospheric gravity wavesthe passage of a fronta line of strong winds (squall)
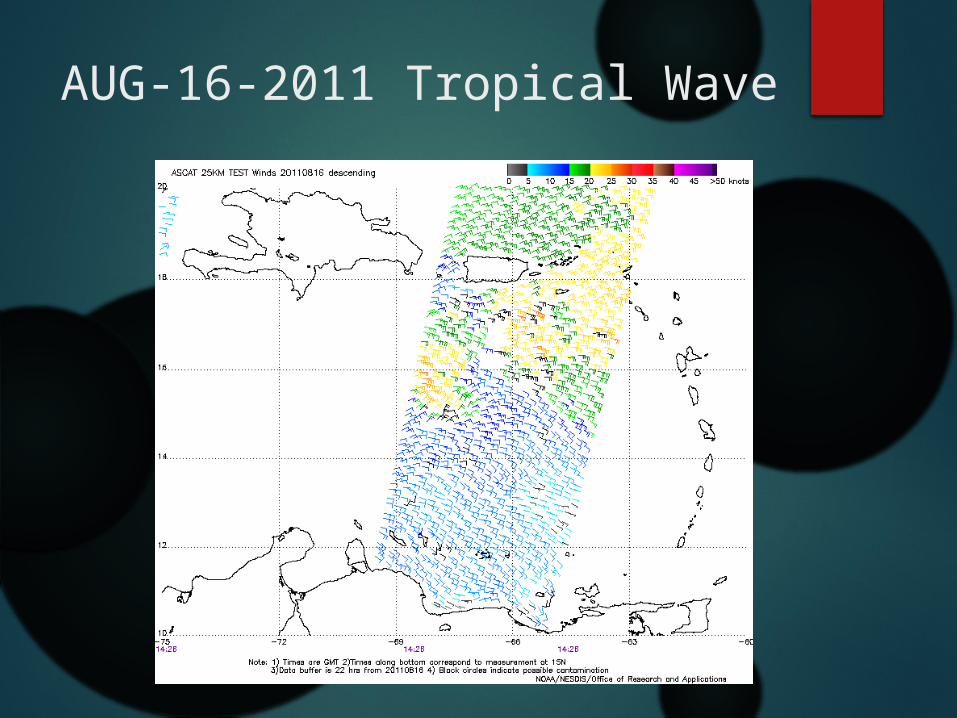
AUG-16-2011 Tropical Wave
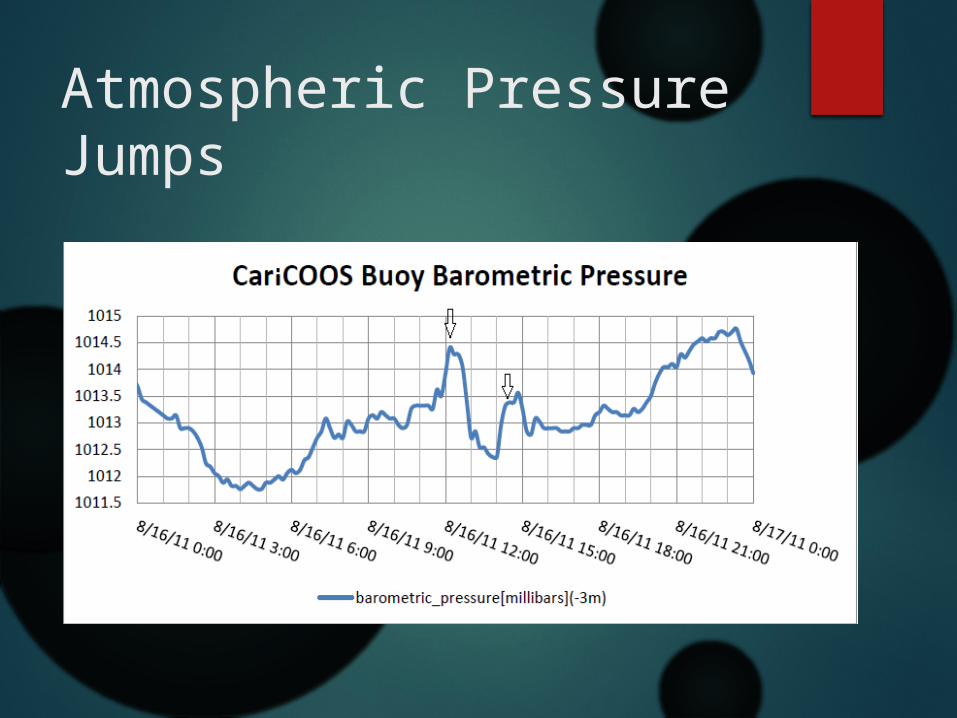
Atmospheric Pressure Jumps
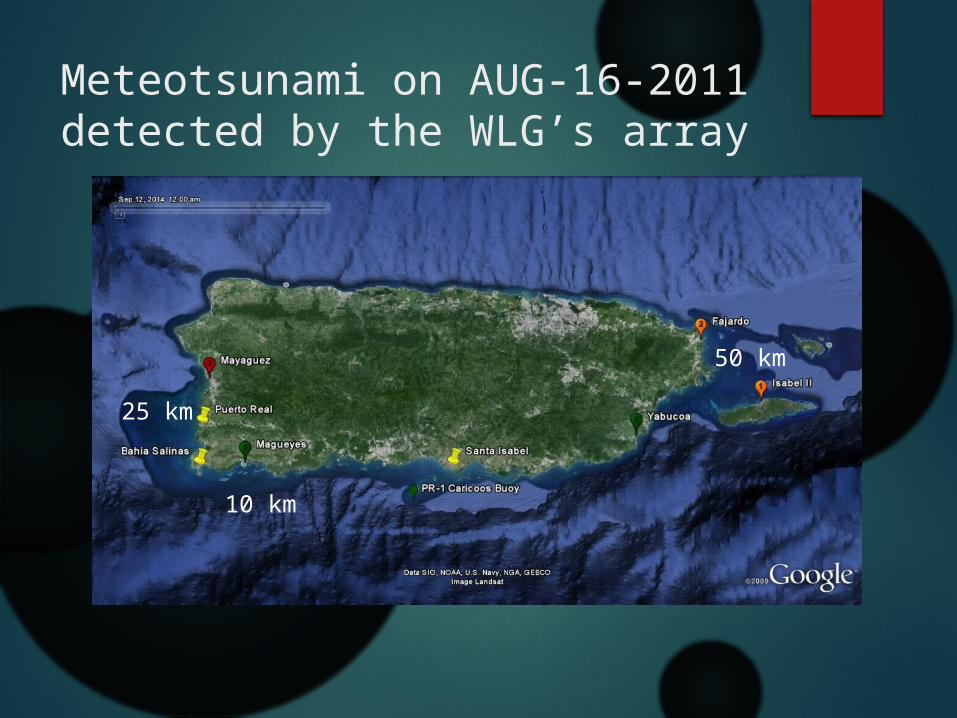
Meteotsunami on AUG-16-2011 detected by the WLG’s array
10 km
25 km
50 km
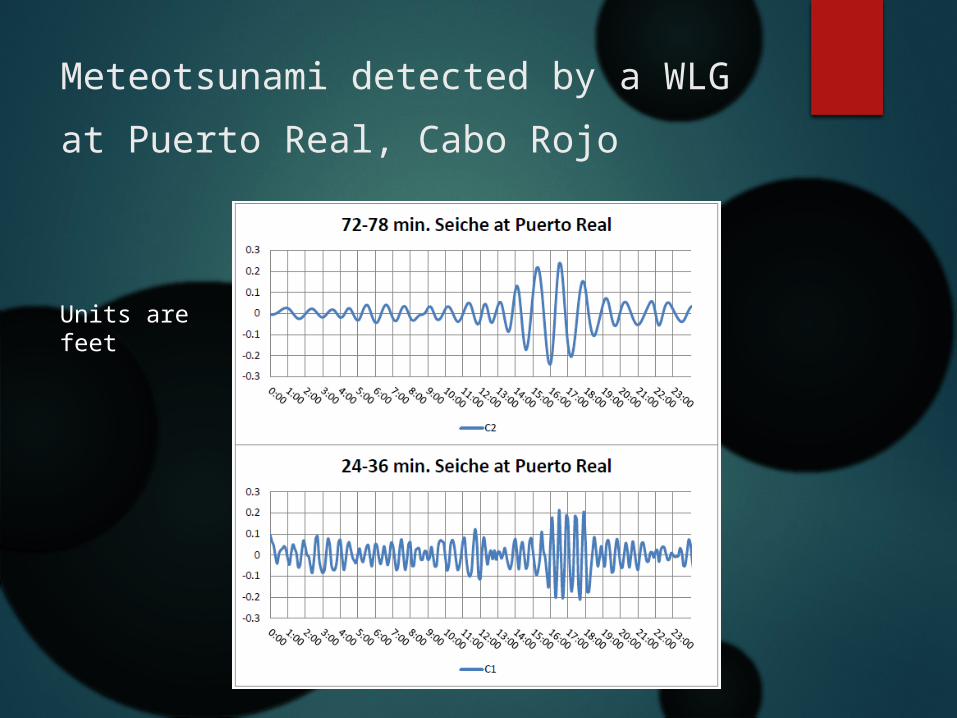
Meteotsunami detected by a WLG at Puerto Real, Cabo Rojo
Units are feet
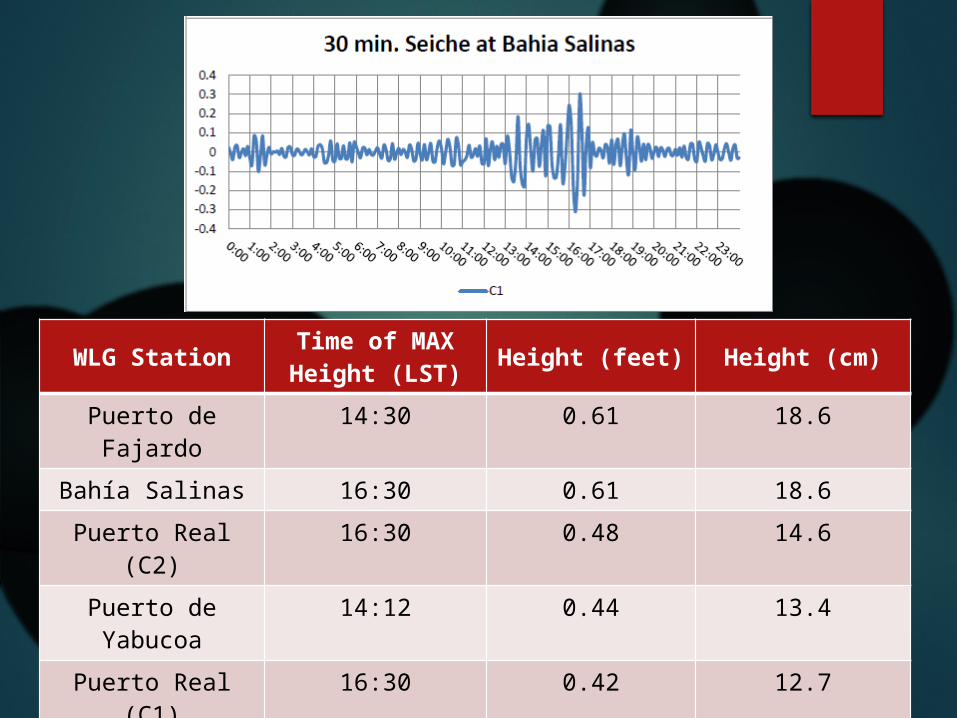
WLG Station Time of MAX Height (LST) Height (feet) Height (cm)
Puerto de Fajardo
14:30 0.61 18.6
Bahía Salinas 16:30 0.61 18.6Puerto Real
(C2)16:30 0.48 14.6
Puerto de Yabucoa
14:12 0.44 13.4
Puerto Real (C1)
16:30 0.42 12.7
Santa Isabel 15:00 0.35 10.7Isla Magueyes 13:48 0.30 9.0
Puerto de Mayagüez
16:24 0.22 6.7
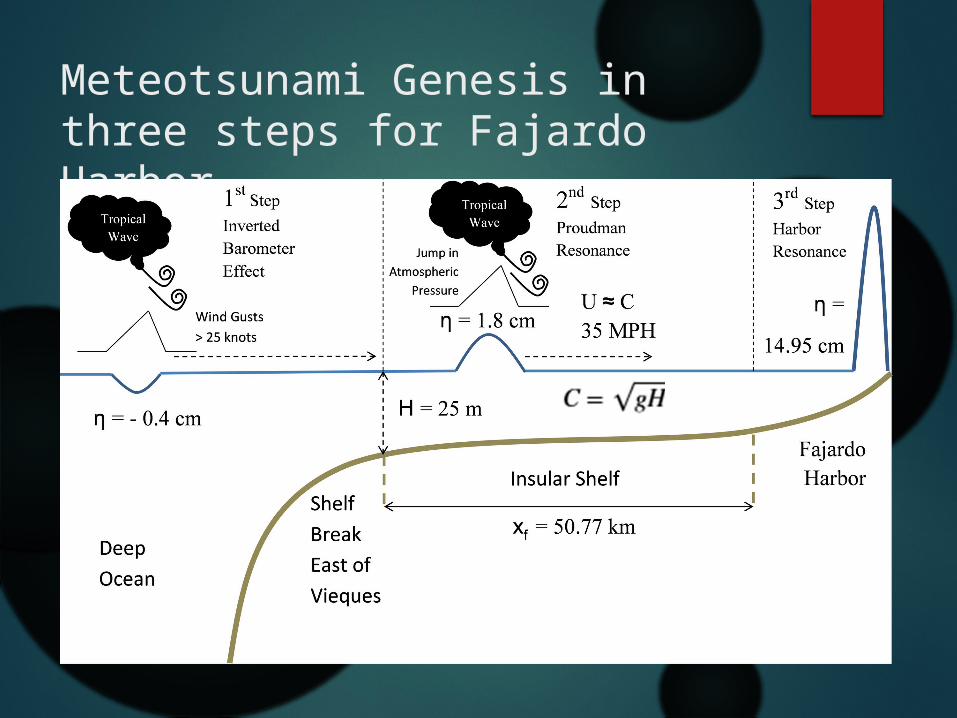
Meteotsunami Genesis in three steps for Fajardo Harbor
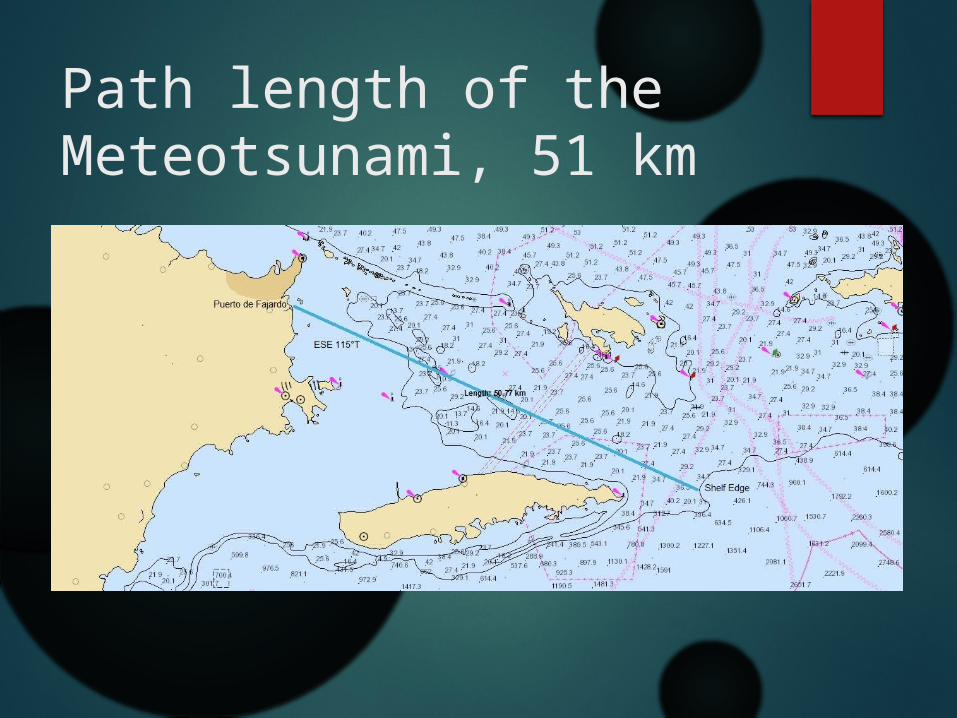
Path length of the Meteotsunami, 51 km
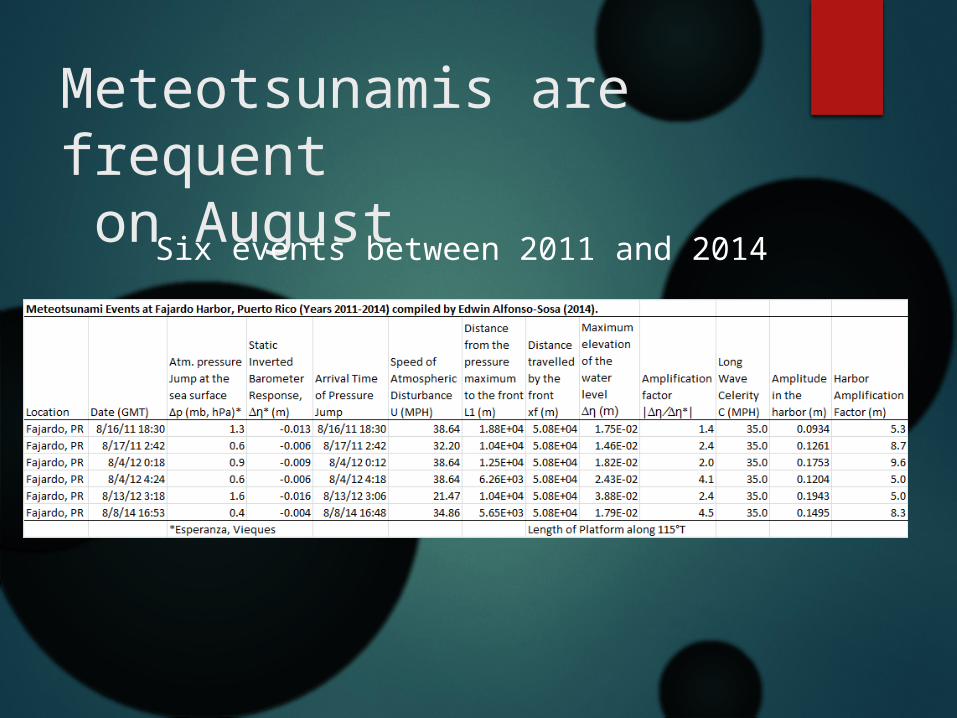
Meteotsunamis are frequent on August Six events between 2011 and 2014
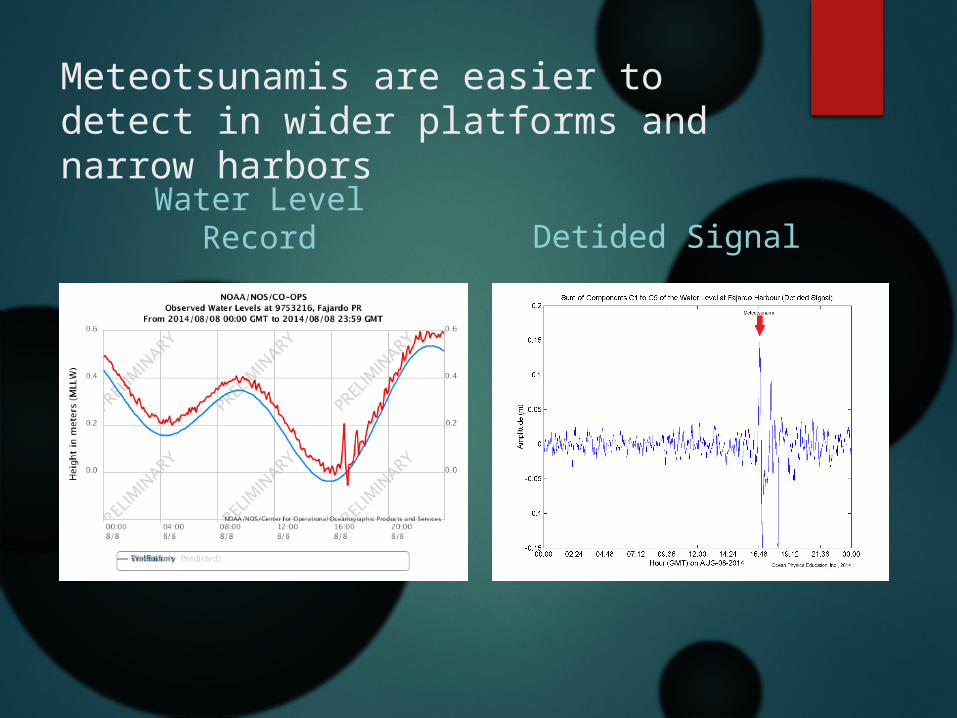
Meteotsunamis are easier to detect in wider platforms and narrow harbors
Water Level Record Detided Signal
Speed of a Transatlantic MeteotsunamiDISCOVERED BY MEANS OF THE WLG’S ARRAY
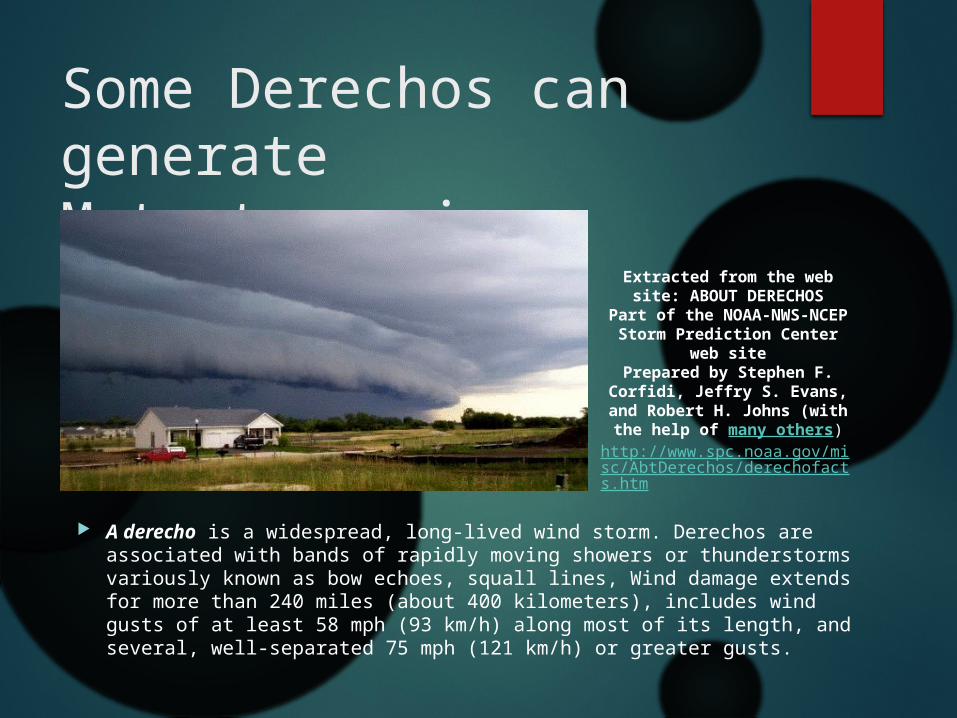
Some Derechos can generate Meteotsunamis
A derecho is a widespread, long-lived wind storm. Derechos are associated with bands of rapidly moving showers or thunderstorms variously known as bow echoes, squall lines, Wind damage extends for more than 240 miles (about 400 kilometers), includes wind gusts of at least 58 mph (93 km/h) along most of its length, and several, well-separated 75 mph (121 km/h) or greater gusts.
Extracted from the web site: ABOUT DERECHOS
Part of the NOAA-NWS-NCEP Storm Prediction Center
web sitePrepared by Stephen F.
Corfidi, Jeffry S. Evans, and Robert H. Johns (with the help of many others)
http://www.spc.noaa.gov/misc/AbtDerechos/derechofacts.htm
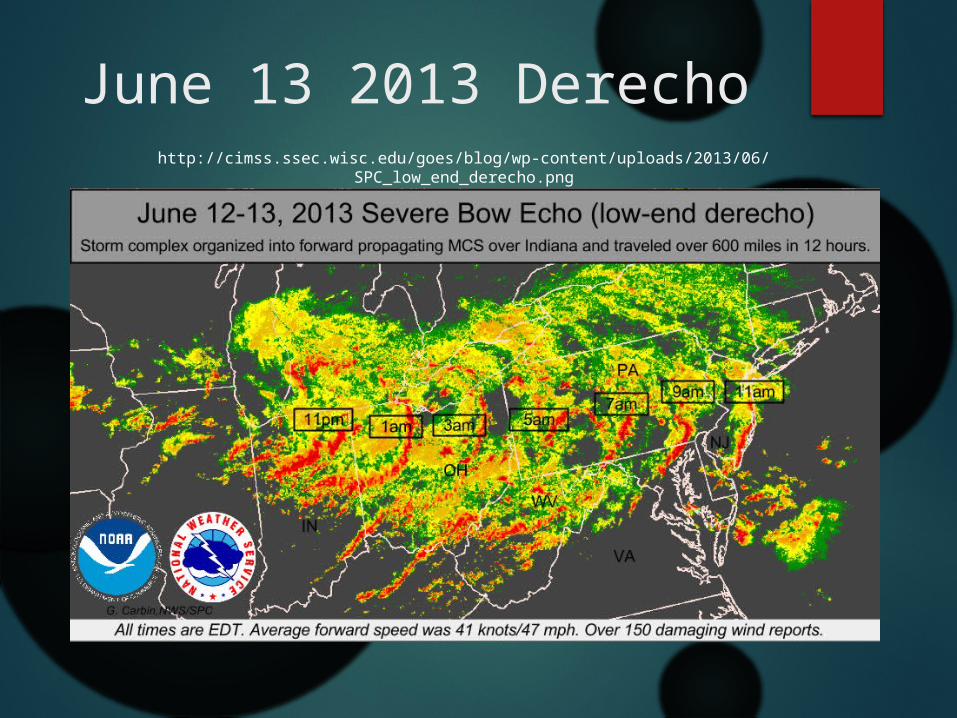
June 13 2013 Derechohttp://cimss.ssec.wisc.edu/goes/blog/wp-content/uploads/2013/06/
SPC_low_end_derecho.png
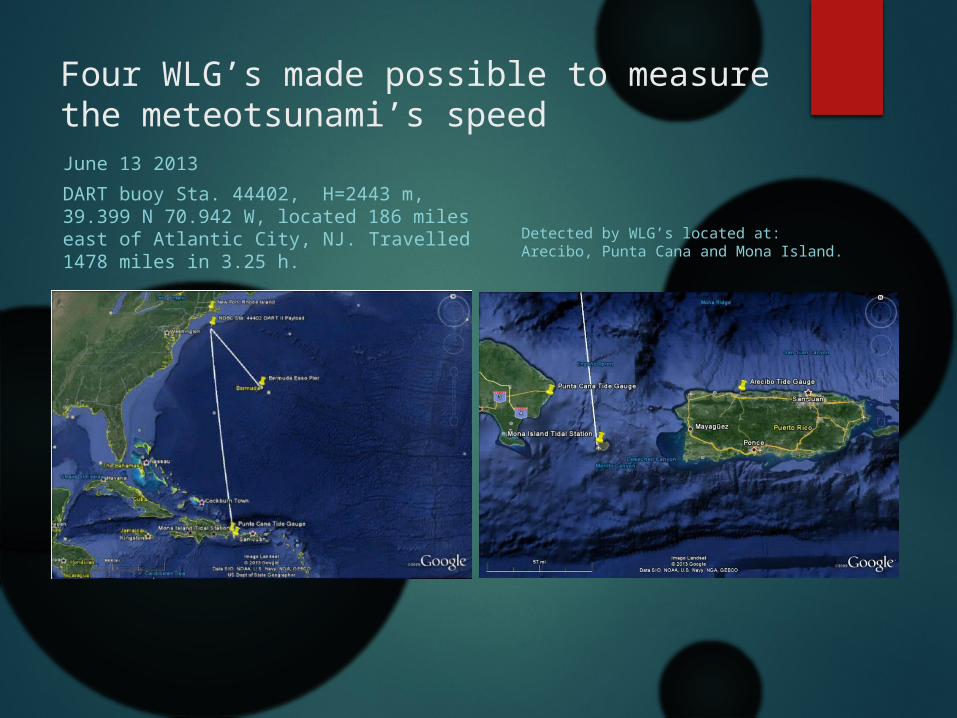
Four WLG’s made possible to measure the meteotsunami’s speedJune 13 2013DART buoy Sta. 44402, H=2443 m, 39.399 N 70.942 W, located 186 miles east of Atlantic City, NJ. Travelled 1478 miles in 3.25 h.
Detected by WLG’s located at: Arecibo, Punta Cana and Mona Island.
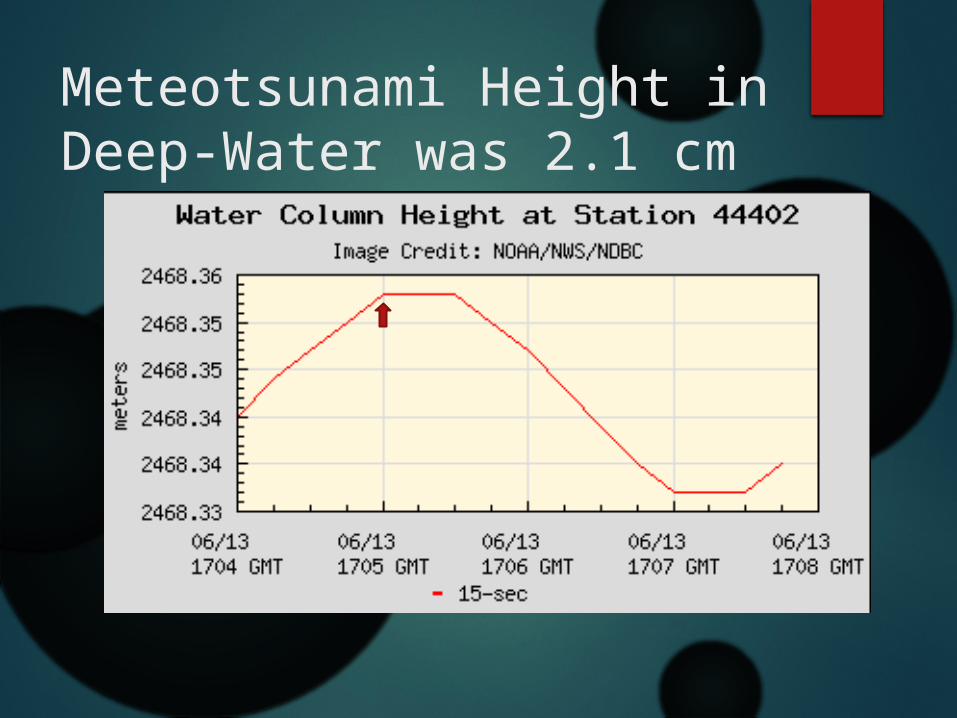
Meteotsunami Height in Deep-Water was 2.1 cm
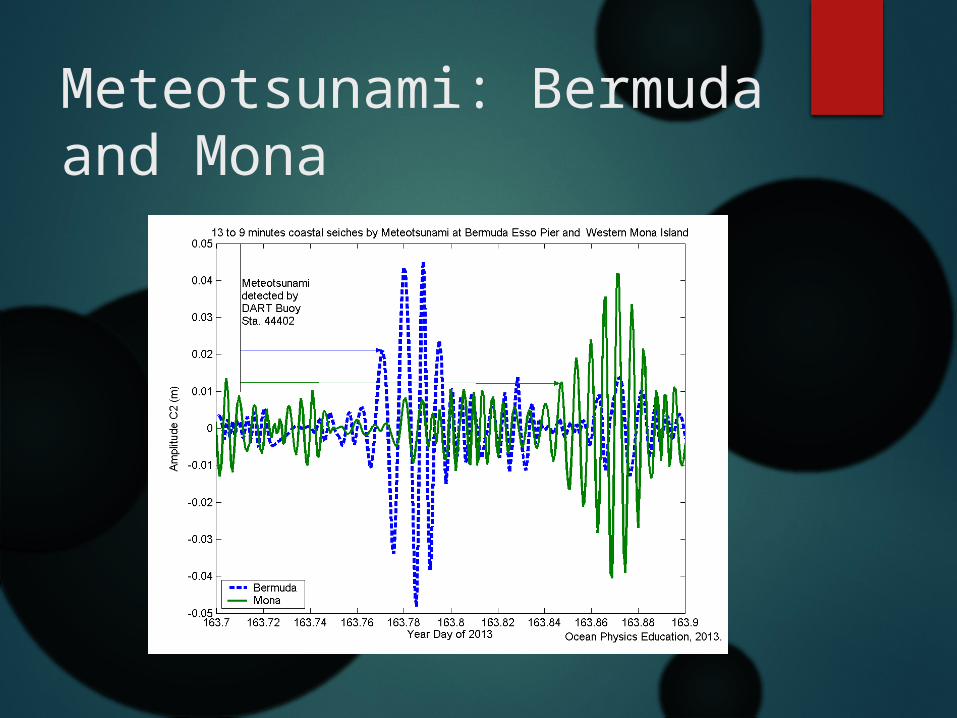
Meteotsunami: Bermuda and Mona
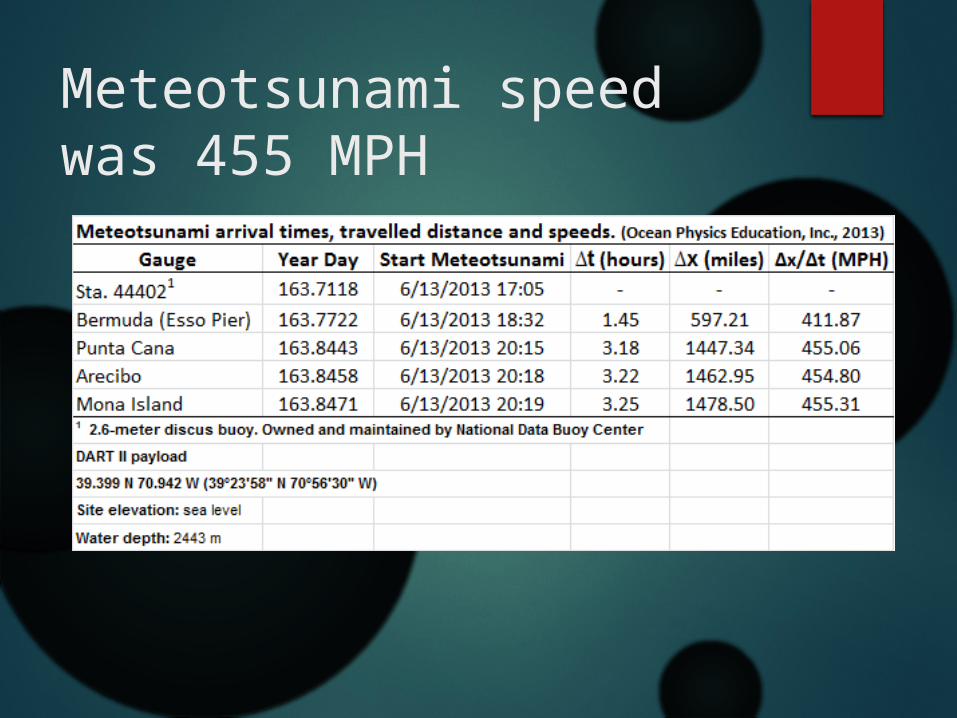
Meteotsunami speed was 455 MPH
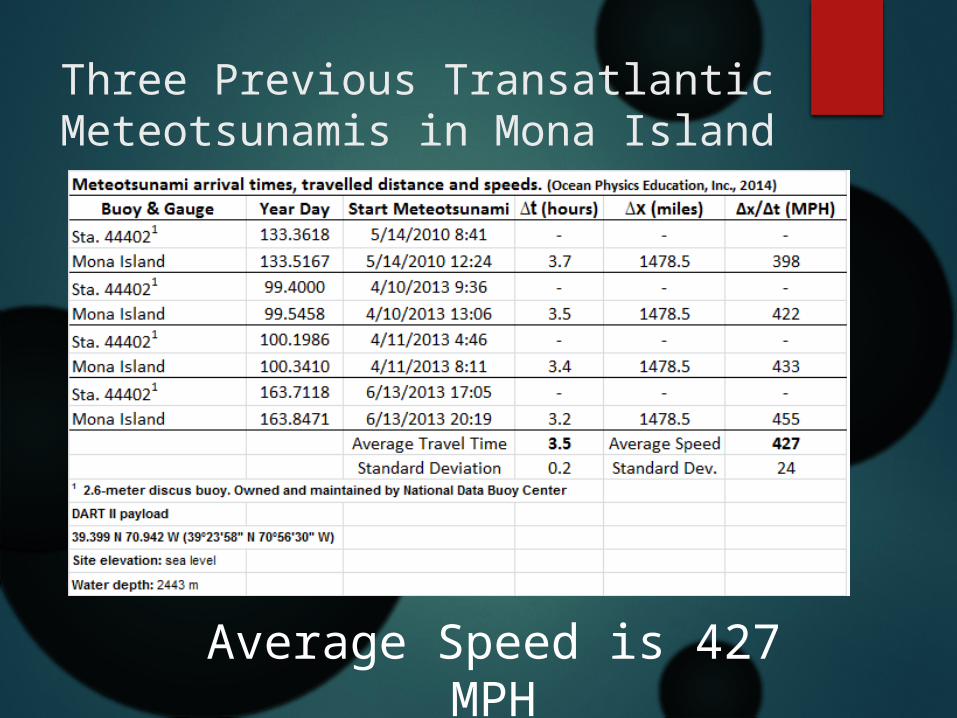
Three Previous Transatlantic Meteotsunamis in Mona Island
Average Speed is 427 MPH
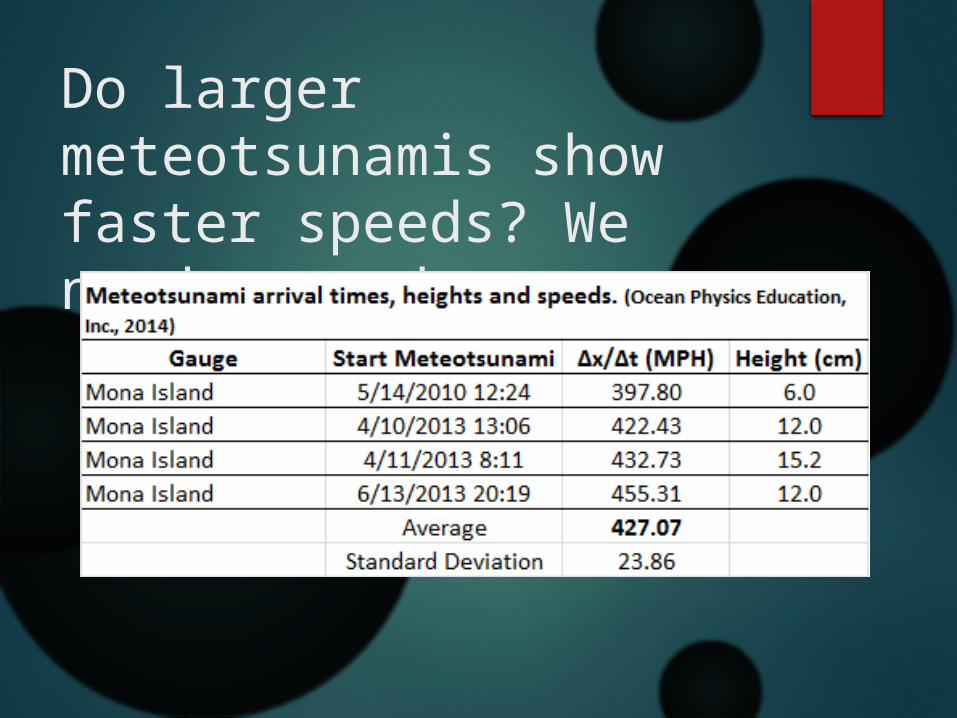
Do larger meteotsunamis show faster speeds? We need more data.
Mean Sea Level trend in Puerto Rico DISCOVERED BY MEANS OF THE WLG’S ARRAY
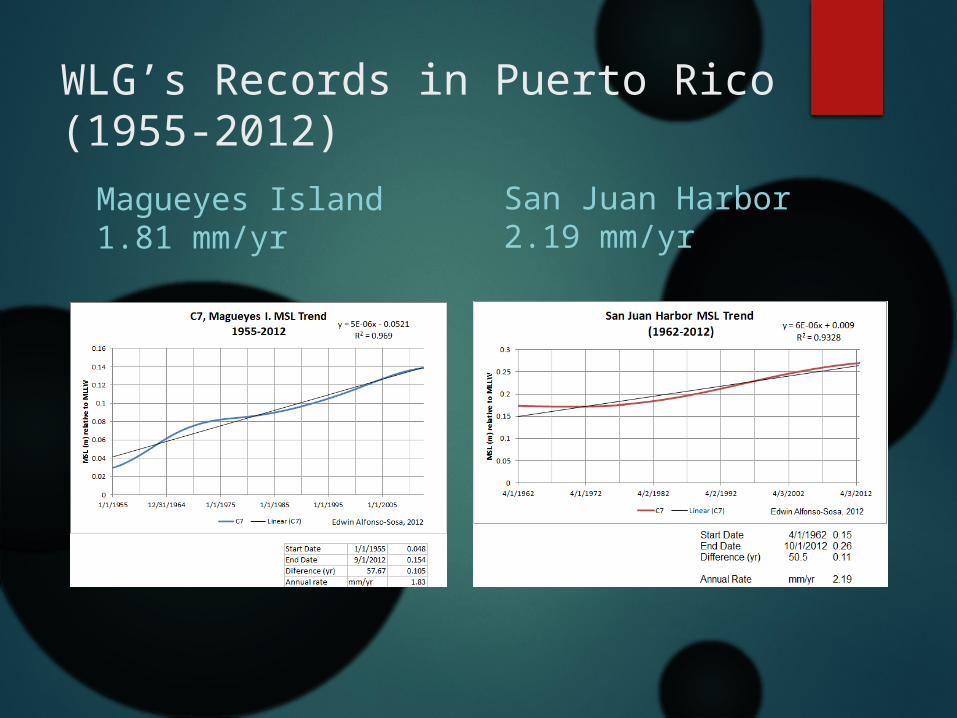
WLG’s Records in Puerto Rico (1955-2012)Magueyes Island 1.81 mm/yr
San Juan Harbor 2.19 mm/yr
Acknowledgements
We acknowledge the use of WLG’s Data and Ocean Buoy Data provided by the following: CariCOOS IOC CIMSS - University of Wisconsin-Madison NOAA / NOS / CO-OPS NOAA / NDBC / DART Program NOAA / NWS