
Cumulative (Dis)advantage? Patterns of Participation and Outcomes of Adult Learning in Great Britain
21
119 6. Cumulative (Dis)advantage? Patterns of Participation and Outcomes of Adult Learning in Great Britain Patricia McMullin and Elina Kilpi-Jakonen INTRODUCTION Throughout Western societies, globalizing and demographic influences have placed additional pressure on policy makers to encourage investment in adult learning in order to maintain high levels of worker productivity and to promote equity between different socioeconomic groups. However, the conclusion of many previous studies on adult learning has been that educational opportunities follow a pattern of cumulative advantage, whereby the highly educated are more likely to participate (e.g., Elman and O’Rand 2004). The British institutional setting promotes relatively high levels of participation in adult learning. In this chapter, we examine how participation opportunities are distributed within the population and across individuals’ life courses. We also aim to analyze how adult learning influences labor market outcomes in a longitudinal manner. Our conclusions about the cumulative nature of advantages related to adult learning are based on the outcomes of these analyses. Our study diverges from previous studies on adult learning in Britain and many of the other studies in this volume by taking into account a number of different types of adult learning and analyzing them separately. We are able to distinguish between formal and non-formal learning, and within non-formal learning, we distinguish between certified and non-certified learning as well as between employer-sponsored and self-sponsored learning. When analyzing labor market outcomes, we are also able to differentiate between qualifications of different levels. Overall, we are able to paint a comprehensive picture of adult learning in Great Britain.
Transcript of Cumulative (Dis)advantage? Patterns of Participation and Outcomes of Adult Learning in Great Britain
119
6. Cumulative (Dis)advantage? Patterns of Participation and Outcomes of Adult Learning in Great Britain
Patricia McMullin and Elina Kilpi-Jakonen
INTRODUCTION
Throughout Western societies, globalizing and demographic influences have placed additional pressure on policy makers to encourage investment in adult learning in order to maintain high levels of worker productivity and to promote equity between different socioeconomic groups. However, the conclusion of many previous studies on adult learning has been that educational opportunities follow a pattern of cumulative advantage, whereby the highly educated are more likely to participate (e.g., Elman and O’Rand 2004).
The British institutional setting promotes relatively high levels of participation in adult learning. In this chapter, we examine how participation opportunities are distributed within the population and across individuals’ life courses. We also aim to analyze how adult learning influences labor market outcomes in a longitudinal manner. Our conclusions about the cumulative nature of advantages related to adult learning are based on the outcomes of these analyses.
Our study diverges from previous studies on adult learning in Britain and many of the other studies in this volume by taking into account a number of different types of adult learning and analyzing them separately. We are able to distinguish between formal and non-formal learning, and within non-formal learning, we distinguish between certified and non-certified learning as well as between employer-sponsored and self-sponsored learning. When analyzing labor market outcomes, we are also able to differentiate between qualifications of different levels. Overall, we are able to paint a comprehensive picture of adult learning in Great Britain.
Adult learning in modern societies120
ADULT LEARNING AND THE BRITISH INSTITUTIONAL CONTEXT
It is important to consider how the British institutional context influences adult learning. In the following section, we discuss how adult learning is structured in Britain and outline our expectations on patterns of participation in adult learning and its possible effects in the labor market.
Adult Learning in Great Britain
Most formal adult education takes place in colleges of further education and in universities. The educational system is relatively open when it comes to adult learning. Boundaries between secondary- and tertiary-level studies are blurred due to the fact that study at the two levels can take place in the same institution, and entry requirements have been widened in order to accommodate those who do not meet the traditional entry conditions (see Eurydice 2003).
The British educational system can generally be characterized as relatively unstratified and unstandardized (Shavit and Müller 1998). Efforts to increase standardization include the development of a centralized National Qualifications Framework (NQF), through which all types of qualifications can be approved and classified (see Eurydice 2003 for more information about the NQF). For the purpose of our study, whether or not a qualification can be classified within the NQF represents the dividing line between formal and non-formal adult learning.1
Certified training that is not included in the NQF tends to be of relatively short duration and is often sponsored by employers (own analyses from the BHPS). Overall, employers are a major provider and sponsor of adult learning in Britain. One of the reasons for this is the low vocational specificity of the British educational system, which means that employers need to invest in the training of new employees, particularly if these employees have recently left the educational system (Scherer 2005). Moreover, there have been multiple interventions on the part of the state aimed at encouraging employers to invest further in the skills of their employees. These interventions include the “New Deal” programs introduced under New Labour as well as regulations that give young workers the right to take time off to participate in adult learning under the “Teaching and Higher Education Act 1998” (Eurydice 2003).
On the other hand, the low level of employment protection in Britain means that labor market turnover is high (Sørensen and Tuma 1981). This means that employers may be put off from investing heavily in their employees due to their fear of poaching from competing firms (Soskice 1999).

Participation and outcomes of adult learning in Great Britain 121
At the individual level, low employment protection and relatively low levels of welfare benefits give individuals incentives to invest in their own job-related skills in order to remain competitive in the labor market.
Patterns of Participation in Different Forms of Adult Learning
Despite the various institutional reasons that lead us to expect relatively high levels of adult learning in Britain, we also expect that there are likely to be differences in which groups find participation the easiest and most beneficial.
The unstratified nature of general education as well as the openness of higher-level institutions to individuals who do not fulfill traditional entry requirements would lead us to expect that educational differentials in entry to formal education should be relatively small. This suspicion is also supported by the generally higher opportunity costs for the higher educated to take part in time-intensive formal education. On the other hand, we also recognize that the lower educated may face dispositional barriers to reentering formal education institutions (Rubenson and Desjardins 2009). Moreover, although opportunity costs may be lower for the lower educated, the absolute costs of formal courses may also be a barrier to entry.
The costs of formal education may also make it more attractive to employees who can get their employers to pay their fees and support them during their (part-time) studies. Employers, on the other hand, are likely to have greater incentives to sponsor the studies of those employees from whom they can expect greater productivity increases, which in general applies to those who are already medium to highly skilled.
Numerous studies have observed a positive relationship between educational attainment and the probability of participating in work-related training programs and in training sponsored by employers (Pallas 2002; Dieckhoff, Jungblut and O’Connell 2007). Therefore, employers’ preferences to train the highly skilled in the British context are expected to affect the educational stratification not only of employer-sponsored non-formal learning but also of formal education.
Employers’ incentives to invest in the training of their employees are also higher for younger employees due to the low level of vocational specificity in the educational system. This can also be the case when individuals begin a new job (Cheung and McKay 2010) and after an employment interruption, e.g., women when they return to work after childbearing. Gendered perceptions of parenthood have been found to give rise to a “motherhood penalty”. It is additionally possible that these perceptions similarly influence the willingness of employers to invest in training opportunities for women (Dieckhoff and Steiber 2011).

Adult learning in modern societies122
Due to the generally high incentives for individuals to invest in adult learning in Britain, we can expect that the groups that are most overlooked by employers have higher probabilities of taking part in other types of adult learning – most notably non-formal learning that is non-employer-sponsored as well as formal education (to some extent). These groups include women, the non-employed, older individuals, and the lower educated.
Previous research has found that those with already high levels of education are more likely to earn new qualifications as adults (Jenkins et al. 2003) and to participate in work-related training (Cheung and McKay 2010). Research using the BHPS has found that individuals with no qualifications in 1991 were significantly less likely to take on additional training in the future (Blanden et al. 2009).
Additionally, research using the NCDS has found that men have a substantially higher probability than women of undertaking both employer-sponsored training and work-related training leading to a formal vocational qualification (Blundell, Dearden and Meghir 1996).
Adult Learning and Career Progress
There are two major institutional factors that lead us to expect relatively small effects of formal adult education on career progression: open employment structures and the low signaling power of qualifications. Open employment structures have to do with the fact that labor market mobility in Britain is high and happens as a consequence of a variety of factors, thus downplaying the role of education. This is further strengthened by the low signaling power of qualifications, which is largely due to the low level of educational stratification and the waves of reforms in the educational system (see Brauns, Müller and Steinmann 1997).
Previous studies on formal education have found contrasting results. On the one hand, studies using the NCDS have not found that new qualifications increase wages (Jenkins et al. 2003; Silles 2007). On the other hand, a study using the BHPS found that new qualifications increase earnings and prestige (Blanden, Buscha and Sturgis 2010). Positive results from formal education, particularly at the tertiary level, have also been found for employment opportunities (Jenkins et al. 2003; Woodfield 2011; Kilpi-Jakonen et al. 2012).
The productivity-enhancing effects of employer-sponsored non-formal learning should also improve the employment outcomes of adult learners. However, since a substantial amount of this type of learning is likely to take place upon hiring new employees, it is likely that in many cases improvements take place simultaneously with, rather than following, training. In the long run, it is expected that those who invest in their own skills, and those whose
Participation and outcomes of adult learning in Great Britain 123
skills employers invest in, have better labor market chances than those who do not. Without appropriate controls for selectivity, some of the beneficial effects of training may be overestimated since they also capture unmeasured individual productivity differentials.
Previous literature has found positive wage returns to work-related training, even after controlling for selectivity (Arulampalam and Booth 1998; Cheung and McKay 2010). Other studies have also found positive returns to obtaining a new qualification or “other” education and training on upward intra-generational mobility, with results moderated by gender and appearing over time (Blanden et al. 2009).
DATA AND METHODS
The dataset used in this study is the nationally representative sample of 5 505 British households collected as the original sample of the British Household Panel Study (BHPS). The BHPS is a longitudinal panel study consisting of 18 waves that began in 1991 and ended in 2008/09.2 We focus on data collected over the years 1998–2008 (waves 8–18 of the BHPS) since the inclusion of additional questions on training from wave 8 onward makes it possible to distinguish between employer-sponsored and unsponsored non-formal training. The first stage of this analysis is to examine the factors influencing participation in adult learning. We use random-effects logistic regression models for panel data in which observations are nested within individuals.
We differentiate between formal adult education and non-formal adult learning. For formal adult education, we examine enrollment patterns rather than educational attainment. This gives us a better idea of the factors that lead adults to begin formal education and (particularly with regard to labor force participation) gives us a more accurate picture than looking at the situation immediately before graduation would do.
Our specification of non-formal adult learning includes receiving a new qualification that is not on the standard list of qualifications covered in the BHPS questionnaire. These other professional, technical, or higher-level qualifications cannot be classified under the National Qualifications Framework. We refer to this type of qualification as certified non-formal adult learning. Based on our descriptive analyses, certified non-formal adult learning is often employer sponsored, with a substantial amount also taking place in private training centers and in colleges of higher or further education (particularly if the respondent is unemployed). Training for these qualifications is typically of quite short duration, often lasting less than one week when converted into working weeks.

Adult learning in modern societies124
An additional type of non-formal adult learning analyzed here is training that does not lead to a qualification. We further break down this category by distinguishing between learning that takes place internally (employer sponsored and/or located at the workplace or employer’s training center) and externally (not sponsored by the employer but with the purpose of improving job skills either for current or future positions).
We model men and women separately, and independent variables include age, age squared, previous educational attainment (highest level of educational attainment), marital status, age of youngest child in the household, household income, year (wave) labor force status, occupational class, firm size, full-time vs part-time job, permanent vs short-term contract, job experience, and branch of industry (based on a modified version of Singelmann’s 1978 classification) collapsing transformative and distributive industries, personal service and producer service industries, and transport and communicative industries (Schmelzer 2008). Employed individuals are those who did paid work the previous week, including those who had a job in the previous week despite being away from it. Unemployment is based on an individual’s self-definition and not being in paid work the previous week.
In order to ensure that we only capture learning events that take place after the completion of initial education, we exclude from our sample individuals studying for qualifications within the “normal age range”. We define this using OECD statistics on the normal age at which specific levels of qualifications are obtained (OECD 2002) and allow for an additional two years of studying. For example, the age at which first degrees are normally obtained in Britain is 21. Therefore, individuals who gain these qualifications up to the age of 23 are excluded from the sample until they have graduated. In addition, we use the retirement age as the cut-off at the other end, excluding women from age 60 and men from age 65. In some analyses, the sample is further restricted to include only those in employment.
The second stage in this study is the examination of returns to adult learning using both discrete time event history analysis for repeated events (multilevel random-effects logistic regression models) and fixed-effects linear regression models. Our outcomes are upward and downward prestige mobility for the first analysis and the absolute level of prestige for the second analysis. For formal adult education, we distinguish between obtaining a new degree, a new tertiary diploma, a qualification equivalent to an A-level, and lower secondary qualifications. For these analyses, we can also extend our data to include waves 1–7. We use the CAMSIS scores available in the BHPS as our measure of prestige and define upward mobility as an increase of at least 5 points on the CAMSIS scale, whereas downward mobility is defined as a decrease of at least 1 point or exit from employment. Depending on the model, we use either
Participation and outcomes of adult learning in Great Britain 125
a measure of “ever having completed adult learning” (as observed during the survey) or a set of yearly lags for the adult learning variables. We also control for missing information in the lags, taking into account missing waves and item non-response for the adult-learning variables.
RESULTS
In this section, we present the results of our investigation of the factors influencing participation in formal adult education and non-formal training. We also present our findings with regard to the impact of adult learning on the probability of prestige mobility (controlling for duration spent in the current job) and on change in prestige.
Descriptive Analysis: Participation Rates in Formal and Non-Formal Adult Learning
Figure 6.1 illustrates patterns of participation in adult learning by age group and gender. Both men and women participate more in non-formal internal training that does not lead to a qualification than in either formal adult education or certified non-formal adult learning.
While female participation in non-formal internal adult learning is greater than male participation in the early and late stages of the life course, women participate less in non-formal internal adult learning than men during their main childbearing years.
In addition, while female participation in formal adult education sharply drops off after the age of 25, women between the ages of 25–45 still participate in formal adult education significantly more than men. After 45, women participate less in formal adult education and more in employer-sponsored internal training. These patterns suggest that both employer-sponsored adult learning and formal adult education are moderated by gender and reflect the interrupted career pattern of females.
For certified non-formal adult learning, we find that male participation increases until it peaks at age 25, steadily declining thereafter. Female participation in certified non-formal learning is lower and the curve gentler until the age of approximately 32, at which point female participation matches that of males. The curve for non-formal external adult training is relatively flat at approximately 2 per cent for both women and men (not shown).

Adult learning in modern societies126
Patterns of Participation in Adult Learning
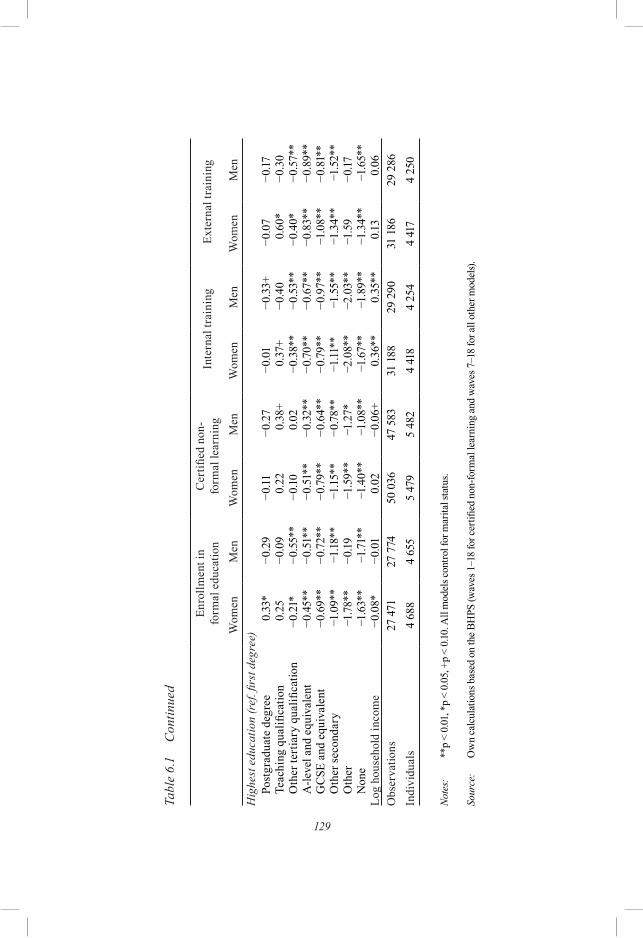
We present our results of enrollment in formal adult learning and participation in non-formal adult learning separately for the general and employed populations (Tables 6.1 and 6.2, respectively). Moreover, we only focus on certified non-formal adult learning and internal training for the employed since these are the most relevant types of adult learning for both groups.
Gender and labor force status shape the type of learning that individuals participate in since they have differential effects on the different types of adult learning. Women are more likely to enter formal adult education and to participate in external training, whereas among the employed there is no gender difference for certified non-formal learning and internal training.
We find that the non-employed are more likely to enroll in formal adult education and undertake external training than the employed. In comparison
Source: Own calculations based on the BHPS.
Figure 6.1 Proportion of adult learners within age range in Britain by type of adult learning
0%
2%
4%
6%
8%
10%
12%
14%
16%
16–24 25–9 30–4 35–9 40–4 45–9 50–4 55–9 60–5
formal adult education (male) formal adult education (female)
certified non-formal adult learning (male) certified non-formal adult learning (female)
non-formal internal adult learning (male) non-formal internal adult learning (female)

Participation and outcomes of adult learning in Great Britain 127
with other groups, unemployed men are particularly likely to participate in external training. This supports the expectation that groups that may be overlooked by employers should have higher probabilities of taking part in other types of adult learning.
On the other hand, the effect of educational level is surprisingly similar across the different types of adult learning. The more-highly educated are more likely to participate in all models, with possibly slightly stronger differences in internal and external training than in the two certified types of learning. In this sense, a “Matthew effect” (Merton 1968) is evident in all types of adult learning. This effect is further enhanced for internal training by the unequal distribution of participation by occupational class since manual workers are less likely to participate than non-manual employees. There is also a separation for women within non-manual employees. For certified non-formal learning, the groups least likely to participate are the routine non-manual and personal service employees.
The effect of age varies by gender and type of learning. In some cases, age does not have a statistically significant effect, whereas in others, the effect is curvilinear (first increasing and then decreasing). The latter is the case for entry into formal education for women and internal and external training for men.
Having children in the household does not seem to affect men, but this variable has a strong effect on women’s enrollment in formal and non-formal qualifications. Higher household income increases internal training for both men and women but reduces enrollment in formal education. For the employed, having children in the household under the age of one increases the probability of participation in certified non-formal learning for men and decreases the probability of participation for women, whereas there is no effect on internal training.
With regard to other employment characteristics, larger firms are more likely to train persons internally than smaller firms. Holding a fixed-term contract reduces the probability of internal training for men. Working part-time reduces the probability of internal training for both genders and of participation in certified non-formal adult learning for women, whereas higher levels of job experience reduce women’s participation in both certified non-formal adult learning and internal training.
Returns to Adult Learning: Career Progress
We present the results of the effect of adult learning on upward and downward prestige mobility and on absolute levels of prestige separately for formal and non-formal adult learning (Tables 6.3 and 6.4 for formal and Table 6.5 for

128
Tabl
e 6.
1
Enro
llmen
t in
form
al a
dult
lear
ning
and
par
ticip
atio
n in
non
-form
al a
dult
lear
ning
(res
ults
as l
og o
dds r
atio
s)
Enro
llmen
t in
form
al e
duca
tion
Cer
tified
non
-fo
rmal
lear
ning
In
tern
al tr
aini
ngEx
tern
al tr
aini
ng
Wom
enM
enW
omen
Men
Wom
enM
enW
omen
Men
Fem
ale
(from
mod
el
with
bot
h ge
nder
s)0.
51**
–−0
.03
–0.
19**
–0.
19*
–
Age
(min
us 1
6)0.
04**
−0.0
3+0.
01−0
.014
−0.0
10.
04**
0.04
0.05
*A
ge sq
uare
d−0
.00*
*−0
.00
−0.0
0**
−0.0
00.
00−0
.00*
*−0
.00
−0.0
0*La
bor f
orce
stat
us (r
ef. e
mpl
oyed
, inc
l. se
lf-em
ploy
ed)
Une
mpl
oyed
0.28
+0.
28−0
.31+
−0.3
4**
−0.8
3**
−1.2
4**
−0.0
81.
24**
Out
side
0.31
**0.
77**
−0.3
4**
−0.6
0**
−2.3
3**
−2.2
3**
−0.6
4**
−0.4
2Ag
e of
you
nges
t chi
ld in
hou
seho
ld (r
ef. n
o ch
ildre
n)U
nder
one
−0.5
6**
−0.16
−0.74
**0.
17−0
.25*
0.14
0.10
−0.2
3B
etw
een
one
and
thre
e−0
.17+
−0.18
−0.2
2**
0.01
−0.0
2−0
.02
0.00
−0.0
5Fo
ur a
nd o
ver
0.21
**−0
.03
0.01
−0.0
9−0
.06
0.04
0.07
−0.1
2
129
Tabl
e 6.
1 C
ontin
ued
Enro
llmen
t in
form
al e
duca
tion
Cer
tified
non
-fo
rmal
lear
ning
In
tern
al tr
aini
ngEx
tern
al tr
aini
ng
Wom
enM
enW
omen
Men
Wom
enM
enW
omen
Men
Hig
hest
edu
catio
n (r
ef. fi
rst d
egre
e)Po
stgr
adua
te d
egre
e0.
33*
−0.2
9−0
.11−0
.27
−0.0
1−0
.33+
−0.0
7−0
.17Te
achi
ng q
ualifi
catio
n0.
25−0
.09
0.22
0.38
+0.
37+
−0.4
00.
60*
−0.3
0O
ther
tert
iary
qua
lifica
tion
−0.2
1*−0
.55*
*−0
.100.
02−0
.38*
*−0
.53*
*−0
.40*
−0.5
7**
A-le
vel a
nd e
quiv
alen
t−0
.45*
*−0
.51*
*−0
.51*
*−0
.32*
*−0
.70*
*−0
.67*
*−0
.83*
*−0
.89*
*G
CSE
and
equ
ival
ent
−0.6
9**
−0.7
2**
−0.7
9**
−0.6
4**
−0.7
9**
−0.9
7**
−1.0
8**
−0.8
1**
Oth
er se
cond
ary
−1.0
9**
−1.18
**−1
.15**
−0.7
8**
−1.11
**−1
.55*
*−1
.34*
*−1
.52*
*O
ther
−1.7
8**
−0.19
−1.5
9**
−1.2
7*−2
.08*
*−2
.03*
*−1
.59
−0.17
Non
e−1
.63*
*−1
.71**
−1.4
0**
−1.0
8**
−1.6
7**
−1.8
9**
−1.3
4**
−1.6
5**
Log
hous
ehol
d in
com
e −0
.08*
−0.0
10.
02−0
.06+
0.36
**0.
35**
0.13
0.06
Obs
erva
tions
27 4
7127
774
50 0
3647
583
31 1
8829
290
31 1
8629
286
Indi
vidu
als
4 68
84
655
5 47
95
482
4 41
84
254
4 41
74
250
Note
s:
**p
< 0.
01, *
p <
0.05
, +p
< 0.1
0. A
ll m
odel
s con
trol f
or m
arita
l sta
tus.
Sour
ce:
Ow
n ca
lcul
atio
ns b
ased
on
the B
HPS
(wav
es 1
–18
for c
ertifi
ed n
on-fo
rmal
lear
ning
and
wav
es 7
–18
for a
ll ot
her m
odel
s).

Adult learning in modern societies130
Table 6.2 Participation in non-formal adult learning for the employed population only (results as log odds ratios)
Certified non-
formal learning Internal training
Women Men Women MenFemale (from model with both genders)
−0.08 – −0.06 –
Age (minus 16) 0.00 −0.03* −0.03* 0.04*Age squared −0.00 −0.00 0.00** −0.00**Age of youngest child in household (ref. no children)
Under one −0.82** 0.23* −0.17 0.14Between one and three −0.17 −0.00 0.14 −0.02Four and over 0.02 −0.08 0.04 0.03
Social class (ref. higher professionals)Lower professionals −0.13 −0.03 −0.10 0.03Routine non-manual employees
−0.39** −0.37** −0.28** 0.06
Personal service employees −0.23+ −0.75** −0.43** 0.25Self-employed −17.64 −14.73 −15.26 −14.99Farmers −17.58 −0.67 −0.46 −1.13Foremen and technicians −0.01 0.27** −0.71** −0.20+Skilled manual workers −0.32 −0.04 −0.65** −0.48**Semi- and unskilled manual workers
−0.11 −0.05 −0.84** −0.74**
Firm size (ref. 50 and fewer)50–250 0.01 0.04 0.15* 0.32**250+ −0.15+ 0.07 0.41** 0.44**
Part-time (ref. full-time 30 h and more)
−0.16* −0.03 −0.25** −0.27+
Fixed-term contract (ref. permanent)
0.08 0.20 −0.10 −0.45**
Log of job experience −0.08* −0.03 −0.09** −0.02Observations 33 043 32 181 21 113 20 608Individuals 4 516 4 403 3 603 3 417
Notes: **p < 0.01, *p < 0.05, +p < 0.10. All models control for highest education, marital status, household income, and industry.
Source: Own calculations based on the BHPS (waves 7–18 for internal training and waves 1–18 for certified non-formal learning).
Participation and outcomes of adult learning in Great Britain 131
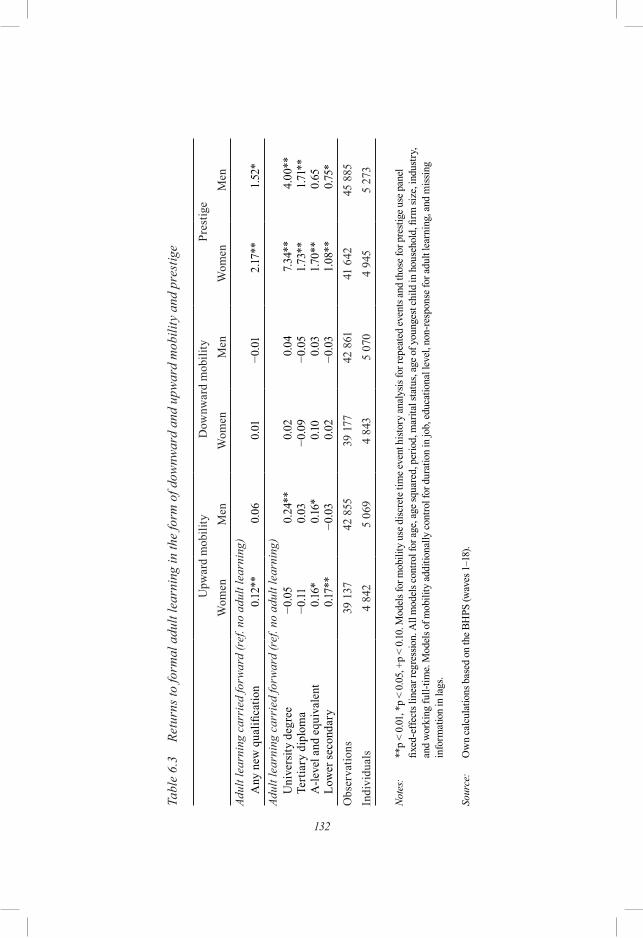
non-formal). More specifically, Table 6.3 examines returns to ever having completed adult learning, Table 6.4 examines the relationship between formal qualifications and career progress lagged over the following three years, and Table 6.5 presents the results of non-formal adult learning on career progress with lagged effects included.
Overall, we find positive returns to formal adult education and few but mainly positive returns to non-formal adult learning. One possible explanation as to why we find less returns to non-formal adult learning is that both prestige mobility and non-formal training occur simultaneously (for reasons outlined above).3 In addition, the fixed-effects models show more positive returns than the event history models. We interpret this as suggesting that adult learning does not necessarily increase the chances of making large “mobility jumps” but that it does tend to increase occupational prestige at the individual level.
In Table 6.3, our results indicate a positive impact on upward mobility for women and a positive impact on prestige score for both genders with regard to ever having obtained a new qualification as an adult. When we differentiate between qualification levels, we find that all levels of qualification obtained as an adult learner have a positive impact on prestige scores, with the possible exception of men who obtain an A-level or equivalent. However, analyzing duration until mobility jumps gives a different picture, with men experiencing upward mobility after obtaining a university degree or an A-level/equivalent and women benefiting from an A-level or lower. A tertiary diploma does not have an effect on upward or downward mobility but does have an effect on prestige scores.
In Table 6.4, we find that a university degree as an adult learner has a quick impact, and the benefits are long term. A tertiary diploma as an adult learner pays off in the first year, weakens in the second, and only benefits men in subsequent years. An A-level or equivalent has a stronger effect for women, yielding them returns in the second year and returns to men in subsequent years. A lower secondary qualification as an adult learner benefits women in the first year, with benefits disappearing in the second year and returning later. A lower secondary qualification benefits men after a lag of two years.
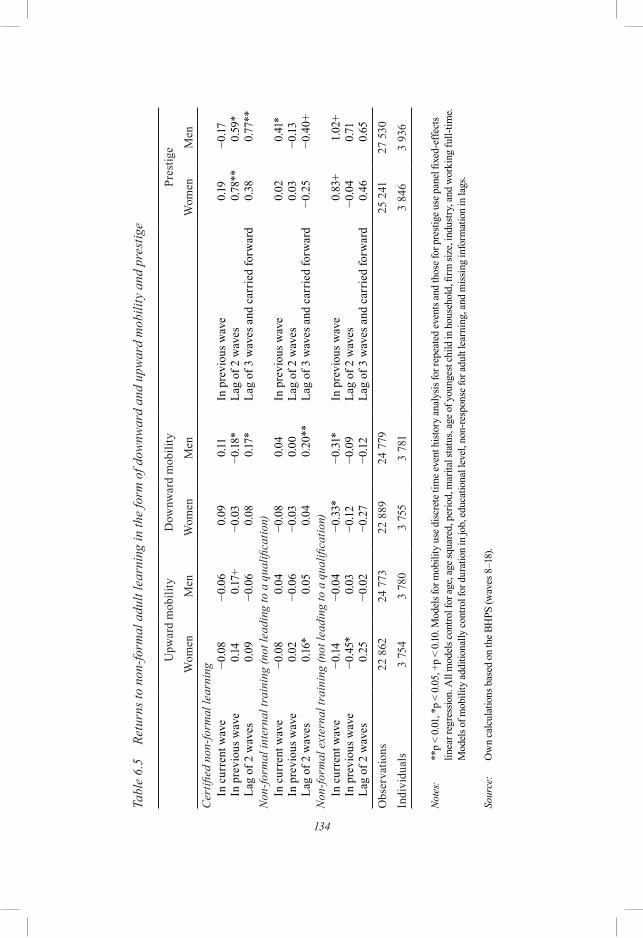
In Table 6.5, we find positive returns for men with regard to upward mobility and downward mobility in the following year for non-formal certified training. However, this advantage with regard to downward mobility turns into a disadvantage after a lag of two years. We find a positive effect on prestige scores for both men and women after a lag of two years.
For non-formal internal training that does not lead to a qualification, only after a lag of two years do we find positive returns to upward mobility for women and an insulating effect from downward mobility for men. In terms of
132
Tabl
e 6.
3 Re
turn
s to
form
al a
dult
lear
ning
in th
e fo
rm o
f dow
nwar
d an
d up
war
d m
obili
ty a
nd p
rest
ige
Upw
ard
mob
ility
Dow
nwar
d m
obili
tyPr
estig
eW
omen
Men
Wom
enM
enW
omen
Men
Adul
t lea
rnin
g ca
rrie
d fo
rwar
d (r
ef. n
o ad
ult l
earn
ing)
Any
new
qua
lifica
tion
0.12
**0.
060.
01−0
.01
2.17
**1.
52*
Adul
t lea
rnin
g ca
rrie
d fo
rwar
d (r
ef. n
o ad
ult l
earn
ing)
Uni
vers
ity d
egre
e−0
.05
0.24
**0.
020.
047.
34**
4.00
**Te
rtia
ry d
iplo
ma
−0.11
0.03
−0.0
9−0
.05
1.73*
*1.7
1**
A-le
vel a
nd e
quiv
alen
t0.
16*
0.16
*0.
100.
031.7
0**
0.65
Low
er se
cond
ary
0.17
**−0
.03
0.02
−0.0
31.
08**
0.75
*O
bser
vatio
ns39
137
42 8
5539
177
42 8
6141
642
45 8
85In
divi
dual
s4
842
5 06
94
843
5 07
04
945
5 27
3
Note
s:
**p
< 0.
01, *
p <
0.05
, +p
< 0.1
0. M
odel
s for
mob
ility
use
disc
rete
tim
e eve
nt h
istor
y an
alys
is fo
r rep
eate
d ev
ents
and
thos
e for
pre
stige
use
pan
el
fixed
-effe
cts l
inea
r reg
ress
ion.
All
mod
els c
ontro
l for
age,
age s
quar
ed, p
erio
d, m
arita
l sta
tus,
age o
f you
nges
t chi
ld in
hou
seho
ld, fi
rm si
ze, i
ndus
try,
and
wor
king
full-
time.
Mod
els o
f mob
ility
add
ition
ally
con
trol f
or d
urat
ion
in jo
b, e
duca
tiona
l lev
el, n
on-re
spon
se fo
r adu
lt le
arni
ng, a
nd m
issin
g in
form
atio
n in
lags
.
Sour
ce:
Ow
n ca
lcul
atio
ns b
ased
on
the B
HPS
(wav
es 1
–18)
.

Participation and outcomes of adult learning in Great Britain 133
Table 6.4 Returns to formal adult learning in terms of absolute prestige (panel fixed-effects linear regression models)
PrestigeWomen Men
University degree as adult learnerIn previous wave 4.44** 2.30**Lag of 2 waves 6.00** 3.32**Lag of 3 waves and carried forward 6.12** 4.77**
Tertiary diploma as adult learnerIn previous wave 1.73** 1.67*Lag of 2 waves 1.06+ 1.45+Lag of 3 waves and carried forward 0.09 1.90**
A-level and equivalent as adult learnerIn previous wave 0.57 −0.10Lag of 2 waves 1.88** 0.24Lag of 3 waves and carried forward 2.51** 0.86+
Lower secondary qualification as adult learnerIn previous wave 0.92** 0.27Lag of 2 waves 0.50 0.10Lag of 3 waves and carried forward 1.64** 1.49**
Observations 41 642 45 885Individuals 4 945 5 273
Notes: **p < 0.01, *p < 0.05, +p < 0.10. All models control for age, age squared, period, marital status, age of youngest child in household, firm size, industry, and working full-time.
Source: Own calculations based on the BHPS (waves 1–18).
134
Tabl
e 6.
5
Retu
rns t
o no
n-fo
rmal
adu
lt le
arni
ng in
the
form
of d
ownw
ard
and
upw
ard
mob
ility
and
pre
stig
e
Upw
ard
mob
ility
Dow
nwar
d m
obili
tyPr
estig
eW
omen
Men
Wom
enM
enW
omen
Men
Cer
tified
non
-form
al le
arni
ngIn
cur
rent
wav
e−0
.08
−0.0
60.
090.
11In
pre
viou
s wav
e0.
19−0
.17In
pre
viou
s wav
e0.
140.
17+
−0.0
3−0
.18*
Lag
of 2
wav
es0.
78**
0.59
*La
g of
2 w
aves
0.09
−0.0
60.
080.
17*
Lag
of 3
wav
es a
nd c
arrie
d fo
rwar
d0.
380.
77**
Non
-form
al in
tern
al tr
aini
ng (n
ot le
adin
g to
a q
ualifi
catio
n)In
cur
rent
wav
e−0
.08
0.04
−0.0
80.
04In
pre
viou
s wav
e0.
020.
41*
In p
revi
ous w
ave
0.02
−0.0
6−0
.03
0.00
Lag
of 2
wav
es0.
03−0
.13La
g of
2 w
aves
0.16
*0.
050.
040.
20**
Lag
of 3
wav
es a
nd c
arrie
d fo
rwar
d−0
.25
−0.4
0+N
on-fo
rmal
ext
erna
l tra
inin
g (n
ot le
adin
g to
a q
ualifi
catio
n)In
cur
rent
wav
e−0
.14−0
.04
−0.3
3*−0
.31*
In p
revi
ous w
ave
0.83
+1.
02+
In p
revi
ous w
ave
−0.4
5*0.
03−0
.12
−0.0
9La
g of
2 w
aves
−0.0
40.
71La
g of
2 w
aves
0.25
−0.0
2−0
.27
−0.1
2La
g of
3 w
aves
and
car
ried
forw
ard
0.46
0.65
Obs
erva
tions
22 8
6224
773
22 8
8924
779
25 2
4127
530
Indi
vidu
als
3 75
43
780
3 75
53
781
3 84
63
936
Note
s:
**p
< 0.
01, *
p <
0.05
, +p
< 0.1
0. M
odel
s for
mob
ility
use
disc
rete
tim
e eve
nt h
istor
y an
alys
is fo
r rep
eate
d ev
ents
and
thos
e for
pre
stige
use
pan
el fi
xed-
effe
cts
linea
r reg
ress
ion.
All
mod
els c
ontro
l for
age,
age s
quar
ed, p
erio
d, m
arita
l sta
tus,
age o
f you
nges
t chi
ld in
hou
seho
ld, fi
rm si
ze, i
ndus
try, a
nd w
orki
ng fu
ll-tim
e.
Mod
els o
f mob
ility
add
ition
ally
con
trol f
or d
urat
ion
in jo
b, e
duca
tiona
l lev
el, n
on-re
spon
se fo
r adu
lt le
arni
ng, a
nd m
issin
g in
form
atio
n in
lags
.
Sour
ce:
Ow
n ca
lcul
atio
ns b
ased
on
the B
HPS
(wav
es 8
–18)
.

Participation and outcomes of adult learning in Great Britain 135
prestige scores, we find positive returns to men from the training reported in the previous wave.
For non-formal external training that does not lead to a qualification, we find the strongest impact for both men and women to be an insulating effect on downward mobility that occurs in the wave after training has been reported. We also find weak positive returns in the form of prestige scores in the following year. Moreover, there seems to be a negative effect on upward mobility for women two years after training has been reported.
CONCLUSION
In conclusion, we find that the most prevalent form of adult learning in Britain is non-formal employer-sponsored training, confirming the role of investment by employers as the main factor that influences adult learning in Britain. However, there is also a sizeable share of individuals participating in other types of adult learning, in particular formal adult education, suggesting that individuals are compelled to invest in their own skills in order to remain competitive in the labor market. This observation is substantiated by the finding that the non-employed are more likely to enroll in formal adult education and external training than the employed.
Besides employment, another key factor influencing participation in different types of adult learning is level of education. The higher educated are more likely to participate in both formal and non-formal adult learning, which supports previous findings of a cumulative advantage in educational attainment in the adult life stage. This effect is slightly stronger for uncertified work-related training, reflecting employers’ propensity to maximize the efficiency of training by investing in employees with the highest levels of education and skill. Within the employed population, this is compounded for both men and women by occupational level.
The findings of the British chapter therefore support the hypothesis outlined in Chapter 1, which stated that more-highly-educated individuals and those in better occupational positions are more likely to participate in non-formal adult learning (“Matthew effect hypothesis”). This chapter does not support the hypothesis that those with medium levels of education are more likely to participate in formal adult education, but we did find that those not employed are more likely to participate (“partial equalization hypothesis”).
Regarding gender, this chapter partially supports the “gendered participation hypothesis”, with women more likely to participate in formal adult education and unsponsored external training. Contrary to our
Adult learning in modern societies136
expectations, men are generally not more likely to participate in internal training than women.
When the relationship is explored in more detail, we find that women participate in non-formal internal training more than men both before and after their peak childbearing years, which suggests that employers are not necessarily unwilling to invest in the training of women. It is more likely that employers are incentivized to invest in their most productive employees as well as in new employees.4 Therefore, since women typically enter the labor market with higher levels of education than men, they may have an initial advantage in internal training before they reach childbearing age, after which point their productivity level potentially drops. During this time, men receive more internal training.
With regard to labor market returns, we found that formal adult education has strong positive effects on prestige mobility, thus supporting the “improved employment outcomes hypothesis” outlined in Chapter 1. However, a more complex picture emerges when the level of qualification and the timing of returns are taken into consideration. We found stronger positive returns in the fixed-effects models than in the event history models, suggesting that adult learning does not necessarily play a large role with regard to large mobility increases or in reducing the risk of downward mobility.
The highest returns were found for tertiary degrees, which produce the largest increases in prestige scores for both men and women. Relatively stable and high returns were also found for A-level and equivalent qualifications. One possible reason why lower qualifications produce weaker increases in prestige is that these qualifications do not serve as educational upgrades for those obtaining them as often as new tertiary qualifications do. This means that there are likely to be more career sidesteppers within the group obtaining lower qualifications, thus driving down average returns to these qualifications. Nevertheless, the differential returns produce more cumulative advantage patterns since individuals who are able to invest in higher levels of education also reap larger benefits from their investments.
We found fewer returns for non-formal internal training, which might be explained by the fact that the key benefits to non-formal adult learning may happen instantaneously with the direction of causality uncertain. In other words, we cannot establish whether training leads to a new job immediately after having taken place or whether new employees receive training immediately after being hired. We assume that both of these processes happen. Moreover, as seen in our participation models, women tend to receive the most training when they have been in their job for a short duration. Therefore, Great Britain can be said to support the “indeterminate employment outcomes hypothesis” with regard to the impact of non-formal adult learning on prestige mobility.
Participation and outcomes of adult learning in Great Britain 137
Overall, our expectation that groups that may be overlooked by employers should have higher probabilities of taking part in other types of adult learning is supported since both the non-employed and women are more likely to enroll in formal adult education and external training. However, we also found evidence of cumulative disadvantage since those with the lowest levels of qualification are the least likely to participate in adult learning of any kind.
Furthermore, labor market chances are improved by investments in skills. This means that investment in adult learning has the potential to compensate for earlier educational disadvantages if the least advantaged are able to overcome barriers to participation.
Further research in this area could explore how dispositional and institutional barriers to participation in formal adult education change over the life course. Another interesting avenue for future research would be further exploration of the relationship between adult learning and the movement of individuals between (as well as within) firms and across sectors. This would be of particular use in exploring the career mobility of women who have more discontinuous career trajectories. Furthermore, in order to increase employability, adult learning could be used to lead to sectoral moves for workers in declining industries.
NOTES
1. This also means that the dividing line between formal and non-formal adult learning in our study differs slightly from that of other studies, e.g., those using the Adult Education Survey.
2. The BHPS was incorporated into the UK Household Longitudinal Study (Understanding Society) from the second wave of interviews onward. For more information, see: https://www.understandingsociety.ac.uk.
3. We found an instantaneous effect when examining the impact of non-formal training on upward and downward mobility, but because causality cannot be determined, we do not include the results here. Full results are available from the authors upon request.
4. However, we also have evidence to suggest that employers invest more in training of a greater duration for men, even directly after labor market entry. Full results are available from the authors upon request.
REFERENCES
Arulampalam, W. and A. Booth (1998), ‘Labour market flexibility and skills acquisition: Is there a trade-off?’, British Journal of Industrial Relations, 36 (4), 521–36.
Blanden, Jo, Patrick Sturgis, Franz Buscha and Peter Unwin (2009), ‘The effect of lifelong learning on intra-generational social mobility: evidence from longitudinal data in the United Kingdom’, DIUS Research Report, Department

Adult learning in modern societies138
for Innovation, Universities and Skills, London, UK. Blanden, Jo, Franz Buscha and Patrick Sturgis (2010), ‘Measuring the returns to
lifelong learning’, CEE Discussion Paper, No. 110, Centre for the Economics of Education, London School of Economics, London, UK.
Blundell, Richard, Lorraine Dearden and Costas Meghir (1996), The determinants and effects of work-related training in Britain, London: Institute for Fiscal Studies.
Brauns, Hildegard, Walter Müller and Susanne Steinmann (1997), ‘Educational expansion and returns to education. A comparative study on Germany, France, the UK, and Hungary’, Arbeitsbereich I, No. 23, University of Mannheim, Germany.
Cheung, Sin Y. and Stephen McKay (2010), ‘Training and progression in the labour market’, DWP Research Report, No. 680, University of Birmingham, UK.
Dieckhoff, M. and N. Steiber (2011), ‘A re-assessment of common theoretical approaches to explain gender differences in continuing training participation’, British Journal of Industrial Relations, 49 (s1), 135–57.
Dieckhoff, Martina, Jean-Marie Jungblut and Philip J. O’Connell (2007), ‘Job-related training in Europe: Do institutions matter?’, in Duncan Gallie (ed.), Employment Regimes and the Quality of Work, Oxford: Oxford University Press, pp. 77–103.
Elman, C. and A. M. O’Rand (2004), ‘The race is to the swift: socioeconomic origins, adult education, and wage attainment’, American Journal of Sociology, 110 (1), 123–60.
Eurydice (2003), Structures of education, vocational training and adult education systems in Europe: United Kingdom, Brussels: Eurydice European Unit.
Jenkins, A., A. Vignoles, A. Wolf and F. Galindo-Rueda (2003), ‘The determinants and labour market effects of lifelong learning’, Applied Economics, 35 (16), 1711–21.
Kilpi-Jakonen, E., D. Vono De Vilhena, Y. Kosyakova, A. Stenberg and H.-P. Blossfeld (2012), ‘The impact of formal adult education on the likelihood of being employed: A comparative overview’, Studies of Transition States and Societies, 4 (1), 48–68.
Merton, R. K. (1968), ‘The Matthew effect in science’, Science, 159 (3810), 56–63.OECD (2002), Education at a Glance 2002: OECD Indicators, Paris: OECD Publishing.Pallas, A. M. (2002), ‘Educational participation across the life course Do the rich get
richer?’, Advances in Life Course Research, 7, 327–54.Rubenson, K. and R. Desjardins (2009), ‘The impact of welfare state regimes on
barriers to participation in adult education: A bounded agency model’, Adult Education Quarterly, 59 (3), 187–207.
Scherer, S. (2005), ‘Patterns of labour market entry – Long wait or career instability? An empirical comparison of Italy, Great Britain and West Germany’, European Sociological Review, 21 (5), 427–40.
Schmelzer, Paul (2008), ‘Increasing employment instability among young people? Labor market entries and early careers in Great Britain since the 1980s’, in Hans-Peter Blossfeld, Sandra Buchholz, Erzsébet Bukodi and Karin Kurz (eds), Young Workers, Globalization and the Labor Market: Comparing Early Working Life in Eleven Countries, Cheltenham, UK and Northampton, MA, USA: Edward Elgar, pp. 181–205.
Shavit, Yossi and Walter Müller (eds) (1998), From School to Work: A Comparative Study of Educational Qualifications and Occupational Destinations, Oxford:

Participation and outcomes of adult learning in Great Britain 139
Clarendon Press.Silles, M. (2007), ‘Adult education and earnings: evidence from Britain’, Bulletin of
Economic Research, 59 (4), 313–26.Singelmann, Joachim (1978), From Agriculture to Services. The Transformation of
Industrial Employment, Beverly Hills, CA: Sage Publications.Sørensen, A. B. and N. B. Tuma (1981), ‘Labor market structures and job mobility’,
Research in Social Stratification and Mobility, 1, 67–94.Soskice, David (1999), ‘Divergent production regimes: coordinated and uncoordinated
market economies in the 1980s and 1990s’, in Herbert Kitschelt, Peter Lange, Gary Marks and John D. Stephens (eds), Continuity and Change in Contemporary Capitalism, New York: Cambridge University Press, pp. 101–34.
Woodfield, R. (2011), ‘Age and first destination employment from UK universities: Are mature students disadvantaged?’, Studies in Higher Education, 36 (4) 409–25.