
Crystallization mechanism of Fe-MFI from wetness impregnated Fe2O3–SiO2 amorphous xerogels: Role...
30
Crystallization mechanism of Fe-MFI from wetness impregnated Fe 2 O 3 -SiO 2 amorphous xerogels: Role of iron species in Fenton-like processes J. A. Melero a ,* , G. Calleja a , F. Martínez a , R. Molina a , K. Lázár b a Department of Environmental, Chemical and Materials Technology, ESCET, Rey Juan Carlos University, 28933 Mostoles, Madrid, Spain b Institute of Isotope and Surface Chemistry, CRC, HAS, Budapest, P.O.B. 77, H-1525, Hungary Published on: Microporous and Mesoporous Materials 74 (2004) 11–21 doi:10.1016/j.micromeso.2004.06.002 Keywords: Crystallization mechanism, wetness-impregnation, Fe-silicalite, Phenol, Catalytic wet peroxide oxidation. * To whom the correspondence should be addressed Tel: 34 91 488 70 87 Fax: 34 91 488 70 68 e-mail: [email protected] 1
Transcript of Crystallization mechanism of Fe-MFI from wetness impregnated Fe2O3–SiO2 amorphous xerogels: Role...
Crystallization mechanism of Fe-MFI from wetness impregnated Fe2O3-SiO2
amorphous xerogels: Role of iron species in Fenton-like processes
J. A. Melero a ,*, G. Calleja a, F. Martínez a, R. Molina a, K. Lázár b
a Department of Environmental, Chemical and Materials Technology, ESCET, Rey Juan Carlos University, 28933 Mostoles, Madrid, Spain
b Institute of Isotope and Surface Chemistry, CRC, HAS, Budapest, P.O.B. 77, H-1525, Hungary
Published on:
Microporous and Mesoporous Materials 74 (2004) 11–21
doi:10.1016/j.micromeso.2004.06.002
Keywords: Crystallization mechanism, wetness-impregnation, Fe-silicalite, Phenol, Catalytic wet peroxide oxidation. *To whom the correspondence should be addressedTel: 34 91 488 70 87 Fax: 34 91 488 70 68 e-mail: [email protected]
1

Abstract
The crystallization mechanism of Fe-MFI zeolite synthesized from amorphous Fe2O3-
SiO2 xerogels wetness impregnated with aqueous TPAOH solutions has been studied.
Samples with different degrees of crystallinity were prepared and characterized by
means of conventional techniques. Activity and stability of these iron-containing
samples has been tested in the catalytic wet peroxide oxidation (CWPO) of phenolic
aqueous solutions. The crystallization mechanism involves a partial dissolution of the
initial xerogel to yield an amorphous material. Nucleation and growth of the MFI phase
is effected by reorganisation of the amorphous phase, although crystal growth also
involves the incorporation of iron and silicon species during the last stage of the
crystallization. A highly crystalline Fe-silicalite material is obtained after 3 hours of
synthesis at 170 ºC. Spectroscopic studies reveal that iron species are in framework
positions (isomorphously substituted) in this highly crystalline material. In addition, the
environment of Fe atoms as well as textural properties of the samples is dramatically
modified along the crystallization affecting significantly to their catalytic activity and
stability in CWPO processes.
2

1. Introduction
Iron-containing silicalite has attracted a great interest due to its high activity as a
catalyst for the reduction of nitrogen oxides [1] and for the selective oxidation of
hydrocarbons with nitrous oxide as oxidant [2]. Several methods of preparation have
been described in literature [3-5]. First attempts for the synthesis of this material were
carried out in alkaline media based on the hydrothermal crystallization of a hydrogel
obtained from basic hydrolysis of the respective precursors with tetrapropylammonium
bromide (TPABr) [3]. The sol-gel process successfully used for the preparation of
different Ti-containing zeolites [6-9] has been also reported for the incorporation of iron
species into the framework of MFI structure [4]. Moreover, the synthesis of Fe-MFI
zeolites in fluoride medium using different inorganic salts as mineralizating agents has
been recently described [5]. In recent years our research group have been carried out a
great effort to elucidate the different crystallization mechanisms involved in the
synthesis of zeolites [6-12]. Most of the works reveal that in many cases the formation
of these materials is not just a solution-mediated process, but the participation of an X-
ray amorphous solid, that undergoes solid-solid transformations in the crystallization
has been demonstrated. In the present work, we report the different stages involved in
the crystallization of Fe-MFI zeolites starting from TPAOH wetness-impregnated
Fe2O3-SiO2 xerogels.
On the other hand iron-containing zeolites have recently evidenced high catalytic
activity in presence of H2O2 for the removal of phenol [13-15] and other refractory
organic compounds [16-17] by means of Fenton-like processes. In this work, we have
presented how the changes of iron environments as well as morphological and textural
properties of the samples during the crystallization influence dramatically on the
3

activity and stability of Fe species in the heterogeneous Fenton-type process. Phenol has
been used as a model reactant, because phenolic wastes are one of the most prevalent
forms of chemical pollutants in industry today and characterised by a high toxicity and a
poor biodegradability.
2. Experimental
2.1 Samples preparation
Preparation of iron-containing raw material. Amorphous Fe2O3-SiO2 mixed
oxide was prepared following a two step sol-gel process widely described: (1) acid-
catalyzed hydrolysis of the respective precursors (tetraethylorthosilicate, TEOS and
FeCl3 6H2O) (2) basic condensation with tetrapropylammonium hydroxide (TPAOH).
The Fe content of the final raw material was 1.13 wt. % (Si/Fe molar ratio of ca. 78).
Hydrothermal crystallization. The resulting solid was wetness impregnated with
aqueous 20 wt. % TPAOH solutions (1.6 g of TPAOH solution per 1 g of dried cogel).
The crystallization of the incipient wet material was carried out in teflon-lined
autoclaves under autogenous pressure and static conditions at 170 oC for different times.
After this treatment, the solid product of the synthesis was separated by centrifugation,
washed several times with distilled water and dried overnight at 110 oC. The calcination
of the samples was carried out in air at 550 oC for 7 hours. The synthesis yield (Ys) was
calculated as weight of calcined solid referenced to the weight of SiO2 + Fe2O3 in the
initial material.
4

2.2 Characterization
Chemical analyses of the samples were performed by ICP-AES with a Varian Vista
AX spectrometer. The content of H, C and N in the as-synthesized samples was
measured by a Vario Elementar analyser. X-ray diffraction patterns (XRD) were
collected with a Philips X-Pert diffractometer with CuKα radiation. Fourier transform
IR (FT-IR) spectra were recorded by means of an Ati Mattson spectrophotometer using
the KBr wafer technique. The crystallinity of the samples (Xc) was determined from
both the XRD peak area between 2θ= 20-24º and the ratio between the intensities in
absorbance units of the 550 and 800 cm-1 IR bands, using a highly crystalline sample as
reference (adsorption volume consistent with a highly crystalline sample of *MFI
topology). The amorphous yield was estimated from the overall solid yield and the
crystallinity of the sample as follows:
−=
100(%)X
1YY csamorphous
An Exstar 6000 thermogravimetric analyser was used for simultaneous thermal
analysis combining thermogravimetry (TGA) and difference thermoanalysis (DTA)
with a heating rate of 10oC/min in air atmosphere. Nitrogen adsorption-desorption
measurements of the calcined samples were carried out at 77 K using the volumetric
method (Micromeritics, Tristar 3000). The surface area was calculated using the BET
equation. With the purpose of comparison, the micropore volume was assumed to be for
all the samples the adsorbed volume at P/Po lower than 0.1. The pore size distribution in
the mesopore region was obtained applying the Barrett-Joyner-Halenda (BJH) method
to the adsorption branch of the isotherm. Morphology and size of the particles was
5

determined by scanning electronic microscopy (SEM) with a XL 30 Esem Philips
microscope.
Mössbauer measurements were carried out by a KFKI spectrometer in constant
acceleration mode. Isomer shift values are related to metallic α-iron. Spectrum
decomposition is performed by assuming Lorentzian line shapes. The accuracy of
positional data is ± 0.03 mm/s. Evacuations of the samples were performed down 4 x
10-1 Pa pressure at 370 ºC for 2.5 h (spectra were recorded in the same vacuum
afterwards). Reducing treatments were carried out in a flow of CO at 350 ºC for 1.5 h
(spectra were recorded in CO atmosphere). Diffuse reflectance UV-VIS spectra (DR
UV-VIS) were obtained under ambient conditions on a Varian Cary-500
spectrophotometer equipped with a diffuse reflectance accessory.
2.3 Catalytic experiments
Catalytic wet oxidation experiments in presence of hydrogen peroxide were carried
out in a 100 mL glass autoclave reactor under continuous mechanical stirring (350 rpm)
in contact with air. The appropriate amount of catalyst suspended in water (0.6 g/L) was
placed into the glass reactor. Thereafter, the system was pressurised with air and heated
up to 100ºC. Once this temperature was achieved, the required amount of H2O2 and
phenol (5.1 and 1.0 g/L respectively) were added. Then, aliquots were withdrawn
during the reaction course with the purpose of monitoring the evolution of phenol,
hydrogen peroxide and total organic carbon (TOC) concentrations. The analysis of
phenol, hydrogen peroxide and other by-products coming from incomplete
mineralization of phenol were carried out by means of an HPLC chromatograph model
Varian Prostar equipped with a Waters Spherisorb column and an UV detector. Total
6
organic carbon (TOC) content of the solutions before and after reaction was analysed
using a combustion/non dispersive infrared gas analyser model TOC-V Shimadzu. Iron
content in the filtered solution after reaction was measured by ICP-AES analysis
collected in a Varian Vista AX spectrometer.
3. Results and discussion
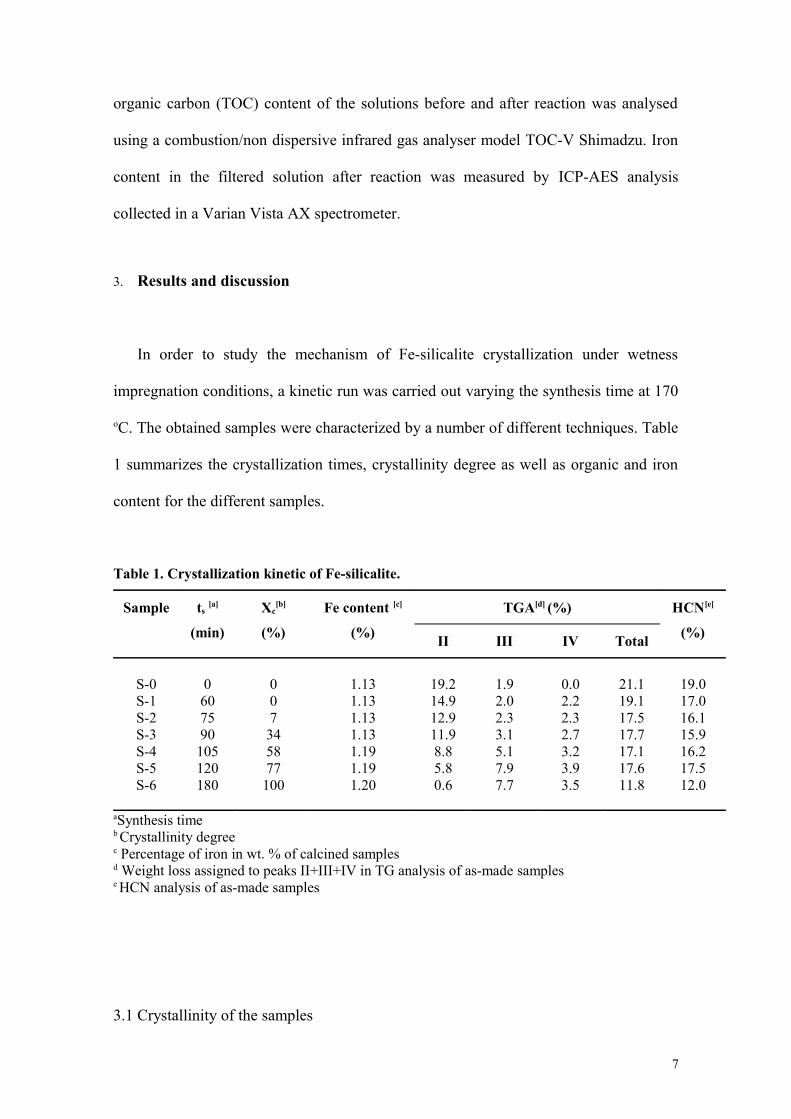
In order to study the mechanism of Fe-silicalite crystallization under wetness
impregnation conditions, a kinetic run was carried out varying the synthesis time at 170
oC. The obtained samples were characterized by a number of different techniques. Table
1 summarizes the crystallization times, crystallinity degree as well as organic and iron
content for the different samples.
Table 1. Crystallization kinetic of Fe-silicalite.
Sample ts [a]
(min)
Xc[b]
(%)
Fe content [c]
(%)
TGA[d] (%) HCN[e]
(%)II III IV Total
S-0S-1S-2S-3S-4S-5S-6
0607590
105120180
007345877
100
1.131.131.131.131.191.191.20
19.214.912.911.98.85.80.6
1.92.02.33.15.17.97.7
0.02.22.32.73.23.93.5
21.119.117.517.717.117.611.8
19.017.016.115.916.217.512.0
aSynthesis time b Crystallinity degreec Percentage of iron in wt. % of calcined samplesd Weight loss assigned to peaks II+III+IV in TG analysis of as-made samplese HCN analysis of as-made samples
3.1 Crystallinity of the samples
7

Figure 1 (a) and (b) illustrate the XRD patterns and FT-IR spectra of the as-
synthesized samples obtained after different synthesis times. The solids collected after
60 and 75 minutes of synthesis (S-1 and S-2 samples) are amorphous as no diffraction
peaks are observed in its XRD spectrum. Likewise, FT-IR band at 550 cm-1, which is
typical of the pentasil zeolite, is absent in S-1 sample and slightly evidenced in S-2
sample. The first signs of macroscopic crystallinity appear in S-3 sample (prepared after
90 min of synthesis) with a clear XRD reflection centred at 2θ=25º that corresponds
with the major reflection of the MFI zeolite topology. As the crystallization progresses,
the XRD reflections and the FT-IR skeleton vibrations at 550 cm-1 increase in intensity.
After 180 minutes of synthesis, a material with very high crystallinity is obtained and
exhibits the typical XRD pattern corresponding to a pure MFI structure (S-6 sample).
This sample is used as reference for calculating the crystallinity of the all synthesised
samples, showing values in Table 1. Likewise, the amount of hydroxyl groups in the
solid collected (FT-IR band centred at 3500 cm-1) lowers as the crystallization proceeds,
indicating an increase in the condensation degree of silicon species.
3.2 Organic content and thermogravimetric analysis
Thermogravimetric analysis of as-synthesised materials obtained at 170°C with
different crystallization times are shown in Figure 2. Four steps can be distinguished in
the TG-DTG curves of these samples. The small weight loss produced below 100 oC
accounts for the thermal desorption of water (step I). In the temperature range 100-300
oC (step II), the weight losses have been attributed to the decomposition of TPA+ ions
occluded within the amorphous solid phase, since this step is negligible for highly
8

crystalline sample (S-6 sample). A third step ranging from 300 to 400oC is detected in
the TG analysis. This weight loss is small for amorphous materials (S-0, S-1 and S-2
samples) and becomes predominant for materials of higher crystallinity (S-3 to S-6
samples). Hence, it is probably originated from TPA+ cations located within the zeolite
cavities and pores. Finally, the weight loss observed between 400 and 500oC (step IV)
has been assigned to the decomposition of TPA+ residues strongly adsorbed on
tetrahedral Fe (III) ions, neutralising the negative framework charges. A reasonable
estimate of the total TPA+ content can be obtained from the overall weight loss
associated to steps II+III+IV, whereas the TPA+ cations present within a microporous
crystalline network can be calculated from the weight loss associated to peaks III+IV. It
must be noted that the HCN content of the as-made samples shown in Table 1 is slightly
lower than that assigned to the weight loss associated to steps II+III+IV. This
difference, which is more accentuated in the amorphous materials, is probably due to
the desorption of water in the 100-200 º C temperature range (step II).
As shown in Table 1 and Figure 2, the total TPA+ content incorporated into the
samples gradually decreases with the crystallization time as consequence of the
transformation of the amorphous network into a microporous crystalline zeolitic
material. The TPA+ content estimated from the TG analysis for a highly crystalline MFI
material (S-6 sample) is around 12 wt. % and is in fair agreement with the values
reported in the literature for pure MFI-type zeolite.
9

Figure 1. (a) XRD patterns and (b) FT-IR spectra of as-synthesised samples obtained after different crystallization times.
10
10 20 30 40 50
4000 3500 3000 2500 2000 1500 1000 500
(b)
(a)
S-6
S-5
S-4
S-3
S-2
S-1
S-0
S-6
S-5
S-4
S-3
S-2
S-1
Wavelength (nm)
2θ
S-0

Figure 2. TG/DTG analyses of as-synthesised samples obtained for different crystallization times: a) S-1 (60 min, Xc=0 %), b) S-3 (90 min, Xc=34 %), c) S-4 (105 min, Xc=58 %) and d)
S_6 (180 min, Xc=100 %).
3.3 Yield of synthesis and iron incorporation
Figure 3 (a) shows the changes in both crystallinity and degree of iron incorporation
into the solid phase with the synthesis time. The evolution of crystallinity follows a
typical sigmoid curve with an induction time of around 75 minutes for the detection of
the first crystalline entities. This period is followed by a period with a high
crystallization rate where the crystallinity changes from 7 to 77 % in just 45 minutes.
The amorphous solid obtained at short synthesis times retains around 80 % of the initial
iron content existing in the raw xerogel. In fact, most of the iron present in the final
11
100 200 300 400 500 600 700
80
85
90
95
100
100 200 300 400 500 600 700
80
85
90
95
100
100 200 300 400 500 600 700
80
85
90
95
100
100 200 300 400 500 600 700
80
85
90
95
100
Wei
ght l
oss
(%)
T (ºC)
IVIII
II (c)
Wei
ght l
oss
(%)
T (ºC)
IV
III
II
I
I
(d)W
eigh
t los
s (%
)
T (ºC)
IV
III
II
I
(a)W
eigh
t los
s (%
)
T(ºC)
IV
III
II
I
(b)

crystalline material is incorporated within the solid phase originated during the first
stages of the crystallization. The incorporation of iron within the final crystalline sample
is almost complete (ca. 90 %). However, this incorporation degree is lower than that
found in the synthesis of Al_TS-1 [9] and Al-Ti-beta [8] where a complete incorporation
of trivalent Al+3 cation was observed even with lower silicon to trivalent ion molar
ratios. Any isomorphous substitution of a silicon atom in silicalite_1 leads to a certain
distortion of the framework, which depends on the nature of the incorporated element.
Thus, the synthesis of zeolites with MFI structure presents no problems for Si/Al molar
ratios up to 15. In contrast, the tetrahedrally incorporation of iron species within the
MFI framework is more limited as consequence of their larger size.
Figure 3 (b) illustrates the evolution of the yield corresponding to the different solid
phases detected along the crystallization: amorphous material and crystalline iron
silicalite. From these results, it is observed that the crystallization proceeds clearly
through three different stages. The first one involves the partial dissolution of the initial
xerogel leading to a decrease of synthesis yield from 100 to 80 % c.a. without any
evidence of crystalline material. In the second stage, crystallinity changes from 0 to 34
% whereas the solid yield keeps constant. Finally, a slight increase in the yield up to 85
% c.a. is observed whereas the crystallinity changes from 34 to 100 %. Interestingly, the
solid yield remains almost constant during the crystallization, pointing out a first
evidence of the participation of solid-solid transformations in the overall process.
12

Figure 3. (a) Crystallization kinetic and iron incorporation into the solid phase (b) Evolution of the synthesis yield of the different solid phases with the crystallization time.
3.4 Textural properties
Nitrogen adsorption/desorption isotherms at 77 K for calcined samples were carried
out in order to follow the changes in the textural properties of the solid phases. The
results obtained are summarised in Table 2 whereas the N2 isotherm and pore size
13
0 40 80 120 160 200
0
20
40
60
80
100
0 40 80 120 160 200
0
20
40
60
80
100
Crystallinity Iron incorporation
(a)
t (min)
%
(b)
Solid yield Zeolite yield Amorphous yield
t (min)
YS (
%)

distribution in the mesopore range corresponding to the different samples are depicted
in Figure 4.
Table 2. Textural properties of the samples.
Sample SBET (m2 g-1) Vp (cm3 g-1) [a] Vmic (cm3 g-1) [b]
S-0S-1S-2S-3S-4S-5S-6
873607603567518445423
0.580.700.780.800.590.330.23
0.320.240.240.230.210.190.18
a Total pore volume, measured at P/Po=0.995b Micropore volume, measured at P/Po=0.1
Significant changes are observed when the textural properties of the calcined
starting xerogel are compared to those of the S-1 and S-2 samples which are also
completely amorphous. It is observed that the hydrothermal treatment leads to a
decrease of BET surface, as well as a development of a higher mesoporosity. Data in
Table 2 indicate that these first amorphous samples exhibit a high proportion of
micropores (Vmic= 0.24 cm3 g-1). This fact suggests that the TPA+ cations detected in
these samples in the TG analysis may be located within the micropores before
calcination. In the subsequent samples, a general trend is observed as the crystallization
process proceeds: sharp decrease of total pore volume, slight decrease of micropore
volume and surface area and progressive disappearance of the mesopores (see Figure 4
(b)). The highest crystalline S_6 sample exhibits a micropore volume of 0.18 cm3 g-1
consistent with a pure MFI structure and with complete absence of mesoporosity. Note
that the extent of microporosity of the initial amorphous samples (S-1 and S-2 samples)
is quite similar to that of the highly crystalline samples (S-5 and S-6 samples), which
also support their active role in the crystallization.
14

Figure 4. (a) Nitrogen adsorption isotherms at 77 K (b) pore size distribution of the different samples.
3.5 Particle size and morphology
SEM micrographs of the samples prepared after different reaction times are shown
in Figure 5. The initial amorphous S-1 sample coming from partial dissolution of the
raw xerogel is highly compact and dense, at least in the micrometer range (Figure 5 (a)).
As the crystallization progresses, small rounded particles with sizes around 0.1-0.2 µm
are clearly evidenced, which emerge and grow from the surface of the amorphous
15
0,0 0,2 0,4 0,6 0,8 1,0
0
100
200
300
400
500
600
10 100 1000
0,0
0,5
1,0
1,5
2,0
(a)
STP
(cm
3 /g)
P/P0
S-0 S-1 S-2 S-3 S-4 S-5 S-6
(b)
dV/d
log(
D) (
cm3 /g
.A)
Dp (A)

material (Figure 5 (b)). These primary particles increase gradually their size (Figure 5
(c) and (d)) whereas less amorphous phase is observed, which agree with a sharp
enhancement of the crystallinity from 7 to 58 % (Table 1). It must be noticed that the
solid yield and iron contents within the solid remain constant during this stage of the
crystallization
Figure 5. SEM images of samples with different crystallinity. (a) S-1 (b) S-2 (c) S-3 (d) S-4 (e) S-5 and (f) S-6.
The SEM images confirm the earlier conclusions, the zeolizitation of the secondary
particles takes place mainly through solid-solid transformations which allow the
16
a
2 µ m
b
2 µ m
c
2 µ m
d
2 µ m
2 µ m2 µ m
e f

amorphous network to be reordered into the zeolite framework. In the last stage of the
crystallization to reach 100 % crystallinity, these particles are transformed into crystals
of 1 µm (Figure 6 (e) and (f)) through a process partially mediated by the incorporation
of soluble species of Si and Fe from the solution. This fact may justify the slight
increase of the synthesis yield depicted in Figure 3. This crystallization mechanism
resembles that found for the TS-1 and Al-TS-1 zeolite starting from wetness-
impregnated xerogels [6,9].
3.6 Environment of iron species
Mössbauer spectroscopy and diffuse reflectance UV-Vis have been used for the
elucidation of environment and location of iron species within the synthesized materials
after different crystallization times.
Mössbauer spectroscopy. This technique has been used very often as a
characterization technique in the analysis of local iron environment in Fe-silicalites [18-
19]. For these spectroscopic studies samples with different crystallinity (S-0, amorphous
xerogel; S-1, Xc= 0 %; S-4, Xc= 58 %; S-6, Xc=100 %) were selected. Figure 6 shows
the Mössbauer spectra for S-0 and S-4 as representative samples. In order to get deeper
information about the state of iron in these samples, measurements were carried out
under different sample conditions: as-received, after evacuation at 370ºC and after CO
treatment at 350ºC. Data collected from the spectra recorded for S-0, S-1, S-4 and S-6
samples are summarized in Table 3.
17

as received
S-0 (Xc=0 %) S-4 (Xc=58 %)
370 /evacuated
-4 -2 0 2 4
350 / CO
-4 -2 0 2 4
Velocity, mm/s
Figure 6. Mössbauer spectra of calcined S-0 and S-4 samples under different analysis conditions
As received samples: The incorporation of iron (III) species into amorphous silica
through impregnation methods have usually led to the existence of symmetric doublets
described with IS ~ 0.3 mm/s, QS: ~ (0.8 – 0.9) mm/s pairs of values. In S-0 and S-1
samples there is always a component with larger quadrupole splitting – so, the structure
is definitely different compared to those obtained in iron species over amorphous silica.
Nevertheless, in S-4 and S-6 samples the doublet is clearly asymmetric, which might be
attributed either to some asymmetry in the vibrations of the crystal lattice, or to a wide
variety of iron environments. Fejes et al. [20] have also observed this asymmetry for
Fe_ZSM-5 materials (zeolite with a MFI topology framework as Fe-silicalite) in the as-
synthesized and calcined samples.
18

Table 3. Mössbauer parameters of the samples with different crystallinity degree (IS: isomer shift, related to metallic α-iron, mm/s; QS: quadrupole splitting, mm/s; LW, full width at half maximum, mm/s; RI: relative spectral contribution, %)
S-0 (xerogel) S-1 (Xc=0 %) S-4 (Xc=58 %) S-6 (Xc=100 %)
Treatment Comp IS QS LW RI IS QS LW RI IS QS LW RI IS QS LW RI
As received
Fe3+ 0.33 1.38 0.66 61 0.36 1.29 0.78 58Fe3+ 0.32 0.85 0.48 39 0.30 0.78 0.53 42Fe3+ (a) 0.32 0.88 0.83 50 0.30 0.84 0.78 50
1.04 50 0.95 50
370 oCevacuation
Fe3+ (t/fr) 0.26 2.04 0.55 37 0.26 1.91 0.67 56 0.25 1.75 1.06 97 0.23 1.73 0.88 93
Fe3+ (o/exfr) 0.32 1.32 0.76 56 0.33 1.02 1.27 29
Fe2+ 1.00 2.09 0.72 7 0.81 1.92 1.02 15 1.06 2.25 0.22 3 1.04 2.09 0.44 7
350 oCCO/reduc
Fe3+ (t/fr) 0.22 1.83 0.70 61 0.23 1.91 0.65 60 0.26 1.80 0.97 91 0.24 1.78 0.83 90
Fe2+ (t/exfr) 0.81 1.24 0.66 26 0.80 1.48 0.99 40
Fe2+ (o/exfr) 0.91 2.17 0.51 13 1.07 1.91 0.67 9 1.06 2.11 0.55 10
(a) Special fit: same intensity but different line width allowed for the lines of the same doublett/fr. Isolated ions in framework positions (tetrahedral coordination, isomorphously substituted)o/exfr. Octahedral iron species in extraframework positions
19

Presence of (Si-O-)n Fe(OH)(4-n) units may be originated as result of the sol-gel
process used for the preparation of the Fe2O3-SiO2 amorphous xerogel [21]. In these
units n may vary from 1 to 4, and if n > 2, oligomerization may also take place.
However, upon calcination at 550oC this hydrous primary structure certainly collapses –
a great amount of water is lost - the tetrahedral coordination is probably preserved only
in part, mostly in larger oligomeric units. This preserved oligomeric state can be
probably assigned to the QS ~ 1.3 mm/s component in S-0 and S-1 samples. In S-4 and
S-6 samples, the structure seems to be more ordered and the calcination does not result
in partial collapse. The asymmetry mentioned previously for S-4 and S-6 samples is
meant in the sense of lattice vibrations – and is not meant from structural point of view.
For instance, a crystalline layered tetragonal planar structure might display this type of
asymmetry in the spectrum.
All the samples analysed contains adsorbed water as well, which can preferably be
coordinated to iron – resulting in completion of the symmetry of coordination around
iron ions. Thus, upon removal of water by evacuation may be expected to obtain a
clearer situation.
Evacuated samples: As expected, the shape of spectra changes for the evacuated
samples – more components appear (Table 3). The component characterized by the 0.23
< IS < 0.26 mm/s and 1.7 < QS < 2.05 mm/s can be probably attributed to the distorted
(Si-O)2=Fe(OH)–O-Si structure, in which the iron is located in tetrahedral coordination
– distortion is originated from the –(OH) group.
In sample S-0 another type of iron is also present – with QS = 1.32 mm/s – this
component may be probably formed on dehydration and calcination of (Si-O-)n Fe(OH)
(4-n) with n = 2. This “partially crystalline” species dominates the spectrum of S_0
sample, and 29 % of spectral area can still be attributed to it in sample S-1. In spectra of
20

samples S-4 and S-6 this component is absent, so we may assume that the extent of
incorporation of iron is almost complete into an ordered zeolitic framework. This fact is
in fair agreement with the XRD spectra, where S-4 sample exhibits ca 60 % of
crystallinity and S-6 sample is almost completely crystalline. Since the information
shown by the Mössbauer technique is of “local” character, almost complete crystallinity
is detected for S-4 sample, which suggest the existence of small crystalline particles
with iron in a tetrahedral environment, not detected by XRD. A minor amount of Fe2+
may also be formed in the process of 2 Fe(3+) – OH → 2 Fe2+ + H2O + ½ O2. The
formation of Fe2+ in a small amount upon evacuation is also a common feature in
zeolites and in ferrisilicates [22].
Reduction CO treatment: The effects of this mild reducing treatment are in
accordance with the previous interpretation. S-0 sample has the most disordered silica-
iron oxide structure – the extra-framework iron can be reduced and Fe2+ may form both
in tetrahedral and in octahedral coordination. In reduction of Fe3+ to Fe2+ by CO
probably two Fe3+ ions are involved since an oxygen atom is extracted, thus these two
Fe3+ ions are probably close to each other. Single distant iron ions inserted into the
framework cannot be probably reduced at this temperature – even being coordinated
between only two Si-O- groups. This reason may explain that a certain amount of the IS
= 0.32, QS = 1.30 mm/s component, present after evacuation, is not reduced to Fe2+ in
CO atmosphere in S-0 sample. S-1 sample exhibits a more clear behaviour – the
proportions of the tetrahedral framework iron are practically the same (c.a. 60 %
spectral area) after evacuation as well as after CO treatment. This attests again for the
more ordered structure of S-1 compared to S-0. S-4 and S-6 samples exhibit again
similar behaviour – the amounts of substituted iron into the framework remain above 90
%, practically not affected by CO treatment. These results attests for the ordered
21

crystalline structure in which separate distant iron ions are substituted in tetrahedral
positions in overwhelming proportion.
DR UV-Vis spectroscopy. This technique also results very useful for studying the
electronic state of isolated transition metal ions. Figure 7 shows the DR UV-Vis spectra
of calcined samples at different synthesis times, being compared with that of the starting
xerogel. The initial xerogel presents a strong absorption in the 200-333 nm interval (two
peaks are clearly distinguished), suggesting a ligand to metal Fe+3 charge transfer
associated to isolated framework Fe+3 species [23]. Likewise, it should be noted that Fe+3
species in octahedral complexes over amorphous supports (Al2O3) have been also
characterized by a strong CT absorption band about 277 nm. As the crystallization
progresses, DR UV-Vis absorption band shifts towards lower wavelengths and the band
located at 250 nm gradually disappears. This fact may be attributed to the gradual
incorporation of tetrahedral iron atoms within the zeolitic framework from the different
Fe+3 species located in the xerogel as stated previously in Mössbauer spectroscopic
results.
The amorphous materials (S-1 and S-2 samples) obtained after 60 and 75 minutes of
hydrothermal treatment shows a similar DR UV-Vis spectrum to that depicted by the
initial xerogel as consequence of their low crystallinity degree. Beyond 75 minutes of
synthesis, as the crystallization progresses, the spectra become narrower in spite of the
fact that the amount of Fe content in the solid remains almost constant. Finally, the
highly crystalline sample (S-6) exhibits an evident displacement toward lower
wavelengths with a clear band located at 220 nm and a smaller one centred at 240 nm.
This spectra result close similar to that reported by Bordiga et al. [23] for iron silicalites.
22

It is furthermore worth mentioning the absence of absorption bands over 300 nm
attributed to small clusters or microaggregates of Fe2O3 particles [23]. DR UV-Vis
spectroscopic results are in agreement with those obtained by Mössbauer spectroscopy
and confirm without doubt the change of iron environments and the incorporation of Fe
in tetrahedral positions within the zeolitic framework with the progress of
crystallization.
Figure 7. DR UV-Vis spectra of calcined samples obtained at different synthesis times.
3.7 Catalytic activity in heterogeneous Fenton-like processes
Advanced oxidation processes and in particular treatments with hydrogen peroxide
(Wet Peroxide Oxidation, WPO) have emerged as a viable alternative for the removal of
organic pollutants from wastewater. The redox properties of transition metal cations,
especially iron species (Fenton reagent), promote the generation of active hydroxyl
200 300 400 500 600
S-6
S-5
S-4
S-3
S-2
S-0
S-1
F(R
)
Wavelength (nm)
23

radicals in presence of hydrogen peroxide under mild reaction conditions. A great
variety of iron-containing heterogeneous catalysts have been already tested for the
oxidative treatment of organic pollutants by means of WPO processes [13-17, 24,25].
Although most of the works are related with the use of iron containing zeolites [13-17],
some papers have been described dealing with the use of Fe-exchanged pillared clays
[25] and iron-containing mesostructured materials [24]. However, the extension to other
iron-containing materials, which combine high stability and activity in a wide pH range,
must be addressed. In this sense, the partially crystalline materials synthesised in this
work with a bimodal pore system (mesoporores and micropores) might be interesting
catalysts for application in Fenton-like processes. The main objective of this section is
to evaluate the activity and stability of iron species incorporated within silica supports
with different crystallinity degree as well as distinctive textural properties and structural
topology in the WPO of phenol. The catalytic performance has been monitored in terms
of phenol and total organic carbon (TOC) conversions as well as efficient use of the
hydrogen peroxide as oxidant. Likewise, a special interest has been focused on the
stability of iron species by means of the amount of metal leached-off into the aqueous
solution after reaction.
Table 4 summarises the TOC, phenol and peroxide conversions for all the samples
after 10 and 90 minutes of reaction. Catalytic experiments were performed with an
initial peroxide concentration of 5.1 g/L, corresponding to the stoichiometric amount for
complete mineralization of phenol (1 g/L, 765 ppm of TOC), according to the reaction:
C6H5OH + 14 H2O2 6 CO2 + 17 H2O
Most of the samples were able to nearly remove phenol in just 10 minutes except
pure Fe-MFI sample. TOC degradation after 10 minutes of reaction is higher for those
partially crystalline samples as compared with that shown by the 100 % crystalline S-6
24

sample (only 21 % removal of the initial TOC concentration). Similar trend is also
evidenced in less extension for 90 minutes of reaction time. These catalytic results
would be in agreement with the intraparticle diffusion problems expected in a
microporous network. However, the partially crystalline samples possessing a bimodal
micro- meso- porous structure allow a faster diffusion of the pollutant with the
subsequent enhancement of its degradation. Summarised in Table 4 are also the values
of Fe iron leached from the samples in terms of iron concentration into the aqueous
solution after 10 and 90 minutes of reaction. Data in this table clearly evidences that
part of the iron incorporated in the sample tend to be dissolved during the reaction. Note
that the iron leached decreases as the crystallinity of the samples increases. This fact
could be related with the different Fe environments observed in Mössbauer and DR UV-
Vis spectra (Figures 6 and 7). Assuming that the Fe species corresponding to a broader
DR UV-Vis absorption band (related to octahedral iron species in extraframework
positions and also detected in Mössbauer spectroscopy) are more labile than those
absorbing at lower wavelengths (associated to isolated iron species in zeolitic
framework positions), the relative high amount of Fe leached for the amorphous xerogel
(S-0 sample) as compared to the zeolitic material (S-6 sample) can be easily explained.
A significant drawback of this kind of oxidation processes is the use of a relative
high cost oxidant such as hydrogen peroxide. For this reason, one of the keys of Fenton
processes is the efficient use of the oxidant that means a high TOC degradation with the
lowest amount of oxidant as possible. Table 4 displays the efficiency in the use of the
oxidant for the different catalysts, defined as TOC removal to hydrogen peroxide
conversion ratio after 10 and 90 minutes of reaction. Pure crystalline Fe silicalite (S-6
sample) yielded low oxidant efficiency as compared with the rest of samples, in
25

particular at low reaction times. Note that partially crystalline samples and in particular
those with more contribution of mesoporosity evidenced the best use of the oxidant.
Table 4. Activity and stability of samples for phenol catalytic wet peroxidation
Sample Xc
(%)Time(min)
Conversion (%) Oxidant Efficiency a
Leaching
Phenol TOC H2O2 (ppm)b
S-0
S-1
S-2
S-3
S-4
S-5
S-6
0
0
7
34
58
77
100
1090
1090
1090
1090
1090
1090
1090
> 99> 99
> 99> 99
> 99> 99
> 99> 99
> 99> 99
96> 99
59.5> 99
54.669.8
58.572.4
62.471.9
49.566.6
42.163.5
43.764.3
21.156.3
72.687.1
65.883.7
65.483.4
60.388.8
57.494.6
55.994.1
56.793.7
0.750.80
0.890.87
0.950.86
0.820.75
0.730.67
0.780.68
0.370.60
5.47.2
5.77.2
5.46.9
4.76.0
2.74.2
1.02.8
0.30.9
a Defined as the ratio among the TOC and oxidant conversionsb Concentration of Fe dissolved into the aqueous solution after catalyst filtration
Finally, in order to check if the amount of iron leached from the catalyst is
responsible of the catalytic activity observed, an additional experiment was carried out
as follows. The resultant solution after 90 minutes of reaction using S-4 sample as
catalyst was filtered in hot conditions to remove the catalyst. Thereafter, phenol and
hydrogen peroxide were further added to return then to the initial concentrations for
running a new reaction. Figure 8 shows the TOC conversion of the filtered solution
(homogeneous test reaction) compared with a blank reaction and that carried out in
26

presence of S-4 sample. The results clearly evidence that the rate of TOC removal as
well as its final degradation is significantly lower as compared to those values obtained
in presence of heterogeneous S-4 catalyst and similar to the blank reaction. These data
demonstrate beyond doubt that the fraction of iron leached from the catalyst is not the
responsible of the degradation of the organic pollutant.
0 20 40 60 80 100
0
10
20
30
40
50
60
70
TOC
con
vers
ion
(%)
t (min)
Heterogeneous reaction Blank reaction Homogeneous test reaction
Figure 8. Contribution of homogeneous iron species in the CWPO process. TOC conversion versus reaction time. Blank reaction performed in absence of catalyst and presence of hydrogen
peroxide.
Conclusions
Based on the results of this work, the following mechanism is proposed for the
crystallization of Fe-MFI zeolite from TPAOH wetness-impregnated xerogels. The
starting polymeric xerogel is partially dissolved during the first hour of synthesis to
yield an amorphous solid, with an incomplete incorporation of Fe species and a high
content of TPA+ molecules. Both the nucleation of MFI phase and the initial steps of
crystal growth take place by reorganisation of this amorphous material and
accompanied with changes on the iron environment. However, crystal growth also
27

involves the incorporation of soluble iron and silicon species during the last stage of the
crystallization. This step is the slowest one in the overall process, mainly governed by a
liquid phase transport. In agreement with this scheme, Fe-MFI crystallization from
amorphous Fe2O3-SiO2 xerogels proceeds by a non-conventional mechanism. In the
system here studied, solid-solid transformations of the amorphous network have an
important relevance in the formation of the iron silicalite crystals.
Activity and stability of the different iron-containing samples for CWPO of phenolic
solutions depend on the nature and environment of iron species, which is closely related
with their degree of crystallinity. In particular, partially crystalline samples having a
dual pore system structure allow a faster removal of aromatic compounds as compared
with the raw xerogel and 100 % crystalline zeolite. Likewise, an efficient use of the
hydrogen peroxide and an enhancement of iron stability accompany this catalytic
performance.
Acknowledgements
The authors thank “Ministerio de Ciencia y Tecnología” through the project PPQ-2003-
03984 and “Programa Grupos Estratégicos de la CAM” for the financial
support of this research.
28

References
1. H.Y. Chen, W.M.H. Sachtler, Catal. Today 42 (1998) 73.
2. G. I. Panov, A.K. Uriaete, M.A: Rodkim, V.I. Sobolov, Catal. Today 41 (1998) 365;
V.I. Sovolev, K.A. Dubkov, O.V. Panna, G.I. Panov, Catal. Today 24 (1995) 251.
3. A. Brückner, R. Lück, W. Wieker, B. Fahlke, Zeolites 12 (1992) 380 .
4. Q.A. Anunziata, L.B. Pierella, E.J. Lede, F.G. Requejo, in: A. Galarneau, F. Di
Renzo, F. Fajula, J. Vedrine (Eds.), Zeolites and Mesoporous Materials at the Dawn
of the 21st Century, Studies in Surface Science and Catalysis, Vol. 135, Elsevier,
Amsterdam, 2001, p.660.
5. F. Testa, L. Pasqua, F. Crea, R. Aiello, K. Lazar, P. Fejes, P. Lentz, J.B. Nagy,
Microporous&Mesoporous Mater. 57 (2003) 57.
6. D. P. Serrano, M. A. Uguina, G. Ovejero, R. van Grieken, M. Camacho,
Microporous Mater., 7 (1996) 309.
7. D. P. Serrano, M. A. Uguina, G. Ovejero, R. van Grieken, M. Camacho, J. Chem.
Soc. Chem. Commun., (1996) 1907.
8. D. P. Serrano, M. A. Uguina, G. Ovejero, R. van Grieken, M. Camacho, J. A.
Melero, J. Mat. Chem., 9 (1999) 2899.
9. J.A. Melero, R. van Grieken, D. P. Serrano, J.J. Espada, J. Mater. Chem., 11 (2001)
1519.
10. D. P. Serrano, R. van Grieken, J. Mater. Chem., 11 (2001) 2391.
11. R. Van Grieken, J.L. Sotelo, J.M. Menendez, J.A. Melero, Microporous and
Mesoporous Mater., 39 (2000) 135.
12. D.P. Serrano, R. Van Grieken, M.E. Davis, J.A. Melero, A. Garcia, G.Morales,
Chem. Eur. J., 8 (2002) 5153.
13. K. Fajerwerg, H. Debellefontaine, Appl. Catal. B : Environ., 10 (1996) 229.
29

14. K. Fajerwerg, J. N. Foussard, A. Perrard, H. Debellefontaine, Water Sci. Technol.,
35 (1997) 103.
15. G. Ovejero, J.L. Sotelo, F. Martinez, J.A. Melero, L. Gordo, Ind. Eng. Chem. Res.,
40 (2001) 3921.
16. F. Larachi, F., S. Lévesque, A. Sayari, J. Chem. Technol. Biotechnol. 73 (1998)
127.
17. G. Centi, S. Perathoner, T. Torre, M. G. Verduna, Catal. Today, 55 (2000) 61.
18. K. Lázár, A.N. Kotastahne, P. Fejes, Catal. Lett. 57 (1999) 171.
19. P. Fejes, J.B. Nagy, K. Lázár, J. Halász, Appl. Catal. A 190 (2000) 117.
20. P. Fejes, I. Kiricsi, K. Lázár, I. Marsi, A. Rockenbauer, L. Korecz, J.B. Nagy, R.
Aiello, F. Testa, Appl. Catal. A 242 (2003) 247.
21. P. Ratnasamy, R. Kumar, Catal. Today 9 (1991) 328.
22. K. Lázár, G. Borbély, H. Beyer, Zeolites 11 (1991) 214.
23. S. Bordiga, R. Buzzoni, F. Geobaldo, C. lamberti, E. Giamello, A. Zecchina, G.
Leofanti, G. Petrini, G. Tozzola, G. Vlaic, J. Catal. 158 (1996) 486.
24. N. Crowther, F. Larachi, Appl. Catal. B. Environ., 46 (2003) 293.
25. C. Catrinescu, C. Teodosiu, M. Macoveanu, J. Miehe-Brendlé, R. Le Dred, Water.
Res., 37 (2003) 1154.
30