Nonlinear effects in the dynamics governed by non-Markovian stochastic Langevin-like equations

Crystal asymmetry and low-angle grain boundary governed persistentphotoinduced magnetization in small bandwidth manganitesS. Majumdar, T. Elovaara, H. Huhtinen, S. Granroth, and P. Paturi Citation: J. Appl. Phys. 113, 063906 (2013); doi: 10.1063/1.4789596 View online: http://dx.doi.org/10.1063/1.4789596 View Table of Contents: http://jap.aip.org/resource/1/JAPIAU/v113/i6 Published by the American Institute of Physics. Related ArticlesControlled epitaxial integration of polar ZnO(0001) with Si(001) Appl. Phys. Lett. 102, 101602 (2013) Oxygen segregation at coherent grain boundaries of cubic boron nitride Appl. Phys. Lett. 102, 091607 (2013) Magnetotransport properties of quasi-one-dimensionally channeled vertically aligned heteroepitaxial nanomazes Appl. Phys. Lett. 102, 093114 (2013) Dewetting of Au and AuPt alloy films: A dewetting zone model J. Appl. Phys. 113, 094301 (2013) Direct atomic imaging of antiphase boundaries and orthotwins in orientation-patterned GaAs Appl. Phys. Lett. 102, 081905 (2013) Additional information on J. Appl. Phys.Journal Homepage: http://jap.aip.org/ Journal Information: http://jap.aip.org/about/about_the_journal Top downloads: http://jap.aip.org/features/most_downloaded Information for Authors: http://jap.aip.org/authors
Downloaded 22 Mar 2013 to 130.233.204.140. Redistribution subject to AIP license or copyright; see http://jap.aip.org/about/rights_and_permissions
Crystal asymmetry and low-angle grain boundary governed persistentphotoinduced magnetization in small bandwidth manganites
S. Majumdar,1 T. Elovaara,1,2 H. Huhtinen,1 S. Granroth,3 and P. Paturi11Wihuri Physical Laboratory, Department of Physics and Astronomy, University of Turku,FI-20014 Turku, Finland2The National Graduate School in Material Physics (NGSMP), Helsinki, Finland3Laboratory of Materials Research, Department of Physics and Astronomy, University of Turku,FI-20014 Turku, Finland
(Received 19 November 2012; accepted 11 January 2013; published online 11 February 2013)
Persistent photo-induced magnetization (PPM) in low bandwidth manganite Pr1�xCaxMnO3
(PCMO) thin film is reported in the low hole doped regime (x¼ 0.1). X-ray diffraction, x-ray
photoelectron spectroscopy, and magnetic measurements in dark and under illumination on the
as-grown, vacuum, and oxygen annealed thin films of PCMO showed that the PPM effect is
strongly dependent on the crystal symmetry, low angle grain boundaries, and the Mn valence states
in the material. Compared with the as-grown and vacuum annealed film, the oxygen annealed film
shows much less low-angle grain boundaries, higher crystal symmetry, and long range
ferromagnetic (FM) ordering and in this sample PPM is not significant. These results clearly
indicate that in this large band gap material PCMO, photo-induced FM interaction mainly arises
due to improved domain-wall movement of the short range FM clusters. Significant PPM can be
obtained for films with higher amount of grain boundaries, oxygen vacancies, and strain related
defects. VC 2013 American Institute of Physics. [http://dx.doi.org/10.1063/1.4789596]
I. INTRODUCTION
The optical control of physical properties in electronic
materials forms the basis of many optoelectronic devices like
photo-diodes, photo-sensors, photo-resistors, photo-transistors,
etc.1 Photo-induced change in electronic states in materials
leading to modified magnetization, resistivity, etc., is not only
interesting from the application point of view but also broad-
ens our scientific understanding about material properties.2–5
Perovskite manganites with the formula R1�xAxMnO3 (where
R is a rare-earth trivalent element and A is a divalent alkaline
earth element) are the extremely versatile class of materials
with the coexistence of phase-separated regimes6 and inter-
play between different phases leading to their application in
resistive7 and magnetic data storage8 as well as in other future
technologies.7,9,10 Among the perovskite manganites, low
bandwidth compound Pr1�xCaxMnO3 (PCMO) is especially
interesting due to a stable charge-order (CO) state near the
hole doping range of 0.3–0.5. In addition to that, large photo-
induced change in resistivity has been observed in PCMO in
their CO phase11 and photo-induced increase in the metallic
volume fraction is proposed to be the main reason. Earlier, we
observed a persistent photo-induced magnetization (PPM) in
low hole-doped La0.9Ca0.1MnO3 (LCMO)12,13 and in
PCMO,14 but the effect was clearly lower in PCMO. A
detailed analysis of the PPM in intermediate bandwidth mate-
rial LCMO and low bandwidth PCMO indicated towards the
fact that the incident light energy is sufficient to induce
charge-transfer (CT) transition in LCMO but due to higher
Jahn-Teller (JT) distortion in PCMO, incident light energy is
unable to introduce CT transition in PCMO.15
In a recent investigation,16 micro-Raman analysis of
PCMO showed that ex situ annealing of PCMO thin films
effectively modifies the JT distortion of the PCMO unit cell.
In the present communication, we have investigated whether
this modified crystal symmetry improves PPM response in
the PCMO samples. For this purpose, differently treated
PCMO films were prepared and characterized with x-ray dif-
fraction (XRD), x-ray photoelectron spectroscopy (XPS),
and by magnetic measurements in dark and under optical
excitation.
II. EXPERIMENTAL DETAILS
PCMO films with thickness of 100 nm were deposited
on (100) SrTiO3 (STO) substrates by pulsed laser deposition
(PLD) using an excimer XeCl 308 nm laser with the laser flu-
ence 2 J/cm2 and the repetition rate 5 Hz. The flowing oxy-
gen pressure in the chamber was p¼ 0.3 Torr and the
substrate temperature during the deposition was 700 �C. The
PCMO (x¼ 0.1) target for PLD was prepared by the solid-
state reaction method by drying of high-purity Pr6O11,
Mn2O3, and CaCO3 salts for 5 h at 500 �C in air and prepar-
ing a stoichiometric mixture in the metal ion molar ratio of
1.5:5:1. After grinding, the mixed powder is pressed into a
pellet and in order to produce single phase material, the final
target is treated in a sequence of four grinding-pressing-sin-
tering process at 1200 �C in air. Details of the target prepara-
tion and the film deposition parameters have been reported
elsewhere.17 In order to decrease or increase the oxygen
content of the films and affect the valency of Mn ions, the
post-annealing treatments for as-grown film A were made in
vacuum of 10�3 Torr for 15 min at 700 �C with heating and
cooling rates of 10 �C/min (sample B) and in flowing oxygen
at 800 �C for 24 h with heating and cooling rates of 1 �C/min
(sample C).
0021-8979/2013/113(6)/063906/9/$30.00 VC 2013 American Institute of Physics113, 063906-1
JOURNAL OF APPLIED PHYSICS 113, 063906 (2013)
Downloaded 22 Mar 2013 to 130.233.204.140. Redistribution subject to AIP license or copyright; see http://jap.aip.org/about/rights_and_permissions
The XPS spectra were obtained by Perkin-Elmer PHI
5400 spectrometer using Al Ka excitation of a twin anode
(1486 eV). Analyzer pass energy of 89.45 eV and 45� take-
off angle were used to measure the core-level spectra of as-
grown (A), vacuum treated (B), and O2-annealed (C) PCMO
samples. The background pressure in the analyzer chamber
was around 1� 10�9 Torr during the measurements. The
binding energy (BE) scale was calibrated by setting the C 1sphotoemission peak to 285 eV.
The temperature dependence of the zero-field-cooled
(ZFC) and field-cooled (FC) magnetizations was measured
between temperatures 5 and 300 K with a superconducting
quantum interference device (SQUID) magnetometer with
different external magnetic fields B. Virgin magnetization as
a function of B and magnetic hysteresis curves were recorded
in a field of B ¼ 6300 mT at different temperatures between
5 and 100 K. All measurements were made for the sample in
the dark or under illumination through an optical fiber using
AlGaInP laser working at k ¼ 658 nm (1.88 eV). The tem-
perature of the sample is controlled during illumination with
two independent thermometers located in He gas flow before
and after the sample. Depending on the position and align-
ment of the optical fibre, the magnetic background signal
vary considerably, but between the each measurement pair in
dark and under the illumination, the sample, and the optical
fibre alignment is not disturbed and therefore the measured
differences are always reliable. The external field B was ori-
ented along the plane of the films, i.e., along the PCMO
[110] axis.
III. RESULTS
A. Structural analysis
The detailed XRD analysis for as-grown, vacuum-, and
oxygen-annealed PCMO films were made earlier,18 and it
was concluded that all the films were phase pure and only
(0 k0) peaks perpendicular to the surface were observed.
From the peak widths of the traditional 2h scans, we have
observed that the vacuum treatment induces more variation
in the lattice parameters while the oxygen treatment makes
the unit cells more uniform when compared to the results of
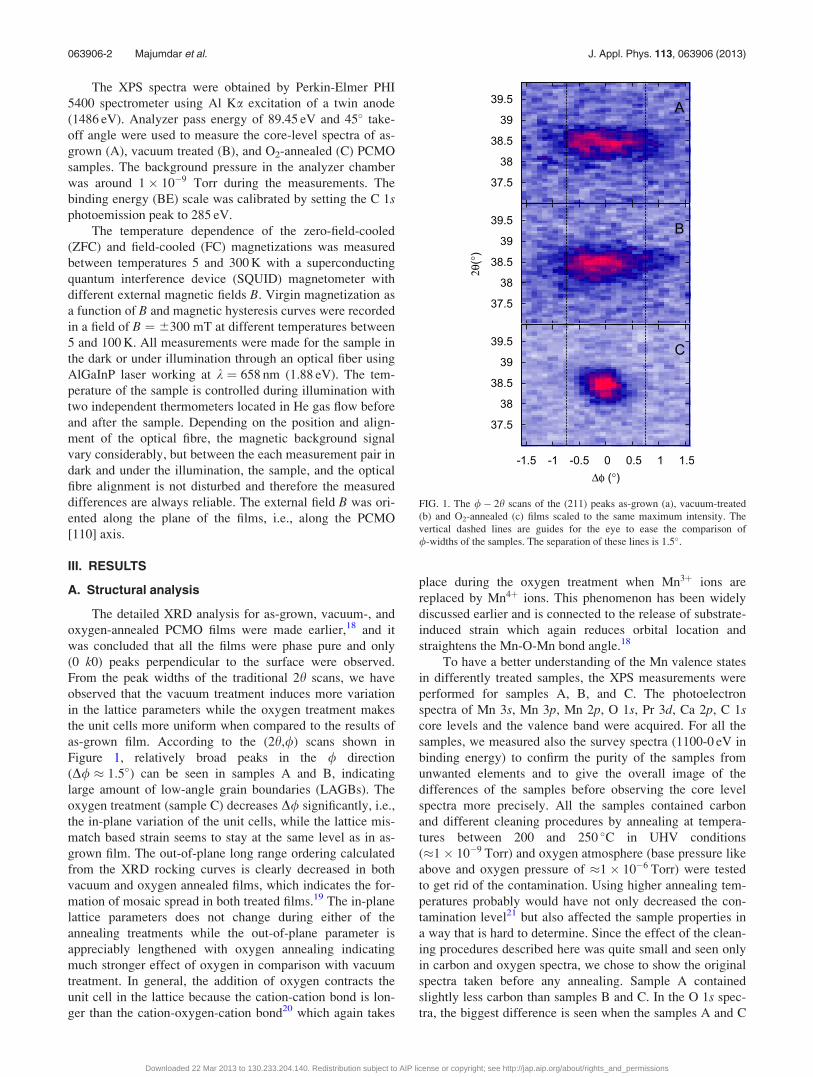
as-grown film. According to the (2h,/) scans shown in
Figure 1, relatively broad peaks in the / direction
(D/ � 1:5�) can be seen in samples A and B, indicating
large amount of low-angle grain boundaries (LAGBs). The
oxygen treatment (sample C) decreases D/ significantly, i.e.,
the in-plane variation of the unit cells, while the lattice mis-
match based strain seems to stay at the same level as in as-
grown film. The out-of-plane long range ordering calculated
from the XRD rocking curves is clearly decreased in both
vacuum and oxygen annealed films, which indicates the for-
mation of mosaic spread in both treated films.19 The in-plane
lattice parameters does not change during either of the
annealing treatments while the out-of-plane parameter is
appreciably lengthened with oxygen annealing indicating
much stronger effect of oxygen in comparison with vacuum
treatment. In general, the addition of oxygen contracts the
unit cell in the lattice because the cation-cation bond is lon-
ger than the cation-oxygen-cation bond20 which again takes
place during the oxygen treatment when Mn3þ ions are
replaced by Mn4þ ions. This phenomenon has been widely
discussed earlier and is connected to the release of substrate-
induced strain which again reduces orbital location and
straightens the Mn-O-Mn bond angle.18
To have a better understanding of the Mn valence states
in differently treated samples, the XPS measurements were
performed for samples A, B, and C. The photoelectron
spectra of Mn 3s, Mn 3p, Mn 2p, O 1s, Pr 3d, Ca 2p, C 1score levels and the valence band were acquired. For all the
samples, we measured also the survey spectra (1100-0 eV in
binding energy) to confirm the purity of the samples from
unwanted elements and to give the overall image of the
differences of the samples before observing the core level
spectra more precisely. All the samples contained carbon
and different cleaning procedures by annealing at tempera-
tures between 200 and 250 �C in UHV conditions
(�1� 10�9 Torr) and oxygen atmosphere (base pressure like
above and oxygen pressure of �1� 10�6 Torr) were tested
to get rid of the contamination. Using higher annealing tem-
peratures probably would have not only decreased the con-
tamination level21 but also affected the sample properties in
a way that is hard to determine. Since the effect of the clean-
ing procedures described here was quite small and seen only
in carbon and oxygen spectra, we chose to show the original
spectra taken before any annealing. Sample A contained
slightly less carbon than samples B and C. In the O 1s spec-
tra, the biggest difference is seen when the samples A and C
FIG. 1. The /� 2h scans of the (211) peaks as-grown (a), vacuum-treated
(b) and O2-annealed (c) films scaled to the same maximum intensity. The
vertical dashed lines are guides for the eye to ease the comparison of
/-widths of the samples. The separation of these lines is 1.5�.
063906-2 Majumdar et al. J. Appl. Phys. 113, 063906 (2013)
Downloaded 22 Mar 2013 to 130.233.204.140. Redistribution subject to AIP license or copyright; see http://jap.aip.org/about/rights_and_permissions

are compared to the sample B (Figure 2) which contains an
additional component at higher BE of 533 eV than other
samples. This difference in O 1s spectra of sample B can be
due to higher amount of Od�-species, Pr-O-C22 or surface
degradation or contamination.23 The O 1s spectra of samples
A and C look very similar only difference being the high BE
shift of the spectra of sample C. The feature around 529–
529.5 eV BE is suggested to originate from Pr-O and Mn-O
bondings based on the XPS study of PrMnO3.24 The O 1s
features at BE of about 532 eV, which is present in all the
spectra, can be related to Pr/Ca-O,25 but also the signal origi-
nating from chemisorbed, physisorbed or bound H2O has
approximately the same BE.26 In some references for LSMO
crystals, the low (high) BE component of O 1s spectrum is
caused by O atoms below the surface, “bulk” (surface) O.27
Based on the changes in the spectra that were taken after
cleaning tests, at least part of this high BE component of our
samples is due to surface contamination since the intensity
of the component decreased during the annealing.
In our previous papers including XPS results, the
changes in Mn valence have been studied by analyzing the
Mn 2p core levels which is known to possess very compli-
cated multiplet splitting26,28 that makes it difficult to resolve
small changes in BE or peak asymmetry. In addition to the
Mn 2p spectra (Figure 2(b)), we have measured the Mn 3s(Figure 3) and 3p core levels and in this work the most
obvious changes caused by sample treatments were observed
in Mn 3s spectra. The splitting of 3s core level spectra, DE3s,
of 3d transition metals is due to the exchange interaction
between the 3s core hole produced in a photoemission
process and 3d electrons.27,29,30 After emission of one 3selectron, the exchange coupling of the remaining 3s core-
electron produces two different final states seen as a split
multiplet structure. In the case of PCMO, this multiplet
splitting depends on the valence state of Mn ions being pro-
portional to the local spin of the 3d electrons in the ground
state. The splitting is known to decrease as the Mn valency
increases.31,32 For example, the exchange splitting of MnO is
about 6 eV, of Mn2O3 is 5.5 eV, and of MnO2 is 4.7 eV, that
is for Mn2þ, Mn3þ, and Mn4þ ions, respectively.29,33
Figure 3 presents the Mn 3s core level spectra of the sam-
ples A, B, and C. The interpretation of the spectra is compli-
cated because of the changes in BE, peak asymmetry, and
DE3s splitting as well as the additional satellite visible at high
BE side of the spectra of post-annealed samples B and C. In
the spectra of sample C, also the low BE component has
shifted towards low BE in a comparison to the A and B spec-
tra. Mannella et al.27 have reported similar behaviour of DE3s
and shifting of the low BE (high BE) peak of Mn 3s (O 1s) as
the temperature passed TC during the heating of UHV frac-
tured La0.7Sr0.3MnO3 crystals. The most obvious difference
between the samples is the increased DE3s from sample A
(5.1 eV) to samples B (5.6 eV) and C (6.4 eV) suggesting,
according to a very simplified interpretation, that post-
annealing would increase the amount of Mn3þ in sample B
and Mn2þ in sample C relative to sample A. However,
improved crystal structure obtained by XRD and improved
ferromagnetic (FM) interaction in magnetic measurements
suggest higher Mn4þ/Mn3þ ratio. The increase of Mn4þ/
Mn3þ ratio also resulted in the increase in the amount of
Mn2þ which is known to give larger DE3s values. The high
BE feature observed in the Mn 3s spectra of samples B and C
cannot be caused by Auger peaks since it does not exist in the
spectra of sample A. Similar structure has been seen in
La0.75Sr0.25MnO3 film34 but was not explained or commented.
In the temperature dependent electronic structure study of
La0.7Sr0.3MnO3, a high BE satellite is visible on the high BE
FIG. 2. The O 1s (a) and Mn 2p3=2 (b) core level spectra of as-grown (A),
vacuum-treated (B), and O2-treated (C) PCMO films at photon energy of
1486 eV measured at room temperature.
FIG. 3. Comparison of Mn 3s core level XPS spectra of as-grown (A),
vacuum-treated (B), and O2-treated (C) PCMO films. The spectra are
adjusted by removing Shirley background and normalized by setting the in-
tensity of the low binding energy component to 1. Binding energy differen-
ces between the component maxima in the doublet, DE3s, are given for
samples A, B, and C.
063906-3 Majumdar et al. J. Appl. Phys. 113, 063906 (2013)
Downloaded 22 Mar 2013 to 130.233.204.140. Redistribution subject to AIP license or copyright; see http://jap.aip.org/about/rights_and_permissions

side of the Mn 3s spectrum measured above the TC.35 This
satellite, which has slightly larger shift from the Mn 3s com-
ponents than what is observed in our spectra, is suggested to
be a reminiscent of the configuration satellites that have been
reported for higher-spin Mn compounds.29 However, after
Shirley type background subtraction and by fitting with Voigt
line shape doublets, we could not quantitatively describe the
Mn2þ, Mn3þ, and Mn4þ intensity ratios. Therefore, we can
qualitatively conclude that, in comparison with samples A
and B, in oxygen annealed film C increased amount of 3delectrons can be expected due to larger DE3s splitting as well
as presence of some Mn2þ on the surface.36,37
B. Photoinduced persistent magnetization
The virgin magnetization curves M(B) measured at 5 K
and up to 500 mT field before and during illumination for as-
grown (A), vacuum-treated (B), and O2-annealed (C) films
are shown in the main panels of Figure 4. The M(B) curves
of sample A show relatively linear increase in both dark (up
to �150 mT) and illumination (up to �120 mT) measure-
ments while in both M(B) curves of sample B two distinctly
different slopes around 90 mT in dark and around 70 mT in
illumination measurements can be observed. These changes
in slopes indicate a metamagnetic transition and confirm the
coexistence of antiferromagnetic (AFM) and FM phases in
the ground state of PCMO38 which is suppressed under the
illumination because the field dependent transition is
decreased around 20 mT. This can be explained by the opti-
cal excitation induced FM ordering which decreases the
field-induced melting of the strain that occurs at the phase
boundary between AFM and FM clusters and thus making
the AFM-FM transition much sharper.39 The effect of illumi-
nation is approximately similar in samples A and B where
the maximum increase in FM can be observed around 90–
100 mT as can be seen from the difference DM ¼Mill �Mdark plotted as a function of applied magnetic field in
the insets of Figure 4. Slight convex shape of DM curve
below 90 mT in sample A can be related to the existence of
minute metamagnetic behaviour in M(B) measured in dark
which disappears completely during illumination where Mill
increases even more rapidly than in sample B. Above
200 mT, the Mill and Mdark curves in both samples A and B
follow each other and the net magnetization is not improved
under illumination. The virgin curves of sample C differ
clearly from the curves of both samples A and B. This leads
to much steeper field dependence of M(B) where Mill and
Mdark curves merge together already around 100 mT which
on the other hand is the field value of maximum DM for sam-
ples A and B. As can be seen from the inset of Figure 4(c),
the sharp peak in DM around 45 mT indicates clearly
improved FM ordering by oxygen treatment which again
restricts the effect of optical excitation. The metamagnetic
transition for sample C can be observed at around 25 mT
field in both measurements made in dark and under illumina-
tion. This again indicates that better lattice symmetry due to
oxygen treatment as observed by micro-Raman analysis16
assists the destabilization of strain related blocking causing
improved FM ordering with lower magnetic field.
Figure 5 shows the magnetic hysteresis loops M(B) meas-
ured at 5 K between �300 and þ300 mT for the PCMO films
A, B, and C. The vacuum-annealed film B measured at 5 K in
dark has the most open loop in terms of coercivity,
Bc � 83 mT, while in as-grown film A, Bc is clearly smaller
of 58 mT and the loop shrinks and sharpens even more by
oxygen-annealing having Bc in the level of 40 mT. This can
be explained by the vacancy related defect structure which
pins the domain wall movement and hence increases the coer-
civity in samples A and B when compared to sample C.18 At
5 K in films A and B, a clear two-step magnetic transition in
the hysteresis loop can be seen, which is in line with earlier
FIG. 4. Virgin curves of the magnetic hysteresis loops measured at 5 K for as-
grown (a), vacuum-treated (b), and O2-annealed (c) PCMO films before (black
symbols) and during (red symbols) illumination with an AlGaInP laser at
658 nm. The background signal of the optical fibre is subtracted in non-
illuminated and illuminated virgin curves in order to obtain the actual differ-
ence between the curves. The insets show the differences of these curves
DM ¼ Mill �Mdark in low fields measured for the same samples A, B, and C.
063906-4 Majumdar et al. J. Appl. Phys. 113, 063906 (2013)
Downloaded 22 Mar 2013 to 130.233.204.140. Redistribution subject to AIP license or copyright; see http://jap.aip.org/about/rights_and_permissions
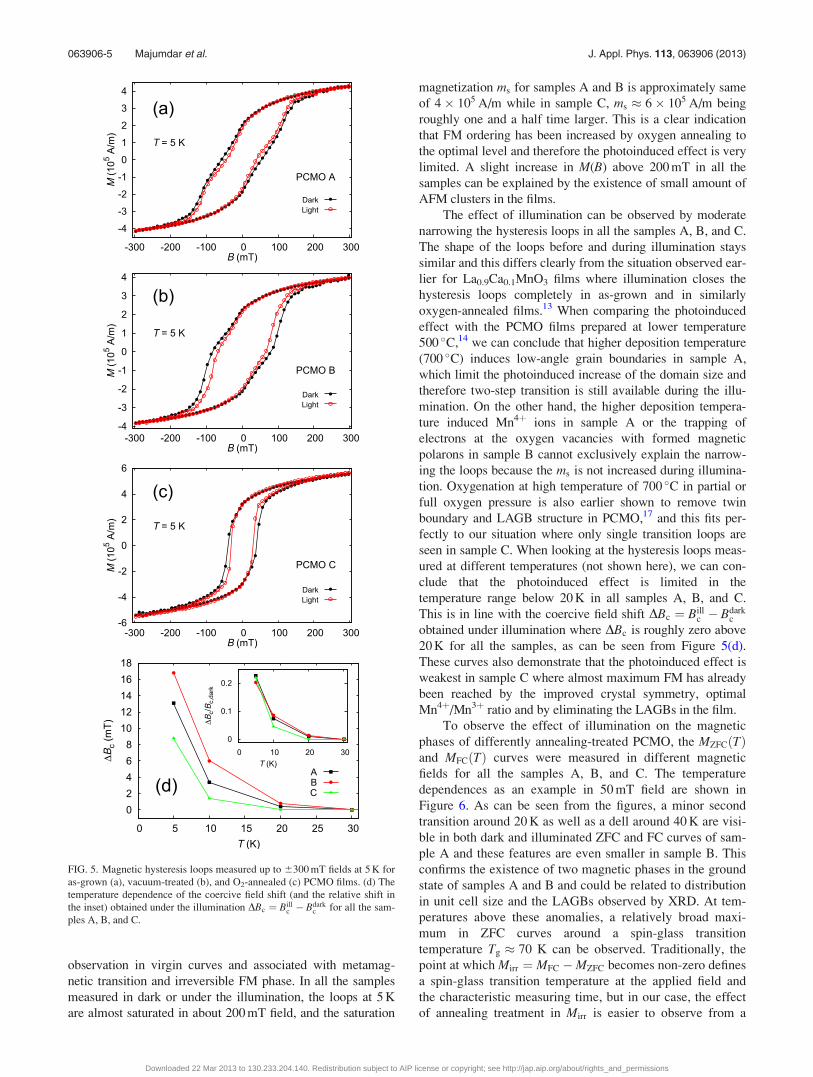
observation in virgin curves and associated with metamag-
netic transition and irreversible FM phase. In all the samples
measured in dark or under the illumination, the loops at 5 K
are almost saturated in about 200 mT field, and the saturation
magnetization ms for samples A and B is approximately same
of 4� 105 A/m while in sample C, ms � 6� 105 A/m being
roughly one and a half time larger. This is a clear indication
that FM ordering has been increased by oxygen annealing to
the optimal level and therefore the photoinduced effect is very
limited. A slight increase in M(B) above 200 mT in all the
samples can be explained by the existence of small amount of
AFM clusters in the films.
The effect of illumination can be observed by moderate
narrowing the hysteresis loops in all the samples A, B, and C.
The shape of the loops before and during illumination stays
similar and this differs clearly from the situation observed ear-
lier for La0.9Ca0.1MnO3 films where illumination closes the
hysteresis loops completely in as-grown and in similarly
oxygen-annealed films.13 When comparing the photoinduced
effect with the PCMO films prepared at lower temperature
500 �C,14 we can conclude that higher deposition temperature
(700 �C) induces low-angle grain boundaries in sample A,
which limit the photoinduced increase of the domain size and
therefore two-step transition is still available during the illu-
mination. On the other hand, the higher deposition tempera-
ture induced Mn4þ ions in sample A or the trapping of
electrons at the oxygen vacancies with formed magnetic
polarons in sample B cannot exclusively explain the narrow-
ing the loops because the ms is not increased during illumina-
tion. Oxygenation at high temperature of 700 �C in partial or
full oxygen pressure is also earlier shown to remove twin
boundary and LAGB structure in PCMO,17 and this fits per-
fectly to our situation where only single transition loops are
seen in sample C. When looking at the hysteresis loops meas-
ured at different temperatures (not shown here), we can con-
clude that the photoinduced effect is limited in the
temperature range below 20 K in all samples A, B, and C.
This is in line with the coercive field shift DBc ¼ Billc � Bdark
c
obtained under illumination where DBc is roughly zero above
20 K for all the samples, as can be seen from Figure 5(d).
These curves also demonstrate that the photoinduced effect is
weakest in sample C where almost maximum FM has already
been reached by the improved crystal symmetry, optimal
Mn4þ/Mn3þ ratio and by eliminating the LAGBs in the film.
To observe the effect of illumination on the magnetic
phases of differently annealing-treated PCMO, the MZFCðTÞand MFCðTÞ curves were measured in different magnetic
fields for all the samples A, B, and C. The temperature
dependences as an example in 50 mT field are shown in
Figure 6. As can be seen from the figures, a minor second
transition around 20 K as well as a dell around 40 K are visi-
ble in both dark and illuminated ZFC and FC curves of sam-
ple A and these features are even smaller in sample B. This
confirms the existence of two magnetic phases in the ground
state of samples A and B and could be related to distribution
in unit cell size and the LAGBs observed by XRD. At tem-
peratures above these anomalies, a relatively broad maxi-
mum in ZFC curves around a spin-glass transition
temperature Tg � 70 K can be observed. Traditionally, the
point at which Mirr ¼ MFC �MZFC becomes non-zero defines
a spin-glass transition temperature at the applied field and
the characteristic measuring time, but in our case, the effect
of annealing treatment in Mirr is easier to observe from a
FIG. 5. Magnetic hysteresis loops measured up to 6300 mT fields at 5 K for
as-grown (a), vacuum-treated (b), and O2-annealed (c) PCMO films. (d) The
temperature dependence of the coercive field shift (and the relative shift in
the inset) obtained under the illumination DBc ¼ Billc � Bdark
c for all the sam-
ples A, B, and C.
063906-5 Majumdar et al. J. Appl. Phys. 113, 063906 (2013)
Downloaded 22 Mar 2013 to 130.233.204.140. Redistribution subject to AIP license or copyright; see http://jap.aip.org/about/rights_and_permissions

cross-over temperature where the variation in Mirr is nearly
linear and which can be defined by the extrapolation to zero
of the sharp increase of Mirr (Ref. 40) (Figure 6(d)). Above
this temperature, the FM to paramagnetic (PM) transition
occurs, having onset temperatures of �125 K and �130 K
for samples A and B, respectively. From the FC curves, simi-
lar kind of PM-FM transition can be observed for both A and
B films where M(T) increases evenly down to 5 K without
saturation. This indicates short-range spin ordering in PCMO
like ferromagnetic spin-glass La0.7-xNdxPb0.3MnO3 (Ref. 41)
and SrRuO3,42 and existence of AFM or canted AFM order-
ing which is expected according to the phase diagram for the
ground state of 10% Ca-doped PCMO.6 This is also in agree-
ment with theoretical predictions where PM-FM transition in
materials with low transition temperature may become dis-
continuous, depending on doping level and competition with
super-exchange AFM interactions.43 As a result of illumina-
tion, the ZFC magnetization improves considerably below Tg
in samples A and B which again indicates the suppressed
AFM and increased FM ordering at low temperature. In con-
trary to our earlier measurements for films deposited at
500 �C,14 the FM ordering is also increased upon field-
cooling and during the illumination. Similar behaviour is
also observed for intermediate electronic bandwidth
La0.9Ca0.1MnO3 films where the bandgap is suitable for CT
transition and the lattices were relatively strained.12,15
As can be seen from Figure 6(c), in 50 mT field, the
oxygen-annealed sample C shows clearly improved FM
ordering in ZFC curve at low temperature and under illumi-
nation ZFC curve approaches the FC curves indicating that
almost complete FM ordering is reached. Similar behaviour
is also observed from the C curve in the main panel of Figure
6(d) where the irreversibility magnetization is shifted clearly
to lower temperatures when compared to Mirr of samples A
and B. This is actually explained by the much steeper field
dependence of M(B) seen also in virgin curves discussed
above and confirmed with the M(T) curves measured in dif-
ferent magnetic fields (not shown here). Based on these
measurements, the inset of Figure 6(d) shows that spin-glass
phase disappears in much lower field range in sample C
(below 100 mT) when compared to the samples A and B
where the transition is still visible with maximum external
field of 150 mT used in our measurements.
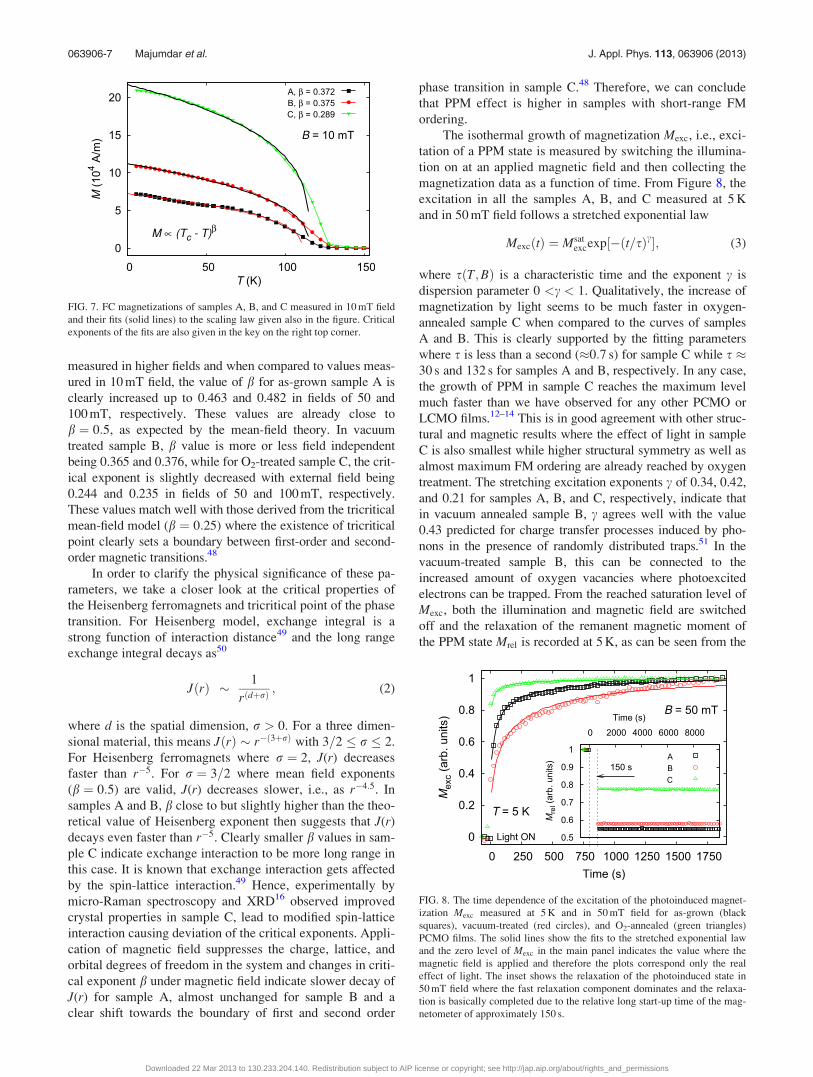
When fitting the FC spontaneous magnetization below
TC to the scaling law
M ¼ CðTC � TÞb; (1)
we can estimate the type of ferromagnet where the critical
exponent b is related to different domain structures, orienta-
tion and strain effects.44 In Figure 7, the fits to the experimen-
tal data of samples A, B, and C are shown in 10 mT field, and
in general, we can conclude that the fitting works for all the
samples below TC, especially when the external field induced
gradual part of the curve next to the onset temperature is
ignored. The critical exponent values b ¼ 0:372ð60:008Þ and
b ¼ 0:375ð60:005Þ for samples A and B, respectively, are
only slightly higher than the theoretical value for 3D isotropic
Heisenberg-type ferromagnet (b ¼ 0:367).45,46 For O2-treated
sample C, b ¼ 0:289ð60:004Þ is clearly smaller, even smaller
than for 3D Ising-type ferromagnet where the theoretical value
b ¼ 0:326 is expected.45,47 The field dependence of critical
exponent can be calculated from the fits of FC curves
FIG. 6. Temperature dependence of MZFC (open symbols) and MFC (solid
symbols) magnetizations measured in magnetic field of 50 mT before (black
squares) and during (red circles) illumination for as-grown (a), vacuum-
treated (b), and O2-annealed (c) PCMO films. The main panel of (d) shows
the temperature dependence of the irreversibility magnetizations Mirr ¼MFC �MZFC in 50 mT field measured before (solid symbols) and during
(open symbols) illumination and the inset of (d) shows the field dependence
of the spin-glass transition temperature Tg, where Mirr becomes non-zero
and starts to increase rapidly.
063906-6 Majumdar et al. J. Appl. Phys. 113, 063906 (2013)
Downloaded 22 Mar 2013 to 130.233.204.140. Redistribution subject to AIP license or copyright; see http://jap.aip.org/about/rights_and_permissions
measured in higher fields and when compared to values meas-
ured in 10 mT field, the value of b for as-grown sample A is
clearly increased up to 0.463 and 0.482 in fields of 50 and
100 mT, respectively. These values are already close to
b ¼ 0:5, as expected by the mean-field theory. In vacuum
treated sample B, b value is more or less field independent
being 0.365 and 0.376, while for O2-treated sample C, the crit-
ical exponent is slightly decreased with external field being
0.244 and 0.235 in fields of 50 and 100 mT, respectively.
These values match well with those derived from the tricritical
mean-field model (b ¼ 0:25) where the existence of tricritical
point clearly sets a boundary between first-order and second-
order magnetic transitions.48
In order to clarify the physical significance of these pa-
rameters, we take a closer look at the critical properties of
the Heisenberg ferromagnets and tricritical point of the phase
transition. For Heisenberg model, exchange integral is a
strong function of interaction distance49 and the long range
exchange integral decays as50
JðrÞ � 1
rðdþrÞ ; (2)
where d is the spatial dimension, r > 0. For a three dimen-
sional material, this means JðrÞ � r�ð3þrÞ with 3=2 � r � 2.
For Heisenberg ferromagnets where r ¼ 2, J(r) decreases
faster than r�5. For r ¼ 3=2 where mean field exponents
(b ¼ 0:5) are valid, J(r) decreases slower, i.e., as r�4:5. In
samples A and B, b close to but slightly higher than the theo-
retical value of Heisenberg exponent then suggests that J(r)
decays even faster than r�5. Clearly smaller b values in sam-
ple C indicate exchange interaction to be more long range in
this case. It is known that exchange interaction gets affected
by the spin-lattice interaction.49 Hence, experimentally by
micro-Raman spectroscopy and XRD16 observed improved
crystal properties in sample C, lead to modified spin-lattice
interaction causing deviation of the critical exponents. Appli-
cation of magnetic field suppresses the charge, lattice, and
orbital degrees of freedom in the system and changes in criti-
cal exponent b under magnetic field indicate slower decay of
J(r) for sample A, almost unchanged for sample B and a
clear shift towards the boundary of first and second order
phase transition in sample C.48 Therefore, we can conclude
that PPM effect is higher in samples with short-range FM
ordering.
The isothermal growth of magnetization Mexc, i.e., exci-
tation of a PPM state is measured by switching the illumina-
tion on at an applied magnetic field and then collecting the
magnetization data as a function of time. From Figure 8, the
excitation in all the samples A, B, and C measured at 5 K
and in 50 mT field follows a stretched exponential law
MexcðtÞ ¼ Msatexcexp½�ðt=sÞc�; (3)
where sðT;BÞ is a characteristic time and the exponent c is
dispersion parameter 0 <c < 1. Qualitatively, the increase of
magnetization by light seems to be much faster in oxygen-
annealed sample C when compared to the curves of samples
A and B. This is clearly supported by the fitting parameters
where s is less than a second (�0:7 s) for sample C while s �30 s and 132 s for samples A and B, respectively. In any case,
the growth of PPM in sample C reaches the maximum level
much faster than we have observed for any other PCMO or
LCMO films.12–14 This is in good agreement with other struc-
tural and magnetic results where the effect of light in sample
C is also smallest while higher structural symmetry as well as
almost maximum FM ordering are already reached by oxygen
treatment. The stretching excitation exponents c of 0.34, 0.42,
and 0.21 for samples A, B, and C, respectively, indicate that
in vacuum annealed sample B, c agrees well with the value
0.43 predicted for charge transfer processes induced by pho-
nons in the presence of randomly distributed traps.51 In the
vacuum-treated sample B, this can be connected to the
increased amount of oxygen vacancies where photoexcited
electrons can be trapped. From the reached saturation level of
Mexc, both the illumination and magnetic field are switched
off and the relaxation of the remanent magnetic moment of
the PPM state Mrel is recorded at 5 K, as can be seen from the
FIG. 7. FC magnetizations of samples A, B, and C measured in 10 mT field
and their fits (solid lines) to the scaling law given also in the figure. Critical
exponents of the fits are also given in the key on the right top corner.
FIG. 8. The time dependence of the excitation of the photoinduced magnet-
ization Mexc measured at 5 K and in 50 mT field for as-grown (black
squares), vacuum-treated (red circles), and O2-annealed (green triangles)
PCMO films. The solid lines show the fits to the stretched exponential law
and the zero level of Mexc in the main panel indicates the value where the
magnetic field is applied and therefore the plots correspond only the real
effect of light. The inset shows the relaxation of the photoinduced state in
50 mT field where the fast relaxation component dominates and the relaxa-
tion is basically completed due to the relative long start-up time of the mag-
netometer of approximately 150 s.
063906-7 Majumdar et al. J. Appl. Phys. 113, 063906 (2013)
Downloaded 22 Mar 2013 to 130.233.204.140. Redistribution subject to AIP license or copyright; see http://jap.aip.org/about/rights_and_permissions

inset of Figure 8. Unfortunately, the fast relaxation component
cannot be measured due to relatively long start-up time of the
magnetometer being approximately 150 s, and therefore only
constant but from the original level elevated magnetization
remains without showing any further relaxation in all the sam-
ples A, B, and C. As can be seen from the figure, the elevated
magnetization level in sample C is roughly doubled when
compared to the levels in samples A and B. This can be quali-
tatively explained by improved original magnetization level in
sample C due to lesser structural distortion and smaller
amount of LAGBs, as well as by smaller effectiveness of illu-
mination due to less Mn3þ ions as observed by XPS.
IV. CONCLUSIONS
Structural characterization, made by x-ray diffraction,
indicates large number of low-angle grain boundaries in as-
grown and vacuum annealed films while oxygen treatment
clearly decreases the structural distortion indicating higher
crystal symmetry in oxygen annealed PCMO film. The effect
of post-annealing treatments on the Mn configuration meas-
ured by x-ray photoelectron spectroscopy was clearly visible
between the samples A, B, and C, especially in the Mn 3score level spectra which are known to be very sensitive to
the changes in Mn valency. Based on the increase in the
DE3s splitting from sample A to B and C, it is concluded that
the oxygen annealing affected the sample C, induces the
largest DE3s split which is related to the increase of Mn2þ on
the surface. For the PCMO films, higher amount of Mn2þ
might be a consequence of Mn3þ changing to Mn4þ which is
consisted with other results presented in this study.
In as-grown and vacuum treated samples A and B, the
amount of oxygen vacancies as well as slightly increased
Mn3þ content with LAGBs in crystal structure results in the
suppressed FM state and increased FM ordering under illu-
mination at low temperature, as confirmed by magnetic
measurements. The suppressed FM in the ground state is a
consequence of higher Mn3þ content that favor AFM super-
exchange interaction between Mn3þ ions in magnetic ground
state. Also the oxygen vacancies in samples A and B can
trap the mobile electrons that induce FM double-exchange
interaction between Mn3þ and Mn4þ ions, forming magnetic
polaron traps. FM ordering is increased in low-field range
and after zero-field cooling by improved domain wall move-
ment under optical excitement. In sample C, where almost
optimal Mn4þ/Mn3þ ratio is reached by oxygen annealing,
the increased FM ordering by double-exchange interaction
limits the effect of illumination since less oxygen vacancies,
i.e., traps and increased amount of mobile electrons are al-
ready achieved by oxygen treatment. These results indicate
that low-angle grain boundaries in crystal structure and
modified oxygen distribution play an important role in deter-
mining PPM in the thin films of manganites.
ACKNOWLEDGMENTS
The Wihuri Foundation, the Turku Collegium for Sci-
ence and Medicine (TCSM) and the Academy of Finland are
acknowledged for financial support.
1X. Li, Optoelectronic Devices: Design, Modeling and Simulation (Cam-
bridge University Press, 2009).2K. Miyano, T. Tanaka, Y. Tomioka, and Y. Tokura, Phys. Rev. Lett. 78,
4257 (1997).3Y. Okimoto, Y. Ogimoto, M. Matsubara, Y. Tomioka, T. Kageyama,
T. Hasegawa, H. Koinuma, M. Kawasaki, and Y. Tokura, Appl. Phys.
Lett. 80, 1031 (2002).4N. Takubo, I. Onishi, K. Takubo, T. Mizokawa, and K. Miyano, Phys.
Rev. Lett. 101, 177403 (2008).5E. Beyreuther, A. Thiessen, S. Grafstr€om, K. D€orr, and L. M. Eng, J. Phys.
Condens. Matter 22, 175506 (2010).6A. Dagotto, T. Hotta, and A. Moreo, Phys. Rep. 344, 1 (2001).7S. Q. Liu, N. J. Wu, and A. Ignatiev, Appl. Phys. Lett. 76, 2749 (2000).8Y. Murakami, H. Kasai, J. J. Kim, S. Mamishin, D. Shindo, S. Mori, and
A. Tonomura, Nat. Nanotechnol. 5, 37 (2010).9S. Jin, T. H. Tiefel, M. McCormack, R. A. Fastnacht, R. Ramesh, and
L. H. Chen, Science 264, 413 (1994).10R. von Helmolt, J. Wecker, B. Holzapfel, L. Schultz, and K. Samwer,
Phys. Rev. Lett. 71, 2331 (1993).11M. Fiebig, K. Miyano, Y. Tomioka, and Y. Tokura, Science 280, 1925
(1998).12H. Huhtinen, R. Laiho, and V. Zakhvalinskii, Phys. Rev. B 71, 132404
(2005).13T. Suominen, H. Huhtinen, S. Majumdar, P. Paturi, V. S. Zakhvalinskii,
and R. Laiho, J. Phys. Condens. Matter 21, 266001 (2009).14S. Majumdar, H. Huhtinen, M. Svedberg, P. Paturi, S. Granroth, and
K. Kooser, J. Phys. Condens. Matter 23, 466002 (2011).15S. Majumdar, H. Huhtinen, and P. Paturi, J. Supercond. Novel Magn. (in
press).16S. Majumdar, H. Huhtinen, P. Paturi, and R. Palai, J. Phys. Condens.
Matter 25, 066005 (2013).17M. Svedberg, S. Majumdar, H. Huhtinen, P. Paturi, and S. Granroth,
J. Phys. Condens. Matter 23, 386005 (2011).18S. Majumdar, H. Huhtinen, S. Granroth, and P. Paturi, J. Phys. Condens.
Matter 24, 206002 (2012).19X. L. Li, J. Gao, H. Y. Wong, and Z. H. Mai, Thin Solid Films 489, 200
(2005).20J. B. Goodenough, Phys. Rev. 100, 564 (1955).21E. Beyreuther, S. Grafstr€om, L. M. Eng, C. Thiele, and K. D€orr, Phys.
Rev. B 73, 155425 (2006).22M. Sawangphruk and J. S. Foord, Diamond Relat. Mater. 19, 885 (2010).23K. Ebata, H. Wadati, M. Takizawa, A. Fujimori, A. Chikamatsu, H. Kumi-
gashira, M. Oshima, Y. Tomioka, and Y. Tokura, Phys. Rev. B 74, 064419
(2006).24K. Ibrahim, F. Liu, H. Qian, L. Guo, D. Xian, G. Xiong, and S. Wu, Mater.
Sci. Eng., B 76, 26 (2000).25D. Hsu, A. Mani, C. H. Chuang, C. H. Chen, M.-T. Lin, and J. G. Lin,
J. Appl. Phys. 105, 07D505 (2009).26H. Nesbitt and D. Banerjee, Am. Mineral. 83, 305 (1998).27N. Mannella, A. Rosenhahn, A. Nambu, B. C. Sell, B. S. Mun, S.-H. Yang,
S. Marchesini, M. Watanabe, K. Ibrahim, S. B. Ritchey, Y. Tomioka, and
C. S. Fadley, J. Electron Spectrosc. Relat. Phenom. 153, 37 (2006).28R. P. Gupta and S. K. Sen, Phys. Rev. B 10, 71 (1974).29C. S. Fadley, D. A. Shirley, A. J. Freeman, P. S. Bagus, and J. V. Mallow,
Phys. Rev. Lett. 23, 1397 (1969).30P. R. Sagdeo, R. J. Choudhary, and D. M. Phase, J. Appl. Phys. 107,
023709 (2010).31V. R. Galakhov, M. Demeter, S. Bartkowski, M. Neumann, N. A. Ovech-
kina, E. Z. Kurmaev, N. I. Lobachevskaya, Y. M. Mukovskii, J. Mitchell,
and D. L. Ederer, Phys. Rev. B 65, 113102 (2002).32N. Mannella, A. Rosenhahn, C. Booth, S. Marchesini, B. Mun, S.-H.
Yang, K. Ibrahim, Y. Tomioka, and C. Fadley, Phys. Rev. Lett. 92,
166401 (2004).33M. Kowalik, R. Zalecki, and A. Kolodziejczyk, Acta Phys. Pol. A 117,
277 (2010).34A. Kowalczyk, A. Slebarski, A. Szajek, J. Baszynski, and A. Winiarski,
J. Magn. Magn. Mater. 212, 107 (2000).35F. Offi, N. Mannella, T. Pardini, G. Panaccione, A. Fondacaro, P. Torelli,
M. W. West, J. F. Mitchell, and C. S. Fadley, Phys. Rev. B 77, 174422
(2008).36M. P. de Jong, V. A. Dediu, C. Taliani, and W. R. Salaneck, J. Appl. Phys.
94, 7292 (2003).37M. P. de Jong, I. Bergenti, V. A. Dediu, M. Fahlman, M. Marsi, and
C. Taliani, Phys. Rev. B 71, 014434 (2005).
063906-8 Majumdar et al. J. Appl. Phys. 113, 063906 (2013)
Downloaded 22 Mar 2013 to 130.233.204.140. Redistribution subject to AIP license or copyright; see http://jap.aip.org/about/rights_and_permissions

38V. S. Kolat, T. Izgi, A. O. Kaya, N. Bayri, H. Gencer, and S. Atalay,
J. Magn. Magn. Mater. 322, 427 (2010).39T. Elovaara, H. Huhtinen, S. Majumdar, and P. Paturi, J. Phys. Condens.
Matter 24, 216002 (2012).40F. Lefloch, J. Hammann, M. Ocio, and E. Vincent, Physica B 203, 63
(1994).41S. L. Young, H. Z. Chen, L. Horng, J. B. Shi, and Y. C. Chen, Jpn. J.
Appl. Phys., Part 1 40, 4878 (2001).42R. Palai, H. Huhtinen, J. F. Scott, and R. S. Katiyar, Phys. Rev. B 79,
104413 (2009).43J. L. Alonso, L. A. Fernandez, F. Guinea, V. Laliena, and V. Martin-
Mayor, Phys. Rev. B 63, 064416 (2001).
44M. Ziese, J. Phys. Condens. Matter 13, 2919 (2001).45S. Blundell, Magnetism in Condensed Matter (Oxford University Press,
New York, 2001).46R. Kajimoto, H. Mochizuki, H. Yoshizawa, S. Okamoto, and S. Ishihara,
Phys. Rev. B 69, 054433 (2004).47A. Pelissetto and E. Vicari, Phys. Rep. 368, 549 (2002).48M. H. Phan, V. Franco, N. S. Bingham, H. Srikanth, N. H. Hur, and S. C.
Yu, J. Alloys Compd. 508, 238 (2010).49L. Zhang, J. Fan, L. Li, R. Li, L. Ling, Z. Qu, W. Tong, S. Tan, and
Y. Zhang, Europhys. Lett. 91, 57001 (2010).50M. E. Fisher, S.-K. Ma, and B. G. Nickel, Phys. Rev. Lett. 29, 917 (1972).51J. C. Phillips, Physica C 340, 292 (2000).
063906-9 Majumdar et al. J. Appl. Phys. 113, 063906 (2013)
Downloaded 22 Mar 2013 to 130.233.204.140. Redistribution subject to AIP license or copyright; see http://jap.aip.org/about/rights_and_permissions
Copyright © 2022 FDOKUMEN