Background-free quasi-steady-state photoinduced absorption spectroscopy by dual optical modulation
17
submitted to Review of Scientific Instruments Background-free quasi-steady-state photoinduced absorption spectroscopy by dual optical modulation Houssem Kallel, 1 Gianluca Latini, 2 Francis Paquin, 1 Robert Rinfret, 1 Natalie Stingelin, 2 and Carlos Silva 1 1) D´ epartement de physique et Regroupement qu´ eb´ ecois sur les mat´ eriaux de pointe, Universit´ e de Montr´ eal, C.P. 6128, Succursale centre-ville, Montr´ eal (Qu´ ebec), H3C 3J7, Canada 2) Department of Materials and Centre for Plastic Electronics, Imperial College London, South Kensington Campus, London SW7 2AZ, United Kingdom (Dated: July 27, 2010) We present a simple and inexpensive means to measure background-free photoin- duced absorption spectra by implementing a dual optical modulation scheme. Our objective is to measure quasi-steady-state absorption spectra of long-lived photoex- citations, such as polarons and triplet excitons in organic semiconductors, when the photoluminescence of the sample is strong compared to the photoinduced absorp- tion signal. In our instrument, we modulate a continuous-wave laser at a frequency f pu with a mechanical chopper before exciting the material. We measure the frac- tional change of transmission of the sample with a tuneable monochromatic probe source modulated at a frequency f pr , and with a digital lockin amplifier at a ref- erence frequency f ref = f pu + f pr . We generate the reference sinusoidal wave for the lockin amplifier using a simple home-built electronic circuit that generates their sum-frequency signal. This scheme allows measurement of the fractional change of transmittance of the sample induced by the pump laser at a frequency f pu + f pr without parasitic signal at a frequency f pu , such as photoluminescence of the sample or pump-laser scatter. We demonstrate the power of this approach by measuring cleanly the photoinduced absorption spectrum of a highly luminescent semiconduc- tor polymer, poly(9,9-dioctylfluorene-co-benzothiadiazole), at 10 K. We compare this measurement favourably with that obtained by simple modulation of the pump laser after subtraction of the dominant photoluminescence background. 1 arXiv:1007.3035v2 [cond-mat.mtrl-sci] 25 Jul 2010
-
Upload
independent -
Category
Documents
-
view
4 -
download
0
Transcript of Background-free quasi-steady-state photoinduced absorption spectroscopy by dual optical modulation

submitted to Review of Scientific Instruments
Background-free quasi-steady-state photoinduced absorption spectroscopy by dual
optical modulation
Houssem Kallel,1 Gianluca Latini,2 Francis Paquin,1 Robert Rinfret,1 Natalie Stingelin,2
and Carlos Silva1
1)Departement de physique et Regroupement quebecois sur les materiaux de pointe,
Universite de Montreal, C.P. 6128, Succursale centre-ville, Montreal (Quebec),
H3C 3J7, Canada
2)Department of Materials and Centre for Plastic Electronics,
Imperial College London, South Kensington Campus, London SW7 2AZ,
United Kingdom
(Dated: July 27, 2010)
We present a simple and inexpensive means to measure background-free photoin-
duced absorption spectra by implementing a dual optical modulation scheme. Our
objective is to measure quasi-steady-state absorption spectra of long-lived photoex-
citations, such as polarons and triplet excitons in organic semiconductors, when the
photoluminescence of the sample is strong compared to the photoinduced absorp-
tion signal. In our instrument, we modulate a continuous-wave laser at a frequency
fpu with a mechanical chopper before exciting the material. We measure the frac-
tional change of transmission of the sample with a tuneable monochromatic probe
source modulated at a frequency fpr, and with a digital lockin amplifier at a ref-
erence frequency fref = fpu + fpr. We generate the reference sinusoidal wave for
the lockin amplifier using a simple home-built electronic circuit that generates their
sum-frequency signal. This scheme allows measurement of the fractional change of
transmittance of the sample induced by the pump laser at a frequency fpu + fpr
without parasitic signal at a frequency fpu, such as photoluminescence of the sample
or pump-laser scatter. We demonstrate the power of this approach by measuring
cleanly the photoinduced absorption spectrum of a highly luminescent semiconduc-
tor polymer, poly(9,9-dioctylfluorene-co-benzothiadiazole), at 10 K. We compare this
measurement favourably with that obtained by simple modulation of the pump laser
after subtraction of the dominant photoluminescence background.
1
arX
iv:1
007.
3035
v2 [
cond
-mat
.mtr
l-sc
i] 2
5 Ju
l 201
0

I. INTRODUCTION
Modulation spectroscopy is a powerful means of characterizing photoexcitations in semi-
conductors, and has been exploited in numerous variations over four decades.1 Following
the development of digital lockin amplifiers in the 1980s, modulation spectroscopies have
been used extensively to measure minuscule steady-state signals following continuous-wave
photoexcitation. Photoinduced absorption2,3 and photoreflectance4 spectroscopies are two
important examples of such techniques. In these, a sample of interest is excited resonantly
with a continous-wave (CW) optical source, usually a laser, that is modulated either with
a mechanical chopper or with an acousto-optic modulator, depending of the desired fre-
quency range. A tuneable monochromatic probe light source is then used to measure the
photoinduced changes in absorbance or reflectance induced by the photomodulated pump
source with the aid of a lockin amplifier. Such techniques measure the quasi-steady-state
photoinduced population change at the pump modulation frequency and the probe photon
energy, which is then scanned to construct the photomodulation spectrum. These tech-
niques are very powerful, because they permit the examination of the electronic structure
of materials, as well as decay kinetics of photoinduced species (e.g. carriers in inorganic
semiconductor nanorstructures,5 or polarons and triplet excitons in organic semiconductor
heterostructures6), by analysing the frequency dependence of the excitation laser. However,
because this technique measures quasi-steady-state population, which is usually very low
relative to absorption cross sections (for example, ∼ 10−16 cm2 for triplet exciton absorption
in semiconductor polymers7), photoinduced absorption signals are typically very small, with
typical fractional changes in transmittance of the sample between 10−3 and 10−5, requiring
phase-sensitive detection techniques. In this paper we focus on photoinduced absorption
spectroscopy, but our apparatus is equally suitable for photoreflectance spectroscopy.
A complication in photoinduced absorption measurements arises when the sample of in-
terest displays efficient photoluminescence (PL) over a similar spectral range as the desired
signal, which may mask it altogether. It is in principle possible to subtract the PL contribu-
tion to yield the photoinduced absorption signal only, but such procedure is time-consuming
because sufficient signal-to-noise ratio is required to extract a small signal discussed above
from the dominant PL signal, which may be orders of magnitude more intense. For exam-
ple, the PL quantum efficiency of F8BT, the semiconductor polymer that we will examine in
2

section III, is 60–70% at room temperature.8 Considering the geometry of the experimental
setup, the signal from PL background to photoinduced absorption can be 10−1 – 10−2, which
can be four orders of magnitude higher than the signal of interest. In order to resolve this
issue, we implement a double modulation scheme in which the probe source is modulated
at a different frequency to the pump, and we analyze the signal at the sum-frequency of the
pump and probe beams. The signal at this sum frequency is free of PL background and
other parasitic components such as scatter from the pump source. We demonstrate that it is
possible to measure cleanly photoinduced absorption spectra of highly luminescent materi-
als. In addition, by simultaneously analyzing the signal at the probe modulation frequency
only, we can measure the ground-state absorption spectrum independently. This apparatus
permits the measurement of a fractional change in transmittance of ∼ 10−6 in our implemen-
tation, currently limited by the temperature stability of our grey-body probe source, and
by the shot noise of the detector. Our instrument is also well suited for photoreflectance
spectroscopy.
II. INSTRUMENT
A. Quasi-steady-state photoinduced absorption spectroscopy
In the photoinduced absorption experiment, a CW pump laser, modulated at a frequency
fpu, excites the sample and the fractional change in the transmission of a probe beam through
the sample, ∆T/T , is measured. By the Beer-Lambert law, this signal is related to the
density of the photoinduced (absorbing) species, n, by9
− nσz = ln
(1 +
∆T
T
)≈ ∆T
T(1)
if ∆T/T � 1. In equation 1, σ is the absorption cross section and z is the sample thickness.
In a general scenario, the long-lived photoexcitation dynamics of the photoinduced species
can decay with a unimolecular rate constant γ and a bimolecular rate constant β, such that
dn
dt= κρG(t)− γn− βn2, (2)
where κ is the photogeneration efficiency (number of species generated per absorbed photon),
ρ is the rate of photon absorption per unit volume, and G is a function describing the pump
modulation. Equation 2 does not yield a unique lifetime that is independent of laser intensity
3

1
10
n s (
1015
cm
-3)
103 104
(rad/s)
100 1000Frequency (Hz)
Figure 1. Steady-state population density versus pump-laser modulation frequency according to
equation 3, with κρ = 1 × 1019 cm−3s−1 for all traces. Shown are the predicted frequency depen-
dence when γ = 1× 10³ s−1, and β = 1× 10⁻¹² cm3s−1 (red, continuous line); γ = 1× 10³ s−1, and
β = 1 × 10⁻¹⁴ cm3s−1 (green, dash-dotted line); and γ = 1 × 10⁴ s−1, and β = 1 × 10⁻¹² cm3s−1
(blue, dashed line).
with a constant value during the entire relaxation process. However, let us consider ns(ω),
the component of n(t), the actual solution, at the fundamental frequency ω = 2πfpu and
under quasi-steady-state conditions. Let us assume that G adopts a symmetric square-wave
functional form. Under these assumptions, the steady-state population density is given by10
ns(ω) =κρ tanh γπ
2ωtanh Pπ
ωγ2
tanh Pπω
+ P tanh γπ2ω
; (3)
P =
√βκρ+
γ2
4. (4)
Fig. 1 displays the dependence of n with frequency as predicted by equation 3, using values
for κ, γ, and β that are typical for polarons and triplet excitons in neat semiconductor
polymers (see, for example, ref. 9). In general, n is weakly dependent on frequency at
low modulation frequency, but falls off as ω−1 at high frequency. When the modulation
period is long compared to the average decay time constant defined by γ and β, n is in
quasi steady state. As the modulation frequency is increased and the modulation period is
4
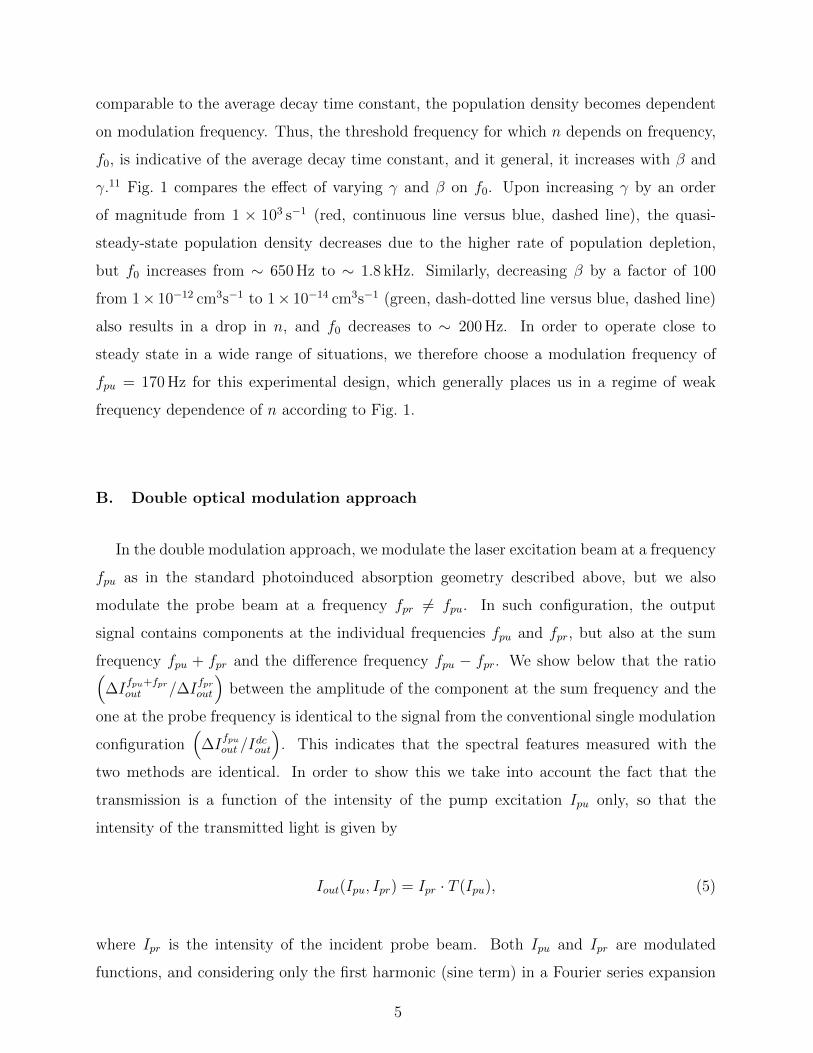
comparable to the average decay time constant, the population density becomes dependent
on modulation frequency. Thus, the threshold frequency for which n depends on frequency,
f0, is indicative of the average decay time constant, and it general, it increases with β and
γ.11 Fig. 1 compares the effect of varying γ and β on f0. Upon increasing γ by an order
of magnitude from 1 × 10³ s−1 (red, continuous line versus blue, dashed line), the quasi-
steady-state population density decreases due to the higher rate of population depletion,
but f0 increases from ∼ 650 Hz to ∼ 1.8 kHz. Similarly, decreasing β by a factor of 100
from 1× 10⁻¹² cm3s−1 to 1× 10⁻¹⁴ cm3s−1 (green, dash-dotted line versus blue, dashed line)
also results in a drop in n, and f0 decreases to ∼ 200 Hz. In order to operate close to
steady state in a wide range of situations, we therefore choose a modulation frequency of
fpu = 170 Hz for this experimental design, which generally places us in a regime of weak
frequency dependence of n according to Fig. 1.
B. Double optical modulation approach
In the double modulation approach, we modulate the laser excitation beam at a frequency
fpu as in the standard photoinduced absorption geometry described above, but we also
modulate the probe beam at a frequency fpr 6= fpu. In such configuration, the output
signal contains components at the individual frequencies fpu and fpr, but also at the sum
frequency fpu + fpr and the difference frequency fpu − fpr. We show below that the ratio(∆I
fpu+fprout /∆I
fprout
)between the amplitude of the component at the sum frequency and the
one at the probe frequency is identical to the signal from the conventional single modulation
configuration(
∆Ifpuout /I
dcout
). This indicates that the spectral features measured with the
two methods are identical. In order to show this we take into account the fact that the
transmission is a function of the intensity of the pump excitation Ipu only, so that the
intensity of the transmitted light is given by
Iout(Ipu, Ipr) = Ipr · T (Ipu), (5)
where Ipr is the intensity of the incident probe beam. Both Ipu and Ipr are modulated
functions, and considering only the first harmonic (sine term) in a Fourier series expansion
5

of the modulation function,
Ipu =I0pu2
[1 + sin(2πfput)] ≡I0pu2
+ ∆Ipu; (6a)
Ipr =I0pr2
[1 + sin(2πfprt)] ≡I0pr2
+ ∆Ipr. (6b)
The photoinduced variation of the transmitted light ∆Iout can be calculated by Taylor-
expanding the differential of Iout up to second order around the average values I0pu/2 and
I0pr/2. This gives
∆Iout =I0pr2
[dT
dIpu
]I0pu/2
∆Ipu + T
(I0pu2
)∆Ipr
+1
2
I0pr2
[d2T
dI2pu
]I0pu/2
∆I2pu +
[dT
dIpu
]I0pu/2
∆Ipu∆Ipr + · · · (7)
where we have considered that T is a function of Ipu only. Thus, from equations (6), and
invoking the trigonometric identity 2 sinα sin β = cos(α− β)− cos(α + β), we obtain
∆Iout =I0puI
0pr
4
[dT
dIpu
]I0pu/2
sin(2πfput)
+I0pr2· T(I0pu2
)sin(2πfprt)
+1
2
(I0pu)2I0pr
8
[d2T
dI2pu
]I0pu/2
sin2(2πfput)
+I0puI
0pr
8{cos [2π(fpu − fpr)t]− cos [2π(fpu + fpr)t]}+ · · · (8)
In the double modulation configuration, we measure the pump-induced signal at the sum
of the pump and probe modulation frequencies, ∆Ifpu+fprout , normalized by the signal at the
probe modulation frequency, ∆Ifprout :
∆Ifpu+fprout
∆Ifprout
=I0pu4
[dT/dIpu]I0pu/2
T(I0pu/2
) . (9)
In a single modulation scheme, equation (7) still applies provided that ∆Ipr = 0, so when
the series is calculated around Ipu = I0pu/2 for Ipr = I0pr (in this case Ipr is not modulated)
then from equations (8) and (5) we obtain
∆Ifpuout
Idcout=I0puI
0pr
4
[dT/dIpu]I0pu/2
I0prT(I0pu/2
) =∆I
fpu+fprout
∆Ifprout
. (10)
6

The output signal in single and double modulation is therefore identical.
We seek to detect the component of the photoinduced absorption signal at the sum of
the two modulation frequencies fpu + fpr. Let us now consider an optimal probe frequency
necessary to meet the most stringent requirements of background-free detection. The probe
beam is aligned through a mechanical chopper prior to being transmitted through the sample
and being detected by a photoreceiver. We can idealize the time-dependent signal of the
modulated probe beam at the detector as a square-wave function of period 2τ and amplitude
V0. Over the period [0, 2τ ], this can be written as
gpr(t) = V0
[H
(t
τ
)−H
(t
τ− 1
)], (11)
where H is the heaviside step function, which, if expressed as a piecewise constant function,
is defined as
H(x) =
0 if x < 0
12
if x = 0
1 if x > 0
. (12)
The Fourier-series expansion of gpr(t) contains only odd terms:
gpr(t) = V0
[1
2+
2
π
∞∑m=1,3,5,···
1
msin
(mπt
τ
)]. (13)
Low odd harmonics m are therefore expected to contain significant amplitude compared to
the signal of interest, and their ‘floor’ noise could be substantial. In order to achieve truly
background-free signal and high sensitivity, we must choose our modulation frequencies such
that fpu+fpr is sufficiently different from fpr or one of its first few odd harmonics. We choose
fpr = 139 Hz, placing the desired photoinduced absorbance signal at fpu + fpr = 309 Hz,
which is sufficiently far from 3fpr = 417 Hz and should therefore not be affected by floor
noise of the intense third harmonic of the probe modulation frequency.
Fig. 2(a) displays the measured form of gpr(t) (open circles) obtained by modulating the
output of a tungsten-halogen lamp at a frequency of 139 Hz using a digital oscilloscope.
This signal deviates from an ideal square-wave function expressed by equation 11. We have
measured this response at various wavelengths and find that it does not depend on probe
wavelength. In order to characterize the experimental form of gpr(t), we have measured
the amplitude of the signal using a digital lockin amplifier (SRS SR830), for which the
7

10-6
10
-4
10
-2
10
0
Am
plit
ude (
V)
150100500Harmonic Number
Odd harmonics Even harmonics
1.5
1.0
0.5
0.0
-0.5
-1.0
-1.5
gp
r(t)
(V
)
1050-5-10
t (ms)
(a)
(b)
Figure 2. (a) Measured response of the photodiode upon modulation of the probe lamp at a
frequency of 139 Hz (open circles), measured at 700 nm. (b) Amplitude of the signal from the
lockin amplifier as a function of harmonic number. The red, continuous line in part (a) is the
reconstructed response function from the amplitudes in part (b) as the coefficients of a Fourier
series.
reference input was the TTL output of the chopper controller at 139 Hz, as a function of
harmonic of the reference signal.12 The results are displayed in Fig 2(b) up to the 180th
harmonic. We observe that even harmonics (blue bars) have amplitude of ∼ 10−3 times that
of odd harmonics (red bars), but may be of comparable amplitude to the desired signal level
at frequency fpu + fpr. At the chosen probe modulation frequency, 2fpr = 278 Hz, which
is closer to the sum frequency at 309 Hz. We address this in more detail in the following
section. We have reconstructed gpr(t) using the harmonic amplitudes as Fourier components,
and we display it as a red continuous line in part (a).
8

Figure 3. Schematic diagram of the experimental instrument.
C. Experimental apparatus
We now discuss the experimental apparatus, shown schematically in Fig. 3. The sample is
contained in a cryostat (Cryo Industries, closed cycle model 350 optical refrigerator cryostat).
To pump the sample, a semiconductor laser (Newport, λ = 405 nm, 50 mW) was modulated
by an optical chopper (Terahertz Technologies model C-995) at frequency fpu = 170 Hz
and directed to the sample. The probe source was a 250-W tungsten-halogen lamp (Oriel),
coupled to a 300-mm focal length monochromator (PI-Acton SP-2300i). The output of this
monochromator was modulated at frequency fpr = 139 Hz by placing an identical chopper
to that for the pump laser at the entrance slit of the monochromator. The monochromatic
output was then imaged through the sample (1/e2 beam waist of 178 ± 30µm at the sam-
ple), where it is overlapped with the pump laser (1/e2 beam waist of 989 ± 17µm), onto
9

the entrance slit of a spectrometer with focal length 300 mm (PI-Acton SP-2300i), which
was matched with the first monochromator. A photoreceiver consisting of a peltier-cooled
sandwich diode structure of Si and PbS (Electro-Optical Systems S/PBS-025/020-TE2-H)
detected the probe light.13 The output of this receiver was then split and sent to the in-
put of two digital lockin amplifiers (Stanford Research Systems SR830 and SR810). We
constructed an electronic circuit to generate the reference signals for the two lockin am-
plifiers. The inputs of this circuit are the TTL sync output of the two chopper controller
units, at frequencies 170 and 139 Hz. Its outputs are two sine waveforms, one at 309 Hz, the
sum frequency, and one at 139 Hz. The former was used as a reference on the dual-phase
lockin amplifier (SR830), which serves to measure the fractional change in transmittance
induced by the pump laser (∆T ), while the second served that purpose on the single-phase
amplifier (SR810), measuring the probe transmittance (T ) through the sample. The lockin
amplifiers, the spectrometers and the cryostat are interfaced to a computer, so that the
spectral response of ∆T/T can be measured as a function of temperature over a spectral
range spanning 500 and 2800 nm, and over a temperature range ranging from 10 K to room
temperature.
A schematic diagram of the sum-frequency generation circuit is shown in Fig. 4(a). Sim-
ilar circuits have been published by Ghosh and Arora14 and by Ho et al.15 Both input TTL
waveforms are converted to sinusoidal signals by bandpass filters (Q = 40) at 170 and 139 Hz
for the pump and probe channels, respectively. Both channels are then input to an AD633
four-quadrant analog multiplier. The sinusoidal signal at the sum frequency is then passed
through a Q = 40 bandpass filter at 309 Hz, and is used as a reference signal for one lockin
amplifier. We also isolate the component at 139 Hz and use it as a reference for the other
lockin amplifier. It is possible to bypass the sum-frequency generation process in the circuit
with a switch in order to produce a sinusoidal output at 170 Hz and thereby switch rapidly
between single and double modulation experiments if desired.
We find that the instrument spectral response at the reference frequency of 309 Hz con-
tains a small but non-negligible contribution of the probe lamp, shown as red, filled squares
in Fig. 4(b). The signal in the near-infrared measured with the PbS photoreceiver shows
this artifactual signal more prominently (not shown here), as the probe lamp intensity is
higher in that spectral range. This is presumably due to floor-noise contributions from the
second harmonic of fpr (at 278 Hz). In order to remove this undesired background response,
10

10-6
10-5
∆T
/T
11001000900800700600
Wvelength (nm)
raw signal
flitered signal
(a) sum frequency generator
(b) (c) signal bandpass filter
Figure 4. (a) Schematic diagram of the sum-frequency generation electronic circuit. Also shown
is the ∆T/T baseline signal (b) when the Si photoreceiver output is filtered (blue open circles)
and unfiltered (solid red squares) with the circuit shown in part (c). The spectra were collected
with a time constant of 300 ms, and two spectral scans. The blue, dashed line in part (b) is at
∆T/T = 1× 10⁻⁶, and the red, dotted line is at ∆T/T = 5× 10⁻⁶.
we filter the photoreceiver output using a 309-Hz bandpass filter, shown schematically in
Fig. 4(c), before the input of the SR830 lockin amplifier (blue open circles in part (b)). This
produces a baseline response free of the lamp response, with baseline at ∆T/T = 1× 10⁻⁶.
The main advantage of this experimental scheme is that it permits essentially background-
free detection of the ∆T/T spectrum. In addition, in our implementation we detect ∆T and
T simultaneously, as opposed to a single modulation approach in which a spectrum of ∆T
and T need to be collected separately by moving the chopper from the pump arm to the
probe arm and repeating the measurement, if the highest signal-to-noise ratio is sought. In
a single modulation experiment with a high luminescence background, three experiments
11

therefore need to be performed. Two in which the pump laser is modulated and the probe
beam is either blocked or unblocked to permit subtraction of the PL background from the
desired ∆T , and one in which the probe beam is modulated and the pump laser is blocked,
to measure T . We consider that the clear simplicity of the double modulation approach is
a significant advantage.
We note that it would also be possible to implement a double modulation scheme by
using a mechanical chopper (such as the SRS SR540) with two different sets of slots in order
to modulate independently two optical beams at different but related frequencies. The con-
troller unit of that chopper is capable of supplying TTL sync outputs at the two modulation
frequencies, which would permit implementation of similar signal processing with two lockin
amplifiers. We opt for the approach implementing the sum-frequency generation circuit de-
scribed in this paper because it permits a simpler optical alignment, and because it permits
us to choose two unrelated modulation frequencies using the logic discussed in Section II B.
We also note that Kita et al. reported a double modulation scheme for photoreflectance
measurements in inorganic semiconductor nanostructures with a function generator to sup-
ply two trigger signals to independent choppers, and a reference signal at the sum frequency
to a lockin amplifier.16 We compared this approach to the sum-frequency generation circuit
discussed here, and found that the phase stability was superior with the latter approach,
even when a high-stability multichannel function generator was used (Berkeley Nucleonics
model 575 digital delay/pulse generator) .
Finally, we point out that because the signal at frequency fpu + fpr is free of PL back-
ground, one could implement the experiment without the detection spectrometer in Fig. 3,
which would simplify the experimental setup. We choose to retain it because the setup as
shown here allows us to measure PL spectra by blocking the probe beam and switching the
reference frequency output of our home-built circuit to fpu.
III. EXPERIMENTAL DEMONSTRATION
In order to demonstrate the power of the double modulation approach, we choose to mea-
sure the photoinduced absorption spectrum at 10 K of a highly luminescent semiconductor
polymer, poly(9,9-dioctylfluorene-co-benzothiadiazole), denoted F8BT.8 The structure of
F8BT is shown in Fig. 5(a). In the solid state at low temperature, F8BT has a PL quantum
12

10-5
10-4
10-3
10-2
Sig
na
l (V
)
Probe On Probe Off
6
4
2
0
10
-4 |∆T
/T|
1000900800700600500Wavelength (nm)
2.5
2.0
1.5
1.0
0.5
0.0
10
-4 |
∆T
/T|
(b)
(c)
(a)
Figure 5. (a) Molecular structure of F8BT. (b) Signal obtained at 10 K by modulating the pump
laser at a frequency of 170 Hz, with the probe beam blocked (‘Probe Off’, measuring PL only),
and unblocked (‘Probe On’, measuring ∆T and the dominant PL background). (c) Photoinduced
absorption spectrum at 10 K, measured with the double modulation apparatus (continuous line)
and by single modulation after subtraction of the large PL background. We plot the absolute
fractional change in transmittance (|∆T/T |), obtained by the R output of the lockin amplifier.
These data are acquired by an average of 25 successive scans with a time constant of 300 ms.
yield of > 70%.17 Neat F8BT films have been reported to feature a photoinduced absorption
centred at ∼ 850 nm (∼ 1.5 eV),18 assigned to absorption of triplet excitons from the lowest
excited state to a higher-lying excited state, generated by intersystem crossing.7,19 Fig. 5(b)
displays the signal measured with a single lockin amplifier upon modulating the pump laser
at a frequency of 170 Hz. The PL background dominates the ∆T signal, and is over a factor
13

of 50 more intense than the features attributed to the photoinduced absorption of triplet ex-
citons. The spectrum of ∆T/T obtained by subtracting the PL spectrum in part (b) before
normalizing by the probe transmittance is shown as open circles in part (c). We also dis-
play the photoinduced absorption spectrum obtained by the double modulation scheme as a
continuous line. The spectrum obtained by double modulation corresponds to that reported
at room temperature,7,18,19 where the PL background is significantly less problematic as the
PL efficiency increases substantially at low temperature because of a decreased contribution
of nonradiative decay channels such as internal conversion and diffusion-limited quenching
at defect sites. On the other hand, the spectrum obtained by single modulation displays
a substantial negative artifact at 752 nm, resulting from substraction of a large PL back-
ground from the ∆T signal shown in part (b). At the red tail of the PL spectrum, the PL
background may become comparable to the desired signal, and the subtraction procedure is
very sensitive to the signal-to-noise quality of the data. It is in principle possible to achieve
a signal-to-noise ratio that is adequate to subtract the PL background satisfactorily with
sufficient signal averaging. However, the double modulation measurement as reported here
is preferable given its simplicity and high intrinsic signal-to-noise capabilities because it is
free from PL, laser scatter, and other spurious background sources.
We have estimated the ultimate detection sensitivity of our system. With an averaging
time constant of 300 ms in the lockin amplifier, we can measure a signal of ∼ 1µV from the Si
photoreceiver in low gain mode at frequency fpu+fpr = 309 Hz, with the lockin sensitivity set
to 10µV. Throughout much of the visible range, the probe signal at frequency fpr = 139 Hz
is ∼ 1 V. We would thus have the capability of measuring a signal of ∆T/T ∼ 1 × 10⁻⁶,
consistent with Fig. 4(b). This is currently limited by the stability of our tungsten-halogen
probe lamp, which is a grey body source with temperature stability limited by our current
source. We estimate that with a more constant current supply, we would improve this
sensitivity to ∆T/T ∼ 1× 10⁻⁷.
IV. CONCLUSION
We have demonstrated the use of a simple and inexpensive sum-frequency generation
circuit to implement a double optical modulation apparatus that allows measurement of
background-free photoinduced absorption spectra, and can also be implemented to measure
14

photreflectance spectra. This circuit processes the TTL sync output signals from two in-
dependent chopper controllers to produce an output at the sum-frequency, which can be
used as a reference signal for a lockin amplifier. Thus, the probe and pump arms of the
experiment can be modulated at distinct frequencies fpr and fpu, respectively, and the pho-
toinduced absorption signal at fpr + fpu can be measured. We have demonstrated the power
of this apparatus by comparing the photoinduced absorption spectrum of a highly lumines-
cent semiconductor polymer, F8BT, at 10 K, where the luminescence background swamps
substantially the pump-laser-induced change in probe transmittance. This double modula-
tion instrument represents a simple and inexpensive means to measure high-signal-to-noise
photoinduced absorption spectra of efficient emitters such as many organic semiconductors
and inorganic semiconductor quantum structures, and is also well suited for photoreflectance
spectroscopy.
ACKNOWLEDGMENTS
This experimental apparatus was funded by a grant from the Natural Sciences and Engi-
neering Research Council of Canada (NSERC), within the Research Tools and Instruments
Scheme. CS acknowledges further funding from NSERC (Discovery Grant) and the Canada
Research Chair in Organic Semiconductor Materials. HK acknowledges the Tunisian gov-
ernment for a graduate scholarship. GL acknowledges funding from the Royal Society for an
International Travel Grant. GL and NS thank the European Community Seventh Frame-
work Programme (FP7/2007-2013) for funding under Grant Agreement No. 212311 of the
ONE-P project.
REFERENCES
1M. Cardona, Modulation Spectroscopy (Academic Press, 1969).
2N. F. Colaneri, D. D. C. Bradley, R. H. Friend, P. L. Burn, A. B. Holmes, and C. W. Span-
gler, “Photoexcited states in poly(p-phenylene vinylene): Comparison with trans,trans-
distyrylbenzene, a model oligomer,” Phys. Rev. B, 42, 11670 (1990).
3J. M. Leng, S. Jeglinski, X. Wei, R. E. Benner, Z. V. Vardeny, F. Guo, and S. Mazumdar,
“Optical probes of excited states in poly(p-phenylenevinylene),” Phys. Rev. Lett., 72, 156
15

(1994).
4O. J. Glembocki and B. Shanabrook, “Photoreflectance spectroscopy of microstructures,
in The Spectroscopy of Semiconductors,” (Academic Press, 1992) Chap. 4, pp. 222 – 293.
5B. V. Shanabrook, O. J. Glembocki, and W. T. Beard, “Photoreflectance modulation
mechanisms in GaAs-AlxGa1−xAs multiple quantum-wells,” Phys. Rev. B, 35, 2540 (1987).
6M. Wohlgenannt, W. Graupner, G. Leising, and Z. Vardeny, “Photogeneration and recom-
bination processes of neutral and charged excitations in films of a ladder-type poly(para-
phenylene),” Phys. Rev. B, 60, 5321 (1999).
7C. Lee, X. Yang, and N. Greenham, “Determination of the triplet excited-state absorption
cross section in a polyfluorene by energy transfer from a phosphorescent metal complex,”
Phys. Rev. B, 76 (2007).
8See Table 1 in L. Sardone, C. Sabatini, G. Latini, F. Barigelletti, G. Marletta, F. Cacialli,
and P. Samori, “Scanning force microscopy and optical spectroscopy of phase-segregated
thin films of poly(9,9 ’-dioctylfluorene-alt-benzothiadiazole) and poly(ethylene oxide),” J.
Mater. Chem., 17, 1387 (2007) for a summary of PL quantum efficiency values published
for F8BT.
9C. Silva, D. Russell, A. Dhoot, L. Herz, C. Daniel, N. Greenham, A. Arias, S. Setayesh,
K. Mullen, and R. Friend, “Exciton and polaron dynamics in a step-ladder polymeric
semiconductor: the influence of interchain order,” J. Phys. Condens. Mat., 14, 9803 (2002).
10G. Dellepiane, C. Cuniberti, D. Comoretto, G. Musso, G. Figari, A. Piaggi, and A. Borgh-
esi, “Long-lived photoexcited states in symmetrical polydicarbazolyldiacetylene,” Phys.
Rev. B, 48, 7850 (1993).
11From equation 4, the threshold value of ω in which ns changes from the limit of ω → 0
to ω →∞ occurs at ω0 = (γπ/4)(
1 +√
1 + (4βκρ/γ2))
. Thus, ω0 increases with both β
and γ.
12Following this procedure, the component of the amplitude of the signal at each harmonic
can be measured independently, up to harmonic number 733 at a fundamental frequency
of 139 Hz with the SR830 lockin amplifier. The SR830 lockin amplifier sets the reference
signal from its internal oscillator to a user-defined harmonic up to a maximum frequency
of 102.4 kHz.
13The bandwidth of the S/PBS-025/020-TE2-H photoreceiver in low gain mode is 2 kHz for
the silicon diode and that of the lead sulphide detector is 500 Hz. Therefore, in order to
16

take advantage of the optimal responsivity of the device, modulation frequencies fpu, fpr <
200 Hz are desirable.
14The circuit reported in Fig. 2 of S. Ghosh and B. Arora, “Photoreflectance spectroscopy
with white light pump beam,” Rev. Sci. Instrum., 69, 1261 (1998) has a few connections
omitted from the schematic diagram and therefore does not function as drawn. Our circuit
is similar to the one reported in that paper, but it implements a newer analog frequency
mixing chip and is simpler.
15The circuit shown in Fig. 2 of C. Ho, C. Hsieh, Y. Chen, Y. Huang, and K. Tiong, “Novel
electronic design for double-modulation spectroscopy of semiconductor and semiconductor
microstructures,” Rev. Sci. Instrum., 72, 4218 (2001) implies that TTL signals can be
summed by an AD633 analog multiplier (also used in our circuit), which is incorrect. This
multiplier requires sinusoidal inputs, and does not function with TTL pulsetrains as drawn
in the paper by Ho et al.
16T. Kita, M. Yamada, and O. Wada, “Dual chopped photoreflectance spectroscopy for non-
destructive characterization of semiconductors and semiconductor nanostructures,” Rev.
Sci. Instrum., 79 (2008).
17J. K. Grey, D. Y. Kim, C. L. Donley, W. L. Miller, J. S. Kim, C. Silva, R. H. Friend, and
P. F. Barbara, “Effect of temperature and chain length on the bimodal emission properties
of single polyfluorene copolymer molecules,” J. Phys. Chem. B, 110, 18898 (2006).
18M. Westerling, C. Vijila, R. Osterbacka, and H. Stubb, “Optical studies of excited-state
relaxation in poly(9,9-dihexylfluorene-co-benzothiadiazole),” Phys. Rev. B, 67 (2003).
19T. Ford, I. Avilov, D. Beljonne, and N. Greenham, “Enhanced triplet exciton generation
in polyfluorene blends,” Phys. Rev. B, 71 (2005).
17