MATHEMATICAL MODEL OF HOT-AIR BALLOON STEADY ...
10
Copyright © 2021 e Author(s). Published by Vilnius Gediminas Technical University is is an Open Access article distributed under the terms of the Creative Commons Attribution License (https://creativecommons.org/licenses/by/4.0/), which permits unre- stricted use, distribution, and reproduction in any medium, provided the original author and source are credited. MATHEMATICAL MODEL OF HOT-AIR BALLOON STEADY-STATE VERTICAL FLIGHT PERFORMANCE Nihad E. DAIDZIC 1, 2, * 1 AAR Aerospace Consulting, LLC, Saint Peter, MN 56082, USA 2 Minnesota State University, Mankato, MN 56001, USA Received 29 August 2020; accepted 9 November 2020 Abstract. Vertical flight performance of Lighter-than-Air free hot-air balloons is derived and discussed. Novel mathemati- cal model using lumped-parameters has been used to model balloon flight dynamics and steady-state performance in par- ticular. ermal model was not treated as the super-heat is under the control of aeronauts/pilots. Buoyancy or gross liſt, net or effective liſt, specific liſt, and excess specific liſt were derived for a general single envelope balloon and can be applied to hot-air, gas and hybrid balloons. Rate-of-climb, absolute ceiling, rate-of-descent, and the maximum rate-of-descent or the uncontrolled terminal descent have all been modeled and sample computations performed for AX8 or AX9 FAI-class hot-air balloons. Liſting index or the specific net/effective liſt have been computed treating ambient and hot air as ideal gases at various pressure altitudes and representative envelope temperatures. Drag coefficient in upward and downward vertical flights have been chosen based on best available data. Experimental scale and full-scale flight tests are suggested for more accurate estimates of external aerodynamics in vertical balloon flights. CFD computations of coupled inner- and external-flows are also recommended in future efforts. Knowledge of free balloon’s vertical performance is essential in flight planning and operational safety of flight. Keywords: lighter-than-air (LTA), hot-air balloon (LBH), buoyancy, liſting index, vertical flight performance, absolute ceiling, terminal descent speed. Introduction e main motivation for this study was to present new and comprehensive approach to performance calculations of free balloons and manned hot-air balloons in particu- lar. Buoyancy-driven or lighter-than-air (LTA) aircraſt find many applications and their utilization may increase in the future. Although the Federal Aviation Administra- tion (FAA) (2008) uses designations LBH (hot-air bal- loon) and LBG (gas balloon), it is also appropriate to call such balloons Montgolfière (LBH) and Charlière (LBG), honoring their respective inventors. A good historical re- view of balloons (LBH, LBG, hybrid), ballooning pioneers and records, balloon art and balloon design developments up to late 1970s can be found in Jackson (1980). While LBGs can reach stratospheric (and higher) heights LBH, thermal airships and gas-filled pressurized (blimps and semi-rigid) and unpressurized (rigid) air- ships (Taylor, 2014) are typically constrained to lower tropospheric altitudes. While lacking importance in com- mercial air transportation since the time of rigid air- ships, LTA aircraſt have several specialized and unique applications. Unmanned LBGs are used for atmospheric sounding and data collection. Much of current weather data comes from the routine atmospheric sounding us- ing stratospheric LBGs. Manned and unmanned aerostats are also used as tethered airborne observational platforms, for atmospheric and astronomical research, or for carrying airborne radars, telecommunication equipment, and other instrumentation. Hot-air ballooning (LBH), chiefly a rec- reational activity, also has small commercial component, such as sightseeing and adventure flights. 1. Literature review Although historically the first flying “machines” (air- craſt), overall less research and development has been conducted in LTA compared to Heavier-than-Air (HTA) aircraſt. First complex thermal and dynamic mathemati- cal models of balloon flights were developed in 1960s and 1970s with the onset of space age and the arising need for high-altitude research (atmospheric sounding). AVIATION ISSN: 1648-7788 / eISSN: 1822-4180 2021 Volume 25 Issue 3: 149–158 https://doi.org/10.3846/aviation.2021.15330 *Corresponding author. E-mail: [email protected]; [email protected]
-
Upload
khangminh22 -
Category
Documents
-
view
3 -
download
0
Transcript of MATHEMATICAL MODEL OF HOT-AIR BALLOON STEADY ...
Copyright © 2021 The Author(s). Published by Vilnius Gediminas Technical University
This is an Open Access article distributed under the terms of the Creative Commons Attribution License (https://creativecommons.org/licenses/by/4.0/), which permits unre-stricted use, distribution, and reproduction in any medium, provided the original author and source are credited.
MATHEMATICAL MODEL OF HOT-AIR BALLOON STEADY-STATE VERTICAL FLIGHT PERFORMANCE
Nihad E. DAIDZIC1, 2, *
1AAR Aerospace Consulting, LLC, Saint Peter, MN 56082, USA2Minnesota State University, Mankato, MN 56001, USA
Received 29 August 2020; accepted 9 November 2020
Abstract. Vertical flight performance of Lighter-than-Air free hot-air balloons is derived and discussed. Novel mathemati-cal model using lumped-parameters has been used to model balloon flight dynamics and steady-state performance in par-ticular. Thermal model was not treated as the super-heat is under the control of aeronauts/pilots. Buoyancy or gross lift, net or effective lift, specific lift, and excess specific lift were derived for a general single envelope balloon and can be applied to hot-air, gas and hybrid balloons. Rate-of-climb, absolute ceiling, rate-of-descent, and the maximum rate-of-descent or the uncontrolled terminal descent have all been modeled and sample computations performed for AX8 or AX9 FAI-class hot-air balloons. Lifting index or the specific net/effective lift have been computed treating ambient and hot air as ideal gases at various pressure altitudes and representative envelope temperatures. Drag coefficient in upward and downward vertical flights have been chosen based on best available data. Experimental scale and full-scale flight tests are suggested for more accurate estimates of external aerodynamics in vertical balloon flights. CFD computations of coupled inner- and external-flows are also recommended in future efforts. Knowledge of free balloon’s vertical performance is essential in flight planning and operational safety of flight.
Keywords: lighter-than-air (LTA), hot-air balloon (LBH), buoyancy, lifting index, vertical flight performance, absolute ceiling, terminal descent speed.
Introduction
The main motivation for this study was to present new and comprehensive approach to performance calculations of free balloons and manned hot-air balloons in particu-lar. Buoyancy-driven or lighter-than-air (LTA) aircraft find many applications and their utilization may increase in the future. Although the Federal Aviation Administra-tion (FAA) (2008) uses designations LBH (hot-air bal-loon) and LBG (gas balloon), it is also appropriate to call such balloons Montgolfière (LBH) and Charlière (LBG), honoring their respective inventors. A good historical re-view of balloons (LBH, LBG, hybrid), ballooning pioneers and records, balloon art and balloon design developments up to late 1970s can be found in Jackson (1980).
While LBGs can reach stratospheric (and higher) heights LBH, thermal airships and gas-filled pressurized (blimps and semi-rigid) and unpressurized (rigid) air-ships (Taylor, 2014) are typically constrained to lower tropospheric altitudes. While lacking importance in com-mercial air transportation since the time of rigid air-
ships, LTA aircraft have several specialized and unique applications. Unmanned LBGs are used for atmospheric sounding and data collection. Much of current weather data comes from the routine atmospheric sounding us-ing stratospheric LBGs. Manned and unmanned aerostats are also used as tethered airborne observational platforms, for atmospheric and astronomical research, or for carrying airborne radars, telecommunication equipment, and other instrumentation. Hot-air ballooning (LBH), chiefly a rec-reational activity, also has small commercial component, such as sightseeing and adventure flights.
1. Literature review
Although historically the first flying “machines” (air-craft), overall less research and development has been conducted in LTA compared to Heavier-than-Air (HTA) aircraft. First complex thermal and dynamic mathemati-cal models of balloon flights were developed in 1960s and 1970s with the onset of space age and the arising need for high-altitude research (atmospheric sounding).
AVIATIONISSN: 1648-7788 / eISSN: 1822-4180
2021 Volume 25 Issue 3: 149–158
https://doi.org/10.3846/aviation.2021.15330
*Corresponding author. E-mail: [email protected]; [email protected]
150 N. E. Daidzic. Mathematical model of hot-air balloon steady-state vertical flight performance
Moreover, LTA balloons and airships may have now es-sential role in future space exploration of other planets and moons. There have been many proposals for using LTA in general and aerobots (robotic balloons) applica-tions for extraterrestrial atmospheric flights in connection with planetary explorations (J. Cameron et al., 1999). We will just mention proposals for using robotic (unmanned) hot-air (thermal) balloons to explore Titan, a largest moon of Saturn (Dorrington, 2013; Furfaro et al., 2008). Due to obvious shortcomings, HTA aircraft would be likely more difficult to deploy, launch and control in space missions.
The FAA, NOAA and other agencies in the USA and similar national agencies elsewhere regularly use radio-sonde or super-pressure LBGs carrying atmospheric sen-sors/probes to stratospheric heights, bursting at designated high altitudes (due to balloon film stretching beyond elas-tic/plastic limits), and falling back to Earth using deployable parachutes. More details on super-pressure balloon physics is given in Lally (1971). Aaron et al. (2002) discussed de-velopments of NASA’s Ultra Long Duration Balloon Project. A lifting control surface deployed and suspended on the tether well beneath the balloon would provide aerodynamic steering forces due to wind vector changes with altitude. Using suspended rudders, no longer will the air-balloons be at the full mercy of atmospheric winds. Zero-pressure strat-ospheric LBGs utilized for long-range and long-endurance airborne payload transport has been investigated recently by Kayhan and Hastaoglu (2014). In particular, authors discussed heat, mass and momentum balances and the compress-release systems for speed-controlled long-term duration flights. Amazingly, it would be possible to use such stratospheric LBGs to carry large payloads at almost constant altitudes over the period of several weeks (such as during Antarctic summer). Daidzic (2014) has discussed designs, deployment and use of giant aerostats as airborne human habitats for colonization of planet Venus. Various other LTA aircraft were proposed for human transportation between floating aerostats in dense Venusian CO2-based at-mosphere. To the best of our knowledge the original idea for colonization of Venus using aerostats was first time mentioned by Soviet scientists in late 1960’s (“Venera” mis-sions) and the idea was later also picked up by some NASA researchers (e.g., Landis, 2003).
Most hot-air balloon (LBH) envelopes today are de-signed in a, so called, “natural shapes” with practically zero circumferential stress. Vertical load tapes meeting at the crown ring carry the weight of the entire system. The envelope film is practically fully stretched with the small over-pressure existing in the heated “lifting” air compared to colder ambient air. For more details on airship applica-tions, technology and designs consult Khoury and Gillett (1999) and Taylor (2014).
However, the estimation of the steady-state vertical performance, absolute and service ceilings and especially the estimation of the terminal descents is missing from previous models to the best of our knowledge. Stated pur-pose of this article is to introduce LBH vertical perfor-mance analysis in a comprehensive, clear and logical way.
2. Mathematical model and methods
This article introduces novel comprehensive analysis of steady-state (static) LTA balloon performance with many results and consequences not previously known or dis-cussed to the best of our knowledge. Among contributions presented here, we mention the estimation of the absolute ceiling and the terminal descent speeds. Additionally, the sensitivity analysis was performed to establish relative in-fluences of various operational parameters.
Lumped-parameter models are typically used to de-scribe dynamic and static LBH flight models. Uniformity of parameters and space–independence leads to mathemati-cal models described in terms of ODEs, which considerably simplifies complex treatment in terms of PDEs. As LBH can be directly controlled only in vertical direction, the force-balance between the inertial force, weight, buoyancy and aerodynamic drag in approximately inertial topo-centric frame-of-reference attached to Earth’s surface yields:
2
2id zM L W Ddt
= − ± , (1)
where, L is the upward buoyancy-driven lift force, D is aerodynamic drag and W is weight. Additionally, Mi is the inertial mass, which includes the gravitational mass of the LBH system plus the virtual mass (Cm) representing equivalent mass of (outside) atmospheric air being affect-ed during air-balloon vertical accelerations (D. Cameron, 1980; Carlson & Horn, 1983; Das et al., 2003; Kayhan & Hastaoglu, 2014; Kreider, 1975; Kreith & Kreider, 1974, Morris, 1975):
i LBH m a BM m C V= + ρ . (2)
The LBH mass consists of the balloon envelope with variable-density hot-air lifting gas and the balloon inert mass:
( ),LBH g g g Bm m p T m= + . (3)
The change of the lifting gas volume in the envelope assuming lifting gas follows the ideal-gas law, yields:
2.
g g g g g
g g
g g g g g
g g
dV m RT m R dTddt dt p p dt
RT dm m RT dp
p dt dtp
= = +
−
(4)
Assuming the LBH envelope volume change is zero, i.e., VB = const., results in:
( ) 0.
g g g gg g
a
g gg g
a
dT dm g m T dzm Tdt dt R T dt
g m Td dzm Tdt R T dt
⋅ + + = ⋅
+ = ⋅
(5)
Eq. (5) implies that in LBH climb (dz/dt >0), the mass of hot-air must be decreasing at constant gas volumes and temperatures. We do not treat LBH thermal model as balloon pilots (aeronauts) actively control the envelope temperature and hence the effective lift. More on balloon

Aviation, 2021, 25(3): 149–158 151
thermal models (mostly stratospheric LBGs) can be found in Carlson and Horn (1983), Das et al. (2003), Dorrington (2013), Du et al. (2019); Kayhan and Hastaoglu (2014), Kreider (1975), Kreith and Kreider (1974), Morris (1975), and Shi et al. (2009). Neglecting change of terrestrial ac-celeration with height (Daidzic, 2015) and latitude/longi-tude (Daidzic, 2017), and the ambient air density gradi-ent over the envelope height, buoyancy force (gross lift) of fully submerged object in fluid (air) yields:
( )
( )( )
5.2558
0 0 0
5.25580 0 0
01 .
ISAa B B
a
B ISAp
ISA p
B g V g V
g T VH
TT H T
θ= ⋅ρ ⋅ = ρ =
θ
ρ ⋅ Γ⋅ + + Δ
(6)
The specific buoyancy is equivalent to the specific weight of displaced air in standard atmosphere, which for ISA atmosphere yields:
( ) ( )4.2558
0 0 00
1 ISAB ISA ISA pISA
B V g g HT
Γ= ρ = γ = ρ ⋅ +
.
(7)Theoretical buoyancy is only affected by the mass of
the displaced fluid (ambient air in this case) and the lo-cal gravitational constant (assumed constant in terrestrial troposphere). In the absence of transitory dynamic (aero-dynamic) lift, which in the LBH terminology is often re-ferred to as “false” lift (D. Cameron, 1980; US Department of Transportation, Federal Aviation Administration, 1982, 2008), the net or effective aerostatic lift is the buoyancy force (Archimedes’ principle of displacement) minus the weight of the lifting gas replacing the ambient atmospheric air in the balloon envelope:
( )0 0
0 ,
eff g B a g
gB aa g
a g
L B g m g V
pg V pR T T
= − ⋅ = ⋅ ⋅ ρ −ρ =
⋅ − ρ ≥ ρ
(8)
where, ( )0 0a g a gρ −ρ = Δρ = ρ σ −σ ≥ . Fully inflated LBH envelope volumes are practically constant. The net lift changes with altitude. Super-pressure and super-heat (super-temperature) of (non-rigid) gas envelopes are:
0, 0g a g ap p T TΠ = − ≥ Θ = − ≥ . Dimensionless super-pressure and the ambient-air super-heat ratio are defined as:
1 0;
1 0.
p p pg a gp p pa a a
T T Tg a gT T Ta a a
− Π ≡ = − ≥
− Θ ≡ = − ≥
(9)
Later in the article, we will introduce a slightly differ-ent dimensionless super-heat ratio. While the super-pres-sure ratio could be larger than one in some super-pressure LBGs (Kreith & Kreider, 1974), the maximum ambient-air super-heat ratio (Eq. 9) is practically midway between zero and one in typical LBH systems. Air pressures inside LBH envelopes are slightly higher (about several hundred Pascal) than surrounding ambient air pressures. However,
LBHs are practically zero-pressure balloons and the small pressure differential required to keep the envelope inflat-ed is often neglected in LBH performance analysis. Fully inflated envelope material is stretched absorbing existing pressure differentials, while maintaining some minimum stiffness of the inflated shape. Air leaks through the en-velope seams and due to internal counter-flows and re-circulation, escapes through the mouth/skirt. The super-heat level is the main instrument in controlling net lift in hot-air balloons. At the envelope mouth entrance open to ambient air, the boundary condition (BC) requires super-pressure to be practically zero, i.e., 0mouth g ap pΠ = − ≈ .
The air specific gas constant does not change much during LPG (Liquefied Petroleum Gases) combustion. Mass of hot air is determined from the ideal-gas law in terrestrial homosphere (Daidzic, 2015, 2019a):
kg kmol J kmol K
287.055 / g Bg g B g
g g g
g air
p Vm V R J kg K
R T= = ρ = =
= = = 28.9647 / 8,314.463 / .
(10)Air mixture follows the ideal-gas law approximation
and Dalton’s law of partial pressures. This approximation is generally suitable for gases at relatively low pressures and temperatures neither too high nor too low (condensation). As William Henry, a contemporary of John Dalton, put it so eloquently for gas mixtures, “Every gas is a vacuum to every other gas” (Mahan & Myers, 1987). Otherwise, one would need a real-gas equation-of-state accounting for various intermolecular forces and finite molecular sizes (e.g., Van der Waals equation), which would tremendously complicate the analysis. Air humidity is neglected in cur-rent analysis. The effective- or net-lift (Eq. 8) becomes:
( )0
0 1 1 .
eff a B g
ag
g a a a a
L g V m
g mp T p T
= ⋅ ρ ⋅ − =
Π Θ Π ⋅Θ⋅ − + − − ⋅
(11)
This expression is further simplified resulting in often-used approximation (Kreith & Kreider, 1974):
( )0
, , , , , 1 .
eff g
a aa g a a
g g a a
L g m
p TT p
≈ ⋅ ⋅Φ
Θ ΠΦ Π Θ = − + −
(12)
Eq. (12), assumes that magnitudes of super-heat and especially super-pressure are relatively small and their product is even smaller (2nd-order infinitesimal). How-ever, Eq. (11) should be used in some hybrid balloons with significant super-pressure and super-heat ratios. Eq. (12) can be used for effective lift computations for many types of balloons where both super-heat and super-pressure ra-tios are not simultaneously large. In LBGs (both zero- and super-pressure) the major lifting action is due to molar mass ratio being larger than one, while super-heat is prac-tically zero and the super-pressure can be zero or some value larger than zero. The major lift component in LBH
152 N. E. Daidzic. Mathematical model of hot-air balloon steady-state vertical flight performance
is due to heating of the envelope’s “lifting” air (molar mass ratio is practically one, super-pressure is practically zero, but the ambient super-heat ratio is positive and larger than zero). In hybrid balloons (e.g., Roziere), the lifting action is due to combination of effects; the molar mass ratio is significantly larger than one (H2 and He), and the super-heat ratio is positive nonzero. As apparent from Eq. (12), increasing super-pressure decreases net lift, while increas-ing super-heat ratio increases effective lift. Hence, hybrid balloons generate effective lift partly due to use of low-density lifting gases (H2 or He) and partly due to heating of air and ballonets filled with lifting gases. Molar mass of air is about 29 kg/kmol, while H2 (hydrogen gas), He (monoatomic noble gas) and H2O (vapor) have molar masses of about 2, 4 and 18 kg/kmol respectively. The molar mass of hot air does not change noticeably while burning LPG (Molar mass of CO2 is 44 kg/kmol). There-fore, molar mass of hot-air products (slightly hypoxic air with byproducts of combustion – mostly CO2 and H2O) is just slightly larger than of the “cold” air. As mentioned earlier, LBH are essentially zero-pressure balloons as they vent openly to atmosphere. Small super-pressure must however exist to maintain inflated envelope shape and is determined from the heat input and leakage resistance through envelope and skirt/mouth. Hence, LBH net-lift is:
( )
00
0 ,
a Beff g
a a a g
a Bg g
g p VL g m
T R T T
g V BT T
Θ Θ ≈ ⋅ ⋅ = ⋅ ⋅ = Θ Θ ρ ⋅ = ⋅
(13)
for: 1, 0a g ap≈ Π ≈ . This net-lift expression cap-tures the basic buoyancy physics of hot-air balloons. The non-dimensional lifting-gas super-heat function is defined as:
( ), 1 1g a ag a g
g g g
T T TT T
T T T
−Θ ϑ = = = − <
. (14)
Effective or net lift is clearly smaller than the theoreti-cal buoyancy:
( ),eff g a gL B T T B≈ ⋅ϑ < . (15)
As will be seen later, the lifting-gas super-heat func-tion is practically always less than 0.5 for LBH flights and the net lift is at best only 40% of the theoretical buoyancy. Practically, the maximum effective lift is 30–35% of the maximum possible theoretical buoyancy (no lifting-gas sealed vacuum-filled volume) for LBH flights. Thus, effec-tive lift increases with lower ambient atmospheric temper-ature and higher atmospheric pressure (high environmen-tal air density). It also increases with increased super-heat and envelope volume (normally constant during flight). Hence, from the performance aspect alone, hot-air bal-looning is activity best practiced in winter months due to low density altitudes (DA) and absence of thermals. Superheat is limited by the envelope fabric material, with the maximum film temperatures typically in the range of
120–130 oC (about 400 K) for common modern ripstop nylon materials.
However, despite increased super-heat ratios of the en-velope gas due to normally lower ambient temperatures at altitudes, the ambient pressure decrease with altitude causes the buoyancy and the effective lift to decline rap-idly with height. Decrease in terrestrial acceleration with height (Daidzic, 2015) is neglected in LBH performance computations. That effect may only be somewhat impor-tant for very accurate computations involving stratospher-ic gas balloons. Hence, an LBH will achieve an absolute ceiling depending on the actual weight (no atmospheric updrafts). The gravitational mass (m) is smaller than the inertial mass (Mi) during vertical accelerations as it does not include the virtual mass of accelerated ambient air nor the mass of the hot air (envelope lifting gas). Since the lifting-gas is already included in the effective-lift expres-sion (Eq. 8), the gravitational mass is:
( ).B i env basket equipment payload
i
ballast f
m m m m m m
m m t
= = + + + +
+
∑ (16)
The LBH’s inert mass is not truly constant as the air-borne-heater fuel is being consumed and the ballast (if available) can be jettisoned if needed. Stepwise reduction of inert mass is primarily due to intermittent fuel con-sumption. Liquid propane fuel typically represents 5 to 10% of the LBH gross weight and the change of inert mass can often be neglected in performance analysis. We model aerodynamic drag and the equatorial cross-section or bal-loon reference area (for non-special shape balloons) as:
2
0 0
22
1 12 2
.4
a D e a D e
ee e
dz dz dzD C A C Adt dt dt
DA R
= ρ σ = ± ρ σ
π= = π
(17)
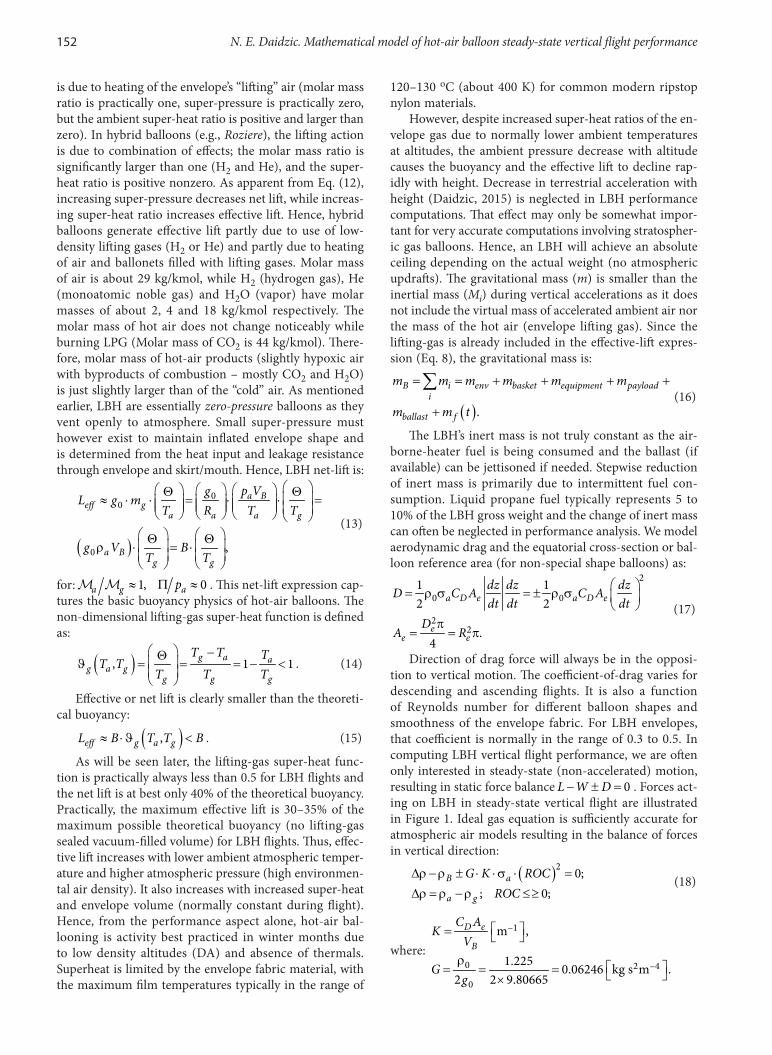
Direction of drag force will always be in the opposi-tion to vertical motion. The coefficient-of-drag varies for descending and ascending flights. It is also a function of Reynolds number for different balloon shapes and smoothness of the envelope fabric. For LBH envelopes, that coefficient is normally in the range of 0.3 to 0.5. In computing LBH vertical flight performance, we are often only interested in steady-state (non-accelerated) motion, resulting in static force balance 0L W D− ± = . Forces act-ing on LBH in steady-state vertical flight are illustrated in Figure 1. Ideal gas equation is sufficiently accurate for atmospheric air models resulting in the balance of forces in vertical direction:
( )2 0;; 0;
B a
a g
G K ROCROC
Δρ−ρ ± ⋅ ⋅σ ⋅ =Δρ = ρ −ρ ≤≥
(18)
where:
–1
0 2 –4
0
m ,
1.225 0.06246 kg s m .2 2 9.80665
D e
B
C AK
V
Gg
=
ρ = = = ×
Aviation, 2021, 25(3): 149–158 153
The parameter K is a structural balloon parameter that depends on the balloon geometry. In general, the param-eter K is different for ascending and descending flights, as the typical natural-shaped LBH system lacks equatorial symmetry and due to location of a basket/gondola un-der the envelope. The average density of the LBH system (without lifting gas/air) is envelope volumetric loading expressed as:
; const.B B B Bm V Vρ = = (19)
It is assumed that the fully inflated LBH envelope vol-ume remains constant and that the film/fabric material cannot be further stretched (as in ascending super-pres-sure LBGs). Pressure of the lifting gas (hot air) is slightly higher than the ambient maintaining envelope shape and volume and producing leakage through the fabric seams and the through the throat exists. The ROC or vertical speed through still air (no vertical airmass motion) yields:
( ) ( ) maxsgn 4 BB
aROC H ROC
K
Δρ−ρ ≈ Δρ−ρ ⋅ ⋅ ≤ σ ⋅
,
(20)where, sgn stands for the signum (sign) function. Verti-cal speed is measured using variometers, which measure temporal static pressure changes. Certified maximum as-cent rates exist for the reason that parachute vent does not open in rapid climbs. Additionally, the fast ascending LBH has almost no visibility above it. Racer balloons are designed with low-drag narrower prolate-shaped enve-lopes to improve vertical flight performance. The reference (cross-section) effective-area mass-loading (kg/m2) is:
0B B B BB
D e eff
V VC A A
Δρ−ρ ⋅ Δρ−ρ ⋅µ = = ≥
⋅. (21)
We now define specific lift (Morris, 1975) or the Lift-ing Index (LI) in kg/m3, as:
0a gLI = Δρ = ρ −ρ ≥ . (22)
Based on the difference between the LI and the balloon mass density, which we call “excess specific lift”, we have different vertical flight scenarios:
0; Ascent (excess Lift positive).0; Ceiling (excess Lift zero).0; Power-on descent (excess Lift negative).
0; Power-off (terminal) descent.
B
B
B
Δρ−ρ >Δρ−ρ =Δρ−ρ <Δρ =
0; Ascent (excess Lift positive).0; Ceiling (excess Lift zero).0; Power-on descent (excess Lift negative).
0; Power-off (terminal) descent.
B
B
B
Δρ−ρ >Δρ−ρ =Δρ−ρ <Δρ =
If the lifting hot air is theoretically cooled to the am-bient air temperature (theoretically no longer possible to maintain envelope shape stiffness and volume), the effec-tive lift or LI is zero and the LBH is in terminal descent at terminal (vertical) airspeed:
max
2 2, ,
, ,
4.0 m s
kg m m
B Bt
a dn a
B B BB eff dn D dn e
eff dn eff dn
ROD vG K
V mA C A
A A
ρ µ = = ≈ ⋅ σ ⋅ ⋅ σ
ρ ⋅ µ = = = .
(23)While the reliable information on the coefficient-of–
drag for LBH envelopes in terminal descent is practically nonexistent to the best of our knowledge, based on the balloon geometry and available CD data (Granger, 1995; Hughes & Brighton, 1999; McCormick, 1995), we assumed CD,dn to be 0.9 in turbulent-flow descent. Based on simple analysis, it was estimated that the envelope cross-section mass loading Bµ for a typical LBH is between 3.0 and 4.0.
The small linear-perturbation analysis around the op-erating point “0” (not to be confused with the reference datum conditions), results in:
( ) ( ) ( ) ( )0 ,0 ,0 ,0
12
B D a
B D a
ROD m CROD m C
Δ Δ Δ Δ σ≈ − −
σ . (24)
Practically, terminal speed will increase with the en-velope cooling and decrease with increasing ambient air density (lower altitude) assuming the shape of the balloon does not change (collapse partially or fully) and ambi-ent air is entering through the mouth in upward direc-tion. A 10% increase in CD will result in 5% decrease in terminal descent speed, everything else being the same. Terminal speed is essential for the safety of LBH flights as it defines maximum vertical (uncontrolled) descent speed (in the absence of any downdrafts or descending air). Evaluation of terminal speed is required under Title 14 CFR 31 (Free manned balloons) airworthiness stand-ards (US Department of Transportation, Federal Aviation Administration, 1999). In particular §31.19 (Performance: Uncontrolled Descent) and §31.27(c) require determina-tion of the terminal (uncontrolled descent) speed in the case of burner(s) failure, fuel exhaustion, limited enve-lope tear, etc. (US Department of Transportation, Federal Aviation Administration, 1999). We can now also evaluate maximum ROC at a given density altitude:
,maxmaxmax
,max
4.0 4.0 ;
.
B B
a up a
g g
ROCK
T T
Δρ−ρ µ≈ ⋅ = ⋅
σ ⋅ σ
=
(25)
This capability is important for short-field perfor-mance or maximum-performance takeoffs/liftoffs, contour
Figure 1. Forces acting on LBH in upward and downward vertical motion
154 N. E. Daidzic. Mathematical model of hot-air balloon steady-state vertical flight performance
flying, climbing over obstacles, such as, power lines (US Department of Transportation, Federal Aviation Adminis-tration, 1981, 1996), etc. Assuming dry air is an ideal gas,
,a g a gT T R R R≤ ≈ = and for practically zero super-pres-sure, we obtain the relationship between the LI (specific lift) and the effective (net) lift:
5.2558eff
00
1 1LI a ISA
a g a g B
p LR T T T g V
θ Θ = Δρ = − = ρ = θ ⋅
. (26)
The off-standard ambient temperature at arbitrary geo-potential altitude is given in a relationship to ISA tem-perature:
( ) ( ) ( ) ( )0 0
0
;
0.
ISAaa ISA T ISA
T H TTH H H
T TT
T
+Δ+ Δ
θ = θ = = = θ + Δθ
ΔΔθ = ≤≥
(27)The ambient-air super-heat ratio and the lifting-gas
super-heat ratios were introduced earlier, noting that:
( ) ( ), ; , ;a a g g a g g aa g
T T T TT T
Θ Θ ϑ = ϑ = ϑ < ϑ . (28)
The absolute ceiling for a given LBH system is reached when ROC is zero at maximum permissible envelope tem-perature, yielding:
5.25580 ,max
max,abs max0
LI 1g ISAp B
aH
T
ρ ⋅ϑ Γ= Δρ = + ⋅ = ρ θ
.
(29)Absolute ceiling in terms of pressure altitude Hp and
for given ambient temperature Ta is estimated from:0.1902
0,max
0 ,max
11 Bp a
ISA g
TH
ρ = − − θ ⋅ ⋅ Γ ρ ϑ
. (30)
Absolute ceiling in terms of DA is:0.23497
0,max
0 ,max
11 B
ISA g
THρ
ρ = − − ⋅ Γ ρ ϑ
. (31)
With the maximum envelope gas temperatures Tg,max, the super-heat function in ISA troposphere can be com-puted for general off-standard conditions:
( ) ,max,max ,max
,max
0
,max ,max ,max
,
1 .
g ag a g
g
ISAp
g g g
T TT T
TT T H
T T T
−ϑ = =
ΓΔ− − −
(32)
Generally, nonlinear Eq. (30) is solved iteratively, un-less super-heat function is known apriori. We use fixed-point iteration method in which we first assume ambient temperature (for desired ISA deviation). Iterations are re-peated until the result converges resulting in the absolute ceiling in terms of PA and the actual ambient tempera-ture. Absolute ceiling in terms of DA is computed from Eq. (31).
Determination of the coefficient-of-drag is not trivial. As it appears, no relevant studies exist in public domain on CD determination for real balloon envelopes to the best of our knowledge. Even the specialized literature and references we found are somewhat frugal on the aerody-namic drag information. Das et al. (2003) used the CD value of 0.5 for natural-shape hot-air balloons. Kreith and Kreider (1974) mention values between 0.1 and 0.3 and the fact that no studies have been conducted for actual balloon shapes.
Drag coefficient could be estimated from wind tun-nel scaled experiments by maintaining Reynolds-number similarity or from the full-scale prototype measurements. Alternatively, using computational-fluid-dynamics (CFD) with appropriate turbulence models, such as Reynolds-Averaged-Navier-Stokes (RANS), Detached Eddy Simula-tion (DES), Large Eddy Simulation (LES), or numerical solutions of Navier-Stokes equations without any turbu-lence model (DNS) for various balloon configurations (in-cluding basket geometry) and envelope shapes and fabrics would provide reasonable estimates of the external flow patterns and the drag coefficient. However, the amount of effort and cost to perform relevant coupled external- and internal-flow CFD analysis would be extraordinary (Daidzic, 2016b). In the absence of any transient dynamic lift, the aerodynamic drag of balloons will consist of the skin-friction (shear) and form (pressure) drag. Coefficient of drag for LBH and LBG will depend on the vertical di-rection because of the configuration lateral asymmetry. In general, CD depends on the Reynolds number, defined as:
( ) ( )Re air e air e airu D u D= ρ ⋅ ⋅ µ = ⋅ ν .Note that airµ here designates dynamic viscosity of air
and is temperature dependent. We use balloon’s equato-rial diameter and equatorial cross section area as refer-ence length and reference area for Reynolds number and drag estimation. Depending on the vertical speed, CD can change appreciably and the boundary layer will in general go through laminar, transition and fully turbulent phases. Drag measurement have been conducted on spheres many times and the CD behavior is well known (Granger, 1995; Hughes & Brighton, 1999; McCormick, 1995). For a sphere and Reynolds number less than about 500,000, the CD is about 0.47, and it suddenly drops to about 0.2 due to BL turbulent transition reducing the wake zone at Reynolds number of about 106. For a vertical speed of 5 m/s and equatorial diameter of 18 m, the cross-sectional reference area is about 254.5 m2 and the Reynolds number at SL is about 6.16 x 10⁶, which results in fully developed turbu-lent BL in external flows around spheres. In this region CD does not change significantly with the increasing Reynolds number. Kinematic viscosity of air at SL ISA conditions is about 1.46 x 10⁻⁵ m2/s (Daidzic, 2015).
3. Results and discussion
Vertical performance for off-standard atmosphere: ISA±10, ISA±20 and ISA±30 oC at given LBH weights,
Aviation, 2021, 25(3): 149–158 155
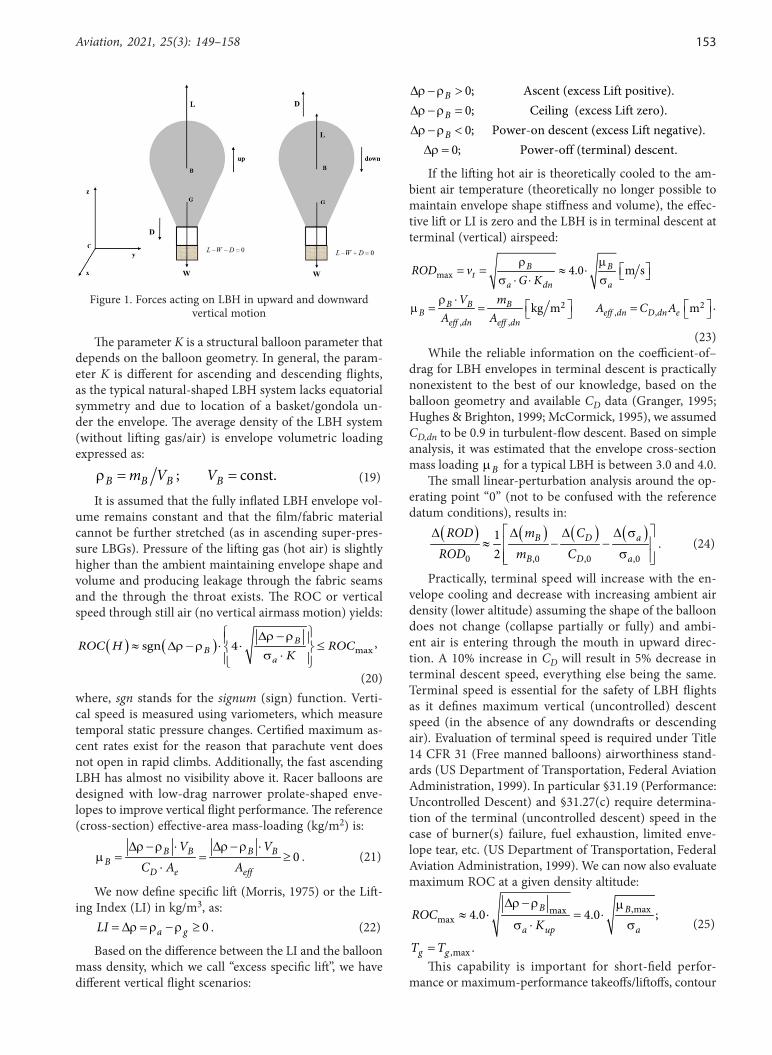
pressure altitudes, and envelope temperatures for dry air is given first. The results in terms of LI in kg/m3 used for various pressure altitudes and various ISA standard and nonstandard ambient (environmental) atmospheric temperatures and for 100 and 120 oC average envelope lifting-gas (hot-air) temperatures are presented. To ob-tain LI in imperial units of lb/1000 ft3, one needs to multiply LI in kg/m3 by a factor of 62.32. Somewhat unusual mixed unit for LI is used in U.K. and is given in kg/1000 ft3. To obtain LI in kg/1000 ft3 multiply LI in kg/m3 by a factor of 35.3. Usually, 100 oC is used as a standard average LBH envelope temperature. The actual temperature distribution inside the balloon envelope is quite complex and depends on the natural (buoyancy-driven) and forced-convection internal airflows with turbulent recirculating zones and counter-flows (Morris, 1975). Specific buoyancy (Eq. 7) as a function of PA in ISA troposphere is shown in Figure 2.
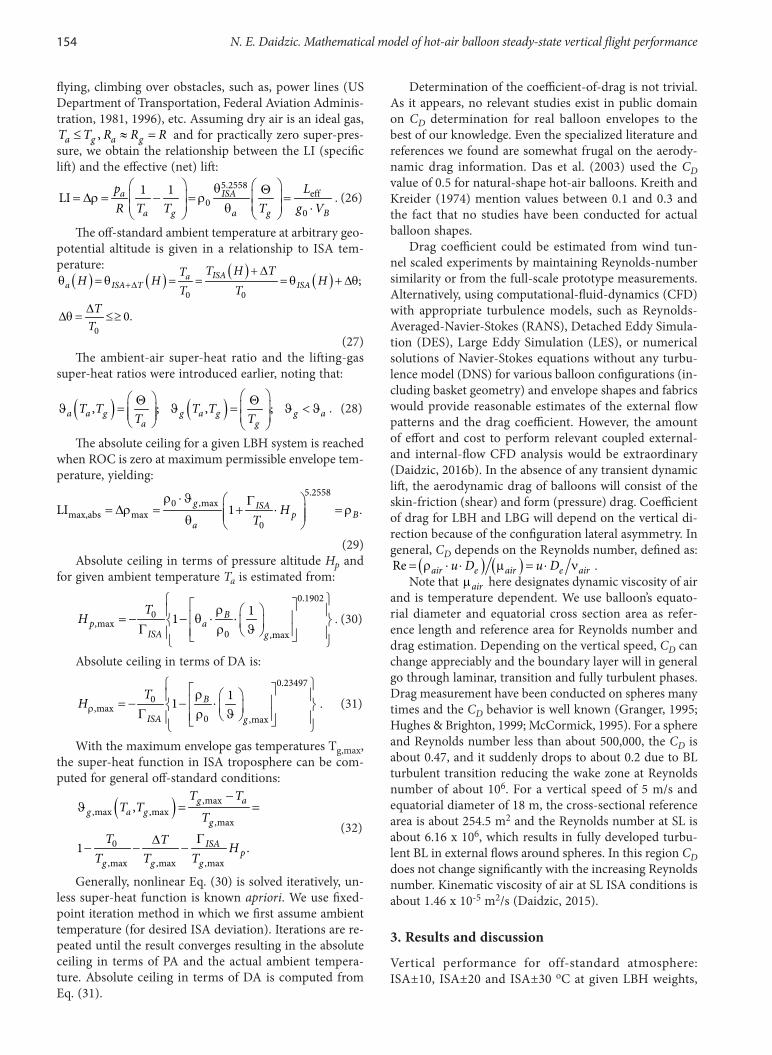
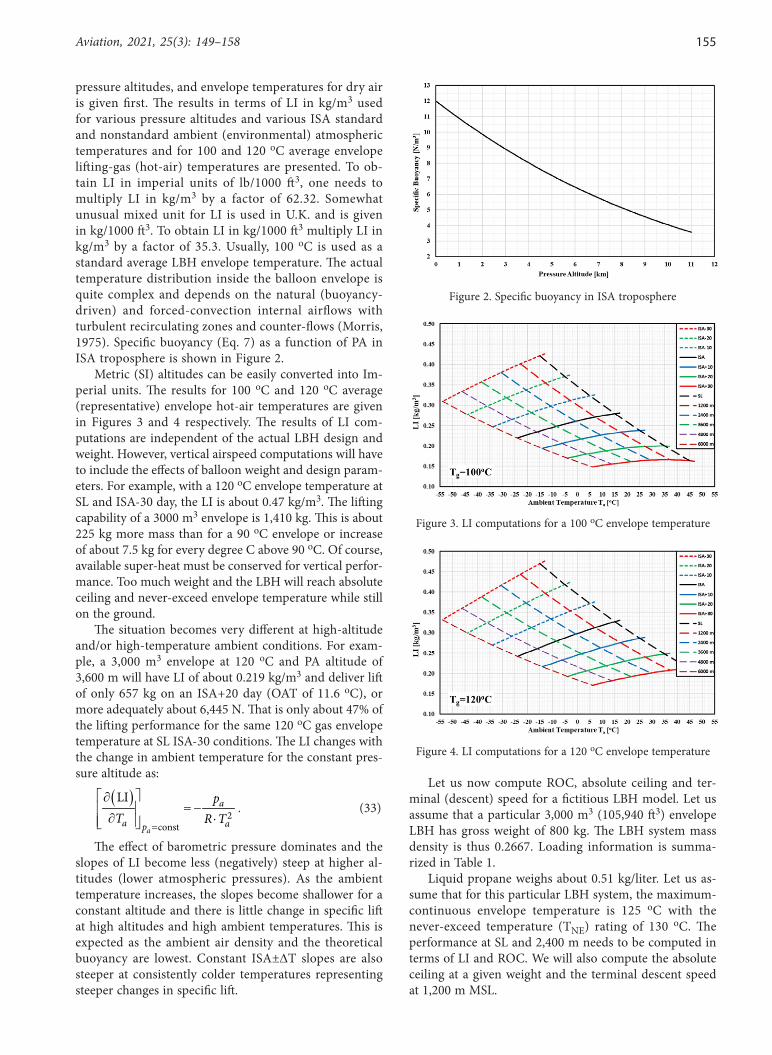
Metric (SI) altitudes can be easily converted into Im-perial units. The results for 100 oC and 120 oC average (representative) envelope hot-air temperatures are given in Figures 3 and 4 respectively. The results of LI com-putations are independent of the actual LBH design and weight. However, vertical airspeed computations will have to include the effects of balloon weight and design param-eters. For example, with a 120 oC envelope temperature at SL and ISA-30 day, the LI is about 0.47 kg/m3. The lifting capability of a 3000 m3 envelope is 1,410 kg. This is about 225 kg more mass than for a 90 oC envelope or increase of about 7.5 kg for every degree C above 90 oC. Of course, available super-heat must be conserved for vertical perfor-mance. Too much weight and the LBH will reach absolute ceiling and never-exceed envelope temperature while still on the ground.
The situation becomes very different at high-altitude and/or high-temperature ambient conditions. For exam-ple, a 3,000 m3 envelope at 120 oC and PA altitude of 3,600 m will have LI of about 0.219 kg/m3 and deliver lift of only 657 kg on an ISA+20 day (OAT of 11.6 oC), or more adequately about 6,445 N. That is only about 47% of the lifting performance for the same 120 oC gas envelope temperature at SL ISA-30 conditions. The LI changes with the change in ambient temperature for the constant pres-sure altitude as:
( )2
const
LI
a
a
a ap
pT R T
=
∂= −
∂ ⋅ . (33)
The effect of barometric pressure dominates and the slopes of LI become less (negatively) steep at higher al-titudes (lower atmospheric pressures). As the ambient temperature increases, the slopes become shallower for a constant altitude and there is little change in specific lift at high altitudes and high ambient temperatures. This is expected as the ambient air density and the theoretical buoyancy are lowest. Constant ISA±ΔT slopes are also steeper at consistently colder temperatures representing steeper changes in specific lift.
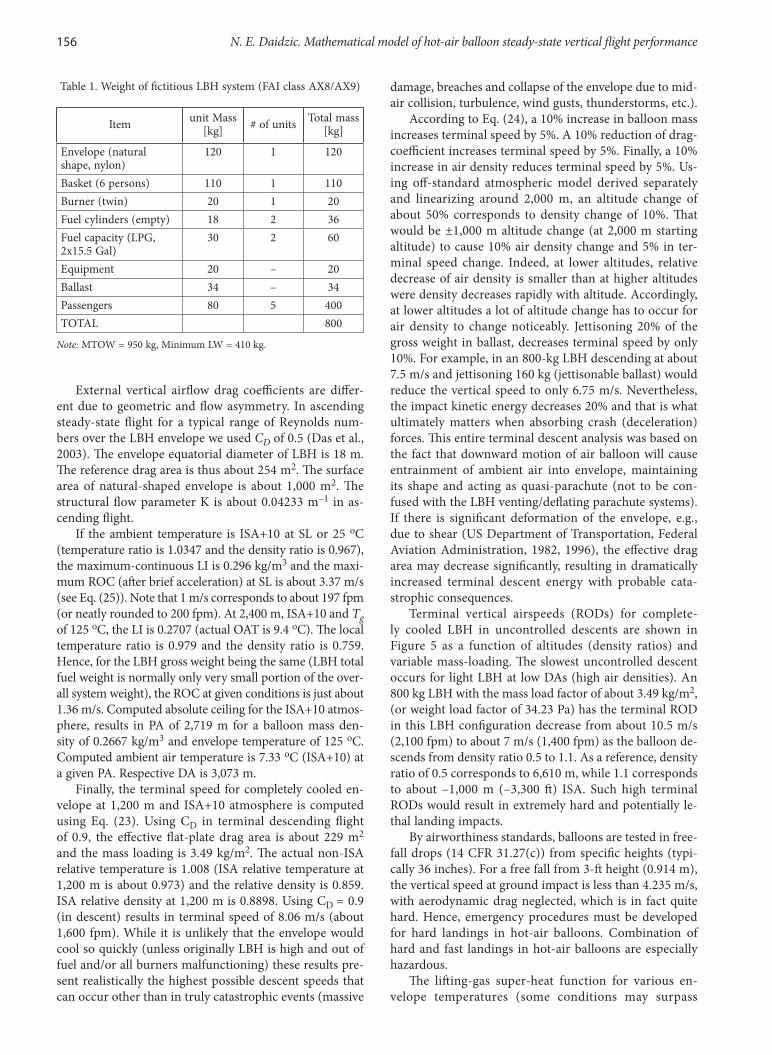
Let us now compute ROC, absolute ceiling and ter-minal (descent) speed for a fictitious LBH model. Let us assume that a particular 3,000 m3 (105,940 ft3) envelope LBH has gross weight of 800 kg. The LBH system mass density is thus 0.2667. Loading information is summa-rized in Table 1.
Liquid propane weighs about 0.51 kg/liter. Let us as-sume that for this particular LBH system, the maximum-continuous envelope temperature is 125 oC with the never-exceed temperature (TNE) rating of 130 oC. The performance at SL and 2,400 m needs to be computed in terms of LI and ROC. We will also compute the absolute ceiling at a given weight and the terminal descent speed at 1,200 m MSL.
Figure 2. Specific buoyancy in ISA troposphere
Figure 3. LI computations for a 100 oC envelope temperature
Figure 4. LI computations for a 120 oC envelope temperature
156 N. E. Daidzic. Mathematical model of hot-air balloon steady-state vertical flight performance
External vertical airflow drag coefficients are differ-ent due to geometric and flow asymmetry. In ascending steady-state flight for a typical range of Reynolds num-bers over the LBH envelope we used CD of 0.5 (Das et al., 2003). The envelope equatorial diameter of LBH is 18 m. The reference drag area is thus about 254 m2. The surface area of natural-shaped envelope is about 1,000 m2. The structural flow parameter K is about 0.04233 m–1 in as-cending flight.
If the ambient temperature is ISA+10 at SL or 25 oC (temperature ratio is 1.0347 and the density ratio is 0.967), the maximum-continuous LI is 0.296 kg/m3 and the maxi-mum ROC (after brief acceleration) at SL is about 3.37 m/s (see Eq. (25)). Note that 1 m/s corresponds to about 197 fpm (or neatly rounded to 200 fpm). At 2,400 m, ISA+10 and Tg of 125 oC, the LI is 0.2707 (actual OAT is 9.4 oC). The local temperature ratio is 0.979 and the density ratio is 0.759. Hence, for the LBH gross weight being the same (LBH total fuel weight is normally only very small portion of the over-all system weight), the ROC at given conditions is just about 1.36 m/s. Computed absolute ceiling for the ISA+10 atmos-phere, results in PA of 2,719 m for a balloon mass den-sity of 0.2667 kg/m3 and envelope temperature of 125 oC. Computed ambient air temperature is 7.33 oC (ISA+10) at a given PA. Respective DA is 3,073 m.
Finally, the terminal speed for completely cooled en-velope at 1,200 m and ISA+10 atmosphere is computed using Eq. (23). Using CD in terminal descending flight of 0.9, the effective flat-plate drag area is about 229 m2 and the mass loading is 3.49 kg/m2. The actual non-ISA relative temperature is 1.008 (ISA relative temperature at 1,200 m is about 0.973) and the relative density is 0.859. ISA relative density at 1,200 m is 0.8898. Using CD = 0.9 (in descent) results in terminal speed of 8.06 m/s (about 1,600 fpm). While it is unlikely that the envelope would cool so quickly (unless originally LBH is high and out of fuel and/or all burners malfunctioning) these results pre-sent realistically the highest possible descent speeds that can occur other than in truly catastrophic events (massive
damage, breaches and collapse of the envelope due to mid-air collision, turbulence, wind gusts, thunderstorms, etc.).
According to Eq. (24), a 10% increase in balloon mass increases terminal speed by 5%. A 10% reduction of drag-coefficient increases terminal speed by 5%. Finally, a 10% increase in air density reduces terminal speed by 5%. Us-ing off-standard atmospheric model derived separately and linearizing around 2,000 m, an altitude change of about 50% corresponds to density change of 10%. That would be ±1,000 m altitude change (at 2,000 m starting altitude) to cause 10% air density change and 5% in ter-minal speed change. Indeed, at lower altitudes, relative decrease of air density is smaller than at higher altitudes were density decreases rapidly with altitude. Accordingly, at lower altitudes a lot of altitude change has to occur for air density to change noticeably. Jettisoning 20% of the gross weight in ballast, decreases terminal speed by only 10%. For example, in an 800-kg LBH descending at about 7.5 m/s and jettisoning 160 kg (jettisonable ballast) would reduce the vertical speed to only 6.75 m/s. Nevertheless, the impact kinetic energy decreases 20% and that is what ultimately matters when absorbing crash (deceleration) forces. This entire terminal descent analysis was based on the fact that downward motion of air balloon will cause entrainment of ambient air into envelope, maintaining its shape and acting as quasi-parachute (not to be con-fused with the LBH venting/deflating parachute systems). If there is significant deformation of the envelope, e.g., due to shear (US Department of Transportation, Federal Aviation Administration, 1982, 1996), the effective drag area may decrease significantly, resulting in dramatically increased terminal descent energy with probable cata-strophic consequences.
Terminal vertical airspeeds (RODs) for complete-ly cooled LBH in uncontrolled descents are shown in Figure 5 as a function of altitudes (density ratios) and variable mass-loading. The slowest uncontrolled descent occurs for light LBH at low DAs (high air densities). An 800 kg LBH with the mass load factor of about 3.49 kg/m2, (or weight load factor of 34.23 Pa) has the terminal ROD in this LBH configuration decrease from about 10.5 m/s (2,100 fpm) to about 7 m/s (1,400 fpm) as the balloon de-scends from density ratio 0.5 to 1.1. As a reference, density ratio of 0.5 corresponds to 6,610 m, while 1.1 corresponds to about –1,000 m (–3,300 ft) ISA. Such high terminal RODs would result in extremely hard and potentially le-thal landing impacts.
By airworthiness standards, balloons are tested in free-fall drops (14 CFR 31.27(c)) from specific heights (typi-cally 36 inches). For a free fall from 3-ft height (0.914 m), the vertical speed at ground impact is less than 4.235 m/s, with aerodynamic drag neglected, which is in fact quite hard. Hence, emergency procedures must be developed for hard landings in hot-air balloons. Combination of hard and fast landings in hot-air balloons are especially hazardous.
The lifting-gas super-heat function for various en-velope temperatures (some conditions may surpass
Table 1. Weight of fictitious LBH system (FAI class AX8/AX9)
Item unit Mass [kg] # of units Total mass
[kg]
Envelope (natural shape, nylon)
120 1 120
Basket (6 persons) 110 1 110Burner (twin) 20 1 20Fuel cylinders (empty) 18 2 36Fuel capacity (LPG, 2x15.5 Gal)
30 2 60
Equipment 20 – 20Ballast 34 – 34Passengers 80 5 400TOTAL 800
Note: MTOW = 950 kg, Minimum LW = 410 kg.

Aviation, 2021, 25(3): 149–158 157
structural envelope never-exceed temperatures) and as a function of ISA geopotential altitudes is presented in Figure 6. Decreasing ambient temperature with altitude in ISA troposphere together with increasing representa-tive envelope temperatures increases lifting-gas super-heat function. Theoretically, it would appear that lifting-gas super-heat ratio and function is one in a limit of zero absolute ambient temperature. While mathematically this seems possible, physically it is a nonsense, as it would im-ply liquefaction of ambient air (O2 at about –183 oC at and N2 at about –196 oC at normal SL atmospheric pressures). Practically, an LBH aeronaut can count with the realistic maximum of 33% of the theoretical buoyancy, while an LBG balloonist could expect 93% (H2) or 87% (He) of the theoretical maximum buoyancy (no “lifting” gas), i.e., ( ) ( ) ( )1 1eff g a g aL B = − ρ ρ = − .
For example, in a predominantly CO2 Venusian at-mosphere, terrestrial atmospheric air would be a lifting gas (CO2 is about 50% denser than air). We estimate effec-tive lift to be about 34% of the theoretical buoyancy, which in itself is higher than terrestrial despite lower Venusian gravity (90% of terrestrial). This fact would at least con-ceptually allow human habitats to exist in giant floating aerostats (Daidzic, 2014).
In this article, we presented modern and concise re-view of the essential LTA and in particular LBH flight
physics and performance. The general effective lift equa-tion for balloons of constant volume has been derived. Specific lift (LI) has been computed at various pressure altitudes and in ISA and off-standard atmospheres at vari-ous balloon envelope temperatures. We have developed simple LBH steady-state vertical performance models. Small super-pressure in hot-air balloon envelopes was ne-glected to simplify performance computations. Relevant performance parameters, such as ROC as a function of altitude, absolute ceiling (in terms of PA and DA) and terminal speed are modeled and computed for a fictitious LBH model (FAI class AX8 and AX9).
Conclusions
The main contribution of this article is in the development and utilization of a comprehensive mathematical model of LBH quasi-state vertical flight performance using some novel definitions and introducing new parameters. Steady-state lumped-parameter analysis of the LBH envelope gas was performed. Theoretical buoyancy or gross lift, net or effective lift and excess specific lift were derived for the general LTA aircraft using novel definitions and usable for LBH, LBG and hybrid balloons. In particular, work-ing equations were derived for the zero super-pressure constant-volume LBH systems. Ambient atmospheric and lifting envelope hot air were treated as an ideal dry-air gas. Lifting index or specific lift for various pressure altitudes, ambient air temperatures and representative envelope hot-air temperatures was used as a major parameter in vertical-flight performance analysis. We derived working equations for the rate-of-climb, absolute ceiling, rate-of-descent and, most importantly, for the terminal descent speeds for com-mon balloon geometries and weights. As a unique feature, these performance figures are directly expressed in terms of standard and off-standard atmospheric models. These performance parameters are essential in LBH air trans-portation, flight operations and flight safety. Perturbation analysis was performed to determine relative importance of various parameters on LBH vertical performance. Ex-perimental and/or CFD evaluation of the drag coefficient for various LBH geometries in vertical flight is needed to calibrate steady-state performance models. Controlled full-scale flight experiments in free atmosphere or LBH scale-models in wind tunnels would enable reliable estimates of CD values. Indeed, it is our intention to perform wind tunnel testing on scale balloon models. Additionally, ac-tual flight tests are in progress using various envelopes and LBH systems/models. Flight tests will be used to calibrate dynamic transients and static performance models, which are already developed, but not presented here, to determine CD in vertical flight more reliably.
ReferencesAaron, K. M., Heun, M. K., & Nock, K. T. (2002). A method for
balloon trajectory control. Advances in Space Research, 30(5), 1227–1232. https://doi.org/10.1016/S0273-1177(02)00526-4
Figure 5. Terminal ROD for completely cooled envelope as a function of altitude and mass load factors
Figure 6. Lifting-gas super-heat function for various maximum envelope temperatures
158 N. E. Daidzic. Mathematical model of hot-air balloon steady-state vertical flight performance
Cameron, D. (1980). Ballooning handbook. Pelham Books (Pen-guin Group).
Cameron, J., Smith, I. S., Cutts, J. A., Raque, S., Jones, J., & Wu, J. (1999, 28 June–4 July). Versatile modeling and simulation of Earth and planetary balloon systems. In AIAA-99-3876, 13th AIAA Lighter-Than-Air Systems Technology Conference AIAA International Balloon Technology Conference. Norfolk, Vir-ginia. https://doi.org/10.2514/6.1999-3876
Carlson, L. A., & Horn, W. J. (1983). New thermal and trajectory model for high-altitude balloons. Journal of Aircraft, 20(6), 500–507. https://doi.org/10.2514/3.44900
Daidzic, N. E. (2014). Could we colonize Venus? Professional Pilot, 48(3), 92–96.
Daidzic, N. E. (2015). Efficient general computational method for estimation of standard atmosphere parameters. Interna-tional Journal of Aviation Aeronautics, and Aerospace, 2(1), 1–35. https://doi.org/10.15394/ijaaa.2015.1053
Daidzic, N. E. (2016). CFD in aircraft designs. Professional Pilot, 50(12), 94–98.
Daidzic, N. E. (2017). Long and short-range air navigation on spherical Earth. International Journal of Aviation Aeronautics and Aerospace, 4(1), 1–54. https://doi.org/10.15394/ijaaa.2017.1160
Daidzic, N. E. (2019a). On moist air and dew points. Interna-tional Journal of Aviation Aeronautics and Aerospace, 6(3), 1–36. https://doi.org/10.15394/ijaaa.2019.1339
Daidzic, N. E. (2019b). On atmospheric lapse rates. International Journal of Aviation Aeronautics and Aerospace, 6(4), 1–20. https://doi.org/10.15394/ijaaa.2019.1374
Das, T., Mukherjee R., & Cameron, J. (2003). Optimal trajectory planning for hot-air balloons in linear wind fields. Journal of Guidance, Control, and Dynamics, 26(3), 416–424. https://doi.org/10.2514/2.5079
Dorrington, G. E. (2013). Buoyancy estimation of a Montgolfière in the atmosphere of Titan. Aeronautical Journal, 177(1195), 1–15. https://doi.org/10.1017/S0001924000008605
Du, H., Li, J., Qu, Z., Zhang, L., & Lv, M. (2019). Flight perfor-mance simulation and station-keeping endurance analysis for stratospheric super-pressure balloon in real wind field. Aero-space Science and Technology, 86, 1–10. https://doi.org/10.1016/j.ast.2019.01.001
Furfaro, R., Lunine, J. I., Elfes, A., & Reh, K. (2008). Wind-based navigation of a hot-air balloon on titan: a feasibility study. In Proceedings Volume 6960, Space Exploration Technolo-gies; 69600C, SPIE Defense and Security Symposium. Orlando, Florida, United States. https://doi.org/10.1117/12.777654
Granger, R. A. (1995). Fluid mechanics. Dover.Hughes, W. F., & Brighton, J. A. (1999). Fluid dynamics (3rd ed.).
McGraw-Hill.
Jackson, D. D. (1980). The aeronauts. Time-Life Books.Kayhan, O., & Hastaoglu, M. A. (2014). Modelling of strato-
spheric balloon using transport phenomena and gas com-press-release system. Journal of Thermophysics and Heat Transfer, 28(3), 534–541. https://doi.org/10.2514/1.T4271
Khoury, G. A., & Gillett, J. D. (1999). Cambridge Aerospace Se-ries: Vol. 10. Airship Technology. Cambridge University Press.
Kreider, J. F. (1975). Mathematical modeling of high altitude bal-loon performance. In 5th Aerodynamic Deceleration Systems Conference, AIAA Paper 75-1385. American Institute of Aero-nautics and Astronautics. https://doi.org/10.2514/6.1975-1385
Kreith, F., & Kreider, J. F. (1974). Numerical prediction of the perfor-mance of high altitude balloons (NCAR-TN/STR-65 1971, revised 1974). National Center for Atmospheric Research (NCAR).
Lally, V. E. (1971). Superpressure balloons for horizontal sound-ings of the atmosphere (NCAR-TN-28). National Center for Atmospheric Research (NCAR).
Landis, G. A. (2003). Colonization of Venus. In AIP Conference Proceedings, 654(1). https://doi.org/10.1063/1.1541418
Mahan, B. M., & Myers, R. J. (1987). University chemistry (4th ed.). The Benjamin/Cummings publishing company.
McCormick, B. W. (1995). Aerodynamics, aeronautics and flight mechanics (2nd ed.). John Wiley & Sons.
Morris, A. L. (Ed.) (1975). Scientific ballooning handbook (NCAR-TN/IA-99). National Center for Atmospheric Re-search (NCAR).
Shi, H., Song, B., & Yao, Q. (2009). Thermal performance of stratospheric airships during ascent and descent. Journal of Thermophysics and Heat Transfer, 23(4), 816–821. https://doi.org/10.2514/1.42634
Taylor, J. A. (2014). Principles of aerostatics: The theory of lighter-than-air flight. CreateSpace.
US Department of Transportation, Federal Aviation Administra-tion (FAA). (1981). Balloon safety tips: Powerlines and thun-derstorms (FAA-P-8740-34, AFO-800-0581). Washington, DC.
US Department of Transportation, Federal Aviation Administra-tion (FAA). (1982). Balloon safety tips: False lift, shear & rotors (FAA-P-8740-39, AFO-800-0582). Washington, DC.
US Department of Transportation, Federal Aviation Administra-tion (FAA). (1996). Operations of hot air balloons with air-borne heater (AC 91-71, 6/13/96 AFS-820). Washington, DC.
US Department of Transportation, Federal Aviation Administra-tion (FAA). (1999). Part 31, Airworthiness Standards: Manned Free Balloons. Washington.
US Department of Transportation, Federal Aviation Administra-tion (FAA). (2008). Balloon flying handbook (FAA-H-8083-11A). Washington, DC.