Cross section and geometry optimization of steel truss arch ...
8
* Corresponding author: [email protected] Cross section and geometry optimization of steel truss arch bridges based on internal forces Malik Mushthofa * , Akhmad Aminullah, and Muslikh Civil and Environmental Department, Gadjah Mada University, Indonesia Abstract. The purpose of this study is to obtain the optimum geometric design and cross section member element of steel arch bridges. It is necessary because the geometric design of the steel truss arch bridges have the direct impact to the steel section used in the structures. Therefore, steel section have the impact to the economic value of the bridge design due to the structure weight. There are many important variables have to considered in the bridge design. Rise to span ratio variable is the major variable in the arch bridge geometric design. Arch bridge structures rely on the axial force capacity of the main arch, whereas shear forces and bending moments as secondary consideration. The optimization process is done by collecting the axial force, shear force and bending moment data of each steel arch bridge numeric model, and scaling its value from 0 to 1 to compare the data of every span in the same field, in order to achieve the optimum rise to span ratio. Rise to span ratio data of steel arch bridges in China and Japan used as the comparison with the result of this study, due to their brief history and rich experiences on arch bridge engineering innovation, and also have the large of amount of steel arch bridges. The results of this study give the optimum value of rise to span ratio between 1/4 to 1/7. It has good correlation with the rise to span ratio data of steel arch bridges in China and Japan i.e. 1/4 - 1/6 and 1/5 – 1/7 respectively. 1 Introduction There are many variables to be considered in choosing geometric design of steel truss arch bridges. Rise to span ratio is an important variable of geometric design which has direct impact to the structural behavior, structure total weight, support reaction and element member cross section. For greater value of rise to span ratio, the arch structures will behave such as columns, whereas for smaller value will behave such as beams. It affects the internal forces that occur along to main arch structure. Internal forces which was mentioned earlier are axial forces, shear forces and bending moments. Therefore, based on that preliminary explanation this optimization is done by reviewing the internal forces that occurs along to main arch structure of the bridges. Bridges with a rise to span ratio value, either large or small, have their respective advantages and disadvantages. In this study will be discussed the relation of rise to span ratio variable to the total weight of the bridges. Therefore, it is required a value of rise to span ratio in which the steel truss arch bridge can be considered as the optimum design. 2 Steel Arch Bridge Geometry A steel truss arch bridges is a type of bridge that rely on the axial capacity of its main structure in the form of an arch structure. The main structure of this arch bridge as the name implies, is a truss composed of short to longer members of axial structures that support and transfer an axial load to the foundation, and only carry a little bending moment [1]. This optimization intended for commonly used type of steel truss arch bridge geometry as shown in Fig. 2.1. (a) Geometry Type 1 (b) Geometry Type 2 Fig. 1. Commonly used type of steel truss arch bridge geometry h L h L ,0 (2019) MATEC Web of Conferences https://doi.org/10.1051/matecconf/20192 258 5802002 SCESCM 2018 2002 © The Authors, published by EDP Sciences. This is an open access article distributed under the terms of the Creative Commons Attribution License 4.0 (http://creativecommons.org/licenses/by/4.0/).
-
Upload
khangminh22 -
Category
Documents
-
view
1 -
download
0
Transcript of Cross section and geometry optimization of steel truss arch ...
* Corresponding author: [email protected]
Cross section and geometry optimization of steel truss arch bridges based on internal forces
Malik Mushthofa*, Akhmad Aminullah, and Muslikh
Civil and Environmental Department, Gadjah Mada University, Indonesia
Abstract. The purpose of this study is to obtain the optimum geometric design and cross section member
element of steel arch bridges. It is necessary because the geometric design of the steel truss arch bridges
have the direct impact to the steel section used in the structures. Therefore, steel section have the impact to
the economic value of the bridge design due to the structure weight. There are many important variables
have to considered in the bridge design. Rise to span ratio variable is the major variable in the arch bridge
geometric design. Arch bridge structures rely on the axial force capacity of the main arch, whereas shear
forces and bending moments as secondary consideration. The optimization process is done by collecting
the axial force, shear force and bending moment data of each steel arch bridge numeric model, and scaling
its value from 0 to 1 to compare the data of every span in the same field, in order to achieve the optimum
rise to span ratio. Rise to span ratio data of steel arch bridges in China and Japan used as the comparison
with the result of this study, due to their brief history and rich experiences on arch bridge engineering
innovation, and also have the large of amount of steel arch bridges. The results of this study give the
optimum value of rise to span ratio between 1/4 to 1/7. It has good correlation with the rise to span ratio data of steel arch bridges in China and Japan i.e. 1/4 - 1/6 and 1/5 – 1/7 respectively.
1 Introduction
There are many variables to be considered in
choosing geometric design of steel truss arch bridges.
Rise to span ratio is an important variable of geometric
design which has direct impact to the structural behavior,
structure total weight, support reaction and element
member cross section.
For greater value of rise to span ratio, the arch
structures will behave such as columns, whereas for
smaller value will behave such as beams.
It affects the internal forces that occur along to main
arch structure. Internal forces which was mentioned
earlier are axial forces, shear forces and bending
moments. Therefore, based on that preliminary
explanation this optimization is done by reviewing the
internal forces that occurs along to main arch structure of
the bridges.
Bridges with a rise to span ratio value, either large or
small, have their respective advantages and
disadvantages. In this study will be discussed the relation
of rise to span ratio variable to the total weight of the
bridges. Therefore, it is required a value of rise to span
ratio in which the steel truss arch bridge can be
considered as the optimum design.
2 Steel Arch Bridge Geometry
A steel truss arch bridges is a type of bridge that rely
on the axial capacity of its main structure in the form of
an arch structure. The main structure of this arch bridge
as the name implies, is a truss composed of short to
longer members of axial structures that support and
transfer an axial load to the foundation, and only carry a
little bending moment [1].
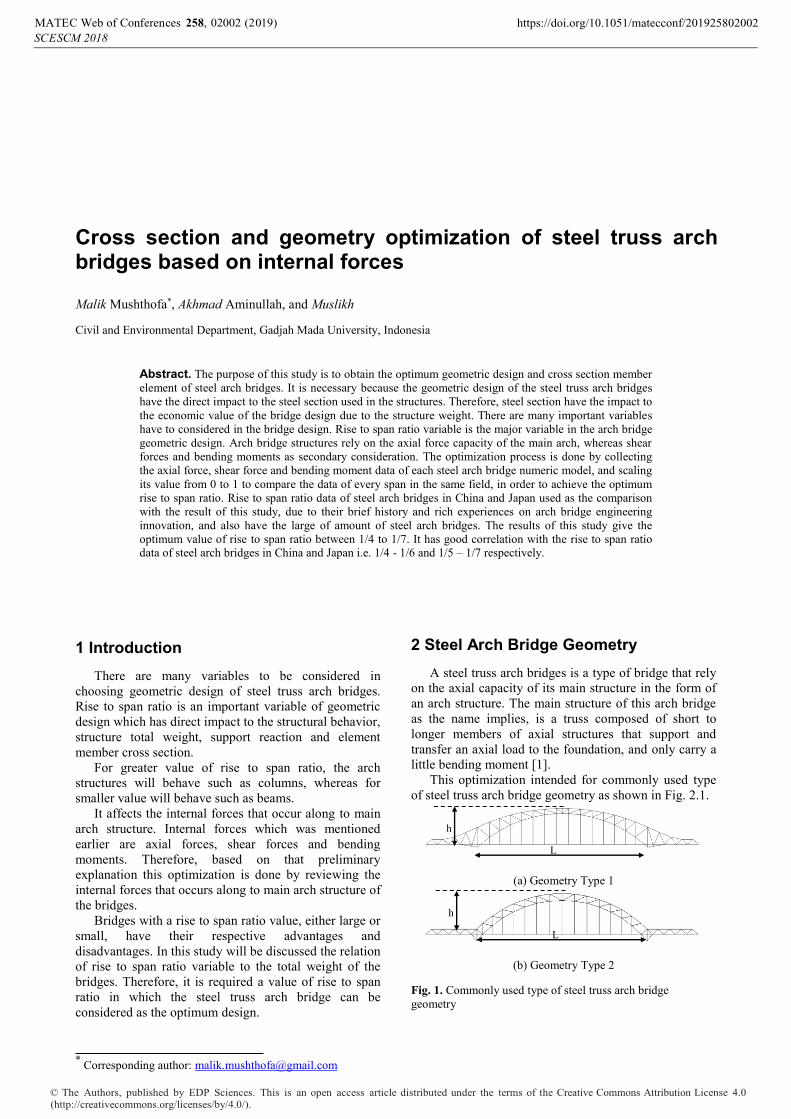
This optimization intended for commonly used type
of steel truss arch bridge geometry as shown in Fig. 2.1.
(a) Geometry Type 1
(b) Geometry Type 2
Fig. 1. Commonly used type of steel truss arch bridge
geometry
h
L
h
L
, 0 (2019)MATEC Web of Conferences https://doi.org/10.1051/matecconf/20192258 5802002SCESCM 2018
2002
© The Authors, published by EDP Sciences. This is an open access article distributed under the terms of the Creative Commons Attribution License 4.0 (http://creativecommons.org/licenses/by/4.0/).

Steel truss arch bridges with geometry Type 1 are more
widely used because of their superiority on its aesthetic
aspect. Bridges with arches as in geometry Type 2 are
more often used on bridge types with the arch structure
located below the deck.
Chen, et al (2013) describes the rise to span ratio is
one of the important parameters in the design
consideration of steel truss arch bridges. The steel truss
arch bridges in China has a rise to span ratio value
distributions between 1: 2 to 1: 8, but mostly from 1: 4 to
1: 6. While the ratio of existing steel arch bridges in
Japan has the rise to span ratio value distribution range
from 1: 3 to 1: 9, mostly from 1: 5 to 1: 7. Very steep or
very sloping ration values (close to 1: 8 or 1: 3) are
usually applied to arch bridges with short span [2].
Steel truss arch bridges with geometry Type 1 are
applied to some arch bridges, as shown from Fig. 2 and
Table 1.
Fig. 2. Chaotianmen Bridge (552 m) Chongqing, Cina [3]
Table 1. Steel truss arch bridge with geometry Type 1 [4]
Bridge Name Span (m)
Chaotianmen Bridge 552
Bridge of the Americas 344
Laviolette Bridge 335
Silver Jubilee Bridge 330
Wanzhou Railway Bridge 360
Arch bridges with geometry Type 2 can be used for
arch bridges with the type of arch structure below the
deck or above the bridge deck. The application of the
geometry Type 2 arch bridge is shown in Fig. 3 and
Table 2.
Fig. 3. Birchenough Bridge (329 m) Manicaland Province,
Zimbabwe [4]
Table 2. Steel truss arch bridge with geometry Type 2 [4]
Bridge Name Span (m)
New River Gorge Bridge 518
Sydney Harbour Bridge 503
Daninghe Bridge 400
Hiroshima Airport Bridge 380
Birchenough Bridge 329
Glen Canyon Dam Bridge 313
3 Geometry Optimalization Method
The process of geometry optimization is done with
help of SAP2000 software, by changing rise to span ratio
parameter to get the structural behaviour of main
structure. Bridge modeling is carried out for spans of 150
m, 200 m, 250 m and 300 m in each geometry. Each
span on each geometry is modeled for each rise to span
ratio, starting from a ratio of 1/2.25 to 1/8.00 with
intervals of 1/0.25.
The type of steel section used to model the bridge is
limited to only the Wide Flange (WF) steel section as the
main member elements, and the hollow pipe steel section
as bracing elements. Load input in the modeling includes
the service load in accordance with SNI 1725: 2016.
Permit deflection variable and P-M ratio variable are
the constraint apllied to bridge model, in purpose to
achieve the efficient section. P-M ratio variable as
strength contraint in scale 0 to 1 set between the value
0.6 to 0.9, in order to get not too wasteful but also not to
risky of section capacity usage. On the other hand,
permit deflection variable as service constraint set to L /
240 with L as length of main span.
Table 3. The main span of the Type 1 arch bridge in
Indonesia[5]
Bridge name Span (m)
Kutai Kartanegara Baru 270
Teluk Masjid 250
Muara Sabak 200
Table 4. The main span of the Type 2 arch bridge in
Indonesia[5]
Bridge name Span (m)
Tayan 280
Rumbai Jaya 150
Batanghari II 150
Ogan Pelengkung 160
Kalahien 200
Rumpiang 200
Mahakam Ulu 200
, 0 (2019)MATEC Web of Conferences https://doi.org/10.1051/matecconf/20192258 5802002SCESCM 2018
2002
2

Bojonegoro 128
Selection of span from 150 m to 300 m based on the
existing bridge spans in Indonesia, as shown in Table 3
for bridges with geometry Type 1, and Table 4 for
bridges with geometry Type 2.
4 Geometry Design Optimization Result
There are 96 models for each geometry consisting of
bridges with rise to span ratio from 1/2.25 to 1/8.00. The
results of numeric model analysis are presented in chart
to see occured patterns. The internal forces that reviewed
are internal forces (axial force, shear force, bending
moment) occurring on main element of arch as main
structure of arch bridge.
The method used for collect required data by
calculating the magnitude of difference between largest
and smallest internal force that occurred in main
structure of the arch as shown in Fig. 4.
Fig. 4. Steel truss arch bridge NFD, BMD and SFD
The maximum and minimum force difference values
obtained for each span and each rise to span ratio value
is plotted on one chart for each span by scaling the force
value that occurs with the range of values 0-1. The result
are charts with rise to span ratio value as abscissa and
internal forces occurring on the bridge as ordinate, the
arch bridge with the geometry Type 1 as shown to Fig. 7
to Fig. 10, and on bridges with geometry Type 2 as
shown in Fig. 11 to Fig. 14, includes:
a. Rise to span ratio value to axial force
b. Rise to span ratio value to shear force
c. Rise to span ratio value to bending moment
Position of the optimum point is set when NFD value
starts flat (no longer having significant fluctuations). It
means, differences gap between maximum value and
minimum value from that point until certain point is
almost constant.
For example, a curved bridge with rise to span ratio
of 1 / 2.25 has NFD as shown in Fig. 5. The behavior of
the arch in main span of the bridge on upper side bears
the tension axial load, while on lower side bears a very
large compression axial load. So the section selection is
based on the need of a very large compression axial
force that occurs on the lower side of the arch.
Therefore, due to structural behaviour such as those
occurring on bridges with rise to span ratio of 1 / 2.25
are considered not optimum.
Fig. 5. Steel truss arch bridge NFD (rise to span ratio 1/2.25)
Fig. 6. Steel truss arch bridge NFD (rise to span ratio 1/5.50)
On the other hand, a bridge with rise of span ratio of
1/5.50 has NFD behavior pattern as shown in Fig. 6. The
axial force that occurs entirely is compression axial
force. The gap between maximum and minimum axial is
a little. So the section selection based on the greatest
compression axial force needs becomes efficient for all
frames along the arch.
Fig. 7. Maximum and minimum force differences value of
spans 150 m geometry Type 1
compression axial force with
minimal differences value
max axial force
min axial force
max bending moment
min bending moment
shear force
large compression force
tension force
rise to span ratio
, 0 (2019)MATEC Web of Conferences https://doi.org/10.1051/matecconf/20192258 5802002SCESCM 2018
2002
3

Fig. 8. Maximum and minimum force differences value of
spans 200 m geometry Type 1
Fig. 9. Maximum and minimum force differences value of
spans 250 m geometry Type 1
Fig. 10. Maximum and minimum force differences value of
spans 300 m geometry Type 1
Fig. 11. Maximum and minimum force differences value of
spans 150 m geometry Type 2
Fig. 12. Maximum and minimum force differences value of
spans 200 m geometry Type 2
Fig. 13. Maximum and minimum force differences value of
spans 250 m geometry Type 2
Fig. 14. Maximum and minimum force differences value of
spans 300 m geometry Type 2
Table 5. Summary of geometry 1 analysis results
No Span Optimum rise to span ratio
1 150 m 1 : 5,50
2 200 m 1 : 6,50
3 250 m 1 : 5,00
4 300 m 1 : 5,50
Based on chart in Fig. 5 until Fig. 8 can be obtained
the position of optimum rise to span ratio based on
internal force values. As presented in Table 5 the
rise to span ratio
rise to span ratio
rise to span ratio
rise to span ratio
rise to span ratio
rise to span ratio
rise to span ratio
rise to span ratio rise to span ratio
, 0 (2019)MATEC Web of Conferences https://doi.org/10.1051/matecconf/20192258 5802002SCESCM 2018
2002
4
optimum rise to span ratio for bridge geometry Type 1 is
between 1 / 5.00 until 1 / 6.00.
Table 6. Summary of geometry Type 2 analysis results
No Span Optimum rise to span ratio
1 150 m 1 : 5,00
2 200 m 1 : 6,50
3 250 m 1 : 4,50
4 300 m 1 : 4,75
Based on chart in Fig. 11 until Fig. 14 can be
obtained the position of optimum rise to span ratio based
on internal force values. As presented in Table 6 the
value of optimum rise to span ratio for bridge geometry
Type 2 is between 1/4.50 until 1/6.50.
Refer to summary discussed in Table 5 and Table 6
can be concluded that the geometry design of optimum
steel truss arch bridge is achieved with rise to span ratio
in range from 1/4.00 to 1/7.00.
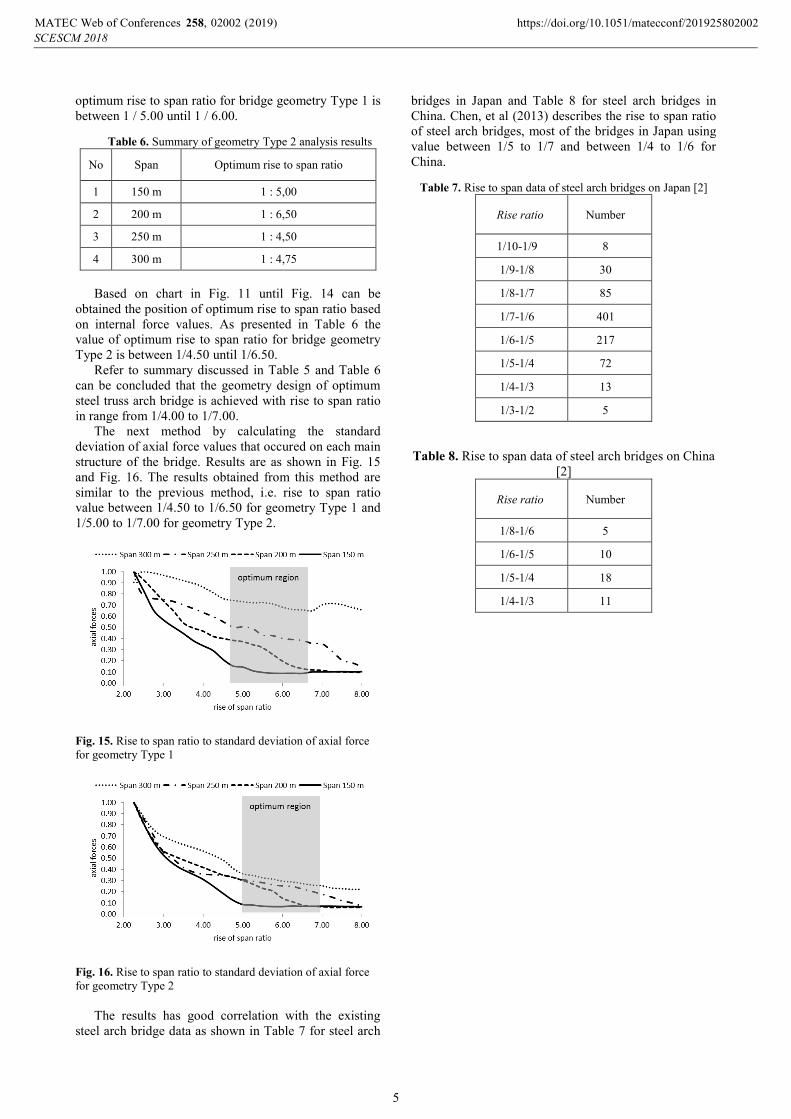
The next method by calculating the standard
deviation of axial force values that occured on each main
structure of the bridge. Results are as shown in Fig. 15
and Fig. 16. The results obtained from this method are
similar to the previous method, i.e. rise to span ratio
value between 1/4.50 to 1/6.50 for geometry Type 1 and
1/5.00 to 1/7.00 for geometry Type 2.
Fig. 15. Rise to span ratio to standard deviation of axial force
for geometry Type 1
Fig. 16. Rise to span ratio to standard deviation of axial force
for geometry Type 2
The results has good correlation with the existing
steel arch bridge data as shown in Table 7 for steel arch
bridges in Japan and Table 8 for steel arch bridges in
China. Chen, et al (2013) describes the rise to span ratio
of steel arch bridges, most of the bridges in Japan using
value between 1/5 to 1/7 and between 1/4 to 1/6 for
China.
Table 7. Rise to span data of steel arch bridges on Japan [2]
Rise ratio Number
1/10-1/9 8
1/9-1/8 30
1/8-1/7 85
1/7-1/6 401
1/6-1/5 217
1/5-1/4 72
1/4-1/3 13
1/3-1/2 5
Table 8. Rise to span data of steel arch bridges on China
[2]
Rise ratio Number
1/8-1/6 5
1/6-1/5 10
1/5-1/4 18
1/4-1/3 11
, 0 (2019)MATEC Web of Conferences https://doi.org/10.1051/matecconf/20192258 5802002SCESCM 2018
2002
5

5 Cross Section Optimization Results
The cross section optimization is performed by
issuing P-M ratio between 6.00 to 9.00 and L/ 240 as
maximum permit deflection. Optimalization performed
by accommodating the environmental load i.e.
earthquake load, load temperature and wind load.
The dominant load on the arch bridge is the axial
compression load, therefore the buckling factor becomes
important thing to be considered in the design of the
main arch structures. With pre-defined design limits,
obtained the optimum steel cross section as shown in
Table 9 to Table 12 for geometry Type 1 and Table 13 to
Table 16 for geometry Type 2.
(a)
(b)
Fig. 17. Grouping of geometry Type 1 bridge element
The result of cross section optimization is defined by
group of element as shown in Fig. 17.
Table 9. Steel cross section of arch bridge span 150 m
geometry Type 1
No Element group Steel Section
1 Arch Bottom (AB) WF 1800.400.20.40+2.20 *)
2 Arch Top (AT) WF 1000.500.14.25
3 Deck Main Girder (DCm) WF 1000.500.14.20
4 Deck Secondary Girder (DCs) WF 392.400.10.16
5 Deck Bracing (BDC) Pipe 323,9x6
6 Hanger (H) Pipe 406,4x6
7 Arch Bracing Side (BS) WF 450.400.10.20
8 Arch Bracing 1 (BM1) WF 1000.500.16.30
9 Arch Bracing 2 (BM2) WF 350.300.7.10
10 Arch Bracing 3 (BM3) WF 304.300.7.10
11 Lateral Arch Bracing (BRm) WF 304.300.7.10
12 Diagonal Arch Bracing (BRs) Pipe 355,6x6
Note:
*) The steel section is customed from steel section
WF 1200.400.20.40
Table 10. Steel cross section of arch bridge span 200 m
geometry Type 1
No Element group Steel Section
1 Arch Bottom (AB) WF 1800.600.16.36+2.16 *)
2 Arch Top (AT) WF 1200.600.14.25
3 Deck Main Girder (DCm) WF 1000.500.14.25
4 Deck Secondary Girder (DCs) WF 400.400.8.14
5 Deck Bracing (BDC) Pipe 377x6
6 Hanger (H) Pipe 457x6
7 Arch Bracing Side (BS) WF 600.400.10.25
8 Arch Bracing 1 (BM1) WF 1000.500.14.25
9 Arch Bracing 2 (BM2) WF 350.350.8.12
10 Arch Bracing 3 (BM3) WF 400.250.6.10
11 Lateral Arch Bracing (BRm) WF 304.300.7.10
12 Diagonal Arch Bracing 1 (BRs1)
Pipe 406,4x6
13 Diagonal Arch Bracing 2 (BRs2)
Pipe 244,5x5
14 Diagonal Arch Bracing 3 (BRs3)
Pipe 355,6x6
Note:
*) The steel section is customed from steel section
WF 1200.600.16.36
Table 11. Steel cross section of arch bridge span 250 m
geometry Type 1 m
No Element group Steel Section
1 Arch Bottom (AB) WF 1800.600.16.36+2.16 *)
2 Arch Top (AT) WF 1200.600.16.36
3 Deck Main Girder (DCm) WF 1200.600.14.25
4 Deck Secondary Girder (DCs) WF 392.400.10.16
5 Deck Bracing (BDC) Pipe 406,4x6
6 Hanger (H) Pipe 610x6
7 Arch Bracing Side (BS) WF 1000.500.14.25
8 Arch Bracing 1 (BM1) WF 1000.500.16.30
9 Arch Bracing 2 (BM2) WF 300.250.8.12
10 Arch Bracing 3 (BM3) WF 304.300.7.10
11 Lateral Arch Bracing (BRm) WF 300.300.8.12
12 Diagonal Arch Bracing 1 (BRs1)
Pipe 508x6
13 Diagonal Arch Bracing 2 (BRs2)
Pipe 508x6
14 Diagonal Arch Bracing 3 (BRs3)
Pipe 508x6
Note:
*) The steel section is customed from steel section
WF 1200.600.16.36
AB
AT
BM3 BM2
BM1 BS
H
DCm DCs
BDC
BRm
BRs
, 0 (2019)MATEC Web of Conferences https://doi.org/10.1051/matecconf/20192258 5802002SCESCM 2018
2002
6
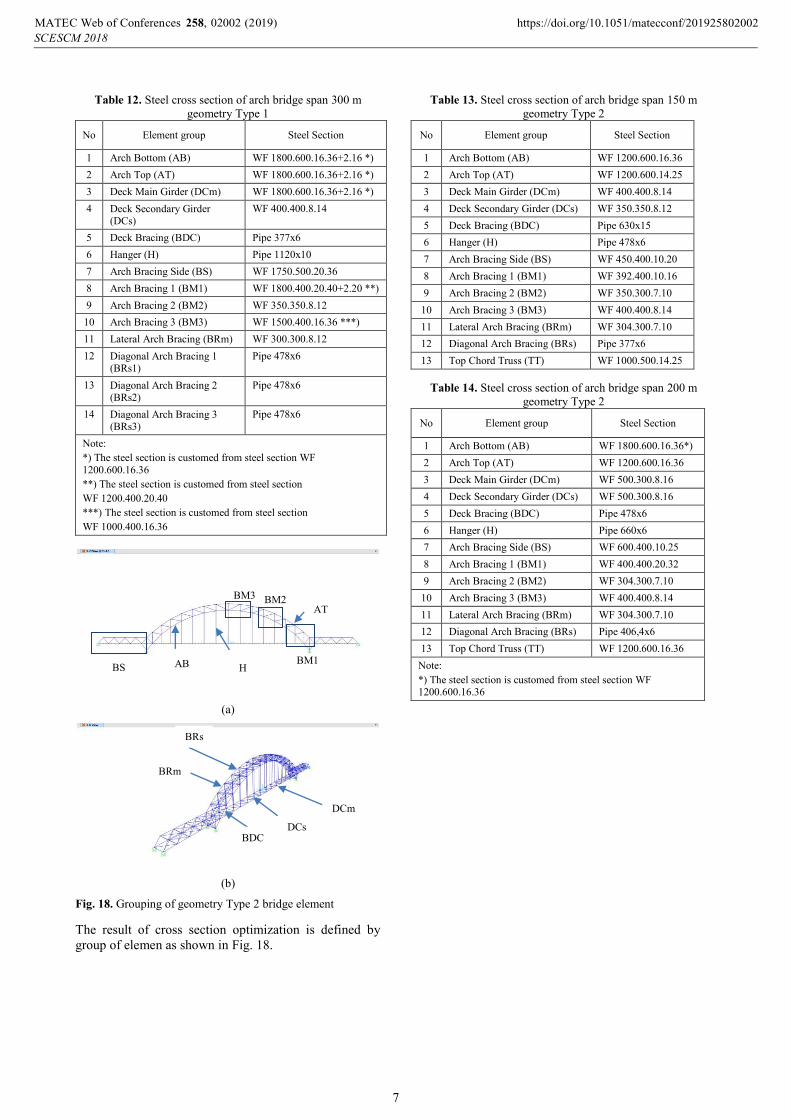
Table 12. Steel cross section of arch bridge span 300 m
geometry Type 1
No Element group Steel Section
1 Arch Bottom (AB) WF 1800.600.16.36+2.16 *)
2 Arch Top (AT) WF 1800.600.16.36+2.16 *)
3 Deck Main Girder (DCm) WF 1800.600.16.36+2.16 *)
4 Deck Secondary Girder (DCs)
WF 400.400.8.14
5 Deck Bracing (BDC) Pipe 377x6
6 Hanger (H) Pipe 1120x10
7 Arch Bracing Side (BS) WF 1750.500.20.36
8 Arch Bracing 1 (BM1) WF 1800.400.20.40+2.20 **)
9 Arch Bracing 2 (BM2) WF 350.350.8.12
10 Arch Bracing 3 (BM3) WF 1500.400.16.36 ***)
11 Lateral Arch Bracing (BRm) WF 300.300.8.12
12 Diagonal Arch Bracing 1 (BRs1)
Pipe 478x6
13 Diagonal Arch Bracing 2 (BRs2)
Pipe 478x6
14 Diagonal Arch Bracing 3 (BRs3)
Pipe 478x6
Note:
*) The steel section is customed from steel section WF
1200.600.16.36
**) The steel section is customed from steel section
WF 1200.400.20.40
***) The steel section is customed from steel section
WF 1000.400.16.36
(a)
(b)
Fig. 18. Grouping of geometry Type 2 bridge element
The result of cross section optimization is defined by
group of elemen as shown in Fig. 18.
Table 13. Steel cross section of arch bridge span 150 m
geometry Type 2
No Element group Steel Section
1 Arch Bottom (AB) WF 1200.600.16.36
2 Arch Top (AT) WF 1200.600.14.25
3 Deck Main Girder (DCm) WF 400.400.8.14
4 Deck Secondary Girder (DCs) WF 350.350.8.12
5 Deck Bracing (BDC) Pipe 630x15
6 Hanger (H) Pipe 478x6
7 Arch Bracing Side (BS) WF 450.400.10.20
8 Arch Bracing 1 (BM1) WF 392.400.10.16
9 Arch Bracing 2 (BM2) WF 350.300.7.10
10 Arch Bracing 3 (BM3) WF 400.400.8.14
11 Lateral Arch Bracing (BRm) WF 304.300.7.10
12 Diagonal Arch Bracing (BRs) Pipe 377x6
13 Top Chord Truss (TT) WF 1000.500.14.25
Table 14. Steel cross section of arch bridge span 200 m
geometry Type 2
No Element group Steel Section
1 Arch Bottom (AB) WF 1800.600.16.36*)
2 Arch Top (AT) WF 1200.600.16.36
3 Deck Main Girder (DCm) WF 500.300.8.16
4 Deck Secondary Girder (DCs) WF 500.300.8.16
5 Deck Bracing (BDC) Pipe 478x6
6 Hanger (H) Pipe 660x6
7 Arch Bracing Side (BS) WF 600.400.10.25
8 Arch Bracing 1 (BM1) WF 400.400.20.32
9 Arch Bracing 2 (BM2) WF 304.300.7.10
10 Arch Bracing 3 (BM3) WF 400.400.8.14
11 Lateral Arch Bracing (BRm) WF 304.300.7.10
12 Diagonal Arch Bracing (BRs) Pipe 406,4x6
13 Top Chord Truss (TT) WF 1200.600.16.36
Note:
*) The steel section is customed from steel section WF 1200.600.16.36
AB
AT
BM3 BM2
BM1 BS H
DCm
DCs BDC
BRm
BRs
, 0 (2019)MATEC Web of Conferences https://doi.org/10.1051/matecconf/20192258 5802002SCESCM 2018
2002
7
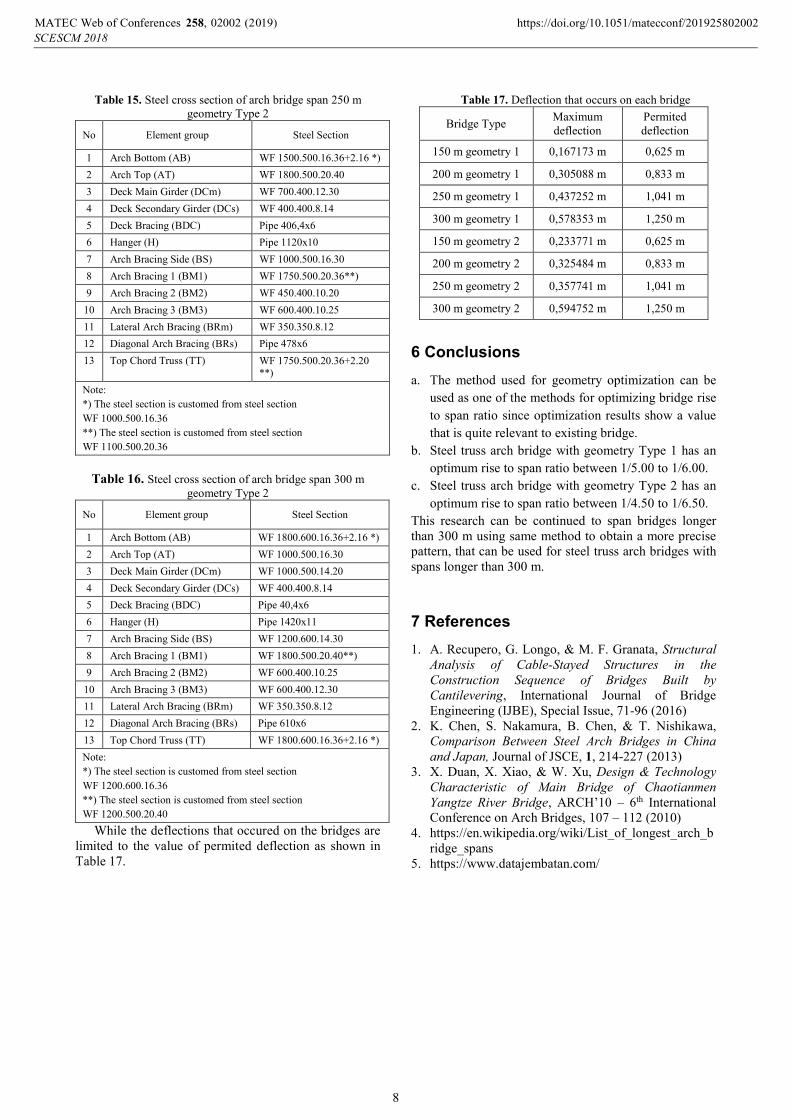
Table 15. Steel cross section of arch bridge span 250 m
geometry Type 2
No Element group Steel Section
1 Arch Bottom (AB) WF 1500.500.16.36+2.16 *)
2 Arch Top (AT) WF 1800.500.20.40
3 Deck Main Girder (DCm) WF 700.400.12.30
4 Deck Secondary Girder (DCs) WF 400.400.8.14
5 Deck Bracing (BDC) Pipe 406,4x6
6 Hanger (H) Pipe 1120x10
7 Arch Bracing Side (BS) WF 1000.500.16.30
8 Arch Bracing 1 (BM1) WF 1750.500.20.36**)
9 Arch Bracing 2 (BM2) WF 450.400.10.20
10 Arch Bracing 3 (BM3) WF 600.400.10.25
11 Lateral Arch Bracing (BRm) WF 350.350.8.12
12 Diagonal Arch Bracing (BRs) Pipe 478x6
13 Top Chord Truss (TT) WF 1750.500.20.36+2.20 **)
Note:
*) The steel section is customed from steel section
WF 1000.500.16.36
**) The steel section is customed from steel section
WF 1100.500.20.36
Table 16. Steel cross section of arch bridge span 300 m
geometry Type 2
No Element group Steel Section
1 Arch Bottom (AB) WF 1800.600.16.36+2.16 *)
2 Arch Top (AT) WF 1000.500.16.30
3 Deck Main Girder (DCm) WF 1000.500.14.20
4 Deck Secondary Girder (DCs) WF 400.400.8.14
5 Deck Bracing (BDC) Pipe 40,4x6
6 Hanger (H) Pipe 1420x11
7 Arch Bracing Side (BS) WF 1200.600.14.30
8 Arch Bracing 1 (BM1) WF 1800.500.20.40**)
9 Arch Bracing 2 (BM2) WF 600.400.10.25
10 Arch Bracing 3 (BM3) WF 600.400.12.30
11 Lateral Arch Bracing (BRm) WF 350.350.8.12
12 Diagonal Arch Bracing (BRs) Pipe 610x6
13 Top Chord Truss (TT) WF 1800.600.16.36+2.16 *)
Note:
*) The steel section is customed from steel section
WF 1200.600.16.36
**) The steel section is customed from steel section
WF 1200.500.20.40
While the deflections that occured on the bridges are
limited to the value of permited deflection as shown in
Table 17.
Table 17. Deflection that occurs on each bridge
Bridge Type Maximum
deflection
Permited
deflection
150 m geometry 1 0,167173 m 0,625 m
200 m geometry 1 0,305088 m 0,833 m
250 m geometry 1 0,437252 m 1,041 m
300 m geometry 1 0,578353 m 1,250 m
150 m geometry 2 0,233771 m 0,625 m
200 m geometry 2 0,325484 m 0,833 m
250 m geometry 2 0,357741 m 1,041 m
300 m geometry 2 0,594752 m 1,250 m
6 Conclusions
a. The method used for geometry optimization can be
used as one of the methods for optimizing bridge rise
to span ratio since optimization results show a value
that is quite relevant to existing bridge.
b. Steel truss arch bridge with geometry Type 1 has an
optimum rise to span ratio between 1/5.00 to 1/6.00.
c. Steel truss arch bridge with geometry Type 2 has an
optimum rise to span ratio between 1/4.50 to 1/6.50.
This research can be continued to span bridges longer
than 300 m using same method to obtain a more precise
pattern, that can be used for steel truss arch bridges with
spans longer than 300 m.
7 References
1. A. Recupero, G. Longo, & M. F. Granata, Structural
Analysis of Cable-Stayed Structures in the
Construction Sequence of Bridges Built by
Cantilevering, International Journal of Bridge
Engineering (IJBE), Special Issue, 71-96 (2016)
2. K. Chen, S. Nakamura, B. Chen, & T. Nishikawa,
Comparison Between Steel Arch Bridges in China
and Japan, Journal of JSCE, 1, 214-227 (2013)
3. X. Duan, X. Xiao, & W. Xu, Design & Technology
Characteristic of Main Bridge of Chaotianmen
Yangtze River Bridge, ARCH’10 – 6th International
Conference on Arch Bridges, 107 – 112 (2010)
4. https://en.wikipedia.org/wiki/List_of_longest_arch_b
ridge_spans
5. https://www.datajembatan.com/
, 0 (2019)MATEC Web of Conferences https://doi.org/10.1051/matecconf/20192258 5802002SCESCM 2018
2002
8