The Arch-Manche European project
62
Transcript of The Arch-Manche European project

Archaeology, art and coastal heritage –
tools to support coastal management and climate
change planning across the Channel Regional Sea
(Arch-Manche)
This project has been undertaken by:
Maritime Archaeology Trust CReAAH Centre de Recherche en Archéologie, Centre National de la Recherche Scientifique
University of Ghent, Renard Centre of Marine Geology, Department of Geology
and Soil Science
Deltares, Sub-surface and Groundwater Systems Research Unit
The project has benefited from funding from the European Regional Development Fund through the Interreg IVA 2 Seas Programme.
www.archmanche.hwtma.org uk www.archmanche-geoportal.eu
Front cover images from top to bottom: Map of the Isle of Wight by A. Brannon 1862 (courtesy Prof. R McInnes). Historic photo of Ventnor Beach c.1900 (Private Collection). Reculver Church, Kent by W. Daniell 1824 (courtesy Prof. R. McInnes). Diver investigating the Alum Bay wreck site (courtesy of R. Brooks).
The document reflects the author’s views. The INTERREG IVA 2 Seas Programme Authorities are not liable for any use that may be made of the information contained therein.
1
Contents
Value of the Data Sources for Understanding Coastal Change
The Importance of Archaeology, Coastal Heritage and Art to Coastal Management
Tools for Analysing Sources to Extract Information on Coastal Change
Combining Data Sources for Long-Term Analysis
Conclusions and Recommendations
The Arch-Manche Project
Project Contacts
Executive Summary 2
4
6
48
16
20
57
58

2
Coastal managers face an ongoing battle to moderate impacts from the sea in the face of a changing climate and pressures from human use of the coastal zone. The challenges that lie ahead are forecast to increase while resources are being forced to go further.
This document quantifies the value of under-used coastal indicators that can be applied as tools to inform long term patterns of coastal change. In addition, it provides instruments to communicate past change effectively, model areas under threat and interpret progressive coastal trends.
• To develop additional tools for decision making in coastal management.When tough coastal management decisions are required to determine levels of future risk, science based evidence is necessary to support these decisions. The project has analysed scientific data within archives to provide evidence of long-term coastal adaptation.
• To extract data from under-used sources from archaeology, art, maps, charts and photographs.It was realised that data from archaeology, heritage features, art, photographs, maps and charts can provide both qualitative and quantitative information on coastal evolution and reactions to climate change spanning from the past decade to many thousands of millennia. The potential of these datasets were not being used to support understanding of long-term coastal change.
• To demonstrate the value of archaeological, historic and artistic resources to understanding long-term coastal change.Study of this data allows understanding and modelling of past changes on the coast and human inter-actions with these processes. This knowledge can be used to plan for current and future changes in the face of increased coastal erosion, flooding and coastal instability.
• The project was delivered between 2011 and 2014.• Project partners from the United Kingdom, France, Belgium and the Netherlands were involved, representing large parts of the coast of the Channel-Southern North Sea area.• The project was part funded by the European Regional Development Fund through the Interreg IVA 2 Seas Programme.
• Data research – using local, regional and national sources of information on geology, geomorphology, archaeology, history, art, maps, charts and photographs. Using existing data enables maximum value to be extracted from available resources. Records consulted included heritage, environmental and geological databases, documentary archives, archaeological collections, online sources, art galleries, private art collections and publications.
• Ranking approach – developed four complementary methods for assessing the data sources for their potential to inform on coastal change.The ranking systems were: 1) archaeological and palaeoenvironmental evidence; 2) artistic depictions; 3) maps and charts; and 4) historic photographs. The ranking enabled sites of highest potential to inform on coastal change to be identified, this helped target sites for more detailed field investigations. It also demonstrated where sites or areas of the coast were represented within several of the available data sources.
• Fieldwork – a range of archaeological and palaeoenvironmental fieldwork approaches were taken to extract primary data from high potential sites. Site visits to areas shown within artistic depictions gathered information on current coastal conditions.Working in the intertidal and marine zones enabled techniques to be used to gather data from exposed and buried archaeological and palaeoenvironmental remains. Survey ranged from ‘low-tech’ drawn records in the intertidal zone and by divers underwater, through to the application of technology deployed from boats to image buried sites and landscapes. More intrusive investigation included a range of augering to collect samples through to larger archaeological excavations. Selected fieldwork case studies are presented in the report.
Executive Summary
Why was the project developed?
When did the project take place and who was involved?
How was the project delivered?Exe
cuti
ve S
umm
ary

3
• Analysis using database and GIS tools – extracting information from each of the datasets and then using this information in combination to maximise the potential for understanding coastal change.A single project database with linked GIS was available online, this allowed all partners to be working in the same platform, with full accessibility of data. Analysis ranged from work within each data source, such as direct comparison between paintings and modern coastal conditions, the use of sequences of maps and charts to determine change over time, the analysis of monitoring data gathered from archaeological sites, and the comparison of results from programs of geophysical survey and coring to investigate submerged landscapes. These results were then used in combination to provide a multi-source detailed analysis of change in a range of locations across the Channel-Southern North Sea area. Modelling in two and three dimensions was achieved using available software packages. By modelling the same area at different periods of time a fourth dimension is added demonstrating long-term coastal change.
• Developed understanding of the potential of archaeological, artistic, map, chart and photographic material held in data archives and repositories across the partner countries for use in understanding coastal change.
• Following identification of source data and records the ranking systems were applied resulting in: — 3150 archaeological sites and palaeoenvironmental deposits ranked, showing that certain types of site and deposit can gain consistent positive scores for their potential to inform on coastal change.— Over 250 artworks were ranked revealing which artists produced the most accurate representations of the coast.— 101 maps and charts ranked based on topographic, geometric and chronometric accuracy. These maps ranged from small to large scale and date from as early as the 16th Century.— 1115 photographs ranked identifying those with significant coastal views and those showing archaeological and historic features.
• Gathered new data on coastal, intertidal and near-shore marine areas which has added significantly to understanding of the evolution of areas of the Channel-Southern North Sea coastline.
• Through analysis and modelling demonstrated key information on the processes ongoing at the coast to help determine areas of significant change and those with more stability.
• Delivered the results through an online accessible project portal, available at:
www.archmanche-geoportal.eu
• Looking back to go forward – understanding past coastal change enables more accurate predictions of future changes and potential impacts;
• The long-term perspective provides a sound evidence base for future coastal planning and sustainable development;
• Areas of the Channel-Southern North Sea coastline are particularly prone to a range of natural hazards including coastal erosion, landslides and sea flooding. Project data has helped identify areas at particular risk;
• Some coastal areas have greater physical stability over the long-term as witnessed through Arch-Manche analysis, helping identify areas of lower risk;
• While detailed coastal monitoring data is often available for the last few decades, the approach taken by Arch-Manche can fill the large ‘data gap’ for earlier periods from the Palaeolithic to the 20th century; and
• Archaeology, coastal heritage, art, charts, maps and photographs are sources of value to coastal scientists, engineers and coastal managers, making decisions on a day-to-day basis.
What did the project achieve?
Executive Sum
mary
What were the key project findings?
4
The Arch-Manche ProjectPast coastal planning regimes have suffered from a poor understanding of the ongoing processes and natural trends that are shaping our coastal zone. Consequently, many coastal settlements are becoming vulnerable as the frequency of coastal erosion, flooding and coastal instability events increase, and the relationship between the land and sea evolves.
In prehistoric times the Channel did not exist but it was an area of low lying land used by early humans. Archaeological traces left in the landscape are common across the region, showing how people adapted to coastal change and a rising sea level. Later historical development includes comparable maritime coastal infrastructure and coastal industries that are represented in the archaeological and artistic record. The evidence can provide high resolution data on coastal change spanning thousands of years. This contribution to our understanding of coastal evolution enhances our appreciation of past change and provides tools to help predict future impacts on coastal communities.
The Arch-Manche project has sought to advance our understanding of the scale and rate of long-term coastal change by addressing sources including archaeology, palaeoenvironmental data, works of art, maps, photographs, as well as historical literature accounts. A unique aspect of this project is the combination of data sources to extract maximum amounts of information. By characterising areas of long-term erosion, coastlines under ongoing stress can be identified. Some areas subject to human intervention have been stabilised while others have not and the effect of hard defences in one area can have a knock-on impact elsewhere. Long-term assessments over broad areas are necessary to recognise cumulative consequences, while an understanding of long-term coastal responses can provide continuity to help predict future trends.
Sea level and coastal change will result in outcomes that are beyond our control. This needs to be recognised by people living along the coast. The records interrogated as part of the project have demonstrated change and shown how people have had to adapt in the past. This is reflected clearly in history and art. This study is important for coastal and marine management as it can support the development of sustainable policies for adapting to future coastal climate change.
Funded by the European Regional Development Fund through the Interreg IVA 2 Seas Programme, the project was led by the Maritime Archaeology Trust (MAT) in the UK, working in partnership with the Centre National de la Recherce Scientifique (CNRS) in France, Ghent University in Belgium, and the research institute Deltares in the Netherlands. The specialist expertise of the partners has enabled a new integrated approach to using data sources from across the Channel-Southern North Sea region. The project has applied its methodology to case study areas which represent a range of different geomorphological situations and coastal frontages facing various coastal management issues.
The
Arc
h-M
anch
e P
roje
ct
Large waves batter the coast in Freshwater Bay during the January storms in 2014, Isle of Wight, UK (courtesy Anna Mustchin).

5
The A
rch-Man
che ProjectFACT BOX: Arch-Manche
What: Demonstrating how archaeology, coastal heritage features and artistic
depictions can provide unparalleled insight into the scale and rate of coastal
change.
Why: To provide additional ‘tools’ through the employment of under-used
data sources related to managing coastal change.
Where: The Channel-Southern North Sea region, featuring the Channel coasts
of England, France, Belgium and the Netherlands.
How: Using specialist approaches to data assessment, data gathering and
analysis within a number of case study areas to provide detailed understanding
of past change.
Project outputs include:
• Application of project results to different coastal management situations;• Enhanced understanding of micro and macro scale coastal change;• Maximising data sources to inform understanding of long-term coastal change;• Undertaking targeted fieldwork to gather new data to help inform on coastal change;• Ranking of a large dataset including archaeology, palaeoenvironmental data, art and coastal
heritage;• Delivery of a specialist database and linked GIS analysis to develop understanding of coastal
change;• Availability of online project portal to enable full access to project results.
Arch-Manche partner organisations and case study areas, see page 20 for detailed case study location map.

6
The Importance of Archaeology, Coastal Heritage and Art to Coastal Management
Traditionally coastal engineers, planners and decision-makers have seldom studied long-term changes. However, when being pressed to develop enduring strategies, or assign funds for particular management options, it is necessary to recognise the principal causes of change as well as the impacts. The roots of coastal instability relate to a progressive geomorphological evolution that dates back thousands of years. This has been driven by fluctuating environmental conditions and sea level change acting on the underlying geology.
With the impacts of coastal change and rising sea level forcing new and critical decisions it is more important than ever to fully understand the long-term evolution of the coast to provide solid foundations for predicting future changes. Some coastal management decisions may be difficult or prove unpopular to implement, highlighting the value of solid scientific data on past changes to help demonstrate the need for new approaches. The outputs from the study of archaeological sites, landscapes, paintings, maps, charts and photographs have a variety of applications. Arch-Manche has identified, reviewed and investigated sites demonstrating long-term indicators of coastal change. The results and their relevance to coastal management situations and issues are presented.
How long has this area of coastline been changing for? Combining resources from (geological) maps and charts, palaeoenvironmental analysis and archaeological evidence has enabled the evolution of the Belgian coast at Ostend-Raversijde to be studied in detail. The position of past coastlines have been mapped and studies of buried material have tracked the palaeolandscape that is now submerged.
Measuring Change
FACT BOX: What archaeology, heritage features and artistic representations can tell us about changes to the coast
Palaeoenvironmental data – provides evidence of past landscapes from early prehistoric times through to the present. Analysis reveals evidence of the environment including plants, animals and insects, the types of soils, and whether it was dry, damp or wet, saline or brackish. Recording changes to these environments demonstrates the impact of rising or falling sea levels and relationships with coastal adaptation.
Archaeology – humans have used the coastal zone for thousands of years. The position of settlements shows the proximity to coastal areas, meanwhile specific features like trackways to cross marshy areas show adaptations to marine environments. Studying the archaeological record can demonstrate how humans adapted to change, and in more recent time, how they effected change.
Maps and charts – contain a record of territories and boundaries and reflect growing techniques and methods for measuring the landscape, coast and seascape. Detailed depictions of the coastal area provide evidence of change from the 16th century to the present.
Art – paintings, drawings and prints of the coast can be very detailed showing the form and composition of coastal areas. These depictions, particularly prior to photography, give unique opportunities to examine coastal areas for data related to physical, environmental and social change.
Photographs – from the earliest examples of photography coastal views have been popular scenes, becoming frequently used for tourist postcards. Early photographs provide data on the coast which can be directly compared to the present day to reveal changes.
The
Im
port
ance
of
Arc
haeo
logy
, Coa
stal
Her
itag
e an
d A
rt t
o C
oast
al M
anag
emen
t
The Belgian coastline c. 7,500 years ago (courtesy M. De Clercq and the SeArch project).

7
The Im
portance of A
rchaeology, Coastal H
eritage and A
rt to Coastal M
anagem
ent
On the French coast it has been possible to compare the foreshore depicted in the late 19th century, as shown in this painting by Daubigny, with the modern day. Despite the construction of an early sea wall and the planting of trees to stabilise the dunes, there have been extensive changes to the landscape as they have been eroded away. Comparison of the images enables changes in the past 150 years to be analysed.
How has sea level in this area changed in the past? Changes in sea level have a direct impact on the processes of change along all coastal frontages. There have been significant changes in sea level over the course of human history with levels much lower in the Palaeolithic at the time of the last Ice Age, meaning that extensive landscapes are now located underwater. In the Mesolithic period, from around 10,000 years ago a significant warming of the climate caused sea levels to rise, drowning landscapes until the late Roman period when sea levels got close to present day levels.
Understanding the rate of sea level change provides data that can be used to help predict potential future changes. At Bouldnor Cliff off the north west coast of the Isle of Wight a sequence of drowned prehistoric landscapes have provided detail of sea level rise, periods of stable sea levels and through monitoring programs micro-scale understanding of modern day seabed erosion. Study of the site has also revealed how a relatively small rise in sea level brought about a change in currents which turned an area of deposition into an area of erosion.
Images showing the development of the western Solent. About 3,500 years ago, the breaching of the final land link to the island transformed a salt marsh into a channel that would eventually extend over 10km long and up to 60m deep. The strong tidal currents introduced when the channel was formed continue to erode the Solent shoreline today (courtesy MAT).
Kérity-Penmarc’h village, located in the Cornouaille area at the south western extremity of Brittany by C.F. Daubigny (1871), analysis by E. motte (courtesy Motte, 2013).
8
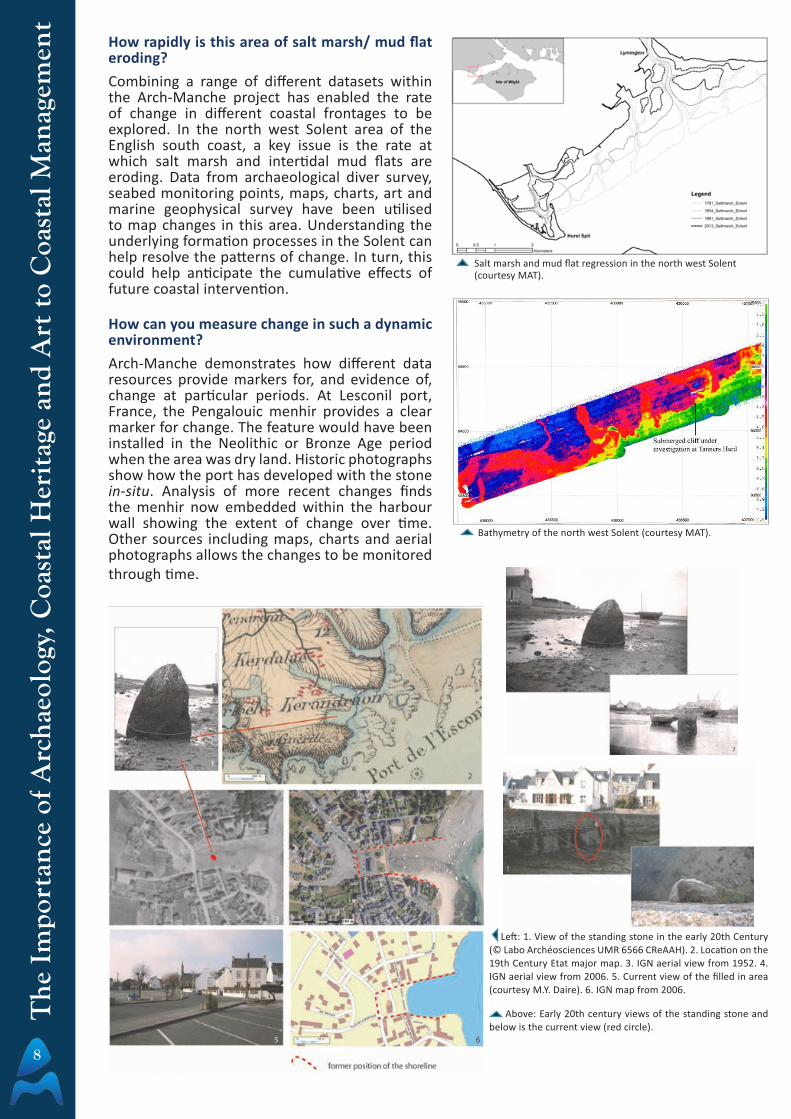
How rapidly is this area of salt marsh/ mud flat eroding? Combining a range of different datasets within the Arch-Manche project has enabled the rate of change in different coastal frontages to be explored. In the north west Solent area of the English south coast, a key issue is the rate at which salt marsh and intertidal mud flats are eroding. Data from archaeological diver survey, seabed monitoring points, maps, charts, art and marine geophysical survey have been utilised to map changes in this area. Understanding the underlying formation processes in the Solent can help resolve the patterns of change. In turn, this could help anticipate the cumulative effects of future coastal intervention.
How can you measure change in such a dynamic environment? Arch-Manche demonstrates how different data resources provide markers for, and evidence of, change at particular periods. At Lesconil port, France, the Pengalouic menhir provides a clear marker for change. The feature would have been installed in the Neolithic or Bronze Age period when the area was dry land. Historic photographs show how the port has developed with the stone in-situ. Analysis of more recent changes finds the menhir now embedded within the harbour wall showing the extent of change over time. Other sources including maps, charts and aerial photographs allows the changes to be monitored through time.
Salt marsh and mud flat regression in the north west Solent (courtesy MAT).
Bathymetry of the north west Solent (courtesy MAT).
Left: 1. View of the standing stone in the early 20th Century (© Labo Archéosciences UMR 6566 CReAAH). 2. Location on the 19th Century Etat major map. 3. IGN aerial view from 1952. 4. IGN aerial view from 2006. 5. Current view of the filled in area (courtesy M.Y. Daire). 6. IGN map from 2006.
Above: Early 20th century views of the standing stone and below is the current view (red circle).
The
Im
port
ance
of
Arc
haeo
logy
, Coa
stal
Her
itag
e an
d A
rt t
o C
oast
al M
anag
emen
t

9
Maximising Data from Available ResourcesWhy is using a combination of sources beneficial for understanding coastal change?Each data source used for the project can provide different but complementary information to help understand the changing coastline. Some data sources provide a very long-term view – particularly archaeology and palaeoenvironmental material, while other sources such as maps, charts and paintings relate to historic periods. A greater number of images are available from the last 150 years or so, following the development of photography. By combining the data from all of these sources we can gain a long-term, holistic view of coastal change.
A combination of historic photographs, historic maps and charts, with more recent mapping and photographs in the case study area of Northern Finistère and Tregor provides a comprehensive insight into the changing coastal context.
Combination of visual documents of the Neolithic passage grave of Kernic Bay (Plouesat, Finistère). 1. Early 20th century photograph of the monument (© Labo Archéosciences UMR 6566 CReAAH). 2. Map of the inner part of the megalithic remains (courtesy J. L’Helgouac’h, 1965). 3. Cassini chart (17th century). 4. ‘Etat major’ chart (1820-1866). 5. Current IGN map (source Géoportail). 6. Current situation (courtesy. M. Monros) .
The Im
portance of A
rchaeology, Coastal H
eritage and A
rt to Coastal M
anagem
ent

10
How can samples of past landscapes provide data relevant for coastal change? Samples extracted through coring can be used to gather data on past landscapes. Both existing and new samples can be analysed to record changes of sediment types with depth. Sediments contain archaeological and climatic details of the surrounding environment at the time they are laid down. As the layers build up this creates a sequential record of events. This data allows the progressive development of archaeological landscapes to be reconstructed. In the Scheldt-polder a large database of core samples was used in a Belgium case study to create reconstructions of past landscape change. The presence and absence of silt and peat layers showed the relationship between natural inundations and those instigated by humans.
Location of data points used for landscape reconstruction (blue: data reaching the top of the Pleistocene; red: shallow data). The black box indicates the extent of the study area. The grey line indicates the border between Belgium and The Netherlands (courtesy K.Heirman, UGent).
9000
BC
5500
BC
4500
BC
3000
BC
1500
BC
500
BC
Series of palaeogeographical maps of the Waasland Scheldt polders from 9,000 BC to 500 BC (courtesy K. Heirman, UGent).
The
Im
port
ance
of
Arc
haeo
logy
, Coa
stal
Her
itag
e an
d A
rt t
o C
oast
al M
anag
emen
t

11
Top: The medieval chapel Notre-Dame-de-la-Joie (Kerity, Penmarc’h), historical postcard from Villard c. 1900 (private collection). Bottom: La Torche Plomeur, WWII blockhaus in the beach, Finistère (courtesy. M. Monros).
How can a heritage feature be used as an indicator of change? Many archaeological and coastal heritage features can be used as indictors of change over time. The position of prominent buildings such as churches and castles can be measured against maps, charts, photographs and paintings. While intertidal sites, illustrated by the fish traps of the Servel-Lannion area, can reveal detail of changing sediment regimes.
Changes in the relationship of fixed archaeological structures to the surrounding landscape can demonstrate shifts in environments that appeared stable in the short term. Underwater sites such as wrecks can be used to establish local monitoring sites where changing sediment levels can be recorded to demonstrate modern evolution of coastal and near-shore areas.
Evolution of the visibility of the Petit-Taureau (Servel-Lannion) fish traps, as a consequence of the sand extraction in the estuary and recent sedimentary evolution in the Léguer estuary (courtesy IGN photos, after Langouët et al. 2012 and Geoportail).
Left: Flower of Ugie Wreck site, Eastern Solent, UK. Site is split into an eastern and western section. Monitoring points were established on both sections of the site (courtesy MAT).
Below: Comparison of monitoring measurements, 2009-2013 across the eastern section. A negative number indicates sediment loss and a positive number indicates sediment accumulation (courtesy MAT).
The Im
portance of A
rchaeology, Coastal H
eritage and A
rt to Coastal M
anagem
ent
12
Presenting Change to a Range of Stakeholders
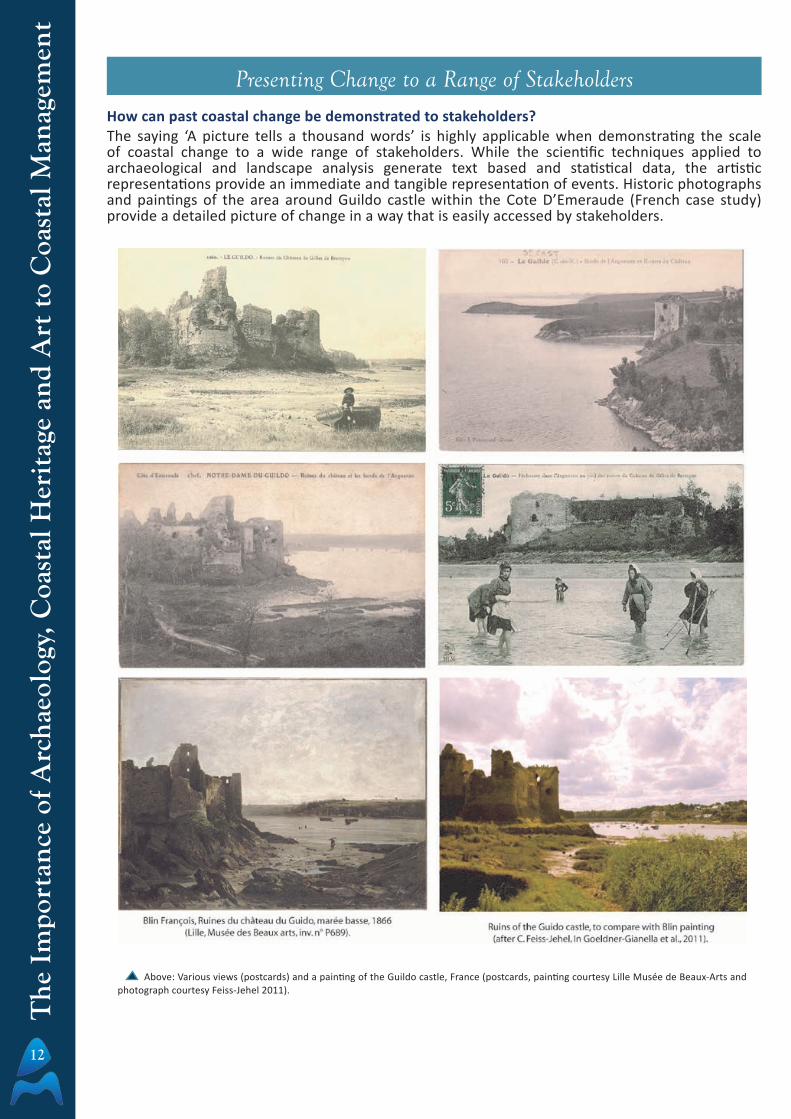
How can past coastal change be demonstrated to stakeholders? The saying ‘A picture tells a thousand words’ is highly applicable when demonstrating the scale of coastal change to a wide range of stakeholders. While the scientific techniques applied to archaeological and landscape analysis generate text based and statistical data, the artistic representations provide an immediate and tangible representation of events. Historic photographs and paintings of the area around Guildo castle within the Cote D’Emeraude (French case study) provide a detailed picture of change in a way that is easily accessed by stakeholders.
Above: Various views (postcards) and a painting of the Guildo castle, France (postcards, painting courtesy Lille Musée de Beaux-Arts and photograph courtesy Feiss-Jehel 2011).
The
Im
port
ance
of
Arc
haeo
logy
, Coa
stal
Her
itag
e an
d A
rt t
o C
oast
al M
anag
emen
t

13
Depictions of the lighthouses at Orford Ness, East Anglia, UK are a good example of how maps and paintings provide evidence of changes prior to photography becoming available.
How can sites or landscapes which only partially survive, are destroyed, buried or underwater be presented? Fundamental to the Arch-Manche approach has been the creation of 2-D, 3-D and 4-D reconstructions to present areas of change. Visualising past landscapes and the impacts of coastal change provide accessible, science based, illustrations for a range of audiences. Data from the Yangtze Harbour site in the Netherlands has been used to develop models of the Mesolithic landscape which had been drowned and buried below current seabed levels. In addition to modelling the landscape form, data from palaeoenvironmental work and archaeological analysis was used to generate more illustrative presentations of the past landscape.
Above: The lighthouses at Orford Ness depicted in 1783, 1822, 1880 and 2013. Such features are often depicted in historic maps and artworks and are good reference points when illustrating coastal change (‘Orford Ness’ engraving courtesy Prof. Robin McInnes).
Above Left: Yangtze Harbour palaeolandscape reconstruction of 6,400 BC (courtesy Peter Vos). Middle and Right: Visualization of the palaeolandscape in 7,000BC (courtesy M. Valkhoff, BOOR, Gemeente Rotterdam).
The Im
portance of A
rchaeology, Coastal H
eritage and A
rt to Coastal M
anagem
ent
14
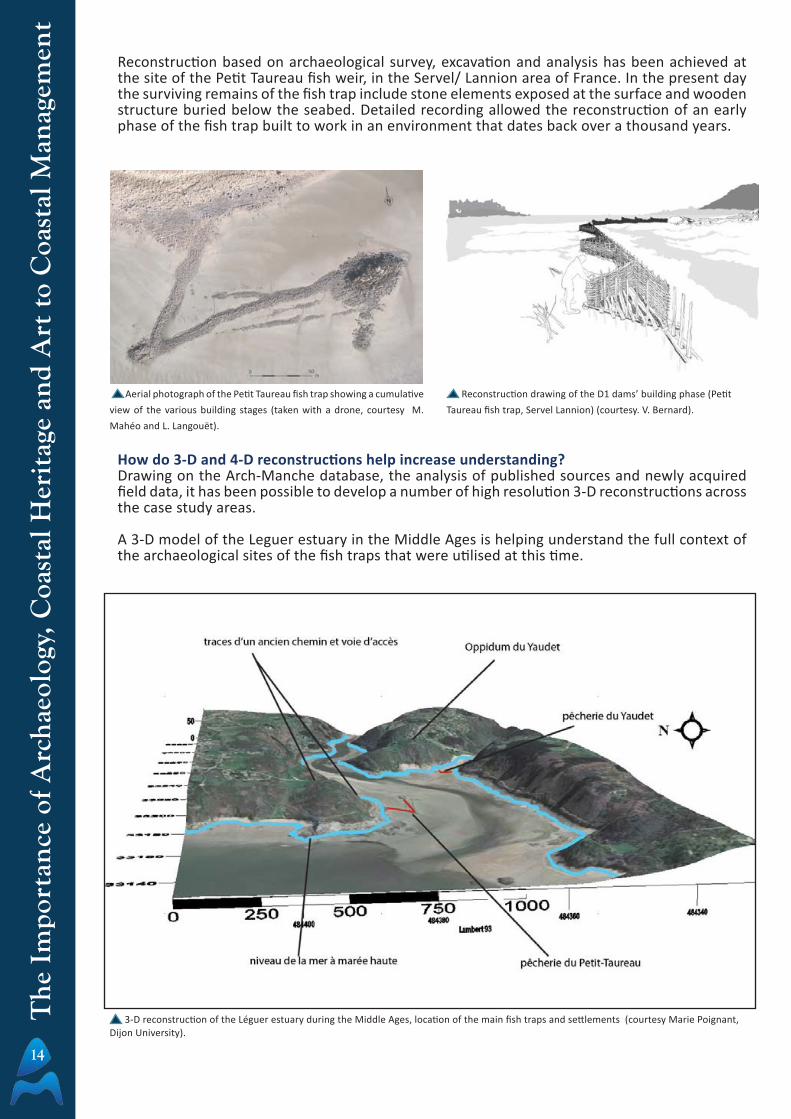
Reconstruction based on archaeological survey, excavation and analysis has been achieved at the site of the Petit Taureau fish weir, in the Servel/ Lannion area of France. In the present day the surviving remains of the fish trap include stone elements exposed at the surface and wooden structure buried below the seabed. Detailed recording allowed the reconstruction of an early phase of the fish trap built to work in an environment that dates back over a thousand years.
Aerial photograph of the Petit Taureau fish trap showing a cumulative view of the various building stages (taken with a drone, courtesy M. Mahéo and L. Langouët).
How do 3-D and 4-D reconstructions help increase understanding? Drawing on the Arch-Manche database, the analysis of published sources and newly acquired field data, it has been possible to develop a number of high resolution 3-D reconstructions across the case study areas.
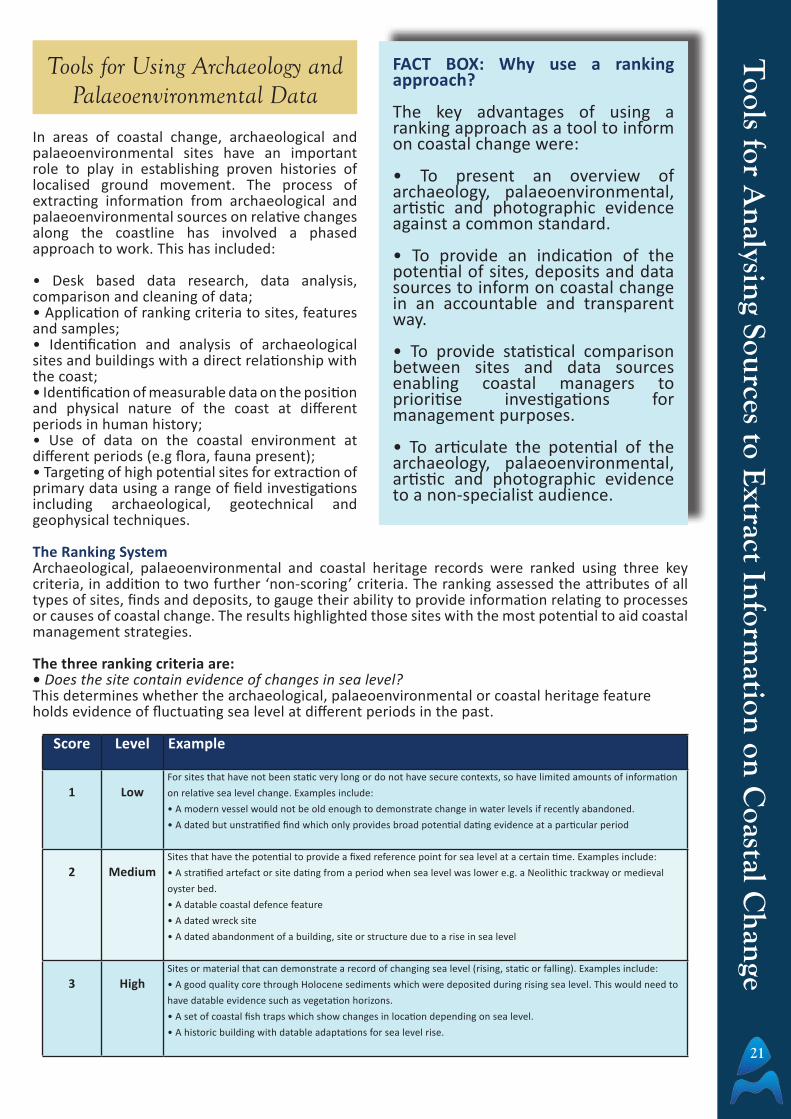
A 3-D model of the Leguer estuary in the Middle Ages is helping understand the full context of the archaeological sites of the fish traps that were utilised at this time.
3-D reconstruction of the Léguer estuary during the Middle Ages, location of the main fish traps and settlements (courtesy Marie Poignant, Dijon University).
The
Im
port
ance
of
Arc
haeo
logy
, Coa
stal
Her
itag
e an
d A
rt t
o C
oast
al M
anag
emen
t
Reconstruction drawing of the D1 dams’ building phase (Petit Taureau fish trap, Servel Lannion) (courtesy. V. Bernard).

15
In Langstone Harbour, southern England, a 3-D model of the changing landscape based on archaeological, palaeoenvironmental, map, chart and photographic evidence has been developed. The introduction of coastal evolutionary sequences over time has added a fourth dimension to demonstrate adaptation of the landscape as the climate warmed. The 4-D model is evidence based providing a powerful depiction of sea level change and the impacts on the coastline.
The Im
portance of A
rchaeology, Coastal H
eritage and A
rt to Coastal M
anagem
ent
Mesolithic In the Mesolithic Langstone Harbour was an inland site, the landscape was dominated by a valley with steep sides leading down to fresh water streams.
Neolithic The Neolithic landscape saw woodland on high and dry land while the valley had been in-filled by organic material giving it a more shallow gentle profile.
Bronze AgeDuring the Bronze Age the area developed towards a stronger marine environment made up of salt marsh and tidal rivers.
Iron AgeThe small rise in sea level during the Iron Age made the area much wetter and the now, almost non- existent valley was flooded.
Current Langstone Harbour is now a large shallow, marine inlet off the English Channel.
4-D reconstruction of Langstone Harbour from the Mesolithic to the present day.
16
Value of the Data Sources for Understanding Coastal Change
The historical evolution of the coast provides valuable information on past trends which can help develop future coastal climate change scenarios. Present coastal landforms have developed since the last Ice Age, studies of their evolution based on archaeology, palaeoenvironmental and coastal heritage features provides a seamless timescale from the Ice Age to the mid-20th century. Early archaeological evidence demonstrates how people were impacted by coastal change in the past and how populations reacted to some large-scale landscape and climate changes. More recent human activity along the coast can show us how humans have had a direct impact on coastal stability. Some has been positive but much has been counterproductive.
Maps, charts and artistic representations of the coast can all be available for study. Combining information from these data sources within particular coastal frontages enables an in-depth understanding of long-term change. An understanding of ongoing changes and the consequent environmental and physical impacts can help inform coastal managers when they are faced with long term strategic decisions.
Sources of data vary within each country with some nations or regions having particular specialist collections, while others do not hold
directly comparable data sets. The research process identified key collections which have then been used in support of the Arch-Manche analysis, many of the data sources were ranked using assessment criteria developed for the project.
FACT BOX:The Arch-Manche project has looked at archaeological and palaeoenvironmental data, artworks, historic photographs, maps and charts from case study areas in the UK, France, Belgium and the Netherlands. Case study locations covering a range of coastal geomorphological types were identified across the partner countries and research was undertaken to identify relevant sources of data.
Val
ue o
f th
e D
ata
Sour
ces
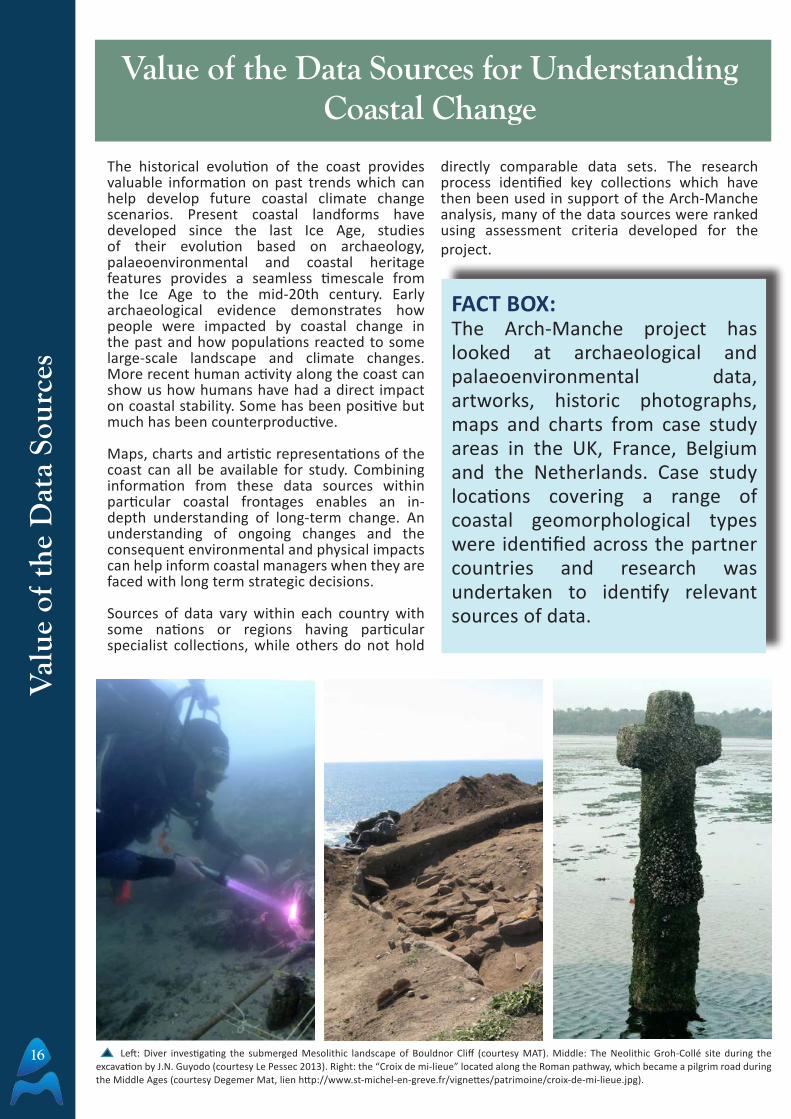
Left: Diver investigating the submerged Mesolithic landscape of Bouldnor Cliff (courtesy MAT). Middle: The Neolithic Groh-Collé site during the excavation by J.N. Guyodo (courtesy Le Pessec 2013). Right: the “Croix de mi-lieue” located along the Roman pathway, which became a pilgrim road during the Middle Ages (courtesy Degemer Mat, lien http://www.st-michel-en-greve.fr/vignettes/patrimoine/croix-de-mi-lieue.jpg).

17
The geological exposures outcropping around the Channel-Southern North Sea coasts have resulted in the formation of a wide range of geomorphological features and have created coastlines of considerable variety, scenic beauty and interest. The nature of the coastal and seabed geology, as well as the structural form of the rocks, together with other factors such as ground water-table levels, natural sedimentary processes and the impacts of change within the earth’s crust have all had an influence on the appearance of the coastal zones as seen today.
The underlying geology has a controlling influence on the formation of the coast. The superficial sediments and silts that cover it contain an archive that can reveal the rate and scale of that change. Some deposits demonstrate long-term stability while others will show short-term volatility. The cumulative consequences of these forces at any given point can indicate coastlines under ongoing stress, making their study fundamental to our understanding of ongoing processes of coastal evolution and providing continuity to help predict future trends. The Arch-Manche project has drawn on data from palaeoenvironmental deposits to model past environments. This has included the use of geophysical and geotechnical survey as well as archaeological excavation. Analysis has enabled detailed understanding of environments at a particular period in time, even if the landscapes now lie underwater or buried below earlier deposits.
Human populations have been utilising the Channel-Southern North Sea area for hundreds of thousands of years. During this time there have been large-scale landscape changes driven by dramatic climatic swings. 20,000 years ago, during the glacial maxima, sea levels were around 120 metres lower than today. Warming meant rising sea levels and advancing coastal zones. These have always been favoured for human occupation and movement. In historic periods settlement around the coast continued and today it continues to be dense. Traces of human occupation and use of the coastal zone have been investigated and analysed during the Arch-Manche project. They range from Mesolithic occupation of about 8,000 years ago, now submerged in the marine zone, through to World War II pill boxes which once marked the coastline position but are now stranded in the intertidal zone. Understanding the broader archaeological and historic developments across the region and in particular how humans interacted with the coastal zone, provides the context for the in-depth work within the Arch-Manche case study areas.
Areas of the coastline which have archaeological or palaeoenvironmental information that can help tell the story of past change were identified i.e. monuments, fish traps, shipwrecks or submerged landscapes. This information was obtained from local, regional and national sources which included:
• Historic environment records and databases; • Archaeological archives;• Geotechnical data; • Publications.
Geomorphology, Archaeology, Historical Features and Palaeoenvironmental Evidence
Value of the D
ata Sources
Left: Aerial photo of Raversijde (around 1970) which indicates an area of medieval peat extraction on the beach (courtesy E. Cools). Right: Framingtimbers protruding from beneath the surviving outer planking on the edge of the Alum Bay 2 wreck, changing sediment levels have been monitored on the site as part of the project (courtesy Roland Brooks).

18
Historical Maps and ChartsHistorical maps provide an important source of information for studying coastal evolution. From the late Middle Ages onwards, maps were made with increasing detail and quality. From the end of the 15th and in the 16th century major cartographical innovations took place. The main factors responsible for the renaissance in land surveying and cartography were the rediscovery of ancient writings on the practice of land surveying, the great explorations on land and at sea, the development of book printing techniques, the development of the instruments used, and the development of trigonometry. Therefore, from that time period onwards, an increasing number of maps more usable for coastal reconstructions can be found.
However, the motivation behind the creation of maps and charts had an impact on their form, particularly in earlier examples. Some maps were commissioned by land owners or companies who had a vested interest in their content. This makes the quality and objectivity of maps vary widely. Therefore, while maps are important as records of change, they cannot always be taken at face value.
It is important to investigate the history of each individual map and chart, and to analyse the quality of a map before using it for interpretation. The Arch-Manche project has developed an innovative approach to the analysis of maps and charts to determine their accuracy.
The most intensive study of maps and charts has been within Belgium and the Netherlands with supplementary examples used in UK and French case study areas. Significant regional and national collections were consulted within each country.
Artistic RepresentationsThe art resources of the Channel coastlines illustrate a rich history of landscape art that can be interrogated to support understanding of long-term coastal change. Parts of the Arch-Manche region were painted more than any other part of Europe’s coastline providing a resource dating back to the 16th century.
Landscape paintings depict the natural beauty of coastal environments, often encompassing a broad view of the shoreline, the sea, the sky, the weather and human activities. Those landscape paintings which depict specific subjects such as parts of the coastline, buildings and structures, are called topographical views and are commonly seen in various types of prints (engravings, aquatints and lithographs) as well as in pencil drawings, watercolour drawings and oil paintings.
The project art case studies focussed on England and France with representative samples from the Dutch and Belgian coastlines. The project reviewed the topographical artworks, drawings and prints held by the principal national, regional and sub-regional collections covering the coastal frontages in these countries. This was achieved through on-line reviews, literature searches and visits.
Val
ue o
f th
e D
ata
Sour
ces
Territorial map of the district of Bruges – one of the earliest overview maps of the coastal plain of Flanders (Franc de Bruges) by Pieter Pourbus, 1561-71 (Remaining fragment of the original map, courtesy Groeningemuseum Brugge, 0000.GRO0220.I).

19
Historical PhotographsDuring the 19th century the modern photograph process became established, with the first widely available cameras on the market in 1888, meaning photography became available to the public. The coast provided a popular subject matter and photography was used extensively in coastal locations to produce tourist postcards. With the mass availability of cameras, individual photographic collections grew.
Photographic images capture detailed and objective views of the coast’s composition. This data source provided important information for the Arch-Manche project as it gave quantifiable representations that could be used for comparative analysis.
Historic photographs were researched and analysed for case study areas primarily in France but also the United Kingdom. National and regional collections held both publicly and privately, were reviewed to identify suitable examples.
Left: Leas Cliff Hall, Kent in 1900, the image can be used to understand changing beach levels against the coastal revetment (Private Collection). Right: Neolithic passage grave of the Kernic Bay (Plouesat, Finistère). Early 20th century photograph of the monument (© Labo Archéosciences UMR 6566 CReAAH).
Value of the D
ata Sources
Above Left: ‘Reculver Church on the north Kent coast, United Kingdom’, an aquatint engraving by William Daniell RA (1823). Daniell produced over three hundred accurate views covering the whole of the British coast between 1814-1825. They form a detailed record of the state of the coastline in the early 19th century (courtesy Prof. Robin McInnes).
Above Right: A detailed steel engraving by artists Alfred and Phillip Brannon showing the famous Needles Rocks and Lighthouse at the western end of the Isle of Wight, United Kingdom in 1859. The view shows the old lighthouse on the top of the cliff and its successor, which provides warning to shipping in the busy and dangerous waters. The detail of the chalk cliff geology is drawn very carefully and allows comparisons to be made of the impacts of erosion and weathering over the last one hundred and fifty years (courtesy Prof. Robin McInnes).
Left: ‘Wreck of the Princess Augusta on Southwold beach, Suffolk, United Kingdom’, on 28th October 1838. This fine lithograph engraving by John Berney Ladbrooke combines maritime heritage interest and coastal geomorphology (courtesy Prof. Robin McInnes).

20
Too
ls fo
r A
nal
ysin
g So
urce
s to
Ext
ract
In
form
atio
n o
n C
oast
al C
han
ge Tools for Analysing Sources to Extract Information on Coastal Change
In order to ensure that a diverse range of coastal situations were assessed across the Channel-Southern North Sea region, fourteen case study areas were selected. These included a variety of coastal frontages which are faced with different challenges in terms of management, physical conditions and available data resources.
To process the assessed data and create a tool of value for coastal management, four ranking systems were developed:
• Archaeology, historic coastal features and palaeoenvironmental evidence – this system provided a relative value on the potential of each site to provide information on coastal change;
• Artistic representations – this system assessed the reliability and accuracy of historic paintings;
• Maps and charts – this system assessed the reliability and accuracy of maps and charts;
• Historic photographs – this system assessed the potential of a photograph to provide information on coastal change.
The case study areas were archaeological and palaeoenvironmental sites and areas with high potential to reveal new evidence on the scale and pace of coastal change. The partners employed
a variety of research and fieldwork techniques. The fieldwork involved in-depth, inter-disciplinary investigations with cross-partner staff involvement, data gathering, scientific dating and analysis.
Work undertaken to extract data on the scale and rate of coastal change included:
• Determining positions and sea level in relation to the coast at particular times;
• Identifying resources showing specific measurable change in areas of the coast;
• Modelling coastal change through time.
FACT BOX:The Arch-Manche project has:
• Assessed a large volume of sources containing information on the changing coastline to identify those with greatest potential;
• Demonstrated how to apply a range of tools to extract the maximum information on coastal change from selected sources;
• Shown how to investigate archaeological and paleaoenvironmental sites and features identified as being of high potential for revealing new evidence on coastal change.
Location of the project case study areas in the Channel-Southern North Sea region. In some locations a smaller area was selected for archaeological investigation, these smaller squares appear within the larger case study area.
21
In areas of coastal change, archaeological and palaeoenvironmental sites have an important role to play in establishing proven histories of localised ground movement. The process of extracting information from archaeological and palaeoenvironmental sources on relative changes along the coastline has involved a phased approach to work. This has included:
• Desk based data research, data analysis, comparison and cleaning of data;• Application of ranking criteria to sites, features and samples;• Identification and analysis of archaeological sites and buildings with a direct relationship with the coast;• Identification of measurable data on the position and physical nature of the coast at different periods in human history;• Use of data on the coastal environment at different periods (e.g flora, fauna present);• Targeting of high potential sites for extraction of primary data using a range of field investigations including archaeological, geotechnical and geophysical techniques.
Tools for Using Archaeology and Palaeoenvironmental Data
FACT BOX: Why use a ranking approach?
The key advantages of using a ranking approach as a tool to inform on coastal change were:
• To present an overview of archaeology, palaeoenvironmental, artistic and photographic evidence against a common standard.
• To provide an indication of the potential of sites, deposits and data sources to inform on coastal change in an accountable and transparent way.
• To provide statistical comparison between sites and data sources enabling coastal managers to prioritise investigations for management purposes.
• To articulate the potential of the archaeology, palaeoenvironmental, artistic and photographic evidence to a non-specialist audience.
The Ranking SystemArchaeological, palaeoenvironmental and coastal heritage records were ranked using three key criteria, in addition to two further ‘non-scoring’ criteria. The ranking assessed the attributes of all types of sites, finds and deposits, to gauge their ability to provide information relating to processes or causes of coastal change. The results highlighted those sites with the most potential to aid coastal management strategies.
The three ranking criteria are: • Does the site contain evidence of changes in sea level? This determines whether the archaeological, palaeoenvironmental or coastal heritage feature holds evidence of fluctuating sea level at different periods in the past.
Tools for A
nalysin
g Sources to Extract In
formation
on C
oastal Chan
ge
Score Level Example
1 LowFor sites that have not been static very long or do not have secure contexts, so have limited amounts of information on relative sea level change. Examples include: • A modern vessel would not be old enough to demonstrate change in water levels if recently abandoned.• A dated but unstratified find which only provides broad potential dating evidence at a particular period
2 MediumSites that have the potential to provide a fixed reference point for sea level at a certain time. Examples include:• A stratified artefact or site dating from a period when sea level was lower e.g. a Neolithic trackway or medieval oyster bed.• A datable coastal defence feature• A dated wreck site• A dated abandonment of a building, site or structure due to a rise in sea level
3 HighSites or material that can demonstrate a record of changing sea level (rising, static or falling). Examples include:• A good quality core through Holocene sediments which were deposited during rising sea level. This would need to have datable evidence such as vegetation horizons.• A set of coastal fish traps which show changes in location depending on sea level.• A historic building with datable adaptations for sea level rise.

22
• Does the site/feature/deposit provide evidence of environmental change? This criteria helps identify sites which demonstrate how an area has adapted to a rising sea level and changing climate in periods since the last Ice Age.
• Does the site contain material that could provide evidence of temporal continuity?Determines whether a site provides information which relates past events to each other, which is important in assessing coastal change in the past.
The non-ranking criteria are:
• An indication of current statusThis provides information on whether sites, features or deposits are known to still be in existence and whether the site includes remains that are above or below the ground, or both.
• An indication of the spatial relationship of the site to the coast line (coastal context)
Too
ls fo
r A
nal
ysin
g So
urce
s to
Ext
ract
In
form
atio
n o
n C
oast
al C
han
ge
Score Level Example
1 LowSites with little datable material that will inform on past environments. Examples might be: • A coastal feature such as a gravel spit which has developed as a result of long term environmental change, but does not have specific information on date or environment• Evidence of coastal salt working without specific dating
2 MediumSites that have the potential to provide an indicator of the environment at certain period. Dates available for the material or artefacts would be broad rather than absolute. This could include:• Coastal Bronze Age occupation site with information on land use, diet etc.• A core through a deposit that has been dated by relative comparison rather than scientific dating• A dated wreck site where there is a monitoring program in place to provide evidence of sediment changes
3 HighSites or material that can demonstrate a record of the changing environment through a long period of time. Examples are:• A good quality core from submerged or buried terrestrial deposits having dated material, archaeological evidence and a well preserved range of environmental material associated with mineragenic deposits
Score Level Example
1 LowSites, palaeoenvironmental material or artefacts which contain evidence from single events or are datable to one period only
2 MediumSites which are known to contain datable evidence of changing sea level, environmental, or climatic change but have yet to be analysed.
3 HighSites with long datable sequences which have been analysed. Sites would provide evidence of changing sea level, environmental, or climatic change over a period of time that straddles a series of geomorphological events.
Code Level
EA Site/ deposits exists and are above ground
EB Site/ deposits exist and are below-ground
EAB Site/ deposits are both above and below ground
D/R Site has been destroyed (or recovered)
UN Don’t know
ID Term1 Marine (below low water)2 Intertidal3 Above High Water4 Estuary5 Hard cliff6 Soft cliff7 Barrier beach8 Dunes9 Lagoon
10 Saltmarsh11 Sandy foreshore12 Rocky foreshore13 Sandflats14 Mudflats15 Coarse sediment plains16 Fine sediment plains17 Mud plains18 Mixed sediment plains19 Sand banks with sand waves20 Exposed bedrock21 Unknown

23
Examples of Ranking ResultsThe following examples demonstrate how a range of different sites and deposits ranked against the criteria.
Bouldnor Cliff: A sequence of stratified prehistoric landscapes including Mesolithic occupation evidence.
Flower of Ugie: A marine wreck site with structure proud of the seabed.
Lannion Petit Taureau Fish trap: Intertidal remains of a Medieval fish trap complex reveals important information on the changing tidal conditions at a micro-scale.
Tools for A
nalysin
g Sources to Extract In
formation
on C
oastal Chan
ge
Criteria Score NotesSea Level Change 3 Long sequence of deposits demonstrating changing sea
levels over 10,000 years.
Environmental Change 3
Contains dated and analysed evidence of changing environment including associated human occupation evidence.
Temporal Continuity 3 Sequence of prehistoric landscapes and associated
inundation are directly related to each other.
Site Status EB Site exists and is below ground
Coastal Context 1 Marine (below low water)
Criteria Score Notes
Sea Level Change 2
Provides known reference point for the seabed situation during the year of wrecking - 1852
Environmental Change 2
Monitoring of wreck site in relation to modern sediment movements provides microscale information on environmental changes
Temporal Continuity 1 The wreck relates to a single event
Site Status EAB Site remains are both above and below the seabed
Coastal Context 1 Marine (below low water)
Diagram showing cross section through the submerged prehistoric landscapes at Bouldnor Cliff off the NW Coast of the Isle of Wight (courtesy SCOPAC).
Diver monitoring sediment levels on the wreck of the Flower of Ugie (courtesy MAT).
Criteria Score Notes
Sea Level Change 3
Fish traps require a very specific relationship to the height of sea level to ensure they are most suitable for catching fish.
Environmental Change 3
Sensitive to environmental change, so adapted over time with additional traps built to account for changes.
Temporal Continuity 3
A sequence of fish traps which changed position over a significant period.
Site Status EAB Site remains are both above and below ground level
Coastal Context 2 Site is located in the intertidal zone Excavation of the Petit Taureau fish trap, the site contains several phases of use (courtesy MAT and CNRS).

24
Ranking OutputsA total of 3,150 archaeological and palaeoenvironmental sites were assessed across the partner case study areas. The image below shows the location of the highest scoring sites.
This study has revealed that certain types of site and deposit can gain consistent positive scores for their potential to inform on coastal change. Some of these sites can represent single and short-lived episodes, these might include a shipwreck or a prehistoric campsite. Sites of this kind can occur at a particular height, location or time that is pertinent to the understanding of shoreline-change. Other sites can offer a broader range or sequence of chronological and environmental information. They can include biostratigraphical evidence such as pollen records in peat deposits, diatoms in accrued marine sediments and plant macro-fossils in river valley alluvium.
The highest ranked sites range from the Mesolithic to modern times and are found in the marine, intertidal and coastal zones. However, the majority of these sites are submerged landsurfaces. They are found in all partner countries and have long stratigraphical dated sequences. Five of the sites which ranked highly; Bouldnor Cliff, Langstone Harbour, the Leguer Estuary, Raversijde and Scheldepolders, were subject to detailed investigation.
UID SITE NAME COUNTRY CASE STUDY AREA PERIOD SITE TYPE SCORE BROAD E’MENT 27 CROOKLETS BEACH - Prehistoric Remains UK North Cornwall/Devon Prehistoric Submerged landsurface 100 Marine 361 SAINT-MICHEL-EN-GREVE - Croix de Mi-Lieu France Leguer Estuary Medieval Monument 100 Intertidal 700 SAINT-MICHEL-EN-GREVE - Roman road France Leguer Estuary Roman Other 100 Intertidal 1297 HOEDIC - Douet alignement France Quiberon Peninsula Neolithic Monument 100 Coastal 1298 HOEDIC - Groah Denn alignement France Quiberon Peninsula Neolithic Monument 100 Coastal 600 PITTS DEEP - Submerged Peat Deposits UK Solent/Isle of Wight Prehistoric Submerged landsurface 100 Marine 708 BULVERHYTHE - Submerged Forest UK Hastings Prehistoric Submerged landsurface 100 Marine 707 BOULDNOR - Submerged Mesolithic landscape UK Solent/Isle of Wight Mesolithic Submerged landsurface 100 Marine 713 LITTLE GALLEY HILL - Submerged Forest UK Hastings Bronze Age Submerged landsurface 100 Marine 457 LANNION - Petit Taureau France Leguer Estuary Early Medieval Marine installation 100 Intertidal 1074 SAINT-PIERRE-QUIBERON - Ile Guernic France Quiberon Peninsula Neolithic Other 100 Coastal 1163 SAINT-PIERRE-QUIBERON - Kerbourgnec France Quiberon Peninsula Neolithic Monument 100 Intertidal 1166 SAINT-PIERRE-QUIBERON - Petit Rohu France Quiberon Peninsula Neolithic Other 100 Intertidal 324 RUSSELLS LAKE - Prehistoric Forest UK Langstone Harbour Prehistoric Submerged landsurface 100 Marine 1213 QUIBERON - Beg er Vil France Quiberon Peninsula Mesolithic Other 100 Coastal 313 DOELPOLDER NOORD – buried landsurface Belgium Scheldepolders Prehistoric Buried lansurface 100 Coastal 2446 WAASLAND POLDERS – buried landsurface Belgium Scheldepolders Prehistoric Buried lansurface 100 Coastal 339 BAKERS RITHE - Prehistoric Forest UK Langstone Harbour Prehistoric Submerged landsurface 100 Marine 604 HURST SPIT - Hurst Castle UK Solent/Isle of Wight Medieval Coasal defense 100 Coastal
Too
ls fo
r A
nal
ysin
g So
urce
s to
Ext
ract
In
form
atio
n o
n C
oast
al C
han
ge
Location of the highest scoring archaeological and palaeoenvironmental sites across the case study areas. These sites are listed in the table below.

25
Gathering Field Data on Coastal ChangeDifferent fieldwork techniques were used to carry out detailed research into the archaeological, palaeoenvironmental and coastal heritage to quantify coastal change. The methods varied depending on the specific environment and the type of information being targeted.
Diving Archaeological InvestigationDiving fieldwork in the Solent, UK, focused on submerged prehistoric landscapes and shipwreck sites. The monitoring of such sites in relation to seabed movement gives us an insight into modern environmental change and has helped to unravel geomorphological impacts of past sea level change. Comparing measurements to previous surveys provides empirical information on the rate and level of sediment change. The timescale of change can range from many millennia to a few years.
Data gathered included:
• Monitoring drowned lands - Erosion monitoring on the submerged prehistoric landscape site at Bouldnor Cliff demonstrated a loss of up to 0.5m per year. Erosion over-winter 2011-12 had exposed fresh Mesolithic artefacts on the seabed.
• Seabed Sampling - Gathering of auger samples from west of Hurst Spit for palaeoenvironmental analysis of prehistoric landscapes has helped characterise a change in landscape from deposition to erosion.
• Shipwreck Inspection and Monitoring - Inspection and monitoring of two shipwreck sites in Alum Bay revealed movement of sediment between seasons. The Alum Bay 1 shipwreck (part of HMS Pomone) revealed a reduction in sediment levels, particularly at its northern end, while at Alum Bay 2 which lies slightly further north and west there was an increase in sediment levels.
Intertidal SurveyIntertidal survey was carried out in the UK on the case study site of Langstone Harbour. Here sites and buried deposits can provide information on past coastal change, as well as more recent change where erosion or extreme weather has exposed archaeological material.
The following field studies revealed a range of new data:
• Walkover surveys – these were carried out in order to identify sites, features and finds which may have eroded or been exposed at the fieldwork sites. Positions were taken using a Real Time Kinematic (RTK) GPS along with a photograph; artefacts were recovered if at risk of loss and archaeologically significant.
• Controlled collection – the south east coast of North Binness Island appears to be the site of Roman activity, large amounts of pottery has been revealed on the foreshore. A controlled collection was carried out in this area and the pottery was sent for analysis to the University of Southampton.
• Monitoring of previously recorded sites – sites recorded during the 1990’s Langstone Harbour project and the 2002-2004 survey work were revisited to determine whether they were still in-situ or had been eroded. Hurst Spit and Pitts Deep in the Western Solent were visited following the storms of January 2014. The migration of the spit is evidenced by the relict landscape exposed on its west side. It now needs ongoing replenishment to maintain it.
Tools for A
nalysin
g Sources to Extract In
formation
on C
oastal Chan
ge
Changes to sediment levels at the site of the Alum Bay 2 wreck, UK. Left: 2003. Right: 2013 (courtesy MAT and Roland Brooks).

26
Landscape survey – the RTK GPS was used to record the edge of the small cliffs off Hayling Island and on Long Island. This data can be used to monitor erosion of the area over the coming years. In order to understand past changes it has been possible to compare the current high water mark with that recorded on the 1st Edition OS Map of Langstone Harbour from 1878. There has been up to 50 metres of erosion off Long Island and notable change on Bakers Island, however in some places there seems to be sediment accumulation, such as the northern edge of North Binness.
Sampling – samples were recovered from the timber structures off Hayling Island and sent for Radiocarbon dating.
Intertidal and Near-Shore ExcavationIntertidal excavation was carried out at a number of case study sites in France and the Netherlands.
At the Beg er Vil site there are localised areas of erosion threatening the stability of the coast. Here excavation of Mesolithic coastal occupation evidence is transforming understanding of the use of the area by past peoples and the nature of the changing environment.
Prehistoric tree stumps and peat were eroded from the submerged landscape off Hurst Spit during the storms in January 2014 (courtesy MAT).
Comparison of the 1878 high water mark in Langstone Harbour with the 2013 high water mark demonstrates the level of erosion in the northern part of the harbour (courtesy MAT).
Stratigraphy of the archaeological layer and features of the Beg er Vil site (courtesy Manchand et al., 2013).
Too
ls fo
r A
nal
ysin
g So
urce
s to
Ext
ract
In
form
atio
n o
n C
oast
al C
han
ge

27
In the Netherlands at the site of Vergulde Hand West – Vlaardingen, archaeological excavation data has been utilised within palaeogeographic reconstructions drawn on by the Arch-Manche project to demonstrate change.
At Lannion excavation of the complex of fish traps revealed fascinating evidence on the wooden detail of the structures which had been buried below the current seabed. Dating evidence provided vital information on the sequence of the traps and changes through time.
From left to right: A sediment profile, settlement evidence and a trackway at the Vergulde Hand West site. (Source: Eijskoot, Y., O. Brinkkemper & T. de Ridder, 2011. Vlaardingen - De Vergulde Hand-West. Onderzoek van archeologische resten van de middenbronstijd tot en met de late middeleeuwen; inclusief Bijlagen en Kaartbijlagen. RCE Rapportage Archeologische Monumentenzorg 200, 588 pp).
Mapping of the wooden installation of the Petit Taureau fish trap and distribution of the dendrochronological dating (courtesy. V. Bernard).
Tools for A
nalysin
g Sources to Extract In
formation
on C
oastal Chan
ge

28
Geophysical and GeotechnicalGeophysical and geotechnical fieldwork was carried out in a number of case study areas including Raversijde and the Scheldt estuary (Belgium), Langstone Harbour (UK), Quiberon and St Malo (France), and Yangtze Harbour (Netherlands). The various techniques and the results achieved are described below.
Cone Penetration Testing (CPT) This geotechnical method provides information on the composition of subsurface deposits. It gathers data on the geology (nature and sequence of the subsurface strata) and hydrology (groundwater conditions) as well as the physical and mechanical properties of the subsurface strata. The method allows fast and continuous profiling with repeatable (and reliable) data, and is highly economical.
Thirteen cone penetration tests were carried out on the beach at Raversijde at low tide. Depth of the CPTs was on average 10 m.
Marine Vibro CoringA large scale coring program was undertaken in advance of the Yangtze Harbour development in the Netherlands. Data from this program was used in support of interpreting past landscapes within the Arch-Manche project. This method allows for the extraction of complete core samples from the marine zone which can then be subject to a range of recording, analysis and dating to provide detailed information on landscape change over time.
Marine Geophysics: Seismic SurveyThis technique is used to map buried landsurfaces and deposits which reside below the level of the current sea floor. A parametric echo sounder was used in case study areas within Belgium and the UK. Equipment is deployed from a boat with survey data being captured digitally by computer equipment which measures signal responses.
In the Netherlands the Yangtze Harbour project involved a range of specialist investigations. Seismic survey was used to map the buried landscapes which would be impacted by a forthcoming dredging operation.
Marine Geophysics: Side-Scan Sonar SurveyThis was carried out on the French case study sites to search for traces of fish traps and other human activity offshore. This type of marine survey also uses a towfish from which soundwaves are transmitted. When the sound waves meet the seabed or any other object they are reflected. Recording the returning signals enables an acoustic image of the seabed to be produced which can be used to measure the size of the features or objects scanned.
Cone penetration testing on the beach at Raversijde (courtesy UGent).
Vibrocores undergoing analysis following extraction and splitting (courtesy Vos 2013, Deltares).
Example seismic profile through the sub-surface deposits at Raversijde (courtesy D. Evangelinos, UGent).
Sonar image of the fish trap Port-Haliguen (courtesy ADRAMAR, Le Ru 2013).
Seismic survey tool which is towed by a boat.
Too
ls fo
r A
nal
ysin
g So
urce
s to
Ext
ract
In
form
atio
n o
n C
oast
al C
han
ge

29
Side scan sonar survey of the fish traps of Port-Haliguen and Saint-Julien off the Quiberon peninsula, revealed detail of structures which are not exposed at low water. The results enabled the location and characteristics of the submerged fish traps to be determined.
Electromagnetic Survey (EMI) This technique was applied in the intertidal area of the Raversijde case study. The method works through applying an electromagnetic (EM) field to an area and measuring the conductivity of underlying deposits and features.
Zones with a high (measured) conductivity are of specific interest as this could indicate the presence of metal objects, or shallow peat layers. In this area the survey technique demonstrated the presence of buried peat layers which have been impacted in the past through extraction leaving patterns in the remaining peat. The results of this survey could be correlated with marine seismic data for maximum interpretation.
Auger SurveyAuger samples were collected off the west coast of Long Island in Langstone Harbour, with the aim of tracking the buried palaeochannel identified during previous excavations. The survey was carried out using hand augers which recover a small column of sub-surface material. Samples were recorded and assessed with sub-samples recovered for more detailed palaeoenvironmental analysis. Comparison of the results across an area can detect the presence of different deposits, contributing to understanding of the buried landscape. Data from these samples informed the 4-D model of Langstone Harbour.
Palaeoenvironmental AnalysisSpecialist palaeoenvironmental analysis of samples from archaeological excavations and coring campaigns was undertaken. Many of the case study areas either had data available from past investigations or new analysis was commissioned as part of the project.
The study of microscopic pollen and diatoms can reveal detailed information on the nature of past environments. This includes data on flora, fauna and the levels of salinity. Examination of the environmental indicators down the length of a core sample can indicate sea level and climate change over thousands of years. The samples can be dated to provide a time frame for changing coastal conditions.
Left: Overview of the 2010 small-scale seismic network, electromagnetic (EMI) survey areas and core locations in a small intertidal area. Right: close-up of the EMI data (apparent electrical conductivity ECa, in mSm-1) (red=high conductivity, blue=low conductivity). EMI data courtesy dept. of Soil management, UGent.
Auger Survey off Long Island, Langstone Harbour (courtesy MAT).
Investigation of the augers off Long Island, Langstone Harbour. (courtesy MAT) .
Left: Marine plankton: indicating marine tidal influence in a fresh to brackish underwater environment.Middle: Pinnularia subrupestris, indicating: Freshwater deposit.Right: Diatom: Cyclotella striata, indicating: Open estuarine environment.(courtesy P. Vos 2013, Deltares).
Tools for A
nalysin
g Sources to Extract In
formation
on C
oastal Chan
ge

30
Tools for Using Historical Maps and ChartsMaps and charts provide an important source of information from the Middle Ages onwards. Through time there is a rapid rise in the quantity of available maps and charts. However, the quality and detail varies widely between different maps, therefore it is important to analyse maps prior to interpretation.
The project used maps and charts which depict the coastal and near-shore area. These were sourced from a range of historical archives. A ranking system was established that enabled them to be evaluated in terms of their topographic, geometric and chronometric accuracy.
Applying the Ranking Criteria
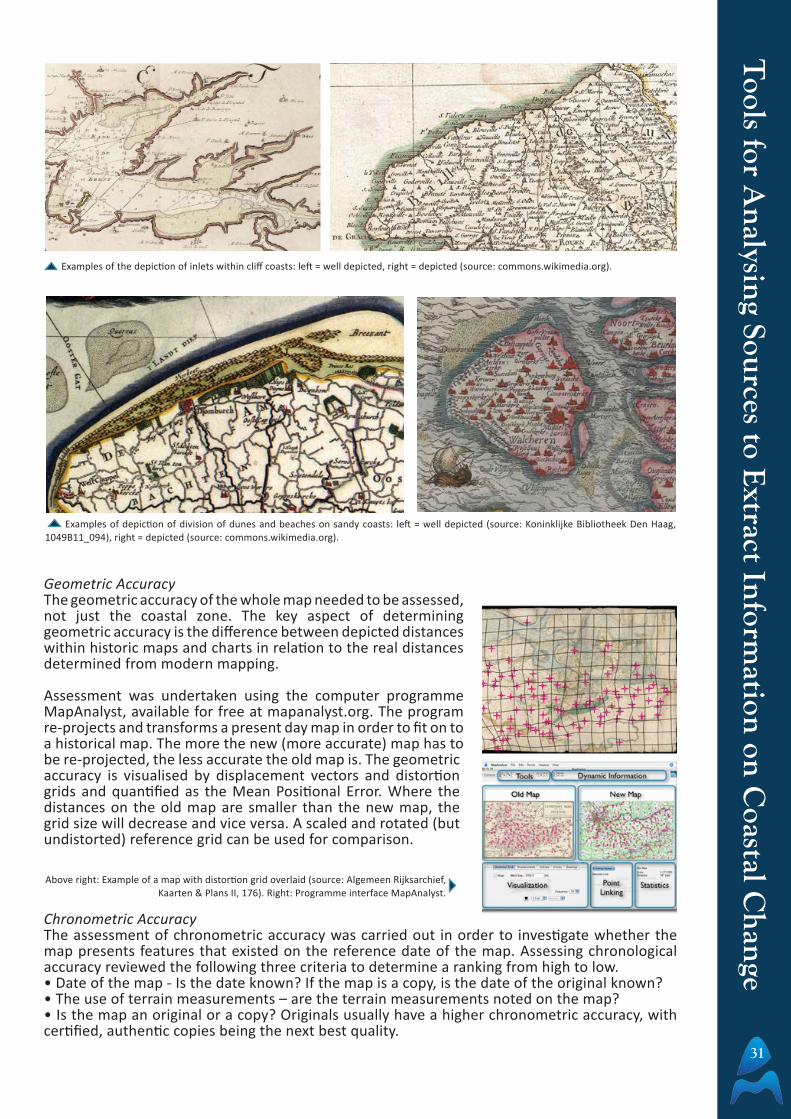
Topographic AccuracyTopographic accuracy was addressed through the assessment of the level of detail included within depictions of features in each map. The assessment took into account the different types of coast present across the Arch-Manche area.
Criteria Notes
Estuaries and Tidal Basins • Division shown between supra-, inter- and subtidal areas depicted• Tidal channels and inlets depicted
Cliff Coasts• Division of cliffs and beaches depicted• Division between supra-, inter- and subtidal area depicted• Inlets (both tidal and river originated) depicted
Dune and Sand Coasts• Division of dunes and beaches depicted• Division between supra-, inter- and subtidal area depicted• Topography of dunes depicted
Detail in Non-Coastal Areas• High quality• Medium quality• Low quality
Examples of the depiction of the division of supra-, inter- and sub-tidal areas within estuaries and tidal basins: Left = Well Depicted (high and low marsh clearly defined (source: Algemeen Rijksarchief, Kaarten & Plans II, 8554)). Right = depicted (marsh is separated, but more subjectively (source: Koninklijke Bibliotheek Den Haag, 1049B11_094)).
Too
ls fo
r A
nal
ysin
g So
urce
s to
Ext
ract
In
form
atio
n o
n C
oast
al C
han
ge
31
Examples of the depiction of inlets within cliff coasts: left = well depicted, right = depicted (source: commons.wikimedia.org).
Examples of depiction of division of dunes and beaches on sandy coasts: left = well depicted (source: Koninklijke Bibliotheek Den Haag, 1049B11_094), right = depicted (source: commons.wikimedia.org).
Geometric AccuracyThe geometric accuracy of the whole map needed to be assessed, not just the coastal zone. The key aspect of determining geometric accuracy is the difference between depicted distances within historic maps and charts in relation to the real distances determined from modern mapping.
Assessment was undertaken using the computer programme MapAnalyst, available for free at mapanalyst.org. The program re-projects and transforms a present day map in order to fit on to a historical map. The more the new (more accurate) map has to be re-projected, the less accurate the old map is. The geometric accuracy is visualised by displacement vectors and distortion grids and quantified as the Mean Positional Error. Where the distances on the old map are smaller than the new map, the grid size will decrease and vice versa. A scaled and rotated (but undistorted) reference grid can be used for comparison.
Chronometric AccuracyThe assessment of chronometric accuracy was carried out in order to investigate whether the map presents features that existed on the reference date of the map. Assessing chronological accuracy reviewed the following three criteria to determine a ranking from high to low. • Date of the map - Is the date known? If the map is a copy, is the date of the original known? • The use of terrain measurements – are the terrain measurements noted on the map?• Is the map an original or a copy? Originals usually have a higher chronometric accuracy, with certified, authentic copies being the next best quality.
Above right: Example of a map with distortion grid overlaid (source: Algemeen Rijksarchief, Kaarten & Plans II, 176). Right: Programme interface MapAnalyst.
Tools for A
nalysin
g Sources to Extract In
formation
on C
oastal Chan
ge

32
Examples of RankingThe development of the ranking and analysis of maps and charts was led by the University of Ghent who applied the methodology extensively within their case study areas. Two examples of the outputs of the map scoring from Belgium are:
• Scoring and analysis of a small scale (supra-regional) map of around 1600 from northern Flanders. The Mean Positional Error was 1619 metres. Details in the estuarine area were mostly sketched while the sandy coast and the the non-coastal areas were even less well depicted, leading to low topographical accuracy scores. Since neither the date of manufacturing nor the use of terrain measurements are noted, the chronometric score is also low.
• The analysis of a regional map (medium scale) showing the inner and outer dike area near the Belgian – Dutch boarder in 1791. The Mean Positional Error is 161 metres, which is far better than the previous small scale map. The map has a high topographic score due to the detailed depiction of both tidal channels and the sub, inter, and supraregional areas. The non-coastal area also has a high level of detail as separate houses are depicted. Chronometric accuracy was fairly high as the exact date of manufacturing of this original map is known. However, no terrain measurements are mentioned.
Details of a regional scale map dating to 1791. The image on the left shows the results of the Geometrical Accuracy using Map Analyst and the image on the right demonstrates the level of detail (source: Zeeuws Archief, Kaarten Zeeland, 1948.41).
Details of the small scale map. All three images are from the same map of northern Flanders, the image on the left shows the towns, the centre image shows the tidal channels and the image on the right shows the detail in the intertidal area (source: Algemeen Rijksarchief, Kaarten & Plans II, 176).
Too
ls fo
r A
nal
ysin
g So
urce
s to
Ext
ract
In
form
atio
n o
n C
oast
al C
han
ge

33
Ranking OutputsA total of 101 maps and charts from the partner countries were evaluated based on topographic, geometric and chronometric accuracy. These maps and charts ranged from small to large scale and date from as early as the 16th Century.
In terms of topographical accuracy the maps varied widely, but many of them proved to be rich in detail. Key factors influencing the level of accuracy were the scale and purpose of the map.
Location of historical maps assessed. The outlines represent the area covered by the map, the colour reflects the score, red is higher and yellow is lower.
Topographical details in various maps (source left: Algemeen Rijksarchief, Kaarten & Plans II, 176, middle Algemeen Rijksarchief, Kaarten & Plans I, 441, right Algemeen Rijksarchief, Arenbergfonds, 842).
Key factors influencing the geometric accuracy were: the date of production with accuracy increasing through time, although some exceptions to this were found, and the scale of the map with large scale maps being most useful for coastal research, and the reason the map/ chart was produced impacting detail in particular areas.
The chronometric accuracy varied largely due to the amount of detail available on the origin and date of the map or chart. While some included date of production, whether a copy or original and the distances it was produced in, others had little information on their origin or context.
A map produced for military purposes shows greater accuracy around key installations and frontiers (source: Scheepvaartmuseum Amsterdam, Atlas van Loon, Coeck 1664).
Tools for A
nalysin
g Sources to Extract In
formation
on C
oastal Chan
ge

34
Analysis of Coastal Change from Maps and ChartsThe (Waasland) Scheldt polders post-medieval landscape was reconstructed using historical maps. The highest scoring maps were selected for GIS-rectification and digitisation. As a result, in five reconstruction maps the landscape evolution from 1570 (just prior to tactical inundations) to 1850 is shown.
Reconstruction of the Waasland polders post-medieval landscape using historical maps from 1570 to 1850 (courtesy I. Jongepier, UGent).
1570 1625
1700 1790
1850
Too
ls fo
r A
nal
ysin
g So
urce
s to
Ext
ract
In
form
atio
n o
n C
oast
al C
han
ge

35
Tools for Using Artistic Representations
The value of historical works of art as a tool to support coastal management arose from the detailed depiction of geology and geomorphological features in paintings of the coast. It was also recognised that there were many paintings of limited worth and a great deal of time could be lost when studying these. Accordingly, a ranking system was devised to aid with the assessment of the paintings and their subject matter. The objective was to develop a readily available tool for use by professionals interested in increasing their knowledge of the coast and to support existing scientific approaches used for measuring coastal change.
During the project over 250 artworks from across the Channel-Southern North Sea region were ranked using the system. A substantial number of these (39%) were deemed to be of sufficient interest to require more detailed investigation (56 in England and 42 in Brittany, France).
Applying the Ranking CriteriaIn order to assess the reliability and accuracy of the historic artworks they were assessed against four criteria: accuracy of artistic style, most advantageous medium for illustrating coastal change, value of the subject matter in supporting understanding of long-term coastal change and value of the time period.
Accuracy of Artistic StyleVarying artistic styles contribute to topographical accuracy to a lesser or greater degree in terms of their portrayal of the coastal environments. Five style sub-categories were considered:
Sub Style Score Details
Caricaturist 1
These works do not usually contain enough detail to make a significant contribution to our understanding of the coastal conditions at that time. Their interest usually lays more in human and social subjects rather than physical or historical aspects.
Picturesque landscapes 2
Often views favoured by those artists and illustrators who were producing works in the manner of the Italian landscapes popularised by those returning from the Grand Tour. Whilst the Picturesque style is less concerned with topographical accuracy, it can provide at least some indicators of the nature of the landscape at the time.
Marine and shipping subjects 3
Depicting coastal shipping and craft form a significant component in terms of coastal art. Many yachting, fishing and other shipping scenes include the coastal scenery as a backdrop. Some works provide a detailed topographical background. Often works produced by naval officers or others who had served on board ship, prove to be particularly accurate.
Topographical art including beach and coastal scenery
4
Including coastal landscape paintings, watercolour drawings and prints. This is a rich resource and most of the Channel-Southern North Sea coast is very well illustrated in this respect. There is great interest in the coastal towns and fishing villages located both on the open coast as well as on the tidal creeks, estuaries and harbours.
Topographical artworks including beach and coastal scenery, which exhibit Pre-Raphaelite detail
5
These are precise images of coastal scenery, usually from the mid-to-late nineteenth century. On account of the detail and accuracy of the subjects, with artists seeking to depict nature in a very exact manner, these works form a particularly valuable resource.
Tools for A
nalysin
g Sources to Extract In
formation
on C
oastal Chan
ge

36
‘Pegwell Bay – Recollections of October 5th 1858’ by William Dyce RA. Oil on canvas, 1858-60 (courtesy of © Tate Images 2014). This is a particularly fine example of an oil painting showing the level of detail that could be achieved by the Pre-Raphaelite School of Artists.
Most Advantageous Medium The second ranking category relates to the most advantageous medium used for illustrating coastal scenery. Six categories were identified:
Sub Style Score Details
Copper plate engravings 1 Generally the softness of the copper plates meant that views were not as
suitable for recording fine detail.
Oil paintings 2 Oil paintings were considered to be rather more valuable as they could provide a greater level of detail.
Oil paintings by Norwich School and Pre-Raphaelite artists
3 Oil paintings by Pre-Raphaelite artists and their followers ranked more highly on account of their precision and the level of detail captured.
Steel plate engravings and aquatints
4Often published individually or as sets; others were contained in topographical books in the pre-Victorian period and through the early-to-mid nineteenth century. This is a rich resource which records fine detail with the combined benefits of colouring of some of the views.
Lithographs, fine pencil drawings and watercolour drawings
5
Capable of achieving extremely fine detail. The quality of some of the hand-coloured lithographs equates almost to that of watercolour drawings; as a result, lithographs are given the same score as watercolour drawings. The detail achieved using this technique provides information on cliff and slope geology, the nature of beach conditions, coastal vegetation patterns, as well as the extent of coastal development at the time.
Watercolour drawings by Pre-Raphaelite artists and their followers
6 Those watercolours by Pre-Raphaelite artists and their followers achieve the maximum score on account of their detailed appreciation of the subject. T
ools
for
An
alys
ing
Sour
ces
to E
xtra
ct I
nfo
rmat
ion
on
Coa
stal
Cha
nge

37
Left: ‘A Beach Scene at Southwold, Suffolk’ by Thomas Smythe (1825-1904). Oil on canvas (private collection). Right: ‘On the coast of South Devon’ by Samuel Edward Kelly, watercolour (with Pre-Raphaelite influence), c.1900 (courtesy Prof. R McInnes).
The Value of the Subject MatterThis third ranking category which looks at the subject being depicted is of prime importance to those interested in studying and evaluating coastal change. As a result, a weighting factor of x2 was applied over the three categories:
Sub Style Score Weighted Details
General coastal view 1 2 Contributes to an overall appreciation of the coastal
geomorphology and character of the landscape
More detailed works 2 4
Providing information on the nature of the beach, the cliff line and hinterland, as well as perhaps information on land usage and environmental conditions
Works providing a detailed appreciation
3 6 Show many aspects of the coast, including the geology, vegetation patterns and coastal development
‘Art – Value of the Subject Matter’. This very detailed watercolour drawing of ‘The Old Undercliff Road, Niton, Isle of Wight’ by George James Knox (1866) shows a location that has since been affected by dramatic coastal erosion and landsliding. This scenic road was severed by a massive rockfall from the cliff (to the right) in July 1928. Understanding the nature and extent of such past events can help geotechnical engineers understand possible scenarios along other potentially unstable coastal frontages (courtesy Prof. R McInnes).
Tools for A
nalysin
g Sources to Extract In
formation
on C
oastal Chan
ge

38
Value of the Time PeriodThe final ranking category represented the value of the time period in which the artist was working. Four time periods were identified:
Time Period Score
1770-1840 (early except Dutch ‘Golden Age’) 1
Dutch Golden Age (17th century paintings) 2
1840-1880 (Victorian coastal development period) 3
1880-1930 (Late Victorian, Edwardian and later coastal development period) 4
‘Value of the time period’. This detailed watercolour drawing of ‘the Harbour, Lowestoft’ is by the prolific watercolourist Alfred Robert Quinton. Painted in about 1910 it shows the form of the construction of the timber breakwater in some detail. Such images can be useful to designers of replacement structures who may need to understand the nature of the existing infrastructure for both design and costing purposes. Like William Daniell RA in the early 19th century Quinton produced over two thousand coastal views of England between the 1890’s and 1934. His art does, therefore, form a particularly valuable resource covering this time period (courtesy J. Salmon Limited of Sevenoaks).
In summary the following table provides an example of the maximum potential score for an artwork. However, during analysis these scores were ‘normalised’ to provide a score out of 100 to ensure parity between the results of the other ranking approaches (for archaeology, maps, charts and photographs):
Compiling the scores for ranking artists and their works (potential Maximum)
1. Accuracy of artistic style Maximum 5
2. Most advantageous medium Maximum 6
3. Value of subject matter Maximum 6
4. Value of the time period Maximum 4
Total Maximum Score 21 Too
ls fo
r A
nal
ysin
g So
urce
s to
Ext
ract
In
form
atio
n o
n C
oast
al C
han
ge

39
Ranking OutputThe ranking system for the artworks provided a shortlist of artists who depicted the coastline in the most accurate way. Through examination of these artists’ works it is possible to make qualitative judgments about long-term coastal change. In some cases, where artists were known for their particular attention to detail it may be possible also to assess quantitative changes (e.g. the extent of cliff retreat or beach change), particularly where structures such as lighthouses, fortifications or coastal protection structures or other historical ruins are located close to the coastline. In addition, beach conditions can be assessed when the level of the beach is shown in historical images, for example, adjacent to structures such as piers, breakwaters and sea walls.
Location of artworks assessed. The size and colour reflect the result of the scoring, with larger dark blue squares scoring highest.
‘Yarmouth’, 1891. Watercolour. Charles Robertson (1844-1891). Robertson was a follower of the Pre-Raphaelites and portrays the extent of the saltmarsh and mudflats on the north-west coast of the Isle of Wight in precise detail (private collection).
Tools for A
nalysin
g Sources to Extract In
formation
on C
oastal Chan
ge

40
East Anglia UK West Devon/East Dorset UK
Artist Medium Used Ranking Score Artist Medium Used Ranking Score
Alfred Robert Quinton Watercolour 70 Arthur Perry Watercolour 70
Walter Frederick Osborne Oil Painting 70 J. Baker Engraving 66
John Moore of Ipswich Oil Painting 66 W. Dawson Engraving 66
Myles Birket Foster Watercolour 62 Daniel Dunster Engraving 66
Alfred Heaton Cooper Watercolour 62 Alfred Robert Quinton Watercolour 62
Edwin Hayes Oil Painting 59
Thomas Smythe Oil Painting 55 West Cornwall UK
John Varley Watercolour 55 Artist Medium Used Ranking Score
William Daniell Engraving 55 Alfred Robert Quinton Watercolour 70
John Brett Oil Painting 62
East Kent UK John Mosford Oil Painting 59
Artist Medium Used Ranking Score William Daniell Engraving 55
William Dyce Oil Painting 62
Henry Pether Oil Painting 55 Brittany France
William Daniell Engraving 55 Artist Medium Used Ranking Score
Eugène Isabey O/WC/E 74
Hastings UK Paul Sébillot WC/P/E 62
Artist Medium Used Ranking Score Theóphile Busnel WC/P/E 62
Alfred Robert Quinton Watercolour 70 Maxime Maufra O 59
William H. Borrow Oil Painting 59 Duroy Bateau WC/P/E 59
Charles A. Graves Oil Painting 59 Alexandre Nozal WC/P/E 59
Edwin Hayes Oil Painting 51 Theodore Godin O 55
Henry Riviere WC/P/E 55
Solent/Isle of Wight UK Emmanuel Lansyer O 51
Artist Medium Used Ranking Score Gaston de Latiney WC/P/E 51
Charles Robertson Watercolour 77
William Gray Watercolour 44 Key
William E. Atkins Watercolour 70 Watercolour WC
Alfred Robert Quinton Watercolour 70 Engraving/Etching E
William Westall Engraving 62 Oil Painting O
Robert Brandard Engraving 55 Pencil P
Clarkson Stanfield Engraving 55 Henry Pether Oil Painting 55 William Turner of Oxford Watercolour 51
Art Fieldwork ApproachAreas that contained a substantial number of highly ranked paintings were visited and photographs were taken to record the current condition. Prior to the site visits the location from which the artist depicted the view was established as closely as possible in order that a direct visual comparison could be made in the field. Inspections were timed, wherever possible, to coincide with low water and a walk-over survey was made along the beach and base of the cliff returning along the cliff top. This ensured that thorough comparison could be made between the geomorphological conditions depicted in the artwork and the present day situation.
The main focus for each case study has been the examination of one or two particular artworks, and then to make an assessment of what the image tells us about changes over time from field observation. However, for some of the study sites it has been found that several artists painted the view from the same or a similar spot. This has helped establish a chronology of coastal change through the nineteenth and twentieth centuries.
The project partners were anxious to ensure that the field study sites represented the full range of geomorphological conditions around the Channel-Southern North Sea coastlines so that art could be used to support evaluation of coastal change across a wide range of environments. Consequently, the case study sites included rock clifflines, soft cliffs, coastal landslides, shingle and sandy beaches and spits and saltmarsh and mudflats.
The fieldwork objective was to support the wider Arch-Manche ambitions of establishing:• What information can the historical images provide to support understanding of long-term coastal change?• How can the potential of this resource be used most effectively by stakeholders?
The tables provide a list of the highest ranking artists for each of the study areas, listing also the medium which the artist used most commonly and the typical scores that their works achieved.
Too
ls fo
r A
nal
ysin
g So
urce
s to
Ext
ract
In
form
atio
n o
n C
oast
al C
han
ge

41
Examples of Art Ranking, Fieldwork and Analysis Works of art were ranked across the study areas, with a particular focus on case studies in the UK and France.
St Michael’s Mount, Mount’s Bay near PenzanceThe site is located on the south coast of Cornwall, approximately 2km east of the town of Penzance. The Mount is connected to the foreshore by a causeway, which is covered at high water. The site is under significant pressures from both tourism, as well as, physical coastal processes including storm surges affecting the beach and its nature conservation interest. Hard defences covering much of the Bay may lead to ‘coastal squeeze’ in the future.
Location Artist Date Type Period Style Environment Total
1 St Michael’s Mount – View 1 William Daniell 1825 Aqua-tint Early Topog. Detailed View 55
2 St Michael’s Mount – View 2 William Daniell 1825 Aqua-tint Early Topog. Detailed View 55
3 St Michael’s Mount G. Townsend c.1850 Steel Engraving Mid. Topog. V.Detailed View 62
4 St Michael’s Mount
Henry B. Wimbush c.1900 Watercolour Late Topog. Detailed View 70
5 St Michael’s Mount
Alfred Robert Quinton c.1900 Watercolour Late Topog. Detailed View 70
The two views of St Michael’s Mount from the shore at Marazion by Alfred Robert Quinton and by Henry Wimbush were both painted in watercolour in about 1900. They are taken at Low Water as shown by the exposed causeway linking the Island to the mainland, which is being accessed by pedestrians in the pictures. In the foreground the rocky foreshore can be seen, which lies seaward of the sandy beach. The watercolours indicate the nature of the foreshore, and it appears that there has been little change since the view was painted.
Comparison of the images with the present day appears to show relatively little change and this is supported by evidence from monitoring of the frontage. The watercolours help to provide a long-term perspective in terms of the nature of conditions at this important location.
1 2 3
4 5
Tools for A
nalysin
g Sources to Extract In
formation
on C
oastal Chan
ge
Images 1, 2 and 3 courtesy of Prof. R McInnes, images 4 and 5 courtesy of J Salmon Limited of Sevenoaks.
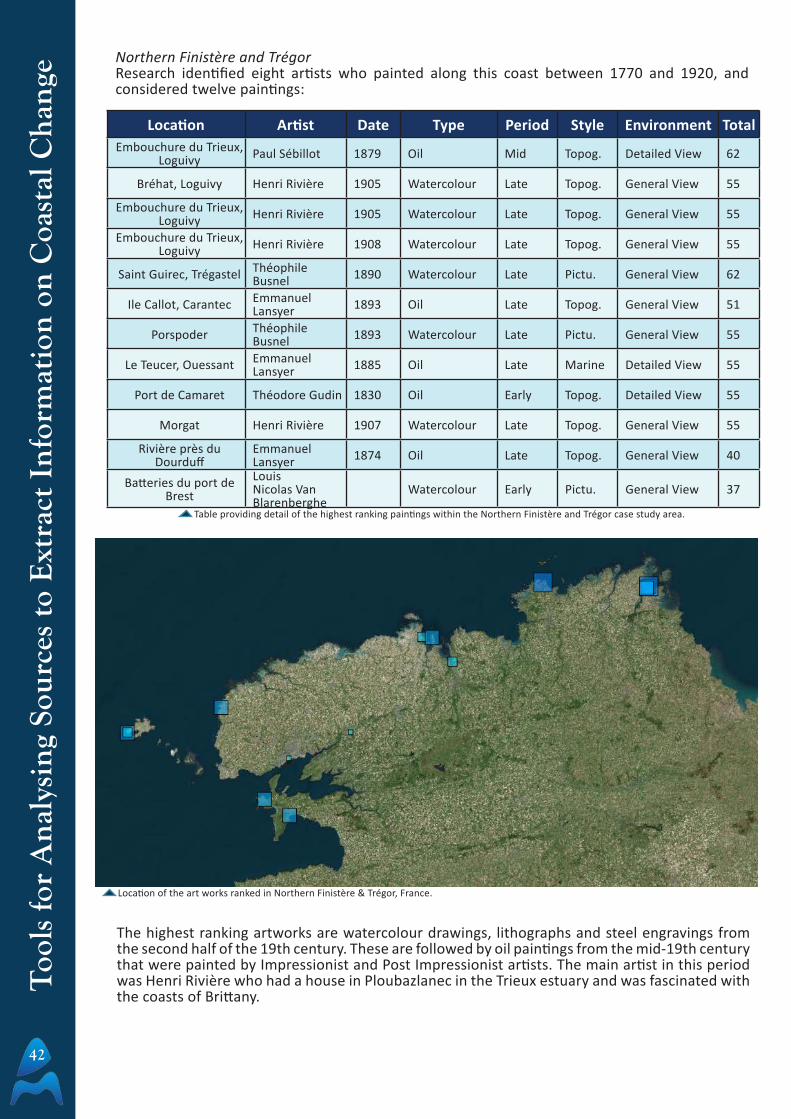
42
Northern Finistère and TrégorResearch identified eight artists who painted along this coast between 1770 and 1920, and considered twelve paintings:
Location Artist Date Type Period Style Environment TotalEmbouchure du Trieux,
Loguivy Paul Sébillot 1879 Oil Mid Topog. Detailed View 62
Bréhat, Loguivy Henri Rivière 1905 Watercolour Late Topog. General View 55
Embouchure du Trieux, Loguivy Henri Rivière 1905 Watercolour Late Topog. General View 55
Embouchure du Trieux, Loguivy Henri Rivière 1908 Watercolour Late Topog. General View 55
Saint Guirec, Trégastel Théophile Busnel 1890 Watercolour Late Pictu. General View 62
Ile Callot, Carantec Emmanuel Lansyer 1893 Oil Late Topog. General View 51
Porspoder Théophile Busnel 1893 Watercolour Late Pictu. General View 55
Le Teucer, Ouessant Emmanuel Lansyer 1885 Oil Late Marine Detailed View 55
Port de Camaret Théodore Gudin 1830 Oil Early Topog. Detailed View 55
Morgat Henri Rivière 1907 Watercolour Late Topog. General View 55
Rivière près du Dourduff
Emmanuel Lansyer 1874 Oil Late Topog. General View 40
Batteries du port de Brest
Louis Nicolas Van Blarenberghe
Watercolour Early Pictu. General View 37
Location of the art works ranked in Northern Finistère & Trégor, France.
The highest ranking artworks are watercolour drawings, lithographs and steel engravings from the second half of the 19th century. These are followed by oil paintings from the mid-19th century that were painted by Impressionist and Post Impressionist artists. The main artist in this period was Henri Rivière who had a house in Ploubazlanec in the Trieux estuary and was fascinated with the coasts of Brittany.
Table providing detail of the highest ranking paintings within the Northern Finistère and Trégor case study area.
Too
ls fo
r A
nal
ysin
g So
urce
s to
Ext
ract
In
form
atio
n o
n C
oast
al C
han
ge
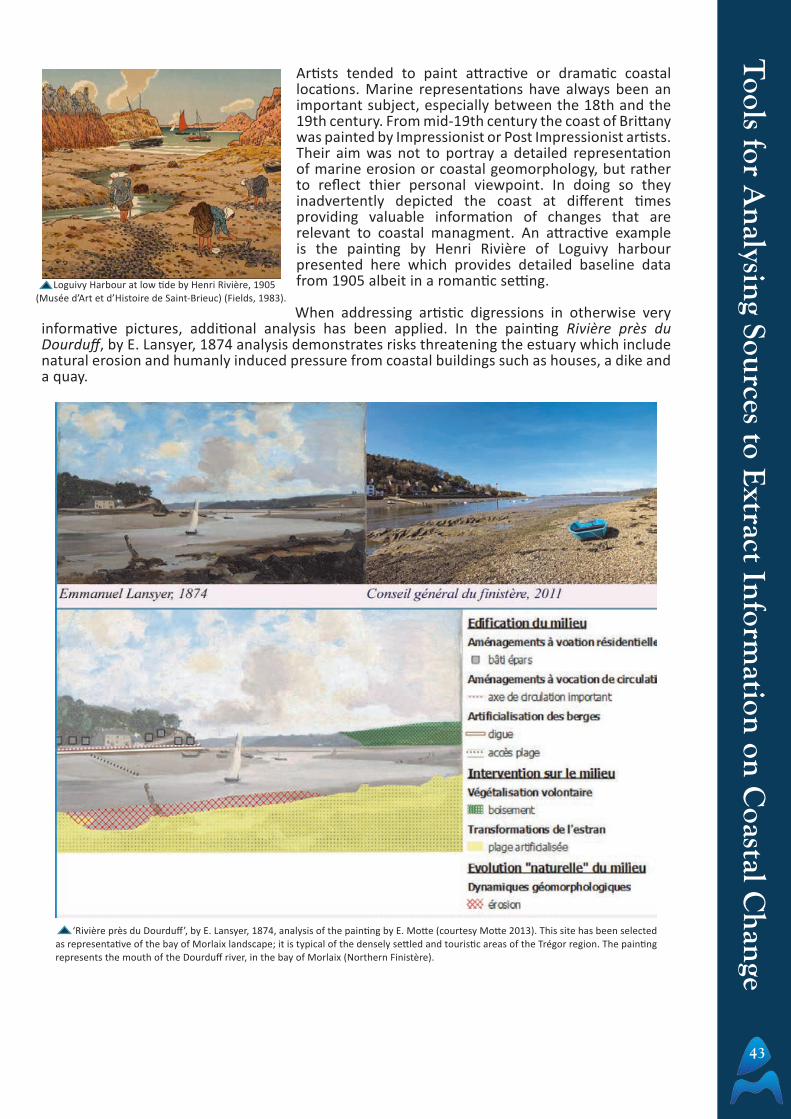
43
Artists tended to paint attractive or dramatic coastal locations. Marine representations have always been an important subject, especially between the 18th and the 19th century. From mid-19th century the coast of Brittany was painted by Impressionist or Post Impressionist artists. Their aim was not to portray a detailed representation of marine erosion or coastal geomorphology, but rather to reflect thier personal viewpoint. In doing so they inadvertently depicted the coast at different times providing valuable information of changes that are relevant to coastal managment. An attractive example is the painting by Henri Rivière of Loguivy harbour presented here which provides detailed baseline data from 1905 albeit in a romantic setting.
When addressing artistic digressions in otherwise very informative pictures, additional analysis has been applied. In the painting Rivière près du Dourduff, by E. Lansyer, 1874 analysis demonstrates risks threatening the estuary which include natural erosion and humanly induced pressure from coastal buildings such as houses, a dike and a quay.
Loguivy Harbour at low tide by Henri Rivière, 1905 (Musée d’Art et d’Histoire de Saint-Brieuc) (Fields, 1983).
‘Rivière près du Dourduff’, by E. Lansyer, 1874, analysis of the painting by E. Motte (courtesy Motte 2013). This site has been selected as representative of the bay of Morlaix landscape; it is typical of the densely settled and touristic areas of the Trégor region. The painting represents the mouth of the Dourduff river, in the bay of Morlaix (Northern Finistère).
Tools for A
nalysin
g Sources to Extract In
formation
on C
oastal Chan
ge

44
Ventnor, Isle of Wight, UKTwo rare images of Ventnor, Isle of Wight show key geomorphology features which have been utilised in the production of a landslide model for the area.
‘Ventnor Beach’ by Rock & Co. 1863. The view shows a rock formation seaward of the existing sea cliff. The rocks illustrated in this engraving, which have long since been lost through erosion, identified a former cliff line further seaward.
A detailed view of the Ventnor, Isle of Wight coast by William Westall (1842). Victorian and Edwardian development over the coastal slopes and planting and spread of the Holm Oak in the early 20th century now mask the geomorphology. The geomorphological boundaries have been identified on the image.
Landslip model for the Ventnor area of the Isle of Wight (courtesy of Halcrow, 2006).
Ventnor Undercliff is a 12km long coastal cliff and landslide complex between Luccombe and Blackgang on the south coast of the Isle of Wight. The Undercliff is regarded as one of the most unstable developed geological settings in the UK; the complex cliffs are formed from weak rocks that are sensitive to the effects of toe erosion and groundwater. There is concern that increases in relative sea level and winter rainfall will result in accelerated ground movement rates and more frequent landslide events over the next 100 years.
In recent years research has sought to understand more about the formation and development of the Undercliff landslide complex in order to support effective planning and risk management. A fundamental need was to understand how the landside complex was formed and its extent seawards.
The paintings studied show the town of Ventnor before the coastal frontage was extensively developed from the 1830s onwards, allowing some of the main components of the landslide complex to be identified, as well as providing information on the former cliffline further seaward.
Too
ls fo
r A
nal
ysin
g So
urce
s to
Ext
ract
In
form
atio
n o
n C
oast
al C
han
ge

45
Tools for Using Historic PhotographsUnlike historic maps, charts and artworks it was not necessary to rank historic photographs for reliability and accuracy. The methodology developed aimed to rank them based on their usefulness in supporting understanding of long term coastal change.
Applying the Ranking CriteriaFour criteria were used for historic photographs, these were:
Purpose of the photo/postcard: This was a non-scoring criteria and consisted of the following four options:• Private;• Touristic;• Scientific (geology, geomorphology, archaeology);• Unknown.
Coastal View: The next criteria chosen depended on whether the image depicted cultural heritage features. If these were not shown (for example the image was a general landscape view) the following criteria were used:• General view – no clear detail on the coastal geomorphology (2 points);• Semi-general view – possible to identify coastal features such as the division between the cliff and beach (4 points);• Detailed view – possible to clearly see the shoreline position, beach profile, geology etc (6 points).
Heritage View: If the image did contain cultural heritage features then the following criteria were used:• The view provides a general insight on coastal evolution without chronological indications (2 points);• The view provides an indication on the chronology – identifiable period (4 points);• The view provides a detailed indication on the chronology – precise chronology (6 points).
Quality: The final criteria was based on the current state of the image:• Poor (1 point);• Medium (2 points);• Good (3 points).
Ranking OutputsA total of 1,115 historic photographs and postcards were assessed as part of the project, these were ranked based on the potential they have to provide information on the changing coast. Photos were generally selected from areas along the coast where historic paintings and archaeological sites were also known. It should be noted that this study is not intended to be exhaustive, it simply aims to highlight the potential for historic photos to provide information on coastal change. Historic photos were mainly assessed in the UK and French case study areas, with some examples from the Dutch and Belgian coasts. Location of historic photographs assessed. The size reflects the score, the larger the star
the higher the score.
Tools for A
nalysin
g Sources to Extract In
formation
on C
oastal Chan
ge

46
Examples of Photographic AnalysisWhile scoring of historic photographs has been conducted in a number of case study areas, the primary focus of this technique has been on the rich photographic collections available within France. Examples include:
Kernic BeachThe photo to the right shows Kernic beach and a prehistoric passage grave in Plouescat, this image contains cultural heritage and scores highly with 6 points under criteria 3, the passage grave has been radiocarbon dated to 4300 Cal BP and is now located 3.2 metres under the current high water line. The current state of the image also achieved a high score as the image has not degraded or been torn so it is still possible to view the detail.
Plouguerneau, Men Ozac’h, by A. Devoir (c. 1910)The Men Ozac’h monument is located in a large flat sandy bay, in the estuary of the “Aber Wrac’h” river, which is a geomorphologic feature typical for the portion of coast, called the “Aber Coast”. This coasts belongs to the “Low Shelf of Léon” formation (northern Finistère), comprising deep indentations and bordered by numerous island and islets; the rocky parts alternate with large sandy beaches. The tide range in this part of Brittany (c. 8 metres) exposes large areas of seabed to enlarge the the territory during low tide. As shown within the photographs, the small islands can be reached on foot during low tide.
This area is subject to intensive coastal erosion, due to several factors:• its geographical location, facing the west and exposed to the main storms;• the tide and waves effects on the soft rocks formations;• the human buildings (ports, quays) which can modify local sedimentation processes and retain sand.
The Kernic beach and prehistoric passage grave, Plouescat (Finistère) historic photo (around 1900), author Cdt. Devoir © Labo Archéosciences UMR 6566 CReAAH.
Views of the tidal Men Ozac’h standing stone (menhir), Plouguerneau (Finistère) (photos by A; Devoir, early 20th century) © Labo Archéosciences UMR 6566 CReAAH.
Too
ls fo
r A
nal
ysin
g So
urce
s to
Ext
ract
In
form
atio
n o
n C
oast
al C
han
ge

47
Among the available pictures of the site, number one was selected for ranking as it appeared to be the most informative due to the view showing the landscape around the standing stone and because the person standing next to the ‘menhir’ provides a “scale” for the monument. The ranking score achieved was high at 77. Despite the very high quality of palaeoenvironmental indications, the ranking score is not maximum due to the fact that menhir (standing stones) monuments are difficult to date with precision, as they are known to have been constructed from the Neolithic to Bronze Age period.
Photograph number two shows the monument at high tide and number three details the presence of attached seaweed. Both images provide historic evidence for the position of the ‘menhir’ which is regularly (twice a day) submerged by sea water.
The original view (glass photographic supports and positive papers) are part of the collection of the Laboratoire Archéosciences (Rennes University).
Example from the French Cornouailles Case Study AreaThe comparison between the historic and recent photos shows the evolution of this area due to human pressure where a modern road has replaced the sandy beach and landing port.
The small stone walls, visible on the photo, reveals the poverty of local people as well as the inefficient nature of early constructions put in place to protect the land behind the shore.
Kerity miln (Penmarc’h) 1. Photograph by Georges Chevalier, 26th of February 1920. 2. Same area today (Source : panoramio.com). 3. © JLouis Guegaden, 2008 (source http://kbcpenmarch.franceserv.com/).
Tools for A
nalysin
g Sources to Extract In
formation
on C
oastal Chan
ge

48
Combining Data Sources for Long-Term Analysis
The Arch-Manche project has sought to advance our understanding of the scale and rate of long-term coastal change by realising the potential of under-used data sources. Resources consulted include archaeology, palaeoenvironmental data, works of art, maps, charts, photographs and literature accounts. Uniquely, this project combines data sources to extract maximum amounts of information that can give details on long-term coastal change.
The analysis process involved in utilising all data sources has required the creation of joint-working through web accessible database and GIS systems, in addition to the use of specialist software and techniques used for initial assessment along with the creation of two and three dimensional illustrated models.
The project has placed a high priority and emphasis on effective, efficient and innovative data management that underpins many of the overarching project aims and objectives.
Database The project database was developed as the central repository for storing, rationalising and distributing the project results. The database is a relational database designed to provide the maximum potential for query building and ease of obtaining the required information and reports.
The key functional aspects of the database are: • Geographic functions: the database is a spatially enabled geodatabase and records are available to the project GIS;
• Accessibility: the database and interface are as accessible as possible and allow concurrent user working for international partnership development;• Ranking: contains the ranking systems for individual records establishing relative scoring of information from various interrelated disciplines, including art, photographic. archaeological, palaeoenvironmental and coastal management data;• Visualisation: the resulting data is suitable and accessible for the development of illustrative material, including 3D models, animations and schematic representations, web-GIS and the project website.
Example ‘Form View’ of the Archaeology / Palaeoenvironmental Table via the web-interface.
Example ‘Grid View’ of the Maps and Charts Table via the web-interface.
Database and Data Analysis
Com
bin
ing
Dat
a So
urce
s fo
r L
ong-
Ter
m A
nal
ysis

49
Data AnalysisThe project has developed an online exploration platform for the visualisation and interpretation of the entire project study area (2D) and specific partner case study areas (2, 3 and 4-D). The platform is browser based, requiring no plugins or additional software. It offers the means to explore, understand and engage with the wealth of art, archaeology and heritage common to the partner states in a way not previously accessible to such a broad and diverse audience. To access the portal go to:
This online geo-portal has a plan-view interactive map illustrating the range and distribution of indicators of coastal change. Each of these points reveals additional information and imagery drawn directly from the underlying database. Additional navigation controls are available to allow the user to zoom into selected sites and features, including the 2, 3 and 4-D models created for several of the case study areas.
WWW.ARCHMANCHE-GEOPORTAL.EU
The Arch-Manche portal. Users are able to zoom in on various case study areas, query the data, view the 2, 3 and 4-D models and download project reports and information.
Zoomed in to the Solent region in the Arch-Manche portal, in this example a painting of Alum Bay has been selected, the details are shown on the right and a thumbnail of the image pops up on the screen.
Com
binin
g Data Sources for L
ong-T
erm A
nalysis

50
The power of combining information from different data sources is well illustrated through examples where all sources types have been available within a particular study area and have been subject to assessment and analysis. Some illustrative examples include:
Gulf of Morbihan, FranceResults of studies within the Gulf of Morbihan have provided direct evidence of sea level and coastal change in both recent times and dating back over thousands of years.
Er Lannic Megalithic site: Combining historic photographs, archaeological data and aerial photographs provides data on the evolution of the coast and sea level in relation to this important archaeological site.
Combined documents on the Er Lannic megalithic site. 1. A view from the air of the half submerged stone circle on the islet of Er Lannic, in the Gulf of Morbihan (Cl. Reynaud, source futura-sciences.com), 2. Zacharie Le Rouzic, Marthe and Saint-Just Péquart, during the restoration of the Er Lannic monument (c. 1920) © Labo Archéosciences UMR 6566 CReAAH., 3. Map of the Er Lannic stone circles (courtesy P. Gouézin, after Gouézin & Le Gall 1992).
Combined ResourcesC
ombi
nin
g D
ata
Sour
ces
for
Lon
g-T
erm
An
alys
is

51
Combined documents on the Gulf of Morbihan area: 1. Sinagot by Ernest-Guerin (1887-1952). 2. The Er Lannic megalithic site during the restoration by Z. Le Rouzic (c. 1920). 3. Golfe du Morbihan, porter 1927 (source http://www.vintage-posters-gallery.com/fr/affiches-de-la-bretagne-htm). 4. Schematic map produced by shifting the bathymetry 10 metres and incorporating qualitative sedimentation phenomena and deepening (source: http://www.ileauxmoines.fr/articles.php?id=25).
Gulf of Morbian area: Different styles of artistic depictions are combined with historic photographs and historic mapping to recreate past landscapes:
Com
binin
g Data Sources for L
ong-T
erm A
nalysis

52
Saint-Servan Promontory, FranceThe use of historic maps, heritage feature data and historic aerial photographs have enabled the analysis of change around the Saint-Servan (Alet) promontory.
Above: Saint-Servan (Alet) promontory and coastal evolution of the harbour: evolution of the topography before (a) and after (b) the 4th century AD. The beak of the alluvial bar led to modification in the use and frequentation of the area. On the ancient map (18th century, Ministère de la Défense, Vincennes) (c) some remains of the alluvial bar still appear. (d) 20th century view (IGN map).
Right: Saint-Servan (Alet) promontory and coastal evolution of the harbour. From top to botton: Carte des Ingénieurs Goégraphes du Roi (c. 1785) (Ministère de la Marine). Napoleonian cadastre (1835) (Archives du département d’Ille-et-Vilaine). Aerial views (1945 and c. 2012) (Geoportail, IGN source).
Location of the Saint-Servan promontory.
Com
bin
ing
Dat
a So
urce
s fo
r L
ong-
Ter
m A
nal
ysis
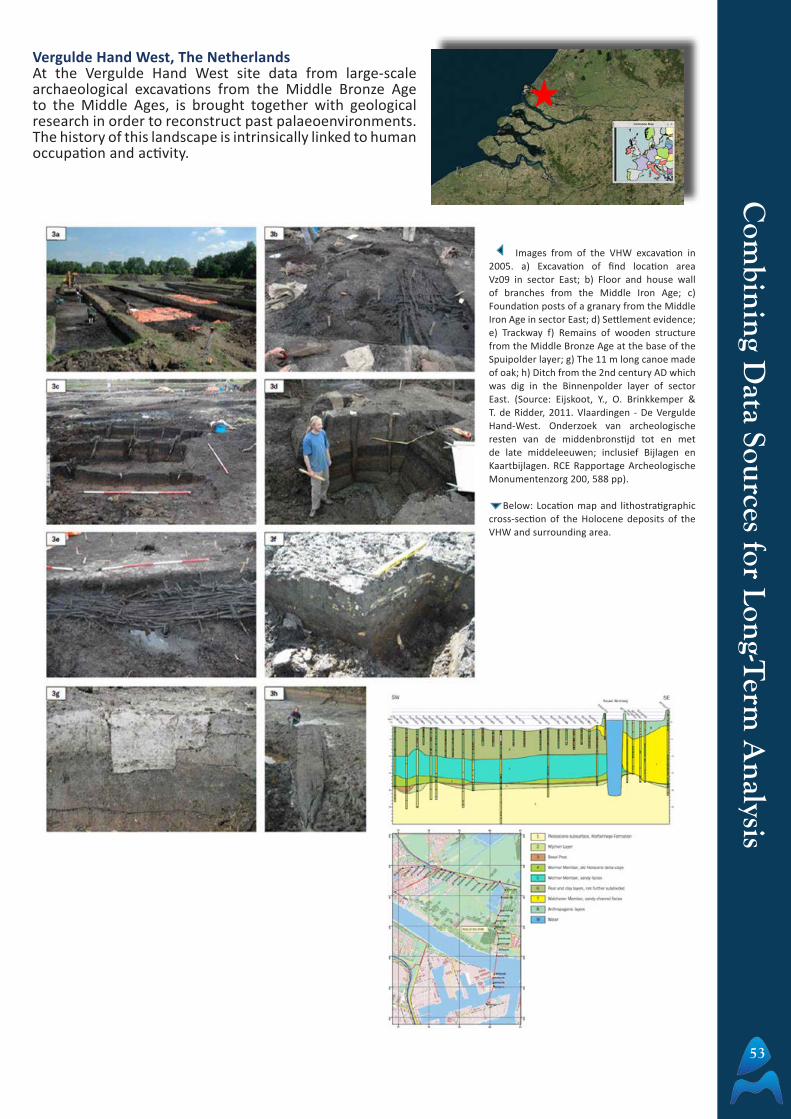
53
Vergulde Hand West, The NetherlandsAt the Vergulde Hand West site data from large-scale archaeological excavations from the Middle Bronze Age to the Middle Ages, is brought together with geological research in order to reconstruct past palaeoenvironments. The history of this landscape is intrinsically linked to human occupation and activity.
Images from of the VHW excavation in 2005. a) Excavation of find location area Vz09 in sector East; b) Floor and house wall of branches from the Middle Iron Age; c) Foundation posts of a granary from the Middle Iron Age in sector East; d) Settlement evidence; e) Trackway f) Remains of wooden structure from the Middle Bronze Age at the base of the Spuipolder layer; g) The 11 m long canoe made of oak; h) Ditch from the 2nd century AD which was dig in the Binnenpolder layer of sector East. (Source: Eijskoot, Y., O. Brinkkemper & T. de Ridder, 2011. Vlaardingen - De Vergulde Hand-West. Onderzoek van archeologische resten van de middenbronstijd tot en met de late middeleeuwen; inclusief Bijlagen en Kaartbijlagen. RCE Rapportage Archeologische Monumentenzorg 200, 588 pp).
Below: Location map and lithostratigraphic cross-section of the Holocene deposits of the VHW and surrounding area.
Com
binin
g Data Sources for L
ong-T
erm A
nalysis

54
Alum Bay, Solent, UK Detailed data from shipwreck surveys, artistic representations of Alum Bay and historic charts come together to provide information on coastal change ranging from micro-scale movements of seabed sediment and cliff material, to bay-wide developments.
Sandown Castle, Kent, UKSandown Castle, built in the 16th century has suffered from coastal erosion with only a trace of the foundations left today. A combination of historic paintings, maps, charts and photographs has enabled us to understand the rate and pace of erosion affecting this part of the coast.
Top left: Measuring sediments levels around the Alum Bay 1 shipwreck (courtesy Roland Brooks). Top Right: Map of Alum Bay by A.Brannon 1862 (courtesy Prof. R. McInnes). Bottom: Painting of Alum Bay c.1860 by William Grey (courtesy Prof. R McInnes).
Above left: Sandown Castle in 1853; a plate from the London Illustrated News. Above right: a Royal Engineer map of Sandown Castle from 1860-1865. Below right: Sandown Castle seen deom the beach in the early 1900’s.
Com
bin
ing
Dat
a So
urce
s fo
r L
ong-
Ter
m A
nal
ysis

55
The aim of combining evidence from all of the various available sources is to develop reconstructions of past environments. This can be achieved in two dimensions, with outputs from either a ‘plan’ aerial view or through profiles.
The 2-D plan view reconstruction from the Yangtze Harbour project shows the changes occurring between 7,500 BC and 6,400BC, demonstrating the level of detail which can be achieved through integrated studies.
A large scale 2-D model of the south west Netherlands alongside the 2-D models created for the Scheldt polder area (see pages 10 and 34) have been made available through the project portal. Users are able to select the timescale and view the evolution of the landscape.
Developing 2-D Reconstructions
2-D plan view reconstructions of Yangtze Harbour (courtesy P. Vos, 2013, Deltares).
2-D profile reconstructions from the site of Vergulde Hand West (courtesy Vos, P.C. & Y. Eijskoot, 2009. Geo- en archeologisch onderzoek bij de opgravingen van de Vergulde Hand West (VHW) in Vlaardingen. Deltares-rapport, 0912-0245, 160 pp.).
250 BC 225 BC
50 BC 2000 AD
2-D evolution maps of the Scheldt polder region on the project portal. The legend on the left details the various layers and allows the user to select the period.
Com
binin
g Data Sources for L
ong-T
erm A
nalysis

56
8,000 years of change - a 4-D model of Langstone Harbour, UK.
A 4-D model of the topographical and environmental change in Langstone Harbour, UK has been produced. The model is presented in an interactive format that allows the user to control the time and place being viewed, providing the 4th dimension.
The model begins with Langstone Harbour in the Mesolithic when the harbour was a very different inland environment with deep ravines and fresh water streams. The user is free to explore the landscape and read more about places of specific interest or move onto the Neolithic, Bronze Age, Iron Age, Saxon, Post-Medieval or modern period, experiencing how the landscape slowly changes from an inland habitat to the tidal harbour it is today.
The model covers a period of 8,000 years and visualises and presents the results from the archaeological research undertaken. The topography and environment in the model has been constructed based on the results from geoarchaeological data analysis including boreholes, sediment analysis and radiocarbon dating.
The model was produced using a Cesium WebGL cross-platform to demonstrate the environmental development of Langstone Harbour. Cesium is a JavaScript library that does not require browser plugins. It is used for creating maps in three views, as well as simulating and controlling time in a web browser. Cesium uses WebGL for hardware-accelerated graphics, it is cross-platform, and cross-browser compliant.
The model is contained in the projects publicly available portal that enables users to explore Langstone Harbour in a uniquely interactive way. The model works in all current internet browsers, using an intuitive interactive map interface familiar to web-users, from the novice to the advanced user. The model offers a unique insight into the geomorphological development of Langstone Harbour as a case study area and promotes how archaeological and historical data can be used to understand and visualise past changes to a coastal environment.
Developing from 3-D Reconstructions to 4-DC
ombi
nin
g D
ata
Sour
ces
for
Lon
g-T
erm
An
alys
is
Screen shot from the Langstone Harbour 4-D model. Users are able to change the time period and can view landscape reconstructions for the Mesolithic, Neolithic, Bronze Age, Iron Age, Saxon, Post-Medieval as well the the present day situation. It is then possible to move around the landscape, zooming in on particular features or sites of interest, such as the Baker’s Rithe and Russell’s Lake submerged forests shown in the above example. The model is accessible through the project portal.

57
The Arch-Manche ProjectConclusions and Recommendations
The coastline is constantly evolving. Analysis of the past enables us to assess progressive changes and alterations to the coast. Data from archaeology, heritage features, art, photographs, maps and charts provides both qualitative and quantitative information on coastal evolution. Research during the Arch-Manche project has highlighted that these data have been under-used as a resource to support understanding of long-term risks associated with a range of coastlines.
This document has presented the value of archaeology, the palaeo-environment and heritage, above and below the water, to identify the effects of change. These science based tools can help inform coastal managers when recognising future risk and assessing budgetary requirements for the coastal zone. The guidance has also shown how art, cartography and photography can be used to demonstrate change clearly and effectively whereby providing a good way of engaging with stakeholders when discussing coastal change and its implications in practice.
The wealth of coastal landscape art and photographic images, as well as cartography, archaeology and palaeoenvironmental data, can be used most effectively when considered alongside one another. With these additional resources those responsible for coastal management will be much better prepared to address the challenges to be faced in the future.
The data assessed, results of the project, technical report and 2, 3 and 4-D models are all accessible through the Arch-Manche portal, www.archmanche-geoportal.eu.
Arch-M
anche P
roject Con
clusions an
d Recom
men
dations
Key Arch-Manche Conclusions:
• Looking back to go forward – understanding past coastal change enables more accurate predictions of future changes and potential impacts in areas under stress.
• The long-term perspective provides a sound evidence base for future coastal planning and sustainable development.
• Areas of the Channel-Southern North Sea coastline are particularly prone to a range of natural hazards including coastal erosion, landslides and sea flooding. Project data has helped identify areas at particular risk.
• Some coastal areas have greater physical stability over the long-term as witnessed through Arch-Manche analysis, helping identify areas of lower risk.
• While detailed coastal monitoring data is often available for the last few decades, the approach taken by Arch-Manche can fill the large ‘data gap’ for earlier periods from the Palaeolithic to the 20th century.
• Archaeology, coastal heritage, art, charts, maps and photographs are sources of value to coastal scientists, engineers and coastal managers, making decisions on coastal management on a day-to-day basis.

58

59
The Project Team
Maritime Archaeology Trust:Julie Satchell
Lauren TidburyGarry MomberPhilippa Naylor
Jasmine Noble-ShelleyKathryn DaglessStephen Fisher
Julian WhitewrightVirginia Dellino-Musgrave
Centre National de la Recherche Scientifique:Marie-Yvane DaireCatherine DupontGregor MarchandCatherine Le Gall
Francis BertinJean-Baptiste Barreau
Laurent QuesnelVincent Bernard
Pau OlmosChloe Martin
University of Ghent: Tine Missiaen
Iason JongepierKatrien HeirmanJeroen Verhegge
Deltares:Peter Vos
Steering Committee Members
Samantha CopePeter Murphy
Yves-Marie PauletOlivia Hulot
Marnix PietersKathy Belpaeme
Hans Peeters
Key External Personnel
Robin McInnesAndrew Williams
Roland BrooksJane Maddocks
Rob ScaifeCaroline Barrie-Smith
Peter WilsonJan Gillespie
Christin HeamagiBrandon MasonEdwige MotteDave Wendes
The Arch-Manche team would like to extend grateful thanks to the following organisations for their assistance in the project:
From top to bottom: Petit Taureau fish trap in Lannion (courtesy of MAT). Painting of Alum Bay c.1860 by William Grey (courtesy of Prof. R McInnes). Map of the Isle of Wight by A. Brannon (courtesy of Prof. R McInnes). Historic photograph on the beach at Kent (Private Collection).

Coastal Management: A guide to using archaeological, palaeoenvironmental,
historical and artistic resources
The coast of the Channel and Southern North Sea is a dynamic environment. Coastal erosion, increased storm frequency, flooding and instability are all providing challenges for managing risks associated with these threats. Understanding the long-term evolution of the coast is vital in order to understand how the present situation has arisen. From this informed position it is then possible to plan for future scenarios.
Detailed coastal monitoring data is usually only available for the past few decades, which means looking to alternative data sources to provide evidence from earlier periods. Archaeology, palaeoenvironmental data, coastal heritage, art, maps, charts and photographs can all be used to extract information on past coastal changes spanning from recent history back through hundreds of thousands of years to the earliest human use of the coast.
This ‘Guide’ has been produced as part of the project ‘Archaeology, art and coastal heritage: tools to support coastal management and climate change planning across the Channel Regional Sea’ (Arch-Manche). It details how data sources have been identified, ranked and analysed together to provide evidence of coastal change. Experiences of deploying a range of field investigation techniques to gather scientific data supporting understanding of past coastal change are detailed. The importance of this work in relation to coastal management is presented through a range of results from case studies within areas exhibiting different physical and geomorphological characteristics. The results demonstrate the as-yet unrealised potential within archaeological, paleoenvironmental, historical and artistic resources to inform on the scale and pace of coastal change.
This project has been part funded by the European Regional Development Fund through the Interreg IVA 2 Seas Programme.