M ARCH TRAINING GUIDE ( SEM 3 for review) revision 0
46
UNIVERSITY OF PUNE MASTER OF ARCHITECTURE (M.ARCH) (ENVIRONMENTAL ARCHITECTURE) TRAINING GUIDE 2013 SEMESTER III 1 | Page
-
Upload
independent -
Category
Documents
-
view
0 -
download
0
Transcript of M ARCH TRAINING GUIDE ( SEM 3 for review) revision 0
UNIVERSITY OF PUNE
MASTER OF ARCHITECTURE (M.ARCH)
(ENVIRONMENTAL ARCHITECTURE)
TRAINING GUIDE 2013
SEMESTER III
1 | P a g e

INDEX
Sr No CHAPTERS Page No
1INTRODUCTION TO ENERGY MANAGEMENT IN BUILDINGS, HVAC SYSTEM
2 ENERGY ANALYSIS OF BUILDINGS USING <VE>3 ENERGY MODELLING LIVE ACTIVITIES
2 | P a g e

CHAPTER 1
ENERGY MANAGEMENT IN BUILDINGS
Commercial buildings utilise more than 42% of all electricity
produced, yet waste up to 50%. It is clear that looking at
innovative ways to manage energy use across the building
portfolio offers very substantial savings. Furthermore
organisations need to urgently adapt from ‘business as usual’
if they are to meet CSR targets, and comply with current and
future environmental legislation, whilst ensuring on-going
reliability and investment value of building stock. We believe
that the application of Virtual Building technology from
design, through construction & commissioning on into operation
and renovation/adaptation offers a 3D platform upon which
Smart building principles can be built. As such through our
consulting services we can furnish you with the analytical
information necessary to make decisions:
League table energy and carbon footprint ratings across your
building portfolio
Detailed surveys of when and where energy is wasted,
including hidden waste
A building portfolio energy reduction strategy that
maximises investment value
Tracked and verified financial savings from energy
conservation initiatives
Detailed accounting solutions that avoid Carbon Tax
penalties
3 | P a g e

Existing Building Management Systems (BMS) frequently operate
inefficiently. We can not only identify how to make the BMS
perform better, but through advanced analytics help you
uncover hidden inefficiencies which when resolved can reduce
operating costs substantially. On a recent project we achieved
a 20% reduction on the annual energy bill without any capital
spend. If there is a need to refurbish, our state of the art
simulation technology can determine the best Energy
Conservation Measure by, for example, assessing the trade-off
between energy savings and costs. Or if the best course of
action is to de-commission and rebuild, we can provide a
sophisticated and integrated Virtual Building solution that
follows the design from conception, through rating and
regulation compliance, on into construction, commissioning and
operation. This ensures that optimal operation is achieved at
all stages and adapts as the building profile changes during
its lifecycle. In this way you can gain enormous benefits
throughout the whole design and subsequent operational
process.
HVAC SYSTEMS & ENERGY EFFICIENCY
Heating Ventilation & Air Conditioning refers to equipment,
distribution systems, and terminals that provide, either
collectively or individually, the heating, ventilation, or air
conditioning requirement to a building or a portion of
building. The HVAC system accounts for significant portion of
a commercial building’s energy use. Proven technologies and
4 | P a g e

design concepts can be used to build energy efficiencies in
the system and generate significant energy and cost savings.
It also affects the health, comfort, and productivity of
occupants. Issues like user discomfort, improper ventilation,
lack of air movement and poor indoor air quality, and poor
acoustic design are linked to HVAC system design and operation
can be improved. The optimum HVAC design considers all the
interrelated building systems while addressing indoor air
quality, thermal comfort, energy consumption, and
environmental benefits. Optimizing both the design and the
benefits requires that the architect and mechanical system
designer address these issues early in the schematic design
phase and continually revise subsequent decisions throughout
the remaining design process. It is also essential that a
process be implemented to monitor proper installation and
operation of the HVAC system throughout construction.
5 | P a g e

Above Figure – A Sketch of HVAC System
CHAPTER 2
ENERGY ANALYSIS FOR BUILDINGS USING <VE>
INTRODUCTION
In this chapter you will be shown how to populate a <VirtualEnvironment> project with thermal template data andconstructions in preparation for performing dynamic thermalsimulations (ApacheSim), thermal load calculations.
The session will explain the concept of the Building TemplateManager (BTM).Fast Accurate thermal simulation is now anessential part of successful low-energy, high-performancebuilding design. ApacheSim is a central simulation processerwhich enables you to assess every aspect of thermalperformance as well as share results and input across a widevariety of other VE modules.
You will also look at the different Renewable Energyharnessing options under fuels data that can be assigned for agiven building model in Virtual Environment. To analyse thepotential for each and the benefits that one could achieve outof each.
You had earlier seen how to create a building model usingModelIT module of <VE>. Now you will be using the ApacheSimmodule of <VE> which is a dynamic thermal simulation programbased on first-principles mathematical modelling of the heattransfer processes occurring within and around a building.
ApacheSim is comprised of the following tools: Apache ApacheEngine Vista & VistaPro ApacheView ApachePro ApacheLocate
6 | P a g e

Constructions Database
DATA ENTRY OPTIONS Extensive database of global weather Data detailing layer-by-layer thermo-physical properties of
building elements Comprehensive data on glazing systems including angle-
dependent transmissivity and absorptivity Sensible and latent gains from lights, equipment and
occupants Natural ventilation, mechanical ventilation and infiltration Plant operation profiles Plant efficiency and fuel characteristics Powerful facilities for assigning and editing time-varying
room data such as plant, casual gains and air exchanges Database of constructions
Configurable using Tabular edit function Time-series profiles Tabular Edit feature for Building Template Manager & NCM
(for UK Part L)
7 | P a g e

MODEL CONSIDERED FOR ENERGY ANALYSIS
BUILDING TEMPLATE MANAGER
The Building Template Manager (BTM) is accessed via the <VE> Tools menu, or via the BTM icon.
8 | P a g e

The BTM controls building level template information for a number of aspects of the project.
ACTIVITY 1: For a single Room Building model assign all theconstructions as per ECBC(Energy Conservation Building Code).Select Mumbai as the location. Consider the room to be anOffice. (Refer ECBC for the required values). Calculateadjusted SHGC for vertical glazing.
9 | P a g e
ImportTemplates
Add Template DeleteTemplate
APpro ProfileDatabase

Step 1: Listing down ECBC requirements with respect toConstructions.
For the Warm & humid climate of Mumbai following shall beconsiderations as per ECBC
1. Roof Assembly: (ECBC Table 4.1)
Roofs24 hrs use building Other Buildings (day time)
Max. U-factorfor overall
assembly W/sq-m-K
Min R-valuefor
insulationalone sq-m-
K/W
Max. U-factorfor overallassemblyW/sq-m-K
Min R-valuefor
insulationalone sq-m-
K/WWarm & Humid
0.261 3.5 0.409 2.1
2. ECBC limits area of vertical glazing up to max of 60% ofgross-wall area. Other requirements area:
ECBC Table 4.3Vertical
Fenestration WWR<=40% WWR<=60%
Climate Max Ufactor Max SHGC Max SHGC
Warm & Humid 3.3 0.25 0.2
3. Minimum Visible Transmission of Glazing
ECBC Table4.5Transmissivity & Window Wall Ratio
Window Wall Ratio Minimum VLT0-0.3 0.27
0.31-0.4 0.20.41-0.5 0.160.51-0.6 0.13
10 | P a g e

4. Opaque Wall Construction:
ECBC Table 4.2Opaque Walls
24 hrs usebuilding
Other Buildings(day time)
Climate
Max Ufactorfor
overallassembl
y
Min R-valuefor
insulation alone
Max Ufactorfor
overallassembl
y
Min R-valuefor
insulation
aloneWarm & Humid 0.44 2.1 0.44 2.1
5. Sky-lights:
ECBC Table 4.6Skylights (max 5% of gross roof area)
Max U-factor Max SHGC
Climate withCurb w/o Curb 0-2%
SRR2.1-5%SRR
Warm & Humid 11.24 7.71 0.4 0.25SRR – Sky-light roof ratio is ratio of total skylight area ofroof measured to the outside of roof, to the gross exteriorroof.
6. Overhangs for vertical fenestration to be used which dependson the Projection Factor. Projection factor is the ratio ofdistance from the window to the farthest edge of the overhang(H) and dividing that by the distance from the bottom of thewindow to the lowest point of the overhang (V). Also, anadjusted SHGC, accounting for overhangs and/or sidefins, iscalculated by multiplying SHGC of un-shaded fenestration by amultiplication factor (M). So there is a M factor for eachorientation and unique shading condition.
11 | P a g e
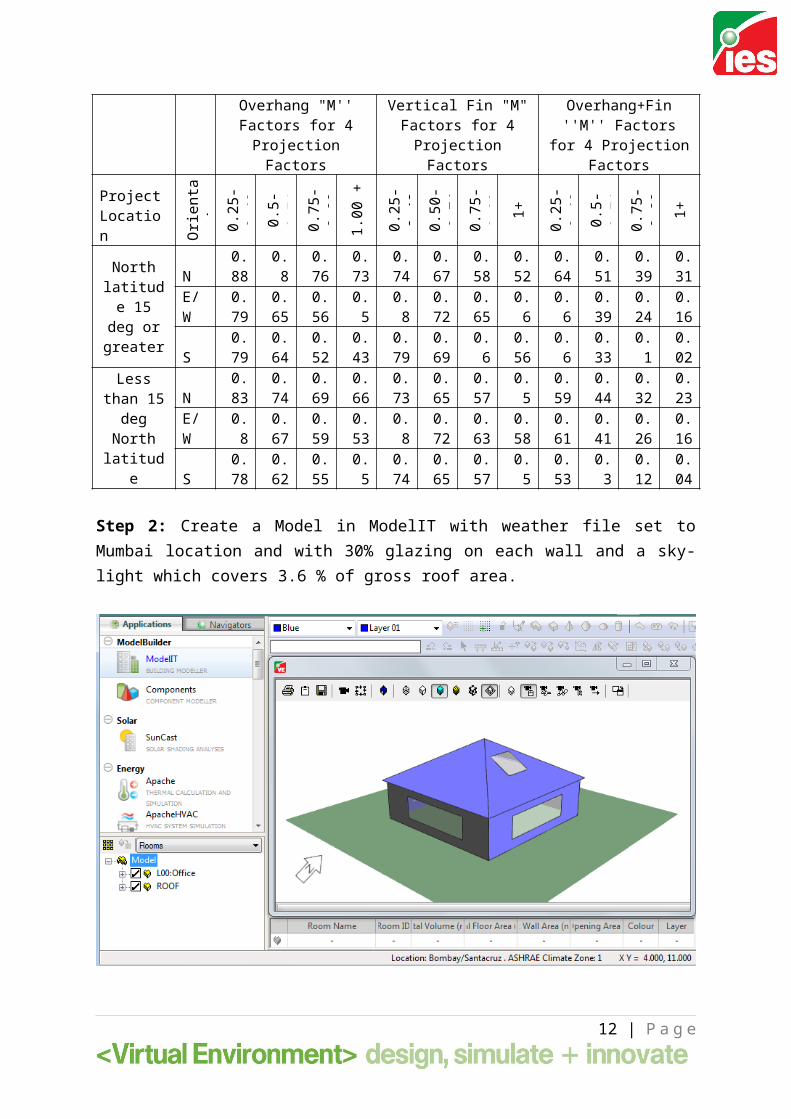
Overhang "M''Factors for 4ProjectionFactors
Vertical Fin "M"Factors for 4ProjectionFactors
Overhang+Fin''M'' Factors
for 4 ProjectionFactors
ProjectLocation Or
ient
ati
on0.25
-0.
490.
5-0.
740.75
-0.
991.
00 +
0.25
-0.
490.50
-0.
740.75
-0.
99 1+
0.25
-0.
490.
5-0.
740.75
-0.
99 1+
Northlatitude 15deg orgreater
N0.88
0.8
0.76
0.73
0.74
0.67
0.58
0.52
0.64
0.51
0.39
0.31
E/W
0.79
0.65
0.56
0.5
0.8
0.72
0.65
0.6
0.6
0.39
0.24
0.16
S0.79
0.64
0.52
0.43
0.79
0.69
0.6
0.56
0.6
0.33
0.1
0.02
Lessthan 15degNorthlatitud
e
N0.83
0.74
0.69
0.66
0.73
0.65
0.57
0.5
0.59
0.44
0.32
0.23
E/W
0.8
0.67
0.59
0.53
0.8
0.72
0.63
0.58
0.61
0.41
0.26
0.16
S0.78
0.62
0.55
0.5
0.74
0.65
0.57
0.5
0.53
0.3
0.12
0.04
Step 2: Create a Model in ModelIT with weather file set toMumbai location and with 30% glazing on each wall and a sky-light which covers 3.6 % of gross roof area.
12 | P a g e
Project location is 18.9° N latitude which is greater than15°. Site orientation is South as per the Building entry. Baseheight of window is approx 0.67 m height of window is approx1.5 m.
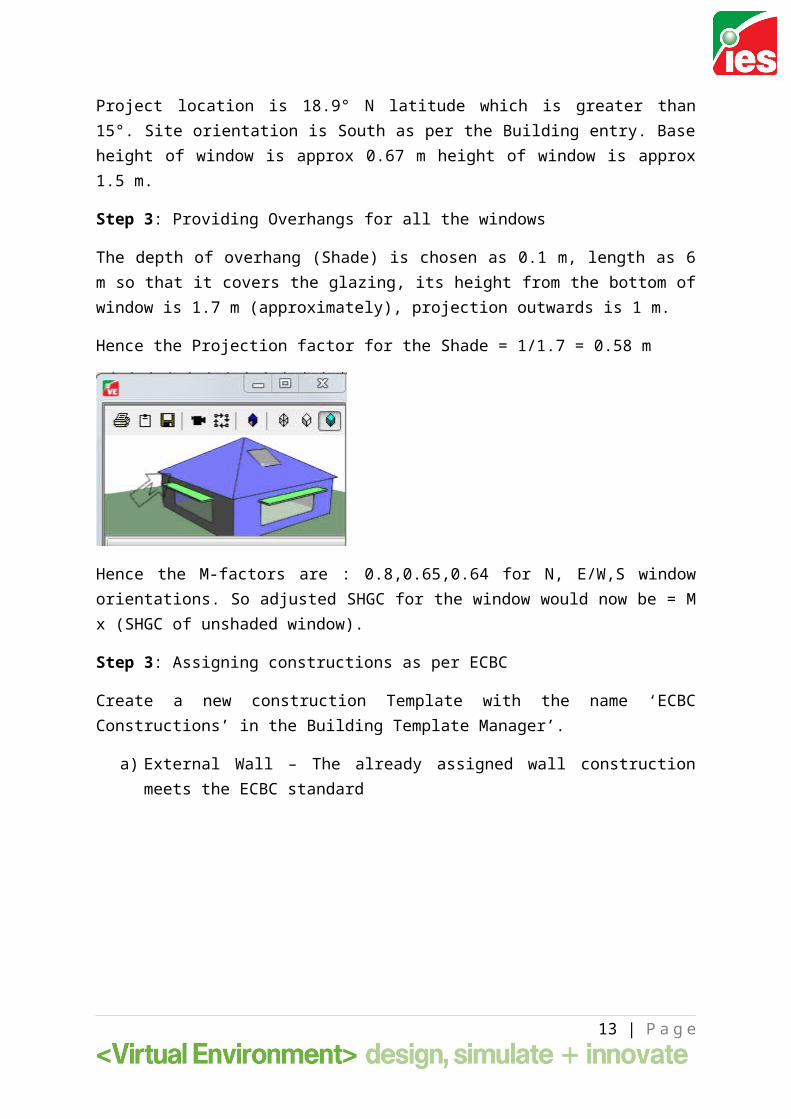
Step 3: Providing Overhangs for all the windows
The depth of overhang (Shade) is chosen as 0.1 m, length as 6m so that it covers the glazing, its height from the bottom ofwindow is 1.7 m (approximately), projection outwards is 1 m.
Hence the Projection factor for the Shade = 1/1.7 = 0.58 m
Hence the M-factors are : 0.8,0.65,0.64 for N, E/W,S windoworientations. So adjusted SHGC for the window would now be = Mx (SHGC of unshaded window).
Step 3: Assigning constructions as per ECBC
Create a new construction Template with the name ‘ECBCConstructions’ in the Building Template Manager’.
a) External Wall – The already assigned wall constructionmeets the ECBC standard
13 | P a g e
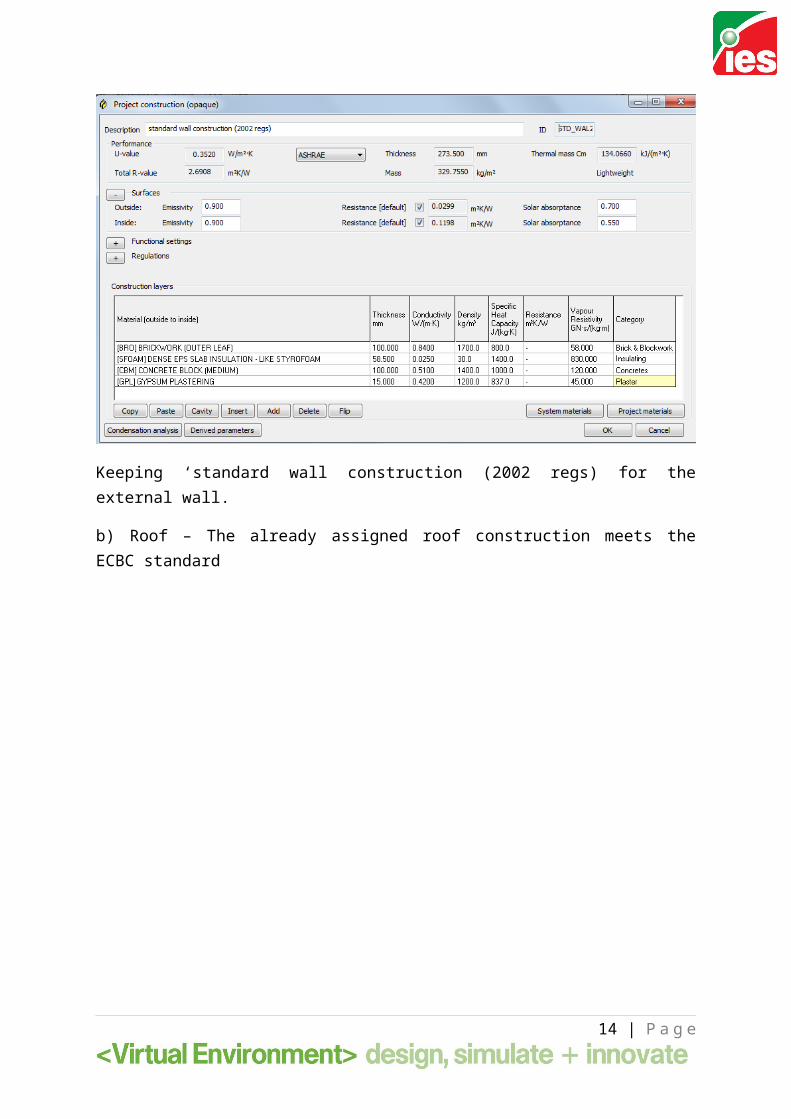
Keeping ‘standard wall construction (2002 regs) for theexternal wall.
b) Roof – The already assigned roof construction meets theECBC standard
14 | P a g e

c) Vertical Fenestration (windows) –
In place of SHGC, g-value has been shown for the windowassembly which is 0.64. This is greater than the 0.25
15 | P a g e

specified under ECBC. Hence we will modify the constructionsuch that the value meets ECBC requirements.
Saving the glazing construction as ‘ECBC Glazing’.
d) Sky-light -
16 | P a g e

The selected glazing construction for sky-light has a high g-value (SHGC) of 0.6457 which should be below 0.25. Hencemodifying the construction of sky-light as below:
Saving the construction as ‘ECBC Skylight’.
Step 4: Assign new constructions for vertical glazing & sky-light to the new template
17 | P a g e

Click ‘Save’ and then Ok. Now we will assign the constructiontemplate to the model.
Step 5: Switch to ApacheSim & assign the newly createdconstruction template
18 | P a g e

ACTIVITY 2: For the same model created in previous activity,calculate the Solar heat gain for the building. For the samemodel re-run the solar heat gain with default constructiontype to analyse any change. Also, find the yearly reduction inSolar gain as a result of the construction complying with ECBCas against non ECBC compliant (default construction).
Step 1: Calculate solar shading for the model with ECBCcompliant construction using SunCast
Making no changes in the existing model, calculate solarshading in SunCast
Step 2: Open ApacheSim & run the dynamic simulation for themodel and save result file as ‘ecbc run 1’
19 | P a g e

Step 3: When in ApacheSim change construction template todefault
Step 4: Repeat Step 1 & Step 2 for the Model with non ECBCcompliant construction.
Step 5: Compare Results (Select both the result files and thensolar gain from variables)
20 | P a g e

Clearly the model when assigned with ECBC compliantconstruction has reduced Solar gain as against with defaultconstruction.
Step 6: Yearly reductions in Solar gain
Click the Monthly totals button when in Vista after selectingthe two result files for the ECBC run and Non- ECBC run
21 | P a g e

ACTIVITY 3: For the Model considered in Activity 1, calculatethe RE potential for the Building if area available for SolarPV is 50 sq-m. Also, comment on the feasibility of Wind powergeneration for the site.
Step 1: Open the project considered under Activity 1 &Selecting the ApacheSim application
22 | P a g e

Step 2: Click on the Renewables button & add a PVS generatorPanel
23 | P a g e

Step 3: Now add a wind generator Let the hub height be 20 mts and Rated Power be 100 kW.
Step 4: Run the ApacheSim Dynamic Simulation to analyse theenergy generation from renewables
24 | P a g e

Name the results file as renewable run 1.aps.
Step 5: Select the required variables under the Energy tab &view the results for the model.
Energy Generation from Renewables is as below:
25 | P a g e

Per day units generation on an average from PV = 24 kWhPer day unit generation on an average from wind energygenerator = 23.8 kWh
This suggests that for the given location both Wind and Solarare feasible options. But due to space constraint for theconsidered building wind may be a better option for RE.
26 | P a g e

ACTIVITY 4: For a single room building model assign HVAC system such that the room temperature is maintained at 24°C during the occupancy hours. The occupancy hours are from morning 8:00 am to evening 6:00 pm on weekdays. Weekends are off. Also calculate the energy consumption and the air flow for the HVAC system.
Step 1: Considering the model that was created in Activity 1
Step 2: Open Building template manager and create an daily & weekly occupancy profile using APpro
Now, create a weekly profile by assigning the new daily profile to the weekdays & Always off profile to the weekends.
27 | P a g e
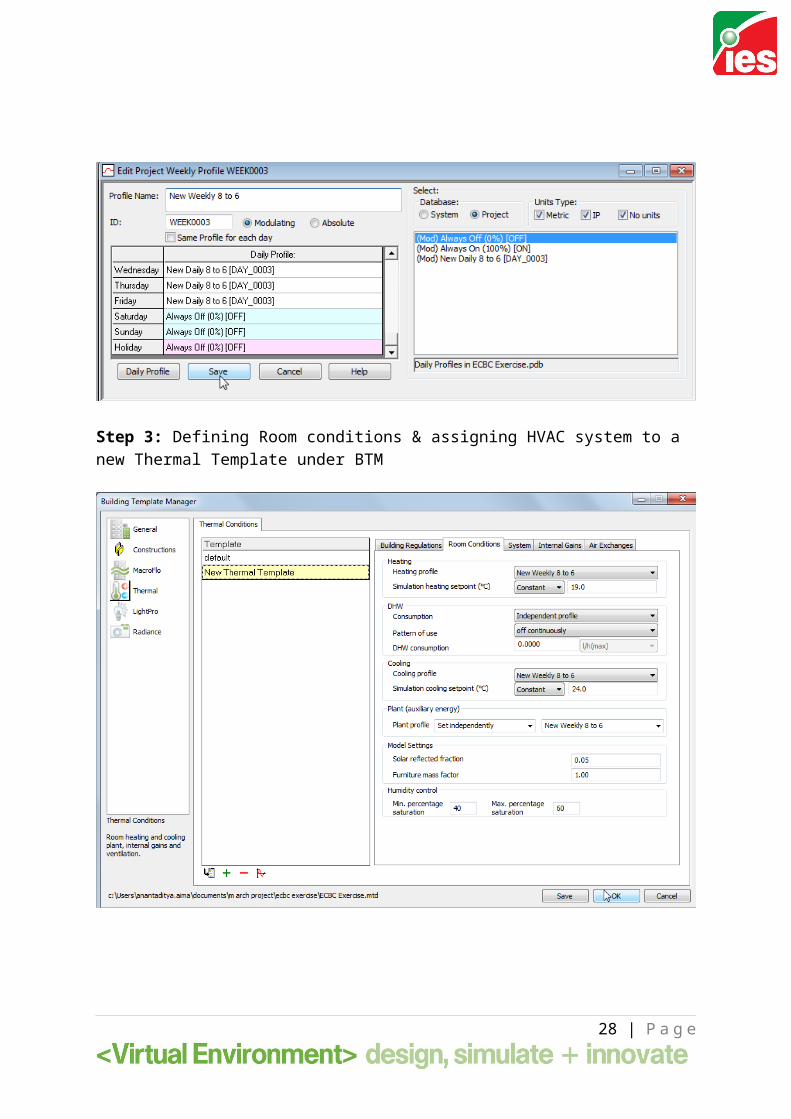
Step 3: Defining Room conditions & assigning HVAC system to a new Thermal Template under BTM
28 | P a g e

Step 4: Assigning the New Thermal template to the model room
29 | P a g e

Step 5: Select ApacheSim & run ApacheSim dynamic simulation
Step 6: View results in Vista
30 | P a g e

After selecting room, select the ‘Air temperature’ from the room variables and Dry bulb temperature from Weather
variables. Then select ‘Graph’ to view result. Step 7: Energy consumption for the HVAC system.
Under the Energy tab for the whole model, select System energyto view energy consumption for the HVAC.
31 | P a g e

From the above data the total HVAC system energy = 24.9315 MW
Step 8: Air flow for HVACSelect ApSys air Supply under room variables and click on monthly totals
32 | P a g e

This gives the per month air flow rate for the HVAC system forthe whole year. The total air supply to the HVAC is 469800 cumfor the year. But we may be interested in air supply flow for the HVAC during heating/cooling hours. For this click ‘Graph’ and then set a date.
This shows that 50 l/s is the constant Volume flow air supply from the HVAC system during its operational time.
ACTIVITY 5: Analyse the change in System cooling load as a result of the followinga) Room electric lighting level is increased from 300 lux to 500 luxb) Change in Room construction as below
ConstructionsU-Value(W/sq-m
K)External Wall 0.5
Roof 1
33 | P a g e
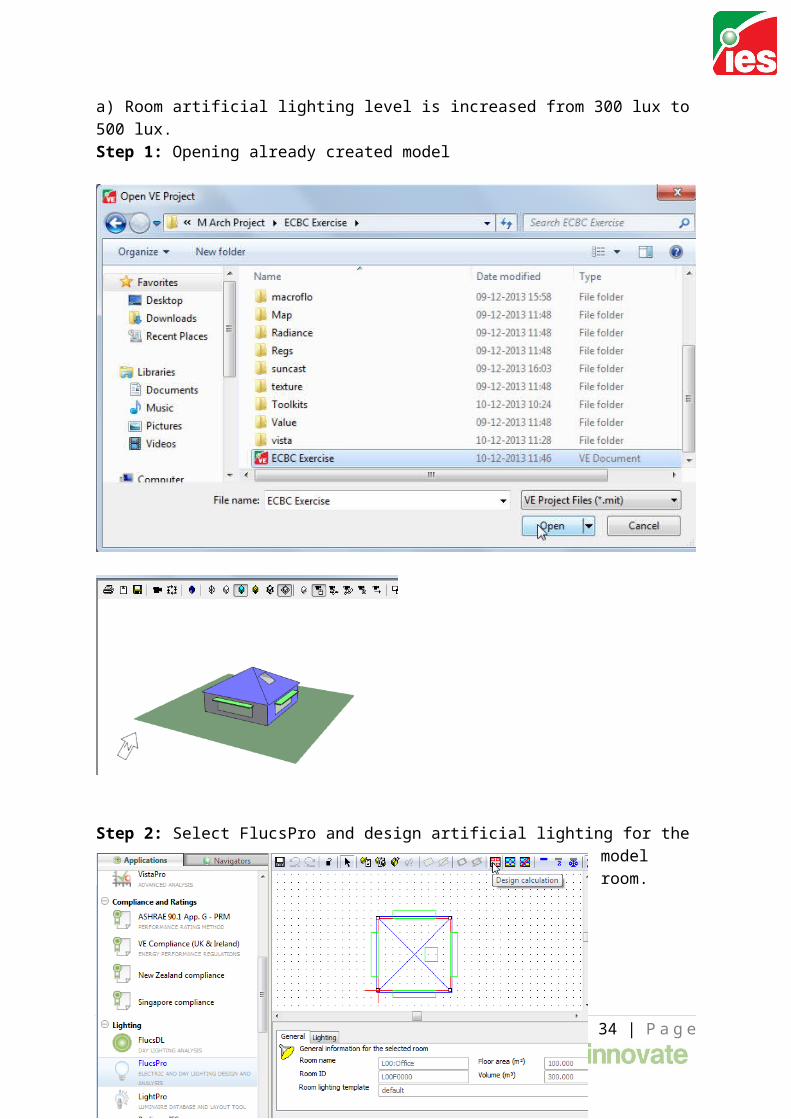
a) Room artificial lighting level is increased from 300 lux to500 lux.Step 1: Opening already created model
Step 2: Select FlucsPro and design artificial lighting for themodel room.
34 | P a g e

Step 3: Run Simulation for only artificial lighting and view results
35 | P a g e

Results
The power density for artificial lighting for 300 lux design levels is 6.24 W/sq-m
36 | P a g e
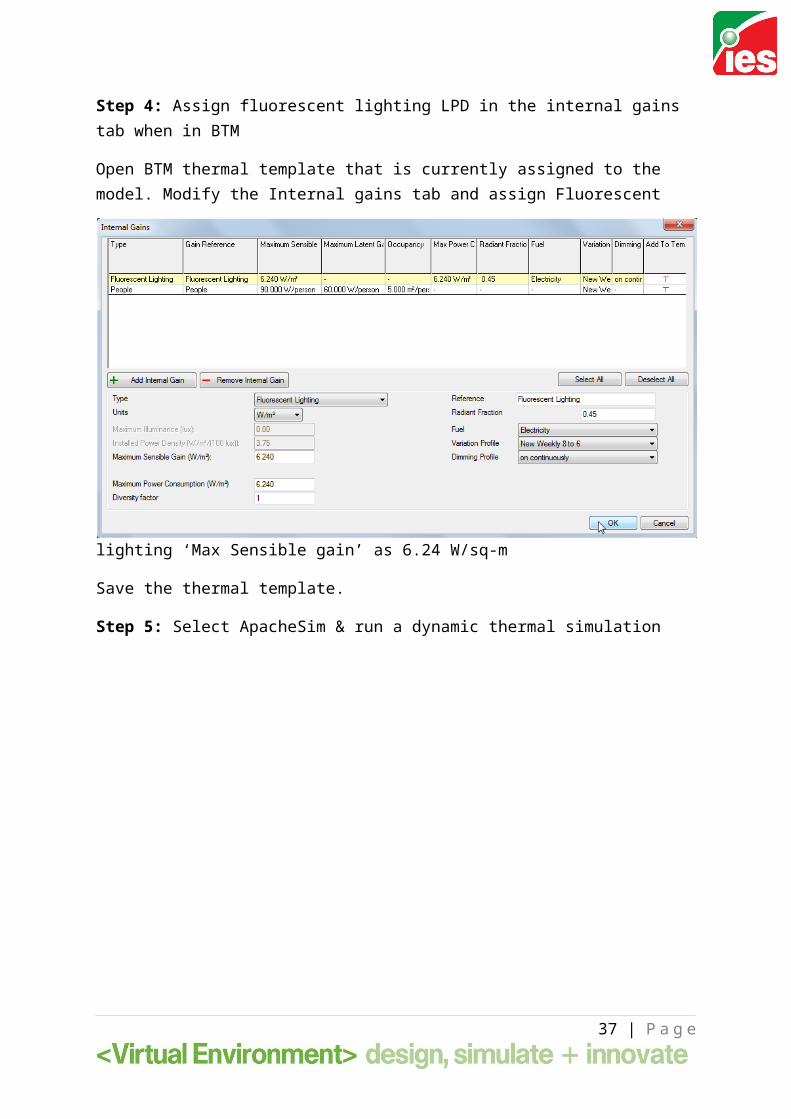
Step 4: Assign fluorescent lighting LPD in the internal gains tab when in BTM
Open BTM thermal template that is currently assigned to the model. Modify the Internal gains tab and assign Fluorescent
lighting ‘Max Sensible gain’ as 6.24 W/sq-m
Save the thermal template.
Step 5: Select ApacheSim & run a dynamic thermal simulation
37 | P a g e

Step 6: Select FlucsPro and design artificial lighting for themodel room
This time design the Artificial Lighting for 500 lux lighting level
38 | P a g e

Step 7: Run the Analysis calculation in FlucsPro to view the results
The Power density for 500 lux lighting level comes to be 9.75 W/sq-m
Step 8: Assign fluorescent lighting LPD in the internal gains tab when in BTM
39 | P a g e

Save and run ApacheSim dynamic simulation for the 500 lux lighting level
Step 9: Run the ApacheSim dynamic simulation for 500 lux lighting level
40 | P a g e

Step 10: Compare the Chillers load for the system
From the analysis you can observe that the Chiller’s energy consumption is reduced by 0.9689 MWh per year if 300 lux level
41 | P a g e
lighting is provided for the model room in place of 500 lux levels.
b) Change in Room Construction
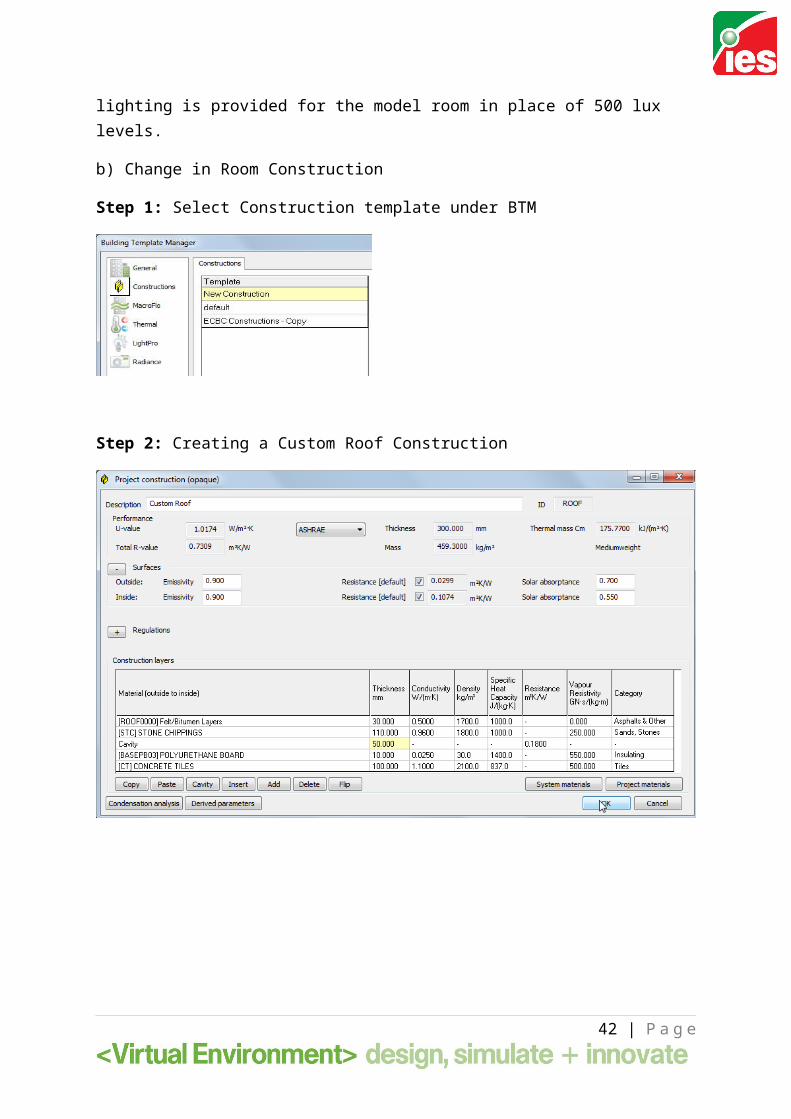
Step 1: Select Construction template under BTM
Step 2: Creating a Custom Roof Construction
42 | P a g e

Step 3: Importing Exterior Wall construction from ‘System Constructions’ with required U-Value
Assign and then save the constructions to the New Constructiontemplate in BTM.
Step 4: Assign the new Construction Template to the model in ApacheSim & run dynamic simulation.
43 | P a g e

Step 5: Change construction Template to ‘ECBC Constructions’ and assign it to the model. Run ApacheSim dynamic simulation for the model with changed construction
44 | P a g e

Step 6: Comparing Vista results for the two runs.
Comparing ‘Room cooling plant sensible load’ for the two runs.
45 | P a g e

It is clearly observed that the Room cooling plant sensible load has increased for the room with new construction where U-values of Roof & Exterior Wall is as below:
ConstructionsU-Value(W/sq-m
K)External Wall 0.5
Roof 1
46 | P a g e