'CRITICAL SUCCESS FACTORS' FOR IMPLEMENTATION OF THEORY OF CONSTRAINTS IN SMALL & MID-SIZE...
125
[MSC Dissertation] 2012/201 3 ‘CRITICAL SUCCESS FACTORS’ FOR IMPLEMENTATION OF THEORY OF CONSTRAINTS IN SMALL & MID-SIZE ENTERPRISES IN INDIA BY SURENDRA PATIL A DISSERTATION SUBMITTED IN PARTIAL FULFILMENT OF THE REQUIREMENTS FOR THE AWARD OF A MASTERS DEGREE IN ENGINEERING BUSINESS MANAGEMENT SCHOOL OF ENGINEERING UNIVERSITY OF WARWICK OCTOBER 2012
-
Upload
independent -
Category
Documents
-
view
3 -
download
0
Transcript of 'CRITICAL SUCCESS FACTORS' FOR IMPLEMENTATION OF THEORY OF CONSTRAINTS IN SMALL & MID-SIZE...
[MSC Dissertation]
2012/2013
‘CRITICAL SUCCESS FACTORS’ FOR IMPLEMENTATION OF THEORY OF CONSTRAINTS
IN SMALL & MID-SIZE ENTERPRISES IN INDIA
BY
SURENDRA PATIL
A DISSERTATION SUBMITTED IN PARTIAL FULFILMENT OF THE
REQUIREMENTS FOR THE AWARD OF A MASTERS DEGREE IN
ENGINEERING BUSINESS MANAGEMENT
SCHOOL OF ENGINEERING
UNIVERSITY OF WARWICK
OCTOBER 2012
[MSC Dissertation] 2012/2013
Project Submission Pro -Forma
(to be bound in front of the submitted Dissertation) NAME :SURENDRA P. PATIL Student ID :0938536301 I wish the dissertation to be considered for (tick one only)
MSc in Cyber security & Management o
MSc in e-Business Management o
MSc in Engineering Business Management þ
MSc in Engineering Business Management for Defence & Security o
MSc in Enterprise Integration Management o
MSc in Innovation & Entrepreneurship o
MSc in International Technology Management o
MSc in Management for Business Excellence o
MSc in Manufacturing Systems Engineering o
MSc in Process Business Management o
MSc in Programme & Project Management o
MSc in Supply Chain & Logistics Management o
I have checked that my modules meet the requirements of the above award þ I confirm that I have included in my dissertation: An abstract of the work completed þ
A declaration of my contribution to the work and its suitability for the degree þ
A table of contents þ
A list of figures & tables (if applicable) þ
A glossary of terms (where appropriate) þ
A clear statement of my project objectives þ
A full reference list þ
I am willing for my marked dissertation to be used for staff training purposes
Signed: ……………………………………………. Date: 04/11/2012

[MSC Dissertation]
2012/2013
I N D E X
1. Declaration …………………………………………… i
2. Acknowledgement ……………………………………. ii
3. Abstract ……………………………………………….. iii
4. Table of Content ……………………………………… v
5. List of Tables………………………………………….. vii
6. List of Figures…………………………………………. viii
7. List of Annexures……………………………………... ix
8. Chapter – 1 : Introduction…..…………………………. 1
9. Chapter – 2: Literature Review ………………………. 3
10. Chapter – 3: Research Methodologies..………………. 44
11. Chapter – 4: Result Of Survey..………………………. 60
12. Chapter – 5: Discussion & Analysis.…………………. 65
13. Chapter – 6: Conclusions & Recommendations………. 93
14. Works Cited…………………………………………….. 96
15. Annexure – 1 : Cross case summary ..……..…………… 110
[MSC Dissertation] 2012/2013
Declaration
“I have read and understood the rules on cheating, plagiarism and appropriate referencing as outlined in my handbook and I declare that the work contained in this assignment is my own, unless otherwise acknowledged. No substantial part of the work submitted here has also been submitted by me in other assessments for my degree course, and I acknowledge that if this has been done an appropriate reduction in the mark I might otherwise have received will be made”. Surendra Patil
[MSC Dissertation]
ii
2012/2013
Acknowledgement
All my gratitude goes to the following people those who had helped me directly or indirectly for this project work;
My philosopher and role model, Mr. Utpat K D, who induced the interest towards TOC in overall and gave his unstinting support for selection of various organizations;
All consultants and respondents, those who are heading the organizations, and in spite of their busy schedule, gave me their valuable time to talk to me their valuable insights;
My supervisor, Dr. Sharad Varde for his understanding and guidance;
My amazing friends, P R Kulkarni, Jayant, Suresh Athani, Laxmikant Virpe for their help and support;
Last but not least I thank my wife Swati and daughter Pranoti. Without their support I would have not completed this task.

[MSC Dissertation]
iii
2012/2013
Abstract
Purpose of the research: -
Theory of Constraints is the invention of Israeli Physicist, Dr. Eliyahu Goldratt. This is a business philosophy, which helps the organizations (profit or non profit) to achieve global objective or goal of the organization, through systematic approach of understanding the cause and effect relationship and variation in the system in question.
Though in the western countries (especially Europe and US), TOC is well known and acknowledged in various industries, in India it comparatively has limited use, being alien to industrial culture. Recently many of organizations have started using TOC as a methodology for improving organizational performance in large and SME sector as well. Thus providing situational advantage to the researcher in selecting research subject at proper time.
The purpose of this study is to understand the issues pertaining to pre and post implementation and analyze the enablers as well inhibitors while implementing the Theory Of Constraint in Small and Medium size enterprises particularly Indian contest.
Research Methodology: -
To enrich understanding of research question, a relevant literature survey was carried out. The topics covered mainly consist of Indian SMEs characteristics, TOC philosophy, recent advances in the tools and techniques and issues in the change management. Based on literature survey, initial research model was developed for identifying key factors, which will leads to successful implementation of TOC.
As the population of the SMEs those who are exposed to TOC, being limited, researcher opted for interviewing the respondent personally and not administer the question are impersonally to avoid the limitation of survey based research through mailed questionnaire. With the help of TOC consultants, 20 organizations from four different states of India were shortlisted after getting their concurrence. Semi structured questionnaire for interview and structured questionnaire for collecting the data for survey was formulated. And with extensive travel, researcher personally visited to all organizations to meet the respondent and collect the data. Thus providing the researcher advantage of meeting the respondent personally to get the first hand unbiased perception, with which it has significantly enhanced the quality, reliability and credibility
[MSC Dissertation]
iv
2012/2013
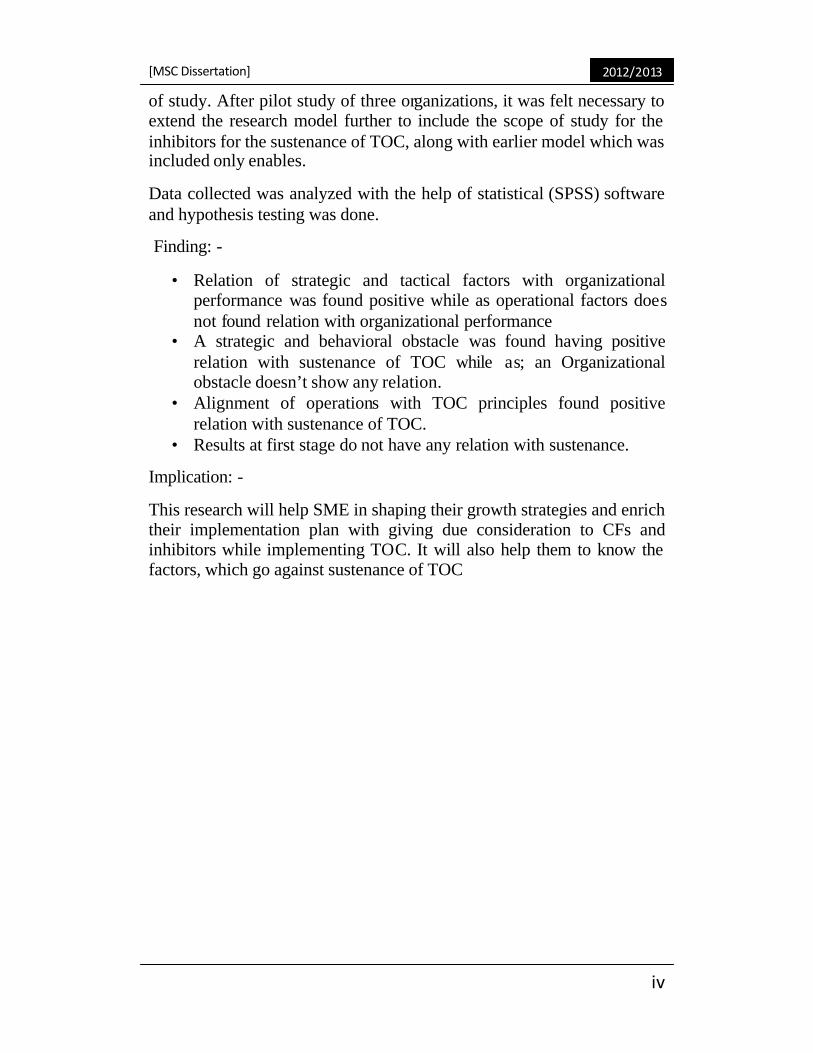
of study. After pilot study of three organizations, it was felt necessary to extend the research model further to include the scope of study for the inhibitors for the sustenance of TOC, along with earlier model which was included only enables.
Data collected was analyzed with the help of statistical (SPSS) software and hypothesis testing was done.
Finding: -
• Relation of strategic and tactical factors with organizational performance was found positive while as operational factors does not found relation with organizational performance
• A strategic and behavioral obstacle was found having positive relation with sustenance of TOC while as; an Organizational obstacle doesn’t show any relation.
• Alignment of operations with TOC principles found positive relation with sustenance of TOC.
• Results at first stage do not have any relation with sustenance.
Implication: -
This research will help SME in shaping their growth strategies and enrich their implementation plan with giving due consideration to CFs and inhibitors while implementing TOC. It will also help them to know the factors, which go against sustenance of TOC

[MSC Dissertation]
v
2012/2013
T a b l e o f C o n t e n t
No. Of Contente
Contentes Page No.
Chapter 1 – Introduction 01 – 02 1.0 Research Background 01
1.1 Research Question 01 1.2 Research Aim & Objective 01 1.3 Research structure 02
Chapter 2 – Literature Review 03 – 43 2.0 Overview of Small and Medium Enterprises in India 03
2.1 Definition of SME 03 2.2 Today’s scenario of SME in India 04 2.3 Current performance of SMEs 08 2.4 Improvement in organizational performance 10
2.4.1 Need for improvement (Why change?) 10 2.4.2 Different Tools & techniques for organizational improvement 11
2.5 Historical background and basic concepts of TOC 15 2.5.1 Various components of TOC 17 2.5.2 Five focusing steps 18 2.5.3 Drum Buffer Rope (DBR) 19 2.5.4 Measurement System & Throughput accounting 19 2.5.5 Thinking Process tools (TP) 22
2.6 Implementation of TOC 26 2.6.1 TOC Implementation Roadmap 26 2.6.2 TOC Five question framework 27 2.6.3 U Shape template for TOC implementation 29 2.6.4 Viable vision 30 2.6.5 Strategy And Tactic tree 30
2.7 Change management 31 2.7.1 Basic Concept 31 2.7.2 Success factors for change management 33
2.8 Change management & TOC 34 2.9 TOC Implementation Results 37
2.10 Critical Success Factors for Improvement project 40 2.10.1 CSF for TMP 41 2.10.2 CSF for TQM 41 2.10.3 CSF for Lean 42 2.10.4 CSF for Six Sigma 42 2.10.5 CSF for ISO-9000 42 2.10.6 CSF for ERP implementation 42 2.10.7 Consultant’s Support 43
[MSC Dissertation]
vi
2012/2013
No. Of Contente
Contentes Page No.
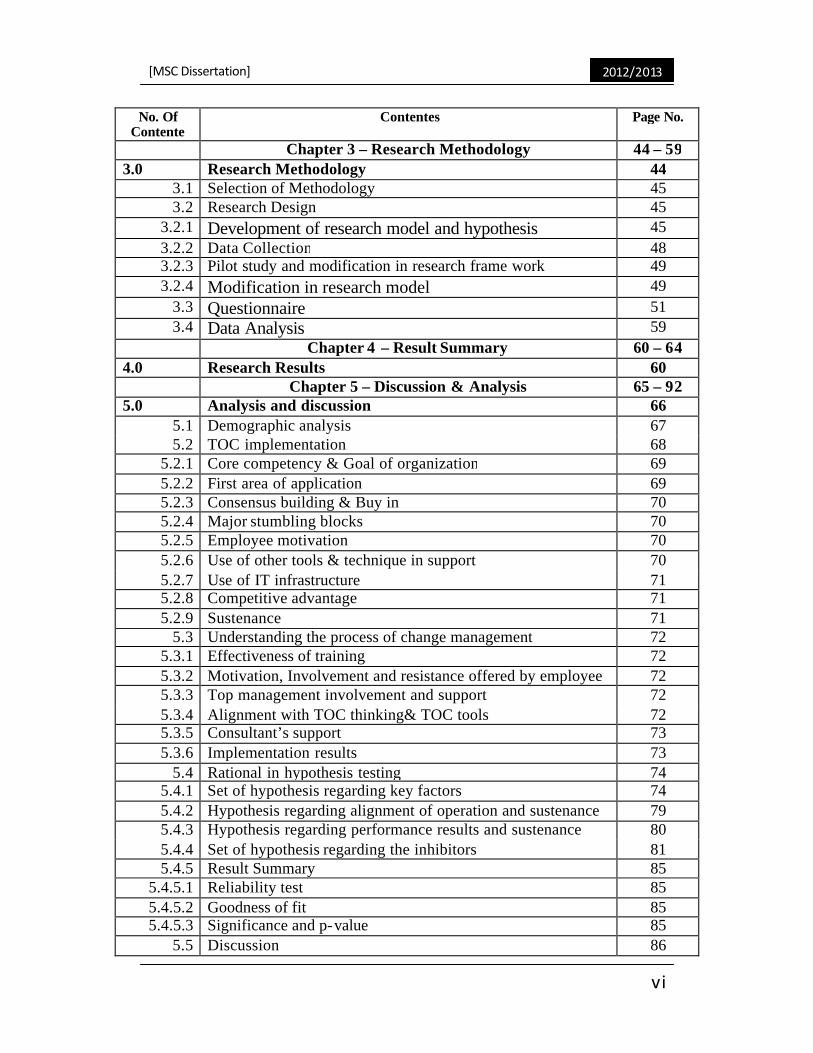
Chapter 3 – Research Methodology 44 – 59 3.0 Research Methodology 44
3.1 Selection of Methodology 45 3.2 Research Design 45
3.2.1 Development of research model and hypothesis 45 3.2.2 Data Collection 48 3.2.3 Pilot study and modification in research frame work 49 3.2.4 Modification in research model 49
3.3 Questionnaire 51 3.4 Data Analysis 59
Chapter 4 – Result Summary 60 – 64 4.0 Research Results 60 Chapter 5 – Discussion & Analysis 65 – 92 5.0 Analysis and discussion 66
5.1 Demographic analysis 67 5.2 TOC implementation 68
5.2.1 Core competency & Goal of organization 69 5.2.2 First area of application 69 5.2.3 Consensus building & Buy in 70 5.2.4 Major stumbling blocks 70 5.2.5 Employee motivation 70 5.2.6 Use of other tools & technique in support 70 5.2.7 Use of IT infrastructure 71 5.2.8 Competitive advantage 71 5.2.9 Sustenance 71
5.3 Understanding the process of change management 72 5.3.1 Effectiveness of training 72 5.3.2 Motivation, Involvement and resistance offered by employee 72 5.3.3 Top management involvement and support 72 5.3.4 Alignment with TOC thinking& TOC tools 72 5.3.5 Consultant’s support 73 5.3.6 Implementation results 73
5.4 Rational in hypothesis testing 74 5.4.1 Set of hypothesis regarding key factors 74 5.4.2 Hypothesis regarding alignment of operation and sustenance 79 5.4.3 Hypothesis regarding performance results and sustenance 80 5.4.4 Set of hypothesis regarding the inhibitors 81 5.4.5 Result Summary 85
5.4.5.1 Reliability test 85 5.4.5.2 Goodness of fit 85 5.4.5.3 Significance and p-value 85
5.5 Discussion 86
[MSC Dissertation]
vii
2012/2013
No. Of
Contente Contentes Page No.
5.5.1 Part 1 86 5.5.2 Part 2 89
Chapter 6 – Conclusions & Recommendations 93 – 95 6.0 Conclusion & suggestion for further work 93
6.1 Conclusion 93 6.2 Suggestion for further work 95
Works Cited 96 – 109
List of Tables, Figures & Annexure
[A] List of Tables : Sr. Table No. Title of Table Page No. 1 2.1 MSMEs Performance: Units, Employment, Investments,
Production & Exports. 04
2 2.2 Comparative Data on Growth Rates of MSE Sector 07 3 2.3 Contribution of MSEs in GDP 07 4 2.4 Distribution of unites according to its activities 08 5 2.5 Distribution of unites according to its type 08 6 2.6 Cyclical process improvement methods and their primary
effect 11
2 2.7 High Failure Rate for Various Change Initiatives and IT Projects
14
3 2.8 Net Profit and Return on Investment 23 4 2.9 Application of TOC Thinking Process 23 5 2.10 How the logic trees relate to four management questions
about change 24
6 2.11 Definitions of selected Thinking Processes and concepts 25 7 2.12 TOC Implementation Phases 27 8 2.13 Simplified Generic Continuous Improvement Process Using
TOC’s TP 29
9 2.14 Resistance to change factors and TOC tools to help utilize them
35
10 2.15 Layers of resistance and their relationship to buy- in 36 11 2.16 Change sequence, tools and managerial utility relationships 37 12 2.17 TOC Elements 39 13 2.18 Critical Success factors for TPM implementation in SME 41 14 2.19 Critical Success factors for ERP implementation in SME
service organization 43
17 3.1 Key Factors for TOC Implementation 48 18 3.2 Inhibitor for Implementation of TOC 50
[MSC Dissertation]
viii
2012/2013
Sr. Table No. Title of Table Page No. 19 4.1 Organization Information 60 20 4.2 Effectiveness of Training 61 21 4.3 Mindset Of Organization 61 22 4.4 Involvement, Motivation & resistance offered 62 23 4.5 Top Management Commitment 62 24 4.6 Contribution made by consultant 62 25 4.7 Alignment of operations with TOC principals 63 26 4.8 TOC Tools 63 27 4.9 Improvement Results after TOC implementation 64 28 4.10 Employee Retention 64
5.1 Area of different states and it’s population 65 29 5.2 Organization age wise distribution 65 30 5.3 Employees wise distribution 66 31 5.4 Turnover wise distribution 66 32 5.5 Present investment wise distribution 67 33 5.6 Reasons for Adopting TOC Methodology 68 34 5.7 No. of years for TOC implementation 68 35 5.8 Implementation Results 74 36 5.9 Reliability Test 74 37 5.10–5.12 Factor Analysis 75 40 5.13–5.16 Regression – [Dataset 1] 76 44 5.17–5.20 Regression – [Dataset 2] 77 48 5.21–5.24 Regression – [Dataset 3] 78 52 5.25–5.28 Regression – [Dataset 4] 79 56 5.29–5.32 Regression – [Dataset 5] 80 60 5.33 Reliability test 81 61 5.34–5.37 Regression – [Dataset 6] 82 65 5.38–5.41 Regression – [Dataset 7] 83 69 5.42–5.45 Regression – [Dataset 8] 84 70 5.46 Result Summary 85
[B] List of Figures :
Sr. Fig. No. Title of Figure Page No. 1 2.1 Total MSMEs Vs total employment 05 2 2.2 Comparing the growth rate of MSMEs with IIP &GDP(%) 06 3 2.3 Fixed investment Vs employment in MSMEs 06 4 2.4 TOC Branches 17 5 2.5 Basic TOC tools & It’s use in specific environment 18 6 2.6 An Integrated TOC framework 20 7 2.7 Limits to T, I, and OE 22 8 2.8 Management Priorities 22 9 2.9 The six logical tools as an integrated thinking process 24
[MSC Dissertation]
ix
2012/2013
Sr. Fig. No. Title of Figure Page No. 10 2.10 TOC Implementation Roadmap 26 11 2.11 5-Step roadmap for implementation & monitoring of TOC
project 28
12 2.12 U-S hape & The Question For Improving System 29 13 2.13 Strategy and Tactic tree 31 14 2.14 Eight Stage Model 32 15 2.15 Three dimensions of throughput orientations 40 16 3.1 A systematic approach for empirical research 44 17 3.2 Proposed Research Model 48 18 3.3 Modified Proposed Research Model 51 19 5.1 Organization age wise distribution 66 20 5.2 Employee wise distribution 67 21 5.3 Turnover wise distribution 67 22 5.4 Present investment wise distribution 67 23 5.5 Reasons for adopting TOC methodology 68 24 5.6 No. of years for TOC implementation 69
[C] List of Annexures :
Sr. Annex. No.
Title of Annexure Page No.
1 1 Annexure 1 110
[MSC Dissertation]
2012/2013
S u r e n d r a P a t i l Page | 1
Chapter 1:Introduction
1.0 Research Background:-Since after adoption of open economy, Indian SMEs are going through crucial phase. Global competition, fast economic growths, increased quality requirements, are some of the challenges faced by SME. To cope up this fast speed of changes in every field SME has adopted some or the other improvement techniques like Lean manufacturing, Six sigma, TQM, TPM etc. TOC is one between recently introduced in India and also increasingly used tool.
Theory of Constraints (TOC) is an overall management philosophy introduced by Dr. Eliyahu M. Goldratt in his 1984 book titled “The Goal” that is geared to help organizations continually achieve their goal. The title comes from the contention that any manageable system is limited in achieving more of its goal by a very small number of constraints, and that there is always at least one constraint. TOC is a large body of knowledge with a strong guiding philosophy of growth. Dr. Eliyahu M. Goldratt, who was the main driving force behind the development and practice of TOC. There is a network of individuals and small companies loosely coupled as practitioners around the world. In Indian SME, in spite of its popularity, use of TOC is limited because of many reasons.
TOC challenges the present way of managing the organization; in turn it fictitiously appears to challenging the ability of existing leader, hurting badly with personal ego at first instance. Because of which it seems to be difficult to buy the acceptance from the current management team at first instance. The success of TOC depends on the actions initiated holistically across the organization and not in one department in isolation. Hence there is big challenge lie in managing the change including the change in the mindset of the people in the organization. Though the tools and techniques are available in ‘Theory’ to manage this change, it would be helpful to check the relevance in case of the Indian and that’s to small and mid size organization. This study will help to guide the rapid progression in adoption of TOC in SME sector.
1.1 Research Question: - “What are the critical factors leading to successful implementation of Theory Of Constraints in Indian, small & mid-sized enterprises”
1.2 Research Aim & Objective: - This research aims to investigate the process through which TOC can be effectively implemented in Indian SME.
The following are the objectives

[MSC Dissertation]
2012/2013
S u r e n d r a P a t i l Page | 2
1. Understanding the critical steps in implementation of TOC 2. Understanding the dynamics of Indian SMEs in respect of
TOC implementation 3. Compare & identify the commonalities the challenges faced
by various units before, while and after implementation 4. Compare & identify the commonalities in process of
implementation. 5. Hypothesis the key factors of success.
Secondary objectives
1. Evaluate theoretical & empirical development in the area of TOC implementation
2. Address unresolved major issues 3. Introduce the most recent development in the field.
1.3 Research structure: - This work consists of different chapters laid down as below Chapter headings
1. Introduction • This chapter describe the background of research question,
giving overview to reader about the research area 2. Literature review
• Briefly containing the spectrum on which theory is based, current status of knowledge of application tools and broad base to enter in to research area.
3. Research methodologies • Procedure & Methods used to carry out the research in order
to satisfy the academic prerequisites & compliance 4. Result of survey
• Summary of finding of research 5. Discussion & analysis
• Finding of research are analyzed against the literature review and implications of results are discussed for its shortcomings
6. Conclusions & Recommendations • Summarizing whole research against its objective with
outcome of the research.
[MSC Dissertation]
2012/2013
S u r e n d r a P a t i l Page | 3
Chapter 2:Literature Review
2.0 Overview of Small and Medium Enterprises in India: -The small and medium enterprise plays an important role in the industrial development of any country. Its importance is well acknowledged due to its significant contribution to employment generation, building the internal strength through export and satisfying needs of various socio-economic objectives of country.
2.1 Definition of SME: - Defining a Small & Medium Enterprise is itself a challenging task, as every country have their own definition for a SME. In India the Small and Medium Enterprise are broadly classified depending on the investment in plant and machinery, however comparing that to EU where it is based on the parameters of employment, turnover and asset size, and OECD on employment. At the same time the sales turnover has totally different criteria for establishment. According to “Micro, Small and Medium Enterprises Development Act2006” [1] the definitions are as below, Small enterprise
“An enterprise where the investment in plant and machinery [original cost excluding land and building and the items specified by the Ministry of Small Scale Industries vide its notification No. S.O. 1722(E) dated October 5, 2006] is more than Rs.2.5 Million but does not exceed Rs.50 Million” Medium enterprise “A medium enterprise is an enterprise where the investment in plant and machinery (original cost excluding land and building and the items specified by the Ministry of Small Scale Industries vide its notification No. S.O. 1722(E) dated October 5, 2006) is more than Rs.50Million but does not exceed Rs.100 Million.”
Enterprise
“The term enterprise in the manufacturing context stands for an industrial undertaking or a business concern involved in the production, processing or preservation of goods for the list of eligible industries in the First Schedule to the Industries (Development and Regulation Act), 1951”
2.2 Today’s scenario of SME in India: - Small and Medium Enterprises (SME’s) in India constitute an important segment of Indian economy. Before 1990, liberalization in economic ---------------------------------------------------------------------------------------------- [1] Ministry of Micro, Small & Medium Enterprises, Government Of India.http://www.msme.gov.in
[MSC Dissertation]
2012/2013
S u r e n d r a P a t i l Page | 4
policies, SME was not in the lime light. However in 1991 policies announced by Indian government were changed the scenario for SME. Few concessions of liberalization like, ‘No need for license to run the industry,’ ‘equity participation, no/fewer restriction on import of capital goods’ etc. has given boost to SME sector. This sector, which played important role in overall economy of the country, started playing pivotal role.
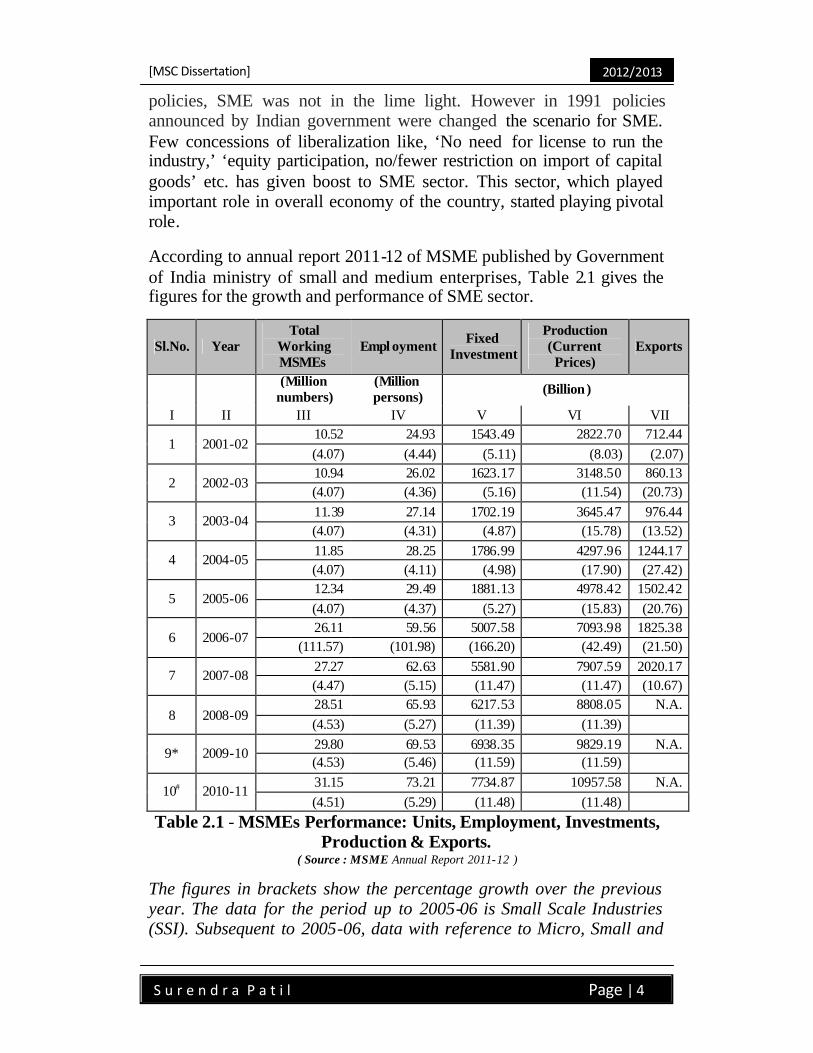
According to annual report 2011-12 of MSME published by Government of India ministry of small and medium enterprises, Table 2.1 gives the figures for the growth and performance of SME sector.
Sl.No. Year Total
Working MSMEs
Empl oyment Fixed Investment
Production (Current Prices)
Exports
(Million numbers)
(Million persons) (Billion)
I II III IV V VI VII
1 2001-02 10.52 24.93 1543.49 2822.70 712.44 (4.07) (4.44) (5.11) (8.03) (2.07)
2 2002-03 10.94 26.02 1623.17 3148.50 860.13 (4.07) (4.36) (5.16) (11.54) (20.73)
3 2003-04 11.39 27.14 1702.19 3645.47 976.44 (4.07) (4.31) (4.87) (15.78) (13.52)
4 2004-05 11.85 28.25 1786.99 4297.96 1244.17 (4.07) (4.11) (4.98) (17.90) (27.42)
5 2005-06 12.34 29.49 1881.13 4978.42 1502.42 (4.07) (4.37) (5.27) (15.83) (20.76)
6 2006-07 26.11 59.56 5007.58 7093.98 1825.38
(111.57) (101.98) (166.20) (42.49) (21.50)
7 2007-08 27.27 62.63 5581.90 7907.59 2020.17 (4.47) (5.15) (11.47) (11.47) (10.67)
8 2008-09 28.51 65.93 6217.53 8808.05 N.A. (4.53) (5.27) (11.39) (11.39)
9* 2009-10 29.80 69.53 6938.35 9829.19 N.A. (4.53) (5.46) (11.59) (11.59)
10# 2010-11 31.15 73.21 7734.87 10957.58 N.A. (4.51) (5.29) (11.48) (11.48)
Table 2.1 - MSMEs Performance: Units, Employment, Investments, Production & Exports.
( Source : MSME Annual Report 2011-12 )
The figures in brackets show the percentage growth over the previous year. The data for the period up to 2005-06 is Small Scale Industries (SSI). Subsequent to 2005-06, data with reference to Micro, Small and
[MSC Dissertation]
2012/2013
S u r e n d r a P a t i l Page | 5
Medium Enterprises are being compiled. The growth for the year 2010-11 is based on the average growth rate for the previous three years. * : Provisional, # : Projected, N.A. : Not Available
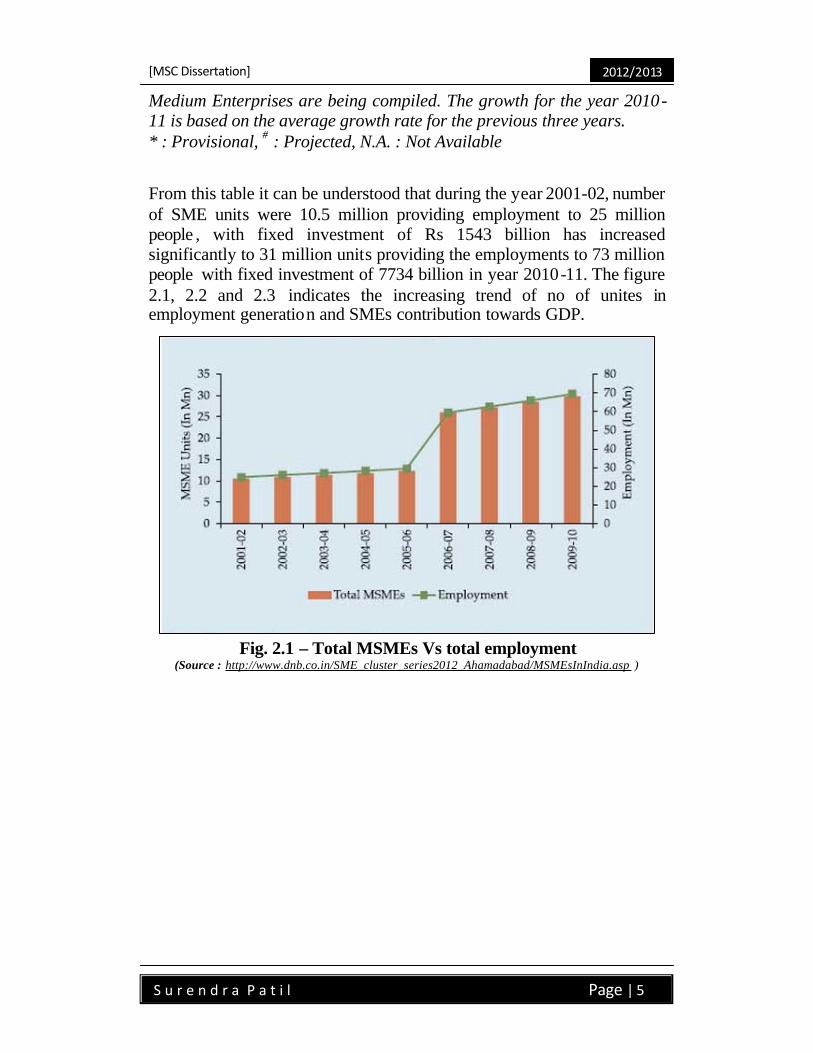
From this table it can be understood that during the year 2001-02, number of SME units were 10.5 million providing employment to 25 million people , with fixed investment of Rs 1543 billion has increased significantly to 31 million units providing the employments to 73 million people with fixed investment of 7734 billion in year 2010-11. The figure 2.1, 2.2 and 2.3 indicates the increasing trend of no of unites in employment generation and SMEs contribution towards GDP.
Fig. 2.1 – Total MSMEs Vs total employment (Source : http://www.dnb.co.in/SME_cluster_series2012_Ahamadabad/MSMEsInIndia.asp )

[MSC Dissertation]
2012/2013
S u r e n d r a P a t i l Page | 6
Fig. 2.2 – Comparing the growth rate of MSMEs with IIP &GDP(%) ( Source : http://www.dnb.co.in/SME_cluster_series2012_Ahamadabad/MSMEsInIndia.asp)
Fig. 2.3 – Fixed investment Vs employment in MSMEs ( Source : http://www.dnb.co.in/SME_cluster_series2012_Ahamadabad/MSMEsInIndia.asp)
SME sector has maintained a higher rate of growth as compared to overall industrial sector. Table 2 .2 gives the comparative figures for both the sectors. It indicates that growth of SME sectors was always ahead of overall industrial sector.

[MSC Dissertation]
2012/2013
S u r e n d r a P a t i l Page | 7
Year Growth rate of SSI sector [2001-02 base IIP(%age)]
Over all Industrial sector Growth rates
(%age)#
2004-2005 10.88 8.40 2005-2006 12.32 8.00 2006-2007 12.60 11.90 2007-2008 13.00* 8.70 2008-2009 ** 3.20 2009-2010 ** 10.50 2010-2011 ** 7.80
Table 2.2 - Comparative Data on Growth Rates of MSE Sector ( Source : MSME Annual Report 2011-12 )
* : Projected, IIP – Index of Industrial Production # : Source – M/o Statistics and PI website – http://www.mospi.nic.in ** : Due to revised definition of MSMEs Sector, methodological revisions are under progress.
SME sector has been contributing considerably to India’s Gross Domestic production (GDP). The table 2.3 shows that SMEs contribution toward total industrial production was increased from 38 to 45 % from the year 2004-05 to 2008-09. And increase in the GDP was from 5.84% to 8.72%. K Jayakumar, (2011) Joint Secretary, Department of Scientific and Industrial Research, DST, recently said, that, ‘Contribution of small and medium enterprises to the country's gross domestic product (GDP) is expected to increase to 22% by 2020, from the present 17%.’
Year Contribution of MSEs(%) at 1999-2000 prices in
Total industrial Production Gross Domestic Product
(GDP) 2004-2005 38.62 5.84 2005-2006 38.56 5.83 2006-2007 45.62 7.20 2007-2008 45.24 8.00 2008-2009 44.86 8.72
Table 2.3–Contribution of MSEs in GDP ( Source : MSME Annual Report 2011-12 )
The data for the period upto 2005-2006 is for Small Scale Industries(SSI)
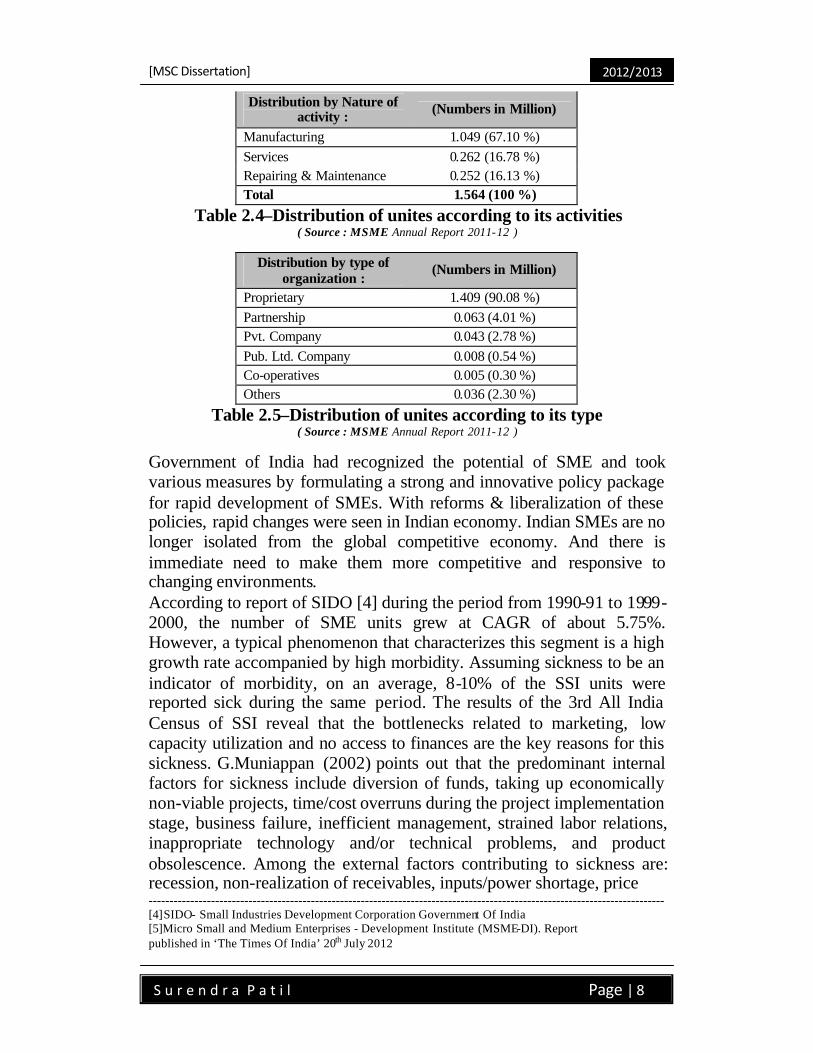
Table 2.4 & 2.5 gives the distribution of units according to its activities and type of organization. Majority of SMEs (67%) are engaged in manufacturing activities and rest engaged in servicing (16.78%) and repairing (16%). The proprietary organization (almost 90.8%) structure is dominant one in SME sector.
[MSC Dissertation]
2012/2013
S u r e n d r a P a t i l Page | 8
Distribution by Nature of activity : (Numbers in Million)
Manufacturing 1.049 (67.10 %) Services 0.262 (16.78 %) Repairing & Maintenance 0.252 (16.13 %) Total 1.564 (100 %)
Table 2.4–Distribution of unites according to its activities ( Source : MSME Annual Report 2011-12 )
Distribution by type of organization :
(Numbers in Million)
Proprietary 1.409 (90.08 %) Partnership 0.063 (4.01 %) Pvt. Company 0.043 (2.78 %) Pub. Ltd. Company 0.008 (0.54 %) Co-operatives 0.005 (0.30 %) Others 0.036 (2.30 %)
Table 2.5–Distribution of unites according to its type ( Source : MSME Annual Report 2011-12 )
Government of India had recognized the potential of SME and took various measures by formulating a strong and innovative policy package for rapid development of SMEs. With reforms & liberalization of these policies, rapid changes were seen in Indian economy. Indian SMEs are no longer isolated from the global competitive economy. And there is immediate need to make them more competitive and responsive to changing environments. According to report of SIDO [4] during the period from 1990-91 to 1999-2000, the number of SME units grew at CAGR of about 5.75%. However, a typical phenomenon that characterizes this segment is a high growth rate accompanied by high morbidity. Assuming sickness to be an indicator of morbidity, on an average, 8-10% of the SSI units were reported sick during the same period. The results of the 3rd All India Census of SSI reveal that the bottlenecks related to marketing, low capacity utilization and no access to finances are the key reasons for this sickness. G.Muniappan (2002) points out that the predominant internal factors for sickness include diversion of funds, taking up economically non-viable projects, time/cost overruns during the project implementation stage, business failure, inefficient management, strained labor relations, inappropriate technology and/or technical problems, and product obsolescence. Among the external factors contributing to sickness are: recession, non-realization of receivables, inputs/power shortage, price ---------------------------------------------------------------------------------------------------------------------------- [4]SIDO- Small Industries Development Corporation Government Of India [5]Micro Small and Medium Enterprises - Development Institute (MSME-DI). Report published in ‘The Times Of India’ 20th July 2012

[MSC Dissertation]
2012/2013
S u r e n d r a P a t i l Page | 9
escalation, accidents and natural calamities. While mentioning the constraint for growth of SME in India Duke Ghosh (2007), states about weakness in terms of bargaining power vis-à-vis its customer. Many unites are catering to large companies and hence are fairly small in capacity and size with respect to such a customer. He also mention about inadequate and untimely finance made available to SME sector as one of constraint. As a result most players in this sector cannot undertake activities pertaining to product/process development and R&D, which could have improved the situation.
2.3 Current performance of SMEs: -
In order to be competitive one has to utilize its resources to its fullest extent. According to Balasubramaniya (2005), the ability of SMEs to compete in the global market place depends on their access to certain critical resources, the most important of which are finance, technology and managerial skills.
Evolving with changes is highly important to be competitive for SMEs, was stated by Rajiv Bajaj, (2011) He advised MSMEs to concentrate on their core strengths and avoid multi- tasking so that they are able to make the optimum use of their resources.
According to data compiled by the MSME-DI (2012), In India, 79 small business units are turning financially unviable every day. This translates to three units falling sick every hour. Report further states that, out of the total 13.3 Million SME units in the country, more than 0.2 Million are sick now. Around 29,000 units are being added to the sick list every year."Lack of enterprise management skills is the biggest reason, “said S Sivagnanam, director of MSME-DI.
Addressing the issue Pillani (2012) states that, though the government has been attempting various policy measures, however the efforts seemed to be inadequate. The tough competition in the both domestic and international market is very stiff. So there is an urgent need to strengthen the SSI sector in India by improving their organizational performance through various tools and techniques availa ble.
In concluding remark P Bharath (2010) mention that, “With the increasing competition, globalization and the uncertainty due to the global downturn, SMEs will have to continuously incorporate the latest technology into their production processes as well as in their marketing and management functions, to cut costs, gain efficiency and consistency. This will help them become successful, and contribute to the Indian

[MSC Dissertation]
2012/2013
S u r e n d r a P a t i l Page | 10
economy in the long run.”
While emphasizing to take separate view for SME, Nicholas & Abby (2004) state that,’ It is important to understand that SMEs are not smaller versions of larger firms. Their needs and often their decision-making processes differ significantly from those of larger firms (Shrader et al., 1989). Other distinct differences include limited resources, lack of specialist expertise (Carson, 1985), reliance on a few key customers (Venkatraman et al., 1990), and unable to influence, to any significant degree, the threats of the external environment (Cromie, 1990).’
Ahire (1996) characterized SMEs by a myopic view of management. Lack of planning, systematic decision-making and strategic thinking makes them vulnerable to competitive environment. M Gupta (2010) describe, lack of trained workers, Lack of financial strength and management deficiency, as a critical factors for growth of SME and emphasize the need to configure & manage their operations to support their business and establish themselves.
2.4 Improvement in organizational performance 2.4.1 Need for improvement (Why change?): - Since from the adoption of liberal economy in 1991, SME in India are experiencing unprecedented degree of change, which involves the change in market condition, customer expectation and suppliers attitude. Management forced to adopt the change in overall business approach. As Kumar et al. (2006), states that,’ The contemporary business environment has become considerably complex and challenging, and as a result variety of factors influence the manufacturing organization’s ability to compete effectively. Organizations today compete on several factors such as time, price, technology, innovation, quality, reliability, and information management’.
According to Ahuja & Khamba (2008), dynamic environment has become highly challenging and the manufacturing organizations are finding it extremely difficult to manage competit ion and consumer expectations. The global marketplace has witnessed an increased pressure from customers and competitors for greater value from their purchaser. Quality, faster delivery, and lower cost in manufacturing have become the implied needs for sustainable business growth. Each organization is struggling with the same question, how one can add the value to our customer by keeping cost as low as possible , and delivery within the acceptable time. Organization found answer by using various tools & techniques developed over years.
[MSC Dissertation]
2012/2013
S u r e n d r a P a t i l Page | 11
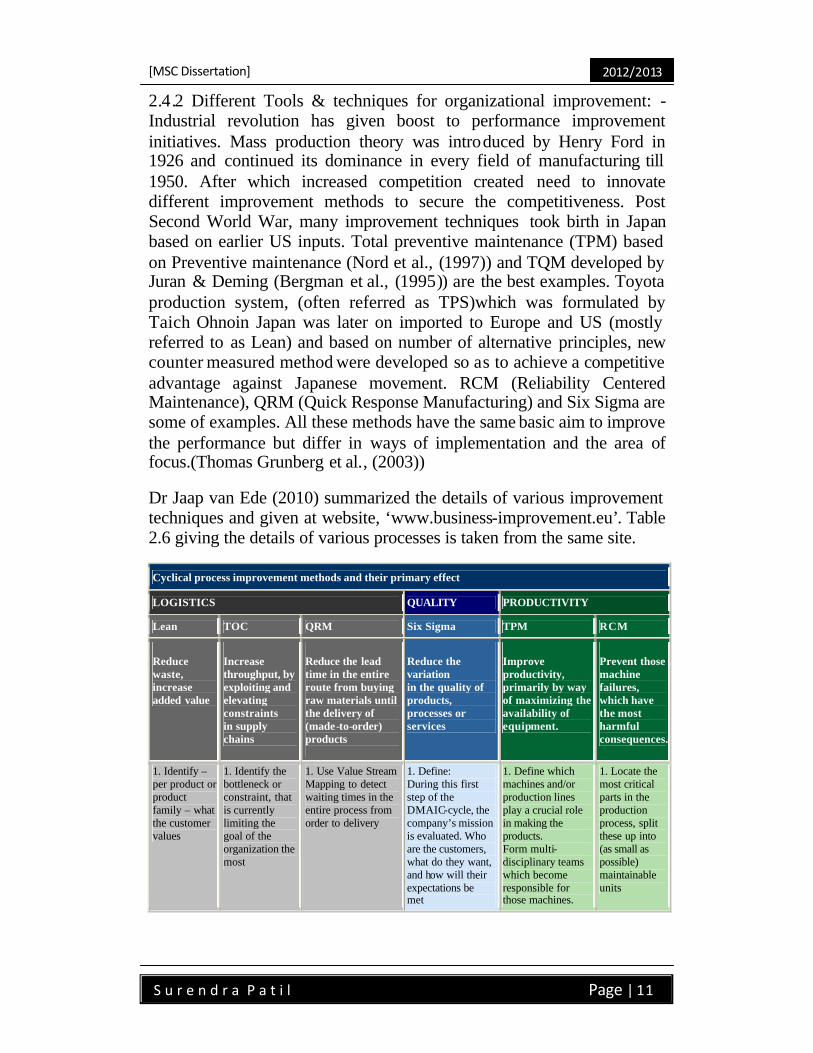
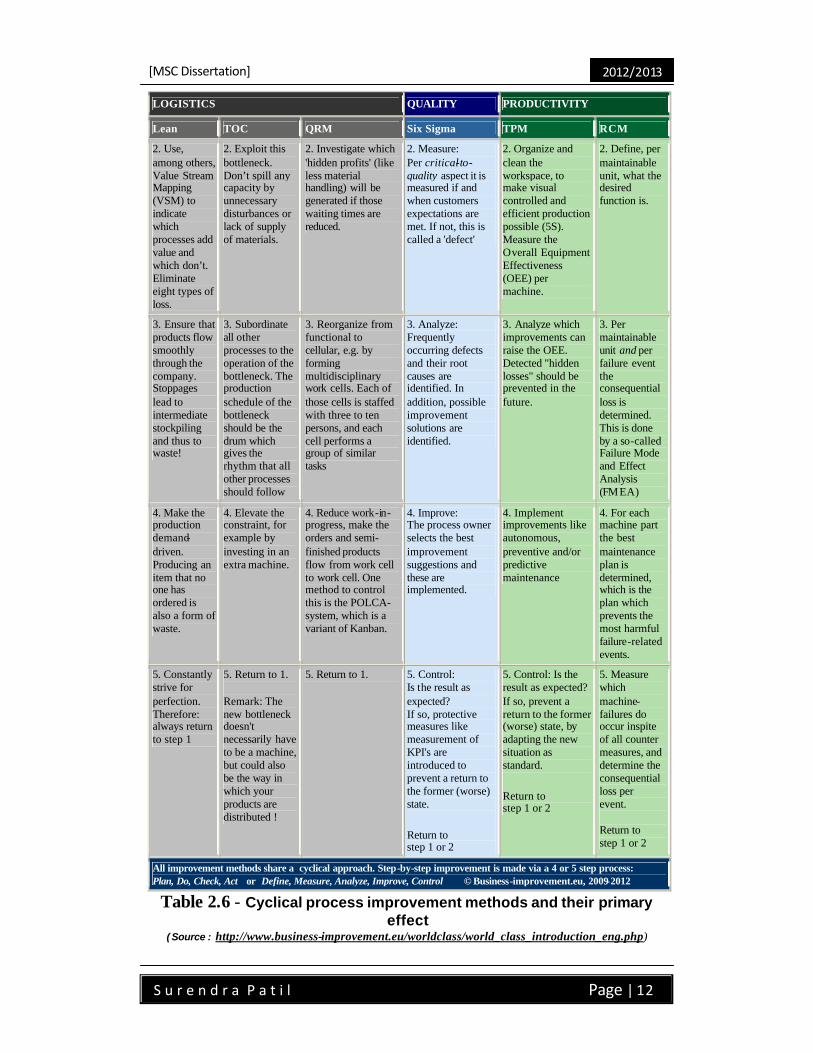
2.4.2 Different Tools & techniques for organizational improvement: - Industrial revolution has given boost to performance improvement initiatives. Mass production theory was introduced by Henry Ford in 1926 and continued its dominance in every field of manufacturing till 1950. After which increased competition created need to innovate different improvement methods to secure the competitiveness. Post Second World War, many improvement techniques took birth in Japan based on earlier US inputs. Total preventive maintenance (TPM) based on Preventive maintenance (Nord et al., (1997)) and TQM developed by Juran & Deming (Bergman et al., (1995)) are the best examples. Toyota production system, (often referred as TPS)which was formulated by Taich Ohnoin Japan was later on imported to Europe and US (mostly referred to as Lean) and based on number of alternative principles, new counter measured method were developed so as to achieve a competitive advantage against Japanese movement. RCM (Reliability Centered Maintenance), QRM (Quick Response Manufacturing) and Six Sigma are some of examples. All these methods have the same basic aim to improve the performance but differ in ways of implementation and the area of focus.(Thomas Grunberg et al., (2003))
Dr Jaap van Ede (2010) summarized the details of various improvement techniques and given at website, ‘www.business-improvement.eu’. Table 2.6 giving the details of various processes is taken from the same site.
Cyclical process improvement methods and their primary effect
LOGISTICS QUALITY PRODUCTIVITY
Lean TOC QRM Six Sigma TPM RCM
Reduce waste, increase added value
Increase throughput, by exploiting and elevating constraints in supply chains
Reduce the lead time in the entire route from buying raw materials until the delivery of (made-to-order) products
Reduce the variation in the quality of products, processes or services
Improve productivity, primarily by way of maximizing the availability of equipment.
Prevent those machine failures, which have the most harmful consequences.
1. Identify – per product or product family – what the customer values
1. Identify the bottleneck or constraint, that is currently limiting the goal of the organization the most
1. Use Value Stream Mapping to detect waiting times in the entire process from order to delivery
1. Define: During this first step of the DMAIC-cycle, the company’s mission is evaluated. Who are the customers, what do they want, and how will their expectations be met
1. Define which machines and/or production lines play a crucial role in making the products. Form multi-disciplinary teams which become responsible for those machines.
1. Locate the most critical parts in the production process, split these up into (as small as possible) maintainable units
[MSC Dissertation]
2012/2013
S u r e n d r a P a t i l Page | 12
LOGISTICS QUALITY PRODUCTIVITY
Lean TOC QRM Six Sigma TPM RCM
2. Use, among others, Value Stream Mapping (VSM) to indicate which processes add value and which don’t. Eliminate eight types of loss.
2. Exploit this bottleneck. Don’t spill any capacity by unnecessary disturbances or lack of supply of materials.
2. Investigate which 'hidden profits' (like less material handling) will be generated if those waiting times are reduced.
2. Measure: Per critical-to-quality aspect it is measured if and when customers expectations are met. If not, this is called a 'defect'
2. Organize and clean the workspace, to make visual controlled and efficient production possible (5S). Measure the Overall Equipment Effectiveness (OEE) per machine.
2. Define, per maintainable unit, what the desired function is.
3. Ensure that products flow smoothly through the company. Stoppages lead to intermediate stockpiling and thus to waste!
3. Subordinate all other processes to the operation of the bottleneck. The production schedule of the bottleneck should be the drum which gives the rhythm that all other processes should follow
3. Reorganize from functional to cellular, e.g. by forming multidisciplinary work cells. Each of those cells is staffed with three to ten persons, and each cell performs a group of similar tasks
3. Analyze: Frequently occurring defects and their root causes are identified. In addition, possible improvement solutions are identified.
3. Analyze which improvements can raise the OEE. Detected "hidden losses" should be prevented in the future.
3. Per maintainable unit and per failure event the consequential loss is determined. This is done by a so-called Failure Mode and Effect Analysis (FMEA)
4. Make the production demand-driven. Producing an item that no one has ordered is also a form of waste.
4. Elevate the constraint, for example by investing in an extra machine.
4. Reduce work-in-progress, make the orders and semi- finished products flow from work cell to work cell. One method to control this is the POLCA-system, which is a variant of Kanban.
4. Improve: The process owner selects the best improvement suggestions and these are implemented.
4. Implement improvements like autonomous, preventive and/or predictive maintenance
4. For each machine part the best maintenance plan is determined, which is the plan which prevents the most harmful failure-related events.
5. Constantly strive for perfection. Therefore: always return to step 1
5. Return to 1. Remark: The new bottleneck doesn't necessarily have to be a machine, but could also be the way in which your products are distributed !
5. Return to 1. 5. Control: Is the result as expected? If so, protective measures like measurement of KPI's are introduced to prevent a return to the former (worse) state.
Return to step 1 or 2
5. Control: Is the result as expected? If so, prevent a return to the former (worse) state, by adapting the new situation as standard.
Return to step 1 or 2
5. Measure which machine-failures do occur inspite of all counter measures, and determine the consequential loss per event. Return to step 1 or 2
All improvement methods share a cyclical approach. Step-by-step improvement is made via a 4 or 5 step process: Plan, Do, Check, Act or Define, Measure, Analyze, Improve, Control © Business-improvement.eu, 2009-2012
Table 2.6 - Cyclical process improvement methods and their primary effect
( Source : http://www.business-improvement.eu/worldclass/world_class_introduction_eng.php)

[MSC Dissertation]
2012/2013
S u r e n d r a P a t i l Page | 13
Many researchers have made the immense contribution to all these tools & techniques & its use in different environment.
Most off SMEs, in order to be competitive, profitable and sustainable in business, pursue the tools based on logistic management perspective. The application of lean thinking has made a significant impact both in academia and industry over the last decade (Peter Hines (2004)). Lean has proven to be a vital tool to successfully achieve growth and sustainability in business.
Goldratt (2008) summarizes the basic concepts used in the tools, which are based on logistic approach as, “both Ford and Ohno followed four concepts
1. Improving flow (or equivalently lead time) is a primary objective of operations.
2. This primary objective should be translated into a practical mechanism that guides the operation when not to produce (prevents overproduction). Ford used space; Ohno used inventory.
3. Local efficiencies must be abolished.
4. A focusing process to balance flow must be in place. Ford used direct observation. Ohno used the gradual reduction of the number of containers and then gradual reduction of parts per container.
He also further states that, Ohnos approach in developing lean demonstrate the difference between the basic concept and its application. The fundamental concepts behind the improvement tool are generic but the application is translation of concept to specific environment. He also emphasizes on verbalizing the assumption behind the specific environment while applying specific tool. To prove his point he states the example of TPS. Most demanding assumption while implementing TPS is stability in the manufacturing environment.
While sharing experiences Ron Moor (2007) mentioned that, “Various tools or methods are touted as a means for a major step forward but never seem to quite deliver the expected results. For example, Bob Williamson, an industry expert in TPM, estimates that some 60% of TPM programs fail after three years of effort; Jeffrey Liker, an industry expert in Lean Manufacturing, estimates that less than1% of U.S. companies are truly effectively applying lean principles. Neil Bloom, an industry expert in reliability-centered maintenance (RCM)
[MSC Dissertation]
2012/2013
S u r e n d r a P a t i l Page | 14
estimates that over 60% of all RCM programs initiated are never successfully implemented, with many of the rest only done in a superficial way.”
Giving the reasons for such a failure Womack (2007) point out the shortcoming of efforts for tying of various individual tools (available in TPS) together in to system. As results many managers are drowned in techniques while implementing the bites of lean in isolation without understanding the whole system.
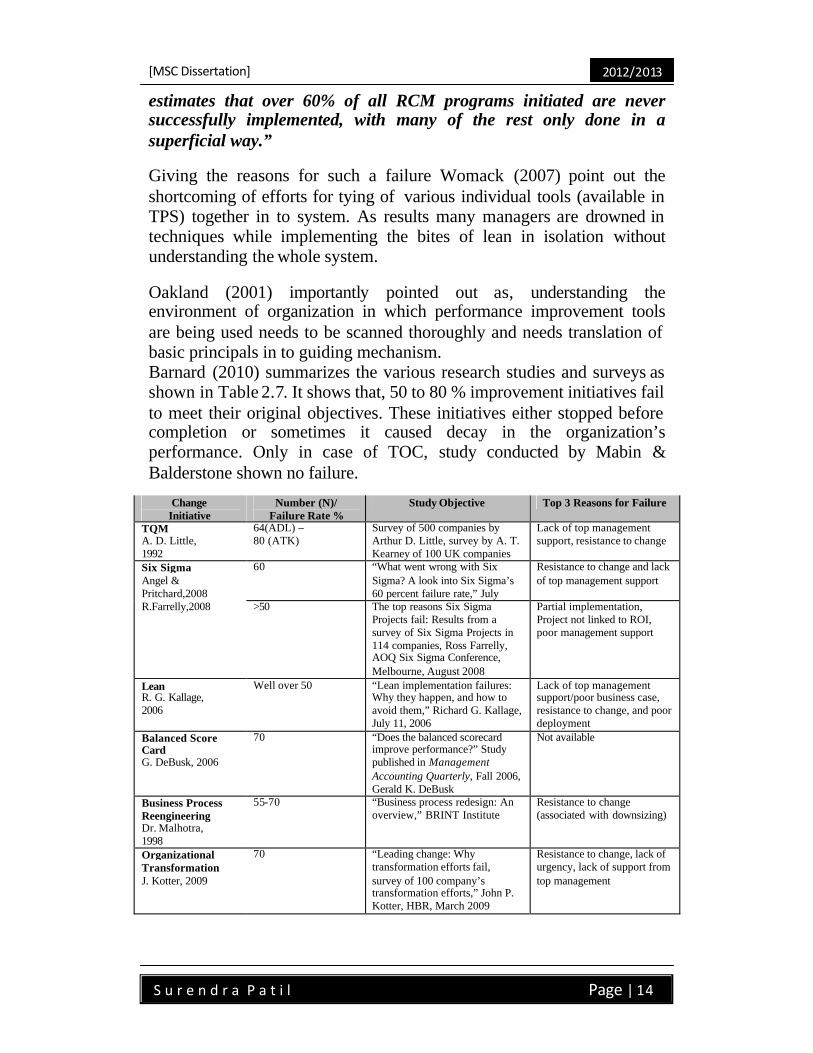
Oakland (2001) importantly pointed out as, understanding the environment of organization in which performance improvement tools are being used needs to be scanned thoroughly and needs translation of basic principals in to guiding mechanism. Barnard (2010) summarizes the various research studies and surveys as shown in Table 2.7. It shows that, 50 to 80 % improvement initiatives fail to meet their original objectives. These initiatives either stopped before completion or sometimes it caused decay in the organization’s performance. Only in case of TOC, study conducted by Mabin & Balderstone shown no failure.
Change Initiative
Number (N)/ Failure Rate %
Study Objective Top 3 Reasons for Failure
TQM A. D. Little, 1992
64(ADL) – 80 (ATK)
Survey of 500 companies by Arthur D. Little, survey by A. T. Kearney of 100 UK companies
Lack of top management support, resistance to change
Six Sigma Angel & Pritchard,2008 R.Farrelly,2008
60 “What went wrong with Six Sigma? A look into Six Sigma’s 60 percent failure rate,” July
Resistance to change and lack of top management support
>50 The top reasons Six Sigma Projects fail: Results from a survey of Six Sigma Projects in 114 companies, Ross Farrelly, AOQ Six Sigma Conference, Melbourne, August 2008
Partial implementation, Project not linked to ROI, poor management support
Lean R. G. Kallage, 2006
Well over 50 “Lean implementation failures: Why they happen, and how to avoid them,” Richard G. Kallage, July 11, 2006
Lack of top management support/poor business case, resistance to change, and poor deployment
Balanced Score Card G. DeBusk, 2006
70 “Does the balanced scorecard improve performance?” Study published in Management Accounting Quarterly, Fall 2006, Gerald K. DeBusk
Not available
Business Process Reengineering Dr. Malhotra, 1998
55-70 “Business process redesign: An overview,” BRINT Institute
Resistance to change (associated with downsizing)
Organizational Transformation J. Kotter, 2009
70 “Leading change: Why transformation efforts fail, survey of 100 company’s transformation efforts,” John P. Kotter, HBR, March 2009
Resistance to change, lack of urgency, lack of support from top management
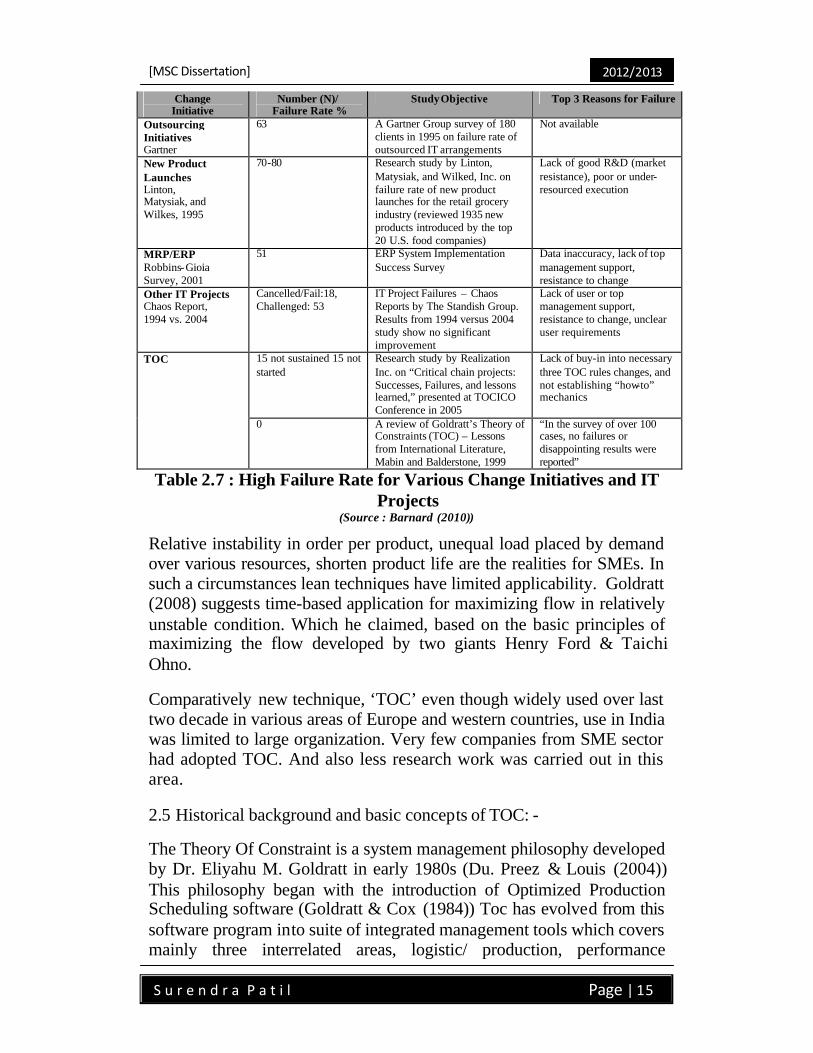
[MSC Dissertation]
2012/2013
S u r e n d r a P a t i l Page | 15
Change Initiative
Number (N)/ Failure Rate %
Study Objective Top 3 Reasons for Failure
Outsourcing Initiatives Gartner
63 A Gartner Group survey of 180 clients in 1995 on failure rate of outsourced IT arrangements
Not available
New Product Launches Linton, Matysiak, and Wilkes, 1995
70-80 Research study by Linton, Matysiak, and Wilked, Inc. on failure rate of new product launches for the retail grocery industry (reviewed 1935 new products introduced by the top 20 U.S. food companies)
Lack of good R&D (market resistance), poor or under-resourced execution
MRP/ERP Robbins-Gioia Survey, 2001
51 ERP System Implementation Success Survey
Data inaccuracy, lack of top management support, resistance to change
Other IT Projects Chaos Report, 1994 vs. 2004
Cancelled/Fail:18, Challenged: 53
IT Project Failures – Chaos Reports by The Standish Group. Results from 1994 versus 2004 study show no significant improvement
Lack of user or top management support, resistance to change, unclear user requirements
TOC 15 not sustained 15 not started
Research study by Realization Inc. on “Critical chain projects: Successes, Failures, and lessons learned,” presented at TOCICO Conference in 2005
Lack of buy-in into necessary three TOC rules changes, and not establishing “how-to” mechanics
0 A review of Goldratt’s Theory of Constraints (TOC) – Lessons from International Literature, Mabin and Balderstone, 1999
“In the survey of over 100 cases, no failures or disappointing results were reported”
Table 2.7 : High Failure Rate for Various Change Initiatives and IT Projects
(Source : Barnard (2010))
Relative instability in order per product, unequal load placed by demand over various resources, shorten product life are the realities for SMEs. In such a circumstances lean techniques have limited applicability. Goldratt (2008) suggests time-based application for maximizing flow in relatively unstable condition. Which he claimed, based on the basic principles of maximizing the flow developed by two giants Henry Ford & Taichi Ohno.
Comparatively new technique, ‘TOC’ even though widely used over last two decade in various areas of Europe and western countries, use in India was limited to large organization. Very few companies from SME sector had adopted TOC. And also less research work was carried out in this area.
2.5 Historical background and basic concepts of TOC: -
The Theory Of Constraint is a system management philosophy developed by Dr. Eliyahu M. Goldratt in early 1980s (Du. Preez & Louis (2004)) This philosophy began with the introduction of Optimized Production Scheduling software (Goldratt & Cox (1984)) Toc has evolved from this software program into suite of integrated management tools which covers mainly three interrelated areas, logistic/ production, performance
[MSC Dissertation]
2012/2013
S u r e n d r a P a t i l Page | 16
measurement, and problem solving/thinking tools (Spencer & Cox (1995)). The Theory of Constraints essential premise is that all firms have at least one critical constraint that limits performance towards achieving its goal. A constraint is any element whatsoever that occurs in a system and that prevents it from achieving optimal performance. (Goldratt (1990)) TOC Philosophy is based on two assumptions, one is system thinking and second one is constraint management (Breen et al. (2002))
Hamilton Pozo (et al.) (2009), writes in article, “TOC claims that a real-world system with more than three constraints is extremely unlikely. This claim is based on linear programming models, which are capable of solving optimization problems for systems with many hundreds of constraints. Researchers found that all but a few such solutions were so unstable that they would be completely impractical amid the noise of a real-world system. Stability had a strong correlation to the number of constraints -- the more constraints, the less stability. TOC practitioners claim that in practice three constraints is the realistic maximum.” Hence it become easy and simple to manage complex system or organization, with focusing on few specific areas in order to increase the performance of the system.
Schragenheim & Dettmer (2001) referred TOC as composition of principles, a set of generic tools and specific application of those tools. The principles explain the systems interaction and guide management for action. While as, tools are specific methods and procedures, for applying principles in particular situation.
Mabin & Balderstone (2000) describe TOC as mainly more than set of tools & technique, fundamentally a paradigm shift in the way we think about our problem, our goal, objectives and as well as our policies, procedures and measures we put in place.
The body of knowledge of TOC was well explained in various books/ novels by Dr. Eliyahu Goldratt and other authors. Fundamental principle of TOC, used in production environment called Drum Buffer Rope was described in ‘The Goal’ (1984) and its application was in second book named ‘The Race’ (1986) Application in project environment was given in book, ‘ Critical chain’ (1997). Constraint handling in marketing was explained in, ‘It’s not Luck’ (1992), while as application of logistic & distribution was discussed in’ Isn’t it Obvious’ (2009)
Large number of articles were published in various journals. Goldratt (1980), Fry et al. (1992), Gardiner et al. (1994) covered the history of
[MSC Dissertation]
2012/2013
S u r e n d r a P a t i l Page | 17
OPT and TOC. While as, Ronen and Starr (1990) Spencer and Cox (1995) covered the basic concepts of TOC. The application area in project management described by Leach (1999) Umble and Umble (2000), process improvement by Schragenheim and Ronen (1991), supply chain management by Rahman (2002), Watson and and Poilto (2003)
Rigorous academic testing has validated the finding that manufacturing system employing TOC techniques produces greater level of output while reducing inventory and manufacturing lead-time resulting the substantial increase in the bottom line (Mabin and Balderstone(2000))
Though in the initial phase, the TOC was evolved from OPT and widely used in production environment, Thinking process (TPs) developed in later stage have been used for problem identification and problem solving by both large as well as small organization. Additionally the tools also have been used in engineering, finance, marketing and sales, strategy and other business function. (Cox et al. (2005))
2.5.1Various components of TOC: -
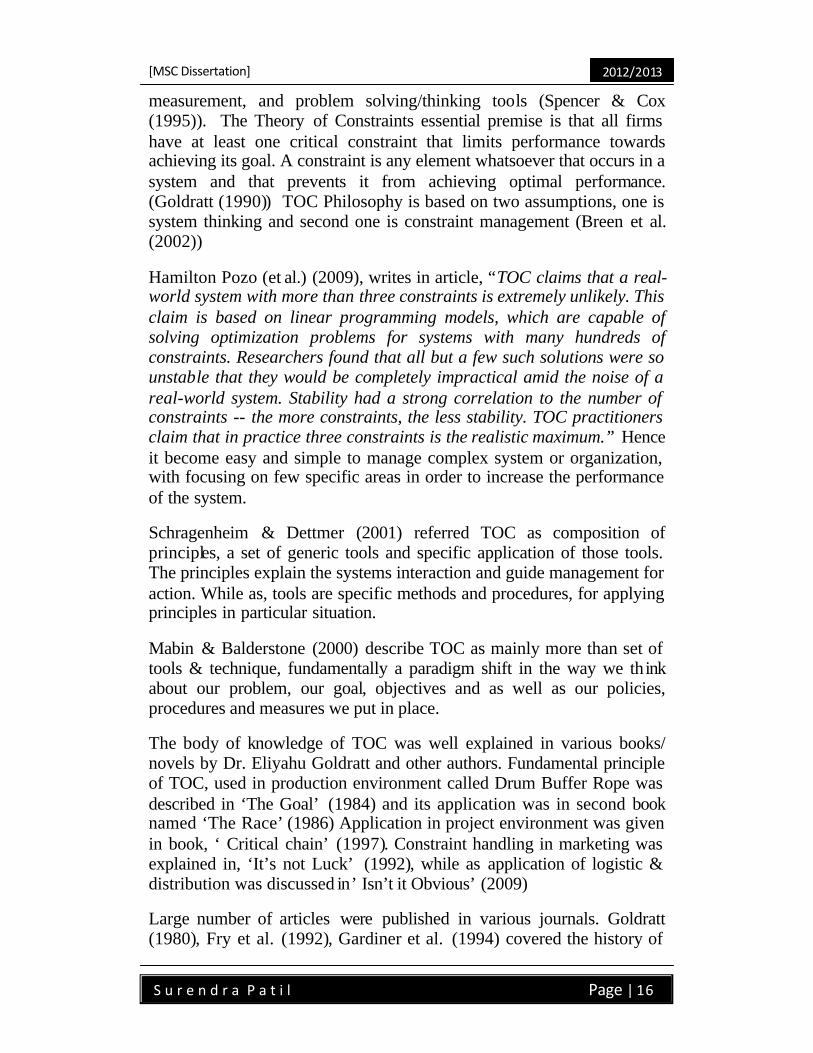
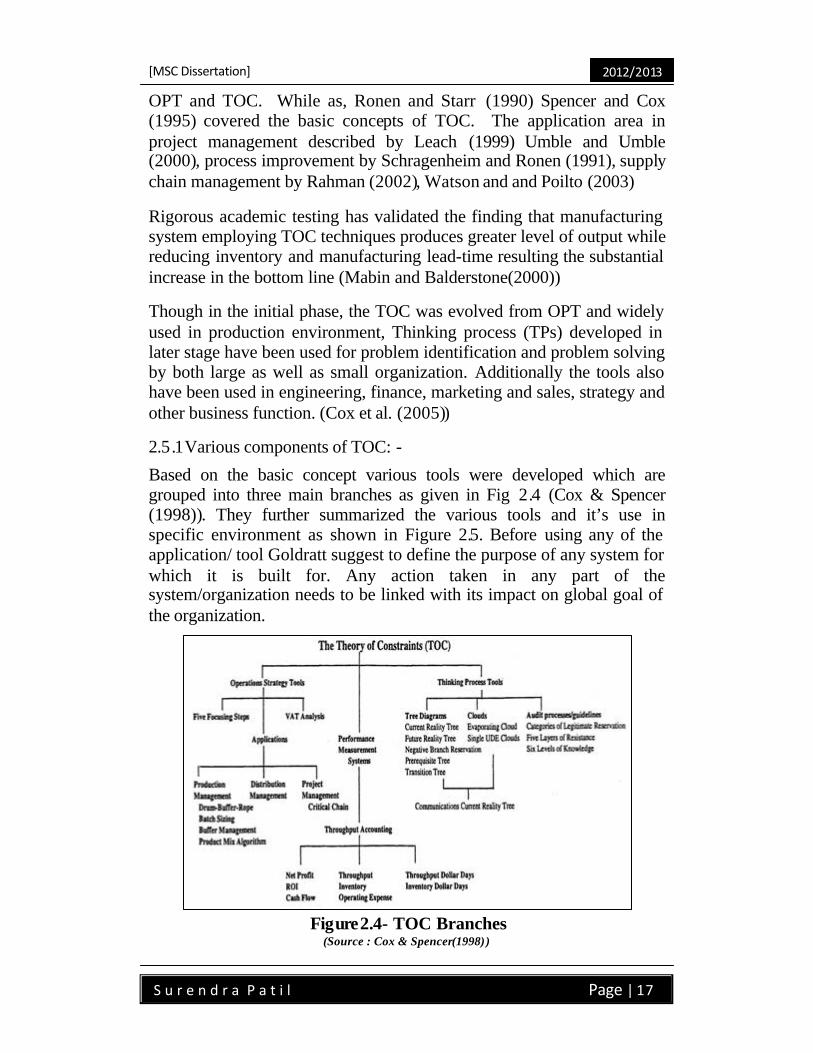
Based on the basic concept various tools were developed which are grouped into three main branches as given in Fig 2.4 (Cox & Spencer (1998)). They further summarized the various tools and it’s use in specific environment as shown in Figure 2.5. Before using any of the application/ tool Goldratt suggest to define the purpose of any system for which it is built for. Any action taken in any part of the system/organization needs to be linked with its impact on global goal of the organization.
Figure2.4- TOC Branches (Source : Cox & Spencer(1998))
[MSC Dissertation]
2012/2013
S u r e n d r a P a t i l Page | 18
Figure2.5- Basic TOC tools & It’s use in specific environment.
( Source : Cox & Spencer(1998 ) )
2.5.2Five focusing steps: -
Schragenheim (2001) describe it as, ‘keep eye on rolling ball’. Goldratt created five focusing step to insure the management’s attention persistently to, what is really important for success- a constraint.
1. Identify the system's constraint(s).
2. Decide how to exploit the constraint(s).
3. Subordinate everything else to the above decision.
4. Elevate the constraint.
5. If, in any of the above steps, the constraint has been broken, go back to Step 1.
These are very similar to the four steps of Plan Do Check Act of Deming’s cycle of improvement. Constraint never get disappear, they only shift to some other area. It may be within the system or in surrounding environment. Breaking the constraint every time raises the organizational performance.
[MSC Dissertation]
2012/2013
S u r e n d r a P a t i l Page | 19
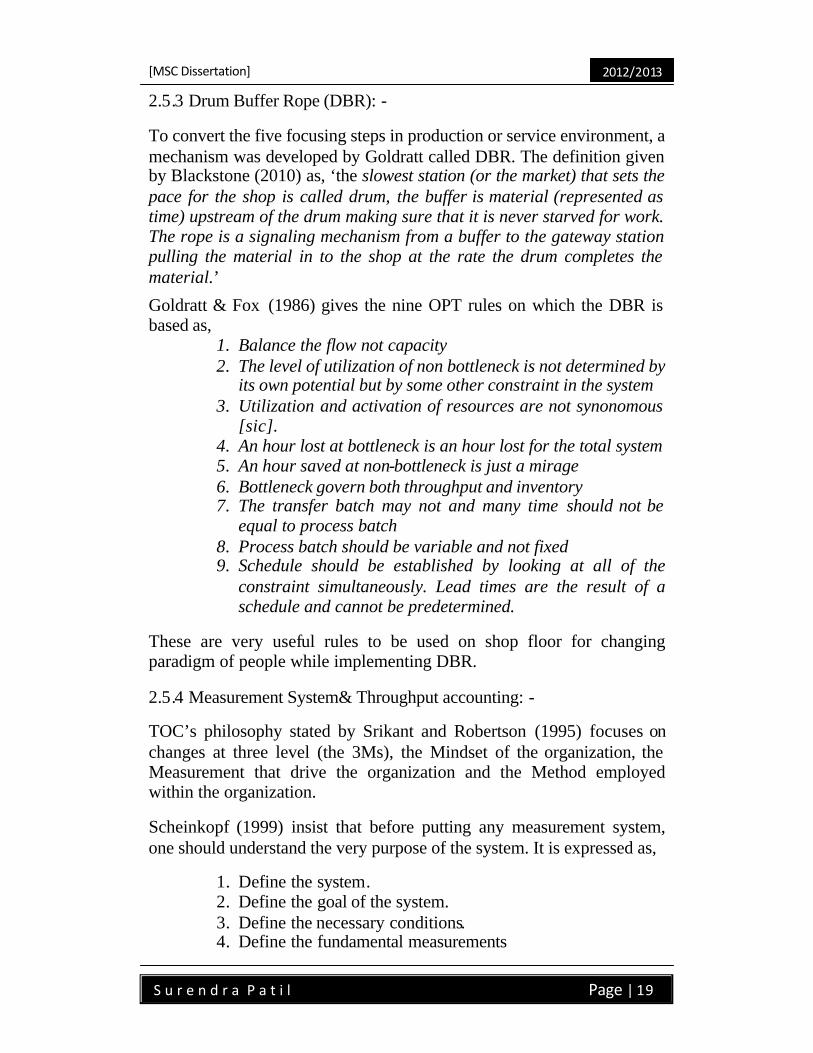
2.5.3 Drum Buffer Rope (DBR): -
To convert the five focusing steps in production or service environment, a mechanism was developed by Goldratt called DBR. The definition given by Blackstone (2010) as, ‘the slowest station (or the market) that sets the pace for the shop is called drum, the buffer is material (represented as time) upstream of the drum making sure that it is never starved for work. The rope is a signaling mechanism from a buffer to the gateway station pulling the material in to the shop at the rate the drum completes the material.’
Goldratt & Fox (1986) gives the nine OPT rules on which the DBR is based as,
1. Balance the flow not capacity 2. The level of utilization of non bottleneck is not determined by
its own potential but by some other constraint in the system 3. Utilization and activation of resources are not synonomous
[sic]. 4. An hour lost at bottleneck is an hour lost for the total system 5. An hour saved at non-bottleneck is just a mirage 6. Bottleneck govern both throughput and inventory 7. The transfer batch may not and many time should not be
equal to process batch 8. Process batch should be variable and not fixed 9. Schedule should be established by looking at all of the
constraint simultaneously. Lead times are the result of a schedule and cannot be predetermined.
These are very useful rules to be used on shop floor for changing paradigm of people while implementing DBR.
2.5.4 Measurement System& Throughput accounting: -
TOC’s philosophy stated by Srikant and Robertson (1995) focuses on changes at three level (the 3Ms), the Mindset of the organization, the Measurement that drive the organization and the Method employed within the organization.
Scheinkopf (1999) insist that before putting any measurement system, one should understand the very purpose of the system. It is expressed as,
1. Define the system. 2. Define the goal of the system. 3. Define the necessary conditions. 4. Define the fundamental measurements
[MSC Dissertation]
2012/2013
S u r e n d r a P a t i l Page | 20
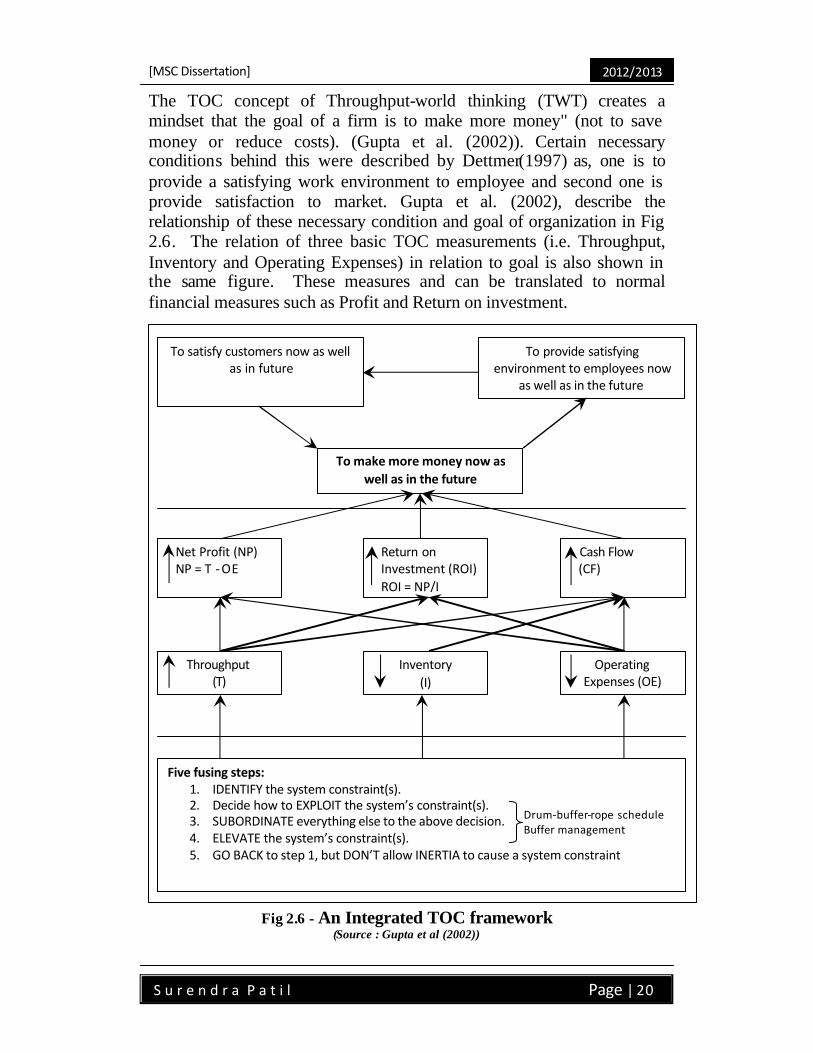
The TOC concept of Throughput-world thinking (TWT) creates a mindset that the goal of a firm is to make more money" (not to save money or reduce costs). (Gupta et al. (2002)). Certain necessary conditions behind this were described by Dettmer(1997) as, one is to provide a satisfying work environment to employee and second one is provide satisfaction to market. Gupta et al. (2002), describe the relationship of these necessary condition and goal of organization in Fig 2.6. The relation of three basic TOC measurements (i.e. Throughput, Inventory and Operating Expenses) in relation to goal is also shown in the same figure. These measures and can be translated to normal financial measures such as Profit and Return on investment.
Fig 2.6 - An Integrated TOC framework
(Source : Gupta et al (2002))
To satisfy customers now as well as in future
To provide satisfying environment to employees now
as well as in the future
To make more money now as well as in the future
Net Profit (NP) NP = T - OE
Return on Investment (ROI) ROI = NP/I
Cash Flow (CF)
Throughput (T)
Inventory (I)
Operating Expenses (OE)
Five fusing steps: 1. IDENTIFY the system constraint(s). 2. Decide how to EXPLOIT the system’s constraint(s). 3. SUBORDINATE everything else to the above decision. 4. ELEVATE the system’s constraint(s). 5. GO BACK to step 1, but DON’T allow INERTIA to cause a system constraint
Drum-buffer-rope schedule Buffer management
[MSC Dissertation]
2012/2013
S u r e n d r a P a t i l Page | 21
Goldratt (1990) define the basic measurement as,’ Throughput, Inventory, and Operating Expense’. These are often shortened to T, I, and OE and are defined as follows
1. Throughput is the rate at which the system generates money through sales.
2. Inventory is all the money that the system invests in purchasing things, which it intends to sell.
3. Operating expense is all the money the system spends in order
Throughput can be considered to be revenue less totally variable costs (Noreen et al.(1995)). A totally variable cost is anything that varies in a direct 1:1 relationship with sales; for instance transportation charges, or commission charges, might be totally variable costs. If the company produces and sells another unit of product it will incur this cost, and if it produces one unit less it will not incur this cost (Corbett (1998)) to turn inventory into throughput.
The next major measure is ‘Inventory’ which includes not only raw material, work-in-process, and finished goods inventory, but also all other money invested in plant, machinery equipment and other capital goods, in short, all the investments.
Operating expense is the on-going cost of running the business including both direct and indirect labor power etc.
Then next question is, ‘On which of these three, the management put emphasize? On reducing the operating expenses and investment or to increase the Throughput?’ It was well explained by Schragenheim (2001).The logic of throughput world, as putting the ‘Throughput’ at first priority, lies in the answering the question,’ what is the goal of the organization? To make money or save the money?’ There is practical limit for reducing the OE and Investment while as Throughput can be increased to infinite. The same is explained in the Fig 2.7. The difference between the priorities in traditional management and constraint management is given in the Fig 2.8.
[MSC Dissertation]
2012/2013
S u r e n d r a P a t i l Page | 22
Fig 2.7- Limits to T, I, and OE (Source : Eli Schragenheim, H. William Dettmer (2001))
TRADITIONAL MANAGEMENT
JAPANESE MANAGEMENT
(“JIT”)
CONSTRAINT MANAGEMENT
1. OE ?
1. I ?
1. T ?
2. I ?
2. T ?
2. I ?
3. T ?
3. OE ?
3. OE ?
Fig 2.8 – Management Priorities (Source : Eli Schragenheim, H. William Dettmer (2001))
Throughput accounting is based on three measurement mentioned above. The comparison between variable costing and throughput accounting is given by Noreen et al. (1995) and given in the Table 2.8.

[MSC Dissertation]
2012/2013
S u r e n d r a P a t i l Page | 23
Table2.8 : Net Profit and Return on Investment
(Source : Noreen et al (1995) )
2.5.5 Thinking Process tools (TP): -
Thinking processes used by Goldratt in the initial stages, for solving the common problematic situations. Goldratt and colleagues then formalized these thinking processes into a suite of TP tools in early 1990s (Goldratt (1990)). The Socratic method described in ‘It’s Not Luck’ by Goldratt, gives the roadmap for discovering novel solution to complex un-structured problem (Mabin & Davis (2010)). The TP provides rigorous and systematic mean to address identification and resolution of un-structured business problem related to management policies (Schragenheim & Dettmer(2001)).
According to Scheinkopf (1999), there are only two TOC Thinking process, one is sufficient cause and second one Necessary condition. There are five applications of these two thinking processes as given in Table 2.9 below
The Sufficient Cause Application Tools The Necessary Condition Application Tools
• Current Reality Tree • Evaporating Cloud • Future Reality Tree • Prerequisite Tree • Transition Tree
Table 2.9 : Application of TOC Thinking Process (Source : Scheinkopf (1999) )
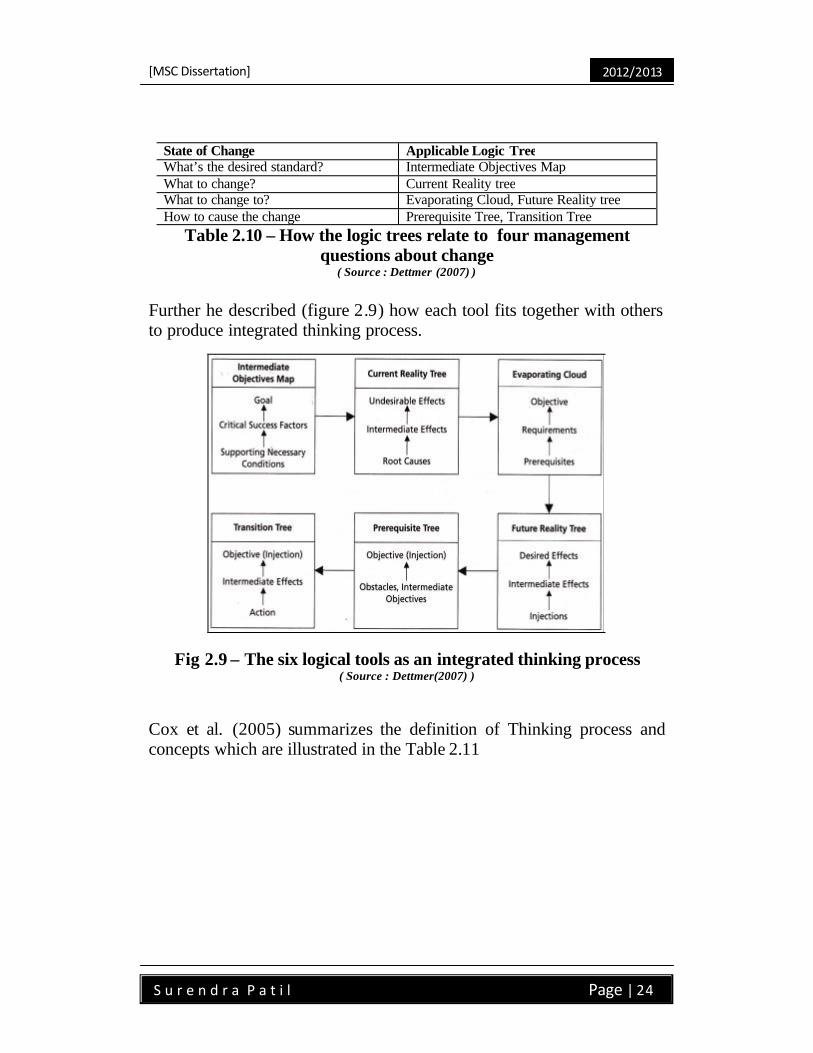
Sixth tool ‘Intermediate Objective’ added afterward by Goldratt, though Goldratt did not pursue it, Dettmer (2007) stressed the importance of it. He suggested the use of these tools in different phases of change management while implementing improvement initiatives, in order to answer the four basic questions as shown in the Table 2.10.
Net Profit= T– OE
Return on Investment
T – OE I
=
[MSC Dissertation]
2012/2013
S u r e n d r a P a t i l Page | 24
State of Change Applicable Logic Tree What’s the desired standard? Intermediate Objectives Map What to change? Current Reality tree What to change to? Evaporating Cloud, Future Reality tree How to cause the change Prerequisite Tree, Transition Tree
Table 2.10 – How the logic trees relate to four management questions about change
( Source : Dettmer (2007) )
Further he described (figure 2.9) how each tool fits together with others to produce integrated thinking process.
Fig 2.9 – The six logical tools as an integrated thinking process ( Source : Dettmer(2007) )
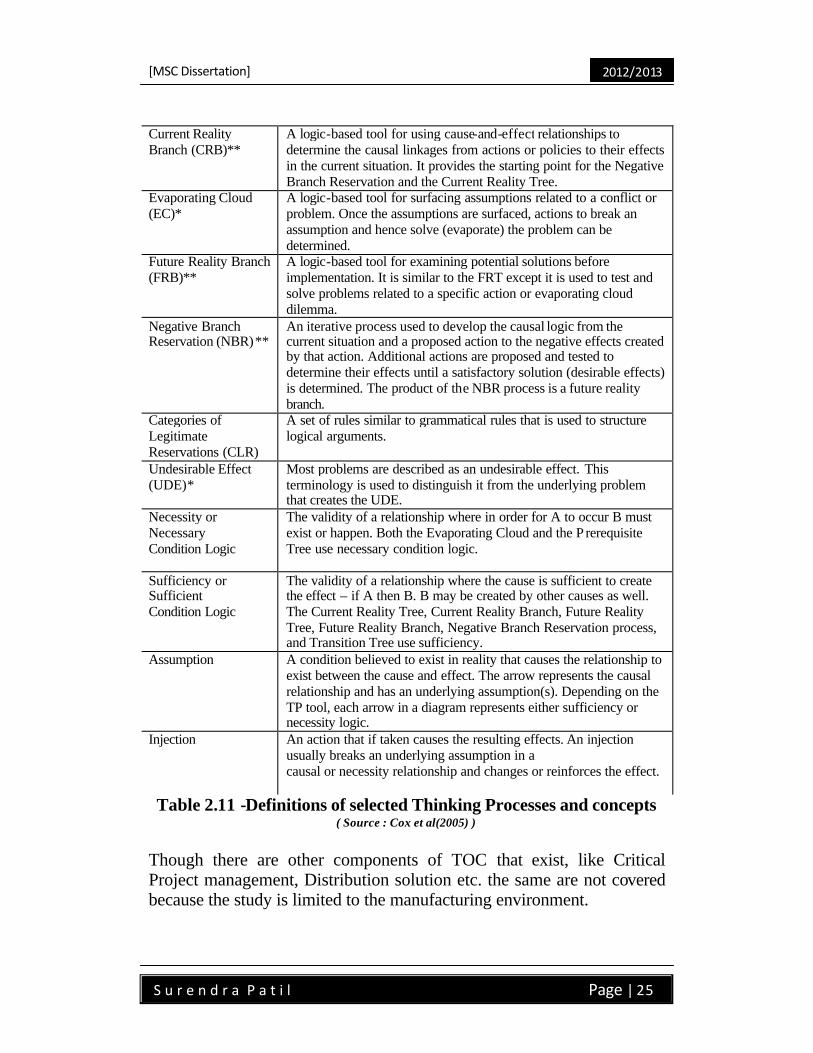
Cox et al. (2005) summarizes the definition of Thinking process and concepts which are illustrated in the Table 2.11
[MSC Dissertation]
2012/2013
S u r e n d r a P a t i l Page | 25
Current Reality Branch (CRB)**
A logic-based tool for using cause-and-effect relationships to determine the causal linkages from actions or policies to their effects in the current situation. It provides the starting point for the Negative Branch Reservation and the Current Reality Tree.
Evaporating Cloud (EC)*
A logic-based tool for surfacing assumptions related to a conflict or problem. Once the assumptions are surfaced, actions to break an assumption and hence solve (evaporate) the problem can be determined.
Future Reality Branch (FRB)**
A logic-based tool for examining potential solutions before implementation. It is similar to the FRT except it is used to test and solve problems related to a specific action or evaporating cloud dilemma.
Negative Branch Reservation (NBR)**
An iterative process used to develop the causal logic from the current situation and a proposed action to the negative effects created by that action. Additional actions are proposed and tested to determine their effects until a satisfactory solution (desirable effects) is determined. The product of the NBR process is a future reality branch.
Categories of Legitimate Reservations (CLR)
A set of rules similar to grammatical rules that is used to structure logical arguments.
Undesirable Effect (UDE)*
Most problems are described as an undesirable effect. This terminology is used to distinguish it from the underlying problem that creates the UDE.
Necessity or Necessary Condition Logic
The validity of a relationship where in order for A to occur B must exist or happen. Both the Evaporating Cloud and the P rerequisite Tree use necessary condition logic.
Sufficiency or Sufficient Condition Logic
The validity of a relationship where the cause is sufficient to create the effect – if A then B. B may be created by other causes as well. The Current Reality Tree, Current Reality Branch, Future Reality Tree, Future Reality Branch, Negative Branch Reservation process, and Transition Tree use sufficiency.
Assumption
A condition believed to exist in reality that causes the relationship to exist between the cause and effect. The arrow represents the causal relationship and has an underlying assumption(s). Depending on the TP tool, each arrow in a diagram represents either sufficiency or necessity logic.
Injection
An action that if taken causes the resulting effects. An injection usually breaks an underlying assumption in a causal or necessity relationship and changes or reinforces the effect.
Table 2.11 -Definitions of selected Thinking Processes and concepts ( Source : Cox et al(2005) )
Though there are other components of TOC that exist, like Critical Project management, Distribution solution etc. the same are not covered because the study is limited to the manufacturing environment.
[MSC Dissertation]
2012/2013
S u r e n d r a P a t i l Page | 26
2.6 Implementation of TOC: -
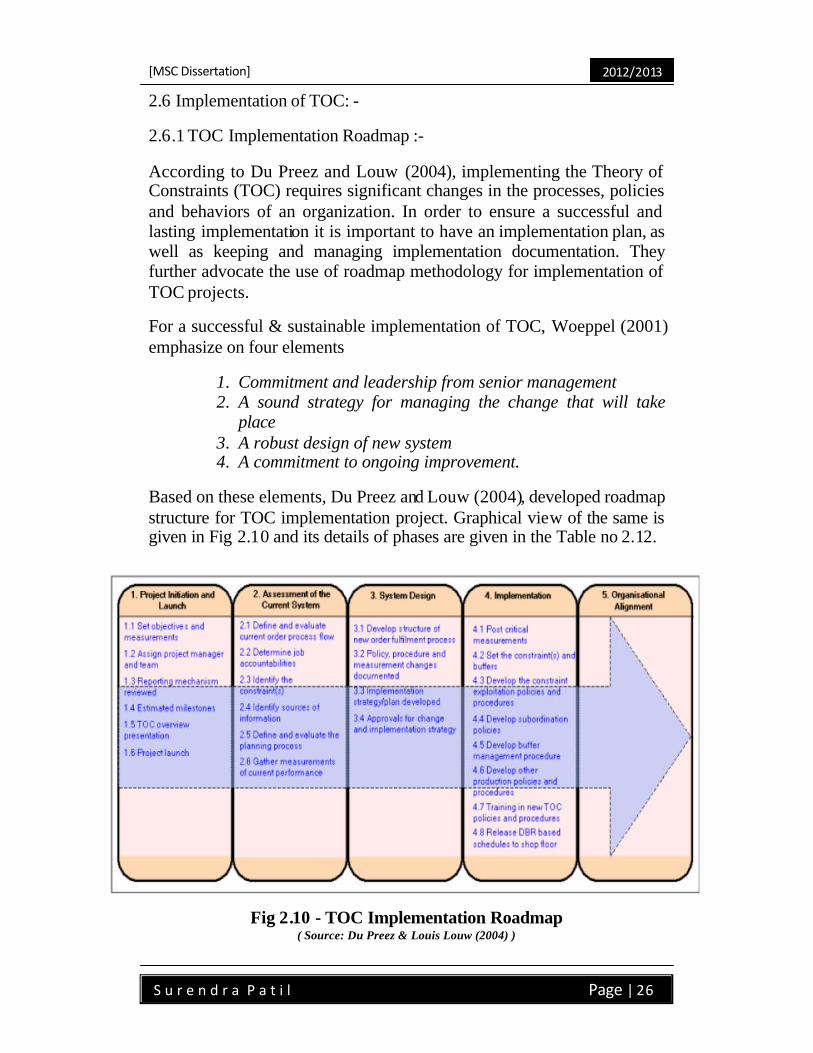
2.6.1 TOC Implementation Roadmap :-
According to Du Preez and Louw (2004), implementing the Theory of Constraints (TOC) requires significant changes in the processes, policies and behaviors of an organization. In order to ensure a successful and lasting implementation it is important to have an implementation plan, as well as keeping and managing implementation documentation. They further advocate the use of roadmap methodology for implementation of TOC projects.
For a successful & sustainable implementation of TOC, Woeppel (2001) emphasize on four elements
1. Commitment and leadership from senior management 2. A sound strategy for managing the change that will take
place 3. A robust design of new system 4. A commitment to ongoing improvement.
Based on these elements, Du Preez and Louw (2004), developed roadmap structure for TOC implementation project. Graphical view of the same is given in Fig 2.10 and its details of phases are given in the Table no 2.12.
Fig 2.10 - TOC Implementation Roadmap ( Source: Du Preez & Louis Louw (2004) )
[MSC Dissertation]
2012/2013
S u r e n d r a P a t i l Page | 27
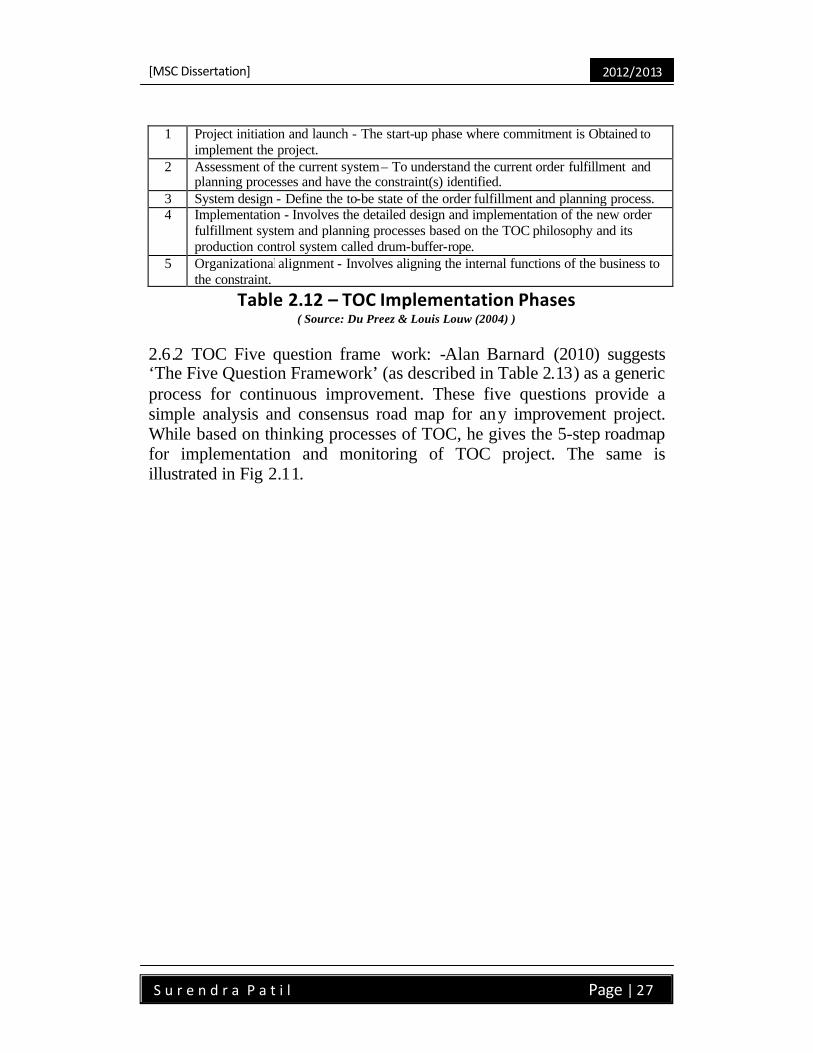
1 Project initiation and launch - The start-up phase where commitment is Obtained to implement the project.
2 Assessment of the current system – To understand the current order fulfillment and planning processes and have the constraint(s) identified.
3 System design - Define the to-be state of the order fulfillment and planning process. 4 Implementation - Involves the detailed design and implementation of the new order
fulfillment system and planning processes based on the TOC philosophy and its production control system called drum-buffer-rope.
5 Organizational alignment - Involves aligning the internal functions of the business to the constraint.
Table 2.12 – TOC Implementation Phases ( Source: Du Preez & Louis Louw (2004) )
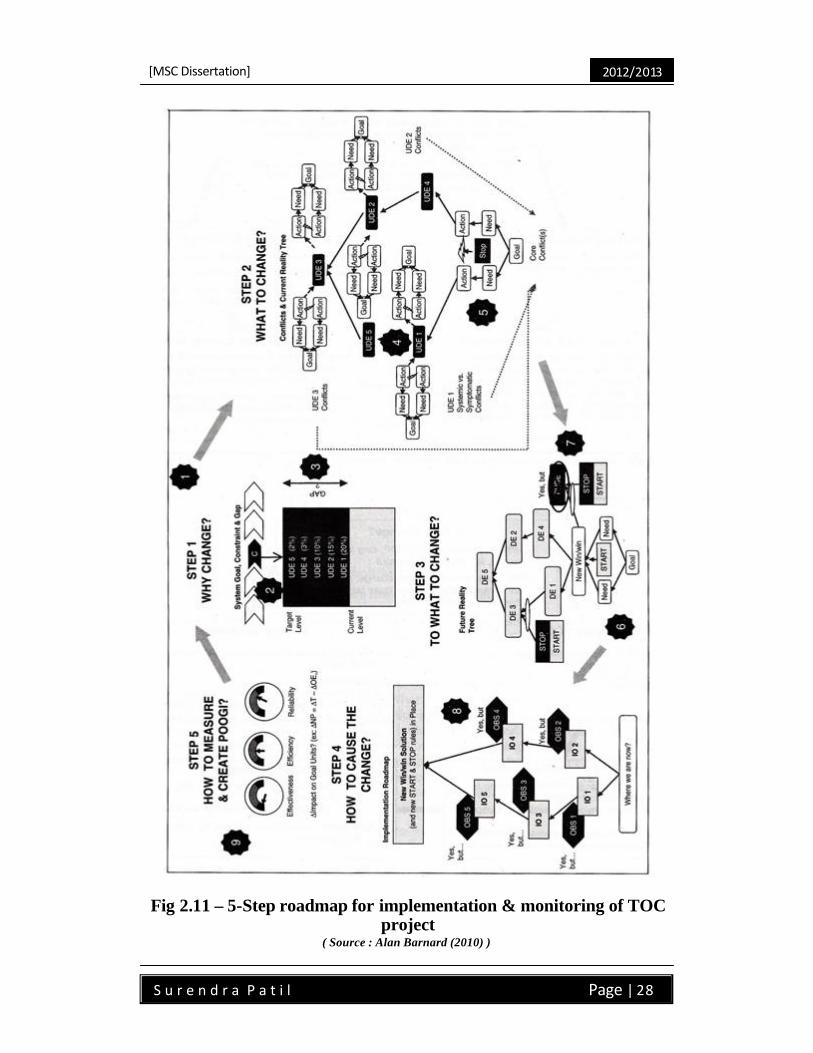
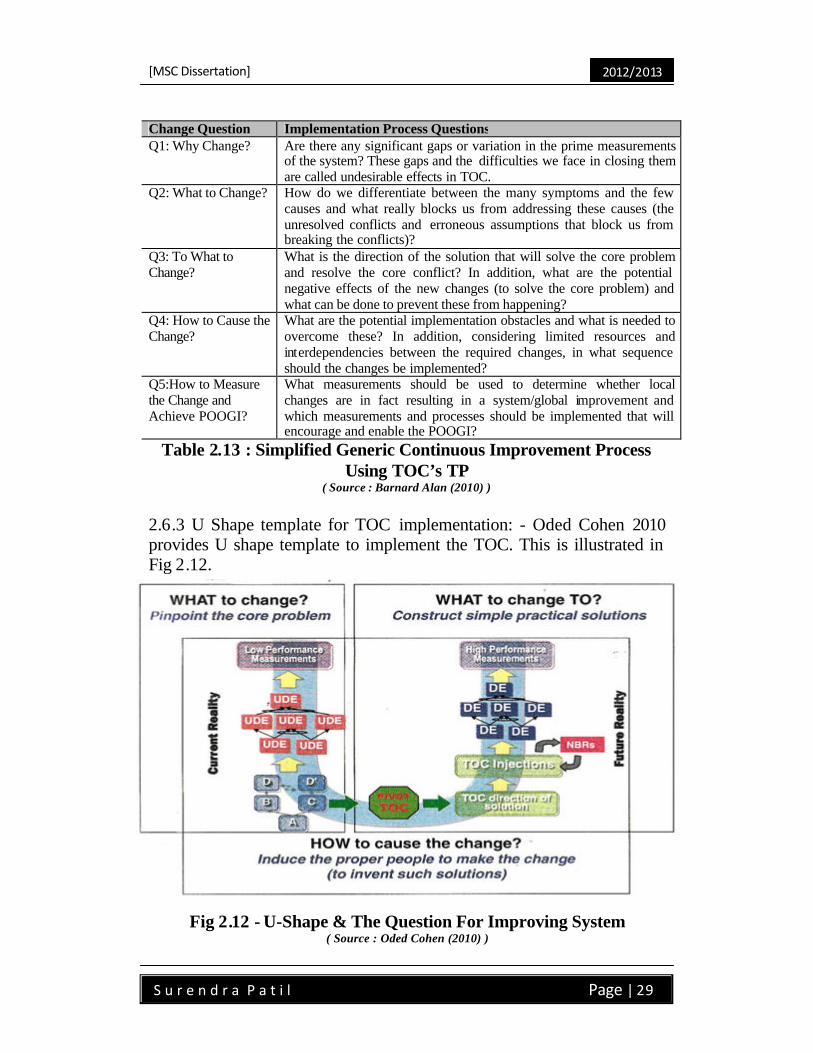
2.6.2 TOC Five question frame work: -Alan Barnard (2010) suggests ‘The Five Question Framework’ (as described in Table 2.13) as a generic process for continuous improvement. These five questions provide a simple analysis and consensus road map for any improvement project. While based on thinking processes of TOC, he gives the 5-step roadmap for implementation and monitoring of TOC project. The same is illustrated in Fig 2.11.
[MSC Dissertation]
2012/2013
S u r e n d r a P a t i l Page | 28
Fig 2.11 – 5-Step roadmap for implementation & monitoring of TOC project
( Source : Alan Barnard (2010) )
[MSC Dissertation]
2012/2013
S u r e n d r a P a t i l Page | 29
Change Question Implementation Process Questions Q1: Why Change? Are there any significant gaps or variation in the prime measurements
of the system? These gaps and the difficulties we face in closing them are called undesirable effects in TOC.
Q2: What to Change? How do we differentiate between the many symptoms and the few causes and what really blocks us from addressing these causes (the unresolved conflicts and erroneous assumptions that block us from breaking the conflicts)?
Q3: To What to Change?
What is the direction of the solution that will solve the core problem and resolve the core conflict? In addition, what are the potential negative effects of the new changes (to solve the core problem) and what can be done to prevent these from happening?
Q4: How to Cause the Change?
What are the potential implementation obstacles and what is needed to overcome these? In addition, considering limited resources and interdependencies between the required changes, in what sequence should the changes be implemented?
Q5:How to Measure the Change and Achieve POOGI?
What measurements should be used to determine whether local changes are in fact resulting in a system/global improvement and which measurements and processes should be implemented that will encourage and enable the POOGI?
Table 2.13 : Simplified Generic Continuous Improvement Process Using TOC’s TP
( Source : Barnard Alan (2010) )
2.6.3 U Shape template for TOC implementation: - Oded Cohen 2010 provides U shape template to implement the TOC. This is illustrated in Fig 2.12.
Fig 2.12 - U-Shape & The Question For Improving System ( Source : Oded Cohen (2010) )

[MSC Dissertation]
2012/2013
S u r e n d r a P a t i l Page | 30
U shape connects the problem to solution through pivot-the paradigm shift from the current way of managing to TOC way. He states that the U shape is based on three basic assumptions, which one can say the uniqueness of TOC.
1. Basic assumption 1- Convergence-reality, human based systems are governed by cause-and-effect relationship. Hence it is always possible to find out root cause that affects the system. This is presented in the left side of U shape.
2. Basic Assumption 2- No conflicts between local and global exist. As the conflicts are caused by the people’s perception or by system and there must be solution for every conflict. The implication of this assumption is that there should be win-win solution for every conflict. The win-win solution comprises of the injection on the right side of the U shape
3. Basic assumption 3 - Handle people with respect the entire U shape represent this basic assumption.
2.6.4 Viable vision: - Viable vision is a project to transform any
organization in to ever flourishing state. Exposing the concept of “ever flourishing” company – enjoying both rapid, continuous growth and remarkable stability regardless of external market conditions (Goldratt (2008)). Viable Vision is Goldratt’s offer to suitable businesses to transform current total sales into net profits within 4 years (Kendall (2005)). Organization that decide to move forward in to this challenge need to work out close the ga p bet TOC theory and practice. Whole team need to understand and acquire knowledge of TOC, in order to use in their specific supply chain environment (Heinert et al. (2012)) Embarking on Viable vision project Goldratt (2008) suggest following steps
a. Have supporter b. Determine your Blue Ocean- the decisive competitive
edge/s. c. Remove the engines of disharmony d. One step at a time implementation – prudently
implement S&T tree. e. Cause and effect auditing- educating management in
rigorous & analytical thinking.
2.6.5 Strategy And Tactic tree: - For implementing Viable Vision project Strategy & Tactic trees are the best guiding tools. (This is the tool used in viable vision that improves the communication and synchronization

[MSC Dissertation]
2012/2013
S u r e n d r a P a t i l Page | 31
dramatically. It provides template for converting strategy to bottom most action. Overall structure of S&T is given in Fig 2.13.
Fig 2.13 - Strategy and Tactic tree
( Source : http://www.goldrattconsulting.com/?categoryId=77828 )
The tree will represent all of the complete elements of Strategy & Tactics as a route map, and through its sound logic, establishes the connection to the desired objective of Viable Vision, to transform into an Ever Flourishing organization. Different S&T are used for different environment with customizing of generic S&T tree
2.7 Change management
2.7.1 Basic Concept
Change management has been defined as ‘the process of continually renewing an organization’s direction, structure, and capabilities to serve the ever-changing needs of external and internal customers’ (Moran and Brightman, 2001: 111)
In today’s ever-changing business environment, it is clear that an organization’s ability to innovate and implement planned change is a requisite for success, if not survival (Hamel, 2002 (2002)). Different management concepts have been developed to meet the challenges evoked by such a rapid change in business environment. Any project
[MSC Dissertation]
2012/2013
S u r e n d r a P a t i l Page | 32
aiming to improvement in organization’s performance, lead to change in the current working environment.
Theories about organizational change implic itly or explicitly include assumptions about what an organization is and its relationship to its environment.(Haveman (2000)).Change management practices include a variety of organizational interventions that, when executed properly and in consistency with internal and external organizational events, facilitate the enactment of organizational change processes.(Raineri (2011))
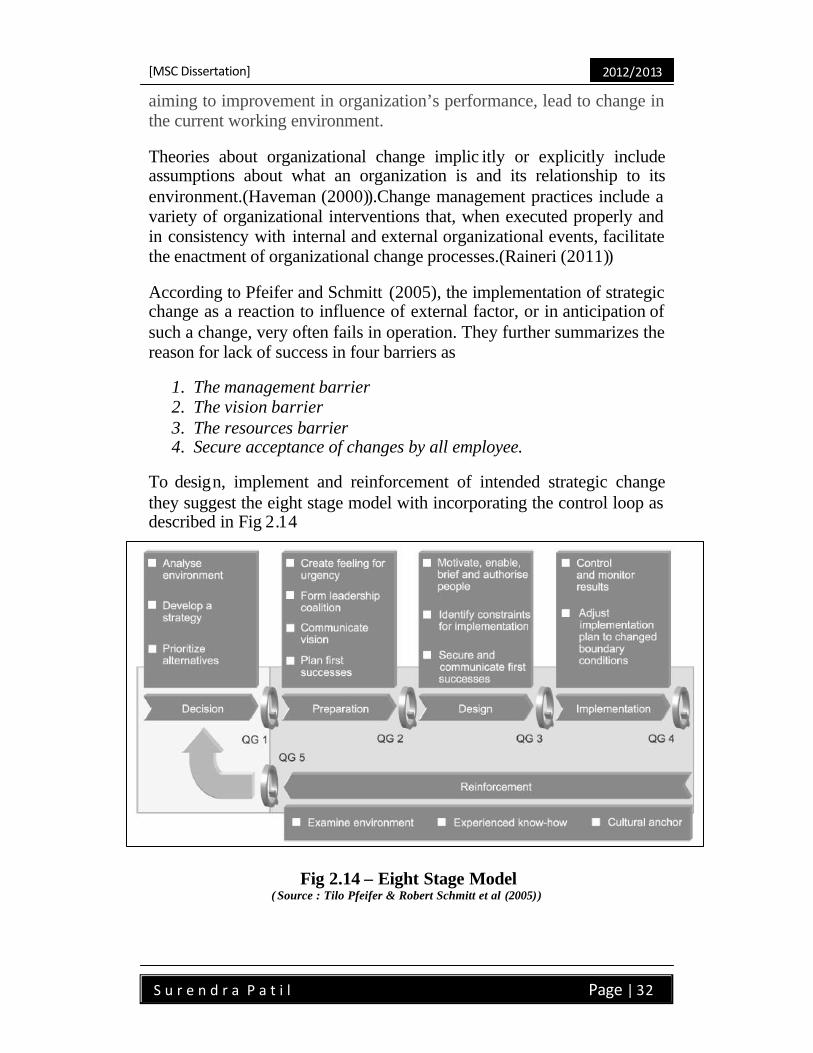
According to Pfeifer and Schmitt (2005), the implementation of strategic change as a reaction to influence of external factor, or in anticipation of such a change, very often fails in operation. They further summarizes the reason for lack of success in four barriers as
1. The management barrier 2. The vision barrier 3. The resources barrier 4. Secure acceptance of changes by all employee.
To design, implement and reinforcement of intended strategic change they suggest the eight stage model with incorporating the control loop as described in Fig 2.14
Fig 2.14 – Eight Stage Model
( Source : Tilo Pfeifer & Robert Schmitt et al (2005))
[MSC Dissertation]
2012/2013
S u r e n d r a P a t i l Page | 33
Lewin’s (1951) suggest three-step model for change based on the principal of force field analysis. The model recognizes the need to increase the driving force and reduce the restraining force in order to achieve new equilibrium.
• First step consists of Unfreezing the status quo • Second step involves, moving towards desired set of behavior • Third step is refreezing, seeks to stabilize the new quasi-stationary
equilibrium to prevent return to previous behavior
Sangamitra [75] summarizes other change management approaches as,
1. Action research: change process based on systematic collection of data and then selection of a change action based on what analyzed data indicate.
2. Organizational development: change process built on humanistic- democratic values, to improve organizational effectiveness and employee well being.
3. Sensitivity training: training groups to change behavior through unstructured group interaction
4. Survey feedback: use of questionnaires to identify discrepancies among member perceptions
5. Process consultation: a consultant helps client understand process events and identify processes for improvement
2.7.2 Success factors for change management
Page and Pearson (2004) suggest, successful change management requires effective leadership at the top and sensitization of top-level executives. While as Garg and Singh (2005) emphasize the institutionalizing and internalizing. Institutionalization means making change a permanent part of an organization & internalization of change means stabilization of change. Dooley (1995) suggested an approach to surfacing and altering hidden aspects of culture, especially systemic patterns of values, thought, and actions. Some authors suggest, need to develop detailed plan of how change will be implemented, including ambitious but realistic objectives, stages to be achieved, and the timing necessary to coordinate the change project (Nguyen Huy, 2001; (2001) Whelan-Berry et al., 2003 (2003)). Addressing of needs of individual as
[MSC Dissertation]
2012/2013
S u r e n d r a P a t i l Page | 34
well as group, in order to anticipate their interest, intention and reaction, pursued them to support the change process and diminishes potential resistance is emphasized by Jones et al. (2004). In order to motivate the employee Kanter (1985) advises, alignment of compensation and incentive systems with new objectives defined in changed plan.
While as pressing of hard side of change management, Sirkin et al.. (2005) states that,’ Our initial 225-company study revealed a consistent correlation between the outcomes (success or failure) of change programs and four hard factors: project duration, particularly the time between project reviews; performance integrity, or the capabilities of project teams; the commitment of both senior executives and the staff whom the change will affect the most; and the additional effort that employees must make to cope with the change. We called these variables the DICE factors because we could load them in favor of projects’ success.’
In Indian contest, Bhatnagaretal (2010) mention that, successful change interventions can occur when management takes a holistic, performance-driven, and excellence-orientated approach to organizational change in India. They further add, India has a high-context culture where work relationships are personalized rather than contractual. Even though it is difficult to characterize the a common pattern for Indian culture, some generic attributed are identified by the Sinha (1990) are as submissiveness, fatalism, power consciousness, possessiveness towards subordinates, fear of independent decision-making, and resistance to change. Hence to overcome these soft sides Ranganathan and Kuruvilla (2008) suggest developing specific HRD intervention to facilitate the change in Indian organizations.
2.8 Change management & TOC
While explaining the TOC methodology Goldratt (1990) mentioned that, ‘every improvement is change, any change is perceived threat to security and any threat on security gives rise to emotional resistance.’
According to Block (1989), resistance can be defined as expression of reservation, which normally arises as a response or reaction to change. He also state that resistance can be caused by individual factors, group factors or of organizational factors. Various types of resistance are, as identified by Kanter (1985) given in the Table 2.14

[MSC Dissertation]
2012/2013
S u r e n d r a P a t i l Page | 35
Cause Outline TOC tools Fear of the unknown
Being uncertain about the nature of a change, feeling that you do not know what is going on and what the future is likely to hold
CRT, FRT
Loss of control Feeling that the change is being done to you, not by you, worrying that you have no say in the situation and the events taking place
FRT, assisting or giving input into building this would assist
Loss of face Feeling embarrassed by the change and viewing it as a testimony that the way you have done things in the pas was wrong
Usually a problem is due to conflict (e.g. over priorities) CRT and EC can help
Loss of competency
Feeling that existing skills and competencies will no longer be of any use after the change
FRT would assist people to think the issues through
Need for security Worrying what your role will be after the change
FRT and NBR (see also loss of face)
Poor timing Being caught by surprise with a change that has been sprung on you, or being asked to change at a time when you already feel overworked
FRT would assist people see outcomes and overcome this fear PRT and TT would help plan for future
Force of habit Not liking to change existing ways of doing things, feeling comfortable in existing routines and habits
Need for change could be helped by the CRT, while PRT and TT would provide practical steps needed to change habits
Lack of support Lacking important support from direct supervisors and/or organization, not having the correct resources to properly implement the change
TT is designed specifically for this use
Lack of confidence Lacking in personal confidence that things, once changed, really will be better that before
FRT would assist people understand the proposed solution and its benefits
Lingering resentment
Being recalcitrant because of a lack of respect for the people involved and/or because of anger over the way you have been treated during past change efforts
NBR,FRT and PRT all address these issues
Table 2.14 - Resistance to change factors and TOC tools to help utilize them
( Source : Kanter R.M. (1985) )
Mabin et al. (2001) described TOC as a methodology, which appreciate resistance as a necessary and positive element in any change process. He further states that, manager needs to identify this resistance in its various
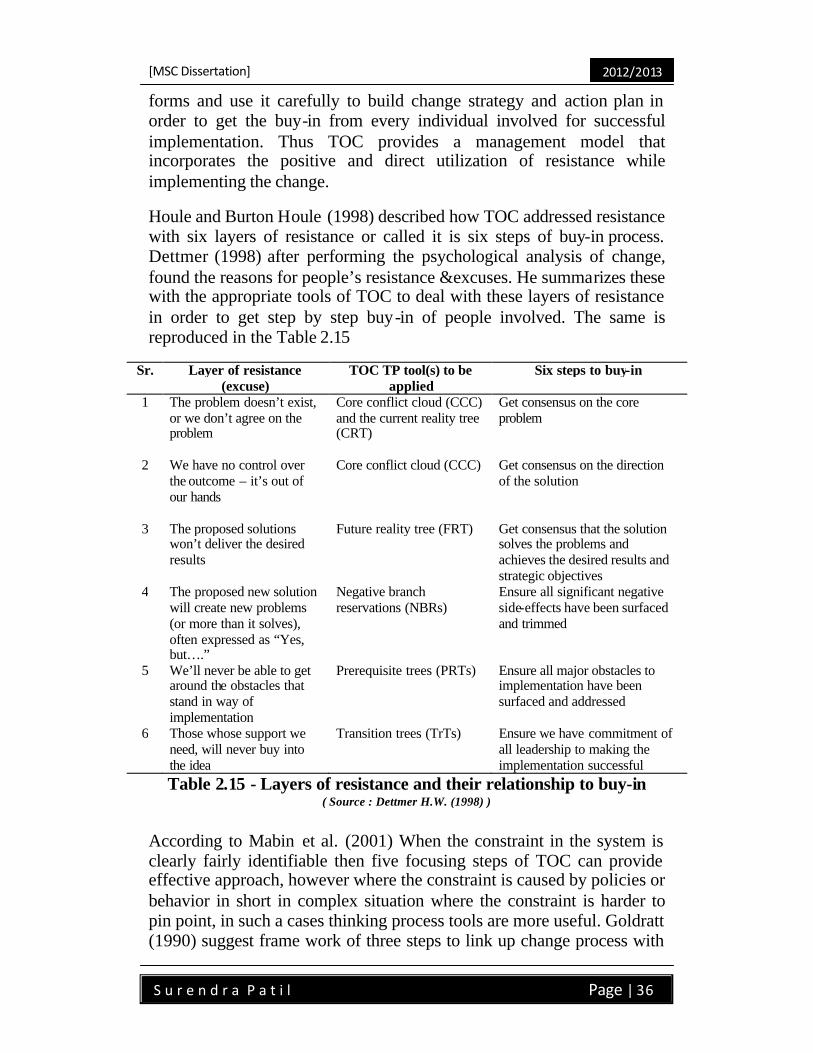
[MSC Dissertation]
2012/2013
S u r e n d r a P a t i l Page | 36
forms and use it carefully to build change strategy and action plan in order to get the buy-in from every individual involved for successful implementation. Thus TOC provides a management model that incorporates the positive and direct utilization of resistance while implementing the change.
Houle and Burton Houle (1998) described how TOC addressed resistance with six layers of resistance or called it is six steps of buy-in process. Dettmer (1998) after performing the psychological analysis of change, found the reasons for people’s resistance &excuses. He summarizes these with the appropriate tools of TOC to deal with these layers of resistance in order to get step by step buy-in of people involved. The same is reproduced in the Table 2.15
Sr. Layer of resistance (excuse)
TOC TP tool(s) to be applied
Six steps to buy-in
1 The problem doesn’t exist, or we don’t agree on the problem
Core conflict cloud (CCC) and the current reality tree (CRT)
Get consensus on the core problem
2 We have no control over the outcome – it’s out of our hands
Core conflict cloud (CCC) Get consensus on the direction of the solution
3 The proposed solutions won’t deliver the desired results
Future reality tree (FRT) Get consensus that the solution solves the problems and achieves the desired results and strategic objectives
4 The proposed new solution will create new problems (or more than it solves), often expressed as “Yes, but….”
Negative branch reservations (NBRs)
Ensure all significant negative side-effects have been surfaced and trimmed
5 We’ll never be able to get around the obstacles that stand in way of implementation
Prerequisite trees (PRTs) Ensure all major obstacles to implementation have been surfaced and addressed
6 Those whose support we need, will never buy into the idea
Transition trees (TrTs) Ensure we have commitment of all leadership to making the implementation successful
Table 2.15 - Layers of resistance and their relationship to buy-in ( Source : Dettmer H.W. (1998) )
According to Mabin et al. (2001) When the constraint in the system is clearly fairly identifiable then five focusing steps of TOC can provide effective approach, however where the constraint is caused by policies or behavior in short in complex situation where the constraint is harder to pin point, in such a cases thinking process tools are more useful. Goldratt (1990) suggest frame work of three steps to link up change process with
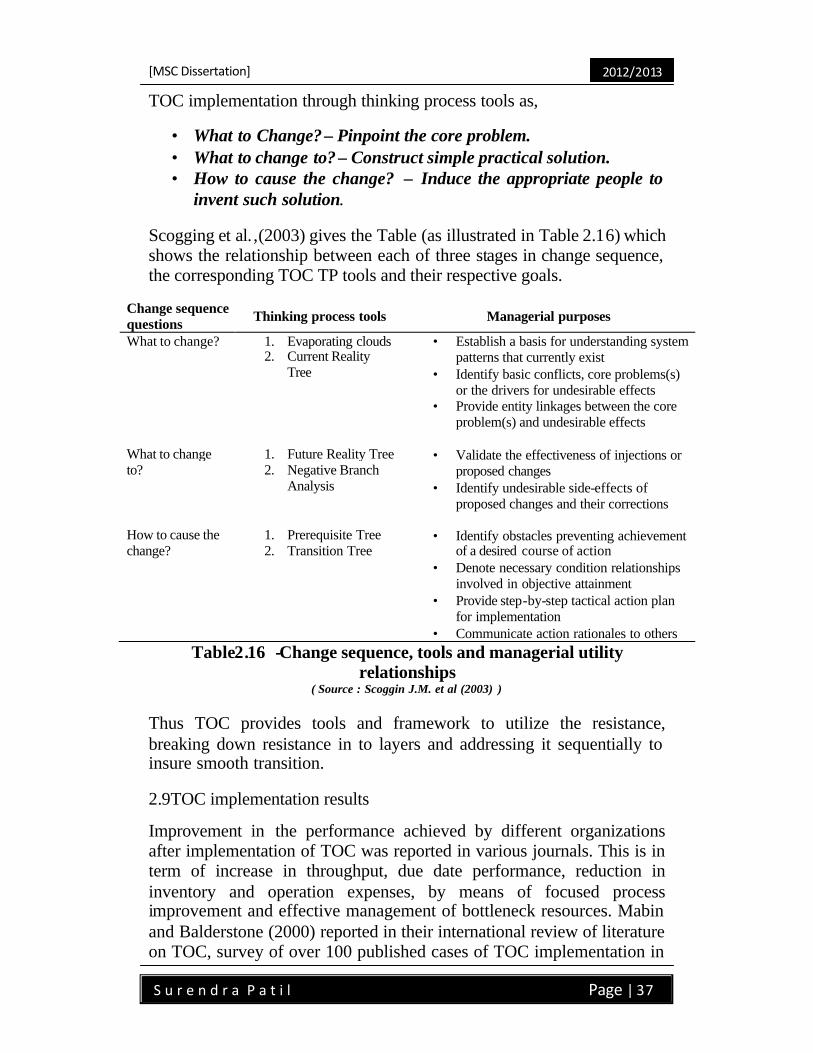
[MSC Dissertation]
2012/2013
S u r e n d r a P a t i l Page | 37
TOC implementation through thinking process tools as,
• What to Change? – Pinpoint the core problem. • What to change to? – Construct simple practical solution. • How to cause the change? – Induce the appropriate people to
invent such solution.
Scogging et al. ,(2003) gives the Table (as illustrated in Table 2.16) which shows the relationship between each of three stages in change sequence, the corresponding TOC TP tools and their respective goals.
Change sequence questions Thinking process tools Managerial purposes
What to change? 1. Evaporating clouds 2. Current Reality
Tree
• Establish a basis for understanding system patterns that currently exist
• Identify basic conflicts, core problems(s) or the drivers for undesirable effects
• Provide entity linkages between the core problem(s) and undesirable effects
What to change to?
1. Future Reality Tree 2. Negative Branch
Analysis
• Validate the effectiveness of injections or proposed changes
• Identify undesirable side-effects of proposed changes and their corrections
How to cause the change?
1. Prerequisite Tree 2. Transition Tree
• Identify obstacles preventing achievement of a desired course of action
• Denote necessary condition relationships involved in objective attainment
• Provide step-by-step tactical action plan for implementation
• Communicate action rationales to others Table2.16 -Change sequence, tools and managerial utility
relationships ( Source : Scoggin J.M. et al (2003) )
Thus TOC provides tools and framework to utilize the resistance, breaking down resistance in to layers and addressing it sequentially to insure smooth transition.
2.9TOC implementation results
Improvement in the performance achieved by different organizations after implementation of TOC was reported in various journals. This is in term of increase in throughput, due date performance, reduction in inventory and operation expenses, by means of focused process improvement and effective management of bottleneck resources. Mabin and Balderstone (2000) reported in their international review of literature on TOC, survey of over 100 published cases of TOC implementation in
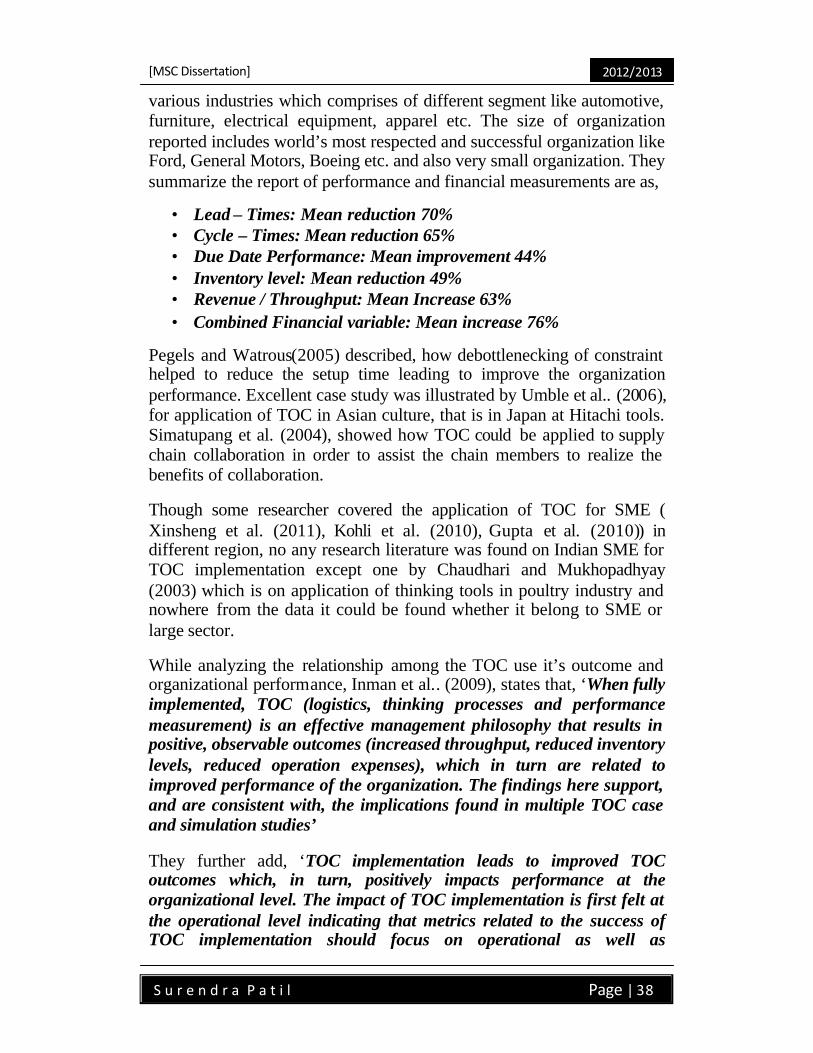
[MSC Dissertation]
2012/2013
S u r e n d r a P a t i l Page | 38
various industries which comprises of different segment like automotive, furniture, electrical equipment, apparel etc. The size of organization reported includes world’s most respected and successful organization like Ford, General Motors, Boeing etc. and also very small organization. They summarize the report of performance and financial measurements are as,
• Lead – Times: Mean reduction 70% • Cycle – Times: Mean reduction 65% • Due Date Performance: Mean improvement 44% • Inventory level: Mean reduction 49% • Revenue / Throughput: Mean Increase 63% • Combined Financial variable: Mean increase 76%
Pegels and Watrous(2005) described, how debottlenecking of constraint helped to reduce the setup time leading to improve the organization performance. Excellent case study was illustrated by Umble et al.. (2006), for application of TOC in Asian culture, that is in Japan at Hitachi tools. Simatupang et al. (2004), showed how TOC could be applied to supply chain collaboration in order to assist the chain members to realize the benefits of collaboration.
Though some researcher covered the application of TOC for SME ( Xinsheng et al. (2011), Kohli et al. (2010), Gupta et al. (2010)) in different region, no any research literature was found on Indian SME for TOC implementation except one by Chaudhari and Mukhopadhyay (2003) which is on application of thinking tools in poultry industry and nowhere from the data it could be found whether it belong to SME or large sector.
While analyzing the relationship among the TOC use it’s outcome and organizational performance, Inman et al.. (2009), states that, ‘When fully implemented, TOC (logistics, thinking processes and performance measurement) is an effective management philosophy that results in positive, observable outcomes (increased throughput, reduced inventory levels, reduced operation expenses), which in turn are related to improved performance of the organization. The findings here support, and are consistent with, the implications found in multiple TOC case and simulation studies’
They further add, ‘TOC implementation leads to improved TOC outcomes which, in turn, positively impacts performance at the organizational level. The impact of TOC implementation is first felt at the operational level indicating that metrics related to the success of TOC implementation should focus on operational as well as
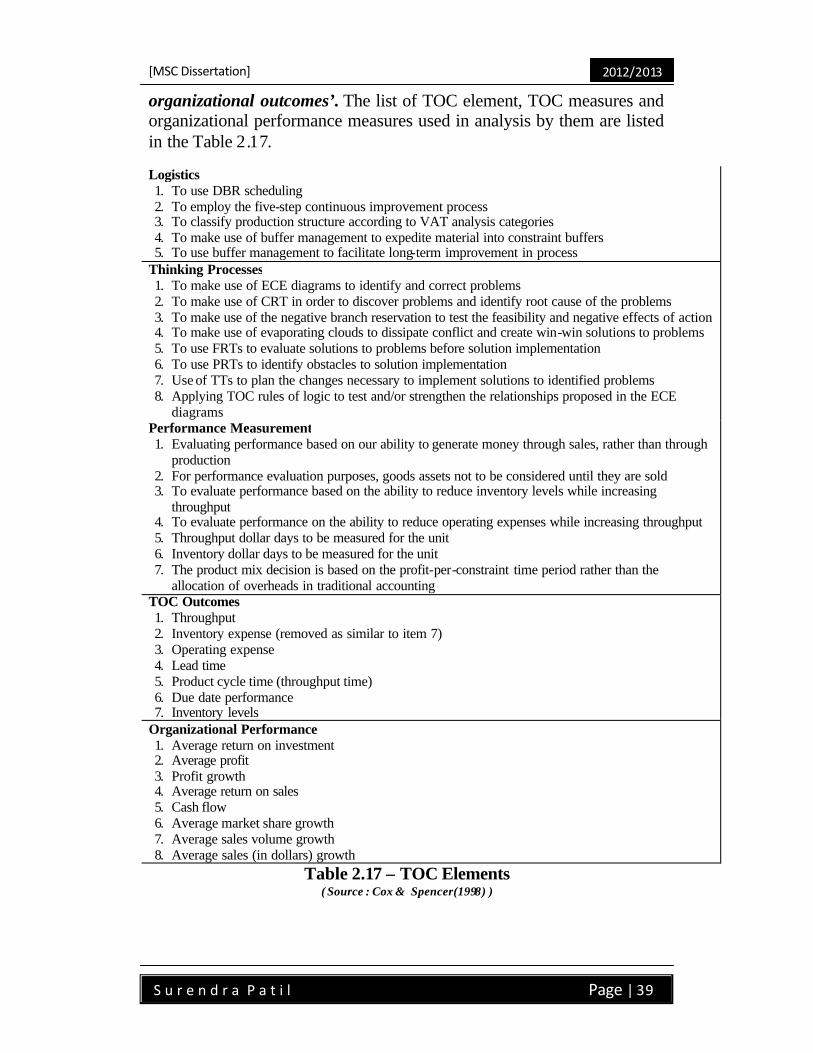
[MSC Dissertation]
2012/2013
S u r e n d r a P a t i l Page | 39
organizational outcomes’. The list of TOC element, TOC measures and organizational performance measures used in analysis by them are listed in the Table 2.17.
Logistics 1. To use DBR scheduling 2. To employ the five-step continuous improvement process 3. To classify production structure according to VAT analysis categories 4. To make use of buffer management to expedite material into constraint buffers 5. To use buffer management to facilitate long-term improvement in process
Thinking Processes 1. To make use of ECE diagrams to identify and correct problems 2. To make use of CRT in order to discover problems and identify root cause of the problems 3. To make use of the negative branch reservation to test the feasibility and negative effects of action 4. To make use of evaporating clouds to dissipate conflict and create win-win solutions to problems 5. To use FRTs to evaluate solutions to problems before solution implementation 6. To use PRTs to identify obstacles to solution implementation 7. Use of TTs to plan the changes necessary to implement solutions to identified problems 8. Applying TOC rules of logic to test and/or strengthen the relationships proposed in the ECE
diagrams Performance Measurement 1. Evaluating performance based on our ability to generate money through sales, rather than through
production 2. For performance evaluation purposes, goods assets not to be considered until they are sold 3. To evaluate performance based on the ability to reduce inventory levels while increasing
throughput 4. To evaluate performance on the ability to reduce operating expenses while increasing throughput 5. Throughput dollar days to be measured for the unit 6. Inventory dollar days to be measured for the unit 7. The product mix decision is based on the profit-per-constraint time period rather than the
allocation of overheads in traditional accounting TOC Outcomes 1. Throughput 2. Inventory expense (removed as similar to item 7) 3. Operating expense 4. Lead time 5. Product cycle time (throughput time) 6. Due date performance 7. Inventory levels
Organizational Performance 1. Average return on investment 2. Average profit 3. Profit growth 4. Average return on sales 5. Cash flow 6. Average market share growth 7. Average sales volume growth 8. Average sales (in dollars) growth
Table 2.17 – TOC Elements ( Source : Cox & Spencer(1998) )
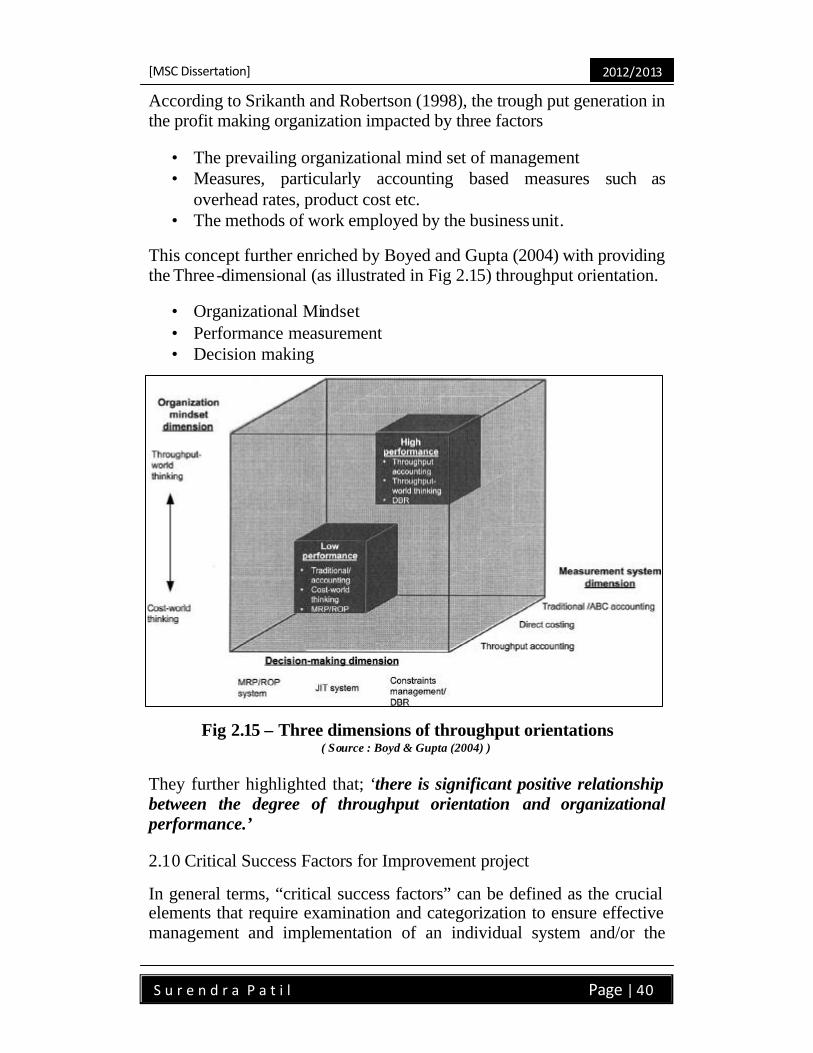
[MSC Dissertation]
2012/2013
S u r e n d r a P a t i l Page | 40
According to Srikanth and Robertson (1998), the trough put generation in the profit making organization impacted by three factors
• The prevailing organizational mind set of management • Measures, particularly accounting based measures such as
overhead rates, product cost etc. • The methods of work employed by the business unit.
This concept further enriched by Boyed and Gupta (2004) with providing the Three-dimensional (as illustrated in Fig 2.15) throughput orientation.
• Organizational Mindset • Performance measurement • Decision making
Fig 2.15 – Three dimensions of throughput orientations ( Source : Boyd & Gupta (2004) )
They further highlighted that; ‘there is significant positive relationship between the degree of throughput orientation and organizational performance.’
2.10 Critical Success Factors for Improvement project
In general terms, “critical success factors” can be defined as the crucial elements that require examination and categorization to ensure effective management and implementation of an individual system and/or the
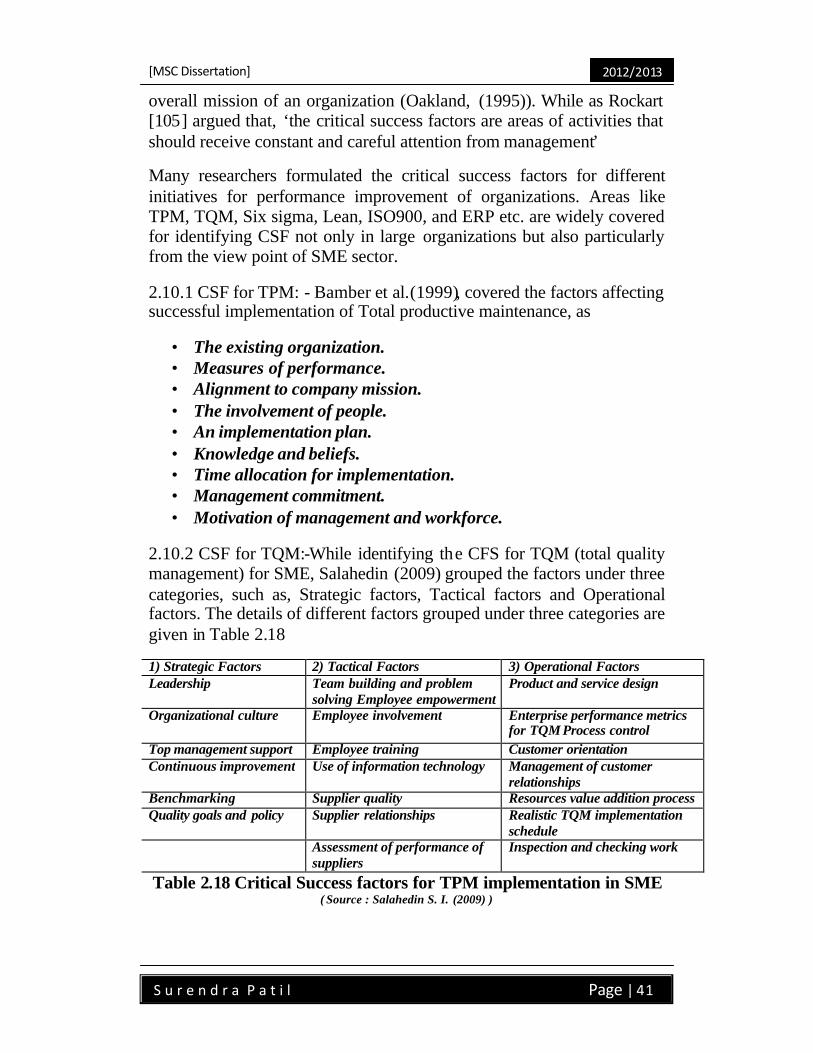
[MSC Dissertation]
2012/2013
S u r e n d r a P a t i l Page | 41
overall mission of an organization (Oakland, (1995)). While as Rockart [105] argued that, ‘the critical success factors are areas of activities that should receive constant and careful attention from management’
Many researchers formulated the critical success factors for different initiatives for performance improvement of organizations. Areas like TPM, TQM, Six sigma, Lean, ISO900, and ERP etc. are widely covered for identifying CSF not only in large organizations but also particularly from the view point of SME sector.
2.10.1 CSF for TPM: - Bamber et al.(1999), covered the factors affecting successful implementation of Total productive maintenance, as
• The existing organization. • Measures of performance. • Alignment to company mission. • The involvement of people. • An implementation plan. • Knowledge and beliefs. • Time allocation for implementation. • Management commitment. • Motivation of management and workforce.
2.10.2 CSF for TQM:-While identifying the CFS for TQM (total quality management) for SME, Salahedin (2009) grouped the factors under three categories, such as, Strategic factors, Tactical factors and Operational factors. The details of different factors grouped under three categories are given in Table 2.18
1) Strategic Factors 2) Tactical Factors 3) Operational Factors Leadership Team building and problem
solving Employee empowerment Product and service design
Organizational culture Employee involvement Enterprise performance metrics for TQM Process control
Top management support Employee training Customer orientation Continuous improvement Use of information technology Management of customer
relationships Benchmarking Supplier quality Resources value addition process Quality goals and policy Supplier relationships Realistic TQM implementation
schedule Assessment of performance of
suppliers Inspection and checking work
Table 2.18 Critical Success factors for TPM implementation in SME ( Source : Salahedin S. I. (2009) )
[MSC Dissertation]
2012/2013
S u r e n d r a P a t i l Page | 42
2.10.3 CSF for Lean:-For implementation of Lean in SME, Achanga et al. (2006), investigated that, leadership and management, finance, skill and expertise and culture of recipient organization, are the key factors. They further hypothesized; out of these leadership and management commitment are the most critical factors.
2.10.4 CSF for Six Sigma: -Antony et al. (2005) summarized CSF for implementing six sigma in SME, in ascending order of their importance as,
• Management involvement and participation • Organizational Infrastructure • Cultural change • Training • Linking six sigma to customers • Linking six sigma to business strategy • Linking six sigma to employees • Linking six sigma to suppliers • Understanding of six sigma methodology • Project managements kills • Project prioritization and selection
2.10.5CSF for ISO-9000:-While implementing ISO9001 in SME service sector, Psomas et al. (2010), research paper states that, factors were majorly concerned with the internal environment of company. These factors were as,
• Meeting customer needs and expectations • Continuous improvement of processes and product quality • Improvement of the company’s image • Equipment and infrastructure required • Calibration and adjustment of instruments and machines • Efficiency improvement • Production technology • Commitment and support of senior management • Costs of production and decreasing waste products • Appropriateness of company size • Increase in internal and external market share
2.10.6CSF for ERP implementation:-For successful implementation of ERP in SME sector, Upadhyay et al. (2011) also summarized the factors under four group named as, ‘technical perspective’, ‘project execution
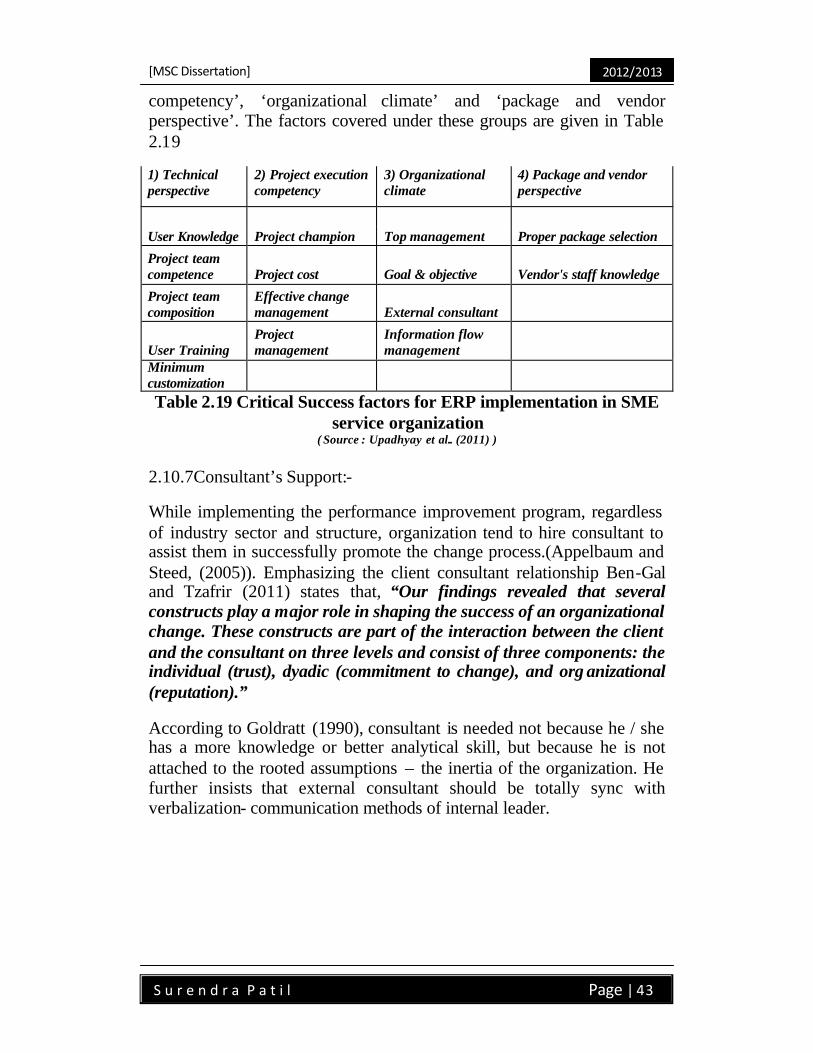
[MSC Dissertation]
2012/2013
S u r e n d r a P a t i l Page | 43
competency’, ‘organizational climate’ and ‘package and vendor perspective’. The factors covered under these groups are given in Table 2.19
1) Technical perspective
2) Project execution competency
3) Organizational climate
4) Package and vendor perspective
User Knowledge Project champion Top management Proper package selection
Project team competence Project cost Goal & objective Vendor's staff knowledge
Project team composition
Effective change management External consultant
User Training Project management
Information flow management
Minimum customization Table 2.19 Critical Success factors for ERP implementation in SME
service organization ( Source : Upadhyay et al.. (2011) )
2.10.7 Consultant’s Support:-
While implementing the performance improvement program, regardless of industry sector and structure, organization tend to hire consultant to assist them in successfully promote the change process.(Appelbaum and Steed, (2005)). Emphasizing the client consultant relationship Ben-Gal and Tzafrir (2011) states that, “Our findings revealed that several constructs play a major role in shaping the success of an organizational change. These constructs are part of the interaction between the client and the consultant on three levels and consist of three components: the individual (trust), dyadic (commitment to change), and org anizational (reputation).”
According to Goldratt (1990), consultant is needed not because he / she has a more knowledge or better analytical skill, but because he is not attached to the rooted assumptions – the inertia of the organization. He further insists that external consultant should be totally sync with verbalization- communication methods of internal leader.

[MSC Dissertation]
2012/2013
S u r e n d r a P a t i l Page | 44
Chapter 3 :Research Methodology
3.0 Research Methodology:
Rajsekar et al. (2006) described research methodology as procedure by which researcher goes about their work of describing, explaining and predicting phenomena.
In order to design &conduct the empirical research in operation management, a logical stepwise process provided by Flynn et al. (1990) is described in Fig 3.1.
Fig. 3.1 - A systematic approach for empirical research ( Source : Flynn et al. (1990) )
3.1 Selection of methodology:
In addressing the research question, ‘What are the critical factors which lead to successful implementation of TOC in Indian SME’, a combination of research methodology approaches has been applied in this research project. This comprises literature review, observation of company’s practices through personal interviews and collecting response through questionnaire. This approach is also known as Triangulation (Jick (1979)). Many authors suggest any form of triangulation, which is simply a combination of more than one approach is more likely to correct the bias from one single method (Denzin (1978), Krishnaswamy et al. (2012), Stone (1978)). The literature review was conducted extensively at the initial stage of this research, which demonstrate the current states of SME in India, the need for improvement in their performance, various tools techniques used currently and the advantages of use of TOC.
[MSC Dissertation]
2012/2013
S u r e n d r a P a t i l Page | 45
As stated in earlier chapter, the literature suggests implementation of TOC enhances the operational as well as financial performance of organization. In order to find the key factors, this work is built on the previous findings and proposes a TOC model particularly for Indian SME.
3.2Research design: -
3.2.1 Development of research model and hypothesis: -
According to Schragenheim & Dettmer (2001) theory of constraint is system-based philosophy, and organization function as a system and not as collection of separate process. They further add that, ‘every system has its goal and set of necessary conditions to achieve that goal’, as assumption of constraint management. The problems verbalized by the people in the organization, to achieve the goal are called as undesirable effects (UDEs) in TOC language. UDEs are reasons what really in existence and something negative to the goal of the organization. When organization adopts any improvement initiative, in other word it is act to deal with undesirable effect. TOC believes that UDEs are not the real problems but are the symptoms and with the help of Current reality tree (which in turn examine the cause and effect relationship) identify the root cause or leveraging point to solve the problems. Researchers have already established that the use of TOC tools and techniques enhances the organizational performance. Inman et al. (2009) proposes the model, which measure of TOC outcomes as a result of use of TOC element and Organizational performance as a result of TOC outcomes. Based on this, Inman et al. (2009), proposes to measure the organizational performance with help of five elements as (referred first four as TOC outcome and fifth as organizational performance)
a. Reduction in Lead time b. Reduction in Inventory c. Increase of On time performance d. Increase in Through Put e. Increase in Profit
Many authors given elaborative guidelines for selecting tool from TOC magazine to be used, depending up on the nature of UDEs and root cause associated with it. The main question is how effectively this can be implemented and what key factors are involved.
Goldratt (1990), suggests three steps methodology that is equivalent to five focusing steps but expressed in terms of change management are as
[MSC Dissertation]
2012/2013
S u r e n d r a P a t i l Page | 46
1. What to change? (Pinpoint the core problem) 2. What to change to? (Construct simple, practical solution) 3. How to cause the change? (Induce the appropriate people to
invent such a solution)
Goldratt (1990) emphasizes that implementation of TOC solutions should be holistically in the organization and not isolated in any one department. As such decision of implementation of TOC is a major change from the perspective of SME’s head of organization. One of the distinguishing characteristic of the small firm is that head of organization plays a role of management themselves or maintain high level of control over day today business and thus influence of these individuals is seen to have major impact on the performance as well as growth of organization. (Barrienger and Jones, 2004, Montserrat, 2002, Lin 19998.) Thus involvement of top management since begins from the first step (pinpointing the core problem) and continues to monitor the implementation throughout the process with keeping effective control. Providing the resources necessary to implement the suggested solution also comes under the purview of top management. In order to implement change effectively, irrespective of its size and sector, organizations tend to hire a consultant (Appelbaum and Steed, 2005). The success of change is also depends upon the consultant, client relationship (Ben-Gal and Tzafrir, 2011).
These four factors, Top management support, Involvement, Consultant support and Resource allocation are grouped under the name of strategic factors and are shown in Table 3.1 Hypothesis regarding these factors is proposed as,
Ho1: - Strategic factors have direct effect on Organizational performance
Robson and Bennett (2000) provided empirical evidence for positive association between employees skill level and firms growth. While dealing with third step of change management, Goldratt suggested to induce the appropriate people to invent solution. This is called as Socratic approach, in order to get the employee involvement, with treating them as if UDEs are their own problem and then asking to find out the solution for the same. Indirectly he was suggesting the involvement of the employee at great extent right from the stage of defining the problem. Leader of the organiz ation needs to enhance their capabilities in carrying out contemporary management concepts. Satisfying employees’ personal development need, delegating authority and responsibility, participative management with motivation & training of employee is a part of the same. (Lin, 1998, Changant et al. 2002) The fourth step of five focusing,
[MSC Dissertation]
2012/2013
S u r e n d r a P a t i l Page | 47
insist the subordinating everything else to constraint and policies pertaining to it. This is only possible with the effective teamwork.
Four factors discussed above, Employee, Training, Employee involvement, Motivation of employee and Effective team working are grouped under Tactical factor and hypothesis proposed is as under
Ho2: - Tactical factors have direct effect on Organizational performance
According to Dvir et al. (2003), planning is considered as a central element for project management. PMI guide gives thrust on the need to invest in project management process and procedure to support the planning. It believes that although planning does not guarantee project success, lack of planning will probably guarantee the failure. They further add that with support of IT infrastructure, use of computerized planning tools may eventually turn out the successful projects.
Enterprise resource planning (ERP) is increasingly being used in SME sector to get competitive advantage (Gable and Stewart, 1999). While implementing some of TOC tools like DBR planning system needs computer support. While customizing the software to specific changed need often leads to situation where the feature of the software needs to modified to fit the process or business process needs to be modified to fit into software with minimum customization. (Buonanno et al., 2005).
Many organizations in order to increase the customer satisfaction, competitiveness and to increase internal efficiencies, are adopting the quality management systems (Magd, 2008). Organization where the quality management system is already exists, needs to integrate the new improvement initiative with it.
As suggested by Oded Cohen (2011), the fixing the role of TOC manager or in other word appointment of project champion who drives the change initiative throughout the life cycle of implementation, needs changes in the organizational structure.
All these four factors, (Project planning, Use of IT infrastructure, Integration with quality system and Change in organization structure) are grouped under name of operational factor and hypothesis related is proposed like,
Ho3: -Operational factors have direct effect on Organizational performance
Hypothesis presented above lead us to theoretical model described in Fig 3.2.
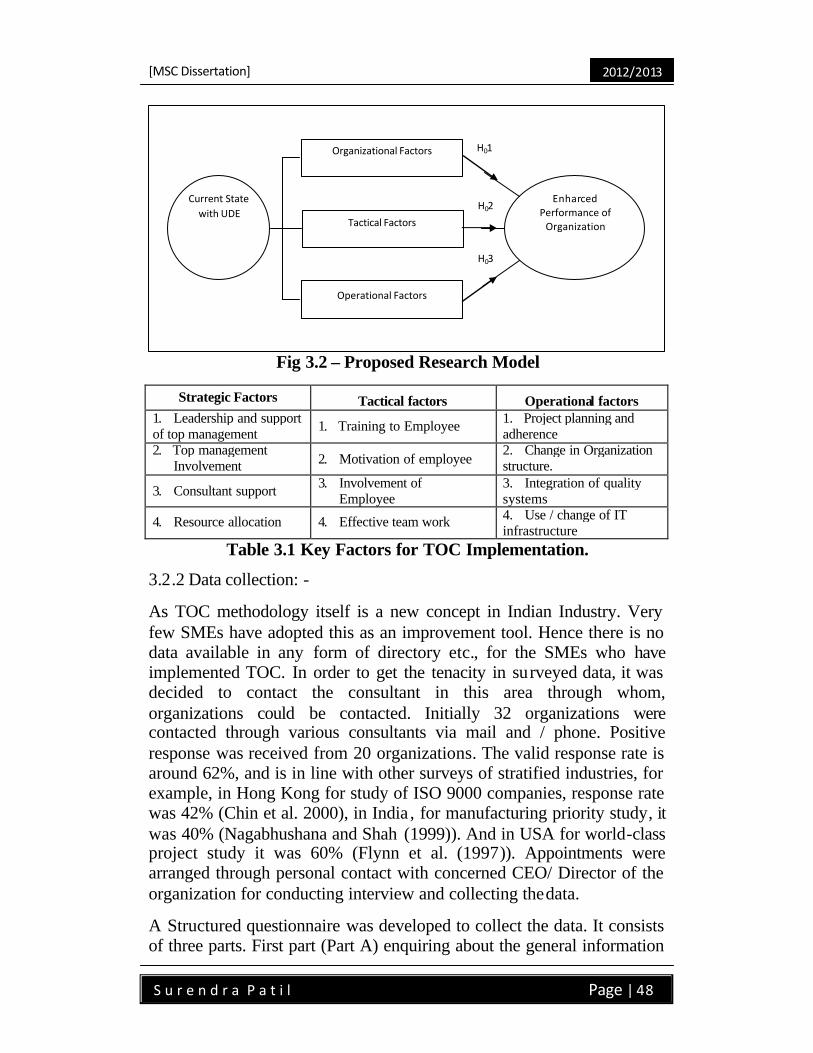
[MSC Dissertation]
2012/2013
S u r e n d r a P a t i l Page | 48
Fig 3.2 – Proposed Research Model
Strategic Factors Tactical factors Operational factors 1. Leadership and support of top management 1. Training to Employee 1. Project planning and
adherence 2. Top management Involvement 2. Motivation of employee
2. Change in Organization structure.
3. Consultant support 3. Involvement of Employee
3. Integration of quality systems
4. Resource allocation 4. Effective team work 4. Use / change of IT infrastructure
Table 3.1 Key Factors for TOC Implementation.
3.2.2 Data collection: -
As TOC methodology itself is a new concept in Indian Industry. Very few SMEs have adopted this as an improvement tool. Hence there is no data available in any form of directory etc., for the SMEs who have implemented TOC. In order to get the tenacity in surveyed data, it was decided to contact the consultant in this area through whom, organizations could be contacted. Initially 32 organizations were contacted through various consultants via mail and / phone. Positive response was received from 20 organizations. The valid response rate is around 62%, and is in line with other surveys of stratified industries, for example, in Hong Kong for study of ISO 9000 companies, response rate was 42% (Chin et al. 2000), in India , for manufacturing priority study, it was 40% (Nagabhushana and Shah (1999)). And in USA for world-class project study it was 60% (Flynn et al. (1997)). Appointments were arranged through personal contact with concerned CEO/ Director of the organization for conducting interview and collecting the data.
A Structured questionnaire was developed to collect the data. It consists of three parts. First part (Part A) enquiring about the general information
Organizational Factors
Tactical Factors
Operational Factors
Current State with UDE
Enhanced Performance of
Organization
H01
H02
H03
[MSC Dissertation]
2012/2013
S u r e n d r a P a t i l Page | 49
like name of organization location, Year of establishment, product manufactured, market segment, present turnover etc. Second part (Part B) consist of structured questions for interviewing CEO / Owner / Managing Director of the organization to understand the Goal & Vision of company, overall TOC plan and implementation, the purpose of TOC adoption, present status and benefits of TOC. Third part (Part C) consists of survey questionnaire for understanding the information regarding key factors (TOC enablers). For all the twenty sites, visits were arranged at mutually convenient time for conducting the interview with respondent and followed by collection of the data through questionnaire filling. Questionnaire was filled later in writing for the part one and three, while as the conversation was recorded from which some data and information was drawn. This formed the part two of questionnaire. Some respondent preferred to give the information in writing instead of recording the conversation.
3.2.3 P ilot study and modification in research frame work: -
As a measure of pre-test and validity of content, three organizations were visited and interviews and filling of questionnaire was done. Out of these in two organizations, in spite of good performance results at first phase, little sustenance of TOC efforts was observed. No efforts were found to pursue TOC as a tool for process of ongoing improvement as expected. This forced the researcher to make the changes in the research model and also in the questionnaire.
3.2.4 Modification in research model: -
Though the factors regarding the successful implementation are hypothesized, necessity was felt to extend the study further to examining the reasons for sustenance of TOC efforts and its inhibitors. Empirical evidence was produced by Inman (2009) et al. regarding the use of TOC elements (alignment of operations with TOC principles) and enhanced organizational performance. Boyd and Gupta (2004) proposed central construct, called as throughput orientation, and higher the throughput orientation greater the organizational performance. Based on these previous researches, this study intends to examine further, if alignment of operation to TOC principal will help to keep the sustenance of TOC efforts as a ‘POOGI’. The hypothesis proposed for the same is Ho4.
Ho4: - Alignment of Operations with TOC principals has strong impact on sustenance of TOC Also it is proposed to check the effcet of the results of the organizational performance, to the sustemnace of TOC. The praposed hypothesis is as inH05.
[MSC Dissertation]
2012/2013
S u r e n d r a P a t i l Page | 50
H05: - Organizational performance at first stage has direct effect on sustenance of TOC As mentioned by Mabin and Balderstone (2003), no published evidence was found reporting the failure of TOC efforts. According to Noreen et al. (1995), ‘as with other improvement programs, such as TQM, the failures (of TOC applications) probably outnumber the successes in the sense that improvements fall short of expectations”. They further caution that, gain in improvement in the operations and in profit within short period will not hold for longer period unless management is willing to embrace TOC in totality.
Though TOC literature is not reflecting any inhibitors, in much other improving methodology like TPM, TQM researchers have given the list of different obstacles / inhibitors. (Ahuja and Khamba (2008), Alinaitwe et al. (2007), Rich and Bateman (2003).
Table 3.3 suggest list of different obstacles based on the literature survey.
Strategic Obstacles Organizational Obstacles Cultural & Behavioral obstacles A. Alienation of partial stakeholders from growth and sustainability efforts.
A. Low quality consciousness leading to high rejection and rework
A. Middle management’s resistance towards offering empowerment
B. Low level Satisfaction as far as growth is concerned
B. High material cost due to wastages
B. Stubborn attitudes regarding existing organization, knowledge and beliefs
C. Fear of losing the control with high growth rate.
C. Supplier issues not tackled properly
C. Concern of employees with “What’s in it for me” attitude
D. Organization’s inability to bring about cultural transformations
D. No faith in Corrective Preventive mechanism.
E. Organization’s inability to change the mindset of people to obtain total involvement
E. Saying ‘NO’ to higher authority is against culture even if it is justified.
F. Occasional difficulties to succeed as Cross Functional Teams (CFT)
G. Lack of motivation on part of employees to contribute effectively towards organization development and sustainability efforts
H. Resistance to change due to job insecurity and apprehension of loss of specialization due to changed policy and procedures.
I. Low synergy and coordination between various departments leading to poor subordination.
Table 3.2 – Inhibitors for Implementation of TOC
[MSC Dissertation] 2012/2013
Factors which come uder purview of CEO or director are grouped under the heading of strategic factors and hypothesis is praposed in H06
H06: - Strategic obstacles have no direct effect on sustenance of TOC
Factors regaring th working method of the organizations are grouped under organizational factors and hypotheis praposed is
H07: - Organizational obstacles have no direct effect on sustenance of TOC
Organizational culture is much emphasied as means for developing sustenable competative advantage (O’Regan N., and Ghobadian A., (2004),). Lounsbury and Glynn (2001) define culture as “an interpretive framework through which individuals make sense of their own behavior, as well as collectivists in their society” Morgan (1989) states that culture can act as an obstacle to deployment of strategic change. Cultural issues particularly associated with Indian SMEs are listed under the group name Behavioral and Cultural obstacles. And hypothesis regarding the same is proposed as,
H08: - Behavioral obstacles have no direct effect on sustenance of TOC
Therotical model praposed earlier in Fig 3.2 is changed , so as to accomdate the extended study and revised model is given in the Fig 3.3.
Questionnaire also modified accordingly as same is reproduced at 3.3.
Fig 3.3 – Modified Proposed Research Model

[MSC Dissertation]
2012/2013
S u r e n d r a P a t i l Page | 52
3.3 Questionnaire
Part A 1. Name of the organization & Address:
_________________________________________________________ _________________________________________________________
2. Year of Establishment _________________________________________________________
3. Product manufacturing _________________________________________________________
4. Market segment
_________________________________________________________
5. Present Turnover
6. Total Investment In plant & Machinery _________________________________________________________
Date Of Visit Place
Name of the CEO / Director
Signature
Company seal / Stamp
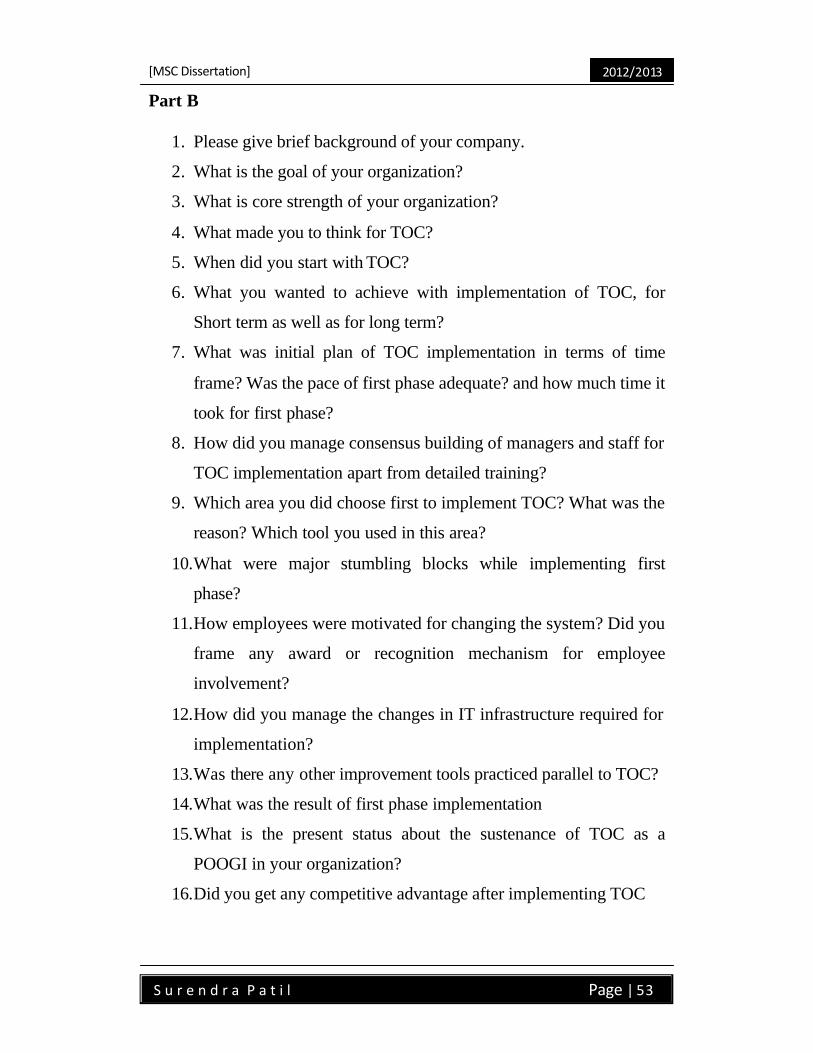
[MSC Dissertation]
2012/2013
S u r e n d r a P a t i l Page | 53
Part B
1. Please give brief background of your company.
2. What is the goal of your organization?
3. What is core strength of your organization?
4. What made you to think for TOC?
5. When did you start with TOC?
6. What you wanted to achieve with implementation of TOC, for
Short term as well as for long term?
7. What was initial plan of TOC implementation in terms of time
frame? Was the pace of first phase adequate? and how much time it
took for first phase?
8. How did you manage consensus building of managers and staff for
TOC implementation apart from detailed training?
9. Which area you did choose first to implement TOC? What was the
reason? Which tool you used in this area?
10. What were major stumbling blocks while implementing first
phase?
11. How employees were motivated for changing the system? Did you
frame any award or recognition mechanism for employee
involvement?
12. How did you manage the changes in IT infrastructure required for
implementation?
13. Was there any other improvement tools practiced parallel to TOC?
14. What was the result of first phase implementation
15. What is the present status about the sustenance of TOC as a
POOGI in your organization?
16. Did you get any competitive advantage after implementing TOC
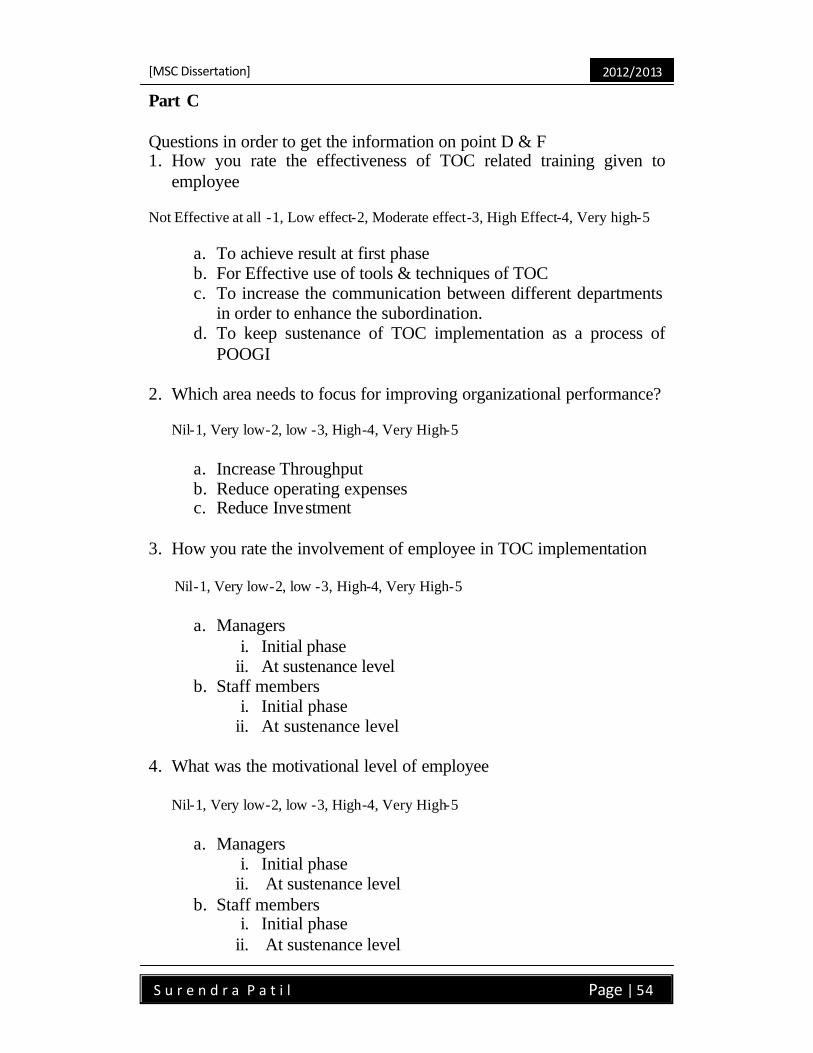
[MSC Dissertation]
2012/2013
S u r e n d r a P a t i l Page | 54
Part C Questions in order to get the information on point D & F 1. How you rate the effectiveness of TOC related training given to
employee Not Effective at all -1, Low effect-2, Moderate effect-3, High Effect-4, Very high-5
a. To achieve result at first phase b. For Effective use of tools & techniques of TOC c. To increase the communication between different departments
in order to enhance the subordination. d. To keep sustenance of TOC implementation as a process of
POOGI
2. Which area needs to focus for improving organizational performance? Nil-1, Very low-2, low -3, High-4, Very High-5
a. Increase Throughput b. Reduce operating expenses c. Reduce Investment
3. How you rate the involvement of employee in TOC implementation
Nil-1, Very low-2, low -3, High-4, Very High-5
a. Managers i. Initial phase
ii. At sustenance level b. Staff members
i. Initial phase ii. At sustenance level
4. What was the motivational level of employee
Nil-1, Very low-2, low -3, High-4, Very High-5
a. Managers i. Initial phase
ii. At sustenance level b. Staff members
i. Initial phase ii. At sustenance level

[MSC Dissertation]
2012/2013
S u r e n d r a P a t i l Page | 55
5. What was level of resistance offered by employee for changes while
implementation of TOC Nil-1, Very low-2, low -3, High-4, Very High-5
i. Initial phase ii. At sustenance level
6. How frequently you were taking review of progress of TOC
implementation. Not at all-1, once in awhile -2, Monthly -3, weekly-4, Daily-5
7. Rate your involvement during different phases of implementation Very low-1, low -2, Neutral-3, High-4, Very High-5
a. Initial planning b. Actual implementation c. Monitoring results d. Sustenance of TOC as POOGI
8. Rate the contribution made by the consultant at various phases. No contribution-1, Very low-2, low -3, High-4, Very High-5
a. Convincing the top management and get the buy in b. Training to employee in TOC tools and techniques. c. Knowledge & experience sharing with team members. d. Handholding during the implementation e. Solution to typical problem related to your organization f. Effective change management g. Tackling cultural & behavioral issues of employee. h. Formulation and implementation of incentive / reward system i. Sustenance of TOC as a POOGI.
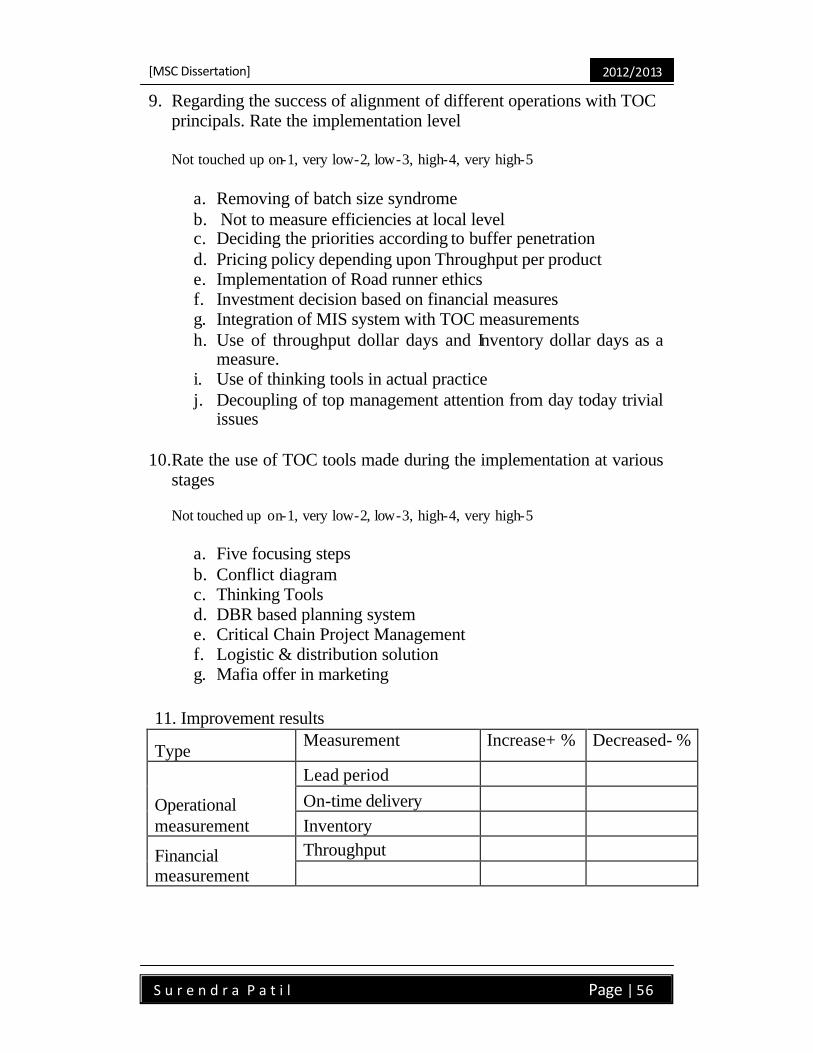
[MSC Dissertation]
2012/2013
S u r e n d r a P a t i l Page | 56
9. Regarding the success of alignment of different operations with TOC principals. Rate the implementation level Not touched up on-1, very low-2, low-3, high-4, very high-5
a. Removing of batch size syndrome b. Not to measure efficiencies at local level c. Deciding the priorities according to buffer penetration d. Pricing policy depending upon Throughput per product e. Implementation of Road runner ethics f. Investment decision based on financial measures g. Integration of MIS system with TOC measurements h. Use of throughput dollar days and Inventory dollar days as a
measure. i. Use of thinking tools in actual practice j. Decoupling of top management attention from day today trivial
issues 10. Rate the use of TOC tools made during the implementation at various
stages Not touched up on-1, very low-2, low-3, high-4, very high-5
a. Five focusing steps b. Conflict diagram c. Thinking Tools d. DBR based planning system e. Critical Chain Project Management f. Logistic & distribution solution g. Mafia offer in marketing
11. Improvement results
Type Measurement Increase+ % Decreased- %
Operational measurement
Lead period On-time delivery Inventory
Financial measurement
Throughput
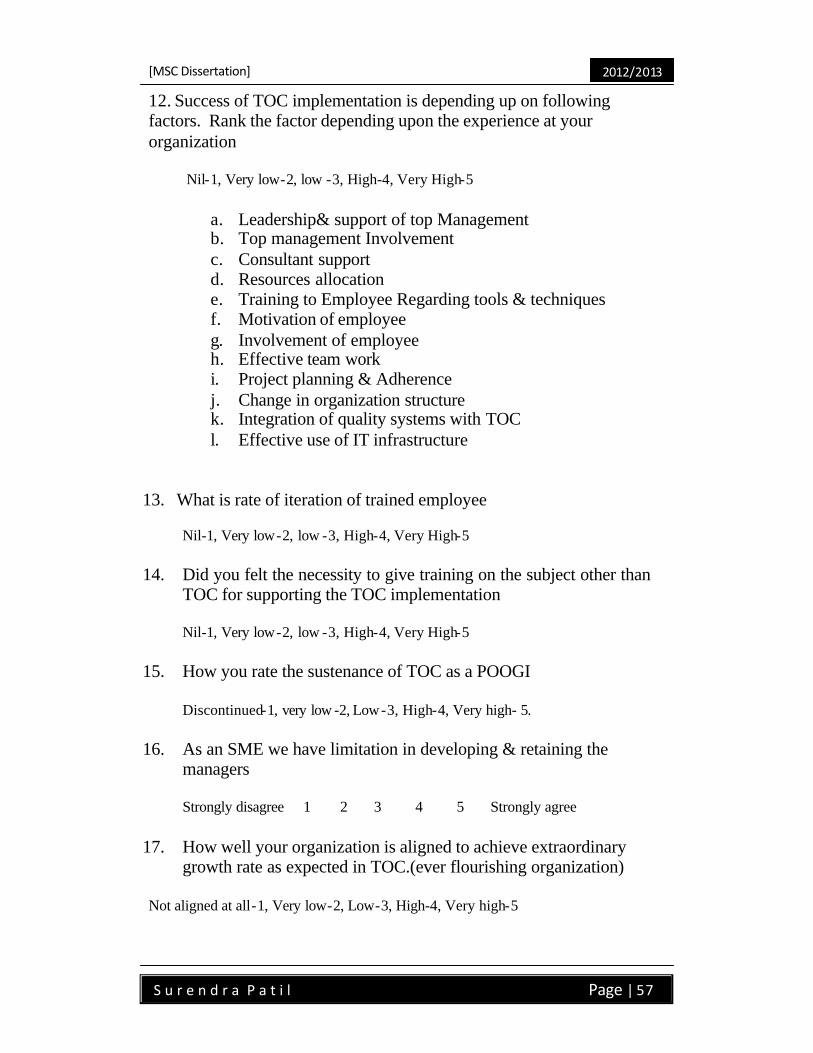
[MSC Dissertation]
2012/2013
S u r e n d r a P a t i l Page | 57
12. Success of TOC implementation is depending up on following factors. Rank the factor depending upon the experience at your organization
Nil-1, Very low-2, low -3, High-4, Very High-5
a. Leadership& support of top Management b. Top management Involvement c. Consultant support d. Resources allocation e. Training to Employee Regarding tools & techniques f. Motivation of employee g. Involvement of employee h. Effective team work i. Project planning & Adherence j. Change in organization structure k. Integration of quality systems with TOC l. Effective use of IT infrastructure
13. What is rate of iteration of trained employee
Nil-1, Very low-2, low -3, High-4, Very High-5
14. Did you felt the necessity to give training on the subject other than
TOC for supporting the TOC implementation Nil-1, Very low-2, low -3, High-4, Very High-5
15. How you rate the sustenance of TOC as a POOGI
Discontinued-1, very low -2, Low-3, High-4, Very high- 5.
16. As an SME we have limitation in developing & retaining the managers Strongly disagree 1 2 3 4 5 Strongly agree
17. How well your organization is aligned to achieve extraordinary growth rate as expected in TOC.(ever flourishing organization)
Not aligned at all-1, Very low-2, Low-3, High-4, Very high-5
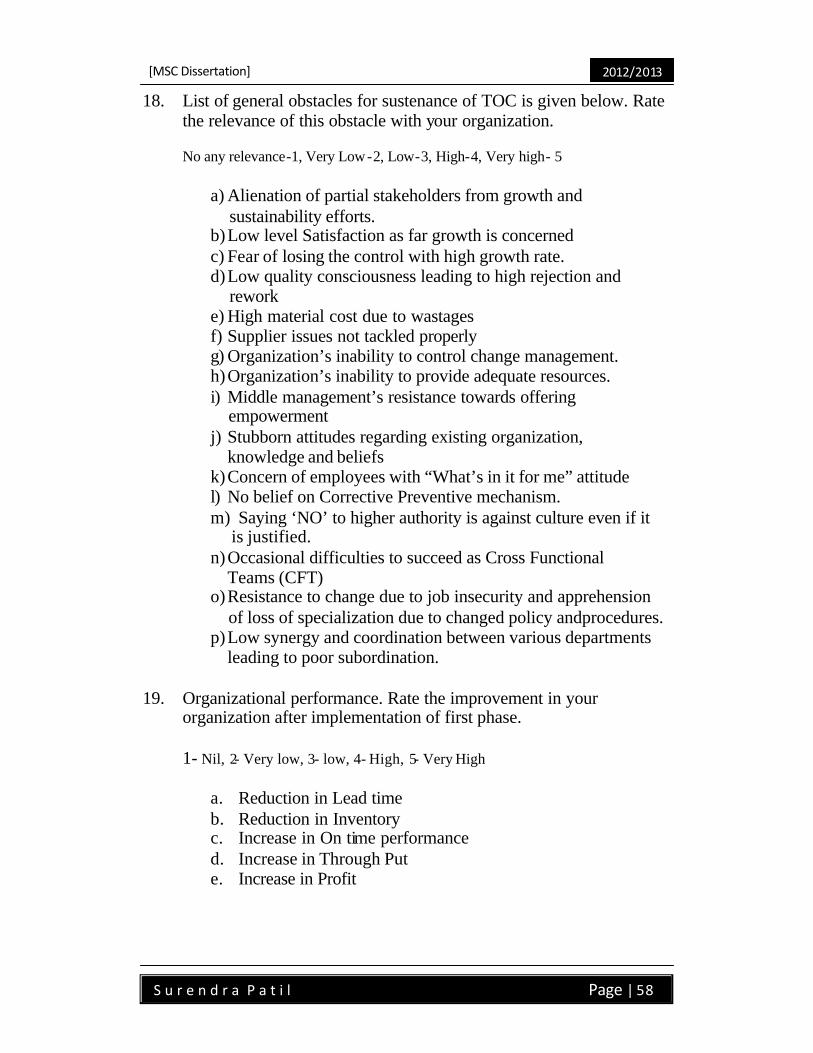
[MSC Dissertation]
2012/2013
S u r e n d r a P a t i l Page | 58
18. List of general obstacles for sustenance of TOC is given below. Rate the relevance of this obstacle with your organization. No any relevance-1, Very Low-2, Low-3, High-4, Very high- 5
a) Alienation of partial stakeholders from growth and sustainability efforts. b) Low level Satisfaction as far growth is concerned c) Fear of losing the control with high growth rate. d) Low quality consciousness leading to high rejection and rework e) High material cost due to wastages f) Supplier issues not tackled properly g) Organization’s inability to control change management. h) Organization’s inability to provide adequate resources. i) Middle management’s resistance towards offering empowerment j) Stubborn attitudes regarding existing organization, knowledge and beliefs k) Concern of employees with “What’s in it for me” attitude l) No belief on Corrective Preventive mechanism. m) Saying ‘NO’ to higher authority is against culture even if it is justified. n) Occasional difficulties to succeed as Cross Functional Teams (CFT) o) Resistance to change due to job insecurity and apprehension of loss of specialization due to changed policy andprocedures. p) Low synergy and coordination between various departments leading to poor subordination.
19. Organizational performance. Rate the improvement in your
organization after implementation of first phase. 1- Nil, 2- Very low, 3- low, 4- High, 5- Very High
a. Reduction in Lead time b. Reduction in Inventory c. Increase in On time performance d. Increase in Through Put e. Increase in Profit
[MSC Dissertation]
2012/2013
S u r e n d r a P a t i l Page | 59
3.4 Data analysis :
Data analysis was done with two methods as below:
1. Cross case analysis with descriptive statistics 2. Hypothesis testing using regression analysis
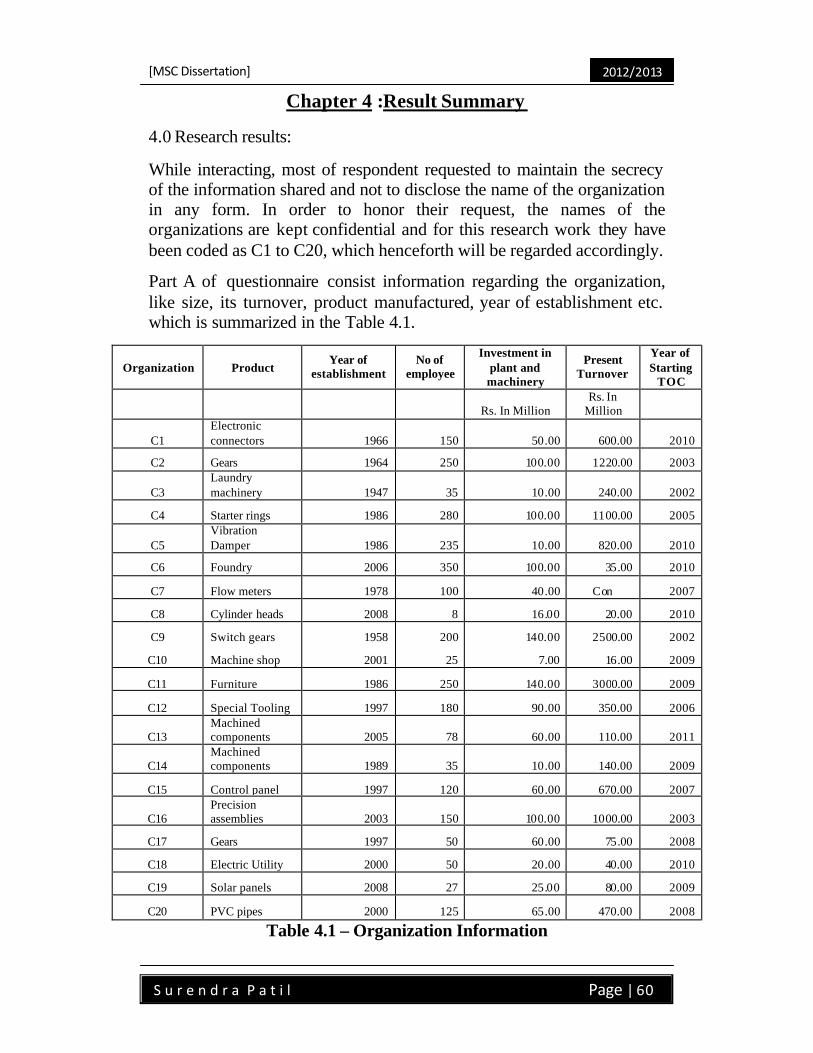
[MSC Dissertation]
2012/2013
S u r e n d r a P a t i l Page | 60
Chapter 4 :Result Summary
4.0 Research results:
While interacting, most of respondent requested to maintain the secrecy of the information shared and not to disclose the name of the organization in any form. In order to honor their request, the names of the organizations are kept confidential and for this research work they have been coded as C1 to C20, which henceforth will be regarded accordingly.
Part A of questionnaire consist information regarding the organization, like size, its turnover, product manufactured, year of establishment etc. which is summarized in the Table 4.1.
Organization Product Year of
establishment No of
employee
Investment in plant and machinery
Present Turnover
Year of Starting
TOC
Rs. In Million Rs. In
Million
C1 Electronic connectors 1966 150 50.00 600.00 2010
C2 Gears 1964 250 100.00 1220.00 2003
C3 Laundry machinery 1947 35 10.00 240.00 2002
C4 Starter rings 1986 280 100.00 1100.00 2005
C5 Vibration Damper 1986 235 10.00 820.00 2010
C6 Foundry 2006 350 100.00 35.00 2010
C7 Flow meters 1978 100 40.00 Con 2007
C8 Cylinder heads 2008 8 16.00 20.00 2010
C9 Switch gears 1958 200 140.00 2500.00 2002
C10 Machine shop 2001 25 7.00 16.00 2009
C11 Furniture 1986 250 140.00 3000.00 2009
C12 Special Tooling 1997 180 90.00 350.00 2006
C13 Machined components 2005 78 60.00 110.00 2011
C14 Machined components 1989 35 10.00 140.00 2009
C15 Control panel 1997 120 60.00 670.00 2007
C16 Precision assemblies 2003 150 100.00 1000.00 2003
C17 Gears 1997 50 60.00 75.00 2008
C18 Electric Utility 2000 50 20.00 40.00 2010
C19 Solar panels 2008 27 25.00 80.00 2009
C20 PVC pipes 2000 125 65.00 470.00 2008
Table 4.1 – Organization Information
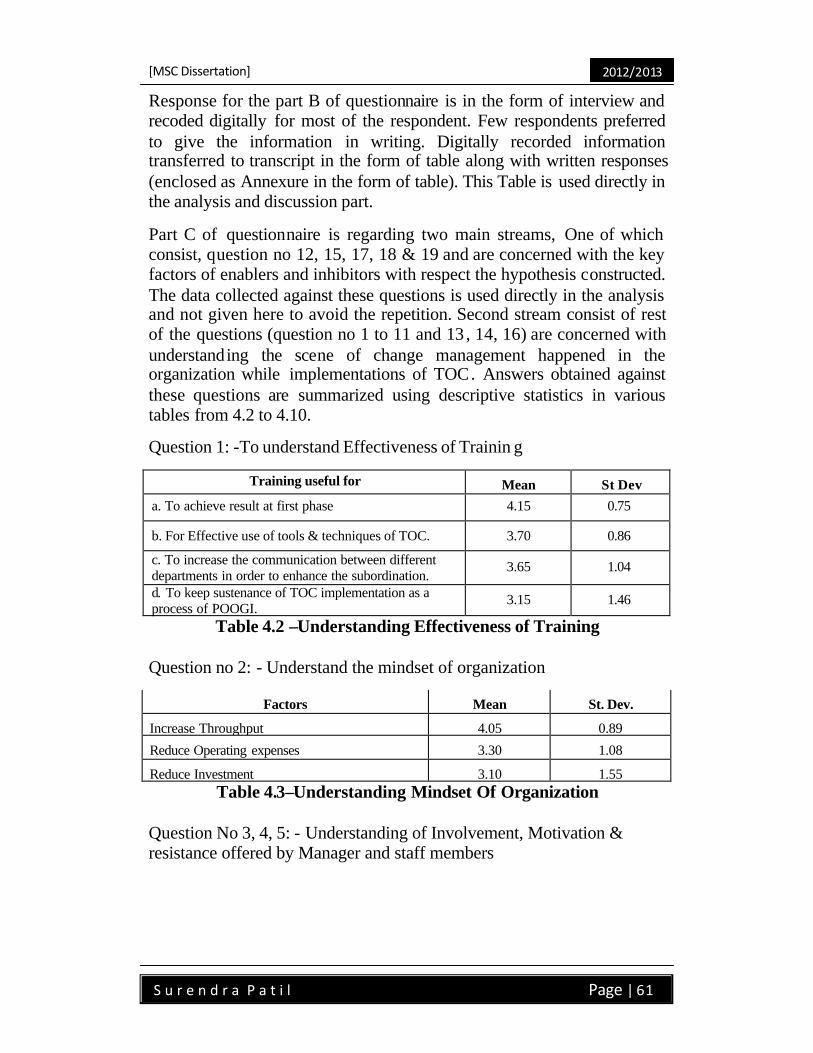
[MSC Dissertation]
2012/2013
S u r e n d r a P a t i l Page | 61
Response for the part B of questionnaire is in the form of interview and recoded digitally for most of the respondent. Few respondents preferred to give the information in writing. Digitally recorded information transferred to transcript in the form of table along with written responses (enclosed as Annexure in the form of table). This Table is used directly in the analysis and discussion part.
Part C of questionnaire is regarding two main streams, One of which consist, question no 12, 15, 17, 18 & 19 and are concerned with the key factors of enablers and inhibitors with respect the hypothesis constructed. The data collected against these questions is used directly in the analysis and not given here to avoid the repetition. Second stream consist of rest of the questions (question no 1 to 11 and 13, 14, 16) are concerned with understanding the scene of change management happened in the organization while implementations of TOC. Answers obtained against these questions are summarized using descriptive statistics in various tables from 4.2 to 4.10.
Question 1: -To understand Effectiveness of Trainin g
Training useful for Mean St Dev a. To achieve result at first phase 4.15 0.75
b. For Effective use of tools & techniques of TOC. 3.70 0.86
c. To increase the communication between different departments in order to enhance the subordination.
3.65 1.04
d. To keep sustenance of TOC implementation as a process of POOGI.
3.15 1.46
Table 4.2 –Understanding Effectiveness of Training
Question no 2: - Understand the mindset of organization
Factors Mean St. Dev.
Increase Throughput 4.05 0.89
Reduce Operating expenses 3.30 1.08
Reduce Investment 3.10 1.55 Table 4.3–Understanding Mindset Of Organization
Question No 3, 4, 5: - Understanding of Involvement, Motivation & resistance offered by Manager and staff members
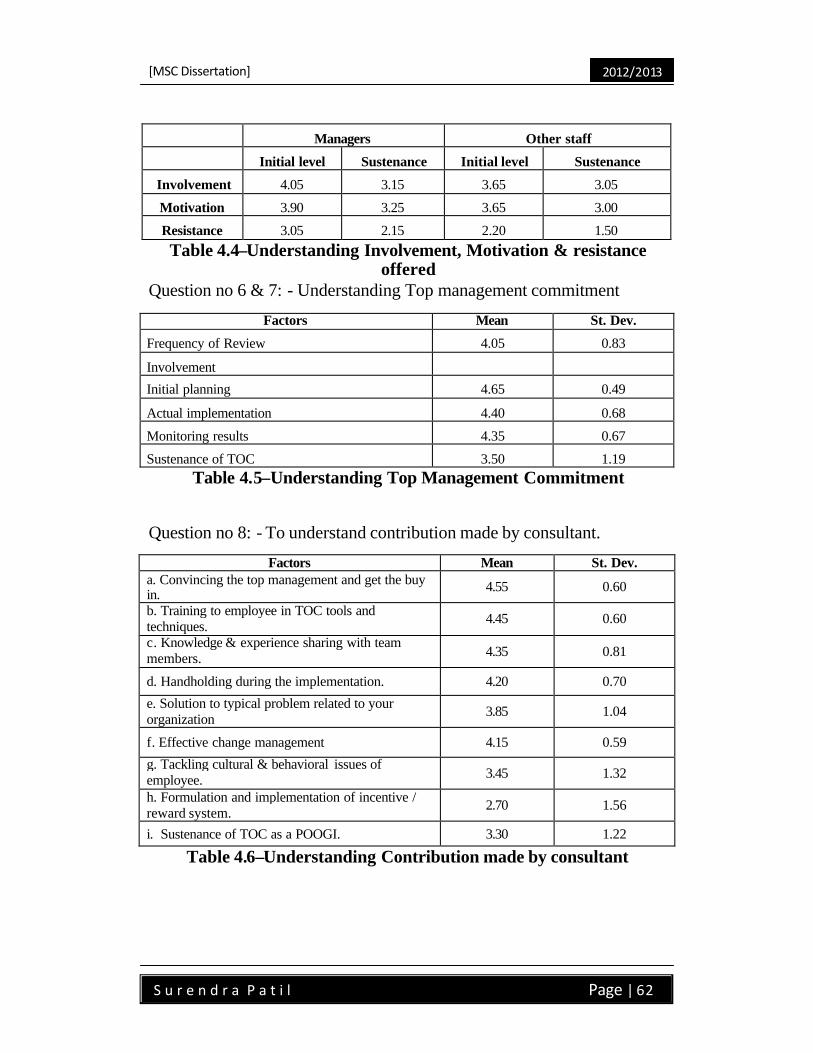
[MSC Dissertation]
2012/2013
S u r e n d r a P a t i l Page | 62
Managers Other staff
Initial level Sustenance Initial level Sustenance
Involvement 4.05 3.15 3.65 3.05
Motivation 3.90 3.25 3.65 3.00
Resistance 3.05 2.15 2.20 1.50 Table 4.4–Understanding Involvement, Motivation & resistance
offered Question no 6 & 7: - Understanding Top management commitment
Factors Mean St. Dev.
Frequency of Review 4.05 0.83
Involvement
Initial planning 4.65 0.49
Actual implementation 4.40 0.68
Monitoring results 4.35 0.67
Sustenance of TOC 3.50 1.19 Table 4.5–Understanding Top Management Commitment
Question no 8: - To understand contribution made by consultant.
Factors Mean St. Dev. a. Convincing the top management and get the buy in. 4.55 0.60
b. Training to employee in TOC tools and techniques. 4.45 0.60
c. Knowledge & experience sharing with team members. 4.35 0.81
d. Handholding during the implementation. 4.20 0.70
e. Solution to typical problem related to your organization 3.85 1.04
f. Effective change management 4.15 0.59
g. Tackling cultural & behavioral issues of employee. 3.45 1.32
h. Formulation and implementation of incentive / reward system. 2.70 1.56
i. Sustenance of TOC as a POOGI. 3.30 1.22
Table 4.6–Understanding Contribution made by consultant

[MSC Dissertation]
2012/2013
S u r e n d r a P a t i l Page | 63
Question no 9: - Alignment of operations with TOC principals.
Factors Mean St. Dev.
a. Removing of batch size syndrome 4.50 0.61
b. Not to measure efficiencies at local level. 4.30 0.57
c. Deciding the priorities according to buffer penetration. 3.85 1.04
d. Pricing policy depending upon Throughput per product. 2.65 1.31
e. Implementation of Road runner ethics 3.15 1.14
f. Investment decision based on financial measures 3.35 1.39
g. Integration of MIS system with TOC measurements 3.30 1.03
h. Use of throughput dollar days and Inventory dollar days as a measure. 2.75 1.16
i. Use of thinking tools in actual practice 2.25 1.21
j. Decoupling of top management attention from day today trivial issues 3.15 1.09
Table 4.7– Alignment of operations with TOC principals
Question no 10: - Understanding use of TOC tools
Factors Mean St. Dev. a. Five focusing steps 4.50 0.83
b. Conflict diagram 2.70 1.22
c. Thinking Tools 2.50 1.36
d. DBR based planning system 4.45 0.94
e. Critical Chain Project Management 2.75 1.65
f. Logistic & distribution solution 2.00 1.34
g. Mafia offer in marketing 1.70 1.03
Table 4.8–Understanding Use of TOC Tools
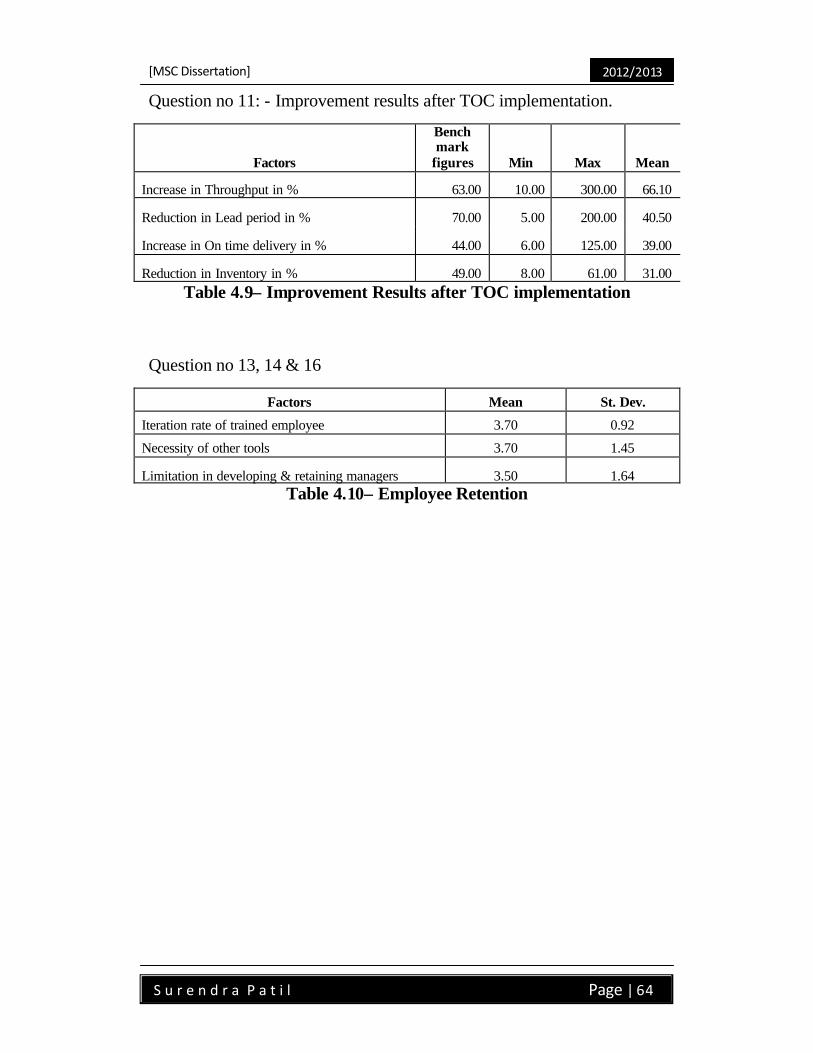
[MSC Dissertation]
2012/2013
S u r e n d r a P a t i l Page | 64
Question no 11: - Improvement results after TOC implementation.
Factors
Bench mark
figures Min Max Mean
Increase in Throughput in % 63.00 10.00 300.00 66.10
Reduction in Lead period in % 70.00 5.00 200.00 40.50
Increase in On time delivery in % 44.00 6.00 125.00 39.00
Reduction in Inventory in % 49.00 8.00 61.00 31.00 Table 4.9– Improvement Results after TOC implementation
Question no 13, 14 & 16
Factors Mean St. Dev.
Iteration rate of trained employee 3.70 0.92
Necessity of other tools 3.70 1.45
Limitation in developing & retaining managers 3.50 1.64 Table 4.10– Employee Retention

[MSC Dissertation]
2012/2013
S u r e n d r a P a t i l Page | 65
Chapter 5 :Discussion & Analysis
5.0 Analysis and discussion
5.1 Demographic analysis: -
Data pertaining to part A of questionnaire is analyzed to ensure the coverage of demographic variation. Units are located in four different states (Maharashtra, Madhya Pradesh, Haryana and Karnataka), representing different geographical location, resulting variation in culture and regulation related issues. Table 5.1 shows the areas and population of these states in order to get the idea of size and spread. All unites are from engineering manufacturing sector and pertaining to SME (except two unites for which the total investment in plant and machinery marginally exceeds the limits of SME as per definition of Indian Government.) Though these units are not covered under the definition of SME, (because of high cost of capital equipment), the culture, size, and numbers of employees etc. are very much similar with the other SME under study, hence both are covered in the present study.
Name of the state Area in square
Kilometers
Population in Millions
Maharashtra 307713 96.70 Madhya Pradesh 308252 72.59 Haryana 44212 25.34 Karnataka 191791 61.13
Table 5.1 Area of different states and it’s population.
Age of the industry, it’s strength in terms of number of employees, present turnover, and capital investment employed are shown in the table 5.2 to 5.5, Percentage distribution in each of the factor is shown in pie graph in corresponding Fig 5.1 to 5.4.
Age of Organization No Of Units Percentage 1 To 5 Years 2 10.00%
5 To 10 Years 3 15.00% 10 To 15 Years 6 30.00% Above 15 Years 9 45.00%
Table5.2–Age of Organization

[MSC Dissertation]
2012/2013
S u r e n d r a P a t i l Page | 66
Fig. 5.1 – Organization age wise distribution
No Of Employees No Of Units Percentage Below 25 2 10.00% 25 to 50 5 25.00% 50 to 100 1 5.00% above 100 12 60.00%
Table 5.3– No. of Employees
Fig. 5.2 – Employee wise distribution
Turnover of company (In Millions) No Of Units Percentage
Below 250 8 40.00% 250 To 500 3 15.00% 500 to 1000 3 15.00% Above 1000 5 25.00% Table5.4– Turnover of Organization
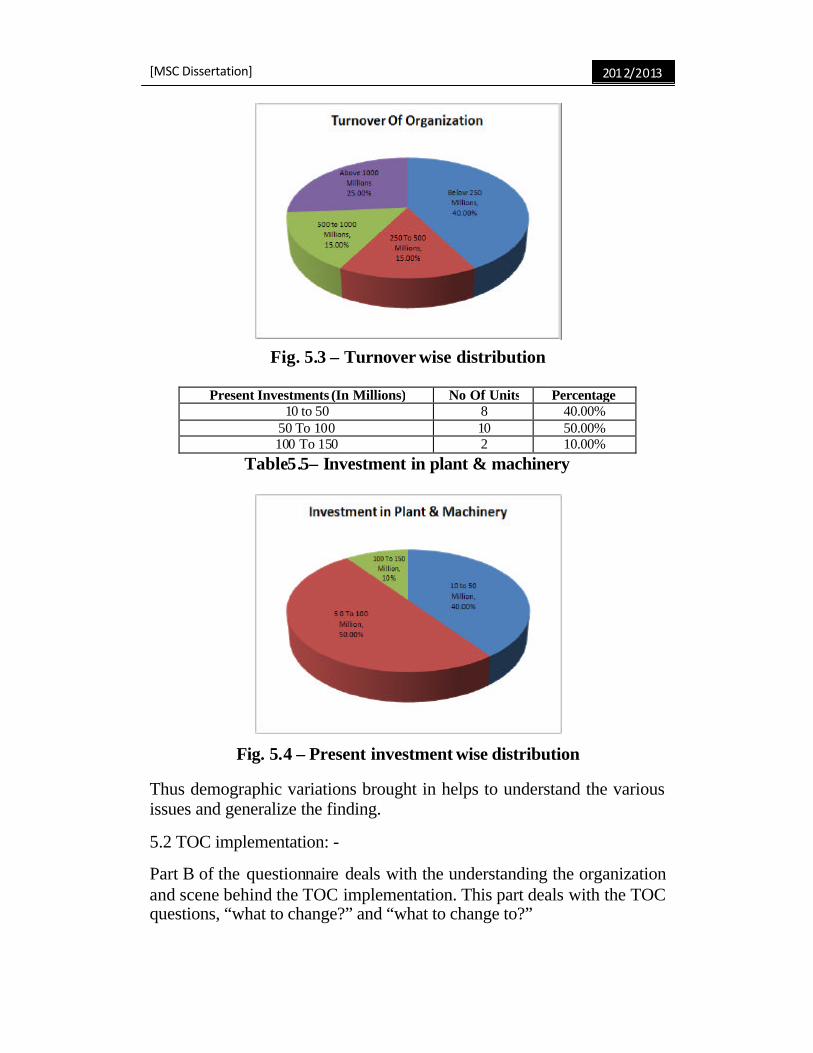
[MSC Dissertation] 2012/2013
Fig. 5.3 – Turnover wise distribution
Present Investments (In Millions) No Of Units Percentage 10 to 50 8 40.00%
50 To 100 10 50.00% 100 To 150 2 10.00%
Table5.5– Investment in plant & machinery
Fig. 5.4 – Present investment wise distribution
Thus demographic variations brought in helps to understand the various issues and generalize the finding.
5.2 TOC implementation: -
Part B of the questionnaire deals with the understanding the organization and scene behind the TOC implementation. This part deals with the TOC questions, “what to change?” and “what to change to?”
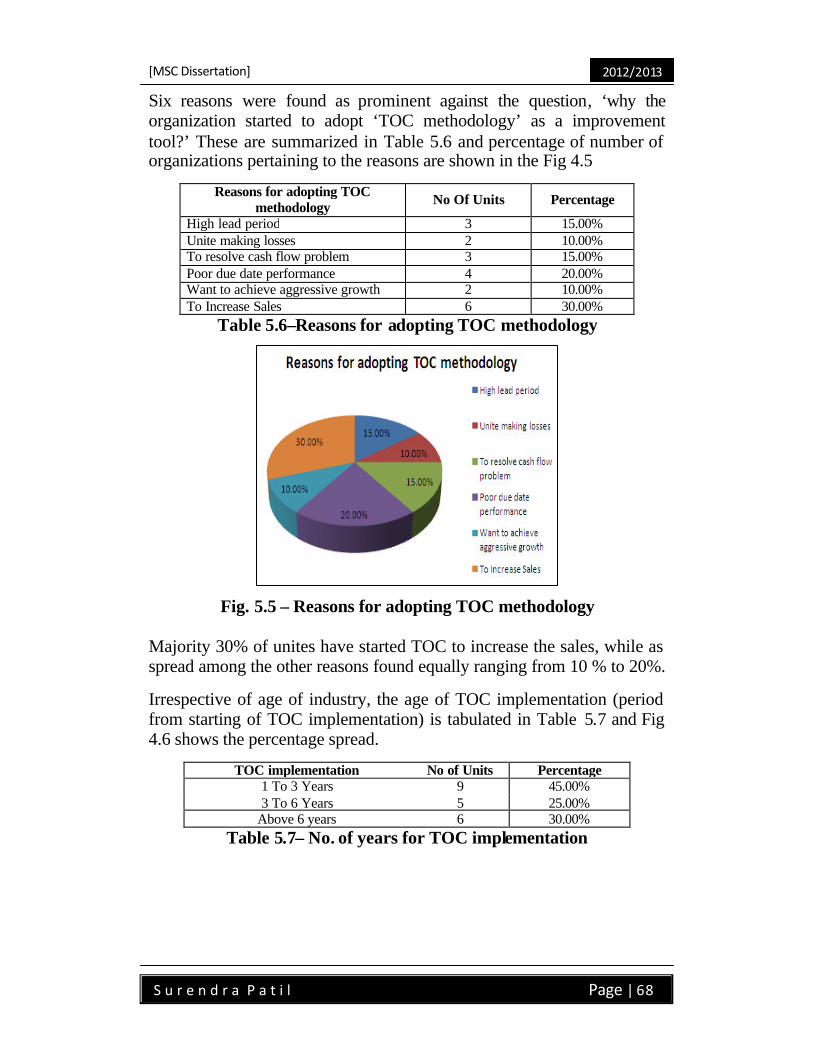
[MSC Dissertation]
2012/2013
S u r e n d r a P a t i l Page | 68
Six reasons were found as prominent against the question, ‘why the organization started to adopt ‘TOC methodology’ as a improvement tool?’ These are summarized in Table 5.6 and percentage of number of organizations pertaining to the reasons are shown in the Fig 4.5
Reasons for adopting TOC methodology No Of Units Percentage
High lead period 3 15.00% Unite making losses 2 10.00% To resolve cash flow problem 3 15.00% Poor due date performance 4 20.00% Want to achieve aggressive growth 2 10.00% To Increase Sales 6 30.00%
Table 5.6–Reasons for adopting TOC methodology
Fig. 5.5 – Reasons for adopting TOC methodology
Majority 30% of unites have started TOC to increase the sales, while as spread among the other reasons found equally ranging from 10 % to 20%.
Irrespective of age of industry, the age of TOC implementation (period from starting of TOC implementation) is tabulated in Table 5.7 and Fig 4.6 shows the percentage spread.
TOC implementation No of Units Percentage 1 To 3 Years 9 45.00% 3 To 6 Years 5 25.00%
Above 6 years 6 30.00% Table 5.7– No. of years for TOC implementation
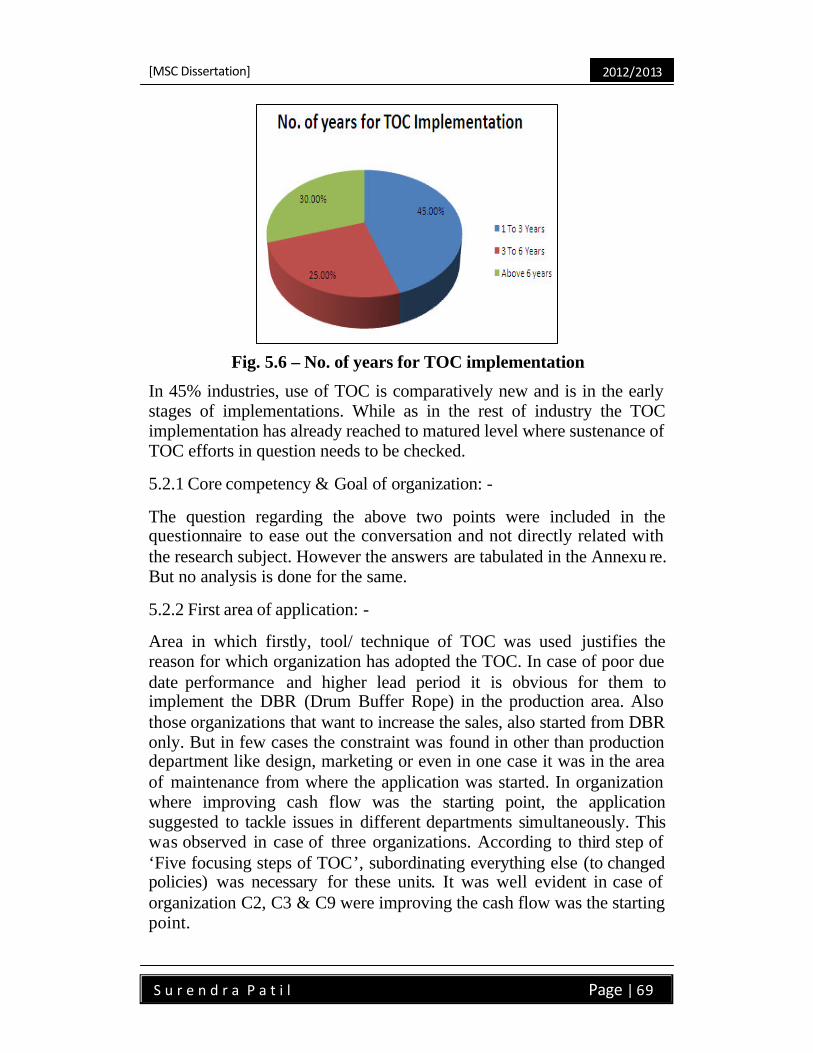
[MSC Dissertation]
2012/2013
S u r e n d r a P a t i l Page | 69
Fig. 5.6 – No. of years for TOC implementation
In 45% industries, use of TOC is comparatively new and is in the early stages of implementations. While as in the rest of industry the TOC implementation has already reached to matured level where sustenance of TOC efforts in question needs to be checked.
5.2.1 Core competency & Goal of organization: -
The question regarding the above two points were included in the questionnaire to ease out the conversation and not directly related with the research subject. However the answers are tabulated in the Annexu re. But no analysis is done for the same.
5.2.2 First area of application: -
Area in which firstly, tool/ technique of TOC was used justifies the reason for which organization has adopted the TOC. In case of poor due date performance and higher lead period it is obvious for them to implement the DBR (Drum Buffer Rope) in the production area. Also those organizations that want to increase the sales, also started from DBR only. But in few cases the constraint was found in other than production department like design, marketing or even in one case it was in the area of maintenance from where the application was started. In organization where improving cash flow was the starting point, the application suggested to tackle issues in different departments simultaneously. This was observed in case of three organizations. According to third step of ‘Five focusing steps of TOC’, subordinating everything else (to changed policies) was necessary for these units. It was well evident in case of organization C2, C3 & C9 were improving the cash flow was the starting point.
[MSC Dissertation]
2012/2013
S u r e n d r a P a t i l Page | 70
5.2.3 Consensus building & Buy in: -
To build consensus is an important part for any change management. Long lasting / continued training, group counseling, video on TOC etc. are generally followed methods in the organizations under study. However few organizations made special efforts like offsite meetings, Group reading of books on TOC, Role-playing, visit to other plants where TOC was already in place. Respondent of organizations in cash crunch and loss making units mentioned that they did not had any option but to make it compulsory to adopt the changed systems. In small organization like C12, without verbalizing the different method, just work instruction were prepared according to new policies and asked to implement it. People just followed it blindly and once they got the result the details of methodology was explained.
5.2.4 Major stumbling blocks: -
Majority of respondent admitted that changing the mindset of the people involved in implementation was great challenge for them, as it was against the set working procedures in the cost world. To remove the deep routed policies and beliefs to bring it to through put world was the most critical issue to tackle. To understand the new knowledge and bring it into practice was taking longer time than usual. At some places even after detailed training, resistance from the senior and middle management was the hindrance.
5.2.5 Employee motivation: -
50% of the organizations do not feel the necessity for formulating any formal incentive / reward system, to motivate the employees. While some of them have linked their KPI with performance measurement. 10% respondents considered, ‘Celebration of milestones / success’ as a better motivation tool.
5.2.6 Use of other tools & techniques in support: -
Most respondents agreed that, no tool other than the use of HR practices (for building the soft skills of people), are required to support the TOC. While as CEO of C12 gave entirely different perspective. He argued that, ‘TOC identifies the focus area and to keep ourselves competitive, we must use other technique to improve the productivity, quality of focused area’ He further added that tools like six sigma, Kaizen, 5S etc. are very much essential to be competitive and also for successful implementation of TOC.
[MSC Dissertation]
2012/2013
S u r e n d r a P a t i l Page | 71
5.2.7 Use of IT infrastructure: -
Increased literacy of computers and wider use of computers found in every industry, almost all process in SMEs are computerized with the help of home grown need based developed software. As such there was no major change required in IT infrastructure while implementing the TOC. Whereas respondent agreed that well groomed IT infrastructure increases the efficiency of DBR planning and buffer management.
5.2.8 Competitive advantage: -
Resu lts of TOC implementation’s first phase for all units were found positive. But few of them (25%) did not succeeded to convert internal strength (build on during first phase), into deceive competitive advantage. While as for other organizations, situation favored them in increasing the customer confidence and in turn increase their business share. Respondent of C5 claim that with the same existing capacity they are now ready to meet the 30% extra demand from the customer. Organization C4 entered in to export market with increased internal strength. While as organizatio n C3 started charging premium in cash for the reduced delivery period. Respondent of C6 (major supplier to automotive segment), has added different view for building the internal strength. He explained that before implementing the TOC, because of poor due date performance, the order placed by buyer was with huge safety buffer included in it. And when the due date performance was improved; the actual demand surfaced out which was very less than the actually proclaimed. Internal capacities built to satisfy this fictitious demand was huge and after implementation of TOC, the constraint immediately turned to marketing because of generation of internal spare capacity. He gives word of caution to those who are implementing TOC newly that they should consider this point and should study what exactly buyer’s actual requirement is owing to his factor of buffer. CEO of C11 while sharing his experiences added that, sometimes delivering the goods on time is not considered as a positive point, buyer thinks that it is because of less work at our plant and he takes disadvantage of that by bargaining the price.
5.2.9 Sustenance: - In case of organization having the age of TOC more than 3 years, even though they have enjoyed the excellent results in the performance of the organization at first outset, the sustenance of TOC has great question mark. Five units out of eleven stopped pursuing the TOC. The reasons stated by respondent are quite different for each case and are studied in more depth in third part of questionnaire. Only one organization was
[MSC Dissertation]
2012/2013
S u r e n d r a P a t i l Page | 72
found (with age less than 2 year) discontinued the TOC at first instance. Reason given was the financial condition was very bad and hence stopped pursuing further. 5.3 Understanding the process of change management: -
Question no 1 to 11 of part C of questionnaire are related with the understanding the factors in change management while implementing the TOC. This part dealt with the question in TOC “How to cause the change?’
5.3.1 Effectiveness of training: - Effectiveness of the training given by various organizations during implementation was analyzed as against four factors. It was found useful in attaining the results at first phase (mean 4.15), while as for using the tools and techniques rigorously, training was found to be of second order (mean 3.7). It also helped equally to enhance the communication in between departments while subordinating to constraint (mean 3.65). But to keep the TOC efforts sustained, training was found comparatively less effective (mean3.15).
5.3.2 Motivation, Involvement and resistance offered by employee: -
Managers are the pillars for any change initiative. Data collected against the question no 4, 5& 6 reveals that, initial involvement and motivation was reduced at later stage of sustenance. Consequently the resistance offered also diminishes once they realize the positive side of change. Involvement by staff and also the resistance offered at both the stage was comparatively low than the managers.
5.3.3 Top management involvement and support: -
It was evident from the answer to the question no 6 & 7 that, top management has well understood the responsibility. The involvement right from planning stage to actual implementation through monitoring the results frequently was observed with score of mean ranging from 4.05 to as high as 4.65. Involvement at sustenance level was found comparatively less resulting mean to 3.5.
5.3.4 Alignment with TOC thinking& TOC tools: -
Toc provokes the Throughput orientation. Boyed and Gupta (2004) defines, ‘Throughput orientation is an organization-wide focus on increasing throughput, rather than reducing operating expenses, as a means of improving financial performance, and an awareness that
[MSC Dissertation]
2012/2013
S u r e n d r a P a t i l Page | 73
financial performance is limited by constraints. Throughput orientation is supported by the use of performance measurement systems and decision-making systems that facilitate the maximization of throughput through management of constraints.’ This TOC orientation evidenced in reply to question no 2. Rating given for increase of throughput (Mean 4.05) is higher than reducing OE (mean 3.3) and reducing investment (mean 3.1)
Answers to question no 9 indicate that TOC principles, like abolishing local efficiencies (answer 9b with mean 4.30 and answer 9a with mean 4.5) removing of batch size syndrome are deeply rooted in to organization. Deciding the priorities (answer 9c with mean 3.85) and Investment decision based on financial measures (answer 9g with mean 3.3) are at second place. Pricing policy (answer 9d) and use of throughput dollar days (answer 9h) are seems not touched up on comparatively (mean 2.65 and 2.75 respectively). Use of thinking tools in actual practice was very limited (mean 2.25) the reason stated by respondent was, may be because of complexity and more specialized training is required for practicing these techniques.
Answer to question no 10, highlights the use of ‘Five focusing steps’ and ‘DBR based planning system’, was well practiced among all implementation (mean 4.5 and 4.45 respectively). Use of conflict diagrams and critical chain project management are at second rank (mean 2.7 and 2.75 respectively). Very few organizations used logistic -distribution solution and mafia offer in marketing (mean 2.0 & 1.7 resp.).
5.3.5 Consultant’s support: -
All of the implementations under this study was started under the guidance / supervision of consultant. Immense contribution was evidenced in the initial stages, like convincing the top management, training to employee, handholding and experience sharing (Mean of all factors is above 4.2). Contribution in change management, giving the solution to the typical problems and tackling cultural issues stood the second in score rating. (Mean 4.15, 3.85 & 3.45 resp.). Comparatively less involvement was observed in formulation & implementation of incentive / reward system.
5.3.6 Implementation results: -
Increase in the performance parameters were captured in four measures. Respondents refused to share the data even on percentage basis for the increase in the profit on account of confidentiality. Hence the column of
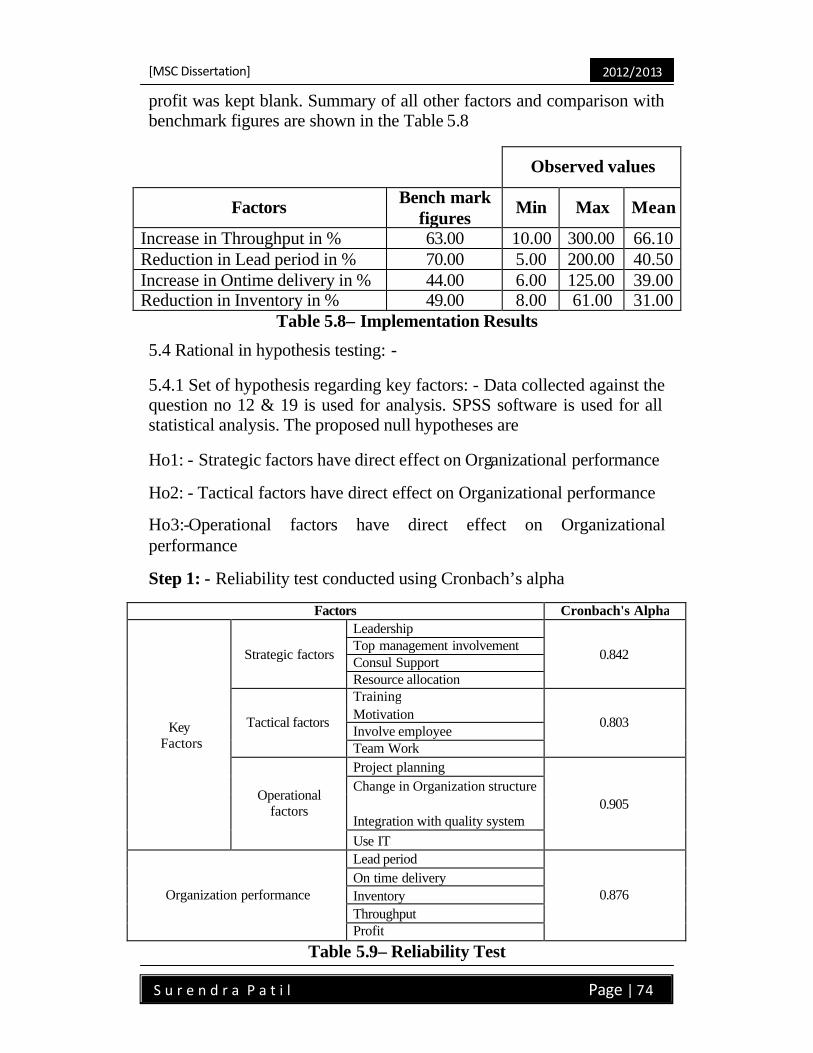
[MSC Dissertation]
2012/2013
S u r e n d r a P a t i l Page | 74
profit was kept blank. Summary of all other factors and comparison with benchmark figures are shown in the Table 5.8
Observed values
Factors Bench mark figures
Min Max Mean
Increase in Throughput in % 63.00 10.00 300.00 66.10 Reduction in Lead period in % 70.00 5.00 200.00 40.50 Increase in Ontime delivery in % 44.00 6.00 125.00 39.00 Reduction in Inventory in % 49.00 8.00 61.00 31.00
Table 5.8– Implementation Results
5.4 Rational in hypothesis testing: -
5.4.1 Set of hypothesis regarding key factors: - Data collected against the question no 12 & 19 is used for analysis. SPSS software is used for all statistical analysis. The proposed null hypotheses are
Ho1: - Strategic factors have direct effect on Organizational performance
Ho2: - Tactical factors have direct effect on Organizational performance
Ho3:-Operational factors have direct effect on Organizational performance
Step 1: - Reliability test conducted using Cronbach’s alpha
Factors Cronbach's Alpha
Key Factors
Strategic factors
Leadership
0.842 Top management involvement Consul Support Resource allocation
Tactical factors
Training
0.803 Motivation Involve employee Team Work
Operational factors
Project planning
0.905 Change in Organization structure
Integration with quality system Use IT
Organization performance
Lead period
0.876 On time delivery Inventory Throughput Profit
Table 5.9– Reliability Test
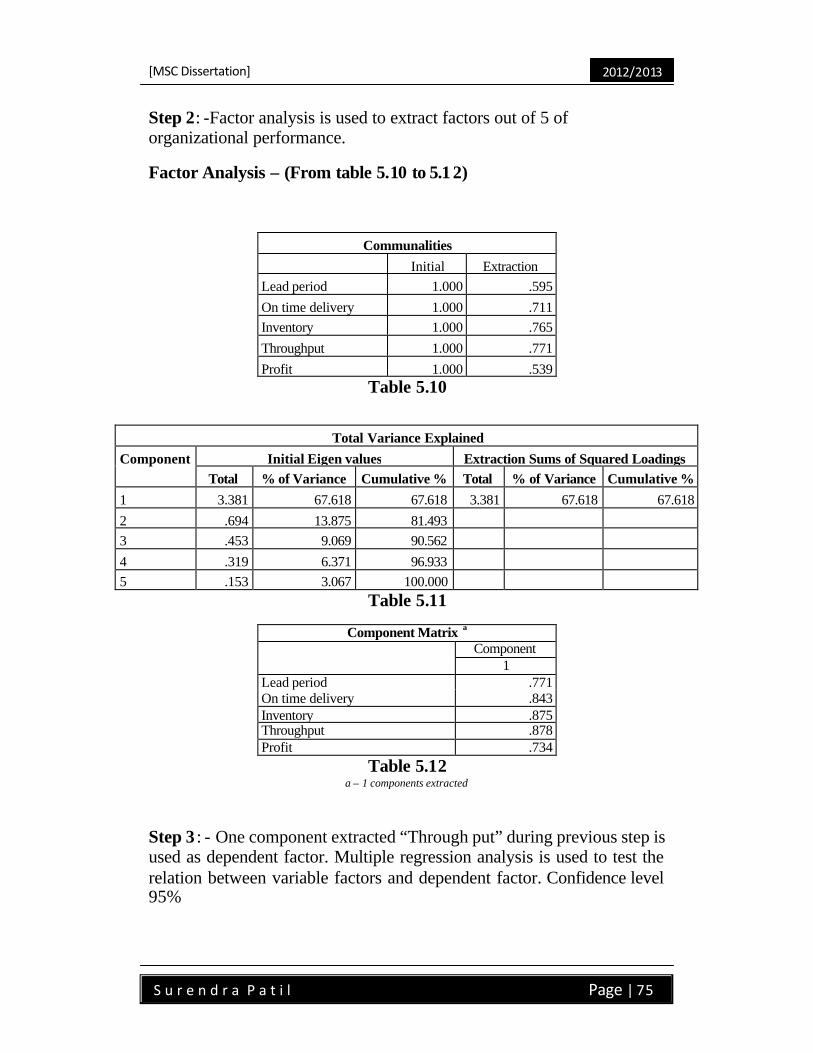
[MSC Dissertation]
2012/2013
S u r e n d r a P a t i l Page | 75
Step 2: -Factor analysis is used to extract factors out of 5 of organizational performance.
Factor Analysis – (From table 5.10 to 5.1 2)
Communalities Initial Extraction Lead period 1.000 .595 On time delivery 1.000 .711 Inventory 1.000 .765 Throughput 1.000 .771 Profit 1.000 .539
Table 5.10
Total Variance Explained Component Initial Eigen values Extraction Sums of Squared Loadings
Total % of Variance Cumulative % Total % of Variance Cumulative % 1 3.381 67.618 67.618 3.381 67.618 67.618 2 .694 13.875 81.493
3 .453 9.069 90.562
4 .319 6.371 96.933
5 .153 3.067 100.000
Table 5.11
Component Matrix a Component
1 Lead period .771 On time delivery .843 Inventory .875 Throughput .878 Profit .734
Table 5.12 a – 1 components extracted
Step 3 : - One component extracted “Through put” during previous step is used as dependent factor. Multiple regression analysis is used to test the relation between variable factors and dependent factor. Confidence level 95%
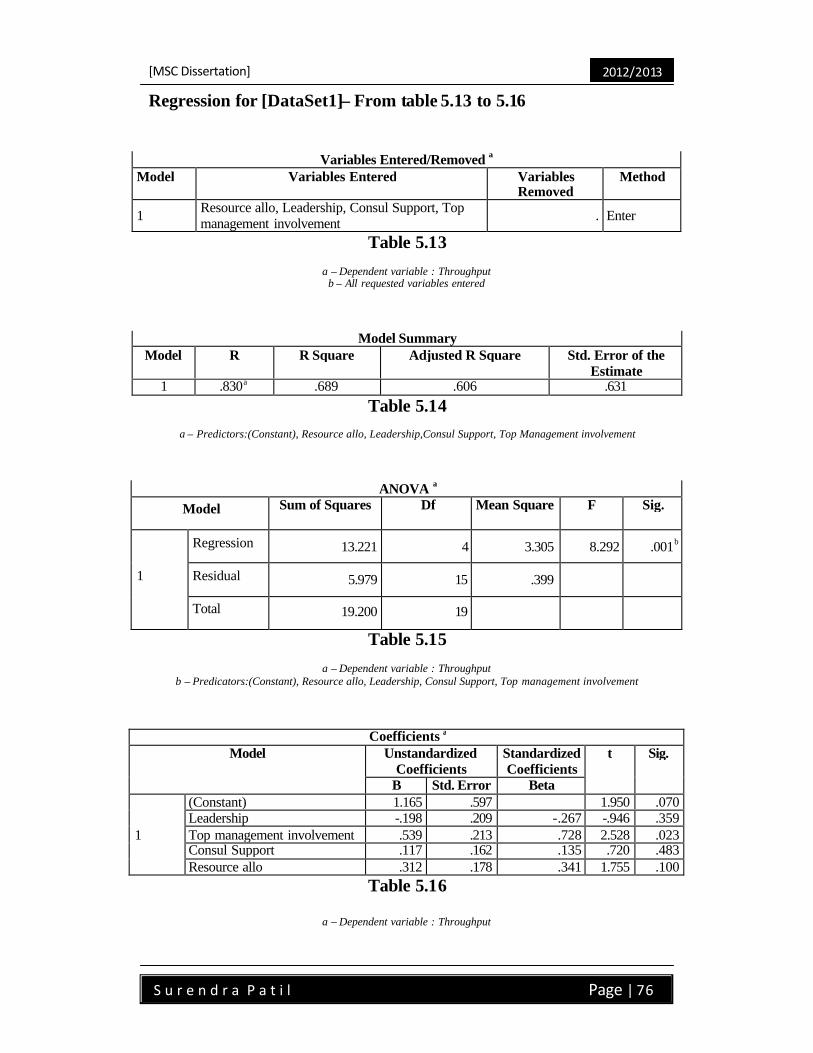
[MSC Dissertation]
2012/2013
S u r e n d r a P a t i l Page | 76
Regression for [DataSet1]– From table 5.13 to 5.16
Variables Entered/Removed a Model Variables Entered Variables
Removed Method
1 Resource allo, Leadership, Consul Support, Top management involvement . Enter
Table 5.13
a – Dependent variable : Throughput b – All requested variables entered
Model Summary Model R R Square Adjusted R Square Std. Error of the
Estimate 1 .830a .689 .606 .631
Table 5.14
a – Predictors:(Constant), Resource allo, Leadership,Consul Support, Top Management involvement
ANOVA a Model Sum of Squares Df Mean Square F Sig.
1
Regression 13.221 4 3.305 8.292 .001b
Residual 5.979 15 .399
Total 19.200 19
Table 5.15
a – Dependent variable : Throughput b – Predicators:(Constant), Resource allo, Leadership, Consul Support, Top management involvement
Coefficients a Model Unstandardized
Coefficients Standardized Coefficients
t Sig.
B Std. Error Beta
1
(Constant) 1.165 .597 1.950 .070 Leadership -.198 .209 -.267 -.946 .359 Top management involvement .539 .213 .728 2.528 .023 Consul Support .117 .162 .135 .720 .483 Resource allo .312 .178 .341 1.755 .100
Table 5.16
a – Dependent variable : Throughput
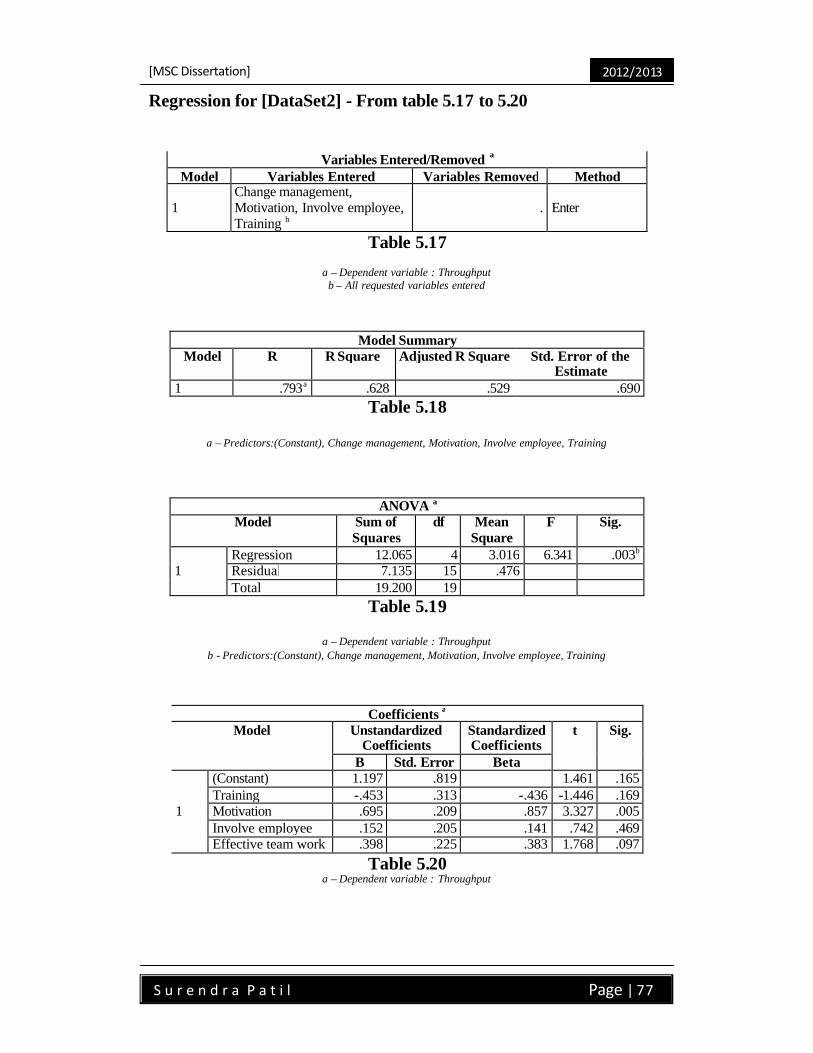
[MSC Dissertation]
2012/2013
S u r e n d r a P a t i l Page | 77
Regression for [DataSet2] - From table 5.17 to 5.20
Variables Entered/Removed a Model Variables Entered Variables Removed Method
1 Change management, Motivation, Involve employee, Training b
. Enter
Table 5.17
a – Dependent variable : Throughput b – All requested variables entered
Model Summary Model R R Square Adjusted R Square Std. Error of the
Estimate 1 .793a .628 .529 .690
Table 5.18
a – Predictors:(Constant), Change management, Motivation, Involve employee, Training
ANOVA a Model Sum of
Squares df Mean
Square F Sig.
1 Regression 12.065 4 3.016 6.341 .003b Residual 7.135 15 .476 Total 19.200 19
Table 5.19
a – Dependent variable : Throughput b - Predictors:(Constant), Change management, Motivation, Involve employee, Training
Coefficients a Model Unstandardized
Coefficients Standardized Coefficients
t Sig.
B Std. Error Beta
1
(Constant) 1.197 .819 1.461 .165 Training -.453 .313 -.436 -1.446 .169 Motivation .695 .209 .857 3.327 .005 Involve employee .152 .205 .141 .742 .469 Effective team work .398 .225 .383 1.768 .097
Table 5.20 a – Dependent variable : Throughput

[MSC Dissertation]
2012/2013
S u r e n d r a P a t i l Page | 78
Regression for [DataSet3] - From table 5.21 to 5.24
Variables Entered/Removed a Model Variables Entered Variables
Removed Method
1 Use IT, Integration with quality system, Project planning, Change in organization structure b
. Enter
Table 5.21
a – Dependent variable : Throughput b – All requested variables entered
Model Summary Model R R Square Adjusted R
Square Std. Error of the
Estimate 1 .482a .232 .027 .991
Table 5.22
a – Predictors:(Constant), Use IT, Integration with quality system, Project planning, Use Tool & tech
ANOVA a Model Sum of
Squares df Mean Square F Sig.
1 Regression 4.456 4 1.114 1.133 .378b Residual 14.744 15 .983 Total 19.200 19
Table 5.23
a – Dependent variable : Throughput b - Predictors:(Constant), Use IT, Integration with quality system, Project planning, Use Tool & tech
Coefficients a Model Unstandardized
Coefficients Standardized Coefficients
t Sig.
B Std. Error Beta
1
(Constant) 3.788 .742 5.102 .000 Project planning -.641 .360 -.667 -1.783 .095 Use Toll & tech .490 .468 .485 1.047 .312 Integration with quality system .210 .490 .160 .428 .675
Use IT .137 .490 .117 .279 .784 Table 5.24
a – Dependent variable : Throughput
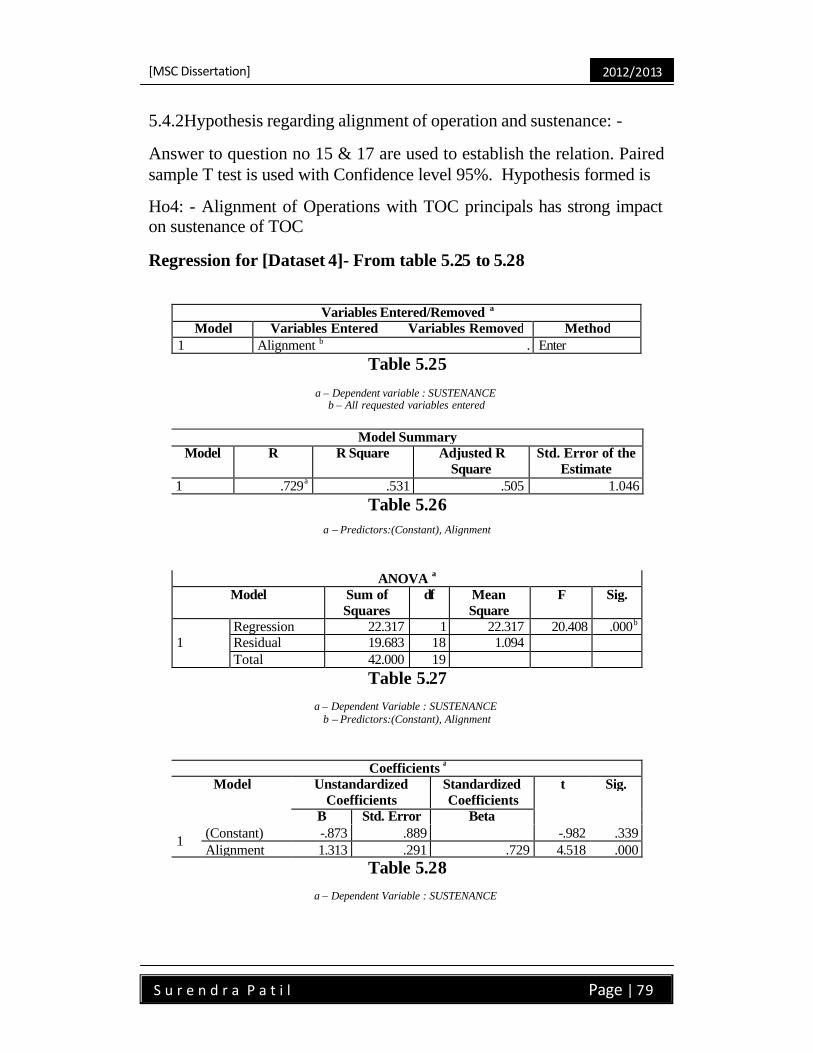
[MSC Dissertation]
2012/2013
S u r e n d r a P a t i l Page | 79
5.4.2Hypothesis regarding alignment of operation and sustenance: -
Answer to question no 15 & 17 are used to establish the relation. Paired sample T test is used with Confidence level 95%. Hypothesis formed is
Ho4: - Alignment of Operations with TOC principals has strong impact on sustenance of TOC
Regression for [Dataset 4]- From table 5.25 to 5.28
Variables Entered/Removed a Model Variables Entered Variables Removed Method
1 Alignment b . Enter Table 5.25
a – Dependent variable : SUSTENANCE
b – All requested variables entered
Model Summary Model R R Square Adjusted R
Square Std. Error of the
Estimate 1 .729a .531 .505 1.046
Table 5.26
a – Predictors:(Constant), Alignment
ANOVA a Model Sum of
Squares df Mean
Square F Sig.
1 Regression 22.317 1 22.317 20.408 .000b Residual 19.683 18 1.094 Total 42.000 19
Table 5.27
a – Dependent Variable : SUSTENANCE b – Predictors:(Constant), Alignment
Coefficients a Model Unstandardized
Coefficients Standardized Coefficients
t Sig.
B Std. Error Beta
1 (Constant) -.873 .889 -.982 .339 Alignment 1.313 .291 .729 4.518 .000
Table 5.28
a – Dependent Variable : SUSTENANCE

[MSC Dissertation]
2012/2013
S u r e n d r a P a t i l Page | 80
5.4.3 Hypothesis regarding performance results and sustenance:-
Answer to question no 15 & 19 are used to establish the relation. Regression analysis is used with Confidence level 95%. Hypothesis formed is
Ho5: - Organizational performance at first stage has direct effect on sustenance of TOC
Regression for [Dataset 5]- From Table 5.29 to 5.32
Variables Entered/Removed a Model Variables Entered Variables
Removed Method
1 profit, Lead period, Throughput, On time delivery, Inventory b . Enter
Table 5.29
a – Dependent Variable : SUSTENANCE b – All requested variables entered
Model Summary
Model R R Square Adjusted R Square
Std. Error of the Estimate
1 .653a .426 .221 1.312 Table 5.30
a –Predictors:(Constant), profit, Lead period, Throughput, On time delivery, Inventory
ANOVA a
Model Sum of Squares Df Mean Square
F Sig.
1 Regression 17.907 5 3.581 2.081 .129b Residual 24.093 14 1.721 Total 42.000 19
Table 5.31
a – Dependent variable:Sustenance b –Predictors:(Constant), profit, Lead period, Throughput, On time delivery, Inventory
Coefficients a Model Unstandardized
Coefficients Standardized Coefficients
T Sig.
B Std. Error Beta
1
(Constant) -1.164 1.456 -.800 .437 Lead period .571 .385 .464 1.484 .160 On time delivery -.203 .485 -.140 -.419 .682 Inventory .005 .476 .004 .011 .991 Throughput .210 .539 .142 .389 .703 profit .514 .434 .325 1.185 .256
Table 5.32
a – Dependent variable: Sustenance
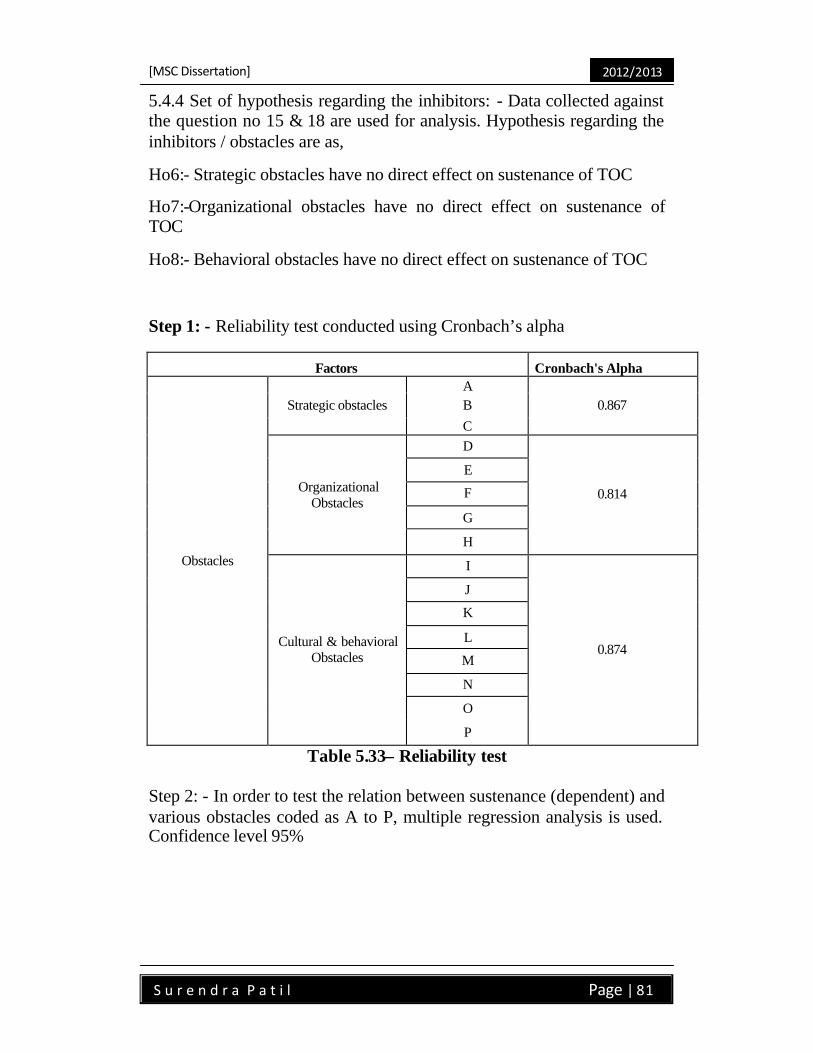
[MSC Dissertation]
2012/2013
S u r e n d r a P a t i l Page | 81
5.4.4 Set of hypothesis regarding the inhibitors: - Data collected against the question no 15 & 18 are used for analysis. Hypothesis regarding the inhibitors / obstacles are as,
Ho6:- Strategic obstacles have no direct effect on sustenance of TOC
Ho7:-Organizational obstacles have no direct effect on sustenance of TOC
Ho8:- Behavioral obstacles have no direct effect on sustenance of TOC
Step 1: - Reliability test conducted using Cronbach’s alpha
Factors Cronbach's Alpha
Obstacles
Strategic obstacles A
0.867 B C
Organizational Obstacles
D
0.814
E
F
G
H
Cultural & behavioral Obstacles
I
0.874
J
K
L
M
N
O
P
Table 5.33– Reliability test
Step 2: - In order to test the relation between sustenance (dependent) and various obstacles coded as A to P, multiple regression analysis is used. Confidence level 95%

[MSC Dissertation]
2012/2013
S u r e n d r a P a t i l Page | 82
Regression for [DataSet 6] – From table 5.34 to 5.37
Variables Entered/Removeda Model Variables Entered Variables Removed Method 1 C, B, Ab . Enter
Table 5.34
a – Dependent variable: Sustenance b – All requested variables entered
Model Summary Model R R Square Adjusted R
Square Std. Error of the
Estimate 1 .943a .890 .869 .537
Table 5.35
a – Predictors:(Constant), C,B,A
ANOVAa
Model Sum of Squares
df Mean Square F Sig.
1 Regression 37.380 3 12.460 43.157 .000b Residual 4.620 16 .289 Total 42.000 19
Table 5.36
a – Dependent Variable: Sustenance
Coefficientsa Model Unstandardized
Coefficients Standardized Coefficients
t Sig.
B Std. Error Beta
1
(Constant) 5.879 .303 19.427 .000 A -.202 .132 -.220 -1.531 .145 B -.391 .136 -.320 -2.878 .011 C -.518 .147 -.511 -3.514 .003
Table 5.37
a – Dependent Variable: Sustenance
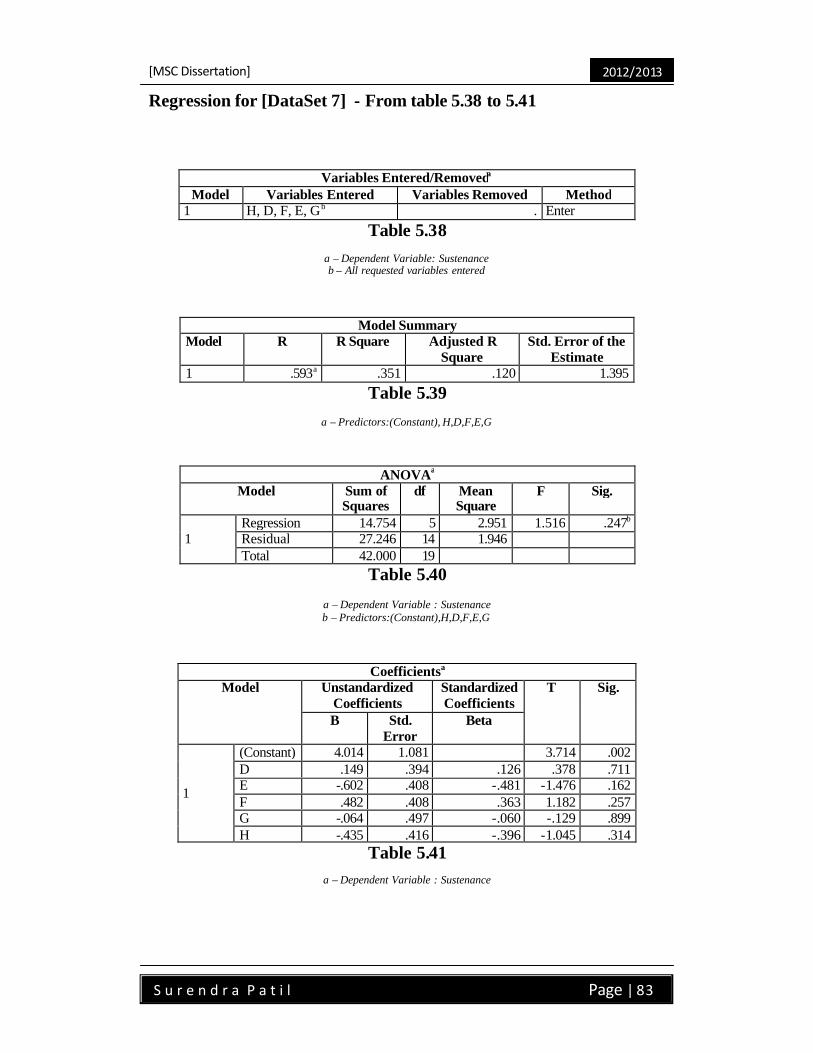
[MSC Dissertation]
2012/2013
S u r e n d r a P a t i l Page | 83
Regression for [DataSet 7] - From table 5.38 to 5.41
Variables Entered/Removeda Model Variables Entered Variables Removed Method
1 H, D, F, E, Gb . Enter Table 5.38
a – Dependent Variable: Sustenance b – All requested variables entered
Model Summary Model R R Square Adjusted R
Square Std. Error of the
Estimate 1 .593a .351 .120 1.395
Table 5.39
a – Predictors:(Constant), H,D,F,E,G
ANOVAa Model Sum of
Squares df Mean
Square F Sig.
1 Regression 14.754 5 2.951 1.516 .247b Residual 27.246 14 1.946 Total 42.000 19
Table 5.40
a – Dependent Variable : Sustenance b – Predictors:(Constant),H,D,F,E,G
Coefficientsa Model Unstandardized
Coefficients Standardized Coefficients
T Sig.
B Std. Error
Beta
1
(Constant) 4.014 1.081 3.714 .002 D .149 .394 .126 .378 .711 E -.602 .408 -.481 -1.476 .162 F .482 .408 .363 1.182 .257 G -.064 .497 -.060 -.129 .899 H -.435 .416 -.396 -1.045 .314
Table 5.41
a – Dependent Variable : Sustenance
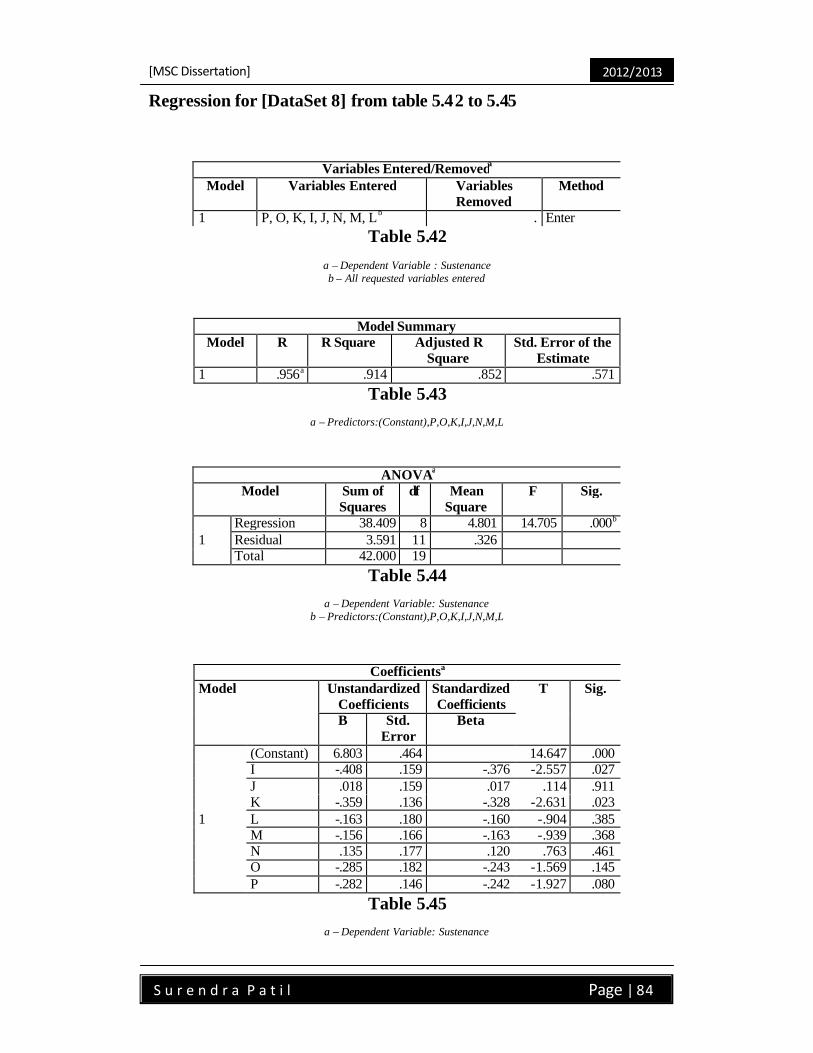
[MSC Dissertation]
2012/2013
S u r e n d r a P a t i l Page | 84
Regression for [DataSet 8] from table 5.42 to 5.45
Variables Entered/Removeda Model Variables Entered Variables
Removed Method
1 P, O, K, I, J, N, M, Lb . Enter Table 5.42
a – Dependent Variable : Sustenance b – All requested variables entered
Model Summary Model R R Square Adjusted R
Square Std. Error of the
Estimate 1 .956a .914 .852 .571
Table 5.43
a – Predictors:(Constant),P,O,K,I,J,N,M,L
ANOVAa Model Sum of
Squares df Mean
Square F Sig.
1 Regression 38.409 8 4.801 14.705 .000b Residual 3.591 11 .326 Total 42.000 19
Table 5.44
a – Dependent Variable: Sustenance b – Predictors:(Constant),P,O,K,I,J,N,M,L
Coefficientsa Model Unstandardized
Coefficients Standardized Coefficients
T Sig.
B Std. Error
Beta
1
(Constant) 6.803 .464 14.647 .000 I -.408 .159 -.376 -2.557 .027 J .018 .159 .017 .114 .911 K -.359 .136 -.328 -2.631 .023 L -.163 .180 -.160 -.904 .385 M -.156 .166 -.163 -.939 .368 N .135 .177 .120 .763 .461 O -.285 .182 -.243 -1.569 .145 P -.282 .146 -.242 -1.927 .080
Table 5.45
a – Dependent Variable: Sustenance
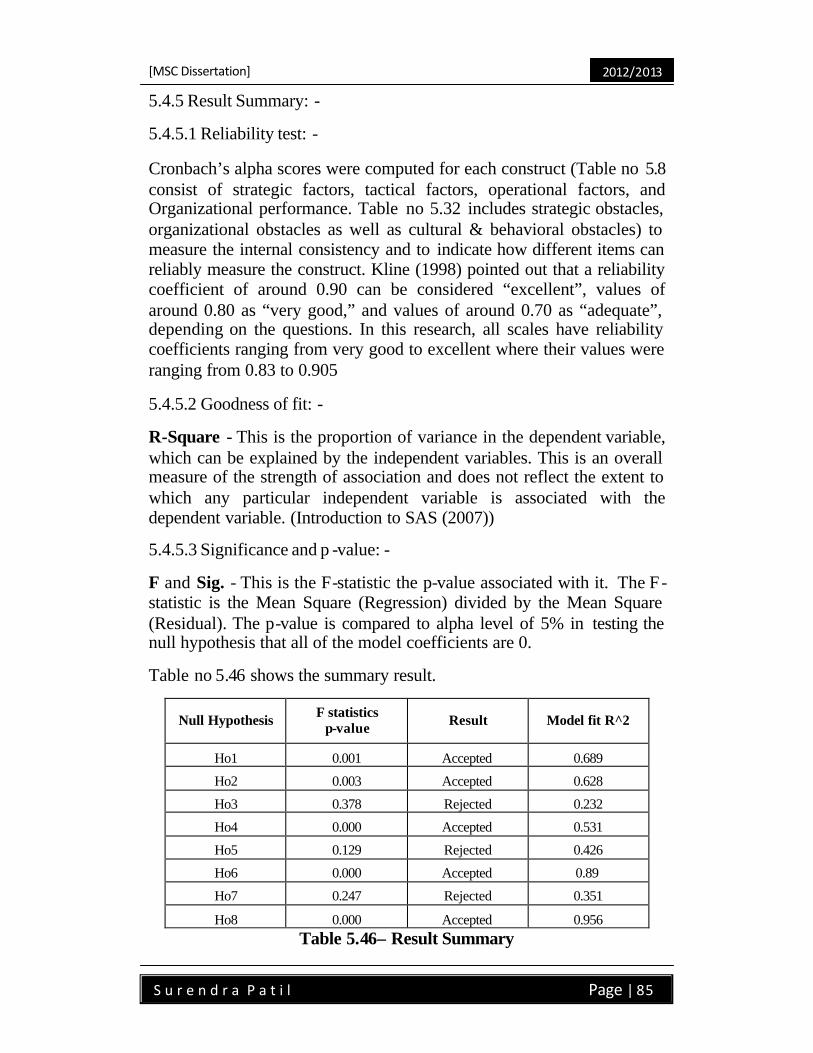
[MSC Dissertation]
2012/2013
S u r e n d r a P a t i l Page | 85
5.4.5 Result Summary: -
5.4.5.1 Reliability test: -
Cronbach’s alpha scores were computed for each construct (Table no 5.8 consist of strategic factors, tactical factors, operational factors, and Organizational performance. Table no 5.32 includes strategic obstacles, organizational obstacles as well as cultural & behavioral obstacles) to measure the internal consistency and to indicate how different items can reliably measure the construct. Kline (1998) pointed out that a reliability coefficient of around 0.90 can be considered “excellent”, values of around 0.80 as “very good,” and values of around 0.70 as “adequate”, depending on the questions. In this research, all scales have reliability coefficients ranging from very good to excellent where their values were ranging from 0.83 to 0.905
5.4.5.2 Goodness of fit: -
R-Square - This is the proportion of variance in the dependent variable, which can be explained by the independent variables. This is an overall measure of the strength of association and does not reflect the extent to which any particular independent variable is associated with the dependent variable. (Introduction to SAS (2007))
5.4.5.3 Significance and p -value: -
F and Sig. - This is the F-statistic the p-value associated with it. The F-statistic is the Mean Square (Regression) divided by the Mean Square (Residual). The p-value is compared to alpha level of 5% in testing the null hypothesis that all of the model coefficients are 0.
Table no 5.46 shows the summary result.
Null Hypothesis F statistics p-value Result Model fit R^2
Ho1 0.001 Accepted 0.689
Ho2 0.003 Accepted 0.628
Ho3 0.378 Rejected 0.232
Ho4 0.000 Accepted 0.531
Ho5 0.129 Rejected 0.426
Ho6 0.000 Accepted 0.89
Ho7 0.247 Rejected 0.351
Ho8 0.000 Accepted 0.956 Table 5.46– Result Summary

[MSC Dissertation]
2012/2013
S u r e n d r a P a t i l Page | 86
Alternative hypothesis accepted are as under,
H13 Operational factors have no direct effect on organizational performance.
H15 Organizational performance at first stage has no effect on sustenance of TOC.
H17 Organizational obstacles have no direct effect on sustenance.
5.5 Discussion: -
5.5.1 Part 1:-
The analysis of the first part of the questionnaire consists study of organization from perspective of demographic variations. According to Antony et al. (2005), Rungaswamy et al. (2002), such a study helps to provide a better understanding of the findings. Therefore, varied factors such as ‘Year of establishment’, ‘Number of employee’, ‘Present turnover’, ‘Investment in Plant and machinery’, ‘Product manufactured’, and ‘Year of staring TOC implementation’ etc., were considered in the analysis.
While analyzing the second part of questionnaire,(i.e. the understanding the TOC implementation), two distinct groups were found among the organizations, as stated by Jalena Fedurko (2011). He mentioned that, in organizational change process from viewpoint of people’s attitude and behavior, one could distinguish between two types of changes. In first one people seek change themselves (‘dream about’ or ‘work towards getting’) and second change that is forced from outside (people have to do something about it). Organization from first group who knowingly had chosen the change for betterment of organizational performance like increase in the sales or maintaining high growth are the examples. And for the second group the change is imposed by the situational circumstances (imposed from external). Factors such as Negative bottom line or cash crunch situation are the examples. With imposed change people don’t have influence over the decision made during the change process and no choice other than to accept it. It was not difficult for these organizations to get the buy in of the people for perceived change. They had to follow which was laid down as a new procedure. But as Fedurko further states; there is likely chance that people may ignore the change by withdrawing themselves during the change process or even after the change implemented. This may be the reason for one organization found

[MSC Dissertation]
2012/2013
S u r e n d r a P a t i l Page | 87
in the survey, where even with positive effect on performance, the TOC was not persuaded further.
Facilitating communication during the change process, allows different stakeholders to understand what, when and why the organization is changing, enhances the acceptance and adaptation to new circumstances (Dutton et al., 2001; Lewis et al. , (2006)). It was quite evident that organizations used different methodologies, to communicate the changes happening through off-site meetings, group discussion, group reading the books, role playing etc., to interact and communicate with concerned people to get their buy-in. Jone et al. (2004) suggest that, understanding and consideration of needs and interest of relevant group and individual, in order to anticipate their intention and reaction, persuade them to support the change process and diminish potential resistance.
For effective change management Nadler (1998), insisted up on formal and/or informal training and coaching in order to teach employees the knowledge and skills necessary to carry out the new tasks. Effectiveness of training to attain the result at first phase and also to use the tools & technique was well evidenced. Respondent also acknowledges the low effectiveness of the training in sustenance. The reasons need to be investigated.
At the organizational level, performance improvement will occur when management provides the entire work force with all the necessary training and technical infrastructure and the appropriate incentives for each situations (Felkins et al., (1993)).Therefore, strategic organizational change efforts must ascertain that different types of rewards are offered to employees who might have quite a different attitude set towards organizational change. (Appelbaum et al. (1998)) but it was evidenced that 50% of organization did not formulated any incentive system. Linking of KPI with performance measure or celebration of milestones may not be sufficient to motivate the people undergoing the change. Care should be taken while designing the incentive system to avoid the promotion of local efficiencies.
Resistance to a change is not the fundamental problem to be solved. Rather, any resistance is usually a symptom of more basic problems underlying the particular situation (Judson, (1966)).Goldratt (1990a) said, 'he wanted to help people learn how to use the psychological aspects to assist, rather than to impair, the implementation of those solutions in a mode of an on-going process.' To overcome the resistance, TOC provides solution with using the thinking process tools. The TOC trees provide the means to articulate the need for change by describing the
[MSC Dissertation]
2012/2013
S u r e n d r a P a t i l Page | 88
current environment (CRT) and outlining a future changed environment (FRT) from which the core problems have been removed (Mabin et al. (2001)). But in actual practice very limited use of these tools and techniques was evidenced. While explaining the reason for this Cox et al. (2005) states that, “Notwithstanding the reported successes of TOC, many users of TOC Thinking Processes (TPs) state that the logic tools are extremely difficult to use. Interestingly, these same individuals indicate that they have never thought so hard about a problem or solution to produce so little paperwork! Indeed, whilst the TPs represent a paradigm shift in how to approach problems how to analyze them, how to develop solutions, and how to develop project implementation plans – most users dislike using the tools but find them in- valuable.”
Importance of leadership and top management commitment was much emphasized by various authors (Buchanan et al., (2005); Kotter, (1996)).One of the distinguishing characteristics of the small firm is the relationship between the owners/founders and managers, which is typically closer than that in larger firms. The owners themselves act as a change agent and exert themselves as TOC managers as expected by Oded Cohen (2011). Thus influence of owner caused major impact on behavioral pattern of employee. Barringer and Jones (2004) supports that influence of Top management has major impact on growth orientation and performance of business
A much of emphasis was given by Cohen (2011) to inoculate TOC manager in the system, which can act as bridge between top management and people down the line. TOC manager should take full responsibility for the proper introduction of TOC to their organization with analyzing the current relationship with key people, provide the values offer and pursue the process of ongoing improvement. But in no any organization surveyed, such a dedicated TOC manager was found, while as it was found that TOC manager’s role was played by owner / top management. And because of the same they could not gave the full justice to the role of TOC manager due to their other responsibilities.
Eli Schragenheim (2011) suggests that, one should understanding the role of transition period in TOC implementation and frame the temporary procedures to bridge the gap between current state and new state with identifying and fixing mistakes and flaws in the implementation. Researcher did not find any evidence for taking care against this point in any organization under study.
While explaining the role of consultant as a agent of change, Alan Leader
[MSC Dissertation]
2012/2013
S u r e n d r a P a t i l Page | 89
(2011), mention that consultant should exert technical skill in use of TP as well as personal influence to insure successful implementation with focus on working with client, to avoid expected resistance to change and to obtain buy-in. This was seen well practiced in almost all organization.
Goldratt (1990) states, use of ERP / IT infrastructure is necessary but not sufficient for growth of organization. Most of the organization had already some or the other system based on home grown technology and majo r modification was not needed to cope up with changed system while TOC implementation.
HR training was the only tool found practiced in supporting TOC. Most of the respondent mentioned the use of the HR practices to handle the issues of behavioral and soft skill related to the middle managers. This supports the finding of Sing and Garg (2010), that, ‘Indian SMEs should continuously focus on developing their HR assets, improving product quality and effective applications of IT tools in different operational areas.’
5.5.2 Part 2: -
Strategic factors (which includes the Top management support & Involvement, Resources allocation, and Consultant support), and Tactical factors(Training, employee involvement & motivation) are found significant with organizational performance. These are the key factors, which lead to enhance organizational performance. The factors identified by various researchers for different improvement initiatives in SMEs well supports the above finding. For example (Upadyay et al. (2011) for ERP implementation, Salahedin (2009) for TQM, Antony et al. (2005) for Six sigma, Rungasamy et al. (2002) for SPC implementation, Psomas et al. (2010) for ISO implementation, Achanga et al. (2006) for Lean implementation, Bamber et al. (1999) for TMP implementation.
It was found that effect of Organizational factors (which includes Project planning, Effective use of other tools and techniques, Integration of quality systems and Effective use of IT infrastructure)were not significant with the organizational performance, while implementing TOC in Indian SMEs.
While guiding the TOC implementation Lisa Scheinkopf (1999), state s two important prerequisites, one defining the system and its purpose and second one is determine the systems fundamental measurements. In case of SME because of its size and control structure, it becomes easy for the founder or CEO to define systems boundary and its purpose. Also for aligning the performance measurement with TOC does not require much
[MSC Dissertation]
2012/2013
S u r e n d r a P a t i l Page | 90
efforts as against the in large firm / corporate culture.
In the proposed model by Boyd and Gupta (2004), there is positive relationship between organizational performance and throughput orientation. Organizational mindset, performance measurement and decision-making are three dimensions of throughput orientation. The data was captured and analyzed against the question no 9, regarding the performance measurement and decision making, which was termed as alignment of operations with TOC principles. And data regarding the organizational mindset was captured by the question no 2. Thus Boyd and Gupta’s proposed model supports research finding regarding the alignment and sustenance of TOC.
Findings regarding the increased organizational performance and sustenance have not shown any correlation. It indicates that positive results are not driving force to maintain the sustenance. Other factors are more influential than gain attains. One of the reason explained by respondent was, ‘the movement we came out of the cash flow problem, we drifted from the TOC and went back to our original comfort zone.’ The same case was found with the unite having the due date performance. Here the TOC is looked as a solution to pinching problem and not an improvement philosophy to achieve the goal of the organization. But for those who have initiated the TOC as tool for achieving growth or increase in the sales, the reasons may be different.
Strategic factors, which contain alienation of partial stakeholders, low level satisfaction and fear of losing control, are found relevant with the sustenance. This is typical characteristic of SME firms. While explaining this phenomenon Dobbs and Hamilton (2007) states that, ‘In small firms where ownership and management are typically combined in one or two individuals, growth is simply not always an objective. The rational factor model of traditional economic theory simply does not hold for small businesses. The rational actor model emphasizes the external constraints on a business, namely the competitive environment within which it operates and in doing so neglects those constraints on performance, which are internal to firms and imposed by the entrepreneur’s motivations. For example, an owner’s desire to retain control, as well as personal lifestyle and family factors may play as much of a role in determining business goals as commercial considerations.’
In support of this Robson and Bennett (2000), states that once the SME attains the minimum efficient scale business tend to grow less rapidly. Three possible explanations for this finding have been put forward
[MSC Dissertation]
2012/2013
S u r e n d r a P a t i l Page | 91
involving the motivation of owners:
5. (1) owners may lack further motivation to grow their business once they have achieved the business objectives and goals they formulated when their businesses were established, for example once they have achieved a sufficient level of income;
6. (2) owners may be reluctant to risk the fruits of their successes by pursuing expansion involving the possibility of failure and the weakening of the company; and
7. (3) owners may wish to avoid the inconveniences and headaches associated with continued expansion
All three reasons mentioned above support finding of strategic factor inhibiting the sustenance.
Organizational culture and behavioral issues find strong relation with the sustenance of TOC. Culture is the collective programming of the mind, which distinguishes one group or category of people from another. It has many levels, such as beliefs, values and mindsets, which shape the behaviors, attitudes and habits of a group of people (Hofstede, 2005). Researcher found the relationship between the national culture, organizational culture (Lagrosen, 2003), and the most important aggregate of culture is national culture that represents the shared values of people within a certain national environment learned from the socialization process of the society (Anwar and Jabnoun, 2006). Researchers have also identified that organizational culture is essential for success at improvement initiatives (e.g. Briscoe et al., 2005; Kumar and Sankaran, 2007; Rad, 2006). Constraint management argued that customer and employee satisfaction should be viewed as necessary condition that must be met before attempting to improve profitability (Inman et al. (2009)). But in SME the thrust has been given on achieving these conditions as a parallel goal while adopting TOC methodology. Because of its inherent limitations the necessary conditions cannot be met without any use of special tool or technique. Gulbro et al. (2000) argued that small firms are lagging behind large firms with regards to continuous improvement activities. Tannock et al. (2002) also insisted that large organizations differ from SME in structure, procedures, behavior, processes, people and contact. Much of published literature on implementation of TOC is concerning either European or US culture and that’s to large organization. The cultural & behavioral issues of Indian SME need to be further evaluated for the tools and technique to be used in order to implement TOC as a methodology to achieve the ever-

[MSC Dissertation]
2012/2013
S u r e n d r a P a t i l Page | 92
flourishing organization.
Because of typical nature of SME, Developing and retention of employee is one more hurdle in implementation of improvement initiative. Many of respondents acknowledged this while answering the question no 16 & 13 (mean 3.5 and 3.75 respectively) The ability of a firm to attract, develop and retain skilled and capable employees effects the probability that they will be able to effectively implement and maintain a growth-oriented strategy (Barringer and Jones, (2004)). SME also need to manage their HRM practices, as employees of the firm are seen as critical resources in the achievement and maintain a growth (Lin, (1998)).
[MSC Dissertation]
2012/2013
S u r e n d r a P a t i l Page | 93
Chapter 6 :Conclusion & Recommendation
6.0 Conclusion& suggestion for further work
6.1 Conclusion: -
This work set outs to achieve the following objectives
1. Understanding the critical steps in implementation of TOC 2. Understanding the dynamics of Indian SMEs in respect of TOC
implementation 3. Compare & identify the commonalities in the challenges faced
by various unites before, while and after implementation 4. Compare & identify the commonalities in process of
implementation. 5. Hypothesis the key factors of success& inhibitors for
sustenance.
While doing so, a review of the philosophy of TOC, process of implementation, major issues faced by SMEs particularly in Indian contest were understood and addressed. TOC implementation of twenty companies was examined and: ‘Key critical factors which are leading to successful and effective implementation of TOC, and ‘inhibitors’ for sustenance of TOC as a process of ongoing improvement were identified Conclusion 1 - Strategic factors have direct effect on Organizational performance.
Conclusion 2- Tactical factors have direct effect on Organizational performance
Conclusion 3 - Operational factors have no direct effect on Organizational performance
Conclusion 4- Alignment of Operations with TOC principals has strong impact on sustenance of TOC
Conclusion 5- Organizational performance at first stage has no effect on sustenance of TOC
Conclusion 6- Strategic obstacles have direct effect on sustenance of TOC
Conclusion 7- Organizational obstacles have no direct effect on sustenance of TOC
[MSC Dissertation]
2012/2013
S u r e n d r a P a t i l Page | 94
Conclusion 8- Behavioral obstacles have direct effect on sustenance of TOC.
When implemented TOC fully (with all the tools and techniques like logistics, thinking process and performance measures) or even use of single tool depending upon the particular situation of the organization, is an effective management philosophy that result in improved performance of organization. The finding in this research supports and in consistence with multiple TOC cases and simulation studies (Mehra et al., 2005; Pegels and Watrous, 2005; Chaudhari and Mukhopadhyay, 2003; Riezebos et al., 2003; Scoggin et al., 2003; Draman et al., 2002; Mabin et al., 2001; Spencer, 2000; Roybal et al., 1999; Westra et al., 1996)
In spite of its inherent simplicity and power to improve the performance of organization it’s adoption and sustenance is limited in Indian SME. The reason lies in the cultural mindset of owners and employee.
TOC is comparatively new improvement philosophy to Indian industry especially for SME sector. It is right time to study the implications of TOC implementation in order to increase the use of this wonderful tool to benefit the SME sector to its fullest extent. Thus because of low population of organizations, it has provided the researcher good opportunity to study the characteristics of SME by personally visiting the organization and interacting with top management. Had it been the large sample size, collecting the data through mailing the questionnaire would have brought the general limitation of survey based research methodology. The generalizability of the present research finding is limited by the nature of sample used in the study. Although it is reasonable to generalize the present finding for other SME manufacturing organizations, care should be taken to extrapolating finding to non manufacturing / service sector. Another limitation comes from the selection of critical success factors included in the survey. As stated earlier literature discusses a wide variety of CFs and there is no consensus upon a definitive set of practices. Even though this paper included a variety of CFs suggested in literature, plenty of space exists to improve in the refinement and classification of CFs and inhibitors.
One more obvious limitation is usual reservation inherent in the use of self reported information and perceptual data provided by the respondent. This can be overcome by collecting data from various levels in the organization like managers, supervisors etc.

[MSC Dissertation]
2012/2013
S u r e n d r a P a t i l Page | 95
6.2 Suggestion for further work: -
1. The tools and techniques required to overcome the cultural issues and mindset of people can be further explored with extending the sample size.
2. Instead of just SME the research can be extended to large organization so as to have comparative study between two types.
3. This research was based on feedback from one level (top management), however feedback from lower level would better represent the cultural and behavioral issues.
4. Further investigation needs to be done in to development of growth model for Indian SMEs
5. Hypothetical approach was used in this research, it is therefore suggested that consideration be given to use the longitudinal studies for assessing the CFs and inhibitors.
6. This work may be used as frame work for further research and will be enable process of cross comparison of subsequent findings
[MSC Dissertation]
2012/2013
S u r e n d r a P a t i l Page | 96
WORKS CITED
Achanga, P. EsamShehab, Rajkumar Roy, R., Nelder, G., (2006),"Critical success factors for lean implementation within SMEs", Journal of Manufacturing Technology Management, Vol. 17 Iss: 4 pp. 460 – 471
Ahire, S. (1996).An empirical investigation of quality management in small firms. Production and Inventory Management Journal, 37(2), 44–50.
Ahuja, I.P.S., and Khamba, J. S., (2008) ‘Strategies and success factors for overcoming challenges in TPM implementation in Indian manufacturing industry’ Journal of Quality in Maintenance Engineering Vol. 14 No. 2, 2008 pp. 123-147
Alan Barnard, (2010) ‘Continuous Improvement and Auditing’ Chapter 15, Theory Of Constraint Handbook, McGraw Hill
Alinaitwe, H.M., Widén, K., Mwakali, J., and Hansson, B., (2007), ‘Innovation Barriers and Enablers that Affect Productivity in Uganda Building Industry’, Journal of Construction in Developing Countries, Vol. 12, No. 1, 2007
Antony, J., Kumar, M., Madu, C.N., (2005),"Six sigma in small- and medium-sized UK manufacturing enterprises: Some empirical observations", International Journal of Quality & Reliability Management, Vol. 22 Iss: 8 pp. 860 – 874
Anwar, S.A. and Jabnoun, N. (2006), ‘The development of a contingency model relating national culture to total quality management’, International Journal of Management, Vol. 23 No. 2, pp. 272-80.
Appelbaum, S. H., St-P ierre, N., and Glavas, W., (1998),"Strategic organizational change: the role of leadership, learning, motivation and productivity", Management Decision, Vol. 36 Iss: 5 pp. 289 – 301
Appelbaum, S.H. and Steed, A.J. (2005), “The critical success factors in the client-consulting relationship”, Journal of Management Development, Vol. 24 Nos 1/2, pp. 68-93.
Bajaj Rahul, (2011) Managing Director, Bajaj Auto Ltd, during his inaugural address at the 7th MSME Development Meet held at Pune on 8 December 2011.
[MSC Dissertation]
2012/2013
S u r e n d r a P a t i l Page | 97
BalaSubrahmanya, M. H., (2005) ‘SMEs IN INDIA: WILL THEY BE ABLE TO JOIN “GLOBAL CHAINS”?’ September 2005The Chartered Accountant
Balnaves, M. and Cupit, P. (2001), Introduction to Quantitative Research Methods: An Investigative Approach, Sage Publishers, London.
Bamber, C.J., Sharp, J.M., Hides, M.T., (1999),"Factors affecting successful implementation of total productive maintenance: A UK manufacturing case study perspective", Journal of Quality in Maintenance Engineering, Vol. 5 Iss: 3 pp. 162 – 181
Barnard Alan, (2010), ‘Continuous Improvement and Auditing’, Chapter 15, ‘Theory Of Constraint’, Tata McGraw Hill.
Barringer, B.R., and Jones, F.F., (2004), ‘Achieving rapid growth - revisiting the managerial capacity problem’, Journal of Developmental Entrepreneurship, Vol. 9 No. 1, pp. 73-87.
Bergman, B. and KlefsjoÈ, B. (1995), KvalitetfraÊ n behov till anvaÈndning, Lund.
Bharath, P., (2010) PROSPECTS AND CHALLENGES OF SME’S IN INDIA A.J.INSTITUTE OF MANAGEMENT (AJIM)
Bhatnagar,J., BudhawarP., SrivastavaP. andSaini S. Debi, S.S., (2010), ‘Organizational cahne and development in India’ A Case of strategic organizational change and transformation. Journal of Organizational Change Management Vol. 23 No. 5, 2010 pp. 485-499.
Bhattacharyya, S., ‘Models Of Planned Change- Management Science II’
Blackstone Jr., J. H., (2010), ‘A Review of literature on Drum-Buffer-Rope, Buffer management and distribution.’ Chapter 7 ‘Theory Of constraint Handbook’ Tata Mc-Graw-Hill
Block, P., (1989), ‘Flawless consulting’, in McLennan, R. (Ed.), Managing Organizational Change, Prentice-Hall, Englewood Cliffs.
Boyd, L., Gupta, M., (2004), ‘Constraint Management: What is the theory?’, International Journal of Operations & Production Management Vol. 24 No. 4, 2004 pp. 350-371
[MSC Dissertation]
2012/2013
S u r e n d r a P a t i l Page | 98
Brah, S. and Lim, H. (2006), “The effects of technology and TQM on the performance of logistics companies, “International Journal of Physical Distribution & Logistics Management, Vol. 36 No. 3, pp. 192-209.
Breen, A.M, Burton-Houle,T., & Aron,c., (2002) ‘Applying the Theory of constraint in Health care Part I, Quality management in Health care 10(3), 40-46
Briscoe, J., Fawcett, S.E. and Todd, R.H. (2005), ‘The implementation and impact of ISO 9000 among small manufacturing enterprises’, Journal of Small Business Management, Vol. 43 No. 3, pp. 309-30.
Buchanan D, Fitzgerald L, Ketley D, Gollop R, Jones JL, Lamont SS, et al., (2005), ‘ No going back: a review of the literature on sustaining organizational change.’Int J Manag Rev2005;7:189–205 [September].
Chaudhari, C. V., Mukhopadhyay, S. K., (2003), ‘Application of Theory Of Constraint In an integrated poultry industry’ International Journal of Production Research, 2003, Vol 41, No 4, 799-817
Chin, K-S., Poon, G.K.K. and Pun, K.-F. (2000), “The critical maintenance issues of the ISO 9000 system: Hong Kong manufacturing industries’ perspective”, Work Study, Vol. 49 No. 3, pp. 89-96.
Cohen Oded, (2010), ‘Ever Improve- A Guide to Managing Production The TOC Way’,
Corbett, T., (1998), ‘Throughput Accounting: TOC’s management accounting system’. North River Press pg 43.
Cox J. F. and Spencer, M. S.,(1998), The Constraint Management Handbook’, Boca Raton FL, St. Lucie Press/APICS Series on Constraint Management.
Cox, J. F. Mabin, V.J., Davies, J., (2005),‘A case of personal productivity: Illustrating methodological developments in TOC’ Human Systems Management 24 (2005) 39-65.
Denzin, N. K., (1978), ‘The Research Act,’ 2nd Ed., 9New York; McGraw-Hill.
[MSC Dissertation]
2012/2013
S u r e n d r a P a t i l Page | 99
Dettmer, H.W. (1997), ‘Goidralt's Theory of Constraints: A Systems Approach to Continuous Improvement’ (Milwaukee: ASQC Quality Press).
Dettmer, H.W. (1998), ‘Navigating Change: Organizational Behaviour and the Thinking Processes’, APICS Constraints Management Symposium.
Dettmer, H. W. (2007), ‘The Logical Thinking process- A Systems Approach to Complex Problem Solving’, ASQ, Quality Press.
Dobbs, M., Hamilton, R. T., (2007),"Small business growth: recent evidence and new directions", International Journal of Entrepreneurial Behavior & Research, Vol. 13 Iss: 5 pp. 296 – 322
Dooley Jeff, (1995), ‘Cultural aspect of systematic change management” Presented at the Ohlone College Foundation Roundtable, April, 1995.
Draman, R.H., Lockamy, A. and Cox, J.F. (2002), “Constraint-based accounting and its impact on organizational performance: a simulation of four common business strategies”, Integrated Manufacturing Systems, Vol. 13 No. 4, pp. 190-200.
Dutton, J., Ashford, S., O'Neill, R., Lawrence, K., (2001) ‘Moves that matter: issue selling and organizational change’. Acad Manage J 2001; 44:716–36 [August].
Felkins, P.K., Chakiris, B.J. and Chakiris, K.N. (1993), ‘Change Management: A Model for Effective Organizational Performance,’ Quality Resources, Chapters 1, 3,8,10, White Plains, New York, NY.
Flynn, B. B., Sakakibara, S., Schroeder, R. G., Bates, K. A., Flynn, E. J., (1990), ‘Empirical Research Methods in Operations Management.’ Journal Of Operation management Vol 9 No 2, April 1990.
Flynn, B.B., Schroeder, R.G., Flynn, E.J., Sakakibara, S. and Bates, K.A. (1997), “World -class manufacturing projects: overview and selected results”, International Journal of Operations & Production Management, Vol. 17 No. 7, pp. 671-85.
Fry, T. D., Cox, J. F. and Blackstone, J. H., JR, (1992), ‘An analysis and discussion of the optimized production technology software and its use’. Production and Operations Management, 1, 229–242.
[MSC Dissertation]
2012/2013
S u r e n d r a P a t i l Page | 100
Gardiner, S. C., Blackstone, J. H. Jr. and Gardiner L. R., (1994), ‘The evolution of the theory of constraints’. IM, May/June, 13–16.
Garg, R.K. and Singh, T.P. (2005), “Status of socio-technical change in Indian automobile industry: a longitudinal study”, Global Journal of Flexible Systems Management, Vol. 6 Nos 3/4, pp. 25-38.
Ghosh Duke, (2007), “SMEs—The Creative Leaders of India: In Search of an Enabling Environment” 2007 SYLFF Regional Forum Selected Papers on “Human Rights and Creative Leadership”
Goldratt, E. M. (1990) ‘The Haystack Syndrome: Shifting Information From The Data Ocean?’, North River press.
Goldratt, E. M. and Cox, J., (1984), ‘The Goal’ (Croton-on-Hudson: North River).
Goldratt, E. M. and Fox R. E. (1986) ‘The Race’, North River Press.
Goldratt, E. M., (2008) “Standing on the Shoulders of Giants “Production concepts versus production applications 2008
Goldratt, E.M. (1992), ‘It’s not Luck’ North River Press, Croton-on- Hudson, MA.
Goldratt, E.M. (1997), ‘Critical Chain’ North River Press, Great Barrington, MA. Goldratt, E.M., (1980), ‘Optimized production timetables: a revolutionary
program for industry.’ In: APICS 23rd Annual International Conference, APICS, Falls Church.
Goldratt, E.M., (1990), ‘What is the thing called Theory Of constraint and how should it be implemented.’ North River Press
Goldratt, E.M., (1990a), ‘What Is This Thing Called The Theory of Constraints and How Should It Be Implemented? The North River Press, Croton-on-Hudson, NY.
Goldratt, E.M., Eshkoli, I., Brownleer J., (2009) ‘Isn’t it Obvious? North River Press.
Goldratt, E.M., Schragenheim, E., Ptak C.A., (2006), “ Necessary but not sufficient’ Productivity and Quality publishing, Madras.
[MSC Dissertation]
2012/2013
S u r e n d r a P a t i l Page | 101
GruÈnberg, T., Posten AB, Gothenburg, Sweden and WoxeÂncentrum, (2003) “Performance improvement towards a method for finding and prioritizing potential performance improvement areas in manufacturing operations” International Journal of Productivity and Performance Management Vol. 53 No. 1, 2004 pp. 52-71
Gulbro, R.D., Shonesy, L. and Dreyfus, P. (2000), “Are small manufacturers failing the quality tests? Industrial Management and Data Systems, Vol. 100 No. 6, pp. 76-80.
Gupta, M. & Boyd, L. (2008), ‘Theory Of Constraint: A Theory in Operation management’ International Journal of Operation And Production Management, 28 (10), 991-1012
Gupta, M., Chahal, H., Kaur, G.,Sharma,R., (2010), ‘Improving the weakest link: A TOC –Based framework for small Business’ Total Quality Management Vol. 21, No. 8, August 2010, 863–883
Gupta, M., Hyun-JeungKo and MIN, H., (2002) ‘TOC-based performance measures and five focusing steps in a job-shop manufacturing environment’, INT. J. PROD.RES., 2002, VOL. 40, NO. 4. 907-930
Hamel, G. (2002), ‘Leading the Revolution: How to Thrive in Turbulent Times by Making?Innovation a Way of Life,’ Harvard Business School Press, Boston, MA.
Harold, S.I., Perry, K., and Alan, j., (2005), ‘The hard side of change management.’ Harvard Business Review October 2005, Harvard Business School Publishing Corporation.
Haveman, Heather A. (2000), ‘The Future of Organizational Sociology: Forging Ties Among Paradigms.’ Contemporary Sociology 29(3):476-486.
Heinert, A., Karoba, G., Hurtado, A. and Fiallos, J., (2012), ‘Management attention to build the ever-flourishing state’, Abstract for TOCICO Conference 2012, Grupo Berlin case.
Hila Chalutz Ben-Gal and Shay S. Tzafrir, (2011), ‘Consultant-client relationship: one of the secrets to effective organizational change?’ Journal of Organizational Change Management?Vol. 24 No. 5, 2011 pp. 662-679
Hofstede, G. (2005), Cultures and Organizations: Software of the Mind, McGraw-Hill, New York, NY.
[MSC Dissertation]
2012/2013
S u r e n d r a P a t i l Page | 102
Houle, D. and Burton-Houle, T. (1998), ``Overcoming resistance to change the TOC way'', APICS ± Constraints Management Symposium Proceedings.
Inman, A. R., Sale, M. L., Green Jr., K. W., (2009), ‘Analysis of the relationship among TOC use, TOC outcomes, and organizational performance,’ International Journal of Operation and Production management. Vol 29 No 4, 2009, 341-356
Introduction to SAS. (2007), UCLA: Academic Technology Services, Statistical Consulting Group. From http://www.ats.ucla.edu/stat/sas/notes2/ (accessed November 24, 2007).
Jaap van Ede (2010), http://www.business- improvement.eu/worldclass/world_class_introduction_eng.php
Jaykumar, K (2011), Press note, Press Trust of India / Coimbatore Nov.
25, 2011, web page: www.business-standard.com/india/news/smes-to-contribute-22-gdp-by-2020
Jick, T. D. (1979), ‘Mixing Qualitative and Quantitative Methods: Triangulation in action’, Administrative Sciences Quarterly, Vol 24, no 4, 1979.
Jones J, Aguirre D, Calderone M., (2004) ‘10 Principles of change management: tools and techniques to help companies transform quickly.’ Resilence report. Booz, Allen & Hamilton; 2004 [April].
Judson, A., (1966), ‘A Managers Guide to Making Changes,’ John Wiley & Sons, London
Kanter, R.M. (1985), ``Managing the human side of change'', Management Review, Vol. 74, pp. 52-6.
Kendall, G. I., (2005), ‘Viable vision: Transforming total sales in to net profit’, J Ross Publishing Inc. Florida.
Kline, R. (1998), Principles and Practice of Structural Equation Modeling, Guilford Press, New York, NY.
Kohli, A. S., Gupta, M., (2010), ‘Improving Operation Strategy: Application of TOC Principles In a small Business’, Journal Of Business & Economics Research- April 2010.
[MSC Dissertation]
2012/2013
S u r e n d r a P a t i l Page | 103
Krishnaswamy, K. N., Sivkumar, A. I., Mathirajan, M., (2012), ‘Management Research Methodology; Integration of Principles, Methods And Techniques.’ Pearsons Education South Asia. 2012.
Kumar, M., Antony, J., Singh, R.K., Tiwari, M.K. and Perry, D. (2006), “Implementing the Lean Sigma framework in an Indian SME: a case study”, Production Planning and Control, Vol. 17 No. 4, pp. 407-23.
Kumar, M.R. and Sankaran, S. (2007), “Indian culture and the culture for TQM: a comparison”, The TQM Magazine, Vol. 19 No. 2, pp. 176-88.
Lagrosen, S. (2003), “Exploring the impact of culture on quality management”, International Journal of Quality and Reliability Management, Vol. 20 No. 4, pp. 473-87.
Leach, L.P., (1999), ‘Critical chain project management improves project performance’. Project Management Journal 30 (2), 39.
Lewin, K. (1951), ‘Field Theory in Social Science: Selected Theoretical Papers’, Harper & Row, New York, NY.
Lewis, L.K., Schmisseur, A.M., Stephens, K.K., Weir, K.E., (2006), ‘Advice on communicating during organizational change: the content of’ popular press books. J Bus Commun 2006; 43(2):113–37.
Lin, C.Y.Y. (1998), “Success factors of small and medium sized enterprises in Taiwan: an analysis of cases”, Journal of Small Business Management, Vol. 36 No. 4, pp. 43-57.
Mabin, V. J., Steven J. Balderstone, S. J., (2000), ‘The world of theory of constraint’ A review of International literature, The CRC press.
Mabin, V. J.And Davies John, (2010), ‘The TOC Thinking Process, Their Nature and Use – Reflection and consolidation’, Chapter 23, Theory Of Constraint Handbook, Tata McGraw Hill.
Mabin,V.J., Steve, F., Lawrence, G., (2001), ‘Harnessing resistance: using the theory of constraints to assist change management’ Journal of European Industrial Training 25/2/3/4 [2001]

[MSC Dissertation]
2012/2013
S u r e n d r a P a t i l Page | 104
Mabin., V. J., Steve Forgeson., S., and Green, L., (2001), ‘Harnessing resistance: using the theory of constraints to assist change management, Journal of European Industrial Training 25/2/3/4 [2001] 168±191
Mehra, S., Inman, R.A. and Tuite, G. (2005), “A simulation-based comparison of TOC and traditional accounting performance measures in a process industry”, Journal of Manufacturing Technology Management, Vol. 16 No. 3, pp. 328-42.
Miah, M.A.Q. (1993), Applied Statistics, Asian Institute of Technology, Pathumthani.
Moore, Ron, (2007), ‘Selecting the Right Manufacturing Improvement Tools’ Chapter 1 Introduction, page 3-4
Moran, J. W. and Brightman, B. K. (2001) ‘Leading organizational change’, Career Development International, 6(2), pp. 111–118.
Muniappan. G., (2002) The NPA Overhang, Magnitude, Solutions and Legal Reforms (Reserve Bank of India, 2002)
Nadler, D., (1998), ‘Champions of change’, San Francisco: Jossey-Bass; 1998. Nagabhushana, T.S. and Shah, J. (1999), “Manufacturing priorities and
action programs in the changing environment: an empirical study of Indian industries”, International Journal of Operations & Production Management, Vol. 19 No. 4, pp. 389-98.
Nguyen Huy Q., (2001), ‘Time, temporal capability, and planned change.' AcadManag Rev 2001; 26:601–23 [October].
Nord, C., Pettersson, B. and Johansson, B. (1997), TPM-Total Productive Maintenance, med erfarenhetfraÊn Volvo, MoÈlnycke.
Noreen, E., Smith, D., and Mackey, T., (1995), ‘The Theory of Constraints and its implications for management accounting.’ North River P ress, pp 12, 13, 80.
O’Regan N., and Ghobadian A., (2004), ‘Short and long-term performance in manufacturing SMEs Different targets, different drivers. International Journal of Productivity and Performance Management Vol. 53 Iss: 5 pp. 405 – 424
Oakland, J. (1995), ‘Total Quality Management – Text with Cases’, 2nd ed., Butterworth-Heinemann Professional Publishing, Oxford.
[MSC Dissertation]
2012/2013
S u r e n d r a P a t i l Page | 105
Oakland, J.S., (2001) ‘Total Organizational Excellence’ Achieving world-class performance, 2001 Elsevier Ltd. ISBN: 978-0-7506-5271-1
Oded, C., (2011), ‘Personal challenges in implementing TOC’, Chapter 1‘Leading the people through change’, First Edition Goldratt school.
Page, S.D. and Pearson, S.R. (2004), “Transforming the IT force”, Indian Management, November, pp. 46-51.
Pegels, C. C., & Waterous (2005), Application of Theory Of Constraint to Bottleneck Operations in Manufacturing Plant’ Journal Of Manufacturing Technology Management 16 (3) 302-311
Peter Hines, P., Holweg, M. and Rich, N., (2004), ’Learning to Evolve- A Review of Contemporary Lean Thinking’, -IJOM vol 24, No. 10, 2004, pp. 994-1011(18)
Pfeifer, T., Schmitt, R., Voigt, T., (2005),’ “Research and concept, Managing change: quality-oriented design of strategic change processes” The TQM Magazine Vol. 17 No. 4, 2005 pp. 297-308
Pillai, A. S., (2012), AGM of rural planning and credit department at RBI. Report published in ‘The Times Of India’ 20th July 2012
Pozo, H.,Takeshi, E., Tachizawa, T., and Picchiai, D., (2009),‘The Theory of Constraint and small firm: an alternativ e strategy in the manufacturing management’. RAI - Revista de Administração e Inovação, São Paulo, v. 6, n. 3, p. 05-25, set./dez. 2009.
Preez, ND. DU., Louw. L., (2004), ‘A Roadmap Approach For Implementing Theory of Constraints In Manufacturing Organizations’ International Conference on Competitive Manufacturing
Psomas, E.L., Fotopoulos, C.V., Kafetzopoulos, D.P., (2010),"Critical factors for effective implementation of ISO 9001 in SME service companies", Managing Service Quality, Vol. 20 Iss: 5 pp. 440 – 457
Rad, A.M.M. (2006), ‘The impact of organizational culture on the successful implementation of TQM,’ The TQM Magazine, Vol. 18 No. 6, pp. 606-25.
[MSC Dissertation]
2012/2013
S u r e n d r a P a t i l Page | 106
Rahman, S., (2002), ‘The theory of constraints’ thinking process approach to developing strategies in supply chains.’ International Journal of Physical Distribution and Logistics Management 32 (10), 809.
Raineri, A.B., (2011), ‘Change management practices: Impact on perceived change results’, Journal of Business Research 64 (2011) 266–272
Rajsekar, S., Philominathan, P., Chinnathambi, V., (2006), ‘Research Methodology &Methods’, Volume: 68, Issue: 1, Publisher: Oxford University Press, Pages: 23 arXiv: physics/0601009
Ranganathan, A. and Kuruvilla, S. (2008), “Employee turnover in the business process outsourcing industry in India”, in Jemielniak, D. and Kociatkiewicz, J. (Eds), Management Practices in High-tech Environments, Ideas Group, Pennsylvania.
Rea, L.M. and Parker, R.A. (1997), Designing and Conducting Survey Research: A Comprehensive Guide, 2nd ed., Jossey-Bass Publishers, San Francisco, CA.
Rich, N., Bateman, N., (2003),"Companies' perceptions of inhibitors and enablers for process improvement activities", International Journal of Operations & Production Management, Vol. 23 Iss: 2 pp. 185 – 199
Riezebos, J., Korte, G.J. and Land, M.J. (2003), “Improving a practical DBR approach using workload control”, International Journal of P roduction Research, Vol. 41 No. 4, pp. 699-712.
Robson, P.J.A. and Bennett, R.J. (2000), “SME growth: the relationship with business advice and external collaboration”, Small Business Economics, Vol. 15 No. 3, pp. 193-205.
Rockart, J.F. (1979), `Chief executives define their own data needs'', HBR, Vol. 57 No. 2, pp. 238-41.
Ronen, B. and Starr, M. K., (1990), ‘Synchronized manufacturing as in OPT: from practice to theory’. Computers in Industrial Engineering, 18, 585–600.
Roybal, H., Baxendale, S. and Gupta, M. (1999), “Using activity-based costing and theory of constraints to guide continuous improvement in managed care”, Managed Care Quarterly, Vol. 7 No. 1, pp. 1 -10.
[MSC Dissertation]
2012/2013
S u r e n d r a P a t i l Page | 107
Rungasamy. S., Antony. J., Ghosh. S., (2002),"Critical success factors for SPC implementation in UK small and medium enterprises: some key findings from a survey", The TQM Magazine, Vol. 14 Iss: 4 pp. 217 – 224
Salaheldin Ismail Salaheldin, (2009),"Critical success factors for TQM implementation and their impact on performance of SMEs", International Journal of Productivity and Performance Management, Vol. 58 Iss: 3 pp. 215 – 237
Scheinkopf, L. J., (1999), ‘Thinking for change, Putting TOC thinking process to use’ The St. Lucie Press / APICS Series on Constraint Management.
Schragenheim Eli (2001), ‘Personal challenges in implementing TOC’, Chapter 2‘Understanding the role of the transition period in TOC implementation’, First Edition Goldratt school.
Schragenheim, E., Dettmer, H.W., (2001), ‘Manufacturing at warp speed, optimizing supply chain financial performance’ The CRC press
Schragenheim, E., Ronen, B., (1991), ‘Buffer management: a diagnostic tool for production control.’ Production and Inventory Management Journal 32 (2), 74–79.
Scoggin J.M., Segelhorst R.J., Reid R.A., (2003), ‘Applying the TOC thinking process in manufacturing: a Case study’ International Journal of production Research2003, vol. 41, no. 4, 767–797
Simatupang, T.M., Wright, A.C., & Sridharan, R. (2004), ‘Applying Theory of constraint to supply chain collaboration’ Supply Chain Management 9 (1), 57-70
Singh, R. K., Garg, S. K., Deshmukh, S. G., (2009),"The competitiveness of SMEs in a globalized economy: Observations from China and India", Management Research Review, Vol. 33 Iss: 1 pp. 54 – 65
Sinha, J.B.P. (1990), Work Culture in the Indian Context, Sage, New Delhi.
Spencer, M. S. and Cox, J. F., (1995), ‘Optimum production technology (OPT) and the theory of constraints (TOC): analysis and genealogy’. International Journal of Production Research, 33, 1495–1504.
[MSC Dissertation]
2012/2013
S u r e n d r a P a t i l Page | 108
Spencer, M.S. (2000), “Theory of constraints in a service application: the swine graphics case”, International Journal of Production Research, Vol. 38 No. 5, pp. 1101-8.
Spencer, M.S., Cox III, J.F., (1995). ‘Optimum production technology (OPT) and the theory of constraints (TOC): analysis and genealogy.’ International Journal of Production Research 33, 1495–1504.
Srikanth, M .L .and Robertson, S. A., (1995), ‘Measurements for Effective Decision Making’ (Guilford, CT: The Spectrum Publishing Company).
Srikanth, M.L. and Robertson, S.A. (1998), Measurements for Effective Decision-making, the Spectrum Publishing Company, Guilford, CT.
Stone, E., (1978), ‘Research methods in organizational behavior.’ Santa Monica; Good year Publishing Company, Inc.
Tannock, J., Krasachol, L. and Ruangpermpool, S. (2002), ‘The development of total quality management in Thai manufacturing SMEs’, International Journal of Quality and Reliability Management, Vol. 19 No. 4, pp. 380-95.
Umble, M., Umble, E., (2000), ‘Manage your projects for success: an application of the theory of constraints.’ Production and Inventory Management Journal 41 (2), 27.
Umble, M., Umble, E., Murakami, S. (2006), Implementing theory of constraint in traditional Japanese Manufacturing environment: A case of Hitachi tool engineering,’ International Journal of P roduction Research 44(10), 1863- 1880
Upadhyay, P., Jahanyan, S., Dan, P.K., (2011),"Factors influencing ERP implementation in Indian manufacturing organizations: A study of micro, small and medium-scale enterprises", Journal of Enterprise Information Management, Vol. 24 Iss: 2 pp. 130 – 145
Watson, K.J., Polito, T., (2003). ‘Comparison of DRP and TOC financial performance within a multi-product, multi-echelon physical distribution environment.’ International Journal of Production Research 41 (4), 741–765.
Westra, D., Srikanth, M.L. and Kane, M. (1996), “Measuring operational performance in a throughput world”, Management Accounting, Vol. 77 No. 10, pp. 41-7.
[MSC Dissertation]
2012/2013
S u r e n d r a P a t i l Page | 109
Whelan-Berry KS, Gordon JR, Hinings CR., (2003), ‘strengthening organizational change processes: recommendations and implications from a multilevel analysis’. J Applied Behavior Science 2003; 39:186–207 [June].
Woeppel, M.J., (2001), ‘Manufacturer’s Guide to Implementing the Theory of Constraints’, St. Lucie Press, Boca Raton.
Womak, J. P., Jones, D. T., (2007) ‘Lean Thinking: What Tools? When?’ Elsevier Inc. ISBN: 978-0-7506-7916-9
Xinsheng, W., Jinli, Z., Haixing, Z., (2011), ‘The Optimization of Small And Medium Manufacturing Enterprises’ Production Logistics System based on TOC’, Q. Zhou (Ed.): ISAEBD 2011, Part I, CCIS 208, pp. 395–401,

[MSC Dissertation]
2012/2013
S u r e n d r a P a t i l Page | 110
Annexure 1
Factor C1 C2 C3 C4 C5 C6 C7 C8 C9 C10
Core strength Quality of
product
People willingness to
change
Very good product and
team.
Product technology
Knowledge of market, Honest
& ethical
Manpower and people with us.
Quality of product
Highly educated
and experienced
directors
Family owned closely
controlled mid size
organization
motivated employee
Goal through TOC
On time performance & reduce lead time
Come out of loss situation
Come out of cash crunch problem Money in the bank
Increase due date performance
Aggressive growth
Performance improvement for customer satisfaction
Increase DDP
Increase sales
To come out of cash crunch
Output from same set up
Long term goal
Not decided Profitable healthy organization
Cash rich company
Steady growth Height growth with
High growth Steady growth
Continues growth
Continues growth
Increase the sales
First application area
Production Area
Whole plant First constraint was cash
Whole organization
Production Production & development
Production production DBR Materials, supply to distributors.
production
Pace of first phase
slow Adequate Adequate slow Slow Good enough adequate very adequate
very adequate
slow
Method for consensus building
Training and compulsion
Jobs were on the stake. No option but the follow directives
Made compulsion
Off site meetings, Training
Long extended training Interaction with person who already implemented
People had to face the customer for day to day , Training video
Group meetings and training
Videos and group discussion
Eight video films shown to all directors.
Training and discussion
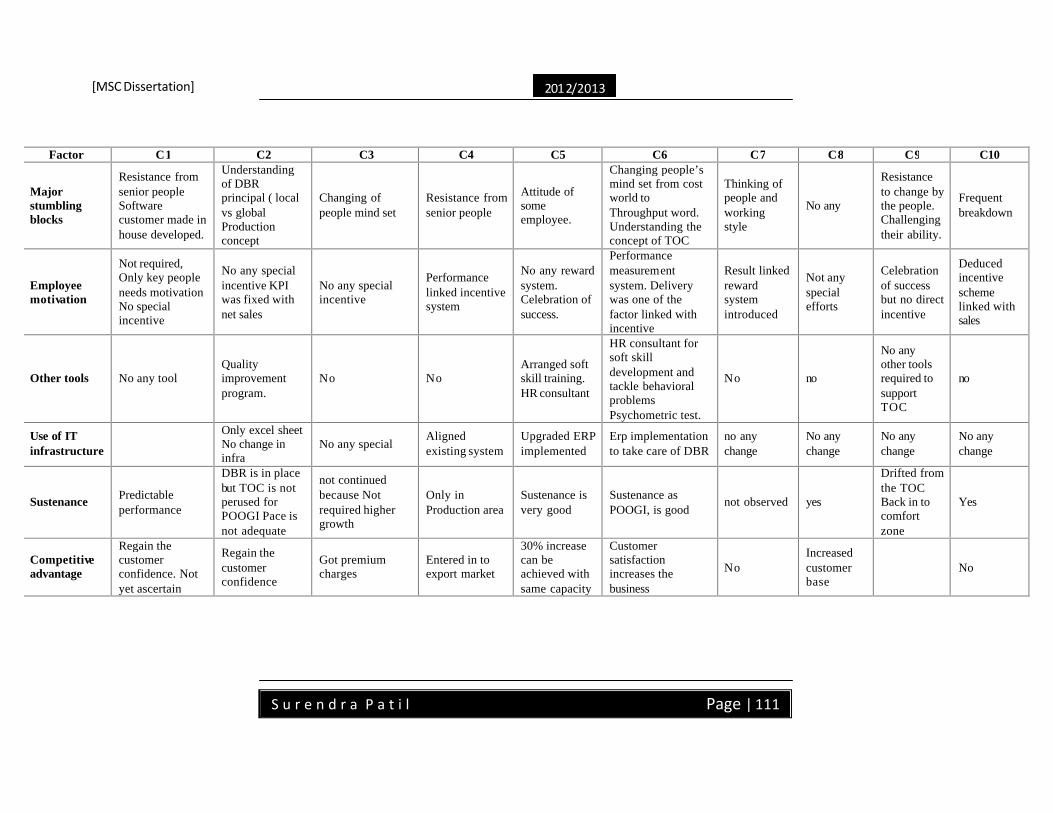
[MSC Dissertation]
2012/2013
S u r e n d r a P a t i l Page | 111
Factor C1 C2 C3 C4 C5 C6 C7 C8 C9 C10
Major stumbling blocks
Resistance from senior people Software customer made in house developed.
Understanding of DBR principal ( local vs global Production concept
Changing of people mind set
Resistance from senior people
Attitude of some employee.
Changing people’s mind set from cost world to Throughput word. Understanding the concept of TOC
Thinking of people and working style
No any
Resistance to change by the people. Challenging their ability.
Frequent breakdown
Employee motivation
Not required, Only key people needs motivation No special incentive
No any special incentive KPI was fixed with net sales
No any special incentive
Performance linked incentive system
No any reward system. Celebration of success.
Performance measurement system. Delivery was one of the factor linked with incentive
Result linked reward system introduced
Not any special efforts
Celebration of success but no direct incentive
Deduced incentive scheme linked with sales
Other tools No any tool Quality improvement program.
No No Arranged soft skill training. HR consultant
HR consultant for soft skill development and tackle behavioral problems Psychometric test.
No no
No any other tools required to support TOC
no
Use of IT infrastructure
Only excel sheet No change in infra
No any special Aligned existing system
Upgraded ERP implemented
Erp implementation to take care of DBR
no any change
No any change
No any change
No any change
Sustenance Predictable performance
DBR is in place but TOC is not perused for POOGI Pace is not adequate
not continued because Not required higher growth
Only in Production area
Sustenance is very good
Sustenance as POOGI, is good
not observed yes
Drifted from the TOC Back in to comfort zone
Yes
Competitive advantage
Regain the customer confidence. Not yet ascertain
Regain the customer confidence
Got premium charges
Entered in to export market
30% increase can be achieved with same capacity
Customer satisfaction increases the business
No Increased customer base
No
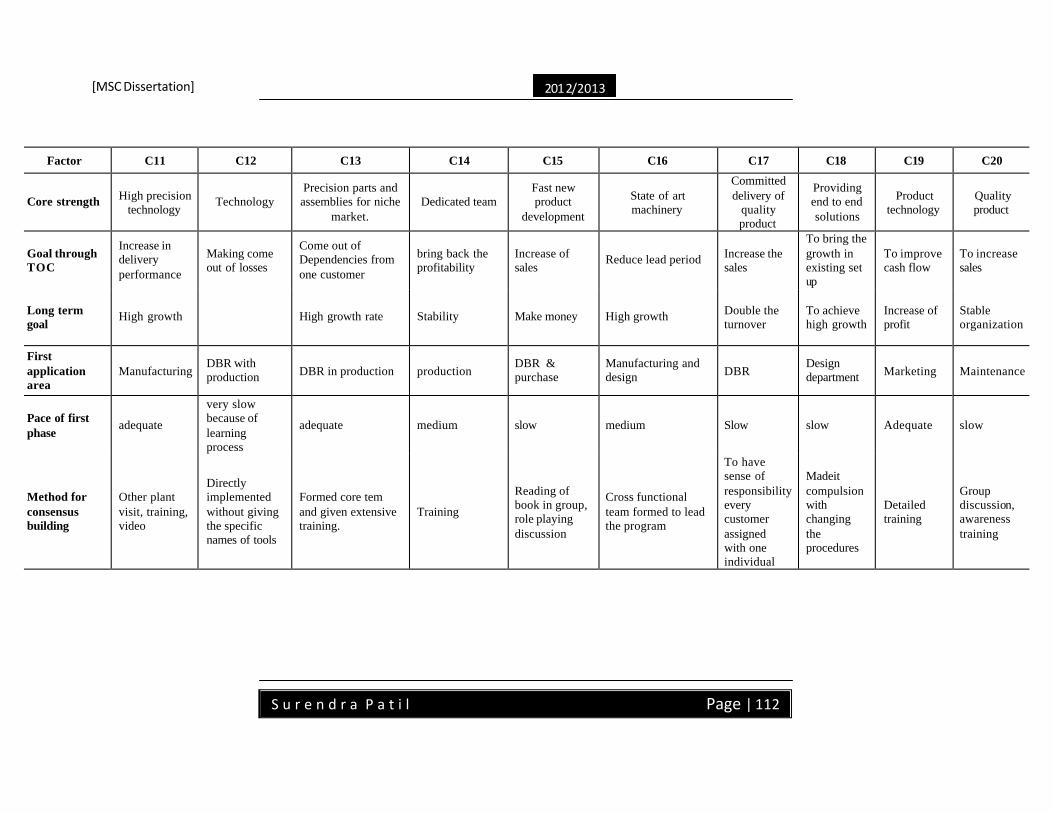
[MSC Dissertation]
2012/2013
S u r e n d r a P a t i l Page | 112
Factor C11 C12 C13 C14 C15 C16 C17 C18 C19 C20
Core strength High precision technology
Technology Precision parts and assemblies for niche
market. Dedicated team
Fast new product
development
State of art machinery
Committed delivery of
quality product
Providing end to end solutions
Product technology
Quality product
Goal through TOC
Increase in delivery performance
Making come out of losses
Come out of Dependencies from one customer
bring back the profitability
Increase of sales
Reduce lead period Increase the sales
To bring the growth in existing set up
To improve cash flow
To increase sales
Long term goal
High growth High growth rate Stability Make money High growth Double the turnover
To achieve high growth
Increase of profit
Stable organization
First application area
Manufacturing DBR with production DBR in production production
DBR & purchase
Manufacturing and design DBR
Design department Marketing Maintenance
Pace of first phase
adequate
very slow because of learning process
adequate medium slow medium Slow slow Adequate slow
Method for consensus building
Other plant visit, training, video
Directly implemented without giving the specific names of tools
Formed core tem and given extensive training.
Training
Reading of book in group, role playing discussion
Cross functional team formed to lead the program
To have sense of responsibility every customer assigned with one individual
Madeit compulsion with changing the procedures
Detailed training
Group discussion, awareness training

[MSC Dissertation]
2012/2013
S u r e n d r a P a t i l Page | 113
Factor C11 C12 C13 C14 C15 C16 C17 C18 C19 C20
Major stumbling blocks
Changing the policies deep routed in culture
Buy in from the people
Understanding of TOC tools in depth
Buy in from other directors
Changing of mind set of people
Old production planning systems and mind sets of people\
Shifting from cost world to throughput world
Middle management mind set
Conventional managing style
resistance form middle managers
Employee motivation
Performance linked incentive system introduced
No any incentive linked
Incentive scheme linked with performance
Incentive scheme
Groups are responsible for customer
TOC measures are added in KRA. Reward systems & Mile stone celebration
No any formal incentive systems but Success are celebrated
No any reward systems
No any award incentive scheme
Ino any special systems
Other tools
HR consultant for handling union issues, Other improvement tools
Yes from TOC we now only focus area, then other tools are requi red.
No No HR training and counseling
5S, Kaizen are implemented in production & design area
No No No No
Use of IT infrastructure
Changes in existing system
No any changes No any change No any change aligned the system with changes
No major change No any change
No any change in existing structure
Specially developed software used
No change
Sustenance presently pursued Not pursued
Presently pursued continuously Yes Yes Yes Its good
TOC is not practiced
No sustenance Yes
Competitive advantage
Yes, Increased market share. Preference over competitor
Yes, got the extra market
Get customer confidence to increase market share
No any change
Due to reduced lead time increased business
Set the benchmark figures for delivery and new product development
Got the 100% business share in OEM business
No any change
Increased market share
No any change