Critical Loads of Acidity for Forest Soils and Relationship to Forest Decline in the Northern Czech...
17
CRITICAL LOADS OF ACIDITY FOR FOREST SOILS AND RELATIONSHIP TO FOREST DECLINE IN THE NORTHERN CZECH REPUBLIC CECILIA AKSELSSON 1∗ , JONAS ARDÖ 2 and HARALD SVERDRUP 3 1 Department of Chemical Engineering, Lund Institute of Technology, Lund, Sweden; 2 Department of Physical Geography and Ecosystem Analysis, Lund, Sweden; 3 Department of Chemical Engineering, Lund Institute of Technology, Lund, Sweden ( ∗ author for correspondence, e-mail: [email protected]) (Received 20 April 2003; accepted 18 September 2003) Abstract. Critical load calculations in the Czech part of ‘the Black Triangle’ show exceedance of critical load in 75% of the forest area. A comparison with forest damage data shows an insignif- icant tendency toward more forest damage in areas with high exceedance. We conclude that high exceedance of critical load is a probable contributing factor to forest damage in the area. Keywords: Black Triangle, critical loads, Czech Republic, forest decline, Simple Mass Balance, soil acidification, sulphur deposition 1. Introduction Forest conditions in parts of Europe have been deteriorating since the late 1970s (Schütt and Cowling, 1985; UN/ECE and EC, 1997, 2000). One of the worst af- fected areas is ‘the Black Triangle’, in the mountainous area where the borders of Germany, the Czech Republic and Poland intersect (Figure 1) (Cerný and Paces, 1995). Research has suggested causes of forest decline to be climate (Innes, 1993, 1999; Jönsson 1991) unsuitable proveneances (Innes, 1993), forest management, heavy metals (Bezvodová, 1995; Rühling, 1994) and air pollution (Slovik et al., 1995; ˘ Srámek, 1998; Tichy, 1996). The many proposed causes of forest decline suggest that there is not one, but several factors contributing to the decline of forests. This is referred to as the ‘multiple stress effect’ (Nihlgård, 1996). The concept of ‘critical load of acidity’ is widely used in political contexts, designed to keep the pollution at or below a level that ensures a sustainable envi- ronment. The critical load is defined as (UN/ECE, 1994): ‘a quantitative estimate of an exposure to one or more pollutants below which significant harmful effects on specified elements do not occur accord- ing to present knowledge’. Environmental Monitoring and Assessment 98: 363–379, 2004. © 2004 Kluwer Academic Publishers. Printed in the Netherlands.
-
Upload
independent -
Category
Documents
-
view
1 -
download
0
Transcript of Critical Loads of Acidity for Forest Soils and Relationship to Forest Decline in the Northern Czech...
CRITICAL LOADS OF ACIDITY FOR FOREST SOILS ANDRELATIONSHIP TO FOREST DECLINE IN THE NORTHERN
CZECH REPUBLIC
CECILIA AKSELSSON1∗, JONAS ARDÖ2 and HARALD SVERDRUP3
1 Department of Chemical Engineering, Lund Institute of Technology, Lund, Sweden; 2 Departmentof Physical Geography and Ecosystem Analysis, Lund, Sweden; 3 Department of Chemical
Engineering, Lund Institute of Technology, Lund, Sweden(∗ author for correspondence, e-mail: [email protected])
(Received 20 April 2003; accepted 18 September 2003)
Abstract. Critical load calculations in the Czech part of ‘the Black Triangle’ show exceedance ofcritical load in 75% of the forest area. A comparison with forest damage data shows an insignif-icant tendency toward more forest damage in areas with high exceedance. We conclude that highexceedance of critical load is a probable contributing factor to forest damage in the area.
Keywords: Black Triangle, critical loads, Czech Republic, forest decline, Simple Mass Balance, soilacidification, sulphur deposition
1. Introduction
Forest conditions in parts of Europe have been deteriorating since the late 1970s(Schütt and Cowling, 1985; UN/ECE and EC, 1997, 2000). One of the worst af-fected areas is ‘the Black Triangle’, in the mountainous area where the borders ofGermany, the Czech Republic and Poland intersect (Figure 1) (Cerný and Paces,1995). Research has suggested causes of forest decline to be climate (Innes, 1993,1999; Jönsson 1991) unsuitable proveneances (Innes, 1993), forest management,heavy metals (Bezvodová, 1995; Rühling, 1994) and air pollution (Slovik et al.,1995; Srámek, 1998; Tichy, 1996). The many proposed causes of forest declinesuggest that there is not one, but several factors contributing to the decline offorests. This is referred to as the ‘multiple stress effect’ (Nihlgård, 1996).
The concept of ‘critical load of acidity’ is widely used in political contexts,designed to keep the pollution at or below a level that ensures a sustainable envi-ronment. The critical load is defined as (UN/ECE, 1994):
‘a quantitative estimate of an exposure to one or more pollutants belowwhich significant harmful effects on specified elements do not occur accord-ing to present knowledge’.
Environmental Monitoring and Assessment 98: 363–379, 2004.© 2004 Kluwer Academic Publishers. Printed in the Netherlands.
364 C. AKSELSSON ET AL.
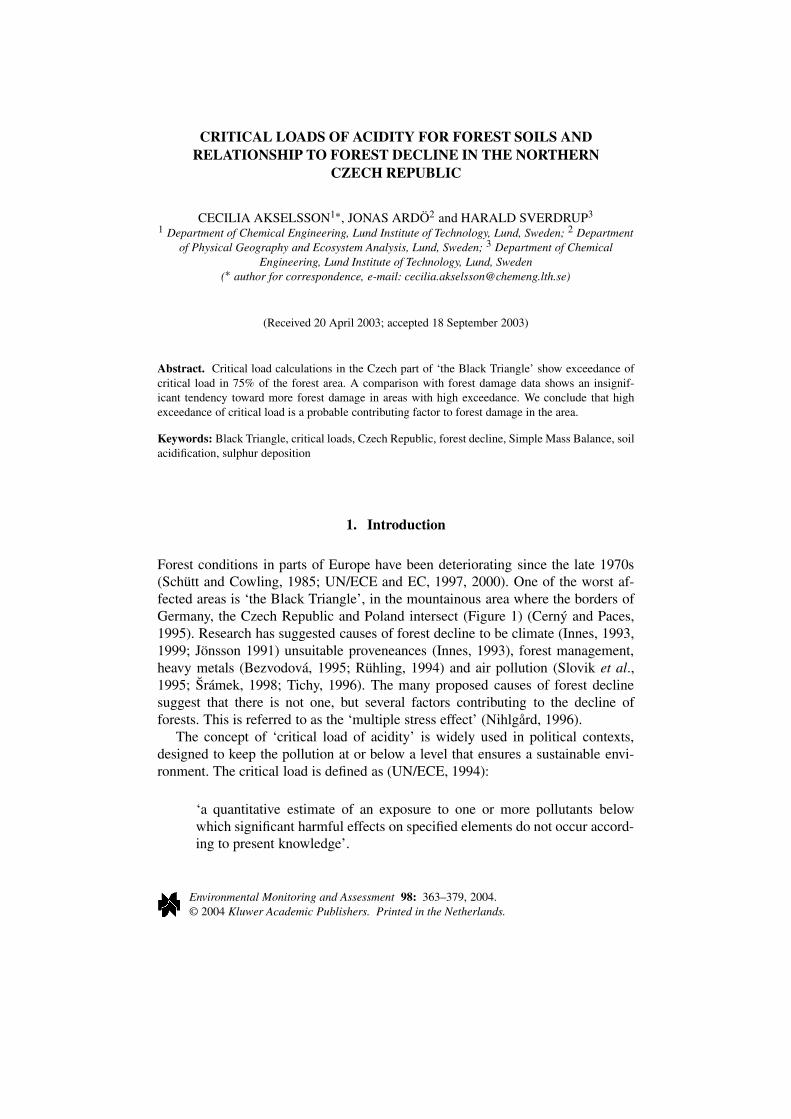
Figure 1. Study area, divided into 18 forest enterprises, for which forest damage data are available(a). (∗ Forest damage data from 1995 is missing). The study area is situated in the mountainousregion where the borders of Czech Republic, Germany and Poland meet (b).
Critical load modeling involves mass balance calculations. A chemical criterionis chosen to predict the risk of damage of a biological indicator. The chemicalcriterion used in this study is the molar ratio between base cations and inorganicaluminium, BC/Al. In the mass balance calculations, the chemical criterion is set toa critical limit, which is ‘the most unfavorable value it can get, without long-termharmful effects on the ecosystem function and structure’ (Warfvinge and Sverdrup,1995). The critical limit was set to 1 in this study, which seems to be a useful limitfor European conditions (Sverdrup and Warfvinge, 1993).
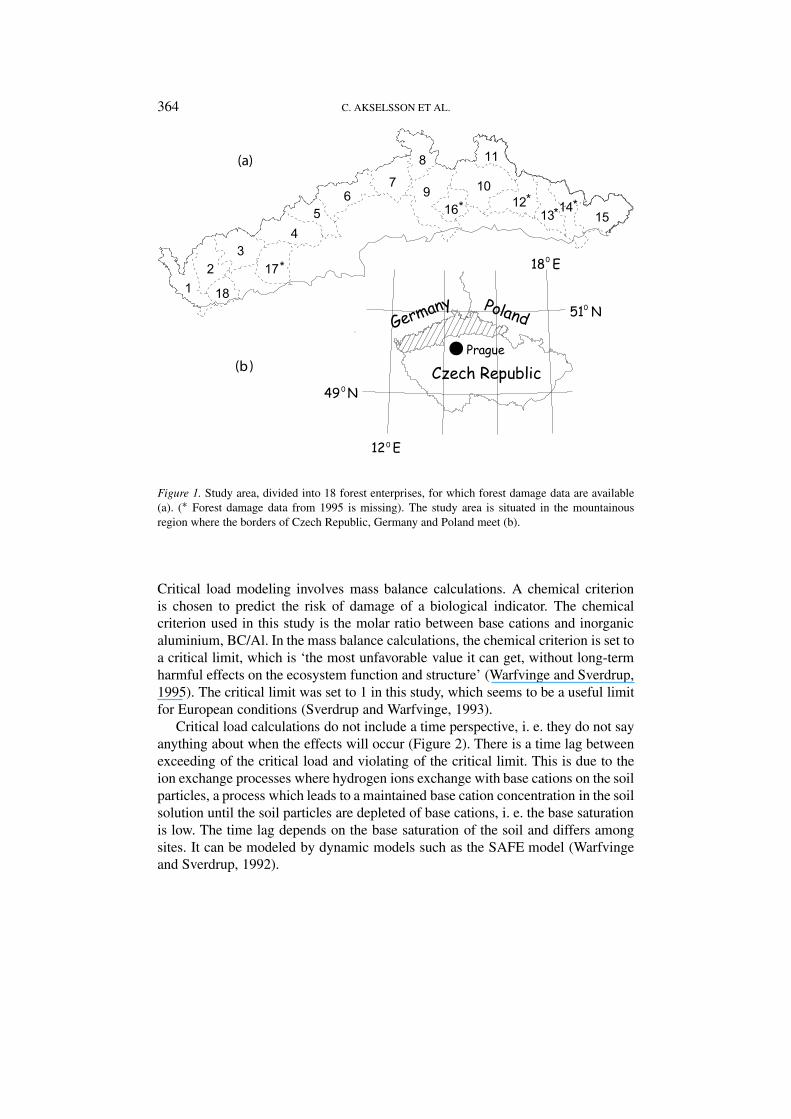
Critical load calculations do not include a time perspective, i. e. they do not sayanything about when the effects will occur (Figure 2). There is a time lag betweenexceeding of the critical load and violating of the critical limit. This is due to theion exchange processes where hydrogen ions exchange with base cations on the soilparticles, a process which leads to a maintained base cation concentration in the soilsolution until the soil particles are depleted of base cations, i. e. the base saturationis low. The time lag depends on the base saturation of the soil and differs amongsites. It can be modeled by dynamic models such as the SAFE model (Warfvingeand Sverdrup, 1992).
CRITICAL LOADS OF ACIDITY FOR FOREST SOILS IN THE CZECH REPUBLIC 365
Figure 2. Development over time of deposition and the limit parameter BC/Al, in an area with fastincreasing deposition leading to a high peak (a) and in an area where the acidification course is slower(b). Limit/CL on the y axis refers to the critical load in the case of the deposition curve and the BC/Allimit of 1 in the case of the limit parameter curve.
The relevancy of a comparison between exceedance of the critical load andforest damage depends on where we are on the time scale and how long the delay is.During the delay period, there is by definition no connection between exceedanceand forest damage. This means that long delays lead to reduced possibilities forcomparisons. In areas like the Black Triangle, where the deposition was increasingfast and reached a high peak (Ardö, 1998; Kubelka et al., 1993), the acidificationcourse over time is likely to look like Figure 2a, with short delays. In Sweden, onthe other hand, the deposition has increased slower, and the acidification courseover time is probably better illustrated by Figure 2b. In 1992, the year of the depo-sition data used in this study, the deposition was decreasing but was still high in theBlack Triangle, which means somewhere on the descending part of the deposition
366 C. AKSELSSON ET AL.
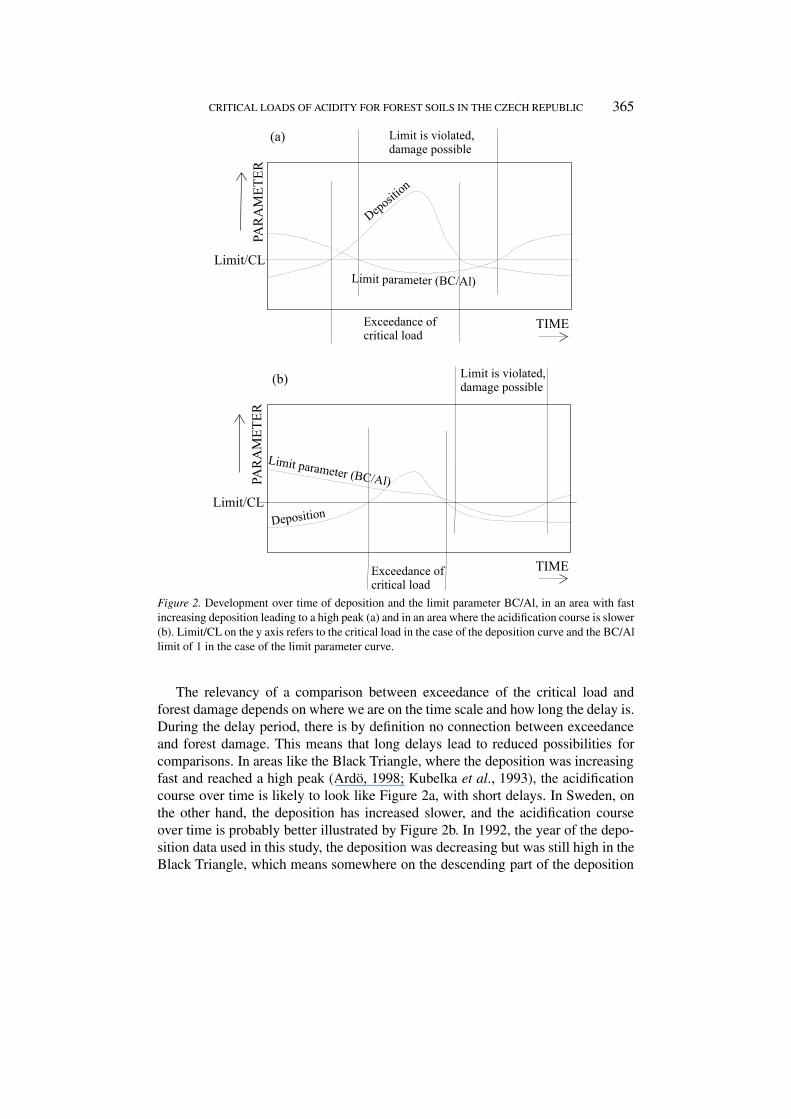
Figure 3. Areas significantly over or below the critical level of 0.07 nPa Pa−1 day−1 for the SO2/VPratio. Modified from Ardö et al. (2000).
curve. The deposition had been high for a long time. Soil water chemistry datafrom the area from 1994–1998 shows very low BC/Al values, near or below thecritical limit of 1, in the areas with the highest deposition (Hruska et al., 2001).Consequently, there is always uncertainty when it comes to comparisons betweenexceedance and forest vitality, but in the Black Triangle area the comparison ismore relevant than in Sweden, due to different acidification courses.
In former studies, there are examples of both relationships and no relationshipsbetween different air pollution factors and tree vitality. In UN/ECE and EC (1997),it was stated that there were no obvious relationships between crown conditionand air pollution. Also, studies in Sweden did not show any relationships betweensoil water chemistry and tree vitality (Örlander et al., 1994). However, significantrelationships have been found between BC/Al in soil water, used in the critical loadcalculations, and different crown vitality factors in the Czech Republic (Hruska etal., 2001). According to the discussion about Figure 2 above, the relevancy of thesekinds of comparisons depends on the deposition level in the area and the significantrelationships found in the Czech Republic indicate that the Black Triangle area isa relevant area.
In this paper, a critical load mapping of the northern part of the Czech Republicis presented, together with a comparison between exceedance of the critical loadand forest damage. The results from the study are also compared with a previousstudy of critical levels of SO2 in the same area (Figure 3) (Ardö et al., 2000). Thereare other similar studies in the Czech Republic on different scales. RIVM (Re-search for man and environment) has summarized mappings for European coun-tries, for example the Czech Republic (Posch et al., 2001). Critical load modelinghas also been made in the Czech Republic in 14 catchments, 5 of which are situated
CRITICAL LOADS OF ACIDITY FOR FOREST SOILS IN THE CZECH REPUBLIC 367
within the area of this study (Fottová and Skorepová, 1998). The results from thosestudies and relations to the result from this study are discussed in this paper.
2. Objectives
The objectives of this paper are:
• to map the critical load of acidity for forest soils and exceedance of the criticalload in the northern Czech Republic;
• to investigate relationships between exceedance and forest decline;• to compare the results of this study with a critical levels mapping (Ardö et al.,
2000).
3. Material and Methodology
3.1. STUDY AREA
The study area (13 500 km2) is a part of the Black Triangle in the northern CzechRepublic (Figure 1). Three mountain areas are situated within the area: Ore Moun-tains, Jizera Mountains and Giant Mountains. The bedrock is dominantly granitesand gneisses, overlaid by base-poor, acidic soils. However, there are minor areaswith richer soils, which have their origin in basic bedrock (Anonymous, 1988). Airtemperatures decrease with increasing elevation and precipitation increases fromwest to east (Anonymous, 1958). A sudden temperature drop during the winter of1978/1979, from 9 to –19 ◦C in two days, is an event that is commonly linked toincreased forest damage in the area (Ardö, 1998; Materna, 1989).
Abundant industrial factories and power plants in the Black Triangle area hasled to extremely high air concentrations of sulphur dioxide, nitrate and particulatematter. Severe forest damage was reported by Stoklasa by 1923 (Srámek, 1998).The sulphur concentrations peaked in the 1980s followed by a reduction since thelate 1980s (Srámek, 1998). Additional environmental risk factors caused by hu-man exploitation are heavy metals (Rühling, 1994), fluoride, arsenic and beryllium(Cerný and Paces, 1995).
About 40% of the study area is forest. Although the natural forest communitiesare deciduous and mixed forest, Norway spruce (Picea abies) is the dominant treespecies today (Materna, 1989; Kubikova, 1991). Most of the forest has some degreeof damage. The worst damage occurs on wind-exposed locations above an altitudeof 750 m. The worst damaged stands have been cut due to salvage felling (Ardö etal., 1997).
368 C. AKSELSSON ET AL.
3.2. CRITICAL LOAD AND EXCEEDANCE OF THE CRITICAL LOAD
SMB, the Simple Mass Balance model (Posch et al., 1995), was used for the criticalload calculations. The model is based on a balance between input and output ofacidity:
Sdep + Ndep + Cldep + BCu + Alkle = BCdep + BCw + Ni + Nu + Nde (1)
CL(S + N) = BCdep – Cldep + BCw – BCu + Ni + Nu + Nde – Alkle(crit) , (2)
where
S = sulphur;
N = nitrogen (oxidized and reduced);
BC = base cations;
Cl = chloride;
Alk = alkalinity;
dep = deposition;
w = weathering of base cations;
u = uptake;
i = immobilization;
de = denitrification;
le = leaching;
CL(S + N) = critical load of acidity;
Alkle(crit) = critical alkalinity leaching.
The exceedance is then calculated as:
Exc = Sdep + Ndep – CL(S + N) , (3)
where
Exc = exceedance;
S = sulphur;
N = nitrogen;
dep = deposition;
CL(S + N) = critical load of acidity.
The methods for calculating the different parameters are described below.
3.2.1. Deposition of Sulphur and NitrogenThe deposition of sulphur and oxidized nitrogen (nitrate) used in the model calcula-tions was based on a Czech dispersion model (Bednár et al., 1994), which involves
CRITICAL LOADS OF ACIDITY FOR FOREST SOILS IN THE CZECH REPUBLIC 369
emissions, weather conditions and topography. Total-, wet- and dry deposition ofsulphur and oxidized nitrogen have been modeled at points on a 13×13 km grid. Toget a map covering the whole area out of the point map, every pixel was assignedthe value from the closest modeled point.
No model calculations are available for reduced nitrogen. Instead, the depo-sition was based on the nitrate deposition and a calculated mean ratio (Equation (4))between the wet deposition of reduced and oxidized nitrogen on eight places in theCzech Republic (Fiala et al., 1994).
NH4(dep) = 1.4×NO3(dep) (4)
The same relation was adopted for dry deposition. Since the model calculationsdo not take differences in landuse into account, a correction was performed, basedon a landuse map. The deposition was increased in forests due to the relativelyhigher dry deposition and correspondingly decreased in open areas in order tokeep the mean deposition in the grid cell on the original level. The correctionswere made by multiplying the wet deposition with different factors in coniferousand deciduous forests for sulphur, reduced and oxidized nitrogen according to(De Vries, 1994). Then the deposition in open areas was set to a specific levelin order not to change the modeled deposition in the grid. Land cover was de-rived from LANDSAT Thematic Mapper data using standard methods (Akselsson,1997). The overall classification accuracy was 88.5%. Three forest classes wereused: coniferous forest, deciduous forest, and clearcuts.
3.2.2. Deposition of Base CationsDeposition data from 19 stations were used, 10 from Krknose and 9 from JizerskéHory (Cerný and Paces, 1995; Hosek and Kaufman, 1992). Interpolation from thesestations is not possible, since they are located geographically in two groups. Thereis a connection between sulphur and base cation deposition, due to the partly sameorigin (Akselsson, 1997). On average, the base cation deposition was 20% of thesulphur deposition on an equivalent basis, and the base cation deposition for thewhole area was based on the sulphur deposition map and the 20% factor:
BCdep = 0.2·Sdep . (5)
3.2.3. Deposition of ChlorideData from three stations with chloride deposition data in the region were available,Pec pod Snezkou (190 eq ha−1 yr−1), Destne v Orlickych horach (100 eq ha−1 yr−1)and Usti nad Labem (90 eq ha−1 yr−1) (Fiala et al., 1994). The chloride depositionused in the model was the mean from these three stations, ∼130 eq ha−1 yr−1.
370 C. AKSELSSON ET AL.
3.2.4. Weathering of Base CationsThe weathering rate was calculated according to Equation (6) (Sverdrup and DeVries, 1994). The first step of the weathering mapping was to assign weatheringrates unadjusted for temperature and moisture (W0), to different regions in thestudy area, based on the parent material of the soil and clay content. Then W0 wasadjusted to temperature and moisture to get the weathering rate.
W = W0·f (T )·f (m) , (6)
where
W = base cation weathering;
W0 = weathering rate unadjusted for temperature and moisture;
f (T ) = temperature correction factor;
f (m) = moisture correction factor.
The weathering rate unadjusted for temperature and moisture (W0) was based on asoil type map (1:1 000 000) with mineralogy of clay-sized material for most of thesoil types (Tomasek, 1995). The different soil types are related to parent materialaccording to De Vries et al. (1992). This was combined with clay content to getthe unadjusted weathering rate (W0) according to De Vries (1994). The average ofthe clay content for the upper 50 cm was used. For some soil types, there were noclay content analyses available on the soil type map. In these cases clay contentanalyses from FAO’s ‘Soil map of the world’ from 1981 (revised 1990) were used,or other information about the soil type from literature (Akselsson, 1997; Bradyand Weil, 1996; FitzPatrick, 1986).
The temperature correction was performed according to De Vries (1994):
W(T ) = W(T0)·e(A/T0−A/T ) , (7)
where
W = weathering of base cations (eq ha−1 yr−1);
T = temperature (K);
T0 = reference temperature (K);
A = constant.T0 was set to 281◦K (Umweltbundesamt, 1996) and A to 3500 (Sverdrup and DeVries, 1994).
The precipitation surplus was calculated as:
PS = P − ET (8)
where
CRITICAL LOADS OF ACIDITY FOR FOREST SOILS IN THE CZECH REPUBLIC 371
PS = precipitation surplus (mm);
P = mean annual precipitation;
ET = actual evapotranspiration (ground evaporation, interception and tran-spiration).
The actual evapotranspiration was calculated based on yearly mean temperatureand precipitation according to Turc (Shaw, 1993).
The mapped precipitation surplus in the study area was used to modify the baserate, according to Sverdrup (1990). The mean value of the precipitation surplusgot the correction factor 1, the maximum value got the correction factor 2 and theminimum value got the correction factor 1/3. A curve was adapted to the pointsand the f (m) factor was then calculated based on the equation of the curve:
f (m) = 0.5495· ln(x) − 2.0398 , (9)
where
x = precipitation surplus;
f (m) = moisture correction factor.
3.2.5. Uptake of NitrogenThe nitrogen uptake was classified in twelve classes, based on base cation weath-ering, temperature, precipitation surplus and landuse, according to Posch et al.(1995). The different classes were assigned a nitrogen uptake varying from 143 eqha−1 yr−1 in coniferous forests with low temperature, low precipitation surplusand low weathering rate, to 1071 eq ha−1 yr−1 in deciduous forests with hightemperature, high precipitation surplus and high weathering rate (Posch et al.,1995).
3.2.6. Uptake of Base CationsA known relation between nitrogen uptake and base cation uptake was used tocalculate the base cation uptake (Posch et al., 1995):
BCu = Nu·x , (10)
where
BCu = base cation uptake;
Nu = nitrogen uptake;
x = 0.9 for spruce and 0.7 for pine and beech.
3.2.7. Immobilization of NitrogenThe immobilization of nitrogen was mapped based on a digital map of yearly meantemperature (scale: 1: 1000 000) (Anonymous, 1958). The immobilization was set
372 C. AKSELSSON ET AL.
to values between 1 and 5 kg ha−1 yr−1, based on the temperature (Posch et al.,1995).
3.2.8. DenitrificationThe denitrification is less than 1 kg ha−1 yr−1 in most forest soils (Posch et al.,1995). It decreases in acid soils, due to a decreased bioactivity and hence thedenitrification was assumed to be 0 in this study.
3.2.9. Critical Alkalinity LeachingIn acid forest soils critical alkalinity leaching can be calculated according to:
Alkle(crit) = –Alle(crit) – Hle(crit) , (11)
where
Alk = alkalinity;
le = leaching;
crit = critical.
The critical aluminium leaching, Alle(crit), was calculated based on the critical levelBC/Al = 1 in soil water, and the base cation balance (weathering + deposition-uptake) according to Akselsson (1997), Sverdrup and De Vries (1994), and Warf-vinge and Sverdrup (1995). The critical aluminium leaching was converted to crit-ical aluminium concentration by dividing by the precipitation surplus (Chapter 3.2.4;Equation (12)).
[Al]crit = Alle(crit)/PS . (12)
Then the critical hydrogen concentration, [H](crit), could be calculated using thegibbsite equilibrium (Equation (13)), i.e. a known relation between the concentra-tions of hydrogen and aluminium (Sverdrup and De Vries, 1994).
[H]crit =([Al]crit /Kgibb)1/3 , (13)
where
[H]crit = critical concentration of hydrogen;
[Al]crit = critical concentration of aluminium;
Kgibb = gibbsite coefficient.
Kgibb was assigned the value 300 m6/eq2 (Sverdrup et al., 1990). Then the calcu-lated critical hydrogen concentration was multiplied with the precipitation surplus,in order to get the critical hydrogen leaching (Equation (14)).
Hle(crit) = [H]crit×PS . (14)
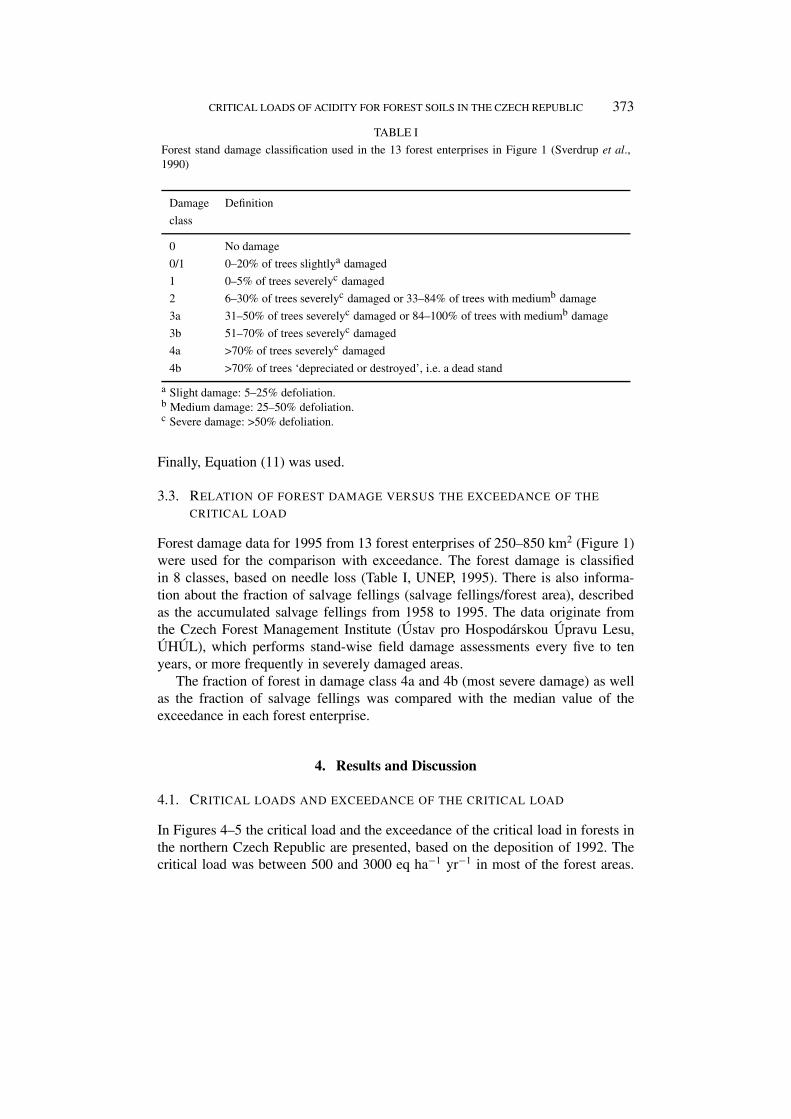
CRITICAL LOADS OF ACIDITY FOR FOREST SOILS IN THE CZECH REPUBLIC 373
TABLE I
Forest stand damage classification used in the 13 forest enterprises in Figure 1 (Sverdrup et al.,1990)
Damage Definition
class
0 No damage
0/1 0–20% of trees slightlya damaged
1 0–5% of trees severelyc damaged
2 6–30% of trees severelyc damaged or 33–84% of trees with mediumb damage
3a 31–50% of trees severelyc damaged or 84–100% of trees with mediumb damage
3b 51–70% of trees severelyc damaged
4a >70% of trees severelyc damaged
4b >70% of trees ‘depreciated or destroyed’, i.e. a dead stand
a Slight damage: 5–25% defoliation.b Medium damage: 25–50% defoliation.c Severe damage: >50% defoliation.
Finally, Equation (11) was used.
3.3. RELATION OF FOREST DAMAGE VERSUS THE EXCEEDANCE OF THE
CRITICAL LOAD
Forest damage data for 1995 from 13 forest enterprises of 250–850 km2 (Figure 1)were used for the comparison with exceedance. The forest damage is classifiedin 8 classes, based on needle loss (Table I, UNEP, 1995). There is also informa-tion about the fraction of salvage fellings (salvage fellings/forest area), describedas the accumulated salvage fellings from 1958 to 1995. The data originate fromthe Czech Forest Management Institute (Ústav pro Hospodárskou Úpravu Lesu,ÚHÚL), which performs stand-wise field damage assessments every five to tenyears, or more frequently in severely damaged areas.
The fraction of forest in damage class 4a and 4b (most severe damage) as wellas the fraction of salvage fellings was compared with the median value of theexceedance in each forest enterprise.
4. Results and Discussion
4.1. CRITICAL LOADS AND EXCEEDANCE OF THE CRITICAL LOAD
In Figures 4–5 the critical load and the exceedance of the critical load in forests inthe northern Czech Republic are presented, based on the deposition of 1992. Thecritical load was between 500 and 3000 eq ha−1 yr−1 in most of the forest areas.
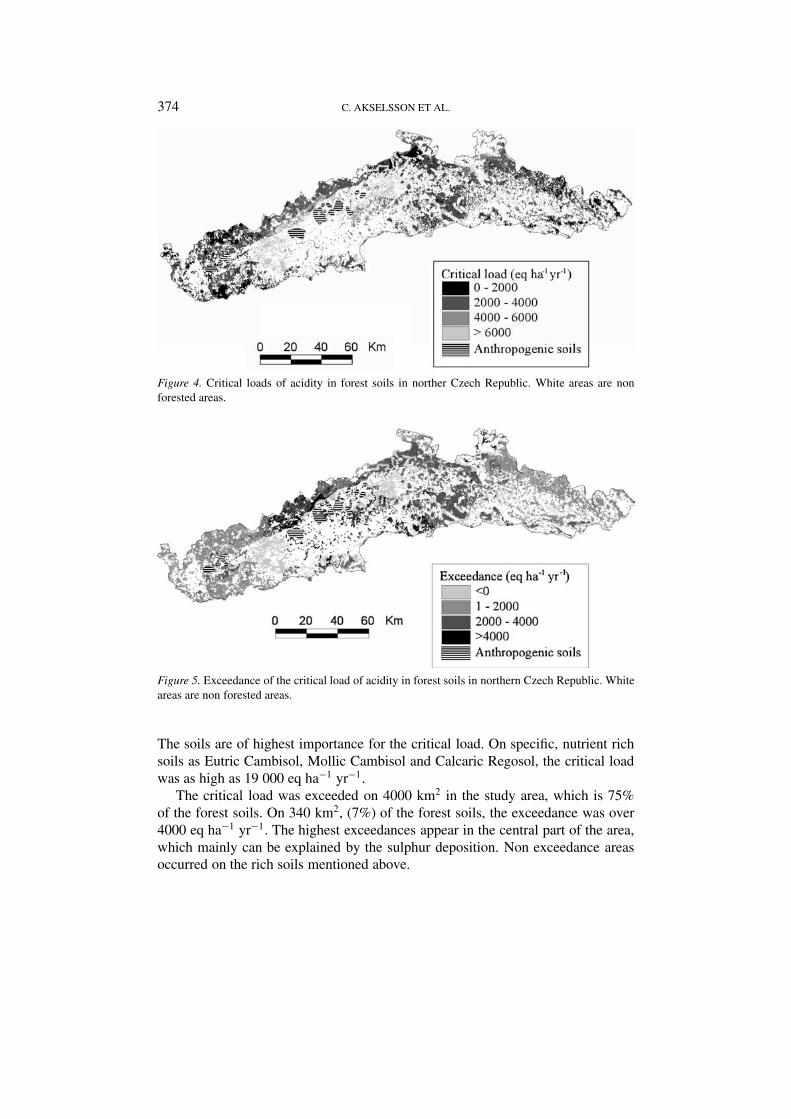
374 C. AKSELSSON ET AL.
Figure 4. Critical loads of acidity in forest soils in norther Czech Republic. White areas are nonforested areas.
Figure 5. Exceedance of the critical load of acidity in forest soils in northern Czech Republic. Whiteareas are non forested areas.
The soils are of highest importance for the critical load. On specific, nutrient richsoils as Eutric Cambisol, Mollic Cambisol and Calcaric Regosol, the critical loadwas as high as 19 000 eq ha−1 yr−1.
The critical load was exceeded on 4000 km2 in the study area, which is 75%of the forest soils. On 340 km2, (7%) of the forest soils, the exceedance was over4000 eq ha−1 yr−1. The highest exceedances appear in the central part of the area,which mainly can be explained by the sulphur deposition. Non exceedance areasoccurred on the rich soils mentioned above.
CRITICAL LOADS OF ACIDITY FOR FOREST SOILS IN THE CZECH REPUBLIC 375
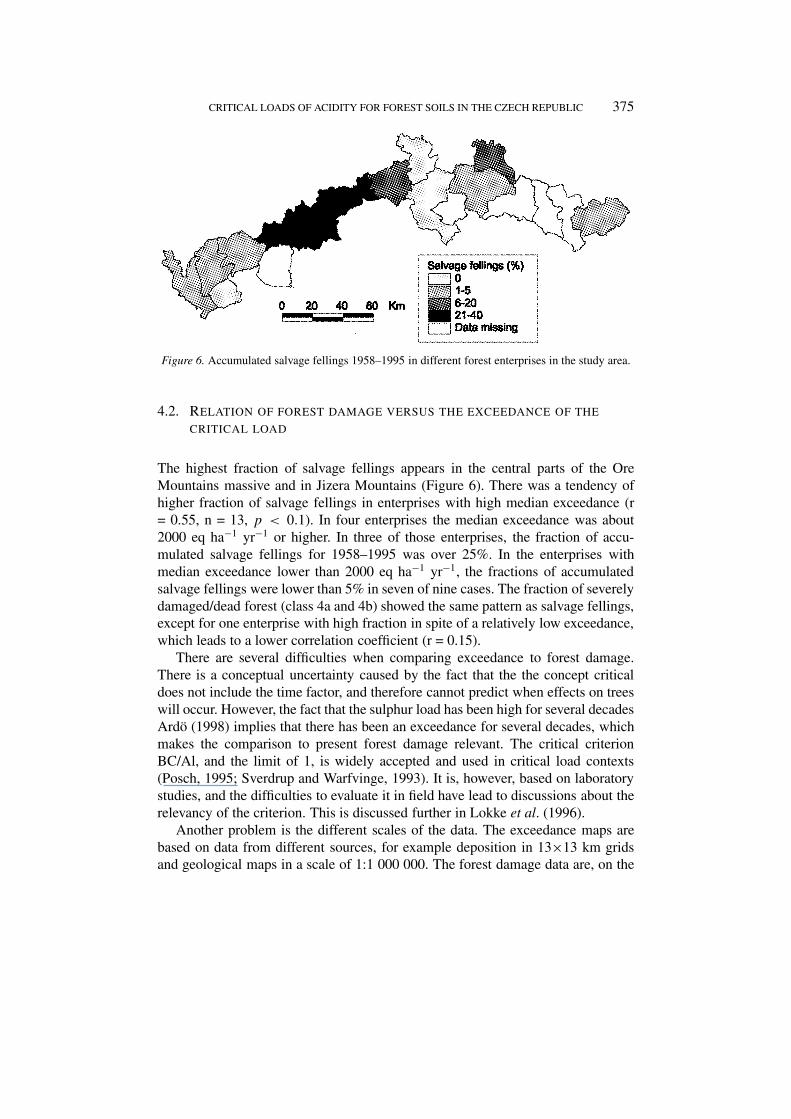
Figure 6. Accumulated salvage fellings 1958–1995 in different forest enterprises in the study area.
4.2. RELATION OF FOREST DAMAGE VERSUS THE EXCEEDANCE OF THE
CRITICAL LOAD
The highest fraction of salvage fellings appears in the central parts of the OreMountains massive and in Jizera Mountains (Figure 6). There was a tendency ofhigher fraction of salvage fellings in enterprises with high median exceedance (r= 0.55, n = 13, p < 0.1). In four enterprises the median exceedance was about2000 eq ha−1 yr−1 or higher. In three of those enterprises, the fraction of accu-mulated salvage fellings for 1958–1995 was over 25%. In the enterprises withmedian exceedance lower than 2000 eq ha−1 yr−1, the fractions of accumulatedsalvage fellings were lower than 5% in seven of nine cases. The fraction of severelydamaged/dead forest (class 4a and 4b) showed the same pattern as salvage fellings,except for one enterprise with high fraction in spite of a relatively low exceedance,which leads to a lower correlation coefficient (r = 0.15).
There are several difficulties when comparing exceedance to forest damage.There is a conceptual uncertainty caused by the fact that the the concept criticaldoes not include the time factor, and therefore cannot predict when effects on treeswill occur. However, the fact that the sulphur load has been high for several decadesArdö (1998) implies that there has been an exceedance for several decades, whichmakes the comparison to present forest damage relevant. The critical criterionBC/Al, and the limit of 1, is widely accepted and used in critical load contexts(Posch, 1995; Sverdrup and Warfvinge, 1993). It is, however, based on laboratorystudies, and the difficulties to evaluate it in field have lead to discussions about therelevancy of the criterion. This is discussed further in Lokke et al. (1996).
Another problem is the different scales of the data. The exceedance maps arebased on data from different sources, for example deposition in 13×13 km gridsand geological maps in a scale of 1:1 000 000. The forest damage data are, on the
376 C. AKSELSSON ET AL.
other hand, summaries from forest enterprises of 250–850 km2. This means thatthe exceedance variation within the enterprises cannot be covered in this study.
4.3. COMPARISONS TO OTHER STUDIES
In a parallel study, critical levels of air concentrations of SO2 were calculated inthe same area (Ardö et al., 2000). Three different methods were used:
1. Critical level of SO2 (Umweltbundesamt, 1996). The SO2 concentration wascompared to the critical level 20 µg m−3 yr−1.
2. The SO2/vegetation period ratio (Slovik et al., 1995). The ratio between SO2
concentration (nPa Pa−1 yr−1) and vegetation period (days per year with meandaily air temperature ≥6 ◦C) was compared to the critical level 0.07 nPa Pa−1
day−1. (Roughly, 1 nPa Pa−1 [= 1 ppb] SO2 equals 2.67–2.87 µg SO2 m−3 air).3. The ‘thinning’ model (Slovik, 1996a, b). A model that involves ecophysiolo-
gical, pedological and meteorological data was used to quantify the effects ofchronic SO2 pollution on spruce forest.
The three methods showed similar results. In Figure 3 the ratio between SO2 con-centration and vegetation period is presented. The critical level map (Figure 3) andthe exceedance of critical load map (Figure 5) look rather similar and a statisticalanalysis based on average values in the forest enterprises shows that exceedance ofthe critical level is significantly positively related to exceedance of the critical load(r2 = 0.48, p < 0.01).
A recent study has shown that although the sulphur concentrations in air havedecreased to low levels, the forest damage is still there Hruska. This indicates thatthe soil acidification is an important factor.
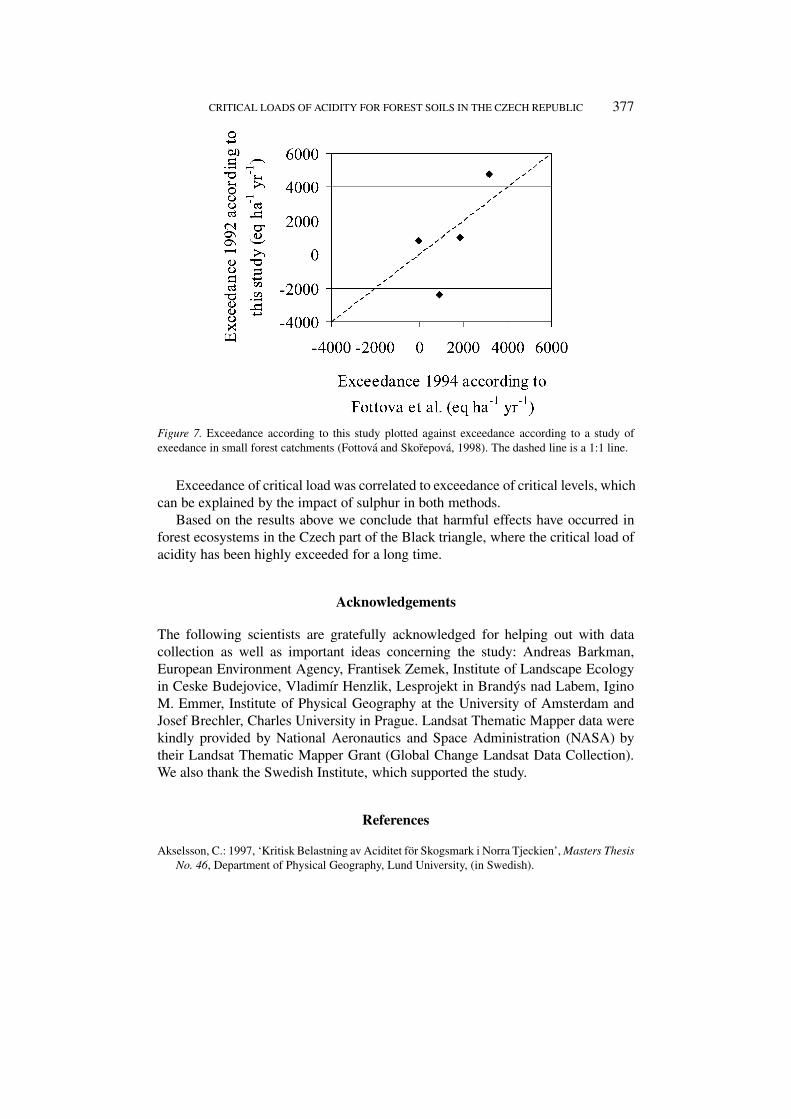
In Fottová and Skorepová (1998) the SMB method was used to calculate criticalloads and exceedance of critical loads in 14 small forest catchments in the CzechRepublic. Five of those were situated in the area of this study. One of them was notmapped as forest in this study, which probably is an effect of different resolutions.Four plots are too few to use for correlation calculations, but Figure 7 shows thatthe results are of the same magnitude.
5. Conclusions
The critical load of acidity was exceeded on 4000 km2 (75% of the forest soils) ofthe study area in the northern Czech Republic, according to the SMB calculationsbased on deposition data from 1992.
There was an insignificant tendency toward higher median exceedance in forestenterprises with more forest damage. This indicates that the exceedance is likelyto be a contributing factor to the forest decline. There are many other factors influ-encing the forest health, and it is impossible to quantify the contribution from theexceedance of critical load without analysing the other factors at the same time.
CRITICAL LOADS OF ACIDITY FOR FOREST SOILS IN THE CZECH REPUBLIC 377
Figure 7. Exceedance according to this study plotted against exceedance according to a study ofexeedance in small forest catchments (Fottova and Skorepova, 1998). The dashed line is a 1:1 line.
Exceedance of critical load was correlated to exceedance of critical levels, whichcan be explained by the impact of sulphur in both methods.
Based on the results above we conclude that harmful effects have occurred inforest ecosystems in the Czech part of the Black triangle, where the critical load ofacidity has been highly exceeded for a long time.
Acknowledgements
The following scientists are gratefully acknowledged for helping out with datacollection as well as important ideas concerning the study: Andreas Barkman,European Environment Agency, Frantisek Zemek, Institute of Landscape Ecologyin Ceske Budejovice, Vladimír Henzlik, Lesprojekt in Brandýs nad Labem, IginoM. Emmer, Institute of Physical Geography at the University of Amsterdam andJosef Brechler, Charles University in Prague. Landsat Thematic Mapper data werekindly provided by National Aeronautics and Space Administration (NASA) bytheir Landsat Thematic Mapper Grant (Global Change Landsat Data Collection).We also thank the Swedish Institute, which supported the study.
References
Akselsson, C.: 1997, ‘Kritisk Belastning av Aciditet för Skogsmark i Norra Tjeckien’, Masters ThesisNo. 46, Department of Physical Geography, Lund University, (in Swedish).
378 C. AKSELSSON ET AL.
Anonymous: 1958, Atlas podnebi ceskoslovenske republiky, Ustredni geodesie a kartografie, Prague.Ardö, J., Lambert, N. J., Henzlík, V. and Rock, B. N.: 1997, Ambio 26, 158–166.Ardö, J.: 1998, ‘Remote Sensing of Forest Decline in the Czech Republic’, Ph.D. Thesis, Department
of Physical Geography, Lund University, Lund, Sweden.Ardö, J., Barkman, A. and Arvidsson, P.: 2000, Geogr. Environ. Model. 4(2), 131–161.Bednár, J., Brechler, J., Halenka, T. and Kopácek, J.: 1994, Meteorol. Zeitschrift 3, 4–10.Bezvodová, B.: 1995, Environ. Monit. Assess. 34, 163–166.Brady, N. C. and Weil, R. R.: 1996, The Nature and Properties of Soil, 11th ed., Prentice Hall
International, Inc., New Jersey.Cerný, J. and Paces, T.: 1995, Acidification in the Black Triangle Region, Excursion guide, Czech
Geological Survey, Prague, Czech Republic.De Vries, W., Posch, M., Reinds, G. J. and Kämäri, J.: 1992, ‘Critical Loads and their Exceedance
on Forest Soils in Europe’, Report 58, DLO The Winand Staring Centre, Wageningen.De Vries, W.: 1994, Soil Response to Acid Deposition at Different Regional Scales, Cip-Gegevens
Koninklijke Bibliotheek, Den Haag.Fiala, J., Sladecek, J., Hunova, I. and Ostatnicka, J.: 1994, Air Pollution in the Czech Republic in
1993, Czech Hydrometeorological Institute, Czech Republic.FitzPatrick, E. A.: 1986, An Introduction to Soil Science, 2nd ed., Longman Scientific and Technical,
Essex, England.Fottová, D. and Skorepová, I.: 1998, Water, Air, and Soil Pollut. 105, 365–376.Hosek and Kaufman: 1992, Celková atmosférická depozice ekologicky významných látek na území
Krknos ského národního parku a Chránené krajinné oblasti Jizerské hory, Agnos (in Czech).Hruska, J., Cudlin, P. and Kram, P.: 2001, Water, Air, and Soil Pollut. 130, 983–988.Innes, J. L.: 1993, Forest Health: Its Assessment and Status, Wallingford, CAB International.Innes, J. L.: 1994, Environ. Pollut. 83, 237–243.Jönsson, P.: 1991, Scand. J. Forest Res. 6, 153–160.Kubelka, L., Karasek, A., Rybar, V. Baldalik, V. and Slodicak, M.: 1993, Forest Regeneration in the
Heavily Polluted NE ‘Krusné Hory’ Mountains, Czech Ministry of Agriculture, Prague.Kubikova, J.: 1991, Vegetatio 93, 101–108.Lokke, H., Bak, J., Falkengren Grerup, U., Finlay, R. D., Iivesniemi, H., Nygaard, P. H. and Starr,
M.: 1996, Ambio 25(8), 510–516.Materna, J.: 1989, Environ. Monit. Assess. 12, 227–235.Nihlgård, B. J.: 1996, Skog & Forskning 3, 6–12 (in Swedish).Örlander, G., Westling, O. and Petersson, P.: 1994, ‘Markvattnets innehåll av baskatjoner och alu-
minium och dess påverkan på tillväxt och kådflöde i kraftigt försurad granskog’, TechnicalReport, IVL Swedish Environmental Research Institute, Aneboda, Sweden (in Swedish).
Posch, M., De Smet, P. A. M., Hetteling, J. P. and Downing, R. J.: 1995, ‘Calculation and Mapping ofCritical Thresholds in Europe’, Status Report 1995, Coordination Center of Effects, Bilthoven,The Netherlands.
Posch, M., de Smet, P. A. M., Hetteling, J.-P. and Downing, R. J.: 2001, ‘Modelling and Mappingof Critical Thresholds in Europe, Status Report 2001, Coordination Center of Effects, Bilthoven,The Netherlands.
Rühling, Å.: 1994, Nord 9, Nordic Council of Ministers, Copenhagen.Schütt, P. and Cowling, E. B.: 1985, Plant Disease 69, 548–558.Shaw, E. M.: 1993, Hydrology in Practise, Chapman and Hall, London.Slovik, S., Siegmund, A., Kindermann, G., Reiblieng, R. and Baláz, Á.: 1995, Plant and Soil 168–
169, 405–419.Slovik, S.: 1996a, Global Change Biol. 2, 443–458.Slovik, S.: 1996b, Global Change Biol. 2, 459–477Sverdrup, H.: 1990, The Kinetics of Base Cation Release due to Chemical Weathering, Lund
University Press, Lund, Sweden.
CRITICAL LOADS OF ACIDITY FOR FOREST SOILS IN THE CZECH REPUBLIC 379
Sverdrup, H., De Vries, W. and Henriksen, A.: 1990, ‘Mapping Critical Loads’, Miljörapport1990:98, Nordic Council of Ministers, Copenhagen.
Srámek, V.: 1998, Chemosphere 36(4–5), 1067–1072.Sverdrup, H. and Warfvinge, P.: 1993, ‘The Effect of Soil Acidification on the Growth of Trees,
Grass and Herbs as Expressed by the (Ca + Mg + K)/Al Ratio’, Technical Report, Department ofChemical Engineering II, Lund University, Lund.
Sverdrup, H. and De Vries, W.: 1994, Water, Air, and Soil Pollut. 72, 143–162.Tichy, J.: 1996, Environ. Pollut. 93(3), 303–312.Tomasek, M.: 1995, Atlas pud ceske republiky. Cesky Geologicky Ustav, Prague.Umweltbundesamt: 1996, ‘Manual on Methodologies and Criteria for Mapping Critical Levels/loads
and Geographical Areas where they are Exceeded’, Technical Report, Texte 71/96, UN/ECEConvention of Long-range Transboundary Air Pollution, Federal Environmental Agency (Um-weltbundesamt), Berlin.
UN/ECE: 1994, Protocol to the 1979 convention on Long-Range Transboundary Air Pollution onFurther Reductions of Sulphur Emissions, Article 1:8.
UNEP: 1995, ‘Forest Damage in Central European Mountains – Final Report of a Large Area Op-erational Experiment for Forest Damage Monitoring in Europe using Satellite Remote Sensing’,Technical Report, UNEP, Geneva.
UN/ECE and EC: 1997, ‘Ten Years of Monitoring Forest Condition in Europe. Studies on Tem-poral Development, Spatial Distribution and Impacts of Natural and Anthropogenic StressFactors’, Technical Report, United Nations, Economic Commission for Europe, and EuropeanCommission, Geneva and Brussels.
UN/ECE and EC: 2000, ‘Forest Condition in Europe. Results from the 1999 Crown ConditionSurvey’, Technical Report, United Nations, Economic Commission for Europe, and EuropeanCommission, Geneva and Brussels.
Warfvinge, P. and Sverdrup, H.: 1992, ‘Modeling Ground Water Response to Acidification’, in P.Sandén and P. Warfvinge (eds), Swedish Meteorological and Hydrological Institute, Norrköping,Sweden, pp. 79–117.
Warfvinge, P. and Sverdrup, H.: 1995, ‘Critical Loads of Acidity to Swedish Forest Soils’, TechnicalReport, Department of Chemical Engineering II, Lund University, Lund.