Credit scoring and decision making in Egyptian public sector banks
16
Credit scoring and decision making in Egyptian public sector banks Hussein A. Abdou Salford Business School, Salford University, Manchester, UK, and John Pointon Plymouth Business School, University of Plymouth, Plymouth, UK Abstract Purpose – The main aims of this paper are: first, to investigate how decisions are currently made within the Egyptian public sector environment; and, second, to determine whether the decision making can be significantly improved through the use of credit scoring models. A subsidiary aim is to analyze the impact of different proportions of sub-samples of accepted credit applicants on both efficient decision making and the optimal choice of credit scoring techniques. Design/methodology/approach – Following an investigative phase to identify relevant variables in the sector, the research proceeds to an evaluative phase, in which an analysis is undertaken of real data sets (comprising 1,262 applicants), provided by the commercial public sector banks in Egypt. Two types of neural nets are used, and correspondingly two types of conventional techniques are applied. The use of two evaluative measures/criteria: average correct classification (ACC) rate and estimated misclassification cost (EMC) under different misclassification cost (MC) ratios are investigated. Findings – The currently used approach is based on personal judgement. Statistical scoring techniques are shown to provide more efficient classification results than the currently used judgemental techniques. Furthermore, neural net models give better ACC rates, but the optimal choice of techniques depends on the MC ratio. The probabilistic neural net (PNN) is preferred for a lower cost ratio, whilst the multiple discriminant analysis (MDA) is the preferred choice for a higher ratio. Thus, there is a role for MDA as well as neural nets. There is evidence of statistically significant differences between advanced scoring models and conventional models. Research limitations/implications – Future research could investigate the use of further evaluative measures, such as the area under the ROC curve and GINI coefficient techniques and more statistical techniques, such as genetic and fuzzy programming. The plan is to enlarge the data set. Practical implications – There is a huge financial benefit from applying these scoring models to Egyptian public sector banks, for at present only judgemental techniques are being applied in credit evaluation processes. Hence, these techniques can be introduced to support the bank credit decision makers. Originality/value – Thie paper reveals a set of key variables culturally relevant to the Egyptian environment, and provides an evaluation of personal loans in the Egyptian public sector banking environment, in which (to the best of the author’s knowledge) no other authors have studied the use of sophisticated statistical credit scoring techniques. Keywords Neural nets, Public sector organizations, Banks, Debit and credit, Egypt, Decision making Paper type Research paper The current issue and full text archive of this journal is available at www.emeraldinsight.com/1743-9132.htm The authors gratefully acknowledge valuable comments by Ralf Zurbruegg, other editors and an anonymous referee. All remaining errors are the authors’ sole responsibility. This work was supported by the Egyptian Cultural & Educational Bureau in London, and the University of Mansoura Business School, Egypt. Credit scoring and decision making 391 International Journal of Managerial Finance Vol. 5 No. 4, 2009 pp. 391-406 q Emerald Group Publishing Limited 1743-9132 DOI 10.1108/17439130910987549
Transcript of Credit scoring and decision making in Egyptian public sector banks
Credit scoring and decisionmaking in Egyptian public sector
banksHussein A. Abdou
Salford Business School, Salford University, Manchester, UK, and
John PointonPlymouth Business School, University of Plymouth, Plymouth, UK
Abstract
Purpose – The main aims of this paper are: first, to investigate how decisions are currently madewithin the Egyptian public sector environment; and, second, to determine whether the decision makingcan be significantly improved through the use of credit scoring models. A subsidiary aim is to analyzethe impact of different proportions of sub-samples of accepted credit applicants on both efficientdecision making and the optimal choice of credit scoring techniques.
Design/methodology/approach – Following an investigative phase to identify relevant variables inthe sector, the research proceeds to an evaluative phase, in which an analysis is undertaken of real datasets (comprising 1,262 applicants), provided by the commercial public sector banks in Egypt. Two typesof neural nets are used, and correspondingly two types of conventional techniques are applied. The useof two evaluative measures/criteria: average correct classification (ACC) rate and estimatedmisclassification cost (EMC) under different misclassification cost (MC) ratios are investigated.
Findings – The currently used approach is based on personal judgement. Statistical scoringtechniques are shown to provide more efficient classification results than the currently usedjudgemental techniques. Furthermore, neural net models give better ACC rates, but the optimal choiceof techniques depends on the MC ratio. The probabilistic neural net (PNN) is preferred for a lower costratio, whilst the multiple discriminant analysis (MDA) is the preferred choice for a higher ratio. Thus,there is a role for MDA as well as neural nets. There is evidence of statistically significant differencesbetween advanced scoring models and conventional models.
Research limitations/implications – Future research could investigate the use of further evaluativemeasures, such as the area under the ROC curve and GINI coefficient techniques and more statisticaltechniques, such as genetic and fuzzy programming. The plan is to enlarge the data set.
Practical implications – There is a huge financial benefit from applying these scoring models toEgyptian public sector banks, for at present only judgemental techniques are being applied in creditevaluation processes. Hence, these techniques can be introduced to support the bank credit decisionmakers.
Originality/value – Thie paper reveals a set of key variables culturally relevant to the Egyptianenvironment, and provides an evaluation of personal loans in the Egyptian public sector bankingenvironment, in which (to the best of the author’s knowledge) no other authors have studied the use ofsophisticated statistical credit scoring techniques.
Keywords Neural nets, Public sector organizations, Banks, Debit and credit, Egypt, Decision making
Paper type Research paper
The current issue and full text archive of this journal is available at
www.emeraldinsight.com/1743-9132.htm
The authors gratefully acknowledge valuable comments by Ralf Zurbruegg, other editors and ananonymous referee. All remaining errors are the authors’ sole responsibility. This work wassupported by the Egyptian Cultural & Educational Bureau in London, and the University ofMansoura Business School, Egypt.
Credit scoringand decision
making
391
International Journal of ManagerialFinance
Vol. 5 No. 4, 2009pp. 391-406
q Emerald Group Publishing Limited1743-9132
DOI 10.1108/17439130910987549
IntroductionThe management of risk plays an important role in the banking sector worldwide. Thefocus here is upon the credit decision. Indeed this is one of the most critical bankingdecisions, requiring a distinction between customers with good and bad credit. Thebehaviour of former and current customers can provide a useful historical data set,which can be crucial in predicting new applicants’ behaviour. One such data set isbased on the commercial public sector banks in Egypt.
According to the Central Bank of Egypt (CBE), Egyptian banks’ credit facilitieshave increased by LE 19.90 billion (6.10 percent), reaching LE 343.90 billion (40.40percent of the aggregate financial position) and representing 58.20 percent of the totaldeposits at December 31, 2006. Household sector bank credit, in total currency,accounts for LE 52,973 million in December 2006, an increase of 10 percent in sixmonths. Also, loans and advances “excluding discounts” by maturity augmented byLE 19.70 billion (6.10 percent), reaching LE 342.70 billion (CBE, 2006/2007). In view ofthe size of lending activities and to make efficient decisions in the granting of credit forconsumer loans, we posit that different statistical techniques may be beneficiallyintroduced to supplement the judgemental techniques, which currently are based onsingle numerical evaluation systems and the CBE’s own perspective ofcreditworthiness. Indeed discussions with key banking personnel have suggestedthat all public sector banks in Egypt are using judgemental techniques in theirevaluation process.
The categorization of good and bad credit is of essential importance, and is indeedthe objective of a credit-scoring model (Lee et al., 2002; Lim and Sohn, 2007). The needof an appropriate classification technique is thus evident. But what determines thecategorization of a new applicant? Characteristics, such as marital status, income andage, have been recommended (Chen and Huang, 2003). The classification techniquesthemselves can also be categorized into conventional methods and advanced statisticaltechniques. The former include multiple linear regression, discriminant analysis,probit analysis and logistic regression. The latter comprize an array of approaches andmethods, such as, fuzzy algorithms, genetic algorithms, expert systems, and neuralnets (Hand and Henley, 1997).
MDA and LR have been used in building scoring models (Orgler, 1971; Boyes et al.,1989; Steenackers and Goovaerts, 1989; Banasik et al., 2001; Sarlija et al., 2004). Thesetechniques perform well in this context (Baesens et al., 2003). MDA, in general, hasbetter classification ability but worse prediction ability, whereas LR has a relativelybetter prediction capability (Liang, 2003). Neural nets are being widely used in manyfields, including financial institutions in general and banks in particular (for example,Baesens et al., 2005; Zhang et al., 1999). In the last couple of decades, neural nets havebeen used as alternatives to conventional techniques. In choosing a neural net for suchapplications, pertinent issues include pattern recognition, and the use of feed-forwardnets’ architecture, such as the MLFNs and PNNs (Bishop, 1995; Masters, 1995).
Comparisons between neural nets and traditional techniques support the superiorability of the neural nets, in terms of average correct classification rates (Desai et al.,1996; Baesens et al., 2003; Malhotra and Malhotra, 2003; Lee and Chen, 2005;Blochlinger and Leippold, 2006). One particular problem, highlighted by Lim and Sohn(2007), is that the assessment of default risk mid-term in the repayment plan can beelusive. Sample selection bias has been highlighted in other studies, particularly
IJMF5,4
392
pertaining to the analysis of only applicants that have been accepted (Greene, 1998;Banasik et al., 2003; Banasik and Crook, 2005; Verstraeten and Van den Poel, 2005;Banasik and Crook, 2007).
Therefore, the aims of this paper are twofold. First, the intent is to investigate howdecisions are currently made within the environment under study. Second, the intent isto investigate whether the decision making can be significantly improved through theuse of credit scoring models instead. To this end, an array of methods is considered forevaluation. To achieve this, it is necessary to deal with some technical issues, such as,the impact of sample proportion selection on the predictive capability of some fairlysophisticated techniques, such as probabilistic neural nets (PNNs) and multi-layerfeed-forward nets (MLFNs). Such techniques will be compared with more traditionalones, namely, multiple discriminant analysis (MDA) and logistic regression (LR). Thetechnique to be implemented is likely to affect the quality of the credit decision.
Correspondingly, the chosen environment is the Egyptian banking sector, in whichno other authors (to the best of our knowledge) have investigated the implications ofintroducing sophisticated statistical appraisal techniques in credit scoring. Sincestatistical techniques have not been used in the Egyptian public sector banks, thesample selection bias problem should be less serious compared with other studies, andthis highlights the importance of the present study.
This paper, which identifies the current practice of credit decision making in Egyptand assesses alternative credit scoring models for the Egyptian credit decision makers,is organized as follows, in the remainder of the paper: details of research methodologyare provided next, followed by a discussion of empirical results, then the concludingremarks regarding implications for credit practitioners and suggestions for furtherresearch.
Research methodologyOur overall research questions are:
RQ1. What are the currently used approaches to personal credit loan evaluations?
RQ2. Can alternative credit scoring models offer the credit decision maker(s) moreefficient classification results than the approaches used at present?
In order to answer the research questions, two phases are proposed, namely, theinvestigative and the evaluative phases. Unlike other published work in this field, as afirst phase of the research an investigation was conducted, as a pilot study, into whichapproaches are currently being applied by Egyptian public banks. Then, an evaluationof personal loan quality was undertaken, based on historical data provided by thosebanks, using new technologies for statistical credit scoring. Furthermore, in assessingalternative models, comparisons were made of the scoring capabilities of differentmodels.
Figure 1 explains the research methodology, comprising these two main phases.Implications for future implementation are also indicated in the figure. We begin withthe investigative phase. So, at an early stage of this research the pilot study wasundertaken. Initially, on an informal basis, four interviews were conducted with thekey personnel in three of the major banks in Egypt. The purpose was to identify thekey characteristics that Egyptian banks are at present using in their credit evaluations,and subsequently in their credit decision making.
Credit scoringand decision
making
393
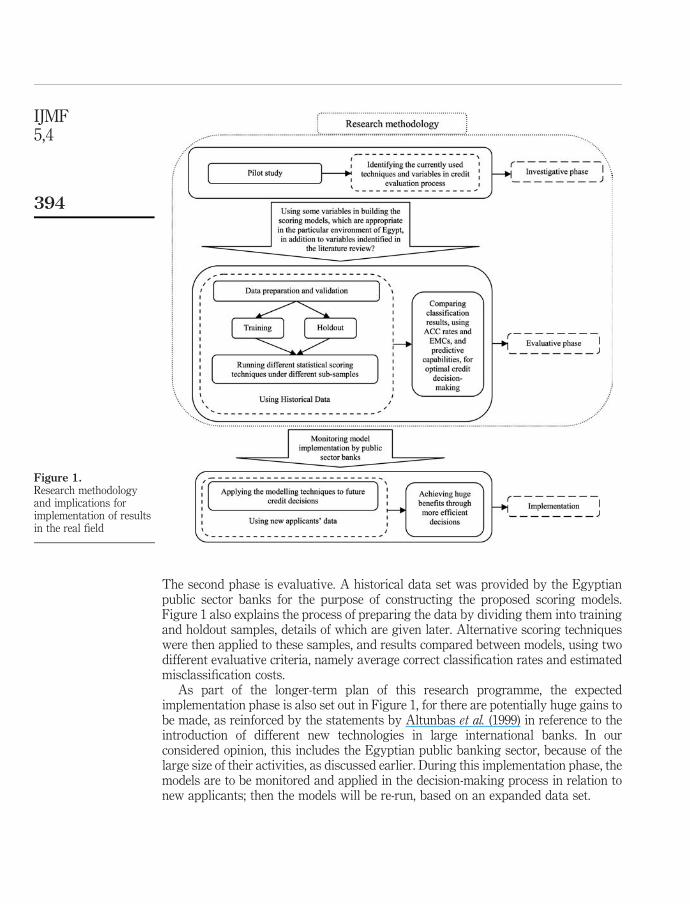
The second phase is evaluative. A historical data set was provided by the Egyptianpublic sector banks for the purpose of constructing the proposed scoring models.Figure 1 also explains the process of preparing the data by dividing them into trainingand holdout samples, details of which are given later. Alternative scoring techniqueswere then applied to these samples, and results compared between models, using twodifferent evaluative criteria, namely average correct classification rates and estimatedmisclassification costs.
As part of the longer-term plan of this research programme, the expectedimplementation phase is also set out in Figure 1, for there are potentially huge gains tobe made, as reinforced by the statements by Altunbas et al. (1999) in reference to theintroduction of different new technologies in large international banks. In ourconsidered opinion, this includes the Egyptian public banking sector, because of thelarge size of their activities, as discussed earlier. During this implementation phase, themodels are to be monitored and applied in the decision-making process in relation tonew applicants; then the models will be re-run, based on an expanded data set.
Figure 1.Research methodologyand implications forimplementation of resultsin the real field
IJMF5,4
394
The common aim of the various models, which will be used for testing purposes, isto predict which applicants will default and which will not. So, let us consideralternative approaches available, namely, conventional multiple discriminant analysisand logistic regression, in addition to two different types of neural nets: firstly, PNNs,because of the categorical nature of the dependent/prediction variable; and, secondly,are MLFNs, for which five nodes are chosen with MLFNs, as a part of the softwaredesign.
Multiple discriminant analysis (MDA)MDA was used in early credit scoring research by Durand (1941), who examined carloan applications. A well-known application in corporate bankruptcy prediction is oneby Altman (1968), who developed the first operational scoring model based on fivefinancial ratios from corporate financial statements. He produced a Z-score, which is alinear combination of the financial ratios. A general formulation of MDA can berepresented by:
Z ¼ aþ d1V 1 þ d2V 2 þ . . .þ dnVn;
where, Z represents the discriminant (zed) score, d is the intercept term, and direpresents the respective coefficient in the linear combination of explanatory variables,Vi; for i ¼ 1 to n. Specifically, the MDA model assumes inter alia normally distributedindependent variables (Desai et al., 1996). To improve accuracy a mixed integerprogramming approach has been recommended by Glen (2001).
Logistic regression (LR)LR, unlike other conventional statistical techniques, can suit different classes ofdistribution functions, and is well suited for credit scoring problems. LR is adichotomous outcome modelling technique, for which the log of odds ratio is given by:
log½p=ð1 2 pÞ� ¼ aþ d1V 1 þ d2V 2 þ . . .þ dnVn;
where, p is the probability that the zero-one dichotomous outcome is one, d is theintercept term, and di represents the respective coefficient in the linear combination ofexplanatory variables, Vi; for i ¼ 1 to n.
P ¼1
½1 þ expð2a2 d1V 1 2 d2V 2 2 . . .2 dnVnÞ�
The probability of a value of one for the dichotomous outcome is:
P ¼1
½1 þ expð2a2 d1V 1 2 d2V 2 2 . . .2 dnVnÞ�
In the application of LR models to credit scoring, the objective is to find the conditionalprobability of a good (or bad) loan, given the values of the independent variablespertaining to that credit applicant (Lee and Chen, 2005).
Probabilistic neural net (PNN)A few credit scoring models using PNNs have been investigated, (Masters, 1995;Zekic-Susac et al., 2004). By applying kernel discriminant analysis, in which the
Credit scoringand decision
making
395
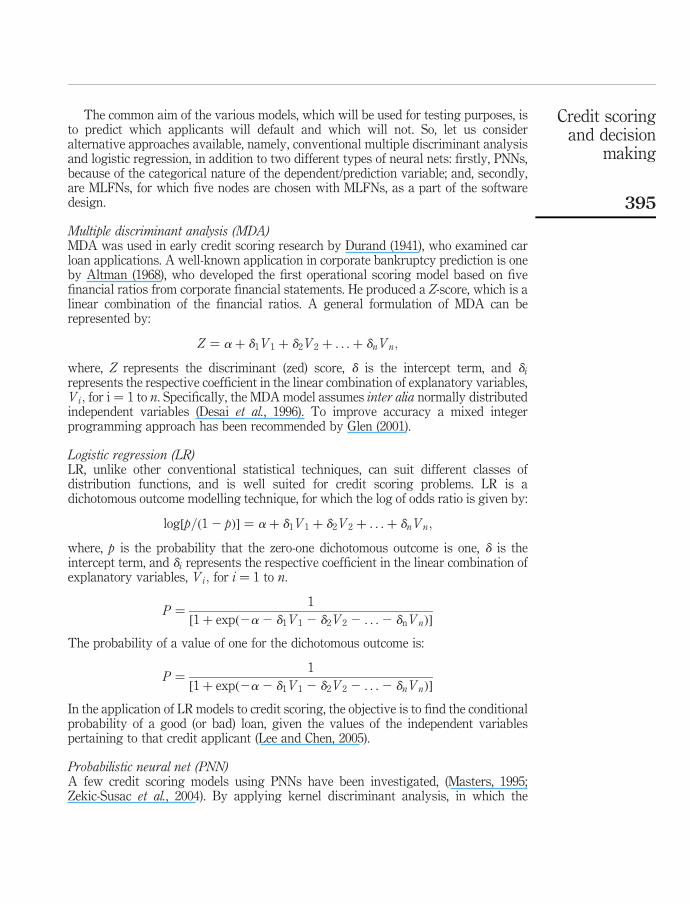
processes are structured into a particular multilayered perceptron net, a PNN can becreated. An example of a PNN, which essentially is predominantly a classifier mappinginputs to a number of classifications, is given in Figure 2.
Independent variables are introduced to the input layer and linked to the patternlayer, at which calculations are made for distances between input and training cases.Values are linked to the summation layer, comprising two dependent categories, atwhich output values from training cases are summed to represent probabilities ofoccurrence for each respective dichotomous class.
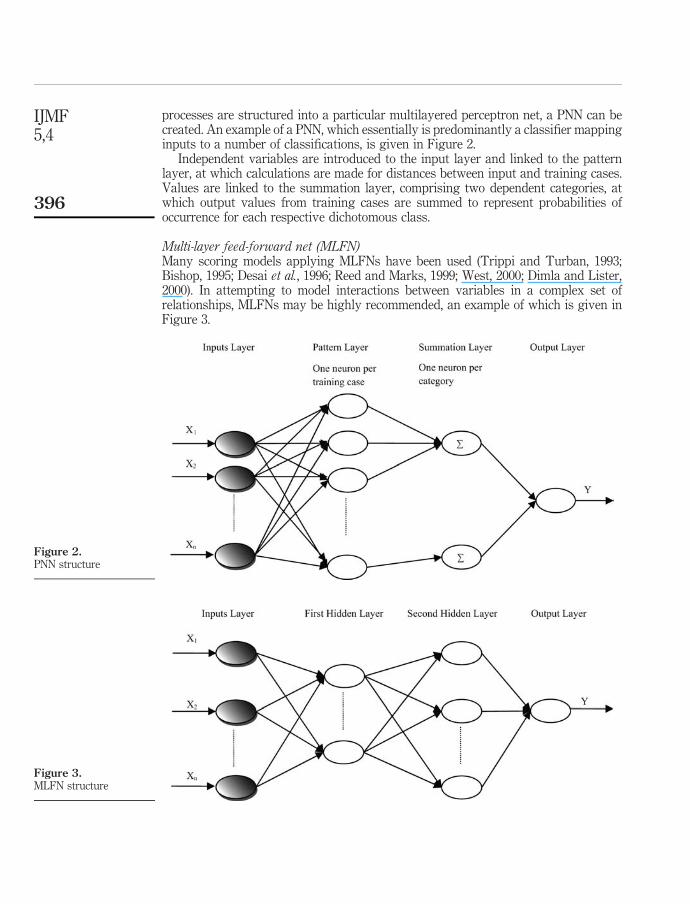
Multi-layer feed-forward net (MLFN)Many scoring models applying MLFNs have been used (Trippi and Turban, 1993;Bishop, 1995; Desai et al., 1996; Reed and Marks, 1999; West, 2000; Dimla and Lister,2000). In attempting to model interactions between variables in a complex set ofrelationships, MLFNs may be highly recommended, an example of which is given inFigure 3.
Figure 2.PNN structure
Figure 3.MLFN structure
IJMF5,4
396
It is important to establish the structure of the net in terms of nodes and hidden layers,parameters associated with connections and neurons; and, conversion functions foreach neuron, which map inputs to outputs (Palisade, 2005).
Data collection and sampling methodIn order to build the proposed credit scoring models, a consumer loans data set wasprovided by the commercial public sector banks in Egypt. This consisted of 1,262personal loans with 851 good loans and 411 bad loans. It should be emphasized thatthis data set is pertinent because of the large number of bad loans (32.57 percent) withgood loans (67.43 percent). Each customer in this data set is linked to 25 independentvariables, in addition to the dependent variable, which is loan quality explained by twovalues, good ¼ 1 and bad ¼ 0. Some variables had identical values for all cases andhence were excluded, e.g. personal reputation and formal documents. Finally, selectedpredictor variables for the proposed models were reduced to 19 variables, namely, loanamount, loan duration, age, gender, dependants, profession, education, house status,telephone, monthly income, CBE report, guarantees, field visit, feasibility study, creditcard status, loans from other banks, car ownership and marital status (dummy forsingle, dummy for married, no dummy for others).
For the purpose of making a fair comparison between conventional techniques andneural net techniques, and to reduce sample bias, we apply a validation technique bydividing the data set into training samples:
. 67 percent, 846 cases (sample1);
. 80 percent, 1,010 cases (sample2); and
. 90 percent, 1136 cases (sample3).
And hold-out (testing) samples:. 33 percent, 416 cases (sample1);. 20 percent, 252 cases (sample2); and. 10 percent 126 cases (sample3).
These test the predictive effectiveness of the fitted model. All models were built usingthe training samples and were tested using the hold-out samples, under each of thedifferent sample sizes. The overall ACC rate for the whole sample is based on aweighted average of the correct classification rates of the hold-out and trainingsamples.
Empirical resultsInvestigative phaseDuring the pilot study, relevant variables were identified, some of which were not onour list of potentially important variables, already obtained from an in-depth review ofthe literature. It was found that credit analysts take account of a wide range of factors,not found in the literature, mainly including:
(1) Investigation report (from CBE), including:. transaction size with the bank and other banks; and. client indebtedness
Credit scoringand decision
making
397
(2) Loans from other bank.
(3) Personal reputation of the client.
(4) Field visit (Market investigation).
(5) Guarantees or warranties.
(6) Feasibility study (if required).
(7) Legal documents.
For small business loans and other products, additional factors were taken intoaccount, such as financial ratios extracted from financial statements, ownershipstructure, type of activity and the legality of the project. However, this paper focuses onpersonal loans rather than other products.
Evaluative phaseIn order to run the proposed models, STATGRAPHICS Plus 5.1, SPSS 15.00, PalisadeNeural Tools Software and ScortoTM Credit Decision Software were used in this paper.The detailed credit scoring results using the above-mentioned scoring modellingtechniques can be summarized next. In applying MDA, LR, PNN and MLFN models inthis section, we used the whole data set, both training and hold-out samples, as a testset to study the overall predictive capability of model classification.
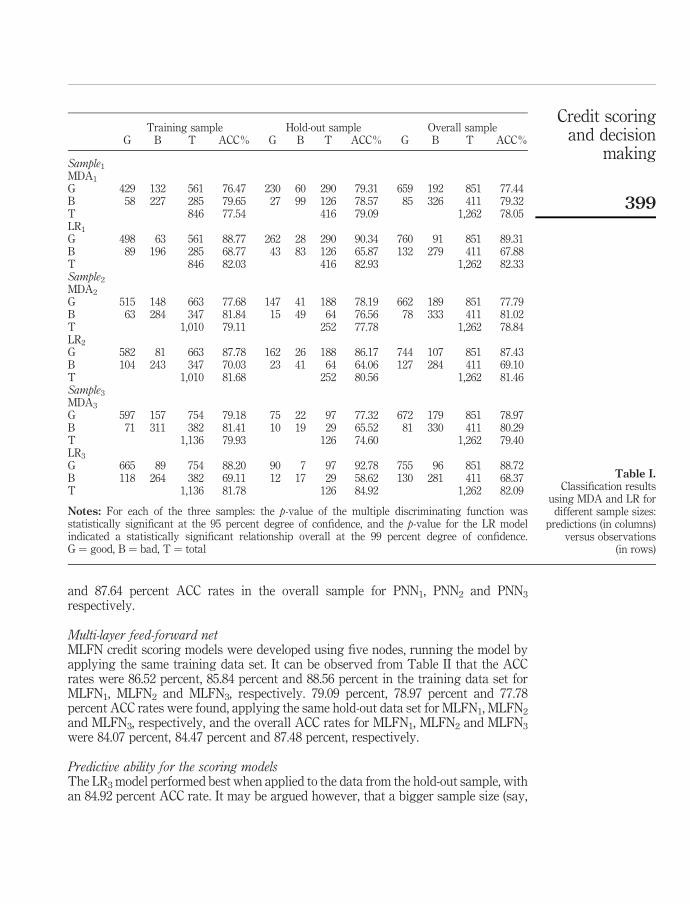
Multiple discriminant analysisFrom the results revealed in Table I it can be observed that the ACC rate for thetraining samples, i.e. the data used in building the model, are 77.54 percent, 79.11percent and 79.93 percent for sample1, sample2 and sample3, respectively. 79.09percent, 77.78 percent and 74.60 percent ACC rates were found using the hold-outsample, for which the data played no role in building the model, for sample1, sample2
and sample3, respectively. The overall ACC rates for samples 1, 2 and 3 are 78.05percent, 78.84 percent and 79.40 percent, respectively.
Logistic regressionTable I summarizes the results of the LR credit scoring models. It can be observed thatthe ACC rates were 82.33 percent, 81.64 percent and 82.09 percent with a 0.5 cut-offpoint in the overall samples for samples 1, 2 and 3, respectively. While 82.03 percent,81.68 percent and 81.78 percent and 82.93 percent, 80.56 percent and 84.92 percent werethe ACC rates for the training and the hold-out samples, respectively, for samples 1, 2and 3, respectively.
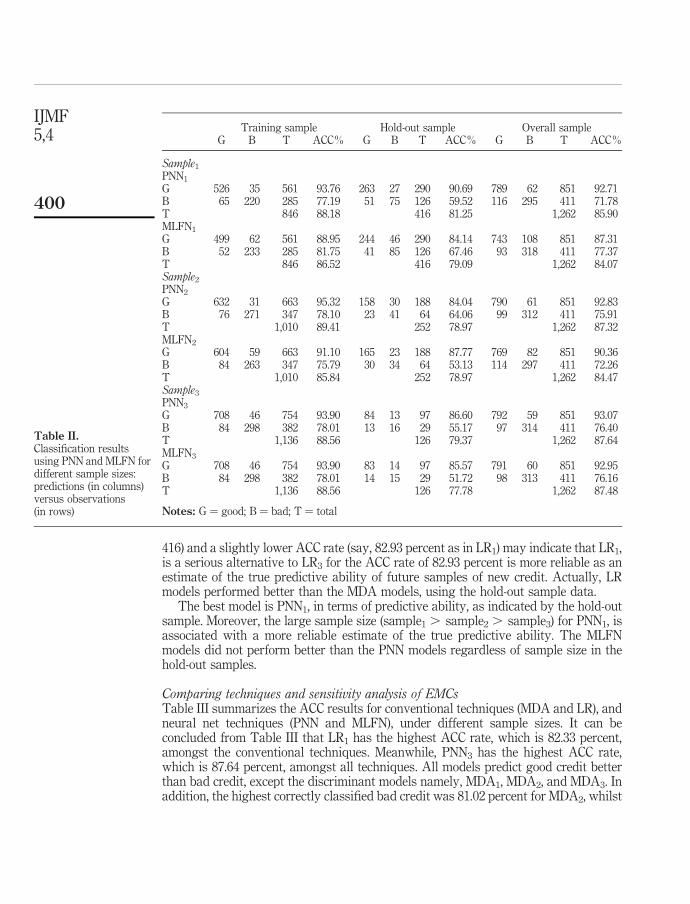
Probabilistic neural netPNN models were designed using the same training data set. Again the same hold-outdata set, for which the data played no role in building the model, was used to test thefitted model. The results for the PNN credit scoring models are summarized in Table II.It can be observed that the ACC rates were 88.18 percent, 89.41 percent and 88.56percent for PNN1, PNN2 and PNN3, respectively, in the training sample, and 81.25percent, 78.97 percent and 79.37 percent for PNN1, PNN2 and PNN3, respectively, in thehold-out sample. Furthermore, the PNN models revealed 85.90 percent, 87.32 percent
IJMF5,4
398
and 87.64 percent ACC rates in the overall sample for PNN1, PNN2 and PNN3
respectively.
Multi-layer feed-forward netMLFN credit scoring models were developed using five nodes, running the model byapplying the same training data set. It can be observed from Table II that the ACCrates were 86.52 percent, 85.84 percent and 88.56 percent in the training data set forMLFN1, MLFN2 and MLFN3, respectively. 79.09 percent, 78.97 percent and 77.78percent ACC rates were found, applying the same hold-out data set for MLFN1, MLFN2
and MLFN3, respectively, and the overall ACC rates for MLFN1, MLFN2 and MLFN3
were 84.07 percent, 84.47 percent and 87.48 percent, respectively.
Predictive ability for the scoring modelsThe LR3 model performed best when applied to the data from the hold-out sample, withan 84.92 percent ACC rate. It may be argued however, that a bigger sample size (say,
Training sample Hold-out sample Overall sampleG B T ACC% G B T ACC% G B T ACC%
Sample1
MDA1
G 429 132 561 76.47 230 60 290 79.31 659 192 851 77.44B 58 227 285 79.65 27 99 126 78.57 85 326 411 79.32T 846 77.54 416 79.09 1,262 78.05LR1
G 498 63 561 88.77 262 28 290 90.34 760 91 851 89.31B 89 196 285 68.77 43 83 126 65.87 132 279 411 67.88T 846 82.03 416 82.93 1,262 82.33Sample2
MDA2
G 515 148 663 77.68 147 41 188 78.19 662 189 851 77.79B 63 284 347 81.84 15 49 64 76.56 78 333 411 81.02T 1,010 79.11 252 77.78 1,262 78.84LR2
G 582 81 663 87.78 162 26 188 86.17 744 107 851 87.43B 104 243 347 70.03 23 41 64 64.06 127 284 411 69.10T 1,010 81.68 252 80.56 1,262 81.46Sample3
MDA3
G 597 157 754 79.18 75 22 97 77.32 672 179 851 78.97B 71 311 382 81.41 10 19 29 65.52 81 330 411 80.29T 1,136 79.93 126 74.60 1,262 79.40LR3
G 665 89 754 88.20 90 7 97 92.78 755 96 851 88.72B 118 264 382 69.11 12 17 29 58.62 130 281 411 68.37T 1,136 81.78 126 84.92 1,262 82.09
Notes: For each of the three samples: the p-value of the multiple discriminating function wasstatistically significant at the 95 percent degree of confidence, and the p-value for the LR modelindicated a statistically significant relationship overall at the 99 percent degree of confidence.G ¼ good, B ¼ bad, T ¼ total
Table I.Classification results
using MDA and LR fordifferent sample sizes:
predictions (in columns)versus observations
(in rows)
Credit scoringand decision
making
399
416) and a slightly lower ACC rate (say, 82.93 percent as in LR1) may indicate that LR1,is a serious alternative to LR3 for the ACC rate of 82.93 percent is more reliable as anestimate of the true predictive ability of future samples of new credit. Actually, LRmodels performed better than the MDA models, using the hold-out sample data.
The best model is PNN1, in terms of predictive ability, as indicated by the hold-outsample. Moreover, the large sample size (sample1 . sample2 . sample3) for PNN1, isassociated with a more reliable estimate of the true predictive ability. The MLFNmodels did not perform better than the PNN models regardless of sample size in thehold-out samples.
Comparing techniques and sensitivity analysis of EMCsTable III summarizes the ACC results for conventional techniques (MDA and LR), andneural net techniques (PNN and MLFN), under different sample sizes. It can beconcluded from Table III that LR1 has the highest ACC rate, which is 82.33 percent,amongst the conventional techniques. Meanwhile, PNN3 has the highest ACC rate,which is 87.64 percent, amongst all techniques. All models predict good credit betterthan bad credit, except the discriminant models namely, MDA1, MDA2, and MDA3. Inaddition, the highest correctly classified bad credit was 81.02 percent for MDA2, whilst
Training sample Hold-out sample Overall sampleG B T ACC% G B T ACC% G B T ACC%
Sample1
PNN1
G 526 35 561 93.76 263 27 290 90.69 789 62 851 92.71B 65 220 285 77.19 51 75 126 59.52 116 295 411 71.78T 846 88.18 416 81.25 1,262 85.90MLFN1
G 499 62 561 88.95 244 46 290 84.14 743 108 851 87.31B 52 233 285 81.75 41 85 126 67.46 93 318 411 77.37T 846 86.52 416 79.09 1,262 84.07Sample2
PNN2
G 632 31 663 95.32 158 30 188 84.04 790 61 851 92.83B 76 271 347 78.10 23 41 64 64.06 99 312 411 75.91T 1,010 89.41 252 78.97 1,262 87.32MLFN2
G 604 59 663 91.10 165 23 188 87.77 769 82 851 90.36B 84 263 347 75.79 30 34 64 53.13 114 297 411 72.26T 1,010 85.84 252 78.97 1,262 84.47Sample3
PNN3
G 708 46 754 93.90 84 13 97 86.60 792 59 851 93.07B 84 298 382 78.01 13 16 29 55.17 97 314 411 76.40T 1,136 88.56 126 79.37 1,262 87.64MLFN3
G 708 46 754 93.90 83 14 97 85.57 791 60 851 92.95B 84 298 382 78.01 14 15 29 51.72 98 313 411 76.16T 1,136 88.56 126 77.78 1,262 87.48
Notes: G ¼ good; B ¼ bad; T ¼ total
Table II.Classification resultsusing PNN and MLFN fordifferent sample sizes:predictions (in columns)versus observations(in rows)
IJMF5,4
400
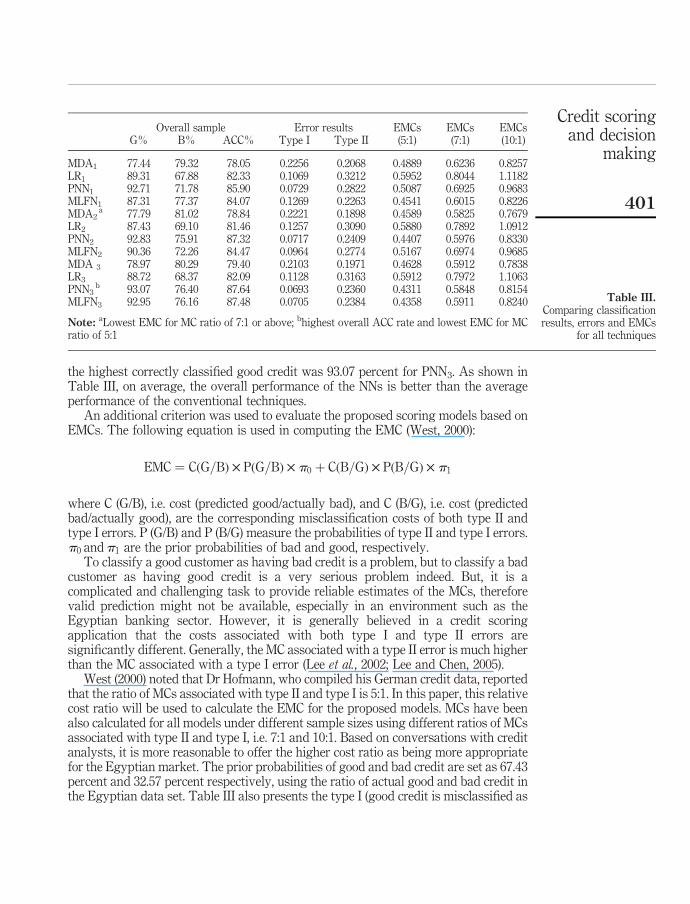
the highest correctly classified good credit was 93.07 percent for PNN3. As shown inTable III, on average, the overall performance of the NNs is better than the averageperformance of the conventional techniques.
An additional criterion was used to evaluate the proposed scoring models based onEMCs. The following equation is used in computing the EMC (West, 2000):
EMC ¼ CðG=BÞ £ PðG=BÞ £ p0 þ CðB=GÞ £ PðB=GÞ £ p1
where C (G/B), i.e. cost (predicted good/actually bad), and C (B/G), i.e. cost (predictedbad/actually good), are the corresponding misclassification costs of both type II andtype I errors. P (G/B) and P (B/G) measure the probabilities of type II and type I errors.p0 andp1 are the prior probabilities of bad and good, respectively.
To classify a good customer as having bad credit is a problem, but to classify a badcustomer as having good credit is a very serious problem indeed. But, it is acomplicated and challenging task to provide reliable estimates of the MCs, thereforevalid prediction might not be available, especially in an environment such as theEgyptian banking sector. However, it is generally believed in a credit scoringapplication that the costs associated with both type I and type II errors aresignificantly different. Generally, the MC associated with a type II error is much higherthan the MC associated with a type I error (Lee et al., 2002; Lee and Chen, 2005).
West (2000) noted that Dr Hofmann, who compiled his German credit data, reportedthat the ratio of MCs associated with type II and type I is 5:1. In this paper, this relativecost ratio will be used to calculate the EMC for the proposed models. MCs have beenalso calculated for all models under different sample sizes using different ratios of MCsassociated with type II and type I, i.e. 7:1 and 10:1. Based on conversations with creditanalysts, it is more reasonable to offer the higher cost ratio as being more appropriatefor the Egyptian market. The prior probabilities of good and bad credit are set as 67.43percent and 32.57 percent respectively, using the ratio of actual good and bad credit inthe Egyptian data set. Table III also presents the type I (good credit is misclassified as
Overall sample Error results EMCs EMCs EMCsG% B% ACC% Type I Type II (5:1) (7:1) (10:1)
MDA1 77.44 79.32 78.05 0.2256 0.2068 0.4889 0.6236 0.8257LR1 89.31 67.88 82.33 0.1069 0.3212 0.5952 0.8044 1.1182PNN1 92.71 71.78 85.90 0.0729 0.2822 0.5087 0.6925 0.9683MLFN1 87.31 77.37 84.07 0.1269 0.2263 0.4541 0.6015 0.8226MDA2
a 77.79 81.02 78.84 0.2221 0.1898 0.4589 0.5825 0.7679LR2 87.43 69.10 81.46 0.1257 0.3090 0.5880 0.7892 1.0912PNN2 92.83 75.91 87.32 0.0717 0.2409 0.4407 0.5976 0.8330MLFN2 90.36 72.26 84.47 0.0964 0.2774 0.5167 0.6974 0.9685MDA 3 78.97 80.29 79.40 0.2103 0.1971 0.4628 0.5912 0.7838LR3 88.72 68.37 82.09 0.1128 0.3163 0.5912 0.7972 1.1063PNN3
b 93.07 76.40 87.64 0.0693 0.2360 0.4311 0.5848 0.8154MLFN3 92.95 76.16 87.48 0.0705 0.2384 0.4358 0.5911 0.8240
Note: aLowest EMC for MC ratio of 7:1 or above; bhighest overall ACC rate and lowest EMC for MCratio of 5:1
Table III.Comparing classificationresults, errors and EMCs
for all techniques
Credit scoringand decision
making
401
bad credit), type II (bad credit is misclassified as good credit) errors and the EMCs forthe proposed models under different MCs ratios.
Four criteria will be used for analytical purposes. Firstly, using the ACC rate, theresults indicate that PNN3 has the highest ACC rate, above that of all other models.Secondly, using an MC ratio of 5:1, PNN3 is again the preferred model. Thirdly,extending our criterion to an MC ratio of 7:1, MDA2 is the optimal choice with aminimum EMC of 0.5825, but only marginally preferred to PNN3 with an EMC of0.5848. Fourthly, we also applied the criterion of an MC ratio of 10:1, because thedecision was not quite sharp using an MC ratio of 7:1, and, as mentioned earlier, a highMC ratio might be more appropriate. Using an MC ratio of 10:1, MDA2 is not only theoptimal choice in terms of having the lowest EMC at 0.7679, but is more clearly betterthan PNN3, whose EMC now becomes 0.8154. As to implementation, the decisionmaker can choose an MC ratio to suit the local circumstances, and a model based on thelowest misclassification cost. Here, a range of parameter values has been offered to thedecision maker, from which to choose. Correspondingly, in an evaluation of alltechniques, sample2 and sample3 are better than sample1 under both ACC rate andEMCs criteria.
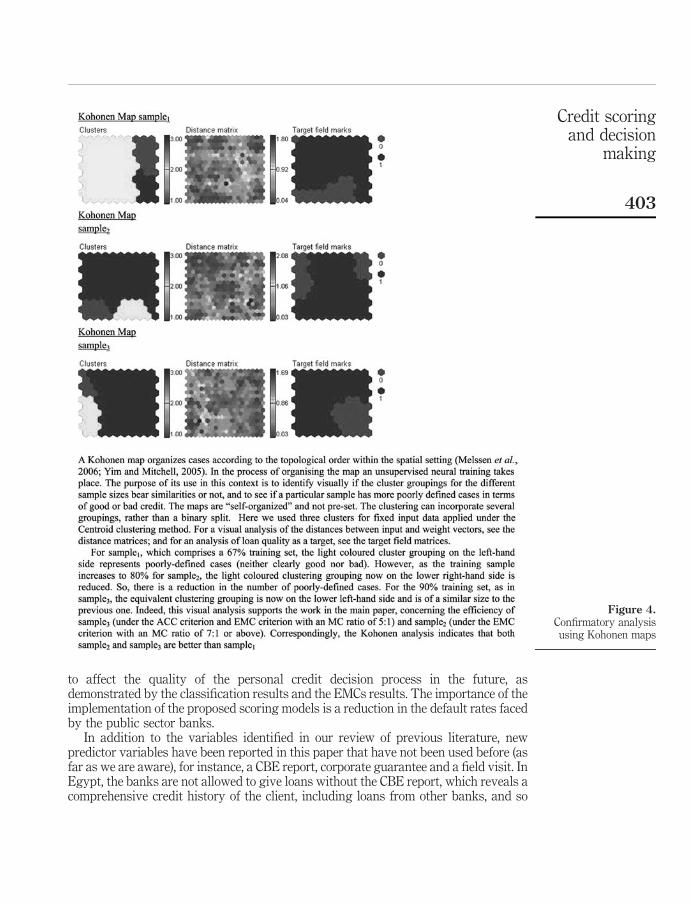
In order to undertake a confirmatory analysis under different sample selections,Kohonen maps were generated to indicate the cluster groupings. The results confirmthat sample2 and sample3 are close contenders (for more details see Figure 4), and thatsample1 is potentially less suitable. However, when comparing only conventionaltechniques under different sample sizes and without reference to Kohonen maps, LR1
has the highest ACC rate for the overall sample. But its result (82.33 percent) is veryclose to LR3 (82.09 percent).
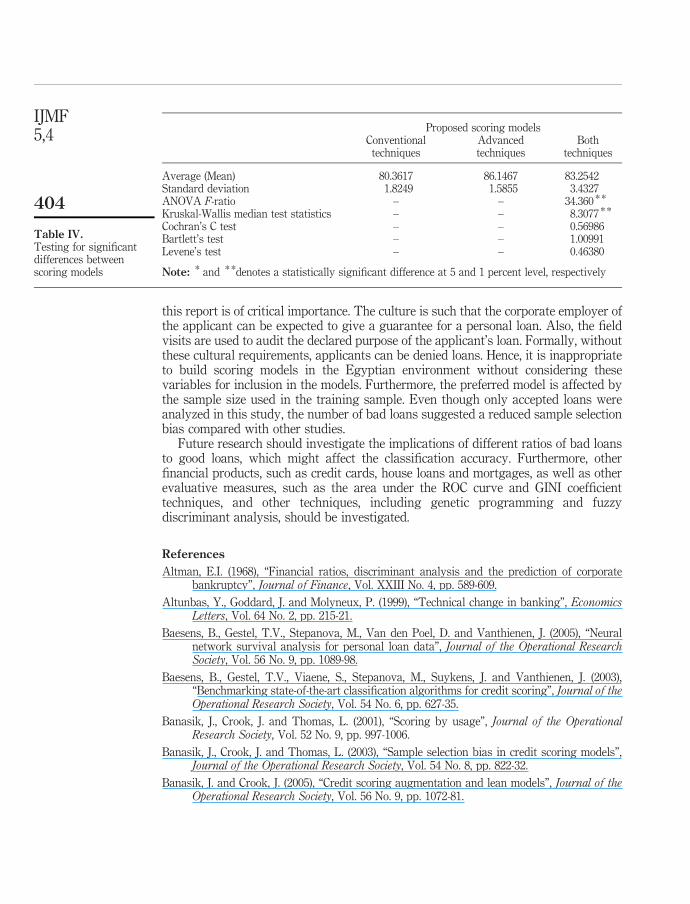
Finally, different statistical tests have been performed to investigate whether thereare statistically significant differences between conventional and advanced scoringmodels. There is clear evidence (see Table IV) of significant differences in means(ANOVA), and medians (Kruskal-Wallis), but not standard deviations (Cochrane,Bartlett and Levene).
Conclusion and area for future researchThere is a clear role for the application of statistical scoring techniques in theevaluation of the bank credit decision. However, at present the Egyptian bankingsector applies judgemental techniques to consumer loans. Now, to introduce statisticalscoring models should improve its decision making, but different credit decisionswould be made dependent upon the chosen model, as evidenced by the analysis of areal data set of 1,262 personal loans. We have identified the currently used approach topersonal credit loan evaluations, namely a judgmental approach, thus addressing thefirst of our research questions. Furthermore, we have demonstrated that alternativecredit scoring models clearly offer the bank credit decision makers more efficientclassification results than their currently used judgmental approach, which addressesthe second research question.
This paper has not only contributed to the literature on credit scoring, by providingan evaluation of personal loans in the Egyptian public sector banks, but also hasdemonstrated how credit classification techniques can be introduced in the real field tosupport the bank credit decision makers. We have found evidence of the superiority ofcredit scoring models to the currently used judgmental approach, which are expected
IJMF5,4
402
to affect the quality of the personal credit decision process in the future, asdemonstrated by the classification results and the EMCs results. The importance of theimplementation of the proposed scoring models is a reduction in the default rates facedby the public sector banks.
In addition to the variables identified in our review of previous literature, newpredictor variables have been reported in this paper that have not been used before (asfar as we are aware), for instance, a CBE report, corporate guarantee and a field visit. InEgypt, the banks are not allowed to give loans without the CBE report, which reveals acomprehensive credit history of the client, including loans from other banks, and so
Figure 4.Confirmatory analysisusing Kohonen maps
Credit scoringand decision
making
403
this report is of critical importance. The culture is such that the corporate employer ofthe applicant can be expected to give a guarantee for a personal loan. Also, the fieldvisits are used to audit the declared purpose of the applicant’s loan. Formally, withoutthese cultural requirements, applicants can be denied loans. Hence, it is inappropriateto build scoring models in the Egyptian environment without considering thesevariables for inclusion in the models. Furthermore, the preferred model is affected bythe sample size used in the training sample. Even though only accepted loans wereanalyzed in this study, the number of bad loans suggested a reduced sample selectionbias compared with other studies.
Future research should investigate the implications of different ratios of bad loansto good loans, which might affect the classification accuracy. Furthermore, otherfinancial products, such as credit cards, house loans and mortgages, as well as otherevaluative measures, such as the area under the ROC curve and GINI coefficienttechniques, and other techniques, including genetic programming and fuzzydiscriminant analysis, should be investigated.
References
Altman, E.I. (1968), “Financial ratios, discriminant analysis and the prediction of corporatebankruptcy”, Journal of Finance, Vol. XXIII No. 4, pp. 589-609.
Altunbas, Y., Goddard, J. and Molyneux, P. (1999), “Technical change in banking”, EconomicsLetters, Vol. 64 No. 2, pp. 215-21.
Baesens, B., Gestel, T.V., Stepanova, M., Van den Poel, D. and Vanthienen, J. (2005), “Neuralnetwork survival analysis for personal loan data”, Journal of the Operational ResearchSociety, Vol. 56 No. 9, pp. 1089-98.
Baesens, B., Gestel, T.V., Viaene, S., Stepanova, M., Suykens, J. and Vanthienen, J. (2003),“Benchmarking state-of-the-art classification algorithms for credit scoring”, Journal of theOperational Research Society, Vol. 54 No. 6, pp. 627-35.
Banasik, J., Crook, J. and Thomas, L. (2001), “Scoring by usage”, Journal of the OperationalResearch Society, Vol. 52 No. 9, pp. 997-1006.
Banasik, J., Crook, J. and Thomas, L. (2003), “Sample selection bias in credit scoring models”,Journal of the Operational Research Society, Vol. 54 No. 8, pp. 822-32.
Banasik, J. and Crook, J. (2005), “Credit scoring augmentation and lean models”, Journal of theOperational Research Society, Vol. 56 No. 9, pp. 1072-81.
Proposed scoring modelsConventional
techniquesAdvancedtechniques
Bothtechniques
Average (Mean) 80.3617 86.1467 83.2542Standard deviation 1.8249 1.5855 3.4327ANOVA F-ratio – – 34.360 * *
Kruskal-Wallis median test statistics – – 8.3077 * *
Cochran’s C test – – 0.56986Bartlett’s test – – 1.00991Levene’s test – – 0.46380
Note: * and * *denotes a statistically significant difference at 5 and 1 percent level, respectively
Table IV.Testing for significantdifferences betweenscoring models
IJMF5,4
404
Banasik, J. and Crook, J. (2007), “Reject inference, augmentation, and sample selection”, EuropeanJournal of Operational Research, Vol. 183 No. 3, pp. 1582-94.
Bishop, C.M. (1995), Neural Networks for Pattern Recognition, Oxford University Press, NewYork, NY.
Blochlinger, A. and Leippold, M. (2006), “Economic benefit of powerful credit scoring”, Journal ofBanking & Finance, Vol. 30 No. 3, pp. 851-73.
Boyes, W.J., Hoffman, D.L. and Low, S.A. (1989), “An econometric analysis of the bank creditscoring problem”, Journal of Econometrics, Vol. 40, pp. 3-14.
Central Bank of Egypt (2007), “Banking developments”, Economic Review, Vol. 47 No. 3,pp. 23-33.
Chen, M. and Huang, S. (2003), “Credit scoring and rejected instances reassigning throughevolutionary computation techniques”, Expert Systems with Applications, Vol. 24 No. 4,pp. 433-41.
Desai, V.S., Crook, J.N. and Overstreet, G.A. (1996), “A comparison of neural networks and linearscoring models in the credit union environment”, European Journal of OperationalResearch, Vol. 95 No. 1, pp. 24-37.
Dimla, D.E. and Lister, P.M. (2000), “On-line metal cutting tool condition monitoring II: tool-stateclassification using multi-layer perceptron neural networks”, International Journal ofMachine Tools and Manufacture, Vol. 40 No. 5, pp. 769-81.
Durand, D. (1941), Risk Elements in Consumer Instalment Financing, Studies in ConsumerInstalment Financing, National Bureau of Economic Research, New York, NY.
Glen, J. (2001), “Classification accuracy in discriminant analysis: a mixed integer programmingapproach”, Journal of the Operational Research Society, Vol. 52 No. 3, pp. 328-39.
Greene, W. (1998), “Sample selection in credit scoring models”, Japan and the World Economy,Vol. 10 No. 3, pp. 299-316.
Hand, D.J. and Henley, W.E. (1997), “Statistical classification methods in consumer credit scoring:a review”, Journal of the Royal Statistical Society. Series A (Statistics in Society), Vol. 160No. 3, pp. 523-41.
Lee, T. and Chen, I. (2005), “A two-stage hybrid credit scoring model using artificial neuralnetworks and multivariate adaptive regression splines”, Expert Systems with Applications,Vol. 28 No. 4, pp. 743-52.
Lee, T., Chiu, C., Lu, C. and Chen, I. (2002), “Credit scoring using the hybrid neural discriminanttechnique”, Expert Systems with Applications, Vol. 23 No. 3, pp. 245-54.
Liang, Q. (2003), “Corporate financial distress diagnosis inChina: empirical analysis using creditscoring models”, Hitotsubashi Journal of Commerce and Management, Vol. 38, pp. 13-28.
Lim, M.K. and Sohn, S.Y. (2007), “Cluster-based dynamic scoring model”, Expert Systems withApplications, Vol. 32 No. 2, pp. 427-31.
Malhotra, R. and Malhotra, D.K. (2003), “Evaluating consumer loans using neural networks”,Omega, Vol. 31 No. 2, pp. 83-96.
Masters, T. (1995), Advanced Algorithms for Neural Networks: ACþþ Sourcebook, John Wiley,New York, NY.
Orgler, Y.E. (1971), “Evaluation of bank consumer loans with credit scoring models”, Journal ofBank Research, Vol. 2 No. 1, pp. 31-7.
Palisade Corporation (2005), Palisade Corporation Neural Tools: Neural Networks Add-In forMicrosoft Excel, Version 1.0, Vol. 0, Palisade Corporation, New York, NY.
Credit scoringand decision
making
405
Reed, R.D. and Marks, R.J. (1999), Neural Smithing: Supervised Learning in Feed-forwardArtificial Neural Networks, The MIT Press, London.
Sarlija, N., Bensic, M. and Bohacek, Z. (2004), “Multinomial model in consumer credit scoring”,Proceedings of the 10th International Conference on Operational Research, Trogir, Croatia.
Steenackers, A. and Goovaerts, M.J. (1989), “A credit scoring model for personal loans”,Insurance: Mathematics and Economics, Vol. 8, pp. 31-4.
Trippi, R.R. and Turban, E. (1993), Neural Networks in Finance and Investing: Using ArtificialIntelligence to Improve Real-World Performance, Irwin, Chicago, IL.
Verstraeten, G. and Van den Poel, D. (2005), “The impact of sample bias on consumer creditscoring performance and profitability”, Journal of the Operational Research Society, Vol. 56No. 8, pp. 981-92.
West, D. (2000), “Neural network credit scoring models”, Computers & Operations Research,Vol. 27, pp. 1131-52.
Zekic-Susac, M., Sarlija, N. and Bensic, M. (2004), “Small business credit scoring: a comparison oflogistic regression, neural networks, and decision tree models”, Proceedings of the 26thInternational Conference on Information Technology Interfaces, Croatia.
Zhang, G., Hu, M.Y., Patuwo, B.E. and Indro, D.C. (1999), “Artificial neural networks inbankruptcy prediction: general framework and cross-validation analysis”, EuropeanJournal of Operational Research, Vol. 116 No. 1, pp. 16-32.
Further reading
Melssen, W., Wehrens, R. and Buydens, L. (2006), “Supervised Kohonen networks forclassification problems”, Chemometrics and Intelligent Laboratory Systems, Vol. 83 No. 2,pp. 99-113.
Yim, J. and Mitchell, H. (2005), “Comparison of country risk models: hybrid neural networks, logitmodels, discriminant analysis and cluster techniques”, Expert Systems with Applications,Vol. 28 No. 1, pp. 137-48.
About the authorsHussein A. Abdou is a Lecturer in Finance and Banking, and a member of The Management andManagement Sciences Research Institute (MAMS), Centre for Economics and Finance Researchat the University of Salford Business School, UK. Also he is affiliated with the Economics andFinance Research Unit of the Peninsula Centre for Sustainable Governance (PCSG) at TheUniversity of Plymouth Business School, UK. As an active researcher in finance and banking, hehas published widely in international journals, including The Journal of Risk Finance, ExpertSystems with Applications, and Journal of International Business Strategy. Hussein A. Abdou canbe contacted at: [email protected]
John Pointon is Professor of Finance at the University of Plymouth Business School, andmember of the CIMA Research Board. Also, he is a member of the Economics and FinanceResearch Unit of the Peninsula Centre for Sustainable Governance (PCSG) at The University ofPlymouth Business School, UK. As an active researcher in finance, he has publications ininternational refereed journals, including International Journal of Theoretical and AppliedFinance, European Journal of Finance, Expert Systems with Applications and Business Ethics: AEuropean Review.
IJMF5,4
406
To purchase reprints of this article please e-mail: [email protected] visit our web site for further details: www.emeraldinsight.com/reprints