CREATiNg vALUE wORLdwidE - Dürr Group
176
2008 ANNUAL REPORT CREATING VALUE WORLDWIDE
-
Upload
khangminh22 -
Category
Documents
-
view
1 -
download
0
Transcript of CREATiNg vALUE wORLdwidE - Dürr Group

2 0 0 8 A N N U A L R E P O R T
CRE AT iNg vALUE wORLdw idE

KEy figURES (ifRS)(ContInuIng operatIons)
2008 2007 2006 2005 2004 2008 / 2007 Change in %
incoming orders in € m 1,464.0 1,781.5 1,459.8 1,216.9 1,387.4 – 17.8
(Paint and Assembly Systems) in € m 1,028.0 1,362.5 1,155.6 931.2 1,086.4 – 24.6
(Measuring and Process Systems) in € m 436.0 419.0 304.2 285.7 301.0 4.1
Orders on hand (dec. 31) in € m 925.0 1,082.0 805.2 723.5 859.9 – 14.5
Sales revenues in € m 1,602.8 1,476.6 1,361.2 1,400.6 1,725.8 8.5
(Paint and Assembly Systems) in € m 1,191.6 1,088.9 1,083.9 1,090.0 1,413.8 9.4
(Measuring and Process Systems) in € m 411.2 387.7 277.3 310.6 312.0 6.1
EBiT in € m 72.7 55.7 33.1 – 70.3 29.0 30.4
(Paint and Assembly Systems) in € m 48.6 32.7 29.4 – 41.4 30.3 48.6
(Measuring and Process Systems) in € m 30.8 23.2 4.6 – 19.1 – 3.9 32.8
Net income/loss in € m 33.7 21.2 8.2 – 104.5 – 1.1 59.0
Cash flow from operating activities in € m 30.9 85.9 – 9.8 – 147.6 – 115.5 – 64.0
Cash flow from investing activities in € m –2.6 – 11.2 17.3 283.9 – 19.5
Cash flow from financing activities in € m – 96.1 – 21.9 – 33.8 – 76.0 – 19.4
free cash flow in € m –14.5 40.6 – 46.5 – 206.1 – 150.9
Equity (with minority interests) (dec. 31) in € m 341.4 257.1 245.7 248.1 222.7 32.8
Net financial debt1 (dec. 31) in € m 34.4 61.8 96.5 84.9 242.8 – 44.3
Net working capital (dec. 31) in € m 151.8 128.9 154.7 171.5 120.5 17.8
Employees (dec. 31) 6,143 5,936 5,650 5,992 6,240 3.5
(Paint and Assembly Systems) 3,595 3,551 3,786 3,979 4,236 1.2
(Measuring and Process Systems) 2,499 2,338 1,821 1,966 1,953 6.9
gearing (dec. 31) in % 9.2 19.4 28.2 25.5 52.2 – 52.6
Equity ratio (dec. 31) in % 31.4 23.9 23.6 20.9 15.5 31.4
EBiT margin in % 4.5 3.8 2.4 – 5.0 1.7 18.4
ROCE (dec. 31) in % 16.8 15.0 7.6 –16.9 3.9 12.0
dürr stock (iSiN: dE0005565204)
High2 in € 33.89 34.70 26.90 20.35 21.10
Low2 in € 9.99 20.20 17.14 13.23 14.50
Close2 in € 12.25 26.60 20.99 20.30 15.11
Number of shares
(weighted average) 16,535,752 15,728,020 15,728,020 14,400,050 14,298,200
Earnings per share in € 1.81 1.33 0.50 – 7.26 0.00 36.1
dividend per share in € 0.703 0.40 – – – 75.0
1 without finance leases2 XETRA3 dividend proposed to the
annual shareholders’ meeting
immaterial variances may occur in this report due to roundings in the computation of sums and percentages.

fACTS ANd figURES
Dürr is the world market leader in 90% of its activities. 60% of the auto
mobile industry´s paint shops are more than 20 years old. Our service business
profits from this, contributing 25% to our sales revenues. Every day over 4 million
automobile components are balanced on machines from Schenck. 48% of our
order intake in 2008 came from the emerging markets. Our equity ratio reached a ten
year high of 31% at the end of 2008, while our net income was up 59 %.
Our new Eco DryScrubber spray booth concept lowers energy consumption in the
automobile painting process by up to 30%. Together with other Dürr innovations,
this reduces a paint shop’s CO2 emissions by over 250,000 tonnes*.
*over a period of seven years (the usual life cycle of an automobile model)

In l Ine wIth the trend
Small, economical cars are in demand worldwide. in Europe,
this growth segment accounted for 39 % of all new registra-
tions in 2008, up from just 31 % in 1999. we are profiting from
this trend, not only with our LeanLine paint systems but also
in balancing, cleaning and assembly technology. Our local
value-added structure makes us a key equipment supplier for
small car production especially in the emerging markets.

CREATING VALUE WORLDWIDE
Dürr is an engineering group with a strong international orientation.
We have been expanding with our customers into new markets since
the early 1960s. Today, Dürr has 47 locations in 21 countries. For us,
local value added has been a traditional focus. This enables us to oper-
ate close to the market and to improve on our cost leadership, for in-
stance through global sourcing offices in Asia and Eastern Europe, our
international manufacturing network, and the Dürr engineering centers
in India and Poland. Dürr’s international presence is also a strategic
advantage for sales and service. As much as 48 % of our incoming orders
came from the growth markets in 2008.
This year’s annual report will give you an idea of how we are seizing
our opportunities around the world and are generating benefits both
for our customers and ourselves, whether as a supplier of plant and
equipment to the automobile industry in India, Mexico or Poland, a
versatile service partner in Brazil, a balancing specialist addressing
the needs of the local market in China, or as a technology partner for
low-emission engines in Germany.

2
CONTENTs
Global Presence
65 Purchasing
66 Employees
69 sustainability
72 Opportunities and risks
85 Events subsequent to the reporting date
87 Outlook
4 MANAGEMENT AND sTOCK
26 Organization and activities
36 Legal and economic factors of influence
37 strategy and business drivers
40 Board of Management´s overall assessment
42 Economy and industry environment
43 Business development
53 Financial development
61 Research and development
26 GROUP MANAGEMENT REPORT
4 Letter from the Board of Management
6 Report of the supervisory Board
10 Dürr on the capital market
13 Corporate Governance report
19 MA RK ET AND BUsINEss
19 Highlights from 2008
22 Project report „Revamp VW Zwickau“
24 Aircraft business
Powerful North AmericA uNit
Mexico page 86
every thiNg from oNe source
Brazil page 35

3
92 CONsOLIDAT ED F INANCIAL sTAT EMENTs 16 3 OT HER
93 Independent auditors’ report
94 Consolidated income statement
95 Consolidated balance sheet
96 Consolidated statement of changes
in shareholders’ equity
98 statement of recognized income and expenses
99 Consolidated cash flow statement
100 Notes to the consolidated financial statements
163 Responsibility statement by management
164 Ten-year summary
166 Glossary
168 Index
COV ER
Milestones 2008
globAl eNgiNeeriNg India page 41
locAl Product develoPmeNt China page 68
Project executioN Across the Net work
Poland | Italy page 51
dowNsiz iNg PArtNer Germany page 77

4
LETTER FROM THE BOARD OF MANAGEMENT
DEAR sHAREHOLDERs, CUsTOMERs, BUsINEss AssOCIATEs,
AND sTAFF,
2008 was Dürr’s most successful year in the past decade. We largely achieved our targets, and key perform- ance indicators were again substantially improved. Three factors supported us in particular: global presence, a solid financial position, and our innovative power, which is an important driver of cost reductions for our customers.
sales were up 8.5 % to € 1.6 billion. This was within our target range of 5 to 10 % growth. On a comparable basis, allowing for the deliberate reduction of our final assembly conveyor business, the growth was 14 %. EBIT rose more than proportionally by 30 % to € 73 million. Our EBIT margin also improved substantially to 4.5 % (2007: 3.8 %), although we did not quite reach our target of 5 %. This was largely due to one-off restruc-turing costs and losses on old orders in the UsA and France in the final assembly conveyor business. This business has been considerably downsized and has been discontinued altogether in the UsA, so we do not expect any further losses here in 2009.
We have further optimized our capital structure, too. Our equity ratio rose strongly, from 23.9 % to 31.4 % at the end of 2008. This was the highest level for ten years and exceeded our target of 30 % two years earlier than planned. Net financial debt was further reduced as well and, at € 34.4 million, was also our best figure for ten years. The third decisive step was the refinancing in 2008. This has increased our financial room for maneuver and placed our financing on a secure basis until into 2011, with reduced interest expense. All in all, we improved our financial strength considerably in 2008 – an asset much valued by our customers, especially in times of crisis.
At € 1.46 billion, new orders were down 18 % from the very high 2007 figure but were level with 2006. Owing to the abruptly accelerating economic downturn, ready-to-sign projects worth around € 200 million were postponed in December.
We have started off the current year in the conviction that the economic crisis will not knock us off our long-term upward trend. We are in fact well prepared for the downswing. The Group-wide FOCUs program and the optimization measures that followed in 2007 and 2008 have made the Group much more flexible and ro-bust. Our business processes are lean and efficient, sources of losses have been systematically eliminated, and risk management has been expanded. Thanks to the low proportion of fixed costs and our variable ca-pacity management we can adjust quickly to market changes. We have responded immediately to the drop in orders in December and will be reducing our capacities in France and the UsA, and our level of leased labor,

54 mANAgemeNt ANd stock 92 CONsOLIDATED FINANCIAL sTATEMENTs 163 OTHER26 MANAGEMENT REPORT19 MARKET AND BUsINEss
4 letter from the boArd of mANAgemeNt
R ALPH HEUW ING, CFOR ALF W. D IET ER, CEO
stuttgart, March 17, 2009
R ALF W. D IETER (4 8), CHAIRMAN
(left)
R ALPH HEUWING (4 3)
Paint and Assembly systems
Measuring and Process systems
Public Relations
Human Resources (Employee Affairs Director)
Research and Development
Quality
Internal Auditing
Dürr Consulting
Finance /Controlling
Investor Relations
Risk Management
Legal Affairs / Patents
Information Technology
Corporate Real Estate
with about 500 job cuts planned by the end of March 2009. Additionally, we are making use of flexible instru-ments such as the rundown of working time accounts and the distribution of work packages within the Group according to capacity utilization.
We want our shareholders to share in our success in 2008. The supervisory Board and the Board of Manage-ment are therefore proposing to the annual general meeting an increased dividend of € 0.70 per share. This underscores our confidence for the coming years. While moderate declines in business volume and earnings are likely in 2009 in view of the difficult operating environment, in the mid and long term we are well pos- itioned with our “Dürr 2010” strategy to grow profitably and to capitalize on the key trends in our markets. This includes not only the growth in mobility and production in the emerging markets but also the high demand for energy-efficient and more productive manufacturing systems in the automobile and aircraft industries. With our LeanLine production systems we are profiting also from the growth in the small car segment. At the same time, the trend towards low-fuel-consumption engines is generating additional demand for Dürr’s cleaning and balancing systems. And, last but not least, we will be leveraging our strong position in services and revamp business to increase its weight to 30 % of sales.
We assume that the support measures by central banks and governments will start to take effect in the se- cond half of the year and will help revive the economy in 2010. However, we are watching the markets closely so that we can initiate further capacity and cost reduction measures if necessary. From today’s vantage point, we expect that the automobile industry will continue to carry through selected investments in strate-gically important markets and in rationalizing production processes, although the volume of available orders in 2009 and 2010 is likely to be lower than in the past two years. On this basis we are convinced that thanks to our operational, financial and technological strengths we can win market share and emerge strengthened from the crisis.
In facing the challenges that lie ahead in 2009 we are counting on the dedication, expertise and enterprise of our employees. At the same time we wish to thank them for their outstanding commitment in the past year. We are also especially grateful to our customers, business associates, and shareholders, who have put their confidence in the company. sincerely,

6
Dürr achieved its most important targets in 2008. As predicted, the equity ratio and net financial debt were substantially improved. Other points to be highlighted are the good liquidity position and the Group refi-nancing completed in september, both factors that make Dürr a reliable partner for its customers also in eco-nomically more difficult times. 2009 will not be an easy year but the supervisory Board believes that Dürr is well equipped, a view that is supported by the company’s outstanding competence in emission and energy-optimized manufacturing processes and strong presence in the growth markets. The “Dürr 2010” strategy program initiated in 2007, with its focuses on customer benefit, growth initiatives, process optimization and value creation, will be rigorously pursued in 2009.
The supervisory Board advised the Board of Management intensively in 2008 and performed all the tasks assigned to it by law and by the articles of incorporation. In all decisions important for the company the Board of Management weighed the arguments together with the supervisory Board. The Board of Manage-ment informed the supervisory Board in a timely and comprehensive manner about the economic situation and company planning and about transactions requiring consent, material business processes, and risk management. The supervisory Board adopted its resolutions after thorough review based on written deci-sion-making materials.
The supervisory Board monitored the Board of Management’s conduct of the company’s affairs closely; it confirms that the Board of Management always acted lawfully, diligently and economically. In its conduct of the company’s affairs, the Board of Management regularly consulted the Group’s Compliance and Legal Department and reached its decisions in conformity with the risk management system. When earnings risks emerged, the Board of Management took counteraction in close consultation with the supervisory Board. One example is the downsizing of the assembly conveyor business where Dürr is now concentrating on tech-nologically more demanding segments with higher margins. The Board of Management also reported con-tinuously and in a timely manner to the supervisory Board about other existing risks. The supervisory Board advised the Board of Management regarding the reorganization and extension of the risk control and moni-toring system.
The supervisory Board held four regular meetings in 2008. The supervisory Board Chairman was also in regular contact with the Board of Management outside the meetings. He kept all members of the super-visory Board informed of the results of these talks. The supervisory Board Chairman also supported the Board of Management in representing the company and in connection with important events.
REPORT OF THE sUPERVIsORy BOARD

74 mANAgemeNt ANd stock 92 CONsOLIDATED FINANCIAL sTATEMENTs 163 OTHER26 MANAGEMENT REPORT19 MARKET AND BUsINEss
6 rePort of the suPervisory boArd
glossAry: P. 166
DR.- ING. E . H . HEINZ DüRR
mAiN focuses of the suPervisory boArd’s Activit ies
At all its meetings the supervisory Board discussed the Group’s business development and financial position with the Board of Management. A special focus was the development of demand and earnings. The liquidity situation was analyzed regularly in view of the more difficult market environment and was also an important consideration in the discussions about the Group’s refinancing. The package of capital increase, new syndi-cated loan and partial bond redemption drawn up by the Board of Management provides Dürr with a stable financing base and reliable source of liquidity. The supervisory Board passed the resolutions required for the capital increase by written circulatory vote in June. The progress of the Campus project – the expansion of the Bietigheim-Bissingen site – was followed at all the meetings.
Important items on the agenda of the supervisory Board meeting on March 19, 2008, were the annual financial statements, the expansion in the growth markets, and the expansion of business with the aircraft industry. The supervisory Board also consented to the sale of two properties in Plymouth and Wixom (UsA) in the form of a sale-and-leaseback transaction. At the meeting on May 2, 2008, the focus was on business devel-opment in the bric countries and the reduction of net financial debt. At the third meeting on October 1, 2008, the Board of Management and the heads of the six business units presented their strategies within the frame work of “Dürr 2010”. The main focus was Dürr’s innovation program with new technologies for the energy efficient production of cars. The supervisory Board also discussed a personnel report that provided infor mation especially on training and human resources development.
Important issues at the fourth supervisory Board meeting on December 15, 2008, were the risk management system and the progress of the Group-wide IT harmonization. The supervisory Board also approved the company planning for the year 2009, acknowledged the planning for the two subsequent years, and was in-formed about the intended business policy. At the same meeting, the supervisory Board’s efficiency was discussed intensively. On December 15, the Chairman of the supervisory Board and the Chairman of the Board of Management also signed an updated declaration of compliance pursuant to sec. 161 of the German stock Corporation Act. Detailed information on Dürr’s corporate governance can be found on pages 13 to 18.
work of the commit tees
The main function of the committees is to prepare resolutions and topics for the supervisory Board meet-ings. The composition of the committees is outlined on pages 156 and 157. The Personnel Committee met twice in 2008 and deliberated on the compensation system for the Board of Management; a main focus at the second meeting was preparations for extending the contract of employment with Mr. Heuwing until May 2012. The Audit Committee met twice. It discussed intensively the unconsolidated and consolidated financial

8
statements, the quarterly results and – at its meeting in December 2008 – the focuses for the external audit. The Audit Committee also monitored compliance with capital market regulations. The Mediation Committee did not need to convene. The Nominating Committee did not convene either as no nominations for the elec-tion of shareholder representatives had to be submitted to the general meeting. The committee chairmen reported regularly on the subject-matter and results of the committee meetings at the supervisory Board’s plenary meetings.
chANges iN the suPervisory boArd
Thomas Hohmann joined the supervisory Board as representative of the management employees on Janu- ary 1, 2008. As the elected substitute member, he replaced Harald Lambacher, who left the supervisory Board and the company on December 31, 2007.
Audit ANd r Atif icAtioN of the ANNuAl f iNANciAl stAtemeNts
Ernst & young AG Wirtschaftsprüfungsgesellschaft steuerberatungsgesellschaft examined the annual financial statements, the consolidated financial statements, the management report, and the Group manage-ment report for Dürr AG prepared by the Board of Management for the period ended December 31, 2008 and issued an unqualified auditors´ certificate.
The annual financial statements, the consolidated financial statements, the management report and the Group management report were submitted to the members of the supervisory Board in good time. They were discussed in detail with the Board of Management and reviewed at the supervisory Board meeting held to approve the financial statements on March 17, 2009. The same applies to the auditors´ reports that were also submitted in due time. The auditors signing the audit certificate participated in that meeting and in the Audit Committee meeting on March 16, 2009. They reported on their audit and were available for further explanations and discussions. At the supervisory Board meeting held to approve the financial statements, the Chairman of the Audit Committee commented in detail on the audit documents, reported on the preliminary talks with the auditors, and elaborated on the dividend proposal and on the areas of impairment testing, company planning, deferred taxes, contingent liabilities and the accounting treatment of derivative financial instruments that were principal focuses of the audit.
On the basis of the documents presented to it and the reports of the Audit Committee and the auditors, the supervisory Board has examined and accepted the annual financial statements, the consolidated financial statements, the management report, and the Group management report. The supervisory Board’s own review found no cause for objection. The supervisory Board approves the results of the audits of both sets

94 mANAgemeNt ANd stock 92 CONsOLIDATED FINANCIAL sTATEMENTs 163 OTHER26 MANAGEMENT REPORT19 MARKET AND BUsINEss
6 rePort of the suPervisory boArd
DR.- ING. E . H . HEINZ DüRR
Chairman of the supervisory Board stuttgart, March 17, 2009
of financial statements, agrees with the Board of Management in its assessment of the situation of the Group and Dürr AG, and approves the annual financial statements and the consolidated financial statements prepared for the period ended December 31, 2008. The annual financial statements are thereby ratified. In light of the Audit Committee’s recommendation and its own review the supervisory Board approves the Board of Management’s proposal on the use of unappropriated profit.
The supervisory Board has examined the report prepared by the Board of Management pursuant to sec. 312 of the German stock Corporation Act concerning relationships with associated enterprises (dependent company report) for 2008. The auditor issued the following unqualified certificate pursuant to sec. 313 (3) of the German stock Corporation Act:
“After examination and assessment in accordance with our professional duties, we confirm that:
1. the factual information given in the report is correct,2. the consideration paid by the company in connection with the transactions mentioned in the report was
not unduly high or disadvantages have been balanced out.”
The supervisory Board concurs with this audit result. According to the final result of the examination by the supervisory Board, there are no objections to be raised against the declaration by the Board of Management at the end of the dependent company report.
The supervisory Board thanks the Board of Management, the employee representatives, and all employees for their dedication in 2008, as well as the shareholders for the confidence they have placed in the company.

10
o N dj f m A m j j A s
Price treNd of dürr stock iN xetr A tr AdiNg from jANuAry – december 2008
comPAred with develoPmeNt of the dA x, mdA x, ANd sdA x ( iNdexed vAlues) iN %
IsIN DE0005565204
REUTERs syMBOL DUEG
BLOOMBERG CODE DUE Gy
THOMsON FINANCIAL DUE-xE
Dürr stock in xETRA trading DAx MDAx sDAx
125
100
75
50
25
The main objective of our capital market communication is a fair valuation of the Dürr stock. This is based on open, up-to-date and continuous information assuring high visibility and transparency.
In spring 2008, the Dürr stock reached prices well above € 30 and showed a better performance than the relevant benchmark indices. However, the stock then lost considerable ground over the rest of the year, although our quarterly results exceeded analysts’ and investors’ expectations in some cases. The downturn was triggered by growing concerns over the economic outlook. This led to strong price falls across the board, especially in cyclical stocks in the automotive and engineering sectors. Investors switched out of small and mid caps into more liquid blue chips and more defensive stocks.
Equity markets around the world suffered massive setbacks in the second half of 2008. The DAx closed the year down 40.4 % versus the beginning of year, while the MDAx lost 43.2 % and the sDAx 46.1 %. The Dürr stock lost 53.9 % over the year to close at € 12.25. In our view, this price level does not adequately reflect the company’s positive longer-term perspectives.
The Dürr stock is listed in the Deutsche Börse Prime standard segment and is traded on all German stock exchanges. More than 90 % of the turnover in the stock is on the xETRA platform. We rejoined Deutsche Börse´s small cap index, the sDAx, at the end of January 2007, and were able to improve our ranking within this index slightly in the course of 2008.
ANAlyst recommeNdAtioNs
The number of analysts covering our stock rose again slightly in 2008. 83 % of the analysts made buy recommendations on our stock and raised their price targets substantially in some cases. This makes us one of the best rated stocks in the sDAx. There were no sell recommendations.
DüRR ON THE CAPITAL MARKET
HIGHER DIVIDEND FOR 2008 PROPOsED

114 management and stock 92 consolidated financial statements 163 other26 management report19 market and business
17 % 83 %
10 dÜRR on the capital maRket
bayerische landesbank
berenberg bank
bhf-bank
cazenove
commerzbank
deutsche bank
dZ bank
hsbc trinkaus & burkhardt
landesbank baden-
Württemberg
merck finck & co.
solventis Wertpapier -
handels bank
Viscardi
buy hold
analyst Recommendations
december 2008
glossaRy: p. 166
intensive capital maRket communication continued
in addition to our annual analyst conference in march, we also organized an investors day at the carl schenck location in darmstadt in november 2008, when we presented our latest nine-month results and also discussed innovations in balancing technology and the contribu-tions we are making towards energy-efficient automobile production. during the year we took part in seven roadshows and five capital market conferences. We also conducted well over 100 one-on-one meetings with investors.
comprehensive information is published for investors and journalists on our website at www.durr.com/en/investor, including the outlook, core elements of the “dürr 2010” strategy program, and information and disclosures on corporate governance.
capital incRease successfully pl aced
in mid-June 2009, we placed 1,572,500 new bearer ordinary shares (just under 10 % of the capi- tal stock) in an accelerated bookbuilding process. the new shares were mostly subscribed by institutional investors. priced at € 28.00 per share, the issue generated net proceeds of € 43.7 million. these funds were partly used to redeem 50 % of our high-interest bond and partly allo-cated to a liquidity reserve to finance smallish bolt-on acquisitions that are planned to round out our activities.
as a result of the capital increase, the number of shares outstanding rose to 17,300,520. the average number of shares outstanding in 2008 was 16.5 million. the growth in shareholders’ equity prompted standard & poor´s and moody´s to upgrade their ratings for dürr ag in august 2008, in each case by one notch to “b+” and “b1“, respectively (for more information see page 82).
awaRd foR dÜRR’s 2007 annual RepoRt
dürr received an award in manager magazin’s best annual reports competition for the second year running. We again took third place out of 50 companies in the sdaX category. in the over- all ranking of all roughly 200 companies (including the eurostoXX 50 blue chips), we were in 34th place, an improvement of six places over the previous year.
key f iguRes foR dÜRR stock
1 dividend proposed to the annual shareholders’ meeting
2008 2007 2006 2005 2004
earnings per share, group (in €) 2.57 1.39 0.45 0.30 0.40
earnings per share, continuing operations (in €) 1.81 1.33 0.50 – 7.26 0.00
book value per share, continuing operations (in €) 19.73 16.35 15.50 15.70 15.30
cash flow per share, continuing operations (in €) 1.87 5.46 – 0.63 – 10.25 – 8.08
dividend per share (in €) 0.70 1 0.40 – – –
high (in €) 33.89 34.70 26.90 20.35 21.10
low (in €) 9.99 20.20 17.14 13.23 14.50
close (in €) 12.25 26.60 20.99 20.30 15.11
average daily trading volume (in shares) 25,661 35,925 19,244 12,726 7,801
market capitalization at dec. 31 (in € m) 211.9 418.4 330.1 319.3 216.0
number of shares (weighted average) 16,535,752 15,728,020 15,728,020 14,400,050 14,298,200

12
shAreholder structure
december 31, 2008
bond buyback conditions
On or after July 15, 2009,
at 102.625 %
On or after July 15, 2010,
at 100.000 %
bond
IsIN (Reg s): xs0195957658
IsIN (144a): xs0195957815
17.2 %
38.3 %
26.7 % 3.5 %
1.3 %
5.0 %
8.0 %
Heinz Dürr GmbH, Berlin
Heinz und Heide Dürr stiftung GmbH, Berlin
ATON GmbH, Fulda
Harris Associates L.P., Chicago
süd-Kapitalbeteiligungs-Gesellschaft mbH, stuttgart
Institutional and private investors
Dürr AG Board of Management
According to Deutsche Börse’s calculations, the free float is 36.0 %.
stAble shAreholder structure
Our shareholder structure did not change materially in 2008 despite the adverse conditions on the equity market and heavy outflows of funds from investment companies. Our stock’s free float, calculated using the Deutsche Börse model, was 36.0 % at the end of 2008 (December 31, 2007: 40.4 %). The principal shareholders – the Dürr family, ATON, and Harris Associates – par- ticipated in the capital increase. The Dürr family’s interest, which is held through Heinz Dürr GmbH and the Heinz und Heide Dürr stiftung GmbH foundation, declined slightly from 44.5 % (end-2007) to 41.8 % (end-2008). The investment company ATON is the second largest sharehold-er with an interest of 17.2 % (up from 12.2 % at the end of 2007). Harris Associates, a Us invest-ment fund company, also increased its stake in 2008 from 5.0 % to 8.0 %. Both members of the Board of Management of Dürr AG purchased additional shares, increasing their combined stake to 1.3 %.
ProPosed divideNd: € 0.70 Per shAre
The Board of Management and the supervisory Board have decided to propose to the annual shareholders´ meeting that the dividend for 2008 be increased to € 0.70 per share (2007: € 0.40). Equivalent to a payout ratio of 26 %, this is slightly below the level of 30 to 35 % announced for our dividend policy. Based on the stock’s closing price in 2008, € 0.70 per share implies to a divi-dend yield of 5.7 %, which is considerably above the yield on German government bonds (Bunds).
boNd: 50 % redeemed
In mid-October 2008, we redeemed half, or € 100 million, of the high-interest bond we issued in 2004 prematurely at a price of 105.25 %. This will reduce our interest burden significantly as from 2009. We still plan to redeem the second tranche of our bond. However, owing to the financial crisis we will be considering the available financing alternatives in due course. Our bond runs until 2011 and cannot be called by the bondholders.

134 mANAgemeNt ANd stock 92 CONsOLIDATED FINANCIAL sTATEMENTs 163 OTHER26 MANAGEMENT REPORT19 MARKET AND BUsINEss
10 dürr oN the cAPitAl mArket
13 corPorAte goverNANce rePort
Dürr identifies with the spirit and aims of the German Corporate Governance Code. since it was introduced in 2002 it has become established as a standard for transparent, responsible company management, although individual rules continue to be controversial. It is our firm conviction that good corporate governance is an essential basis for successful business development and sus-tained value creation. At the same time, we consider it to be an integral part of a corporate culture driven by fairness and respect.
We have considered the revised version of the Code that was published on June 6, 2008, very carefully. As in the past, we are implementing most of the recommendations. Upon careful con-sideration, we have not complied with only four recommendations. The relevant passages from the Code and our reasons for not conforming are cited in the excerpt from the declaration of compliance from December 15, 2008, which was also published in the Internet at www.durr.com.
excerPt from the decl Ar AtioN of comPliANce As of december 15, 2008
item 3.8, PArAgrAPh 2: if the company takes out a d&o (directors and officers’ liability insurance)
policy for the management board and supervisory board, a suitable deductible shall be agreed. A D&O insurance policy with no deductibles exists for the members of the Board of Manage-ment and the supervisory Board. This is a group insurance policy for executives at home and abroad, although a differentiation between members of the executive body and employees does not appear appropriate. In addition, a deductible is not usual abroad and would therefore make it difficult to recruit executives from abroad.
CORPORATE GOVERNANCE REPORT
NEW VERsION OF THE CODE
LARGELy IMPLEMENTED

14
Item 4.2.3, ParagraPhs 4 and 5: In concluding management Board contracts, care shall be taken
to ensure that payments made to a management Board member on premature termination of his
contract without serious cause do not exceed the value of two years’ compensation (severance pay-
ment cap) and compensate no more than the remaining term of the contract. the severance payment
cap shall be calculated on the basis of the total compensation for the past full financial year and if
appropriate also the expected total compensation for the current financial year. Payments promised
in the event of premature termination of a management Board member’s contract due to a change
of control shall not exceed 150 % of the severance payment cap.
Existing contracts with Management Board members will not be adapted to the recommendations of the Code introduced in June 2008. The implementation of the recommendations will be considered for the conclusion of new contracts.
Item 5.4.1, sentence 2: ... an age limit to be specified for the members of the supervisory Board
shall be taken into account. Dürr sees no necessity for defining an age limit for members of its Supervisory Board.
Item 5.4.6, ParagraPh 3: the compensation of the members of the supervisory Board shall be
reported individually in the corporate governance report, subdivided according to components.
also payments made by the enterprise to the members of the supervisory Board or advantages ex-
tended for services provided individually, in particular, advisory or agency services shall be listed
separately in the corporate governance report. We report the sum of compensation of the members of our Supervisory Board in the Notes to our consolidated financial statements. In our view a special, individualized disclosure by components would not provide any additional benefit for the shareholders as the compensation is defined in the company’s articles of incorporation.
Off-exchange purchase of shares
Price in €
number
transaction volume in €
2008
Ralf W. Dieter, Board member Jan. 18, 2008 18.00 20,000 360,000.00
Ralph Heuwing, Board member Jan. 18, 2008 18.00 20,000 360,000.00
Ralph Heuwing, Board member Sept. 26, 2008 20.00 30,000 600,000.00
rePOrted secUrIt Ies tr ansactIOns Of the memBers Of the BOard Of management Of dürr ag

154 mANAgemeNt ANd stock 92 CONsOLIDATED FINANCIAL sTATEMENTs 163 OTHER26 MANAGEMENT REPORT19 MARKET AND BUsINEss
13 corPorAte goverNANce rePort
tr ANsPAreNt commuNicAtioN ANd equAl treAtmeNt
It is especially important for us that all shareholders and other stakeholders have timely and equal access to information. We are concerned not only to disseminate facts and figures but also explain them in their context. We do this for instance in annual and quarterly reports and in our press releases for the financial and trade press. Our website at www.durr.com is a further comprehensive source of information. Under the heading “Corporate Governance”, information is published there for instance on the Board of Management, the supervisory Board, directors’ dealings, compliance and compensation as well as the articles of incorporation of Dürr AG and the so-called Annual Document.
shAreholdiNgs ANd securit ies tr ANsActioNs thAt must be rePorted
(d irectors’ deAliNgs)
The Chairman of the supervisory Board, Heinz Dürr, owns 41.8 % of the shares of Dürr AG (De-cember 31, 2008) through the company Heinz Dürr GmbH and the Heinz und Heide Dürr stiftung GmbH foundation. Altogether, members of the supervisory Board own 41.9 % of the capital (December 31, 2008). The members of the Board of Management of Dürr AG own 1.3 % of the shares of the company; 0.4 % is held by Ralf W. Dieter and 0.9 % by Ralph Heuwing. securities transactions that have to be reported pursuant to sec. 15a of the German securities Trading Act – so-called directors’ dealings – are published in the Internet at www.durr.com/en/investor/corporate-governance immediately the company is notified. In 2008, the overwhelming major-ity of the securities transactions subject to the reporting requirement were carried out by Heinz Dürr GmbH which, with the exception of two sales transactions to the members of the Board of Management of Dürr AG, made purchases only. The security lending transaction on June 17, 2008, served merely for the technical execution of the capital increase and was reversed after-wards.
comPliANce
Ralph Heuwing is responsible as Chief Financial Officer for matters relating to corporate gover-nance and compliance with capital market regulations. He works closely with the compliance officer within the legal department of Dürr AG.
rePorted securit ies tr ANsActioNs of he iNz dürr gmbh
off-exchange purchase of shares
off-exchange sale of shares
off-exchange security lending
Price in €
Number
transaction volume in €
Jan. 02, 2008 26.60 10,000 266,000.00
Jan. 18, 2008 18.00 40,000 720,000.00
Jun. 17, 2008 1,572,500
Jun. 18, 2008 28.00 200,000 5,600,000.00
Aug. 14, 2008 23.16 20,000 463,200.00
sept. 01, 2008 22.65 10,000 226,500.00
sept. 03, 2008 23.14 5,000 115,700.00
sept. 08, 2008 22.34 5,000 111,700.00
sept. 13, 2008 21.79 5,000 108,950.00
sept. 24, 2008 19.98 10,000 199,800.00
sept. 26, 2008 20.00 30,000 600,000.00
Oct. 02, 2008 18.632 10,000 186,320.00
Nov. 17, 2008 11.94 20,000 238,000.00

16
risk mANAgemeNt
We have systematically improved and extended our risk management over the past years. The most important aim was to minimize execution risks in the plant engineering business. A detailed description of our risk management and the company’s current risk situation can be found on pages 72 to 82 of this report.
Auditor
As in the preceding years, the annual shareholders’ meeting appointed Ernst & young AG Wirtschaftsprüfungsgesellschaft steuerberatungsgesellschaft, stuttgart, as the independent auditor for fiscal 2008. Before the supervisory Board proposed Ernst & young for election, it received a statement from Ernst & young stating that no relationships exist between the auditor, its bodies, and its head auditors, on the one hand, and Dürr or members of Dürr’s bodies, on the other hand, that could cast doubt on Ernst & young’s independence. Pursuant to item 7.2.3 of the German Corporate Governance Code the supervisory Board also instructed Ernst & young to inform it immediately of all matters relevant for the work of the supervisory Board that come to its notice in the course of the audit. The auditor is also required to inform the supervi-sory Board if it encounters any deviations from the declaration of compliance. However, there were no grounds for this to be done.
COMPENsATION REPORT
The German Corporate Governance Code recommends that companies report on the compen-sation of the members of the supervisory Board and the Board of Management in the corporate governance report. The German Commercial Code requires that information on the compensa-tion of the two boards be disclosed in the management report and in the notes to the consoli-dated financial statements (secs. 315 and 314 of the German Commercial Code). Thus, in addition to the information given below, we refer readers to the corresponding information in the notes to the consolidated financial statements (item 36) which shall be deemed part of this corporate governance report. The information in the following eight paragraphs fulfills the disclosure re-quirements pursuant to sec. 315 of the German Commercial code. These disclosures constitute part of the group management report.
174 mANAgemeNt ANd stock 92 CONsOLIDATED FINANCIAL sTATEMENTs 163 OTHER26 MANAGEMENT REPORT19 MARKET AND BUsINEss
13 corPorAte goverNANce rePort
The members of the Board of Management do not carry on significant sideline activities other than those listed in the notes to the consolidated financial statements (item 36). Moreover, they hold no significant stakes in other companies. The Dürr Group granted no loans or advances ei-ther to Mr. Dieter or to Mr. Heuwing in fiscal 2008; the same applies to the members of the su-pervisory Board.
comPeNsAtioN system for the boArd of mANAgemeNt
The supervisory Board Personnel Committee decides on the basic structure and level of com-pensation paid to the members of the Board of Management; both are discussed and reviewed by the supervisory Board at regular intervals. Criteria for determining the appropriateness of the compensation are the tasks of the Board of Management as a whole as well as of the respec-tive member, the personal performance of the members of the Board of Management, the eco-nomic situation and the performance and outlook of the enterprise. Allowance is also made for salary trends at comparable companies.
The compensation for the members of the Board of Management comprises performance-relat-ed and non-performance-related components. The non-performance-related compensation largely consists of a fixed base amount paid out monthly as a salary. In addition, there are non-cash benefits consisting in the main of the use of company cars on which taxes have been paid by the company. The variable compensation is paid in the form of an annual bonus. The bonus is linked to the Dürr Group’s performance in the respective fiscal year and is based on earnings before tax. In 2008, the performance-related component accounted for two-thirds of the total compensation. A further component of the compensation is the employer-financed pension contribution which is based on the amount of the fixed salary and variable compensation. This contribution is paid into our “VORaB” scheme (“Vorsorge aus Bruttogehalt”). This is a defined benefit company pension plan. There is no stock based compensation at Dürr since the super-visory Board considers the existing variable compensation components to be adequate.
Total expenses for the compensation paid to the members of the Board of Management of Dürr AG in 2008 were € 2,374 thousand (2007: € 1,902 thousand). € 792 thousand were paid as pen-sions to former members of the Board of Management (2007: € 780 thousand).
The contracts of employment of the members of the Board of Management are concluded ini-tially for three years upon joining the board. When renewing the contracts of employment the statutorily permitted extension to a total of five years is mostly chosen. The contracts of employ-

18
ment of both members of the Board of Management have a term of five years. The contract with Mr. Dieter ends on December 31, 2010, and the contract with Mr. Heuwing was renewed in October 2008 until May 13, 2012. In the event of a takeover of Dürr AG, both members of the Board of Management have an option either to remain with the company or to leave the company in return for compensation.
comPeNsAtioN system for the suPervisory boArd
The compensation paid to the members of the supervisory Board is regulated in Article 15 of the articles of incorporation of Dürr AG, the text of which can be found on our website at www.durr.com under the heading Investor Relations/Corporate Governance/Articles of Incorporation. The compensation system can only be adjusted by an amendment of the articles of incorpora-tion by the annual shareholders´ meeting which requires a majority of two-thirds of the votes of the capital present.
The total remuneration paid to the supervisory Board in 2008 amounted to € 545 thousand (2007: € 493 thousand). The members of the supervisory Board receive an annual fixed remu-neration of € 15,000 and an attendance fee of € 500 for each meeting attended in addition to reimbursement for their expenses. Furthermore, they receive variable compensation equal to 0.4 ‰ of reported consolidated earnings before tax. This variable compensation may not ex- ceed € 25,000. The fixed remuneration is payable at the end of each fiscal year. The Chairman receives three times the total compensation paid to a regular member; each Deputy Chairman of the supervisory Board receives one and a half times the total compensation paid to a regular member.
The members of the Audit Committee receive an annual remuneration of € 7,500; the Chairman of this committee receives two times that amount. The remuneration paid to the members of the Personnel Committee is € 5,000 per year; the Chairman receives one and a half times that amount. The members of the Nominating Committee receive a remuneration of € 2,500 per meeting, the Chairman receiving one and a half times that amount. supervisory Board mem-bers serving on the supervisory Board only for a part of the fiscal year are remunerated pro rata temporis. The same applies to members of the committees.

19
GLOSSARY: P. 166
HARALd RübeR (56)
Head of Paint and Final
Assembly Systems
ness Framework Partner. This means that Ford will approach Dürr first with planned paint systems projects and, assuming competitive pricing, develop and implement technical solutions together with us. In October, we un-veiled the EcodryScrubber spray booth con-cept, one of our most important innovations in recent years. This system, which reduces a paint shop’s energy consumption by up to 30 % through dry separation of the paint over-spray, is described in more detail on page 60. Our international presence was further ex-panded. We set up an engineering center in India and extended the service network especially in the emerging markets, with new
PAint And F inAL ASSembLY SYStemS
Large orders from the
emerging markets
The Paint and Final Assembly Systems busi-ness unit won numerous important projects
and further expanded its global leadership in 2008. Our biggest orders came from Mahindra & Mahindra in India, Chongqing Changan in China, and Volkswagen in Mexico. Ford ordered paint shops for plants in Romania, Mexico, and India. We signed an agreement with Ford which gives us the status of an Aligned Busi-
We continued to profit from the strong demand out of the automobile industry’s growth
markets in 2008. About half of our incoming orders came from emerging markets such as
Russia, China, Mexico, and India. We further expanded our presence in the growth markets,
where over 23 % of our workforce is employed today. We were also able to leverage our
strengths in the traditional markets of Western Europe and North America, for instance in
revamp business, with which we can realize cost benefits for our customers.
HIGHlIGHTS FROM 2008
Broad inTernaTionaL posiTioning pays off

20
GLOSSARY: P. 166
DR. HAnS ScHumAcHeR (54)
Head of Application
Technology
JOAcHim KAufmAnn (52)
Head of Environmental and
Energy Systems
DR. uwe SieweRt (48)
Head of Aircraft and
Technology Systems
enviROnmentAL AnD eneRGY SYStemS
New customer segments
developed
The environmental technology business temporarily slackened off a little in 2008,
with some customers shelving investment projects in response to the worsening eco-nomic outlook. Nonetheless, we successfully continued our reference customer strategy with which we have gained access to new customer groups. The carbon fiber industry is a good example. After the successful com-pletion of a project for Toho Tenax, we quickly won orders from other companies. In order to tap further growth potential in exhaust-air purification technology we stepped up our market coverage, especially in Asia and South America. The service business has also been extended further; it includes important aspects such as plant modernization, energy consult-ing, and customer training for instance. We continued with the global standardization of our systems. This is an important advantage especially in business with international com-panies.
AiRcR Af t AnD tecHnOLOGY SYStemS
Turnkey competence in aircraft
business
The Aircraft and Technology Systems busi-ness unit that was set up in spring 2008
and bundles our business with the aircraft in-dustry achieved first successes. Together with partner EDAG, a member of the ATON Group, we installed a complete assembly line for the Airbus A320 in Tianjin (China). This project is a landmark in the industry, demonstrating the customer benefits of turnkey project execu-tion by a consortium: fewer interfaces and less complexity, and completion exactly on budget
bases in Bratislava (Slovakia) and St. Peters-burg (Russia) for instance. The focus of our service business is on modernizing existing systems. Here, we offer our customers support beforehand in the form of productivity assess-ments. We executed over 40 revamp projects alone while automobile factories were shut down during the summer holidays. In this busi-ness we help our customers to lower their costs per unit and energy consumption through in-vestments with short payback times.
APPLicAtiOn tecHnOLOGY
More than 50 % world market
share with painting robots
2008 was again a very good year for appli-cation technology. Major orders were
booked not only in the emerging markets but also in the United States and Western Europe, for instance from Audi in Belgium and BMW Group in Germany. With the sale of over 600 painting robots, our world market share was over 50 %. Some three-fourths of our robots are installed in existing plants. This high per-centage reflects how important subsequent upgrading to full automation is for our cus-tomers to increase the productivity, quality and competitiveness of their production plants. In the summer, one of the largest revamp or-ders booked since the Dürr painting robot was introduced ten years ago was executed at Volkwagen’s plant in Zwickau, Germany. A de-tailed description of this project, where Dürr installed 87 painting and handling robots within a very tight time frame, can be found on page 22. Our new EcoPurgeLcc color changer sets new standards in terms of flexi-bility and color diversity. It minimizes paint loss on color changes, shortens the change-over time to less than 10 seconds, and can handle 36 color shades.

214 MANAGEMENT AND STOCk 92 CONSOlIDATED FINANCIAl STATEMENTS 163 OTHER26 MANAGEMENT REPORT19 mARKet And buSineSS
19 HiGHLiGHtS FROm 2008
dR. RALF-micHAeL FucHS (50)
Head of Balancing and
Assembly Products
dR. FRitz dORneR (46)
Head of Cleaning and
Filtration Systems
uring system for testing the filled brake sys-tems for leaks and proper functioning for the Tata Nano in India. There are also synergies in product development. Among other things, engineers from balancing and testing jointly developed a concept to measure and elimi-nate drive shaft imbalances on ready assem-bled automobiles. In China, a joint unit is be-ing created for the assembly and filling activi-ties, for instance for engineering and production.
cLe AninG And F iLtR AtiOn SYStemS
penetration of new markets
continued
in the cleAning systems business, which we conduct under the brand name Dürr
Ecoclean, we stepped up our penetration of new markets, especially in Asia and Eastern Europe. We were particularly successful in China and Russia, where we received several large orders for tooling various engine plants. In China, we moved to a new office and facto-ry site and increased the workforce to around 80 employees. We also held up well in West-ern Europe. This was thanks not least to the strong pace of innovation in the automobile industry, which is pushing the development of small, economical engines for which it re-quires innovative cleaning technology. At the end of the year we received a large order from BMW Group for the supply of eight EcoC Flex cleaning systems. This highly flexible, robot-based machine type will be used in the manu-facture of cylinder heads and crankcases for a new four-cylinder engine. To broaden our product portfolio we entered into a partner-ship with the Swiss company UCM in October 2008. This now enables us to support our cus-tomers in ultrAfine cleAning – in other words cleaning processes removing contami-nation to micron-scale tolerances – with the backing of our global sales and service net-work.
and on time. Building on the success of the project in Tianjin, we set up the marketing joint venture Dürr EDAG Aircraft Systems with EDAG in September. With this move we are intensi-fying the marketing of our combined offering for the aircraft industry. We also broadened the range of services offered by Dürr Consult-ing. We now also provide project management services and advise on process optimization in mechanical and plant engineering and the renewable energies sector.
bAL AncinG And ASSembLY PROductS
More than 400 employees in the
emerging markets
Balancing and Assembly Products raised its sales and earnings to new record levels
in 2008. In bAlAncing technology, where we operate under the Schenck brand name, we profited from extensive orders from the en-ergy industry. There was buoyant demand worldwide also for machines to balance tur-bochargers for low-fuel-consumption engines. In order to expand this business further we plan a bolt-on acquisition in the coming months. In the United States, we are currently execut-ing the biggest order ever in Schenck RoTec’s history. We are supplying the entire balancing and spinning systems for a new turbine and generator factory for Alstom Power. The inte-gration of the assembly, testing and filling Activities into the newly created Balancing and Assembly Products business unit has lead to the expected synergies. Among other things, these activities are benefiting from integration in the balancing systems business’s global net-work. We now have over 400 employees cover-ing the full spectrum of the business unit’s activities just in the bric countries. For in-stance, we supplied the crankshaft balancing machines as well as a newly developed meas-

22
The order for the revamp at the Zwickau plant was placed in December 2007. We immediately set up a project team with roughly 50 mem-bers, mostly comprising engineers and tech-nicians from the ApplicAtion technology business unit in Bietigheim-Bissingen. The preliminary work on the paint supply system and structural steelwork was already carried
We installed 87 painting and hAndling robots at the Zwickau plant to replace hand spray guns and painting machines. They guarantee a top-quality surface finish and reduce material con-sumption in the painting of the Golf and Passat models. Additionally, the capacity of the two lines for interior and exterior painting was in-creased by about 10 %.
The Dürr team celebrates completion of Top Coat line 1, together with Supervisory Board Chairman Dr. Heinz Dürr, who congratulated the installation team.
Revamp business is acquiring growing importance in the established markets of Western
Europe and North America. New technologies and processes from Dürr help decisively
towards increasing the productivity of existing plants and maintaining their international
competitiveness. A prime example is the revamp at Volkswagen’s Zwickau plant where we
installed two 112 meter long top coat lines in just three weeks in summer 2008.
REVAMP BUSINESS
JusT Three weeks for Two Top coaT Lines

4 MANAGEMENT AND STOCk 92 CONSOlIDATED FINANCIAl STATEMENTS 163 OTHER26 MANAGEMENT REPORT19 mARKet And buSineSS 23
22 PROJect RePORt „RevAmP vw zwicKAu“
GLOSSARY: P. 166
out at the paint shop in February 2008, while the engineering, sourcing and manufacturing proceeded in parallel at Dürr. The extremely important precommissioning phase of the project began in May. The two top coat lines, including the conveyor and supervisory control systems, were preassembled to test the interaction of all the components. At the same time, the movements of the robots were programmed, fine-tuning them exactly to the contours of the car body.
The actual conversion work on site had to be done during the three-week factory holiday in July. We used the tight time frame available with utmost efficiency. It took us only three days to dismantle the old line. In all, 300 tonnes
of scrap were carted away in 72 containers. This was followed by the installation of 280 tonnes of structural steelwork, 126 meters of roller conveyors and 52 meters of overhead chain conveyors before work could start on installing the robots with a total of ten base coat and clear coat stations. The 51 painting robots and 36 handling robots together with 61 control cabinets were delivered from Bie-tigheim-Bissingen on a “just in time” basis. Once they had been installed, the next task was the laying of 70 kilometers of cable. The spray booths also had to be erected, using a total of 360 meters of paneling. We had 170 people working each shift. After the assembly
»such achievements are the reason why our customers put their trust in dürr.« Dr. Heinz Dürr
work was completed, the final step was to put the paint supply systems, robots, drying ovens and conveyor systems into operation.
Thanks to forward-sighted planning, tight pro- ject management and an experienced team we were able to meet all the deadlines in the assembly and commissioning process exactly. The first paint was applied on August 1. A short while later the first VW bodyshell was finished on Top Coat line 1. Another 685 followed before the official start of production. The commis-sioning of the second line was equally success-ful. The first body was painted three days ahead of schedule.
HOw ARe ORdeRS Set tLed And AccOunted FOR?
On the basis of the percentage-of-completion (POC) method provided for in the
IFRS accounting standards, we realize our sales revenues according to a project’s
progress. The costs are incurred continuously. The income statement therefore
always reflects the current status of an order. In the balance sheet the effects are
more complex. When an order is placed we usually receive a first prepayment; this
increases the cash position on the assets side and is shown under “trade payables”
on the liabilities side. Initially, we are mainly involved with the planning and design
work, so personnel costs are the main cost item. When the actual work in process
begins, we usually receive the second prepayment. This phase mainly affects inven -
tories and receivables on the assets side of the balance sheet. The cash position is
either reduced or trade payables increase as we receive materials or components
from our suppliers. We receive the bulk of the remaining payments in most cases
after the plant is commissioned. The final payment is usually withheld until full pro-
duction capacity is reached.

24
As passenger and freight traffic is set to rise in the mid term, the aircraft industry will prob-ably see annual growth rates of 4 to 5 % again from 2010. Aside from the two majors, Boeing and Airbus, smaller manufacturers are also extending their range of models. In the mid term, there will be stronger stimulus from the emerging markets as well. China and India, for instance, are building up their own aircraft in-dustries. Russia, too, intends to expand its po-sition in aircraft production again.
We have already executed over 200 paint and assembly systems projects for the aircraft industry and have extensive expertise in this business. In 2008, we bundled our aircraft activities, which had previously been spread over several business units, in order to cap-italize on the market’s growth even more strongly than hitherto. Under the roof of the new Aircraft and Technology Systems busi-ness unit we have created a global organiza-tion with products and services for the painting and assembly process in aircraft production. This spectrum also includes control and su-pervisory control systems.
SPeciALiSt FOR cFRP cOmPOnentS
In painting technology, Dürr Aircraft can draw on the extensive technology competence ac-cumulated within the Dürr Group. Building on this, we develop custom-engineered applica-tions for aircraft coating – a recent development being an extremely compact paint system for aircraft components made of carbon fiber re-inforced plastic, or CFRP for short.
Expanding businesses with growth potential is a core focus of our “Dürr 2010” strategy pro-
gram. A foremost area are our paint and assembly systems activities for the aircraft industry,
where we stand to profit not only from the market’s long-term growth but also from the fact
that manufacturers are consolidating their supplier bases and turning more and more to sys-
tem suppliers with turnkey competence. Our know-how in automobile production also makes
us an ideal partner in the process of automating aircraft manufacture.
ASSEMBly AND PAINT SySTEMS
FOR THE AIRCRAFT INDUSTRy
aircrafT Business on The ascenT
Dürr station for the fabrication and
assembly of the upper fuselage
shells for a wide-body aircraft.

25
GLOSSARY: P. 166
2
3
1
13
2
This material will be used more and more in aircraft manufacture in future as it combines high rigidity with low weight, thus reducing fuel consumption. For our assembly systems we are therefore also designing equipment for the exact positioning and joining of large CFRP components, such as the rudders, ele-vators, fuselage sections or wings.
On the assembly systems side we are coop-erating with the German engineering firm EDAG GmbH & Co. kGaA, with which we set up a joint venture, Dürr EDAG Aircraft Systems GmbH, in September 2008. Specializing in outfitting equipment, which includes systems for installing electrical and hydraulic compo-nents, EDAG’s technologies complement our own. Together, we offer our customers a com-plete product portfolio and, as system part-ners, can realize large planning and construc-tion projects on a turnkey basis. This expertise is sought after. The aircraft industry is con-centrating on larger partners with wider com-petence so as to minimize the need for inter-face management and coordination.
We have already been able to demonstrate our turnkey competence on a major project for Airbus in Tianjin, China, where Dürr and EDAG commissioned a complete assembly
line for the Airbus A320 at the end of 2008. It fills a hangar 250 meters long and 70 meters wide. We are also constructing three paint shops in Tianjin, which are due to be completed in August 2009.
Moreover, we are involved in the design phase for the fuselage assembly line for the new long-range Airbus A350. We are tapping productivity enhancement potential by trans-ferring automated manufacturing processes from automobile production to aircraft pro-duction.
Parallel with the reorganization of Dürr’s air-craft activities we were able to win a number of new customers in 2008. This includes manufacturers such as Bombardier and lock-heed as well as component suppliers like Ruag (Switzerland) and Aernnova (Mexico).
Dürr robots for
wing painting
In addition to painting technology, Dürr also offers systems for the final assembly of complete aircraft and for assembling large
components such as fuselage sections (1), wings (2) and turbine engines (3).

26
1 Asia (ex Japan), Mexico, Brazil, Eastern Europe
Profile
As a leading mechanical and plant engineering group, Dürr is present in all the world’s major markets. With 47 locations in 21 countries, we operate both in the traditional markets of North America and Western Europe and in the emerging markets. Our internationalism is also reflect-ed in the regional distribution of our workforce and orders. The emerging markets1 accounted for 23 % of our employees and 48 % of incoming orders at the last count; just less than half of our workforce is employed in Germany. We generate about 85 % of our sales with automobile manufacturers and their suppliers. Other important customer groups are the aircraft industry, mechanical engineering, the chemical, pharmaceutical, electrical engineering and electronics industries, and the energy sector. Plant engineering accounts for about 55 % of our business and mechanical engineering for about 45 %.
GrouP structure: HoldinG comPany, div is ions and business units
Our operating business is grouped into two divisions: Paint and Assembly Systems and Meas- uring and Process Systems. They form the basis for the segment reporting according to IFRS standards. A total of six business units are attached to the two divisions. Dürr AG, based in Stuttgart, Germany, is a management holding company and performs corporate functions for the Group.
cHanGes in tHe GrouP structure at tHe beGinninG of 2008
The present Group structure, as shown in the table, was an upshot of the “Dürr 2010“ strategy program and has been in place since March 2008. In line with our strategy we wound up the former Factory Assembly Systems business unit and transferred its activities to three other business units:
The assembly, filling and testing products business was merged with the former Balancing and Diagnostic Systems business unit into the newly created business unit Balancing and Assembly Products. All the Balancing and Assembly Products activities are mechanical
GROuP MANAGEMENT REPORT 2008
DüRR AT A GlANcE:
ORGANIzATION AND AcTIvITIES

274 MANAGEMENT AND STOck 92 cONSOlIDATED FINANcIAl STATEMENTS 163 OThER24 manaGement rePort19 MARkET AND BuSINESS
26 orGanization and activities
Divisions*
Application Technology
Environmental and Energy Systems
Aircraft and Technology Systems
Paint and Final Assembly Systems
cleaning and Filtration Systems
Balancing and Assembly Products
GrouP structure
dürr aGmanaGement- HoldinG
Business units
Measuring anD Process systeMsPaint anD asseMbly systeMs
* basis for segment reporting
engineering activities, offer technologically sophisticated products, and operate with similar processes. Synergies exist within the business unit in manufacturing, assembly and services, as well as in international sales.
The business with final assembly systems for the automobile industry was integrated into the former Paint Systems business unit, which since March 1, 2008, has been operating under the name Paint and Final Assembly Systems. Synergies exist between the painting and final assembly activities in the areas of technology and engineering, and in project management and execution. We significantly reduced our final assembly conveyor systems activities in the course of 2008 and are now concentrating on profitable niches such as the modular final assembly system FAStplant ®.
The business with paint and assembly systems for the aircraft industry, which we are expand-ing as part of our “Dürr 2010“ strategy, forms the new business unit Aircraft and Technology Systems together with the Dürr consulting activities.
The reorganization has transferred the assembly, filling and testing products business from the Paint and Assembly Systems division to the Measuring and Process Systems division. This af-fected our segment reporting, which is aligned to the two divisions. To ensure full comparability we have adjusted the figures for the two divisions retroactively as from 2007. The assembly, filling and testing products business generated sales of € 74 million in 2008 after € 71 million in 2007.
business units and market Posit ions
Paint and final assembly systems plans and builds complete paint shops for the automobile industry. As a turnkey supplier, we offer our customers complete project execution, from the layout planning and detailed engineering through to final commissioning. We adopt a similar turnkey approach in our final assembly systems business.
The main products in the paint systems business are systems for the pretreatment and dip-coating of vehicle bodies, advanced spraying booths, control and supervisory control systems, drying ovens, and conveyor systems. We are the world market leader with a market share of about 40 %, followed by a German and a Japanese competitor. There are also a few regional suppliers based in Italy, the uSA, china and Japan.
Glossary: P. 166
Glossary: P. 166

28
Automobile manufacturers
Automotive suppliers
Electrical engineering & electronics
Mechanical engineering
Aerospace
Turbines/power stations
Balancing and diagnostic systems
Testing, assembly and filling products for vehicle final assembly
Services
Mechanical engineering
Automobile manufacturers
Automotive suppliers
Electrical engineering & electronics
Mechanical engineering
Aerospace
Medical and laboratory equipment
Industrial cleaning systems
Automation technology (work-piece handling, automation)
Filtration systems
Services
Mechanical engineering
Automobile manufacturers
Automotive suppliers
General industry (e. g. construction equipment and farm machinery)
complete paint shops
Individual painting process stations
Services
Final assembly systems
Automobile manufacturers
Automotive suppliers
General industry (e. g. construction equipment and farm machinery)
Products for automated spray painting
Sealing technology
Services
Mechanical engineering
Automobile manufacturers (paint shops)
Automotive suppliers (paint shops)
Pharmaceuticals
chemicals
carbon fiber production
Printing/coating
Woodworking
Waste-air purification systems
Energy management and consulting
Services
Plant engineering
Aircraft manufacturers
Suppliers to the aircraft industry
Automobile manufacturers
Automotive suppliers
General industry
Assembly and paint systems for aircraft production
Service
consulting
Plant engineering
consulting
Plant engineering
activ it ies and customers by business unit
customer groupsactivitiesbusiness typebusiness unit
me asurinG and Process systems div is ion
BAl ANcING AND ASSEMBly
PRODuc TS
clE ANING AND F IlTR AT ION
SyST EMS
customer groupsactivitiesbusiness typebusiness unit
Paint and assembly systems div is ion
PAINT AND F INAl ASSEMBly
SyST EMS
APPlIcAT ION T EchNOlOGy
ENvIRONMENTAl AND ENERGy
SyST EMS
AIRcR AF T AND T EchNOlOGy
SyST EMS

294 MANAGEMENT AND STOck 92 cONSOlIDATED FINANcIAl STATEMENTS 163 OThER24 manaGement rePort19 MARkET AND BuSINESS
26 orGanization and activities
Dürr consulting
Finance / controlling
Investor Relations
Risk Management
legal Affairs/Patents
Information Technology
corporate Real Estate
corporate communications
human Resources (Employee Affairs Director)
Research & Development
Quality Management
Internal Auditing
resPonsib il it ies of tHe members of tHe board of manaGement
Paint and Assembly Systems
Measuring and Process Systems
r alPH HeuwinG
(cfo)
r alf w. d ieter
(ceo)
DIv IS IONAl / OPER ATIvE
RESPONSIBIl IT IES
cORPOR AT E FuNc TIONS
application technology develops and supplies solutions for automated spray painting. The chief products are the new EcorP, generation of painting robots, the Ecobell 2 line of atomizers, paint supply systems, and software for process control and evaluation. Our world market share of about 50 % derives from our competence in supplying integrated end-to-end systems. Our two main competitors are suppliers of standard robots. A growing area of activity for application technology is the business in sealing (for instance, weld sealing, underbody protection) and gluing applications.
environmental and energy systems offers systems for the combustion of harmful substances contained in the emissions from industrial manufacturing processes. Originally, they were mainly supplied for automobile paint shops, but today some 80 % of our incoming orders are from other sectors, especially the chemical and pharmaceutical industries but also the wood-working industry and carbon fiber production. We offer all the customary processes for waste-air purification. We are the world leader for waste-air systems for the automobile industry with a market share of about 30 %.
aircraft and technology systems focuses on business with the aircraft industry, one of the growth areas in our “Dürr 2010” strategy program. The aircraft industry is increasingly consolidating its supplier base and placing larger order packages with efficient system partners. Our core competence is the supply of turnkey systems for the painting and the precise positioning and fitting of preassembled aircraft components. On this basis, we believe we have good chances of positioning ourselves as a key supplier in a dynamic environment.
balancing and assembly Products supplies balancing and diagnostic systems as well as assembly, testing and filling products for final automobile assembly. We are by far the world’s largest supplier of balancing systems with a market share of about 35 %. This is due not least to our global production, distribution and service network. Besides the broad services portfolio, which contributes a good 30 % of sales, balancing systems for turbines, generators and crankshafts, and the universal balancing machine Pasio are currently our most important products. We are also one of the world’s leading suppliers in the assembly, testing and filling products business, with market shares of over 20 %. here, the focus is on wheel geometry, brake and electronic system test stands, so-called marriage stations, and systems for fill-ing vehicles with air-conditioning refrigerant, gearbox oil, brake fluid and other media required for operation.
Glossary: P. 166
Glossary: P. 166
Glossary: P. 166
Glossary: P. 166

30
cleaning and filtration systems is the only global player in the market for industrial cleaning systems, filtration systems, and automation technology for interlinking machining centers and cleaning stations. In addition to standalone systems, the business unit also offers system inte-gration for complete engine and transmission production lines. Thanks to our international positioning, we can also equip a customer’s factories in different countries with standardized technology. Our product portfolio was substantially rejuvenated with new machine generations in 2007 and 2008. These include the robot-based EcoC flex system, the EcoC trans transfer cleaning systems, and the EcoCspeed, EcoCJet, and EcoC max models. We are the clear world market leader with a market share of about 35 %.
In addition to the Balancing and Assembly Products and cleaning and Filtration Systems busi-ness units, schenck technologie- und industriepark GmbH (tiP) is also part of the Measuring and Process Systems division. Based at the Schenck headquarters in Darmstadt, Germany, TIP is a real estate services company that markets office, production and warehouse space, and pro-vides related services such as facility management, logistics and training. The portfolio com-prises 105,000 m2 of land and 134,000 m2 of lettable space. 53 % of the lettable space is office space; the remainder is warehouse space and production buildings.
leGal structure
As the management holding company, Dürr AG directly owns 100 % of carl Schenck AG, Dürr Systems Gmbh, and Dürr International Gmbh. These three companies in turn have ownership interests, directly or indirectly, in all the other 46 Group companies, including two intermediate holding companies which provide tax advantages. In most cases the Group companies are wholly owned. Further details can be found in item 38 in the notes to the consolidated financial statements. As the ultimate holding company, Dürr AG has concluded profit and loss transfer agreements with carl Schenck AG, Dürr Systems Gmbh, and Dürr International Gmbh. The members of the Board of Management of Dürr AG and the managing directors of Dürr Systems Gmbh are represented on the supervisory boards of all the principal foreign companies.
manaGement and control
The chairman of the Board of Management is responsible for the operating business with the focus on sales; the chief Financial Officer is also closely involved in the operating activities. The heads of the six business units report to the Board of Management through the two divi-sions and have global responsibility for the results of their respective business unit. At the divi-
Glossary: P. 166

314 MANAGEMENT AND STOck 92 cONSOlIDATED FINANcIAl STATEMENTS 163 OThER24 manaGement rePort19 MARkET AND BuSINESS
26 orGanization and activities
sional level steering functions are performed by the Paint and Assembly Systems Board and the Measuring and Process Systems Board. These two boards consist of the Board of Manage-ment, the heads of the respective business units and their controllers. At Group level, the Senior Executive Group and the broader Senior Management Group represent the international man-agement teams. These two bodies are briefed about current developments and issues by the Board of Management and meet regularly for consultations.
The Supervisory Board of Dürr AG is the ultimate control body that oversees the Board of Man-agement’s conduct of the Group’s affairs. The Auditing department of Dürr AG is responsible for internal audits. Within the business units the regular control function is performed mainly by the controlling departments and by the appointed risk managers.
imPortant business Processes
Our core process, especially in plant engineering, is order execution. Its quality is determined largely by our project management. Project managers have overall responsibility for meeting deadlines and budgets, and coordinate the various processes and subprojects. In the plant engineering business a large project usually takes between twelve and 24 months, while in the mechanical engineering business orders are mostly executed in two to six months. The diagram below shows the sequence of the main stages in the execution of a large plant engineering project.
low manufacturinG dePtH
Dürr is primarily an engineering group. Our core competence lies in the development, planning and implementation of rational manufacturing processes based on own machinery, systems and software. The manufacturing depth in our plant engineering business is about 20 %, and it
Glossary: P. 166
Accept-ance
commis-sioning
Production Engineering Technical clarification
Planning Quotation
Pl ANNING PhASE ORDER Pl AcED
ORDER ExEcuTION
Installation

32
dürr locations
Germany Bietigheim-Bissingen 1, 2
Braunschweig Darmstadt 1, 2
Filderstadt 1, 2
Grenzach-Wyhlen 1, 2
Monschau 1, 2
Ochtrup 1
Püttlingen 1, 2
Stollberg 1, 2
Stuttgart 2
europe zistersdorf 1 (A) Oslavany-Padochov 1 (cz) Madrid 2 (E) San Sebastian 2 (E) valladolid (E) viladecans 2 (E)
cergy-Pontoise1 (F)
loué 1, 2 (F)
Montigny-le-Bretonneux 2 (F)
Warwick 1, 2 (GB) Beinasco 1, 2 (I) Novegro di Segrate 2 (I) Paderno Dugnano (I) Rodano 1, 2 (I) Rotterdam (Nl) Radom 1, 2 (Pl) Moscow (RuS) St. Petersburg (RuS) Bratislava (Sk) Istanbul (TR)
americas São Paulo 1, 2 (BR) Querétaro 1, 2 (MEx) Auburn hills 1, 2, Michigan (uSA) Bowling Green 1, Ohio (uSA) Deer Park 1, New york (uSA)
Orion 1, Michigan (uSA) Plymouth 1, 2, Michigan (uSA) Wixom 1, Michigan (uSA)
asia, africa, australia Adelaide (AuS) Beijing (cN) Shanghai 1, 2 (cN) chennai 1, 2 (IND) Delhi 1, 2 (IND) Osaka 1 (J) yokohama 2 (J) Seoul 2 (ROk) Port Elizabeth 2 (zA)
1 Production or assembly location2 Engineering location
The other locations mainly perform sales and service functions.
is comparatively low in our mechanical engineering business, too, at around 30 % since we con-centrate on development, sales and assembly. This results in low capital intensity and a relatively low fixed cost base, which not only enables us to react more flexibly to fluctuations in order levels but also increases the return on capital employed.
locations and divis ion of l abor witHin tHe GrouP
Our largest locations are Stuttgart, Darmstadt, Bietigheim-Bissingen, Detroit and Shanghai. Stuttgart is the central hub of the Group’s plant engineering activities, and it is also where the Group headquarters of Dürr AG is located. Our balancing systems business operates out of Darmstadt, while Bietigheim-Bissingen is the global center of competence for application technology. We are expanding and modernizing this location on a major scale under the “campus project”, and will be transferring our Stuttgart activities there, too, in summer 2009. There will then be about 1,500 people working on the “Dürr campus” in an ultra-modern office and technology complex with short distances. Dürr AG’s legal domicile will continue to be situated in Stuttgart. Other major locations are chennai and São Paulo. Monschau, Germany, is the central location for cleaning and Filtration Systems.
Within our global network it is clearly regulated which Group companies are responsible for what tasks on system projects. Within the Paint and Final Assembly Systems business unit, project leadership for large orders always lies with the system center in Stuttgart. All other companies are responsible for sales and service activities in their respective markets and pro-vide local support with the execution of orders. They also perform functions such as engineer-ing and production as part of our global value-added structure.
rePort on rel ationsHiPs witH rel ated comPanies
In conformity with Sec. 312 of the German Stock corporation Act, the Board of Management of Dürr AG prepared a report on relationships with related companies, in which it issued the following concluding declaration: “Our company and the companies affiliated to our company received fair and reasonable consideration in each transaction listed in the report on relation-ships with related companies. This assessment is based on circumstances known to us at the time the reportable events took place.”
Glossary: P. 166
Glossary: P. 166

334 MANAGEMENT AND STOck 92 cONSOlIDATED FINANcIAl STATEMENTS 163 OThER24 manaGement rePort19 MARkET AND BuSINESS
26 orGanization and activities
disclosures Pursuant to sec. 289 (4) and sec. 315 (4) of tHe German commercial
code (HGb) (German ec takeover directive imPlementinG act)
structure of subscribed capital : Dürr AG’s subscribed capital is divided into 17,300,520 bearer ordinary shares with full voting rights. The rights and obligations arising from the ownership of ordinary shares are regulated in the German Stock corporation Act.
restrictions on voting rights/the transfer of shares and related agreements: The Board of Man-agement has no knowledge of any pool arrangements between shareholders of Dürr AG.
shareholdings which exceed 10 %: heinz Dürr Gmbh holds 38.4 % of Dürr AG’s capital stock. ATON Gmbh holds 17.2 %.
shares conferring special rights: There are no shares of Dürr AG which confer special rights.
voting right control of any employee stock ownership plan where the control rights are not exer-
cised directly by the employees: There are no employee stock ownership plans where the con-trol rights are not exercised directly by the employees.
rules governing the appointment and replacement of members of the board of management: The relevant statutory rules are regulated in Sections 84 and 85 of the German Stock corporation Act. Dürr AG’s articles of incorporation do not provide for any other rules in this regard.
rules governing the amendment of the articles of incorporation: Sec. 179 of the German Stock corporation Act requires the consent of the shareholders’ meeting to amendments of the articles of incorporation. Dürr AG’s articles of incorporation do not provide for any other rules in this regard.
Powers of the board of management to issue or buy back shares: Information of this point can be found in item 21 in the notes to the consolidated financial statements.
agreements in the event of a change of control following a takeover bid: The terms of our cor- porate bond include a covenant which obligates us, in the event of a change of control, to make an offer to the holders of the bond to redeem the bond at 101 % of its nominal value plus the accrued interest. A change of control is deemed to take place if one or more persons,

34
acting in unison, acquire at least 35 % of the voting shares of Dürr AG while, simultaneously, members of the Dürr family who were shareholders of the company, directly or indirectly, at the time the bond was issued hold less than 35 % of the voting shares. Such covenants are customary practice, and are incorporated in comparable form in the terms and conditions of bonds of other issuers. They serve to protect the interests of the bondholders.
The terms of the syndicated loan stipulate that, in the event of a change of control, no add- itional cash drawings may be made or guarantees applied for. In addition, the credit commit-ments can be called by the majority banks so that the cash drawings and guarantees have to be repaid. The agent representing the interests of the banking syndicate must be informed about a change of control immediately this becomes known. A change of control is deemed to take place if the relevant conditions provided for in the issuing agreement of the bond are fulfilled or if another person acquires, or persons acting in unison acquire direct or indirect control of Dürr AG. Exempted therefrom are members of the Dürr family who were direct or indirect shareholders of Dürr AG at the time the syndicated loan agreement was concluded or are their legal heirs.
agreements providing for compensation in the event of takeover bids: In the event of a takeover the members of the Board of Management have an option either to remain with the company or to leave the company in return for compensation. There are no other agreements in this regard.
disclosures on tHe comPensation of tHe suPervisory board and tHe board of
manaGement
The corporate governance report discloses information on the compensation of the Supervisory Board and the Board of Management of Dürr AG. The compensation report reproduced there is an integral part of this management report.

35
»Dürr brasil is in excellent financial shape
and is an extremely versatile company. We
cover the entire Dürr and schenck offering
under the one roof. For our customers throughout
south america that means service and consulting from one
source. at the same time, they have access to the global
resources and expertise of the whole Dürr group. that is a
special advantage in the execution of large projects.«
Paulo sentieiro, Head of sales and marketing, dürr brasil ltda., brazil

36
lEGAl AND EcONOMIc FAcTORS OF INFluENcE
We have an extremely broad international presence and can execute projects at any of our cus-tomers’ locations. This places us in a better position to offset cyclical downturns in demand in individual regions.
We are mainly reliant on investment activity in the automobile industry as it accounts for about 85 % of our sales. This is oriented not so much to current production levels but primarily to the automobile manufacturers’ mid- to long-term sales expectations and their strategic goals. This includes for instance the penetration of new regional markets, the expansion of market shares, the long-term orientation of the model portfolio, and cost reductions. however, short-term liquidi-ty considerations also have a bearing on investment decisions.
Our new plant business is driven increasingly by the growing demand in the emerging markets. The automobile industry will continue to build up additional capacities in these countries in order to profit from the long-term growth in mobility there. On the other hand, the modernization of older facilities is acquiring growing importance especially in North America and Western Europe. here, our customers are investing in technology upgrades in order to make their facto-ries more flexible, productive and energy efficient.
Instead of exporting, our customers are looking to build up own production facilities in their target markets. This enables trade restrictions and exchange rate risks to be avoided. Moreover, many consumers prefer automobiles that are produced in their own country. We are convinced that our uS business will also profit from this in the mid to long term. We ourselves are affected comparatively little by trade restrictions since we export little. In fact, much of our own value added and our sourcing is in the countries where we execute our orders. The low export ratio also means that our currency risk is comparatively small. Our main exposure is from currency translation effects when converting foreign currency items in the balance sheet and income statement into euro.
lower limits for fleet consumption and co2 emissions are speeding up the development of fuel-saving propulsion concepts in automobile production. For Dürr, this means additional demand: in cleaning technology, special machines are required for smaller engines, while our balancing systems business is profiting from growing demand for turbocharger balancing equipment. Our environmental systems business benefits from the stricter emission standards for industry.
Glossary: P. 166

374 MANAGEMENT AND STOck 92 cONSOlIDATED FINANcIAl STATEMENTS 163 OThER24 manaGement rePort19 MARkET AND BuSINESS
36 leGal and economic factors of influence
37 strateGy and business drivers
STRATEGy AND BuSINESS DRIvERS
”dürr 2010“
The “Dürr 2010” strategy which we formulated in 2007 and are vigorously pursuing contains ambitious return and growth targets, and defines the measures underlying them. The individual targets for 2010 are:
6 % EBIT margin ≥ € 1.7 billion sales ROcE of around 22 % ≥ 30 % equity ratio.
Implementation of the measures is continuously monitored and is progressing well. At 31.4 %, our equity ratio already exceeded our target of 30 % at the end of 2008. however, the general economic conditions will need to improve if we are to achieve our EBIT, roce and sales tar-gets as planned in 2010.
“Dürr 2010” consists of four strategic focuses each comprising a number of individual objectives and measures. In the following overview we outline the objectives we have achieved since the beginning of 2008 and what the next steps are.
a) customer benefit
here, the focus is on reducing unit costs in our customers’ production, either through innovative products or through customized services. One example is our Ecodryscrubber spray booth concept – described in more detail on page 62 – which we unveiled in October 2008. Reducing energy consumption by up to 30 %, this innovation has the potential to establish itself as an in-tegral part of modern painting processes in the coming years. Our pioneering product develop-ment yields benefits for both sides: our customers enhance their competitiveness, while we se-cure our market leadership long term. Other examples of this innovation strategy are cleaning Systems, where we have introduced a completely new line of standard products in the last two years, and application technology which, through systematic modularization, offers a fully- integrated spectrum of solutions. By extending our global service activities with the addition of new locations we can provide our customers with an even more comprehensive service offering.
Glossary: P. 167
Glossary: P. 166

38
GROWTh INITIATIvES
Emerging markets
New products
Expansion of aircraft assembly business
Individual acquisitions
Earnings at benchmark level
ROcE > capital costs
long-term positive
free cash flows Optimization of
financing structure
Optimization of unit costs
Innovation
Services
PROcESS OPTIMIzATION
vAluE
cREATION
cuSTOMER
BENEFITDÜrr 2010
Globalization of production and engineering
Design to cost
Reduction of fixed costs
Risk management
Product standardization
b) GrowtH initiatives
We have developed specific growth programs for all six business units. An overview of the individual initiatives can be found in the “Opportunities and Risks” section on page 72. The key growth opportunity for the Group is the business in paint and assembly systems for the air- craft industry. In 2008, we put in place important platforms for pushing this business: From the creation of the Aircraft and Technology Systems business unit, via product standardization, through to the founding of the sales joint venture Dürr EDAG Aircraft Systems.
c) oPtimizinG Processes
This cornerstone of the “Dürr 2010” strategy continues on seamlessly from the FOcuS program, with which we successfully restructured and realigned Dürr in the years 2005 to 2007. It is cen-tered on our eight-point program for strengthening competitiveness. It takes special account of the increasing importance of the growth markets in Eastern Europe, Asia, Brazil, and Mexico, and comprises the following measures and objectives:
1. Product standardization: Shorter engineering times
2. design to cost: Orientation of product development to predefined product and manufacturing costs
3. Global production: Increasing value added in low-cost countries
4. Global sourcing: Additional procurement offices in low-cost countries
5. Global engineering: Expansion of the engineering centers in India and Poland
6. workflow management: Integrated processes from engineering, via order execution, through to financing (based on standardized global cAD-ERP platforms)
7. risk management: Strict risk control in project selection, creation of an early warning system, swift intervention when risks arise
8. overhead costs: Strict limitation
considerable progress was achieved in all eight areas in 2008, making us more efficient and crisis-resistant today.
Glossary: P. 166

394 MANAGEMENT AND STOck 92 cONSOlIDATED FINANcIAl STATEMENTS 163 OThER24 manaGement rePort19 MARkET AND BuSINESS
37 strateGy and business drivers
aGe of automobile Paint sHoPs, PercentaGe sPl it
Eu
62
19 19
Asia
3934
27
Russia
67
26
7
71
25
South America
4
North America
75
17
8
Source: Dürr database10 – 20 years> 20 years < 10 years
Another core measure, which we have already implemented, was the restructuring of the final
assembly conveyor systems business. We have considerably downsized this loss-making activity: from sales and incoming orders in the region of € 175 million in 2007 to around € 100 million in 2008; going forward, the volume is to be reduced further to about € 40 million. This adjustment enables us to concentrate on selected, technologically demanding projects with a balanced risk-reward profile. These projects offer sufficient margins which cannot be achieved in the simple conveyor systems business.
d) value creation
This goal relates to the sustainable improvement of key performance indicators, especially roce, free cash flow and EBIT. Besides operational efficiency, this also requires our financ-
ing structure to be optimized, placing it on a long-term basis, increasing our flexibility and low-ering interest expense. We have already achieved this goal with the refinancing concluded in September 2008. Further details can be found in the “Debt Financing” section on page 54.
main Grow tH drivers
Supported by our “Dürr 2010” strategy program we will continue to leverage our strengths in future, especially in business with the automobile industry. The four main drivers for our busi-ness are:
1. The growth in automobile production in the emerging markets;
2. Our contribution to reducing costs per unit and emissions through technologically leading products and systems;
3. Increasing investment in more economical and lower-emission engine and transmission technologies;
4. The growth in revamp business, where we profit from our broad installed base of machinery and systems and the large number of outdated paint shops (60 % of all automobile paint shops are more than 20 years old).
Glossary: P. 167

40
+5 to +10 %
2007 level (€ 1.78 billion)
5 %
considerable increase
2007 level (€ 85.9 million)
Reduction (2007: € 61.8 million)
closer to 30 %
Increase (basis € 0.40)
+ 8.5 % / adjusted + 14.3 %1
€ 1.46 billion
4,5 %
+ 59 %
€ 30.9 million
€ 34.4 million
31.4 %
0.70 € 2
Sales
Incoming orders
EBIT margin
Earnings after tax continuing operations
cash flow (operating activities)
Net financial debt (December 31)
Equity ratio (December 31)
Dividend
f iscal ye ar 2008: tarGets and actual results
actual 2008tarGet 2008
1 on a like-for-like basis2 proposal to the annual general meeting
ThE BOARD OF MANAGEMENT’S OvERAll
ASSESSMENT OF BuSINESS DEvElOPMENT
IN 2008
board of manaGement views business develoPment in 2008 Posit ively
Dürr witnessed a record year in 2008 and achieved most of its corporate targets. At +8.5 %, the growth in sales was within the target range of 5 to 10 %; on a like-for-like basis, that is allowing for the downsized final assembly conveyor systems business, the growth was 14.3 %. Gross profit, EBIT and earnings after tax were increased substantially again; in the fourth quarter of 2008 the gross margin reached a new record level of 19.5 %. The EBIT margin improved from 3.8 % to 4.5 %; our original target for 2008 had been about 5 %. Earnings would have seen a stronger improvement had it not been for last operating losses from old orders in the final as-sembly conveyor systems business. This business was substantially downsized in 2008 and was discontinued altogether in the uSA, so there will be no further negative earnings contribu-tions from it in 2009. Administrative and selling expenses rose less than proportionally com-pared to sales. Before one-off refinancing expenses (partial redemption of the bond, termina-tion costs for the old syndicated loan), our net interest position was substantially improved.
At € 30.9 million, cash flow from operating activities fell short of the targeted 2007 level. This was due to the postponement of orders and the associated prepayments from customers at the end of the year. free cash flow was slightly negative at € – 14.5 million. As a result of the proceeds from the capital increase in June 2008, we were able to reduce net financial debt substantially to € 34.4 million as of December 31, 2008 (December 31, 2007: € 61.8 million). At 31.4 %, the equity ratio already exceeded our mid-term target of 30 % at the end of 2008.
In view of the difficult economic environment, we were unable to achieve our original target to match the high 2007 level of incoming orders. This was mainly due to the fact that the automo-bile industry postponed projects worth a total of € 200 million at the end of the fourth quarter. In addition, we deliberately refrained from taking on low-margin orders worth around € 80 mil-lion in the final assembly conveyor systems business. Order backlog at the end of the year was € 925 million, a decline of € 157 million versus the end of 2007.
Glossary: P. 167

41
»in the emerging markets, Dürr has all the compe-
tences that our customers expect from us. at our
new engineering center in chennai, we have over 70
colleagues working on innovative designs. our solutions are
destined not only for the indian market but for Dürr projects
around the globe. the group-wide harmonization of our it
infrastructure will make this collaboration still more efficient.
the opening of a global sourcing office in chennai also un-
derscores the importance of Dürr india for the group’s
global activities.«
somnath bhattacharya (right), senior manager, and balaji ramachandran, divisional manager engineering center, dürr india Pvt. ltd., india

42
Production l iGHt veHicles
Source: Pwc, 12/2008 1 estimate 2 incl. Mexico
in million units 20081 2007
World 66.2 68.9
Eu 17.6 18.8
Germany 5.4 5.6
Eastern Europe 3.3 3.1
Russia 1.6 1.4
North America 2 12.7 15.1
uSA 8.6 10.5
South America 3.8 3.6
Brazil 2.9 2.7
Asia 27.2 26.7
china 7.5 6.9
Japan 10.8 11.0
India 2.0 1.9
in %1 20082 2007
World 2.9 5.0
Germany 0.9 2.5
Eu 27 0.7 2.9
Russia 5.6 8.1
uSA 1.1 2.0
china 9.0 11.9
India 7.6 9.3
Japan – 0.7 2.1
Brazil 5.4 5.4
GdP Grow tH
Source: European commission, Deutsche Bank, 03/2009 1 year-on-year change 2 estimate
EcONOMy AND INDuSTRy ENvIRONMENT
2008: world economic Grow tH weakens
The world economy turned down sharply in the second half of 2008. The growth forecasts were revised downwards in rapid succession from September onwards. After the financial crisis esca-lated in the wake of the lehman collapse, central banks and governments swiftly intervened in the fourth quarter to contain the threat to the financial system and the economy. Nonetheless, the repercussions of the financial crisis on the real economy made themselves increasingly felt. North America, parts of Europe and Japan moved into recession in the third and fourth quarter of 2008. The strong growth of the Asian and Eastern European economies also slowed from the third quarter onwards.
automobile Production declines for tHe f irst t ime in sever al years
After a good start, demand in the automobile markets fell sharply in the second half of 2008. In the fourth quarter, subdued consumer sentiment caused demand to plummet, with unit sales falling by over 25 % in some markets. hardest hit were North America, Japan and some Euro-pean countries. As a result, the automobile industry postponed a number of investment projects that had already been planned. The automobile markets in china and Russia witnessed strong growth rates year over year.
World light vehicle production was down by about 4 % in 2008. consumers turned increasingly to smaller, cheaper and more economical vehicles. The automobile industry therefore accelerated its efforts to develop innovative propulsion concepts with lower fuel consumption and cO2 emissions.
aircr af t industry
Aircraft manufacturers booked fewer orders after the boom year 2007. The two industry majors suffered sharp setbacks: orders at Boeing fell by 754 to 669 aircraft and at Airbus by 558 to 900 units. yet, at 375 and 483 units, respectively, the number of aircraft delivered was well below the level of new orders, so there was a further increase in orders on hand. however, Boeing and Air-bus expect cancellations in response to the economic downturn. Both manufacturers reduced their capital spending in the past year but are still focusing on consolidating their supplier struc-tures.

434 MANAGEMENT AND STOck 92 cONSOlIDATED FINANcIAl STATEMENTS 163 OThER24 manaGement rePort19 MARkET AND BuSINESS
42 economy and industry environment
43 business develoPment
Gross domestic product Source: Dürr database1 estimateAutomobile production
1981 198 3 198 5 1987 198 9 19 91 19 93 19 9 5 19 97 19 9 9 2001 2003 200 5 2007 200 91
12
8
4
0
– 4
– 8
–12
develoPment of world automobile Production and Gross domestic Product
(ye ar- on -ye ar cHanGe in %)
boom in mecHanical and Pl ant enGineerinG subsides
The mechanical and plant engineering industry increased production by a further 5 % in 2008. After demand had continued to rise in the first half of 2008, orders fell off appreciably here, too, in the fourth quarter. Overall, German suppliers were able to further expand their world market position.
BuSINESS DEvElOPMENT
unless indicated otherwise, the details in this management report refer to the continuing oper-ations. The business figures for the continuing operations for 2007 and 2008 are fully compara-ble. EBIT – as referred to in the following – is earnings before interest, income taxes and invest-ment income. We have made a minor adjustment in the reporting of liabilities in 2008. Accord- ingly, a volume of € 9.0 million in the balance sheet as of December 31, 2007, was reclas sified with retroactive effect (for further details see item 27 in the notes to the consolidated financial statements). Accounting policies (accounting and valuation methods) have remained largely un-changed since 2004. We have merely adjusted the accounting and valuation methods to the re-spectively prevailing legal requirements. changes in the International Financial Reporting Stan-dards (IFRS) had no material effect on the presentation of the company’s position.
order backloG down 15 % from very HiGH Previous year’s level
We witnessed continued buoyant demand in the first three quarters of 2008. The effects of the sharp economic downturn were not felt until the end of the fourth quarter. In response to the slump in consumer demand, the automobile industry reviewed its investments and partly post-poned them to 2009. In December 2008, ready-to-sign projects with Dürr worth around € 200 mil-lion were postponed. In all, our order intake for the full year was down 18 % to € 1,464 million. however, on year-on-year comparison two aspects should be borne in mind. Firstly, we deliber-ately refrained from taking on low-margin orders in the final assembly conveyor systems busi-ness in 2008. This reduced our order intake versus the previous year by about € 80 million. On a like-for-like basis new orders were down 14 %. Secondly, order intake in the fourth quarter of 2007 had been affected by a very large order from BMW Group worth around € 140 million, which was well in excess of our normal size of order.

44
2008
15.1 %
23.2 %
40.5 %
15.9 %
5.3 %
2008
21.5 % 78.5 %
viewed by region, there were appreciable differences in order intake. While Germany accounted for only 16 % of new orders, the level of orders in the rest of the Eu increased due to large orders from Italy, France, Belgium, and Great Britain. Order intake in Eastern Europe declined slightly after the boom year in 2007. however, we won several orders in Russia, and a large paint systems order was received from Romania. Order intake in North America was down after it had been affected in 2007 by the order from BMW Group. In Brazil orders were up appreciably. Asian busi-ness developed very well, with growth of 22 %. This was driven primarily by demand in china; order intake in India was also up on the previous year’s high level. Orders from the growth mar-kets (Mexico, Brazil, Eastern Europe, Asia ex Japan) increased to 48 % of our total order intake (2007: 43 %). We therefore benefited once again from our above-average international presence.
At € 925 million, orders on hand at the end of 2008 fell short of the previous year’s high level (€ 1,082.0 million). As usual, this does not include most of the regular, short-term replacement parts and services business, which represents a volume of about € 400 million. Together, orders on hand and short-term services business cover roughly 75 % of our sales target for 2009. In 2008, only about € 10 million, or roughly 1 %, of orders on hand was cancelled.
Our reach of orders is 6.9 months (2007: 8.8 months) and assures a good level of capacity util- i zation in most areas until well into the current year. however, there are pronounced differences between the two divisions: owing to the longer-term plant engineering business order backlog at Paint and Assembly Systems is equivalent to 7.3 months (2007: 10.0 months), while at Meas-uring and Process Systems, where the focus is on mechanical engineering, it is 5.8 months (2007: 5.5 months).
sales uP 8 .5 %, adJusted +14.3 %
At € 1,602.8 million, consolidated sales were up 8.5 % on the previous year (€ 1,476.6 million). This is due not only to the high order backlog at the end of 2007 but also to the continued order intake in the past year. 24.7 % of our revenues came from the steadily growing services business. On an adjusted basis, in other words allowing for the deliberate reduction in order intake in the final assembly conveyor systems business, sales would have been up 14.3 %.
in € million 2008 2007 2006 2005 2004
Germany 232.2 318.8 237.8 249.3 374.5
Rest of Europe 593.0 639.2 509.4 453.2 501.3
North and central America 220.4 510.2 263.8 254.2 292.6
South America 77.9 47.4 26.3 20.3 13.0
Asia / Africa / Australia 340.5 265.9 422.5 239.9 206.0
total 1,464.0 1,781.5 1,459.8 1,216.9 1,387.4
consolidated incominG orders by reGion
in € million 2008 2007 2006 2005 2004
Paint and Assembly Systems 725.9 903.4 671.9 612.1 730.9
Measuring and Process Systems 199.1 178.6 133.3 111.4 129.0
total 925.0 1,082.0 805.2 723.5 859.9
consolidated orders on Hand (december 31)

454 management and stock 92 consolidated financial statements 163 other24 management report19 market and business
43 Business Development
2008
20.2 %
20.0 %
38.4 %
18.4 %
3.0 %
europe accounted for 56.8 % of sales, asia (including africa and australia) for 20.0 %, and north and south america for 23.2 %. business in the emerging markets contributed 43.2 % of consolidated sales, with the greater part coming from the bric countries. sales were up 8 % in germany, and up 6 % in the rest of europe. in north america, the very large order from bmW group led to sales growth of 12 %. in asia, africa and australia we achieved growth of 9 %; however, as expected, sales revenues in china, the region’s biggest single market, were down 7 %. this was due to the cyclical falloff in orders the year before.
income statement key f igures anD profitaBil it y r atios
2008 2007 2006 2005 2004
sales revenues in € million 1,602.8 1,476.6 1,361.2 1,400.6 1,725.8
gross profit in € million 285.2 240.0 220.2 220.2 240.6
ebitda in € million 87.1 73.5 52.7 – 18.8 50.2
ebit in € million 72.7 55.7 33.1 – 70.3 29.0
ebt in € million 46.4 34.8 14.8 – 106.6 4.5
earnings after tax in € million 33.7 21.2 8.2 – 104.5 – 1.1
earnings per share in € 1.81 1.33 0.50 – 7.26 0.00
gross margin in % 17.8 16.3 16.2 15.7 13.9
ebitda margin in % 5.4 5.0 3.9 – 1.3 2.9
ebit margin in % 4.5 3.8 2.4 – 5.0 1.7
ebt margin in % 2.9 2.4 1.1 – 7.6 0.3
return on sales (after tax) in % 2.1 1.4 0.6 – 7.5 – 0.1
return on equity in % 9.9 8.2 3.3 – 42.1 – 0.5
return on investment in % 6.2 4.5 3.4 – 5.6 1.7
glossary: P. 166
in € million 2008 2007 2006 2005 2004
germany 294.9 274.0 281.4 310.1 436.5
rest of europe 615.4 579.0 513.5 502.5 391.6
north and central america 323.7 289.6 258.9 397.7 654.7
south america 48.1 38.8 27.2 15.2 5.2
asia / africa / australia 320.7 295.2 280.2 175.1 237.8
total 1,602.8 1,476.6 1,361.2 1,400.6 1,725.8
consoliDateD sales By region

46
Gross Profit well uP
We improved our gross margin, which is the difference between sales and the cost of sales expressed as a percentage of sales, again in 2008 to 17.8 % (2007: 16.3 %). This was attributable above all to the continued optimization of our internal processes. The improvement would have been still more pronounced had it not been for the fact that, with growth of 3 %, the higher-mar-gin services business grew less strongly than new business. The final assembly conveyor sys-tems business still posted losses in the high single-digit millions, resulting from the execution of old low-margin orders and incurred primarily in France and the uSA.
overHead costs Held in cHeck
Selling expenses rose less than proportionally compared to sales in 2008. Administrative ex-penses even declined in absolute terms despite rising labor costs. Through strict cost manage-ment selling and administrative expenses rose by 1.2 %, and thus at much slower pace than sales. As a result, the ratio of administrative and selling expenses to sales fell from 12.4 % to 11.5 %. In line with our “Dürr 2010” strategy we increased our research and development (R&D) spending by 24.7 % to € 25.5 million (2007: € 20.5 million) in order to expand our technology leadership.
Other operating income and expenses had a much smaller impact on our earnings in 2008 than in the previous years, with a negative net balance of € – 3.5 million after a positive net balance of € 18.0 million in 2007. There was a book profit of € 3.9 million from asset sales (including sale-and-leaseback transactions in the uSA). Set against this there was net expense of € – 4.1 mil lion from currency translation. The net balance of income and expenses for the campus relocation project was € – 2.1 million. Additional expenses of € 1.2 million for the campus project are in-cluded under other functional costs. In 2007, other operating income and expenses had not only included gains from asset sales but also income from the release of provisions and one-time income from the campus project. Further information on this can be found in item 11 in the notes to the consolidated financial statements.
ebit1
2008 2007 2006 2005 2004
in € million ebitas % of
sales ebitas % of
sales ebitas % of
sales ebitas % of
sales ebitas % of
sales
Paint and Assembly Systems 48.6 4.1 32.7 3.0 29.4 2.7 – 41.4 – 3.8 30.3 2.1
Measuring and Process Systems 30.8 7.5 23.2 6.0 4.6 1.7 – 19.1 – 6.1 – 3.9 – 1.3
corporate center / consolidation – 6.7 – – 0.2 – – 0.9 – – 9.8 – 2.6 –
total 72.7 4.5 55.7 3.8 33.1 2.4 – 70.3 – 5.0 29.0 1.7
1 Figures for the years prior to 2007 are only comparable to a limited extent due to the reorganization of the final assembly products business (for details please see page 27)

474 MANAGEMENT AND STOck 92 cONSOlIDATED FINANcIAl STATEMENTS 163 OThER24 manaGement rePort19 MARkET AND BuSINESS
43 business develoPment
stronG earninGs imProvement
EBITDA was up 18.5 % on the previous year to € 87.1 million. EBIT reached € 72.7 million, an in-crease of 30.4 %.
Two one-off earnings effects more or less balanced each other out in 2008. consequently, EBIT is fully comparable with 2007. To downsize the final assembly conveyor systems business, we initiated capacity reductions above all in France and the uSA. Total restructuring costs amount-ed to € 3.3 million. Set against this there was a positive net balance of € 4.7 million from impair-ment losses and reversals, which was mostly attributable to an impairment reversal at Schenck Technologie- und Industriepark in Darmstadt. The reversal was justified by the high occupancy rate on long-term lease and the sustained good earnings situation, both of which were well above the level at the time the impairment was recognized in 2005. The yearly impairment test result-ed in only minor impairments of € 0.2 million. In view of the economic risks we tested our good-will on the basis of various economic scenarios and their possible impact on Dürr.
EBIT includes the restructuring costs mentioned above as well as the income from the impair-ment reversals, while EBITDA only includes the restructuring costs. The growth in EBIT is there-fore more pronounced. corporate center EBIT (including consolidation effects) was € – 6.7 mil-lion (2007: € – 0.2 million). The negative balance results from expenses for the campus project, on the one hand, and exchange rate effects, on the other hand. Normally, the corporate center achieves a more or less balanced result as corporate overheads are reallocated over the Group.
Personnel exPense r atio furtHer reduced
The number of employees rose to 6,143 at the end of 2008, an increase of 3.5 %. This was less than proportional compared to sales, so the personnel expense ratio fell to 23.5 % (2007: 25.0 %). The growth in the workforce was entirely in the emerging markets. More information can be found in the “Employees” section on page 66. Personnel expenses rose only slightly in absolute terms, with an increase of 2.2 %. They are subsumed in all the categories of operating costs in the income statement.
2008 2007 2006 2005 2004
Employees (December 31) 6,143 5,936 5,650 5,992 6,240
Employees (annual average) 6,060 5,809 5,732 6,089 6,507
Personnel expenses in € million 377.1 368.8 349.8 381.3 398.4
Personnel expense ratio in % 23.5 25.0 25.7 27.2 23.1
Personnel expenses per employee
(annual average) in € 62,200 63,500 61,000 62,600 61,200
Sales per employee (annual average) in € 264,500 254,200 237,500 230,000 265,200
emPloyee- rel ated f iGures and Performance indicators
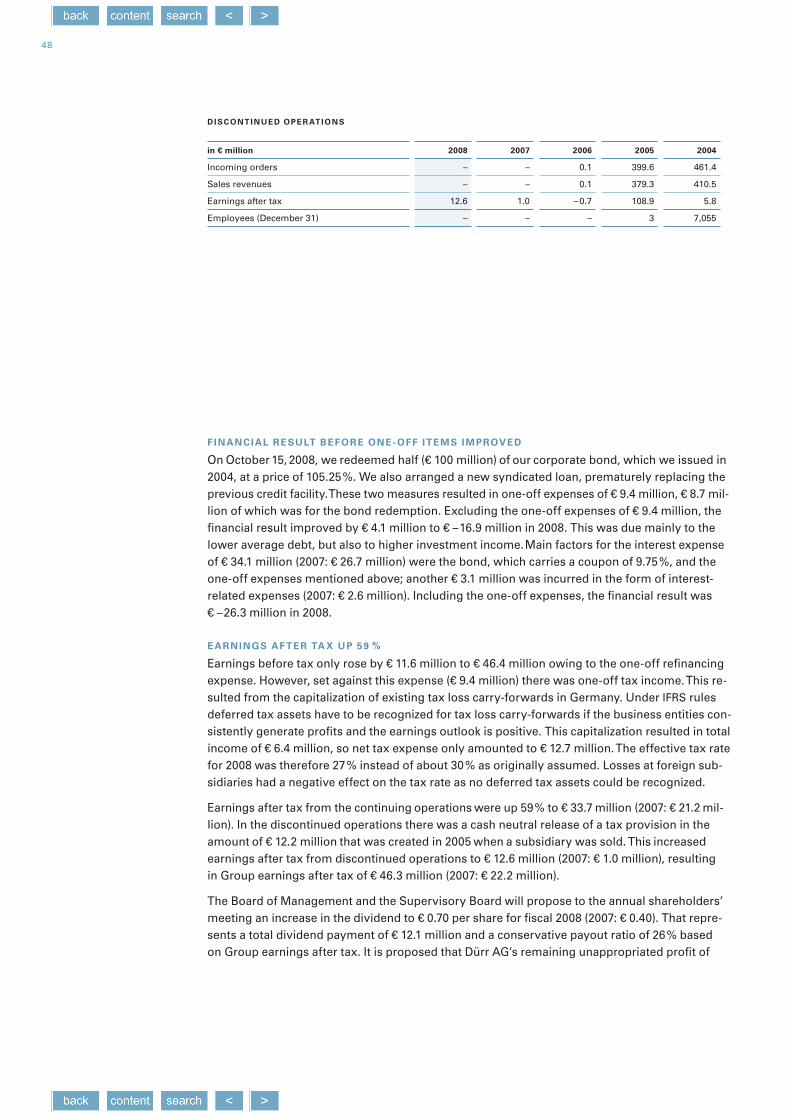
48
financial result before one- off items imProved
On October 15, 2008, we redeemed half (€ 100 million) of our corporate bond, which we issued in 2004, at a price of 105.25 %. We also arranged a new syndicated loan, prematurely replacing the previous credit facility. These two measures resulted in one-off expenses of € 9.4 million, € 8.7 mil-lion of which was for the bond redemption. Excluding the one-off expenses of € 9.4 million, the financial result improved by € 4.1 million to € – 16.9 million in 2008. This was due mainly to the lower average debt, but also to higher investment income. Main factors for the interest expense of € 34.1 million (2007: € 26.7 million) were the bond, which carries a coupon of 9.75 %, and the one-off expenses mentioned above; another € 3.1 million was incurred in the form of interest- related expenses (2007: € 2.6 million). Including the one-off expenses, the financial result was € – 26.3 million in 2008.
earninGs af ter ta x uP 59 %
Earnings before tax only rose by € 11.6 million to € 46.4 million owing to the one-off refinancing expense. however, set against this expense (€ 9.4 million) there was one-off tax income. This re-sulted from the capitalization of existing tax loss carry-forwards in Germany. under IFRS rules deferred tax assets have to be recognized for tax loss carry-forwards if the business entities con-sistently generate profits and the earnings outlook is positive. This capitalization resulted in total income of € 6.4 million, so net tax expense only amounted to € 12.7 million. The effective tax rate for 2008 was therefore 27 % instead of about 30 % as originally assumed. losses at foreign sub-sidiaries had a negative effect on the tax rate as no deferred tax assets could be recognized.
Earnings after tax from the continuing operations were up 59 % to € 33.7 million (2007: € 21.2 mil-lion). In the discontinued operations there was a cash neutral release of a tax provision in the amount of € 12.2 million that was created in 2005 when a subsidiary was sold. This increased earnings after tax from discontinued operations to € 12.6 million (2007: € 1.0 million), resulting in Group earnings after tax of € 46.3 million (2007: € 22.2 million).
The Board of Management and the Supervisory Board will propose to the annual shareholders’ meeting an increase in the dividend to € 0.70 per share for fiscal 2008 (2007: € 0.40). That repre-sents a total dividend payment of € 12.1 million and a conservative payout ratio of 26 % based on Group earnings after tax. It is proposed that Dürr AG’s remaining unappropriated profit of
in € million 2008 2007 2006 2005 2004
Incoming orders – – 0.1 399.6 461.4
Sales revenues – – 0.1 379.3 410.5
Earnings after tax 12.6 1.0 – 0.7 108.9 5.8
Employees (December 31) – – – 3 7,055
discontinued oPer ations

494 MANAGEMENT AND STOck 92 cONSOlIDATED FINANcIAl STATEMENTS 163 OThER24 manaGement rePort19 MARkET AND BuSINESS
43 business develoPment
€ 8.0 million be carried forward. Earnings per share amounted to € 1.81 (2007: € 1.33) for the continuing operations and to € 2.57 (2007: € 1.39) at the Group level.
The reporting for discontinued operations relates to divestments, most of which took place in 2005. Further information can be found in item 6 in the notes to the consolidated financial state-ments. No operations were divested in fiscal 2008.
annual f inancial statements of dürr aG
The full individual annual financial statements of Dürr AG are available at www.durr.com/ investor/financialreports.html.
income statement, dürr aG indiv idual f inancial statements (HGb)
in € million 2008 2007
Income from profit and loss transfer agreements 66.2 10.3
Income from investments 0.0 20.2
changes in inventory 4.6 1.8
Other operating income and expenses – 6.6 6.8
cost of purchased services – 4.6 – 1.8
Personnel expenses – 7.2 – 6.5
Depreciation and amortization – 0.3 – 0.3
Financial result – 29.3 – 25.0
Profit/loss from ordinary activities 22.8 5.5
Taxes – 3.5 – 0.7
net income 19.3 4.8
Profit brought forward from the previous year 0.8 2.3
unappropriated profit 20.1 7.1

50
bal ance sHeet, dürr aG indiv idual f inancial statements (HGb)
in € million dec. 31, 2008 dec. 31, 2007
assets
fixed assets
Intangible assets 1.4 1.6
Property, plant and equipment 0.1 0.2
Financial assets 490.3 490.3
491.8 492.1
current assets
Work in progress 6.4 1.8
Prepayments paid 16.8 –
Prepayments received – 6.3 – 1.7
Receivables and other assets 20.9 15.9
cash and cash equivalents 14.1 84.4
Prepaid expenses 1.7 4.5
total assets 545.4 597.0
eQuit y and l iabil it ies
equity
Subscribed capital 44.3 40.3
capital reserve 200.5 160.5
unappropriated profit 20.1 7.1
264.9 207.9
liabilities
Provisions 17.2 19.1
liabilities 263.3 370.0
total equity and liabilities 545.4 597.0

51
»Dürr places great value on
forging close partnerships with
its customers and also supports
them with their investments abroad. in 2008, we completely
modernized an existing spray booth in tychy, Poland, where Fiat
is producing the new cinquecento – with help of course from
Dürr in Poland and germany. such projects demon strate how
important our international presence and the close collaboration
within the group are.«
silvano temporali, manager engineering and operations, olpidürr s.p.a., italy

52
Paint and assembly systems divis ion
Paint and Assembly Systems won several large paint systems orders in 2008, for instance in Russia, Romania, china, India, and Mexico but also in Western Europe. Nonetheless, order in-take fell short of the previous year’s very high level. This was due to three factors: firstly, the larger than average order from BMW Group in 2007, secondly, the deliberate restraint in taking on low-margin orders in the final assembly conveyor systems business, and thirdly, the project postponements at the end of the fourth quarter of 2008.
Paint and Assembly Systems increased its sales by 9 %. EBIT rose more than proportionally. This was due above all to better order quality and further optimizations in process efficiency and risk management. The paint systems business was mainly responsible for the earnings improvement, but application technology achieved further growth, too. Earnings perform-ance in the final assembly conveyor business was unsatisfactory. however, following its down-sizing in 2008, we are confident that this business will deliver positive results in the current year. Start-up losses were incurred, too, at Aircraft and Technology Systems in the first half of the year. In all, these two businesses posted losses of about € 10 million. This does not include the restructuring costs of € 4.4 million for the final assembly conveyor systems activities.
measurinG and Process systems divis ion
Measuring and Process Systems improved its order intake in 2008 by 4 %. With a book-to-bill ratio of 1.1, new orders still exceeded sales. The Balancing and Assembly Products business unit especially showed a continued positive development. We regard the decline in demand at cleaning and Filtration Systems in the second half of the year as temporary given that the quali-ty standards required in workpiece cleaning are steadily rising. In particular, the smaller engines now being developed require greater cleaning precision because of their filigree technology and geometry.
Both business units achieved gratifying rates of growth in sales revenues. cleaning and Filtra-tion Systems even posted a double-digit increase and further improved its earnings. Balancing and Assembly Products achieved a record result despite necessary adjustments to the reduced volume of business in the uSA.
Glossary: P. 166
2008 2007 2006 2005 2004
Incoming orders in € million 1,028.0 1,362.5 1,155.6 931.2 1,086.4
Sales revenues in € million 1,191.6 1,088.9 1,083.9 1,090.0 1,413.8
EBIT in € million 48.6 32.7 29.4 – 41.4 30.3
EBIT margin in % 4.1 3.0 2.7 – 3.8 2.1
capital expenditure ² in € million 10.6 18.2 12.1 16.8 15.4
Employees (December 31) 3,595 3,551 3,786 3,979 4,236
Paint and assembly systems div is ion1
1 Figures for the years prior to 2007 are only comparable to a limited extent due to the reorganization of the final assembly products business (for details please see page 27)
2 in property, plant and equipment and intangible assets

534 management and stock 92 consolidated financial statements 163 other24 management report19 market and business
43 Business Development
53 Financial Development
schenck technologie- unD inDustriepark gmBh
schenck technologie- und industriepark gmbh achieved ebit in the low single-digit millions before income from the reversal of impairments. as mentioned earlier, there were write-ups of € 4.3 million in 2008. the reasons for the reversal were the high occupancy rate and the sus-tained good earnings situation, both of which were well above the level at the time the corre-sponding impairments were recognized in 2005.
financial development
FunDing anD l iquiDit y management
dürr ag’s funding and liquidity management pursues two principal objectives: to control risk and to optimize income and costs. risk control encompasses all financial risks that could threaten the company’s existence. a special priority is to assure sufficient liquidity so that the company is able to meet its payment obligations at all times. further information can be found in the risk report on page 72.
We achieve cost benefits and better transparency through the centralization of our funding and liquidity management. as the central funding platform, dürr ag raises the overwhelming major - ity of the debt needed within the group and distributes this to the companies as required. liquidi-ty management is also organized by dürr ag through a cash pool with the principal group com-panies. surplus cash is taken over from group companies and made available to other group companies.
me asuring anD process systems Div is ion1
schenck technologie- unD inDustriepark gmBh
1 figures for the years prior to 2007 are only comparable to a limited extent due to the reorganization of the final assembly products business (for details please see page 27)
2 in property, plant and equipment and intangible assets
1 n.a. = not available
2008 2007 2006 2005 2004
incoming orders in € million 436.0 419.0 304.2 285.7 301.0
sales revenues in € million 411.2 387.7 277.3 310.6 312.0
ebit in € million 30.8 23.2 4.6 – 19.1 – 3.9
ebit margin in % 7.5 6.0 1.7 – 6.1 – 1.3
capital expenditure ² in € million 8.4 7.8 5.4 8.3 6.3
employees (december 31) 2,499 2,338 1,821 1,966 1,953
in € million 2008 2007 2006 2005 2004
external revenues 16.3 15.1 13.7 6.5 4.5
of which external rental income 8.5 7.4 6.9 3.9 n. a.1

54
debt f inancinG
Despite the difficult conditions on the capital market, we arranged an extensive refinancing in 2008, enabling us to optimize our financing structure and place our funding on a secure long-term basis. The refinancing was carried out in three steps. In June, we placed an issue of shares, increasing our capital by just less than ten percent and generating proceeds of € 43.7 mil lion. At the beginning of September, we signed a new syndicated loan agreement which runs for three years and gives us access to widened credit and guarantee lines totaling € 440 million. In a third step, we redeemed half, or € 100 million, of our corporate bond on October 15.
The two core elements of our debt financing are the syndicated loan facility and the remaining tranche of our corporate bond. Additionally, we have bilateral credit lines at our disposal on a fairly small scale. The corporate bond, which is due in 2011, is subordinated in relation to the syndicated loan facility and therefore carries a higher rate of interest compared to a bank loan. The credit facilities can be drawn in different currencies and for different terms. We also employ money and capital market instruments, and make selective use of off-balance sheet financing instruments such as accounts receivable financing programs and operating leases.
The credit line available to us under the syndicated loan facility amounts to € 200 million (De-cember 31, 2007: € 100 million). € 10.0 million was drawn as of the balance sheet date; the aver-age amount drawn in 2008 was € 7.2 million. A further € 10.6 million was drawn under bilateral credit lines as of the end of the year. Our guarantee lines amounted to € 484.9 million (Decem-ber 31, 2007: € 377.4 million). Together with cash and cash equivalents, our available credit and guarantee lines should be sufficient to cover our financing needs in 2009 without difficulty. De-tailed information on the syndicated loan and the corporate bond can be found in item 25 in the notes to the consolidated financial statements.
In the new syndicated loan agreement, the covenants – that is the financial ratios we are required to meet – were adjusted to our current corporate planning. According to our calculations, we complied with the covenants as of the year-end 2008 reporting date. The syndicated loan car-ries interest at the refinancing rate for the respective currency and maturity (EuRIBOR, lIBOR) plus a margin calculated in steps on the basis of the ratio of total net debt to EBITDAR. Shares in subsidiaries and second-tier subsidiaries are pledged as security for the bond and the syndi-cated loan facility.

554 MANAGEMENT AND STOck 92 cONSOlIDATED FINANcIAl STATEMENTS 163 OThER24 manaGement rePort19 MARkET AND BuSINESS
53 financial develoPment
Information on Dürr AG’s credit ratings can be found in the “Opportunities and Risks” section on page 82.
Our principal cash obligations in connection with our operating activities are the repayment of financial debt, interest payments, purchasing obligations, and the payment of wages and sala-ries. In addition, there are obligations under operating leases that we employ in addition to the assets reported in the consolidated balance sheet.
off-bal ance sHeet f inancinG instruments
Our future payment obligations under operating leases amounted to € 147.7 million as of the balance sheet date (December 31, 2007: € 145.5 million). The slight increase is due to the sale and leaseback of two buildings in the uSA. A list can be found in item 33 in the notes to the consolidated financial statements. We also make selective use of accounts receivable financing (factoring, forfaiting) to reduce capital employed. At the end of 2008, our factoring volume amounted to € 15.0 million (December 31, 2007: € 14.2 million). Our forfaiting volume as of December 31, 2008, was € 67.6 million, which was higher than at the end of 2007 (€ 20.8 million). This is due to a planned and agreed sale of € 61 million of receivables in connection with the large BMW order in the uSA. The increased forfaiting volume is of a one-off nature and was due to the contractual conditions and payment terms. Over half of the € 61 million was already util-ized for executing the order.
The off-balance sheet financing instruments are not included in net financial debt and reduce the balance sheet to some extent. Despite the increase in 2008 their total volume still stands in reasonable relation to our business volume. The forfaiting volume will return to the normal level again in the first half of 2009.
casHflow
cash flow from operating activities was comfortably in positive territory at € 30.9 million but was lower than in 2007 despite the better earnings situation. A main reason for this was the project postponements by customers in the fourth quarter. This meant that the related prepayments that had been planned and would have had a positive impact on net working capital were not realized. This led to an increase in net working capital, despite the higher forfaiting volume, and squeezed cash flow. Inventories and trade receivables also rose due to the higher volume
Glossary: P. 167
Glossary: P. 167
in € million 2008 2007 2006 2005 2004
Earnings before income taxes 46.4 34.8 14.8 – 106.6 4.5
Depreciation and amortization 14.4 17.8 19.1 54.2 21.3
Interest result 29.3 22.9 21.0 35.1 24.5
Income taxes paid – 11.9 – 5.8 – 5.6 – 4.6 0.8
change in provisions – 2.4 – 4.1 – 20.2 – 25.1 – 21.8
change in net working capital – 22.3 37.0 8.8 – 82.1 – 110.8
Other – 22.6 – 16.7 – 47.7 – 18.5 – 34.0
cash flow from operating activities 30.9 85.9 – 9.8 – 147.6 – 115.5
Interest paid (net) – 26.3 – 19.4 – 18.7 – 32.8 – 14.0
capital expenditure – 19.1 – 25.9 – 18.0 – 25.7 – 21.4
free cash flow – 14.5 40.6 – 46.5 – 206.1 – 150.9
Other cash flows 41.9 – 5.9 34.9 364.0 – 4.6
Decrease (+), increase (–) in net financial debt +27.4 +34.7 – 11.6 +157.9 – 155.5
casH flow

56
of business. The interest result includes the one-off expenses for the refinancing. The largest single items under “Other” were the net proceeds of € 3.9 million from asset disposals and the change in other receivables and assets.
cash flow from investing activities amounted to € – 2.6 million (2007: € – 11.2 million). € 10.8 million was invested in property, plant and equipment, which was exactly the same level as in 2007. capital expenditure on intangible assets fell to € 8.3 million and was mainly for the continued implementation of our erp system, the decline being a result of the project’s progress.
cash flow from financing activities amounted to € – 96.1 million (2007: € – 21.9 million) and was influenced on the one hand by interest payments of € 30.7 million and on the other by the expen-ditures for the partial redemption of the bond. On the positive side there were the proceeds from the capital increase. cash flow from financing activities was also affected by the capitalized transaction costs for the new syndicated loan, which led to a cash outflow.
free cash flow indicates the remaining cash available for dividend payments and share buybacks, and for reducing net financial debt. In addition to the cash flow from operating activities, this includes interest received and capital expenditures (included in cash flow from investing activities) as well as interest paid (included in cash flow from financing activities). free cash flow was slightly negative at € – 14.5 million in 2008.
The biggest item under “Other cash flows” (table page 55) is the cash inflow of € 43.7 million from the capital increase. Including these funds, net financial debt was reduced by € 27.4 million, after a reduction of € 34.7 million already in 2007. The low debt is an important stability factor in view of the economic crisis.
Glossary: P. 166
Glossary: P. 167
in % 2008 2007 2006 2005 2004
Non-current assets 40.8 39.5 43.0 40.8 39.1
current assets 59.2 60.5 57.0 59.2 60.9
total assets 100 100 100 100 100
Equity with minority interests 31.4 23.9 23.6 20.9 15.5
Non-current liabilities 18.5 28.4 30.9 27.3 23.6
current liabilities 50.1 47.7 45.5 51.8 60.9
total equity and liabilities 100 100 100 100 100
bal ance sHeet structure (december 31)

574 MANAGEMENT AND STOck 92 cONSOlIDATED FINANcIAl STATEMENTS 163 OThER24 manaGement rePort19 MARkET AND BuSINESS
53 financial develoPment
Performance indicators: ebit, oPer atinG casH flow, free casH flow and roce
In connection with our “Dürr 2010” strategy, we have defined value-oriented performance targets to back up our strategic goals. EBIT, cash flow from operating activities, free cash flow and roce are the chief performance benchmarks for the companies and the business units. ROcE, which is EBIT relative to capital employed, rose to 16.8 % at the end of 2008 (2007: 15.0 %). The improvement was mainly due to the strong growth in EBIT. EBIT and cash flow are discussed on pages 47 and 55/56.
As in 2007, the Dürr Group generated positive Economic value Added (EvA) and thus created value in 2008. EvA measures the value that a company creates or destroys in a fiscal year and is calculated on the basis of the following formula:
eva = noPat – (wacc x capital employed)
Paint and Assembly Systems improved its ROcE strongly to 31.2 % (December 31, 2007: 23.5 %). Measuring and Process Systems also improved on the high 2007 level with a ROcE of 10.9 % (9.7 %). The difference in the two divisions’ rates of return is mostly due to the higher capital employed in the mechanical engineering business at Measuring and Process Systems. Both divisions generated positive EvA, and thus created value.
furtHer reduction in net f inancial debt
cash and cash equivalents decreased by € 63.1 million to € 84.4 million as of December 31, 2008, mainly due to the partial redemption of the bond. The bond redemption reduced financial lia-bilities by € 92.0 million to € 122.6 million. As a result of the proceeds from the capital increase, net financial debt fell to € 34.4 million at the end of 2008. This was a further reduction of € 27.4 mil-lion versus the end of 2007.
imProved bal ance sHeet r atios
The balance sheet expanded by only € 13.2 million to € 1,088.0 million as of December 31, 2008. The growth was due, firstly, to the higher volume of business and the resulting increase in in-ventories and trade receivables and, secondly, to the proceeds from the capital increase. The partial redemption of our bond, however, had a reducing effect.
Glossary: P. 167
noPat =
Net Operating Profit After Taxes
wacc =
Weighted Average cost of
capital
(see glossary p. 167)
2008 2007 2006
capital Employed in € million 432.1 378.8 420.1
ROcE in % 16.8 15.0 7.6
ROcE Paint and Assembly Systems in % 31.2 23.5 11.4
ROcE Measuring and Process Systems in % 10.9 9.7 1.7
NOPAT in € million 52.8 34.0 18.3
Weighted average cost of capital (WAcc) in % 7.58 7.41 6.66
EvA in € million 20.0 5.9 – 9.7
comPany value
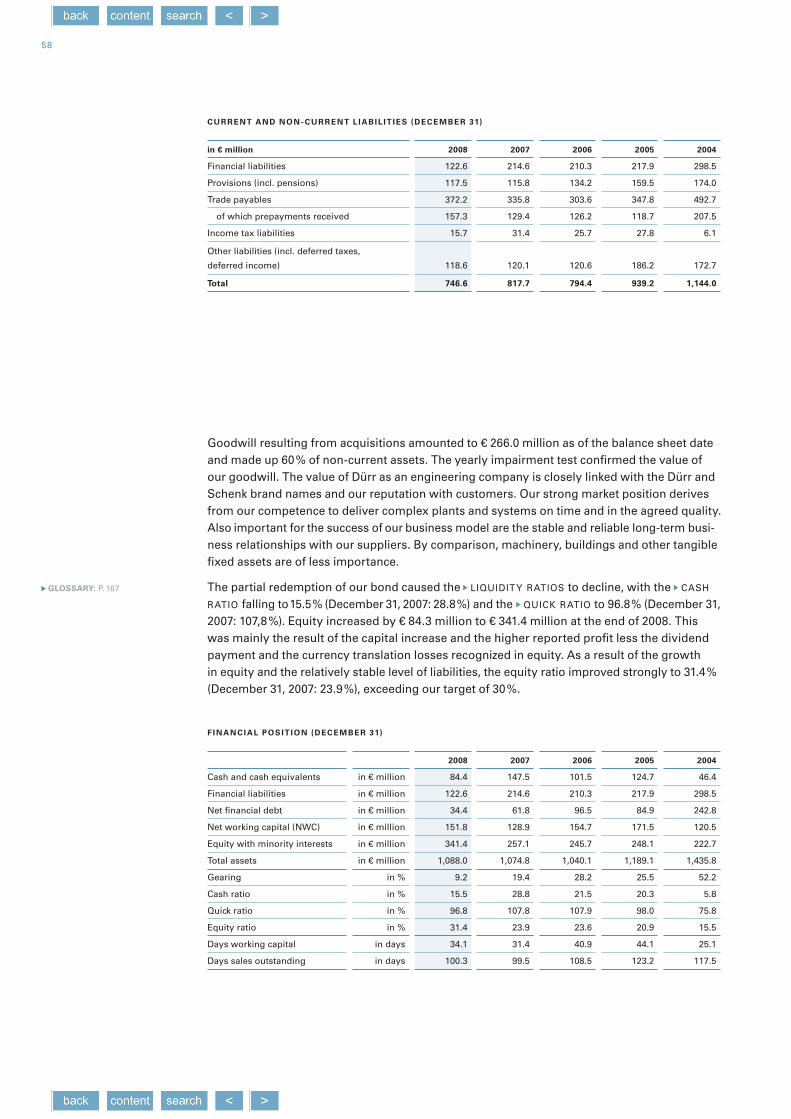
58
Goodwill resulting from acquisitions amounted to € 266.0 million as of the balance sheet date and made up 60 % of non-current assets. The yearly impairment test confirmed the value of our goodwill. The value of Dürr as an engineering company is closely linked with the Dürr and Schenk brand names and our reputation with customers. Our strong market position derives from our competence to deliver complex plants and systems on time and in the agreed quality. Also important for the success of our business model are the stable and reliable long-term busi-ness relationships with our suppliers. By comparison, machinery, buildings and other tangible fixed assets are of less importance.
The partial redemption of our bond caused the liquidity ratios to decline, with the cash ratio falling to 15.5 % (December 31, 2007: 28.8 %) and the quick ratio to 96.8 % (December 31, 2007: 107,8 %). Equity increased by € 84.3 million to € 341.4 million at the end of 2008. This was mainly the result of the capital increase and the higher reported profit less the dividend payment and the currency translation losses recognized in equity. As a result of the growth in equity and the relatively stable level of liabilities, the equity ratio improved strongly to 31.4 % (December 31, 2007: 23.9 %), exceeding our target of 30 %.
GLOSSARY: P. 167
in € million 2008 2007 2006 2005 2004
Financial liabilities 122.6 214.6 210.3 217.9 298.5
Provisions (incl. pensions) 117.5 115.8 134.2 159.5 174.0
Trade payables 372.2 335.8 303.6 347.8 492.7
of which prepayments received 157.3 129.4 126.2 118.7 207.5
Income tax liabilities 15.7 31.4 25.7 27.8 6.1
Other liabilities (incl. deferred taxes,
deferred income) 118.6 120.1 120.6 186.2 172.7
Total 746.6 817.7 794.4 939.2 1,144.0
CuRRenT And nOn - CuRRenT L iAbiL iT ieS (deCembeR 31)
F inAnCiAL pOSiT iOn (deCembeR 31)
2008 2007 2006 2005 2004
Cash and cash equivalents in € million 84.4 147.5 101.5 124.7 46.4
Financial liabilities in € million 122.6 214.6 210.3 217.9 298.5
Net financial debt in € million 34.4 61.8 96.5 84.9 242.8
Net working capital (NWC) in € million 151.8 128.9 154.7 171.5 120.5
Equity with minority interests in € million 341.4 257.1 245.7 248.1 222.7
Total assets in € million 1,088.0 1,074.8 1,040.1 1,189.1 1,435.8
Gearing in % 9.2 19.4 28.2 25.5 52.2
Cash ratio in % 15.5 28.8 21.5 20.3 5.8
Quick ratio in % 96.8 107.8 107.9 98.0 75.8
Equity ratio in % 31.4 23.9 23.6 20.9 15.5
Days working capital in days 34.1 31.4 40.9 44.1 25.1
Days sales outstanding in days 100.3 99.5 108.5 123.2 117.5

594 MANAGEMENT AND STOck 92 cONSOlIDATED FINANcIAl STATEMENTS 163 OThER24 manaGement rePort19 MARkET AND BuSINESS
53 financial develoPment
Trade payables rose by € 36.4 million to € 372.2 million, which was due to higher prepayments compared to the previous year. The more-than-proportional increase in inventories and trade receivables is due to the higher volume of business. This caused net working capital to rise from € 128.9 million to € 151.8 million despite active management; however, on the balance sheet date it was only equivalent to 9.5 % of sales (December 31, 2007: 8.7 %).
Assets are carried at acquisition or production cost. Their carrying values did not exceed their current market value on the balance sheet date.
As our own manufacturing input is low, we generally have less need to invest in property, plant and equipment. The expansion of capacities in the emerging markets was not all that capital- intensive either. There, the focus was on expenditures for the recruitment, training and coach-ing of new employees.
capital expenditure on property, plant and equipment and intangible assets declined in both divisions from € 26.0 million to € 19.0 million. This was due to the fact that the bulk of our capital spending on IT harmonization was undertaken in 2007. While most of the expenditures for soft-ware and licenses were incurred in 2007, the implementation costs are continuing into the cur-rent fiscal year. In addition to the IT investments, the expenditure in 2008 was mainly on main-tenance and replacement. capital spending on property, plant and equipment was unchanged at € 10.8 million, with factory and office equipment accounting for about 50 %. The increase in capital expenditure in the corporate center (Dürr AG) is mainly due to the capitalization of the trans action costs for the new syndicated loan. In the cash flow statement these transaction costs are included in cash flow from financing activities.
Regular depreciation and amortization was € 19.2 million (2007: € 17.9 million); this puts the re-investment ratio at 79 % (2007: 68 %). Including the net balance of impairment losses/reversals of € 4.7 million (2007: € 0.1 million), total depreciation and amortization expense was € 14.4 mil-lion (2007: € 17.8 million) and the reinvestment ratio was 59 % (2007: 67 %). We acquired no com-panies in 2008 or the year before.
Glossary: P. 167
in € million 2008 2007 2006 2005 2004
Paint and Assembly Systems 10.6 18.2 12.1 16.8 15.4
Measuring and Process Systems 8.4 7.8 5.4 8.3 6.3
corporate center 5.3 0.5 0.5 0.9 5.7
total 24.3 26.5 18.0 26.0 27.4
in € million 2008 2007 2006 2005 2004
Paint and Assembly Systems 10.6 10.0 10.4 14.6 14.0
Measuring and Process Systems 6.3 6.4 4.8 7.0 6.0
corporate center 2.3 1.5 3.9 2.0 1.1
total 19.2 17.9 19.1 23.6 21.1
caPital exPenditure on ProPert y, Pl ant and eQuiPment and intanGible assets
dePreciat ion and amortiz ation1
1 Excluding impairment losses and reversals

60
ecoDryscrubber– 30% E N E R G y c O N S u M P T I O N
new spray booth concept with dry separation | When applying wet paints, up to 85 % of the paint
sprayed reaches the body surface. The surplus paint (so-called overspray) has to be fi ltered from
the air to minimize emissions. A stream of fresh air, which is conditioned exactly to a specifi c tempera-
ture and humidity, carries the paint particles down into the sump of the booth. There, the particles are
usually removed from the air with the aid of water and chemicals, and the air is then discharged. This
is not so with the ecodryscrubber. In this case, the paint particles are removed in dry fi lters. This has
the advantage that, in contrast to wet separation with water and chemicals, the air in the booth does
not absorb any additional moisture. It can therefore be recirculated. This considerably reduces energy
consumption as there is no continuous supply of fresh air that has to be conditioned.

614 MANAGEMENT AND STOck 92 cONSOlIDATED FINANcIAl STATEMENTS 163 OThER24 manaGement rePort19 MARkET AND BuSINESS
61 researcH and develoPment
RESEARch AND DEvElOPMENT
The direct costs of research and development (R&D) increased by 24.7 % in 2008 to € 25.5 mil-lion (previous year: € 20.5 million). The decisive factor was our innovation initiative in the frame-work of the “Dürr 2010” strategy program, mainly including the completion of the Ecodry-scrubber paint booth concept. The R&D ratio rose slightly on the previous year to 1.6 %. Besides the R&D costs shown in the income statement, further project-related development expenses were incurred, as is usual in plant engineering. Since those expenses are allocable to individual customer orders, they flow into the cost of sales. Another € 3.1 million was capitalized and there-fore likewise not shown in R&D costs (previous year: € 4.7 million). Information on the account-ing of development costs is contained in item 7 in the notes to the consolidated financial state-ments.
The number of R&D employees remained nearly constant at 152 and made up 2.5 % of the total workforce (Dec. 31, 2007: 158 employees; 2.7 %). Added to that are numerous other employees that are moving forward with new developments in the framework of customer orders, espe-cially in the mechanical, electrical, and software fields. We applied for 44 new patent families in 2008 (previous year: 42). Altogether, we had 547 patent families as of December 31, 2008. That Dürr takes innovation very seriously is also shown by the heinz Dürr Innovation Award, which is presented annually to especially creative employee teams.
Our own know-how is supplemented through cooperation with about 50 universities and re-search centers. We prefer not to disclose the content of these cooperative activities for reasons of competition. We maintain especially close relations with the universities of Darmstadt, Dortmund, and Stuttgart and various Fraunhofer Institutes. We procure external R&D expertise only in selected cases. The annual costs of that amount to less than € 1 million.
The Dürr Group has had a standardized R&D process with uniform methods, instruments, and reporting patterns since 2006. The main process stages are idea gathering, project selection, project execution, and product release. This standardized process increases the transparency of individual development projects at Dürr and thus promotes the exchange of results among the business units.

62
main Goal: reducinG unit costs
Our customers make capital investment decisions to a large extent dependent on what unit cost advantages a new machine or system allows. Accordingly, the various types of costs in produc-tion are important starting points for our R&D work. A new technology from Dürr must operate more economically than other products on the market, whether through lower consumption of materials, lower maintenance costs, greater automation or – ever more importantly – lower en-ergy needs. To calculate the operating costs of new paint systems in advance, we use a database that processes all cost factors and their determinants. On this basis, we can work up cost-opti-mized solutions for any paint shop, regardless of whether it involves new construction or an existing plant.
volatile fuel prices, heightened environmental awareness, and the desire for individual mobility in fast-growing regions have recently caused demand for small cars to increase considerably. Against this background, we are systematically developing concepts for outfitting small car factories. One example is our leanline concept with functional standardized products and sim-ple layouts and processes. These solutions are in line with budgets and quality requirements for the construction of low-cost small cars for emerging markets and have already proven them-selves repeatedly in Asia and Eastern Europe.
The modularization of our systems and machines is another pacesetter of our R&D work. That enables us to supply our customers with everything from the individual machine to a complete custom-configured system and at the same time exploit the advantages of standardization.
Paint and f inal assembly systems: innovations for HiGHer enerGy effic iency
Paint and Final Assembly Systems presented a milestone innovation in October. The new Ecodryscrubber spray booth concept reduces energy needs in the painting process by up to 30 % and thus contributes substantially to lowering unit costs in automobile production. More-over, cO2 emissions are reduced, and expensive disposal of paint sludge avoided. Dry separa-tion of excess paint particles by means of special filter modules is the centerpiece of the new system. It replaces the previous method of wet separation, which relied on binding excess paint particles to water and chemicals. The effect of the new process is that exactly humidified and

634 management and stock 92 consolidated financial statements 163 other24 management report19 market and business
61 research and development
tempered booth air is completely cleaned of paint particles and does not absorb additional moisture, since contact with water is not involved. the booth air can therefore be reused, and fresh air need not be fed in constantly for use in the booth. Water consumption in the paint shop is also reduced significantly.
Jointly with the henkel group, we have developed the acquence® dip-coating process further. our contribution is a special plant technology that produces an anti-corrosion coating on com-ponents with a ferrous surface. unlike cathodic dip-coating, no electrical voltage is needed to draw the paint particles out of the dip bath onto the components. instead, the paint is precipi-tated from a water-based organic emulsion. that considerably reduces the energy used. more-over, the process is entirely free of heavy metals and gives rise to hardly any volatile organic compounds (Voc).
application technology: Flexibil it y in color changing
We introduced a color changer, the Ecopurgelcc, that is as flexible as it is material-saving. lo-cated in the arm of the painting robot, the system reduces material loss per color change from 55 milliliters to less than 10 milliliters. that is ensured primarily by the push-out and reflow tech-nology, which pushes the residual paint back into the paint line. moreover, with a palette of 36 colors, the change from one color to another can be performed in less than ten seconds.
We developed an optimized and even more flexible travel rail system for our new generation of painting robots. for interior painting, two travel rails are installed as a dual-rail system on top of each other on the booth wall. traveling on the upper rail, for example, the handling robot, which opens the hood and the trunk lid, can “overtake” the painting robot on the lower rail. in this way, the paint booth can be shortened by one to two meters, which cuts investment, oper-ating, and energy costs. Productivity is also increased thanks to reduced auxiliary process times. during exterior painting, the robot travels on a higher-mounted rail and can thus reach the surfaces of the car body better. finally, narrower booths with correspondingly lower oper-ating costs are also possible.
glossary: P. 166
glossary: P. 166
r&d expense
2008 2007 2006 2005 2004
in € million expense ratio expense ratio expense ratio expense ratio expense ratio
Paint and assembly systems 19.9 1.7 % 15.5 1.4 % 17.6 1.6 % 17.5 1.6 % 16.2 1.1 %
measuring and Process systems 5.6 1.3 % 5.0 1.3 % 3.5 1.3 % 3.6 1.2 % 4.1 1.3 %
total 25.5 1.6 % 20.5 1.4 % 21.1 1.6 % 21.1 1.5 % 20.3 1.2 %

64
environmental and enerGy systems: lower oPer atinG costs
In the area of environmental technology, our focus in 2008 was on reducing the energy consump-tion of our systems, too. For example, we combined for the first time an exhaust-air purification system for regenerative thermal oxidation with an evaporation tower. That enables the system to dispose of not only hydrocarbon-bearing exhaust air, but also solid-free wastewater. The new process combination leads to lower operating costs because it reduces primary energy use. Instead of burning gas, the energy in the hydrocarbons is reclaimed for plant operation.
The TARcOM 5 burner is another energy-saving innovation. The new model is used for inciner-ating pollutants in industrial exhaust air. compared with conventional burners, the TARcOM 5 needs less gas and reduces nitrogen oxide emissions.
aircr af t and tecHnoloGy systems: focus on standardiz ation
Aircraft and Technology Systems concentrated especially on standardizing its product range. The emphasis was on spray booths for painting aircraft components. With its standard product catalog, the unit has laid a substantial foundation for expanding its business. Furthermore, we are developing additional key products for the structural assembly of aircraft modules such as, for example, positioning systems for fuselage shells and segments.
bal ancinG and assembly Products: downsiz inG as innovation driver
R&D work in balancing technology was strongly shaped by the trend toward smaller power train units for more fuel efficient cars (“ downsizing”). For example, Schenck introduced a new, ultra-compact machine for automatic balancing of downsized crankshafts that requires less space and energy and reduces manufacturing costs. Another trendsetting innovation of 2008 is the Pasio 5 balancing machine for rotors weighing up to five kilograms, which include, for example, electric armatures, blowers and spindles. The compact machine works with laser measurement technology and can cover a broad range of applications thanks to its flexible drive system.
At our location in Stollberg (Germany), we have developed a system that fills diesel cars during final assembly with an aqueous urea solution. The solution is injected into the car’s exhaust system during vehicle operation to reduce nitrogen oxide emissions and thus allow new regu-latory requirements to be met. Our innovative system for the initial filling process comprises both the plant technology and a patented filling adapter.
Glossary: P. 166

654 MANAGEMENT AND STOck 92 cONSOlIDATED FINANcIAl STATEMENTS 163 OThER24 manaGement rePort19 MARkET AND BuSINESS
61 researcH and develoPment
65 PurcHasinG
cleaninG and f iltr ation systems: enerGy-savinG cleaninG tecHnoloGy
cleaning and Filtration Systems presented the new, highly flexible EcoC max cleaning system in October 2008. The basic version of this high-performance single-chamber system can be adapted easily to a wide variety of requirements by means of expansion modules, whether it be a matter of changing workpieces or different types of contamination and quality standards. Moreover, EcoC max convinces by means of consistently high-grade cleaning results, because the cleaning medium is continuously processed.
The new version of our EcoCJet system performs energy-saving cleaning of engine blocks for fuel-efficient internal combustion drives. Such downsized aggregates with winding channels and small cavities require a refined cleaning process. The EcoCJet meets this demand by using a special high-pressure waterflooding process. Since the new version operates at a pressure of only 15 bar, energy needs and cO2 emissions are reduced by almost 70 % in comparison with the predecessor model (40 bar). The energy savings alone already pay for the system in at most four years. We are intensifying product development in the area of ultrafine cleaning in the framework of our cooperation with the Swiss firm ucM AG.
PuRchASING
In fiscal 2008, our purchasing volume was reduced to 65 % of Group sales. The prices of the raw materials we use – mainly steel, stainless steel and copper – were much higher than the year before on average but fell back below the 2007 level at the end of the year. The sharp rise in the oil price until the middle of the year also temporarily increased our energy and logistics costs.
We were able to offset the price fluctuations through framework agreements with first-line sup-pliers. To additionally cushion the increase in raw material prices, more bought-in parts were sourced in low-cost countries. Among other things, we stepped up the export of components from our production facilities in china. We have also built up new suppliers in India who will be supplying us on a global basis in future. Broad-based market studies which we conducted in south-east Europe, Turkey, Morocco, the uSA and Brazil, mainly in connection with our “Strate-gic Suppliers“ project, served as a basis for identifying and assessing potential new suppliers.
Glossary: P. 167
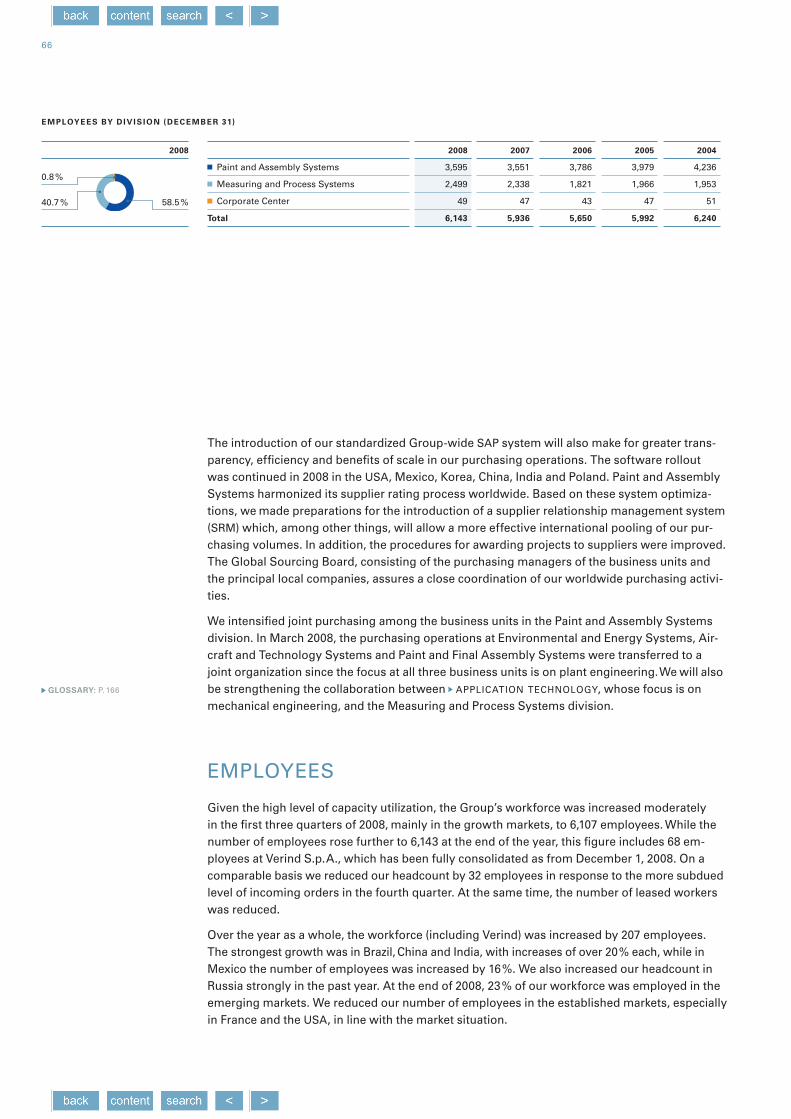
66
2008
40.7 %
0.8 %
58.5 %
The introduction of our standardized Group-wide SAP system will also make for greater trans-parency, efficiency and benefits of scale in our purchasing operations. The software rollout was continued in 2008 in the uSA, Mexico, korea, china, India and Poland. Paint and Assembly Systems harmonized its supplier rating process worldwide. Based on these system optimiza-tions, we made preparations for the introduction of a supplier relationship management system (SRM) which, among other things, will allow a more effective international pooling of our pur-chasing volumes. In addition, the procedures for awarding projects to suppliers were improved. The Global Sourcing Board, consisting of the purchasing managers of the business units and the principal local companies, assures a close coordination of our worldwide purchasing activi-ties.
We intensified joint purchasing among the business units in the Paint and Assembly Systems division. In March 2008, the purchasing operations at Environmental and Energy Systems, Air-craft and Technology Systems and Paint and Final Assembly Systems were transferred to a joint organization since the focus at all three business units is on plant engineering. We will also be strengthening the collaboration between application technology, whose focus is on mechanical engineering, and the Measuring and Process Systems division.
EMPlOyEES
Given the high level of capacity utilization, the Group’s workforce was increased moderately in the first three quarters of 2008, mainly in the growth markets, to 6,107 employees. While the number of employees rose further to 6,143 at the end of the year, this figure includes 68 em-ployees at verind S.p.A., which has been fully consolidated as from December 1, 2008. On a comparable basis we reduced our headcount by 32 employees in response to the more subdued level of incoming orders in the fourth quarter. At the same time, the number of leased workers was reduced.
Over the year as a whole, the workforce (including verind) was increased by 207 employees. The strongest growth was in Brazil, china and India, with increases of over 20 % each, while in Mexico the number of employees was increased by 16 %. We also increased our headcount in Russia strongly in the past year. At the end of 2008, 23 % of our workforce was employed in the emerging markets. We reduced our number of employees in the established markets, especially in France and the uSA, in line with the market situation.
Glossary: P. 166
2008 2007 2006 2005 2004
Paint and Assembly Systems 3,595 3,551 3,786 3,979 4,236
Measuring and Process Systems 2,499 2,338 1,821 1,966 1,953
corporate center 49 47 43 47 51
total 6,143 5,936 5,650 5,992 6,240
emPloyees by div is ion (december 31)

674 MANAGEMENT AND STOck 92 cONSOlIDATED FINANcIAl STATEMENTS 163 OThER24 manaGement rePort19 MARkET AND BuSINESS
65 PurcHasinG
66 emPloyees
2008
13.4 %
19.2 %
15.6 %
49.8 %2.0 %
internal tr ansfer of know-How intensif ied
In 2008, 2,444 employees (2007: 1,972) took part in a total of 312 training measures and know-how transfer events (2007: 248) at Dürr in Germany. By know-how transfer events we mean systematic training measures where experienced Dürr employees pass on their knowledge to colleagues. Some 30 employees received training in teaching and public speaking skills for this purpose in 2008 and were awarded our “Dürr Special Trainer” certificate. There was particularly strong demand for training in project management, management systems and IT as well as language courses. We increased the budget for further training to around € 650 per employee (2007: € 600), which is well above the German industry average (€ 420).
With a view to better assessing the success of further training measures we introduced the online rating instrument “Maxment” in 2008. We use this not only to measure the quality of the seminars but also to gauge how well the know-how imparted is put into practice.
award for tHe suPPort Given to younG PeoPle at dürr
In October 2008, Dürr was awarded the German Department of Employment’s certificate for outstanding commitment to furthering young people for its innovative approach to vocational training. With this award the Department of Employment honored the broadening of our oppor-tunities for job starters. For the first time Dürr is also providing apprenticeships in mechatron-ics. Since September 2008 we have been offering studentships in industrial engineering, too, in collaboration with the vocational training academy in Stuttgart; at the same, time we increased the number of student places offered in other disciplines.
At the end of 2008, Dürr was providing professional training for a total of 122 young people (2007: 112), consisting of 50 students on vocational training academy courses and 72 appren-tices. In addition, we employed 153 students who were either on internships or working on projects for their final theses, ten of whom were taken over as regular employees.
We further intensified our university marketing in order to avoid potential bottlenecks in the recruitment of suitably qualified young talent. We took part at ten graduate careers fairs and also put in an appearance at other university events, for instance at a symposium at Aachen university. We were also represented at job fairs for professionals.
2008 2007 2006 2005 2004
Germany 3,059 3,040 2,995 3,205 3,311
Rest of Europe 1,177 1,125 1,145 1,303 1,332
North and central America 826 886 801 886 1,036
South America 121 97 78 83 84
Asia / Africa / Australia 960 788 631 515 477
total 6,143 5,936 5,650 5,992 6,240
emPloyees by reGion (december 31)

68
»schenck shanghai not only produces
balancing machines but also develops
them locally. this ensures that our products
are tailored exactly to the needs of the asian market. as part of
Dürr’s global manufacturing network, we also produce machines
for the world market. in this way, we are contributing to the
group’s overall competitiveness.«
xiaoda cai, manufacturing manager, schenck shanghai machinery corp. ltd., china

694 MANAGEMENT AND STOck 92 cONSOlIDATED FINANcIAl STATEMENTS 163 OThER24 manaGement rePort19 MARkET AND BuSINESS
69 sustainability
SuSTAINABIlITy
Operating sustainably, fairly and responsibly is a key concern for Dürr. Respect for our employ-ees, the protection of the environment, the conservation of resources, and our responsibility to society at large are especially important to us. Our actions are consistent with prevailing law and the Global compact, in which the united Nations has formulated the principles for fair labor relations and ecologically sustainable corporate activity.
emPloyees: H iGH levels of satisfaction
As a highly specialized engineering company we are particularly reliant on the know-how and dedication of our employees. We therefore support them in developing their professional and personal skills, for instance by providing a comprehensive program of training measures, furthering the systematic transfer of know-how or through international job rotation. We also promote an open and stimulating working climate. This is a principle we are also pursuing with the design of the Dürr campus in Bietigheim-Bissingen. At this new Group headquarters, we are creating all the conditions for optimal communication and teamwork – for instance through a transparent architecture, modern open-space offices, short distances, and meeting points.
The employees have been actively involved in the planning of the campus through user teams and surveys. We also conduct surveys in order to take account of the opinions and preferences of our employees in important decisions. We recently carried out an online employee satisfac-tion survey at Dürr’s German locations. The results were extremely positive on comparison with other companies in the metalworking and electrical engineering industries. The employees at Dürr showed an above-average level of satisfaction both with their jobs and with their col-leagues and superiors. Also very pronounced was their identification with the company, their openness to change and their confidence in the management. The employees also feel that they are kept particularly well informed about corporate strategy.
We also actively involve our employees in the quest for new business opportunities. At an ideas workshop in April 2008, 40 employees from all the German locations developed proposals for new areas of activity. Employees can also submit ideas for improvements through the internal suggestions scheme. The suggestions are examined and are then rated by a committee, with
Glossary: P. 166

70
individual prizes being awarded. Also part of our sustainable human resources policy is our commitment to vocational training. This reflects our responsibility to society and at the same time helps us to meet our future demand for skilled people. More information can be found on page 67.
Our employees’ identification with Dürr is also reflected in the classic human resources statis-tics. The average length of service at Dürr in Germany is 14.7 years (2007: 14.3 years) which is well above the national average of 4 to 6 years. Employee turnover in 2008 was 6.0 % in Germany and 10.1 % for the Group as a whole (2007: 5.7 % and 9.3 %). Our absenteeism rate was 3.3 % in Germany, which is below the national average, and 2.6 % for the Group as a whole (2007: 3.1 % and 2.3 %).
low environmental imPact at dürr
Protecting the environment and conserving resources has high priority at Dürr. We generate fewer emissions than other industrial companies since our Group-wide manufacturing depth is very low at around 25 %. In our more production-intensive mechanical engineering activities, too, assembly processes with low energy, waste and emission levels predominate.
19 Dürr locations are certified according to the internationally recognized ISO 14001 environmental management standard. The other locations are not certified as they are mainly sales and service locations with low consumption and emission levels.
Dürr participates in the so-called carbon Disclosure Project. This Internet database for investors (www.cdproject.net) gathers information on the ecobalance of quoted companies and on busi-ness opportunities for sustainable products.
We aim to achieve further reductions in our consumption and emission levels and volume of waste in 2009 and 2010. An important contribution will come from the pioneering energy con-cept “campus Energy 21” at the Dürr campus. It reduces energy consumption by 50 % and cO2 emissions by 60 % compared to conventional energy supply. The innovative feature of “campus Energy 21” is above all its combination of regenerative energy sources and processes, such as deep geothermics, geothermal heat exchangers, heat recovery, and photovoltaics. In addition to the resource-conserving energy supply concept, another focus has been on an energy- saving design of the buildings with outstanding insulation, daylight-controlled lighting, and concrete core activation for temperature regulation.
Glossary: P. 166

714 MANAGEMENT AND STOck 92 cONSOlIDATED FINANcIAl STATEMENTS 163 OThER24 manaGement rePort19 MARkET AND BuSINESS
69 sustainability
co 2 emissions
82 %
83 %
17 %
18 %
auto life cycle
Running life
Production
auto production
Total painting process
(including add-on parts)
Other production steps
r&d: focus on environmentally-friendly and resource-savinG manufacturinG
tecHnoloGies
The development of environmentally-friendly manufacturing technologies is a key driver of our R&D efforts. This meets the needs of our customers, for whom energy savings and the reduc-tion of emissions have long become a key motive for investing in new machines and equipment.
18 % of the cO2 emissions caused by an automobile during its life cycle are generated during production, and about 17 % of that is attributable to the painting process. Six tonnes of cO2 are released per automobile during the entire production process (including the supplier and trans-port chain), with the painting accounting for as much as 1.3 tonnes.
With a consumption of 3.3 megawatt hours per car, the painting process is the most energy- intensive part of automobile production; at current prices the cost of energy per unit painted is about € 40. This is equivalent to roughly one-tenth of the total painting costs for a mid-range automobile model and is an important leverage point for cost optimization for our customers.
According to figures cited by leading automobile manufacturers, energy consumption per auto-mobile produced has been reduced by up to 25 % over the last ten to twelve years, to which our technologies have also made an important contribution. In 2008, Paint and Final Assembly Systems developed a new technology concept with a number of optimization measures and new products. If all the elements of this concept are incorporated in a new paint shop, energy costs and cO2 emissions can be reduced by up to 47 %; water consumption is also significantly reduced. The concept comprises the following points:
Spray booth: dry separation of the overspray and air recirculation (Ecodryscrubber); a detailed description of this pioneering painting booth concept can be found in the R&D report on page 62;
Body pretreatment: conventional zinc phosphating substituted by a metal oxide process, dispensing with the need to heat the pretreatment tank;
cathodic dip-painting: use of a chemical process instead of electrical voltage;
heat recovery for workplaces: use of heat wheels to recover moisture and heat;
Wet-in-wet painting: which eliminates the primer drying oven;
Oven technology: use of waste heat from the oven; longer oven heat-up times.
Glossary: P. 166

72
The reduction of emissions and energy consumption also plays a pivotal role in the R&D work at all the other business units. For examples please see the R&D report beginning on page 62.
focus on suPPortinG researcH and universit ies
Our social engagement is focused mainly on supporting research institutes and universities. Among other things, we are a member of the Stifterverband für die Deutsche Wissenschaft (Endowment Association for Germany’s Sciences and humanities) and a sponsor of the uni-versities of Mannheim and Darmstadt. We also support academic education through our em-ployees’ teaching activities, for instance in the areas of surface technology and balancing technology. Because the Group operates globally, we also support several institutions that promote international exchanges in education and business. These include the American Academy in Berlin, the American chamber of commerce in Frankfurt/Main, and the German-French chamber of commerce in Paris.
OPPORTuNITIES AND RISkS
Our performance depends on a careful weighing of the opportunities and risks. We only under-take those transactions where the opportunities clearly outweigh. Speculative transactions are strictly prohibited throughout the Group. All transactions must comply with prevailing law and with ethical and moral standards.
risk manaGement system
To clearly determine the opportunity-risk profile of our projects we use a standardized Group-wide risk management system. The aim of the risk management process is to analyze and eval-uate risks in a systematic, holistic and standardized manner so as to be able to take appropriate control measures and counteraction.
standard risk manaGement Process
We perform a new risk management cycle consisting of nine steps every six months. The most important step is the risk inventory, for which the management of the respective operating units is responsible. here, the individual risks are identified and are assigned to the 15 defined risk
Glossary: P. 166

734 MANAGEMENT AND STOck 92 cONSOlIDATED FINANcIAl STATEMENTS 163 OThER24 manaGement rePort19 MARkET AND BuSINESS
69 sustainability
72 oPPortunities and risks
R&D
competition
risk f ields at dürr
External risk areas
Management processesManagement
core process
Support processes
Market
Procurement
Taxes and laws
Production
Economic environment and capital market
Finance/ controlling
Society and environment
human resources
IT
After-sales phaseProject execution, engineering
Quotation phase
fields and evaluated. A risk is evaluated according to standard criteria with the aid of so-called risk structure spreadsheets. Factors assessed are the maximum possible loss, the probability of occurrence, and the effectiveness of possible counter measures. The end result of this review is the so-called net risk or actual risk potential. By aggregating all the individual risk potentials, we ascertain the overall risk situation for the Group. This can then be segmented according to specific risks in the six business units and according to aggregate risks at Group level.
The results of the individual risk inventories and the overall risk situation are bundled in the six-monthly Group risk report and are discussed within the Board of Management. The risk report is then submitted to the Supervisory Board Audit committee. In particularly critical cases the Board of Management and the heads of the business units are informed about risks on an ad hoc basis. The risk managers at the Group and business unit level are responsible for carrying out the regular standard risk process. From an organizational point of view, they form the first level of our risk management system, followed by controlling and Internal Auditing. Risk man-agers are also defined at the level of the respective national companies.
A central element of our risk management is avoiding or minimizing risks in order execution. For this, we employ three overarching functions:
Project controlling oversees in a timely, close-knit manner whether there are indications, es-pecially on large projects, of negative deviations between the actual status and the planning. The control focuses especially on deadlines, supply and performance targets, costs and revenues.
Project management is responsible for project control at the operational level and for meeting time schedules and budgets. It is in close touch with Project controlling and is guided by the standards of the Group-wide project management manual. Other important tools serving to make the status and risks of projects transparent are the project management software “Dürr Projects” and our new Group-wide erp system. Dürr project managers also receive regular training by our corporate center of Excellence Project Management.
claim management oversees customer modifications on projects that are in progress together with Project controlling and Project Management, and claims the resulting additional costs.
Glossary: P. 166

74
Guideline for financial risk manaGement
The management of currency, interest rate and liquidity risks is regulated by a special guideline within the general risk management system. Next to the Board of Management, the top corpor-ate body responsible for this area is the Financial Risk committee, which is concerned with stra-tegic financial policy matters. It consists of the chief Financial Officer, the heads of Group con-trolling and Group Treasury, and the financial officers of the six business units.
currency risks
In the case of projects exposed to currency risks, when the order is received we hedge that portion of the sales revenues over and above the costs incurred in local currency. The trans-actions are mostly in the form of allocable micro-hedges for the respective individual project. In the standard machinery and replacement parts business, where order volumes are smaller, we make selective use of macro-hedges in order to keep transaction costs as low as possible. however, they have to be sanctioned beforehand by the Financial Risk committee. Generally, responsibility for hedging transactions lies with Group Treasury at Dürr AG. In this way, all currency risks are apparent at Group level and can be eliminated.
interest rate risks
Interest rate risk management covers interest-bearing and interest-sensitive balance sheet items. Interest rate analyses are performed regularly to control the risks. Since the external funding and the investment of free cash are conducted almost entirely through Group Treasury, it is also responsible for interest rate hedging. Exceptions have to be expressly authorized by the chief Financial Officer.
liQuidity risks
Dürr is managed with a strong focus on cash flow in order to assure a permanently stable li quidity position. Furthermore, our external funding is structured in such a way that we have sufficient funds available at all times and can bridge temporary liquidity needs arising from our operating business. Please also note the information on our Group financing on page 54. The cash pooling and external sources of liquidity are managed by Group Treasury at Dürr AG.

754 MANAGEMENT AND STOck 92 cONSOlIDATED FINANcIAl STATEMENTS 163 OThER24 manaGement rePort19 MARkET AND BuSINESS
72 oPPortunities and risks
individual r isks
economic environment and caPital market
The Group’s plant engineering business especially tends to be a cyclical laggard as it is largely driven by our customers’ long-term strategic investment plans. As a result, we generally feel the effects of cyclical fluctuations much later than automotive parts suppliers for instance. In addition, our balanced international presence makes us less exposed to regional cyclical fluctuations. Nonetheless, the impact of the financial crisis on the real economy, especially the massive slump in demand on the automobile market, affected our business, too, in the fourth quarter of 2008. We assume that the crisis will also lead to project postponements by custom-ers in the further course of 2009. We are prepared for this situation. The restructuring in 2005 and 2006 has made us leaner and more flexible. Additionally, we launched a package of meas-ures at the end of 2008 that has increased our resilience. This includes the rundown of work ing time accounts and flexible international capacity management. We also initiated capacity ad-justments in December 2008. Over 200 jobs will be cut in France and the uSA by the end of March 2009. Parallel with that, the number of temporary external workers is being reduced by over 50 % to around 250. In Germany, we have applied for short-time working in some areas. however, it cannot be ruled out that further capacity utilization risks might arise in the further course of the year.
As we were able to complete our refinancing successfully in September 2008, we are not affect-ed by the current credit squeeze. The risk of a hostile takeover is small, despite our reduced market capitalization, since the Dürr family (including the foundation) still owns over 40 % of the shares of Dürr AG. Another 17.2 % and 5.0 % are held by the long-term investors ATON and Süd-kapitalbeteiligungs-Gesellschaft.
taxes and laws
At present we see no serious disadvantages from new tax and legislative measures. As a result of the tax reform that came into force in Germany at the beginning of 2008, our effective tax rate will probably be in the region of 30 % in the medium term. In 2007, it was still 39 %.

76
market / industry
As we maintain business relationships with all the automobile manufacturers and with numer-ous parts suppliers, we can largely offset cyclical fluctuations in demand at individual customers. Our extensive volume of business with emerging local manufacturers in India and china, which is responsible to a large extent for our strong market position in these growth markets, may be highlighted.
In 2008, we derived 44 % of our sales revenues from business with our five largest customers (2007: 40 %). however, since customers’ investment cycles vary, the composition of the group of top five customers changes each year. This reduces the risk of over-dependence on indivi dual customers.
The risk of payment defaults by individual customers has increased as a result of the economic crisis. however, the liquidity position at many automobile manufacturers is still good. More-over, the majority of the international OEMs have investment grade ratings. We pursue a two-pronged strategy to counter default risks. Firstly, payments from customers who have either no rating or a non-investment-grade rating are subject to more intensive – mostly weekly – monitoring. Secondly, we seek to ensure that our projects are always cash positive, in other words that the prepayments we receive from our customers at least cover our own costs at each stage of the project.
Accounts receivable from the uS automakers General Motors, Ford and – to a very small extent – chrysler amounted to about € 40 million as of December 31, 2008. Another € 18 million was not yet billed on current projects. The uS government made a uS$ 17 billion credit package available for the uS automobile manufacturers in December 2008. This has considerably re-duced the risk that one or more companies will file for bankruptcy under uS law in the short term. however, even if there is a petition for bankruptcy in the uSA, this would not necessarily mean that all our claims against that company would be written off. A large part of the receiv-ables are due from foreign subsidiaries, whose capacity to pay would not necessarily be affect-ed by bankruptcy proceedings in the uSA. Moreover, our systems are vital for continued pro-duction.

77
»the automobile industry is vigorously pushing
ahead with the development of economical engines.
Dürr supplies the cleaning technology needed in the
production of such downsized engines. For instance, we offer spe-
cial robot solutions that enable chips to be reliably removed even
from intricate ducts and cavities within small engine blocks. More-
over, our new cleaning systems also lead to significant energy
savings.«
robert Pauels, mechanical engineering manager, dürr ecoclean GmbH, Germany

78
The risk of failures among suppliers has also increased as a result of the economic crisis. We have therefore further intensified our supplier monitoring, especially for financial stability. Moreover, we are not dependent on individual suppliers but can select from a broad, interna-tional supplier base from project to project. We only conclude framework agreements for larger volumes with first-line suppliers of good credit standing.
Our business with the automotive industry continues to be subject to considerable price pres-
sure. We counter this challenge with different strategies.
lowering costs per unit: A focus of the “Dürr 2010” strategy is the development of solutions that help to reduce costs per unit in our customers’ production (further details can be found on page 37). In this way we can stress the return on investment and the benefits in terms of the total life cycle cost rather than the pure investment costs of a new plant.
Design to budget: With this approach the customer limits its specification for a new plant to a minimum and sets a budget as term of reference. On this basis we design a plant consisting largely of proven standard products and meeting the customer’s production targets. This re-duces the planning and engineering costs on both sides.
leanline: under the catchword “leanline” we are developing low-cost, functional products with which we are also competitive for customers with low investment budgets, for instance in the emerging markets in the small car segment.
cost optimization: We are permanently adjusting our cost of sales to the prices realizable in the market. The key instrument here is the continuous improvement process at Dürr. Our overhead costs are also continuously monitored and optimized.
An important market for our cleaning technology would fall away should the development of alternative propulsion concepts lead to internal combustion engines being replaced altogether in the long run. however, according to recent studies this scenario is not realistic at least for the next 20 years since the development of battery-assisted electric drives for large-volume series is still in its infancy. The problem of the battery’s reach between recharging intervals is still unresolved. For the present, the automobile industry is therefore likely to continue focusing on low-fuel-consumption engines and increasingly on hybrid drives that are a combination of electric motor and internal combustion engine. In both cases production will still require industrial cleaning systems for the components.
Glossary: P. 166
Glossary: P. 166

794 MANAGEMENT AND STOck 92 cONSOlIDATED FINANcIAl STATEMENTS 163 OThER24 manaGement rePort19 MARkET AND BuSINESS
72 oPPortunities and risks
str ateGic r isks
In 2008, almost half of our incoming orders came from the growth markets of Asia (ex Japan), Eastern Europe, Brazil and Mexico. Although we are familiar with these markets, having had a local presence there in most cases for many years, risks can arise according to their level of ma-turity. Besides cultural and language barriers, this includes insufficient knowledge of suppliers, customers and market mechanisms as well as specific legal and political parameters.
In our “Dürr 2010” strategy program we are looking to leverage our know-how and existing technologies to expand certain areas of business and to penetrate new industries. Examples are the business with the aircraft industry, sealing applications, ultrafine cleaning, and environmental technology. With such diversification strategies, there is always the risk that tar-get markets are misjudged, for instance with regard to customer requirements or the resources required. however, we believe this risk is manageable since we are only engaging in areas that border directly on our core business. Moreover, we analyze the opportunities and risks of all target markets meticulously beforehand.
comPetit ive r isks
We do not see any exceptional competitive risks at present. There are no indications to suggest a change in market structures to our disadvantage, for instance by a merger among competi-tors, in any of our markets. The disadvantage we had suffered versus Japanese competitors due to the adverse rates of exchange has fallen away with the firming of the yen. We know of no product developments that could give competitors a relevant lead.
oPer ational r isks
By operational risks we mean all risks that can arise at the quotation stage, in order execution and in after-sales business. The most probable risk at the quotation stage is that the procure-ment prices on which we base our quotation rise between the time we submit the quotation and the time the order is placed. As soon as the order is received we agree on fixed prices with our suppliers for the entire duration of the project.
In the execution of large projects, additional costs can arise if we fail to meet deadlines or other agreements. The technical and logistical complexity of a project can also present risks. This risk is higher in the emerging markets since there are more imponderables. For this reason we have integrated the special requirements in the growth markets in our execution strategy. This in-
Glossary: P. 166

80
cludes close supplier monitoring, contract and claim management, and regular project reviews. In addition, we have strengthened the organizational structure and capacities at Dürr in India, Mexico, china and Brazil in order to cope with the growing volume of business.
The standardization and modularization of our products reduces risks in assembly and commis-sioning. Tried and tested, compatible standard products reduce interface problems between individual plant sections and the probability of technical faults.
Procurement r isks
To counter procurement risks, we conclude international framework agreements with first-line suppliers and bundle procurement volumes. We also have a close-knit supplier monitoring process as well as a materials planning system to ascertain future requirements.
r&d r isks
We protect ourselves against the risk of poor market acceptance of new products by aligning new developments closely to market needs and – as far as possible – involving pilot customers in the projects early on. The careful analysis of market needs also reduces the risk of impair-ment losses on capitalized development costs.
Personnel r isks
Judging by past experience, the risk of strikes is low throughout the Group. The low numbers of science and engineering graduates in Germany could lead to shortages in the recruitment of suitably qualified employees. We are countering this through foresighted human resources marketing and long-term development and career planning within the Group. We also endeavor to take on trainees, vocational training academy students, and apprentices as regular employees after their training so as to assure a balanced age structure of our workforce.
it r isks
Back-up servers, redundant data lines and a no-break power supply reduce the risk of a total breakdown of our IT systems. We protect ourselves against attacks from outside through up-to-date firewall and antivirus software. We see no unusually high risk of manipulation by hackers.
Glossary: P. 166

814 MANAGEMENT AND STOck 92 cONSOlIDATED FINANcIAl STATEMENTS 163 OThER24 manaGement rePort19 MARkET AND BuSINESS
72 oPPortunities and risks
environmental and Production r isks
Substances that are harmful to the health and to the environment have to be used for testing and development purposes especially in cleaning and painting technology. The handling of these materials and their storage are regulated by strict internal guidelines. We also comply with the standards specified by the respective certification systems. As our manufacturing depth is low, the environmental and other risks presented by our production and assembly processes are small.
leGal r isks
We are exposed to the legal risks customary in mechanical and plant engineering, such as the assertion of warranty claims. In our contracts, we exclude any claims that cannot be fulfilled. To protect our interests, we have also increased staffing levels in contract and claim manage-ment and in patent and license management.
currency, interest r ate and l iQuidit y r isks
In compliance with IFRS standards, we have considerably expanded on the information on cur-rency, interest rate, and liquidity risks disclosed in the notes to the consolidated financial state-ments. To avoid duplication we discuss these risks in less detail in the management report and refer readers to item 34 in the notes to the consolidated financial statements.
The main currency risk for Dürr is the translation risk, in other words possible disadvantages when we convert foreign currency items into euros. We view this risk to be of a normal order usual in business and to be comparatively low. Our exposure to transaction risks from product exports is even much lower since we export little and source a large part of the goods required in local currency or manufacture them locally.
The interest rate risk is limited as the fixed-interest bond that is due in 2011 accounts for the bulk of our gross financial debt. The interest on drawings under the syndicated loan is based on Eu-
RIBOR plus a margin for the banks. EuRIBOR fell appreciably in the course of 2008, from which we are profiting. In view of the economic crisis we do not expect any marked rise in the interest rate level in 2009. We are therefore not hedging interest rate risks at present.
Glossary: P. 166
Glossary: P. 166

82
No exceptional liquidity and debt risks are discernible at the present time. At the end of 2008 we had cash and cash equivalents of € 84.4 million as well as a credit line of € 200 million that was only marginally drawn. We have further reduced our net financial debt. It amounted to € 34.4 million at the end of 2008.
In 2008 we complied with the covenants of the old and the new syndicated loan at each calcula-tion date. The covenants are based on a rolling twelve-month review. The syndicated loan can only be terminated prematurely by the banking syndicate if the financial ratios (covenants) are not complied with and subject to a two-thirds majority of the lending banks. Because of the eco-nomic development over the past months and the repercussions this might possibly have on the ratios we are currently in talks with the syndicate banks.
The issuing agreement of our corporate bond imposes the usual limitations and obligations on Dürr as issuer. Failure to adhere to these could result in the bond plus accrued interest being called due.
over all assessment of tHe r isk s ituation
The deterioration of the market environment in the automobile industry has generally impaired our risk position, especially with regard to possible capacity underutilization and payment de-fault risks for instance. however, this does not present a threat to the company’s existence. Rather, we expect to weather the crisis in generally stable condition. Apart from the market risks, disruptions in order execution are the biggest single risk, both in terms of their probability and in terms of their impact on earnings.
Standard & Poor’s and Moody’s have been publishing ratings for Dürr since our corporate bond was issued in 2004. In the wake of the refinancing in summer 2008, both rating agencies first raised the outlook and then shortly afterwards raised the ratings for Dürr. At the beginning of March 2009, Moody’s placed the outlook on review for a possible downgrade.
oPPortunit ies
oPPortunities manaGement system
As a rule, it is the business units, which are in close touch with the market, that identify and seize on opportunities in our operating business. Dürr AG supports the business units here in three ways. Firstly, the Board of Management becomes actively involved early on in the opportunities
Glossary: P. 167
march 2009 June 2004 (first rating)
standard & Poor’s moody’s standard & Poor’s moody’s
corporate credit rating B+ B1 BB- Ba3
Outlook stable
Review for a
possible downgrade stable stable
Bond rating B- B3 B B2
r atinGs

834 MANAGEMENT AND STOck 92 cONSOlIDATED FINANcIAl STATEMENTS 163 OThER24 manaGement rePort19 MARkET AND BuSINESS
72 oPPortunities and risks
management process, for instance in the preparations for and during the budget and planning processes. Secondly, Dürr AG makes financing facilities and liquidity available for the realiza-tion of opportunities. Thirdly, the holding company regularly initiates strategy processes in the course of which opportunities are evaluated, selected and integrated with the Group’s over-arching corporate strategy.
GrouP-wide oPPortunities
expansion of the services business: All the business units have a large installed base of sys-tems and machines. For instance, 60 % of all the paint shops in the automotive industry use Dürr technology. This presents good growth opportunities for our services business, such as modernizations, energy optimization and the supply of replacement parts.
Growth in the emerging markets: Despite the present sales weakness in the automobile in-dustry, the demand for individual mobility in the emerging markets will continue to grow in the future. We therefore expect strong demand for additional production facilities in the mid to long term.
ever stricter environmental standards: To meet defined climate protection targets, the auto-mobile industry requires systems with an optimized emissions and energy balance. Our product development is aligned to these needs.
tighter focus on costs per unit: Automobile manufacturers and their suppliers are focusing more and more on unit costs per vehicle. We also want to profit from this in future by devel-oping manufacturing technologies that offer measurable added value. This applies especial-ly to the smaller classes of vehicle that are growing the fastest around the world.
recovery of the north american market: The uS automobile market will regain its sales volume of about 17 million light vehicles a year in the mid term. Based on the forecast population growth, volume is likely to increase further in the long term. Besides new projects, this will also lead to investment in modernizing older plants and making them more flexible. It is also likely that more and more European and Asian automobile manufacturers will set up plants in North America in order to avoid trade restrictions and exchange rate risks and to win market share. We see good opportunities for expansion in other areas of business, too, in the mid term, for instance in the aircraft sector and in balancing and environmental systems.
Glossary: P. 166

84
software marketing: Over the past years we have developed our own proprietary software solutions for control, supervisory control and visualization applications. We have begun marketing these programs, developed originally for our core business, externally also as standalone products. In expanding this business we are benefiting from the fact that our software offering can be used in a wide range of industries without the need for major adaptation.
improved productivity through it harmonization: The introduction of a standardized global SAP system, which will be completed in 2009, yields productivity gains. The harmonization of the IT infrastructure, which also includes the integration of our SAP and cAD systems, strengthens the international cooperation within the Group. For instance, it enables us to dis-tribute the work on large projects more effectively between different locations and thus util- ize our capacities better. The IT harmonization also allows business processes to be more highly automated.
oPPortunities witHin tHe business units
Paint and final assembly systems: We see growth potential in business with paint systems for automotive suppliers and general industry. Important target industries are for instance farm machinery, construction equipment and wind power units.
application technology: Opportunities are presented in application technology above all by the full automation of the automobile painting process. We are also expanding the sealing business.
environmental and energy systems: We see two overarching market opportunities for envir-onmental systems: expansion of the services business (for instance energy consulting) and further market penetration in Asia and South America.
aircraft and technology systems: Our efforts to expand the business in aircraft manufacturing technology have been strengthened by the new sales joint venture Dürr EDAG Aircraft Systems. In particular, we see potential to widen our customer base beyond Airbus, our main customer. Moreover, through the partnership with EDAG, we cover a broader spectrum of products and services. This strengthens our position as the aircraft industry is consolidating its supplier base and turning more and more to large suppliers with turnkey competence.
Glossary: P. 166
Glossary: P. 166

854 MANAGEMENT AND STOck 92 cONSOlIDATED FINANcIAl STATEMENTS 163 OThER24 manaGement rePort19 MARkET AND BuSINESS
72 oPPortunities and risks
85 events subseQuent to tHe rePortinG date
balancing and assembly Products: In balancing technology, opportunities are presented above all in business with the power generating sector. We have a very strong position in this market and are profiting from the high demand from Asia. In the automobile industry, the downsizing trend promises to create growing demand for turbocharger balancing machines. For testing, assembly and filling products we see opportunities above all from the further international-ization of the business, which hitherto has been mainly concentrated on Europe.
cleaning and filtration systems: Engine downsizing is also generating additional demand in cleaning technology because the more compact units require cleaning systems that can reli-ably clean even narrow boreholes, ducts and chambers.
EvENTS SuBSEQuENT TO ThE REPORTING DATE
In January 2009, we signed a cooperation agreement with Parker Engineering co. ltd. of Japan. The aim is to expand our two companies’ paint systems business with the Japanese automobile industry. The cooperation covers the sale and planning as well as the construction and servicing of paint systems for Japanese automobile manufacturers in Japan and other Asian markets. Through the cooperation, we are strengthening our position in the Japanese market which is traditionally marked by local suppliers. Parker Engineering is a subsidiary of Nihon Parkerizing co. ltd. and has longstanding, close customer relationships with the Japanese automobile in-dustry. The focus of the company’s technology is on corrosion protection through body pre-treatment and dip coating.
In the first quarter of 2009, we applied for short-time working for about 400 employees due to the postponement of projects worth around € 200 million.
No other events that materially affected, or could materially affect the net assets, financial pos-ition and results of operations of the Group occurred between the beginning of the current fis-cal year and March 4, 2009.
Glossary: P. 166

86
»Mexico is a strategically important
market where both the automobile
industry and the aircraft industry are
increasingly building up production capacities. besides our
engineering competence, we also have advanced production
facilities in Querétaro. the us market will also recover. We
are ready for that: together with our colleagues in the united
states, we form a powerful north america unit within the
global Dürr network.«
steffen zörn, chief operating officer, dürr de méxico s.a. de c.v., mexico
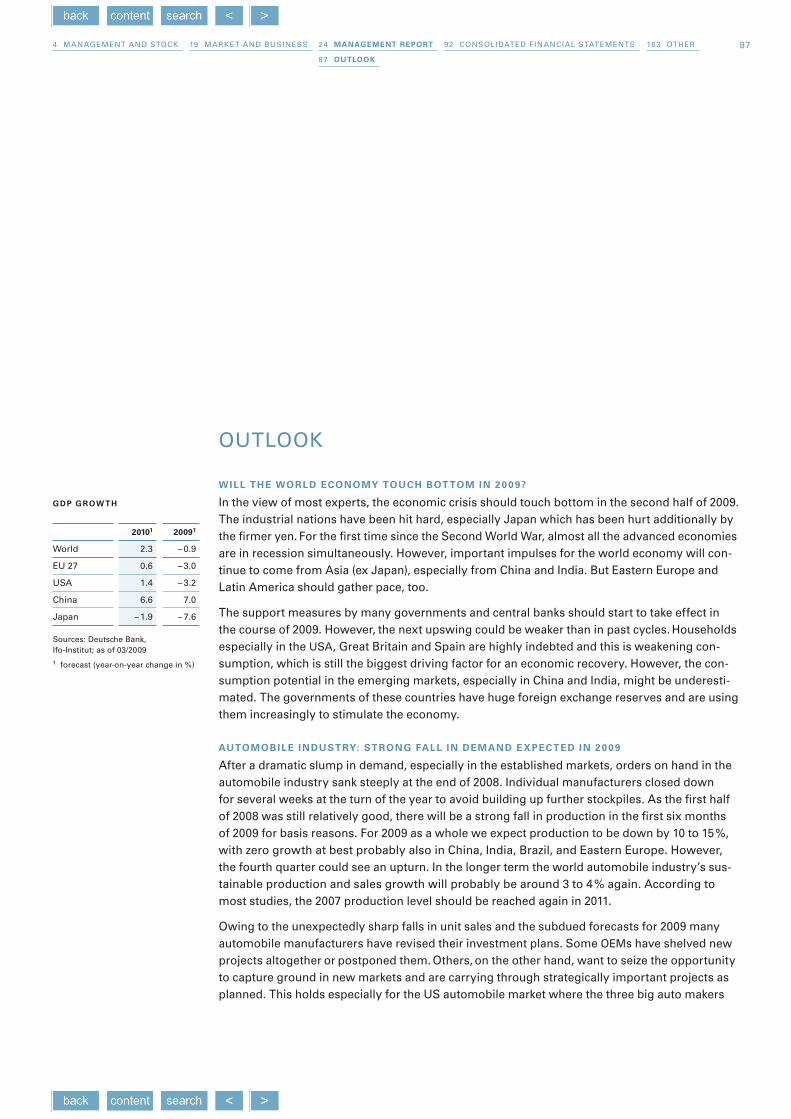
874 MANAGEMENT AND STOck 92 cONSOlIDATED FINANcIAl STATEMENTS 163 OThER24 manaGement rePort19 MARkET AND BuSINESS
87 outlook
OuTlOOk
will tHe world economy toucH bot tom in 2009?
In the view of most experts, the economic crisis should touch bottom in the second half of 2009. The industrial nations have been hit hard, especially Japan which has been hurt additionally by the firmer yen. For the first time since the Second World War, almost all the advanced economies are in recession simultaneously. however, important impulses for the world economy will con-tinue to come from Asia (ex Japan), especially from china and India. But Eastern Europe and latin America should gather pace, too.
The support measures by many governments and central banks should start to take effect in the course of 2009. however, the next upswing could be weaker than in past cycles. households especially in the uSA, Great Britain and Spain are highly indebted and this is weakening con-sumption, which is still the biggest driving factor for an economic recovery. however, the con-sumption potential in the emerging markets, especially in china and India, might be underesti-mated. The governments of these countries have huge foreign exchange reserves and are using them increasingly to stimulate the economy.
automobile industry: stronG fall in demand exPected in 2009
After a dramatic slump in demand, especially in the established markets, orders on hand in the automobile industry sank steeply at the end of 2008. Individual manufacturers closed down for several weeks at the turn of the year to avoid building up further stockpiles. As the first half of 2008 was still relatively good, there will be a strong fall in production in the first six months of 2009 for basis reasons. For 2009 as a whole we expect production to be down by 10 to 15 %, with zero growth at best probably also in china, India, Brazil, and Eastern Europe. however, the fourth quarter could see an upturn. In the longer term the world automobile industry’s sus-tainable production and sales growth will probably be around 3 to 4 % again. According to most studies, the 2007 production level should be reached again in 2011.
Owing to the unexpectedly sharp falls in unit sales and the subdued forecasts for 2009 many automobile manufacturers have revised their investment plans. Some OEMs have shelved new projects altogether or postponed them. Others, on the other hand, want to seize the opportunity to capture ground in new markets and are carrying through strategically important projects as planned. This holds especially for the uS automobile market where the three big auto makers
20101 20091
World 2.3 – 0.9
Eu 27 0.6 – 3.0
uSA 1.4 – 3.2
china 6.6 7.0
Japan – 1.9 – 7.6
Sources: Deutsche Bank, Ifo-Institut; as of 03/2009
1 forecast (year-on-year change in %)
GdP Grow tH

88
are tottering on the brink and have heavily cut back their capital spending. Other automobile manufacturers are likely to exploit this situation and improve their market position in North America.
aircr af t industry
The aircraft industry faces major challenges in 2009 as well. Passenger and freight traffic is closely coupled with the economy and could decline by over 3 % in 2009. While airlines are benefiting from lower kerosene prices, they are burdened by higher financing costs and lower levels of capacity utilization. Airbus and Boeing forecast a decline in aircraft deliveries in 2009 and 2010. Nonetheless, both manufacturers are investing in production facilities in order to be able to manufacture new models at lower cost and avoid delays in bringing them to market. Other drivers of capital investment are the use of innovative materials (such as carbon fiber), efforts to reduce fuel consumption, and the globalization of production in order to avoid cur-rency risks and trade restrictions.
new orders, sales revenues, and earninGs
In the longer term, we take a clearly positive view of our business prospects. We expect rising demand again for new plants especially in the automobile industry’s strategically important markets, in other words in Asia, Eastern Europe, and South America. In Europe and America we expect investment above all in revamp and optimization projects at existing plants, but a number of new plants are in the pipeline, too. The chief demand drivers are productivity and efficiency improvements, the reduction of energy costs, and the trend towards smaller auto-mobiles.
For the Dürr Group, our goal is average longer-term volume growth of 5 % per year. After orders rose at an average rate of 6.4 % over the last three years, we expect moderate declines in order intake and sales in 2009. The high order backlog at the end of 2008 and the steady services busi-ness, which is being further expanded, secure a large part of our sales in 2009.
We also expect a moderate decline in earnings in 2009 as a result of the economic crisis. how-ever, the losses in the final assembly conveyor systems business and at the Aircraft and Tech-nology Systems business unit should fall away. We also expect positive earnings effects from the continuous improvement process at Dürr, the eight-point process optimization program ini-tiated with “Dürr 2010” (see page 38), and the completion of our global SAP rollout this year.

894 MANAGEMENT AND STOck 92 cONSOlIDATED FINANcIAl STATEMENTS 163 OThER24 manaGement rePort19 MARkET AND BuSINESS
87 outlook
The interest result will improve substantially in 2009. While we expect a higher average usage of the syndicated loan this year owing to the project postponements in the automobile industry, interest expenses will be reduced by the partial redemption of our high-interest bond. In add-ition, the one-off refinancing costs of € 9.4 million included in the interest result in 2008 will fall away. In line with our dividend policy, it is planned to continue to distribute roughly 30 % of Group net profit as dividends in future.
As part of our “Dürr 2010” strategy, we set targets for 2010 of sales of at least € 1.7 billion, an EBIT margin of 6 %, and a roce of 22 %. We are pursuing these ambitious goals with the great-est determination but, owing to the economic crisis, it is likely that we will not achieve them until 2011/2012. yet, we have already reached our target of an equity ratio of over 30 %, with a figure of 31.4 % at the end of 2008.
divisions
The development of our two divisions will depend very much on when the investment restraint among our customers unwinds. Nonetheless, we anticipate an only moderate decline in earnings.
casH flow
In the plant engineering business, the postponement of projects and prepayments has a direct impact on net working capital, and thus on cash flow. Against this backdrop, we expect an at least slight drop in cash flow, even though a reliable forecast is difficult. To limit the possible decline in cash flow we will continue to focus on strict cash and net working capital manage-ment.
caPital exPenditure
In the current year, we will be reducing our capital expenditure on property, plant and equipment and intangible assets and confining it to the essential. The completion of the Dürr campus in Bietigheim-Bissingen will require some investments. however, this project is being largely financed off the balance sheet by way of an operating lease. In 2010, capital expenditure on property, plant and equipment and intangible assets should be in the region of € 15 to € 20 mil-lion and be mostly on replacements.
Glossary: P. 167
Glossary: P. 167

90
net f inancial debt, eQuit y, and f inancinG structure
From today’s vantage point, we expect that net financial debt will be above the year-end 2008 level in 2009 and 2010. With regard to equity we expect continued growth in absolute terms and a ratio of over 30 %. The early redemption of the second tranche of our corporate bond is still on the agenda. however, owing to the financial crisis we will be reviewing the available financing alternatives at the appropriate time.
PurcHasinG
The procurement prices relevant for us passed their peak in mid-2008, so we expect a decline in the current year. This should present potential for savings especially on the mechanical en- gineering side. As part of our “Dürr 2010“ strategy we are extending our international sourcing in the growth markets of Eastern Europe and Asia, and are pressing ahead with the process of standardizing products and the Group-wide pooling of procurement volumes.
emPloyees
We expect the number of employees to decline slightly in 2009. Depending on the development of new orders, and the distribution of projects and capacity utilization within the Group, we do not rule out the possibility of further capacity adjustments in individual areas and countries. Through the Group-wide FOcuS program we have increased our flexibility and can respond well to project postponements. We are also using flexible instruments such as short-time working, the rundown of working time accounts, the distribution of work packages within the Group ac-cording to capacity utilization, the reduction of external labor, and employee turnover. head-count in the emerging markets will increase further in the medium term, while capacities in the established markets will tend to decline. By the end of 2010, the emerging markets will presum-ably account for 24 to 25 % of our employees (December 31, 2008: 23 %).
r&d
Our R&D spending will probably be in the region of € 25 million in 2009, and thus at the same elevated level as in 2008. From today’s vantage point, the number of R&D employees will remain constant. The main focuses of our R&D efforts are the further reduction of costs per unit for our customers, the development of new service products, and the expansion of our product portfolio for the production of small and low-cost cars. The process of modularization will also be continued. This accommodates the growing demand for flexible systems that can be moved and adapted quickly and easily.
Glossary: P. 167

914 MANAGEMENT AND STOck 92 cONSOlIDATED FINANcIAl STATEMENTS 163 OThER24 manaGement rePort19 MARkET AND BuSINESS
87 outlook
Possible reactions if tHe crisis escal ates furtHer
We will react with additional measures should the economic crisis escalate further and place our targets at risk. This includes the reduction of further personnel capacities at locations where demand is expected to remain weak in the longer term. We are responding to the growing fi-nancial problems at some customers by monitoring payments more intensively and coordin- ating closely with our customers. New orders that might be cash negative temporarily are only accepted in exceptional cases and with authorization from the Board of Management.
summary
With our “Dürr 2010” strategy, we are well positioned for profitable growth in the longer term. The reduction of debt over the past years and the successful refinancing in 2008 are important foundations for a successful development: Dürr has greater financial room for maneuver and is securely financed until into the year 2011, with reduced interest expense. We have prepared ourselves for the economic crisis with numerous measures and are sufficiently flexible to take additional steps immediately in the event of further market changes. Furthermore, we believe the automobile industry will continue with its investments in strategically important markets and in rationalizing production processes. We are convinced that we will win market share in 2009 and emerge strengthened from the crisis. In this, our international presence and technol-ogy leadership, optimized business processes, and our financial strength are important assets.
Stuttgart, March 4, 2009
Dürr Aktiengesellschaft
The Board of Management

92
93 Independent auditors’ report
94 Consolidated income statement
95 Consolidated balance sheet
96 Consolidated statement of changes
in shareholders’ equity
98 Statement of recognized income
and expense in the consolidated
financial statements
99 Consolidated cash flow statement
100 Notes to the consolidated
financial statements
CoNSolIdated fINaNCIal StatemeNtS
for the 2008 reportINg perIod
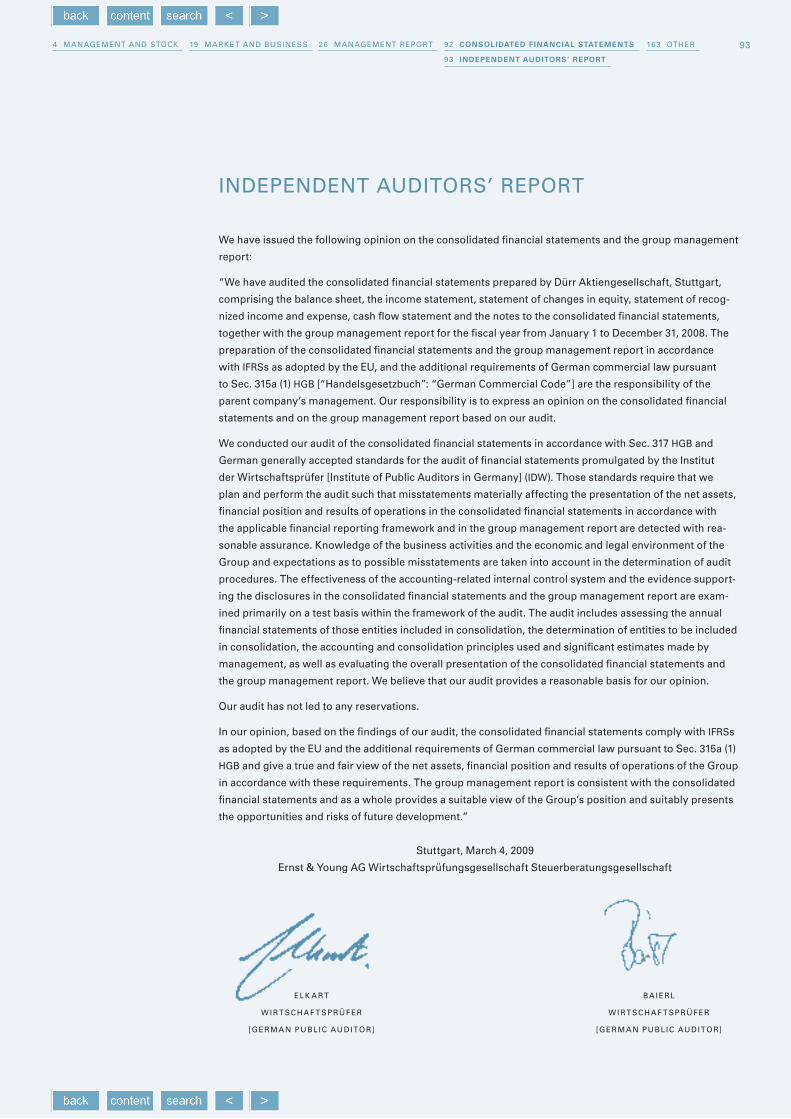
934 maNagemeNt aNd StoCk 92 consolidated financial statements 163 other26 maNagemeNt report19 market aNd buSINeSS
93 indePendent aUditoRs’ RePoRt
Stuttgart, march 4, 2009
ernst & Young ag Wirtschaftsprüfungsgesellschaft Steuerberatungsgesellschaft
baIerl
W IrtSChaf tSprüfer
[germaN publIC audItor]
elk a rt
W IrtSChaf tSprüfer
[germaN publIC audItor]
INdepeNdeNt audItorS’ report
We have issued the following opinion on the consolidated financial statements and the group management
report:
“We have audited the consolidated financial statements prepared by dürr aktiengesellschaft, Stuttgart,
comprising the balance sheet, the income statement, statement of changes in equity, statement of recog-
nized income and expense, cash flow statement and the notes to the consolidated financial statements,
together with the group management report for the fiscal year from January 1 to december 31, 2008. the
preparation of the consolidated financial statements and the group management report in accordance
with IfrSs as adopted by the eu, and the additional requirements of german commercial law pursuant
to Sec. 315a (1) hgb [“handelsgesetzbuch”: “german Commercial Code”] are the responsibility of the
parent company’s management. our responsibility is to express an opinion on the consolidated financial
statements and on the group management report based on our audit.
We conducted our audit of the consolidated financial statements in accordance with Sec. 317 hgb and
german generally accepted standards for the audit of financial statements promulgated by the Institut
der Wirtschaftsprüfer [Institute of public auditors in germany] (IdW). those standards require that we
plan and perform the audit such that misstatements materially affecting the presentation of the net assets,
financial position and results of operations in the consolidated financial statements in accordance with
the applicable financial reporting framework and in the group management report are detected with rea-
sonable assurance. knowledge of the business activities and the economic and legal environment of the
group and expectations as to possible misstatements are taken into account in the determination of audit
procedures. the effectiveness of the accounting-related internal control system and the evidence support-
ing the disclosures in the consolidated financial statements and the group management report are exam-
ined primarily on a test basis within the framework of the audit. the audit includes assessing the annual
financial statements of those entities included in consolidation, the determination of entities to be included
in consolidation, the accounting and consolidation principles used and significant estimates made by
management, as well as evaluating the overall presentation of the consolidated financial statements and
the group management report. We believe that our audit provides a reasonable basis for our opinion.
our audit has not led to any reservations.
In our opinion, based on the findings of our audit, the consolidated financial statements comply with IfrSs
as adopted by the eu and the additional requirements of german commercial law pursuant to Sec. 315a (1)
hgb and give a true and fair view of the net assets, financial position and results of operations of the group
in accordance with these requirements. the group management report is consistent with the consolidated
financial statements and as a whole provides a suitable view of the group’s position and suitably presents
the opportunities and risks of future development.”

94
CoNSolIdated INCome StatemeNtof düRR aktiengesellschaft, stUttgaRt, foR fiscal YeaR 2008
in € k note 2008 2007
Sales revenues (8) 1,602,773 1,476,641
Cost of sales – 1,317,538 – 1,236,662
gross profit on sales 285,235 239,979
Selling expenses – 98,257 – 95,110
general and administrative expenses – 86,775 – 87,675
research and development costs – 25,528 – 20,471
other operating income and expenses (11) – 3,462 17,980
71,213 54,703
gain or loss on restructuring / onerous contracts (12) – 3,294 886
Impairment losses /reversal of impairment losses (12) 4,741 131
earnings before investment income, interest and similar income,
interest and similar expenses, and income taxes 72,660 55,720
profit/loss from entities accounted for using the equity method (13) 3,040 1,924
Interest and similar income (14) 4,767 3,805
Interest and similar expenses (14) – 34,080 – 26,690
of which non-recurring expenses of € – 9,388 thousand from premature
termination of the syndicated loan and partial repayment of the bond
(2007: € 0 thousand)
earnings before income taxes from continuing operations 46,387 34,759
Income taxes (15) – 12,661 – 13,565
Profit from continuing operations 33,726 21,194
Profit from discontinued operations (6) 12,556 981
Profit for the year of the dürr group 46,282 22,175
profit share of minority interests, continuing operations 3,853 265
profit share of minority interests, discontinued operations – –
profit share of minority interests, dürr group 3,853 265
Profit share of shareholders of dürr aktiengesellschaft,
continuing operations 29,873 20,929
Profit share of shareholders of dürr aktiengesellschaft,
discontinued operations 12,556 981
Profit share of shareholders of dürr aktiengesellschaft,
dürr group 42,429 21,910
earnings per share in € (basic and diluted) (7)
Continuing operations 1.81 1.33
discontinued operations 0.76 0.06
dürr group 2.57 1.39

954 maNagemeNt aNd StoCk 92 consolidated financial statements 163 other26 maNagemeNt report19 market aNd buSINeSS
94 income statement
95 balance sheet
CoNSolIdated balaNCe Sheetof düRR aktiengesellschaft, stUttgaRt, as of decembeR 31, 2008
in € k note 2008 2007
assets
goodwill (16, 37) 265,974 263,180
other intangible assets (16, 37) 36,131 31,666
property, plant and equipment (16, 37) 89,005 89,802
Investment property (16) 21,019 13,575
Investments in entities accounted for using the equity method (17, 38) 13,040 11,837
other financial assets (38) 342 350
trade receivables (19) 2,803 2,706
Income tax receivables (15) 116 156
other receivables and other assets (20) 5,950 6,787
deferred taxes (15) 4,716 3,666
prepaid expenses 4,383 445
non-current assets 443,479 424,170
Inventories and prepayments (18) 77,923 57,966
trade receivables (19) 443,810 405,357
Income tax receivables (15) 6,377 10,099
other receivables and other assets (20) 29,294 20,283
Cash and cash equivalents 84,385 147,489
prepaid expenses 2,745 2,624
644,534 643,818
Non-current assets classified as held-for-sale (6) – 6,782
current assets 644,534 650,600
total assets dürr group 1,088,013 1,074,770
eqUit Y and l iabil it ies
Subscribed capital (21) 44,289 40,264
Capital reserve (21) 200,186 160,459
revenue reserves (21) 131,814 94,911
accumulated other comprehensive income (21) – 42,039 – 37,294
amounts recorded directly in equity from non-current assets classified as held for sale – – 2,800
equity without minority interests 334,250 255,540
minority interests (22) 7,119 1,569
equity with minority interests 341,369 257,109
provisions for post-employment benefit obligations (23) 52,222 50,007
other provisions (24) 8,575 6,180
bond (25) 96,917 191,699
other financial liabilities (25) 6,854 7,831
Income tax liabilities (27) 123 15,609
other liabilities (27) 16,189 14,289
deferred taxes (15) 19,513 18,152
deferred income 895 1,205
non-current liabilities 201,288 304,972
other provisions (24) 56,663 59,626
trade payables1 (26) 372,179 335,771
financial liabilities (25) 18,834 15,054
Income tax liabilities (27) 15,601 15,842
other liabilities1 (27) 81,666 85,446
deferred income 413 950
current liabilities 545,356 512,689
total equity and liabilities dürr group 1,088,013 1,074,770
1 adjustment of prior-year figures; cf. note 27 in the notes to the consolidated financial statements

96
Consolidated statement of
Changes in shareholders’ equity
of Dürr AktiengesellschAft, stuttgArt, for fiscAl yeAr 2008
Accumulated other comprehensive income
subscribedcapital
capitalreserve
revenuereserves
unrealizedgains / losses
fromcash flow
hedges
unrealizedgains / losses
from available-for-
sale securities
changes related to the consolidated
group
unrealizedgains / losses
from a put option
unrealizedactuarial
gains / lossescurrency
translation
Accumulatedother
comprehensiveincome
Amounts resulting
from assets held for sale
equitywithout minorityinterests
Minorityinterests
equitywith minority
interests
in € k (21) (21) (21) (21) (21) (21) (21) (21) (21) (21) (21) (22)
January 1, 2007 40,264 160,459 73,021 – 392 – 9 – – – 12,796 – 16,060 – 29,257 – 495 243,992 1,708 245,700
accumulated other comprehensive
income – – – – 509 – 9 – – 465 6,885 – 13,939 – 8,037 – 2,305 – 10,342 – 199 – 10,541
Profit for the year – – 21,910 – – – – – – – – 21,910 265 22,175
total income and expense for the year – – 21,910 – 509 – 9 – – 465 6,885 – 13,939 – 8,037 – 2,305 11,568 66 11,634
other changes – – – 20 – – – – – – – – – 20 – 205 – 225
December 31, 2007 40,264 160,459 94,911 – 901 – 18 – – 465 – 5,911 – 29,999 – 37,294 – 2,800 255,540 1,569 257,109
accumulated other comprehensive
income – – – 96 – 822 – 792 – 757 – 4,114 – 4,745 2,800 – 1,945 – 865 – 2,810
Profit for the year – – 42,429 – – – – – – – – 42,429 3,853 46,282
total income and expense for the year – – 42,429 96 – 822 – 792 – 757 – 4,114 – 4,745 2,800 40,484 2,988 43,472
Capital increase dürr aktiengesellschaft 4,025 39,727 – – – – – – – – – 43,752 – 43,752
dividends – – – 6,291 – – – – – – – – – 6,291 – 36 – 6,327
other changes – – 765 – – – – – – – – 765 2,598 3,363
December 31, 2008 44,289 200,186 131,814 – 805 – 18 822 – 1,257 – 6,668 – 34,113 – 42,039 – 334,250 7,119 341,369

974 maNagemeNt aNd StoCk 92 consolidated financial statements 163 other26 maNagemeNt report19 market aNd buSINeSS
96 changes in shaReholdeRs’ eqUitY
accumulated other comprehensive income
subscribedcapital
capitalreserve
Revenuereserves
Unrealizedgains / losses
fromcash flow
hedges
Unrealizedgains / losses
from available-for-
sale securities
changes related to the consolidated
group
Unrealizedgains / losses
from a put option
Unrealizedactuarial
gains / lossescurrency
translation
accumulatedother
comprehensiveincome
amounts resulting
from assets held for sale
equitywithout minorityinterests
minorityinterests
equitywith minority
interests
in € k (21) (21) (21) (21) (21) (21) (21) (21) (21) (21) (21) (22)
Januar 1, 2007 40,264 160,459 73,021 – 392 – 9 – – – 12,796 – 16,060 – 29,257 – 495 243,992 1,708 245,700
accumulated other comprehensive
income – – – – 509 – 9 – – 465 6,885 – 13,939 – 8,037 – 2,305 – 10,342 – 199 – 10,541
profit for the year – – 21,910 – – – – – – – – 21,910 265 22,175
total income and expense for the year – – 21,910 – 509 – 9 – – 465 6,885 – 13,939 – 8,037 – 2,305 11,568 66 11,634
other changes – – – 20 – – – – – – – – – 20 – 205 – 225
december 31, 2007 40,264 160,459 94,911 – 901 – 18 – – 465 – 5,911 – 29,999 – 37,294 – 2,800 255,540 1,569 257,109
accumulated other comprehensive
income – – – 96 – 822 – 792 – 757 – 4,114 – 4,745 2,800 – 1,945 – 865 – 2,810
profit for the year – – 42,429 – – – – – – – – 42,429 3,853 46,282
total income and expense for the year – – 42,429 96 – 822 – 792 – 757 – 4,114 – 4,745 2,800 40,484 2,988 43,472
Capital increase dürr aktiengesellschaft 4,025 39,727 – – – – – – – – – 43,752 – 43,752
dividends – – – 6,291 – – – – – – – – – 6,291 – 36 – 6,327
other changes – – 765 – – – – – – – – 765 2,598 3,363
december 31, 2008 44,289 200,186 131,814 – 805 – 18 822 – 1,257 – 6,668 – 34,113 – 42,039 – 334,250 7,119 341,369

98
StatemeNt of reCogNIzed INCome aNd
expeNSe IN the CoNSolIdated fINaNCIal
StatemeNtS
of düRR aktiengesellschaft, stUttgaRt, foR fiscal YeaR 2008
in € k 2008 2007
Changes in fair value of financial instruments used for hedging purposes
recognized in equity 46 – 507
Changes in the fair value of available-for-sale securities recognized in equity – – 9
revaluation from recognition of hidden reserves arising from changes in the
consolidated group 2,348 –
Changes in the fair value of a put option recognized in equity – 2,469 – 680
Currency translation reserve of foreign subsidiaries – 4,114 – 13,939
amounts recognized directly in equity from non-current assets classified
as held for sale – 2,800 – 2,305
actuarial gains/losses from defined benefit obligations and similar obligations – 451 10,755
deferred taxes on revaluations recognized directly in equity – 970 – 3,856
Revaluations recognized directly in equity – 2,810 – 10,541
of which attributable to minority interests – 865 – 199
of which attributable to shareholders of dürr aktiengesellschaft – 1,945 – 10,342
Profit for the year of the dürr group 46,282 22,175
of which attributable to minority interests 3,853 265
of which attributable to shareholders of dürr aktiengesellschaft 42,429 21,910
total profit for the year and revaluations recognized directly in equity
in the year 43,472 11,634
of which attributable to minority interests 2,988 66
of which attributable to shareholders of dürr aktiengesellschaft 40,484 11,568

994 management and stock 92 consolidated financial statements 163 other26 management report19 market and business
98 recognized income and expense
99 cash flow
consolidated cash flow statementof dürr aktiengesellschaft, stuttgart, for fiscal year 2008
in € k 2008 2007
earnings before income taxes from continuing operations 46,387 34,759
income taxes paid – 11,875 – 5,779
net interest 29,313 22,885
profit/loss from entities accounted for using the equity method – 3,040 – 1,924
dividends from entities accounted for using the equity method 504 155
amortization and depreciation of non-current assets 14,421 17,816
net gain/loss on the disposal of non-current assets – 3,870 – 7,124
other non-cash income and expenses – 1,608 – 47
changes in operating assets and liabilities
inventories – 15,849 – 8,487
trade receivables – 37,915 3,113
other receivables and assets – 10,213 264
provisions – 2,371 – 4,104
trade payables 31,601 42,338
other liabilities (other than bank) 194 – 7,321
other assets and liabilities – 4,795 – 667
cash flow from operating activities 30,884 85,877
purchase of intangible assets – 8,255 – 15,098
purchase of property, plant and equipment – 10,808 – 10,806
purchase of entities accounted for using the equity method – – 10
proceeds from the sale of non-current assets 12,207 14,237
acquisitions, net of cash acquired – 100
disposal of discontinued operations, net of cash disposed of – 201 – 3,148
interest received 4,451 3,561
cash flow from investing activities – 2,606 – 11,164
change in current bank liabilities – 971 2,659
proceeds from non-current financial liabilities – 179
repayment of non-current financial liabilities – 1,060 – 932
repayment of bond – 100,000 –
payment of finance lease liabilities – 826 – 881
borrowing (repayment) of financial liabilities due to entities accounted for using the equity method 17 29
sale of securities – 23
increase in subscribed capital 4,025 –
increase in capital reserve 39,727 –
dividends paid to shareholders of dürr aktiengesellschaft – 6,291 –
dividends paid to minority interests – 36 –
interest paid – 30,727 – 22,967
cash flow from financing activities – 96,142 – 21,890
effects of exchange rate changes – 3,487 – 6,816
changes in cash and cash equivalents related to changes in the consolidated group 8,247 –
change in cash and cash equivalents – 63,104 46,007
cash and cash equivalents
at the beginning of the period 147,489 101,482
at the end of the period 84,385 147,489

100
NoteS to the CoNSolIdated fINaNCIal
StatemeNtS for the 2008 reportINg perIod
baSIS of preSeNtatIoN
dürr aktiengesellschaft (“dürr ag” or the “Company”) is headquartered in Stuttgart, germany. the dürr
group (“dürr” or the “group”) consists of dürr ag and its subsidiaries. the dürr group specializes in me-
chanical and plant engineering and is one of the global market leaders in almost all of its fields of business.
It generates some 85 % of sales revenues with the automotive industry, but also acts as supplier of produc-
tion technology for other industries including the aviation, mechanical engineering as well as the chemical
and pharmaceutical industries. dürr serves the market with two divisions: the paint and assembly Systems
division offers production and paint finishing technology, mainly for automotive bodyshells. the machines
and systems produced by the measuring and process Systems division are used in engine and drive con-
struction as well as final assembly.
the consolidated financial statements are prepared as of the balance sheet date in accordance with Inter-
national financial reporting Standards (IfrSs) as adopted by the european union (eu), and the additional
requirements of german commercial law pursuant to Sec. 315a (1) hgb [“handelsgesetzbuch”: german
Commercial Code].
the accounting policies used generally correspond to the policies applied in the prior period. In addition,
the group has applied the new and/or revised standards that are effective for reporting periods beginning
on or after January 1, 2008.
the changes in accounting policies result from the adoption of the following new or revised standards.
International accounting Standard (IaS) 39 “financial Instruments: recognition and measurement” and
IfrS 7 “financial Instruments: disclosures”: the International accounting Standards board (IaSb) published
amendments to IaS 39 and IfrS 7 on october 13, 2008. the changes are in response to the crisis on the
financial markets and give companies the option of reclassifying individual financial instruments to other
measurement categories in certain circumstances. eligible financial instruments are those in the measure-
ment categories “financial assets at fair value through profit or loss” as well as “available-for-sale financial
assets”. the amendments to IfrS 7 require additional disclosures in the notes when reclassifications be-
tween measurement categories are made. the amendments apply with retroactive effect as of July 1,
2008. the amendments did not have any effect on the consolidated financial statements because dürr did
not carry out any reclassifications of this kind.
International financial reporting Interpretations Committee (IfrIC) 11 “IfrS 2 - group and treasury Share
transactions”: IfrIC 11 clarifies how IfrS 2 “Share-based payment” applies to share-based payment ar-
rangements involving the entity’s own equity instruments or equity instruments of another group entity.
IfrIC 11 is effective for reporting periods beginning on or after march 1, 2007. adoption of IfrIC 11 did
not have any effect on the consolidated financial statements.
the group decided not to early adopt standards and IfrIC interpretations which have already been issued
but have not yet entered into force. generally speaking, dürr intends to adopt all standards when they
become effective for the first time.
1. sUmmaRY of significant accoUnting Policies
the comPanY
accoUnting Policies

101
10 0 notes
4 maNagemeNt aNd StoCk 92 consolidated financial statements 163 other26 maNagemeNt report19 market aNd buSINeSS
the following IfrSs and IfrIC interpretations adopted by the eu in the comitology procedures have not
yet entered into effect:
amendment to IaS 1 “presentation of financial Statements”: one significant change compared to the pre-
vious version is the presentation of changes in equity. IaS 1 now provides for all changes other than those
arising from transactions with owners to be presented either in a statement of comprehensive income or
based on two separate statements. Components of comprehensive income are no longer permitted to be
presented in the statement of changes in equity. In addition, IaS 1 requires income tax relating to each
component of other comprehensive income and reclassification adjustments to be disclosed separately.
furthermore, IaS 1 introduces new titles for the individual financial statement elements, entities may use
titles other than those set forth in the standard, however. the revised IaS 1 is effective for reporting periods
beginning on or after January 1, 2009. the new standard will have an effect on the form in which the
group’s financial information is published, but not on the recognition and measurement of assets and
liabilities in the consolidated financial statements.
amendment to IaS 23 “borrowing Costs”: the IaSb issued an amended version of IaS 23 in march 2007.
It requires borrowing costs that are directly attributable to the acquisition, construction or production of
a qualifying asset to be capitalized. the current option of immediately recognizing borrowing costs as an
expense was eliminated. the revised standard is effective for reporting periods beginning on or after
January 1, 2009. the revised IaS 23 generally applies prospectively. borrowing costs will be capitalized in
relation to long-term construction contracts. the group had not completed the quantitative analysis of
the effects of this amendment by the time the consolidated financial statements were prepared.
amendment to IaS 32 “financial Instruments: presentation”: the IaSb published the revised standard in
february 2008. It allows puttable financial instruments to be classified as equity under certain conditions.
the revised standard, which also gave rise to changes in IaS 1, is effective for reporting periods beginn-
ing on or after January 1, 2009. these changes are not expected to be relevant for the Company and will
accordingly not affect the consolidated financial statements.
IfrS 1 “first-time adoption of International financial reporting Standards” and IaS 27 “Consolidated and
Separate financial Statements”: In may 2008, the IaSb published amendments mainly concerned with
adjusting methods for determining the cost of an investment upon first-time adoption of IfrSs. adoption
of the revised standards is mandatory for reporting periods beginning on or after January 1, 2009. these
changes are not relevant for the Company and will accordingly not affect the consolidated financial state-
ments.
IfrS 2 “Share-based payment”: In January 2008, the IaSb published a revised version of IfrS 2, which con-
tains guidance on the definition of vesting conditions and cancellation of share-based payment arrange-
ments. the revised standard is effective for reporting periods beginning on or after January 1, 2009. these
changes are not expected to be relevant for the Company and will accordingly not affect the consolidated
financial statements.
IfrS 8 “operating Segments”: IfrS 8 replaces IaS 14 “Segment reporting”. IfrS 8 requires the disclosure
of financial and narrative information on the reportable segments. reportable segments are either operat-
ing segments or aggregations of operating segments that meet specified criteria. operating segments are
components of an entity about which separate financial information is available that is evaluated regularly
by the chief operating decision maker in deciding how to allocate resources and in assessing performance.
generally, financial information is required to be reported on the same basis as is used internally for evalu-
ating operating segment performance (management approach). the standard is effective for reporting
periods beginning on or after January 1, 2009. early adoption is permitted. the new standard will have
an effect on the form in which financial information on the group’s divisions is published, but not on the
recognition and measurement of assets and liabilities in the consolidated financial statements.

102
annual amendment process: on may 22, 2008, the IaSb issued the first final omnibus standard with
changes to existing IfrSs in the course of its first annual improvements project. the annual improvements
project is an annual project in which non-urgent but necessary amendments to the standards are carried
out. the amendments are primarily concerned with eliminating inconsistencies and improving clarity. the
amendments are effective for reporting periods beginning on or after January 1, 2009. In particular , the
changes listed below shall be mentioned, however, they are not expected to be relevant for the Company
and will accordingly not materially affect the consolidated financial statements:
IaS 1 “presentation of financial Statements”: Clarification that financial instruments classified as held
for trading do not have to be disclosed as current assets or liabilities in the balance sheet. Classification
as “current“ is based solely on the criteria set out in IaS 1.
IaS 19 “employee benefits”: In addition to the revision of numerous definitions, clarification that plan
adjustments that result in a reduction in benefits related to future services must be treated as a curtail-
ment. plan adjustments where the reduction in benefits relates to services already rendered must be
recognized as past service cost.
IaS 28 “Investments in associates”: because goodwill included in the carrying amount of an investment
in an associate is not recognized separately, it is not tested for impairment separately. rather, the total
carrying amount of the investments is subject to impairment testing and written down as necessary. It
has now been clarified that the reversal of impairment losses on an investment in an associate should
be recognized as an increase in this investment and not allocated to goodwill contained therein.
IaS 36 “Impairment of assets”: harmonization of the disclosures required on determining value in use
and fair value less costs to sell using the discounted cash flow method.
IfrS 5 “Non-current assets held for Sale and discontinued operations”: Clarification that all assets and
liabilities of a subsidiary whose planned disposal would lead to a loss of control over this subsidiary are
to be classified as held for sale if the entity retains a non-controlling interest in the former subsidiary.
IfrIC 13 “Customer loyalty programmes”: IfrIC 13 deals with accounting for customer loyalty programs
operated by manufacturers or service providers themselves or by third parties. IfrIC 13 is effective for
reporting periods beginning on or after 1 July 2008. Since it is not relevant to the Company, it will not have
any impact on the consolidated financial statements.
IfrIC 14 “IaS 19 – the limit on a defined benefit asset, minimum funding requirements and their Interac-
tion”: IfrIC 14 provides guidance on how to determine the limit on the amount of surplus in a defined bene-
fit scheme that can be recognized as an asset (asset ceiling) under IaS 19 “employee benefits”. In addition,
the interpretation provides explanations of the potential effects of statutory or contractual minimum fund-
ing requirements on plan assets or liabilities. adoption of IfrS 14 is mandatory for reporting periods begin-
ning on or after January 1, 2008, later adoption from January 1, 2009 is permitted by the eu Commission,
however. IfrIC 14 is not expected to affect the group’s accounting for benefit obligations.
IfrSs and IfrIC interpretations which have not yet entered into force and have not yet been adopted by
the eu in the comitology procedures:
IaS 27 “Consolidated and Separate financial Statements” and IfrS 3 “business Combinations”: the IaSb
published these two revised standards in January 2008. the main revisions concern the cost of a business
combination, the full goodwill method, accounting for business combinations achieved in stages, account-
ing for changes in the investment in subsidiaries without loss of control and the scope of IfrS 3. the
revised versions of IaS 27 and IfrS 3 are effective for reporting periods beginning on or after July 1, 2009.
the revised standards will have an effect on accounting for future business combinations and can there-
fore not be assessed in full until such a situation arises.

103
10 0 notes
4 maNagemeNt aNd StoCk 92 consolidated financial statements 163 other26 maNagemeNt report19 market aNd buSINeSS
IaS 39 “financial Instruments: recognition and measurement”: In July 2008, the IaSb issued an amend-
ment to IaS 39. the corresponding new regulations define the principles for the treatment of hedges in two
special situations. the amendments to IaS 39 are applicable for reporting periods beginning on or after
July 1, 2009. these amendments are not expected to be relevant for the Company and will accordingly not
affect the consolidated financial statements.
IfrS 1 “first-time adoption of IfrS”: In November 2008, the IaSb published the revised standard to which
only editorial changes and restructuring had been made. the standard is effective for reporting periods
beginning on or after January 1, 2009. the standard is aimed at first-time adopters of IfrS and therefore
does not affect the Company’s consolidated financial statements.
IfrIC 12 “Service Concession arrangements”: the scope of IfrIC 12 is limited to accounting for public con-
cessions (e.g. for the operation of motorways or hospitals) from the perspective of the licensee and relates
solely to arrangements with public licensors. IfrIC 12 is mandatory for reporting periods beginning on
or after January 1, 2008. Since it is not relevant to the Company, it will not have any impact on the consoli-
dated financial statements.
IfrIC 15 “agreements for the Construction of real estate”: IfrIC 15 addresses the accounting treatment for
the sale of real estate where an agreement is reached with a purchaser before the construction work is
completed. IfrIC 15 is effective for reporting periods beginning on or after January 1, 2009. Since it is not
relevant to the Company, it will not have any impact on the consolidated financial statements.
IfrIC 16 “hedges of a Net Investment in a foreign operation”: IfrIC 16 addresses individual issues result-
ing from hedges of a net investment in a foreign operation. IfrIC 16 is effective for reporting periods
beginning on or after october 1, 2008. Since it is not relevant to the Company, it is not expected to have
any impact on the consolidated financial statements.
IfrIC 17 “distributions of Non-Cash assets to owners”: this interpretation deals with the recognition and
measurement of an obligation arising from a distribution of non-cash assets, the distribution is to be
measured at fair value on the date when the distribution is no longer at the discretion of the entity. IfrIC 17
is effective for reporting periods beginning on or after July 1, 2009. Since the Company is unlikely to
distribute any non-cash assets, IfrIC 17 will not have any impact on the consolidated financial statements.
IfrIC 18 “transfers of assets from Customers”: this interpretation is of particular relevance in the public
utilities sector. IfrIC 18 clarifies the IfrS regulations for agreements in which an entity may receive from
its customers items of property, plant and equipment that must be used to connect those customers to a
network and provide them with ongoing access to a supply of goods or services. IfrIC 18 is applicable for
reporting periods beginning on or after July 1, 2009. this interpretation is not relevant for the Company
and will accordingly not affect the consolidated financial statements.
the requirements of the standards applied were satisfied in full. the financial statements thus give a true
and fair view of the net assets, financial position and results of operations and cash flows of the Company.
the reporting period of dürr is the calendar year. the consolidated financial statements are prepared in
thousands of euro (€ thousand or € k), unless stated otherwise.
all assets and liabilities are measured at historical or amortized cost. an exception to the rule are derivative
financial instruments and financial assets classified as available for sale, which are measured at fair value.
assets and liabilities are treated as current if they are realized or settled within a period of twelve months
after the balance sheet date.

104
the consolidated financial statements and group management report of dürr ag prepared by the board
of management as of december 31, 2008, were authorized at the meeting of the board of management on
march 4, 2009, for issue to the Supervisory board.
the consolidated financial statements of dürr are based on the IfrS financial statements of dürr ag
and the subsidiaries and entities accounted for using the equity method included in consolidation as of
december 31, 2008, prepared in accordance with uniform rules and audited by independent auditors.
for subsidiaries included in the consolidated financial statements for the first time, capital consolidation is
performed according to the purchase method of accounting pursuant to IfrS 3 “business Combinations”.
this involves offsetting the cost of the shares acquired against pro rata equity of the subsidiaries. all as-
sets and liabilities and contingent liabilities acquired are included in the consolidated balance sheet at the
acquisition date taking hidden reserves and encumbrances into account. any remaining debit difference
is shown as goodwill. When the entity is removed from consolidation, the goodwill is released to profit or
loss. Negative differences are posted immediately to profit or loss.
entities over which the Company exercises significant influence (associates) are measured using the equity
method; this is generally the case with a share of voting rights ranging from 20 % to 50 %. the equity
method is also applied for joint ventures in which dürr together with other venturers undertakes an eco-
nomic activity which is subject to joint control. any goodwill is disclosed under investments in entities
accounted for using the equity method. all other investments are accounted for at cost because market
values are not available and fair values cannot be reliably determined by other means.
Intragroup sales, other income and expenses and all intragroup receivables, liabilities and provisions are
eliminated. Intragroup profits which are not realized by sale to third parties are eliminated.
besides dürr ag, the consolidated financial statements as of december 31, 2008, contain all domestic and
foreign companies which dürr ag can control directly or indirectly (control concept). the entities are in-
cluded in the consolidated financial statements from the date on which the possibility of control was ob-
tained. Joint ventures and associates are included in the consolidated financial statements using the equity
method from the date on which joint control or the possibility of significant influence, respectively, existed.
the table below shows the number of entities included in the consolidated group besides dürr ag:
number of fully consolidated entities 2008 2007
germany 10 10
other countries 39 40
49 50
number of entities accounted for using the equity method 2008 2007
germany 2 2
other countries 1 2
3 4
the consolidated financial statements contain four entities (december 31, 2007: three) in which minority
shareholders hold interests.
aUthoRization foR issUe
of the consolidated
financial statements
as of decembeR 31, 2008
2. basis of
consolidation
3. consolidated
gRoUP

105
10 0 notes
4 maNagemeNt aNd StoCk 92 consolidated financial statements 163 other26 maNagemeNt report19 market aNd buSINeSS
behr Industrial Systems Inc., Windsor, ontario, Canada, was merged into dürr acco Canada Inc., Windsor,
ontario, Canada, with economic effect as of January 1, 2008. Since then the company has been operating
under the name dürr Systems Canada Inc.
dürr Systems gmbh and edag SIgma Concurrent engineering gmbh signed the articles of incorporation
and bylaws for the joint venture dürr edag aircraft Systems gmbh on September 23, 2008. dürr and edag
each hold an interest of 50 % in the joint venture, which is designed to accelerate marketing of their joint
product and service range for the aviation industry. following authorization by the antitrust authorities,
preparations are currently underway to register the company in the commercial register. once it has been
filed in the commercial register, the company will be accounted for using the equity method as a joint
venture in the consolidated financial statements.
as of September 30, 2008, dürr ecoclean S.a., barcelona, Spain, was liquidated.
the shareholder agreement with Verind S.p.a., rodano, Italy, was amended with effect as of November 30,
2008, to reflect the fact that dürr Systems gmbh can hereinafter control Verind S.p.a. (control concept).
Verind S.p.a. is therefore included in the consolidated financial statements for the first time with effect as
of december 1, 2008.
financial statements denominated in the foreign currencies of the subsidiaries included in the consolida-
tion are translated to the euro on the basis of the functional currency concept pursuant to IaS 21 “the ef-
fects of Changes in foreign exchange rates”. the functional currency is the local currency for all foreign
subsidiaries of the group, since these entities operate independently from a financial, economic and orga-
nizational viewpoint. according to this concept, assets and liabilities are thus translated at the closing
rates as of the balance sheet date, while income and expenses are generally translated at average rates.
any currency translation differences are recorded without effect on profit or loss in accumulated other
comprehensive income.
In the separate financial statements of dürr ag and its subsidiaries, receivables and liabilities in a currency
other than the euro are measured at the historical rate, current transactions are translated at the spot rate.
any exchange rate gains and losses as of the balance sheet date are included in the income statement. for
actual figures of the exchange rate gains and losses recognized in profit or loss, please refer to note 11.
the following main exchange rates are decisive for currency translation in the group (in relation to € 1):
closing rate average rate
dec. 31, 2008 dec. 31, 2007 2008 2007
uS dollar 1.3977 1.4716 1.4741 1.3790
pound sterling 0.9600 0.7346 0.8038 0.6873
Indian rupee 68.4300 57.9500 64.3776 56.6800
Canadian dollar 1.7160 1.4440 1.5655 1.4651
brazilian real 3.2843 2.6205 2.6881 2.6604
Chinese renminbi yuan 9.6090 10.7400 10.2301 10.4424
korean won 1,775.0000 1,377.0000 1,621.5000 1,278.7500
polish zloty 4.1823 3.5928 3.5383 3.7834
mexican peso 19.3500 16.0700 16.4258 15.0650
In the separate financial statements of the foreign subsidiaries, goodwill is translated at the rate prevailing
on the group’s balance sheet date. applying the transitional ruling of IaS 21.59, goodwill that already exist-
ed as of January 1, 2005, and is not accounted for in the separate financial statements of the subsidiaries is
still accounted for at the historical exchange rate (at the date of acquisition) as of the group’s balance sheet
date. hidden reserves disclosed in the course of business combinations are accounted for in euro as these
were only recorded by entities whose local currency is the euro.
4. changes in
the consolidated
gRoUP
5. cURRencY
tRanslation

106
an asset is classified as held for sale when the associated carrying amount will be recovered principally
through a sales transaction and not through continuing use. In accordance with IfrS 5 “Non-current assets
held for Sale and discontinued operations”, an operation of an entity is classified as a discontinued opera-
tion at the date when the operation meets the criteria to be classified as held for sale or is actually discon-
tinued. Such an operation represents a separate major line of business or geographical area of operations,
is part of a single coordinated plan to dispose of a separate major line of business or geographical area of
operations or is a subsidiary acquired exclusively with a view to resale.
the financial statements for the 2008 and 2007 reporting periods include subsequent effects from the sale
of the Services, development test Systems (dtS) and measuring and process technologies (mpt) busi-
ness units carried out in the 2005 reporting period.
the profit/loss from discontinued operations breaks down as follows:
in € k 2008 2007
revenue 459 1,807
expenses 110 724
earnings before taxes 349 1,083
Income tax expense / income (–) – 12,207 102
Profit after taxes 12,556 981
No discontinued operations were sold in the reporting period. however, net cash out-flows of € 201 thou-
sand (prior period: € 3,148 thousand) resulted from the sale effected in 2005 of the Services (€ 13 thousand,
prior period: € 602 thousand), development test Systems (€ 22 thousand, prior period: € 2,385 thousand)
as well as measuring and process technologies (€ 166 thousand, prior period: € 161 thousand) business
units. the cash out-flows are attributable to the utilization of provisions.
In 2005, Carl Schenck ag set up a provision of € 12,207 thousand for australian income taxes in relation to
the sale of the measuring and process technologies business unit. based on the latest rulings in australia,
the entity assumes that the risk of utilization has gone down significantly. the provision was therefore
reversed and recognized in profit and loss.
as of december 31, 2007, the carrying amounts of land and buildings of dürr Systems Inc., plymouth, uSa,
and dürr ecoclean Inc., Wixom, uSa, of € 6,782 thousand were presented in the balance sheet under
“Non-current assets classified as held for sale”. € 3,578 thousand of this amount was accounted for by the
paint and assembly Systems division and € 3,204 thousand by the measuring and process Systems divi-
sion. this real estate was sold in a sale-and-leaseback transaction and is leased back under an operating
lease, which generated gains on disposal of € 3,906 thousand in the 2008 reporting period.
Schenck Shanghai testing machinery Corporation ltd., Shanghai, China, was sold in the 2007 reporting
period. as of december 31, 2006, the investment’s carrying amount of € 903 thousand was disclosed in the
balance sheet item “Non-current assets classified as held for sale”. until it was sold, this entity had been
consolidated as an associate in accordance with the provisions of IfrS 5 “Non-current assets held for Sale
and discontinued operations”. the gain on sale was posted to the item “other operating income and ex-
penses”. the net cash inflow from the sale after deducting transaction costs and taxes came to € 2,280
thousand.
In addition, a building owned by dürr ecoclean S.a., barcelona, Spain, was sold in the 2007 reporting period.
It had been held for sale as a result of restructuring of the entity. the carrying amount of € 226 thousand
as of december 31, 2006, was disclosed in the balance sheet item “Non-current assets classified as held for
sale”. the gain on sale was posted to the item “other operating income and expenses”.
6. discontinUed
oPeRations/assets
classified as held
foR sale
discontinUed
oPeRations
assets classified
as held foR sale

107
10 0 notes
4 maNagemeNt aNd StoCk 92 consolidated financial statements 163 other26 maNagemeNt report19 market aNd buSINeSS
Intangible assets comprise goodwill, franchises, industrial rights and similar rights as well as capitalized
development costs. purchased and internally generated intangible assets are recognized pursuant to IaS
38 “Intangible assets” if, in addition to other criteria, it is probable that a future economic benefit will flow
to the entity from the use of the asset, and the cost of the asset can be reliably determined.
Intangible assets are recognized at cost. Intangible assets with a finite useful life are amortized over their
useful life using the straight-line method, unless they are impaired. goodwill and intangible assets with
indefinite useful lives are not amortized.
In the group, development costs are only recognized as internally generated intangible assets if the condi-
tions set forth in IaS 38 are satisfied. this includes the following criteria:
technical feasibility of completing the intangible asset so that it will be available for use or sale,
the use of the asset must generate probable future economic benefits,
the ability to measure reliably the expenditure attributable to the intangible asset during its development.
Cost is the sum of expenditure incurred from the date when the intangible asset first meets the recognition
criteria. development costs which do not meet these criteria as well as research costs are expensed imme-
diately. amortization of capitalized development costs is disclosed in the income statement under research
and development costs.
the useful life of intangible assets is estimated as follows:
in years
franchises, industrial rights and similar rights 1 to 10
Capitalized development costs 1 to 8
property, plant and equipment are accounted for at cost less straight-line depreciation over their useful life.
Cost comprises all production costs that can be allocated directly to the production process.
the useful life of property, plant and equipment is estimated as follows:
in years
It hardware 3 to 5
furniture and fixtures 1 to 25
machines and equipment 1 to 21
buildings and leasehold improvements 4 to 60
further comments on the balance sheet item property, plant and equipment can be found in note 16.
the cost of property, plant and equipment includes major expenditures and replacements which extend
useful lives or increase capacity. the historical cost of assets that are either sold or scrapped is derecog-
nized, as is the accumulated depreciation. any gains or losses from derecognition are determined as the
difference between the net disposal proceeds and the carrying amount and recognized in profit or loss
as other operating income or expenses in the period in which the item is derecognized. Costs of on-going
repairs and maintenance are expensed immediately.
7. accoUnting Policies
intangible assets
PRoPeRtY, Plant and
eqUiPment

108
Investment properties are measured initially at depreciated cost, including transaction costs. the carrying
amount contains the costs for investments to replace an existing investment property at the time these
costs are incurred, provided the recognition criteria are satisfied, and excludes the costs of day-to-day ser-
vicing of an investment property. Subsequent to initial recognition, investment properties are stated at
depreciated cost.
Investment property is derecognized when it is sold or retired from active use and no future economic
benefit is expected upon its disposal. gains or losses arising from the retirement or disposal of investment
property are recognized in the year of retirement or disposal.
properties are allocated to investment property if a change in use has occurred which is substantiated by
their being occupied by another party after the end of owner-occupation or the inception of an operating
lease with another party.
all intangible assets with an indefinite useful life, intangible assets which are not yet ready for use and
goodwill are tested for impairment at the end of each reporting period. other intangible assets and
property, plant and equipment are reviewed for impairment whenever events or changes in circumstances
indicate that an asset may be impaired, i.e. that the carrying amount of an asset may not be recoverable.
Investment property that is largely rented to third parties is also subjected to an impairment test by exter-
nal valuers.
an impairment loss is recognized if the recoverable amount of the asset falls short of its carrying amount.
the recoverable amount is the higher of an asset’s net selling price and its value in use. the net selling
price is the amount recoverable from the disposal of an asset at market conditions less costs to sell. Value
in use is the fair value of estimated future cash flows expected to arise from the continuing use of an asset
and from its disposal at the end of its useful life. the recoverable amount is determined for each asset indi-
vidually or, if that is not possible, for the cash-generating unit to which the asset belongs. as regards
goodwill acquired in business combinations, the relevant cash-generating units correspond to the business
units of the dürr group based on internal reporting structures. to determine the estimated cash flows
of each cash-generating unit, basic assumptions have to be made. these include assumptions regarding
financial planning and the interest rates used for discounting.
Impairment losses recognized in prior periods are reversed against profit or loss if they cease to exist or
have decreased. the increase in value or the reduction of an impairment loss of an asset is, however, only
recognized to the extent that it does not exceed the carrying amount that would have existed if the regular
amortization or depreciation had been recorded and no impairment losses had been recognized. Impair-
ments on goodwill may not be reversed.
In accordance with IaS 20 “accounting for government grants and disclosure of government assistance”,
government grants are only recorded if it is reasonably certain that the conditions attached to the grants
will be fulfilled and the grants actually awarded. grants that relate to an investment are deducted from the
carrying amount of the subsidized asset. grants related to income are recognized as deferred income and
released in the correct period.
the entities in the dürr group are lessees of land, buildings, office and operating equipment. the majority
of leases are classified as operating leases.
assets leased under finance leases, which transfer to the group substantially all the risks and rewards
incidental to ownership of the leased asset, are capitalized at the inception of the lease at the fair value of
the leased asset or, if lower, at the present value of the minimum lease payments. lease payments are
apportioned between the finance charges and reduction of the lease liability so as to achieve a constant
investment PRoPeRtY
imPaiRment test
goveRnment gRants
leases

109
10 0 notes
4 maNagemeNt aNd StoCk 92 consolidated financial statements 163 other26 maNagemeNt report19 market aNd buSINeSS
rate of interest over the period on the remaining balance of the lease liability. finance charges are taken
to profit or loss immediately. a liability is also established at that time for the same amount. the leased
asset is depreciated over the shorter of the lease term and its estimated useful life.
lease payments on operating leases are recorded in the income statement as an expense over the term
of the lease.
entities over which dürr either has significant influence or in which dürr together with other venturers
undertakes an economic activity which is subject to joint control are recorded as investments in entities
accounted for using the equity method. the group’s share of profits and losses is shown in the consoli-
dated balance sheet as a change in the carrying amount and recognized in the consolidated income state-
ment under profit/loss from entities accounted for using the equity method. Where there has been a
change recognized directly in the equity of the entity accounted for using the equity method, the group
also recognizes its share of the change directly in equity in proportion to its shareholding and discloses
this in the statement of changes in equity. dividends received are deducted from the carrying amount.
a financial instrument is a contract that gives rise to both a financial asset of one entity and a financial
liability or equity instrument of another entity. pursuant to IaS 39, financial instruments are classified in the
following categories:
financial assets held for trading
held-to-maturity investments
loans and receivables originated by the entity
available-for-sale financial assets
financial liabilities measured at amortized cost, and
financial liabilities at fair value through profit or loss
purchases or sales of financial assets are recognized using the trade date accounting.
financial assets with fixed or determinable payments and fixed maturity that the entity intends and has the
ability to hold to maturity other than loans and receivables originated by the entity pursuant to IaS 39 are
classified as held-to-maturity investments. financial assets that are acquired principally for the purpose of
generating a profit from short-term fluctuations in price or dealer’s margins are classified as held-for-trad-
ing financial assets. all other financial assets apart from loans and receivables originated by the entity
pursuant to IaS 39 are classified as available-for-sale financial assets.
held-to-maturity investments are disclosed under non-current assets. this does not apply if they are due
within one year of the balance sheet date. held-for-trading financial assets are disclosed under current
assets. available-for-sale financial assets are disclosed under current assets if management intends to sell
them within twelve months of the balance sheet date.
When a financial asset is recognized initially, it is measured at cost. this comprises the fair value of the
consideration and – with the exception of financial assets held for trading – the transaction costs.
Changes in the fair value of held-for-trading financial assets are recorded in profit or loss. the fair value
of a financial instrument is the amount that can be generated from the asset in an arm’s length transaction
between knowledgeable and willing parties under current market conditions.
held-to-maturity investments are measured at amortized cost using the effective interest method. If it is
more likely than not that the financial assets measured at amortized cost are impaired, the impairment loss
is recognized in profit or loss. If an impairment loss recorded in a prior period decreases and the decrease
investments in entities
accoUnted foR Using
the eqUitY method
financial instRUments
financial assets

110
in the impairment loss (or reversal) can be objectively related to an event occurring after the impairment
loss, the reversal is recognized in profit or loss. a reversal of an impairment loss cannot, however, exceed
the carrying amount that would have been recognized without the impairment loss.
loans and receivables originated by an entity and not held for trading are measured at the lower of amor-
tized cost or net realizable value on the balance sheet date.
available-for-sale financial assets are recognized at fair value. unrealized gains and losses are disclosed
in accumulated other comprehensive income, net of a tax portion. the reserve is released to profit or loss
either upon disposal or if the assets are impaired.
to date, dürr has not made use of the option to designate financial assets upon initial recognition as
financial assets at fair value through profit or loss.
financial liabilities generally give rise to the right to receive settlement net in cash or another financial
asset. they include, for example, trade payables, liabilities to banks, bonds, derivative financial liabilities
and other liabilities.
after initial measurement, financial liabilities carried at amortized cost are subsequently measured at
amortized cost using the effective interest method. financial liabilities measured at fair value through
profit or loss include financial liabilities held for trading. derivatives are deemed to be held for trading
unless they are designated and effective hedging instruments. gains or losses on financial liabilities held
for trading are recognized in profit or loss.
to date, the group has not made use of the option to designate financial liabilities upon initial recognition
as financial liabilities at fair value through profit or loss.
dürr uses derivative financial instruments such as forward exchange contracts and interest/currency
swaps in order to hedge against interest and currency risks.
derivative financial instruments are measured at fair value on initial recognition and in subsequent periods.
recognition of these changes – whether in profit or loss or directly in equity – depends on whether the
derivative financial instrument is part of an effective hedge in accordance with IaS 39. Changes in fair value
are recognized in profit or loss unless the special criteria of IaS 39 for hedge accounting are satisfied.
depending on the nature of the hedged item, hedging instruments are designed as follows:
fair value hedges if they hedge exposure to changes in fair value of a recognized asset or liability or an
unrecognized firm commitment, or an identified portion of such an asset, liability or firm commitment
that could affect profit or loss,
Cash flow hedges if they hedge exposure to variability in cash flows that is attributable to a recognized
asset or liability or a forecast transaction and could affect profit or loss, or
hedge of a net investment in a foreign operation.
In the case of fair value hedges, the carrying amount of a hedged item is adjusted through profit or loss by
the profit or loss that is attributable to the hedged exposure. In addition, the derivative financial instrument
is remeasured at its fair value, gains or losses arising as a result are also recognized in profit or loss. In
a perfect hedge, the fluctuation in fair value recognized in profit or loss for the hedged item practically off-
sets that of the hedging instrument. for fair value hedges which relate to hedged items carried at amor-
tized cost, the adjustments of the carrying amount are released to profit or loss over their term until matu-
rity. every adjustment of the carrying amount of a hedged financial instrument is released to profit or loss
using the effective interest method. the amount can be released as soon as an adjustment is made. It is
released at the latest when the hedged item ceases to be adjusted for the changes in fair value that are
attributable to the hedged exposure. If the hedge item is derecognized, the unamortized fair value is recog-
nized immediately in the income statement.
financial liabilities
deRivative financial
instRUments and
hedges
faiR valUe hedge
accoUnting

111
10 0 notes
4 maNagemeNt aNd StoCk 92 consolidated financial statements 163 other26 maNagemeNt report19 market aNd buSINeSS
If an unrecognized firm commitment is designated as a hedged item, the subsequent accumulated change
in its fair value that is attributable to the hedged risk is recognized as an asset or liability in the profit or
loss of the period. the changes in fair value of the hedging instrument are also recognized in the profit or
loss of the period. however, this does not apply if foreign exchange exposure is hedged, as that is treated
as a cash flow hedge. hedge accounting is discontinued when the hedging instrument expires or is sold,
terminated or exercised, or no longer qualifies for hedge accounting.
In the case of cash flow hedges, the effective portion of the gain or loss on a hedging instrument is recog-
nized directly in equity. the ineffective portion is recognized in profit or loss. amounts that are recognized
directly in equity are reclassified to profit or loss in the period in which the hedged item affects the net
profit or loss for the period. Where the hedged item is the cost of a non-financial asset or non-financial lia-
bility, the amounts taken to equity are transferred to the initial carrying amount of the non-financial asset
or non-financial liability. If the forecast transaction is no longer expected to occur, any amounts previously
taken to equity are reclassified to the net profit or loss for the period. When the hedge expires, is sold or
terminated, the amounts previously disclosed remain a separate item in equity until the forecast transac-
tion occurs. the same applies if the hedging instrument is exercised without replacement or rollover, or
if the criteria for cash flow hedge accounting are no longer in place. If the forecast transaction is no longer
expected, the amount is recognized in profit or loss. further explanations on derivative financial instru-
ments are given in note 34.
the marketable securities disclosed under other financial assets include securities classified as available
for sale, which are measured at market value on the balance sheet date, and securities classified as held to
maturity, which are measured at amortized cost. available-for-sale securities had a fair value of € 316 thou-
sand as of both december 31, 2008, and december 31, 2007.
Inventories of materials and supplies, work in process from small series production and finished goods
are carried at the lower of cost or net realizable value on the balance sheet date. Write-downs are recorded
for obsolete and slow-moving inventories.
Costs of conversion comprise direct materials costs, direct labor costs as well as all production-related
overheads and depreciation. borrowing costs are not included.
dürr generates most of its sales revenues from long-term construction contracts. Contract revenue is
generally disclosed using the percentage of completion method (poC method) pursuant to IaS 11 “Con-
struction Contracts”. this involves recognizing sales revenues and the planned margin in line with the
degree to which the contract has been completed. the degree of completion is calculated on the basis of
the costs incurred relative to the total estimated costs. this ensures that both sales revenues and the asso-
ciated costs are recognized in the period in which they are incurred. the zero-profit method (zp method) is
used in instances where estimated costs to complete cannot be reliably determined, but it is probable that
the costs incurred will be reimbursed. With the zero-profit method sales revenues and the associated costs
are realized in equal amounts until the contract is completed. the result is thus not recognized in profit or
loss until the contract is completed.
other revenue is recognized when the significant risks and rewards of ownership have been transferred
pursuant to IaS 18 “revenue”. this is usually the date on which the goods or merchandise are delivered
or services rendered.
progress billings issued to customers and cash received from customers are deducted without effect on in-
come from cost and estimated earnings in excess of billings on uncompleted contracts or added to billings
in excess of cost and estimated earnings.
to the extent that costs have been incurred on contracts, but the amounts cannot yet be billed under the
terms of the contracts, they are reported under receivables together with the corresponding estimated
earnings as “cost and estimated earnings in excess of billings on uncompleted contracts”. the invoicing of
cash flow hedge
accoUnting
otheR financial assets
inventoRies and
PRePaYments
long-teRm
constRUction
contRacts

112
such amounts is dependent on certain contractually defined milestones being reached. Cost and estimated
earnings in excess of billings on uncompleted contracts includes directly allocable costs (materials and
labor costs and cost of purchased services) as well as an appropriate portion of production-related over-
heads and estimated earnings.
also included in cost and estimated earnings in excess of billings on uncompleted contracts are amounts
that dürr seeks to collect from customers or others for errors or changes in contract specifications or
design, contract change orders in dispute or unapproved as to both scope and price, or other customer-
related causes of unanticipated additional contract costs, claims and pending change orders. these are
carried at the estimated amount provided their realization is probable and can be reliably estimated. No
profits are reported on these accumulated costs. pending change orders involve the use of estimates.
therefore, it is possible that adjustments to the estimated recoverable amounts of recorded pending
change orders will be made in the future.
the poC method and zp method are based on estimates. due to the uncertainties prevailing in this re-
spect, estimates of the expenses required for completion, including expenses for contractual penalties and
warranties, may have to be adjusted subsequently. Such adjustments to costs and revenue are recognized
in the period in which the adjustments are determined. provisions for onerous contracts are recognized in
the period in which losses are identified.
receivables are carried at the lower of amortized cost or net realizable value. the group assesses the re-
coverability of its receivables by referring to a number of factors. Should any issues arise which would
impinge on the ability of certain customers to meet their financial obligations, dürr posts a specific valua-
tion allowance to write down the net receivable to the reasonably expected recoverable amount. Impair-
ment losses on trade receivables are posted via allowance accounts. receivables are derecognized as soon
as they become uncollectible.
the assessment of the separate accounts receivable as overdue or in default is made by management. for
all other customers, the group records bad debt allowances on a portfolio basis depending on the days
past due, current business circumstances and past experience. a central monitoring and local collection
management system counters the risk of bad debts. this system includes regular credit ratings, the con-
clusion of credit insurance policies and – particularly in the export business – issuing letters of credit.
all short-term liquid investments with an original term to maturity of less than three months are carried
at face value as cash and cash equivalents.
this item presents changes in equity other than those arising from capital transactions with owners
(e.g., capital increases or distributions). these include exchange differences, accumulated actuarial gains
and losses from the measurement of pensions and similar obligations as well as unrealized gains and
losses from the measurement of available-for-sale securities and derivative financial instruments at fair
value.
pursuant to IaS 39 “financial Instruments: recognition and measurement”, borrowing costs incurred in
connection with the issue of a bond are deducted from the bond on the liabilities’ side of the consolidated
balance sheet. Calculated using the effective interest method, borrowing costs are amortized over the
term of the bond.
transaction costs incurred in connection with the syndicated loan are shown in the consolidated balance
sheet as other intangible assets and amortized over the term of the syndicated loan.
tRade Receivables
cash and cash
eqUivalents
accUmUlated otheR
comPRehensive income
boRRowing costs in
connection with
the Refinancing of
the gRoUP

113
10 0 notes
4 maNagemeNt aNd StoCk 92 consolidated financial statements 163 other26 maNagemeNt report19 market aNd buSINeSS
the group’s post-employment benefits include defined contribution plans and defined benefit plans. In the
case of defined contribution plans, the Company pays contributions to state or private pension companies
either on a voluntary basis or based on statutory or contractual provisions. No further payment obligations
arise for the Company following the payment of contributions.
the majority of the Company’s post-employment benefit systems is based on defined benefit plans
which guarantee the beneficiary a monthly old-age pension for life. these benefit plans are funded by the
Company and by the employees.
In accordance with IaS 19 “employee benefits”, provisions for pension obligations are measured using
the projected unit credit method. for this purpose, the future obligations are measured on the basis of
the pro rata employee benefit obligations as of the balance sheet date. pension provisions are calculated
taking into account development assumptions (e.g., salary developments) for those factors which affect
the amount of the benefit.
dürr has applied IaS 19 (revised) for the measurement the benefit obligations since the 2005 reporting
period. accordingly, actuarial gains and losses are recorded directly in equity net of deferred taxes.
provisions for employer’s pension liability insurance obligations are offset against plan assets in accor-
dance with the criteria of IaS 19 (revised).
other provisions are recorded if the obligation to a third party results from a past event which is expected
to lead to an outflow of economic benefits and can be determined reliably. these are contingent liabilities
recognized on the basis of a best estimate. provisions with a residual term of more than one year are dis-
counted at market interest rates which reflect the risk and period until the obligation is settled.
at the inception of the lease, liabilities from finance leases are carried at the lower of fair value of the
leased asset or the present value of the minimum lease payments (we refer to the explanations on leases),
other liabilities are accounted for at amortized cost.
deferred taxes are accounted for using the balance sheet oriented liability method according to IaS 12
“Income taxes”. this involves creating deferred tax items for all temporary accounting and measurement
differences between the carrying amounts for IfrS purposes and the tax bases of the assets and liabilities.
they are not created if the temporary difference arises from goodwill or the initial recognition of other as-
sets and liabilities in a transaction (that is not a business combination) which affects neither the accounting
profit nor the taxable profit or loss. a deferred tax asset is recognized for all taxable temporary differences
arising from investments in subsidiaries or associates, and interests in joint ventures, unless the parent
can control the reversal of the temporary difference and the temporary difference will probably not reverse
in the foreseeable future. further, deferred tax assets for future economic benefits from unused tax losses
and unused tax credits are taken into account if it is highly probable that they will be used.
deferred taxes are measured taking into account the respective local income tax rates which apply in the
individual countries at the time of realization or which are expected (basis: applicable tax law). deferred
tax assets are only reversed if it is more probable that the tax benefit will be forfeited than that it will be
utilized.
deferred tax assets and deferred tax liabilities are netted if, and only if, the entity has a legally enforceable
right to offset current tax assets against current tax liabilities and the deferred tax assets and liabilities
relate to income taxes levied on the same taxable entity by the same taxation authority. deferred taxes are
recorded as tax income or expense in the income statement unless they relate to items recorded directly
in equity, in this case, the deferred taxes are also recorded directly in equity.
PRovisions
liabilities
defeRRed taxes

114
liabilities are disclosed as contingent liabilities for possible obligations that arise from past events and
whose existence will be confirmed only by the occurrence or non-occurrence of one or more uncertain
future events not wholly within the control of the entity. Contingent liabilities can arise from a present obli-
gation that results from past events but is not recognized because
it is not probable that an outflow of resources embodying economic benefits will be required to settle
the obligation, or
the amount of the obligation cannot be measured with sufficient reliability.
a contingent liability is not disclosed if the possibility of an outflow of resources embodying economic
benefits is remote.
research and non-capitalizable development costs are recorded in profit or loss as incurred.
earnings per share is determined pursuant to IaS 33 “earnings per Share”. earnings per share is calculated
as the profit share of the shareholders of dürr ag divided by the weighted average number of shares
issued. the calculation is presented in the table below. there were no dilutive effects in the 2008 and 2007
reporting periods.
in € k (with the exception of disclosures per share) 2008 2007
profit attributable to the shareholders of dürr ag 42,429 21,910
of which continuing operations 29,873 20,929
of which discontinued operations 12,556 981
Number of shares outstanding in thousand (weighted average) 16,535.8 15,728.0
earnings per share (basic and diluted) 2.57 1.39
of which continuing operations 1.81 1.33
of which discontinued operations 0.76 0.06
the preparation of the consolidated financial statements pursuant to IfrSs requires management to make
estimates and assumptions that affect the reported amounts of assets and liabilities and disclosure of
contingent liabilities at the balance sheet date and the reported amounts of revenues and expenses during
the reporting period. actual figures may diverge from these estimates.
operating lease commitments – group as lessor
the group has entered into commercial property leases on its investment property portfolio. the group
has determined that it retains all the significant risks and rewards of ownership of these properties and so
accounts for them as operating leases.
operating lease commitments – group as lessee
the group has entered into lease agreements for real estate. the group has determined that the special
purpose entities which are the lessor of the real estate retain all the significant risks and rewards of owner-
ship of these.
consolidation of special purpose entities
two special purpose entities were founded for the purpose of concluding the aforementioned lease
agreement. dürr has no influence on the financing or business policies of either of these special purpose
entities. the opportunities and risk structures of the special purpose entities are such that they cannot be
included in the consolidated group.
contingent liabilities
ReseaRch and non-
caPitalizable
develoPment costs
eaRnings PeR shaRe
Use of estimates
and JUdgments
JUdgments

115
10 0 notes
4 maNagemeNt aNd StoCk 92 consolidated financial statements 163 other26 maNagemeNt report19 market aNd buSINeSS
the key assumptions concerning the future and other key sources of estimation uncertainty as of the
balance sheet date that risk causing a material adjustment to the carrying amounts of assets and liabilities
within the next reporting period are discussed below.
impairment of goodwill
the group tests goodwill for impairment at least once a year. this requires an estimation of the value in
use of the cash-generating units to which the goodwill is allocated. to do this, management is required to
make an estimate of the expected future cash flows from the cash-generating units and also to choose a
suitable discount rate in order to calculate the present value of those cash flows. the carrying amount of
goodwill as of december 31, 2008, was € 265,974 thousand (prior period: € 263,180 thousand). please refer
to note 16 for further details.
Pensions and other post-employment benefits
the cost of defined benefit plans is determined using actuarial calculations. this involves making assump-
tions about discount rates, expected rates of return on assets, future salary increases, mortality rates and
future pension increases. due to the long-term nature of these plans, such assumptions are subject to sig-
nificant uncertainty. pension provisions amounted to € 52,222 thousand as of december 31, 2008 (prior pe-
riod: € 50,007 thousand). please refer to note 23 for further details.
development costs
development costs are capitalized in accordance with the accounting policy presented in note 7. determin-
ing the amounts to be capitalized requires management to make assumptions regarding the expected
future cash generation of the assets, interest rates to be applied and the expected period of benefits. the
carrying amount of capitalized development costs as of december 31, 2008, was € 14,963 thousand (prior
period: € 14,863 thousand).
Put option of minority shareholders for shares held in cPm s.p.a.
In the course of consolidating Cpm S.p.a. in full for the first time in 2007, a put option of the minority inter-
ests for the shares held by them was measured at fair value in accordance with IaS 32 and recognized
under other liabilities. the fair value is calculated as of each balance sheet date. this requires an estimate
to be made regarding the future revenue of Cpm S.p.a. the fair value of the option came to € 6,394 thou-
sand as of december 31, 2008 (prior period: € 3,925 thousand).
estimates and assumptions are also required for the recognition and measurement of cost and estimated
earnings in excess of billings on uncompleted contracts, for bad debt allowances (cf. note 34 and com-
ments on risks and opportunities in the management report) as well as for contingent liabilities and other
provisions, the same applies to determining the fair value of long-lived items of property, plant and equip-
ment and intangible assets and the recognition of deferred taxes on unused tax losses (cf. note 15).
estimates and
assUmPtions

116
NoteS to the ItemS of the CoNSolIdated
fINaNCIal StatemeNtS
NoteS to the CoNSolIdated INCome StatemeNt
in € k 2008 2007
Contract revenues 1,158,057 1,046,417
revenues from services 395,934 383,726
other sales revenues 48,782 46,498
1,602,773 1,476,641
the expense positions of the income statement contain the following personnel expenses:
in € k 2008 2007
Wages and salaries 310,077 305,956
Social security contributions 67,018 62,830
377,095 368,786
of which post-employment benefits 6,743 6,659
the expense positions of the income statement contain cost of materials of € 1,038,221 thousand
(prior period: € 1,050,177 thousand).
in € k 2008 2007
other operating income
exchange rate gains 21,952 5,113
Income from allocation of expenses for Campus construction project 4,856 –
reversal of provisions 867 2,274
gains on disposal of non-current assets 4,157 7,474
Income from the sale or liquidation of entities 117 5,464
Insurance and other reimbursements – 5,912
distribution agreement – 725
other 5,678 6,130
other operating expenses
exchange rate losses 26,086 5,060
expenses for Campus construction project 6,966 –
losses on disposal of non-current assets 287 350
Impairment of receivables and other current assets 12 136
other 7,738 9,566
– 3,462 17,980
8. sales RevenUes
9. PeRsonnel
exPenses
10. cost of mateRials
11. otheR oPeRating
income
and exPenses

117
10 0 notes
4 maNagemeNt aNd StoCk 92 consolidated financial statements 163 other26 maNagemeNt report19 market aNd buSINeSS
In the course of the group-wide program foCuS, which was completed in 2007, dürr restructured the paint
and assembly Systems division and the Cleaning and filtration Systems business unit. the largest part of
the restructuring expense was accounted for by the paint and assembly Systems division. In the reporting
period, accruals recognized in prior periods were either utilized or reversed in relation to foCuS.
In the 2008 reporting period, a decision was taken to rescale the final assembly systems/conveyor tech-
nology unit. the capacity downscaling introduced in france and the uSa entailed restructuring expenses
of € 4,391 thousand.
the balance of restructuring expenses, on the one hand, and income from the reversal of accruals for
restructuring no longer needed, on the other, came to € – 3,294 thousand in the reporting period (prior
period: income of € 886 thousand). expenses of € 861 thousand relate to measures already implemented
in the 2008 reporting period, the remaining expenses and income result from changes in other liabilities.
accruals for restructuring measures have developed as follows:
in € k
Paint and assembly
systems
measuring and Process
systems
dürr-
group
January 1, 2007 8,681 10,695 19,376
Changes in consolidated group 225 – 225
exchange difference 61 – 15 46
utilization 4,747 4,525 9,272
reversal 791 422 1,213
addition 21 – 21
december 31, 2007 3,450 5,733 9,183
reclassification – 71 71 –
exchange difference – 31 – 3 – 34
utilization 1,303 505 1,808
reversal 737 377 1,114
addition 3,543 4 3,547
december 31, 2008 4,851 4,923 9,774
the composition of the cash-generating unit was modified through the addition of further buildings
and the disposal of one building from the investment property portfolio of Schenck technologie- und
Industriepark gmbh in darmstadt, which belongs to the measuring and process Systems division.
owing to the positive rental situation in 2008, the Company expects the market value to continue to rise.
In light of this, the reasons for the impairment loss previously recognized no longer apply. therefore,
the Company reversed the impairment loss by writing up the carrying amount by € 4,324 thousand. this
took into account the scheduled depreciation that would have been recorded had no impairment loss
been recognized. this development was offset by an impairment loss of € 33 thousand recorded on a
longitudinal lifting magnet.
In addition, in the course of determining the value in use of a building on the darmstadt site which is
treated as a finance lease, the reason for the impairment loss recognized in 2005 was found to no longer
apply. therefore, the Company reversed the impairment loss by writing up the carrying amount by
€ 562 thousand. this took into account the scheduled depreciation that would have been recorded had
no impairment loss been recognized.
12. gain oR loss on RestRUctURing/oneRoUs contRacts and imPaiRment
losses/ReveRsals of imPaiRment losses
gain oR loss on
RestRUctURing
imPaiRment losses/
ReveRsal of
imPaiRment losses

118
In the 2007 reporting period, the continuing use of leasehold improvements in a warehouse in Poland,
which had been written down in 2005, led to a reversal of impairment losses € 131 thousand. In the
2008 reporting period, it was decided to prematurely terminate the leases for the warehouse. As a result,
an impairment loss of € 112 thousand was recognized on the leasehold improvements.
The net expense of restructuring/onerous contracts as well as the net impairment losses/reversals of
impairment losses breaks down by functional cost in the income statement as follows:
in € k
Income statement (as
reported)
Gain or loss on
restructuring/onerous
contracts
Net impairment
losses/reversal of
impairment losses
Income statement
(reconciled)
Sales revenues 1,602,773 – – 1,602,773
(2007) (1,476,641) (– ) (– ) (1,476,641)
Cost of sales – 1,317,538 – 2,321 4,179 – 1,315,680
(2007) (– 1,236,662) (147) (131) (– 1,236,384)
Gross profit 285,235 – 2,321 4,179 287,093
(2007) (239,979) (147) (131) (240,257)
Selling expenses – 98,257 – 541 – – 98,798
(2007) (– 95,110) (106) (– ) (– 95,004)
General and administrative expenses – 86,775 – 432 562 – 86,645
(2007) (– 87,675) (618) (– ) (– 87,057)
Research and development costs – 25,528 – – – 25,528
(2007) (– 20,471) (15) (– ) (– 20,456)
Other operating income and expenses – 3,462 – – – 3,462
(2007) (17,980) (– ) (– ) (17,980)
71,213 – 3,294 4,741 72,660
(2007) (54,703) (886) (131) (55,720)
Gain or loss on restructuring/onerous contracts – 3,294 3,294 – –
(2007) (886) (– 886) (– ) (– )
Impairment losses/reversal of impairment losses 4,741 – – 4,741 –
(2007) (131) (– ) (– 131) (– )
EBIT 72,660 – – 72,660
(2007) (55,720) (– ) (– ) (55,720)

119
10 0 notes
4 maNagemeNt aNd StoCk 92 consolidated financial statements 163 other26 maNagemeNt report19 market aNd buSINeSS
the profit from entities accounted for using the equity method amounted to € 3,040 thousand (prior
period: € 1,924 thousand). this disclosure comprises the profit shares from entities accounted for
using the equity method. Currency effects were recorded directly in equity under accumulated other
comprehensive income.
in € k 2008 2007
Interest and similar income 4,767 3,805
Interest expense – 34,080 – 26,690
of which from:
Scheduled amortization of transaction costs /debt discount from a bond issue
and from a syndicated loan – 3,050 – 2,598
Non-recurring effects from premature termination of the syndicated loan and
partial repayment of the bond – 9,388 –
Interest expenses from finance leases – 392 – 490
other interest expenses – 21,250 – 23,602
net interest – 29,313 – 22,885
of which from financial instruments under the measurement categories
in accordance with IaS 39:
loans and receivables (amortized cost) 4,750 3,791
available-for-sale financial assets 17 14
financial liabilities measured at amortized cost – 33,998 – 26,448
other interest expenses also comprise the net interest expense of € 82 thousand from the interest/currency
swaps accounted for at fair value (prior period: € 242 thousand). for details of the group financing struc-
ture, please refer to note 25.
the income taxes relate to the german corporate income tax including a solidarity surcharge, trade tax on
income and comparable taxes levied at foreign subsidiaries. the tax expense for discontinued operations
is explained in note 6.
deferred taxes in germany are computed using an unchanged tax rate of 29.9 % (prior period: 29.9 %).
the tax expense on income comprises the following:
in € k 2008 2007
current income taxes
Income tax expense for the reporting period 15,029 9,986
adjustment of tax expense for prior periods – 14,034 – 375
tax on transaction costs recognized directly in equity 118 –
1,113 9,611
deferred taxes
origin and reversal of temporary differences – 659 4,056
total tax expense 454 13,667
less tax income/expense from discontinued operations – 12,207 102
disclosed tax expense 12,661 13,565
13. PRofit/loss fRom
entities accoUnted
foR Using the
eqUitY method
14. net inteRest
15. income taxes

120
pursuant to IaS 12, a deferred tax asset should be recognized for the carryforward of unused tax losses to
the extent that it is probable that future taxable profit will be available against which the unused tax losses
can be utilized. In calculating the possibilities for utilizing tax losses, dürr uses a three-year planning hori-
zon and takes into account the minimum taxation in germany. Since there are no longer any accumulated
losses in germany, dürr recognizes additional deferred tax assets of € 3,312 thousand on unused tax loss-
es. In other tax jurisdictions, deferred tax assets were again not recognized on unused tax losses due to the
accumulated losses of the past three years.
the following table shows the reconciliation of theoretical income tax expense to the current income tax
expense disclosed. the reconciliation is based on the total effective tax rate in germany of 29.9 % (prior
period: 39.0 %):
in € k 2008 2007
earnings before income taxes from continuing operations 46,387 34,759
earnings before income taxes from discontinued operations 349 1,083
Profit before income taxes 46,736 35,842
theoretical income tax expense in germany of 29.9 % (prior period: 39.0 %) 13,974 13,978
adjustments of current and deferred income tax incurred in prior periods – 14,035 1,715
Non-deductible operating expenses 4,345 5,089
foreign tax rate differential – 240 – 2,294
tax rate difference (effects from the german business tax reform) – – 1,830
unrecognized deferred tax assets especially on unused tax losses 5,632 798
utilization of unrecognized unused tax losses – 6,352 – 4,099
Change in impairments of deferred tax assets 561 4,495
Subsequent recognition of deferred taxes on unused tax losses – 3,312 – 1,467
zero-rated income – 429 – 3,206
other 310 488
current income tax expense of the group 454 13,667
Income tax expense/income disclosed in the consolidated income statement 12,661 13,565
actual income taxes attributable to discontinued operations – 12,207 41
deferred income taxes attributable to discontinued operations – 61
454 13,667

121
10 0 notes
4 maNagemeNt aNd StoCk 92 consolidated financial statements 163 other26 maNagemeNt report19 market aNd buSINeSS
the deferred tax assets and liabilities break down as follows:
consolidated balance sheet
consolidated income statement
in € k 2008 2007 2008 2007
deferred tax assets
accounting for intangible assets 306 331 – 25 – 649
revaluation of land and buildings 774 915 – 141 292
revaluation of financial assets 1,321 1,255 66 – 154
bad debt allowances 606 435 171 – 50
Interest/currency transactions 1,300 633 617 73
long-term construction contracts 1,622 1,573 49 – 416
post-employment benefits 6,371 4,831 1,856 – 1,734
restructuring, provisions not recognized
for tax purposes 1,449 2,215 – 766 – 332
other assets – – – – 325
Interest and tax loss carryforwards 24,723 19,497 5,226 – 6,628
total deferred income tax assets before
impairments 38,472 31,685
Impairment losses – 10,401 – 9,840 – 561 – 4,495
total deferred tax assets 28,071 21,845
Netting – 23,355 – 18,179
all deferred tax assets 4,716 3,666
deferred tax liabilities
accounting for intangible assets – 986 – 936 – 50 1,537
Capitalized development costs – 3,328 – 2,810 – 518 501
tax-deductible goodwill – 9,561 – 6,431 – 3,130 1,489
revaluation of land and buildings – 11,887 – 12,272 1,089 2,973
revaluation of financial assets – 2,361 – 2,361 – 1,889
long-term construction contracts – 13,334 – 9,937 – 3,397 1,183
amortization of costs related to bonds and
syndicated loan facilities – 1,411 – 1,584 173 790
total deferred tax liabilities – 42,868 – 36,331
Netting 23,355 18,179
all deferred tax liabilities – 19,513 – 18,152
deferred tax expense 659 – 4,056
In the 2008 reporting period, deferred taxes of € 970 thousand were recognized directly in equity (prior
period: € 3,856 thousand).
deferred tax assets and deferred tax liabilities are netted if, and only if, the entity has a legally enforceable
right to offset current tax assets against current tax liabilities and the deferred tax assets and liabilities
relate to income taxes levied by the same taxation authority on the same taxable entity.
unused tax losses for which no deferred tax assets were recognized came to € 161,019 thousand (prior
period: € 179,924 thousand). the decrease is primarily attributable to the utilization of tax losses and sub-
sequent recognition. of these, tax losses carried forward of € 6,011 thousand have to be used by 2011 at
the latest (prior period: € 9,068 thousand by 2011) and unused tax losses of € 12,425 thousand have to be
used by 2024 at the latest and of € 54,888 thousand by 2025 (prior period: € 11,810 thousand by 2024 and
€ 34,058 thousand by 2025).

122
as of december 31, 2008, the distributable reserves of foreign subsidiaries amounted to around € 92,939
thousand (prior period: € 88,813 thousand). as dürr ag intends to reinvest these gains for an indefinite
period of time, no tax implications from possible distributions or dividend payments of foreign subsidiaries
were considered in the consolidated financial statements.
the effects from back taxation and the adjustment of the corporate income tax credit gave rise to a net
expense of € 53 thousand (prior period: € 148 thousand).
NoteS to the CoNSolIdated balaNCe Sheet: aSSetS
details regarding the changes in the group’s intangible assets and property, plant and equipment are
presented in the statement of changes in non-current assets in the group in note 37.
prepayments relate exclusively to franchises, industrial rights and similar rights as well as property,
plant and equipment. property, plant and equipment are recognized as assets under construction if costs
for own or third-party work have already been incurred for their manufacture but they have not been
completed by the balance sheet date.
amortization and depreciation is shown in the income statement under the respective functional costs:
in € k 2008 2007
Cost of sales 6,951 7,434
Selling expenses 671 890
general and administrative expenses 4,906 3,976
research and development costs 4,608 3,845
other operating income and expenses 56 1,024
Interest expenses 1,970 775
19,162 17,944
In the reporting period as in the prior period, assets were also written up or down to the recoverable
amount by recording impairment losses or reversing impairment losses. the recoverable amount is gener-
ally determined on the basis of the value in use and at the level of the cash-generating unit. the recover-
able amount was only determined on the basis of fair values when determining the reversal of impairment
losses on investment property. to improve insight into the results of operations, this was disclosed sepa-
rately in the income statement. for additional information, please refer to note 12.
the goodwill acquired from business combinations was allocated to the cash-generating units for impair-
ment testing. dürr has defined the business units within the paint and assembly Systems and measuring
and process Systems divisions as the cash-generating units. the calculation model is used in exactly the
same way for all cash-generating units as the main parameters apply equally to all business units.
16. intangible assets
and PRoPeRtY,
Plant and
eqUiPment
imPaiRment test
foR goodwill

123
10 0 notes
4 maNagemeNt aNd StoCk 92 consolidated financial statements 163 other26 maNagemeNt report19 market aNd buSINeSS
the recoverable amount of the cash-generating units is determined based on the value in use. this cal-
culation is prepared on the basis of cash flow forecasts which are based on the three-year business plan
approved by management. In the reporting period, the pre-tax discount rate for the cash flow forecast
ranged from 10.00 % to 10.17 % (prior period: 10.43 % to 10.58 %). Cash flows after the three-year period are
extrapolated using a growth rate of 1.5 % (prior period: 1.5 %) based on the long-term growth rate of the
business units.
the gross profit margins are determined in the subsidiaries’ and business units’ bottom-up planning.
they are based on the figures determined for the previous reporting period taking anticipated efficiency
increases into account.
the cost of capital is the weighted average cost of debt and equity before tax. the cost of debt is based
both on the credit rating and the rating for the bond issued in 2004. When calculating the cost of capital,
a beta factor is assumed, which is derived from the capital market data of comparable companies and the
capital structure of dürr.
price increases in raw materials are determined from the forecast price indices of the countries from which
the raw materials are procured by the respective subsidiaries.
In the three-year plan, the german subsidiaries have assumed annual salary increases of 4.5 % (prior
period: 2.75 %). the foreign subsidiaries have used the applicable local rate of increase for the respective
planning period.
In response to the current economic downturn in the automotive and automotive supply industry, dürr
carried out sensitivity analyses to examine the impact of the reduction in the projected ebIt in the 2009
and 2010 reporting periods on impairment of goodwill in the business units. based on the information
currently available, the sensitivity analyses revealed that no impairment of goodwill will be necessary,
even if the economy weakens considerably further than assumed in planning at present.
the table below shows the development of goodwill, broken down by division and business unit: as of the
beginning of the 2008 reporting period, the product business with assembly, filling and testing technology
was spun off from the factory assembly Systems business unit, which has since been discontinued.
together with the previous balancing and diagnostic Systems business unit, it now makes up the new
balancing and assembly products business unit, which is part of the measuring and process Systems
division. the goodwill was reclassified accordingly in each case.
Planned gRoss PRofit
maRgins
cost of caPital
(discoUnt Rate)
incRease in the PRice
of Raw mateRials
incRease in salaRY
costs
sensitivitY analYsis
of goodwill

124
the changes in goodwill are explained below.
2008 reporting period:
the shareholder agreement with Verind S.p.a., rodano, Italy, was amended with effect as of November 30,
2008, to reflect the fact that dürr Systems gmbh, Stuttgart, can hereinafter control Verind S.p.a. (control
concept). Verind S.p.a. is therefore included in the consolidated financial statements for the first time with
effect as of december 1, 2008. until then, goodwill of € 2,027 thousand was included in the carrying
amount of the interest and was reclassified to the balance sheet item goodwill in the course of the full
consolidation of Verind S.p.a. In the course of the purchase accounting, hidden reserves on land and
buildings of € 2,348 thousand were disclosed directly in equity and added to the revaluation reserve taking
into account deferred taxes pursuant to IfrS 3. of this amount, € 822 thousand was allocated to minority
interests.
at the date of first-time consolidation, Verind S.p.a. had recognized the following items:
in € k
Non-current assets 1,880
Current assets 23,701
of which cash and cash equivalents 8,247
Non-current liabilities 1,641
Current liabilities 18,745
equity 5,195
in € k
carrying
amount as of January
1, 2007
changes
in the consolidated
group
exchange difference
additions
disposals
carrying amount
as of december
31, 2007
Reclassi-fications
changes
in the consolidated
group
exchange difference
carrying amount
as of december
31, 2008
paint and final
assembly Systems 81,987 – – 2,401 – – 79,586 9,591 – – 1,057 88,120
application
technology 55,472 – – 294 – – 55,178 – 2,027 – 70 57,135
environmental and
energy Systems 5,493 – – 573 – – 4,920 – – 260 5,180
aircraft and
technology Systems – – – – – – 7,563 – – 7,563
factory assembly
Systems 75,939 5,154 42 172 – 81,307 – 81,307 – – –
Paint and assembly
systems 218,891 5,154 – 3,226 172 – 220,991 – 64,153 2,027 – 867 157,998
balancing and
assembly products 27,733 – – 245 – 27,978 64,153 – 971 93,102
Cleaning and filtration
Systems 15,672 – – 1,461 – – 14,211 – – 663 14,874
measuring and
process technologies – – – 125 – 125 – – – – –
measuring and
Process systems 43,405 – – 1,461 370 – 125 42,189 64,153 – 1,634 107,976
dürr group 262,296 5,154 – 4,687 542 – 125 263,180 – 2,027 767 265,974
acqUisitions

125
10 0 notes
4 maNagemeNt aNd StoCk 92 consolidated financial statements 163 other26 maNagemeNt report19 market aNd buSINeSS
the contribution to earnings made by Verind S.p.a. from the date of first-time consolidation came to
€ 2,342 thousand. If the consolidation had taken place as of January 1, 2008, the group’s sales revenues
would have amounted to € 1,611,178 thousand and profit of continuing operations to € 34,130 thousand.
2007 reporting period:
dürr acquired another 1 % of the shares in Cpm S.p.a., beinasco, Italy, in the 2007 reporting period for
€ 93 thousand. thus, 51 % of the Cpm S.p.a. shares are now held by dürr. prior to this acquisition, the
investment in Cpm S.p.a. had been accounted for as an associate using the equity method. In the course
of consolidating Cpm S.p.a. in full for the first time, a put option of the minority shareholders for the
shares held by them was measured at fair value in accordance with IaS 32 and recognized under other
liabilities. the minority shareholders can exercise the option in may 2013 at the earliest.
full consolidation of Cpm S.p.a. for the first time involves including Stimas engineering S.r.l., turin, Italy,
in which Cpm S.p.a. has a shareholding of 51 %, as a fully consolidated entity in the consolidated financial
statements.
the transaction gave rise to an increase of € 5,154 thousand in goodwill. It mainly contains synergies in
distribution and marketing, in particular in the business with Italian automotive manufacturers. It also
reflects an increase in efficiency in procurement, processing and technology.
at the date of acquisition, Cpm S.p.a. had recognized the following items:
in € k
Non-current assets 630
Current assets 13,519
of which cash and cash equivalents 393
Non-current liabilities 2,022
Current liabilities 11,600
equity 527
the profit contribution made by Cpm S.p.a. since the date of acquisition in 2007 amounted to € 835 thou-
sand. If the acquisition had taken place as of January 1, 2007, the group’s sales revenues for 2007 would
have amounted to € 1,477,935 thousand and profit of continuing operations to € 21,191 thousand.
Schenck S.a.S., Cergy-pontoise, france, acquired the “equilibrage Service” operations from Camm
Services S.a.S, houilles, france, in the 2007 reporting period. It processes customer orders for balancing
workpieces (from repair workshops and production plants) and provides maintenance services for rotat-
ing components. the acquisition was an asset deal. the purchase price amounted to € 200 thousand, of
which € 25 thousand was allocated to the equipment, furniture and fixtures acquired. No cash and cash
equivalents were acquired. Synergies were achieved in the areas of distribution and production, resulting
in goodwill of € 175 thousand.
the arbitration proceedings that have been pending since 2004 in relation to the squeeze-out of the
minority interests in Carl Schenck ag were brought to conclusion in the 2007 reporting period by a ruling
in first instance of the frankfurt a.m. regional Court. according to the court ruling, dürr had to pay a total
of € 367 thousand to minority shareholders of Carl Schenck ag. this amount was subsequently recognized
as goodwill, and € 125 thousand thereof was allocated to the measuring and process technologies busi-
ness unit sold. the resulting disposal of goodwill of € 125 thousand was recognized in profit or loss and
posted to profit from discontinued operations.
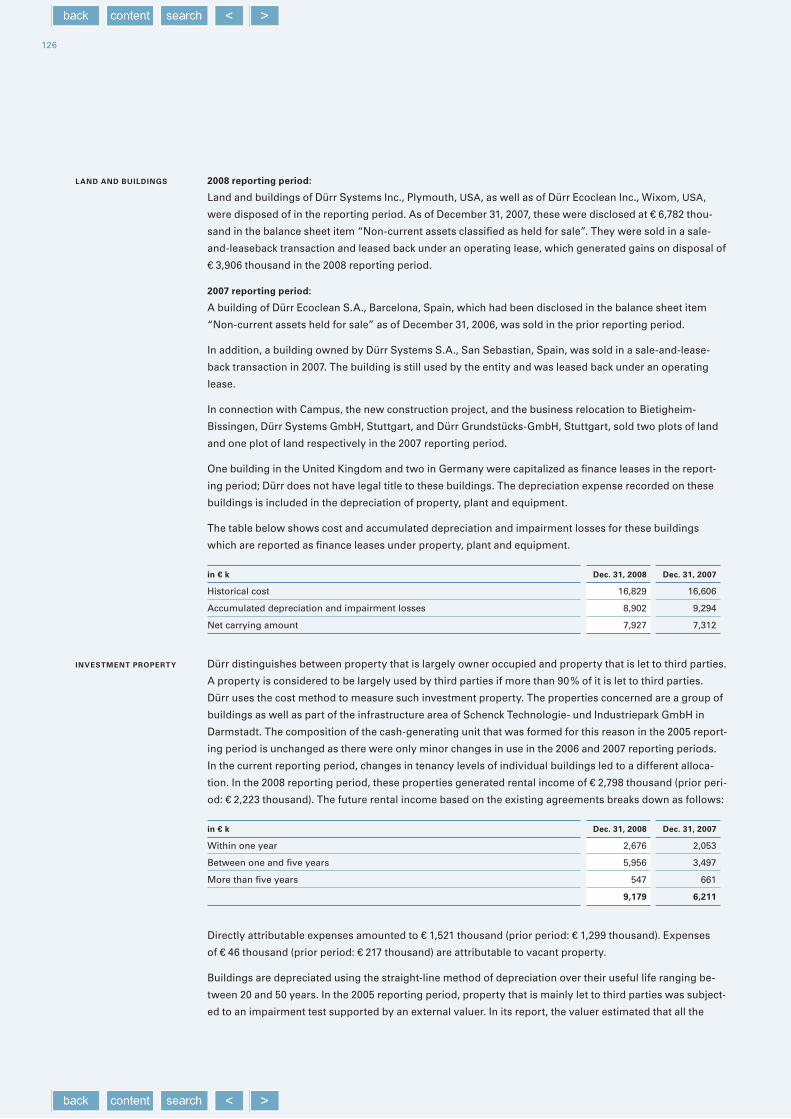
126
2008 reporting period:
land and buildings of dürr Systems Inc., plymouth, uSa, as well as of dürr ecoclean Inc., Wixom, uSa,
were disposed of in the reporting period. as of december 31, 2007, these were disclosed at € 6,782 thou-
sand in the balance sheet item “Non-current assets classified as held for sale”. they were sold in a sale-
and-leaseback transaction and leased back under an operating lease, which generated gains on disposal of
€ 3,906 thousand in the 2008 reporting period.
2007 reporting period:
a building of dürr ecoclean S.a., barcelona, Spain, which had been disclosed in the balance sheet item
“Non-current assets held for sale” as of december 31, 2006, was sold in the prior reporting period.
In addition, a building owned by dürr Systems S.a., San Sebastian, Spain, was sold in a sale-and-lease-
back transaction in 2007. the building is still used by the entity and was leased back under an operating
lease.
In connection with Campus, the new construction project, and the business relocation to bietigheim-
bissingen, dürr Systems gmbh, Stuttgart, and dürr grundstücks-gmbh, Stuttgart, sold two plots of land
and one plot of land respectively in the 2007 reporting period.
one building in the united kingdom and two in germany were capitalized as finance leases in the report-
ing period; dürr does not have legal title to these buildings. the depreciation expense recorded on these
buildings is included in the depreciation of property, plant and equipment.
the table below shows cost and accumulated depreciation and impairment losses for these buildings
which are reported as finance leases under property, plant and equipment.
in € k dec. 31, 2008 dec. 31, 2007
historical cost 16,829 16,606
accumulated depreciation and impairment losses 8,902 9,294
Net carrying amount 7,927 7,312
dürr distinguishes between property that is largely owner occupied and property that is let to third parties.
a property is considered to be largely used by third parties if more than 90 % of it is let to third parties.
dürr uses the cost method to measure such investment property. the properties concerned are a group of
buildings as well as part of the infrastructure area of Schenck technologie- und Industriepark gmbh in
darmstadt. the composition of the cash-generating unit that was formed for this reason in the 2005 report-
ing period is unchanged as there were only minor changes in use in the 2006 and 2007 reporting periods.
In the current reporting period, changes in tenancy levels of individual buildings led to a different alloca-
tion. In the 2008 reporting period, these properties generated rental income of € 2,798 thousand (prior peri-
od: € 2,223 thousand). the future rental income based on the existing agreements breaks down as follows:
in € k dec. 31, 2008 dec. 31, 2007
Within one year 2,676 2,053
between one and five years 5,956 3,497
more than five years 547 661
9,179 6,211
directly attributable expenses amounted to € 1,521 thousand (prior period: € 1,299 thousand). expenses
of € 46 thousand (prior period: € 217 thousand) are attributable to vacant property.
buildings are depreciated using the straight-line method of depreciation over their useful life ranging be-
tween 20 and 50 years. In the 2005 reporting period, property that is mainly let to third parties was subject-
ed to an impairment test supported by an external valuer. In its report, the valuer estimated that all the
land and bUildings
investment PRoPeRtY

127
10 0 notes
4 maNagemeNt aNd StoCk 92 consolidated financial statements 163 other26 maNagemeNt report19 market aNd buSINeSS
buildings have a residual useful life of on average of 20 years. for each building, the valuer estimated the
rental income and expenses for this period and, where contracts exist, adjusted the rental income in the
appraisal to reflect the current contractual situation. based on this expert appraisal, an impairment loss of
€ 5,471 thousand was recorded in the 2005 reporting period to write the property down to fair value. the
composition of the cash-generating units was modified through the addition of further buildings and the
disposal of one building from the investment property portfolio. owing to the positive rental situation in
2008, the Company expects the market value to continue to rise. In the light of this, the reasons for the im-
pairment loss previously recognized no longer apply. therefore, the Company reversed the impairment
loss by writing up the carrying amount by € 4,324 thousand. this took into account the scheduled deprecia-
tion that would have been recorded had no impairment loss been recognized.
the fair value comes to some € 21.0 million as of december 31, 2008, taking into account additions due to
subsequent expenditure. It is calculated using capitalized income from the cash-generating unit based on
market rents adjusted by risk mark-downs. the accumulated cost of land and buildings came to € 30,057
thousand as of January 1, 2008, and € 35,901 thousand as of december 31, 2008. the accumulated depreci-
ation including all impairment losses and reversals of impairment losses increased from € 16,482 thousand
as of January 1, 2008, to € 14,882 thousand as of december 31, 2008.
the table below presents a reconciliation of the development of the carrying amount of the investment
property belonging to the measuring and process Systems division at the beginning and end of the report-
ing period.
in € k 2008 2007
as of January 1 13,575 13,269
additions of buildings 2,811 –
additions of subsequent expenditure 657 820
disposal of acquisition costs – 258 – 150
depreciation – 223 – 501
disposals of accumulated depreciation and impairment losses 133 137
reversal of impairment losses 4,324 –
as of december 31 21,019 13,575
details of the investments in entities accounted for using the equity method are presented in the table
below:
in € k 2008 2007
total assets 91,259 64,955
Non-current assets 27,853 3,966
Current assets 63,406 60,989
Non-current liabilities and deferred income 6,759 6,445
Current liabilities and deferred income 58,030 37,272
revenue 76,587 84,646
profit for the period 4,824 3,897
the balance sheet date of one associate is September 30, it is included using the equity method on the
basis of the figures contained in the financial statements from that date. Significant effects that occurred
between that date and december 31 are considered. for additional information about the consolidated
entities, please refer to notes 3 and 4.
17. investments in
entities accoUnted
foR Using the
eqUitY method

128
in € k dec. 31, 2008 dec. 31, 2007
materials and supplies 54,289 44,261
less write-downs – 6,720 – 7,028
Work in process from small series production 11,729 9,188
less write-downs – 573 – 619
finished goods 7,321 7,091
less write-downs – 636 – 1,007
prepayments 12,513 6,080
77,923 57,966
materials and supplies of € 50,861 thousand (prior period: € 40,977 thousand) were measured at average
cost and € 3,428 thousand (prior period: € 3,284 thousand) using the fifo method (first in, first out). on
aggregate, write-downs decreased to € 7,929 thousand (prior period: € 8,654 thousand) after taking into
account exchange differences and consumption. the additions to write-downs in the reporting period
of € 4,507 thousand (prior period: € 2,581 thousand) were recognized in profit or loss.
the table below shows an ageing analysis of the recognized trade receivables that are not impaired:
18. inventoRies and
PRePaYments
19. tRade Receivables
dec. 31, 2008 dec. 31, 2007
in € k total current non-current total current non-current
Costs and estimated earnings in excess of billings 197,440 197,440 – 134,880 134,880 –
trade receivables due from third parties 248,614 245,811 2,803 267,028 264,402 2,626
trade receivables from entities accounted for
using the equity method 559 559 – 6,155 6,075 80
446,613 443,810 2,803 408,063 405,357 2,706
costs and estimated earnings
in excess of billings
trade receivables due from
third parties
trade receivables from entities accounted for using
the equity method
in € k dec. 31, 2008 dec. 31, 2007 dec. 31, 2008 dec. 31, 2007 dec. 31, 2008 dec. 31, 2007
Neither past due nor impaired as of the balance
sheet date 197,440 134,880 165,760 195,565 529 5,263
not impaired as of balance sheet date,
but past due by
less than 3 months – – 41,658 53,945 30 717
between 3 and 6 months – – 15,257 6,678 – 55
between 6 and 9 months – – 5,705 1,370 – 16
between 9 and 12 months – – 2,473 2,951 – 24
more than 12 months – – 7,708 4,599 – 80
total – – 72,801 69,543 – 892
Net receivables on which specific bad debt
allowances have been recognized – – 10,053 1,920 – –
carrying amount (net) 197,440 134,880 248,614 267,028 559 6,155

129
10 0 notes
4 management and stock 92 consolidated financial statements 163 other26 management report19 market and business
With respect to the trade receivables that were neither impaired nor past due, there was no indication as
of the balance sheet that the debtors would not meet their payment obligations.
no contractual terms and conditions were renegotiated in the 2008 and 2007 reporting periods where the
underlying trade receivables would otherwise have been impaired or past due.
bad debt allowances on trade receivables due from third parties and due from entities accounted for using
the equity method developed as follows:
in € k 2008 2007
January 1 8,485 10,173
changes in consolidated group 193 72
exchange difference – 45 – 142
utilization 752 2,655
reversal 2,176 1,539
increases (expenses for bad debt allowances) 3,111 2,576
december 31 8,816 8,485
receivables of € 838 thousand (prior period: € 2,853 thousand) were derecognized in the 2008 reporting
period, € 752 thousand (prior period: € 2,655 thousand) thereof had already been written down in the prior
period. the remaining € 86 thousand (prior period: € 198 thousand) was derecognized with effect on profit
or loss in the 2008 reporting period.
the following table provides a summary of cost and estimated earnings in excess of billings on uncompleted
contracts and billings in excess of cost and estimated earnings:
these amounts are offset on a contract basis and are included in either cost and estimated earnings in
excess of billings (assets) or billings in excess of cost and estimated earnings (liabilities). please also refer
to note 26.
dec. 31, 2008 dec. 31, 2007
in € k total current non-current total current non-current
assets
costs and estimated earnings 665,995 665,995 – 638,068 638,068 –
less billings 468,555 468,555 – 503,188 503,188 –
costs and estimated earnings in excess of billings 197,440 197,440 – 134,880 134,880 –
liabilities
costs and estimated earnings 630,127 630,127 – 386,738 386,738 –
less billings 772,035 772,035 – 505,266 505,266 –
Billings in excess of costs on uncompleted
contracts 141,908 141,908 – 118,528 118,528 –
total
costs and estimated earnings 1,296,122 1,296,122 – 1,024,806 1,024,806 –
less billings 1,240,590 1,240,590 – 1,008,454 1,008,454 –
costs and estimated earnings in excess of billings 55,532 55,532 – 16,352 16,352 –

130
other assets include in particular tax refund claims not relating to income taxes of € 14,161 thousand
(prior period: € 8,811 thousand), forward exchange contracts recorded at fair value of € 5,486 thousand (prior
period: € 5,155 thousand), credit notes from suppliers of € 1,967 thousand (prior period: € 1,236 thousand),
receivables from employees of € 1,946 thousand (prior period: € 1,154 thousand) and rent deposits as well
as security deposits of € 6,137 thousand (prior period: € 5,008 thousand).
other receivables and other assets contain € 13,901 thousand (prior period: € 12,490 thousand) pertaining
to financial assets which are presented in the disclosures pursuant to IfrS 7 under note 28.
NoteS to the CoNSolIdated balaNCe Sheet: equIt Y aNd lIabIlItIeS
as of december 31, 2008, the capital stock of dürr ag came to € 44,289 thousand (prior period: € 40,264
thousand) and was made up of 17,300,520 shares (prior period: 15,728,020 shares). based on the authori-
zation granted by the annual general meeting of may 24, 2006, 1,572,500 no-par common bearer shares
(just under 10 % of the capital stock) were placed primarily with institutional investors as part of an acceler-
ated bookbuilding procedure in the second quarter of 2008. the new shares are fully entitled to dividends.
With a placement price of € 28.00, dürr ag received net income of € 43,752 thousand. of this, transaction
costs of € 396 thousand less income taxes incurred of € 118 thousand were recognized directly in the capi-
tal reserve. each share represents € 2.56 of the subscribed capital and is made out to the bearer. the
shares issued were fully paid in as of the balance sheet date.
the annual general meeting of may 24, 2006, authorized the board of management, subject to the approval
of the Supervisory board, to increase the capital stock once or several times until may 23, 2011, by up to
€ 20,132 thousand by issuing up to 7,864,000 no-par value shares made out to the bearer (authorized capi-
tal). a portion of the authorized capital was used for the issue of 1,572,500 shares in the course of the capi-
tal increase described above. With effect as of december 31, 2008, the board of management is authorized
to increase the capital stock once or several times by up to € 16,106 thousand by issuing up to 6,291,500
no-par value shares made out to the bearer for contributions in cash or kind.
the annual general meeting on may 2, 2008, authorized the board of management, subject to the approval
of the Supervisory board, to issue once or several times until april 30, 2013, registered convertible bonds,
warrant-linked bonds, participation rights or income bonds or combinations of these instruments with or
without fixed maturity with a total nominal value of up to € 201,318 thousand. for this purpose, the share
capital has been conditionally increased by a maximum of € 20,132 thousand by issue of up to 7,864,000
new no-par value bearer shares in the form of common stock (conditional capital). the conditional capital
approved at the last annual general meeting of may 18, 2007, was cancelled.
20. otheR Receivables and otheR assets
dec. 31, 2008 dec. 31, 2007
in € k total current non-current total current non-current
other assets 35,244 29,294 5,950 27,070 20,283 6,787
35,244 29,294 5,950 27,070 20,283 6,787
21. eqUitY withoUt minoRitY inteRests
sUbscRibed caPital
aUthoRized caPital
(düRR ag)
conditional caPital
(düRR ag)

131
10 0 notes
4 maNagemeNt aNd StoCk 92 consolidated financial statements 163 other26 maNagemeNt report19 market aNd buSINeSS
the capital reserve increased to € 200,186 thousand as of december 31, 2008 (prior period: € 160,459 thou-
sand) as a result of the capital increase. the capital reserve is subject to the restrictions on disposal of Sec.
150 aktg [“aktiengesetz”: german Stock Corporations act].
as of december 31, 2008, the revenue reserves amounted to € 131,814 thousand (prior period: € 94,911
thousand). the change was essentially due to the transfer of the profit for the period, dividend payments
and effects from first-time consolidation and deconsolidation.
the board of management and the Supervisory board decided to propose to the annual general meeting
that a dividend of € 0.70 per share be distributed for the 2008 reporting period. In proportion to the profit
for the period, this is a distribution rate of 26 %. When distributing the dividend, tax on investment income,
including solidarity surcharge, totaling € 3.2 million will have to be withheld.
the table below presents the development of accumulated other comprehensive income and the associat-
ed tax effects, taking into account the changes of the items “amounts resulting from assets held for sale”
and “minority interests”.
minority interests contain adjustment items from the capital consolidation for minority interests in capital
required to be consolidated and the profits and losses attributable to them. the consolidated financial
statements contain four entities (prior period: three) in which minority shareholders hold interests. the
table below presents the composition of minority interests.
in € k 2008 2007
olpidürr S.p.a., Novegro di Segrate, Italy 2,681 1,562
Verind S.p.a., rodano, Italy 4,417 –
Cpm S.p.a., beinasco, Italy – –
Stimas engineering S.r. l., paderno dugnano, Italy 21 7
7,119 1,569
caPital ReseRve
(düRR ag)
RevenUe ReseRves
dividends
accUmUlated otheR
comPRehensive income
2008 2007
in € k before tax tax effect net before tax tax effect net
Net gains/losses (–) from derivatives used to
hedge cash flows 46 50 96 – 507 – 2 – 509
Change in unrealized gains/losses (–) from
available-for-sale financial assets – – – – 9 – – 9
revaluation from recognition of hidden reserves
from changes to the consolidated group 2,348 – 704 1,644 – – –
Change in unrealized gains/losses (–) from a
put option – 2,469 – – 2,469 – 680 – – 680
exchange differences – 4,114 – – 4,114 – 13,939 – – 13,939
amounts recorded directly in equity from
non-current assets classified as held for sale 2,800 – 2,800 – 2,305 – – 2,305
Change in net actuarial gains and losses from
benefit obligations – 451 – 316 – 767 10,755 – 3,854 6,901
changes in accumulated other comprehensive
income – 1,840 – 970 – 2,810 – 6,685 – 3,856 – 10,541
22. minoRitY
inteRests

132
the group’s post-employment benefits include defined contribution plans and defined benefit plans.
the post-employment benefits available to the employees of dürr’s german subsidiaries include a life in-
surance program (bzV) in line with the respective tariff group for which the Company recorded contributions
of € 752 thousand (prior period: € 716 thousand) as an expense. In addition, dürr has paid contributions of
€ 15,823 thousand to the german statutory pension scheme, which also constitutes a defined contribution
plan. the uS subsidiaries contribute to external pension funds for union employees. In the reporting period,
pension expenses for these employees amounted to € 2,466 thousand (prior period: € 1,437 thousand).
In addition, dürr’s uS subsidiaries have a “401(k)” profit-sharing plan for certain employees. profit-sharing
is based on years of service and the employees’ compensation. the group’s contribution is discretionary
and is determined annually by management. In the reporting period, expenses came to € 1,356 thousand
(prior period: € 461 thousand).
pension entitlements have been granted to individual former members of the board of management of
dürr ag and the members of the board of management and general managers of german subsidiaries
based on their most recent fixed salary and years of service.
In addition, employees of dürr’s german subsidiaries are offered deferred compensation. under these
plans, dürr employees are entitled to convert certain parts of their future pay into an entitlement to future
supplementary company benefits. to secure and finance the resulting obligation, dürr has taken out
employer’s pension liability insurance for the life of the beneficiaries. dürr has the exclusive right to the
respective benefits. the amount of post-employment benefits equals the benefit paid out under the
employer’s pension liability insurance concluded by dürr, which consists of a guaranteed pension and
the divisible surplus allocated by the insurance company. dürr reports the benefit obligation net of plan
assets from the employer’s pension liability insurance, with actuarial gains and losses potentially giving
rise to a surplus or deficit.
at the german dürr subsidiaries, those workers who were employed at the locations in filderstadt and
Wyhlen and at the Schenck entities at the time their entities were acquired were entitled to post-employ-
ment benefits. these are based on years of service. the payments provided for by the pension plan
comprise actual contributions plus an element that is dependent on years of service.
the uS subsidiaries of dürr have pension plans covering all non-union employees at these subsidiaries. the
plan provides benefits based on the average salaries earned in the past five years before the employees
reach retiring age.
23. PRovisions foR
Post-emPloYment
benefit obligations
defined
contRibUtion Plans
defined benefit
Plans
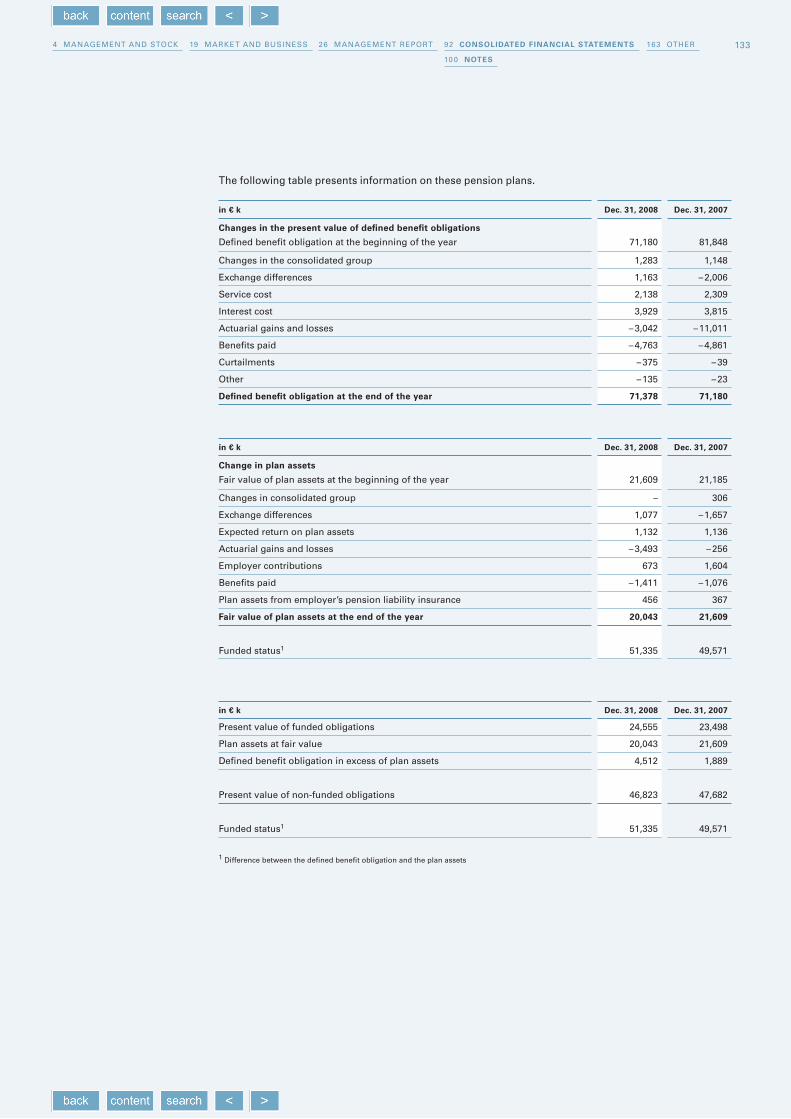
133
10 0 notes
4 maNagemeNt aNd StoCk 92 consolidated financial statements 163 other26 maNagemeNt report19 market aNd buSINeSS
the following table presents information on these pension plans.
in € k dec. 31, 2008 dec. 31, 2007
changes in the present value of defined benefit obligations
defined benefit obligation at the beginning of the year 71,180 81,848
Changes in the consolidated group 1,283 1,148
exchange differences 1,163 – 2,006
Service cost 2,138 2,309
Interest cost 3,929 3,815
actuarial gains and losses – 3,042 – 11,011
benefits paid – 4,763 – 4,861
Curtailments – 375 – 39
other – 135 – 23
defined benefit obligation at the end of the year 71,378 71,180
in € k dec. 31, 2008 dec. 31, 2007
change in plan assets
fair value of plan assets at the beginning of the year 21,609 21,185
Changes in consolidated group – 306
exchange differences 1,077 – 1,657
expected return on plan assets 1,132 1,136
actuarial gains and losses – 3,493 – 256
employer contributions 673 1,604
benefits paid – 1,411 – 1,076
plan assets from employer’s pension liability insurance 456 367
fair value of plan assets at the end of the year 20,043 21,609
funded status1 51,335 49,571
in € k dec. 31, 2008 dec. 31, 2007
present value of funded obligations 24,555 23,498
plan assets at fair value 20,043 21,609
defined benefit obligation in excess of plan assets 4,512 1,889
present value of non-funded obligations 46,823 47,682
funded status1 51,335 49,571
1 difference between the defined benefit obligation and the plan assets

134
the following balance sheet items are affected by the accounting for post-employment benefit obligations:
in € k dec. 31, 2008 dec. 31, 2007
prepaid expenses 887 436
pension provisions 52,222 50,007
51,335 49,571
accumulated other comprehensive income (including exchange differences) – 6,066 – 5,176
as of december 31, 2008, the plan assets were invested in various portfolios consisting mostly of fixed-
interest securities and shares. at the end of the reporting period, the fair value of plan assets breaks down
as follows:
in € k dec. 31, 2008 dec. 31, 2007
Shares 4,877 7,396
fixed-interest securities 14,245 13,781
real estate 374 401
other 547 31
20,043 21,609
the plan assets of the german entities mainly consist of employer’s pension liability insurance policies
which cover the pension entitlements acquired. these employer’s pension liability insurance policies have
been invested mainly in fixed-interest securities (including government bonds and mortgage bonds).
When selecting the issuers, the factors considered include the individual rating by international agencies
and the equity capitalization of the issuers.
total return expected on plan assets is generally calculated on the basis of the market prices at this point in
time. these apply for the period of time over which the obligation is settled. the aim of the investment
strategy is long-term capital accumulation on the one hand, and ongoing interest income on the other. this
leads to somewhat greater volatility. as part of a balanced approach, the portfolio mix contains debt and
equity securities. the long-term accumulation of capital is to be achieved above all by equity investments.
fixed-interest securities intended to secure ongoing interest receivables are an equally important part of
the investment portfolio. the planned long-term return on plan assets for the main benefit plans in the
uSa ranges between 6.75 % and 7.75 %. depending on the investment strategy, stocks account for 20 % and
54 % of the portfolio, respectively.
experience adjustments of the post-employment benefit obligations and the plan assets are presented
below.
in € k 2008 2007
post-employment benefit obligations 348 2,611
plan assets – 2,192 244
for the 2009 reporting period, employer contributions to the plans of € 604 thousand are expected.

135
10 0 notes
4 maNagemeNt aNd StoCk 92 consolidated financial statements 163 other26 maNagemeNt report19 market aNd buSINeSS
Composition of net periodic pension cost:
in € k 2008 2007
Service cost 2,138 2,309
Interest cost 3,929 3,815
expected return on plan assets – 1,132 – 1,136
Curtailments 375 39
other – 323 – 59
4,987 4,968
In the 2008 reporting period, the return on plan assets came to € -2,361 thousand (prior period:
€ 880 thousand).
the net periodic pension cost is contained in the following items of the income statement:
in € k 2008 2007
Cost of sales 608 467
Selling expenses 183 337
general and administrative expenses 4,149 4,112
research and development costs 15 19
other operating income and expenses 32 33
4,987 4,968
the cut-off date for the measurement of benefit obligations and plan assets is december 31, the measure-
ment date for pension cost is January 1.
the following averages were used to calculate benefit obligations:
in % 2008 2007
discount rate 5.92 5.57
long-term salary increases 2.68 2.14
the following averages were used to calculate pension cost:
in % 2008 2007
discount rate 5.57 4.70
estimated long-term return on plan assets 7.85 7.67
long-term salary increases 2.14 2.29
the estimated long-term return on plan assets is based on historical and projected returns and volatilities
of the individual categories of the portfolio, taking into account the customary benchmarks.
amounts for the current and previous reporting periods are as follows:
in € k dec. 31, 2008 dec. 31, 2007 dec. 31, 2006 dec. 31, 2005 dec. 31, 2004
defined benefit obligation 71,378 71,180 81,848 88,296 67,784
plan assets at fair value 20,043 21,609 21,185 20,558 14,228
Surplus /deficit (–) – 51,335 – 49,571 – 60,663 – 67,738 – 53,556
experience adjustments on post-
employment benefit obligations 348 2,611 1,416 – 2,735 –
experience adjustments on plan
assets – 2,192 244 158 – 518 –

136
the contract-related provisions mainly consist of provisions for after-sales expenses, warranties and for
onerous contracts in the order backlog. the personnel provisions mainly contain provisions for long-service
awards and obligations for phased retirement. other provisions relate to various identifiable specific risks
and contingent liabilities.
those other provisions that are expected to be used within the next twelve months are classified as
current. the payments for non-current provisions are expected to be incurred within the next two to five
years.
other provisions developed as follows in the reporting period:
in € k
contract-related
provisions
Personnel provisions
other
provisions
as of January 1, 2008 51,272 10,726 3,808
Changes in consolidated group 2,827 – 66
exchange difference – 693 – 29 103
utilization 31,734 3,390 1,193
reversal 9,628 160 592
addition 37,214 3,482 3,159
as of december 31, 2008 49,258 10,629 5,351
all interest-bearing liabilities of the group are shown under the item bonds and other financial liabilities.
they break down as follows:
24. otheR PRovisions
dec. 31, 2008 dec. 31, 2007
in € k total current non-current total current non-current
Contract-related provisions 49,258 47,484 1,774 51,272 49,617 1,655
personnel provisions 10,629 4,068 6,561 10,726 6,201 4,525
other provisions 5,351 5,111 240 3,808 3,808 –
65,238 56,663 8,575 65,806 59,626 6,180
25. bond and
otheR financial
liabilities
in € k total short total medium long
bond 96,917 – 96,917 96,917 –
(2007) (191,699) (–) (191,699) (191,699) (–)
liabilities to banks 20,796 17,619 3,177 1,718 1,459
(2007) (16,510) (12,879) (3,631) (1,845) (1,786)
financial liabilities due to entities accounted
for using the equity method 1,081 161 920 – 920
(2007) (1,064) (1,064) (–) (–) (–)
finance lease liabilities 3,811 1,054 2,757 2,399 358
(2007) (5,311) (1,111) (4,200) (3,278) (922)
december 31, 2008 122,605 18,834 103,771 101,034 2,737
(december 31, 2007) (214,584) (15,054) (199,530) (196,822) (2,708)

137
10 0 notes
4 management and stock 92 consolidated financial statements 163 other26 management report19 market and business
those liabilities with a residual term of between one and five years are disclosed as medium term, other-
wise as short or long-term.
dürr ag issued a fixed-interest bond with a total volume of € 200,000 thousand, a coupon of 9.75 % and a
term of seven years on July 6, 2004. the purpose of the bond is to serve the long-term financing of the
group. on october 15, 2008, dürr made a premature repayment of half of this amount, i.e. € 100,000 thou-
sand, at a rate of 105.25 %.
until september 2008, a syndicated loan facility of € 271,000 thousand was also in place with a syndicate
of banks, consisting of a revolving cash line and bank guarantee line. in september 2008, dürr ag entered
into a new syndicated loan agreement of € 440,000 thousand with a syndicate of banks. the leads are
baden-Württembergische bank, commerzbank, hypoVereinsbank and deutsche bank. a total of seven
banks are included in the syndicate.
the multi-currency syndicated loan has a term of three years (until september 2011) and comprises a
revolving cash line of € 200,000 thousand and a bank guarantee line of € 240,000 thousand. the cash line
can be utilized across its term as needed to meet financing requirements throughout the year. the bank
guarantee line is in place to enable dürr to offer guarantees and warranties for prepayments received from
customers and other obligations. the fees associated with the agreement are distributed over its term.
as of the balance sheet date, € 10,000 thousand of the cash line and € 105,593 thousand of the bank guar-
antee line had been utilized. premature termination by the bank syndicate is only possible if the covenants
are infringed and with a two-third majority of the lending banks. based on the calculations of the board
of management, the agreed covenants were complied with as of the balance sheet date. depending on the
currency, the interest is based on the refinancing rate with the same maturity (euribor or Libor) plus a
margin determined in relation to the financial ratio of total net debt to ebitdar (earnings before interest,
taxes, depreciation, amortization and rent).
shares in subsidiaries have been pledged as collateral for the bond and the syndicated loan facility.
besides the syndicated loan facility, the company has bilateral credit facilities (€ 19.9 million) in place for
working capital, bank guarantees (€ 244.0 million) as well as smaller credit lines with various banks and
insurance firms. these loans have terms of up to 12 years, interest is charged once every three or six
months (between 2.73 % and 7.86 % p.a. or the three-month euribor or 1-week usd-Libor plus a custom-
ary bank margin). as of the balance sheet date, these credit lines were no longer secured by mortgages
(prior period: € 595 thousand).
the total lines of credit and bank guarantees can be broken down as follows:
in € k dec. 31, 2008 dec. 31, 2007
total amount of lines of credit and bank guarantees 704,936 494,901
total amount of credit lines/guarantees utilized 294,605 229,027
of which due within one year 256,618 182,977
of which due in more than one year 37,987 46,050
€ 1,861 thousand (prior period: € 1,903 thousand) of the liabilities to banks are payable in us dollars.
the remainder is payable in euro. the weighted average interest rate for current liabilities to banks in 2008
was 5.10 % (prior period: 5.91 %) and for non-current liabilities to banks 4.04 % (prior period: 4.26 %).

138
those liabilities with a residual term of between one and five years are disclosed as medium term, all
others as short or long-term.
in € k total short total medium long
tax liabilities 15,724 15,601 123 123 –
(2007) (31,451) (15,842) (15,609) (15,609) (–)
other liabilities 97,855 81,666 16,189 16,139 50
(2007) (99,735) (85,446) (14,289) (14,289) (–)
december 31, 2008 113,579 97,267 16,312 16,262 50
(december 31, 2007) (131,186) (101,288) (29,898) (29,898) (–)
those liabilities with a residual term of between one and five years are disclosed as medium term, all
others as short or long-term.
deferred interest of € 4,550 thousand was disclosed under other liabilities for the first time in the 2008 re-
porting period. the prior-period disclosure of € 8,992 thousand (recognized in trade payables in the prior
period) was adjusted accordingly. other main items included under other liabilities are: tax liabilities not
relating to income taxes of € 16,684 thousand (prior period: € 19,874 thousand), liabilities relating to social
security of € 4,526 thousand (prior period: € 4,566 thousand), liabilities to employees of € 39,545 thousand
(prior period: € 37,871 thousand), derivative financial instruments of € 4,977 thousand (prior period: € 2,060
thousand) and obligations from an existing put option for the shares held by minority shareholders in Cpm
S.p.a. of € 6,394 thousand (prior period: € 3,925 thousand). there are also obligations from restructuring
measures of € 9,774 thousand (prior period: € 9,183 thousand), which are explained in note 12.
other liabilities contain € 20,375 thousand (prior period: € 24,258 thousand) pertaining to financial assets
which are presented in the disclosures pursuant to IfrS 7 under note 28.
26. tRade PaYables
in € k total short total medium long
billings in excess of costs on uncompleted contracts
(resulting from small series production) 15,424 15,424 – – –
(2007) (10,917) (10,917) (–) (–) (–)
billings in excess of costs on uncompleted contracts
(from construction production) 141,908 141,908 – – –
(2007) (118,528) (118,528) (–) (–) (–)
trade payables 214,847 214,847 – – –
(2007) (203,203) (203,203) (–) (–) (–)
liabilities to entities accounted for using the equity method – – – – –
(2007) (3,123) (3,123) (–) (–) (–)
december 31, 2008 372,179 372,179 – – –
(december 31, 2007) (335,771) (335,771) (–) (–) (–)
27. tax liabilities and
otheR liabilities

139
10 0 notes
4 maNagemeNt aNd StoCk 92 consolidated financial statements 163 other26 maNagemeNt report19 market aNd buSINeSS
based on the relevant balance sheet items, the relationship between the classification of financial
instruments pursuant to IaS 39, pursuant to IfrS 7 and the carrying amounts of financial instruments is
presented in the table below.
28. otheR notes on financial instRUments
measURement of
financial instRUments
bY categoRY
amount recognized at
in € k
carrying amount
dec. 31, 2008 costamortized
cost
fair value (recognized
directly in equity)
fair value (recognized
in profit or loss)
assets
Cash and cash equivalents 84,385 – 84,385 – –
Costs and estimated earnings in excess of billings1 197,440 – – – –
trade receivables due from third parties 248,614 – 248,614 – –
trade receivables due from entities accounted for using
the equity method 559 – 559 – –
other financial receivables 13,901 – 13,901 – –
other primary financial instruments
held-to-maturity investments 24 – 24 – –
available-for-sale financial assets 318 2 – 316 –
derivative financial assets
derivatives without hedging relationship 1,297 – – – 1,297
derivatives with hedging relationship 4,189 – – 4,105 84
eqUit Y and l iabil it ies
trade payables 214,847 – 214,847 – –
other financial liabilities 20,375 – 20,375 – –
bond 96,917 – 96,917 – –
liabilities to banks 20,796 – 20,796 – –
financial liabilities due to entities accounted for using
the equity method 1,081 – 1,081 – –
finance lease liabilities 3,811 – 3,811 – –
derivative financial liabilities
derivatives without hedging relationship 1,122 – – – 1,122
derivatives with hedging relationship 3,855 – – 3,350 505
of which combined according to the measurement categories
in accordance with ias 39:
held-for-trading financial assets 1,297 – – – 1,297
loans and receivables 544,899 – 347,459 – –
held-to-maturity investments 24 – 24 – –
available-for-sale financial assets 318 2 – 316 –
financial liabilities at fair value through profit or loss 1,122 – – – 1,122
financial liabilities measured at amortized cost 357,827 – 357,827 – –
1 Cost and estimated earnings in excess of billings on uncompleted contracts are accounted for pursuant to IaS 11 “Construction Contracts” and are therefore not included in this item.

140
amount recognized at
in € k
carrying amount
dec. 31, 2007 costamortized
cost
fair value (recognized
directly in equity)
fair value (recognized
in profit or loss)
assets
Cash and cash equivalents 147,489 – 147,489 – –
Costs and estimated earnings in excess of billings1 134,880 – – – –
trade receivables due from third parties 267,028 – 267,028 – –
trade receivables due from entities accounted for using
the equity method 6,155 – 6,155 – –
other financial receivables 12,490 – 12,490 – –
other primary financial instruments
held-to-maturity investments 32 – 32 – –
available-for-sale financial assets 318 2 – 316 –
derivative financial assets
derivatives without hedging relationship 258 – – – 258
derivatives with hedging relationship 4,897 – – 4,347 550
eqUit Y and l iabil it ies
trade payables 203,203 – 203,203 – –
trade payables to entities accounted for using the equity method 3,123 – 3,123 – –
other financial liabilities 24,258 – 24,258 – –
bond 191,699 – 191,699 – –
liabilities to banks 16,510 – 16,510 – –
financial liabilities due to entities accounted for using
the equity method 1,064 – 1,064 – –
finance lease liabilities 5,311 – 5,311 – –
derivative financial liabilities
derivatives without hedging relationship 273 – – – 273
derivatives with hedging relationship 1,787 – – 1,408 379
of which combined according to the measurement categories
in accordance with ias 39:
held-for-trading financial assets 258 – – – 258
loans and receivables 568,042 – 433,162 – –
held-to-maturity investments 32 – 32 – –
available-for-sale financial assets 318 2 – 316 –
financial liabilities at fair value through profit or loss 273 – – – 273
financial liabilities measured at amortized cost 445,168 – 445,168 – –
1 Cost and estimated earnings in excess of billings on uncompleted contracts are accounted for pursuant to IaS 11 “Construction Contracts” and are therefore not included in this item.

141
10 0 notes
4 management and stock 92 consolidated financial statements 163 other26 management report19 market and business
the table below shows the fair value of the financial assets and liabilities carried at cost or amortized cost.
the fair value of financial instruments not carried at amortized cost approximates their carrying amount
(with the exception of available-for-sale financial assets measured at cost because their fair value cannot
be determined reliably).
dec. 31, 2008 dec. 31, 2007
in € k fair value
carrying amount fair value
carrying amount
assets
cash and cash equivalents 84,385 84,385 147,489 147,489
costs and estimated earnings in excess of billings 197,440 197,440 134,880 134,880
trade receivables due from third parties 248,614 248,614 267,028 267,028
trade receivables due from entities accounted
for using the equity method 559 559 6,155 6,155
other financial receivables 13,901 13,901 12,490 12,490
other primary financial instruments
held-to-maturity investments 24 24 32 32
equit y and l iabil it ies
trade payables 214,847 214,847 203,203 203,203
trade payables to entities accounted for using the
equity method – – 3,123 3,123
other liabilities 20,375 20,375 24,258 24,258
bond 101,000 96,917 210,900 191,699
Liabilities to banks 20,796 20,796 16,510 16,510
Financial liabilities due to entities accounted for
using the equity method 1,081 1,081 1,064 1,064
Finance lease liabilities 4,472 3,811 6,119 5,311
of which combined according to the measurement
categories in accordance with ias 39:
Loans and receivables 544,899 544,899 568,042 568,042
held-to-maturity investments 24 24 32 32
Financial liabilities measured at amortized cost 362,571 357,827 465,177 445,168
cash and cash equivalents, trade receivables, other receivables, trade payables, other liabilities and over-
draft facilities mostly fall due within the short term. consequently, their carrying amounts as of the balance
sheet date approximate their fair value.
it was not possible to determine the fair values of equity interests measured at cost because market prices
were not available as no active markets exist. these are interests in two non-listed entities where the
estimated future cash flows were not discounted because they could not be determined reliably. it was
assumed that their fair value approximates their carrying amount.
the fair value of non-current liabilities is based on the current interest rate for borrowing at similar terms
and conditions with comparable due date and credit rating. With the exception of the bond, the fair value
of liabilities corresponds closely to the carrying amount. the fair value of the bond is equal to the nominal
value multiplied by the quoted price as of the balance sheet date. as of december 31, 2008, the bond
is listed at 101.00 % which is equal to a fair value of € 101,000 thousand (prior period: 105.45 %, € 210,900
thousand).
fair values of financial
instruments carried at
amortized cost

142
measurement of available-for-sale securities did not give rise to any gains or losses recognized directly in
equity (prior period: loss of € 9 thousand).
as of the balance sheet date, financial assets of € 2.5 million (prior period: € 2.1 million) were pledged as
collateral for factoring as well as for non-current liabilities to banks.
the cash flow statement shows how the cash and cash equivalents of the group changed in the reporting
period as a result of cash received and paid. In accordance with IaS 7 “Cash flow Statements”, a distinc-
tion is made between the cash flows from operating, investing and financing activities.
the cash and cash equivalents presented in the cash flow statement contain all cash and cash equivalents
shown in the balance sheet, i.e. cash in hand, checks and bank balances, with an original term to maturity
of less than three months.
the cash flow from investing and financing activities is determined on the basis of payments made or re-
ceived. the cash flow from operating activities, on the other hand, is derived indirectly from the earnings
before taxes. When performing these calculations, changes in balance sheet items considered in connec-
tion with ordinary activities are adjusted for effects from currency translation and changes in the consoli-
dated group. there are therefore differences compared to changes in the relevant balance sheet items in
the consolidated financial statements. for information about the cash flows from business acquisitions
and sales, please refer to notes 6 and 16.
the cash flow from operating activities contains effects from factoring and non-recourse financing of
€ 15.0 million (prior period: € 14.2 million) and € 67.6 million (prior period: € 20.8 million) respectively as
of the balance sheet date.
net gain oR loss bY
measURement categoRY
from subsequent measurement
in € k from interest at fair value
currency translation impairment
from disposals
net gain or loss
held-for-trading financial assets – 1,656 – – – 1,656
(2007) (–) (448) (–) (–) (–) (448)
loans and receivables 4,750 – 626 – 937 – 86 4,353
(2007) (3,791) (–) (585) (– 1,034) (– 198) (3,144)
available-for-sale financial assets 17 – – – – 17
(2007) (14) (–) (–) (–) (–) (14)
financial liabilities at fair value through
profit or loss – – 1,329 – – – – 1,329
(2007) (–) (– 981) (–) (–) (–) (– 981)
financial liabilities measured at amortized cost – 34,080 – – 4,645 – – – 38,725
(2007) (– 26,690) (–) (– 1,097) (–) (–) (– 27,787)
2008 – 29,313 327 – 4,019 – 937 – 86 – 34,028
(2007) (– 22,885) (– 533) (– 512) (– 1,034) (– 198) (– 25,162)
29. notes to the
consolidated cash
flow statement

143
10 0 notes
4 maNagemeNt aNd StoCk 92 consolidated financial statements 163 other26 maNagemeNt report19 market aNd buSINeSS
other NoteS
the segment reporting was prepared according to IaS 14 “Segment reporting”. based on the internal
reporting and organizational structure of the group, the consolidated financial statement data is presented
by division and region. the segmentation provides details on the results of operations, net assets and
financial position and the regional spread of the activities.
the primary reporting is based on the divisions of the group. the dürr group consists of a management
holding company and two divisions, each with global responsibility for their earnings.
paint and assembly Systems develops and builds paint shops and final assembly lines for the automotive
industry. the portfolio also includes exhaust cleaning systems for various industries as well as assembly
and finishing systems for aircraft construction.
measuring and process Systems offers balancing and diagnosis technology, testing, filling and assembly
technologies as well as industrial cleaning and filtration technology. besides the automotive industry,
the division serves industries like machine engineering, electrical engineering industry or the aerospace
industry.
details of the discontinued operations in the reporting period can be found in note 6. the Corporate Center
essentially consists of dürr ag.
as of the beginning of the 2008 reporting period, the product business with assembly, filling and testing
technology was spun off from the factory assembly Systems business unit, which was part of the paint
and assembly Systems division and has since been discontinued. together with the previous balancing
and diagnostic Systems business unit, it now makes up the new balancing and assembly products busi-
ness unit, which is part of the measuring and process Systems division. the prior-period figures were ad-
justed accordingly at the level of the divisions.
the principles underlying the group’s management reporting and controlling are substantially the same
as those described in these consolidated financial statements according to IfrS. dürr measures the per-
formance of its divisions by earnings before interest and taxes (ebIt) in accordance with the disclosure in
the consolidated income statement. transactions between the divisions are carried out at arm’s length
prices. Sales revenues are generally allocated to regions based on the location of the customer. assets of
the divisions are allocated on the basis of the location of the subsidiary reporting these assets.
30. segment RePoRting
Paint and assemblY
sYstems division
measURing and
PRocess sYstems
division

144
in € k
Paint and assembly
systems
measuring and Process
systems
corporate
center
consolidation
continuing operations
discontinued
operations
total
divisions
2008
external sales revenues 1,191,587 411,186 – – 1,602,773 – 1,602,773
Sales revenues with other
divisions 816 29,347 – – 30,163 – – –
total sales revenues 1,192,403 440,533 – – 30,163 1,602,773 – 1,602,773
earnings before interest and taxes
(ebIt) 48,569 30,833 – 6,609 – 133 72,660 349 73,009
profit/loss from entities accounted
for using the equity method 975 2,065 – – 3,040 – 3,040
Scheduled amortization and
depreciation – 10,611 – 6,256 – 2,295 – – 19,162 – – 19,162
Impairment losses – 112 – 33 – – – 145 – – 145
reversal of impairment losses – 4,886 – – 4,886 – 4,886
other non-cash income and
expenses – 366 257 – 1,499 – – 1,608 – – 1,608
Capital expenditures 4,742 6,059 7 – 10,808 – 10,808
Investments in entities accounted
for using the equity method 493 12,547 – – 13,040 – 13,040
assets 609,657 407,088 496,536 – 533,902 979,379 – 979,379
liabilities 444,140 147,790 20,186 – 25,705 586,411 – 586,411
employees (as of december 31) 3,595 2,499 49 – 6,143 – 6,143
in € k
Paint and assembly
systems
measuring and Process
systems
corporate
center
consolidation
continuing operations
discontinued
operations
total
divisions
2007
external sales revenues 1,088,944 387,697 – – 1,476,641 – 1,476,641
Sales revenues with other
divisions 1,555 20,553 – – 22,108 – – –
total sales revenues 1,090,499 408,250 – – 22,108 1,476,641 – 1,476,641
earnings before interest and taxes
(ebIt) 32,678 23,247 – 376 171 55,720 1,087 56,807
profit/loss from entities accounted
for using the equity method 797 1,127 – – 1,924 – 1,924
amortization, depreciation and
impairment losses – 9,993 – 6,456 – 1,498 – – 17,947 – – 17,947
reversal of impairment losses 131 – – – 131 – 131
other non-cash income and
expenses 75 – 28 – – 47 – 47
Capital expenditures 5,150 5,589 92 – 10,831 – 10,831
Investments in entities accounted
for using the equity method 3,864 7,973 – – 11,837 – 11,837
assets 545,953 393,309 494,096 – 538,617 894,741 – 894,741
liabilities 411,413 138,252 22,086 – 20,521 551,230 – 551,230
employees (as of december 31) 3,551 2,338 47 – 5,936 – 5,936

145
10 0 notes
4 maNagemeNt aNd StoCk 92 consolidated financial statements 163 other26 maNagemeNt report19 market aNd buSINeSS
the profit/loss from continuing operations is derived as follows from the earnings before interest and
taxes (ebIt):
in € k 2008 2007
earnings before interest and taxes (ebIt) of continuing operations 72,660 55,720
profit from entities accounted for using the equity method 3,040 1,924
Interest and similar income 4,767 3,805
Interest and similar expenses – 34,080 – 26,690
Income taxes – 12,661 – 13,565
Profit from continuing operations 33,726 21,194
earnings before interest and taxes (ebIt) of discontinued operations 349 1,087
Interest and similar expenses – – 4
Income taxes 12,207 – 102
Profit/loss from discontinued operations 12,556 981
gross assets and gross liabilities from continuing operations are derived as follows from the segment
assets and segment liabilities:
in € k dec. 31, 2008 dec. 31, 2007
Segment assets of continuing operations 979,379 894,741
Cash and cash equivalents 84,385 147,489
tax receivables 6,493 10,255
Investments in entities accounted for using the equity method 13,040 11,837
deferred tax assets 4,716 3,666
Non-current assets classified as held-for-sale – 6,782
gross assets of continuing operations 1,088,013 1,074,770
in € k dec. 31, 2008 dec. 31, 2007
Segment liabilities of continuing operations 586,411 551,230
bond 96,917 191,699
liabilities to banks 20,796 16,510
finance lease liabilities 3,811 5,311
tax liabilities 15,724 31,451
other taxes 3,472 3,308
deferred tax liabilities 19,513 18,152
gross liabilities of continuing operations1 746,644 817,661
1 Consolidated balance sheet total less equity including minority interests
in € k
germany
other european countries
north/ central
america
south
america
asia/ africa/
australia
continuing operations
2008
external sales revenues 294,853 615,461 323,693 48,062 320,704 1,602,773
Capital expenditures 5,488 1,808 1,688 468 1,356 10,808
assets 434,017 293,578 164,105 26,514 61,165 979,379
employees (as of december 31) 3,059 1,177 826 121 960 6,143
2007
external sales revenues 273,993 578,983 289,604 38,831 295,230 1,476,641
Capital expenditures 4,778 2,117 1,486 1,333 1,117 10,831
assets 379,344 239,039 203,533 21,680 51,145 894,741
employees (as of december 31) 3,040 1,125 886 97 788 5,936

146
In the 2008 reporting period, sales with one customer accounted for 15.1 % of consolidated net sales reve-
nues compared to 9.4 % in the prior period. the second- and third-largest customers accounted for 8.6 %
(prior period: 8.4 %) and 7.5 % (prior period: 7.9 %) respectively. entities that are known to be under common
control are considered together as one customer.
dr.-Ing. e. h. heinz dürr is the chairman of the Supervisory board of dürr ag, dürr Systems gmbh. until
march 19, 2007, he was also chairman of the Supervisory board of Carl Schenck ag. he received remuner-
ation of € 121 thousand (prior period: € 127 thousand) for these duties. dr.-Ing. e. h. heinz dürr is also a
member of the supervisory board of landesbank baden-Württemberg. expenses of € 267 thousand (prior
period: € 344 thousand) were payable to heinz dürr gmbh, berlin, of which dr.-Ing. e. h. heinz dürr is
general manager, for reimbursement of office and travel expenses relating to supervisory board activities
and for cost reimbursements for the dürr office in the german capital, berlin. In addition, heinz dürr
gmbh cross-charged expenses of € 32 thousand (incl. Vat) to dürr ag for advisory services purchased
on behalf of the latter relating to corporate and tax issues. In 2007, heinz dürr gmbh, berlin, was refunded
for the prepayments it had made on behalf of dürr ag for personnel consulting costs of € 200 thousand.
for his former activity as general manager, dr.-Ing. e. h. heinz dürr also received benefits from the pension
commitment (of april 2, 1978, supplemented december 21, 1988) of € 218 thousand (prior period: € 212
thousand).
mr. Joachim Schielke is a Supervisory board member of dürr ag, member of the board of management of
landesbank baden-Württemberg and chairman of the board of management of baden-Württembergische
bank. from the current business relationship, a balance of € 4,025 thousand (prior period: € 57,492 thou-
sand) and liability from utilization of the cash line of the syndicated loan of € 2,500 thousand were held at
baden-Württembergische bank as of the balance sheet date. transactions with baden-Württembergische
bank resulted in interest expenses of € 458 thousand (prior period: € 525 thousand) in the reporting period.
the warranties and guarantees issued by baden-Württembergische bank on behalf of dürr amounted to
€ 21,209 thousand as of the balance sheet date (prior period: € 19,650 thousand).
for further information about members of the Supervisory board of dürr ag, please refer to note 36.
the forward exchange transactions and interest hedges are mainly processed by baden-Württembergische
bank and deutsche bank ag. for details of the forward exchange transactions and interest hedges, please
refer to note 34.
the board of management confirms that all the related party transactions described above were carried
out at arm’s length conditions.
the members of the board of management purchased a total of 70,000 dürr ag shares from heinz dürr
gmbh, berlin, in 2008. of these, 40,000 were purchased at a price of € 18.00 per share and 30,000 at a price
of € 20.00 per share (prior period: € 134,000 shares at a purchase price of € 23.25 per share). to finance
part of the purchase price, heinz dürr gmbh granted the members of the board of management an on-call
loan at market conditions, the remaining purchase price was financed privately by the members of the
board of management. respite has been granted for no more than five years as of conclusion of the agree-
ment for the outstanding amount repayable of the loan of € 3,105 thousand (prior period: € 2,256 thou-
sand). the board of management has pledged the shares purchased to heinz dürr gmbh as collateral for
the loan.
31. Related-PaRtY
tRansactions

147
10 0 notes
4 maNagemeNt aNd StoCk 92 consolidated financial statements 163 other26 maNagemeNt report19 market aNd buSINeSS
in € k dec. 31, 2008 dec. 31, 2007
Contingent liabilities from guarantees, notes and check guarantees 38,881 31,683
other 34,838 32,135
73,719 63,818
other contingent liabilities include contingent liabilities of € 12,207 thousand relating to the disposal of the
measuring and process technologies business unit in australia in the 2005 reporting period (cf. note 6).
Contingent liabilities due to group entities were included in the prior-period figure, the disclosure of contin-
gent liabilities was adjusted from € 155,295 thousand to € 63,818 thousand. the Company assumes that
these contingent liabilities will not lead to any liabilities or thus cash outflows.
besides liabilities, provisions and contingent liabilities, the Company has other financial obligations, in
particular from rental and lease agreements for buildings, furniture and fixtures, office space and vehicles.
future minimum payments up to the first contractually agreed termination date are as follows:
in € k dec. 31, 2008 dec. 31, 2007
Within one year 24,987 19,931
between one and five years 54,078 54,444
more than five years 68,676 71,146
147,741 145,521
In the 2008 reporting period, expenses of € 21,258 thousand (prior period: € 19,866 thousand) were
recorded in the income statement for operating leases.
the group has entered into finance leases for various items of property, plant and equipment. future
minimum lease payments relating to these are reconciled to their present value below:
the other financial obligations that do not result from rental and lease agreements are listed below.
the group operates in countries in which there are political and commercial risks. these risks did not have
any effects on the group in the reporting period. dürr may be involved in lawsuits, including product liabil-
ity, in the ordinary course of business. there are no such matters pending that the board of management
expects to be material in relation to the group’s business or financial position. provision has been made for
expected litigation costs. dürr is generally exposed to financial risks. these include above all credit risks,
liquidity risks and exposure to interest rate changes or currency risks. the regulations for a group-wide risk
policy are set forth in the group guidelines.
32. contingent
liabilities
33. otheR financial obligations
Rent and lease
agReements
(oPeRating leases)
finance leases
dec. 31, 2008 dec. 31, 2007
in € k
minimum lease
payments
interest expense due to
discounting
Present value
minimum lease
payments
interest expense due to
discounting
Present value
Within one year 1,346 292 1,054 1,523 412 1,111
between one and five years 3,095 696 2,399 4,351 1,073 3,278
more than five years 458 100 358 1,184 262 922
4,899 1,088 3,811 7,058 1,747 5,311
otheR financial
obligations
in € k 2009 2010 2011 2012 2013 total
liabilities from other continuous obligations 7,788 5,316 5,266 327 – 18,697
34. Risk management
and deRivative
financial
instRUments

148
the credit risk relates to the possibility that business partners may fail to perform their obligation with
primary and derivative financial instruments and that capital losses could be incurred as a result. Credit
ratings are performed for all new customers. the payment patterns of regular customers are analyzed on
an ongoing basis.
as dürr does not conclude any general netting agreements with its customers, the sum of the financial as-
sets reported in the balance sheet (including derivative financial instruments with a positive market value)
also represents the maximum credit risk. for a presentation of the figures, please refer to note 28. there is
no apparent concentration of credit risk from exposures to a single debtor or to groups of debtors. as of
the balance sheet date, there were no significant agreements that would mitigate the maximum credit risk
(such as netting agreements, guarantees).
In connection with the investment of cash and the portfolio of derivative financial assets, the group is
exposed to losses from credit risks should the banks fail to meet their obligations. dürr manages the result-
ing risk position by diversifying its portfolio and selecting its counterparties carefully. No cash and cash
equivalents or derivative financial assets were past due or impaired due to credit defaults.
the development of dürr hinges on the willingness of the automotive industry to invest. a significant por-
tion of the group’s sales revenues is generated with a limited number of customers because the number
of manufacturers on the worldwide market for automobiles is comparatively small. the majority of the
group’s receivables are due from automobile manufacturers. generally these receivables are not secured
by bank guarantees or collateral. as of december 31, 2008, 53.2 % (prior period: 51.4 %) of the trade receiv-
ables were due from six (prior period: seven) customers. receivables and advance payments relating to
ongoing projects with the uS manufacturers general motors, ford and, to a very limited extent, Chrysler
are monitored globally on a weekly basis. In addition, we have tightened the internal authorization proce-
dures for new contracts. at present, the Company does not expect these customers to default on pay-
ment. the total receivables disclosed contain bad debt allowances for doubtful debts of € 8,816 thousand
(prior period: € 8,485 thousand).
the liquidity risk is the risk that the group may not be in a position in the future to meet its obligations
when they fall due or not at a reasonable price.
the liquidity situation is secured by available cash and cash equivalents as well as the credit lines which
the group can draw on. the situation is monitored and managed by means of a liquidity forecast with a
planning horizon of 18 months, coupled with a short-term liquidity plan.
In addition, use of cross-border cash pooling systems has improved the balance sheet structure through
liquidity pooling, reduced the volume of borrowed funds and thus helped to enhance the financial result.
at the same time, the liquidity situation has become more transparent. moreover, excess liquidity at indi-
vidual entities within the group can be used to finance the cash needs of other group entities internally.
for additional information, please refer to note 25.
the corporate bond agreement contains certain restrictions and obligations. Should any of these not be
complied with, the principal and accumulated interest could be called. the terms of the agreement were
not infringed in the 2008 reporting period.
the syndicated loan agreement concluded in September 2008 can also be terminated prematurely by the
syndicate of banks in the event that certain covenants are breached. In the 2008 reporting period, the cove-
nants applicable were complied with as of each cut-off date. Covenants are calculated for a rolling period
of twelve months. for additional information, please refer to note 25.
cRedit Risk
dePendence on a
few cUstomeRs
liqUiditY Risk

149
10 0 notes
4 management and stock 92 consolidated financial statements 163 other26 management report19 market and business
the table below shows the contractually agreed (undiscounted) interest and principal payments for primary
financial liabilities and for derivative financial instruments. the cash flows presented for the forward
exchange contracts correspond to the market values as of december 31, 2008. the negative amount under
interest/currency swaps in 2011 represents a cash inflow.
cash flows
in € k
carrying amount
dec. 31, 2008 2009 2010 2011 2012from 2013
onwards
Primary financial liabilities
trade payables 214,847 214,847 – – – –
other financial liabilities 20,375 13,670 132 18 37 6,518
bond 96,917 9,750 9,750 104,875 – –
Liabilities to banks 20,796 17,800 568 547 530 2,172
Financial liabilities due to entities accounted
for using the equity method 1,081 161 – – – 920
Finance lease liabilities 3,811 1,346 900 773 803 1,077
derivative financial liabilities
Forward exchange contracts without
hedging relationship 1,122 1,122 – – – –
Forward exchange contracts with
hedging relationship 3,855 3,621 203 31 – –
derivative financial assets
interest and currency swaps with
hedging relationship 1,086 280 280 – 1,806 – –
cash flows
in € k
carrying amount
dec. 31, 2007 2008 2009 2010 2011from 2012
onwards
Primary financial liabilities
trade payables 203,203 203,203 – – – –
trade payables to entities accounted for using
the equity method 3,123 3,123 – – – –
other financial liabilities 24,258 20,151 4,045 62 – –
bond 191,699 19,500 19,500 19,500 219,500 –
Liabilities to banks 16,510 13,122 634 614 596 2,630
Financial liabilities due to entities accounted
for using the equity method 1,064 1,064 – – – –
Finance lease liabilities 5,311 1,523 1,495 1,047 920 2,073
derivative financial liabilities
Forward exchange contracts without
hedging relationship 273 273 – – – –
Forward exchange contracts with
hedging relationship 1,787 1,784 3 – – –
derivative financial assets
interest and currency swaps with hedging
relationship 2,122 123 123 123 – 3,221 –

150
Currency risks exist in particular where receivables or liabilities are carried or will arise in the ordinary
course of business in a currency other than the functional currency of the entity. foreign exchange risks
are hedged where they affect the cash flows of the group. foreign exchange risks that do not affect the
cash flows of the group (i.e., the risks from translating balance sheet items of foreign operations to the euro,
the group’s reporting currency), however, are generally not hedged. forward exchange transactions are
entered into to hedge against exchange rate fluctuations from cash flows relating to forecast purchasing
and sales transactions with terms of up to 30 months (prior period: 35 months).
In addition, there are foreign currency risks arising from loans denominated in foreign currency that are
issued to group entities for financing purposes. these were hedged by forward exchange contracts and
interest and currency swaps. the terms range between one month and 31 months.
regarding the presentation of market risks, IfrS 7 requires sensitivity analyses showing how profit or loss
and equity would have been affected by hypothetical changes in the relevant risk variable. the periodic
expenses are determined by setting the hypothetical changes in the risk variables in relation to the port-
folio of financial instruments as of the balance sheet date. the presentation is based on the assumption
that the portfolio at the balance sheet date was representative for the whole year. Currency risks as defined
by IfrS 7 arise from financial instruments that are denominated in a currency other than the functional
currency and are of a monetary nature, exchange differences from the translation of financial statements
to the group’s currency are not taken into account. all currencies other than the functional currency in
which dürr enters into financial instruments are relevant risk variables.
material primary monetary financial instruments which constitute currency risks for dürr are cash, trade
receivables and payables as well as intercompany receivables and liabilities that are denominated in differ-
ent functional currencies. Intercompany loans which could give rise to currency risks are usually hedged
by derivative financial instruments that are accounted for as fair value hedges, with the exception of the
interest/currency swaps described above.
the sensitivity analyses for currency risks refer to the currency pairs that are most relevant for dürr:
eur/uSd, eur/gbp, eur/rub, uSd/mxN and uSd/CNY. the average volatility of the individual currencies in
2008 was taken as the basis for the calculation. assuming that the euro had appreciated by 13 %, 10 % and
5 % respectively against the uS dollar, pound sterling and russian ruble and the uS dollar had risen by
16 % and 3 % respectively against the mexican peso and the Chinese renminbi yuan at the same time,
dürr’s profit would have been € 1.2 million higher (prior period: € 2.9 million). had the euro and uS dollar
weakened to the same extent as described above, profit would have been € 1.5 million lower (prior period:
€ 3.6 million).
In addition, dürr is exposed to currency risks from derivatives that are embedded, in accordance with IaS
39, in effective cash flow hedges of fluctuation in payments caused by exchange rates. exchange rate
changes concerning the currencies underlying these transactions affect the hedge reserve in equity and
the fair value of the hedges. the following sensitivity analyses were carried out in relation to this: If the
euro had risen by 13 % and 5 % respectively against the uS dollar and russian ruble, the hedge reserve
in equity would have been € 4.0 million higher (prior period: € 3.1 million). had the euro fallen by the same
amount against these two currencies, the hedge reserve in equity would have been € 4.9 million lower
(prior period: € 4.0 million).
cURRencY Risk

151
10 0 notes
4 maNagemeNt aNd StoCk 92 consolidated financial statements 163 other26 maNagemeNt report19 market aNd buSINeSS
Interest rate risks result from interest rate changes that have a negative effect on the group’s net assets,
financial position and results of operations. Interest rate fluctuations lead to changes in net interest and in
the carrying amounts of the assets subject to interest. Changes in the interest rates applicable to primary
financial instruments with fixed interest rates only affect profit or loss if they are measured at fair value.
Since dürr measures all primary financial instruments at amortized cost, there are no interest rate risks
inherent in them within the meaning of IfrS 7. dürr’s liabilities with floating interest rates are counterbal-
anced by bank balances with floating interests rates of a similar amount. this functions like a natural hedge
so that there is no significant interest rate risk and, consequently, no other derivative financial instruments
are used to hedge interest risks. dürr only has exposure to interest rate risks from interest/currency swaps
that are reported as cash flow hedges. they are carried at fair value and changes in their market value are
recognized directly in equity. this risk is presented in a sensitivity analysis in accordance with IfrS 7,
based on assumptions concerning changes in the eur and uSd yield curves. the table below shows the
changes in the hedge reserve under equity that would result from a hypothetical change in the market
value of the interest/currency swaps.
change in interest rates (in base points)
€
change in interest rates (in base points)
Us$
change in equity as of dec. 31, 2008
(in € k)
change in equity as of dec. 31, 2007
(in € k)
+ 0 + 100 704 871
+ 0 – 100 – 728 – 908
+ 100 + 0 – 712 – 941
– 100 + 0 736 981
In the presentation of market risks, IfrS 7 also requires disclosures on the effects of hypothetical changes
in the risk variable on the price of financial instruments. the main risk variables include stock market prices
and indices.
as of december 31, 2008, the Company did not have any significant investments classified as available
for sale, and price risks therefore play only a minor role at dürr.
derivative financial instruments are used in the group to minimize the risks concerning changes in
exchange rates, interest rates or cash flows and the change in fair value of receivables and liabilities. dürr
is exposed to credit risk in the event of non-performance by counterparties (banks) to the financial instru-
ments described below. all financial derivatives as well as their underlyings are subject to regular internal
control and measurement in accordance with the directive of the board of management. derivative finan-
cial instruments are only entered into to hedge the operating business.
at the inception of the hedge, the hedging relationship and the entity’s risk management objective and
strategy for undertaking the hedge are formally documented. this documentation contains identification
of the hedging instrument, the related hedged item or transaction, the nature of the risk being hedged,
and how the entity will assess the hedging instrument’s effectiveness in offsetting the exposure to changes
in the hedged item’s fair value or the hedged item’s cash flows that is attributable to the hedged risk.
Such hedges are expected to be highly effective in offsetting changes in fair value or cash flows and are
assessed on an ongoing basis to determine that they actually have been highly effective throughout the
financial reporting periods for which they were designated.
depending on their fair value as of the balance sheet date, derivative financial instruments are reported
under other assets (positive fair value) or other liabilities (negative fair value) respectively.
inteRest Rate Risk
otheR PRice Risks
Use of deRivative
financial instRUments

152
the scope and fair value of the financial instruments as of december 31, 2008, are shown below:
the fair value of the financial instruments was estimated using the following methods and assumptions:
the fair values of the forward exchange contracts were estimated at the present value of cash flows on
the basis of the difference between the contractually agreed exchange rates and forward rate prevailing
on the balance sheet date. the fair values of the interest hedges are estimated as the discounted value of
expected future cash flows based on current market parameters.
Currency hedges and interest/currency swaps that clearly serve to hedge future cash flows from foreign
exchange transactions and which meet the requirements of IaS 39 in terms of documentation and effec-
tiveness, are accounted for as cash flow hedges. Such derivative financial instruments are recognized at
fair value. Changes in fair value that impact hedge effectiveness are recognized directly in equity as accu-
mulated other comprehensive income until the hedged item is realized. upon realization of the future
transaction (hedged item), the accumulated other comprehensive income recorded in equity is transferred
to profit or loss and recognized in sales revenues or cost of sales (forward exchange contracts) or other
operating income and expenses (interest/currency swap) in the income statement.
In the 2008 reporting period, an unrealized loss of € 178 thousand was recognized directly in equity under
accumulated other comprehensive income (prior period: loss of € 66 thousand). It is attributable to the
recognition of the fluctuation in fair value from forward exchange contracts being recognized directly in
equity. a gain of € 224 thousand from the interest/currency swaps and the foreign exchange loans (prior
period: loss of € 441 thousand) was recognized directly in equity.
In addition, € 2,285 thousand was reclassified due to the realization of hedged items in the course of the
reporting period from accumulated other comprehensive income to profit or loss and disclosed in sales
revenues and cost of sales in the income statement. the effect on earnings (before taxes) expected for
the following reporting period from the amounts recognized directly in equity as of the balance sheet date
under accumulated other comprehensive income came to € 258 thousand. In the 2010 and 2011 reporting
periods, effects on earnings are expected to total € – 468 thousand and € – 998 thousand, respectively.
there were no effects on earnings from ineffective hedges in the 2008 and 2007 reporting periods.
nominal value Positive market value negative market value
in € k 2008 2007 2008 2007 2008 2007
Interest/currency swaps in connection with cash
flow hedges 27,127 27,127 1,086 2,122 – –
forward exchange contracts 176,867 98,267 4,400 3,033 4,977 2,060
of which in connection with cash flow hedges 75,939 52,639 3,019 2,225 3,350 1,408
of which in connection with fair value hedges 6,723 21,410 84 550 505 379
of which without hedging relationship 94,205 24,218 1,297 258 1,122 273
accoUnting and
disclosURe of
deRivative financial
instRUments and cash
flow hedge accoUnting

153
10 0 notes
4 maNagemeNt aNd StoCk 92 consolidated financial statements 163 other26 maNagemeNt report19 market aNd buSINeSS
a loss of € 592 thousand arising from derivative financial instruments classified as fair value hedges was
recognized in profit or loss (prior period: gain of € 171 thousand). measuring the hedged items at closing
rate gave rise to income in the same amount.
the changes in the fair value of all derivative financial instruments that do not meet the requirements for
hedge accounting in accordance with IaS 39 are recognized in profit or loss as of the balance sheet date.
the primary objective of the group’s capital management is to ensure that it maintains a strong credit
rating and healthy capital ratios in order to support its business and maximize shareholder value.
dürr monitors capital on a monthly basis using a gearing ratio, which is net financial debt divided by total
capital plus net financial debt. pursuant to the group’s internal policy, the ratio should not exceed 30 %. on
account of the substantially increased equity and reduced net financial liabilities, the group’s ratio of 9.2 %
(prior period: 19.4 %) is clearly below that maximum in 2008.
in € k dec. 31, 2008 dec. 31, 2007
Cash and cash equivalents 84,385 147,489
bond – 96,917 – 191,699
financial liabilities due to entities accounted for using the equity method – 1,081 – 1,064
liabilities to banks, non-current – 3,177 – 3,631
liabilities to banks, current – 17,619 – 12,879
net financial debt – 34,409 – 61,784
equity 341,369 257,109
Net financial debt and equity 375,778 318,893
gearing ratio 9.2 % 19.4 %
the equity is also included in the calculation of a net worth covenant, stipulated by the agreement on the
syndicated loan. the net worth covenant may not fall below a certain value. this covenant was always
complied with in the 2008 and 2007 reporting periods.
With reference to Sec. 264 (3) hgb [“handelsgesetzbuch”: german Commercial Code], the financial
statements of the following german subsidiaries are not published:
dürr Systems gmbh, Stuttgart
dürr International gmbh, Stuttgart
dürr Somac gmbh, Stollberg
Carl Schenck ag, darmstadt
dürr ecoclean gmbh, filderstadt
Schenck rotec gmbh, darmstadt
Schenck technologie- und Industriepark gmbh, darmstadt
dürr assembly products gmbh, püttlingen
Schenck atis gmbh, darmstadt
caPital management
35. additional disclosURe ReqUiRements
exemPtion PURsUant
to sec. 264 (3) hgb

154
In January 2009, dürr entered into a cooperation agreement with the Japanese plant manufacturer parker
engineering Co., ltd. with the aim of working together to expand the finishing technology business with
the Japanese automotive industry. the scope of the collaboration includes sales and planning as well as
construction and services relating to finishing plants for Japanese automotive manufacturers in Japan
and other asian markets.
In the first quarter of 2009, dürr announced short-time working for around 400 employees on account
of postponements to contracts with a volume of some € 200 million.
the declaration of compliance prescribed by Sec. 161 aktg [“aktiengesetz”: german Stock Corporation
act] was submitted by the board of management and the Supervisory board of dürr ag in Stuttgart on
december 15, 2008, and made accessible to the shareholders in the Internet.
annual average number of employees:
2008 2007
Wage earners 2,339 2,215
Salaried employees 3,432 3,301
trainees/apprentices 289 293
6,060 5,809
as of december 31, 2008, dürr had 6,143 employees (prior period: 5,936).
the audit fees of the auditors of the consolidated financial statements recorded as an expense for the
reporting period break down as follows:
in € k 2008 2007
Statutory audit 646 666
tax advisory services 125 158
other services rendered for the parent company or subsidiaries 419 235
1,190 1,059
36. otheR notes
sUbseqUent events
geRman coRPoRate
goveRnance code:
declaRation of
comPliance PURsUant
to sec. 161 aktg
aveRage headcoUnt
fees of the aUditoR
of the consolidated
financial
statements

155
10 0 notes
4 maNagemeNt aNd StoCk 92 consolidated financial statements 163 other26 maNagemeNt report19 market aNd buSINeSS
offices held by members of the board of management membership in statutory supervisory boards
membership in comparable domestic and foreign control bodies (of business entities)
* group boards
memberS of the board of maNagemeNt
Ralf w. dieteR
Chairman
Chairman of the board of management of
Carl Schenck ag
paint and assembly Systems
measuring and process Systems
public relations, human resources
(employee affairs director),
research and development, quality,
Internal auditing
thyssenkrupp technologies ag
(since September 8, 2008)
dürr, Inc.* (Chairman)
RalPh heUwing
dürr Consulting
finance/Controlling, Investor relations,
risk management, legal affairs/patents,
Information technology,
Corporate real estate
Carl Schenck ag* (Chairman) mCh management Capital holding ag
dürr, Inc.* (since January 3, 2008)
the total expense for remuneration of the board
of management in the reporting period was €
2,374 thousand (prior period: € 1,902 thousand)
and comprises the following: short-term em-
ployee benefits of € 2,211 thousand (prior period:
€ 1,842 thousand) as well as additions to the pen-
sion provisions for these persons of € 163 thou-
sand (prior period: € 60 thousand).
the former members of the board of manage-
ment received remuneration of € 792 thousand in
the 2008 reporting period (prior period: € 780
thousand). pension provisions for this group of
persons amounted to € 12,305 thousand as of de-
cember 31, 2008 (prior period: € 12,524 thousand).

156
memberS of the SuperVISorY board
dR.- ing. e .h. heinz düRR1, 4, 5
entrepreneur, berlin
Chairman
dürr Systems gmbh (Chairman) dussmann ag & Co. kgaa
(Chairman since July 3, 2008) dussmann Verwaltungs ag (since January 11,
2008; Chairman since october 30, 2008) adC krone gmbh (Chairman)
landesbank baden-Württemberg
(member of the Supervisory board)
PRof. dR. noRbeRt loos1, 2, 4, 5
managing partner of loos beteiligungs-gmbh,
Stuttgart
deputy Chairman
bhS-tabletop ag (Chairman) hans r. Schmid holding ag (Chairman) ltS lohmann therapie-Systeme ag
(Chairman) mVV energie ag
ltS Corp., uSa (Chairman)
mannheimer kongress- und touristik gmbh
Stadt mannheim beteiligungsgesellschaft mbh
haYo Raich1, 3, 4
Chairman of the group Works Council
of dürr ag, Stuttgart
deputy Chairman
dürr Systems gmbh (deputy Chairman)
miRko beckeR3
deputy Chairman of the Works Council of
dürr Systems gmbh at the bietigheim-bissingen
facility
dR. dR. alexandRa düRR 5
Senior physician at the Neurogenetic
Clinic of département de génétique,
hôpital de la Salpêtrière, paris, france
benno ebeRl1, 3
trade union Secretary of Ig metall,
Stuttgart administrative offices
thyssenkrupp elevator ag
(deputy Chairman) alcatel-lucent ag
(deputy Chairman since april 18, 2008) alcatel-lucent holding gmbh
thyssenkrupp aufzüge gmbh
(deputy Chairman)
PRof. dR.- ing. holgeR hanselk a
professor for Systems reliability and machine
acoustics at the faculty of mechanical and
process engineering at darmstadt technical
university
head of the fraunhofer-Institute for Structural
durability and System reliability lbf in
darmstadt
harmonic drive ag (since april 8, 2008)
thomas hohmann3
head of personnel at dürr Systems gmbh,
Stuttgart
eRich hoRst2, 3, 4
Chairman of the Works Council of dürr ecoclean
gmbh at the monschau facility
deputy Chairman of the group Works Council
of dürr ag, Stuttgart

157
10 0 notes
4 maNagemeNt aNd StoCk 92 consolidated financial statements 163 other26 maNagemeNt report19 market aNd buSINeSS
1 member of the executive committee and personnel committee2 member of the audit committee3 employee representative 4 member of the mediation committee5 member of the nomination committee membership in statutory supervisory boards membership in comparable domestic and foreign control bodies (of business entities)
dR. hans michael schmidt-denckeR
general manager of Süddeutsche beteiligung
gmbh, Stuttgart
Schuler ag (since april 10, 2008) Südwestbank ag (since September 12, 2008)
aebi-Schmidt holding (until June 6, 2008)
loba gmbh & Co. kg (Chairman of the
advisory board)
Schmidt holding gmbh (Chairman until
february 15, 2008)
Schwäbische Werkzeugmaschinen gmbh
(since September 30, 2008, Chairman)
In the reporting period, total remuneration of
the Supervisory board totaled € 545 thousand
(prior period: € 493 thousand).
günteR loRenz 2, 3
principal authorized representative of Ig metall
trade union, darmstadt administrative offices
Joachim schielke2
Chairman of the management board of
baden-Württembergische bank, Stuttgart
member of the management board of
landesbank baden-Württemberg, Stuttgart
paul hartmann ag (since april 30, 2008) ICS Informatik Consulting Systems ag lrp landesbank rheinland-pfalz
(deputy Chairman of the administrative
board until June 30, 2008) landesbank Sachsen ag (deputy Chairman
until march 31, 2008) Süd kb unternehmensbeteiligungsgesell-
schaft gmbh & Co. kgaa (deputy Chairman) Wüstenrot & Württembergische ag
allgaier Werke gmbh
behr Verwaltung gmbh
bWk gmbh unternehmensbeteiligungs-
gesellschaft (Chairman)
lbbW equity partners gmbh & Co. kg
(since September 11, 2008)
lbbW equity partners Verwaltungs-gmbh
(since September 11, 2008)
leitz gmbh Verwaltungen
(until July 18, 2008)
leitz metalworking technologies gmbh
& Co. kg (until July 18, 2008)
lhI leasing gmbh (Chairman)
mkb mittelrheinische bank gmbh
(Chairman)
mmV leasing gmbh (Chairman of the
advisory board)

158
37. statement of changes in non-cURRent assets
intangible assets
in € k
goodwill
franchises, industrial
rights and similar rights
capitalized
development costs
Prepayments for intangible
assets
continuing operations
accumulated cost as of January 1, 2007 262,296 49,884 17,315 3,170 332,665
exchange difference – 4,687 – 418 – 705 – 26 – 5,836
Changes in consolidated group 5,154 330 – – 5,484
additions 542 9,958 4,710 430 15,640
disposals – 125 – 266 – 189 – – 580
reclassifications – 3,461 – – 3,106 355
accumulated cost as of december 31, 2007 263,180 62,949 21,131 468 347,728
exchange difference 767 – 152 300 – 82 833
Changes in consolidated group 2,027 181 – – 2,208
additions – 9,740 3,131 647 13,518
disposals – – 3,715 – 451 – – 4,166
reclassifications – 850 – – 404 446
accumulated cost as of december 31, 2008 265,974 69,853 24,111 629 360,567
accumulated amortization as of January 1, 2007 – 44,084 3,918 – 48,002
exchange difference – – 408 – 352 – – 760
Changes in consolidated group – 288 – – 288
Scheduled amortization – 2,571 2,840 – 5,411
disposals – – 261 – 138 – – 399
reclassifications – 340 – – 340
accumulated amortization as of december 31, 2007 – 46,614 6,268 – 52,882
exchange difference – – 123 196 – 73
Changes in consolidated group – 166 – – 166
Scheduled amortization – 5,968 2,922 – 8,890
disposals – – 3,702 – 238 – – 3,940
reclassifications – 391 – – 391
accumulated amortization as of december 31, 2008 – 49,314 9,148 – 58,462
net carrying amount as of december 31, 2008 265,974 20,539 14,963 629 302,105
Net carrying amount as of december 31, 2007 263,180 16,335 14,863 468 294,846
Net carrying amount as of January 1, 2007 262,296 5,800 13,397 3,170 284,663

159
10 0 notes
4 maNagemeNt aNd StoCk 92 consolidated financial statements 163 other26 maNagemeNt report19 market aNd buSINeSS
PRoPeRtY, Plant and eqUiPment
in € k
land, land rights and buildings including
buildings on third-party
land
investment property
technical equipment
and machines
other equipment,
furniture and fixtures
Prepayments and assets
under construction
continuing operations
accumulated cost as of January 1, 2007 142,477 29,387 37,264 71,580 789 281,497
exchange difference – 4,009 – – 1,636 – 1,970 – 13 – 7,628
Changes in consolidated group – – 1,163 867 – 2,030
additions 960 820 1,026 5,252 2,773 10,831
disposals – 6,051 – 150 – 2,458 – 6,663 – 5 – 15,327
reclassifications – – 24 – 178 – 201 – 355
reclassification to assets held for sale – 16,876 – – – – – 16,876
accumulated cost as of december 31, 2007 116,501 30,057 35,383 68,888 3,343 254,172
exchange difference – 884 – 391 – 473 – 2 – 968
Changes in consolidated group 4,761 – 336 568 – 5,665
additions 2,004 657 2,201 5,267 679 10,808
disposals – 1,184 – 258 – 2,127 – 4,580 – 638 – 8,787
reclassifications – 3,192 5,445 445 – 435 – 2,709 – 446
accumulated cost as of december 31, 2008 118,006 35,901 36,629 69,235 673 260,444
accumulated depreciation as of
January 1, 2007 59,265 16,118 28,810 57,496 – 161,689
exchange difference – 2,012 – – 1,173 – 1,542 – – 4,727
Changes in consolidated group – – 839 696 – 1,535
Scheduled depreciation 4,648 501 2,121 5,263 – 12,533
reversal of impairment losses – 131 – – – – – 131
reclassifications – – 78 – 418 – – 340
disposals – 835 – 137 – 2,378 – 6,320 – – 9,670
reclassification to assets held for sale – 10,094 – – – – – 10,094
accumulated depreciation as of
december 31, 2007 50,841 16,482 28,297 55,175 – 150,795
exchange difference – 199 – 280 – 250 – – 169
Changes in consolidated group 1,381 – 297 436 – 2,114
Scheduled depreciation 3,450 223 1,886 4,713 – 10,272
Impairment losses 112 – – 33 – 145
reversal of impairment losses – 562 – 4,324 – – – – 4,886
reclassifications – 2,634 2,634 104 – 495 – – 391
disposals – 973 – 133 – 1,878 – 4,476 – – 7,460
accumulated depreciation as of
december 31, 2008 51,416 14,882 28,986 55,136 – 150,420
net carrying amount as of december 31, 2008 66,590 21,019 7,643 14,099 673 110,024
Net carrying amount as of december 31, 2007 65,660 13,575 7,086 13,713 3,343 103,377
Net carrying amount as of January 1, 2007 83,212 13,269 8,454 14,084 789 119,808

160
financial assets
in € k
investments in entities accounted
for using the equity method
other investments
long-term securities
other loans
continuing operations
accumulated cost as of January 1, 2007 16,384 29 367 4,966 21,746
exchange difference – 382 – – 1 33 – 350
Changes in consolidated group – 4,022 – – 28 – 3,994
additions 1,857 – – – 1,857
disposals – 1,263 – 5 – 18 – 5,027 – 6,313
reclassifications – 5 5 – – –
accumulated cost as of december 31, 2007 12,569 29 348 – 12,946
exchange difference 2,509 – – 6 – 2,503
Changes in consolidated group – 4,475 – – – – 4,475
additions 2,941 – – – 2,941
disposals – 504 – – 2 – – 506
accumulated cost as of december 31, 2008 13,040 29 340 – 13,409
accumulated impairment losses as of January 1, 2007 3,403 27 – 114 3,544
Changes in consolidated group – 1,697 – – – – 1,697
Impairment losses – – – 3 3
disposals – 974 – – – 117 – 1,091
accumulated impairment losses as of december 31, 2007 732 27 – – 759
Changes in consolidated group – 732 – – – – 732
accumulated impairment losses as of december 31, 2008 – 27 – – 27
net carrying amount as of december 31, 2008 13,040 2 340 – 13,382
Net carrying amount as of december 31, 2007 11,837 2 348 – 12,187
Net carrying amount as of January 1, 2007 12,981 2 367 4,852 18,202

161
10 0 notes
4 maNagemeNt aNd StoCk 92 consolidated financial statements 163 other26 maNagemeNt report19 market aNd buSINeSS
38. list of gRoUP shaReholdings
1 profit and loss transfer agreement with the respective parent company2 fully consolidated entity in the dürr group3 entity accounted for using the equity method in the dürr group4 Non-consolidated entity in the dürr group
name and location
share of capital in %
germany
dürr Systems gmbh, Stuttgart1, 2 100
dürr ecoclean gmbh, filderstadt1, 2 100
dürr grundstücks-gmbh, Stuttgart 2 100
dürr International gmbh, Stuttgart1, 2 100
dürr Somac gmbh, Stollberg1, 2 100
Carl Schenck ag, darmstadt1, 2 100
Schenck rotec gmbh, darmstadt1, 2 100
Schenck atis gmbh, darmstadt1, 2 100
Schenck technologie- und Industriepark gmbh, darmstadt1, 2 100
dürr assembly products gmbh, püttlingen1, 2 100
prime Contractor Consortium fal China, Stuttgart 3 50
dürr gmbh & Co. Campus kg, pöcking 3 100
fludicon gmbh, darmstadt 4 4
unterstützungseinrichtung der Carl Schenck ag, darmstadt, gmbh, darmstadt 4 100
dürr Consulting gmbh, Stuttgart 4 100
other eU countries
dürr anlagenbau ges. m.b.h., zistersdorf / austria 2 100
dürr ltd., Warwick / uk 2 100
Schenck ltd., Warwick / uk 2 100
Schenck test automation ltd., Warwick / uk 2 100
dürr ecoclean S.a.S., loué / france 2 100
dürr Systems S.a.S., montigny-le-bretonneux / france 2 100
Schenck S.a.S., Cergy-pontoise / france 2 100
dürr Systems Spain S.a., San Sebastian / Spain 2 100
olpidürr S.p.a., Novegro di Segrate / Italy 2 65
Verind S.p.a., rodano / Italy 2 50
Cpm S.p.a., beinasco / Italy 2 51
Schenck Italia S.r.l., paderno dugnano / Italy 2 100
Stimas engineering S.r.l., turin / Italy 2 51
Carl Schenck machines en Installaties b.V., rotterdam / Netherlands 2 100
dürr poland Sp. z o.o., radom / poland 2 100
dürr ecoclean spol. s r.o., oslavany / Czech republic 2 100
dürr Systems Slovakia spol. s r.o., bratislava / Slovakia 2 100
other european countries
Schenck Industrie-beteiligungen ag, glarus / Switzerland 2 100
dürr Systems ltd. Sirketi, Istanbul / turkey 2 100
ooo dürr Systems ruS, moscow / russia 2 100

162
r alph heuW INgr alf W. d Iet er
name and location
share of capital in %
north america/central america
dürr Inc., plymouth, michigan / uSa 2 100
dürr Systems Inc., plymouth, michigan / uSa 2 100
dürr ecoclean Inc., Wixom, michigan / uSa 2 100
Schenck Corporation, deer park, New York / uSa 2 100
Schenck rotec Corporation, troy, michigan / uSa 2 100
Schenck trebel Corporation, deer park, New York / uSa 2 100
dürr Canada Corp., halifax, Nova Scotia / Canada 2 100
dürr Systems Canada Inc., Windsor, ontario / Canada 2 100
dürr de méxico, S.a. de C.V., querétaro / mexico 2 100
south america
dürr brasil ltda., São paulo / brazil 2 100
Irigoyen 330 S.a., Cap. fed. buenos aires / argentina 2 100
africa/asia/australia
dürr South africa (pty.) ltd., port elizabeth / South africa 2 100
dürr India private ltd., Chennai / India 2 100
Schenck rotec India limited, Noida / India 2 100
dürr korea Inc., Seoul / South korea 2 100
Schenck Shanghai machinery Corporation ltd., Shanghai / China 2 99
dürr paintshop Systems engineering (Shanghai) Co. ltd., Shanghai / China 2 100
dürr Japan k.k., Yokohama / Japan 2 100
Nagahama Seisakusho ltd., osaka / Japan 3 50
dürr pty. ltd., adelaide / australia 2 100
1 profit and loss transfer agreement with the respective parent company2 fully consolidated entity in the dürr group3 entity accounted for using the equity method in the dürr group4 Non-consolidated entity in the dürr group
Stuttgart, march 4, 2009
dürr aktiengesellschaft
the board of management

1634 management and stock 92 consolidated financial statements 163 other26 management report19 market and business
163 responsibility statement by management
other
responsibility statement by management
r alph heuw ing, cfor alf w. d iet er, ceo
to the best of our knowledge, and in accordance with the applicable reporting principles, the consolidated
financial statements give a true and fair view of the assets, liabilities, financial position and profit or loss
of the group, and the group management report includes a fair review of the development and performance
of the business and the position of the group, together with a description of the principal opportunities
and risks associated with the expected development of the group.
stuttgart, march 4, 2009

164
ten-year summary *
2008 2007 2006 2005 2004 2003 2002 2001 2000 1999
incoming orders in € m 1,464.0 1,781.5 1,459.8 1,216.9 1,387.4 2,356.2 2,346.7 2,063.2 1,969.7 1,120.2
sales revenues in € m 1,602.8 1,476.6 1,361.2 1,400.6 1,725.8 2,271.9 2,082.1 2,196.2 2,042.3 1,223.9
gross profit on sales in € m 285.2 240.0 220.2 220.2 240.6 365.6 381.2 427.2 343.8 174.5
ebitda in € m 87.1 73.5 52.7 – 18.8 50.2 45.9 89.1 127.8 115.3 65.4
ebit in € m 72.7 55.7 33.1 – 70.3 29.0 14.9 55.1 83.7 68.6 41.4
net income / loss in € m 33.7 21.2 8.2 – 104.5 – 1.1 – 30.9 12.0 20.0 17.8 16.6
earnings per share in € 1.81 1.33 0.50 – 7.26 0.00 – 2.14 0.84 1.40 1.31 1.28
dividend per share in € 0.70 1 0.40 – – – – 0.80 1.10 1.10 1.00
gross margin in % 17.8 16.3 16.2 15.7 13.9 16.1 18.3 19.5 16.8 14.3
ebitda margin in % 5.4 5.0 3.9 – 1.3 2.9 2.0 4.3 5.8 5.6 5.3
ebit margin in % 4.5 3.8 2.4 – 5.0 1.7 0.7 2.6 3.8 3.4 3.4
cash flow from operating activities in € m 30.9 85.9 – 9.8 – 147.6 – 115.5 81.0 198.7 188.4 –80.7 – 123.5
free cash flow in € m – 14.5 40.6 – 46.5 – 206.1 – 150.9 32.9 156.4 121.3 – 135.3 – 151.0
equity (with minority interests) (dec. 31) in € m 341.4 257.1 245.7 248.1 222.7 224.1 270.5 301.4 302.6 247.2
net financial debt 2 (dec. 31) in € m 34.4 61.8 96.5 84.9 242.8 95.0 123.1 289.8 395.9 80.1
net working capital (dec. 31) in € m 151.8 128.9 154.7 171.5 120.5 n. a. n. a. n. a. n. a. n. a.
gearing (dec. 31) in % 9.2 19.4 28.2 25.5 52.2 29.8 31.3 49.0 56.7 24.5
equity ratio (dec. 31) in % 31.4 23.9 23.6 20.9 15.5 13.5 15.1 16.4 20.2 29.7
roce (dec. 31) in % 16.8 15.0 7.6 – 16.9 3.9 n. a. n. a. n. a. n. a. n. a.
employees (dec. 31) 6,143 5,936 5,650 5,992 6,240 12,747 12,902 12,675 11,558 7,255
1 dividend proposal to the annual shareholders’ meeting2 without finance leases
* notes: 1999 to 2002 based on us-gaap
since 2003 based on ifrs
since 2004 continuing operations, that is without the divested business units services (premier group), measuring and process technologies (schenck process) and development test systems
figures from 2004 to 2008 are fully comparable n. a. = not available

1654 management and stock 92 consolidated financial statements 163 other26 management report19 market and business
164 ten-year summary
2008 2007 2006 2005 2004 2003 2002 2001 2000 1999
incoming orders in € m 1,464.0 1,781.5 1,459.8 1,216.9 1,387.4 2,356.2 2,346.7 2,063.2 1,969.7 1,120.2
sales revenues in € m 1,602.8 1,476.6 1,361.2 1,400.6 1,725.8 2,271.9 2,082.1 2,196.2 2,042.3 1,223.9
gross profit on sales in € m 285.2 240.0 220.2 220.2 240.6 365.6 381.2 427.2 343.8 174.5
ebitda in € m 87.1 73.5 52.7 – 18.8 50.2 45.9 89.1 127.8 115.3 65.4
ebit in € m 72.7 55.7 33.1 – 70.3 29.0 14.9 55.1 83.7 68.6 41.4
net income / loss in € m 33.7 21.2 8.2 – 104.5 – 1.1 – 30.9 12.0 20.0 17.8 16.6
earnings per share in € 1.81 1.33 0.50 – 7.26 0.00 – 2.14 0.84 1.40 1.31 1.28
dividend per share in € 0.70 1 0.40 – – – – 0.80 1.10 1.10 1.00
gross margin in % 17.8 16.3 16.2 15.7 13.9 16.1 18.3 19.5 16.8 14.3
ebitda margin in % 5.4 5.0 3.9 – 1.3 2.9 2.0 4.3 5.8 5.6 5.3
ebit margin in % 4.5 3.8 2.4 – 5.0 1.7 0.7 2.6 3.8 3.4 3.4
cash flow from operating activities in € m 30.9 85.9 – 9.8 – 147.6 – 115.5 81.0 198.7 188.4 –80.7 – 123.5
free cash flow in € m – 14.5 40.6 – 46.5 – 206.1 – 150.9 32.9 156.4 121.3 – 135.3 – 151.0
equity (with minority interests) (dec. 31) in € m 341.4 257.1 245.7 248.1 222.7 224.1 270.5 301.4 302.6 247.2
net financial debt 2 (dec. 31) in € m 34.4 61.8 96.5 84.9 242.8 95.0 123.1 289.8 395.9 80.1
net working capital (dec. 31) in € m 151.8 128.9 154.7 171.5 120.5 n. a. n. a. n. a. n. a. n. a.
gearing (dec. 31) in % 9.2 19.4 28.2 25.5 52.2 29.8 31.3 49.0 56.7 24.5
equity ratio (dec. 31) in % 31.4 23.9 23.6 20.9 15.5 13.5 15.1 16.4 20.2 29.7
roce (dec. 31) in % 16.8 15.0 7.6 – 16.9 3.9 n. a. n. a. n. a. n. a. n. a.
employees (dec. 31) 6,143 5,936 5,650 5,992 6,240 12,747 12,902 12,675 11,558 7,255
1 dividend proposal to the annual shareholders’ meeting2 without finance leases
* notes: 1999 to 2002 based on us-gaap
since 2003 based on ifrs
since 2004 continuing operations, that is without the divested business units services (premier group), measuring and process technologies (schenck process) and development test systems
figures from 2004 to 2008 are fully comparable n. a. = not available

166
glossary
a
application technologygeneral term for all products related to the appli-cation of paint and high-viscosity materials, e. g. painting robots, paint atomizers, and color change systems.
atomizer technologypaint atomizers ensure that the paint is applied in a consistent spray jet. a distinction is made between high-speed rotation atomizers and air atomizers. the use of electrostatics in high-speed rotation atomizers generates a high degree of application efficiency.
b
balancing and diagnostic systemsrotating components such as wheels and turbines must be tested for imbalances. the imbalances are equalized because they result in vibrations or oscillations.
bric countriesabbreviation for the fast-growing emerging markets of brazil, russia, india and china.
c
cathodic electro-coatingprocess for applying the first prime coat that pro-tects against corrosion. to coat the interior of the body as well, it is immersed. the coating is applied with the aid of an electronic field. the process is called “cathodic” as the car body serves as the cathode.
claim management claim management deals with customers’ departures from contractual specifications and provisions, e. g. technical changes and delays. the resulting additional expense is charged to the customer.
d
downsizing the development of economical combustion engines that have a smaller cubic capacity but deliver a similar performance as larger engines.
drying oventunnel-like systems for curing freshly applied coats of paint.
e
end of linethe area at the end of vehicle final assembly where fully assembled vehicles are tuned, tested, and prepared for shipping.
engineeringdevelopment and design of machinery and plants. at dürr, engineering often involves developing technical solutions that are geared to customers’ specific production goals.
erp system (enterprise resource planning)software used to support resource planning within a company. erp systems should cover all business processes.
f
filling systemssystems that dispense materials essential for vehicle operation (e. g. brake fluid, air-conditioning refrigerant) in the final assembly stage of produc-tion.
filtration systems (coolant recycling) coolants are used in the machining of workpieces. they cool the workpieces and tools, reduce friction and wear, and bind metal shavings. the recycling or filtration systems cool the used coolant and remove the shavings so the coolant can be reused in the machining process.
front and rear window gluingautomated adhesive application to the front and rear windows with following assembly of the window in the car body.
h
handling robotsrobots that open, hold, and close hoods and car doors at the painting station.
i
industrial cleaning systemscleaning systems remove contaminants from workpieces that arise during the machining process.
l
light vehiclescars and light trucks.
m
manufacturing depththe value added (content) which the company actually contributes itself in the manufacture of a product or a plant.
marriageJoining and bolting together of power train, chassis, and body in vehicle final assembly.
p
pretreatmentthis is the first stage in the painting process. when it comes from the body shop, the bodyshell is first cleaned, degreased and in most cases phosphated in preparation for the next coating. the phosphating produces a corrosion-inhibit- ing conversion layer (non metallic crystalline structure) to which the subsequent paint layers bond better.
s
sealingprocess for sealing welding seams created when car body parts are joined. sealing also includes the application of an undercoating that protects against rock impact.
supervisory control systemcentralized computer system for controlling and supervising control of a complete production plant.
t
test systemsend-of-line systems test the functions of fully assembled vehicles, e. g. headlights and abs.
top coatin painting automobiles, the base coat (containing the color and effect pigments) and the shiny clear coat (protective coat) are applied as the final layers, which are called the top coat.
transfer line integrated cleaning systemscleaning systems (with a high throughput rate) where the workpieces pass through several treat-ment stations, such as cleaning and drying.
turnkeycomplete construction of a plant by a single general contractor.
u
ultrafine cleaningcleaning process that removes contamination on a single-digit μm (micron) scale.
V
visualization technologysoftware for the operation and observation of machinery and equipment with the aid of graphic user interfaces.
voc (volatile organic compounds) Volatile organic compounds are substances contained for instance in solvents that already evap orate at low temperatures and are harmful to the health.
w
wheel geometry measuring systemtheses systems determine the correct alignment of vehicle wheels. the wheels are aligned so that the vehicle’s steering wheel is centered when the vehicle is moving straight ahead, to prevent uneven wear on the tires.
technology and products

1674 management and stock 92 consolidated financial statements 163 other26 management report19 market and business
166 glossary
f
Free Cash Flowfree cash flow is the cash flow from operating activi-ties remaining after deducting capital expenditures and net interest paid and received, and represents the amount of cash that is freely available to pay a divi-dend and to run off debt.
g
gearingthis is the ratio of net financial debt to shareholders’ equity. the higher the relative weight of net financial debt the higher the reliance on external lenders. However, a high gearing is not necessarily negative if the interest paid does not reduce profits excessively.
net financial debt100 (%)
(net financial debt + shareholders‘ equity)
l
liquidity ratios: Cash ratio and quiCk ratiothese two liquidity ratios show the degree to which current liabilities are covered by cash and cash equivalents (and other current assets). they serve to measure a company’s solvency.
cash and cash equivalents100 (%)
current liabilities
cash and cash equivalents + short-term receivables100 (%)
current liabilities
n
net FinanCial debtthis represents the balance of the financial liabilities reported in the balance sheet after deducting cash and cash equivalents. if a company’s cash and cash equivalents exceed its financial liabilities it is de facto debt free.
financial liabilities
cash and cash equivalents
net working Capital (nwC)this is a measure of the net funding required to finance current assets. negative nWc is beneficial since it implies that sales are prefinanced by suppliers and customers. at dürr, the prepayments received from customers are an important factor affecting nWc. the formula shows a simplified calculation.
inventories trade receivables trade payables
nopat (net operating profit after taxes)nopat is operating profit (ebit) less company- specific taxes. it is used to calculate other perfor-mance indicators such as “economic Value added” (see page 57).
ebit company-specific taxes
r
return on Capital employed (roCe)this measures the rate of return on the capital tied up in a company’s operating assets (for instance in machinery and equipment, inventories, accounts receivable) and is the ratio of earnings before interest and taxes (ebit) to capital employed.
ebit100 (%)
capital employed
return on equity (roe)this is the rate of return earned on shareholders’ equity. it should exceed the rate of return on a comparable investment.
earnings after taxes100 (%)
shareholders‘ equity
return on investment (roi)this ratio serves to measure how efficiently a company employs the total resources at its disposal.
earnings after taxes + interest expense100 (%)
total assets
W
waCC (weighted average Cost of Capital)the weighted average cost of capital reflects the opportunity cost of the capital invested taking the company’s financing structure into account, in other words what minimum rate of return the company has to earn to justify an investment.
equity cost of equity in %
1 tax ratedebt cost of
debt in %total capital total capital
FinanCial

168
index
b
balance sheet key figures 58
board of management 4, 29, 155
board of management’s overall assessment 40
c
capital increase 11, 54, 130
cash flow 55, 142
company value 57
consolidated balance sheet 95, 122
consolidated cash flow statement 99, 142
consolidated income statement 94, 116
d
declaration of compliance with the german corporate governance code 13
dividend 12, 48
“dürr 2010“ strategy program 37
e
earnings 47
employees 66
equity 58, 130
eVa 57
f
financial calendar 169
free cash flow 56
funding 54, 136
g
glossary 166, 167
h
highlights from 2008 19
i
independent auditors´ report 93
l
locations 32
m
management report 26
measuring and process systems 28, 52, 144
n
net financial debt 57, 58
notes to the consolidated financial statements 100
o
off-balance sheet financing instruments 55
opportunities 82
outlook 87
p
paint and assembly systems 28, 52, 144
patents 61
positions held by members of the board of management 155
positions held by members of the supervisory board 156
prepayments received 59, 138
r
ratings 82
refinancing 54, 137
remuneration of the board of management 17, 155
remuneration of the supervisory board 18, 157
research and development 61
risk management 72, 147
s
segment information 143
stock 10
supervisory board 6, 18, 156
sustainability 69
t
ten-year summary 164
training 67
forward-looking statements
this annual report includes forward-looking statements about future developments. as is the case for any business activity conducted in a global environment, such forward-looking statements are always subject to uncertainty. our information is based on the conviction and assumptions of the board of management of dürr ag, as developed from the information currently available. however, the following factors may affect the success of our strategic and operating measures: geopolitical risks, changes in general economic conditions (especially a prolonged recession), exchange rate fluctuations and changes in interest rates, new products launched by competitors, and a lack of customer acceptance for new dürr products or services, including growing competitive pressure. should any of these factors or other imponderable circumstances arise, or should the assumptions underlying the forward-looking statements prove incorrect, actual re-sults may differ from those projected. dürr ag undertakes no obligation to provide continuous updates of forward-looking statements and information. such statements and information are based upon the circumstances as of the date of their publication.

Published by: Dürr AG, Otto-Dürr-Strasse 8, 70435 Stuttgart, Germany The English translation of our 2008 annual report is based on the German version. The German version shall prevail.
Design: 3st kommunikation, Mainz, Germany · Setting: Knecht GmbH, Ockenheim, Germany · Printing: Societätsdruck, Walldorf, Germany · Binding: Thalhofer, Schönaich, Germany
FinAnciAl cAlEnDAr 2009
04 / 28 / 2009 interim report on the first quarter of 2009
04 / 30 / 2009 Annual shareholders´ meeting, Stuttgart
08 / 06 / 2009 interim financial report on the first half of 2009
11/ 05 / 2009 interim report on the first nine months of 2009
cOnTAcT
PleaSe contact uS for
further information
Dürr AG
corporate communications & investor relations
Otto-Dürr-Strasse 8
70435 Stuttgart
Germany
Phone +49 711 136-1785
Fax +49 711 136-1716
www.durr.com

MiLESTONES 2008
reopening at dürr Brasildürr Brasil celebrates the re-opening of its plant that was destroyed by fire in 2006 with an Open House event for cus-tomers.
largest-ever order for bal ancing systemsSchenck RoTec books the larg- est order in its more than 100-year history, supplying the entire balancing and spinning technology for turbine produc-tion at Alstom Power in the USA.
heinz dürr Innovation awardSupervisory Board Chairman Heinz dürr awards staff teams for innovative ideas for the seventh year.
successful start of production in ChinaAt the inauguration of their new paint shop in wuhan, Peugeot Citroën and its joint venture partner dongfeng laud the high quality of the systems supplied by dürr.
January
FeBruary
aprIl
May
Junelower costs per unitdürr presents the innovative EcopurgelCC color changer at vw’s booth at the Hanover Trade fair. This technology sub-stantially reduces paint loss per change and thus costs per unit.
Fiat Quality award BrazilAt its annual Supplier Confer-ence in São Paulo, fiat honors dürr for its achievement in in-stalling painting robots with - out interrupting production.
praise for “Campus energy 21”Baden-württemberg’s Environ-ment Minister Tanja gönner praises the forward-looking ener-gy concept for the dürr Campus as a “lighthouse” project. in the autumn, “Campus Energy 21” is awarded the german Solar Energy Prize.
successful capital increaseTo further improve its financing structure, dürr increases its capital stock by just under 10 %. The proceeds amount to € 43.7 million.
Customer day in Indiadürr presents its specially tailored product portfolio for the growth markets of Asia and South America to the specialist public.

topping-out ceremony at the dürr CampusNumerous guests attend the topping-out ceremony for our new office building in Bietig-heim-Bissingen. The three mod-ern pavilions will be occupied in summer 2009.
dürr ecoclean wins large order from BMwBMw group places an order with dürr for the cleaning sys-tems for the production of a new four-cylinder engine. it is the biggest order dürr has ever received from BMw for cleaning technol ogy.
award from Forddürr and volvo Car Company jointly receive the Henry ford Technology Award for a system for “perfect steering-wheel alignment“.
a world first – the Ecodryscrubber dürr presents the Ecodryscrub-ber paint booth concept, which enables energy consumption in the automobile painting process to be reduced by up to 30 %. The painting process is the most en-ergy-intensive step in vehicle manufacture.
septeMBer
oCtoBer
deCeMBer
assembly line for airbusdürr and EdAg commission a complete aircraft assembly line for Airbus in Tianjin, China. The order is a landmark in the indus-try. it is the first time that a pro- ject of this kind is realized on a turnkey basis by just two suppli-ers.
dürr and edag establish a joint venturedürr and EdAg join forces to step up the marketing of their combined offering for the aircraft industry through the joint ven-ture dürr EdAg Aircraft Systems gmbH.
new financing packagedürr closes a € 440 million syndicated loan with a banking consortium. A few weeks later dürr redeems half (€ 100 million) of its high-yield bond.
august
July
dürr and Ford sign a frame- work agreementdürr becomes an Aligned Business framework (ABf) partner of ford. This means that in future ford will approach dürr first with planned paint systems projects.
large robot revamp projectdürr successfully revamps two complete top coat paint lines at vw’s Zwickau plant in just three weeks.

technologies · systems · solutions
www.durr.com